Finding transition pathways using the string method with swarms of trajectories
19
Finding Transition Pathways Using the String Method with Swarms of Trajectories Albert C. Pan * , Deniz Sezer ‡ , and Benoît Roux *,† * Institute of Molecular Pediatric Sciences, Gordon Center of Integrative Science, University of Chicago, Chicago, Illinois † Bioscience Division, Mathematics and Computer Science Division, Argonne National Laboratory, Argonne, Illinois ‡ Department of Physics, Cornell University, Ithaca, New York Abstract An approach to find transition pathways in complex systems is presented. The method, which is related to the string method in collective variables of Maragliano et al. [J.Chem. Phys. 125:024106 (2006)], is conceptually simple and straightforward to implement. It consists in refining a putative transition path in the multi-dimensional space supported by a set of collective variables using the average dynamic drift of those variables. This drift is estimated on-the-fly via swarms of short unbiased trajectories started at different points along the path. Successive iterations of this algorithm, which can be naturally distributed over many computer nodes with negligible inter-processor communication, refine an initial trial path toward the most probable transition path (MPTP) between two stable basins. The method is first tested by determining the pathway for the C 7eq to C 7ax transition in an all-atom model of the alanine dipeptide in vacuum, which has been studied previously with the string method in collective variables. A transition path is found with a committor distribution peaked at 1/2 near the free energy maximum, in accord with previous results. Lastly, the method is applied to the allosteric conformational change in the nitrogen regulatory protein C (NtrC), represented here with a two-state elastic network model. Even though more than 550 collective variables are used to describe the conformational change, the path converges rapidly. Again, the committor distribution is found to be peaked around 1/2 near the free energy maximum between the two stable states, confirming that a genuine transition state has been localized in this complex multi-dimensional system. I. INTRODUCTION Conformational changes in large biomolecules are complex and slow processes taking place on timescales that are beyond the reach of brute force molecular dynamics simulations. Assuming that the conformational transitions occur between stable states implies that the long- time behavior of the system can be described in terms of transition rate constants. A central concept in the characterization of slow processes is the potential of mean force along the reaction coordinate describing the mechanism of the transition [1]. In practice, however, identifying a “good” reaction coordinate able to capture the microscopic mechanism that is responsible for the dynamical bottleneck separating the stable states in a complex system is challenging. To help resolve this issue, it is sometimes useful to use methods like umbrella sampling to map out the free energy landscape explicitly for a few promising coordinates. The latter can then be examined to reveal the mechanism and seek out the most plausible pathway between stable states (see [2], for example). Nonetheless, the efficiency of umbrella sampling methods scales poorly with the number of coordinates used, and their applicability becomes prohibitive when the dimensionality of the subspace is greater than 2 or 3. To reduce the NIH Public Access Author Manuscript J Phys Chem B. Author manuscript; available in PMC 2009 October 5. Published in final edited form as: J Phys Chem B. 2008 March 20; 112(11): 3432–3440. doi:10.1021/jp0777059. NIH-PA Author Manuscript NIH-PA Author Manuscript NIH-PA Author Manuscript
-
Upload
independent -
Category
Documents
-
view
1 -
download
0
Transcript of Finding transition pathways using the string method with swarms of trajectories

Finding Transition Pathways Using the String Method withSwarms of Trajectories
Albert C. Pan*, Deniz Sezer‡, and Benoît Roux*,†* Institute of Molecular Pediatric Sciences, Gordon Center of Integrative Science, University ofChicago, Chicago, Illinois† Bioscience Division, Mathematics and Computer Science Division, Argonne National Laboratory,Argonne, Illinois‡ Department of Physics, Cornell University, Ithaca, New York
AbstractAn approach to find transition pathways in complex systems is presented. The method, which isrelated to the string method in collective variables of Maragliano et al. [J.Chem. Phys. 125:024106(2006)], is conceptually simple and straightforward to implement. It consists in refining a putativetransition path in the multi-dimensional space supported by a set of collective variables using theaverage dynamic drift of those variables. This drift is estimated on-the-fly via swarms of shortunbiased trajectories started at different points along the path. Successive iterations of this algorithm,which can be naturally distributed over many computer nodes with negligible inter-processorcommunication, refine an initial trial path toward the most probable transition path (MPTP) betweentwo stable basins. The method is first tested by determining the pathway for the C7eq to C7ax transitionin an all-atom model of the alanine dipeptide in vacuum, which has been studied previously with thestring method in collective variables. A transition path is found with a committor distribution peakedat 1/2 near the free energy maximum, in accord with previous results. Lastly, the method is appliedto the allosteric conformational change in the nitrogen regulatory protein C (NtrC), represented herewith a two-state elastic network model. Even though more than 550 collective variables are used todescribe the conformational change, the path converges rapidly. Again, the committor distributionis found to be peaked around 1/2 near the free energy maximum between the two stable states,confirming that a genuine transition state has been localized in this complex multi-dimensionalsystem.
I. INTRODUCTIONConformational changes in large biomolecules are complex and slow processes taking placeon timescales that are beyond the reach of brute force molecular dynamics simulations.Assuming that the conformational transitions occur between stable states implies that the long-time behavior of the system can be described in terms of transition rate constants. A centralconcept in the characterization of slow processes is the potential of mean force along thereaction coordinate describing the mechanism of the transition [1]. In practice, however,identifying a “good” reaction coordinate able to capture the microscopic mechanism that isresponsible for the dynamical bottleneck separating the stable states in a complex system ischallenging. To help resolve this issue, it is sometimes useful to use methods like umbrellasampling to map out the free energy landscape explicitly for a few promising coordinates. Thelatter can then be examined to reveal the mechanism and seek out the most plausible pathwaybetween stable states (see [2], for example). Nonetheless, the efficiency of umbrella samplingmethods scales poorly with the number of coordinates used, and their applicability becomesprohibitive when the dimensionality of the subspace is greater than 2 or 3. To reduce the
NIH Public AccessAuthor ManuscriptJ Phys Chem B. Author manuscript; available in PMC 2009 October 5.
Published in final edited form as:J Phys Chem B. 2008 March 20; 112(11): 3432–3440. doi:10.1021/jp0777059.
NIH
-PA Author Manuscript
NIH
-PA Author Manuscript
NIH
-PA Author Manuscript

computational cost, it is possible, as in metadynamics [3] or the adaptive biasing force (ABF)method [4] to bias the simulations on-the-fly within a given subspace spanned by a fewcoordinates to avoid spending time sampling irrelevant regions. All of these strategies,however, become inefficient if more than a few coordinates are explored. Ultimately, it is clearthat a very large number of coordinates need to be considered in order to capture the mechanismgoverning conformational changes in proteins accurately. Thus, to determine optimal reactioncoordinates for describing conformational transitions, one may need to explore pathways on afree energy surface of high dimensionality.
Many methods have been developed to determine proper transition pathways between stablestates [5–15]. One class of techniques explores the reaction without making any a prioriassumptions about reaction mechanisms. These techniques include transition path sampling(TPS) [9] and the original string method [10] (see also [16]). Important advances to TPS fordiffusive systems have been transition interface sampling [17], and the development of efficientmethods to sample double-ended paths [18]. Application of any of these path sampling methodsto large, diffusive conformational transitions in proteins, however, remains a daunting task.Moreover, gaining physical insight from analyzing the pathway or ensemble of pathwaysfound, such as determining the transition state ensemble, is often as computationally intensiveas finding the paths themselves.
The recently developed string method of Maragliano et al. [12] is based on a different strategy.It aims to discover the minimum free energy path (MFEP) and the free energy along the pathin the subspace corresponding to a large but finite set of coordinates, z, referred to as “collectivevariables”. The MFEP method builds paths onto the free energy surface as a function of thecollective variables. This is advantageous because many of the stiff degrees of freedom thatare often present in the potential energy surface governing the underlying microscopicdynamics can be integrated out. Since a path is a quasi one-dimensional construct in this highdimensional space, little efficiency is lost by increasing the number of collective variables todescribe the transition. In contrast, each additional coordinate used in umbrella samplingrequires the mapping of another dimension in the multi-dimensional free energy landscape.Moreover, if the set of collective variables used to describe the mechanism is large enough(i.e., all the relevant reaction coordinates are included), then the MFEP is also an isocommittorpath. In that case, the transition pathway found is a well-ordered set of states representing theprogress of the reaction from one basin to another.
In the original formulation of the string method in collective variables, the string, orparameterized curve representing the transition pathway, was evolved as a collection of imagesby estimating the mean force and the metric tensor at each image with constrained dynamicssimulations. Here, we propose to evolve the string instead by using a swarm of trajectoriesinitiated from each image to estimate the average drift of each image in collective variablespace.
The theoretical framework is elaborated in Section II. The details of the computational modelsand the simulations are given in Section III. All the results are presented in Section IV, followedby a general discussion in Section V. The paper is concluded in Section VI with an outlook tofuture work.
II. THEORETICAL BACKGROUNDConsider a molecular system described by the Cartesian coordinates X ∈ ℝ3N and the potentialenergy U(X). The equilibrium statistics of the system at a temperature T is given by theBoltzmann distribution,
Pan et al. Page 2
J Phys Chem B. Author manuscript; available in PMC 2009 October 5.
NIH
-PA Author Manuscript
NIH
-PA Author Manuscript
NIH
-PA Author Manuscript

(1)
where β = 1/kBT is one over Boltzmann’s constant times the temperature. We are interested incharacterizing the slow transitions between two basins corresponding to stable states definedby a set of n collective variables z = {z1, z2, …zn}, such that n ≪ N. To this end, the mostprobable transition path (MPTP), loosely defined as the most probable sequence of time-ordered configurations visited during a transition between the two states, is a very useful andpowerful concept. Defining the potential of equilibrium mean force for the collective variablesz as,
(2)
we assume that, over some coarse-grained timestep δτ, the collective variables evolveaccording to non-inertial Brownian dynamics on a free energy surface [19],
(3)
where Dij is the diffusion tensor, Fi = −∂i (z) is the mean force, and Ri(0) is a Gaussian thermalnoise, with ⟨Ri(0)⟩ = 0, and ⟨Ri(0) Ri(0)⟩ = 2Dijδτ. The timestep, δτ, is, in some sense, similarto the lag time used in Markov models [20,21]. In principle, the value of an appropriate δτ fora specific system would need to be established.
It should be emphasized that no assumptions are made here about the underlying microscopicdynamics that govern the evolution of the Cartesian coordinates X(t) giving rise to the effectivenon-inertial dynamics of the collective variables z. In fact, the variables X(t) need not evolvewith either Brownian or Langevin dynamics, and may instead evolve with Newtonian dynamicsas is often the case in all-atom MD simulations of biomolecular systems with explicit solvent.In the present development, we forgo entirely the question of how the effective dynamics ofz might emerge from the microscopic dynamics of X.
Let us now consider a path z(α) connecting two stable states in the system. The path is a listof collective variables parameterized by α, where α = 0 corresponds to the starting state andα = 1 corresponds to the final state. The MPTP has the property that a system initiated anywherealong the path connecting the two stable basins has the highest probability to evolve whileremaining along the path. In Eq. 3, this condition on the MPTP is met when the thermal noiseRi is equal to zero (i.e., Ri is a Gaussian variable with zero mean so zero is its most probablevalue). Equivalently, this is realized when the system evolves according to,
(4)
Pan et al. Page 3
J Phys Chem B. Author manuscript; available in PMC 2009 October 5.
NIH
-PA Author Manuscript
NIH
-PA Author Manuscript
NIH
-PA Author Manuscript

If the diffusion tensor were independent of z, then the MPTP has the property that (DF)⊥ = 0everywhere along the path. We note that this path differs from one constructed such that F⊥ =0, which is not invariant upon a change of scale of the collective variables. Therefore, thediffusion tensor establishes the “metric” in the subspace of the collective variables.
In practice, a path is represented by an ordered sequence of M discrete “images”, {z(1), z(2),…, z(M)}. An algorithm for converging an arbitrary initial path of M images toward the MPTPwould evolve each image until the propagation only moved each image along the path. In otherwords, at convergence, there should be no movement of the images perpendicular to the path.One may note, however, that repeated propagation according to Eq. 4 will also move the imagesdownhill toward the regions of low free energy, which is undesirable. A solution to resolvethis issue is to impose a constraint on the distances between path images after each iteration[10]. For example, an equal Euclidean distance could be maintained between each image. Sucha constraint prevents images from pooling together into the stable basins, allowing the reactionpath to remain well-resolved, especially in high energy transition regions. This idea is animportant insight of the string method [10,12,22,23], and is called re-parameterization. Adepiction of an algorithm to find the MPTP by evolving the images with re-parameterizationis shown in Fig. 1.
To evolve an initial path toward the MPTP, an approximation to the propagation correspondingto Eq. 4 is needed. A natural way to accomplish this is to use the average drift evaluated froman ensemble of unbiased trajectories of length δτ initiated from each image [24],
(5)
where it has been assumed that the thermal noise Ri in Eq. 3 cancels out by construction(averages over an ensemble of trajectories with constrained initial conditions are indicated asoverline bars). The swarm-of-trajectories estimation method is depicted schematically in Fig.1(b) for a segment of a path shown in Fig. 1(a). For each image, the system X is first thermalizedwith a bias potential restraint to keep the collective variables near z(m), and then those restraintsare released to generate the unbiased trajectory. In this way, a formal estimate of the averagedrift is achieved without any assumptions about the dynamical character of X(t). Afterevolution, the path is then modified to satisfy the re-parameterization conditions as in theoriginal string method in collective variables [10,12,22,23]. This process can be repeated anynumber of times to generate a collection of unbiased trajectories, each starting near one of theM images of the path.
In practice, one cycle of the swarm-of-trajectories string method for determining the MPTPconsists of 5 steps:
i. Prepare a configuration with X coordinates for each of the M images of the path whosecorresponding collective variables z are close to the value z(m), for m = 1, M.
ii. Generate an equilibrium (thermalized) trajectory for the each of the M images withz restrained around the value z(m), for m = 1, M.
iii. Using configurations from the trajectories generated in (ii) as initial configurations,run large numbers of short unbiased trajectories for each of the M images.
iv. Use the resulting average displacement, , to determine the position in collectivevariable space of each of the M images.
Pan et al. Page 4
J Phys Chem B. Author manuscript; available in PMC 2009 October 5.
NIH
-PA Author Manuscript
NIH
-PA Author Manuscript
NIH
-PA Author Manuscript

Re-parameterize the path to ensure that the images are equidistant in collectivevariable space.
This cycle should be repeated until convergence is reached. Details for how each of these stepsare accomplished in specific applications will be addressed below.
The swarm-of-trajectories string method for evolving the images along the path is based uponthe following observation. Because the collective variables obey the BD dynamics via Eq. 3,the converged MPTP has the property that . In effect, once the path described by thiscondition has been determined, it traces the trajectory that the overdamped dynamics of thevariable z follow after starting at the saddle point without the random kicks caused by thethermal noise. From this point of view, the MPTP corresponds to the zero-temperature path onthe free energy surface (z), though the evolution of the degrees of freedom, X, of the all-atomsystem is nonetheless taking place at a finite (non-zero) temperature. This may affect theconvergence. However, since the algorithm is working in the subspace of the collectivevariables where the free energy landscape is expected to be significantly smoother than thepotential energy, U(X), getting trapped in local minima may not be a critical issue.
III. COMPUTATIONAL DETAILS1. Alanine dipeptide in vacuum
The structure of alanine dipeptide is shown in Fig. 2(a). For this system, all calculations wereperformed using the CHARMM simulation program [25] and the CHARMM22 force fieldwithout the CMAP correction [26]. Langevin dynamics trajectories were generated with auniform friction coefficient of 10.0 ps−1 on all atoms at 300 K. The simulations were run invacuum and a dielectric constant of 1 was used. When needed, harmonic dihedral restraintswith a force constant of 1000 kcal/mol/rad2 were applied using the MMFP module. A timestepof 2.0 and 0.5 fs were used during the free and restrained simulations, respectively. The fourdihedral angles φ, ψ, θ, and ζ, indicated in Fig. 2(a), were used as collective variables to describethe path, following [12].
An initial path in dihedral space was created by linearly interpolating 20 images between thetwo stable states defined by (φ, ψ, θ, ζ) = (−82.7, 73.5, 1.6, −4.3) for C7eq and (φ, ψ, θ, ζ) =(70.5, −69.5, −0.8, 5.7) for C7ax. Though the stable states were defined as in [12], their precisedefinition is not expected to be critical since the end-points were allowed to move during therelaxation of the path. Due to the simplicity of the system, the configurations (in Cartesiancoordinate space) of alanine dipeptide corresponding to the collective variables along the initialpath were built using the internal coordinates (IC) module in CHARMM with dihedral anglesfixed at the interpolated values along the path. This straightforward procedure is convenienthere because the simulated system is a small molecule in vacuum, though a restrainedsimulation would normally be required to prepare the atomic coordinates, X, of a system nearthe target collective variable values. Each of the prepared configurations was then minimizedwith dihedral restraints and thermalized with Langevin dynamics.
Each iteration of the path involved the following simulation protocol: (i) construct the dipeptidefrom internal coordinates such that the dihedral angles are close to the target collective variablesof the current path and perform 1000 steps of restrained minimization followed by 10000 stepsof a restrained Langevin simulation to thermalize the system; (ii) run 50000 steps of restraineddynamics; (iii) generate 250 short 20 step unbiased trajectories with no restraints initializedfrom configurations taken from the restrained equilibrium run in the previous step; (iv) updatethe position of the images using the average drift of the swarm of trajectories; and (v) re-parameterize the path. Step (v) involved a linear re-parameterization of the path (see Eq. 49and Eq. 50 in [12]). The path was relaxed for 100 iterations following this procedure.
Pan et al. Page 5
J Phys Chem B. Author manuscript; available in PMC 2009 October 5.
NIH
-PA Author Manuscript
NIH
-PA Author Manuscript
NIH
-PA Author Manuscript
The committor distributions [27,28] along the transition path of alanine dipeptide werecalculated as follows. The committor, pA, was defined as the probability that a givenconfiguration, with initial velocities averaged over a Gaussian distribution, commits to basinA defined as having a dihedral angle φ< 0. A set of independent initial configurations was firstobtained by running a restrained MD simulation at values of ((φ, ψ, θ, ζ) corresponding to atarget position along the path. One thousand initial configurations were extracted from thisrestrained trajectory every 1000 steps. A hundred trajectories of 500 steps were run from eachconfiguration. Values of the committor, pA, were then calculated and binned into a histogram.
2. Two-state elastic network model of NtrCr
A two-state elastic network model to represent the allosteric protein domain NtrCr wasconstructed as follows. Each residue of the protein was represented by a single particle (e.g.,the carbon α position of the residue). For a protein of N residues, a configuration wouldtherefore be described by the Cartesian coordinates X = (x1, x2, …, xN). The energetics of themodel were governed by:
(6)
Here, UA(X) and UB(X) are the (Tirion) [29,30] elastic network model energies of each stablestate:
(7)
where Δxij = |xi − xj|, kA and kB are the elastic network model force constants for each state
and and are the contact matrices given by:
(8)
The contact matrices indicate that only pairs of residues within a certain radius, dA for state A
and dB for state B, should be held harmonically around the target distances, and . Forour model, we took the target distances to be those of the alpha carbon positions of theexperimentally determined structures (Fig. 4). The first term in equation 6 thereforeexponentially mixes two harmonic basins to create a two-state system with a Boltzmannweighting in the manner of [31]. The parameter, βm, modulates the height of the barrier betweenthe two states, and is not to be confused with the actual temperature of the system. Following[32], we modified the elastic force constants constants, kA,B, to reduce the unphysical strainimposed by the elastic network model framework on large amplitude conformational changes(see below).
The final term in Eq. 6 is the repulsive potential
(9)
Pan et al. Page 6
J Phys Chem B. Author manuscript; available in PMC 2009 October 5.
NIH
-PA Author Manuscript
NIH
-PA Author Manuscript
NIH
-PA Author Manuscript

where ε modulates the strength of the repulsion and σ controls its length scale. This termrepresents the hard core repulsion between different residues.
The dynamics of the two-state elastic network model was propagated with Langevin dynamicsat a temperature of 300 Kelvin with a uniform mass and friction of 100 AMU and 30 ps−1,respectively, per coarse-grained particle. The elastic network force constants, kA and kB, wereset equal and defined, according to [32], as site-dependent force constants, kij, such that
where εk was taken to be 0.5 kcal/mol. Thecarbon alphas of the averaged NMR structures, Protein Data Bank ID’s 1DC7 and 1DC8, were
used as reference states for the contact matrices, and , respectively, and dA = dB = 11.5Å. The parameters, ε and σ, for the hard core repulsion term, UR, were chosen to be 1 kcal/moland 2.5 Å, respectively. The timestep was taken to be 2.5 fs when the system was restrainedand 50 fs when the system was free. Finally, the exponential mixing coefficient, βm, was takento be 0.005.
An initial path in collective variable space was created by linearly interpolating 50 imagesbetween the two stable states defined by a set of 553 inter-residue distances. Due to thecomplexity of the conformational change involved in this system, initial structures along thepath cannot be constructed in the same way as done with alanine dipeptide. Instead, the initialpath for the conformational change in NtrCr was prepared using a targeted simulationtechnique. The crystal structure (1DC7) was gradually pulled from one image to another alongthe initial pathway defined in collective variable space. For each image, 10000 steps ofrestrained dynamics with 100 kcal/mol harmonic restraints on each of the 553 inter-residuedistances was run using as an initial configuration the last configuration from the restraineddynamics run of the previous image.
The iteration of the path method followed a protocol similar to that of alanine dipeptidedescribed above. (i) Thermalize an initial configuration (here, the initial configurationcorresponded to the final configuration of the image from the last iteration) for 10000 stepswith Langevin dynamics for each image; (ii) Run an additional 50000 steps of a restraineddynamics simulation at each of the images saving a configuration every 500 steps in preparationfor the next step; (iii) Initiate 100 short (10 step) trajectories from the configurations saved inthe previous step; (iv) update the position of the images using the average drift of the swarmof trajectories; and; (v) re-parameterize the path. The path was relaxed for 100 iterationsfollowing this procedure.
The committor distributions were also calculated in the same way as for alanine dipeptide. Weran 100 trajectories of 2000 steps from a configuration of interest each time with velocitiesdrawn randomly from a Gaussian distribution. The initial configurations used were obtainedfrom restrained dynamics run at various points along the path. A configuration was consideredcommitted to basin A if its RMSD was less than 2 Å from the inactive NtrCr conformation.
For comparison, the transition was also characterized in terms of the order parameter Δη, thedifference in the fraction of the number of native contacts between the two stable states, Δη =ηA − ηB [33]. The free energy profile as a function of Δη was computed using 140 umbrella
sampling windows with the harmonic bias potential . Native contactswere defined with a cutoff of 6.5 Å using the experimental NMR structures. For the purposeof performing restrained simulations with Δη we define the fraction of native contacts as:
(10)
Pan et al. Page 7
J Phys Chem B. Author manuscript; available in PMC 2009 October 5.
NIH
-PA Author Manuscript
NIH
-PA Author Manuscript
NIH
-PA Author Manuscript

where is the total number of contacts in each conformation, the sum is over all native
contact pairs, and is the sigmoidal function:
(11)
where γ = 1.2 and w = 0.1 Å. The windows ranged from values of Δηi = −0.35 to 0.35 withkNC = 50 kcal/mol. Different windows were combined with the weighted histogram analysismethod (WHAM) [34]. The committor was calculated by running 100 short trajectories of 2000steps initiated from 1000 independent configurations restrained to be at a value of Δη = −0.03corresponding to the top of the free energy barrier in Fig. 6(a).
IV. RESULTSA. Application of the swarm-of-trajectories string method to the alanine dipeptide
First, the swarm-of-trajectories string method is illustrated for the C7eq to C7ax transition in thealanine dipeptide. The conformational transitions in the alanine dipeptide molecule, shown inFig. 2(a), have been the subject of several previous studies [12, 35–37]. This is due, in part, toits biological relevance, but also to its simplicity. Of particular interest is the transition betweenthe the C7eq and C7ax conformation, corresponding to two stable basins in the potential energysurface shown as a function of the φ and ψ torsion angles in Fig. 2(b).
Previous studies found that the φ and ψ angles are not, in fact, “good” reaction coordinates fordescribing the C7eq-C7ax transition. In other words, a dynamic description based on these twoangles φ and ψ alone is actually insufficient to correctly track down the dynamical progress ofthe system [35,36]. The implication is that other degrees of freedom, which cannot be ignored,must be strongly coupled to the transition. In their study, Maragliano et al [12] found that thefour dihedral angles φ, ψ, θ, and ζ, shown in Fig. 2(a), could describe the transition pathwaydynamically. To make the comparison with their studies more transparent, we use the samechoice of collective variables.
The swarm-of-trajectories string method was initiated from a linearly interpolated path andthen iterated for 100 cycles to determine the MPTP between the C7eq and C7ax conformations.The resulting four dimensional transition pathway projected onto two dimensions is shown inFig. 2(b). The free energy along the final converged path is shown in the top panel of Fig. 3.The estimate of the free energy along this path was obtained by integrating the total derivativeof the free energy along the path [12]:
(12)
In other words, the path free energy can be found as a sum over the product of the mean forceat each image multiplied by the curvature of the path at that point. With no additionalcomputational effort, the mean force can be estimated for each image during the restrainedequilibration step using the displacement of the collective variables from their target positionsalong the path. This free energy estimation method is discussed in detail in [12]. We found thatthe path converged after 80 iterations because the fluctuations of the free energy along the pathduring the last 20 iteration cycles were small (i.e., within the size of the circles in Fig. 3).
Pan et al. Page 8
J Phys Chem B. Author manuscript; available in PMC 2009 October 5.
NIH
-PA Author Manuscript
NIH
-PA Author Manuscript
NIH
-PA Author Manuscript

To demonstrate that the final path is dynamically relevant, we calculated the committordistributions near the free energy barrier [27]. If the path is indeed an isocommittor path, thenthe distribution of the committor, pA, along the path should move monotonically from 1 to 0and the distribution of the committor for the image at the free energy maximum shouldcharacterize the transition state ensemble. This is shown in the bottom panel of Fig. 3. We notethat a previous study found that only 2 dihedrals are necessary to describe this conformationalchange in alanine dipeptide (either φ and θ or ψ and θ [35]). As mentioned earlier, we chose 4dihedrals as a proof of principle that this method can describe pathways with many collectivevariables. This demonstrates that a dynamically relevant path can be found even with theintroduction of dynamically irrelevant collective variables.
B. Application of the swarms-of-trajectories string method to NtrCr
To illustrate the swarms-of-trajectories string method in the case of a non-trivialmultidimensional system, we determined the MPTP for a model of the nitrogen regulatoryprotein C receiver domain (NtrCr), a two-state allosteric protein involved in bacterial signaltransduction [38,39]. Phosphorylation of an aspartate residue modulates the populationequilibrium between the active and inactive conformations and atomic structures of both theseconformations have been solved by NMR [39].
For the sake of simplicity, we use a coarse-grained two-state elastic network model of theprotein such that each residue is represented by a single particle (the carbon α). The presentmodel is constructed to incorporate the topological constraints arising from the connectivityof the polypeptide chain as well as the residue-residue core repulsion. The details of the model,described above, builds on previous work describing similar models [31,32,40–42]. Althoughsuch coarse-grained models are highly simplified caricatures of a protein, they provide a usefulframework for understanding conformational changes. By construction, our model possessessome of the fundamental ingredients that are at the origin of the complexity of the atomicmotions during the conformational change. This should be adequate for the purpose ofillustrating the method with a non-trivial multi-dimensional system.
The two states of the NtrCr elastic network model are shown in Fig. 4. The coloring schemecorresponds to the average strain energy per residue. The strain energy is a measure of theextent of inter-residue distance change during the conformational transition and is here defined
as . This is also the quantity used to modulate the value the elastic forceconstants (see methods). The average strain energy of the ith residue is defined as Σjsij/Ni whereNi is the number of residues having elastic interactions with residue i. The figure illustratesthat the conformational change mainly occurs on the left side of the protein, the switchingregion.
A priori, string-based transition path methods remain effective even if a very large number ofcollective variables is used to describe the path in NtrCr. Thus, we chose an exhaustive list ofover 550 inter-residue distances to characterize the transition. The list of distances was takento be the target distances in the two stable states, which differed by more than a cutoff valueof ΔΔx in absolute value. That is, the intermolecular distance between residue i and j was
included if . Here, we took Δxmin = 5 Å, resulting in 553 distances.
The free energy along the NtrCr pathway is shown in the top panel of Fig. 5. The free energybarrier converged to ~ 30 kcal/mol from an initial value of ~ 400 kcal/mol resulting from thetargeted simulation technique after 50 iterations. As a test of the dynamical relevance of thepath obtained and the suitability of using a large set of inter-residue distances as appropriatereaction coordinates for describing the conformational change, we calculated the committordistribution, N(pA), at several images along the converged string. The lower panel of Fig. 5
Pan et al. Page 9
J Phys Chem B. Author manuscript; available in PMC 2009 October 5.
NIH
-PA Author Manuscript
NIH
-PA Author Manuscript
NIH
-PA Author Manuscript

shows N(pA) at three points along the path indicating that we have indeed found anisocommittor path. A large collection of inter-residue distances is therefore a good reactioncoordinate for protein conformational changes, at least for the coarse-grained model studiedhere. Moreover, our modification of the original string method in collective variables stillretains the ability to find isocommittor pathways in a complex system.
To illustrate the difficulty in finding a subset of dynamically meaningful collective variablesin a multi-dimensional system, we tested the ability of the fraction of native contacts, η, areaction coordinate that is commonly used in protein folding [28,33], to describe theconformational change. Since we are studying the transition between two conformations of aprotein, the collective variable we used was the difference in the fraction of native contactsbetween the two states, Δη. We began by computing the free energy, or potential of mean force,
(Δη), shown in Fig. 6(a). The free energy has a well-pronounced barrier separating two stablebasins, though the maximum is much smaller than in Fig. 5. If Δη were indeed a good reactioncoordinate for describing the conformational transition, then an ensemble of configurationsrestrained to be at the free energy maximum should have a committor distribution peakedaround 0.5, indicating that they all belong to the dynamical bottleneck in the conformationaltransition. Instead, we find that the committor is mostly peaked at 0, with a few examples ofvalues greater than 0 that are randomly distributed (Fig. 6(b)). This indicates that the differencein the fraction of native contacts is not a suitable reaction coordinate for describing thisconformational change [28].
V. DISCUSSIONThe string method with swarms of trajectories presented here is conceptually simple andstraightforward to implement. Using the information from the average systematic drift of thecollective variables from short trajectories, the algorithm progressively refines an initial trialpath toward the most probable transition path (MPTP) between two stable basins. The methodwas illustrated with applications to conformational transitions in alanine dipeptide and to atwo-state elastic network model of the allosteric nitrogen regulatory protein C receiver domain(NtrCr). Calculated committor distributions confirm that genuine transition states werelocalized. In the applications, the CHARMM program was used to simulate alanine dipeptideand an in-house program was used to simulate the two-state network model. The main iterationcycle was driven via scripts external to the simulation programs, so that a number of MDpackage could be used to propagate the system. Furthermore, the method lends itself naturallyto a distributed computing strategy, since it is based on a large number of independentasynchronous calculations that require very infrequent communications. From this point ofview, the computational effort for relaxing a path is spent very effectively.
The swarms-of-trajectories string method exploits the natural BD time-evolution of z(t), whichis constructed on-the-fly from the complete and unbiased dynamics of X(t). This provides aroute to estimate both the average drift and the magnitude of the fluctuations:
(13)
Thus, the swarm-of-trajectories can be used to estimate the first two moments of a localGaussian approximation to the short-time propagator, P [z(τ), z′(τ + δτ)], valid only in theneighborhood of z,
(14)
Pan et al. Page 10
J Phys Chem B. Author manuscript; available in PMC 2009 October 5.
NIH
-PA Author Manuscript
NIH
-PA Author Manuscript
NIH
-PA Author Manuscript

Clearly, a proper estimate of the propagator in the neighborhood of z will depend on the choiceof δτ. As discussed in [24], δτ should be longer than the molecular relaxation time governingthe fast initial relaxation processes of the system, but should not be so long that the curvatureof the underlying free energy surface begins to be resolved. Evidence of the latter could bedetermined from monitoring the time evolution of the averages and standard deviations ofdifferent trajectories within a swarm. More systematic methods for choosing a proper δτ willbe explored in future work.
One could imagine using a chain of such short-time propagators to evaluate the probability ofdifferent path realizations. Considering a given path of length τ = Mδτ, supported by M imagesat {z(1), z(2), …z(M)}, the probability of this path realization is proportional to
(15)
By definition, the MPTP corresponds to the particular realization that maximizes [z(1), z(2),…z(M); τ], while asymptotically taking the time τ to infinity. It is in this sense that the MPTPcorresponds to a noiseless path (effectively, at a temperature of “zero”). These considerationscould be helpful to handle the contributions from paths deviating away from the MPTP, whichare obtained by allowing finite temperature fluctuations of the string.
Lastly, it is worthwhile noting that there are similarities and differences between the presentapproach and the string method in collective variables introduced by Maragliano et al. [12],which largely inspired out efforts. From the applications presented in this work, particularlyin the alanine dipeptide example, it appears that the MPTP found with the swarm-of-trajectoriesstring method is similar to the MFEP, which would be found by the string method in collectivevariables. The underlying perspective of the two methods, however, is somewhat different. Inparticular, we are making the assumption that the collective variables effectively evolveaccording to overdamped non-inertial BD over some coarse-grained timestep δτ. This leads toEq. 4 to evolve an initial path toward the MPTP. Such an assumption is not invoked in ref.[12], where a variational argument was used to derive the evolution equation for relaxing aninitial path toward the MFEP (see section III in [12]). This led to Eq. 18 of ref. [12] to evolvean initial path toward the MFEP. The M tensor in the latter, which is evaluated as a localaverage, is not identical to the effective diffusion tensor D in Eq. 4, which is estimated fromunbiased trajectories of length δτ. Therefore, it appears that the propagation of the images torelax the path in the two approaches is not exactly the same. More work will be needed toclarify this point further.
VI. CONCLUSIONAn approach based on the string method in collective variables of Maragliano et al. [12] todetermine transition pathways in complex systems was presented. This method progressivelyrefines an initial trial path toward the most probable transition path (MPTP) between two stablebasins by using the average drift of the collective variables, estimated on-the-fly via a swarmof short unbiased trajectories. The method was implemented and illustrated with applicationsto two non-trivial systems. In both cases, a genuine transition state region was localized, asdemonstrated by committor distributions. This implies that, in principle, one may be able toinitiate reactive trajectories from the transition state and perform TPS simulations [9].Similarly, the converged, parametrized path along α could serve as a framework for othermethods, such as the λ-interfaces in transition interface sampling [17], for calculatingdynamical quantities
Pan et al. Page 11
J Phys Chem B. Author manuscript; available in PMC 2009 October 5.
NIH
-PA Author Manuscript
NIH
-PA Author Manuscript
NIH
-PA Author Manuscript

The string method with swarm-of-trajectories to determine the MPTP is conceptually simpleand computationally efficient. During an iteration, the computations required for each imageon the string can be distributed to separate compute nodes. From a practical point of view, therequired iterative procedure can be implemented at a script level for any MD program, as longas the desired biasing restraints are available. The approach is flexible and a number ofadditional concepts and idea could readily be implemented. For example, in the spirit of thefinite temperature string method [22], random kicks could be included to evolve the imagesduring each iteration. This would allow the possibility of avoiding local minima, as well assampling multiple transition pathways.
Our hope is that the present method will be useful in the study of conformational changes inlarge protein systems. More work will obviously be needed to refine practical and formalaspects of the method in real biomolecular applications. In particular, computational strategiesto exploit the MPTP in the calculations of transition rates would be useful. Technical issuessuch as re-parameterization, finite-temperature evolution, exploring the dependence on thecoarse-grained timestep, δτ, and parallel tempering, will also require additional efforts. Lastly,additional clarification of the physical significance of the path of maximum probability shouldhelp deepen our understanding of string-based methods.
AcknowledgmentsWe thank Eric Vanden-Eijnden, Luca Maragliano, Aaron Dinner and Giovanni Cicotti for important discussions aboutthis work, which has been supported by the National Institute of Health through the grant CA-NIH93577 and by theNational Science Foundation through the grant MCB-0415784.
VIII. REFERENCES1. Chandler D. J Chem Phys 1978;68:2959–2970.2. Bernèche S, Roux B. Nature 2001;414:73–77. [PubMed: 11689945]3. Laio A, Parrinello M. PNAS 2002;99:12562–12566. [PubMed: 12271136]4. Chipot C, Henin J. J Chem Phys 2005;123:244906. [PubMed: 16396572]5. Fischer S, Karplus M. Chem Phys Lett 1992;194:252–261.6. Schlitter J, Engels M, Krüger P, Jacoby E, Wollmer A. Mol Simul 1993;10:291.7. Jónsson, H.; Jacobsen, KW. Nudged Elastic Band Method for Finding Minimum Energy Paths of
Transitions. In: Berne, BJ.; Ciccotti, G.; Coker, DF., editors. Classical and Quantum Dynamics inCondensed Phase Simulations. Vol. Chapter 16. World Scientific; Singapore: 1998. p. 385
8. Isralewitz B, Gao M, Schulten K. Curr Opin Struc Biol 2001;11:224.9. Bolhuis PG, Dellago C, Chandler D, Geissler P. Ann Rev of Phys Chem 2002;59:291. [PubMed:
11972010]10. EW, Ren W, Vanden-Eijnden E. Phys Rev B 2002;66:052301.11. Elber R. Curr Opin Struc Bio 2005;15:151.12. Maragliano L, Fischer A, Vanden-Eijnden E, Ciccotti G. J Chem Phys 2006;125:024106.13. Branduardi D, Gervasio FL, Parrinello M. J Chem Phys 2007;126:054103. [PubMed: 17302470]14. van der Vaart A, Karplus M. J Chem Phys 2007;126:164106. [PubMed: 17477588]15. Yang H, Wu H, Li D, Han L, Huo S. J Chem Theory and Comp 2007;3:17.16. Vanden-Eijnden, E. Transition path theory. Ferrario, M.; Ciccotti, G.; Binder, K., editors. Vol. 2.
Springer; 2006. p. 43917. van Erp TS, Moroni D, Bolhuis PG. J Chem Phys 2003;118:7762–7774.18. Miller TF, Predescu C. J Chem Phys 2007;126:144102. [PubMed: 17444696]19. Ermak DL, McCammon JA. J Chem Phys 1978;69:1352–1360.20. Swope W, Pitera J, Suits F. J Phys Chem B 2004;108:6571–6581.
Pan et al. Page 12
J Phys Chem B. Author manuscript; available in PMC 2009 October 5.
NIH
-PA Author Manuscript
NIH
-PA Author Manuscript
NIH
-PA Author Manuscript

21. Swope W, Pitera J, Suits F, Pitman M, Eleftheriou M, Fitch B, Germain R, Rayshub-ski A, Ward T,Zhestkov Y, Zhou R. J Phys Chem B 2004;108:6582–6594.
22. EW, Ren W, Vanden-Eijnden E. J Phys Chem B 2005;109:6688–6693. [PubMed: 16851751]23. EW, Ren W, Vanden-Eijnden E. J Chem Phys 2007;126:164103. [PubMed: 17477585]24. Hummer G, Kevrekidis IG. J Chem Phys 2003;118:10762–10773.25. Brooks BR, Bruccoleri RE, Olafson BD, States DJ, Swaminathan S, Karplus M. J Comp Chem
1983;4:187.26. MacKerell AD Jr, Feig M, Brooks CL III. J Comp Chem 2004;25:1400. [PubMed: 15185334]27. Dellago C, Bolhuis PG, Geissler P. Adv Chem Phys 2002;123year28. Du R, Pande VS, Grosberg AY, Tanaka T, Shakhnovich ES. J Chem Phys 1998;108:334–350.29. Tirion MM. Phys Rev Lett 1996;77:1905. [PubMed: 10063201]30. Bahar I, Atilgan AR, Erman B. Fold Des 1997;2:173. [PubMed: 9218955]31. Best RB, Hummer G. PNAS 2005;102:6732–6737. [PubMed: 15814618]32. Okazaki, K-i; Koga, N.; Takada, S.; Onuchic, JN.; Wolynes, PG. PROCEEDINGS OF THE
NATIONAL ACADEMY OF SCIENCES OF THE UNITED STATES OF AMERICA2006;103:11844–11849. [PubMed: 16877541]
33. Socci ND, Onuchic JN, Wolynes PG. J Chem Phys 1996;104:5860.34. Grossfield, A. 2003. http://dasher.wustl.edu/alan/35. Bolhuis PG, Dellago C, Chandler D. PNAS 2000;97:5877. [PubMed: 10801977]36. Ma A, Dinner AR. J Phys Chem B 2005;109:6769. [PubMed: 16851762]37. Ren W, Vanden-Eijnden E, Maragakis P, EW. J Chem Phys 2005;123:134109. [PubMed: 16223277]38. Volkman BF, Lipson D, Wemmer DE, Kern D. Science 2001;291:2429–2433. [PubMed: 11264542]39. Kern D, Volkman BF, Luginbühl P, Nohaile MJ, Kustu S, Wemmer DE. Nature 1999;402:894.
[PubMed: 10622255]40. Maragakis P, Karplus M. J Mol Bio 2005;352:807. [PubMed: 16139299]41. Chu J-W, Voth GA. Biophys J. 2007biophysj.107.11206042. Zheng W, Brooks BR, Hummer G. Proteins 2007;69:43–57. [PubMed: 17596847]
Pan et al. Page 13
J Phys Chem B. Author manuscript; available in PMC 2009 October 5.
NIH
-PA Author Manuscript
NIH
-PA Author Manuscript
NIH
-PA Author Manuscript

Fig. 1.The contours represent schematically a free energy surface in two dimensions and the lineswith circles are paths and their discretized images on this surface. (a) This series of pathsillustrate the iteration of an initial path until it converges to a most probable transition path(shown in red) as discussed in the text. (b) A detail of a portion of the path, which is outlinedby the dashed rectangle in (a) showing a depiction of estimating the drift of an image with aswarm of trajectories. The images on this path have yet to converge because there is an overalldrift of the short trajectories whose displacement is not solely along the current path. The thinred lines depict a swarm of trajectories initiated in the vicinity of one of the images. The thickblack arrow deviating from the image indicates the direction of the average drift and points towhere the image evolves before re-parameterization.
Pan et al. Page 14
J Phys Chem B. Author manuscript; available in PMC 2009 October 5.
NIH
-PA Author Manuscript
NIH
-PA Author Manuscript
NIH
-PA Author Manuscript

Fig. 2.(a) Structure of the alanine dipeptide molecule and the dihedral angles used in describing thepath. (b) The projection onto the φ − ψ plane of the pathway described by the 4 collectivevariables (φ, ψ, θ, and ζ in panel (a)) for the C7eq-C7ax transition of the alanine dipeptide. Thered curve shows the position of the converged pathway and the arrow indicates the position ofthe transition state/free energy maximum along this path (see Fig. 3). The contour lines are anadiabatic map in φ − ψ space.
Pan et al. Page 15
J Phys Chem B. Author manuscript; available in PMC 2009 October 5.
NIH
-PA Author Manuscript
NIH
-PA Author Manuscript
NIH
-PA Author Manuscript

Fig. 3.(Top panel) The free energy along the converged path for the C7eq-C7ax transition of the alaninedipeptide. (Bottom panels) Distributions of the committor, pA, at three α positions near the freeenergy maximum.
Pan et al. Page 16
J Phys Chem B. Author manuscript; available in PMC 2009 October 5.
NIH
-PA Author Manuscript
NIH
-PA Author Manuscript
NIH
-PA Author Manuscript
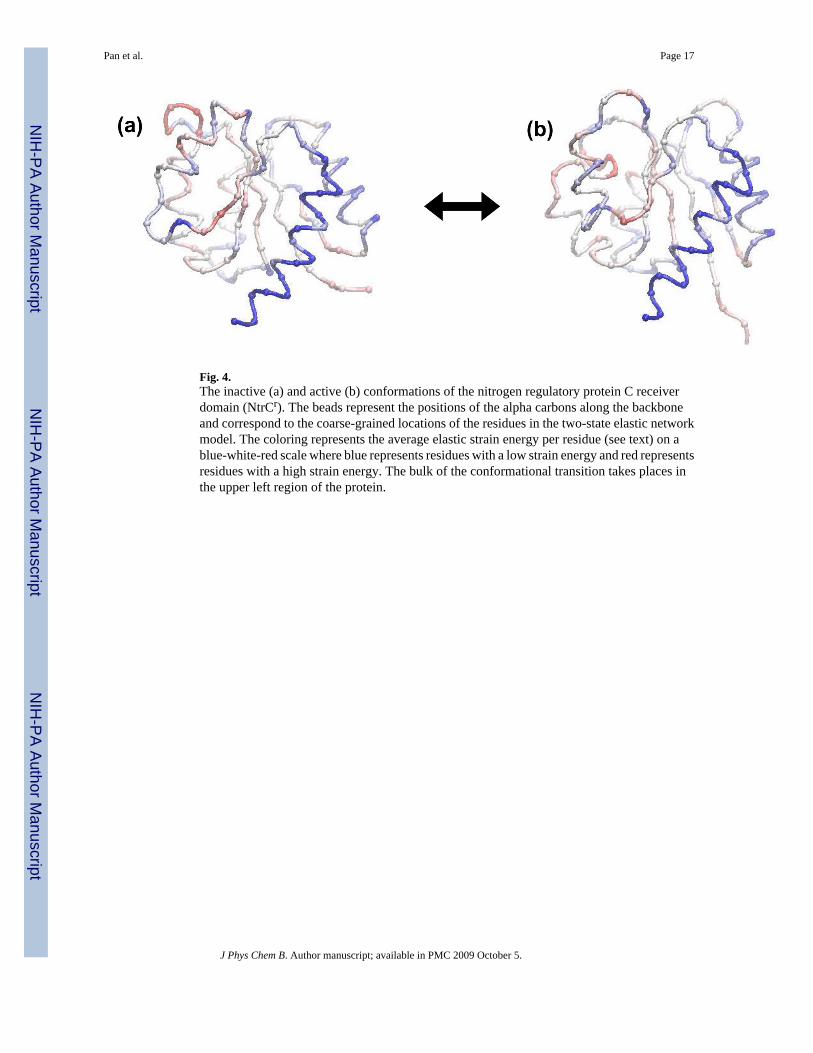
Fig. 4.The inactive (a) and active (b) conformations of the nitrogen regulatory protein C receiverdomain (NtrCr). The beads represent the positions of the alpha carbons along the backboneand correspond to the coarse-grained locations of the residues in the two-state elastic networkmodel. The coloring represents the average elastic strain energy per residue (see text) on ablue-white-red scale where blue represents residues with a low strain energy and red representsresidues with a high strain energy. The bulk of the conformational transition takes places inthe upper left region of the protein.
Pan et al. Page 17
J Phys Chem B. Author manuscript; available in PMC 2009 October 5.
NIH
-PA Author Manuscript
NIH
-PA Author Manuscript
NIH
-PA Author Manuscript

Fig. 5.(Top panel) The free energy along the string averaged over the last 50 iterations. Arepresentative error bar, corresponding to the standard deviation over these 50 samples, isshown at the free energy maximum. (Bottom panels) Distributions of the committor, pA, atthree α positions near the free energy maximum.
Pan et al. Page 18
J Phys Chem B. Author manuscript; available in PMC 2009 October 5.
NIH
-PA Author Manuscript
NIH
-PA Author Manuscript
NIH
-PA Author Manuscript

Fig. 6.(a) Free energy as a function of the difference of the fraction of native contacts, Δη, betweenthe active and inactive states. (b) The committor distribution for configurations restrained tobe at the value of Δη corresponding to the maximum of the free energy barrier in (a). The insetshows the same distribution on a magnified y-axis scale.
Pan et al. Page 19
J Phys Chem B. Author manuscript; available in PMC 2009 October 5.
NIH
-PA Author Manuscript
NIH
-PA Author Manuscript
NIH
-PA Author Manuscript