qPCR as a powerful tool for microbial food spoilage quantification: Significance for food quality

Performance Characteristics of qPCR Assays Targeting Human- andRuminant-Associated Bacteroidetes for Microbial Source Trackingacross Sixteen Countries on Six ContinentsGeorg H. Reischer,*,†,‡ James E. Ebdon,§ Johanna M. Bauer,† Nathalie Schuster,† Warish Ahmed,∥
Johan Åstrom,⊥ Anicet R. Blanch,# Gunter Bloschl,∇ Denis Byamukama,¶ Tricia Coakley,○
Christobel Ferguson,● Goraw Goshu,◇ GwangPyo Ko,◆ Ana Maria de Roda Husman,△
Douglas Mushi,▲ Ramiro Poma,☆ Bandana Pradhan,★ Veronica Rajal,☆ Margit A. Schade,□
Regina Sommer,■,‡ Huw Taylor,§ Erika M. Toth,☼ Virgil Vrajmasu,⋈ Stefan Wuertz,⧓
Robert L. Mach,† and Andreas H. Farnleitner†,‡
†Research Group Environmental Microbiology and Molecular Ecology, Research Division Biotechnology and Microbiology,Institute of Chemical Engineering, Vienna University of Technology, Vienna, Austria‡InterUniversity Cooperation Centre Water & Health, Vienna, Austria (www.waterandhealth.at)§Environment & Public Health Research Unit, School of Environment and Technology, University of Brighton, Brighton, U.K.∥CSIRO Land and Water, Brisbane, Australia⊥Water and Environment Technology, Chalmers University of Technology, Gothenburg, Sweden#Department of Microbiology, University of Barcelona, Barcelona, Spain∇Institute of Hydraulic Engineering and Water Resources Management, Vienna University of Technology, Vienna, Austria¶Department of Biochemistry, Makerere University, Kampala, Uganda○University of Kentucky, Lexington, Kentucky, United States●ALS Water Sciences Group, Sydney, Australia◇College of Agriculture and Environmental Sciences, Blue Nile Water Institute, Bahir Dar University◆Seoul National University, Seoul, Korea△National Institute for Public Health and the Environment (RIVM), Bilthoven, The Netherlands▲Sokoine University, Morogoro, Tanzania☆Laboratorio de Aguas y Suelos, Instituto de Investigaciones para la Industria Química (INIQUI), Consejo Nacional deInvestigaciones Científicas y Tecnicas and Universidad National de Salta, Salta, Argentina
★Tribhuvan University, Kathmandu, Nepal□Bavarian Environment Agency, Munich, Germany■Institute for Hygiene and Applied Immunology, Water Hygiene, Medical University of Vienna, Vienna, Austria☼Biological Institute, Department of Microbiology, Eotvos Lorand University, Budapest, Hungary⋈Veterinary State Laboratory, Tulcea, Romania⧓University of California−Davis, Davis, California, United States
*S Supporting Information
Received: October 25, 2012Revised: June 11, 2013Accepted: June 11, 2013Published: June 11, 2013
Article
pubs.acs.org/est
© 2013 American Chemical Society 8548 dx.doi.org/10.1021/es304367t | Environ. Sci. Technol. 2013, 47, 8548−8556

ABSTRACT: Numerous quantitative PCR assays for microbialfecal source tracking (MST) have been developed and evaluatedin recent years. Widespread application has been hindered by alack of knowledge regarding the geographical stability and henceapplicability of such methods beyond the regional level. Thisstudy assessed the performance of five previously reportedquantitative PCR assays targeting human-, cattle-, or ruminant-associated Bacteroidetes populations on 280 human and animalfecal samples from 16 countries across six continents. Thetested cattle-associated markers were shown to be ruminant-associated. The quantitative distributions of marker concen-trations in target and nontarget samples proved to be essentialfor the assessment of assay performance and were used to establish a new metric for quantitative source-specificity. In general,this study demonstrates that stable target populations required for marker-based MST occur around the globe. Ruminant-associated marker concentrations were strongly correlated with total intestinal Bacteroidetes populations and with each other,indicating that the detected ruminant-associated populations seem to be part of the intestinal core microbiome of ruminantsworldwide. Consequently tested ruminant-targeted assays appear to be suitable quantitative MST tools beyond the regional levelwhile the targeted human-associated populations seem to be less prevalent and stable, suggesting potential for improvements inhuman-targeted methods.
■ INTRODUCTION
The presence of fecal pollution in environmental waters posesa potential threat to human health all around the globe. Whiletraditional fecal indicator bacteria such as Escherichia coli arecapable of detecting the presence of fecal contamination, they areunable to determine its origin. Understanding the sources ofcontamination is essential for facilitating remediation measures,resolving legal responsibility and characterizing potential publichealth risks via quantitative microbial risk assessment.1 This hasled to the development of a plethora of microbial source tracking(MST) methods, many of which have been recently reviewed.2
During recent years library-independent MST methods suchas those involving genetic markers targeting host-associatedand abundant populations of fecal anaerobic bacteria, e.g. fromthe phylum Bacteroidetes, have become increasingly prom-inent.3,4 The anaerobic members from the phyla Bacteroidetesand Firmicutes numerically and funcionally dominate the intes-tinal microbiota of mammals,4 play an important role in hosthealth and nutrition,5−7 and are therefore prime targets as indi-cators of state-of-the-art fecal pollution detection and charac-terization. In particular, quantitative PCR (qPCR) has emergedas the preferred molecular method of detection, as it offers theability to determine the concentration of a particular target gene(i.e. marker) and not just presence or absence. To date qPCRassays have been developed for various fecal sources includinghumans, ruminants, cattle, swine, gulls, and others.3,4 In additionseveral markers for total fecal pollution have also beenproposed.8−10 However, the widespread use of many qPCRassays has been limited, resulting in a paucity of data regardingthe source-specificity and sensitivity of markers beyond theregional level.11−14
In this study the authors set out to assess the performanceof a range of previously reported qPCR assays targeting host-associated genetic markers from the phylum Bacteroidetes ona transcontinental scale. More than 300 fecal samples werecollected across six continents. The study concept called for25% of the samples, each, to come from the target sourceshumans and ruminant animals and 50% to come from variousnontarget sources. Assays were selected among the methodsavailable at the beginning of the study in 2008 according to the
following criteria: (i) that they targeted either humanor ruminant/bovine sources, (ii) that they reported high levels of specificityin the original publications, and (iii) that they were previouslyevaluated probe-based 5′-nuclease assays. The selected assayswere the human-targeted qPCR assays BacH15 and BacHum,10 thecattle-targeted qPCR assays BacCow10 and BoBac,9 and theruminant-targeted assay BacR.16 All these assays amplify markerssituated in the variable region 2 of the 16S rRNA gene of fecalBacteroidetes and they had shown source-specificities higher than90% in their original publication. The aim of the study was todetermine (i) the prevalence and abundance of the markers infeces of the targeted source-group, (ii) the source-specificity of theassay against nontarget fecal sources, and (iii) the quantitativecontribution of source-associated markers to the total intestinalBacteroidetes community.
■ MATERIALS AND METHODSCollection and Processing of Fecal Samples. During the
period 2007 to 2008 samples of fecal material from healthyhuman volunteers and nonhuman sources were collected byparticipating laboratories in 16 countries: Argentina, Australia,Austria, Ethiopia, Germany, Hungary, Korea, Nepal, Nether-lands, Romania, Spain, Sweden, Tanzania, Uganda, UnitedKingdom, and the United States of America (for a map, seeabstract art). Clearly defined sampling guidelines were circulatedto all partners prior to sampling to ensure that only samples ofknown origin were included in the study and to avoid any con-tamination of samples. Sampling guidelines specifically called forsampling a broad variety of domesticated and wild host animalsfrom various habitats. In total 320 freshly voided, individualfecal samples of known origin were collected during the study.Of these samples 22% were of human origin, 28% of ruminantorigin, and 50% from other animal sources (e.g., wild birds,swine, horses, companion animals). All fecal samples werecollected in sterile sampling vials and transported in the darkand on ice to the individual laboratories. Samples were stored at−20 °C within 6 h after sampling, and DNA extraction wasperformed within two months after sampling.
DNA Extraction. Fecal DNA was extracted using commer-cially available kits (MoBio Power Soil DNA Isolation Kit, the
Environmental Science & Technology Article
dx.doi.org/10.1021/es304367t | Environ. Sci. Technol. 2013, 47, 8548−85568549

Qiagen Stool DNAKit or theQIAmpViral RNAMini Kit), DNAwas precipitated using isopropanol (0.6× volume), and DNApellets were covered with 70% ethanol and shipped to the leadpartner institution in Austria for further analysis. Blankextractions with no added fecal material were also performedin parallel. Upon arrival in Austria all extracted fecal DNAsamples were purified using the Wizard DNA Cleanup Kit(Promega, Mannheim, Germany) to ensure comparable DNApurity and removal of PCR inhibitors. DNA concentrationand quality were subsequently determined using a NanoDropND 1000 UV spectrophotometer (Thermo Fisher ScientificInc., Vienna, Austria). DNA extracts with concentrations of>30 ng μL−1 were diluted 10-fold, in order to bring the DNAconcentration in all extracts to between 3 and 30 ng μL−1 forfurther analysis. The majority of the DNA concentrations in thepurified extracts were between 5 and 12 ng/μL (Figure S1). Thefinal data set included samples of fecal DNA from the followingsources: Homo sapiens (human, n = 61); ruminant animals(n = 79) comprised of Bos taurus (cattle, n = 47), Ovis aries(sheep, n = 16), Cervus elaphus (deer, n = 8), Capra hircus (goat,n = 6), Rupicapra rupicapra (chamois, n = 1), and Lama sp.(llama, n = 1); nonruminant animals (n = 140) covering Equuscaballus (horse, n = 17), Macropus sp. (kangaroo, n = 4),Oryctolagus cuniculus (rabbit, n = 2), Lepus timidus (mountainhare, n = 1), Equus asinus (donkey, n = 2), Equus quagga (zebra,n =1),Marmota marmota (groundhog, n =1), Sus scrofa domesticus(swine, n = 21), Sus scrofa (wild boar, n = 8), Canis lupus familiaris(dog, n = 29), Felis catus (cat, n = 7), Canis latrans (coyote, n = 1),Didelphis sp. (opposum, n = 1), Lontra canadensis (river otter,n = 1), Gallus gallus (chicken, n = 19), Anas platyrhynchos (duck,n = 5), members of the subfamilyAnserinae (geese, n = 3), membersof the family Columbidae (pigeons, n = 3), members of the familySturnidae (starlings, n = 2), Meleagris gallopavo (turkey, n = 2),Larus sp. (gull, n = 1) and other wild birds including parrot, coot,grebe, owl, and pelican (n = 9).qPCR Assays. The DNA extracts were then tested for
amplifiable fecal DNA and absence of PCR inhibition by applyingthe AllBac qPCR assay which detects the 16S rRNA genes of abroad spectrum of Bacteroidetes.9 In this study the AllBac qPCRassay was used to assess the quality of DNA extracts and toestimate total Bacteroidetes concentrations in the samples. PCRinhibition was assessed by determining the AllBac markerconcentrations in the 1:4 and 1:16 sample dilutions. Extracts withmatching concentrations in the two dilutions (2 cycles differencein threshold cycle value in qPCR) were judged free of PCRinhibitory substances in the 1:4 dilution. The human-targetedassays tested in this study were the BacH assay15 and theBacHum assay.10 The ruminant- or bovine-specific assays testedin this study were the BacCow assay,10 the BacR assay,16 and theBoBac assay9 (see Table S1 for further details). An effort wasmade to reproduce the composition of the published reactionmixtures and conditions as closely as possible. However, not allreaction components (e.g. polymerases) used in the originalpublications were commercially available at the time of this studyand therefore all assays were run using the iQ Supermix (Biorad,Hercules, U.S.A.) on an iCycler iQ Real-Time Detection System(Biorad). All qPCR reactions were run in a total volume of 25 μL,with 2.5 μL of sample DNA dilution, 12.5 μL of Supermix, and400 ng μL−1 bovine serum albumin, while the originallypublished primer, probe, and MgCl2 concentrations weremaintained. All qPCR assays followed the published temperatureprogram with 40 PCR cycles. The adapted assays were checkedfor stringency by annealing temperature gradient experiments,
and the PCR efficiency under the applied conditions was verified.Quantification was based on appropriate plasmid standard dilu-tions.17 Plasmid DNA was prepared using either the respectivespecific PCR product amplified out of a fecal DNA with therespective primers or matching full-length 16S rRNA genes.Fragments were cloned into a pGEM-T vector (Promega,Mannheim, Germany) and transformed into E. coli strain JM109.After subsequent cultivation at 37 °C for 15± 1 h, plasmids wereextracted using the Fast Plasmid MiniKit (Eppendorf, Hamburg,Germany) resulting in a pure plasmid solution. Plasmid DNAconcentration was measured using a NanoDrop 1000 spectro-photometer (Thermo Fisher Scientific). The plasmid stock wasdiluted in an unspecific 500 ng/mL poly(dI-dC) background toavoid adsorption of plasmid DNA to reaction vials at low plasmidconcentrations (Roche Diagnostics, Mannheim, Germany).A total of at least five 10-fold serial dilutions of plasmid standard(100 to 104 gene copies) were run on each well plate as well asseveral no-template and DNA extraction controls. All qPCR runsin this study had a PCR efficiency of between 92% and 105%, andthe no-template controls were consistently negative.All sample DNA extracts were diluted 4-fold and measured
in duplicate with the tested source-associated assays. Resultswere reported as marker copy numbers per reaction volume inthis dilution. Results <1 copy per reaction were set to 0. All theresults in this study are reported directly as qPCR copy numbersin the 4-fold dilution, and analysis was focused on comparisonsbetween distributions of concentrations in groups of samples.
Data Analysis. All the data analysis was done with eitherMicrosoft Excel 2003 or Sigma Plot 11 (Systat Software Inc.,Chicago, IL). All qPCR data were converted into a logarithmicformat by adding 1 to each value and subsequent log10 trans-formation. The 25th/75th metric was calculated by subtractingthe 75th percentile concentration in nontarget samples for agiven assay from the 25th percentile concentration in target samples(25th/75th metric = 25th percentiletarget − 75th percentilenontarget).Spearman rank order correlation was used for calculation ofcorrelation coefficients between parameters. For the correlationanalysis between AllBac and the source-associated markers severalsamples with very low AllBac but high source-associated markerconcentrations were tagged as outliers and removed from theanalysis (n = 3 for BacH, BacCow, BacR, and BoBac, respectively).
■ RESULTSSample Logistics and Processing. The participating
laboratories in this study collected 320 fecal samples frommammal and bird species in 16 countries on six continents (seeabstract art). While human and ruminant fecal sources weresampled in all participating countries, the selection of nontargetsources was based on prevalence and importance of such sourcesin watersheds from each respective country. This accounts for thevarying representation of the different nontarget species fromeach country (as shown in Table S2). Extracted sample DNAwas transferred to the lead partner institution in Austria (ViennaUniversity of Technology), and the DNA was purified to ensurecomparable DNA purity and remove possible PCR inhibitors.Figure S1 shows the distribution of DNA concentrations inthe purified DNA extracts. The AllBac qPCR assay 9 was usedto enumerate the total intestinal Bacteroidetes population andserved as a control parameter for DNA quality and purity.In total, 280 samples contained the AllBac marker in match-ing quantities in the two tested extract dilutions (4-fold and16-fold), providing evidence for the presence of Bacteroidetes16S rRNA genes and the absence of PCR inhibition in those
Environmental Science & Technology Article
dx.doi.org/10.1021/es304367t | Environ. Sci. Technol. 2013, 47, 8548−85568550

extract dilutions18,19 (Figure S2). The provenance of the samplesincluded in further analysis is shown in Table S2. Following thesepreparatory steps the human-targeted qPCR assays BacH15
and BacHum,10 the cattle-targeted qPCR assays BacCow10 andBoBac,9 and the ruminant-targeted assay BacR16 were applied onthe 4-fold dilution of these selected DNA extracts (Table 1).
DNA extraction controls did not contain detectable levelsof any of the source-associated markers. Due to the limitednumber of samples per region (approximately 20), the hetero-geneous mix of available sources and the biogeographicaldiversity, the authors refrained from analyzing samples by sampleprovenance.
Qualitative Aspects of Assay Sensitivity and Specificity.The qualitative source-sensitivity was defined as the percentageof target samples (i.e., human fecal samples for human-targetedassays) giving a positive detection by qPCR, regardless of themarker concentration (all signals ≥1 copy per reaction; true-positives). Qualitative source-specificity was defined as the per-centage of nontarget samples not detected by qPCR (all signals<1 copy per reaction; true-negatives) (Table 1).Qualitative source-sensitivities ranged from 77% for BacH
to 92% for BacCow, with BacR and BacCow showing sensitivities≥90% (Table 1). At this stage in the analysis the qualitativesource-sensitivity results revealed that the previously publishedbovine-specific assays (BacCow, BoBac) tended to detect notonly cattle but also samples from other ruminant animals. Forthis reason it was decided to treat BacCow and BoBac asruminant-targeted assays rather than bovine-specific assays in allsubsequent analyses.The qualitative source-specificities of the human-targeted
assays were 53% for BacH and 68% for BacHum (Table 1). Theruminant-targeted assays BacCow and BoBac showed qualitativespecificities of 57% and 59%, respectively, while the specificity ofthe BacR assay was higher at 84%.Detailed investigation of the results revealed that in the case
of BacH a disproportionally high number of false-positivesoccurred with cattle feces (64% of the samples positive withBacH) and with carnivore samples (dog, cat, opossum, coyote,otter). BacHum also seemed to lack specificity against carnivores,while it was much more specific against bird fecal material thanBacH. BacCow yielded high numbers of false-positives with horse,swine and poultry samples. BacR showed the highest qualitativespecificities in most subgroups with some false-positives fromdog samples. BoBac had the lowest levels of qualitative source-specificity of all assays in the subgroups of carnivores and birds.
Quantitative Aspects of Assay Specificity and Sensi-tivity. Although qualitative source-specificity and -sensitivityprovide a general indication of assay performance based on thepresence/absence of specific markers, they give no informationconcerning the relative abundance of those markers in suchsources. This is important as differences in marker abundancewith respect to the source have significant implications forsuitability and applicability of qPCR assays for MST purposes.Fortunately, qPCR assays (as the name suggests) allow thequantitative distribution of the marker concentrations in targetand nontarget samples to be determined, leading to a moreaccurate and in-depth assessment of assay performance(specificity and sensitivity).The results of the quantitative analysis of source-sensitivity
and -specificity revealed that marker concentrations in targetsamples exhibited relatively broad distributions (Figures 1 and S5).For example, the 10th and 90th percentiles of the ruminant-associated assays were separated by 5 to 6 orders of magnitude.The median values ranged from below log 2 marker copies perreaction (cp/rct) for BacH to almost log 4 cp/rct for BoBac.Among the human-targeted assays the BacH marker had aslightly lower median concentration and a broader quantitativedistribution in human fecal extracts than BacHum. Incomparison, the levels of ruminant-associated markers in targetsamples were higher and showed quite similar distributions(Figures 1 and S5).The marker concentrations in nontarget samples were much
lower with very distinct distributions for the tested assays.The markers were not detectable in more than half of the non-target samples for all assays tested in the study. The distribution
Table 1. Numbers of qPCR Positives with Tested Assays inSource Species or Source Groupsa
qPCR positive
sourceno.
samples BacH BacHum BacCow BacR BoBac
human 61 47 53 14 5 17ruminants
cattle 47 30 13 45 45 40sheep 16 5 8 14 14 11deer 8 5 1 7 6 6goat 6 3 0 5 4 6chamois 1 1 0 1 1 1llama 1 0 0 1 1 1total 79 44 22 73 71 65
nonruminantherbivores
horse 17 5 8 14 4 5kangaroo 4 2 2 4 0 0hare/rabbit 3 1 3 0 0 1donkey 2 1 0 0 0 0zebra 1 0 0 0 0 0groundhog 1 0 0 0 0 0total 28 9 13 18 4 6
omnivorespig 21 7 5 14 1 6wild boar 8 2 1 5 1 1total 29 9 6 19 2 7
carnivoresdog 29 15 15 11 10 22cat 7 6 5 0 0 6coyote 1 1 1 1 1 1opossum 1 1 1 1 0 0otter 1 0 0 1 1 0total 39 23 22 14 12 29
birdschicken 19 9 1 12 4 11duck 5 0 3 1 0 3pigeon 3 1 0 1 0 2goose 3 1 1 2 2 3otherbirdsb
14 7 3 5 3 5
total 44 18 8 21 9 24sensitivity (%)c 280e 77 87 92 90 82specificity (%)d 280e 53 68 57 84 59aOverall source sensitivities and source specificities appear at the bottomof the table. bSamples from parrot, coot, grebe, owl, pelican, turkey, starling,and gull (all n ≤ 2). cSource-sensitivity (%) = 100 × true-positives/(true-positives + false-negatives). dSource-specficity (%) = 100 × true-negatives/(true-negatives + false-positives). eTotal number of samples.
Environmental Science & Technology Article
dx.doi.org/10.1021/es304367t | Environ. Sci. Technol. 2013, 47, 8548−85568551
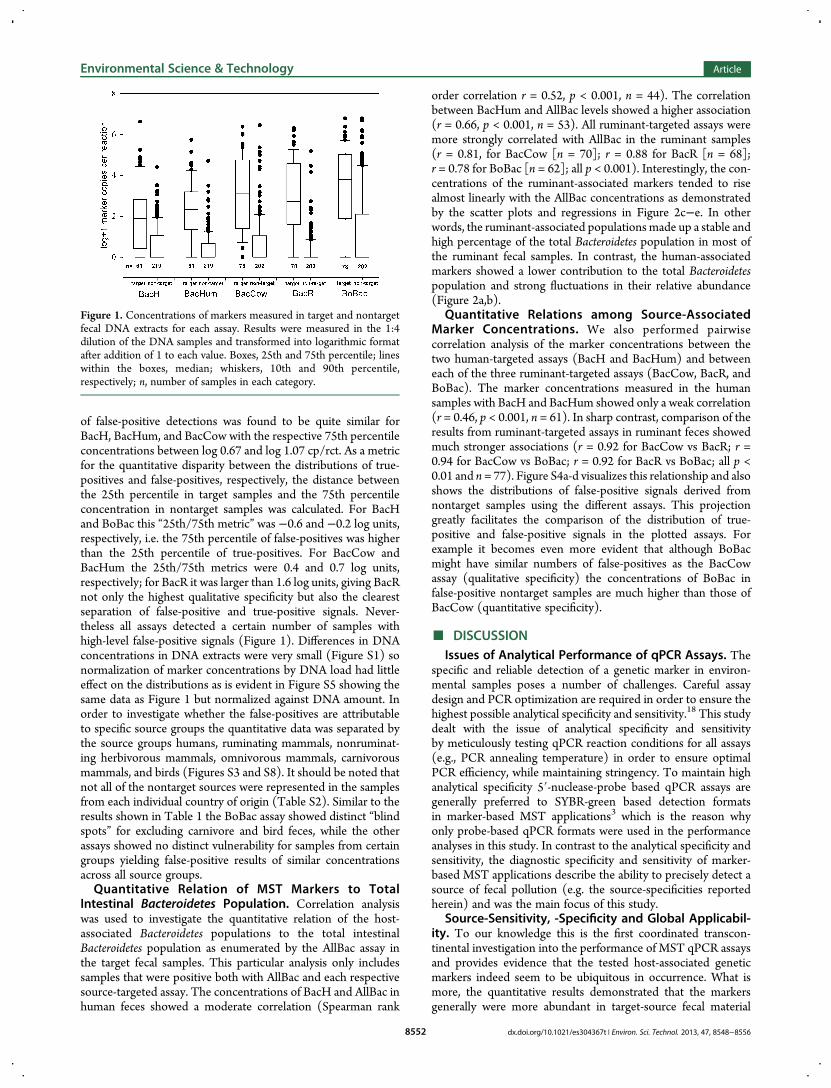
of false-positive detections was found to be quite similar forBacH, BacHum, and BacCow with the respective 75th percentileconcentrations between log 0.67 and log 1.07 cp/rct. As a metricfor the quantitative disparity between the distributions of true-positives and false-positives, respectively, the distance betweenthe 25th percentile in target samples and the 75th percentileconcentration in nontarget samples was calculated. For BacHand BoBac this “25th/75th metric” was −0.6 and −0.2 log units,respectively, i.e. the 75th percentile of false-positives was higherthan the 25th percentile of true-positives. For BacCow andBacHum the 25th/75th metrics were 0.4 and 0.7 log units,respectively; for BacR it was larger than 1.6 log units, giving BacRnot only the highest qualitative specificity but also the clearestseparation of false-positive and true-positive signals. Never-theless all assays detected a certain number of samples withhigh-level false-positive signals (Figure 1). Differences in DNAconcentrations in DNA extracts were very small (Figure S1) sonormalization of marker concentrations by DNA load had littleeffect on the distributions as is evident in Figure S5 showing thesame data as Figure 1 but normalized against DNA amount. Inorder to investigate whether the false-positives are attributableto specific source groups the quantitative data was separated bythe source groups humans, ruminating mammals, nonruminat-ing herbivorous mammals, omnivorous mammals, carnivorousmammals, and birds (Figures S3 and S8). It should be noted thatnot all of the nontarget sources were represented in the samplesfrom each individual country of origin (Table S2). Similar to theresults shown in Table 1 the BoBac assay showed distinct “blindspots” for excluding carnivore and bird feces, while the otherassays showed no distinct vulnerability for samples from certaingroups yielding false-positive results of similar concentrationsacross all source groups.Quantitative Relation of MST Markers to Total
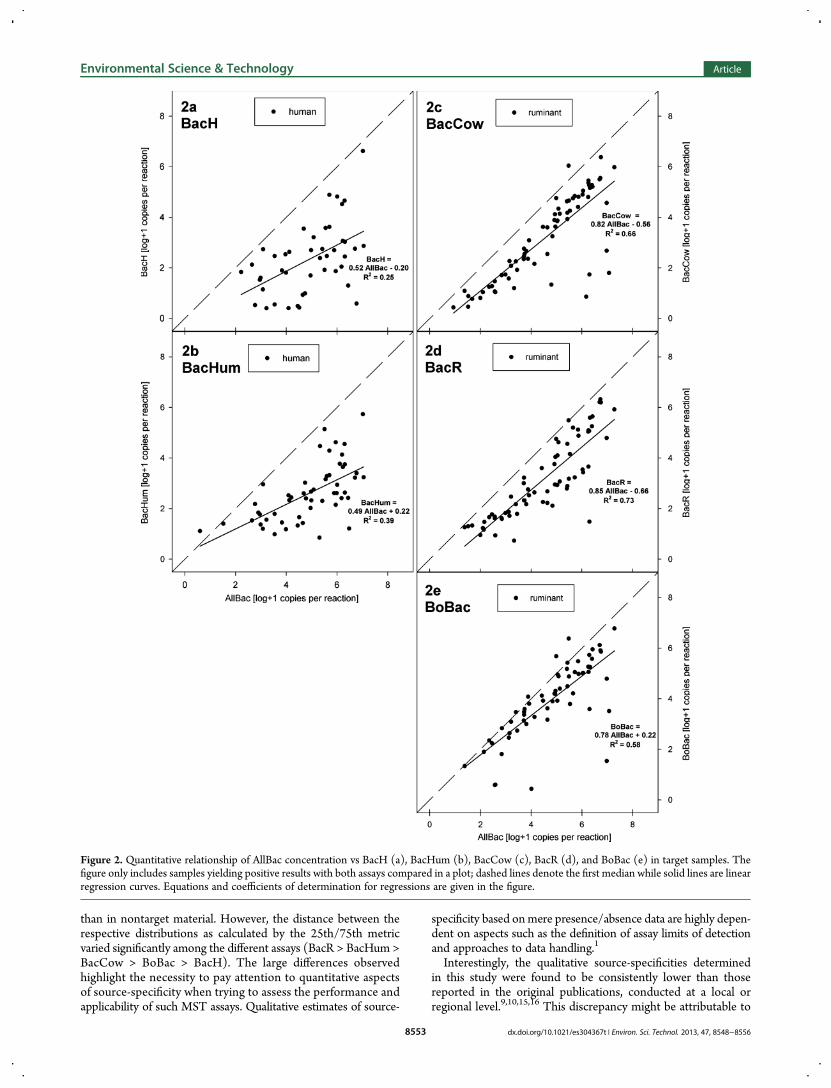
Intestinal Bacteroidetes Population. Correlation analysiswas used to investigate the quantitative relation of the host-associated Bacteroidetes populations to the total intestinalBacteroidetes population as enumerated by the AllBac assay inthe target fecal samples. This particular analysis only includessamples that were positive both with AllBac and each respectivesource-targeted assay. The concentrations of BacH and AllBac inhuman feces showed a moderate correlation (Spearman rank
order correlation r = 0.52, p < 0.001, n = 44). The correlationbetween BacHum and AllBac levels showed a higher association(r = 0.66, p < 0.001, n = 53). All ruminant-targeted assays weremore strongly correlated with AllBac in the ruminant samples(r = 0.81, for BacCow [n = 70]; r = 0.88 for BacR [n = 68];r = 0.78 for BoBac [n = 62]; all p < 0.001). Interestingly, the con-centrations of the ruminant-associated markers tended to risealmost linearly with the AllBac concentrations as demonstratedby the scatter plots and regressions in Figure 2c−e. In otherwords, the ruminant-associated populations made up a stable andhigh percentage of the total Bacteroidetes population in most ofthe ruminant fecal samples. In contrast, the human-associatedmarkers showed a lower contribution to the total Bacteroidetespopulation and strong fluctuations in their relative abundance(Figure 2a,b).
Quantitative Relations among Source-AssociatedMarker Concentrations. We also performed pairwisecorrelation analysis of the marker concentrations between thetwo human-targeted assays (BacH and BacHum) and betweeneach of the three ruminant-targeted assays (BacCow, BacR, andBoBac). The marker concentrations measured in the humansamples with BacH and BacHum showed only a weak correlation(r = 0.46, p < 0.001, n = 61). In sharp contrast, comparison of theresults from ruminant-targeted assays in ruminant feces showedmuch stronger associations (r = 0.92 for BacCow vs BacR; r =0.94 for BacCow vs BoBac; r = 0.92 for BacR vs BoBac; all p <0.01 and n = 77). Figure S4a-d visualizes this relationship and alsoshows the distributions of false-positive signals derived fromnontarget samples using the different assays. This projectiongreatly facilitates the comparison of the distribution of true-positive and false-positive signals in the plotted assays. Forexample it becomes even more evident that although BoBacmight have similar numbers of false-positives as the BacCowassay (qualitative specificity) the concentrations of BoBac infalse-positive nontarget samples are much higher than those ofBacCow (quantitative specificity).
■ DISCUSSIONIssues of Analytical Performance of qPCR Assays. The
specific and reliable detection of a genetic marker in environ-mental samples poses a number of challenges. Careful assaydesign and PCR optimization are required in order to ensure thehighest possible analytical specificity and sensitivity.18 This studydealt with the issue of analytical specificity and sensitivityby meticulously testing qPCR reaction conditions for all assays(e.g., PCR annealing temperature) in order to ensure optimalPCR efficiency, while maintaining stringency. To maintain highanalytical specificity 5′-nuclease-probe based qPCR assays aregenerally preferred to SYBR-green based detection formatsin marker-based MST applications3 which is the reason whyonly probe-based qPCR formats were used in the performanceanalyses in this study. In contrast to the analytical specificity andsensitivity, the diagnostic specificity and sensitivity of marker-based MST applications describe the ability to precisely detect asource of fecal pollution (e.g. the source-specificities reportedherein) and was the main focus of this study.
Source-Sensitivity, -Specificity and Global Applicabil-ity. To our knowledge this is the first coordinated transcon-tinental investigation into the performance of MST qPCR assaysand provides evidence that the tested host-associated geneticmarkers indeed seem to be ubiquitous in occurrence. What ismore, the quantitative results demonstrated that the markersgenerally were more abundant in target-source fecal material
Figure 1. Concentrations of markers measured in target and nontargetfecal DNA extracts for each assay. Results were measured in the 1:4dilution of the DNA samples and transformed into logarithmic formatafter addition of 1 to each value. Boxes, 25th and 75th percentile; lineswithin the boxes, median; whiskers, 10th and 90th percentile,respectively; n, number of samples in each category.
Environmental Science & Technology Article
dx.doi.org/10.1021/es304367t | Environ. Sci. Technol. 2013, 47, 8548−85568552
than in nontarget material. However, the distance between therespective distributions as calculated by the 25th/75th metricvaried significantly among the different assays (BacR > BacHum >BacCow > BoBac > BacH). The large differences observedhighlight the necessity to pay attention to quantitative aspectsof source-specificity when trying to assess the performance andapplicability of such MST assays. Qualitative estimates of source-
specificity based onmere presence/absence data are highly depen-dent on aspects such as the definition of assay limits of detectionand approaches to data handling.1
Interestingly, the qualitative source-specificities determinedin this study were found to be consistently lower than thosereported in the original publications, conducted at a local orregional level.9,10,15,16 This discrepancy might be attributable to
Figure 2. Quantitative relationship of AllBac concentration vs BacH (a), BacHum (b), BacCow (c), BacR (d), and BoBac (e) in target samples. Thefigure only includes samples yielding positive results with both assays compared in a plot; dashed lines denote the first median while solid lines are linearregression curves. Equations and coefficients of determination for regressions are given in the figure.
Environmental Science & Technology Article
dx.doi.org/10.1021/es304367t | Environ. Sci. Technol. 2013, 47, 8548−85568553

differences in DNA isolation procedure (yield and quality) andqPCR preparation (PCR chemistry, sample DNA load, etc.) aswell as the lower numbers of samples used for initial evaluationbut also to geographical patterns of marker occurrence in non-target samples. The few published evaluation studies investigat-ing source-specificities in other regions found similar percentagesof false-positives in nontarget fecal samples as the current trans-continental study.11,12,14
It should be mentioned that this study was focused on definedfecal samples from humans, ruminants, and other animals as theprimary sources of fecal pollution and therefore did not includesecondary environmental compartments such as raw and treatedwastewater.It has been suggested that there is no fixed performance
threshold that categorizes a particular assay as suitable/applicablefor MST.19,20 Therefore, the requirements on assay performanceare very much specific to each MST problem and the conditionspresent within a particular study area. In a recent study theauthors showed that the applicability of specific methods ishighly dependent on the presence and quantitative importanceof the specific fecal source groups.21 Models incorporatingthe uncertainties arising from low source-specificity can be usedto assess whether a reliable source identification, or even quanti-tative allocation, can been achieved.3,10,20−22
Characteristics of MST Target Populations across theGlobe. Total intestinal Bacteroidetes marker concentrationswere enumerated using the AllBac assay. This marker has beenreported to target not only intestinal but also nonintestinalBacteroidetes, casting doubt on its value for fecal indication.23,24
For the purposes of this investigation, however, the broad sensi-tivity and the consistently high concentrations of AllBac invarious fecal sources make this marker a suitable choice as ameasure for the total intestinal Bacteroidetes population in asample setup consisting exclusively of fecal samples.9,23,25 Com-paring source-associated marker concentrations to the totalintestinal Bacteroidetes population as enumerated by AllBacprovided some insight into population dynamics and the stabilityof the assays’ target populations at a worldwide level. For the vastmajority of the ruminant samples, an increase in the host-associated marker concentrations using either of the threeruminant markers corresponded directly to an increase inconcentrations of the AllBac marker. Keeping in mind thewidespread origin of the investigated samples it is remarkable thatthe populations detected by the BacCow, BacR, and BoBacmarkers seem to form a stable and highly abundant subpopulationof the total intestinal Bacteroidetes population, as detected byAllBac in ruminant feces from around the globe. In contrast to theruminant-targeted assays the populations detected using thehuman-associated markers (BacH and BacHum) appeared to be aless dominant and more variable subpopulation of the totalintestinal Bacteroidetes population, as detected by AllBac in humanfecal samples from around the globe (Figure 3).Interestingly, the strong correlations between the results
from the different ruminant-targeted assays suggest that the threedifferent assays actually detect the same core bacterial popula-tion albeit with strong differences in source-specificity againstnonruminant samples. In general, a trade-off appears to existbetween source-specificity and source-sensitivity with an increasein one leading to a decrease in the other parameter.11,26 Forinstance, when comparing BacR and BoBac in this study,BacR showed higher quantitative source-specificity while BoBacexhibited higher quantitative source-sensitivity (marker abun-dance in target samples). Several studies by Shanks et al. found
evidence for a strong influence of different diets (e.g., forage vsprocessed feed) on bacterial population structure27 as well as onMST marker prevalence and abundance11 in feces of differentcattle populations in the United States. They found the highestmarker concentrations in feces from cows fed with forage. Theseresults are consistent with the high prevalence of the ruminant-associated markers in feces frommostly wild or grazing ruminantanimals sampled in the current study.In contrast to the ruminant-targeted assays, the relatively weak
correlation observed between the results of the two human-targeted assays in human samples suggested that BacH andBacHum target distinct human-associated clades of the phylumBacteroidetes (Figure S4a-d). As such, the complementary natureof the target populations indicated that it might be worthwhile tocombine the two assays in order to improve specificity to humanfecal contamination. By combining these two assays in our dataset and defining that only a positive result with both BacH andBacHum in a sample counts as a positive human-associated signalqualitative source-specificity would have been improved to80%, while the combined source-sensitivity would only decreaseslightly to 74%.The results of this study are significant in that they suggest that
the bacterial populations detected with the ruminant-targetedassays form a dominant and stable portion of the fecalBacteroidetescommunities in ruminant animals sampled all around the worldfor this study. This indicates strong host-adaptation of thisparticular population.27−30 The broad distribution of the targetedbacterial subpopulation in the current study might even representobligatory symbionts in the ruminant digestive systemmaking it anideal MST target.1 On the other hand, the human associatedBacteroidetes populations present in human feces appear tofluctuate in terms of their abundance relative to total Bacteroidetesand their prevalence. These fluctuations may suggest a lowerdegree of host adaptation and a less close symbiosis of thesebacteria with the human host. It was beyond the scope of this studyto investigate the temporal stability of the abundance of thedetected markers in human individuals and/or populations.However, one of the major contributing factors responsible forthe higher variability in human-associated marker concentrationsmight be the highly diverse human diet.31,32 It has been shown thatthe diversity and composition of human intestinal microbiota differsstrongly among humanpopulations around theworld and is not onlyinfluenced by host genotype and diet but also by cultural factors.33
Nevertheless, there might be bacterial clades34 and, alternatively,
Figure 3. Percentages of the host-associated marker concentrationsin relation to AllBac concentrations in the respective target samples.The y-axis is scaled logarithmically.
Environmental Science & Technology Article
dx.doi.org/10.1021/es304367t | Environ. Sci. Technol. 2013, 47, 8548−85568554

also viral targets35 in the human intestinal microbiome better suitedas MST targets than the ones used in the human assays tested inthis study.High fluctuations of MST target populations (relative to
the total intestinal Bacteroidetes population) in target samplescan be a strong confounding factor when relating marker concen-trations to proposed measures of total fecal pollution in MSTapplications. When calculating these relations care must betaken to actually investigate the dynamic range of the relativeabundance of the used parameters in fecal samples. For instanceFigure 3 shows the distribution of the ratio of source-associatedmarker concentrations to the total fecal marker (AllBac) concen-trations, across all transcontinental study locations. What isapparent is that issues of abundance and distribution need to beaddressed if the MST marker concentrations are to be related totraditional fecal indicator counts or DNA concentration in theextract. For these reasons the marker concentrations determinedin this study were not related to any external parameters butrather reported as unprocessed results from qPCR. It should alsobe noted that, due to the different DNA extraction proceduresused by the various participating laboratories, this study cannot and does not report and discuss absolute quantities of themarkers in the investigated fecal samples but rather the rela-tive quantitative distributions. It should be noted that this con-servative approach makes the interpretation relatively insensitiveto effects such as differences in DNA concentrations among thesamples and DNA degradation during storage (compare Figures 1and S5, Figures 2 and S6, Figures S3 and S8, Figures S4 and S7,respectively).Practical Implications. The findings of this study are
significant as they suggest that the ruminant-targeted assays(BacR, BacCow) appear to be suitable for application as quanti-tative MST tools beyond the regional level. Unfortunately,the source-specificities associated with the human-targetedassays were relatively low with BacHum showing slightly higherspecificity than BacH. Therefore, there is a strong need forimproved human-targeted MST approaches and the inadequa-cies of tested assays serve to highlight the importance of this task.This study set out to investigate one of the basic prerequisites
for MST which is source-specificity and -sensitivity in fecalsources. It was beyond the scope of this study to broadly investi-gate the practical environmental applicability of the tested assays.Issues such as changes in populations structure during wastewater disposal and treatment, environmental differential persis-tence of marker populations, interference by autochthonouscommunities, and the challenges of source apportionment havebeen and will be the subject of other investigations. However theassays tested in this study have all already been applied inenvironmental investigation of fecal pollution in water and haveproved their usefulness on the local and regional level.3,21,36−39
Before application in a new study area, marker-based MSTassays must be locally validated using a range of fecal samplesto assess their diagnostic performance.19 The quantitative dataprovided by the qPCR detection technology proved to beextremely useful for thorough assessment of assay performance.Future developments of successful qPCR assays are likely to behighly dependent not only on the quality of sequence infor-mation from target and nontarget populations but also on state-of-the-art assay design and optimization.The findings of this study are encouraging as it indicates
that globally applicable methods for the molecular detection andcharacterization of a range of human and nonhuman sources offecal pollution may well be possible.
■ ASSOCIATED CONTENT*S Supporting InformationSupporting Information contains Tables S1 and S2 and Figures S1,S2, S3, S4a−d, S5, S6a−e, S7a−d, and S8 as referenced in text.This material is available free of charge via the Internet at http://pubs.acs.org.
■ AUTHOR INFORMATIONCorresponding Author*Mailing address: Research Group Environmental Microbiologyand Molecular Ecology, Institute of Chemical Engineering,Vienna University of Technology, Gumpendorfer Straße 1a/166-5-2, A-1060 Vienna, Austria; phone: +43-1-58801-166556;fax: +43-1-58801-17299; e-mail: [email protected] authors declare no competing financial interest.
■ ACKNOWLEDGMENTSThis investigation was initiated in the course of meetings of theSpecialist Group for Health-Related Water Microbiology of theInternational Water Association (IWA). Our special thanks go toProf. Joan Rose, founder of the International Collaboratory forSewage (http://www.cws.msu.edu/ic-sewage/) supporting theinteraction between different research groups from differentregions and continents. This study was financed by the AustrianScience Fund (FWF) Translational project TRP L414-B03 andthe FWF project P22309 granted to Andreas Farnleitner and theFWF DKplus “Vienna Doctoral Programme on Water ResourceSystems” (W1219-N22) granted to Gunter Bloschl and AndreasFarnleitner. Further support came from the FWF project P22032granted to Georg Reischer. Georg Reischer is a recipient of anAPART Fellowship of the Austrian Academy of Sciences. Thisstudy is a joint publication of the Interuniversity CooperationCenter Water & Health (www.waterandhealth.at).
■ REFERENCES(1) Santo Domingo, J. W.; Bambic, D. G.; Edge, T. A.; Wuertz, S. Quovadis source tracking? Towards a strategic framework for environmentalmonitoring of fecal pollution. Water Res. 2007, 41 (16), 3539−3552.(2) Hagedorn, C.; Harwood, V. J.; Blanch, A. Microbial SourceTracking: Methods, Applications, and Case Studies; Springer: New York,2011; p 642.(3) Wuertz, S.; Wang, D.; Reischer, G. H.; Farnleitner, A. H., Library-Independent Source Tracking Methods. In Microbial Source Tracking:Methods, Applications, and Case Studies; Hagedorn, C., Blanch, A. R.,Harwood, V. J., Eds.; Springer: New York, 2011; pp 61−113.(4) Roslev, P.; Bukh, A. S. State of the art molecular markers for fecalpollution source tracking in water. Appl. Microbiol. Biotechnol. 2011, 89(5), 1341−1355.(5) Ley, R. E.; Backhed, F.; Turnbaugh, P.; Lozupone, C. A.; Knight, R.D.; Gordon, J. I. Obesity alters gut microbial ecology. Proc. Natl. Acad.Sci. U.S.A. 2005, 102 (31), 11070−11075.(6) Ley, R. E.; Knight, R.; Gordon, J. I. The human microbiome:eliminating the biomedical/environmental dichotomy in microbialecology. Environ. Microbiol. 2007, 9 (1), 3−4.(7) Dethlefsen, L.; McFall-Ngai, M.; Relman, D. A. An ecological andevolutionary perspective on human-microbe mutualism and disease.Nature 2007, 449 (7164), 811−818.(8) Dick, L. K.; Field, K. G. Rapid estimation of numbers of fecalBacteroidetes by use of a quantitative PCR assay for 16S rRNA genes.Appl. Environ. Microbiol. 2004, 70 (9), 5695−7.(9) Layton, A.; McKay, L.; Williams, D.; Garrett, V.; Gentry, R.; Sayler,G. Development of Bacteroides 16S rRNA gene TaqMan-based real-timePCR assays for estimation of total, human, and bovine fecal pollution inwater. Appl. Environ. Microbiol. 2006, 72 (6), 4214−24.
Environmental Science & Technology Article
dx.doi.org/10.1021/es304367t | Environ. Sci. Technol. 2013, 47, 8548−85568555
(10) Kildare, B. J.; Leutenegger, C. M.; McSwain, B. S.; Bambic, D. G.;Rajal, V. B.;Wuertz, S. 16S rRNA-based assays for quantitative detectionof universal, human-, cow-, and dog-specific fecal Bacteroidales: ABayesian approach. Water Res. 2007, 41 (16), 3701−3715.(11) Shanks, O. C.; White, K.; Kelty, C. A.; Hayes, S.; Sivaganesan, M.;Jenkins, M.; Varma, M.; Haugland, R. A. Performance assessment PCR-based assays targeting Bacteroidales genetic markers of bovine fecalpollution. Appl. Environ. Microbiol. 2010, 76 (5), 1359−1366.(12) Shanks, O. C.; White, K.; Kelty, C. A.; Sivaganesan, M.; Blannon,J.; Meckes, M.; Varma, M.; Haugland, R. A. Performance of PCR-basedassays targeting Bacteroidales Genetic markers of human fecal pollutionin sewage and fecal samples. Environ. Sci. Technol. 2010, 44 (16), 6281−6288.(13) Lamendella, R.; Domingo, J. W. S.; Yannarell, A. C.; Ghosh, S.; DiGiovanni, G.; Mackie, R. I.; Oerther, D. B. Evaluation of swine-specificPCR assays used for fecal source tracking and analysis of moleculardiversity of swine-specific ″Bacteroidales″ populations. Appl. Environ.Microbiol. 2009, 75 (18), 5787−5796.(14) Ahmed, W.; Goonetilleke, A.; Powell, D.; Gardner, T. Evaluationof multiple sewage-associated Bacteroides PCR markers for sewagepollution tracking. Water Res. 2009, 43 (19), 4872−4877.(15) Reischer, G. H.; Kasper, D. C.; Steinborn, R.; Farnleitner, A. H.;Mach, R. L. A quantitative real-time PCR assay for the highly sensitiveand specific detection of human faecal influence in spring water from alarge alpine catchment area. Lett. Appl. Microbiol. 2007, 44 (4), 351−356.(16) Reischer, G. H.; Kasper, D. C.; Steinborn, R.; Mach, R. L.;Farnleitner, A. H. Quantitative PCR method for sensitive detection ofruminant fecal pollution in freshwater and evaluation of this method inalpine karstic regions. Appl. Environ. Microbiol. 2006, 72 (8), 5610−4.(17) Reischer, G. H.; Kasper, D. C.; Steinborn, R.; Farnleitner, A. H.;Mach, R. L. A quantitative real-time PCR assay for the highly sensitiveand specific detection of human faecal influence in spring water from alarge alpine catchment area. Lett. Appl. Microbiol. 2007, 44 (4), 351−356.(18) Bustin, S. A.; Benes, V.; Garson, J. A.; Hellemans, J.; Huggett, J.;Kubista, M.; Mueller, R.; Nolan, T.; Pfaffl, M. W.; Shipley, G. L.;Vandesompele, J.; Wittwer, C. T. The MIQE guidelines: MinimumInformation for publication of quantitative real-time PCR experiments.Clin. Chem. 2009, 55 (4), 611−622.(19)Harwood, V. J.; Stoeckel, D.M. Performance Criteria. InMicrobialSource Tracking: Methods, Applications, and Case Studies; Hagedorn, C.,Blanch, A. R., Harwood, V. J., Eds.; Springer: New York, 2011; pp 7−30.(20) Belanche, L. A.; Blanch, A. Statistical Approaches for Modeling inMicrobial Source Tracking. In Microbial Source Tracking: Methods,Applications, and Case Studies; Hagedorn, C., Blanch, A. R., Harwood, V.J., Eds.; Springer: New York, 2011; pp 207−227.(21) Reischer, G. H.; Kollanur, D.; Vierheilig, J.; Wehrspaun, C.; Mach,R. L.; Sommer, R.; Stadler, H.; Farnleitner, A. H. Hypothesis-Drivenapproach for the identification of fecal pollution sources in waterresources. Environ. Sci. Technol. 2011, 45 (9), 4038−4045.(22) Bloschl, G.; Sivapalan, M. Scale issues in hydrological modeling - areview. Hydrol. Processes 1995, 9 (3−4), 251−290.(23) Vierheilig, J.; Farnleitner, A. H.; Kollanur, D.; Bloschl, G.;Reischer, G. H. High abundance of genetic Bacteroidetes markers fortotal fecal pollution in pristine alpine soils suggests lack in specificity forfeces. J. Microbiol. Methods 2012, 88 (3), 433−5.(24) van der Wielen, P. W. J. J.; Medema, G. Unsuitability ofquantitative Bacteroidales 16S rRNA gene assays for discerning fecalcontamination of drinking water.Appl. Environ. Microbiol. 2010, 76 (14),4876−4881.(25) Jeong, J. Y.; Park, H. D.; Lee, K. H.; Hwang, J. H.; Ka, J. O.Quantitative analysis of human- and cow-specific 16S rRNA genemarkers for assessment of fecal pollution in river waters by real-timePCR. J. Microbiol. Biotechnol. 2010, 20 (2), 245−253.(26) Shanks, O. C.; Atikovic, E.; Blackwood, A. D.; Lu, J. R.; Noble, R.T.; Domingo, J. S.; Seifring, S.; Sivaganesan, M.; Haugland, R. A.Quantitative PCR for detection and enumeration of genetic markers ofbovine fecal pollution. Appl. Environ. Microbiol. 2008, 74 (3), 745−752.
(27) Shanks, O. C.; Kelty, C. A.; Archibeque, S.; Jenkins, M.; Newton,R. J.; McLellan, S. L.; Huse, S. M.; Sogin, M. L. Community structures offecal bacteria in cattle from different animal feeding operations. Appl.Environ. Microbiol. 2011, 77 (9), 2992−3001.(28) Ley, R. E.; Hamady, M.; Lozupone, C.; Turnbaugh, P. J.; Ramey,R. R.; Bircher, J. S.; Schlegel, M. L.; Tucker, T. A.; Schrenzel, M. D.;Knight, R.; Gordon, J. I. Evolution of mammals and their gut microbes.Science 2008, 320 (5883), 1647−1651.(29) Ley, R. E.; Lozupone, C. A.; Hamady, M.; Knight, R.; Gordon, J. I.Worlds within worlds: evolution of the vertebrate gut microbiota. Nat.Rev. Microbiol. 2008, 6 (10), 776−788.(30) Dowd, S. E.; Callaway, T. R.; Wolcott, R. D.; Sun, Y.; McKeehan,T.; Hagevoort, R. G.; Edrington, T. S. Evaluation of the bacterialdiversity in the feces of cattle using 16S rDNA bacterial tag-encodedFLX amplicon pyrosequencing (bTEFAP). BMC Microbiol. 2008, 8,(e125), -.(31) Zimmer, J.; Lange, B.; Frick, J. S.; Sauer, H.; Zimmermann, K.;Schwiertz, A.; Rusch, K.; Klosterhalfen, S.; Enck, P. A vegan orvegetarian diet substantially alters the human colonic faecal microbiota.Eur. J. Clin. Nutr. 2012, 66 (1), 53−60.(32) Muegge, B. D.; Kuczynski, J.; Knights, D.; Clemente, J. C.;Gonzalez, A.; Fontana, L.; Henrissat, B.; Knight, R.; Gordon, J. I. Dietdrives convergence in gut microbiome functions across mammalianphylogeny and within humans. Science 2011, 332 (6032), 970−974.(33) Yatsunenko, T.; Rey, F. E.; Manary, M. J.; Trehan, I.; Dominguez-Bello, M. G.; Contreras, M.; Magris, M.; Hidalgo, G.; Baldassano, R. N.;Anokhin, A. P.; Heath, A. C.; Warner, B.; Reeder, J.; Kuczynski, J.;Caporaso, J. G.; Lozupone, C. A.; Lauber, C.; Clemente, J. C.; Knights,D.; Knight, R.; Gordon, J. I. Human gut microbiome viewed across ageand geography. Nature 2012, 486 (7402), 222−227.(34) Newton, R. J.; VandeWalle, J. L.; Borchardt, M. A.; Gorelick, M.H.; McLellan, S. L. Lachnospiraceae and Bacteroidales alternative fecalindicators reveal chronic human sewage contamination in an urbanharbor. Appl. Environ. Microbiol. 2011, 77 (19), 6972−6981.(35) McQuaig, S. M.; Noble, R. T. Viruses as Tracers of FecalContamination. InMicrobial Source Tracking: Methods, Applications, andCase Studies; Hagedorn, C., Blanch, A. R., Harwood, V. J., Eds.; Springer:New York, 2011; pp 61−113.(36) Farnleitner, A. H.; Reischer, G. H.; Stadler, H.; Kollanur, D.;Sommer, R.; Zerobin, W.; Barella, M.; Truesdale, J. A.; Casarez, E. A.; DiGiovanni, G. D. Agricultural and Rural Watersheds. InMicrobial SourceTracking: Methods, Applications, and Case Studies; Hagedorn, C., Blanch,A. R., Harwood, V. J., Eds.; Springer: New York, 2011; pp 399−433.(37) Bell, A.; Layton, A. C.; Mckay, L.; Williams, D.; Gentry, R.; Sayler,G. S. Factors influencing the persistence of fecal bacteroides in streamwater. J. Environ. Qual. 2009, 38 (3), 1224−1232.(38) Reischer, G. H.; Haider, J. M.; Sommer, R.; Stadler, H.;Keiblinger, K. M.; Hornek, R.; Zerobin, W.; Mach, R. L.; Farnleitner, A.H. Quantitative microbial faecal source tracking with sampling guided byhydrological catchment dynamics. Environ. Microbiol. 2008, 10 (10),2598−2608.(39) Reischer, G. H.; Kavka, G. G.; Kasper, D. C.; Winter, C.; Mach, R.L.; Farnleitner, A. H. Applicability of DNA based quantitative microbialsource tracking (QMST) evaluated on a large scale in the Danube Riverand its important tributaries. Fundam. Appl. Limnol./Arch. Hydrobiol.Suppl. 2008, 166 (1−2), 117−125.
Environmental Science & Technology Article
dx.doi.org/10.1021/es304367t | Environ. Sci. Technol. 2013, 47, 8548−85568556
Copyright © 2022 FDOKUMEN