Regulatory T cells can migrate to follicles upon T cell activation and suppress GC-Th cells and...
10
Research article 1640 The Journal of Clinical Investigation http://www.jci.org Volume 114 Number 11 December 2004 Regulatory T cells can migrate to follicles upon T cell activation and suppress GC-Th cells and GC-Th cell–driven B cell responses Hyung W. Lim, 1 Peter Hillsamer, 2 and Chang H. Kim 1 1 Laboratory of Immunology and Hematopoiesis, Department of Pathobiology; School of Veterinary Medicine, Purdue Cancer Center; Bindley Bioscience Center; and Biochemistry and Molecular Biology Program; Purdue University, West Lafayette, Indiana, USA. 2 Sagamore Surgical Center, Lafayette, Indiana, USA. How Tregs migrate to GCs, and whether they regulate the helper activity of the T cells in GCs (GC-Th cells) remains poorly understood. We found a T cell subset in human tonsils that displays potent suppressive activities toward GC-Th cell–dependent B cell responses. These Tregs with the surface phenotype of CD4 + CD25 + CD69 – migrate well to CCL19, a chemokine expressed in the T cell zone, but poorly to CXCL13, a chemokine expressed in the B cell zone. This migration toward the T cell–rich zone rapidly changes to trafficking toward B cell follicles upon T cell activation. This change in chemotactic behavior upon activation of T cells is consistent with their switch in the expression of the 2 chemokine receptors CXCR5 and CCR7. CD4 + CD25 + CD69 – Tregs suppress GC-Th cells and GC-Th cell–induced B cell responses such as Ig production, survival, and expression of activation-induced cytosine deaminase. Our results have identified a subset of Tregs that is physiologically relevant to GC-Th cell–dependent B cell responses and a potential regulation mechanism for the trafficking of these Tregs to GCs. Introduction B cell maturation to produce high-affinity Igs occurs in GCs in B cell follicles of secondary lymphoid tissues during T cell–dependent antibody responses (1–5). B cells are initially activated in interfol- licular areas (IFAs) of secondary lymphoid tissues in response to antigens and Th cells (6, 7). Activated B cells colonize primary fol- licles (8, 9) and undergo massive clonal expansion to form GCs (7, 10). B cells then undergo somatic hypermutation in the light zone of GCs to change the affinity of Ig variable regions (11, 12) and under- go Ig class switch from IgM to IgG, IgA, and IgE (13). GC T cells (GC-Th cells) are thought to play important roles in inducing somatic hypermutation and class switch recombination (14). In this regard, a GC-Th cell subset expressing CD57, specifically localized in GCs of human lymphoid tissues, is highly efficient in supporting B cell production of Ig (15). These T cells are unique T helpers in that (a) they can produce the follicle-homing chemokine CXCL13 upon T cell activation (16), (b) they poorly induce B cell proliferation but are efficient in supporting B cell survival (17, 18), (c) they express the follicular homing receptor CXCR5 but not the T cell area local- ization receptor CCR7 (15), (d) they efficiently produce IL-10 but poorly produce Th1 or Th2 cytokines (15, 19, 20), and (e) they are preferentially located in the light zone of GCs (21–23). T cells that are able to suppress immune responses were reported in the 1970s (24–26). In 1995, CD25 (the IL-2 receptor α chain) was first described as a cell surface antigen associated with Tregs (27). CD4 + CD25 + T cells in circulation and many other tissue sites are enriched with Tregs that can inhibit T cell activation and T cell– mediated immune responses (28–31). In animal models, it has been shown that CD4 + CD25 + T cells suppress a number of autoimmune diseases, and that they can prevent graft rejection and graft-versus- host disease. CD4 + CD25 + suppressor T cells are typically positive for intracellular CTL-associated antigen 4 (CTLA-4), express the tran- scription factor Foxp3 and surface TGF-β1, and lack the produc- tion capacities of IL-2, IL-4, and IFN-γ (32–40). The potential role of suppressor T cells in regulation of humoral immune responses has been proposed by others based on the facts that CD4 + CD25 + T cells, isolated from mouse spleen, suppress mitogen-induced Ig produc- tion by splenocytes (35), and that depletion of CD4 + CD25 + T cells led to a deregulated humoral response (41). However, it is largely unknown how Tregs migrate to GCs and whether they can regulate GC-Th cell–dependent B cell responses. We identified a Treg subset in human tonsils that displays a potent suppressive activity toward GC-Th cells and GC-Th cell– dependent B cell responses, such as production of Ig, survival, and expression of activation-induced cytosine deaminase (AID). These suppressor T cells, upon T cell activation, switch their chemokine receptor expression and chemotactic responsiveness to migrate from IFAs or the T cell–rich zone to GCs. Results The CD4 + CD25 + CD69 – cells in tonsils are potent suppressors of GC-Th cell–dependent B cell Ig synthesis. In human tonsils, the CD4 + CD25 + T cells (5–6% of the total CD4 + T cell population) are composed of 2 subsets based on CD69 expression: CD4 + CD25 + CD69 – and CD4 + CD25 + CD69 + T cells (Figure 1A). The CD4 + CD25 + CD69 – T cells account for 1–2% of total CD4 + T cells. Most CD57 + GC-Th cells, efficient in supporting B cell production of Ig (15), are CD69 + CD25 – . Therefore, CD57 + GC-Th cells and CD4 + CD25 + T cells, particularly CD4 + CD25 + CD69 – T cells, are mutually exclu- sive populations (Figure 1A). We examined the impact of the total tonsillar CD4 + CD25 + T cell population and its subset of CD4 + CD25 + CD69 – T cells on CD57 + GC-Th cell–driven B cell production of Ig (Figure 1B). While the total Nonstandard abbreviations used: AID, activation-induced cytosine deaminase; CTLA-4, CTL-associated antigen 4; GC-Th cell, GC T cell; GITR, glucocorticoid- induced TNF receptor; IFA, interfollicular area. Conflict of interest: The authors have declared that no conflict of interest exists. Citation for this article: J. Clin. Invest. 114:1640–1649 (2004). doi:10.1172/JCI200422325.
-
Upload
comunidadandina -
Category
Documents
-
view
4 -
download
0
Transcript of Regulatory T cells can migrate to follicles upon T cell activation and suppress GC-Th cells and...
Research article
1640 The Journal of Clinical Investigation http://www.jci.org Volume 114 Number 11 December 2004
Regulatory T cells can migrate to follicles upon T cell activation and suppress GC-Th
cells and GC-Th cell–driven B cell responsesHyung W. Lim,1 Peter Hillsamer,2 and Chang H. Kim1
1Laboratory of Immunology and Hematopoiesis, Department of Pathobiology; School of Veterinary Medicine, Purdue Cancer Center; Bindley Bioscience Center; and Biochemistry and Molecular Biology Program; Purdue University, West Lafayette, Indiana, USA. 2Sagamore Surgical Center, Lafayette, Indiana, USA.
How Tregs migrate to GCs, and whether they regulate the helper activity of the T cells in GCs (GC-Th cells) remains poorly understood. We found a T cell subset in human tonsils that displays potent suppressive activities toward GC-Th cell–dependent B cell responses. These Tregs with the surface phenotype of CD4+CD25+CD69– migrate well to CCL19, a chemokine expressed in the T cell zone, but poorly to CXCL13, a chemokine expressed in the B cell zone. This migration toward the T cell–rich zone rapidly changes to trafficking toward B cell follicles upon T cell activation. This change in chemotactic behavior upon activation of T cells is consistent with their switch in the expression of the 2 chemokine receptors CXCR5 and CCR7. CD4+CD25+CD69– Tregs suppress GC-Th cells and GC-Th cell–induced B cell responses such as Ig production, survival, and expression of activation-induced cytosine deaminase. Our results have identified a subset of Tregs that is physiologically relevant to GC-Th cell–dependent B cell responses and a potential regulation mechanism for the trafficking of these Tregs to GCs.
IntroductionB cell maturation to produce high-affinity Igs occurs in GCs in B cell follicles of secondary lymphoid tissues during T cell–dependent antibody responses (1–5). B cells are initially activated in interfol-licular areas (IFAs) of secondary lymphoid tissues in response to antigens and Th cells (6, 7). Activated B cells colonize primary fol-licles (8, 9) and undergo massive clonal expansion to form GCs (7, 10). B cells then undergo somatic hypermutation in the light zone of GCs to change the affinity of Ig variable regions (11, 12) and under-go Ig class switch from IgM to IgG, IgA, and IgE (13). GC T cells (GC-Th cells) are thought to play important roles in inducing somatic hypermutation and class switch recombination (14). In this regard, a GC-Th cell subset expressing CD57, specifically localized in GCs of human lymphoid tissues, is highly efficient in supporting B cell production of Ig (15). These T cells are unique T helpers in that (a) they can produce the follicle-homing chemokine CXCL13 upon T cell activation (16), (b) they poorly induce B cell proliferation but are efficient in supporting B cell survival (17, 18), (c) they express the follicular homing receptor CXCR5 but not the T cell area local-ization receptor CCR7 (15), (d) they efficiently produce IL-10 but poorly produce Th1 or Th2 cytokines (15, 19, 20), and (e) they are preferentially located in the light zone of GCs (21–23).
T cells that are able to suppress immune responses were reported in the 1970s (24–26). In 1995, CD25 (the IL-2 receptor α chain) was first described as a cell surface antigen associated with Tregs (27). CD4+CD25+ T cells in circulation and many other tissue sites are enriched with Tregs that can inhibit T cell activation and T cell–mediated immune responses (28–31). In animal models, it has been
shown that CD4+CD25+ T cells suppress a number of autoimmune diseases, and that they can prevent graft rejection and graft-versus-host disease. CD4+CD25+ suppressor T cells are typically positive for intracellular CTL-associated antigen 4 (CTLA-4), express the tran-scription factor Foxp3 and surface TGF-β1, and lack the produc-tion capacities of IL-2, IL-4, and IFN-γ (32–40). The potential role of suppressor T cells in regulation of humoral immune responses has been proposed by others based on the facts that CD4+CD25+ T cells, isolated from mouse spleen, suppress mitogen-induced Ig produc-tion by splenocytes (35), and that depletion of CD4+CD25+ T cells led to a deregulated humoral response (41). However, it is largely unknown how Tregs migrate to GCs and whether they can regulate GC-Th cell–dependent B cell responses.
We identified a Treg subset in human tonsils that displays a potent suppressive activity toward GC-Th cells and GC-Th cell–dependent B cell responses, such as production of Ig, survival, and expression of activation-induced cytosine deaminase (AID). These suppressor T cells, upon T cell activation, switch their chemokine receptor expression and chemotactic responsiveness to migrate from IFAs or the T cell–rich zone to GCs.
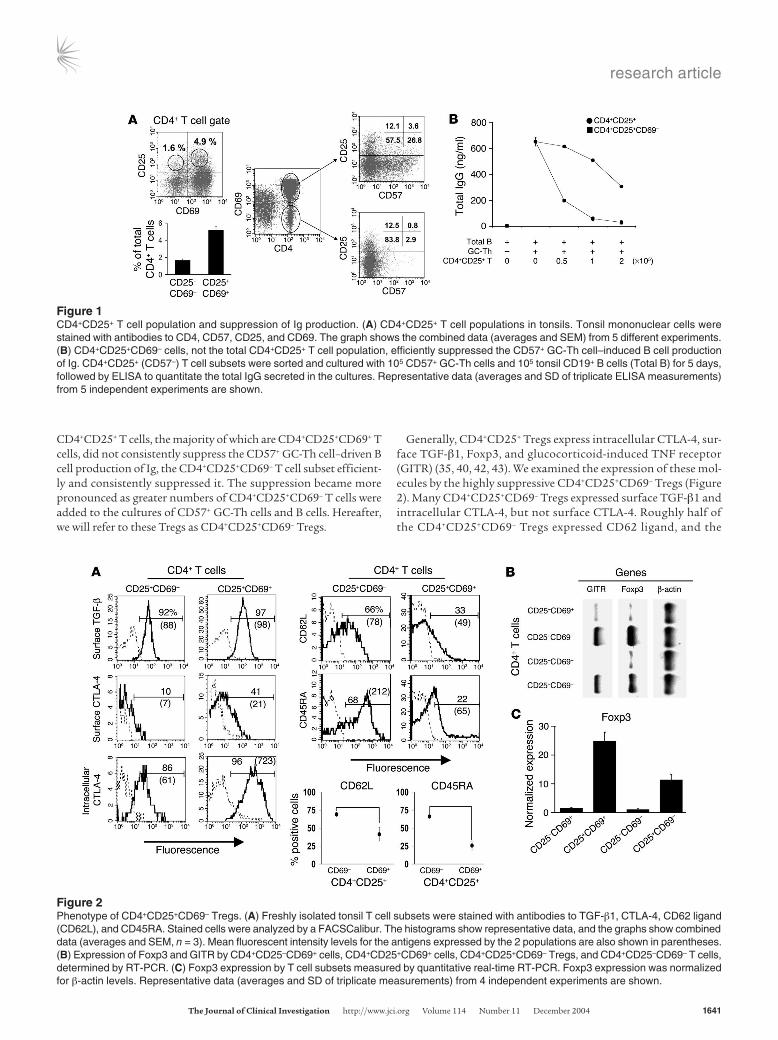
ResultsThe CD4+CD25+CD69– cells in tonsils are potent suppressors of GC-Th cell–dependent B cell Ig synthesis. In human tonsils, the CD4+CD25+ T cells (5–6% of the total CD4+ T cell population) are composed of 2 subsets based on CD69 expression: CD4+CD25+CD69– and CD4+CD25+CD69+ T cells (Figure 1A). The CD4+CD25+CD69– T cells account for 1–2% of total CD4+ T cells. Most CD57+ GC-Th cells, efficient in supporting B cell production of Ig (15), are CD69+CD25–. Therefore, CD57+ GC-Th cells and CD4+CD25+ T cells, particularly CD4+CD25+CD69– T cells, are mutually exclu-sive populations (Figure 1A).
We examined the impact of the total tonsillar CD4+CD25+ T cell population and its subset of CD4+CD25+CD69– T cells on CD57+ GC-Th cell–driven B cell production of Ig (Figure 1B). While the total
Nonstandard abbreviations used: AID, activation-induced cytosine deaminase; CTLA-4, CTL-associated antigen 4; GC-Th cell, GC T cell; GITR, glucocorticoid-induced TNF receptor; IFA, interfollicular area.
Conflict of interest: The authors have declared that no conflict of interest exists.
Citation for this article: J. Clin. Invest. 114:1640–1649 (2004). doi:10.1172/JCI200422325.
research article
The Journal of Clinical Investigation http://www.jci.org Volume 114 Number 11 December 2004 1641
CD4+CD25+ T cells, the majority of which are CD4+CD25+CD69+ T cells, did not consistently suppress the CD57+ GC-Th cell–driven B cell production of Ig, the CD4+CD25+CD69– T cell subset efficient-ly and consistently suppressed it. The suppression became more pronounced as greater numbers of CD4+CD25+CD69– T cells were added to the cultures of CD57+ GC-Th cells and B cells. Hereafter, we will refer to these Tregs as CD4+CD25+CD69– Tregs.
Generally, CD4+CD25+ Tregs express intracellular CTLA-4, sur-face TGF-β1, Foxp3, and glucocorticoid-induced TNF receptor (GITR) (35, 40, 42, 43). We examined the expression of these mol-ecules by the highly suppressive CD4+CD25+CD69– Tregs (Figure 2). Many CD4+CD25+CD69– Tregs expressed surface TGF-β1 and intracellular CTLA-4, but not surface CTLA-4. Roughly half of the CD4+CD25+CD69– Tregs expressed CD62 ligand, and the
Figure 1CD4+CD25+ T cell population and suppression of Ig production. (A) CD4+CD25+ T cell populations in tonsils. Tonsil mononuclear cells were stained with antibodies to CD4, CD57, CD25, and CD69. The graph shows the combined data (averages and SEM) from 5 different experiments. (B) CD4+CD25+CD69– cells, not the total CD4+CD25+ T cell population, efficiently suppressed the CD57+ GC-Th cell–induced B cell production of Ig. CD4+CD25+ (CD57–) T cell subsets were sorted and cultured with 105 CD57+ GC-Th cells and 105 tonsil CD19+ B cells (Total B) for 5 days, followed by ELISA to quantitate the total IgG secreted in the cultures. Representative data (averages and SD of triplicate ELISA measurements) from 5 independent experiments are shown.
Figure 2Phenotype of CD4+CD25+CD69– Tregs. (A) Freshly isolated tonsil T cell subsets were stained with antibodies to TGF-β1, CTLA-4, CD62 ligand (CD62L), and CD45RA. Stained cells were analyzed by a FACSCalibur. The histograms show representative data, and the graphs show combined data (averages and SEM, n = 3). Mean fluorescent intensity levels for the antigens expressed by the 2 populations are also shown in parentheses. (B) Expression of Foxp3 and GITR by CD4+CD25–CD69+ cells, CD4+CD25+CD69+ cells, CD4+CD25+CD69– Tregs, and CD4+CD25–CD69– T cells, determined by RT-PCR. (C) Foxp3 expression by T cell subsets measured by quantitative real-time RT-PCR. Foxp3 expression was normalized for β-actin levels. Representative data (averages and SD of triplicate measurements) from 4 independent experiments are shown.
research article
1642 The Journal of Clinical Investigation http://www.jci.org Volume 114 Number 11 December 2004
majority (approximately 80%) of these T cells expressed CD45RA. CD4+CD25+CD69– Tregs highly expressed GITR and Foxp3 at the RNA level. The CD4+CD25+CD69+ T cells were similar to CD4+CD25+CD69– Tregs in expression of Foxp3, intracellular CTLA-4, and GITR, but they were significantly different from CD4+CD25+CD69– Tregs in expression of CD62 ligand and CD45RA, surface antigens that often indicate migration capac-ity and differentiation status, respectively.
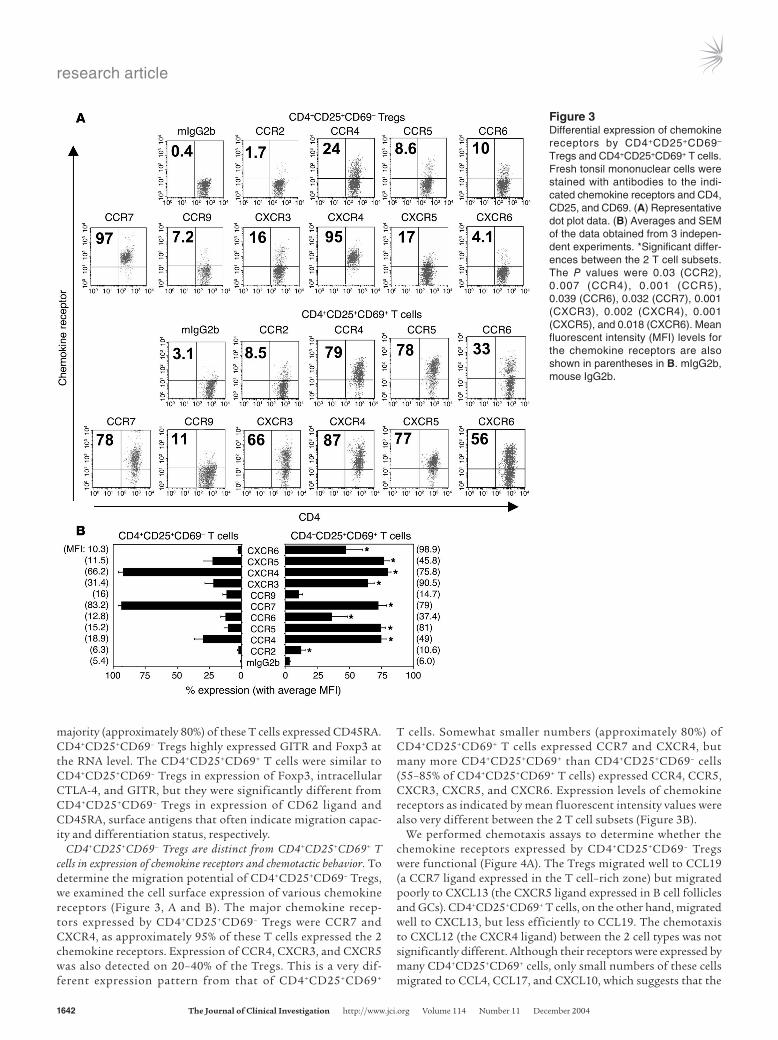
CD4+CD25+CD69– Tregs are distinct from CD4+CD25+CD69+ T cells in expression of chemokine receptors and chemotactic behavior. To determine the migration potential of CD4+CD25+CD69– Tregs, we examined the cell surface expression of various chemokine receptors (Figure 3, A and B). The major chemokine recep-tors expressed by CD4+CD25+CD69– Tregs were CCR7 and CXCR4, as approximately 95% of these T cells expressed the 2 chemokine receptors. Expression of CCR4, CXCR3, and CXCR5 was also detected on 20–40% of the Tregs. This is a very dif-ferent expression pattern from that of CD4+CD25+CD69+
T cells. Somewhat smaller numbers (approximately 80%) of CD4+CD25+CD69+ T cells expressed CCR7 and CXCR4, but many more CD4+CD25+CD69+ than CD4+CD25+CD69– cells (55–85% of CD4+CD25+CD69+ T cells) expressed CCR4, CCR5, CXCR3, CXCR5, and CXCR6. Expression levels of chemokine receptors as indicated by mean fluorescent intensity values were also very different between the 2 T cell subsets (Figure 3B).
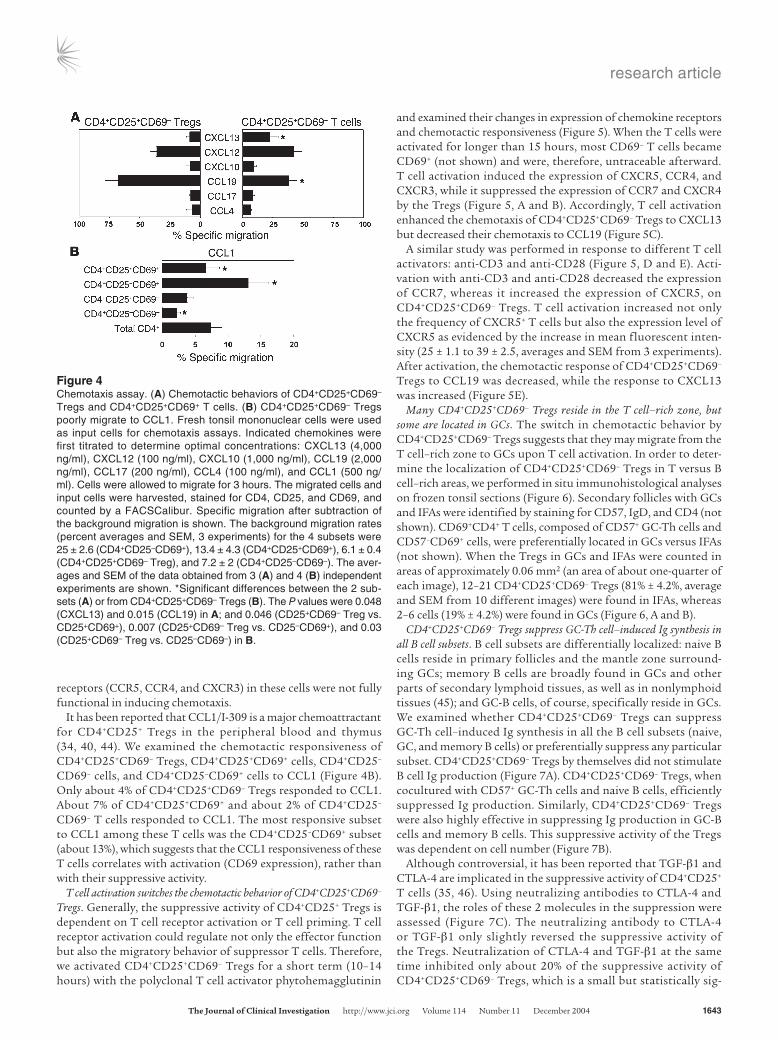
We performed chemotaxis assays to determine whether the chemokine receptors expressed by CD4+CD25+CD69– Tregs were functional (Figure 4A). The Tregs migrated well to CCL19 (a CCR7 ligand expressed in the T cell–rich zone) but migrated poorly to CXCL13 (the CXCR5 ligand expressed in B cell follicles and GCs). CD4+CD25+CD69+ T cells, on the other hand, migrated well to CXCL13, but less efficiently to CCL19. The chemotaxis to CXCL12 (the CXCR4 ligand) between the 2 cell types was not significantly different. Although their receptors were expressed by many CD4+CD25+CD69+ cells, only small numbers of these cells migrated to CCL4, CCL17, and CXCL10, which suggests that the
Figure 3Differential expression of chemokine receptors by CD4+CD25+CD69– Tregs and CD4+CD25+CD69+ T cells. Fresh tonsil mononuclear cells were stained with antibodies to the indi-cated chemokine receptors and CD4, CD25, and CD69. (A) Representative dot plot data. (B) Averages and SEM of the data obtained from 3 indepen-dent experiments. *Significant differ-ences between the 2 T cell subsets. The P values were 0.03 (CCR2), 0.007 (CCR4), 0.001 (CCR5), 0.039 (CCR6), 0.032 (CCR7), 0.001 (CXCR3), 0.002 (CXCR4), 0.001 (CXCR5), and 0.018 (CXCR6). Mean fluorescent intensity (MFI) levels for the chemokine receptors are also shown in parentheses in B. mIgG2b, mouse IgG2b.
research article
The Journal of Clinical Investigation http://www.jci.org Volume 114 Number 11 December 2004 1643
receptors (CCR5, CCR4, and CXCR3) in these cells were not fully functional in inducing chemotaxis.
It has been reported that CCL1/I-309 is a major chemoattractant for CD4+CD25+ Tregs in the peripheral blood and thymus (34, 40, 44). We examined the chemotactic responsiveness of CD4+CD25+CD69– Tregs, CD4+CD25+CD69+ cells, CD4+CD25–
CD69– cells, and CD4+CD25–CD69+ cells to CCL1 (Figure 4B). Only about 4% of CD4+CD25+CD69– Tregs responded to CCL1. About 7% of CD4+CD25+CD69+ and about 2% of CD4+CD25–
CD69– T cells responded to CCL1. The most responsive subset to CCL1 among these T cells was the CD4+CD25–CD69+ subset (about 13%), which suggests that the CCL1 responsiveness of these T cells correlates with activation (CD69 expression), rather than with their suppressive activity.
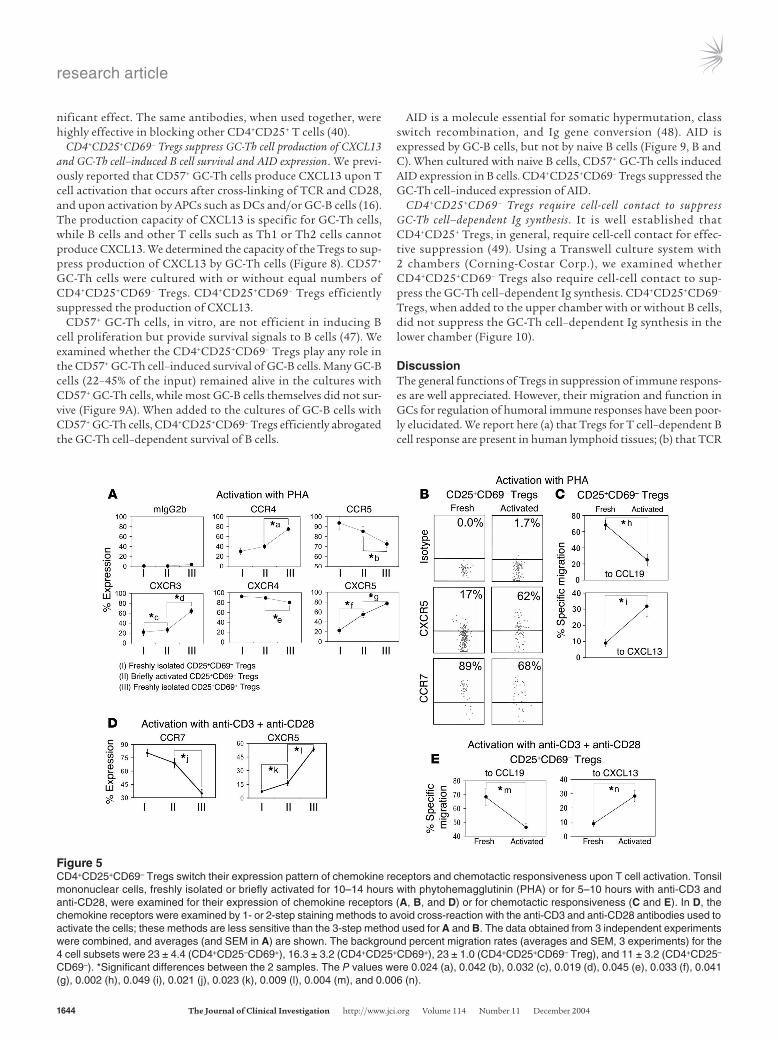
T cell activation switches the chemotactic behavior of CD4+CD25+CD69– Tregs. Generally, the suppressive activity of CD4+CD25+ Tregs is dependent on T cell receptor activation or T cell priming. T cell receptor activation could regulate not only the effector function but also the migratory behavior of suppressor T cells. Therefore, we activated CD4+CD25+CD69– Tregs for a short term (10–14 hours) with the polyclonal T cell activator phytohemagglutinin
and examined their changes in expression of chemokine receptors and chemotactic responsiveness (Figure 5). When the T cells were activated for longer than 15 hours, most CD69– T cells became CD69+ (not shown) and were, therefore, untraceable afterward. T cell activation induced the expression of CXCR5, CCR4, and CXCR3, while it suppressed the expression of CCR7 and CXCR4 by the Tregs (Figure 5, A and B). Accordingly, T cell activation enhanced the chemotaxis of CD4+CD25+CD69– Tregs to CXCL13 but decreased their chemotaxis to CCL19 (Figure 5C).
A similar study was performed in response to different T cell activators: anti-CD3 and anti-CD28 (Figure 5, D and E). Acti-vation with anti-CD3 and anti-CD28 decreased the expression of CCR7, whereas it increased the expression of CXCR5, on CD4+CD25+CD69– Tregs. T cell activation increased not only the frequency of CXCR5+ T cells but also the expression level of CXCR5 as evidenced by the increase in mean fluorescent inten-sity (25 ± 1.1 to 39 ± 2.5, averages and SEM from 3 experiments). After activation, the chemotactic response of CD4+CD25+CD69– Tregs to CCL19 was decreased, while the response to CXCL13 was increased (Figure 5E).
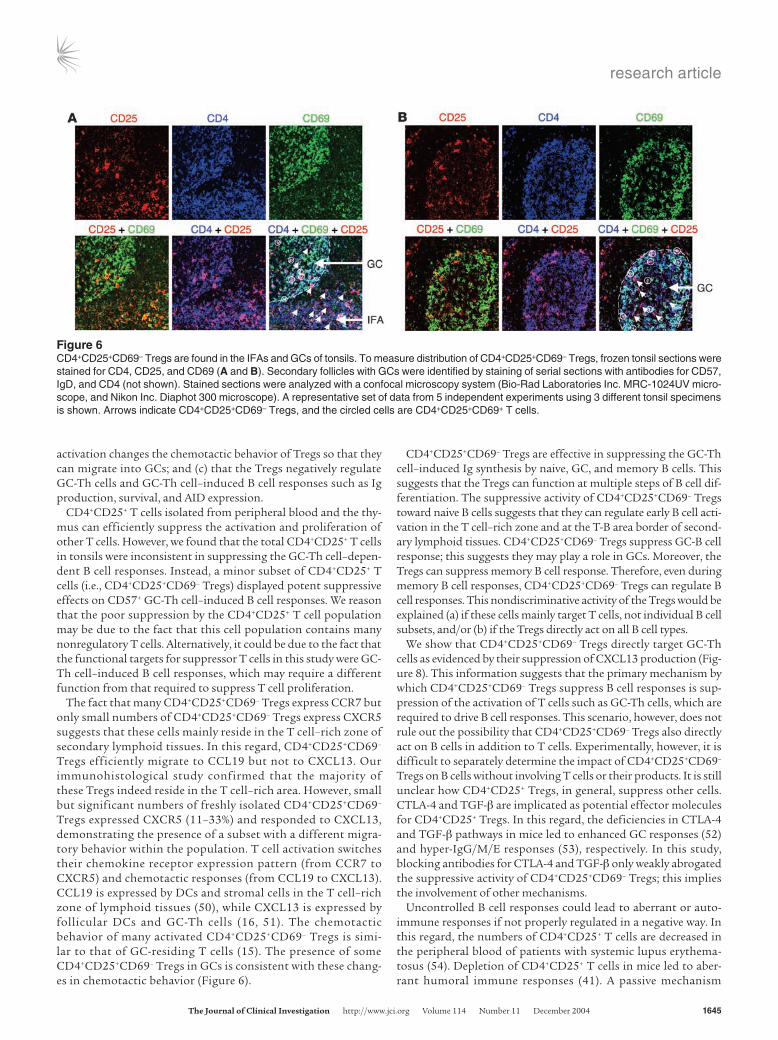
Many CD4+CD25+CD69– Tregs reside in the T cell–rich zone, but some are located in GCs. The switch in chemotactic behavior by CD4+CD25+CD69– Tregs suggests that they may migrate from the T cell–rich zone to GCs upon T cell activation. In order to deter-mine the localization of CD4+CD25+CD69– Tregs in T versus B cell–rich areas, we performed in situ immunohistological analyses on frozen tonsil sections (Figure 6). Secondary follicles with GCs and IFAs were identified by staining for CD57, IgD, and CD4 (not shown). CD69+CD4+ T cells, composed of CD57+ GC-Th cells and CD57–CD69+ cells, were preferentially located in GCs versus IFAs (not shown). When the Tregs in GCs and IFAs were counted in areas of approximately 0.06 mm2 (an area of about one-quarter of each image), 12–21 CD4+CD25+CD69– Tregs (81% ± 4.2%, average and SEM from 10 different images) were found in IFAs, whereas 2–6 cells (19% ± 4.2%) were found in GCs (Figure 6, A and B).
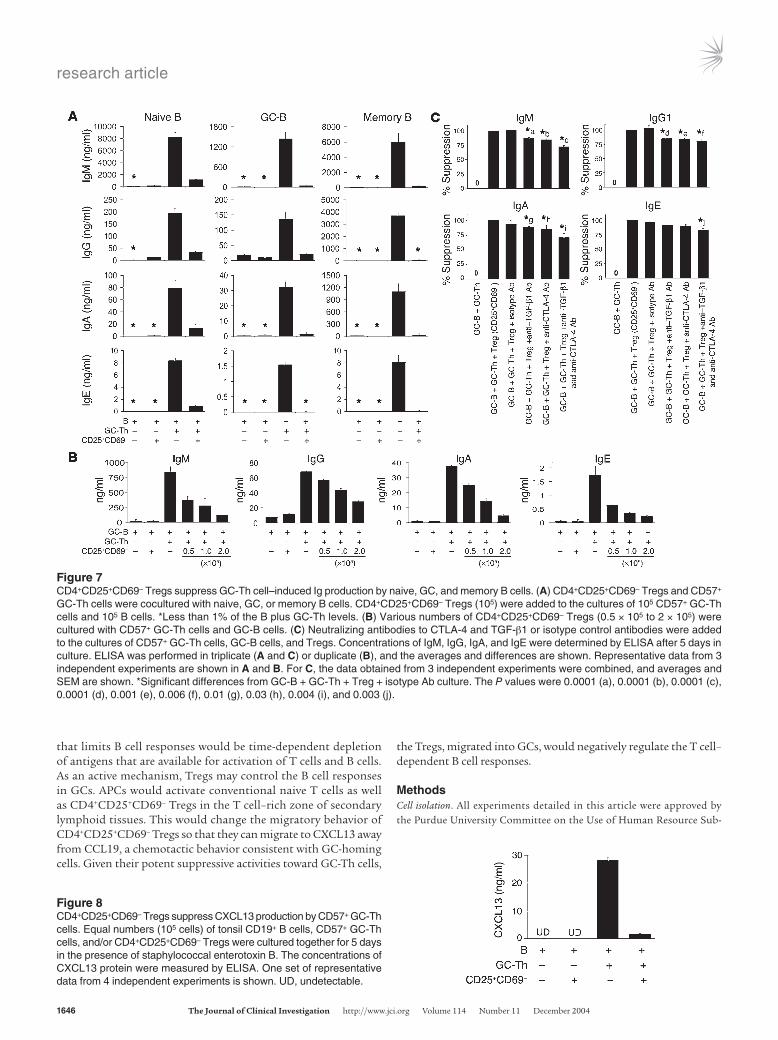
CD4+CD25+CD69– Tregs suppress GC-Th cell–induced Ig synthesis in all B cell subsets. B cell subsets are differentially localized: naive B cells reside in primary follicles and the mantle zone surround-ing GCs; memory B cells are broadly found in GCs and other parts of secondary lymphoid tissues, as well as in nonlymphoid tissues (45); and GC-B cells, of course, specifically reside in GCs. We examined whether CD4+CD25+CD69– Tregs can suppress GC-Th cell–induced Ig synthesis in all the B cell subsets (naive, GC, and memory B cells) or preferentially suppress any particular subset. CD4+CD25+CD69– Tregs by themselves did not stimulate B cell Ig production (Figure 7A). CD4+CD25+CD69– Tregs, when cocultured with CD57+ GC-Th cells and naive B cells, efficiently suppressed Ig production. Similarly, CD4+CD25+CD69– Tregs were also highly effective in suppressing Ig production in GC-B cells and memory B cells. This suppressive activity of the Tregs was dependent on cell number (Figure 7B).
Although controversial, it has been reported that TGF-β1 and CTLA-4 are implicated in the suppressive activity of CD4+CD25+ T cells (35, 46). Using neutralizing antibodies to CTLA-4 and TGF-β1, the roles of these 2 molecules in the suppression were assessed (Figure 7C). The neutralizing antibody to CTLA-4 or TGF-β1 only slightly reversed the suppressive activity of the Tregs. Neutralization of CTLA-4 and TGF-β1 at the same time inhibited only about 20% of the suppressive activity of CD4+CD25+CD69– Tregs, which is a small but statistically sig-
Figure 4Chemotaxis assay. (A) Chemotactic behaviors of CD4+CD25+CD69– Tregs and CD4+CD25+CD69+ T cells. (B) CD4+CD25+CD69– Tregs poorly migrate to CCL1. Fresh tonsil mononuclear cells were used as input cells for chemotaxis assays. Indicated chemokines were first titrated to determine optimal concentrations: CXCL13 (4,000 ng/ml), CXCL12 (100 ng/ml), CXCL10 (1,000 ng/ml), CCL19 (2,000 ng/ml), CCL17 (200 ng/ml), CCL4 (100 ng/ml), and CCL1 (500 ng/ml). Cells were allowed to migrate for 3 hours. The migrated cells and input cells were harvested, stained for CD4, CD25, and CD69, and counted by a FACSCalibur. Specific migration after subtraction of the background migration is shown. The background migration rates (percent averages and SEM, 3 experiments) for the 4 subsets were 25 ± 2.6 (CD4+CD25–CD69+), 13.4 ± 4.3 (CD4+CD25+CD69+), 6.1 ± 0.4 (CD4+CD25+CD69– Treg), and 7.2 ± 2 (CD4+CD25–CD69–). The aver-ages and SEM of the data obtained from 3 (A) and 4 (B) independent experiments are shown. *Significant differences between the 2 sub-sets (A) or from CD4+CD25+CD69– Tregs (B). The P values were 0.048 (CXCL13) and 0.015 (CCL19) in A; and 0.046 (CD25+CD69– Treg vs. CD25+CD69+), 0.007 (CD25+CD69– Treg vs. CD25–CD69+), and 0.03 (CD25+CD69– Treg vs. CD25–CD69–) in B.
research article
1644 The Journal of Clinical Investigation http://www.jci.org Volume 114 Number 11 December 2004
nificant effect. The same antibodies, when used together, were highly effective in blocking other CD4+CD25+ T cells (40).
CD4+CD25+CD69– Tregs suppress GC-Th cell production of CXCL13 and GC-Th cell–induced B cell survival and AID expression. We previ-ously reported that CD57+ GC-Th cells produce CXCL13 upon T cell activation that occurs after cross-linking of TCR and CD28, and upon activation by APCs such as DCs and/or GC-B cells (16). The production capacity of CXCL13 is specific for GC-Th cells, while B cells and other T cells such as Th1 or Th2 cells cannot produce CXCL13. We determined the capacity of the Tregs to sup-press production of CXCL13 by GC-Th cells (Figure 8). CD57+ GC-Th cells were cultured with or without equal numbers of CD4+CD25+CD69– Tregs. CD4+CD25+CD69– Tregs efficiently suppressed the production of CXCL13.
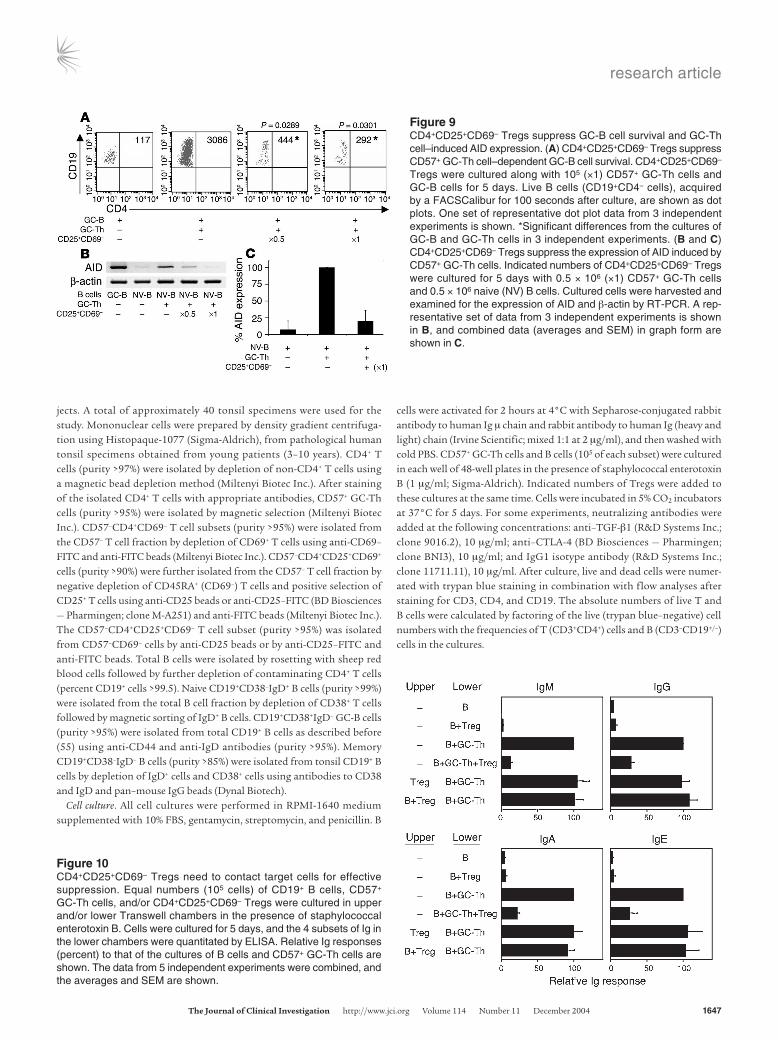
CD57+ GC-Th cells, in vitro, are not efficient in inducing B cell proliferation but provide survival signals to B cells (47). We examined whether the CD4+CD25+CD69– Tregs play any role in the CD57+ GC-Th cell–induced survival of GC-B cells. Many GC-B cells (22–45% of the input) remained alive in the cultures with CD57+ GC-Th cells, while most GC-B cells themselves did not sur-vive (Figure 9A). When added to the cultures of GC-B cells with CD57+ GC-Th cells, CD4+CD25+CD69– Tregs efficiently abrogated the GC-Th cell–dependent survival of B cells.
AID is a molecule essential for somatic hypermutation, class switch recombination, and Ig gene conversion (48). AID is expressed by GC-B cells, but not by naive B cells (Figure 9, B and C). When cultured with naive B cells, CD57+ GC-Th cells induced AID expression in B cells. CD4+CD25+CD69– Tregs suppressed the GC-Th cell–induced expression of AID.
CD4+CD25+CD69– Tregs require cell-cell contact to suppress GC-Th cell–dependent Ig synthesis. It is well established that CD4+CD25+ Tregs, in general, require cell-cell contact for effec-tive suppression (49). Using a Transwell culture system with 2 chambers (Corning-Costar Corp.), we examined whether CD4+CD25+CD69– Tregs also require cell-cell contact to sup-press the GC-Th cell–dependent Ig synthesis. CD4+CD25+CD69– Tregs, when added to the upper chamber with or without B cells, did not suppress the GC-Th cell–dependent Ig synthesis in the lower chamber (Figure 10).
DiscussionThe general functions of Tregs in suppression of immune respons-es are well appreciated. However, their migration and function in GCs for regulation of humoral immune responses have been poor-ly elucidated. We report here (a) that Tregs for T cell–dependent B cell response are present in human lymphoid tissues; (b) that TCR
Figure 5CD4+CD25+CD69– Tregs switch their expression pattern of chemokine receptors and chemotactic responsiveness upon T cell activation. Tonsil mononuclear cells, freshly isolated or briefly activated for 10–14 hours with phytohemagglutinin (PHA) or for 5–10 hours with anti-CD3 and anti-CD28, were examined for their expression of chemokine receptors (A, B, and D) or for chemotactic responsiveness (C and E). In D, the chemokine receptors were examined by 1- or 2-step staining methods to avoid cross-reaction with the anti-CD3 and anti-CD28 antibodies used to activate the cells; these methods are less sensitive than the 3-step method used for A and B. The data obtained from 3 independent experiments were combined, and averages (and SEM in A) are shown. The background percent migration rates (averages and SEM, 3 experiments) for the 4 cell subsets were 23 ± 4.4 (CD4+CD25–CD69+), 16.3 ± 3.2 (CD4+CD25+CD69+), 23 ± 1.0 (CD4+CD25+CD69– Treg), and 11 ± 3.2 (CD4+CD25–
CD69–). *Significant differences between the 2 samples. The P values were 0.024 (a), 0.042 (b), 0.032 (c), 0.019 (d), 0.045 (e), 0.033 (f), 0.041 (g), 0.002 (h), 0.049 (i), 0.021 (j), 0.023 (k), 0.009 (l), 0.004 (m), and 0.006 (n).
research article
The Journal of Clinical Investigation http://www.jci.org Volume 114 Number 11 December 2004 1645
activation changes the chemotactic behavior of Tregs so that they can migrate into GCs; and (c) that the Tregs negatively regulate GC-Th cells and GC-Th cell–induced B cell responses such as Ig production, survival, and AID expression.
CD4+CD25+ T cells isolated from peripheral blood and the thy-mus can efficiently suppress the activation and proliferation of other T cells. However, we found that the total CD4+CD25+ T cells in tonsils were inconsistent in suppressing the GC-Th cell–depen-dent B cell responses. Instead, a minor subset of CD4+CD25+ T cells (i.e., CD4+CD25+CD69– Tregs) displayed potent suppressive effects on CD57+ GC-Th cell–induced B cell responses. We reason that the poor suppression by the CD4+CD25+ T cell population may be due to the fact that this cell population contains many nonregulatory T cells. Alternatively, it could be due to the fact that the functional targets for suppressor T cells in this study were GC-Th cell–induced B cell responses, which may require a different function from that required to suppress T cell proliferation.
The fact that many CD4+CD25+CD69– Tregs express CCR7 but only small numbers of CD4+CD25+CD69– Tregs express CXCR5 suggests that these cells mainly reside in the T cell–rich zone of secondary lymphoid tissues. In this regard, CD4+CD25+CD69– Tregs efficiently migrate to CCL19 but not to CXCL13. Our immunohistological study confirmed that the majority of these Tregs indeed reside in the T cell–rich area. However, small but significant numbers of freshly isolated CD4+CD25+CD69– Tregs expressed CXCR5 (11–33%) and responded to CXCL13, demonstrating the presence of a subset with a different migra-tory behavior within the population. T cell activation switches their chemokine receptor expression pattern (from CCR7 to CXCR5) and chemotactic responses (from CCL19 to CXCL13). CCL19 is expressed by DCs and stromal cells in the T cell–rich zone of lymphoid tissues (50), while CXCL13 is expressed by follicular DCs and GC-Th cells (16, 51). The chemotactic behavior of many activated CD4+CD25+CD69– Tregs is simi-lar to that of GC-residing T cells (15). The presence of some CD4+CD25+CD69– Tregs in GCs is consistent with these chang-es in chemotactic behavior (Figure 6).
CD4+CD25+CD69– Tregs are effective in suppressing the GC-Th cell–induced Ig synthesis by naive, GC, and memory B cells. This suggests that the Tregs can function at multiple steps of B cell dif-ferentiation. The suppressive activity of CD4+CD25+CD69– Tregs toward naive B cells suggests that they can regulate early B cell acti-vation in the T cell–rich zone and at the T-B area border of second-ary lymphoid tissues. CD4+CD25+CD69– Tregs suppress GC-B cell response; this suggests they may play a role in GCs. Moreover, the Tregs can suppress memory B cell response. Therefore, even during memory B cell responses, CD4+CD25+CD69– Tregs can regulate B cell responses. This nondiscriminative activity of the Tregs would be explained (a) if these cells mainly target T cells, not individual B cell subsets, and/or (b) if the Tregs directly act on all B cell types.
We show that CD4+CD25+CD69– Tregs directly target GC-Th cells as evidenced by their suppression of CXCL13 production (Fig-ure 8). This information suggests that the primary mechanism by which CD4+CD25+CD69– Tregs suppress B cell responses is sup-pression of the activation of T cells such as GC-Th cells, which are required to drive B cell responses. This scenario, however, does not rule out the possibility that CD4+CD25+CD69– Tregs also directly act on B cells in addition to T cells. Experimentally, however, it is difficult to separately determine the impact of CD4+CD25+CD69– Tregs on B cells without involving T cells or their products. It is still unclear how CD4+CD25+ Tregs, in general, suppress other cells. CTLA-4 and TGF-β are implicated as potential effector molecules for CD4+CD25+ Tregs. In this regard, the deficiencies in CTLA-4 and TGF-β pathways in mice led to enhanced GC responses (52) and hyper-IgG/M/E responses (53), respectively. In this study, blocking antibodies for CTLA-4 and TGF-β only weakly abrogated the suppressive activity of CD4+CD25+CD69– Tregs; this implies the involvement of other mechanisms.
Uncontrolled B cell responses could lead to aberrant or auto-immune responses if not properly regulated in a negative way. In this regard, the numbers of CD4+CD25+ T cells are decreased in the peripheral blood of patients with systemic lupus erythema-tosus (54). Depletion of CD4+CD25+ T cells in mice led to aber-rant humoral immune responses (41). A passive mechanism
Figure 6CD4+CD25+CD69– Tregs are found in the IFAs and GCs of tonsils. To measure distribution of CD4+CD25+CD69– Tregs, frozen tonsil sections were stained for CD4, CD25, and CD69 (A and B). Secondary follicles with GCs were identified by staining of serial sections with antibodies for CD57, IgD, and CD4 (not shown). Stained sections were analyzed with a confocal microscopy system (Bio-Rad Laboratories Inc. MRC-1024UV micro-scope, and Nikon Inc. Diaphot 300 microscope). A representative set of data from 5 independent experiments using 3 different tonsil specimens is shown. Arrows indicate CD4+CD25+CD69– Tregs, and the circled cells are CD4+CD25+CD69+ T cells.
research article
1646 The Journal of Clinical Investigation http://www.jci.org Volume 114 Number 11 December 2004
that limits B cell responses would be time-dependent depletion of antigens that are available for activation of T cells and B cells. As an active mechanism, Tregs may control the B cell responses in GCs. APCs would activate conventional naive T cells as well as CD4+CD25+CD69– Tregs in the T cell–rich zone of secondary lymphoid tissues. This would change the migratory behavior of CD4+CD25+CD69– Tregs so that they can migrate to CXCL13 away from CCL19, a chemotactic behavior consistent with GC-homing cells. Given their potent suppressive activities toward GC-Th cells,
the Tregs, migrated into GCs, would negatively regulate the T cell–dependent B cell responses.
MethodsCell isolation. All experiments detailed in this article were approved by the Purdue University Committee on the Use of Human Resource Sub-
Figure 7CD4+CD25+CD69– Tregs suppress GC-Th cell–induced Ig production by naive, GC, and memory B cells. (A) CD4+CD25+CD69– Tregs and CD57+ GC-Th cells were cocultured with naive, GC, or memory B cells. CD4+CD25+CD69– Tregs (105) were added to the cultures of 105 CD57+ GC-Th cells and 105 B cells. *Less than 1% of the B plus GC-Th levels. (B) Various numbers of CD4+CD25+CD69– Tregs (0.5 × 10⁵ to 2 × 10⁵) were cultured with CD57+ GC-Th cells and GC-B cells. (C) Neutralizing antibodies to CTLA-4 and TGF-β1 or isotype control antibodies were added to the cultures of CD57+ GC-Th cells, GC-B cells, and Tregs. Concentrations of IgM, IgG, IgA, and IgE were determined by ELISA after 5 days in culture. ELISA was performed in triplicate (A and C) or duplicate (B), and the averages and differences are shown. Representative data from 3 independent experiments are shown in A and B. For C, the data obtained from 3 independent experiments were combined, and averages and SEM are shown. *Significant differences from GC-B + GC-Th + Treg + isotype Ab culture. The P values were 0.0001 (a), 0.0001 (b), 0.0001 (c), 0.0001 (d), 0.001 (e), 0.006 (f), 0.01 (g), 0.03 (h), 0.004 (i), and 0.003 (j).
Figure 8CD4+CD25+CD69– Tregs suppress CXCL13 production by CD57+ GC-Th cells. Equal numbers (105 cells) of tonsil CD19+ B cells, CD57+ GC-Th cells, and/or CD4+CD25+CD69– Tregs were cultured together for 5 days in the presence of staphylococcal enterotoxin B. The concentrations of CXCL13 protein were measured by ELISA. One set of representative data from 4 independent experiments is shown. UD, undetectable.
research article
The Journal of Clinical Investigation http://www.jci.org Volume 114 Number 11 December 2004 1647
jects. A total of approximately 40 tonsil specimens were used for the study. Mononuclear cells were prepared by density gradient centrifuga-tion using Histopaque-1077 (Sigma-Aldrich), from pathological human tonsil specimens obtained from young patients (3–10 years). CD4+ T cells (purity >97%) were isolated by depletion of non-CD4+ T cells using a magnetic bead depletion method (Miltenyi Biotec Inc.). After staining of the isolated CD4+ T cells with appropriate antibodies, CD57+ GC-Th cells (purity >95%) were isolated by magnetic selection (Miltenyi Biotec Inc.). CD57–CD4+CD69– T cell subsets (purity >95%) were isolated from the CD57– T cell fraction by depletion of CD69+ T cells using anti-CD69–FITC and anti-FITC beads (Miltenyi Biotec Inc.). CD57–CD4+CD25+CD69+ cells (purity >90%) were further isolated from the CD57– T cell fraction by negative depletion of CD45RA+ (CD69–) T cells and positive selection of CD25+ T cells using anti-CD25 beads or anti-CD25–FITC (BD Biosciences — Pharmingen; clone M-A251) and anti-FITC beads (Miltenyi Biotec Inc.). The CD57–CD4+CD25+CD69– T cell subset (purity >95%) was isolated from CD57–CD69– cells by anti-CD25 beads or by anti-CD25–FITC and anti-FITC beads. Total B cells were isolated by rosetting with sheep red blood cells followed by further depletion of contaminating CD4+ T cells (percent CD19+ cells >99.5). Naive CD19+CD38–IgD+ B cells (purity >99%) were isolated from the total B cell fraction by depletion of CD38+ T cells followed by magnetic sorting of IgD+ B cells. CD19+CD38+IgD– GC-B cells (purity >95%) were isolated from total CD19+ B cells as described before (55) using anti-CD44 and anti-IgD antibodies (purity >95%). Memory CD19+CD38–IgD– B cells (purity >85%) were isolated from tonsil CD19+ B cells by depletion of IgD+ cells and CD38+ cells using antibodies to CD38 and IgD and pan–mouse IgG beads (Dynal Biotech).
Cell culture. All cell cultures were performed in RPMI-1640 medium supplemented with 10% FBS, gentamycin, streptomycin, and penicillin. B
cells were activated for 2 hours at 4°C with Sepharose-conjugated rabbit antibody to human Ig μ chain and rabbit antibody to human Ig (heavy and light) chain (Irvine Scientific; mixed 1:1 at 2 μg/ml), and then washed with cold PBS. CD57+ GC-Th cells and B cells (105 of each subset) were cultured in each well of 48-well plates in the presence of staphylococcal enterotoxin B (1 μg/ml; Sigma-Aldrich). Indicated numbers of Tregs were added to these cultures at the same time. Cells were incubated in 5% CO2 incubators at 37°C for 5 days. For some experiments, neutralizing antibodies were added at the following concentrations: anti–TGF-β1 (R&D Systems Inc.; clone 9016.2), 10 μg/ml; anti–CTLA-4 (BD Biosciences — Pharmingen; clone BNI3), 10 μg/ml; and IgG1 isotype antibody (R&D Systems Inc.; clone 11711.11), 10 μg/ml. After culture, live and dead cells were numer-ated with trypan blue staining in combination with flow analyses after staining for CD3, CD4, and CD19. The absolute numbers of live T and B cells were calculated by factoring of the live (trypan blue–negative) cell numbers with the frequencies of T (CD3+CD4+) cells and B (CD3–CD19+/–) cells in the cultures.
Figure 9CD4+CD25+CD69– Tregs suppress GC-B cell survival and GC-Th cell–induced AID expression. (A) CD4+CD25+CD69– Tregs suppress CD57+ GC-Th cell–dependent GC-B cell survival. CD4+CD25+CD69– Tregs were cultured along with 105 (×1) CD57+ GC-Th cells and GC-B cells for 5 days. Live B cells (CD19+CD4– cells), acquired by a FACSCalibur for 100 seconds after culture, are shown as dot plots. One set of representative dot plot data from 3 independent experiments is shown. *Significant differences from the cultures of GC-B and GC-Th cells in 3 independent experiments. (B and C) CD4+CD25+CD69– Tregs suppress the expression of AID induced by CD57+ GC-Th cells. Indicated numbers of CD4+CD25+CD69– Tregs were cultured for 5 days with 0.5 × 10⁶ (×1) CD57+ GC-Th cells and 0.5 × 10⁶ naive (NV) B cells. Cultured cells were harvested and examined for the expression of AID and β-actin by RT-PCR. A rep-resentative set of data from 3 independent experiments is shown in B, and combined data (averages and SEM) in graph form are shown in C.
Figure 10CD4+CD25+CD69– Tregs need to contact target cells for effective suppression. Equal numbers (105 cells) of CD19+ B cells, CD57+ GC-Th cells, and/or CD4+CD25+CD69– Tregs were cultured in upper and/or lower Transwell chambers in the presence of staphylococcal enterotoxin B. Cells were cultured for 5 days, and the 4 subsets of Ig in the lower chambers were quantitated by ELISA. Relative Ig responses (percent) to that of the cultures of B cells and CD57+ GC-Th cells are shown. The data from 5 independent experiments were combined, and the averages and SEM are shown.
research article
1648 The Journal of Clinical Investigation http://www.jci.org Volume 114 Number 11 December 2004
In situ fluorescent immunohistochemistry. Frozen sections of tonsils were acetone-fixed and stained using directly labeled antibodies to CD57 (BD Biosciences — Pharmingen; clone NK-1, labeled with FITC), CD4 (Caltag Laboratories; clone S3.5, labeled with allophycocyanin), IgD (BD Biosciences — Pharmingen; clone IA6-2, labeled with PE), CD25 (BD Biosciences — Pharmingen; clone M-A251, labeled with PE), and/or CD69 (BD Biosciences — Pharmingen; clone FN50, labeled with PE or FITC). Control antibodies were used to determine the background fluorescent levels versus specific signals. Stained sections were analyzed using a confocal microscopy system (Bio-Rad Laboratories Inc. MRC-1024UV microscope, and Nikon Inc. Dia-phot 300 microscope) at Purdue University Cytometry Laboratories.
ELISA. Isolated T cells and B cells were cultured for 5 days, and Ig con-centrations in the supernatants were determined by ELISA as previously described (15). The sensitivities of the ELISA systems were greater than 5 ng/ml, 300 pg/ml, 600 pg/ml, 15 pg/ml, and 30 pg/ml for IgM, IgG, IgA, IgE, and IgG1, respectively. In Figure 7C, IgG1 was measured instead of total IgG to avoid cross-reaction of the capturing antibody for IgG with neutralizing antibodies. An ELISA kit (R&D Systems Inc.) was used to measure the concentrations of CXCL13 according to the manufacturer’s protocols. The sensitivity of this ELISA kit is greater than 10 pg/ml.
Quantitative and conventional RT-PCR analyses of AID, Foxp3, and GITR. Total RNA was extracted with Trizol reagent (Invitrogen Corp.) and was reverse-transcribed into cDNAs with SuperScript First-Strand Synthesis System for RT-PCR (Invitrogen Corp.) according to the manufacturer’s protocol. A 569-bp product of AID was amplified by PCR (45 seconds at 94°C, 45 seconds at 57°C, and 45 seconds at 72°C) for 30 cycles using 2 primers: forward (5′-GAGGCAAGAAGACACTCTGG-3′) and reverse (5′-CAAAAGGATGCGCCGAAGCTGTCTGGAG-3′). β-Actin was also ampli-fied using 2 primers: forward (5′-GTGGGGCGCCCCAGGCACCA-3′) and reverse (5′-CTCCTTAATGTCACGCACGATTTC-3′). Foxp3 (a 340-bp product) was amplified using 2 primers: forward (5′-TGGTACAGTCTCTG-GAGCAG-3′) and reverse (5′-AGGATGGCCCAGCGGATGAG-3′). GITR (a 328-bp product) was amplified using 2 primers: forward (5′-TGCTGCCGC-GATTACCCGG-3′) and reverse (5′-GCCACCCAAGCGGCTCTGC-3′). For quantitative real-time PCR assays, we used SYBR Green PCR Master Mix system (Applied Biosystems) on DNA Engine Opticon system (MJ Research Inc.) using the same primer sets.
Chemotaxis assay. Chemotaxis assays were performed as described pre-viously (56). Tonsil lymphocytes (5 × 10⁵) were placed in each Transwell insert (5-μm pore, 24-well format; Corning-Costar Corp.) with 600 μl of chemotaxis medium (RPMI-1640 with 0.5% BSA). Chemokines were used at indicated optimal concentrations determined by titration (see Figure 4). Cells were allowed to migrate for 3 hours in a 5% CO2 incubator at 37°C. After chemotaxis, cells migrated to the lower chambers, input cells were harvested and stained with antibodies to CD4 (Caltag Laboratories; clone S3.5, labeled with allophycocyanin), CD25 (BD Biosciences — Pharmingen; clone M-A251, labeled with PE), and CD69 (BD Biosciences — Pharmingen; clone FN50, labeled with FITC), and then cell numbers for each subset were
determined by a FACSCalibur (BD Biosciences) for 60 seconds. The numbers of cells that spontaneously migrated to medium controls were subtracted from the numbers of cells that migrated to chemokines to calculate specific migration rates.
Chemokine receptor expression. Expression of chemotaxis receptors was exam-ined as described previously (57). Fresh or activated CD4+ T cells (activated by phytohemagglutinin at 1 μg/ml for 10–14 hours or immobilized anti-CD3 and anti-CD28 for 5–10 hours) were stained with antibodies to CCR2 (R&D Systems Inc.; clone 48607.121), CCR4 (BD Biosciences — Pharmingen; clone 1G1), CCR5 (R&D Systems Inc.; clone 45531.111), CCR6 (R&D Systems Inc.; clone 53103.111), CCR7 (BD Biosciences — Pharmingen; clone 2H4), CCR9 (Millennium Pharmaceuticals Inc.; clone 3C3), CXCR3 (R&D Systems Inc.; clone 49801.111), CXCR4 (R&D Systems Inc.; clone 44717.111), CXCR5 (R&D Systems Inc.; clone 51505.111), and CXCR6 (R&D Systems Inc.; clone 56811.111) for 20 minutes on ice. Mouse IgG2b (Caltag Laboratories) was used for a negative control. Cells were further stained with biotinylated goat anti-mouse IgG (heavy and light) antibody (Vector Laboratories Inc.) for 20 minutes, followed by final staining with peridinin chlorophyll pro-tein–streptavidin and antibodies to CD4 (Caltag Laboratories; clone S3.5, labeled with APC), CD25 (BD Biosciences — Pharmingen; clone M-A251, labeled with PE), and CD69 (BD Biosciences — Pharmingen; clone FN50, labeled with FITC) in 10% mouse serum. Stained cells were acquired with a FACSCalibur, and the data were analyzed with CellQuest (BD Biosciences). For the Tregs activated with anti-CD3 and anti-CD28, surface CXCR5 was detected with anti-CXCR5–biotin (R&D Systems Inc.) and peridinin chloro-phyll protein–streptavidin. CCR7 was detected by PE-conjugated anti-CCR7 (BD Biosciences — Pharmingen).
Statistical analysis. Student’s paired t test was used to determine the sig-nificance of the differences between 2 sets of related data. P values less than or equal to 0.05 were considered to be significant.
AcknowledgmentsThis study was supported by grants from the Leukemia and Lym-phoma Society, the American Cancer Society (IRG-58-006-44), the Leukemia Research Foundation, the US Department of Agricul-ture (IND73077AH), and the Eli and Edythe L. Broad Foundation (to C.H. Kim). We thank J. Kim for his excellent technical assis-tance, J. Xie and M. Chester (Department of Statistics, Purdue Uni-versity) for their advice on statistical analysis, and H. Crocker for her help in preparation of this manuscript.
Received for publication June 2, 2004, and accepted in revised form September 29, 2004.
Address correspondence to: Chang Kim, VPTH 126, 725 Har-rison Street, Purdue University, West Lafayette, Indiana 47907, USA. Phone: (765) 494-0976; Fax: (765) 494-9830; E-mail: [email protected].
1. Garside, P., et al. 1998. Visualization of specific B and T lymphocyte interactions in the lymph node. Science. 281:96–99.
2. Camacho, S.A., Kosco-Vilbois, M.H., and Berek, C. 1998. The dynamic structure of the germinal cen-ter. Immunol. Today. 19:511–514.
3. Jacob, J., Kelsoe, G., Rajewsky, K., and Weiss, U. 1991. Intraclonal generation of antibody mutants in germinal centres. Nature. 354:389–392.
4. Kelsoe, G. 1996. The germinal center: a crucible for lymphocyte selection. Semin. Immunol. 8:179–184.
5. Lipsky, P.E., Attrep, J.F., Grammer, A.C., McIl-raith, M.J., and Nishioka, Y. 1997. Analysis of CD40-CD40 ligand interactions in the regula-
tion of human B cell function. Ann. N. Y. Acad. Sci. 815:372–383.
6. Jacob, J., and Kelsoe, G. 1992. In situ studies of the primary immune response to (4-hydroxy-3-nitrophenyl)acetyl. II. A common clonal origin for periarteriolar lymphoid sheath-associated foci and germinal centers. J. Exp. Med. 176:679–687.
7. Liu, Y.J., Zhang, J., Lane, P.J., Chan, E.Y., and MacLennan, I.C. 1991. Sites of specific B cell acti-vation in primary and secondary responses to T cell-dependent and T cell-independent antigens. Eur. J. Immunol. 21:2951–2962.
8. Gray, D. 1988. Recruitment of virgin B cells into an immune response is restricted to activation outside
lymphoid follicles. Immunology. 65:73–79. 9. Vonderheide, R.H., and Hunt, S.V. 1990. Immigra-
tion of thoracic duct B lymphocytes into estab-lished germinal centers in the rat. Eur. J. Immunol. 20:79–86.
10. Hanna, M.G., Jr. 1964. An autoradiographic study of the germinal center in spleen white pulp during early intervals of the immune response. Lab. Invest. 13:95–104.
11. Jacob, J., Kassir, R., and Kelsoe, G. 1991. In situ studies of the primary immune response to (4-hydroxy-3-nitrophenyl)acetyl. I. The architec-ture and dynamics of responding cell populations. J. Exp. Med. 173:1165–1175.
research article
The Journal of Clinical Investigation http://www.jci.org Volume 114 Number 11 December 2004 1649
12. Jacob, J., and Kelsoe, G. 1992. In situ studies of the primary immune response to (4-hydroxy-3-nitrophenyl)acetyl. II. A common clonal origin for periarteriolar lymphoid sheath-associated foci and germinal centers. J. Exp. Med. 176:679–687.
13. Feuillard, J., Taylor, D., Casamayor-Palleja, M., John-son, G.D., and MacLennan, I.C. 1995. Isolation and characteristics of tonsil centroblasts with reference to Ig class switching. Int. Immunol. 7:121–130.
14. Parker, D.C. 1993. T cell-dependent B cell activa-tion. Annu. Rev. Immunol. 11:331–360.
15. Kim, C.H., et al. 2001. Subspecialization of CXCR5+ T cells: B helper activity is focused in a germinal center-localized subset of CXCR5+ T cells. J. Exp. Med. 193:1373–1381.
16. Kim, C.H., et al. 2004. Unique gene expression program of human germinal center T helper cells. Blood. 104:1952–1960.
17. Bouzahzah, F., Bosseloir, A., Heinen, E., and Simar, L.J. 1995. Germinal center T cells: analysis of their proliferative capacity. Adv. Exp. Med. Biol. 378:305–307.
18. Andersson, E., Dahlenborg, K., Ohlin, M., Bor-rebaeck, C.A., and Carlsson, R. 1996. Immuno-globulin production induced by CD57+ GC-derived helper T cells in vitro requires addition of exogenous IL-2. Cell. Immunol. 169:166–173.
19. Bowen, M.B., Butch, A.W., Parvin, C.A., Levine, A., and Nahm, M.H. 1991. Germinal center T cells are distinct helper-inducer T cells. Hum. Immunol. 31:67–75.
20. Butch, A.W., Chung, G.H., Hoffmann, J.W., and Nahm, M.H. 1993. Cytokine expression by germi-nal center cells. J. Immunol. 150:39–47.
21. Mori, S., Mohri, N., Morita, H., Yamaguchi, K., and Shimamine, T. 1983. Germinal centers as the main sites of Leu 7 (HNK-1) lymphocytes in human lymph node and tonsil. Nippon Ketsueki Gakkai Zasshi. 46:1016–1019.
22. Porwit-Ksiazek, A., Ksiazek, T., and Biberfeld, P. 1983. Leu 7+ (HNK-1+) cells. I. Selective compart-mentalization of Leu 7+ cells with different immu-nophenotypes in lymphatic tissues and blood. Scand. J. Immunol. 18:485–493.
23. Ritchie, A.W., James, K., and Micklem, H.S. 1983. The distribution and possible significance of cells identified in human lymphoid tissue by the monoclonal antibody HNK-1. Clin. Exp. Immunol. 51:439–447.
24. Gershon, R.K., and Kondo, K. 1970. Cell interac-tions in the induction of tolerance: the role of thy-mic lymphocytes. Immunology. 18:723–735.
25. Gershon, R.K., and Kondo, K. 1971. Infectious immunological tolerance. Immunology. 21:903–914.
26. Kilshaw, P.J., Brent, L., and Pinto, M. 1975. Sup-pressor T cells in mice made unresponsive to skin allografts. Nature. 255:489–491.
27. Sakaguchi, S., Sakaguchi, N., Asano, M., Itoh, M., and Toda, M. 1995. Immunologic self-tolerance maintained by activated T cells expressing IL-2
receptor alpha-chains (CD25). Breakdown of a single mechanism of self-tolerance causes various autoimmune diseases. J. Immunol. 155:1151–1164.
28. Wood, K.J., and Sakaguchi, S. 2003. Regula-tory T cells in transplantation tolerance. Nat. Rev. Immunol. 3:199–210.
29. Bach, J.F., and Francois Bach, J. 2003. Regulatory T cells under scrutiny. Nat. Rev. Immunol. 3:189–198.
30. Baecher-Allan, C., Viglietta, V., and Hafler, D.A. 2004. Human CD4+CD25+ regulatory T cells. Semin. Immunol. 16:89–98.
31. Shevach, E.M., Piccirillo, C.A., Thornton, A.M., and McHugh, R.S. 2003. Control of T cell activation by CD4+CD25+ suppressor T cells. Novartis Found. Symp. 252:24–36.
32. Wang, X.B., Zheng, C.Y., Giscombe, R., and Lefvert, A.K. 2001. Regulation of surface and intracellular expression of CTLA-4 on human peripheral T cells. Scand. J. Immunol. 54:453–458.
33. Ermann, J., et al. 2001. CD4(+)CD25(+) T cells facilitate the induction of T cell anergy. J. Immunol. 167:4271–4275.
34. Iellem, A., et al. 2001. Unique chemotactic response profile and specific expression of chemokine recep-tors CCR4 and CCR8 by CD4(+)CD25(+) regula-tory T cells. J. Exp. Med. 194:847–853.
35. Nakamura, K., Kitani, A., and Strober, W. 2001. Cell contact-dependent immunosuppression by CD4(+)CD25(+) regulatory T cells is mediated by cell surface-bound transforming growth factor beta. J. Exp. Med. 194:629–644.
36. Baecher-Allan, C., Brown, J.A., Freeman, G.J., and Hafler, D.A. 2001. CD4+CD25high regula-tory cells in human peripheral blood. J. Immunol. 167:1245–1253.
37. Taylor, P.A., Noelle, R.J., and Blazar, B.R. 2001. CD4(+)CD25(+) immune regulatory cells are required for induction of tolerance to alloantigen via costimulatory blockade. J. Exp. Med. 193:1311–1318.
38. Dieckmann, D., Plottner, H., Berchtold, S., Berger, T., and Schuler, G. 2001. Ex vivo isolation and char-acterization of CD4(+)CD25(+) T cells with regu-latory properties from human blood. J. Exp. Med. 193:1303–1310.
39. Jonuleit, H., et al. 2001. Identification and func-tional characterization of human CD4(+)CD25(+) T cells with regulatory properties isolated from peripheral blood. J. Exp. Med. 193:1285–1294.
40. Annunziato, F., et al. 2002. Phenotype, localization, and mechanism of suppression of CD4(+)CD25(+) human thymocytes. J. Exp. Med. 196:379–387.
41. Bystry, R.S., Aluvihare, V., Welch, K.A., Kallikour-dis, M., and Betz, A.G. 2001. B cells and profes-sional APCs recruit regulatory T cells via CCL4. Nat. Immunol. 2:1126–1132.
42. Read, S., Malmstrom, V., and Powrie, F. 2000. Cytotoxic T lymphocyte-associated antigen 4 plays an essential role in the function of CD25(+)CD4(+) regulatory cells that control intestinal inflamma-tion. J. Exp. Med. 192:295–302.
43. Levings, M.K., Sangregorio, R., and Roncarolo, M.G. 2001. Human cd25(+)cd4(+) t regulatory cells suppress naive and memory T cell proliferation and can be expanded in vitro without loss of function. J. Exp. Med. 193:1295–1302.
44. Sebastiani, S., et al. 2001. Chemokine receptor expression and function in CD4+ T lymphocytes with regulatory activity. J. Immunol. 166:996–1002.
45. Ochsenbein, A.F., et al. 2000. Protective long-term antibody memory by antigen-driven and T help-dependent differentiation of long-lived memory B cells to short-lived plasma cells independent of secondary lymphoid organs. Proc. Natl. Acad. Sci. U. S. A. 97:13263–13268.
46. Piccirillo, C.A., et al. 2002. CD4(+)CD25(+) regula-tory T cells can mediate suppressor function in the absence of transforming growth factor beta1 produc-tion and responsiveness. J. Exp. Med. 196:237–246.
47. Bouzahzah, F., Bosseloir, A., Heinen, E., and Simar, L.J. 1995. Human germinal center CD4+CD57+ T cells act differently on B cells than do classical T-helper cells. Dev. Immunol. 4:189–197.
48. Muramatsu, M., et al. 1999. Specific expression of activation-induced cytidine deaminase (AID), a novel member of the RNA-editing deaminase family in germinal center B cells. J. Biol. Chem. 274:18470–18476.
49. Thornton, A.M., and Shevach, E.M. 1998. CD4+CD25+ immunoregulatory T cells suppress polyclonal T cell activation in vitro by inhibiting interleukin 2 production. J. Exp. Med. 188:287–296.
50. Ngo, V.N., Tang, H.L., and Cyster, J.G. 1998. Epstein-Barr virus-induced molecule 1 ligand chemokine is expressed by dendritic cells in lym-phoid tissues and strongly attracts naive T cells and activated B cells. J. Exp. Med. 188:181–191.
51. Gunn, M.D., et al. 1998. A B-cell-homing chemokine made in lymphoid follicles activates Burkitt’s lym-phoma receptor-1. Nature. 391:799–803.
52. Walker, L.S., et al. 2003. Established T cell-driven germinal center B cell proliferation is independent of CD28 signaling but is tightly regulated through CTLA-4. J. Immunol. 170:91–98.
53. van Ginkel, F.W., et al. 1999. Partial IgA-deficiency with increased Th2-type cytokines in TGF-beta 1 knockout mice. J. Immunol. 163:1951–1957.
54. Liu, M.F., Wang, C.R., Fung, L.L., and Wu, C.R. 2004. Decreased CD4+CD25+ T cells in peripheral blood of patients with systemic lupus erythemato-sus. Scand. J. Immunol. 59:198–202.
55. Roy, M.P., Kim, C.H., and Butcher, E.C. 2002. Cytokine control of memory B cell homing machinery. J. Immunol. 169:1676–1682.
56. Kim, C.H., et al. 1998. CK beta-11/macrophage inf lammatory protein-3 beta/EBI1-ligand chemokine is an efficacious chemoattractant for T and B cells. J. Immunol. 160:2418–2424.
57. Kim, C.H., et al. 2001. Rules of chemokine receptor association with T cell polarization in vivo. J. Clin. Invest. 108:1331–1339. doi:10.1172/JCI200113543.