Prioritizing Climate Change Adaptations in Canadian ... - MDPI

Regional Management Units for Marine Turtles: A NovelFramework for Prioritizing Conservation and Researchacross Multiple ScalesBryan P. Wallace1,2,3*, Andrew D. DiMatteo1,4, Brendan J. Hurley1,2, Elena M. Finkbeiner1,3, Alan B.
Bolten1,5, Milani Y. Chaloupka1,6, Brian J. Hutchinson1,2, F. Alberto Abreu-Grobois1,7, Diego
Amorocho1,8, Karen A. Bjorndal1,5, Jerome Bourjea1,9, Brian W. Bowen1,10, Raquel Briseno Duenas1,11,
Paolo Casale1,12,13, B. C. Choudhury1,14, Alice Costa1,15, Peter H. Dutton1,16, Alejandro Fallabrino1,17,
Alexandre Girard1,18, Marc Girondot1,19, Matthew H. Godfrey1,20, Mark Hamann1,21, Milagros Lopez-
Mendilaharsu1,22,23, Maria Angela Marcovaldi1,22, Jeanne A. Mortimer1,24, John A. Musick1,25, Ronel
Nel1,26, Nicolas J. Pilcher1,27, Jeffrey A. Seminoff1,28, Sebastian Troeng1,2,29,30, Blair Witherington1,31,
Roderic B. Mast1,2
1 International Union for Conservation of Nature (IUCN)/SSC Marine Turtle Specialist Group – Burning Issues Working Group, Arlington, Virginia, United States of America,
2Global Marine Division, Conservation International, Arlington, Virginia, United States of America, 3Center for Marine Conservation, Duke University, Beaufort, North
Carolina, United States of America, 4Marine Geospatial Ecology Laboratory, Duke University, Durham, North Carolina, United States of America, 5Department of Biology,
Archie Carr Center for Sea Turtle Research, University of Florida, Gainesville, Florida, United States of America, 6 Ecological Modelling Services, Pty Ltd, University of
Queensland, Brisbane, Australia, 7Unidad Academica Mazatlan, Instituto de Ciencias del Mar y Limnologıa, Universidad Nacional Autonoma de Mexico, Mazatlan, Sinaloa,
Mexico, 8Centro de Investigacion para el Medio Ambiente y Desarrollo, Cali, Colombia, 9 Laboratoire Ressources Halieutiques, IFREMER, Ile Reunion, France, 10Hawaii
Institute of Marine Biology, Kaneohe, Hawaii, United States of America, 11 Banco de Informacion sobre Tortugas Marinas (BITMAR), Unidad Mazatlan, Instituto de Ciencias
del Mar y Limnologıa, Universidad Nacional Autonoma de Mexico, Mazatlan, Sinaloa, Mexico, 12Department of Biology and Biotechnology ‘‘Charles Darwin,’’ University of
Rome ‘‘La Sapienza,’’ Rome, Italy, 13World Wildlife Fund (WWF) Mediterranean Turtle Programme, World Wildlife Fund-Italy, Rome, Italy, 14Department of Endangered
Species Management, Wildlife Institute of India, Dehradun, Uttarakhand, India, 15World Wildlife Fund-Mozambique, Maputo, Mozambique, 16 Southwest Fisheries
Science Center, National Marine Fisheries Service, National Oceanic and Atmospheric Administration (NOAA), La Jolla, California, United States of America, 17 Karumbe,
Montevideo, Uruguay, 18Association RENATURA, Albens, France, and Pointe-Noire, Congo, 19 Laboratoire d’Ecologie, Systematique et Evolution, Universite Paris-Sud,
Orsay, France, 20North Carolina Wildlife Resources Commission, Beaufort, North Carolina, United States of America, 21 School of Earth and Environmental Sciences, James
Cook University, Townsville, Australia, 22 Projeto Tamar-ICMBio/Fundacao Pro Tamar, Salvador, Bahıa, Brazil, 23Department of Ecology, Institute of Biology, Universidade
do Estado do Rio de Janeiro, Rio de Janeiro, Brazil, 24Department of Biology, University of Florida, Gainesville, Florida, United States of America, 25 Virginia Institute of
Marine Sciences, College of William and Mary, Gloucester Point, Virginia, United States of America, 26 School of Environmental Sciences, Nelson Mandela Metropolitan
University, Summerstrand Campus, South Africa, 27Marine Research Foundation, Sabah, Malaysia, 28Marine Turtle Ecology and Assessment Program, Southwest
Fisheries Science Center, NOAA-National Marine Fisheries Service, La Jolla, California, United States of America, 29Department of Animal Ecology, Lund University, Lund,
Sweden, 30 Scientific Advisory Committee, Sea Turtle Conservancy, Gainesville, Florida, United States of America, 31 Florida Fish and Wildlife Conservation Commission,
Melbourne Beach, Florida, United States of America
Abstract
Background: Resolving threats to widely distributed marine megafauna requires definition of the geographic distributionsof both the threats as well as the population unit(s) of interest. In turn, because individual threats can operate on varyingspatial scales, their impacts can affect different segments of a population of the same species. Therefore, integration ofmultiple tools and techniques — including site-based monitoring, genetic analyses, mark-recapture studies and telemetry— can facilitate robust definitions of population segments at multiple biological and spatial scales to address differentmanagement and research challenges.
Methodology/Principal Findings: To address these issues for marine turtles, we collated all available studies on marineturtle biogeography, including nesting sites, population abundances and trends, population genetics, and satellitetelemetry. We georeferenced this information to generate separate layers for nesting sites, genetic stocks, and coredistributions of population segments of all marine turtle species. We then spatially integrated this information from fine- tocoarse-spatial scales to develop nested envelope models, or Regional Management Units (RMUs), for marine turtles globally.
Conclusions/Significance: The RMU framework is a solution to the challenge of how to organize marine turtles into units ofprotection above the level of nesting populations, but below the level of species, within regional entities that might be onindependent evolutionary trajectories. Among many potential applications, RMUs provide a framework for identifying datagaps, assessing high diversity areas for multiple species and genetic stocks, and evaluating conservation status of marineturtles. Furthermore, RMUs allow for identification of geographic barriers to gene flow, and can provide valuable guidanceto marine spatial planning initiatives that integrate spatial distributions of protected species and human activities. Inaddition, the RMU framework — including maps and supporting metadata — will be an iterative, user-driven tool madepublicly available in an online application for comments, improvements, download and analysis.
PLoS ONE | www.plosone.org 1 December 2010 | Volume 5 | Issue 12 | e15465
Citation: Wallace BP, DiMatteo AD, Hurley BJ, Finkbeiner EM, Bolten AB, et al. (2010) Regional Management Units for Marine Turtles: A Novel Framework forPrioritizing Conservation and Research across Multiple Scales. PLoS ONE 5(12): e15465. doi:10.1371/journal.pone.0015465
Editor: Steven J. Bograd, NOAA/NMFS/SWFSC, United States of America
Received August 2, 2010; Accepted October 1, 2010; Published December 17, 2010
This is an open-access article distributed under the terms of the Creative Commons Public Domain declaration which stipulates that, once placed in the publicdomain, this work may be freely reproduced, distributed, transmitted, modified, built upon, or otherwise used by anyone for any lawful purpose.
Funding: This study was funded by the National Fish and Wildlife Foundation and the Offield Family Foundation. These funders had no role in study design, datacollection and analysis, decision to publish, or preparation of the manuscript. MYC is employed by a commercial company that provides ecological modellingservices, and his involvement in this study was partially supported by this company. However, this support in no way biased his contributions to all aspects of thisstudy, the overall process or resulting products generated by this study.
Competing Interests: The authors have declared that no competing interests exist.
* E-mail: [email protected]
Introduction
Geospatial characterization of commercially important orconservation-dependent marine species provides crucial input forresource management in multi-use situations, as is currentlydescribed by ecosystem-based marine spatial planning [1]. Inparticular, linking impacts of various threats to widely distributedmarine megafauna populations (e.g. mammals, birds, turtles,sharks) requires description of overlaps between threats and thepopulation segment of interest. Furthermore, widespread marinespecies often exhibit inter-population variation in life history traitsand population dynamics that warrant population-specific man-agement schemes [2,3].However, resolution of population units for conservation is not
always straightforward, and requires clear understanding ofconservation objectives, as well as the natural history of – andthreats to – the species of interest [4]. For example, evolutionarilysignificant units (ESUs) were first described to include sufficientgenetic diversity to retain evolutionary potential, and thus addresslong-term conservation issues as well as historical populationtrends [5,6]. In contrast, population segments or managementunits (MUs) are functionally independent (i.e. exhibit distinctdemographic processes), can be characterized using various toolsor indicators, such as genetic markers, life history traits, behavior,or morphology, and are appropriate short-term targets forconservation [5]. A major challenge to prioritization schemesarises when multiple population segments meet the criteria of aMU, each deserving specially designed conservation strategies.Six of the seven marine turtle species are categorized as
Vulnerable, Endangered, or Critically Endangered globally by theIUCN Red List of Threatened Species [7], but threats on regional scalescan differentially affect life-stages of the same populations. Similarto other long-lived marine vertebrates, marine turtles occupybroad geographic ranges including separate breeding and feedingareas utilized by adults, and in some cases geographically distinctontogenetic habitats for immature life stages, with different levelsof population overlap at each stage [8]. Furthermore, marineturtles have complex population structures characterized byfemale nesting site fidelity, male-mediated gene flow, andpopulation overlap during migrations and in developmentalhabitats, with the degree of genetic population structuringincreasing with life stages (see [9] for review). Understanding thecomplex relationships among various nesting sites, nurseries, andforaging areas, particularly in the context of variation inenvironmental conditions, is crucial to quantifying population-level impacts of anthropogenic threats, as well as to designingeffective conservation responses to these threats [10–12]. Howev-er, these complexities in population structures, habitat use,environmental factors, and life-stage-specific threats have con-founded the definition of marine turtle MUs.
Molecular genetic analyses are often used to describe populationstructures and, by extension, to define MUs [4,5,13]. Due tocomplex population structure and life history of marine turtles,different molecular analyses can be applied to determine geneticstock structure for different demographic segments of a popula-tion. Maternally inherited mitochondrial DNA (mtDNA) is usefulfor resolving nest site fidelity and homing behavior [14,15]. Inaddition to defining nesting populations (i.e. one level of MUs), thisgenetic marker is also useful for resolving maternal origin of bothmales and females at various life stages and feeding habitats [9].Nesting females typically demonstrate philopatry to nesting
areas, and both males and females can be philopatric to breedingareas adjacent to a nesting beach [16]. However, males do notrestrict mating efforts to their ancestral breeding area, andapparently copulate with females in coastal feeding habitat ormigratory corridors as well, where they encounter females fromother regional nesting populations. The result, registered inbiparentally-inherited nuclear DNA (nDNA), is that regionalnesting colonies are connected by this male-mediated gene flow[2,17–18]. Because nDNA reflects contributions of both males andfemales, analyses of nDNA markers (e.g. microsatellites) canresolve breeding or reproductive stocks that encompass multiplemtDNA-defined nesting stocks [9,19].Genetic analyses clearly contribute to the resolution of MUs,
but are not always sufficient for this purpose; such analyses canindicate that genetic population structure exists, but usuallycannot resolve the boundaries of that structure [4,20]. Uniqueidentifier tags applied to marine turtles at various life stages andin various habitats via mark-recapture monitoring programs canilluminate migration routes and connectivity of individualanimals between habitats [21–23]. Furthermore, the advent ofelectronic tracking technology, specifically satellite telemetry andremote sensing, has facilitated an exponential increase inunderstanding of marine turtle movements, behaviors, biology,and conservation concerns (see [24] for review). Therefore,integration of multiple tools and techniques, including site-basedmonitoring (e.g. nesting beaches, foraging areas), geneticanalyses, mark-recapture studies, and telemetry, especially whensupplemented with information on threats and influence ofenvironmental conditions [25], can facilitate robust definitions ofMUs for marine turtles at multiple scales to address differentmanagement and research challenges.In response to these issues, we compiled, collated, and
georeferenced available information on marine turtle biogeogra-phy – including individual nesting sites, genetic stocks, andgeographic distributions based on monitoring research – todevelop multi-scale Regional Management Units (RMUs). TheseRMUs spatially integrate sufficient information to account forcomplexities in marine turtle population structures, and thusprovide a flexible, dynamic framework for evaluating threats,
Regional Management Units for Marine Turtles
PLoS ONE | www.plosone.org 2 December 2010 | Volume 5 | Issue 12 | e15465
identifying high diversity areas, highlighting data gaps, andassessing conservation status of marine turtles.
Methods
The IUCN’s Marine Turtle Specialist Group convened theBurning Issues Working Group (MTSG-BI) for two meetings(August 2008 and September 2009) of marine turtle experts fromaround the world who represented government agencies, non-governmental organizations, and academic institutions. Theprimary objective of these meetings was to develop a process forevaluating and prioritizing the conservation status of marine turtlepopulations worldwide. In this context, the MTSG-BI developedRegional Management Units (RMUs) as the framework for thisevaluation and prioritization process.To generate RMUs for marine turtles, we collated and
georeferenced available data from more than 1,200 papers,reports, abstracts, and other sources (available for download athttp://tinyurl.com/29w4kbf), extracting information on nestingsites, population genetics, tag returns, and satellite telemetry, aswell as other relevant natural history and biogeography. We thenspatially integrated this information in ArcMap 9.3 (ESRI,Redlands, CA USA) from fine (i.e. points with geographiccoordinates for nesting sites) to coarse (i.e. polygon shapefiles fordistributions) spatial scales. We constructed separate layersaccording to distinct biological/spatial scales, including a layerfor nesting sites (i.e. individual nesting beaches), and two layers forgenetic stocks (i.e. a layer each for maternally inherited mtDNAand biparentally inherited nDNA, respectively). Finally, all finer-scale levels were nested within the known core geographicdistributions of these population units, according to satellitetelemetry and tag return data. In this way, all nesting sites thatwere sampled and analyzed for genetic studies were representedwithin genetic stock layers, and defined genetic stocks wererepresented within RMU layers, such that information sharedacross scales was retained in each relevant layer. We also compiledavailable information on population sizes (i.e. annual numbers ofnesting females) and trends (i.e. change in annual numbers ofnesting females over time) at each spatial/biological scale.Although considerable uncertainty exists in estimates of populationsizes and trends for marine turtles among sites globally, we did notattempt to standardize or improve estimates; we urge caution ininterpretation of these metadata. This ‘‘nested envelope’’ ap-proach allowed for metadata to be arranged within and acrossbiologically defined spatial scales.
Nesting SitesWe defined a nesting site as a beach or beaches with confirmed
marine turtle nesting activity monitored or analyzed as a singularsite by the groups or individuals providing or publishing thenesting data. To compile and georeference nesting sites globallyfor all species, we used the State of the World’s Sea Turtles –SWOT (www.seaturtlestatus.org) database, which relies on aglobal network of researchers who voluntarily contribute annualnesting data. We augmented the SWOT database with publishedinformation. We filtered all nesting sites to distinguish sites withconfirmed, quantified nesting activity (i.e. counts) from thosewithout quantified counts since 2000. Across species globally, wecompiled more than 4,200 nesting sites, ranging from 30 forKemp’s ridleys (Lepidochelys kempii) to 1,337 for hawksbill turtles(Eretmochelys imbricata) (Table 1; Figs. 1, 2, 3, 4, 5, 6, 7, panel A). Inaccordance with data sharing protocols, metadata for SWOTnesting sites are not provided here. However, all SWOT nestingdata can be viewed at http://seamap.env.duke.edu/swot, and acomplete list of SWOT data providers is provided in Appendix S1.
Genetic StocksWe compiled and georeferenced genetic stock information from
available mtDNA and nDNA studies by constructing shapefilesthat included all individual nesting sites upon which the geneticsampling and analyses were based. We identified 87 distinctmtDNA and 28 nDNA reported genetic stocks globally acrossmarine turtle species (Table 1; Figs. 1, 2, 3, 4, 5, 6, 7, panels B andC; Appendix S2). While recognizing the diversity of analyticaltechniques – particularly the number and types of genetic markers,sample sizes, and statistical approaches – used to determinegenetic stocks of marine turtles, we accepted genetic stockdefinitions as described by the original sources, rather thanattempting to standardize or prioritize methodologies or interpre-tations. However, in cases where more recent studies clarified orcontradicted earlier studies, we based our dataset on the results ofthe updated studies.
Regional Management UnitsWe generated polygons representing RMUs for all species of
marine turtles, or geographically explicit population segmentsbased on geographic boundaries to distributions derived fromstudies on genetics, tag returns, satellite telemetry, and other data(Figs. 1, 2, 3, 4, 5, 6, 7, panel D; Table S1; Appendix S2). RMUswere meant to encompass multiple nesting sites, mtDNA-defined
Table 1. Summary of number of nesting sites, genetic stocks, and RMUs identified for all marine turtle species.
species no. nesting sites no. mtDNA stocks no. nDNA stocksno. RMUs(no. putative RMUs)
Caretta caretta 626 15 8 10 (1)
Chelonia mydas 935 33 9 17
Demochelys coriacea 652 9 6 7
Eretmochelys imbricata 1,337 19 2 13 (7)
Lepidochelys kempii 30 1* 1* 1
Lepidochelys olivacea 426 6 2 8 (1)
Natator depressus 287 4 ND 2
TOTAL 4,293 87 28 58 (9)
ND: no data. Putative RMUs were described for regions with available nesting data but no associated data on genetics or distributions. (*denotes that although nesting sites have not been sampled for genetics, all L. kempii individuals are presumed to belong to same stock and a single RMU.)doi:10.1371/journal.pone.0015465.t001
Regional Management Units for Marine Turtles
PLoS ONE | www.plosone.org 3 December 2010 | Volume 5 | Issue 12 | e15465
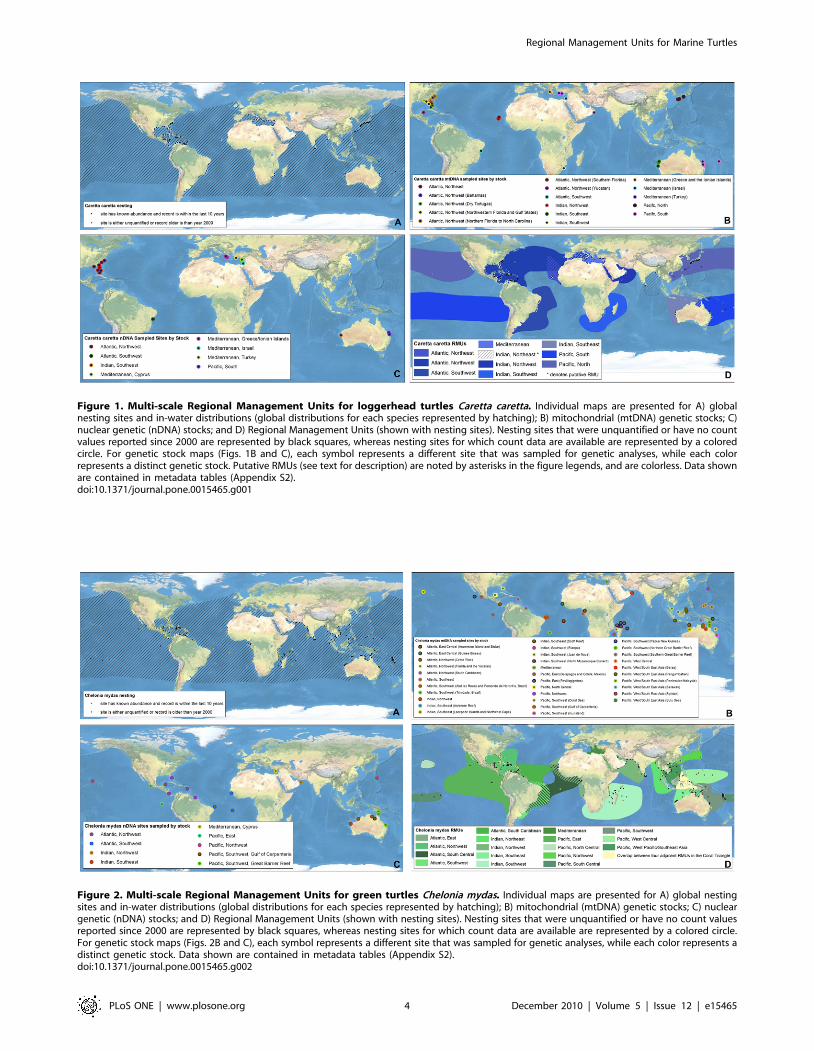
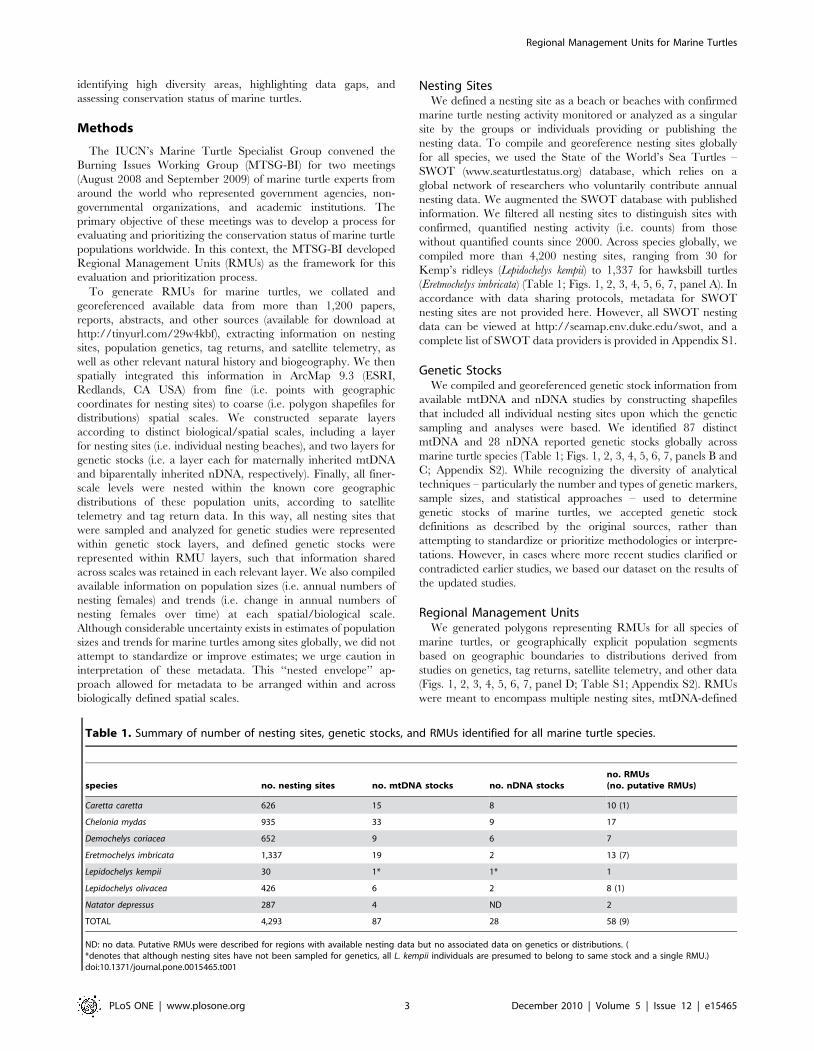
Figure 2. Multi-scale Regional Management Units for green turtles Chelonia mydas. Individual maps are presented for A) global nestingsites and in-water distributions (global distributions for each species represented by hatching); B) mitochondrial (mtDNA) genetic stocks; C) nucleargenetic (nDNA) stocks; and D) Regional Management Units (shown with nesting sites). Nesting sites that were unquantified or have no count valuesreported since 2000 are represented by black squares, whereas nesting sites for which count data are available are represented by a colored circle.For genetic stock maps (Figs. 2B and C), each symbol represents a different site that was sampled for genetic analyses, while each color represents adistinct genetic stock. Data shown are contained in metadata tables (Appendix S2).doi:10.1371/journal.pone.0015465.g002
Figure 1. Multi-scale Regional Management Units for loggerhead turtles Caretta caretta. Individual maps are presented for A) globalnesting sites and in-water distributions (global distributions for each species represented by hatching); B) mitochondrial (mtDNA) genetic stocks; C)nuclear genetic (nDNA) stocks; and D) Regional Management Units (shown with nesting sites). Nesting sites that were unquantified or have no countvalues reported since 2000 are represented by black squares, whereas nesting sites for which count data are available are represented by a coloredcircle. For genetic stock maps (Figs. 1B and C), each symbol represents a different site that was sampled for genetic analyses, while each colorrepresents a distinct genetic stock. Putative RMUs (see text for description) are noted by asterisks in the figure legends, and are colorless. Data shownare contained in metadata tables (Appendix S2).doi:10.1371/journal.pone.0015465.g001
Regional Management Units for Marine Turtles
PLoS ONE | www.plosone.org 4 December 2010 | Volume 5 | Issue 12 | e15465
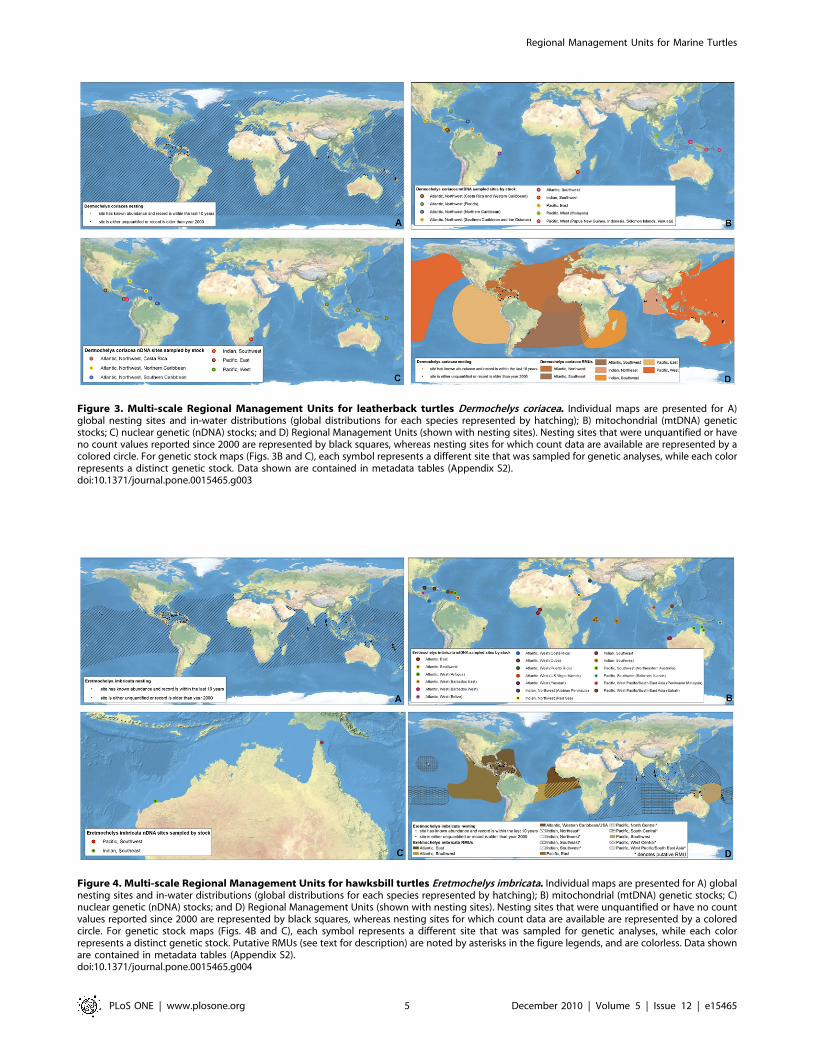
Figure 4. Multi-scale Regional Management Units for hawksbill turtles Eretmochelys imbricata. Individual maps are presented for A) globalnesting sites and in-water distributions (global distributions for each species represented by hatching); B) mitochondrial (mtDNA) genetic stocks; C)nuclear genetic (nDNA) stocks; and D) Regional Management Units (shown with nesting sites). Nesting sites that were unquantified or have no countvalues reported since 2000 are represented by black squares, whereas nesting sites for which count data are available are represented by a coloredcircle. For genetic stock maps (Figs. 4B and C), each symbol represents a different site that was sampled for genetic analyses, while each colorrepresents a distinct genetic stock. Putative RMUs (see text for description) are noted by asterisks in the figure legends, and are colorless. Data shownare contained in metadata tables (Appendix S2).doi:10.1371/journal.pone.0015465.g004
Figure 3. Multi-scale Regional Management Units for leatherback turtles Dermochelys coriacea. Individual maps are presented for A)global nesting sites and in-water distributions (global distributions for each species represented by hatching); B) mitochondrial (mtDNA) geneticstocks; C) nuclear genetic (nDNA) stocks; and D) Regional Management Units (shown with nesting sites). Nesting sites that were unquantified or haveno count values reported since 2000 are represented by black squares, whereas nesting sites for which count data are available are represented by acolored circle. For genetic stock maps (Figs. 3B and C), each symbol represents a different site that was sampled for genetic analyses, while each colorrepresents a distinct genetic stock. Data shown are contained in metadata tables (Appendix S2).doi:10.1371/journal.pone.0015465.g003
Regional Management Units for Marine Turtles
PLoS ONE | www.plosone.org 5 December 2010 | Volume 5 | Issue 12 | e15465
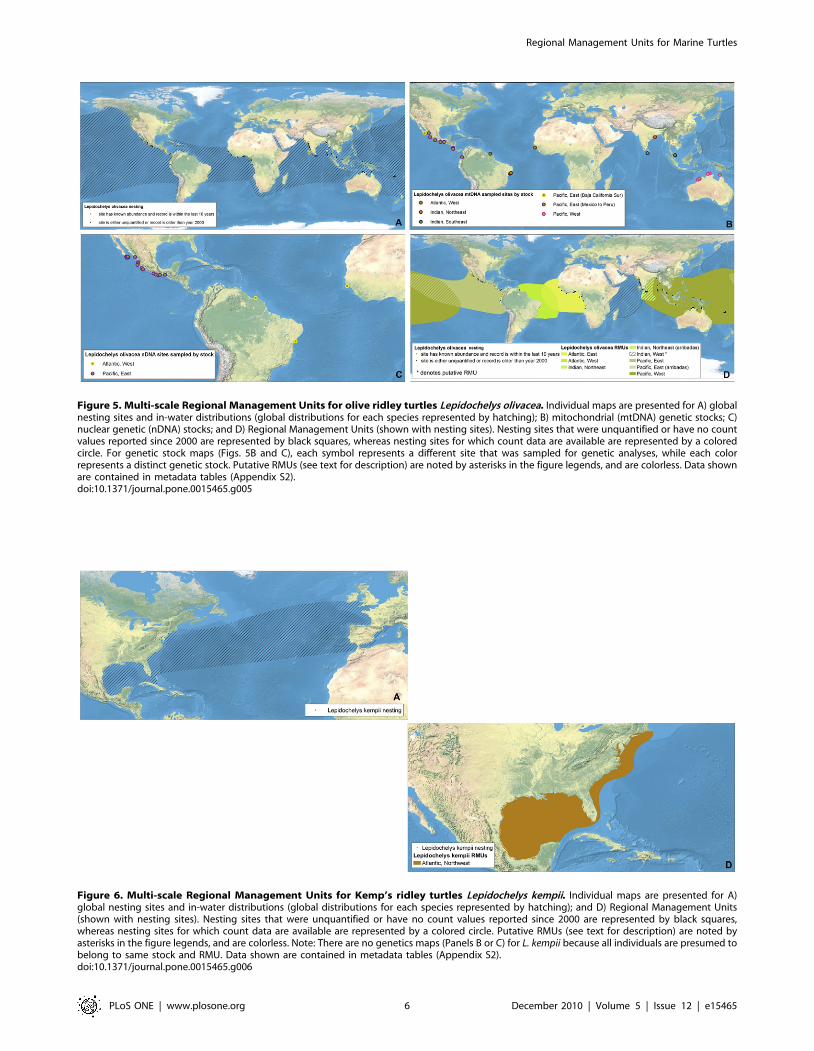
Figure 5. Multi-scale Regional Management Units for olive ridley turtles Lepidochelys olivacea. Individual maps are presented for A) globalnesting sites and in-water distributions (global distributions for each species represented by hatching); B) mitochondrial (mtDNA) genetic stocks; C)nuclear genetic (nDNA) stocks; and D) Regional Management Units (shown with nesting sites). Nesting sites that were unquantified or have no countvalues reported since 2000 are represented by black squares, whereas nesting sites for which count data are available are represented by a coloredcircle. For genetic stock maps (Figs. 5B and C), each symbol represents a different site that was sampled for genetic analyses, while each colorrepresents a distinct genetic stock. Putative RMUs (see text for description) are noted by asterisks in the figure legends, and are colorless. Data shownare contained in metadata tables (Appendix S2).doi:10.1371/journal.pone.0015465.g005
Figure 6. Multi-scale Regional Management Units for Kemp’s ridley turtles Lepidochelys kempii. Individual maps are presented for A)global nesting sites and in-water distributions (global distributions for each species represented by hatching); and D) Regional Management Units(shown with nesting sites). Nesting sites that were unquantified or have no count values reported since 2000 are represented by black squares,whereas nesting sites for which count data are available are represented by a colored circle. Putative RMUs (see text for description) are noted byasterisks in the figure legends, and are colorless. Note: There are no genetics maps (Panels B or C) for L. kempii because all individuals are presumed tobelong to same stock and RMU. Data shown are contained in metadata tables (Appendix S2).doi:10.1371/journal.pone.0015465.g006
Regional Management Units for Marine Turtles
PLoS ONE | www.plosone.org 6 December 2010 | Volume 5 | Issue 12 | e15465
nesting populations, and nDNA-defined breeding populations toreflect shared geographic distribution among conspecific marineturtles in the same region. Thus, RMUs do not represent completegeographic distributions of species on global or regional scales, butrather distributions that are anchored to landmasses by knownnesting site(s) and/or genetic stock origins and defined bybiogeographical information.Specifically, we defined the boundaries of RMU polygons by
generating termini directly from published satellite tracks, tagreturns, or other data sources. These polygons were then digitizedor imported into ArcGIS 9.3 either using the georeference tool inthe ArcMap Toolbox, or based on text descriptions. In the absenceof sufficient information, boundaries were further refined byMTSG experts. To allow clear distinctions between RMUs andcomplete global distributions, we also generated global distributionpolygons for all species (Figs. 1, 2, 3, 4, 5, 6, 7, panel A; AppendixS2). These global distributions are coarse geographical represen-tations of documented occurrence patterns – bounded bymaximum extents – for each species. This process was generallysimilar to that used to generate species range maps for othertaxonomic groups, such as those produced by the IUCN Red List ofThreatened Species (http://www.iucnredlist.org/technical-docu-ments/spatial-data). We acknowledge that this distinction meansthat RMU designations might not address threats occurringoutside RMU boundaries but within the distribution of a species,but RMUs nonetheless encompass known core habitats and lifestages. However, the important point is that whereas globaldistributions simply display broad geographic ranges for eachspecies (including RMUs), the RMUs themselves provide refinedspatial guidance for conservation strategies.Olive ridley turtles (Lepidochelys olivacea) (along with their
congener, Kemp’s ridleys), are unique among marine turtles fortheir polymorphic nesting behavior; i.e. synchronous mass nestingat particular beaches (termed arribadas) and disperse, asynchronous
or solitary nesting at the rest of the species’ nesting beaches.Therefore, we established separate RMUs for arribadas and solitarynesters in regions where both behaviors occur (i.e. East PacificOcean, East Indian Ocean). Although the geographic boundariesof these RMUs are identical within a region, this dichotomyaccurately reflects differences in population abundances andtrends between the two behaviors [26].In regions where nesting sites were known for certain species,
but no other biological information (e.g. genetics or distributions)was available, we developed ‘putative RMUs’ so that no region-species combination was excluded. As with all RMUs, theseputative RMUs will require modification as new informationbecomes available, but in the meantime, they represent obviousresearch and reporting priorities.
Results and Discussion
We identified 58 RMUs among the seven marine turtle speciesworldwide, ranging from a single RMU for Kemp’s ridleys to 17RMUs for green turtles (Chelonia mydas) (Figs. 1, 2, 3, 4, 5, 6, 7;Table S1, Appendix S2). The RMU framework is essentially a setof nested envelope models intended for multiple research andmanagement applications. However, the efficacy of applicationsusing RMUs depends on the accuracy and quality of the datacontained in the files; data exist that we were unable to acquireand incorporate, and current designations of genetic stocks andgeographic distributions are subject to change with new andimproved analyses. For example, genetic analyses using newmarkers, larger sample sizes, and broader geographic samplingcould reveal new or more nuanced stock structures, especiallybecause insufficient sampling is always a major detractor toexplanatory power of these analyses [20,27,28]. Furthermore,because RMU boundaries are sometimes based on reports thatcontain relatively few localizations, some of which might be species
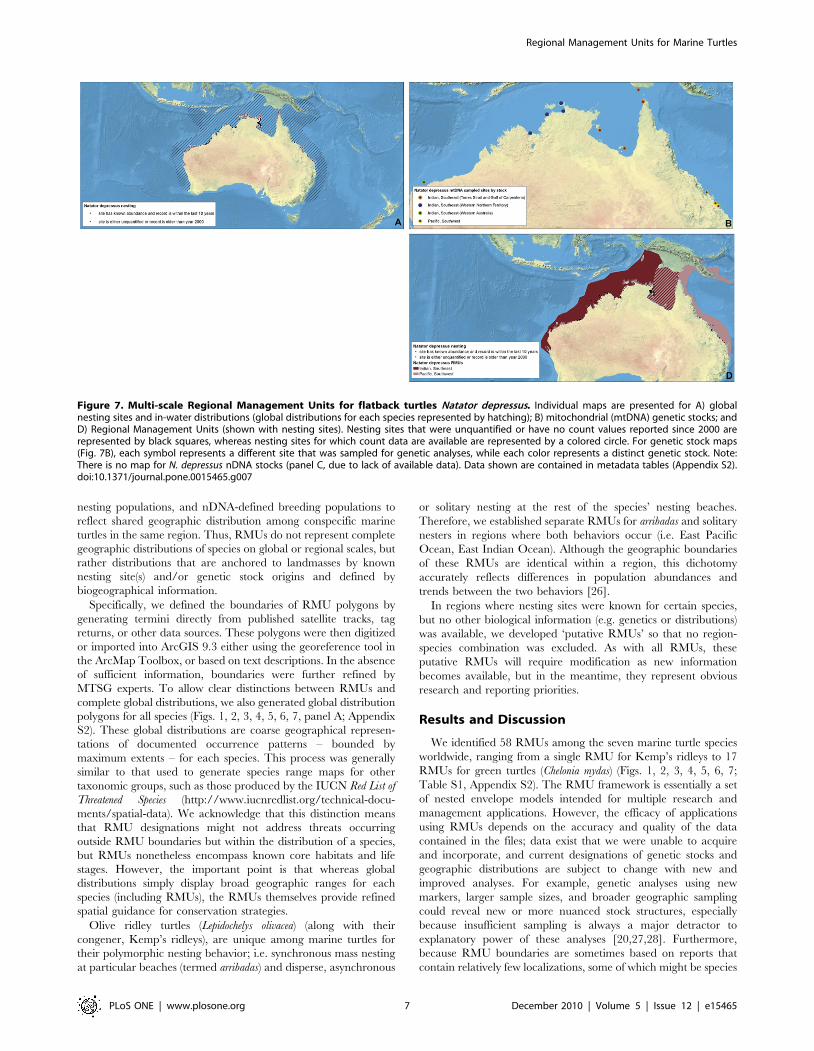
Figure 7. Multi-scale Regional Management Units for flatback turtles Natator depressus. Individual maps are presented for A) globalnesting sites and in-water distributions (global distributions for each species represented by hatching); B) mitochondrial (mtDNA) genetic stocks; andD) Regional Management Units (shown with nesting sites). Nesting sites that were unquantified or have no count values reported since 2000 arerepresented by black squares, whereas nesting sites for which count data are available are represented by a colored circle. For genetic stock maps(Fig. 7B), each symbol represents a different site that was sampled for genetic analyses, while each color represents a distinct genetic stock. Note:There is no map for N. depressus nDNA stocks (panel C, due to lack of available data). Data shown are contained in metadata tables (Appendix S2).doi:10.1371/journal.pone.0015465.g007
Regional Management Units for Marine Turtles
PLoS ONE | www.plosone.org 7 December 2010 | Volume 5 | Issue 12 | e15465

misidentifications [29], improved data quality will help to resolvethe geographic extents of RMUs.Along these lines, because the metadata we compiled is derived
from publicly available sources, the RMUs themselves will changewith new, refined data. To facilitate iterative improvement ofRMUs, we have made all map files (Figs. 1, 2, 3, 4, 5, 6, 7) andmetadata associated with each layer (Appendix S2) available forcomments and suggested edits, as well as download and analysis (inaccordance with relevant data sharing protocols) by users withinthe OBIS-SEAMAP framework (Ocean Biogeographic Informa-tion System-Spatial Ecological Analysis of Megavertebrate Popu-lations [30]; http://seamap.env.duke.edu/swot). Thus, the appli-cability of RMUs to marine turtle conservation and research willbe user-dependent, relying on collaboration among users in thecommunity to maintain up-to-date, accurate files.An important caveat inherent in the RMUs is that we are
largely unable to differentiate between true absences (i.e. a speciesis not identified or is no longer present in an area despite thoroughsearch effort) and absence due to lack of monitoring or reporting.Clearly, distributions of nesting sites and other types ofinformation are biased by areas of high monitoring effort andreporting (e.g. Wider Caribbean region; [31]). In this vein, themaps and RMUs generally could be used in gap analyses toidentify areas toward which enhanced census efforts should bedirected in order to improve inter-regional comparisons of marineturtle distribution patterns. For example, the distribution ofputative RMUs illustrates gaps in scientific understanding ofmarine turtle biogeography in much of the Indian Ocean, andbiogeography of hawksbill turtles in particular (Figs. 1, 2, 3, 4, 5, 6,7).In addition to identifying data gaps, a major advantage of the
RMU approach is the potential to connect impacts of particularthreats to biologically relevant units and their associateddemographic characteristics. For example, because marine turtlepopulations occur in terrestrial and marine habitats, the RMU toolprovides the ability to overlay the geographic extent of not onlynesting beach threats along a particular coastline (e.g. coastaldevelopment) to the particular marine turtle nesting sites andstocks that would be impacted, but also threats across a widerocean area (e.g. fisheries bycatch) that could impact several nestingstocks and broader population units simultaneously [12]. Further-more, this system allows identification of spatial overlaps amongRMUs – within and among species – which are important areasfor conservation because threats impacting multiple RMUs mightwarrant different management attention than threats acting on asingle RMU. Ultimately, although RMUs will not be equallyvaluable to conservation efforts in all regions, this framework isintended for setting conservation priorities at different levels ofspatial and biological organization for marine turtles on a globalscale. Below, we outline other potential applications of RMUs tomarine turtle conservation and research.
Potential applications of RMUsIdentification essential habitats for marine turtles.
Characterization of heavily-utilized areas for marine turtles atdifferent spatial scales is fundamental for creating effectiveconservation strategies [12,32–34]. One straightforwardapplication of RMUs is to identifying important geographicareas for marine turtle populations in terms of determination ofpresence, density, and richness. For example, geographic regionsthat host high densities of nesting sites, possibly of multiple speciesand/or genetic stocks, could merit investment of conservationresources. Demographic information included in the RMU
metadata could also be incorporated in these evaluations toaccount for abundance and trends among sites and regions.Likewise, areas of overlap among genetic stocks or geographic
distributions, as well as regional variation in population trends atvarious spatial or biological scales could also be identified usingRMUs. Although reproduction areas are relatively discretegeographically and genetically, foraging areas for marine turtlesof all life stages host con-specific individuals from multiple stocksand geographic locations [2,10,28,35–38]. Therefore, character-izing the connectivity among multiple nesting sites and multipleforaging areas – i.e. ‘many-to-many’ relationships [10] – isnecessary for holistically assessing demographic trends andconservation effectiveness [38,39].With this in mind, one next step for refining RMUs would be to
expand on the genetic stocks based on nesting sites by spatiallycharacterizing at-sea mixed-stock foraging or developmental areas[9,10,28,40,41]. Moreover, weighting distribution layers accordingto a relative measure of proportional habitat use (e.g. kerneldensities, home ranges) – incorporating both spatial and temporalinformation – to distinguish among high-use areas and fringehabitats would be another useful extension of the RMUframework. Although incorporating and mapping this informationwould be challenging given data currently available in publishedresearch studies, this step would dramatically improve the abilityof RMUs to facilitate identification of marine turtle habitats inrelation to other georeferenced information of threats orenvironmental factors.
Improved definition of genetic stock distributions.Despite the emphasis on genetic resolution of MUs, reliance onpopulation structure derived from such analyses can be inadequatefor management [4,42]. Failure to detect population units withgenetic markers does not necessarily mean that no management-relevant structuring exists. For example, a newly colonized nestingbeach might host turtles that are genetically indistinguishable fromthe parent (source) population, yet the new nesting cohort isgeographically isolated from the parent population. Theselimitations highlight the need for alternative types of informationto make informed MU designations [20].Along these lines, several studies have proposed or identified
geographic or environmental barriers to migration of marineturtles among nesting sites or foraging areas that appear to resultin significant population (but not necessarily genetic) differentia-tion. The distance between nesting sites that results in isolatednesting stocks appears to vary within [2,43] and among species[13,44]. Based on identification of 17 distinct green turtle geneticstocks among 27 nesting sites sampled in Australasia, Dethmers etal. [13] proposed that nesting sites separated by more than 500 kmare likely to host isolated nesting populations; in contrast,undifferentiated leatherback (Dermochelys coriacea) genetic stocksspan thousands of kilometers of coastlines within geographicregions [44]. Furthermore, recent studies have described spatialdistributions of genetic stocks in foraging and developmental areasat-sea based on local and regional ocean current patterns in theWider Caribbean [28,37], Atlantic Ocean [40], MediterraneanSea [45], and Pacific Ocean [46,47].Although barriers to gene flow have not been defined in most
cases, these studies illustrate geographic and environmentalinfluences on marine turtle population structures that can betested within the RMU framework, because nesting sites as well asknown genetic stocks are georeferenced. Thus, by applyingoceanographic or other physical information as well as relativelysimple distance buffering analyses to the RMU files, researcherscan test hypotheses about spatial distributions of genetic stockswithin and across geographic regions. Resulting distributions of
Regional Management Units for Marine Turtles
PLoS ONE | www.plosone.org 8 December 2010 | Volume 5 | Issue 12 | e15465
population segments would allow more flexibility in defining MUsthan those derived solely from quantitative analyses of geneticdifferentiation, and would also provide clear objectives for furtheranalyses.
Conservation status assessments. Evaluation of species orpopulation status, including population sizes and trends, as wellas threats and relevant biological information, is a prerequisitefor prioritizing conservation resources. However, becausedefining the relevant biological or geographic scale at which toconduct assessments and make recommendations is always afundamental question in these processes, RMUs are a valuableresource to guide how populations of marine turtle species areassessed.For example, the IUCN Red List of Threatened Species represents the
only globally accepted system for evaluating extinction risk forspecies, but the IUCN/SSC Marine Turtle Specialist Group(MTSG) has debated the utility and validity of a globalclassification system for marine turtles, and has advocated forregional assessments (see [48] for review). A survey of MTSGmembers from 23 countries revealed that nearly 90% ofrespondents believed that regional assessments should use either‘new MTSG criteria’ or ‘flexible, non-standardized criteria’ [48].However, there was less consensus among members about theappropriate population segment upon which to base regionalassessments, with nearly 50% of respondents stating ‘‘bygeographic region,’’ ,30% stating ‘‘by genetic stocks,’’ and,20% stating ‘‘by nesting sites,’’ illustrating the challengesinherent in defining management units for marine turtles.Utilizing the RMU framework – which contains information ateach of those spatial and biological scales – within or inconjunction with the Red List assessment process could addresssome of the controversy within the MTSG regarding theapplication of a single global listing for geographically variablemarine turtle species by providing regional units for assessment[48,49].Another example of incorporating population differences in
conservation status assessments is the listing process under the U.S.Endangered Species Act (ESA). The ESA provides for designationand listing of Distinct Population Segments (DPS) of a speciesbased on ‘discreteness’ and ‘significance’ of that segment [50,51].In a recent Biological Review of loggerhead turtles (Caretta caretta)for purposes of evaluating the species’ current Threatened listingstatus on ESA, nine DPSs were defined, with distinct recommen-dations for each DPS [52]. Not surprisingly, the process by whichDPSs are defined is very similar to that used to define RMUs, asboth depend on biogeographical information from genetics,distribution, movements, and demographics. There was nearlycomplete agreement between the loggerhead DPSs and our RMUdesignations; the two schemes essentially differed only in howputative RMUs are handled [52] (Table 1). This result providesfurther support for the validity of the RMU framework for intra-specific conservation assessments.It is important to note that in geographic regions where there
are existing systems for effectively identifying marine turtlepopulation segments to which to target conservation efforts, suchas well-defined breeding populations in eastern Australia[13,16,18,21–23], RMUs will be of limited utility. In contrast,RMUs will be most appropriately applied to areas hosting severalpopulations or stocks, possibly of multiple species, especially inregions with relatively little available information. Thus, RMUsare designed to be coarse yet flexible enough to be applicableanywhere in the world, rather than being restricted to areas withthe best available information, but can be refined in the futurewhen new information becomes available.
Marine spatial planning and applications to similarspecies with complex life histories. To optimize ecosystemfunction, especially in areas where multiple activities by multiplenations occur, ecosystem-based marine management approachesshould be designed to preserve marine biodiversity, keystonespecies, and biological connectivity among marine habitats [1,53].Thus, detailed characterizations of distributions and naturalhistories of key species (e.g. keystones, top predators, ecosystemengineers) are instrumental to guiding exercises in marine spatialplanning [54].RMUs provide explicit, ecologically based spatial and demo-
graphic information about geographic distributions of marineturtle populations that could be integrated with other georefer-enced layers, including human activities subject to management(e.g. fisheries operations, hydrocarbon extraction, coastal devel-opment, shipping, etc.). Furthermore, the RMU concept could beapplied easily to multi-scale biogeographical characterization ofother marine megafauna species with similar life history traits andbroad, complex distributions. As with marine turtles, identificationof high-use habitats, connectivity between breeding and feedingareas, as well as overlapping distributions of distinct populations isextremely important for designing appropriate managementschemes for these species [55–58].
Conclusions. The novel RMU framework synthesizesavailable biogeographical information on globally distributedand imperiled marine turtles into a multi-scaled, geospatial toolfor which we envision numerous pertinent applications for marineturtle conservation and research. For example, the MTSGBurning Issues Working Group is utilizing RMUs as the basisfor status assessments in a developing process of globalconservation priority setting for marine turtles. The RMUclassification system is consistent with endangered species laws inthe United States and elsewhere, and could provide the IUCN-MTSG with a way forward for regional evaluations of extinctionrisk.Although species are predominantly used as the currency for
evaluating and prioritizing conservation efforts (e.g. IUCN Red List,Alliance for Zero Extinction, Conservation ‘Hotspots’), in the caseof globally distributed species like marine turtles, regionalpopulation segments occupy distinct ecological roles and thusmerit conservation attention, because extinction of an RMUwould represent the loss of the species’ ecological role within anentire region and ecosystems therein [59]. By defining populationsaccording to ecological characteristics, the RMU approach impliesthe inherent importance of each RMU as an independentconservation unit, which species-focused conservation approachesmight fail to recognize.We emphasize that the resolution of RMUs does not detract
from the treatment of nesting populations as management units.Abundant historical, mark-recapture, and genetic data indicatethat nesting populations will rise and fall as independentdemographic units. The value of RMUs is in the recognition ofregional groupings of marine turtles that overlap in feeding andnursery habitats, exchange genetic material, and face commonthreats at sea. Therefore, the RMU framework is a solution to thechallenge of how to organize marine turtles into units ofprotection above the level of nesting populations, but below thelevel of species, within regional entities that might be onindependent evolutionary trajectories. Finally, the RMU systemis neither static nor proprietary, but rather is iterative and user-driven. We encourage broad and creative engagement with andapplication of this tool, whose long-term accuracy and efficacywill rely on updates, edits, and improvements arising from userinteractions.
Regional Management Units for Marine Turtles
PLoS ONE | www.plosone.org 9 December 2010 | Volume 5 | Issue 12 | e15465

Supporting Information
Table S1 Summary of Regional Management Units (RMUs) formarine turtles worldwide, including number of nesting sites andgenetic stocks contained within each RMU.(DOC)
Appendix S1 Complete list of SWOT – The State of theWorld’s Sea Turtles data providers.(XLS)
Appendix S2 Metadata associated with each layer synthesized togenerate Regional Management Units.(XLS)
Acknowledgments
This work resulted from meetings of the IUCN/SSC Marine TurtleSpecialists Group’s Burning Issues Working Group, which consisted of
representatives of governmental agencies, NGOs, and academia fromaround the world. Special recognition goes to SWOT Team members andpartners who contributed information to the SWOT database and to thisinitiative. We thank MTSG members and others who contributed valuablecomments, including GC Hays and an anonymous reviewer.
Author Contributions
Conceived and designed the experiments: BPW ADD BJH EMF ABBMYC BJH FAAG DA KAB JB BWB RBD PC BCC AC PHD AF AGMGMHG MH MLM MAM JAM JAM RN NJP JAS ST BW RBM.Performed the experiments: BPW ADD BJH EMF. Analyzed the data:BPW ADD BJH EMF. Contributed reagents/materials/analysis tools:BPW ADD BJH EMF ABB MYC BJH FAAG DA KAB JB BWB RBD PCBCC AC PHD AF AG MG MHG MH MLM MAM JAM JAM RN NJPJAS ST BW RBM. Wrote the paper: BPW ADD BJH EMF ABB MYCBJH FAAG DA KAB JB BWB RBD PC BCC AC PHD AF AG MGMHG MH MLM MAM JAM JAM RN NJP JAS ST BW RBM.
References
1. Foley MM, Halpern BS, Micheli F, Armsby MH, Caldwell MR, et al. (2010)Guiding ecological principles for marine spatial planning. Mar Pol 34: 955–966.
2. Bowen BW, Bass AL, Soares L, Toonen RJ (2005) Conservation implications ofcomplex population structure: lessons from the loggerhead turtle (Caretta caretta).Mol Ecol 14: 2389–2402.
3. Suryan RM, Saba VS, Wallace BP, Hatch SA, Frederiksen M, et al. (2009)Environmental forcing on life history strategies: Multi-trophic level response atocean basin scales. Prog Oceanogr 81: 214–218.
4. Taylor BL, Dizon AE (1999) First policy then science: why a management unitbased solely on genetic criteria cannot work. Mol Ecol 8: S11–S16.
5. Moritz C (1994) Defining ‘evolutionary significant units’ for conservation.Trends in Ecology & Evolution 9: 373–375.
6. Ashley MV, Willson MF, Pergams ORW, O’Dowd DJ, Gende SM, et al. (2003)Evolutionarily enlightened management. Biol Conserv 111: 1150–123.
7. IUCN (2010) IUCN Red List of Threatened Species. Version 2010.1. www.iucnredlist.org. Downloaded on 11 April 2010.
8. Musick JA, Limpus CJ (1997) Habitat utilization and migration in juvenile seaturtles. In: Lutz PL, Musick JA, eds. The Biology of Sea Turtles. Boca RatonFL:CRC Press. pp 137–164.
9. Bowen BW, Karl SA (2007) Population genetics and phylogeography of seaturtles. Mol Ecol 16: 4886–4907.
10. Bolker BM, Okuyama T, Bjorndal KA, Bolten AB (2007) Incorporating multiplemixed stocks in mixed stock analysis: ‘many-to-many’ analyses. Mol Ecol 16:68–695.
11. Wallace BP, Saba VS (2009) Environmental and anthropogenic impacts onintra-specific variation in leatherback turtles: opportunities for targeted researchand conservation Endangered Species Research 7: 1–11.
12. Hamann M, Godfrey MH, Seminoff JA, Arthur K, Barata PCR, et al. (2010)Global research priorities for sea turtles: informing management andconservation in the 21st century. Endangered Species Research 11: 245–269.
13. Dethmers KEM, Broderick D, Moritz C, FitzSimmons NN, Limpus CJ, et al.(2006) The genetic structure of Australasian green turtles (Chelonia mydas):exploring the geographical scale of genetic exchange. Mol Ecol 15: 3931–3946.
14. Meylan AB, Bowen BW, Avise JC (1990) A genetic test of the natal homingversus social facilitation models for green turtle migration. Science 248:724–727.
15. Bowen BW, Bass AL, Chow S-M, Bostrom M, Bjorndal KA, et al. (2004) Natalhoming in juvenile loggerhead turtles (Caretta caretta). Mol Ecol 13: 3797–3808.
16. FitzSimmons NN, Limpus CJ, Norman JA, Goldizen AR, Miller JD, et al.(1997a) Philopatry of male marine turtles inferred from mitochondrial DNAmarkers. Proc Nat Acad Sci 94: 8912–8917.
17. Karl SA, Bowen BW, Avise JC (1992) Global population genetic structure andmale-mediated gene flow in the green turtle (Chelonia mydas): RFLP analyses ofanonymous nuclear loci. Genetics 131: 163–173.
18. FitzSimmons NN, Moritz C, Limpus CJ, Pope L, Prince R (1997b) Geographicstructure of mitochondrial and nuclear gene polymorphisms in Australian greenturtle populations and male-biased gene flow. Genetics 147: 1843–1854.
19. Carreras C, Pascual M, Cardona LM, Aguilar A, Margaritoulis D, et al. (2007)The genetic structure of the loggerhead sea turtle (Caretta caretta) in theMediterranean as revealed by nuclear and mitochondrial DNA and itsconservation implications. Cons Gen 8: 761–775.
20. Martien KK, Taylor BT (2003) Limitations of hypothesis-testing in definingmanagement units for continuously distributed species. J Cet Res Manag 5:213–218.
21. Limpus CJ, Miller JD, Parmenter CJ, Reimer D, McLachlan N, et al. (1992)Migration of green (Chelonia mydas) and loggerhead (Caretta caretta) turtles to andfrom eastern Australian rookeries. Wildlife Res 19: 347–358.
22. Limpus CJ, Miller JD, Parmenter CJ, Limpus DJ (2003) The green turtle,Chelonia mydas, population of Raine Island and the Northern Great Barrier Reef:1843-2001. Memoirs Queensland Museum 49: 349–440.
23. Limpus CJ (2008) A biological review of Australian Marine turtles: Green turtleChelonia mydas (Linnaeus), Queensland Environmental Protection Agency, 96.
24. Godley BJ, Blumenthal JM, Broderick AC, Coyne MS, Godfrey MH, et al.(2008) Satellite tracking of sea turtles: Where have we been and where do we gonext? Endangered Species Research 4: 3–22.
25. Godley BJ, Barbosa C, Bruford M, Broderick AC, Catry P, et al. (2010)Unravelling migratory connectivity in marine turtles using multiple methods.J Appl Ecol;doi: 10.1111/j.1365-2664.2010.01817.x.
26. Abreu-Grobois FA, Plotkin PT (2007) IUCN Red List Status Assessment of theolive ridley sea turtle (Lepidochelys olivacea). IUCN/SSC-Marine Turtle SpecialistGroup, 39.
27. Formia A, Broderick AC, Glen F, Godley BJ, Hays GC, et al. (2007) Geneticcomposition of the Ascension Island green turtle rookery based on mitochondrialDNA: implications for sampling and diversity. Endangered Species Research 3:145–158.
28. Blumenthal JM, Abreu-Grobois FA, Austin TJ, Broderick AC, Bruford MW,et al. (2009) Turtle groups or turtle soup: dispersal patterns of hawksbill turtles inthe Caribbean. Mol Ecol 18: 4841–4853.
29. Frazier J (1985) Misidentifications of sea turtles in the East Pacific: Caretta carettaand Lepidochelys olivacea. J Herp 19: 1–11.
30. Halpin PN, Read AJ, Fujioka E, Best BD, Donnelly B, et al. (2009) OBIS-SEAMAP The World Data Center for Marine Mammal, Sea Bird, and SeaTurtle Distributions. Oceanography 22: 104–115.
31. Dow W, Eckert KL, Palmer M, Kramer P (2007) An Atlas of Sea Turtle NestingHabitat for the Wider Caribbean Region. The Wider Caribbean Sea TurtleConservation Network and The Nature Conservancy. WIDECAST TechnicalReport No. 6, Beaufort, NC, USA, 267.
32. Dryden J, Grech A, Moloney J, Hamann M (2008) Re-zoning of the GreatBarrier Reef World Heritage Area: does it afford greater protection for marineturtles? Wildlife Res 35: 477–485.
33. Witt MJ, Broderick AC, Coyne MS, Formia A, Ngouessono S, et al. (2008)Satellite tracking highlights difficulties in the design of effective protected areasfor Critically Endangered leatherback turtles Dermochelys coriacea during the inter-nesting period. Oryx 42: 296–300.
34. Shillinger GL, Palacios DM, Bailey H, Bograd SJ, Swithenbank AM, et al.(2008) Persistent leatherback turtle migrations present opportunities forconservation. PLoS Biol 6: e171.
35. Bolten AB, Bjorndal KA, Martins HR, Dellinger T, Biscoito MJ, et al. (1998)Transatlantic development migrations of loggerhead sea turtles demonstrated bymtDNA sequence analysis. Ecol App 8: 1–7.
36. Lahanas PN, Bjorndal K, Bolten A, Encalada SE, Miyamoto MM, et al. (1998)Genetic composition of a green turtle (Chelonia mydas) feeding ground population:evidence for multiple origins. Mar Biol 130: 345–352.
37. Bass AL, Epperly SP, Braun-McNeill J (2006) Green turtle (Chelonia mydas)foraging and nesting aggregations in the Caribbean and Atlantic: impact ofcurrents and behavior on dispersal. J Hered 97: 346–354.
38. Bjorndal K, Bolten A (2008) Annual variation in source contributions to a mixedstock: implications for quantifying connectivity. Mol Ecol 17: 2185–2193.
Regional Management Units for Marine Turtles
PLoS ONE | www.plosone.org 10 December 2010 | Volume 5 | Issue 12 | e15465
39. Bjorndal KA, Bolten AB, Troeng S (2005) Population structure and geneticdiversity in green turtles nesting at Tortuguero, Costa Rica, based onmitochondrial DNA control region sequences. Mar Biol 147: 1449–1457.
40. Monzon-Arguello C, Lopez-Jurado L, Rico C, Marco A, Lopez P, Hays G, Lee P(2010) Evidence from gnetic and Lagrangian drifter data for transatlantictransport of small juvenile green turtles. J Biogeogr 37: 1752–1766.
41. Bass AL, Epperly S, Braun-McNeill J (2004) Multi-year analysis of stockcomposition of a loggerhead turtle (Caretta caretta) foraging habitat usingmaximum likelihood and Bayesian methods. Cons Gen 5: 783–796.
42. Waples RS, Punt AE, Cope JM (2008) Integrating genetic data intomanagement of marine resources: how can we do better? Fish and Fisheries9: 423–449.
43. Lahanas PN, Miyamoto MM, Bjorndal KA, Bolten AB (1994) Molecularevolution and population genetics of Greater Caribbean green turtles (Cheloniamydas) as inferred from mitochondrial DNA control region sequences. Genetica94: 57–67.
44. Dutton PH, Bowen BW, Owens DW, Barragan A, Davis SK (1999) Globalphylogeography of the leatherback turtle (Dermochelys coriacea). J Zool (Lond) 248:397–409.
45. Carreras C, Pont S, Maffucci F, Pascual M, Barcelo A, et al. (2006) Geneticstructuring of immature loggerhead sea turtles (Caretta caretta) in theMediterranean Sea reflects water circulation patterns. Mar Biol 149: 1269–1279.
46. Bowen BW, Abreu-Grobois FA, Balazs GH, Kamezaki N, Limpus CJ, et al.(1995) Trans-Pacific migrations of the loggerhead turtle (Caretta caretta)demonstrated with mitochondrial DNA markers. Proc Nat Acad Sci 92:3371–3734.
47. Boyle MC, Fitzsimmons NN, Limpus CJ, Kelez S, Velez-Zuazo X, et al. (2009)Evidence for transoceanic migrations by loggerhead turtles in the southernPacific Ocean. Proc Roy Soc B 276: 1993–1999.
48. Seminoff JA, Shanker K (2008) Marine turtles and IUCN Red Listing: A reviewof the process, the pitfalls, and novel assessment approaches. J Exp Mar BiolEcol 356: 52–68.
49. Mrosovsky N (2003) Predicting Extinction: Fundamental Flaws In IUCN’s Red ListSystem, Exemplified By The Case Of Sea Turtles. http://members.seaturtle.org/mrosovsky/.
50. Waples RS (1995) Evolutionary significant units and the conservation ofbiological diversity under the Endangered Species Act. Evolution and the AquaticEcosystem: Defining Unique Units in Population Conservation (ed. JL Nielsen), pp. 8-27.American Fisheries Society Symposium 17, American Fisheries Society,Bethesda, MD.
51. U.S. Fish and Wildlife Service and National Marine Fisheries Service (1996)Policy regarding the recognition of distinct vertebrate population segmentsunder the Endangered Species Act. Federal Register 61(26): 4722–4725.February 7, 1996.
52. Conant TA, Dutton PH, Eguchi T, Epperly SP, Fahy CC, et al. (2009)Loggerhead sea turtle (Caretta caretta) 2009 status review under the U.S.Endangered Species Act. Report of the Loggerhead Biological Review Team tothe National Marine Fisheries Service, August 2009. 222 p.
53. Bowen BW (1999) Preserving genes, ecosystems, or species? Healing thefractured foundations of conservation policy. Mol Ecol 8: S5–S10.
54. Crowder LB, Norse E (2008) Essential ecological insights for marine ecosystem-based management and marine spatial planning. Mar Pol 32: 772–778.
55. Block BA, Teo SLH, Walli A, Boustany A, Stokesbury MJW, et al. (2005)Electronic tagging and population structure of Atlantic bluefin tuna. Nature 434:1121–1127.
56. Foote AD, Simila T, Vıkingsson GA, Stevick PT (2009) Movement, site fidelityand connectivity in a top marine predator, the killer whale. Evol Ecol;DOI:10.1007/s10682-009-9337-x.
57. Yorio P (2009) Marine protected areas, spatial scales, and governance:implications for the conservation of breeding seabirds. Cons Lett 2: 171–178.
58. Jorgensen SJ, Reeb CA, Chapple TK, Anderson S, Perle C, et al. (2010)Philopatry and migration of Pacific white sharks. Proc of the Roy Soc B 277:679–688.
59. Bjorndal KA, Jackson J (2003) Roles of sea turtles in marine ecosystems:reconstructing the past. In: Lutz PL, Musick JA, Wyneken J, eds. The Biology ofSea Turtles. Boca RatonFL: CRC Press 2: 259–274.
Regional Management Units for Marine Turtles
PLoS ONE | www.plosone.org 11 December 2010 | Volume 5 | Issue 12 | e15465
Copyright © 2022 FDOKUMEN