Regional Convergence in Portugal: Policy Impacts (1990-2001
143
Universidade de Aveiro Departamento de Economia, Gestão e Engenharia Industrial Documentos de Trabalho em Economia Working Papers in Economics Área Científica de Economia E/nº 35/2005 Regional Convergence in Portugal: Policy Impacts (1990-2001) Miguel Lebre de Freitas and Francisco Torres (coord.) and Celeste Amorim, Annette Bongardt, Marta Ferreira Dias and Ricardo Silva Submission of Papers for Publication (Para submissão de artigos para publicação): Prof. Francisco Torres ([email protected] ). Universidade de Aveiro, DEGEI, Economia, Campus Universitário de Santiago. 3810-193 Aveiro. Portugal.
Transcript of Regional Convergence in Portugal: Policy Impacts (1990-2001
Universidade de Aveiro Departamento de Economia, Gestão e Engenharia Industrial
Documentos de Trabalho em Economia Working Papers in Economics
Área Científica de Economia E/nº 35/2005
Regional Convergence in Portugal: Policy Impacts (1990-2001)
Miguel Lebre de Freitas and Francisco Torres (coord.) and
Celeste Amorim, Annette Bongardt, Marta Ferreira Dias and Ricardo Silva
Submission of Papers for Publication (Para submissão de artigos para publicação): Prof. Francisco Torres ([email protected]). Universidade de Aveiro, DEGEI, Economia, Campus Universitário de Santiago. 3810-193 Aveiro. Portugal.
Regional Convergence in Portugal: Policy Impacts (1990-2001)1
by Miguel Lebre de Freitas and Francisco Torres (coord.)
and Celeste Amorim, Annette Bongardt, Marta Dias and Ricardo Silva
Abstract
In this study we look at whether the seven Portuguese NUTS II regions have been able to share equally in the country’s overall growth or whether there have been asymmetries and divergences in their growth patterns. We assess the regional impact of a wide range of Portuguese domestic policies on cohesion. We focus mainly on regional economic cohesion, although social cohesion effects are also considered. As in the case of Portugal structural operations within the community framework programmes and national efforts were highly intertwined, we also contrast the impact of Community policies in two regions.
JEL classification: O18, O22, O23, O38, O52. Keywords: Portugal, European Union, Regional Convergence, Cohesion, National Policies, Structural Funds, Institutions.
DEGEI, Universidade de Aveiro Campus Universitário de Santiago, P-3810-193 Aveiro, Portugal; Tel: +351-234.370.361/215-fax; Emails: [email protected]; [email protected]
1 A more complete version was published as INA Paper 12 on European Affairs (www.ina.pt) with the title National and EU Policies and Regional Convergence: the Case of Portugal, Oeiras: INA. A summary in Portuguese of the major objectives and findings of the paper is available in appendix B at the end of the paper. See also Box 5.1 (section 5 – Conclusion) for a summary of main conclusions.
2
Acknowledgements
This paper results from the authors’ earlier research carried out at the University of Aveiro within a
broader study on the impact of Member State policies on social and economic cohesion at the
regional level. That research was funded by the European Commission (2002 CE 160 AT 172) and
gathered a consortium made up by a core team, constituting of Iain Begg, Francisco Torres, Miguel L.
Freitas, Carlos Mulas-Granados, El Mouhoub Mouhoud, Frank Barry, Gianfranco Viesti, V.
Monastiriotis, Phedon Nicolaides, Sébastien Dupuch, based at the London School of Economics and
at other European universities and institutes, among which the University of Aveiro, and a network of
correspondents from all EU-15 Member States. That broader study is available / downloadable from:
http://europa.eu.int/comm/regional_policy/sources/docgener/studies/pdf/3cr/impact_member.pdf. The
present study also draws on our contributions to a complementary study on the impact of Community
policies on regional cohesion, which has improved our understanding of how national policies are
closely tied to Community policies and EU funding and for which we are especially grateful to
Ricardo Rodríguez Contreras and many people in the Açores and Algarve whose helpful discussions
are acknowledge in that study and in its subsequente and broader version published by the National
Institute for Public Administration (www.ina.pt).
We would like to express our gratitude to DG Regio of the European Commission for its support. In
addition, we would like to thank our colleagues of the core team and participants in the several
working sessions that took place at the European Information Centre Jacques Delors in Lisbon, at the
DG Regio in Brussels, at the University of Aveiro, and in a workshop held in July 2003 at the
National Institute for Public Administration (INA) to discuss our work, namely Iain Begg, Frank
Barry, Vasco Cal, Mathew Brooke, Luís Valadares Tavares, Nuno Vitorino, Ana Filipa Pereira and
Isabel Marques. We are also indebted to Teresa Moura, Maria João Botelho, Luísa Dias, Luís Alves
Monteiro and Jorge Abegão, for fruitful discussions, as well as to Rui Monteiro and Cláudia Leite,
CCR Norte, Rui Jacinto, CCR Centro, Isabel de Carvalho, CCR LVT, Manuel Bento Rosado, CCR
Alentejo.
Our views do not necessarily coincide with the views expressed in the above-referred projects nor do
they implicate any of the above-mentioned persons and institutions or institutions with whom the
authors are affiliated with. A more complete version was published as INA Paper 12 on European
Affairs (National and EU Policies and Regional Convergence: the Case of Portugal).
3
1 - Introduction
Cohesion is a wide concept. In a broad sense, it embraces inequalities, whether in terms of
income, living standards, employment or of environmental conditions, and has to be seen in
terms of opportunities as well as outcomes (Ardy et al., 2002a). Convergence, a related
notion, focuses on “real variables” such as per capita income or productivity. Convergence
and divergence, however, are long-term processes that reflect both history and the effects of
recent trends that shape the ability of a region to compete.
Following the terminology of the first Cohesion Report (European Commission, 1996),
economic cohesion refers to the aim of promoting competitiveness and convergence through
faster GDP growth in the poorest regions. Such an aim implicitly requires EU policies to
raise the production capability of the poorer regions, thus creating conditions for faster
growth, rather than simply promoting consumption through income transfers from the richer
areas. As pointed out by Ardy et al. (2002b), the EU views cohesion as a development issue:
one of the ways for the EU to achieve cohesion is through structural and cohesion funding
that seeks to foster the long-term growth potential of regions, avoiding situations of
dependence on those transfers and of high unemployment. The concept shall, then, be
distinguished from the notion of social cohesion, which is related to the aim of ensuring that
the least well-off have access to social protection and services of general interest. Social
cohesion may be assessed by means of a number of indicators; some of the most important
are unemployment, inequality of incomes, poverty, and social exclusion which in turn is
multidimensional.
Three basic mechanisms through which policies impact on economic and social cohesion can
be identified:
A first mechanism is economic efficiency. Policies aimed at promoting the efficient
allocation of resources include regulation and institutional development, adequate incentives,
the internalisation of externalities, a sound tax system, increased competition, public
infrastructure, training and other labour market measures and science and technology-related
initiatives. Their purpose is to correct shortcomings on the supply side of the economy that
result in an inefficient economic performance.
A second mechanism is income redistribution. Policies aimed at reducing income disparities
at the individual level may have a significant regional impact if the incidence of social needs
4
is asymmetrically distributed among regions, even when they do not have any regional
dimension. Regions with below-average economic activity will have a propensity to draw in
proportionally higher inflows of public expenditure, while dynamic regions contribute more
to tax revenue.
A third mechanism is demand stabilisation, which may act in a preventive way with respect
to disparities. The inter-play of public expenditure and taxation performs an important role in
stabilising demand, attenuating short-term fluctuations in regional demand that might
otherwise give rise to problems of cohesion.
It should be noted that each one of these three mechanisms may have an impact on both
economic and social cohesion.
Some of the policies that act through the three mechanisms are implemented at the Member
State level while others may involve both Community and national efforts.
- Community policies, insofar as they aim at raising the productivity of the less
competitive regions, are specifically aimed at promoting economic cohesion (through
Structural Funds, the Cohesion Fund, the CAP and others).
- Demand stabilisation in the Eurozone may to some extent be undertaken by the ECB,
although this is only possible when not conflicting with the primary objective of price
stability. At the Community level, however, the budget is too small to provide a demand
stabilisation function. Therefore, the burden of demand stabilisation falls mainly on national
policies. The scale of domestic public expenditure, typically in the range of 40-50 per cent of
GDP, is much greater than that emanating from the EU, roughly amounting to 1 per cent of
GDP.
- As far as income redistribution is concerned, Community policies do not have any
direct role. Member States’ policies, in contrast, deliberately do.
The fact that some cohesion policies can only be implemented through action at the Member
State level while others may involve both Community and national efforts requires good
coordination between both levels of government as to avoid that different policies contradict
each other and in order to maximise effectiveness.
Purpose of the study
5
This study sets out to assess the impact of Portuguese domestic policies on cohesion in its
seven regions. The discussion, along the lines of the broader study of Begg et al. (2004),
focuses mainly on regional economic cohesion, although social cohesion effects are also
considered. While it is well known that Portugal as a whole has been able to converge to the
Community average since joining the EC in 1986, it remains to be seen whether the
Portuguese regions have been able to share equally in that growth or whether there have been
asymmetries and divergences in the growth patterns.
Our purpose is to analyse the impact of national rather than Community policies on cohesion.
However, two regional studies enrich the analysis to the extent that they allow examining and
contrasting the impact of Community policies in two out of the seven Portuguese regions
(one continental and one ultra-peripheral). This is important for the case of Portugal
(especially during the period of analysis, 1990-2001) where EU and national efforts seem to
be highly intertwined. Portuguese national policies are closely tied to EU funding, and given
the lack of a regional policy tradition, most were set up under the EU policies framework.
There is a wide range of national policies with a positive or negative bearing on cohesion,
some of which explicitly have a regional dimension while others have only indirect effects on
regional cohesion. The following policies are examined in this study:
a) Macroeconomic policy. This policy plays a major role in stabilising demand and the
level of unemployment. Its impact on cohesion comes through various channels: the interest
rate, the exchange rate, taxation, the scale of public expenditures and output and price
stability. Although determined at the aggregate level, macroeconomic policy may have a
differential effect across regions.
b) Public expenditures. As far as regional cohesion is concerned, the impact of public
expenditures will emerge through a variety of channels, namely investments in education,
health, social security, transport infrastructure. Even though being defined at the country-
level, public structural expenditures may also have an indirect effect on regional cohesion (a
territorial dimension) by increasing accessibility and living conditions in many laggard areas
and also as a source of employment in less populated areas.
c) Transfers from central government. Transfers to municipalities and to the
autonomous regions may play an important role in cohesion to the extent that the level of
proximity with respect to the utilisation of national funds may work in favour of its
6
effectiveness. Public transfers, impacting on the regional distribution of income, have also a
role on social cohesion and may act as a regional demand stabilisation tool.
d) State aid. State aid has a potential role in social cohesion, but can distort trade and
competition between firms, regions or countries and delay restructuring. Whether or not state
aids contribute to cohesion depends on their sectoral and spatial distribution, on the degree of
distortion provoked in the market and on whether such distortions work in favour or against
less-favoured regions.
e) Employment and social policies. In general, these policies are potentially effective in
boosting social cohesion. Employment policies that improve the attributes of the labour force
may also contribute to economic cohesion, by facilitating adaptability and entrepreneurship
and helping to make individuals more employable. Yet whether they are being used so as to
improve the relative position of less-favoured regions is an open question.
f) Science and technology. Science and Technology policy can be thought of as a
specific set of policies that aim to improve the ability of firms to compete. However, regions
have different capacities to exploit the potential stemming from innovation and innovation
diffusion. At the national level there can be a tension between attempts to reinforce national
competitive advantage and the desire to spread the benefits of high technology across
regions.
g) Foreign direct investment policy. Inward investment is typically an important part of
a regional development strategy. FDI not only has a direct incidence on economic activity,
income and jobs; it is also a mechanism for transferring technology, new managerial
techniques and know-how. As in the case of Science and Technology policy, there might be a
policy dilemma between wanting investment to go towards the less-developed regions and
the fact that investment is more easily attracted to the better-endowed regions.
Whereas other policies could have been addressed, the primary goal of this study is not to
examine in detail all initiatives but rather to analyse those national policies that are most
relevant at a regional level.
We also draw on secondary data as well as on primary qualitative data collected through
interviews with policy makers, regional leaders and academics. Open-ended exploratory
questions allow for the collection of comprehensive data on regional specificities. All seven
Portuguese regions are characterised in terms of their evolution over the decade 1991-2001,
their specialisation patterns and the evolution of regional indicators. Interview evidence on
7
the assessment by regional representatives of the domestic policies’ impact on regional
cohesion is also presented and contrasted with the researchers’ perspective.
The study is organised as follows: In Chapter 2 we analyse the impact of the above-
mentioned national policies on cohesion. Chapter 3 addresses the question whether there has
been convergence among the Portuguese NUTS II regions, characterising each of the seven
regions both in quantitative and qualitative terms. This chapter also provides a qualitative
evaluation of each policy dimension, based on the researchers’ perspective and also on the
opinions of key policy actors. The impact of Community policies is analysed in Chapter 4
where two regional case studies, Açores and Algarve, are presented. Chapter 5 concludes. In
Box 5.1 we summarise the conclusions on the impact of national policies on regional
(economic and social) cohesion and on the national economy.
2 – The impact of national policies on cohesion
2.1 – Macroeconomic policy
Long-term effects are positive: the incidence of nominal instability is asymmetric, hurting
more those without access to financial instruments. EMU and SGP have a competitiveness-
enhancing effect in laggard regions.
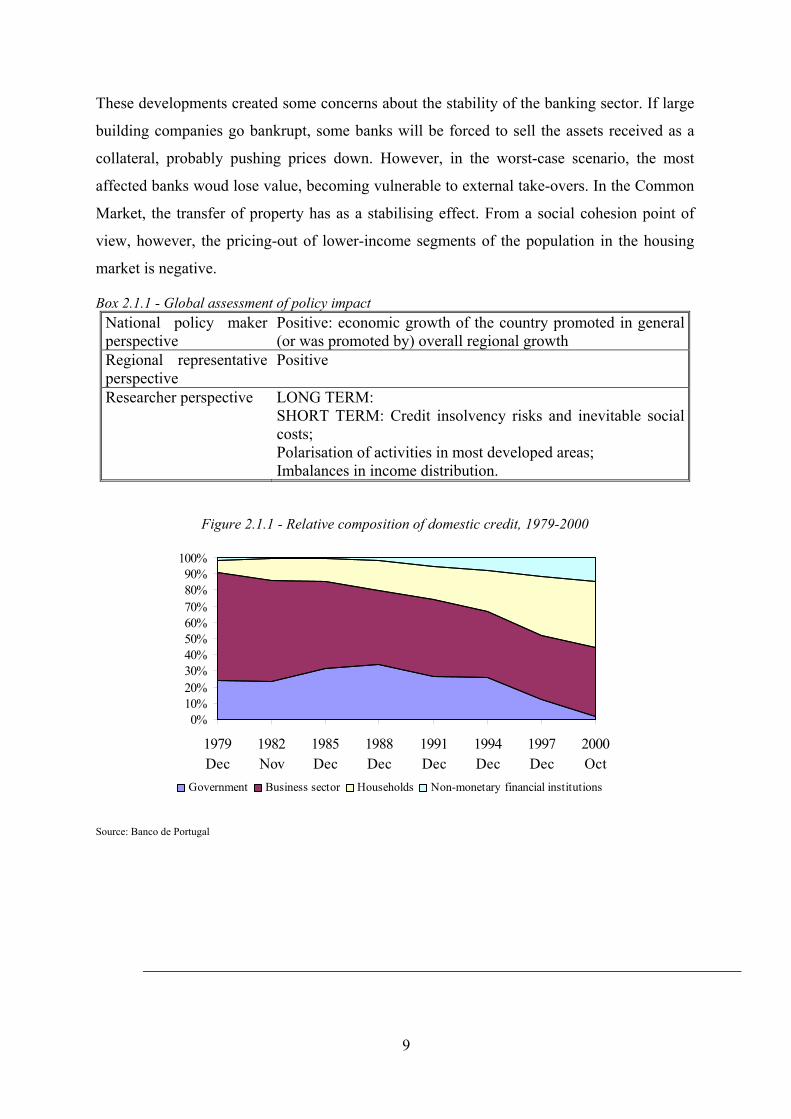
During the transition to EMU (European and Monetary Union), domestic credit expanded at
very fast rates in Portugal (see figure 2.1.1). The rapid expansion in the demand for credit
goes hand in hand with the changing composition of domestic credit in Portugal between
1979 and 2000, with households and non-monetary financial institutions (mainly devoted to
consumer credit) emerging as important actors (see figure 2.1.1) while public sector
borrowing requirements decreased significantly. This change was motivated by the drop in
interest rates (see table 2.1.1) and the elimination of liquidity constraints that allowed
households to smooth their lifetime expenditures, after decades of financial repression. The
phenomenon accelerated in 1998 when Portugal qualified for the euro. Domestic banks were
able to import money from abroad at favourable conditions.
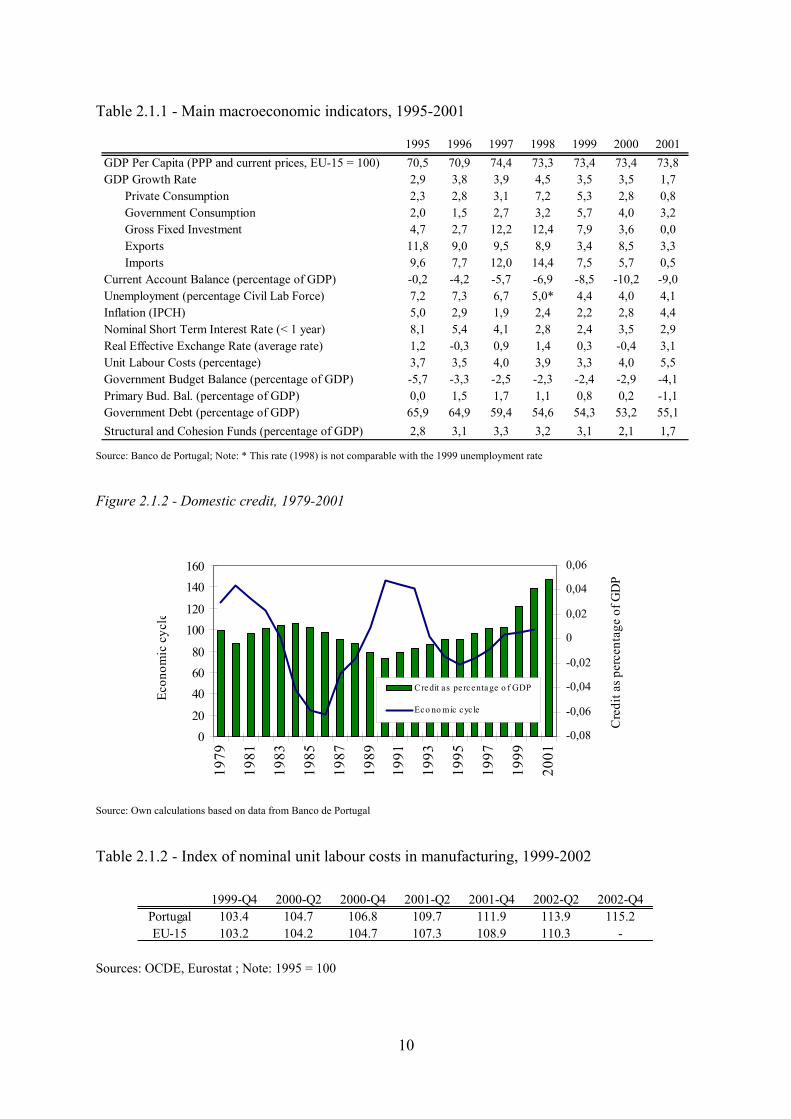
The fast expansion of domestic credit allowed domestic demand to grow at a very high pace
in the late 1990s (see figure 2.1.2). This phenomenon was exacerbated by a pro-cyclical
fiscal policy. In a small open economy, this leads to a rise in the relative price of non-
8
tradable goods, a production shift from tradables to non-tradables and a current account
deficit2. In the non-tradables sector, there was an enormous impact on the demand for real
estate. As real estate prices were rising, speculative demand emerged, driving the prices even
higher. The resulting pressure on the labour market caused wages to grow significantly faster
than productivity, leading to an increase in unit labour costs and the loss of external
competitiveness (see table 2.1.2).
Since the shift in aggregate demand due to monetary and fiscal factors was of a temporary
nature, the large current account deficit that emerged was not a problem in itself, but rather a
symptom of the macroeconomic adjustment that was taking place.
The relative price effect (real appreciation) may be, however, a source of concern. In the last
three decades, changes in relative prices had been made easier by nominal exchange rate
adjustments. Now, this instrument is no longer available. The question is, then, whether
nominal prices in the non-tradable sector will be able to fall. Thus far, producers have been
reluctant to adjust prices downward, thus giving rise to excess supply and rising
unemployment in some services and a sharp contraction in the real estate sector. In some
urban areas, namely in the greater Lisbon area, a large excess supply of residential buildings
has emerged.
The question is whether these developments have impacted differently on Portuguese
regions. On an a priori basis, one would say that those regions in which the boom in the real
estate sector was more pronounced would be more affected by the current crisis, especially
the metropolitan areas that expanded without caring about urban quality. This includes the
region of Lisboa e Vale do Tejo in particular, but also important urban areas in Norte and
some cities in the coastal Algarve. In the vicinity of Lisbon, the traditional deficit in
residential buildings was clearly overcome and a large excess supply has emerged. The same
is true for areas around major industrial cities all over the country. In the Algarve, the
demand was mostly driven by tourism, so that the excess supply might be easier to invert
with the business cycle.
2 The overall balance of payments deficit was even larger because economic agents in general, and pension funds in particular, were re-adjusting the composition of their portfolios from domestic securities into euro-area securities other than those issued by Portuguese entities. Also, direct investment overseas by the business sector contributed significantly to raise the econmy's financing needs.
9
These developments created some concerns about the stability of the banking sector. If large
building companies go bankrupt, some banks will be forced to sell the assets received as a
collateral, probably pushing prices down. However, in the worst-case scenario, the most
affected banks woud lose value, becoming vulnerable to external take-overs. In the Common
Market, the transfer of property has as a stabilising effect. From a social cohesion point of
view, however, the pricing-out of lower-income segments of the population in the housing
market is negative.
Box 2.1.1 - Global assessment of policy impact National policy maker perspective
Positive: economic growth of the country promoted in general (or was promoted by) overall regional growth
Regional representative perspective
Positive
Researcher perspective LONG TERM: SHORT TERM: Credit insolvency risks and inevitable social costs; Polarisation of activities in most developed areas; Imbalances in income distribution.
Figure 2.1.1 - Relative composition of domestic credit, 1979-2000
0%10%20%30%40%50%60%70%80%90%
100%
1979Dec
1982Nov
1985Dec
1988Dec
1991Dec
1994Dec
1997Dec
2000Oct
Government Business sector Households Non-monetary financial institutions
Source: Banco de Portugal
10
Table 2.1.1 - Main macroeconomic indicators, 1995-2001
1995 1996 1997 1998 1999 2000 2001GDP Per Capita (PPP and current prices, EU-15 = 100) 70,5 70,9 74,4 73,3 73,4 73,4 73,8GDP Growth Rate 2,9 3,8 3,9 4,5 3,5 3,5 1,7
Private Consumption 2,3 2,8 3,1 7,2 5,3 2,8 0,8Government Consumption 2,0 1,5 2,7 3,2 5,7 4,0 3,2Gross Fixed Investment 4,7 2,7 12,2 12,4 7,9 3,6 0,0Exports 11,8 9,0 9,5 8,9 3,4 8,5 3,3Imports 9,6 7,7 12,0 14,4 7,5 5,7 0,5
Current Account Balance (percentage of GDP) -0,2 -4,2 -5,7 -6,9 -8,5 -10,2 -9,0Unemployment (percentage Civil Lab Force) 7,2 7,3 6,7 5,0* 4,4 4,0 4,1Inflation (IPCH) 5,0 2,9 1,9 2,4 2,2 2,8 4,4Nominal Short Term Interest Rate (< 1 year) 8,1 5,4 4,1 2,8 2,4 3,5 2,9Real Effective Exchange Rate (average rate) 1,2 -0,3 0,9 1,4 0,3 -0,4 3,1Unit Labour Costs (percentage) 3,7 3,5 4,0 3,9 3,3 4,0 5,5Government Budget Balance (percentage of GDP) -5,7 -3,3 -2,5 -2,3 -2,4 -2,9 -4,1Primary Bud. Bal. (percentage of GDP) 0,0 1,5 1,7 1,1 0,8 0,2 -1,1Government Debt (percentage of GDP) 65,9 64,9 59,4 54,6 54,3 53,2 55,1Structural and Cohesion Funds (percentage of GDP) 2,8 3,1 3,3 3,2 3,1 2,1 1,7
Source: Banco de Portugal; Note: * This rate (1998) is not comparable with the 1999 unemployment rate
Figure 2.1.2 - Domestic credit, 1979-2001
020
406080
100120
140160
1979
1981
1983
1985
1987
1989
1991
1993
1995
1997
1999
2001
Econ
omic
cyc
le
-0,08
-0,06
-0,04
-0,02
0
0,02
0,04
0,06
Cre
dit a
s per
cent
age
of G
DP
C redit as pe rcentage o f GDP
Eco no mic cyc le
Source: Own calculations based on data from Banco de Portugal
Table 2.1.2 - Index of nominal unit labour costs in manufacturing, 1999-2002
1999-Q4 2000-Q2 2000-Q4 2001-Q2 2001-Q4 2002-Q2 2002-Q4Portugal 103.4 104.7 106.8 109.7 111.9 113.9 115.2EU-15 103.2 104.2 104.7 107.3 108.9 110.3 -
Sources: OCDE, Eurostat ; Note: 1995 = 100
11
2.2 - Public expenditures
Tables 2.2.1 and 2.2.2 compare the Portuguese and EU15 government spending by category
and by function, respectively (the totals do not match because of a statistical discrepancy). As
shown in Table 2.2.1, government spending as a percentage of GDP (Gross Domestic
Product) has declined significantly in the EU between 1995 and 2002, while in Portugal it
increased by one percentage point. By 2002, Portuguese government spending reached 46.1
per cent of GDP, a figure very close to the EU15 average. In spite of this small increase,
given of the obligations under the SGP (Stability and Growth Pact), there is a clear tightening
constraint, arguably implying an increasing incentive for Portugal to improve the quality of
expenditure programmes. To what extent this has resulted in more effective policies for
regional cohesion remains an open question, though.
The weight of the public sector wage bill is well above the EU15 average, and continued to
increase in the period 1995 to 2002 (Table 2.2.1). The ageing of the population put
significant pressure on social spending. As shown in table 2.2.3, between 1995 and 2000
expenditures on old age pensions increased from 41.7 per cent to 45.6 per cent of the
expenditures on social benefits. Still, spending on social benefits in Portugal is still relatively
low when compared to the EU15 average. Transfers and subsidies other than social benefits
(which includes spending on industrial and regional support) have also increased relative to
GDP, as opposed to the EU15 average. The amount of public investment on infrastructure of
various kinds is also higher tan in the EU average, but it has declined sliglty from 1995 to
20023.
As shown in Table 2.2.2, government expenditures in educatioon are higher in Portugal than
in the EU average, both in percentage of GDP and in percentage of total expenditure.
Expenditures with the health care system are still below the EU15 average, when measured
in percentage of GDP, but increased slightly between 1995 and 2001. The increase in public
expenditures does not necessarily translate, however to higher provision of education and
health care. Comparing the relative efficiency of education and health care expenditures in a
1 Pereira and Andraz’s (2002) estimated the long run impact on growth of public investment in transportation infrastructures. The results point to an impact on output of 9.5 times the amount invested, suggesting that public infrastructues have been a powerful instrument to promote long-term growth in Portugal.
12
number of countries, St. Aubyn (2002), pointed out to the existence of important
inefficiencies in the Portuguese systems. This means that provision could increase
significantly without extra costs if incentives and the administration were set to be more
efficient.
Despite a tendency to increase over tha last decades, spending on social protection in
portugal is still significatly below the EU15 average. This reflects the different stages in the
building up of the European welfare state, which means a lower social commitment with the
reduction of income disparities and the provision of equal opportunities. Because of the
existing ineficiences, however, it not obvious that social costs will be lower in Portugal than
in other European countris, in case globalisation and increasing competition force a resclale
of the current model of social protection.
Most public expenditures in Portugal do not possess an explicit regional dimension. Policy-
making in Portugal is very much centralised and regional and local authorities’ discretion
over the way they spend the budget is very limited. Expenditures that take place at the
regional or local level are a direct consequence of policies determined nationally.
Notwithstanding, to the extent that the amount spent in different regions depends on the age
structure of the resident population and on the perceived needs for social support, this may
translate into higher levels of government expenditure per capita in less prosperous regions4.
In that case, social cohesion is acccounted indirectly at the regional level. Social expenditures
have, however, only a limited effect on strengthening underlying competitiveness. Although
in Portugal there is concern, as it is in other countries, to ensure that the provision levels of
essential public goods do not differ much across the territory, infrastructures building tends
to be concenytrated in regions with larger population. Unfortunatly, the relative scale of the
different public expenditure in different regions in Portugal cannot be assessed, because of
data unavailability.
The regional distribution of CSF (Community Support Framework) funds may provide an
indication of the regional incidence of those public expenditures that are set to co-finance EU
4 The Third Report on Economic and Social Cohesion (2004) confirms this expectation for the case of the United Kingdom.
13
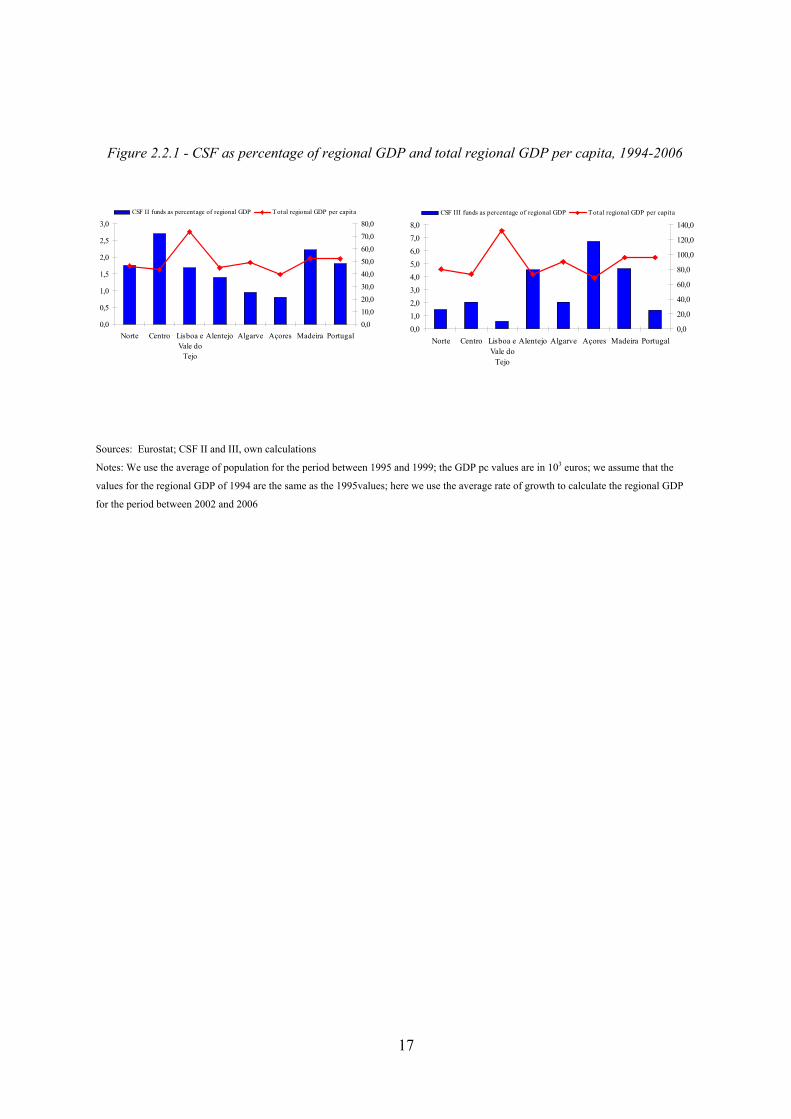
funding5. As shown in Tables 2.2.4 under CSF II, funds per capita for the poorest regions of
Açores and Alentejo were substantially lower than those for the richest regions of Lisboa e
Vale do Tejo, Centro and Madeira. CSF funds per capita in Lisboa e Vale do Tejo are nearly
six times the amount received by Açores. Table 2.2.5 shows that, relative to regional GDP,
transfers to the poorest regions Açores and Alentejo amount to barely 0.8 and 1.39 per cent,
respectively, while the richest region Lisboa e Vale do Tejo received 1.67 per cent. This
suggests that, if CSF II induced' public expenditure did have any impact on regional
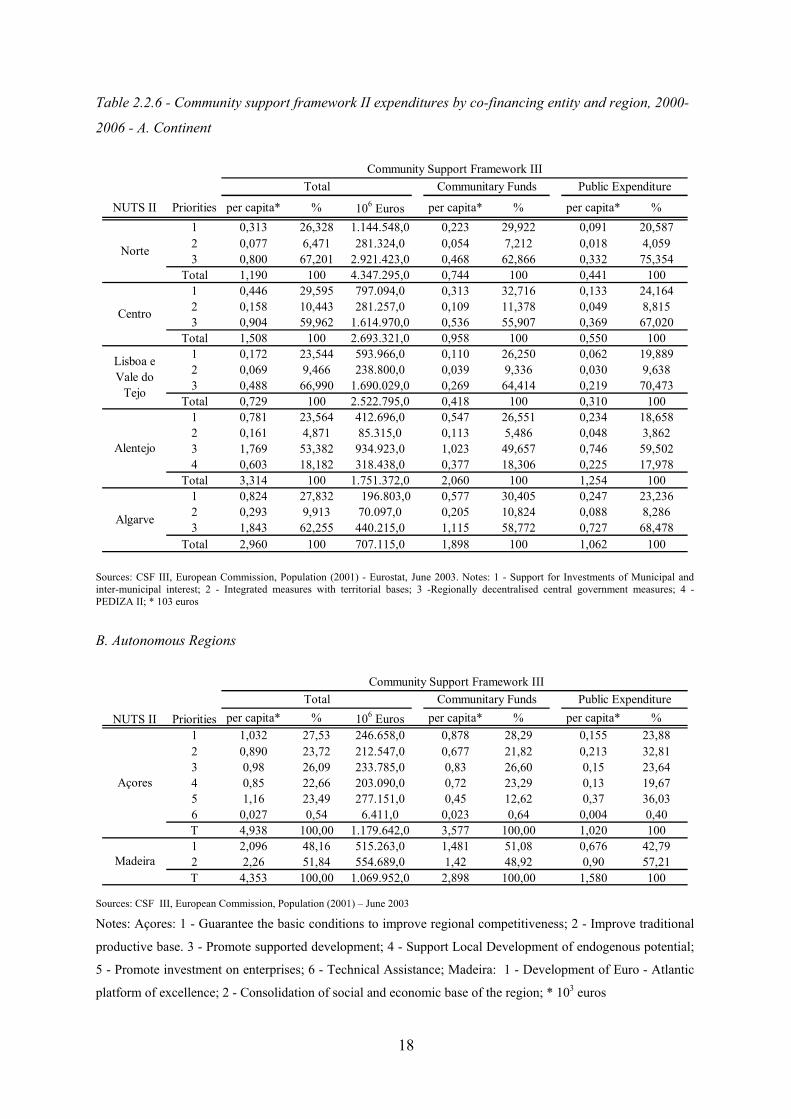
cohesion, it might have been one of divergence rather than convergence6. Under CSF III, in
constrast, transfers tend to be inversely related to income, with Lisboa e Vale do Tejo
receiving less than a fourth of the amount per head of population of the poorer region,
Alentejo (see Table 2.2.6).
Although spending under CSF may provide an insight on how the concerns about regional
cohesion have evolved, it is important to note that the size of these expenditures is very small
when compared to total government expenditures (as shown in Table 2.2.5, between 1994
and 2006, CSF II funds amounted to 1.8 only per cent of GDP on average). Hence, the
regional distribution of CSF expenditures tell us nothing about the regional distribution of
government expenditures.
The ‘regional cohesion problem’ is clearly recognized in the TIP (Territorial Improvement
Programme). The TIP, created within the Portuguese Operational Programme for 2000-2006,
is now the main national instrument for promoting economic and social cohesion at the sub-
national level. The programme targets regional development in order to reduce regional
asymmetries and pays attention to investments in specific areas as to avoid the continuous
concentration of funds in the coastal areas. The programme features three different
dimensions: small cities (strengthening their functional importance), agricultural areas
(supporting their specific potential) and metropolitan peripheries. The intervention almost
encloses the totality of the Portuguese NUTS II regions, with distinct weights and emphasis
5 Note that taking opportunity of structural funds is quite demanding from a domestic budget point of view. Table 2.2.1 shows that the share of public (national) expenditure has increased markedly from 20 to 37 per cent of the total CSF. Given this pressure, the scope for other national initiatives in similar areas of intervention is very small.
6 Note, however, that the modernization of the most advanced regions may be highly important in the early stages of development, if the Williamson hypothesis (1965), that regional imbalances first rise and then decrease when the economy meets a growth pattern, holds (see Artis and Nixson, 2001).
14
in accordance to each region’s specific characteristics and problems. Promoting the
development of small peripheral cities is expected to generate significant spill-over effects
within less developed regions. This policy shall not be seen, however, as of domestic nature,
because most of the funds are attributed through the CSF III.
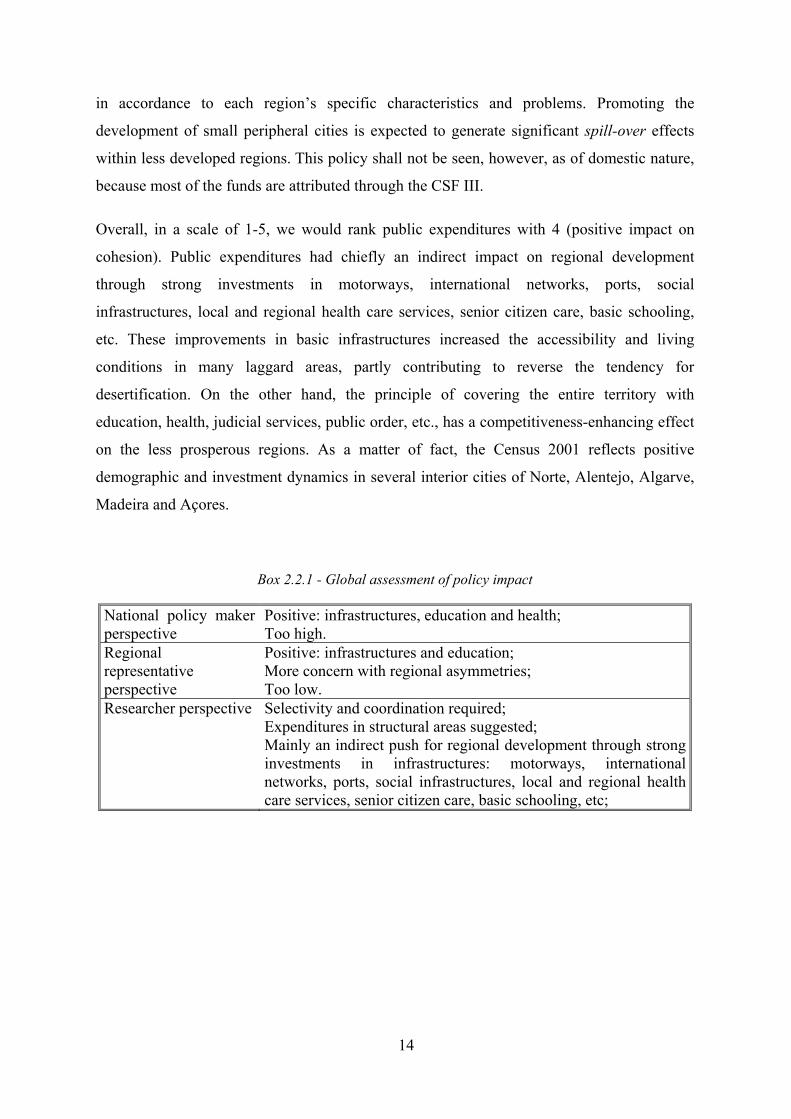
Overall, in a scale of 1-5, we would rank public expenditures with 4 (positive impact on
cohesion). Public expenditures had chiefly an indirect impact on regional development
through strong investments in motorways, international networks, ports, social
infrastructures, local and regional health care services, senior citizen care, basic schooling,
etc. These improvements in basic infrastructures increased the accessibility and living
conditions in many laggard areas, partly contributing to reverse the tendency for
desertification. On the other hand, the principle of covering the entire territory with
education, health, judicial services, public order, etc., has a competitiveness-enhancing effect
on the less prosperous regions. As a matter of fact, the Census 2001 reflects positive
demographic and investment dynamics in several interior cities of Norte, Alentejo, Algarve,
Madeira and Açores.
Box 2.2.1 - Global assessment of policy impact
National policy maker perspective
Positive: infrastructures, education and health; Too high.
Regional representative perspective
Positive: infrastructures and education; More concern with regional asymmetries; Too low.
Researcher perspective Selectivity and coordination required; Expenditures in structural areas suggested; Mainly an indirect push for regional development through strong investments in infrastructures: motorways, international networks, ports, social infrastructures, local and regional health care services, senior citizen care, basic schooling, etc;
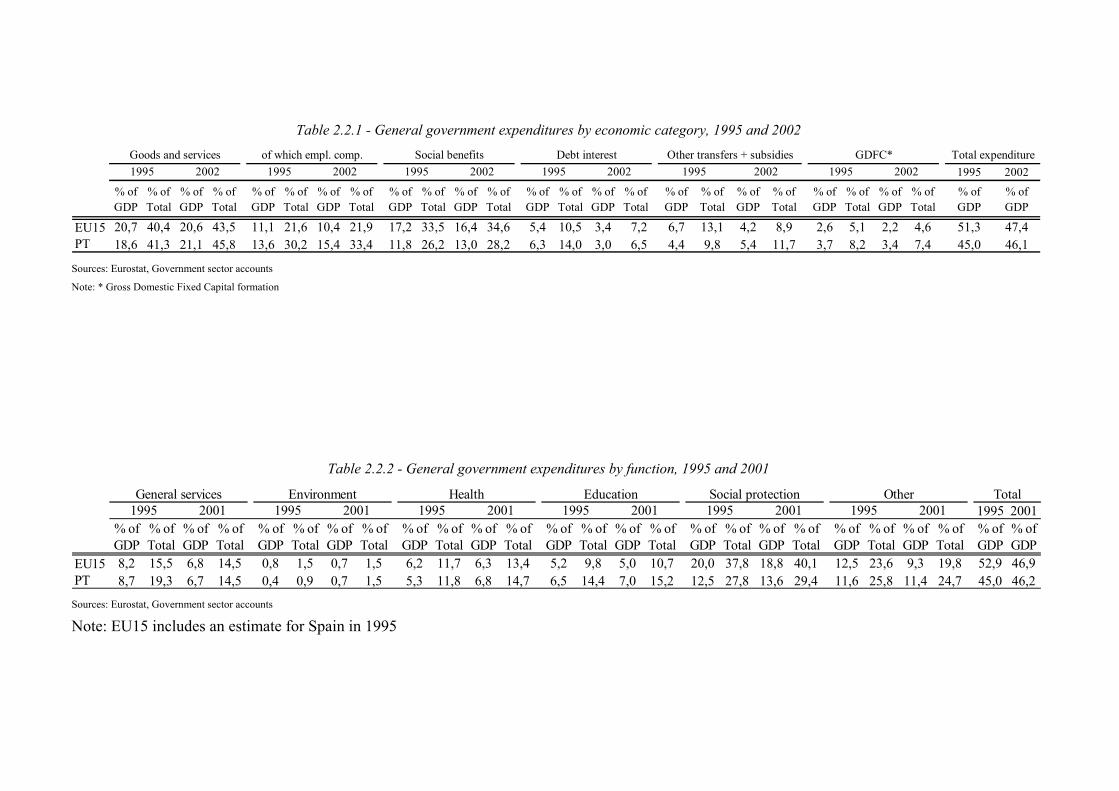
Table 2.2.1 - General government expenditures by economic category, 1995 and 2002
1995 2002
% of GDP
% of Total
% of GDP
% of Total
% of GDP
% of Total
% of GDP
% of Total
% of GDP
% of Total
% of GDP
% of Total
% of GDP
% of Total
% of GDP
% of Total
% of GDP
% of Total
% of GDP
% of Total
% of GDP
% of Total
% of GDP
% of Total
% of GDP
% of GDP
EU15 20,7 40,4 20,6 43,5 11,1 21,6 10,4 21,9 17,2 33,5 16,4 34,6 5,4 10,5 3,4 7,2 6,7 13,1 4,2 8,9 2,6 5,1 2,2 4,6 51,3 47,4PT 18,6 41,3 21,1 45,8 13,6 30,2 15,4 33,4 11,8 26,2 13,0 28,2 6,3 14,0 3,0 6,5 4,4 9,8 5,4 11,7 3,7 8,2 3,4 7,4 45,0 46,1
Goods and services1995 19951995 2002 1995 2002
of which empl. comp.1995 2002 2002
Total expenditure2002
GDFC*Other transfers + subsidiesSocial benefits Debt interest1995 2002
Sources: Eurostat, Government sector accounts
Note: * Gross Domestic Fixed Capital formation
Table 2.2.2 - General government expenditures by function, 1995 and 2001
1995 2001% of GDP
% of Total
% of GDP
% of Total
% of GDP
% of Total
% of GDP
% of Total
% of GDP
% of Total
% of GDP
% of Total
% of GDP
% of Total
% of GDP
% of Total
% of GDP
% of Total
% of GDP
% of Total
% of GDP
% of Total
% of GDP
% of Total
% of GDP
% of GDP
EU15 8,2 15,5 6,8 14,5 0,8 1,5 0,7 1,5 6,2 11,7 6,3 13,4 5,2 9,8 5,0 10,7 20,0 37,8 18,8 40,1 12,5 23,6 9,3 19,8 52,9 46,9PT 8,7 19,3 6,7 14,5 0,4 0,9 0,7 1,5 5,3 11,8 6,8 14,7 6,5 14,4 7,0 15,2 12,5 27,8 13,6 29,4 11,6 25,8 11,4 24,7 45,0 46,2
1995 2001 1995 2001 1995 2001 1995 2001 1995 2001 1995 2001Social protection Other TotalGeneral services Environment Health Education
Sources: Eurostat, Government sector accounts
Note: EU15 includes an estimate for Spain in 1995
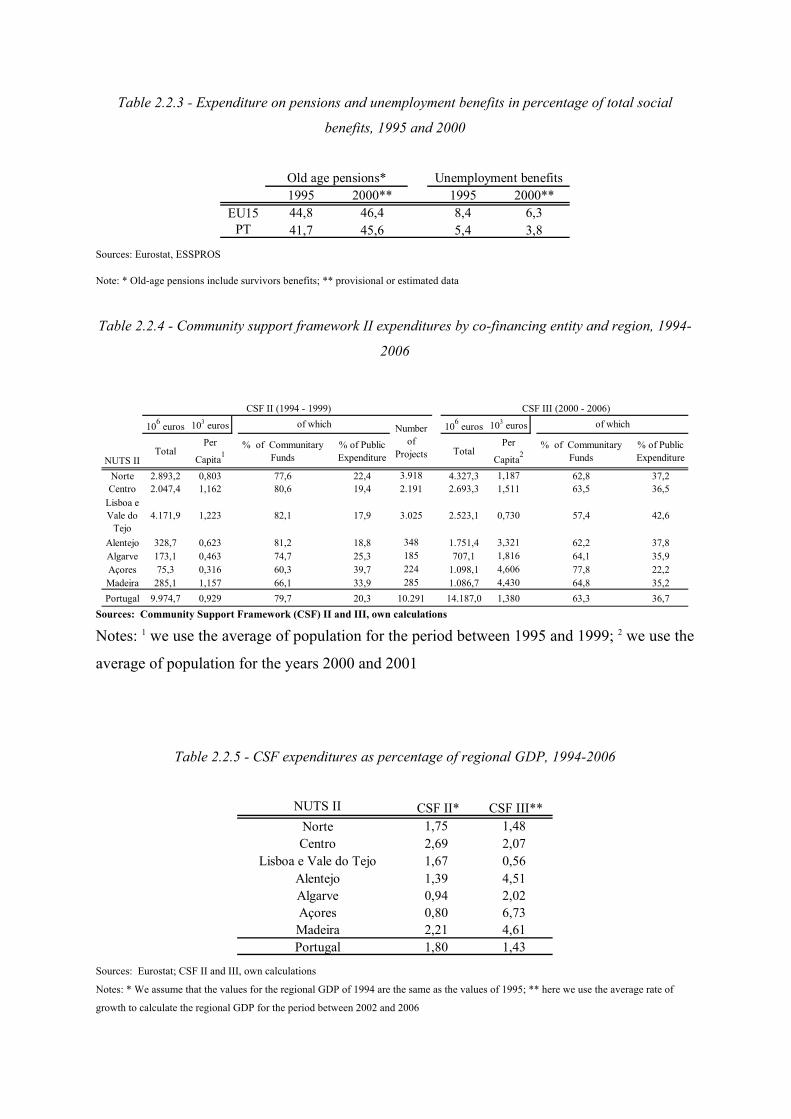
Table 2.2.3 - Expenditure on pensions and unemployment benefits in percentage of total social
benefits, 1995 and 2000
1995 2000** 1995 2000**EU15 44,8 46,4 8,4 6,3
PT 41,7 45,6 5,4 3,8
Old age pensions* Unemployment benefits
Sources: Eurostat, ESSPROS
Note: * Old-age pensions include survivors benefits; ** provisional or estimated data
Table 2.2.4 - Community support framework II expenditures by co-financing entity and region, 1994-
2006
106 euros 103 euros 106 euros 103 euros
NUTS IITotal
Per
Capita1% of Communitary
Funds% of Public Expenditure Total
Per
Capita2% of Communitary
Funds% of Public Expenditure
Norte 2.893,2 0,803 77,6 22,4 3.918 4.327,3 1,187 62,8 37,2Centro 2.047,4 1,162 80,6 19,4 2.191 2.693,3 1,511 63,5 36,5
Lisboa e Vale do
Tejo4.171,9 1,223 82,1 17,9 3.025 2.523,1 0,730 57,4 42,6
Alentejo 328,7 0,623 81,2 18,8 348 1.751,4 3,321 62,2 37,8Algarve 173,1 0,463 74,7 25,3 185 707,1 1,816 64,1 35,9Açores 75,3 0,316 60,3 39,7 224 1.098,1 4,606 77,8 22,2Madeira 285,1 1,157 66,1 33,9 285 1.086,7 4,430 64,8 35,2Portugal 9.974,7 0,929 79,7 20,3 10.291 14.187,0 1,380 63,3 36,7
of which CSF II (1994 - 1999)
Number of
Projects
of which CSF III (2000 - 2006)
Sources: Community Support Framework (CSF) II and III, own calculations
Notes: 1 we use the average of population for the period between 1995 and 1999; 2 we use the
average of population for the years 2000 and 2001
Table 2.2.5 - CSF expenditures as percentage of regional GDP, 1994-2006
NUTS II CSF II* CSF III**
Norte 1,75 1,48Centro 2,69 2,07
Lisboa e Vale do Tejo 1,67 0,56Alentejo 1,39 4,51Algarve 0,94 2,02Açores 0,80 6,73Madeira 2,21 4,61Portugal 1,80 1,43
Sources: Eurostat; CSF II and III, own calculations
Notes: * We assume that the values for the regional GDP of 1994 are the same as the values of 1995; ** here we use the average rate of
growth to calculate the regional GDP for the period between 2002 and 2006
17
Figure 2.2.1 - CSF as percentage of regional GDP and total regional GDP per capita, 1994-2006
0,0
0,5
1,0
1,5
2,0
2,5
3,0
Norte Centro Lisboa eVale do
Tejo
Alentejo Algarve Açores Madeira Portugal0,010,020,030,040,050,060,070,080,0
CSF II funds as percentage of regional GDP Total regional GDP per capita
0,01,02,03,04,05,06,07,08,0
Norte Centro Lisboa eVale do
Tejo
Alentejo Algarve Açores Madeira Portugal0,0
20,0
40,0
60,0
80,0
100,0
120,0
140,0CSF III funds as percentage of regional GDP Total regional GDP per capita
Sources: Eurostat; CSF II and III, own calculations
Notes: We use the average of population for the period between 1995 and 1999; the GDP pc values are in 103 euros; we assume that the
values for the regional GDP of 1994 are the same as the 1995values; here we use the average rate of growth to calculate the regional GDP
for the period between 2002 and 2006
18
Table 2.2.6 - Community support framework II expenditures by co-financing entity and region, 2000-
2006 - A. Continent
NUTS II Priorities per capita* % 106 Euros per capita* % per capita* %1 0,313 26,328 1.144.548,0 0,223 29,922 0,091 20,5872 0,077 6,471 281.324,0 0,054 7,212 0,018 4,0593 0,800 67,201 2.921.423,0 0,468 62,866 0,332 75,354
Total 1,190 100 4.347.295,0 0,744 100 0,441 1001 0,446 29,595 797.094,0 0,313 32,716 0,133 24,1642 0,158 10,443 281.257,0 0,109 11,378 0,049 8,8153 0,904 59,962 1.614.970,0 0,536 55,907 0,369 67,020
Total 1,508 100 2.693.321,0 0,958 100 0,550 1001 0,172 23,544 593.966,0 0,110 26,250 0,062 19,8892 0,069 9,466 238.800,0 0,039 9,336 0,030 9,6383 0,488 66,990 1.690.029,0 0,269 64,414 0,219 70,473
Total 0,729 100 2.522.795,0 0,418 100 0,310 1001 0,781 23,564 412.696,0 0,547 26,551 0,234 18,6582 0,161 4,871 85.315,0 0,113 5,486 0,048 3,8623 1,769 53,382 934.923,0 1,023 49,657 0,746 59,5024 0,603 18,182 318.438,0 0,377 18,306 0,225 17,978
Total 3,314 100 1.751.372,0 2,060 100 1,254 1001 0,824 27,832 196.803,0 0,577 30,405 0,247 23,2362 0,293 9,913 70.097,0 0,205 10,824 0,088 8,2863 1,843 62,255 440.215,0 1,115 58,772 0,727 68,478
Total 2,960 100 707.115,0 1,898 100 1,062 100
Community Support Framework IIICommunitary Funds Public ExpenditureTotal
Algarve
Norte
Centro
Lisboa e Vale do
Tejo
Alentejo
Sources: CSF III, European Commission, Population (2001) - Eurostat, June 2003. Notes: 1 - Support for Investments of Municipal and inter-municipal interest; 2 - Integrated measures with territorial bases; 3 -Regionally decentralised central government measures; 4 - PEDIZA II; * 103 euros
B. Autonomous Regions
per capita* % 106 Euros per capita* % per capita* %1 1,032 27,53 246.658,0 0,878 28,29 0,155 23,882 0,890 23,72 212.547,0 0,677 21,82 0,213 32,813 0,98 26,09 233.785,0 0,83 26,60 0,15 23,644 0,85 22,66 203.090,0 0,72 23,29 0,13 19,675 1,16 23,49 277.151,0 0,45 12,62 0,37 36,036 0,027 0,54 6.411,0 0,023 0,64 0,004 0,40T 4,938 100,00 1.179.642,0 3,577 100,00 1,020 1001 2,096 48,16 515.263,0 1,481 51,08 0,676 42,792 2,26 51,84 554.689,0 1,42 48,92 0,90 57,21T 4,353 100,00 1.069.952,0 2,898 100,00 1,580 100
NUTS II Priorities
Community Support Framework IIICommunitary FundsTotal
Açores
Madeira
Public Expenditure
Sources: CSF III, European Commission, Population (2001) – June 2003
Notes: Açores: 1 - Guarantee the basic conditions to improve regional competitiveness; 2 - Improve traditional
productive base. 3 - Promote supported development; 4 - Support Local Development of endogenous potential;
5 - Promote investment on enterprises; 6 - Technical Assistance; Madeira: 1 - Development of Euro - Atlantic
platform of excellence; 2 - Consolidation of social and economic base of the region; * 103 euros
19
2.3 - Transfers from Central Government
2.3.1 - Transfers to municipalities
In Portugal taxes are predominantly levied centrally. The burden of regional and local taxes
represents less than five per cent of the general government revenues. Municipalities are
hence largely dependent on transfers from the state.
Transfers to municipalities follow the Principle of “Equilíbrio Financeiro”, which envisages
a "fair" distribution of resources between the State and municipalities (vertical balance) and
between municipalities of the same type (horizontal balance). The Portuguese Constitution
establishes in its article 254, n.º 1 that: “Municipalities shall share, in their own right, and in
accordance with the law, the revenue from direct taxation”. Transfers to municipalities
correspond to a percentage of the arithmetic average of the receipts from those taxes.
A 1999 law extinguished the FEF (Financial Balance Fund) and created three new
instruments: the FGM (Municipalities’ General Fund) that allocates resources to the regions,
largely based on regional needs for spending per capita (this value is assessed centrally,
involving the estimation of a standardised level of service per head of population), but with
additional criteria that benefit two island regions; a second fund, with explicit cohesion
objectives (FCM - Municipal Cohesion Fund) is limited to less developed municipalities,
while two additional funds aim ensure that the municipalities have adequate resources (FFF -
Freguesias (smallest unit of local government) Financing Fund - and the FBM - Municipal
Base Fund -, created in 2002).
The municipalities’ participation in the state taxes is currently defined by the LFL (Local
Finance Law) [Law n. º 94/2001, of 20th August]. At present, the financial State transfers to
municipalities are processed through the four distinct instruments referred above:
i) FGM (Municipalities’ General Fund)
This fund is attributed to all municipalities. The total of the FGM is distributed through three
territorial units (Continent, Autonomous Region of Açores and Autonomous Region of
Madeira), as a direct function of criteria like resident population or area. The distribution to
the municipalities inside territorial units obeys to a variety of different criteria, such as:
resident population under 15 years, the number of municipalities within the region, area, or
related to the receipts of direct taxes.
20
The fund aims to endow the municipalities with financial conditions adjusted to their
performance in terms of effected investment relative to attributions. The fund envisages
vertical balance in function of the type and amount of carried-out investments per item (???).
ii) FCM (Municipal Cohesion Fund)
This fund acts as a complement to the FGM and aims at strengthening municipal cohesion
and fostering the correction of asymmetries, to the benefit of the less developed
municipalities (horizontal balance). It is to be received only by those municipalities with a
development index below the national average. The assignments of this fund have been
inherited from the Cohesion Fund created by the European Union in favour of its less
developed Member States, namely in Southern Europe.
iii) FBM (Municipal Base Fund)
This fund was created in 2002. It aims at endowing the municipalities with minimum
financial capacity for their functioning. It is distributed on equal terms and by equal amounts.
iv) FFF (Freguesias Financing Fund)
When the law of local finance began to be enforced, the freguesias (smallest administrative
units in Portugal) at the outset benefited from an autonomous fund corresponding to 2.5 per
cent of the simple arithmetic average of the receipts from direct (personal and corporate) and
indirect (VAT - Value Added Tax) taxation, assigned for FFF. This fund is distributed
through three territorial units (Continent, Açores and Madeira) in accordance with criteria
such as resident population or area. The public transfer under item c) of paragraph 12 of the
Budget Law of 2001 (???) was substituted in the following years by FBM. Regional
distribution follows the same criteria. Excess detail?
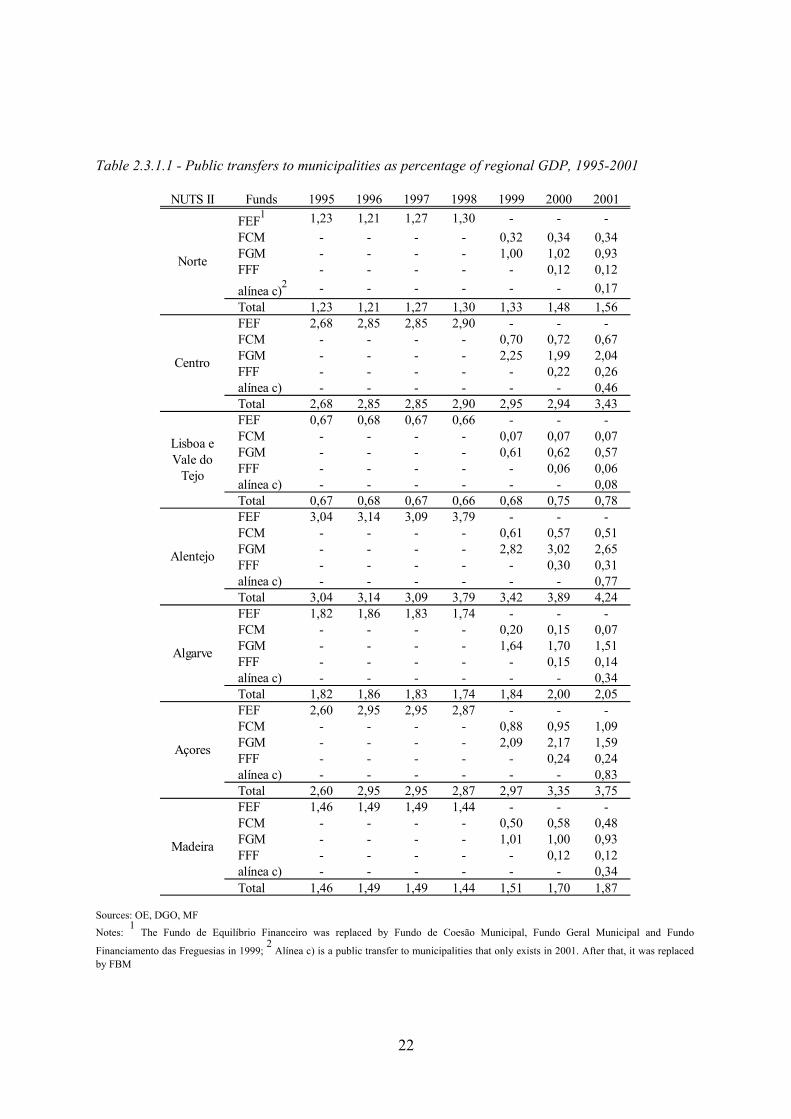
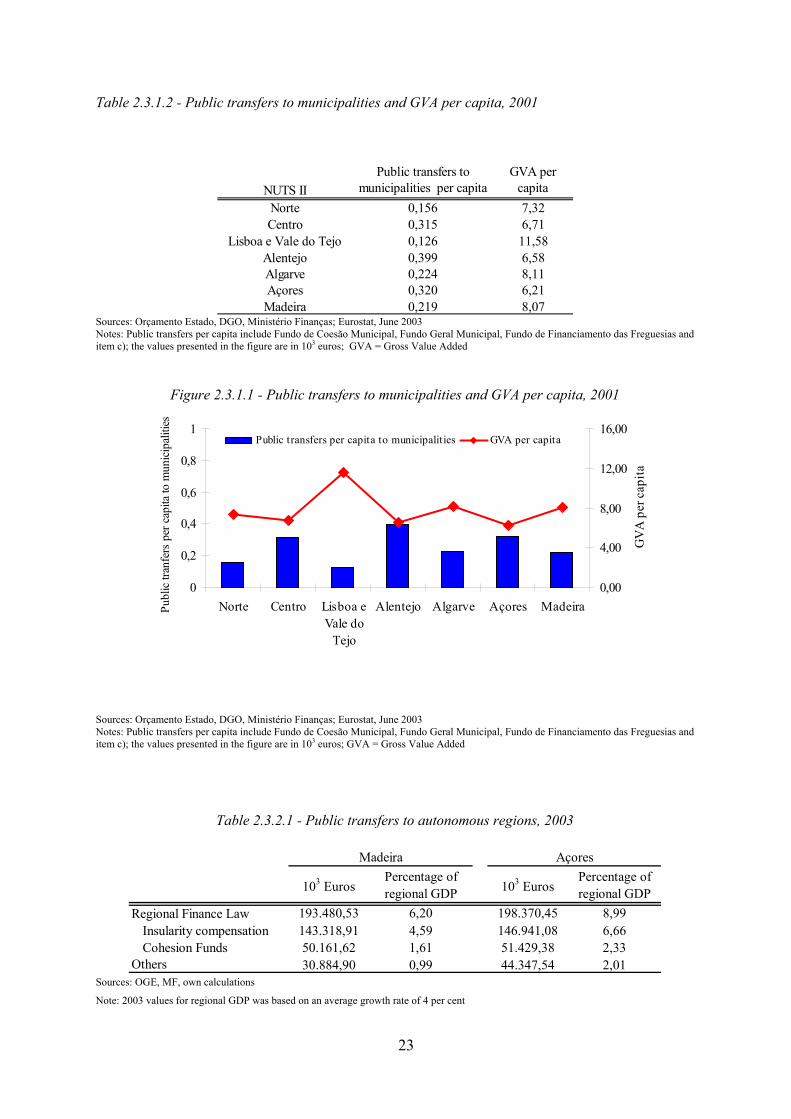
As shown in tables 2.3.1.1 and 2.3.1.2 and in figure 2.3.1.1, transfers to municipalities are
higher in per capita terms in the least prosperous regions, Alentejo and Açores. In percentage
of regional GDP, public transfers ranged between 0.67 per cent (for the richer area of Lisboa
e Vale do Tejo) and 3.04 per cent (the poor region of Alentejo) of regional GDP in 1995, and
between 0.78 per cent (for the richer area of Lisboa e Vale do Tejo) and 4.24 per cent (the
poor region of Alentejo) in 2001. Taking all these funds together, public transfers to
municipalities in terms of regional GDP increased steadily over the period 1995-2001 (with
exception of the year 1998), with a higher increase in the poorer regions (Alentejo and
21
Açores). Looking at figure 2.3.1, it is evident that by 2001 the transfers per capita were
relatively higher in less prosperous regions of Alentejo and Açores.
According to these data and to the policy makers and to regional representatives interviewed,
transfers from to municipalities are seen to endow the later with the indispensable minimum
financial capacity for their functioning, and to have a positive impact on both economic and
social cohesion. The recent changes in the legislation suggest that in the future these transfers
will still contribute to reduce regional imbalances. Nevertheless, since the scope for higher
funding is limited, the quality of local expenditures and the efficiency of the location criteria
for the distribution of funds among municipalities are of crucial importance.
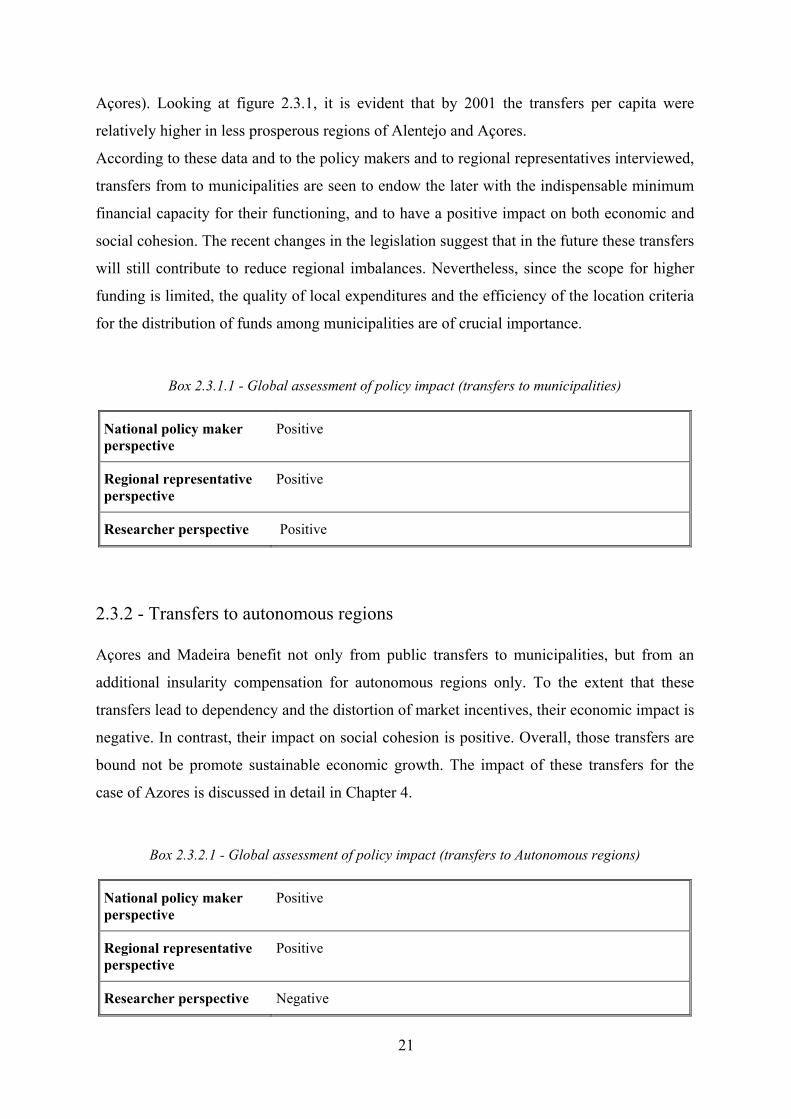
Box 2.3.1.1 - Global assessment of policy impact (transfers to municipalities)
National policy maker perspective
Positive
Regional representative perspective
Positive
Researcher perspective Positive
2.3.2 - Transfers to autonomous regions Açores and Madeira benefit not only from public transfers to municipalities, but from an
additional insularity compensation for autonomous regions only. To the extent that these
transfers lead to dependency and the distortion of market incentives, their economic impact is
negative. In contrast, their impact on social cohesion is positive. Overall, those transfers are
bound not be promote sustainable economic growth. The impact of these transfers for the
case of Azores is discussed in detail in Chapter 4.
Box 2.3.2.1 - Global assessment of policy impact (transfers to Autonomous regions)
National policy maker perspective
Positive
Regional representative perspective
Positive
Researcher perspective Negative
22
Table 2.3.1.1 - Public transfers to municipalities as percentage of regional GDP, 1995-2001
NUTS II Funds 1995 1996 1997 1998 1999 2000 2001
FEF1 1,23 1,21 1,27 1,30 - - -FCM - - - - 0,32 0,34 0,34FGM - - - - 1,00 1,02 0,93FFF - - - - - 0,12 0,12alínea c)2 - - - - - - 0,17Total 1,23 1,21 1,27 1,30 1,33 1,48 1,56FEF 2,68 2,85 2,85 2,90 - - -FCM - - - - 0,70 0,72 0,67FGM - - - - 2,25 1,99 2,04FFF - - - - - 0,22 0,26alínea c) - - - - - - 0,46Total 2,68 2,85 2,85 2,90 2,95 2,94 3,43FEF 0,67 0,68 0,67 0,66 - - -FCM - - - - 0,07 0,07 0,07FGM - - - - 0,61 0,62 0,57FFF - - - - - 0,06 0,06alínea c) - - - - - - 0,08Total 0,67 0,68 0,67 0,66 0,68 0,75 0,78FEF 3,04 3,14 3,09 3,79 - - -FCM - - - - 0,61 0,57 0,51FGM - - - - 2,82 3,02 2,65FFF - - - - - 0,30 0,31alínea c) - - - - - - 0,77Total 3,04 3,14 3,09 3,79 3,42 3,89 4,24FEF 1,82 1,86 1,83 1,74 - - -FCM - - - - 0,20 0,15 0,07FGM - - - - 1,64 1,70 1,51FFF - - - - - 0,15 0,14alínea c) - - - - - - 0,34Total 1,82 1,86 1,83 1,74 1,84 2,00 2,05FEF 2,60 2,95 2,95 2,87 - - -FCM - - - - 0,88 0,95 1,09FGM - - - - 2,09 2,17 1,59FFF - - - - - 0,24 0,24alínea c) - - - - - - 0,83Total 2,60 2,95 2,95 2,87 2,97 3,35 3,75FEF 1,46 1,49 1,49 1,44 - - -FCM - - - - 0,50 0,58 0,48FGM - - - - 1,01 1,00 0,93FFF - - - - - 0,12 0,12alínea c) - - - - - - 0,34Total 1,46 1,49 1,49 1,44 1,51 1,70 1,87
Norte
Centro
Lisboa e Vale do
Tejo
Alentejo
Algarve
Açores
Madeira
Sources: OE, DGO, MF Notes:
1 The Fundo de Equilíbrio Financeiro was replaced by Fundo de Coesão Municipal, Fundo Geral Municipal and Fundo
Financiamento das Freguesias in 1999; 2
Alínea c) is a public transfer to municipalities that only exists in 2001. After that, it was replaced by FBM
23
Table 2.3.1.2 - Public transfers to municipalities and GVA per capita, 2001
NUTS IIPublic transfers to
municipalities per capita GVA per
capitaNorte 0,156 7,32Centro 0,315 6,71
Lisboa e Vale do Tejo 0,126 11,58Alentejo 0,399 6,58Algarve 0,224 8,11Açores 0,320 6,21Madeira 0,219 8,07
Sources: Orçamento Estado, DGO, Ministério Finanças; Eurostat, June 2003 Notes: Public transfers per capita include Fundo de Coesão Municipal, Fundo Geral Municipal, Fundo de Financiamento das Freguesias and item c); the values presented in the figure are in 103 euros; GVA = Gross Value Added
Figure 2.3.1.1 - Public transfers to municipalities and GVA per capita, 2001
0
0,2
0,4
0,6
0,8
1
Norte Centro Lisboa eVale do
Tejo
Alentejo Algarve Açores MadeiraPubl
ic tr
anfe
rs p
er c
apita
to m
unic
ipal
ities
0,00
4,00
8,00
12,00
16,00
GV
A p
er c
apita
Public transfers per capita to municipalities GVA per capita
Sources: Orçamento Estado, DGO, Ministério Finanças; Eurostat, June 2003 Notes: Public transfers per capita include Fundo de Coesão Municipal, Fundo Geral Municipal, Fundo de Financiamento das Freguesias and item c); the values presented in the figure are in 103 euros; GVA = Gross Value Added
Table 2.3.2.1 - Public transfers to autonomous regions, 2003
103 EurosPercentage of regional GDP 103 Euros
Percentage of regional GDP
193.480,53 6,20 198.370,45 8,99143.318,91 4,59 146.941,08 6,6650.161,62 1,61 51.429,38 2,3330.884,90 0,99 44.347,54 2,01Others
Regional Finance Law
Cohesion FundsInsularity compensation
Madeira Açores
Sources: OGE, MF, own calculations
Note: 2003 values for regional GDP was based on an average growth rate of 4 per cent
24
2.4 - State aid Not all measures of public support, even those that may involve public subsidies, are
classified as state aid. In the EU, state aids are considered compatible with the common
market, as long as they are designed to “promote the economic development of areas where
the standard of living is abnormally low or where there is serious underemployment” -
Article 87, n. 3 (paragraph a) of the EC (European Community) Treaty - or “to facilitate the
development of certain economic activities or of certain economic areas, where such aid does
not adversely affect trading conditions to an extent contrary to the common interest” - Article
87, n. 3 (paragraph c). The Stockholm European Council in 2001 asked Member States to
“demonstrate a downward trend in State aid in relation to GDP by 2003” and also to “redirect
aid toward horizontal objectives”.
In some EU countries, state aid continues to account for large amounts of public spending7.
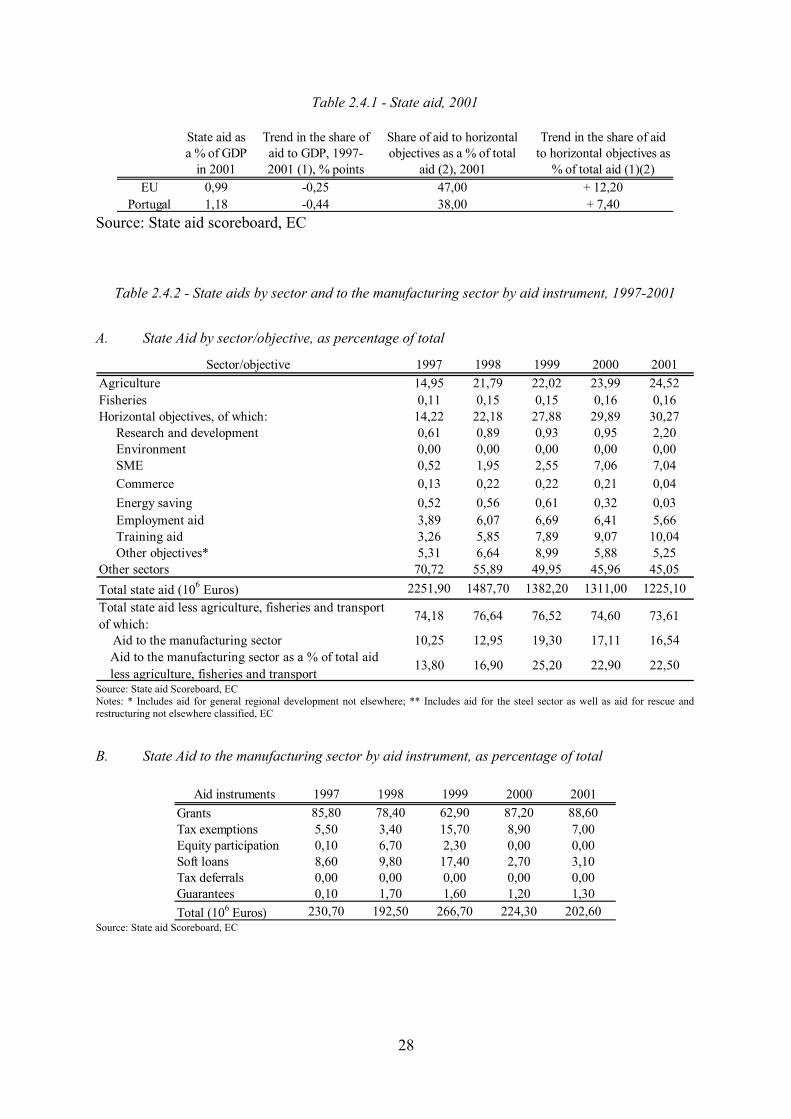
Table 2.4.1 provides an indication that staite aids are being reduced, both in Portugal and in
the EU.
Table 2.4.2.A shows the sectoral distribution of state aids in Portugal. State aid to agriculture
is declining, but is still higher than that for manufacturing. Aid to manufacturing has kept
within a relatively narrow band for a number of years. The most important aid to the
manufacturing sector is grants with more than sixty per cent of the total (see table 2.4.2.B).
The share of horizontal aid in Portugal has duplicated in the period between 1997 and 2001
to about 30 per cent whilst aid for particular sectors dropped in the same period by about 25
per cent to close to 45 per cent. Horizontal aid was mainly allocated to training, employment
aid, SMEs and R&D. State aid to commerce is very low and exhibits a declining trend (see
table 2.4.2.A).
Because of data limitations, it was not possible to obtain the regional breakdown of state aid
by recipient regions. Neither could we distinguish how much has been spent on particular
categories of policy assistance under the general heading of “regional state aid” because this
7 Midelfart-Knarvik and Overman’s (2002) found a weak relationship between industrial relocation in the EU, deeper economic integration and changes in factor endowments. The conclusion spells out for the need to coordinate and regulate state aids at EU level, because national state aids could cause disparities in EU location.
25
information is generally not publicly available. Notwithstanding, at the outset one can raise a
number of questions regarding the regional incidence of state aid, on the basis of the sectoral
informations.
State aid to agriculture has been considered by policy makers as very important for the
population residing in poorer regions, helping this population to obtain the indispensable
minimum financial capacity for survival. Nevertheless, it may not create conditions for
sustainable development. n general, the agriculture programme establishes its priorities in
accordance with the conditions of the CAP (Common Agricultural Policy), even though the
CAP is not in conformity with the characteristics of certain regions.
As far as the manufacturing sector is concerned, grants are the predominant aid instrument.
Tax exemptions are the second most used mechanism.
Under the CSF I, II and III, the national funding contributed greatly to the key incentive
systems available in Portugal: SIBR8 (Incentive System of Regional Base), the main regional
incentive programme, for PEDIP (Specific Programme for the Development of the
Portuguese Industry I & II) and SIPIE (Incentive System to the Small Enterprises Initiatives);
SIME (Incentive System to the Enterprises Modernization). The main criteria to calibrate the
level of entitlement are the level of local content, capital investment, training, R&D, export
orientation, technological content, employment created and wage level, with a clear focus on
large projects.
In the first two CSFs the weight of the sectoral programmes was still dominant and
omnipresent. This characteristic has been reduced in the CSF III. Although the decision was
taken by Portugal, one can say that the CSF I and II implemented between 1989 and 1999
contributed to strengthening an almost exclusively sectoral logic in the organisation of public
investments, with the territory becoming only a statistical unit of reference for the
accountancy of actions to be implemented.
In this regard, it is worth highlighting that the largest share of business incentives under the
CSF I and II (PEDIP II, RIME - Incentive System for Micro-enterprises, PROCOM -
Support Programme to Commerce Modernization, SIFIT - Financial Incentives System for
8 SIBR package comprised three main elements; an industrial policy instrument, a location component and an employment component.
26
the Investment in Tourism) and III (SIPIE, SIME, Measure 2.1, 2.4) were distributed in the
Lisboa e Vale to Tejo, Norte and Centro. Algarve, Alentejo and Açores, were the regions
with least investments co-participated by the CSF II and III. Within the Norte and Centro
there was a polarization towards the coastal areas. 9
The DG Competition (Directorate-General Competition) web page provides exhaustive
information on special state aid cases that have been subjected to the European Commission
for consideration and whose primary objective is regional aid (table 2.4.3 summerises some
of this information). Madeira and Açores are the Portuguese regions with clear and specific
regional state aid instruments.
There are positive aspects related to the externalities associated with the (sectoral) approach
followed. It can be argued that a sectoral investment programme co-financed by state aid
always has an explicit territorial dimension. The impact on the territory emerges because
sectoral programmes pursue national objectives that cross all the territories or because it
emerges as an unambiguous priority to cope with important problems at the regional level
rather than at the national level. Such a generalisation should be taken with caution, of
course. Results from the application of the CSF I and II in the Norte of Portugal for example,
suggest that in regard to ‘Manufacturing, Science and Technology’, ‘Tourism’ and even
‘Infrastructures’, it proved to be very difficult to introduce into these programmes qualitative
specificities in conformity with the characteristics of regional problems. On the contrary,
with respect to the sectoral programmes where the socio-economic cohesion dimension is
explicit, such as in the fields ‘Education’, ‘Employment’, and ‘Social integration’ there is a
clearer contribution of the sectoral programmes to the qualitative specificities of the regional
strategy that are not accounted for by national objectives. Representatives of most of the
regions have confirmed these specificities.
Overall, and in spite of the positive evaluation by national policy makers and regional
representatives, we consider state aid to have had a negative impact on economic and social
regional cohesion on the continent and a negative economic but positive social impact in the
autonomous regions. Above all, Portuguese subsidy dependence and exaggerated reliance on
9 Over 60 per cent of the business investments co-financed by CSF II and III were in the industry, while the share of investments in the other sectors was very low. With the exception to Algarve, Madeira and Açores where tourism represents a significant share of the total incentives received (for more, see http://www.poe.min-economia.pt/3000/3210_main1.htm).

27
state protectionism distort incentives and competition, with a negative impact on national
economic growth.
Box 2.4.1 - Global assessment of policy impact
National policy maker perspective
Positive
Regional representative perspective
Positive
Researcher perspective Portuguese subsidy dependence and exaggerated reliance on state protectionism need to be changed
28
Table 2.4.1 - State aid, 2001
State aid as a % of GDP
in 2001
Trend in the share of aid to GDP, 1997-2001 (1), % points
Share of aid to horizontal objectives as a % of total
aid (2), 2001
Trend in the share of aid to horizontal objectives as
% of total aid (1)(2)EU 0,99 -0,25 47,00 + 12,20
Portugal 1,18 -0,44 38,00 + 7,40 Source: State aid scoreboard, EC
Table 2.4.2 - State aids by sector and to the manufacturing sector by aid instrument, 1997-2001
A. State Aid by sector/objective, as percentage of total
Sector/objective 1997 1998 1999 2000 2001Agriculture 14,95 21,79 22,02 23,99 24,52Fisheries 0,11 0,15 0,15 0,16 0,16Horizontal objectives, of which: 14,22 22,18 27,88 29,89 30,27 Research and development 0,61 0,89 0,93 0,95 2,20 Environment 0,00 0,00 0,00 0,00 0,00 SME 0,52 1,95 2,55 7,06 7,04 Commerce 0,13 0,22 0,22 0,21 0,04 Energy saving 0,52 0,56 0,61 0,32 0,03 Employment aid 3,89 6,07 6,69 6,41 5,66 Training aid 3,26 5,85 7,89 9,07 10,04 Other objectives* 5,31 6,64 8,99 5,88 5,25Other sectors 70,72 55,89 49,95 45,96 45,05Total state aid (106 Euros) 2251,90 1487,70 1382,20 1311,00 1225,10Total state aid less agriculture, fisheries and transport of which: 74,18 76,64 76,52 74,60 73,61
Aid to the manufacturing sector 10,25 12,95 19,30 17,11 16,54Aid to the manufacturing sector as a % of total aid less agriculture, fisheries and transport
13,80 16,90 25,20 22,90 22,50
Source: State aid Scoreboard, EC Notes: * Includes aid for general regional development not elsewhere; ** Includes aid for the steel sector as well as aid for rescue and restructuring not elsewhere classified, EC
B. State Aid to the manufacturing sector by aid instrument, as percentage of total
Aid instruments 1997 1998 1999 2000 2001Grants 85,80 78,40 62,90 87,20 88,60Tax exemptions 5,50 3,40 15,70 8,90 7,00Equity participation 0,10 6,70 2,30 0,00 0,00Soft loans 8,60 9,80 17,40 2,70 3,10Tax deferrals 0,00 0,00 0,00 0,00 0,00Guarantees 0,10 1,70 1,60 1,20 1,30Total (106 Euros) 230,70 192,50 266,70 224,30 202,60
Source: State aid Scoreboard, EC
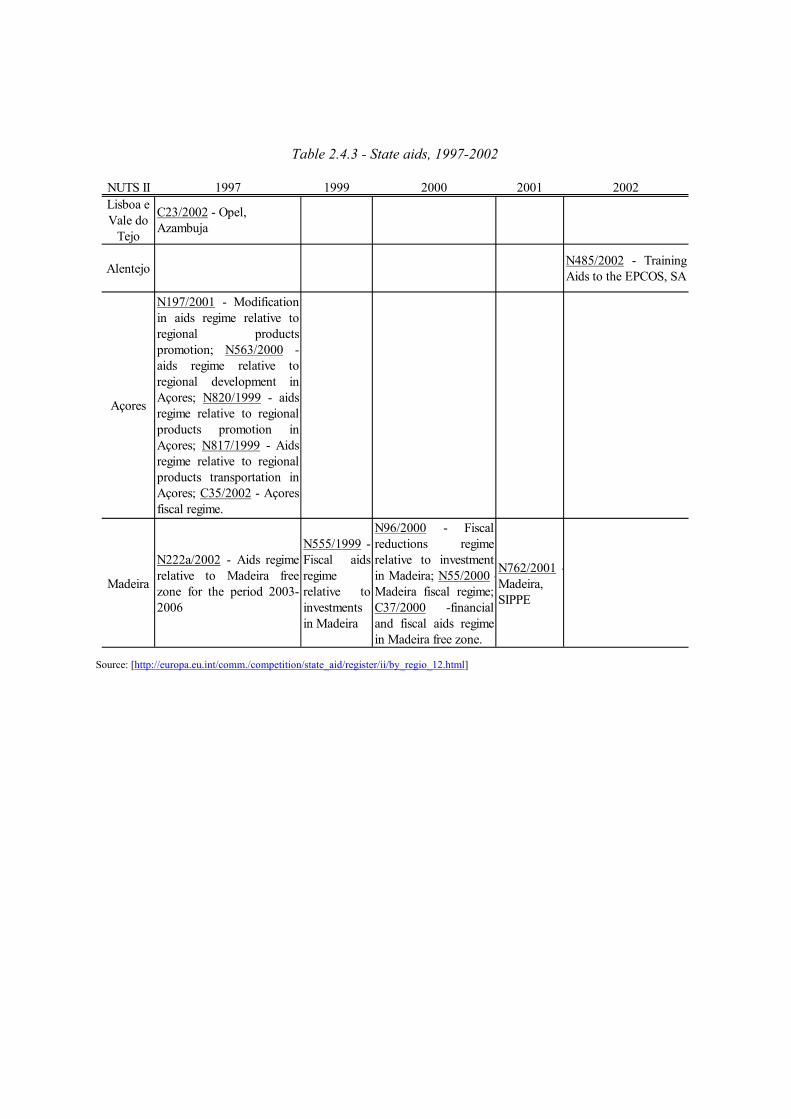
Table 2.4.3 - State aids, 1997-2002
NUTS II 1997 1999 2000 2001 2002Lisboa e Vale do
Tejo
C23/2002 - Opel, Azambuja
Alentejo N485/2002 - TrainingAids to the EPCOS, SA
Açores
N197/2001 - Modificationin aids regime relative toregional productspromotion; N563/2000 -aids regime relative toregional development inAçores; N820/1999 - aidsregime relative to regionalproducts promotion inAçores; N817/1999 - Aidsregime relative to regionalproducts transportation inAçores; C35/2002 - Açoresfiscal regime.
Madeira
N222a/2002 - Aids regimerelative to Madeira freezone for the period 2003-2006
N555/1999 -Fiscal aidsregime relative toinvestments in Madeira
N96/2000 - Fiscalreductions regimerelative to investmentin Madeira; N55/2000 -Madeira fiscal regime;C37/2000 -financialand fiscal aids regimein Madeira free zone.
N762/2001 -Madeira, SIPPE
Source: [http://europa.eu.int/comm./competition/state_aid/register/ii/by_regio_12.html]
2.5- Employment and social policies
Over the recent years, the Portuguese labour market has depicted a globally positive
performance. Between 1998 and 2001, employment in Portugal has grown at an annual
average of 1.8 per cent. The employment evolution continues to be more favourable in
Portugal than in the rest of the European Union (EU). The unemployment rate in Portugal,
still significantly below the EU average, was 4.1 per cent in 2001, up 0.1 per cent from the
year before. In the EU, the unemployment rate has dropped from 8.1 to 7.6 per cent in the
same period. Since the beginning of 2002, the evolution of the unemployment rate has been
significantly negative, because of cyclical reasons.
In March 2000, the Lisbon European Council elaborated a strategy stressing the importance
of a “fully decentralised approach, applied in line with the principle of subsidiary in which
the Union, the Member States, the regional and local levels, as well as the social partners and
civil society will be actively involved, using variable forms of partnership”. The Commission
supports the role that local and regional actors can play in the development of new forms of
governance in the Union. However, the level of involvement of regional and local actors in
the European Employment Strategy depends on the political and constitutional structures of
each Member State, and has to be determined in accordance with the principle of subsidiary.
Since 1997 the annual PNE (National Employment Plan) is deeply articulated with the
interventions supported by structural community financial instruments - ERDF (European
Regional Development Fund), EAGGF and FIFG (Financial Instrument for Fisheries
Guidance), cohesion fund and in particular ESF (European Social Fund). The PNE has the
following general objectives, following the European Strategy for Employment:
⇒ Promoting youths’ adequate transition to working life;
⇒ Promoting the social-professional inclusion and combating long-term unemployment and
exclusion;
⇒ Improving manpower’s basic professional qualifications under the perspective of life-long
learning, in particular in regard to permanent vocational training and the fight against
technological inadequacy;
31
⇒ Promoting the quality of employment, namely through the reinforcement of labour
protection, notably at the labour security level.
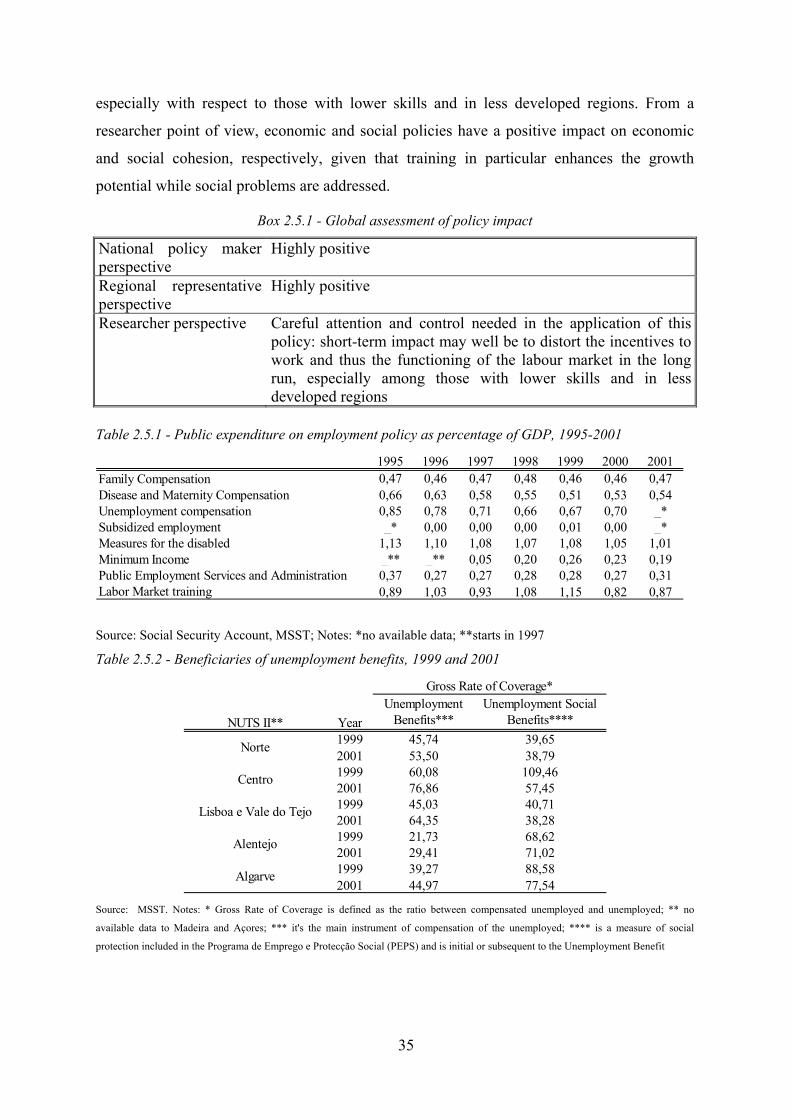
However, the Portuguese employment policy still focuses strongly on unemployment
benefits, as illustrated by table 2.5.1 for the period 1995-2001. Besides measures for the
disabled, the most important instruments of employment policy are, first, labour market
training and, second, unemployment compensation. All these instruments are managed by a
Central Authority (MSST - Labour and Social Security Ministry).
The support for the unemployed in Portugal consists in the attribution of the following
compensations:
i) Unemployment Benefits;
ii) Unemployment Social Benefits (initial or subsequent to the Unemployment Benefit).
These compensations have two purposes: to compensate the beneficiary for the lack of
remuneration or reduction because of partial timework earnings and to promote job creation.
In July 1997 the RMG (Guaranteed Minimum Income) was introduced, aimed at
guaranteeing minimum living conditions to the beneficiaries and their families in situations
of serious economic needs. This income is usually complemented by some measures that aim
at the gradual social and professional insertion of the beneficiaries and the members of their
families. This model is not included in the system of non-contributory benefits.
Regarding the regional incidence of the employment policy, table 2.5.2 illustrates the
different rate of coverage of unemployment benefits. The support to the unemployed in
Portugal depicts an unequal regional distribution. On the positive extremity there is the
region Centro where about 77 per cent of the unemployed enjoyed this financial support,
whereas in the Alentejo about 70 per cent of the unemployed did not benefit from
compensation. Still, one needs to draw attention to the positive evolution in the efficiency of
this instrument. Recall that the two columns are not added.
As for unemployment social benefits, table 2.5.2 highlights the discrepancy between the
regions of Alentejo and Algarve relatively to the gross rate of unemployment benefit
coverage. This situation results from the large importance of the agricultural sector in
employment and is consequence of the fact that many people do not qualify for
32
unemployment benefits due to insufficient social security contributions. In these cases, the
solution is the attribution of social unemployment benefit. For that reason the gross coverage
rate of this instrument is very high in those two regions.
The RMG is a measure in frank expansion: since its implementation the attributed sums have
increased every year, having passed from 43.834 thousand euros in 1997 to 261.774
thousand euros in 1999. In terms of the evolution of the number of individuals to whom this
income was attributed (titular of the RMG) in 1997 there were 14.184 beneficiaries of this
measure while in 1999 this number reached 153 885.
An analysis of the annual evolution of the number of RMG beneficiaries as per cent of the
active population (table 2.5.3) leads to the conclusion that Açores is the region that tops the
list. Norte, Lisboa e Vale do Tejo and Centro are the regions that over the five years (1998 at
2002) have presented the greatest number of beneficiaries. In 2002, these three regions had
about 86.1 per cent of the total of the existing beneficiaries in Portugal (Norte: 37 per cent;
Lisboa e Vale do Tejo: 27.2 per cent; Centro: 21.9 per cent).
Programmes promoting self-employment and stimulating measures to integrate disabled
workers are managed by central authorities. Training measures are disaggregated between
those allocated to employed and to unemployed workers. Both programmes are managed by
the IEFP (Professional Training and Employment Institute), in two ways: direct management
and participated management. This latter one consists of a partnership of the IEFP with some
private professional training centres.
Table 2.5.4 shows the number of unemployed workers participating in these training
programs as per cent of the total enrolled unemployed in the period 1999-2001, by region.
The regional distribution of this indicator is very similar, with the exception of the case of
Alentejo. In almost all regions this percentage is very low, suggesting an insufficient
application of this measure.
The Portuguese PNE subscribed to the logic that promoting employment and fighting
unemployment is more effective when employment policies are implemented at regional and
local levels. This strategy allows a response more adapted to the actual problems, a more
33
efficient use of resources, a better coordination of initiatives and a greater co-responsibility
of the public and private sectors that can contribute to this objective10.
Public employment services are managed by IEFP regional delegations, although legislation
and general decisions are taken by the central government. As one can see from table 2.6.5,
the percentage of people that found a job after being enrolled as unemployed is very low in
all regions, a fact that may be interpreted as indicating some inefficiency of this employment
measure.
There are also some local programs of employment promotion such as the RRE (Regional
Networks for Employment), PTE (Territorial Employment Pacts) and ILDE (Regional
Initiatives for Development and Employment). Community initiatives, such as Employment
and Urban, also grant central authorities greater flexibility in applying active policy
strategies.
In the autonomous Regions of Açores and Madeira, the support of the Structural Funds,
within CSF, is prevailing, integrated in the corresponding regional operational programmes
of multi-fund character (PEDRAA - Specific Programme for the Development of Açores
Autonomous Region - and PROPAM - Specific Programme for the Development of Madeira
Autonomous Region - in the Açores and Madeira, respectively). In regions where
employment and unemployment problems are more pressing, the establishment of specific
intervention programmes seems justified, featuring committed and comprehensive action in
regard to the factors that determine employment evolution, strengthened by means of
interventions conceived and stimulated in compliance with the specificities of those regions.
Within this context, the regional employment plans of Alentejo and the Metropolitan area of
Porto have been created and are being currently implemented; the regional employment plan
of Trás-os-Montes and Alto Douro has been concluded in 2001.
The institutionalisation of the ESM (Employment Social Market) in July 1996 allowed for
some already existing activities (occupational programmes and protecting employment) to
join new initiatives. In the five-year period 1998-2002, action was assured through a set of
10 Figueiredo (2001) compares the five Portuguese regions and concludes that there has been a cumulative process of divergence, caused by differentials in regional competitiveness. He argues that national policy only contributes to reducing regional disparities to the extent that it contains a local dimension.
34
programmes and measures: schools’ workshops (1996); joint initiatives and protocols (1996);
insertion in companies (1998); digital Alentejo (1999); employment insertion (2000).
These Programmes have a distinct nature, integrating components of occupational, formative
and employment nature. What they have in common is the fact that they strengthen
employment conditions for the unemployed who attend the training.
The application of training and employment policies in territorial forms is at the origin of the
creation of employment regional networks, initiated in 1998 and concluded in December
2000, as a strategic option, with the set up of the last one for the region of Lisboa.
With the local one being the privileged sphere for finding an answer to problems, the
Regional Networks are an intervention model which aims the use all the resources and
potentialities of each region, stimulating the partnership for local development, for
employment promotion and for professional qualification.
The promotion of human resources, the creation of conditions that allow for the fixing of the
population and the combat of exclusion are especially highlighted in the context of the
objectives stipulated for the regional networks.
The success of the interventions necessarily depends on the intermediaries’ capacity tomake
the best out of each region. Functioning in networks and partnerships, the decentralised
services of the public administration, the municipalities, trade unions and employers and
local development associations and other local agents come to increase significantly the
possibilities to get an up-to-date diagnosis of the reality where they intervene, thereby giving
value effectively to all the local resources (human, material and financial).
The construction of RRE and PTE constitutes the framework for some existing instruments
of regional and local policies with incidence in the areas of employment, training and poverty
and social exclusion. Thus, these measures stimulate the development of positive and
dynamic relations for the training of competences and job finding.
Based on the data, the interviews with national policy makers and regional representatives,
the employment policy had a highly positive impact on regional cohesion. However, one
should take into account potential trade-offs and pay due attention to and control in the
application of this policy to the extent that the short-term impact may well be to distort the
incentives to work, thus impairing the functioning of the labour market in the long run,
35
especially with respect to those with lower skills and in less developed regions. From a
researcher point of view, economic and social policies have a positive impact on economic
and social cohesion, respectively, given that training in particular enhances the growth
potential while social problems are addressed.
Box 2.5.1 - Global assessment of policy impact
National policy maker perspective
Highly positive
Regional representative perspective
Highly positive
Researcher perspective Careful attention and control needed in the application of this policy: short-term impact may well be to distort the incentives to work and thus the functioning of the labour market in the long run, especially among those with lower skills and in less developed regions
Table 2.5.1 - Public expenditure on employment policy as percentage of GDP, 1995-2001
1995 1996 1997 1998 1999 2000 2001Family Compensation 0,47 0,46 0,47 0,48 0,46 0,46 0,47Disease and Maternity Compensation 0,66 0,63 0,58 0,55 0,51 0,53 0,54Unemployment compensation 0,85 0,78 0,71 0,66 0,67 0,70 _*Subsidized employment _* 0,00 0,00 0,00 0,01 0,00 _*Measures for the disabled 1,13 1,10 1,08 1,07 1,08 1,05 1,01Minimum Income _** _** 0,05 0,20 0,26 0,23 0,19Public Employment Services and Administration 0,37 0,27 0,27 0,28 0,28 0,27 0,31Labor Market training 0,89 1,03 0,93 1,08 1,15 0,82 0,87
Source: Social Security Account, MSST; Notes: *no available data; **starts in 1997
Table 2.5.2 - Beneficiaries of unemployment benefits, 1999 and 2001
1999 45,74 39,652001 53,50 38,791999 60,08 109,462001 76,86 57,451999 45,03 40,712001 64,35 38,281999 21,73 68,622001 29,41 71,021999 39,27 88,582001 44,97 77,54
Gross Rate of Coverage*
YearNUTS II**Unemployment
Benefits***Unemployment Social
Benefits****
Norte
Centro
Lisboa e Vale do Tejo
Alentejo
Algarve
Source: MSST. Notes: * Gross Rate of Coverage is defined as the ratio between compensated unemployed and unemployed; ** no
available data to Madeira and Açores; *** it's the main instrument of compensation of the unemployed; **** is a measure of social
protection included in the Programa de Emprego e Protecção Social (PEPS) and is initial or subsequent to the Unemployment Benefit
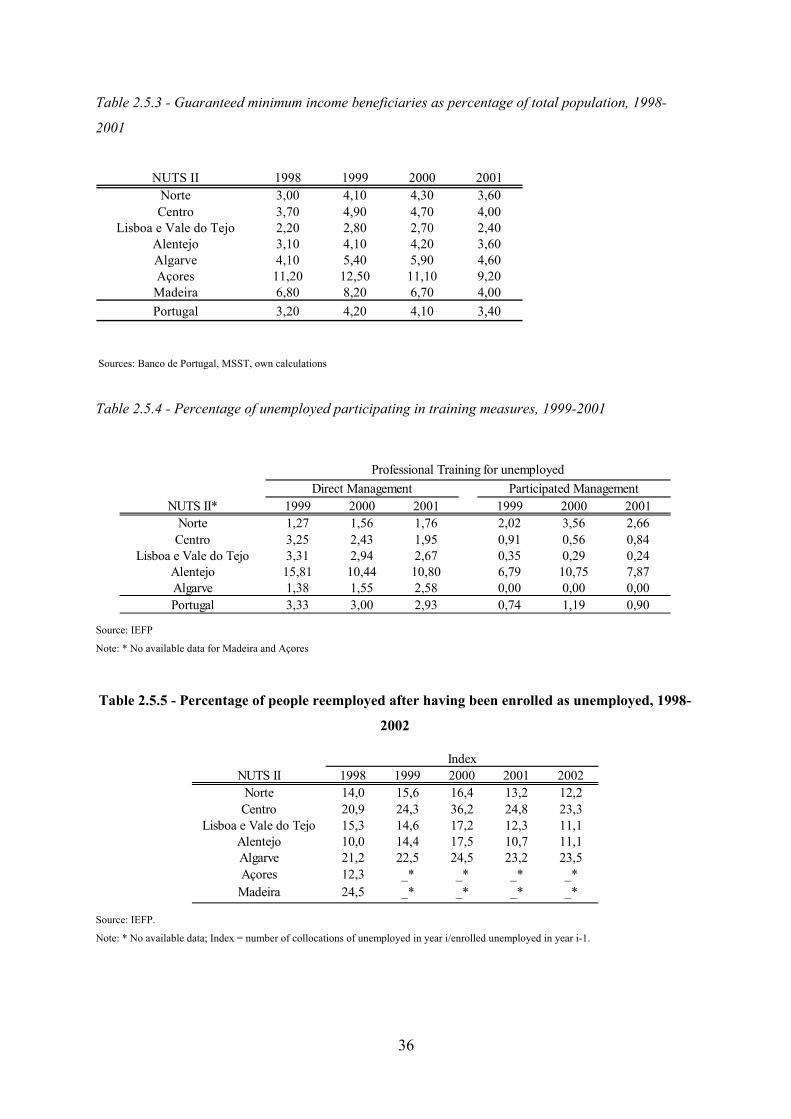
36
Table 2.5.3 - Guaranteed minimum income beneficiaries as percentage of total population, 1998-
2001
NUTS II 1998 1999 2000 2001Norte 3,00 4,10 4,30 3,60Centro 3,70 4,90 4,70 4,00
Lisboa e Vale do Tejo 2,20 2,80 2,70 2,40Alentejo 3,10 4,10 4,20 3,60Algarve 4,10 5,40 5,90 4,60Açores 11,20 12,50 11,10 9,20
Madeira 6,80 8,20 6,70 4,00Portugal 3,20 4,20 4,10 3,40
Sources: Banco de Portugal, MSST, own calculations
Table 2.5.4 - Percentage of unemployed participating in training measures, 1999-2001
NUTS II* 1999 2000 2001 1999 2000 2001Norte 1,27 1,56 1,76 2,02 3,56 2,66Centro 3,25 2,43 1,95 0,91 0,56 0,84
Lisboa e Vale do Tejo 3,31 2,94 2,67 0,35 0,29 0,24Alentejo 15,81 10,44 10,80 6,79 10,75 7,87Algarve 1,38 1,55 2,58 0,00 0,00 0,00Portugal 3,33 3,00 2,93 0,74 1,19 0,90
Professional Training for unemployedDirect Management Participated Management
Source: IEFP
Note: * No available data for Madeira and Açores
Table 2.5.5 - Percentage of people reemployed after having been enrolled as unemployed, 1998-
2002
NUTS II 1998 1999 2000 2001 2002Norte 14,0 15,6 16,4 13,2 12,2Centro 20,9 24,3 36,2 24,8 23,3
Lisboa e Vale do Tejo 15,3 14,6 17,2 12,3 11,1Alentejo 10,0 14,4 17,5 10,7 11,1Algarve 21,2 22,5 24,5 23,2 23,5Açores 12,3 _* _* _* _*
Madeira 24,5 _* _* _* _*
Index
Source: IEFP.
Note: * No available data; Index = number of collocations of unemployed in year i/enrolled unemployed in year i-1.
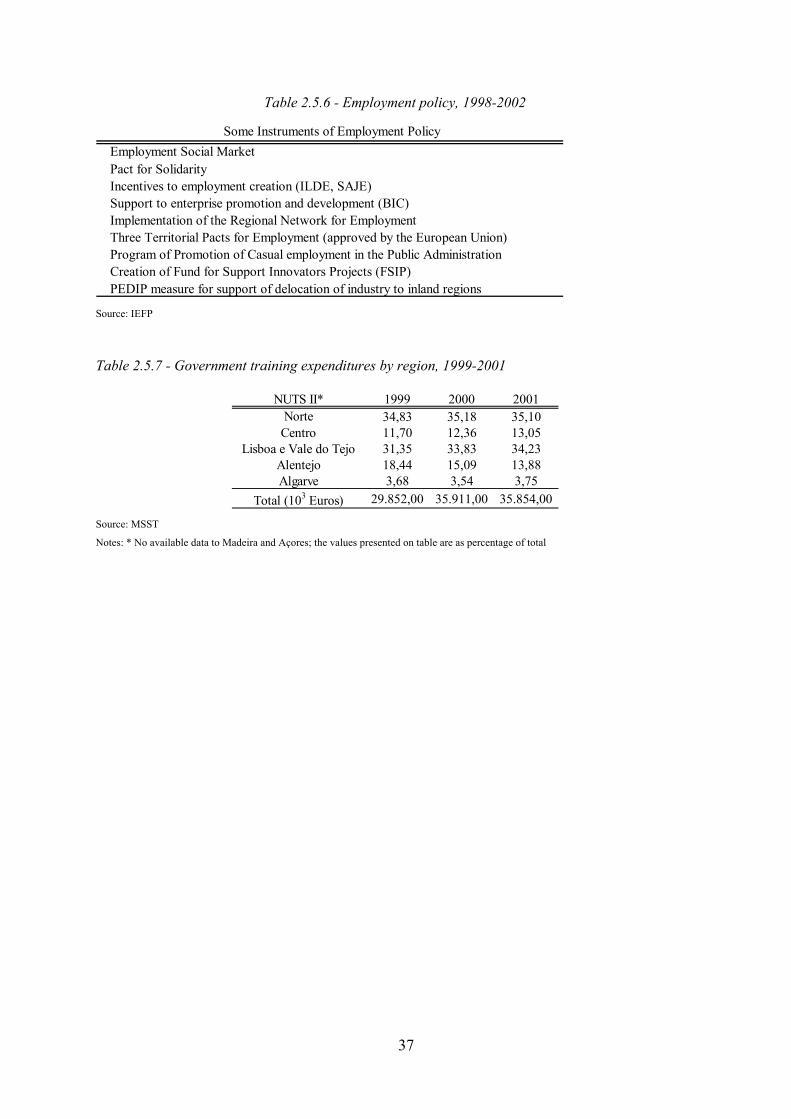
37
Table 2.5.6 - Employment policy, 1998-2002
Some Instruments of Employment Policy Employment Social MarketPact for SolidarityIncentives to employment creation (ILDE, SAJE)Support to enterprise promotion and development (BIC)Implementation of the Regional Network for Employment Three Territorial Pacts for Employment (approved by the European Union)Program of Promotion of Casual employment in the Public AdministrationCreation of Fund for Support Innovators Projects (FSIP)PEDIP measure for support of delocation of industry to inland regions
Source: IEFP
Table 2.5.7 - Government training expenditures by region, 1999-2001
NUTS II* 1999 2000 2001Norte 34,83 35,18 35,10Centro 11,70 12,36 13,05
Lisboa e Vale do Tejo 31,35 33,83 34,23Alentejo 18,44 15,09 13,88Algarve 3,68 3,54 3,75
Total (103 Euros) 29.852,00 35.911,00 35.854,00 Source: MSST
Notes: * No available data to Madeira and Açores; the values presented on table are as percentage of total
38
2.6 - Science and Technology
Up to the 1990s, there was no a clear innovation and technology policy in Portugal. More
recently, technology policy received strong support as one of the structural policies needed to
improve the prospects of economic development in Portugal. The Government supported the
development of local technological capabilities with programmes geared towards technical
assistance to local firms, incentives for foreign direct investment, quality and training, and
the modernisation of infrastructure. Additional funds have been allocated in Portugal through
the EC Structural Funds for the Objective I regions and from RTD (Research and
Technological Development) Framework Programmes. R&D has significantly progressed
over the past decade thanks to support provided by EC programmes that have financed more
than half of the cost of the R&D infrastructure. Portugal evolves significantly over the last
few years11.
Over the 1990s, Portugal launched a number of specific programmes for the development of
scientific and technological activities: CIENCIA (Programme for Creation of National Infra-
structures in Science and R&D); Programme “Ciência Viva” launched in 1996-1997 by the
Ministry of Science and Technology with the purpose to promote the ‘scientific culture’ of
the Portuguese population, stimulate the geminating of scientific institutions and schools and
the scientific occupation of young people in their vacations in institutions of scientific
research.
Education was singled out has the cornerstone of Portuguese science and technology policy
in the 1990s. The strong public investment in higher education, via PRAXIS XXI
(Operational intervention for Science and Technology) and PRODEP (Educative
Development Programme for Portugal), the MCT (Science and Technology Ministry), which
had been more focussed on science than on technology, strengthened its support for higher
education and for university-based scientific research. The creation of MCES (Science and
Higher Education Ministry) bears witness to the blurring of boundaries between science and
higher education. A further improvement is expected from the government’s creation of the
11 Rodrigues, Neves and Mira Godinho’s (2003) book puts together the main contributions of the expert team involved in the launching and development of PROINOV (Integrated Programme on Innovation Support) and it includes three main parts dealing with the broad perspective, the organisation, and the ways on how to make the Portuguese innovation system more dynamic.
39
Commission on the Teaching of Mathematics and Sciences, which aims at increasing the
future supply of science and engineering graduates.
In 2000 the government launched PROINOV, an integrated programme which emphasises
policy instruments of a horizontal nature, clearly in line with the EC objectives and policy
recommendations. In regard to the development of a regulatory framework conducive to
innovation, it pursued four main actions: First, the launching of the measures on R&D
activities by consortia (see PT 21 in table 2.6.1), under the POCTI (Science, Technology and
Innovation Operational Programme) and POSI (Information Society Operational
Programme). Second, the measure on mobilising programmes for technological development
(PT 23) - the PASI (Action Plan for the Information Society) - under the POE (Operational
Programme for the Economy), also aimed at supporting consortia between S&T (Science and
Technology) activities and companies to carry out projects concerning the development of
new, innovative products and/or processes. Third, the creation of the GAPIs (Industrial
Property Support Offices - PT 26) whose aim is to provide support on the strategic use of
intellectual property rights. The fourth relevant measure was the revision of the financial
incentives for investment in R&D (PT 4). This confirms a trend towards an increased use of
tax instead of financial incentives, in accordance with the suggestion by the European
Community. In addition, actions were also launched to encourage the creation and growth of
innovative enterprises (objective 3). A document by the Economics Ministry spells out the
intention to launch a network for providing technology support services to companies.
Similarly, the recent PME Digital Initiative envisages the creation of information and
technical assistance networks (RIAT - Information and Technical Assistance Networks) to
help SMEs to respond to challenges related to the digital economy. Another area where some
efforts are being undertaken is the support and development of incubator services for firms.
Life-long learning is another area where some progress was made. A major step was the
agreement reached last year at the Social Concertation Council, on employment, labour
market, education and training, where specific reference was made to the importance of life-
long learning. To that end, the Government has introduced policies to improve the
qualification and employability of adults and to develop a national system for training,
certification and development of competences in telecommunications and information
technologies.
40
While the national government did not have any specific regional technology strategy, it is
possible to explore the regional incidence of main science and technology policy actions in
the recent past.
Over time, the Government supported the development of local technological capabilities
with programmes geared towards technical assistance to local firms, incentives to FDIs
(Foreign Direct Investments), training, and the modernisation of infrastructure. The territorial
impact of these measures emerges from its sectoral component, and is largely attributable to
the location of the initiatives that receive funding. In general, the most developed regions
will have the most dynamic socio-economic actors. Hence, at the outset this suggests that the
most developed regions are the ones which will benefit most from these initiatives.
The decentralised component of the operational regional interventions in the domain of
science, technology and innovation corresponds to the CIENCIA programme that envisages
to strike a balance such that 50 per cent of the investment is outside the Lisboa e Vale do
Tejo region, chiefly for the development of actions relative to scientific and technological
culture, especially to the creation of “centros de ciência viva” at the district level. The
creation of these centres is based on the set-up of local partnerships between cities and
scientific institutions, technological educational institutions, companies with R&D activities,
centres, or other public and private entities with activities of formation and scientific and
technological spreading. During the period under review there was an upsurge in the debate
on innovation policy, mainly spurred by initiatives taken by the President of the Republic –
the ‘Innovation Week’ and the launching of COTEC (Entrepreneur Association for
Innovation). The launching of COTEC also contributed to an increase in public awareness
about innovation.
Nowadays there are two main groups of activities to stimulate and co-ordinate regional
initiatives and regional actors with a view to promoting innovation. The first group is
concerned with two innovation support actions at regional level: LISACTION (Lisboa e Vale
do Tejo Programme on Innovation-Oriented Actions - PT 28), and INOVAlgarve
(Programme of Innovative Actions for the Region of Algarve - PT 29). LISACTION was
built on the experience of RITTS (Regional Innovation and Technology Transfer Strategies)
and was structured around two main themes: the regional economy based on knowledge and
technological innovation, and the information society at the service of regional development.
The second is associated with Programa Integrado de Suporte à Inovação (PROINOV). Two
aspects deserve a mention: The first one concerns the setting up of a systematic collaboration
41
between the PROINOV Office and the Regional Coordination Commissions, aimed at
identifying and developing regional innovation projects. The second is related to the work
carried out on the development of clusters. Four clusters were selected for a first round of
activities - footwear, software, automotive industry and tourism. Although defined from a
sectoral interaction perspective, some of them have a strong regional focus. The work carried
out so far in the two most advanced - footwear and software - enabled close cooperation with
the main actors, some of them at a regional level, and the definition of a reasonably well-
defined set of activities to be launched.
Technological centres are now key institutions in providing technological services to firms
throughout the country. Some centres are very active and increasingly involved in providing
technology and management support services valued by firms. Examples of this include
CTC (Community Technology Centres - footwear), CENTIMFE (Technological Center of
the Industry of Moulds, Special Tools and Plastics - mould making industry) and CITEVE
(Technological centre of Textile and Clothes Industries - textiles and wearing apparel).
Others, however, have still not been able to win a strong recognition in their industries.
Worth mentioning is also the PROINOV’s “Advanced Training Course on Innovation
Policies and Management”, to train ‘agents of innovation’ who may act as catalysers of
innovation processes. Improving key interfaces of the innovation system (objective 4) figures
high among PROINOV objectives. The PROINOV Office has developed a systematic way of
stimulating interfaces and collaboration between different agents, namely in the context of
the cluster development exercise.
‘Non-concentrated’ actions’ are addressed to the development of regionally-based projects
with a ‘structuring’ content. In the case of POE/PRIME (Programme of Incentives for the
Modernisation of the Economy) they include, for instance, the setting up or improvement of
company location areas, tourism-integrated projects and the strengthening of local
endogenous capabilities. The amounts assigned to these ‘non-concentrated’ actions
correspond to around 25 per cent, 3 per cent and 23 per cent, respectively, for the ‘old’ POE
(now PRIME), POCTI and POSI (EC, 2003). By the time of this study, a few initiatives had
been put forward. The first was the launching of PRASD (Reconvergence Programme for
Depressed Areas and Sectors), to fight the heavy problems of unemployment and divestment
faced by some geographic areas and industrial sectors. The second is the Tecnopolos
initiative. Disclosed by the former Minister for Towns, Territorial Planning and
42
Environment, a committed supporter of technology parks, the initiative was aimed at regional
development and at fostering the synergies between science and industry at a local level.
After the quarrelsome resignation of the Minister, the Tecnopolos programme seemed to be
at stake. Recently, however, the new Minister reassured that it will be implemented soon. A
final reference is due to the re-launching of the Oporto Science and Technology Park. This
will involve an investment of €12 millions. Besides the Maia pole (branch) already in place,
it will have two others in Taipas and Feira which will be focused on automotive technology.
Overall, the territorial impact of these policies is largely attributable to the location of the
initiatives that get the funding. In general, the most developed regions are those that have the
most dynamic socio-economic actors. Hence, at the outset one may suggest that the most
developed regions are the ones which will benefit most from these initiatives.
Table 2.6.1 summarises the policy measures envisaged by Portuguese government targeting
of R&D, while table 2.6.2 provides a positive qualitative evaluation of the Portuguese policy
according to EU policy priority actions.
Public R&D expenditures are a good indicator of the existence of voluntary policies directed
at specific regions. Table 2.6.3 shows a continuous increase in the share of public budget
R&D as a percentage of GDP and as per cent of Portuguese government budget.
Table 2.6.4 displays total GERD (Gross Expenditure on R&D) in the Portuguese NUTS II
regions in per cent of regional GDP. With the exception to Madeira, GERD as a percentage
of regional GDP has been increasing for all regions. Figure 2.6.1 shows a positive
relationship between gross expenditure on R&D as percentage of regional GDP and regional
GDP per capita.
Traditionally, Lisboa e Vale do Tejo and Centro are the regions with the highest GERD as
percentage of GDP. On the other extreme we find Madeira and Algarve, with the lowest
value of GERD as a percentage of regional GDP during the period under consideration. In
1999 exceptionally Açores was the region with the highest R&D expenditure as a percentage
of regional GDP (2.62 per cent), reflecting rather some extraordinary governmental spending
than properly a trend.
Business GERD is very low for all regions compared to EU average (see table 2.6.4),
registering significant values only in the richest regions of Lisboa e Vale do Tejo, Centro and
Norte. The poor performance of Madeira and Açores in this regard is notorious.
43
As for government expenditure on R&D in the Portuguese regions, table 2.6.4 indicates that
there is a significant concentration in Lisboa and Vale do Tejo in the continental part of
Portugal. By 1999, government GERD reached 0.32 per cent of regional GDP in Lisboa e
Vale do Tejo, with each of the remaining regions receiving less than 0.1 per cent of regional
GDP. It is curious to note that Government GERD is particularly visible in the richest area
of Lisboa e Vale do Tejo, and on the Islands, Açores in particular. For the other regions,
government GERD never represents more then 0.1 per cent of regional GDP.
A region’s public R&D intensity will also depend heavily on the presence of both university
and public and non-profit research institutes. Up to 2001, the most visible regional efforts
and effects of R&D policy regard the national education programme and tertiary education in
particular.
Higher education GERD is less concentrated than government GERD. With the exception of
the Islands and of Lisboa e Vale do Tejo, higher education GERD accounts for the largest
share of total GERD (see table 2.6.4). This fact results from the growth of universities and
polytechnic institutes in many regions all over the country. Higher education GERD has
increased continuously over the triennial and represents in 1999 over 0.26 per cent of
regional GDP for all regions, with the exception of Madeira.
After the review on the regional incidence of the Portuguese science and technology policy in
recent years, we explore next the current situation concerning the technological standing of
Portugal and of its seven NUTS II regions.
Figure 2.6.2 shows the results for the 2003 SII-1. Finland and Sweden have by far the highest
SII-1 and are confirmed as the European innovation leaders. Spain, Portugal and Greece
display the weakest innovation performance. In comparison with the SII 2001, Portugal
shifted from a "falling behind" to a "catching up" situation.
In 1999 Portugal’s R&D expenditure as a percentage of GDP was 0.77 compared with 1.81
for the EU average. With levels about half of those of the EU average for the supply of new
S&E (Science and Engineering) graduates and population with tertiary education, patent
applications and business R&D expenditures are particularly low relative to the EU. These
indicators show however shows strong signs of catching up.
The indicator public budget to R&D as percentage of GDP increased from 0.45 in 1995 to
0.69 in 2002. Regarding education, the positive development is due to the launching of new
44
courses by public and private universities in the first half of the 1990s. In spite of these
positive developments, University remained to some extent closed to the interaction with the
outside world. The promotion of the diffusion of knowledge and technologies, although
always included in the agenda, was not accomplished12.
In spite of the above improvements, the business sector is among the weaker areas of
innovation performance in Portugal13. High-tech patent applications, business R&D and, to a
lesser extent, the employment shares in high-tech services and medium/high-tech
manufacturing are all well below the EU average. The government launched several
initiatives to promote R&D, but these may take a long time to show results, because
Portugal’s specialisation in traditional sectors with low R&D-intensity will take time to
change.
Portugal has also improved significantly with respect to two indicators related to the
information society: ICT (Information and Communication Technology) expenditures and
home Internet access. This suggests that the Portuguese economy is relatively proficient in
adopting new technologies. Growth of home internet access started from low base levels in
1998/99 and was spurred by several government initiatives (e.g. POSI).
It remains to be investigated whether these developments apply equally to all of the country,
or whether they have a certain regional specificity. To address this question, table 2.6.5
displays the technological standing of the Portuguese NUTS II regions. The regional
innovation summary indicator shows a strong concentration of technological capacity in a
few regions, namely Lisboa and Vale do Tejo and Centro. These are the two regions above
the country average. Nevertheless, they both rank below the EU average. The analysis of
statistical similarities between these two regions identified some differences. The first one,
Lisboa e Vale do Tejo, has the best-educated workforce and a relative orientation towards
services. It is the region with the highest per capita income in Portugal. The second region,
12 There are, however, a few exceptions of interaction between the University and Industry, either directly (namely in the University of Aveiro and Minho) or through inter-face organisations (such as INEGI - Institute of Mechanics Engineering and Industrial Management - in Porto, UNINOVA - Institute for the Development of New Technologies - and INESC - Institute of Engineering of Systems and Computers - in Lisbon, and Institute Pedro Nunes in Coimbra).
13 Amorim (2002) shows that ere are signs of change, but much remains to be done regarding the innovative behaviour of firms in product and process innovation as well as in complementary organisational modernisation, and interactions between firms and external services.
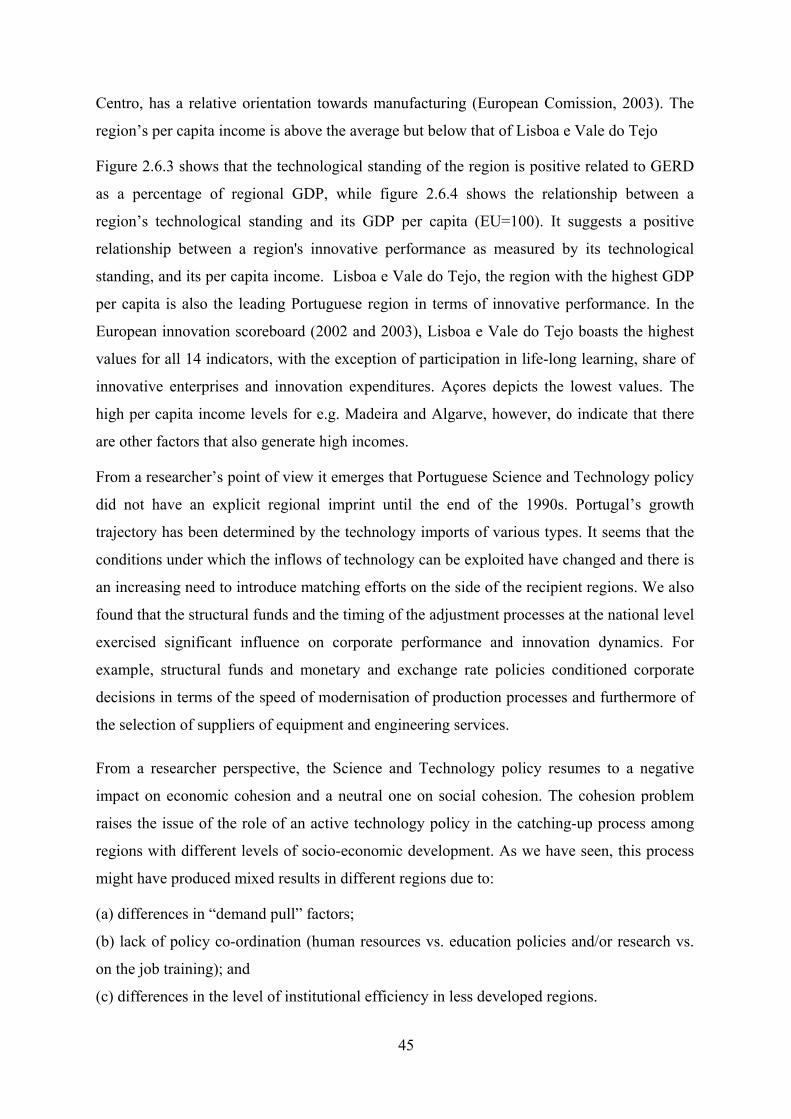
45
Centro, has a relative orientation towards manufacturing (European Comission, 2003). The
region’s per capita income is above the average but below that of Lisboa e Vale do Tejo
Figure 2.6.3 shows that the technological standing of the region is positive related to GERD
as a percentage of regional GDP, while figure 2.6.4 shows the relationship between a
region’s technological standing and its GDP per capita (EU=100). It suggests a positive
relationship between a region's innovative performance as measured by its technological
standing, and its per capita income. Lisboa e Vale do Tejo, the region with the highest GDP
per capita is also the leading Portuguese region in terms of innovative performance. In the
European innovation scoreboard (2002 and 2003), Lisboa e Vale do Tejo boasts the highest
values for all 14 indicators, with the exception of participation in life-long learning, share of
innovative enterprises and innovation expenditures. Açores depicts the lowest values. The
high per capita income levels for e.g. Madeira and Algarve, however, do indicate that there
are other factors that also generate high incomes.
From a researcher’s point of view it emerges that Portuguese Science and Technology policy
did not have an explicit regional imprint until the end of the 1990s. Portugal’s growth
trajectory has been determined by the technology imports of various types. It seems that the
conditions under which the inflows of technology can be exploited have changed and there is
an increasing need to introduce matching efforts on the side of the recipient regions. We also
found that the structural funds and the timing of the adjustment processes at the national level
exercised significant influence on corporate performance and innovation dynamics. For
example, structural funds and monetary and exchange rate policies conditioned corporate
decisions in terms of the speed of modernisation of production processes and furthermore of
the selection of suppliers of equipment and engineering services.
From a researcher perspective, the Science and Technology policy resumes to a negative
impact on economic cohesion and a neutral one on social cohesion. The cohesion problem
raises the issue of the role of an active technology policy in the catching-up process among
regions with different levels of socio-economic development. As we have seen, this process
might have produced mixed results in different regions due to:
(a) differences in “demand pull” factors;
(b) lack of policy co-ordination (human resources vs. education policies and/or research vs.
on the job training); and
(c) differences in the level of institutional efficiency in less developed regions.
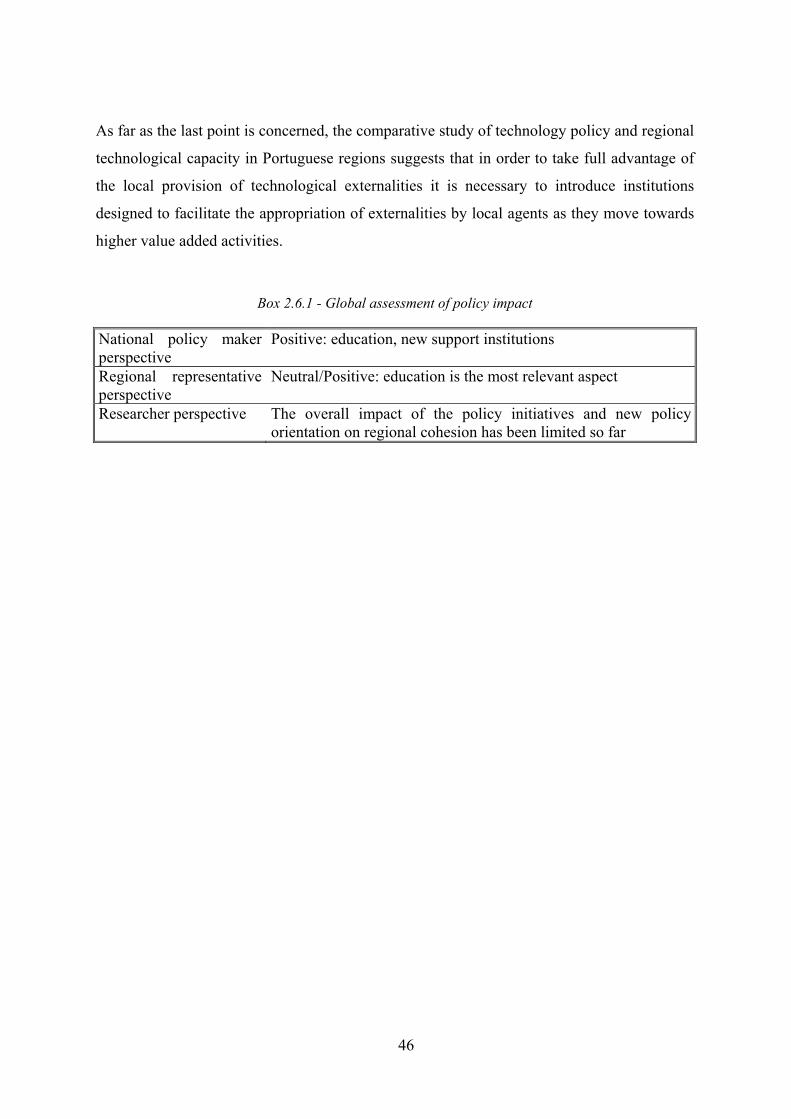
46
As far as the last point is concerned, the comparative study of technology policy and regional
technological capacity in Portuguese regions suggests that in order to take full advantage of
the local provision of technological externalities it is necessary to introduce institutions
designed to facilitate the appropriation of externalities by local agents as they move towards
higher value added activities.
Box 2.6.1 - Global assessment of policy impact
National policy maker perspective
Positive: education, new support institutions
Regional representative perspective
Neutral/Positive: education is the most relevant aspect
Researcher perspective The overall impact of the policy initiatives and new policy orientation on regional cohesion has been limited so far
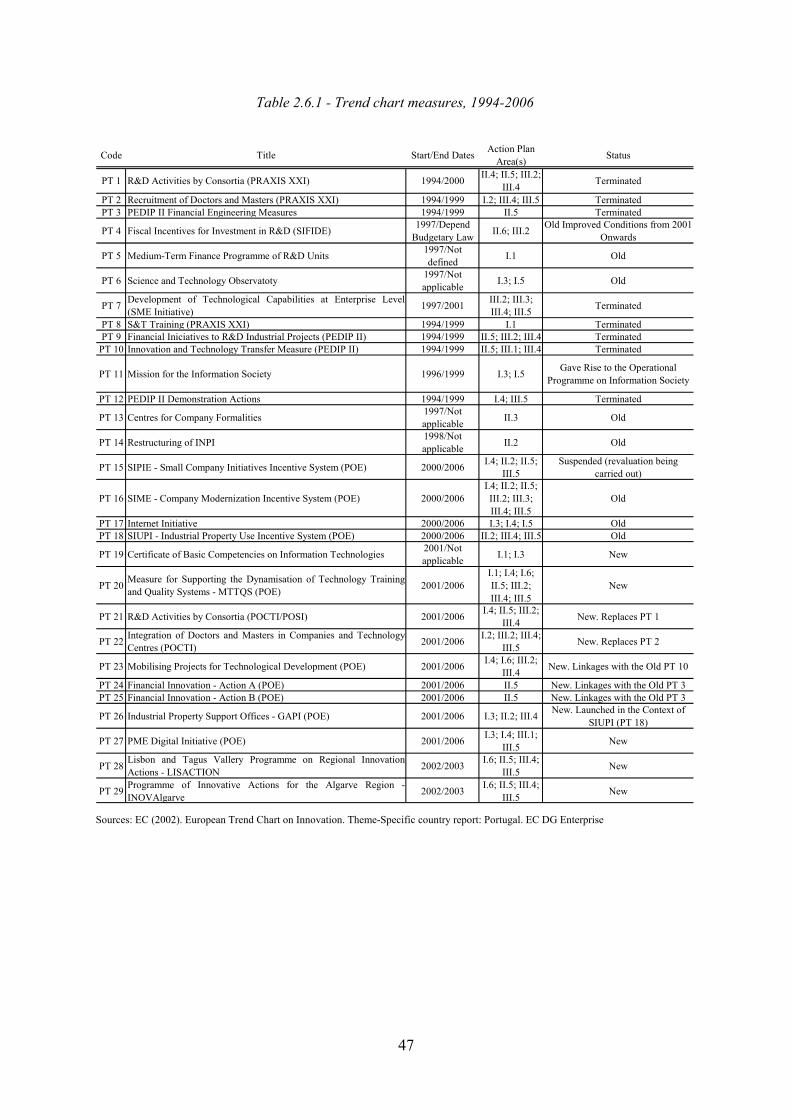
47
Table 2.6.1 - Trend chart measures, 1994-2006
Code Title Start/End Dates Action Plan Area(s) Status
PT 1 R&D Activities by Consortia (PRAXIS XXI) 1994/2000 II.4; II.5; III.2; III.4 Terminated
PT 2 Recruitment of Doctors and Masters (PRAXIS XXI) 1994/1999 I.2; III.4; III.5 TerminatedPT 3 PEDIP II Financial Engineering Measures 1994/1999 II.5 Terminated
PT 4 Fiscal Incentives for Investment in R&D (SIFIDE) 1997/Depend Budgetary Law II.6; III.2 Old Improved Conditions from 2001
Onwards
PT 5 Medium-Term Finance Programme of R&D Units 1997/Not defined I.1 Old
PT 6 Science and Technology Observatoty 1997/Not applicable I.3; I.5 Old
PT 7 Development of Technological Capabilities at Enterprise Level(SME Initiative) 1997/2001 III.2; III.3;
III.4; III.5 Terminated
PT 8 S&T Training (PRAXIS XXI) 1994/1999 I.1 TerminatedPT 9 Financial Iniciatives to R&D Industrial Projects (PEDIP II) 1994/1999 II.5; III.2; III.4 Terminated
PT 10 Innovation and Technology Transfer Measure (PEDIP II) 1994/1999 II.5; III.1; III.4 Terminated
PT 11 Mission for the Information Society 1996/1999 I.3; I.5 Gave Rise to the Operational Programme on Information Society
PT 12 PEDIP II Demonstration Actions 1994/1999 I.4; III.5 Terminated
PT 13 Centres for Company Formalities 1997/Not applicable II.3 Old
PT 14 Restructuring of INPI 1998/Not applicable II.2 Old
PT 15 SIPIE - Small Company Initiatives Incentive System (POE) 2000/2006 I.4; II.2; II.5; III.5
Suspended (revaluation being carried out)
PT 16 SIME - Company Modernization Incentive System (POE) 2000/2006I.4; II.2; II.5; III.2; III.3; III.4; III.5
Old
PT 17 Internet Initiative 2000/2006 I.3; I.4; I.5 OldPT 18 SIUPI - Industrial Property Use Incentive System (POE) 2000/2006 II.2; III.4; III.5 Old
PT 19 Certificate of Basic Competencies on Information Technologies 2001/Not applicable I.1; I.3 New
PT 20 Measure for Supporting the Dynamisation of Technology Trainingand Quality Systems - MTTQS (POE) 2001/2006
I.1; I.4; I.6; II.5; III.2; III.4; III.5
New
PT 21 R&D Activities by Consortia (POCTI/POSI) 2001/2006 I.4; II.5; III.2; III.4 New. Replaces PT 1
PT 22 Integration of Doctors and Masters in Companies and TechnologyCentres (POCTI) 2001/2006 I.2; III.2; III.4;
III.5 New. Replaces PT 2
PT 23 Mobilising Projects for Technological Development (POE) 2001/2006 I.4; I.6; III.2; III.4 New. Linkages with the Old PT 10
PT 24 Financial Innovation - Action A (POE) 2001/2006 II.5 New. Linkages with the Old PT 3PT 25 Financial Innovation - Action B (POE) 2001/2006 II.5 New. Linkages with the Old PT 3
PT 26 Industrial Property Support Offices - GAPI (POE) 2001/2006 I.3; II.2; III.4 New. Launched in the Context of SIUPI (PT 18)
PT 27 PME Digital Initiative (POE) 2001/2006 I.3; I.4; III.1; III.5 New
PT 28 Lisbon and Tagus Vallery Programme on Regional InnovationActions - LISACTION 2002/2003 I.6; II.5; III.4;
III.5 New
PT 29 Programme of Innovative Actions for the Algarve Region -INOVAlgarve 2002/2003 I.6; II.5; III.4;
III.5 New Sources: EC (2002). European Trend Chart on Innovation. Theme-Specific country report: Portugal. EC DG Enterprise
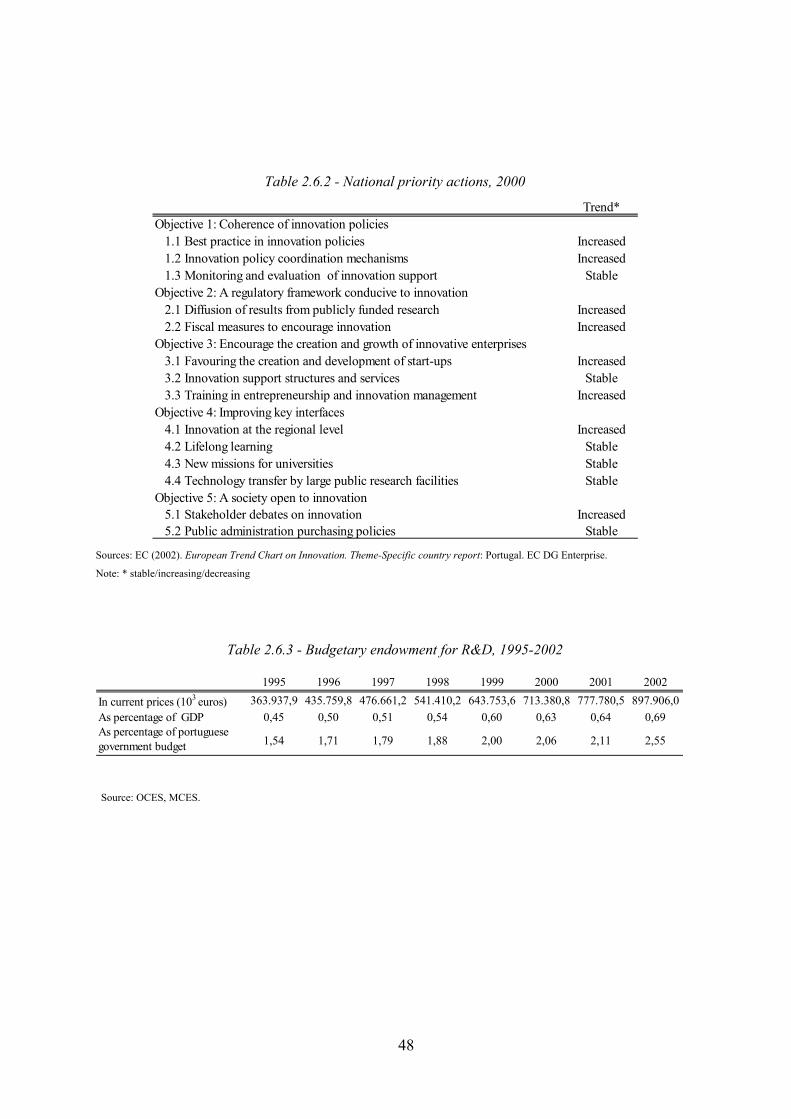
48
Table 2.6.2 - National priority actions, 2000
Trend*Objective 1: Coherence of innovation policies 1.1 Best practice in innovation policies Increased 1.2 Innovation policy coordination mechanisms Increased 1.3 Monitoring and evaluation of innovation support StableObjective 2: A regulatory framework conducive to innovation 2.1 Diffusion of results from publicly funded research Increased 2.2 Fiscal measures to encourage innovation IncreasedObjective 3: Encourage the creation and growth of innovative enterprises 3.1 Favouring the creation and development of start-ups Increased 3.2 Innovation support structures and services Stable 3.3 Training in entrepreneurship and innovation management IncreasedObjective 4: Improving key interfaces 4.1 Innovation at the regional level Increased 4.2 Lifelong learning Stable 4.3 New missions for universities Stable 4.4 Technology transfer by large public research facilities StableObjective 5: A society open to innovation 5.1 Stakeholder debates on innovation Increased 5.2 Public administration purchasing policies Stable
Sources: EC (2002). European Trend Chart on Innovation. Theme-Specific country report: Portugal. EC DG Enterprise.
Note: * stable/increasing/decreasing
Table 2.6.3 - Budgetary endowment for R&D, 1995-2002
1995 1996 1997 1998 1999 2000 2001 2002
In current prices (103 euros) 363.937,9 435.759,8 476.661,2 541.410,2 643.753,6 713.380,8 777.780,5 897.906,0As percentage of GDP 0,45 0,50 0,51 0,54 0,60 0,63 0,64 0,69As percentage of portuguese government budget 1,54 1,71 1,79 1,88 2,00 2,06 2,11 2,55
Source: OCES, MCES.
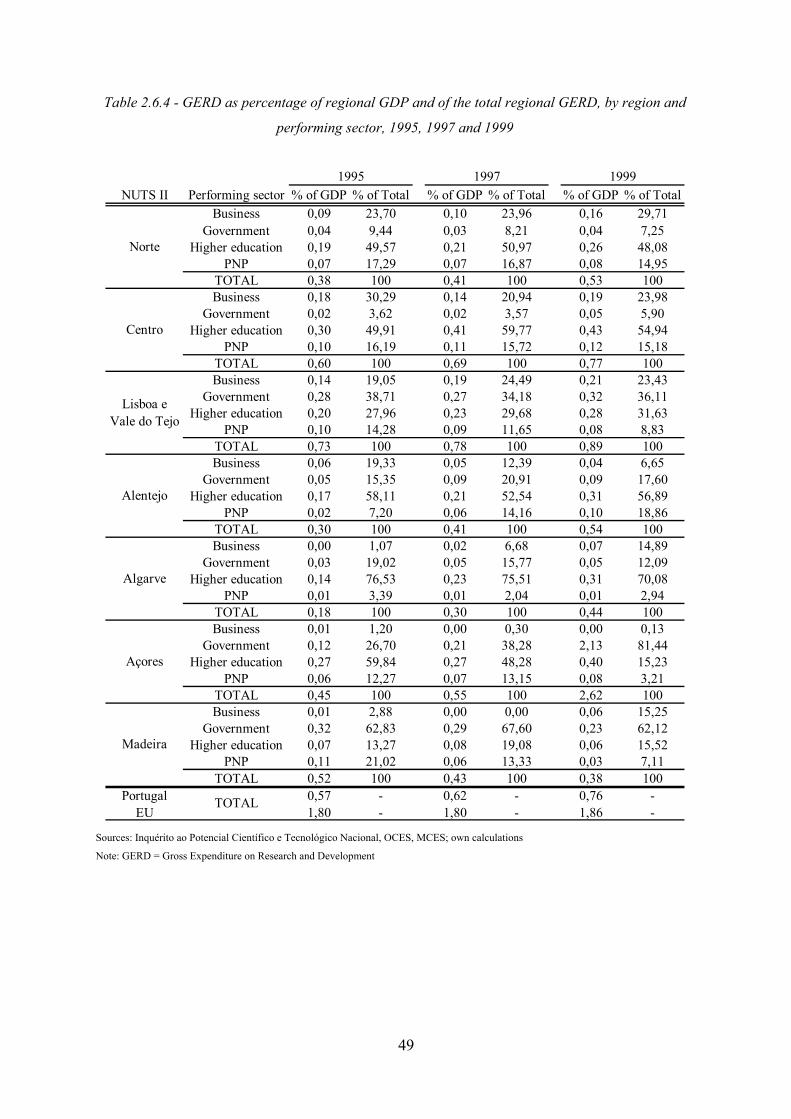
49
Table 2.6.4 - GERD as percentage of regional GDP and of the total regional GERD, by region and
performing sector, 1995, 1997 and 1999
NUTS II Performing sector % of GDP % of Total % of GDP % of Total % of GDP % of TotalBusiness 0,09 23,70 0,10 23,96 0,16 29,71
Government 0,04 9,44 0,03 8,21 0,04 7,25Higher education 0,19 49,57 0,21 50,97 0,26 48,08
PNP 0,07 17,29 0,07 16,87 0,08 14,95TOTAL 0,38 100 0,41 100 0,53 100Business 0,18 30,29 0,14 20,94 0,19 23,98
Government 0,02 3,62 0,02 3,57 0,05 5,90Higher education 0,30 49,91 0,41 59,77 0,43 54,94
PNP 0,10 16,19 0,11 15,72 0,12 15,18TOTAL 0,60 100 0,69 100 0,77 100Business 0,14 19,05 0,19 24,49 0,21 23,43
Government 0,28 38,71 0,27 34,18 0,32 36,11Higher education 0,20 27,96 0,23 29,68 0,28 31,63
PNP 0,10 14,28 0,09 11,65 0,08 8,83TOTAL 0,73 100 0,78 100 0,89 100Business 0,06 19,33 0,05 12,39 0,04 6,65
Government 0,05 15,35 0,09 20,91 0,09 17,60Higher education 0,17 58,11 0,21 52,54 0,31 56,89
PNP 0,02 7,20 0,06 14,16 0,10 18,86TOTAL 0,30 100 0,41 100 0,54 100Business 0,00 1,07 0,02 6,68 0,07 14,89
Government 0,03 19,02 0,05 15,77 0,05 12,09Higher education 0,14 76,53 0,23 75,51 0,31 70,08
PNP 0,01 3,39 0,01 2,04 0,01 2,94TOTAL 0,18 100 0,30 100 0,44 100Business 0,01 1,20 0,00 0,30 0,00 0,13
Government 0,12 26,70 0,21 38,28 2,13 81,44Higher education 0,27 59,84 0,27 48,28 0,40 15,23
PNP 0,06 12,27 0,07 13,15 0,08 3,21TOTAL 0,45 100 0,55 100 2,62 100Business 0,01 2,88 0,00 0,00 0,06 15,25
Government 0,32 62,83 0,29 67,60 0,23 62,12Higher education 0,07 13,27 0,08 19,08 0,06 15,52
PNP 0,11 21,02 0,06 13,33 0,03 7,11TOTAL 0,52 100 0,43 100 0,38 100
Portugal 0,57 - 0,62 - 0,76 -EU 1,80 - 1,80 - 1,86 -
Centro
Norte
Madeira
Açores
Algarve
Alentejo
Lisboa e Vale do Tejo
TOTAL
1995 1997 1999
Sources: Inquérito ao Potencial Científico e Tecnológico Nacional, OCES, MCES; own calculations
Note: GERD = Gross Expenditure on Research and Development
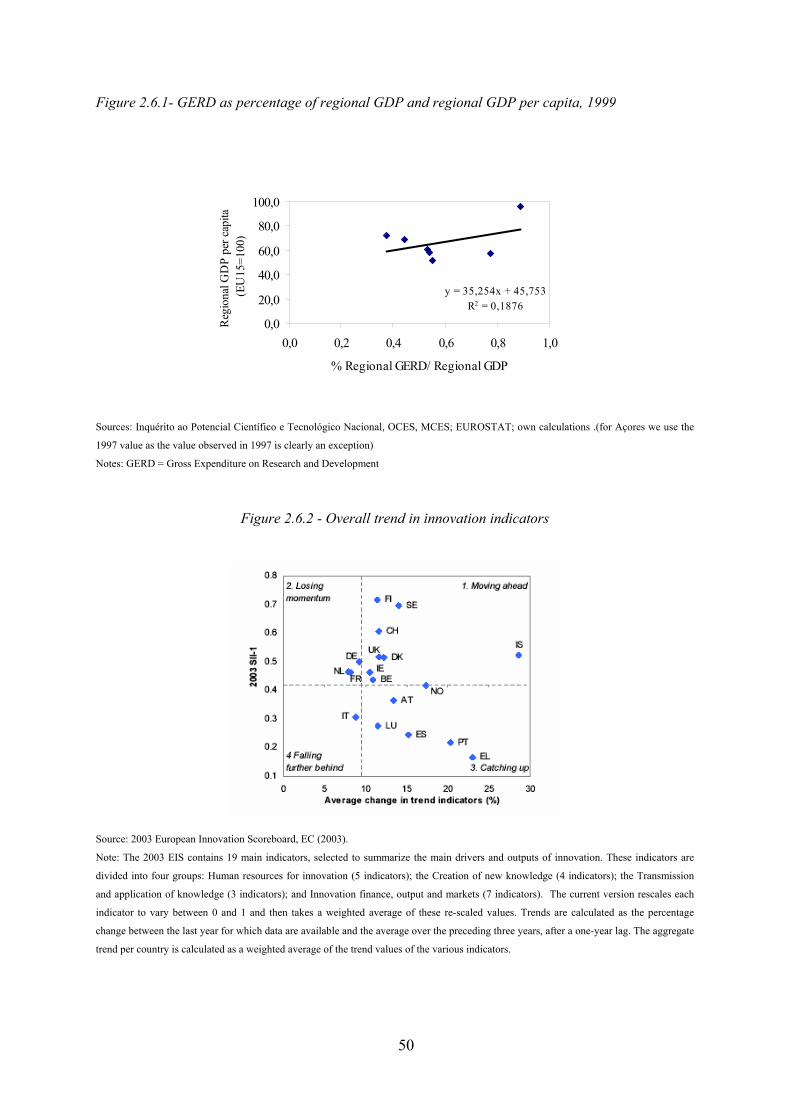
50
Figure 2.6.1- GERD as percentage of regional GDP and regional GDP per capita, 1999
y = 35,254x + 45,753R2 = 0,1876
0,0
20,0
40,0
60,0
80,0
100,0
0,0 0,2 0,4 0,6 0,8 1,0
% Regional GERD/ Regional GDP
Reg
iona
l GD
P pe
r cap
ita
(EU
15=1
00)
Sources: Inquérito ao Potencial Científico e Tecnológico Nacional, OCES, MCES; EUROSTAT; own calculations .(for Açores we use the
1997 value as the value observed in 1997 is clearly an exception)
Notes: GERD = Gross Expenditure on Research and Development
Figure 2.6.2 - Overall trend in innovation indicators
Source: 2003 European Innovation Scoreboard, EC (2003).
Note: The 2003 EIS contains 19 main indicators, selected to summarize the main drivers and outputs of innovation. These indicators are
divided into four groups: Human resources for innovation (5 indicators); the Creation of new knowledge (4 indicators); the Transmission
and application of knowledge (3 indicators); and Innovation finance, output and markets (7 indicators). The current version rescales each
indicator to vary between 0 and 1 and then takes a weighted average of these re-scaled values. Trends are calculated as the percentage
change between the last year for which data are available and the average over the preceding three years, after a one-year lag. The aggregate
trend per country is calculated as a weighted average of the trend values of the various indicators.
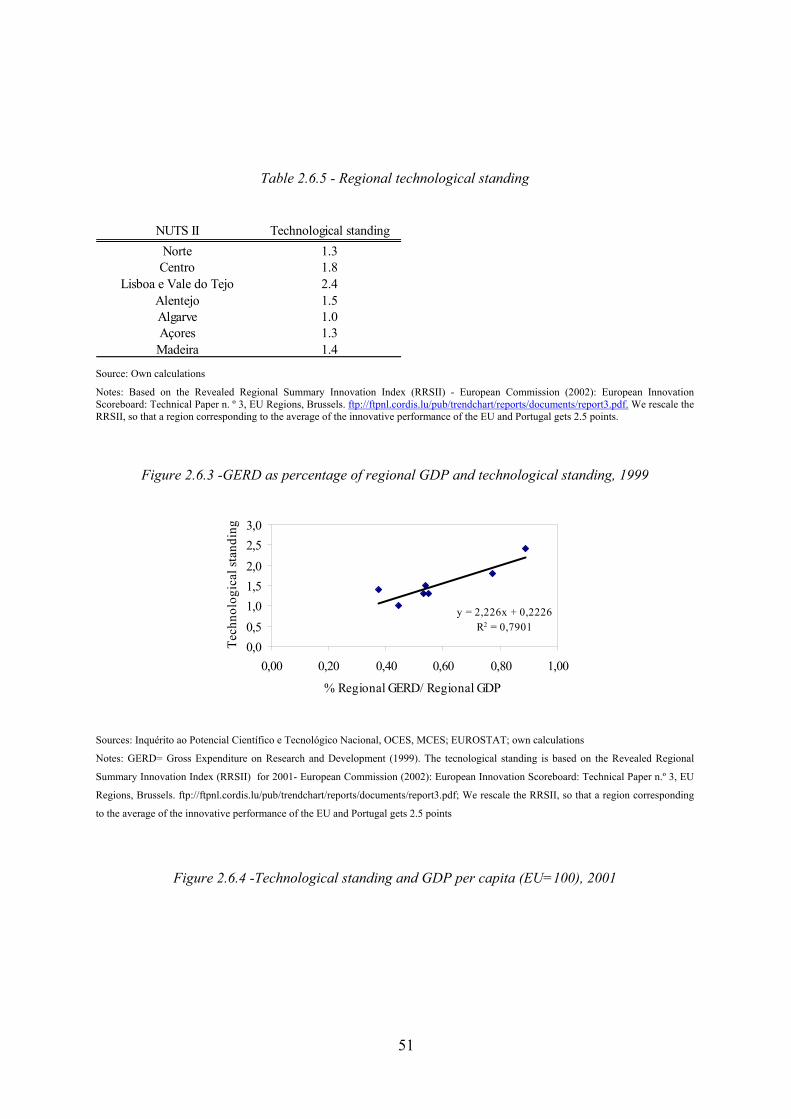
51
Table 2.6.5 - Regional technological standing
NUTS II Technological standingNorte 1.3Centro 1.8
Lisboa e Vale do Tejo 2.4Alentejo 1.5Algarve 1.0Açores 1.3Madeira 1.4
Source: Own calculations
Notes: Based on the Revealed Regional Summary Innovation Index (RRSII) - European Commission (2002): European Innovation Scoreboard: Technical Paper n. º 3, EU Regions, Brussels. ftp://ftpnl.cordis.lu/pub/trendchart/reports/documents/report3.pdf. We rescale the RRSII, so that a region corresponding to the average of the innovative performance of the EU and Portugal gets 2.5 points.
Figure 2.6.3 -GERD as percentage of regional GDP and technological standing, 1999
y = 2,226x + 0,2226R2 = 0,7901
0,00,51,01,52,02,53,0
0,00 0,20 0,40 0,60 0,80 1,00
% Regional GERD/ Regional GDP
Tech
nolo
gica
l sta
ndin
g
Sources: Inquérito ao Potencial Científico e Tecnológico Nacional, OCES, MCES; EUROSTAT; own calculations
Notes: GERD= Gross Expenditure on Research and Development (1999). The tecnological standing is based on the Revealed Regional
Summary Innovation Index (RRSII) for 2001- European Commission (2002): European Innovation Scoreboard: Technical Paper n.º 3, EU
Regions, Brussels. ftp://ftpnl.cordis.lu/pub/trendchart/reports/documents/report3.pdf; We rescale the RRSII, so that a region corresponding
to the average of the innovative performance of the EU and Portugal gets 2.5 points
Figure 2.6.4 -Technological standing and GDP per capita (EU=100), 2001
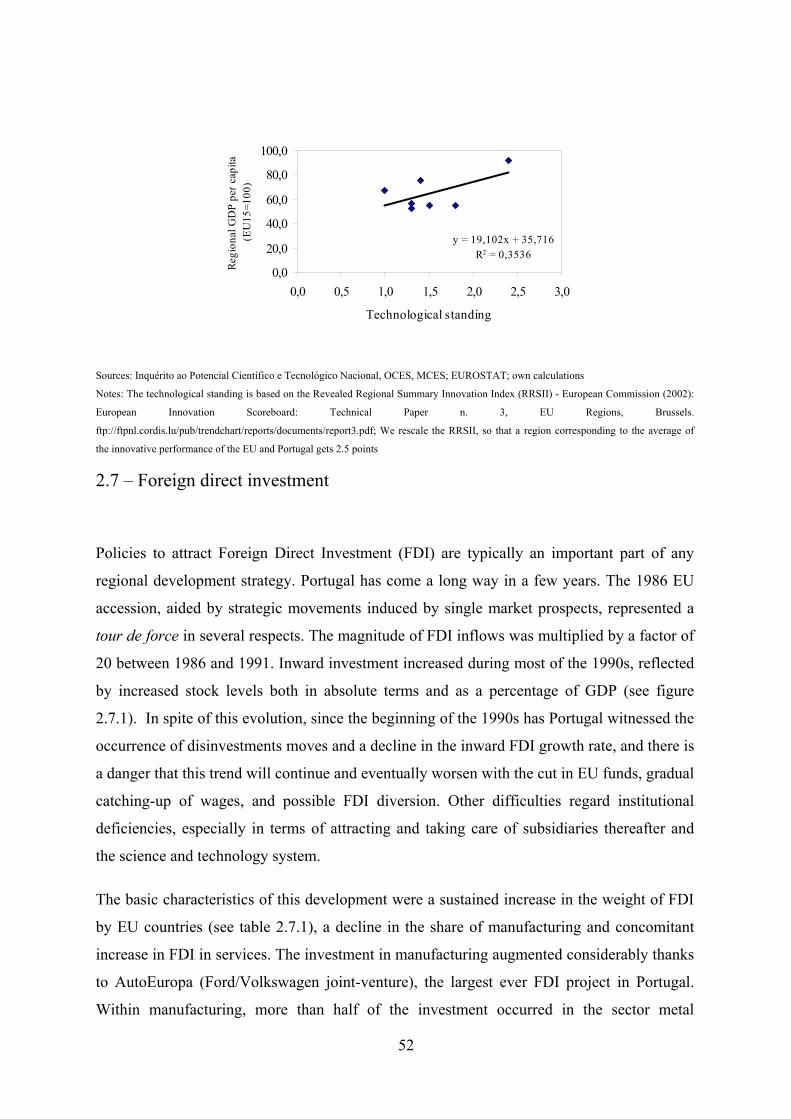
52
y = 19,102x + 35,716R2 = 0,3536
0,0
20,0
40,0
60,0
80,0
100,0
0,0 0,5 1,0 1,5 2,0 2,5 3,0
Technological standing
Regi
onal
GD
P pe
r cap
ita
(EU
15=1
00)
Sources: Inquérito ao Potencial Científico e Tecnológico Nacional, OCES, MCES; EUROSTAT; own calculations
Notes: The technological standing is based on the Revealed Regional Summary Innovation Index (RRSII) - European Commission (2002):
European Innovation Scoreboard: Technical Paper n. 3, EU Regions, Brussels.
ftp://ftpnl.cordis.lu/pub/trendchart/reports/documents/report3.pdf; We rescale the RRSII, so that a region corresponding to the average of
the innovative performance of the EU and Portugal gets 2.5 points
2.7 – Foreign direct investment
Policies to attract Foreign Direct Investment (FDI) are typically an important part of any
regional development strategy. Portugal has come a long way in a few years. The 1986 EU
accession, aided by strategic movements induced by single market prospects, represented a
tour de force in several respects. The magnitude of FDI inflows was multiplied by a factor of
20 between 1986 and 1991. Inward investment increased during most of the 1990s, reflected
by increased stock levels both in absolute terms and as a percentage of GDP (see figure
2.7.1). In spite of this evolution, since the beginning of the 1990s has Portugal witnessed the
occurrence of disinvestments moves and a decline in the inward FDI growth rate, and there is
a danger that this trend will continue and eventually worsen with the cut in EU funds, gradual
catching-up of wages, and possible FDI diversion. Other difficulties regard institutional
deficiencies, especially in terms of attracting and taking care of subsidiaries thereafter and
the science and technology system.
The basic characteristics of this development were a sustained increase in the weight of FDI
by EU countries (see table 2.7.1), a decline in the share of manufacturing and concomitant
increase in FDI in services. The investment in manufacturing augmented considerably thanks
to AutoEuropa (Ford/Volkswagen joint-venture), the largest ever FDI project in Portugal.
Within manufacturing, more than half of the investment occurred in the sector metal
53
products, machinery and transport equipment. Chemicals, plastics, food and beverages were
also important recipients of FDI.
Most studies claim that MNEs (Multinational Enterprises) had clearly a positive impact
overall, raising productivity levels directly or through competition and demonstrating effects
on domestic entrepreneurs. They contributed to investment, value and employment creation
which otherwise may not have occurred. However, for the most recent period, the studies
also note the over-specialisation of inward FDI, the predominance of rationalised types of
subsidiaries with low value-added scope, the scarce spill-over potential and the reduced
interaction between MNEs and local industry.
It is argued that this situation resulted partly from the weaknesses of the local industrial
fabric and from inadequate government policies. The low value-added scope of most
subsidiaries located in Portugal is partly related to a weak and fragmented national system of
innovation and to a lack of links between industry and University. Regarding policy, the
main criticisms refer to the lack of success at targeting, passivity, concession of important
incentives without evidence of clear guidelines, apart from a focus on very large projects.
State aid, through direct FDI incentives, infrastructure development and indirectly, through
the stimulus it provided to domestic consumption, might have fostered FDI. However, the
emphasis on Portugal as a cheap labour location did not prove effective. Instead, there was a
weakening of the bargaining power of the Portuguese authorities vis-à-vis foreign investors.
In the beginning of this century, Portugal rethought her approach towards FDI. The new
approach highlights country excellence in science & technology, culture, and business
practices. It emphasises Portuguese advantages: strategic access to markets, proactive
investment reforms, cost-competitive, qualified and flexible workforce, strategic
commitment to education and science, excellent environment to live and work, infrastructure
and FDI record of accomplishment. The Portuguese track record in automotive, chemicals,
electric and electronics, ICT, life sciences, moulds and tourism evidences a clear
commitment to high-value added industries/activities.
API, the new Portuguese Investment Agency was created in November 2002, with the
mission to promote large-scale investment in Portugal. This translates into attracting more
projects (from new and existing investors), but also higher value-adding initiatives. To
promote the competitiveness and the productivity of the Portuguese economy, through the
support of investments with a significant impact on the national GVA (Gross Value Added),
54
the Government elaborated a package of measures, whose general philosophy takes the State
as risk partner and intends to reward effective performance and fiscal transparency. Finally,
an investment code is being created in Portugal, with the aim to review, simplify and
coordinates the normative support for productive investment.
The economic development of the economy of the country as such has been the primary goal
of FDI policy, given the general low level of development and the overall need for
modernisation and for investment. Concerns about regional imbalances ranked much lower.
Overall, the territorial concepts in the definition and formulation of the Portuguese inward
investment policy refer to delimitation of areas eligible for financial support and modulation
of assistance rates; and measures on the basis of specific territorial criteria. The regional
aspects refer mainly to bonus for investments located in regions with PPP (Purchasing Power
Parity) below the national average. Nowadays, the large FDI projects are negotiated with API
on a case-by-case basis, and the ‘Investment Contract’ includes all the concessions from the
state and from local governments, avoiding unclear situations and duplication of benefits.
The policy of incentives for FDI is the same applied to any other large project: the POE
allows investments project to accumulate additional points on a regional basis, to the benefit
of less developed regions.
Although complete recent data on the regional location of inward investment in Portugal are
not available, the available information suggests that FDI inflows have tended to go
disproportionately to the economically stronger regions14. Based on a database of foreign
investments in Europe since 1997, table 2.7.2 shows that Lisboa e Vale do Tejo, Norte and
Centro are the main beneficiaries of projects: Lisboa e Vale do Tejo accounted for 36 per cent of
the total number of projects between 2001 and 2002, Norte for 33 per cent, and Centro for 22 per
cent. Within these regions, investments are mainly located near the coast15. These results are not
surprising, considering that service agglomeration economies, followed by industry-level
economies, seem to have the strongest pull effect on new foreign plant investment in Portugal.
14 Data for Ireland, Spain, Italy and Germany, show that investment was concentrated in a limited number of regions, the most developed ones (EC, 2003).
15 Guimarães et al. (2000) analysis for the period 1985-1992 also point to a concentration of new foreign investments on the more urban coastal part of the country, especially around the largest cities of Lisboa and Porto. To our knowledge, Guimarães et al. (2000) is the only previous location analysis of plant openings by foreign-owned companies in Portugal. The study focuses 758 newly created establishments that were totally or partially participated in by foreign capital, using annual data (Quadros de Pessoal) collected by the Ministry of Employment and Social Security from 1985 to 1992.
55
Moreover, distance to the major Portuguese cities, Porto and Lisboa, apparently deters new plant
location. Note that regional GDP per capita per si tends to have no influence on regional FDI
because it is unlikely that the market served by the foreign firm coincides with the
boundaries of the regions considered. Moreover, wages may well be a determinant of the
decision to locate in Portugal as opposed to other EC countries, but not a part of the decision
to pick a specific location.
In more remote areas, we do find some investments. Large-scale public infrastructure
investment in Portugal throughout the 1990s may have improved accessibilities, attracting
private investment to more remote regions, hence dispersing economic activities. However,
most of these subsidiaries are of ‘enclave-type’, export-platforms, with few potential of spill-
over and interaction with local industry16.
Based on the above-referred data, confirmed by means of interviews with policy makers and
regional representatives, the regional impact of FDI policy resumes to the reinforcement of
the concentration of activities on the coast, namely in the Norte, Centro and Lisboa e Vale do
Tejo. The growth of medium/high tech manufacturing investments and of the service sector
in the total of FDI, contributed to the concentration of the activities in Urban/Metropolitan
areas. In the future, the focus on high-value added activities is imperative, and may well
reinforce the concentration of activities where critical mass already exists. The relative
importance of service agglomeration indicates that developed urban areas will continue to
attract most FDI.
Besides the economic cohesion problem, there is the challenge to attract FDI concomittantly
with the cut in the EU funds, gradual catching-up of wages, and possibly FDI diversion. At
the regional level, Portugal faces a particular dilemma where there is a potential trade-off
between wanting investment to go towards laggard regions to provide a stimulus and help
them to catch up, and the fact that investment tends naturally to be attracted to the regions
which are most dynamic. Inward investment policy alone is not sufficient to prevent this. If
the government insists in trying to persuade multinationals to locate in less favourable
regions, it runs the risk to discourage the MNE from investing in Portugal altogether. The
development of the most backward regions will go hand-in-hand with its degree of attraction
as location for inward foreign investment. Wages may well not be a part of the decision to
16 Farinha and Mata (1996), Simões (1992) and Tavares (2001) provide an exhaustive examination of MNEs’ activities in Portugal.
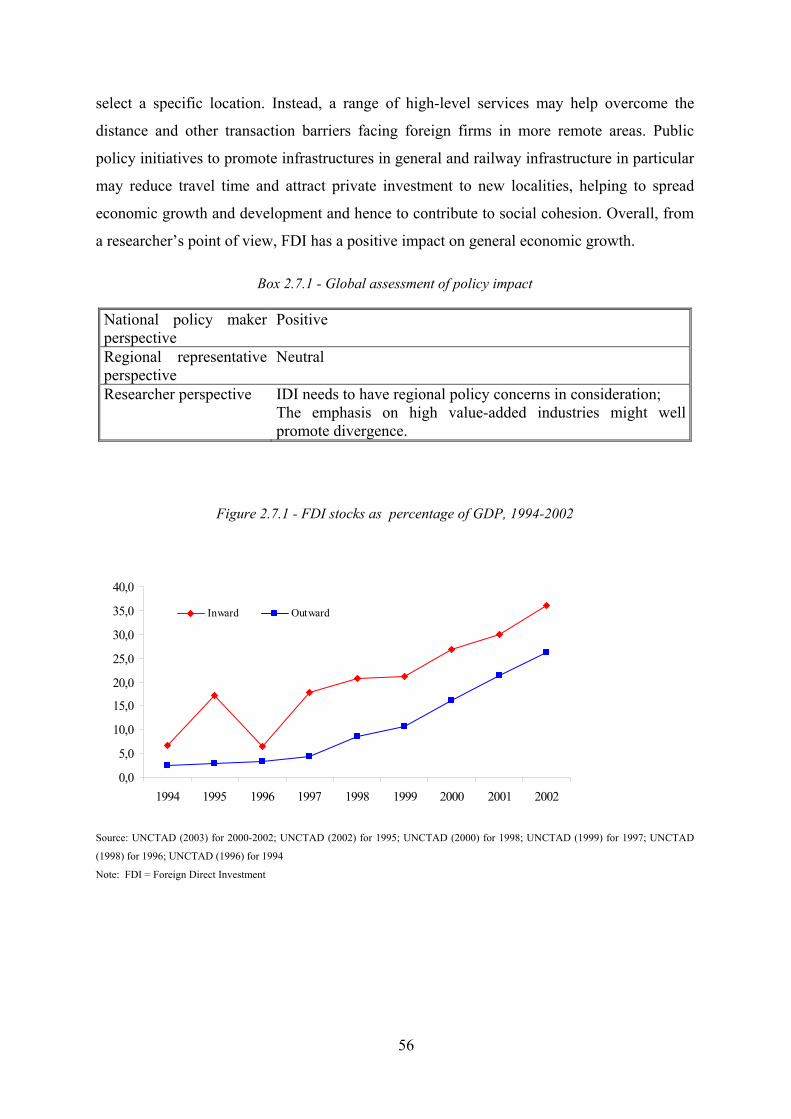
56
select a specific location. Instead, a range of high-level services may help overcome the
distance and other transaction barriers facing foreign firms in more remote areas. Public
policy initiatives to promote infrastructures in general and railway infrastructure in particular
may reduce travel time and attract private investment to new localities, helping to spread
economic growth and development and hence to contribute to social cohesion. Overall, from
a researcher’s point of view, FDI has a positive impact on general economic growth.
Box 2.7.1 - Global assessment of policy impact
National policy maker perspective
Positive
Regional representative perspective
Neutral
Researcher perspective IDI needs to have regional policy concerns in consideration; The emphasis on high value-added industries might well promote divergence.
Figure 2.7.1 - FDI stocks as percentage of GDP, 1994-2002
0,0
5,0
10,0
15,0
20,0
25,0
30,0
35,0
40,0
1994 1995 1996 1997 1998 1999 2000 2001 2002
Inward Outward
Source: UNCTAD (2003) for 2000-2002; UNCTAD (2002) for 1995; UNCTAD (2000) for 1998; UNCTAD (1999) for 1997; UNCTAD
(1998) for 1996; UNCTAD (1996) for 1994
Note: FDI = Foreign Direct Investment
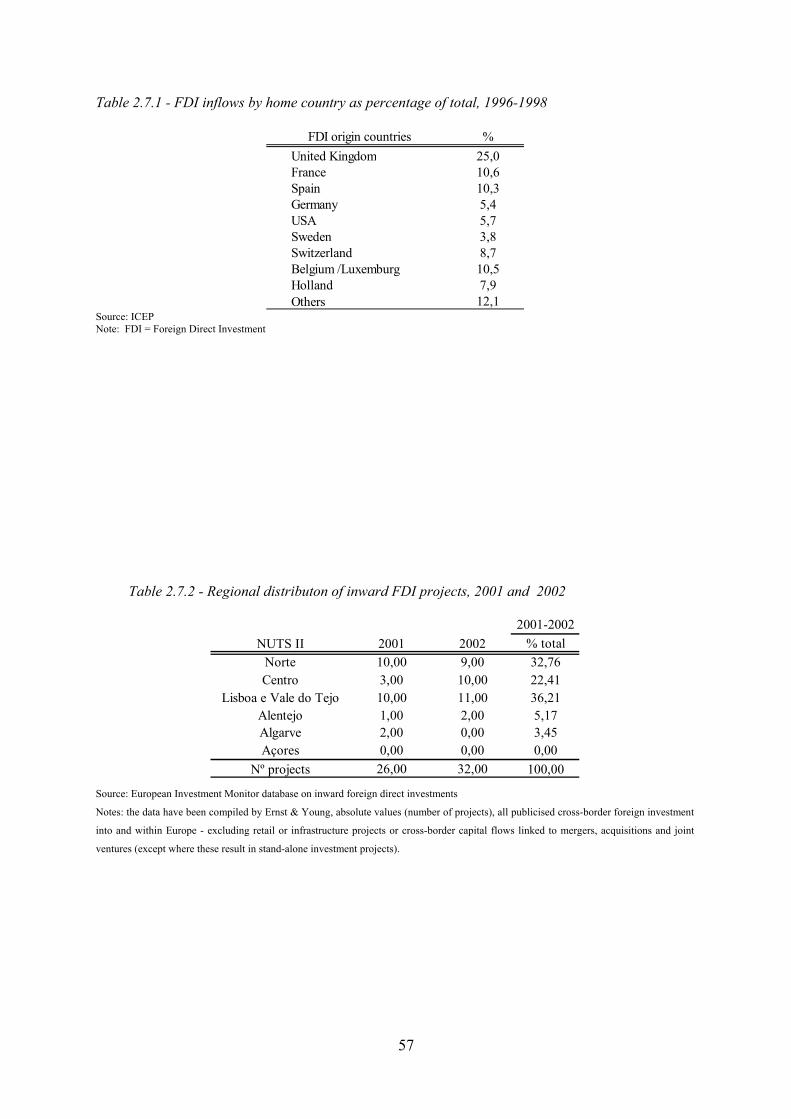
57
Table 2.7.1 - FDI inflows by home country as percentage of total, 1996-1998
FDI origin countries %United Kingdom 25,0France 10,6Spain 10,3Germany 5,4USA 5,7Sweden 3,8Switzerland 8,7Belgium /Luxemburg 10,5Holland 7,9Others 12,1
Source: ICEP Note: FDI = Foreign Direct Investment
Table 2.7.2 - Regional distributon of inward FDI projects, 2001 and 2002
2001-2002NUTS II 2001 2002 % total
Norte 10,00 9,00 32,76Centro 3,00 10,00 22,41
Lisboa e Vale do Tejo 10,00 11,00 36,21Alentejo 1,00 2,00 5,17Algarve 2,00 0,00 3,45Açores 0,00 0,00 0,00
Nº projects 26,00 32,00 100,00 Source: European Investment Monitor database on inward foreign direct investments
Notes: the data have been compiled by Ernst & Young, absolute values (number of projects), all publicised cross-border foreign investment
into and within Europe - excluding retail or infrastructure projects or cross-border capital flows linked to mergers, acquisitions and joint
ventures (except where these result in stand-alone investment projects).
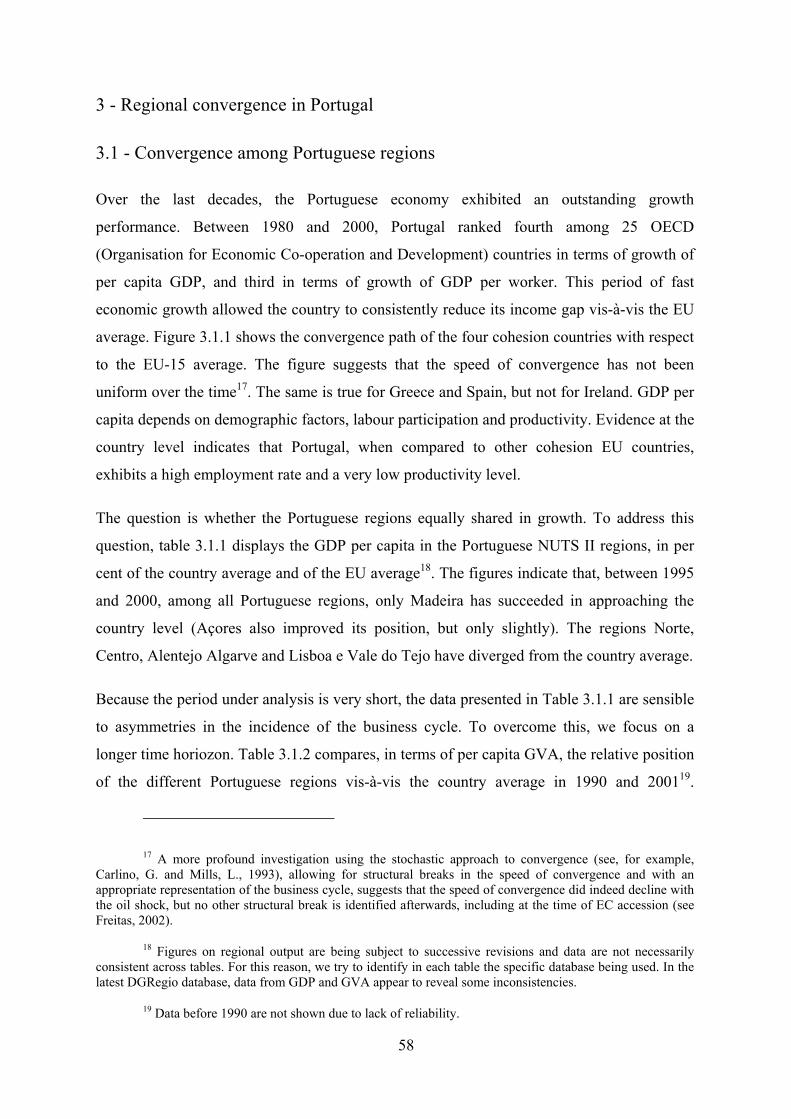
58
3 - Regional convergence in Portugal
3.1 - Convergence among Portuguese regions
Over the last decades, the Portuguese economy exhibited an outstanding growth
performance. Between 1980 and 2000, Portugal ranked fourth among 25 OECD
(Organisation for Economic Co-operation and Development) countries in terms of growth of
per capita GDP, and third in terms of growth of GDP per worker. This period of fast
economic growth allowed the country to consistently reduce its income gap vis-à-vis the EU
average. Figure 3.1.1 shows the convergence path of the four cohesion countries with respect
to the EU-15 average. The figure suggests that the speed of convergence has not been
uniform over the time17. The same is true for Greece and Spain, but not for Ireland. GDP per
capita depends on demographic factors, labour participation and productivity. Evidence at the
country level indicates that Portugal, when compared to other cohesion EU countries,
exhibits a high employment rate and a very low productivity level.
The question is whether the Portuguese regions equally shared in growth. To address this
question, table 3.1.1 displays the GDP per capita in the Portuguese NUTS II regions, in per
cent of the country average and of the EU average18. The figures indicate that, between 1995
and 2000, among all Portuguese regions, only Madeira has succeeded in approaching the
country level (Açores also improved its position, but only slightly). The regions Norte,
Centro, Alentejo Algarve and Lisboa e Vale do Tejo have diverged from the country average.
Because the period under analysis is very short, the data presented in Table 3.1.1 are sensible
to asymmetries in the incidence of the business cycle. To overcome this, we focus on a
longer time horiozon. Table 3.1.2 compares, in terms of per capita GVA, the relative position
of the different Portuguese regions vis-à-vis the country average in 1990 and 200119.
17 A more profound investigation using the stochastic approach to convergence (see, for example, Carlino, G. and Mills, L., 1993), allowing for structural breaks in the speed of convergence and with an appropriate representation of the business cycle, suggests that the speed of convergence did indeed decline with the oil shock, but no other structural break is identified afterwards, including at the time of EC accession (see Freitas, 2002).
18 Figures on regional output are being subject to successive revisions and data are not necessarily consistent across tables. For this reason, we try to identify in each table the specific database being used. In the latest DGRegio database, data from GDP and GVA appear to reveal some inconsistencies.
19 Data before 1990 are not shown due to lack of reliability.

59
Comparing the levels of 1990 and 2001, we observe that Norte, Lisboa e Vale do Tejo and
Algarve have approached the country average, while Centro, Alentejo, Açores and Madeira
have diverged. Taken together, the coefficient of variation of per capita GVA in Figure 3.1.2
points to a slight divergence.
To assess the impact of policy actions on competitiveness, one should abstract from
demographic effects. From a policy point of view, demography is rather exogenous. Labour
productivity and the employment rate are not. To assess the overall policy impact of the
policy, irrespective of whether the underlying mechanism is labour productivity or the
reduction of the unemployment rate, we focus on the GVA per working age person. This
variable measures what the region gets out of its human resources of working age,
independently of whether they are employed, unemployed or out of the labour force.
In columns (2) and (3) of table 3.1.2, the relative per capita GVA is broken down into a
demographic component (working age population divided by the total population) and a
policy-induced component (GVA per working age person). In columns (4) and (5) the
relative GVA per working age person is broken down into GVA per worker and the
employment rate. The figures reveal that in 2001 the most developed region, Lisboa e Vale
do Tejo, not only enjoyed the highest productivity level (GVA per worker) but also the
highest and the most favourable demographic structure. In contrast, Açores suffered from the
lowest productivity level, the lowest employment rate and the second-least favourable
demographic structure.
To assess dynamics, figure 3.1.3 displays the information depicted in columns (2) and (3) of
table 3.1.2 in terms of changes from 1990 to 2001. The y-axis measures the difference
between the regional growth rates of GVA per working age person and the country average.
The horizontal axis measures the difference between the regional demographic trend and the
country average. The dashed line shows the combinations of demographic trends and
productivity changes that would allow per capita GVA to grow in tune with the country
average. The figure defines four different regions, according to the relative performance of
regions with respect to the two variables, as compared to the country average.
As shown in figure 3.1.3, Algarve exhibited quite favourable dynamics, both in terms of
demography and productivity, as measured by GVA per working age person. Lisboa e Vale
do Tejo experienced an unfavourable demographic trend which, coupled with a neutral
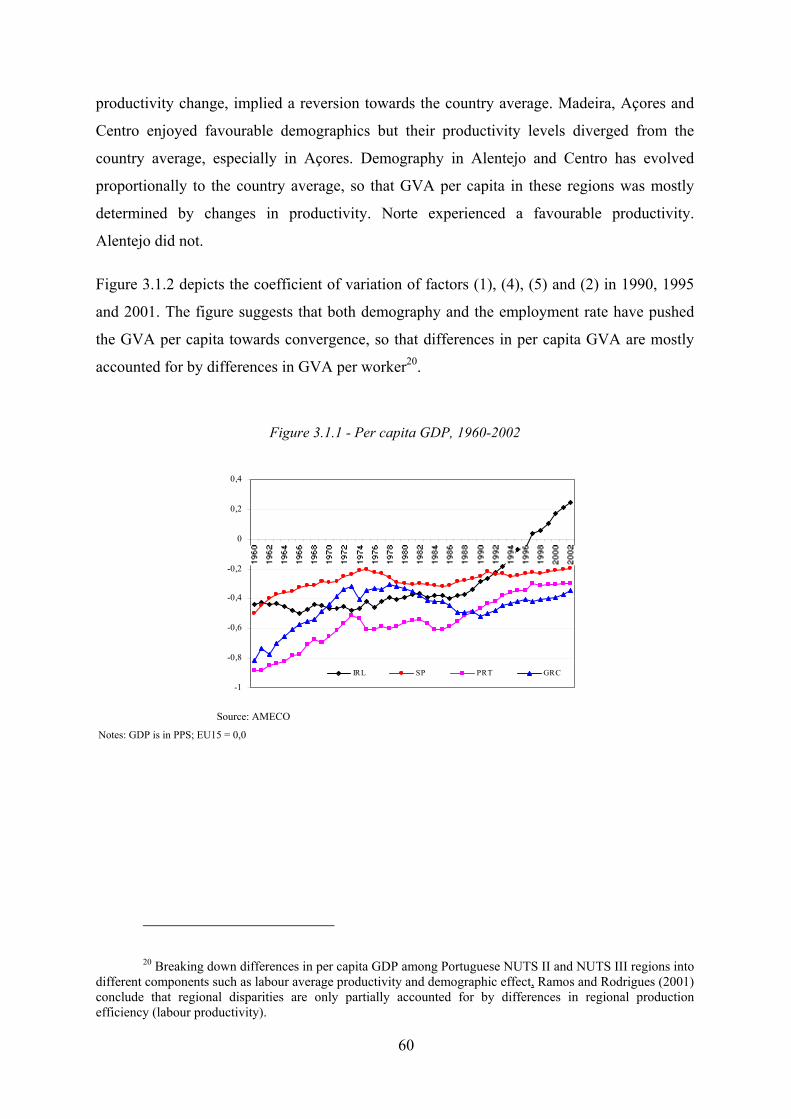
60
productivity change, implied a reversion towards the country average. Madeira, Açores and
Centro enjoyed favourable demographics but their productivity levels diverged from the
country average, especially in Açores. Demography in Alentejo and Centro has evolved
proportionally to the country average, so that GVA per capita in these regions was mostly
determined by changes in productivity. Norte experienced a favourable productivity.
Alentejo did not.
Figure 3.1.2 depicts the coefficient of variation of factors (1), (4), (5) and (2) in 1990, 1995
and 2001. The figure suggests that both demography and the employment rate have pushed
the GVA per capita towards convergence, so that differences in per capita GVA are mostly
accounted for by differences in GVA per worker20.
Figure 3.1.1 - Per capita GDP, 1960-2002
-1
-0,8
-0,6
-0,4
-0,2
0
0,2
0,4
IRL SP PRT GRC
Source: AMECO
Notes: GDP is in PPS; EU15 = 0,0
20 Breaking down differences in per capita GDP among Portuguese NUTS II and NUTS III regions into different components such as labour average productivity and demographic effect, Ramos and Rodrigues (2001) conclude that regional disparities are only partially accounted for by differences in regional production efficiency (labour productivity).
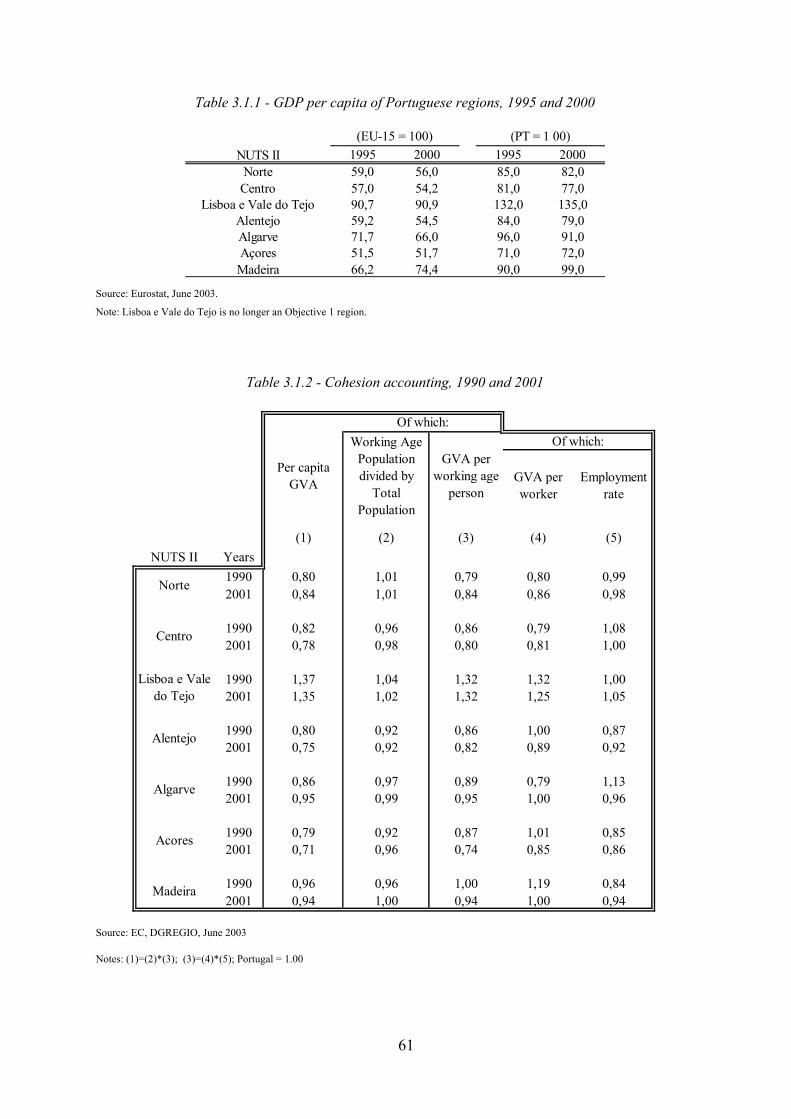
61
Table 3.1.1 - GDP per capita of Portuguese regions, 1995 and 2000
1995 2000 1995 2000Norte 59,0 56,0 85,0 82,0Centro 57,0 54,2 81,0 77,0
Lisboa e Vale do Tejo 90,7 90,9 132,0 135,0Alentejo 59,2 54,5 84,0 79,0Algarve 71,7 66,0 96,0 91,0Açores 51,5 51,7 71,0 72,0Madeira 66,2 74,4 90,0 99,0
(EU-15 = 100) (PT = 1 00)NUTS II
Source: Eurostat, June 2003.
Note: Lisboa e Vale do Tejo is no longer an Objective 1 region.
Table 3.1.2 - Cohesion accounting, 1990 and 2001
GVA per worker
Employment rate
(1) (2) (3) (4) (5)NUTS II Years
1990 0,80 1,01 0,79 0,80 0,992001 0,84 1,01 0,84 0,86 0,98
1990 0,82 0,96 0,86 0,79 1,082001 0,78 0,98 0,80 0,81 1,00
1990 1,37 1,04 1,32 1,32 1,002001 1,35 1,02 1,32 1,25 1,05
1990 0,80 0,92 0,86 1,00 0,872001 0,75 0,92 0,82 0,89 0,92
1990 0,86 0,97 0,89 0,79 1,132001 0,95 0,99 0,95 1,00 0,96
1990 0,79 0,92 0,87 1,01 0,852001 0,71 0,96 0,74 0,85 0,86
1990 0,96 0,96 1,00 1,19 0,842001 0,94 1,00 0,94 1,00 0,94
Madeira
Of which: Of which:
Algarve
Acores
Alentejo
Per capita GVA
Norte
Centro
Lisboa e Vale do Tejo
Working Age Population divided by
Total Population
GVA per working age
person
Source: EC, DGREGIO, June 2003
Notes: (1)=(2)*(3); (3)=(4)*(5); Portugal = 1.00
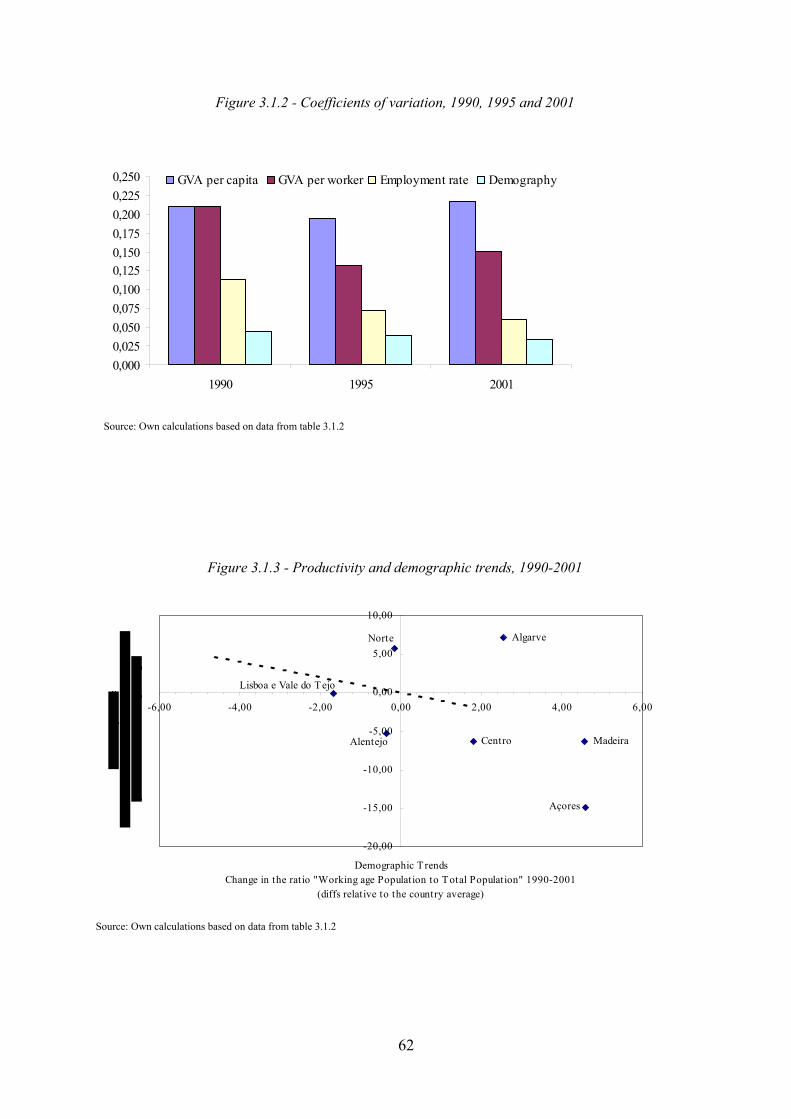
62
Figure 3.1.2 - Coefficients of variation, 1990, 1995 and 2001
0,0000,0250,0500,0750,1000,1250,1500,1750,2000,2250,250
1990 1995 2001
GVA per capita GVA per worker Employment rate Demography
Source: Own calculations based on data from table 3.1.2
Figure 3.1.3 - Productivity and demographic trends, 1990-2001
MadeiraAlentejo
Lisboa e Vale do Tejo
Centro
Norte Algarve
Açores
-20,00
-15,00
-10,00
-5,00
0,00
5,00
10,00
-6,00 -4,00 -2,00 0,00 2,00 4,00 6,00
Demographic Trends Change in the ratio "Working age Population to Total Population" 1990-2001
(diffs relative to the country average)
Source: Own calculations based on data from table 3.1.2
63
3.2 - Regional profiles
The data provided in this section draws on secondary data as well as on primary qualitative
data collected through interviews with policy makers, regional leaders and academics. The
interviews were based on a pre-defined questionnaire on the impact of national/regional
policies on the development path of each region in the recent past. In addition, open-ended
exploratory questions allowed for the collection of comprehensive data on regional
specificities that were not predicted at the outset.
Hereafter, all seven Portuguese regions are characterised in terms of their evolution over the
decade 1991-2001, their specialisation pattern and the evolution of regional indicators. Then,
a SWOT analysis evidences strengths, weaknesses, opportunities and threats for the
development of the regions. Finally, we present interview evidence on the assessment by
regional representatives of the domestic policies’ impact on regional cohesion and contrast it
with a researcher’s perspective.
3.2.1 - Regional profile: Norte
The Norte is the largest Portuguese NUTS II region in terms of population and population
employed. It is thus of major concern to see that per capita GDP and GVA per head of this
region have persistently been below the national and the European average, placing itself
amongst the poorest regions Europe-wide21. Moreover, table 3.2.1.1 shows that, between
1995 and 2001, the Norte has worsened its GDP per capita level with reference both to the
EU average and to the national average. Nevertheless, in table 3.1.2 above (see subsection
3.1), we observed that in terms of per capita GVA, Norte has approached the country average
over 1990-2001. The development is characterised by a favourable productivity trend
coupled with a neutral demographic change (see figure 3.1.3, subsection 3.1).
21 Figures on regional output are being subject to successive revisions and data are not necessarily consistent across tables. For this reason, we try to identify in each table the specific database being used. In the latest DGRegio (Regional Policy Directorate-General) database, data from GDP and GVA appear to reveal some inconsistencies.
64
The Norte region has been traditionally industrial. Accordingly to the 2001 Census, industry
accounts for 43 per cent of total employment in the region, the highest value in the country
and amongst the highest shares Europe-wide. The region specialises in traditional industry
(see Box 3.2.1.1), and the restructuring process over the last decades reinforced this pattern.
Box 3.2.1.1 – Chief industrial specialisation
Textile/apparel, leather/footwear;
Electric machinery and products;
Metal-working machinery and metal
products;
Wood/furniture, cork.
Beverages;
Transport material;
Commerce.
In a context where agriculture based on ‘minifondia’ (small holdings) is dominant and where
entrepreneurial spirit is lacking, there has been no room for productivity increases and
farming employment has been clearly declining. The decline in the share of agricultural
employment in the total employment has probably contributed to the increase in the overall
level of productivity.
Behind the overall indicators, one must add an intra-regional phenomenon characterised by
significant intra-regional divergence. The Norte coast is the most developed part of the Norte
region, with the metropolitan city of Porto accounting for about 98 per cent of the industry in
the Norte region, and it displays a more diversified structure. The case study of Norte-
Portugal points to a very high concentration of investments in transport infrastructure in the
area of larger Porto, to the detriment of internal areas of the hinterland. Agriculture is still an
important activity, especially in the internal mountain areas and along the Douro Valley.
Cow’s milk and wine, horticultural and fruit production, olive oil, sheep and goats are the
most significant products.
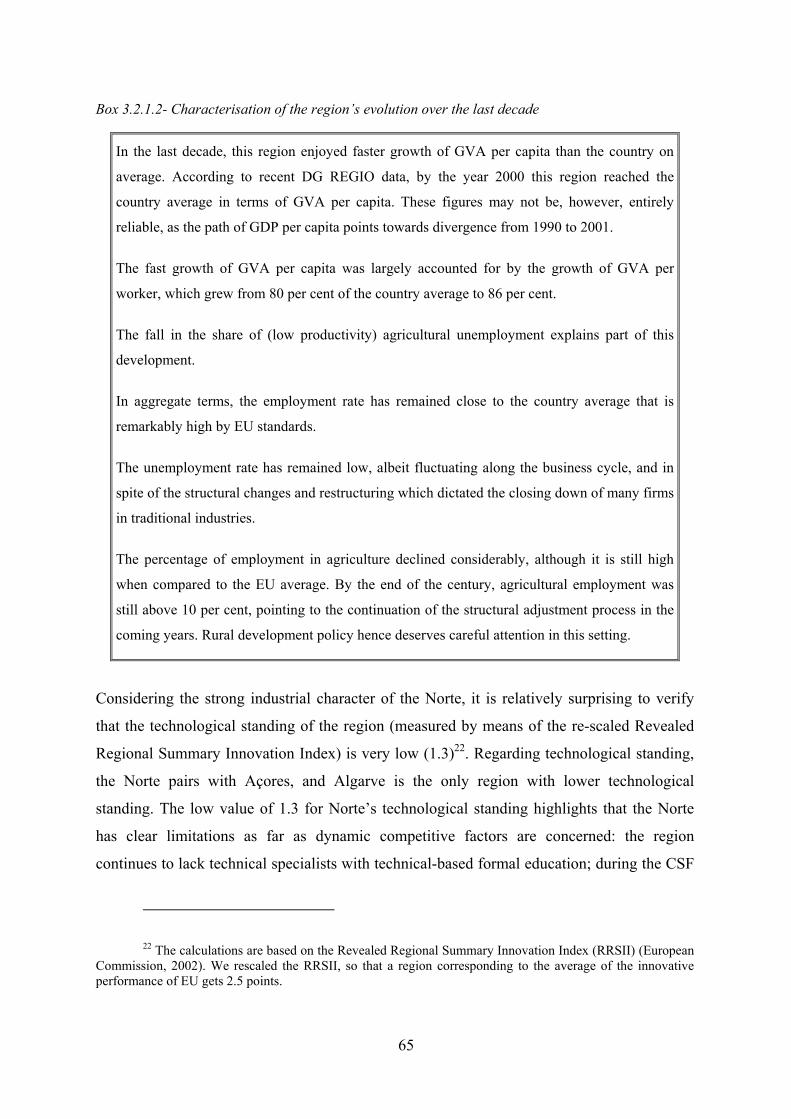
65
Box 3.2.1.2- Characterisation of the region’s evolution over the last decade
Considering the strong industrial character of the Norte, it is relatively surprising to verify
that the technological standing of the region (measured by means of the re-scaled Revealed
Regional Summary Innovation Index) is very low (1.3)22. Regarding technological standing,
the Norte pairs with Açores, and Algarve is the only region with lower technological
standing. The low value of 1.3 for Norte’s technological standing highlights that the Norte
has clear limitations as far as dynamic competitive factors are concerned: the region
continues to lack technical specialists with technical-based formal education; during the CSF
22 The calculations are based on the Revealed Regional Summary Innovation Index (RRSII) (European Commission, 2002). We rescaled the RRSII, so that a region corresponding to the average of the innovative performance of EU gets 2.5 points.
In the last decade, this region enjoyed faster growth of GVA per capita than the country on
average. According to recent DG REGIO data, by the year 2000 this region reached the
country average in terms of GVA per capita. These figures may not be, however, entirely
reliable, as the path of GDP per capita points towards divergence from 1990 to 2001.
The fast growth of GVA per capita was largely accounted for by the growth of GVA per
worker, which grew from 80 per cent of the country average to 86 per cent.
The fall in the share of (low productivity) agricultural unemployment explains part of this
development.
In aggregate terms, the employment rate has remained close to the country average that is
remarkably high by EU standards.
The unemployment rate has remained low, albeit fluctuating along the business cycle, and in
spite of the structural changes and restructuring which dictated the closing down of many firms
in traditional industries.
The percentage of employment in agriculture declined considerably, although it is still high
when compared to the EU average. By the end of the century, agricultural employment was
still above 10 per cent, pointing to the continuation of the structural adjustment process in the
coming years. Rural development policy hence deserves careful attention in this setting.
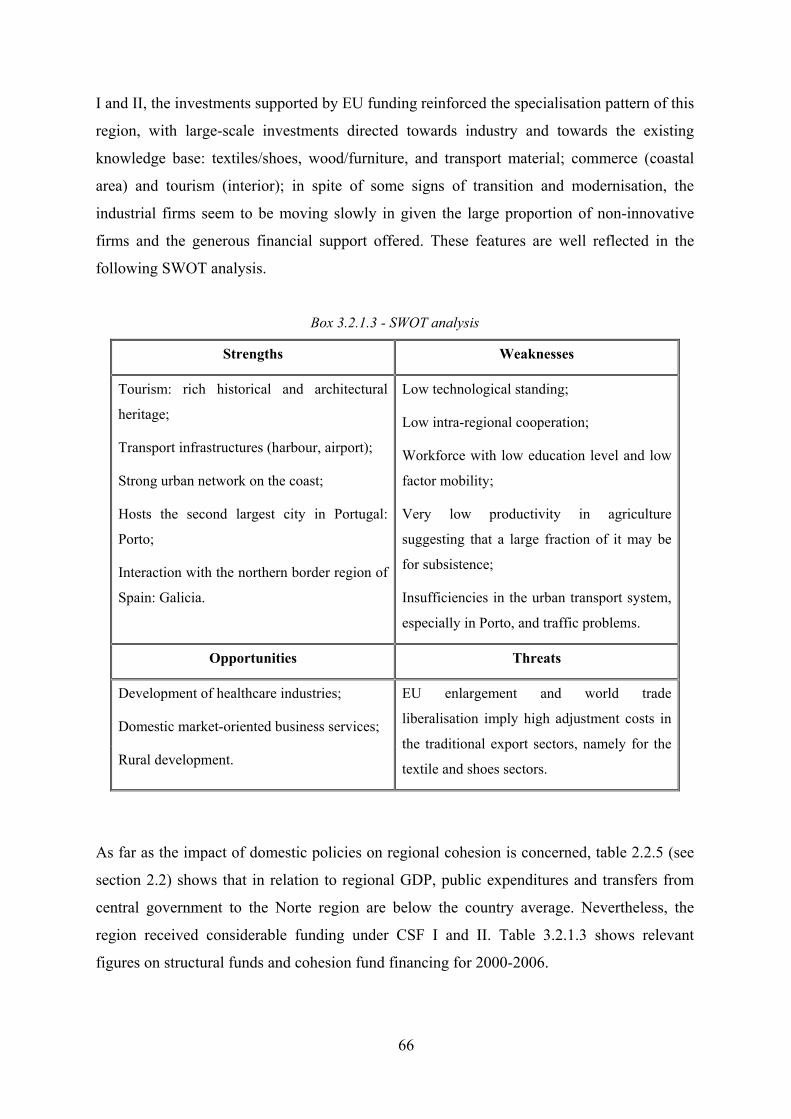
66
I and II, the investments supported by EU funding reinforced the specialisation pattern of this
region, with large-scale investments directed towards industry and towards the existing
knowledge base: textiles/shoes, wood/furniture, and transport material; commerce (coastal
area) and tourism (interior); in spite of some signs of transition and modernisation, the
industrial firms seem to be moving slowly in given the large proportion of non-innovative
firms and the generous financial support offered. These features are well reflected in the
following SWOT analysis.
Box 3.2.1.3 - SWOT analysis
Strengths Weaknesses
Tourism: rich historical and architectural
heritage;
Transport infrastructures (harbour, airport);
Strong urban network on the coast;
Hosts the second largest city in Portugal:
Porto;
Interaction with the northern border region of
Spain: Galicia.
Low technological standing;
Low intra-regional cooperation;
Workforce with low education level and low
factor mobility;
Very low productivity in agriculture
suggesting that a large fraction of it may be
for subsistence;
Insufficiencies in the urban transport system,
especially in Porto, and traffic problems.
Opportunities Threats
Development of healthcare industries;
Domestic market-oriented business services;
Rural development.
EU enlargement and world trade
liberalisation imply high adjustment costs in
the traditional export sectors, namely for the
textile and shoes sectors.
As far as the impact of domestic policies on regional cohesion is concerned, table 2.2.5 (see
section 2.2) shows that in relation to regional GDP, public expenditures and transfers from
central government to the Norte region are below the country average. Nevertheless, the
region received considerable funding under CSF I and II. Table 3.2.1.3 shows relevant
figures on structural funds and cohesion fund financing for 2000-2006.
67
According to the regional representatives, national policies overall had a highly positive
impact on regional sustainable development and cohesion (5 on a 5-point scale). Table
3.2.1.4 indicates the quantitative evaluation of domestic policies from a regional
representative perspective.
According to the interviewees, public expenditures on training and infrastructures in
particular and public transfers from the government had a highly positive impact on regional
competitive dimensions and on raising families’ income.
Along with macroeconomic developments, employment policy and S&T were considered
positive for cohesion. While employment policy, through the recycling of competencies and
financial support for families, fostered intra-regional cohesion (these problems are of major
concern in lower income regions), S&T policy worked to the benefit of the most developed
areas within the region. The present regional development plan, expressed in the
NORTINOV (Regional Programme of Innovative Actions of Region Norte) programme
coordinated by the CCRN moved from a generalist to a more selective strategy. Automobile,
automation, robotics, communication and information technologies are the industries under
focus. These developments indicate clear efforts to promote structural change based on the
development of high value-added selected industrial clusters, maximising the potential of
areas in which there is already a knowledge-base.
The interviewees were more critical about the impact of state aids and foreign direct
investment policy, given that, despite some signs of transition and modernisation, the
industrial firms seem to be moving slowly considering the high percentage of non-innovative
firms and the generous financial support offered. Moreover, under the CSF I and II, the state
aid to business investments in the Litoral (Porto coastal area in particular) also accounted for
the largest share of the total business state aid attributed in the region, contributing to the
concentration of investments in the coastal area. In contrast, several districts of the interior
Norte show considerable positive investment dynamics under the CSF III (e.g. Tourism,
Territorial Improvement Programmes).
Foreign Direct Investment is not considered to have had a significant impact on regional
cohesion. Moreover, it has contributed to intra-regional divergence, with larger investments
located at central and larger poles. One may also predict low interaction between the local
fabric and MNEs, based on the opinion that MNEs establish in distinct industries, hence
reducing spill-over effects.
68
As referred above, the Norte is characterised by significant intra-regional divergence. FDI,
S&T and state aids seem to have worked to the detriment of internal areas of the hinterland.
In these areas agriculture is still an important activity. Income support is very low.
Opportunities for the rural areas will occur mainly within the context of the rural
development policy (with progressive CAP reform). One cannot ignore that the receptivity to
this type of policy represents a very strong asset, mainly because a major part of rural areas
still preserve a major capacity to fix people and activities. In the Douro-valley with its large
potential in terms of image, resource-landscape and heritage or in rural areas where rural
tourism is already developed and organised, the challenge is not one of starting from zero
but, on the contrary, to strengthen a tendency whose effects already start to be perceived by
the population. It is these areas of the Norte region which benefited most from the LEADER
initiative by developing the component of rural development, by improving the endowment
with social and cultural facilities, etc. In territories where desertification progressed
irreversibly, the environmental component of CAP will become a key factor enabling rural
income to reach a threshold essential for fixing people.
As reflected in table 3.2.1.5, with the exception of business support and tourism, domestic
policies overall are considered to have had a strongly positive impact on a variety of areas,
from social to economic dimensions.
In order to improve policy efficiency, regional representatives call for greater involvement of
private firms, associations and institutions in the design and implementation of regional
policy. Increasing efficiency in the allocation of resources and changes in governance are
suggested to improve the policies’ impact. The regional representative argues that
decentralization to regional and local entities has been minimal. There is higher coordination
between regional and local levels, but communication with national programme leaders is
difficult.
In spite of not being the primary aim of this research, the fieldwork did provide some insights
about the impact of prominent European Community policies on regional cohesion. The
relevance of structural funds was clearly highlighted. (5 on a 5-point scale). While
environmental policy had a positive impact, fisheries and agricultural policies had a negative
to neutral impact on regional cohesion. Agriculture programmes were not able to eliminate
the problems inherited from the past: very small holdings, auto-sufficiency agriculture and

69
low productivity; yet, these measures influenced the quality of life and the environment
positively.
Table 3.2.1.1 - Evolution of regional indicators, 1991-2001
Variable 1991 1995 2000 2001(1) GDP per head (PPS) EU-15 = 100 - 59,0 56,0 56,8(2) GDP per head (PPS) Portugal = 100 88,0 85,0 82,0 84,0(3) Population (thousands) 3.514,2 3.558,0 3.638,0 3.653,0(4) % Population < 15 plus % Population > 64 33,0 31,7 31,5 31,7(5) Working age population 67,0 68,3 68,5 68,3(6) Employment rate1 69,0 64,5 69,2 70,2(7) Unemployment rate2 2,7 6,3 4,1 3,7(8) GVA per worker (1995 - 103 euros) 12,8 13,8 15,1 15,2(9) GVA per worker on agricultural sector (1995 in 103 euros) 4,0 4,7 4,8 4,3(10) Employment on agricultural sector/total employment 17,1 13,7 11,1 10,6
Year
Sources: (1) - Eurostat, April 2003; (2), (3), (4), (5), (6), (8), (9) and (10) - Eurostat, June 2003; (7) - Eurostat, July 2003
Notes: (5) Working age population = (Population older than 15 years and younger than 64 years/total population)*100; (6) Employment
Rate = (Employment/Working age population)*100; (7) Unemployment rate = (Number of unemployed people/Number of people in the
labour force)*100; 1is defined as the percentage of working-age people who have jobs; 2 is defined as the percentage of the labour force that
actively seeks work but is unable to find work at a given time
Table 3.2.1.2 - Transfers from Central Government, 1999-2001
Funds per inhabitant (103 euros) Portugal = 100 Scale31,3 33,0 1,691,9 79,0 0,0123,2 81,0 0,8
Municipal Cohesion Fund (FCM)Municipalities’ General Fund (FGM)
Total
Fund
Note: Scale for region i =
−−
mM
mi
xxxx5 . M is the maximum and m is the minimum value for the regional funds. The numerator is the
distance relatively to the minimum and the denominator is the total amplitude. The minimum scale is 0 and the maximum is 5.
Table 3.2.1.3 - European regional policy, 2000-2006
Fund Funds per inhabitant (103 euros) Portugal = 100Structural Funds 0,74 85,39Cohesion Funds n.a.d. n.a.d.
Total - - Note: n.a.d. = no available data
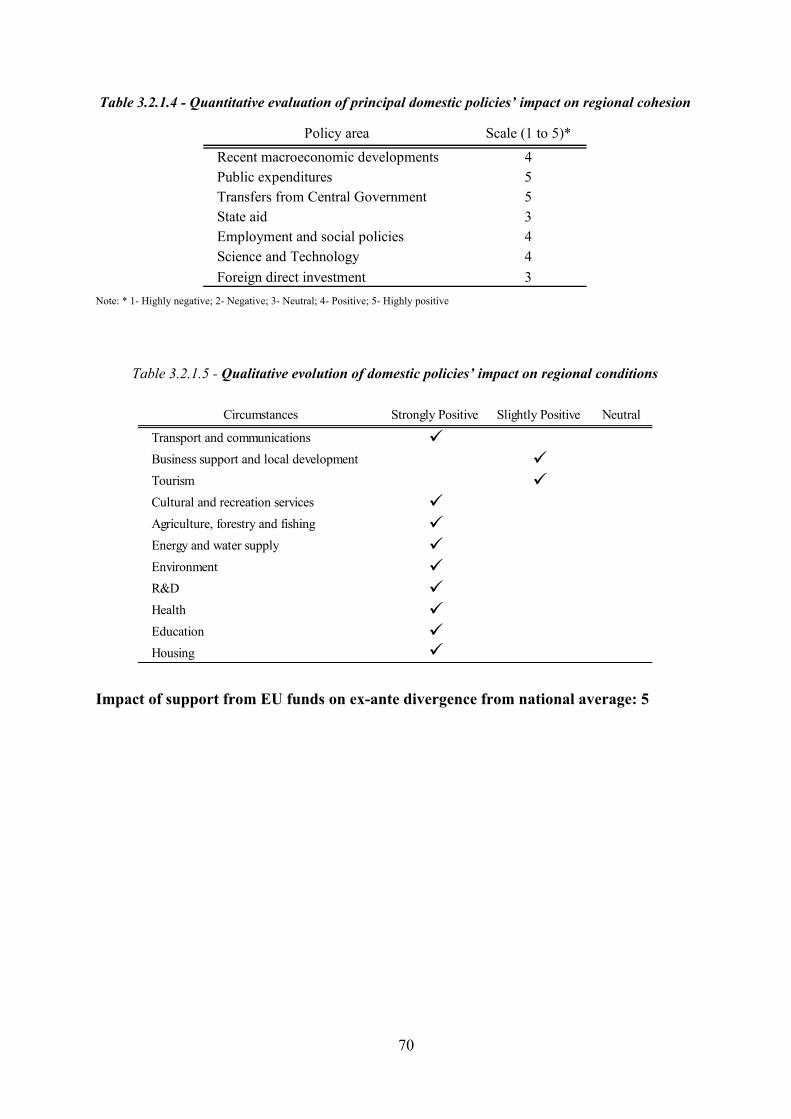
70
Table 3.2.1.4 - Quantitative evaluation of principal domestic policies’ impact on regional cohesion
Policy area Scale (1 to 5)* Recent macroeconomic developments 4 Public expenditures 5 Transfers from Central Government 5 State aid 3 Employment and social policies 4 Science and Technology 4 Foreign direct investment 3
Note: * 1- Highly negative; 2- Negative; 3- Neutral; 4- Positive; 5- Highly positive
Table 3.2.1.5 - Qualitative evolution of domestic policies’ impact on regional conditions
Circumstances Strongly Positive Slightly Positive Neutral
Transport and communications
Business support and local development
Tourism
Cultural and recreation services
Agriculture, forestry and fishing
Energy and water supply
Environment
R&D
Health
Education
Housing
Impact of support from EU funds on ex-ante divergence from national average: 5
71
3.2.2 - Regional profile: Centro
The Centro is the third largest Portuguese NUTS II region in terms of population and
population employed. It is thus significant that the per capita GDP and GVA per head of this
region are persistently below the national and European average. Table 3.2.2.1 shows that,
between 1995 and 2001, Centro has worsened its GDP per capita levels with reference both
to the EU average and to the national average23.
Table 3.1.2 above (see subsection 3.1) compared, in terms of per capita GVA, the relative
position of the different Portuguese regions vis-à-vis the country average in 1990 and in
200124. Comparing the levels of 1990 and 2001 in each region, we observed that Centro has
diverged from the country average. As shown in figure 3.1.3 (see subsection 3.1), Centro
enjoyed favourable demographics but its productivity level diverged from the country
average.
According to the 2001 Census, industry accounts for 32 per cent of the region’s total
employment, the second-highest value in the country. Traditional industries such as footwear
manufacturing and wood/cork still account for a significant share of employment in the
region. Nevertheless, the Centro has witnessed the development of a modernised and
technology-based sector composed of ceramics and glass, and new areas in metal working
machinery and products, electronics and transport material. Within industry, the funds
reinforced the regional specialisation pattern, with large-scale investments directed towards
the existing knowledge-base in textiles and leather/footwear. Under the CSF III the area of
specialisation, namely the electronics and automotive sectors, receive more funding.
23 Figures on regional output are being subject to successive revisions and data are not necessarily consistent across tables. For this reason, we try to identify in each table the specific database being used. In the latest DGRegio database, data from GDP and GVA appear to reveal some inconsistencies.
24 Data before 1990 is not shown due to lack of reliability.
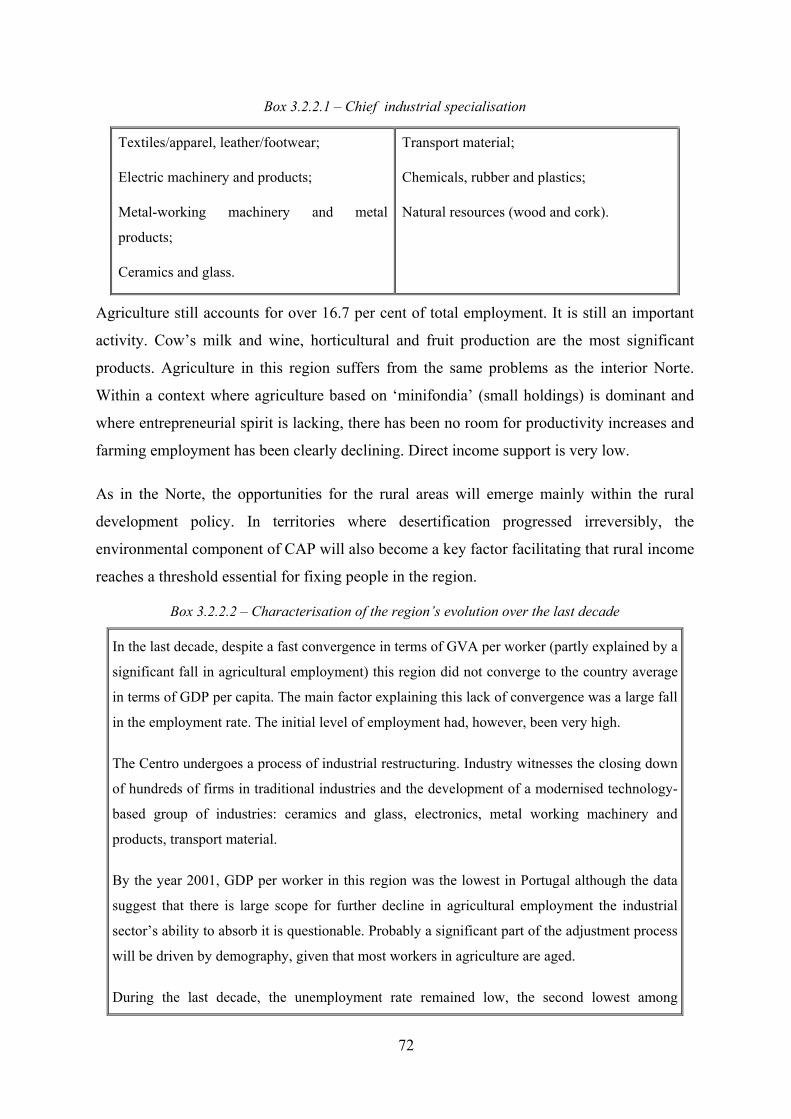
72
Box 3.2.2.1 – Chief industrial specialisation
Textiles/apparel, leather/footwear;
Electric machinery and products;
Metal-working machinery and metal
products;
Ceramics and glass.
Transport material;
Chemicals, rubber and plastics;
Natural resources (wood and cork).
Agriculture still accounts for over 16.7 per cent of total employment. It is still an important
activity. Cow’s milk and wine, horticultural and fruit production are the most significant
products. Agriculture in this region suffers from the same problems as the interior Norte.
Within a context where agriculture based on ‘minifondia’ (small holdings) is dominant and
where entrepreneurial spirit is lacking, there has been no room for productivity increases and
farming employment has been clearly declining. Direct income support is very low.
As in the Norte, the opportunities for the rural areas will emerge mainly within the rural
development policy. In territories where desertification progressed irreversibly, the
environmental component of CAP will also become a key factor facilitating that rural income
reaches a threshold essential for fixing people in the region.
Box 3.2.2.2 – Characterisation of the region’s evolution over the last decade
In the last decade, despite a fast convergence in terms of GVA per worker (partly explained by a
significant fall in agricultural employment) this region did not converge to the country average
in terms of GDP per capita. The main factor explaining this lack of convergence was a large fall
in the employment rate. The initial level of employment had, however, been very high.
The Centro undergoes a process of industrial restructuring. Industry witnesses the closing down
of hundreds of firms in traditional industries and the development of a modernised technology-
based group of industries: ceramics and glass, electronics, metal working machinery and
products, transport material.
By the year 2001, GDP per worker in this region was the lowest in Portugal although the data
suggest that there is large scope for further decline in agricultural employment the industrial
sector’s ability to absorb it is questionable. Probably a significant part of the adjustment process
will be driven by demography, given that most workers in agriculture are aged.
During the last decade, the unemployment rate remained low, the second lowest among
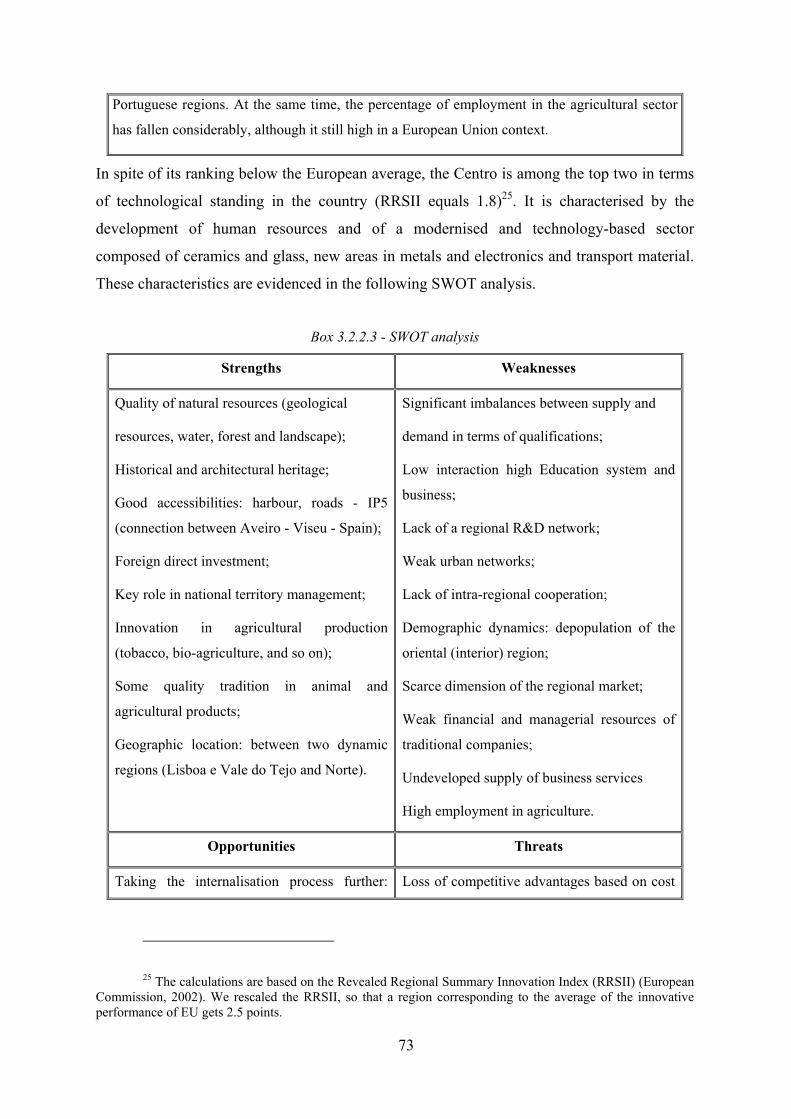
73
Portuguese regions. At the same time, the percentage of employment in the agricultural sector
has fallen considerably, although it still high in a European Union context.
In spite of its ranking below the European average, the Centro is among the top two in terms
of technological standing in the country (RRSII equals 1.8)25. It is characterised by the
development of human resources and of a modernised and technology-based sector
composed of ceramics and glass, new areas in metals and electronics and transport material.
These characteristics are evidenced in the following SWOT analysis.
Box 3.2.2.3 - SWOT analysis
Strengths Weaknesses
Quality of natural resources (geological
resources, water, forest and landscape);
Historical and architectural heritage;
Good accessibilities: harbour, roads - IP5
(connection between Aveiro - Viseu - Spain);
Foreign direct investment;
Key role in national territory management;
Innovation in agricultural production
(tobacco, bio-agriculture, and so on);
Some quality tradition in animal and
agricultural products;
Geographic location: between two dynamic
regions (Lisboa e Vale do Tejo and Norte).
Significant imbalances between supply and
demand in terms of qualifications;
Low interaction high Education system and
business;
Lack of a regional R&D network;
Weak urban networks;
Lack of intra-regional cooperation;
Demographic dynamics: depopulation of the
oriental (interior) region;
Scarce dimension of the regional market;
Weak financial and managerial resources of
traditional companies;
Undeveloped supply of business services
High employment in agriculture.
Opportunities Threats
Taking the internalisation process further: Loss of competitive advantages based on cost
25 The calculations are based on the Revealed Regional Summary Innovation Index (RRSII) (European Commission, 2002). We rescaled the RRSII, so that a region corresponding to the average of the innovative performance of EU gets 2.5 points.
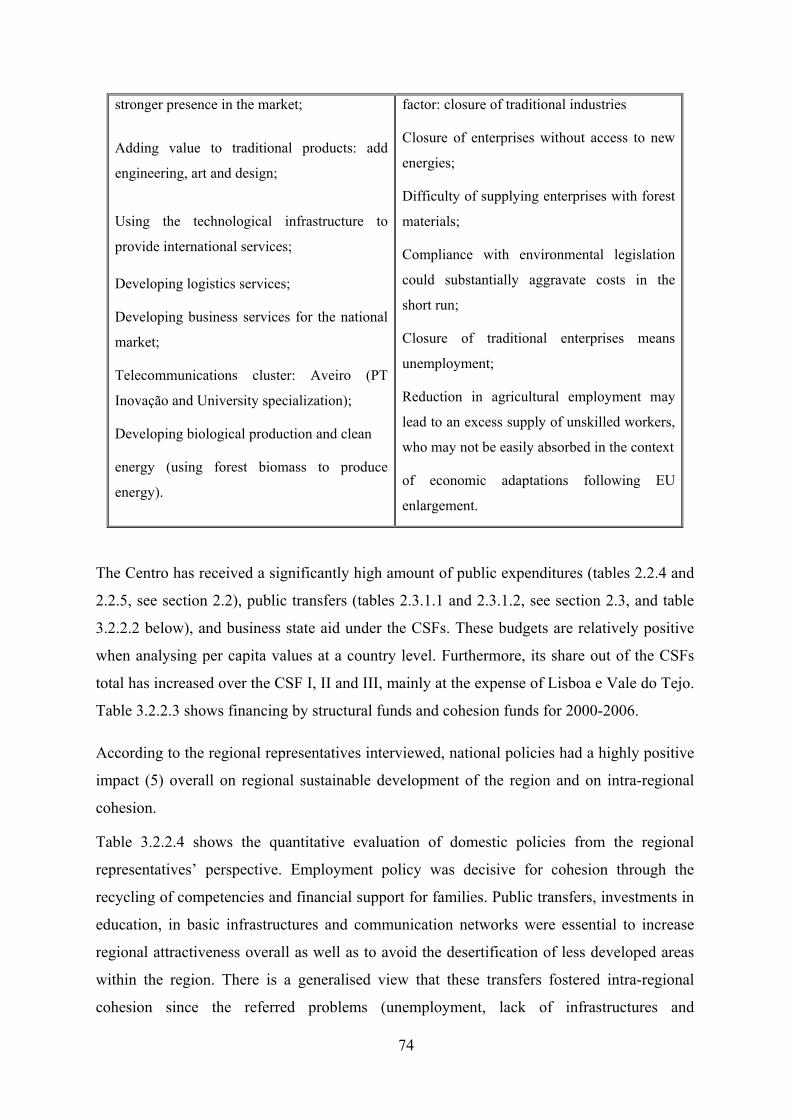
74
stronger presence in the market;
Adding value to traditional products: add
engineering, art and design;
Using the technological infrastructure to
provide international services;
Developing logistics services;
Developing business services for the national
market;
Telecommunications cluster: Aveiro (PT
Inovação and University specialization);
Developing biological production and clean
energy (using forest biomass to produce
energy).
factor: closure of traditional industries
Closure of enterprises without access to new
energies;
Difficulty of supplying enterprises with forest
materials;
Compliance with environmental legislation
could substantially aggravate costs in the
short run;
Closure of traditional enterprises means
unemployment;
Reduction in agricultural employment may
lead to an excess supply of unskilled workers,
who may not be easily absorbed in the context
of economic adaptations following EU
enlargement.
The Centro has received a significantly high amount of public expenditures (tables 2.2.4 and
2.2.5, see section 2.2), public transfers (tables 2.3.1.1 and 2.3.1.2, see section 2.3, and table
3.2.2.2 below), and business state aid under the CSFs. These budgets are relatively positive
when analysing per capita values at a country level. Furthermore, its share out of the CSFs
total has increased over the CSF I, II and III, mainly at the expense of Lisboa e Vale do Tejo.
Table 3.2.2.3 shows financing by structural funds and cohesion funds for 2000-2006.
According to the regional representatives interviewed, national policies had a highly positive
impact (5) overall on regional sustainable development of the region and on intra-regional
cohesion.
Table 3.2.2.4 shows the quantitative evaluation of domestic policies from the regional
representatives’ perspective. Employment policy was decisive for cohesion through the
recycling of competencies and financial support for families. Public transfers, investments in
education, in basic infrastructures and communication networks were essential to increase
regional attractiveness overall as well as to avoid the desertification of less developed areas
within the region. There is a generalised view that these transfers fostered intra-regional
cohesion since the referred problems (unemployment, lack of infrastructures and
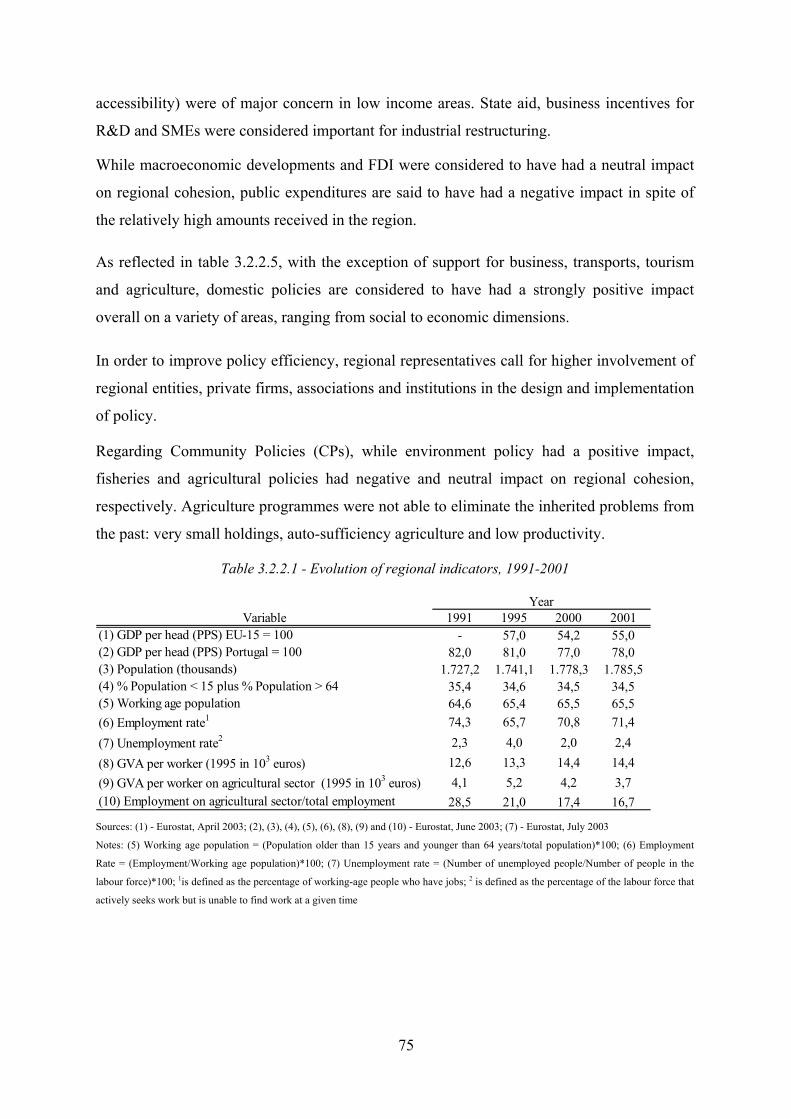
75
accessibility) were of major concern in low income areas. State aid, business incentives for
R&D and SMEs were considered important for industrial restructuring.
While macroeconomic developments and FDI were considered to have had a neutral impact
on regional cohesion, public expenditures are said to have had a negative impact in spite of
the relatively high amounts received in the region.
As reflected in table 3.2.2.5, with the exception of support for business, transports, tourism
and agriculture, domestic policies are considered to have had a strongly positive impact
overall on a variety of areas, ranging from social to economic dimensions.
In order to improve policy efficiency, regional representatives call for higher involvement of
regional entities, private firms, associations and institutions in the design and implementation
of policy.
Regarding Community Policies (CPs), while environment policy had a positive impact,
fisheries and agricultural policies had negative and neutral impact on regional cohesion,
respectively. Agriculture programmes were not able to eliminate the inherited problems from
the past: very small holdings, auto-sufficiency agriculture and low productivity.
Table 3.2.2.1 - Evolution of regional indicators, 1991-2001
Variable 1991 1995 2000 2001(1) GDP per head (PPS) EU-15 = 100 - 57,0 54,2 55,0(2) GDP per head (PPS) Portugal = 100 82,0 81,0 77,0 78,0(3) Population (thousands) 1.727,2 1.741,1 1.778,3 1.785,5(4) % Population < 15 plus % Population > 64 35,4 34,6 34,5 34,5(5) Working age population 64,6 65,4 65,5 65,5(6) Employment rate1 74,3 65,7 70,8 71,4(7) Unemployment rate2 2,3 4,0 2,0 2,4(8) GVA per worker (1995 in 103 euros) 12,6 13,3 14,4 14,4(9) GVA per worker on agricultural sector (1995 in 103 euros) 4,1 5,2 4,2 3,7(10) Employment on agricultural sector/total employment 28,5 21,0 17,4 16,7
Year
Sources: (1) - Eurostat, April 2003; (2), (3), (4), (5), (6), (8), (9) and (10) - Eurostat, June 2003; (7) - Eurostat, July 2003
Notes: (5) Working age population = (Population older than 15 years and younger than 64 years/total population)*100; (6) Employment
Rate = (Employment/Working age population)*100; (7) Unemployment rate = (Number of unemployed people/Number of people in the
labour force)*100; 1is defined as the percentage of working-age people who have jobs; 2 is defined as the percentage of the labour force that
actively seeks work but is unable to find work at a given time
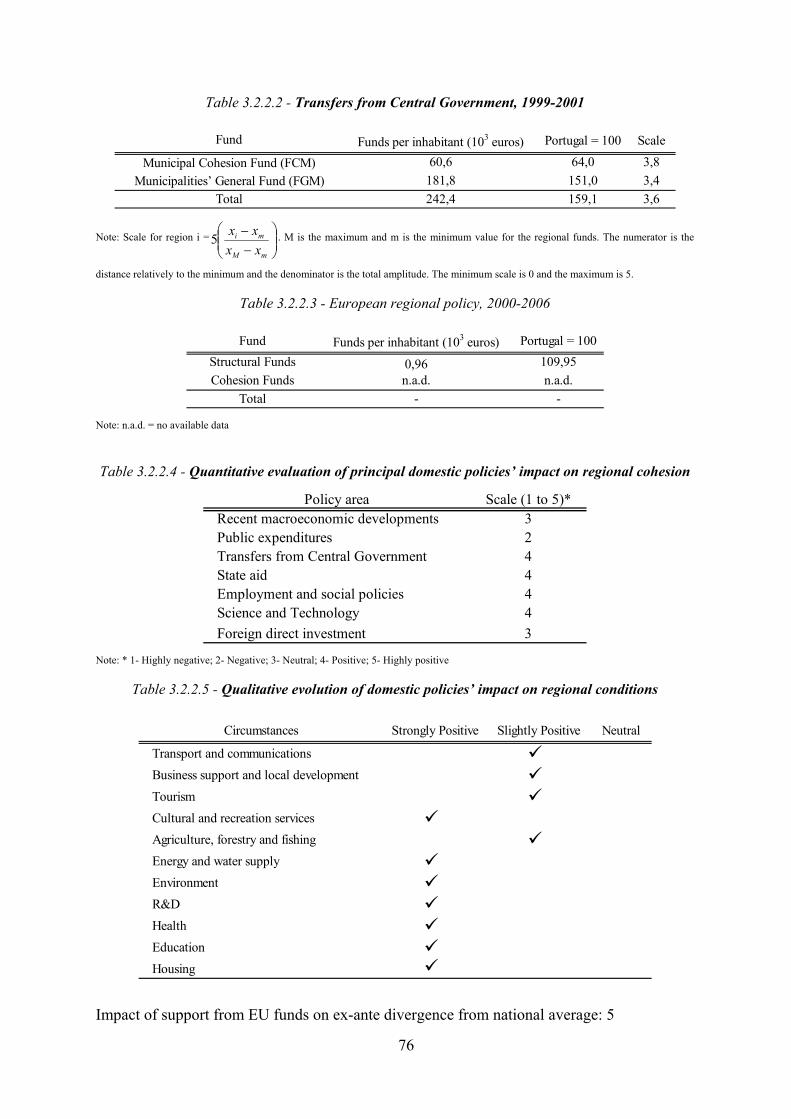
76
Table 3.2.2.2 - Transfers from Central Government, 1999-2001
Funds per inhabitant (103 euros) Portugal = 100 Scale60,6 64,0 3,8
181,8 151,0 3,4242,4 159,1 3,6
Fund
Municipal Cohesion Fund (FCM)Municipalities’ General Fund (FGM)
Total
Note: Scale for region i =
−−
mM
mi
xxxx5 . M is the maximum and m is the minimum value for the regional funds. The numerator is the
distance relatively to the minimum and the denominator is the total amplitude. The minimum scale is 0 and the maximum is 5.
Table 3.2.2.3 - European regional policy, 2000-2006
Fund Funds per inhabitant (103 euros) Portugal = 100Structural Funds 0,96 109,95Cohesion Funds n.a.d. n.a.d.
Total - - Note: n.a.d. = no available data
Table 3.2.2.4 - Quantitative evaluation of principal domestic policies’ impact on regional cohesion
Policy area Scale (1 to 5)* Recent macroeconomic developments 3Public expenditures 2Transfers from Central Government 4State aid 4Employment and social policies 4Science and Technology 4Foreign direct investment 3
Note: * 1- Highly negative; 2- Negative; 3- Neutral; 4- Positive; 5- Highly positive
Table 3.2.2.5 - Qualitative evolution of domestic policies’ impact on regional conditions
Circumstances Strongly Positive Slightly Positive Neutral
Transport and communications
Business support and local development
Tourism
Cultural and recreation services
Agriculture, forestry and fishing
Energy and water supply
Environment
R&D
Health
Education
Housing
Impact of support from EU funds on ex-ante divergence from national average: 5
77
3.2.3 - Regional profile: Lisboa e Vale do Tejo
Lisboa e Vale do Tejo includes the Portuguese capital (Lisboa) and a surrounding area that
has been very attractive to medium/high-tech manufacturing (e.g. automotive sector in
Palmela), showing high investment and educational dynamics. With the highest GDP per
head in Portugal, Lisboa e Vale do Tejo is the only Portuguese NUTS II region which does
not qualify as Objective 1. This region was covered under Objective 1 up to 1999 and has
meanwhile passed the 75 per cent income threshold. Nevertheless, the unemployment rate is
one of the highest in the country.
Lisboa e Vale do Tejo still enjoys not only a high productivity level but also a high
employment rate and a favourable demographic structure26. However, table 3.1.2 above (see
subsection 3.1), shows that Lisboa e Vale do Tejo’s per capita GVA has decreased towards
the country average between 1990-2001. As shown in figure 3.1.3 (see subsection 3.1),
Lisboa e Vale do Tejo experienced an unfavourable demographic trend which, coupled with
a neutral productivity change, implied a reversion towards the country average value.
The status of the region is related to various systemic conditions, which favour continuous
development and opportunities for growth. Services account for over 60 per cent of the
population employed, while the share of employment in agriculture (3.8 per cent) is the
lowest in the country (see table 3.2.3.1). Probably due to conditions existing from the outset,
namely strong tertiary education, high-value services, accessibilities and centrality close to
decision centres, the region appears to have made the best out of policy conditions.
26 In Table A.2.1.2, the relative per capita GVA is broken down into a demographic component (working age population divided by total population) and a policy-induced component (GVA per working age person). In Columns (4) and (5), the relative GVA per working age person is broken down into GVA per worker and the employment rate.
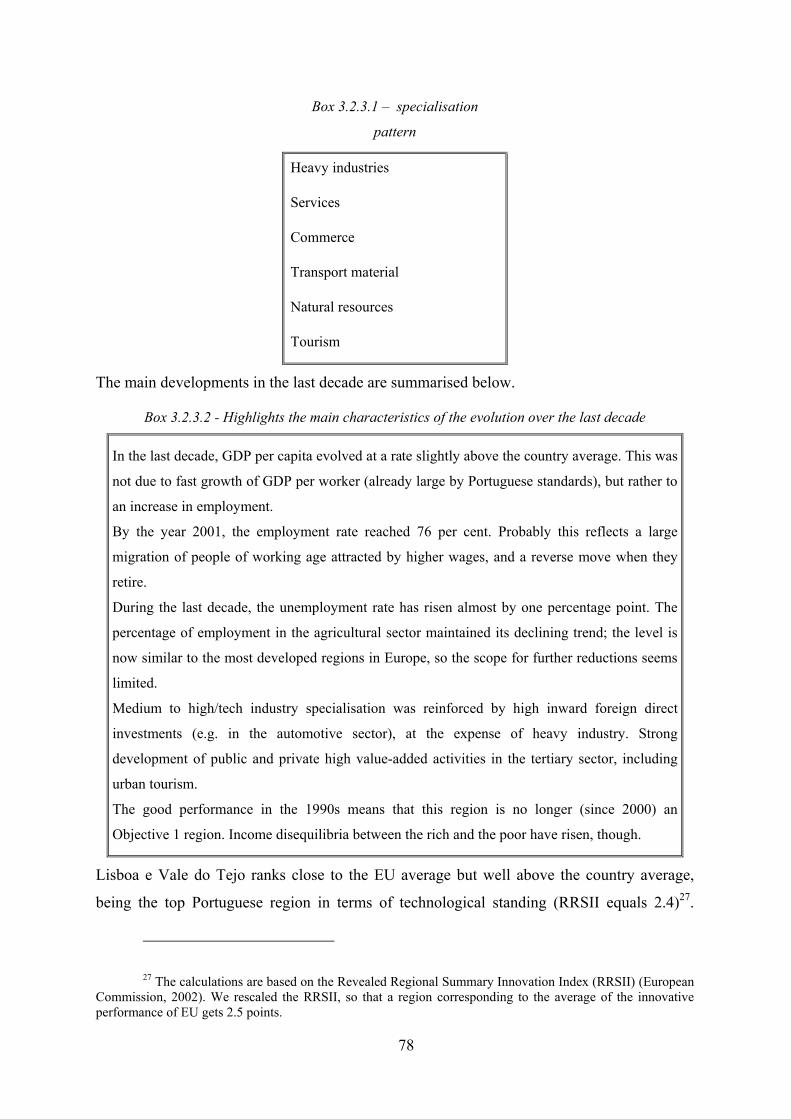
78
Box 3.2.3.1 – specialisation
pattern
Heavy industries
Services
Commerce
Transport material
Natural resources
Tourism
The main developments in the last decade are summarised below.
Box 3.2.3.2 - Highlights the main characteristics of the evolution over the last decade
In the last decade, GDP per capita evolved at a rate slightly above the country average. This was
not due to fast growth of GDP per worker (already large by Portuguese standards), but rather to
an increase in employment.
By the year 2001, the employment rate reached 76 per cent. Probably this reflects a large
migration of people of working age attracted by higher wages, and a reverse move when they
retire.
During the last decade, the unemployment rate has risen almost by one percentage point. The
percentage of employment in the agricultural sector maintained its declining trend; the level is
now similar to the most developed regions in Europe, so the scope for further reductions seems
limited.
Medium to high/tech industry specialisation was reinforced by high inward foreign direct
investments (e.g. in the automotive sector), at the expense of heavy industry. Strong
development of public and private high value-added activities in the tertiary sector, including
urban tourism.
The good performance in the 1990s means that this region is no longer (since 2000) an
Objective 1 region. Income disequilibria between the rich and the poor have risen, though.
Lisboa e Vale do Tejo ranks close to the EU average but well above the country average,
being the top Portuguese region in terms of technological standing (RRSII equals 2.4)27.
27 The calculations are based on the Revealed Regional Summary Innovation Index (RRSII) (European Commission, 2002). We rescaled the RRSII, so that a region corresponding to the average of the innovative performance of EU gets 2.5 points.
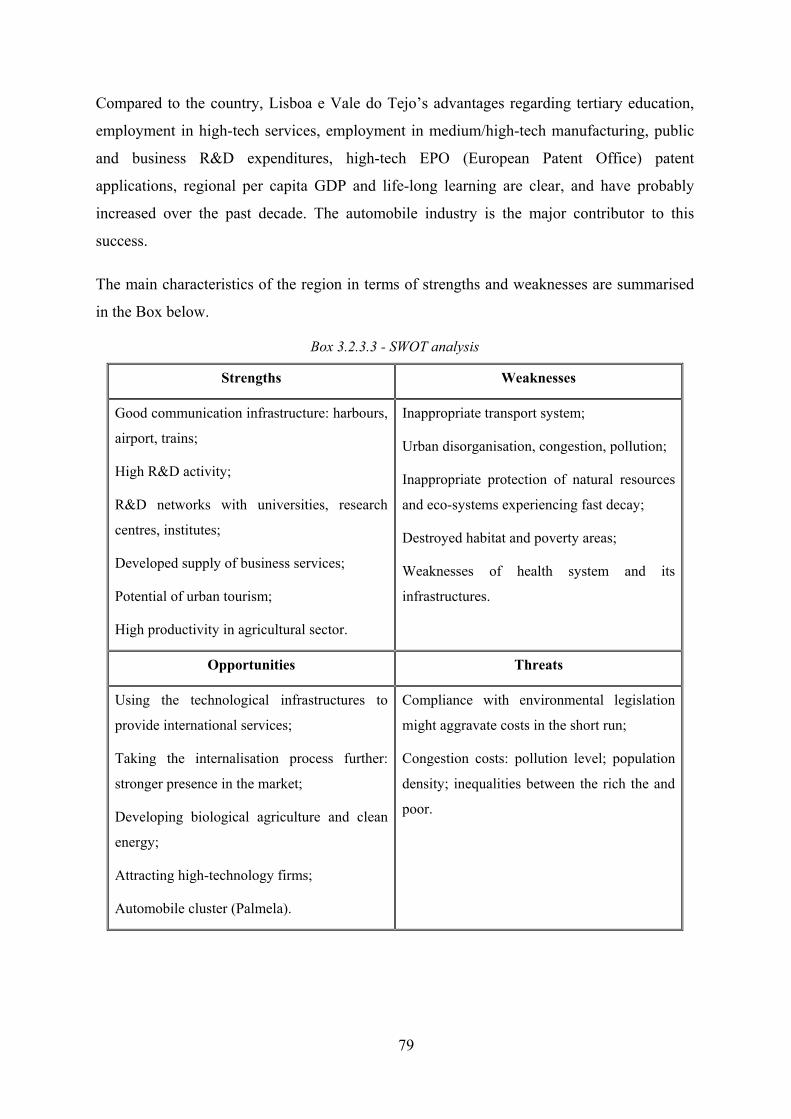
79
Compared to the country, Lisboa e Vale do Tejo’s advantages regarding tertiary education,
employment in high-tech services, employment in medium/high-tech manufacturing, public
and business R&D expenditures, high-tech EPO (European Patent Office) patent
applications, regional per capita GDP and life-long learning are clear, and have probably
increased over the past decade. The automobile industry is the major contributor to this
success.
The main characteristics of the region in terms of strengths and weaknesses are summarised
in the Box below.
Box 3.2.3.3 - SWOT analysis
Strengths Weaknesses
Good communication infrastructure: harbours,
airport, trains;
High R&D activity;
R&D networks with universities, research
centres, institutes;
Developed supply of business services;
Potential of urban tourism;
High productivity in agricultural sector.
Inappropriate transport system;
Urban disorganisation, congestion, pollution;
Inappropriate protection of natural resources
and eco-systems experiencing fast decay;
Destroyed habitat and poverty areas;
Weaknesses of health system and its
infrastructures.
Opportunities Threats
Using the technological infrastructures to
provide international services;
Taking the internalisation process further:
stronger presence in the market;
Developing biological agriculture and clean
energy;
Attracting high-technology firms;
Automobile cluster (Palmela).
Compliance with environmental legislation
might aggravate costs in the short run;
Congestion costs: pollution level; population
density; inequalities between the rich the and
poor.
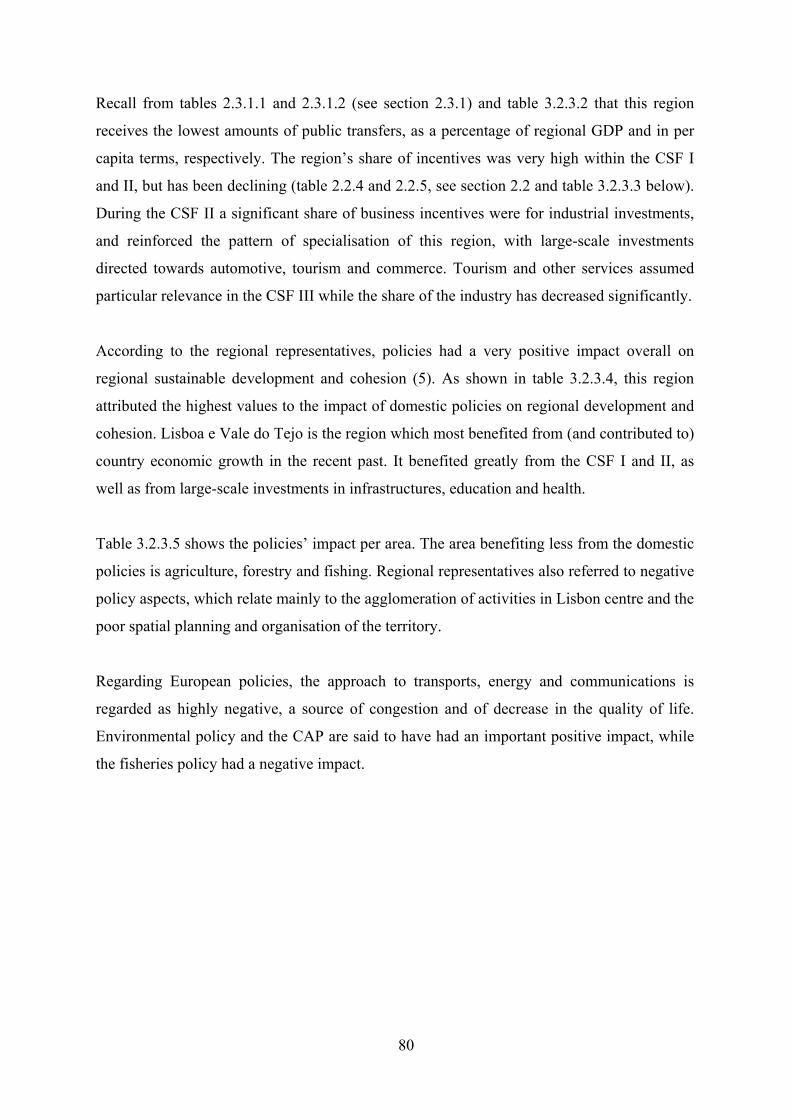
80
Recall from tables 2.3.1.1 and 2.3.1.2 (see section 2.3.1) and table 3.2.3.2 that this region
receives the lowest amounts of public transfers, as a percentage of regional GDP and in per
capita terms, respectively. The region’s share of incentives was very high within the CSF I
and II, but has been declining (table 2.2.4 and 2.2.5, see section 2.2 and table 3.2.3.3 below).
During the CSF II a significant share of business incentives were for industrial investments,
and reinforced the pattern of specialisation of this region, with large-scale investments
directed towards automotive, tourism and commerce. Tourism and other services assumed
particular relevance in the CSF III while the share of the industry has decreased significantly.
According to the regional representatives, policies had a very positive impact overall on
regional sustainable development and cohesion (5). As shown in table 3.2.3.4, this region
attributed the highest values to the impact of domestic policies on regional development and
cohesion. Lisboa e Vale do Tejo is the region which most benefited from (and contributed to)
country economic growth in the recent past. It benefited greatly from the CSF I and II, as
well as from large-scale investments in infrastructures, education and health.
Table 3.2.3.5 shows the policies’ impact per area. The area benefiting less from the domestic
policies is agriculture, forestry and fishing. Regional representatives also referred to negative
policy aspects, which relate mainly to the agglomeration of activities in Lisbon centre and the
poor spatial planning and organisation of the territory.
Regarding European policies, the approach to transports, energy and communications is
regarded as highly negative, a source of congestion and of decrease in the quality of life.
Environmental policy and the CAP are said to have had an important positive impact, while
the fisheries policy had a negative impact.
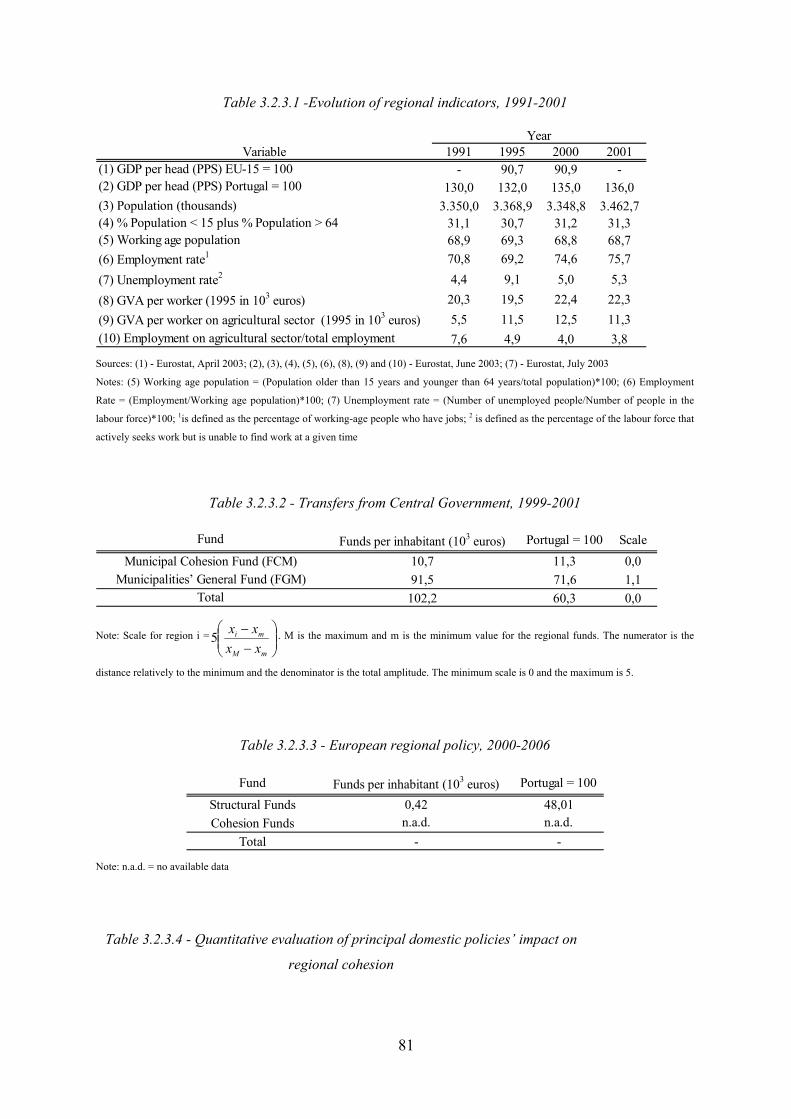
81
Table 3.2.3.1 -Evolution of regional indicators, 1991-2001
Variable 1991 1995 2000 2001(1) GDP per head (PPS) EU-15 = 100 - 90,7 90,9 -(2) GDP per head (PPS) Portugal = 100 130,0 132,0 135,0 136,0(3) Population (thousands) 3.350,0 3.368,9 3.348,8 3.462,7(4) % Population < 15 plus % Population > 64 31,1 30,7 31,2 31,3(5) Working age population 68,9 69,3 68,8 68,7(6) Employment rate1 70,8 69,2 74,6 75,7(7) Unemployment rate2 4,4 9,1 5,0 5,3(8) GVA per worker (1995 in 103 euros) 20,3 19,5 22,4 22,3(9) GVA per worker on agricultural sector (1995 in 103 euros) 5,5 11,5 12,5 11,3(10) Employment on agricultural sector/total employment 7,6 4,9 4,0 3,8
Year
Sources: (1) - Eurostat, April 2003; (2), (3), (4), (5), (6), (8), (9) and (10) - Eurostat, June 2003; (7) - Eurostat, July 2003
Notes: (5) Working age population = (Population older than 15 years and younger than 64 years/total population)*100; (6) Employment
Rate = (Employment/Working age population)*100; (7) Unemployment rate = (Number of unemployed people/Number of people in the
labour force)*100; 1is defined as the percentage of working-age people who have jobs; 2 is defined as the percentage of the labour force that
actively seeks work but is unable to find work at a given time
Table 3.2.3.2 - Transfers from Central Government, 1999-2001
Funds per inhabitant (103 euros) Portugal = 100 Scale10,7 11,3 0,091,5 71,6 1,1
102,2 60,3 0,0
Fund
Municipal Cohesion Fund (FCM)Municipalities’ General Fund (FGM)
Total
Note: Scale for region i =
−−
mM
mi
xxxx5 . M is the maximum and m is the minimum value for the regional funds. The numerator is the
distance relatively to the minimum and the denominator is the total amplitude. The minimum scale is 0 and the maximum is 5.
Table 3.2.3.3 - European regional policy, 2000-2006
Fund Funds per inhabitant (103 euros) Portugal = 100
Structural Funds 0,42 48,01Cohesion Funds n.a.d. n.a.d.
Total - - Note: n.a.d. = no available data
Table 3.2.3.4 - Quantitative evaluation of principal domestic policies’ impact on
regional cohesion
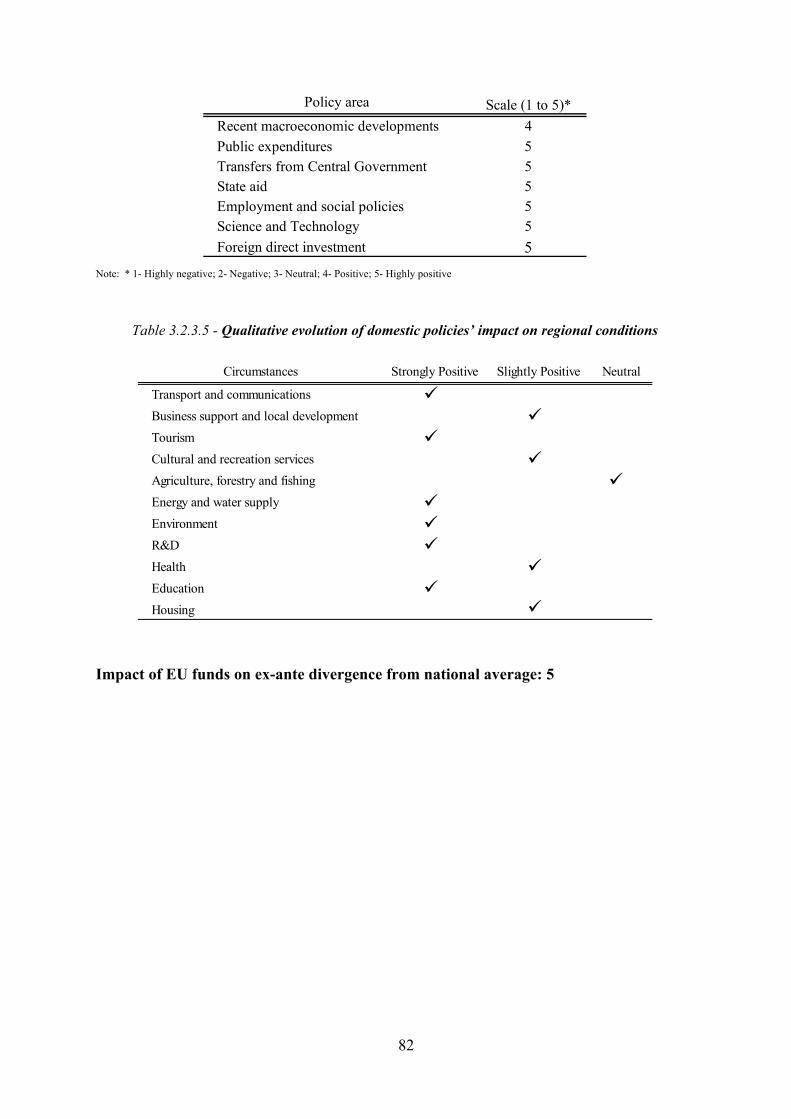
82
Policy area Scale (1 to 5)* Recent macroeconomic developments 4Public expenditures 5Transfers from Central Government 5State aid 5Employment and social policies 5Science and Technology 5Foreign direct investment 5
Note: * 1- Highly negative; 2- Negative; 3- Neutral; 4- Positive; 5- Highly positive
Table 3.2.3.5 - Qualitative evolution of domestic policies’ impact on regional conditions
Circumstances Strongly Positive Slightly Positive Neutral
Transport and communications
Business support and local development
Tourism
Cultural and recreation services
Agriculture, forestry and fishing
Energy and water supply
Environment
R&D
Health
Education
Housing
Impact of EU funds on ex-ante divergence from national average: 5
83
3.2.4 - Regional profile: Alentejo
The table 3.2.4.1 displays the GDP per capita in the Alentejo, in per cent of the country
average and of the EU average28. It shows that, between 1995 and 2001, Alentejo worsened
its GDP with reference to the national and the EU average.
Comparing the relative position of the different regions vis-à-vis the country average in 1990
and 2001 (see table 3.1.2, subsection 3.1), we observe that Alentejo has diverged in terms of
per capita GVA29. As shown in the figure 3.1.3 (see subsection 3.1), this path was mostly
determined by changes in productivity. A detailed analysis provided in subsection 3.1 further
revealed that Alentejo suffers from a low productivity level and an unfavourable
demography.
Services account for over 60 per cent of the population employed, while agriculture is still
relevant with a share of 18.7 per cent of the total employment by 2001. This region reveals
an unfavourable demography but high educational dynamics. The University gained
increasing role in this regard and as an engine for regional development.
Box 3.2.4.1 - Principal industrial specialisation
Heavy industries;
Electric machinery and products.
Food, beverages and tobacco;
Natural resources.
Box 3.2.4.2 - Highlights the main characteristics of the evolution over the last decade
In this period, the unemployment rate has reduced significantly, but it is still high in the
national context. This reduction is the result of an important development, which reduced the
high immigration verified in 70’s and 80’s. To these situation also contributes the low rate of
activity. The percentage of employment on agricultural sector has reduced but it still high in
the European Union context.
28 Figures on regional output are being subject to successive revisions and data are not necessarily consistent across tables. For this reason, we try to identify in each table the specific database being used. In the latest DG REGIO database, data from GDP and GVA appear to reveal some inconsistencies.
29 Data before 1990 is not shown due to lack of reliability.
84
Alentejo reveals a poor technological standing with relation to the EU, but higher than most
of the Portuguese regions (RRSII equals 1.5)30. As stimulating characteristics we highlight
the development of tourism, the geo-strategic location of Sines port, the development of
competitive advantages in wine, cork and decorative stones, technological innovation,
products and design on several traditional activities, the restructuring of Beja airbase, and the
Growth of the Évora University.
Box 3.2.4.3 - SWOT analysis
Strengths Weaknesses
Geo-strategic location of Sines harbour;
Development of tourism, logistic and
recreation activities possible due to the
availability of low populated areas;
High tourist potential of sun and sea activities,
as well as natural, cultural and historical
riches and diversity of local food and
landscape and rural spaces;
Identification of growing investment
dynamics in the tourism sector (on multi-
functional compounds in Alentejo Litoral
associated with golf activities and second
residences);
Dynamics in agriculture related products:
wine, cheese, meat, olive oil, fruit and
vegetables, cork).
Low level of R&D and lack of innovation
infrastructures;
Aging of local population;
Lack of human resources with high technical
skills;
Low quality of labour, supporting
equipments, and services related to tourism
Tourism highly concentrated on high seasons;
Low productivity in agriculture;
Lack of strong partnerships, specially at an
international level;
Inappropriate flow of distribution channels
and its logistic structures.
Opportunities Threats
Development of Sines harbour as an
international distribution cargo platform
Job and qualification creation in the region;
Territorial dispersion: the urban system is
composed by a regional city – Évora – and
sub-regional cities – Portalegre, Beja, Sines –
30 The calculations are based on the Revealed Regional Summary Innovation Index (RRSII) (European Commission, 2002). We rescaled the RRSII, so that a region corresponding to the average of the innovative performance of EU gets 2.5 points.
85
High quality tourist construction in Alqueva;
Sun and sea and rural tourism growth;
High quality in meat production;
Constant growth related with bio-agricultural
products;
Development of competitive advantages in
wine, cork and decorative stones;
Technological innovation, products and
design on several traditional activities;
Use of Beja’s airbase for other purposes.
and smaller cities;
High dependency on funds;
Strong competition in foreign markets;
Lack of incentives for the population to return
and not to leave the rural area;
Low technological innovation capabilities.
As shown in tables 2.3.1.1 and 2.3.1.2 (see section 2.3.1) and table 3.2.3.2 below, the
transfers per capita to the less prosperous region of Alentejo is relatively higher than to other
richer regions. Otherwise, recalling Tables 2.2.4 and 2.2.5 (see section 2.2), under the CSF I
and II, public expenditures per capita for the poor region of Alentejo was substantially lower
than those for the richest regions of Lisboa e Vale do Tejo. The investments in commerce
and in the industry were relatively low, with the large scale of investments directed towards
natural resources. Table 3.2.3.3 summarises the EU funding for the 2000-2006 period.
Overall, domestic policies had a positive impact on regional development and cohesion (4).
As summarised in table 3.2.4.4, public expenditures (in infrastructures and health),
employment and social policy had the most positive effect, while the public transfers and
state aid were severely criticised. As for state aid, the significant concentration of business
incentives in the metropolitan areas of Lisbon and Porto is considered to have contributed to
divergence rather than to convergence. Regarding public transfers, it is referred that the
region lost with changes in the criteria for allocation of funds (the area is not considered).
The intra-regional concentration in few urban areas fosters intra-regional disequilibrium.
Table 3.2.4.5 shows the policies’ impact per area. The areas benefiting less from the
domestic policies are business support and local development and R&D.
In spite of not being explicitly the aim of the research, our interviewer revealed some aspects
of matter regarding European Community policies and regional cohesion. In this regard, the

86
structural funds were considered important in what concerns investments in infrastructures
and education. Transports, energy and communications as well as environmental policy are
said to have had a strong positive impact on regional development and cohesion. PAC had
neutral impact: positive by raising income for beneficiaries, and negative by promoting
products for which the region does not have the most suitable conditions and by promoting
farming ‘structural’ unemployment. These farmers will never be absorbed by other sectors
because of their low educational level.
Table 3.2.4.1 - Evolution of regional indicators, 1991-2001
Variable 1991 1995 2000 2001(1) GDP per head (PPS) EU-15 = 100 - 59,2 54,5 55,3(2) GDP per head (PPS) Portugal = 100 76,0 84,0 79,0 79,0(3) Population (thousands) 536,3 530,2 526,3 528,4(4) % Population < 15 plus % Population > 64 36,6 36,4 37,1 62,8(5) Working age population 63,4 63,6 62,9 37,2(6) Employment rate1 61,4 57,8 65,1 65,7(7) Unemployment rate2 9,1 11,8 5,7 5,7(8) GVA per worker (1995 in 103 euros) 15,4 16,1 15,9 15,9(9) GVA per worker on agricultural sector (1995 in 103 euros) 6,0 13,6 14,1 13,4(10) Employment on agricultural sector/total employment 29,2 21,4 19,7 18,7
Year
Sources: (1) - Eurostat, April 2003; (2), (3), (4), (5), (6), (8), (9) and (10) - Eurostat, June 2003; (7) - Eurostat, July 2003
Notes: (5) Working age population = (Population older than 15 years and younger than 64 years/total population)*100; (6)
Employment Rate = (Employment/Working age population)*100; (7) Unemployment rate = (Number of unemployed
people/Number of people in the labour force)*100; 1is defined as the percentage of working-age people who have jobs; 2 is
defined as the percentage of the labour force that actively seeks work but is unable to find work at a given time
Table 3.2.4.2 - Transfers from Central Government, 1999-2001
Funds per inhabitant (103 euros) Portugal = 100 Scale50,0 53,0 3,0
251,0 209,0 5,0301,0 198,0 5,0
Fund
Municipal Cohesion Fund (FCM)Municipalities’ General Fund (FGM)
Total
Note: Scale for region i =
−−
mM
mi
xxxx5 . M is the maximum and m is the minimum value for the regional funds. The numerator is the
distance relatively to the minimum and the denominator is the total amplitude. The minimum scale is 0 and the maximum is 5.
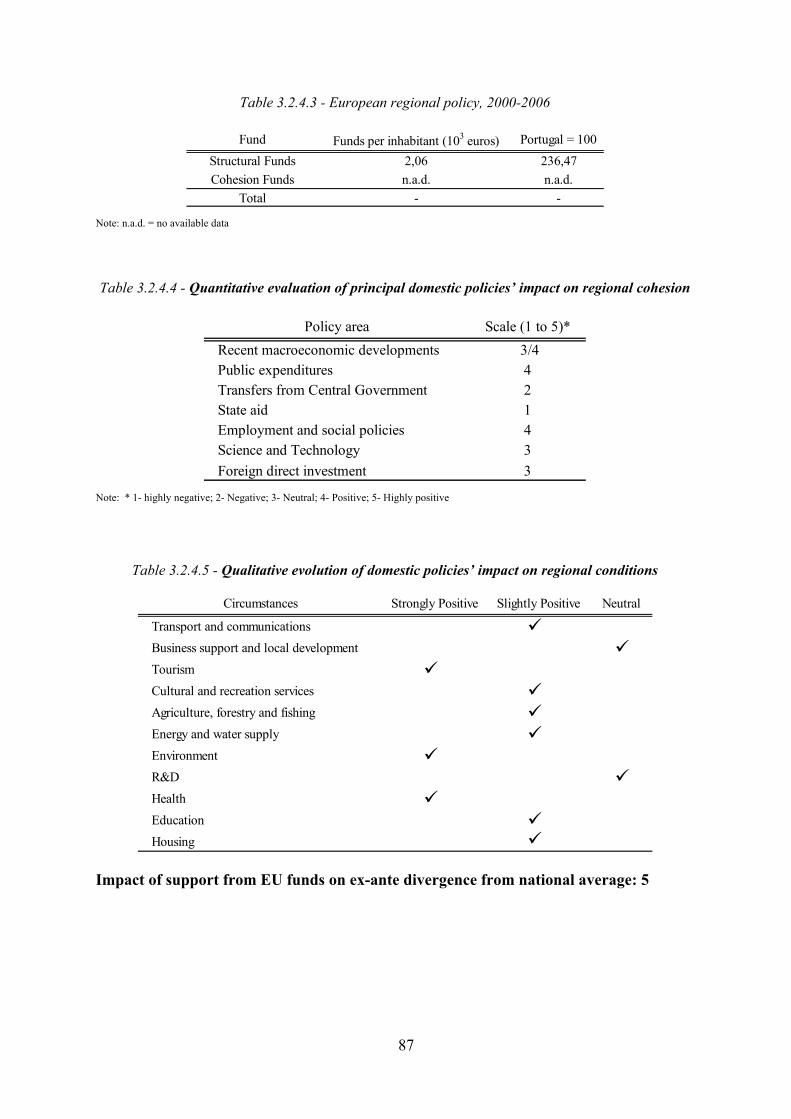
87
Table 3.2.4.3 - European regional policy, 2000-2006
Fund Funds per inhabitant (103 euros) Portugal = 100Structural Funds 2,06 236,47Cohesion Funds n.a.d. n.a.d.
Total - - Note: n.a.d. = no available data
Table 3.2.4.4 - Quantitative evaluation of principal domestic policies’ impact on regional cohesion
Policy area Scale (1 to 5)* Recent macroeconomic developments 3/4Public expenditures 4Transfers from Central Government 2State aid 1Employment and social policies 4Science and Technology 3Foreign direct investment 3
Note: * 1- highly negative; 2- Negative; 3- Neutral; 4- Positive; 5- Highly positive
Table 3.2.4.5 - Qualitative evolution of domestic policies’ impact on regional conditions
Circumstances Strongly Positive Slightly Positive Neutral
Transport and communications
Business support and local development Tourism Cultural and recreation services Agriculture, forestry and fishing Energy and water supply Environment
R&D Health Education Housing
Impact of support from EU funds on ex-ante divergence from national average: 5
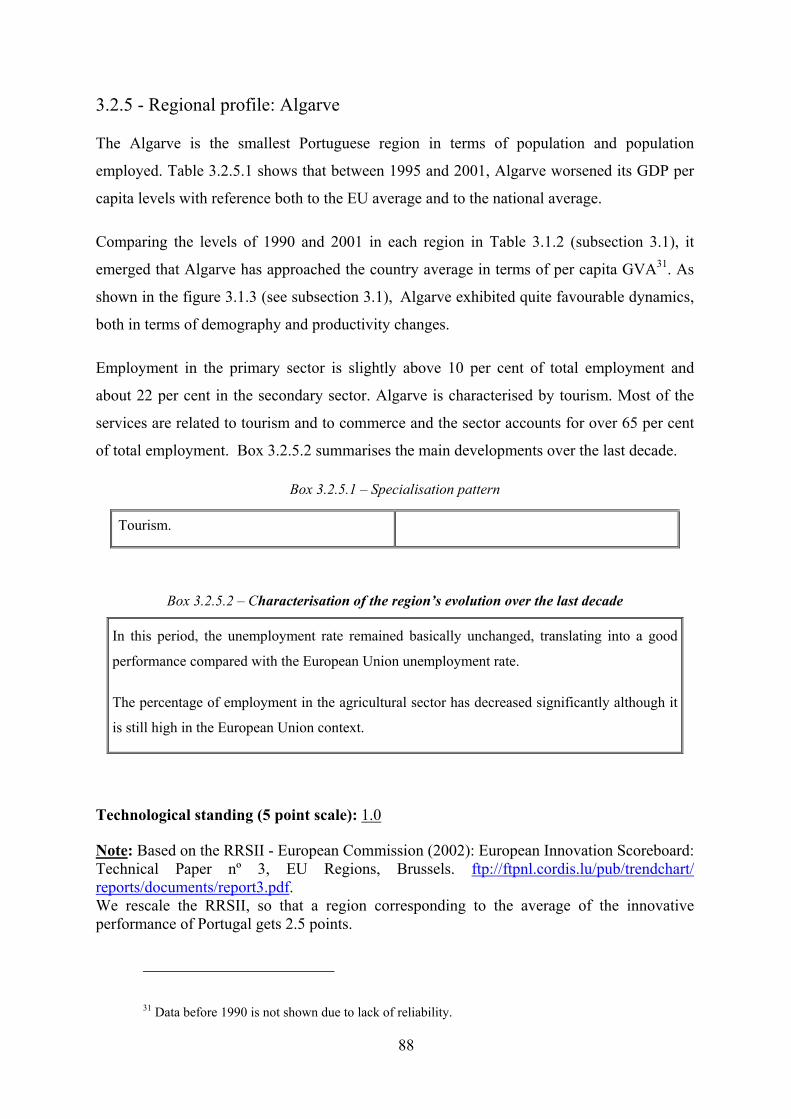
88
3.2.5 - Regional profile: Algarve
The Algarve is the smallest Portuguese region in terms of population and population
employed. Table 3.2.5.1 shows that between 1995 and 2001, Algarve worsened its GDP per
capita levels with reference both to the EU average and to the national average.
Comparing the levels of 1990 and 2001 in each region in Table 3.1.2 (subsection 3.1), it
emerged that Algarve has approached the country average in terms of per capita GVA31. As
shown in the figure 3.1.3 (see subsection 3.1), Algarve exhibited quite favourable dynamics,
both in terms of demography and productivity changes.
Employment in the primary sector is slightly above 10 per cent of total employment and
about 22 per cent in the secondary sector. Algarve is characterised by tourism. Most of the
services are related to tourism and to commerce and the sector accounts for over 65 per cent
of total employment. Box 3.2.5.2 summarises the main developments over the last decade.
Box 3.2.5.1 – Specialisation pattern
Tourism.
Box 3.2.5.2 – Characterisation of the region’s evolution over the last decade
In this period, the unemployment rate remained basically unchanged, translating into a good
performance compared with the European Union unemployment rate.
The percentage of employment in the agricultural sector has decreased significantly although it
is still high in the European Union context.
Technological standing (5 point scale): 1.0
Note: Based on the RRSII - European Commission (2002): European Innovation Scoreboard: Technical Paper nº 3, EU Regions, Brussels. ftp://ftpnl.cordis.lu/pub/trendchart/ reports/documents/report3.pdf. We rescale the RRSII, so that a region corresponding to the average of the innovative performance of Portugal gets 2.5 points.
31 Data before 1990 is not shown due to lack of reliability.
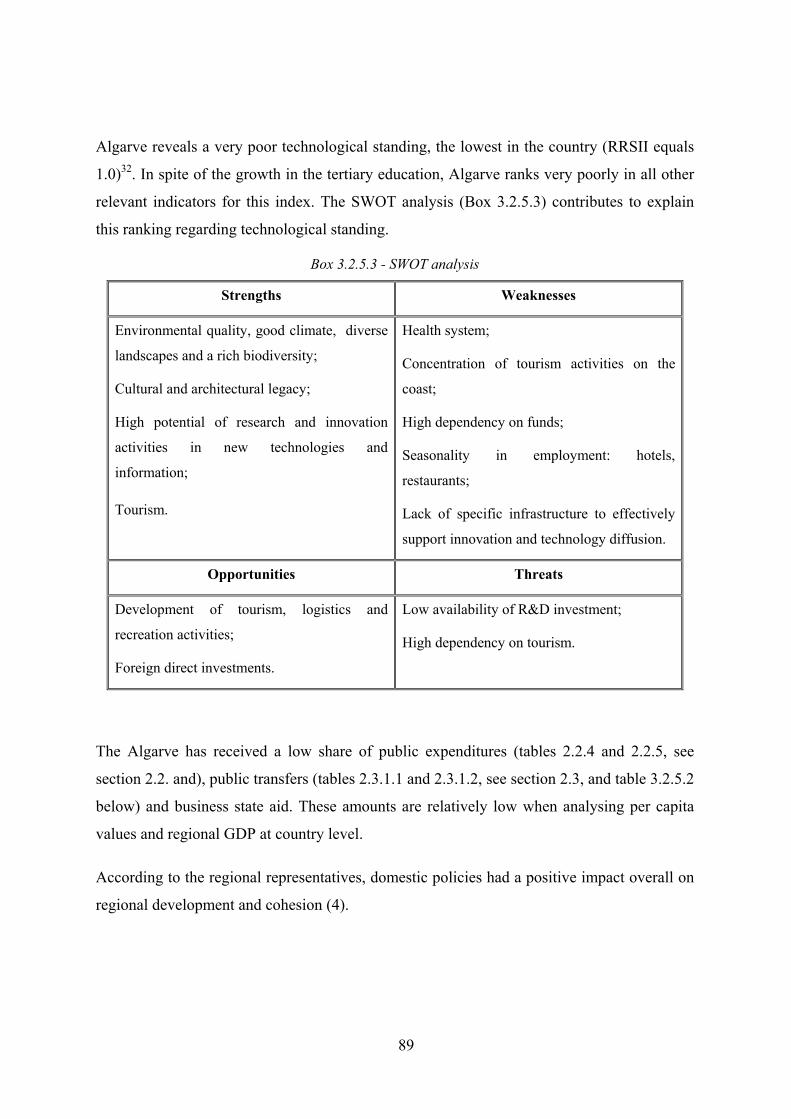
89
Algarve reveals a very poor technological standing, the lowest in the country (RRSII equals
1.0)32. In spite of the growth in the tertiary education, Algarve ranks very poorly in all other
relevant indicators for this index. The SWOT analysis (Box 3.2.5.3) contributes to explain
this ranking regarding technological standing.
Box 3.2.5.3 - SWOT analysis
Strengths Weaknesses
Environmental quality, good climate, diverse
landscapes and a rich biodiversity;
Cultural and architectural legacy;
High potential of research and innovation
activities in new technologies and
information;
Tourism.
Health system;
Concentration of tourism activities on the
coast;
High dependency on funds;
Seasonality in employment: hotels,
restaurants;
Lack of specific infrastructure to effectively
support innovation and technology diffusion.
Opportunities Threats
Development of tourism, logistics and
recreation activities;
Foreign direct investments.
Low availability of R&D investment;
High dependency on tourism.
The Algarve has received a low share of public expenditures (tables 2.2.4 and 2.2.5, see
section 2.2. and), public transfers (tables 2.3.1.1 and 2.3.1.2, see section 2.3, and table 3.2.5.2
below) and business state aid. These amounts are relatively low when analysing per capita
values and regional GDP at country level.
According to the regional representatives, domestic policies had a positive impact overall on
regional development and cohesion (4).
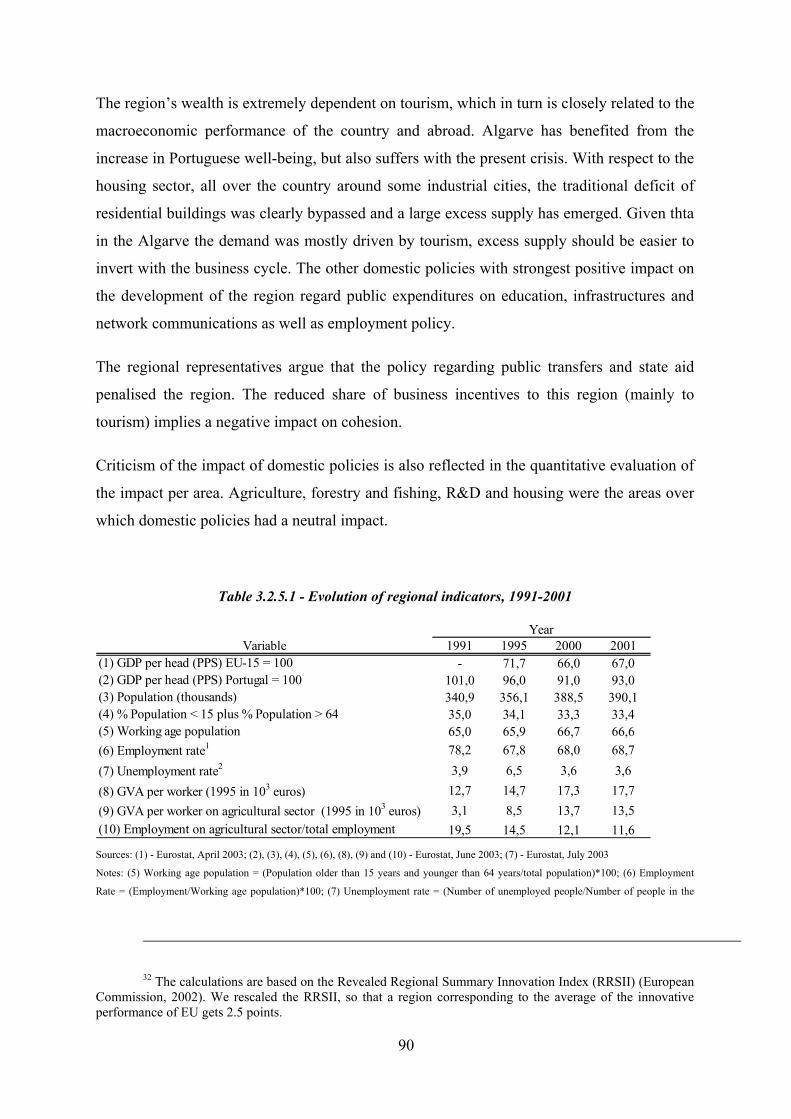
90
The region’s wealth is extremely dependent on tourism, which in turn is closely related to the
macroeconomic performance of the country and abroad. Algarve has benefited from the
increase in Portuguese well-being, but also suffers with the present crisis. With respect to the
housing sector, all over the country around some industrial cities, the traditional deficit of
residential buildings was clearly bypassed and a large excess supply has emerged. Given thta
in the Algarve the demand was mostly driven by tourism, excess supply should be easier to
invert with the business cycle. The other domestic policies with strongest positive impact on
the development of the region regard public expenditures on education, infrastructures and
network communications as well as employment policy.
The regional representatives argue that the policy regarding public transfers and state aid
penalised the region. The reduced share of business incentives to this region (mainly to
tourism) implies a negative impact on cohesion.
Criticism of the impact of domestic policies is also reflected in the quantitative evaluation of
the impact per area. Agriculture, forestry and fishing, R&D and housing were the areas over
which domestic policies had a neutral impact.
Table 3.2.5.1 - Evolution of regional indicators, 1991-2001
Variable 1991 1995 2000 2001(1) GDP per head (PPS) EU-15 = 100 - 71,7 66,0 67,0(2) GDP per head (PPS) Portugal = 100 101,0 96,0 91,0 93,0(3) Population (thousands) 340,9 356,1 388,5 390,1(4) % Population < 15 plus % Population > 64 35,0 34,1 33,3 33,4(5) Working age population 65,0 65,9 66,7 66,6(6) Employment rate1 78,2 67,8 68,0 68,7(7) Unemployment rate2 3,9 6,5 3,6 3,6(8) GVA per worker (1995 in 103 euros) 12,7 14,7 17,3 17,7(9) GVA per worker on agricultural sector (1995 in 103 euros) 3,1 8,5 13,7 13,5(10) Employment on agricultural sector/total employment 19,5 14,5 12,1 11,6
Year
Sources: (1) - Eurostat, April 2003; (2), (3), (4), (5), (6), (8), (9) and (10) - Eurostat, June 2003; (7) - Eurostat, July 2003
Notes: (5) Working age population = (Population older than 15 years and younger than 64 years/total population)*100; (6) Employment
Rate = (Employment/Working age population)*100; (7) Unemployment rate = (Number of unemployed people/Number of people in the
32 The calculations are based on the Revealed Regional Summary Innovation Index (RRSII) (European Commission, 2002). We rescaled the RRSII, so that a region corresponding to the average of the innovative performance of EU gets 2.5 points.
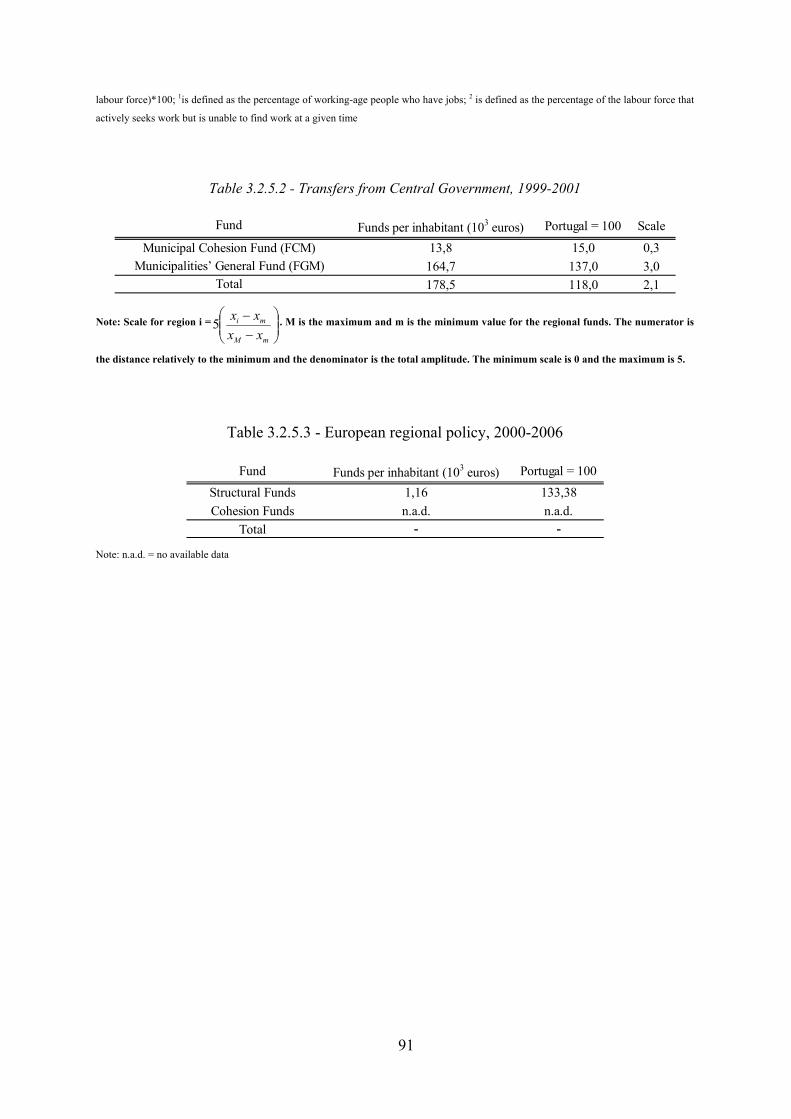
91
labour force)*100; 1is defined as the percentage of working-age people who have jobs; 2 is defined as the percentage of the labour force that
actively seeks work but is unable to find work at a given time
Table 3.2.5.2 - Transfers from Central Government, 1999-2001
Funds per inhabitant (103 euros) Portugal = 100 Scale
13,8 15,0 0,3164,7 137,0 3,0178,5 118,0 2,1
Fund
Municipal Cohesion Fund (FCM)Municipalities’ General Fund (FGM)
Total
Note: Scale for region i =
−−
mM
mi
xxxx5 . M is the maximum and m is the minimum value for the regional funds. The numerator is
the distance relatively to the minimum and the denominator is the total amplitude. The minimum scale is 0 and the maximum is 5.
Table 3.2.5.3 - European regional policy, 2000-2006
Fund Funds per inhabitant (103 euros) Portugal = 100Structural Funds 1,16 133,38Cohesion Funds n.a.d. n.a.d.
Total - - Note: n.a.d. = no available data
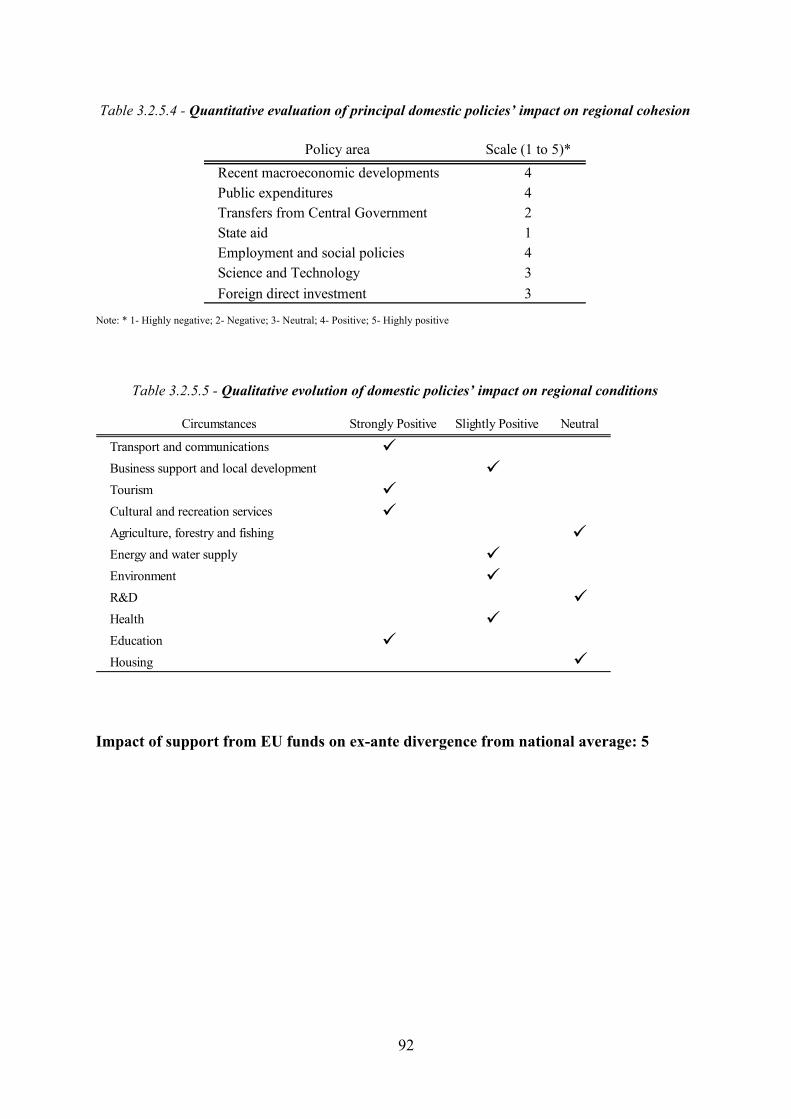
92
Table 3.2.5.4 - Quantitative evaluation of principal domestic policies’ impact on regional cohesion
Policy area Scale (1 to 5)* Recent macroeconomic developments 4 Public expenditures 4Transfers from Central Government 2State aid 1Employment and social policies 4Science and Technology 3Foreign direct investment 3
Note: * 1- Highly negative; 2- Negative; 3- Neutral; 4- Positive; 5- Highly positive
Table 3.2.5.5 - Qualitative evolution of domestic policies’ impact on regional conditions
Circumstances Strongly Positive Slightly Positive Neutral
Transport and communications Business support and local development
Tourism Cultural and recreation services Agriculture, forestry and fishingEnergy and water supply Environment R&D Health Education Housing
Impact of support from EU funds on ex-ante divergence from national average: 5
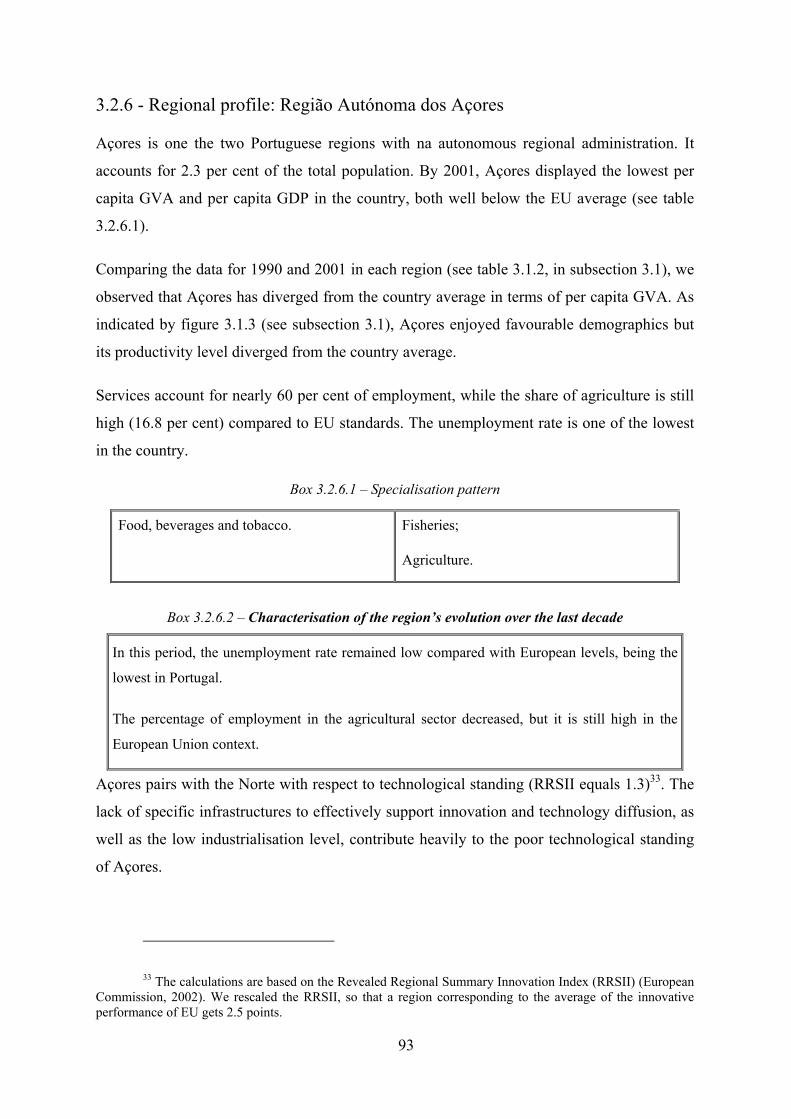
93
3.2.6 - Regional profile: Região Autónoma dos Açores
Açores is one the two Portuguese regions with na autonomous regional administration. It
accounts for 2.3 per cent of the total population. By 2001, Açores displayed the lowest per
capita GVA and per capita GDP in the country, both well below the EU average (see table
3.2.6.1).
Comparing the data for 1990 and 2001 in each region (see table 3.1.2, in subsection 3.1), we
observed that Açores has diverged from the country average in terms of per capita GVA. As
indicated by figure 3.1.3 (see subsection 3.1), Açores enjoyed favourable demographics but
its productivity level diverged from the country average.
Services account for nearly 60 per cent of employment, while the share of agriculture is still
high (16.8 per cent) compared to EU standards. The unemployment rate is one of the lowest
in the country.
Box 3.2.6.1 – Specialisation pattern
Food, beverages and tobacco. Fisheries;
Agriculture.
Box 3.2.6.2 – Characterisation of the region’s evolution over the last decade
In this period, the unemployment rate remained low compared with European levels, being the
lowest in Portugal.
The percentage of employment in the agricultural sector decreased, but it is still high in the
European Union context.
Açores pairs with the Norte with respect to technological standing (RRSII equals 1.3)33. The
lack of specific infrastructures to effectively support innovation and technology diffusion, as
well as the low industrialisation level, contribute heavily to the poor technological standing
of Açores.
33 The calculations are based on the Revealed Regional Summary Innovation Index (RRSII) (European Commission, 2002). We rescaled the RRSII, so that a region corresponding to the average of the innovative performance of EU gets 2.5 points.
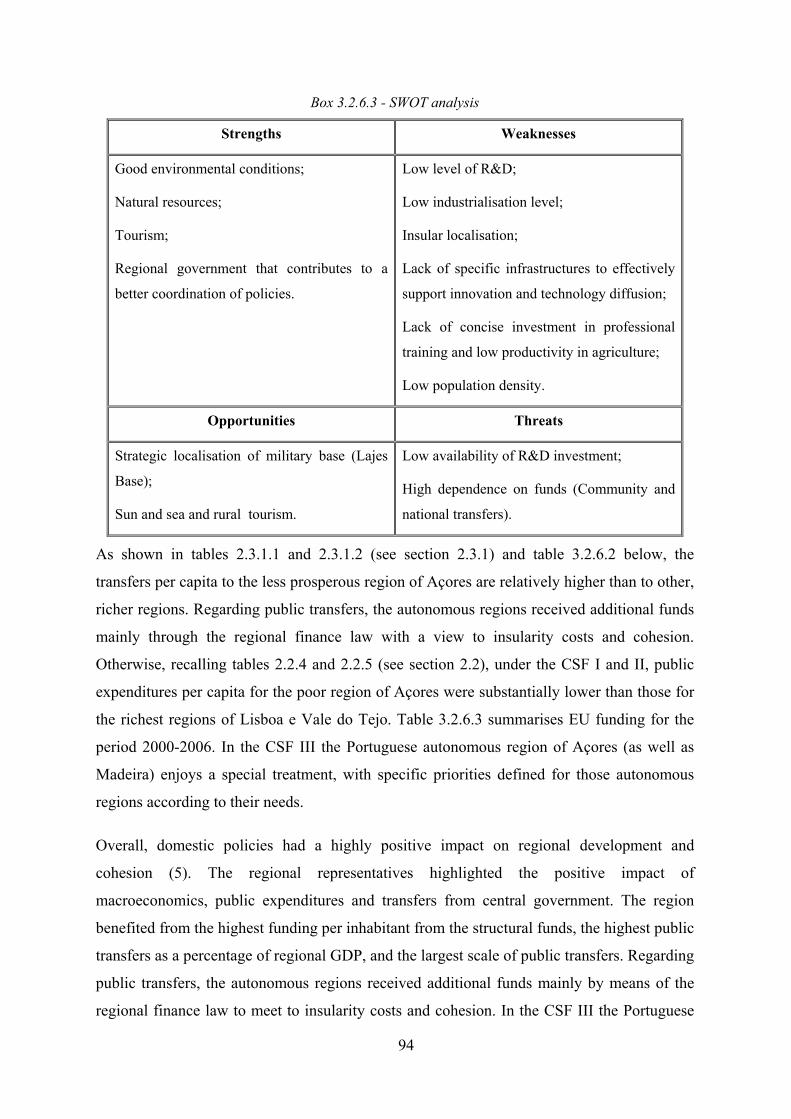
94
Box 3.2.6.3 - SWOT analysis
Strengths Weaknesses
Good environmental conditions;
Natural resources;
Tourism;
Regional government that contributes to a
better coordination of policies.
Low level of R&D;
Low industrialisation level;
Insular localisation;
Lack of specific infrastructures to effectively
support innovation and technology diffusion;
Lack of concise investment in professional
training and low productivity in agriculture;
Low population density.
Opportunities Threats
Strategic localisation of military base (Lajes
Base);
Sun and sea and rural tourism.
Low availability of R&D investment;
High dependence on funds (Community and
national transfers).
As shown in tables 2.3.1.1 and 2.3.1.2 (see section 2.3.1) and table 3.2.6.2 below, the
transfers per capita to the less prosperous region of Açores are relatively higher than to other,
richer regions. Regarding public transfers, the autonomous regions received additional funds
mainly through the regional finance law with a view to insularity costs and cohesion.
Otherwise, recalling tables 2.2.4 and 2.2.5 (see section 2.2), under the CSF I and II, public
expenditures per capita for the poor region of Açores were substantially lower than those for
the richest regions of Lisboa e Vale do Tejo. Table 3.2.6.3 summarises EU funding for the
period 2000-2006. In the CSF III the Portuguese autonomous region of Açores (as well as
Madeira) enjoys a special treatment, with specific priorities defined for those autonomous
regions according to their needs.
Overall, domestic policies had a highly positive impact on regional development and
cohesion (5). The regional representatives highlighted the positive impact of
macroeconomics, public expenditures and transfers from central government. The region
benefited from the highest funding per inhabitant from the structural funds, the highest public
transfers as a percentage of regional GDP, and the largest scale of public transfers. Regarding
public transfers, the autonomous regions received additional funds mainly by means of the
regional finance law to meet to insularity costs and cohesion. In the CSF III the Portuguese
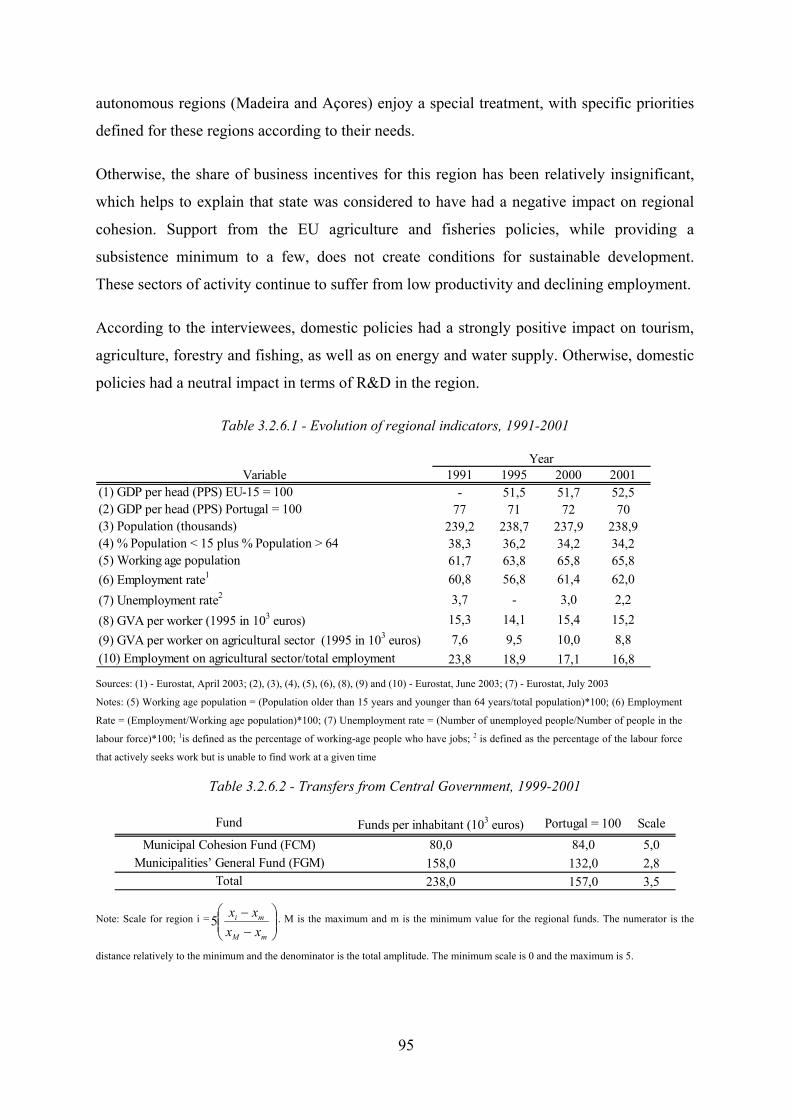
95
autonomous regions (Madeira and Açores) enjoy a special treatment, with specific priorities
defined for these regions according to their needs.
Otherwise, the share of business incentives for this region has been relatively insignificant,
which helps to explain that state was considered to have had a negative impact on regional
cohesion. Support from the EU agriculture and fisheries policies, while providing a
subsistence minimum to a few, does not create conditions for sustainable development.
These sectors of activity continue to suffer from low productivity and declining employment.
According to the interviewees, domestic policies had a strongly positive impact on tourism,
agriculture, forestry and fishing, as well as on energy and water supply. Otherwise, domestic
policies had a neutral impact in terms of R&D in the region.
Table 3.2.6.1 - Evolution of regional indicators, 1991-2001
Variable 1991 1995 2000 2001(1) GDP per head (PPS) EU-15 = 100 - 51,5 51,7 52,5(2) GDP per head (PPS) Portugal = 100 77 71 72 70(3) Population (thousands) 239,2 238,7 237,9 238,9(4) % Population < 15 plus % Population > 64 38,3 36,2 34,2 34,2(5) Working age population 61,7 63,8 65,8 65,8(6) Employment rate1 60,8 56,8 61,4 62,0(7) Unemployment rate2 3,7 - 3,0 2,2(8) GVA per worker (1995 in 103 euros) 15,3 14,1 15,4 15,2(9) GVA per worker on agricultural sector (1995 in 103 euros) 7,6 9,5 10,0 8,8(10) Employment on agricultural sector/total employment 23,8 18,9 17,1 16,8
Year
Sources: (1) - Eurostat, April 2003; (2), (3), (4), (5), (6), (8), (9) and (10) - Eurostat, June 2003; (7) - Eurostat, July 2003
Notes: (5) Working age population = (Population older than 15 years and younger than 64 years/total population)*100; (6) Employment
Rate = (Employment/Working age population)*100; (7) Unemployment rate = (Number of unemployed people/Number of people in the
labour force)*100; 1is defined as the percentage of working-age people who have jobs; 2 is defined as the percentage of the labour force
that actively seeks work but is unable to find work at a given time
Table 3.2.6.2 - Transfers from Central Government, 1999-2001
Funds per inhabitant (103 euros) Portugal = 100 Scale80,0 84,0 5,0
158,0 132,0 2,8238,0 157,0 3,5
Fund
Municipal Cohesion Fund (FCM)Municipalities’ General Fund (FGM)
Total
Note: Scale for region i =
−−
mM
mi
xxxx5 . M is the maximum and m is the minimum value for the regional funds. The numerator is the
distance relatively to the minimum and the denominator is the total amplitude. The minimum scale is 0 and the maximum is 5.

96
Table 3.2.6.3 - European regional policy, 2000-2006
Fund Funds per inhabitant (103 euros) Portugal = 100
Structural Funds 3,58 410,50Cohesion Funds n.a.d. n.a.d.
Total - -
Table 3.2.6.4 - Quantitative evaluation of principal domestic policies’ impact on regional cohesion
Policy area Scale (1 to 5)* Recent macroeconomic developments 4 Public expenditures 4Transfers from Central Government 4State aid 2Employment and social policies 3Science and Technology 3Foreign direct investment 3
Note: * 1- highly negative; 2- Negative; 3- Neutral; 4- Positive; 5- Highly positive
Note: n.a.d. = no available data
Table 3.2.6.5 - Qualitative evolution of domestic policies’ impact on regional conditions
Circumstances Strongly Positive Slightly Positive Neutral
Transport and communications Business support and local development Tourism Cultural and recreation services
Agriculture, forestry and fishing Energy and water supply Environment R&D Health Education Housing
Impact of support from EU funds on ex-ante divergence from national average: 4
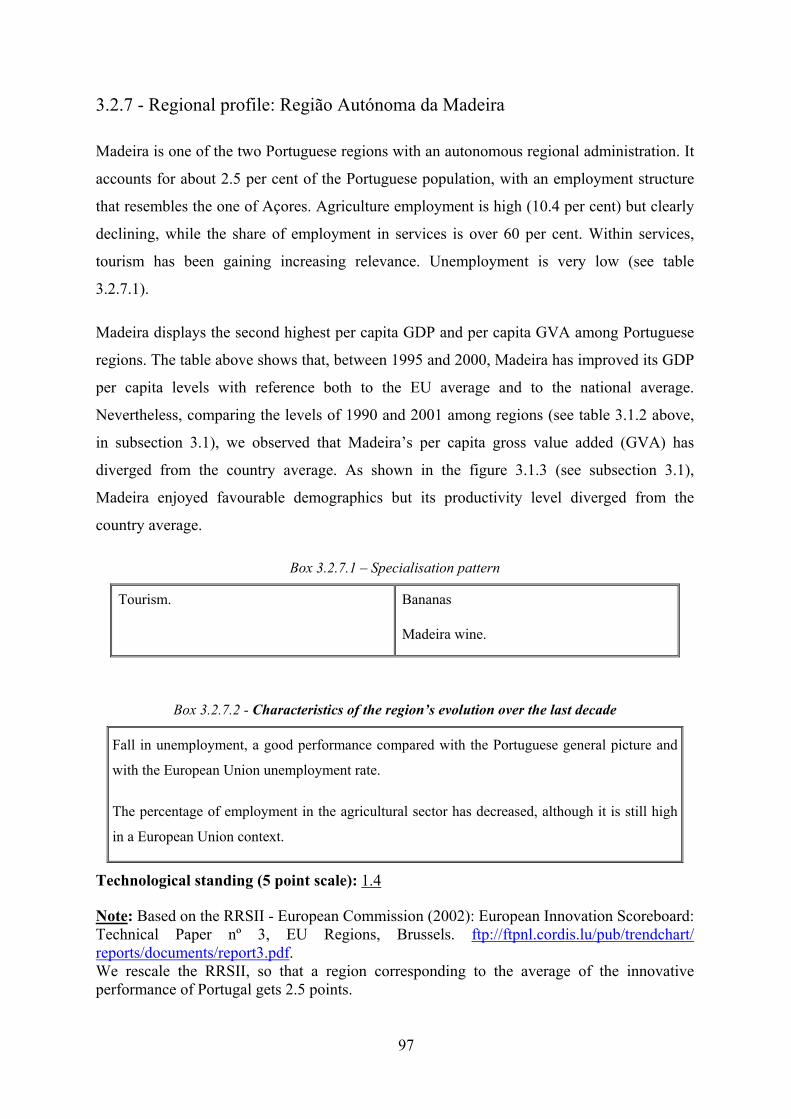
97
3.2.7 - Regional profile: Região Autónoma da Madeira
Madeira is one of the two Portuguese regions with an autonomous regional administration. It
accounts for about 2.5 per cent of the Portuguese population, with an employment structure
that resembles the one of Açores. Agriculture employment is high (10.4 per cent) but clearly
declining, while the share of employment in services is over 60 per cent. Within services,
tourism has been gaining increasing relevance. Unemployment is very low (see table
3.2.7.1).
Madeira displays the second highest per capita GDP and per capita GVA among Portuguese
regions. The table above shows that, between 1995 and 2000, Madeira has improved its GDP
per capita levels with reference both to the EU average and to the national average.
Nevertheless, comparing the levels of 1990 and 2001 among regions (see table 3.1.2 above,
in subsection 3.1), we observed that Madeira’s per capita gross value added (GVA) has
diverged from the country average. As shown in the figure 3.1.3 (see subsection 3.1),
Madeira enjoyed favourable demographics but its productivity level diverged from the
country average.
Box 3.2.7.1 – Specialisation pattern
Tourism. Bananas
Madeira wine.
Box 3.2.7.2 - Characteristics of the region’s evolution over the last decade
Fall in unemployment, a good performance compared with the Portuguese general picture and
with the European Union unemployment rate.
The percentage of employment in the agricultural sector has decreased, although it is still high
in a European Union context.
Technological standing (5 point scale): 1.4
Note: Based on the RRSII - European Commission (2002): European Innovation Scoreboard: Technical Paper nº 3, EU Regions, Brussels. ftp://ftpnl.cordis.lu/pub/trendchart/ reports/documents/report3.pdf. We rescale the RRSII, so that a region corresponding to the average of the innovative performance of Portugal gets 2.5 points.
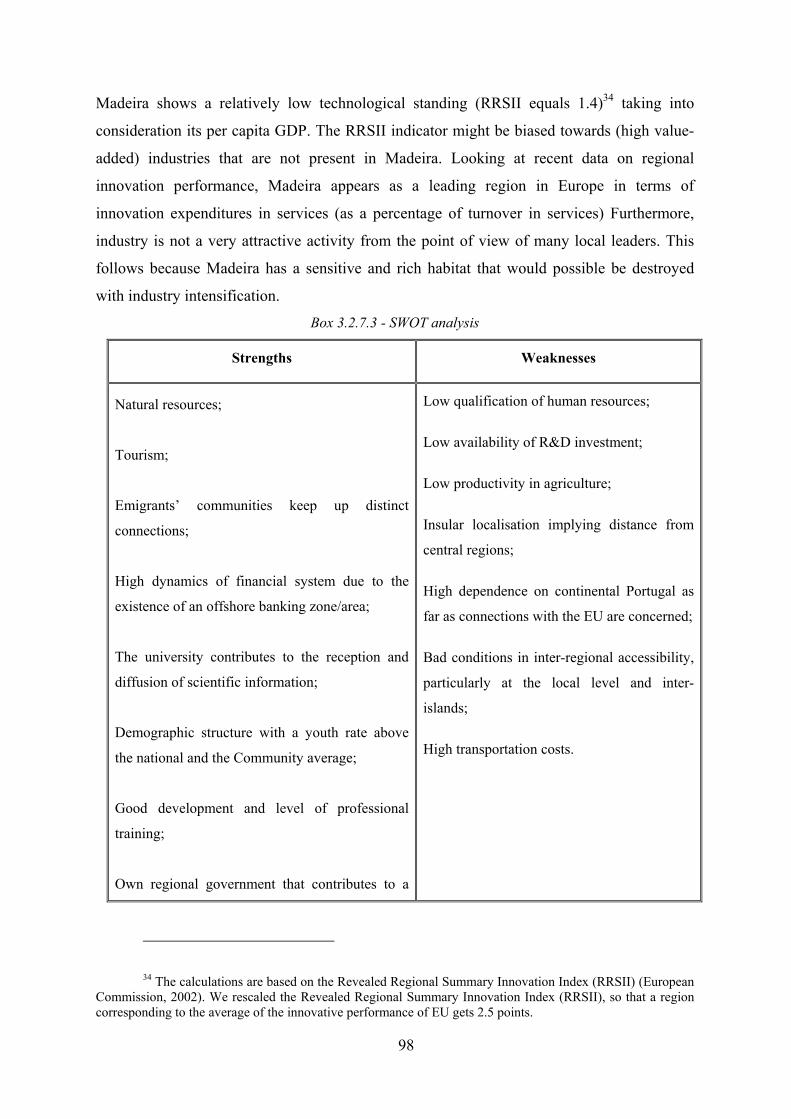
98
Madeira shows a relatively low technological standing (RRSII equals 1.4)34 taking into
consideration its per capita GDP. The RRSII indicator might be biased towards (high value-
added) industries that are not present in Madeira. Looking at recent data on regional
innovation performance, Madeira appears as a leading region in Europe in terms of
innovation expenditures in services (as a percentage of turnover in services) Furthermore,
industry is not a very attractive activity from the point of view of many local leaders. This
follows because Madeira has a sensitive and rich habitat that would possible be destroyed
with industry intensification.
Box 3.2.7.3 - SWOT analysis
Strengths Weaknesses
Natural resources;
Tourism;
Emigrants’ communities keep up distinct
connections;
High dynamics of financial system due to the
existence of an offshore banking zone/area;
The university contributes to the reception and
diffusion of scientific information;
Demographic structure with a youth rate above
the national and the Community average;
Good development and level of professional
training;
Own regional government that contributes to a
Low qualification of human resources;
Low availability of R&D investment;
Low productivity in agriculture;
Insular localisation implying distance from
central regions;
High dependence on continental Portugal as
far as connections with the EU are concerned;
Bad conditions in inter-regional accessibility,
particularly at the local level and inter-
islands;
High transportation costs.
34 The calculations are based on the Revealed Regional Summary Innovation Index (RRSII) (European Commission, 2002). We rescaled the Revealed Regional Summary Innovation Index (RRSII), so that a region corresponding to the average of the innovative performance of EU gets 2.5 points.
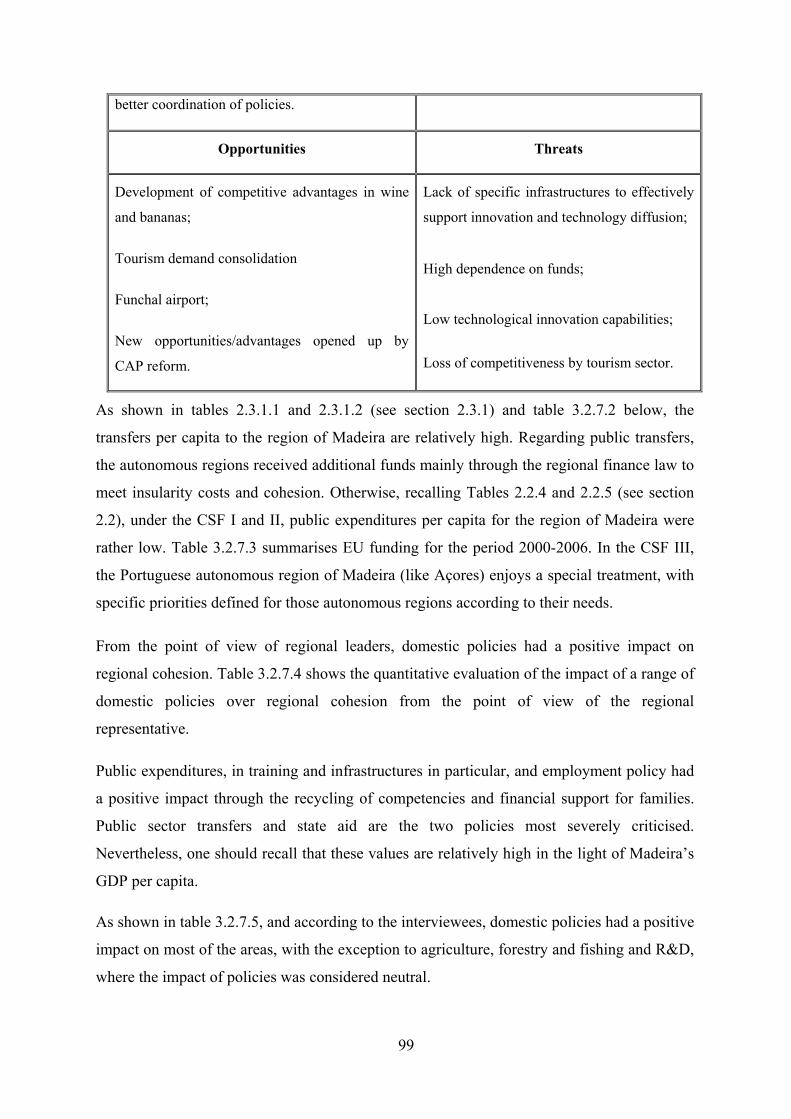
99
better coordination of policies.
Opportunities Threats
Development of competitive advantages in wine
and bananas;
Tourism demand consolidation
Funchal airport;
New opportunities/advantages opened up by
CAP reform.
Lack of specific infrastructures to effectively
support innovation and technology diffusion;
High dependence on funds;
Low technological innovation capabilities;
Loss of competitiveness by tourism sector.
As shown in tables 2.3.1.1 and 2.3.1.2 (see section 2.3.1) and table 3.2.7.2 below, the
transfers per capita to the region of Madeira are relatively high. Regarding public transfers,
the autonomous regions received additional funds mainly through the regional finance law to
meet insularity costs and cohesion. Otherwise, recalling Tables 2.2.4 and 2.2.5 (see section
2.2), under the CSF I and II, public expenditures per capita for the region of Madeira were
rather low. Table 3.2.7.3 summarises EU funding for the period 2000-2006. In the CSF III,
the Portuguese autonomous region of Madeira (like Açores) enjoys a special treatment, with
specific priorities defined for those autonomous regions according to their needs.
From the point of view of regional leaders, domestic policies had a positive impact on
regional cohesion. Table 3.2.7.4 shows the quantitative evaluation of the impact of a range of
domestic policies over regional cohesion from the point of view of the regional
representative.
Public expenditures, in training and infrastructures in particular, and employment policy had
a positive impact through the recycling of competencies and financial support for families.
Public sector transfers and state aid are the two policies most severely criticised.
Nevertheless, one should recall that these values are relatively high in the light of Madeira’s
GDP per capita.
As shown in table 3.2.7.5, and according to the interviewees, domestic policies had a positive
impact on most of the areas, with the exception to agriculture, forestry and fishing and R&D,
where the impact of policies was considered neutral.

100
In spite of not being the primary aim of this research, the fieldwork provided some insights
about the impact of major European Community policies on regional cohesion. The
relevance of structural funds was clearly highlighted. While environmental policy had a
positive impact, fisheries and agricultural policies had a negative to neutral impact on
regional cohesion. Agriculture programmes were not able to eliminate the problems inherited
from the past: very small holdings, auto-sufficiency agriculture and low productivity. These
measures also impacted positively on the quality of life and on the environment.
Table 3.2.7.1 - Evolution of regional indicators, 1991-2001
Variable 1991 1995 2000 2001(1) GDP per head (PPS) EU-15 = 100 - 66,2 74,4 75,6(2) GDP per head (PPS) Portugal = 100 97,0 90,0 99,0 99,0(3) Population (thousands) 252,6 248,6 244,8 245,8(4) % Population < 15 plus % Population > 64 35,4 34,0 32,7 32,8(5) Working age population 64,6 66,1 67,3 67,2(6) Employment rate1 60,3 62,4 66,9 67,7(7) Unemployment rate2 3,0 - 2,5 2,8(8) GVA per worker (1995 in 103 euros) 18,0 15,9 17,9 17,7(9) GVA per worker on agricultural sector (1995 in 103 euros) 2,7 4,3 5,4 5,0(10) Employment on agricultural sector/total employment 20,0 13,7 10,9 10,4
Year
Sources: (1) - Eurostat, April 2003; (2), (3), (4), (5), (6), (8), (9) and (10) - Eurostat, June 2003; (7) - Eurostat, July 2003 Notes: (5) Working age population = (Population older than 15 years and younger than 64 years/total population)*100; (6) Employment Rate = (Employment/Working age population)*100; (7) Unemployment rate = (Number of unemployed people/Number of people in the labour force)*100; 1is defined as the percentage of working-age people who have jobs; 2 is defined as the percentage of the labour force that actively seeks work but is unable to find work at a given time
Table 3.2.7.2 - Transfers from Central Government, 1999-2001 Funds per inhabitant (103 euros) Portugal = 100 Scale
58,0 61,0 3,6109,0 91,0 1,7167,0 110,0 1,8
Fund
Municipal Cohesion Fund (FCM)Municipalities’ General Fund (FGM)
Total
Note: Scale for region i =
−−
mM
mi
xxxx5 .M is the maximum and m is the minimum value for the regional funds. The numerator is
the distance relatively to the minimum and the denominator is the total amplitude. The minimum scale is 0 and the maximum is 5.
Table 3.2.7.3 - European regional policy, 2000-2006
Fund Funds per inhabitant (103 euros) Portugal = 100Structural Funds 2,87 329,06Cohesion Funds n.a.d. n.a.d.
Total - - Note: n.a.d. = no available data
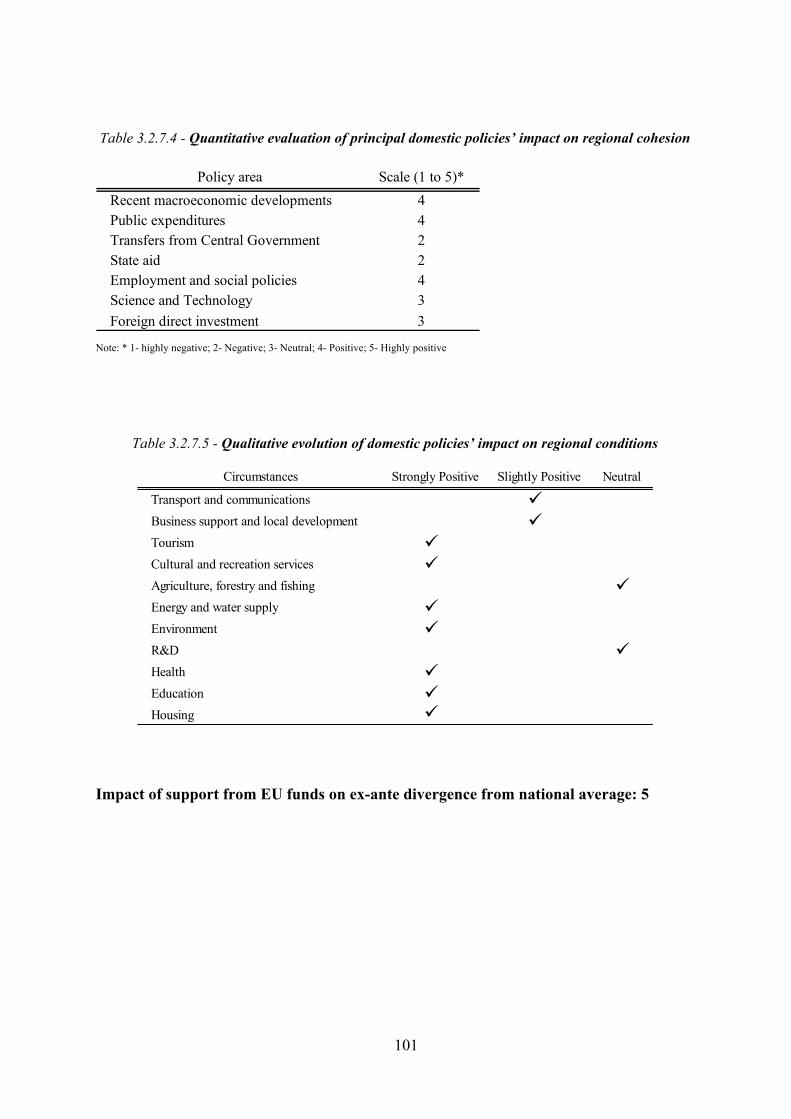
101
Table 3.2.7.4 - Quantitative evaluation of principal domestic policies’ impact on regional cohesion
Policy area Scale (1 to 5)* Recent macroeconomic developments 4 Public expenditures 4Transfers from Central Government 2State aid 2Employment and social policies 4Science and Technology 3Foreign direct investment 3
Note: * 1- highly negative; 2- Negative; 3- Neutral; 4- Positive; 5- Highly positive
Table 3.2.7.5 - Qualitative evolution of domestic policies’ impact on regional conditions
Circumstances Strongly Positive Slightly Positive Neutral
Transport and communications Business support and local development
Tourism Cultural and recreation services Agriculture, forestry and fishing Energy and water supply Environment R&D Health Education Housing
Impact of support from EU funds on ex-ante divergence from national average: 5
102
4 - The impact of EC policies on cohesion
4.1 - Two regional case studies - potential effects
The contribution of CPs to cohesion has been subject to increasing attention in recent years.
As far as the Portuguese economy is concerned, recent estimates from Ministério do
Planeamento (DPP, 2001) point to an overall additional growth of GDP by 0.4 percentage
points due to the CSF II. The study conducted by the evaluates the macroeconomic impact of
the CSF II at the country level, without analysing the regional incidence of the programme.
This raises the question as to whether these developments have had diverse impacts on
different regions in Portugal.
At the regional level, Cappelen, Castellacci, Fagerberg and Verspagen’s (2003) suggests that
EU regional support had a significant and positive impact on growth performance. The
authors argue that the major reform of the structural funds undertaken in 1988 may have
succeeded in making EU regional policy more effective. However, they also conclude that
the economic effects of such support are much stronger in developed environments,
accompanying policies that improve the competence level of the receiving environments. In
contrast, Freitas, Pereita e Torres (2003) found no evidence that eligibility for objective one
EU funding has resulted in extra growth, as compared to what would be expected, given the
region attributes.
A fact that has been pointed out is that CPs differ in their results, depending on the region
and that in some cases different policies contradict each other. The second intermediate
Report on Economic and Social Cohesion explicitly recoggnizes that “the content of these
policies should also consider the enormous diversity and the greater territorial imbalances in
the extended Union”. The two regions that we focus on, Açores and Algarve, provide a good
illustration of differential impact of the community policy package on regional development.
The aim of these two regional case studies is to examine on the ground the effects of CPs on
regional development, both in terms of convergence and progress of the region. The goal is
not to examine in detail all community initiatives but rather those that are most relevant for
the regions at hand.
The analysis is extensive to issues not directly budget-related, such as the extent to which
CPs have contributed to reinforce the capacity of endogenous regional development, namely
103
through its influence on the local governance and capability to implement coordinated policy
actions aiming the development of the region as a whole.
The analysis and subsequent conclusions are based on discussions with key actors in the
region. This includes government officials with responsibility for managing relevant
Community Programmes, as well as private associations and academics with relevant
research experience.
4.2 - Regional case study 1: Açores
Context and Background
Açores is one of the poorer regions in EU. The economic potential of Açores is largely
affected by its location. The territory is located in the middle of the Atlantic Ocean. This
translates into high transport costs, which affect regional competitiveness.
Because the territory is composed of nine islands, spread over an area of 66.000 square
kilometres, the domestic market is highly fragmented. The resident population in some
islands is small enough to generate natural monopolies. Lack of economies of scale also
limits the ability to realise the full benefits of self-financed basic infrastructures, such as
hospitals, roads, courts and schools. In order to compensate for ulytra-periphery, this region
has been recipient of considerable transfers from the rest of the country.
The economy of the archipelagos is largely dependent on the public administration and on
the flow of official (and also private) transfers. The bulk of regional GDP is accounted for by
non-tradables, such as government services, public administration, schools, hospitals, courts
(which are present in each island), housing construction, commerce, health care, etc.
The most important tradable good in the region is milk. This is a direct consequence of the
CAP policy. Fishing had a significant weight in the past, but is now of decreasing
importance. The sector of tourism has been recently elected as a key sector in the
development strategy and has consequently received a significant official impulse. However,
the flow of tourists into the region is still too low to meet the region’s financing needs. The
average hostel’s occupation stands at around 50 per cent, according to the interviewers.
There are some concerns as to whether such an emphasis on tourism may be risky due to the
climatic conditions of Açores.
104
The economy of Açores was mostly affected by the 1989 revision of the contract with the
United States for the use of the Lages military base. With this revision, the US government
stopped paying a rent, that was an important source of resouces for the regional government.
Facing a fall in revenues, the regional government accumulated arrears to the rest of the
economy, causing a general liquidity problem and a recession in the region. Between 1989
and 1996, the economy of Açores followed a diverging path.
In 1998, a new financial regime for the autonomous regions of Madeira and Açores came
into operation (including a newly created cohesion fund). As a consequence, official transfers
from the continent rose significantly. Under the new financial framework, the economy of
Açores entered a new period of economic growth and convergence.
Progress towards cohesion
Growth in Açores has been polarised: universities and training centres are localised in the
three main urban centres: Ponta Delgada, Angra do Heroísmo and Horta. Because of
agglomeration effects and network economies, there is a natural tendency for regional
imbalances to increase. Economic policy has tried to offset this tendency, equipping each
island with basic infrastructures, such as hospitals, schools, public administration, airports
and harbours. This effort translates into a dramatic loss of economies of scale.
To assess the impact of policy actions on competitiveness, one needs to abstract from
demographic effects. In columns (2) and (3) of table 3.1.2 (see subsection 3.1), the relative
per capita GVA is broken down into a demographic component (working age population
divided by total population) and a policy induced component (GVA per working age person).
In Columns (4) and (5), the relative GVA per working age person is broken down into GVA
per worker and the employment rate (employed divided by working age population). Figure
3.1.3 (see subsection 3.1) displays the same information depicted in columns (2) and (3) of
table 3.1.2, but in terms of changes, from 1990 to 2001.
The y-axis measures the difference between the growth rates of GVA per working age person
in the region and the country average. The horizontal axis measures the difference between
the demographic trend in the region and the country average. The dashed line shows the
combinations of demographic trends and productivity changes that would allow per capita
GVA to grow proportionally to the rest of the country. The graph defines four different
regions, according to the regions relative performance vis-à-vis the country average.
105
The figures reveal that Açores enjoyed favourable demography, but that productivity levels
diverged from the country average. Since the second effect dominated the first, the economy
diverged in terms of per capita GVA, from 79 per cent of the country average in 1990 to 71
per cent in 2001.
From 1998 to 2001 the living conditions have improved, however, significantly. Because of
the large subsidies received, the living conditions of the resident population have improved
and the benefits were reasonably shared across the population. Notwithstanding a general
perception that the latest policy package has contributed to improve the citizens’ quality of
life in Açores, there is disagreement as far as the impact of specific policies on
competitiveness is concerned.
In general, the economy is highly dependent on external funding and affected by wrong
incentives. A policy shift towards the market would be desirable, to promote competitiveness
and self-sustained development. More focused policies and "getting the prices right" are
necessary steps to achieve greater efficiency and a pattern of production more in accordance
with the comparative advantages.
Revising the existing incentives does not mean that the region should receive less financial
support. Because of its geographical conditions, it is important for Açores to keep receiving
substantial aids. However, progress towards a less distortionary fund allocation would be
advisable.
4.2.1 – Impact of specific policies
a) Structural Funds and the Cohesion Fund
Açores has benefitted from substantial amounts of Structural Funds. Under the CSF II, it was
a recipient of 45.372 thousand euros up to the end of 1999. In 1994, the Region has been
designated as ultra-peripheral, which implies that it will be elegible for objective one
funding, irrespectively of its per capita income level. In any case, per capita GDP in Açores
is below 75 per cent of the EU average.
The main development plan in Açores is PRODESA (Operational Programme for the
Economic and Social Development of Açores), co-financed by the regional government and
the European Commission. The plan integrates a significant part of the available structural
funds in the region. It covers the construction of public infra-infrastructures, the shaping of
106
the public administration and support for the private sector. Other relevant community
programmes include: REGIS (Community Initiative Programmes for the Development of
Ultra-Peripheral Regions), POSEIMA (Programme of specific options to address distance
and insularity of Madeira and Açores), INTERREG (Interregional Co-operation Programme)
and LEADER.
ERDF funding has been of major importance for the region. By supporting the provision of
essential infrastructures, this policy has contributed to increase the territory’s
competitiveness. The same applies to the Cohesion Fund. ERDF is quite a visible policy.
Thanks to significant investments in roads, airports and, to a lesser extent, harbours, mobility
within the region and into the region has increased significantly. The development of Airport
infrastructures was considered fundamental in this process, because it created new
opportunities, namely in the tourism sector. Improvements in hospitals, schools, water supply
and drainage of urban residuals also had a considerable impact on the citizens’ living
conditions, especially outside the main urban centres. The effort to spread the infrastructures
over the entire territory has led, however, to the loss of economies of scale. The policy has
been less generous as far as urban transports are concerned. Insufficient support to this
industry is giving rise to geographical imbalances in the labour market, especially in the
minimum-wage segment where people cannot afford to buy a car.
The ESF has a lower financial impact than ERDF, but its effect on competitiveness is
perceived to be large. Unfortunately, ESF spending in Açores is not proportional to the
existing needs. Açores is the European region with the lowest education level. With equity
and cohesion concerns, regional governments tried to provide all islands with basic
infrastructures, so that each one of the nine islands now boasts a professional school. Despite
this, the amount of ESF allocated to Açores is very low, as compared to other Portuguese
regions. The regional government has begun to promote market-oriented training actions
based on a survey conducted in order to discover market needs. More than 90 per cent of the
firms all over Açores responded. It was reported that all training actions are now following
the guidelines identified in this survey, that is, training courses are only approved if they
meet local employmentl needs. Thus far, the existing indications suggest that this change in
policy has been positive. However, there are some reported cases of people who, after having
received specific training, were not able to take up jobs because of the lack of an efficient
transport system or because of the cultural characteristics of Azorean people.
107
In order to raise efficiency in the allocation of funds, the authorities require a bank collateral
in the application process for job creation subsidies. This allows the government to cut the
subsidy when the job is closed before the agreed term.
Without question, investment in human capital is of crucial importance in Açores. There is
an opportunity given that the population in Açores is very young. More than 50.000 students
are registered at school, representing one third of the current working age population. This
will impact significantly on the structure of the labour force over the next twelve years. If the
authorities are well succeeded in educating the younger people, the competitiveness of the
economy may improve significantly. So far, the qualification rate, defined as the proportion
of workers endowed with a technical course within the total workforce, has risen from 1.4
per cent in 1996 to 5 per cent in 2003. Within three years time this ratio is expected to rise to
10 per cent. The target for 2010 is 25 per cent.
b) Common Agricultural Policy
The CAP has been the dominant source of EU funding and plays a very important role in tthe
economy of Azores. Most of this aid comes through production support. CAP pillar II and
agro-tourism initiatives play a limited role in the region, the farmers not being motivated for
these dimensions.
Without CAP aids, Açores would suffer a dramatic economic and social problem. As far as
economic cohesion is concerned, however, this policy is rather ineffective: it creates
dependency, it gives rise to significant distortions in resource allocation and it has raised
significant environmental problems. As it stands, the CAP is more effective a tool for social
cohesion than a competitiveness-enhancing policy.
Owing to the Açores’ climatic and soil conditions, during the 1990s a regional cluster based
on cattle derivatives (butter, cheese, beef and other) has emerged: farmers were induced to
engage in cattle creation. Milk production became and still is the most important sector in
Açores. Although some other cultures subsist (pineapple, garden-beet), farmers were led in
the 1990s to expand milk production to benefit from higher levels of funding. Because of the
CAP, the Federation of Farmers became an important political lobby, which has to be heard
on any policy subject in Açores.
Since most exploitation are of small scale, CAP aids play an important role in Açores, as far
as social cohesion is concerned. CAP aids are well distributed among farmers and over the
108
territory. This contrasts with the general rule of CAP that 80 per cent of the aid goes to 20
per cent of the farmers. Pillar I aids represent a reasonable share of farmer incomes, helping
the rural population to remain in situ. The drawback is that the policy has created dependency
and is contributing to keeping the exploitation sizes small.
Due to the existing milk quotas, a plan is now being developed involving farmers and the
authorities to promote beef production, under a common umbrella of geographical
certification. This may involve some CAP pillar II funding. This plan is based on the
recognition that, because of the increasing EC regulation, the minimum scale for milk
production has risen over the last few years. According to the farmers’ representatives, CAP
regulations are driving some small producers out of the market (through anticipated
retirements). According to this plan, smaller farmers would be induced to shift from milk
production to beef production. The process of anticipated retirements is also envisaged in
order to promote the rescaling of exploitations.
To the extent that aids are proportional to production, they give rise to a distortion, measured
by the deviation opf the actual production pattern in respect to the one that would be
achieved by means of the law of comparative advantage. Although the natural conditions in
Açores are favourable for milk production, one should note that milk production was not that
important before CAP protection schemes were put in place. As in other European regions, it
may well be the case that other cultures with higher ex ante profitability are being neglected
because of the community policy.
The production bias has also impacted negatively on the environment. The excessive use of
chemical products (phosphates) in agriculture is contaminating water resources all over the
territory and two important lagoons (Sete Cidades and Furnas) are under ecological distress
(recall that the Açores tourist bet is based on its natural beauty). A generalised problem of
water pollution could thus threat the recent development strategy formulated for the
archipelagos.
The de-linkage of aids from production is desirable from an efficiency point of view.
However, the Federation of Farmers reacted negatively to the PAC reform. Aparetntly,
farmers first want to obtain a rise in the milk quota, as to increase the total amount of aids
received before considering the de-linkage option. The farmers also reacted negatively to the
modulation mechanism, that is, the progressive reduction of aids for those farmers receiving
109
more than 5.000 euros per annun. Although in Açores most of the exploitations are small-
scale, farmers actually receive more than 5.000 euros per annum under a special programme
called POSEIMA. If farmers in Açores did not enjoy a special regime, modulation would
result in significant losses within the farmer community.
Although this is pure rent-seeking, it should be noted that a significant fraction of farmers is
aged and not suitable to be transferred to other sectors. Had these subsidies been removed, a
dramatic social and economic problem would have emerged in the economy of Açores.
c) Competition Policy
Because of geographical discontinuation, the advent of the internal market had only limited
effects in the economy of Açores. Firms are partially protected from external competition.
Moreover, wherever the local market is not big enough to support a large number of
competitors, this translates into local natural monopolies and consumer losses.
To compensate for the costs caused by the physical barriers, both direct and indirect taxes in
Açores are lower than in mainland Portugal. The reduction in VAT is however uniform
across products, thus not depending on the actual transport costs. This gives rise to
significant distortions. For example, software industries, which are not affected by transport
costs, are not surprisingly moving from the continent to Açores, so as to profit from lower
direct and indirect taxes. On the other hand, in industries where transport costs are important
(milk, beef), relative prices have moved in the wrong direction.
A main competition problem was identified in connection flights. In Açores, airlines are
being explored under monopoly or under special arrangements involving the operators. As a
consequence, airfares for non-residents are well above market prices. In Açores, where
periphery and transport costs are a key issue, such an extra inefficiency is rather unwelcome.
d) State Aids
Because of its insularity, the region benefits from a wide range of investment-supporting
packages. The EC approved a special aid programme for the regional development of Açores
called SIDER (Incentive System for Regional Development). With this instrument, the
regional government is able to support firms operating in a wide range of industries. The use
of this ability has lead however to significant price distortions. Funds have been distributed
over almots all sectors in the economy, including services, housing construction and tourism-
related activities.
110
From a social cohesion point of view, this policy is probably effective. However, such a
generosity lacks an economic rationale. It is questionable whether firms operating in non-
tradable sectors like housing construction or street shops should be supported by SIDER.
Non-tradables are, by definition, isolated from external competition in every economy.
Hence, there is no point of these industries being eligible for a subsidy specific to insular
economies. Moreover, some of these activities only exist because their demand is derived
from subsidies attributed elsewhere. Tradable sectors, on the contrary, are highly affected by
transport costs. Unfortunately, the policy does not distinguish these two situations. Rather
than spreading the subsidies all over the economy, a more focused policy would be desirable.
e) Environment
The environment policy has produced relevant effects in three main areas:
- the implementation of structural policies has been accompanied by studies evaluating their
environmental impact. In general, whenever a negative impact was foreseen, alternative
solutions have been proposed, without any particular political or social problem.
- over the last years, the production of urban waste has risen significantly in Açores. A
significant amount of ERDF has been used to improve the waste collection system and the
drainage of urban liquid residuals. Since the Açores do not have the minimum scale for an
incinerator, waste has been exported abroad. This is, of course, an expensive solution,
especially because nine islands are involved.
- in Açores, air pollution caused by carbon emissions is negligible. However, cattle creation
has led to a fast deterioration of the quality of water sources. At the moment, the authorities
are dealing withthe problem of excess phosphates in the lagoons of Sete Cidades and Furnas,
in São Miguel. This affects roughly 60 farmers. The intervention is however, restricted to
these areas. According to the opinions collected, there is no general approach for dealing
with the pollution caused by agriculture in the archipelagos.
In general, environmental protection rules are well accepted in the region. Azoreans
perceived environmental policy as having been dominated by specific interventions in order
to face up to particular problems. The actions undertaken are perceived, however, as prompt
and efficient. On balance, there is no perception that environment regulations are
constraining theregion’s growth perspectives. On the contrary, there is an understanding that
environmental protection is essential for sustained development.
111
f) Innovation and Research and Development
Innovation Policies are not significant in Açores. A notable exception is the research
undertaken to explore geothermal energy. With ERDF co-financing geothermal electric
generator was created in S. Miguel. Research and development in the region is mostly
undertaken by the University of Açores. Excellence has been achieved in the areas of
geothermal energy and oceanography.
Biological agriculture is negligible in the region. There is no link between agriculture and
regional innovation policy. In general, R&D policies do not have a major impact on the
economy of Açores. Firms are not involved in R&D activities and government initiatives
became more visible in the couple of last years.
In general, innovation policy is perceived as having a ‘broadly neutral’ effect.
g) Common Fisheries Policy (CFP)
Although the weight of fishing-related activities in GDP is declining, there are still some
important fishermen communities. By contributing to the modernisation of the fleet and
regulating the industry, the CFP had an important role in driving fishermen’s incomes up to
levels comparable to those of other activities. The reduction of the fleet led however to some
early retirements and may have contributed to some long-term unemployment in specific
communities.
We perceived the Fishing Sector as to be largely ignored within the Açores community. A
general concern is whether the openness of the exclusive fishing area to other EU countries
will threat the existing fish stocks, because the exclusive ocean area is huge and the Azorean
authorities do not have sufficient means at their disposal to patrol the entire area. For some
authorities this problem already exists with respect to some Spanish fishermen.
h) Transports, energy and telecommunications
Improvements in airport infrastructures on all islands (especially in Ponta Delgada, Angra do
Heroísmo and Horta) had a significant impact in the region. Although mobility within the
archipelagos has improved, it is still dependent on random factors, such as weather
conditions.
112
As far as energy and water supply is concerned, there is still a lot to be done. For example, it
was reported that the existing electricity network and water supply only reach 5 per cent of
the farmers.
4.2.2. Co-ordination between policies
Despite the large degree of policy interdependency in a small region like Açores, the
different programmes are perceived to be implemented in a rather independent (and, in some
cases, conflicting) manner. As far as agriculture and tourism is concerned, the natural link via
agro-tourism is not being explored.
4.2.3.- Governance
The existence of a regional government constitutes an advantage for Açores with respect to
other Portuguese regions. However, the administration’s structure is not perceived to be fully
adapted to promote an effective intervention. The desirability of greater co-ordination
between the regional government and other levels of the administration was referred by
almost all of the persons interviewed. It appears, however, that co-ordination problems are
now a matter of increasing attention by the administration.
Access to EC funds has helped the local authorities (as well as private agents) to improve
their planning capabilities. As in other regions, the elaboration of PRODESA was preceded
by an overall discussion involving key actors in the region, enriching the debate and the
understanding of the global problems facing the economy. Because of the eligibility
requirements, the policy was also forced to incorporate some concerns (e.g., environment)
that otherwise could have been neglected.
The Federation of Farmers complains about the slow official response to project applications
(IFADAP - Institute of Financing and Support to the Development of Agriculture and
Fisheries - and regional government). A usual practice has been to proceed with project
implementation prior to approval, using some special credit lines offered by the banking
system. Nevertheless, the risk exists that projects be rejected because of this. This was
pointed out as an example of lack of coordination and bad governance.
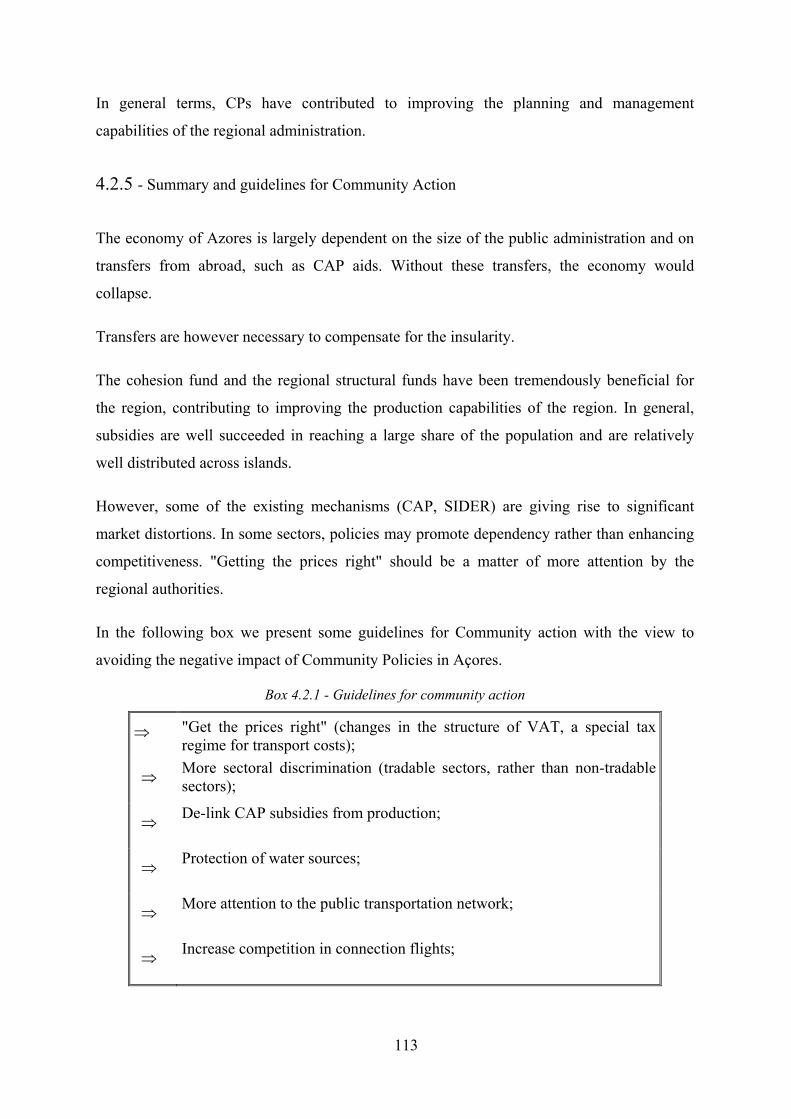
113
In general terms, CPs have contributed to improving the planning and management
capabilities of the regional administration.
4.2.5 - Summary and guidelines for Community Action
The economy of Azores is largely dependent on the size of the public administration and on
transfers from abroad, such as CAP aids. Without these transfers, the economy would
collapse.
Transfers are however necessary to compensate for the insularity.
The cohesion fund and the regional structural funds have been tremendously beneficial for
the region, contributing to improving the production capabilities of the region. In general,
subsidies are well succeeded in reaching a large share of the population and are relatively
well distributed across islands.
However, some of the existing mechanisms (CAP, SIDER) are giving rise to significant
market distortions. In some sectors, policies may promote dependency rather than enhancing
competitiveness. "Getting the prices right" should be a matter of more attention by the
regional authorities.
In the following box we present some guidelines for Community action with the view to
avoiding the negative impact of Community Policies in Açores.
Box 4.2.1 - Guidelines for community action
⇒ "Get the prices right" (changes in the structure of VAT, a special tax regime for transport costs);
⇒ More sectoral discrimination (tradable sectors, rather than non-tradable sectors);
⇒ De-link CAP subsidies from production;
⇒ Protection of water sources;
⇒ More attention to the public transportation network;
⇒ Increase competition in connection flights;
114
⇒ Reinforce training actions;
⇒ Greater co-ordination between agriculture, tourism and environment.
4. 3 - Regional case study: Algarve
Context and Background
Algarve is a region with roughly 350.000 inhabitants. Tourism-related activities (including
hotels and real state) represent the bulk of regional GDP. In 1998, the number of tourists
entering in Algarve through Faro airport and Andaluzia exceeded 4.7 million.
Agriculture and fishing represent roughly 8 per cent of regional GVA and 10 per cent of
employment. Manufacturing accounts for less than 5 per cent of regional GVA. Due to
tourism, most of activity is located in the coastal area of the south (Campina).
Progress towards cohesion
Over the last years, the Algarve economy has performed relatively well. The region has been
able to converge towards the country average in terms of per capita GDP and this progress
encompassed the coastal as well as the rural areas.
The impulse provided by Community Policies in promoting economic cohesion has
perceived to be very positive. The region is now better endowed in terms of infrastructures
and ability to converge than one decade ago. In general, intervention did not give rise to
excessive distortions or dependency.
Special attention is needed, however, in regard to two dimensions: human capital and
environmental protection.
To assess the impact of policy actions on competitiveness, one should abstract from
demographic effects. In columns (2) and (3) of table 3.1.2 (see subsection 3.1), the relative
per capita GVA is broken down into a demographic component (working age population
divided by total population) and a policy induced component (GVA per working age person).
115
In columns (4) and (5), the relative GVA per working age person is broken down into GVA
per worker and the employment rate (employment divided by working age population).
Figure 3.1.3 (see subsection 3.1) displays the same information depicted in columns (2) and
(3) of table 3.1.2, but in changes, from 1990 to 2001. The y-axis measures the difference
between the growth rates of GVA per working age person in each region and the country
average. The horizontal axis measures the difference between the demographic trend of each
region and the country average. The dashed line shows the combinations of demographic
trends and productivity changes that would allow regional per capita GVA to grow
proportionally to the country average. The graph defines four different zones, according to
the relative performance of the different regions vis-à-vis the country average.
The figures reveal that Algarve enjoyed both favourable demography and a fast rise in
productivity. This twin advantage translated into a fast convergence towards the country
average of per capita GDP.
4.2.1 – Impact of specific policies
a) Structural Funds and the Cohesion Fund
Algarve has received large amounts of Structural Funds, which are managed under a regional
programme called PROALGARVE - Algarve Operational Programme in the CSF III -
(PROA in CSF II). The cohesion fund has been used mostly for environmental issues. The
region also receives direct support from community initiatives, such as INTERREG and PIC
(Programmes of Community Initiative) LEADER + and EQUAL (European Social Fund
Initiative).
The fund that was perceived to have had most impact in the region is EDRF. This Fund has
been used to improve public infrastructures, such as roads, hospitals, water supply, drainage
of urban residuals, etc. Although most funds are spent in the coastal area (Campina), this is
also the region where most of the population lives. In proportion of the residential
population, the understanding is that investments have been higher in rural areas. EFRD
funding is perceived to have impacted positively on living standards and on competitiveness
both in rural and urban areas.
The improvement in accessibilities allowed the flow of tourists into the region increased
significantly. For example, tourists entering by the Spanish border and/orthe airport increased
116
from 2.1 million in 1990 to 4.7 million in 1998. The railways now connects Faro directly
with Lisbon. This allows travellers to move from the North of Portugal to the South without
changing train. There is a perception, however, that the investment effort made in the
regional railways system was too low. Since the railroad connects the main cities in Algarve,
its improvement could have a positive impact on labour mobility and on traffic conditions in
the main urban centres. The improvement in municipal roads helped people living in the
countryside to share in the benefits of economic development, as long as they afford to have
a car. People are now able to live in the rural areas of Barrocal and Serra and work on the
coast (Campina).
The Portuguese IEFP has been surveying the employers, with the aim to identify training
opportunities, rather than to offer courses according to the jobless’ requirements. The results
so far have been promising. It was reported, however, that some unemployed, after receiving
appropriate training, were unable to take jobs outside their residential areas because of the
lack of an appropriate public transport system.
In the Algarve region, the labour market is significantly affected by seasonality. Since most
demand for labour arises in the summer, a large share of the employment created is short-
term. A significant share of the workforce engages in summer work, enjoying high monthly
wages and benefitting from unemployment protection during the winter. The authorities tried
to reduce this phenomenon, supporting longer-term employment with training actions during
the winter35. However, only the larger firms (those that usually hire long-term) have
responded. Small firms (the target of the policy) are insisting in hiring only short-term
workers.
ESF spending, depending on private bids, is thus highly concentrated in the more polarised
regions of Campina. To offset this, attempts are being made by the national and regional
authorities to promote specific training actions in the less favoured regions of Barrocal and
Serra.
35 Employment policies are implemented through the Plano Nacional de Emprego (PNE), which is
designed according to EC guidelines and targets and came into operation in 1999. The implementation of PNE
in Algarve is undertaken by three different structures (National Employment Networks). This applies however
only to operational purposes, given that there is no regional autonomy in the policy formulation.
117
Despite being one of the European regions with a lower level of human capital, ESF
spending has been evolving at a slow pace. Although the seasonal nature of the labour
market may explain this, it may also reflect a cultural problem. Remarkably, training actions
specifically directed at the municipalities' own staff (accounted for in PROALGARVE)
reveal very low spending as well. This pattern, in a region with such a low level of human
capital should be a matter of concern in the future policy formulation.
b) CAP
The CAP policy is administrated in the region at two different levels. The bulk of the CAP
policy is under the national framework, named AGRO (Agriculture and Rural Development
Operational Programme in the CSF III). Pillar II policies, because they are more linked to the
region, were incorporated in PROALGARVE, under the name AGRIS (Generic Assignment
of the Measures Regionally Disconcentrated of Agriculture and Rural Development). This
includes rural development, diversification, incentives for workmanship, urban interventions
in small villages, support for small-scale production, quality development, environmental
protection, etc. From a cohesion point of view, this dimension of the CAP is of great
importance.
Due to the fact that agriculture in Algarve is predominantly of the Mediterranean type, CAP
supports are not as important as in other EU regions. Consequently, CAP aids do not
constitute a significant share of farmers’ incomes. Still, farmers in Algarve have benefitted
from considerable investment supports. Most of the aid is taking the form of investment
subsidies, thus contributing to the modernisation of agriculture without giving rise to
significant dependency.
The sectors that received help include citrus production, horticulture and forestry (pinewood,
cork, eucalyptus). These were and still are some of the most important cultures of the region.
The traditional cultures (almonds, figs and carobs), are not so dynamic, but have a high
social value. Milk production has practically disappeared and the production of cereals is
declining every year. Contrary to other regions, in Algarve the CAP has not caused a
significant move toward production patterns that are contrary to the comparative advantage.
In this framework, de-linkage of supports from production is not likely to cause any
significant change.

118
Under the CAP’s second pillar there has also been some investment in the development of
rural areas and supports for production diversification. Biological agriculture and agro-
tourism have not yet reached a visible scale in Algarve. However, the bulk of the CAP policy
originates in the first pillar.
Important from the social point of view is the small-scale production of agricultural
derivatives, such as cheese, liqueurs and olives. Although special supporting programmes
were designed for these activities, eligibility requires producers to satisfy a heavy set of
consumer protection rules. It has been reported that many small-scale producers prefer to
remain on the sidelines, not satisfying the requirements (and in some cases not paying taxes),
rather than to benefit from CAP pillar II aids.
To the extent that the CAP's first pillar promotes extensive production, it is likely to have a
detrimental impact on the environment. In Algarve, some contamination of water resources is
likely to be caused by extensive horticulture.
Some of the research projects undertaken in Algarve are related to agriculture. The most
significant ones involve the Regional Direction of Agriculture, the University of Algarve
and, in some cases, Spanish entities (under INTERREG).
c) State Aid
Subsidies for private business are attributed at the national level. Some of these are however
accounted for in the regional programme, PROALGARVE. Some of them constitute support
for local small-scale investment (firms with fewer than 20 workers), information society and
PITER - Regional Programme for Tourism Development. These are all co-financed by
ERDF.
d) Common Fisheries Policy
The Fisheries policy is defined at the national level. Regarding implementation, however,
there are two levels. The measures accounted for in the national policy framework are called
MARE (Fisheries Operational Programme). Those accounted for in PROALGARVE are call
MARIS (Generic Assignment for the Measures Regionally Disconcentrated of Fisheries) and
include infrastructure development (ERDF) and quality improvement (FIFG). In practice,
however, all policy is mediated by the national government. Since the regional director of
fisheries has no autonomy, de-centralisation is only virtual.
119
From 1994 to 1999, the number of registered fishermen has declined from 8.200 to 6.800.
The same trend is foreseen until 2008. The number of ships has also declined, from 2.900 to
2.300. The fleet is now more modern and with better working and safety conditions than
before. In this process, there has been a tendency for the ships’ fishing capacity to increase.
Despite these developments, 30 to 40 per cent of the fleet is still obsolete.
In general, the implementation of CFP has been perceived to be positive for the sector.
Fishermen’s incomes have improved and the re-scaling of the fishing sector has not caused
significant social effects. Early retirements were well accepted and transfers of workers to
other sectors were smooth. However, a problem of false retirements was identified: because
pensions are very low, some retired fishermen are maintaining a fishing activity, under the
umbrella of "sport fishery". Since, in Algarve, sport fishery is not being subject to adequate
supervision, this is a problem that needs to be taken into account in the future.
Some fishermen in Algarve were affected by the failure of EU negotiations with Morocco.
Those who were forced to stop their activity have been supported by different mechanisms in
the last few years, but are now facing the threat of an early retirement.
The reduction of the exclusive fishing area to 12 miles is a matter of concern among
fishermen in Algarve. This is because most of the fishing activity takes place between the
coast and within the 20 mile zone. Fishermen claim that the Portuguese government has
discriminated them. In particular, they claim that the licensing of ships in Portugal obeys to
stricter rules than in Spain, giving rise to an unfair competition in terms of fishing capacity.
e) Environmental Policies
After decades of negligence and insufficient monitoring, there is now an understanding that
environmental protection is crucial for sustained development, particularly in a region where
tourism plays such a special role. Those urban areas that have grown chaotically in the past
(excess building, lack of green areas) are losing competitiveness to alternative areas where
planning and environment protection are accounted for. This process of "flight to quality" is
not sufficient, however, as a disciplinary device. Because of the externalities involved,
individual decisions tend not to incorporate the social losses, giving rise to excess building
and environment problems.
The situation has evolved differently in the countryside. Up to the 1980s, housing
construction has led to a fast deterioration of the rural landscape. In 1990, PROTAL -
120
Territorial Order Plan (MA - Environment Ministry) imposed serious restrictions on housing
construction in rural areas. According to this plan, house construction in rural areas was only
allowed as a replacement for earlier buildings. Restricting the supply, this law has lead to a
general improvement in the housing quality outside the urban centres. At the moment,
PROTAL is under revision and pressures exist so to make it looser.
Environmental policies have received substantial Community support over the last years,
mostly through ERDF and the Cohesion Fund. Remarkably, the bulk of the Cohesion Fund
received under CSF II was allocated to environmental policies (improvements in the water
supply, collection and drainage of waste and urban residuals, etc). Evidence from
environmental indicators shows that the policy had a very positive impact.
The policy was enacted by the Regional Direction of Environment. This body has also been
involved in the evaluation of the environmental impact of projects that are not usually subject
to such requirement by the EC (small roads, for example).
POLIS (Urban Requalification and Environmental Valuation Programme) is a national
initiative aiming at the re-qualification of distressed urban centres. The first wave of projects
is being realised in Albufeira and Silves. An extension of the POLIS programme to other
municipalities would be of great interest for the region.
A significant proportion of the territory is now subject to environmental protection, under
Reserva Ecológica Nacional, Natura 2000, or other protection schemes. In the areas of
special protection (Ria Formosa, Costa Vicentina, Guadiana), the Nature Protection Institute
(ICN - Nature Protection Institute) has managed to avoid a further deterioration of
environmental conditions.
Despite the progress made, environmental issues should be kept on the top of the policy
agenda in the future. The erosion of the coast, a final solution for solid urban residuals, and
interventions in the urban centres that have grown chaotically and protection of natural areas
are aspects in need for urgent intervention. Given the extreme sensitivity of the region and
the economic interests involved, a strict governance system is required.
121
4.3.2 - Co-ordination between policies
During the preparation of the regional operational programme the policy debate was enriched
by the participation of key actors in the region. This includes the CCR (Regional
Coordination Commissions), the regional directorates representing the national government
(agriculture, economy, employment, etc), the municipalities (AMAL - Algarve
Municipalities Association, representing the 17 municipalities of this region), business
associations, academics and the Tourism Regional Commission (where both the central
government and the municipalities are represented). This debate allowed key actors and
government officials in the region to get in contact with the problems identified by each other
and to incorporate different solutions in the new programme. A strategic document was
prepared, containing the main policy options for the region. After the creation of the
operational programme, called PROALGARVE, the co-ordination effort lost impetus.
In PROALGARVE, two main innovations with respect to PROA were introduced:
In order to avoid more dynamic areas to absorb the bulk of the financial resources, a
special dimension was created called “Territorial Actions”. Territorial actions were
introduced to promote a more balanced development across the territory, taking into account
the two different dimensions: a coastal area subject to urban pressures (Campina) and the
rural periphery (Barrocal and Serra). Although expenditures in territorial actions are evolving
at a slower pace than planned, since resources cannot be re-allocated between actions,
authorities trust this mechanism to become an effective cohesion tool.
De-centralisation: attempt to incorporate into the regional plan some spending from
national policy. For example, the agriculture policy was split into AGRIS (regional) and
AGRO (national). The fisheries policy was split into MARE (national) and MARIS
(regional). For the employment policy, the split between policies is less obvious: initiatives
for unemployed are under PROALGARVE, while initiatives for youth and job-training
actions are kept as a national policy.
In practice, however, the procedures and the decision process for policies contained in the
regional plan obey to the same rules as for those policies that remain under the national
umbrella. In agriculture, for example, AGRIS rules are equal in all Portuguese regions and
the final decision is given to the Ministry. This means that, from the co-ordination point of
122
view, the incorporation of national policies in PROALGARVE is little more than an
accounting change.
In general, co-ordination between different levels of government (regional, national,
municipalities) is perceived to be deficient.
Specific co-ordination problems were identified at the launch of POLIS. This initiative was
to be co-financed by both the European Funds (Cohesion Fund, Sectoral Operational
Programs) and the Portuguese Government. The policy was however only formulated after
the CSF III was on its way. Since the selection and eligibility criteria of POLIS (Programa de
Requalificação Urbana e Valorização Ambiental) had not been subject to the scrutiny of the
EC, negotiations had to be conducted thereafter. This led to a significant delay. Three years
after the initiative was announced, no physical interventions have yet taken place.
Rural development, electrification of isolated areas, promotion of small-scale activities in
areas with low density (cheese, liqueurs, olives, workmanship) involves different funds such
as ERDF, CAP/AGRIS, and LEADER. Co-ordination between these initiatives was claimed
to be low.
4.3.3 - Governance
In Algarve, there is no regional government. The regional development programme is
managed by CCR, which has neither executive power nor direct authority over the regional
directions or the municipalities. This gives rise to significant accountability and governance
problems. Since, in contrast, municipalities have their own political legitimacy, this translates
into an excessive weight of municipalities in the decision-making process. Perhaps this
explains the excess of symbolic infrastructure and some lack of scale in policy formulation.
During CSF II, Algarve displayed a low spending capability as compared to the rest of the
country. This was not so much a problem of regional governance (actually, funds depending
on the regional plan were spend at a normal pace), but mostly the failure of regional
directorates in driving resources into the region. Since these "national policies" represent the
bulk of the budget, PROALGARVE attempted to re solve the problem incorporating into the
regional plan some "national" policies (de-centralisation).
123
Under INTERREG, cross-border partnerships involving bodies from Algarve, Andaluzia and
Alentejo have been supported. Within the current framework, eligibility requirements are
stricter than under CSF II: only effectively integrated projects are being supported. Two
problems were identified in terms of the implementation of this programme. The first is that,
contrary to what happens in Spain, in Portugal, there are no regional governments. This
means that, in some matters, the dialogue takes place between the authorities in Andalusia
and the Portuguese government. On the other hand, some communication problems may
have resulted from the fact that Andalusia is economically much larger than Algarve.
Notwithstanding, roughly 50 projects supported by INTERREG III are under way.
It was reported, as an example of “bad governance”, that projects submitted to
PROALGARVE have a faster approval than those supported by national policies.
4.3.5 - Summary and guidelines for Community Action
With no doubt in Algarve CPs have played a crucial role in promoting economic cohesion.
Public infrastructures, such as accessibilities, water supply and drainage of urban residuals
have been the main vehicles. Greater attention should be paid, however, to public transport
and in particular to the regional railway system which lacks modernisation. Despite being
one of the regions in Europe with the lowest level of human capital, in Algarve ESF spending
has evolved at a slow pace. Contrary to other regions, in Algarve the CAP is not leading to
significant distortions.
Environmental problems caused by deficient planning and excess construction are a main
concern in Algarve. Although stricter rules are now in place, economic pressures are very
strong. A co-ordinated intervention, involving different actors and ministries would be of
interest, so as to avoid further damage for the competitiveness of the territory.
In CSF III, an effort was made to decentralise some policies. This effort gave rise to the
formulation of a strategic plan in which many key actors have intervened, enriching the
debate. In the implementation phase, however, governance problems related to the absence of
a regional authority have emerged. National policies, even when accounted for in
PROALGARVE, are subject to government approval and the programme manager has little
influence in the decision process.
124
In the following box we present some guidelines for Community action with the view to
avoiding the negative impact of Community Policies in Algarve.
Box 4.3.1 - Guidelines for community action
Stricter environmental protection;
raising the effectiveness of training actions: market orientation rather than orientation according to preferences of the unemployed;
Support for the re-qualification of urban areas; Reinforcement of the authority of the CCR; Improvements in the railways system; Strict control over fishing; Reduction of official incentives for seasonal unemployment.
5 - Conclusions
Portugal is a centralised state. In general (with the exception of two autonomous regions),
regional authorities' policy discretion is very limited. Most policies that take place at the
regional level are mere extensions of policies determined nationally which in turn tend not to
have an explicit regional dimension. To a large extent, Portugal features national policies
with regional concerns as a consequence and in the moulds of EU policy, in particular
according to the requirements of the CSF programmes. There is a good match between
national and EU designations of territories for regional and other forms of economic
development assistance. The structural funds framework that is widely adopted for national
policy and most government spending on promoting economic and social cohesion goes
through the CSF. Since the CSF is rather demanding in terms of national contributions, the
scope for other national initiatives involving public expenditures is very limited.
Given that some national public expenditures in Portugal are closely tied to EU funding, the
regional distribution of CSF funds serves as a useful indicator for the regional incidence of
public expenditures. Under the second Community Support Framework, however, regional
problems were largely disregarded. This is shown by the fact that the funds per capita for the
poorest regions (Açores and Alentejo) were substantially lower than those for the richest
regions (Lisboa e Vale do Tejo, Centro and Madeira).
Not surprisingly, the evidence for the period 1995-2000 is of divergence between the
Portuguese regions, both in per capita terms and in terms od GVA per worker. Among all
Portuguese regions, only Madeira has approached the country average in terms of per capita
125
GDP. Taking a longer time horizon (1990-2001) to avoid the differential impact of the
business cycle, we observe that only Algarve and Norte have succeded in growing faster than
the country average, both in terms of GVA per capita and GVA per working age person. As
far as regional convergence is concerned, the overall picture has been disappointing.
Box 5.1 below summarises our main conclusions on the impact of national policies on
regional (economic and social) cohesion and on the national economy. Column 1 and 2
regard the policy areas and sub-areas under analysis; column 3 lists the main institutions and
instruments through which the policy is implemented; column 4 points out whether or not the
policy design differentiates among regions; columns 5a and 5b summarise the impact of the
policy at hand on regional cohesion; column 5a (5b) addresses specifically the issue of
whether there is a differential impact among regions as far as economic (social) cohesion is
concerned; column 6 summarises the impact of the policy on the national economy.
In general, macroeconomic developments have had a positive impact on cohesion. The
regime shift (to EMU, with the SGP) has doubtlessly created favourable conditions for
economic development in the poorer regions. However, the transition to the new regime gave
rise to adjustment costs not equally shared by all regions.
It is a common concern to EU member states, including Portugal, to ensure that the level of
provision of public goods does not differ too much between localities. Unfortunately, given
the available data, the relative scale of public expenditure in different regions in Portugal
cannot be duly assessed. In broad terms, the principle of covering the entire territory with
education, health, judicial services, public order, etc., has a competitiveness-enhancing effect
on the less prosperous regions. This also translates into a significant social-cohesion effect,
as employment in the public administration tend to be an important source of income in less
populated areas. However, those expenditures that are a counterpart of CSF II (1994-1999)
did not properly address the need to reduce regional imbalances. It is only under the CSF III
(2000-2006) that the ‘regional cohesion problem’ is clearly addressed.
Transfers from the central government include transfers to municipalities and additional
transfers to autonomous regions, which are the expression of a specific regional policy
towards overseas regions. To the extent that the delegation of decision-making results in
more efficient resource allocation, the economic impact of these transfers on cohesion is
positive. However, the high discretionary capacity of the regional authorities regarding the
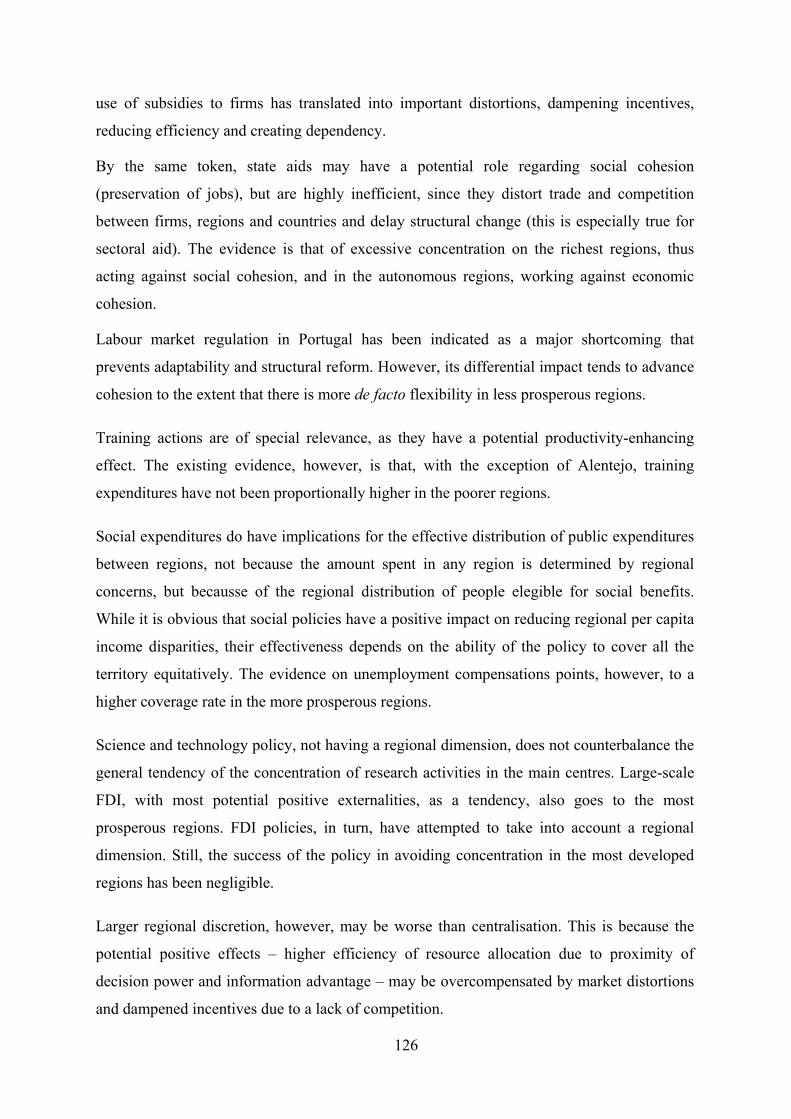
126
use of subsidies to firms has translated into important distortions, dampening incentives,
reducing efficiency and creating dependency.
By the same token, state aids may have a potential role regarding social cohesion
(preservation of jobs), but are highly inefficient, since they distort trade and competition
between firms, regions and countries and delay structural change (this is especially true for
sectoral aid). The evidence is that of excessive concentration on the richest regions, thus
acting against social cohesion, and in the autonomous regions, working against economic
cohesion.
Labour market regulation in Portugal has been indicated as a major shortcoming that
prevents adaptability and structural reform. However, its differential impact tends to advance
cohesion to the extent that there is more de facto flexibility in less prosperous regions.
Training actions are of special relevance, as they have a potential productivity-enhancing
effect. The existing evidence, however, is that, with the exception of Alentejo, training
expenditures have not been proportionally higher in the poorer regions.
Social expenditures do have implications for the effective distribution of public expenditures
between regions, not because the amount spent in any region is determined by regional
concerns, but becausse of the regional distribution of people elegible for social benefits.
While it is obvious that social policies have a positive impact on reducing regional per capita
income disparities, their effectiveness depends on the ability of the policy to cover all the
territory equitatively. The evidence on unemployment compensations points, however, to a
higher coverage rate in the more prosperous regions.
Science and technology policy, not having a regional dimension, does not counterbalance the
general tendency of the concentration of research activities in the main centres. Large-scale
FDI, with most potential positive externalities, as a tendency, also goes to the most
prosperous regions. FDI policies, in turn, have attempted to take into account a regional
dimension. Still, the success of the policy in avoiding concentration in the most developed
regions has been negligible.
Larger regional discretion, however, may be worse than centralisation. This is because the
potential positive effects – higher efficiency of resource allocation due to proximity of
decision power and information advantage – may be overcompensated by market distortions
and dampened incentives due to a lack of competition.
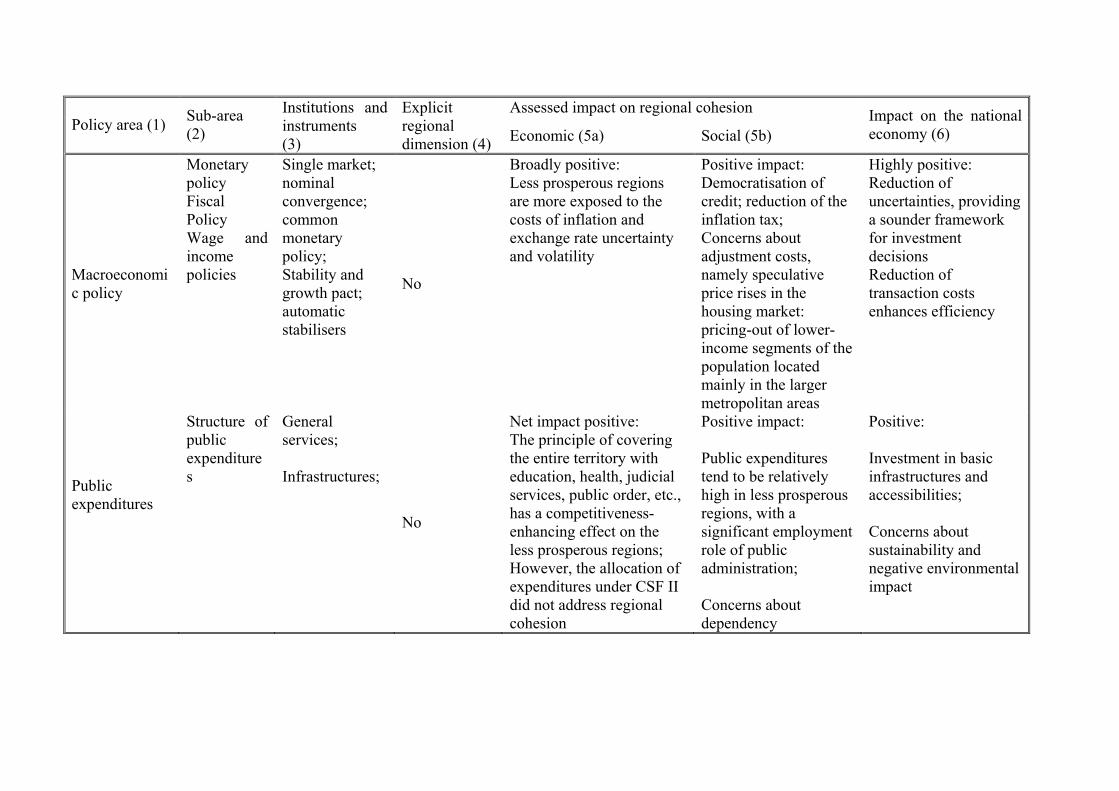
Assessed impact on regional cohesion
Policy area (1) Sub-area (2)
Institutions and instruments (3)
Explicit regional dimension (4) Economic (5a) Social (5b)
Impact on the national economy (6)
Macroeconomic policy
Monetary policy Fiscal Policy Wage and income policies
Single market; nominal convergence; common monetary policy; Stability and growth pact; automatic stabilisers
No
Broadly positive: Less prosperous regions are more exposed to the costs of inflation and exchange rate uncertainty and volatility
Positive impact: Democratisation of credit; reduction of the inflation tax; Concerns about adjustment costs, namely speculative price rises in the housing market: pricing-out of lower-income segments of the population located mainly in the larger metropolitan areas
Highly positive: Reduction of uncertainties, providing a sounder framework for investment decisions Reduction of transaction costs enhances efficiency
Public expenditures
Structure of public expenditures
General services; Infrastructures;
No
Net impact positive: The principle of covering the entire territory with education, health, judicial services, public order, etc., has a competitiveness-enhancing effect on the less prosperous regions; However, the allocation of expenditures under CSF II did not address regional cohesion
Positive impact: Public expenditures tend to be relatively high in less prosperous regions, with a significant employment role of public administration; Concerns about dependency
Positive: Investment in basic infrastructures and accessibilities; Concerns about sustainability and negative environmental impact
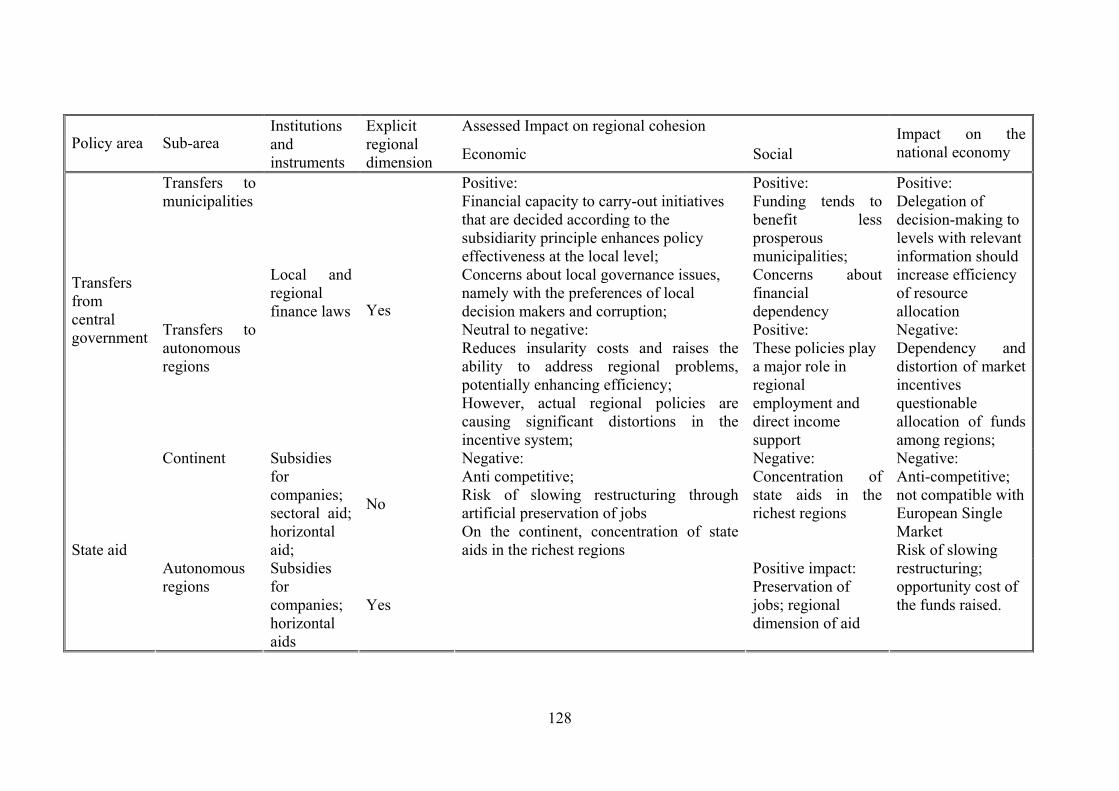
128
Assessed Impact on regional cohesion
Policy area Sub-area Institutions and instruments
Explicit regional dimension Economic Social
Impact on the national economy
Transfers to municipalities
Positive: Financial capacity to carry-out initiatives that are decided according to the subsidiarity principle enhances policy effectiveness at the local level; Concerns about local governance issues, namely with the preferences of local decision makers and corruption;
Positive: Funding tends to benefit less prosperous municipalities; Concerns about financial dependency
Positive: Delegation of decision-making to levels with relevant information should increase efficiency of resource allocation
Transfers from central government Transfers to
autonomous regions
Local and regional finance laws Yes
Neutral to negative: Reduces insularity costs and raises the ability to address regional problems, potentially enhancing efficiency; However, actual regional policies are causing significant distortions in the incentive system;
Positive: These policies play a major role in regional employment and direct income support
Negative: Dependency and distortion of market incentives questionable allocation of funds among regions;
Continent Subsidies for companies; sectoral aid; horizontal aid;
No
Negative: Concentration of state aids in the richest regions
State aid Autonomous regions
Subsidies for companies; horizontal aids
Yes
Negative: Anti competitive; Risk of slowing restructuring through artificial preservation of jobs On the continent, concentration of state aids in the richest regions
Positive impact: Preservation of jobs; regional dimension of aid
Negative: Anti-competitive; not compatible with European Single Market Risk of slowing restructuring; opportunity cost of the funds raised.
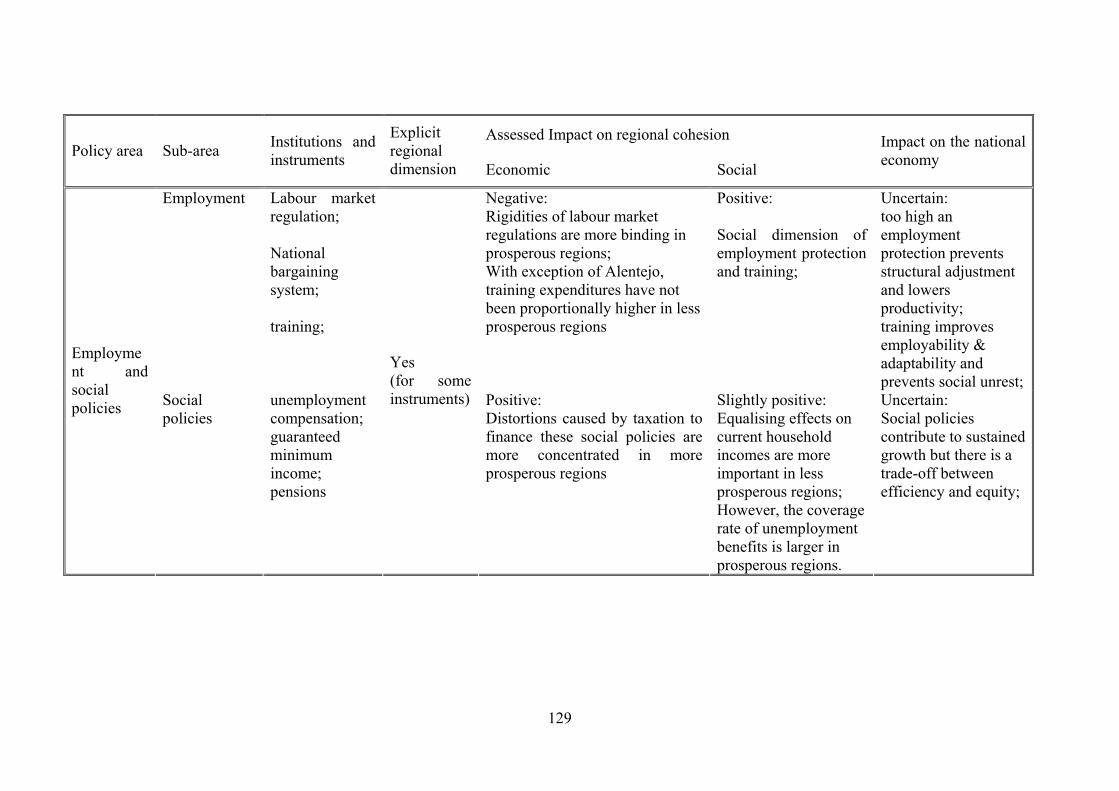
129
Assessed Impact on regional cohesion Policy area Sub-area Institutions and
instruments
Explicit regional dimension Economic Social
Impact on the national economy
Employment
Labour market regulation; National bargaining system; training;
Negative: Rigidities of labour market regulations are more binding in prosperous regions; With exception of Alentejo, training expenditures have not been proportionally higher in less prosperous regions
Positive: Social dimension of employment protection and training;
Uncertain: too high an employment protection prevents structural adjustment and lowers productivity; training improves employability & adaptability and prevents social unrest;
Employment and social policies Social
policies unemployment compensation; guaranteed minimum income; pensions
Yes (for some instruments) Positive:
Distortions caused by taxation to finance these social policies are more concentrated in more prosperous regions
Slightly positive: Equalising effects on current household incomes are more important in less prosperous regions; However, the coverage rate of unemployment benefits is larger in prosperous regions.
Uncertain: Social policies contribute to sustained growth but there is a trade-off between efficiency and equity;
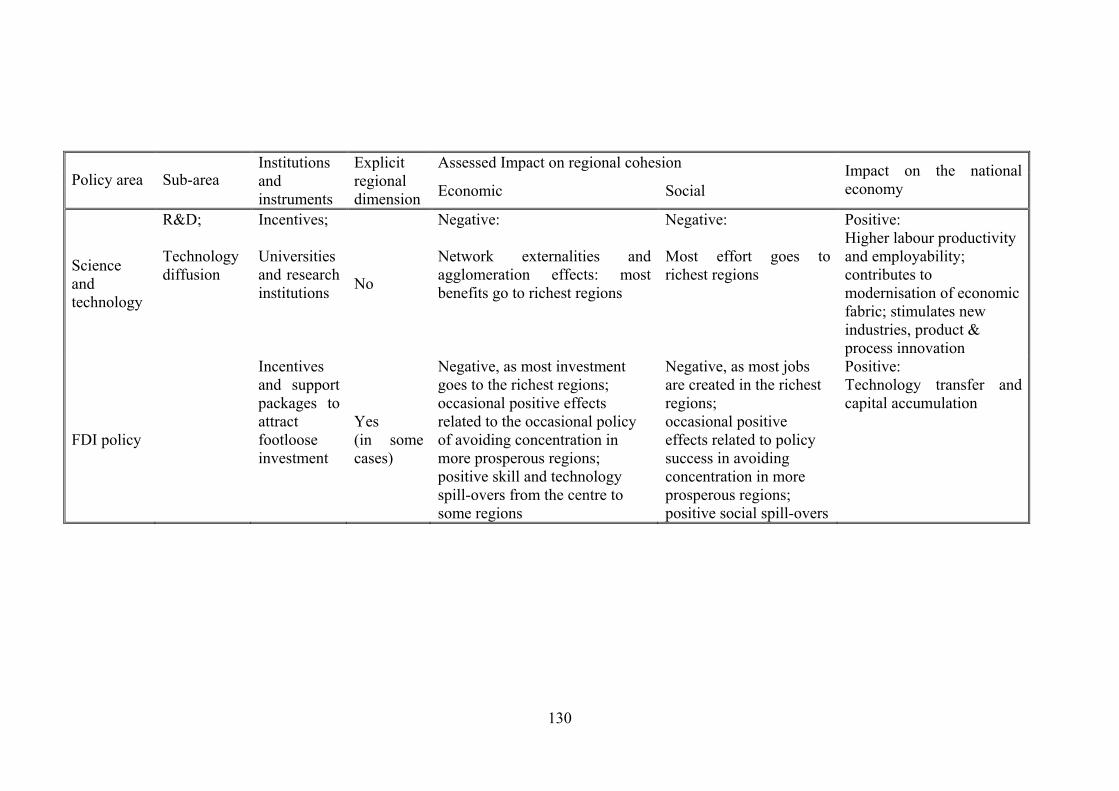
130
Assessed Impact on regional cohesion
Policy area Sub-area Institutions and instruments
Explicit regional dimension Economic Social
Impact on the national economy
Science and technology
R&D; Technology diffusion
Incentives; Universities and research institutions No
Negative: Network externalities and agglomeration effects: most benefits go to richest regions
Negative: Most effort goes to richest regions
Positive: Higher labour productivity and employability; contributes to modernisation of economic fabric; stimulates new industries, product & process innovation
FDI policy
Incentives and support packages to attract footloose investment
Yes (in some cases)
Negative, as most investment goes to the richest regions; occasional positive effects related to the occasional policy of avoiding concentration in more prosperous regions; positive skill and technology spill-overs from the centre to some regions
Negative, as most jobs are created in the richest regions; occasional positive effects related to policy success in avoiding concentration in more prosperous regions; positive social spill-overs
Positive: Technology transfer and capital accumulation

References Amorim, C. (2002), “Diffusion of innovations in economies in the periphery-core transition”,
Unpublished Ph.D. thesis, Department of Economics, University of Reading.
Ardy, B., Begg, I., Schelkle, W., and F. Torres (2002a), EMU and Cohesion: Theory and
Policy, Cascais: Principia.
Ardy, B., Begg, I., Schelkle, W., and F. Torres (2002b), “How will EMU affect Cohesion?”,
Intereconomics - Review of European Economic Policy, Volume 37, 6, Springer, 300-314,
2002; reprinted in Rolf Caesar, Konrad Lammers and Hans-Eckart Scharrer (eds.),
Konvergenz und Divergenz in der Europäischen Union - Empirische Befunde und
wirtschaftspolitische Implikationen, Baden-Baden: Nomos Verlagsgesellschaft, 149-85.
Artis, M. and F. Nixson (2001), The Economics of the European Union - policy and analysis,
3rd edition, Oxford: Oxford University Press.
Begg, I., Barry, F., Dupuch, S., Freitas, M. L., Mulas-Granados, C., Mouhoud, M., Viesti, G.,
Monastiriotis, V., Nicolaides, P., and F. Torres (2004), “The Impact of Member State
Policies on Cohesion”, report submitted to the DG Regio of the European Commission.
Cappelen A., Castellacci, F., Fagerberg, J. and B. Verspagen (2003), “The impact of EU
Regional Support on Growth and Convergence in the European Union”, Journal of Common
Market Studies, 41, 4, 621-44.
Carlino, G. and L. Mills (1993), “Are US regional incomes converging?: a time series
analysis”, Journal of Monetary Economics, 32, 335-46.
Farinha, L. and J. Mata (1996), “The Impact of Foreign Direct Investment in the Portuguese
Economy”, Banco de Portugal Working Papers. 16/96.
Freitas, M. L., Pereira, F. and F. Torres (2003), “Convergence among EU Regions (1990-
2001): Quality of National Institutions and «Objective 1» Status”, Intereconomics, 38(5),
September/October, 270-75.
Freitas, M. L. (2002), “Portuguese Economic Growth Re-Examined: an Anti-Fado
Manifesto”, Proceedings of a conference organised by the Bank of Portugal on Portuguese
Economic Development in the European Context: Determinants and Policies, 33-59.
Figueiredo, A. M. (2001), “Uma visão espacial da estratégia e das prioridades de
desenvolvimento económico e social para Portugal”, Revista de Prospectiva e Planeamento,
7, 13-41.
Guimarães, P., Figueiredo, O. and D. Woodward (2000), “Agglomeration and the location of
Foreign Direct Investment in Portugal”, Journal of Urban Economics, 47, 115-35.
132
Midelfart-Knarvik, K. H. and H. G. Overman (2002), “Delocation and European Integration
– Is structural Spending justified?”, Economic Policy, October, 35, 322-59, October.
Pereira, A. M. and J. M. Andraz (2002), “Public investment in transportation infrastructures
and economic performance in Portugal”, Proceedings of a conference organised by the Bank
of Portugal on Portuguese Economic Development in the European Context: Determinants
and Policies, 85-125.
Ramos, P. N. and A. Rodrigues (2001), “Porque é diferente o PIB per capita das Regiões
Portuguesas?”, Cadernos Regionais, Instituto Nacional de Estatística - Direcção Regional do
Centro, 13, 5-14
Rodrigues, M. J., Neves, A. and M. M. Godinho (2003), Para uma Política de Inovação em
Portugal, Lisboa: Publicações Dom Quixote.
Simões, V. C. (1992), “Impacto do Investimento Directo Estrangeiro na Estrutura Industrial
Portuguesa”, Study for programme 5 of PEDIP I (http://www.ceso-id.pt/ps_estudos1.htm).
St. Aubyn, M. (2002), “Evaluating the efficiency in the Portuguese health and education
sectors”, Proceedings of a conference organised by the Bank of Portugal on Portuguese
Economic Development in the European Context: Determinants and Policies, 253-301.
Tavares, A.T.T. (2001), “Systems, Evolution and Integration: Modelling the Impact of
Economic Integration on Multinational Strategies”, Unpublished Ph.D. thesis, Department of
Economics, University of Reading.
Williamson, J. (1965), After Slavery: The Negro in South Carolina During Reconstruction,
1861-1877, Chapel Hill, North Carolina: University of North Carolina Press.
Reports:
Departamento de Prospectiva e Planeamento (2001), O Impacto Macroeconómico do Quadro
Comunitário de Apoio 1994 - 1999, Lisboa: Ministério do Planeamento.
European Commission (1996), “First Report on Economic and Social Cohesion”,
Commission of the European Communities.
European Comission (2002), “European Innovation Scoreboard”, Technical Paper n. 3, EU
Regions, Brussels.
European Commission (2003), Enterprise Policy Scoreboard 2003, Commission Staff
Working Paper, Brussels.
European Comission (2004), “A New Partnership for Cohesion: Convergence,
Competitiveness and Cooperation”, Third Report on Economic and Social Cohesion,
February.
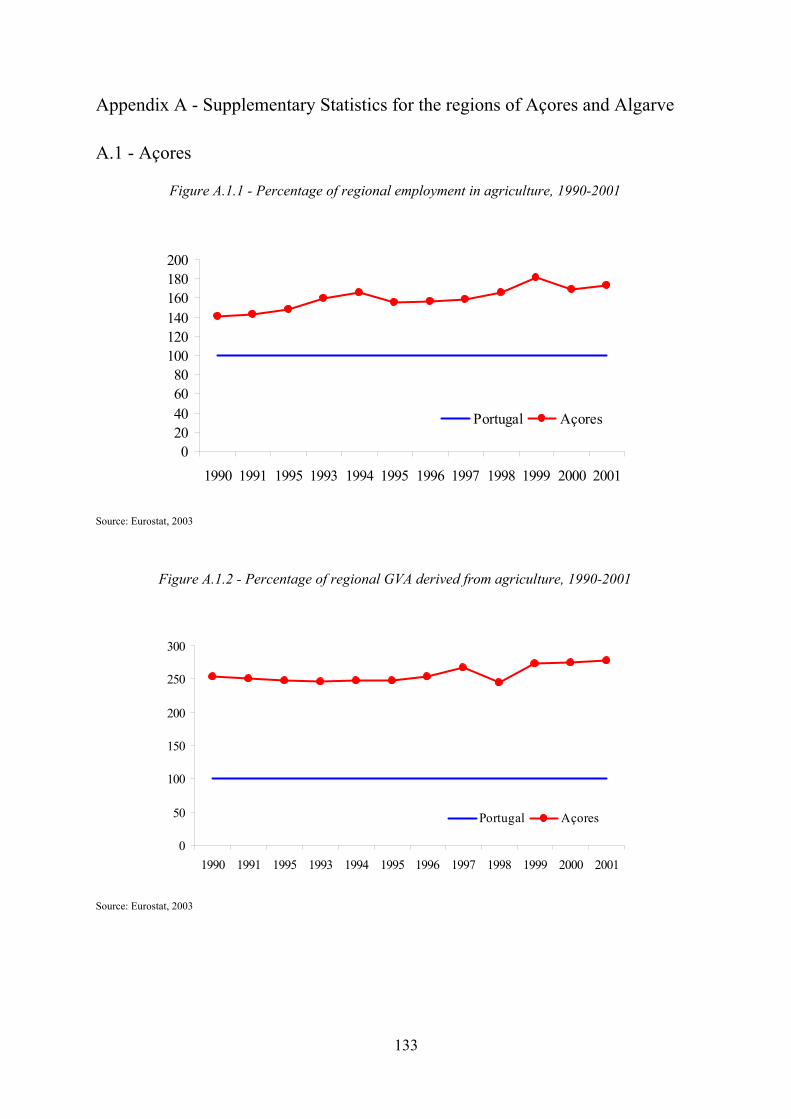
133
Appendix A - Supplementary Statistics for the regions of Açores and Algarve
A.1 - Açores
Figure A.1.1 - Percentage of regional employment in agriculture, 1990-2001
020406080
100120140160180200
1990 1991 1995 1993 1994 1995 1996 1997 1998 1999 2000 2001
Portugal Açores
Source: Eurostat, 2003
Figure A.1.2 - Percentage of regional GVA derived from agriculture, 1990-2001
0
50
100
150
200
250
300
1990 1991 1995 1993 1994 1995 1996 1997 1998 1999 2000 2001
Portugal Açores
Source: Eurostat, 2003
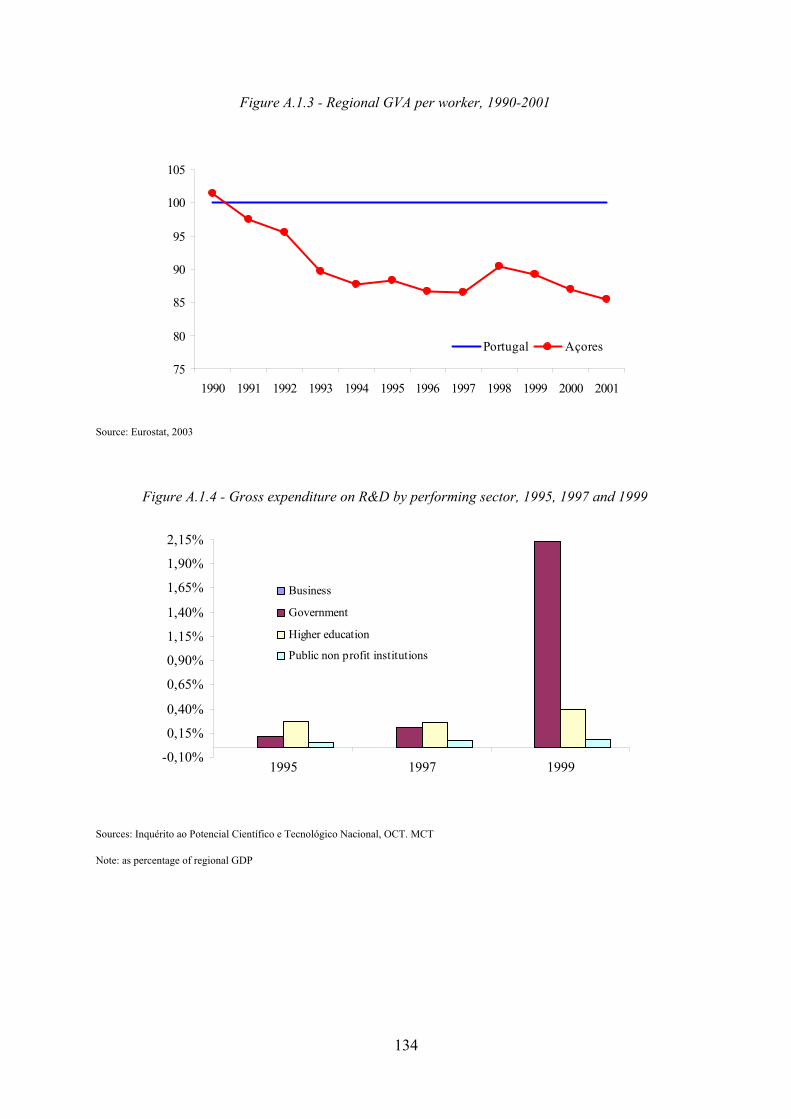
134
Figure A.1.3 - Regional GVA per worker, 1990-2001
75
80
85
90
95
100
105
1990 1991 1992 1993 1994 1995 1996 1997 1998 1999 2000 2001
Portugal Açores
Source: Eurostat, 2003
Figure A.1.4 - Gross expenditure on R&D by performing sector, 1995, 1997 and 1999
-0,10%
0,15%
0,40%
0,65%
0,90%
1,15%
1,40%
1,65%
1,90%
2,15%
1995 1997 1999
Business
Government
Higher education
Public non profit institutions
Sources: Inquérito ao Potencial Científico e Tecnológico Nacional, OCT. MCT
Note: as percentage of regional GDP
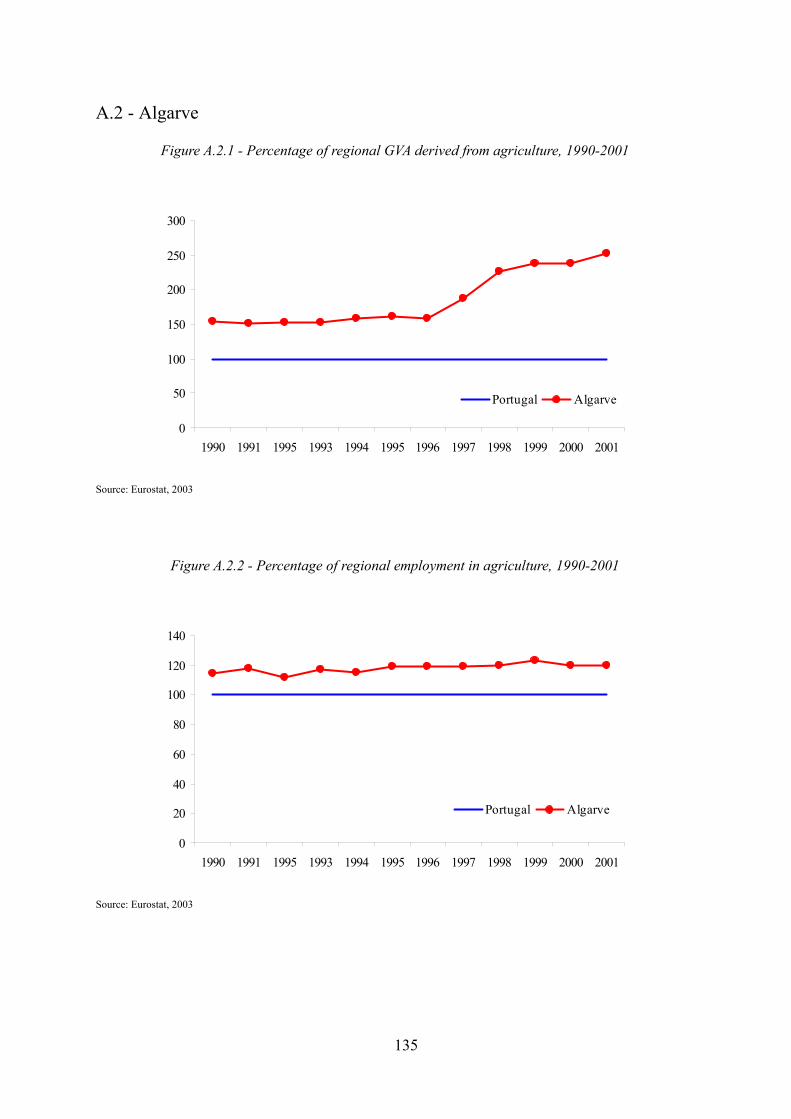
135
A.2 - Algarve
Figure A.2.1 - Percentage of regional GVA derived from agriculture, 1990-2001
0
50
100
150
200
250
300
1990 1991 1995 1993 1994 1995 1996 1997 1998 1999 2000 2001
Portugal Algarve
Source: Eurostat, 2003
Figure A.2.2 - Percentage of regional employment in agriculture, 1990-2001
0
20
40
60
80
100
120
140
1990 1991 1995 1993 1994 1995 1996 1997 1998 1999 2000 2001
Portugal Algarve
Source: Eurostat, 2003
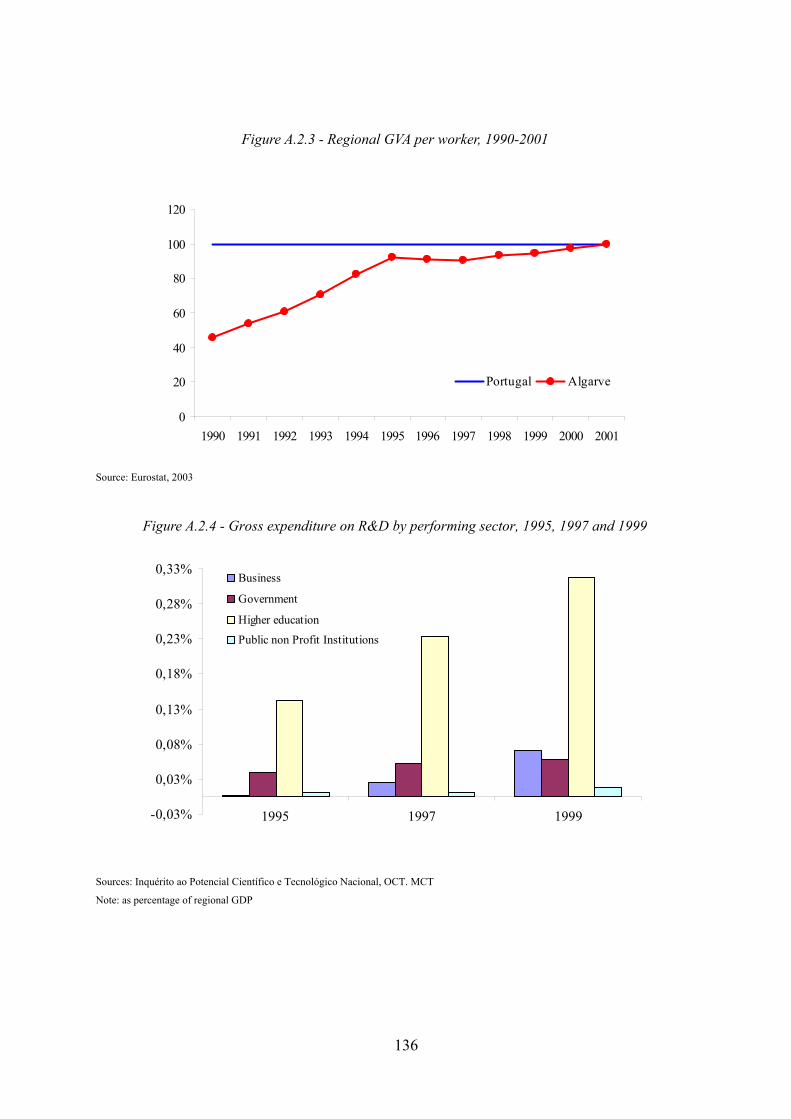
136
Figure A.2.3 - Regional GVA per worker, 1990-2001
0
20
40
60
80
100
120
1990 1991 1992 1993 1994 1995 1996 1997 1998 1999 2000 2001
Portugal Algarve
Source: Eurostat, 2003
Figure A.2.4 - Gross expenditure on R&D by performing sector, 1995, 1997 and 1999
-0,03%
0,03%
0,08%
0,13%
0,18%
0,23%
0,28%
0,33%
1995 1997 1999
Business
Government
Higher education
Public non Profit Institutions
Sources: Inquérito ao Potencial Científico e Tecnológico Nacional, OCT. MCT
Note: as percentage of regional GDP
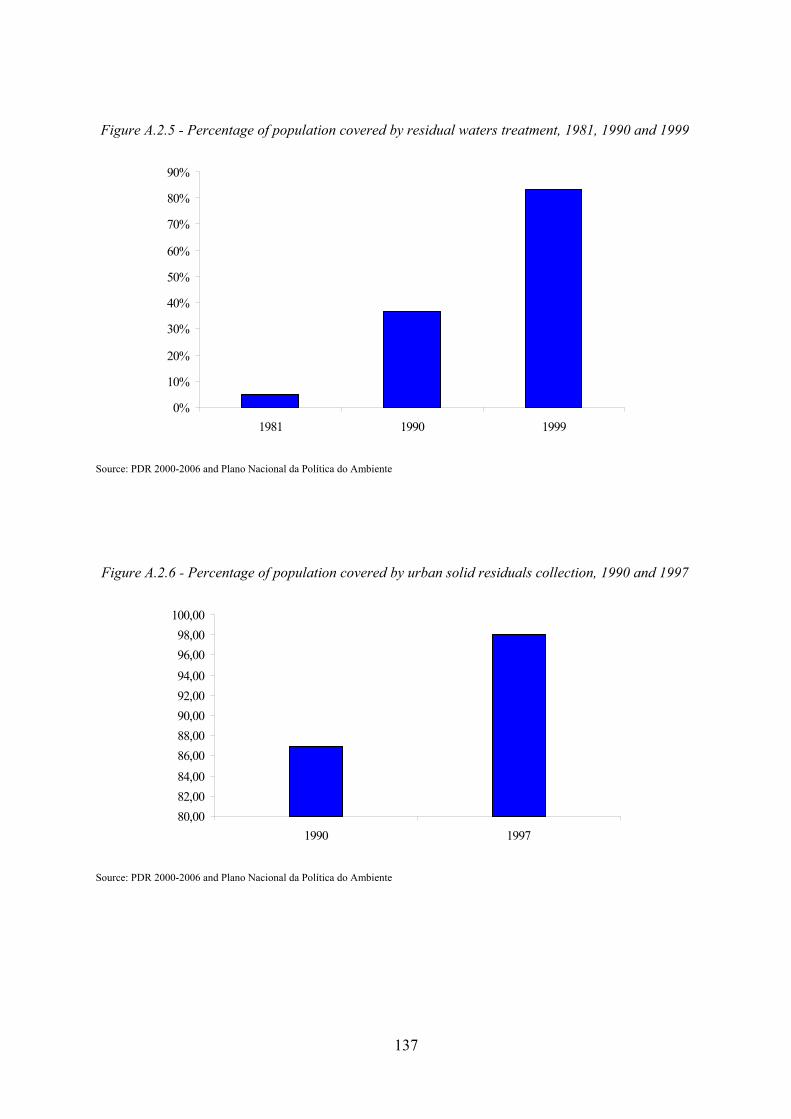
137
Figure A.2.5 - Percentage of population covered by residual waters treatment, 1981, 1990 and 1999
0%
10%
20%
30%
40%
50%
60%
70%
80%
90%
1981 1990 1999
Source: PDR 2000-2006 and Plano Nacional da Política do Ambiente
Figure A.2.6 - Percentage of population covered by urban solid residuals collection, 1990 and 1997
80,0082,0084,0086,0088,0090,0092,0094,0096,0098,00
100,00
1990 1997
Source: PDR 2000-2006 and Plano Nacional da Política do Ambiente
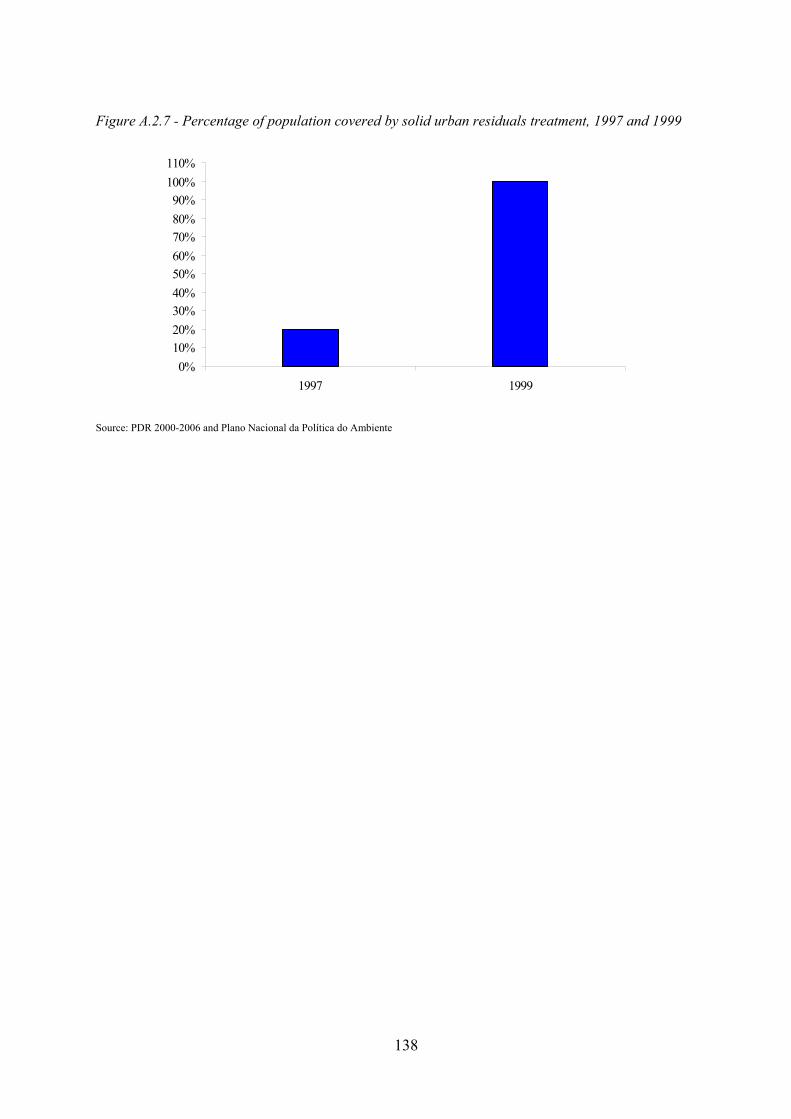
138
Figure A.2.7 - Percentage of population covered by solid urban residuals treatment, 1997 and 1999
0%10%20%30%40%50%60%70%80%90%
100%110%
1997 1999
Source: PDR 2000-2006 and Plano Nacional da Política do Ambiente
139
Appendix B - Portuguese brief summary of the major objectives and findings of the
paper / Sumário dos principais objectivos e resultados deste estudo
Este estudo avalia o impacto das políticas nacionais portuguesas na coesão regional, usando a
definição NUTS II. O estudo enquadra-se num trabalho mais geral para o conjunto da União
Europeia, disponível em Begg et al. (2004). O enfoque é primordialmente na coesão
económica embora os aspectos ligados à coesão social também sejam tidos em consideração.
Embora Portugal como um todo tenha convergido para a média comunitária desde a sua
adesão à Comunidade Europeia em 1986, esse processo não foi igualmente partilhado pelas
regiões. De acordo com as estatísticas disponíveis, na última década verificaram-se
assimetrias significativas nos padrões de crescimento das 7 regiões NUTS II.
A evidência para o período 1995-2000 mostra divergência entre as regiões portuguesas, quer
em termos per capita quer em termos de VAB por trabalhador. Apenas a Madeira se
aproximou da média do País em termos de PIB per capita. Considerando um horizonte
temporal mais amplo (1990-2001), para abstrair do impacto diferencial do ciclo económico,
observamos que apenas o Algarve e a Região Norte cresceram mais depressa que a média do
País, quer em termos de VAB per capita quer em termos de VAB por pessoa com idade para
trabalhar.
Além da evidência quantitativa, baseada em dados oficiais das instituições nacionais e
comunitárias, este estudo também se baseou em evidência qualitativa coligida através de
entrevistas junto de decisores públicos, líderes regionais e especialistas/académicos. Essa
evidência é contrastada com a perspectiva dos autores.
Existem várias e diversas políticas nacionais com impacto potencial (positivo ou negativo) na
coesão. Algumas têm uma dimensão regional explícita. Outras apenas afectam
indirectamente a coesão regional. Em geral (com a excepção dos Açores e Madeira), a
discricionariedade das autoridades regionais é muito limitada. As políticas implementadas a
nível regional são, na sua maioria, meras extensões das políticas gizadas a nível nacional que
por seu turno tendem a não ter uma dimensão regional explícita.
Examinamos as seguintes políticas:
140
f) Política macroeconómica, com efeitos na estabilização da procura e do nível de
desemprego. Em termos gerais os desenvolvimentos macroeconómicos recentes
tiveram um impacto positivo na coesão. A alteração de regime (para a União
Económica e Monetária, com o Pacto de Estabilidade e Crescimento) criou sem
dúvida condições favoráveis para o crescimento económico das regiões mais pobres.
Contudo, a transição para o novo regime (o efeito “esticão do euro”, com a
consequente rápida expansão do crédito interno e a procura interna exacerbada por
uma política fiscal pró-cíclica) deram origem a custos de ajustamento partilhados de
forma diferente pelas várias regiões.
g) Despesas públicas, cujo impacto se faz sentir através duma variedade de canais,
também têm uma dimensão territorial embora sejam definidas ao nível do país. É uma
preocupação comum a todos os Estados Membros da UE, incluindo Portugal,
assegurar que o nível de provisão não difere demasiado entre localidades.
Infelizmente, dada a informação disponível, não é possível avaliar a escala relativa de
despesa pública nas diferentes regiões em Portugal. Em termos gerais, o princípio de
cobertura de todo o território com a provisão de bens públicos tem um efeito
estimulador da actividade económica nas regiões menos prósperas. Isso também se
traduz num efeito significativo na coesão social, dado que o emprego na
administração pública tende a representar uma fonte importante de rendimento em
regiões menos povoadas. Contudo, as despesas utilizadas como contrapartida do
segundo Quadro Comunitário de Apoio (1944-1999) não internalizaram
adequadamente a necessidade de reduzir os desequilíbrios regionais. Apenas no
âmbito do terceiro Quadro Comunitário de Apoio (2000-2006) o problema da coesão
regional é explicitamente considerado. Na medida em que algumas despesas públicas
em Portugal estão estreitamente ligadas ao financiamento comunitário, a distribuição
regional dos fundos dos quadros comunitários de apoio serve como um indicador útil
sobre a orientação regional das despesas públicas.
h) Transferências do governo central para os municípios e para as regiões autónomas.
Estas políticas desempenham um papel importante na coesão económica.
i) Uma maior coincidência entre a esfera de intervenção e a dimensão territorial dos
efeitos da política resulta, em princípio, em maior eficiência. Nessa medida, uma
descentralização selectiva resultará em maior eficiência. Contudo, uma maior
capacidade discricionária por parte das autoridades locais na utilização dos fundos
pode também resultar em distorções significativas, reduzindo a eficiência e criando

141
dependência. Esse efeito não é significativo nas transferências para as autarquias, cuja
margem de manobra é limitada, mas é particularmente visível nas transferências para
as regiões autónomas. Isso mostra que uma maior discricionariedade regional não é
necessariamente superior à centralização. As transferências do governo central,
influenciando a distribuição regional do rendimento, também têm um impacto sobre a
coesão social e actuam como um instrumento de estabilização da procura regional.
j) Ajudas de Estado, que têm um papel potencial na coesão social (preservação de
empregos) mas que são tendencialmente ineficientes, uma vez que distorcem o
comércio e concorrência entre as empresas, regiões e países e atrasam as mudanças
estruturais (especialmente no caso de ajudas sectoriais). A evidência aponta para uma
excessiva concentração nas regiões mais ricas, o que significa que este instrumento
tem também actuado contra a coesão social, e nas regiões autónomas, reforçando os
efeitos negativos apontados em c).
k) Emprego e políticas sociais, que nalguns casos têm uma condicionalidade específica à
região, podem actuar a favor da competitividade e coesão social de uma região. Entre
estas, a formação profissional tem especial relevância, devido aos seus efeitos
potenciais sobre o reforço da produtividade. A evidência existente aponta contudo
para o facto de as despesas em formação não terem sido proporcionalmente mais
elevadas nas regiões mais pobres, com uma excepção no Alentejo. A regulação do
mercado de trabalho tem sido apontada como uma das maiores deficiências em
Portugal, bloqueando a adaptabilidade e as reformas estruturais. Contudo, o seu
impacto diferencial tende a favorecer a coesão na medida em que existe de facto mais
flexibilidade nas regiões menos prósperas. As despesas sociais têm implicações sobre
a distribuição efectiva das despesas públicas entre as regiões, não porque os
montantes dispendidos em cada região sejam determinados de acordo com
preocupações regionais, mas devido à distribuição regional das pessoas elegíveis para
apoio social. Embora seja de esperar que as políticas sociais tenham um impacto
positivo na redução das disparidades no rendimento regional per capita, a sua
efectividade depende da capacidade de cobertura equitativa de todo o território. A
evidência relativa aos subsídios de desemprego aponta contudo para uma taxa de
cobertura mais elevada nas regiões mais prósperas.
l) Política de ciência e tecnologia pode melhorar a capacidade concorrencial das
empresas localizadas em regiões menos prósperas. Contudo, podem-se registar
tensões entre tentativas de reforço da competitividade nacional e o desejo de
142
distribuição dos benefícios decorrentes do uso de alta tecnologia pelas várias regiões.
A evidência sugere que a política de ciência e tecnologia em Portugal, não tendo uma
dimensão regional, não consegue contrariar a tendência geral para a concentração das
actividades de investigação nos principais centros do país.
m) A política de investimento directo estrangeiro (IDE) é uma componente importante de
uma estratégia de desenvolvimento regional. Não só tem uma incidência directa sobre
a actividade económica, o rendimento e o emprego mas constitui também um veículo
de transferência de tecnologia, novas técnicas de gestão e conhecimentos. Aqui
aplica-se o mesmo dilema da política anterior: IDE de grande escala, com
externalidades potenciais mais elevadas, tende a localizar-se nas regiões mais
prósperas. Embora as políticas de promoção de IDE tenham incorporado uma
dimensão regional, aparentemente daí não resultaram resultados práticos
significativos.
Outras políticas poderiam ter sido analisadas mas foram deixadas fora deste estudo cujo
objectivo principal não é examinar em detalhe as várias iniciativas mas sim analisar as
políticas nacionais cujo impacto é potencialmente mais relevante ao nível regional.
Embora o objectivo deste estudo seja analisar o impacto das políticas nacionais na coesão,
duas regiões (uma continental e outra ultraperiférica) são objecto de uma análise mais
profunda, que inclui uma discussão sobre o impacto das políticas comunitárias. Esse
contraste é importante para Portugal (especialmente durante o período em análise, 1990-
2001) na medida em que as políticas nacionais estão fortemente ligadas aos fundos da União
Europeia. Dada a falta de tradição de uma política regional portuguesa, em geral, as políticas
nacionais em Portugal incorporam preocupações de carácter regional como consequência e
nos moldes das políticas da União Europeia. Como os quadros comunitários de apoio são
bastante exigentes em termos das contribuições nacionais, o espaço para outras iniciativas
nacionais envolvendo despesas públicas é muito limitado.