Reference values for healthy human myocardium using a T1 mapping methodology: results from the...
12
RESEARCH Open Access Reference values for healthy human myocardium using a T1 mapping methodology: results from the International T1 Multicenter cardiovascular magnetic resonance study Darius Dabir 1† , Nicholas Child 1† , Ashwin Kalra 1 , Toby Rogers 1 , Rolf Gebker 2 , Andrew Jabbour 3 , Sven Plein 4 , Chung-Yao Yu 3 , James Otton 3 , Ananth Kidambi 4 , Adam McDiarmid 4 , David Broadbent 4 , David M Higgins 5 , Bernhard Schnackenburg 6 , Lucy Foote 1 , Ciara Cummins 1 , Eike Nagel 1 and Valentina O Puntmann 1* Abstract Background: T1 mapping is a robust and highly reproducible application to quantify myocardial relaxation of longitudinal magnetisation. Available T1 mapping methods are presently site and vendor specific, with variable accuracy and precision of T1 values between the systems and sequences. We assessed the transferability of a T1 mapping method and determined the reference values of healthy human myocardium in a multicenter setting. Methods: Healthy subjects (n = 102; mean age 41 years (range 17–83), male, n = 53 (52%)), with no previous medical history, and normotensive low risk subjects (n=113) referred for clinical cardiovascular magnetic resonance (CMR) were examined. Further inclusion criteria for all were absence of regular medication and subsequently normal findings of routine CMR. All subjects underwent T1 mapping using a uniform imaging set-up (modified Look- Locker inversion recovery, MOLLI, using scheme 3(3)3(3)5)) on 1.5 Tesla (T) and 3 T Philips scanners. Native T1-maps were acquired in a single midventricular short axis slice and repeated 20 minutes following gadobutrol. Reference values were obtained for native T1 and gadolinium-based partition coefficients, λ and extracellular volume fraction (ECV) in a core lab using standardized postprocessing. Results: In healthy controls, mean native T1 values were 950 ± 21 msec at 1.5 T and 1052 ± 23 at 3 T. λ and ECV values were 0.44 ± 0.06 and 0.25 ± 0.04 at 1.5 T, and 0.44 ± 0.07 and 0.26 ± 0.04 at 3 T, respectively. There were no significant differences between healthy controls and low risk subjects in routine CMR parameters and T1 values. The entire cohort showed no correlation between age, gender and native T1. Cross-center comparisons of mean values showed no significant difference for any of the T1 indices at any field strength. There were considerable regional differences in segmental T1 values. λ and ECV were found to be dose dependent. There was excellent inter- and intraobserver reproducibility for measurement of native septal T1. Conclusion: We show transferability for a unifying T1 mapping methodology in a multicenter setting. We provide reference ranges for T1 values in healthy human myocardium, which can be applied across participating sites. Keywords: T1 mapping, Reference values, Multicenter study, MOLLI, Native T1, ECV * Correspondence: [email protected] † Equal contributors 1 Cardiovascular Imaging Department, King’ s College London, The Rayne Institute, 4th Floor Lambeth Wing, St. Thomas’ Hospital Campus, London SE1, UK Full list of author information is available at the end of the article © 2014 Dabir et al.; licensee BioMed Central Ltd. This is an Open Access article distributed under the terms of the Creative Commons Attribution License (http://creativecommons.org/licenses/by/4.0), which permits unrestricted use, distribution, and reproduction in any medium, provided the original work is properly credited. The Creative Commons Public Domain Dedication waiver (http://creativecommons.org/publicdomain/zero/1.0/) applies to the data made available in this article, unless otherwise stated. Dabir et al. Journal of Cardiovascular Magnetic Resonance 2014, 16:69 http://jcmr-online.com/content/16/1/69
-
Upload
independent -
Category
Documents
-
view
0 -
download
0
Transcript of Reference values for healthy human myocardium using a T1 mapping methodology: results from the...

Dabir et al. Journal of Cardiovascular Magnetic Resonance 2014, 16:69http://jcmr-online.com/content/16/1/69
RESEARCH Open Access
Reference values for healthy human myocardiumusing a T1 mapping methodology: results fromthe International T1 Multicenter cardiovascularmagnetic resonance studyDarius Dabir1†, Nicholas Child1†, Ashwin Kalra1, Toby Rogers1, Rolf Gebker2, Andrew Jabbour3, Sven Plein4,Chung-Yao Yu3, James Otton3, Ananth Kidambi4, Adam McDiarmid4, David Broadbent4, David M Higgins5,Bernhard Schnackenburg6, Lucy Foote1, Ciara Cummins1, Eike Nagel1 and Valentina O Puntmann1*
Abstract
Background: T1 mapping is a robust and highly reproducible application to quantify myocardial relaxation oflongitudinal magnetisation. Available T1 mapping methods are presently site and vendor specific, with variableaccuracy and precision of T1 values between the systems and sequences. We assessed the transferability of a T1mapping method and determined the reference values of healthy human myocardium in a multicenter setting.
Methods: Healthy subjects (n = 102; mean age 41 years (range 17–83), male, n = 53 (52%)), with no previousmedical history, and normotensive low risk subjects (n=113) referred for clinical cardiovascular magnetic resonance(CMR) were examined. Further inclusion criteria for all were absence of regular medication and subsequentlynormal findings of routine CMR. All subjects underwent T1 mapping using a uniform imaging set-up (modifiedLook- Locker inversion recovery, MOLLI, using scheme 3(3)3(3)5)) on 1.5 Tesla (T) and 3 T Philips scanners. NativeT1-maps were acquired in a single midventricular short axis slice and repeated 20 minutes following gadobutrol.Reference values were obtained for native T1 and gadolinium-based partition coefficients, λ and extracellularvolume fraction (ECV) in a core lab using standardized postprocessing.
Results: In healthy controls, mean native T1 values were 950 ± 21 msec at 1.5 T and 1052 ± 23 at 3 T. λ and ECVvalues were 0.44 ± 0.06 and 0.25 ± 0.04 at 1.5 T, and 0.44 ± 0.07 and 0.26 ± 0.04 at 3 T, respectively. There were nosignificant differences between healthy controls and low risk subjects in routine CMR parameters and T1 values. Theentire cohort showed no correlation between age, gender and native T1. Cross-center comparisons of mean valuesshowed no significant difference for any of the T1 indices at any field strength. There were considerable regionaldifferences in segmental T1 values. λ and ECV were found to be dose dependent. There was excellent inter- andintraobserver reproducibility for measurement of native septal T1.
Conclusion: We show transferability for a unifying T1 mapping methodology in a multicenter setting. We providereference ranges for T1 values in healthy human myocardium, which can be applied across participating sites.
Keywords: T1 mapping, Reference values, Multicenter study, MOLLI, Native T1, ECV
* Correspondence: [email protected]†Equal contributors1Cardiovascular Imaging Department, King’s College London, The Rayne Institute,4th Floor Lambeth Wing, St. Thomas’ Hospital Campus, London SE1, UKFull list of author information is available at the end of the article
© 2014 Dabir et al.; licensee BioMed Central Ltd. This is an Open Access article distributed under the terms of the CreativeCommons Attribution License (http://creativecommons.org/licenses/by/4.0), which permits unrestricted use, distribution, andreproduction in any medium, provided the original work is properly credited. The Creative Commons Public DomainDedication waiver (http://creativecommons.org/publicdomain/zero/1.0/) applies to the data made available in this article,unless otherwise stated.

Dabir et al. Journal of Cardiovascular Magnetic Resonance 2014, 16:69 Page 2 of 12http://jcmr-online.com/content/16/1/69
BackgroundThe increasing contribution of cardiovascular magneticresonance (CMR) in clinical management is due to itsaccurate measurements and versatility of the imagingreadouts, providing a comprehensive assessment of car-diac function and structure. Insights provided by tissuecharacterization using late gadolinium enhancement(LGE) imaging, inform on the underlying etiology, relateto prognosis and guide treatment [1-5]. LGE relies onvisual and semi-quantitative determination of relativemyocardial differences commonly presenting with char-acteristic patterns of LGE distribution [6]. As it requiresregional relative differences between normal and abnor-mal tissue, it is limited in revealing diffuse myocardialdisease, where abnormal and normal tissue are intertwined[7]. Recent advances in image acquisition and quantitativepostprocessing now allow fast tissue characterisation basedon the absolute quantifiable differences in recovery rates oflongitudinal magnetisation by T1 mapping [8]. T1 mappingis emerging as a robust and highly reproducible applicationto provide meaningful measures reflecting biologicallyimportant myocardial properties [9]. Currently proposedT1-based indices and potential novel measures includenative T1, which reflects myocardial disease involving themyocyte and interstitium without the need for gadoliniumbased contrast agents (GBCA); and extracellular volumefraction (ECV), a direct GBCA-based measurement of thesize of the extracellular space, reflecting only intersti-tial disease. Emerging evidence shows that myocardialT1-values correlate with the content of underlyingmyocardial fibrosis, they are abnormal in a variety of heartconditions and also reflect pathological substrates such asoedema or infiltration [9].Despite a recognized potential for clinical application,
there is an identified lack of standardization and trans-ferability of T1 mapping methods beyond a single andcommonly expert center. Setups of available T1 mappingmethods are presently site and vendor specific, withvariable accuracy and precision of T1 values betweenthe systems and sequences [10]. Considerable differencesin image acquisition, post-processing approaches and pro-posed clinical applications further complicate the use of T1values as standard application in clinical decision-making[11,12]. Finally, because T1 mapping is presently used ina research (or work-in- progress, WIP) domain and notyet a clinical product for all vendors, the experience isconcentrated to a few specialist centers. We establisheda multicenter consortium of CMR centers that adopteda uniform T1 mapping methodology, which is supportedby a single vendor platform. We assessed the transferabilityof a T1 mapping method in terms of the standardizedacquisition and postprocessing approach, and determinedbiological reference values of human myocardium in amulticenter setting.
MethodsMulticenter consortiumStandardized T1-mapping sequence and imaging protocol,developed and validated at King’s College London (KCL)[13-16], were distributed to 4 CMR centers using 1.5and 3 T Philips scanners (University of Leeds (UL),United Kingdom; German Heart Institute Berlin (DHZB),Germany and St Vincent University (StVU), Sydney,Australia). The participating centers were identified viathe worldwide Philips Healthcare clinical science net-work and hold individual partnership research agreements,allowing for adequate clinical science support and provisionof compatible sequences and scanner software packages.Imaging parameters were unified across participating sites.Concordance of local T1-values with KCL values wasestablished in preliminary experiments using standardizedphantoms (Eurospin II Test System®) at each location foreach field strength, as well as healthy subjects scanned ateach location. The respective local ethical review panelsapproved the study protocols and all subjects providedwritten informed consent.
Study populationHealthy subjects with no significant medical history, noevidence of cardiovascular disease (normal ECG, normalcardiac dimensions and function by cine CMR, normaltissue characterization) or taking any regular medication,were included (n = 102). An independent group of normo-tensive subjects referred for clinical CMR with a low pretestprobability of cardiomyopathy or cardiac disease, takingno medication, and with subsequently normal findingson routine CMR, were used as a comparative cohort(n = 113) [17]. Characteristics were recorded for allsubjects, including age, gender, body mass index, heartrate and blood pressure. Exclusion criteria were thegenerally accepted contraindications to CMR (implantabledevices, cerebral aneurysm clips, cochlear implants, se-vere claustrophobia) or a history of renal disease with acurrent eGFR < 60 mL/min/1.73 m2.
CMR protocolCMR studies were performed with the patient supineusing clinical 1.5 T or 3 T scanners (Achieva or Ingenia,Philips Healthcare, Best, The Netherlands) equipped withadvanced cardiac package, radiofrequency magnetic fieldshimming (MultiTransmit) technology and a 32-channelcoil. Subjects underwent a standardized imaging protocolfor assessment of cardiac function and size, as describedpreviously [14-16]. Contrast-enhanced study was performedin a total of 179 subjects (healthy volunteers, n = 66, 65%;low risk subjects, n = 113, 100%). Balanced steady state freeprecession, single breath-hold modified inversion recoveryLook-Locker (MOLLI) was used for T1 mapping and per-formed in a single mid-ventricular short axis slice, prior to

Dabir et al. Journal of Cardiovascular Magnetic Resonance 2014, 16:69 Page 3 of 12http://jcmr-online.com/content/16/1/69
contrast administration and to scar imaging, respect-ively (TE/TR/flip-angle (FA): 1.64 ns/3.3 ns/50°, voxelsize 1.8 × 1.8 × 8 mm, phase encoding steps n = 166, 11images from three inversions (3 + 3 + 5) with three-heartbeat pauses prior to the second and third inver-sions and an adiabatic prepulse) [13-16]. Intravenousgadobutrol (Bayer Healthcare, Leverkusen, Germany)was administered in doses 0.1, 0.15 or 0.2 mmol/kg perbody weight, as per the local clinical protocol.
Image analysisAll routine CMR analysis was performed using commerciallyavailable software (ViewForum, Extended Workspace,Philips Healthcare, The Netherlands), as previously de-scribed [14-16].Myocardial T1 relaxation was measured by placing a
region of interest (ROI) conservatively within the septalmyocardium, as previously described [13-16] (Figure 1). T1values were also measured for the complete mid-ventricularSAX slice as well as for 6 equiangular segments (7–12) [18].Care was taken to avoid contamination with signal fromthe blood pool. Following offline image co-registration andmotion correction, T1 values were determined by fitting anexponential model to the measured data applying Look-Locker, noise and heart rate correction, as previouslydescribed [13-16]. In addition to the T1 measurementsof native myocardium and blood pool, we calculated themyocardial partition coefficient (λ) and extracellularvolume fraction (ECV) according to the formulas [19]:
a. λ = ΔR1myocardium/ΔR1blood where R1 = 1/T1measured before and twenty minutes after GBCAadministration.
b. ECV = λ(1 − hematocrit).
Statistical analysisStatistical analysis was performed using SPSS software(SPSS Inc., Chicago, IL, USA, version 20.0). Normality of
Figure 1 Illustration of T1 measurements by ROI placements in septamyocardium in short axis slice (SAX) (C).
distributions was tested with the Kolmogorov-Smirnovstatistic. Categorical data are expressed as percentages, andcontinuous variables as mean ± SD or median (interquartilerange), as appropriate. For comparison of two and morethan two normally distributed variables, Student’s t-test andone-way analysis of variance (ANOVA, with Bonferroni’spost-hoc test) as appropriate. Associations were exploredby single and multivariate linear regressions. Imagesconsidered of sufficient quality and free of artefacts[20] to be deemed diagnostic were used for analysis ofseptal native T1. Inter- and intraobserver reproducibilityand agreement of post-processing approaches was assessedaccording to the method of Bland and Altman. Becausehematocrit has been only available in 34% of all subjects,missing values for calculation of ECV were obtained usingmultiple imputation method [21]. All values are reported asmean ± SD and a p-value of less than 0.05 was consideredstatistically significant.
ResultsContribution of cases per recruiting centers was as follows:KCL (n = 146, 68%; 1.5 T: n = 101, 3 T, n = 45), DHZB(n = 46, 22%, all 3 T), UL (n = 14, 7%, all 3 T), StVU(n = 9, 4%, all 1.5 T). Subject characteristics for healthyvolunteers and low risk patients are presented in Table 1.There were no differences in mean age or gender represen-tation and routine CMR measures between field strengths(p > 0.05), as well as between the two groups (Figure 2).
Comparison of T1 values per field strengthIn healthy controls, mean native T1 values were 950 ±21 msec at 1.5 T and 1052 ± 23 at 3 T, whereas λ andECV values were 0.44 ± 0.06 and 0.25 ± 0.04 at 1.5 T,and 0.44 ± 0.07 and 0.26 ± 0.04 at 3 T, respectively(Table 1). There were no significant differences betweenhealthy controls and low risk subjects in routine CMRparameters and T1 values (Figure 2). Mean native T1was significantly higher at 3 T compared to 1.5 T for
l myocardium (A), blood pool (B), and by coverage of

Table 1 Subject characteristics
Variables Healthyvolunteers
Low riskpatients
Sig.
(n = 102) (n = 113) (p-value)
Age (years) 41 ± 17 44 ± 14 0.21
Gender (male(n,%)) 53 (52) 57 (51) 0.88
BMI 26 ± 4 26 ± 4 0.97
Heart rate (bpm) 66 ± 11 67 ± 13 0.26
Systolic BP (mmHg) 119 ± 11 121 ± 15 0.27
Diastolic BP (mmHg) 71 ± 11 75 ± 9 0.39
eGFR (ml/m2) 92 ± 36 97 ± 25 0.57
Hematocrit (%) 40 ± 0.04 41 ± 0.04 0.91
LV-EDV index (ml/m2) 79 ± 15 77 ± 13 0.41
LV-ESV index (ml/m2) 30 ± 8 30 ± 7 0.79
LV-EF (%) 63 ± 5 62 ± 5 0.37
RV-EF (%) 59 ± 7 58 ± 7 0.89
LV mass index (g/m2) 51 ± 12 53 ± 13 0.21
LA area (g/m2) 22 ± 4 21 ± 4 0.49
1.5 T (n = 34) (n = 58)
Native T1myocardium (msec) 950 ± 21 952 ± 23 0.66
Native T1blood (msec) 1551 ± 115 1572 ± 111 0.36
Postcontrast T1 myocardium (msec) 415 ± 113 406 ± 94 0.77
Postcontrast T1 blood (msec) 291 ± 122 278 ± 107 0.51
λ 0.44 ± 0.06 0.43 ± 0.08 0.72
ECV 0.25 ± 0.04 0.26 ± 0.06 0.32
3 T (n = 32) (n = 55)
Native T1myocardium (msec) 1052 ± 23 1053 ± 24 0.51
Native T1blood (msec) 1736 ± 139 1716 ± 149 0.64
Postcontrast T1 myocardium (msec) 421 ± 131 402 ± 117 0.81
Postcontrast T1 blood (msec) 277 ± 106 250 ± 112 0.69
λ 0.44 ± 0.07 0.43 ± 0.09 0.46
ECV 0.26 ± 0.04 0.26 ± 0.06 0.72
BMI – Body mass index, BP – blood pressure. Student t-test, P < 0.05 isconsidered significant. A total of 179 subjects underwent a contrast-enhancedstudy (healthy volunteers, n = 66; patients, n = 113). Student t-test or one-wayANOVA, P < 0.05 is considered significant.
Dabir et al. Journal of Cardiovascular Magnetic Resonance 2014, 16:69 Page 4 of 12http://jcmr-online.com/content/16/1/69
both groups. There was a close association between thetwo partition coefficient variables: 1.5 T: r = 0.92, 3 T:r = 0.94, (p < 0.001 for both).
Comparison of T1 values for post-processing approachesAge-gender matched samples of subjects from each site(n = 7 per site, a total of 28) were examined for segmentalvalues and average T1 value per short-axis (SAX) slice(Figure 3). As expected, there were considerable regionaldifferences in T1 values in controls with the highestvalues in inferior septal segments (segment 9, nativeT1 (msec) – 1.5 T: 995 ± 23; 3 T: 1107 ± 21) and the lowestvalues in anterolateral segments (segment 12, native T1
(msec) – 1.5 T 902 ± 59; 3 T: 1029 ± 67) at both fieldstrengths (native T1, one-way ANOVA for 6 segmentscomparisons: 1.5 T: F = 8.0, p < 0.01; 3 T F = 3.1, p < 0.05).Compared to septal native T1 (msec, 1.5 T: 3 T:), nativeT1 values averaged per SAX slice were significantlylower (native T1 (msec) septal vs. SAX: 1.5 T: 957 ± 22 vs.941 ± 58; 3 T 1043 ± 23 vs. 1072 ± 63, p < 0.05) [16].
Comparisons of T1 values between the core lab andinvestigator sitesThere was close agreement between T1 values obtainedin core-lab and locally for all sites for native septal andSAX T1 measurements (a mixed sample of 1.5 T and 3 Tcases from all sites, n = 9, p = 0.57 and p = 0.42; betweensites comparisons, repeated measures ANOVA) (Figure 4).Post-contrast values showed lower concordance for bothseptal and SAX T1 measurements (p = 0.104 and p = 0.08).
Comparisons of T1 indices for age, gender, contrast doseand investigator sitesAge groups were determined by separating the entirestudy population into quartiles (group 1: ≤30 years (1.5 T,n = 27, 3 T = 26), group 2: 31 and 42 years (1.5 T, n = 28,3 T = 27); group 3: 42 and 53 years (1.5 T, n = 27, 3 T = 24),group 4: ≥ 53 years (1.5 T, n = 28; 3 T = 28) (Figure 5).T1-values were similar across the age groups for any fieldstrength (Table 2). Comparisons of mean values betweenthe participating sites revealed no significant difference fornative T1 (F = 1.9, p = 0.86), λ (F = 0.4, p = 0.89) and ECV(F = 0.3, p = 0.91). Mean time from administration to post-contrast T1 mapping acquisition was 18 ± 4.9 min, with nosignificant departures between the sites (F = 2.9, p = 0.61).A sub-analysis for GBCA dose (Gadovist® 0.1 mmol/kg vs.0.15 mmol/kg vs. 0.2 mmol/kg) revealed a significant differ-ence for λ and ECV (Table 3) between the protocols.
Analysis of relationshipsThere was a trend of a positive association between nativeT1 and age at 1.5 T (r = 0.21, p < 0.1 for all), which wasstronger in the male cohort (r = 0.23, p = 0.04) (Figure 6).There were no such associations noted on 3 T. Comparisonsof native T1, λ and ECV by gender revealed no significantdifferences at any field strength (p > 0.05 for all). NativeT1 was mildly associated with LV-EDV, LV-ESV andLV mass at both field strengths (native T1: 1.5 T: r = 0.21,p = 0.04; r = −0.24, p = 0.02; r = −0.23, p = 0.03; 3 T: r = 0.13,p = 0.14; r = −0.21, p = 0.05, r = −0.19, p = 0.07). Results ofinter and intraobserver reproducibility and agreement areprovided in Additional file 1 (Figure 7).
DiscussionWe demonstrate that myocardial T1 values obtainedin an investigator-led, single vendor, multicenter studybased on similar imaging infrastructure and unified

Figure 2 Concordance of T1 values and routine CMR measures between healthy volunteers (n = 102) and a subgroup of patients withlow pretest likelihood of cardiovascular disease (n = 113).
Dabir et al. Journal of Cardiovascular Magnetic Resonance 2014, 16:69 Page 5 of 12http://jcmr-online.com/content/16/1/69
imaging parameters, can be reliably reproduced at thecore lab as well as the participating sites by standardizedimage acquisition and post-processing approach. Weprovide reference values for native T1 and hybrid mea-sures for 1.5 and 3 T magnetic field strengths in healthyhuman myocardium. The present study provides a proofof transferability of a T1 mapping methodology beyonda single (and expert) center and suggests a pathway towardsa wider use of T1 mapping.A substantial body of evidence suggests that T1 mapping
is sufficiently accurate, reproducible and robust to enterinto clinical translational pathway; T1-values were foundabnormal in a variety of cardiomyopathies and permit dis-crimination between normal and abnormal myocardium.Thus far, a couple of studies reported on the associationswith outcomes, albeit short-term, in a selected patientpopulation and single centre set-ups [22,23]. Difficultiesfor immediate clinical translation also relate to the ongoingtechnical evolution of T1 mapping sequences, scarcity ofmulticenter and prospective controlled studies as well asoutcome evidence in subgroups and in large populations[11,24]. This is the first study to provide reference valuesfor myocardium healthy humans, including native T1 andECV based on a unified T1 mapping methodology at bothfield strengths, in a multicenter setting. The average T1values obtained at 1.5 T field strength are closest to thesegmental values obtained by Messroghli et al. [13,20,25]using MOLLI in its original form, 3(3)3(3)5, which was
also used for the current data acquisition. Advances in MRIscanning equipment with improved coils and shimming,combined with a rigorous postprocessing approach withmotion correction, as well as considerably greater samplesize, may explain the lower spread of native T1 valuesobserved in the present study. Subsequent generations ofMOLLI sequence, which introduced several parametermodifications, most noticeably a lower flip angle of 35°(compared to 50° in the original sequence), showed similaraverage myocardial native T1 values in healthy volunteers(Messroghli: 939 ± 24 msec; Piechnik, 976 ± 46 msec)[26,27], and were also implemented across other vendorplatforms. A series of publications from a single centre(National Institutes of Health, NIH) revealed either similarvalues at 1.5 T (Gai et al. 986 ± 168 msec, FA = 50° [28]; Liuet al.: native T1: 977 ± 42 msec, FA 35° [12]) or higher nativeT1 values (Nacif et al. native T1: 1034 ± 56 msec, FA 35°)[29], with considerably greater scatter. T1 relaxation timesincrease with higher field strength, which is also reflected inour findings: myocardial native T1 values at 3 T are approxi-mately 100 msec longer in comparison to 1.5 T. This obser-vation is concordant with previous studies, including byPiechnick et al. (average SAX 1169 ± 45 msec) [27], and sev-eral publications from the NIH (Kawel et al. 1286 ± 59 msec[30]; Lee et al. (1315 ± 39 msec) [31], and more recently,Von Knobelsdorff-Brenkenhoff et al. (1159 ± ~73 msec)[32]. The magnitude of native T1 values at 3 T observed inthe present multicenter study concord with the values in

Figure 3 Segmental variations of T1 values in midventricular short axis slice (SAX, segments 7–12) at 1.5 T and 3 T field strengths.Bull’s eye with annotated segments in midventricular SAX slice.
Dabir et al. Journal of Cardiovascular Magnetic Resonance 2014, 16:69 Page 6 of 12http://jcmr-online.com/content/16/1/69
patient cohort comparisons studies we have reported onpreviously [14-16], supporting the unchanging source ofresults based on a uniform imaging platform. We alsoprovide further insights into the reference ranges for λand ECV based on a MOLLI sequence at both fieldstrengths based on the bolus technique [19,22,30]. Ourfindings concord with previous reports concerning theaverage and spread of ECV values in healthy subjects(at 1.5 T: Liu et al. 0.27 ± 0.03 (calculated as an average ofvalues for men: 0.26 ± 0.03 and women: 0.28 ± 0.03) [12],Wong et al. ~0.24 ± 0.02 [22]; at 3 T: Kawel et al. ~0.29 ±0.03 (estimated from the Figure 2 at ~20 min time-point)[30], Lee et al. 0.27 ± 0.10 [31]), and the independency ofthe calculated parameters from the field strengths.Sequence parameters, vendors’ specific set-up and stan-
dardized acquisition in part explain the observed diversityin T1 values in the above studies. A standardized approachto postprocessing is an additional important considerationfor reproducibility and spread of T1 measurements, allow-ing robust discrimination between health and disease. Weand others have previously shown that there are signifi-cant regional variations of native T1-values in SAX slices
of normal subjects [16,27,33-35], with differences betweenthe septal and lateral segments ranging between 60 to150 msec. We have previously shown that native T1measurement in the septum provide the most robustpost-processing approach with an excellent intra-observerand inter-observer reproducibility irrespective of the fieldstrength [14-16]. We now show that this post-processingapproach is robust also in a multicenter setting, providingmeaningful values on the expected reference ranges inhealthy myocardium. Regional variation in segmentalvalues may also account for a higher spread of valuesin some of the above studies, because T1 measurements inaverage SAX approach integrate native T1 values observedin all myocardial segments. It is unlikely that these regionaldifferences represent a true difference in tissue composition.We found no relationship between T1 values and age.
Several previous publications showed decreasing nativeT1 values [36] or increasing ECV values with age [12,22].Whereas decreasing trend with age is difficult to explain,the latter studies used a cross-sectional study design andinvestigated subclinical or overt disease, respectively. Wehave shown previously that T1 values increase with age in
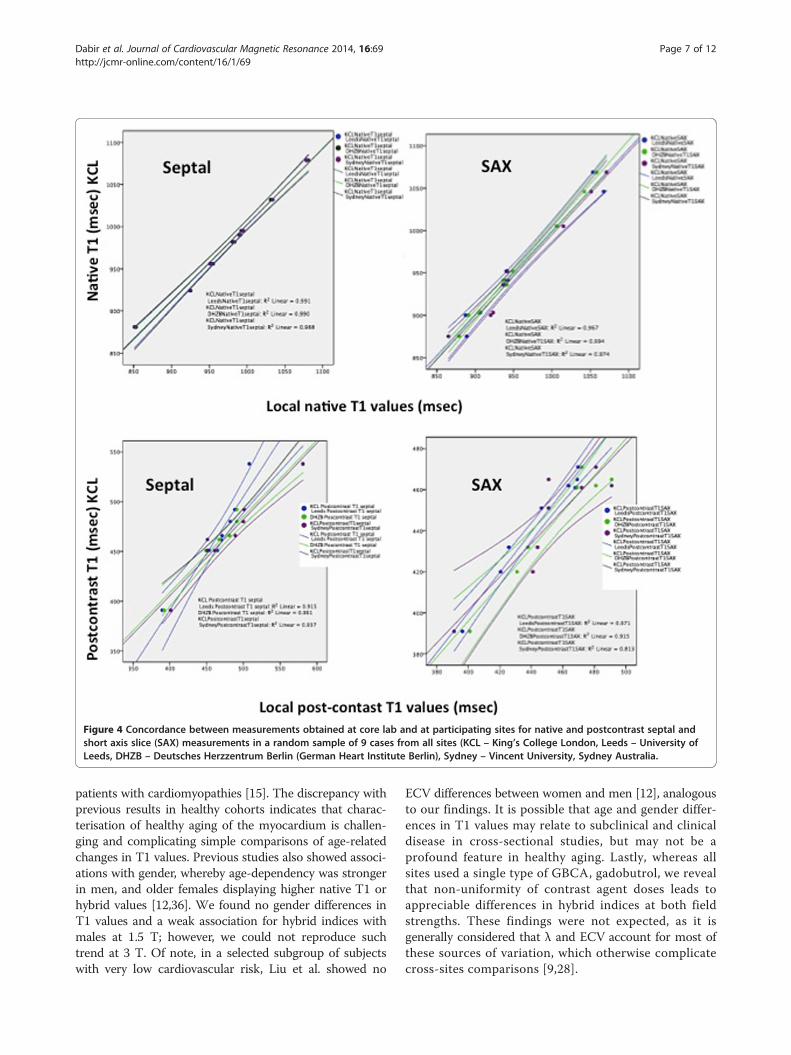
Figure 4 Concordance between measurements obtained at core lab and at participating sites for native and postcontrast septal andshort axis slice (SAX) measurements in a random sample of 9 cases from all sites (KCL – King’s College London, Leeds – University ofLeeds, DHZB – Deutsches Herzzentrum Berlin (German Heart Institute Berlin), Sydney – Vincent University, Sydney Australia.
Dabir et al. Journal of Cardiovascular Magnetic Resonance 2014, 16:69 Page 7 of 12http://jcmr-online.com/content/16/1/69
patients with cardiomyopathies [15]. The discrepancy withprevious results in healthy cohorts indicates that charac-terisation of healthy aging of the myocardium is challen-ging and complicating simple comparisons of age-relatedchanges in T1 values. Previous studies also showed associ-ations with gender, whereby age-dependency was strongerin men, and older females displaying higher native T1 orhybrid values [12,36]. We found no gender differences inT1 values and a weak association for hybrid indices withmales at 1.5 T; however, we could not reproduce suchtrend at 3 T. Of note, in a selected subgroup of subjectswith very low cardiovascular risk, Liu et al. showed no
ECV differences between women and men [12], analogousto our findings. It is possible that age and gender differ-ences in T1 values may relate to subclinical and clinicaldisease in cross-sectional studies, but may not be aprofound feature in healthy aging. Lastly, whereas allsites used a single type of GBCA, gadobutrol, we revealthat non-uniformity of contrast agent doses leads toappreciable differences in hybrid indices at both fieldstrengths. These findings were not expected, as it isgenerally considered that λ and ECV account for most ofthese sources of variation, which otherwise complicatecross-sites comparisons [9,28].
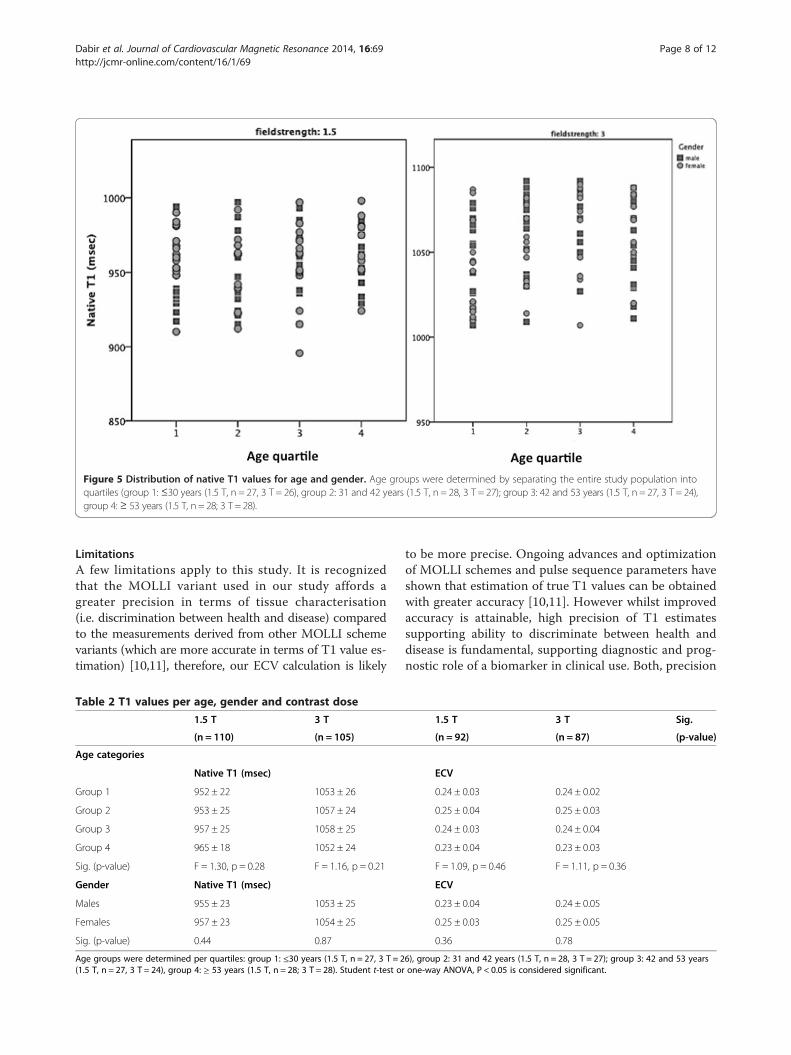
Figure 5 Distribution of native T1 values for age and gender. Age groups were determined by separating the entire study population intoquartiles (group 1: ≤30 years (1.5 T, n = 27, 3 T = 26), group 2: 31 and 42 years (1.5 T, n = 28, 3 T = 27); group 3: 42 and 53 years (1.5 T, n = 27, 3 T = 24),group 4: ≥ 53 years (1.5 T, n = 28; 3 T = 28).
Dabir et al. Journal of Cardiovascular Magnetic Resonance 2014, 16:69 Page 8 of 12http://jcmr-online.com/content/16/1/69
LimitationsA few limitations apply to this study. It is recognizedthat the MOLLI variant used in our study affords agreater precision in terms of tissue characterisation(i.e. discrimination between health and disease) comparedto the measurements derived from other MOLLI schemevariants (which are more accurate in terms of T1 value es-timation) [10,11], therefore, our ECV calculation is likely
Table 2 T1 values per age, gender and contrast dose
1.5 T 3 T
(n = 110) (n = 105)
Age categories
Native T1 (msec)
Group 1 952 ± 22 1053 ± 26
Group 2 953 ± 25 1057 ± 24
Group 3 957 ± 25 1058 ± 25
Group 4 965 ± 18 1052 ± 24
Sig. (p-value) F = 1.30, p = 0.28 F = 1.16, p = 0.21
Gender Native T1 (msec)
Males 955 ± 23 1053 ± 25
Females 957 ± 23 1054 ± 25
Sig. (p-value) 0.44 0.87
Age groups were determined per quartiles: group 1: ≤30 years (1.5 T, n = 27, 3 T = 2(1.5 T, n = 27, 3 T = 24), group 4: ≥ 53 years (1.5 T, n = 28; 3 T = 28). Student t-test or
to be more precise. Ongoing advances and optimizationof MOLLI schemes and pulse sequence parameters haveshown that estimation of true T1 values can be obtainedwith greater accuracy [10,11]. However whilst improvedaccuracy is attainable, high precision of T1 estimatessupporting ability to discriminate between health anddisease is fundamental, supporting diagnostic and prog-nostic role of a biomarker in clinical use. Both, precision
1.5 T 3 T Sig.
(n = 92) (n = 87) (p-value)
ECV
0.24 ± 0.03 0.24 ± 0.02
0.25 ± 0.04 0.25 ± 0.03
0.24 ± 0.03 0.24 ± 0.04
0.23 ± 0.04 0.23 ± 0.03
F = 1.09, p = 0.46 F = 1.11, p = 0.36
ECV
0.23 ± 0.04 0.24 ± 0.05
0.25 ± 0.03 0.25 ± 0.05
0.36 0.78
6), group 2: 31 and 42 years (1.5 T, n = 28, 3 T = 27); group 3: 42 and 53 yearsone-way ANOVA, P < 0.05 is considered significant.
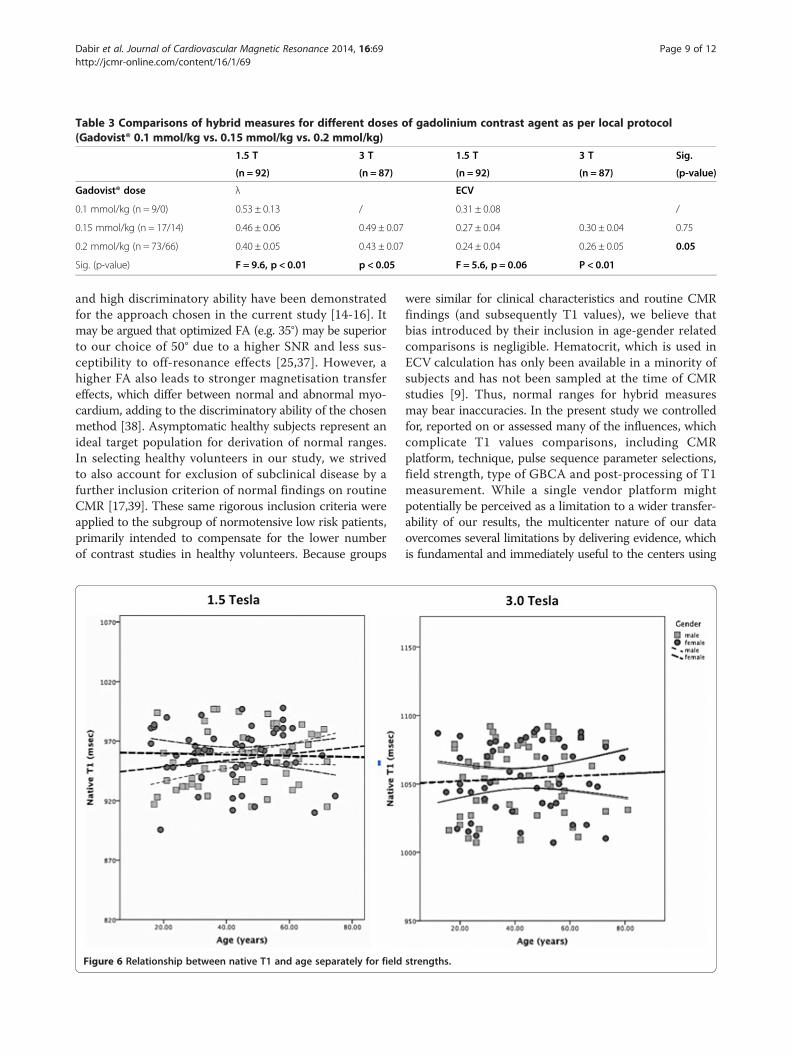
Table 3 Comparisons of hybrid measures for different doses of gadolinium contrast agent as per local protocol(Gadovist® 0.1 mmol/kg vs. 0.15 mmol/kg vs. 0.2 mmol/kg)
1.5 T 3 T 1.5 T 3 T Sig.
(n = 92) (n = 87) (n = 92) (n = 87) (p-value)
Gadovist® dose λ ECV
0.1 mmol/kg (n = 9/0) 0.53 ± 0.13 / 0.31 ± 0.08 /
0.15 mmol/kg (n = 17/14) 0.46 ± 0.06 0.49 ± 0.07 0.27 ± 0.04 0.30 ± 0.04 0.75
0.2 mmol/kg (n = 73/66) 0.40 ± 0.05 0.43 ± 0.07 0.24 ± 0.04 0.26 ± 0.05 0.05
Sig. (p-value) F = 9.6, p < 0.01 p < 0.05 F = 5.6, p = 0.06 P < 0.01
Dabir et al. Journal of Cardiovascular Magnetic Resonance 2014, 16:69 Page 9 of 12http://jcmr-online.com/content/16/1/69
and high discriminatory ability have been demonstratedfor the approach chosen in the current study [14-16]. Itmay be argued that optimized FA (e.g. 35°) may be superiorto our choice of 50° due to a higher SNR and less sus-ceptibility to off-resonance effects [25,37]. However, ahigher FA also leads to stronger magnetisation transfereffects, which differ between normal and abnormal myo-cardium, adding to the discriminatory ability of the chosenmethod [38]. Asymptomatic healthy subjects represent anideal target population for derivation of normal ranges.In selecting healthy volunteers in our study, we strivedto also account for exclusion of subclinical disease by afurther inclusion criterion of normal findings on routineCMR [17,39]. These same rigorous inclusion criteria wereapplied to the subgroup of normotensive low risk patients,primarily intended to compensate for the lower numberof contrast studies in healthy volunteers. Because groups
Figure 6 Relationship between native T1 and age separately for field
were similar for clinical characteristics and routine CMRfindings (and subsequently T1 values), we believe thatbias introduced by their inclusion in age-gender relatedcomparisons is negligible. Hematocrit, which is used inECV calculation has only been available in a minority ofsubjects and has not been sampled at the time of CMRstudies [9]. Thus, normal ranges for hybrid measuresmay bear inaccuracies. In the present study we controlledfor, reported on or assessed many of the influences, whichcomplicate T1 values comparisons, including CMRplatform, technique, pulse sequence parameter selections,field strength, type of GBCA and post-processing of T1measurement. While a single vendor platform mightpotentially be perceived as a limitation to a wider transfer-ability of our results, the multicenter nature of our dataovercomes several limitations by delivering evidence, whichis fundamental and immediately useful to the centers using
strengths.
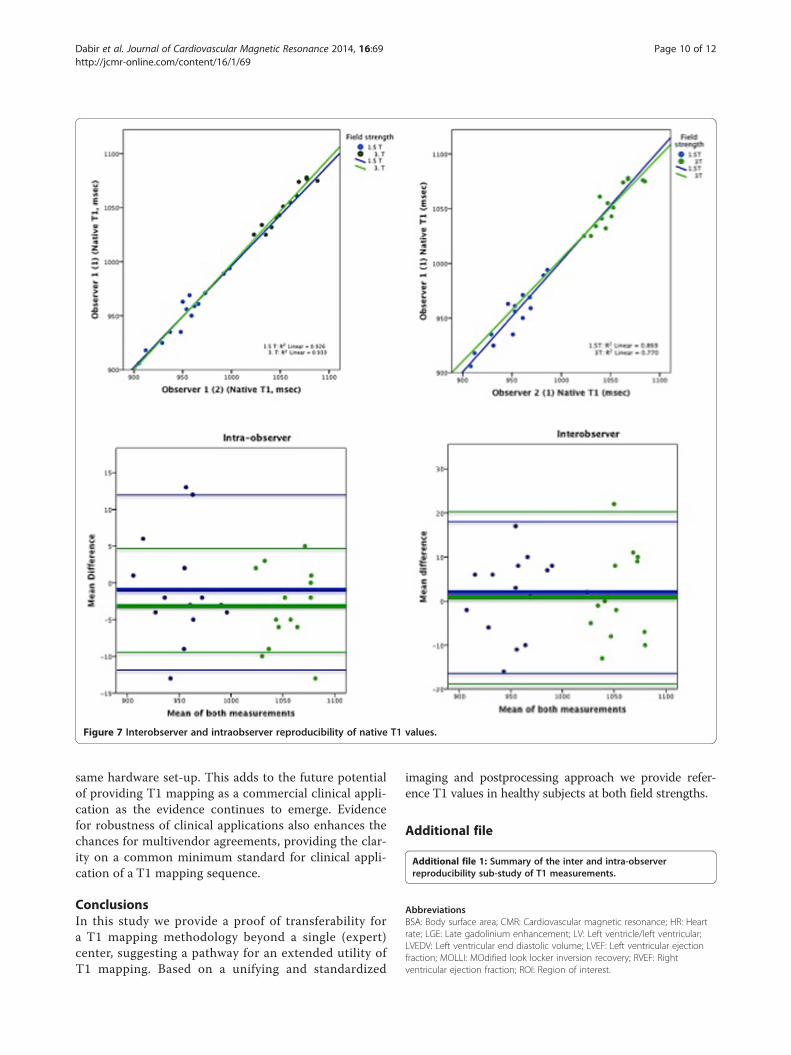
Figure 7 Interobserver and intraobserver reproducibility of native T1 values.
Dabir et al. Journal of Cardiovascular Magnetic Resonance 2014, 16:69 Page 10 of 12http://jcmr-online.com/content/16/1/69
same hardware set-up. This adds to the future potentialof providing T1 mapping as a commercial clinical appli-cation as the evidence continues to emerge. Evidencefor robustness of clinical applications also enhances thechances for multivendor agreements, providing the clar-ity on a common minimum standard for clinical appli-cation of a T1 mapping sequence.
ConclusionsIn this study we provide a proof of transferability fora T1 mapping methodology beyond a single (expert)center, suggesting a pathway for an extended utility ofT1 mapping. Based on a unifying and standardized
imaging and postprocessing approach we provide refer-ence T1 values in healthy subjects at both field strengths.
Additional file
Additional file 1: Summary of the inter and intra-observerreproducibility sub-study of T1 measurements.
AbbreviationsBSA: Body surface area; CMR: Cardiovascular magnetic resonance; HR: Heartrate; LGE: Late gadolinium enhancement; LV: Left ventricle/left ventricular;LVEDV: Left ventricular end diastolic volume; LVEF: Left ventricular ejectionfraction; MOLLI: MOdified look locker inversion recovery; RVEF: Rightventricular ejection fraction; ROI: Region of interest.

Dabir et al. Journal of Cardiovascular Magnetic Resonance 2014, 16:69 Page 11 of 12http://jcmr-online.com/content/16/1/69
Competing interestsThe authors declare that they have no competing interests.
Authors’ contributions1) Multicenter study design and local funding: VP, EN, SP, AJ, RG; 2) Dataacquisition and clinical science support: VP, EN, AD, AK, AJ, RG, AD, SK, AD,CH, DD, NC, TR, DMH, BS; 3) Data analysis: VP, DD, NC, RG, AD, SK, AD, CH, LF; 4)Manuscript: drafting, critical revision and final approval: VP, EN, DD, NC, TR,DMH, AJ, CH, JO, AD, SP, RG, AD, SK, BS, LF. All authors read and approved thefinal manuscript.
AcknowledgementsDepartment of Health via the National Institute for Health Research (NIHR)comprehensive Biomedical Research Centre award to Guy’s & St Thomas’NHS Foundation Trust in partnership with King's College London and King’sCollege Hospital National Health Service Foundation Trust. Localradiographer support at participating sites is thoroughly appreciated.
Author details1Cardiovascular Imaging Department, King’s College London, The Rayne Institute,4th Floor Lambeth Wing, St. Thomas’ Hospital Campus, London SE1, UK. 2GermanHeart Institute Berlin, Berlin, Germany. 3St Vincent’s Hospital and The Victor ChangCardiac Research Institute, Sydney, NSW, Australia. 4Leeds University, Leeds, UK.5Philips Healthcare, Guildford, UK. 6Philips Healthcare, Hamburg, Germany.
Received: 26 March 2014 Accepted: 13 August 2014
References1. Kwon DH, Halley CM, Carrigan TP, Zysek V, Popovic ZB, Setser R, Schoenhagen P,
Starling RC, Flamm SD, Desai MY. Extent of left ventricular scar predictsoutcomes in ischemic cardiomyopathy patients with significantly reducedsystolic function: a delayed hyperenhancement cardiac magnetic resonancestudy. JACC Cardiovasc Imaging. 2009; 2(1):34–44.
2. Schelbert EB, Cao JJ, Sigurdsson S, Aspelund T, Kellman P, Aletras AH, DykeCK, Thorgeirsson G, Eiriksdottir G, Launer LJ, Gudnason V, Harris TB, Arai AE.Prevalence and prognosis of unrecognized myocardial infarctiondetermined by cardiac magnetic resonance in older adults. JAMA. 2012;308(9):890–96.
3. Neilan TG, Coelho-Filho OR, Danik SB, Shah RV, Dodson JA, Verdini DJ,Tokuda M, Daly CA, Tedrow UB, Stevenson WG, Jerosch-Herold M,Ghoshhajra BB, Kwong RY. CMR quantification of myocardial scar providesadditive prognostic information in nonischemic cardiomyopathy.JACC Cardiovasc Imaging. 2013; 6(9):944–54.
4. Gulati A, Jabbour A, Ismail TF, Guha K, Khwaja J, Raza S, Morarji K, Brown TD,Ismail NA, Dweck MR, Di Pietro E, Roughton M, Wage R, Daryani Y, O’HanlonR, Sheppard MN, Alpendurada F, Lyon AR, Cook SA, Cowie MR, Assomull RG,Pennell DJ, Prasad SK. Association of fibrosis with mortality and suddencardiac death in patients with nonischemic dilated cardiomyopathy.JAMA. 2013; 309(9):896–908.
5. Iles L, Pfluger H, Lefkovits L, Butler MJ, Kistler PM, Kaye DM, Taylor AJ.Myocardial fibrosis predicts appropriate device therapy in patients withimplantable cardioverter-defibrillators for primary prevention of suddencardiac death. J Am Coll Cardiol. 2011; 15(57(7)):821–28.
6. Schulz-Menger J, Bluemke DA, Bremerich J, Flamm SD, Fogel MA, FriedrichMG, Kim RJ, von Knobelsdorff-Brenkenhoff F, Kramer CM, Pennell DJ, Plein S,Nagel E. Standardized image interpretation and post processing incardiovascular magnetic resonance: Society for Cardiovascular MagneticResonance (SCMR) board of trustees task force on standardized postprocessing. J Cardiovasc Magn Reson. 2013; 15:35.
7. Mewton N, Liu CY, Croisille P, Bluemke D, Lima JA. Assessment of myocardialfibrosis with cardiovascular magnetic resonance. J Am Coll Cardiol. 2011;57(8):891–903.
8. Nagel E, Narula J. Evolution and revolution in CMR imaging. JACCCardiovasc Imaging. 2013; 6(7):837–38.
9. Moon JC, Messroghli DR, Kellman P, Piechnik SK, Robson MD, Ugander M,Gatehouse PD, Arai AE, Friedrich MG, Neubauer S, Schulz-Menger J, Schelbert EB.Myocardial T1 mapping and extracellular volume quantification: a Society forCardiovascular Magnetic Resonance (SCMR) and CMR Working Group of theEuropean Society of Cardiology consensus statement. J Cardiovasc MagnReson. 2013; 15:92.
10. Kellman P, Hansen MS. T1-mapping in the heart: accuracy and precision.J Cardiovasc Magn Reson. 2014; 16(1):2.
11. Higgins DM, Moon JC. Review of T1 mapping methods: comparativeeffectiveness including reproducibility issues. Curr Cardiovasc Imaging Rep.2014; 7:9252.
12. Liu CY, Liu YC, Wu C, Armstrong A, Volpe GJ, van der Geest RJ, Liu Y,Hundley WG, Gomes AS, Liu S, Nacif M, Bluemke DA, Lima JA. Evaluation ofage-related interstitial myocardial fibrosis with cardiac magnetic resonancecontrast-enhanced T1 mapping: MESA (Multi-Ethnic Study of Atherosclerosis).J Am Coll Cardiol. 2013; 62(14):1280–87.
13. Messroghli DR, Radjenovic A, Kozerke S, Higgins DM, Sivananthan MU, Ridgway JP.Modified Look-Locker inversion recovery (MOLLI) for high-resolution T1mapping of the heart. Magn Reson Med. 2004; 52:141–46.
14. Puntmann VO, D’Cruz D, Smith Z, Pastor A, Choong P, Voigt T, Carr-White G,Sangle S, Schaeffter T, Nagel E. Native myocardial T1 mapping bycardiovascular magnetic resonance imaging in subclinical cardiomyopathyin patients with systemic lupus erythematosus. Circ Cardiovasc Imaging.2013; 6:295–301.
15. Puntmann VO, Voigt T, Chen Z, Mayr M, Karim R, Rhode K, Pastor A,Carr-White G, Razavi R, Schaeffter T, Nagel E. Native T1 mapping in differentiationof normal myocardium from diffuse disease in hypertrophic and dilatedcardiomyopathy. JACC Cardiovasc Imaging. 2013; 6:475–84.
16. Rogers T, Dabir D, Mahmoud I, Voigt T, Schaeffter T, Nagel E, Puntmann VO.Standardization of T1 measurements with MOLLI in differentiationbetween health and disease – the ConSept study. J Cardiovasc MagnReson. 2013; 15:78.
17. Natori S, Lai S, Finn JP, Gomes AS, Hundley WG, Jerosch-Herold M, Pearson G,Sinha S, Arai A, Lima JA, Bluemke DA. Cardiovascular function in multi-ethnicstudy of atherosclerosis: normal values by age, sex, and ethnicity. AJR Am JRoentgenol. 2006; 186:S357–65.
18. Cheitlin MD, Armstrong WF, Aurigemma GP, Beller GA, Bierman FZ, Davis JL,Douglas PS, Faxon DP, Gillam LD, Kimball TR, Kussmaul WG, Pearlman AS,Philbrick JT, Rakowski H, Thys DM, Antman EM, Smith SC Jr, Alpert JS,Gregoratos G, Anderson JL, Hiratzka LF, Faxon DP, Hunt SA, Fuster V,Jacobs AK, Gibbons RJ, Russell RO. A report of the American College ofCardiology/American Heart Association Task Force on PracticeGuidelines (ACC/AHA/ASE Committee Update the 1997 Guidelines onthe Clinical Application of Echocardiography). Circulation. 2003;108:1146–62.
19. Schelbert EB, Testa SM, Meier CG, Ceyrolles WJ, Levenson JE, Blair AJ,Kellman P, Jones BL, Ludwig DR, Schwartzman D, Shroff SG, Wong TC.Myocardial extravascular extracellular volume fraction measurement bygadolinium cardiovascular magnetic resonance in humans: slow infusionversus bolus. J Cardiovasc Magn Reson. 2011; 13:16.
20. Messroghli DR, Walters K, Plein S, Sparrow P, Friedrich MG, Ridgway JP,Sivananthan MU. Myocardial T1 mapping: application to patients withacute and chronic myocardial infarction. Magn Reson Med. 2007;58(1):34–40.
21. Sterne JA, White IR, Carlin JB, Spratt M, Royston P, Kenward MG, Wood AM,Carpenter JR. Multiple imputation for missing data in epidemiologicaland clinical research: potential and pitfalls. BMJ. 2009; 338:b2393.
22. Wong TC, Piehler KM, Kang IA, Kadakkal A, Kellman P, Schwartzman DS,Mulukutla SR, Simon MA, Shroff SG, Kuller LH, Schelbert EB. Myocardialextracellular volume fraction quantified by cardiovascular magneticresonance is increased in diabetes and associated with mortality andincident heart failure admission. Eur Heart J. 2014; 35(10):657–64.
23. Mascherbauer J1, Marzluf BA, Tufaro C, Pfaffenberger S, Graf A, Wexberg P,Panzenböck A, Jakowitsch J, Bangert C, Laimer D, Schreiber C, Karakus G,Hülsmann M, Pacher R, Lang IM, Maurer G, Bonderman D. Cardiacmagnetic resonance postcontrast T1 time is associated with outcome inpatients with heart failure and preserved ejection fraction. Circ CardiovascImaging. 2013; 6(6):1056–65.
24. Mahmoud IZ, Cummins C, Hussain Z, Rogers T, Dabir D, Voigt T, HigginsDM, Nagel E, Schaeffter T, Puntmann VO. T1 values in discriminationbetween health and disease using different T1 sequences: comparisonbetween 3L3L5-MOLLI, 3 L5-MOLLI, shMOLLI and SASHA. J CardiovascMagn Reson. 2014; 15(S1):18.
25. Messroghli DR, Plein S, Higgins DM, Walters K, Jones TR, Ridgway JP,Sivananthan MU. Human myocardium: single-breath-hold MR T1mapping with high spatial resolution–reproducibility study. Radiology.2006; 238(3):1004–12.

Dabir et al. Journal of Cardiovascular Magnetic Resonance 2014, 16:69 Page 12 of 12http://jcmr-online.com/content/16/1/69
26. Messroghli DR, Greiser A, Fröhlich M, Dietz R, Schulz-Menger J. Optimizationand validation of a fully-integrated pulse sequence for modifiedlook-locker inversion-recovery (MOLLI) T1 mapping of the heart. J MagnReson Imaging. 2007; 26(4):1081–86.
27. Piechnik SK, Ferreira VM, Dall’Armellina E, Cochlin LE, Greiser A, Neubauer S,Robson MD. Shortened Modified Look-Locker Inversion recovery(ShMOLLI) for clinical myocardial T1-mapping at 1.5 and 3 T within a 9heartbeat breathhold. J Cardiovasc Magn Reson. 2010; 12:69.
28. Gai N, Turkbey EB, Nazarian S, Van der Geest RJ, Liu CY, Lima JA, BluemkeDA. T1 mapping of the gadolinium-enhanced myocardium: adjustmentfor factors affecting interpatient comparison. Magn Reson Med. 2011;65(5):1407–15.
29. Nacif MS, Turkbey EB, Gai N, Nazarian S, Van der Geest RJ, Noureldin RA,Sibley CT, Ugander M, Liu S, Arai AE, Lima JA, Bluemke DA. Myocardial T1mapping with MRI: comparison of look-locker and MOLLI sequences.J Magn Reson Imaging. 2011; 34(6):1367–73.
30. Kawel N, Nacif M, Zavodni A, Jones J, Liu S, Sibley CT, Bluemke DA. T1mapping of the myocardium: intra-individual assessment of post-contrastT1 time evolution and extracellular volume fraction at 3 T for Gd-DTPA andGd-BOPTA. J Cardiovasc Magn Reson. 2012; 14:26.
31. Lee JJ, Liu S, Nacif MS, Ugander M, Han J, Kawel N, Sibley CT, Kellman P,Arai AE, Bluemke DA. Myocardial T1 and extracellular volume fractionmapping at 3 tesla. J Cardiovasc Magn Reson. 2011; 13:75.
32. Von Knobelsdorff-Brenkenhoff F, Prothmann M, Dieringer MA, Wassmuth R,Greiser A, Schwenke C, Niendorf T, Schulz-Menger J. Myocardial T1 and T2mapping at 3 T: reference values, influencing factors and implications.J Cardiovasc Magn Reson. 2013; 15(1):53.
33. Kawel N, Nacif M, Zavodni A, Jones J, Liu S, Sibley CT, Bluemke DA. T1mapping of the myocardium: intra-individual assessment of the effect offield strength, cardiac cycle and variation by myocardial region.J Cardiovasc Magn Reson. 2012; 14:27.
34. Rogers T, Puntmann VO. T1 mapping - beware regional variations.Eur Heart J Cardiovasc Imaging. 2014.
35. Puntmann VO, Ucar EA, Baydes RH, Ngah NB, Kuo YS, Dabir D, Macmillan A,Cummins C, Higgins DM, Gaddum N, Chowienczyk P, Plein S, Carr-White G,Nagel E. Aortic stiffness and interstitial myocardial fibrosis by native T1are independently associated with left ventricular remodeling in patientswith dilated cardiomyopathy. Hypertension. 2014; [Epub ahead of print].
36. Piechnik SK, Ferreira VM, Lewandowski AJ, Ntusi NA, Banerjee R, Holloway C,Hofman MB, Sado DM, Maestrini V, White SK, Lazdam M, Karamitsos T,Moon JC, Neubauer S, Leeson P, Robson MD. Normal variation of magneticresonance T1 relaxation times in the human population at 1.5 T usingShMOLLI. J Cardiovasc Magn Reson. 2013; 15:13.
37. Kellman P, Herzka DA, Arai AE, Hansen MS. Influence of Off-resonance inmyocardial T1-mapping using SSFP based MOLLI method. J CardiovascMagn Reson. 2013; 15:63.
38. Robson MD, Piechnik SK, Tunnicliffe EM, Neubauer S. T1 measurements inthe human myocardium: the effects of magnetization transfer on theSASHA and MOLLI sequences. Magn Reson Med. 2013; 670:664–70.
39. Hinojar R, Botnar R, Kaski JC, Prasad S, Nagel E, Puntmann VO.Individualized cardiovascular risk assessment by cardiovascular magneticresonance. Future Cardiol. 2014; 10(2):273–89.
doi:10.1186/s12968-014-0069-xCite this article as: Dabir et al.: Reference values for healthy humanmyocardium using a T1 mapping methodology: results from theInternational T1 Multicenter cardiovascular magnetic resonance study.Journal of Cardiovascular Magnetic Resonance 2014 16:69.
Submit your next manuscript to BioMed Centraland take full advantage of:
• Convenient online submission
• Thorough peer review
• No space constraints or color figure charges
• Immediate publication on acceptance
• Inclusion in PubMed, CAS, Scopus and Google Scholar
• Research which is freely available for redistribution
Submit your manuscript at www.biomedcentral.com/submit