Phantom-based quality assurance for multicenter quantitative ...
9
University of Southern Denmark Phantom-based quality assurance for multicenter quantitative MRI in locally advanced cervical cancer van Houdt, Petra J.; Kallehauge, Jesper F.; Tanderup, Kari; Nout, Remi; Zaletelj, Marko; Tadic, Tony; van Kesteren, Zdenko J.; van den Berg, Cornelius A.T.; Georg, Dietmar; Côté, Jean Charles; Levesque, Ives R.; Swamidas, Jamema; Malinen, Eirik; Telliskivi, Sven; Brynolfsson, Patrik; Mahmood, Faisal; van der Heide, Uulke A.; EMBRACE Collaborative Group Published in: Radiotherapy and Oncology DOI: 10.1016/j.radonc.2020.09.013 Publication date: 2020 Document version: Final published version Document license: CC BY-NC-ND Citation for pulished version (APA): van Houdt, P. J., Kallehauge, J. F., Tanderup, K., Nout, R., Zaletelj, M., Tadic, T., van Kesteren, Z. J., van den Berg, C. A. T., Georg, D., Côté, J. C., Levesque, I. R., Swamidas, J., Malinen, E., Telliskivi, S., Brynolfsson, P., Mahmood, F., van der Heide, U. A., & EMBRACE Collaborative Group (2020). Phantom-based quality assurance for multicenter quantitative MRI in locally advanced cervical cancer. Radiotherapy and Oncology, 153, 114-121. https://doi.org/10.1016/j.radonc.2020.09.013 Go to publication entry in University of Southern Denmark's Research Portal Terms of use This work is brought to you by the University of Southern Denmark. Unless otherwise specified it has been shared according to the terms for self-archiving. If no other license is stated, these terms apply: • You may download this work for personal use only. • You may not further distribute the material or use it for any profit-making activity or commercial gain • You may freely distribute the URL identifying this open access version If you believe that this document breaches copyright please contact us providing details and we will investigate your claim. Please direct all enquiries to [email protected] Download date: 04. Sep. 2022
-
Upload
khangminh22 -
Category
Documents
-
view
0 -
download
0
Transcript of Phantom-based quality assurance for multicenter quantitative ...

University of Southern Denmark
Phantom-based quality assurance for multicenter quantitative MRI in locally advancedcervical cancer
van Houdt, Petra J.; Kallehauge, Jesper F.; Tanderup, Kari; Nout, Remi; Zaletelj, Marko;Tadic, Tony; van Kesteren, Zdenko J.; van den Berg, Cornelius A.T.; Georg, Dietmar; Côté,Jean Charles; Levesque, Ives R.; Swamidas, Jamema; Malinen, Eirik; Telliskivi, Sven;Brynolfsson, Patrik; Mahmood, Faisal; van der Heide, Uulke A.; EMBRACE CollaborativeGroupPublished in:Radiotherapy and Oncology
DOI:10.1016/j.radonc.2020.09.013
Publication date:2020
Document version:Final published version
Document license:CC BY-NC-ND
Citation for pulished version (APA):van Houdt, P. J., Kallehauge, J. F., Tanderup, K., Nout, R., Zaletelj, M., Tadic, T., van Kesteren, Z. J., van denBerg, C. A. T., Georg, D., Côté, J. C., Levesque, I. R., Swamidas, J., Malinen, E., Telliskivi, S., Brynolfsson, P.,Mahmood, F., van der Heide, U. A., & EMBRACE Collaborative Group (2020). Phantom-based qualityassurance for multicenter quantitative MRI in locally advanced cervical cancer. Radiotherapy and Oncology,153, 114-121. https://doi.org/10.1016/j.radonc.2020.09.013
Go to publication entry in University of Southern Denmark's Research Portal
Terms of useThis work is brought to you by the University of Southern Denmark.Unless otherwise specified it has been shared according to the terms for self-archiving.If no other license is stated, these terms apply:
• You may download this work for personal use only. • You may not further distribute the material or use it for any profit-making activity or commercial gain • You may freely distribute the URL identifying this open access versionIf you believe that this document breaches copyright please contact us providing details and we will investigate your claim.Please direct all enquiries to [email protected]
Download date: 04. Sep. 2022
Radiotherapy and Oncology 153 (2020) 114–121
Contents lists available at ScienceDirect
Radiotherapy and Oncology
journal homepage: www.thegreenjournal .com
Original Article
Phantom-based quality assurance for multicenter quantitative MRI inlocally advanced cervical cancer
https://doi.org/10.1016/j.radonc.2020.09.0130167-8140/� 2020 The Authors. Published by Elsevier B.V.This is an open access article under the CC BY-NC-ND license (http://creativecommons.org/licenses/by-nc-nd/4.0/).
Abbreviations: ADC, apparent diffusion coefficient; DWI, diffusion-weightedMRI; DCE–MRI, dynamic contrast-enhanced MRI; LoA, limits of agreement; QA,quality assurance; QIBA, quantitative imaging biomarker alliance; qMRI, quantita-tive MRI; %RC, percentage repeatability coefficient; %RDC, percentage reproducibil-ity coefficient; ROI, region of interest; SNR, signal-to-noise; wCV, within subjectstandard deviation.⇑ Corresponding author at: Department of Radiation Oncology, the Netherlands
Cancer Institute, Plesmanlaan 121, 1066 CX Amsterdam, the Netherlands.E-mail address: [email protected] (P.J. van Houdt).
Petra J. van Houdt a,⇑, Jesper F. Kallehauge b, Kari Tanderup c, Remi Nout d, Marko Zaletelj e, Tony Tadic f,Zdenko J. van Kesteren g, Cornelius A.T. van den Berg h, Dietmar Georg i, Jean-Charles Côté j,Ives R. Levesque k, Jamema Swamidas l, Eirik Malinenm, Sven Telliskivi n, Patrik Brynolfsson o,Faisal Mahmood p,q, Uulke A. van der Heide a, and EMBRACE Collaborative GroupaDepartment of Radiation Oncology, the Netherlands Cancer Institute, Amsterdam, the Netherlands; bDanish Centre for Particle Therapy, Aarhus; cDepartment of Clinical Medicine,Aarhus University Hospital, Denmark; dDepartment of Radiation Oncology, Leiden University Medical Center, the Netherlands; eDepartment of Radiotherapy, Institute of OncologyLjubljana, Slovenia; fRadiation Medicine Program, Princess Margaret Cancer Center, Toronto, Canada; gDepartment of Radiation Oncology, Amsterdam University Medical Center;hDepartment of Radiotherapy, University Medical Center Utrecht, the Netherlands; iDivision of Medical Radiation Physics, Department of Radiation Oncology, Medical University OfVienna, Austria; jDepartment of Radiation Oncology, Centre Hospitalier de l’Universite de Montreal, Canada; kMedical Physics Unit and Gerald Bronfman Department of Oncology,McGill University, Montreal, Canada; lDepartment of Radiation Oncology, Tata Memorial Centre, Mumbai, India; mDepartment of Medical Physics, Oslo University Hospital, Norway;nDepartment of Radiation Oncology, North-Estonia Medical Centre, Tallinn, Estonia; oDepartment of Translational Sciences, Skåne University Hospital, Lund, Sweden; pDepartment ofOncology, Odense University Hospital; and qDepartment of Clinical Research, University of Southern Denmark, Odense, Denmark
a r t i c l e i n f o
Article history:Received 4 June 2020Received in revised form 7 September 2020Accepted 8 September 2020Available online 12 September 2020
Keywords:Uterine cervical neoplasmsMagnetic resonance imagingRadiotherapy
a b s t r a c t
Background and purpose: A wide variation of MRI systems is a challenge in multicenter imaging biomar-ker studies as it adds variation in quantitative MRI values. The aim of this study was to design and test aquality assurance (QA) framework based on phantom measurements, for the quantitative MRI protocolsof a multicenter imaging biomarker trial of locally advanced cervical cancer.Materials and methods: Fifteen institutes participated (five 1.5 T and ten 3 T scanners). Each institute opti-mized protocols for T2, diffusion-weighted imaging, T1, and dynamic contrast-enhanced (DCE–)MRIaccording to system possibilities, institutional preferences and study-specific constraints. Calibrationphantoms with known values were used for validation. Benchmark protocols, similar on all systems, wereused to investigate whether differences resulted from variations in institutional protocols or from systemvariations. Bias, repeatability (%RC), and reproducibility (%RDC) were determined. Ratios were used for T2and T1 values.Results: The institutional protocols showed a range in bias of 0.88–0.98 for T2 (median %RC = 1%; %RDC = 12%), �0.007 to 0.029 � 10�3 mm2/s for the apparent diffusion coefficient (median %RC = 3%; %RDC = 18%), and 0.39–1.29 for T1 (median %RC = 1%; %RDC = 33%). For DCE a nonlinear vendor-specificrelation was observed between measured and true concentrations with magnitude data, whereas therelation was linear when phase data was used.Conclusion: We designed a QA framework for quantitative MRI protocols and demonstrated for a multi-center trial for cervical cancer that measurement of consistent T2 and apparent diffusion coefficient val-ues is feasible despite protocol differences. For DCE–MRI and T1 mapping with the variable flip anglemethod, this was more challenging.� 2020 The Authors. Published by Elsevier B.V. Radiotherapy and Oncology 153 (2020) 114–121 This is anopen access article under the CC BY-NC-ND license (http://creativecommons.org/licenses/by-nc-nd/4.0/).
The interest in quantitative MRI (qMRI) for radiation oncology isgrowing as it has the potential to improve outcome prediction andthe assessment of treatment response [1,2]. The two most investi-gated techniques are diffusion weighted imaging (DWI), providingimages associated with cell density modulated water mobility, anddynamic contrast-enhanced (DCE–) MRI, depicting tissue perfusionand vascular permeability. Nonetheless, the use of qMRI in clinicalpractice is currently limited [1]. Most studies using DWI and DCE–MRI have been performed in a single-center setting or in collabora-

P.J. van Houdt et al. Radiotherapy and Oncology 153 (2020) 114–121
tion between a few expert centers [3–7]. O’Connor et al. identifiedthe challenges in imaging biomarker research and proposed a road-map to go from feasibility studies to clinical implementation [8].One of the challenges in multicenter imaging studies is that theyinvolve a variety of MR systems, with different vendors, fieldstrengths, scanner models, software versions, and imaging proto-cols [9]. This explains for example part of the variation in theapparent diffusion coefficient (ADC) from DWI between differentstudies [10].
One approach to reach consistency is to use standardized MRIprotocols. The quantitative imaging biomarkers alliance (QIBA) isworking towards consensus recommendations for standardizedacquisition protocols for DWI and DCE–MRI based on existing liter-ature [11]. For example, Malyarenko et al. showed an improvedreproducibility of the ADC across different MR systems when astandardized DWI protocol was used [12]. However, standardiza-tion may be difficult to achieve in practice. As standardized proto-cols have to be feasible for the oldest system, this limits the use ofadvanced functionality of newer systems (e.g. parallel imagingtechniques) affecting the scanning time for patients. Therefore, amore feasible approach for large-scale studies could be to givemore freedom for protocol development such that the protocolscan be optimized for each system individually based on systempossibilities and local preferences. However, before initiating clin-ical trials quality assurance to assess the performance of the qMRIprotocols between institutes will be even more crucial [8,13].
Quality assurance (QA) with phantoms can be used to estimatethe bias, repeatability, and reproducibility of the qMRI parameters[9,11]. In this study, we designed a QA framework to reduce differ-ences in qMRI parameters between institutes without having touse fixedMR protocols. As a first step we introduced a set of bench-mark protocols to investigate whether deviations in qMRI valuesbetween institutes result from protocol differences or from systemvariations. Second, we measured qMRI values from protocols thatwere optimized by each institute. We applied this QA frameworkto the qMRI protocols optimized for a multicenter imaging biomar-ker discovery trial of locally advanced cervical cancer (IQ-EMBRACE, clinicaltrials.gov NCT03210428). In the trial patientsundergo an extended pre-treatment MRI examination with T2mapping, DWI, and DCE–MRI to assess whether they can be usedto predict disease free survival. As the trial is a sub-study of theEMBRACE-II trial [14], the treatment of patients is homogeneousacross centers creating a unique opportunity for biomarker discov-ery. The aim of this study was to design a QA framework and test itfor the qMRI protocols of the IQ-EMBRACE trial to assess the vari-ation in qMRI values in the participating institutes.
Fig. 1. Overview of the QA framework illustrated for one institute. Calibration phantomsDCE. First, benchmark protocols, which are established protocols without acceleration,variations could be investigated. Next, the MR protocols used for the patients in the IQ-differences were assessed with benchmark protocols, any additional variations in qMRI vparameter settings or sequence choice.
115
Materials and methods
Design of quality assurance framework
Fig. 1 illustrates the design of the QA framework for validationof T2, DWI, and DCE–MRI based on measurements with calibrationphantoms with known values (qMRItrue). First, benchmark proto-cols, which are established protocols without acceleration, andtoo slow for clinical use, were tested. By comparing the measuredvalues to qMRItrue the effect of system variations were investi-gated, including differences in hardware, such as gradient systemsand coil-set-up, as well as vendor-specific implementations of thesequences. Next, the MR protocols used for the patients in the IQ-EMBRACE trial were optimized per institute (i.e. institutional pro-tocols). As system differences were assessed with benchmark pro-tocols, any additional variations in qMRI values measured with theinstitutional protocols should originate from differences in param-eter settings or sequence choice. The evaluation of DCE–MRI con-sisted of multiple steps, because direct evaluation ofpharmacokinetic parameters (e.g. Ktrans) with phantoms andbenchmark protocols is not practically feasible. Consistent withthe QIBA DCE–MRI profile, we therefore tested the performanceof T1 mapping necessary for the conversion of DCE–MRI signalintensities to contrast agent concentration values, signal stabilityto investigate magnet stability, and signal linearity to investigatethe accuracy of the conversion of signal intensity to concentrationvalues [15]. As a result, a benchmark protocol was not included inthe QA for DCE–MRI.
Data acquisition
In total 15 centers participated in the QA measurements withMR systems from three vendors (five 1.5 T systems and ten 3 T sys-tems, Table 1). The measurements were done between 2017 and2020.
The parameters of the benchmark protocols were specified indetail in Table 2. For T2 mapping, a non-accelerated multi-echospin-echo sequence was used. For DWI, the echo-planar imaging(EPI) sequence for phantom scans specified by QIBA was used[16]. For T1 mapping, as one of the validation steps for DCE–MRI,an inversion recovery acquisition was used as the benchmark.
For the institutional sequences more freedom in protocol set-tings was allowed. However, a few minimal requirements wereset, for example to ensure full tumor coverage (Table 3). Detailsof the institutional protocols are summarized in SupplementaryTables 1–4. All institutes used a multi-echo spin echo based
were used with known values (qMRItrue) for T2, T1, ADC, and concentration values ofwere tested. By comparing the measured values to qMRItrue the effect of systemEMBRACE trial were optimized per institute (i.e. institutional protocols). As systemalues measured with the institutional protocols should originate from differences in

Table 1Description of all systems.
Institute Code Field Strength Vendor Type
A 1.5 T Philips IngeniaB 1.5 T Philips IngeniaC 1.5 T Philips IngeniaD 1.5 T Siemens AeraE 1.5 T GE OptimaF 3 T Philips IngeniaG 3 T Philips IngeniaH 3 T Philips IngeniaI 3 T Philips IngeniaJ 3 T Siemens SkyraK 3 T Siemens SkyraL 3 T Siemens SkyraM 3 T Siemens VerioN 3 T GE DiscoveryO 3 T GE Signa
Phantom-based QA for multicenter quantitative MRI
sequence for T2 mapping, except for institute E and N where sep-arate T2-weighted images were acquired with different echo times.For DWI, all institutes used an EPI-based protocol. Maximum avail-able gradient amplitudes and slew rates were recommended toachieve the shortest echo time to minimize geometrical distor-tions. Five institutes (A, C, J, M, N) included more b-values thanb = 0, 200, and 1000 s/mm2 according to institutional preferences.For DCE–MRI, every institute used a variable flip angle approach forT1 mapping. The DCE–MRI sequence itself was a spoiled-gradientecho sequence with or without a Dixon technique for fat suppres-sion. Phase data from DCE–MRI was saved in ten institutes. B1maps were acquired in seven of the ten institutes with a 3 T sys-tem, which was based on the actual flip angle imaging method ordouble angle method [17,18].
We used three copies of the Eurospin II TO5 phantom (Diagnos-tic Sonar LTD, Livingston, Scotland) for T2 assessment. A set oftwelve gel samples was chosen with T2 values ranging between49 to 212 ms at 296 K and 3 T according to the manufacturer.For DWI, we used three copies of the Diffusion Phantom Model128 (High Precision Devices, Inc, Boulder, Colorado, USA) filledwith ice water to obtain a temperature of 273.15 K at the beginningof the measurements per phantom instructions. For DCE–MRI weused two phantoms. For the evaluation of T1 mapping, the Euro-spin II TO5 phantom was used with eleven samples of T1 valuesranging from 331 to 1615 ms (296 K, 3 T) according to the vendor.To assess signal stability and linearity, a series of ten tubes withvarying concentration of gadolinium-based (Gd) contrast agent(Dotarem, Guerbet, France) was created in a range of 0 to 10 mMin a solution of 0.045 mM manganese chloride (native T1 � 1.5 s,T2 � 0.2 s). The samples fitted in the holder of the Eurospin IITO5 phantom. If the phantoms were not available locally, arrange-ments were made to ship them around.
Table 2Details of benchmark protocols.
Parameter T2
Sequence type Multi-echo spin echoFOV (mm3) 250 � 250 � 4Voxel size (mm3) 2 � 2 � 4TR (ms) 2000TE (ms) Max TE = 200*TI (ms) n.a.
No. of averages 1b-Values (s/mm2) n.a.Acceleration factor no
* For Philips systems use minimal dTE that resulted in perfect (i.e. nontruncated) pul
116
The phantoms were positioned such that the samples werealigned with the main magnetic field. The DWI phantom was posi-tioned with the center tube at the isocenter of the scanner to min-imize the effect of gradient nonlinearities. The same receive coilswere used as will be used in the patient MRI examinations. Theinstitutional protocols were repeated three times within the sameexamination for assessment of short-term repeatability. For valida-tion of the DCE–MRI protocol, the institutional protocol wasscanned for the full five minutes to collect data on signal stabilityas well as signal linearity. If phase data could be saved in the pro-tocol, an additional experiment was performed in which the tubeswere scanned one by one for at least five dynamic scans at thesame location in the phantom to avoid field inhomogeneity effects[19]. Temperature was measured before and after each experimenteither from a tube filled with water placed next to the phantom forT2, T1, and DCE–MRI or by measuring the temperature of the icewater for DWI measurements.
Data analysis
Centralized data analysis was performed in institute I. Allacquired data were uploaded in DICOM format. The analysis wasdone for regions of interest (ROIs), which were selected manuallyin the center of each tube and in the center slice of the phantom.T2, ADC, T1, and Gd concentration values were estimated fromthe mean signal intensities of the ROIs. Fitting details are describedin Supplementary information. T2 and T1 values were corrected toa temperature of 296 K using the tables provided in the phantommanual. If a B1 map was available, T1 values and Gd concentrationvalues were derived both with and without correction of the flipangles.
Statistical analysis
Accuracy was assessed with Bland-Altman analysis calculatingthe bias and the limits of agreement for the average of the repeatedmeasurements per institute [20]. The true values were plotted onthe x-axis with the differences on the y-axis (DqMRI). Kendall’stau test was used to test whether the differences were proportionalto the magnitude of the true value [21]. If this was the case(p < 0.05), relative values were used to calculate bias by takingthe ratio of the measurement and the true value [20]. As the biasis calculated for all ROIs of one institute together, we also calcu-lated the percentage error (%error) for each ROI of each instituteto be comparable with previous literature [12,22,23]:
%error ¼ 100 � DqMRIj jreference
ð1Þ
To estimate the short-term repeatability, the percentagerepeatability coefficient (%RC) was estimated as 2.77 times thewithin-subject coefficient of variation (wCV) calculated from the
DWI T1 for DCE–MRI
Single-shot EPI Inversion recovery series220 � 220 � 100 250 � 250 � 41.72 � 1.72 � 4 2 � 2 � 410,000 8000Shortest Not specifiedn.a. 30, 50, 75, 100, 150, 200, 250, 300, 400,
500, 750, 1000, 1250, 1500, 2000, 40001 10, 500, 900, 2000 n.a.2 No
ses.
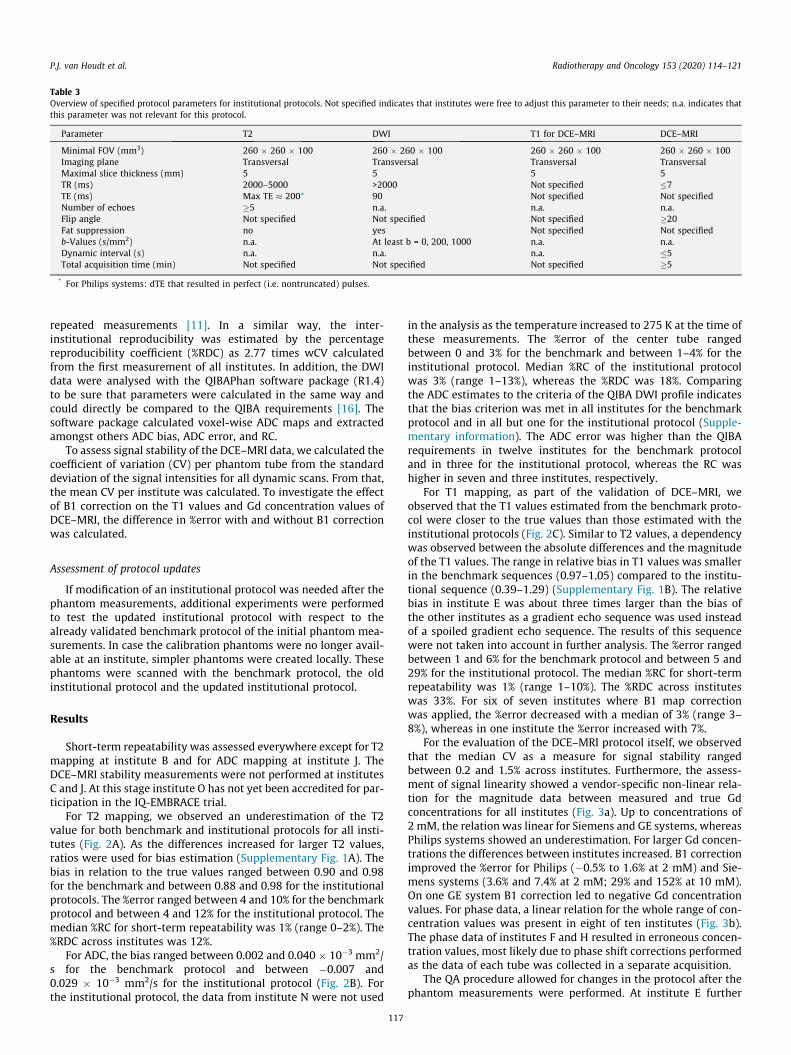
Table 3Overview of specified protocol parameters for institutional protocols. Not specified indicates that institutes were free to adjust this parameter to their needs; n.a. indicates thatthis parameter was not relevant for this protocol.
Parameter T2 DWI T1 for DCE–MRI DCE–MRI
Minimal FOV (mm3) 260 � 260 � 100 260 � 260 � 100 260 � 260 � 100 260 � 260 � 100Imaging plane Transversal Transversal Transversal TransversalMaximal slice thickness (mm) 5 5 5 5TR (ms) 2000–5000 >2000 Not specified �7TE (ms) Max TE � 200* 90 Not specified Not specifiedNumber of echoes �5 n.a. n.a. n.a.Flip angle Not specified Not specified Not specified �20Fat suppression no yes Not specified Not specifiedb-Values (s/mm2) n.a. At least b = 0, 200, 1000 n.a. n.a.Dynamic interval (s) n.a. n.a. n.a. �5Total acquisition time (min) Not specified Not specified Not specified �5
* For Philips systems: dTE that resulted in perfect (i.e. nontruncated) pulses.
P.J. van Houdt et al. Radiotherapy and Oncology 153 (2020) 114–121
repeated measurements [11]. In a similar way, the inter-institutional reproducibility was estimated by the percentagereproducibility coefficient (%RDC) as 2.77 times wCV calculatedfrom the first measurement of all institutes. In addition, the DWIdata were analysed with the QIBAPhan software package (R1.4)to be sure that parameters were calculated in the same way andcould directly be compared to the QIBA requirements [16]. Thesoftware package calculated voxel-wise ADC maps and extractedamongst others ADC bias, ADC error, and RC.
To assess signal stability of the DCE–MRI data, we calculated thecoefficient of variation (CV) per phantom tube from the standarddeviation of the signal intensities for all dynamic scans. From that,the mean CV per institute was calculated. To investigate the effectof B1 correction on the T1 values and Gd concentration values ofDCE–MRI, the difference in %error with and without B1 correctionwas calculated.
Assessment of protocol updates
If modification of an institutional protocol was needed after thephantom measurements, additional experiments were performedto test the updated institutional protocol with respect to thealready validated benchmark protocol of the initial phantom mea-surements. In case the calibration phantoms were no longer avail-able at an institute, simpler phantoms were created locally. Thesephantoms were scanned with the benchmark protocol, the oldinstitutional protocol and the updated institutional protocol.
Results
Short-term repeatability was assessed everywhere except for T2mapping at institute B and for ADC mapping at institute J. TheDCE–MRI stability measurements were not performed at institutesC and J. At this stage institute O has not yet been accredited for par-ticipation in the IQ-EMBRACE trial.
For T2 mapping, we observed an underestimation of the T2value for both benchmark and institutional protocols for all insti-tutes (Fig. 2A). As the differences increased for larger T2 values,ratios were used for bias estimation (Supplementary Fig. 1A). Thebias in relation to the true values ranged between 0.90 and 0.98for the benchmark and between 0.88 and 0.98 for the institutionalprotocols. The %error ranged between 4 and 10% for the benchmarkprotocol and between 4 and 12% for the institutional protocol. Themedian %RC for short-term repeatability was 1% (range 0–2%). The%RDC across institutes was 12%.
For ADC, the bias ranged between 0.002 and 0.040 � 10�3 mm2/s for the benchmark protocol and between �0.007 and0.029 � 10�3 mm2/s for the institutional protocol (Fig. 2B). Forthe institutional protocol, the data from institute N were not used
117
in the analysis as the temperature increased to 275 K at the time ofthese measurements. The %error of the center tube rangedbetween 0 and 3% for the benchmark and between 1–4% for theinstitutional protocol. Median %RC of the institutional protocolwas 3% (range 1–13%), whereas the %RDC was 18%. Comparingthe ADC estimates to the criteria of the QIBA DWI profile indicatesthat the bias criterion was met in all institutes for the benchmarkprotocol and in all but one for the institutional protocol (Supple-mentary information). The ADC error was higher than the QIBArequirements in twelve institutes for the benchmark protocoland in three for the institutional protocol, whereas the RC washigher in seven and three institutes, respectively.
For T1 mapping, as part of the validation of DCE–MRI, weobserved that the T1 values estimated from the benchmark proto-col were closer to the true values than those estimated with theinstitutional protocols (Fig. 2C). Similar to T2 values, a dependencywas observed between the absolute differences and the magnitudeof the T1 values. The range in relative bias in T1 values was smallerin the benchmark sequences (0.97–1.05) compared to the institu-tional sequence (0.39–1.29) (Supplementary Fig. 1B). The relativebias in institute E was about three times larger than the bias ofthe other institutes as a gradient echo sequence was used insteadof a spoiled gradient echo sequence. The results of this sequencewere not taken into account in further analysis. The %error rangedbetween 1 and 6% for the benchmark protocol and between 5 and29% for the institutional protocol. The median %RC for short-termrepeatability was 1% (range 1–10%). The %RDC across instituteswas 33%. For six of seven institutes where B1 map correctionwas applied, the %error decreased with a median of 3% (range 3–8%), whereas in one institute the %error increased with 7%.
For the evaluation of the DCE–MRI protocol itself, we observedthat the median CV as a measure for signal stability rangedbetween 0.2 and 1.5% across institutes. Furthermore, the assess-ment of signal linearity showed a vendor-specific non-linear rela-tion for the magnitude data between measured and true Gdconcentrations for all institutes (Fig. 3a). Up to concentrations of2 mM, the relation was linear for Siemens and GE systems, whereasPhilips systems showed an underestimation. For larger Gd concen-trations the differences between institutes increased. B1 correctionimproved the %error for Philips (�0.5% to 1.6% at 2 mM) and Sie-mens systems (3.6% and 7.4% at 2 mM; 29% and 152% at 10 mM).On one GE system B1 correction led to negative Gd concentrationvalues. For phase data, a linear relation for the whole range of con-centration values was present in eight of ten institutes (Fig. 3b).The phase data of institutes F and H resulted in erroneous concen-tration values, most likely due to phase shift corrections performedas the data of each tube was collected in a separate acquisition.
The QA procedure allowed for changes in the protocol after thephantom measurements were performed. At institute E further

Fig. 2. Summary of the results of the benchmark (left column) and institutional protocol (right column). Absolute differences are shown between the measured values andthe true values for T2 (A), ADC (B), and T1 (C). For the institutional T1 protocol, the data are shown without B1 correction. Error bars represent the standard deviation of therepeated measurements. The colors of the markers refer to different vendors, whereas the symbols refer to the field strength. The reason for the outlier results in theinstitutional T1 protocol (C) is that a gradient echo sequence was used and not a spoiled-gradient echo sequence. The protocol was modified later, which resulted in a lowerbias.
Phantom-based QA for multicenter quantitative MRI
118

Fig. 3. The measured concentration values with the DCE protocols versus the true concentration values of the phantom samples. (A) Shows the results for the magnitude partof the data with the insert showing a zoomed image between 0 and 2 mM. The results without B1 correction are shown. (B) Shows the results for the phase part of the data.The colors of the markers refer to different vendors, whereas the symbols refer to the field strength. The black solid line represents the identity line.
P.J. van Houdt et al. Radiotherapy and Oncology 153 (2020) 114–121
optimization of the institutional T1 mapping protocol after the QAmeasurements reduced the bias to 0.73 with respect to the bench-mark protocol. This was tested with a phantom consisting of four30 mL tubes filled with water and contrast agent (Gadovist, BayerAG, Germany) with estimated T1 values of 600, 1000, 1200, and1600 ms. At institute N where the temperature increased duringthe DWI measurements, the benchmark DWI protocol wasrepeated at 296 K as well. As the bias of the benchmark protocolat 273 K was acceptable, the ADC values of the institutional proto-col could be compared to the benchmark data at 275 K instead ofthe true values at 273 K showing a bias similar as the otherinstitutes.
Discussion
In this study, we designed a QA framework for qMRI studies inthe presence of a large variety of MR systems and institutional pro-tocols. We applied this framework to assess the performance of T2mapping, DWI, and DCE–MRI across fifteen institutes participatingin the IQ-EMBRACE trial. Despite the freedom to choose the imag-ing method (e.g. inversion recovery, look-locker, or variable flipangle method for T1 mapping), many institutes opted for the samebasic method. By including benchmark protocols in the QA frame-work, we enabled modification of the institutional protocols duringthe trial by comparing the updated protocol with the benchmarkprotocol.
For T2 mapping, we observed a consistent underestimation ofthe T2 values with the benchmark and institutional protocols com-pared to the values provided by the manufacturer, which could beexplained by the presence of stimulated echoes due to imperfectrefocusing pulses for example [24–26]. Interestingly, the bias and%error were similar between benchmark and institutional proto-cols suggesting that the larger variation in protocol settings thatwas present in the institutional protocols did not affect the accu-racy of the T2 values. Short-term repeatability values were similaras reported in previous studies [22,27]. The %RDC of 12% washigher than reported in a previous study [27] employing MR sys-tems from a single vendor using the same acquisition scheme. Toour knowledge, T2 mapping data in cervical cancer has not been
119
reported yet to get an indication whether the reproducibility willbe sufficient to distinguish non-responders and responders.
For ADC, the bias with both the benchmark and the institutionalprotocols satisfied the QIBA DWI criteria [16]. However, for thebenchmark protocol ADC error and RC exceeded the limits in mostinstitutes. An explanation for these findings could be that we usedthe coil set-up for scanning patients with cervical cancer instead ofthe head coil as recommended in the phantom instructions, whichcould result in a lower SNR. This is illustrated by the results of theinstitutional protocols where larger voxel sizes and lower maxi-mum b-values were used, resulting in more institutes passing theADC error and RC requirements. The %RDC reported in this studywas higher than reported by Malyarenko et al. for standardizedDWI protocols [12]. However, in their calculation only the centertube was taken into account, whereas we included all samples inthe %RDC calculation. Phantom positioning is most likely the mainexplanation for these differences. The center tube was always inthe iso-center of the MRI, but the phantom was rotated differentlymeaning that the position of the other tubes varied between insti-tutes. This results in extra variation explained by gradient nonlin-earities. When repeating our analysis for the center tube only, the %RDC was 3.1% which is close to the reproducibility they reportedfor using torso coils. Some previously reported differences in ADCvalues between responders and non-responders [28,29] weresmaller than the %RDC of 18% we found in this study, but larger dif-ferences have also been reported [30].
The results we found for both the benchmark and institutionalbaseline T1 mapping protocol are similar to those obtained in arecent multicenter phantom T1 study [23]. As the large uncertaintyin the institutional T1 mapping data will introduce extra uncer-tainty in the DCE–MRI analysis, the use of a fixed T1 value couldbe considered instead, like in prostate data for example [31]. Thestability of the DCE–MRI signal was considered good with a medianCV below 1.5% which will have negligible impact on the pharma-cokinetic parameters [32]. The results found for the estimated con-centration values with magnitude and phase are in line withpreviously reported results [33,34]. The vendor-specific relationbetween measured and true concentration values for magnitudevalues suggests that this is related to the vendor implementation

Phantom-based QA for multicenter quantitative MRI
of the spoiled gradient echo sequence such as RF spoiling [35], forexample. The large variations for higher concentration values indi-cate that arterial input functions derived frommagnitude data onlywill be inaccurate, especially for the peak height. Instead using thecombination of the magnitude and phase data, i.e. complex data,will result in more accurate arterial input functions [36,37]. How-ever, not all institutes were able to save the phase data due to scan-ner software limitations, consequently a population or referenceAIF will be used in the analysis of the patient data. In tumor tissue,usually lower concentrations of contrast agent are present (be-tween 0 and 1 mM [38,39]). However, even for these concentra-tions values we observed substantial variation across institutes,which will impact the accuracy of the pharmacokinetic parametersas the conversion from signal intensity to concentration value is anessential step in the analysis. Errors in concentration values willdirectly propagate to the Ktrans values estimated with the Toftsmodel. For example, a 50% underestimation of concentration valuewill result in a 50% underestimation of Ktrans. kep is less sensitive forthe variations in concentration values and might therefore, be amore reproducible parameter to be compared between institutes[40]. Several studies suggest that DCE–MRI is prognostic for cervi-cal cancer [3,41–43]. However, difference in methods of analyzingthe data make a direct comparison difficult and except for [44], noabsolute Ktrans values of responders and non-responders werereported.
While the results of the phantom measurements in this studyare specific for the qMRI protocols optimized for the IQ-EMBRACE trial, the QA framework can be applied generally. Forother tumor sites, qMRI protocols may need to be modified. Then,new phantom measurements are required to ensure consistentqMRI values. The results of the phantom measurements can beused for sample size calculations in clinical trial design [13]. Inaddition, as the reproducibility of T2 and ADC was good, an institu-tional bias is not to be expected in the patient data. As a result, thepatient data that will be acquired in the IQ-EMBRACE trial can beused to determine thresholds or build prediction models to sepa-rate between responders and non-responders. Furthermore, theresults of the phantom data for DCE–MRI and T1 mapping mightexplain an institutional bias in the patient data that will be col-lected and could potentially be used to apply institute-specific cor-rections to reduce the variations between institutes. In addition,the current data can be a starting point for the development of rec-ommendations for quantitative MR protocols for cervical cancer, inline with the recommendations of QIBA for DWI and DCE–MRI pro-tocols for brain, breast, prostate, liver, and head and neck [11]. Fora large part the protocols for cervix can be based on prostate pro-tocols. However, cervical tumors are larger than prostate tumorsand therefore larger field-of-views are required. This puts con-straints on other parameters to limit the acquisition time.
While the benchmark sequences would ideally be identical, inpractice this is challenging. Even if protocol parameters are speci-fied, this does not mean that the sequences are implemented iden-tically by different vendors. Differences in the qMRI values of thebenchmark protocols can be related to differences in sequenceimplementation as well as hardware differences, such as gradientsystems and coil set-up. However, despite these challenges, theqMRI values of the benchmark sequences were consistent andreproducible across institutes. As a certain degree of freedomwas allowed for the optimization of the institutional protocols,we could assess whether differences in qMRI values obtained withthese institutional protocols were related to differences in protocolparameters or mainly due to more general system differences.Additional sources of variation, like gradient nonlinearities forADC [12], were not considered in this study. For logistical reasonswe were not able to use the same phantom copy for all measure-ments, which may have introduced unnecessary variation.
120
Phantom measurements are only a part of the validation of qMRIprotocols. Aspects like SNR, image artifacts and day-to-day varia-tions in patients were not taken into account [10,45]. This needsto be investigated with healthy volunteers or in patient test–reteststudies.
In conclusion, to meet the challenge of multicenter MRI biomar-ker studies, we designed and tested a QA framework with calibra-tion phantoms to assess the variation in qMRI values. Theframework allows updates of institutional protocols during a run-ning trial by comparing themwith the benchmark protocols. Whileallowing some variability in scan protocols, consistent ADC and T2values were obtained. For DCE–MRI and T1 mapping with variableflip angle mapping this was more challenging. The results of thephantom measurements can be used for sample size calculationsand to apply corrections to the acquired patient data to furtherreduce the variation.
Declaration of Competing Interest
The authors declare the following financial interests/personalrelationships which may be considered as potential competinginterests: This work was funded by a grant from Varian MedicalSystems received by Kari Tanderup and Uulke van der Heide. Rele-vant financial activities outside the submitted work are reported forthe following authors: Uulke van der Heide receives research fund-ing from Philips Healthcare and Elekta AB. Remi Nout receivesresearch funding from Elekta AB, Varian Medical Systems, andAccuray. Cornelius van den Berg receives research funding fromPhilips Healthcare.
Acknowledgements
We thank the following people for their assistance with phan-tom measurements and/or protocol optimization: Robert Hudej,PhD (Dept. of Radiotherapy, Institute of Oncology Ljubljana),Michaela Daniel (Dept. of Radiation Oncology, Medical Universityof Vienna), Pascal A. Baltzer, MD (Dept. of Biomedical Imagingand Image-guided Therapy, Medical University of Vienna), SupriyaChopra, MD PhD (ACTREC, Tata Memorial Centre), Kelly McPhee,PhD and Warren Foltz, PhD (Radiation Medicine Program, PrincessMargaret Cancer Center) and Djordje Kovacevic (Oslo UniversityHospital). We thank Iris Walraven, PhD (Dept. of Radiation Oncol-ogy, the Netherlands Cancer Institute) for consultation on statisti-cal analysis. This work was funded by a research grant from VarianMedical Systems received by Kari Tanderup, PhD and Uulke vander Heide, PhD.
Appendix A. Supplementary data
Supplementary data to this article can be found online athttps://doi.org/10.1016/j.radonc.2020.09.013.
References
[1] Press RH, Shu HKG, Shim H, Mountz JM, Kurland BF, Wahl RL, et al. The use ofquantitative imaging in radiation oncology: A quantitative imaging network(QIN) perspective. Int J Radiat Oncol Biol Phys 2018;102:1219–35. https://doi.org/10.1016/j.ijrobp.2018.06.023.
[2] Hall WA, Paulson ES, van der Heide UA, Fuller CD, Raaymakers BW, LagendijkJJW, et al. The transformation of radiation oncology using real-time magneticresonance guidance: A review. Eur J Cancer 2019;122:42–52. https://doi.org/10.1016/j.ejca.2019.07.021.
[3] Halle C, Andersen E, Lando M, Aarnes E-K, Hasvold G, Holden M, et al. Hypoxia-induced gene expression in chemoradioresistant cervical cancer revealed bydynamic contrast-enhanced MRI. Cancer Res 2012;72:5285–95. https://doi.org/10.1158/0008-5472.CAN-12-1085.
[4] Daniel M, Andrzejewski P, Sturdza A, Majercakova K, Baltzer P, Pinker K, et al.Impact of hybrid PET/MR technology on multiparametric imaging and

P.J. van Houdt et al. Radiotherapy and Oncology 153 (2020) 114–121
treatment response assessment of cervix cancer. Radiother Oncol2017;125:420–5. https://doi.org/10.1016/j.radonc.2017.10.036.
[5] Akkus Yildirim B, Onal C, Erbay G, Cem Guler O, Karadeli E, Reyhan M, et al.Prognostic values of ADCmean and SUVmax of the primary tumour in cervicalcancer patients treated with definitive chemoradiotherapy. J Obstet Gynaecol(Lahore) 2018;39:224–30. https://doi.org/10.1080/01443615.2018.1492528.
[6] Schurink NW, Lambregts DMJ, Beets-Tan RGH. Diffusion-weighted imaging inrectal cancer: current applications and future perspectives. Br J Radiol2019;92:20180655. https://doi.org/10.1259/bjr.20180655.
[7] Noij DP, de Jong MC, Mulders LGM, Marcus JT, de Bree R, Lavini C, et al.Contrast-enhanced perfusion magnetic resonance imaging for head and necksquamous cell carcinoma: A systematic review. Oral Oncol 2015;51:124–38.https://doi.org/10.1016/j.oraloncology.2014.10.016.
[8] O’Connor JPB, Aboagy EO, Adams JE, Aerts HJWL, Barrington SF, Beer AJ, et al.Imaging biomarker roadmap for cancer studies. Nat Rev Clin Oncol2016;14:169–86. https://doi.org/10.1038/nrclinonc.2016.162.
[9] DeSouza NM, Winfield JM, Waterton JC, Weller A, Papoutsaki MV, Doran SJ,et al. Implementing diffusion-weighted MRI for body imaging in prospectivemulticentre trials: current considerations and future perspectives. Eur Radiol2018;28:1118–31. https://doi.org/10.1007/s00330-017-4972-z.
[10] Jafar MM. Diffusion-weighted magnetic resonance imaging in cancer:Reported apparent diffusion coefficients, in-vitro and in-vivo reproducibility.World J Radiol 2016;8:21–49. https://doi.org/10.4329/wjr.v8.i1.21.
[11] Shukla-Dave A, Obuchowski NA, Chenevert TL, Jambawalikar S, Schwartz LH,Malyarenko D, et al. Quantitative imaging biomarkers alliance (QIBA)recommendations for improved precision of DWI and DCE-MRI derivedbiomarkers in multicenter oncology trials. J Magn Reson Imaging 2019;49:e101–21. https://doi.org/10.1002/jmri.26518.
[12] Malyarenko D, Galbán CJ, Londy FJ, Meyer CR, Johnson TD, Rehemtulla A, et al.Multi-system repeatability and reproducibility of apparent diffusioncoefficient measurement using an ice-water phantom. J Magn Reson Imaging2013;37:1238–46. https://doi.org/10.1002/jmri.23825.
[13] Obuchowski NA, Mozley PD, Matthews D, Buckler A, Bullen J, Jackson E.Statistical considerations for planning clinical trials with quantitative imagingbiomarkers. J Natl Cancer Inst 2019;111:19–26. https://doi.org/10.1093/jnci/djy194.
[14] Pötter R, Tanderup K, Kirisits C, de Leeuw A, Kirchheiner K, Nout R, et al. TheEMBRACE II study: The outcome and prospect of two decades of evolutionwithin the GEC-ESTRO GYN working group and the EMBRACE studies. ClinTransl Radiat Oncol 2018;9:48–60. https://doi.org/10.1016/j.ctro.2018.01.001.
[15] DCE MRI Biomarker Committee. Profile: DCE MRI Quantification, QuantitativeImaging Biomarkers Alliance. Version 1.6. QIBA, Dec 13, 2011. Available from:http://qibawiki.rsna.org/index.php/Profiles.
[16] DWI MR Biomarker Committee. Diffusion-Weighted Magnetic ResonanceImaging Profile, Quantitative Imaging Biomarkers Alliance. Version 2019-Feb-05. QIBA, Feb 05, 2019. Available from: http://qibawiki.rsna.org/index.php/Profiles.
[17] Stollberger R, Wach P. Imaging of the active B1 field in vivo. Magn Reson Med1996;35:246–51. https://doi.org/10.1002/mrm.1910350217.
[18] Yarnykh VL. Actual flip-angle imaging in the pulsed steady state: A method forrapid three-dimensional mapping of the transmitted radiofrequency field.Magn Reson Med 2007;57:192–200. https://doi.org/10.1002/mrm.21120.
[19] Akbudak E, Norberg RE, Conturo TE. Contrast-agent phase effects: Anexperimental system for analysis of susceptibility, concentration, and bolusinput function kinetics. Magn Reson Med 1997;38:990–1002. https://doi.org/10.1002/mrm.1910380619.
[20] Bland JM, Altman DG. Measuring agreement in method comparison studies.Stat Methods Med Res 1999;8:135–60. https://doi.org/10.1191/096228099673819272.
[21] Bland JM, Altman DG. Statistics notes: Measurement error proportional to themean. BMJ 1996;313:106. https://doi.org/10.1136/bmj.313.7049.106.
[22] Kooreman ES, van Houdt PJ, Nowee ME, van Pelt VWJ, Tijssen RHN, Paulson ES,et al. Feasibility and accuracy of quantitative imaging on a 1.5 T MR-linearaccelerator. Radiother Oncol 2019;133:156–62. https://doi.org/10.1016/j.radonc.2019.01.011.
[23] Bane O, Hectors SJ, Wagner M, Arlinghaus LL, Aryal MP, Cao Y, et al. Accuracy,repeatability, and interplatform reproducibility of T1 quantification methodsused for DCE-MRI: Results from a multicenter phantom study. Magn ResonMed 2018;79:2564–75. https://doi.org/10.1002/mrm.26903.
[24] Liney GP, Knowles AJ, Manton DJ, Turnbull LW, Blackband SJ, Horsman A.Comparison of conventional single echo and multi-echo sequences with a fastspin-echo sequence for quantitative T2 mapping: Application to the prostate. JMagn Reson Imaging 1996;6:603–7. https://doi.org/10.1002/jmri.1880060408.
[25] Poon CS, Henkelman RM. Practical T2 quantitation for clinical applications. JMagn Reson Imaging 1992;2:541–53. https://doi.org/10.1002/jmri.1880020512.
[26] McPhee KC, Wilman AH. Limitations of skipping echoes for exponential T 2fitting. J Magn Reson Imaging 2018;48:1432–40. https://doi.org/10.1002/jmri.26052.
121
[27] van Houdt PJ, Agarwal HK, van Buuren LD, Heijmink SWTPJ, Haack S, van derPoel HG, et al. Performance of a fast and high-resolution multi-echo spin-echosequence for prostate T2 mapping across multiple systems. Magn Reson Med2018;79:1586–94. https://doi.org/10.1002/mrm.26816.
[28] Erbay G, Onal C, Karadeli E, Guler OC, Arica S, Koc Z. Predicting tumorrecurrence in patients with cervical carcinoma treated with definitivechemoradiotherapy: Value of quantitative histogram analysis on diffusion-weighted MR images. Acta Radiol 2017;58:481–8. https://doi.org/10.1177/0284185116656492.
[29] Meng J, Zhu L, Zhu L, Xie L, Wang H, Song L, et al. Whole-lesion ADC histogramand texture analysis in predicting recurrence of cervical cancer treated withCCRT. Oncotarget 2017;8:92442–53. https://doi.org/10.18632/oncotarget.21374.
[30] Zhao B, Cao K, Li XT, Zhu HT, Sun YS. Whole lesion histogram analysis ofapparent diffusion coefficients on MRI predicts disease-free survival in locallyadvanced squamous cell cervical cancer after radical chemo-radiotherapy.BMC Cancer 2019;19:1–7. https://doi.org/10.1186/s12885-019-6344-3.
[31] Daniel M, Polanec SH, Wengert G, Clauser P, Pinker K, Helbich TH, et al. Intra-and inter-observer variability in dependence of T1-time correction forcommon dynamic contrast enhanced MRI parameters in prostate cancerpatients. Eur J Radiol 2019;116:27–33. https://doi.org/10.1016/j.ejrad.2019.04.015.
[32] Garpebring A, Brynolfsson P, Yu J, Wirestam R, Johansson A, Asklund T, et al.Uncertainty estimation in dynamic contrast-enhanced MRI. Magn Reson Med2013;69:992–1002. https://doi.org/10.1002/mrm.24328.
[33] Foltz W, Driscoll B, Lee SL, Nayak K, Nallapareddy N, Fatemi A, et al. Phantomvalidation of DCE-MRI magnitude and phase-based vascular input functionmeasurements. Tomography 2019;5:77–89. https://doi.org/10.18383/j.tom.2019.00001.
[34] Korporaal JG, van den Berg CAT, van Osch MJP, Groenendaal G, van Vulpen M,van der Heide UA. Phase-based arterial input function measurements in thefemoral arteries for quantification of dynamic contrast-enhanced (DCE) MRIand comparison with DCE-CT. Magn Reson Med 2011;66:1267–74. https://doi.org/10.1002/mrm.22905.
[35] Yarnykh VL. Optimal radiofrequency and gradient spoiling for improvedaccuracy of T1 and B1 measurements using fast steady-state techniques. MagnReson Med 2010;63:1610–26. https://doi.org/10.1002/mrm.22394.
[36] Simonis FFJ, Sbrizzi A, Beld E, Lagendijk JJW, van den Berg CAT. Improving thearterial input function in dynamic contrast enhanced MRI by fitting the signalin the complex plane. Magn Reson Med 2016;76:1236–45. https://doi.org/10.1002/mrm.26023.
[37] Klawer EME, van Houdt PJ, Simonis FFJ, van den Berg CAT, Pos FJ, HeijminkSWTPJ, et al. Improved repeatability of dynamic contrast-enhanced MRI usingthe complex MRI signal to derive arterial input functions: a test-retest study inprostate cancer patients. Magn Reson Med 2019;81:3358–69. https://doi.org/10.1002/mrm.27646.
[38] Donaldson SB, West CML, Davidson SE, Carrington BM, Hutchison G, Jones AP,et al. A comparison of tracer kinetic models for T1-weighted dynamic contrast-enhanced MRI: application in carcinoma of the cervix. Magn Reson Med2010;63:691–700. https://doi.org/10.1002/mrm.22217.
[39] Kallehauge JF, Sourbron S, Irving B, Tanderup K, Schnabel JA, Chappell MA.Comparison of linear and nonlinear implementation of the compartmentaltissue uptake model for dynamic contrast-enhanced MRI. Magn Reson Med2017;77:2414–23. https://doi.org/10.1002/mrm.26324.
[40] Li X, Cai Y, Moloney B, Chen Y, Huang W, Woods M, et al. Relative sensitivitiesof DCE-MRI pharmacokinetic parameters to arterial input function (AIF)scaling. J Magn Reson 2016;269:104–12. https://doi.org/10.1016/j.jmr.2016.05.018.
[41] Dickie BR, Rose CJ, Kershaw LE, Withey SB, Carrington BM, Davidson SE, et al.The prognostic value of dynamic contrast-enhanced MRI contrast agenttransfer constant Ktrans in cervical cancer is explained by plasma flowrather than vessel permeability. Br J Cancer 2017;116:1436–43. https://doi.org/10.1038/bjc.2017.121.
[42] Andersen EKF, Hole KH, Lund KV, Sundfør K, Kristensen GB, Lyng H, et al.Pharmacokinetic parameters derived from dynamic contrast enhanced MRI ofcervical cancers predict chemoradiotherapy outcome. Radiother Oncol2013;107:117–22. https://doi.org/10.1016/j.radonc.2012.11.007.
[43] Lund KV, Simonsen TG, Kristensen GB, Rofstad EK. DCE-MRI of locally-advanced carcinoma of the uterine cervix: Tofts analysis versus non-model-based analyses. Radiat Oncol 2020;15:79. https://doi.org/10.1186/s13014-020-01526-2.
[44] Zhang Z, Wang Z, Zhao R. Dynamic contrast-enhanced magnetic resonanceimaging of advanced cervical carcinoma: the advantage of perfusionparameters from the peripheral region in predicting the early response toradiotherapy. Int J Gynecol Cancer 2018;28:1342–9. https://doi.org/10.1097/IGC.0000000000001308.
[45] Winfield JM, Collins DJ, Priest AN, Quest RA, Glover A, Hunter S, et al. Aframework for optimization of diffusion-weighted MRI protocols for largefield-of-view abdominal-pelvic imaging in multicenter studies. Med Phys2016;43:95–110. https://doi.org/10.1118/1.4937789.