Reference values and sex differences in absolute and relative ...
11
RESEARCH ARTICLE Open Access Reference values and sex differences in absolute and relative kidney size. A Swiss autopsy study Sabrina Addidou Kalucki 1 , Christelle Lardi 2 , Jonas Garessus 1 , Alain Kfoury 1 , Silke Grabherr 2,3 , Michel Burnier 1 and Menno Pruijm 1* Abstract Background: Men have larger kidneys than women, but it is unclear whether gender remains an independent predictor of kidney size (expressed as weight or length) after correction for body size. We analysed autopsy data to assess whether relative renal length and weight (e.g. corrected for body weight, height or body surface area (BSA)) are also larger in men. Assuming that kidney size is associated with nephron number, opposite findings could partly explain why women are less prone to the development and progression of chronic kidney disease than men. Methods: All forensic autopsies performed between 2009 and 2015 at the local university hospital of Geneva in individuals of European descent aged ≥18 years without a known history of diabetes and/or kidney disease were examined. Individuals with putrefied or severely injured bodies were excluded. Relative renal weight and length were respectively defined as renal weight divided by body weight or BSA and renal length divided by body height or BSA. Results: A total of 635 autopsies (68.7% men) were included in the analysis. Left kidneys were on average 8 g heavier and 2 mm longer than right kidneys (both: p < 0.05). Absolute renal weight (165 ± 40 vs 122 ± 29 g) and length (12.0 ± 1.3 vs 11.4 ± 1.1 cm) were higher in men. Relative renal weight was also higher in men, but relative renal length was larger in women. In multivariable regression analysis, body height, body weight, the degree of blood congestion or depletion at autopsy and age were determinants of renal weight, whereas arterial hypertension and smoking were not. Percentile curves of renal weight and length according to sex and body height were constructed. Conclusion: Absolute and relative renal weights were both smaller in women. This is in line with recent studies stating that nephron numbers are also lower in women. Relative renal length was longer in women, suggesting that female kidneys have a more elongated shape. In comparison with older autopsy studies, renal weight appears to be stable over time. Keywords: Nephron mass, Autopsy, Gender, Sex, Chronic kidney disease, Reference values © The Author(s). 2020 Open Access This article is licensed under a Creative Commons Attribution 4.0 International License, which permits use, sharing, adaptation, distribution and reproduction in any medium or format, as long as you give appropriate credit to the original author(s) and the source, provide a link to the Creative Commons licence, and indicate if changes were made. The images or other third party material in this article are included in the article's Creative Commons licence, unless indicated otherwise in a credit line to the material. If material is not included in the article's Creative Commons licence and your intended use is not permitted by statutory regulation or exceeds the permitted use, you will need to obtain permission directly from the copyright holder. To view a copy of this licence, visit http://creativecommons.org/licenses/by/4.0/. The Creative Commons Public Domain Dedication waiver (http://creativecommons.org/publicdomain/zero/1.0/) applies to the data made available in this article, unless otherwise stated in a credit line to the data. * Correspondence: [email protected] 1 Service of Nephrology and Hypertension, Lausanne University Hospital and University of Lausanne, Rue du Bugnon 17, 1011 Lausanne, Switzerland Full list of author information is available at the end of the article Kalucki et al. BMC Nephrology (2020) 21:289 https://doi.org/10.1186/s12882-020-01946-y
-
Upload
khangminh22 -
Category
Documents
-
view
4 -
download
0
Transcript of Reference values and sex differences in absolute and relative ...

RESEARCH ARTICLE Open Access
Reference values and sex differences inabsolute and relative kidney size. A Swissautopsy studySabrina Addidou Kalucki1, Christelle Lardi2, Jonas Garessus1, Alain Kfoury1, Silke Grabherr2,3, Michel Burnier1 andMenno Pruijm1*
Abstract
Background: Men have larger kidneys than women, but it is unclear whether gender remains an independentpredictor of kidney size (expressed as weight or length) after correction for body size. We analysed autopsy data toassess whether relative renal length and weight (e.g. corrected for body weight, height or body surface area (BSA))are also larger in men. Assuming that kidney size is associated with nephron number, opposite findings could partlyexplain why women are less prone to the development and progression of chronic kidney disease than men.
Methods: All forensic autopsies performed between 2009 and 2015 at the local university hospital of Geneva inindividuals of European descent aged ≥18 years without a known history of diabetes and/or kidney disease wereexamined. Individuals with putrefied or severely injured bodies were excluded. Relative renal weight and lengthwere respectively defined as renal weight divided by body weight or BSA and renal length divided by body heightor BSA.
Results: A total of 635 autopsies (68.7% men) were included in the analysis. Left kidneys were on average 8 gheavier and 2 mm longer than right kidneys (both: p < 0.05). Absolute renal weight (165 ± 40 vs 122 ± 29 g) andlength (12.0 ± 1.3 vs 11.4 ± 1.1 cm) were higher in men. Relative renal weight was also higher in men, but relativerenal length was larger in women. In multivariable regression analysis, body height, body weight, the degree ofblood congestion or depletion at autopsy and age were determinants of renal weight, whereas arterialhypertension and smoking were not. Percentile curves of renal weight and length according to sex and bodyheight were constructed.
Conclusion: Absolute and relative renal weights were both smaller in women. This is in line with recent studiesstating that nephron numbers are also lower in women. Relative renal length was longer in women, suggestingthat female kidneys have a more elongated shape. In comparison with older autopsy studies, renal weight appearsto be stable over time.
Keywords: Nephron mass, Autopsy, Gender, Sex, Chronic kidney disease, Reference values
© The Author(s). 2020 Open Access This article is licensed under a Creative Commons Attribution 4.0 International License,which permits use, sharing, adaptation, distribution and reproduction in any medium or format, as long as you giveappropriate credit to the original author(s) and the source, provide a link to the Creative Commons licence, and indicate ifchanges were made. The images or other third party material in this article are included in the article's Creative Commonslicence, unless indicated otherwise in a credit line to the material. If material is not included in the article's Creative Commonslicence and your intended use is not permitted by statutory regulation or exceeds the permitted use, you will need to obtainpermission directly from the copyright holder. To view a copy of this licence, visit http://creativecommons.org/licenses/by/4.0/.The Creative Commons Public Domain Dedication waiver (http://creativecommons.org/publicdomain/zero/1.0/) applies to thedata made available in this article, unless otherwise stated in a credit line to the data.
* Correspondence: [email protected] of Nephrology and Hypertension, Lausanne University Hospital andUniversity of Lausanne, Rue du Bugnon 17, 1011 Lausanne, SwitzerlandFull list of author information is available at the end of the article
Kalucki et al. BMC Nephrology (2020) 21:289 https://doi.org/10.1186/s12882-020-01946-y

BackgroundChronic kidney disease (CKD) is a fast growing globalpublic health problem affecting an estimated ~ 9–16% ofthe world population and ~ 10% in Switzerland [1]. Theprevalence of arterial hypertension (AHT), by many con-sidered as a disease of renal origin, is even higher around30–45% [2]. There is an ongoing debate on the questionwhether women are less prone to develop and progressCKD than men. In this context, many (but not all) stud-ies have reported a higher prevalence of CKD in men,especially before the age of 60 [3]. In a recent worldwidesurvey, the age-standardized prevalence of arterial hyper-tension in adults was also higher in men: 24% versus20% in women [4].In the general population, the decline of renal function
-generally expressed as (estimated) glomerular filtrationrate ((e)GFR)- appears to start earlier and is faster inhealthy men as compared to women [5, 6]. Moreover,cohorts of CKD patients have shown that men withCKD progress faster to end stage renal disease (ESRD)than women [7], suggesting that intrinsic renal differ-ences exist between men and women.This debate is hampered by a lack of insight in the
mechanisms underlying the presumed protective effectof gender. Experimental models suggest a protective ef-fect of estrogens, but data in human remain controver-sial [3, 8]. A low nephron number (for example due tolow birth weight) leads, according to the Brenner hy-pothesis, to a compensatory glomerular hypertrophy andhyperfiltration in the remaining functional glomeruli,and ultimately to glomerular sclerosis, hypertension andprogressive renal failure [9]. As kidney size (weight orlength) probably correlates with nephron number [10,11], one may wonder if kidney size is larger in womenthan men, which would offer them protection against orduring kidney disease.It is well known that imaging studies performed in
humans have merely reported the opposite, namely thatkidney size is larger in men [12].However, body size, expressed as weight and length, is
an important factor to consider when analyzing sex dif-ferences in kidney size. In this context, relative kidneysize (corrected for body weight or body surface area(BSA)) may offer more accurate information than abso-lute kidney size, and tell us if kidney size remains largerin men once corrected for body size. Only few reportshave published data on relative kidney size or integratedbody size in their analysis [12–14]. Besides, most studiesused radiological imaging techniques to measure kidneydimensions instead of directly measuring renal dimen-sions, as is only possible at autopsy or kidney donation.One of the largest autopsy study to date reported ahigher absolute renal weight and length in men, yet rela-tive renal weight and length were not reported [15]. This
study also did not integrate the degree of blood deple-tion. This parameter is clinically assessed by the patholo-gist, and provides clues to the underlying cause of death.For example, signs of blood depletion may be observedfollowing deaths due to stab wounds, whereas renal sta-sis/congestion can be observed in case of acute intoxica-tion (typically opioid intoxication) [16, 17]. The degreeof blood depletion is also an important parameter whenassessing kidney dimensions, as circulating and renalblood volume may theoretically influence renal weight.The above cited autopsy study was performed in 2001,
and based on data collected between 1987 and 1991. Asthe average body height and weight of the populationare increasing, at least in the Occidental world [18], thereported reference values of kidney size and weight maybe less accurate nowadays. For these reasons, recent aut-opsy data on sex-differences in absolute and relative sizeof kidneys would be welcome.The main objective of this autopsy study was to assess
whether there are sex-differences in absolute and relativekidney size in a modern Western population. We hy-pothesized that absolute kidney size (expressed as weightand length) would be larger in men, but that relativekidney size (corrected for body weight or BSA) wouldnot differ. If in contrast relative kidney size appeared lar-ger in women, this could partly explain why they aremore protected against the development and progressionof CKD than men. A second aim was to update refer-ence values of renal weight and length by providing sex-specific centile curves.
MethodsStudy populationThis retrospective study was based on the medico-legalautopsies ordered by the Geneva authorities between2009 and 2015, preserved in the archives of the Univer-sity Center of Legal Medicine of Geneva and Lausanne(CURML).Autopsies performed in adults of European descent
(Caucasians) aged 18 and above whose deaths were sud-den, unexpected or violent, or for which the cause ofdeath was not considered as natural by the attendingphysician could be included in the analysis. Subjects whohad known kidney disease or who suffered from condi-tions known to possibly affect kidney function (diabetestype 1 and 2) were excluded. Subjects were also excludedif the autopsy revealed unexpected kidney diseases such aspolycystic disease, renal agenesis, glomerulonephritis orinterstitial nephritis. Other exclusion criteria were: non-European descent, moderate to severe putrefaction, post-mortem interval more than 72 h between death / deathdiscovery and autopsy, renal trauma and/or any conditioncapable of affecting the subject’s weight or height (e.g.
Kalucki et al. BMC Nephrology (2020) 21:289 Page 2 of 11

body strongly mutilated by severe trauma, burned bodyand/or amputated body parts).Subjects with missing information on renal weight
were also excluded.
Data collectedThe following clinical data were collected: sex, age, causeof death, body weight and height, and presence of car-diovascular comorbidities (hypertension, myocardial in-farction). Hypertension status was determined based onmedical history and medication intake by the deceased.Smoking status, alcohol or drug abuse (history of orpositive drug screening that includes cocaine, cannabis,morphine and other opiates) were also recorded. Toxico-logical screening was performed on clinical indication, atthe discretion of the forensic specialist.All subjects were categorized according to the pres-
ence of blood congestion or blood depletion. Three cat-egories of congestion status were defined: congestedstatus, normal amount of blood, or depleted status, atthe discretion of the pathologist.Autopsies were performed by different pathologists,
including one of the authors, following the same tech-niques and protocol. At autopsy, the following macro-scopic data were collected: weight and length of the leftand the right kidney and heart weight. The weight ofeach kidney appears in all autopsy reports, according tothe local protocol, whereas renal dimensions (height,width and thickness) were only measured in autopsiesperformed before 2011. All organ measurements wereconducted using the same scale (Mettler ToledoSB16001), after removal of the renal capsule and perire-nal fat. Measurements of renal length were carried outusing a metric ruler (cm). Body height was measuredfrom head to sole with a metric ruler while the corpsewas lying on the autopsy table. The presence of renalcysts, renal scars and atherosclerosis (ATS) of the renalarteries was also registered.
Statistical analysisAll variables were expressed as mean, median (min-max)or percentage, as appropriate. The Shapiro–Wilk test wasused to assess whether data were normally distributed.We defined the relative renal weight and the relative
renal length in two ways. The relative renal weight wasfirstly computed as the ratio between renal weight andbody weight and secondly by dividing renal weight byBSA. The BSA was computed according to the DuBoisformula [19].In the same way, the relative renal length was defined
as the ratio between renal height and body height andby dividing renal height by BSA. The renal measureswere compared with the Student’s t-test or Wilcoxon-
Mann-Whitney test, according to the distribution of thevariables.Multiple linear regression analyses were applied to de-
scribe the relation between renal weight or length anddifferent pre-defined independent parameters (sex, age,body height, body weight, smoking, known arterialhypertension and the degree of renal blood congestion).In case the conditions of linear regression were not satis-fied, a log transformation was performed. The modelwith the smallest Akaike information criterion (AIC)and the best R2 value was kept in the final analysis. Thedirection of the relation between each independent vari-able and the response variable was expressed as the re-gression coefficient β and its 95% confidence interval.All analyses were performed using R (version 3.5.2).The reference centile curves according to the gender
and the renal laterality were defined by fitting a general-ized additive model for location scale and shape (GAMLSS). The different regression models were tested with di-verse distributions and cubic and penalized B-splines.The best model for each centile curve was selected basedon the AICs. The one with the lowest AIC was chosenfor each curve. The final models used penalized B-splines (P-splines) to smooth the curves. These analyseswere performed with the GAMLSS package from R [20].
ResultsStudy populationThe CURML in Geneva performed 1′166 forensic aut-opsies during the period 2009–2015. In total, 531 sub-jects were excluded from this study, leaving 635 subjectsfor the final analysis. The principal cause of exclusionwas the presence of moderate to severe cadaverous alter-ation, responsible for 133 exclusions, followed by non-European descent (96 individuals). Fourteen cases withone or more missing kidneys were also excluded. Onlyone of these had unilateral agenesis (prevalence of 0.1%);10 persons were neurologically deceased donors whounderwent bilateral kidney donation before the autopsy(see Supplementary Information, Table S1 for details).Toxicological screening was performed in 361 of the
included subjects (57.0%) and was positive in 83 persons(13.1%). The characteristics of all included subjects areshown in Table 1. The majority of subjects were men(68.7%). Men were on average 6 years younger thanwomen. Almost half of the kidneys presented signs ofcongestions (45.5%) as compared to those with normalrenal blood volume (38.9%) or a depletion status(15.6%).
Absolute and relative renal measurementsKidney dimensions are summarized in Table 2 A-B. Inboth men and women, the left kidney was significantlyheavier than the right kidney. This was also true for the
Kalucki et al. BMC Nephrology (2020) 21:289 Page 3 of 11

relative renal weight. In contrast, there was no differencein absolute and relative renal length between the rightand left kidneys.Absolute renal weight and length were higher in men
for both kidneys. Relative weight was also higher in men(Fig. 1), but relative renal length was larger in women(Table 2B).Important differences in renal weight were observed
according to the congestion status. Depleted kidneysweighed on average 25.8 g (36–15.6 g) less than con-gested ones (p < 0.001). Kidneys with normal bloodamount weighed 14.8 g (22.6–7.0 g) less than congestedones (p < 0.001).
Determinants of renal weightWe applied a multiple linear regression to assess the as-sociations between mean renal weight and the prede-fined variables sex, age, body height, body weight,smoking habit, known hypertension and renal blood de-gree. A log-transformation of renal weight was
performed to fulfill the conditions of the regression. Asshown in Table 3, a positive association was found be-tween renal weight and body weight, body height andthe degree of renal congestion. The analysis also demon-strated a negative association between renal weight, sexand the age at death. There was a difference betweenmen and women: in men, renal weight slightly increasedtill the age of 52.5 years, and decreased sharply hereafter.In women, the relationship was flatter and decreasedgradually after the age of 50 years (see Fig. 2). Renalweight was not associated with smoking habit or knownarterial hypertension. The model included two interac-tions between the explanatory variables, respectively be-tween body height and body weight (P < 0.011) and bodyheight and age (P < 0.001).
Determinants of renal lengthA multiple regression analysis including the same ex-planatory variables as above was performed to assesswhich factors were associated with renal length in the
Table 1 Clinical characteristics of the population. Data are expressed as mean (standard deviation), median (25-75th percentile) orpercentage, as appropriate
Participants (n = 635) Men (n = 436) Women (n = 199)
Age of death, years 53.1 (17.6) 51.2 (17.0) 57.2 (19.0)
Body Height, cm 173.0 (9.9) 177.2 (7.9) 163.8 (7.3)
Body Weight, kg 75 (62–87) 80 (71–90) 61 (54–72)
Smoking, number (%) 162 (25.5) 125 (28.7) 37 (18.6)
BMI, kg/m2 24.7 (21.6–28.3) 25.4 (22.6–28.7) 23.1 (20.3–26.8)
Body surface, m2 1.9 (1.7–2.1) 2.0 (1.8–2.1) 1.7 (1.6–1.8)
Blood degree, number (%)
Congested 289 (45.5) 217 (49.8) 72 (36.2)
No particularity 247 (38.9) 153 (35.1) 94 (47.2)
Depleted 99 (15.6) 66 (15.1) 33 (16.6)
Cause of death, number (%)
Intoxication 103 (16.2) 60 (13.8) 43 (21.6)
Asphyxiation 83 (13.1) 62 (14.2) 21 (10.5)
Drowning 28 (4.4) 26 (5.1) 14 (7.0)
Cold weapon 15 (2.4) 15 (3.0) 3 (1.5)
Polytrauma 75 (11.8) 49 (11.2) 26 (13.1)
Gunshot 48 (7.6) 42 (9.6) 6 (3.0)
Other unnatural cause 81 (12.8) 57 (13.1) 24 (12.1)
Cardiac 89 (14.0) 72 (16.5) 17 (5.4)
Lung 21 (3.3) 12 (2.8) 9 (4.5)
Vascular 19 (3.0) 13 (3.0) 6 (3.0)
Other diverse natural cause 38 (6.0) 22 (5.3) 15 (7.5)
Natural but unknown origin 29 (4.6) 18 (4.1) 11 (5.5)
No information 6 (0.9) 2 (0.5) 4 (2.0)
Arterial Hypertension 88 (13.9) 61 (14.0) 27 (13.6)
Kalucki et al. BMC Nephrology (2020) 21:289 Page 4 of 11

142 subjects with information on this parameter. Renallength was log-transformed. Renal length was not associ-ated with the degree of blood congestion, smoking habitor the age of death. Significant positive associations werefound with body weight, body height and sex for bothkidneys (Table 4). Two significant interactions wereidentified: between body weight and height (p = 0.001)and between sex and body height (p = 0.01).
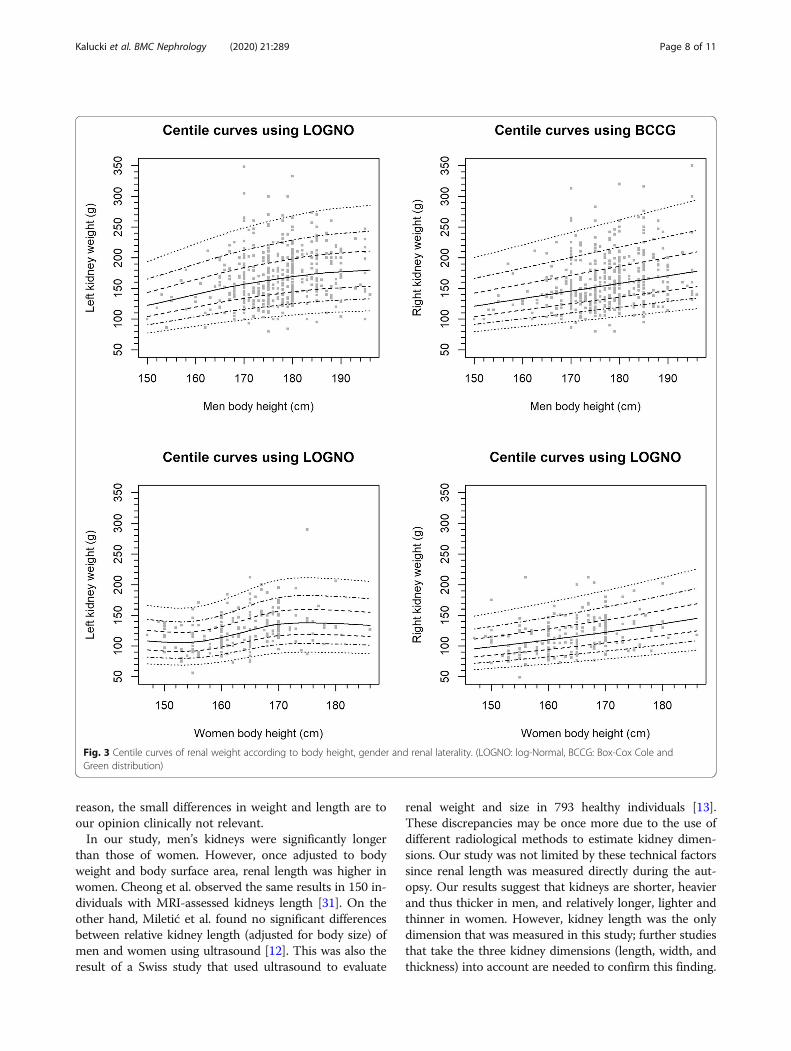
Centile curvesThe reference centile curves of renal weight accordingto sex, body height and laterality are shown in Fig. 3.Additional curves were created according to the degreeof blood depletion (Supplementary information, Fig. S1A-C).
DiscussionThe present study shows that absolute and relative renalweight (corrected for body weight and/or body surfacearea) are both greater in men than in women. This find-ing was not explained by differences in the prevalence ofarterial hypertension or smoking habits. This result was
also independent of the amount of blood in the kidneys(blood degree) at the time of the autopsy. As expected,blood-depleted kidneys were lighter and blood-congested kidneys heavier, but this did not affect theconclusion that the relative renal weight is greater inmen than women. This autopsy study also shows thatleft kidneys are heavier (and thus larger) than right kid-neys. Finally, absolute renal length was larger in men,but relative length (adjusted for body height) was largerin women, suggesting a more elongated shape of kidneysin women.Our results show that gender is a determinant of renal
weight, irrespective of anthropometric parameters.Hence, women have relatively smaller kidneys that are25% lighter than men’s kidneys. This result is in linewith a recent biopsy study in healthy kidney donors byDenic et al., who reported that male kidneys are not onlylarger in size, but also contain a higher number of neph-rons [11]. Denic et al. estimated the nephron number in-directly by multiplying the glomerular density inprotocol kidney biopsies with the cortical volume asmeasured by CT scan and a correction factor.
Table 2 Absolute and relative renal dimensions. The relative measurements were calculated according to the body weight, thebody height and the body surface. A) Comparison of absolute and relative renal values according to kidney laterality. B) Comparisonof absolute and relative renal data according to sex
n Left n Right P-value
Mean (sd) Median (25–75%) Mean (sd) Median (25–75%)
A/
Renal weight (g) 635 155.8 (43.9) 150 (126–180) 635 147.6 (42.8) 140 (120–170) < 0.001
Renal weight /g) / body weight (kg) 635 2.09 (0.55) 2.03 (1.73–2.41) 635 1.98 (0.49) 1.91 (1.60–2.28) < 0.001
Renal weight (g) / body surface (m2) 631 82.1 (19.1) 79.8 (68.5–93.5) 631 77.6 (17.8) 75.7 (64.8–87.5) < 0.001
Renal length (cm) 142 12.0 (1.2) 12 (11–13) 142 11.8 (1.3) 12 (11–12.5) 0.08
Renal length (cm)/ body height (cm) 142 0.068 (0.007) 0.068 (0.063–0.072) 142 0.069 (0.007) 0.069 (0.064–0.073) 0.9
Renal length (cm) / body surface (m2) 142 6.33 (0.79) 6.28 (5.8–6.9) 142 6.22 (0.80) 6.26 (5.54–6.70) 0.01
n Men n Women P-value
Mean (sd) Median (25–75%) Mean (sd) Median (25–75%)
B/
Left renal weight (g) 436 169.5 (42.0) 165 (140–195) 199 125.4 (31.2) 121 (103–141) < 0.001
Left renal weight (g) / body weight (kg) 436 2.12 (0.51) 2.04 (1.75–2.41) 199 2.04 (0.64) 1.96 (1.59–2.37) 0.042
Left renal weight (g) / body surface (m2) 434 85.4 (18.6) 82.4 (72.0–96.8) 195 74.6 (17.9) 71.5 (63.4–84.7) < 0.001
Left renal length (cm) 101 12.2 (1.3) 12 (11–13) 41 11.6 (1.1) 11 (10.5–12) 0.011
Left renal length (cm)/ body height (cm) 101 0.068 (0.007) 0.069 (0.063–0.072) 41 0.071 (0.007) 0.071 (0.065–0.075) 0.039
Left renal length (cm) / body surface (m2) 101 6.14 (0.69) 6.14 (5.66–6.55) 41 6.82 (0.81) 6.89 (6.15–7.35) < 0.001
Right renal weight (g) 436 160.9 (41.4) 155 (132–182) 199 117.9 (28.7) 116 (97–133) < 0.001
Right renal weight (g) / body weight (kg) 436 2.01 (0.46) 1.96 (1.63–2.29) 199 1.91 (0.54) 1.88 (1.49–2.25) 0.011
Right renal weight (g) / body surface (m2) 436 81.0 (17.6) 78.5 (68.4–90.3) 195 70.1 (15.9) 68.8 (58.2–79.0) < 0.001
Right renal length (cm) 101 12.0 (1.3) 12 (11–12.5) 41 11.4 (1.1) 11 (10.5–12) 0.011
Right renal length (cm) / body height (cm) 101 0.067 (0.007) 0.066 (0.062–0.071) 41 0.069 (0.007) 0.069 (0.065–0.073) 0.03
Right renal length (cm) / body surface (m2) 101 6.02 (0.68) 6.11 (5.45–6.45) 41 6.69 (0.88) 6.61 (5.96–7.45) < 0.001
Kalucki et al. BMC Nephrology (2020) 21:289 Page 5 of 11

Why absolute and relative renal weights are larger inmen cannot be answered by our retrospective autopsystudy. High protein intake has according to some a posi-tive impact on kidney size, and may therefore partly ex-plain this difference [21]. Unfortunately, we have no data
on dietary intake of proteins in the studied population,but we know that food and protein intake is higher inmen in the Swiss population [22]. Hormonal factors alsohave a significant impact on kidney function and hist-ology [23, 24]. Animal studies have shown that estradiol
Fig. 1 Absolute and relative renal weight according to gender. Left kidneys are heavier than right kidneys. Absolute and relative weight arehigher in men
Table 3 Multiple regression analysis showing associations between the outcome variable renal weight (log-transformed mean ofboth kidneys) and predefined clinical variables
Estimateβ
Standarderror
P-value
unadjusted adjusted
(Intercept) 4.641 0.0555 < 0.001 < 0.001
Blood degree (depletion) −0.236 0.0718 < 0.001 0.001
Blood degree (no particularity) −0.035 0.0571 < 0.001 0.54
Weight 0.0174 0.0046 < 0.001 < 0.001
Height 0.012 0.0004 0.024 < 0.001
Sex (women) −0.149 0.022 < 0.001 < 0.001
Age of death −0.0273 0.0059 0.035 < 0.001
Weight:height −0.001 0.00003 < 0.001 0.011
Age of death:height 0.002 0.00003 0.51 < 0.001
Kalucki et al. BMC Nephrology (2020) 21:289 Page 6 of 11

slows glomerulosclerosis and helps maintain kidney sizein women [25]. In contrast, testosterone stimulatesapoptosis of proximal tubular cells in animal studies[26]. If similar effects occur in humans, our study shouldhave shown opposite results; as histological data andhormone levels were not available, we could not explorethese sex hormone-kidney interactions.In multivariable models, other determinants of renal
weight were age, body height and body weight, whereashypertension was not. Denic et al. found the same deter-minants in their study. Although these authors focusedon nephron number, not renal weight, this is an interest-ing finding as it can be interpreted as an argument infavor of the notion that kidney size is a proxy of neph-ron number. However, this statement should be inter-preted with caution, as the relationship between kidneysize and nephron number may not be linear [27]. Inboth our study and the study by Denic et al., renal mass
(expressed as nephron number or (relative) kidney size)was smaller in women [11]. Therefore, it seems reason-able to conclude that differences in renal mass do notexplain the lower susceptibility of women to CKD andits progression.Age was negatively associated with renal weight. Of
interest, there was a difference between men andwomen: in men, renal weight slightly increased till theage of 52.5 years, and decreased sharply hereafter. Inwomen, the relationship was flat and decreased graduallyafter the age of 50. These data are in line with a recentItalian population-based study in 2256 subjects thatassessed kidney size with ultrasound [28]. The observeddifferences may be driven by sex hormones. For ex-ample, the initial increase in renal size in men may becaused by androgen-induced nephron hypertrophy [29].The decrease in renal size may be caused by progressivenephrosclerosis, but we did not collect data on this vari-able. Microscopic studies are needed to further explorethe association between age and renal size.Left kidneys were on average 8 g heavier and 0.2 cm
longer than right kidneys. This finding confirms the gen-eral paradigm that left kidneys are larger than right kid-neys. Previous studies showed discrepant results, butwere often limited by the indirect (radiological) methodsused to measure kidney dimensions [13, 28]. It has beensuggested that the perfusion and development of theright kidneys are hampered by the passage of the rightrenal artery posterior to the inferior vena cava and thelarger volume taken by the liver as compared to thespleen, but this is hypothetical [30]. Whatever the
Fig. 2 Age-related changes in renal weight according to gender
Table 4 Multiple regression analysis illustrating the associationsbetween renal length (log-transformed mean of both kidneys)and clinical variables
Estimateβ
Standarderror
P-value
unadjusted adjusted
Sex (women) 0.198 0.065 0.009 0.003
Weight 0.045 0.0129 < 0.001 < 0.001
Height 0.021 0.0063 0.019 0.001
Age of death 0.0114 0.0082 0.27 0.17
Weight:height −0.0024 0.0007 < 0.001 0.001
Sex (women):height −0.0959 0.0366 0.29 0.01
Kalucki et al. BMC Nephrology (2020) 21:289 Page 7 of 11
reason, the small differences in weight and length are toour opinion clinically not relevant.In our study, men’s kidneys were significantly longer
than those of women. However, once adjusted to bodyweight and body surface area, renal length was higher inwomen. Cheong et al. observed the same results in 150 in-dividuals with MRI-assessed kidneys length [31]. On theother hand, Miletić et al. found no significant differencesbetween relative kidney length (adjusted for body size) ofmen and women using ultrasound [12]. This was also theresult of a Swiss study that used ultrasound to evaluate
renal weight and size in 793 healthy individuals [13].These discrepancies may be once more due to the use ofdifferent radiological methods to estimate kidney dimen-sions. Our study was not limited by these technical factorssince renal length was measured directly during the aut-opsy. Our results suggest that kidneys are shorter, heavierand thus thicker in men, and relatively longer, lighter andthinner in women. However, kidney length was the onlydimension that was measured in this study; further studiesthat take the three kidney dimensions (length, width, andthickness) into account are needed to confirm this finding.
Fig. 3 Centile curves of renal weight according to body height, gender and renal laterality. (LOGNO: log-Normal, BCCG: Box-Cox Cole andGreen distribution)
Kalucki et al. BMC Nephrology (2020) 21:289 Page 8 of 11
Our study provides updated sex-specific referencevalues for renal weight. The percentile curves may be ofclinical use for pathologists and forensic specialists. Forexample, a renal weight under the 2.5th percentile maypoint towards CKD, whereas values over the 97.5th per-centile may point towards underlying pathologies suchas diabetes, amyloidosis and other storage diseases. Thereference values are provided for both depleted, con-gested and normal kidneys, as renal weight varied ac-cording to blood degree. The percentile curves may alsohave some clinical implications in renal transplantation.Although today, one usually does not take into accountkidney size to decide which kidney should be given towhich patient, in general, larger donor kidneys result inbetter graft function at follow up [32]. The percentilecurves in our article will allow clinicians to estimate ex-pected kidney size of potential donors before organ re-moval or imaging.Of note, results should be interpreted with caution, as
there was a wide variance of renal weight at any renalsize. This is possibly one of the reasons why no relation-ship was found between hypertension and renal weightin our study, nor between nephron number and bloodpressure in recent large biopsy studies [27].To the best of our knowledge, no update of reference
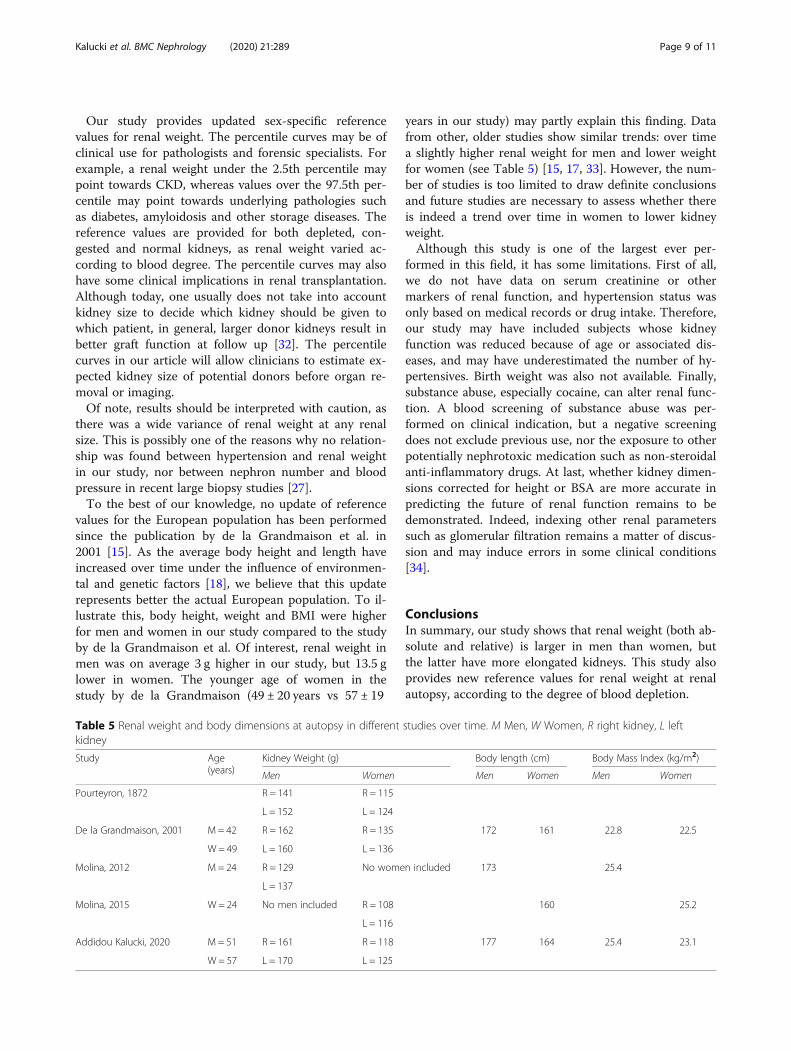
values for the European population has been performedsince the publication by de la Grandmaison et al. in2001 [15]. As the average body height and length haveincreased over time under the influence of environmen-tal and genetic factors [18], we believe that this updaterepresents better the actual European population. To il-lustrate this, body height, weight and BMI were higherfor men and women in our study compared to the studyby de la Grandmaison et al. Of interest, renal weight inmen was on average 3 g higher in our study, but 13.5 glower in women. The younger age of women in thestudy by de la Grandmaison (49 ± 20 years vs 57 ± 19
years in our study) may partly explain this finding. Datafrom other, older studies show similar trends: over timea slightly higher renal weight for men and lower weightfor women (see Table 5) [15, 17, 33]. However, the num-ber of studies is too limited to draw definite conclusionsand future studies are necessary to assess whether thereis indeed a trend over time in women to lower kidneyweight.Although this study is one of the largest ever per-
formed in this field, it has some limitations. First of all,we do not have data on serum creatinine or othermarkers of renal function, and hypertension status wasonly based on medical records or drug intake. Therefore,our study may have included subjects whose kidneyfunction was reduced because of age or associated dis-eases, and may have underestimated the number of hy-pertensives. Birth weight was also not available. Finally,substance abuse, especially cocaine, can alter renal func-tion. A blood screening of substance abuse was per-formed on clinical indication, but a negative screeningdoes not exclude previous use, nor the exposure to otherpotentially nephrotoxic medication such as non-steroidalanti-inflammatory drugs. At last, whether kidney dimen-sions corrected for height or BSA are more accurate inpredicting the future of renal function remains to bedemonstrated. Indeed, indexing other renal parameterssuch as glomerular filtration remains a matter of discus-sion and may induce errors in some clinical conditions[34].
ConclusionsIn summary, our study shows that renal weight (both ab-solute and relative) is larger in men than women, butthe latter have more elongated kidneys. This study alsoprovides new reference values for renal weight at renalautopsy, according to the degree of blood depletion.
Table 5 Renal weight and body dimensions at autopsy in different studies over time. M Men, W Women, R right kidney, L leftkidney
Study Age(years)
Kidney Weight (g) Body length (cm) Body Mass Index (kg/m2)
Men Women Men Women Men Women
Pourteyron, 1872 R = 141 R = 115
L = 152 L = 124
De la Grandmaison, 2001 M = 42 R = 162 R = 135 172 161 22.8 22.5
W = 49 L = 160 L = 136
Molina, 2012 M = 24 R = 129 No women included 173 25.4
L = 137
Molina, 2015 W = 24 No men included R = 108 160 25.2
L = 116
Addidou Kalucki, 2020 M = 51 R = 161 R = 118 177 164 25.4 23.1
W = 57 L = 170 L = 125
Kalucki et al. BMC Nephrology (2020) 21:289 Page 9 of 11

Why men have relatively larger kidneys, and how kid-ney size correlates with nephron number needs furtherstudy, possibly with new imaging techniques such asmicro-CT or cationized ferritin MRI that are capable ofmeasuring directly the total number of nephrons in onekidney. So far, they are restricted to small animals, butthis may change in the near future [35].
Supplementary informationSupplementary information accompanies this paper at https://doi.org/10.1186/s12882-020-01946-y.
Additional file 1. Centile curves of renal weight taking into accountdepletion status of the kidneys.
AbbreviationsAHT: Arterial hypertension; BMI: Body mass index; BSA: Body surface area;CKD: Chronic kidney disease; eGFR: Estimated glomerular filtration rate;MRI: Magnetic resonance imaging
AcknowledgementsWe wish to thank Mrs. Wendy Brito and M. Nicolas Loncle for their valuablehelp during the data acquisition.
Authors’ contributionsSK, MP: study design, data acquisition, data analysis, data interpretation,manuscript draft, final submission. CL: data acquisition, interpretation,manuscript draft, approval of submitted version. JG: data analysis,interpretation, manuscript draft, approval of submitted version. AK: dataacquisition, interpretation, approval of submitted version. SG, MB: datainterpretation, manuscript draft, approval of submitted version. The author(s)read and approved the final manuscript.
FundingThis study was supported by a grant from the Swiss National ScienceFoundation (SNF 320030–169191).
Availability of data and materialsOn reasonable request from the principal investigator (MP).
Ethics approval and consent to participateThis study was approved by the Ethics Committee of the Canton de Vaud(commission cantonale d’éthique de la recherche sur l‘être humain) underprotocol number CER-VD 2017–01378. Due to the nature of the study, no in-formed consent was obtained. Administrative permission to access the datawas provided by the ethical committee, in line with the regulations on Clin-ical Trials in the Human Research Act, article 9c and 34. Subject’s confidenti-ality was respected and all data were anonymized. The data analyzed duringthe current study are available on request to the principal investigator (MP).
Consent for publicationNot applicable.
Competing interestsNone.
Author details1Service of Nephrology and Hypertension, Lausanne University Hospital andUniversity of Lausanne, Rue du Bugnon 17, 1011 Lausanne, Switzerland.2University Center of Legal Medicine Lausanne-Geneva, Rue Michel-Servet 1,Geneva University Hospital, Geneva, Switzerland. 3UUniversity Center of LegalMedicine Lausanne-Geneva, Chemin de la Vulliette 4, University Hospital ofLausanne and University of Lausanne, Lausanne, Switzerland.
Received: 20 April 2020 Accepted: 12 July 2020
References1. Ponte B, Pruijm M, Marques-Vidal P, Martin P-Y, Burnier M, Paccaud F, et al.
Determinants and burden of chronic kidney disease in the population-based CoLaus study: a cross-sectional analysis*. Nephrol Dial Transplant.2013;28:2329–39.
2. Chow CK. Prevalence, awareness, treatment, and control of hypertension inrural and urban communities in high-, middle-, and low-income countries.JAMA. 2013;310:959.
3. Neugarten J, Acharya A, Silbiger SR. Effect of Gender on the Progression ofNondiabetic Renal Disease: A Meta-Analysis. J Am Soc Nephrol. 2000:11.
4. Zhou B, Bentham J, Di Cesare M, Bixby H, Danaei G, Cowan MJ, et al.Worldwide trends in blood pressure from 1975 to 2015: a pooled analysis of1479 population-based measurement studies with 19·1 million participants.Lancet. 2017;389:37–55.
5. Berg UB. Differences in decline in GFR with age between males andfemales. Reference data on clearances of inulin and PAH in potential kidneydonors. Nephrol Dial Transplant. 2006;21:2577–82.
6. Eriksen BO, Ingebretsen OC. The progression of chronic kidney disease: a10-year population-based study of the effects of gender and age. KidneyInt. 2006;69:375–82.
7. Coggins C. Differences between women and men with chronic renaldisease. Nephrol Dial Transplant. 1998;13:1430–7.
8. Neugarten J, Golestaneh L. Influence of sex on the progression of chronickidney disease. Mayo Clin Proc. 2019;94:1339–56.
9. Hostetter TH, Rennke HG, Brenner BM. Compensatory renal hemodynamicinjury: a final common pathway of residual nephron destruction. Am JKidney Dis Off J Natl Kidney Found. 1982;1:310–4.
10. Singh GR, Hoy WE. Kidney volume, blood pressure, and albuminuria:findings in an Australian Aboriginal community. Am J Kidney Dis Off J NatlKidney Found. 2004;43:254–9.
11. Denic A, Mathew J, Lerman LO, Lieske JC, Larson JJ, Alexander MP, et al.Single-nephron glomerular filtration rate in healthy adults. N Engl J Med.2017;376:2349–57.
12. Miletić D, Fuckar Z, Sustić A, Mozetic V, Stimac D, Zauhar G. Sonographicmeasurement of absolute and relative renal length in adults. J ClinUltrasound JCU. 1998;26:185–9.
13. Pruijm M, Ponte B, Ackermann D, Vuistiner P, Paccaud F, Guessous I, et al.Heritability, determinants and reference values of renal length: a family-based population study. Eur Radiol. 2013;23:2899–905.
14. Denic A, Lieske JC, Chakkera HA, Poggio ED, Alexander MP, Singh P, et al.The substantial loss of nephrons in healthy human kidneys with aging. JAm Soc Nephrol JASN. 2017;28:313–20.
15. de la Grandmaison GL, Clairand I, Durigon M. Organ weight in 684 adultautopsies: new tables for a Caucasoid population. Forensic Sci Int. 2001;119:149–54.
16. Madea B, editor. Handbook of forensic medicine. Hoboken, NJ: Wiley-Blackwell; 2013.
17. Molina DK, DiMaio VJM. Normal organ weights in men: part II—the brain,lungs, liver, spleen, and kidneys. Am J Forensic Med Pathol. 2012;33:368–72.
18. Roser M, Appel C, Ritchie H. Human Height. Our World Data. 2013. https://ourworldindata.org/human-height. Accessed 17 Oct 2019.
19. Bois DD, Bois EFD. A formula to estimate the approximate surface area ifheight and weight be known. 1916. Nutrition. 1989;5:303–311; discussion312-3.
20. R Development Core team. A language and environment for statisticalcomputing: reference index. Vienna: R Foundation for Statistical Computing;2010. http://www.polsci.wvu.edu/duval/PS603/Notes/R/fullrefman.pdf.Accessed 17 Oct 2019.
21. Ko GJ, Obi Y, Tortoricci AR, Kalantar-Zadeh K. Dietary protein intake andchronic kidney disease. Curr Opin Clin Nutr Metab Care. 2017;20:77–85.
22. Glatz N, Chappuis A, Conen D, Erne P, Péchère-Bertschi A, Guessous I, et al.Associations of sodium, potassium and protein intake with blood pressureand hypertension in Switzerland. Swiss Med Wkly. 2017;147:w14411.
23. Jelinsky SA, Harris HA, Brown EL, Flanagan K, Zhang X, Tunkey C, et al.Global transcription profiling of estrogen activity: estrogen receptor αregulates gene expression in the kidney. Endocrinology. 2003;144:701–10.
24. Wilson CM, McPhaul MJ. A and B forms of the androgen receptor areexpressed in a variety of human tissues. Mol Cell Endocrinol. 1996;120:51–7.
Kalucki et al. BMC Nephrology (2020) 21:289 Page 10 of 11

25. Kwan G, Neugarten J, Sherman M, Ding Q, Fotadar U, Lei J, et al. Effects ofsex hormones on mesangial cell proliferation and collagen synthesis. KidneyInt. 1996;50:1173–9.
26. Verzola D, Villaggio B, Procopio V, Gandolfo MT, Gianiorio F, Famà A, et al.Androgen-mediated apoptosis of kidney tubule cells: role of c-Jun aminoterminal kinase. Biochem Biophys Res Commun. 2009;387:531–6.
27. Hughson M, Farris AB, Douglas-Denton R, Hoy WE, Bertram JF. Glomerularnumber and size in autopsy kidneys: the relationship to birth weight.Kidney Int. 2003;63:2113–22.
28. Piras D, Masala M, Delitala A, Urru SAM, Curreli N, Balaci L, et al. Kidney sizein relation to ageing, gender, renal function, birthweight and chronickidney disease risk factors in a general population. Nephrol Dial Transplant.2020;35:640–7.
29. Mulroney SE, Woda C, Johnson M, Pesce C. Gender differences in renalgrowth and function after uninephrectomy in adult rats. Kidney Int. 1999;56:944–53.
30. Mirjalili SA, Hale SJM, Buckenham T, Wilson B, Stringer MD. A reappraisal ofadult thoracic surface anatomy. Clin Anat N Y N. 2012;25:827–34.
31. Cheong B, Muthupillai R, Rubin MF, Flamm SD. Normal values for renallength and volume as measured by magnetic resonance imaging. Clin J AmSoc Nephrol. 2006;2:38–45.
32. Vasconcelos Ordones F, Pajolli PIR, Guerra da Silva R, Yamamoto HA, GomesFilho FF, Kawano PR, et al. Impact of adjusted kidney volume measured inthe bench surgery on one-year renal function in kidney transplantation.PloS One. 2019;14:e0224364.
33. Moëll H. Size of normal kidneys. Acta Radiol. 1956;46:640–5.34. Geddes CC, Woo YM, Brady S. Glomerular filtration rate what is the rationale
and justification of normalizing GFR for body surface area? Nephrol DialTransplant. 2007;23:4–6.
35. Caroli A, Pruijm M, Burnier M, Selby NM. Functional magnetic resonanceimaging of the kidneys: where do we stand? The perspective of theEuropean COST Action PARENCHIMA. Nephrol Dial Transplant. 2018;33(suppl_2):ii1–3.
Publisher’s NoteSpringer Nature remains neutral with regard to jurisdictional claims inpublished maps and institutional affiliations.
Kalucki et al. BMC Nephrology (2020) 21:289 Page 11 of 11