
Reevaluation of Stolwijk's 25-node human thermal model under thermal-transient conditions:...
11
Re-evaluation of Stolwijk’s 25-node human thermal model under thermal-transient conditions: Prediction of skin temperature in low-activity conditions Abdul Munir a , Satoru Takada b, * , Takayuki Matsushita b a Department of Architecture, Faculty of Engineering, Syiah Kuala University, Darussalam, Banda Aceh 23111, Indonesia b Department of Architecture, Graduate School of Engineering, Kobe University,1-1 Rokkodaicho, Nada, Kobe 657-8501, Japan article info Article history: Received 12 August 2008 Received in revised form 27 November 2008 Accepted 27 November 2008 Keywords: Human thermal model Skin temperature Skin blood flow Subject experiment Thermoregulatory response Low activity abstract The performance of Stolwijk’s 25-node thermal model of the human body was evaluated for the prediction of the skin temperature of a sedentary person in a thermal-transient state. The skin temperature calculated by the original Stolwijk model was compared to experimental data obtained systematically from a large number of subjects exposed to stepwise changes in environmental condi- tions, including neutral (29.4 C), low (19.5 C), and high (38.9 C) ambient temperatures. The results show that the original Stolwijk model accurately predicts both the absolute value and the tendency in the transient mean skin temperature. This suggests that the Stolwijk model is valid for the prediction of the transient mean skin temperature for the ‘‘average’’ person under low-activity conditions. Discrepancies are observed in the local skin temperature for some segments. However, these discrepancies can be significantly reduced through modification of the basal skin blood flow distributions and the distribu- tions of vasoconstriction and workload in the model. Ó 2008 Elsevier Ltd. All rights reserved. 1. Introduction Various thermal models of the human body have been developed. Stolwijk’s 25-node model of thermoregulation [1] is one of the most influential multi-node models and has provided the basis and inspiration for many human thermal-modeling studies. Stolwijk model has been used as the framework for further development of these models, which has included improving modeling of the thermoregulatory systems and body segmentation [2–6], considering individual body characteristics [7,8], increasing the number of body segments to obtain a higher resolution temperature distribution on the skin surface [9,10], and applications for specific purposes, such as cold-water immersion [11]. Furthermore, the model has also been simplified as a two- node model [12]. In the context of pursuing indoor thermal comfort, these models have been applied for the precise analysis of asymmetrical thermal radiation between the human body and its surroundings [10,13], and the coupling of simulations of human thermal models with computational fluid dynamics [14–16]. The models have also been used to predict indoor thermal comfort [17,18]. For the practical application of these human thermal models, it is important to show their reliability for not only steady state, but also for thermal-transient-state conditions. For further improvements to both the Stolwijk model and those models derived from it, it is meaningful to characterize the basic behav- iors of the original model. However, the characteristics of the original Stolwijk model have not been evaluated comprehensively for a thermal-transient state, even though Stolwijk himself provided examples for the validation of the model from a limited number of subjects. Moreover, the models derived from the Stolwijk model were developed for specific purposes without an explicit evaluation of the weaknesses and strengths of the original model. A re-evaluation of the weaknesses and strengths of the original model will make it possible to effectively improve or develop contemporary human thermal models based on the Stolwijk model. Thus, this paper aims to evaluate the validity of the original Stolwijk model for the prediction of skin temperature under a thermal-transient condition at a low level of activity (sedentary case), by comparing the results calculated by the model with the results of experiments from a large number of subjects. This work also seeks to provide an understanding of the fundamentals for * Corresponding author. Tel./fax: þ81 78 803 6038. E-mail address: [email protected] (S. Takada). Contents lists available at ScienceDirect Building and Environment journal homepage: www.elsevier.com/locate/buildenv 0360-1323/$ – see front matter Ó 2008 Elsevier Ltd. All rights reserved. doi:10.1016/j.buildenv.2008.11.016 Building and Environment 44 (2009) 1777–1787
-
Upload
independent -
Category
Documents
-
view
2 -
download
0
Transcript of Reevaluation of Stolwijk's 25-node human thermal model under thermal-transient conditions:...
lable at ScienceDirect
Building and Environment 44 (2009) 1777–1787
Contents lists avai
Building and Environment
journal homepage: www.elsevier .com/locate/bui ldenv
Re-evaluation of Stolwijk’s 25-node human thermal model underthermal-transient conditions: Prediction of skin temperature inlow-activity conditions
Abdul Munir a, Satoru Takada b,*, Takayuki Matsushita b
a Department of Architecture, Faculty of Engineering, Syiah Kuala University, Darussalam, Banda Aceh 23111, Indonesiab Department of Architecture, Graduate School of Engineering, Kobe University, 1-1 Rokkodaicho, Nada, Kobe 657-8501, Japan
a r t i c l e i n f o
Article history:Received 12 August 2008Received in revised form27 November 2008Accepted 27 November 2008
Keywords:Human thermal modelSkin temperatureSkin blood flowSubject experimentThermoregulatory responseLow activity
* Corresponding author. Tel./fax: þ81 78 803 6038.E-mail address: [email protected] (S. Takada).
0360-1323/$ – see front matter � 2008 Elsevier Ltd.doi:10.1016/j.buildenv.2008.11.016
a b s t r a c t
The performance of Stolwijk’s 25-node thermal model of the human body was evaluated for theprediction of the skin temperature of a sedentary person in a thermal-transient state. The skintemperature calculated by the original Stolwijk model was compared to experimental data obtainedsystematically from a large number of subjects exposed to stepwise changes in environmental condi-tions, including neutral (29.4 �C), low (19.5 �C), and high (38.9 �C) ambient temperatures. The resultsshow that the original Stolwijk model accurately predicts both the absolute value and the tendency in thetransient mean skin temperature. This suggests that the Stolwijk model is valid for the prediction of thetransient mean skin temperature for the ‘‘average’’ person under low-activity conditions. Discrepanciesare observed in the local skin temperature for some segments. However, these discrepancies can besignificantly reduced through modification of the basal skin blood flow distributions and the distribu-tions of vasoconstriction and workload in the model.
� 2008 Elsevier Ltd. All rights reserved.
1. Introduction
Various thermal models of the human body have beendeveloped. Stolwijk’s 25-node model of thermoregulation [1] isone of the most influential multi-node models and has providedthe basis and inspiration for many human thermal-modelingstudies. Stolwijk model has been used as the framework forfurther development of these models, which has includedimproving modeling of the thermoregulatory systems and bodysegmentation [2–6], considering individual body characteristics[7,8], increasing the number of body segments to obtain a higherresolution temperature distribution on the skin surface [9,10], andapplications for specific purposes, such as cold-water immersion[11]. Furthermore, the model has also been simplified as a two-node model [12]. In the context of pursuing indoor thermalcomfort, these models have been applied for the precise analysisof asymmetrical thermal radiation between the human bodyand its surroundings [10,13], and the coupling of simulationsof human thermal models with computational fluid dynamics
All rights reserved.
[14–16]. The models have also been used to predict indoorthermal comfort [17,18].
For the practical application of these human thermal models,it is important to show their reliability for not only steady state,but also for thermal-transient-state conditions. For furtherimprovements to both the Stolwijk model and those modelsderived from it, it is meaningful to characterize the basic behav-iors of the original model. However, the characteristics of theoriginal Stolwijk model have not been evaluated comprehensivelyfor a thermal-transient state, even though Stolwijk himselfprovided examples for the validation of the model from a limitednumber of subjects. Moreover, the models derived from theStolwijk model were developed for specific purposes without anexplicit evaluation of the weaknesses and strengths of the originalmodel. A re-evaluation of the weaknesses and strengths of theoriginal model will make it possible to effectively improve ordevelop contemporary human thermal models based on theStolwijk model.
Thus, this paper aims to evaluate the validity of the originalStolwijk model for the prediction of skin temperature undera thermal-transient condition at a low level of activity (sedentarycase), by comparing the results calculated by the model with theresults of experiments from a large number of subjects. This workalso seeks to provide an understanding of the fundamentals for
Nomenclature
BC(i,j) convective heat transfer from node (i,j) to centralblood (W)
C(i,j) thermal capacitance of the node (J/K)CCB thermal capacitance of blood (J/K)E(i,4) evaporative heat loss from the skin surface (W)Eb(i,4) basal evaporative heat loss from the skin surface (W)Esw(i) evaporative heat loss due to sweating (W)Emax(i) maximum evaporative heat loss from skin surface
(W)hfg heat of vaporization of water (2430 J/g)msw(i) accumulated sweat on the skin surface (g)Q(i,j) rate of heat production (W)Qt(i,4) convective and radiative heat exchange rate
between skin surface and environment (W)T(i,j) temperature (�C)TCB temperature of central blood compartment (�C)TD(i,j) conductive heat transfer from layer j to layer jþ 1 (W)t time (s)
A. Munir et al. / Building and Environment 44 (2009) 1777–17871778
improving the Stolwijk model for the prediction of skintemperature.
2. Subject experiment
2.1. Method
Fifteen healthy male students (Table 1) participated as subjectsin two series of experiments under a thermal-transient condition.They were exposed to a series of conditions: a nearly (thermally)neutral condition, followed by low air temperature, a secondneutral condition, high air temperature, and finally, a third neutralcondition. The experiments were conducted in two climaticchambers. The environmental settings of the climatic chambersand the two experimental schedules are shown in Fig. 1. Thenumbers of subjects involved in schedule-1 and schedule-2 were10 and 7, respectively (Table 2). Two of these subjects (subjects ‘‘G’’and ‘‘I’’) participated in both experiments.
Table 1Information about subjects.
Subject Age (year) WT (kg) HT (cm) BMI (kg/m2) BSA (m2)
A 24 58.8 1.69 20.59 1.67B 24 64.4 1.67 23.09 1.72C 23 56.7 1.62 21.60 1.60D 24 72.1 1.73 24.09 1.86E 30 76.8 1.70 26.57 1.88F 23 74.5 1.74 24.61 1.89Ga 23 84.4 1.70 29.20 1.96H 23 79.0 1.78 24.93 1.97Ia 22 56.4 1.70 19.52 1.65J 22 56.4 1.62 21.49 1.59K 22 56.7 1.73 18.94 1.68L 23 47.1 1.64 17.51 1.49M 25 93.6 1.77 29.88 2.11N 22 59.9 1.70 20.73 1.69O 23 61.6 1.71 21.07 1.72
Average 23.5 66.6 1.70 22.92 1.77S.D. 2.0 12.9 0.05 3.62 0.17
HT: height; WT: weight; BMI: body mass index; BSA: body surface area calculatedfrom height and weight [19].
a Subjects ‘‘G’’ and ‘‘I’’ participated in both experiment schedules.
All subjects wore only trunks (undershorts) and remainedsedentary under a thermally neutral condition (29.4 �C, 47% rh) for1 h before the experiment began. During the experiments, the coreand skin temperatures and the environmental conditions (airtemperature, relative humidity, globe temperature, and windvelocity) were measured continually at intervals of 10 s. Hardy andDuBois’s seven-point method was employed to measure the skintemperature. The measured variables are given in detail in Table 3.The body surface area was calculated from the height and weight ofthe subjects [19].
Table 4 shows the environmental data, such as room airtemperature, relative humidity, globe temperature, and windvelocity. The subjects moved from one room to another at sched-uled times (at the 30th, 50th, 110th, and 130th min in schedule-1,and at the 30th, 70th, 130th, and 170th min in schedule-2); it tookapproximately 1 min to move between rooms. The time requiredfor moving was recorded and considered in the analysis.
2.2. Experimental results
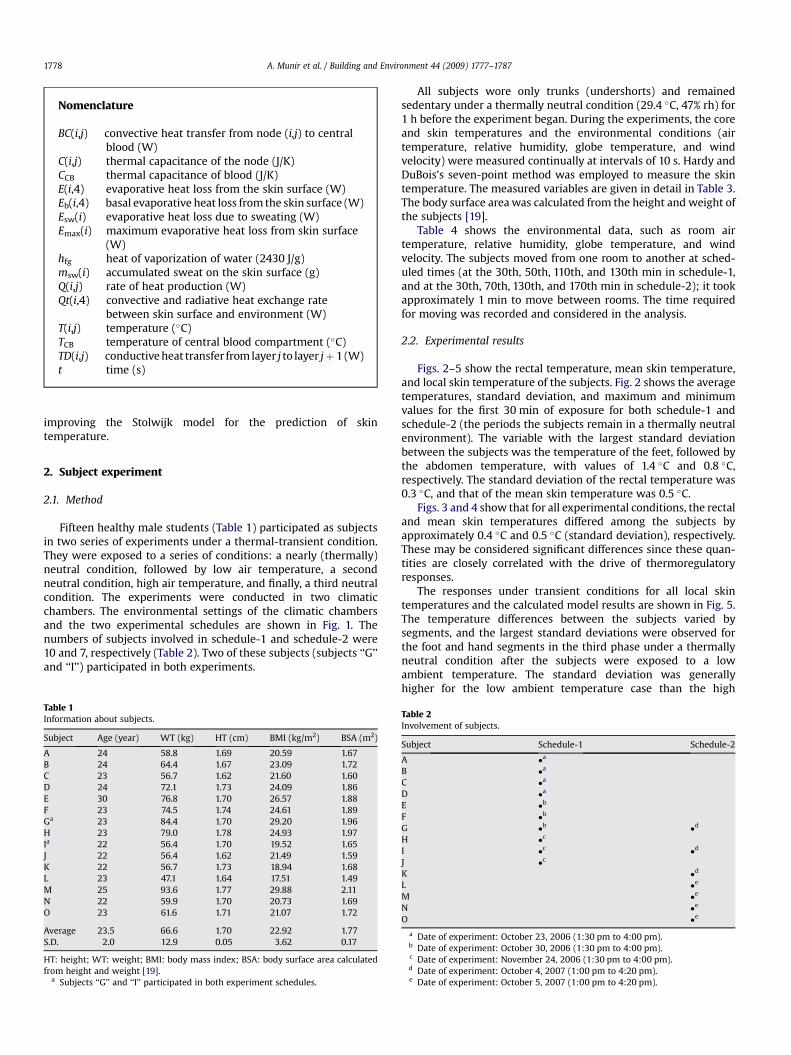
Figs. 2–5 show the rectal temperature, mean skin temperature,and local skin temperature of the subjects. Fig. 2 shows the averagetemperatures, standard deviation, and maximum and minimumvalues for the first 30 min of exposure for both schedule-1 andschedule-2 (the periods the subjects remain in a thermally neutralenvironment). The variable with the largest standard deviationbetween the subjects was the temperature of the feet, followed bythe abdomen temperature, with values of 1.4 �C and 0.8 �C,respectively. The standard deviation of the rectal temperature was0.3 �C, and that of the mean skin temperature was 0.5 �C.
Figs. 3 and 4 show that for all experimental conditions, the rectaland mean skin temperatures differed among the subjects byapproximately 0.4 �C and 0.5 �C (standard deviation), respectively.These may be considered significant differences since these quan-tities are closely correlated with the drive of thermoregulatoryresponses.
The responses under transient conditions for all local skintemperatures and the calculated model results are shown in Fig. 5.The temperature differences between the subjects varied bysegments, and the largest standard deviations were observed forthe foot and hand segments in the third phase under a thermallyneutral condition after the subjects were exposed to a lowambient temperature. The standard deviation was generallyhigher for the low ambient temperature case than the high
Table 2Involvement of subjects.
Subject Schedule-1 Schedule-2
A �a
B �a
C �a
D �a
E �b
F �b
G �b �d
H �c
I �c �d
J �c
K �d
L �e
M �e
N �e
O �e
a Date of experiment: October 23, 2006 (1:30 pm to 4:00 pm).b Date of experiment: October 30, 2006 (1:30 pm to 4:00 pm).c Date of experiment: November 24, 2006 (1:30 pm to 4:00 pm).d Date of experiment: October 4, 2007 (1:00 pm to 4:20 pm).e Date of experiment: October 5, 2007 (1:00 pm to 4:20 pm).
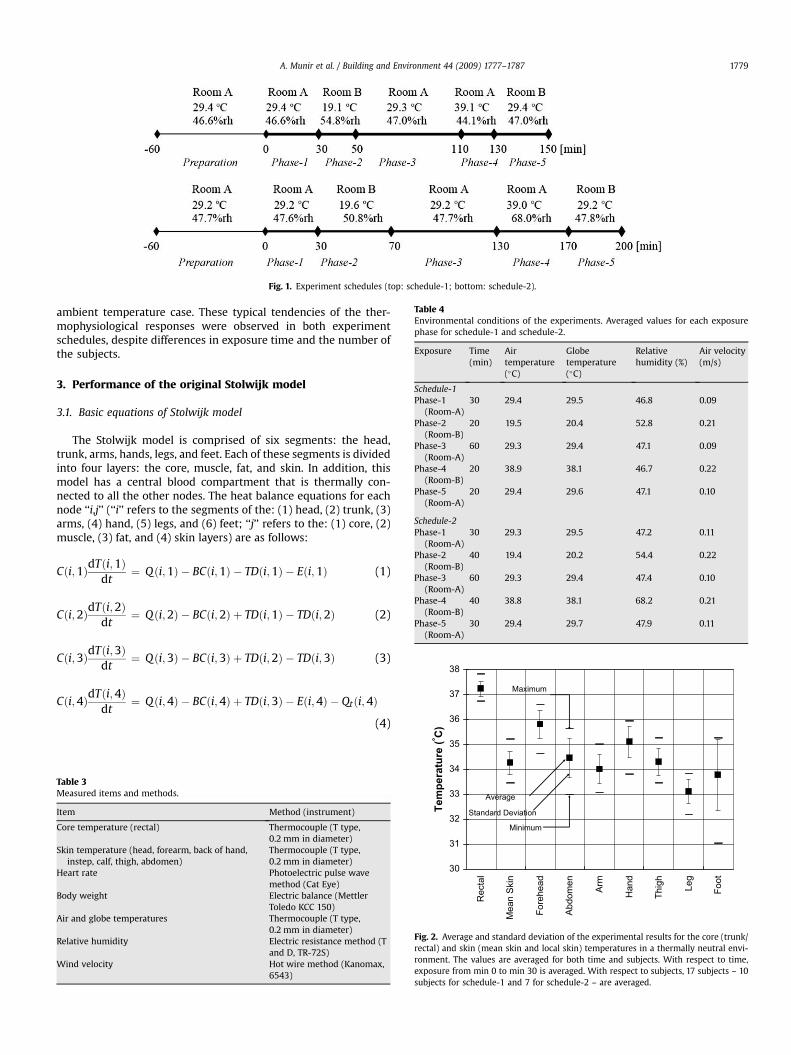
Fig. 1. Experiment schedules (top: schedule-1; bottom: schedule-2).
Table 4Environmental conditions of the experiments. Averaged values for each exposurephase for schedule-1 and schedule-2.
Exposure Time(min)
Airtemperature(�C)
Globetemperature(�C)
Relativehumidity (%)
Air velocity(m/s)
Schedule-1Phase-1
(Room-A)30 29.4 29.5 46.8 0.09
Phase-2(Room-B)
20 19.5 20.4 52.8 0.21
Phase-3(Room-A)
60 29.3 29.4 47.1 0.09
Phase-4(Room-B)
20 38.9 38.1 46.7 0.22
Phase-5(Room-A)
20 29.4 29.6 47.1 0.10
Schedule-2Phase-1
(Room-A)30 29.3 29.5 47.2 0.11
Phase-2(Room-B)
40 19.4 20.2 54.4 0.22
Phase-3(Room-A)
60 29.3 29.4 47.4 0.10
Phase-4(Room-B)
40 38.8 38.1 68.2 0.21
Phase-5(Room-A)
30 29.4 29.7 47.9 0.11
35
36
37
38
e (°C
)
Maximum
A. Munir et al. / Building and Environment 44 (2009) 1777–1787 1779
ambient temperature case. These typical tendencies of the ther-mophysiological responses were observed in both experimentschedules, despite differences in exposure time and the number ofthe subjects.
3. Performance of the original Stolwijk model
3.1. Basic equations of Stolwijk model
The Stolwijk model is comprised of six segments: the head,trunk, arms, hands, legs, and feet. Each of these segments is dividedinto four layers: the core, muscle, fat, and skin. In addition, thismodel has a central blood compartment that is thermally con-nected to all the other nodes. The heat balance equations for eachnode ‘‘i,j’’ (‘‘i’’ refers to the segments of the: (1) head, (2) trunk, (3)arms, (4) hand, (5) legs, and (6) feet; ‘‘j’’ refers to the: (1) core, (2)muscle, (3) fat, and (4) skin layers) are as follows:
Cði;1ÞdTði;1Þdt
¼ Qði;1Þ � BCði;1Þ � TDði;1Þ � Eði;1Þ (1)
Cði;2ÞdTði;2Þdt
¼ Qði;2Þ � BCði;2Þ þ TDði;1Þ � TDði;2Þ (2)
Cði;3ÞdTði;3Þdt
¼ Qði;3Þ � BCði;3Þ þ TDði;2Þ � TDði;3Þ (3)
Cði;4ÞdTði;4Þdt
¼ Qði;4Þ � BCði;4Þ þ TDði;3Þ � Eði;4Þ � Qtði;4Þ
(4)
Table 3Measured items and methods.
Item Method (instrument)
Core temperature (rectal) Thermocouple (T type,0.2 mm in diameter)
Skin temperature (head, forearm, back of hand,instep, calf, thigh, abdomen)
Thermocouple (T type,0.2 mm in diameter)
Heart rate Photoelectric pulse wavemethod (Cat Eye)
Body weight Electric balance (MettlerToledo KCC 150)
Air and globe temperatures Thermocouple (T type,0.2 mm in diameter)
Relative humidity Electric resistance method (Tand D, TR-72S)
Wind velocity Hot wire method (Kanomax,6543)
30
31
32
33
34
Rec
tal
Mea
n Sk
in
Fore
head
Abdo
men
Arm
Han
d
Thig
h
Leg
Foot
Tem
peratu
r
Minimum
Average
Standard Deviation
Fig. 2. Average and standard deviation of the experimental results for the core (trunk/rectal) and skin (mean skin and local skin) temperatures in a thermally neutral envi-ronment. The values are averaged for both time and subjects. With respect to time,exposure from min 0 to min 30 is averaged. With respect to subjects, 17 subjects – 10subjects for schedule-1 and 7 for schedule-2 – are averaged.
28
29
30
31
32
33
34
35
36
37
38
0 30 60 90 120 150 180 210Time [min]
Tem
peratu
re [°C
]
Exp. Mean skin. (±SD)
Calculated Mean skin
Calculated, trunk core
29.4°C; 46.8%rh 29.3°C; 47.1%rh19.5°C; 52.8%rh 38.9°C;46.7%r 29.4°C; 47.1%rh
Schedule-1
n = 10 subjects
Exp.Rectal (±SD)
Fig. 3. Mean skin temperature and core temperature. Experimental results of the average and S.D. of all the subjects compared with calculated results using the original Stolwijkmodel for schedule-1.
A. Munir et al. / Building and Environment 44 (2009) 1777–17871780
The heat balance equation for the central blood compartment is
CCBdTCB
dt¼X6
i¼1
X4
j¼1
BCði; jÞ (5)
The ‘‘standard man’’ values proposed by Stolwijk [1] wereused to describe the passive system of the model for thecalculations.
3.2. Calculation conditions
The calculations were performed using the measured envi-ronmental conditions averaged for each phase of the experiments,as shown in Table 4. The convective heat-transfer coefficients (ac)and radiative heat-transfer coefficients (ar) used in these calcu-lations are given in Table 5. The initial temperatures, except forthe skin and trunk core temperatures, which were based on theexperimental data at time zero, were used as the set pointtemperatures of the nodes, and are shown in Table 6. The meanradiant temperature was assumed to be equal to the air temper-ature because the difference between the globe and air temper-ature was sufficiently small (Table 4). The clothing insulation
28
29
30
31
32
33
34
35
36
37
38
0 30 60 90
Tem
peratu
re [°C
]
29.3ºC; 47.2%rh 19.4ºC; 54.4%rh 29.3ºC; 47.4%rh
Exp.Rectal (±SD)
Calculated, trunk core
E
Time
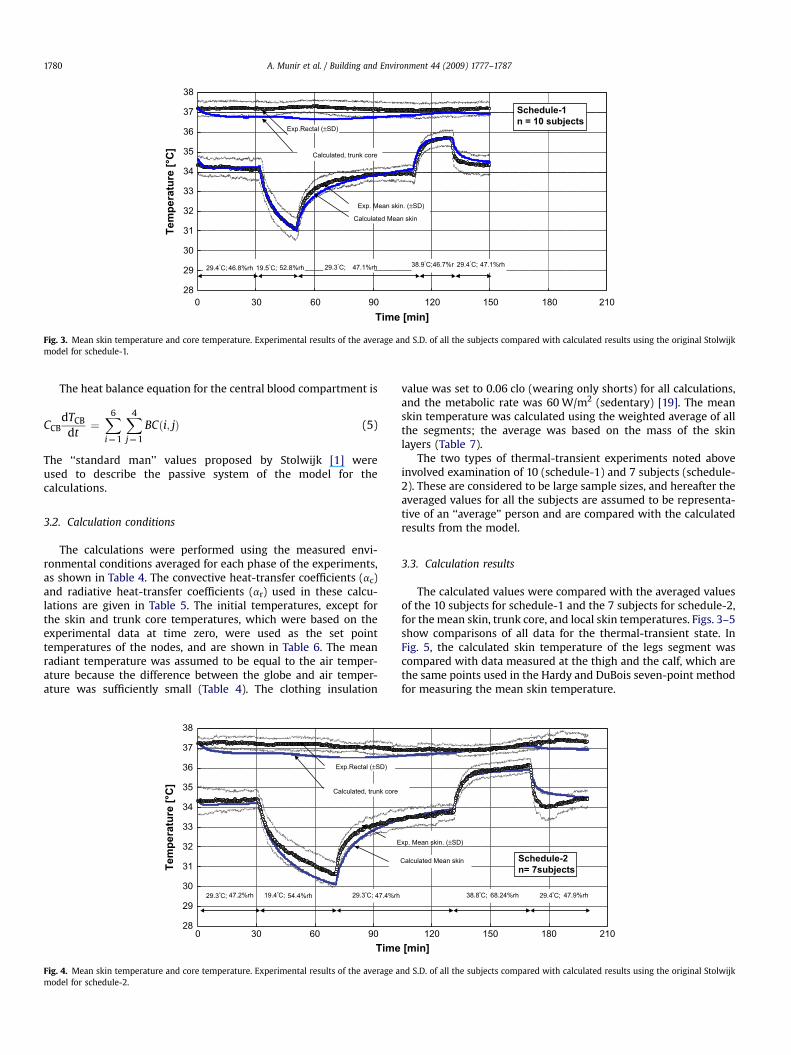
Fig. 4. Mean skin temperature and core temperature. Experimental results of the average amodel for schedule-2.
value was set to 0.06 clo (wearing only shorts) for all calculations,and the metabolic rate was 60 W/m2 (sedentary) [19]. The meanskin temperature was calculated using the weighted average of allthe segments; the average was based on the mass of the skinlayers (Table 7).
The two types of thermal-transient experiments noted aboveinvolved examination of 10 (schedule-1) and 7 subjects (schedule-2). These are considered to be large sample sizes, and hereafter theaveraged values for all the subjects are assumed to be representa-tive of an ‘‘average’’ person and are compared with the calculatedresults from the model.
3.3. Calculation results
The calculated values were compared with the averaged valuesof the 10 subjects for schedule-1 and the 7 subjects for schedule-2,for the mean skin, trunk core, and local skin temperatures. Figs. 3–5show comparisons of all data for the thermal-transient state. InFig. 5, the calculated skin temperature of the legs segment wascompared with data measured at the thigh and the calf, which arethe same points used in the Hardy and DuBois seven-point methodfor measuring the mean skin temperature.
120 150 180 210
38.8ºC; 68.24%rh 29.4ºC; 47.9%rh
Schedule-2
n= 7subjects
xp. Mean skin. (±SD)
Calculated Mean skin
[min]
nd S.D. of all the subjects compared with calculated results using the original Stolwijk
A. Munir et al. / Building and Environment 44 (2009) 1777–1787 1781
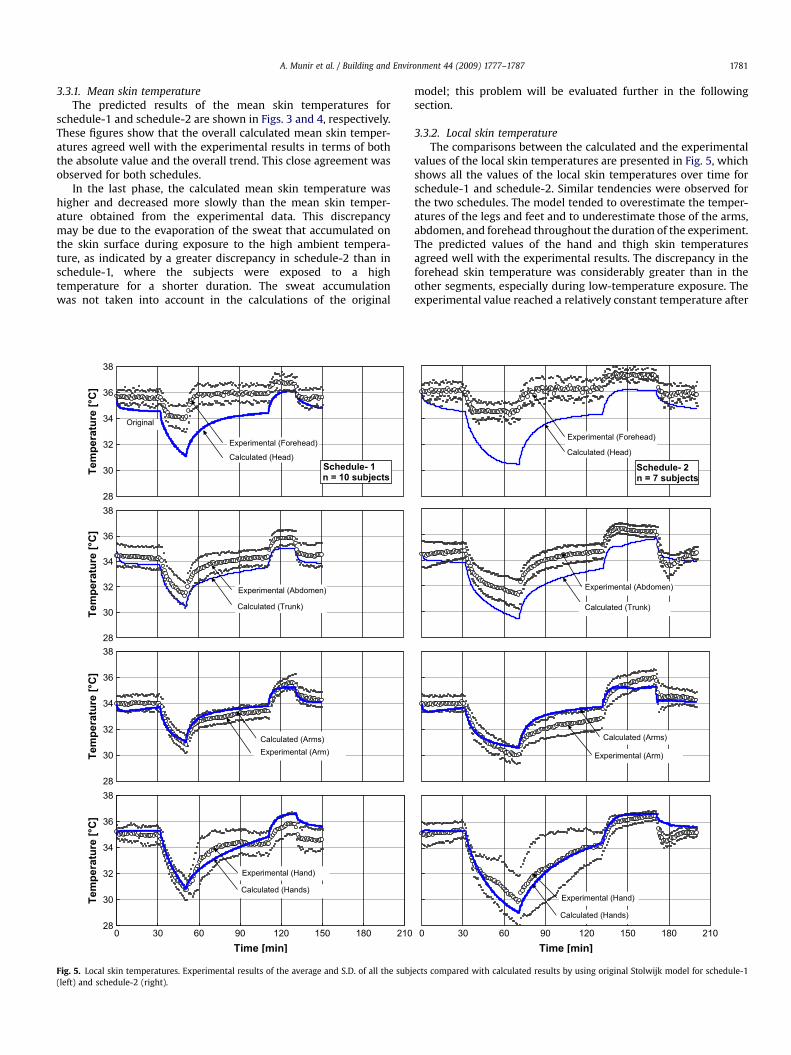
3.3.1. Mean skin temperatureThe predicted results of the mean skin temperatures for
schedule-1 and schedule-2 are shown in Figs. 3 and 4, respectively.These figures show that the overall calculated mean skin temper-atures agreed well with the experimental results in terms of boththe absolute value and the overall trend. This close agreement wasobserved for both schedules.
In the last phase, the calculated mean skin temperature washigher and decreased more slowly than the mean skin temper-ature obtained from the experimental data. This discrepancymay be due to the evaporation of the sweat that accumulated onthe skin surface during exposure to the high ambient tempera-ture, as indicated by a greater discrepancy in schedule-2 than inschedule-1, where the subjects were exposed to a hightemperature for a shorter duration. The sweat accumulationwas not taken into account in the calculations of the original
28
30
32
34
36
38
Tem
peratu
re [°C
]T
em
peratu
re [°C
]T
em
peratu
re [°C
]T
em
peratu
re [°C
]
Experimental (Forehead)
Original
Calculated (Head) Schedule- 1
n = 10 subjects
28
30
32
34
36
38
Experimental (Abdomen)
Calculated (Trunk)
28
30
32
34
36
38
Experimental (Arm)Calculated (Arms)
28
30
32
34
36
38
0 30 60 90 120 150 180 210Time [min]
Experimental (Hand)
Calculated (Hands)
Fig. 5. Local skin temperatures. Experimental results of the average and S.D. of all the subj(left) and schedule-2 (right).
model; this problem will be evaluated further in the followingsection.
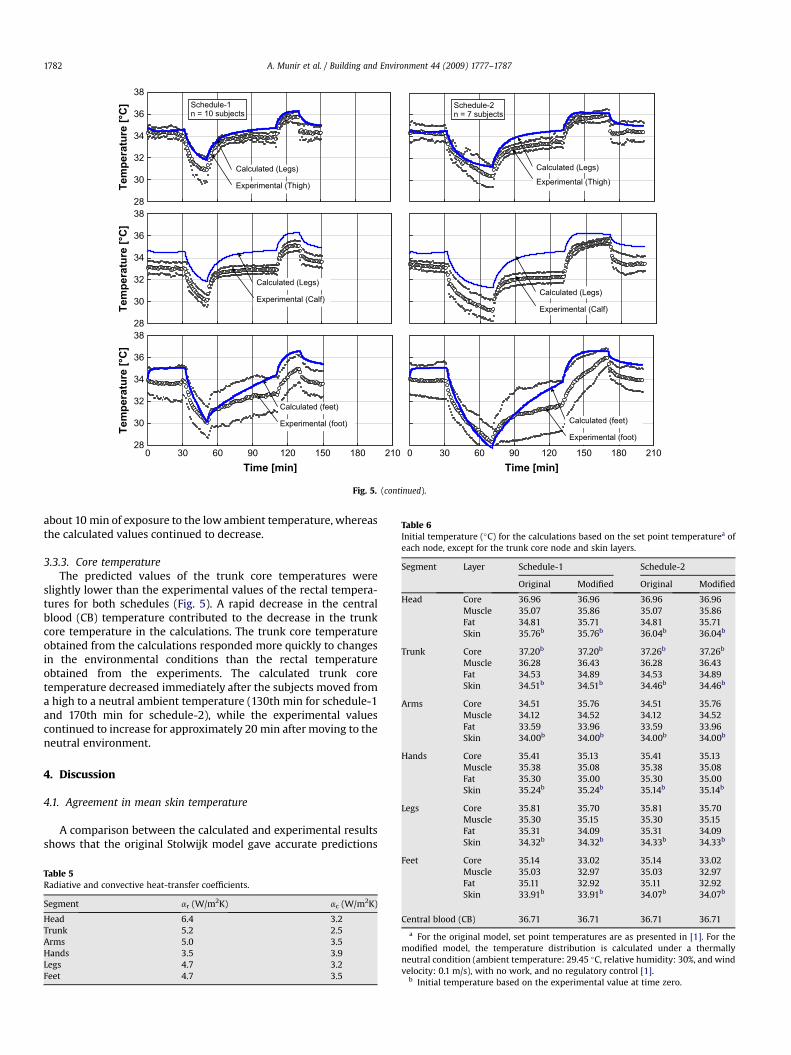
3.3.2. Local skin temperatureThe comparisons between the calculated and the experimental
values of the local skin temperatures are presented in Fig. 5, whichshows all the values of the local skin temperatures over time forschedule-1 and schedule-2. Similar tendencies were observed forthe two schedules. The model tended to overestimate the temper-atures of the legs and feet and to underestimate those of the arms,abdomen, and forehead throughout the duration of the experiment.The predicted values of the hand and thigh skin temperaturesagreed well with the experimental results. The discrepancy in theforehead skin temperature was considerably greater than in theother segments, especially during low-temperature exposure. Theexperimental value reached a relatively constant temperature after
Schedule- 2
n = 7 subjects
Experimental (Abdomen)
Calculated (Trunk)
Experimental (Arm)
Calculated (Arms)
Experimental (Hand)
Calculated (Hands)
Experimental (Forehead)
Calculated (Head)
0 30 60 90 120 150 180 210Time [min]
ects compared with calculated results by using original Stolwijk model for schedule-1
Experimental (Thigh)
Calculated (Legs)
Schedule-2n = 7 subjects
Experimental (Calf)
Calculated (Legs)
Experimental (foot)
Calculated (feet)
28
30
32
34
36
38
Experimental (Thigh)
Calculated (Legs)
Schedule-1n = 10 subjects
28
30
32
34
36
38
Experimental (Calf)
Calculated (Legs)
28
30
32
34
36
38
Experimental (foot)
Calculated (feet)
Tem
peratu
re [°C
]T
em
peratu
re [°C
]T
em
peratu
re
[°C
]
0 30 60 90 120 150 180 2100 30 60 90 120 150 180 210Time [min] Time [min]
Fig. 5. (continued).
Table 6Initial temperature (�C) for the calculations based on the set point temperaturea ofeach node, except for the trunk core node and skin layers.
Segment Layer Schedule-1 Schedule-2
Original Modified Original Modified
Head Core 36.96 36.96 36.96 36.96Muscle 35.07 35.86 35.07 35.86Fat 34.81 35.71 34.81 35.71Skin 35.76b 35.76b 36.04b 36.04b
Trunk Core 37.20b 37.20b 37.26b 37.26b
Muscle 36.28 36.43 36.28 36.43Fat 34.53 34.89 34.53 34.89Skin 34.51b 34.51b 34.46b 34.46b
Arms Core 34.51 35.76 34.51 35.76Muscle 34.12 34.52 34.12 34.52Fat 33.59 33.96 33.59 33.96Skin 34.00b 34.00b 34.00b 34.00b
Hands Core 35.41 35.13 35.41 35.13Muscle 35.38 35.08 35.38 35.08Fat 35.30 35.00 35.30 35.00Skin 35.24b 35.24b 35.14b 35.14b
Legs Core 35.81 35.70 35.81 35.70Muscle 35.30 35.15 35.30 35.15Fat 35.31 34.09 35.31 34.09Skin 34.32b 34.32b 34.33b 34.33b
A. Munir et al. / Building and Environment 44 (2009) 1777–17871782
about 10 min of exposure to the low ambient temperature, whereasthe calculated values continued to decrease.
3.3.3. Core temperatureThe predicted values of the trunk core temperatures were
slightly lower than the experimental values of the rectal tempera-tures for both schedules (Fig. 5). A rapid decrease in the centralblood (CB) temperature contributed to the decrease in the trunkcore temperature in the calculations. The trunk core temperatureobtained from the calculations responded more quickly to changesin the environmental conditions than the rectal temperatureobtained from the experiments. The calculated trunk coretemperature decreased immediately after the subjects moved froma high to a neutral ambient temperature (130th min for schedule-1and 170th min for schedule-2), while the experimental valuescontinued to increase for approximately 20 min after moving to theneutral environment.
4. Discussion
4.1. Agreement in mean skin temperature
A comparison between the calculated and experimental resultsshows that the original Stolwijk model gave accurate predictions
Table 5Radiative and convective heat-transfer coefficients.
Segment ar (W/m2K) ac (W/m2K)
Head 6.4 3.2Trunk 5.2 2.5Arms 5.0 3.5Hands 3.5 3.9Legs 4.7 3.2Feet 4.7 3.5
Feet Core 35.14 33.02 35.14 33.02Muscle 35.03 32.97 35.03 32.97Fat 35.11 32.92 35.11 32.92Skin 33.91b 33.91b 34.07b 34.07b
Central blood (CB) 36.71 36.71 36.71 36.71
a For the original model, set point temperatures are as presented in [1]. For themodified model, the temperature distribution is calculated under a thermallyneutral condition (ambient temperature: 29.45 �C, relative humidity: 30%, and windvelocity: 0.1 m/s), with no work, and no regulatory control [1].
b Initial temperature based on the experimental value at time zero.
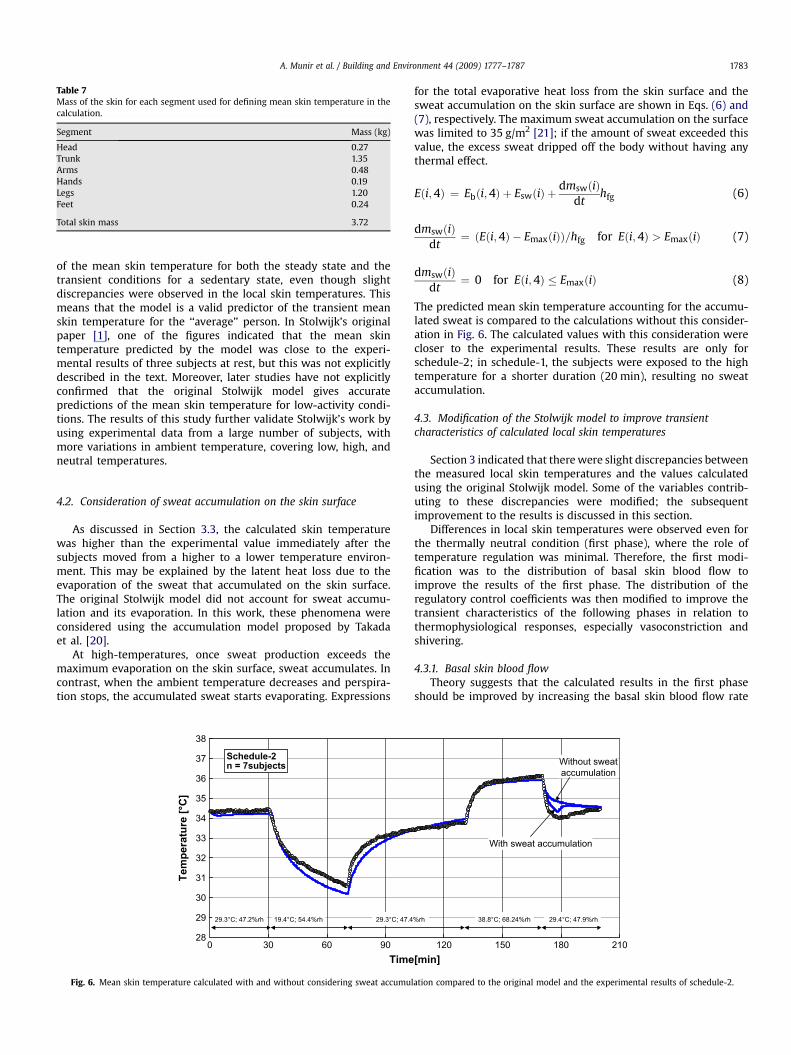
Table 7Mass of the skin for each segment used for defining mean skin temperature in thecalculation.
Segment Mass (kg)
Head 0.27Trunk 1.35Arms 0.48Hands 0.19Legs 1.20Feet 0.24
Total skin mass 3.72
A. Munir et al. / Building and Environment 44 (2009) 1777–1787 1783
of the mean skin temperature for both the steady state and thetransient conditions for a sedentary state, even though slightdiscrepancies were observed in the local skin temperatures. Thismeans that the model is a valid predictor of the transient meanskin temperature for the ‘‘average’’ person. In Stolwijk’s originalpaper [1], one of the figures indicated that the mean skintemperature predicted by the model was close to the experi-mental results of three subjects at rest, but this was not explicitlydescribed in the text. Moreover, later studies have not explicitlyconfirmed that the original Stolwijk model gives accuratepredictions of the mean skin temperature for low-activity condi-tions. The results of this study further validate Stolwijk’s work byusing experimental data from a large number of subjects, withmore variations in ambient temperature, covering low, high, andneutral temperatures.
4.2. Consideration of sweat accumulation on the skin surface
As discussed in Section 3.3, the calculated skin temperaturewas higher than the experimental value immediately after thesubjects moved from a higher to a lower temperature environ-ment. This may be explained by the latent heat loss due to theevaporation of the sweat that accumulated on the skin surface.The original Stolwijk model did not account for sweat accumu-lation and its evaporation. In this work, these phenomena wereconsidered using the accumulation model proposed by Takadaet al. [20].
At high-temperatures, once sweat production exceeds themaximum evaporation on the skin surface, sweat accumulates. Incontrast, when the ambient temperature decreases and perspira-tion stops, the accumulated sweat starts evaporating. Expressions
28
29
30
31
32
33
34
35
36
37
38
0 30 60 90Time
29.3°C; 47.2%rh 19.4°C; 54.4%rh 29.3°C; 47.4
Schedule-2
n = 7subjects
Tem
peratu
re [°C
]
Fig. 6. Mean skin temperature calculated with and without considering sweat accumul
for the total evaporative heat loss from the skin surface and thesweat accumulation on the skin surface are shown in Eqs. (6) and(7), respectively. The maximum sweat accumulation on the surfacewas limited to 35 g/m2 [21]; if the amount of sweat exceeded thisvalue, the excess sweat dripped off the body without having anythermal effect.
Eði;4Þ ¼ Ebði;4Þ þ EswðiÞ þdmswðiÞ
dthfg (6)
dmswðiÞdt
¼ ðEði;4Þ � EmaxðiÞÞ=hfg for Eði;4Þ > EmaxðiÞ (7)
dmswðiÞdt
¼ 0 for Eði;4Þ � EmaxðiÞ (8)
The predicted mean skin temperature accounting for the accumu-lated sweat is compared to the calculations without this consider-ation in Fig. 6. The calculated values with this consideration werecloser to the experimental results. These results are only forschedule-2; in schedule-1, the subjects were exposed to the hightemperature for a shorter duration (20 min), resulting no sweataccumulation.
4.3. Modification of the Stolwijk model to improve transientcharacteristics of calculated local skin temperatures
Section 3 indicated that there were slight discrepancies betweenthe measured local skin temperatures and the values calculatedusing the original Stolwijk model. Some of the variables contrib-uting to these discrepancies were modified; the subsequentimprovement to the results is discussed in this section.
Differences in local skin temperatures were observed even forthe thermally neutral condition (first phase), where the role oftemperature regulation was minimal. Therefore, the first modi-fication was to the distribution of basal skin blood flow toimprove the results of the first phase. The distribution of theregulatory control coefficients was then modified to improve thetransient characteristics of the following phases in relation tothermophysiological responses, especially vasoconstriction andshivering.
4.3.1. Basal skin blood flowTheory suggests that the calculated results in the first phase
should be improved by increasing the basal skin blood flow rate
120 150 180 210[min]
Without sweataccumulation
With sweat accumulation
%rh 38.8°C; 68.24%rh 29.4°C; 47.9%rh
ation compared to the original model and the experimental results of schedule-2.
Table 8Skin blood flow distribution according to the Stolwijk and Fiala models.
Segment Skin blood flow in Stolwijkmodel (L/h)
Skin blood flow in Fialamodel (L/h)
Head 1.44 4.54a
Trunk 2.10 3.88b
Arms 0.50 1.10Hands 2.00 1.50Legs 2.85 1.79Feet 3.00 0.66
Total SkBF 12.22 13.49Total COc 285.13 294.00
a Combined values of the head and the face segments.b Combined values of the neck, shoulders, thorax, and abdomen segments.c CO: cardiac output, total blood flow of all the 24 nodes.
A. Munir et al. / Building and Environment 44 (2009) 1777–17871784
to the segments that had calculated local skin temperaturevalues that were lower than the experimental values and viceversa. For this adjustment, we kept the total skin blood flow inthe entire body constant. Thus, the basal skin blood flow wasincreased for the head and the trunk, but decreased for the legsand feet.
The abovementioned improvement methods are supported bythe values that were proposed in the Fiala model [2], wherein thebasal skin blood flow is higher for the head segment and lower forthe feet than the values proposed in the Stolwijk model. Acomparison of the basal skin blood flow rates between the modelsis presented in Table 8. Since the Fiala model considered approxi-mately the same body size (1.86 m2) as the Stolwijk model(1.89 m2), the value of the skin blood flow rate in the Fiala model isapplicable to the Stolwijk model.
The calculated results of local skin temperatures after modifi-cation of the basal skin blood flow using Fiala’s values (Table 8)are shown in Figs. 7–10. Fig. 7 shows that there is little changeto the mean skin temperature as a result of this modification,and that the local skin temperatures improved significantly forthe neutral first phase and steady state environments, as well asfor all other exposure phases. Figs. 9 and 10 show the sametendency for all the characteristics, as shown by the root meansquare deviation (RMSD) value. The calculation of head skintemperature was considerably improved. The other segmentcalculations (abdomen, thigh, calf, and foot) also showed greateragreement with the experimental values. As a whole, this modifi-cation yields a significant improvement for the calculated local skintemperatures.
Exp.
Modified-1Modified-2
Original
29.3°C47.2%rh
29.3°C47.2%
29.3°C47.2%rh
29.3°C47.2%rh
29.3°C47.2%rh
Schedule-1
n = 10 subjects
Mean Skin Temperature
0 30 60 90 120 150 180 210Time [min]
2829303132333435363738
Tem
peratu
re [°C
]
Fig. 7. Mean skin temperature. Experimental results of the average of all the subjects comparschedule-1 (left) and schedule-2 (right). (Original: original Stolwijk model without modificafor both the distribution of basal skin blood flow and that of vasoconstriction and workloconsidered.)
4.3.2. Distribution coefficients of vasoconstriction and workloadThe element related to local vasoconstriction in the Stolwijk
model was modified in order to improve model performance fortransient states, and especially for low-temperature exposure.Furthermore, to allow the higher skin blood flow in the head andthe trunk segments to increase the local skin temperature in thelow-temperature phase, it is suggested that the vasoconstrictiondistribution coefficient of these segments should be reduced, whilethe distribution in the leg and the feet segments should beincreased. With respect to the coefficients of workload distribution(WORKM) for sedentary activity, as utilized in the experiments, thedistribution in the leg muscle should be lower than the coefficientassigned for exercise activity, but higher for the trunk muscle layer.Stolwijk proposed the value of WORKM on the basis of the esti-mation for bicycle exercise.
The abovementioned methods for improving the model arealso supported by the values proposed in the Fiala model [3], asshown in Table 9. The values of the local skin temperatures calcu-lated by modifying both the skin blood flow distribution, as shownpreviously, and the distribution coefficient of workload andvasoconstriction using Fiala’s values in Table 9 are presented in Figs.7–10.
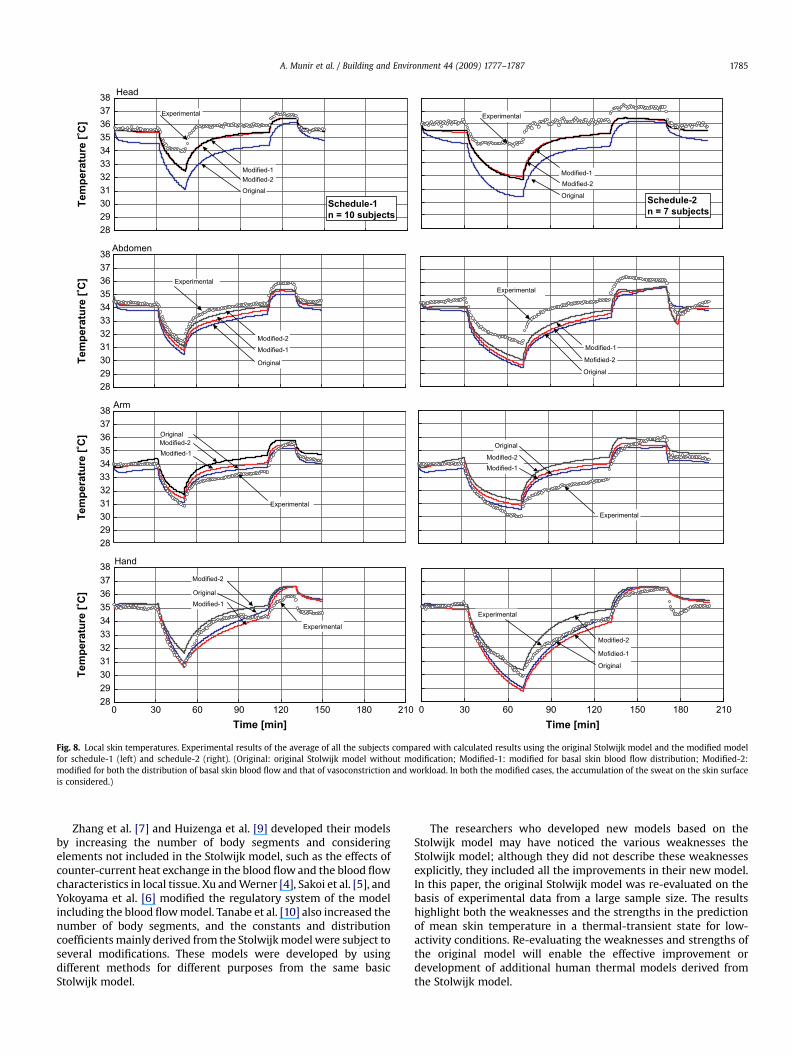
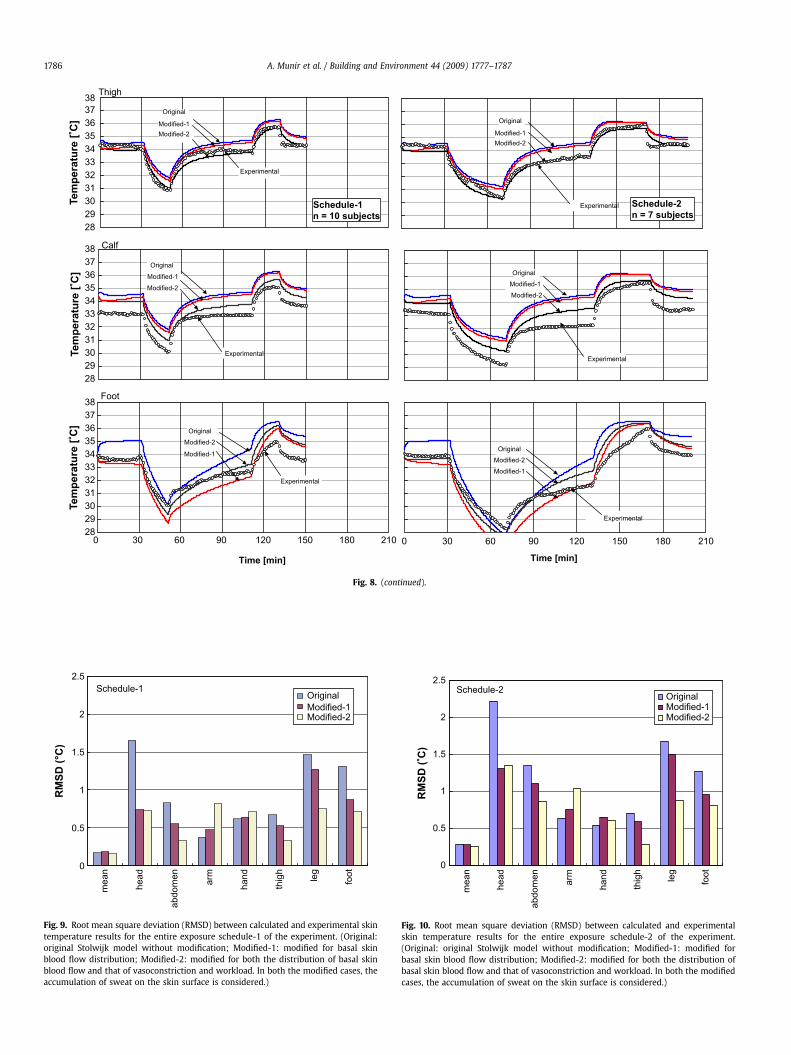
The predicted values of the local skin temperatureswere improved for the abdomen, thigh, leg, and foot segments(Figs. 8–10), though the arm and hand segments show morediscrepancies, particularly in the transient state conditions (Fig. 8).However, the mean skin temperatures remained relatively constantafter this modification, as shown in Fig. 7.
4.4. Approaches for the improvement of the original Stolwijk model
Fiala et al. [2,3] completely modified and developed the multi-node thermal model for both passive and active systems on thebasis of statistical approaches with available data. The improve-ments were focused on thermoregulatory control systems thatessentially influence the responses of the entire body. Furthermore,some segmental distribution variables were also assigned differ-ently from those in the Stolwijk model. However, the degree ofimprovement due to the modification was not evaluated becauseFiala et al. presented their work as the ‘‘development of a newmodel,’’ and not as the ‘‘modification of the Stolwijk model.’’ This isalso true of the studies by Xu and Werner [4], Sakoi et al. [5],Yokoyama et al. [6], Zhang et al. [7], Huizenga et al. [9], and Tanabeet al. [10].
19.4°C54.4%rh
29.3°C47.4%rh
38.8°C68.24%rh
29.4°C47.9%rh
Experimental
Original
Modified-1Modified-2
29.3°C47.2%rh
Schedule-1
n = 7 subjects
0 30 60 90 120 150 180 210Time [min]
ed with calculated results using the original Stolwijk model and the modified model fortion; Modified-1: modified for basal skin blood flow distribution; Modified-2: modifiedad. In both the modified cases, the accumulation of the sweat on the skin surface is
Experimental
Modified-1Modified-2
OriginalSchedule-2
n = 7 subjects
2829303132333435363738
Temp
erat
ure
] Experimental
Modified-1
Original
38
Experimental
Modified-1Modified-2
Original
2829303132333435363738
0 30 60 90 120 150 180 210
Temp
erat
ure
]
Experimental
Modified-2
Mofidied-1
Original
2829303132333435363738
0 30 60 90 120 150 180 210
Time[min]
Head
Experimental
Modified-1Modified-2Original
Schedule-1
n = 10 subjects
2829303132333435363738 Abdomen
Experimental
Modified-2Modified-1
Original
29303132333435363738
0 30 60 90 120 150 180Time[min]
Experimental
Modified-1Modified-2Original
2829303132333435363738
0 30 60 90 120 150 180 210Time [min] Time [min]
Hand
Experimental
Modified-1
Modified-2
Original
Tem
peratu
re [°C
]T
em
peratu
re [°C
]T
em
peratu
re [°C
]T
em
peratu
re [°C
]
Arm
28
Mofidied-2
Fig. 8. Local skin temperatures. Experimental results of the average of all the subjects compared with calculated results using the original Stolwijk model and the modified modelfor schedule-1 (left) and schedule-2 (right). (Original: original Stolwijk model without modification; Modified-1: modified for basal skin blood flow distribution; Modified-2:modified for both the distribution of basal skin blood flow and that of vasoconstriction and workload. In both the modified cases, the accumulation of the sweat on the skin surfaceis considered.)
A. Munir et al. / Building and Environment 44 (2009) 1777–1787 1785
Zhang et al. [7] and Huizenga et al. [9] developed their modelsby increasing the number of body segments and consideringelements not included in the Stolwijk model, such as the effects ofcounter-current heat exchange in the blood flow and the blood flowcharacteristics in local tissue. Xu and Werner [4], Sakoi et al. [5], andYokoyama et al. [6] modified the regulatory system of the modelincluding the blood flow model. Tanabe et al. [10] also increased thenumber of body segments, and the constants and distributioncoefficients mainly derived from the Stolwijk model were subject toseveral modifications. These models were developed by usingdifferent methods for different purposes from the same basicStolwijk model.
The researchers who developed new models based on theStolwijk model may have noticed the various weaknesses theStolwijk model; although they did not describe these weaknessesexplicitly, they included all the improvements in their new model.In this paper, the original Stolwijk model was re-evaluated on thebasis of experimental data from a large sample size. The resultshighlight both the weaknesses and the strengths in the predictionof mean skin temperature in a thermal-transient state for low-activity conditions. Re-evaluating the weaknesses and strengths ofthe original model will enable the effective improvement ordevelopment of additional human thermal models derived fromthe Stolwijk model.
Experimental Schedule-2
n = 7 subjects
Experimental
Modified-1Modified-2
Original
0 30 60 90 120 150 180 210
Time [min]Time [min]
Experimental
Modified-1Modified-2
Original
2829303132333435363738 Thigh
Experimental
Modified-1Modified-2
Original
Schedule-1
n = 10 subjects
2829303132333435363738 Calf
Experimental
Modified-1
Modified-2
Original
2829303132333435363738
0 30 60 90 120 150 180 210
Foot
Experimental
Modified-2Original
Modified-1Modified-2
Original
Modified-1
Tem
peratu
re [°C
]Tem
peratu
re [°C
]Tem
peratu
re [°C
]
Fig. 8. (continued).
0
0.5
1
1.5
2
2.5
mea
n
head
abdo
men arm
hand
thig
h
leg
foot
RM
SD
(°C
)
OriginalModified-1Modified-2
Schedule-1
Fig. 9. Root mean square deviation (RMSD) between calculated and experimental skintemperature results for the entire exposure schedule-1 of the experiment. (Original:original Stolwijk model without modification; Modified-1: modified for basal skinblood flow distribution; Modified-2: modified for both the distribution of basal skinblood flow and that of vasoconstriction and workload. In both the modified cases, theaccumulation of sweat on the skin surface is considered.)
0
0.5
1
1.5
2
2.5
mea
n
head
abdo
men arm
hand
thig
h
leg
foot
RM
SD
(°C
)
Schedule-2OriginalModified-1Modified-2
Fig. 10. Root mean square deviation (RMSD) between calculated and experimentalskin temperature results for the entire exposure schedule-2 of the experiment.(Original: original Stolwijk model without modification; Modified-1: modified forbasal skin blood flow distribution; Modified-2: modified for both the distribution ofbasal skin blood flow and that of vasoconstriction and workload. In both the modifiedcases, the accumulation of sweat on the skin surface is considered.)
A. Munir et al. / Building and Environment 44 (2009) 1777–17871786
Table 9Distribution coefficients of vasoconstriction (SKINC) and workload (WORKM) for theStolwijk and Fiala models.
SKINC WORKM
Stolwijk Fiala Stolwijk Fiala
Head 0.05 0.06a 0.00 0.00Trunk 0.15 0.06b 0.30 0.66b
Arms 0.05 0.19 0.08 0.19Hands 0.35 0.11 0.01 0.02Legs 0.05 0.20 0.60 0.11Feet 0.35 0.38 0.01 0.02
a Combined values of the head and the face segments.b Combined values of the neck, shoulders, thorax, and abdomen segments.
A. Munir et al. / Building and Environment 44 (2009) 1777–1787 1787
5. Conclusion
The characteristics of the multi-segmented human thermalmodel (Stolwijk’s 25-node model) were evaluated using skintemperature measurements at low activity in transient environ-ments by comparing the results of two series of experiments,involving 10 and 7 subjects. The subjects were exposed to step-wise changes in environmental conditions, including neutral, low,and high ambient temperatures. It is concluded that the originalStolwijk model accurately predicts the absolute value of and thetendency of the transient mean skin temperature. This suggeststhat the original Stolwijk model is valid for the prediction of thetransient mean skin temperature of an ‘‘average’’ person in low-activity conditions. Some body segments showed deviations ofthe local skin temperature. Modification of the distribution of thebasal skin blood flow and the distributions of vasoconstrictionand workload significantly improved the predicted results both atthe thermally neutral condition and for thermal-transientconditions.
Acknowledgments
The experiments were conducted at the Techno-amenity Labo-ratory of the Katsura-Int’tech Center, Graduate School of Engi-neering, Kyoto University.
This research was partially supported by the Ministry ofEducation, Science, Sports and Culture, Grant-in-Aid for YoungScientists (A), 17686050, 2005–2007.
The authors would like to express their sinceregratitude to Mr. Hiroaki Kobayashi for his cooperation in theexperiments.
References
[1] Stolwijk JAJ. A mathematical model of physiological temperature regulation inman, NASA-Langley, CR-1855; 1971.
[2] Fiala D, Lomas KJ, Stohrer M. A computer model of human thermoregulationfor a wide range of environmental conditions: the passive system. J ApplPhysiol 1999;87:1957–72.
[3] Fiala D, Lomas KJ, Stohrer M. Computer prediction of human thermoregulatoryand temperature responses to a wide range of environmental conditions. Int JBiometeorol 2001;45:143–59.
[4] Xu X, Werner J. A dynamic model of the human/clothing/environment-system.Appl Human Sci 1997;16(2):61–75.
[5] Sakoi T, Tsuzuki K, Kato S, Ooka R, Song D, Zhu S. Development of a three-dimen-sional human thermal model accounting for direction of blood flow. The thirdinternational conference on human–environment system 2005, Tokyo, Japan.
[6] Yokoyama S, Tao M, Kakuta N. Prediction computer program for whole bodytemperatures and its application under various working level and thermalenvironmental condition combinations. Industr Health 2007;45:118–24.
[7] Zhang H, Huizenga C, Arens E, Yu T. Considering individual physiologicaldifferences in a human thermal model. J Therm Biol 2001;26:401–8.
[8] Takada S, Kobayashi H, Matsushita T. Thermal model of human body fittedwith individual characteristics of body temperature regulation. Build Environ2009;44:463–70.
[9] Huizenga C, Hui Z, Arens E. A model of human physiology andcomfort for assessing complex thermal environments. Build Environ 2001;36(6):691–9.
[10] Tanabe S, Kobayashi K, Nakano J, Ozeki Y, Konishi M. Evaluation ofthermal comfort using combined multi-node thermoregulation (65MN) andradiation models and computational fluid dynamics (CFD). Energy Build2002;34:637–46.
[11] Castellani JW, O’Brien C, Tikuisis P, Sils IV, Xu X. Evaluation of two cold ther-moregulatory models for prediction of core temperature during exercise incold water. J Appl Physiol 2007;103:2034–41.
[12] Gagge AP, Stolwijk JAJ, Nishi Y. An effective temperature scale based ona simple model of human physiological regulatory response. ASHRAE Trans1971;77:247–62.
[13] Zhang H, Huizenga C, Arens E, Yu T. Modeling thermal comfort in stratifiedenvironments. In: Proceedings of the indoor air 2005: 10th Internationalconference on indoor air quality and climate, Beijing, China; 2005.
[14] Xue H, Kang ZJ, Bong TY. Coupling of three-dimensional field and humanthermoregulatory models in crowded enclosure. Numer Heat Transf A1999;36:601–13.
[15] Zhu S, Kato S, Ooka R, Sakoi T, Tsuzuki K. Development of a computationalthermal manikin applicable in a non-uniform thermal environment – part 2:couples simulation using Sakoi’s human thermal physiological model. HVAC &R Res 2008;14(4):545–64.
[16] Gao N, Niu J, Zhang H. Coupling CFD and human body thermoregulationmodel for the assessment of personalize ventilation. HVAC&R Res2006;12(3):497–518.
[17] Atmaca I, Kaynakli O, Yigit A. Effects of radiant temperature on thermalcomfort. Build Environ 2007;42:3210–20.
[18] Kaynakli O, Kilic M. Investigation of indoor thermal comfort under transientconditions. Build Environ 2005;40:165–74.
[19] ASHRAE handbook fundamentals. Atlanta: American Society of Heating,Refrigerating and Air-Conditioning Engineers; 2005. Chapter 8.
[20] Takada S, Hokoi S, Kawakami N, Kudo M. Thermophysiological responses ofhuman body in non-steady state considering influence of transfer and storageof heat and moisture in and around clothing. J Archit Plann Environ Eng ArchInst Jpn 2001;549:23–30 (in Japanese, with English abstract).
[21] Jones BW, Ogawa Y. Transient interaction between the human and the thermalenvironment. ASHRAE Trans 1992;98(1):189–95.


![Thermal [4 + 2] Cycloadditions of 3Acetyl, 3Carbamoyl, and 3-Ethoxycarbonyl-Coumarins with 2,3Dimethyl1,3-butadiene under Solventless Conditions: A Structural Study](https://static.fdokumen.com/doc/165x107/631436e25cba183dbf077646/thermal-4-2-cycloadditions-of-3acetyl-3carbamoyl-and-3-ethoxycarbonyl-coumarins.jpg)