REDUCTION OF p-NITROPHENOL TO p-AMINOPHENOL ... - REAL-J
37
Reduction of p-nitrophenol by using NiO catalysts Section A-Research paper Eur. Chem. Bull. 2019, 8(2), 34-37 DOI: 10.17628/ecb.2019.8.34-37 34 REDUCTION OF p-NITROPHENOL TO p-AMINOPHENOL BY USING NiO CATALYSTS: A COMPARATIVE STUDY R. S. Sutar, [a] R. P. Barkul [a] and M. K. Patil [a]* Keywords: nickel oxide; p-nitrophenol reduction; sodium dodecyl sulfate; p-aminophenol. Different nickel oxide catalysts have been prepared by simple precipitation method using different nickel precursors and using surfactant sodium dodecyl sulfate (SDS) or without surfactant. The prepared catalysts have been characterized by using XRD and FT-IR. The particle sizes have been calculated by using the Scherrer equation. The nickel oxide catalyst prepared by using nickel acetate as precursor and surfactant SDS has shown less particle size as compared to other catalysts prepared by using other precursors. Also, nickel oxide catalyst prepared using nickel acetate precursor and surfactant SDS has shown higher catalytic activity for reduction of p-nitrophenol (PNP) to p- aminophenol (PAP) using sodium borohydride (NaBH4). Also, for the said reaction effect of concentration of p-nitrophenol on catalytic efficiency has been studied. * Corresponding Authors E-Mail: [email protected] [a] Department of Chemistry, Dr. Babasaheb Ambedkar Marathwada University, Aurangabad, Sub-campus Osmanabad- 413 501, MS, India Introduction Countless chemical protocols have been depended upon the catalysis, and the catalysts play a crucial role in the production and manufacture of chemicals and materials because catalytic reactions generally occur under milder conditions compared to the noncatalytic reactions. 1,2,3 The use of heterogeneous catalysts is one of the best attractive alternatives for synthetic strategies and adopted by organic chemists for increasing the efficiency of a wide range of organic reactions. 4 Recently, transition metal oxides as catalysts are to tailor and design according to their sizes, structure in nanodimensions and therefore their surface chemistry and catalytic properties. 5-9 An increasing number of illustrations are accessible in the literature where nickel-based nanoparticles have been used as catalysts during organic transformations. 10,11 Nickel oxide (NiO) is a p-type semiconductor material with magnetic power and wide band-gap energy (3.6-4.0 eV). It has been exploited in many different areas such as gas sensing, biomedicinal, electrochemical, supercapacitors, photovoltaic devices, memory storage, fuel cells, conducting materials, and electrode materials. 12 Also, NiO nanoparticles have been used as heterogeneous catalysts for various organic transformations. 13-16 The nanoparticulate NiO catalysts have shown an edge over the bulk NiO catalysts since they have a higher surface to volume ratios. 17 NiO nanoparticles have been synthesized by various routes such as chemical precipitation method, microemulsion, electron spray synthesis, laser ablation, and hydrothermal method. 18,19 Arylamines are useful raw materials for several industries such as for the synthesizing rubbers, paints, plastics and pharmaceutically significant value-added products. The wide commercial use of arylamines has led to the improvement of new and efficient protocols for the reduction of nitroarenes. The reduction of nitroarenes with sodium borohydride is one of the most simple, cleanest and most accepted methods, but the very slow hydrolysis of sodium borohydride makes this method unusable 20,21 until some catalyst is used. In this work, we have been prepared NiO nanomaterials by simple precipitation method (with and without surfactant) using two different precursors (nickel acetate and nickel nitrate). Prepared catalysts were characterized by XRD, FT- IR and applied for catalytic reduction of p-nitrophenol to p- aminophenol.es: Experimental The main starting materials were nickel(II) acetate, nickel(II) nitrate hexahydrate, sodium hydroxide (NaOH), sodium dodecyl sulfate (SDS) and ethanol, all of them were analytical grade and purchased from Kemphasol and Sigma- Aldrich. These chemicals were used as received without further purification. Synthesis of NiO nanoparticles In this preparation, we have prepared two separate solutions; a solution of 16.65 g of nickel acetate in 83.25 mL of deionized water, and a solution of 10 g sodium hydroxide in 250 ml of deionized water. Amount of 6.34 g of surfactant sodium dodecyl sulfate has been added to above-mentioned nickel acetate solution with continuous stirring. Next, the prepared sodium hydroxide solution was added dropwise with constant stirring to the solution of nickel acetate and surfactant. The mixed solution was stirred by a magnetic stirrer at room temperature for 1 h. The resultant light-green solution was kept at room temperature for settle down. The formed precipitate was then filtered, washed with deionized water several times and dried at 50ºC for 24 hours. Finally, the obtained powder has been calcined at 500ºC for 4 hrs. The
-
Upload
khangminh22 -
Category
Documents
-
view
2 -
download
0
Transcript of REDUCTION OF p-NITROPHENOL TO p-AMINOPHENOL ... - REAL-J
Reduction of p-nitrophenol by using NiO catalysts Section A-Research paper
Eur. Chem. Bull. 2019, 8(2), 34-37 DOI: 10.17628/ecb.2019.8.34-37 34
REDUCTION OF p-NITROPHENOL TO p-AMINOPHENOL BY
USING NiO CATALYSTS: A COMPARATIVE STUDY
R. S. Sutar,[a] R. P. Barkul[a] and M. K. Patil[a]*
Keywords: nickel oxide; p-nitrophenol reduction; sodium dodecyl sulfate; p-aminophenol.
Different nickel oxide catalysts have been prepared by simple precipitation method using different nickel precursors and using surfactant
sodium dodecyl sulfate (SDS) or without surfactant. The prepared catalysts have been characterized by using XRD and FT-IR. The particle
sizes have been calculated by using the Scherrer equation. The nickel oxide catalyst prepared by using nickel acetate as precursor and
surfactant SDS has shown less particle size as compared to other catalysts prepared by using other precursors. Also, nickel oxide catalyst
prepared using nickel acetate precursor and surfactant SDS has shown higher catalytic activity for reduction of p-nitrophenol (PNP) to p-
aminophenol (PAP) using sodium borohydride (NaBH4). Also, for the said reaction effect of concentration of p-nitrophenol on catalytic
efficiency has been studied.
* Corresponding Authors
E-Mail: [email protected] [a] Department of Chemistry, Dr. Babasaheb Ambedkar
Marathwada University, Aurangabad, Sub-campus Osmanabad- 413 501, MS, India
Introduction
Countless chemical protocols have been depended upon the catalysis, and the catalysts play a crucial role in the production and manufacture of chemicals and materials because catalytic reactions generally occur under milder conditions compared to the noncatalytic reactions.1,2,3 The use of heterogeneous catalysts is one of the best attractive alternatives for synthetic strategies and adopted by organic chemists for increasing the efficiency of a wide range of organic reactions.4
Recently, transition metal oxides as catalysts are to tailor and design according to their sizes, structure in nanodimensions and therefore their surface chemistry and catalytic properties.5-9 An increasing number of illustrations are accessible in the literature where nickel-based nanoparticles have been used as catalysts during organic transformations.10,11
Nickel oxide (NiO) is a p-type semiconductor material with magnetic power and wide band-gap energy (3.6-4.0 eV). It has been exploited in many different areas such as gas sensing, biomedicinal, electrochemical, supercapacitors, photovoltaic devices, memory storage, fuel cells, conducting materials, and electrode materials.12 Also, NiO nanoparticles have been used as heterogeneous catalysts for various organic transformations.13-16 The nanoparticulate NiO catalysts have shown an edge over the bulk NiO catalysts since they have a higher surface to volume ratios.17 NiO nanoparticles have been synthesized by various routes such as chemical precipitation method, microemulsion, electron spray synthesis, laser ablation, and hydrothermal method.18,19
Arylamines are useful raw materials for several industries such as for the synthesizing rubbers, paints, plastics and
pharmaceutically significant value-added products. The wide commercial use of arylamines has led to the improvement of new and efficient protocols for the reduction of nitroarenes. The reduction of nitroarenes with sodium borohydride is one of the most simple, cleanest and most accepted methods, but the very slow hydrolysis of sodium borohydride makes this method unusable20,21 until some catalyst is used.
In this work, we have been prepared NiO nanomaterials by simple precipitation method (with and without surfactant) using two different precursors (nickel acetate and nickel nitrate). Prepared catalysts were characterized by XRD, FT-IR and applied for catalytic reduction of p-nitrophenol to p-aminophenol.es:
Experimental
The main starting materials were nickel(II) acetate, nickel(II) nitrate hexahydrate, sodium hydroxide (NaOH), sodium dodecyl sulfate (SDS) and ethanol, all of them were analytical grade and purchased from Kemphasol and Sigma-Aldrich. These chemicals were used as received without further purification.
Synthesis of NiO nanoparticles
In this preparation, we have prepared two separate solutions; a solution of 16.65 g of nickel acetate in 83.25 mL of deionized water, and a solution of 10 g sodium hydroxide in 250 ml of deionized water. Amount of 6.34 g of surfactant sodium dodecyl sulfate has been added to above-mentioned nickel acetate solution with continuous stirring. Next, the prepared sodium hydroxide solution was added dropwise with constant stirring to the solution of nickel acetate and surfactant. The mixed solution was stirred by a magnetic stirrer at room temperature for 1 h. The resultant light-green solution was kept at room temperature for settle down. The formed precipitate was then filtered, washed with deionized water several times and dried at 50ºC for 24 hours. Finally, the obtained powder has been calcined at 500ºC for 4 hrs. The
Reduction of p-nitrophenol by using NiO catalysts Section A-Research paper
Eur. Chem. Bull. 2019, 8(2), 34-37 DOI: 10.17628/ecb.2019.8.34-37 35
catalyst is abbreviated as NiAC-SDS. By adopting a similar protocol, we have synthesized NiO nanoparticles by using nickel acetate as precursor without using surfactant and abbreviated as NiAC. Furthermore, we have prepared NiO nanoparticles by using nickel nitrate as a precursor, SDS as a surfactant and without surfactant. These catalysts are abbreviated as NiNT-SDS and NiNT respectively.
Characterization
X-ray diffraction analysis of prepared catalysts has been carried using X-ray diffractometer (Bruker) with CuKα irradiation at 40 kV and 40 mA. Phase identification of the nickel oxide was performed. Furthermore, FT-IR analysis has been conducted on Thermo Nicolet Nexus 670 spectrometer in the range 4000 to 400 cm−1.
Conversion of p-nitrophenol to p-aminophenol
Firstly, p-nitrophenol (10 mg) was dissolved in 100 ml distilled water, the reaction mixture was kept for stirring for 1 h. The reducing agent sodium borohydride was added to the solution of p-nitrophenol in a round bottom flask and stirred for 30 min. After that 30 mg prepared NiO catalyst was added. The UV-visible spectra have been taken for samples collected after a different time interval from the reaction mixture. The various experiments of reduction of p-nitro phenol have been carried out by varying p-nitrophenol concentration.
Results and Discussions
X-Ray diffraction analysis
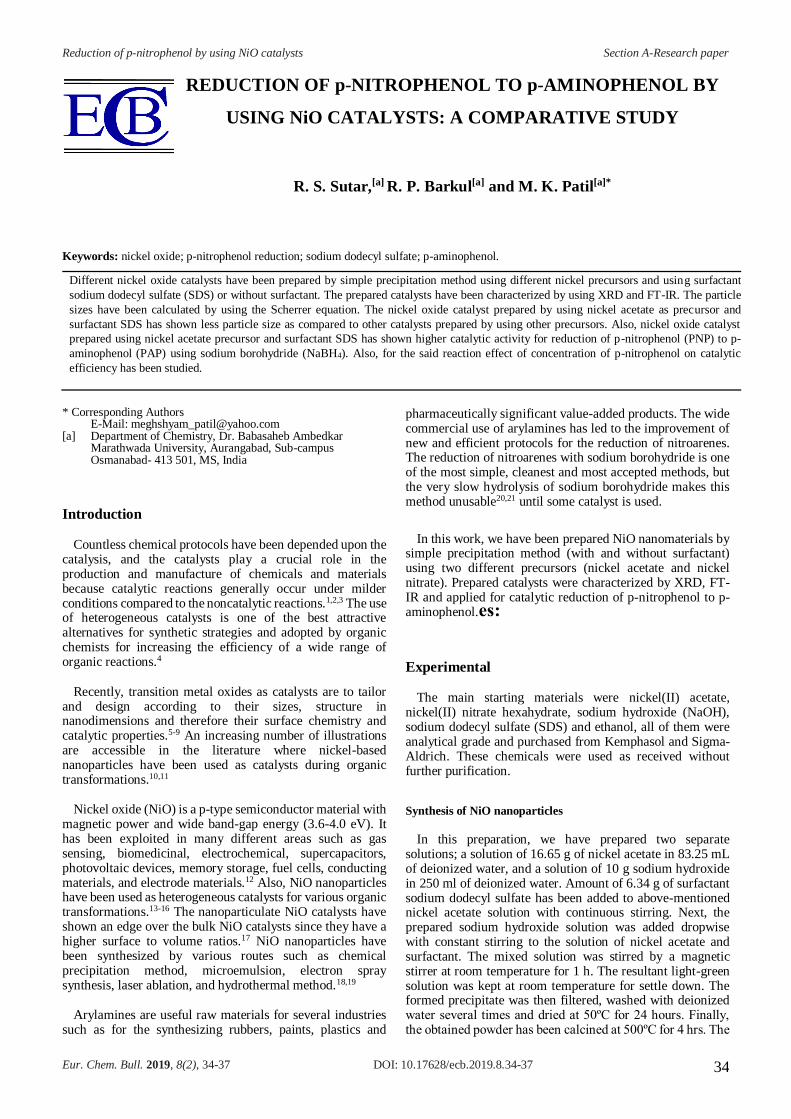
XRD was used for the identification of phase and size of NiO material and also gives information on unit cell dimensions. The Figure 1 shows the XRD pattern of NiO catalyst exhibited five XRD peaks at 2θ 37.1°, 43.3°, 62.9°, 75.2° and 79.2°, corresponding to the (101), (012), (110), (113) and (202) planes, respectively of cubic NiO (JCPDS44-1159).29
Figure 1. XRD pattern of NiO catalyst.
The particle size of the nanoparticles was calculated through the Scherrer's equation.30
[D = kλ/βcosθ]
where D is the average crystallite domain size perpendicular to the reflecting planes, k is the constant, λ is the wavelength, β is the full width at half maximum and θ is the diffraction angle. The calculated average crystallite size of NiAC-SDS, NiAC, NiNT-SDS and NiNT are 11.76 nm, 19.23 nm, 20.08 nm and 21.55 nm, respectively.
FT-IR analysis
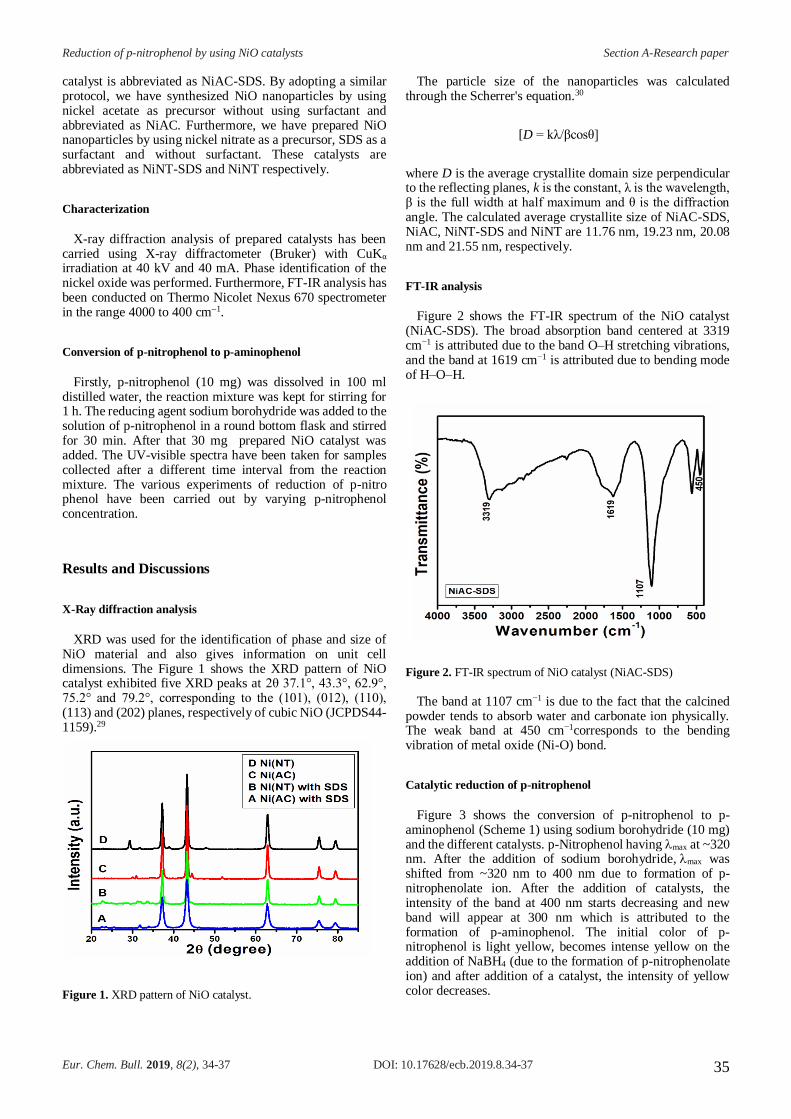
Figure 2 shows the FT-IR spectrum of the NiO catalyst (NiAC-SDS). The broad absorption band centered at 3319 cm−1 is attributed due to the band O–H stretching vibrations, and the band at 1619 cm−1 is attributed due to bending mode of H–O–H.
Figure 2. FT-IR spectrum of NiO catalyst (NiAC-SDS)
The band at 1107 cm−1 is due to the fact that the calcined powder tends to absorb water and carbonate ion physically. The weak band at 450 cm−1corresponds to the bending vibration of metal oxide (Ni-O) bond.
Catalytic reduction of p-nitrophenol
Figure 3 shows the conversion of p-nitrophenol to p-aminophenol (Scheme 1) using sodium borohydride (10 mg) and the different catalysts. p-Nitrophenol having max at ~320 nm. After the addition of sodium borohydride, max was shifted from ~320 nm to 400 nm due to formation of p-nitrophenolate ion. After the addition of catalysts, the intensity of the band at 400 nm starts decreasing and new band will appear at 300 nm which is attributed to the formation of p-aminophenol. The initial color of p-nitrophenol is light yellow, becomes intense yellow on the addition of NaBH4 (due to the formation of p-nitrophenolate ion) and after addition of a catalyst, the intensity of yellow color decreases.

Reduction of p-nitrophenol by using NiO catalysts Section A-Research paper
Eur. Chem. Bull. 2019, 8(2), 34-37 DOI: 10.17628/ecb.2019.8.34-37 36
(a)
(b)
(c)
Figure 3. Conversion of PNP to PAP using catalysts a) NiAC-SDS, b) NiAC, c) NiNT-SDS.
Scheme 1. Conversion of p-nitrophenol to p-aminophenol
From Figure 3 among the four NiO catalysts prepared, the NiAC-SDS have considerably good activity for this reaction than other catalysts. We have carried out further study, by using NiAC-SDS catalyst.
Effect of concentration of p-nitrophenol
On increasing the concentration of p-nitrophenol, the rate of conversion to p-aminophenol decreases (Figure 4). It is due to a decrease in active sites of the catalysts as compared to a number of molecules of p-nitrophenol.
(a)
(b)
Figure 4. Kinetical parameters of PNP conversion into PAP using various catalysts (a) and the effect of p-nitrophenol concentration with using NiAC-SDS catalyst
Conclusions
We have successfully synthesized the NiO material by using a simple precipitation method and prepared catalysts having crystallite size on the nanometer scale. From the XRD analysis, NiO catalyst prepared by using acetate precursor and sodium dodecyl sulfate as surfactant have shown crystalline size 11.76 nm and formation of cubic phase. Furthermore, this catalyst has shown better catalytic activity for the conversion of p-nitrophenol to p-aminophenol.

Reduction of p-nitrophenol by using NiO catalysts Section A-Research paper
Eur. Chem. Bull. 2019, 8(2), 34-37 DOI: 10.17628/ecb.2019.8.34-37 37
Acknowledgment
RSS thanks the University Grants Commission (UGC), New Delhi, India for a Senior Research Fellowship.
This paper was presented at the “International Symposium on
Exploring New Horizons in Chemical Sciences”, January 10–12,
2019, Aurangabad, India (ENHCS–2019).
References
1Sheldon, R. A. and Dakka, J., Heterogeneous catalytic oxidations in the manufacture of fine chemicals, Catal. Today,1994, 19, 213. https://doi.org/10.1016/0920-5861(94)80186-X
2Sheldon, R. A., Catalysis and pollution prevention, Chem. Ind. (London), 1997, 1, 12.
3Clark, J. And Macquarrie, D., Catalysis of liquid phase organic reactions using chemically modified mesoporous inorganic solids, Chem. Commun., 1998, 8, 853. DOI: 10.1039/A709143E
4Sheldon, R. A. and Downing, R. S., Heterogeneous catalytic transformations for environmentally friendly production, Appl. Catal., A., 1999, 189,163. https://doi.org/10.1016/S0926-860X(99)00274-4
5Kung, H. H., Transition metal oxides: surface chemistry and catalysis, Elsevier, 1989, 45.
6Henrich, V. E., Cox, P. A., The surface science of metal oxides. Cambridge University Press, 1996.
7Noguera, C., Physics and chemistry at oxide surfaces. Cambridge University Press, 1996.
8Salem, I., Recent Studies on the Catalytic Activity of Titanium, Zirconium, and Hafnium Oxides, Catal. Rev., 2003, 45(2), 205. https://doi.org/10.1081/CR-120015740
9Kalbasi, R. J., Mosaddegh, N., Suzuki-Miyaura cross-coupling reaction catalyzed by nickel nanoparticles supported on poly(N-vinyl-2-pyrrolidone)/TiO2-ZrO2 composite, Bull. Korean Chem. Soc., 2011, 32, 2584. https://doi.org/10.5012/bkcs.2011.32.8.2584
10Alonso, F., Riente, P., Yus, M., Nickel Nanoparticles in Hydrogen Transfer Reactions, Acc. Chem. Res., 2011, 44,379. DOI: 10.1021/ar1001582
11Yuan, F., Ni, Y., Zhang, L., Yuan, S. and Wei, J., Synthesis, properties and applications of flowerlike Ni–NiO composite microstructures, J. Mater. Chem. A, 2013, 1, 8438. DOI: 10.1039/C3TA11219E
12Liu, F., Sang, Y., Ma, H., Li, Z. And Gao, Z., Nickel oxide as an effective catalyst for catalytic combustion of methane, J. Nat. Gas Sci. Eng., 2017, 41, 1. https://doi.org/10.1016/j.jngse.2017.02.025
13Sachdeva, H., Dwivedi, D., Bhattacharjee, R. R., Khaturia, S. and Saroj, R., NiO Nanoparticles: An Efficient Catalyst for the Multicomponent One-Pot Synthesis of Novel Spiro and Condensed Indole Derivatives, J. Chem., 2012, 2013. http://dx.doi.org/10.1155/2013/606259
14Morozov, Y. G., Belousova, O. V. and Kuznetsov, M. V., Preparation of nickel nanoparticles for catalytic applications, Inorg. Mater., 2011, 47, 36. https://doi.org/10.1134/S0020168510121027
15Polshettiwar, V., Baruwati, B. and Varma, R. S., Nanoparticle-supported and magnetically recoverable nickel catalyst: a robust and economic hydrogenation and transfer hydrogenation protocol, Green Chemistry, 2009, 11, 127. DOI: 10.1039/B815058C
16Peck, M. A., Langell, M. A., Comparison of nanoscaled and bulk NiO structural and environmental characteristics by XRD, XAFS, and XPS, Chem. Mater., 2012, 24, 4483. DOI: 10.1021/cm300739y
17Imran Din, M. and Rani, A., Recent Advances in the Synthesis and Stabilization of Nickel and Nickel Oxide Nanoparticles: A Green Adeptness, Int. J. Anal. Chem., 2016, 2016. http://dx.doi.org/10.1155/2016/3512145
18Jiang, Z., Xie, J., Jiang, D., Wei, X., Chen, M., Modifiers-assisted formation of nickel nanoparticles and their catalytic application to p-nitrophenol reduction, Cryst. Eng. Comm., 2013, 15, 560. DOI: 10.1039/C2CE26398J
19Foo, Y. T., Chan, J. E. M., Ngoh, G. C., Abdullah, A. Z., Horri, B. A., Salamatinia, B., Synthesis and characterization of NiO and Ni nanoparticles using nanocrystalline cellulose (NCC) as a template, Ceram. Int., 2017, 43, 16331. https://doi.org/10.1016/j.ceramint.2017.09.006
20Theivasanthi, T., Alagar, M., ArXiv preprint arXiv, Chemical Capping Synthesis of Nickel Oxide Nanoparticles and their Characterizations Studies, DOI: 10.5923/j.nn.20120205.01, 2012, 1212, 4595.
21Wang, X., Yang, Z., Sun, X., Li, X., Wang, D., Wang, P. and He, D., NiO nanocone array electrode with high capacity and rate capability for Li-ion batteries, J. Mater. Chem., 2011, 21, 9988. DOI: 10.1039/C1JM11490E
22Venkat Narayan, R., Kanniah, V., and Dhathathreyan, A., Tuning size and catalytic activity of nano-clusters of cobalt oxide, J. Chem. Sci., 2006, 118(2), 179. DOI https://doi.org/10.1007/BF02708470
Received: 03.03.2019. Accepted: 19.03.2019.
Effects of Cd(II), Hg(II) and -irradiation on Spirulina patensis Section B-Research paper
Eur. Chem. Bull. 2019, 8(2), 38-43 DOI: 10.17628/ecb.2019.8.38-43 38
SIMULTANEOUS EFFECTS OF Cd(II) AND Pb(II) IONS AND γ-IRRA-
DIATION ON STABILITY OF SPIRULINA PLATENSIS
J. Monaselidze,[a] E. Gelagutashvili,[a] N. Bagdavadze,[a] M. Gorgoshidze[a] and E. Lomidze[a]
Keywords: metal ions; γ-irradiation; Spirulina platensis; differential scanning microcalorimetry.
Effect of toxic metal ions Cd(II) and Pb(II) on cyanobacterium (blue-green algae) Spirulina platensis intact cells have been studied with
optical and differential scanning microcalorimetry (DSC) methods after 7.2 kGy 137Cs gamma irradiation and without irradiation. It is shown
that the addition of metal ions causes a decrease in optical absorption spectra band intensities. In the case of irradiation, the absorption band
intensity decreases higher than without irradiation. The binding constant of Pb(II) with Spirulina platensis is calculated for nutrition medium
with pH 9.2. DSC data show that Cd(II) and Pb(II) ions do not change the integral heat of absorption (ΔHm) that equals to 24.6 J g-1. In the
case of irradiation, the DSC melting curve profile changes significantly and ΔHm decreases two times, which indicates that 50 % of proteins
are denaturated. The DSC method also gives a possibility to evaluate C-phycocyanin content from deconvoluted heat absorption peak at
50 °C, which equals to 35.5 %. In case of irradiated wet mass, sub-cultured wet mass, and wet mass re-irradiated with the same dose, contents
of Spirulina platensis ingredients – C-phycocyanin, chlorophyll, and carotenoids – increase as a result of the simultaneous effect of the metal
ions and irradiation.
* Corresponding Authors
E-Mail: [email protected]; [email protected]
[a] I. Javakhishvili State University, E. Andronikashvili Institute of Physics. 6 M. Tamarashvili Str., Tbilisi, 0177, Georgia
Introduction
Nanotechnology gives a possibility to introduce a lot of new tools to be used in cellular and molecular biology. One of the modern trends in nanotechnology is associated with using the blue-green microalgae (cyanobacteria) Spirulina platensis that have been utilized in the food industry, pharmaceuticals, medicine and science.1 It is one of nature's first photosynthetic organisms capable of converting light directly for complex metabolic processes. One of the algae's useful qualities is its ability to protect us from radiation. Algae contain a large amount of iodine and sodium alginate that help removal of radioactive substances from the living organisms.
It was shown2 that Spirulina is a ubiquitous organism. Spirulina platensis has attracted more attention because of its high nutritional content that includes 50–70 % protein and minerals, vitamins, amino acids, essential fatty acids, etc.3 The thermal stability of C-phycocyanin from Spirulina platensis and the compounds that additionally stabilize C-phycocyanin are crucial to food industry.4 Spirulina platensis absorbs toxic metal ions from its environment.5 It was also demonstrated that some compounds of the algal cell biomass are responsible for binding to various ions.6,7 Spirulina platensis may be able to reduce many types of harmful stresses, including those caused by heavy metals and irradiation.8,9 In our previous works, the accumulation and biosorption of metal ions by Spirulina platensis and their components10–13 as well as Spirulina platensis usability as a matrix for production of noble metal nanoparticles14,15 have been studied.
Thermostability of Spirulina platensis cells and their component have been successfully studied with the help of differential scanning microcalorimetry (DSC).16,17
At present, some innovative technologies are focused on the metal binding capacities of various microorganisms and their components. However, the mechanism of their interaction with metal ions and gamma irradiation are unknown. In this work, we have studied the simultaneous effects of 137Cs gamma irradiation and toxic metal ions on the growth of Spirulina platensis intact cells and their constituents using UV–VIS spectrometry and DSC.
Materials and methods
Spirulina platensis IPPAS B–256 strain was cultivated in a standard Zarrouk18 alkaline saline medium at 34 ºС, illumination ∼5000 lux, at constant mixing in batch cultures.19 Cultivation of the Spirulina platensis cells was conducted for 7 days. The cell growth was evaluated by optical density by monitoring of changes in absorbance at wavelength 560 nm measured with a spectrophotometer (UV–Visible spectrometer, Cintra 10e GBC Scientific Equipment Pty Ltd, Australia). The absorption spectra from 380 to 850 nm of intact cells suspension of Spirulina platensis (pH 9.2) in Zarrouk medium have been recorded. In all abovementioned cases, the concentration of Spirulina platensis was 1.6 mg mL-1. This was determined by instrumental measurements.20,21 The concentration of Cd(II) and Pb(II) ions was 0.5 µM.
To study the biosorption process on the Spirulina platensis intact cells, the methods of dialysis and atomic absorption analysis were used. A known quantity of cyanobacterium suspension in the nutrient medium was in contact with the solution containing a known concentration of metal ions.
Effects of Cd(II), Hg(II) and -irradiation on Spirulina patensis Section B-Research paper
Eur. Chem. Bull. 2019, 8(2), 38-43 DOI: 10.17628/ecb.2019.8.38-43 39
The intact cell weight content was kept constant (1.6 mg mL-1), while the initial metal concentration varied within the interval 10–3 to 10–6 M. All experiments were carried out at the ambient temperature. The dialysis was carried out in 5 mL cylindrical vessels made of organic glass. A 30µm wide cellophane membrane (Visking type, manufactures by Serva) was used as a partition. The duration of dialysis was 72 h. The metal concentration after the dialysis was measured using the atomic absorption spectrophotometer Analyst–900 (Perkin-Elmer). Each value was determined as an average of three independent estimated values with the standard deviation.
Spirulina platensis cells were exposed to 7.2 kGy -irradiation using 137Cs as a -source, at the Applied Research Center, E. Andronikashvili Institute of Physics. After the irradiation, the cells were cultivated in Zarrouk medium for 21 days. The adsorption isotherm data for metal ion binding by Spirulina cells were calculated from the Freundlich equation.22
The Spirulina platensis cell suspension and wet mass were also measured with DSC designed for diluted solutions and complex biological systems.23 The calorimeter sensitivity was 0.1 µW, the volume of measuring vessels was 0.3 cm3, the heating rate was 0.5 °C min-1, and the temperature range of measurements was from 25 to 130 °C. The accuracy of the temperature measurements was not less than 0.05 °C. The error in the determination of melting enthalpy (Hm), heat capacity dQ/dT (Cmax) was not more than 10 %.
Results and discussions
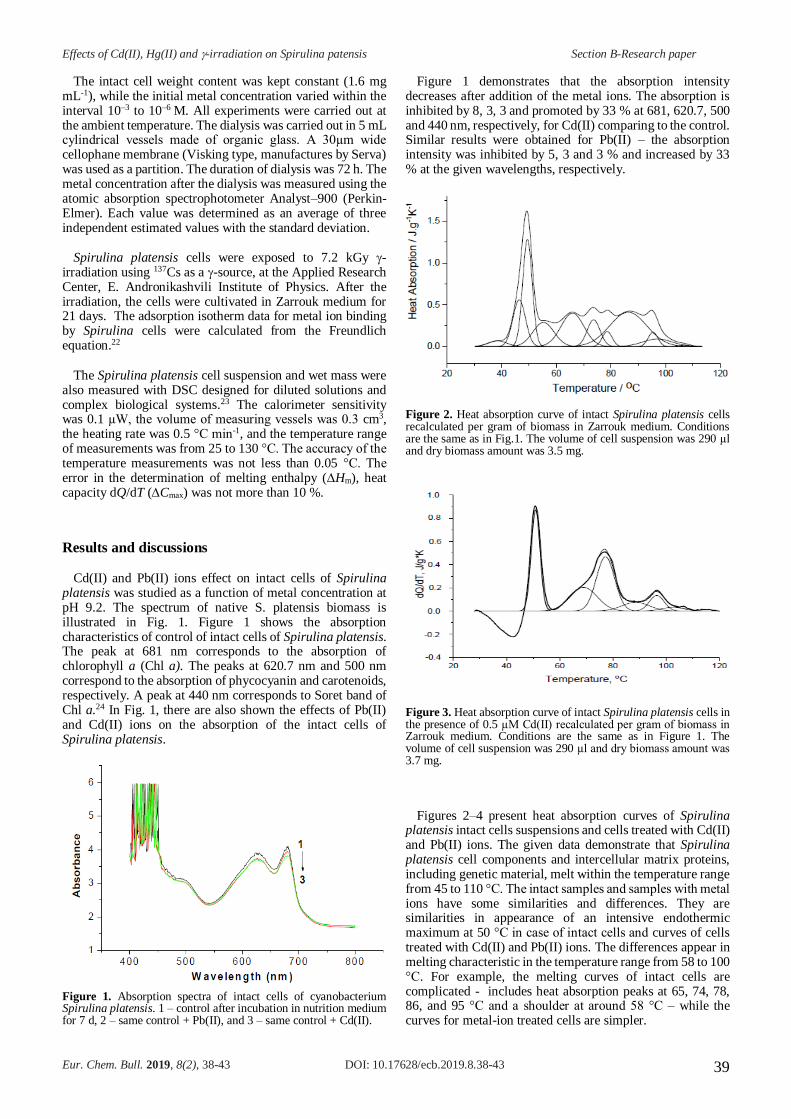
Cd(II) and Pb(II) ions effect on intact cells of Spirulina platensis was studied as a function of metal concentration at pH 9.2. The spectrum of native S. platensis biomass is illustrated in Fig. 1. Figure 1 shows the absorption characteristics of control of intact cells of Spirulina platensis. The peak at 681 nm corresponds to the absorption of chlorophyll a (Chl a). The peaks at 620.7 nm and 500 nm correspond to the absorption of phycocyanin and carotenoids, respectively. A peak at 440 nm corresponds to Soret band of Chl a.24 In Fig. 1, there are also shown the effects of Pb(II) and Cd(II) ions on the absorption of the intact cells of Spirulina platensis.
Figure 1. Absorption spectra of intact cells of cyanobacterium Spirulina platensis. 1 – control after incubation in nutrition medium for 7 d, 2 – same control + Pb(II), and 3 – same control + Cd(II).
Figure 1 demonstrates that the absorption intensity decreases after addition of the metal ions. The absorption is inhibited by 8, 3, 3 and promoted by 33 % at 681, 620.7, 500 and 440 nm, respectively, for Cd(II) comparing to the control. Similar results were obtained for Pb(II) – the absorption intensity was inhibited by 5, 3 and 3 % and increased by 33 % at the given wavelengths, respectively.
Figure 2. Heat absorption curve of intact Spirulina platensis cells recalculated per gram of biomass in Zarrouk medium. Conditions are the same as in Fig.1. The volume of cell suspension was 290 µl and dry biomass amount was 3.5 mg.
Figure 3. Heat absorption curve of intact Spirulina platensis cells in the presence of 0.5 µM Cd(II) recalculated per gram of biomass in Zarrouk medium. Conditions are the same as in Figure 1. The volume of cell suspension was 290 µl and dry biomass amount was 3.7 mg.
Figures 2–4 present heat absorption curves of Spirulina platensis intact cells suspensions and cells treated with Cd(II) and Pb(II) ions. The given data demonstrate that Spirulina platensis cell components and intercellular matrix proteins, including genetic material, melt within the temperature range from 45 to 110 °C. The intact samples and samples with metal ions have some similarities and differences. They are similarities in appearance of an intensive endothermic maximum at 50 °C in case of intact cells and curves of cells treated with Cd(II) and Pb(II) ions. The differences appear in melting characteristic in the temperature range from 58 to 100 °C. For example, the melting curves of intact cells are complicated - includes heat absorption peaks at 65, 74, 78, 86, and 95 °C and a shoulder at around 58 °C – while the curves for metal-ion treated cells are simpler.
Effects of Cd(II), Hg(II) and -irradiation on Spirulina patensis Section B-Research paper
Eur. Chem. Bull. 2019, 8(2), 38-43 DOI: 10.17628/ecb.2019.8.38-43 40
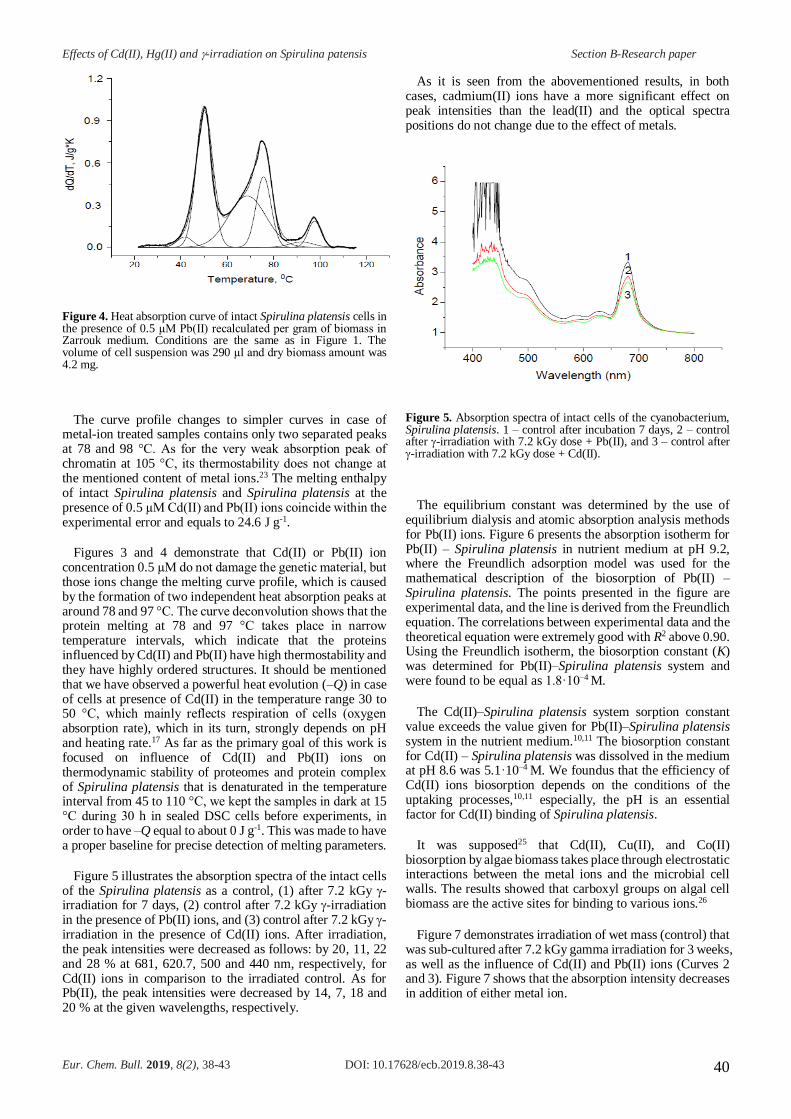
Figure 4. Heat absorption curve of intact Spirulina platensis cells in the presence of 0.5 µM Pb(II) recalculated per gram of biomass in Zarrouk medium. Conditions are the same as in Figure 1. The volume of cell suspension was 290 µl and dry biomass amount was 4.2 mg.
The curve profile changes to simpler curves in case of metal-ion treated samples contains only two separated peaks at 78 and 98 °C. As for the very weak absorption peak of chromatin at 105 °C, its thermostability does not change at the mentioned content of metal ions.23 The melting enthalpy of intact Spirulina platensis and Spirulina platensis at the presence of 0.5 µM Cd(II) and Pb(II) ions coincide within the experimental error and equals to 24.6 J g-1.
Figures 3 and 4 demonstrate that Cd(II) or Pb(II) ion concentration 0.5 µM do not damage the genetic material, but those ions change the melting curve profile, which is caused by the formation of two independent heat absorption peaks at around 78 and 97 °C. The curve deconvolution shows that the protein melting at 78 and 97 °C takes place in narrow temperature intervals, which indicate that the proteins influenced by Cd(II) and Pb(II) have high thermostability and they have highly ordered structures. It should be mentioned that we have observed a powerful heat evolution (–Q) in case of cells at presence of Cd(II) in the temperature range 30 to 50 °C, which mainly reflects respiration of cells (oxygen absorption rate), which in its turn, strongly depends on pH and heating rate.17 As far as the primary goal of this work is focused on influence of Cd(II) and Pb(II) ions on thermodynamic stability of proteomes and protein complex of Spirulina platensis that is denaturated in the temperature interval from 45 to 110 °C, we kept the samples in dark at 15 °C during 30 h in sealed DSC cells before experiments, in order to have –Q equal to about 0 J g-1. This was made to have a proper baseline for precise detection of melting parameters.
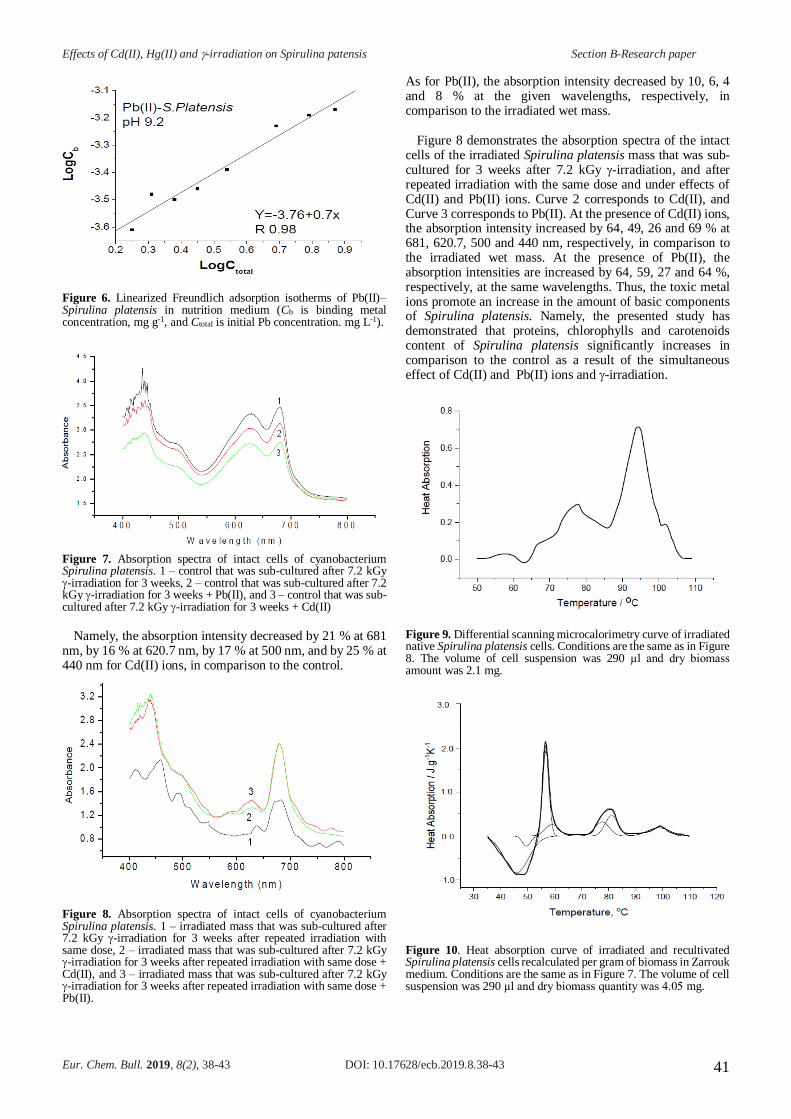
Figure 5 illustrates the absorption spectra of the intact cells of the Spirulina platensis as a control, (1) after 7.2 kGy -irradiation for 7 days, (2) control after 7.2 kGy -irradiation in the presence of Pb(II) ions, and (3) control after 7.2 kGy -irradiation in the presence of Cd(II) ions. After irradiation, the peak intensities were decreased as follows: by 20, 11, 22 and 28 % at 681, 620.7, 500 and 440 nm, respectively, for Cd(II) ions in comparison to the irradiated control. As for Pb(II), the peak intensities were decreased by 14, 7, 18 and 20 % at the given wavelengths, respectively.
As it is seen from the abovementioned results, in both cases, cadmium(II) ions have a more significant effect on peak intensities than the lead(II) and the optical spectra positions do not change due to the effect of metals.
Figure 5. Absorption spectra of intact cells of the cyanobacterium, Spirulina platensis. 1 – control after incubation 7 days, 2 – control after -irradiation with 7.2 kGy dose + Pb(II), and 3 – control after -irradiation with 7.2 kGy dose + Cd(II).
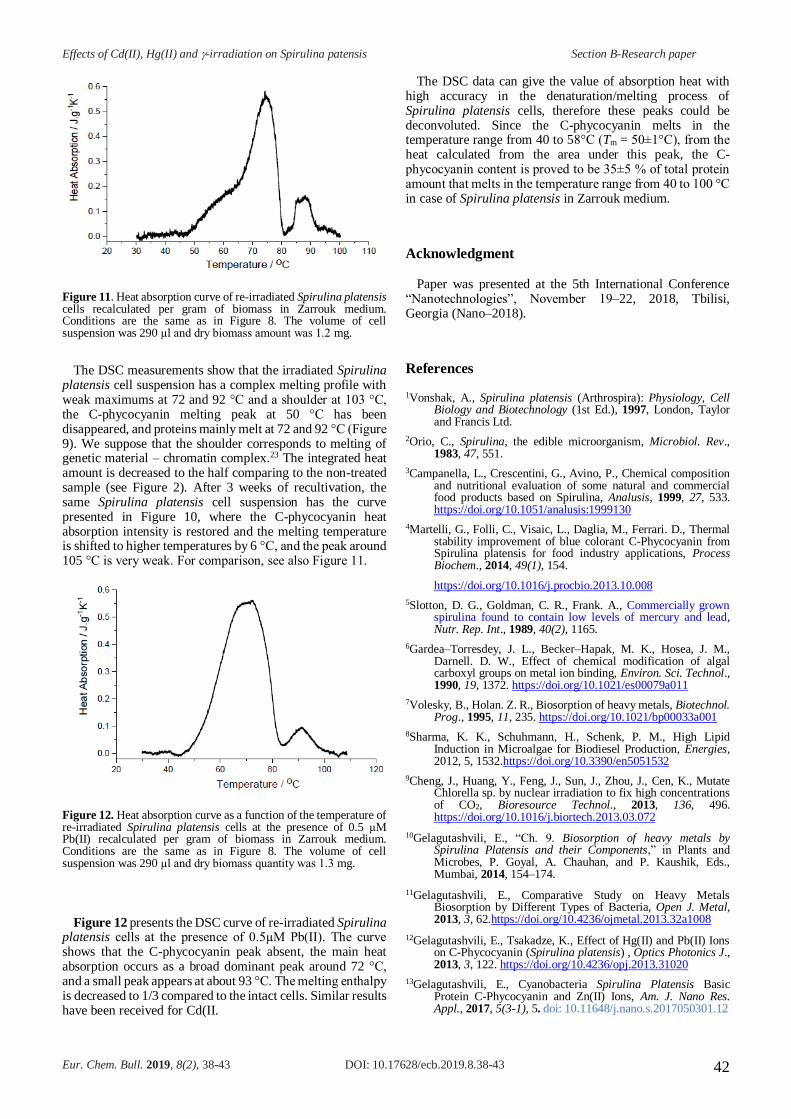
The equilibrium constant was determined by the use of equilibrium dialysis and atomic absorption analysis methods for Pb(II) ions. Figure 6 presents the absorption isotherm for Pb(II) – Spirulina platensis in nutrient medium at pH 9.2, where the Freundlich adsorption model was used for the mathematical description of the biosorption of Pb(II) – Spirulina platensis. The points presented in the figure are experimental data, and the line is derived from the Freundlich equation. The correlations between experimental data and the theoretical equation were extremely good with R2 above 0.90. Using the Freundlich isotherm, the biosorption constant (K) was determined for Pb(II)–Spirulina platensis system and were found to be equal as 1.8·10–4 M.
The Cd(II)–Spirulina platensis system sorption constant value exceeds the value given for Pb(II)–Spirulina platensis system in the nutrient medium.10,11 The biosorption constant for Cd(II) – Spirulina platensis was dissolved in the medium at pH 8.6 was 5.1·10–4 M. We foundus that the efficiency of Cd(II) ions biosorption depends on the conditions of the uptaking processes,10,11 especially, the pH is an essential factor for Cd(II) binding of Spirulina platensis.
It was supposed25 that Cd(II), Cu(II), and Co(II) biosorption by algae biomass takes place through electrostatic interactions between the metal ions and the microbial cell walls. The results showed that carboxyl groups on algal cell biomass are the active sites for binding to various ions.26
Figure 7 demonstrates irradiation of wet mass (control) that was sub-cultured after 7.2 kGy gamma irradiation for 3 weeks, as well as the influence of Cd(II) and Pb(II) ions (Curves 2 and 3). Figure 7 shows that the absorption intensity decreases in addition of either metal ion.
Effects of Cd(II), Hg(II) and -irradiation on Spirulina patensis Section B-Research paper
Eur. Chem. Bull. 2019, 8(2), 38-43 DOI: 10.17628/ecb.2019.8.38-43 41
Figure 6. Linearized Freundlich adsorption isotherms of Pb(II)–Spirulina platensis in nutrition medium (Cb is binding metal concentration, mg g-1, and Ctotal is initial Pb concentration. mg L-1).
Figure 7. Absorption spectra of intact cells of cyanobacterium Spirulina platensis. 1 – control that was sub-cultured after 7.2 kGy -irradiation for 3 weeks, 2 – control that was sub-cultured after 7.2 kGy -irradiation for 3 weeks + Pb(II), and 3 – control that was sub-cultured after 7.2 kGy -irradiation for 3 weeks + Cd(II)
Namely, the absorption intensity decreased by 21 % at 681 nm, by 16 % at 620.7 nm, by 17 % at 500 nm, and by 25 % at 440 nm for Cd(II) ions, in comparison to the control.
Figure 8. Absorption spectra of intact cells of cyanobacterium Spirulina platensis. 1 – irradiated mass that was sub-cultured after 7.2 kGy -irradiation for 3 weeks after repeated irradiation with same dose, 2 – irradiated mass that was sub-cultured after 7.2 kGy -irradiation for 3 weeks after repeated irradiation with same dose + Cd(II), and 3 – irradiated mass that was sub-cultured after 7.2 kGy -irradiation for 3 weeks after repeated irradiation with same dose + Pb(II).
As for Pb(II), the absorption intensity decreased by 10, 6, 4 and 8 % at the given wavelengths, respectively, in comparison to the irradiated wet mass.
Figure 8 demonstrates the absorption spectra of the intact cells of the irradiated Spirulina platensis mass that was sub-cultured for 3 weeks after 7.2 kGy -irradiation, and after repeated irradiation with the same dose and under effects of Cd(II) and Pb(II) ions. Curve 2 corresponds to Cd(II), and Curve 3 corresponds to Pb(II). At the presence of Cd(II) ions, the absorption intensity increased by 64, 49, 26 and 69 % at 681, 620.7, 500 and 440 nm, respectively, in comparison to the irradiated wet mass. At the presence of Pb(II), the absorption intensities are increased by 64, 59, 27 and 64 %, respectively, at the same wavelengths. Thus, the toxic metal ions promote an increase in the amount of basic components of Spirulina platensis. Namely, the presented study has demonstrated that proteins, chlorophylls and carotenoids content of Spirulina platensis significantly increases in comparison to the control as a result of the simultaneous effect of Cd(II) and Pb(II) ions and -irradiation.
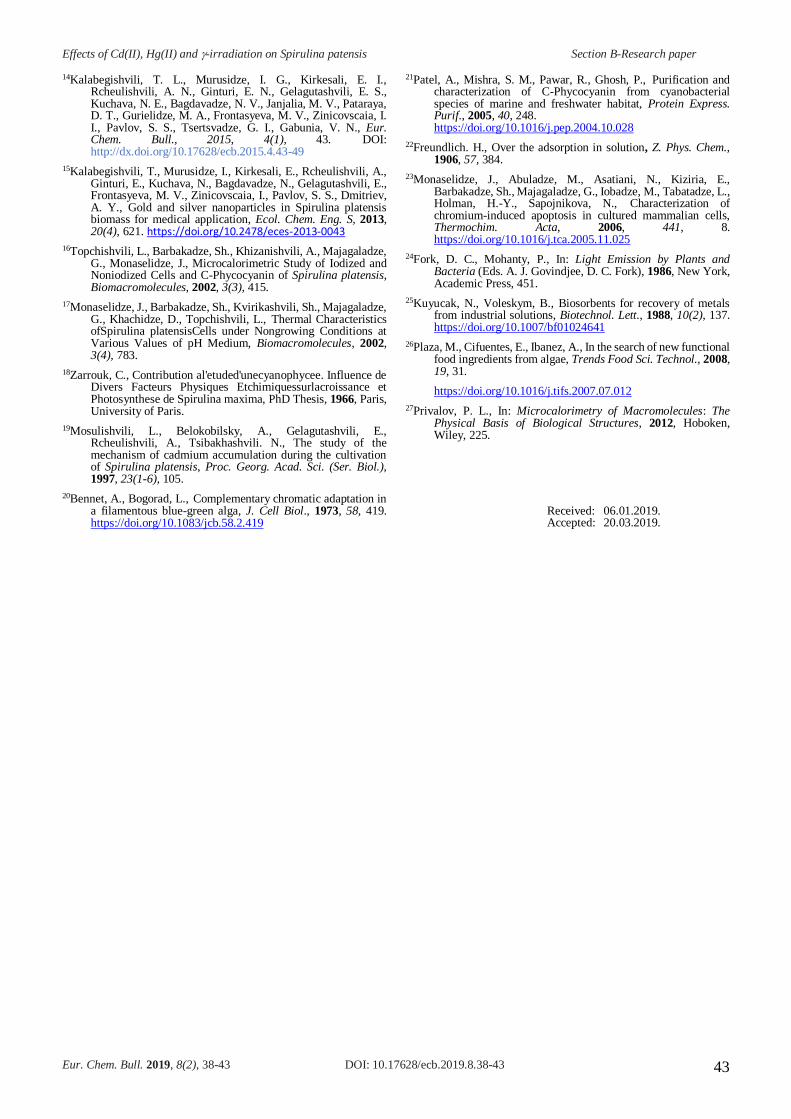
Figure 9. Differential scanning microcalorimetry curve of irradiated native Spirulina platensis cells. Conditions are the same as in Figure 8. The volume of cell suspension was 290 µl and dry biomass amount was 2.1 mg.
Figure 10. Heat absorption curve of irradiated and recultivated Spirulina platensis cells recalculated per gram of biomass in Zarrouk medium. Conditions are the same as in Figure 7. The volume of cell suspension was 290 µl and dry biomass quantity was 4.05 mg.
Effects of Cd(II), Hg(II) and -irradiation on Spirulina patensis Section B-Research paper
Eur. Chem. Bull. 2019, 8(2), 38-43 DOI: 10.17628/ecb.2019.8.38-43 42
Figure 11. Heat absorption curve of re-irradiated Spirulina platensis cells recalculated per gram of biomass in Zarrouk medium. Conditions are the same as in Figure 8. The volume of cell suspension was 290 µl and dry biomass amount was 1.2 mg.
The DSC measurements show that the irradiated Spirulina platensis cell suspension has a complex melting profile with weak maximums at 72 and 92 °C and a shoulder at 103 °C, the C-phycocyanin melting peak at 50 °C has been disappeared, and proteins mainly melt at 72 and 92 °C (Figure 9). We suppose that the shoulder corresponds to melting of genetic material – chromatin complex.23 The integrated heat amount is decreased to the half comparing to the non-treated sample (see Figure 2). After 3 weeks of recultivation, the same Spirulina platensis cell suspension has the curve presented in Figure 10, where the C-phycocyanin heat absorption intensity is restored and the melting temperature is shifted to higher temperatures by 6 °C, and the peak around 105 °C is very weak. For comparison, see also Figure 11.
Figure 12. Heat absorption curve as a function of the temperature of re-irradiated Spirulina platensis cells at the presence of 0.5 µM Pb(II) recalculated per gram of biomass in Zarrouk medium. Conditions are the same as in Figure 8. The volume of cell suspension was 290 µl and dry biomass quantity was 1.3 mg.
Figure 12 presents the DSC curve of re-irradiated Spirulina platensis cells at the presence of 0.5µM Pb(II). The curve shows that the C-phycocyanin peak absent, the main heat absorption occurs as a broad dominant peak around 72 °C, and a small peak appears at about 93 °C. The melting enthalpy is decreased to 1/3 compared to the intact cells. Similar results have been received for Cd(II.
The DSC data can give the value of absorption heat with high accuracy in the denaturation/melting process of Spirulina platensis cells, therefore these peaks could be deconvoluted. Since the C-phycocyanin melts in the temperature range from 40 to 58°C (Tm = 50±1°C), from the heat calculated from the area under this peak, the C-phycocyanin content is proved to be 35±5 % of total protein amount that melts in the temperature range from 40 to 100 °C in case of Spirulina platensis in Zarrouk medium.
Acknowledgment
Paper was presented at the 5th International Conference “Nanotechnologies”, November 19–22, 2018, Tbilisi, Georgia (Nano–2018).
References
1Vonshak, A., Spirulina platensis (Arthrospira): Physiology, Cell Biology and Biotechnology (1st Ed.), 1997, London, Taylor and Francis Ltd.
2Orio, C., Spirulina, the edible microorganism, Microbiol. Rev., 1983, 47, 551.
3Campanella, L., Crescentini, G., Avino, P., Chemical composition and nutritional evaluation of some natural and commercial food products based on Spirulina, Analusis, 1999, 27, 533. https://doi.org/10.1051/analusis:1999130
4Martelli, G., Folli, C., Visaic, L., Daglia, M., Ferrari. D., Thermal stability improvement of blue colorant C-Phycocyanin from Spirulina platensis for food industry applications, Process Biochem., 2014, 49(1), 154.
https://doi.org/10.1016/j.procbio.2013.10.008
5Slotton, D. G., Goldman, C. R., Frank. A., Commercially grown spirulina found to contain low levels of mercury and lead, Nutr. Rep. Int., 1989, 40(2), 1165.
6Gardea–Torresdey, J. L., Becker–Hapak, M. K., Hosea, J. M., Darnell. D. W., Effect of chemical modification of algal carboxyl groups on metal ion binding, Environ. Sci. Technol., 1990, 19, 1372. https://doi.org/10.1021/es00079a011
7Volesky, B., Holan. Z. R., Biosorption of heavy metals, Biotechnol. Prog., 1995, 11, 235. https://doi.org/10.1021/bp00033a001
8Sharma, K. K., Schuhmann, H., Schenk, P. M., High Lipid Induction in Microalgae for Biodiesel Production, Energies, 2012, 5, 1532.https://doi.org/10.3390/en5051532
9Cheng, J., Huang, Y., Feng, J., Sun, J., Zhou, J., Cen, K., Mutate Chlorella sp. by nuclear irradiation to fix high concentrations of CO2, Bioresource Technol., 2013, 136, 496. https://doi.org/10.1016/j.biortech.2013.03.072
10Gelagutashvili, E., “Ch. 9. Biosorption of heavy metals by Spirulina Platensis and their Components,” in Plants and Microbes, P. Goyal, A. Chauhan, and P. Kaushik, Eds., Mumbai, 2014, 154–174.
11Gelagutashvili, E., Comparative Study on Heavy Metals Biosorption by Different Types of Bacteria, Open J. Metal, 2013, 3, 62.https://doi.org/10.4236/ojmetal.2013.32a1008
12Gelagutashvili, E., Tsakadze, K., Effect of Hg(II) and Pb(II) Ions on C-Phycocyanin (Spirulina platensis) , Optics Photonics J., 2013, 3, 122. https://doi.org/10.4236/opj.2013.31020
13Gelagutashvili, E., Cyanobacteria Spirulina Platensis Basic Protein C-Phycocyanin and Zn(II) Ions, Am. J. Nano Res. Appl., 2017, 5(3-1), 5. doi: 10.11648/j.nano.s.2017050301.12
Effects of Cd(II), Hg(II) and -irradiation on Spirulina patensis Section B-Research paper
Eur. Chem. Bull. 2019, 8(2), 38-43 DOI: 10.17628/ecb.2019.8.38-43 43
14Kalabegishvili, T. L., Murusidze, I. G., Kirkesali, E. I., Rcheulishvili, A. N., Ginturi, E. N., Gelagutashvili, E. S., Kuchava, N. E., Bagdavadze, N. V., Janjalia, M. V., Pataraya, D. T., Gurielidze, M. A., Frontasyeva, M. V., Zinicovscaia, I. I., Pavlov, S. S., Tsertsvadze, G. I., Gabunia, V. N., Eur. Chem. Bull., 2015, 4(1), 43. DOI: http://dx.doi.org/10.17628/ecb.2015.4.43-49
15Kalabegishvili, T., Murusidze, I., Kirkesali, E., Rcheulishvili, A., Ginturi, E., Kuchava, N., Bagdavadze, N., Gelagutashvili, E., Frontasyeva, M. V., Zinicovscaia, I., Pavlov, S. S., Dmitriev, A. Y., Gold and silver nanoparticles in Spirulina platensis biomass for medical application, Ecol. Chem. Eng. S, 2013, 20(4), 621. https://doi.org/10.2478/eces-2013-0043
16Topchishvili, L., Barbakadze, Sh., Khizanishvili, A., Majagaladze, G., Monaselidze, J., Microcalorimetric Study of Iodized and Noniodized Cells and C-Phycocyanin of Spirulina platensis, Biomacromolecules, 2002, 3(3), 415.
17Monaselidze, J., Barbakadze, Sh., Kvirikashvili, Sh., Majagaladze, G., Khachidze, D., Topchishvili, L., Thermal Characteristics ofSpirulina platensisCells under Nongrowing Conditions at Various Values of pH Medium, Biomacromolecules, 2002, 3(4), 783.
18Zarrouk, C., Contribution al'etuded'unecyanophycee. Influence de Divers Facteurs Physiques Etchimiquessurlacroissance et Photosynthese de Spirulina maxima, PhD Thesis, 1966, Paris, University of Paris.
19Mosulishvili, L., Belokobilsky, A., Gelagutashvili, E., Rcheulishvili, A., Tsibakhashvili. N., The study of the mechanism of cadmium accumulation during the cultivation of Spirulina platensis, Proc. Georg. Acad. Sci. (Ser. Biol.), 1997, 23(1-6), 105.
20Bennet, A., Bogorad, L., Complementary chromatic adaptation in a filamentous blue-green alga, J. Cell Biol., 1973, 58, 419. https://doi.org/10.1083/jcb.58.2.419
21Patel, A., Mishra, S. M., Pawar, R., Ghosh, P., Purification and characterization of C-Phycocyanin from cyanobacterial species of marine and freshwater habitat, Protein Express. Purif., 2005, 40, 248. https://doi.org/10.1016/j.pep.2004.10.028
22Freundlich. H., Over the adsorption in solution, Z. Phys. Chem., 1906, 57, 384.
23Monaselidze, J., Abuladze, M., Asatiani, N., Kiziria, E., Barbakadze, Sh., Majagaladze, G., Iobadze, M., Tabatadze, L., Holman, H.-Y., Sapojnikova, N., Characterization of chromium-induced apoptosis in cultured mammalian cells, Thermochim. Acta, 2006, 441, 8. https://doi.org/10.1016/j.tca.2005.11.025
24Fork, D. C., Mohanty, P., In: Light Emission by Plants and Bacteria (Eds. A. J. Govindjee, D. C. Fork), 1986, New York, Academic Press, 451.
25Kuyucak, N., Voleskym, B., Biosorbents for recovery of metals from industrial solutions, Biotechnol. Lett., 1988, 10(2), 137. https://doi.org/10.1007/bf01024641
26Plaza, M., Cifuentes, E., Ibanez, A., In the search of new functional food ingredients from algae, Trends Food Sci. Technol., 2008, 19, 31.
https://doi.org/10.1016/j.tifs.2007.07.012
27Privalov, P. L., In: Microcalorimetry of Macromolecules: The Physical Basis of Biological Structures, 2012, Hoboken, Wiley, 225.
Received: 06.01.2019. Accepted: 20.03.2019.
Kinetics of isothermal annealing of irradiated eutectic (Na,K)NO3 Section A-Research paper
Eur. Chem. Bull., 2019, 8(2), 44-46 DOI: 10.17628/ecb.2019.8.44-46 44
KINETICS OF ISOTHERMAL ANNEALING OF -IRRADIATED
EUTECTIC MIXTURE OF NaNO3-KNO3
Pawar S. S.[a] and Patil S. F.[b]
Keywords: annealing; kinetics; -irradiation; eutectic of NaNO3-KNO3.
A considerable amount of work has been reported on isothermal annealing of pure alkali and alkaline earth metal nitrates. In the present work,
initially, the eutectic of NaNO3-KNO3 was prepared by mixing NaNO3 (45%) and KNO3 (55%) fused at 225 0C and cooled naturally. The
samples of a eutectic of NaNO3-KNO3 were irradiated in 60Co – gamma source. The radiation decomposition of the eutectic mixture takes
place. Present work mainly deals with the study of isothermal annealing of radiation damage in a eutectic mixture of NaNO3-KNO3. This
data has been analyzed by using conventional kinetics and the Waite model. Results of annealing show that a significant fraction of annealing
obeys second order kinetics except in the initial short period. The energies of activation are calculated by two methods and are found to
agree.
* Pawar S. S.
E-Mail: [email protected] [a] Department of Chemistry, Fergusson College (Autonomous),
Pune-411004, Maharashtra, India. [b] Ex-Professor, Department of Chemistry, Savitribai Phule
Pune University, Pune 411007, Maharashtra, India.
INTRODUCTION
A considerable amount of research results has been reported on isothermal annealing of pure alkali and alkaline earth metal nitrates,1-7 however, only limited data are available on the annealing of eutectics.
It is well established that defect concentration in solids increases after irradiation as compared to the thermal equilibrium level. These defects are responsible for different property changes in solids. These defects react to reduce the free energy of the system. When the temperature of irradiated solids is raised sufficiently, the property reverts to its original value. This general process of decay of property-change by temperature is known as annealing.
Several workers carried out the experiments on the thermal annealing process in alkali and alkaline earth nitrates.8-10. The kinetic analysis showed that the order of reaction varied concerning the nature of nitrates. Bedekar et. al2 reported 100 % annealing of damage in ammonium nitrate crystals and about 35 % annealing to take place in KNO3-Sr(NO3)2 eutectic at 200 0C.
The process of annealing is generally formulated using equations similar to those of chemical kinetics. Various diffusion-controlled models have been proposed such as Fletcher-Brown model and Waite model11,12 to explain the characteristics of annealing kinetics. The energy of activation for the annealing reaction is computed. An appropriate mechanism of annealing consistent with the observed results is proposed.
EXPERIMENTAL
The eutectic mixture of NaNO3 (45 %)-KNO3(55 %) was fused at 2250 C and cooled naturally.13 The irradiation of samples of eutectic was carried out in 2.5 kCi 60Co -source at ambient temperature. The results of the radiolytic decomposition of a eutectic mixture of NaNO3-KNO3 are already reported in terms of G(NO2
-) values.
After irradiation, the samples of the eutectic mixture of NaNO3-KNO3 were subjected to isothermal annealing at various temperatures for different time intervals using an electric furnace.
The annealed samples of the eutectic mixture after removal from thermostat or furnace were analyzed to estimate the amount of nitrite [G(NO2
-)] left after annealing by using Shinn’s method.14
RESULTS AND DISCUSSION
The fraction annealed, ø, after heating for time t, is defined by an expression
ø =(NO2-)0 - (NO2
-)t/(NO2-)0
where, (NO2-)0 and (NO2
-)t are the concentrations expressed in a number of NO2
- molecules per gram of the eutectic mixture present initially and after time t, respectively.
A plot of fraction annealed ø, as a function of annealing time at various temperatures, are shown in Fig. 1. The examination of the annealing curves obtained reveals that there is an abrupt recovery of damage in the initial period of annealing followed by a slow rate of annealing at every temperature.

Kinetics of isothermal annealing of irradiated eutectic (Na,K)NO3 Section A-Research paper
Eur. Chem. Bull., 2019, 8(2), 44-46 DOI: 10.17628/ecb.2019.8.44-46 45
For example, the extent of annealing in a eutectic mixture of NaNO3-KNO3 at 200 0C is found to be 45 % in 10 h, while only 10 % of annealing takes place during the next 20 h.
Figure 1. A plot of fraction annealed ø, as a function of annealing time at various temperatures
Figure 2. First order plots for annealing of nitrite in γ–irradiated NaNO3-KNO3 eutectic.
Analysis of data of annealing obtained at various temperatures by conventional kinetics5 showed that the annealing occurs by a combination of the first and the second order processes. The first order process taking place in the initial stages is attributed to the germinate recombination of
fragments in the damaged zone. The first order disappearance of the nitrite is the recovery of closely correlated NO2
- and O pairs in the form of NO3
- (Fig. 2).
While, the occurrence of the second order is explained on the basis of a random combination of NO2
- and O or O2 fragments which have diffused farther apart in the crystal lattice. (Fig. 3)
Figure 3. Second order plots for annealing of nitrite in γ–irradiated NaNO3-KNO3 eutectic.
The energy of activation for the first and the second order processes computed from the Arrhenius plot are found to be 8.0 kJ. mol-1 and 14.4 kJ mol-1 respectively. The kinetics of annealing is also explored by using the Waite Model which considers the annealing as a diffusion-controlled reaction. This model envisages a spread in the separation of an interstitial from the corresponding vacancy and a random distribution of pairs concerning one another. The resulting expression for short time of annealing is
ø = K {D0 e-E/ RT }1/2 t1/2
where,
D0 is the diffusion coefficient and
E is the energy of activation for diffusion.
The energy of activation of annealing from this is found to be 13.7 kJ mol-1 which is in reasonable agreement with the value obtained for the second order process using the conventional method.
CONCLUSIONS
The present investigations revealed that the recovery of damage in irradiated samples of the eutectic mixture of NaNO3-KNO3 occurs due to thermal reactions as well as reactions accompanying phase transformations in the damaged crystals.
The isothermal annealing process is formed to consist of a fast first-order reaction in addition to a slow predominant second order reaction.
Kinetics of isothermal annealing of irradiated eutectic (Na,K)NO3 Section A-Research paper
Eur. Chem. Bull., 2019, 8(2), 44-46 DOI: 10.17628/ecb.2019.8.44-46 46
Acknowledgments
The authors express their thanks to the Principal, Fergusson College (Autonomous), Pune-411004, Maharashtra, India and HOD, Department of Chemistry, Savitribai Phule Pune University, Pune 411007, Maharashtra, India.
REFERENCES
1Patil, S. F., Nalawade, C. G., Kinetics of the isothermal annealing of radiation damage in barium nitrate crystals, J. Radiochem. Radioanal. Lett., 1980, 45(2), 133.
2Patil, S. F., Bedekar, A. G., Effect of particle size of nitrate and oxides as a heterophase impurity on the radiation decomposition of pure and Ba2+ doped KNO3 crystals, Int. J. Radiation Phys. Chem., 1987, 29(2), 121. https://doi.org/10.1016/1359-0197(87)90045-2
3Mahapatra, B. M., Bhatia, D., Chemical recovery of damage fragments in gamma-irradiated doped potassium nitrate, Radiat. Phys. Chem., 1986, 29(5), 339. https://doi.org/10.1016/1359-0197(86)90076-7
4Arnikar, H. J., Patil, B. T., Patil, S. F., Kinetics of the annealing of radiation damage in barium chlorate monohydrate J. Radiochem. Radioanal. Lett., 1976, 24(2), 67.
5Samuel, J., Culas, S., Kinetics of Isothermal Annealing of Gamma-irradiation Damage in Thallous Nitrate, Orient. J. Chem., 2013 29(4).
http://dx.doi.org/10.13005/ojc/290433 6Agarwal, N., Garg, A. N., Effect of cation size on the 60Co-
gamma radiolytic decomposition of alkali and alkaline earth metal nitrates, Radiat. Phys. Chem., 2005, 73 147. https://doi.org/10.1016/j.radphyschem.2004.07.010
7Rathore N., Krishan, B., Synthesis and Characterization of Complexes of Glipizide with Zirconium and Cobalt, Orient. J. Chem., 2013, 29(3), 1001. DOI: http://dx.doi.org/10.13005/ojc/290320
8Maddock, A. G., Mohanty, S. R., Thermal Annealing of Chemical Radiation Damage, Nature, 1959, 182, 1797. https://doi.org/10.1038/1821797a0
9Dalai, P. C., Mohanty, S. R., Kinetics of Thermal Annealing of Chemical Radiation Damage in Hexammino-Cobaltic Nitrate, Radiochim, Acta, 1976, 23, 171. DOI: https://doi.org/10.1524/ract.1976.23.34.171
10Nair, S. M. K., Krishnan, M. S., James, C., Thermal decomposition of irradiated strontium nitrate, J. Indian Chem. Soc., 1982, 59(10), 1147.
11Waite, T. R., Theoretical Treatment of the Kinetics of Diffusion-Limited Reactions, Phys. Rev., 1957, 107, 463. DOI:https://doi.org/10.1103/PhysRev.107.463
12Fletcher, R. C., Brown, W. L., Annealing of Bombardment Damage in a Diamond-Type Lattice: Theoretical, Phys. Rev., 1953, 92, 585.
DOI:https://doi.org/10.1103/PhysRev.92.585 13Pawar, S. S., Patil, S. F., Effect of Heterophase Additives
on the gamma-Radiolysis of some nitrates, eutectic mixture and Sr2+-doped eutectic mixture of NaNO3-KNO3, Int. J. Manag. Technol., Eng., 2018, 8(11), 1661.
14Shinn, M. B., Colorimetric method for determination of nitrite, Ind. Eng. Chem. Anal. Ed. 1941, 13, 33.
This paper was presented at the “International Symposium on Exploring New Horizons in Chemical Sciences”, January 10–12, 2019, Aurangabad, India (ENHCS–2019).
Received: 03.03.2019. Accepted: 20.03.2019.
Phytochemical properties of Cestrum necturm leaves Section C-Preliminary communication
Eur. Chem. Bull. 2019, 8(2), 47-50 DOI: 10.17628/ecb.2019.8.47-50 47
PHYTOCHEMICAL PROPERTIES OF CONVENTIONAL
AQUEOUS EXTRACT AND MICROWAVE ASSISTED EXTRACT
OF CESTRUM NECTURM LEAVES
Samreen Fatema,[a] Mohd Imran Anees,[b] Mazahar Farooqui[c] and Pathan Mohd Arif[a]*
Keywords: extraction; phytochemical analysis; antibacterial activity; Cestrum necturm
Cestrum nocturnum Linn. belongs to Solanaceae. It is commonly known as Raat rani, lady of night or night Jessamine have great medicinal
value. The plant was extracted using conventional extraction as well as microwave-assisted extraction. The phytochemicals such as
carbohydrate, proteins, amino acid, glycoside, phenolic compounds and tannins have been qualitatively determined. The physicochemical
properties such as relative density, viscosity, surface tension and refractive index were determined. All features of microwave assisted
extract were found to be higher than aqueous extract. UV-Vis and IR data were evaluated. The extracts were screened for biological activity
and aqueous extract is found to be active against E. Coli, B. Subtilis, S. Typhi, S. Aureus, tuberculosis and malaria
* Corresponding Authors
Tel: 09423456007 E-Mail: [email protected]
[a] Postgraduate and research center, Maulana Azad College, Aurangabad (MS), India 431001
[b] Y.B Chavan College of Pharmacy, Aurangabad (MS) India 431001
[c] Dr. Rafiq Zakaria College for women, Navkhanda, Aurangabad (MS) India 431001
Introduction
Plants are the vital source to combat the severe diseases in the world.1 World health organization (WHO) reported that the more than 80 % of the world population used the remedies based on plants for their primary health care need.2,3 The plants are the source for the new drugs, in which the majority are still unexplored. Among the 25 000 000 to 50 000 000 plant species - several percentages of the plants are investigated for their phytochemical and biological screening.4 India is known for the thousands of species for its medicinal value and the use of the different parts of the plant to cure specific alignment.5
Cestrum nocturnum Linn. belongs to Solanaceae. It is commonly known as Raat rani, lady of night or night Jessamine.6 It contains simple glossy leaves, vine-like stems, greenish-creamy white tubular flowers. The species name ‘nocturnum' refers to the species which have the habit of opening its small, heavily-scented flowers at night.7,8 Hemant Kumar Nagar et al. reported the wound healing activity of Cestrum nocturnum (L.) ointment,9 antidiabetic10 and antibacterial11,12 activities.
The present study is done for the investigation of the phytochemicals are occurred in Cestrum nocturnum and to determine the physical parameters of its aqueous-extract by different methods. The comparative study was done for conventional extraction (CE) and microwave-assisted extraction (MAE).
Experimental
The plant leaves were collected from the nearby field of Aurangabad city. The leaves were washed gently and dried under shade and were ground. The extraction and analytical methods of phytochemical and physico-chemical parameters like relative density, viscosity, surface tension and refractive index along with phytochemical qualitative tests were carried out as described in our earlier reports.13-16 The UV-visible spectra were recorded in the range from 190 to 800 nm by using double beam spectrophotometer of Model Elico-159 and λmax values were determined. The FT-IR instrument IRT3000 (JASCO) used to get IR spectra. Antibacterial activity is investigated by cup plate method in which 70 µL of standard test solution was added in each cups or wels and these cups were prepared by using sterile metal borer. The media used was sterile nutrient agar and sterilization was performed in autoclave at 121 0C for 20 min. For the present study Streptomycine is used as a standard against bacterial culture.
Results and discussion
The leaves of Cestrum nocturnum were analyzed to determine their phytochemical, physicochemical and biological properties.
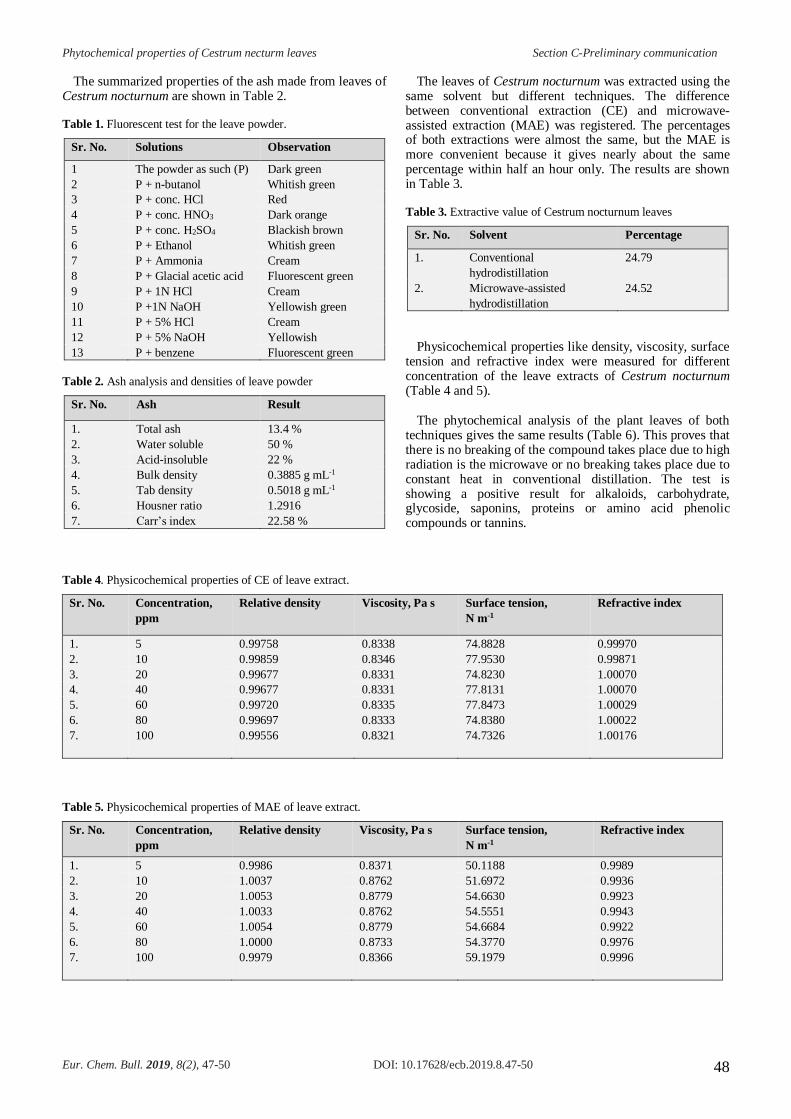
The powder sample is treated with different chemicals and changes in color were registered. The results are shown in Table 1. The solutions gave different colors, for example, concentrated hydrochloric acid gave red while 1 M hydrochloric acid gave creamy color. It can be attributed due to differences in reactivity and color changes according to the pH (indicator property) of different materials are present. The ash content showed the presence of inorganic compounds. The total ash content in the leaves of Cestrum nocturnum was found to be 13.4 %. The water-soluble part of the ash was found to be 50 %, while 22 % of the ash does not dissolve even in 1 M hydrochloric acid either.
Phytochemical properties of Cestrum necturm leaves Section C-Preliminary communication
Eur. Chem. Bull. 2019, 8(2), 47-50 DOI: 10.17628/ecb.2019.8.47-50 48
The summarized properties of the ash made from leaves of Cestrum nocturnum are shown in Table 2.
Table 1. Fluorescent test for the leave powder.
Sr. No. Solutions Observation
1 The powder as such (P) Dark green
2 P + n-butanol Whitish green
3 P + conc. HCl Red
4 P + conc. HNO3 Dark orange
5 P + conc. H2SO4 Blackish brown
6 P + Ethanol Whitish green
7 P + Ammonia Cream
8 P + Glacial acetic acid Fluorescent green
9 P + 1N HCl Cream
10 P +1N NaOH Yellowish green
11 P + 5% HCl Cream
12 P + 5% NaOH Yellowish
13 P + benzene Fluorescent green
Table 2. Ash analysis and densities of leave powder
Sr. No. Ash Result
1. Total ash 13.4 %
2. Water soluble 50 %
3. Acid-insoluble 22 %
4. Bulk density 0.3885 g mL-1
5. Tab density 0.5018 g mL-1
6. Housner ratio 1.2916
7. Carr’s index 22.58 %
The leaves of Cestrum nocturnum was extracted using the same solvent but different techniques. The difference between conventional extraction (CE) and microwave-assisted extraction (MAE) was registered. The percentages of both extractions were almost the same, but the MAE is more convenient because it gives nearly about the same percentage within half an hour only. The results are shown in Table 3.
Table 3. Extractive value of Cestrum nocturnum leaves
Sr. No. Solvent Percentage
1. Conventional
hydrodistillation
24.79
2. Microwave-assisted
hydrodistillation
24.52
Physicochemical properties like density, viscosity, surface tension and refractive index were measured for different concentration of the leave extracts of Cestrum nocturnum (Table 4 and 5).
The phytochemical analysis of the plant leaves of both techniques gives the same results (Table 6). This proves that there is no breaking of the compound takes place due to high radiation is the microwave or no breaking takes place due to constant heat in conventional distillation. The test is showing a positive result for alkaloids, carbohydrate, glycoside, saponins, proteins or amino acid phenolic compounds or tannins.
Table 4. Physicochemical properties of CE of leave extract.
Sr. No. Concentration,
ppm
Relative density Viscosity, Pa s Surface tension,
N m-1
Refractive index
1. 5 0.99758 0.8338 74.8828 0.99970
2. 10 0.99859 0.8346 77.9530 0.99871
3. 20 0.99677 0.8331 74.8230 1.00070
4. 40 0.99677 0.8331 77.8131 1.00070
5. 60 0.99720 0.8335 77.8473 1.00029
6. 80 0.99697 0.8333 74.8380 1.00022
7. 100 0.99556 0.8321 74.7326 1.00176
Table 5. Physicochemical properties of MAE of leave extract.
Sr. No. Concentration,
ppm
Relative density Viscosity, Pa s Surface tension,
N m-1
Refractive index
1. 5 0.9986 0.8371 50.1188 0.9989
2. 10 1.0037 0.8762 51.6972 0.9936
3. 20 1.0053 0.8779 54.6630 0.9923
4. 40 1.0033 0.8762 54.5551 0.9943
5. 60 1.0054 0.8779 54.6684 0.9922
6. 80 1.0000 0.8733 54.3770 0.9976
7. 100 0.9979 0.8366 59.1979 0.9996
Phytochemical properties of Cestrum necturm leaves Section C-Preliminary communication
Eur. Chem. Bull. 2019, 8(2), 47-50 DOI: 10.17628/ecb.2019.8.47-50 49
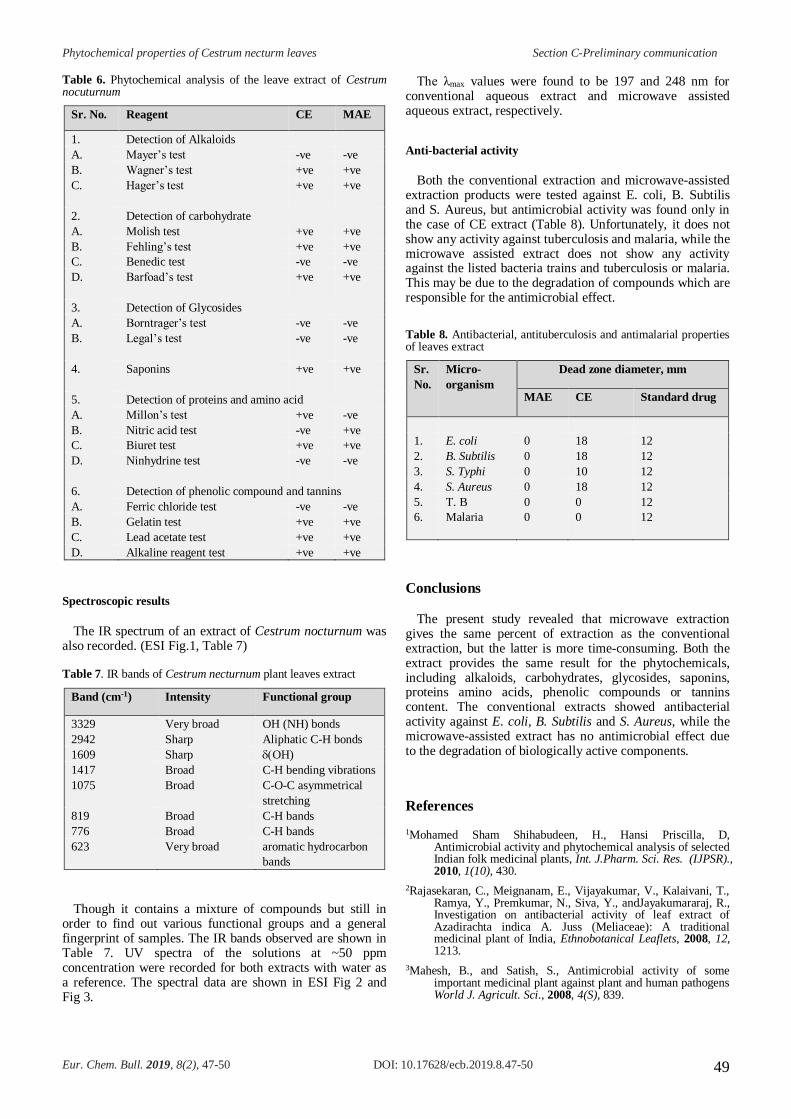
Table 6. Phytochemical analysis of the leave extract of Cestrum nocuturnum
Sr. No. Reagent CE MAE
1. Detection of Alkaloids
A. Mayer’s test -ve -ve
B. Wagner’s test +ve +ve
C. Hager’s test +ve +ve
2. Detection of carbohydrate
A. Molish test +ve +ve
B. Fehling’s test +ve +ve
C. Benedic test -ve -ve
D. Barfoad’s test +ve +ve
3. Detection of Glycosides
A. Borntrager’s test -ve -ve
B. Legal’s test -ve -ve
4. Saponins +ve +ve
5. Detection of proteins and amino acid
A. Millon’s test +ve -ve
B. Nitric acid test -ve +ve
C. Biuret test +ve +ve
D. Ninhydrine test -ve -ve
6. Detection of phenolic compound and tannins
A. Ferric chloride test -ve -ve
B. Gelatin test +ve +ve
C. Lead acetate test +ve +ve
D. Alkaline reagent test +ve +ve
Spectroscopic results
The IR spectrum of an extract of Cestrum nocturnum was also recorded. (ESI Fig.1, Table 7)
Table 7. IR bands of Cestrum necturnum plant leaves extract
Band (cm-1) Intensity Functional group
3329 Very broad OH (NH) bonds
2942 Sharp Aliphatic C-H bonds
1609 Sharp (OH)
1417 Broad C-H bending vibrations
1075 Broad C-O-C asymmetrical
stretching
819 Broad C-H bands
776 Broad C-H bands
623 Very broad aromatic hydrocarbon
bands
Though it contains a mixture of compounds but still in order to find out various functional groups and a general fingerprint of samples. The IR bands observed are shown in Table 7. UV spectra of the solutions at ~50 ppm concentration were recorded for both extracts with water as a reference. The spectral data are shown in ESI Fig 2 and Fig 3.
The λmax values were found to be 197 and 248 nm for conventional aqueous extract and microwave assisted aqueous extract, respectively.
Anti-bacterial activity
Both the conventional extraction and microwave-assisted extraction products were tested against E. coli, B. Subtilis and S. Aureus, but antimicrobial activity was found only in the case of CE extract (Table 8). Unfortunately, it does not show any activity against tuberculosis and malaria, while the microwave assisted extract does not show any activity against the listed bacteria trains and tuberculosis or malaria. This may be due to the degradation of compounds which are responsible for the antimicrobial effect.
Table 8. Antibacterial, antituberculosis and antimalarial properties of leaves extract
Sr.
No.
Micro-
organism
Dead zone diameter, mm
MAE CE Standard drug
1. E. coli 0 18 12
2. B. Subtilis 0 18 12
3. S. Typhi 0 10 12
4. S. Aureus 0 18 12
5. T. B 0 0 12
6. Malaria 0 0 12
Conclusions
The present study revealed that microwave extraction gives the same percent of extraction as the conventional extraction, but the latter is more time-consuming. Both the extract provides the same result for the phytochemicals, including alkaloids, carbohydrates, glycosides, saponins, proteins amino acids, phenolic compounds or tannins content. The conventional extracts showed antibacterial activity against E. coli, B. Subtilis and S. Aureus, while the microwave-assisted extract has no antimicrobial effect due to the degradation of biologically active components.
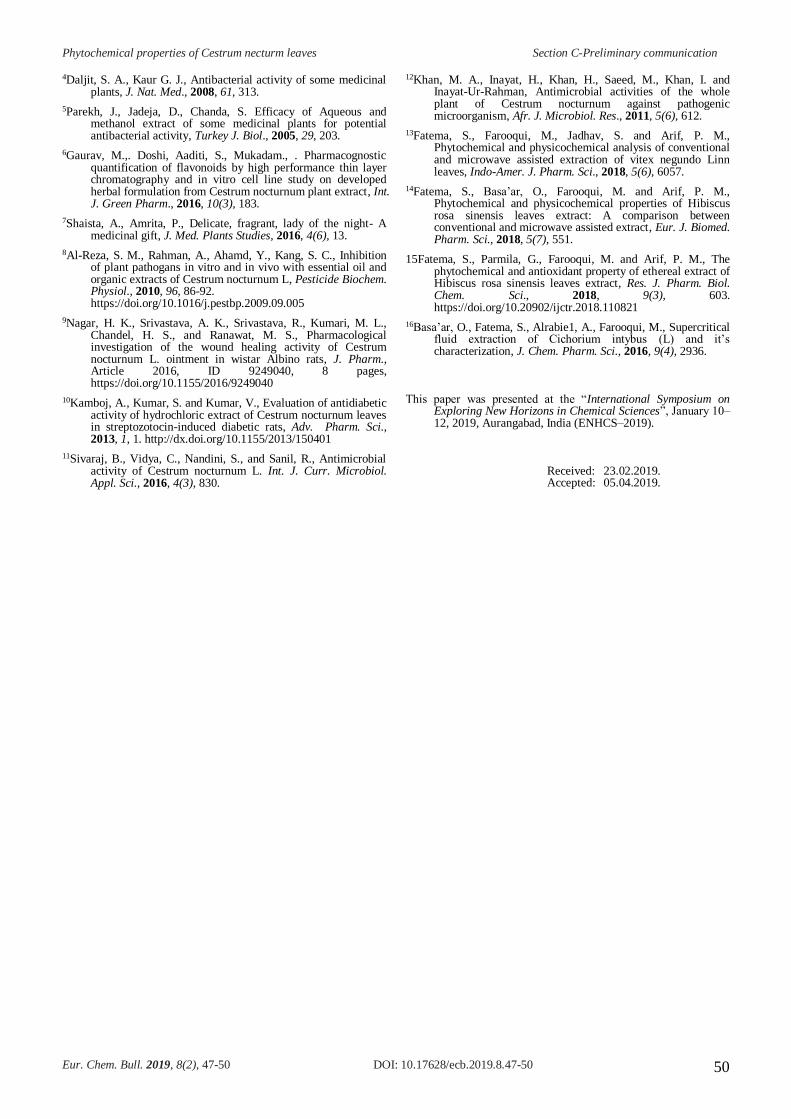
References
1Mohamed Sham Shihabudeen, H., Hansi Priscilla, D, Antimicrobial activity and phytochemical analysis of selected Indian folk medicinal plants, Int. J.Pharm. Sci. Res. (IJPSR)., 2010, 1(10), 430.
2Rajasekaran, C., Meignanam, E., Vijayakumar, V., Kalaivani, T., Ramya, Y., Premkumar, N., Siva, Y., andJayakumararaj, R., Investigation on antibacterial activity of leaf extract of Azadirachta indica A. Juss (Meliaceae): A traditional medicinal plant of India, Ethnobotanical Leaflets, 2008, 12, 1213.
3Mahesh, B., and Satish, S., Antimicrobial activity of some important medicinal plant against plant and human pathogens World J. Agricult. Sci., 2008, 4(S), 839.
Phytochemical properties of Cestrum necturm leaves Section C-Preliminary communication
Eur. Chem. Bull. 2019, 8(2), 47-50 DOI: 10.17628/ecb.2019.8.47-50 50
4Daljit, S. A., Kaur G. J., Antibacterial activity of some medicinal plants, J. Nat. Med., 2008, 61, 313.
5Parekh, J., Jadeja, D., Chanda, S. Efficacy of Aqueous and methanol extract of some medicinal plants for potential antibacterial activity, Turkey J. Biol., 2005, 29, 203.
6Gaurav, M.,. Doshi, Aaditi, S., Mukadam., . Pharmacognostic quantification of flavonoids by high performance thin layer chromatography and in vitro cell line study on developed herbal formulation from Cestrum nocturnum plant extract, Int. J. Green Pharm., 2016, 10(3), 183.
7Shaista, A., Amrita, P., Delicate, fragrant, lady of the night- A medicinal gift, J. Med. Plants Studies, 2016, 4(6), 13.
8Al-Reza, S. M., Rahman, A., Ahamd, Y., Kang, S. C., Inhibition of plant pathogans in vitro and in vivo with essential oil and organic extracts of Cestrum nocturnum L, Pesticide Biochem. Physiol., 2010, 96, 86-92. https://doi.org/10.1016/j.pestbp.2009.09.005
9Nagar, H. K., Srivastava, A. K., Srivastava, R., Kumari, M. L., Chandel, H. S., and Ranawat, M. S., Pharmacological investigation of the wound healing activity of Cestrum nocturnum L. ointment in wistar Albino rats, J. Pharm., Article 2016, ID 9249040, 8 pages, https://doi.org/10.1155/2016/9249040
10Kamboj, A., Kumar, S. and Kumar, V., Evaluation of antidiabetic activity of hydrochloric extract of Cestrum nocturnum leaves in streptozotocin-induced diabetic rats, Adv. Pharm. Sci., 2013, 1, 1. http://dx.doi.org/10.1155/2013/150401
11Sivaraj, B., Vidya, C., Nandini, S., and Sanil, R., Antimicrobial activity of Cestrum nocturnum L. Int. J. Curr. Microbiol. Appl. Sci., 2016, 4(3), 830.
12Khan, M. A., Inayat, H., Khan, H., Saeed, M., Khan, I. and Inayat-Ur-Rahman, Antimicrobial activities of the whole plant of Cestrum nocturnum against pathogenic microorganism, Afr. J. Microbiol. Res., 2011, 5(6), 612.
13Fatema, S., Farooqui, M., Jadhav, S. and Arif, P. M., Phytochemical and physicochemical analysis of conventional and microwave assisted extraction of vitex negundo Linn leaves, Indo-Amer. J. Pharm. Sci., 2018, 5(6), 6057.
14Fatema, S., Basa’ar, O., Farooqui, M. and Arif, P. M., Phytochemical and physicochemical properties of Hibiscus rosa sinensis leaves extract: A comparison between conventional and microwave assisted extract, Eur. J. Biomed. Pharm. Sci., 2018, 5(7), 551.
15Fatema, S., Parmila, G., Farooqui, M. and Arif, P. M., The phytochemical and antioxidant property of ethereal extract of Hibiscus rosa sinensis leaves extract, Res. J. Pharm. Biol. Chem. Sci., 2018, 9(3), 603. https://doi.org/10.20902/ijctr.2018.110821
16Basa’ar, O., Fatema, S., Alrabie1, A., Farooqui, M., Supercritical fluid extraction of Cichorium intybus (L) and it’s characterization, J. Chem. Pharm. Sci., 2016, 9(4), 2936.
This paper was presented at the “International Symposium on
Exploring New Horizons in Chemical Sciences”, January 10–12, 2019, Aurangabad, India (ENHCS–2019).
Received: 23.02.2019. Accepted: 05.04.2019.
Radiotherapy quality assurance devices Section C-Research paper
Eur. Chem. Bull., 2019, 8(1), 51-56 DOI: 10.17628/ecb.2019.8.51-56 51
DIFFERENCE BETWEEN RADIOTHERAPY QUALITY
ASSURANCE DEVICES (ARC- AND MAP-CHECKS)
T. Gonashvili,[a] K. Kotetishvili,[b]and G. Gavashelishvili[a]
Keywords: QA assurance and control; arc and map-check; oncology; breast and larynx patient; linear accelerator; external beam
therapy, intensity-modulated-radiotherapy; volumetric-modulated-arc-therapy; dose distribution and measurement; dosimeters, c-
index technique; two and three-dimensional plane.
The radiotherapy is a complex procedure and involves understanding of the principles of medical physics, radiobiology, radiation safety,
dosimetry, radiation treatment planning, simulation and interaction of radiation with other treatment modalities. Each step in the integrated
process of RT needs quality control and quality assurance to prevent errors and to give high confidence that patients will receive the
prescribed treatment correctly. A patient-specific quality assurance program has been developed to facilitate the clinical implementation of
the intensity-modulated radiotherapy delivered using a micro‐multileaf collimator. The methodology includes several dosimetric tasks that
are performed prior to the treatment of each patient. Film dosimeter is performed for each individual field and the multifield composite
plan. Individual field measurements are performed at a depth of 5 cm in a water equivalent slab phantom. The heterogeneity inserts of
phantom are 2 cm×2 cm×22 cm with absorption characteristics of water, brain, muscle, lung, breast, adipose tissue, bone, and liver.
* Corresponding Authors
E-Mail: [email protected] [a] LIV Hospital, Radiation Medicine Centre, Tbilisi, Georgia [b] Georgian Technical University, Engineering Physics
Department, Tbilisi, Georgia
INTRODUCTION
The purpose of the research is related to the need to develop an analytical approach to planning and question anything different from the norm. This study was conducted to verify planar dose distributions acquired during the pretreatment step of the radiotherapy (RT), in particular, the patient-specific intensity-modulated-radiotherapy (IMRT) quality assurance (QA) delivered at LIV Hospital Radiation Medicine Centre (Tbilisi, Georgia).
EXPERIMENTALS
Our study took one year to provide the appropriate radiation database with clinical conditions: ELEKTA, type of treatment machine, and treatment planning systems (TPS); Treatment approaches: IMRT, S and S IMRT, SBRT, SRS, and volumetric-modulated-arc-therapy (VMAT); QA-devices: Subnuclear, Arc-Check, and Map-Check; Fraction dose: between 1.5–3.0 Gy; and the number of patients: breast – 87 and larynx – 504.
RESULTS AND DISCUSSION
Five hundred ninety-one patient data were evaluated for a time ranging from 2017 to 2018. These data were gauged using several methods used in the QA process. Several patient plan QA in the latter years.
Patients were grouped according to several parameters including TPS, site of treatment, and type of treatment machine used in comparing the measured versus computed dose differences.
With the introduction of advanced RT techniques such as VMAT and IMRT, the three-dimensional (3D) dose distribution for radiation therapy has become both more conformal and complex. These features pose a great challenge for the QA of the dose distribution, which commonly consists of both point dose and two-dimensional (2D) plane dose measurements.1 And an urgent need for 3D dosimetry has also been stated.2
Various techniques have been developed to compare measured dose distributions with those generated by the treatment planning system.3–24 The c-index technique,3,4 which is the standard method for planar dose verification in IMRT QA,5,6 calculates the quantity c for each point of interest using preselected dose-difference (DD) and distance-to-agreement (DTA) criteria and then uses the c value to determine the outcome (pass–fail) of the IMRT QA.
QA measurements are conducted per year for each patient. Quality assurance is specifically defined as the systematic actions necessary to ensure that a product or process performs to specification. The accuracy of each step in the process has a direct impact on treatment outcome.
The following criteria are used for absolute dose and relative dose to determine if a point passes or fails: threshold (TH %), percent difference (Diff %), and distance (Dist, mm). TH % is the minimum dose percent value that must be met in either the device measured or planned dose data for the point to be included in the analysis. Global, so-called Van Dyk, Diff % is the percent difference between the doses at any measured point and the corresponding plan point normalized to a common point (a user-selected normalization point or the maximum dose point – default).
Radiotherapy quality assurance devices Section C-Research paper
Eur. Chem. Bull., 2019, 8(1), 51-56 DOI: 10.17628/ecb.2019.8.51-56 52
As for the Dist, it is a radius in mm around the measured point. This test refers to points, where the difference between measured and planned values of co-located points exceeds the selected percent difference. Using the distance to agreement criteria, measured point passes if, within a circle of DTA in mm, there exists at least one plan point that
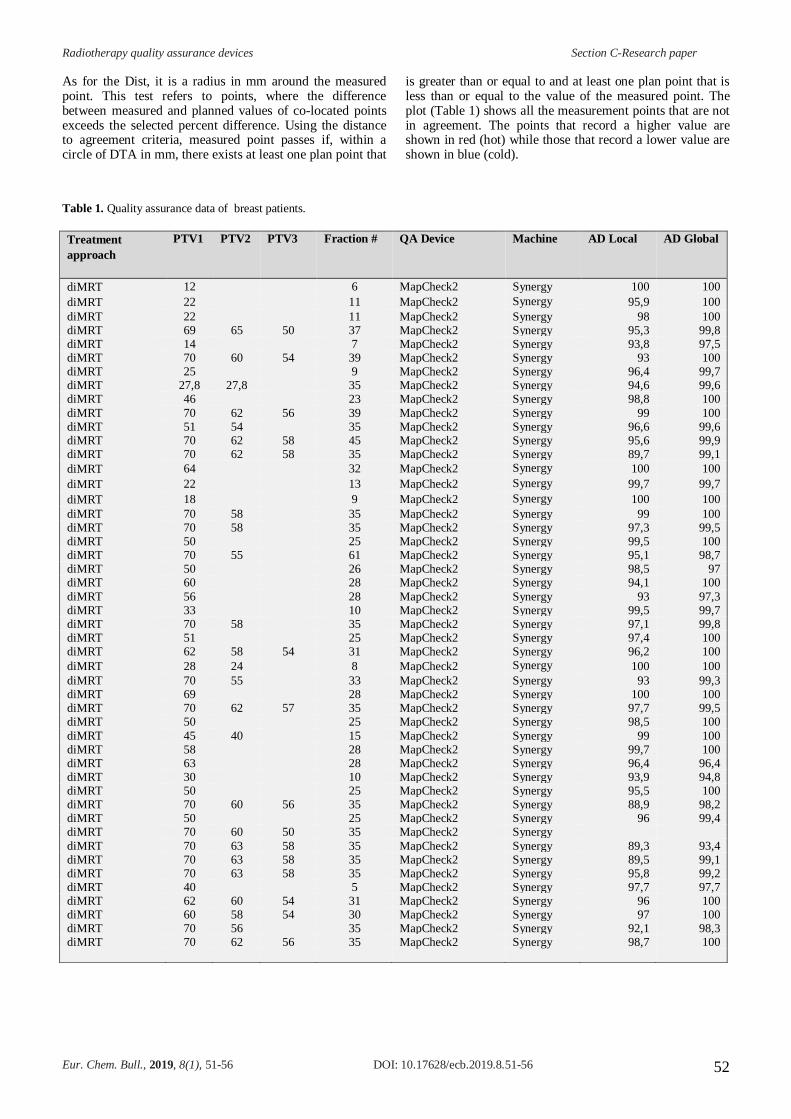
is greater than or equal to and at least one plan point that is less than or equal to the value of the measured point. The plot (Table 1) shows all the measurement points that are not in agreement. The points that record a higher value are shown in red (hot) while those that record a lower value are shown in blue (cold).
Table 1. Quality assurance data of breast patients.
Treatment
approach
PTV1
PTV2 PTV3 Fraction #
QA Device
Machine
AD Local
AD Global
diMRT 12 6 MapCheck2 Synergy 100 100
diMRT 22 11 MapCheck2 Synergy 95,9 100
diMRT 22 11 MapCheck2 Synergy 98 100 diMRT 69 65 50 37 MapCheck2 Synergy 95,3 99,8 diMRT 14 7 MapCheck2 Synergy 93,8 97,5 diMRT 70 60 54 39 MapCheck2 Synergy 93 100 diMRT 25 9 MapCheck2 Synergy 96,4 99,7 diMRT 27,8 27,8 35 MapCheck2 Synergy 94,6 99,6 diMRT 46 23 MapCheck2 Synergy 98,8 100
diMRT 70 62 56 39 MapCheck2 Synergy 99 100 diMRT 51 54 35 MapCheck2 Synergy 96,6 99,6 diMRT 70 62 58 45 MapCheck2 Synergy 95,6 99,9 diMRT 70 62 58 35 MapCheck2 Synergy 89,7 99,1
diMRT 64 32 MapCheck2 Synergy 100 100
diMRT 22 13 MapCheck2 Synergy 99,7 99,7
diMRT 18 9 MapCheck2 Synergy 100 100
diMRT 70 58 35 MapCheck2 Synergy 99 100 diMRT 70 58 35 MapCheck2 Synergy 97,3 99,5 diMRT 50 25 MapCheck2 Synergy 99,5 100 diMRT 70 55 61 MapCheck2 Synergy 95,1 98,7 diMRT 50 26 MapCheck2 Synergy 98,5 97 diMRT 60 28 MapCheck2 Synergy 94,1 100
diMRT 56 28 MapCheck2 Synergy 93 97,3 diMRT 33 10 MapCheck2 Synergy 99,5 99,7 diMRT 70 58 35 MapCheck2 Synergy 97,1 99,8 diMRT 51 25 MapCheck2 Synergy 97,4 100 diMRT 62 58 54 31 MapCheck2 Synergy 96,2 100
diMRT 28 24 8 MapCheck2 Synergy 100 100
diMRT 70 55 33 MapCheck2 Synergy 93 99,3 diMRT 69 28 MapCheck2 Synergy 100 100 diMRT 70 62 57 35 MapCheck2 Synergy 97,7 99,5 diMRT 50 25 MapCheck2 Synergy 98,5 100
diMRT 45 40 15 MapCheck2 Synergy 99 100 diMRT 58 28 MapCheck2 Synergy 99,7 100 diMRT 63 28 MapCheck2 Synergy 96,4 96,4 diMRT 30 10 MapCheck2 Synergy 93,9 94,8 diMRT 50 25 MapCheck2 Synergy 95,5 100 diMRT 70 60 56 35 MapCheck2 Synergy 88,9 98,2 diMRT 50 25 MapCheck2 Synergy 96 99,4 diMRT 70 60 50 35 MapCheck2 Synergy
diMRT 70 63 58 35 MapCheck2 Synergy 89,3 93,4 diMRT 70 63 58 35 MapCheck2 Synergy 89,5 99,1 diMRT 70 63 58 35 MapCheck2 Synergy 95,8 99,2 diMRT 40 5 MapCheck2 Synergy 97,7 97,7 diMRT 62 60 54 31 MapCheck2 Synergy 96 100 diMRT 60 58 54 30 MapCheck2 Synergy 97 100 diMRT 70 56 35 MapCheck2 Synergy 92,1 98,3 diMRT 70 62 56 35 MapCheck2 Synergy 98,7 100
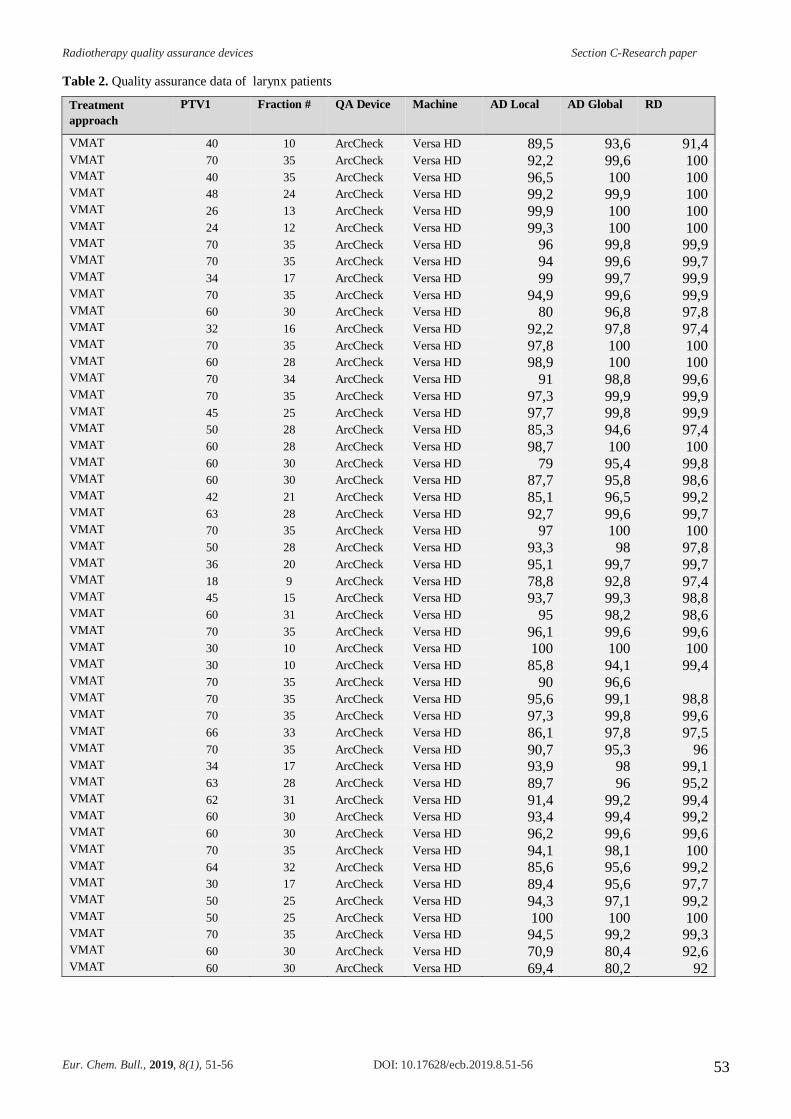
Radiotherapy quality assurance devices Section C-Research paper
Eur. Chem. Bull., 2019, 8(1), 51-56 DOI: 10.17628/ecb.2019.8.51-56 53
Table 2. Quality assurance data of larynx patients
Treatment
approach
PTV1
Fraction #
QA Device
Machine
AD Local
AD Global
RD
VMAT 40 10 ArcCheck Versa HD 89,5 93,6 91,4 VMAT 70 35 ArcCheck Versa HD 92,2 99,6 100 VMAT 40 35 ArcCheck Versa HD 96,5 100 100 VMAT 48 24 ArcCheck Versa HD 99,2 99,9 100 VMAT 26 13 ArcCheck Versa HD 99,9 100 100 VMAT 24 12 ArcCheck Versa HD 99,3 100 100 VMAT 70 35 ArcCheck Versa HD 96 99,8 99,9 VMAT 70 35 ArcCheck Versa HD 94 99,6 99,7 VMAT 34 17 ArcCheck Versa HD 99 99,7 99,9 VMAT 70 35 ArcCheck Versa HD 94,9 99,6 99,9 VMAT 60 30 ArcCheck Versa HD 80 96,8 97,8 VMAT 32 16 ArcCheck Versa HD 92,2 97,8 97,4 VMAT 70 35 ArcCheck Versa HD 97,8 100 100 VMAT 60 28 ArcCheck Versa HD 98,9 100 100 VMAT 70 34 ArcCheck Versa HD 91 98,8 99,6 VMAT 70 35 ArcCheck Versa HD 97,3 99,9 99,9 VMAT 45 25 ArcCheck Versa HD 97,7 99,8 99,9 VMAT 50 28 ArcCheck Versa HD 85,3 94,6 97,4 VMAT 60 28 ArcCheck Versa HD 98,7 100 100 VMAT 60 30 ArcCheck Versa HD 79 95,4 99,8 VMAT 60 30 ArcCheck Versa HD 87,7 95,8 98,6 VMAT 42 21 ArcCheck Versa HD 85,1 96,5 99,2 VMAT 63 28 ArcCheck Versa HD 92,7 99,6 99,7 VMAT 70 35 ArcCheck Versa HD 97 100 100 VMAT 50 28 ArcCheck Versa HD 93,3 98 97,8 VMAT 36 20 ArcCheck Versa HD 95,1 99,7 99,7 VMAT 18 9 ArcCheck Versa HD 78,8 92,8 97,4 VMAT 45 15 ArcCheck Versa HD 93,7 99,3 98,8 VMAT 60 31 ArcCheck Versa HD 95 98,2 98,6 VMAT 70 35 ArcCheck Versa HD 96,1 99,6 99,6 VMAT 30 10 ArcCheck Versa HD 100 100 100 VMAT 30 10 ArcCheck Versa HD 85,8 94,1 99,4 VMAT 70 35 ArcCheck Versa HD 90 96,6 VMAT 70 35 ArcCheck Versa HD 95,6 99,1 98,8 VMAT 70 35 ArcCheck Versa HD 97,3 99,8 99,6 VMAT 66 33 ArcCheck Versa HD 86,1 97,8 97,5 VMAT 70 35 ArcCheck Versa HD 90,7 95,3 96 VMAT 34 17 ArcCheck Versa HD 93,9 98 99,1 VMAT 63 28 ArcCheck Versa HD 89,7 96 95,2 VMAT 62 31 ArcCheck Versa HD 91,4 99,2 99,4 VMAT 60 30 ArcCheck Versa HD 93,4 99,4 99,2 VMAT 60 30 ArcCheck Versa HD 96,2 99,6 99,6 VMAT 70 35 ArcCheck Versa HD 94,1 98,1 100 VMAT 64 32 ArcCheck Versa HD 85,6 95,6 99,2 VMAT 30 17 ArcCheck Versa HD 89,4 95,6 97,7 VMAT 50 25 ArcCheck Versa HD 94,3 97,1 99,2 VMAT 50 25 ArcCheck Versa HD 100 100 100 VMAT 70 35 ArcCheck Versa HD 94,5 99,2 99,3 VMAT 60 30 ArcCheck Versa HD 70,9 80,4 92,6 VMAT 60 30 ArcCheck Versa HD 69,4 80,2 92
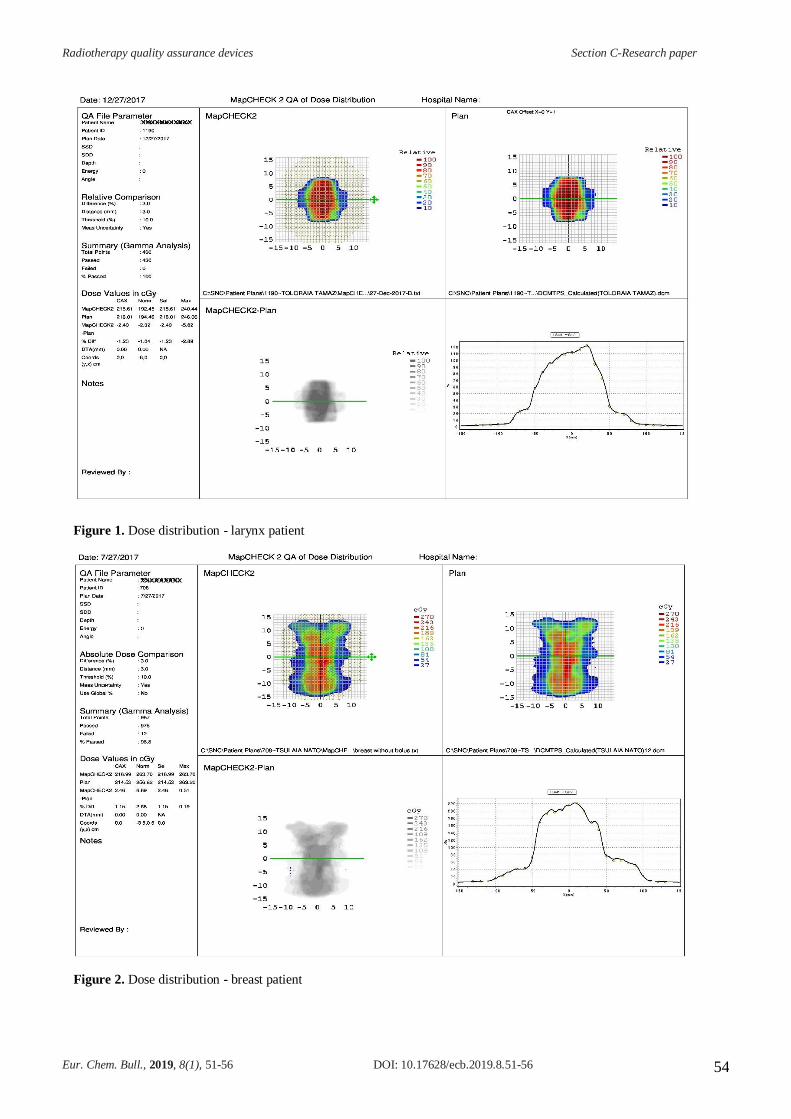
Radiotherapy quality assurance devices Section C-Research paper
Eur. Chem. Bull., 2019, 8(1), 51-56 DOI: 10.17628/ecb.2019.8.51-56 54
Figure 1. Dose distribution - larynx patient
Figure 2. Dose distribution - breast patient
Radiotherapy quality assurance devices Section C-Research paper
Eur. Chem. Bull., 2019, 8(1), 51-56 DOI: 10.17628/ecb.2019.8.51-56 55
If the Global % checkbox is selected in the analysis panel, the Van Dyk comparison is used during DTA and gamma analysis (Figures 1 and 2).
Global % difference for DTA analysis is defined as the following expression in the SNC patient software:
where:
PDEk,l is the percent dose difference between Mg,h and Pk,l,
Mg,h is the measured value at the point (g, h),
Pk,l is the planned value at the point (k, l), and
Pnorm is the planned value at the normalization point.
Global % difference for gamma analysis is defined as the following expression in the SNC patient software:
where:
PDEk,l is the percent dose difference between Mg,h and Pk,l,
Mg,h is the measured value at the point (g, h),
Pk,l is the planned value at the point (k, l), and
Mnorm is the measured value at the normalization point.
CONCLUSION
For dose distribution overlays or dose-difference determinations, the results were independent to within a sign of selection of the reference or evaluated distribution. However, for the DTA and γ tools, the results could be profoundly affected by the selection, especially when one or both of the dose distributions contained some noises. Typically, the reference and evaluated distributions would refer to measured and calculated distributions, respectively. But, the final selection should be based on which distribution is considered the standard by which the other is compared.
The γ tool provides a quantitative method for comparing two dose distributions. In this paper, we have shown the utility of the tool to compare two similar dose distributions and evaluated the sensitivity of the tool to pseudorandom noise. In all of these tests, the dose and distance criteria were fixed, preselected values. In practice, the values can be set as functions of space the location of the dose comparison or dose value.
ACKNOWLEDGMENT
Paper was presented at the 5th International
Conference “Nanotechnologies”, November 19–22, 2018,
Tbilisi, Georgia (Nano–2018).
REFERENCES
1Bedford, J. L., Nordmark, H. V., McNair, H. A., Aitken, A. H., Brock, J. E., Warrington, A. P., Brada, M., Treatment of lung cancer using volumetric modulated arc therapy and image guidance: A case study. Acta Oncol., 2008, 47(7), 1438-1443. https://doi.org/10.1080/02841860802282778
2Otto, K., Volumetric modulated arc therapy: IMRT in a single gantry arc, Med. Phys., 2008, 35(1), 310-317. https://doi.org/10.1118/1.2818738
3Feygelman,V.,Zhang,G.,and Stevens, C. Initial dosimetric evaluation of SmartArc - a novel VMAT treatment planning module implemented in a multi-vendor delivery chain. J Appl Clin. Med. Phys., 2010, 11(1), 99-116. https://doi.org/10.1120/jacmp.v11i1.3169
4Tang. X., Yu, G., Intensity-modulated arc therapy: Principles, Technologies and clinical implementation. Phys. Med. Biol.,2011, 56(5), R31-R54.https://doi.org/10.1088/0031-9155/56/5/r01
5Pallotta, S., Marazzo, L., Bucciolini, M., Design and implementation of a water phantom for IMRT, arc therapy, and tomotherapy dose distribution measurements, Med. Phys., 2007, 34(10), 3724-3731. https://doi.org/10.1118/1.2776249
6Letourneau, J., Publicover, J., Kozelka, D. J., Moseley, D., Jaffray, A., Novel dosimetric phantom for quality assurance of volumetric modulated arc therapy, Med. Phys., 2009, 36(5), 1813-1821. https://doi.org/10.1118/1.3117563
7Gagne, M. W., Ansbacher, S., Zavgorodni, C., Popescu, W. A., Beckham, A., Monte Carlo evaluation of RapidArc dose calculations for oropharynx radiotherapy. Phys. Med. Biol.,2008,53(24),7167-7185.https://doi.org/10.1088/0031-9155/53/24/011
8Korreman, S., Medin, J., Kjaer–Kristoffersen, F., Dosimetric verification of RapidArc treatment delivery. Acta Oncol.,2009,48(7),185-191.https://doi.org/10.1080/02841860802287116
9Verbakel, W., Cuijpers, J.P., Hoffmans, D., Bieker, M., Slotman, B.J., and Senan, S. Volumetric intensity-modulated arc therapy vs. conventional IMRT in head-and-neck cancer: a comparative planning and dosimetric study. Int. J. Radiat. Oncol. Biol. Phys., 2009, 74(1), 252–259. https://doi.org/10.1016/j.ijrobp.2008.12.033
10Rao, M., W., Yang, F., Chen, K., Sheng, J., Ye, V., Mehta, D., Shepard, D., Cao. Comparison of Elekta VMAT with helical tomotherapy and fixed field IMRT: Plan quality, delivery efficiency and accuracy. Med. Phys., 2010, 37(3), 1350-1359. https://doi.org/10.1118/1.3326965
11Ezzell G. A., Burmeister, J. W., Dogan, N., LoSasso, T. J., Mechalakos, J. G., Mihailidis, D., Molineu, A., Palta, J. R., Ramsey, Ch. R., Shi, J., Xia, P., Yue, N. J., Xiao, Y., IMRT commissioning: multiple institution planning and dosimetry comparisons, a report from AAPM Task Group 119. Med. Phys., 2009, 36(11), 5359-5373. https://doi.org/10.1118/1.3238104
12J. O’Daniel, S. Das, Q. J. Wu, F. F. Yin. Volumetric-modulated arc therapy: Effective and efficient end-to-end patient-specific quality assurance. Int. J. Radiat. Oncol. Biol. Phys.,2012,82(5),1567-1574.https://doi.org/10.1016/j.ijrobp.2011.01.018
norm
100M P
PDEP
−=
g,h k,l
k,l
norm
100P M
PDEM
−=
k,l g,h
k,l
Radiotherapy quality assurance devices Section C-Research paper
Eur. Chem. Bull., 2019, 8(1), 51-56 DOI: 10.17628/ecb.2019.8.51-56 56
13Schreibmann, E., Dhabaan, A., Elder, E., Fox, T., Patient-specific quality assurance method for VMAT treatment delivery. Med. Phys., 2009, 36(10), 4530-4535. https://doi.org/10.1118/1.3213085
14Zhen, H., Nelms, B. E., Tome, W. A., Moving from gamma passing rates to patient DVH-based QA metrics in pretreatment dose QA, Med. Phys., 2011, 38(10), 5477-5489. https://doi.org/10.1118/1.3633904
15Stasi, M., Bresciani, S., Miranti, A., Maggio, A., Sapino, V., Gabriele, P., Pretreatment patient-specific IMRT quality assurance: a correlation study between gamma index and patient clinical dose volume histogram. Med. Phys., 2012, 39(12), 7626-7634. https://doi.org/10.1118/1.4767763
16Jin, X., Yi, J., Zhou, Y., Yan, H., Han, C., Xie, C., Comparison of whole field simultaneous integrated boost VMAT and IMRT in the treatment of nasopharyngeal cancer. Med. Dosim., 2013, 38(4), 418-423. https://doi.org/10.1016/j.meddos.2013.05.004
17 Jin X., Yi, J., Zhou, Y., Yan, H., Han, C, Xie, C., CRT combined with a sequential VMAT boost in the treatment of upper thoracic esophageal cancer. J. Appl. Clin. Med. Phys., 2013, 14(5), 153-161. https://doi.org/10.1120/jacmp.v14i5.4325
18Yan G., Lu, B., Kozelka, J., Liu, C., Li, J. G., Calibration of a novel four-dimensional diode array. Med. Phys., 2010, 37(1), 108-115.https://doi.org/10.1118/1.3266769
19Nelms, B. E., Opp, D., Robinson, J., Wolf, T. K., Zhang, G., Moros, E., Feygelman, V., VMAT QA: measurement-guided 4D dose reconstruction on a patient. Med. Phys.,2012, 39(7-1), 4228-4238. https://doi.org/10.1118/1.4729709
20Bailey, D. W., Nelms, B. E., Attwood, K., Kumaraswamy, L., Podgorsak, M., Statistical variability and confidence intervals for planar dose QA pass rates. Med. Phys., 2011, 38(11), 6053-6064. https://doi.org/10.1118/1.3651695
21Nelms, B. E., Zhen, H., Tome, W. A., Per-beam, planar IMRT QA passing rates do not predict clinically relevant patient dose errors. Med. Phys., 2011, 38(2), 1037-1044. https://doi.org/10.1118/1.3544657
22Feygelman, V., Opp, D., Zhang, G., Stevens, C., Nelms, B., Experimental verification of the planned dose perturbation algorithm in an anthropomorphic phantom. J. Phys.Conf. Ser., 2013, 444, 012047, 4pp. https://doi.org/10.1088/1742-6596/444/1/012047
23Carrasco, P., Jornet, N., Latorre, A., Eudaldo, T., Ruiz, A., Ribas, M., 3D DVH-based metric analysis versus per-beam planar analysis in IMRT pretreatment verification. Med. Phys., 2012, 39(8), 5040-5049. https://doi.org/10.1118/1.4736949
Received: 06.01.2019. Accepted: 11.04.2019.
Deformations in PbSe nanolayers Section B-Research paper
Eur. Chem. Bull. 2019, 8(2), 57-62 DOI: 10.17628/ecb.2019.8.57-62 57
HIGH DEFORMATIONS IN LEAD SELENIDE NANOLAYERS
AND RELATED NEW PROPERTIES
A. M. Pashaev,[a] O. I. Davarashvili,[b]* M. I. Enukashvili,[b] Z. G. Akhvlediani,[b,c]
L. P. Bychkova,[b] R.G. Gulayev,[b] M. A. Dzagania,[b,d] and V. P. Zlomanov[e]
Keywords: nanolayers; deformations; dislocations; supercriticality; “negative” pressure.
The article deals with the modified method of “hot-wall” beam epitaxy for obtaining the strained lead selenide nanolayers over a wide range
of growth rates and controlling their thickness. With detection of the two-stage growth of the layers, the layers with high deformations –
tangential lattice constants, and hence with high “negative” pressure were formed. Observations of the shift of the optical spectrum in strained
layers and the possibility of deep compensation of the concentration of current carriers when doping the layers with impurities with variable
valence turned out to be interesting as well. Under high deformations, the texture of a tetragonal phase is formed. There appears a new level
in the conduction band and hence additional absorption in the optical spectrum. The given specific features were first discovered in the physics
and technology of IV–VI semiconductors, and they open new opportunities of using these semiconductors in IR optoelectronics.
* Corresponding Authors
E-Mail: [email protected] [a] National Aviation Academy of Azerbaijan, Baku, Azerbaijan [b] I. Javakhishvili Tbilisi State University, Tbilisi, Georgia [c] E. Andronikashvili Institute of Physics, Tbilisi, Georgia [d] P. Melikishvili Institute of Physical & Organic Chemistry,
Tbilisi, Georgia [e] M. V. Lomonosov Moscow State University, Moscow,
Russia
Introduction
Some new data on the comprehensive research of the strained layers of IV–VI semiconductors have been presented recently.1 In bulk crystals and thick layers, the atomic number – the weight of the components of the compound determines the chain of interconnected physical properties of IV–VI semiconductors: a narrow band gap leads to small values of effective mass which, in turn, lead to high mobility of current carriers. In thin strained layers, a slight change in the distance between the atoms constituting the compound, for example, with tensile strain is accompanied by an increase in the lattice constant and the band gap, while the mobility of current carriers decreases more significantly than without relaxation of strains at the substrate-layer interface.2 As the investigation showed, it is important that, when the strained state is retained for two and more years, new opportunities to control smoothly and flexibly the properties of the nanolayers of IV–VI semiconductors and to realize innovative semiconductor device solutions are viewed.3 Hence the strained nanolayers can be classified as new nanomaterials.
Among the specific features discovered in the strained nanolayers of IV–VI semiconductors, the following ones stand out: supercritical layers under “negative” pressure, non-monotonous dependence of deformations on the growth rate for certain layer thickness, and detection of additional absorption in optical spectra.4
From the variety of methods of growing the epitaxial layers of IV–VI semiconductors from liquid and gas phases to obtain single-crystal strained layers, we chose the method of “hot-wall” beam epitaxy.5–9 In this work, the problems of the growth of the strained layers of IV-VI semiconductors and their discovered physical properties are considered and analyzed by the example of lead selenide.
Technological design and research methods
The method of “hot-wall” beam chosen for growing the strained lead selenide nanolayers is convenient for modification and control of the parameters of the layers. The schematic of the design is shown in Figure 1.
Figure 1. Schematic of design for growing PbSe layers by “hot-wall” beam epitaxy: 1 – substrate, 2 – flapper, 3 – radiation screen, 4 – quartz ampoule, 5 – polycrystals PbSe source, 6 – heater, 7 – tube for selenium vapor, 8 – screen, and 9 – selenium vapor source.
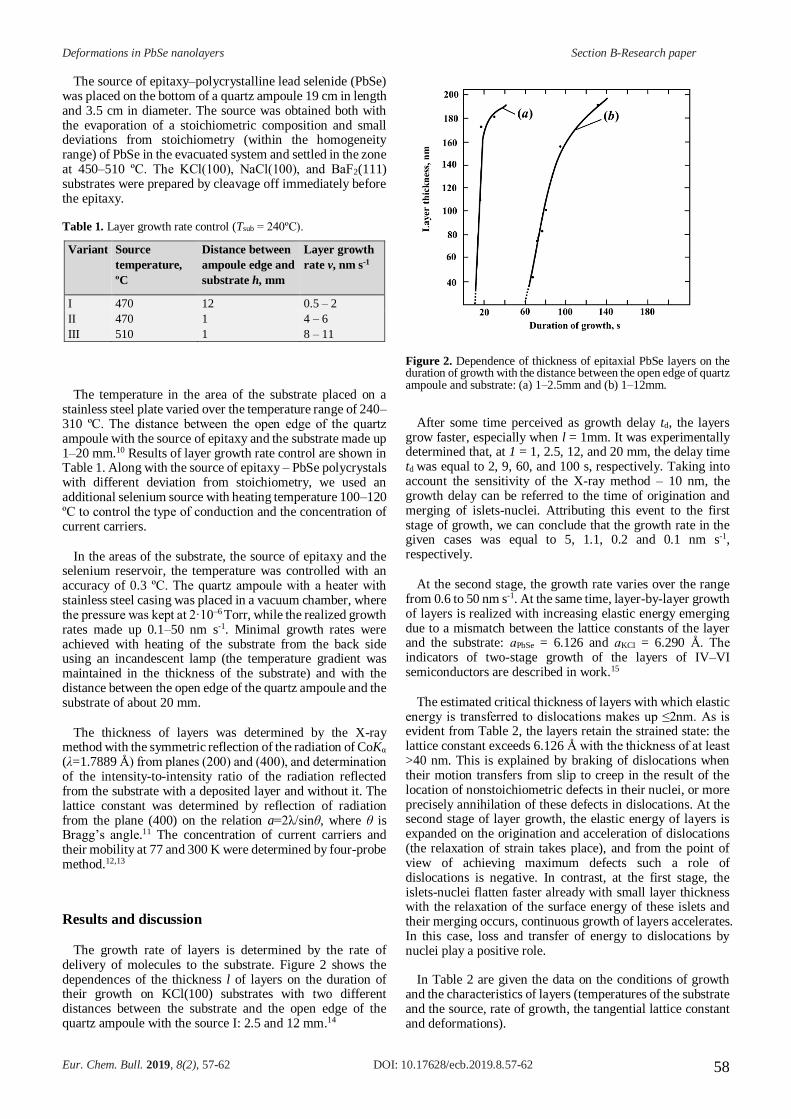
Deformations in PbSe nanolayers Section B-Research paper
Eur. Chem. Bull. 2019, 8(2), 57-62 DOI: 10.17628/ecb.2019.8.57-62 58
The source of epitaxy–polycrystalline lead selenide (PbSe) was placed on the bottom of a quartz ampoule 19 cm in length and 3.5 cm in diameter. The source was obtained both with the evaporation of a stoichiometric composition and small deviations from stoichiometry (within the homogeneity range) of PbSe in the evacuated system and settled in the zone at 450–510 ºС. The KCl(100), NaCl(100), and BaF2(111) substrates were prepared by cleavage off immediately before the epitaxy.
Table 1. Layer growth rate control (Tsub = 240ºC).
Variant Source
temperature,
ºC
Distance between
ampoule edge and
substrate h, mm
Layer growth
rate v, nm s-1
I 470 12 0.5 – 2
II 470 1 4 – 6
III 510 1 8 – 11
The temperature in the area of the substrate placed on a stainless steel plate varied over the temperature range of 240–310 ºС. The distance between the open edge of the quartz ampoule with the source of epitaxy and the substrate made up 1–20 mm.10 Results of layer growth rate control are shown in Table 1. Along with the source of epitaxy – PbSe polycrystals with different deviation from stoichiometry, we used an additional selenium source with heating temperature 100–120 ºС to control the type of conduction and the concentration of current carriers.
In the areas of the substrate, the source of epitaxy and the selenium reservoir, the temperature was controlled with an accuracy of 0.3 ºС. The quartz ampoule with a heater with stainless steel casing was placed in a vacuum chamber, where the pressure was kept at 2·10–6 Torr, while the realized growth rates made up 0.1–50 nm s-1. Minimal growth rates were achieved with heating of the substrate from the back side using an incandescent lamp (the temperature gradient was maintained in the thickness of the substrate) and with the distance between the open edge of the quartz ampoule and the substrate of about 20 mm.
The thickness of layers was determined by the X-ray method with the symmetric reflection of the radiation of CoKα (λ=1.7889 Å) from planes (200) and (400), and determination of the intensity-to-intensity ratio of the radiation reflected from the substrate with a deposited layer and without it. The lattice constant was determined by reflection of radiation from the plane (400) on the relation a=2λ/sinθ, where θ is Bragg’s angle.11 The concentration of current carriers and their mobility at 77 and 300 K were determined by four-probe method.12,13
Results and discussion
The growth rate of layers is determined by the rate of delivery of molecules to the substrate. Figure 2 shows the dependences of the thickness l of layers on the duration of their growth on KCl(100) substrates with two different distances between the substrate and the open edge of the quartz ampoule with the source I: 2.5 and 12 mm.14
Figure 2. Dependence of thickness of epitaxial PbSe layers on the duration of growth with the distance between the open edge of quartz ampoule and substrate: (a) 1–2.5mm and (b) 1–12mm.
After some time perceived as growth delay td, the layers grow faster, especially when l = 1mm. It was experimentally determined that, at 1 = 1, 2.5, 12, and 20 mm, the delay time td was equal to 2, 9, 60, and 100 s, respectively. Taking into account the sensitivity of the X-ray method – 10 nm, the growth delay can be referred to the time of origination and merging of islets-nuclei. Attributing this event to the first stage of growth, we can conclude that the growth rate in the given cases was equal to 5, 1.1, 0.2 and 0.1 nm s-1, respectively.
At the second stage, the growth rate varies over the range from 0.6 to 50 nm s-1. At the same time, layer-by-layer growth of layers is realized with increasing elastic energy emerging due to a mismatch between the lattice constants of the layer and the substrate: аPbSe = 6.126 and аKCl = 6.290 Å. The indicators of two-stage growth of the layers of IV–VI semiconductors are described in work.15
The estimated critical thickness of layers with which elastic energy is transferred to dislocations makes up ≤2nm. As is evident from Table 2, the layers retain the strained state: the lattice constant exceeds 6.126 Å with the thickness of at least >40 nm. This is explained by braking of dislocations when their motion transfers from slip to creep in the result of the location of nonstoichiometric defects in their nuclei, or more precisely annihilation of these defects in dislocations. At the second stage of layer growth, the elastic energy of layers is expanded on the origination and acceleration of dislocations (the relaxation of strain takes place), and from the point of view of achieving maximum defects such a role of dislocations is negative. In contrast, at the first stage, the islets-nuclei flatten faster already with small layer thickness with the relaxation of the surface energy of these islets and their merging occurs, continuous growth of layers accelerates. In this case, loss and transfer of energy to dislocations by nuclei play a positive role.
In Table 2 are given the data on the conditions of growth and the characteristics of layers (temperatures of the substrate and the source, rate of growth, the tangential lattice constant and deformations).
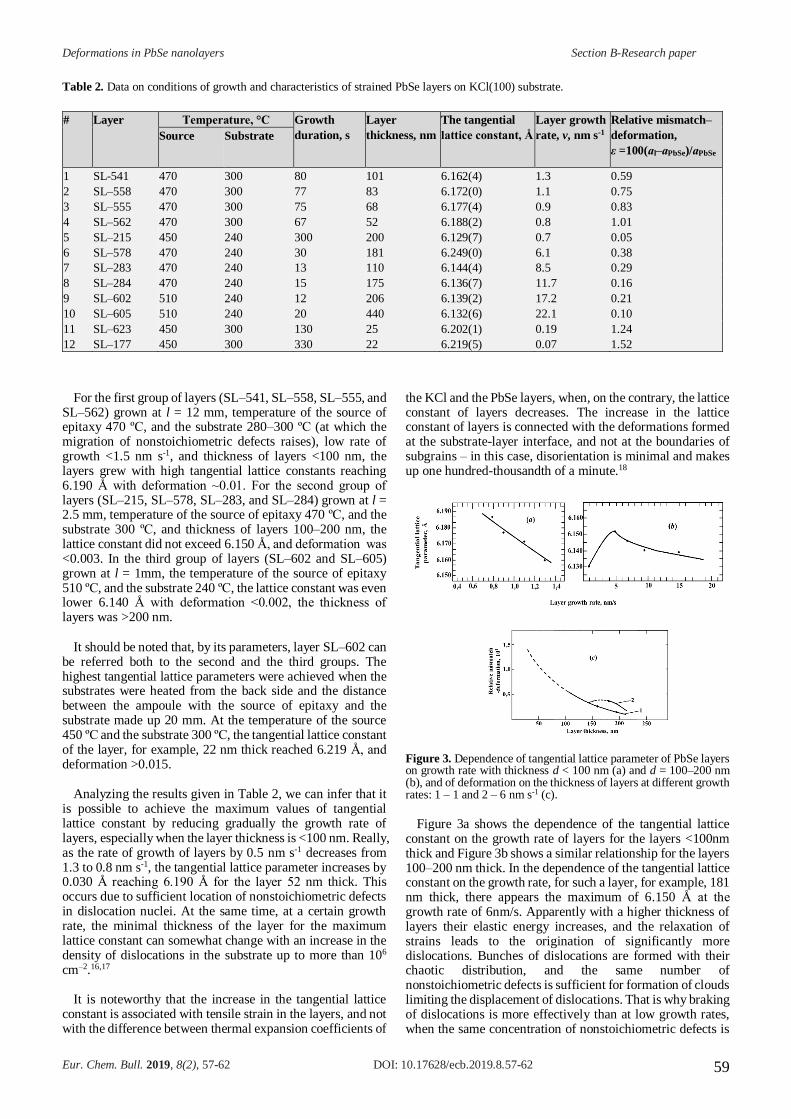
Deformations in PbSe nanolayers Section B-Research paper
Eur. Chem. Bull. 2019, 8(2), 57-62 DOI: 10.17628/ecb.2019.8.57-62 59
Table 2. Data on conditions of growth and characteristics of strained PbSe layers on KCl(100) substrate.
For the first group of layers (SL–541, SL–558, SL–555, and SL–562) grown at l = 12 mm, temperature of the source of epitaxy 470 ºС, and the substrate 280–300 ºС (at which the migration of nonstoichiometric defects raises), low rate of growth <1.5 nm s-1, and thickness of layers <100 nm, the layers grew with high tangential lattice constants reaching 6.190 Å with deformation ~0.01. For the second group of layers (SL–215, SL–578, SL–283, and SL–284) grown at l = 2.5 mm, temperature of the source of epitaxy 470 ºС, and the substrate 300 ºС, and thickness of layers 100–200 nm, the lattice constant did not exceed 6.150 Å, and deformation was <0.003. In the third group of layers (SL–602 and SL–605) grown at l = 1mm, the temperature of the source of epitaxy 510 ºС, and the substrate 240 ºС, the lattice constant was even lower 6.140 Å with deformation <0.002, the thickness of layers was >200 nm.
It should be noted that, by its parameters, layer SL–602 can be referred both to the second and the third groups. The highest tangential lattice parameters were achieved when the substrates were heated from the back side and the distance between the ampoule with the source of epitaxy and the substrate made up 20 mm. At the temperature of the source 450 ºС and the substrate 300 ºС, the tangential lattice constant of the layer, for example, 22 nm thick reached 6.219 Å, and deformation >0.015.
Analyzing the results given in Table 2, we can infer that it is possible to achieve the maximum values of tangential lattice constant by reducing gradually the growth rate of layers, especially when the layer thickness is <100 nm. Really, as the rate of growth of layers by 0.5 nm s-1 decreases from 1.3 to 0.8 nm s-1, the tangential lattice parameter increases by 0.030 Å reaching 6.190 Å for the layer 52 nm thick. This occurs due to sufficient location of nonstoichiometric defects in dislocation nuclei. At the same time, at a certain growth rate, the minimal thickness of the layer for the maximum lattice constant can somewhat change with an increase in the density of dislocations in the substrate up to more than 106
cm–2.16,17
It is noteworthy that the increase in the tangential lattice constant is associated with tensile strain in the layers, and not with the difference between thermal expansion coefficients of
the KCl and the PbSe layers, when, on the contrary, the lattice constant of layers decreases. The increase in the lattice constant of layers is connected with the deformations formed at the substrate-layer interface, and not at the boundaries of subgrains – in this case, disorientation is minimal and makes up one hundred-thousandth of a minute.18
Figure 3. Dependence of tangential lattice parameter of PbSe layers on growth rate with thickness d < 100 nm (a) and d = 100–200 nm (b), and of deformation on the thickness of layers at different growth rates: 1 – 1 and 2 – 6 nm s-1 (c).
Figure 3a shows the dependence of the tangential lattice constant on the growth rate of layers for the layers <100nm thick and Figure 3b shows a similar relationship for the layers 100–200 nm thick. In the dependence of the tangential lattice constant on the growth rate, for such a layer, for example, 181 nm thick, there appears the maximum of 6.150 Å at the growth rate of 6nm/s. Apparently with a higher thickness of layers their elastic energy increases, and the relaxation of strains leads to the origination of significantly more dislocations. Bunches of dislocations are formed with their chaotic distribution, and the same number of nonstoichiometric defects is sufficient for formation of clouds limiting the displacement of dislocations. That is why braking of dislocations is more effectively than at low growth rates, when the same concentration of nonstoichiometric defects is
# Layer Temperature, °C Growth
duration, s
Layer
thickness, nm
The tangential
lattice constant, Å
Layer growth
rate, v, nm s-1
Relative mismatch–
deformation,
ε =100(аl–аPbSe)/аPbSe
Source Substrate
1 SL-541 470 300 80 101 6.162(4) 1.3 0.59
2 SL–558 470 300 77 83 6.172(0) 1.1 0.75
3 SL–555 470 300 75 68 6.177(4) 0.9 0.83
4 SL–562 470 300 67 52 6.188(2) 0.8 1.01
5 SL–215 450 240 300 200 6.129(7) 0.7 0.05
6 SL–578 470 240 30 181 6.249(0) 6.1 0.38
7 SL–283 470 240 13 110 6.144(4) 8.5 0.29
8 SL–284 470 240 15 175 6.136(7) 11.7 0.16
9 SL–602 510 240 12 206 6.139(2) 17.2 0.21
10 SL–605 510 240 20 440 6.132(6) 22.1 0.10
11 SL–623 450 300 130 25 6.202(1) 0.19 1.24
12 SL–177 450 300 330 22 6.219(5) 0.07 1.52
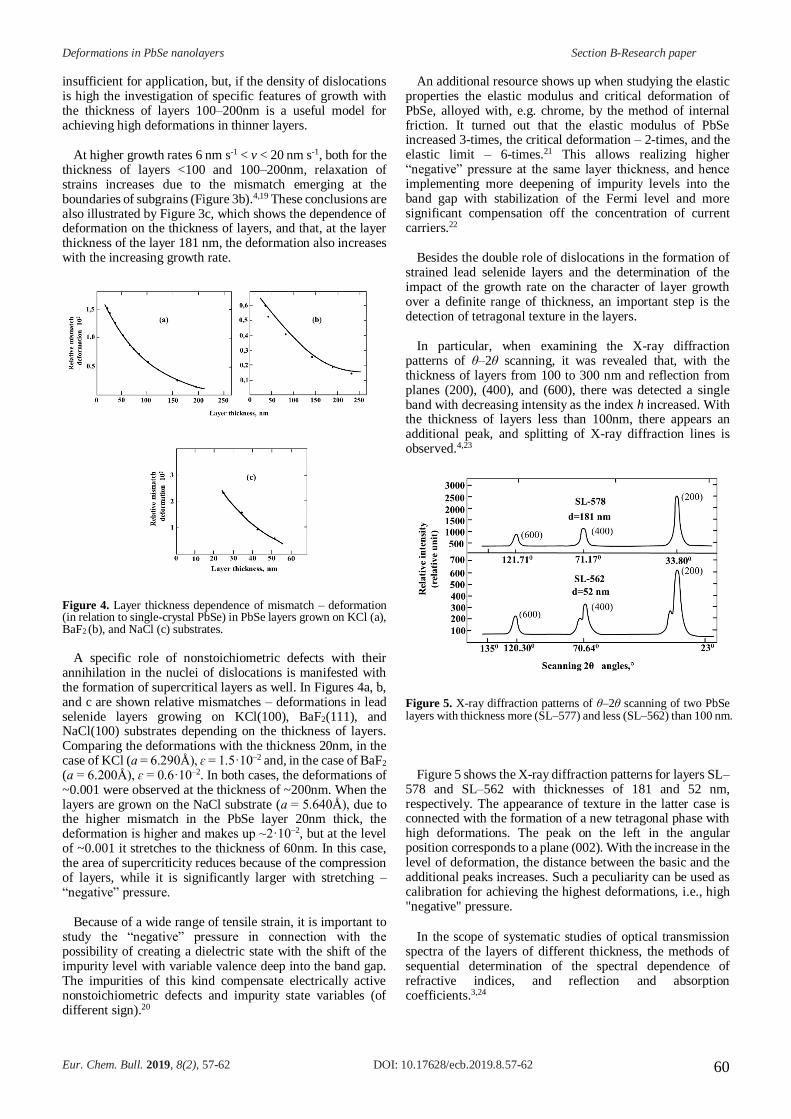
Deformations in PbSe nanolayers Section B-Research paper
Eur. Chem. Bull. 2019, 8(2), 57-62 DOI: 10.17628/ecb.2019.8.57-62 60
insufficient for application, but, if the density of dislocations is high the investigation of specific features of growth with the thickness of layers 100–200nm is a useful model for achieving high deformations in thinner layers.
At higher growth rates 6 nm s-1 < v < 20 nm s-1, both for the thickness of layers <100 and 100–200nm, relaxation of strains increases due to the mismatch emerging at the boundaries of subgrains (Figure 3b).4,19 These conclusions are also illustrated by Figure 3c, which shows the dependence of deformation on the thickness of layers, and that, at the layer thickness of the layer 181 nm, the deformation also increases with the increasing growth rate.
Figure 4. Layer thickness dependence of mismatch – deformation (in relation to single-crystal PbSe) in PbSe layers grown on KCl (a), BaF2 (b), and NaCl (c) substrates.
A specific role of nonstoichiometric defects with their annihilation in the nuclei of dislocations is manifested with the formation of supercritical layers as well. In Figures 4a, b, and c are shown relative mismatches – deformations in lead selenide layers growing on KCl(100), BaF2(111), and NaCl(100) substrates depending on the thickness of layers. Comparing the deformations with the thickness 20nm, in the case of KCl (а = 6.290Å), ɛ = 1.5·10–2 and, in the case of BaF2 (а = 6.200Å), ɛ = 0.6·10–2. In both cases, the deformations of ~0.001 were observed at the thickness of ~200nm. When the layers are grown on the NaCl substrate (а = 5.640Å), due to the higher mismatch in the PbSe layer 20nm thick, the deformation is higher and makes up ~2·10–2, but at the level of ~0.001 it stretches to the thickness of 60nm. In this case, the area of supercriticity reduces because of the compression of layers, while it is significantly larger with stretching – “negative” pressure.
Because of a wide range of tensile strain, it is important to study the “negative” pressure in connection with the possibility of creating a dielectric state with the shift of the impurity level with variable valence deep into the band gap. The impurities of this kind compensate electrically active nonstoichiometric defects and impurity state variables (of different sign).20
An additional resource shows up when studying the elastic properties the elastic modulus and critical deformation of PbSe, alloyed with, e.g. chrome, by the method of internal friction. It turned out that the elastic modulus of PbSe increased 3-times, the critical deformation – 2-times, and the elastic limit – 6-times.21 This allows realizing higher “negative” pressure at the same layer thickness, and hence implementing more deepening of impurity levels into the band gap with stabilization of the Fermi level and more significant compensation off the concentration of current carriers.22
Besides the double role of dislocations in the formation of strained lead selenide layers and the determination of the impact of the growth rate on the character of layer growth over a definite range of thickness, an important step is the detection of tetragonal texture in the layers.
In particular, when examining the X-ray diffraction patterns of θ–2θ scanning, it was revealed that, with the thickness of layers from 100 to 300 nm and reflection from planes (200), (400), and (600), there was detected a single band with decreasing intensity as the index h increased. With the thickness of layers less than 100nm, there appears an additional peak, and splitting of X-ray diffraction lines is observed.4,23
Figure 5. X-ray diffraction patterns of θ–2θ scanning of two PbSe layers with thickness more (SL–577) and less (SL–562) than 100 nm.
Figure 5 shows the X-ray diffraction patterns for layers SL–578 and SL–562 with thicknesses of 181 and 52 nm, respectively. The appearance of texture in the latter case is connected with the formation of a new tetragonal phase with high deformations. The peak on the left in the angular position corresponds to a plane (002). With the increase in the level of deformation, the distance between the basic and the additional peaks increases. Such a peculiarity can be used as calibration for achieving the highest deformations, i.e., high "negative" pressure.
In the scope of systematic studies of optical transmission spectra of the layers of different thickness, the methods of sequential determination of the spectral dependence of refractive indices, and reflection and absorption coefficients.3,24
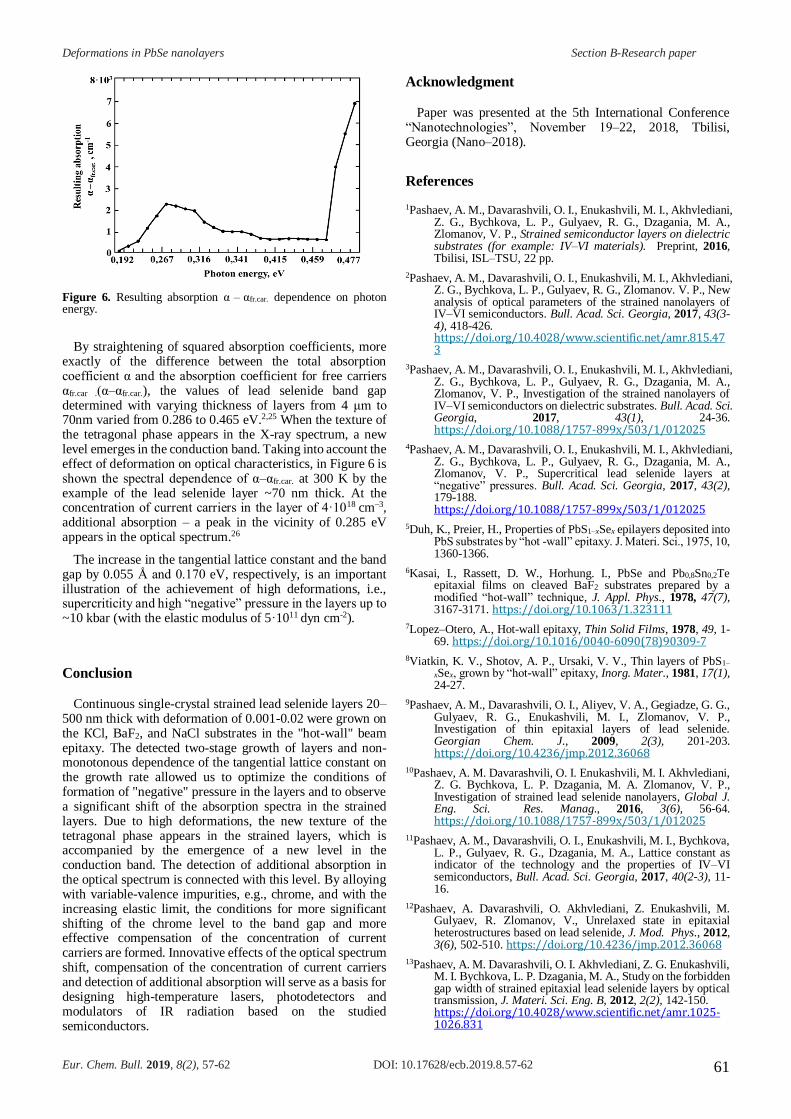
Deformations in PbSe nanolayers Section B-Research paper
Eur. Chem. Bull. 2019, 8(2), 57-62 DOI: 10.17628/ecb.2019.8.57-62 61
Figure 6. Resulting absorption α – αfr.car. dependence on photon energy.
By straightening of squared absorption coefficients, more exactly of the difference between the total absorption coefficient α and the absorption coefficient for free carriers αfr.car .(α–αfr.car.), the values of lead selenide band gap determined with varying thickness of layers from 4 μm to 70nm varied from 0.286 to 0.465 eV.2,25 When the texture of the tetragonal phase appears in the X-ray spectrum, a new level emerges in the conduction band. Taking into account the effect of deformation on optical characteristics, in Figure 6 is shown the spectral dependence of α–αfr.car. at 300 K by the example of the lead selenide layer ~70 nm thick. At the concentration of current carriers in the layer of 4·1018 cm–3, additional absorption – a peak in the vicinity of 0.285 eV appears in the optical spectrum.26
The increase in the tangential lattice constant and the band gap by 0.055 Å and 0.170 eV, respectively, is an important illustration of the achievement of high deformations, i.e., supercriticity and high “negative” pressure in the layers up to ~10 kbar (with the elastic modulus of 5·1011 dyn cm-2).
Conclusion
Continuous single-crystal strained lead selenide layers 20–500 nm thick with deformation of 0.001-0.02 were grown on the КCl, BaF2, and NaCl substrates in the "hot-wall" beam epitaxy. The detected two-stage growth of layers and non-monotonous dependence of the tangential lattice constant on the growth rate allowed us to optimize the conditions of formation of "negative" pressure in the layers and to observe a significant shift of the absorption spectra in the strained layers. Due to high deformations, the new texture of the tetragonal phase appears in the strained layers, which is accompanied by the emergence of a new level in the conduction band. The detection of additional absorption in the optical spectrum is connected with this level. By alloying with variable-valence impurities, e.g., chrome, and with the increasing elastic limit, the conditions for more significant shifting of the chrome level to the band gap and more effective compensation of the concentration of current carriers are formed. Innovative effects of the optical spectrum shift, compensation of the concentration of current carriers and detection of additional absorption will serve as a basis for designing high-temperature lasers, photodetectors and modulators of IR radiation based on the studied semiconductors.
Acknowledgment
Paper was presented at the 5th International Conference “Nanotechnologies”, November 19–22, 2018, Tbilisi, Georgia (Nano–2018).
References
1Pashaev, A. M., Davarashvili, O. I., Enukashvili, M. I., Akhvlediani, Z. G., Bychkova, L. P., Gulyaev, R. G., Dzagania, M. A., Zlomanov, V. P., Strained semiconductor layers on dielectric substrates (for example: IV–VI materials). Preprint, 2016, Tbilisi, ISL–TSU, 22 pp.
2Pashaev, A. M., Davarashvili, O. I., Enukashvili, M. I., Akhvlediani, Z. G., Bychkova, L. P., Gulyaev, R. G., Zlomanov. V. P., New analysis of optical parameters of the strained nanolayers of IV–VI semiconductors. Bull. Acad. Sci. Georgia, 2017, 43(3-4), 418-426. https://doi.org/10.4028/www.scientific.net/amr.815.473
3Pashaev, A. M., Davarashvili, O. I., Enukashvili, M. I., Akhvlediani, Z. G., Bychkova, L. P., Gulyaev, R. G., Dzagania, M. A., Zlomanov, V. P., Investigation of the strained nanolayers of IV–VI semiconductors on dielectric substrates. Bull. Acad. Sci. Georgia, 2017, 43(1), 24-36. https://doi.org/10.1088/1757-899x/503/1/012025
4Pashaev, A. M., Davarashvili, O. I., Enukashvili, M. I., Akhvlediani, Z. G., Bychkova, L. P., Gulyaev, R. G., Dzagania, M. A., Zlomanov, V. P., Supercritical lead selenide layers at “negative” pressures. Bull. Acad. Sci. Georgia, 2017, 43(2), 179-188. https://doi.org/10.1088/1757-899x/503/1/012025
5Duh, K., Preier, H., Properties of PbS1–xSex epilayers deposited into PbS substrates by “hot -wall” epitaxy. J. Materi. Sci., 1975, 10, 1360-1366.
6Kasai, I., Rassett, D. W., Horhung. I., PbSe and Pb0,8Sn0,2Te epitaxial films on cleaved BaF2 substrates prepared by a modified “hot-wall” technique, J. Appl. Phys., 1978, 47(7), 3167-3171. https://doi.org/10.1063/1.323111
7Lopez–Otero, A., Hot-wall epitaxy, Thin Solid Films, 1978, 49, 1-69. https://doi.org/10.1016/0040-6090(78)90309-7
8Viatkin, K. V., Shotov, A. P., Ursaki, V. V., Thin layers of PbS1–
xSex, grown by “hot-wall” epitaxy, Inorg. Mater., 1981, 17(1), 24-27.
9Pashaev, A. M., Davarashvili, O. I., Aliyev, V. A., Gegiadze, G. G., Gulyaev, R. G., Enukashvili, M. I., Zlomanov, V. P., Investigation of thin epitaxial layers of lead selenide. Georgian Chem. J., 2009, 2(3), 201-203. https://doi.org/10.4236/jmp.2012.36068
10Pashaev, A. M. Davarashvili, O. I. Enukashvili, M. I. Akhvlediani, Z. G. Bychkova, L. P. Dzagania, M. A. Zlomanov, V. P., Investigation of strained lead selenide nanolayers, Global J. Eng. Sci. Res. Manag., 2016, 3(6), 56-64. https://doi.org/10.1088/1757-899x/503/1/012025
11Pashaev, A. M., Davarashvili, O. I., Enukashvili, M. I., Bychkova, L. P., Gulyaev, R. G., Dzagania, M. A., Lattice constant as indicator of the technology and the properties of IV–VI semiconductors, Bull. Acad. Sci. Georgia, 2017, 40(2-3), 11-16.
12Pashaev, A. Davarashvili, O. Akhvlediani, Z. Enukashvili, M. Gulyaev, R. Zlomanov, V., Unrelaxed state in epitaxial heterostructures based on lead selenide, J. Mod. Phys., 2012, 3(6), 502-510. https://doi.org/10.4236/jmp.2012.36068
13Pashaev, A. M. Davarashvili, O. I. Akhvlediani, Z. G. Enukashvili, M. I. Bychkova, L. P. Dzagania, M. A., Study on the forbidden gap width of strained epitaxial lead selenide layers by optical transmission, J. Materi. Sci. Eng. B, 2012, 2(2), 142-150. https://doi.org/10.4028/www.scientific.net/amr.1025-1026.831

Deformations in PbSe nanolayers Section B-Research paper
Eur. Chem. Bull. 2019, 8(2), 57-62 DOI: 10.17628/ecb.2019.8.57-62 62
14Pashaev, A. M. Davarashvili, O. I. Enukashvili, M. I. Akhvlediani, Z. G. Gulуaev, R. G. Bychkova, L. P. Zlomanov, V. P., New studies of growth patterns of lead selenide nanolayers. Proc. Natl. Acad. Avia. Azerbaijan, 2012, 14(4), 3-8. https://doi.org/10.4028/www.scientific.net/amr.815.473
15Palatnik, L. S. Sorokin, R. K. Zozulya, L. P., The mechanism of growth of isolated particles at epitaxy of lead chalcogenides on NaCl and KCl, Solid State Phys., 1969, 11(5), 1265-1270.
16Pashaev, A. M. Davarashvili, O. I. Enukashvili, M. I. Akhvlediani, Z. G. Gulyaev, R. G. Dzagania. M. A., Variations of the parameters of PbSe nanolayers with change of their technology. IOP Conf. Ser. Mater. Sci. Eng., 2015, 77, 012017, 2-9. https://doi.org/10.1088/1757-899x/77/1/012017
17Pashaev, A. M. Davarashvili, O. I. Enukashvili, M. I. Akhvlediani, Z. G. Gulyaev, R. G. Dzagania, M. A., Analysis of growth and properties of epitaxial lead selenide layers in the connection of realization of high “negative” pressure. Bull. Acad. Sci. Georgia, 2012, 38(1), 31-35.
https://doi.org/10.4236/jmp.2012.36068
18Pashaev, A. M., Davarashvili, O. I., Enukashvili, M. I., Akhvlediani, Z. G., Gulуaev, R. G., Bychkova, L. P., Zlomanov, V. P., Stretching strain – effective “negative” pressure in lead selenide nanolayers. Int. J. Eng. & Innov. Technol., 2014, 3(11), 318-323. https://doi.org/10.4028/www.scientific.net/amr.1025-1026.831
19Pashaev, A. M., Davarashvili, O. I., Enukashvili, M. I., Akhvlediani, Z. G., Gulyaev, R. G., Bychkova, L. P., Zlomanov, V. P., Modification of the properties of lead selenide layers at their nanothickness, Nano Studies, 2013, 7, 233-240. https://doi.org/10.4028/www.scientific.net/amr.815.473
20Volkov, B. A., Riabova, L. I., Khokhlov, D. R., Impurities with variable valence in the solid solutions on the base of lead telluride. Usp. Phys., 2002, 152, 1-68.
21Pashaev, A. M., Davarashvili, O. I., Aliyev, V. A., Darsavelidze, G. Sh., Enukashvili, M. I., Zlomanov, V. P., Experimental modeling of elastic properties in epitaxial layers of IV–VI semiconductors. Trans. Natl. Acad. Avia. Azerbaijan, 2008, 5, 96-100.
22Pashaev, A. M. Davarashvili, O. I. Enukashvili, M. I. Akhvlediani, Z. G. Gulyaev, R. G. Bychkova, L. P. Zlomanov, V. P., Modeling of quasi-dielectric state in PbSnTe and PbSnSe nanolayers with a high concentration of nonstoichiometric defects. Nano Studies, 2013, 8, 253-258. https://doi.org/10.4028/www.scientific.net/amr.815.473
23Pashaev, A. M. Davarashvili, O. I. Enukashvili, M. I. Gulyaev, R. G. Dzagania, M. A. Zlomanov, V. P., On the tangential and the normal lattice constants of epitaxial lead selenide layers. Herald Azerbaijan Eng. Acad., 2011, 3(4), 13-21. https://doi.org/10.4236/jmp.2012.36068
24Pashaev, A. M., Davarashvili, O. I., Enukashvili, M. I., Akhvlediani, Z. G., Bychkova, L. P., Zlomanov, V. P., Study of the optical characteristics of epitaxial PbS1–xSex layers. Global J. Eng. Sci. Res. Manag., 2016, 3(2), 46-53.
25Pashaev, A. M., Davarashvili, O. I., Enukashvili, M. I., Akhvlediani, Z. G., Bychkova, L. P., Zlomanov, V. P., Analysis of the absorption spectra of epitaxial lead telluride and lead selenide layers. Int. J. Eng. Inn. Technol., 2015, 4(11), 193-198. https://doi.org/10.4236/jmp.2012.36068
26Pashaev, A. M., Davarashvili, O. I., Enukashvili, M. I., Akhvlediani, Z. G., Bychkova, L. P., Dzagania, M. A., Zlomanov, V. P., Additional absorption in the optical spectra of the lead selenide epitaxial layers, Bull. Acad. Sci. Georgia, 2014, 40(4), 285-292. https://doi.org/10.4236/jmp.2012.36068
Received: 06.01.2019. Accepted: 13.04.2019.
Benzylidene-4-oxo-4,5-dihydrothiazol-2-yl) substituted amino acids Section A-Research paper
Eur. Chem. Bull. 2019, 8(2), 63-70 DOI: 10.17628/ecb.2019.8.63-70 63
SYNTHESIS OF 2-((5-BENZYLIDENE-4-OXO-4,5-
DIHYDROTHIAZOL-2-YL)-SUBSTITUTED AMINO ACIDS AS
ANTICANCER AND ANTIMICROBIAL AGENTS
Rohini N. Shelke,[a] Dattatraya N. Pansare,*[b]Chandraknat D. Pawar,
[c]Mininath C. Khade,[a] Vrushali N. Jadhav,[a]Satish U. Deshmukh, [b] Aniket P. Sarkate,
[c]Nileema S. Gore, [e]Rajendra P. Pawar, [b] Devanand B. Shinde, [d] Shankar R. Thopate[a]
Keywords:2-thioxothiazolidin-4-one; Knoevenagel condensation; anticancer activity; antimicrobial activity.
A series of Rhodanine derivatives were synthesized by Knoevenagel condensation. All the synthesized compounds were tested for their in
vitro anticancer activity against MCF-7 and BT-474 human breast cancer cell lines. All the synthesized compounds were characterized and
screened for their antimicrobial activity against the bacterial and fungal strain. Majority of the compounds showed good to moderate
anticancer and antimicrobial activity. Among these compounds, one showed promising activity against gram-positive bacteria B. subtilis
and S. aureus when compared with ampicillin. Some of the most potent compounds possessed selective antimicrobial activity.
*Corresponding Authors
Fax: +91 0240-2400413 E-Mail: [email protected]
[a] Department of Chemistry, Prof. John Barnabas Post Graduate School of Biological Studies, Ahmednagar College, Ahmednagar-414001, MS, India
[b] Department of Chemistry, Deogiri college, Station road, Aurangabad-431 005, MS, India.
[c] Department of Chemical Technology, Dr. Babasaheb Ambedkar Marathwada University, Aurangabad-431 004, MS, India.
[d] Shivaji University, Vidyanagar, Kolhapur- 416 004, MS, India.
[e] MGM’s Institute of Biosciences & Technology, N-6, Cidco, Aurangabad-431003, MS, India.
INTRODUCTION
The dealing of microbial infections remains a very challenging salutary problem because of emerging infectious diseases and the increasing number of multidrug-resistant microbial pathogens. Even though the many antibiotics, drugs and chemotherapeutic available, the emergence of old and newer antibiotic-resistant bacterial strains in the last two decades created an urgent need for the discovery and development of new antimicrobials with a broader spectrum of activity and lower toxicity.1-3
The 2-thioxothiazolidin-4-one (Rhodanine) based molecules exhibit biological activities, such as antidiabetic,4 anticancer,5 antitubercular,6,7 anti-HIV,8-10 antiparasitic,11 anticonvulsant,12 and antiproliferative.13,14 Thiazole also has anti-inflammatory,15 anticancer,16 anti-fungal17 and anti-microbial18activity. The Rhodanine derivatives have been known for over five decades, and there are various reports available on Rhodanine derivatives as antimicrobial agents.19-24 These reports suggested that Rhodanine nuclei were essential to the observed levels of antimicrobial activity.25-28
We make a plan to synthesized Rhodanine derivatives as an antimicrobial agent by preparing hybrid molecules having similar features of reported potent antimicrobial agents (Figure 1).
Figure 1. Previously reported antibacterial agents and synthesized compounds.
Because of the facts mentioned above, Rhodanine derivatives were synthesized, characterized by different spectral analysis techniques and screened for their antimicrobial activity. All the synthesized compounds were also screened for their anticancer activity against cell line MCF-7. The results suggest that the compounds could be exploited as an antimicrobial agent. In continuation of our work,29-42 on the synthesis of heterocyclic and bioactive compounds, we have synthesized some Rhodanine analogs.
MATERIALS AND METHODS
Rhodanine, benzaldehyde and various solvents were commercially available. The major chemicals were purchased from Sigma Aldrich and Avra labs. Reaction courses were monitored by TLC on silica gel precoated F254 Merck plates. Developed plates were examined with UV lamps (254 nm). IR spectra were recorded on an FT-IR (Bruker). Melting points were recorded on SRS Optimelt, melting point apparatus and are uncorrected. The 13C NMR spectra were recorded on a 400 MHz Varian NMR spectrometer. The 1H NMR spectra were recorded on a 400 MHz Varian NMR spectrometer. The chemical shifts are reported as δ (ppm) units (tetramethylsilane). The following

Benzylidene-4-oxo-4,5-dihydrothiazol-2-yl) substituted amino acids Section A-Research paper
Eur. Chem. Bull. 2019, 8(2), 63-70 DOI: 10.17628/ecb.2019.8.63-70 64
abbreviations are used; singlet (s), doublet (d), triplet (t), quartet (q), multiplet (m) and broad (br). Mass spectra were taken with Micromass-QUATTRO-II of WATER mass spectrometer.
Procedure for the synthesis of (Z)-5-benzylidene-2-
thioxothiazolidin-4-one (3)
A mixture of benzaldehyde 1 (1 mmol), 2-thioxothiazolidin-4-one 2 (1 mmol), anhydrous sodium acetate (1 mmol) and glacial acetic acid (1 ml) was refluxed for 5 h. The progress of the reaction was monitored by TLC (20% ethyl acetate: n-hexane). After completion of the reaction, the reaction mixture was poured into the ice-cold water. The precipitate was filtered off and washed with water (3×10 ml), dried, and purified by recrystallization in ethanol as a solvent to give 82 % yield.
Orange solid, Yield: 82%. mp 204–206 ºC; ES-MS m/z: 221.05. IR νmax/cm–1: 1670 (C=O), 1600 (C=C), 1585 (C=N), 1230 (C=S), 1192(C–N). 1H NMR: δ (ppm) = 7.40–7.55 (m, 5H, Ar–CH), 7.70 (s, 1H, =CH), 13.90 (s, 1H, NH). 13C NMR: δ(ppm) = 125.5, 128.5, 130.7, 130.9, 131.4, 133.5, 169.4, 194.7.
Procedure for the synthesis of (Z)-5-benzylidene-2-
(methylthio)thiazol-4(5H)-one (4)
In a 50 ml round bottom flask, the compound (Z)-5-benzylidene-2-thioxothiazolidin-4-one (3) (1 mmol), triethylamine (1.2 mmol), iodomethane (1.2 mmol), and dichloromethane (10 ml) were stirred at room temperature for 2 h. The progress of the reaction was monitored by TLC (10% methanol: chloroform). After completion of the reaction, the reaction mixture was concentrated in-vacuo. The residue was washed with water (3×15 mL) to afford the crude product and it was recrystallized from ethanol. Orange solid, Yield: 85%. M.p 145–147 ºC; ES-MS m/z: 235.00. IR νmax/cm–1: 3026 (CH–Ar), 1694 (C=O), 1590 (C=C), 1462 (C=N),1151 (C-S), 979 (C–N). 1H NMR: δ (ppm)= 2.85 (s, 3H, S-CH3), 7.40–7.72 (m, 5H, Ar–CH), 7.90 (s, 1H, =CH). 13C NMR: δ (ppm) = 14.4, 126.5, 128.6, 131.4, 132.9, 133.5, 135.7, 152.3, 162.7, 169.2.
General procedure for the synthesis of (Z)-2-((5-benzylidene-4-
oxo-4,5-dihydrothiazol-2-yl)amino) acid (6a-l)
In a 50 ml round bottom flask, the compound (4) (1 mmol), amino acids (5a-l) (1.2 mmol), potassium carbonate (1 mmol) and ethanol (5 ml) were mixed and stirred for 20-60 min at room temperature. The progress of the reaction was monitored by TLC (10% methanol:chloroform). After completion of the reaction, the reaction mixture was concentrated in-vacuo. The residue was washed with water (3×15 mL) to afford the crude product. The (Z)-2-((5-benzylidene-4-oxo-4,5-dihydrothiazol-2-yl) substituted amino acids (6a-l) were recrystallized from ethanol and isolated as yellowish solids.
(Z)-2-((5-Benzylidene-4-oxo-4,5-dihydrothiazol-2-
yl)amino)propanoic acid (6a).
Yellow solid, Yield: 92%, M.p 221–223 ºC; ES-MS m/z: 277.00. IR νmax /cm–1: 3384 (OH), 3210 (NH), 3026 (CH–Ar), 1737 (HO–C=O), 1599 (C=O), 1553 (C=C), 1599 (C=N), 1006 (C-S), 1091 (C–N). 1H NMR: δ(ppm)= 1.40–1.50 (d, 3H, C–CH3), 4.60–4.70 (q, 1H, CH), 7.40–7.60 (m, 5H, Ar–CH), 7.70 (s, 1H, =CH), 9.15 (s, 1H, NH), 10.20 (s, 1H, COOH). 13C NMR: δ(ppm) = 16.7, 53.4, 127.5, 128.7, 132.7, 135.7, 152.3, 158.6, 167.7, 179.2.
(Z)-2-((5-Benzylidene-4-oxo-4,5-dihydrothiazol-2-yl)amino)-3-
methylbutanoic acid (6b).
Yellow solid, Yield: 90%, M.p 178–180 ºC; ES-MS m/z: 304.50. IR νmax /cm–1: 3744 (OH), 3011 (NH), 1737 (HO–C=O), 1689 (C=O), 1553 (C=C), 1509 (C=N), 1232 (C-S), 1010 (C–N). 1H NMR: δ(ppm)= 0.90–0.92 (d, 6H, CH–(CH3)2), 1.52–1.54 (m, 1H, CH), 4.44–4.46 (d, 1H, CH), 7.26–7.68 (m, 5H, Ar–CH), 7.76 (s, 1H, =CH), 9.18 (s, 1H, NH), 10.26 (s, 1H, COOH). 13C NMR: δ(ppm) = 18.7, 30.4, 61.4, 127.9, 128.6, 128.9, 132.3, 135.9, 152.9, 158.1, 167.3, 178.2.
(Z)-2-((5-Benzylidene-4-oxo-4,5-dihydrothiazol-2-yl)amino)-3-
methylpentanoic acid (6c).
Yellow solid, Yield: 94%, M.p 110–112 ºC; ES-MS m/z: 319. IR νmax/cm–1: 3365 (OH), 3211 (NH), 3007 (CH–Ar), 1732 (HO–C=O), 1693 (C=O), 1556 (C=C), 1583 (C=N), 1014 (C-S), 1096 (C–N). 1H NMR: δ(ppm)= 0.99–1.01 (t, 3H, CH2–CH3), 1.19–1.22 (d, 3H, CH3) 1.52–1.60 (m, 2H, CH2), 1.81–1.92 (m, 1H, CH), 4.43–4.45 (d, 1H, CH), 7.21–7.62 (m, 5H, Ar–CH), 7.78 (s, 1H, =CH), 9.12 (s, 1H, NH), 11.01 (s, 1H, COOH). 13C NMR: δ(ppm) = 18.7, 30.4, 61.4, 127.9, 128.6, 128.9, 132.3, 135.9, 152.9, 158.1, 167.3, 178.2.
(Z)-2-((5-Benzylidene-4-oxo-4,5-dihydrothiazol-2-yl)amino)-3-
phenylpropanoic acid (6d).
Yellow solid, Yield: 92%, M.p 187–189 ºC; ES-MS m/z: 353. IR νmax /cm–1: 3395 (OH), 3213 (NH), 2990 (CH–Ar), 1737 (HO–C=O), 1691 (C=O), 1551 (C=C), 1581 (C=N), 1017 (C-S), 1098 (C–N). 1H NMR: δ(ppm)= 2.51–2.53 (d, 2H, CH2), 4.43–4.78 (q, 1H, CH), 7.21–7.72 (m, 10H, Ar–CH), 7.79 (s, 1H, =CH), 9.14 (s, 1H, NH), 11.02 (s, 1H, COOH). 13C NMR: δ(ppm) = 36.4, 58.4, 125.9, 127.7, 128.6, 128.9, 135.3, 136.9, 152.2, 158.5, 167.1, 175.2.
(Z)-2-((5-Benzylidene-4-oxo-4,5-dihydrothiazol-2-yl)amino)-4-
(methylthio)butanoic acid (6e).
Yellow solid, Yield: 90%, M. p 122–124 ºC; ES-MS m/z: 337. IR νmax /cm–1: 3398 (OH), 3200 (NH), 2980 (CH–Ar), 1733 (HO–C=O), 1695 (C=O), 1541 (C=C), 1586 (C=N), 1011 (C-S), 1092 (C–N).
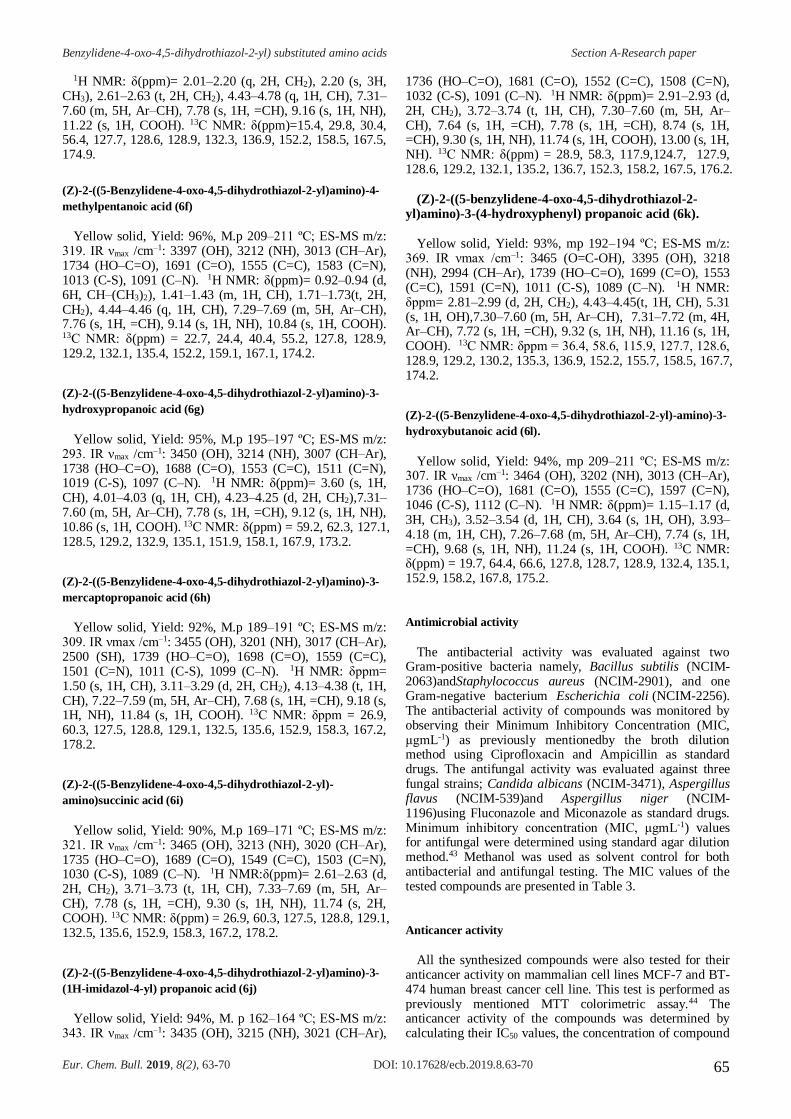
Benzylidene-4-oxo-4,5-dihydrothiazol-2-yl) substituted amino acids Section A-Research paper
Eur. Chem. Bull. 2019, 8(2), 63-70 DOI: 10.17628/ecb.2019.8.63-70 65
1H NMR: δ(ppm)= 2.01–2.20 (q, 2H, CH2), 2.20 (s, 3H, CH3), 2.61–2.63 (t, 2H, CH2), 4.43–4.78 (q, 1H, CH), 7.31–7.60 (m, 5H, Ar–CH), 7.78 (s, 1H, =CH), 9.16 (s, 1H, NH), 11.22 (s, 1H, COOH). 13C NMR: δ(ppm)=15.4, 29.8, 30.4, 56.4, 127.7, 128.6, 128.9, 132.3, 136.9, 152.2, 158.5, 167.5, 174.9.
(Z)-2-((5-Benzylidene-4-oxo-4,5-dihydrothiazol-2-yl)amino)-4-
methylpentanoic acid (6f)
Yellow solid, Yield: 96%, M.p 209–211 ºC; ES-MS m/z: 319. IR νmax /cm–1: 3397 (OH), 3212 (NH), 3013 (CH–Ar), 1734 (HO–C=O), 1691 (C=O), 1555 (C=C), 1583 (C=N), 1013 (C-S), 1091 (C–N). 1H NMR: δ(ppm)= 0.92–0.94 (d, 6H, CH–(CH3)2), 1.41–1.43 (m, 1H, CH), 1.71–1.73(t, 2H, CH2), 4.44–4.46 (q, 1H, CH), 7.29–7.69 (m, 5H, Ar–CH), 7.76 (s, 1H, =CH), 9.14 (s, 1H, NH), 10.84 (s, 1H, COOH). 13C NMR: δ(ppm) = 22.7, 24.4, 40.4, 55.2, 127.8, 128.9, 129.2, 132.1, 135.4, 152.2, 159.1, 167.1, 174.2.
(Z)-2-((5-Benzylidene-4-oxo-4,5-dihydrothiazol-2-yl)amino)-3-
hydroxypropanoic acid (6g)
Yellow solid, Yield: 95%, M.p 195–197 ºC; ES-MS m/z: 293. IR νmax /cm–1: 3450 (OH), 3214 (NH), 3007 (CH–Ar), 1738 (HO–C=O), 1688 (C=O), 1553 (C=C), 1511 (C=N), 1019 (C-S), 1097 (C–N). 1H NMR: δ(ppm)= 3.60 (s, 1H, CH), 4.01–4.03 (q, 1H, CH), 4.23–4.25 (d, 2H, CH2),7.31–7.60 (m, 5H, Ar–CH), 7.78 (s, 1H, =CH), 9.12 (s, 1H, NH), 10.86 (s, 1H, COOH). 13C NMR: δ(ppm) = 59.2, 62.3, 127.1, 128.5, 129.2, 132.9, 135.1, 151.9, 158.1, 167.9, 173.2.
(Z)-2-((5-Benzylidene-4-oxo-4,5-dihydrothiazol-2-yl)amino)-3-
mercaptopropanoic acid (6h)
Yellow solid, Yield: 92%, M.p 189–191 ºC; ES-MS m/z: 309. IR νmax /cm–1: 3455 (OH), 3201 (NH), 3017 (CH–Ar), 2500 (SH), 1739 (HO–C=O), 1698 (C=O), 1559 (C=C), 1501 (C=N), 1011 (C-S), 1099 (C–N). 1H NMR: δppm= 1.50 (s, 1H, CH), 3.11–3.29 (d, 2H, CH2), 4.13–4.38 (t, 1H, CH), 7.22–7.59 (m, 5H, Ar–CH), 7.68 (s, 1H, =CH), 9.18 (s, 1H, NH), 11.84 (s, 1H, COOH). 13C NMR: δppm = 26.9, 60.3, 127.5, 128.8, 129.1, 132.5, 135.6, 152.9, 158.3, 167.2, 178.2.
(Z)-2-((5-Benzylidene-4-oxo-4,5-dihydrothiazol-2-yl)-
amino)succinic acid (6i)
Yellow solid, Yield: 90%, M.p 169–171 ºC; ES-MS m/z: 321. IR νmax /cm–1: 3465 (OH), 3213 (NH), 3020 (CH–Ar), 1735 (HO–C=O), 1689 (C=O), 1549 (C=C), 1503 (C=N), 1030 (C-S), 1089 (C–N). 1H NMR:δ(ppm)= 2.61–2.63 (d, 2H, CH2), 3.71–3.73 (t, 1H, CH), 7.33–7.69 (m, 5H, Ar–CH), 7.78 (s, 1H, =CH), 9.30 (s, 1H, NH), 11.74 (s, 2H, COOH). 13C NMR: δ(ppm) = 26.9, 60.3, 127.5, 128.8, 129.1, 132.5, 135.6, 152.9, 158.3, 167.2, 178.2.
(Z)-2-((5-Benzylidene-4-oxo-4,5-dihydrothiazol-2-yl)amino)-3-
(1H-imidazol-4-yl) propanoic acid (6j)
Yellow solid, Yield: 94%, M. p 162–164 ºC; ES-MS m/z: 343. IR νmax /cm–1: 3435 (OH), 3215 (NH), 3021 (CH–Ar),
1736 (HO–C=O), 1681 (C=O), 1552 (C=C), 1508 (C=N), 1032 (C-S), 1091 (C–N). 1H NMR: δ(ppm)= 2.91–2.93 (d, 2H, CH2), 3.72–3.74 (t, 1H, CH), 7.30–7.60 (m, 5H, Ar–CH), 7.64 (s, 1H, =CH), 7.78 (s, 1H, =CH), 8.74 (s, 1H, =CH), 9.30 (s, 1H, NH), 11.74 (s, 1H, COOH), 13.00 (s, 1H, NH). 13C NMR: δ(ppm) = 28.9, 58.3, 117.9,124.7, 127.9, 128.6, 129.2, 132.1, 135.2, 136.7, 152.3, 158.2, 167.5, 176.2.
(Z)-2-((5-benzylidene-4-oxo-4,5-dihydrothiazol-2-yl)amino)-3-(4-hydroxyphenyl) propanoic acid (6k).
Yellow solid, Yield: 93%, mp 192–194 ºC; ES-MS m/z: 369. IR νmax /cm–1: 3465 (O=C-OH), 3395 (OH), 3218 (NH), 2994 (CH–Ar), 1739 (HO–C=O), 1699 (C=O), 1553 (C=C), 1591 (C=N), 1011 (C-S), 1089 (C–N). 1H NMR: δppm= 2.81–2.99 (d, 2H, CH2), 4.43–4.45(t, 1H, CH), 5.31 (s, 1H, OH),7.30–7.60 (m, 5H, Ar–CH), 7.31–7.72 (m, 4H, Ar–CH), 7.72 (s, 1H, =CH), 9.32 (s, 1H, NH), 11.16 (s, 1H, COOH). 13C NMR: δppm = 36.4, 58.6, 115.9, 127.7, 128.6, 128.9, 129.2, 130.2, 135.3, 136.9, 152.2, 155.7, 158.5, 167.7, 174.2.
(Z)-2-((5-Benzylidene-4-oxo-4,5-dihydrothiazol-2-yl)-amino)-3-
hydroxybutanoic acid (6l).
Yellow solid, Yield: 94%, mp 209–211 ºC; ES-MS m/z: 307. IR νmax /cm–1: 3464 (OH), 3202 (NH), 3013 (CH–Ar), 1736 (HO–C=O), 1681 (C=O), 1555 (C=C), 1597 (C=N), 1046 (C-S), 1112 (C–N). 1H NMR: δ(ppm)= 1.15–1.17 (d, 3H, CH3), 3.52–3.54 (d, 1H, CH), 3.64 (s, 1H, OH), 3.93–4.18 (m, 1H, CH), 7.26–7.68 (m, 5H, Ar–CH), 7.74 (s, 1H, =CH), 9.68 (s, 1H, NH), 11.24 (s, 1H, COOH). 13C NMR: δ(ppm) = 19.7, 64.4, 66.6, 127.8, 128.7, 128.9, 132.4, 135.1, 152.9, 158.2, 167.8, 175.2.
Antimicrobial activity
The antibacterial activity was evaluated against two Gram-positive bacteria namely, Bacillus subtilis (NCIM-2063)andStaphylococcus aureus (NCIM-2901), and one Gram-negative bacterium Escherichia coli (NCIM-2256). The antibacterial activity of compounds was monitored by observing their Minimum Inhibitory Concentration (MIC, μgmL-1) as previously mentionedby the broth dilution method using Ciprofloxacin and Ampicillin as standard drugs. The antifungal activity was evaluated against three fungal strains; Candida albicans (NCIM-3471), Aspergillus flavus (NCIM-539)and Aspergillus niger (NCIM-1196)using Fluconazole and Miconazole as standard drugs. Minimum inhibitory concentration (MIC, μgmL-1) values for antifungal were determined using standard agar dilution method.43 Methanol was used as solvent control for both antibacterial and antifungal testing. The MIC values of the tested compounds are presented in Table 3.
Anticancer activity
All the synthesized compounds were also tested for their anticancer activity on mammalian cell lines MCF-7 and BT-474 human breast cancer cell line. This test is performed as previously mentioned MTT colorimetric assay.44 The anticancer activity of the compounds was determined by calculating their IC50 values, the concentration of compound
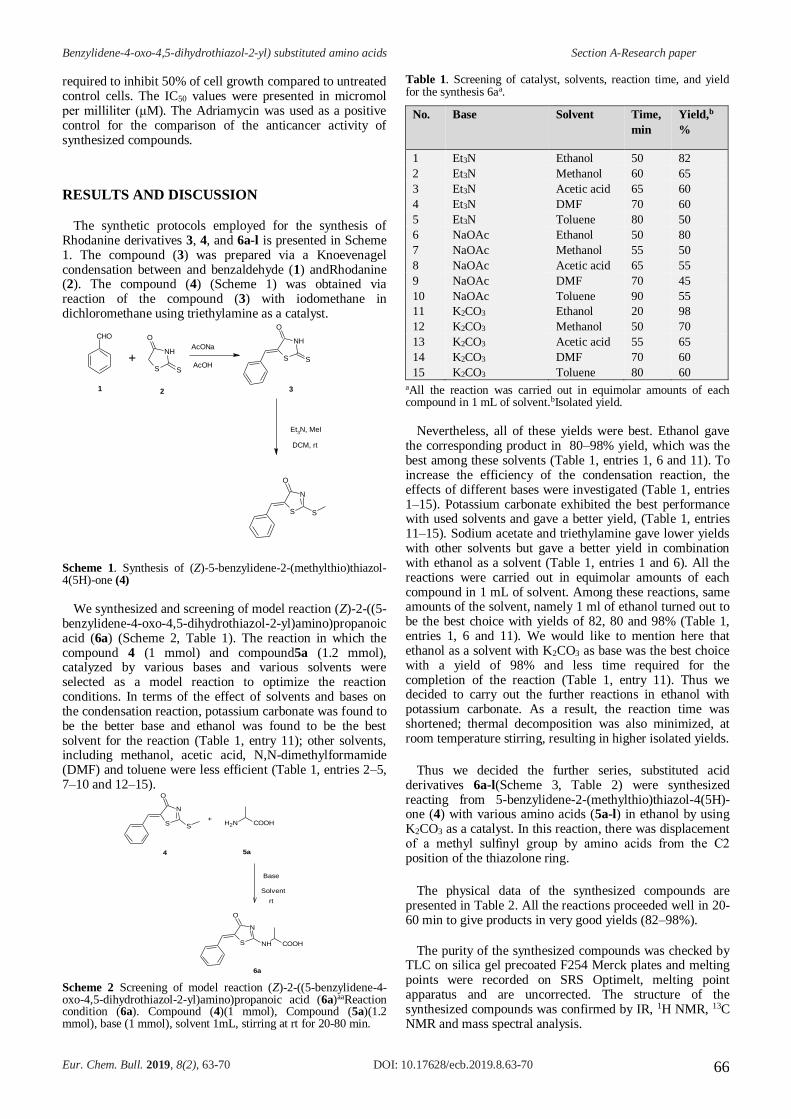
Benzylidene-4-oxo-4,5-dihydrothiazol-2-yl) substituted amino acids Section A-Research paper
Eur. Chem. Bull. 2019, 8(2), 63-70 DOI: 10.17628/ecb.2019.8.63-70 66
required to inhibit 50% of cell growth compared to untreated control cells. The IC50 values were presented in micromol per milliliter (μM). The Adriamycin was used as a positive control for the comparison of the anticancer activity of synthesized compounds.
RESULTS AND DISCUSSION
The synthetic protocols employed for the synthesis of Rhodanine derivatives 3, 4, and 6a-l is presented in Scheme 1. The compound (3) was prepared via a Knoevenagel condensation between and benzaldehyde (1) andRhodanine (2). The compound (4) (Scheme 1) was obtained via reaction of the compound (3) with iodomethane in dichloromethane using triethylamine as a catalyst.
Scheme 1. Synthesis of (Z)-5-benzylidene-2-(methylthio)thiazol-4(5H)-one (4)
We synthesized and screening of model reaction (Z)-2-((5-benzylidene-4-oxo-4,5-dihydrothiazol-2-yl)amino)propanoic acid (6a) (Scheme 2, Table 1). The reaction in which the compound 4 (1 mmol) and compound5a (1.2 mmol), catalyzed by various bases and various solvents were selected as a model reaction to optimize the reaction conditions. In terms of the effect of solvents and bases on the condensation reaction, potassium carbonate was found to be the better base and ethanol was found to be the best solvent for the reaction (Table 1, entry 11); other solvents, including methanol, acetic acid, N,N-dimethylformamide (DMF) and toluene were less efficient (Table 1, entries 2–5, 7–10 and 12–15).
Scheme 2 Screening of model reaction (Z)-2-((5-benzylidene-4-oxo-4,5-dihydrothiazol-2-yl)amino)propanoic acid (6a)aaReaction condition (6a). Compound (4)(1 mmol), Compound (5a)(1.2 mmol), base (1 mmol), solvent 1mL, stirring at rt for 20-80 min.
Table 1. Screening of catalyst, solvents, reaction time, and yield for the synthesis 6aa.
No. Base Solvent Time,
min
Yield,b
%
1 Et3N Ethanol 50 82
2 Et3N Methanol 60 65
3 Et3N Acetic acid 65 60
4 Et3N DMF 70 60
5 Et3N Toluene 80 50
6 NaOAc Ethanol 50 80
7 NaOAc Methanol 55 50
8 NaOAc Acetic acid 65 55
9 NaOAc DMF 70 45
10 NaOAc Toluene 90 55
11 K2CO3 Ethanol 20 98
12 K2CO3 Methanol 50 70
13 K2CO3 Acetic acid 55 65
14 K2CO3 DMF 70 60
15 K2CO3 Toluene 80 60 aAll the reaction was carried out in equimolar amounts of each compound in 1 mL of solvent.bIsolated yield.
Nevertheless, all of these yields were best. Ethanol gave the corresponding product in 80–98% yield, which was the best among these solvents (Table 1, entries 1, 6 and 11). To increase the efficiency of the condensation reaction, the effects of different bases were investigated (Table 1, entries 1–15). Potassium carbonate exhibited the best performance with used solvents and gave a better yield, (Table 1, entries 11–15). Sodium acetate and triethylamine gave lower yields with other solvents but gave a better yield in combination with ethanol as a solvent (Table 1, entries 1 and 6). All the reactions were carried out in equimolar amounts of each compound in 1 mL of solvent. Among these reactions, same amounts of the solvent, namely 1 ml of ethanol turned out to be the best choice with yields of 82, 80 and 98% (Table 1, entries 1, 6 and 11). We would like to mention here that ethanol as a solvent with K2CO3 as base was the best choice with a yield of 98% and less time required for the completion of the reaction (Table 1, entry 11). Thus we decided to carry out the further reactions in ethanol with potassium carbonate. As a result, the reaction time was shortened; thermal decomposition was also minimized, at room temperature stirring, resulting in higher isolated yields.
Thus we decided the further series, substituted acid derivatives 6a-l(Scheme 3, Table 2) were synthesized reacting from 5-benzylidene-2-(methylthio)thiazol-4(5H)-one (4) with various amino acids (5a-l) in ethanol by using K2CO3 as a catalyst. In this reaction, there was displacement of a methyl sulfinyl group by amino acids from the C2 position of the thiazolone ring.
The physical data of the synthesized compounds are presented in Table 2. All the reactions proceeded well in 20-60 min to give products in very good yields (82–98%).
The purity of the synthesized compounds was checked by TLC on silica gel precoated F254 Merck plates and melting points were recorded on SRS Optimelt, melting point apparatus and are uncorrected. The structure of the synthesized compounds was confirmed by IR, 1H NMR, 13C NMR and mass spectral analysis.
S
N
O
S
AcOH
AcONa
S
NH
O
S
S
NH
O
S
CHO
+
Et3N, MeI
DCM, rt
31 2
NH2 COOHS
N
O
S
S
N
O
NH COOH
4 5a
6a
Base
Solvent
+
rt
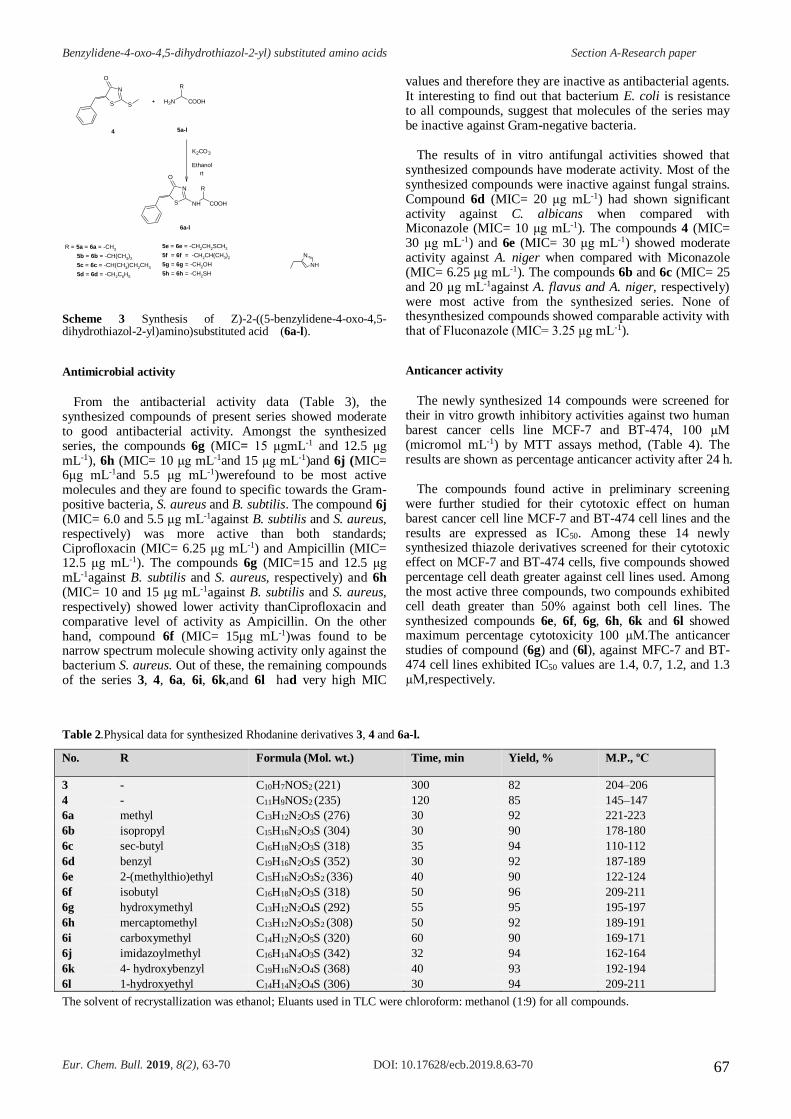
Benzylidene-4-oxo-4,5-dihydrothiazol-2-yl) substituted amino acids Section A-Research paper
Eur. Chem. Bull. 2019, 8(2), 63-70 DOI: 10.17628/ecb.2019.8.63-70 67
Scheme 3 Synthesis of Z)-2-((5-benzylidene-4-oxo-4,5-dihydrothiazol-2-yl)amino)substituted acid (6a-l).
Antimicrobial activity
From the antibacterial activity data (Table 3), the synthesized compounds of present series showed moderate to good antibacterial activity. Amongst the synthesized series, the compounds 6g (MIC= 15 μgmL-1 and 12.5 μg mL-1), 6h (MIC= 10 μg mL-1and 15 μg mL-1)and 6j (MIC= 6μg mL-1and 5.5 μg mL-1)werefound to be most active molecules and they are found to specific towards the Gram-positive bacteria, S. aureus and B. subtilis. The compound 6j (MIC= 6.0 and 5.5 μg mL-1against B. subtilis and S. aureus, respectively) was more active than both standards; Ciprofloxacin (MIC= 6.25 μg mL-1) and Ampicillin (MIC= 12.5 μg mL-1). The compounds 6g (MIC=15 and 12.5 μg mL-1against B. subtilis and S. aureus, respectively) and 6h (MIC= 10 and 15 μg mL-1against B. subtilis and S. aureus, respectively) showed lower activity thanCiprofloxacin and comparative level of activity as Ampicillin. On the other hand, compound 6f (MIC= 15μg mL-1)was found to be narrow spectrum molecule showing activity only against the bacterium S. aureus. Out of these, the remaining compounds of the series 3, 4, 6a, 6i, 6k,and 6l had very high MIC
values and therefore they are inactive as antibacterial agents. It interesting to find out that bacterium E. coli is resistance to all compounds, suggest that molecules of the series may be inactive against Gram-negative bacteria.
The results of in vitro antifungal activities showed that synthesized compounds have moderate activity. Most of the synthesized compounds were inactive against fungal strains. Compound 6d (MIC= 20 μg mL-1) had shown significant activity against C. albicans when compared with Miconazole (MIC= 10 μg mL-1). The compounds 4 (MIC= 30 μg mL-1) and 6e (MIC= 30 μg mL-1) showed moderate activity against A. niger when compared with Miconazole (MIC= 6.25 μg mL-1). The compounds 6b and 6c (MIC= 25 and 20 μg mL-1against A. flavus and A. niger, respectively) were most active from the synthesized series. None of thesynthesized compounds showed comparable activity with that of Fluconazole (MIC= 3.25 μg mL-1).
Anticancer activity
The newly synthesized 14 compounds were screened for their in vitro growth inhibitory activities against two human barest cancer cells line MCF-7 and BT-474, 100 µM (micromol mL-1) by MTT assays method, (Table 4). The results are shown as percentage anticancer activity after 24 h.
The compounds found active in preliminary screening were further studied for their cytotoxic effect on human barest cancer cell line MCF-7 and BT-474 cell lines and the results are expressed as IC50. Among these 14 newly synthesized thiazole derivatives screened for their cytotoxic effect on MCF-7 and BT-474 cells, five compounds showed percentage cell death greater against cell lines used. Among the most active three compounds, two compounds exhibited cell death greater than 50% against both cell lines. The synthesized compounds 6e, 6f, 6g, 6h, 6k and 6l showed maximum percentage cytotoxicity 100 µM.The anticancer studies of compound (6g) and (6l), against MFC-7 and BT-474 cell lines exhibited IC50 values are 1.4, 0.7, 1.2, and 1.3 µM,respectively.
Table 2.Physical data for synthesized Rhodanine derivatives 3, 4 and 6a-l.
No. R Formula (Mol. wt.) Time, min Yield, % M.P., ºC
3 - C10H7NOS2 (221) 300 82 204–206
4 - C11H9NOS2 (235) 120 85 145–147
6a methyl C13H12N2O3S (276) 30 92 221-223
6b isopropyl C15H16N2O3S (304) 30 90 178-180
6c sec-butyl C16H18N2O3S (318) 35 94 110-112
6d benzyl C19H16N2O3S (352) 30 92 187-189
6e 2-(methylthio)ethyl C15H16N2O3S2 (336) 40 90 122-124
6f isobutyl C16H18N2O3S (318) 50 96 209-211
6g hydroxymethyl C13H12N2O4S (292) 55 95 195-197
6h mercaptomethyl C13H12N2O3S2 (308) 50 92 189-191
6i carboxymethyl C14H12N2O5S (320) 60 90 169-171
6j imidazoylmethyl C16H14N4O3S (342) 32 94 162-164
6k 4- hydroxybenzyl C19H16N2O4S (368) 40 93 192-194
6l 1-hydroxyethyl C14H14N2O4S (306) 30 94 209-211
The solvent of recrystallization was ethanol; Eluants used in TLC were chloroform: methanol (1:9) for all compounds.
NH
N
NH2 COOH
R
S
N
O
NH COOH
R
S
N
O
S
K2CO3
4
R = 5a = 6a = -CH3
5b = 6b = -CH(CH3)2
5c = 6c = -CH(CH3)CH
2CH
3
5d = 6d = -CH2C
6H
5
5e = 6e = -CH2CH
2SCH
3
5f = 6f = -CH2CH(CH
3)2
5g = 6g = -CH2OH
5h = 6h = -CH2SH
5a-l
6a-l
Ethanol
+
rt
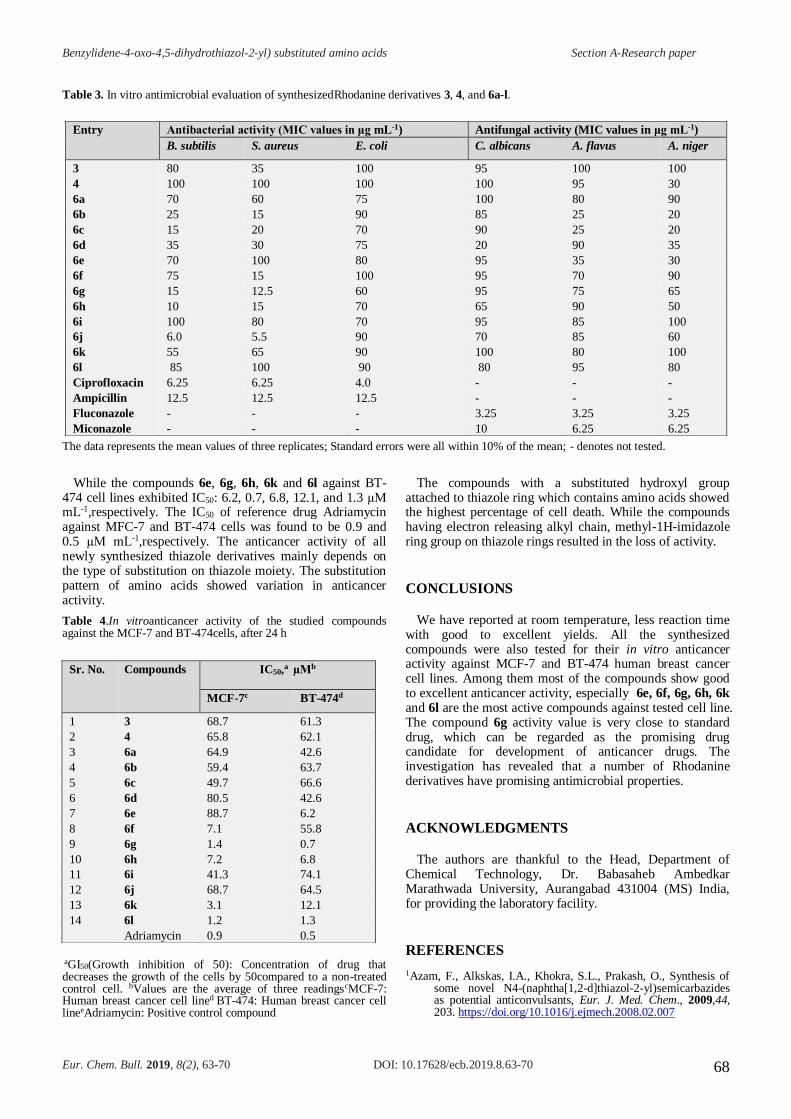
Benzylidene-4-oxo-4,5-dihydrothiazol-2-yl) substituted amino acids Section A-Research paper
Eur. Chem. Bull. 2019, 8(2), 63-70 DOI: 10.17628/ecb.2019.8.63-70 68
Table 3. In vitro antimicrobial evaluation of synthesizedRhodanine derivatives 3, 4, and 6a-l.
The data represents the mean values of three replicates; Standard errors were all within 10% of the mean; - denotes not tested.
While the compounds 6e, 6g, 6h, 6k and 6l against BT-474 cell lines exhibited IC50: 6.2, 0.7, 6.8, 12.1, and 1.3 µM mL-1,respectively. The IC50 of reference drug Adriamycin against MFC-7 and BT-474 cells was found to be 0.9 and 0.5 µM mL-1,respectively. The anticancer activity of all newly synthesized thiazole derivatives mainly depends on the type of substitution on thiazole moiety. The substitution pattern of amino acids showed variation in anticancer activity.
Table 4.In vitroanticancer activity of the studied compounds against the MCF-7 and BT-474cells, after 24 h
aGI50(Growth inhibition of 50): Concentration of drug that decreases the growth of the cells by 50compared to a non-treated control cell. bValues are the average of three readingscMCF-7: Human breast cancer cell lined BT-474: Human breast cancer cell lineeAdriamycin: Positive control compound
The compounds with a substituted hydroxyl group attached to thiazole ring which contains amino acids showed the highest percentage of cell death. While the compounds having electron releasing alkyl chain, methyl-1H-imidazole ring group on thiazole rings resulted in the loss of activity.
CONCLUSIONS
We have reported at room temperature, less reaction time with good to excellent yields. All the synthesized compounds were also tested for their in vitro anticancer activity against MCF-7 and BT-474 human breast cancer cell lines. Among them most of the compounds show good to excellent anticancer activity, especially 6e, 6f, 6g, 6h, 6k and 6l are the most active compounds against tested cell line. The compound 6g activity value is very close to standard drug, which can be regarded as the promising drug candidate for development of anticancer drugs. The investigation has revealed that a number of Rhodanine derivatives have promising antimicrobial properties.
ACKNOWLEDGMENTS
The authors are thankful to the Head, Department of Chemical Technology, Dr. Babasaheb Ambedkar Marathwada University, Aurangabad 431004 (MS) India, for providing the laboratory facility.
REFERENCES
1Azam, F., Alkskas, I.A., Khokra, S.L., Prakash, O., Synthesis of some novel N4-(naphtha[1,2-d]thiazol-2-yl)semicarbazides as potential anticonvulsants, Eur. J. Med. Chem., 2009,44, 203. https://doi.org/10.1016/j.ejmech.2008.02.007
Entry Antibacterial activity (MIC values in μg mL-1) Antifungal activity (MIC values in μg mL-1)
B. subtilis S. aureus E. coli C. albicans A. flavus A. niger
3 80 35 100 95 100 100
4 100 100 100 100 95 30
6a 70 60 75 100 80 90
6b 25 15 90 85 25 20
6c 15 20 70 90 25 20
6d 35 30 75 20 90 35
6e 70 100 80 95 35 30
6f 75 15 100 95 70 90
6g 15 12.5 60 95 75 65
6h 10 15 70 65 90 50
6i 100 80 70 95 85 100
6j 6.0 5.5 90 70 85 60
6k 55 65 90 100 80 100
6l 85 100 90 80 95 80
Ciprofloxacin 6.25 6.25 4.0 - - -
Ampicillin 12.5 12.5 12.5 - - -
Fluconazole - - - 3.25 3.25 3.25
Miconazole - - - 10 6.25 6.25
Sr. No. Compounds IC50,a µMb
MCF-7c BT-474d
1 3 68.7 61.3
2 4 65.8 62.1
3 6a 64.9 42.6
4 6b 59.4 63.7
5 6c 49.7 66.6
6 6d 80.5 42.6
7 6e 88.7 6.2
8 6f 7.1 55.8
9 6g 1.4 0.7
10 6h 7.2 6.8
11 6i 41.3 74.1
12 6j 68.7 64.5
13 6k 3.1 12.1
14 6l 1.2 1.3
Adriamycin 0.9 0.5
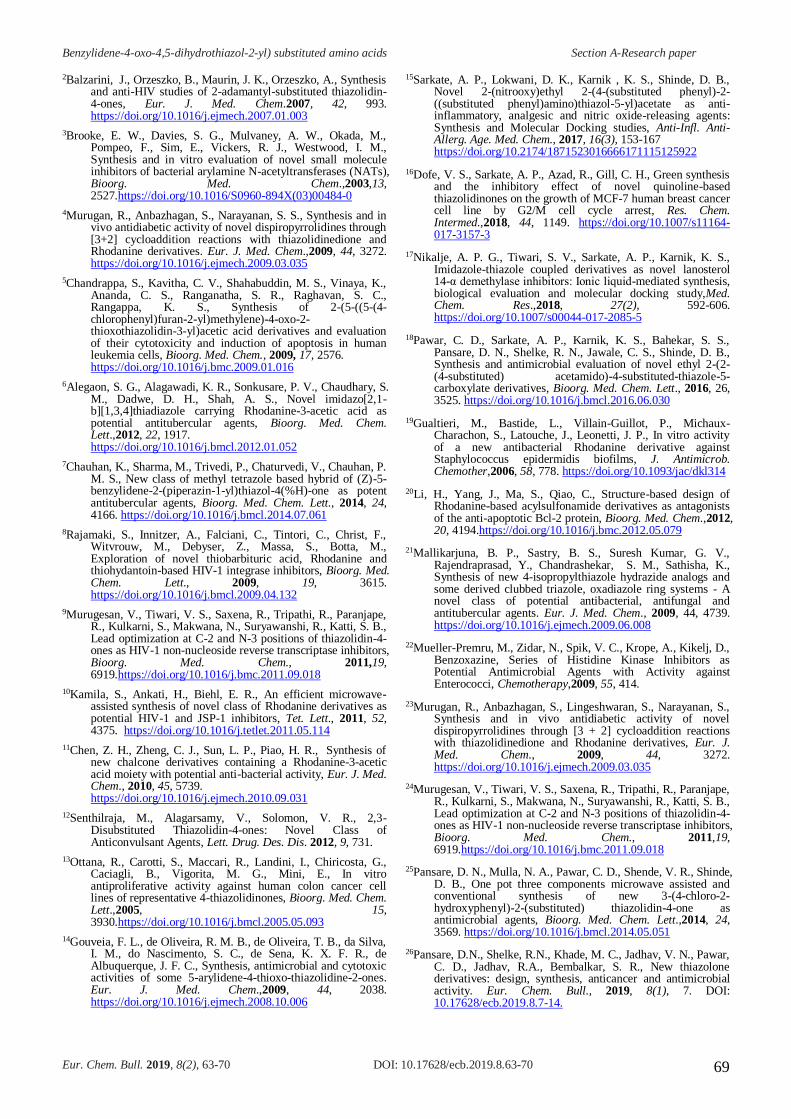
Benzylidene-4-oxo-4,5-dihydrothiazol-2-yl) substituted amino acids Section A-Research paper
Eur. Chem. Bull. 2019, 8(2), 63-70 DOI: 10.17628/ecb.2019.8.63-70 69
2Balzarini, J., Orzeszko, B., Maurin, J. K., Orzeszko, A., Synthesis and anti-HIV studies of 2-adamantyl-substituted thiazolidin-4-ones, Eur. J. Med. Chem.2007, 42, 993. https://doi.org/10.1016/j.ejmech.2007.01.003
3Brooke, E. W., Davies, S. G., Mulvaney, A. W., Okada, M., Pompeo, F., Sim, E., Vickers, R. J., Westwood, I. M., Synthesis and in vitro evaluation of novel small molecule inhibitors of bacterial arylamine N-acetyltransferases (NATs), Bioorg. Med. Chem.,2003,13, 2527.https://doi.org/10.1016/S0960-894X(03)00484-0
4Murugan, R., Anbazhagan, S., Narayanan, S. S., Synthesis and in vivo antidiabetic activity of novel dispiropyrrolidines through [3+2] cycloaddition reactions with thiazolidinedione and Rhodanine derivatives. Eur. J. Med. Chem.,2009, 44, 3272. https://doi.org/10.1016/j.ejmech.2009.03.035
5Chandrappa, S., Kavitha, C. V., Shahabuddin, M. S., Vinaya, K., Ananda, C. S., Ranganatha, S. R., Raghavan, S. C., Rangappa, K. S., Synthesis of 2-(5-((5-(4-chlorophenyl)furan-2-yl)methylene)-4-oxo-2-thioxothiazolidin-3-yl)acetic acid derivatives and evaluation of their cytotoxicity and induction of apoptosis in human leukemia cells, Bioorg. Med. Chem., 2009, 17, 2576. https://doi.org/10.1016/j.bmc.2009.01.016
6Alegaon, S. G., Alagawadi, K. R., Sonkusare, P. V., Chaudhary, S. M., Dadwe, D. H., Shah, A. S., Novel imidazo[2,1-b][1,3,4]thiadiazole carrying Rhodanine-3-acetic acid as potential antitubercular agents, Bioorg. Med. Chem. Lett.,2012, 22, 1917. https://doi.org/10.1016/j.bmcl.2012.01.052
7Chauhan, K., Sharma, M., Trivedi, P., Chaturvedi, V., Chauhan, P. M. S., New class of methyl tetrazole based hybrid of (Z)-5-benzylidene-2-(piperazin-1-yl)thiazol-4(%H)-one as potent antitubercular agents, Bioorg. Med. Chem. Lett., 2014, 24, 4166. https://doi.org/10.1016/j.bmcl.2014.07.061
8Rajamaki, S., Innitzer, A., Falciani, C., Tintori, C., Christ, F., Witvrouw, M., Debyser, Z., Massa, S., Botta, M., Exploration of novel thiobarbituric acid, Rhodanine and thiohydantoin-based HIV-1 integrase inhibitors, Bioorg. Med. Chem. Lett., 2009, 19, 3615. https://doi.org/10.1016/j.bmcl.2009.04.132
9Murugesan, V., Tiwari, V. S., Saxena, R., Tripathi, R., Paranjape, R., Kulkarni, S., Makwana, N., Suryawanshi, R., Katti, S. B., Lead optimization at C-2 and N-3 positions of thiazolidin-4-ones as HIV-1 non-nucleoside reverse transcriptase inhibitors, Bioorg. Med. Chem., 2011,19, 6919.https://doi.org/10.1016/j.bmc.2011.09.018
10Kamila, S., Ankati, H., Biehl, E. R., An efficient microwave-assisted synthesis of novel class of Rhodanine derivatives as potential HIV-1 and JSP-1 inhibitors, Tet. Lett., 2011, 52, 4375. https://doi.org/10.1016/j.tetlet.2011.05.114
11Chen, Z. H., Zheng, C. J., Sun, L. P., Piao, H. R., Synthesis of new chalcone derivatives containing a Rhodanine-3-acetic acid moiety with potential anti-bacterial activity, Eur. J. Med. Chem., 2010, 45, 5739. https://doi.org/10.1016/j.ejmech.2010.09.031
12Senthilraja, M., Alagarsamy, V., Solomon, V. R., 2,3-Disubstituted Thiazolidin-4-ones: Novel Class of Anticonvulsant Agents, Lett. Drug. Des. Dis. 2012, 9, 731.
13Ottana, R., Carotti, S., Maccari, R., Landini, I., Chiricosta, G., Caciagli, B., Vigorita, M. G., Mini, E., In vitro antiproliferative activity against human colon cancer cell lines of representative 4-thiazolidinones, Bioorg. Med. Chem. Lett.,2005, 15, 3930.https://doi.org/10.1016/j.bmcl.2005.05.093
14Gouveia, F. L., de Oliveira, R. M. B., de Oliveira, T. B., da Silva, I. M., do Nascimento, S. C., de Sena, K. X. F. R., de Albuquerque, J. F. C., Synthesis, antimicrobial and cytotoxic activities of some 5-arylidene-4-thioxo-thiazolidine-2-ones. Eur. J. Med. Chem.,2009, 44, 2038. https://doi.org/10.1016/j.ejmech.2008.10.006
15Sarkate, A. P., Lokwani, D. K., Karnik , K. S., Shinde, D. B., Novel 2-(nitrooxy)ethyl 2-(4-(substituted phenyl)-2-((substituted phenyl)amino)thiazol-5-yl)acetate as anti-inflammatory, analgesic and nitric oxide-releasing agents: Synthesis and Molecular Docking studies, Anti-Infl. Anti-Allerg. Age. Med. Chem., 2017, 16(3), 153-167 https://doi.org/10.2174/1871523016666171115125922
16Dofe, V. S., Sarkate, A. P., Azad, R., Gill, C. H., Green synthesis and the inhibitory effect of novel quinoline-based thiazolidinones on the growth of MCF-7 human breast cancer cell line by G2/M cell cycle arrest, Res. Chem. Intermed.,2018, 44, 1149. https://doi.org/10.1007/s11164-017-3157-3
17Nikalje, A. P. G., Tiwari, S. V., Sarkate, A. P., Karnik, K. S., Imidazole-thiazole coupled derivatives as novel lanosterol 14-α demethylase inhibitors: Ionic liquid-mediated synthesis, biological evaluation and molecular docking study,Med. Chem. Res.,2018, 27(2), 592-606. https://doi.org/10.1007/s00044-017-2085-5
18Pawar, C. D., Sarkate, A. P., Karnik, K. S., Bahekar, S. S., Pansare, D. N., Shelke, R. N., Jawale, C. S., Shinde, D. B., Synthesis and antimicrobial evaluation of novel ethyl 2-(2-(4-substituted) acetamido)-4-substituted-thiazole-5-carboxylate derivatives, Bioorg. Med. Chem. Lett., 2016, 26, 3525. https://doi.org/10.1016/j.bmcl.2016.06.030
19Gualtieri, M., Bastide, L., Villain-Guillot, P., Michaux-Charachon, S., Latouche, J., Leonetti, J. P., In vitro activity of a new antibacterial Rhodanine derivative against Staphylococcus epidermidis biofilms, J. Antimicrob. Chemother,2006, 58, 778. https://doi.org/10.1093/jac/dkl314
20Li, H., Yang, J., Ma, S., Qiao, C., Structure-based design of Rhodanine-based acylsulfonamide derivatives as antagonists of the anti-apoptotic Bcl-2 protein, Bioorg. Med. Chem.,2012, 20, 4194.https://doi.org/10.1016/j.bmc.2012.05.079
21Mallikarjuna, B. P., Sastry, B. S., Suresh Kumar, G. V., Rajendraprasad, Y., Chandrashekar, S. M., Sathisha, K., Synthesis of new 4-isopropylthiazole hydrazide analogs and some derived clubbed triazole, oxadiazole ring systems - A novel class of potential antibacterial, antifungal and antitubercular agents. Eur. J. Med. Chem., 2009, 44, 4739. https://doi.org/10.1016/j.ejmech.2009.06.008
22Mueller-Premru, M., Zidar, N., Spik, V. C., Krope, A., Kikelj, D., Benzoxazine, Series of Histidine Kinase Inhibitors as Potential Antimicrobial Agents with Activity against Enterococci, Chemotherapy,2009, 55, 414.
23Murugan, R., Anbazhagan, S., Lingeshwaran, S., Narayanan, S., Synthesis and in vivo antidiabetic activity of novel dispiropyrrolidines through [3 + 2] cycloaddition reactions with thiazolidinedione and Rhodanine derivatives, Eur. J. Med. Chem., 2009, 44, 3272. https://doi.org/10.1016/j.ejmech.2009.03.035
24Murugesan, V., Tiwari, V. S., Saxena, R., Tripathi, R., Paranjape, R., Kulkarni, S., Makwana, N., Suryawanshi, R., Katti, S. B., Lead optimization at C-2 and N-3 positions of thiazolidin-4-ones as HIV-1 non-nucleoside reverse transcriptase inhibitors, Bioorg. Med. Chem., 2011,19, 6919.https://doi.org/10.1016/j.bmc.2011.09.018
25Pansare, D. N., Mulla, N. A., Pawar, C. D., Shende, V. R., Shinde, D. B., One pot three components microwave assisted and conventional synthesis of new 3-(4-chloro-2-hydroxyphenyl)-2-(substituted) thiazolidin-4-one as antimicrobial agents, Bioorg. Med. Chem. Lett.,2014, 24, 3569. https://doi.org/10.1016/j.bmcl.2014.05.051
26Pansare, D.N., Shelke, R.N., Khade, M. C., Jadhav, V. N., Pawar, C. D., Jadhav, R.A., Bembalkar, S. R., New thiazolone derivatives: design, synthesis, anticancer and antimicrobial activity. Eur. Chem. Bull., 2019, 8(1), 7. DOI: 10.17628/ecb.2019.8.7-14.
Benzylidene-4-oxo-4,5-dihydrothiazol-2-yl) substituted amino acids Section A-Research paper
Eur. Chem. Bull. 2019, 8(2), 63-70 DOI: 10.17628/ecb.2019.8.63-70 70
27Shelke, R.N.,Pansare, D.N., Pawar, C. D.,Khade, M. C., Jadhav, V. N.,Deshmukh, S.U., Dhas, A. K., Chavan, P. N., Sarkate, A. P., Pawar, R. P., Shinde, D. B., Thopate, S.R., Synthesis and anticancer evaluation of new benzenesulfonamide derivatives. Eur. Chem. Bull. 2019, 8(1), 1. DOI: 10.17628/ecb.2019.8.1-6.
28Petrikaite, V., Tarasevicius, E., Pavilonis, A., New ethacridine derivatives as the potential antifungal and antibacterial preparation, Medicina,2007, 43, 657.
29Pansare, D. N., Shinde, D. B. A facile synthesis of novel series (Z)-2-((4-oxo-5-(thiophen-2-yl methylene)-4,5-dihydro thiazol-2-yl)amino) substituted acid, J. Saudi. Chem. Soc.,2017, 21, 434. https://doi.org/10.1016/j.jscs.2015.10.005
30Pansare, D. N., Shelke,R. N., Pawar, C. D., A facile synthesis of (Z)-2-((5-(4-chlorobenzylidene)-4-oxo-4,5-dihydrothiazol-2-yl)amino)substituted acid using microwave irradiation and conventional method, Lett. Org. Chem.,2017, 14(7), 517. https://doi.org/10.2174/1570178614666170524142722
31Pansare, D. N., Shelke,R. N., Shinde, D. B., A facial synthesis and anticancer activity of (Z)-2-((5-(4-nitrobenzylidene) -4-oxo-4,5-dihydrothiazol-2-yl)amino) substituted acid, J. Het. Chem., 2017, 54(6), 3077. https://doi.org/10.1002/jhet.2919
32Pansare, D. N., Shinde, D. B. Synthesis and Antimicrobial Activity of new (Z)-2-((5-(4-Hydroxybenzylidene)-4-Oxo-4,5-Dihydrothiazol-2-Yl)Amino) Acid and its Derivatives, Res. Rev. J. Chem.,2015, 4(1), 1.
33Pawar, C. D., Sarkate, A. P., Karnik, K. S., Pansare, D. N., Shinde, D. B., Synthesis and antiproliferative evaluation of new (4-substituted-3,4-dihydro-2H-benzo[b][1,4]oxazin-2-yl)methane substituted sulfonamide derivatives Eur. J. Chem.,2017, 8, 384. https://doi.org/10.5155/eurjchem.8.4.384-390.1635
34Pawar, C. D., Pansare, D. N., Shinde, D. B., Synthesis of new 3-(substituted phenyl)-N-(2-hydroxy-2-(substituted phenyl)ethyl)-N-methylthiophene-2-sulfonamide derivatives as antiproliferative agents, Eur. J. Chem., 2018, 9(1), 13. https://doi.org/10.5155/eurjchem.9.1.13-21.1669
35Pawar, C. D., Pansare, D. N., Shinde, D. B., Synthesis and antiproliferative activity of 3-(substituted)-4,5,6,7-tetrahydro-6-(substituted)-1H-pyrazolo[3,4-c]pyridine Derivatives, Eur. J. Chem.,2017, 8(4), 400‐409. https://doi.org/10.5155/eurjchem.8.4.400-409.1645
36Shelke,R. N., Pansare, D. N., Pawar, C. D., Pawar, R. P., Bembalkar, S. R., Synthesis of 3H‐imidazo[4,5‐b] pyridine with evaluation of their anticancer and antimicrobial activity, Eur. J. Chem.,2017, 8(1), 25. https://doi.org/10.5155/eurjchem.8.1.25-32.1522
37Shelke,R. N., Pansare, D. N., Pawar, C. D., Deshmukh, A. K., Pawar, R. P., Bembalkar, S. R., Synthesis of 2-((substituted)-2-chloroquinolin-3-yl)-3-((substituted) phenyl) thiazolidin-4-one with β-cyclodextrin-SO3H catalyst under solvent-free condition, Res. Rev. J. Chem., 2017, 6(1), 24.
38Shelke,R. N., Pansare, D. N., Pawar, C. D., Shinde, D. B., Pawar, R. P., Bembalkar, S. R., Synthesis of Novel 2H-Pyrano[2,3-D]Thiazole-6-Carbonitrile Derivatives in Aqueous Medium. Res. Rev. J. Chem.,2016, 5(2), 29.
39Sarkate, A. P., Pansare, D. N., Kale, I., Shinde, D. B., Microwave and Conventional Method Assisted Synthesis of 2-(substituted) -3-(4-methoxybenzyl) Thiazolidin-4-ones Using ZrOCl2•8H2O as a Catalyst. Curr. Microwave Chem.,2017, 4(2), 139-145. https://doi.org/10.2174/2213335603666160922115342
40Sarkate, A. P., Pansare, D. N., Kale, I., Bahekar, S. S., Shinde, D. B., Microwave-assisted copper-catalyzed synthesis of substituted benzamides through decarboxylative C-N cross-coupling, Curr. Microwave Chem.2017, 4, 163.https://doi.org/10.2174/2213335603666161017120230
41Pawar, C. D., Pansare, D. N., Shinde, D. B., (Substituted)-benzo[b]thiophene-4-carboxamide synthesis and antiproliferative activity study. Lett. Drug. Des. Disc.,2018, https://doi.org/10.2174/1570180815666181004114125
42Pawar, C. D., Chavan, S. L., Pawar, U. D., Pansare, D. N., Deshmukh, S. V., Shinde, D. B., Synthesis, anti-proliferative activity, SAR and Kinase inhibition studies of thiazol-2-yl- substituted sulfonamide derivatives. J. Chin. Chem. Soc.,2018, https://doi.org/10.1002/jccs.201800312
43Jin, X., Zheng, C. J., Song, M. X., Wu, Y., Sun, L. P., Li, Y. J., Yu, L. J., Piao, H. R., Synthesis and antimicrobial evaluation of L-phenylalanine-derived C5-substituted Rhodanine and chalcone derivatives containing thiobarbituric acid or 2-thioxo-4-thiazolidinone, Eur. J. Med. Chem.,2012, 56, 203.https://doi.org/10.1016/j.ejmech.2012.08.026
44Denizot, F., Lang, R., Rapid colorimetric assay for cell growth and survival: Modifications to the tetrazolium dye procedure giving improved sensitivity and reliability, J. Immunol. Met., 1986, 89, 271.
Received: 10.02.2019. Accepted: 14.04.2019.


![P-omission under sluicing, [P clitic] and the nature of P-stranding](https://static.fdokumen.com/doc/165x107/632111e6f2b35f3bd10fb543/p-omission-under-sluicing-p-clitic-and-the-nature-of-p-stranding.jpg)