Reducing Air Pollution in India's Industrial Cluster through ...
90
Prepared for Climate and Clean Air Coalition (CCAC) By International Institute for Energy Conservation (IIEC) South Asia Office: D – 1, First Floor, Shopping Centre, D – Block, Paschimi Marg, Vasant Vihar, New Delhi – 110 057 INDIA Tel: +91-11-41828216 Fax: +91-41828217 Website: www.iiec.org October 2020 Reducing Air Pollution in India’s Industrial Cluster through Smart Energy Management Report: Ankleshwar, Gujarat Reference number: M1-32SLP-000047
-
Upload
khangminh22 -
Category
Documents
-
view
2 -
download
0
Transcript of Reducing Air Pollution in India's Industrial Cluster through ...

Prepared for
Climate and Clean Air Coalition (CCAC)
By
International Institute for Energy Conservation (IIEC) South Asia Office:
D – 1, First Floor, Shopping Centre, D – Block, Paschimi Marg,
Vasant Vihar, New Delhi – 110 057 INDIA
Tel: +91-11-41828216
Fax: +91-41828217
Website: www.iiec.org
October 2020
Reducing Air Pollution in India’s Industrial Cluster through Smart Energy Management
Report: Ankleshwar, Gujarat Reference number: M1-32SLP-000047

Climate and Clean Air Coalition (CCAC)
Reducing Air Pollution in India’s Industrial Cluster through Smart Energy Management August 2020 | i
Table of Contents
1 Executive Summary .............................................................................. 2
2 Introduction .......................................................................................... 6
3 Project Approach and Summary of Activities ....................................... 8
4 Methodology Adopted For The Study ................................................. 11
5 Published VOC Levels in Industrial Area ............................................ 14
6 Industrial Emission Inventory – Baseline Scenario ............................ 15
7 VOC Destruction Technologies ............................................................ 21
8 Predicting Ground Level Concentrations (GLCs) For The Baseline
Emission Scenario ............................................................................... 28
8.1 Meteorological Data ............................................................................................. 28
8.2 Local and Regional Geographical Features ............................................................. 29
8.3 Modelling Results-Predicted GLC for Baseline Emission Scenario (uncontrolled
emissions) .......................................................................................................... 30
9 Estimated Emissions Post Cleaner Technology Options ..................... 32
10 Predicted GLC’s – Post ENCON Measures And Clean Technology
Scenario .............................................................................................. 36
11 Impact of VOC And Other Pollutants on Human Health ..................... 39

Climate and Clean Air Coalition (CCAC)
Reducing Air Pollution in India’s Industrial Cluster through Smart Energy Management August 2020 | ii
List of Annexures
Annexure-I: Various VOC Control Technologies
Annexure-II: Emission Inventory
Annexure-III: Uncontrolled Emission Scenario - Model Input and Output
Annexure-IV: Reduced Envisaged Emission Scenario - Model Input and Output
Annexure-V: Control of VOC in Chemical Industry
Annexure-VI: Total VOC Exposure Guidelines Recommended by the Commission of The European Communities (CEC 1992)

Climate and Clean Air Coalition (CCAC)
Reducing Air Pollution in India’s Industrial Cluster through Smart Energy Management August 2020 | iii
List of Abbreviations
AAQ Ambient Air Quality
AAS Atomic Absorption Spectrometry
AERMOD Atmospheric Dispersion Modeling System (Software)
APEC Asia Pacific Economic Cooperation
ASU Air Separation Unit
AQ-SEMP Air Quality and Smart Energy Management
BAT Best Available Technology
BAU Business as Usual
BHEL Bharat Heavy Electrical Limited
Ca (OH)2 Calcium Hydroxide
CaCO3 Calcium Carbonate
CaO Calcium Oxide
CaSO3 Calcium Sulphite
CCS Carbon Capture and Sequestration
CEA Central Electricity Authority
CEPI Comprehensive Environmental Pollution Index
CO2 Carbon Dioxide
CPCB Central Pollution Control Board
CPP Captive Power Plant
DISCOM Distribution Company
EDXRF Energy Dispersive X-ray Fluorescence
EE Energy Efficiency
EIA Environment Impact Assessment
ENCON Energy Conservation
EP Act Environmental protection Act
FBC Fluidized Bed Combustion Boilers
FGD Flue Gas Desulfurization
GHG Green House Gas
GIDC Gujarat Industrial Development Corporation
GLC Ground Level Concentrations
GPCB Gujarat Pollution Control Board
GRP Gross Rating Point
GW Giga Watt

Climate and Clean Air Coalition (CCAC)
Reducing Air Pollution in India’s Industrial Cluster through Smart Energy Management August 2020 | iv
HCL Hydrochloric Acid
HF Hydrogen Fluoride
HHV Higher Heating Value
HPLC/GC Analysis High Performance Liquid Chromatography
and Gas Chromatography
ICP-ES Inductively Coupled Plasma Emission Spectrometry
IGCC Integrated Coal Gasification Combined Cycle
IMD India Meteorological Department
Kg/hr Kilogram per Hour
kWh Kilowatt Hour
LP Low Pressure
MOD Merit Order Dispatch
MoEFCC Ministry of Environment Forest and Climate Change
M/S Meter per Second
MPa Megapascals
Mtoe Million Tonnes of carbon Equivalent
MW Mega Watt
MWh Mega Watt Hour
NAAQs National Ambient Air Quality standards
NOx Nitrogen Oxides
NTPC National Thermal Power Corporation
PAT Perform, Achieve and Trade
PC boiler Pulverized Coal Boiler
PCBs Pollution Control Boards
PM Particulate Matter
RE Renewable Energy
SC-FBC Super Critical Fluidized Bed Combustion Boilers
SNCR Selective Non-Catalytic Reduction
SOx Sulphur Oxides
SPCB State Pollution Control Board
Sq.Km Square Kilometers
tCO2 Tonnes of Carbon Dioxide
TOEM Technology for Particulate Measurement
T/hr Tonne per hour
TPP Thermal Power Plant

Climate and Clean Air Coalition (CCAC)
Reducing Air Pollution in India’s Industrial Cluster through Smart Energy Management August 2020 | v
USC Ultra-Supercritical
USC-FBC Ultra-Super Critical Fluidized Bed Combustion Boilers
USEPA United States Environmental Protection Agency
VOC Volatile Organic Compounds
µg/m3 Microgram per Cubic Meter

Climate and Clean Air Coalition (CCAC)
Reducing Air Pollution in India’s Industrial Cluster through Smart Energy Management August 2020 | 1
Acknowledgement
This report was prepared by the International Institute for Energy Conservation (IIEC)
team in cooperation with Gujarat State Pollution Control Board (GSPCB), India. The Regional
Pollution Control Office, Ankleshwar, Gujarat has greatly contributed to the study and
provided all the possible support to intensive field work conducted by IIEC team. Dr. B.
Sengupta, Ex Member Secretary of Central Pollution Board (CPCB), India has
provided the guidance throughout the life of the project.
This report was made possible through the generous support of the Climate and Clean
Air Coalition (CCAC). IIEC is thankful to Sandra Cavalieri, Health Initiative and
Household Energy Initiative Coordinator, CCAC Secretariat for providing technical and
managerial support during the entire period of the study. IIEC gratefully acknowledge
reviewers, team members, and technical experts from OSPCB and Odisha State utility who
supported this report. We would like to thank Mr. B. Mahendra, Deputy Manager –
Environment and his team of Chola MS for providing modeling support while conducting the
Air Quality and Smart Energy Management (AQ-SEMP) analysis. Wilaiwan
Kunchansombut carried editorial and formatting responsibility.
Workshops of national and state level experts was organized by IIEC to gather essential input
to this study and was held in June 2019 in December 2019 in Ankleshwar. The workshop
participants offered valuable insights, feedback, and data for this analysis.
Many experts from outside of the IIEC provided inputs, commented on the underlying
analytical work and/or reviewed the report. Their comments and suggestions were of great
value.

Climate and Clean Air Coalition (CCAC)
Reducing Air Pollution in India’s Industrial Cluster through Smart Energy Management August 2020 | 2
1 EXECUTIVE SUMMARY
India has an urgent need to address rapidly worsening effects of air pollution—on the climate
as well as on human health. The situation is serious as out of the 20 most polluted cities in
the world, 12 are in India. In response to reduce the worsening effects of air quality, the
International Institute for Energy Conservation (IIEC) with funding support from Climate and
Clean Air Coalition (CCAC) is working in India to build air quality monitoring and tracking
capacity among government, industry, and utility partners, and to demonstrate and deliver
cost-effective air pollution reduction strategies in two industrial Indian states—Gujarat and
Odisha—through smart management of industrial energy use. These states were selected
based on a need assessment as well as the demonstrated interest and commitment of their
Pollution Control Boards. The project responded to a large body of evidence that points to
industrial and power plant emissions as two of the major sources of air pollution in industrial
areas. It also builds on an increasing number of studies demonstrating the effectiveness of
smart energy management as a strategy for reducing air pollution in industrialized urban areas.
The project selected Jharsuguda and Ankleshwar Industrial Areas in Odisha and Gujarat States
to develop the framework to transform the efforts to mitigate air pollution from industrial
areas. The project addressed two key barriers to the adoption of energy management as a
solution to the deteriorating air quality in industrial areas: 1) Lack of a demonstrated link
between smart energy management and air quality improvement; and 2) the difficulty of
financing smart energy solutions, that could help address air pollution in industrialized urban
areas. The project established a clear connection between industrial energy use and air quality
and showing how highly polluted areas can address air pollution through adoption of energy
efficiency measures and through deploying clean energy solutions. This report presents the
outcomes of the study conducted in Ankleshwar Industrial Area of Gujarat.
Adopted Methodology for the Study
The project focused on improving understanding among government, industry, and utility
partners of the linkages between air quality and utility/industrial energy management,
demonstrating the potential for reducing
air pollution levels to achieve multiple
health-related and economic benefits
through smart management of industrial
energy use and developing a methodology
for clean energy solutions. To
demonstrate the Air Quality and Smart
Energy Management (AQ-SEMP)
Framework, the following methodology
has been adopted in Ankleshwar Industrial
Area.
▪ Step 1: Defining the Study Area /
Boundary: The boundary of the study area is confined to Gujarat Industrial Development
Corporation (GIDC) area in Ankleshwar, which covers 28.14 Sq.Km (Figure 1). As per
Figure 1: Study Area in Ankleshwar, Gujarat

Climate and Clean Air Coalition (CCAC)
Reducing Air Pollution in India’s Industrial Cluster through Smart Energy Management August 2020 | 3
the Agro-Climatic Regions map1, the area falls under “Gujarat Plains and Hills” with
semi-arid environmental conditions and the published map is presented in Figure 2. Based
on the published meteorological sub divisional rainfall normal data (1951-2000) (IMD)2, the
area experiences annual rainfall ranging
from 50 to 100 cm. The highest
temperature is recorded in between
25°C and 45°C in the summer season
and lowest temperature is recorded in
between 15°C and 25°C in winter
season. The Ankleshwar Industrial
Area has maximum number of
chemical and pharmaceutical
industries.
▪ Step 2: Review of Published
Baseline Air Quality in the GIDC
Area – As a part of the study, ambient
air quality data for Volatile Organic
Compounds (VOCs) in the GIDC area has been collected from online/ continuous ambient
air quality stations installed by Gujarat State Pollution Control Board (GPCB), and also
from the recently published Environment Impact Assessment (EIA) Reports for the projects
at Ankleshwar.
▪ Step 3: Developing Emission Inventory: An attempt was made to develop baseline
VOC emission inventory data for the major pharmaceutical industrial facilities in the study
area based on the published emission factors and other published environmental impact
assessment and sector specific reports. Since majority of the VOC emissions in
pharmaceutical industries and other chemical industries are fugitive in nature rather than
point source emissions, each industry is considered as an individual area source. Major 32
pharmaceutical industries located in the GIDC industrial area are classified as small,
medium, and large scales industries as per the consented production capacity.
▪ Step 4: Predicting Ground Level Concentrations (GLCs) for the Baseline
Emission Scenario Case: To model the current baseline GLCs using AERMOD model,
due to release of Total VOC emissions from the pharmaceutical industries and other
chemical industries located in Ankleshwar, the baseline emission inventory data as
discussed in Step 3 is used. Since the emissions are considered to be an area source as
mentioned above, the chances of air VOC pollutants getting trapped in the atmosphere is
higher in winter season due to its meteorological conditions. Hence, winter season is
generally been considered as a worst-case scenario for ambient air quality modelling.
▪ Step 5: Proposed ENCON Measures and Clean Technology Options for VOC
Control: As on date there are no regulations on control of VOC emissions from pharmaceutical industries in India, hence there is no unified approach is adopted for the
control VOC emissions by the Industry. As per the MOEF&CC circular issued in 2018 with
regards to standardization of environmental clearance conditions for regulated industries
under EIA Notification 2006, all expansion and greenfield pharmaceutical industries are
1 https://geography4u.com/agro-climatic-zones-in-india/ 2 https://mausam.imd.gov.in/imd_latest/contents/index_rainfall_subdiv.php?msg=M#.
Figure 2: Agro-Climatic Zone Map of the Study Area

Climate and Clean Air Coalition (CCAC)
Reducing Air Pollution in India’s Industrial Cluster through Smart Energy Management August 2020 | 4
required to demonstrate 98% recovery of solvents. This means the overall VOC emissions
(unaccounted losses) shall be maintained less than 2% of the fresh solvent used. IIEC has
prepared a revised emission inventory for the study area and estimated reduced emission
levels due to the proposed ENCON measures and cleaner production opportunities.
▪ Step 6: Predicting Post Project Scenario GLCs in the Study Area and Evaluating
the Benefits: Based on the emission inventory data prepared considering the
implementation of ENCON measures and cleaner production initiatives, the revised GLCs
are predicted using AERMOD, an air quality modeling software. Based on the model
outcome, the possible benefits on ambient air quality due to reduced TVOC emissions in
the study area were highlighted.
The flow diagram of the model depicting the methodology is presented in Figure-3.
Summary of Results
Due to the implementation of ENCON measures and cleaner technologies options, around
90% reduction of VOC emissions is envisaged. Hence, the Total VOC emission load per unit
or facility shall be reduced from current baseline scenario of 1.0 ton per day per industry to 0.1 tons per day per industry. The predicted concentrations of the TVOC before and after
implementation ENCON measures are presented in Table 1 and Table 2. The model input
and output files are attached as Annexure-IV.
Figure 3: AQ-SEMP Framework Model and Methodology
Flow Chart for the Methodology Adopted
Obtaining information on Emission
Inventories for VOC, PM, SO2, NOX
emissions for individual clusters.
Obtaining the Meteorological data
and upper air data from IMD or any
other authentic sources.
Modelling using AERMOD Software
Estimation of 24 hours and annual average GLC’s
Generation of pollution contours for the criteria pollutants
Comparison of modelled data with published
baseline air quality data in the region
Considering all Encon and Clean
Technology Measures adopted in the
industries, the revised air quality modeling
will be undertaken
Predicted GLC’s will be modelled using
AERMOD
Collecting and analyzing data from local hospitals and
Medical officers of the Industries in the industrial cluster,
for respiratory / pollutant concentration related diseases
Correlate this health Impact with Air quality
and concentration of pollutants
Use the revised Air quality modelling to
estimate the possible reductions in
respiratory diseases in future

Climate and Clean Air Coalition (CCAC)
Reducing Air Pollution in India’s Industrial Cluster through Smart Energy Management August 2020 | 5
Table 1 Predicted GLC for Baseline Emission Scenario Vs. Post ENCON Scenario
Location
Baseline Emission Scenario
(2nd Highest Predicted 24
Hrs. Avg GLC) (mg/m3)
Post Encon & Cleaner
Technologies Implementation
(2nd Highest Predicted 24
Hrs. Avg GLC) (mg/m3)
Average Reported
Baseline Air Quality Data in
GIDC (mg/m3)
TLV of VOC Species (mg/m3)
Long-Term Chronic
Exposure Risk Levels for
Various VOC Species (mg/m3)
Within the core zone (industrial areas)
2.5 to 7.5 0.25 to 0.75 0.65 to 2.4
0.5 to 1200 0.15 to 30
Outside the industrial area (within 1km from industrial area boundary)
<2 <0.2 No data
1 km to 3km from the industrial area boundary
Traces to 1 Traces to 0.1 No data
Table 2 Predicted GLC for Baseline Emission Scenario Vs. Post ENCON Scenario
Location
Baseline Emission
Scenario with Atmospheric Scavenging
Effect (2nd Highest Predicted 24
Hrs. Avg GLC) (mg/m3)
Post Encon & Cleaner
Technologies implementation
with Atmospheric Scavenging
Effect (2nd Highest Predicted 24
Hrs. Avg GLC) (mg/m3)
Average Reported
Baseline Air Quality Data in
GIDC (mg/m3)
TLV of VOC Species (mg/m3)
Long-Term Chronic
Exposure Risk Levels for
Various VOC Species (mg/m3)
Within the core zone (industrial areas)
1.75 to 5.25 0.17 to 0.52 0.65 to 2.4
0.5 to 1200 0.15 to 30
Outside the industrial area (within 1km from industrial area boundary)
<1.4 <0.15 No data
1 km to 3km from the industrial area boundary
Traces to 0.7 Traces to 0.07 No data

Climate and Clean Air Coalition (CCAC)
Reducing Air Pollution in India’s Industrial Cluster through Smart Energy Management August 2020 | 6
2 INTRODUCTION
Rapid economic growth has brought many benefits to India, but at a cost to human health and
the environment. Growth in industrial production, construction of buildings, roads and
highways and urban transport has led to poor air quality in many Indian cities and industrial
clusters. There is an urgent need to address the rapidly worsening effects of air pollution—
on both human health and the global climate—by implementing measures to improve air
quality and reduce pollution and air emissions in India’s industrial clusters.
Smart energy management, along with clean technologies and advanced pollution control
measures have proven to be an effective strategy for reducing air pollution in both developed
and transitioning economies, holds significant potential to reduce emissions from industries
and power plants—two of the major sources of air pollution in many of India’s urban areas.
The project provides a critical proof of concept: That developing country cities can achieve
significant, measurable reductions in air pollution specially, Volatile Organic Compound
(VOC) emissions and greenhouse gas emissions through investing in smart energy
management. and advance control technologies. Achieving this goal, however, requires
addressing two key challenges: 1) Lack of a demonstrated link between smart energy
management and air quality improvements in India; and 2) the need to scale up development,
financing, and implementation of smart energy solutions, including renewable energy (RE) and
energy efficiency (EE), that can help address air pollution in industrialized urban areas, critically
polluted areas by offsetting fossil fuel use for diesel and coal-fired electricity generation.
Project Objectives
The project tends to transform efforts to mitigate air pollution from India’s industrial and
power sectors by: 1) improving understanding among government, industry, and utility
partners of the linkages between air quality and utility/industrial energy management; 2)
demonstrating the potential for reducing air pollution levels to achieve multiple health-related
and economic benefits through smart management; and 3) developing and testing an approach
for providing clean energy solutions. The project activities have been implemented in
industrialized areas of Gujarat and Odisha States, where air pollution is a critical concern. The
project has support from both State Governments, indicating their strong interest in the
project.
In view of the implementation of various energy conservation (ENCON) strategies and
cleaner production initiatives, IIEC intended to develop a technical report to demonstrate the
advantages of implementing ENCON measures and cleaner production initiatives to reduce
the targeted Volatile Organic Compound (VOC) emissions and air emissions from the
respective industrial clusters. For the study, two such industrial clusters located at Jharsuguda
in Odisha and Ankleshwar in Gujarat were selected. These are among 44 critically polluted
industrial clusters as identified by the Central Pollution Control Board (CPCB) based on
Comprehensive Environment Pollution (CEPI) Index. The implementation of ENCON
measures and clean technology options in industrial clusters will exhibit multiple advantages
and benefits such as reduced fossil fuel consumption and thereby conservation of natural
resources for future generations. Reduction in greenhouse gas and criteria pollutant emissions
such as PM, SO2, NOx and Volatile Organic Compound (VOC) emissions will help to improve
the regional air quality and reduced the health effect due to air pollution in the region.

Climate and Clean Air Coalition (CCAC)
Reducing Air Pollution in India’s Industrial Cluster through Smart Energy Management August 2020 | 7
The project tends to predict possible reduction in ground level concentration of above-
mentioned criteria pollutants due to adoption of ENCON measures and cleaner production
initiatives in various sectors in the Ankleshwar Region. This report presents the air quality
modelling results for current baseline emissions scenario and post project implementation
scenario.
This report focuses on the major pharmaceutical industries located at GIDC, Ankleshwar
in Gujarat. This cluster faces major Volatile Organic Compounds (VOCs) emissions.
The majority of anthropogenic volatile Organic Compounds (VOCs) released into the
atmosphere are from transportation sources and industrial processes utilizing solvents such
as surface coating (paints), printing (inks), and petrochemical processing. Notably VOC
compounds are not formed in industrial processes, they are lost.
VOCs are organic compounds that can volatilize and participate in photochemical reactions
when the gas stream is released to the ambient air. Almost all the organic compounds used as solvents and as chemical feedstock are VOCs. However, a few organic compounds, such
as methane, are not considered to be VOCs.

Climate and Clean Air Coalition (CCAC)
Reducing Air Pollution in India’s Industrial Cluster through Smart Energy Management August 2020 | 8
3 PROJECT APPROACH AND SUMMARY OF ACTIVITIES
The project started in February 2019 with gathering the understanding from the concerned
stakeholders on the subject matter identifying linkages between the industrial air pollution
and its mitigation through introduction of smart energy management techniques, was
completed. Several meetings with the Odisha and Gujarat State Pollution Control Board were
organized. The meetings focused on presenting the project objectives and seeking acceptance
from the State Pollution Control Board in helping the project team in implementation of
project activities. Jharsuguda Industrial Area in Odisha and Ankaleshwar Industrial Area in
Gujarat were mutually selected to conduct project activities.
Consecutive to the same a desk-based literature review was carried out understanding the
critical important industries present in the identified industrial areas and developing
questionnaire to collect air pollution relevant data from the industries. It was identified that
the majorly the Chemical Industries including Pharmaceutical, Pesticide and Dye Intermediate
Industries are present in Ankleshwar industrial areas. The data was collected from these
industries using the questionnaires. Before using, the questionnaires were peer reviewed by
the state pollution control board in Gujarat.
Followed by this, a good number of outreach activities were conducted to mobilize the
support of industries, utilities, experts, industry associations, donor agencies, financing
institutions and the staff at Pollution Control Board Gujarat.
Workshops were organised to launch the project in both the states wherein stakeholders
such as industry representatives, health department representatives and government
stakeholders were present. The main objective of the launch workshops was to generate
awareness amongst the local stakeholder on the project activities, request the information
required from them and discuss the issues in implementation.
After the launch workshops, surveys of select industries were conducted to understand the
critical areas responsible for emissions and developed the methodology to performs emission load analysis for the two selected industrial areas. The emission data was analysed and the
current emission load and pollution levels for Jharsuguda were calculated. The sections below
discuss about the project findings and emission data analysis. Also, the report compares the
business as usual and post implementation scenarios for Air Quality Management with the
help of Smart Energy Management.

Climate and Clean Air Coalition (CCAC)
Reducing Air Pollution in India’s Industrial Cluster through Smart Energy Management August 2020 | 9
Activity Summary
Activity Description of Work Undertaken During Reporting Period
Deliverables Delivery Date
Status of Activity
(Completed/ On-Going/ Delayed)
Comments - Brief Description of Implementing Challenges, Strategy / Actions
which have been Adopted to Address the Challenges and Planned Actions to Mitigate
any Identified Risks.
Activity 1: Improving the Understanding of Stakeholders
Coordinated and convened launch events and workshops with key partners present in Odisha and Gujarat including state pollution control board, health departments, department of industries etc. Develop a detailed work plan and collection pollution data, energy data and health data
1. Detailed work-plan including timeline for carrying workshop activities
2. Power point presentation delivered at workshop
3. Workshop report including agenda attendees list
15th July 2019
Completed
The main challenge experienced while implementing the project activity 1 was to collaborate with the industrial organizations and convince them to provide required air pollution data. To overcome the barrier, the project team organized meetings with the State Pollution Control Boards (SPCBs) and requested their intervention on the same. Understanding the need for the study, the SPCBs collaborated with the project team. The project is now being implemented in the selected industrial areas with the help and support provided by SPCBs. The data from the industry organizations is being collected and routed through SPCBs.
Activity 2: Collection and Analysis of Data
Collection of available data from SPCBs, industry associations and utilities
1. Current scenario of extent/ source of air pollution and energy consumption in Odisha and Gujarat
July 2019
Completed
The main challenges faced by the project team, were the collection of data. To mitigate this the project team adopted the approach of taking the help of the authority of the Regional Offices at the state pollution control boards to collect data from the utilities and industrial associations.
Activity 2: Development of Detailed Methodologies
Develop detailed methodology for air quality assessment and impact attribution, in consultation with state PCBs and other stakeholders
1. Air quality and Health Impact Assessment
Aug 2020 Completed
The project Team deployed the highly accurate modelling software to generate the air quality models and patterns which would further be utilized to plot against the health indices and respiratory disease indices from these two states to establish a correlation between the air quality and health. Major challenge is the inconsistent data.
Activity 3: Final Reporting
Submission of final reports to CCAC and stakeholders. Showcase Smart Energy Management pollution reduction potential and its
1. Completed CCAC Demonstrating Impacts reporting database questionnaire and
Aug 2020 Completed The project team run the Software modelling to estimate reduction potential of the EE measures to showcase BAU vs After EE adoption scenarios and corelated health benefits.

Climate and Clean Air Coalition (CCAC)
Reducing Air Pollution in India’s Industrial Cluster through Smart Energy Management August 2020 | 10
Activity Description of Work Undertaken During Reporting Period
Deliverables Delivery Date
Status of Activity
(Completed/ On-Going/ Delayed)
Comments - Brief Description of Implementing Challenges, Strategy / Actions
which have been Adopted to Address the Challenges and Planned Actions to Mitigate
any Identified Risks.
corelated health impact benefits. submission of Annual Report 2. Final Report to Stakeholders

Climate and Clean Air Coalition (CCAC)
Reducing Air Pollution in India’s Industrial Cluster through Smart Energy Management August 2020 | 11
4 METHODOLOGY ADOPTED FOR THE STUDY
To meet the specific objectives of the study, the following methodology has been adopted.
▪ Step 1: Defining the Study Area / Boundary: The boundary of the study is confined
to GIDC Industrial Area in Ankleshwar, which covers an area of 28.14 Sq. Km (Figure 4).
As per the Agro-climatic Regions Map3, the area falls under “Gujarat Plains and Hills” with
semi-arid environmental conditions and the published map is presented in Figure 5. Based
on the published meteorological sub divisional rainfall normal data (1951-2000) (IMD)4, the
area experiences annual rainfall ranging from 50 to 100 cm. The highest temperature is
recorded in between 25°C and 45°C in the summer season and lowest temperature is
recorded in between 15°C and 25°C in winter season.
Figure 4: Study Area (GIDC, Ankleshwar)
3 https://geography4u.com/agro-climatic-zones-in-india/ 4 https://mausam.imd.gov.in/imd_latest/contents/index_rainfall_subdiv.php?msg=M#.

Climate and Clean Air Coalition (CCAC)
Reducing Air Pollution in India’s Industrial Cluster through Smart Energy Management August 2020 | 12
Figure 5: Agro-Climatic Zones of India
▪ Step 2: Review of Published Baseline Air Quality in the GIDC Area – As a part of
the study, ambient air quality data for VOC in the GIDC area has been collected from
online/ continuous ambient air quality stations installed by Gujarat State Pollution Control
Board (GPCB), and also from the recently published EIA reports for the projects at
Ankleshwar.
▪ Step 3: Developing Emission Inventory: An attempt was made to develop baseline
VOC emission inventory data for the major pharmaceutical industrial facilities in the study
area based on the published emission factors and other published environmental impact
assessment and sector specific reports. Since majority of the VOC emissions in
pharmaceutical industries and other chemical industries are fugitive in nature rather than
point source emissions, each industry is considered as an individual area source. Major 32
pharmaceutical industries located in the GIDC industrial area are classified as small,
medium, and large scales industries as per the consented production capacity. VOC
emissions are envisaged form reactor vents, dryers, centrifuges, solvent recovery units and
other areas such as flanges, valves etc, Level of VOC emission release form the facility
depends on the production operations, quantity of solvents used, and volatility of solvents
and recovery rate of solvents in the facility. Properties of some of the most common VOC
and semi-VOCs that are used in pharmaceutical industries are presented in Table 6 of this
report. VOC emission from pharmaceutical industries vary between traces to as high as 2.5 TPD. Except few large industries, majority of the pharmaceutical industries in the study
area fall under small to medium size industries and it is ideal to assume a VOC emission
rate of 1 TPD per unit.
▪ Step 4: Predicting Ground Level Concentrations (GLCs) for the Baseline
Emission Scenario Case: To model the current baseline GLCs using AERMOD model,
due to the release of Total VOC (TVOC) emissions from the pharmaceutical industries
and other chemical industries located in the GIDC of Ankleshwar, the baseline emission

Climate and Clean Air Coalition (CCAC)
Reducing Air Pollution in India’s Industrial Cluster through Smart Energy Management August 2020 | 13
inventory data as discussed in Step 3 is used. These VOC emissions are non-buoyant
plumes and does not experience any momentum rise. Since the emissions are considered
to be an area source, the chances of air VOC pollutants getting trapped in the atmosphere
is higher in winter season due to its meteorological conditions. Hence, winter season is
generally been considered as a worst-case scenario for ambient air quality modelling. Hence
the air quality modelling exercise was undertaken based on winter meteorological data.
The modelled GLCs are plotted as isopleths to establish the spread and distribution of
VOCs with respect to its concentration profile in the study area. The 2nd highest GLC’s
represent the worst-case emission release scenario.
▪ Step 5: Proposed ENCON Measures and Clean Technology Options for VOC
Control: Till date, there are no regulations on control of VOC emissions from
pharmaceutical industries in India. Hence, there is no unified approach is adopted for the
control VOC emissions by the Industry. As per the MOEF&CC circular issued in 2018 with
regards to standardization of environmental clearance conditions for regulated industries under EIA Notification 2006, all expansion and greenfield pharmaceutical industries are
required to demonstrate 98% recovery of solvents. This means the overall VOC emissions
(unaccounted losses) shall be maintained less than 2% of the fresh solvent used. IIEC has
prepared a revised emission inventory levels in the study area. The estimated depicting
reduced emission levels (up to 90% reduction in baseline emissions) are due to the
proposed ENCON measures and cleaner production opportunities. Hence the specific
VOC emission rate of 0.1 TPD per unit has been considered for modelling the GLCs due
to implementation of ENCON and cleaner production initiatives.
▪ Step 6: Predicting Post Project Scenario GLCs in the Study Area and Evaluating
the Benefits: Based on the emission inventory data prepared considering the
implementation of ENCON measures and cleaner production initiatives, the revised GLCs
are predicted using AERMOD, an air quality modelling software. Based on the model
outcome, the possible benefits on ambient air quality due to reduced TVOC emissions in
the study area were highlighted.

Climate and Clean Air Coalition (CCAC)
Reducing Air Pollution in India’s Industrial Cluster through Smart Energy Management August 2020 | 14
5 PUBLISHED VOC LEVELS IN INDUSTRIAL AREA
The ambient air quality data for VOCs published by GPCB and from the latest EIA study
reports for the developmental projects in the region are considered for the study. The GPCB
is measuring the VOC concentrations in ambient air at M/s. Rallis India Limited with the GIDC
of Ankleshwar area and the details are presented in Table 3. Based on GPCB data published,
the average VOC concentrations in ambient air is exhibited to be about 0.2 mg/m3 (200
µg/m3). Based on the published EIA reports, baseline ambient VOC levels are reported to be
ranging from 0.26 mg/m3 (260 µg/m3) to 2.7 mg/m3 (2700 µg/m3) in the vicinity and nearby
areas of the facilities (Table 4).
Table 3: Concentration of VOC in ambient air-Published GPCB data in 20115
Pollutant Location Annual (2011) (µg/m3)
Conc of VOC Rallis India Limited 200
Table 4: Ambient Air VOC Levels in the Vicinity and Area (24-Hours Avg. Conc)6
Location- GIDC Industrial Estate Coordinates VOC (µg/m3)
Minimum Value
Maximum Value
Average Value
M/s. Shree Colosperse Pvt Ltd. 21° 37' 9.57"N 73° 2' 34.38"E
1600 2700 2400
M/s. Shree Chemopharma Ankleshwar Pvt Ltd.
73° 1'16.81" E 21°37'24.67" N
- - 650
Mittolia Chemicals, GIDC, Ankleshwar
21°37'42.40"N 73° 0'43.94"E
260 650 -
Note: The reported values in PPM of VOC is converted into mg/m3 based on methane scale
5 State of Air Environment,2011, GPCB,Gujarat. http://gujenvis.nic.in/PDF/soe-air.pdf) 6 Environmental Impact Assessment report of M/s. Shree Colosperse Pvt Ltd., GIDC Estate, Ankleshwar and
M/s. Shree Chemopharma Ankleshwar Pvt Ltd and M/s Mittolia Chemicals
(http://environmentclearance.nic.in/writereaddata/FormB/EC/EIA_EMP/17052019DXJGY596only.pdf
http://environmentclearance.nic.in/writereaddata/EIA/130520199MVM0QVHEIAReportUmaOrganic.pdf
http://environmentclearance.nic.in/writereaddata/FormB/EC/EIA_EMP/26032019C7S21OHQAnnexure-EIAEMP.pdf)

Climate and Clean Air Coalition (CCAC)
Reducing Air Pollution in India’s Industrial Cluster through Smart Energy Management August 2020 | 15
6 INDUSTRIAL EMISSION INVENTORY – BASELINE
SCENARIO
GIDC Ankleshwar is an industrial hub of the Gujarat state constituting many chemical and
pharmaceutical industries. Based on the internet search and published data, the small, medium,
and large industries in GIDC were identified and taken into consideration for the study. A
total of 32 major pharmaceutical industries and other chemical industries has been identified
in the study area. The list is presented in Table 5 and satellite google imagery is presented in
Figure 6.
Table 5: List of Major Pharmaceutical Industries in GIDC Industrial Area
S. N. Industry Name
1 Apex Healthcare Ltd.
2 Cadila Healthcare Ltd- Unit 1, Zydus A, Cadila Pharmaceuticals Ltd-Unit 1
3 Zydus Cadila Unit 2
4 Dynamic Products Ltd-1
5 Dynamic Products Ltd-2
6 Intas Pharmaceuticals Ltd.
7 Shree Mahadev Intermediates
8 Pragna Dye Chem Pvt Ltd.
9 Rajesh Pharmaceuticals
10 Shree Sulphurics Pvt Ltd
11 Suyog Dye Chemie Pvt Ltd
12 UPL Ltd, Unit 3
13 Skylark Pharmaceuticals Pvt. Ltd.
14 Prudence Pharma Chem
15 Riddhi Pharma
16 Ratnamani Bio-chemicals & Pharmaceuticals Pvt Ltd
17 Vihita Chem Pvt Ltd. (Unit 1)
18 Vihita Chem Pvt Ltd. (Unit 2)
19 Tatva Chintan Pharma Chem Pvt Ltd.
20 Norris Medicines Ltd.
21 Hema Pharmaceuticals Pvt Ltd.
22 Sanofi India Limited
23 Sun Pharmaceuticals India Limited
24 Ronak Chemicals
25 Shree Ganesh Remedies Private Limited
26 ZCL Chemical Limited
27 Kenoor Organics Private Limited
28 Basic Science Life Science Private Limited
29 IPCA Laboratories
30 Link Pharma Chem Ltd
31 Euphoric Pharmaceuticals Private Limited
32 Samrat Pharmachem Limited

Climate and Clean Air Coalition (CCAC)
Reducing Air Pollution in India’s Industrial Cluster through Smart Energy Management August 2020 | 16
Figure 6: Satellite Google Imagery Showing the Major Pharmaceutical Industries in
GIDC Ankleshwar
Solvents contribute to almost 98% of the VOC emissions in pharmaceutical industries. Solvents in the facility will be subjected to recovery at the onsite recovery facilities to the
maximum possible extent for resource conservation and operating cost reduction. Often the
still residues will be sent to common solvent recycling facilities for further processing as per
the Hazardous Waste Management Rules. The unaccounted solvent loss in the process vents,
dryers, centrifuges, storage tanks, ETP drains and strippers will eventually entre into the
atmosphere as fugitive emissions. These VOC emissions are classified into three categories
such as very volatile (VV-VOC), volatile (V-VOC) and semi-volatile (SVOC) as per USEPA7
guidelines. Volatility is indicated by a substance's vapor pressure. It is a tendency of a substance
to vaporize or the speed at which it vaporizes. Substances with higher vapor pressure will
vaporize more readily at a given temperature than substances with lower vapor pressure.
▪ Very Volatile (VV-VOC) – Solvents with boiling point ranging from (<0°C to 50-100°C)
▪ Volatile (V-VOC) – Solvents with boiling point ranging from (50 -100°C to 240 – 260°C)
▪ Semi-Volatile (S-VOC) – Solvents with boiling point ranging from (240 -260 °C to 380
– 400°C)
Based on the USEPA and other agencies, majority of the VOC emissions are generated from
VV-VOC and V-VOC compounds in the industrial environment. Hence for the purpose of
this study, VV-VOC and V-VOC solvents are commonly used in pharmaceutical industries are
considered. Based on the VOC emission inventory report related to GIDC Ankleshwar, the
VOC concentration in the ambient air resulting from operations of pharmaceutical industries
and other chemical industries, major volatile solvents used in such industries are listed out in
7 Technical Overview of Volatile Organic Compounds, USEPA
https://www.epa.gov/indoor-air-quality-iaq/technical-overview-volatile-organic-compounds

Climate and Clean Air Coalition (CCAC)
Reducing Air Pollution in India’s Industrial Cluster through Smart Energy Management August 2020 | 17
Table 6. It can be noted that among the 14 solvents that are most common used in
Pharmaceutical industries, Benzene, Acetonitrile, Ethylene Dichloride, Chloroform fall under
VV-VOC and also highly toxic compounds, those need to be considered as priority VOC
compounds under cleaner production initiatives.
Based on the data collected, VOC emission from pharmaceutical industries would vary
between from traces to as high as 2.5 TPD. Except few large industries, majority of the
pharmaceutical industries in the study area fall under small to medium size plants and it is ideal
to assume a VOC emission rate of 1 TPD per unit. The area emission factor in g/m2/sec for
each industry is estimated based on its footprint (m2) of the facility estimated from the google
satellite layout. The details are presented in Annexure-I.
VOC emissions undergo numerous physical and photochemical process in the atmosphere
depending on several intrinsic characteristics of the hydrocarbons, solar radiation, and oxides
of nitrogen. This will lead to degradation, transformation, and deposition of pollutants from the atmosphere. VOCs are transformed by the chemical process of photolysis such as
reaction with hydroxyl radicals (OH) during daylight hours, reaction with nitrate radical (NO3)
during evening and night-time. The rate of chemical reactions is dependent on
temperature/solar insolation, hence the lifetimes/half-life of VOCs with respect to each of
these potential transformation processes are dependent on the concentrations of OH
radicals, NO3 radicals, Cl atoms, and O3 in the troposphere8.
Although there are no published data on the scavenging rate (rate of removal from
atmosphere) of hydrocarbons, the half-life period of some of VOC compounds were reported
to be few hours to three days depending on the structure of the molecule and other climatic
conditions University of California, USA)9. The predicted GLCs estimated using AERMOD
will assume that VOC compounds does not undergo chemical reaction and degradation in the
atmosphere. Based on this information, a VOC scavenging (removal rate) of 30% has been
considered for reporting the corrected GLC values. This means that 30% of the predicted
GLC will undergo chemical degradation and deposition and the resultant 24-Hrs average GLC
will be only 0.7 times the predicted GLC values.
8 Atmospheric Degradation of Volatile Organic Compounds, Roger Atkinson, and Janet Aery,
https://pubs.acs.org/doi/10.1021/cr0206420 9 Reactivity Scale for Atmospheric Hydrocarbons Based on Reaction with Hydroxyl Radical, State-wide Air
Pollution Research Center, University of California, Riverside, Calif. 92502
https://ww3.arb.ca.gov/coatings/eir/ref/0300.pdf

Climate and Clean Air Coalition (CCAC)
Reducing Air Pollution in India’s Industrial Cluster through Smart Energy Management August 2020 | 18
Table 6 Properties of Some of the Critical Solvents Considered for the Study10
Rank Solvents
Typical
Percentage
Consumption
Pattern in
Pharma
Industries (% of
Total Solvent
Use)
Typical
Emission Rate
in Pharma
Industries11
(TPD)
Chemical
Formula
Volatility
(Based on
Boiling
Point)
Boiling
Point
(°C)
Melting
Point
(°C)
Flash
Point
(Closed
Cup)
(°C)
Vapour
Pressure
@25°C
(mm Hg)
TLV-TWA
(8hr -Time
Weight
Average)
(PPM)
TLV-TWA
(8hr -Time
Weight
Average)
(mg/m3)
Chronic Exposure
Levels – International
Standards of Different
Countries (USA,
European Countries,
Germany, India, USSR,
Japan etc)
Maximum Permissible
Limits of HAPS12
1 Benzene 4 0.04 C6H6 Very volatile 80 5.5 -11 94.8 0.5 1.6
0.005 mg/m3 (India)
(annual average)
0.03 mg/m3 (USEPA)13
2 Acetonitrile 4 0.04 CH3CN Very volatile 81.6 -44 6 - 20 34 0.06 mg/m3 (USEPA)14
3 Ethylene Dichloride 8 0.08 C2H4Cl2 Very volatile 83.5 -35.5 13 78.9 10 40 1 0 mg/m3 (USSR)
0.8 mg/m3 (USEPA)15
4 Chloroform 4 0.04 CHCl3 Very volatile 61.1 -63.6 - 197 10 50 0.3 mg/m3 (USEPA)16
5 Toluene 6 0.06 C7H8 Volatile 110.6 -94.9 4 28.4 20 75 1.9 mg/m3 (Germany)
10 Handbook of organic solvent properties by Ian M. Smallwood
National Library of Medicine (Pub Chem), National Center for Biotechnology Information( https://pubchem.ncbi.nlm.nih.gov/) 11 Typical VOC emission from Chemical Industry at Ankhleswar, data shared by IIEC 12 WHO –IPCS (Health & Safety Guide for Occupational Exposure Limit Values),
Emissions Specification in Europe and the US-Limits (TVOC, LCI,CREL..) in critical discussion. https://www.eurofins.com/media/2273/emission_limit_values_in_critical_discussion_953.pdf
Published PARIVESH HAZARDOUS AIR POLLUTANTS REPORT, CPCB and MoEF&CC http://home.iitk.ac.in/~anubha/HAP.pdf
Criteria and Methods for Establishing Maximum Permissible Concentrations of Air Pollution, by V.A.RJAZANOV, 1965,32,389-398
Toxic Volatile Organic Compounds (VOCs) in the Atmospheric Environment: Regulatory Aspects and Monitoring in Japan and Korea, by Wen-Tien Tsai, MDPI, 7TH September 2016. 13 Benzene; CASRN 71-43-2: https://cfpub.epa.gov/ncea/iris/iris_documents/documents/subst/0276_summary.pdf 14 Acetonitrile : https://19january2017snapshot.epa.gov/sites/production/files/2016-09/documents/acetonitrile.pdf 15 Ethylene Dichloride https://19january2017snapshot.epa.gov/sites/production/files/2016-09/documents/ethylene-dichloride.pdf 16 Chloroform : https://19january2017snapshot.epa.gov/sites/production/files/2016-09/documents/chloroform.pdf

Climate and Clean Air Coalition (CCAC)
Reducing Air Pollution in India’s Industrial Cluster through Smart Energy Management August 2020 | 19
Rank Solvents
Typical
Percentage
Consumption
Pattern in
Pharma
Industries (% of
Total Solvent
Use)
Typical
Emission Rate
in Pharma
Industries11
(TPD)
Chemical
Formula
Volatility
(Based on
Boiling
Point)
Boiling
Point
(°C)
Melting
Point
(°C)
Flash
Point
(Closed
Cup)
(°C)
Vapour
Pressure
@25°C
(mm Hg)
TLV-TWA
(8hr -Time
Weight
Average)
(PPM)
TLV-TWA
(8hr -Time
Weight
Average)
(mg/m3)
Chronic Exposure
Levels – International
Standards of Different
Countries (USA,
European Countries,
Germany, India, USSR,
Japan etc)
Maximum Permissible
Limits of HAPS12
5 mg/m3 (USEPA)17
6 N-Methyl
Pyrrolidone 6 0.06 C5H9NO Volatile 202 -24 96 0.345 20 80 Not specified
7 Methylene
Dichloride (MDC) 14 0.14 CH2Cl2 Very volatile 40 -95.1 - 435 50 175
0.15 mg/m3 (Japan) -
(annual average)
3 0 mg/m3 (USEPA)18
8 N-Hexane 5 0.05 C6H14 Very volatile 68.7 -95 -22 153 50 180 0.28 mg/m3 (USEPA)19
9 Cyclohexane 8 0.08 C6H12 Very volatile 81 7 -18 96.9 100 350 6 mg/m3 (USEPA)20
10 Xylene 6 0.06 C8H10 Volatile 144.5 -25.2 31 6.65 100 440 2.2 mg/m3 (Germany)
0.1 mg/m3 (USEPA)21
11 Iso Propyl Alcohol
(IPA) 10 0.1 C3H8O Very volatile 82 -89.5 12 45.4 200 500 2.2 mg/m3 (USEPA)22
17 Toluene; CASRN 108-88-3 : https://cfpub.epa.gov/ncea/iris/iris_documents/documents/subst/0118_summary.pdf 18 https://www.epa.gov/sites/production/files/2016-09/documents/methylene-chloride.pdf 19 https://www.mass.gov/doc/1995-ambient-air-exposure-limits-aals-for-chemicals/download 20 Cyclohexane; CASRN 110-82-7 : https://cfpub.epa.gov/ncea/iris/iris_documents/documents/subst/1005_summary.pdf 21 Xylenes; CASRN 1330-20-7 : https://cfpub.epa.gov/ncea/iris/iris_documents/documents/subst/0270_summary.pdf 22 https://cfpub.epa.gov/ncea/pprtv/documents/Isopropanol.pdf

Climate and Clean Air Coalition (CCAC)
Reducing Air Pollution in India’s Industrial Cluster through Smart Energy Management August 2020 | 20
Rank Solvents
Typical
Percentage
Consumption
Pattern in
Pharma
Industries (% of
Total Solvent
Use)
Typical
Emission Rate
in Pharma
Industries11
(TPD)
Chemical
Formula
Volatility
(Based on
Boiling
Point)
Boiling
Point
(°C)
Melting
Point
(°C)
Flash
Point
(Closed
Cup)
(°C)
Vapour
Pressure
@25°C
(mm Hg)
TLV-TWA
(8hr -Time
Weight
Average)
(PPM)
TLV-TWA
(8hr -Time
Weight
Average)
(mg/m3)
Chronic Exposure
Levels – International
Standards of Different
Countries (USA,
European Countries,
Germany, India, USSR,
Japan etc)
Maximum Permissible
Limits of HAPS12
12 Methanol 6 0.06 CH30H Very volatile 65 -98 9 12.9 200 540 0.5 mg/m3 (USSR)
2 mg/m3 (USEPA)23
13 Acetone 11 0.11 C3H6O Very volatile 56 -95 -18 231 500 1200
0.35 mg/m3 (USSR)
20 to 35 mg/m3
(USEPA – By various
states)24
14 Pet ether 4 0.04 C6H14 Very volatile 36 -129 -40 538 400 1360 1200 mg/m3
(USEPA)25
Total 100 1
23 Methanol; CASRN 67-56-1: https://cfpub.epa.gov/ncea/iris/iris_documents/documents/subst/0305_summary.pdf 24 https://www.atsdr.cdc.gov/ToxProfiles/tp21.pdf 25 Ethyl ether (Diethyl ether) : https://cfpub.epa.gov/ncea/pprtv/documents/EthylEther.pdf
Climate and Clean Air Coalition (CCAC)
Reducing Air Pollution in India’s Industrial Cluster through Smart Energy Management August 2020 | 21
7 VOC DESTRUCTION TECHNOLOGIES
To reduce the quantities of VOCs that are lost as fugitive emissions, it is necessary to redesign
the industrial processes, both form a chemical and an engineering point of view. End-of-pipe
technology (thermal incinerators, catalytic incinerators, liquid and solids adsorbents,
condensers, biodegradation, etc) must be applied when redesign of the process is inapplicable
or insufficient.
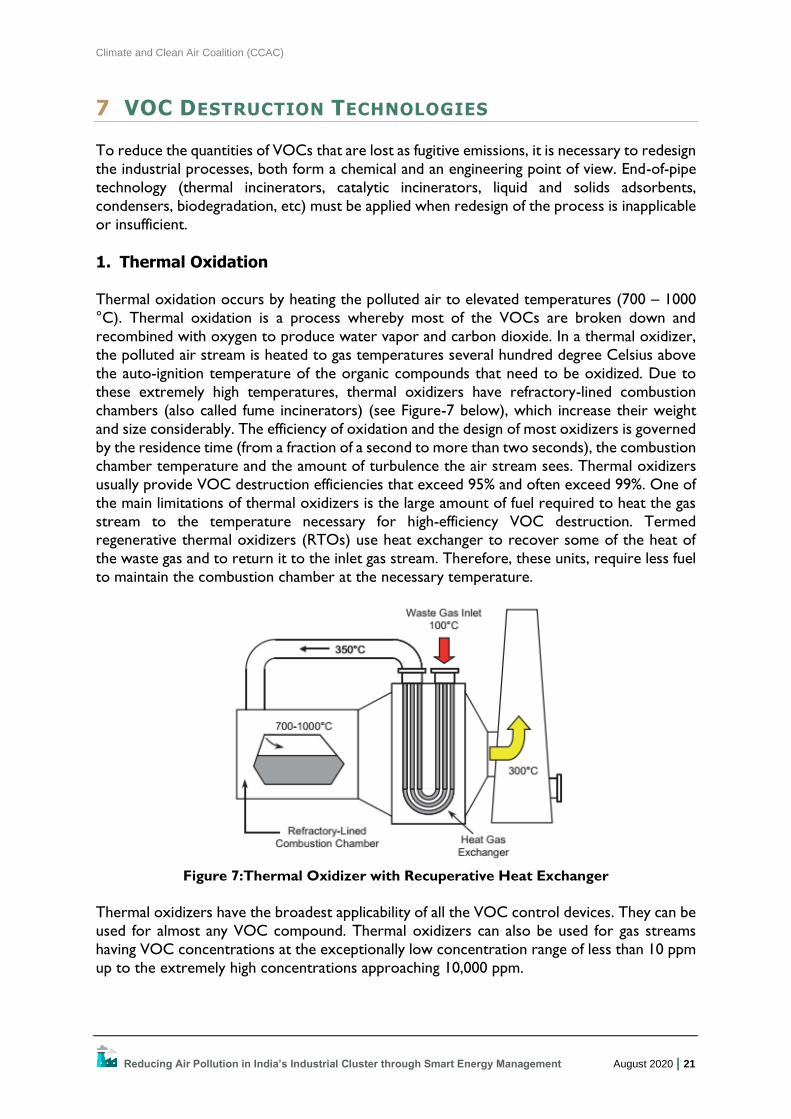
1. Thermal Oxidation
Thermal oxidation occurs by heating the polluted air to elevated temperatures (700 – 1000
°C). Thermal oxidation is a process whereby most of the VOCs are broken down and
recombined with oxygen to produce water vapor and carbon dioxide. In a thermal oxidizer,
the polluted air stream is heated to gas temperatures several hundred degree Celsius above
the auto-ignition temperature of the organic compounds that need to be oxidized. Due to
these extremely high temperatures, thermal oxidizers have refractory-lined combustion
chambers (also called fume incinerators) (see Figure-7 below), which increase their weight
and size considerably. The efficiency of oxidation and the design of most oxidizers is governed
by the residence time (from a fraction of a second to more than two seconds), the combustion
chamber temperature and the amount of turbulence the air stream sees. Thermal oxidizers
usually provide VOC destruction efficiencies that exceed 95% and often exceed 99%. One of
the main limitations of thermal oxidizers is the large amount of fuel required to heat the gas
stream to the temperature necessary for high-efficiency VOC destruction. Termed regenerative thermal oxidizers (RTOs) use heat exchanger to recover some of the heat of
the waste gas and to return it to the inlet gas stream. Therefore, these units, require less fuel
to maintain the combustion chamber at the necessary temperature.
Figure 7:Thermal Oxidizer with Recuperative Heat Exchanger
Thermal oxidizers have the broadest applicability of all the VOC control devices. They can be
used for almost any VOC compound. Thermal oxidizers can also be used for gas streams
having VOC concentrations at the exceptionally low concentration range of less than 10 ppm
up to the extremely high concentrations approaching 10,000 ppm.

22 | P a g e
Climate and Clean Air Coalition (CCAC)
Reducing Air Pollution in India’s Industrial Cluster through Smart Energy Management August 2020 | 22
Safety constraints impose to use thermal oxidizers for gas streams having VOC
concentrations not exceedingly approximately 25% of the lower explosive limit (LEL). This
constrain has been introduced to be able to cope with possible short-term concentration
spike that would exceed the LEL. The 25% LEL limit depends on the actual gas constituents
and usually is in the 10,000 to 20,000 ppm range.
Thermal oxidizers handling VOC materials that contain chlorine, fluorine, or bromine atoms
generate HCl, Cl2, HF, and HBr as additional reaction products during oxidation. A gaseous
absorber is used as part of the air pollution control system to collect these contaminants
prior to gas stream release to the atmosphere.
2. Catalytic Oxidation
Due to the presence of a catalyst, oxidation reactions can be performed at substantially lower
temperatures (250-550 °C) than thermal oxidizers (700-1000°C). Common types of catalysts
include noble metals (i.e. platinum and palladium) and ceramic materials. VOC destruction by
catalytic oxidizers usually exceeds 95% and often exceeds 99%. Due to the relatively low gas
temperatures in the combustion chamber, there is no need for a refractory lining to protect
the oxidizer shell. This minimizes the overall weight of catalytic oxidizers and provides an
option for mounting the units on roofs close to the point of VOC generation. This placement
can reduce the overall cost of the system by limiting the distance the VOC-laden stream must
be transported in ductwork. Catalytic oxidizers are also applicable to a wide range of VOC-
laden streams; however, they cannot be used on sources that also generate small quantities
of catalyst poisons. Catalyst poisons are compounds that react chemically in an irreversible
manner with the catalyst. Common catalyst poisons include phosphorus, tin, and zinc. Another
potential operating problem associated with catalytic oxidizers is their vulnerability to
chemicals and/or particulate matter that masks or fouls the surface of the catalyst. (Masking
is the reversible reaction of a chemical with the catalyst and fouling is the coating of the
catalyst with a deposited material.) If the conditions are potentially severe, catalytic units are
not installed.
Figure 8: Scheme of a Catalytic Oxidation System
As with thermal oxidizers, catalytic oxidizers should not exceed 25% of the LEL, a value that
is often equivalent to a VOC concentration of 10,000 to 20,000 ppm.

23 | P a g e
Climate and Clean Air Coalition (CCAC)
Reducing Air Pollution in India’s Industrial Cluster through Smart Energy Management August 2020 | 23
The catalytic incineration method has become most popular because, in many cases, it is more
versatile and economic for the low concentrations of organic emissions (i.e., <5,000 vppm).
The actual operating temperature and amount of preheat varies, depending on the organic
molecule, space velocity, composition of feed (i.e., contaminants water vapor, and so forth),
and organic concentration. Typical examples of operating temperatures are given in Table-7
below. One-way of comparing thermal versus catalytic abatement is to look at the energy
required (air preheat temperature) to obtain quantitative removal of a given hydrocarbon.
The operating temperatures shown in the Table-7 are well below the corresponding
temperatures necessary to initiate thermal (noncatalytic) oxidation. The catalyst initiates
reaction at lower temperatures. This demonstrates the major advantage of catalysed
processed, which is that they proceed faster than noncatalytic reactions, allowing lower
temperatures for the same amount of conversion. This translates directly into improved
economic for fuel use and less expensive reactor construction materials since corrosion is
greatly reduced. Selection of the catalytic material for various organic pollutants has been the subject of many studies. Because metal oxides, precious metals, and combinations are used
both for hydrocarbons and chlorinated hydrocarbons. As a rule, precious metals (especially
platinum and/or palladium dispersed on carriers) are preferred because of their, resistance to
deactivation, and ability to be regenerated.
Table 7: Operating Temperatures for Catalytic Abatement of Organic Compounds
Name of Constituent
Chemical Formula
Temperature Rise 1,000
ppm (°C)
Operating Temperature
(°C)
Concentration Before Treatment
(ppm)
Styrene C6H6CHCH2 138 250 310
Acetaldehyde CH3CHO 35 350 240
Benzene C6H6 103 210 380
Toluene C6H5CH3 123 210 320
M-xylene C 6 H 5 ( CH 3 ) 143 210 270
Phenol C6H5OH 101 300 380
Formaldehyde HCHO 17 150 410
Acrolein CH2CHCHO 51 180 500
Acetic acid CH2COOH 26 350 590
Butyric acid C3H2COOH 66 20 370
Acetone CH3COCH3 57 350 410
Methyl ethyl ketone
CH3COC2H3 74 220 380
Methyl isobutyl ketone
CH3COC4H5 116 250 270
Ethyl acetate CH3COOC2H5 68 350 350
Butyl acetate CH3COOC4H9 108 350 480
Methyl alcohol CH3OH 21 150 830
Ethyl alcohol C2H5OH 44 350 550
Isopropyl alcohol C3H7OH 64 280 230
Butyl alcohol C4H9OH 84 260 330
Carbon monoxide CO 9 150 4,000
Methyl cello solve HOCH2CH2OCH3 55 300 110
Ethyl cello solve HOCH2CH2OC2H5 76 300 80
Butyl cello solve HOCH2CH2OC4H9 118 300 50

24 | P a g e
Climate and Clean Air Coalition (CCAC)
Reducing Air Pollution in India’s Industrial Cluster through Smart Energy Management August 2020 | 24
3. Adsorption
Adsorption systems beds are generally used when the gas stream contains one to three
volatile organic compounds, and it is economical to recover and reuse these compounds, or
when a large number of organic compounds at low concentration, and it is necessary to pre-
concentrate these organics prior to thermal or catalytic oxidation.
The Figure-9 shows the diagram of a multi-bed adsorber system used for collection and
recovery of organic solvent compounds. The VOC-laden gas is often cooled prior to entry
into the adsorption system to improve the effectiveness of adsorption. As the gas stream
passes through the bed, the organic compounds adsorb weakly onto the surfaces of the
adsorbent (high surface area activated carbon, zeolite, or organic polymer). When the
adsorbent is approaching saturation with organic vapor, a bed is isolated from the gas stream
and desorbed. Low-pressure steam or hot N2 is often used to remove the weakly adsorbed
organics. The concentrated stream from the desorption cycle is treated to recover the
organic compounds. After desorption, the adsorption bed is returned to service, and another
bed in the system is isolated and desorbed.
An adsorption system used for pre-concentration prior to solvent recovery is shown in
following Figure. The gas stream containing the VOC passes through a rotary wheel containing
zeolite or carbon-based adsorbents. Approximately 75-90% of the wheel is in adsorption
service while the remaining portion of the adsorbent passes through an area where the
organics are desorbed into an exceedingly small, moderately hot gas stream. The
concentrated organic vapours are then transported to a thermal or catalytic oxidizer for
destruction. The preconcentration step substantially reduces the fuel requirements for the
thermal or catalytic oxidizer.
Adsorption systems are not recommended for gas streams that contain particulate matter
and/or high moisture concentrations because the particulate matter and moisture compete
with the gaseous pollutants for pore space on the adsorbent material.
Figure 9: Multi-Bed Adsorber System for Solvent Recovery

25 | P a g e
Climate and Clean Air Coalition (CCAC)
Reducing Air Pollution in India’s Industrial Cluster through Smart Energy Management August 2020 | 25
The adsorption removal efficiency usually exceeds 95% and is often in the 98% to 99% range
for both solvent recovery and pre-concentrator type systems. In both types of units, the
removal efficiency increases with reduced gas temperatures.
Figure 10: Pre-Concentrator Type Adsorption System
The suitability of an adsorption system for a situation should be considered on a case-by-case
basis. However, as a general guideline, adsorption systems can be used for organic compounds
having a molecular weight of more than 50 and less than approximately 200. In fact, the low
molecular weight organics usually do not adsorb sufficiently. The high molecular weight compounds adsorb so strongly that is it is difficult to remove these materials from the
adsorbent during the desorption cycle. Adsorption systems can be used for a wide range of
VOC concentrations from less than 10 ppm to approximately 10,000 ppm. The upper
concentration limit is due to the potential explosion hazards when the total VOC
concentration exceeds 25% of the LEV.
4. Condensation, Refrigeration and Cryogenics
Condensation, refrigeration, and cryogenic systems remove organic vapor by making them
condense on cold surfaces. These cold conditions can be created by passing cold water
through an indirect heat exchanger, by spraying cold liquid into an open chamber with the gas
stream, by using a freon-based refrigerant to create very cold coils, or by injecting cryogenic
gases such as liquid nitrogen into the gas stream. The concentration of VOCs is reduced to
the level equivalent to the vapor pressures of the compounds at the operating temperature.
Condensation and refrigeration systems are usually used on high concentration, low gas flow
rate sources. Typical applications include gasoline loading terminals and chemical reaction
vessels.
The removal efficiencies attainable with this approach depend strongly on the outlet gas
temperature. For cold-water-based condensation systems, the outlet gas temperature is
usually in the 4 to 10°C range, and the VOC removal efficiencies are in the 90 to 99% range
depending on the vapor pressures of the specific compounds. For refrigerant and cryogenic systems, the removal efficiencies can be considerably above 99% due to the extremely low
vapor pressures of essentially all VOC compounds at the extremely low operating
temperatures of -56°C to less than -130°C.

26 | P a g e
Climate and Clean Air Coalition (CCAC)
Reducing Air Pollution in India’s Industrial Cluster through Smart Energy Management August 2020 | 26
Condensation, refrigeration, and cryogenic systems are usually used on gas streams that
contain only VOC compounds. High particulate concentrations are rare in the types of
applications that can usually apply this type of VOC control system. However, if particulate
matter is present, it could accumulate on heat exchange surfaces and reduce heat transfer
efficiency.
5. Biological Oxidation
VOCs can be removed by forcing them to absorb into an aqueous liquid or moist media
inoculated with microorganisms that consume the dissolved and/or adsorbed organic
compounds. The control systems usually consist of an irrigated packed bed that hosts the
microorganisms (biofilters). A pre-saturator is often placed ahead of the biological system to
increase the gas stream relative humidity to more than 95%. The gas stream temperatures
are maintained at less than approximately 40 °C to avoid harming the organisms and to
prevent excessive moisture loss from the media.
Biological oxidation systems are used primarily for extremely low concentration VOC laden
streams. The VOC inlet concentrations are often less than 500 ppm and sometimes less than
100 ppm. The overall VOC destruction efficiencies are often above 95%.
Biological oxidation systems are used for a wide variety of organic compounds; however,
there are certain materials that are toxic to the organisms. In these cases, an alternative type
of VOC control system is needed.
General Applicability of VOC Control Systems
Limiting the consideration of the VOC’s control systems to gas streams having total VOC
concentrations less than approximately 25% of the LEL, it is possible to arbitrarily divide the
control system applicability into two separate groups: low VOC concentration (less than 500 ppm) and high VOC concentration. It should be noted that there is no generally accepted
distinction between low and high concentration. The low concentration group can be further
divided into three main categories depending on the number of different VOC compounds in
the gas stream and the value of recovering these compounds for re-use (Figure given below).
27 | P a g e
Climate and Clean Air Coalition (CCAC)
Reducing Air Pollution in India’s Industrial Cluster through Smart Energy Management August 2020 | 27
Figure 11: Scheme of General Applicability of VOC Control Systems for Low
Concentration
If recovery and reuse are necessary, an adsorber system is generally used as the control
technique. Due to the low VOC concentrations, the cost of organic compound recovery can
be quite high.
The applicability of VOC control systems for high concentration systems also depends, in
part, on the number of separate VOC compounds present in the gas stream and the economic
incentives for recovery and reuse. Thermal oxidizers can be used in all cases in which recovery
and reuse are not desired or economically feasible. Catalytic oxidizers can be used in these
same situations if there are no gas stream components that would poison, mask, or foul the
catalyst. Adsorbers can also be used for this service if there are environmentally acceptable
means for disposal of the collected organics.
If recovery and reuse are desired, either adsorbers or condenser/refrigeration systems can
be used. Usually, these systems are limited to gas streams containing at most three organic
compounds due to the costs associated with separating the recovered material into individual
components. However, if the process can reuse a multi-component organic stream, both
adsorbers and condenser or refrigeration systems can be used without the costs of recovered
material purification and reprocessing.

28 | P a g e
Climate and Clean Air Coalition (CCAC)
Reducing Air Pollution in India’s Industrial Cluster through Smart Energy Management August 2020 | 28
8 PREDICTING GROUND LEVEL CONCENTRATIONS (GLCS)
FOR THE BASELINE EMISSION SCENARIO
The primary objective of this air quality modelling is to predict the most likely possible ground-
level concentrations due to VOC emissions from pharmaceutical industries in Ankleshwar
Industrial Area under the current scenario. US-EPA approved air quality modelling tool,
AERMOD has been used to model the regional level dispersion pattern of VOCs. The
overview of air quality modelling and prediction of ground-level concentrations for the
designated pollutants is shown in the below block diagram. The basic inputs required for the
air quality modelling are emission source details (emission rate in g/m2/sec and the release
height), an hourly meteorological parameter such as wind speed, wind direction, ambient
temperature and mixing heights. The site-specific online meteorological information adopted
from December 2019 to February 2020 (ref)26 was adopted for air quality modelling exercise.
The mixing height data (Mixing Height Atlas of India27) for winter season for published by the
Indian Meteorological Department was adopted. The model output as 24-hours average
ground level concentrations (GLCs) of VOC were plotted in the form of Isopleths (also
known as iso-concentration contours).
8.1 Meteorological Data
Unlike point source and buoyant emission sources such as power plant stacks, higher flue gas
temperature stacks, VOC emission sources from industries are non-buoyant and area sources
so the dispersion of these emissions will be relatively slower and will experience higher
concentrations in the nearby areas. Concentrations with the epicentre (area source), will be
much higher as the emissions are considered to be released from multiple sources in the
facility. Although good amount of dispersion of pollutants is possible due day time, unstable and windy conditions, significant amount of pollutants will be trapped under at the near surface
area due to lower mixing heights and normal wind speed conditions during evening, night and
early morning periods. These conditions result in relatively higher GLCs. The hourly
meteorological data of the winter season (December 2019 to February 2020) considered for
modelling given in Annexure-II. The wind rose diagrams are presented below in Figure 12.
It is observed that the wind direction during winter is predominantly blew from North East
with an average wind speed of 3.31 m/s.
The mixing height data pertaining to the region was collected from the Atlas of Hourly Mixing
Height published by IMD New Delhi. The winter season 24hr average mixing height variation
for the region is varying from 50m to 1500m and is plotted and shown in Figure 13.
26 https://www.worldweatheronline.com/ankleshwar-weather-history/gujarat/in.aspx 27 Atlas of hourly mixing height and assimilative capacity of atmosphere in India, Environment Monitoring and Research
centre, IMD, New Delhi, 2008

29 | P a g e
Climate and Clean Air Coalition (CCAC)
Reducing Air Pollution in India’s Industrial Cluster through Smart Energy Management August 2020 | 29
Figure 12: Wind Rose Diagram for Winter Season (December 2019 to February 2020)
Figure 13: Hourly Variation of Mixing Height28
8.2 Local and Regional Geographical Features
The region is majorly covered by older alluvium which is greyish in colour suggestive of
genetically related to underlying trappean formation. The surrounding landscape is
characterized by small hillocks gentle slope type terrain experiences varied wind patterns and
speeds, which can have impact on the pollutant dispersion in the atmosphere. In the current
scenario, the study area is considered to be a plain land without any undulations. Given the
geological features of the region, its influence on to VOCs ambient air quality is insignificant.
28 Atlas of hourly mixing height and assimilative capacity of atmosphere in India, Environment Monitoring and Research centre, IMD, New Delhi,
2008
0
250
500
750
1000
1250
1500
1750
0 2 4 6 8 10 12 14 16 18 20
Mix
ing
he
igh
t in
m
Time in hours

30 | P a g e
Climate and Clean Air Coalition (CCAC)
Reducing Air Pollution in India’s Industrial Cluster through Smart Energy Management August 2020 | 30
8.3 Modelling Results-Predicted GLC for Baseline Emission Scenario (uncontrolled emissions)
Air quality modelling exercise was undertaken to establish the most likely possible ground
level concentration of total VOC’s due to the industrial activities located in the GIDC,
Ankleshwar. The predicted concentration of pollutant concerning the winter season (December 2019 to January 2020) is depicted in Figures 14. The summary of model results
is presented in Table 8. The model output files are presented in Annexure-III.
Table 8 Predicted VOC GLC - Baseline Emission Scenario
Location
2nd Highest Predicted 24-Hrs
Avg GLC (mg/m3)
Average Reported Baseline Air
Quality Data in GIDC
(mg/m3)
TLV of VOC Species (Please Refer to Table 6
(mg/m3)
Long-term Chronic Exposure
Risk Levels for Various VOC
Species (Please Refer to Table 6)
(mg/m3)
Within the core zone (industrial areas)
2.5 to 7.5 0.65 to 2.4
0.5 to 1200 0.15 to 30
Outside the industrial area (within 1km from industrial area boundary)
<2 No data
1 km to 3km from the industrial area boundary
Traces to 1 No data
Predicted GLC of VOC: Predicted 2nd highest GLC of VOC is reported to be in the order
of 7.53 mg/m3 (7530 µg/m3) within the emission source locations (industries), whereas the
GLC were found to rapidly get diluted within two to three kilometres from the industrial area
boundary. Since the emission sources are area type without any buoyant rise, entire industrial
area shall be considered as area source and core zone. The predicted GLCs outside industrial
are diluted to below detectable limits within 5 Km from the industrial boundary.
It can be noted that there is a variation between predicted GLC and actual reported baseline
data. Unlike SO2 and NOX, atmospheric half-life of VOCs due to deposition (wet and dry)
tend to be highly variable depending on photochemical characteristics of VOC compounds
and particle size distribution of PM present and oxides of nitrogen in the atmosphere. Based
on the discussions presented in the previous sections, the rate of VOC degradation in the
atmosphere can be considered as 30%. Based on these assumptions, it can be estimated that
the resultant VOC GLCs after considering natural degradation in the atmosphere could be in
the range of 1.5 to 5 mg/m3 within the industrial area and traces level to 0.5 mg/m3 outside
the industrial area.
▪ It can be inferred the modelled GLCs that there are certain level health risks
to the local people living within 1 to 2 km radius of the industrial area. This
aspect confirms that there is a need to adopt certain level of VOC emission
control strategies in the industrial facilities.

31 | P a g e
Climate and Clean Air Coalition (CCAC)
Reducing Air Pollution in India’s Industrial Cluster through Smart Energy Management August 2020 | 31
Figure 14: Isopleths Showing Predicted GLC of VOC (Baseline Emission Scenario)

32 | P a g e
Climate and Clean Air Coalition (CCAC)
Reducing Air Pollution in India’s Industrial Cluster through Smart Energy Management August 2020 | 32
9 ESTIMATED EMISSIONS POST CLEANER TECHNOLOGY
OPTIONS
VOC emissions from pharmaceutical industries are envisaged from dryers, reactors,
distillation systems, storage tanks and transfer operations, filters, extractors, centrifuges,
Crystallizers, and wastewater treatment facilities. The list is not intended to represent every
plant; a single list could not possibly fit all situations. It is intended to convey that for many
plants, emissions from dryers will be the largest source of VOC emissions, reactors the
second largest, and so on. For most plants, the first four listed process sources will account
for the great majority of total plant VOC emissions. However, this does not preclude the last
five from being-significant emitters.
Based on the studies conducted by IIEC29, the following cleaner production measures are
proposed to reduce the VOC emission levels from industries. According to the MoEF&CC
notification dated 9th August 2018, suitable fugitive emission control systems shall be installed
in pharmaceutical industry to minimize VOC emissions. IIEC has suggested the following VOC
emission reduction technologies for process industries to achieve about 90% reduction in
VOC emissions in progressive manner.
Pollution Prevention Methods:
▪ Adoption of green chemistry methods to replace highly volatile compounds with low
volatile and lower toxic compounds,
▪ Exploring the possibility of replacing organic solvent-based process technologies with
water-based process technologies
▪ Replacing manual solvents loading operations with automated loading operations to avoid
VOC losses,
▪ The solvent handling pumps should be provided with mechanical seals to avoid leakages
and spillage and thus reduce fugitive emissions of VOCs.
▪ The solvent recovery system shall be adopted to recovery the solvents.
▪ The use of closed loop liquid and gas collection equipment for cleaning of reactors and other equipment.
▪ Proper implementation of VOC leak detection and repair (LDAR) as per USEPA method
20 can be adopted for effective predictive maintenance and fugitive VOC emission
reduction.
Reactor Emissions Control Strategies:
▪ Reactor emissions stem from the following causes: (a) displacement of air containing VOC
during reactor charging, (b) solvent evaporation during the reaction cycle (often VOC's
29 IIEC report on VOC assessment and Control Strategies from Ankleshwar Industrial Area
ii. Characterization and assessment of volatile organic compounds (VOCs) emissions from typical industries,
WANG HaiLin1, NIE Lie2, LI Jing2, WANG YuFei1, WANG Gang1, WANG JunHui1 & HAO ZhengPing, March
2013, Chinese Science Bulletin.
iii. Environmental, Health, and Safety Guidelines for Pharmaceuticals and Biotechnology Manufacturing, IFC,
WHO. http://documents1.worldbank.org/curated/pt/151641489556364662/pdf/113495-WP-ENGLISH-
Pharmaceuticals-and-Biotechnology-Mnfg-PUBLIC.pdf
iv. Cleaner Production Guidelines in Pharmaceuticals Sector, Gujarat Cleaner production Centre,2015
v. Guidance on VOC Substitution and Reduction for Activities Covered by the VOC Solvents Emissions Directive
(Directive 1999/13/EC)
vi. USEPA – Profile of pharmaceutical industry and control technologies, https://clu-
in.org/download/toolkit/pharma.pdf

33 | P a g e
Climate and Clean Air Coalition (CCAC)
Reducing Air Pollution in India’s Industrial Cluster through Smart Energy Management August 2020 | 33
are emitted along with reaction by-product gases which act as carriers), (c) overhead
condenser venting uncondensed VOCs during refluxing, (d) purging vaporized VOC
remaining from a solvent wash, and (e) opening reactors during a reaction cycle to take
samples, determine reaction end-points, etc.
▪ Surface condensers are the most prevalent form of control for reactor emissions. Water
is the usual cooling medium. Barometric condensers are seldom used since they
contaminate, and dilute condensed VOC. Refrigerated cooling systems also are widely
used to control lower boiling VOCs. Sometimes two condensers in series are used to
effect greater VOC removal.
▪ A brine-cooled condenser is also normally installed in series to further reduce the exit
gas temperature to 2-3OC. An additional emission reduction was achieved by putting a
conservation vent on the brine condenser vent and by regulating nitrogen pad pressure.
▪ Normally, the emissions from a single reactor would not be large enough to warrant
installing an adsorber; rather, the emissions from several reactors or several VOC sources
within the plant would be ducted together and treated by a common control system. Manifolding sources to a common control device is most easily done on process
equipment dedicated to the production of a single product.
▪ Liquid scrubbers are used to treat a variety of pharmaceutical plant polar VOC sources,
including reactor emissions. Most are low pressure drop scrubbers which handle several
sources, although special purpose units such as venturi scrubbers may control a single
vent.
▪ Vapor incinerators will be feasible control options in certain instances. They are
sometimes used in the industry to control odours from fermentation operations.
Incineration technology has also been applied to VOC emissions from reactors. VOC
emissions from reactors, storage tanks, evaporators, and distillation apparatus can be
collected in a single ventilation header and fed to an incinerator.
Distillation Units Emissions Control Strategies:
▪ Volatile organic compounds may be emitted from the distillation condensers used to
recover evaporated solvents. The magnitude of emissions depends on the operating
parameters of the condenser, the type and quantity of organic being condensed, and the
quantity of inert entrained in the organic.
▪ Emissions from distillation condensers can be controlled through use of after-condensers,
scrubbers, and carbon adsorbers.
▪ The main condenser efficiency can be increased by lowering the coolant temperature or
can be augmented by installing another condenser in series. The second condenser would
utilize a circulating fluid cooler than that for the main condenser.
▪ No examples of the use of incinerators were found, although incineration may be feasible
in some instances. This may be due to higher moisture content and lower VOC
concentration in the vents.
Solvent Extraction Process Emissions Control Strategies:
▪ Emissions from batch extraction stem mainly from displacement' of vapor while pumping
solvent into the extractor and while purging or cleaning the vessel after extraction. Some
VOC also may be emitted while the liquids are being agitated. Column extractors may emit VOC while the column is being filled, during extraction, or when it is emptied after
extraction. Emissions not only occur at the extractor itself, but also through associated
surge tanks. These tanks may emit significant amounts of solvent due to working losses as
the tank is repeatedly filled and emptied during the extraction process.

34 | P a g e
Climate and Clean Air Coalition (CCAC)
Reducing Air Pollution in India’s Industrial Cluster through Smart Energy Management August 2020 | 34
▪ VOC extraction and condensation facilities using brine and chilled water condensers can
be adopted to control VOC emissions. Effectiveness of carbon adoption systems shall be
verified on case to case basis for solvent extraction unit VOC control operations. In case
VOC emissions are high the vents can be treated in incinerator.
Centrifuge Emissions Control Strategies:
▪ A large potential source is open type centrifuges which permit large quantities of air to
contact and evaporate solvents. The industry trend is toward completely enclosed
centrifuges. In fact, inert gas blanket is used, it will be a transport vehicle for solvent vapor.
This vapour may be vented directly from the centrifuge or from a process tank receiving
the mother liquor. However, this emission source is likely to be small because the inert
gas flow is generally exceedingly small.
▪ VOC emission methods suggested for source emission sources will work for controlling
emissions from centrifuge emissions.
Crystallization Units Emissions Control Strategies:
▪ If crystallization is done mainly through cooling of a solution, there will be little VOC
emission. In fact, the equipment may be completely enclosed. However, when the
crystallization is done by solvent evaporation, there is greater potential for emissions.
Emissions will be significant if evaporated solvent is vented directly to the atmosphere.
More likely the solvent will be passed through a condenser or from a vacuum jet (if the
crystallization is done under vacuum).
▪ VOC emission methods suggested for source emission sources will work for controlling
emissions from centrifuge emissions.
Dryer Emissions Control Strategies:
▪ Dryers are used to remove most of the remaining solvent in a centrifuged or filtered
product. This is done by evaporating solvent until an acceptable level of "dryness" is
reached. Evaporation is accelerated by applying heat and/or vacuum to the solvent laden
product or by blowing warm air around or through it. Dryers are potentially large
emission sources. Emission rates vary during a drying cycle and are greatest at the
beginning of the cycle and least at the end of the cycle. Drying cycle times can range from
several hours to several days. Emissions from air dryers are normally greater than those
from vacuum dryers, mainly because air dryer emissions are dilute and more difficult to
control.
▪ VOC emission methods suggested for source emission sources will work for controlling
emissions from centrifuge emissions. Condensers and carbon adsorption units are
commonly recommended VOC control technologies. Wet scrubbers have also been used
to control many plant sources, including dryers. They can also remove particulates
generated during drying. Although vapor incinerators may be a viable control option,
varying VOC flows and gas volumes to the incinerator may present operating problems.
Solvent Storage Vessels and Tanks Emissions Control Strategies:
▪ The vapor space in a tank will in tine become saturated with the stored organics. During
tank filling, vapours are displaced causing an emission or a "working loss." Some vapours also are displaced as the temperature of the stored VOC rises, such as from solar
radiation, or as atmospheric pressure drops; these are "breathing losses." The amount of
loss depends on several factors: type of VOC stored, size of tank, type of tank, diurnal
temperature changes, and tank throughput. Pharmaceutical plant process equipment and

35 | P a g e
Climate and Clean Air Coalition (CCAC)
Reducing Air Pollution in India’s Industrial Cluster through Smart Energy Management August 2020 | 35
storage tanks are much smaller and, for the most part, is not subjected to the elevated
temperatures and pressures often used in refineries and chemical plants.
▪ Emissions from storage or process holding vessels may be reduced with varying efficiency
through use of vapor balance systems, conservation vents, vent condensers, pressurized
tanks, and carbon adsorption. Good housekeeping practices can also assist in reducing
emissions. For example, operating procedures should require that covers and ports be
closed when a tank contains solvents or is being cleaned and dried with solvents. Covers
should be open for only short periods when solid materials are charged, or samples taken.
▪ Conservation vents are devices-that seal a tank vent against small pressure changes.
During the day, a conservation vent prevents tank emissions due to vapor warming and
expansion until the internal tank pressure exceeds the vent set pressure. Similarly, at night
the vapor inside a tank cools causing a decrease in internal tank pressure. Outside air is
prevented from entering the tank until the vacuum setting of the vent is exceeded.
Conservation vents will provide small reductions in breathing losses.
▪ Fixed roof tank emissions may be controlled by use of refrigerated vent condensers. Condensers should be sized to handle the maximum vapor rate expected at any given
time, which normally occurs during tank filling. Condensers also may have to be designed
to handle freezing of moisture. The moisture gets into the tank along with ambient air
during breathing. This problem can be solved by defrosting the condenser and separating
the recovered water-VOC mixture. Vent condenser removal efficiency depends on the
vapor concentration of VOC in the vapor space and on the refrigeration temperature.
▪ Floating roof tanks will help to reduce the VOC emissions from tanks. These are widely
used in refineries and petrochemical plants; however, their applicability to pharmaceutical
plant storage tanks is less certain. This control option is usually reasonable only for large
vertical solvent storage tanks with size more than 70 m3.
▪ Another alternative for reducing storage losses is utilizing pressurized storage tanks.
Pressure tanks are designed to withstand the internal pressure built up through rising
stored VOC temperatures during the daytime, thereby eliminating breathing losses. A
practical pressure tank system would use an inert gas to occupy the vapor space during
emptying; this gas, containing VOC, would have to be purged during refilling operations.
Thus, working losses will not be eliminated. Because of their high cost, pressure tanks are
feasible only for storage of highly volatile VOC.
▪ Carbon adsorbers have been used to control many different process emission sources,
including process tanks in pharmaceutical plants Control of similar emission sources also
can be achieved through scrubbing. One problem is that the systems handle all input VOC
and the recovered mixed solvents have little value; therefore, recovery would be difficult.

36 | P a g e
Climate and Clean Air Coalition (CCAC)
Reducing Air Pollution in India’s Industrial Cluster through Smart Energy Management August 2020 | 36
10 PREDICTED GLC’S – POST ENCON MEASURES AND
CLEAN TECHNOLOGY SCENARIO
Given the above ENCON measures and cleaner technologies options are implemented, above
90% reduction of VOC emissions is envisaged. Hence, for the study purpose, the TVOC
emission load per unit or facility shall be reduced from current baseline scenario of 1.0 ton
per day per industry to 0.1 tons per day per industry. The predicted concentrations of the
TVOC before and after implementation ENCON measures are presented in Figure 15 and
the summary of model results is given in Table 9 and Table 10. The model input and output
files are attached as Annexure-IV.
It can be noted the predicted GLCs that the ambient VOC levels will be maintained less than
0.5 mg/m3 within the industrial area and these levels will be further diluted to trace levels
within 1 to 2km from the boundary of industrial area. Hence by adoption the suggested VOC
control measures, the overall background VOC concentrations can be maintained within the
threshold long-term chronic exposure values suggested by USEPA and other international
agencies.
Table 9 Predicted GLC for Baseline Emission Scenario Vs. Post ENCON Scenario
(Without Photochemical reaction and Natural Atmospheric Degradation of VOC)
Location
Baseline Emission Scenario
(2nd Highest Predicted 24-Hrs Avg GLC)
(mg/m3)
Post Encon and Cleaner
Technologies Implementation
(2nd Highest Predicted 24-Hrs Avg GLC)
(mg/m3)
Average Reported
Baseline Air Quality Data in
GIDC (mg/m3)
TLV of VOC Species
(Please Refer to Table 6)
(mg/m3)
Long-Term Chronic
Exposure Risk Levels for
Various VOC Species
(Please Refer to Table 6)
(mg/m3)
Within the core zone (industrial areas)
2.5 to 7.5 0.25 to 0.75 0.65 to 2.4
0.5 to 1200 0.15 to 30
Outside the industrial area (within 1km from industrial area boundary)
<2 <0.2 No data
1 km to 3km from the industrial area boundary
Traces to 1 Traces to 0.1 No data
Table 10 Predicted GLC for Baseline Emission Scenario Vs. Post ENCON Scenario
(Considering VOC Decay - Photochemical reaction and Natural Atmospheric Degradation of VOC)
Location
Baseline Emission
Scenario with Atmospheric Scavenging
Effect (2nd Highest
Predicted 24-
Post Encon & Cleaner
Technologies Implementation
with Atmospheric Scavenging
Effect
Average Reported
Baseline Air Quality Data in
GIDC (mg/m3)
TLV of VOC Species
(Please Refer to Table 6)
(mg/m3)
Long-Term Chronic
Exposure Risk Levels for
Various VOC Species
(Please Refer to Table 6)

37 | P a g e
Climate and Clean Air Coalition (CCAC)
Reducing Air Pollution in India’s Industrial Cluster through Smart Energy Management August 2020 | 37
Hrs Avg GLC) (mg/m3)
(2nd Highest Predicted 24-Hrs Avg GLC)
(mg/m3)
(mg/m3)
Within the core zone (industrial areas)
1.75 to 5.25 0.17 to 0.52 0.65 to 2.4
0.5 to 1200 0.15 to 30
Outside the industrial area (within 1km from industrial area boundary)
<1.4 <0.15 No data
1 km to 3km from the industrial area boundary
Traces to 0.7 Traces to 0.07 No data

38 | P a g e
Climate and Clean Air Coalition (CCAC)
Reducing Air Pollution in India’s Industrial Cluster through Smart Energy Management August 2020 | 38
Uncontrolled Emission Scenario -Predicted GLC of TVOC Envisaged Reduced Emission Scenario-Predicted GLC of TVOC
Figure 15: Isopleths Showing Predicted GLC of TVOC

39 | P a g e
Climate and Clean Air Coalition (CCAC)
Reducing Air Pollution in India’s Industrial Cluster through Smart Energy Management August 2020 | 39
11 IMPACT OF VOC AND OTHER POLLUTANTS ON HUMAN
HEALTH
In India, CPCB under section 16 (2) (h) of Air Pollution Control Act 1981 has notified
following Ambient Air Quality Standards (AAQS) based on health effects of pollutants:
Table 11: Revised national Ambient Air Quality Standards (2009)
S. N. Pollutants Time Weighted Average
Concentration in Ambient Air Methods of Measurement
Industrial, Residential, Rural, and
other Areas
Ecologically Sensitive Area
(notified by Central
Government)
1 Sulphur Dioxide
(SO2), µg/m
3
Annual* 50 20 1. Improved West and Gaeke 2. Ultraviolet Fluorescence 24 Hours** 80 80
2 Nitrogen Dioxide
(NO2 ), µg/m
3
Annual* 40 30 1. Modified Jacob & Hochheiser (Na-Arsenite) 2. Chemiluminescence
24 Hours** 80 80
3 Particulate Matter (Size <10µm) or
PM10
µg/m3
Annual* 60 60 Gravimetric TOEM Beta attenuation
24 Hours** 100 100
4 Particulate Matter (Size <2.5 µm)
or PM2.5
µg/m3
Annual* 40 40 Gravimetric TOEM Beta attenuation
24 Hours ** 60 60
5 Ozone (O3),
µg/m3
8 hours** 100 100 UV photometric Chemiluminescence Chemical Method
1 hours ** 180 180
6 Lead (Pb),
µg/m3
Annual * 0.50 0.50 1. AAS/ICP Method after sampling using EPM 2000 or equivalent filter paper 2. ED-XRF using Teflon filter
24 Hour** 1.0 1.0
7 Carbon Monoxide (CO),
mg/m3
8 Hours ** 02 02 Non-dispersive Infra-Red (NDIR) Spectroscopy 1 Hour** 04 04
8 Ammonia (NH3),
µg/m3
Annual* 100 100 Chemiluminescence Indophenol blue method 24 Hour** 400 400
9 Benzene (C6H
6)
, µg/m3
Annual * 05 05 Gas chromatography based continuous analyzer Adsorption and Desorption followed by GC analysis
10 Benzo(a)Pyrene (BaP)- particulate phase only,
ng/m3
Annual* 01 01 Solvent extraction followed by HPLC/GC analysis
11 Arsenic (As),
ng/m3
Annual* 06 06 AAS/ICP method after sampling on EPM 2000 or equivalent filter paper

Climate and Clean Air Coalition (CCAC)
Reducing Air Pollution in India’s Industrial Cluster through Smart Energy Management August 2020 | 40
12 Nickel (Ni),
ng/m3
Annual* 20 20 AAS/ICP method after sampling on EPM 2000 or equivalent filter paper
* Annual Arithmetic mean of minimum 104 measurements in a year at a particular site taken twice a week 24
hourly at uniform interval.
** 24 hourly 08 hourly or 01 hourly monitored values, as applicable shall be complied with 98% of the time in
a year. 2% of the time, they may exceed the limits but not on two consecutive days of monitoring.
NOTE: Whenever and wherever monitoring results on two consecutive days of monitoring exceed the limits
specified above for the respective category, it shall be considered adequate reason to institute regular or
continuous monitoring and further investigation
This implies that if air quality is within the prescribed limit of notified standards then there
will not be any significant impact of pollutants on human health. In India, so far, no VOC
standards have been prescribed by CPCB / MoEF&CC under Air Act / E(P) Act, only standards
for benzene is notified. However, ambient air quality guidelines for VOC of other countries
are compiled and attached at Annexure-VI.
In Table 3 & 4 VOC data in ambient air as reported by GPCB in Ankleshwar area are given.
The average value of VOC is ranging from 650 μg/m3 to 2400 μg/m3.
Based on emission inventory data of Ankleshwar, air quality modelling has been done using
AERMOD model and second highest predicted 24 hourly average values of VOCs are given
in table 5 as 2.5 mg/m3 to 7.5 mg/m3 (2500 μg/m3 to 7500 μg/m3) within the core zones of
industrial areas. In ambient air i.e. outside industrial core zone, it is less than 2 mg/m3 (less
than 2000 μg/m3).
If the industries located in Ankleshwar adopts the various clean technologies as control
options for VOC emission control as given in the report then as per air quality modelling
exercise the second highest 24 hour predicted GLC (considering also VOC decay due to
natural atmospheric degradation of VOC) are given in Table 9. The shows that second
highest predicted value of VOC within the core zone is 0.17 mg/m3 to 0.52 mg/m3 (170 μg/m3
to 520 μg/m3) and at ambient air (outside the industrial area) is less than 0.15 mg/m3 (less than
150 μg/m3) within 1 km and between 1 to 3 km from the industrial area it is 70 μg/m3.
Therefore, it may be concluded that if the industries located in Ankleshwar industrial area
adopts the clean technology options / ENCON measures then the resultant impact of VOC
at ambient air shall be less than international VOC guidelines values. If the values are within
the guideline values, then impact of VOC on the health of the population at Ankleshwar area
will be bare minimal.

Climate and Clean Air Coalition (CCAC)
Reducing Air Pollution in India’s Industrial Cluster through Smart Energy Management August 2020 | 41
Annexure-I
Various VOC Control Technologies

Climate and Clean Air Coalition (CCAC)
Reducing Air Pollution in India’s Industrial Cluster through Smart Energy Management August 2020 | 42
Chilled Water Solvent Vapor Condensation System (Tranter)30
Solvent Vapor Adsorption and Recovery Systems (GCE)31
30 https://www.tranter.com/wp-content/uploads/2018/02/vapour-condensers.pdf 31 http://www.gcesystems.com/carbon-adsorbers.html

Climate and Clean Air Coalition (CCAC)
Reducing Air Pollution in India’s Industrial Cluster through Smart Energy Management August 2020 | 43
Thermal Oxidation of VOCs (Condorchem Envitech)32
Catalytic Oxidation of VOCs
32 https://condorchem.com/files/catalogos/Air%20Treatment%20-%20ONLINE.pdf

Climate and Clean Air Coalition (CCAC)
Reducing Air Pollution in India’s Industrial Cluster through Smart Energy Management August 2020 | 44
Annexure-II
Emission Inventory

Climate and Clean Air Coalition (CCAC)
Reducing Air Pollution in India’s Industrial Cluster through Smart Energy Management August 2020 | 45
Detailed VOC Emissions Considered for the Study
S. N. Name of Industry Geographical
Latitude Geographical
Longitude Area (Sq.m)
Uncontrolled Scenario
Estimated Factor Estimated (g/m2/sec)
Controlled Scenario-Emission Factors
(g/m2/sec)
Remarks
1 Apex Healthcare Ltd. 296718.68 m E 2391783.30 m N 779.31115 0.0149 0.00149
Typical solvent discharge rate assumed for various industries is considered as 1 TPD (11.6 g/s)
2 Cadila Healthcare Ltd & Cadila Pharmaceuticals Ltd 294733.61 m E 2392781.87 m N 29028.6803 0.0004 0.00004
3 Zydus Cadila Unit 2 293606.51 m E 2392009.03 m N 7682.82495 0.0015 0.00015
4 Dynemic Products Ltd-1 296335.18 m E 2391767.55 m N 1131.4086 0.0103 0.00103
5 Dynemic Products Ltd-2 297515.45 m E 2391940.30 m N 4486.1923 0.0026 0.00026
6 Intas Pharmaceuticals Ltd. 295754.18 m E 2392226.97 m N 4016.67005 0.0029 0.00029
7 Shree Mahadev Intermediates 295450.91 m E 2391415.75 m N 652.06165 0.0178 0.00178
8 Pragna Dye Chem Pvt Ltd. 295160.65 m E 2391867.97 m N 653 0.0178 0.00178
9 Rajesh Pharmaceuticals 295611.03 m E 2391724.42 m N 688.76325 0.0168 0.00168
10 Shree Sulphurics Pvt Ltd 295424.66 m E 2392722.90 m N 2941 0.0039 0.00039
11 Suyog Dye Chemie Pvt Ltd 295520.90 m E 2392011.66 m N 1038 0.011175 0.00112
12 UPL Ltd, Unit-3 295856.49 m E 2392683.27 m N 19587.4482 0.0006 0.00006
13 Skylark Pharmaceuticals Pvt. Ltd. 297641.60 m E 2392050.62 m N 790.22765 0.0147 0.00147
14 Prudence Pharma Chem 297032.00 m E 2391538.00 m N 1406.08045 0.0082 0.00082
15 Riddhi Pharma 295681.25 m E 2392173.44 m N 669.66205 0.0173 0.00173
16 Ratnamani Bio-chemicals & Pharmaceuticals Pvt Ltd 297597.50 m E 2392712.59 m N 1493.57805 0.0078 0.00078
17 Vihita Chem Pvt Ltd. (Unit 1) 294961.00 m E 2392703.00 m N 330.1882 0.0351 0.00351
18 Vihita Chem Pvt Ltd. (Unit 2) 296162.00 m E 2391776.00 m N 1471.8277 0.0079 0.00079
19 Tatva Chintan Pharma Chem Pvt Ltd. 294697.00 m E 2391868.00 m N 1413.45145 0.0082 0.00082
20 Norris Medicines Ltd. 294645.00 m E 2391372.00 m N 2711.9841 0.0043 0.00043
21 Hema Pharmaceuticals Pvt Ltd. 297520.00 m E 2392366.00 m N 1923.26305 0.0060 0.00060
22 Sanofi India Limited 297170.00 m E 2392324.00 m N 2924.473 0.0040 0.00040
23 Sun Pharmaceuticals India Limited 294106.32 m E 2391388.61 m N 1890.9392 0.0061 0.00061
24 Ronak Chemicals 296781.40 m E 2391776.30 m N 648.18635 0.0179 0.00179
25 Shree Ganesh Remedies Private Limited 297004.69 m E 2392594.27 m N 1121.91455 0.0103 0.00103
26 ZCL Chemical Limited 296375.05 m E 2392778.66 m N 2566.40385 0.0045 0.00045
27 Kenoor Organics Private Limited 296567.58 m E 2391165.15 m N 1703.40705 0.0068 0.00068
28 Basic Science Life Science Private Limited 293951.28 m E 2391538.87 m N 816.60625 0.0142 0.00142

Climate and Clean Air Coalition (CCAC)
Reducing Air Pollution in India’s Industrial Cluster through Smart Energy Management August 2020 | 46
S. N. Name of Industry Geographical
Latitude Geographical
Longitude Area (Sq.m)
Uncontrolled Scenario
Estimated Factor Estimated (g/m2/sec)
Controlled Scenario-Emission Factors
(g/m2/sec)
Remarks
29 IPCA Laboratories 296495.19 m E 2391971.08 m N 3729.94655 0.0031 0.00031
30 Link Pharma Chem Ltd 294196.92 m E 2392482.72 m N 15281.665 0.0008 0.00008
31 Euphoric Pharmaceuticals Private Limited 294363.54 m E 2391330.23 m N 11960.0871 0.0010 0.00010
32 Samrat Pharma Chem Limited 296590.89 m E 2392614.56 m N 811.5969 0.0143 0.00143

47 | P a g e
Climate and Clean Air Coalition (CCAC)
Reducing Air Pollution in India’s Industrial Cluster through Smart Energy Management August 2020 | 47
Annexure-III
Uncontrolled Emission Scenario - Model Input and
Output

48 | P a g e
Climate and Clean Air Coalition (CCAC)
Reducing Air Pollution in India’s Industrial Cluster through Smart Energy Management August 2020 | 48
TVOC – Baseline Uncontrolled Emissions
*** THE SUMMARY OF MODEL INPUT AREAPLOY SOURCES DATA***
Source ID EMISSION RATE
(GRAMS/SEC* METER**2 X (METERS) Y (METERS)
BASE ELEV. (METERS)
RELEASE HEIGHT
(METERS)
NUMBER OF VERTS.
PAREA1 7.59E-04 294256 2392711 6 6 4
PAREA2 4.00E-04 294748.2 2392884 6 6 6
PAREA3 3.51E-02 294961 2392682 6 6 4
PAREA4 1.51E-03 293796 2392040 6 6 9
PAREA5 8.21E-03 294692 2391987 6 6 4
PAREA6 1.42E-02 293980 2391592 6 6 7
PAREA7 9.70E-04 294396.2 2391179 6 6 4
PAREA8 4.28E-03 294645 2391374 6 6 4
PAREA9 5.92E-04 295866.5 2392724 6 6 4
PAREA10 4.52E-03 296260 2392805 6 6 4
PAREA11 2.89E-03 295761.9 2392244 6 6 6
PAREA12 1.73E-02 295678 2392147 6 6 4
PAREA13 1.68E-02 295633 2391731 6 6 4
PAREA14 1.78E-02 295458 2391423 6 6 4
PAREA15 1.43E-02 296586 2392620 6 6 4
PAREA16 1.03E-02 297007 2392601 6 6 4
PAREA17 3.97E-03 297182 2392343 6 6 11
PAREA18 3.11E-03 296484 2391914 6 6 6
PAREA19 1.03E-02 296335 2391783 6 6 4
PAREA20 7.88E-03 296166 2391776 6 6 8
PAREA21 6.81E-03 296565 2391185 6 6 4
PAREA22 6.13E-03 296722 2391580 6 6 4
PAREA23 1.49E-02 296724.7 2391796 6 6 4
PAREA24 2.59E-03 297521 2391961 6 6 6
PAREA25 1.47E-02 297675 2392076 6 6 6
PAREA26 6.03E-03 297591 2392433 6 6 4
PAREA27 8.25E-03 297034 2391546 6 6 12
PAREA28 1.79E-02 296785.7 2391817 6 6 4
PAREA29 7.77E-03 297616.6 2392726 6 6 4

Climate and Clean Air Coalition (CCAC)
Reducing Air Pollution in India’s Industrial Cluster through Smart Energy Management August 2020 | 49
PAREA30 4.03E-03 295447.4 2392736 6 6 4
PAREA31 1.78E-02 295179 2391871 6 6 4
PAREA32 1.17E-02 295560.2 2392023 6 6 4
*** THE SUMMARY OF HIGHEST 24-HR RESULTS ***
Uncontrolled VOC Emission Scenario
GROUP ID RANK HIGHEST VALUES AVERAGE CONC MILLI GRAM/M**3
DATE (YYMMDDHH)
RECEPTOR (XR, YR, ZELEV, ZHILL, ZFLAG)
TYPE (GRIDCART
NETWORK GRID-ID
ALL
1ST HIGH VALUE IS 8.69932 19122424: (295413.00, 2392798.00, 6.00, 6.00, 0.00) GC UCART1
2ND HIGH VALUE IS 7.53325 20010724: (295413.00, 2392798.00, 6.00, 6.00, 0.00) GC UCART1
3RD HIGH VALUE IS 7.39628 20010724: (296163.00, 2391798.00, 6.00, 6.00, 0.00) GC UCART1
4TH HIGH VALUE IS 7.26532 19120424: (296163.00, 2391798.00, 6.00, 6.00, 0.00) GC UCART1
5TH HIGH VALUE IS 6.38694 19120324: (296163.00, 2391798.00, 6.00, 6.00, 0.00) GC UCART1
6TH HIGH VALUE IS 6.28496 19121324: (296163.00, 2391798.00, 6.00, 6.00, 0.00) GC UCART1
7TH HIGH VALUE IS 6.27971 20010124: (296163.00, 2391798.00, 6.00, 6.00, 0.00) GC UCART1
8TH HIGH VALUE IS 6.27971 20021724: (296163.00, 2391798.00, 6.00, 6.00, 0.00) GC UCART1
9TH HIGH VALUE IS 4.80576 20011224: (296163.00, 2391798.00, 6.00, 6.00, 0.00) GC UCART1
10TH HIGH VALUE IS 4.53473 19120524: (296163.00, 2391798.00, 6.00, 6.00, 0.00) GC UCART1
Climate and Clean Air Coalition (CCAC)
Reducing Air Pollution in India’s Industrial Cluster through Smart Energy Management August 2020 | 50
Annexure-IV
Reduced Envisaged Emission Scenario-
Model Input and Output

Climate and Clean Air Coalition (CCAC)
Reducing Air Pollution in India’s Industrial Cluster through Smart Energy Management August 2020 | 51
TVOC – Controlled Emission Scenario
*** THE SUMMARY OF MODEL INPUT AREAPLOY SOURCES DATA***
Source ID EMISSION RATE
(GRAMS/SEC* METER**2 X (METERS) Y (METERS)
BASE ELEV. (METERS)
RELEASE HEIGHT
(METERS)
NUMBER OF VERTS.
PAREA1 7.59E-05 294256 2392711 6 6 4
PAREA2 4.00E-05 294748.2 2392884 6 6 6
PAREA3 3.51E-03 294961 2392682 6 6 4
PAREA4 1.51E-04 293796 2392040 6 6 9
PAREA5 8.21E-04 294692 2391987 6 6 4
PAREA6 1.42E-03 293980 2391592 6 6 7
PAREA7 9.70E-05 294396.2 2391179 6 6 4
PAREA8 4.28E-04 294645 2391374 6 6 4
PAREA9 5.92E-05 295866.5 2392724 6 6 4
PAREA10 4.52E-04 296260 2392805 6 6 4
PAREA11 2.89E-04 295761.9 2392244 6 6 6
PAREA12 1.73E-03 295678 2392147 6 6 4
PAREA13 1.68E-04 295633 2391731 6 6 4
PAREA14 1.78E-03 295458 2391423 6 6 4
PAREA15 1.43E-03 296586 2392620 6 6 4
PAREA16 1.03E-04 297007 2392601 6 6 4
PAREA17 3.97E-04 297182 2392343 6 6 11
PAREA18 3.11E-04 296484 2391914 6 6 6
PAREA19 1.03E-03 296335 2391783 6 6 4
PAREA20 7.88E-04 296166 2391776 6 6 8
PAREA21 6.81E-04 296565 2391185 6 6 4
PAREA22 6.13E-04 296722 2391580 6 6 4
PAREA23 1.49E-03 296724.7 2391796 6 6 4
PAREA24 2.59E-04 297521 2391961 6 6 6
PAREA25 1.47E-03 297675 2392076 6 6 6
PAREA26 6.03E-04 297591 2392433 6 6 4
PAREA27 8.25E-04 297034 2391546 6 6 12
PAREA28 1.79E-03 296785.7 2391817 6 6 4
PAREA29 7.77E-04 297616.6 2392726 6 6 4

Climate and Clean Air Coalition (CCAC)
Reducing Air Pollution in India’s Industrial Cluster through Smart Energy Management August 2020 | 52
Source ID EMISSION RATE
(GRAMS/SEC* METER**2 X (METERS) Y (METERS)
BASE ELEV. (METERS)
RELEASE HEIGHT
(METERS)
NUMBER OF VERTS.
PAREA30 4.03E-04 295447.4 2392736 6 6 4
PAREA31 1.78E-03 295179 2391871 6 6 4
PAREA32 1.17E-03 295560.2 2392023 6 6 4
*** THE SUMMARY OF HIGHEST 24-HR RESULTS ***
Controlled Emissions Scenario
GROUP ID RANK HIGHEST VALUES AVERAGE CONC MILLI GRAM/M**3
DATE (YYMMDDHH)
RECEPTOR (XR, YR, ZELEV, ZHILL, ZFLAG)
TYPE (GRIDCART
NETWORK GRID-ID
ALL
1ST HIGH VALUE IS 0.869932 19122424: (295413.00, 2392798.00, 6.00, 6.00, 0.00) GC UCART1
2ND HIGH VALUE IS 0.753325 20010724: (295413.00, 2392798.00, 6.00, 6.00, 0.00) GC UCART1
3RD HIGH VALUE IS 0.739628 20010724: (296163.00, 2391798.00, 6.00, 6.00, 0.00) GC UCART1
4TH HIGH VALUE IS 0.726532 19120424: (296163.00, 2391798.00, 6.00, 6.00, 0.00) GC UCART1
5TH HIGH VALUE IS 0.638694 19120324: (296163.00, 2391798.00, 6.00, 6.00, 0.00) GC UCART1
6TH HIGH VALUE IS 0.628496 19121324: (296163.00, 2391798.00, 6.00, 6.00, 0.00) GC UCART1
7TH HIGH VALUE IS 0.627971 20010124: (296163.00, 2391798.00, 6.00, 6.00, 0.00) GC UCART1
8TH HIGH VALUE IS 0.627971 20021724: (296163.00, 2391798.00, 6.00, 6.00, 0.00) GC UCART1
9TH HIGH VALUE IS 0.480576 20011224: (296163.00, 2391798.00, 6.00, 6.00, 0.00) GC UCART1
10TH HIGH VALUE IS 0.453473 19120524: (296163.00, 2391798.00, 6.00, 6.00, 0.00) GC UCART1

Climate and Clean Air Coalition (CCAC)
Reducing Air Pollution in India’s Industrial Cluster through Smart Energy Management August 2020 | 53
Annexure-V
Control of VOC in Chemical Industry
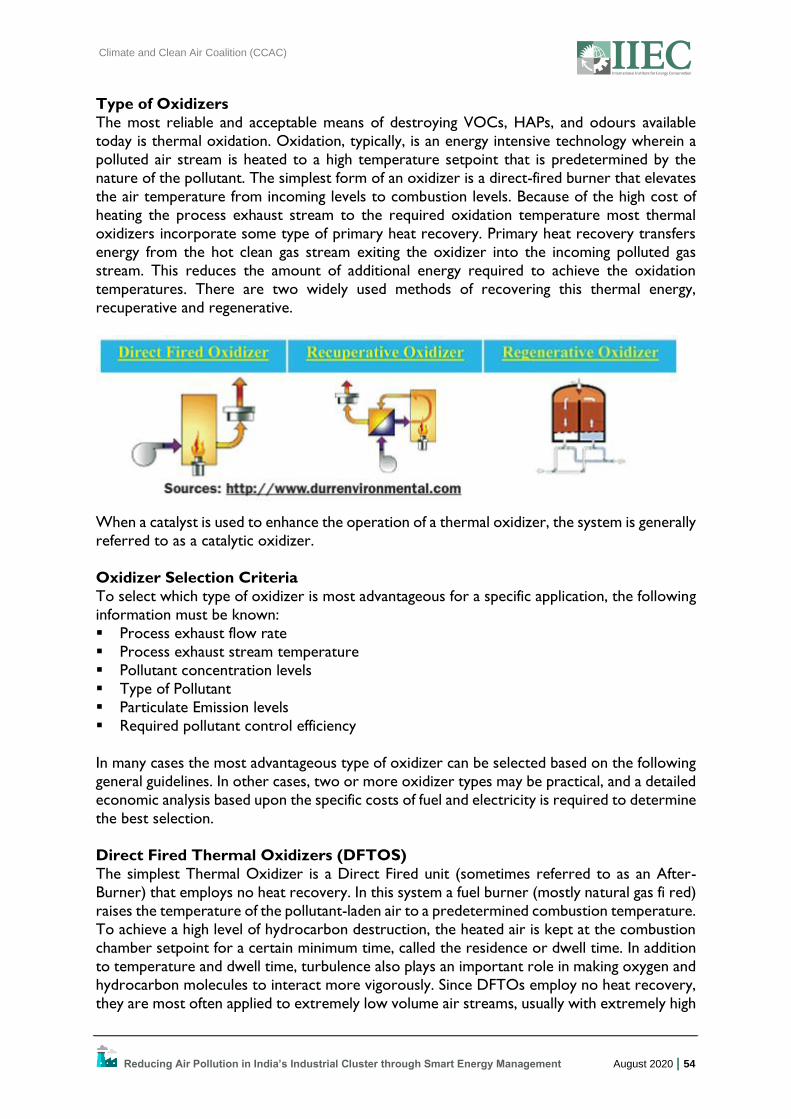
Climate and Clean Air Coalition (CCAC)
Reducing Air Pollution in India’s Industrial Cluster through Smart Energy Management August 2020 | 54
Type of Oxidizers
The most reliable and acceptable means of destroying VOCs, HAPs, and odours available
today is thermal oxidation. Oxidation, typically, is an energy intensive technology wherein a
polluted air stream is heated to a high temperature setpoint that is predetermined by the
nature of the pollutant. The simplest form of an oxidizer is a direct-fired burner that elevates
the air temperature from incoming levels to combustion levels. Because of the high cost of
heating the process exhaust stream to the required oxidation temperature most thermal
oxidizers incorporate some type of primary heat recovery. Primary heat recovery transfers
energy from the hot clean gas stream exiting the oxidizer into the incoming polluted gas
stream. This reduces the amount of additional energy required to achieve the oxidation
temperatures. There are two widely used methods of recovering this thermal energy,
recuperative and regenerative.
When a catalyst is used to enhance the operation of a thermal oxidizer, the system is generally
referred to as a catalytic oxidizer.
Oxidizer Selection Criteria
To select which type of oxidizer is most advantageous for a specific application, the following
information must be known:
▪ Process exhaust flow rate
▪ Process exhaust stream temperature
▪ Pollutant concentration levels
▪ Type of Pollutant
▪ Particulate Emission levels
▪ Required pollutant control efficiency
In many cases the most advantageous type of oxidizer can be selected based on the following
general guidelines. In other cases, two or more oxidizer types may be practical, and a detailed
economic analysis based upon the specific costs of fuel and electricity is required to determine
the best selection.
Direct Fired Thermal Oxidizers (DFTOS)
The simplest Thermal Oxidizer is a Direct Fired unit (sometimes referred to as an After-
Burner) that employs no heat recovery. In this system a fuel burner (mostly natural gas fi red)
raises the temperature of the pollutant-laden air to a predetermined combustion temperature.
To achieve a high level of hydrocarbon destruction, the heated air is kept at the combustion
chamber setpoint for a certain minimum time, called the residence or dwell time. In addition
to temperature and dwell time, turbulence also plays an important role in making oxygen and
hydrocarbon molecules to interact more vigorously. Since DFTOs employ no heat recovery,
they are most often applied to extremely low volume air streams, usually with extremely high

Climate and Clean Air Coalition (CCAC)
Reducing Air Pollution in India’s Industrial Cluster through Smart Energy Management August 2020 | 55
concentrations of VOCs, HAPs, and other pollutants. These oxidizers are characterized by
specialized burners to ensure mixing of combustion air and low volume, high concentration
inert airstreams, which are often injected directly into the burner ports or directly in the
flame cone via lances. This minimizes the risk of explosion and takes maximum advantage of
the enriched fuel value of high VOC content exhaust streams.
Recuperative Oxidizers
A Recuperative Oxidizer is a Direct Fired unit that employs integral primary heat recovery.
To minimize the energy consumption of the oxidizer, the hot air exiting the combustion
chamber is passed over an air-to-air heat exchanger. The heat recovered is used to preheat
the incoming pollutant laden air. The primary heat exchangers are usually supplied as either a
plate-type or a shell and tube type heat exchanger. These heat exchangers can be designed
for various heat transfer efficiencies, but the nominal maximum is 70%. Thus, by the addition
of a heat exchanger, the net heat load on the burner can be reduced by up to 70% of that
required in a DFTO. The addition of the heat exchanger, because it is made of heat corrosion resistant alloy, substantially increases the cost of the oxidizer system. Also, the fan for moving
the polluted gas through the oxidizer must be more powerful to overcome the additional
pressure drop of the heat exchanger. In most cases, the savings in fuel will more than offset
the additional up-front cost within the first two years of operation, however, even with 70%
heat recovery, recuperative oxidizers can be expensive to operate, especially if the airflow is
large and has dilute concentration levels, unless additional secondary heat recovery can be
applied to the customer’s process.
Regenerative Thermal Oxidizers (RTOs)
A Regenerative Oxidizer is also a Direct Fired oxidizer that employs integral primary heat
recovery. However, the RTO operates is periodic, repetitive cycle rather than a steady state
mode. Instead of conventional heat exchangers, which indirectly transfer heat from hot side
to cold side across the exchanger walls, RTOs use a store and release mechanism. The nature
of a RTOs heat recovery process requires it to have at least two beds of appropriate heat
recovery media. In many applications, the additional step of purging a bed before reversing
the flow through it from inlet to exhaust is necessary to maintain extremely high destruction
efficiencies. This purge step creates the requirement for an additional (or odd number)
chamber making the RTO more complicated and more expensive than a recuperative
oxidizer. RTO systems can utilize more than two beds (operating in parallel) to be capable of
handling larger air volumes. The primary advantage of an RTO is lower operating costs due
to high heat recovery and low fuel consumption. Depending on the mass of media included in
an RTO, heat recoveries of up to 95% are common. Because of their capability for high heat
recovery, RTOs are often operated in an “auto-thermal” or self-sustaining mode, where the
heat content of the VOCs being oxidized is enough to sustain the combustion chamber
temperature at setpoint, requiring no external fuel input.
Industries Served by Oxidizers:
▪ Automotive
▪ Surface Finishing/Coating
▪ Semiconductor ▪ Wood Panel Manufacturing
▪ Chemical Manufacturing
▪ Petrochemical
▪ Pharmaceutical

Climate and Clean Air Coalition (CCAC)
Reducing Air Pollution in India’s Industrial Cluster through Smart Energy Management August 2020 | 56
▪ Aerospace
▪ Glass Manufacturing
▪ Foundry
▪ Styrene
▪ Wastewater Treatment
▪ Tank Farms
▪ Printing & Flexography
▪ Wallpaper
▪ Flooring
▪ Solid Waste Treatment
▪ Fibre Manufacturing
▪ Pulp and Paper
▪ Rendering
▪ Corn Milling
Application Selection Chart
Choosing the right equipment for VOC control applications depends primarily on the exhaust
air volume and the average concentration of VOCs. The chart displayed provides general
guidelines for choosing equipment to fi t applications.
Example of Commercial Technologies
Classification of Technology: Air Pollution (Add – on Control)
Name of Technology/Technique: Catalytic incinerator
Applied: Chemical industries, painting, printing, rubber, and casting factories
Description: This equipment catches malodorous gases with the platinum catalyst and
decomposes them by oxidation to harmless and odourless carbonic acid gas and water.

Climate and Clean Air Coalition (CCAC)
Reducing Air Pollution in India’s Industrial Cluster through Smart Energy Management August 2020 | 57
Compared with the direct combustion type, this equipment can treat malodorous gases at
lower temperature, running et lower cost. In case of low malodorous substances
concentration, it is advisable to install Honeycomb Type Deodorization Equipment as pre-
treatment equipment to save energy.
Exhaust Gasses are Pre-Heated in Heat Exchanger
Exhaust gasses are heated to the predesigned temperature by the auxiliary heater (generally
to 300 °C). Electricity, city gas, LPG, kerosene oil, etc. can be selected as heat source. When
the polluted gas passes through the catalyst-bed, malodorous substances contained are
decomposed by oxidation. Purified gas is exhausted after passing through the heat exchanger
where heat is exchanged between purified gas and treating gas. In combination with a steam
heater: In case electricity is used as heat source for the auxiliary heater, it is advisable to use
a steam heater together with it to reduce electric consumption.
Advantages: Low running cost: Compared with the direct combustion system, this
equipment can treat malodorous substance at low temperature. Fuel costs can be reduced by 1/3. Low boiling organic solvents and wider ranges of malodorous substances can be purified.

Climate and Clean Air Coalition (CCAC)
Reducing Air Pollution in India’s Industrial Cluster through Smart Energy Management August 2020 | 58
Examples of Commercial Catalysts
Engelhard Catalysts
Carbon Monoxide, VOCs, or HAPs Control VOCat® PTA.
This noble metals-based catalyst family is designed to abate pollutants generated during the
process of purification of terephthalic acid, a key raw material to produce
polyethylenterephthalate (PET). The volatile organic compound (VOC) most difficult to abate
during this process is methyl bromide. These catalysts were specifically, but not exclusively,
designed.
VOCat® 350 HC and 360 PFC.
These noble metals based two catalysts were specifically designed to selectively abate both
chlorinated and fluorinated VOCs (including dioxins and furans) producing the relevant
halogenated acids, easy to be scrubbed during a further step. Amount of generated chlorine
and fluorine, very nasty to be eliminated, is produced at lowest possible level.
VOCat® 310 ST S and ST H
These noble metals based; two catalysts provide effective VOC abatement in an environment
rich in sulfur.
VOCat® RCO
This is a noble metal-based catalyst family, designed to either retrofit or build up new
regenerative oxidizers. It is useful to treat large exhaust flows with a VOC total amount of
more than 1 g/Nm3. Those catalysts substantially lower operating costs of regenerative
oxidizers with a quick payback period (often less than 1 year).

Climate and Clean Air Coalition (CCAC)
Reducing Air Pollution in India’s Industrial Cluster through Smart Energy Management August 2020 | 59
Zeolite Rotor Concentrators
This product family is aimed to optimize economics of either thermal or catalytic oxidizers
(also regenerative ones). It is economically convenient to treat exhaust flows larger than 20–
30,000 Nm3/h and with a VOC total amount of less than 1–2 g/Nm3. These concentrators
safely and effectively adsorb and desorb VOC in such a way that 85–95% of the original flow
rate can directly proceed to the stack, whereas a much lower flow rate, rich of VOCs, is sent
to the oxidizer. The latter can, therefore, work with much lower operative costs. The payback
period is very quick. Special hydrophobic zeolites are coated onto a fi ber–ceramic
honeycomb. The same technology–but with non-rotating panels–is used in VOC abatement
for food service.
Photocatalytic Self-Cleaning Ceramic
The self-cleaning ceramic can degrade contaminants (e.g., oil) on the surface, deodorize some
harmful gases, and kill bacteria or virus. It can be used for indoor or outdoor fitment for
kitchen, toilet, natatorium, operating rooms, and so on.
Solid Superacid Photocatalyst with High Efficiency
The solid superacid photocatalyst possesses higher photocatalytic activity and higher efficiency
for destroying organic contaminants at room temperature. It can be applied to the areas
including environmental protection, reclamation of noble metal, preservation of fruits and so
on.
Multi-Functional Photocatalytic Air Cleaner
The air cleaner has multi-functions such as destroying volatile organic compounds (e.g.,
trichloroethylene, benzene, formaldehyde, etc.), killing bacteria, deodorization, and dedusting.
It is favourable for reducing air pollution in home vehicles, hotel, offices, meeting rooms, and
so on.
Source: http://www.nerc-cfc.com/production.html
References
1. Air Pollution Control Engineering, de Nevers N., second Edition, 2000, McGraw Hill,
New York.
2. www.epin.ncsu.edu
3. Buscom.com
4. www.engelhard.com
CONTROL OF VOC IN CHEMICAL INDUSTRY (Case study of a typical
chemical industry in India)

Climate and Clean Air Coalition (CCAC)
Reducing Air Pollution in India’s Industrial Cluster through Smart Energy Management August 2020 | 60
Typical Consumption of Solvents in a Pharma Unit of 5 Tons/day Capacity
Name of
Solvent
Consumption
Coeff.
(BP)
Consumption /
Day
MT
Loss with
Residue
Tons
Loss to
Environment
Tons
Methanol 0.30 (65°C) 1.20 0.18 1.02
Toluene 0.20 (111°C) 1.00 0.15 0.85
Cyclohexane 0.25 (81°C) 1.25 0.19 1.06
N-Methyl
Pyrrolidone 0.10 (202°C) 0.50 0.08 0.42
Xylene 0.20 (140°C) 1.00 0.15 0.85
Ethylene
Dichloride 0.25 (40°C) 1.25 0.19 1.06
Methylene
Dichloride 0.50 (40°C) 2.50 0.38 1.30
Acetone 0.40 (56°C) 2.00 0.30 1.70
Iso Propyl
Alcohol 0.35 (82°C) 1.75 0.30 1.45
Total 12.45 1.87 10.58
Name of
Solvent
Consumption/
Day
MT
Loss to
Environment
Tons
Unit
Price,
INR / Ton
Total Value
of Solvents
Lost / Day
INR
Methanol 1.20 1.02 23,000 23,460
Toluene 1.00 0.85 54,500 46,325
Cyclohexane 1.25 1.06 67,000 71,020
N-Methyl
Pyrolidone 0.50 0.42 160000 67,200
BULK STORAGE
Solvents fromTankers, SOContainersDrums
BATCH TANKS/DAY TANKS
PROCESS/OPERATIONS
RECOVERIES
Organic Residues+
Solvent
INCINERATOR
1 2 3 4
1.Breathing and evaporation losses2.Breathing and evaporation losses3&4 :Loss of uncondensed vapors

Climate and Clean Air Coalition (CCAC)
Reducing Air Pollution in India’s Industrial Cluster through Smart Energy Management August 2020 | 61
Xylene 1.00 0.85 59000 50,050
Ethylene
Dichloride 1.25 1.06 31,000 32,860
Methylene
Dichloride 2.50 1.30 56,000 72,800
Acetone 2.00 1.70 60,000 1,02,000
Iso Propyl
Alcohol 1.75 1.45 60,000 87,000
Total 12.45 12.45 5,52,715
(Abort Rs 18.25
crores / Year
Source of VOCs in Batch Processing Industry
Volatile Organic Raw Materials and Solvents constitutes about 75 % of raw materials in
Pharma, Fine and Agrochemicals manufacturing. Out of this, about 50% are solvents.
In the Indian industry, handling losses of organic chemicals is as high as 2 to 3 times of the
daily manufacturing capacity. Major portion of chemicals lost are organic solvents. About 80%
of loss is to the air environment.
In US, Europe and Japan, this loss is limited to less than 0.5 times of the manufacturing capacity.
About 5 % of loss is to the air environment. Remaining 95% quantity is retained with organic
residues to avoid accidents due to thermal decomposition.
Losses of organic chemicals in our Industry (high VOC) is main cause of fire accidents, heath
risk to employees and weak balance sheets.
Good Engineering practices in Storage and Handling organic chemicals drastically reduces
losses.

Climate and Clean Air Coalition (CCAC)
Reducing Air Pollution in India’s Industrial Cluster through Smart Energy Management August 2020 | 62
Myths about Solvent / RM Usage
▪ Solvent content in the Reactor shall be 50 to 75 % of the volume of Reaction mass to
ensure good yield, good temperature control and quality.
▪ Recovered solvent may contain impurities and may have impact on the conversions and
quality of the finished product.
▪ Solvent is the least important material and loss of solvent does not impact profitability of
the company.
▪ Loss of solvent is not a concern because it is going into the air from equipment vents and
disperses immediately.
▪ Contamination of Aqueous waste streams with solvents is a natural phenomenon and it is
the responsibility of EHS department to treat this waste.
▪ My responsibility ends with the process plant. I am not responsible for the quality of the
waste.
▪ Process waste is pumped to ETP and then responsibility is handed over to EHS
department.
▪ Quality of waste may change due to some abnormalities in the Reaction/ operations.
▪ Change in the waste characteristics can have an adverse impact on the functioning of waste
treatment equipment.
▪ Management will never know the cause of abnormal behaviour of ETP. Production blames
EHS, EHS blames production, Production and EHS blames Equipment, Equipment supplier
blames the feed characteristics are different -- blame game continuous without any
solution to the problem.
▪ Best practice is to recover all solvents, chemicals present in the waste within the process
plant and only clean waste is sent to Waste Treatment Facilities.
Impact of Solvent Loss
▪ Makes operations financially non-viable.
▪ Solvent loss to environment causes damage to environment and health of employees.
▪ Presence of solvent vapor with lower flashpoint in environment can cause explosion /
flashback.
PROSPERITY TRIANGLE
Good engineering practices reduces VOCs, enhance Safety , ensures clean environment and maximizes profitability resulting Prosperity

Climate and Clean Air Coalition (CCAC)
Reducing Air Pollution in India’s Industrial Cluster through Smart Energy Management August 2020 | 63
▪ Low TDS waste streams contaminated with solvents are difficult to treat by biological
treatment. Capital cost and operating cost of treatment will be extremely high.
▪ High TDS waste contaminated with solvents makes Forced Evaporation difficult. Causes
scaling and odour nuisance.
Typical Consumption of Solvents in a Pharma Unit of 5 Tons/Day Capacity Name of
Solvent
Consumption
/ Day
MT
Loss to
Environment
Tons
Unit
Price, Rs /
Ton
Total Value
of Solvents
Lost / Day
INR
Methanol 1.20 1.02 23,000 23,460
Toluene 1.00 0.85 54,500 46,325
Cyclohexane 1.25 1.06 67,000 71,020
N-Methyl
Pyrolidone 0.50 0.42 160000 67,200
Xylene 1.00 0.85 59000 50,050
Ethylene
Dichloride 1.25 1.06 31,000 32,860
Methylene
Dichloride 2.50 1.30 56,000 72,800
Acetone 2.00 1.70 60,000 1,02,000
Iso Propyl
Alcohol 1.75 1.45 60,000 87,000
Total 12.45 12.45 5,52,715
(Abort Rs 18.25
crores / Year
Sources of Solvent Loss
Solvent storage and transfer : 3 to 5 %
Vent losses from process plant : 3 to 5 %
Losses during evaporation (Vacuum & Atmospheric) : 70 to 75 %
Solvent recovery by fractionation : 5 to 10 %
Drying and Loss with organic residues : 10 to 15 %
SOURCE Loss
Storage Evaporation, breathing and diffusivity
losses
Handling Leak Proof Pumps/Pipelines
Recovery by Atmospheric
Distillation/Evaporation
Loss of Uncondensed Vapours.
Recovery by Vacuum
Distillation/Evaporation
Loss of Vapours from Vacuum Systems
(Ejectors, Pumps)
Fractionation/Stripping Loss in the form of mixed solvents
Filtration/Drying Evaporation loss
Distillation Residues Solvent
Storage and Handling of Solvents
▪ Solvents are stored in bulk storage tanks or drums
▪ Solvents are transported by Road in Tankers/ Iso containers or in drums and transferred
to Bulk Storage tanks using Pumps.

Climate and Clean Air Coalition (CCAC)
Reducing Air Pollution in India’s Industrial Cluster through Smart Energy Management August 2020 | 64
▪ Transfer to bulk storage tanks by using centrifugal pumps or Nitrogen Pressure. From
drums solvent is transferred by using positive displacement pumps.
▪ From bulk storage tanks, solvents transferred to batch tanks/ day tanks. From these tanks,
fresh solvent makes up is done along with recovered solvents to the extent of loss.
Storage and Handling Loss
▪ Solvent gradually diffuses to the vapour space and escapes from the vent. Rate of diffusion
depends on the ambient temperature, vapour pressure and diffusion coefficient of the
material stored.
▪ Solvent loss from a 30 KL capacity storage tank is estimated to be as high as 20 to 30 MT
per annum.
▪ The environment around storage tanks contains solvent vapours.
▪ Solvents with low flash points can even cause fire/ explosion if there is a source of ignition.
▪ Storage losses can be minimised by designing good storage systems.
Flash Point
Measure of ease of ignition of the liquid. It is the lowest temperature at which the material
will ignite from an open flame.

Climate and Clean Air Coalition (CCAC)
Reducing Air Pollution in India’s Industrial Cluster through Smart Energy Management August 2020 | 65
Solvent Flash Point, Deg C
Acetone (-) 18
n-Butyl alcohol 29
Ethyl Acetate (-) 4
Ethyl alcohol 13
Methyl Alcohol 12
Ethylene Glycol 111
n-Hexane (-)22
Toluene 4.5
Vapour Density Solvent Vapor Density
( Air :1)
Acetone 2
n-Butyl alcohol 2.55
Ethyl Acetate 3.04
Ethyl alcohol 1.59
Methyl Alcohol 1.11
Ethylene Glycol 2.14
n-Hexane 2.91
Toluene 3.14
High concentration at ground level near storage tanks and processing area. Exposure and Fire Hazards. Leak free systems to be provided.
Chilled
Water
Chilled
Water
•Tank with open vent continuous loss of vapor.
•Tank with breather valve
•Air goes in when tank is evacuated.
• Vapor loss when material is filled.
•Tank with condenser and breather valve.
•No loss of vapor if condenser is provided on the vent line.
•Nitrogen blanketing is provided if material stored is flammable.

Climate and Clean Air Coalition (CCAC)
Reducing Air Pollution in India’s Industrial Cluster through Smart Energy Management August 2020 | 66
Vapour Pressure Data Vapor
Pressure,
mmH g
20 40 100 200 400 760
Acetone -21 -9 8 23 39 56
n-Butyl
alcohol
41 53 70 84 101 118
Ethyl
Acetate
-3 9 27 42 50 77
Ethyl
alcohol
8 19 35 48 63 78
Temperature in Deg C

Climate and Clean Air Coalition (CCAC)
Reducing Air Pollution in India’s Industrial Cluster through Smart Energy Management August 2020 | 67

Climate and Clean Air Coalition (CCAC)
Reducing Air Pollution in India’s Industrial Cluster through Smart Energy Management August 2020 | 68

Climate and Clean Air Coalition (CCAC)
Reducing Air Pollution in India’s Industrial Cluster through Smart Energy Management August 2020 | 69
Storage and Handling of Organic Solvents
▪ Completely closed operation
▪ Breather valves to all storage tanks
▪ Condensers for volatile solvents
▪ Nitrogen blanketing and flame arrestors for flammable solvents
▪ Common vent headers in process plant to Scrubber and
▪ Incinerator
VACCUM DISTILLATION (Case Study 1)
▪ Intermediates and finished products are thermally sensitive. Solvents used for reactions
are distilled under vacuum at low temperature. Intermediates and products need to be
free from solvents used in the earlier process before they go to the next process.
▪ Vacuum system is designed to evacuate air leaked from various flanges and uncondensed
solvents.
▪ Condensers are provided before vacuum system to condense solvent. ▪ Some solvent vapours escape with air from Condensers. Quantity of solvent loss depends
on temperature of vapor at the suction of vacuum system, vapor pressure of solvent at
this temperature and air leakage rate.
▪ Reduction in VOC by replacing steam ejector with Dry Vacuum System (Case Study I)
▪ Ethylene Dichloride (EDC) solvent is recovered after the Reaction under vacuum at less
than 50oC. Vacuum is used because Product is thermally sensitive.
▪ About 5 Tons of EDC recovered / day. About 1.3 Tons / day of EDC loss from steam
ejector (about 100 kgs/ hr loss)
▪ Operators used to feel skin itching and uneasiness due to high concentrations of EDC in
environment.
▪ It is impossible to minimize this loss because EDC vapor does not completely condense
in condensers before ejector. Some EDC will escape along with air / nitrogen through the
ejector.
▪ Condensers at the outlet of ejectors required to minimize this loss but EDC gets
contaminated with motive fluid steam used in the Ejector.

Climate and Clean Air Coalition (CCAC)
Reducing Air Pollution in India’s Industrial Cluster through Smart Energy Management August 2020 | 70
▪ EDC vapours can easily be condensed if dry vacuum system is used.
Air Leakage Rate in to Vacuum System Type of Fitting Estimated Air Leakage Rate, kgs/hr
Screwed connections up to 50 mm 0.045
Screwed connections above 50 mm 0.09
Flanged connections up to 150 mm 0.23
CWR
CWS
CHWR
CHB
ChWSCHB
Steam Ejector
SteamCooling Water
Loss of
Steam
+Solvent
Steam
condensate
+ Solvent to
`ETP
1. Cooling water condenser
2. Chilled water condenser.
3. Chilled water Condenser.
1 2 3
RecoveredSolvent

Climate and Clean Air Coalition (CCAC)
Reducing Air Pollution in India’s Industrial Cluster through Smart Energy Management August 2020 | 71
Flanged connections from 150 mm to
600 mm
0.49
Packed Valves up to 20 mm stem diameter 0.20
Plug Valves 0.04
Sight Glass 0.45
Air Leakage Rate in to Vacuum System Type of Fitting Estimated Air Leakage Rate
kgs/hr
Stuffing Box, per inch shaft diameter 0.67
Mechanical seal , per inch shaft
diameter
0.13
Safety valves and vacuum breakers
per inch of nominal size
0.45
Air Leakage Rate for 10 KL Evaporator
Description Size in mm. Air Leakage Rate in
kgs/Hr.
Manhole 500 0.49
Sight Glass 100 0.45
Light Glass 150 0.45
Agitator 200 1.04
Baffle 150 0.23
Process Nozzles 5 X150 1.15
Vapor Nozzle 2 X300 0.49
Safety Relief Valves 0.45
Vapor line 3 X 150 0.69
TOTAL 5.44 kgs/hr
LOSS OF ETHYLENE DICHLORIDE FROM VACUUM SYSTEM
Vapor Pressure (mmHg)
TemperatureDeg C
1 (-) 44.5
5 (-) 24
10 (-) 13.6
20 (-) 2,4
40 10
60 18.1
100 29.4
200 45.7
400 64
760 82.4
Temperature of Vapor at vacuum system= (-)10OC
Vapor Pressure at (-)10OC = 13mmHg
Absolute Pressure at vacuum system = 20mmHg
No. of Moles of EDC (A)
No. of Moles of Air(B)+ No. of Moles of EDC ( A)= 13/20 = 0.65
B=10 Kg/hr 10/29=0.345 Kg.Moles/hr
A/(A+B)=0.65
Loss of EDC = 0.345X99 = 34 kgs/hr at 20 mm Hs abs pressure
Average loss of EDC during vacuum concentration from Vacuum system ( 100 mm hg to 5 mm Hg abs pressure) = 600 kgs/day
Total loss of EDC / annum = 198 MTValue of EDC lost / annum = Rs 61.40 lacs

Climate and Clean Air Coalition (CCAC)
Reducing Air Pollution in India’s Industrial Cluster through Smart Energy Management August 2020 | 72
General Comparison of Technologies Technology Vacuum
Level
Effluent Initial
Cost
Utility
Costs
Maintenance
Costs
Steam Ejector Good High Low High Low
Water Ring
Pump
Poor Medium Low Medium Medium
Oil ring pump Good Medium low Medium Medium
General Comparison of Technologies
Steam Ejector:
▪ Steam condensate gets contaminated with solvent vapours.
▪ Difficult to recover solvent from condensate. Condensate at 80 to 85 oC. ▪ Difficult to treat the effluent (condensate with traces of solvent).
▪ Solvent escapes from exhaust. High emissions.
Water Ring vacuum pump:
▪ Water gets contaminated with solvent.
▪ Partial recovery of solvent. Difficult to treat the effluent.
▪ Can generate vacuum up to 690 mm Hg only.
▪ Solvent escapes from exhaust. High emissions.
Oil ring vacuum pump:
▪ Oil gets contaminated with solvent. Frequent replacement of oil.
▪ High emissions.
▪ Difficult to dispose the contaminated oil.
STEAM EJECTORS

Climate and Clean Air Coalition (CCAC)
Reducing Air Pollution in India’s Industrial Cluster through Smart Energy Management August 2020 | 73
LIQUID RING VACUUM PUMP
Reduction of Loss from Vacuum System
▪ Solvent from exhaust of vacuum system can be recovered completely if there is no motive
fluid in the vacuum system
▪ Effluent generation from vacuum system can be avoided if solvent vapour does not come
in to contact with any motive fluid.
▪ Usage of expensive utilities like steam, Cooling Water, Chilled water not required in the
absence of motive fluid for generating vacuum
Dry Vacuum Pump
▪ There is no motive fluid.
▪ Elimination of steam usage. Cost of utility is exceptionally low. Motor of 7.5 to 10 Kw is
enough.
▪ Solvent from exhaust can be condensed and recycled. No contamination of solvent.
▪ Solvent emission to atmosphere is nil.
▪ Ultimate vacuum < 1 mbar(a).
▪ Higher capacity & vacuum achievable if used in combination with mechanical booster(s)
and/or vapor boosters.

Climate and Clean Air Coalition (CCAC)
Reducing Air Pollution in India’s Industrial Cluster through Smart Energy Management August 2020 | 74
DRYSTAR PUMP
Reduction in VOC by Replacing Steam Ejector with Dry Vacuum System (Case
Study II)
▪ Ethylene Dichloride (EDC) solvent is recovered after the Reaction under vacuum at less
than 50oC. Vacuum is used because Product is thermally sensitive.
▪ About 5 Tons of EDC recovered / day. About 1.3 Tons / day of EDC loss from steam
ejector (about 100 kgs/ hr loss)
▪ Operators used to feel skin itching and uneasiness due to high concentrations of EDC in environment.
1 Inlet flange
2 Upper bearing in removable cartridge
3 Coolant jacket
4 Heat exchanger for
cooling water circuit
5 Three stage claw
mechanism
6 Reversed claws for
shortest gas path
7 Outlet flange
8 Gear box
9 Clutch assembly
12
3
45
6
7
9
8

Climate and Clean Air Coalition (CCAC)
Reducing Air Pollution in India’s Industrial Cluster through Smart Energy Management August 2020 | 75
▪ It is impossible to minimize this loss because EDC vapor does not completely condense
in condensers before ejector. Some EDC will escape along with air / nitrogen through the
ejector.
▪ Condensers at the outlet of ejectors required to minimize this loss but EDC gets
contaminated with motive fluid steam used in the Ejector.
▪ EDC vapours can easily be condensed if dry vacuum system is used.
S. N. Details EDC Consumption
1. Consumption of EDC MT/day 2.10
2. Saving in EDC Consumption, MT/day with one Dry Vacuum
Pump
1.20
3. Saving of EDC/annum, MT 396
4. Average Cost of EDC/MT, Rs. 31000
5. Saving on DCE, Rs. Lacs 123
6. Savings in Utilities 15
Total Saving on Steam Power and EDC, Million INR 13.3
Dry Vacuum Pumps
Crystallization after Solvent Change Over (Case Study III)
▪ In chemical Reactions, solvent used for Reaction will have high solubility of product.
▪ In crystallizations, solvent used for crystallization shall have exceptionally low solubility so
that maximum product is isolated by Crystallization.

Climate and Clean Air Coalition (CCAC)
Reducing Air Pollution in India’s Industrial Cluster through Smart Energy Management August 2020 | 76
▪ Solvent I used for Reaction is distilled out and then solvent II used for crystallization is
charged. Complete removal of solvent I is especially important to ensure good yield of the
product. This operation is done under vacuum.
▪ In this case Acetone is used as Solvent for Reaction and Isopropyl Alcohol is used for
Crystallization.
Crystallization before Modification

Climate and Clean Air Coalition (CCAC)
Reducing Air Pollution in India’s Industrial Cluster through Smart Energy Management August 2020 | 77
Crystallization After Modification
COMPARISON
Before Modification
▪ About 50 % of Acetone distilled at atmospheric pressure. Temperature: 70 o C
▪ Vacuum applied and about 20% acetone is distilled at 70 o C. Water jet ejector used to
get vacuum
▪ Product precipitates after distilling 60% Acetone and agitator gets jammed
▪ IPA is charged to avoid agitator getting jammed
▪ IPA + Acetone distilled out under vacuum. About 15 % Acetone is removed.
▪ Vacuum applied through common header. Maximum vacuum achieved was 100 mm
hg(abs)
▪ Loss of Acetone from Vacuum Pump exhaust was high causing high VOC
▪ Product exposed to high temperature, 70 to 75 o C for about 20 hrs/ day leading to
decomposition
▪ Product yield was 60 % due to incomplete removal of Acetone
▪ Additional equipment to recover product in filtrate as second crop.
▪ Overall yield 82.5%
After modification
▪ About 98 % Acetone distilled out under vacuum at less than 40 oC
▪ Dry vacuum pump installed near the Crystallizer to get good vacuum
▪ There is enough vacuum to completely remove even after precipitation and jamming of
Agitator
▪ Charged IPA after completely removing Acetone

Climate and Clean Air Coalition (CCAC)
Reducing Air Pollution in India’s Industrial Cluster through Smart Energy Management August 2020 | 78
▪ Dedicated dry vacuum pump kept close to the Reactor applied high vacuum at the
beginning itself (about 5 mm hg absolute pressure)
▪ Chilled water condenser provided at the exhaust of vacuum pump to recover Acetone
completely and no VOC at the exhaust
▪ Maximum temperature 40 o C and batch time reduced to 8 hrs
▪ Product yield high (95%) due to complete removal of IPA before charging second crop
▪ No need to recover second crop.
Summary of savings (Case Study III) Operation Without Dry Vacuum Pump
S.
N.
Description Unit Value
1 Average quantity of solvent Input Its 4100
2 Average quantity of solvent output Its 3150
3 Loss of Acetone during filtration and
distillation
Its 950
Common Vent Systems
▪ All batch tanks, receivers, reactors, vents from condensers shall be connected to common
vent headers.
▪ Equipment containing compatible chemicals only shall be connected to common headers.
More than one common header may be provided depending on the compatibility.
▪ Avoid using PVC, HDPE, PPFRP materials for common headers because of presence of
organic vapours ▪ Use the right MOC for headers. It is not possible to detect the leakage of vapours in
operating plant because they are located at higher elevation
▪ Vent headers shall be connected separately to common scrubber by providing trap and
barometric loops. This is to avoid entry of scrubber liquid to vessels through common
header.
Operation with Dry Vacuum Pump
S. N. Description Unit Value
1 Average quantity of solvent Input Lts 4100
2 Average quantity of solvent output Lts 3800
3 Loss of Acetone during filtration and distillation Lts 300
4 Additional quantity of Acetone recovered per batch Lts 650
5 Additional quantity of Acetone recovered per batch kgs 514
6 Landed Cost of Acetone solvent / kg Rs. 56
7 Value of Acetone saved/ day Rs 28784
8 Value of additional product output - 150 4 Rs 135000
(Yield improved from 82.5 % to 95%)
9 Number of batches / months Nos 24
10 Additional profit / month Rs lack 39

Climate and Clean Air Coalition (CCAC)
Reducing Air Pollution in India’s Industrial Cluster through Smart Energy Management August 2020 | 79
Vent Systems
Process Equipment’s
▪ Number of common vent headers based on compatibility of chemicals.
▪ Provision of cold trap before scrubbers to trap volatile organic vapours.
▪ Heat exchanger with chilled water circulation traps solvent which can be used as fuel for
Incinerator
CONCLUSION
▪ Minimization of solvent loss and reduction of VOC’s is the biggest concern in batch
process industries
▪ Reduction of solvent loss by adoption of Cleaner Production Technologies is easy and
makes organizations more profitable and highly competitive.
▪ Efforts required for minimization of solvent loss and waste generation are far less than the
efforts required to treat wastes contaminated with solvents and sustain the business in
the highly competitive global market.
▪ Lack of knowledge and poor engineering practices are main reasons for extremely high
VOCs in the Environment surrounding industry.
▪ It is especially important to educate the Industry regarding harmful effects of VOCs and
any effort to minimise VOCs will result in substantial enhancement in profits. Return on
investment on equipment to minimise VOCs is 3 months to 6 months.
ScrubberVent Header

Climate and Clean Air Coalition (CCAC)
Reducing Air Pollution in India’s Industrial Cluster through Smart Energy Management August 2020 | 80
Annexure-VI
Total VOC Exposure Guidelines Recommended by the
Commission of the European Communities (CEC 1992)

Climate and Clean Air Coalition (CCAC)
Reducing Air Pollution in India’s Industrial Cluster through Smart Energy Management August 2020 | 81
Total VOC Exposure Guidelines Recommended by the Commission of the
European Communities (CEC 1992)
Substances Exposure Guideline 96 Hr. Average
(Itgim3)
Alkanes 100
Aromatic hydrocarbons 50
Terpenes 30
Halocarbons 30
Esters 20
Aldehydes and ketones (excluding
formaldehyde)
20
Other 50
Sum of VOC 300
Massachusetts Threshold Effects Exposure Limits (TELS) and Allowable Ambient
Limits (AALS) for Ambient Air
Chemical CAS
Number
Threshold Effects
Exposure Limit (TEL)
Allowable Ambient
Limit (AAL)
24 – Hour Average Annual Average
ug/m3 (ppb) ug/m3 (ppb)
* Acetaldehyde 75070 2 (1.11) 0.5 (0.28)
Acetone 67641 160.54 (68.03) 160.54 (68.03)
* Acrylonitrile 107131 0.4 (0.18) 0.01 (0.0046)
Alkanes / Alkenes (Not to
Exceed 25% n-Hexane)
95.24 - 47.62 -
* Ammonia 7664417 100 (143.57) 100 (143.57)
* Aniline 62533 0.2 (0.053) 0.1 (0.026)
Antimony 7440360 2 - 1 -
Arsenic 7440382 0.0005 - 0.0002 -
Asbestos 1332214 0.0002 f/cm3 0.000004
f/cm3
Benzene 71432 1.74 (0.54) 0.12 (0.04)
Benzyl Chloride 100447 14.08 (2.72) 0.94 (0.18)
Beryllium 7440417 0.001 - 0.0004
1,3-Butadiene 106990 1.20 (0.54) 0.003 (0.002)
n-Butyl Alcohol 71363 412.24 (136.05) 412.24 (136.05)
Cadmium 7440439 0.003 - 0.001 -
Calcium Chromate 13765190 0.003 - 0.0001 -
Carbon Disulfide 75150 0.1 (0.032) 0.1 (0.032)
Carbon Tetrachloride 56235 85.52 (13.61) 0.07 (0.01)
Carbonyl Sulfide 463581 0.1 (0.041) 0.1 (0.041)
Chlordane 57749 0.14 (0.008) 0.03 (0.002)
Chromic Acid 7738945 0.003 - 0.0001 -
Chromium (metal) 7440473 1.36 0.68 -
Chromium (VI)
Compounds
0.003 0.0001 -
Copper 7440508 0.54 - 0.54 -
p-Cresol 106445 24.05 (5.44) 12.02 (2.72)

Climate and Clean Air Coalition (CCAC)
Reducing Air Pollution in India’s Industrial Cluster through Smart Energy Management August 2020 | 82
Cyclohexane 110827 280.82 (81.63) 280.82 (81.63)
o-Dichlorobenzene 95501 81.74 (13.61) 81.74 (13.61)
p-Dichlorobenzene 106467 122.61 (20.41) 0.18 (0.03)
1,2-Dichloroethane 107062 11.01 (2.72) 0.04 (0.01)
1,2-Dichloroethylene 540590 215.62 (54.42) 107.81 (27.21)
Dichloromethane 75092 9.45 (2.72) 0.24 (0.07)
1,2-Dichloropropane 78875 0.9 (0.19) 0.05 (0.01)
Diethylamine 109897 8.13 (2.72) 4.07 (1.36)
Di(2-ethylhexyl) phthalate 117817 1.36 (0.09) 0.77 (0.05)
Dimethylformamide 68122 6 (2.01) 3 (1.004)
1,4-Dioxane 123911 24.49 (6.80) 0.24 (0.07)
Diphenyl 92524 0.34 (0.05) 0.09 (0.01)
Diphenylamine 122394 2.72 (0.39) 0.68 (0.10)
Epichlorohydrin 106898 0.08 (0.021) 0.08 (0.021)
Ethanol 64175 51.24 (27.21) 51.24 (27.21)
Ethyl Acetate 141786 391.84 (108.84) 391.84 (108.84)
Ethyl Acrylate 140885 0.56 (0.14) 0.28 (0.07)
Ethylbenzene 100414 300 (69.09) 300 (69.09)
Ethylene Glycol 107211 34.50 (13.61) 34.50 (13.61)
Ethyl Ether 60297 329.80 (108.84) 164.90 (54.42)
Fluoride 16984488 6.80 (8.76) 6.80 (8.76)
Formaldehyde 50000 0.33 (0.27) 0.08 (0.06)
Furan 110009 0.40 (0.14) 0.02 (0.007)
Heptachlor 76448 0.14 (0.009) 0.001 (0.0001)
Hexachlorocyclopentadiene 77474 0.006 (0.0005) 0.006 (0.0005)
Hexachloroethane 67721 0.53 (0.05) 0.25 (0.03)
2-Hexanone 591786 10.88 (2.66) 10.88 (2.66)
Hydrazine 302012 0.007 (0.005) 0.002 (0.001)
Hydrogen Bromide 10035106 5 (1.51) 5 (1.51)
Hydrogen Chloride 7647010 7 (4.69) 7 (4.69)
Hydrogen Cyanide 74908 0.6 (0.54) 0.3 (0.27)
Hydrogen Fluoride 7664393 0.68 (0.83) 0.34 (0.42)
Hydrogen Sulfide 7783064 0.9 (0.65) 0.9 (0.65)
Isoamyl Acetate 123922 144.76 (27.21) 144.76 (27.21)
Isobutyl Acetate 110190 193.77 (40.82) 193.77 (40.82)
Isobutyl Alcohol 78831 41.22 (13.61) 41.22 (13.61)
Isopropyl Acetate 108214 283.81 (68.03) 283.81 (68.03)
Lead 7439921 0.14 - 0.07 -
Lead Subacetate 1335326 0.14 - 0.01 -
Lindane 58899 0.14 (0.11) 0.003 (0.0002)
Maleic Anhydride 108316 0.27 (0.07) 0.14 (0.03)
Mercury (elemental) 7439976 0.14 - 0.07 -
(inorganic) 0.14 - 0.01 -
(methylmercury) 0.003 - 0.0014 -
Methanol 67561 7.13 (5.44) 7.13 (5.44)
* 2-Methoxy Ethanol 109864 3 (0.96) 2 (0.64)
Methyl Acrylate 96333 9.57 (2.72) 4.79 (1.36)
Methyl Bromide 74839 5.28 (1.36) 2.64 (0.68)
Methyl Ethyl Ketone (MEK) 78933 200 (67.82) 10 (3.39)

Climate and Clean Air Coalition (CCAC)
Reducing Air Pollution in India’s Industrial Cluster through Smart Energy Management August 2020 | 83
Methyl Isobutyl Ketone
(MIBK)
108101 55.70 (13.61) 55.70 (13.61)
Methyl Methacrylate 80626 22.27 (5.44) 22.27 (5.44)
Naphthalene (including 2-
methylnaphthalene)
91203 14.25 (2.72) 14.25 (2.72)
Nickel (metal) 7440020 0.27 - 0.18 -
Nickel Oxide 1313991 0.27 - 0.01 -
Nitrobenzene 98953 13.69 (2.72) 6.84 (1.36)
Pentachlorophenol 87865 0.01 (0.001) 0.01 (0.001)
Phenol 108952 52.33 (13.61) 52.33 (13.61)
Phosphoric Acid 7664382 0.27 (0.07) 0.27 (0.07)
Phthalic Anhydride 85449 1.65 (0.27) 0.82 (0.14)
PCBs 1336363 0.003 0.0005 -
Propyl Alcohol 71238 133.63 (54.42) 133.63 (54.42)
* Propylene Oxide 75569 6 (2.53) 0.3 (0.13)
Resorcinol 108463 12.24 (2.72) 3.06 (0.68)
Selenium 7782492 0.54 0.54 -
Selenium Sulfide 7446346 0.54 - 0.05 -
*Styrene 100425 200 (46.96) 2 (0.47)
Sulfuric Acid 7664939 2.72 (0.68) 2.72 (0.68)
1,1,2,2-Tetrachloro- 1,2-
Difluoroethane
76120 1133.33 (136.05) 566.67 (68.03)
1,1,2,2-Tetrachloroethane 79345 18.67 (2.72) 0.02 (0.003)
Tetrachloroethylene 127184 922.18 (136.05) 0.02 (0.003)
Tetrahydrofuran 109999 160.35 (54.42) 80.18 (27.21)
*Toluene 108883 80 (21.23) 20 (5.31)
Toluene Diisocyanate 584849 0.10 (0.01) 0.10 (0.01)
o-Toluidine 95534 2.38 (0.54) 0.17 (0.04)
1,1,1-Trichloroethane 71556 1038.37 (190.48) 1038.37 (190.48)
1,1,2-Trichloroethane 79005 14.84 (2.72) 0.06 (0.01)
Trichloroethylene 79016 36.52 (6.80) 0.61 (0.11)
2,4,6-Trichlorophenol 88062 0.16 -
*Triethylamine 121448 1 (0.24) 0.7 (0.17)
Vanadium 1314621 0.27 - 0.27 -
Vanadium Pentoxide 1314621 0.14 (0.02) 0.03 (0.005)
NOTE: All new and revised values are expressed in ug/m 3 to one significant figure. To allow for
more accurate interconversion between ug/m 3 and ppb, no rounding of the ppb-equivalent values
was conducted.
New and revised criteria are shaded.
*Criteria which were derived based on an Environmental Protection Agency Reference Concentration
(RfC).

Climate and Clean Air Coalition (CCAC)
Reducing Air Pollution in India’s Industrial Cluster through Smart Energy Management August 2020 | 84
Reducing Air Pollution in India’s
Industrial Cluster through
Smart Energy Management