Reduced availability of voltage-gated sodium channels by depolarization or blockade by tetrodotoxin...
23
J Physiol 593.4 (2015) pp 905–927 905 The Journal of Physiology Neuroscience Reduced availability of voltage-gated sodium channels by depolarization or blockade by tetrodotoxin boosts burst firing and catecholamine release in mouse chromaffin cells David H. F. Vandael 1 , Matteo M. Ottaviani 1 , Christian Legros 2 , Claudie Lefort 2 , Nathalie C. Gu´ erineau 2 , Arianna Allio 1 , Valentina Carabelli 1 and Emilio Carbone 1 1 Department of Drug Science, Laboratory of Cellular and Molecular Neuroscience, NIS Center, CNISM Unit, Torino, Italy 2 CNRS UMR6214, Inserm U1083, Laboratory of Integrated Neurovascular and mitochondrial Biology, Angers, France Key points Mouse chromaffin cells (MCCs) of the adrenal medulla possess fast-inactivating Nav channels whose availability alters spontaneous action potential firing patterns and the Ca 2+ -dependent secretion of catecholamines. Here, we report MCCs expressing large densities of neuronal fast-inactivating Nav1.3 and Nav1.7 channels that carry little or no subthreshold pacemaker currents and can be slowly inactivated by 50% upon slight membrane depolarization. Reducing Nav1.3/Nav1.7 availability by tetrodotoxin or by sustained depolarization near rest leads to a switch from tonic to burst-firing patterns that give rise to elevated Ca 2+ -influx and increased catecholamine release. Spontaneous burst firing is also evident in a small percentage of control MCCs. Our results establish that burst firing comprises an intrinsic firing mode of MCCs that boosts their output. This occurs particularly when Nav channel availability is reduced by sustained splanchnic nerve stimulation or prolonged cell depolarizations induced by acidosis, hyper- kalaemia and increased muscarine levels. Abstract Action potential (AP) firing in mouse chromaffin cells (MCCs) is mainly sustained by Cav1.3 L-type channels that drive BK and SK currents and regulate the pacemaking cycle. As secretory units, CCs optimally recruit Ca 2+ channels when stimulated, a process potentially dependent on the modulation of the AP waveform. Our previous work has shown that a critical determinant of AP shape is voltage-gated sodium channel (Nav) channel availability. Here, we studied the contribution of Nav channels to firing patterns and AP shapes at rest (−50 mV) and upon stimulation (−40 mV). Using quantitative RT-PCR and immunoblotting, we show that MCCs mainly express tetrodotoxin (TTX)-sensitive, fast-inactivating Nav1.3 and Nav1.7 channels that carry little or no Na + current during slow ramp depolarizations. Time constants and the percentage of recovery from fast inactivation and slow entry into closed-state inactivation are similar to that of brain Nav1.3 and Nav1.7 channels. The fraction of available Nav channels is reduced by half after 10 mV depolarization from −50 to −40 mV. This leads to low amplitude spikes and a reduction in repolarizing K + currents inverting the net current from outward to inward during the after-hyperpolarization. When Nav channel availability is reduced by up to 20% of total, either by TTX block or steady depolarization, a switch from tonic to burst firing is observed. The spontaneous occurrence of high frequency bursts is rare under control conditions (14% of cells) but leads to major Ca 2+ -entry and increased catecholamine release. Thus, Nav1.3/Nav1.7 channel availability sets the AP shape, burst-firing initiation and regulates C 2014 The Authors. The Journal of Physiology C 2014 The Physiological Society DOI: 10.1113/jphysiol.2014.283374
-
Upload
independent -
Category
Documents
-
view
2 -
download
0
Transcript of Reduced availability of voltage-gated sodium channels by depolarization or blockade by tetrodotoxin...

J Physiol 593.4 (2015) pp 905–927 905
The
Jou
rnal
of
Phys
iolo
gy
Neuroscience Reduced availability of voltage-gated sodium channels by
depolarization or blockade by tetrodotoxin boosts burstfiring and catecholamine release in mouse chromaffin cells
David H. F. Vandael1, Matteo M. Ottaviani1, Christian Legros2, Claudie Lefort2, Nathalie C. Guerineau2,Arianna Allio1, Valentina Carabelli1 and Emilio Carbone1
1Department of Drug Science, Laboratory of Cellular and Molecular Neuroscience, NIS Center, CNISM Unit, Torino, Italy2CNRS UMR6214, Inserm U1083, Laboratory of Integrated Neurovascular and mitochondrial Biology, Angers, France
Key points
� Mouse chromaffin cells (MCCs) of the adrenal medulla possess fast-inactivating Nav channelswhose availability alters spontaneous action potential firing patterns and the Ca2+-dependentsecretion of catecholamines.
� Here, we report MCCs expressing large densities of neuronal fast-inactivating Nav1.3 andNav1.7 channels that carry little or no subthreshold pacemaker currents and can be slowlyinactivated by 50% upon slight membrane depolarization.
� Reducing Nav1.3/Nav1.7 availability by tetrodotoxin or by sustained depolarization near restleads to a switch from tonic to burst-firing patterns that give rise to elevated Ca2+-influx andincreased catecholamine release.
� Spontaneous burst firing is also evident in a small percentage of control MCCs.� Our results establish that burst firing comprises an intrinsic firing mode of MCCs that boosts
their output. This occurs particularly when Nav channel availability is reduced by sustainedsplanchnic nerve stimulation or prolonged cell depolarizations induced by acidosis, hyper-kalaemia and increased muscarine levels.
Abstract Action potential (AP) firing in mouse chromaffin cells (MCCs) is mainly sustainedby Cav1.3 L-type channels that drive BK and SK currents and regulate the pacemaking cycle.As secretory units, CCs optimally recruit Ca2+ channels when stimulated, a process potentiallydependent on the modulation of the AP waveform. Our previous work has shown that a criticaldeterminant of AP shape is voltage-gated sodium channel (Nav) channel availability. Here, westudied the contribution of Nav channels to firing patterns and AP shapes at rest (−50 mV)and upon stimulation (−40 mV). Using quantitative RT-PCR and immunoblotting, we showthat MCCs mainly express tetrodotoxin (TTX)-sensitive, fast-inactivating Nav1.3 and Nav1.7channels that carry little or no Na+ current during slow ramp depolarizations. Time constantsand the percentage of recovery from fast inactivation and slow entry into closed-state inactivationare similar to that of brain Nav1.3 and Nav1.7 channels. The fraction of available Nav channelsis reduced by half after 10 mV depolarization from −50 to −40 mV. This leads to low amplitudespikes and a reduction in repolarizing K+ currents inverting the net current from outwardto inward during the after-hyperpolarization. When Nav channel availability is reduced by upto 20% of total, either by TTX block or steady depolarization, a switch from tonic to burstfiring is observed. The spontaneous occurrence of high frequency bursts is rare under controlconditions (14% of cells) but leads to major Ca2+-entry and increased catecholamine release.Thus, Nav1.3/Nav1.7 channel availability sets the AP shape, burst-firing initiation and regulates
C© 2014 The Authors. The Journal of Physiology C© 2014 The Physiological Society DOI: 10.1113/jphysiol.2014.283374

906 D. H. F. Vandael and others J Physiol 593.4
catecholamine secretion in MCCs. Nav channel inactivation becomes important during periodsof high activity, mimicking stress responses.
(Received 29 August 2014; accepted after revision 5 December 2014; first published online 12 December 2014)Corresponding author Emilio Carbone: Department of Drug Science, Corso Raffaello 30, 10125 Torino, Italy.Email: [email protected]
Abbreviations AHP, after-hyperpolarization; AP, action potential; BCC, bovine chromaffin cell; CC, chromaffin cells;DMEM, Dulbecco’s modified Eagle’s medium; ISI, interspike interval; LTCC, L-type calcium channel; MCC, mousechromaffin cell; Nav, voltage-gated sodium channel; RCC, rat chromaffin cell; TTX, tetrodotoxin.
Introduction
Chromaffin cells (CCs) of the adrenal medulla representthe main hub of the sympathetic nervous system. Uponsplanchnic nerve stimulation, they secrete catecholaminesthat are central players of the stress response (deDiego et al. 2008; Guerineau et al. 2012). To exerttheir function, CCs are endowed with a broad arrayof ion channels that support action potential (AP)generation in a spontaneous manner (Vandael et al.2010). Upon splanchnic nerve discharge, acetylcholineleads to sustained cell depolarizations, which increasethe firing frequency, Ca2+-entry and exocytosis ofcatecholamine-containing vesicles (Garcia et al. 2006).
Recent studies have shown the importance of Cav1.3L-type Ca2+ channels (LTCCs) in driving spontaneousfiring in mouse chromaffin cells (MCCs) (Marcantoniet al. 2007; Marcantoni et al. 2010). Nevertheless, reportssuggesting a partial contribution of voltage-gated Na+channels (Nav) to CC excitability can be found. Earlystudies showed the existence of a background sodiumconductance that could drive Na+-influx at rest inrat and gerbil CCs (Biales et al. 1976; Brandt et al.1976). Tetrodotoxin (TTX) application or Na+ removalfrom the extracellular medium reduces but does notblock rat CCs firing (Kidokoro & Ritchie, 1980). InMCCs, Nav channel blockade by TTX preserves AP firing(Nassar-Gentina et al. 1988), suggesting that Nav channelsplay a different role in excitability than LTCCs (Vandaelet al. 2010). Furthermore, Nav channels in MCCs activateat 24 mV more positive potentials than Cav1.3, suggestinga minor contribution to subthreshold pacemaker currents(Mahapatra et al. 2011). As in most neurons, Nav channelsare shown to be critical for shaping the AP waveform inMCCs (Vandael et al. 2012). Subtle changes in spike shapecan lead to drastic changes in Ca2+ channel recruitmentand in AP-induced Ca2+ transients (Li et al. 2007). APbroadening is indeed a common way to optimize pre-synaptic Ca2+ influx at central presynaptic terminals(Engel & Jonas, 2005).
At present, Nav1.7 is considered to be the mainvoltage-gated Nav channel expressed in bovine and humanadrenal tissues (Klugbauer et al. 1995; Sangameswaranet al. 1997). In the rat adrenal gland, mRNA encoding
Nav1.7 is expressed only in the medulla (Morinville et al.2007), with a plausible localization in CCs, as also reportedin PC12 cells (Toledo-Aral et al. 1997). The few functionalstudies performed with CC Nav channels show that theyare TTX-sensitive, fast-inactivating and rather insensitiveto closed-state inactivation (Fenwick et al. 1982; Louet al. 2003; Wada et al. 2008; Mahapatra et al. 2011). Thecontribution of Nav channels to CC spiking at rest andupon stimulation remains controversial and studies thathave considered Nav properties and availability at physio-logically relevant potentials (−55 to −40 mV) are lacking.
In the present study, using quantitative RT-PCR andwestern-blot analysis, we show that, besides Nav1.7,Nav1.3 is highly expressed together with β1–3 sub-units. The two principal MCC Nav channels possessrather similar activation–inactivation properties (Catterallet al. 2005) and contribute to spike generation butnot to the pacemaker current. This is evident whenboth channels are blocked by TTX or when theiravailability is strongly reduced by steady inactivationduring slight membrane depolarizations. Block or reducedNav1.3/Nav1.7 availability induces a switch of firingfrom tonic single APs to doublet and triplet bursts ofAPs, which cause a paradoxical increase of Ca2+-entryand catecholamine secretion. Nav channel inactivationthus appears to comprise an important phenomenonthat boosts MCC output during strong splanchnic nervedischarges as occurs during the stress response (Garciaet al. 2006) or during prolonged depolarizations nearrest induced by acidosis, hyperkalaemia or increasedmuscarine levels.
Methods
Ethical approval
Ethical approval for all experimental protocols wasobtained from the University of Torino Animal Careand Use Committee, Torino, Italy. All experiments wereconducted in accordance with the National Guide for theCare and Use of Laboratory Animals adopted by the ItalianMinistry of Health. Every effort was made to minimizeanimal suffering and the number of animals used. For
C© 2014 The Authors. The Journal of Physiology C© 2014 The Physiological Society

J Physiol 593.4 Burst firing in chromaffin cells 907
removal of tissues, animals were deeply anaesthetized withCO2 inhalation and rapidly killed by cervical dislocation.
Cell culture
Chromaffin cells were obtained from male C57BL/6 Jmice (Harlan, Correzzano, Italy) aged 3 months. Animalswere killed by cervical dislocation. All procedures wereperformed in accordance with the guidelines establishedby the National Council on Animal Care and wereapproved by the local Animal Care committee of theUniversity of Turin. Under sterile conditions, the abdomenwas opened, and then the adrenal glands were isolatedand transferred to an ice-cold Ca2+ and Mg2+ free Locke’sbuffer containing (in mM) 154 NaCl, 3.6 KCl, 5.6 NaHCO3,5.6 glucose and 10 Hepes (pH 7.4) (Marcantoni et al. 2009;Vandael et al. 2012). Under a dissecting microscope, theadrenal glands were decapsulated and subsequently sub-jected to an enzymatic dissociation with 20–25 units ml–1
papain (Worthington Biochemical Corporation, Segrate,Italy) dissolved in Dulbecco’s modified Eagle’s medium(DMEM) (Gibco, Invitrogen Life Technologies, Monza,Italy) supplemented with 1.5 mM of L-cysteine, 1 mM ofCaCl2 and 0.5 mM of EDTA (Sigma-Aldrich, Munich,Germany) for 25 −30 min at 37°C in a water saturatedatmosphere with 5% CO2. Afterwards, two washing stepswere performed with DMEM supplemented with 1 mM
CaCl2 and 10 mg ml–1 of BSA (Sigma-Aldrich). Adrenalmedulla’s were re-suspended in DMEM containing 1%penicillin/streptomycin and 15% fetal bovine serum(both from Sigma-Aldrich) and were mechanicallydissociated with a fire polished Pasteur pipette. A drop(100 μl) of this concentrated cell suspension was platedon poly-ornithine (1 mg ml–1) and laminin (5 μg ml–1)coated Petri dishes and, subsequently (30 min later),1.9 ml of DMEM containing 1% penicillin/streptomycinand 15% fetal bovine serum (all from Sigma-Aldrich)was added. The primary CC culture was maintained in anincubator at 37°C at water saturated atmosphere with 5%CO2. Measurements were performed on cultured MCCs2–5 days after plating.
Electrophysiology
Macroscopic whole-cell currents and APs were recordedin perforated-patch conditions using a multiclamp 700-Bamplifier and pClamp 10.0 software (Molecular Devices,Sunnyvale, CA, USA) (Marcantoni et al. 2010; Vandaelet al. 2012). Traces were sampled at 10 kHz usinga digidata 1440 A acquisition interface (MolecularDevices) and filtered using a low-pass Bessel filter setat 1–2 kHz. Borosilicate glass pipettes (Kimble ChaseLife Science, Vineland, NJ, USA) with a resistance of2–3 M� were dipped in an Eppendorf tube containingintracellular solution before being back filled with thesame solution containing 500 μg ml–1 of amphotericin
B (Sigma-Aldrich), dissolved in dimethyl sulphoxide(Sigma-Aldrich) (Cesetti et al. 2003). Recordings wereinitiated after amphotericin B lowered the access resistancebelow 15 M� (5–10 min). Series resistance wascompensated by 80% and monitored throughout theexperiment. Fast capacitive transients during stepwisedepolarizations (in voltage-clamp mode) were minimizedonline by the use of patch clamp analogue compensation.Uncompensated capacitive currents were further reducedby subtracting the averaged currents in response toP/4 hyperpolarizing pulses. To eliminate any additionalleakage current, the recorded ion current during stepdepolarizations was subtracted from traces measuredin the presence of saturating concentrations of TTX(300 nM) (Carbone & Lux, 1986). The same was appliedfor the AP-clamp experiments in which the cell wasclamped to a train of previously recorded APs. L-typeCa2+ currents were isolated by subtracting the non-L-typecurrent (in the presence of nifedipine, 3 μM) from thewhole-cell Ca2+ current.
Single channel recordings were performed on perfor-ated microvesicles that were pulled out of the cell afteramphotericin B lowered the access resistance below15 M� (Levitan & Kramer, 1990). Glass pipettes forthis purpose were pulled and fired polished to obtainelectrode resistances of �7 M� (Carabelli et al. 2001).Single channel recordings were sampled at 20 kHz andlow-pass filtered at 2 kHz. Blockade by TTX at the endof the recording gave rise to single channel-free base-line traces that were averaged and used to correct forthe capacitive artefacts. Further baseline correction wasperformed manually using Clampfit software (MolecularDevices). Mean open and closed times were analysedusing pClamp software (Molecular Devices). The criteriafor selecting the detection levels of channel openingand closing were similar to those described previously(Carbone & Lux, 1987; Carabelli et al. 2001). The effectiveminimal duration of detectable opening and closing wasset to 150 μs (Carbone & Lux, 1986)
Carbon fibres (tip diameter of 5 μm) were purchasedfrom Ala Scientific Instruments Inc. (Westbury, NY,USA). Electrochemical recordings were performed usinga HEKA EPC-10 amplifier (HEKA Elektronik Dr SchulzeGmbH, Lambrecht/Pfalz, Germany). Amperometricmeasurements were performed by positioning the carbonfibre microelectrode (polarized at +800 mV) adjacent tothe cell membrane (Carabelli et al. 2007b; Marcantoniet al. 2009). MCCs were current clamped and spontaneousfiring was suppressed by the injection of −5 pA. Sub-sequently, inhibition was relieved and cells were allowedto fire spontaneously for 40 s. Amperometric currents weresampled at 4 kHz and low-pass filtered at 1 kHz. Data wereanalysed by IGOR macros (WaveMetrics, Lake Oswego,OR, USA) as described previously (Segura et al. 2000). Theanalysis of individual exocytotic events was carried out by
C© 2014 The Authors. The Journal of Physiology C© 2014 The Physiological Society

908 D. H. F. Vandael and others J Physiol 593.4
measuring the parameters: maximum oxidation current(Imax), spike width at half-height (t1/2), total charge of thespike (Q), ascending slope of the spike (m) and time toreach the spike (tp). All experiments were performed atroom temperature.
Solutions
Intracellular solution for current-clamp and Na+current/K+ current measurements in voltage-clamp orAP-clamp mode comprised (in mM): 135 KAsp, 8 NaCl,20 Hepes, 2 MgCl2 and 5 EGTA (pH 7.4) (with NaOH;Sigma-Aldrich). For Ca2+ current recordings, the intra-cellular solution contained (in mM): 135 Cs-MeSO3,8 NaCl, 2 MgCl2 and 20 Hepes (pH 7.4) (withCsOH; Sigma-Aldrich). The extracellular solution usedfor current-clamp measurements is based on a physio-logical Tyrode’s solution containing (in mM): 130 NaCl,4 KCl, 2 CaCl2, 2 MgCl2, 10 Hepes and 10 glucose (pH7.4) (with NaOH). The same solution was also usedto measure K+ currents. KV currents were obtained byapplication of 200 μM Cd2+, whereas Ca2+-activated BKcurrents were estimated by subtracting KV from the totalK+ currents. In rat chromaffin cell (RCCs) and MCCs,500 μM Cd2+ are shown to be effective as 1 μM paxillinefor blocking transient BK channels (Marcantoni et al.2007; Marcantoni et al. 2010) and we have confirmedthat, in 2 mM extracellular Ca2+, 200 μM Cd2+ is aseffective as 500 μM Cd2+ for blocking Cav channels andCa2+-activated BK channels (not shown). In addition,residual Cd2+-insensitive voltage-dependent BK currentscontribute little (<5%) to the total BK currents at +20to +30 mV (Berkefeld & Fakler, 2013). Thus, isolationof transient BK currents using 200 μM Cd2+ appearsto be a justified protocol. The extracellular solutionused for Na+ current measurements comprised (in mM):104 NaCl, 30 TEACl, 4 KCl, 2 CaCl2, 2 MgCl2, 10 Hepesand 10 glucose (pH 7.4) (with NaOH), plus 200 μM
Cd2+. The extracellular solution used for Ca2+ currentmeasurements in voltage- and AP-clamp configurationcontained (in mM): 135 TEA, 2 CaCl, 2 MgCl2, 10 Hepesand 10 glucose (pH 7.4) (with TEA-OH; Sigma-Aldrich).TTX was purchased from Tocris Bioscience (Bristol,UK), dissolved in bi-distilled water and stored at −20°Cuntil used. Solutions were applied using a gravity basedperfusion system. Current-clamp data were not correctedfor the liquid junction potential (15.4 mV at 22°C)(Marcantoni et al. 2010) because TTX (up to 1 μM) didnot affect the liquid junction potential any further.
Real-time PCR and western blotting
Adrenal medullary tissue was prepared from six miceas described previously (Desarmenien et al. 2013).After removal, the glands were incubated in RNAlaterRNA Stabilization Reagent (Sigma-Aldrich, Saint Quentin
Fallavier, France) at 0–4°C for 24 h. Next, the glands weredecapsulated and the cortical tissue was gently separated,under a microscope, from the medulla using micropincersand discarded. Both macrodissected adrenal medulla fromeach animal were pooled and used separately for RNAor protein extraction. Total RNA was extracted usingthe RNeasy micro kit (Qiagen, Courtaboeuf, France).For retrotranscription, total RNA (200 ng) from adrenalmedulla of each animal was used and the reactionswere performed using random hexamer primers and theQuantiTect Reverse Transcription kit (Qiagen). Real-timePCR assays were carried out on a LightCycler 480Instrument II (Roche, Meylan, France) with Sybr SelectMaster Mix (Applied Biosystems, Foster City, CA, USA).Gene-specific primers for real-time PCR (Table 1) weredesigned using Primer3 Software (Rozen & Skaletsky,2000). Differences in transcript level were determinedusing the cycle threshold method, in accordance with themanufacturer’s instructions. Specificity of amplificationwas checked by melting curve analysis and geneexpression was normalized to expression of threehousekeeping genes: Gapdh (glyceraldehyde-3-phosphatedehydrogenase), Gusb (β-glucuronidase) and Hprt (hypo-xanthine phosphoribosyltransferase 1), according to theformula E = 2−[Ct(Target)–Ctmean(Reference)], where Ct is thethreshold cycle. Amplicon sizes (70–106 bp) and ATcontent (47–55%) were chosen to allow comparisonbetween relative expression values obtained for each gene(Colborn et al. 2008).
For protein extraction, adrenal medullary and braintissues were dissociated using lysis buffer (10 mM Tris-HCl,pH 7.4, 5 mM EDTA, 1 mM sodium orthovanadateand 10 mM NaF as phosphatase inhibitors, 10 mM
β-glycerophosphate and 1% Triton X-100), supplementedwith complete mini protease inhibitor tablets (RocheApplied Science, Laval, Quebec, Canada). Adrenalmedullary homogenates were centrifuged for 5 minat 2000×g. The resulting supernatants were collectedand centrifuged for 30 min at 15,000×g. Proteinconcentrations were determined using the Dc ProteinAssay Kit (Bio-Rad Laboratories, Hercules, CA, USA).Equal amount of protein samples (10 μg for adrenalmedulla and 30 μg for brain) were heated for 5 min at95°C, separated on a 7% polyacrylamide gel and trans-ferred onto a nitrocellulose membrane. To ensure equalloading of protein samples, blots were cut in two at�60 kDa. The lower parts of the blots were probed with aspecific anti-β-actin antibody (Mono/Poly BD BiosciencesClontech, Palo Alto, CA, USA; 1:5000). The upper partsof the blots were first probed for the Nav1.3 N-terminal(Sigma-Aldrich, clone 3F3; 1:500) and the Nav1.7C-terminal (University of California, Davis/NationalInstitutes of Health NeuroMab Facility, clone N68/6;1:500). Blots were incubated with a peroxydase-conjugatedsecondary antibodies and the signal was detected using the
C© 2014 The Authors. The Journal of Physiology C© 2014 The Physiological Society

J Physiol 593.4 Burst firing in chromaffin cells 909
Table 1. Sequence of primers used for quantitative RT-PCR
Gene name GenBank accession number Protein name forward primer (5′ to 3′) reverse primer (5′ to 3′)
scn1A NM 018733.2 Nav1.1 TTGCAAGGGGCTTCTGTTTA AGGTCCACAAACTCCGTCACscn2A NM 001099298.2 Nav1.2 GGGTTGCATATGGTTTCCAA CCCAAGGCATTTGCAGTTAscn3A NM 018732.3 Nav1.3 TCCTCAGTAGTGGTGCTTTGG GATGTAAGTGAAGACTTTGTCAGCAscn4A NM 133199.2 Nav1.4 GAAAACCATCACGGTCATCC TCCGAGAGCTTTTTCACAGACscn5A NM 021544.4 Nav1.5 GCCAGATCTCTATGGCAACC TTGCCCTTATTCAGCACGATscn8A NM 001077499.2 Nav1.6 CTGGTGCTGGTTGGACTTC GCCCAGGGCATTAGCTATAAscn9A NM 018852.2 Nav1.7 AAAGCAGGTGGGACAAAGG CTCTCCTTGGCACTCTTTGAGscn10a NM 009134.3 Nav1.8 GCTGAGCCTATCAATGCAGA ACTTGGCAGCATGGAAATCTscn11A NM 011887.3 Nav1.9 TGGGTAGCTTATGGCTTCAAA CTATGAGGCTTGTGAGGGAGAscn1B NM 011322.2 β1 TGCTACAAGAAGATTGCTGCTG AATGGCCAGGTATTCTGAGGscn2B NM 001014761.2 β2 CAGGAGTGTAACAATTGCACAGA GGGTTCCCTGAGAACTCCACscn3B NM 153522.2 β3 CCCCTAGCTTCTCTAGTGCTCA CTGTCTCCGAGGGTACTTCTACAscn4B NM 001013390.2 β4 TGAAGAAGACCCGAGAGAAGA ACCCGTTCTCTGTGTTGTCAGusb NM 010368.1 Gus CTCTGGTGGCCTTACCTGAT CAGTTGTTGTCACCTTCACCTCHprt NM 013556.2 Hprt AGGACCTCTCGAAGTGT ATTCAAATCCCTGAAGTACTCATGapdh NM 008084.2 Gapdh CCGGGGCTGGCATTGCTCTC GGGGTGGGTGGTCCAGGGTT
ECL-Plus Chemiluminescence kit (Amersham Biotech,Little Chalfont, UK). Labelled blots were then exposed toFujifilm Medical X-Ray Film to visualize antibody bindingwith a luminescent image analyser (LAS-3000; Fujifilm,Tokyo, Japan). Intensities of Nav1.3 and Nav1.7 channelbands were normalized to those of β-actin and quantifiedusing Image Gauge software (Fujifilm).
Statistical analysis
Data are given as the mean ± SEM for the number (n)of cells. Statistical significance was estimated with pairedStudent’s t tests in case two groups of measurementshad to be compared and with a one-way ANOVAfollowed by post hoc Bonferroni analysis in case morethan two groups had to be compared with one another.Data were found statistically significant when P � 0.05.Statistical analysis was performed with SPSS software,version 20.0 (IBM Corp., Armonk, NY, USA). Dataanalysis was performed with pClamp and Origin software(OriginLab Corporation, Northampton, MA, USA).
Results
Nav1.3 and Nav1.7 channel expression in MCCs
We first addressed, by real-time PCR, the transcriptionalexpression profile of all known Nav channel isoforms.The data showed a differential expression of the sixmRNAs (scn1a, scn2a, scn3a, scn4s, scn8a and scn9a)encoding Nav1.1, Nav1.2, Nav1.3, Nav1.4, Nav1.6 andNav1.7 TTX-sensitive Nav channels respectively (Fig. 1A,
left). Among the detectable isoforms (26 < Ct < 30),the rank order of the relative mRNAs abundance wasscn3A > scn9a > scn2a > scn1a. Scn3a mRNA levelwas �7-fold higher compared to scn9a (∗∗∗P < 0.001).Scn4a cDNA was amplified with a Ct of 35 and thuswas considered not significantly expressed. Scn8a wasundetectable. Messenger RNAs encoding all TTX-resistantNav channels were detected at very low levels (Ct of 34for scn5a and 35 for scn10a and scn11a) and thereforewere considered absent from the mouse adrenal medullatissue. We also examined the expression profile of theNav channel auxiliary β subunits (Fig. 1A, right). Scn1b,2b and 3b (β1–3 subunits were significantly expressed(26 < Ct < 28), whereas scn4b mRNA (β4 subunit)was considered absent (Ct of 35). Scn1b and scn2b sub-units displayed comparable mRNA expression levels andscnb3 mRNA was found to be 1.7-fold more abundantthan the scnb1 subunit (∗∗P < 0.01). The expressionof Nav1.3 and 1.7 was also investigated at the proteinlevel by immunoblotting using specific antibodies. Thewestern blots (macro-dissected adrenal medulla extracts)showed a strong immunoreactivity for a single band withan apparent molecular weight of �230 kDa (Nav1.3) and�220 kDa (Nav1.7) (Fig. 1B).
Altogether, quantitative RT-PCR experiments andwestern blots indicate that voltage-gated Na+ channelsexpressed in the mouse adrenal medullary tissue areprobably formed by combination of β1–3 subunits withNav α-subunits, with a predominance of Nav1.3 andNav1.7. These data are in agreement with previouslyreported electrophysiological studies showing that MCCNav channels are sensitive to TTX (Mahapatra et al. 2011;Vandael et al. 2012).
C© 2014 The Authors. The Journal of Physiology C© 2014 The Physiological Society

910 D. H. F. Vandael and others J Physiol 593.4
MCC Nav channels are TTX-sensitive and fullyinactivating
Voltage-clamp recordings of Na+ currents at −10 mVwere carried out to confirm TTX sensitivity, as wellas the activation and inactivation properties of MCCNav channels. TTX was perfused in gradually increasingconcentrations and the degree of Na+ current blockwith respect to control was fitted with a dose–responsecurve (Fig. 2A). Half-maximal block was obtained at6.7 ± 0.8 nM (n = 11) and saturation set at �300 nM.This confirms the quantitative RT-PCR data and alsoconfirms that all α-subunits expressed in MCCs (inparticular the two dominant ones: Nav1.3 and Nav1.7)are TTX-sensitive. Accordingly, we used subtraction ofcurrent traces measured in the presence of 300 nM TTXfrom control traces to obtain pure Na+ currents. From thispoint on, we use Nav to refer to a mixture of Nav1.3 andNav1.7 channels.
So far, the activation properties of Na+ channels havebeen described for bovine and rat CCs (Fenwick et al.1982; Lou et al. 2003; Wada et al. 2008). Nav channelactivation properties have been studied also in MCCs
(Mahapatra et al. 2011), although many aspects remainunexplored. Of particular interest in excitable cells is thepresence of persistent Na+ currents, as well as resurgentNa+ currents (Raman & Bean, 1997; Bean, 2007). Totest for the existence of persistent currents, we opted fordepolarization steps of 1 s in duration, representing theaverage time that a MCC spends between two consecutivespontaneous APs. It is known that, besides the persistentnature of slow inactivating Na+ currents, the activationkinetics of these currents are typically shifted to a morenegative Vm (French et al. 1990; Magistretti et al. 1999).These two features are thus ideally suited for a rolein generating spontaneous membrane oscillations andcan be exploited to help distinguish ‘persistent’ from‘transient’ current components. All of the cells tested(n = 8) showed no direct signs of a persistent Na+ currentcomponent (Fig. 2B). For potentials above −20 mV,time constants of channel inactivation (τinact) did notexceed 1 ms, whereas, for −40 and −30 mV, we obtainedτinact = 35.5 ± 11.9 ms and 12.7 ± 2.2 ms, respectively(Fig. 2E). Currents at steady-state did not show the typicalbell-shaped current–voltage relationship (Fig. 2B, arrow)as was observed for the transient current component,
Figure 1. Expression profile of Nav channel α and β-subunit genes and immunodetection of Nav1.3 andNav1.7 proteins in the mouse adrenal medullaA, RT-qPCR data illustrating that, among all Nav channel genes, only TTX-sensitive isoforms are expressed in theadrenal medulla, with major expression for mRNAs encoding Nav1.3 and Nav1.7 (left: ∗∗∗P < 0.001 for scn3acompared to scn9a). Except for scn4b (β4-subunit), all β-subunit mRNAs are present (right: ∗∗P < 0.01 for scn3bcompared to scn1b). Significance tests between groups of data were performed using one-way ANOVA followedby a post hoc Bonferroni test. Data are the mean ± SEM of six independent samples. B, western blot analysis ofproteins extracted from macrodissected mouse adrenal medulla (am, 10 μg) and from mouse brain (b, 30 μg).Note that a 3-fold higher amount of proteins was used for the brain as a result of the weak expression of Nav1.3and Nav1.7 channels, as reported previously (Sangameswaran et al. 1997; Catterall et al. 2005). When probed forNav1.3 and Nav1.7 proteins, a single band is immunodetected at 230 kDa (Nav1.3) and 220 kDa (Nav1.7) in bothtissues, with stronger signal intensities in the adrenal medulla (upper membranes). Immunoblotting of β-actin wasused as a control (lower membranes).
C© 2014 The Authors. The Journal of Physiology C© 2014 The Physiological Society

J Physiol 593.4 Burst firing in chromaffin cells 911
which rose steeply with voltage and had half-maximalactivation (V½) at −21 mV. This suggests that we aremainly dealing with noise fluctuations near the baselinerather than steady-currents conducted by voltage-gatedchannels. Nevertheless, whole-cell Na+ currents were too
noisy at steady state (1 s) to provide conclusive evidence infavour of the absence of persistent Na+ currents. BecauseMCCs typically exhibit high input resistances (2–5 G�),small non-inactivating currents could lead to sizeablemembrane depolarizations, and thus should be carefully
100 ms
2 pA
-20 mV -30 mV -40 mV
10 p
A
10 p
A
10 ms
2 pA
5 ms
-40 -30 -20-1.2
-1.1
-1.0
pA
mV
gslope= 11 pS
Tau
(ms)
mV dwell time
ms
0.00.40.81.2
***
0.0000.001
0.002
0.003
PO (200 - 1000 ms)
-40 -3
0-2
0
ctrl
5 ms
10 nM
30 nM 100 nM
300 nM
0.1 1 10 100 10000
20406080
100
Na+
bloc
k
TTX [nM] 100 ms
200
pA
2 ms20 p
A
5 ms
200
pA
-40 -30 -20 -100
1020304050
-40
-30
-20
-40 mV
-30
-20
-60-40 -20 0 20
-1.2-0.8-0.40
nA
mV
A B
C
D E F G
20 ms2 pA 20 ms2 pA 20 ms2 pA
5 ms1pA
H
-10
-20 mV -30 mV -40 mV
0
Figure 2. Nav channels in MCCs are transient and fully blocked by TTXA, TTX dose–response curve representing the mean of 11 cells, fitted by a sigmoidal function with IC50 = 7 nM.Traces are normalized against control values. Currents were triggered by step depolarizations to −10 mV fromVh = −70 mV every 5 s. B, whole-cell Nav currents after subtraction of TTX-insensitive currents evoked bydepolarizing pulses lasting 1 s in steps of 10 mV from Vh = −70 mV (n = 8). Left inset: transient segment of Navcurrents at an expanded time scale. Right inset: an enlargement of the current at steady-state indicated by thearrow. Bottom inset: I/V relationship for the transient component (continuous line) and the steady-state component(dotted line). C, three representative single channel traces recorded from perforated microvesicles pulled off fromsix MCCs at −20, −30 and −40 mV. Bottom trace represents the ensemble currents obtained by summing-up10 consecutive single channel traces. Decay of the ensemble currents were fitted by a single exponential function(grey line superimposing the current trace). Grey windows show ensemble currents at steady-state indicated bythe arrow. D, single channel slope conductance obtained by linear fit through the mean unitary current amplitudesestimated within the last 800 ms of the recording at −40 mV (226 openings), −30 mV (243 openings) and −20 mV(111 openings). F, time constants of Nav current inactivation for whole-cell currents (referred to B, thick line) andensemble currents (referred to C, dotted line) obtained from single exponential fits. F, single channel mean dwelltimes for the indicated potentials, starting at Vh = −70 mV. G, estimated mean open probability of Nav channelsduring the steady state normalized to the total amount of channels in the patch. H, Single channel traces obtainedat the indicated test potentials at expanded time scale (100 ms).
C© 2014 The Authors. The Journal of Physiology C© 2014 The Physiological Society

912 D. H. F. Vandael and others J Physiol 593.4
evaluated. Based on our recordings, we estimated thatthese currents could not be larger than 1–2 pA.
Single Nav channel recordings in perforatedmicro-vesicles
To better test for the presence of a persistent Na+ currentin MCCs, we studied the properties of single Na+ channelsin perforated micro-vesicles that were pulled out from aperforated-patch configuration (Fig. 2C). This procedureleads to excellent voltage control and allows validation ofthe entity of the measured channels by selective blockers,maintaining the intracellular environment intact (Levitan& Kramer, 1990). Typically, micro-vesicles (n = 6 cells)were obtained containing six to 15 Nav channels. Thetotal number of channels in a patch was estimated bythe maximal number of superimposed channel openingsat potentials of maximal activation (−10 mV) (Carbone& Lux, 1986). Levels were set based on unitary channelcurrent amplitude that was revealed for each potential atsteady state and threshold based statistics were performed(Carabelli et al. 2001; Carabelli et al. 2002). Mostunitary events occurred soon after the onset of thedepolarizing pulse and reopenings were observed forthe whole duration of the recording. Unitary eventsbecame infrequent and dwell times were rather shortlived (Fig. 2C and H). Based on the unitary currentamplitudes at −40, −30 and −20 mV (distributedaround a Gaussian function), we estimated a singlechannel conductance of 11 pS (Fig. 2D), which is ingood agreement with single Nav channel recordings frombovine CCs (BCCs) (13 pS; Fenwick et al. 1982) andchick dorsal root ganglion neurons (11 pS; Carbone &Lux, 1986). Dwell time was measured at steady state(200–1000 ms) because individual channel openings couldbe accurately followed in this time interval. Altogether, thenumber of openings that were included in the analysiswere 226, 243 and 111 for voltage steps to −40, −30and −20 mV, respectively. Concerning the mean dwelltime, single openings significantly increased in duration(∗∗∗P < 0.001, ANOVA, post hoc Bonferroni) at moredepolarized potentials (−30 mV and −20 mV) comparedto −40 mV (Fig. 2F). This is in good agreement withthe reported values in BCCs (Fenwick et al. 1982) anddorsal root ganglion neurons (Carbone & Lux, 1986) ifour MCCs data were shifted by −10 mV to −15 mV toaccount for the different recording conditions (perforatedvesicle vs. outside-out patch). With respect to the Navchannels of BCCs, the mean dwell time in MCCs wasalways below the inactivation time constant (τinact) of theensemble current (mean dwell time 1.35 ms and meanτinact 2.0 ms at −20 mV) (Fig. 2E and F).
One disadvantage of using perforated micro-vesiclesis the rare occurrence of obtaining single ion channel
recordings. This issue limits the possibility to measure withaccuracy the channel open probability (PO). Because wewere interested in persistent Na+ currents (late openings),we measured PO at steady state and divided for the totalnumber of Nav channels estimated at −10 mV where allavailable Nav channels are expected to be open and thewhole-cell current is maximal. PO obtained in this waywas extremely low (PO < 0.0025 with n = 6 at −40 mV;Fig. 2G), suggesting that Na+ channels are more transientthan persistent. Even if, in the worst case, the openings atsteady-state would represent only one single ion channel,open probabilities would not exceed 0.01, which wouldstill be too low to be considered persistent. In stellate cellsof the enthorinal cortex, persistent openings have beenreported to result in PO values in the range of 0.1–0.9(Magistretti et al. 1999).
Finally, the ensemble currents were constructed bysumming up 10 consecutive traces as shown in Fig. 2C(bottom). Again, we found a well-defined transientcomponent with no signs of persistent inward currents at1 s depolarization (shadowed traces in Fig. 2C, bottom).The decay phase of the ensemble current was well fittedby a single exponential with τinact similar to the whole-cellrecordings (Fig. 2E).
Nav channel inactivation in MCCs reduces the size of‘window currents’
The availability of voltage-gated Nav channels dependscritically on the holding potential (Vh) that the cell isclamped to. Given the transient nature of Nav channelsand the low PO, a critical factor that will determine thefinal steady-state current is how many channels will entera Vh-dependent state of slow (ultraslow) inactivation.Accordingly, we performed voltage-clamp experimentsin which we simply stepwise depolarized the cell up to+60 mV (�V = 10 mV) from a Vh varying from −100 mVto −30 mV (Fig. 3). As expected, the maximal currentdensity significantly decreased by �3-fold (∗∗P < 0.01)when the cell was maintained at Vh = −40 mV comparedto −100 mV (Fig. 3B). Maximal current densities plottedvs. Vh revealed a clear sigmoidal relationship (Fig. 4B)with half-available Nav channels at −47.9 ± 1.9 mV. AtVh = −40 mV, the availability of Nav channels reducesfurther to only 30%. This phenomenon will clearly reducethe Nav current amplitudes at critically low pacemakerpotentials between −50 mV and −40 mV.
To quantify the current flowing at steady-statepotentials, we calculated the corresponding ‘windowcurrent’ (Fig. 4A) by measuring activation and steady-stateinactivation at diverse Vh (Fig. 3C). The latter wasobtained by anticipating the test pulse at −10 mV(Imax) by a pre-pulse lasting 100 ms. Multiplying theactivation curve by the inactivation curve gave the PO(V)
C© 2014 The Authors. The Journal of Physiology C© 2014 The Physiological Society

J Physiol 593.4 Burst firing in chromaffin cells 913
(Fig. 4A, middle) that, when multiplied by the whole-cellcurrent (upper traces), led to the inward ‘window current’vs. voltage (Fig. 4A, bottom). As expected, we foundrather low PO values at −40 mV (0.0035) comparedto Vh = −100 mV (0.009). The closer the values for
half-maximal activation and half-maximal inactivation,the bigger the overlap between the relative activationand inactivation curve and the bigger the windowcurrent. We observed that the gap between half-maximalactivation and inactivation became bigger as we fixed
10 ms
500
pA
Vh −100
Vh −80
Vh −60
Vh −40
0.5
nA
2 ms
−120 0 40
0.0
0.2
0.4
0.6
0.8
1.0
g no
rm
mV
0 40
0.0
0.2
0.4
0.6
0.8
1.0
mV
0 40mV
0.0
0.2
0.4
0.6
0.8
1.0
−120 −80 −40 0 40mV
0.0
0.2
0.4
0.6
0.8
1.0
g no
rmg
norm
g no
rm
0 40 80−200
−160
−120
−80
−40
0
0 40 80
0
pA/p
F
0
−80 −40 0 40 80
0
−80 −40 0 40 80
pA/p
FpA
/pF
pA/p
F
mV
mV
mV
mV
0.5
nA
2 ms
0.5
nA
2 ms
0.5
nA
2 ms
A B C
−200
−160
−120
−80
−40
−200
−160
−120
−80
−40
−200
−160
−120
−80
−40
−80 −40
−80 −40 −80 −40
−120 −80 −40
−120 −80 −40
Figure 3. Holding potential dependent availability of MCC Nav channels and window currentsA, Representative Nav currents evoked from varying Vh as indicated: −100 mV (black), −80 mV (red), −60 mV(blue) and −40 mV (green). Cells were maintained for 10 s at Vh before recording; intersweep intervals of 5 swere applied. Traces shown were obtained after subtracting the TTX-insensitive current traces measured in thepresence of 300 nM TTX. B, I–V relationship (n = 26) for Nav current densities measured at the indicated Vh.C, normalized conductance (n = 26) (derived from the data shown in B and normalized steady-state inactivation(n = 16) measured at −10 mV for the indicated Vh. Boltzmann equations were used for fitting both activationand inactivation curves. Insets depict representative traces that show steady-state inactivation of Nav currents atthe indicated Vh. Half-maximal values (in mV) and slope factors of activation (in mV) obtained from the fit are−21.9 and 5.5 for Vh = −100 mV; −21.3 and 5.0 for −80 mV, 20.3 and 5.5 for −60 mV, and −13.4 and 6.0 for−40 mV, respectively. Half-maximal inactivation (in mV) and slope factors of inactivation (in mV) are −44.6 and7.6 at Vh = −100 mV, −46.0 and 8.2 at −80 mV, −48.0 and 9.5 at −60 mV, and −59.7 and 13.4 at −40 mV,respectively.
C© 2014 The Authors. The Journal of Physiology C© 2014 The Physiological Society

914 D. H. F. Vandael and others J Physiol 593.4
Vh to gradually more positive values. The discrepancybetween both relative activation and inactivation doubledwhen we compared Vh = −100 mV with Vh = −40 mV(−21.4 ± 0.3 mV and −44.6 ± 0.7 mV for Vh = −100 mVand −13.4 ± 0.3 mV and −59.7 ± 1.2 mV forVh = −40 mV) (Fig. 4C). Not unexpectedly, the windowcurrent that we measured decreased from −15.6 pA atVh = −100 mV to −2.2 pA at Vh = −40 mV. The fact thatthe window current is bell shaped and almost zero aro-und −20 mV, further indicates that inactivationis complete towards more positive potentials. Theinactivation curve of a ‘persistent current’ would not fallto zero but rather would give robust currents at positivepotentials (given the high relative channel availability atthese voltages) (French et al. 1990). Altogether, channelavailability and activation/inactivation properties of Navcurrent in MCCs at physiologically relevant Vh (−50 mV,−40 mV) do not favour sizeable steady-state currents thatcould drive spontaneous membrane oscillations.
Recovery from fast inactivation and onset of slowinactivation of Nav channels
Nav channels contributing to rhythmic firing shouldbe able to recover sufficient Na+ current between twoconsecutive APs to guarantee stable AP waveforms. Wethus assayed the onset of recovery from fast inactivationby comparing the timing at Vh =−90 mV with two physio-logical Vh representing the resting state (Vh = −50 mV)and a depolarized state that would occur during acutestress response (Vh = −40 mV; Fig. 5A). Recoveryfrom fast inactivation in all three conditions occurredin a bi-exponential mode and striking differences werenotable. Recovery was slow and remarkably incomplete(50%) after 1 s when Vh was set at −40 mV, whereas it wasfast and fully complete (100%) at Vh = −90 mV (Fig. 5A).The time constant of the dominant fast component (τfast)decreased from 23.7 ms (Vh = −40 mV) to 4.9 ms(Vh = −90 mV). A pulse of moderate duration (100 ms)
−120 −80 −40 0 40
0.0
0.2
0.4
0.6
0.8
1.0
g no
rm
mV
−40 0 40
0.02
200
pA
Itot
Po
−40 0 40 −40 0 40
5 pA
−40 0 40 mVIwindow
−100 −80 −60 −40 -20−200
−160
−120
−80
−40
0
pA/p
F
Vh
−80 −80 −80 −80
Vh −100 Vh −80 Vh −60 Vh -40
Vh −40
Vh −100
A
B C
Figure 4. Holding potential dependent reduction of window currents and channel availability in MCCsA, top: whole-cell currents; middle: open probabilities (Po) obtained by multiplying activation and inactivationcurves shown in Fig. 3c; bottom: window currents calculated by multiplying the whole-cell currents (top) by Po
(middle). The Vh values of the experiment are indicated at the top: −100 mV (black), −80 mV (red), −60 mV (blue)and −40 mV (green). B, availability of Nav current densities with respect to the indicated holding potentials (n = 26).Data were fit by a Boltzmann equation. The half-maximal value and slope factor of inactivation are −47.9 mV and10.5 mV. C, overlap of activation and inactivation curves at Vh = −100 mV (black) and Vh = −40 mV (green),derived from Fig. 3.
C© 2014 The Authors. The Journal of Physiology C© 2014 The Physiological Society

J Physiol 593.4 Burst firing in chromaffin cells 915
starting from Vh = −40 mV thus leads to a loss ofapproximately half of the available Nav channels that failedto recover.
In addition to fast inactivation, Nav channels can transitinto a phase of slow inactivation from which the recoverycan take several seconds (Cantrell & Catterall, 2001).Thus, the question arises as to whether the incompleterecovery from inactivation at Vh = −40 mV is theresult of a switch of channels to such a state of slowinactivation. To answer this question, we constructed aprotocol where slow inactivation was induced by a strong
depolarization to −10 mV, lasting up to 10 s. The Navcurrent before this pulse (I1) was then compared with thecurrent available after the conditioning step (I2). Betweenthe conditioning pulse and the second test pulse (I2),the cell was maintained at Vh for 1.2 s to allow for therecovery from fast inactivation (Fig. 5B). The data shownin Fig. 5B were fit with a 1st order exponential functionwith time constants that declined with increasing Vh. Navcurrent decay measured in this way was 14-fold faster forVh = −40 mV compared to Vh = −90 mV and 3-foldfaster compared to Vh = −50 mV (τ = 7.8 ± 1.6 s for
0 0.4 0.8 1.2
0.0
0.2
0.4
0.6
0.8
1.0
1.2
100 ms
Δ time −10 mVI1 I2
inter-pulse duration (s)
I 2/I 1
Vh −90
Vh -50
Vh −50
VhVh -40
Vh
Vh -40
INa: Vh −40
INa: Vh −50
Vh
Vh −90
Vh −90
Vh −90
0 20.0
0.2
0.4
0.6
0.8
1.0
1.2
4 6 8 10 12conditioning duration (s)
500 ms
−10 mV
I1 I2
Δ time
−20 mV
100 ms
50 p
A
0 0.2 0.4 0.6 0.8 1−60
−40
−20
0
pA
ramp duration (s)200 ms
100
pA20
mV
V −55 mVh
0 mV
I1 I250 mV
***
I max
(nA
)
I1 I2
−28 mV
2 ms
200
pA
I1
I2
400
pA
5 ms
I1
I2
−1.2−0.8−0.4
0
A B
C D
I : V −50L-type h
INa: Vh -40
INa: Vh −50
INa INa
IL-type: Vh −50
IL-type
IL-type
***
50 p
A
100 ms
100 ms ramp
1s ramp
Figure 5. Inactivation properties of MCC Nav channelsA, recovery from steady-state inactivation of Nav currents from Vh = −90 mV (blue, n = 13), −50 mV (black, n = 14)and −40 mV (red, n = 10). Current amplitudes at the test pulse (I2) were normalized against current amplitudes atthe preceding pulse (I1). Averaged data were fit by double exponentials with fast and slow components of differentamplitude (Afast, Aslow) and time constants (τ fast, τ slow). τ fast, τ slow and amplitudes (in parenthesis) were: 4.8 ms(0.6) and 156 ms (0.4) at −90 mV, 21.3 ms (0.6) and 501 ms (0.3) at −50 mV, 23.7 ms (0,34) and 229 ms (0.22)at −40 mV. B, onset of closed-state slow inactivation during Vh = −90 mV (blue, n = 10), −50 mV (black, n = 5)and −40 mV (red, n = 6). Current amplitudes during the test pulse (I2) were compared with currents at onset (I1).The conditioning pulse was followed by a recovery period of 1.2 s to allow recovery from fast inactivation. Datawere fit by a single exponential function of different time constant (τ ) and amplitude (A). τ and A (in parenthesis)were 7.8 s (0.32) at Vh = −90 mV, 1.6 s (0.45) at −50 mV and 0.58 s (0.54) at −40 mV. C, Nav and L-typecurrents elicited by ramp depolarizations starting from Vh = −50 mV (black) or Vh = −40 mV (red). Nav currentsare the result of subtracting control traces from the TTX-resistant component. L-type currents (blue) are the resultsof subtracting control traces from nifedipine-insensitive currents. Inset to the right: mean ± SEM of peak Na+ andL-type currents at different ramp duration. D, comparison of Nav currents evoked by a 20 ms ramp in the presence(I2, red trace) or absence (I1, black trace) of a preceding slow pacemaker such as ramp of 1 s duration subsequentto the indicated protocol on top (∗∗∗P < 0.001, paired Student’s t test). The black and red voltage-clamp protocolsindicated on top were separated by 5 s. The starting voltage of the ramp (−55 mV) is the mean AHP peak of theAps, whereas −28 mV is the mean spike threshold value (Vandael et al. 2012).
C© 2014 The Authors. The Journal of Physiology C© 2014 The Physiological Society

916 D. H. F. Vandael and others J Physiol 593.4
Vh = −90; 1.64 ± 0.3 s for Vh = −50 and 0.58 ± 0.63 sfor Vh = −40 mV). Thus, at physiologically relevantholding potentials, a larger fraction of channels enter statesfrom which recovery from inactivation is slower. Thisphenomenon is of relevance when CCs are depolarizedduring stress responses. The incomplete recovery fromfast inactivation and the fast onset of slow inactivation canthus produce a drastic reduction of available Nav channelsat −40 mV and −50 mV.
Slow inactivation of Nav channels during slow rampcommands
So far, we considered only square pulse protocols that donot represent the spontaneous membrane oscillations atrest. We thus tested the Nav current behaviour duringslow gradual depolarizing pulses (ramp commands of0.1 to 1 s) that mimic MCCs interspike intervals (ISI).The ramps reached −20 mV, starting from two differentVh values (−40 mV and −50 mV). Currents evokedin this manner in both conditions were then compared(Fig. 5C). In line with the above findings, currentamplitude was bigger (1.8-fold) when ramps of 100 msduration were triggered from Vh = −50 mV comparedto −40 mV. With increasing ramp duration, currentsdecayed in an exponential manner both for Vh = −50 mV(τ = 134 ± 15 s) and Vh = −40 mV (τ = 160 ± 23 s).For ramps lasting 1 s, the remaining currents had meanamplitudes of −3.3 ± 1.2 pA for Vh = −50 mV and −2.5 ± 0.8 pA for Vh = −40 mV (Fig. 5C). Note that,when the same protocol (Vh = −50 mV) was performed,the LTCCs were 8-fold bigger after ramps lasting 1 s(−25 ± 3.6 pA, Fig. 5C and inset). Together with themore negative activation kinetics, it is clear that LTCCspossess more suitable features to contribute to pacemakerdepolarization than Nav channels do. Nav currents activateat �20 mV more depolarized potentials with respect toLTCCs (Mahapatra et al. 2011) and inactivate fully duringlong ramp commands, as shown in the bottom-right insetof Fig. 5C.
It thus appears that the slow depolarization precedingthe AP will carry a rather small (although not negligible)current and will probably inactivate the Na+ currentsustaining the spike upstroke. To test this hypothesis,we constructed a protocol where a fast ramp (20 ms)starting from spike threshold (−28 mV) and reaching+50 mV (I2) was anticipated by a 1 s ramp (ISI)that covers the pacemaker potential (i.e. from its mostnegative and most positive average values) (−55 mV and−28 mV). These values represent the previously reportedmean after-hyperpolarization peak (AHP = −53 mV) andmean spike threshold (−28 mV) (Vandael et al. 2012). Theresulting current was then compared with a ramp of 20 msduration (I1) elicited from −55 mV to +50 mV (Fig. 5D).
Both ramp depolarizations were separated by intersweepintervals of 5 s to ensure complete recovery of Nav channelsfrom fast inactivation. Nav currents were 14-fold smallerduring I2 as compared to I1 (−65 ± 17 pA vs. −889 ± 223pA, n = 8; ∗∗∗P < 0.001, t test). This suggests that, duringthe pacemaker potential, massive Nav channel inactivationoccurs (Fig. 5D).
Loss of Nav channels during depolarizationprofoundly modifies the AP shape
Given the profound effects of Vh on Nav channelavailability, we assayed how this phenomenon affectsMCCs firing and AP-waveform properties (Fig. 6).Experiments were performed in current-clamp modewithout current injection. Cells under control conditionsfired at 0.98 ± 0.08 Hz and Vrest was −46 ± 1.3 mV(n = 12). By injecting inward current to bring Vrest near−40 mV (−38.4 ± 1.0 mV), the firing frequency increasedalmost 3-fold (∗∗∗P < 0.001, t test) accompanied bya significant widening of the AP half-width (2.5-fold;∗∗∗P < 0.001) and robust decrease of the peak overshoot(by �25 mV; ∗∗∗P < 0.001) (Fig. 6A and B, right). AveragedAPs under control conditions and after current injectionwere used to calculate dV/dt, which was then visualizedgraphically vs. Vm in a phase plane plot (Fig. 6B, left). Amassive reduction of dV/dtmax (�5 fold; ∗∗∗P < 0.001,t test) is evident. This parameter represents the pointwhere the AP rising phase is fastest during the up-strokeand is associated with Nav channel density (Bean, 2007).Altogether, these changes point towards a strong decreaseof Nav channel contribution to the AP at depolarized Vh.To confirm this, we performed AP-clamp experiments,using trains of APs measured under control conditionsand after depolarization (Fig. 6C). Clean Nav currents wereobtained by final subtraction of control recordings fromtraces measured in the presence of 300 nM TTX (Fig. 6C).Comparison of Nav currents under control conditions(Vh = −50 mV) and depolarized Vrest (Vh = −40 mV)showed marked reductions of Nav current amplitudesafter each AP: �60% at −40 mV and �40% at −50 mV,respectively (∗P < 0.05) (Fig. 6C, right)
Nav channel blockade by TTX leads to a switch fromtonic to burst-like firings
As cell depolarization leads to a reduction in thecontribution of Nav channels to the AP, we planneda series of experiments in which increasing fractionsof Nav channels were pharmacologically blocked totest how Nav current availability may impact on firingpatterns and spike parameters (Fig. 7). TTX was testedon spontaneously firing MCCs and applied at thesame concentration used in voltage-clamp experiments
C© 2014 The Authors. The Journal of Physiology C© 2014 The Physiological Society

J Physiol 593.4 Burst firing in chromaffin cells 917
(Fig. 2B). As previously reported (Vandael et al. 2010;Mahapatra et al. 2011), TTX did not impede the cellfrom generating spontaneous APs, not even at saturatingconcentrations (300 nM; Fig. 7A). As expected, weobserved a dose-dependent reduction of the AP peak(IC50 = 9.0 ± 1.9 nM) and a dose-dependent increase of thehalf-width (IC50 = 18.7 ± 4.3 nM) (Fig. 7C and D). We alsomeasured the coefficient of variance (CV = SD mean–1)
for the ISI duration as an indication of the regularity of thefiring pattern. The CV during control firing was 0.8 ± 0.01and increased up to 1.1 ± 0.1 in the presence of 300 nM
TTX, indicating that, in the absence of Nav channels, thefiring pattern is clearly more irregular.
A closer look at the firing patterns after Nav channelblockade shows the tendency of MCCs to fire its APspreferentially in bursts, especially at saturating doses
10 s20 m
V
0 mV
−40 mV
−50 mV 20 m
V
5 ms
CtrlTTX
Vh −50 mV
Vh −40 mV
0.20.40.60.81.0
I vh −
40/I v
h −5
0
1 2 3 4spike n°
40
20
0
−20
0−20−40 20
−10
30
10
−10−30 10 30−50
dV/d
t (V
/s)
−40 mV
−50 mV
dV/dtmax
01020304050
V/s
02468
1012
012345
Hz
dV/dtmax half width
ms
frequency−10
0102030
mV
peak
****** *** ***
−1.0−0.8−0.6−0.4−0.20.0
I nor
m
1 2 3 4spike n°
Vh −50 mV
Vh -40 mV***
****
* *
A
B
C
1 s
20 m
V
1 s
200
pA
0 mV
−40 mV
−50 mV
Vh −40 mVVh −50 mV
Subtracted (Na+)
mV
Figure 6. Chromaffin cell stimulation leads to Nav channel inactivation and AP wideningA, representative response of a current clamped MCC to a 10 mV steady depolarization. Right: overlap of a controlAP (black) with an AP obtained after the imposed depolarization (grey). B, Phase plane plots (dV/dt vs. V) from thesame cell constructed by averaging n = 4 APs at Vh = −50 and n = 5 APs at −40 mV, respectively. Right: effectsof a 10 mV depolarization on spike parameters (∗∗∗P < 0.001, paired Student’s t test). Half-width was measuredas the duration of the AP at half of the total amplitude (from the after-hyperpolarization peak to overshoot peak).C, Nav currents measured by AP-clamp using APs at rest (left) and APs that originate from a depolarized restingpotential (right). Middle: control trace in black and TTX (300 nM) resistant component in grey. Bottom: pure Navcurrents after subtraction for TTX-insensitive currents. Top-right inset: normalized current amplitudes against thefirst current peak amplitude of the spike train. The grey line and dots refer to Nav currents triggered at depolarizedresting potentials (−40 mV, n = 12), whereas the black line and squares represent Nav currents that flow duringspikes at rest (n = 12) (∗P < 0.05, ∗∗∗P < 0.001, paired Student’s t test). Bottom-right inset: the ratio between Navcurrents triggered by control APs and APs at depolarized resting potentials for each consecutive spike (∗P < 0.05,ANOVA followed by a post hoc Bonferroni analysis).
C© 2014 The Authors. The Journal of Physiology C© 2014 The Physiological Society

918 D. H. F. Vandael and others J Physiol 593.4
of TTX (Fig. 7B). The switch from tonic to burst-likefiring is particularly evident in the distributions of theISI duration (Fig. 7B, centre). Under control conditions,the distribution is nearly random (low CV), whereas, atincreasing TTX concentrations, two separate Gaussiandistributions with distinct peaks become evident. The
first peak (brief durations) represents the ISI betweentwo consecutive spikes in a burst (intra-burst interval),whereas the second peak at longer times represents the ISIbetween bursts (inter-burst interval). The centres of theGaussian for the intraburst interval varied from 77.1 msto 57.8 ms by increasing TTX from 30 nM to 300 nM,
0 1 2 30
20406080
100
012345
0 1 2 3
01020304050
0 1 2 3
0 1 2 3012345
0 1 2 3012345
020406080
100
0 1 2 3
0 1 2 3012345
020406080
100
0 1 2 3
0 1 2 3012345
04080
120160200
0 1 2 3
coun
t per
bin
ISI i+
1 (m
s)
ISI (s) ISI (s) ISI (s)
ISIi (s)ISIi (s)ISIi (s)ISIi (s)
ISI (s) ISI (s)
ISIi (s)
10 m
V
1 min
10 nM 30 nM 100 nM 300 nM TTX
1 10 1000
20
40
60
80
% s
pike
s in
bur
st
05
1015202530
half
wid
th (m
s)
1 10 100−25−15
-55
1525
peak
(mV
)
[TTX, nM] 1 10 100 [TTX, nM] [TTX, nM]
A
B
C D E
20 m
V
1 s
control TTX 10 nM30 nM 100 nM 300 nM
200ms
Figure 7. TTX leads to a dose-dependent switch to burst firing of MCCsA, representative current clamp trace showing the action of increasing TTX concentration. B, top: a better viewof the effects of diverse TTX concentrations on the AP waveforms and firing patterns at slower and faster(grey windows) time scales. Periods of activity were taken from (a). Middle: ISI distribution for the indicated TTXconcentrations. Lower: joint ISI plots obtained by plotting each ISI on the x-axis (ISIi) against its succeeding ISIduration (ISIi+1) on the y-axis. Random firing in the absence or presence of 10 nM TTX leads to a cloudy pattern,whereas burst firing patterns at an elevated TTX concentration (30–300 nM) leads to an L-shaped distribution.C, dose–response curve of AP peak vs. TTX concentration. Data were fit with a sigmoid function with saturatingvalue at 17.5 mV (IC50 = 9 nM). D, dose–response curve of AP half-width vs. TTX concentration. Data were fitwith a sigmoid function with saturating value at 26.2 ms (IC50 = 18.7 nM). E, dose–response curve of the fractionof spikes fired in bursts vs. TTX concentration. Data were fit with a sigmoid function with saturating value at 76%(IC50 = 39.9 nM).
C© 2014 The Authors. The Journal of Physiology C© 2014 The Physiological Society

J Physiol 593.4 Burst firing in chromaffin cells 919
whereas the Gaussian of the interburst intervals centredat 1.1 s to 1.3 s.
When we subsequently plotted each ISI against itspreceding ISI duration, we could distinguish a cleardifference between control and Nav block-inducedfiring patterns (Fig. 7B, bottom). In these so calledjoint-interspike-interval plots, irregular ‘tonic’ firingpatterns give rise to a cloudy distribution of events,whereas ‘burst’ firing gives rise to an ‘L-shaped’distribution. The L-shaped joint ISI can be ascribed tothe prevalence of altering a long with a peculiarly briefISI during a burst. Together with a change in the ISIdistribution, there was also a dose-dependent percentageincrease (IC50 of 38.9 ± 9.8 nM) of spikes fired in burstswith increasing doses of TTX (Fig. 7E). The parameterthat was most sensitive to TTX was the AP amplitude(IC50 = 9.0 nM; Fig. 7C), followed by the half-width(IC50 = 18.7 nM; Fig. 7D) and the percentage of spikesfired in bursts (Fig. 7E). Out of 16 cells, the overallfiring frequency was increased after Nav channel blockadecompared to control, whereas, in three cells, we observeda decrease.
Altogether, we did not observe a significant difference(∗P > 0.05) for the firing frequency when controlconditions (0.9 ± 0.1 Hz) were compared with firingthat persisted after Nav channel blockade (1.2 ± 0.2 Hz).During burst firing, however, brief periods of highfrequency firing (14.8 ± 1.2 Hz; n = 16) were alteredby relatively long gaps of no activity. In addition, spikesfired in bursts emerge from depolarization plateaus(−38.7 ± 1.3 mV up to −33.1 ± 1.2 mV) that last forthe whole burst duration. It is thus possible that the Ca2+influx is particularly high during such firing patterns andan increased degree of catecholamine secretion takes place.
Reduced Nav availability inverts the net currentduring the AHP from outward to inward
Figure 7 shows clearly a reduction of Na+ currentamplitude upon cell depolarization, leading to broad andlow amplitude spikes that oscillate in a voltage range wherethe driving force on Ca2+ ions is high. Less Nav channelavailability leads to less KV and BK channel activationbecause cells do not reach positive membrane potentialsduring the AP peak and this in turn will result in a slowerreturn to baseline potentials. Of particular interest is theeffect of this phenomenon on the currents flowing duringthe AHP. A possible switch from a net outward to anet inward current could explain the development of asufficiently low AHP that drives the burst of APs whenNav channel availability is drastically reduced.
To better understand this issue, we performed AP-clampexperiments in which we aimed to unravel the balancebetween outward K+ and inward Ca2+ currents during
APs measured under three conditions: (i) control firingpatterns; (ii) depolarized Vh potentials; and (iii) burstfiring in 300 nM TTX (Fig. 8). Ca2+-activated K+ currents(IKCa) were isolated by subtraction of the whole-cell Ca2+current (measured in 135 mM TEA, 2 mM Ca2+ and 300 nM
TTX) and the KV current (IKV) (Tyrode standard with200 μM of Cd2+ and TTX) from the total current measuredin Tyrode standard with 300 nM TTX. Compared to controlspikes, we observed a 4-fold reduction of IKV flowingduring spikes that started from a depolarized membranepotential (∗∗P < 0.01, n = 9) and a 25-fold reductionduring the burst doublets in the presence of 300 nM TTX(∗∗∗P < 0.001, n = 9). Note that, during the APs burst, IKV
is almost absent (Fig. 8C, red trace) and IKCa is drasticallyreduced (Fig. 8C, blue trace; ∗P < 0.05, n = 9). The netcurrent during the spikes remained outward, justifyingthe effective repolarizing phase under all three conditions.However, marked changes were observed during the AHP.Although the net current during the AHP of control spikeswas outward, the current during the intraburst intervalwas net inward and carried by Ca2+ (Fig. 8B, inset). Itthus results that incoming Ca2+, together with a lackof sufficient outward K+ current, is the trigger of burstfiring when Nav channels are blocked. Broadening of APsduring cell depolarization and bursts of APs in the pre-sence of TTX caused a 2- to 10-fold prolongation of Ca2+currents (Fig. 8A–C, bottom insets) that, despite the loweramplitudes, could carry 2- and 3.5-fold more Ca2+ chargesinside the cell, respectively (Fig. 8C, inset).
A minority of MCCs exhibits spontaneous burst firing
Spontaneous burst firing (zero current injected) wasalso observed in a minority of cells (14%; 39 out of278) that were measured in current clamp (Fig. 9A). Atrain of high frequency spikes emerged on a ‘slow-wave’depolarization plateau with somewhat different shape andduration but comparable frequency of those induced byTTX. Burst durations were 2.6-fold longer (0.37 ± 0.08 svs. 0.14 ± 0.03 s with TTX; ∗∗∗P < 0.001, unpairedt test) but occurred at almost the same frequency(0.56 ± 0.09 Hz vs. 0.48 ± 0.15 Hz). As a result ofNav channel availability, the first spike overshoot wasalways larger compared to the subsequent APs. Spikesshowed a gradual reduction in peak amplitude (from+16.3 mV to −10.11 mV; ∗∗∗P < 0.001, paired t test),a sequential increase in half-width duration (from 2.9 msto 6.8 ms; ∗∗∗P < 0.001) and reduction in AHP amplitude(from −41 mV to −34.4 mV; ∗∗∗P < 0.001) (Fig. 9B).The intraburst ISI duration and thus also the intraburstinstantaneous firing frequency increased strongly towardsthe end of the burst (from 170.3 ms to 65.3 ms andfrom 8.9 Hz to 21.2 Hz, respectively; ∗∗∗P < 0.001).Again we hypothesized that Nav channel inactivation leads
C© 2014 The Authors. The Journal of Physiology C© 2014 The Physiological Society

920 D. H. F. Vandael and others J Physiol 593.4
to a reduction in the AP peak, which leads to less KV
activation and thus spike broadening. The low amplitudespikes could furthermore explain the gradual reductionin the AHP that helps shape the burst envelope. Toquantify this, we performed AP-clamp recordings usingbursts as voltage clamp commands (Fig. 9C–E). Whenconsidering Na+-currents, we found that the amplitudessignificantly (∗∗∗P < 0.001, n = 6) decreased by 15-foldwhen comparing the currents elicited during the first andlast spike of the burst (Fig. 9F). This is not unexpectedgiven that a narrow ISI does not allow sufficient timefor recovery from inactivation. In addition, graduallydecreasing AHP and spike broadening lead to an increaseddepolarization and thus more complete Nav inactivation.A decrease of outward currents also occurred. KV currentsreduced by 4.4-fold (∗∗∗P < 0.001, n = 18), whereas BKcurrent amplitudes decreased by 5.6-fold (∗∗∗P < 0.001,n = 7) comparing currents during the first and lastspike (Fig. 9F). Ca2+ current amplitudes reduced by3-fold (∗∗∗P < 0.001, n = 17) but, when we measuredthe area under the curve, we found a 1.7-fold increase
(∗∗∗P < 0.001) in Ca2+ charge (Fig. 9F). In line with theidea of Ca2+ building up with each and every spike, wefound a sequential and significant increase in SK currentamplitudes (∗∗∗P < 0.001, n = 7) (Fig. 9F). It is worthnoting that the decrease of Nav, Kv, BK and Cav currentamplitude during consecutive APs is a result not only ofinactivation, but also the decreasing amplitude of the APsin the command waveform.
Block of Nav channels boosts MCCs exocytosis
Bursts of APs originating from plateau potentials of−35 mV, and lasting for hundreds of milliseconds, thus gohand in hand with an increase of inflowing Ca2+ charge(Figs 8C and 9E and F). One can hypothesize that theblock of TTX-sensitive Nav channels paradoxically leads toan increased Ca2+-dependent secretion of catecholaminesin MCCs as a result of both the sustained depolarization(slow-wave) and the increased AP frequency during bursts.To test this, we combined current-clamp recordings with
10 ms
20 m
V
10 ms 50 ms
200
pA50
pA
0 mV0 mV0 mV
control depolarized 300 nM TTX A B C
IKv
IKCa
ICa
10 msICa
−50−40
−50
0246
2+C
a c
harg
e (p
C)
ab
c****
−100
102030
net c
urre
nt (p
A)
ab
c* *
Figure 8. Reducing Nav availability inverts net current covering the AHP from outward to inwardA, top: AP-clamp experiment showing representative ctrl spike. (middle) Kv currents (red traces) were measuredin a Tyrode standard solution with TTX (300 nM) and Cd2+ (200 μM). Ca2+ currents (black) were measured in thepresence of TTX (300 nM) and high extracellular TEA (135 mM). Ca2+-activated K+ currents (blue) were obtained bysubtracting from a control recording in Tyrode standard with TTX (300 nM) the KV and the Ca2+ current. Bottom:close up. The grey rectangle indicates the AHP phase and the respective currents that sustain it. B and C, as forA, using a single spike stimulus protocol triggered from −40 mV and a spike doublet fired after complete blockof Nav currents with 300 nM TTX. B, inset: net current amplitudes measured during the AHP phase indicated bythe grey windows. C, inset: Ca2+ charge entering the cell during the AHP phase calculated by the integrating thecorresponding Ca2+ inward current (∗P < 0.05; ∗∗∗P < 0.001; n = 9; ANOVA followed by a post hoc Bonferronianalysis).
C© 2014 The Authors. The Journal of Physiology C© 2014 The Physiological Society

J Physiol 593.4 Burst firing in chromaffin cells 921
carbon fibre amperometry to reveal fast quantal release ofcatecholamines during MCCs firing patterns (for 40 s)at rest and after Nav block (Fig. 10) (Carabelli et al.2007b). Cells were hyperpolarized to −70 mV to ceasespontaneous activity and to prevent Ca2+ accumulationat the onset of the recording. Subsequently, inhibition wasrelieved and spontaneous activity was measured for 40 s.As expected, in the presence of TTX, all cells switchedfrom a tonic (Fig. 10A) into a burst-firing mode (Fig. 10B).Amperometric signals associated with vesicle fusion andcatecholamine release were detected in both cases but at
a significantly different frequency. Block of Nav channelsby TTX caused an almost 2.5-fold increase of the rate ofvesicle release with respect to control (∗P < 0.05, n = 14)(Fig. 10D, bottom) with no significant changes to thewaveform of amperometric spikes (Fig. 10D, top). Theparameters associated with the peak amplitude (Imax),time to peak (tp), half-width (t1/2), rise time (m), totalquantity of charge released (Q) and cubic root of Q(Q1/3) (as an estimate of vesicle size) remained unchanged(∗P > 0.05, t test), regardless of Nav channel blockadeand the switch of cell firing mode (Fig. 10D). We
2 s
20 m
V
0.5 s 5 ms
20 m
V
1
23
4
4 5 6−15−10
−505
101520
peak (mV)
1 2 3 4 5 6−42−40−38−36−34−32 antipeak (mV)
1 2 3 4 5 62345678 half width (ms)
1 2 3 4 560
100
140
180 ISI (ms)
1 2 3 4 56
10141822 frequency (Hz)
spike n°
−400
−200
0
spike n°
ampl
itude
(pA
)
Na+
Na+
Ca2+
400
200
600
KV
KV
SK
BK
inward
outward
1 s
20 m
V20
0 pA
BK
1 s
SK
1 s
Ca2+
1 2 3
0
ampl
itude
(pA
)
3 6 9 12
200
pA
200
pA
200
pA
A
B
DC E F
200
pA
3 6 9 12
Figure 9. Spontaneous burst firing in a minority of MCCsA, left: representative trace of spontaneous trains of APs fired in burst-like mode. Centre: a single burst at anexpanded time scale. Right: overlap of consecutive APs of a burst. Numbers indicate the position/sequence inthe burst. B, evolution of the AP peak, AHP amplitude, half-width, interspike interval and instantaneous firingfrequency of consecutive spikes in a burst. Mean values were obtained for each bursting cell (n = 39) and thenaveraged. C, AP-clamp experiment measuring KV (n = 18) and BK (n = 7) currents. Top: burst recorded and usedas voltage command (black trace), KV currents are shown in red and BK currents in grey. D and E, as for C butthe currents isolated were Ca2+ (blue, n = 17), SK (orange, n = 7) and Na+ (black, n = 6). F, top, BK, SK andKv outward current amplitudes vs. the spike number of the burst. Bottom, as for top but for the Na+ and Ca2+inward currents (∗∗∗P < 0.001, paired Student’s t test).
C© 2014 The Authors. The Journal of Physiology C© 2014 The Physiological Society

922 D. H. F. Vandael and others J Physiol 593.4
also determined the time course of cumulative secretion(Fig. 10C) and calculated the mean quantity of cumulativecharges recorded during a 40 s recording and found a3.7-fold increase of the cumulative charge (Fig. 10D).As shown previously (Marcantoni et al. 2009), this canbe explained by the increase of the amperometric spikefrequency (2.5-fold), which may sum to a small net chargeincrease of the single secretory events not sufficiently largeto be detected (Fig. 10D). Given that the quantity ofCa2+ charges is linearly related to the amount of releasedvesicles in CCs (Carabelli et al. 2003; Carabelli et al. 2007a),the 2.5-fold increased frequency of amperometric spikesand the 3.7-fold increase of cumulative released chargesin the presence of TTX are in very good agreement withthe 3.5-fold increase of Ca2+-entry during bursts of APs(Fig. 8C).
On average, five APs are required to elicit an exocytoticevent in RCCs under control conditions (1.1 Hz APs vs.0.2 Hz amperometric spikes) (Zhou & Misler, 1995). Wefound that the same occurs in MCCs. Specifically, we foundno strict correlation between APs and amperometricevents under both control conditions or during burstfiring induced by TTX. During burst firing, periods ofelevated vesicle release sometimes occurred during thegaps that separated the bursts rather than during the burststhemselves. It is thus evident that Ca2+ has to diffuse in thecell to trigger most of the exocytotic events. It is important
to emphasize that our data do not clarify whether increasedsecretion in the presence of TTX is mainly a result ofCa2+-entry during the slow-wave depolarization or a resultof the increased frequency of APs riding on top of the slowwave. Both phenomena occur simultaneously and causeincreased Ca2+-influx, whose separation requires specificprotocols.
Discussion
We have provided evidence indicating that Nav channelsare not mandatory for generating spontaneous APs inMCCs. APs persist in the presence of saturating dosesof TTX and the contribution of persistent or resurgentNav channels to pacemaking is null. We have shown that,similar to TTX, small depolarizations from rest drasticallylower Nav channel availability, mostly as a result of theincomplete recovery from fast inactivation and fast onsetof closed-state inactivation. Similar to TTX, this causesdrastic changes in AP-shape and firing patterns thatincrease Ca2+-entry and catecholamine release. BecauseNav channel down-regulation is implicated in the controlof input–output relationships in several neurons, a keyimplication of our findings is that gradual loss of Navchannels may drastically change electrical excitability ofneuroendocrine cells (Cantrell & Catterall, 2001).
40
pA
10 s
20 m
V
ctrl
TTX0
20
40
Imax
(pA
)
0.00.20.40.6
Q1/
3 (p
C3 )
048
12
t 1/2
(ms)
0.0
0.2
0.4
0.6
Q (p
C)
0
20
40
m (p
A/m
s)
02468
10
t p (m
s)
0.00.20.40.6
freq.
(Hz)
*
A
B
C
tp
t1/2 Imax
m
Q
0
2
4
6
cum
m Q
(pC
)
**
D
0.8 12
20
15
10
50
pC
TTX
ctrl
Figure 10. Burst firing associated with Navchannel blockade boosts MCC exocytosisA, example of combined recording of APs(black traces) and amperometric events (greytraces) by carbon fibre amperometry in thecontrol. B, representation of combinedrecording of AP bursts after TTX application(same cell as shown in A) and amperometricevents by amperometry. C, overlap ofcumulative secretion plots obtained fromamperometric measurements shown in A andB for control (black curve) and during TTXapplication (grey curve). D, comparison ofamperometric spike parameters (see top),frequency and cumulative charge betweencontrol (black bars) and TTX-treated cells (greybars) (∗P < 0.05 and ∗∗P < 0.01, n = 14;paired Student’s t test).
C© 2014 The Authors. The Journal of Physiology C© 2014 The Physiological Society

J Physiol 593.4 Burst firing in chromaffin cells 923
Expression profile of the fast-inactivatingTTX-sensitive Nav channels of MCCs
Previously, scn9a (Nav1.7) was considered to be theprincipal Nav α-subunit gene expressed in the adrenalmedulla (Klugbauer et al. 1995; Morinville et al. 2007;Wada et al. 2008; Yanagita et al. 2011). Our expressiondata confirm the presence of scn9A in MCCs but,unexpectedly, uncover a 7.3-fold higher expressionlevel of scn3A transcripts (Nav1.3). Both isoforms areconfirmed at the protein level and it cannot be excludedthat Nav1.1 and Nav1.2 are expressed despite their lowdegree of transcripts. The absence of the mRNA ofTTX-resistant Nav isoforms such as scn5A (Nav1.5),scn10A (Nav1.8) and scn11A (Nav1.9) supports ourdata suggesting that saturating doses of TTX blockall Nav currents (IC50 �7 nM). Half-maximal Navblockade by TTX is comparable with that reported forNav1.7 and Nav1.3 (IC50 �4 nM) (Sangameswaran et al.1997; Catterall et al. 2005), which are the main Navchannels expressed by MCCs. Our Nav activation data(V1/2 = −21 mV) on MCCs fit with those reported forBCCs (Fenwick et al. 1982) and RCCs (Lou et al. 2003;Wada et al. 2008) and are also in good agreement withthe reported values for Nav1.3 and Nav1.7 α-subunitsexpressed in HEK cells (V1/2 = −26 mV; Catterall et al.2005). Based on their V1/2 of activation and inactivationand their kinetics of recovery from fast inactivationand onset of slow closed-state inactivation, Nav1.3 andNav1.7 are almost indistinguishable, except for the slowerrecovery of inactivation of Nav1.7 with respect to Nav1.3(26 ms vs. 11 ms at Vh = −100 mV and 113 ms vs. 60 msat Vh = −80 mV) (Cummins et al. 2001). These lattervalues, however, are too small to be associated to the slowcomponent of the recovery of inactivation of Nav channelsin MCCs (156 ms to 501 ms; Fig. 5A), whose cause remainsto be clarified. Compared to Nav1.2, both channels displaya marked slow entry rate in the closed-state inactivation,which makes both of them suitable for sustaining robustresponses to slowly depolarizing inputs. Together withan absence of reported values on the single channelconductance of Nav1.3 (Catterall et al. 2005), this makes italmost impossible to associate the functional Nav channelproperties of MCCs to either Nav1.3 or Nav1.7. This issuewould certainly benefit from analysis of the Nav currentsof MCCs in Nav1.3 (Nassar et al. 2006) and Nav1.7 nullmice (Nassar et al. 2004).
Our whole-cell data and single-channel recordingsconfirm that MCC Nav currents are not persistent.Sustained Nav currents are typically associated with theNav1.6 isoform (scn8a) (Raman & Bean, 1997), whichactivates at potentials as negative as −70 mV (Taddese& Bean, 2002) and sustains tonic-firing at elevatedfrequencies (20–100 Hz) in several neurons (Smith et al.1998; Rush et al. 2005; Enomoto et al. 2007; Mercer et al.
2007). MCCs do not fire at elevated frequencies and lackscn8a. In addition, the auxiliary subunit scn4b (Navβ4) islinked to resurgent Na+ currents (Bant & Raman, 2010).Neither scn4b, nor resurgent Na+ currents were revealedin MCCs.
Nav1.3/Nav1.7 channel contribution to MCCautorythmicity
Early reports showed that Nav channels are criticallyinvolved in driving AP firing in gerbil and humanCCs (Biales et al. 1976). Recording conditions in thesestudies were nevertheless strikingly different from ours(perforated-patch in 2 mM Ca2+ vs. sharp-electrodeimpalement in 10 mM Ca2+) and cells were moredepolarized (−40 mV to −10 mV) than MCCs (−50 mVto −45 mV). A similar approach on RCCs resulted ina Vrest –49 mV and TTX strongly interfered with APgeneration (Brandt et al. 1976). The present assumptionis that Nav1.7 represents the main Nav channel isoformin bovine and rat adrenal glands (Klugbauer et al. 1995;Morinville et al. 2007; Wada et al. 2008). Nav1.7 possessesslow closed-state inactivation during very negative rampdepolarizations, a feature that favours its contribution toautorythmicity (Lou et al. 2003). In the present study,we report that Nav1.3 is highly expressed in MCCsand, similar to Nav1.7, undergoes strong inactivationduring prolonged depolarizations (Cummins et al. 2001).MCC Nav channels can inactivate considerably duringramp-depolarizations, mimicking the velocity of the inter-spike depolarization from physiological Vh values (Fig. 5Cand D).
An important factor that influences Nav channelavailability in MCCs is the relatively depolarized Vh.Between −50 mV and −40 mV, Nav availability rangesfrom 50% to 30%. We report, moreover, the drasticchanges in recovery from inactivation at physiologicallyrelevant Vh. At −40 mV, recovery of inactivation remainsfast (τ = 24 ms) but is strikingly incomplete as a resultof the transition into a slow-inactivation state. The APamplitude and the velocity of the spike upstroke stronglydepend on the amount of available Nav channels. The‘vulnerability’ of MCC Nav channels to inactivation isindeed reflected in profound changes of AP shape whencells are depolarized to −40 mV. At such depolarizedpotentials, the Nav window-current is peculiarly smallbecause of a shift of the inactivation curve to morenegative potentials. Opposing shifts of both activation andinactivation curves (as occurs in MCCs when changing Vh
from −100 mV to −40 mV) are expected to slow downthe frequency of tonic firing, indicating their effectivecontribution to pacemaking. This is true for dopaminergicneurons of the substantia nigra, where Nav channelscontribute to pacemaking (Tucker et al. 2012) but opposite
C© 2014 The Authors. The Journal of Physiology C© 2014 The Physiological Society

924 D. H. F. Vandael and others J Physiol 593.4
to that found in MCCs in which firing is accelerated.The fact that saturating doses of TTX do not interferewith spontaneous AP generation is conclusive evidencethat Nav channels are not required for MCC pacemaking.Activation threshold for Nav channels occurs at morepositive voltages than the MCC ISI (−46 mV), suggestingthat a channel such as the L-type Cav1.3 is required tobridge the gap (Marcantoni et al. 2010; Vandael et al. 2012).
Physiological relevance of Nav currents in MCCs:switch from tonic to burst firing
Fast-firing cells typically exhibit very narrow APs withsmall overshoots and fast AP-repolarization (Bean, 2007).In this way, Nav inactivation is kept incomplete andcontributes to fast-firing phenotypes (Carter & Bean,2010). In the present study, we clearly show that,upon sustained depolarization, the AP peak of MCCsgradually drops and broadens, reducing the velocityof spike depolarization and repolarization. Such broadand low amplitude spikes are correlated with stronglyreduced Na+ current amplitudes (by 50% compared toVrest). Nav1.3/Nav1.7 blockade by TTX leads to similardose-dependent changes of AP waveform. Indeed, TTXblocks both AP peak and Nav currents with almostthe same IC50 (9 mM vs.7 nM). This is differentfrom several neurons that, at Vrest –70 mV, possesshigh-densities of Nav channels and the AP-shape is lesssensitive to TTX (Madeja, 2000). MCCs have a lowersurplus of Nav1.3/Nav1.7 channels whose availability isthus extremely sensitive to slight changes in membranepotential or channel down-regulation.
An interesting finding of the present study is thatsaturating doses of TTX do not lead to a cessation of firingbut rather trigger a switch from single irregular APs intoburst firing. Crucial to burst firing is the inward/outwardcurrent balance in between spikes (Swensen & Bean, 2003)and we have shown that blocking Nav channels inverts thenet outward K+ current during the AHP to a net inwardCa2+ current. Similar changes on AP shape have beenobserved during TTX application or K+ channel block byTEA on spontaneously active MCCs in the intact adrenalgland (Nassar-Gentina et al. 1988). Spontaneous burstfiring not only occurs in a minority of MCCs (Fig. 9),but also in a small fraction of MCCs of adrenal slices(Martinez-Espinosa et al. 2014). This latter study alsoshows that burst firing occurs in the majority of MCCsin which the β2-subunit of fast-inactivating BK channelsis deleted. Thus, burst firing appears as an intrinsic firingmode in a subpopulation of MCCs and may be easilyuncovered during altered cell conditions. The final outputis an increased Ca2+-entry that boosts cell activity andsecretion.
Firing modes regulate catecholamine release in CCs
We found an excellent correlation between the 3.5-foldenhanced Ca2+-entry during the TTX-induced burstfiring and the 3.7-fold increased total charges ofreleased catecholamines. This is expected given thelinear-dependence of Ca2+-entry and catecholaminerelease in MCCs (Marcantoni et al. 2009) and RCCs(Carabelli et al. 2003), which derives from the weakcoupling of Ca2+-channels to the release sites (Marcantoniet al. 2008). Whether the major source of Ca2+-influxrequired for secretion in MCCs is a result of the slow-wavedepolarization or the increased AP frequency duringbursts remains to be resolved. Nevertheless, it is inter-esting to recall that secretion in RCCs is more sensitive tostimulations in form of repeated bursts rather than singleAP-trains of increasing frequency (Duan et al. 2003). Inmidbrain dopaminergic neurons, bursting stimulationsare twice as potent in triggering secretion compared toregular spaced ones, although with the same averagefrequency (Gonon, 1988).
The action of TTX reported in the present study isunique. The toxin does not block the Ca2+-dependentrelease of catecholamines but rather increases it. In PC12cells, catecholamine release is fully Ca2+-dependent andTTX preserves this rather than blocking it (Ritchie,1979). In intact perfused rat adrenal glands, 300 nM
TTX leads to a reduction of �43% of catecholaminesecretion after transmural stimulation (Wakade, 1981).This apparent conflicting result may correlate with ourdata by assuming that the TTX concentration used was notsufficient to guarantee an efficient block of Nav channelsin the whole-gland or that TTX could have partiallyblocked the Nav channels of presynaptic splanchnicnerve endings. In our hands, RCC pacemaking is moresensitive to Nav channel blockade (Martin et al. 2001).A species-dependent origin of these divergent results isprobable.
The present study indicates that the loss ordown-regulation of Nav channels is a critical processleading to alteration of the AP waveform. In extremesituations, this phenomenon might result in a switchto slow waves of burst firing that boost Ca2+-entryinside the cell. Under physiological conditions, this mayoccur as a result of plasma hyperkalaemia, acidosis orincreased histamine levels to which CCs respond withsustained depolarizations, burst firing (Wallace et al.2002; Inoue et al. 2008; Mahapatra et al. 2011) andenhanced circulating catecholamines (Clausen, 1983).Of particular interest in CC biology is the potentialrole of muscarinic receptors, whose activation causesprolonged membrane depolarizations, increased cell firingand sustained catecholamines release (Nassar-Gentinaet al. 1988; Olivos & Artalejo, 2007). The action ismediated by the M1 muscarinic receptor and proceeds
C© 2014 The Authors. The Journal of Physiology C© 2014 The Physiological Society

J Physiol 593.4 Burst firing in chromaffin cells 925
through the inhibition of TASK1-like channels (Inoueet al. 2008). Because muscarine activates the proteinkinase C pathway in RCCs (Akaike et al. 1993),Nav channels will probably undergo the well knownprotein kinase C-dependent down-regulation mediatedby muscarinic receptors (Carr et al. 2003). This, togetherwith the 30% reduced availability of Nav channels atdepolarized Vh, would critically increase the probabilityof MCCs switching to burst-firing patterns, boostingcatecholamine release during ACh-driven acute stressresponses.
References
Akaike A, Sasa M, Tamura Y, Ujihara H & Takaori S (1993).Effects of protein kinase C on the muscarinic excitation ofrat adrenal chromaffin cells. Jpn J Pharmacol 61, 145–148.
Bant JS & Raman IM (2010). Control of transient, resurgent,and persistent current by open-channel block by Na channelbeta4 in cultured cerebellar granule neurons. Proc Natl AcadSci U S A 107, 12357–12362.
Bean BP (2007). The action potential in mammalian centralneurons. Nat Rev Neurosci 8, 451–465.
Berkefeld H & Fakler B (2013). Ligand-gating by Ca2+ is ratelimiting for physiological operation of BK(Ca) channels.J Neurosci 33, 7358–7367.
Biales B, Dichter M & Tischler A (1976). Electrical excitabilityof cultured adrenal chromaffin cells. J Physiol 262, 743–753.
Brandt BL, Hagiwara S, Kidokoro Y & Miyazaki S (1976).Action potentials in the rat chromaffin cell and effects ofacetylcholine. J Physiol 263, 417–439.
Cantrell AR & Catterall WA (2001). Neuromodulation of Na+channels: an unexpected form of cellular plasticity. Nat RevNeurosci 2, 397–407.
Carabelli V, D’Ascenzo M, Carbone E & Grassi C (2002). Nitricoxide inhibits neuroendocrine Ca(v)1 L-channel gating viacGMP-dependent protein kinase in cell-attached patches ofbovine chromaffin cells. J Physiol 541, 351–366.
Carabelli V, Giancippoli A, Baldelli P, Carbone E & ArtalejoAR (2003). Distinct potentiation of L-type currents andsecretion by cAMP in rat chromaffin cells. Biophys J 85,1326–1337.
Carabelli V, Hernandez-Guijo JM, Baldelli P & Carbone E(2001). Direct autocrine inhibition and cAMP-dependentpotentiation of single L-type Ca2+ channels in bovinechromaffin cells. J Physiol 532, 73–90.
Carabelli V, Marcantoni A, Comunanza V & Carbone E(2007a). Fast exocytosis mediated by T- and L-type channelsin chromaffin cells: distinct voltage-dependence but similarCa2+-dependence. Eur Biophys J 36, 753–762.
Carabelli V, Marcantoni A, Comunanza V, De Luca A, Diaz J,Borges R & Carbone E (2007b). Chronic hypoxiaup-regulates alpha(1H) T-type channels and low-thresholdcatecholamine secretion in rat chromaffin cells. J Physiol584, 149–165.
Carbone E & Lux HD (1986). Sodium-channels in culturedchick dorsal-root ganglion neurons. Eur Biophys J 13,259–271.
Carbone E & Lux HD (1987). Single low-voltage-activatedcalcium channels in chick and rat sensory neurons. J Physiol386, 571–601.
Carr DB, Day M, Cantrell AR, Held J, Scheuer T, Catterall WA& Surmeier DJ (2003). Transmitter modulation of slow,activity-dependent alterations in sodium channel availabilityendows neurons with a novel form of cellular plasticity.Neuron 39, 793–806.
Carter BC & Bean BP (2010). Sodium entry during actionpotentials of mammalian neurons: incomplete inactivationand reduced metabolic efficiency in fast-spiking neurons.Neuron 64, 898–909.
Catterall WA, Goldin AL & Waxman SG (2005). InternationalUnion of Pharmacology. XLVII. Nomenclature andstructure–function relationships of voltage-gated sodiumchannels. Pharmacol Rev 57, 397–409.
Cesetti T, Hernandez-Guijo JM, Baldelli P, Carabelli V &Carbone E (2003). Opposite action of beta 1- and beta2-adrenergic receptors on Ca(V)1 L-channel current in ratadrenal chromaffin cells. J Neurosci 23, 73–83.
Clausen T (1983). Adrenergic control of Na+-K+-homoeostasis. Acta Med Scand Suppl 672, 111–115.
Colborn JM, Byrd BD, Koita OA & Krogstad DJ (2008).Estimation of copy number using SYBR Green: confoundingby AT-rich DNA and by variation in amplicon length. Am JTrop Med Hyg 79, 887–892.
Cummins TR, Aglieco F, Renganathan M, Herzog RI, Dib-HajjSD & Waxman SG (2001). Nav1.3 sodium channels: rapidrepriming and slow closed-state inactivation displayquantitative differences after expression in a mammalian cellline and in spinal sensory neurons. J Neurosci 21,5952–5961.
de Diego AM, Gandia L & Garcia AG (2008). A physiologicalview of the central and peripheral mechanisms that regulatethe release of catecholamines at the adrenal medulla. ActaPhysiol (Oxf) 192, 287–301.
Desarmenien MG, Jourdan C, Toutain B, Vessieres E,Hormuzdi SG & Guerineau NC (2013). Gap junctionsignalling is a stress-regulated component of adrenalneuroendocrine stimulus-secretion coupling in vivo. NatCommun 4, 2938.
Duan K, Yu X, Zhang C & Zhou Z (2003). Control of secretionby temporal patterns of action potentials in adrenalchromaffin cells. J Neurosci 23, 11235–11243.
Engel D & Jonas P (2005). Presynaptic action potentialamplification by voltage-gated Na+ channels inhippocampal mossy fiber boutons. Neuron 45, 405–417.
Enomoto A, Han JM, Hsiao CF & Chandler SH (2007). Sodiumcurrents in mesencephalic trigeminal neurons from Nav1.6null mice. J Neurophysiol 98, 710–719.
Fenwick EM, Marty A & Neher E (1982). Sodium and calciumchannels in bovine chromaffin cells. J Physiol 331,599–635.
French CR, Sah P, Buckett KJ & Gage PW (1990). Avoltage-dependent persistent sodium current in mammalianhippocampal neurons. J Gen Physiol 95, 1139–1157.
Garcia AG, Garcia-De-Diego AM, Gandia L, Borges R &Garcia-Sancho J (2006). Calcium signaling and exocytosis inadrenal chromaffin cells. Physiol Rev 86, 1093–1131.
C© 2014 The Authors. The Journal of Physiology C© 2014 The Physiological Society

926 D. H. F. Vandael and others J Physiol 593.4
Gonon FG (1988). Nonlinear relationship between impulseflow and dopamine released by rat midbrain dopaminergicneurons as studied by in vivo electrochemistry. Neuroscience24, 19–28.
Guerineau NC, Desarmenien MG, Carabelli V & Carbone E(2012). Functional chromaffin cell plasticity in response tostress: focus on nicotinic, gap junction, and voltage-gatedCa2+ channels. J Mol Neurosci 48, 368–386.
Inoue M, Harada K, Matsuoka H, Sata T & Warashina A(2008). Inhibition of TASK1-like channels by muscarinicreceptor stimulation in rat adrenal medullary cells.J Neurochem 106, 1804–1814.
Kidokoro Y & Ritchie AK (1980). Chromaffin cell actionpotentials and their possible role in adrenaline secretionfrom rat adrenal medulla. J Physiol 307, 199–216.
Klugbauer N, Lacinova L, Flockerzi V & Hofmann F (1995).Structure and functional expression of a new member of thetetrodotoxin-sensitive voltage-activated sodium channelfamily from human neuroendocrine cells. EMBO J 14,1084–1090.
Levitan ES & Kramer RH (1990). Neuropeptide modulation ofsingle calcium and potassium channels detected with a newpatch clamp configuration. Nature 348, 545–547.
Li L, Bischofberger J & Jonas P (2007). Differential gating andrecruitment of P/Q-, N-, and R-type Ca2+ channels inhippocampal mossy fiber boutons. J Neurosci 27,13420–13429.
Lou XL, Yu X, Chen XK, Duan KL, He LM, Qu AL, Xu T &Zhou Z (2003). Na+ channel inactivation: a comparativestudy between pancreatic islet beta-cells and adrenalchromaffin cells in rat. J Physiol 548, 191–202.
Madeja M (2000). Do neurons have a reserve of sodiumchannels for the generation of action potentials? A study onacutely isolated CA1 neurons from the guinea-pighippocampus. Eur J Neurosci 12, 1–7.
Magistretti J, Ragsdale DS & Alonso A (1999). Highconductance sustained single-channel activity responsiblefor the low-threshold persistent Na(+) current in entorhinalcortex neurons. J Neurosci 19, 7334–7341.
Mahapatra S, Marcantoni A, Vandael DHF, Striessnig J &Carbone E (2011). Are Ca(v)1.3 pacemaker channels inchromaffin cells? Possible bias from resting cell conditionsand DHP blockers usage. Channels 5, 219–224.
Marcantoni A, Baldelli P, Hernandez-Guijo JM, Comunanza V,Carabelli V & Carbone E (2007). L-type calcium channels inadrenal chromaffin cells: role in pace-making and secretion.Cell Calcium 42, 397–408.
Marcantoni A, Carabelli V, Comunanza V, Hoddah H &Carbone E (2008). Calcium channels in chromaffin cells:focus on L and T types. Acta Physiol (Oxf) 192, 233–246.
Marcantoni A, Carabelli V, Vandael DH, Comunanza V &Carbone E (2009). PDE type-4 inhibition increases L-typeCa2+ currents, action potential firing, and quantal size ofexocytosis in mouse chromaffin cells. Pflugers Archiv Eur JPhysiol 457, 1093–1110.
Marcantoni A, Vandael DHF, Mahapatra S, Carabelli V,Sinnegger-Brauns MJ, Striessnig J & Carbone E (2010). Lossof Cav1.3 channels reveals the critical role of L-type and BKchannel coupling in pacemaking mouse adrenal chromaffincells. J Neurosci 30, 491–504.
Martin AO, Mathieu MN, Chevillard C & Guerineau NC(2001). Gap junctions mediate electrical signaling andensuing cytosolic Ca2+ increases between chromaffin cells inadrenal slices: a role in catecholamine release. J Neurosci 21,5397–5405.
Martinez-Espinosa PL, Yang C, Gonzalez-Perez V, Xia XM &Lingle CJ (2014). Knockout of the BK beta2 subunitabolishes inactivation of BK currents in mouse adrenalchromaffin cells and results in slow-wave burst activity.J Gen Physiol 144, 275–295.
Mercer JN, Chan CS, Tkatch T, Held J & Surmeier DJ (2007).Nav1.6 sodium channels are critical to pacemaking and fastspiking in globus pallidus neurons. J Neurosci 27,13552–13566.
Morinville A, Fundin B, Meury L, Jureus A, Sandberg K, KruppJ, Ahmad S & O’Donnell D (2007). Distribution of thevoltage-gated sodium channel Na(v)1.7 in the rat: expressionin the autonomic and endocrine systems. J Comp Neurol 504,680–689.
Nassar-Gentina V, Pollard HB & Rojas E (1988). Electricalactivity in chromaffin cells of intact mouse adrenal gland.Am J Physiol Cell Physiol 254, C675–C683.
Nassar MA, Baker MD, Levato A, Ingram R, Mallucci G,McMahon SB & Wood JN (2006). Nerve injury inducesrobust allodynia and ectopic discharges in Nav1.3 nullmutant mice. Mol Pain 2, 33.
Nassar MA, Stirling LC, Forlani G, Baker MD, Matthews EA,Dickenson AH & Wood JN (2004). Nociceptor-specific genedeletion reveals a major role for Nav1.7 (PN1) in acute andinflammatory pain. Proc Natl Acad Sci U S A 101,12706–12711.
Olivos L & Artalejo AR (2007). Muscarinic excitation-secretioncoupling in chromaffin cells. Acta Physiol (Oxf) 192,213–220.
Raman IM & Bean BP (1997). Resurgent sodium current andaction potential formation in dissociated cerebellar Purkinjeneurons. J Neurosci 17, 4517–4526.
Ritchie AK (1979). Catecholamine secretion in a ratpheochromocytoma cell line: two pathways for calciumentry. J Physiol 286, 541–561.
Rozen S & Skaletsky H (2000). Primer3 on the WWW forgeneral users and for biologist programmers. Methods MolBiol 132, 365–386.
Rush AM, Dib-Hajj SD & Waxman SG (2005).Electrophysiological properties of two axonal sodiumchannels, Nav1.2 and Nav1.6, expressed in mouse spinalsensory neurones. J Physiol 564, 803–815.
Sangameswaran L, Fish LM, Koch BD, Rabert DK,Delgado SG, Ilnicka M, Jakeman LB, Novakovic S, Wong K,Sze P, Tzoumaka E, Stewart GR, Herman RC, Chan H,Eglen RM & Hunter JC (1997). A noveltetrodotoxin-sensitive, voltage-gated sodium channelexpressed in rat and human dorsal root ganglia. J Biol Chem272, 14805–14809.
Segura F, Brioso MA, Gomez JF, Machado JD & Borges R(2000). Automatic analysis for amperometrical recordings ofexocytosis. J Neurosci Meth 103, 151–156.
Smith MR, Smith RD, Plummer NW, Meisler MH & GoldinAL (1998). Functional analysis of the mouse Scn8a sodiumchannel. J Neurosci 18, 6093–6102.
C© 2014 The Authors. The Journal of Physiology C© 2014 The Physiological Society
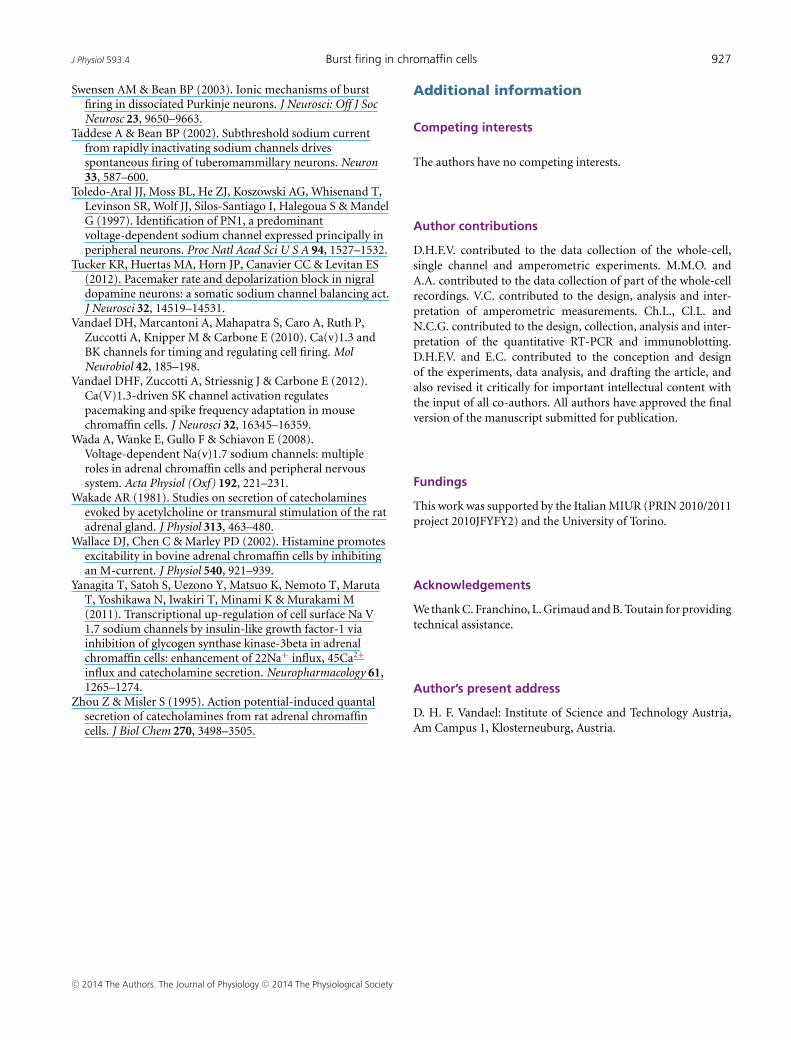
J Physiol 593.4 Burst firing in chromaffin cells 927
Swensen AM & Bean BP (2003). Ionic mechanisms of burstfiring in dissociated Purkinje neurons. J Neurosci: Off J SocNeurosc 23, 9650–9663.
Taddese A & Bean BP (2002). Subthreshold sodium currentfrom rapidly inactivating sodium channels drivesspontaneous firing of tuberomammillary neurons. Neuron33, 587–600.
Toledo-Aral JJ, Moss BL, He ZJ, Koszowski AG, Whisenand T,Levinson SR, Wolf JJ, Silos-Santiago I, Halegoua S & MandelG (1997). Identification of PN1, a predominantvoltage-dependent sodium channel expressed principally inperipheral neurons. Proc Natl Acad Sci U S A 94, 1527–1532.
Tucker KR, Huertas MA, Horn JP, Canavier CC & Levitan ES(2012). Pacemaker rate and depolarization block in nigraldopamine neurons: a somatic sodium channel balancing act.J Neurosci 32, 14519–14531.
Vandael DH, Marcantoni A, Mahapatra S, Caro A, Ruth P,Zuccotti A, Knipper M & Carbone E (2010). Ca(v)1.3 andBK channels for timing and regulating cell firing. MolNeurobiol 42, 185–198.
Vandael DHF, Zuccotti A, Striessnig J & Carbone E (2012).Ca(V)1.3-driven SK channel activation regulatespacemaking and spike frequency adaptation in mousechromaffin cells. J Neurosci 32, 16345–16359.
Wada A, Wanke E, Gullo F & Schiavon E (2008).Voltage-dependent Na(v)1.7 sodium channels: multipleroles in adrenal chromaffin cells and peripheral nervoussystem. Acta Physiol (Oxf) 192, 221–231.
Wakade AR (1981). Studies on secretion of catecholaminesevoked by acetylcholine or transmural stimulation of the ratadrenal gland. J Physiol 313, 463–480.
Wallace DJ, Chen C & Marley PD (2002). Histamine promotesexcitability in bovine adrenal chromaffin cells by inhibitingan M-current. J Physiol 540, 921–939.
Yanagita T, Satoh S, Uezono Y, Matsuo K, Nemoto T, MarutaT, Yoshikawa N, Iwakiri T, Minami K & Murakami M(2011). Transcriptional up-regulation of cell surface Na V1.7 sodium channels by insulin-like growth factor-1 viainhibition of glycogen synthase kinase-3beta in adrenalchromaffin cells: enhancement of 22Na+ influx, 45Ca2+influx and catecholamine secretion. Neuropharmacology 61,1265–1274.
Zhou Z & Misler S (1995). Action potential-induced quantalsecretion of catecholamines from rat adrenal chromaffincells. J Biol Chem 270, 3498–3505.
Additional information
Competing interests
The authors have no competing interests.
Author contributions
D.H.F.V. contributed to the data collection of the whole-cell,single channel and amperometric experiments. M.M.O. andA.A. contributed to the data collection of part of the whole-cellrecordings. V.C. contributed to the design, analysis and inter-pretation of amperometric measurements. Ch.L., Cl.L. andN.C.G. contributed to the design, collection, analysis and inter-pretation of the quantitative RT-PCR and immunoblotting.D.H.F.V. and E.C. contributed to the conception and designof the experiments, data analysis, and drafting the article, andalso revised it critically for important intellectual content withthe input of all co-authors. All authors have approved the finalversion of the manuscript submitted for publication.
Fundings
This work was supported by the Italian MIUR (PRIN 2010/2011project 2010JFYFY2) and the University of Torino.
Acknowledgements
We thank C. Franchino, L. Grimaud and B. Toutain for providingtechnical assistance.
Author’s present address
D. H. F. Vandael: Institute of Science and Technology Austria,Am Campus 1, Klosterneuburg, Austria.
C© 2014 The Authors. The Journal of Physiology C© 2014 The Physiological Society