Dual effects of botulinum neurotoxin A on the secretory stages of chromaffin cells
Redistribution of Ca2� among cytosol and organelladuring stimulation of bovine chromaffin cells
CARLOS VILLALOBOS, LUCIA NUNEZ, MAYTE MONTERO, ANTONIO G. GARCIA,*MARIA TERESA ALONSO, PABLO CHAMERO, JAVIER ALVAREZ,AND JAVIER GARCIA-SANCHO1
Instituto de Biologıa y Genetica Molecular (IBGM), Universidad de Valladolid y Consejo Superior deInvestigaciones Cientıficas, Departamento de Fisiologıa y Bioquımica, Facultad de Medicina, E-47005Valladolid, Spain; and *Instituto Teofilo Hernando, Departamento de Farmacologıa y Terapeutica,Facultad de Medicina, Universidad Autonoma de Madrid, E-28029 Madrid, Spain.
ABSTRACT Recent results indicate that Ca2� trans-port by organella contributes to shaping Ca2� signalsand exocytosis in adrenal chromaffin cells. Therefore,accurate measurements of [Ca2�] inside cytoplasmicorganella are essential for a comprehensive analysis ofthe Ca2� redistribution that follows cell stimulation.Here we have studied changes in Ca2� inside theendoplasmic reticulum, mitochondria, and nucleus byimaging aequorins targeted to these compartments incells stimulated by brief depolarizing pulses with highK� solutions. We find that Ca2� entry through voltage-gated Ca2� channels generates subplasmalemmal high[Ca2�]c domains adequate for triggering exocytosis. Asmaller increase of [Ca2�]c is produced in the cell core,which is adequate for recruitment of the reserve poolof secretory vesicles to the plasma membrane. Most ofthe Ca2� load is taken up by a mitochondrial pool, M1,closer to the plasma membrane; the increase of[Ca2�]M stimulates respiration in these mitochondria,providing local support for the exocytotic process.Relaxation of the [Ca2�]c transient is due to Ca2�
extrusion through the plasma membrane. At this stage,mitochondria release Ca2� to the cytosol through theNa�/Ca2� exchanger, thus maintaining [Ca2�]c dis-cretely increased, especially at core regions of the cell,for periods that outlast the duration of the stimulus.—Villalobos, C., Nunez, L., Montero, M., Garcıa, A. G.,Alonso, M. T., Chamero, P., Alvarez, J., Garcıa-Sancho,J. Redistribution of Ca2� among cytosol and organelladuring stimulation of bovine chromaffin cells. FASEB J.16, 343–353 (2002)
Key Words: calcium � mitochondria � aequorin � nucleus
Cell stimulation is often associated with an increaseof the cytosolic Ca2� concentration ([Ca2�]c) thattransduces the appropriate cellular responses. In chro-maffin cells, Ca2� entry through voltage-operated Ca2�
channels (VOCC) of the plasma membrane is essentialfor triggering the secretory response (1). Since Ca2�
may act on many different effectors at different subcel-lular locations, considerable attention has been paid to
the spatiotemporal profiles of [Ca2�]c transients. Dif-fusion of Ca2� through the cytosol, cytosolic Ca2�
buffering, and Ca2� transport by organella are essentialfor shaping the [Ca2�]c transients. Changes of [Ca2�]inside organella may also be relevant to determine cellresponses (2–4).
Cytosolic Ca2� buffering and diffusion in bovinechromaffin cells have been studied by Neher andco-workers (5, 6). The cytosol has a total bindingcapacity of 4 mM and the endogenous Ca2� buffer ispoorly mobile, fast (association rate�10�8 M�1s�1),and with low affinity for Ca2� (dissociation con-stant�100 �M). The activity coefficient of the endoge-nous buffer is �1/40. Cytosolic buffering slows downCa2� mobility to reach an apparent diffusion of �10�7
cm2s�1. The 2-dimensional apparent diffusion coeffi-cient is �40 �m2/s and shows inhomogeneities at thenuclear envelope and at the plasma membrane (7).Brief opening of VOCC generates microdomains ofhigh [Ca2�]c near the mouth of the channel that canbe detected in Ca2� imaging measurements (8). Insuch microdomains, Ca2� can reach concentrations ashigh as 10 �M and perhaps 100 �M (2, 9). Because ofrapid diffusion of Ca2� toward the surrounding cytosol,[Ca2�]c microdomains are highly restricted in time andspace (2, 10).
The Ca2� fluxes relevant to determine [Ca2�]c tran-sients after stimulation of chromaffin cells are entryand extrusion at the plasma membrane and uptake andrelease at the cytoplasmic organella. Among the last,the endoplasmic reticulum (ER) and mitochondriaseem to be the most directly involved. Secretory gran-ules contain large amounts of calcium, but exchangethrough their membrane is too slow to contribute to[Ca2�]c transients (but see ref 11).
Ca2� entry through VOCC and its subsequent clear-ance have been studied extensively in bovine and ratchromaffin cells (5, 6, 12, 13). Membrane depolariza-tion to 0 mV elicits Ca2� currents peaking near 800 pA
1 Correspondence: IBGM, Departamento de Fisiologıa yBioquımica, Facultad de Medicina, E-47005 Valladolid, Spain.E-mail: [email protected]
3430892-6638/02/0016-0343 © FASEB

and deactivating with half-time constants of 300–500ms. In bovine chromaffin cells, a 0.5 s stimulationperiod typically elicits a mean ICa of 250 pA. In terms ofCa2� flow, this current is equivalent (for a 15 �mdiameter cell) to 700 �mol/l of cells/s (5). Measure-ments of 45Ca uptake by bovine chromaffin cells depo-larized with high K� (59 mM) was linear during the first5 s at an estimated rate of 0.7�10�15 mol per cell/s,which is equivalent to 400 �mol/l of cells/s (14).
Plasma membrane Ca2� extrusion is due to opera-tion of a plasma membrane Ca2� ATPase and anNa�/Ca2� exchange system. The joint action of bothtransport systems has been estimated to decrease[Ca2�]c at a maximal rate of �0.2 �M/s, equivalent to20 �mol/l cells/s, in rat chromaffin cells at 27°C(12, 13).
Most of the information on transport parameters byorganella in intact cells is indirect, inferred from theireffects on [Ca2�]c. Maximal uptake by ER is consideredto contribute little, perhaps 1–1.5 �M/s (equivalent to40–60 �mol/l cells/s), to changes in [Ca2�]c duringstimulation of bovine (6) and rat (13) chromaffin cells.It has been shown recently that cytosolic Ca2� maytrigger Ca2�-induced Ca2� release (CICR) from the ERof bovine chromaffin cells (15).
Ca2� transport by mitochondria has received renewedattention in the last few years, both because of possibleparticipation in shaping [Ca2�]c transients and becausechanges of intramitochondrial [Ca2�] ([Ca2�]M) seemimportant by themselves for the regulation of cellfunctions, such as the rate of respiration or pro-grammed cell death (16, 17). Ca2� is taken up throughthe Ca2� uniporter, a low-affinity/high-capacity systemdriven by the mitochondrial membrane potential (18).Ca2� exit from mitochondria through an Na�/Ca2�
exchanger and through an Na�-independent system,the first being dominant in the adrenal gland (18, 19).The activity coefficient of Ca2� inside the mitochon-drial matrix seems to be very low, in the 1/1000 range(20–22). It has been shown that mitochondria cancontribute to clearing cytosolic Ca2� loads in rat (13,21) and cow (6) chromaffin cells. Herrington et al. (13)reported mitochondrial uptake rates of (in terms ofchanges of [Ca2�]c) 0.4 to 0.7 �M/s at [Ca2�]c con-centrations of 0.5–2 �M. Xu et al. (6) report muchlarger rates: 120 �M/s at saturating [Ca2�]c concentra-tions (200 �M). These differences are consistent withthe [Ca2�]c dependence of the activity of the mito-chondrial Ca2� uniporter (23, 24).
We have recently shown the validity of using targetedaequorins with different Ca2� affinities to monitordirectly changes of [Ca2�] inside ER and mitochondriaof living chromaffin cells (15, 23–25). Taking advan-tage of this technology, we attempt here a quantitativeexplanation of fluxes among the extracellular, cyto-solic, and organellar compartments during depolariza-tion of chromaffin cells leading to Ca2� entry throughVOCC.
MATERIALS AND METHODS
Cell culture, [Ca2�]c measurements, andexpression of aequorins
Isolation and culture of bovine adrenal chromaffin cells was asdescribed (15). Cells were plated on 12 mm glass poly-d-lysine-coated coverslips (1–5�105 cells; 0.5 ml) and maintained at37°C in a humidified atmosphere of 5% CO2. [Ca2�]c imagingin cells loaded with either Fura-2 (26) or fura-4F (24) was asdescribed previously. Recombinant aequorins containing target-ing sequences to several subcellular locations (27) have beenused. Both wild-type aequorin and mutated (Asp1193Ala), lowCa2� affinity aequorin (AEQmut; ref 28) were used. For ae-quorin expression, cells were infected with a defective herpessimplex virus type 1 (HSV-1) containing the correspondingchimeric aequorin gene and cultured for 12–24 h prior tomeasurement. Viruses expressing mitochondrial aequorin(mitAEQ), low Ca2� affinity mutated mitochondrial(mitAEQmut), or ER (erAEQmut) aequorins have beendescribed (15, 23, 24). Nuclear (nucleoplasmin) and cytosolicaequorin cDNAs were obtained from Molecular Probes(Eugene, OR) and cloned in the pHSVpUC plasmid. Packag-ing and titration of the pHSVnucAEQ (nuclear) andpHSVcytAEQ (cytosolic) viruses were performed as reportedbefore (25). The multiplicity of infection was from 0.01 to 0.1for batch luminescence measurements (15, 24) and from 0.3to 1 for bioluminescence imaging.
Measurements of aequorin bioluminescence andNAD(P)H fluorescence
Cells expressing apoaequorins were incubated for 1–2 h atroom temperature with 1 �M coelenterazine. Coelenterazinen was used to reconstitute mitAEQmut in order to decreasefurther Ca2� affinity (29). Batch cell aequorin photolumines-cence measurements were performed as described (15, 24)and calibrations in [Ca2�] were done using published con-stant values (30). For bioluminescence imaging (31, 32), cellswere placed into a perfusion chamber thermostatized to 37°Cunder a Zeiss Axiovert S100 TV microscope (objective, Fluar40� oil, 1.3 n.a.) and perfused at 5–10 ml/min with testsolutions prewarmed at 37°C. The standard incubation me-dium had the following composition (in mM): NaCl, 145;KCl; 5; CaCl2, 1; MgCl2, 1; glucose, 10; sodium-HEPES, 10, pH7.4. At the end of each experiment, cells were permeabilizedwith 0.1 mM digitonin in 10 mM CaCl2 to release all residualaequorin counts. Images were taken with a Hamamatsu VIMphoton-counting camera handled with an Argus-20 imageprocessor and integrated for 10 s periods. Photons/cell ineach image were quantified using the Hamamatsu Aquacos-mos software. Total counts per cell ranged between 3 � 103
and 3 � 105 and noise was (mean�sd) 1 � 1 c.p.s. per typicalcell area (3000 pixels). Values are referred to the whole cellarea. Data were first quantified as rates of photoluminescenceemission/total c.p.s remaining at each time and divided bythe integration period (L/LTOTAL in s�1). Calibrations in[Ca2�] were performed using published constant values (30).A transmission image was also taken at the beginning of eachexperiment.
Mitochondrial NAD(P)H fluorescence was measured usingthe same set up as for aequorin with excitation at 340 � 10nm and emission at 450 � 40 nm. The integration period was6 s. For these experiments, 1 mM pyruvate was added to thestandard medium in order to keep the cytosolic NAD in theoxidized state.
Coelenterazines and the acetoxymethyl (AM) esters offura-2 and fura-4F were obtained from Molecular Probes.
344 Vol. 16 March 2002 VILLALOBOS ET AL.The FASEB Journal

CGP37157 was from Tocris (Bristol, UK). Other reagentswere of the highest quality available from Sigma (St. Louis,MO) Calbiochem (San Diego, CA), or Merck (Rahway, NJ).
RESULTS
Increase of [Ca2�]c upon stimulationwith high K solutions
To induce Ca2� entry through VOCC, cells were depo-larized by stimulation with high K� (75 mM) solutionfor 10 s. Experiments in cells loaded with fura-2 showedquite a homogeneous response, with estimated average[Ca2�]c peaks of 1.7–2 �M. There was, however, a cleartendency to saturation of the dye in many cells (notshown); this would lead to an underestimation of the[Ca2�]c concentrations. To circumvent this problem,fura-4F, which has a smaller affinity for Ca2� (Kd�0.77�M), was used. Figure 1 illustrates a typical experimentin which the cells were stimulated by two consecutivehigh K� pulses. The peak [Ca2�]c reached 4.8 �M inthis experiment (Fig. 1A). In five similar experiments,the average [Ca2�]c peak (expressed as �[Ca2�]c;mean�sd; n�213 cells) was 4.05 � 1.41 �M. The ratesof [Ca2�]c change are shown in Fig. 1B. The increase of[Ca2�]c reached a maximum rate of �1.1 �M/s duringstimulation. In five similar experiments, the averagevalue was (mean�sd) 1.15 � 0.15 �M/s. In two similar
experiments performed at 22°C, changes of [Ca2�]cwere similar in both peak amplitude (mean�sd,4.05�1.51 �M; n�75) and kinetics (the maximum rateof [Ca2�]c increase ranged between 0.7 and 1 �M/s infour independent measurements; results not shown).
The rate of [Ca2�]c increase measured here is muchsmaller than expected from typical ICa or 45Ca uptakemeasurements. For an activity coefficient of 1/40 forthe cytosolic Ca2� buffers (5, 6), Ca2� entry would beexpected to increase [Ca2�]c at a rate of 10–17.5 �M/s,which is one order of magnitude larger than measuredin cells loaded with fura-4F. These results suggest thatmost Ca2�entering the cell during the 10 s stimulationperiod is taken up into organella.
Once the stimulation pulse ends, Ca2� is cleared fromthe cytosol at a rate of �0.7 �M/s, which declines quicklyas [Ca2�]c approaches its prestimulation value (Fig. 1B).At this stage, Ca2� clearance (unopposed by Ca2� entry)reflects the joint action of uptake into organella andextrusion through the plasma membrane.
Uptake of Ca2� by the ER
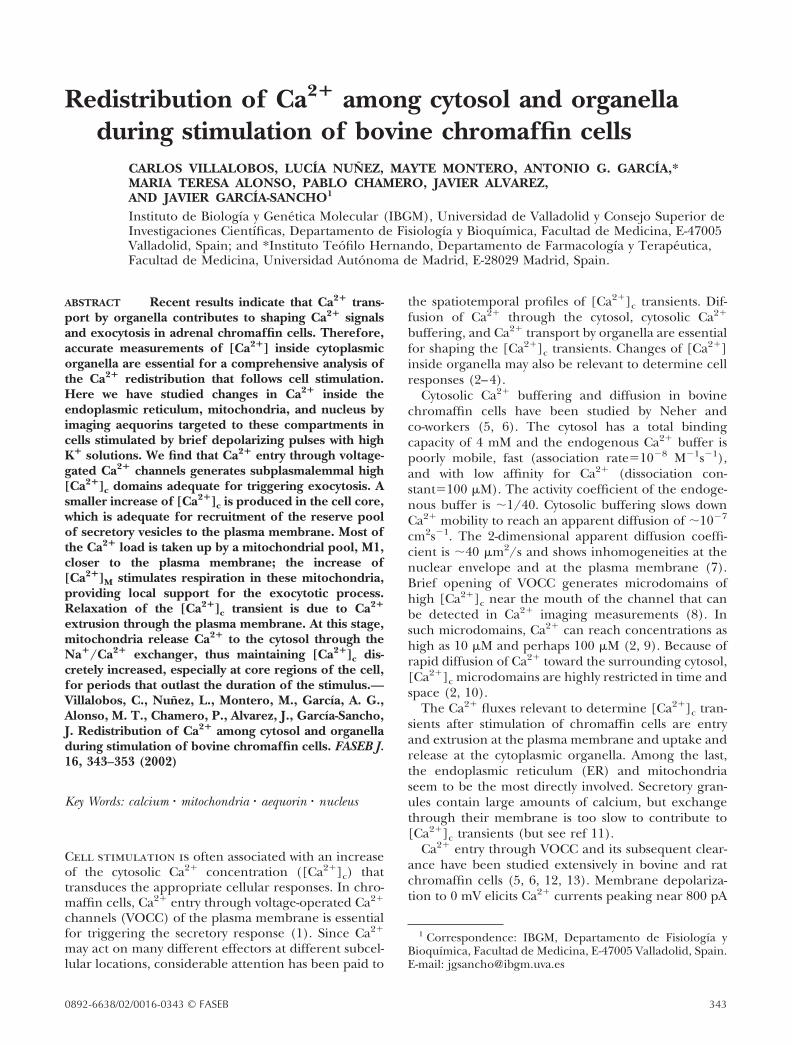
The uptake of Ca2� by the ER can be monitoredprecisely using targeted aequorins with low Ca2� affin-ity (15, 25, 29, 33). Figure 2A shows the time course ofER refilling in Ca2�-depleted chromaffin cells uponincubation with Ca2�-containing medium, measured at22°C. On addition of Ca2�, [Ca2�]ER increased to500–600 �M in 2–3 min. The maximum rate of the[Ca2�]ER increase was �5.5 �M/s. In 12 similar exper-iments, the maximum rate was (mean�sd) 4.5 � 1.3.This value decreased to 0.8 �M/s in cells loaded withBAPTA and increased to 9.0 � 3.2 (n�8) when cellswere depolarized with high K� solution during therefilling period (data not shown). At 37°C, uptake is�fourfold faster (33), which gives a maximum figure of�36 �M/s. Assuming an activity coefficient of 1/20 anda volume of 10% relative to the cytosol (3, 34), thisvalue would be equivalent to 72 �mol/l cells/s, which isstill one order of magnitude smaller than the valueestimated for Ca2� influx through VOCC. When Ca2�
influx takes place in cells with Ca2�-filled ER, net Ca2�
release rather than Ca2� uptake is produced (Fig. 2B),an expression of the activation of the CICR mechanism(15). We conclude that the ER could not be responsibleof the buffering of [Ca2�]c during stimulation ofbovine chromaffin cells. Based on measurements of[Ca2�]c clearance and the effects of inhibitors ofSERCA ATPases, Neher and co-workers (6) and Hilleand co-workers (13) arrived to the same conclusion inbovine and murine chromaffin cells, respectively.
Uptake of Ca2� by mitochondria and nucleus
We have shown before that the bovine chromaffin cellmitochondria accumulate large amounts of Ca2� dur-ing stimulation with either high K� solutions, acetyl-choline, or caffeine (23). The Ca2� load was taken upselectively into a mitochondrial pool amounting to 50%
Figure 1. Increase of [Ca2�]c in response to repeated stimu-lation with high K� solution. Measurements performed at37°C in cells loaded with fura-4F; time resolution, 2.5 s. K, 75mM KCl. A) Time course of the [Ca2�]c changes; average of58 single cells. B) Instantaneous rates of [Ca2�]c changes;same cells as in panel A.
345Ca2� REDISTRIBUTION AMONG CYTOSOL AND ORGANELLA
of the total (pool M1); the other half (pool M2) takesup much smaller amounts (23). A similar conclusionwas reached by Pivovarova et al. (35) for rat chromaffincells by studying mitochondrial calcium content byelectron microscopy X-ray microanalysis.
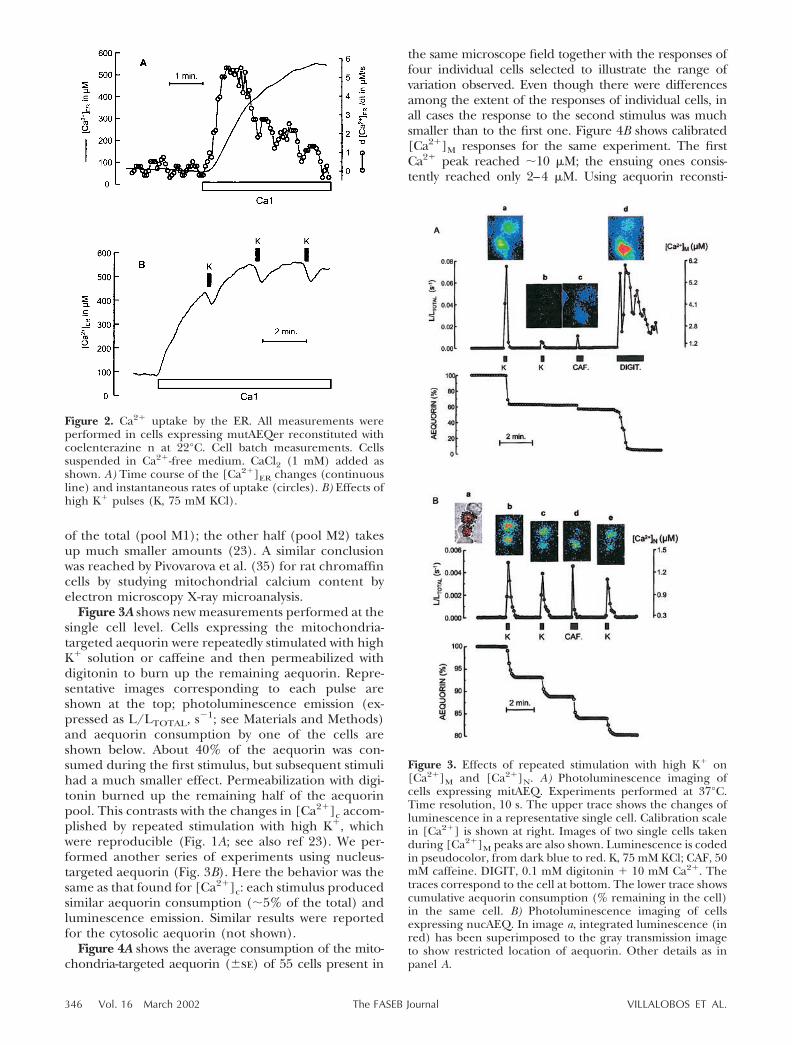
Figure 3A shows new measurements performed at thesingle cell level. Cells expressing the mitochondria-targeted aequorin were repeatedly stimulated with highK� solution or caffeine and then permeabilized withdigitonin to burn up the remaining aequorin. Repre-sentative images corresponding to each pulse areshown at the top; photoluminescence emission (ex-pressed as L/LTOTAL, s�1; see Materials and Methods)and aequorin consumption by one of the cells areshown below. About 40% of the aequorin was con-sumed during the first stimulus, but subsequent stimulihad a much smaller effect. Permeabilization with digi-tonin burned up the remaining half of the aequorinpool. This contrasts with the changes in [Ca2�]c accom-plished by repeated stimulation with high K�, whichwere reproducible (Fig. 1A; see also ref 23). We per-formed another series of experiments using nucleus-targeted aequorin (Fig. 3B). Here the behavior was thesame as that found for [Ca2�]c: each stimulus producedsimilar aequorin consumption (�5% of the total) andluminescence emission. Similar results were reportedfor the cytosolic aequorin (not shown).
Figure 4A shows the average consumption of the mito-chondria-targeted aequorin (�se) of 55 cells present in
the same microscope field together with the responses offour individual cells selected to illustrate the range ofvariation observed. Even though there were differencesamong the extent of the responses of individual cells, inall cases the response to the second stimulus was muchsmaller than to the first one. Figure 4B shows calibrated[Ca2�]M responses for the same experiment. The firstCa2� peak reached �10 �M; the ensuing ones consis-tently reached only 2–4 �M. Using aequorin reconsti-
Figure 2. Ca2� uptake by the ER. All measurements wereperformed in cells expressing mutAEQer reconstituted withcoelenterazine n at 22°C. Cell batch measurements. Cellssuspended in Ca2�-free medium. CaCl2 (1 mM) added asshown. A) Time course of the [Ca2�]ER changes (continuousline) and instantaneous rates of uptake (circles). B) Effects ofhigh K� pulses (K, 75 mM KCl).
Figure 3. Effects of repeated stimulation with high K� on[Ca2�]M and [Ca2�]N. A) Photoluminescence imaging ofcells expressing mitAEQ. Experiments performed at 37°C.Time resolution, 10 s. The upper trace shows the changes ofluminescence in a representative single cell. Calibration scalein [Ca2�] is shown at right. Images of two single cells takenduring [Ca2�]M peaks are also shown. Luminescence is codedin pseudocolor, from dark blue to red. K, 75 mM KCl; CAF, 50mM caffeine. DIGIT, 0.1 mM digitonin � 10 mM Ca2�. Thetraces correspond to the cell at bottom. The lower trace showscumulative aequorin consumption (% remaining in the cell)in the same cell. B) Photoluminescence imaging of cellsexpressing nucAEQ. In image a, integrated luminescence (inred) has been superimposed to the gray transmission imageto show restricted location of aequorin. Other details as inpanel A.
346 Vol. 16 March 2002 VILLALOBOS ET AL.The FASEB Journal

tuted with coelenterazine n, which has a lower affinity forCa2� (measuring range 1–100 �M, ref 23), behaviorregarding aequorin consumption was similar (Fig. 4C).The calibrated signal (Fig. 4D) now revealed a [Ca2�]Mpeak of �80 �M for the first stimulus; the second reachedonly 8 �M and subsequent ones where in the 2–4 �Mrange, which is barely detectable for this aequorin–co-elenterazine combination.
We conclude from the above experiments that Ca2�
is taken up during the first stimulus into a fraction ofmitochondria (pool M1, amounting to �50% of thetotal mitochondrial pool) at a high enough concentra-tion to burn out all its aequorin. Because of this, theensuing high K� stimuli do not produce light emissionfrom this pool. The other half of the mitochondria(pool M2) takes up much smaller amounts of Ca2�,resulting in a modest light emission that is seen uncon-taminated during the last stimuli. The aequorin con-tained into pool M2, however, is burned out uponpermeabilization with digitonin (Fig. 3A).
The extent of the uptake of Ca2� into pool M1 canbe quantified using a mutated, low Ca2� affinity ae-quorin reconstituted with coelenterazine n (mitAEQmut)that can report Ca2� concentrations as high as 10�3 Mfor several minutes (23). Due to its lower Ca2� affinity,this aequorin is burned only partly during each stimu-lation with high K�. Figure 4E shows the averageresponse (�se) of 10 single cells to a challenge withhigh K�, as reported by mitAEQmut reconstituted withcoelenterazine n. [Ca2�]M reached a peak of �350 �Mwithin 10–15 s, then decreased slowly (the decrease of[Ca2�]M is especially slow because it was performed at20°C, see below), remaining above 300 �M for at least1 min. According to our estimates (see Materials andMethods), 90% of the wild-type aequorin should beconsumed by 1 s when reconstituted with normalcoelenterazine and within 1 min when reconstitutedwith coelenterazine n.
Figure 5A shows the time course of Ca2� uptake,measured with mitAEQmut at 37°C, by the mitochon-dria of pool M1 during repeated stimulation with highK� solution. [Ca2�]M increased to 300–400 �M by theend of the stimulation period. The rate of uptakereached maximum values of 40–50 �M/s (Fig. 5B). In18 similar measurements, the maximum rate of[Ca2�]M increase was (mean�sd) 56 � 12 �M/s.Assuming an activity coefficient of 1/1000 and a rela-tive mitochondrial volume of 4%, this Ca2� load wouldbe equivalent to 1100 �mol/l cells/s (taking intoaccount that only 50% of the mitochondria take upCa2�). This value is similar to the one estimated forCa2� influx through VOCC, suggesting that most of theCa2� load taken up by the cell during stimulation canaccumulate into mitochondria.
To study the kinetics of Ca2� transport through theuniporter, we measured mitochondrial uptake in bo-vine chromaffin cells permeabilized by brief treatmentwith digitonin and perfused with different Ca2� buffers(see Materials and Methods). Results are shown in Fig.5C. The uptake was very slow at [Ca2�]c below 2 �M,but increased steeply at higher concentrations. The lineis the best fit to the equation:
v � �Vmax � � Ca2��c�2�/��K50 �2 � � Ca2��c�
2�
for Vmax � 158 � 7 �M/s and K50 � 23 � 2 �M. The K50value is similar to both the one obtained earlier withisolated mitochondria from liver and heart and bovineadrenal medulla (10–15 �M; refs 18, 19, 36) and the oneestimated by Xu et al. (6) from measurements of thedecrease of [Ca2�]c in intact bovine chromaffin cells (40�M). The value of Vmax would be equivalent to 6320�mol/l cells/s, not far from the 4800 value estimated byXu et al. (6) at 200 �M [Ca2�]c.
Relaxation of [Ca2�]c peaks
When Ca2� entry through VOCC ceases, [Ca2�]c be-gins to decrease as a result of multiple fluxes. Plasmamembrane Ca2� ATPase and Na�/Ca2� exchangerextrude Ca2� from the cytosol to the extracellular
Figure 4. Effects of repeated stimulation with high K� on[Ca2�]M. Photoluminescence imaging was performed in cellsexpressing mitAEQ reconstituted with either wild-type co-elenterazine (measuring range 0.3–10 �M; A, B) or coelen-terazine n (measuring range 1–100 �M; C, D). Temperature,22°C. Other details as in Fig. 3. Circles represent the mean �se of 38 (A) and 21 (B) single cells. Lines without symbols inpanels A, C represent four individual cells selected to illus-trate the range of variation. E) Photoluminescence imagingwas performed at 22°C in cells expressing mitAEQmut recon-stituted coelenterazine n (measuring range 50–1000 �M).Values are mean � se of 10 single cells.
347Ca2� REDISTRIBUTION AMONG CYTOSOL AND ORGANELLA

medium. We have not performed specific measure-ments of these fluxes, but an upper limit of �0.8 �M/scan be estimated from the maximum rate of [Ca2�]cdecrease (Fig. 1C). The mean value from six indepen-dent measurements was (mean�sd) 0.73 � 0.07, whichis equivalent to 29 �mol/l cells/s. Herrington et al.(13) have estimated a value of �0.3 �M/s in ratchromaffin cells at 27°C. Assuming a Q10 value of 3–4,this value is comparable to our estimate.
If this maximum rate was sustained for a few seconds,the return of [Ca2�]c to the prestimulation level wouldbe extremely fast. However, the rate of [Ca2�]c declineslows down quickly (Fig. 1C). Desaturation of theplasma membrane Ca2� extrusion mechanism mayhelp to slow down relaxation. However, the major
determinant of this [Ca2�]c stabilization is that once itdeclines below 2 �M, plasma membrane Ca2� extru-sion is almost matched by Ca2� release from theorganella (see below).
Ca2� release from the ER is comparatively quite slow.Upon treatment of chromaffin cells with cyclopiazonicacid, we find a maximal rate of [Ca2�]ER decrease of�1.3 �M/s, which is equivalent to 2.6 �mol/l cells/s(15). Release from mitochondria is much faster. Upontermination of the stimulus with high K�, [Ca2�]Mdecreases at a maximal rate of 13–18 �M/s (Fig. 5B). Infive similar experiments, the maximum rate of [Ca2�]Mdecrease was (mean�sd) 14.2 � 3.4 �M/s. Since exittakes place from only one-half of the mitochondrialpool, it would be equivalent to 280 �mol/l cells/s. Thisrate decreases quickly as [Ca2�]M declines (Fig. 5B).
Kinetics of Ca2� release from mitochondria loadedwith Ca2� is shown in Fig. 6. Traces A and B comparethe time course of the [Ca2�]M changes in control cellsand in cells treated with CGP37157, an inhibitor of themitochondrial Na�/Ca2� exchanger. Traces C and Dshow the estimated rate constants and E a plot of exitagainst [Ca2�]M. As shown before (23, 24), CGP37157slowed down Ca2� efflux. In control cells, mitochon-drial Ca2� exit showed saturation at the higher[Ca2�]M and a sigmoidal shape at the lower [Ca2�]M.In the presence of CGP37157, saturation and sig-moidicity both seemed to disappear (Fig. 6E). When weconstructed a similar plot with the average results of 11control experiments, the resulting data points could bewell fitted by the following equation:
Figure 5. Time course and concentration dependence ofmitochondrial Ca2� uptake. Batch measurements performedin cells expressing mitAEQmut (reconstituted with coelen-terazine n) at 37°C. Results have been corrected for a 50% ofthe mitochondrial pool (23). A, B) The time course andinstantaneous rates of uptake in the same cells. C) Uptake incells permeabilized with digitonin (20 �M, 1 min) andincubated with HEDTA/Ca2� buffers at 37°C (23).
Figure 6. Exit of mitochondrial Ca2�. The time course andinstantaneous rates are compared in control cells (A, C) andcells treated with 20 �M CGP37157 (B, D). Details as in Fig. 5.E) Concentration dependence of mitochondrial Ca2� exitat 37°C; the plot was constructed from data in panels A–D.F) Concentration dependence of mitochondrial exit at22°C. Experiments performed with the same cell batch asin panel E.
348 Vol. 16 March 2002 VILLALOBOS ET AL.The FASEB Journal
v � �Vmax � � Ca2��M�2�/�K50 � � Ca2��M�2�
with K50 � 217 � 12 �M and Vmax � 19.6 � 1.0 �M/s.This Vmax value would be equivalent to 780 �mol/lcells/s.
The efflux of Ca2� from loaded mitochondria wasalso highly sensitive to temperature (23; compare Fig.4E and Fig. 5A). At 22°C, both sigmoidicity and satura-tion were lost, although CGP37157 still produced alarge inhibition of mitochondrial exit (Fig. 6F).
Changes in mitochondrial NADH fluorescence uponstimulation with high K�
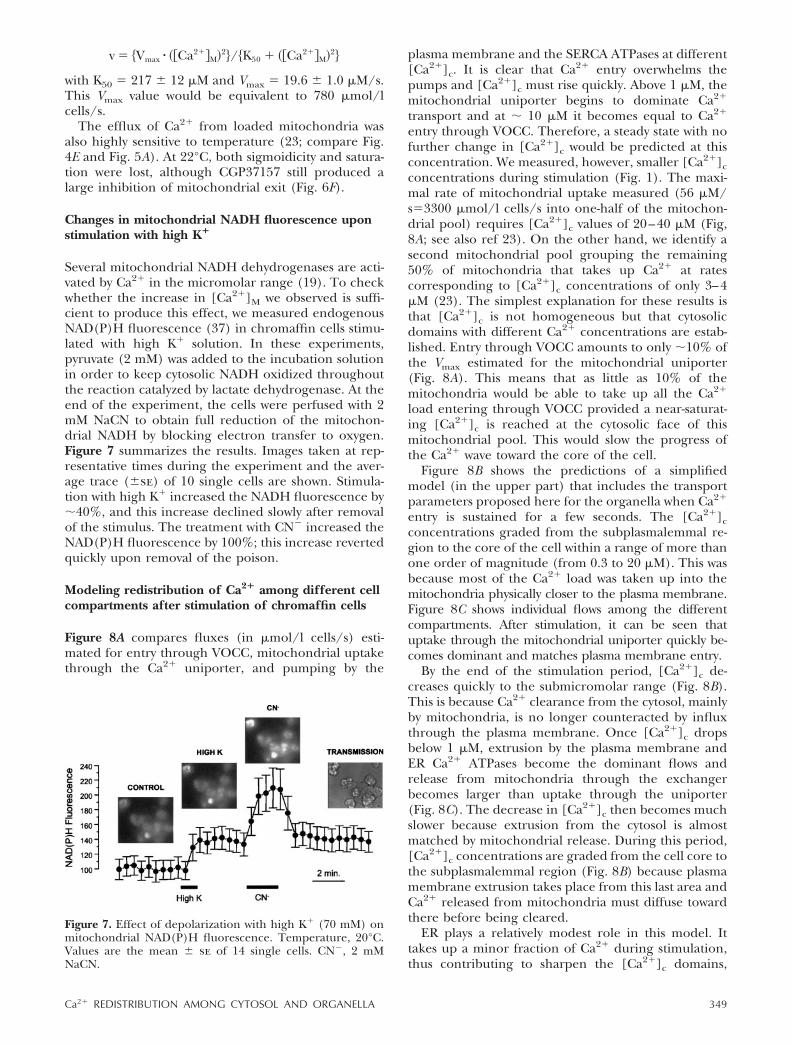
Several mitochondrial NADH dehydrogenases are acti-vated by Ca2� in the micromolar range (19). To checkwhether the increase in [Ca2�]M we observed is suffi-cient to produce this effect, we measured endogenousNAD(P)H fluorescence (37) in chromaffin cells stimu-lated with high K� solution. In these experiments,pyruvate (2 mM) was added to the incubation solutionin order to keep cytosolic NADH oxidized throughoutthe reaction catalyzed by lactate dehydrogenase. At theend of the experiment, the cells were perfused with 2mM NaCN to obtain full reduction of the mitochon-drial NADH by blocking electron transfer to oxygen.Figure 7 summarizes the results. Images taken at rep-resentative times during the experiment and the aver-age trace (�se) of 10 single cells are shown. Stimula-tion with high K� increased the NADH fluorescence by�40%, and this increase declined slowly after removalof the stimulus. The treatment with CN� increased theNAD(P)H fluorescence by 100%; this increase revertedquickly upon removal of the poison.
Modeling redistribution of Ca2� among different cellcompartments after stimulation of chromaffin cells
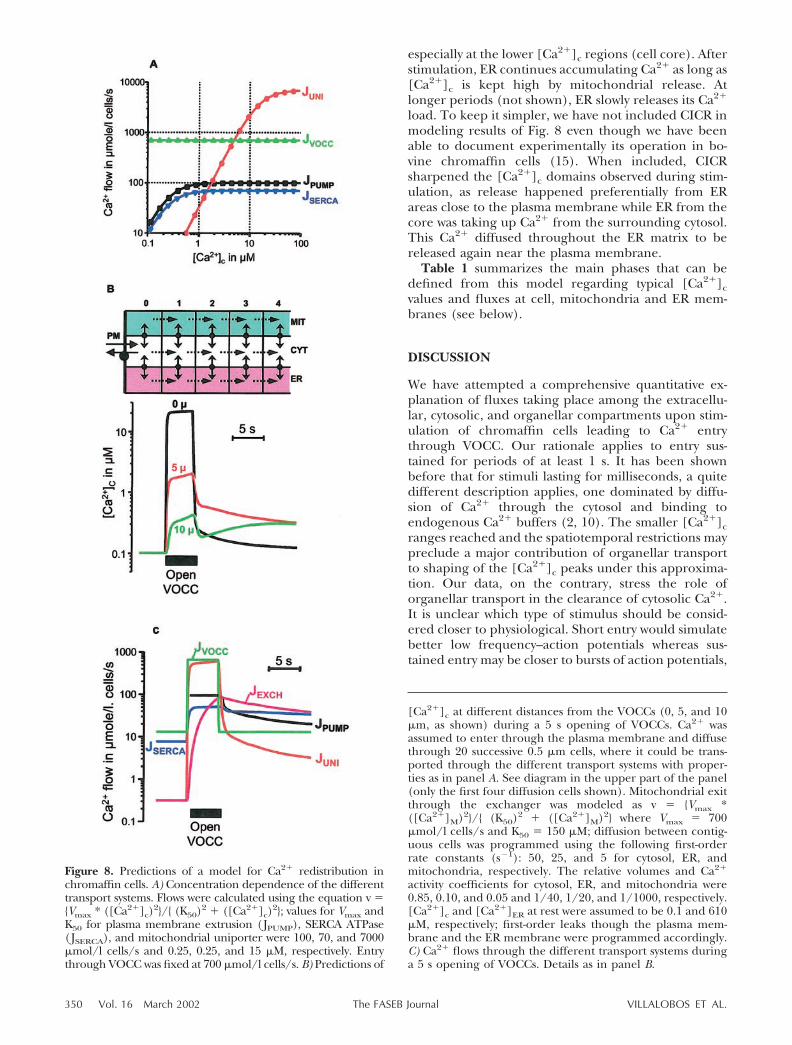
Figure 8A compares fluxes (in �mol/l cells/s) esti-mated for entry through VOCC, mitochondrial uptakethrough the Ca2� uniporter, and pumping by the
plasma membrane and the SERCA ATPases at different[Ca2�]c. It is clear that Ca2� entry overwhelms thepumps and [Ca2�]c must rise quickly. Above 1 �M, themitochondrial uniporter begins to dominate Ca2�
transport and at � 10 �M it becomes equal to Ca2�
entry through VOCC. Therefore, a steady state with nofurther change in [Ca2�]c would be predicted at thisconcentration. We measured, however, smaller [Ca2�]cconcentrations during stimulation (Fig. 1). The maxi-mal rate of mitochondrial uptake measured (56 �M/s�3300 �mol/l cells/s into one-half of the mitochon-drial pool) requires [Ca2�]c values of 20–40 �M (Fig,8A; see also ref 23). On the other hand, we identify asecond mitochondrial pool grouping the remaining50% of mitochondria that takes up Ca2� at ratescorresponding to [Ca2�]c concentrations of only 3–4�M (23). The simplest explanation for these results isthat [Ca2�]c is not homogeneous but that cytosolicdomains with different Ca2� concentrations are estab-lished. Entry through VOCC amounts to only �10% ofthe Vmax estimated for the mitochondrial uniporter(Fig. 8A). This means that as little as 10% of themitochondria would be able to take up all the Ca2�
load entering through VOCC provided a near-saturat-ing [Ca2�]c is reached at the cytosolic face of thismitochondrial pool. This would slow the progress ofthe Ca2� wave toward the core of the cell.
Figure 8B shows the predictions of a simplifiedmodel (in the upper part) that includes the transportparameters proposed here for the organella when Ca2�
entry is sustained for a few seconds. The [Ca2�]cconcentrations graded from the subplasmalemmal re-gion to the core of the cell within a range of more thanone order of magnitude (from 0.3 to 20 �M). This wasbecause most of the Ca2� load was taken up into themitochondria physically closer to the plasma membrane.Figure 8C shows individual flows among the differentcompartments. After stimulation, it can be seen thatuptake through the mitochondrial uniporter quickly be-comes dominant and matches plasma membrane entry.
By the end of the stimulation period, [Ca2�]c de-creases quickly to the submicromolar range (Fig. 8B).This is because Ca2� clearance from the cytosol, mainlyby mitochondria, is no longer counteracted by influxthrough the plasma membrane. Once [Ca2�]c dropsbelow 1 �M, extrusion by the plasma membrane andER Ca2� ATPases become the dominant flows andrelease from mitochondria through the exchangerbecomes larger than uptake through the uniporter(Fig. 8C). The decrease in [Ca2�]c then becomes muchslower because extrusion from the cytosol is almostmatched by mitochondrial release. During this period,[Ca2�]c concentrations are graded from the cell core tothe subplasmalemmal region (Fig. 8B) because plasmamembrane extrusion takes place from this last area andCa2� released from mitochondria must diffuse towardthere before being cleared.
ER plays a relatively modest role in this model. Ittakes up a minor fraction of Ca2� during stimulation,thus contributing to sharpen the [Ca2�]c domains,
Figure 7. Effect of depolarization with high K� (70 mM) onmitochondrial NAD(P)H fluorescence. Temperature, 20°C.Values are the mean � se of 14 single cells. CN�, 2 mMNaCN.
349Ca2� REDISTRIBUTION AMONG CYTOSOL AND ORGANELLA
especially at the lower [Ca2�]c regions (cell core). Afterstimulation, ER continues accumulating Ca2� as long as[Ca2�]c is kept high by mitochondrial release. Atlonger periods (not shown), ER slowly releases its Ca2�
load. To keep it simpler, we have not included CICR inmodeling results of Fig. 8 even though we have beenable to document experimentally its operation in bo-vine chromaffin cells (15). When included, CICRsharpened the [Ca2�]c domains observed during stim-ulation, as release happened preferentially from ERareas close to the plasma membrane while ER from thecore was taking up Ca2� from the surrounding cytosol.This Ca2� diffused throughout the ER matrix to bereleased again near the plasma membrane.
Table 1 summarizes the main phases that can bedefined from this model regarding typical [Ca2�]cvalues and fluxes at cell, mitochondria and ER mem-branes (see below).
DISCUSSION
We have attempted a comprehensive quantitative ex-planation of fluxes taking place among the extracellu-lar, cytosolic, and organellar compartments upon stim-ulation of chromaffin cells leading to Ca2� entrythrough VOCC. Our rationale applies to entry sus-tained for periods of at least 1 s. It has been shownbefore that for stimuli lasting for milliseconds, a quitedifferent description applies, one dominated by diffu-sion of Ca2� through the cytosol and binding toendogenous Ca2� buffers (2, 10). The smaller [Ca2�]cranges reached and the spatiotemporal restrictions maypreclude a major contribution of organellar transportto shaping of the [Ca2�]c peaks under this approxima-tion. Our data, on the contrary, stress the role oforganellar transport in the clearance of cytosolic Ca2�.It is unclear which type of stimulus should be consid-ered closer to physiological. Short entry would simulatebetter low frequency–action potentials whereas sus-tained entry may be closer to bursts of action potentials,
Figure 8. Predictions of a model for Ca2� redistribution inchromaffin cells. A) Concentration dependence of the differenttransport systems. Flows were calculated using the equation v �{Vmax * ([Ca2�]c)
2}/{ (K50)2 � ([Ca2�]c)2}; values for Vmax and
K50 for plasma membrane extrusion (JPUMP), SERCA ATPase(JSERCA), and mitochondrial uniporter were 100, 70, and 7000�mol/l cells/s and 0.25, 0.25, and 15 �M, respectively. Entrythrough VOCC was fixed at 700 �mol/l cells/s. B) Predictions of
[Ca2�]c at different distances from the VOCCs (0, 5, and 10�m, as shown) during a 5 s opening of VOCCs. Ca2� wasassumed to enter through the plasma membrane and diffusethrough 20 successive 0.5 �m cells, where it could be trans-ported through the different transport systems with proper-ties as in panel A. See diagram in the upper part of the panel(only the first four diffusion cells shown). Mitochondrial exitthrough the exchanger was modeled as v � {Vmax *([Ca2�]M)2}/{ (K50)2 � ([Ca2�]M)2} where Vmax � 700�mol/l cells/s and K50 � 150 �M; diffusion between contig-uous cells was programmed using the following first-orderrate constants (s�1): 50, 25, and 5 for cytosol, ER, andmitochondria, respectively. The relative volumes and Ca2�
activity coefficients for cytosol, ER, and mitochondria were0.85, 0.10, and 0.05 and 1/40, 1/20, and 1/1000, respectively.[Ca2�]c and [Ca2�]ER at rest were assumed to be 0.1 and 610�M, respectively; first-order leaks though the plasma mem-brane and the ER membrane were programmed accordingly.C) Ca2� flows through the different transport systems duringa 5 s opening of VOCCs. Details as in panel B.
350 Vol. 16 March 2002 VILLALOBOS ET AL.The FASEB Journal

as is the case at the splanchnic nerve–chromaffin cellsynapse (38), or to maintained action of acetylcholineor other chemical stimuli.
We find several new properties of mitochondrialCa2� transport systems acting on intact cells usingtargeted low Ca2� affinity aequorins, which are able tomeasure near millimolar [Ca2�]M. For example, maxi-mum capacity of the mitochondrial uniporter ap-proaches 6000–7000 �mol/l cells/s, a value well abovemost previous proposals. Previous estimates of Ca2�
accumulation by mitochondria of rat chromaffin cells(13) or frog sympathetic neurons (35, 39, 40) are in therange of 50–200 �mol/l cells/s at [Ca2�]c concentra-tions of 0.5–2 �M. However, the uniporter shows sec-ond-order kinetics with regard to Ca2� (18); since theseconcentrations are well below saturation of the trans-port system (K50�10–40 �M), it is not possible toextrapolate reliable Vmax values from these data. In-creasing [Ca2�]c over a much wider range (� 200 �M)by photon-induced Ca2� release from DM-dinitrophen,Xu et al. (6) estimated in bovine chromaffin cells Vmaxvalues of 4800 �mol/l cells/s, a value close to the onereported here. Dialysis of cytosolic components in cellsmaintained under whole cell patch, which decreases �eightfold the activity of the uniporter (21), could alsocontribute to explain differences with previous results.Therefore, we believe that the high rates of uptakereported here are representative of the real values inintact cells. This implies that mitochondria can take upmost of the Ca2� load entering the cells through VOCCif cytosolic Ca2� concentrations high enough to acti-vate the uniporter are built up. The idea that mitochon-dria can contribute to clearing Ca2� loads from thecytosol has already been proposed for chromaffin cells(6, 21, 23) and pancreatic acinar cells (41, 42), but weprovide a solid quantitative argument.
Our model predicts that a fraction of the mitochon-drial pool closer to the plasma membrane can sinkmost of the Ca2� load entering through VOCC duringseveral seconds (Fig. 8). This results in the generation
of subcellular domains with different [Ca2�]c. Thus,high Ca2� domains are restricted to the subplasmalem-mal region, whereas low Ca2� domains locate at thecore of the cell. Mitochondria act as biosensors todiscriminate high and low Ca2� domains. Second-orderkinetics of the uptake through the uniporter sharpensdifferences in [Ca2�]c above and below a thresholdlocated near its K50, 10�5 M. Taking advantage of thefact that the native, high Ca2� affinity aequorin is fullyburned up within a few seconds into a high Ca2�
(10�5 M) environment, we have defined two mito-chondrial pools, M1 and M2, each amounting to �50%of the total, which differ by their rate of Ca2� uptakeafter cell stimulation (23). Pool M1 takes up Ca2� atrates of 50 �M/s (Fig. 5) corresponding to [Ca2�]cconcentrations of 20 �M (Fig. 8A). Pool M2 takes upCa2� at only 0.3 �M/s, corresponding to 2–3 �M[Ca2�]c (23). Electron microscopy X-ray microanalysisof frog sympathetic neurons after stimulation with highK� also revealed the existence of two mitochondrialpools with different Ca2� contents (35). In pancreaticacinar cells, entry of Ca2� through plasma membranealso caused preferential Ca2� uptake into subplasma-lemmal mitochondria (42).
Continuity of the intramitochondrial space seemsmuch greater than previously thought (43, 44). Thus, itis conceivable that the Ca2� load that fills the M1 poolmay have been taken up by a smaller fraction ofmitochondria close to the plasma membrane Ca2�
channels, then diffused throughout the mitochondrialmatrix to invade a larger fraction of the mitochondrialpool. According to the figures used here for Vmax of theuniporter and Ca2� entry through VOCC, the full Ca2�
load could be taken up by only 10% of the mitochon-drial pool if a high enough [Ca2�]c is reached. Assum-ing a spherical shape for the cells and uniform distri-bution of mitochondria, 10% of the mitochondrialspace would occupy only 0.25 �m beneath the plasmamembrane in a 15 �m diameter cell.
Neher and co-workers first elaborated the idea that
TABLE 1. Different phases of cell Ca2� homeostasis after stimulation of Ca2� entry through VOCC
Phase [Ca2�]c Fluxes
0 (Prestimulus) Resting All fluxes at steady state
S (Stimulus) 1 �M PM: influx effluxGraded from PM to core MIT: uptake release
PM influx � MIT uptakeER: uptake release or vice versaa
PS1 (Early poststimulus) Quick decrease to 1 �M PM: efflux influxMIT: uptake release�d[Ca2�]c � MIT uptakeER: uptake release
PS2 (Late poststimulus) 1 �M; Slow decrease to restingGraded from core to PM
PM: efflux influxMIT: release uptakeER: first uptake release, then vice versa
0 Resting All fluxes at steady state
a Depends on the activity of ryanodine receptors. PM: plasma membrane; MIT: mitochondria; ER: endoplasmic reticulum.
351Ca2� REDISTRIBUTION AMONG CYTOSOL AND ORGANELLA
transient opening of VOCC during action potentialsshould generate high Ca2� microdomains near thechannel mouth. Such microdomains are highly re-stricted in time (ms scale) and space (nm scale) due todissipation by rapid diffusion of Ca2� to the surround-ing cytosol. The existence of such microdomains as wellas the constrictions imposed by diffusion and bindingto cytosolic Ca2� buffers has been convincingly docu-mented in bovine chromaffin cells (2, 10). The highCa2� subcellular domains proposed here are main-tained for seconds because of the pump/leak steadystate established between Ca2� entry and mitochon-drial uptake. We have no indication of the size of suchdomains, although they would probably be bigger thanmicrodomains. When modeling, the ratio between theVmax of the uniporter and the diffusion coefficient isimportant in determining the shape of the [Ca2�]c gra-dation, which becomes sharper the larger this ratio is. Forthese reasons, the present model should be regarded as acrude approximation. For example, denser packing of theorganella or slower diffusion rates at the subplasmalem-mal region would render gradation of Ca2� domainssteeper. Previous observations on irregular progression ofthe Ca2� wave at this region (7) suggest that such physicalconstraints may apply.
After stimulation, two phases can be defined in therelaxation of the [Ca2�]c peak (Table 1). In the earlypoststimulation period (PS1), [Ca2�]c drops quicklyto concentrations below 1 �M mainly because ofrapid clearance from the cytosol by mitochondrialuptake. After this initial drop, [Ca2�]c decreasesmuch more slowly, as extrusion through the plasmamembrane is counteracted by mitochondrial Ca2�
release (late poststimulation period; PS2 in Table1).This phase is usually evident in fura-2 measurementsas a long period when [Ca2�]c remains moderatelyincreased above resting levels. It has been reportedthat collapsing the mitochondrial membrane poten-tial by addition of protonophores induces a [Ca2�]cincrease by mitochondrial Ca2� release, but only fora short period after the end of stimulation (13, 21).We have documented recently that protonophoresmay induce rapid release of mitochondrial Ca2� byreversal of the Ca2� uniporter, but this requiresrelatively high [Ca2�]c (24), a condition accom-plished only during period PS1. During the PS2period, [Ca2�]c is graded from the cell core to thesubplasmalemmal region. In the last region [Ca2�]cdrops very quickly to the resting level, thus securingthe end of exocytosis, by action of the plasma mem-brane Ca2� extrusion mechanisms. At the cell core,[Ca2�]c remains discretely high for many secondsbecause of the relatively slow release of the mito-chondrial load. Perhaps this maintained increasehelps mobilize new secretory vesicles from the re-serve pool toward the plasma membrane, thus be-coming ready to be used for the next exocytoticepisode (2).
Exit of the Ca2� load from mitochondria occursprimarily through the Na�/Ca2� exchanger (Fig. 6; ref
19). We also document some new properties for the insitu operation of this transport system. First, activity ismuch faster than most of previous estimates in isolatedmitochondria (18, 19). The same reasons cited abovefor the uniporter may apply here. Moreover, the mito-chondrial Na�/Ca2� exchanger is very sensitive totemperature (Fig. 6), which was 20°C in most of theprevious estimates. Another new finding was the sig-moidal, second-order kinetics of [Ca2�]M. The activityof this transport system had been reported to showMichaelian first-order kinetics with regard to Ca2� inexperiments with isolated mitochondria (18). Again,temperature may explain some of the discrepancies, assigmoidicity disappears at 20°C (Fig. 6). Sigmoidicityalso disappeared in the presence of the inhibitorCGP37157 (Fig. 6), thus excluding an artifact gener-ated by the measuring procedure.
Second-order kinetics fits well with the high rates ofmitochondrial Ca2� clearance observed at high [Ca2�]Mand the rapid decline when [Ca2�]M decreases (Fig. 6).Accordingly, [Ca2�]M would remain in the micromolarrange several minutes after the stimulus. Stimulation ofpyruvate- and �-ketoglutarate-dehydrogenase by Ca2� hasbeen reported to be complete at 3 �M (16, 19). Thus,residual Ca2� would keep these dehydrogenases activeduring the poststimulus period, as suggested by NAD(P)Hfluorescence measurements (Fig. 7). The stimulation ofrespiration may help to provide energy for clearing theCa2� load. Isocitrate dehydrogenase shows stimulation byCa2� at higher concentration ranges (2�10�5 to 1�10�4
M; ref 19) so that activity of this enzyme may changeduring period PS1.
In summary, our results suggest a highly structuredspatiotemporal organization of Ca2� signals originatedby sustained Ca2� entry through VOCC in adrenalchromaffin cells. High [Ca2�]c domains suitable fortriggering exocytosis are generated at the subplasma-lemmal region. Domains with a smaller [Ca2�]c in-crease but more sustained in time (adequate for mobi-lizing the reserve pool of secretory vesicles; ref 2) aregenerated at the core regions of the cytosol and at thenucleus. Mitochondria seem to be essential for shapingthese local Ca2� domains. On the other hand, Ca2�
uptake by mitochondria activates NADH-dehydroge-nases, thus tuning up respiration to match the in-creased local energy needs (16). Full relaxation of the[Ca2�]c peak requires clearance of the mitochondrialCa2� load through the Na�/Ca2� exchanger, whichproceeds slowly at low micromolar [Ca2�]M levels. Thiskeeps respiration stimulated and core [Ca2�]c dis-cretely high for a long period after stimulation, actingas a kind of memory that may help to secure restorationof the initial conditions.
This work was supported by the Spanish Direccion General deEnsenanza Superior (DGES, grants PB97–0474, APC1999–011,and 1FD97–1725-C02–02 to J.G.S., PM98–0142 to J.A., andPM99–0005 to A.G.G.) and the Instituto de Salud Carlos III(to A.G.G.). C.V. and L.N. hold postdoctoral fellowships fromthe Spanish DGES.
352 Vol. 16 March 2002 VILLALOBOS ET AL.The FASEB Journal

REFERENCES
1. Douglas, W. W. (1968) Stimulus-secretion coupling: the conceptand clues from chromaffin and other cells. Br. J. Pharmacol. 34,453–474
2. Neher, E. (1998) Vesicle pools and Ca2� microdomains: new toolsfor understanding their roles in neurotransmitter release. Neuron20, 389–399
3. Alvarez, J., Montero, M., and Garcıa-Sancho, J. (1999) Subcel-lular Ca2� dynamics. News Physiol. Sci. 14, 161–168
4. Berridge, M. J., Lipp, P., and Bootman, M. D. (2000) Theversatility and universality of calcium signalling. Nat. Rev. Mol.Cell. Biol. 1, 11–21
5. Zhou, Z., and Neher, E. (1993) Mobile and immobile calciumbuffers in bovine adrenal chromaffin cells. J. Physiol. (London)469, 245–273
6. Xu, T., Naraghi, M., Kang, H., and Neher, E. (1997) Kineticstudies of Ca2� binding and Ca2� clearance in the cytosol ofadrenal chromaffin cells. Biophys. J. 73, 53
7. Naraghi, M., Muller, T. H., and Neher, E. (1998) Two-dimen-sional determination of the cellular Ca2� binding in bovinechromaffin cells. Biophys. J. 75, 1635–1647
8. Neher, E., and Augustine, G. J. (1992) Calcium gradients andbuffers in bovine chromaffin cells. J. Physiol. (London) 450, 273–301
9. Augustine, G. J., and Neher, E. (1992) Calcium requirementsfor secretion in bovine chromaffin cells. J. Physiol. (London) 450,247–271
10. Neher, E. (1998) Usefulness and limitations of linear approxi-mations to the understanding of Ca�� signals. Cell Calcium 24,345–357
11. Petersen, O. H. (1996) Can Ca2� be released from secretorygranules or synaptic vesicles? Trends Neurosci. 19, 411–413
12. Park, Y. B., Herrington, J., Babcock, D. F., and Hille, B. (1996)Ca2� clearance mechanisms in isolated rat adrenal chromaffincells. J. Physiol. (London) 492, 329–346
13. Herrington, J., Park, Y. B., Babcock, D. F., and Hille, B. (1996)Dominant role of mitochondria in clearance of large Ca2� loadsfrom rat adrenal chromaffin cells. Neuron 16, 219–228
14. Artalejo, C. R., Garcıa, A. G., and Aunis, D. (1987) Chromaffincell calcium kinetics measured isotopically through fast calcium,strontium, and barium fluxes. J. Biol. Chem. 262, 915–926
15. Alonso, M. T., Barrero, M. J., Michelena, P., Carnicero, E., Cu-chillo, I., Garcia, A. G., Garcia-Sancho, J., Montero, M., andAlvarez, J. (1999) Ca2�-induced Ca2� release in chromaffin cellsseen from inside the ER with targeted aequorin. J. Cell Biol. 144,241–254
16. Rizzuto, R., Bernardi, P., and Pozzan, T. (2000) Mitochondria asall-round players of the calcium game. J. Physiol. (London) 529,37–47
17. Duchen, M. R. (2000) Mitochondria and calcium: from cellsignalling to cell death. J. Physiol. (London) 529, 57–68
18. Gunter, T. E., and Pfeiffer, D. R. (1990) Mechanisms by whichmitochondria transport calcium. Am. J. Physiol. 258, C755–C786
19. Gunter, T. E., Gunter, K. K., Sheu, S. S., and Gavin, C. E. (1994)Mitochondrial calcium transport: physiological and pathologi-cal relevance. Am. J. Physiol. 267, C313–C339
20. Coll, K. E., Joseph, S. K., Corkey, B. E., and Williamson, J. R.(1982) Determination of the matrix free Ca2� concentrationand kinetics of Ca2� efflux in liver and heart mitochondria.J. Biol. Chem. 257, 8696–8704
21. Babcock, D. F., Herrington, J., Goodwin, P. C., Park, Y. B., andHille, B. (1997) Mitochondrial participation in the intracellularCa2� network. J. Cell Biol. 136, 833–844
22. Horikawa, Y., Goel, A., Somlyo, A. P., and Somlyo, A. V. (1998)Mitochondrial calcium in relaxed and tetanized myocardium.Biophys. J 74, 1579–1590
23. Montero, M., Alonso, M. T., Carnicero, E., Cuchillo-Ibanez, I.,Albillos, A., Garcia, A. G., Garcia-Sancho, J., and Alvarez, J.(2000) Chromaffin-cell stimulation triggers fast millimolar mi-tochondrial Ca2� transients that modulate secretion. Nat. CellBiol. 2, 57–61
24. Montero, M., Alonso, M. T., Albillos, A., Garcia-Sancho, J., andAlvarez, J. (2001) Mitochondrial Ca2�-induced Ca2� releasemediated by the Ca2� uniporter. Mol. Biol. Cell 12, 63–71
25. Alonso, M. T., Barrero, M. J., Carnicero, E., Montero, M.,Garcia-Sancho, J., and Alvarez, J. (1998) Functional measure-
ments of [Ca2�] in the endoplasmic reticulum using a herpesvirus to deliver targeted aequorin. Cell Calcium 24, 87–96
26. Nunez, L., De La Fuente, M. T., Garcia, A. G., and Garcia-Sancho, J. (1995) Differential Ca2� responses of adrenergic andnoradrenergic chromaffin cells to various secretagogues. Am. J.Physiol. 269, C1540–C1546
27. Chiesa, A., Rapizzi, E., Tosello, V., Pinton, P., De Virgilio, M.,Fogarty, E., and Rizzuto, R. (2001) Recombinant aequorin andgreen fluorescent protein as valuable tools in the study of cellsignalling. Biochem. J. 355, 1–12
28. Montero, M., Brini, M., Marsault, R., Alvarez, J., Sitia, R., Pozzan,T., and Rizzuto, R. (1995) Monitoring dynamic changes in freeCa2� concentration in the endoplasmic reticulum of intact cells.EMBO J. 14, 5467–5475
29. Montero, M., Barrero, M. J., and Alvarez, J. (1997) [Ca2�]microdomains control agonist-induced Ca2� release in intactHeLa cells. FASEB J. 11, 881–885
30. Alvarez, J., and Montero, M. (2001) Ca2� measurement withluminescent probes in the endoplasmic reticulum. In MeasuringCalcium and Calmodulin Inside and Outside Cells (Petersen, O. H.,ed) pp. 147–163, Springer Lab Manual, Springer, Berlin
31. Frawley, L. S., Faught, W. J., Nicholson, J., and Moomaw, B.(1994) Real time measurement of gene expression in livingendocrine cells. Endocrinology 135, 468–471
32. Rutter, G. A., Burnett, P., Rizzuto, R., Brini, M., Murgia, M.,Pozzan, T., Tavare, J. M., and Denton, R. M. (1996) Subcellularimaging of intramitochondrial Ca2� with recombinant targetedaequorin: significance for the regulation of pyruvate dehydro-genase activity. Proc. Natl. Acad. Sci. USA 93, 5489–5494
33. Barrero, M. J., Montero, M., and Alvarez, J. (1997) Dynamics of[Ca2�] in the endoplasmic reticulum and cytoplasm of intactHeLa cells. A comparative study. J. Biol. Chem. 272, 27694–27699
34. Mogami, H., Gardner, J., Gerasimenko, O. V., Camello, P.,Petersen, O. H., and Tepikin, A. V. (1999) Calcium bindingcapacity of the cytosol and endoplasmic reticulum of mousepancreatic acinar cells. J. Physiol. (London) 518, 463–467
35. Pivovarova, N. B., Hongpaisan, J., Andrews, S. B., and Friel,D. D. (1999) Depolarization-induced mitochondrial Ca accumu-lation in sympathetic neurons: spatial and temporal character-istics. J. Neurosci. 19, 6372–6384
36. Uceda, G., Garcıa, A. G., Guantes, J. M., Michelena, P., andMontiel, C. (1995) Effects of Ca2� channel antagonist subtypeson mitochondrial transport. Eur. J. Pharmacol. 289, 73–80
37. Hajnoczky, G., Robb-Gaspers, L. D., Seitz, M. B., and Thomas,A. P. (1995) Decoding of cytosolic calcium oscillations in themitochondria. Cell 82, 415–424
38. Holman, M. E., Coleman, H. A., Tonta, M. A., and Parkington,H. C. (1994) Synaptic transmission from splanchnic nerves to theadrenal medulla of guinea-pigs. J. Physiol. (London) 478, 115–124
39. Friel, D. D., and Tsien, R. W. (1994) An FCCP-sensitive Ca2�
store in bullfrog sympathetic neurons and its participation instimulus-evoked changes in [Ca2�]i. J. Neurosci. 14, 4007–4024
40. Colegrove, S. L., Albrecht, M. A., and Friel, D. D. (2000)Dissection of mitochondrial Ca2� uptake and release fluxes insitu after depolarization-evoked [Ca2�]i elevations in sympa-thetic neurons. J. Gen. Physiol. 115, 351–370
41. Tinel, H., Cancela, J. M., Mogami, H., Gerasimenko, J. V.,Gerasimenko, O. V., Tepikin, A. V., and Petersen, O. H. (1999)Active mitochondria surrounding the pancreatic acinar granuleregion prevent spreading of inositol trisphosphate-evoked localcytosolic Ca2� signals. EMBO J 18, 4999–5008
42. Park, M. K., Ashby, M. C., Erdemli, G., Petersen, O. H., andTepikin, A. V. (2001) Perinuclear, perigranular and sub-plas-malemmal mitochondria have distinct functions in the regula-tion of cellular calcium transport. EMBO J. 20, 1863–1874
43. Rizzuto, R., Pinton, P., Carrington, W., Fay, F. S., Fogarty, K. E.,Lifshitz, L. M., Tuft, R. A., and Pozzan, T. (1998) Close contactswith the endoplasmic reticulum as determinants of mitochon-drial Ca2� responses. Science 280, 1763–1766
44. Skulachev, V. P. (2001) Mitochondrial filaments and clusters asintracellular power-transmitting cables. Trends Biochem. Sci. 26,23–29
Received for publication September 28, 2001.Accepted for publication November 6, 2001.
353Ca2� REDISTRIBUTION AMONG CYTOSOL AND ORGANELLA
Copyright © 2022 FDOKUMEN