Recruitment of members from the rare biosphere of marine bacterioplankton communities after an...
9
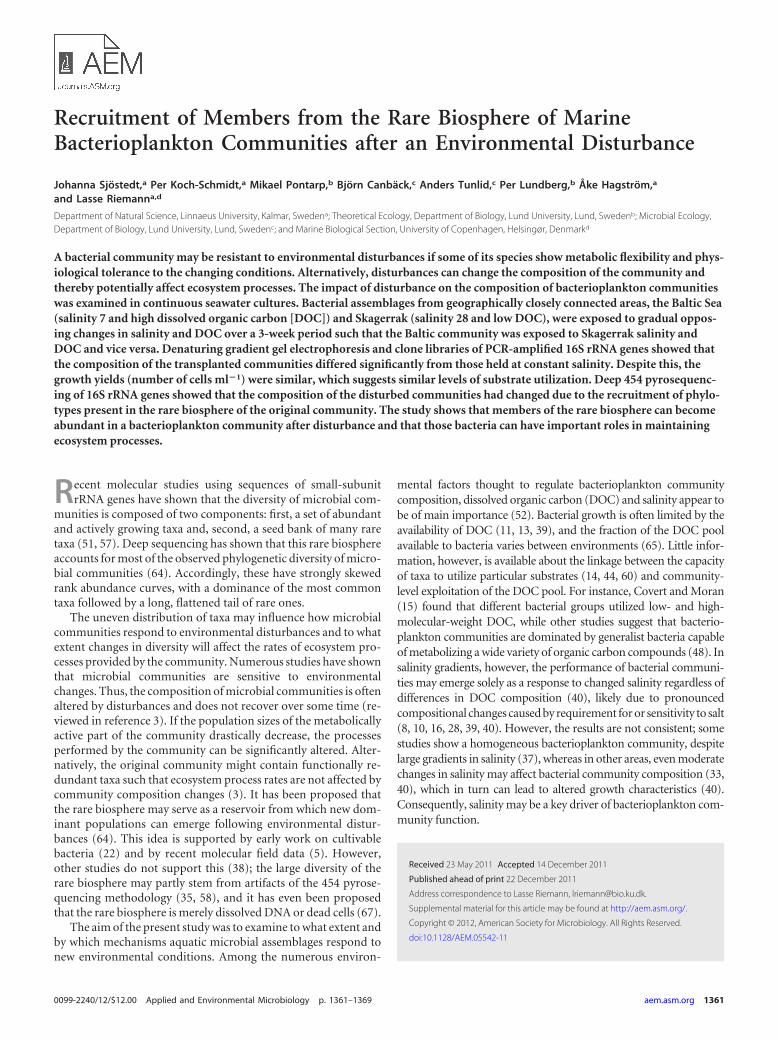
Recruitment of Members from the Rare Biosphere of Marine Bacterioplankton Communities after an Environmental Disturbance Johanna Sjöstedt, a Per Koch-Schmidt, a Mikael Pontarp, b Björn Canbäck, c Anders Tunlid, c Per Lundberg, b Åke Hagström, a and Lasse Riemann a,d Department of Natural Science, Linnaeus University, Kalmar, Sweden a ; Theoretical Ecology, Department of Biology, Lund University, Lund, Sweden b ; Microbial Ecology, Department of Biology, Lund University, Lund, Sweden c ; and Marine Biological Section, University of Copenhagen, Helsingør, Denmark d A bacterial community may be resistant to environmental disturbances if some of its species show metabolic flexibility and phys- iological tolerance to the changing conditions. Alternatively, disturbances can change the composition of the community and thereby potentially affect ecosystem processes. The impact of disturbance on the composition of bacterioplankton communities was examined in continuous seawater cultures. Bacterial assemblages from geographically closely connected areas, the Baltic Sea (salinity 7 and high dissolved organic carbon [DOC]) and Skagerrak (salinity 28 and low DOC), were exposed to gradual oppos- ing changes in salinity and DOC over a 3-week period such that the Baltic community was exposed to Skagerrak salinity and DOC and vice versa. Denaturing gradient gel electrophoresis and clone libraries of PCR-amplified 16S rRNA genes showed that the composition of the transplanted communities differed significantly from those held at constant salinity. Despite this, the growth yields (number of cells ml 1 ) were similar, which suggests similar levels of substrate utilization. Deep 454 pyrosequenc- ing of 16S rRNA genes showed that the composition of the disturbed communities had changed due to the recruitment of phylo- types present in the rare biosphere of the original community. The study shows that members of the rare biosphere can become abundant in a bacterioplankton community after disturbance and that those bacteria can have important roles in maintaining ecosystem processes. R ecent molecular studies using sequences of small-subunit rRNA genes have shown that the diversity of microbial com- munities is composed of two components: first, a set of abundant and actively growing taxa and, second, a seed bank of many rare taxa (51, 57). Deep sequencing has shown that this rare biosphere accounts for most of the observed phylogenetic diversity of micro- bial communities (64). Accordingly, these have strongly skewed rank abundance curves, with a dominance of the most common taxa followed by a long, flattened tail of rare ones. The uneven distribution of taxa may influence how microbial communities respond to environmental disturbances and to what extent changes in diversity will affect the rates of ecosystem pro- cesses provided by the community. Numerous studies have shown that microbial communities are sensitive to environmental changes. Thus, the composition of microbial communities is often altered by disturbances and does not recover over some time (re- viewed in reference 3). If the population sizes of the metabolically active part of the community drastically decrease, the processes performed by the community can be significantly altered. Alter- natively, the original community might contain functionally re- dundant taxa such that ecosystem process rates are not affected by community composition changes (3). It has been proposed that the rare biosphere may serve as a reservoir from which new dom- inant populations can emerge following environmental distur- bances (64). This idea is supported by early work on cultivable bacteria (22) and by recent molecular field data (5). However, other studies do not support this (38); the large diversity of the rare biosphere may partly stem from artifacts of the 454 pyrose- quencing methodology (35, 58), and it has even been proposed that the rare biosphere is merely dissolved DNA or dead cells (67). The aim of the present study was to examine to what extent and by which mechanisms aquatic microbial assemblages respond to new environmental conditions. Among the numerous environ- mental factors thought to regulate bacterioplankton community composition, dissolved organic carbon (DOC) and salinity appear to be of main importance (52). Bacterial growth is often limited by the availability of DOC (11, 13, 39), and the fraction of the DOC pool available to bacteria varies between environments (65). Little infor- mation, however, is available about the linkage between the capacity of taxa to utilize particular substrates (14, 44, 60) and community- level exploitation of the DOC pool. For instance, Covert and Moran (15) found that different bacterial groups utilized low- and high- molecular-weight DOC, while other studies suggest that bacterio- plankton communities are dominated by generalist bacteria capable of metabolizing a wide variety of organic carbon compounds (48). In salinity gradients, however, the performance of bacterial communi- ties may emerge solely as a response to changed salinity regardless of differences in DOC composition (40), likely due to pronounced compositional changes caused by requirement for or sensitivity to salt (8, 10, 16, 28, 39, 40). However, the results are not consistent; some studies show a homogeneous bacterioplankton community, despite large gradients in salinity (37), whereas in other areas, even moderate changes in salinity may affect bacterial community composition (33, 40), which in turn can lead to altered growth characteristics (40). Consequently, salinity may be a key driver of bacterioplankton com- munity function. Received 23 May 2011 Accepted 14 December 2011 Published ahead of print 22 December 2011 Address correspondence to Lasse Riemann, [email protected]. Supplemental material for this article may be found at http://aem.asm.org/. Copyright © 2012, American Society for Microbiology. All Rights Reserved. doi:10.1128/AEM.05542-11 0099-2240/12/$12.00 Applied and Environmental Microbiology p. 1361–1369 aem.asm.org 1361
-
Upload
independent -
Category
Documents
-
view
0 -
download
0
Transcript of Recruitment of members from the rare biosphere of marine bacterioplankton communities after an...
Recruitment of Members from the Rare Biosphere of MarineBacterioplankton Communities after an Environmental Disturbance
Johanna Sjöstedt,a Per Koch-Schmidt,a Mikael Pontarp,b Björn Canbäck,c Anders Tunlid,c Per Lundberg,b Åke Hagström,a
and Lasse Riemanna,d
Department of Natural Science, Linnaeus University, Kalmar, Swedena; Theoretical Ecology, Department of Biology, Lund University, Lund, Swedenb; Microbial Ecology,Department of Biology, Lund University, Lund, Swedenc; and Marine Biological Section, University of Copenhagen, Helsingør, Denmarkd
A bacterial community may be resistant to environmental disturbances if some of its species show metabolic flexibility and phys-iological tolerance to the changing conditions. Alternatively, disturbances can change the composition of the community andthereby potentially affect ecosystem processes. The impact of disturbance on the composition of bacterioplankton communitieswas examined in continuous seawater cultures. Bacterial assemblages from geographically closely connected areas, the Baltic Sea(salinity 7 and high dissolved organic carbon [DOC]) and Skagerrak (salinity 28 and low DOC), were exposed to gradual oppos-ing changes in salinity and DOC over a 3-week period such that the Baltic community was exposed to Skagerrak salinity andDOC and vice versa. Denaturing gradient gel electrophoresis and clone libraries of PCR-amplified 16S rRNA genes showed thatthe composition of the transplanted communities differed significantly from those held at constant salinity. Despite this, thegrowth yields (number of cells ml�1) were similar, which suggests similar levels of substrate utilization. Deep 454 pyrosequenc-ing of 16S rRNA genes showed that the composition of the disturbed communities had changed due to the recruitment of phylo-types present in the rare biosphere of the original community. The study shows that members of the rare biosphere can becomeabundant in a bacterioplankton community after disturbance and that those bacteria can have important roles in maintainingecosystem processes.
Recent molecular studies using sequences of small-subunitrRNA genes have shown that the diversity of microbial com-
munities is composed of two components: first, a set of abundantand actively growing taxa and, second, a seed bank of many raretaxa (51, 57). Deep sequencing has shown that this rare biosphereaccounts for most of the observed phylogenetic diversity of micro-bial communities (64). Accordingly, these have strongly skewedrank abundance curves, with a dominance of the most commontaxa followed by a long, flattened tail of rare ones.
The uneven distribution of taxa may influence how microbialcommunities respond to environmental disturbances and to whatextent changes in diversity will affect the rates of ecosystem pro-cesses provided by the community. Numerous studies have shownthat microbial communities are sensitive to environmentalchanges. Thus, the composition of microbial communities is oftenaltered by disturbances and does not recover over some time (re-viewed in reference 3). If the population sizes of the metabolicallyactive part of the community drastically decrease, the processesperformed by the community can be significantly altered. Alter-natively, the original community might contain functionally re-dundant taxa such that ecosystem process rates are not affected bycommunity composition changes (3). It has been proposed thatthe rare biosphere may serve as a reservoir from which new dom-inant populations can emerge following environmental distur-bances (64). This idea is supported by early work on cultivablebacteria (22) and by recent molecular field data (5). However,other studies do not support this (38); the large diversity of therare biosphere may partly stem from artifacts of the 454 pyrose-quencing methodology (35, 58), and it has even been proposedthat the rare biosphere is merely dissolved DNA or dead cells (67).
The aim of the present study was to examine to what extent andby which mechanisms aquatic microbial assemblages respond tonew environmental conditions. Among the numerous environ-
mental factors thought to regulate bacterioplankton communitycomposition, dissolved organic carbon (DOC) and salinity appear tobe of main importance (52). Bacterial growth is often limited by theavailability of DOC (11, 13, 39), and the fraction of the DOC poolavailable to bacteria varies between environments (65). Little infor-mation, however, is available about the linkage between the capacityof taxa to utilize particular substrates (14, 44, 60) and community-level exploitation of the DOC pool. For instance, Covert and Moran(15) found that different bacterial groups utilized low- and high-molecular-weight DOC, while other studies suggest that bacterio-plankton communities are dominated by generalist bacteria capableof metabolizing a wide variety of organic carbon compounds (48). Insalinity gradients, however, the performance of bacterial communi-ties may emerge solely as a response to changed salinity regardless ofdifferences in DOC composition (40), likely due to pronouncedcompositional changes caused by requirement for or sensitivity to salt(8, 10, 16, 28, 39, 40). However, the results are not consistent; somestudies show a homogeneous bacterioplankton community, despitelarge gradients in salinity (37), whereas in other areas, even moderatechanges in salinity may affect bacterial community composition (33,40), which in turn can lead to altered growth characteristics (40).Consequently, salinity may be a key driver of bacterioplankton com-munity function.
Received 23 May 2011 Accepted 14 December 2011
Published ahead of print 22 December 2011
Address correspondence to Lasse Riemann, [email protected].
Supplemental material for this article may be found at http://aem.asm.org/.
Copyright © 2012, American Society for Microbiology. All Rights Reserved.
doi:10.1128/AEM.05542-11
0099-2240/12/$12.00 Applied and Environmental Microbiology p. 1361–1369 aem.asm.org 1361
Specifically, we examined effects of gradual changes in salinityon bacterial community composition in continuous cultures us-ing water and inocula from the Baltic Sea (salinity 7) and Skager-rak (salinity 28), the strait between Norway, Sweden, and Den-mark connected with the North Sea. These two connected systemsalso differ in DOC, with concentrations in the Baltic Sea beingroughly double those in the Skagerrak (70), as well as in bacterialcommunity composition (55). The Baltic Sea has its outflow ofbrackish water through the Danish straits, resulting in a stablesalinity gradient with increasing salinity from the Baltic towardthe Skagerrak. Nevertheless, exchange of water masses does occuroccasionally during storm-driven events when high-salinity waterfrom the Skagerrak enters the Baltic Sea. Thereby, the indigenousbacterial assemblages in the respective environments are exposedto pronounced fluctuations in salinity as well as in DOC, and itmay be assumed that the bacterial communities are able to re-spond to these abrupt environmental changes.
Our experimental approach demonstrates that the bacterialcommunities responded to an environmental disturbance andchanged salinity and DOC by compositional succession, partlyaccommodated by recruitment of members of the rare biosphere.Nevertheless, community growth remained stable.
MATERIALS AND METHODSExperimental setup. Natural bacterial communities were exposed to agradual transformation from a low- to a high-salinity environment andvice versa in continuous seawater cultures. Two experiments were per-formed: one in June 2007, referred to as experiment 1, and one in August2007, referred to as experiment 2. In experiment 2, in addition to culturesexposed to changed salinity, control incubations with constant high salin-ity (salinity 28) or low salinity (salinity 7) were included in the experimen-tal setup. Most data presented are from experiment 2, but some data fromexperiment 1 are included to illustrate that observed patterns of bacterialdynamics were similar in the two experiments.
Water collection. Seawater from 2 m depth was collected on two oc-casions in 2007 in the Baltic Sea (57°27=N, 17°05=E) and the Skagerrak(58°15=N, 11°22=E) using a Niskin bottle: experiment 1, Baltic Sea andSkagerrak on 19 and 20 June, respectively; experiment 2, Baltic Sea on 20August and Skagerrak on 21 August. Sampling for experiment 1 was per-formed after the spring bloom, which otherwise would have affected thecommunity composition (54), and sampling for experiment 2 was beforethe autumn storms, which transfer high-salinity water into the Baltic Sea.Samples were kept in 20-liter polycarbonate bottles and processed within1.5 h.
Preparation of medium and inoculum. Baltic and Skagerrak seawaterwas used as medium and was prepared by consecutive filtration through3.0-�m-pore-size polycarbonate filters (Whatman) and 0.22-�m-pore-size Sterivex filters (Millipore) using a peristaltic pump. The filtered sea-water, one full 20-liter container per continuous culture, was autoclavedbefore assembly of the continuous culture system. The Sterivex filterswere frozen at �80°C until DNA extraction. The seawater inoculum wasgravity filtered (once through 3.0-�m-pore-size polycarbonate filters andtwice through 0.6-�m-pore-size polycarbonate filters [Whatman], to en-sure that no protozoa were present in the inoculum) and stored at 4°C for�24 h before inoculation of the continuous seawater cultures.
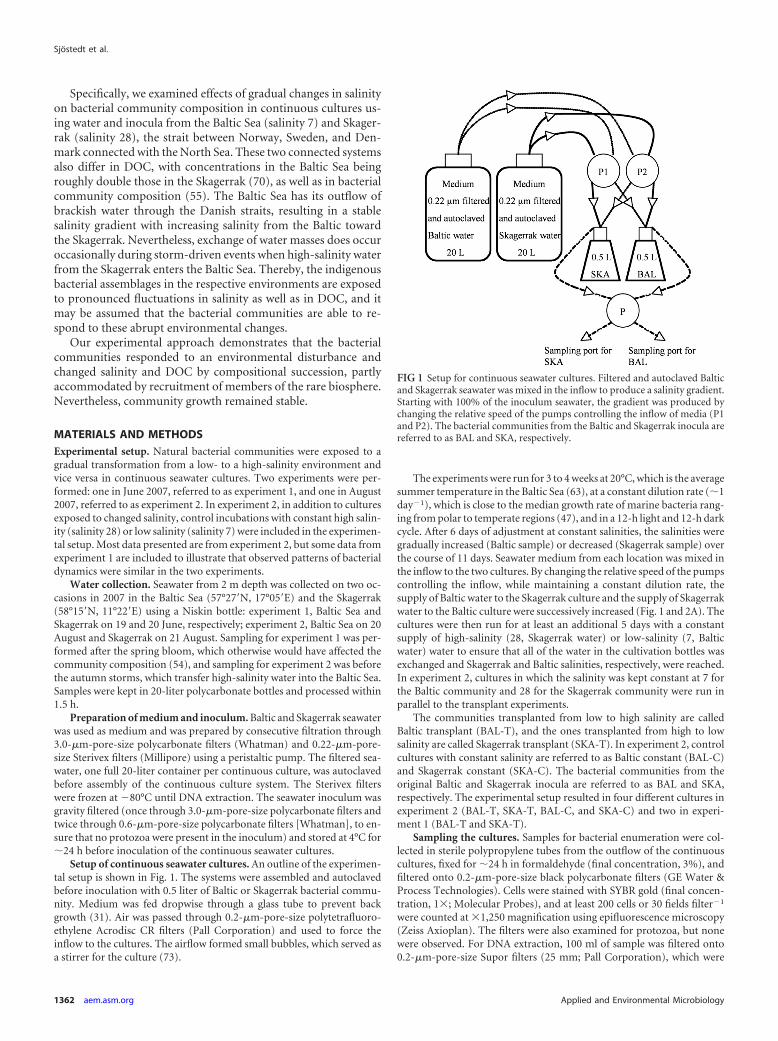
Setup of continuous seawater cultures. An outline of the experimen-tal setup is shown in Fig. 1. The systems were assembled and autoclavedbefore inoculation with 0.5 liter of Baltic or Skagerrak bacterial commu-nity. Medium was fed dropwise through a glass tube to prevent backgrowth (31). Air was passed through 0.2-�m-pore-size polytetrafluoro-ethylene Acrodisc CR filters (Pall Corporation) and used to force theinflow to the cultures. The airflow formed small bubbles, which served asa stirrer for the culture (73).
The experiments were run for 3 to 4 weeks at 20°C, which is the averagesummer temperature in the Baltic Sea (63), at a constant dilution rate (�1day�1), which is close to the median growth rate of marine bacteria rang-ing from polar to temperate regions (47), and in a 12-h light and 12-h darkcycle. After 6 days of adjustment at constant salinities, the salinities weregradually increased (Baltic sample) or decreased (Skagerrak sample) overthe course of 11 days. Seawater medium from each location was mixed inthe inflow to the two cultures. By changing the relative speed of the pumpscontrolling the inflow, while maintaining a constant dilution rate, thesupply of Baltic water to the Skagerrak culture and the supply of Skagerrakwater to the Baltic culture were successively increased (Fig. 1 and 2A). Thecultures were then run for at least an additional 5 days with a constantsupply of high-salinity (28, Skagerrak water) or low-salinity (7, Balticwater) water to ensure that all of the water in the cultivation bottles wasexchanged and Skagerrak and Baltic salinities, respectively, were reached.In experiment 2, cultures in which the salinity was kept constant at 7 forthe Baltic community and 28 for the Skagerrak community were run inparallel to the transplant experiments.
The communities transplanted from low to high salinity are calledBaltic transplant (BAL-T), and the ones transplanted from high to lowsalinity are called Skagerrak transplant (SKA-T). In experiment 2, controlcultures with constant salinity are referred to as Baltic constant (BAL-C)and Skagerrak constant (SKA-C). The bacterial communities from theoriginal Baltic and Skagerrak inocula are referred to as BAL and SKA,respectively. The experimental setup resulted in four different cultures inexperiment 2 (BAL-T, SKA-T, BAL-C, and SKA-C) and two in experi-ment 1 (BAL-T and SKA-T).
Sampling the cultures. Samples for bacterial enumeration were col-lected in sterile polypropylene tubes from the outflow of the continuouscultures, fixed for �24 h in formaldehyde (final concentration, 3%), andfiltered onto 0.2-�m-pore-size black polycarbonate filters (GE Water &Process Technologies). Cells were stained with SYBR gold (final concen-tration, 1�; Molecular Probes), and at least 200 cells or 30 fields filter�1
were counted at �1,250 magnification using epifluorescence microscopy(Zeiss Axioplan). The filters were also examined for protozoa, but nonewere observed. For DNA extraction, 100 ml of sample was filtered onto0.2-�m-pore-size Supor filters (25 mm; Pall Corporation), which were
FIG 1 Setup for continuous seawater cultures. Filtered and autoclaved Balticand Skagerrak seawater was mixed in the inflow to produce a salinity gradient.Starting with 100% of the inoculum seawater, the gradient was produced bychanging the relative speed of the pumps controlling the inflow of media (P1and P2). The bacterial communities from the Baltic and Skagerrak inocula arereferred to as BAL and SKA, respectively.
Sjöstedt et al.
1362 aem.asm.org Applied and Environmental Microbiology
then frozen. Samples for salinity measurements were stored frozen untilmeasurement of conductivity. Flow rate was recorded daily by weighingthe bottles collecting the outflow.
DOC and inorganic nutrients. Samples were taken from media andcultures at the end of experiment 2. DOC samples were filtered (0.2-�m-pore-size Supor filters; Pall Corporation), acidified, and stored frozenuntil analysis on a Shimadzu TOC-5000 high-temperature catalytic oxi-dation instrument. Calculation of carbon concentrations was made withpotassium hydrogen phthalate as the standard substance. Samples forinorganic nutrients were filtered through glass fiber filters (GF/F) andstored frozen until analysis on a Bran & Luebbe TRAACS 800 autoana-lyzer using standard seawater methods (29).
DNA extraction. DNA was extracted from Sterivex filters (5 litersBaltic and Skagerrak inocula) and Supor filters (community DNA fromthe continuous cultures) using an enzyme/phenol-chloroform protocol(25, 62) but with a 30-min lysozyme digestion (final concentrations, 5 mgml�1 for Sterivex filters and 1 mg ml�1 for Supor filters) at 37°C and anovernight proteinase K digestion (final concentration, 100 �g ml�1) at55°C (9). DNA was quantified using the PicoGreen assay (MolecularProbes).
PCR, DGGE, clone libraries, and 454 pyrosequencing. For experi-ment 2, time course changes in bacterial community compositions werefollowed by PCR-denaturing gradient gel electrophoresis (DGGE) as de-scribed by Riemann et al. (62). Bacterial 16S rRNA genes were PCR am-plified using puReTaq Ready-To-Go PCR beads (GE Healthcare), 0.04 ng
DNA �l�1, and primers GC341F (50) and 907R (49). Based on the pres-ence/absence of DGGE bands, a dendrogram was constructed by the soft-ware Quantity One, version 4.6.2 (Bio-Rad), using the Dice coefficientand cluster analysis by the unweighted-pair group method using arithme-tic average (UPGMA).
A total of 10 libraries of 96 clones were generated from experiments 1and 2. Bacterial 16S rRNA genes were amplified using primers 27F and1492R (27), and products were purified using a gel extraction kit(E.Z.N.A.), followed by a Cycle-Pure kit (E.Z.N.A.). Products were cloned(TOPO TA cloning kit; Invitrogen), plasmid DNA was extracted (R.E.A.L.Prep 96 plasmid kit; Qiagen), and the inserts (�750 bp) were sequencedby the dideoxynucleotide termination method with primer 27F (commer-cially by Macrogen, South Korea).
Partial bacterial 16S rRNA genes (including the variable V4 to V6regions) were amplified for pyrosequencing from the Baltic inoculum andthe transplanted Baltic community from experiment 2 using a primercocktail containing the degenerate primers 530F (5=-GTGCCAGCMGCNGCGGTA-3= [19]), but with TA added at the 3 prime end to increasespecificity, and 1061R (5=-CRRCACGAGCTGACGAC-3= [4]). Pyrose-quencing was performed at the University of Copenhagen on a 454 GSFLX system (Roche Applied Science) according to the manufacturer’sinstructions.
Sequence analysis. Base calling on the Sanger data was performedusing the PHRED software (21) and resulted in 960 sequences. For the 454data (16,793 sequences with an average length of 224 bp), primer andadaptor sequences were trimmed using the SeqClean software (http://compbio.dfci.harvard.edu/tgi/software/) with UniVec_Core as the da-tabase (http://www.ncbi.nlm.nih.gov/VecScreen/UniVec.html). Reads�150 bp long and reads with undetermined nucleotides were removedfrom the 454 data set (34). The Greengenes online tool (http://greengenes.lbl.gov) was used to align sequences and exclude non-16S rRNA genes.Aligned sequences retrieved from Greengenes are truncated if the querysequences do not properly align to any one of the nonchimeric templatesequences that Greengenes uses internally for aligning sequences. This is away to prevent possible chimeras from being included in the Greengenesoutput. In total, 848 aligned sequences were retrieved from Greengenesfor the Sanger data set and 16,760 were retrieved for the 454 data set. Anadditional, more thorough screening for chimeric sequences was made byuse of the ChimeraSlayer utility (30) using default settings, detecting 21additional chimeras in the Sanger data set and 247 in the 454 data set.
The Greengenes classification tool was used to assign a taxon for eachsequence (17). Greengenes currently supports three different taxonomies:RDP, National Center for Biotechnology Information (NCBI), andHugenholtz (17). If two of these showed the same taxonomic lineage onthe phylum/class level, the sequence was kept for further analysis, result-ing in 821 sequences for the Sanger data set and 16,497 for the 454 data set.Sequences shorter than 750 nucleotides were removed from the Sangerdata set, leaving a final number of 727 sequences.
Maximum likelihood trees were inferred with the aid of RaxML soft-ware (version 7.0.4), using the GTRMIX model with default settings (66).The phylum trees were used as input to the RAMI tool to cluster similarsequences (56). RAMI defines clusters on the basis of the patristic distance(branch length) between external nodes in a phylogenetic tree. The patris-tic distance threshold was set to 0.06, which corresponds approximately toa 97% similarity cutoff (56). The produced clusters are used here as oper-ational taxonomic units (OTUs). OTUs were defined as abundant if theyaccounted for �1% of the 454 reads (51) and rare if they accounted for�0.1% of the reads (24, 51).
Community distance analysis of the clone libraries was performedusing the UniFrac software. To assess whether the UniFrac distance met-rics between communities were significant, P value significance tests weredone as implemented in the UniFrac program (42). The combinationswere constructed so that all pairwise library combinations were testedagainst each other. The relative differences between all community phy-logenies were examined by Jackknife clustering, which performs hierar-
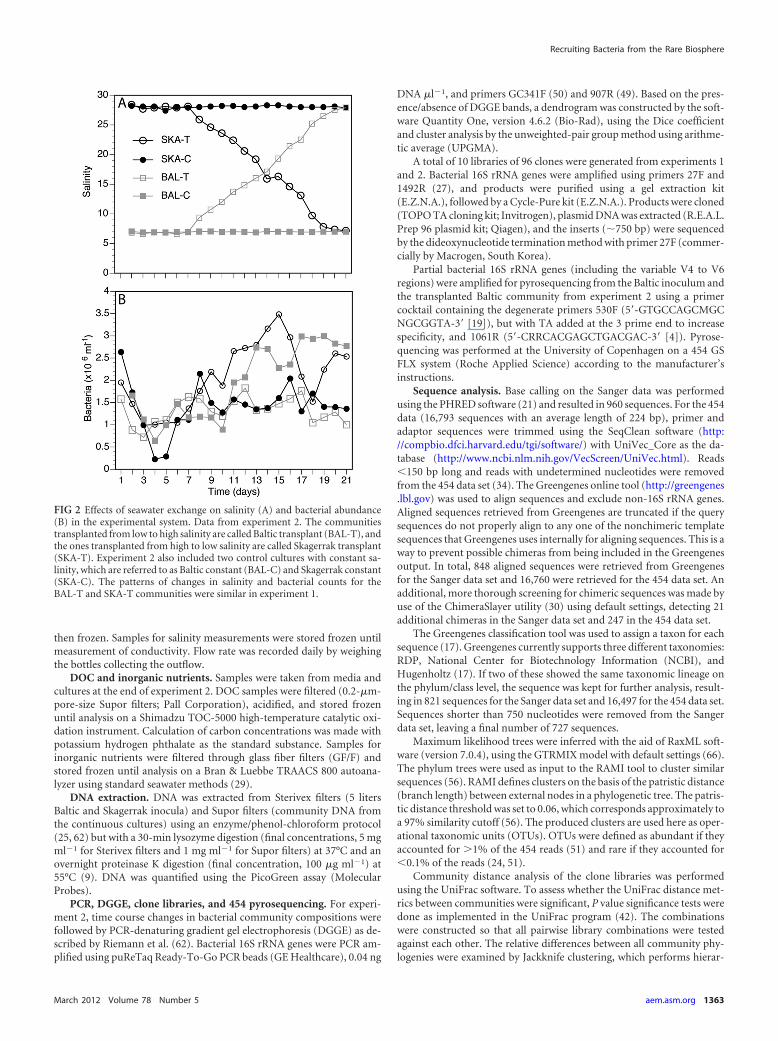
FIG 2 Effects of seawater exchange on salinity (A) and bacterial abundance(B) in the experimental system. Data from experiment 2. The communitiestransplanted from low to high salinity are called Baltic transplant (BAL-T), andthe ones transplanted from high to low salinity are called Skagerrak transplant(SKA-T). Experiment 2 also included two control cultures with constant sa-linity, which are referred to as Baltic constant (BAL-C) and Skagerrak constant(SKA-C). The patterns of changes in salinity and bacterial counts for theBAL-T and SKA-T communities were similar in experiment 1.
Recruiting Bacteria from the Rare Biosphere
March 2012 Volume 78 Number 5 aem.asm.org 1363
chical clustering based on the pairwise UniFrac distance metrics. Therobustness of the Jackknife analysis for sampling size and evenness isassessed by quantifying how often the cluster nodes are recovered for arandom sample from part of the original data. This resampling was per-mutated 1,000 times using 75% of the smallest library (26 sequences) asthe minimum number of sequences kept for each sample in the resam-pling.
Nucleotide sequence accession numbers. Sanger sequences havebeen deposited in the EMBL database under accession numbers FR647485to FR648326, while pyrotag sequences have been deposited in the NCBISequence Read Archive under accession number SRA012481.2.
RESULTSSalinity, DOC, and inorganic nutrients. The salinities of the Bal-tic and Skagerrak samples were �7 and �28, respectively. In ex-periment 2, an increase in salinity was recorded on day 7 in theBAL-T community, and the salinity reached the Skagerrak level,salinity 28, on day 21 (Fig. 2A). In contrast, the salinity in theSKA-T community started to decrease on day 7 and reached theBaltic level, salinity 7, on day 21. The DOC concentrations inthe Baltic and Skagerrak media were 450 �M and 267 �M, respec-tively, and were 258 �M and 483 �M in the transplanted commu-nities, BAL-T and SKA-T, respectively, on day 21. Concentrationsof inorganic nitrogen and phosphate in the cultures were 1.6 to 2.5�M and 0.04 to 0.13 �M, respectively. Thus, we do not considerthat the growth of the bacteria was limited by nitrogen and phos-phate.
Total count and growth yield. In experiment 2, the bacterialabundance of the transplanted communities, BAL-T and SKA-T,reached the same levels as in the respective controls with the samesalinity (SKA-C and BAL-C; Table 1; Fig. 2B). The bacterial abun-dance in the BAL-T community decreased between days 15 and 18but then reached the same level as in SKA-C. In experiment 1, asimilar time course of development of bacterial abundance wasobserved, with slightly higher levels in SKA-T than in BAL-T (Ta-ble 1). The number of cells per ml is used in this study as a mea-surement of growth yield.
Bacterial community dynamics. DGGE of 16S rRNA genesfrom experiment 2 showed that the composition changed consid-erably in the SKA-T treatment as the salinity decreased, withbands disappearing and appearing over time (see lanes 1 to 8 inFig. S1A in the supplemental material). The SKA inoculumshowed 17 discernible bands, which after 3 weeks were reduced to
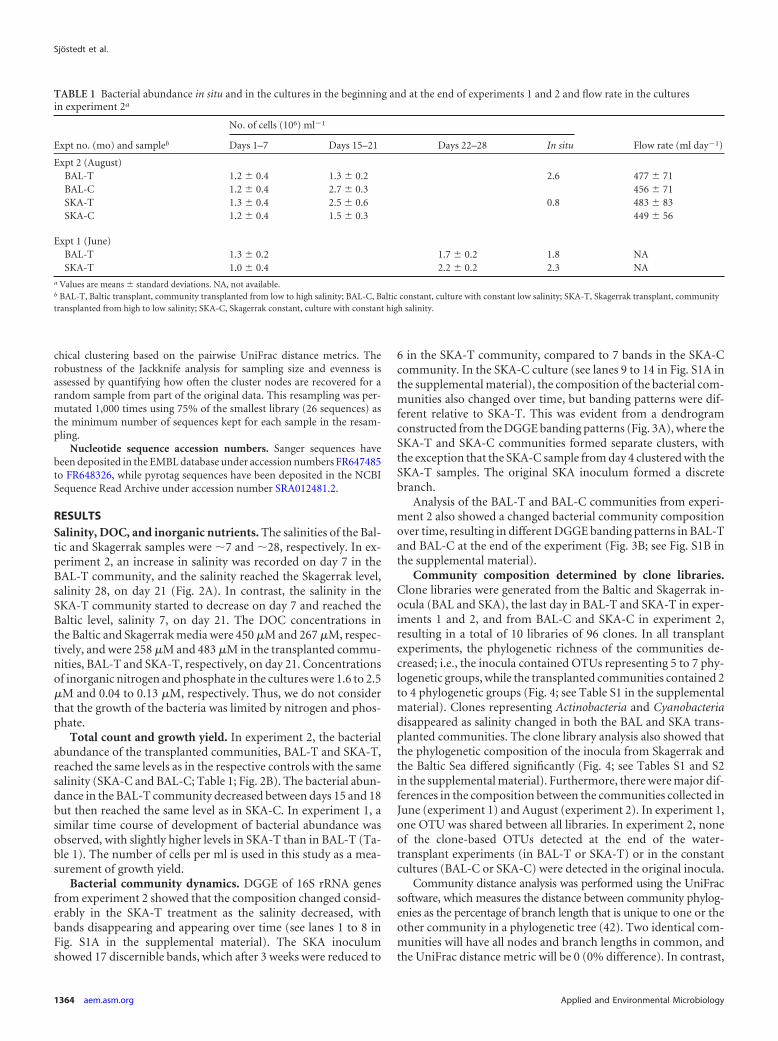
6 in the SKA-T community, compared to 7 bands in the SKA-Ccommunity. In the SKA-C culture (see lanes 9 to 14 in Fig. S1A inthe supplemental material), the composition of the bacterial com-munities also changed over time, but banding patterns were dif-ferent relative to SKA-T. This was evident from a dendrogramconstructed from the DGGE banding patterns (Fig. 3A), where theSKA-T and SKA-C communities formed separate clusters, withthe exception that the SKA-C sample from day 4 clustered with theSKA-T samples. The original SKA inoculum formed a discretebranch.
Analysis of the BAL-T and BAL-C communities from experi-ment 2 also showed a changed bacterial community compositionover time, resulting in different DGGE banding patterns in BAL-Tand BAL-C at the end of the experiment (Fig. 3B; see Fig. S1B inthe supplemental material).
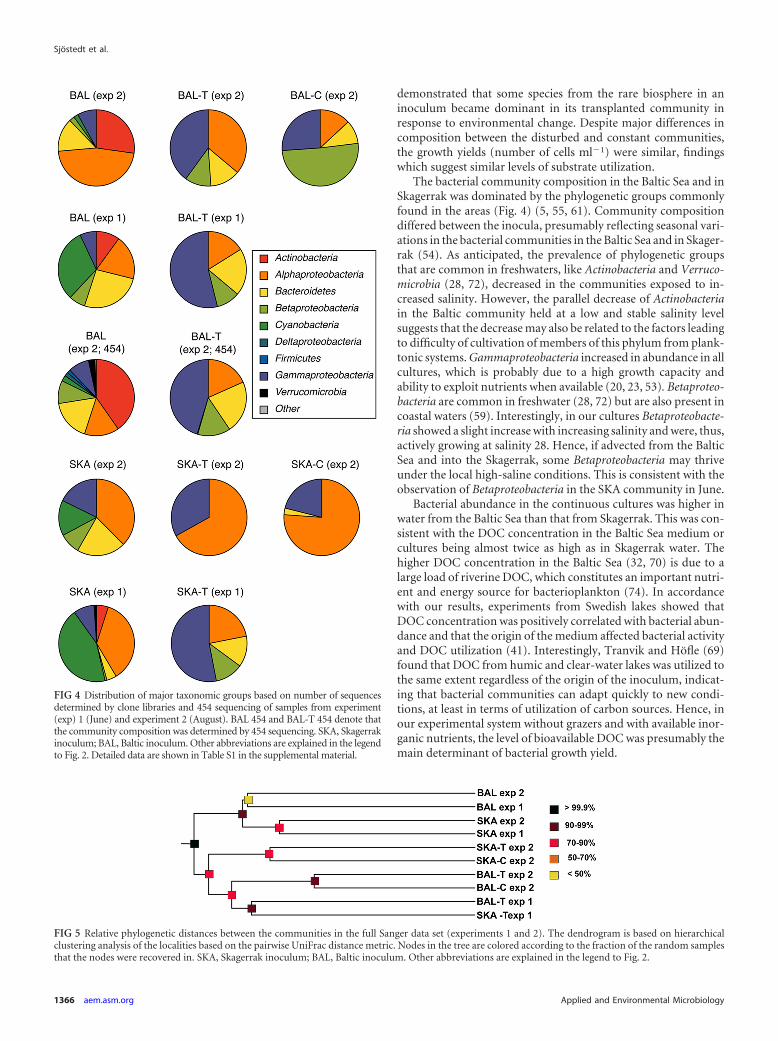
Community composition determined by clone libraries.Clone libraries were generated from the Baltic and Skagerrak in-ocula (BAL and SKA), the last day in BAL-T and SKA-T in exper-iments 1 and 2, and from BAL-C and SKA-C in experiment 2,resulting in a total of 10 libraries of 96 clones. In all transplantexperiments, the phylogenetic richness of the communities de-creased; i.e., the inocula contained OTUs representing 5 to 7 phy-logenetic groups, while the transplanted communities contained 2to 4 phylogenetic groups (Fig. 4; see Table S1 in the supplementalmaterial). Clones representing Actinobacteria and Cyanobacteriadisappeared as salinity changed in both the BAL and SKA trans-planted communities. The clone library analysis also showed thatthe phylogenetic composition of the inocula from Skagerrak andthe Baltic Sea differed significantly (Fig. 4; see Tables S1 and S2in the supplemental material). Furthermore, there were major dif-ferences in the composition between the communities collected inJune (experiment 1) and August (experiment 2). In experiment 1,one OTU was shared between all libraries. In experiment 2, noneof the clone-based OTUs detected at the end of the water-transplant experiments (in BAL-T or SKA-T) or in the constantcultures (BAL-C or SKA-C) were detected in the original inocula.
Community distance analysis was performed using the UniFracsoftware, which measures the distance between community phylog-enies as the percentage of branch length that is unique to one or theother community in a phylogenetic tree (42). Two identical com-munities will have all nodes and branch lengths in common, andthe UniFrac distance metric will be 0 (0% difference). In contrast,
TABLE 1 Bacterial abundance in situ and in the cultures in the beginning and at the end of experiments 1 and 2 and flow rate in the culturesin experiment 2a
Expt no. (mo) and sampleb
No. of cells (106) ml�1
Flow rate (ml day�1)Days 1–7 Days 15–21 Days 22–28 In situ
Expt 2 (August)BAL-T 1.2 � 0.4 1.3 � 0.2 2.6 477 � 71BAL-C 1.2 � 0.4 2.7 � 0.3 456 � 71SKA-T 1.3 � 0.4 2.5 � 0.6 0.8 483 � 83SKA-C 1.2 � 0.4 1.5 � 0.3 449 � 56
Expt 1 (June)BAL-T 1.3 � 0.2 1.7 � 0.2 1.8 NASKA-T 1.0 � 0.4 2.2 � 0.2 2.3 NA
a Values are means � standard deviations. NA, not available.b BAL-T, Baltic transplant, community transplanted from low to high salinity; BAL-C, Baltic constant, culture with constant low salinity; SKA-T, Skagerrak transplant, communitytransplanted from high to low salinity; SKA-C, Skagerrak constant, culture with constant high salinity.
Sjöstedt et al.
1364 aem.asm.org Applied and Environmental Microbiology
if two samples already differ in the first node of the phylogenetictree, no common nodes or branches exist and the UniFrac metricwill be 1 (100% difference). The UniFrac analysis confirmed thatthe transplanted and constant communities were significantly dif-ferent from the inocula (P � 0.05, UniFrac significance test/P test;Fig. 5; see Table S2 in the supplemental material) and that thestructures of the communities transplanted from low to high sa-linity and vice versa were generally significantly different fromthose held under constant conditions (P � 0.03).
454 pyrosequencing of BAL and BAL-T communities. In ex-periment 2, a total of 7,775 and 8,722 sequences were retrievedfrom the transplanted community (BAL-T) and the inoculum(BAL), respectively (Fig. 4; see Table S1 in the supplemental ma-terial). The numbers of OTUs identified in BAL and BAL-T were432 and 116, respectively. The Baltic community was dominatedby Actinobacteria, Alphaproteobacteria, and Bacteroidetes, whichwere also the dominant groups in the clone libraries. The BAL-Tcommunity was dominated by Gammaproteobacteria, comparedto Gamma- and Alphaproteobacteria in the clone library. The per-centages of 454 reads found in the Sanger libraries were 24% and53% for the BAL and BAL-T communities, respectively, whensequences were compared at a 100% similarity level. It should benoted that the overlapping region was only 150 bp.
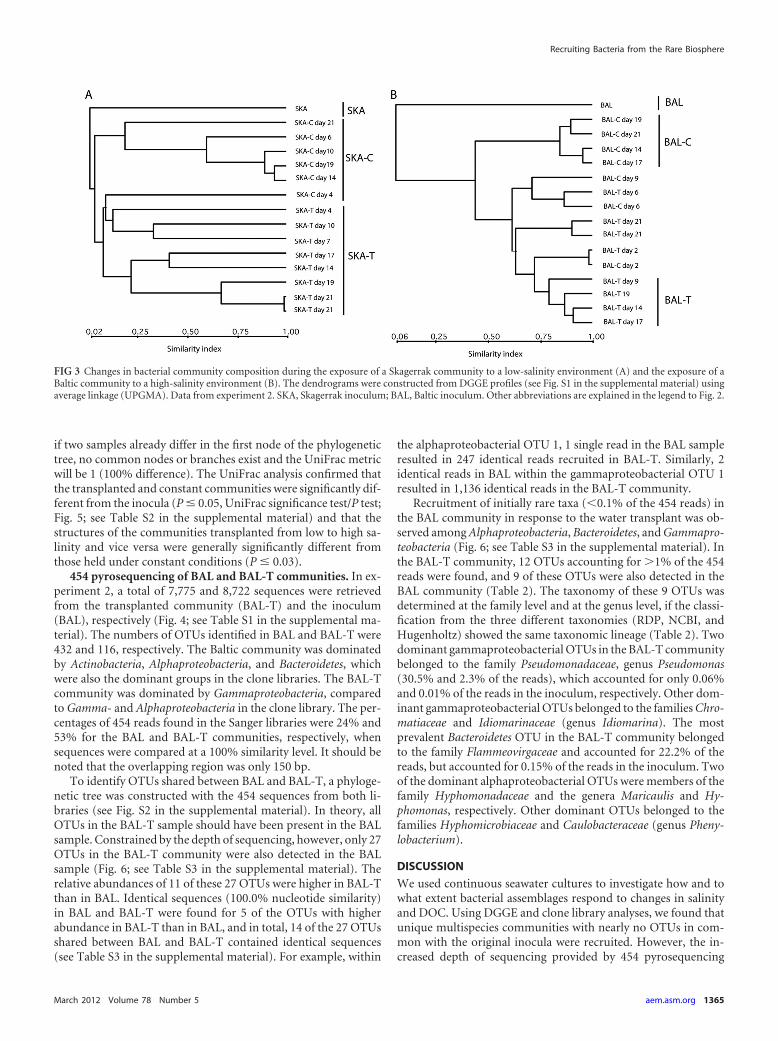
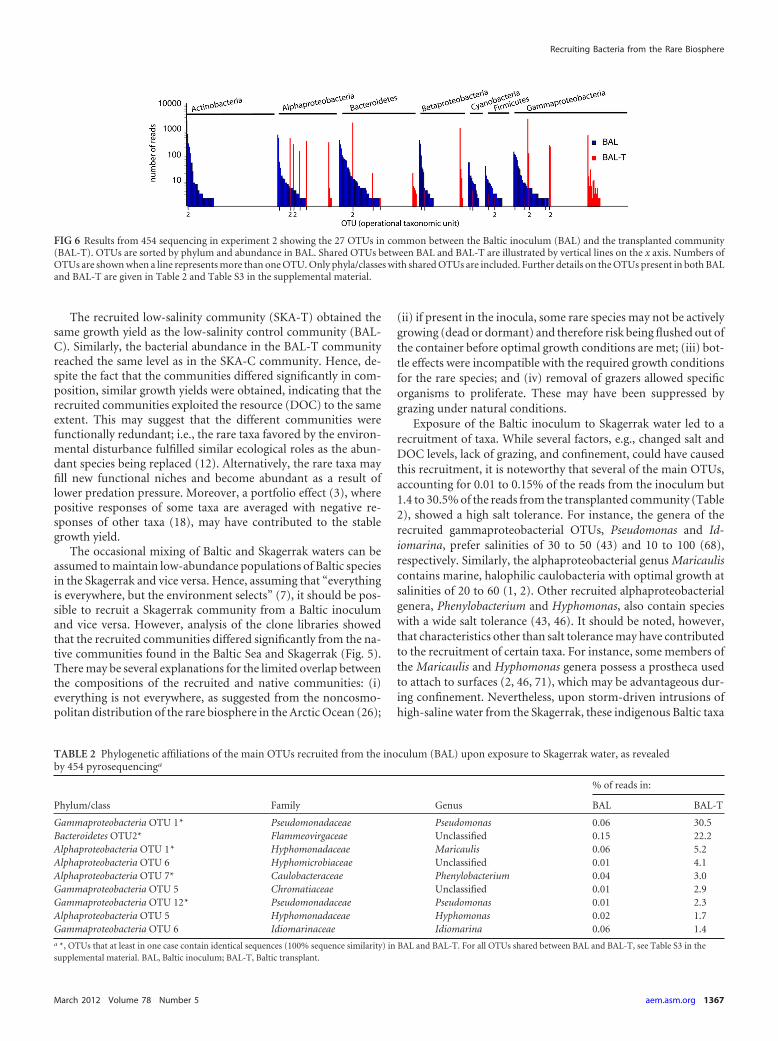
To identify OTUs shared between BAL and BAL-T, a phyloge-netic tree was constructed with the 454 sequences from both li-braries (see Fig. S2 in the supplemental material). In theory, allOTUs in the BAL-T sample should have been present in the BALsample. Constrained by the depth of sequencing, however, only 27OTUs in the BAL-T community were also detected in the BALsample (Fig. 6; see Table S3 in the supplemental material). Therelative abundances of 11 of these 27 OTUs were higher in BAL-Tthan in BAL. Identical sequences (100.0% nucleotide similarity)in BAL and BAL-T were found for 5 of the OTUs with higherabundance in BAL-T than in BAL, and in total, 14 of the 27 OTUsshared between BAL and BAL-T contained identical sequences(see Table S3 in the supplemental material). For example, within
the alphaproteobacterial OTU 1, 1 single read in the BAL sampleresulted in 247 identical reads recruited in BAL-T. Similarly, 2identical reads in BAL within the gammaproteobacterial OTU 1resulted in 1,136 identical reads in the BAL-T community.
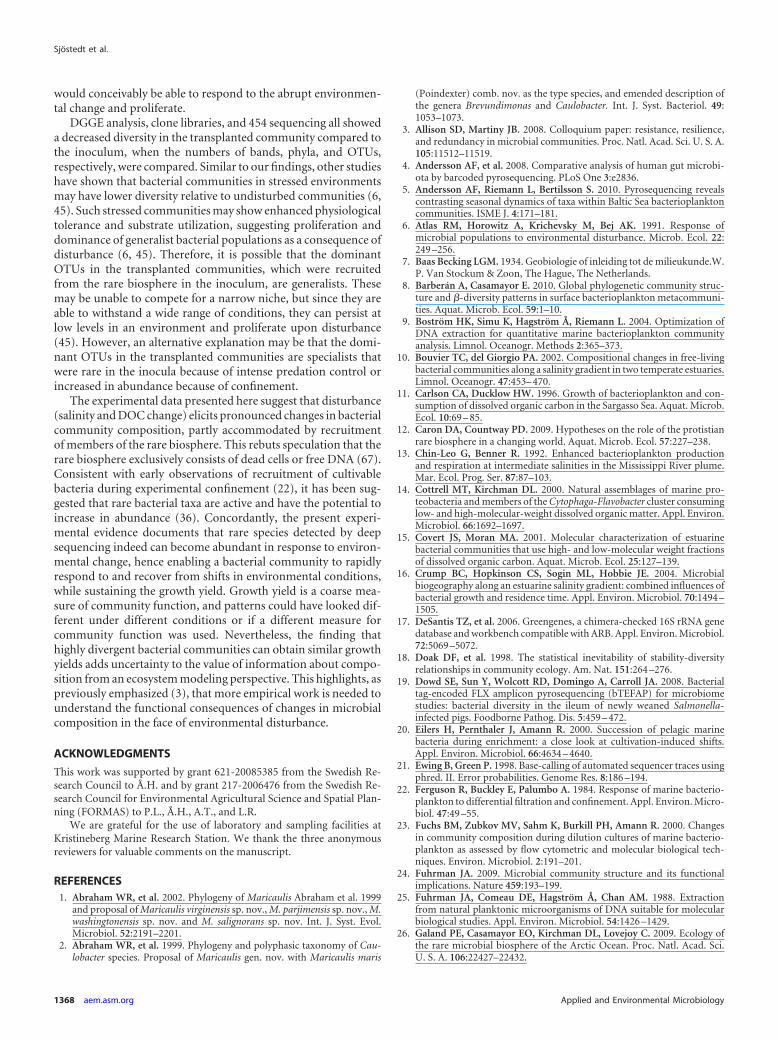
Recruitment of initially rare taxa (�0.1% of the 454 reads) inthe BAL community in response to the water transplant was ob-served among Alphaproteobacteria, Bacteroidetes, and Gammapro-teobacteria (Fig. 6; see Table S3 in the supplemental material). Inthe BAL-T community, 12 OTUs accounting for �1% of the 454reads were found, and 9 of these OTUs were also detected in theBAL community (Table 2). The taxonomy of these 9 OTUs wasdetermined at the family level and at the genus level, if the classi-fication from the three different taxonomies (RDP, NCBI, andHugenholtz) showed the same taxonomic lineage (Table 2). Twodominant gammaproteobacterial OTUs in the BAL-T communitybelonged to the family Pseudomonadaceae, genus Pseudomonas(30.5% and 2.3% of the reads), which accounted for only 0.06%and 0.01% of the reads in the inoculum, respectively. Other dom-inant gammaproteobacterial OTUs belonged to the families Chro-matiaceae and Idiomarinaceae (genus Idiomarina). The mostprevalent Bacteroidetes OTU in the BAL-T community belongedto the family Flammeovirgaceae and accounted for 22.2% of thereads, but accounted for 0.15% of the reads in the inoculum. Twoof the dominant alphaproteobacterial OTUs were members of thefamily Hyphomonadaceae and the genera Maricaulis and Hy-phomonas, respectively. Other dominant OTUs belonged to thefamilies Hyphomicrobiaceae and Caulobacteraceae (genus Pheny-lobacterium).
DISCUSSION
We used continuous seawater cultures to investigate how and towhat extent bacterial assemblages respond to changes in salinityand DOC. Using DGGE and clone library analyses, we found thatunique multispecies communities with nearly no OTUs in com-mon with the original inocula were recruited. However, the in-creased depth of sequencing provided by 454 pyrosequencing
FIG 3 Changes in bacterial community composition during the exposure of a Skagerrak community to a low-salinity environment (A) and the exposure of aBaltic community to a high-salinity environment (B). The dendrograms were constructed from DGGE profiles (see Fig. S1 in the supplemental material) usingaverage linkage (UPGMA). Data from experiment 2. SKA, Skagerrak inoculum; BAL, Baltic inoculum. Other abbreviations are explained in the legend to Fig. 2.
Recruiting Bacteria from the Rare Biosphere
March 2012 Volume 78 Number 5 aem.asm.org 1365
demonstrated that some species from the rare biosphere in aninoculum became dominant in its transplanted community inresponse to environmental change. Despite major differences incomposition between the disturbed and constant communities,the growth yields (number of cells ml�1) were similar, findingswhich suggest similar levels of substrate utilization.
The bacterial community composition in the Baltic Sea and inSkagerrak was dominated by the phylogenetic groups commonlyfound in the areas (Fig. 4) (5, 55, 61). Community compositiondiffered between the inocula, presumably reflecting seasonal vari-ations in the bacterial communities in the Baltic Sea and in Skager-rak (54). As anticipated, the prevalence of phylogenetic groupsthat are common in freshwaters, like Actinobacteria and Verruco-microbia (28, 72), decreased in the communities exposed to in-creased salinity. However, the parallel decrease of Actinobacteriain the Baltic community held at a low and stable salinity levelsuggests that the decrease may also be related to the factors leadingto difficulty of cultivation of members of this phylum from plank-tonic systems. Gammaproteobacteria increased in abundance in allcultures, which is probably due to a high growth capacity andability to exploit nutrients when available (20, 23, 53). Betaproteo-bacteria are common in freshwater (28, 72) but are also present incoastal waters (59). Interestingly, in our cultures Betaproteobacte-ria showed a slight increase with increasing salinity and were, thus,actively growing at salinity 28. Hence, if advected from the BalticSea and into the Skagerrak, some Betaproteobacteria may thriveunder the local high-saline conditions. This is consistent with theobservation of Betaproteobacteria in the SKA community in June.
Bacterial abundance in the continuous cultures was higher inwater from the Baltic Sea than that from Skagerrak. This was con-sistent with the DOC concentration in the Baltic Sea medium orcultures being almost twice as high as in Skagerrak water. Thehigher DOC concentration in the Baltic Sea (32, 70) is due to alarge load of riverine DOC, which constitutes an important nutri-ent and energy source for bacterioplankton (74). In accordancewith our results, experiments from Swedish lakes showed thatDOC concentration was positively correlated with bacterial abun-dance and that the origin of the medium affected bacterial activityand DOC utilization (41). Interestingly, Tranvik and Höfle (69)found that DOC from humic and clear-water lakes was utilized tothe same extent regardless of the origin of the inoculum, indicat-ing that bacterial communities can adapt quickly to new condi-tions, at least in terms of utilization of carbon sources. Hence, inour experimental system without grazers and with available inor-ganic nutrients, the level of bioavailable DOC was presumably themain determinant of bacterial growth yield.
FIG 4 Distribution of major taxonomic groups based on number of sequencesdetermined by clone libraries and 454 sequencing of samples from experiment(exp) 1 (June) and experiment 2 (August). BAL 454 and BAL-T 454 denote thatthe community composition was determined by 454 sequencing. SKA, Skagerrakinoculum; BAL, Baltic inoculum. Other abbreviations are explained in the legendto Fig. 2. Detailed data are shown in Table S1 in the supplemental material.
FIG 5 Relative phylogenetic distances between the communities in the full Sanger data set (experiments 1 and 2). The dendrogram is based on hierarchicalclustering analysis of the localities based on the pairwise UniFrac distance metric. Nodes in the tree are colored according to the fraction of the random samplesthat the nodes were recovered in. SKA, Skagerrak inoculum; BAL, Baltic inoculum. Other abbreviations are explained in the legend to Fig. 2.
Sjöstedt et al.
1366 aem.asm.org Applied and Environmental Microbiology
The recruited low-salinity community (SKA-T) obtained thesame growth yield as the low-salinity control community (BAL-C). Similarly, the bacterial abundance in the BAL-T communityreached the same level as in the SKA-C community. Hence, de-spite the fact that the communities differed significantly in com-position, similar growth yields were obtained, indicating that therecruited communities exploited the resource (DOC) to the sameextent. This may suggest that the different communities werefunctionally redundant; i.e., the rare taxa favored by the environ-mental disturbance fulfilled similar ecological roles as the abun-dant species being replaced (12). Alternatively, the rare taxa mayfill new functional niches and become abundant as a result oflower predation pressure. Moreover, a portfolio effect (3), wherepositive responses of some taxa are averaged with negative re-sponses of other taxa (18), may have contributed to the stablegrowth yield.
The occasional mixing of Baltic and Skagerrak waters can beassumed to maintain low-abundance populations of Baltic speciesin the Skagerrak and vice versa. Hence, assuming that “everythingis everywhere, but the environment selects” (7), it should be pos-sible to recruit a Skagerrak community from a Baltic inoculumand vice versa. However, analysis of the clone libraries showedthat the recruited communities differed significantly from the na-tive communities found in the Baltic Sea and Skagerrak (Fig. 5).There may be several explanations for the limited overlap betweenthe compositions of the recruited and native communities: (i)everything is not everywhere, as suggested from the noncosmo-politan distribution of the rare biosphere in the Arctic Ocean (26);
(ii) if present in the inocula, some rare species may not be activelygrowing (dead or dormant) and therefore risk being flushed out ofthe container before optimal growth conditions are met; (iii) bot-tle effects were incompatible with the required growth conditionsfor the rare species; and (iv) removal of grazers allowed specificorganisms to proliferate. These may have been suppressed bygrazing under natural conditions.
Exposure of the Baltic inoculum to Skagerrak water led to arecruitment of taxa. While several factors, e.g., changed salt andDOC levels, lack of grazing, and confinement, could have causedthis recruitment, it is noteworthy that several of the main OTUs,accounting for 0.01 to 0.15% of the reads from the inoculum but1.4 to 30.5% of the reads from the transplanted community (Table2), showed a high salt tolerance. For instance, the genera of therecruited gammaproteobacterial OTUs, Pseudomonas and Id-iomarina, prefer salinities of 30 to 50 (43) and 10 to 100 (68),respectively. Similarly, the alphaproteobacterial genus Maricauliscontains marine, halophilic caulobacteria with optimal growth atsalinities of 20 to 60 (1, 2). Other recruited alphaproteobacterialgenera, Phenylobacterium and Hyphomonas, also contain specieswith a wide salt tolerance (43, 46). It should be noted, however,that characteristics other than salt tolerance may have contributedto the recruitment of certain taxa. For instance, some members ofthe Maricaulis and Hyphomonas genera possess a prostheca usedto attach to surfaces (2, 46, 71), which may be advantageous dur-ing confinement. Nevertheless, upon storm-driven intrusions ofhigh-saline water from the Skagerrak, these indigenous Baltic taxa
FIG 6 Results from 454 sequencing in experiment 2 showing the 27 OTUs in common between the Baltic inoculum (BAL) and the transplanted community(BAL-T). OTUs are sorted by phylum and abundance in BAL. Shared OTUs between BAL and BAL-T are illustrated by vertical lines on the x axis. Numbers ofOTUs are shown when a line represents more than one OTU. Only phyla/classes with shared OTUs are included. Further details on the OTUs present in both BALand BAL-T are given in Table 2 and Table S3 in the supplemental material.
TABLE 2 Phylogenetic affiliations of the main OTUs recruited from the inoculum (BAL) upon exposure to Skagerrak water, as revealedby 454 pyrosequencinga
Phylum/class Family Genus
% of reads in:
BAL BAL-T
Gammaproteobacteria OTU 1* Pseudomonadaceae Pseudomonas 0.06 30.5Bacteroidetes OTU2* Flammeovirgaceae Unclassified 0.15 22.2Alphaproteobacteria OTU 1* Hyphomonadaceae Maricaulis 0.06 5.2Alphaproteobacteria OTU 6 Hyphomicrobiaceae Unclassified 0.01 4.1Alphaproteobacteria OTU 7* Caulobacteraceae Phenylobacterium 0.04 3.0Gammaproteobacteria OTU 5 Chromatiaceae Unclassified 0.01 2.9Gammaproteobacteria OTU 12* Pseudomonadaceae Pseudomonas 0.01 2.3Alphaproteobacteria OTU 5 Hyphomonadaceae Hyphomonas 0.02 1.7Gammaproteobacteria OTU 6 Idiomarinaceae Idiomarina 0.06 1.4a *, OTUs that at least in one case contain identical sequences (100% sequence similarity) in BAL and BAL-T. For all OTUs shared between BAL and BAL-T, see Table S3 in thesupplemental material. BAL, Baltic inoculum; BAL-T, Baltic transplant.
Recruiting Bacteria from the Rare Biosphere
March 2012 Volume 78 Number 5 aem.asm.org 1367
would conceivably be able to respond to the abrupt environmen-tal change and proliferate.
DGGE analysis, clone libraries, and 454 sequencing all showeda decreased diversity in the transplanted community compared tothe inoculum, when the numbers of bands, phyla, and OTUs,respectively, were compared. Similar to our findings, other studieshave shown that bacterial communities in stressed environmentsmay have lower diversity relative to undisturbed communities (6,45). Such stressed communities may show enhanced physiologicaltolerance and substrate utilization, suggesting proliferation anddominance of generalist bacterial populations as a consequence ofdisturbance (6, 45). Therefore, it is possible that the dominantOTUs in the transplanted communities, which were recruitedfrom the rare biosphere in the inoculum, are generalists. Thesemay be unable to compete for a narrow niche, but since they areable to withstand a wide range of conditions, they can persist atlow levels in an environment and proliferate upon disturbance(45). However, an alternative explanation may be that the domi-nant OTUs in the transplanted communities are specialists thatwere rare in the inocula because of intense predation control orincreased in abundance because of confinement.
The experimental data presented here suggest that disturbance(salinity and DOC change) elicits pronounced changes in bacterialcommunity composition, partly accommodated by recruitmentof members of the rare biosphere. This rebuts speculation that therare biosphere exclusively consists of dead cells or free DNA (67).Consistent with early observations of recruitment of cultivablebacteria during experimental confinement (22), it has been sug-gested that rare bacterial taxa are active and have the potential toincrease in abundance (36). Concordantly, the present experi-mental evidence documents that rare species detected by deepsequencing indeed can become abundant in response to environ-mental change, hence enabling a bacterial community to rapidlyrespond to and recover from shifts in environmental conditions,while sustaining the growth yield. Growth yield is a coarse mea-sure of community function, and patterns could have looked dif-ferent under different conditions or if a different measure forcommunity function was used. Nevertheless, the finding thathighly divergent bacterial communities can obtain similar growthyields adds uncertainty to the value of information about compo-sition from an ecosystem modeling perspective. This highlights, aspreviously emphasized (3), that more empirical work is needed tounderstand the functional consequences of changes in microbialcomposition in the face of environmental disturbance.
ACKNOWLEDGMENTS
This work was supported by grant 621-20085385 from the Swedish Re-search Council to Å.H. and by grant 217-2006476 from the Swedish Re-search Council for Environmental Agricultural Science and Spatial Plan-ning (FORMAS) to P.L., Å.H., A.T., and L.R.
We are grateful for the use of laboratory and sampling facilities atKristineberg Marine Research Station. We thank the three anonymousreviewers for valuable comments on the manuscript.
REFERENCES1. Abraham WR, et al. 2002. Phylogeny of Maricaulis Abraham et al. 1999
and proposal of Maricaulis virginensis sp. nov., M. parjimensis sp. nov., M.washingtonensis sp. nov. and M. salignorans sp. nov. Int. J. Syst. Evol.Microbiol. 52:2191–2201.
2. Abraham WR, et al. 1999. Phylogeny and polyphasic taxonomy of Cau-lobacter species. Proposal of Maricaulis gen. nov. with Maricaulis maris
(Poindexter) comb. nov. as the type species, and emended description ofthe genera Brevundimonas and Caulobacter. Int. J. Syst. Bacteriol. 49:1053–1073.
3. Allison SD, Martiny JB. 2008. Colloquium paper: resistance, resilience,and redundancy in microbial communities. Proc. Natl. Acad. Sci. U. S. A.105:11512–11519.
4. Andersson AF, et al. 2008. Comparative analysis of human gut microbi-ota by barcoded pyrosequencing. PLoS One 3:e2836.
5. Andersson AF, Riemann L, Bertilsson S. 2010. Pyrosequencing revealscontrasting seasonal dynamics of taxa within Baltic Sea bacterioplanktoncommunities. ISME J. 4:171–181.
6. Atlas RM, Horowitz A, Krichevsky M, Bej AK. 1991. Response ofmicrobial populations to environmental disturbance. Microb. Ecol. 22:249 –256.
7. Baas Becking LGM. 1934. Geobiologie of inleiding tot de milieukunde.W.P. Van Stockum & Zoon, The Hague, The Netherlands.
8. Barberán A, Casamayor E. 2010. Global phylogenetic community struc-ture and �-diversity patterns in surface bacterioplankton metacommuni-ties. Aquat. Microb. Ecol. 59:1–10.
9. Boström HK, Simu K, Hagström Å, Riemann L. 2004. Optimization ofDNA extraction for quantitative marine bacterioplankton communityanalysis. Limnol. Oceanogr. Methods 2:365–373.
10. Bouvier TC, del Giorgio PA. 2002. Compositional changes in free-livingbacterial communities along a salinity gradient in two temperate estuaries.Limnol. Oceanogr. 47:453– 470.
11. Carlson CA, Ducklow HW. 1996. Growth of bacterioplankton and con-sumption of dissolved organic carbon in the Sargasso Sea. Aquat. Microb.Ecol. 10:69 – 85.
12. Caron DA, Countway PD. 2009. Hypotheses on the role of the protistianrare biosphere in a changing world. Aquat. Microb. Ecol. 57:227–238.
13. Chin-Leo G, Benner R. 1992. Enhanced bacterioplankton productionand respiration at intermediate salinities in the Mississippi River plume.Mar. Ecol. Prog. Ser. 87:87–103.
14. Cottrell MT, Kirchman DL. 2000. Natural assemblages of marine pro-teobacteria and members of the Cytophaga-Flavobacter cluster consuminglow- and high-molecular-weight dissolved organic matter. Appl. Environ.Microbiol. 66:1692–1697.
15. Covert JS, Moran MA. 2001. Molecular characterization of estuarinebacterial communities that use high- and low-molecular weight fractionsof dissolved organic carbon. Aquat. Microb. Ecol. 25:127–139.
16. Crump BC, Hopkinson CS, Sogin ML, Hobbie JE. 2004. Microbialbiogeography along an estuarine salinity gradient: combined influences ofbacterial growth and residence time. Appl. Environ. Microbiol. 70:1494 –1505.
17. DeSantis TZ, et al. 2006. Greengenes, a chimera-checked 16S rRNA genedatabase and workbench compatible with ARB. Appl. Environ. Microbiol.72:5069 –5072.
18. Doak DF, et al. 1998. The statistical inevitability of stability-diversityrelationships in community ecology. Am. Nat. 151:264 –276.
19. Dowd SE, Sun Y, Wolcott RD, Domingo A, Carroll JA. 2008. Bacterialtag-encoded FLX amplicon pyrosequencing (bTEFAP) for microbiomestudies: bacterial diversity in the ileum of newly weaned Salmonella-infected pigs. Foodborne Pathog. Dis. 5:459 – 472.
20. Eilers H, Pernthaler J, Amann R. 2000. Succession of pelagic marinebacteria during enrichment: a close look at cultivation-induced shifts.Appl. Environ. Microbiol. 66:4634 – 4640.
21. Ewing B, Green P. 1998. Base-calling of automated sequencer traces usingphred. II. Error probabilities. Genome Res. 8:186 –194.
22. Ferguson R, Buckley E, Palumbo A. 1984. Response of marine bacterio-plankton to differential filtration and confinement. Appl. Environ. Micro-biol. 47:49 –55.
23. Fuchs BM, Zubkov MV, Sahm K, Burkill PH, Amann R. 2000. Changesin community composition during dilution cultures of marine bacterio-plankton as assessed by flow cytometric and molecular biological tech-niques. Environ. Microbiol. 2:191–201.
24. Fuhrman JA. 2009. Microbial community structure and its functionalimplications. Nature 459:193–199.
25. Fuhrman JA, Comeau DE, Hagström Å, Chan AM. 1988. Extractionfrom natural planktonic microorganisms of DNA suitable for molecularbiological studies. Appl. Environ. Microbiol. 54:1426 –1429.
26. Galand PE, Casamayor EO, Kirchman DL, Lovejoy C. 2009. Ecology ofthe rare microbial biosphere of the Arctic Ocean. Proc. Natl. Acad. Sci.U. S. A. 106:22427–22432.
Sjöstedt et al.
1368 aem.asm.org Applied and Environmental Microbiology

27. Giovannoni SJ. 1991. The polymerase chain reaction, p 177–201. InStackebrandt E, Goodfelow M (ed), Nucleic acid techniques in bacterialsystematics. John Wiley & Sons, Inc., New York, NY.
28. Glöckner FO, et al. 2000. Comparative 16S rRNA analysis of lake bacte-rioplankton reveals globally distributed phylogenetic clusters including anabundant group of actinobacteria. Appl. Environ. Microbiol. 66:5053–5065.
29. Grasshoff K, Ehrhardt M, Kremling K. 1983. Methods of seawater analy-sis.Verlag Chemie, GmbH, Weinheim, Germany.
30. Haas B, et al. 2011. Chimeric 16S rRNA sequence formation and detec-tion in Sanger and 454-pyrosequencing PCR amplicons. Genome Res.21:494 –504.
31. Hagström Å, Ammerman JW, Henrichs S, Azam F. 1984. Bacterioplank-ton growth in seawater. II. Organic matter utilization during steady-stategrowth in seawater cultures. Mar. Ecol. Prog. Ser. 18:41– 48.
32. Hagström Å, Azam F, Kuparinen J, Zweifel UL. 2001. Pelagic planktongrowth and resource limitations in the Baltic Sea, p 177–210. In Wulff F,Rahm L, Larsson P (ed), Ecological studies, a system analysis of the BalticSea. Springer, Berlin, Germany.
33. Holmfeldt K, et al. 2009. Diversity and abundance of freshwater Actino-bacteria along environmental gradients in the brackish northern BalticSea. Environ. Microbiol. 11:2042–2054.
34. Huse SM, Huber JA, Morrison HG, Sogin ML, Welch DM. 2007.Accuracy and quality of massively parallel DNA pyrosequencing. GenomeBiol. 8:R143.
35. Huse SM, Welch DM, Morrison HG, Sogin ML. 2010. Ironing out thewrinkles in the rare biosphere through improved OTU clustering. Envi-ron. Microbiol. 12:1889 –1898.
36. Jones SE, Lennon JT. 2010. Dormancy contributes to the maintenance ofmicrobial diversity. Proc. Natl. Acad. Sci. U. S. A. 107:5881–5886.
37. Kan J, Suzuki MT, Wang K, Evans SE, Chen F. 2007. High temporal butlow spatial heterogeneity of bacterioplankton in the Chesapeake Bay.Appl. Environ. Microbiol. 73:6776 – 6789.
38. Kirchman DL, Cottrell MT, Lovejoy C. 2010. The structure of bacterialcommunities in the western Arctic Ocean as revealed by pyrosequencingof 16S rRNA genes. Environ. Microbiol. 12:1132–1143.
39. Kirchman DL, Rich JH. 1996. Regulation of bacterial growth rates bydissolved organic carbon and temperature in the equatorial Pacific Ocean.Microb. Ecol. 33:11.
40. Langenheder S, Kisand V, Wikner J, Tranvik LJ. 2003. Salinity as astructuring factor for the composition and performance of bacterioplank-ton degrading riverine DOC. FEMS Microbiol. Ecol. 45:189 –202.
41. Langenheder S, Lindström ES, Tranvik LJ. 2005. Weak coupling betweencommunity composition and functioning of aquatic bacteria. Limnol.Oceanogr. 50:957–967.
42. Lozupone C, Knight R. 2005. UniFrac: a new phylogenetic method forcomparing microbial communities. Appl. Environ. Microbiol. 71:8228 –8235.
43. Lysenko O. 1961. Pseudomonas—an attempt at a general classification. J.Gen. Microbiol. 25:379 – 408.
44. Martinez J, Smith DC, Steward GF, Azam F. 1996. Variability in ecto-hydrolytic enzyme activities of pelagic marine bacteria and its significancefor substrate processing in the sea. Aquat. Microb. Ecol. 10:223–230.
45. Mills AL, Mallory LM. 1987. The community structure of sessile hetero-trophic bacteria stressed by acid mine drainage. Microb. Ecol. 14:219 –232.
46. Moore RL, Weiner RM, Gebers R. 1984. Genus Hypomonas Pongratz1957 nom. rev. emend., Hypomonas polymorpha Pongratz 1957 nom. rev.emend., and Hyphomonas neptunium (Leifson 1964) comb. nov. emend.(Hyphomicrobium neptunium). Int. J. Syst. Bacteriol. 34:71–73.
47. Moriarty DJW. 1986. Measurement of bacterial-growth rates inaquatic systems using rates of nucleic-acid synthesis. Adv. Microb.Ecol. 9:245–292.
48. Mou X, Sun S, Edwards RA, Hodson RE, Moran MA. 2008. Bacterialcarbon processing by generalist species in the coastal ocean. Nature 451:708 –711.
49. Muyzer G, et al. 1998. Denaturing gradient gel electrophoresis (DGGE)in microbial ecology, p 1–27. In Akkermans ADL, van Elsas JD, de Bruin FJ(ed), Molecular microbial ecology manual. Kluwer Academic Publishers,London, United Kingdom.
50. Muyzer G, de Waal EC, Uitterlinden AG. 1993. Profiling of complex
microbial populations by denaturing gradient gel electrophoresis analysisof polymerase chain reaction-amplified genes coding for 16S rRNA. Appl.Environ. Microbiol. 59:695–700.
51. Pedrós-Alió C. 2006. Marine microbial diversity: can it be determined?Trends Microbiol. 14:257–263.
52. Pernthaler J, Amann R. 2005. Fate of heterotrophic microbes in pelagichabitats: focus on populations. Microbiol. Mol. Biol. Rev. 69:440 – 461.
53. Pinhassi J, Berman T. 2003. Differential growth response of colony-forming �- and �-proteobacteria in dilution culture and nutrient additionexperiments from Lake Kinneret (Israel), the eastern Mediterranean Sea,and the Gulf of Eilat. Appl. Environ. Microbiol. 69:199 –211.
54. Pinhassi J, Hagström Å. 2000. Seasonal succession in marine bacterio-plankton. Aquat. Microb. Ecol. 21:245–256.
55. Pinhassi J, et al. 2003. Spatial variability in bacterioplankton commu-nity composition at the Skagerrak-Kattegat Front. Mar. Ecol. Prog. Ser.255:1–13.
56. Pommier T, Canbäck B, Lundberg P, Hagström Å, Tunlid A. 2009.RAMI: a tool for identification and characterization of phylogenetic clus-ters in microbial communities. Bioinformatics 25:736 –742.
57. Pommier T, et al. 2007. Global patterns of diversity and communitystructure in marine bacterioplankton. Mol. Ecol. 16:867– 880.
58. Quince C, et al. 2009. Accurate determination of microbial diversity from454 pyrosequencing data. Nat. Methods 6:639 – 641.
59. Rappé MS, Vergin K, Giovannoni SJ. 2000. Phylogenetic comparisons ofa coastal bacterioplankton community with its counterparts in openocean and freshwater systems. FEMS Microbiol. Ecol. 33:219 –232.
60. Riemann L, Azam F. 2002. Widespread N-acetyl-D-glucosamine uptakeamong pelagic marine bacteria and its ecological implications. Appl. En-viron. Microbiol. 68:5554 –5562.
61. Riemann L, et al. 2008. The native bacterioplankton community in thecentral Baltic Sea is influenced by freshwater bacterial species. Appl. En-viron. Microbiol. 74:503–515.
62. Riemann L, Steward GF, Azam F. 2000. Dynamics of bacterial commu-nity composition and activity during a mesocosm diatom bloom. Appl.Environ. Microbiol. 66:578 –587.
63. Siegel H, Gerth M, Tschersich G. 2006. Sea surface temperature develop-ment of the Baltic Sea in the period 1990-2004. Oceanologia 48:119–131.
64. Sogin ML, et al. 2006. Microbial diversity in the deep sea and the underex-plored “rare biosphere.” Proc. Natl. Acad. Sci. U. S. A. 103:12115–12120.
65. Søndergaard M, Middelboe M. 1995. A cross-system analysis of labileorganic carbon. Mar. Ecol. Prog. Ser. 118:283–294.
66. Stamatakis A. 2006. RAxML-VI-HPC: maximum likelihood-based phy-logenetic analyses with thousands of taxa and mixed models. Bioinformat-ics 22:2688 –2690.
67. Stoeck T, Epstein S. 2009. Crystal ball-2009: protist and the rare bio-sphere. Environ. Microbiol. Rep. 1:20 –22.
68. Taborda M, et al. 2009. Description of Idiomarina insulisalsae sp. nov.,isolated from the soil of a sea salt evaporation pond, proposal to transferthe species of the genus Pseudidiomarina to the genus Idiomarina andemended description of the genus Idiomarina. Syst. Appl. Microbiol. 32:371–378.
69. Tranvik LJ, Höfle MG. 1987. Bacterial growth in mixed cultures ondissolved organic carbon from humic and clear waters. Appl. Environ.Microbiol. 53:482– 488.
70. Wedborg M, Skoog A, Fogelqvist E. 1994. Organic carbon and humicsubstances in the Baltic Sea, Kattegat and Skagerrak, p 917–942. In SenseN, Miano TM (ed), Humic substances in the global environment andimplication on human health. Elsevier, Amsterdam, The Netherlands.
71. Weiner RM, Devine RA, Powell DM, Dagasan L, Moore RL. 1985.Hyphomonas oceanitis sp. nov., Hyphomonas hirschiana sp. nov., and Hy-phomonas jannaschiana sp. nov. Int. J. Syst. Bacteriol. 35:237–243.
72. Zwart G, et al. 2003. Rapid screening for freshwater bacterial groups byusing reverse line blot hybridization. Appl. Environ. Microbiol. 69:5875–5883.
73. Zweifel UL, Blackburn N, Hagström Å. 1996. Cycling of marine dis-solved organic matter. I. An experimental system. Aquat. Microb. Ecol.11:65–77.
74. Zweifel UL, Wikner J, Hagström Å, Lundberg E, Norrmann B. 1995.Dynamics of dissolved organic carbon in a coastal ecosystem. Limnol.Oceanogr. 40:299 –305.
Recruiting Bacteria from the Rare Biosphere
March 2012 Volume 78 Number 5 aem.asm.org 1369