Recovery Behavior of Fe-Based Shape Memory Alloys ... - MDPI
18
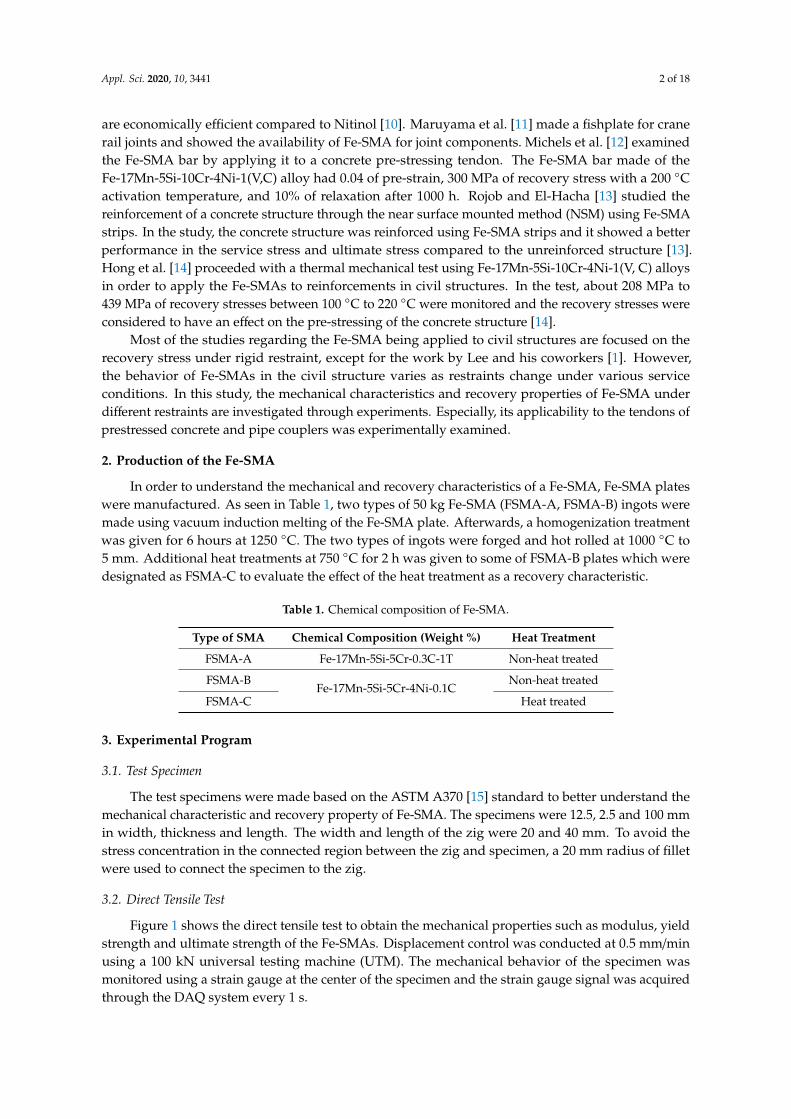
applied sciences Article Recovery Behavior of Fe-Based Shape Memory Alloys under Different Restraints Ki-Nam Hong 1 , Yeong-Mo Yeon 1, * , Won-Bo Shim 1 and Do-Hyung Kim 2,3 1 Department of Civil Engineering, Chungbuk National University, 1 Chungdae-ro, Seowon-Gu, Cheongju, Chungbuk 28644, Korea; [email protected] (K.-N.H.); fi[email protected] (W.-B.S.) 2 Dongnam Regional Division, Korea Institute of Industrial Technology (KITECH), Yangsan 50623, Korea; [email protected] 3 Department of Mechanical Engineering, Pusan National University, Busan 46241, Korea * Correspondence: [email protected]; Tel.: +82-10-6400-3092 Received: 28 April 2020; Accepted: 15 May 2020; Published: 16 May 2020 Abstract: This paper presents the experimental results of an evaluation of the recovery behavior of Fe-based shape memory alloys (Fe-SMAs) under different restraints. For the study, three types of Fe-SMA (FSMA-A, FSMA-B, FSMA-C) were produced. As a result of the direct tensile test, the yield strength of the FSMA-A specimen was nearly 34% higher than the strength of FSMA-B and FSMA-C. Under free restraint, the recovery strains are 0.00956, 0.01445, and 0.01977 for FSMA-A, FSMA-B and FSMA-C specimens, respectively, after activation when the pre-strain is 0.04, and the heating temperature 200 ◦ C. Under rigid restraint, the final recovery stresses are 518, 391 and 401 MPa for FSMA-A, FSMA-B, FSMA-C specimens after activation when a pre-strain of 0.04 and heating temperature 200 ◦ C. Additionally, under the rigid restraint, the effect of pre-strain on the final recovery stress was insignificant, whereas the final recovery stress increased as the heating temperature increased. When Fe-SMA was constrained during cooling, the recovery stress is 50% lower than under rigid restraint. Hence, in order to develop a large recovery stress, Fe-SMA must be constrained during heating. In addition, a method for calculating the effective confining stress of the Fe-SMA coupler for pipe joining was proposed based on the experimental results. Keywords: Fe-based shape memory alloy (Fe-SMA); recovery stress; activation; restraint; pre-strain; heating temperature; pipe joining 1. Introduction Shape memory alloys (SMAs) are a special type of material that can be returned to their original shape by an external stimulus, such as heating or cooling, after having gone through a large plastic deformation [1]. The behavior of SMA exhibits a shape memory effect (SME), which is the phase transformation from the martensite phase to the austenite phase depending on the temperature [2]. Around 30 alloys that show a SME have been reported so far and nickel-titanium alloy (Nitinol), is the most common SMA [3]. Since these materials have a remarkable recovery characteristisc in the region of strain of 0.08, Nitinol has been used in a variety of industries including aerospace, mechanical, aeronautical and medical engineering [4,5]. However, the usage of Nitinol in any civil or architecture field has been limited due to the high cost of raw materials and limited temperature history [6,7]. Alternatively, many studies on Fe-based SMAs (Fe-SMA) have been carried out after a Fe-SMA was developed by Sato et al. [8]. Kajiwara et al. [9] reported that Nb and C particles enhanced the SME in the Fe-SMA without a training stage. Leinenbach et al. [2] developed an alloy that has a high recovery stress of 300 to 500 MPa at 130 to 160 ◦ C using a Fe-17Mn-5Si-10Cr-4Ni-1(V, C)-based alloy. In particular, Fe-SMAs are favorable when applied to civil and architecture engineering because they Appl. Sci. 2020, 10, 3441; doi:10.3390/app10103441 www.mdpi.com/journal/applsci
-
Upload
khangminh22 -
Category
Documents
-
view
0 -
download
0
Transcript of Recovery Behavior of Fe-Based Shape Memory Alloys ... - MDPI
applied sciences
Article
Recovery Behavior of Fe-Based Shape Memory Alloysunder Different Restraints
Ki-Nam Hong 1, Yeong-Mo Yeon 1,* , Won-Bo Shim 1 and Do-Hyung Kim 2,3
1 Department of Civil Engineering, Chungbuk National University, 1 Chungdae-ro, Seowon-Gu, Cheongju,Chungbuk 28644, Korea; [email protected] (K.-N.H.); [email protected] (W.-B.S.)
2 Dongnam Regional Division, Korea Institute of Industrial Technology (KITECH), Yangsan 50623, Korea;[email protected]
3 Department of Mechanical Engineering, Pusan National University, Busan 46241, Korea* Correspondence: [email protected]; Tel.: +82-10-6400-3092
Received: 28 April 2020; Accepted: 15 May 2020; Published: 16 May 2020�����������������
Abstract: This paper presents the experimental results of an evaluation of the recovery behavior ofFe-based shape memory alloys (Fe-SMAs) under different restraints. For the study, three types ofFe-SMA (FSMA-A, FSMA-B, FSMA-C) were produced. As a result of the direct tensile test, the yieldstrength of the FSMA-A specimen was nearly 34% higher than the strength of FSMA-B and FSMA-C.Under free restraint, the recovery strains are 0.00956, 0.01445, and 0.01977 for FSMA-A, FSMA-Band FSMA-C specimens, respectively, after activation when the pre-strain is 0.04, and the heatingtemperature 200 ◦C. Under rigid restraint, the final recovery stresses are 518, 391 and 401 MPafor FSMA-A, FSMA-B, FSMA-C specimens after activation when a pre-strain of 0.04 and heatingtemperature 200 ◦C. Additionally, under the rigid restraint, the effect of pre-strain on the final recoverystress was insignificant, whereas the final recovery stress increased as the heating temperatureincreased. When Fe-SMA was constrained during cooling, the recovery stress is 50% lower thanunder rigid restraint. Hence, in order to develop a large recovery stress, Fe-SMA must be constrainedduring heating. In addition, a method for calculating the effective confining stress of the Fe-SMAcoupler for pipe joining was proposed based on the experimental results.
Keywords: Fe-based shape memory alloy (Fe-SMA); recovery stress; activation; restraint; pre-strain;heating temperature; pipe joining
1. Introduction
Shape memory alloys (SMAs) are a special type of material that can be returned to their originalshape by an external stimulus, such as heating or cooling, after having gone through a large plasticdeformation [1]. The behavior of SMA exhibits a shape memory effect (SME), which is the phasetransformation from the martensite phase to the austenite phase depending on the temperature [2].Around 30 alloys that show a SME have been reported so far and nickel-titanium alloy (Nitinol), is themost common SMA [3]. Since these materials have a remarkable recovery characteristisc in the regionof strain of 0.08, Nitinol has been used in a variety of industries including aerospace, mechanical,aeronautical and medical engineering [4,5]. However, the usage of Nitinol in any civil or architecturefield has been limited due to the high cost of raw materials and limited temperature history [6,7].
Alternatively, many studies on Fe-based SMAs (Fe-SMA) have been carried out after a Fe-SMAwas developed by Sato et al. [8]. Kajiwara et al. [9] reported that Nb and C particles enhanced theSME in the Fe-SMA without a training stage. Leinenbach et al. [2] developed an alloy that has a highrecovery stress of 300 to 500 MPa at 130 to 160 ◦C using a Fe-17Mn-5Si-10Cr-4Ni-1(V, C)-based alloy. Inparticular, Fe-SMAs are favorable when applied to civil and architecture engineering because they
Appl. Sci. 2020, 10, 3441; doi:10.3390/app10103441 www.mdpi.com/journal/applsci
Appl. Sci. 2020, 10, 3441 2 of 18
are economically efficient compared to Nitinol [10]. Maruyama et al. [11] made a fishplate for cranerail joints and showed the availability of Fe-SMA for joint components. Michels et al. [12] examinedthe Fe-SMA bar by applying it to a concrete pre-stressing tendon. The Fe-SMA bar made of theFe-17Mn-5Si-10Cr-4Ni-1(V,C) alloy had 0.04 of pre-strain, 300 MPa of recovery stress with a 200 ◦Cactivation temperature, and 10% of relaxation after 1000 h. Rojob and El-Hacha [13] studied thereinforcement of a concrete structure through the near surface mounted method (NSM) using Fe-SMAstrips. In the study, the concrete structure was reinforced using Fe-SMA strips and it showed a betterperformance in the service stress and ultimate stress compared to the unreinforced structure [13].Hong et al. [14] proceeded with a thermal mechanical test using Fe-17Mn-5Si-10Cr-4Ni-1(V, C) alloysin order to apply the Fe-SMAs to reinforcements in civil structures. In the test, about 208 MPa to439 MPa of recovery stresses between 100 ◦C to 220 ◦C were monitored and the recovery stresses wereconsidered to have an effect on the pre-stressing of the concrete structure [14].
Most of the studies regarding the Fe-SMA being applied to civil structures are focused on therecovery stress under rigid restraint, except for the work by Lee and his coworkers [1]. However,the behavior of Fe-SMAs in the civil structure varies as restraints change under various serviceconditions. In this study, the mechanical characteristics and recovery properties of Fe-SMA underdifferent restraints are investigated through experiments. Especially, its applicability to the tendons ofprestressed concrete and pipe couplers was experimentally examined.
2. Production of the Fe-SMA
In order to understand the mechanical and recovery characteristics of a Fe-SMA, Fe-SMA plateswere manufactured. As seen in Table 1, two types of 50 kg Fe-SMA (FSMA-A, FSMA-B) ingots weremade using vacuum induction melting of the Fe-SMA plate. Afterwards, a homogenization treatmentwas given for 6 hours at 1250 ◦C. The two types of ingots were forged and hot rolled at 1000 ◦C to5 mm. Additional heat treatments at 750 ◦C for 2 h was given to some of FSMA-B plates which weredesignated as FSMA-C to evaluate the effect of the heat treatment as a recovery characteristic.
Table 1. Chemical composition of Fe-SMA.
Type of SMA Chemical Composition (Weight %) Heat Treatment
FSMA-A Fe-17Mn-5Si-5Cr-0.3C-1T Non-heat treated
FSMA-BFe-17Mn-5Si-5Cr-4Ni-0.1C
Non-heat treated
FSMA-C Heat treated
3. Experimental Program
3.1. Test Specimen
The test specimens were made based on the ASTM A370 [15] standard to better understand themechanical characteristic and recovery property of Fe-SMA. The specimens were 12.5, 2.5 and 100 mmin width, thickness and length. The width and length of the zig were 20 and 40 mm. To avoid thestress concentration in the connected region between the zig and specimen, a 20 mm radius of filletwere used to connect the specimen to the zig.
3.2. Direct Tensile Test
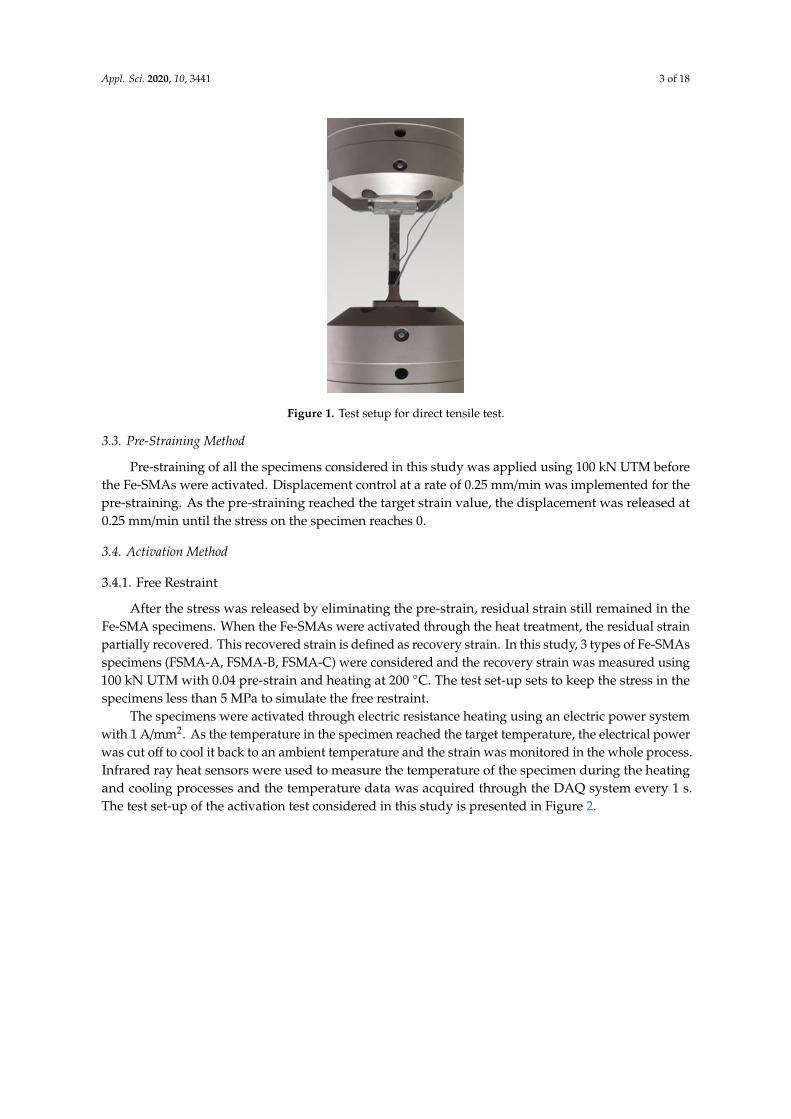
Figure 1 shows the direct tensile test to obtain the mechanical properties such as modulus, yieldstrength and ultimate strength of the Fe-SMAs. Displacement control was conducted at 0.5 mm/minusing a 100 kN universal testing machine (UTM). The mechanical behavior of the specimen wasmonitored using a strain gauge at the center of the specimen and the strain gauge signal was acquiredthrough the DAQ system every 1 s.
Appl. Sci. 2020, 10, 3441 3 of 18Appl. Sci. 2020, 10, x FOR PEER REVIEW 3 of 18
Figure 1. Test setup for direct tensile test.
3.3. Pre-straining Method
Pre-straining of all the specimens considered in this study was applied using 100 kN UTM before
the Fe-SMAs were activated. Displacement control at a rate of 0.25 mm/min was implemented for the
pre-straining. As the pre-straining reached the target strain value, the displacement was released at
0.25 mm/min until the stress on the specimen reaches 0.
3.4. Activation Method
3.4.1. Free Restraint
After the stress was released by eliminating the pre-strain, residual strain still remained in the
Fe-SMA specimens. When the Fe-SMAs were activated through the heat treatment, the residual strain
partially recovered. This recovered strain is defined as recovery strain. In this study, 3 types of Fe-
SMAs specimens (FSMA-A, FSMA-B, FSMA-C) were considered and the recovery strain was
measured using 100 kN UTM with 0.04 pre-strain and heating at 200 °C. The test set-up sets to keep
the stress in the specimens less than 5 MPa to simulate the free restraint.
The specimens were activated through electric resistance heating using an electric power system
with 1 A/mm2. As the temperature in the specimen reached the target temperature, the electrical
power was cut off to cool it back to an ambient temperature and the strain was monitored in the
whole process. Infrared ray heat sensors were used to measure the temperature of the specimen
during the heating and cooling processes and the temperature data was acquired through the DAQ
system every 1 s. The test set-up of the activation test considered in this study is presented in Figure
2.
Figure 1. Test setup for direct tensile test.
3.3. Pre-Straining Method
Pre-straining of all the specimens considered in this study was applied using 100 kN UTM beforethe Fe-SMAs were activated. Displacement control at a rate of 0.25 mm/min was implemented for thepre-straining. As the pre-straining reached the target strain value, the displacement was released at0.25 mm/min until the stress on the specimen reaches 0.
3.4. Activation Method
3.4.1. Free Restraint
After the stress was released by eliminating the pre-strain, residual strain still remained in theFe-SMA specimens. When the Fe-SMAs were activated through the heat treatment, the residual strainpartially recovered. This recovered strain is defined as recovery strain. In this study, 3 types of Fe-SMAsspecimens (FSMA-A, FSMA-B, FSMA-C) were considered and the recovery strain was measured using100 kN UTM with 0.04 pre-strain and heating at 200 ◦C. The test set-up sets to keep the stress in thespecimens less than 5 MPa to simulate the free restraint.
The specimens were activated through electric resistance heating using an electric power systemwith 1 A/mm2. As the temperature in the specimen reached the target temperature, the electrical powerwas cut off to cool it back to an ambient temperature and the strain was monitored in the whole process.Infrared ray heat sensors were used to measure the temperature of the specimen during the heatingand cooling processes and the temperature data was acquired through the DAQ system every 1 s.The test set-up of the activation test considered in this study is presented in Figure 2.
Appl. Sci. 2020, 10, 3441 4 of 18Appl. Sci. 2020, 10, x FOR PEER REVIEW 4 of 18
(a) Test setup for activation test (b) Detailed of activation test
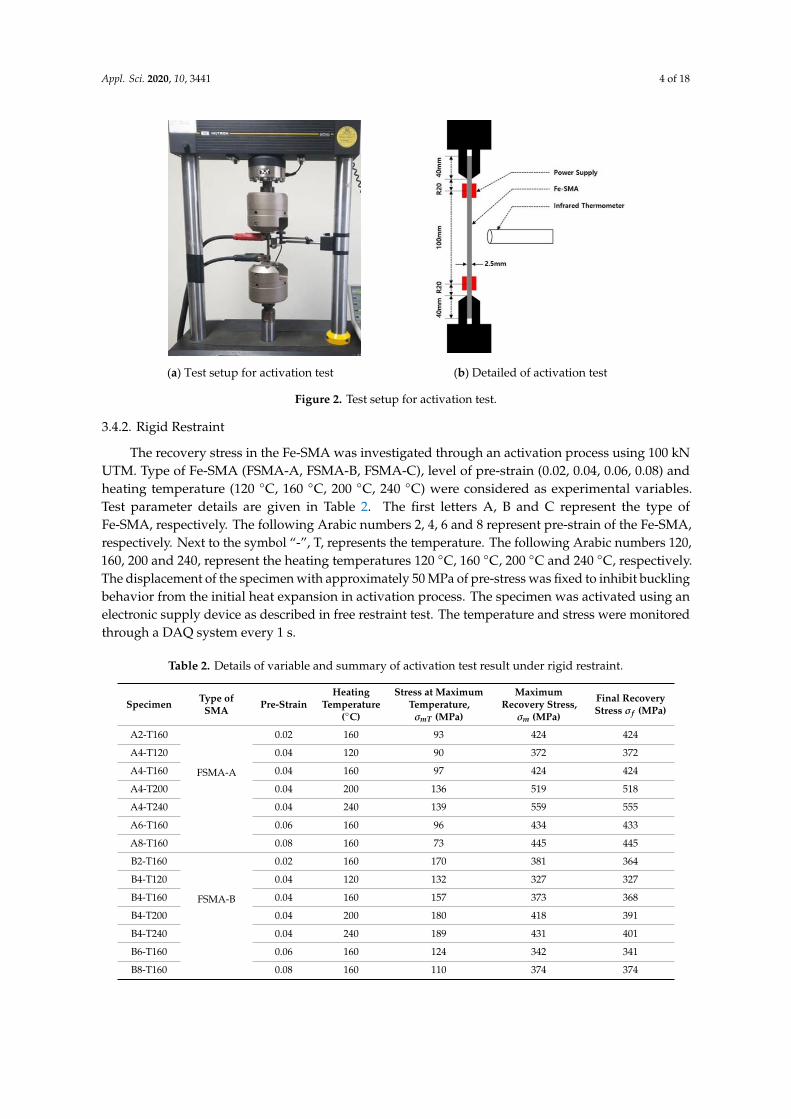
Figure 2. Test setup for activation test.
3.4.2. Rigid Restraint
The recovery stress in the Fe‐SMA was investigated through an activation process using 100 kN
UTM. Type of Fe‐SMA (FSMA‐A, FSMA‐B, FSMA‐C), level of pre‐strain (0.02, 0.04, 0.06, 0.08) and
heating temperature (120 °C, 160 °C, 200 °C, 240 °C) were considered as experimental variables. Test
parameter details are given in Table 2. The first letters A, B and C represent the type of Fe‐SMA,
respectively. The following Arabic numbers 2, 4, 6 and 8 represent pre‐strain of the Fe‐SMA,
respectively. Next to the symbol “‐”, T, represents the temperature. The following Arabic numbers
120, 160, 200 and 240, represent the heating temperatures 120 °C, 160 °C, 200 °C and 240 °C, respectively. The displacement of the specimen with approximately 50 MPa of pre‐stress was fixed
to inhibit buckling behavior from the initial heat expansion in activation process. The specimen was
activated using an electronic supply device as described in free restraint test. The temperature and
stress were monitored through a DAQ system every 1 s.
Table 2. Details of variable and summary of activation test result under rigid restraint.
Specimen Type of
SMA
Pre‐
Strain
Heating
Temperature
(°C)
Stress at Maximum
Temperature,
𝝈𝒎,𝑻 (MPa)
Maximum
Recovery Stress,
𝝈𝒎 (MPa)
Final Recovery
Stress
𝝈𝒇 (MPa)
A2‐T160
FSMA‐A
0.02 160 93 424 424
A4‐T120 0.04 120 90 372 372
A4‐T160 0.04 160 97 424 424
A4‐T200 0.04 200 136 519 518
A4‐T240 0.04 240 139 559 555
A6‐T160 0.06 160 96 434 433
A8‐T160 0.08 160 73 445 445
B2‐T160
FSMA‐B
0.02 160 170 381 364
B4‐T120 0.04 120 132 327 327
B4‐T160 0.04 160 157 373 368
B4‐T200 0.04 200 180 418 391
B4‐T240 0.04 240 189 431 401
B6‐T160 0.06 160 124 342 341
B8‐T160 0.08 160 110 374 374
C2‐T160
FSMA‐C
0.02 160 188 380 342
C4‐T120 0.04 120 154 322 321
C4‐T160 0.04 160 171 377 362
C4‐T200 0.04 200 189 416 401
Figure 2. Test setup for activation test.
3.4.2. Rigid Restraint
The recovery stress in the Fe-SMA was investigated through an activation process using 100 kNUTM. Type of Fe-SMA (FSMA-A, FSMA-B, FSMA-C), level of pre-strain (0.02, 0.04, 0.06, 0.08) andheating temperature (120 ◦C, 160 ◦C, 200 ◦C, 240 ◦C) were considered as experimental variables.Test parameter details are given in Table 2. The first letters A, B and C represent the type ofFe-SMA, respectively. The following Arabic numbers 2, 4, 6 and 8 represent pre-strain of the Fe-SMA,respectively. Next to the symbol “-”, T, represents the temperature. The following Arabic numbers 120,160, 200 and 240, represent the heating temperatures 120 ◦C, 160 ◦C, 200 ◦C and 240 ◦C, respectively.The displacement of the specimen with approximately 50 MPa of pre-stress was fixed to inhibit bucklingbehavior from the initial heat expansion in activation process. The specimen was activated using anelectronic supply device as described in free restraint test. The temperature and stress were monitoredthrough a DAQ system every 1 s.
Table 2. Details of variable and summary of activation test result under rigid restraint.
Specimen Type ofSMA Pre-Strain
HeatingTemperature
(◦C)
Stress at MaximumTemperature,σmT (MPa)
MaximumRecovery Stress,σm (MPa)
Final RecoveryStress σ f (MPa)
A2-T160
FSMA-A
0.02 160 93 424 424
A4-T120 0.04 120 90 372 372
A4-T160 0.04 160 97 424 424
A4-T200 0.04 200 136 519 518
A4-T240 0.04 240 139 559 555
A6-T160 0.06 160 96 434 433
A8-T160 0.08 160 73 445 445
B2-T160
FSMA-B
0.02 160 170 381 364
B4-T120 0.04 120 132 327 327
B4-T160 0.04 160 157 373 368
B4-T200 0.04 200 180 418 391
B4-T240 0.04 240 189 431 401
B6-T160 0.06 160 124 342 341
B8-T160 0.08 160 110 374 374
Appl. Sci. 2020, 10, 3441 5 of 18
Table 2. Cont.
Specimen Type ofSMA Pre-Strain
HeatingTemperature
(◦C)
Stress at MaximumTemperature,σmT (MPa)
MaximumRecovery Stress,σm (MPa)
Final RecoveryStress, σ f (MPa)
C2-T160
FSMA-C
0.02 160 188 380 342
C4-T120 0.04 120 154 322 321
C4-T160 0.04 160 171 377 362
C4-T200 0.04 200 189 416 401
C4-T240 0.04 240 213 462 416
C6-T160 0.06 160 153 376 375
C8-T160 0.08 160 118 377 377
3.4.3. Partial Restraint
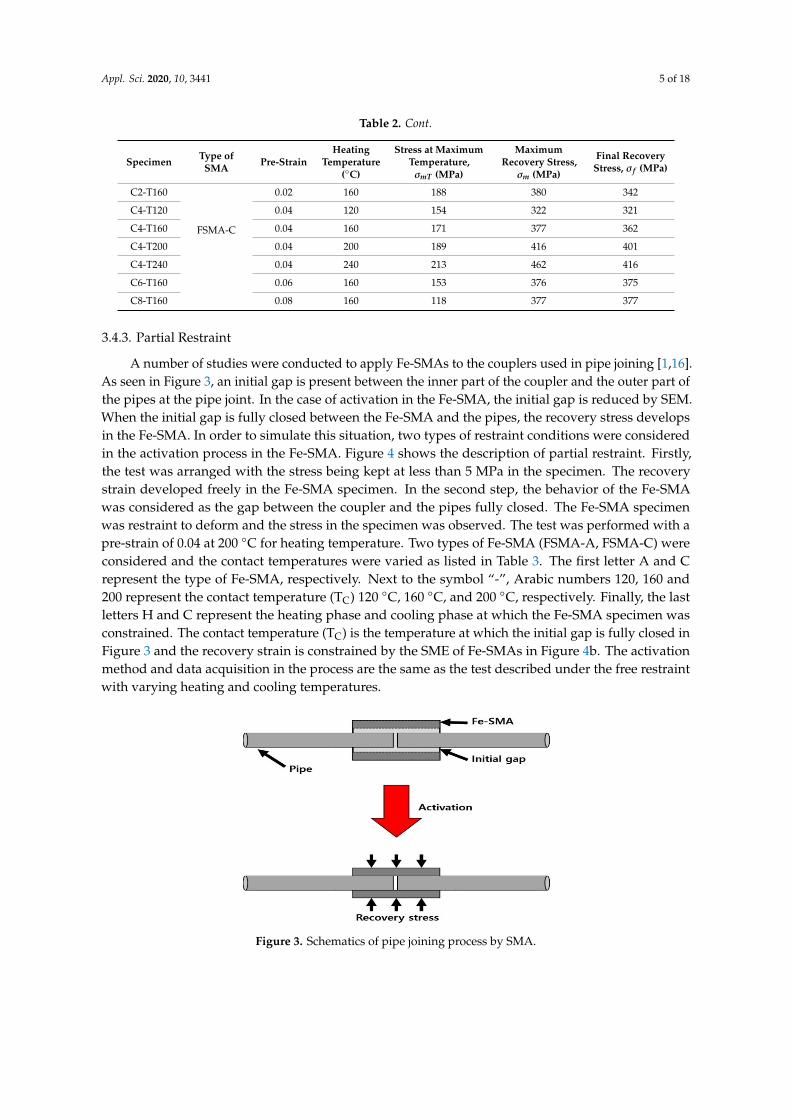
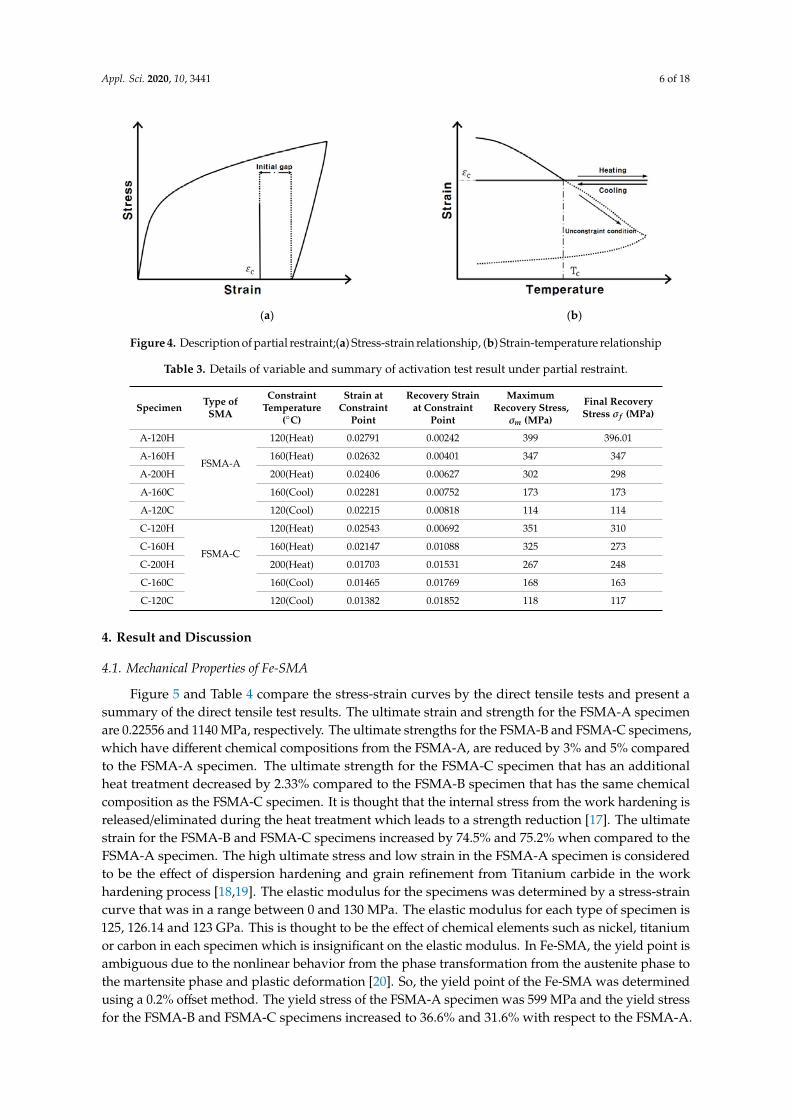
A number of studies were conducted to apply Fe-SMAs to the couplers used in pipe joining [1,16].As seen in Figure 3, an initial gap is present between the inner part of the coupler and the outer part ofthe pipes at the pipe joint. In the case of activation in the Fe-SMA, the initial gap is reduced by SEM.When the initial gap is fully closed between the Fe-SMA and the pipes, the recovery stress developsin the Fe-SMA. In order to simulate this situation, two types of restraint conditions were consideredin the activation process in the Fe-SMA. Figure 4 shows the description of partial restraint. Firstly,the test was arranged with the stress being kept at less than 5 MPa in the specimen. The recoverystrain developed freely in the Fe-SMA specimen. In the second step, the behavior of the Fe-SMAwas considered as the gap between the coupler and the pipes fully closed. The Fe-SMA specimenwas restraint to deform and the stress in the specimen was observed. The test was performed with apre-strain of 0.04 at 200 ◦C for heating temperature. Two types of Fe-SMA (FSMA-A, FSMA-C) wereconsidered and the contact temperatures were varied as listed in Table 3. The first letter A and Crepresent the type of Fe-SMA, respectively. Next to the symbol “-”, Arabic numbers 120, 160 and200 represent the contact temperature (TC) 120 ◦C, 160 ◦C, and 200 ◦C, respectively. Finally, the lastletters H and C represent the heating phase and cooling phase at which the Fe-SMA specimen wasconstrained. The contact temperature (TC) is the temperature at which the initial gap is fully closed inFigure 3 and the recovery strain is constrained by the SME of Fe-SMAs in Figure 4b. The activationmethod and data acquisition in the process are the same as the test described under the free restraintwith varying heating and cooling temperatures.
Appl. Sci. 2020, 10, x FOR PEER REVIEW 5 of 18
C4‐T240 0.04 240 213 462 416
C6‐T160 0.06 160 153 376 375
C8‐T160 0.08 160 118 377 377
3.4.3. Partial restraint
A number of studies were conducted to apply Fe‐SMAs to the couplers used in pipe joining
[1,16]. As seen in Figure 3, an initial gap is present between the inner part of the coupler and the outer
part of the pipes at the pipe joint. In the case of activation in the Fe‐SMA, the initial gap is reduced
by SEM. When the initial gap is fully closed between the Fe‐SMA and the pipes, the recovery stress
develops in the Fe‐SMA. In order to simulate this situation, two types of restraint conditions were
considered in the activation process in the Fe‐SMA. Figure 4 shows the description of partial restraint.
Firstly, the test was arranged with the stress being kept at less than 5 MPa in the specimen. The
recovery strain developed freely in the Fe‐SMA specimen. In the second step, the behavior of the Fe‐
SMA was considered as the gap between the coupler and the pipes fully closed. The Fe‐SMA
specimen was restraint to deform and the stress in the specimen was observed. The test was
performed with a pre‐strain of 0.04 at 200 °C for heating temperature. Two types of Fe‐SMA (FSMA‐
A, FSMA‐C) were considered and the contact temperatures were varied as listed in Table 3. The first
letter A and C represent the type of Fe‐SMA, respectively. Next to the symbol “‐”, Arabic numbers
120, 160 and 200 represent the contact temperature (TC) 120 °C, 160 °C, and 200 °C, respectively. Finally, the last letters H and C represent the heating phase and cooling phase at which the Fe‐SMA
specimen was constrained. The contact temperature (TC) is the temperature at which the initial gap
is fully closed in Figure 3 and the recovery strain is constrained by the SME of Fe‐SMAs in Figure 4b.
The activation method and data acquisition in the process are the same as the test described under
the free restraint with varying heating and cooling temperatures.
Figure 3. Schematics of pipe joining process by SMA.
(a) (b)
Figure 3. Schematics of pipe joining process by SMA.
Appl. Sci. 2020, 10, 3441 6 of 18
Appl. Sci. 2020, 10, x FOR PEER REVIEW 5 of 18
C4‐T240 0.04 240 213 462 416
C6‐T160 0.06 160 153 376 375
C8‐T160 0.08 160 118 377 377
3.4.3. Partial restraint
A number of studies were conducted to apply Fe‐SMAs to the couplers used in pipe joining
[1,16]. As seen in Figure 3, an initial gap is present between the inner part of the coupler and the outer
part of the pipes at the pipe joint. In the case of activation in the Fe‐SMA, the initial gap is reduced
by SEM. When the initial gap is fully closed between the Fe‐SMA and the pipes, the recovery stress
develops in the Fe‐SMA. In order to simulate this situation, two types of restraint conditions were
considered in the activation process in the Fe‐SMA. Figure 4 shows the description of partial restraint.
Firstly, the test was arranged with the stress being kept at less than 5 MPa in the specimen. The
recovery strain developed freely in the Fe‐SMA specimen. In the second step, the behavior of the Fe‐
SMA was considered as the gap between the coupler and the pipes fully closed. The Fe‐SMA
specimen was restraint to deform and the stress in the specimen was observed. The test was
performed with a pre‐strain of 0.04 at 200 °C for heating temperature. Two types of Fe‐SMA (FSMA‐
A, FSMA‐C) were considered and the contact temperatures were varied as listed in Table 3. The first
letter A and C represent the type of Fe‐SMA, respectively. Next to the symbol “‐”, Arabic numbers
120, 160 and 200 represent the contact temperature (TC) 120 °C, 160 °C, and 200 °C, respectively. Finally, the last letters H and C represent the heating phase and cooling phase at which the Fe‐SMA
specimen was constrained. The contact temperature (TC) is the temperature at which the initial gap
is fully closed in Figure 3 and the recovery strain is constrained by the SME of Fe‐SMAs in Figure 4b.
The activation method and data acquisition in the process are the same as the test described under
the free restraint with varying heating and cooling temperatures.
Figure 3. Schematics of pipe joining process by SMA.
(a) (b)
Figure 4. Description of partial restraint;(a) Stress-strain relationship, (b) Strain-temperature relationship
Table 3. Details of variable and summary of activation test result under partial restraint.
Specimen Type ofSMA
ConstraintTemperature
(◦C)
Strain atConstraint
Point
Recovery Strainat Constraint
Point
MaximumRecovery Stress,σm (MPa)
Final RecoveryStress σ f (MPa)
A-120H
FSMA-A
120(Heat) 0.02791 0.00242 399 396.01
A-160H 160(Heat) 0.02632 0.00401 347 347
A-200H 200(Heat) 0.02406 0.00627 302 298
A-160C 160(Cool) 0.02281 0.00752 173 173
A-120C 120(Cool) 0.02215 0.00818 114 114
C-120H
FSMA-C
120(Heat) 0.02543 0.00692 351 310
C-160H 160(Heat) 0.02147 0.01088 325 273
C-200H 200(Heat) 0.01703 0.01531 267 248
C-160C 160(Cool) 0.01465 0.01769 168 163
C-120C 120(Cool) 0.01382 0.01852 118 117
4. Result and Discussion
4.1. Mechanical Properties of Fe-SMA
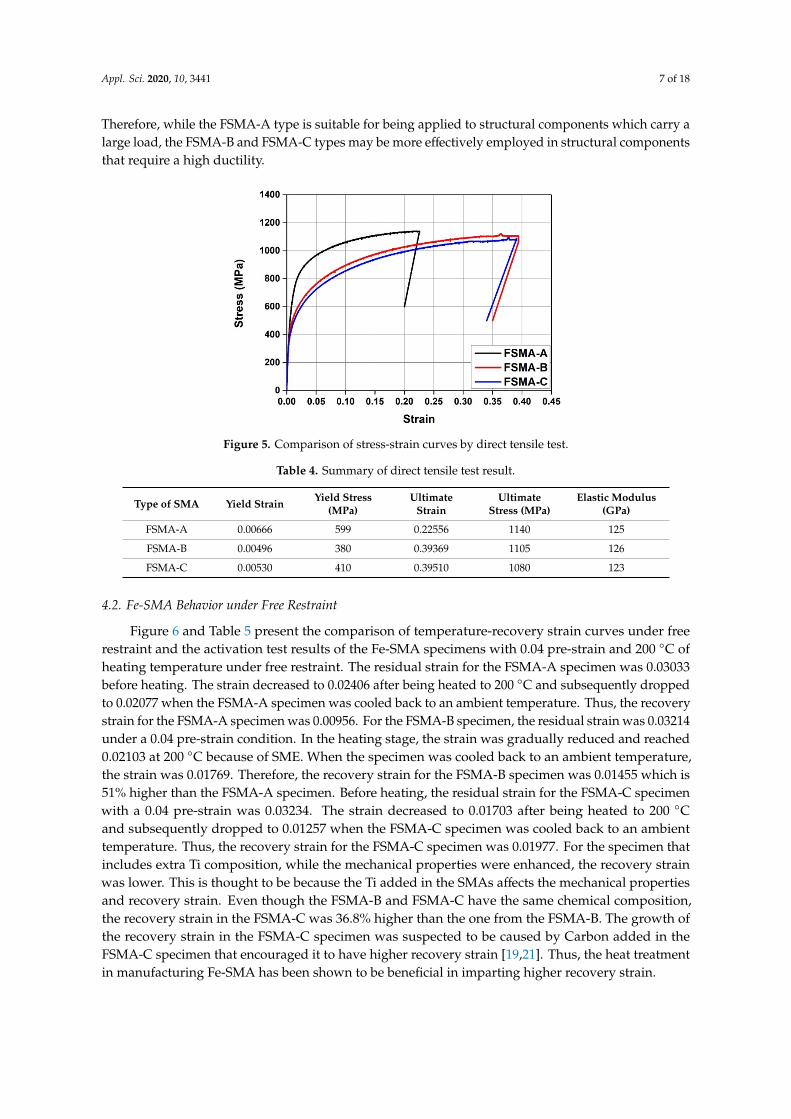
Figure 5 and Table 4 compare the stress-strain curves by the direct tensile tests and present asummary of the direct tensile test results. The ultimate strain and strength for the FSMA-A specimenare 0.22556 and 1140 MPa, respectively. The ultimate strengths for the FSMA-B and FSMA-C specimens,which have different chemical compositions from the FSMA-A, are reduced by 3% and 5% comparedto the FSMA-A specimen. The ultimate strength for the FSMA-C specimen that has an additionalheat treatment decreased by 2.33% compared to the FSMA-B specimen that has the same chemicalcomposition as the FSMA-C specimen. It is thought that the internal stress from the work hardening isreleased/eliminated during the heat treatment which leads to a strength reduction [17]. The ultimatestrain for the FSMA-B and FSMA-C specimens increased by 74.5% and 75.2% when compared to theFSMA-A specimen. The high ultimate stress and low strain in the FSMA-A specimen is consideredto be the effect of dispersion hardening and grain refinement from Titanium carbide in the workhardening process [18,19]. The elastic modulus for the specimens was determined by a stress-straincurve that was in a range between 0 and 130 MPa. The elastic modulus for each type of specimen is125, 126.14 and 123 GPa. This is thought to be the effect of chemical elements such as nickel, titaniumor carbon in each specimen which is insignificant on the elastic modulus. In Fe-SMA, the yield point isambiguous due to the nonlinear behavior from the phase transformation from the austenite phase tothe martensite phase and plastic deformation [20]. So, the yield point of the Fe-SMA was determinedusing a 0.2% offset method. The yield stress of the FSMA-A specimen was 599 MPa and the yield stressfor the FSMA-B and FSMA-C specimens increased to 36.6% and 31.6% with respect to the FSMA-A.
Appl. Sci. 2020, 10, 3441 7 of 18
Therefore, while the FSMA-A type is suitable for being applied to structural components which carry alarge load, the FSMA-B and FSMA-C types may be more effectively employed in structural componentsthat require a high ductility.Appl. Sci. 2020, 10, x FOR PEER REVIEW 7 of 18
Figure 5. Comparison of stress‐strain curves by direct tensile test.
Table 4. Summary of direct tensile test result.
Type of
SMA
Yield
Strain
Yield
Stress
(MPa)
Ultimate
Strain
Ultimate Stress
(MPa)
Elastic Modulus
(GPa)
FSMA‐A 0.00666 599 0.22556 1140 125
FSMA‐B 0.00496 380 0.39369 1105 126
FSMA‐C 0.00530 410 0.39510 1080 123
4.2. Fe‐SMA Behavior Under Free Restraint
Figure 6 and Table 5 present the comparison of temperature‐recovery strain curves under free
restraint and the activation test results of the Fe‐SMA specimens with 0.04 pre‐strain and 200 °C of
heating temperature under free restraint. The residual strain for the FSMA‐A specimen was 0.03033
before heating. The strain decreased to 0.02406 after being heated to 200 °C and subsequently
dropped to 0.02077 when the FSMA‐A specimen was cooled back to an ambient temperature. Thus,
the recovery strain for the FSMA‐A specimen was 0.00956. For the FSMA‐B specimen, the residual
strain was 0.03214 under a 0.04 pre‐strain condition. In the heating stage, the strain was gradually
reduced and reached 0.02103 at 200 °C because of SME. When the specimen was cooled back to an
ambient temperature, the strain was 0.01769. Therefore, the recovery strain for the FSMA‐B specimen
was 0.01455 which is 51% higher than the FSMA‐A specimen. Before heating, the residual strain for
the FSMA‐C specimen with a 0.04 pre‐strain was 0.03234. The strain decreased to 0.01703 after being
heated to 200 °C and subsequently dropped to 0.01257 when the FSMA‐C specimen was cooled back
to an ambient temperature. Thus, the recovery strain for the FSMA‐C specimen was 0.01977. For the
specimen that includes extra Ti composition, while the mechanical properties were enhanced, the
recovery strain was lower. This is thought to be because the Ti added in the SMAs affects the
mechanical properties and recovery strain. Even though the FSMA‐B and FSMA‐C have the same
chemical composition, the recovery strain in the FSMA‐C was 36.8% higher than the one from the
FSMA‐B. The growth of the recovery strain in the FSMA‐C specimen was suspected to be caused by
Carbon added in the FSMA‐C specimen that encouraged it to have higher recovery strain [19,21].
Thus, the heat treatment in manufacturing Fe‐SMA has been shown to be beneficial in imparting
higher recovery strain.
Figure 5. Comparison of stress-strain curves by direct tensile test.
Table 4. Summary of direct tensile test result.
Type of SMA Yield Strain Yield Stress(MPa)
UltimateStrain
UltimateStress (MPa)
Elastic Modulus(GPa)
FSMA-A 0.00666 599 0.22556 1140 125
FSMA-B 0.00496 380 0.39369 1105 126
FSMA-C 0.00530 410 0.39510 1080 123
4.2. Fe-SMA Behavior under Free Restraint
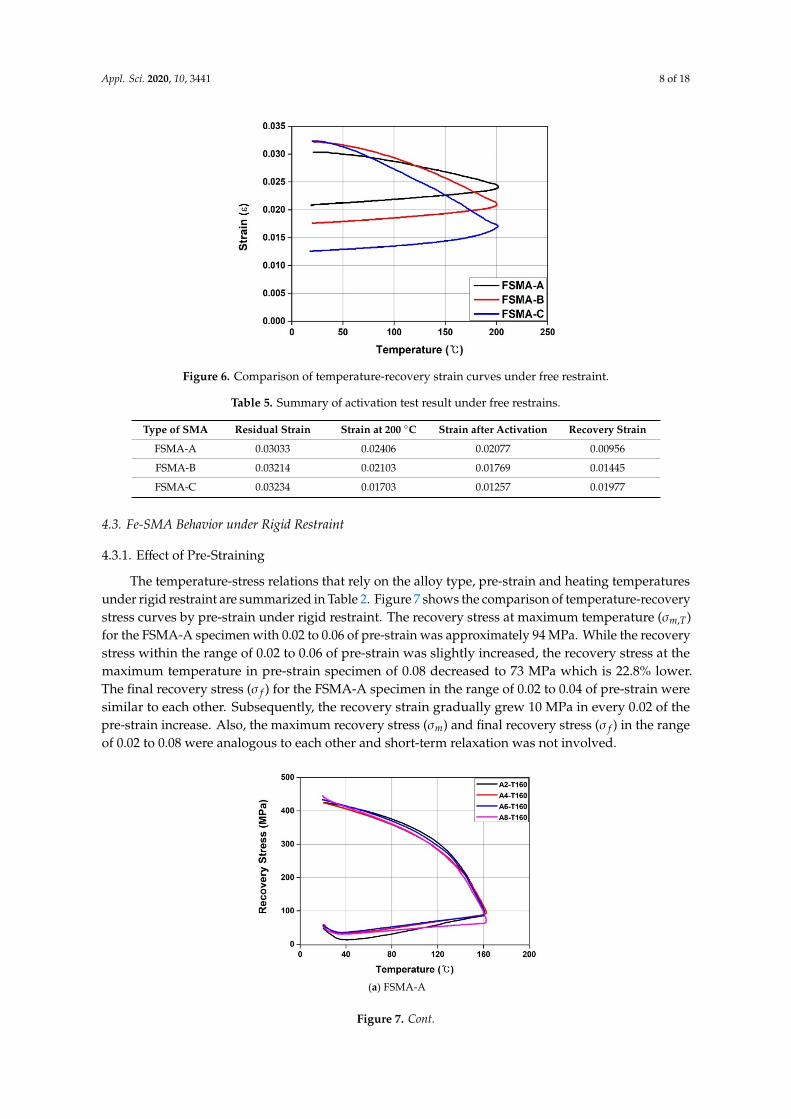
Figure 6 and Table 5 present the comparison of temperature-recovery strain curves under freerestraint and the activation test results of the Fe-SMA specimens with 0.04 pre-strain and 200 ◦C ofheating temperature under free restraint. The residual strain for the FSMA-A specimen was 0.03033before heating. The strain decreased to 0.02406 after being heated to 200 ◦C and subsequently droppedto 0.02077 when the FSMA-A specimen was cooled back to an ambient temperature. Thus, the recoverystrain for the FSMA-A specimen was 0.00956. For the FSMA-B specimen, the residual strain was 0.03214under a 0.04 pre-strain condition. In the heating stage, the strain was gradually reduced and reached0.02103 at 200 ◦C because of SME. When the specimen was cooled back to an ambient temperature,the strain was 0.01769. Therefore, the recovery strain for the FSMA-B specimen was 0.01455 which is51% higher than the FSMA-A specimen. Before heating, the residual strain for the FSMA-C specimenwith a 0.04 pre-strain was 0.03234. The strain decreased to 0.01703 after being heated to 200 ◦Cand subsequently dropped to 0.01257 when the FSMA-C specimen was cooled back to an ambienttemperature. Thus, the recovery strain for the FSMA-C specimen was 0.01977. For the specimen thatincludes extra Ti composition, while the mechanical properties were enhanced, the recovery strainwas lower. This is thought to be because the Ti added in the SMAs affects the mechanical propertiesand recovery strain. Even though the FSMA-B and FSMA-C have the same chemical composition,the recovery strain in the FSMA-C was 36.8% higher than the one from the FSMA-B. The growth ofthe recovery strain in the FSMA-C specimen was suspected to be caused by Carbon added in theFSMA-C specimen that encouraged it to have higher recovery strain [19,21]. Thus, the heat treatmentin manufacturing Fe-SMA has been shown to be beneficial in imparting higher recovery strain.
Appl. Sci. 2020, 10, 3441 8 of 18
Appl. Sci. 2020, 10, x FOR PEER REVIEW 8 of 18
Figure 6. Comparison of temperature‐recovery strain curves under free restraint.
Table 5. Summary of activation test result under free restrains.
Type of SMA Residual Strain Strain at 200 °C Strain after Activation Recovery Strain
FSMA‐A 0.03033 0.02406 0.02077 0.00956
FSMA‐B 0.03214 0.02103 0.01769 0.01445
FSMA‐C 0.03234 0.01703 0.01257 0.01977
4.3. Fe‐SMA Behavior Under Rigid Restraint
4.3.1. Effect of Pre‐straining
The temperature‐stress relations that rely on the alloy type, pre‐strain and heating temperatures
under rigid restraint are summarized in Table 2. Figure 7 shows the comparison of temperature‐
recovery stress curves by pre‐strain under rigid restraint. The recovery stress at maximum
temperature (𝜎 , ) for the FSMA‐A specimen with 0.02 to 0.06 of pre‐strain was approximately 94
MPa. While the recovery stress within the range of 0.02 to 0.06 of pre‐strain was slightly increased,
the recovery stress at the maximum temperature in pre‐strain specimen of 0.08 decreased to 73 MPa
which is 22.8% lower. The final recovery stress (𝜎 ) for the FSMA‐A specimen in the range of 0.02 to
0.04 of pre‐strain were similar to each other. Subsequently, the recovery strain gradually grew 10
MPa in every 0.02 of the pre‐strain increase. Also, the maximum recovery stress (𝜎 ) and final
recovery stress (𝜎 ) in the range of 0.02 to 0.08 were analogous to each other and short‐term relaxation
was not involved.
(a) FSMA‐A
Figure 6. Comparison of temperature-recovery strain curves under free restraint.
Table 5. Summary of activation test result under free restrains.
Type of SMA Residual Strain Strain at 200 ◦C Strain after Activation Recovery Strain
FSMA-A 0.03033 0.02406 0.02077 0.00956
FSMA-B 0.03214 0.02103 0.01769 0.01445
FSMA-C 0.03234 0.01703 0.01257 0.01977
4.3. Fe-SMA Behavior under Rigid Restraint
4.3.1. Effect of Pre-Straining
The temperature-stress relations that rely on the alloy type, pre-strain and heating temperaturesunder rigid restraint are summarized in Table 2. Figure 7 shows the comparison of temperature-recoverystress curves by pre-strain under rigid restraint. The recovery stress at maximum temperature (σm,T)for the FSMA-A specimen with 0.02 to 0.06 of pre-strain was approximately 94 MPa. While the recoverystress within the range of 0.02 to 0.06 of pre-strain was slightly increased, the recovery stress at themaximum temperature in pre-strain specimen of 0.08 decreased to 73 MPa which is 22.8% lower.The final recovery stress (σ f ) for the FSMA-A specimen in the range of 0.02 to 0.04 of pre-strain weresimilar to each other. Subsequently, the recovery strain gradually grew 10 MPa in every 0.02 of thepre-strain increase. Also, the maximum recovery stress (σm) and final recovery stress (σ f ) in the rangeof 0.02 to 0.08 were analogous to each other and short-term relaxation was not involved.
Appl. Sci. 2020, 10, x FOR PEER REVIEW 8 of 18
Figure 6. Comparison of temperature‐recovery strain curves under free restraint.
Table 5. Summary of activation test result under free restrains.
Type of SMA Residual Strain Strain at 200 °C Strain after Activation Recovery Strain
FSMA‐A 0.03033 0.02406 0.02077 0.00956
FSMA‐B 0.03214 0.02103 0.01769 0.01445
FSMA‐C 0.03234 0.01703 0.01257 0.01977
4.3. Fe‐SMA Behavior Under Rigid Restraint
4.3.1. Effect of Pre‐straining
The temperature‐stress relations that rely on the alloy type, pre‐strain and heating temperatures
under rigid restraint are summarized in Table 2. Figure 7 shows the comparison of temperature‐
recovery stress curves by pre‐strain under rigid restraint. The recovery stress at maximum
temperature (𝜎 , ) for the FSMA‐A specimen with 0.02 to 0.06 of pre‐strain was approximately 94
MPa. While the recovery stress within the range of 0.02 to 0.06 of pre‐strain was slightly increased,
the recovery stress at the maximum temperature in pre‐strain specimen of 0.08 decreased to 73 MPa
which is 22.8% lower. The final recovery stress (𝜎 ) for the FSMA‐A specimen in the range of 0.02 to
0.04 of pre‐strain were similar to each other. Subsequently, the recovery strain gradually grew 10
MPa in every 0.02 of the pre‐strain increase. Also, the maximum recovery stress (𝜎 ) and final
recovery stress (𝜎 ) in the range of 0.02 to 0.08 were analogous to each other and short‐term relaxation
was not involved.
(a) FSMA‐A
Figure 7. Cont.
Appl. Sci. 2020, 10, 3441 9 of 18
Appl. Sci. 2020, 10, x FOR PEER REVIEW 9 of 18
(b) FSMA‐B
(c) FSMA‐C
Figure 7. Comparison of temperature‐recovery stress curves by pre‐strain under rigid restraint.
In contrast to the FSMA‐A specimen, the recovery stress at the maximum temperature (𝜎 , )
steadily decreased 10 MPa for every 0.02 of pre‐strain increase. However, the maximum recovery
stress (𝜎 ) and final recovery stress (𝜎 ) were not affected by the increase of pre‐straining in the
FSMA‐B specimen. This is because any pre‐strain over 0.02 does not affect to the recovery stress in
Fe‐SMA [20]. With the same pre‐strain level, the final recovery stress (𝜎 ) in the FSMA‐B specimen
was approximately 19% smaller than one in the FSMA‐A specimen. This is due to the fact that the
recovery stress depends on the yield strength rather than the recovery strain [2]. The maximum
recovery stress (𝜎 ) and final recovery stress (𝜎 ) with 0.02 of pre‐strain in the FSMA‐B specimen are
381 MPa and 364 MPa. The short‐term relaxation of the FSMA‐B specimen is evaluated at 17.21 MPa.
Afterward, the short‐term relaxation gradually decreased as the pre‐strain increased. The short‐term
relaxations in pre‐strains of 0.06 and 0.08 are 0.4 MPa and 0.13 MPa.
In a similar manner as the FSMA‐B specimen, the recovery stress at the maximum temperature
(𝜎 , ) in the FSMA‐C specimen decreased 11 MPa for every 0.02 of pre‐strain increase. The recovery
stress at the maximum temperature (𝜎 , ) in the FSMA‐C was 13% higher than the one in the FSMA‐
B at the same pre‐strain. The magnitude of the pre‐strain did not affect the maximum recovery stress
(𝜎 ) and final recovery stress (𝜎 ). The maximum recovery stress (𝜎 ) and final recovery stress (𝜎 ).
in the FSMA‐C were different by 8.2% and 0.7% from the FSMA‐B and the relaxation gradually
decreased according to the increase in the pre‐strain value. In the case of a pre‐strain of 0.08, the short‐
term relaxation did not develop. However, short term relaxation of the FSMA‐C, which had heating
treatment, developed more than 50% when compared to the one in the FSMA‐B.
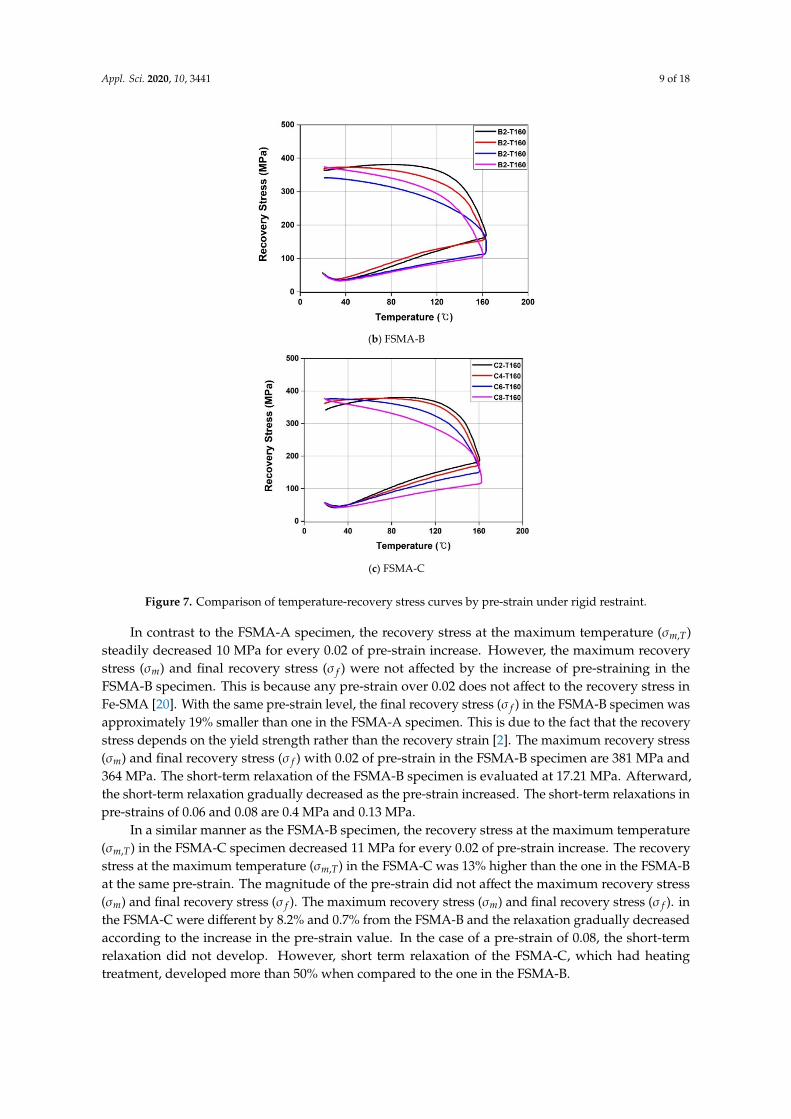
Figure 7. Comparison of temperature-recovery stress curves by pre-strain under rigid restraint.
In contrast to the FSMA-A specimen, the recovery stress at the maximum temperature (σm,T)steadily decreased 10 MPa for every 0.02 of pre-strain increase. However, the maximum recoverystress (σm) and final recovery stress (σ f ) were not affected by the increase of pre-straining in theFSMA-B specimen. This is because any pre-strain over 0.02 does not affect to the recovery stress inFe-SMA [20]. With the same pre-strain level, the final recovery stress (σ f ) in the FSMA-B specimen wasapproximately 19% smaller than one in the FSMA-A specimen. This is due to the fact that the recoverystress depends on the yield strength rather than the recovery strain [2]. The maximum recovery stress(σm) and final recovery stress (σ f ) with 0.02 of pre-strain in the FSMA-B specimen are 381 MPa and364 MPa. The short-term relaxation of the FSMA-B specimen is evaluated at 17.21 MPa. Afterward,the short-term relaxation gradually decreased as the pre-strain increased. The short-term relaxations inpre-strains of 0.06 and 0.08 are 0.4 MPa and 0.13 MPa.
In a similar manner as the FSMA-B specimen, the recovery stress at the maximum temperature(σm,T) in the FSMA-C specimen decreased 11 MPa for every 0.02 of pre-strain increase. The recoverystress at the maximum temperature (σm,T) in the FSMA-C was 13% higher than the one in the FSMA-Bat the same pre-strain. The magnitude of the pre-strain did not affect the maximum recovery stress(σm) and final recovery stress (σ f ). The maximum recovery stress (σm) and final recovery stress (σ f ). inthe FSMA-C were different by 8.2% and 0.7% from the FSMA-B and the relaxation gradually decreasedaccording to the increase in the pre-strain value. In the case of a pre-strain of 0.08, the short-termrelaxation did not develop. However, short term relaxation of the FSMA-C, which had heatingtreatment, developed more than 50% when compared to the one in the FSMA-B.
Appl. Sci. 2020, 10, 3441 10 of 18
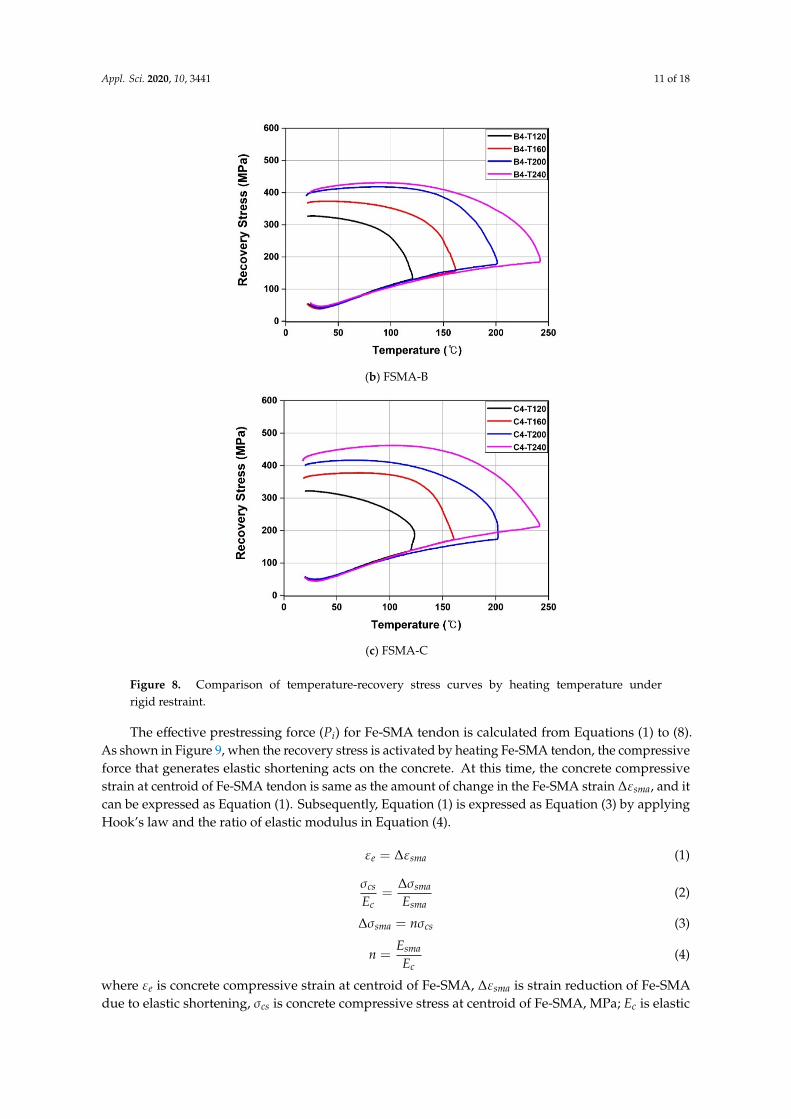
4.3.2. Effect of Heating Temperature
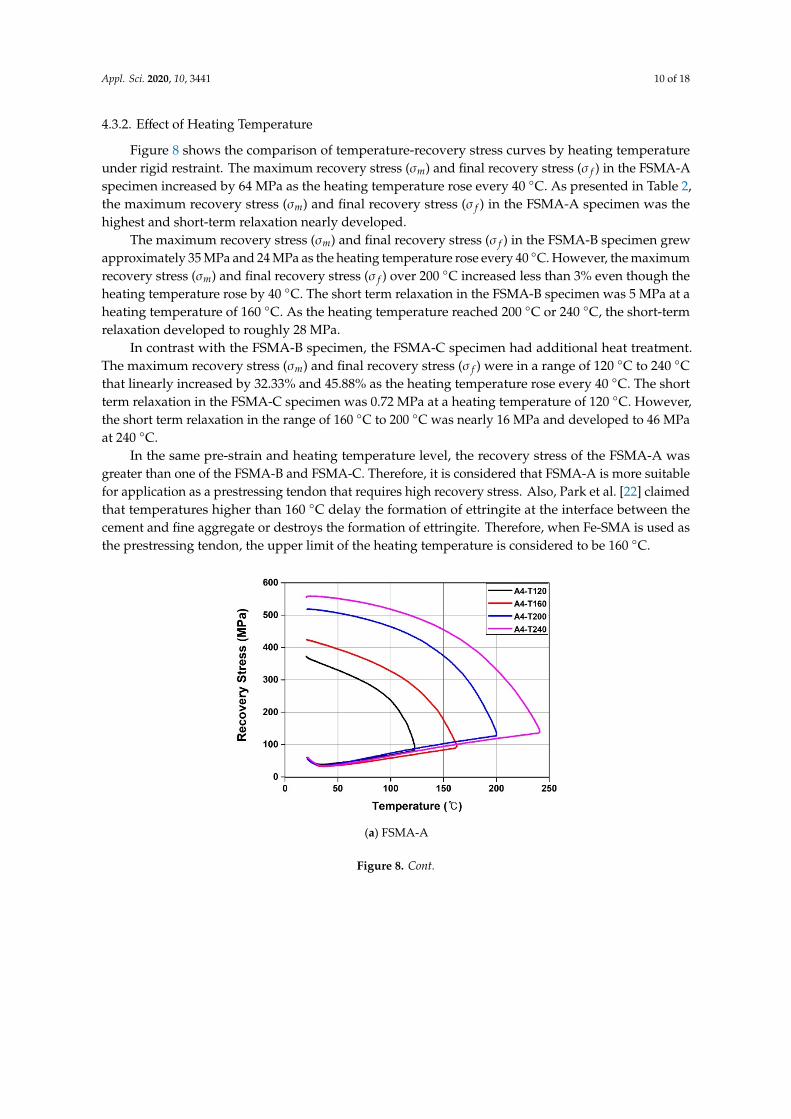
Figure 8 shows the comparison of temperature-recovery stress curves by heating temperatureunder rigid restraint. The maximum recovery stress (σm) and final recovery stress (σ f ) in the FSMA-Aspecimen increased by 64 MPa as the heating temperature rose every 40 ◦C. As presented in Table 2,the maximum recovery stress (σm) and final recovery stress (σ f ) in the FSMA-A specimen was thehighest and short-term relaxation nearly developed.
The maximum recovery stress (σm) and final recovery stress (σ f ) in the FSMA-B specimen grewapproximately 35 MPa and 24 MPa as the heating temperature rose every 40 ◦C. However, the maximumrecovery stress (σm) and final recovery stress (σ f ) over 200 ◦C increased less than 3% even though theheating temperature rose by 40 ◦C. The short term relaxation in the FSMA-B specimen was 5 MPa at aheating temperature of 160 ◦C. As the heating temperature reached 200 ◦C or 240 ◦C, the short-termrelaxation developed to roughly 28 MPa.
In contrast with the FSMA-B specimen, the FSMA-C specimen had additional heat treatment.The maximum recovery stress (σm) and final recovery stress (σ f ) were in a range of 120 ◦C to 240 ◦Cthat linearly increased by 32.33% and 45.88% as the heating temperature rose every 40 ◦C. The shortterm relaxation in the FSMA-C specimen was 0.72 MPa at a heating temperature of 120 ◦C. However,the short term relaxation in the range of 160 ◦C to 200 ◦C was nearly 16 MPa and developed to 46 MPaat 240 ◦C.
In the same pre-strain and heating temperature level, the recovery stress of the FSMA-A wasgreater than one of the FSMA-B and FSMA-C. Therefore, it is considered that FSMA-A is more suitablefor application as a prestressing tendon that requires high recovery stress. Also, Park et al. [22] claimedthat temperatures higher than 160 ◦C delay the formation of ettringite at the interface between thecement and fine aggregate or destroys the formation of ettringite. Therefore, when Fe-SMA is used asthe prestressing tendon, the upper limit of the heating temperature is considered to be 160 ◦C.
Appl. Sci. 2020, 10, x FOR PEER REVIEW 10 of 18
4.3.2. Effect of heating temperature
Figure 8 shows the comparison of temperature‐recovery stress curves by heating temperature
under rigid restraint. The maximum recovery stress (𝜎 ) and final recovery stress (𝜎 ) in the FSMA‐
A specimen increased by 64 MPa as the heating temperature rose every 40 °C. As presented in Table 2, the maximum recovery stress (𝜎 ) and final recovery stress (𝜎 ) in the FSMA‐A specimen was the
highest and short‐term relaxation nearly developed.
The maximum recovery stress (𝜎 ) and final recovery stress (𝜎 ) in the FSMA‐B specimen grew
approximately 35 MPa and 24 MPa as the heating temperature rose every 40 °C. However, the
maximum recovery stress (𝜎 ) and final recovery stress (𝜎 ) over 200 °C increased less than 3% even though the heating temperature rose by 40 °C. The short term relaxation in the FSMA‐B specimen
was 5 MPa at a heating temperature of 160 °C. As the heating temperature reached 200 °C or 240 °C, the short‐term relaxation developed to roughly 28 MPa.
In contrast with the FSMA‐B specimen, the FSMA‐C specimen had additional heat treatment.
The maximum recovery stress (𝜎 ) and final recovery stress (𝜎 ) were in a range of 120 °C to 240 °C that linearly increased by 32.33% and 45.88% as the heating temperature rose every 40 °C. The short term relaxation in the FSMA‐C specimen was 0.72 MPa at a heating temperature of 120 °C. However,
the short term relaxation in the range of 160 °C to 200 °C was nearly 16 MPa and developed to 46
MPa at 240 °C. In the same pre‐strain and heating temperature level, the recovery stress of the FSMA‐A was
greater than one of the FSMA‐B and FSMA‐C. Therefore, it is considered that FSMA‐A is more
suitable for application as a prestressing tendon that requires high recovery stress. Also, Park et al.
[22] claimed that temperatures higher than 160 °C delay the formation of ettringite at the interface
between the cement and fine aggregate or destroys the formation of ettringite. Therefore, when Fe‐
SMA is used as the prestressing tendon, the upper limit of the heating temperature is considered to
be 160 °C.
(a) FSMA‐A
Figure 8. Cont.
Appl. Sci. 2020, 10, 3441 11 of 18
Appl. Sci. 2020, 10, x FOR PEER REVIEW 11 of 18
(b) FSMA‐B
(c) FSMA‐C
Figure 8. Comparison of temperature‐recovery stress curves by heating temperature under rigid
restraint.
The effective prestressing force (𝑃 ) for Fe‐SMA tendon is calculated from Equations (1) to (8).
As shown in Figure 9, when the recovery stress is activated by heating Fe‐SMA tendon, the
compressive force that generates elastic shortening acts on the concrete. At this time, the concrete
compressive strain at centroid of Fe‐SMA tendon is same as the amount of change in the Fe‐SMA
strain ∆𝜀 , and it can be expressed as Equation (1). Subsequently, Equation (1) is expressed as
Equation (3) by applying Hook’s law and the ratio of elastic modulus in Equation (4).
Figure 9. Elastic shortening due to recovery stress of Fe‐SMA.
Figure 8. Comparison of temperature-recovery stress curves by heating temperature underrigid restraint.
The effective prestressing force (Pi) for Fe-SMA tendon is calculated from Equations (1) to (8).As shown in Figure 9, when the recovery stress is activated by heating Fe-SMA tendon, the compressiveforce that generates elastic shortening acts on the concrete. At this time, the concrete compressivestrain at centroid of Fe-SMA tendon is same as the amount of change in the Fe-SMA strain ∆εsma, and itcan be expressed as Equation (1). Subsequently, Equation (1) is expressed as Equation (3) by applyingHook’s law and the ratio of elastic modulus in Equation (4).
εe = ∆εsma (1)
σcs
Ec=
∆σsma
Esma(2)
∆σsma = nσcs (3)
n =Esma
Ec(4)
where εe is concrete compressive strain at centroid of Fe-SMA, ∆εsma is strain reduction of Fe-SMAdue to elastic shortening, σcs is concrete compressive stress at centroid of Fe-SMA, MPa; Ec is elastic
Appl. Sci. 2020, 10, 3441 12 of 18
modulus of concrete, MPa; ∆σsma is stress reduction of Fe-SMA due to elastic shortening, MPa; Esma iselastic modulus of Fe-SMA, MPa; and n is elastic modulus ratio. At this time, concrete compressivestress at centroid of Fe-SMA can be summarized in Equation (5). The effective pre-stressing force byFe-SMA tendon can expressed as Equation. (6). For example, the final recovery stress (σ f ) for FSMA-Awith 4% pre-strain and 160 ◦C heating temperature can be taken as 423 MPa. Substituting Equation (5)and Equation (6) into Equation (3) yields Equation (7):
σcs =PiAc
(1 +
e2
r2
)−
MdIc
e (5)
Pi = Asma(σ f − ∆σsma
)(6)
∆σsma =1 + nρ
(1 + e2
r2
)σ f − n Md
Ice
1 + nρ(1 + e2
r2
) (7)
ρ =Asma
Ac(8)
where, Pi is initial pre-stressing force due to recovery stress of Fe-SMA, N; Ac is area of the concrete,mm2; e is eccentric distance, mm; r is radius of gyration, mm; Md moment due to self-weight of concretebeam, N·mm; Ic is moment of inertia of the section, mm4; σ f is final recovery stress, MPa; and ρ is thereinforcement ratio.
Appl. Sci. 2020, 10, x FOR PEER REVIEW 11 of 18
(b) FSMA‐B
(c) FSMA‐C
Figure 8. Comparison of temperature‐recovery stress curves by heating temperature under rigid
restraint.
The effective prestressing force (𝑃 ) for Fe‐SMA tendon is calculated from Equations (1) to (8).
As shown in Figure 9, when the recovery stress is activated by heating Fe‐SMA tendon, the
compressive force that generates elastic shortening acts on the concrete. At this time, the concrete
compressive strain at centroid of Fe‐SMA tendon is same as the amount of change in the Fe‐SMA
strain ∆𝜀 , and it can be expressed as Equation (1). Subsequently, Equation (1) is expressed as
Equation (3) by applying Hook’s law and the ratio of elastic modulus in Equation (4).
Figure 9. Elastic shortening due to recovery stress of Fe‐SMA. Figure 9. Elastic shortening due to recovery stress of Fe-SMA.
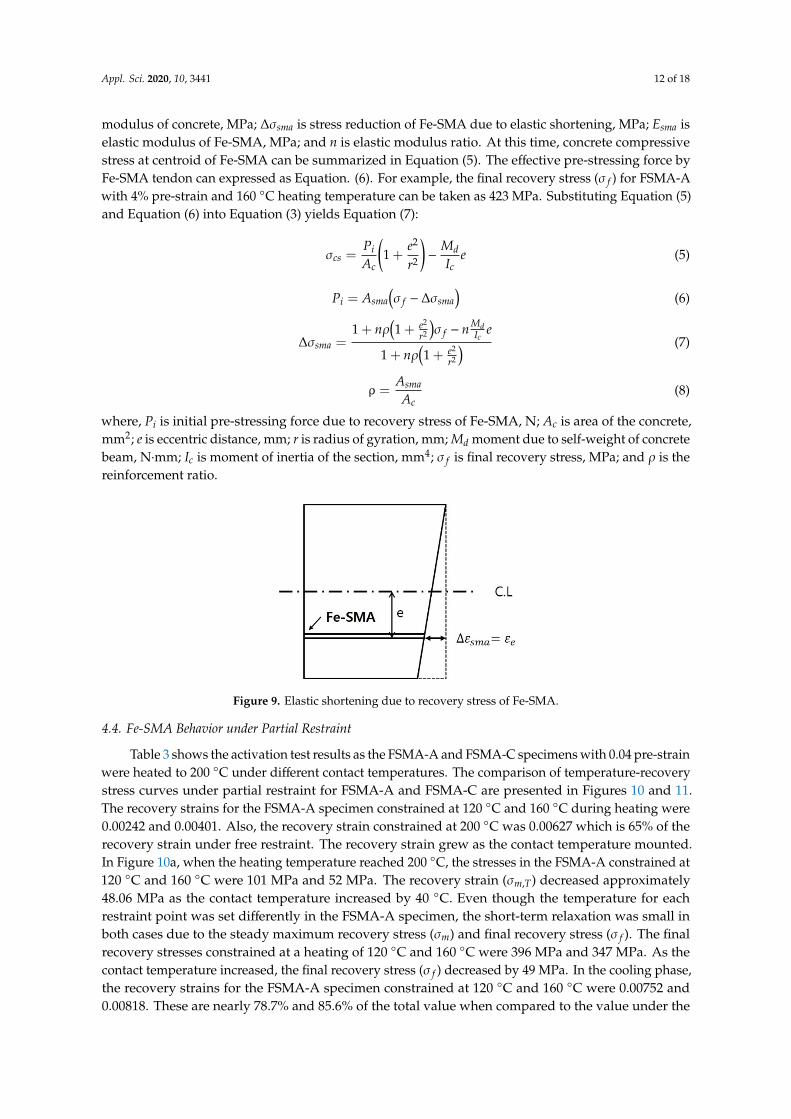
4.4. Fe-SMA Behavior under Partial Restraint
Table 3 shows the activation test results as the FSMA-A and FSMA-C specimens with 0.04 pre-strainwere heated to 200 ◦C under different contact temperatures. The comparison of temperature-recoverystress curves under partial restraint for FSMA-A and FSMA-C are presented in Figures 10 and 11.The recovery strains for the FSMA-A specimen constrained at 120 ◦C and 160 ◦C during heating were0.00242 and 0.00401. Also, the recovery strain constrained at 200 ◦C was 0.00627 which is 65% of therecovery strain under free restraint. The recovery strain grew as the contact temperature mounted.In Figure 10a, when the heating temperature reached 200 ◦C, the stresses in the FSMA-A constrained at120 ◦C and 160 ◦C were 101 MPa and 52 MPa. The recovery strain (σm,T) decreased approximately48.06 MPa as the contact temperature increased by 40 ◦C. Even though the temperature for eachrestraint point was set differently in the FSMA-A specimen, the short-term relaxation was small inboth cases due to the steady maximum recovery stress (σm) and final recovery stress (σ f ). The finalrecovery stresses constrained at a heating of 120 ◦C and 160 ◦C were 396 MPa and 347 MPa. As thecontact temperature increased, the final recovery stress (σ f ) decreased by 49 MPa. In the cooling phase,the recovery strains for the FSMA-A specimen constrained at 120 ◦C and 160 ◦C were 0.00752 and0.00818. These are nearly 78.7% and 85.6% of the total value when compared to the value under the
Appl. Sci. 2020, 10, 3441 13 of 18
free restraint. As presented in Figure 10b, the final recovery stresses constrained at 120 ◦C and 160 ◦Cafter cooling were 173 MPa and 114 MPa which are roughly 33.5% and 22.1% of the value compared tothe value from the one under the rigid restraint.
Appl. Sci. 2020, 10, x FOR PEER REVIEW 13 of 18
constrained at 120 °C and 160 °C after cooling were 173 MPa and 114 MPa which are roughly 33.5%
and 22.1% of the value compared to the value from the one under the rigid restraint.
(a) Heating (b) Cooling
Figure 10. Comparison of FSMA‐A’s temperature‐recovery stress curves under partial restraint; (a)
Heating; (b) Cooling
In the case of the FSMA‐C specimen, the recovery strains constrained at 120 °C and 160 °C during heating were 0.00692 and 0.01088. Also, the recovery strain constrained at 200 °C was 0.01531 which
is 77.4% of the recovery strain under the free restraint. Like the FSMA‐A specimen, the recovery strain
increased when the contact temperature mounted. As shown in Figure 11a, the stresses in the
specimen constrained at 120 °C and 160 °C were 105 MPa and 81 MPa when the heating temperature
arrived at 200 °C. The recovery strain (𝜎 , ) decreased as the contact temperature increased.
However, short‐term relaxation developed in accordance with the variation in the maximum
recovery stress (𝜎 ) and final recovery stress (𝜎 ). The maximum recovery stresses constrained at 120 °C and 160 °C in heating were 351 MPa and 325 MPa. Subsequently, the final recovery stresses
became 310 MPa and 273 MPa. As the contact temperature increased, the maximum recovery stress
and final recovery stress decreased. In the cooling phase, the recovery strains for the FSMA‐C
specimen constrained at 120 °C and 160 °C were 0.01769 and 0.01852 which are nearly 89.5% and
93.7% of the value compared to the values under free restraint. As described in Figure 11b, the
maximum recovery stress and final recovery stress in the cooling phase were comparable. The
recovery stress decreased in accordance with the decrease of the contact temperature and the final
recovery stresses constrained at 120 °C and 160 °C were 40.5% and 29.2% from the recovery stress in
the specimen under initially restraint condition.
Figure 11. Comparison of FSMA‐C’s temperature‐recovery stress curves under partial restraint; (a)
Heating, (b) Cooling
(a) Heating (b) Cooling
Figure 10. Comparison of FSMA-A’s temperature-recovery stress curves under partial restraint;(a) Heating; (b) Cooling
Appl. Sci. 2020, 10, x FOR PEER REVIEW 13 of 18
constrained at 120 °C and 160 °C after cooling were 173 MPa and 114 MPa which are roughly 33.5%
and 22.1% of the value compared to the value from the one under the rigid restraint.
(a) Heating (b) Cooling
Figure 10. Comparison of FSMA‐A’s temperature‐recovery stress curves under partial restraint; (a)
Heating; (b) Cooling
In the case of the FSMA‐C specimen, the recovery strains constrained at 120 °C and 160 °C during heating were 0.00692 and 0.01088. Also, the recovery strain constrained at 200 °C was 0.01531 which
is 77.4% of the recovery strain under the free restraint. Like the FSMA‐A specimen, the recovery strain
increased when the contact temperature mounted. As shown in Figure 11a, the stresses in the
specimen constrained at 120 °C and 160 °C were 105 MPa and 81 MPa when the heating temperature
arrived at 200 °C. The recovery strain (𝜎 , ) decreased as the contact temperature increased.
However, short‐term relaxation developed in accordance with the variation in the maximum
recovery stress (𝜎 ) and final recovery stress (𝜎 ). The maximum recovery stresses constrained at 120 °C and 160 °C in heating were 351 MPa and 325 MPa. Subsequently, the final recovery stresses
became 310 MPa and 273 MPa. As the contact temperature increased, the maximum recovery stress
and final recovery stress decreased. In the cooling phase, the recovery strains for the FSMA‐C
specimen constrained at 120 °C and 160 °C were 0.01769 and 0.01852 which are nearly 89.5% and
93.7% of the value compared to the values under free restraint. As described in Figure 11b, the
maximum recovery stress and final recovery stress in the cooling phase were comparable. The
recovery stress decreased in accordance with the decrease of the contact temperature and the final
recovery stresses constrained at 120 °C and 160 °C were 40.5% and 29.2% from the recovery stress in
the specimen under initially restraint condition.
Figure 11. Comparison of FSMA‐C’s temperature‐recovery stress curves under partial restraint; (a)
Heating, (b) Cooling
(a) Heating (b) Cooling
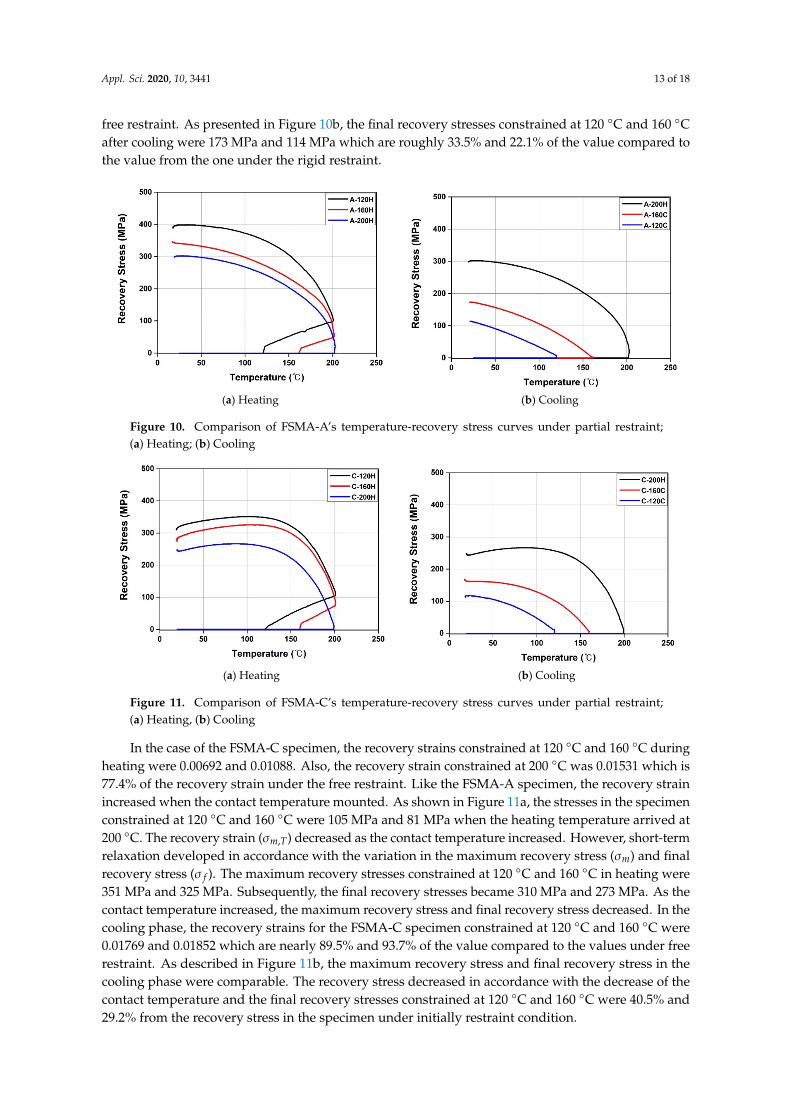
Figure 11. Comparison of FSMA-C’s temperature-recovery stress curves under partial restraint;(a) Heating, (b) Cooling
In the case of the FSMA-C specimen, the recovery strains constrained at 120 ◦C and 160 ◦C duringheating were 0.00692 and 0.01088. Also, the recovery strain constrained at 200 ◦C was 0.01531 which is77.4% of the recovery strain under the free restraint. Like the FSMA-A specimen, the recovery strainincreased when the contact temperature mounted. As shown in Figure 11a, the stresses in the specimenconstrained at 120 ◦C and 160 ◦C were 105 MPa and 81 MPa when the heating temperature arrived at200 ◦C. The recovery strain (σm,T) decreased as the contact temperature increased. However, short-termrelaxation developed in accordance with the variation in the maximum recovery stress (σm) and finalrecovery stress (σ f ). The maximum recovery stresses constrained at 120 ◦C and 160 ◦C in heating were351 MPa and 325 MPa. Subsequently, the final recovery stresses became 310 MPa and 273 MPa. As thecontact temperature increased, the maximum recovery stress and final recovery stress decreased. In thecooling phase, the recovery strains for the FSMA-C specimen constrained at 120 ◦C and 160 ◦C were0.01769 and 0.01852 which are nearly 89.5% and 93.7% of the value compared to the values under freerestraint. As described in Figure 11b, the maximum recovery stress and final recovery stress in thecooling phase were comparable. The recovery stress decreased in accordance with the decrease of thecontact temperature and the final recovery stresses constrained at 120 ◦C and 160 ◦C were 40.5% and29.2% from the recovery stress in the specimen under initially restraint condition.
Appl. Sci. 2020, 10, 3441 14 of 18
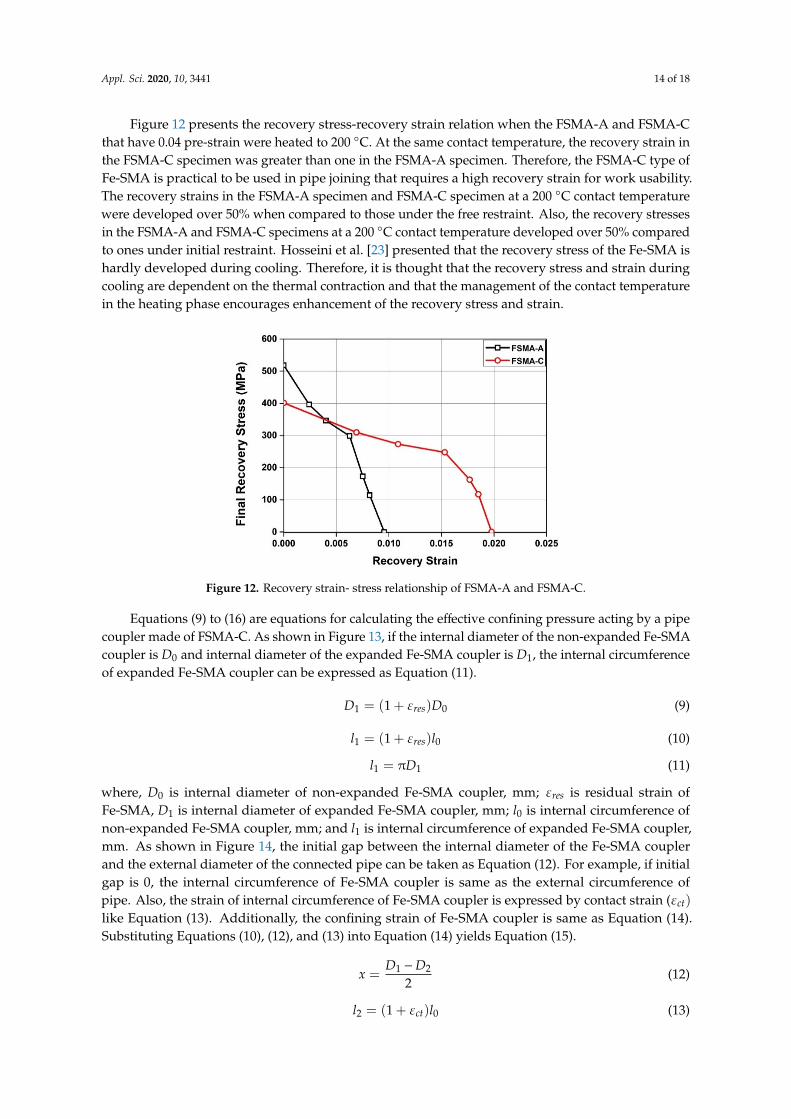
Figure 12 presents the recovery stress-recovery strain relation when the FSMA-A and FSMA-Cthat have 0.04 pre-strain were heated to 200 ◦C. At the same contact temperature, the recovery strain inthe FSMA-C specimen was greater than one in the FSMA-A specimen. Therefore, the FSMA-C type ofFe-SMA is practical to be used in pipe joining that requires a high recovery strain for work usability.The recovery strains in the FSMA-A specimen and FSMA-C specimen at a 200 ◦C contact temperaturewere developed over 50% when compared to those under the free restraint. Also, the recovery stressesin the FSMA-A and FSMA-C specimens at a 200 ◦C contact temperature developed over 50% comparedto ones under initial restraint. Hosseini et al. [23] presented that the recovery stress of the Fe-SMA ishardly developed during cooling. Therefore, it is thought that the recovery stress and strain duringcooling are dependent on the thermal contraction and that the management of the contact temperaturein the heating phase encourages enhancement of the recovery stress and strain.
Appl. Sci. 2020, 10, x FOR PEER REVIEW 14 of 18
Figure 12 presents the recovery stress‐recovery strain relation when the FSMA‐A and FSMA‐C
that have 0.04 pre‐strain were heated to 200 °C. At the same contact temperature, the recovery strain
in the FSMA‐C specimen was greater than one in the FSMA‐A specimen. Therefore, the FSMA‐C type
of Fe‐SMA is practical to be used in pipe joining that requires a high recovery strain for work
usability. The recovery strains in the FSMA‐A specimen and FSMA‐C specimen at a 200 °C contact temperature were developed over 50% when compared to those under the free restraint. Also, the
recovery stresses in the FSMA‐A and FSMA‐C specimens at a 200 °C contact temperature developed
over 50% compared to ones under initial restraint. Hosseini et al. [23] presented that the recovery
stress of the Fe‐SMA is hardly developed during cooling. Therefore, it is thought that the recovery
stress and strain during cooling are dependent on the thermal contraction and that the management
of the contact temperature in the heating phase encourages enhancement of the recovery stress and
strain.
Figure 12. Recovery strain‐ stress relationship of FSMA‐A and FSMA‐C.
Equations (9) to (16) are equations for calculating the effective confining pressure acting by a
pipe coupler made of FSMA‐C. As shown in Figure 13, if the internal diameter of the non‐expanded
Fe‐SMA coupler is 𝐷 and internal diameter of the expanded Fe‐SMA coupler is 𝐷 , the internal
circumference of expanded Fe‐SMA coupler can be expressed as Equation (11).
Figure 13. Expanded Fe‐SMA coupler for pre‐straining.
𝐷 1 𝜀 𝐷 (9)
𝑙 1 𝜀 𝑙 (10)
𝑙 π𝐷 (11)
where, 𝐷 is internal diameter of non‐expanded Fe‐SMA coupler, mm; 𝜀 is residual strain of Fe‐
SMA, 𝐷 is internal diameter of expanded Fe‐SMA coupler, mm; 𝑙 is internal circumference of
Figure 12. Recovery strain- stress relationship of FSMA-A and FSMA-C.
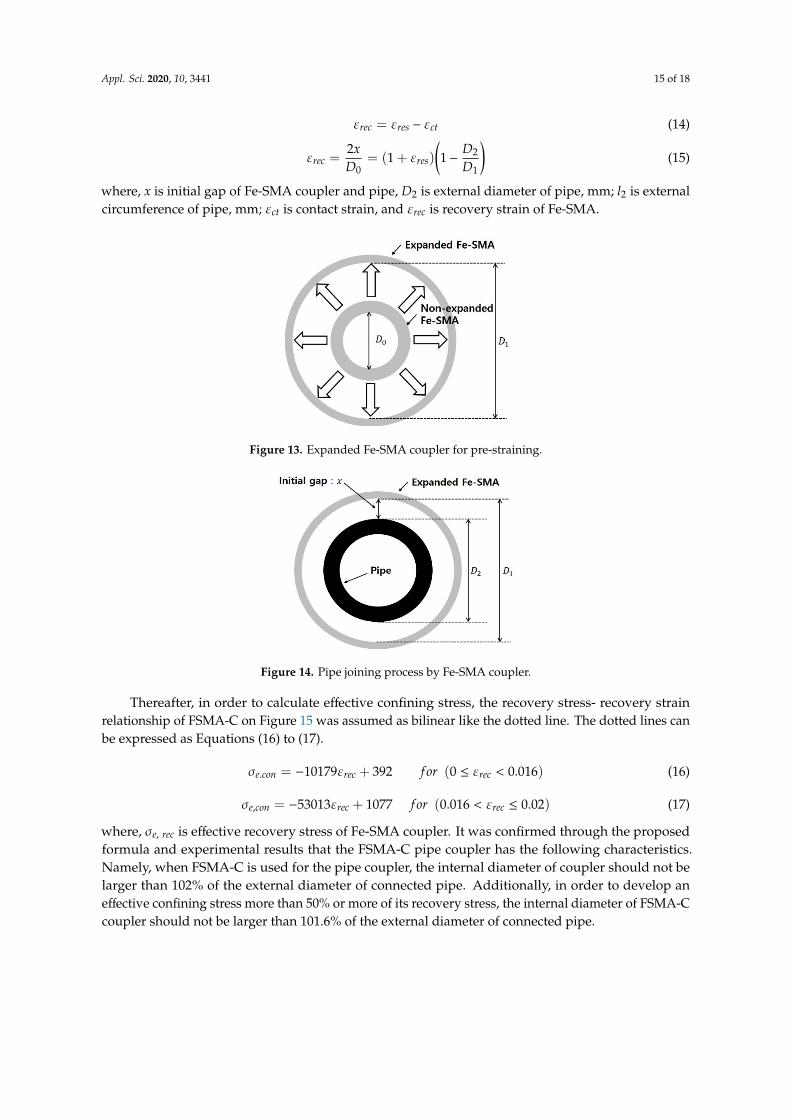
Equations (9) to (16) are equations for calculating the effective confining pressure acting by a pipecoupler made of FSMA-C. As shown in Figure 13, if the internal diameter of the non-expanded Fe-SMAcoupler is D0 and internal diameter of the expanded Fe-SMA coupler is D1, the internal circumferenceof expanded Fe-SMA coupler can be expressed as Equation (11).
D1 = (1 + εres)D0 (9)
l1 = (1 + εres)l0 (10)
l1 = πD1 (11)
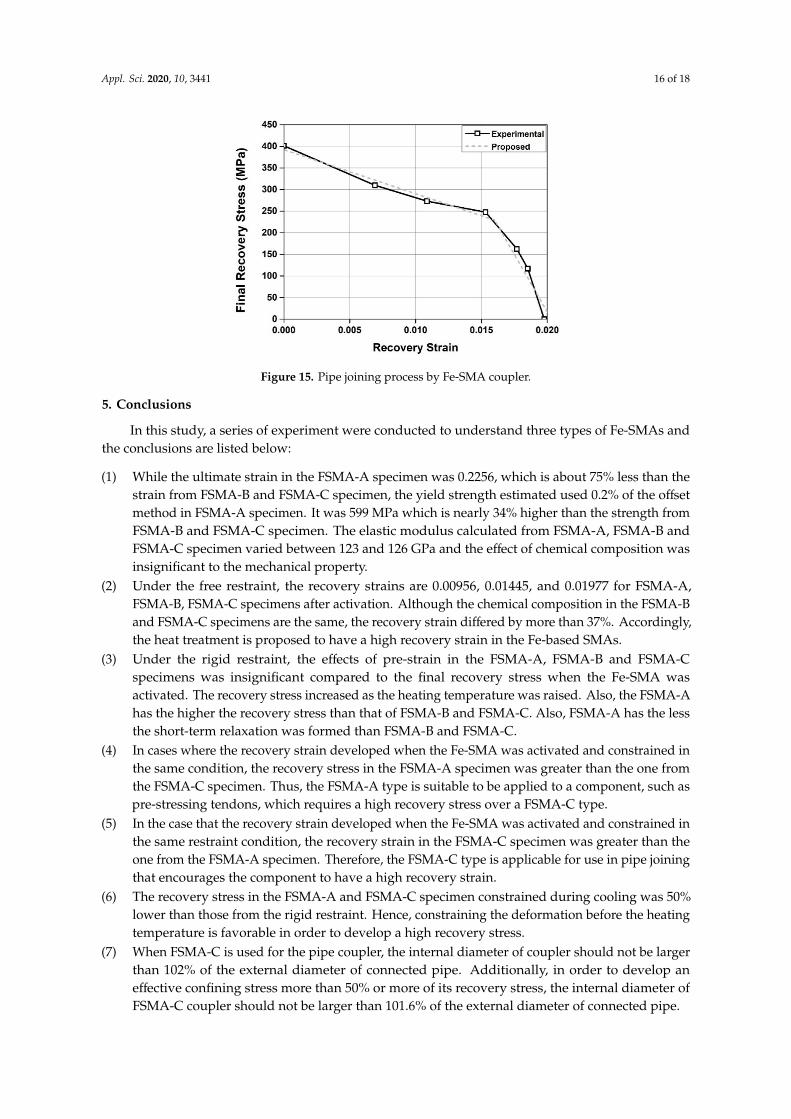
where, D0 is internal diameter of non-expanded Fe-SMA coupler, mm; εres is residual strain ofFe-SMA, D1 is internal diameter of expanded Fe-SMA coupler, mm; l0 is internal circumference ofnon-expanded Fe-SMA coupler, mm; and l1 is internal circumference of expanded Fe-SMA coupler,mm. As shown in Figure 14, the initial gap between the internal diameter of the Fe-SMA couplerand the external diameter of the connected pipe can be taken as Equation (12). For example, if initialgap is 0, the internal circumference of Fe-SMA coupler is same as the external circumference ofpipe. Also, the strain of internal circumference of Fe-SMA coupler is expressed by contact strain (εct)
like Equation (13). Additionally, the confining strain of Fe-SMA coupler is same as Equation (14).Substituting Equations (10), (12), and (13) into Equation (14) yields Equation (15).
x =D1 −D2
2(12)
l2 = (1 + εct)l0 (13)
Appl. Sci. 2020, 10, 3441 15 of 18
εrec = εres − εct (14)
εrec =2xD0
= (1 + εres)
(1−
D2
D1
)(15)
where, x is initial gap of Fe-SMA coupler and pipe, D2 is external diameter of pipe, mm; l2 is externalcircumference of pipe, mm; εct is contact strain, and εrec is recovery strain of Fe-SMA.
Appl. Sci. 2020, 10, x FOR PEER REVIEW 14 of 18
Figure 12 presents the recovery stress‐recovery strain relation when the FSMA‐A and FSMA‐C
that have 0.04 pre‐strain were heated to 200 °C. At the same contact temperature, the recovery strain
in the FSMA‐C specimen was greater than one in the FSMA‐A specimen. Therefore, the FSMA‐C type
of Fe‐SMA is practical to be used in pipe joining that requires a high recovery strain for work
usability. The recovery strains in the FSMA‐A specimen and FSMA‐C specimen at a 200 °C contact temperature were developed over 50% when compared to those under the free restraint. Also, the
recovery stresses in the FSMA‐A and FSMA‐C specimens at a 200 °C contact temperature developed
over 50% compared to ones under initial restraint. Hosseini et al. [23] presented that the recovery
stress of the Fe‐SMA is hardly developed during cooling. Therefore, it is thought that the recovery
stress and strain during cooling are dependent on the thermal contraction and that the management
of the contact temperature in the heating phase encourages enhancement of the recovery stress and
strain.
Figure 12. Recovery strain‐ stress relationship of FSMA‐A and FSMA‐C.
Equations (9) to (16) are equations for calculating the effective confining pressure acting by a
pipe coupler made of FSMA‐C. As shown in Figure 13, if the internal diameter of the non‐expanded
Fe‐SMA coupler is 𝐷 and internal diameter of the expanded Fe‐SMA coupler is 𝐷 , the internal
circumference of expanded Fe‐SMA coupler can be expressed as Equation (11).
Figure 13. Expanded Fe‐SMA coupler for pre‐straining.
𝐷 1 𝜀 𝐷 (9)
𝑙 1 𝜀 𝑙 (10)
𝑙 π𝐷 (11)
where, 𝐷 is internal diameter of non‐expanded Fe‐SMA coupler, mm; 𝜀 is residual strain of Fe‐
SMA, 𝐷 is internal diameter of expanded Fe‐SMA coupler, mm; 𝑙 is internal circumference of
Figure 13. Expanded Fe-SMA coupler for pre-straining.
Appl. Sci. 2020, 10, x FOR PEER REVIEW 15 of 18
non‐expanded Fe‐SMA coupler, mm; and 𝑙 is internal circumference of expanded Fe‐SMA coupler,
mm;. As shown in Figure 14, the initial gap between the internal diameter of the Fe‐SMA coupler and
the external diameter of the connected pipe can be taken as Equation (12). For example, if initial gap
is 0, the internal circumference of Fe‐SMA coupler is same as the external circumference of pipe. Also,
the strain of internal circumference of Fe‐SMA coupler is expressed by contact strain (𝜀 like
Equation (13). Additionally, the confining strain of Fe‐SMA coupler is same as Equation (14).
Substituting Equations (10), (12), and (13) into Equation (14) yields Equation (15).
Figure 14. Pipe joining process by Fe‐SMA coupler.
𝑥𝐷 𝐷
2 (12)
𝑙 1 𝜀 𝑙 (13)
𝜀 𝜀 𝜀 (14)
𝜀 2𝑥𝐷
1 𝜀 1𝐷𝐷
(15)
where, 𝑥 is initial gap of Fe‐SMA coupler and pipe, 𝐷 is external diameter of pipe, mm; 𝑙 is external circumference of pipe, mm; 𝜀 is contact strain, and 𝜀 is recovery strain of Fe‐SMA.
Thereafter, in order to calculate effective confining stress, the recovery stress‐ recovery strain
relationship of FSMA‐C on Figure 15 was assumed as bilinear like the dotted line. The dotted lines
can be expressed as Equations (16) to (17).
Figure 15. Pipe joining process by Fe‐SMA coupler.
𝜎 . 10179𝜀 392 𝑓𝑜𝑟 0 𝜀 0.016 (16)
𝜎 , 53013𝜀 1077 𝑓𝑜𝑟 0.016 𝜀 0.02 (17)
Figure 14. Pipe joining process by Fe-SMA coupler.
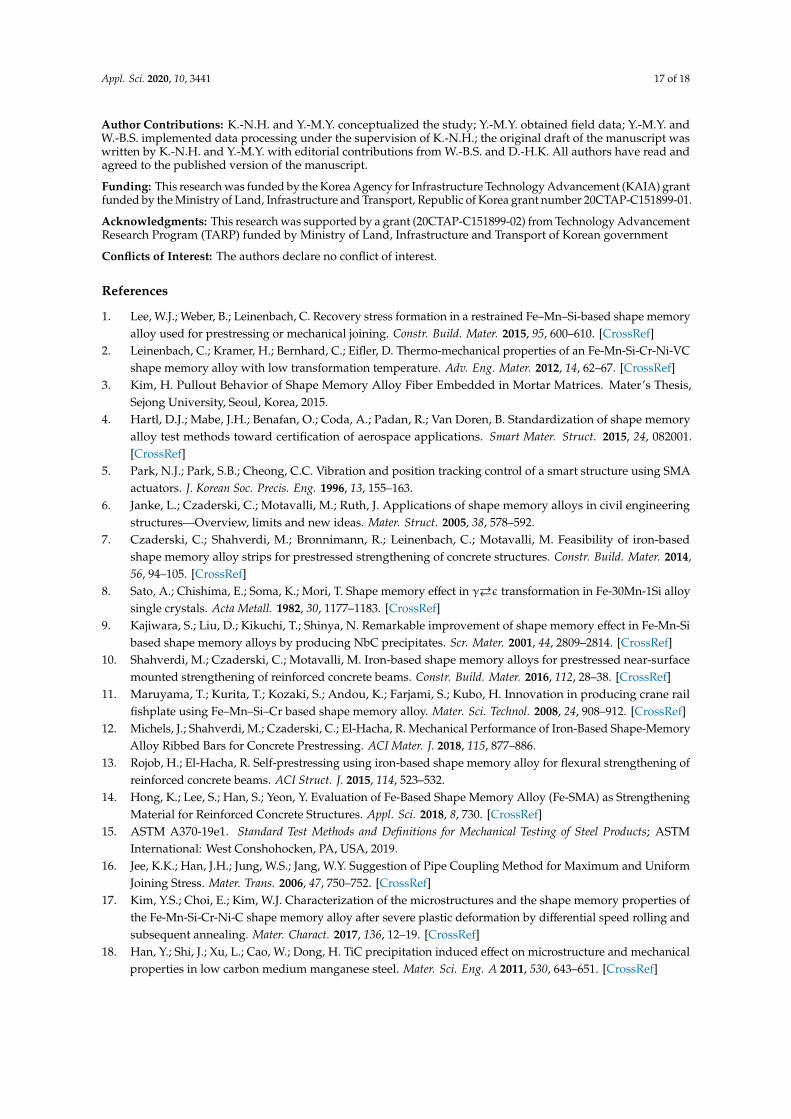
Thereafter, in order to calculate effective confining stress, the recovery stress- recovery strainrelationship of FSMA-C on Figure 15 was assumed as bilinear like the dotted line. The dotted lines canbe expressed as Equations (16) to (17).
σe.con = −10179εrec + 392 f or (0 ≤ εrec < 0.016) (16)
σe,con = −53013εrec + 1077 f or (0.016 < εrec ≤ 0.02) (17)
where, σe, rec is effective recovery stress of Fe-SMA coupler. It was confirmed through the proposedformula and experimental results that the FSMA-C pipe coupler has the following characteristics.Namely, when FSMA-C is used for the pipe coupler, the internal diameter of coupler should not belarger than 102% of the external diameter of connected pipe. Additionally, in order to develop aneffective confining stress more than 50% or more of its recovery stress, the internal diameter of FSMA-Ccoupler should not be larger than 101.6% of the external diameter of connected pipe.
Appl. Sci. 2020, 10, 3441 16 of 18
Appl. Sci. 2020, 10, x FOR PEER REVIEW 15 of 18
non‐expanded Fe‐SMA coupler, mm; and 𝑙 is internal circumference of expanded Fe‐SMA coupler,
mm;. As shown in Figure 14, the initial gap between the internal diameter of the Fe‐SMA coupler and
the external diameter of the connected pipe can be taken as Equation (12). For example, if initial gap
is 0, the internal circumference of Fe‐SMA coupler is same as the external circumference of pipe. Also,
the strain of internal circumference of Fe‐SMA coupler is expressed by contact strain (𝜀 like
Equation (13). Additionally, the confining strain of Fe‐SMA coupler is same as Equation (14).
Substituting Equations (10), (12), and (13) into Equation (14) yields Equation (15).
Figure 14. Pipe joining process by Fe‐SMA coupler.
𝑥𝐷 𝐷
2 (12)
𝑙 1 𝜀 𝑙 (13)
𝜀 𝜀 𝜀 (14)
𝜀 2𝑥𝐷
1 𝜀 1𝐷𝐷
(15)
where, 𝑥 is initial gap of Fe‐SMA coupler and pipe, 𝐷 is external diameter of pipe, mm; 𝑙 is external circumference of pipe, mm; 𝜀 is contact strain, and 𝜀 is recovery strain of Fe‐SMA.
Thereafter, in order to calculate effective confining stress, the recovery stress‐ recovery strain
relationship of FSMA‐C on Figure 15 was assumed as bilinear like the dotted line. The dotted lines
can be expressed as Equations (16) to (17).
Figure 15. Pipe joining process by Fe‐SMA coupler.
𝜎 . 10179𝜀 392 𝑓𝑜𝑟 0 𝜀 0.016 (16)
𝜎 , 53013𝜀 1077 𝑓𝑜𝑟 0.016 𝜀 0.02 (17)
Figure 15. Pipe joining process by Fe-SMA coupler.
5. Conclusions
In this study, a series of experiment were conducted to understand three types of Fe-SMAs andthe conclusions are listed below:
(1) While the ultimate strain in the FSMA-A specimen was 0.2256, which is about 75% less than thestrain from FSMA-B and FSMA-C specimen, the yield strength estimated used 0.2% of the offsetmethod in FSMA-A specimen. It was 599 MPa which is nearly 34% higher than the strength fromFSMA-B and FSMA-C specimen. The elastic modulus calculated from FSMA-A, FSMA-B andFSMA-C specimen varied between 123 and 126 GPa and the effect of chemical composition wasinsignificant to the mechanical property.
(2) Under the free restraint, the recovery strains are 0.00956, 0.01445, and 0.01977 for FSMA-A,FSMA-B, FSMA-C specimens after activation. Although the chemical composition in the FSMA-Band FSMA-C specimens are the same, the recovery strain differed by more than 37%. Accordingly,the heat treatment is proposed to have a high recovery strain in the Fe-based SMAs.
(3) Under the rigid restraint, the effects of pre-strain in the FSMA-A, FSMA-B and FSMA-Cspecimens was insignificant compared to the final recovery stress when the Fe-SMA wasactivated. The recovery stress increased as the heating temperature was raised. Also, the FSMA-Ahas the higher the recovery stress than that of FSMA-B and FSMA-C. Also, FSMA-A has the lessthe short-term relaxation was formed than FSMA-B and FSMA-C.
(4) In cases where the recovery strain developed when the Fe-SMA was activated and constrained inthe same condition, the recovery stress in the FSMA-A specimen was greater than the one fromthe FSMA-C specimen. Thus, the FSMA-A type is suitable to be applied to a component, such aspre-stressing tendons, which requires a high recovery stress over a FSMA-C type.
(5) In the case that the recovery strain developed when the Fe-SMA was activated and constrained inthe same restraint condition, the recovery strain in the FSMA-C specimen was greater than theone from the FSMA-A specimen. Therefore, the FSMA-C type is applicable for use in pipe joiningthat encourages the component to have a high recovery strain.
(6) The recovery stress in the FSMA-A and FSMA-C specimen constrained during cooling was 50%lower than those from the rigid restraint. Hence, constraining the deformation before the heatingtemperature is favorable in order to develop a high recovery stress.
(7) When FSMA-C is used for the pipe coupler, the internal diameter of coupler should not be largerthan 102% of the external diameter of connected pipe. Additionally, in order to develop aneffective confining stress more than 50% or more of its recovery stress, the internal diameter ofFSMA-C coupler should not be larger than 101.6% of the external diameter of connected pipe.
Appl. Sci. 2020, 10, 3441 17 of 18
Author Contributions: K.-N.H. and Y.-M.Y. conceptualized the study; Y.-M.Y. obtained field data; Y.-M.Y. andW.-B.S. implemented data processing under the supervision of K.-N.H.; the original draft of the manuscript waswritten by K.-N.H. and Y.-M.Y. with editorial contributions from W.-B.S. and D.-H.K. All authors have read andagreed to the published version of the manuscript.
Funding: This research was funded by the Korea Agency for Infrastructure Technology Advancement (KAIA) grantfunded by the Ministry of Land, Infrastructure and Transport, Republic of Korea grant number 20CTAP-C151899-01.
Acknowledgments: This research was supported by a grant (20CTAP-C151899-02) from Technology AdvancementResearch Program (TARP) funded by Ministry of Land, Infrastructure and Transport of Korean government
Conflicts of Interest: The authors declare no conflict of interest.
References
1. Lee, W.J.; Weber, B.; Leinenbach, C. Recovery stress formation in a restrained Fe–Mn–Si-based shape memoryalloy used for prestressing or mechanical joining. Constr. Build. Mater. 2015, 95, 600–610. [CrossRef]
2. Leinenbach, C.; Kramer, H.; Bernhard, C.; Eifler, D. Thermo-mechanical properties of an Fe-Mn-Si-Cr-Ni-VCshape memory alloy with low transformation temperature. Adv. Eng. Mater. 2012, 14, 62–67. [CrossRef]
3. Kim, H. Pullout Behavior of Shape Memory Alloy Fiber Embedded in Mortar Matrices. Mater’s Thesis,Sejong University, Seoul, Korea, 2015.
4. Hartl, D.J.; Mabe, J.H.; Benafan, O.; Coda, A.; Padan, R.; Van Doren, B. Standardization of shape memoryalloy test methods toward certification of aerospace applications. Smart Mater. Struct. 2015, 24, 082001.[CrossRef]
5. Park, N.J.; Park, S.B.; Cheong, C.C. Vibration and position tracking control of a smart structure using SMAactuators. J. Korean Soc. Precis. Eng. 1996, 13, 155–163.
6. Janke, L.; Czaderski, C.; Motavalli, M.; Ruth, J. Applications of shape memory alloys in civil engineeringstructures—Overview, limits and new ideas. Mater. Struct. 2005, 38, 578–592.
7. Czaderski, C.; Shahverdi, M.; Bronnimann, R.; Leinenbach, C.; Motavalli, M. Feasibility of iron-basedshape memory alloy strips for prestressed strengthening of concrete structures. Constr. Build. Mater. 2014,56, 94–105. [CrossRef]
8. Sato, A.; Chishima, E.; Soma, K.; Mori, T. Shape memory effect in γ�ε transformation in Fe-30Mn-1Si alloysingle crystals. Acta Metall. 1982, 30, 1177–1183. [CrossRef]
9. Kajiwara, S.; Liu, D.; Kikuchi, T.; Shinya, N. Remarkable improvement of shape memory effect in Fe-Mn-Sibased shape memory alloys by producing NbC precipitates. Scr. Mater. 2001, 44, 2809–2814. [CrossRef]
10. Shahverdi, M.; Czaderski, C.; Motavalli, M. Iron-based shape memory alloys for prestressed near-surfacemounted strengthening of reinforced concrete beams. Constr. Build. Mater. 2016, 112, 28–38. [CrossRef]
11. Maruyama, T.; Kurita, T.; Kozaki, S.; Andou, K.; Farjami, S.; Kubo, H. Innovation in producing crane railfishplate using Fe–Mn–Si–Cr based shape memory alloy. Mater. Sci. Technol. 2008, 24, 908–912. [CrossRef]
12. Michels, J.; Shahverdi, M.; Czaderski, C.; El-Hacha, R. Mechanical Performance of Iron-Based Shape-MemoryAlloy Ribbed Bars for Concrete Prestressing. ACI Mater. J. 2018, 115, 877–886.
13. Rojob, H.; El-Hacha, R. Self-prestressing using iron-based shape memory alloy for flexural strengthening ofreinforced concrete beams. ACI Struct. J. 2015, 114, 523–532.
14. Hong, K.; Lee, S.; Han, S.; Yeon, Y. Evaluation of Fe-Based Shape Memory Alloy (Fe-SMA) as StrengtheningMaterial for Reinforced Concrete Structures. Appl. Sci. 2018, 8, 730. [CrossRef]
15. ASTM A370-19e1. Standard Test Methods and Definitions for Mechanical Testing of Steel Products; ASTMInternational: West Conshohocken, PA, USA, 2019.
16. Jee, K.K.; Han, J.H.; Jung, W.S.; Jang, W.Y. Suggestion of Pipe Coupling Method for Maximum and UniformJoining Stress. Mater. Trans. 2006, 47, 750–752. [CrossRef]
17. Kim, Y.S.; Choi, E.; Kim, W.J. Characterization of the microstructures and the shape memory properties ofthe Fe-Mn-Si-Cr-Ni-C shape memory alloy after severe plastic deformation by differential speed rolling andsubsequent annealing. Mater. Charact. 2017, 136, 12–19. [CrossRef]
18. Han, Y.; Shi, J.; Xu, L.; Cao, W.; Dong, H. TiC precipitation induced effect on microstructure and mechanicalproperties in low carbon medium manganese steel. Mater. Sci. Eng. A 2011, 530, 643–651. [CrossRef]
Appl. Sci. 2020, 10, 3441 18 of 18
19. Wang, G.; Peng, H.; Sun, P.; Wang, S.; Wen, Y. Effect of titanium addition on shape memory effect and recoverystress of training-free cast Fe–Mn–Si–Cr–Ni shape memory alloys. Mater. Sci. Eng. A 2016, 657, 339–346.[CrossRef]
20. Shahverdi, M.; Michels, J.; Czaderski, C.; Motavalli, M. Iron-based shape memory alloy strips for strengtheningRC members: Material behavior and characterization. Constr. Build. Mater. 2018, 173, 586–599. [CrossRef]
21. Wen, Y.H.; Yan, M.; Li, N. Effects of carbon addition and aging on the shape memory effect of Fe–Mn–Si–Cr–Nialloys. Scr. Mater. 2004, 50, 441–444. [CrossRef]
22. Park, S.J.; Yim, H.J.; Kwak, H.G. Evaluation of microcracks in thermal damaged concrete using nonlinearultrasonic modulation technique. J. Korea Concr. Inst. 2012, 24, 651–658. [CrossRef]
23. Hosseini, E.; Ghafoori, E.; Leinenbach, C.; Motavalli, M.; Holdsworth, R. Stress recovery and cyclic behaviorof an Fe–Mn–Si shape memory alloy after multiple thermal activation. Smart Mater. Struct. 2018, 27, 025009.[CrossRef]
© 2020 by the authors. Licensee MDPI, Basel, Switzerland. This article is an open accessarticle distributed under the terms and conditions of the Creative Commons Attribution(CC BY) license (http://creativecommons.org/licenses/by/4.0/).