
"Abondance et précarité. Conditions de vie et alimentation des sans-abri à Tahiti"
JOURNAL OF GEOPHYSICAL RESEARCH, VOL. 95, NO. B3, PAGES 2713-2726, MARCH 10, 1990
Records of Geomagnetic Reversals From Volcanic Islands of French Polynesia 1. Paleomagnetic Study of a Polarity Transition in a Lava Sequence
From the Island of Huahine
PIERRICK ROPERCH 1,2
ORSTOM et Laboratoire de Gdophysique Interne, Universitd de Rennes I, Rennes, France
ROBERT A. DUNCAN
College of Oceanography, Oregon State University, Corvallis
We report the behavior of the earth's magnetic field for a transition recorded in lavas at the volcanic island of Huahine in French Polynesia, south-central Pacific Ocean. Detailed intermediate fields are observed that record an apparent N-N excursion. The available K-Ar ages indicate that most volcanic rocks of the southern part of Huahine erupted at a time close to the Kaena subchron. Gaps in the paleomagnetic sampling or a hiatus in the volcanic activity during the Kaena event may have led to the partial record of a complete polarity transition, missing the fully reversed state. Nevertheless, numerous flows have recorded intermediate fields that somewhat constrain reversal models. The low intensities of magnetization associated with the intermediate directions suggest that the transitional field has mainly low intensities. The beginning of the transition shows inclination steepening, consistent with a zonal model of geomagnetic field reversal based on an axial quadrupole. Large deviations from a north-south planar distribution of the intermediate directions show that non axisymmetrical nondipolar fields are important in the middle of the transition.
INTRODUCTION
In the past few years, numerous papers have been devoted to the description of the geomagnetic field during reversals. However, very few transition studies are situated in the southern hemisphere [Van Zijl et al., 1962; Clement and Kent, 1984; Hoffman, 1986] and new data are necessary to provide accurate reversal models. In addition, most of the studies of transitional fields are from
sedimentary records [Hillhouse and Cox, 1976; Valet and Laj, 1981; Valet et al., 1983; Clement and Kent, 1984; Theyet et al., 1985] and the need for volcanic records which provide accurate spot readings of the paleofield has become more apparent [Hoffman and Slade, 1986]. Some difficulties with sedimentary records of transitions are exemplified by the new study of the Lake Tecopa transition using thermal demagnetization of these sediments [Valet et al., 1988], showing that strong post-depositional overprints were not easily removed by alternating field (AF) demagnetization and hence provide an unreliable transitional path [Hilhouse and Cox, 1976].
However, volcanic records are rarely detailed enough to describe completely the reversal [Shaw, 1975; Bogue and Coe, 1982]. Except in the Steens Mountain data [Mankinen et al., 1985; Prdvot et al., 1985a,b], few intermediate directions have been observed for any transition. A common feature of the volcanic results is that a similar direction can be recorded in successive
flows, followed by large changes to another intermediate position. This can be explained either by a jerky behavior of the transitional field or, more probably, by irregularities in the extrusion rate of the flows. The fact that the magnetic field is nondipolar during
1Also at College of Oceanography, Oregon State University, Corvallis 2 Permanently at Institut Franqais de Recherche Scientifi-que pour le
D6veloppement en Coop6ration, ORSTOM, Paris, France
Copyright 1990 by the American Geophysical Union
Paper number 89JB03429. 0148-0227/90/89JB -03429 $05.00
reversals is, at the moment, the main result obtained from paleomagnetic studies of transitions. During intermediate states, a large decrease in the intensity of the field to 10 to 20% of the typi- cal nontransition value is also well documented. Statistical
analyses of magnetic polarity observed in flow sequences from Iceland suggest that the interval of time needed to complete a reversal is of the order of 5 to 6 thousands years [Kristjansson, 1985]. Estimation of the length of a transition from individual volcanic records is almost impossible. However, assuming that the flows were grossly regularly erupted did enable Mankinen et al. [1985] to quantify the length of the Steens Mountain transition based on the pattern of secular variation before and after the transition. That estimate (4,500 years) is in good agreement with the one from Iceland. In principle, sediments should provide a better insight on the length of a transition because the average sedimentation rate can generally be fairly well established. Such estimates are in the range of 1,000 to 20,000 years. Even though there is no reason to believe that all transitions have the same time
constant, the scatter in the determinations of the duration of a
reversal may also result from unrecognized variations in the sedimentation rate, and from an incomplete understanding of the recording process in some sediments.
Volcanic rocks in the Society Islands (French Polynesia) had been sampled previously for a paleomagnetic secular variation study [Duncan, 1975]. This sampling showed the existence of possible transition zones in the island of Huahine and in the island of Tahiti. Here, we will report only a detailed paleomagnetic study of the island of Huahine. New results from the island of Tahiti are
being published in a second paper [Chauvin et al., this issue].
GEOMORPHOLOGY AND GEOLOGICAL SETYING
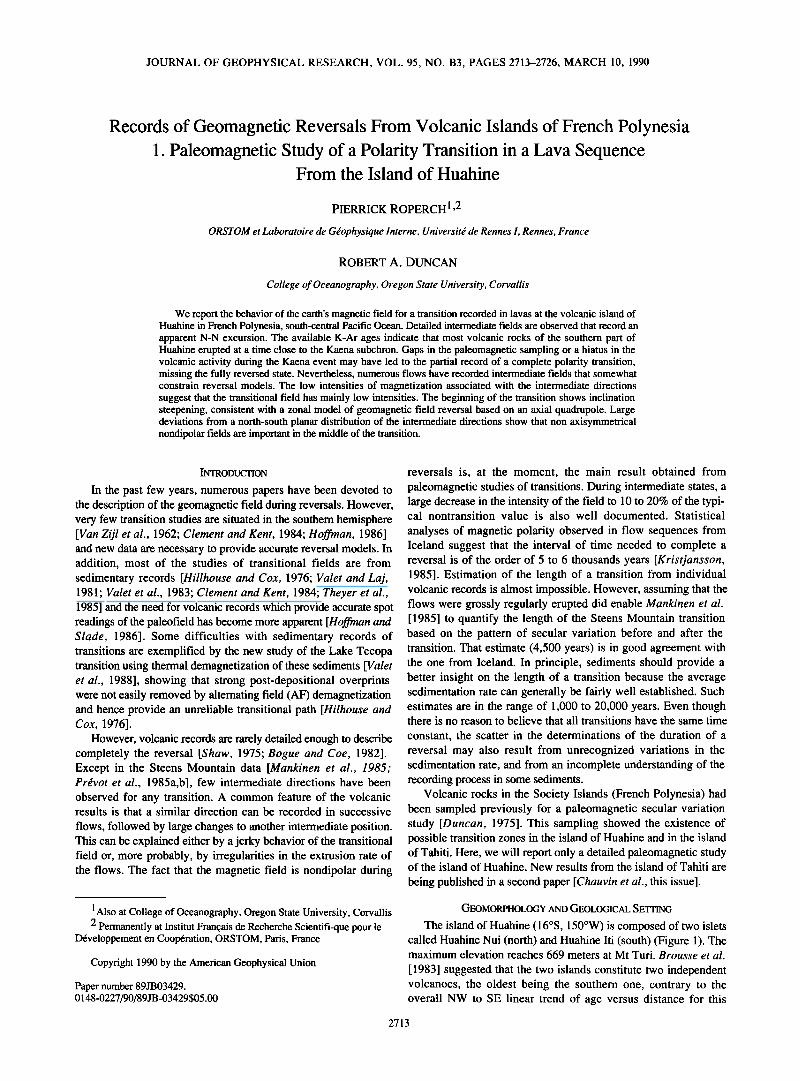
The island of Huahine (16øS, 150øW) is composed of two islets called Huahine Nui (north) and Huahine Iti (south) (Figure 1). The maximum elevation reaches 669 meters at Mt Turi. Brousse et al.
[1983] suggested that the two islands constitute two independent volcanoes, the oldest being the southern one, contrary to the overall NW to SE linear trend of age versus distance for this
2713
2714 ROPERCH AND DUNCAN: GEOMAGNETIC REVERSALS, FRENCH POLYNESIA, 1
•/l\-
SOCIETY ISLANDS
/• • Huahine
,.•l "5'' ' e-•\ •\ i I i I1'"•1•,/ /\
.•'•, •.½' .............
- • ' MAHUTI
Bay
• % Tahiti 18øS 150oW 148øW
, 2 km •
Fig. 1. A detailed paleomagnetic sampling program was carried out in the southern part of the island of Huahine near the Mahuti bay (indicated by the shaded area, see Figure 2). The attitudes of the flows for the southern island Huahine Iti show clearly a cone-shaped volcano. Dots indicate the paleomagnetic sampling sites outside the shaded area.
volcanic lineament [Duncan and McDougall, 1976]. These Hawaiian type volcanoes are composed mostly of flows averaging one meter in thickness and dipping 5 to 10 ø away from the eruptive centers. The flow sequences are often cut by vertical dikes and occasionally small horizontal sills are interbedded. Vegetation and extensive tropical weathering limited the possibilities for paleomagnetic sampling, which was confined to coastal cliffs or stream canyons.
GEOCHRONOLOGY
The first K-Ar radiometric results from Huahine were obtained
by Krummenacher and Noetzlin [ 1966] which suggested a time span from 1.9 to 5.4 Ma. A more complete geochronological
study [Duncan and McDougall, 1976] showed less dispersed ages from 2.01 to 2.58 Ma. New age determinations extend the time of earliest subaerial volcanism to around 3.0 Ma for the southern part of the island (Table 1).
Samples were provided from the paleomagnetic minicores. Some 5-6 g of fresh rock chips (0.1-1.0 mm) were ultrasonically washed in distilled water, dried and loaded in molybdenum crucibles in high-vacuum glass lines. Sample argon was extracted by radio frequency fusion, spiked with 38Ar, and measured with an AEI MS-10S mass spectrometer, according to conventional methods described by Dalrymple and Lamphere [ 1969]. Potassium contents were measured by atomic absorption spectrophotometry from powdered splits of the crushed samples.
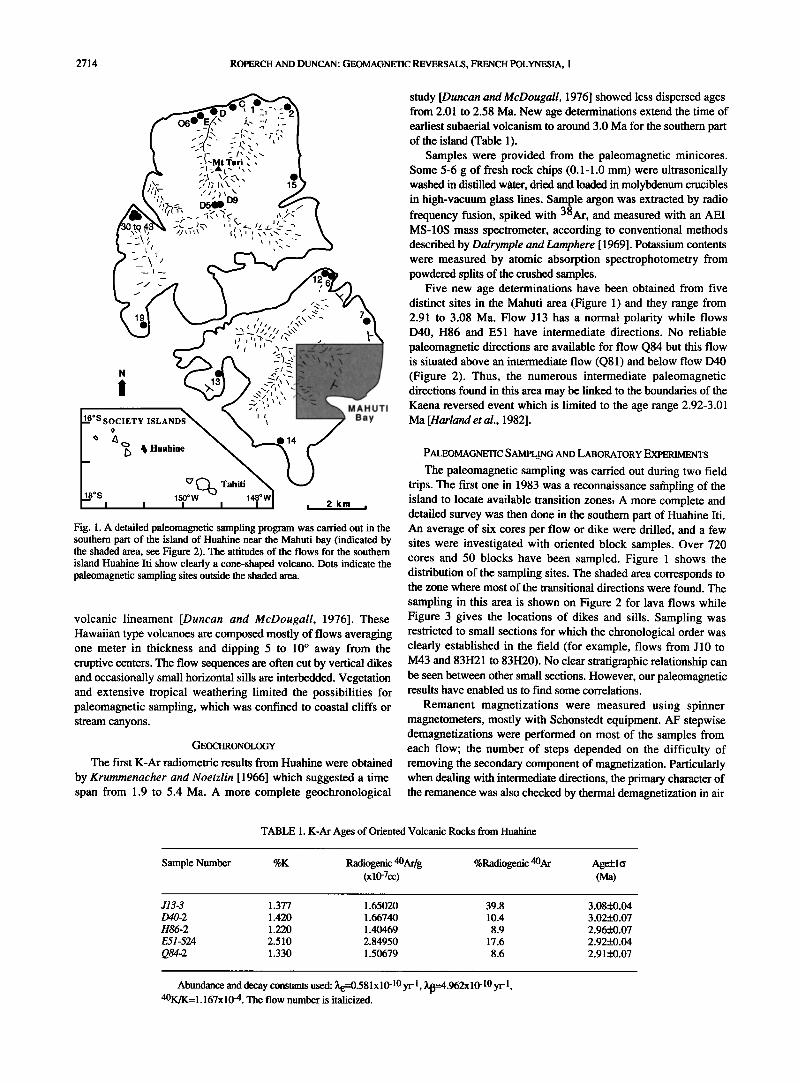
Five new age determinations have been obtained from five distinct sites in the Mahuti area (Figure 1) and they range from 2.91 to 3.08 Ma. Flow J13 has a normal polarity while flows D40, H86 and E51 have intermediate directions. No reliable
paleomagnetic directions are available for flow Q84 but this flow is situated above an intermediate flow (Q81) and below flow D40 (Figure 2). Thus, the numerous intermediate paleomagnetic directions found in this area may be linked to the boundaries of the Kaena reversed event which is limited to the age range 2.92-3.01 Ma [Harland et al., 1982].
PALEOMAGNETIC SAMPLING AND LABORATORY EXPERIMENTS
The paleomagnetic sampling was carried out during two field trips. The first one in 1983 was a reconnaissance sampling of the island to locate available transition zones• A more complete and detailed survey was then done in the southern part of Huahine Iti. An average of six cores per flow or dike were drilled, and a few sites were investigated with oriented block samples. Over 720 cores and 50 blocks have been sampled. Figure 1 shows the distribution of the sampling sites. The shaded area corresponds to the zone where most of the transitional directions were found. The
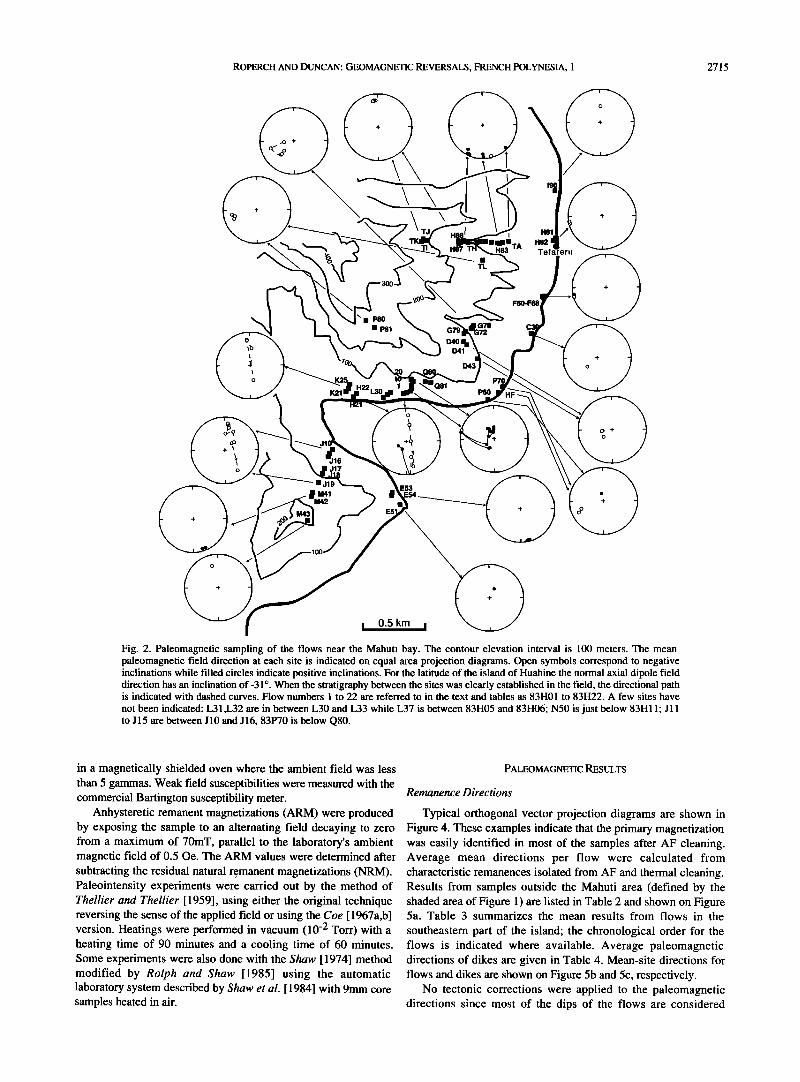
sampling in this area is shown on Figure 2 for lava flows while Figure 3 gives the locations of dikes and sills. Sampling was restricted to small sections for which the chronological order was clearly established in the field (for example, flows from J10 to M43 and 83H21 to 83H20). No clear stratigraphic relationship can be seen between other small sections. However, our paleomagnetic results have enabled us to find some correlations.
Remanent magnetizations were measured using spinner magnetometers, mostly with Schonstedt equipment. AF stepwise demagnetizations were performed on most of the samples from each flow; the number of steps depended on the difficulty of removing the secondary component of magnetization. Particularly when dealing with intermediate directions, the primary character of the remanence was also checked by thermal demagnetization in air
TABLE 1. K-Ar Ages of Oriented Volcanic Rocks from Huahine
Sample Number %K Radiogenic 40Ar/g %Radiogenic 40Ar (x10-7cc)
J13-3 1.377 1.65020 39.8 D40-2 1.420 1.66740 10.4 H86-2 1.220 1.40469 8.9 E51-524 2.510 2.84950 17.6
Q84-2 1.330 1.50679 8.6
Abundance and decay constants used: )h70.58 lx10 -10 yr -1, •[•--4.962x10 -10 yr -1, 40K/K= 1.167x 10 -4. The flow number is italicized.
Age_+1o (Ma)
3.08+0.04
3.02+0.07
2.96+0.07
2.92+0.04
2.91+0.07
ROPERCH AND DUNCAN: GEOMAGNETIC REVERSALS, FRENCH POLYNESIA, 1 2715
300-
P80
• ß P81 G70
I .82_• __ • Tefarerii •
F60-F68
Q81
4-
D43 o
K21 P60
J17
I 0
i• I M41 E53 M42 •---___• +
ß
4-
I 0.5 km I
Fig. 2. Paleomagnetic sampling of the flows near the Mahuti bay. The contour elevation interval is 100 meters. The mean paleomagnetic field direction at each site is indicated on equal area projection diagrams. Open symbols correspond to negative inclinations while filled circles indicate positive inclinations. For the latitude of the island of Huahine the normal axial dipole field direction has an inclination of -31 ø. When the stratigraphy between the sites was clearly established in the field, the directional path is indicated with dashed curves. Flow numbers 1 to 22 are referred to in the text and tables as 83H01 to 83H22. A few sites have
not been indicated: L31,L32 are in between L30 and L33 while L37 is between 83H05 and 83H06; N50 is just below 83H11; J11 to J15 are between J10 and J16, 83P70 is below Q80.
in a magnetically shielded oven where the ambient field was less PALEOMAGNETIC RESULTS than 5 gammas. Weak field susceptibilities were measured with the commercial Bartington susceptibility meter. Remanence Directions
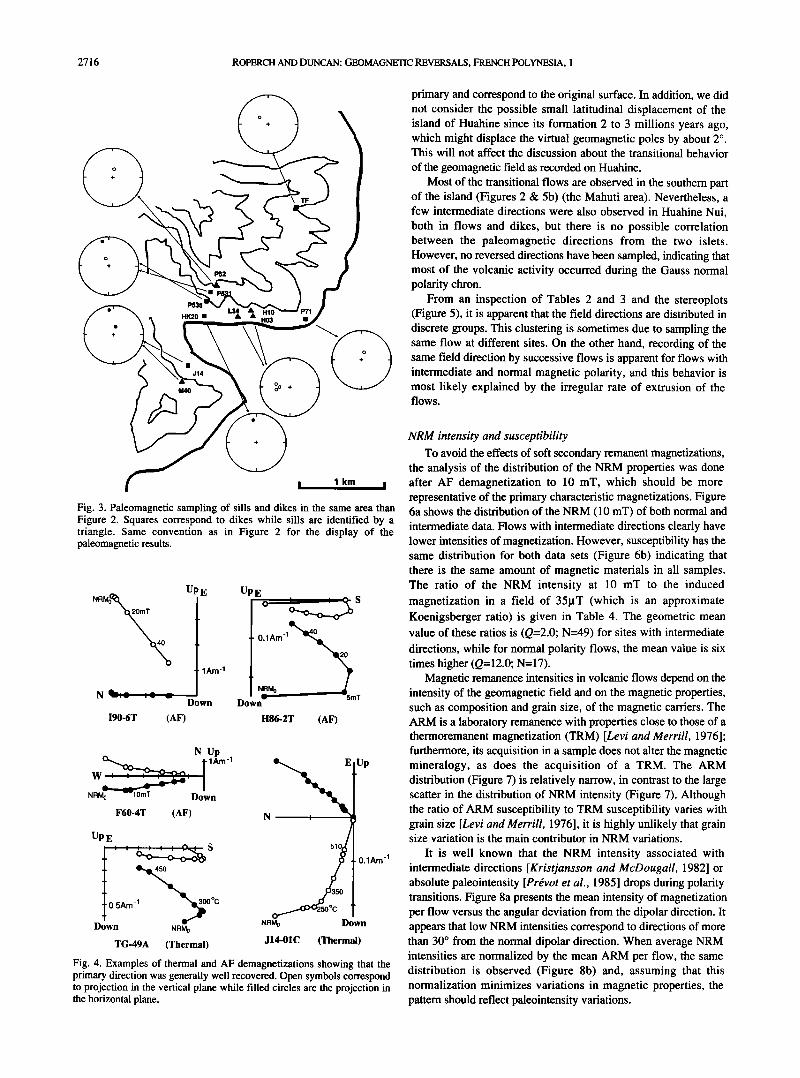
Anhysteretic remanent magnetizations (ARM)were produced Typical orthogonal vector projection diagrams are shown in by exposing the sample to an alternating field decaying to zero Figure 4. These examples indicate that the primary magnetization from a maximum of 70mT, parallel to the laboratory's ambient was easily identified in most of the samples after AF cleaning. magnetic field of 0.50e. The ARM values were determined after Average mean directions per flow were calculated from subtracting the residual natural remanent magnetizations (NRM). Paleointensity experiments were carried out by the method of Thellier and Thellier [1959], using either the original technique reversing the sense of the applied field or using the Coe [ 1967a,b] version. Heatings were performed in vacuum (10 -2 Torr) with a heating time of 90 minutes and a cooling time of 60 minutes. Some experiments were also done with the Shaw [ 1974] method modified by Rolph and Shaw [1985] using the automatic laboratory system described by Shaw et al. [ 1984] with 9mm core samples heated in air.
characteristic remanences isolated from AF and thermal cleaning. Results from samples outside the Mahuti area (defined by the shaded area of Figure 1) are listed in Table 2 and shown on Figure 5a. Table 3 summarizes the mean results from flows in the
southeastern part of the island; the chronological order for the flows is indicated where available. Average paleomagnetic directions of dikes are given in Table 4. Mean-site directions for flows and dikes are shown on Figure 5b and 5c, respectively.
No tectonic corrections were applied to the paleomagnetic directions since most of the dips of the flows are considered
2716 ROPERCH AND DUNCAN: GEOMAGNETIC REVERSALS, FRENCH POLYNESIA, 1
I 1 km I
Fig. 3. Paleomagnetic sampling of sills and dikes in the same area than Figure 2. Squares correspond to dikes while sills are identified by a triangle. Same convention as in Figure 2 for the display of the paleomagnetic results.
NRMo%
I90-6T
UPE
1Am-1
Down
(AF)
UpE
0.1 Am '1•2 0 N?
D. •wn
H86-2T (AF)
N Up
W '. '•, 11Am-1 Down
F60-4T (AF)
Up E
: : : ••S
4.% 0.5Am 1 •oøc
Down NRM o
TG-49A (Thermal)
e.,• p
N •
0.1Am -1
_/7o 1 o ••25øøc l
NRMo Down
J14-01C (Thermal)
Fig. 4. Examples of thermal and AF demagnetizations showing that the primary direction was generally well recovered. Open symbols correspond to projection in the vertical plane while filled circles are the projection in the horizontal plane.
primary and correspond to the original surface. In addition, we did not consider the possible small latitudinal displacement of the island of Huahine since its formation 2 to 3 millions years ago, which might displace the virtual geomagnetic poles by about 2 ø . This will not affect the discussion about the transitional behavior
of the geomagnetic field as recorded on Huahine. Most of the transitional flows are observed in the southern part
of the island (Figures 2 & 5b) (the Mahuti area). Nevertheless, a few intermediate directions were also observed in Huahine Nui, both in flows and dikes, but there is no possible correlation between the paleomagnetic directions from the two islets. However, no reversed directions have been sampled, indicating that most of the volcanic activity occurred during the Gauss normal polarity chron.
From an inspection of Tables 2 and 3 and the stereoplots (Figure 5), it is apparent that the field directions are distributed in discrete groups. This clustering is sometimes due to sampling the same flow at different sites. On the other hand, recording of the same field direction by successive flows is apparent for flows with intermediate and normal magnetic polarity, and this behavior is most likely explained by the irregular rate of extrusion of the flows.
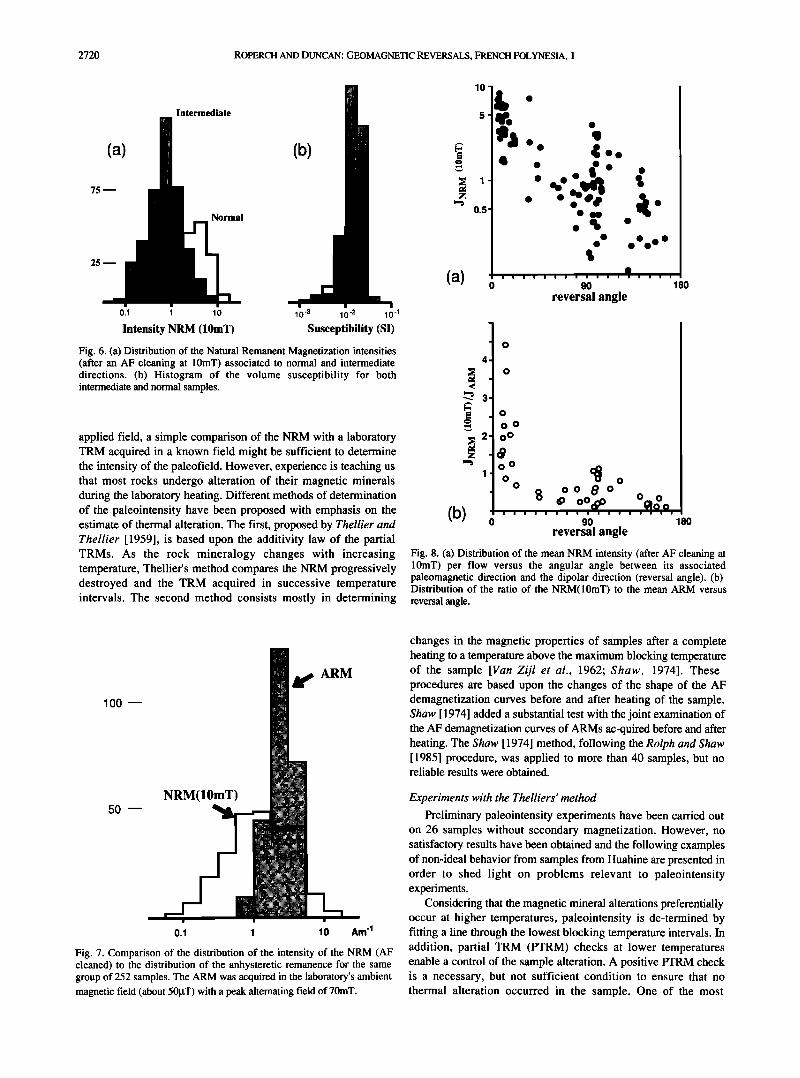
NRM intensity and susceptibility
To avoid the effects of soft secondary remanent magnetizations, the analysis of the distribution of the NRM properties was done after AF demagnetization to 10 mT, which should be more representative of the primary characteristic magnetizations. Figure 6a shows the distribution of the NRM (10 mT) of both normal and intermediate data. Flows with intermediate directions clearly have lower intensities of magnetization. However, susceptibility has the same distribution for both data sets (Figure 6b) indicating that there is the same amount of magnetic materials in all samples. The ratio of the NRM intensity at 10 mT to the induced magnetization in a field of 351.tT (which is an approximate Koenigsberger ratio) is given in Table 4. The geometric mean value of these ratios is (Q=2.0; N=49) for sites with intermediate directions, while for normal polarity flows, the mean value is six times higher (Q=12.0; N=I 7).
Magnetic remanence intensities in volcanic flows depend on the intensity of the geomagnetic field and on the magnetic properties, such as composition and grain size, of the magnetic carriers. The ARM is a laboratory remanence with properties close to those of a thermoremanent magnetization (TRM) [Levi and ?derrill, 1976]; furthermore, its acquisition in a sample does not alter the magnetic mineralogy, as does the acquisition of a TRM. The ARM distribution (Figure 7) is relatively narrow, in contrast to the large scatter in the distribution of NRM intensity (Figure 7). Although the ratio of ARM susceptibility to TRM susceptibility varies with grain size [Levi and ?derrill, 1976], it is highly unlikely that grain size variation is the main contributor in NRM variations.
It is well known that the NRM intensity associated with intermediate directions [Kristjansson and McDougall, 1982] or absolute paleointensity [Prdvot et al., 1985] drops during polarity transitions. Figure 8a presents the mean intensity of magnetization per flow versus the angular deviation from the dipolar direction. It appears that low NRM intensities correspond to directions of more than 30 ø from the normal dipolar direction. When average NRM intensities are normalized by the mean ARM per flow, the same distribution is observed (Figure 8b) and, assuming that this normalization minimizes variations in magnetic properties, the pattern should reflect paleointensity variations.
ROPERCH AND DUNCAN: GEOMAGNETIC REVERSALS, FRENCH POLYNESIA, 1 2717
TABLE 2. Paleomagnetic Results from the Island of Huahine Except the Mahuti Area
N Dec Inc k a95 Lat Long P J10
Flows
75H-1
75H-6
75H-12
75H-14
75H-19
83H-42
83H-41
83H-39
83H-37
83H-36
83H-35
83H-34
83H-33
83H-32
83H-31
83H-30
83H-C
83H-D
83H-E1
83H-E2
85H-O6
Dikes
75H-15
75H-13
75H-7
75H-2
83H-43
83H-38
83H-D5
83H-D6
83H-D7
83H-D8
83H-D9
5 319.0 -61.9 501 3.4 46.3 72.7 I N.d
5 334.1 -27.5 344 4.1 65.0 120.7 N N.d 4 350.6 - 27.9 437 4.4 80.8 128.6 N N.d
5 8.2 .-26.9 752 2.7 81.7 283.8 N N.d
4 29.4 -36.8 258 5.7 61.8 311.6 N N.d
3 344.0 -32.7 345 6.6 75.0 112.5 N 4.95
4 349.0 -29.5 1118 2.7 79.0 122.0 N 5.93 3 0.0 -37.7 704 4.7 86.0 29.0 N 3.33
3 0.0 -37.7 538 5.3 86.0 29.0 N 7.42
3 358.2 40.4 287 7.3 84.0 44.0 N 6.44
3 358.0 -36.4 1472 3.2 86.0 57.0 N 7.21
4 360.0 -35.8 423 4.4 87.0 29.0 N 6.12 3 2.9 -37.0 548 5.3 85.0 355.0 N 7.43
3 7.4 -34.7 305 7.1 83.0 320.0 N 8.39
2 2.5 40.2 N.d N.d 84.0 9.0 N 1.63
2 5.5 -36.0 N.d N.d 84.0 332.0 N 4.86
4 15.3 -22.3 72 10.9 74.3 282.0 N N.d
5 313.0 -68.6 135 6.6 39.0 64.0 I 2.24 3 330.6 -59.7 1900 2.8 55.0 70.0 N 0.63
3 328.0 -60.0 1548 3.1 53.3 71.0 N 2.54
4 326.3 -58.4 348 4.9 53.1 74.8 N 7.39
5 33.5 -35.6 324 4.2 58.0 309.7 N N.d
5 337.3 -31.4 82 8.5 68.3 114.6 N N.d
5 15.0 -44.5 21 16.8 73.0 336.0 N N.d
4 344.1 36.9 52 12.8 49.7 186.1 I N.d
4 328.0 -29.0 304 5.3 59.3 116.6 N N.d 4 3.7 -22.1 95 9.5 84.0 244.0 N N.d
3 356.0 -52.0 476 5.7 73.7 41.0 N N.d
3 349.0 -14.0 1230 3.5 75.6 159.0 N N.d
3 2.3 -24.0 450 5.8 85.3 237.0 N N.d
4 37.9 -35.5 354 4.9 53.9 309.0 N N.d
4 57.0 -10.0 153 7.5 33.0 294.0 I N.d
N, number of samples used in calculating the mean direction; Dec and Inc, mean declination and inclination; k, Fisher parameter; a95' Confidence angle at 95%' Lat and Long, latitude and longitude of the corresponding virtual geomagnetic pole; P, magnetic polarity, Normal or Intermediate; JlO, Geometric mean intensity of the magnetization after altemating field demagnetization at a level of 10mT. (in Am-1).
Figure 8 also shows that some low magnetizations are as- sociated with directions close to the reversed state. We think that
an intermediate direction should not be defined solely by an angular departure from the normal or reversed dipole direction, or from the
colatitude of the VGP associated with that direction. Directions
close to the reversed or normal dipole field should not be considered as indicators of a stable reversed or normal geomagnetic field, if they are associated with low paleointensities. Indeed,
(a)
lq
o +•P o oOoø i,ø o
o
o
+ + + + + + + --• + + + + + + + + +
+
+
+
+
+
+
+
lq
(b)
• ocO •+
: :
(c)
lq
o +
+
+
+
o o+o o
o + e + + + + + + + --• + + + + + + + +
oO + +
+
+
+
+
+
+
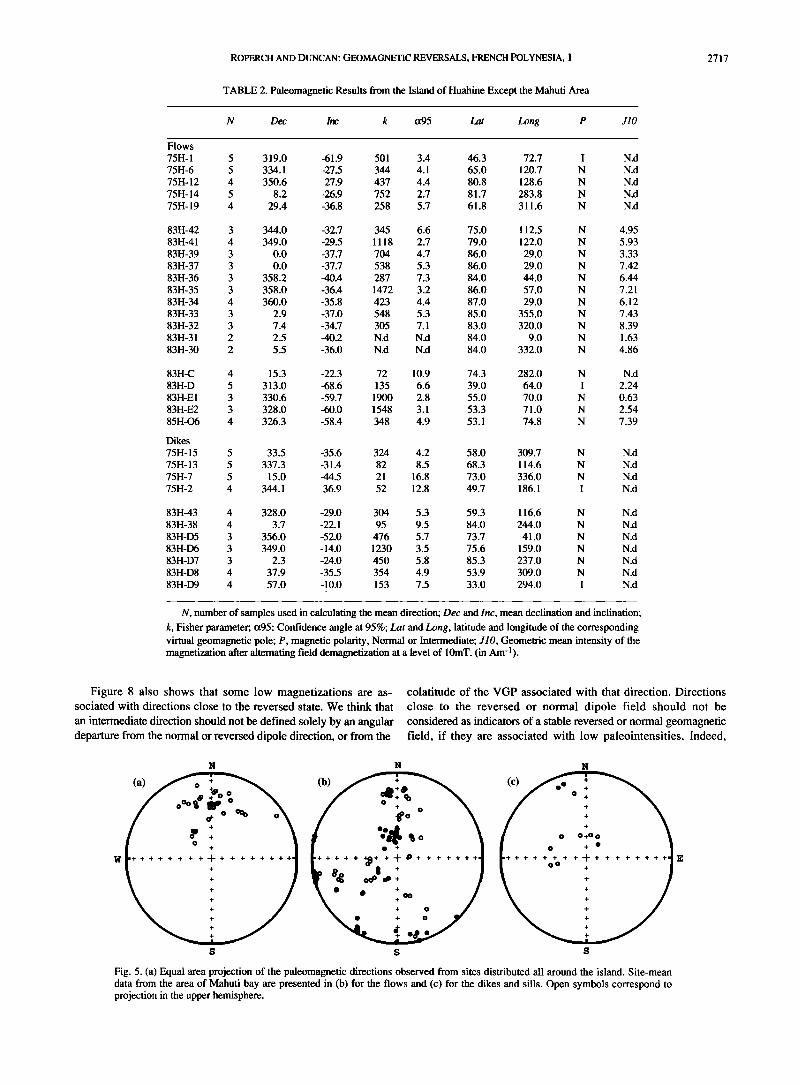
Fig. 5. (a) Equal area projection of the paleomagnetic directions observed from sites distributed all around the island. Site-mean data from the area of Mahuti bay are presented in (b) for the flows and (c) for the dikes and sills. Open symbols correspond to projection in the upper hemisphere.
2718 ROPERCH AND DUNCAN: GEOMAGNETIC REVERSALS, FRENCH POLYNESIA, 1
TABLE 3. Paleomagnetic Results from Flows of the Mahuti Area
N Dec Inc k ct95 Lat Long P DG JlO Z ARM Q
Top D40
D41
D43
G79
G78
G72
G71
G70
83H20
83H18
83H17
83H16
83H15
83H14
83H13
83H12
83H11
N50
83H08
83H06
L37
83H05
83H04
83H02
83H01
L33
L32
L31
L30
83H22
83H21
Bottom
Top M43
M42
M41
J19
J18
J17
J16
J15
J13
J12
Jll
J10
Bottom
Top E51
E53
Bottom
Top F68
F67
F60
F61
F63
F64
F65
F66
Bottom
Top K25
K24
K23
K22
K21
Bottom
7 229.4 -60.9 11 263.3 -63.9
4 258.8 -61.2 6 268.4 -63.9 7 255.3 -24.6
4 224.8 -42.5
4 224.8 -41.2 8 230.2 -56.9 5 306.0 75.0 4 354.0 75.0
3 354.0 69.0 3 360.0 62.0 3 335.0 71.0 4 339.0 69.0 4 359.0 66.0 3 327.0 65.0
3 349.0 73.0 5 329.6 57.4 3 337.0 61.0 3 233.0 67.0 5 284.8 0.6 3 282.0 0.0 3 285.0 0.0 4 209.0 66.0
4 241.0 69.0 5 203.5 69.0
5 161.8 -51.5 4 155.6 -23.7 4 82.9 -78.4 4 14.0 -48.0 3 5.0 -22.0
6 346.4 -33.4 4 158.7 6.6
4 165.4 10.6
5 150.4 -31.8 5 39.7 -66.9 4 49.5 -60.3 6 25.3 -37.8 5 2.4 -48.8 6 8.3 -27.9
4 11.1 -30.2 4 6.1 -19.0 6 6.6 -20.1
6 31.9 65.0
5 170.7 10.7 5 165.2 10.6
7 256.7 -2.9
5 253.9 0.3 4 258.8 -8.0
4 257.6 -1.9 4 257.0 -0.8 3 259.0 -2.2
4 255.8 -3.1 6 260.3 1.1
5 167.8 -53.2 5 351.2 -26.2
6 353.7 -27.7 7 353.3 -25.9
9 5.9 -46.8
204 4.2 -15.8 64.9 I D20 1.11 0.98 1.95 4.46 103 4.5 7.3 73.5 I D19 0.66 0.95 2.36 2.75 465 4.3 3.2 75.6 I D19 1.00 1.55 1.81 2.55 138 5.7 10.8 74.4 I D19 0.83 2.48 3.39 1.33 217 4.1 -9.9 102.2 I D18 0.82 2.12 2.87 1.53 50 10.9 -28.9 77.5 I D17 0.36 1.88 3.51 0.76
157 7.4 -30.5 77.5 I D17 0.36 1.60 3.68 0.90 375 2.9 -18.2 68.9 I D16 0.70 1.87 2.98 1.48 254 5.0 0.7 186.5 I D15 1.37 N.d N.d N.d 663 3.6 11.3 206.1 I D15 0.25 N.d N.d N.d 633 5.0 20.6 205.1 I D15 0.32 N.d N.d N.d 361 6.5 30.1 209.0 I D15 0.66 N.d N.d N.d
1769 3.0 14.8 194.6 I D15 0.96 N.d N.d N.d 191 6.7 18.5 195.7 I D15 0.43 N.d N.d N.d 44 14.0 25.0 208.3 I D15 0.84 N.d N.d N.d 65 15.0 19.7 185.8 I D15 0.21 N.d N.d N.d
1000 4.0 14.2 203.1 I D15 0.76 N.d N.d N.d 111 7.3 28.3 182.1 I D15 0.17 1.29 N.d 0.53
1000 4.0 27.5 189.9 I D15 0.15 N.d N.d N.d 42 19.0 -36.3 169.1 I D14 0.20 N.d N.d N.d
141 6.5 14.1 123.6 I D13 0.55 0.97 N.d 2.26 163 9.7 11.5 122.5 I D13 0.31 N.d N.d N.d 657 4.8 14.3 123.4 I D13 0.74 N.d N.d N.d 149 8.0 -50.5 178.6 I D12 0.49 N.d N.d N.d 81 10.0 -30.7 170.7 I D12 0.37 N.d N.d N.d
932 2.5 -49.6 186.8 I D12 1.05 2.06 2.81 2.01 2451 1.5 -38.1 9.4 I Dll 1.15 1.37 2.35 3.31 792 3.3 -52.2 347.8 I D10 1.84 1.34 2.34 4.53 945 3.0 18.1 5.6 I D8 0.89 1.05 N.d 3.39 222 6.2 72.2 345.0 N 134 3.00 N.d N.d N.d
1287 3.4 82.8 252.2 N D1 4.65 N.d N.d N.d
230 4.4 76.9 110.2 N N.d 1.57 1.19 1.83 5.21 186 6.8 -65.2 329.3 I G1 0.44 0.85 2.46 2.08 86 9.9 -71.7 335.8 I G1 0.22 0.76 2.23 1.13
275 4.6 -45.3 346.9 I D9 1.95 2.16 3.37 3.55 178 5.8 44.2 353.7 I D7 1.46 2.07 2.89 2.80 108 8.9 41.1 339.6 I D6 1.05 1.60 2.94 2.59 140 5.7 65.7 313.6 N D5 2.72 1.91 3.97 5.61 120 7.0 76.8 19.9 N D3 2.42 0.46 1.93 20.42 138 5.7 81.8 287.0 N D2 2.80 0.73 2.39 15.11 556 3.9 79.9 298.1 N D2 4.24 1.37 2.19 12.13
1799 2.2 80.9 250.3 N D1 6.20 0.80 1.67 30.41 874 2.3 81.0 255.2 N D1 5.95 1.18 1.35 19.83
53 9.3 20.1 231.6 I N.d 0.57 1.66 3.02 1.35 235 5.0 -75.5 349.1 I G1 0.57 1.08 1.80 2.10 75 8.9 -71.6 335.4 I G1 0.58 1.30 3.25 1.78
255 3.8 -12.3 113.7 I G2 1.86 1.66 2.21 4.42 138 6.5 -15.4 114.4 I G2 0.82 2.15 3.39 1.50 327 5.1 -9.5 111.8 I G2 3.85 2.03 3.65 7.48 942 3.0 -11.6 114.5 I G2 2.98 1.95 N.d 6.01 698 3.5 -12.3 114.8 I G2 3.08 2.08 3.13 5.84 223 8.3 -10.2 114.7 I G2 3.05 1.44 N.d 8.34 916 3.0 -13.1 113.3 I G2 2.84 1.18 2.54 9.46 970 2.2 -9.4 116.7 I G2 1.49 0.83 1.55 7.11
213 5.3 -38.2 16.1 I Dll 1.27 1.31 N.d 3.81 478 3.5 81.0 136.5 N G5 4.61 0.65 2.88 27.72 523 2.9 83.6 136.3 N G5 4.49 2.01 3.00 8.82 302 3.5 82.8 143.4 N G5 4.57 1.97 3.09 9.16 519 2.3 77.4 4.4 N N.d 4.15 1.56 2.05 10.48
ROPERCH AND DUNCAN: GEOMAGNETIC REVERSALS, FRENCH POLYNESIA, 1 2719
TABLE 3. (continued)
N Dec Inc k ct95 Lat Long P DG JlO Z ARM Q
Top TK 6 352.9 -20.3 513 3.0 80.7 160.1 N G4 3.07 1.73 N.d 7.01 TJ 6 354.7 -21.3 1733 1.6 82.3 166.1 N G4 1.70 1.46 N.d 4.59 TI 6 347.5 -24.8 154 5.4 77.4 134.3 N G4 3.45 0.90 N.d 15.00 H88 5 354.9 -22.9 177 5.6 83.1 162.3 N G4 3.22 0.89 1.24 14.26 H87 4 350.4 -24.6 159 7.3 79.9 140.0 N G4 3.55 1.08 1.57 12.95 TH 6 203.9 4.5 155 5.4 -62.4 90.0 I G3 0.53 2.18 N.d 0.96 TG 6 209.8 4.6 403 3.3 -57.4 96.1 I G3 0.91 1.57 N.d 2.30 Bottom
TE 7 210.2 7.5 215 4.1 -57.7 98.8 I G3 0.67 1.99 N.d 1.33 TD 6 208.0 1.4 49 9.6 -58.1 91.7 I G3 0.53 1.29 N.d 1.63 TC 7 209.3 5.7 473 2.8 -58.1 96.5 I G3 1.26 1.51 N.d 3.30 H86 5 213.7 16.6 49 11.1 -56.1 109.1 I G3 0.46 1.23 3.37 1.48 TB 5 209.6 5.6 475 3.5 -57.8 96.7 I G3 0.52 1.61 N.d 1.27 H85 4 181.2 15.7 21 20.4 -81.2 36.8 I N.d 0.24 2.02 2.54 0.48 H84 5 181.1 -1.0 85 8.3 -72.8 32.8 I N.d 0.20 1.82 3.20 0.43 H83 6 167.5 -6.7 139 5.7 -66.4 356.3 I N.d 0.24 1.25 N.d 0.75 TA 7 135.0 3.0 59 7.9 -43.2 313.1 I N.d 0.11 1.69 N.d 0.26 H81 3 261.3 -0.4 236 8.0 -8.3 116.3 I G2 1.97 1.81 3.30 4.29 H82 5 256.8 -3.2 44 11.6 -12.2 113.6 I G2 2.24 1.31 2.64 0.75
I90 8 2.6 -52.7 708 2.1 73.3 21.4 N N.d 2.45 0.76 1.06 12.71 C30 6 234.3 -52.8 402 3.3 -18.0 74.5 I N.d 0.45 0.93 N.d 1.91 TL 9 258.4 -26.7 83 5.7 -6.7 102.0 I N.d 1.33 3.11 N.d 1.69 83P70 3 357.0 68.0 506 5.5 22.2 207.0 I D15 N.d N.d N.d N.d Q80 5 347.2 65.0 103 7.6 25.3 199.4 I D15 0.93 1.90 N.d 1.93 Q81 4 6.5 70.5 196 6.6 18.4 212.9 I D15 0.62 1.45 N.d 1.68 83P60 3 357.0 65.0 150 10.0 26.2 206.7 I D15 0.43 N.d N.d N.d 83P81 4 253.0 -32.0 613 3.7 -10.5 97.7 I D18 0.90 N.d N.d N.d 83P80 4 248.0 -30.0 141 7.8 -15.4 96.5 I D18 0.87 N.d N.d N.d 83HF 3 242.3 -20.4 630 4.9 -22.7 99.6 I D18 1.00 N.d N.d N.d 75Hll 5 242.9 -21.1 155 6.1 -21.8 99.4 I D18 N.d N.d N.d N.d P70 5 250.1 -27.7 38 12.6 -14.0 98.6 I D18 0.63 1.60 N.d 1.55
Same conventions as in Table 2; N.d, not determined; DG, Directional Group number; Z, Geometric mean of susceptibility (10 -2 SI); ARM, Geometric mean intensity of the Anhysteretic Remanent Magnetization; Q, Geometric mean of the Koenigsberger ratio as defined in the text. The data have been grouped with relative chronology from bottom to top when available. Data from TE to H82 come from the lower part of the Tefarerii stream but have no clear relative relationship. Data I90 to P70 correspond to a dispersed sampling.
nondipolar features may produce intermediate geomagnetic fields which, in some cases, have directions close to an apparent dipolar state (e.g., Roperch et al., [1988]). In the case of the Huahine data, we can speculate that low intensities of magnetization are a good indication of low paleointensity values and these directions should be considered as intermediate.
Nevertheless, it must be stressed that an individual flow-mean
intensity of magnetization is not an absolute measure of the paleointensity, and only the overall distribution magnetization from several sites reflects the main characteristic of the paleofield.
PALEOINTENSITY EXPERIMENTS
Since the NRM carried by a volcanic rock is assumed to be a TRM, and since TRM intensity is directly proportional to the
TABLE 4. Paleomagnetic Results of Dikes from the Mahuti Area
N Dec Inc k c•95 Lat Long
HK20
83P52
HP71
P535
P531
HM40
83H10
83H03
HJ14
HL34
HTF
349.5 -24.7 165 4.7 79.2 11.0 -68.0 191 5.6 54.5 28.5 -67.2 197 6.6 49.6
345.0 -68.0 N.d N.d 54.0 343.0 11.0 196 8.8 62.1 338.3 13.0 1101 2.8 58.3 258.0 -62.0 95 9.5 3.0 258.0 -55.0 20 21.0 0.3
41.3 73.2 116 7.1 7.2 284.3 -54.2 168 7.1 21.0
310.4 -58.8 141 5.1 41.4
137.9
17.0
0.7
45.0
170.0
164.6
74.5
81.8
229.1
87.5
80.6
Same conventions as in Table 2.
2720 ROPERCH AND DUNCAN: GEOMAGNETIC REVERSALS, FRENCH POLYNESIA, 1
(a)
75 /
25 /
Intermediate
Normal
(b)
0.1 1 10 10-3 10-2 10-1
Intensity NRM (10mT) Susceptibility (SI)
Fig. 6. (a) Distribution of the Natural Remanent Magnetization intensities (after an AF cleaning at 10mT) associated to normal and intermediate directions. (b) Histogram of the volume susceptibility for both intermediate and normal samples.
applied field, a simple comparison of the NRM with a laboratory TRM acquired in a known field might be sufficient to determine the intensity of the paleofield. However, experience is teaching us that most rocks undergo alteration of their magnetic minerals during the laboratory heating. Different methods of determination of the paleointensity have been proposed with emphasis on the estimate of thermal alteration. The first, proposed by Thellier and Thellier [1959], is based upon the additivity law of the partial TRMs. As the rock mineralogy changes with increasing temperature, Thellier's method compares the NRM progressively destroyed and the TRM acquired in successive temperature intervals. The second method consists mostly in determining
10
5
(a)
ß o•o • ' ß ß ß
ß ß ß oooo
I i i i i i i i i i • i i i l 90
reversal angle 180
4-
(b) o lSO
o
oo
o o
o o o o
O0 • 0 0 0 o • • oO•fo, •oo i i i i i i i i ! i i i I i i i
90
reversal angle
Fig. 8. (a) Distribution of the mean NRM intensity (after AF cleaning at 10mT) per flow versus the angular angle between its associated paleomagnetic direction and the dipolar direction (reversal angle). (b) Distribution of the ratio of the NRM(10mT) to the mean ARM versus reversal angle.
100 --
50 / NRM(10mT)
ARM
0.1 I 10 Am q
Fig. 7. Comparison of the distribution of the intensity of the NRM (AF cleaned) to the distribution of the anhysteretic remanence for the same group of 252 samples. The ARM was acquired in the laboratory's ambient magnetic field (about 50gT) with a peak alternating field of 70mT.
changes in the magnetic properties of samples after a complete heating to a temperature above the maximum blocking temperature of the sample [Van Zijl et al., 1962; Shaw, 1974]. These procedures are based upon the changes of the shape of the AF demagnetization curves before and after heating of the sample. Shaw [ 1974] added a substantial test with the joint examination of the AF demagnetization curves of ARMs ac-quired before and after heating. The Shaw [1974] method, following the Rolph and Shaw [1985] procedure, was applied to more than 40 samples, but no reliable results were obtained.
Experiments with the Thelliers' method
Preliminary paleointensity experiments have been carried out on 26 samples without secondary magnetization. However, no satisfactory results have been obtained and the following examples of non-ideal behavior from samples from Huahine are presented in order to shed light on problems relevant to paleointensity experiments.
Considering that the magnetic mineral alterations preferentially occur at higher temperatures, paleointensity is de-termined by fitting a line through the lowest blocking temperature intervals. In addition, partial TRM (PTRM) checks at lower temperatures enable a control of the sample alteration. A positive PTRM check is a necessary, but not sufficient condition to ensure that no thermal alteration occurred in the sample. One of the most
ROPERCH AND DUNCAN: GEOMAGNETIC REVERSALS, FRENCH POLYNESIA, 1 2721
NRM
1
5.00 A/= NRM mu•0 = 4.66 A/= NRM mu•0 = 3.72 A/= 10.0 gT H•,,a= 10.0 gT H•,,a= 10.0 gT 21.2 !.tT I H -- 14.6 !.tT I H = 11.0 !.tT 12.4 Q = 7.4 Q = 11.3
o o
o o
o o
1 TRM I TRM
85HF0602B 85HF0601B 85HF0611B
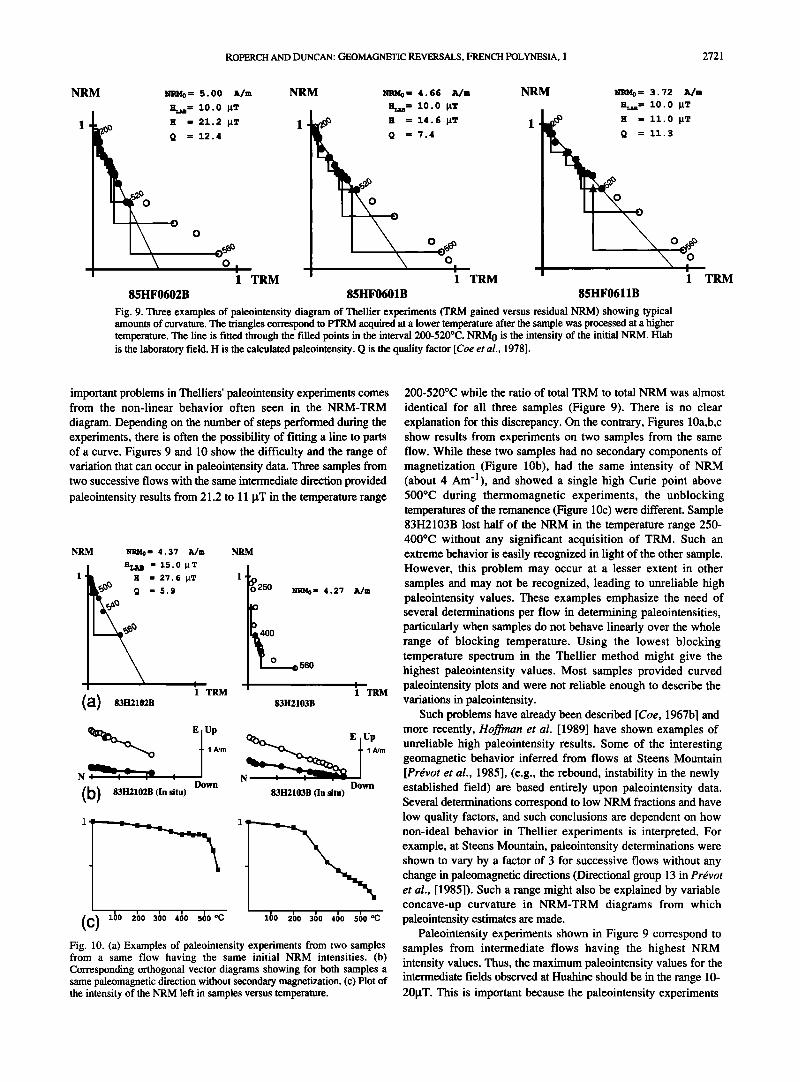
Fig. 9. Three examples of paleointensity diagram of Thellier experiments (TRM gained versus residual NRM) showing typical amounts of curvature. The triangles correspond to PTRM acquired at a lower temperature after the sample was processed at a higher temperature. The line is fitted through the filled points in the interval 200-520øC. NRM 0 is the intensity of the initial NRM. Hlab is the laboratory field. H is the calculated paleointensity. Q is the quality factor [Coe et al., 1978].
TRM
important problems in Thelliers' paleointensity experiments comes from the non-linear behavior often seen in the NRM-TRM
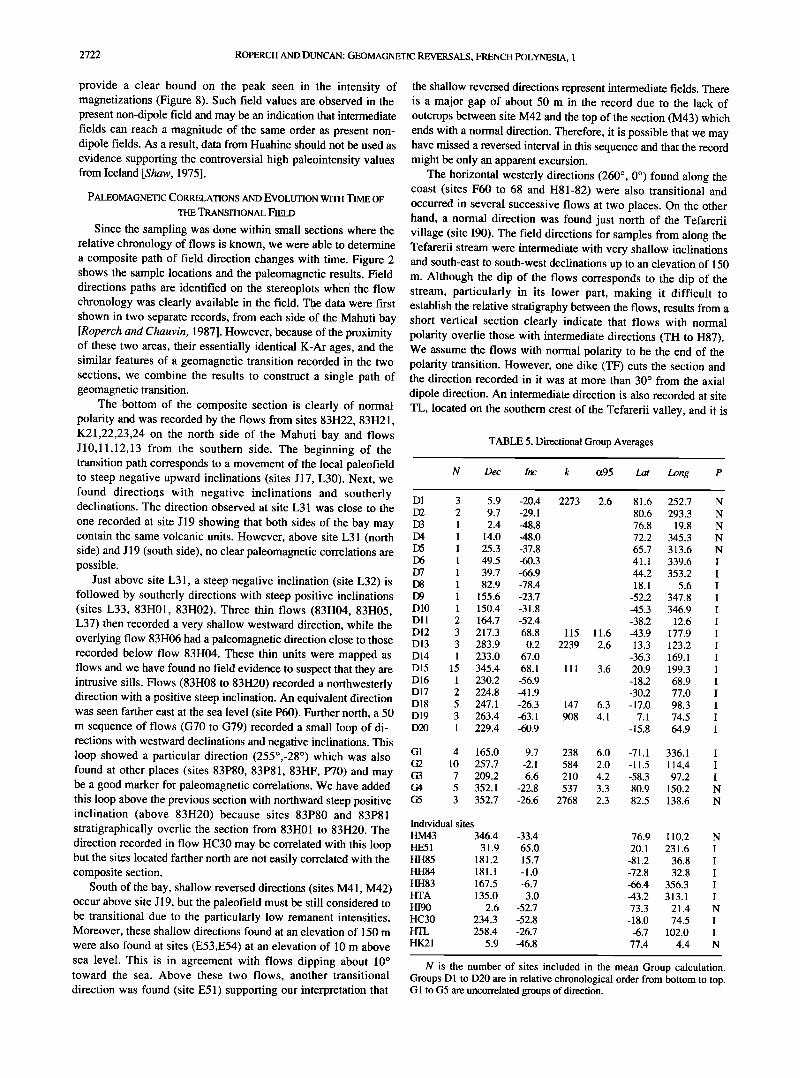
diagram. Depending on the number of steps performed during the experiments, there is often the possibility of fitting a line to parts of a curve. Figures 9 and 10 show the difficulty and the range of variation that can occur in paleointensity data. Three samples from two successive flows with the same intermediate direction provided paleointensity results from 21.2 to 11 !.tT in the temperature range
NRM NRM0 = 4.37 A/m NRM
HLA B = 15.0 •tT
•3• • H = 27.6 •tT Q =5.9
I
(a)
1 •o250 NRM0 = 4.27 A/m
0: o 560
I I 1 TRM 1 TRM
83H2103B
• E t Up • ß 1Nm
N •l•'•'• • Down
(b) 83H2102B (In situ) Down
83H2103B (In situ)
1
(C)
1
i i i
100 200 300 400 500 øO
Fig. 10. (a) Examples of paleointensity experiments from two samples from a same flow having the same initial NRM intensities. (b) Corresponding orthogonal vector diagrams showing for both samples a same paleomagnetic direction without secondary magnetization. (c) Plot of the intensity of the NRM left in samples versus temperature.
200-520øC while the ratio of total TRM to total NRM was almost
identical for all three samples (Figure 9). There is no clear explanation for this discrepancy. On the contrary, Figures 10a,b,c show results from experiments on two samples from the same flow. While these two samples had no secondary components of magnetization (Figure 10b), had the same intensity of NRM (about 4 Am-1), and showed a single high Curie point above 500øC during thermomagnetic experiments, the unblocking temperatures of the remanence (Figure 10c) were different. Sample 83H2103B lost half of the NRM in the temperature range 250- 400øC without any significant acquisition of TRM. Such an extreme behavior is easily recognized in light of the other sample. However, this problem may occur at a lesser extent in other samples and may not be recognized, leading to unreliable high paleointensity values. These examples emphasize the need of several determinations per flow in determining paleointensities, particularly when samples do not behave linearly over the whole range of blocking temperature. Using the lowest blocking temperature spectrum in the Thellier method might give the highest paleointensity values. Most samples provided curved paleointensity plots and were not reliable enough to describe the variations in paleointensity.
Such problems have already been described [Coe, 1967b] and more recently, Hoffman et al. [1989] have shown examples of unreliable high paleointensity results. Some of the interesting geomagnetic behavior inferred from flows at Steens Mountain [Pr•vot et al., 1985], (e.g., the rebound, instability in the newly established field) are based entirely upon paleointensity data. Several determinations correspond to low NRM fractions and have low quality factors, and such conclusions are dependent on how non-ideal behavior in Thellier experiments is interpreted. For example, at Steens Mountain, paleointensity determinations were shown to vary by a factor of 3 for successive flows without any change in paleomagnetic directions (Directional group 13 in PrWvot et al., [1985]). Such a range might also be explained by variable concave-up curvature in NRM-TRM diagrams from which paleointensity estimates are made.
Paleointensity experiments shown in Figure 9 correspond to samples from intermediate flows having the highest NRM intensity values. Thus, the maximum paleointensity values for the intermediate fields observed at Huahine should be in the range 10- 201.tT. This is important because the paleointensity experiments
2722 ROPERCH AND DUNCAN: GEOMAGNETIC REVERSALS, FRENCH POLYNESIA, 1
provide a clear bound on the peak seen in the intensity of magnetizations (Figure 8). Such field values are observed in the present non-dipole field and may be an indication that intermediate fields can reach a magnitude of the same order as present non- dipole fields. As a result, data from Huahine should not be used as evidence supporting the controversial high paleointensity values from Iceland [Shaw, 1975].
PALEOMAGNETIC CORRELATIONS AND EVOLUTION WITH TIME OF THE TRANSITIONAL FIELD
Since the sampling was done within small sections where the relative chronology of flows is known, we were able to determine a composite path of field direction changes with time. Figure 2 shows the sample locations and the paleomagnetic results. Field directions paths are identified on the stereoplots when the flow chronology was clearly available in the field. The data were first shown in two separate records, from each side of the Mahuti bay [Roperch and Chauvin, 1987]. However, because of the proximity of these two areas, their essentially identical K-Ar ages, and the similar features of a geomagnetic transition recorded in the two sections, we combine the results to construct a single path of geomagnetic transition.
The bottom of the composite section is clearly of normal polarity and was recorded by the flows from sites 83H22, 83H21, K21,22,23,24 on the north side of the Mahuti bay and flows J10,11,12,13 from the southern side. The beginning of the transition path corresponds to a movement of the local paleofield to steep negative upward inclinations (sites J17, L30). Next, we found directions with negative inclinations and southerly declinations. The direction observed at site L31 was close to the
one recorded at site J19 showing that both sides of the bay may contain the same volcanic units. However, above site L31 (north side) and J19 (south side), no clear paleomagnetic correlations are possible.
Just above site L31, a steep negative inclination (site L32) is followed by southerly directions with steep positive inclinations (sites L33, 83H01, 83H02). Three thin flows (83H04, 83H05, L37) then recorded a very shallow westward direction, while the overlying flow 83H06 had a paleomagnetic direction close to those recorded below flow 83H04. These thin units were mapped as flows and we have found no field evidence to suspect that they are intrusive sills. Flows (83H08 to 83H20) recorded a northwesterly direction with a positive steep inclination. An equivalent direction was seen farther east at the sea level (site P60). Further north, a 50 m sequence of flows (G70 to G79) recorded a small loop of di- rections with westward declinations and negative inclinations. This loop showed a particular direction (255ø,-28 ø) which was also found at other places (sites 83P80, 83P81, 83HF, P70) and may be a good marker for paleomagnetic correlations. We have added this loop above the previous section with northward steep positive inclination (above 83H20) because sites 83P80 and 83P81 stratigraphically overlie the section from 83H01 to 83H20. The direction recorded in flow HC30 may be correlated with this loop but the sites located farther north are not easily correlated with the composite section.
South of the bay, shallow reversed directions (sites M41, M42) occur above site J19, but the paleofield must be still considered to be transitional due to the particularly low remanent intensities. Moreover, these shallow directions found at an elevation of 150 m
were also found at sites (E53,E54) at an elevation of 10 m above sea level. This is in agreement with flows dipping about 10 ø toward the sea. Above these two flows, another transitional
direction was found (site E51) supporting our interpretation that
the shallow reversed directions represent intermediate fields. There is a major gap of about 50 m in the record due to the lack of outcrops between site M42 and the top of the section (M43) which ends with a normal direction. Therefore, it is possible that we may have missed a reversed interval in this sequence and that the record might be only an apparent excursion.
The horizontal westerly directions (260 ø, 0 ø) found along the coast (sites F60 to 68 and H81-82) were also transitional and occurred in several successive flows at two places. On the other hand, a normal direction was found just north of the Tefarerii village (site I90). The field directions for samples from along the Tefarerii stream were intermediate with very shallow inclinations and south-east to south-west declinations up to an elevation of 150 m. Although the dip of the flows corresponds to the dip of the stream, particularly in its lower part, making it difficult to establish the relative stratigraphy between the flows, results from a short vertical section clearly indicate that flows with normal polarity overlie those with intermediate directions (TH to H87). We assume the flows with normal polarity to be the end of the polarity transition. However, one dike (TF) cuts the section and the direction recorded in it was at more than 30 ø from the axial dipole direction. An intermediate direction is also recorded at site TL, located on the southern crest of the Tefarerii valley, and it is
TABLE 5. Directional Group Averages
N Dec Inc k ct95 Lat Long P
D1 3 5.9 -20.4 2273 2.6 81.6 252.7 N D2 2 9.7 -29.1 80.6 293.3 N D3 1 2.4 -48.8 76.8 19.8 N D4 1 14.0 -48.0 72.2 345.3 N D5 1 25.3 -37.8 65.7 313.6 N D6 1 49.5 -60.3 41.1 339.6 I D7 1 39.7 -66.9 44.2 353.2 I 138 1 82.9 -78.4 18.1 5.6 I D9 1 155.6 -23.7 -52.2 347.8 I D10 1 150.4 -31.8 -45.3 346.9 I D11 2 164.7 -52.4 -38.2 12.6 I D12 3 217.3 68.8 115 11.6 -43.9 177.9 I D13 3 283.9 0.2 2239 2.6 13.3 123.2 I D14 1 233.0 67.0 -36.3 169.1 I D15 15 345.4 68.1 111 3.6 20.9 199.3 I D16 1 230.2 -56.9 -18.2 68.9 I D17 2 224.8 -41.9 -30.2 77.0 I D18 5 247.1 -26.3 147 6.3 -17.0 98.3 I D19 3 263.4 -63.1 908 4.1 7.1 74.5 I D20 1 229.4 -60.9 -15.8 64.9 I
G1 4 165.0 9.7 238 6.0 -71.1 336.1 I G2 10 257.7 -2.1 584 2.0 -11.5 114.4 I G3 7 209.2 6.6 210 4.2 -58.3 97.2 I G4 5 352.1 -22.8 537 3.3 80.9 150.2 N G5 3 352.7 -26.6 2768 2.3 82.5 138.6 N
Individual sites
HM43 346.4 -33.4 76.9 110.2 N HE51 31.9 65.0 20.1 231.6 I HH85 181.2 15.7 -81.2 36.8 I HH84 181.1 -1.0 -72.8 32.8 I HH83 167.5 -6.7 -66.4 356.3 I HTA 135.0 3.0 -43.2 313.1 I HI90 2.6 -52.7 73.3 21.4 N HC30 234.3 -52.8 -18.0 74.5 I HTL 258.4 -26.7 -6.7 102.0 I HK21 5.9 -46.8 77.4 4.4 N
N is the number of sites included in the mean Group calculation. Groups D1 to D20 are in relative chronological order from bottom to top. G 1 to G5 are uncorrelated groups of direction.
ROPERCH AND DUNCAN: GEOMAGNETIC REVERSALS, FRENCH POLYNESIA, 1 2723
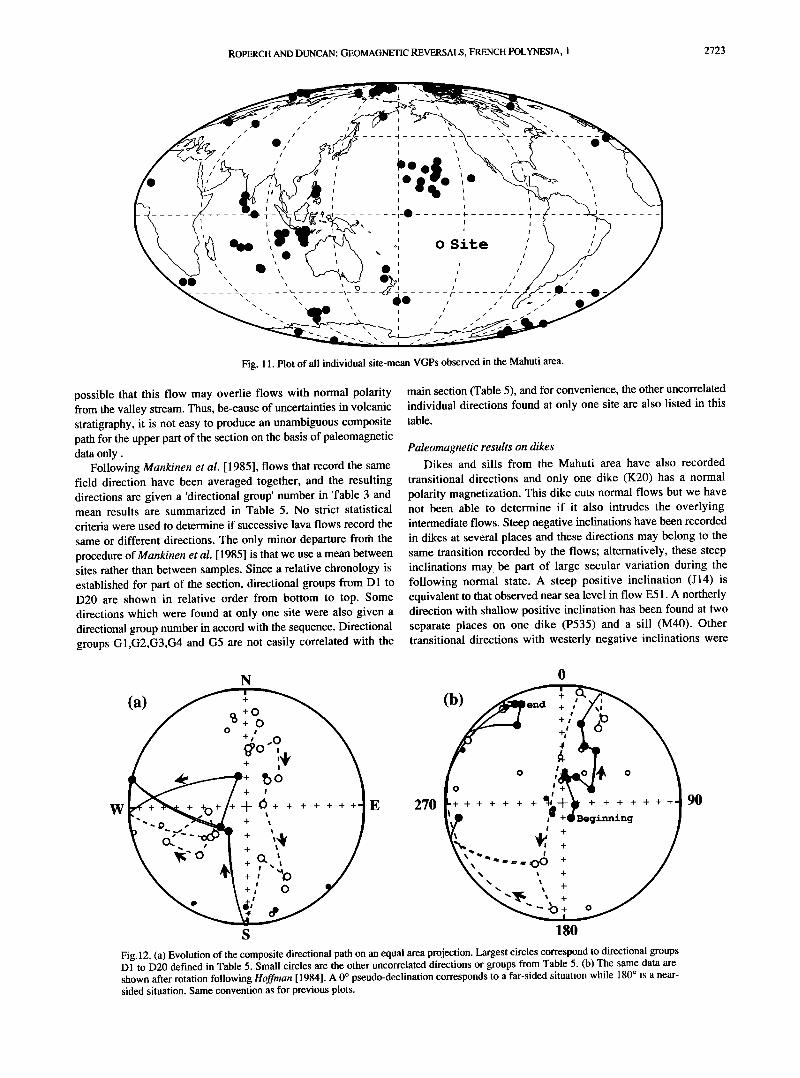
Fig. 11. Plot of all individual site-mean VGPs observed in the Mahuti area.
possible that this flow may overlie flows with normal polarity from the valley stream. Thus, be-cause of uncertainties in volcanic stratigraphy, it is not easy to produce an unambiguous composite path for the upper part of the section on the basis of paleomagnetic data only.
Following Mankinen et al. [1985], flows that record the same field direction have been averaged together, and the resulting directions are given a 'directional group' number in Table 3 and mean results are summarized in Table 5. No strict statistical criteria were used to determine if successive lava flows record the same or different directions. The only minor departure from the procedure of Mankinen et al. [1985] is that we use a mean between sites rather than between samples. Since a relative chronology is established for part of the section, directional groups from D 1 to D20 are shown in relative order from bottom to top. Some directions which were found at only one site were also given a directional group number in accord with the sequence. Directional groups G1,G2,G3,G4 and G5 are not easily correlated with the
main section (Table 5), and for convenience, the other uncorrelated individual directions found at only one site are also listed in this table.
Paleomagnetic results on dikes Dikes and sills from the Mahuti area have also recorded
transitional directions and only one dike (K20) has a normal polarity magnetization. This dike cuts normal flows but we have not been able to determine if it also intrudes the overlying intermediate flows. Steep negative inclinations have been recorded in dikes at several places and these directions may belong to the same transition recorded by the flows; alternatively, these steep inclinations may be part of large secular variation during the following normal state. A steep positive inclination (J14) is equivalent to that observed near sea level in flow E51. A northerly direction with shallow positive inclination has been found at two separate places on one dike (P535) and a sill (M40). Other transitional directions with westerly negative inclinations were
w
(a)
N
%+0 +0
0 •:•0 .,0 I
+
+ + + + + + + +
%
+
+ +,' 0
E 270
(b)
o
o t
++ + + + + lJ• I
+
+
+ t t +/ 4
i
•' •' • • -- -- = .O3 + \ % +
+
• •x +
180
o
+ + + + + + +
Beginning
Fig. 12. (a) Evolution of the composite directional path on an equal area projection. Largest circles correspond to directional groups D1 to D20 defined in Table 5. Small circles are the other uncorrelated directions or groups from Table 5. (b) The same data are shown after rotation following Hoffman [ 1984]. A 0 ø pseudo-declination corresponds to a far-sided situation while 180 ø is a near- sided situation. Same convention as for previous plots.
9O
2724 ROPERCH AND DUNCAN: GEOMAGNETIC REVERSALS, FRENCH POLYNESIA, 1
found from sills and dikes (L34, 83H10, 83H03) and might be The path through high inclinations observed for the two opposite correlated with directions found in flows (G70 to G79) in the upper reversals from Polynesia may be fit with a decaying dipole and a part of the section. These correlations indicate that all the igneous growing axial quadrupole field having the same sign as the initial units in this area are products of the same phase of volcanic dipole. A growing axial octupole of opposite sign of the dipole is activity. a less likely candidate because this combination cannot produce
DISCUSSION
Excursion or Reversal?
The bottom of the composite section is clearly normal followed upsection by transitional directions. Furthermore, the regular shift of the directions from normal to steep negative inclinations (D1 to D8) suggests that there is no important gap in the beginning of the record and that we are deal-ing with either a N-T-R reversal or a N-T-N excursion. In two cases, normal directions have been found above transitional directions. Thus,
taking into account the radiometric data which give ages between 2.9 and 3.1 Ma, a hiatus in the volcanic activity during the Kaena reversed subchron could explain the record. Then, the numerous intermediate directions found in the Mahuti section would
correspond to one (or both) transitions which limit the Kaena subchron.
Several excursions have been found, especially in the Brunhes period [Champion et al., 1988], that suggest the occurrence of short unrecognized excursions in the geological past; therefore, we cannot dismiss the excursion hypothesis. Moreover, Prdvot et al. [ 1985] argued that the Steens Mountain reversal is characterized by a rebound in the transition indicating that some instability might occur in the following established dipole field. The transitional record from Huahine might be a rebound above the Kaena subchron or a short excursion preceding the lower Kaena boundary. However, because no reversed directions have been found and no
detailed magnetostratigraphy is available from below and above the section, we cannot definitely choose between the different possibilities.
Insight into the reversal process
Despite the lack of chronology for the entire section, the various intermediate directions show that important directional changes have been recorded over a significant period of time. Moreover, we suspect that the irregularity in the extrusion of lava flows either in time or space has led to an incomplete recording of the transition. Thus, paleomagnetic records of transitions which show a very simple configuration of the field might simply result from insufficient sampling of the earth's magnetic field by the volcanic sequence (or from an incomplete paleomagnetic sampling) or from a high averaging of recording in sediments. More than half the VGPs associated with intermediate directions found in the
Mahuti area (Figure 11) are outside the longitudinal band containing the site. Prdvot et al. [1985b] suggested that non-zonal components are as important as the components lying within the geographical meridian during transitions. However, data from Huahine provide some evidence that transitions may have two different configurations for the beginning (axisymmetric) and the middle of the reversal (chaotic) (Figure 12). As is often the case for transitions recorded in lava sequence, the timing of the reversal is not well constrained. Nevertheless, the regular movement from the axial dipole direction toward high inclinations, observed at Huahine as well as for the lower Jaramillo transition recorded at
Tahiti [Chauvin et al., this issue], allow us to speculate that this corresponds to the first phase of the transition.
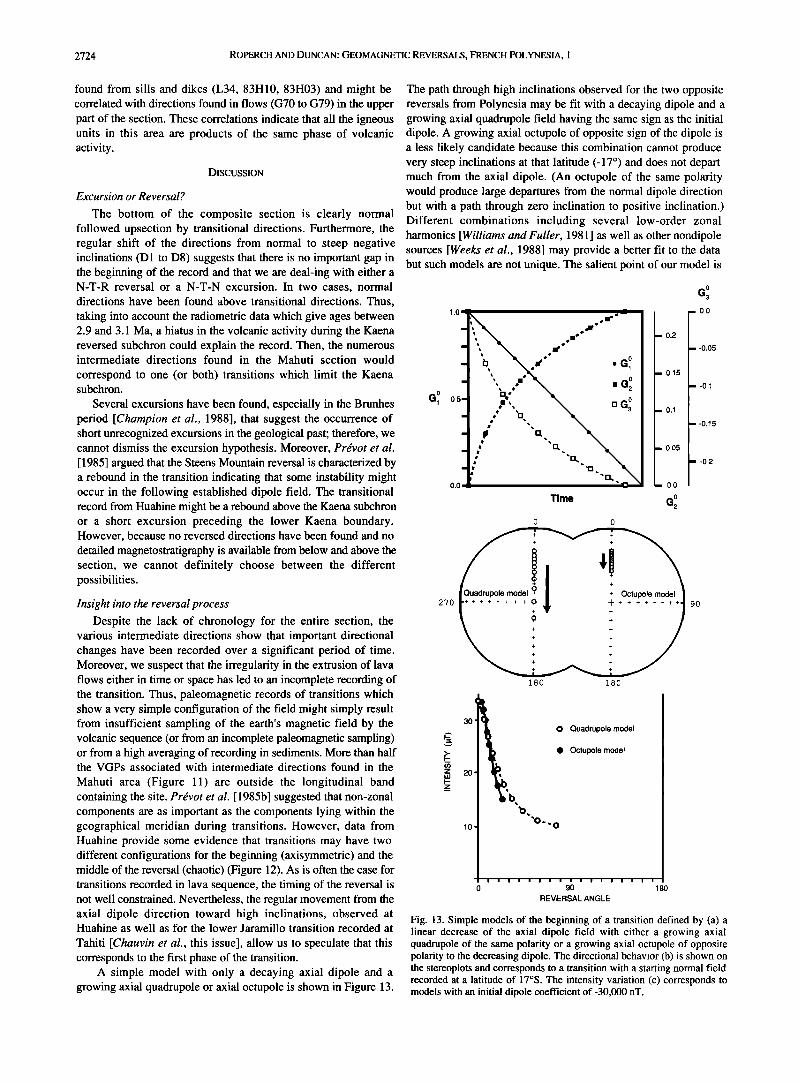
A simple model with only a decaying axial dipole and a growing axial quadrupole or axial octupole is shown in Figure 13.
very steep inclinations at that latitude (-17 ø) and does not depart much from the axial dipole. (An octupole of the same polarity would produce large departures from the normal dipole direction but with a path through zero inclination to positive inclination.) Different combinations including several low-order zonal harmonics [Williams and Fuller, 1981 ] as well as other nondipole sources [Weeks et al., 1988] may provide a better fit to the data but such models are not unique. The salient point of our model is
0
o
Time G2
270
o
-- -0.05
-- -0.1
-0.15
0 0
90
180 180
b•
O Quadrupole model
ß Octupole model
0 90 180
REVERSAL ANGLE
Fig. 13. Simple models of the beginning of a transition defined by (a) a linear decrease of the axial dipole field with either a growing axial quadrupole of the same polarity or a growing axial octupole of opposite polarity to the decreasing dipole. The directional behavior (b) is shown on the stereoplots and corresponds to a transition with a starting normal field recorded at a latitude of 17øS. The intensity variation (c) corresponds to models with an initial dipole coefficient of -30,000 nT.
ROPERCH AND DUNCAN: GEOMAGNETIC REVERSALS, FRENCH POLYNESIA, 1 2725
its simplicity which suggests a predominant role of the quadrupole field.
Some other volcanic records show, although less clearly, a trend toward axisymmetry at the onset of reversal [Pr•vot et al., 1985b] and the same predominance of the zonal terms at the beginning of some records of the Matuyama-Brunhes reversal has
been noted [Hoffman, 1982]. These records are also compatible with a model involving a quadrupole at the onset of a transition. This hypothesis finds some support from recent analyses of paleosecular variation by Merrill and McFadden [1988] who have argued that a reversal may occur if the axial dipole field is weak and the quadrupole family field is strong. In this case, the quadrupole family may be dominated by the axial quadrupole field.
Our data lead us to speculate that a significant difference in the transitional field geometry exists between the beginning of the reversal, controlled by axisymmetric components, and the following more complex phase. This second phase is mostly characterized by intermediate fields with low intensity and large directional changes. Although no absolute paleointensity is available, the intensity of the magnetization clearly decreases during the transition and normalizations with susceptibility and ARM demonstrate that, on average, this feature is due to the low intensity of the intermediate field. The earth's surface magnetic field, at the middle stage of a reversal, might be dominated by low intensity nondipole fields with high-order harmonic content, which suggests that the quadrupole field apparent at the beginning of the transition must also vanish through the reversal process. This apparent chaotic behavior of the magnetic field at the earth's surface may correspond to an increase in turbulence in the fluid earth's core.
Coe, R.S., The determination of paleointensities of the Earth's magnetic field with emphasis on mechanisms which could cause non-ideal behavior in Thellier's method. J. Geomagn. Geoelectr., 19, 157-179, 1967b.
Coe, R.S., C.S. Gromm6, and E.A. Mankinen, Geomagnetic paleointensities from radiocarbon dated lava flows on Hawaii and the question of the Pacific non-dipole low, J. Geophys. Res., 83, 1740- 1756, 1978.
Coe, R.S., C.S. Gromm6, and E.A. Mankinen, Geomagnetic paleointensities from excursion sequences in lavas on Oahu, Hawaii, J. Geophys. Res., 89, 1059-1069, 1984.
Dalrymple, G.B., and M.A. Lamphere, Potassium-Argon Dating, 258pp., W.H. Freeman, New York, 1969.
Duncan, R. A., and I. McDougall, Linear volcanism in French Polynesia, J. Volcanol. Geotherm. Res., 1, 197-227, 1976.
Duncan, R.A., Paleosecular variation at the Society islands, French Polynesia, Geophys. J. R. Astron. Soc., 41,245-254, 1975.
Harland, W.B., A.V. Cox, P.G. Llewellyn, C.A.G. Pickton, A.G. Smith, and R. Walters, A Geologic Time Scale, 131pp., Cambridge University Press, New York, 1982.
Harrison, C.G.A., Secular variation and excursions of the earth's magnetic field, J. Geophys. Res., 85, 3511-3522, 1980.
Hillhouse, J., and A. Cox, Brunhes-Matuyama polarity transitions, Earth Planet. Sci. Lett., 29, 51-64, 1976.
Hoffman, K.A., Paleomagnetic excursions, aborted reversals and transitional fields, Nature, 294, 67-69, 1981.
Hoffman, K.A., The testing of the geomagnetic reversal models/recent developments, Philos. Trans. R. Soc. London, Ser. A, 306, 147-159, 1982.
Hoffman, K.A., A method for the display and analysis of transitional paleomagnetic data, J. Geophys. Res., 89, 6285-6292, 1984.
Hoffman, K.A., Transitional field behavior from southern hemisphere lavas: evidence for two stage reversals of the geodynamo, Nature, 320, 228-232, 1986.
Hoffman, K.A., and S.B. Slade, Polarity transition records and the acquisition of remanence: a cautionary note, Geophys. Res. Lett., 13, 483-486, 1986.
Excursions are often interpreted as reversal attempts which have Hoffman, K.A., V.L. Constantine, and D.L. Morse, Determination of not been successful [Harrison, 1980; Hoffman, 1981; Coe at al., absolute paleointensity using a multi-specimen procedure, Nature, 339, 1984]. If we assume the observed magnetic stratigraphy to be real and thus to correspond to an excursion, the similar characteristics of the intermediate fields observed at Huahine and those recorded
during full reversals [Chauvin et al., this issue] would support the aborted reversal hypothesis.
Acknowledgments. Thanks are due to Leonard Chungue for his major help during the sampling and the Centre ORSTOM of Tahiti for providing the logistical support for field work. Thanks are due to John Shaw who made his laboratory available for paleointensity experiments. Discussion with N. Bonhommet, C. Laj, M. Pr6vot and H. Perroud have been very helpful at different stages of this study. Comments by the Editors, the reviewers, and S. Levi help to improve this paper.
REFERENCES
Bogue, S.W., and R.S. Coe, Successive paleomagnetic reversal records from Kauai, Nature, 295, 399-401, 1982.
Brousse, R., C. Macherey, E. Berger, and G. Boutault, L'ile de Huahine: 3 volcans successifs (Archipel de la SociStS, PolynSsie), C. R. Acad. Sci. Paris, 296, 1559-1562, 1983.
Champion, D.E., M.A. Lanphere, and M.A. Kuntz, Evidence for a new geomagnetic reversal from lava flows in Idaho: Discussion of short polarity reversals in the Brunhes and late Matuyama polarity chrons, J. Geophys. Res., 93, 11,667-11,681, 1988.
Chauvin, A., P. Roperch, and R.A. Duncan, Records of geomagnetic reversals from volcanic island from French Polynesia, 2, Paleomagnetic study of a flow sequence (1.2-0.6 Ma) from the island of Tahiti and discussion of reversal models, J. Geophys. Res., this issue.
Clement, B.M., and D.V. Kent, A detailed record of the lower Jaramillo polarity transition from a southern hemisphere, deep sea sediment core, J. Geophys. Res., 89, 1049-1058, 1984.
Coe, R.S., Paleointensities of the Earth's magnetic field determined from Tertiary and Quaternary rocks, J. Geophys. Res., 72, 3247-3262, 1967a.
295-297, 1989. Kristjansson, L., Some statistical properties of paleomagnetic directions in
Icelandic lava flows, Geophys. J. R. Astron. Soc., 80, 57-71, 1985. Kristjansson, L., and I. McDougall, Some aspects of the late Tertiary
geomagnetic field in Iceland, Geophys. J. R. Astron. Soc., 68, 273- 294, 1982.
Krummenacher, D., and J. Noetzlin, Ages isotopiques K-Ar de roches pr61ev6es dans les possessions fran•aises du Pacifique. Bull. Soc. Gdol. Ft., 8, 173-175, 1966.
Levi, S., and R.T. Merrill, A comparison of ARM and TRM in magnetite, Earth Planet. Sci. Lett., 32,171-184, 1976.
Mankinen, E.A., M. Pr6vot, C.S. Gromm6, and R.S. Coe, The Steens Mountain (Oregon) geomagnetic polarity transition, 1. Directional history, duration of episodes and rock magnetism. J. Geophys. Res., 90,10393-10416. 1985.
Merrill, R.T., and P.L. McFadden, Secular variation and the origin of geomagnetic field reversals, J. Geophys. Res., 93, 11589-11598, 1988.
Pr6vot, M., E.A. Mankinen, R.S. Coe, and C.S. Gromm6, The Steens Mountain (Oregon) geomagnetic polarity transition, 2. Field intensity variations and discussion of reversals models, J. Geophys. Res., 90, 10417-10448, 1985a.
Pr6vot, M., E.A. Mankinen, C.S. Gromm6, and R.S. Coe, How the geomagnetic field vector reverses polarity, Nature, 316, 230-234, 1985b.
Rolph T.C., and J. Shaw, A new method of paleofield magnitude correction for thermally altered samples and its application to lower Carboniferous lavas, Geophys. J. R. Astron. Soc., 80, 773-781, 1985.
Roperch, P., and A. Chauvin, Transitional geomagnetic field behavior: Volcanic records from French Polynesia, Geophys. Res. Lett., 14, 151-154, 1987.
Roperch, P., N. Bonhommet, and S. Levi, Paleointensity of the earth's magnetic field during the Laschamp excursion and its geomagnetic implications, Earth Planet. Sci. Lett, 88, 209-219, 1988.
Shaw J., A new method of determining the magnitude of the paleomagnetic field: Application to five historic lavas and five archaeological samples. Geophys. J. R. Astron. Soc., 39, 133-141, 1974.

2726 ROPERCH AND DUNCAN: GEOMAGNETIC REVERSALS, FRENCH POLYNESIA, 1
Shaw, J., Strong geomagnetic fields during a single Icelandic polarity transition, Geophys. J. R. astr. $oc., 40, 345-350, 1975.
Shaw J., J. Share, and J. Rogers, An automated superconducting magnetometer and demagnetizing system, Geophys. J. R. Astron. $oc., 8, 209-218, 1984.
Thellier E., and O. Thellier, Sur l'intensit6 du champ magn6tique terrestre dans le pass6 historique et g6ologique, Ann. Geophys., 15, 285-376, 1959.
Theyer F., E. Herrero-Bervera, and V. Hsu, The zonal harmonic model of polarity transition: a test using successive reversals, J. Geophys. Res., 90, 1963-1982, 1985.
Valet, J.P., and C. Laj, Paleomagnetic record of two successive Miocene geomagnetic reversals in western Crete, Earth Planet. $ci. Lett., 54, 53-63, 1981.
Valet, J.P., C. Laj, and C. Langeris, Two different R-N geomagnetic reversals with identical VGP paths recorded at the same site, Nature, 304, 1983.
Valet, J.P., L. Tauxe, and D.R. Clark, The Matuyama-Brunhes transition recorded from the Lake Tecopa sediments (Califomia), Earth Planet. $ci. Lett., 87, 463-472, 1988a.
Van Zijl, J.S.V., K.V.T. Graham, and A.L. Hales, The paleomagnetism of the Stormberg laves, II, The behavior of the magnetic field during a reversal, Geophys. J. R. Astron. $oc., 7, 169-182, 1962.
Weeks, R.J., M. Fuller, and I. Williams, A model for transitional field geometries involving low-order zonals and drifting nondipole harmonics, J. Geophys. Res., 93, 11,613-11-620, 1988.
Williams, I., and M. Fuller, Zonal harmonic models of reversal transition fields, J. Geophys. Res., 87, 9408-9418, 1981.
R.A. Duncan, College of Oceanography, Oregon State University, Corvallis, OR97331.
P. Roperch, ORSTOM and Laboratoire de G6ophysique Interne, Universit6 de Rennes I, av. G6n6ral Leclerc, 35042 Rennes, France.
(Received March 10, 1989; revised October 3, 1989;
accepted November 7, 1989.)
Copyright © 2022 FDOKUMEN