Recommended Practice for Use of Faraday Probes in Electric ...
32
Recommended Practice for Use of Faraday Probes in Electric Propulsion Testing Daniel L. Brown ∗ U.S. Air Force Research Laboratory, Edwards Air Force Base, California 93524 Mitchell L. R. Walker † Georgia Institute of Technology, Atlanta, Georgia 30332 James Szabo ‡ Busek Co., Inc., Natick, Massachusetts 01760 Wensheng Huang § NASA John H. Glenn Research Center, Cleveland, Ohio 44135 and John E. Foster ¶ University of Michigan, Ann Arbor, Michigan 48109 DOI: 10.2514/1.B35696 Faraday probes are a common plasma diagnostic used to determine the local ion charge flux of electric propulsion plumes. Standard practices, guidelines, and recommendations are provided for experimental methods and analysis techniques that aim to standardize community practices, to mitigate test environment effects, and to reduce systematic measurement error in order to improve plume predictions in the space environment. The approaches are applicable to time-averaged plasma properties in the near-field and far-field of electric propulsion plumes, with emphasis on Hall effect thrusters and gridded ion thrusters. Considerations for other electric propulsion technologies are provided, including electrosprays, arcjets, and electromagnetic thruster concepts. These test strategies are expected to increase the quality of comparisons between different thrusters and vacuum environments, thereby broadening the applicability of ground-based measurements and enhancing the fidelity for on-orbit predictions and modeling validation. Nomenclature A C = cross-sectional geometric area, m 2 A G = Richardson constant, A · cm −2 · K −2 C 1;2 = curve-fit parameters D T = thruster diameter, m E δ = error metric of divergence angle E θ = error metric of travel angle e = elementary charge; 1.6022 × 10 −19 C F t = thrust loss parameter h C = height of collector, m h GR = height of guard ring, m I Axial = axial component of ion beam current parallel to thrust axis, A I Beam = integrated ion beam current, A I d = thruster discharge current, A I FP = measured ion current on the Faraday probe collector, A j = ion current density, A ⋅ m −2 J Bohm = Bohm ion current density, A ⋅ m −2 j t = thermionic emission ion current density, A ⋅ m −2 k = propellant charge state index; 0, 1, 2, 3, etc., for Xe 0 , Xe 1 , Xe 2 , Xe 3 k B = Boltzmann constant; 1.3806 × 10 −23 J · K −1 M i = ion mass, kg m = iteration index, 0, 1, 2, ::: _ m T = total propellant flow rate, kg · s −1 N = number axial positions n = plasma density, m −3 n n = neutral density, m −3 Q = average ion charge r = radial coordinate R = radial measurement distance, m R C = radius of collector, m R C-GR = collector to guard ring resistance, Ω R FP = probe shunt resistance, Ω R GR = inner radius of guard ring, m R N , R F = near and far probe distances in two-point source model, m R P = probe radius, m r 0 = shift in jet radial point of origin, m S f = linear regression slope T = thrust, N T e = electron temperature, eV T S = surface temperature, K V Beam = thruster beam voltage, V V bias = probe bias voltage, V V FP = measured shunt voltage, V w = plasma discharge width, m Z = downstream measurement distance, m Z k = ion charge state of the kth species z = axial coordinate z 0 = shift in jet axial point of origin, m α = thrust reduction due to multiple charged ions α A = ion divergence angle in two-point source model, rad α N , α F = angle of the probe in two-point source model, rad β = near-field gridded ion thruster divergence half-angle, rad β 1;2 = tuning parameters Γ k = particle flux of the kth species, m −2 · s −1 Received 15 December 2014; revision received 1 July 2016; accepted for publication 5 July 2016; published online 14 September 2016. This material is declared a work of the U.S. Government and is not subject to copyright protection in the United States. Copies of this paper may be made for personal and internal use, on condition that the copier pay the per-copy fee to the Copyright Clearance Center (CCC). All requests for copying and permission to reprint should be submitted to CCC at www.copyright.com; employ the ISSN 0748-4658 (print) or 1533-3876 (online) to initiate your request. *Chief, Liquid Rocket Engines Branch, Aerospace Systems Directorate. Associate Fellow AIAA. † Associate Professor, High-Power Electric Propulsion Laboratory. Associate Fellow AIAA. ‡ Chief Scientist for Hall Thrusters. Associate Fellow AIAA. § Research Engineer, Propulsion and Propellants. Member AIAA. ¶ Associate Professor, Nuclear Engineering and Radiological Sciences. Associate Fellow AIAA. 582 JOURNAL OF PROPULSION AND POWER Vol. 33, No. 3, May–June 2017 Downloaded by GEORGIA INST OF TECHNOLOGY on January 19, 2018 | http://arc.aiaa.org | DOI: 10.2514/1.B35696
-
Upload
khangminh22 -
Category
Documents
-
view
1 -
download
0
Transcript of Recommended Practice for Use of Faraday Probes in Electric ...

Recommended Practice for Use of Faraday Probesin Electric Propulsion Testing
Daniel L. Brown∗
U.S. Air Force Research Laboratory, Edwards Air Force Base, California 93524
Mitchell L. R. Walker†
Georgia Institute of Technology, Atlanta, Georgia 30332
James Szabo‡
Busek Co., Inc., Natick, Massachusetts 01760
Wensheng Huang§
NASA John H. Glenn Research Center, Cleveland, Ohio 44135
and
John E. Foster¶
University of Michigan, Ann Arbor, Michigan 48109
DOI: 10.2514/1.B35696
Faraday probes are a common plasma diagnostic used to determine the local ion charge flux of electric propulsion
plumes. Standard practices, guidelines, and recommendations are provided for experimental methods and analysis
techniques that aim to standardize communitypractices, tomitigate test environment effects, and to reduce systematic
measurement error in order to improve plume predictions in the space environment. The approaches are applicable
to time-averagedplasmaproperties in the near-field and far-field of electric propulsionplumes,with emphasis onHall
effect thrusters and gridded ion thrusters. Considerations for other electric propulsion technologies are provided,
including electrosprays, arcjets, and electromagnetic thruster concepts. These test strategies are expected to increase
the quality of comparisons between different thrusters and vacuum environments, thereby broadening the
applicability of ground-based measurements and enhancing the fidelity for on-orbit predictions and modeling
validation.
Nomenclature
AC = cross-sectional geometric area, m2
AG = Richardson constant, A · cm−2 · K−2
C1;2 = curve-fit parametersDT = thruster diameter, mEδ = error metric of divergence angleEθ = error metric of travel anglee = elementary charge; 1.6022 × 10⁻¹⁹ CFt = thrust loss parameterhC = height of collector, mhGR = height of guard ring, mIAxial = axial component of ion beam current parallel to thrust
axis, AIBeam = integrated ion beam current, AId = thruster discharge current, AIFP = measured ion current on the Faraday probe collector, Aj = ion current density, A ⋅m−2
JBohm = Bohm ion current density, A ⋅m−2
jt = thermionic emission ion current density, A ⋅m−2
k = propellant charge state index; 0, 1, 2, 3, etc., for Xe0,Xe�1, Xe�2, Xe�3
kB = Boltzmann constant; 1.3806 × 10⁻²³ J · K−1
Mi = ion mass, kgm = iteration index, 0, 1, 2, : : :_mT = total propellant flow rate, kg · s−1
N = number axial positionsn = plasma density, m−3
nn = neutral density, m−3
Q = average ion charger = radial coordinateR = radial measurement distance, mRC = radius of collector, mRC-GR = collector to guard ring resistance, ΩRFP = probe shunt resistance, ΩRGR = inner radius of guard ring, mRN ,RF
= near and far probe distances in two-point sourcemodel, m
RP = probe radius, mr0 = shift in jet radial point of origin, mSf = linear regression slopeT = thrust, NTe = electron temperature, eVTS = surface temperature, KVBeam = thruster beam voltage, VVbias = probe bias voltage, VVFP = measured shunt voltage, Vw = plasma discharge width, mZ = downstream measurement distance, mZk = ion charge state of the kth speciesz = axial coordinatez0 = shift in jet axial point of origin, mα = thrust reduction due to multiple charged ionsαA = ion divergence angle in two-point source model, radαN , αF = angle of the probe in two-point source model, radβ = near-field gridded ion thruster divergence half-angle,
radβ1;2 = tuning parametersΓk = particle flux of the kth species, m−2 · s−1
Received 15 December 2014; revision received 1 July 2016; accepted forpublication 5 July 2016; published online 14 September 2016. Thismaterial isdeclared a work of the U.S. Government and is not subject to copyrightprotection in the United States. Copies of this paper may be made for personaland internal use, on condition that the copier pay the per-copy fee to theCopyright Clearance Center (CCC). All requests for copying and permissionto reprint should be submitted to CCC at www.copyright.com; employ theISSN 0748-4658 (print) or 1533-3876 (online) to initiate your request.
*Chief, Liquid Rocket Engines Branch, Aerospace Systems Directorate.Associate Fellow AIAA.
†Associate Professor, High-Power Electric Propulsion Laboratory.Associate Fellow AIAA.
‡Chief Scientist for Hall Thrusters. Associate Fellow AIAA.§Research Engineer, Propulsion and Propellants. Member AIAA.¶Associate Professor, Nuclear Engineering and Radiological Sciences.
Associate Fellow AIAA.
582
JOURNAL OF PROPULSION AND POWER
Vol. 33, No. 3, May–June 2017
Dow
nloa
ded
by G
EO
RG
IA I
NST
OF
TE
CH
NO
LO
GY
on
Janu
ary
19, 2
018
| http
://ar
c.ai
aa.o
rg |
DO
I: 1
0.25
14/1
.B35
696

γk = secondary electron emission yield of the kth species,electrons/ion
δ = near-field Hall effect thruster divergence half-angle,rad
δj = jet divergence angle, radε = surface emissivityεo = permittivity of free space; 8.8542 × 10⁻¹² F · m−1
ηBeam = beam divergence utilizationηCurrent = current utilizationηMass = mass utilizationθ = angular coordinateθj = jet travel angle, radκA = correction for ion angle of incidenceκD = correction for probe distance to thrusterκG = correction for probe ion collection areaκSEE = correction for collector secondary electron emissionλ = far-field divergence half-angle, radλD = Debye length, mλMFP = mean free path, mσ = collision cross section, m2
σSB = Stefan–Boltzmann constant; 5.6704×10⁻⁸W ·m−2 ·K−4
Φ = azimuthal angle, radφ = work function, eVΨ = probe angle, radΩk = ion current fraction of the kth specieshiJ = charge flux-weighted average quantity
I. Introduction
FARADAY probe measurements of ion charge flux in the plume of
spacecraft electric propulsion (EP) technologies are used for several
purposes, including 1) ground predictions and flight measurements of
local plume properties to determine plasma–spacecraft interactions,
2) characterization of global plume properties to assess the thruster
plasma discharge and loss mechanisms, 3) validation data for modeling
and simulation, and 4) data for thruster acceptance tests. In addition to
EP, these diagnostics have been used for many applications, such as
space plasma experiments, dense plasma focus experiments, and laser-
produced plasma [1–4]. In its simplest form, the Faraday probe consists
of a collector electrode that measures local ion charge flux. Other
configurations use collimators, guard rings, or biased grids to filter
charged particles, such as the Faraday cup. Although Faraday probe
design and implementation is straightforward, the test methodology and
data analysis required forEP technologies are complicatedby systematic
measurement errors.This paper provides recommendations for time-averaged
Faraday probe measurements in the near-field and far-field plumes
of Hall effect thrusters (HETs) and gridded ion thrusters (GITs)
to provide common test methodologies, diagnostic design, and
analysis techniques. Although this paper is applicable to other EP
technologies, there is insufficient data in the literature to establish
standard methods for electrosprays, arcjets, and electromagnetic
thruster concepts. Section II discusses the applicability to EP
technologies and considerations of theplasmaenvironment. Sections III
and IV describe experimental apparatus and test methodologies,
respectively. SectionV presents data reduction and analysis techniques.
SectionVI provides information onmeasurement error and uncertainty.
Section VII discusses probe design considerations. Section VIII
contains considerations for other EP technologies. A tabulated
summary of all guidelines and recommendations is provided in
Appendix A, and an analysis method to remove the cathode plume
is included in Appendix B.The guidance in this paper uses precise definitions for the words
should and may. The word should denotes the statement is advisory;
there may be circumstances when the statement is ignored, but the
associated implications must be understood and accounted for. The
word may denotes the statement is a recommendation, and it is
considered discretionary.
II. Applicability
A. Electric Propulsion Technologies
In EP systems, electrical energy is added to the propellant from an
external power source to ionize and accelerate propellant to high
exhaust velocities; this is in contrast to chemical rockets where the
propellant exhaust velocity is limited to less than 5 km∕s by the
energy released during propellant combustion processes. Thus, EP
technologies decouple the available energy from the propellant
chemical reactions, and they impart energy through electric heating,
electrostatic fields, and/or electromagnetic fields. Additional details
on EP thruster concepts and plasma processes are found in the
literature [5,6].
This paper focuses on HETs and GITs due to the flight heritage
and extensive Faraday probe measurements in ground testing,
which enables development of guidelines and recommendations.
Examples of Faraday probe measurements and analysis of HET and
GIT plumes are provided, with particular consideration for HET
plumes due to the more recent investigations that have further
improved test methodologies and analyses to reduce systematic
measurement uncertainty. In addition, HETs may have additional
complexities associated with annular geometry, oscillatory behavior,
and facility effects on the plasma ionization and acceleration
processes. The guidance for HETs and GITs may also serve as a
starting point for Faraday probe measurements of other EP
technologies, as discussed in Sec. VIII.
In HETs, propellant ionization and acceleration are achieved with
orthogonal electric and magnetic fields in the annular discharge
channel, as shown in Fig. 1 for a typical stationary plasma thruster
configuration. The guidelines and recommendations in this paper are
based primarily on numerous past experiments with stationary
plasma thrusters; however, the paper is applicable to alternative HET
configurations, including nested channel HETs and the thruster with
anode layer variants [7–9]. In HETs, a constant potential difference is
applied between the anode and cathode, where the cathode may be
located external to the thruster body (as in Fig. 1) or centrally
mounted on the thruster centerline axis. The cathode provides
electrons to the plasma discharge and to neutralize the ion beam. The
anode often serves as the propellant gas distributor. The HETelectric
and magnetic fields are designed such that electrons are confined in
the plasma discharge and have a net azimuthal motion known as the
Hall effect, which is the origin of the device name. Said electrons
ionize propellant through a cascade of electron impact collisions. The
generated ions are weakly magnetized and are accelerated by the
axial electric field to generate thrust. Plasma in the HET channel is
North
North
SouthThruster Centerline
Magnets
Cathode with Gas Feed
Insulator
Anode with Propellant Gas Feed
e -
Neutralizing e -
Propellant Xe0
Ionization and Acceleration
Xe0 E
B
y
z
Fig. 1 Schematic of design features and plasma properties for HETs.
BROWN ETAL. 583
Dow
nloa
ded
by G
EO
RG
IA I
NST
OF
TE
CH
NO
LO
GY
on
Janu
ary
19, 2
018
| http
://ar
c.ai
aa.o
rg |
DO
I: 1
0.25
14/1
.B35
696

quasi neutral, and thus the extracted current density is not space-
charge limited.The GIT plasma is generated within an enclosed discharge
chamber via a direct current (dc) discharge, a radio-frequency (RF)
discharge, or a microwave discharge [6]. Neutral propellant gas isinjected into the discharge chamber and ionized by electrons from the
discharge cathode, as shown in Fig. 2, or by alternating electric andmagnetic field in the case of RF or microwave discharge chambers.
Magnetic fields are typically used near the anode wall to confineenergetic electrons, and thereby improve ionization processes.
Propellant ions are extracted, focused, and accelerated to generatethrust by the ion optics, which are typically a series of closely spaced,
multiaperture grids terminating at the thruster exit plane. The ion
optics geometry determines ion trajectories, particle grid interactions,and beamdivergence.Maximum ion current density extracted though
the ion optics is limited by space-charge considerations; thus, themaximum GIT ion beam current density is lower than a HET beam.
The exhaust ion plume is neutralized by an externally mountedhollow cathode.A Faraday probe is typically employed to assess time-averaged ion
current density in the plume. Time-resolved Faraday probemeasurements at tens of kilohertz are feasible (up to low megahertz
are possible) with existing capabilities, as demonstrated by localplasma measurements with ion saturation reference probes at fixed
bias voltages that were used in experiments with high-speed dualLangmuir probes in the near-field of HETs [10,11]. However, time-
resolved Faraday probes have not been used tomap an EP plume or toevaluate facility effects. Although certain guidelines related to time-
averaged Faraday probe measurements may be applicable to time-
resolved measurements, there may be significant differences in theprobe configuration, data acquisition, data analysis, measurement
error, and quantification of ion beam parameters. These differencesare beyond the scope of this paper.The guidelines in this paper were generated for inert, nonreactive
propellants such as the noble gases. Faraday probes may also be usedwith low vapor pressure (“condensable”) and reactive propellants,
such as bismuth, iodine,mercury, and ionic liquids [12,13]. Althoughthis paper is applicable to HETs and GITs with these propellants,
additional issues may arise that should be accounted for. Forexample, a possible concern with condensable propellants is the
potential for contamination of dielectric surfaces leading to electricalleakage from the collector. Laboratory HET measurements with
iodine propellant showed negligible accumulation on test coupons in
the plume [14]. Mercury GITs on the Space Electric Rocket Test 2
(SERT II) spacecraft were successfully fired on orbit for 4000 h,
where most critical spacecraft surfaces, such as solar arrays, were too
warm to permit mercury condensation and no evidence of condensate
accumulation was expected [15]. However, the issues unique to
condensable and reactive propellant should be carefully considered for
each application, such as deposition of propellant upon probe
electrodes, deposition on ceramic surfaces leading to reduced electrical
isolation, leakage current, and material degradation due to corrosion.
B. Plasma Plume Characterization
The plume of EP thrusters is associated with dynamic and complex
processes that must be considered for Faraday probe measurements.
Examples include downstream regions of ion acceleration, spatial and
temporal gradients in plasma properties, and interactionswith neutrals.
In addition, there are thruster specific processes such as beamlet
interactions downstream of GIT ion optics or HET ion beam merging
from opposing sides of the annular channel. These challenges will be
addressedwith regard to experimental configuration, testmethods, and
analysis in Secs. III, IV, and V, respectively.
Facility effects influence thruster operation and the plasma plume,
and they are well characterized in the EP literature [16–21]. These
interactions are present in both the near-field and far-field regions,
including the influence of facility background neutrals, backsputtering
of facility surfaces, pressure gradients due to facility configuration and
pumping, and the thruster discharge circuit in a grounded vacuum test
facility. The interactions are inherent in ground-based EP plume
investigations, and thus cannot be completely eliminated to fully
replicate the space environment. The two primary facility interactions
on the thruster plume are related to facility background neutrals, and
they are illustrated in Figs. 3 and 4 for HETs and GITs, respectively.
The first interaction is collisional processes between facility neutrals
and the thruster beam, where ion-neutral charge exchange (CEX)
collisions are the dominant interaction. The second interaction is
ingestion, ionization, and acceleration of facility neutrals.
The influence of collisional processes between facility neutrals
and the thruster beam may be evaluated with respect to the neutral
particle populations in EP plumes, as shown in Fig. 5 for simulations
of the BPT-4000 HET [22]. In Fig. 5, the ambient facility neutral
density exceeds the thruster neutral density beyond approximately
0.02 m, which is comparable to GIT plumes for a similar propellant
flow rate [23]. The mean free path (MFP) in Eq. (1) represents the
mean distance a fast particle will travel in a background of stationary
neutrals before a collision:
Thruster Centerline
Neutralizer Cathode with Gas Feed
Ion Optics
e -
Neutralizing e -
Xe0
Anode
Plasma Generator
Propellant Gas Feed
Xe+, +2,…
Beam Ions
Discharge Cathode with Gas Feed
Electrostatic Ion Acceleration
y
z
Fig. 2 Schematic of design features and plasma properties for GITs.
Xe+, +2,…
Beam Ions
North
North
Thruster Centerline
Magnets
Cathode with Gas Feed
Insulator
Anode with Propellant Gas Feed
Xe0
Background Xe0
Ionization and Acceleration Xe+, +2,…
Accelerated Background Ions
Xe0↔Xe+
CEX Collision
Fast Xe0
Slow Xe+
Slow Xe+Fast Xe0
Fast Xe0Slow Xe+
Ingested Background Xe0
y
zSouth
Fig. 3 Diagram of HET plasma interactions of facility backgroundneutrals.
584 BROWN ETAL.
Dow
nloa
ded
by G
EO
RG
IA I
NST
OF
TE
CH
NO
LO
GY
on
Janu
ary
19, 2
018
| http
://ar
c.ai
aa.o
rg |
DO
I: 1
0.25
14/1
.B35
696

λMFP � �nnσ�−1 (1)
In Eq. (1), nn is the neutral density and σ is the particle collision
cross section. TheMFPmay be used to determine the dominant beam
collisional processes in the plume region; an overview of particle
collisions and relevant cross sections was described elsewhere
[6,24,25]. The cross section for CEX collisions between ambient
xenon neutrals and xenon ions has been experimentally measured as
5 × 10⁻¹⁹ to 8 × 10⁻¹⁹ m2 [25],whichwasmuch larger than the cross
section for xenon-neutral elastic scattering (10−20 m2), as well as
xenon ionization and excitation cross sections (10−20 m2) [6,26]. The
CEX collisions between background neutral particles and beam ions
generated high-velocity neutrals and low-energy scattered ions. The
CEX collisional processes scattered beam ions and increased ion
current density on the periphery of the plume, thereby increasing
thruster plume divergence [18,27,28]. Based on Eq. (1), the xenon
ion-neutral MFP of CEX collisions is shown in Fig. 6. For a HETor
GIT operating at a 300 V discharge condition, the relative velocity
between the xenon ions and neutral atoms was approximately
17;000 m∕s and the CEX cross section was 6 × 10⁻¹⁹ m2 [25]. For a
background neutral pressure of 1.3 × 10⁻⁵ torr of xenon gas
(torr-Xe), the neutral number density was 4.2 × 10¹⁷ m−3 [29] and
the ion-neutral CEX collision MFP was 3.97 m. The MFP values inFig. 6 are on the order of the far-field spatialmeasurement region, andthey are consistent with far-field experimental results showingincreased plume divergence at elevated facility pressure in Sec. V.Although the ion-neutral CEX MFP is larger than the near-fieldspatial region of interest for most HETs and GITs, the difference isnot significant; thus, CEX collisions are expected to have anonnegligible effect in the near-field plume. These observations willbe discussed with experimental results in Sec. V.The second dominant facility interaction is associated with
ingestion of facility background neutrals near the thruster dischargeexit, which increases the amount of propellant used by the thruster.These ingested neutrals undergo ionization and subsequentacceleration, which increases the amount of propellant available tothe thruster. The ingested facility neutrals may be ionized andaccelerated downstream of the peak electric field, and thus manifestas a low-velocity divergent ion population in the beam. In GITs, theaccelerator grid current may become prohibitively high at an elevatedbackground pressure due to a CEX ion current, and thereforeoperation at these elevated pressures is often impractical well beforeingestion effects become a significant factor. This is further discussedin Sec. IV.E.Multiple studies have evaluated Faraday probe designmodifications
to minimize facility effects associated with probe collection of low-energy CEX ions and ions generated from ingested propellant,including probe filtering mechanisms and collimators [1,30–32].Although these techniques successfully mitigate the collection of low-energy ions generated through facility interactions, they introduceadditional error that is not representative of thruster plumes in the spaceenvironment. The impact of these facility interactions on Faradayprobe measurements will be discussed, and guidelines to mitigate andaccount for the effects will be recommended.In theory, computational simulations of the EP plume allow
isolation and elimination of facility pressure effects to predict theon-orbit ion beam. However, this predictive capability relies onaccurate plasma input source models, understanding of facilityinteractions, and validation with flight measurements and groundtesting. To date, comparisons of plume profiles between groundtesting, flight data, and/or simulations demonstrate inconsistentagreement [33–37].
III. Experimental Apparatus
The test hardware and configuration requirements for plumemeasurements of ion current density include the Faraday probe,motion control system, power electronics, and data acquisition(DAQ) system to monitor collected current. The power electronics,experimental configuration, and probe calibration considerations aredescribed in the following sections.
0 0.1 0.2 0.3 0.4
Distance Downstream of Thruster Exit Plane (m)
Neu
tral
Par
ticl
e D
ensi
ty (
m-3
)
4.0x10¹⁸
2.0x10¹⁸
0
TotalFacilityHall ThrusterHollow Cathode
Fig. 5 Neutral particle density on thruster centerline, recreated from[22].
0.0
1.0
2.0
3.0
4.0
5.0
Neutral Particle Density (m-3)
Ion-
Neu
tral
Mea
n Fr
ee P
ath
(m)
4.0x10183.0x10182.0x10181.0x10180.0
Fig. 6 Xenon ion-neutral CEX mean free path for expected neutralparticle density in the near-field plume, for σ � 6 × 10⁻¹⁹ m2.
Thruster Centerline
Xe+, +2,…
AcceleratedBackground Ions
CEX Collision
Slow Xe+
Slow Xe+Fast Xe0
Fast Xe0
Ingested Background Xe0
Neutralizer Cathode with Gas Feed
Xe0
y
z
Ion Optics
Anode
Plasma Generator
Propellant Gas Feed
Discharge Cathode with Gas Feed
Electrostatic Ion Acceleration
Xe0↔Xe+
Fig. 4 Diagram of GIT plasma interactions of facility backgroundneutrals.
BROWN ETAL. 585
Dow
nloa
ded
by G
EO
RG
IA I
NST
OF
TE
CH
NO
LO
GY
on
Janu
ary
19, 2
018
| http
://ar
c.ai
aa.o
rg |
DO
I: 1
0.25
14/1
.B35
696

A. Hemispherical Coordinate System and Test Configuration
Faraday probe measurements in a hemispherical coordinate systemare shown inFig. 7with respect toCartesian coordinates,where θ is theangular position from thruster centerline,Φ is the azimuthal angle,R isthe measurement distance, and DT is the thruster diameter. In thispaper, DT is defined as the outer grid diameter for GITs or outerchannel diameter for HETs. Different definitions, such as themidchannel diameter of HETs, may necessitate minor modification toequations and will be identified in the text. The plume is assumedaxisymmetric about the z axis, and the probe axis of rotation is typicallythe y axis at the intersection of the thruster exit plane and the thrustercenterline axis in Fig. 7. The Faraday probe is swept in an arc atconstantR, and the collector face is pointed toward the rotation axis atall angular locations of the measurement.Note that, in a true hemispherical coordinate system, the angular
coordinate θ cannot be negativewith respect to the thruster centerlineaxis. However, for EP thruster testing, probes are generally sweptfrom one side of the thruster to the other. Plasma measurements arecollected during the entire sweep, thereby providing data from twoopposing azimuthal angles (i.e., Φ � 0 and 180 deg). Commonconvention within the EP test community is to refer to these twodatasets as the positive θ and negative θ datasets, where −θ refers todata collected atΦ � 180 deg since cos�180 deg� is−1. Collectingdata in this fashion has the advantage of allowing researchers todetermine the symmetry of the plasma plume in the swept plane. Forthe purpose of this paper, −θ positions represent the left side of theplume where Φ � 180 deg and is understood to represent angularpositions opposite of the azimuthal plane at Φ � 0 deg.The hemispherical coordinate geometry should be used for
measurements of the far-field HETand GIT plume, which is definedas the region where R is greater than four thruster diameters
downstream (TDD) of the exit plane, such that R∕DT is greater
than 4. Measurements where R∕DT is less than 4 have been shownto introduce systematic error, since the hemispherical coordinate
system assumes a point ion source [18]. This issue is further
discussed in Sec. V.B. In addition, multiple HET investigations haveshown a nonnegligible population of beam ions on the periphery of
the plume beyond θ � 50 deg for different thruster designs and overa wide range of operating conditions [38,39]; the hemispherical
coordinate system is well-suited to evaluate these divergent plume
structures.If an external cathode is used for beam neutralization and the
Faraday probe measurement sweep is conducted in the Φ � 0 degplane, the cathode should be positioned in the Φ � 90 deg or270 deg plane (i.e., �y-axis). Faraday probe sweeps in the cathode
plane may measure localized plume asymmetry near the cathode.
B. Cylindrical Coordinate System and Test Configuration
The cylindrical coordinate system is defined in Fig. 8 with respecttoCartesian coordinates,where r is the radial coordinate, z is the axialcoordinate, andΦ is the azimuthal angle [40]. The plume is assumed
to be axisymmetric about the z-axis and the axial measurementdistance Z is defined with respect to the thruster exit plane, where
z � 0. Beam ions are assumed to be aligned in the axial direction, and
therefore the probe face is oriented normal to the z-axis. The probe istypically swept in the radial direction at a fixed axial distance Z, withΦ � 0 deg and/or 180 deg.In a true cylindrical coordinate system, r cannot be negative with
respect to the thruster centerline axis. Similar to discussions of −θ inthe hemispherical coordinate system, near-field Faraday probemeasurements are typically swept across the plume. Thus, a single
Fig. 7 Diagram of a) hemispherical coordinate system for far-fieldFaradayprobemeasurements andb)measurement geometry inx-zplanewhere Φ � 0 and 180 deg.
Fig. 8 Diagram of a) cylindrical coordinate system for Faraday probemeasurements and b) measurement geometry in x-z plane whereΦ � 0 deg.
586 BROWN ETAL.
Dow
nloa
ded
by G
EO
RG
IA I
NST
OF
TE
CH
NO
LO
GY
on
Janu
ary
19, 2
018
| http
://ar
c.ai
aa.o
rg |
DO
I: 1
0.25
14/1
.B35
696

dataset includes opposing azimuthal angles (i.e., Φ � 0 and180 deg). Common convention within the EP test community is torefer to these two datasets as the positive r and negative r datasets,where −r refers to data collected at Φ � 180 deg becausecos�180 deg� is−1. Collecting data in this fashion has the advantageof allowing researchers to assess plume symmetry. For the purpose ofthis paper, −r positions represent the right side of the plume whereΦ � 180 deg and are understood to represent angular positionsopposite of the azimuthal plane at Φ � 0 deg.A cylindrical coordinate system should be used in the near-field
plume extending from the thruster exit plane to Z∕DT less than four,which is equivalent to R∕DT less than four on the thruster centerlinein the hemispherical coordinate system. If an external cathode is usedfor beam neutralization and the Faraday probemeasurement sweep isconducted in the Φ � 0 deg and/or 180 deg plane, the cathodeshould be positioned in the Φ � 90 or 270 deg plane (i.e.,�y axis).Faraday probe sweeps in the cathode plane may measure localizedplume asymmetry and plasma gradients near the cathode, whichcomplicate data analysis [41].A limitation of the cylindrical coordinate system is the inability to
measure high-energy beam ion flux at high angles from the thrustercenterline approaching Ψ � 90 deg (in Fig. 8) because the probe isoriented perpendicular to the thrust axis. HETs in particular exhibit anonnegligible fraction of beam ions on the plume periphery [38,42];thus, the cylindrical coordinate system may not be practical forquantitative evaluation of the near-fieldHETplume for 1 < Z∕DT < 4.
C. Probe Positioning Techniques
Faraday probe measurement positioning may be performed withtwo methods, either 1) maintain continuous motion and dataacquisition, or 2) stop at a specificmeasurement position, record data,and thenmove to the next position. Probe acceleration and translationspeed impacts spatial accuracy, resolution, and scan duration. Largeacceleration and decelerationmagnitudemay induce probe vibration,and thus it is critical to characterize the effect on resolution if the probeis stopped at each measurement location. For continuous motion, theprobe translation speed will limit spatial measurement resolution.Limiting factors for slow translation speeds include long duration ofthe measurement sweep, probe heating, and survivability. High-speedmotion stages should be employed if excessive probe heating andsurvivability are an issue, which imposes additional demands on themechanical setup. For example, the supporting structure for Faradayprobe armature and the high-speed motion stage must be secure, andthey should be attached to the test facility in a way that also bracesagainst possible torsional modes. Additional information on high-speed probe positioning may be found in [43,44].There is currently no simple formula for determining a minimum
motion stage speed necessary to pass through the thruster plasma.The probe area and the residence time in the plasma are proportionalto the total energy transferred to the probe as heat. Past near-fieldstudies of a 20 kWHET plasma demonstrated a probe residence timein the plasma of ∼1 s was acceptable for a probe with frontal area of∼10 mm2 at 0.05 TDD from the exit plane [45]. During these studies,the probe translation speed ranged from 150 to 500 mm∕s.
D. Power Electronics and Data Acquisition
Power electronics serve two functions: to source electrode biasvoltage, and to measure ion current collected by the electrode. Theprobe bias repels electrons such that the probe is in ion saturation.Probe electrode biasing is accomplished through the use of one ormore dc power supplies, typically −15 to −30 V with respect tofacility ground in far-field measurements and approaching −100 Vwith respect to facility ground in near-field measurements. A singlepower supply can bias the collector and guard ring electrodes to thesame bias potential Vbias, assuming equivalent electrical wiringlengths are used to both electrodes.Additional power suppliesmay benecessary if a filtering or collimating technique is used that requiresdifferent voltages than that applied to the collector. The electricaldiagramof a recommended probe circuit is shown in Fig. 9, where theion current to the collector IFP may be read as a voltageVFP across the
resistor RFP. The resistance of RFP is typically between 10 and1000 Ω. Larger RFP resistance values may influence measurementsin several ways, including generation of a low-pass filter, creating a
voltage divider effect with measurement equipment, or Johnson–Nyquist noise [46]. Avoltmetermay be used tomeasureVFP. Often, aDAQ system or digital multimeter with high impedance (greater thangigaohms) is required to further reduce leakage current. (Leakage
current is equivalent to probe voltage divided by input impedance.For megaohm input impedance, the leakage current may exceed anonnegligible fraction of the probe signal strength in the far-fieldplume (∼10–100 μA∕cm2), thereby limiting resolution and increas-
ing measurement uncertainty. For example, a probe bias of −20 Vand 1 MΩ input impedance generates leakage current of ∼20 μA,whereas 1 GΩ input impedance corresponds to ∼20 nA.)Resistance between the collector and guard ring, identified as
RC-GR in Fig. 9, and between the collector to ground should be large,
such that stray current does not exceed the ion current measurementresolution. For ion current measurement resolution of 1 nA andtypical electrode bias voltage ranging from −10 to −100 V, theresistance RC-GR from the collector to the guard ring should exceed
100 MΩ�� 10 V∕1 nA). An isolation amplifier may be imple-mented to prevent arc events from damaging the DAQ system.The measurement DAQ rate is typically determined by the desired
spatial resolution and probe speed. High-speed probe positioning mayrequire an encoder. If an encoder is not used, the repeatability of probe
positioning should be characterized to evaluate precision and estimatepositioning error. During measurements with low data acquisitionrates, the probe location may be monitored through encoders, throughthe motion controller, or through the controlling program.
E. Probe Calibration, Alignment, and Periodic Maintenance
The methods described in this section are suitable to minimizesystematic error in key aspects of the measurement system andexperimental configuration in a ground test environment. The Faraday
probe, probe positioning, and DAQ systemmay be characterized and/orcalibrated according to manufacturer recommendations before Faradayprobe measurements. Ideally, before testing the probe, an experimentalmeasurement system would be evaluated with an ion source that could
provide a uniform, monoenergetic ion beam with the ion energy percharge ranging from 0 V to greater than the maximum thrusteracceleration voltage. Although this approach may be ideal in an
investigationwith unlimited resources, there are significant limitations inapplying the characterizationof an ideal ionbeam tomeasurements ofEPthruster plumes and mitigating systematic error associated with facilitypressure effects. First, the thruster ion beam will vary spatially (and
temporally in the case of HETs) throughout the plume, including ionenergy distribution and ion charge states. Second, the thruster ion beamwill be influenced by facility effects and vary with thruster operatingcondition.Thus, the complexities ofEPplumes and resources required to
characterize the experiment with an ion source make it impractical formost investigations. In practice, the errors may be characterized and/ormitigated with careful probe design, using correction factors, and
implementing the test and analysis methods described in Secs. IVandV.The manufacturer uncertainty in DAQ system components should
account for many drift errors or offsets. It is important to account for
RFP
Guard Ring VFP Vbias
RC-GR
Collector
Fig. 9 Electrical schematic of a typical Faraday probe showing thecollector and guard ring.
BROWN ETAL. 587
Dow
nloa
ded
by G
EO
RG
IA I
NST
OF
TE
CH
NO
LO
GY
on
Janu
ary
19, 2
018
| http
://ar
c.ai
aa.o
rg |
DO
I: 1
0.25
14/1
.B35
696

DAQ system error for the measurement range and DAQ thermalenvironment specified by the manufacturer. In addition, a nullmeasurement of the DAQ system without plasma may be used toassess DAQ system uncertainties.Resistance of the collector to ground and RC-GR should be
measured before testing; both should exceed 100 MΩ. If theresistance is below this threshold, the exposed surfaceswithin the gapbetween the collector and guard ring should be evaluated for surfacedeposition. Faraday probe contaminants may include materials usedin the thruster, cathode, spacecraft or facility, Faraday probematerials, and experimentalmounting hardware. Common sputteringcontaminants may include iron, tungsten, molybdenum, stainlesssteel, ceramics (i.e., boron nitride, alumina, etc.), graphite, andKapton. Sputtering of dielectric or conductive materials may impactprobe ion collection in different ways, such as leakage current fromthe collector, collector thermionic emission, or collector secondaryelectron emission (SEE) [47–50]. Contamination effects will likelymanifest in multiple ways and may affect the data in a competingmanner. In this case, the probe should undergo a cleaning process toreduce contamination and remove buildup of sputtered materialthrough exposure to high-energy ions in the beam [51,52], or it maybe cleaned periodically, such as with 40% isopropyl alcohol.Although it is possible to remove surface material buildup, and evenachieve a polished finish by sanding the probe surfaces, this should bedonewith caution to avoid altering probe dimensions and tolerances;reassessment of probe dimensions and evaluation of the collectionarea are recommended if sanding is implemented.Probe alignment and orientation with respect to the thruster should
be conducted before evacuating the facility. For evaluation of theaxisymmetric plume, the collector face should be aligned parallel tothe thruster exit plane to within 1 deg when the probe is located on thethruster centerline. The downstream distance R (or Z) should bemeasured along the thruster centerline from the centerpoint of theprobecollector surface to the intersectionwith the thruster exit plane, asshown in Figs. 7 and 8. The definition of the thruster exit plane isthruster design dependent, and it is left to the user. The probe axial andradial position accuracy should be within 1 mm or 0.5% of R (or Z) atthe furthest measurement distance (i.e., 5 mm atR � 1 m): whicheveris greater. Alignment may be repeated at multiple distances and anglesfrom the thruster centerline. These alignment tolerances are less thanthe measurement resolution, and they are intended to minimize spatialerror in measurements to provide sufficient resolution for plumeregions with steep gradients in plasma properties and for validation ofhigh-fidelitymodeling and simulation [53,54].Due to the possibility ofdamage to the probe or thruster with misalignment, a device foralignment while under vacuum may be used, such as a contact probeand a reference with a fixed, known position relative to the thruster.During plasma plume mapping, there should be no obstructions in
the line of sight of the Faraday probe to any point of the thrusterplasma discharge. Diagnostic wiring should be a coaxial cable ortwisted shielded pair, and electrical connections should not beexposed to the plasma. Cable shielding should be grounded to thefacility walls in ground testing. All probe mounting structure andcables near the probe should be downstream of the probe collectionsurface. Any mounting structure that experiences direct beam ionimpingement should be shielded with low-sputter materials, such asKapton or graphite [48,55].The user should consider Faraday probe distance from the facility
walls or other grounded surfaces. One possibility is maintaining aprobe distance greater than onemean free path from the facility walls.In this case, using Eq. (1) for a thruster operating at 1.3 ×10⁻⁵ torr-Xe and a local electron temperature of 2 eV (electron-neutral elastic collision cross section of 1.6 × 10⁻¹⁹ m2) results in anelectron-neutralMFP of 12.3m [56]. Thus, this approach is likely notpractical. An alternative approach is based on the Debye length λD inEq. (2), which is the length scale that the bulk plasma shields theeffect of the perturbing electrode:
λD ����������������ε0kBTe
e2n
r(2)
Electron number densities typically vary over more orders ofmagnitude than electron temperature in the EP plume; therefore, theelectronDebye length is primarily dictated by the plasma density. Fora typical thruster plasma with an electron temperature of 2 eVand anelectron number density of 1013 m−3, the electron Debye lengthis 3.3 mm.
IV. Test Methodology
A. Test Conditions and Plasma Regimes
Spatial variations of plasma properties in EP plumes span orders ofmagnitude, and they necessitate consideration of the facilityinteractions with the thruster plasma and probe ion collection. Thetime-averaged ion current density in the plume of HETs and GITstypically ranges from 1 to 100 mA∕cm2 in the near-field to less than0.001 mA∕cm2 in they periphery of the far-field plume [21,45]. Overthis region, the time-averaged electron temperature and ion densityrange from approximately 10 eV and greater than 1018 m−3 in thenear-field (Z > 0.2DT) to less than 1 eVand 1013 m−3 in the far-fieldplume periphery.Analyses of collisional processes in the plasma plume indicate
CEX collisions between beam ions and facility neutrals dominateover ion-neutral momentum collisions or Coulomb interactions [39].There is an important distinction in CEX collisions between beamions with facility neutrals or beam ions with non-ionized propellantfrom the thruster and cathode. The former are a leading source offacility effects that should be evaluated and corrected for. The latterCEX collisional processes exist on orbit and should not be filteredfrom Faraday probe measurements. Differentiating these CEXprocesses and characterizing the facility influence on ion beamproperties requires the lowest facility pressure achievable andexecution of the methodologies described in this paper.Facility pressure during Faraday probemeasurements should be as
low as possible to better replicate the space environment. Modernvacuum facilities may achieve background pressure less than10−5 torr-Xe. Lower pressure will give more accurate results, andtherefore it is highly recommended for model validation data andpredictions of the in-space plume properties. The pressure should bemonitored near the thruster and adhere to recommendations in [57].The thruster discharge should reach operational steady state before
conducting Faraday probe measurements. Thruster input parametersare typically fixed, such as appliedmagnetic fields and voltage appliedto electrodes. In addition, the thruster should bemonitored for possibleperturbation during a sweep, which may be associated with plasmainteraction with the probemounting structure or the influence of probebias and local sheath effects. The definition of steady state andperturbation should be identified by the user. It is recommended thatthe thruster discharge telemetry be monitored throughout plumecharacterization. Monitoring may include time-resolved and time-averaged thruster telemetry such as dischargevoltage(s) and current(s),mass flow rate, cathode to ground potential, and thrust.Facility background pressure may influence the ratio of thruster
discharge current to the anode propellant flow rate. If Faraday probesare used to measure the ion current density of the HET plume atmultiple background pressures, either the thruster discharge currentor anode mass flow rate should be held constant; this may requireadjustment of the unfixed parameter and should be reported.
B. Probe Operating Characteristics
The bias potential to the collector and guard ring should be equal,and it must be sufficient for collector ion current saturationthroughout the plume measurement region. The probe ion saturationshould be characterized at multiple locations in the plume to span themaximum and minimum plasma densities and electron temperature.In far-fieldmeasurements, this typically corresponds to theminimumR at θ � 0 deg and the maximum R at θ � 90 deg. In cylindricalcoordinates, this typically corresponds to the minimum Z down-stream of the plasma discharge (e.g., channel centerline for HET) andat maximum distance on the plume periphery (i.e., maximum Z and/or r). At each location, the collector ion current should be assessed,starting from 0 V to a negative bias voltage where the collected
588 BROWN ETAL.
Dow
nloa
ded
by G
EO
RG
IA I
NST
OF
TE
CH
NO
LO
GY
on
Janu
ary
19, 2
018
| http
://ar
c.ai
aa.o
rg |
DO
I: 1
0.25
14/1
.B35
696
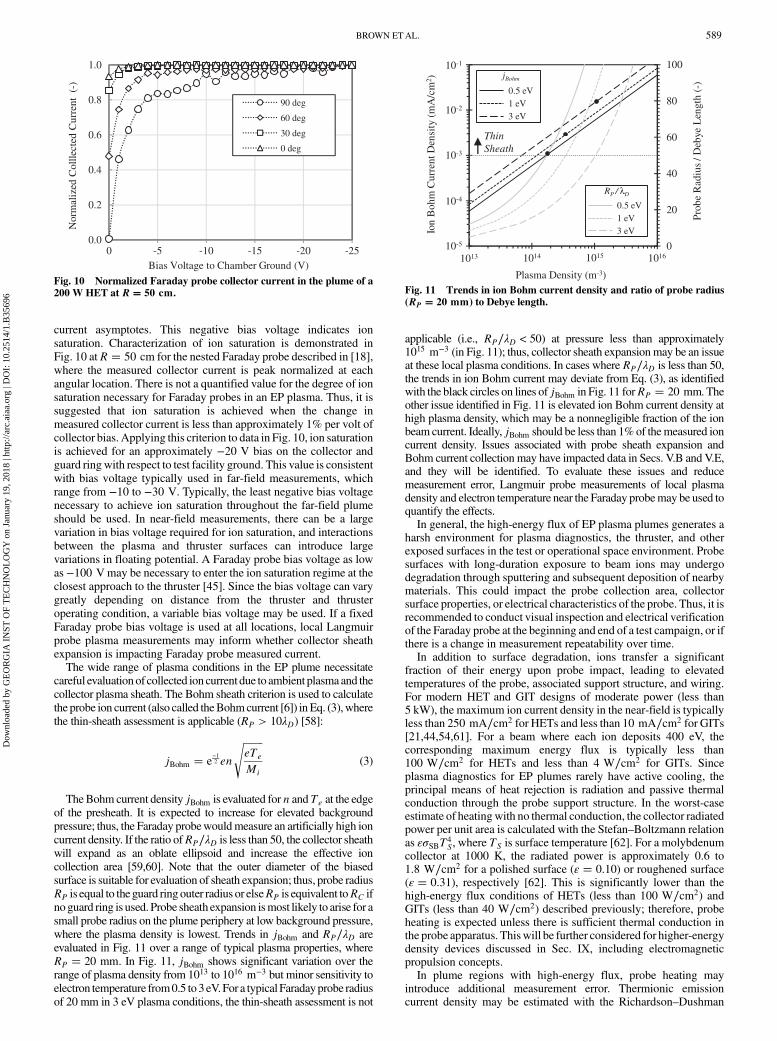
current asymptotes. This negative bias voltage indicates ionsaturation. Characterization of ion saturation is demonstrated inFig. 10 atR � 50 cm for the nested Faraday probe described in [18],where the measured collector current is peak normalized at each
angular location. There is not a quantified value for the degree of ionsaturation necessary for Faraday probes in an EP plasma. Thus, it issuggested that ion saturation is achieved when the change inmeasured collector current is less than approximately 1% per volt ofcollector bias. Applying this criterion to data in Fig. 10, ion saturationis achieved for an approximately −20 V bias on the collector and
guard ringwith respect to test facility ground. This value is consistentwith bias voltage typically used in far-field measurements, whichrange from −10 to −30 V. Typically, the least negative bias voltagenecessary to achieve ion saturation throughout the far-field plumeshould be used. In near-field measurements, there can be a largevariation in bias voltage required for ion saturation, and interactions
between the plasma and thruster surfaces can introduce largevariations in floating potential. A Faraday probe bias voltage as lowas−100 Vmay be necessary to enter the ion saturation regime at theclosest approach to the thruster [45]. Since the bias voltage can varygreatly depending on distance from the thruster and thruster
operating condition, a variable bias voltage may be used. If a fixedFaraday probe bias voltage is used at all locations, local Langmuirprobe plasma measurements may inform whether collector sheathexpansion is impacting Faraday probe measured current.The wide range of plasma conditions in the EP plume necessitate
careful evaluationof collected ion current due to ambient plasmaand thecollector plasma sheath. The Bohm sheath criterion is used to calculatethe probe ion current (also called theBohmcurrent [6]) in Eq. (3),wherethe thin-sheath assessment is applicable (RP > 10λD) [58]:
jBohm � e−12 en
��������eTe
Mi
s(3)
TheBohm current density jBohm is evaluated for n andTe at the edgeof the presheath. It is expected to increase for elevated backgroundpressure; thus, the Faraday probewouldmeasure an artificially high ion
current density. If the ratio ofRP∕λD is less than 50, the collector sheathwill expand as an oblate ellipsoid and increase the effective ioncollection area [59,60]. Note that the outer diameter of the biasedsurface is suitable for evaluation of sheath expansion; thus, probe radiusRP is equal to theguard ring outer radius or elseRP is equivalent toRC ifno guard ring is used. Probe sheath expansion ismost likely to arise for a
small probe radius on the plume periphery at low background pressure,where the plasma density is lowest. Trends in jBohm and RP∕λD areevaluated in Fig. 11 over a range of typical plasma properties, whereRP � 20 mm. In Fig. 11, jBohm shows significant variation over therange of plasma density from 1013 to 1016 m−3 but minor sensitivity toelectron temperature from0.5 to3eV.For a typical Faradayprobe radius
of 20 mm in 3 eV plasma conditions, the thin-sheath assessment is not
applicable (i.e., RP∕λD < 50) at pressure less than approximately1015 m−3 (in Fig. 11); thus, collector sheath expansionmay be an issueat these local plasma conditions. In cases where RP∕λD is less than 50,the trends in ion Bohm current may deviate from Eq. (3), as identifiedwith the black circles on lines of jBohm in Fig. 11 forRP � 20 mm. Theother issue identified in Fig. 11 is elevated ion Bohm current density athigh plasma density, which may be a nonnegligible fraction of the ionbeam current. Ideally, jBohm should be less than 1%of themeasured ioncurrent density. Issues associated with probe sheath expansion andBohm current collection may have impacted data in Secs. V.B and V.E,and they will be identified. To evaluate these issues and reducemeasurement error, Langmuir probe measurements of local plasmadensity and electron temperature near the Faraday probemay be used toquantify the effects.In general, the high-energy flux of EP plasma plumes generates a
harsh environment for plasma diagnostics, the thruster, and otherexposed surfaces in the test or operational space environment. Probesurfaces with long-duration exposure to beam ions may undergodegradation through sputtering and subsequent deposition of nearbymaterials. This could impact the probe collection area, collectorsurface properties, or electrical characteristics of the probe. Thus, it isrecommended to conduct visual inspection and electrical verificationof the Faraday probe at the beginning and end of a test campaign, or ifthere is a change in measurement repeatability over time.In addition to surface degradation, ions transfer a significant
fraction of their energy upon probe impact, leading to elevatedtemperatures of the probe, associated support structure, and wiring.For modern HET and GIT designs of moderate power (less than5 kW), the maximum ion current density in the near-field is typicallyless than 250 mA∕cm2 for HETs and less than 10 mA∕cm2 for GITs[21,44,54,61]. For a beam where each ion deposits 400 eV, thecorresponding maximum energy flux is typically less than100 W∕cm2 for HETs and less than 4 W∕cm2 for GITs. Sinceplasma diagnostics for EP plumes rarely have active cooling, theprincipal means of heat rejection is radiation and passive thermalconduction through the probe support structure. In the worst-caseestimate of heatingwith no thermal conduction, the collector radiatedpower per unit area is calculated with the Stefan–Boltzmann relationas εσSBT
4S, where TS is surface temperature [62]. For a molybdenum
collector at 1000 K, the radiated power is approximately 0.6 to1.8 W∕cm2 for a polished surface (ε � 0.10) or roughened surface(ε � 0.31), respectively [62]. This is significantly lower than thehigh-energy flux conditions of HETs (less than 100 W∕cm2) andGITs (less than 40 W∕cm2) described previously; therefore, probeheating is expected unless there is sufficient thermal conduction inthe probe apparatus. Thiswill be further considered for higher-energydensity devices discussed in Sec. IX, including electromagneticpropulsion concepts.In plume regions with high-energy flux, probe heating may
introduce additional measurement error. Thermionic emissioncurrent density may be estimated with the Richardson–Dushman
0.0
0.2
0.4
0.6
0.8
1.0
-25-20-15-10-50
Nor
mal
ized
Col
llect
ed C
urre
nt (
-)
Bias Voltage to Chamber Ground (V)
90 deg
60 deg
30 deg
0 deg
Fig. 10 Normalized Faraday probe collector current in the plume of a200 W HET at R � 50 cm.
0
20
40
60
80
100
Plasma Density (m-3)
Ion
Boh
m C
urre
nt D
ensi
ty (
mA
/cm
2 )
10-1
10161014
Prob
e R
adiu
s / D
ebye
Len
gth
(-)
Thin Sheath
10-2
10-3
10-4
10-5
1013
jBohm
0.5 eV1 eV3 eV
RP / λD
0.5 eV1 eV3 eV
1015
Fig. 11 Trends in ion Bohm current density and ratio of probe radius(RP � 20 mm) to Debye length.
BROWN ETAL. 589
Dow
nloa
ded
by G
EO
RG
IA I
NST
OF
TE
CH
NO
LO
GY
on
Janu
ary
19, 2
018
| http
://ar
c.ai
aa.o
rg |
DO
I: 1
0.25
14/1
.B35
696

equation in Eq. (4), where φ is the material work function and the
parameter AG is specific to material and surface properties (based on
the theoretical Richardson constant) [63]:
jt � AGT2Se
−φkBTS (4)
The Richardson–Dushman equation is valid for surfaces in zero or
weak electric fields. Past measurements of the region surrounding a
nude Faraday probe in the far-field HET plume revealed local electric
fields were less than approximately 100 V∕m [19], and Eq. (4) is
suitable in these plasma conditions. Measurements in regions of high
electric field strength may be susceptible to field enhanced thermionic
emission, also known as the Schottky effect, and may require a
modified version of the Richardson–Dushman equation [64]. A
thermionic emission current less than 1% of the Faraday probe
collected current is recommended, and the maximum collector
temperature may be estimated accordingly for each experiment. For
example, a far-field measurement with an ion current density of
0.01 mA∕cm2 on the plume periphery would correspond to a
maximum collector temperature of ∼1500 K for thermionic emission
less than 10−4 mA∕cm2, based on Eq. (4) for a pure tungsten surface
where AG � 60 A∕�cm2 · K2� and φ � 4.52 eV [65,66]. Note that
Eq. (4) is sensitive toφ, whichmay have a significant error due surface
characteristics, such as adsorption of contaminants on the surface [67].
Since the collector surface material properties are typically not well
defined, the collector temperature may be monitored with a
thermocouple to enable qualitative analysis of thermionic emission.
Thismay also set allowable limits for collector temperature and inform
probe positioning speed through the plume. For example, a collector
temperature less than 700 K would maintain thermionic emission
below 10−4 mA∕cm2, even if surface contamination was suspected of
lowering the work function to φ � 2 eV.In the absence of collector temperature measurements, the effects
of probe heating and measurement drift are often considered by
consecutive measurements in opposite sweep directions. The user
may determine whether discrepancies between scans are acceptable.
For example, a past study showed Faraday probe measurements
unaffected by probe heating yielded repeatable profiles of collected
current density to within 2% [18]. In the event ion current density
profiles are not repeatable, experience measurement drift, or the
measurement exhibits sensitivity to sweep direction, further
assessment of the cause is necessary, as this could be associated
with effects not related to the Faraday probe, such as thruster
construction, experimental misalignment, and plasma dynamics or
perturbations.
C. Far-Field Spatial Range and Resolution
When using the hemispherical coordinate system for far-field
plume measurements, the angular sweep should be performed in a
single plane from θ � 0 to 90 deg at constant R and fixed Φ (i.e.,
Φ � 0 deg), according to Fig. 7a. Faraday probe sweeps should alsobe conducted from θ � 0 to 90 deg at fixedΦ for the opposite side of
the plume (i.e.,Φ � 180 deg), such that a continuous measurement
is taken from θ � �90 deg at fixedR, as shown in Fig. 7b, to assessplume symmetry. Asymmetry in the plume may arise due to thruster
misalignment with respect to the coordinate geometry, probe
positioning misalignment, or an asymmetric feature of the thruster,
such as external cathode placement or a mechanical misalignment in
thruster assembly. If significant asymmetry in the plume is observed,
the cause and the impact on measurement uncertainty should be
evaluated.The plume periphery beyond θ � 90 deg may be evaluated to
characterize particle scattering, although data are more susceptible to
facility effects and may influence calculations of total ion beam
current and divergence. Angular measurement resolution should be
less than or equal to 2 deg, and less than 1 deg is recommended. In
addition, the Faraday probe should be sized such that the ratio of
probe collector diameter to measurement radius is less than the
angular resolution (i.e., 2RC∕R ≤ dθ ≤ 2 deg). Thus, for a
measurement resolution of 1 deg at a measurement distance of100 cm, the probe collector diameter should be less than 1.7 cm.A distance greater than four TDD should be used for far-field
Faraday probe measurements employing the hemispherical coor-dinate system. This is necessary based on the assumption of anaxisymmetric hemispherical coordinate system with a point sourceorigin, where approximating the plasma discharge as a point source isa poor assumption for measurement distances closer than four TDD[18]. Further discussion on the systematic spatial measurement errorand analytical corrections are provided in Sec. V.B.
D. Near-Field Spatial Range and Resolution
When using the cylindrical coordinate system for near-fieldmeasurements, the Faraday probe radial sweep should be performedat constant axial distance Z and fixedΦ (e.g.,Φ � 0 deg), as shownin Fig. 8. The radial measurement range should extend to the locationwheremeasured ion current density is less than 0.2%of themaximumcurrent density along the radial profile at fixedZ. This range enables a0.2% threshold-based integration limit, and it is recommended basedon past experiments [45]. Faraday probe sweeps should also beconducted at fixed Φ for the opposite side of the plume (i.e.,Φ � 180 deg), such that a continuous radial sweep is taken to lessthan 0.2% of the maximum current density value for the left side(r > 0) and right side (r < 0), as shown in Fig. 8b, in order to assessplume symmetry. Multiple axial measurement distances may beevaluated for near-field plume asymmetry. Measurement resolutionin the radial coordinate should be less than 0.01DT betweenmeasurement locations, where the best resolution is limited by theprobe collector diameter 2RC. In the event this criterion is notpractical for small thruster designs or for suitable probe signalstrength, the probe collector diameter may be minimized to approachthe 0.01DT criteria and the radial distance between measurementsmay be less than 1 mm (i.e., 2RC ≤ dr ≤ 0.01DT or ≤ 1 mm,whichever is greater).The near-field HET plume should be analyzed at axial distances
upstream of the plume merging region, termed the “transitionalregion” in [54], where ion beams from opposing sides of the channelmerge. Past near-field studies of multiple HET designs found thistransitional region was approximately 0.5 to 1.0 TDD [44,45,54].Axial distances less than 0.2 TDD are not recommended due toionization and acceleration processes that may occur downstream ofthe HET exit plane, and they have been shown to be influenced bybackground pressure [68]. In addition, distances within 0.2 TDD ofthe HET body may perturb discharge plasma behavior or encounterplasma floating potentials on the order of the Faraday probe biaspotential, such that the probe is not electron repelling and may besusceptible to sheath effects [54]. It should be noted that regions ofplumemerging, probe perturbation, and issues due to collector sheathsor ion Bohm current may vary with thruster design, operating condi-tions, and background environment. Thus, the spatial measurementand analysis range should be evaluated for each experiment, and thiswill be further discussed in Secs. V.C and V.E. In many cases, theseissues are mitigated by avoiding plume regions where the issues arepresent (i.e., plume merging, probe perturbation) or addressed bymonitoring thruster discharge telemetry, described in Sec. IV.A.Near-field measurements of GIT plumes can be made at distances
as close as a few millimeters downstream of the ion optics. Suchmeasurements can be used to study individual beamlets. Near-fieldmeasurements of the NASA Evolutionary Xenon Thruster (NEXT)plume revealed beamlets merged within 0.1DT downstream of theexit [21]. In NEXT investigations, the very near-field Faraday probemeasurements revealed beamlet merging was a viable indicator offar-field plume divergence. However, the actual location of beamletmerging is in large part a function of the ion optics geometry. Forexample, investigations of the High Power Electric Propulsion(HiPEP) ion thruster, which has flat rectangular ion optics apertures(40 by 90 cm), measured individual beamlets as far as 13 cmdownstream of the grids, which was approximately 36% of the gridwidth (analogous to 0.36DT) [69]. To accurately interrogate theregion upstream of beamlet merging in GITs, a small Faraday probe
590 BROWN ETAL.
Dow
nloa
ded
by G
EO
RG
IA I
NST
OF
TE
CH
NO
LO
GY
on
Janu
ary
19, 2
018
| http
://ar
c.ai
aa.o
rg |
DO
I: 1
0.25
14/1
.B35
696

collector diameter less than the grid aperture spacing is required and a
high radial measurement resolution is necessary to resolve beamlet
ion current density profiles. Systematic evaluation of different
thrusters and examination of facility interactions in thevery near-field
of GITs is recommended to establish a minimum measurement
distance. The maximum near-field distance for GITs is likely limited
by the radial measurement range required to capture a significant
fraction of beam ions, where proximity to facility walls may be a
factor. Thus, the spatial measurement range should be evaluated for
each GIT experiment.
E. Characterization of Facility Effects
Facility pressure effects associated with background neutral
particles are inherent in ground-based EP plumes, and they are
unavoidable in both near-field and far-field plume measurements.
The following guidelines are based on experiments with multiple
thrusters at multiple facilities. Although understanding of facility
effects on the near-field plume region is limited, many of the same
plasma interactions known to impact far-field measurements are
expected, as described in Sec. II.B. Thus, recommendations for near-
field measurements are primarily derived from the current state of
knowledge for far-field Faraday probe measurements.
Faraday probemeasurements of the far-field and near-field plumes
should be conducted at a minimum of four distances. Further, plume
measurements at each distance should be conducted at a minimum of
four background pressures to enable the extrapolation to spacelike
conditions from ground testing, and they should adhere to
recommendations in [57]. One of the four background pressures
should be the lowest achievable facility pressure during thruster
operation. Background pressure variation is often achieved by
injecting additional propellant gas into the ground test facility or
varying the facility pumping. The maximum background pressure is
typically less than 5.0 × 10⁻⁵ torr-Xe; however, this value may vary
with thruster technology, operating condition, and facility pumping
capability. In HETs, the facility background pressure may influence
thruster operating mode and stability, which is caused by the
additional neutral density near the thruster plasma that is not present
on orbit [70,71]. This behavior has been observed in HETs and may
be identified by a large change in discharge oscillation behavior or
time-averaged discharge current, voltage, or mass flow rate [72,73].
Significant changes in HET operation may invalidate the pressure
characterization for Faraday probe measurements; therefore, the
thruster should be monitored for large changes in operation, as
described in Sec. IV.A.
In GITs, the influence of background pressure is evident from the
accelerator grid current. In the space environment, the accelerator
grid current is primarily associatedwith collection of low-energy ions
generated from CEX collisions between beam ions and the non-
ionized thruster neutrals that escape through the ion optic grids [23].
The elevated pressure in ground testing introduces additional CEX
collisions, and thereby increases GIT accelerator grid current that is
not present in flight conditions; the increased GIT accelerator grid
current indicates increased CEX ions impinging the grid, which
cause significant erosion and eventually form holes through the
accelerator grid webbing. At high propellant utilization of∼90%, the
space equivalent accelerator grid current ranges between 0.25 to
0.5%of the total beam current over a range of operating conditions, as
shown in Fig. 12 for the NASA Solar Technology Application
Readiness (NSTAR) ion thruster on the Deep Space One (DS1)
Mission and in ground test facilities [74,75]. In general, the ratio of
accelerator grid current relative to thruster beam current decreases
with decreasing chamber pressure, as shown in Fig. 13 for a 30 cm
GIT at 3.2 A beam current in ground tests at NASA Glenn Research
Center (GRC) and Jet Propulsion Laboratory (JPL) [76]. This
variation can be used as guidance to determine the maximum facility
background pressure used in pressure characterization of GIT
plumes. Although a maximum allowable ratio of accelerator grid
current to total beam current has not been determined, it is expected to
be less than a few percent and may be determined by the user.
Without predictive capability of facility pressure effects on thethruster and on the Faraday probe, the systematic error cannot bedetermined a priori. Different facility interactions may dominate indifferent regions of the plume; thus, plume characterization withdistance and pressure is considered the best approach to quantifyspatial variation in plume properties and probe behavior; systematicerrors are not easily quantified through data postprocessing orgeneralized analysis. Plume characterizations over a range ofmeasurement distances and background pressures are recommendedto resolve nonlinear trends, as will be shown for experiments with a200 W HET in Sec. V.E. Additional measurement distances, lowerfacility background pressure, and characterizations at additionalpressures will improve corrections for facility interactions andpredictions of the space environment.Qualitative assessment of the plasma profile may be conducted at a
single measurement distance or pressure, which limits the applicationto thruster-to-thruster comparisons of the samemodel (i.e., acceptancetesting) or over the course of an extended firing (i.e., life test). A singleFaraday probe measurement should not be used to quantify ion beamcurrent or plume divergence losses in performance. Further, using asingle Faraday probe measurement should be avoided for plumepredictions of the space environment, comparisons between facilities,or validation data for computational simulations.
V. Data Analysis
A. Ion Current Density
For a Faraday probe collector in ion saturation, the ion charge fluxor ion current density j is calculated as
j �Xk
ΓkZke � IFPAc � κG
κSEE (5)
where Γ is the local ion flux of the kth species, Zk is the ion chargestate, AC is the cross-sectional geometric area of the collector face
0.0
1.0
2.0
3.0
4.0
5.0
0.4 0.6 0.8 1.0 1.2 1.4 1.6Beam Current (A)
Acc
eler
ator
Gri
d C
urre
nt (m
A)
Ground Test, VF 5 at NASA GRCGround Test, 10 ft Chamber at JPLDS1 Flight, 0-432 hDS1 Flight, 432-14200 h
Markers = DataLines = Best Fit
Fig. 12 Accelerator grid current of theNSTARGIT, recreated from[74].
0.0
0.5
1.0
1.5
2.0
0
10
20
30
40
50
60
70
Background Pressure (torr-Xe)
Acc
eler
ator
Gri
d C
urre
nt (m
A)
10-4 10-5 10-6
Acc
eler
ator
Gri
d C
urre
nt /
Bea
m C
urre
nt (%
)
GRC 890 hlife test
Curve-Fit to GRC Data
JPL Data
Fig. 13 Accelerator grid current of a 30 cm GIT, recreated from [76].
BROWN ETAL. 591
Dow
nloa
ded
by G
EO
RG
IA I
NST
OF
TE
CH
NO
LO
GY
on
Janu
ary
19, 2
018
| http
://ar
c.ai
aa.o
rg |
DO
I: 1
0.25
14/1
.B35
696

(AC � πR2C), κG is a correction for ions collected in the gap between
collector and guard ring, and κSEE is a correction for SEE at the
collector surface. The collected ion current IFP is a point
measurement by the Faraday probe at (θ, R) for hemispherical
coordinates as shown in Fig. 7 or at (r, Z) for cylindrical coordinatesin Fig. 8. The correction factors are calculated as
κG � π�R2GR-R
2C��
2πRChC2πRChC � 2πRGRhGR
�(6)
κSEE � 1
1�PkΩkγkZk
(7)
where γk is the SEE yield from the kth ion species; Ωk is the ion
current fraction of the kth species; and the parameters RC, RGR, hC,and hGR are collector and guard ring dimensions for a typical nude
Faraday probe configuration, as shown in Fig. 14.Past experiments demonstrated ions entering the gap between the
Faraday probe collector and guard ring are a nonnegligible fraction of
the measured collector current [77]. The effect is illustrated in Fig. 14,
where the effective cross-sectional ion collection area is the sum ofAC
and κG. The correction κG in Eq. (6) is formulated based on the
assumption that ions entering the gap volume will be collected by
exposed, conductive walls and distributed between the collector and
guard ring based on relativewall surface areas. Laboratory studies have
shown the assumption is suitable for probes with a nonconducting
material at the base of the gap, such as ceramic. Ions entering the gap in
probes with a conductive base are preferentially collected by this line-
of-sight surface, and the current collected on the sidewalls becomes
sensitive to changes in background pressure [77]. The conductive gap
base raises issues for facility characterizations, and it is discussed with
respect to probe design considerations in Sec. VII.Although the Faraday probe collector is typicallymade of lowSEE
yield material, such as molybdenum or tungsten, SEE has a
nonnegligible effect on measured ion current. Secondary electrons
born on the negatively biased collector surface will accelerate awayfrom the probe, which artificially increases measured current. Thecorrection κSEE formulated in Eq. (7) accounts for the effect, and itmay be calculated using the SEE yield values in Table 1 [78–80].Tungsten and molybdenum SEE yields in Table 1 were averaged for
xenon ion bombardment over the energy range of 100–1000V,wheremeasured yields varied by less than 20% for Xe� bombardment andless than 10% for Xe2� and Xe3� bombardment. Note themolybdenum SEE yield forXe3� ion bombardment is unavailable inthe literature, and it is estimated in Table 1 based on trends observedfor tungsten. Calculation of κSEE in Eq. (7) requires knowledge of theion species composition, which may be measured using analysistechniques for ExB probes (also known asWien filters) developed in[81]. The effect of κSEE is small but nonnegligible for the ion speciescompositions of typical HET and GIT plumes; the value of κSEE isgreater than 0.95 for typical EP plumes and greater than 0.90 if the
Xe� ion current fraction is reduced to 60%. Thus, not correctingmeasurements with κSEE may lead to overprediction of local ioncurrent density by 5 to 10%, and it should be accounted for in the dataanalysis and/or error assessment. However, the spatial variation ofion species composition in the central plume is not expected to havea significant effect on the value of κSEE; therefore, a singlemeasurement of ion species current fraction in the central core issufficient to calculate κSEE [82] for evaluation of ion beam current anddivergence. The population of multiply charged ions may increasebeyond the central core; thus, it is advised to incorporate local values
of ion species current composition in evaluations of local spacecraftplume interactions on the plume periphery.
B. Far-Field Plume
Far-field test methodologies described in Sec. IV.C provide thenecessary characterization to isolate pressure effects and predicttime-averaged ion current density properties in the space vacuumenvironment. This is achieved by simple linear regression [83] of ioncurrent density as a function of pressure at each location in the plume,
as exemplified by far-field measurements of the H6 HET plume inFig. 15. The linear extrapolations of ion current density to vacuumconditions in Fig. 15 reveal regions where the linear regression slopeis positive, negative, and near zero. In this paper, a positive sloperefers to an increase of ion current density with increasing pressure,such as θ � 0, 30, 40, and 90 deg in Fig. 15.A negative slope refers toa decrease of ion current density with increasing pressure, such asθ � 3 and 15 deg. A linear regression slope near zero, such as θ � 1and 24 deg, occurs in regions when the extrapolation to zero pressuretransitions between positive and negative linear regression slope. The
coefficient of determination, termed R-squared (no relation to radialmeasurement distance R), for each linear extrapolation is calculatedas the square of the Pearson product moment correlation coefficient,and it can be interpreted as a metric for howwell the linear regressionfits the data [83]. TheR-squared term ranges from zero to one, wherea value of unity indicates a perfect fit. Although the linear regressionslope is near zero in the transition region and is associated with lowcoefficient of determination, there is minimal change in ion currentdensity as a function of background pressure, and thus the correctionis small. The method of extrapolating ion current density to zeropressure conditions has been conducted with multiple HETs at
different facilities [18,70,84–86]. Based on the far-field plumeprocesses involved,GITplumes are expected to follow similar trends.
RP
Collector
RC
RGR hGR
hC
Ceramic
Guardring
Ions to collector face AC = Cross-Sectional area
Ions to guard ring face
Ions to guard ring Sidewall
Ions to collector Sidewall κG = effective Cross-Sectional collection area
+
+
++
+
+
Fig. 14 Illustration of ions collected by the sidewalls of the Faradayprobe and the effective increase in cross-sectional ion collection area.
Table 1 Summary of SEE yield for xenon ionbombardment of Faraday probe collector materials [78–80]
Bombarding particle ioncharge state Zk
SEE yield ofmolybdenum γk
SEE yield oftungsten γk
�1 0.022 0.016�2 0.20 0.20�3 0.70a 0.71
aSEE yield unavailable in literature; value estimated based on measured
yield for tungsten.
592 BROWN ETAL.
Dow
nloa
ded
by G
EO
RG
IA I
NST
OF
TE
CH
NO
LO
GY
on
Janu
ary
19, 2
018
| http
://ar
c.ai
aa.o
rg |
DO
I: 1
0.25
14/1
.B35
696

In Fig. 16, angular profiles of far-field ion current density in theH6HET plume reveal background pressure effects and show the ioncurrent density linear regression to vacuum conditions at eachangular location, based on themethod shown in Fig. 15. At the plumeperiphery in Fig. 16, a difference in ion current density greater thanone order of magnitude between low-pressure measurements andextrapolated vacuum conditions is consistent with comparison offlight and ground data for the SPT-100 on the Express Satellite[33,34,42]. It should be noted that the linear regression to zeropressure does not arbitrarily force the extrapolated ion current densityto zero at θ � 90 deg. The primary sources of error, unrelated tofacility effects, in H6 HET results in Figs. 15 and 16 were accountedfor, including the effective probe collection area and collector SEE.The effective collection area was determined using Eq. (6), where κGincreased the collection area by 13%. The thruster plume wasapproximately 90%Xe� and κSEE � 0.97 as calculated fromEq. (7).Thus, facility effects were the principal source of error, which is themotivation for facility pressure characterization. Remaining errorswere expected to be minimal with respect to the trends in Figs. 15and 16.
Figure 17 displays the angular distribution of the linear regressionslope and coefficient of determination of the H6 thruster operating at120, 150, and 300 V with 10 mg/s anode flow and 7% cathode flow.The linear regression slope at thruster centerline decreased from15 A∕�torr · cm2� at 150 V H6 HET operation to less than3 A∕�torr · cm2� at 120 and 300 Voperation. All H6 HEToperatingconditions showed reduction in ion current density with increasingfacility pressure within the central plume core at θ � �25 deg,where the linear regression slope approached−30 A∕�torr · cm2� for
a)
b)
c)
y = 7197.4x + 3.39R² = 0.8723
y = -222.9x + 3.72R² = 0.0033
y = -34082x + 4.38R² = 0.9857
θ = 0°θ = 1°θ = 3°
Ion
Cur
rent
Den
sity
(m
A/c
m2 )
4.5
4.2
3.9
3.6
3.3
3.0
Pressure (torr-xenon)
0 1x10⁻⁵ 2x10⁻⁵ 3x10⁻⁵ 4x10⁻⁵ 5x10⁻⁵
y = 7197.4x + 3.39R-Squared = 0.8723
y = -34,082x + 4.38R-Squared = 0.9857
y = -222.9x + 3.72R-Squared = 0.0033
y = 93.7x + 0.30R² = 0.0582
y = 1925.1x + 0.12R² = 0.9933Io
n C
urre
nt D
ensi
ty (
mA
/cm
2 )
1.0
0.8
0.6
0.4
0.2
0
Pressure (torr-xenon)
0 1x10⁻⁵ 2x10⁻⁵ 3x10⁻⁵ 4x10⁻⁵ 5x10⁻⁵
θ = 15°θ = 24°θ = 30°
y = -5535.6x + 0.89R-Squared = 0.9560
y = 93.7x + 0.30R-Squared = 0.0582
y = 1925.1x + 0.12R-Squared = 0.9933
y = 1525.9x 0.0002R² = 0.9981
y = 2949.8x + 0.04R² = 0.9989
θ = 40°θ = 90°
Ion
Cur
rent
Den
sity
(m
A/c
m2 )
0.20
0.16
0.12
0.08
0.04
0
Pressure (torr-xenon)
0 1x10⁻⁵ 2x10⁻⁵ 3x10⁻⁵ 4x10⁻⁵ 5x10⁻⁵
y = 2949.8x + 0.04R-Squared = 0.9989
y = 1525.9x - 0.0002R-Squared = 0.9981
Fig. 15 Ion current density at six TDD as a function of pressure for the
H6 HET at 300 V, 10 mg∕s anode flow, and 7% cathode flow.
0.0001
0.001
0.01
0.1
1
10
Ion
Cur
rent
Den
sity
, mA
/cm
2
-90 -60 -30 0 30 60 90
Angular Position, deg
Extrapolation to Vacuum 9.1x10 torr 1.5x10 torr 1.9x10 torr 2.5x10 torr 3.0x10 torr
-6
-5
-5
-5
-5
Ion
Cur
rent
Den
sity
(m
A/c
m2 )
Angular Position (deg)
Fig. 16 Ion current density at six TDD as a function of angular positionfor the H6 HET at 300 V, 10 mg∕s anode flow, and 7% cathode flow.
-50
-40
-30
-20
-10
0
10
20
30
Slop
e, A
/torr
-cm
2
-90 -60 -30 0 30 60 90
Angular Position, deg
0.0001
0.001
0.01
0.1
1
Residuals
Line Style Line Color 300V Slope 150V Residuals 120V
Slop
e (A
/tor
r-cm
2 )
Angular Position (deg)
R-Squared (-)
R-SquaredSlope
Fig. 17 Linear regression slope and coefficient of determination of theH6 HET ion current density at six TDD.
BROWN ETAL. 593
Dow
nloa
ded
by G
EO
RG
IA I
NST
OF
TE
CH
NO
LO
GY
on
Janu
ary
19, 2
018
| http
://ar
c.ai
aa.o
rg |
DO
I: 1
0.25
14/1
.B35
696

the 300 V condition. The ion current density ranged fromapproximately 1 to 3 A∕�torr · cm2� beyond θ � �25 deg, which isattributed to the net migration of scattered beam ions from theprimary ion beam. Although the angular features of the linearregression slope in Fig. 17 are consistent across operating conditions(i.e., positive on thruster centerline, negative in the central core, andpositive on the wings), the magnitude and shape are significantlydifferent, thereby revealing the importance of characterizingbackground pressure interactions.The linear regression of ion current density and extrapolation to zero
pressure are further demonstrated in Figs. 18 and 19 for a 200WHET[18]. In Fig. 18, ion current density profiles at 8 and 20 TDD show theinfluence of background pressure varieswith downstreamdistance andpressure,where ion current density isnormalized to the centerlinevalueat eight TDD and 3.1 × 10⁻⁶ torr-Xe. The effects are also evident inFig. 19, where a positive linear regression slope on the thrustercenterline is attributed to ingestion, ionization, and acceleration offacility neutral particles within �10 deg. The region from �10 to�40 deg in Fig. 19 shows a negative linear regression slope. Thisfeature may be attributed to ion scattering when a slow ion, resultingfrom aCEXcollision event, is accelerated by radial electric fields in theplume. The process leads to increased ion scattering to the plumeperiphery beyond �40 deg from centerline and increased overalldivergence of the plasma plume.The angular profiles of linear regression slope were decomposed
into contributions from facility neutral ingestion and ion scattering in[18], and they enabled examination of the magnitude and angularrange of each effect to enhance evaluations of EP plume structurewith variation in pressure, downstream distance, or operatingcondition. The consistent angular features in the linear regressionslope between different thrusters in Figs. 17 and 19 at multipleoperating conditions and at multiple downstream measurementdistances is evidence that the dominant facility effects are commonbetween the two thruster plumes. Note that ion scattering may be thedominant effect on thruster centerline rather than facility neutralingestion effects, resulting in a net negative linear regression slope.These results increase confidence that facility effects on the HET ionbeamcan be effectively characterized and extrapolation of ion currentdensity to vacuum is suitable, given the thruster operation andoscillations are not significantly altered with variation in facilitybackground pressure.
The far-fieldGIT beam also shows complex plume structure on the
periphery, as shown for the T5 GIT in Fig. 20 [87] at 11.8 m
downstream (~11.8 TDD) and 2 × 10⁻⁶ torr-Xe. Similar structures
were observed on the NEXT thruster [21]. As discussed in Sec. V.D,
the integrated ion beam current from GIT Faraday probe
measurements is often greater than beam current measured by the
ion optics. This may be associated with not using corrections
described in Sec. V.A, such as κG for the effective probe collection
area. To remedy this discrepancy and improve evaluation of GIT
beam divergence, a systematic investigation of the GIT far-field
plume and characterization with background pressure is warranted,
similar to investigations of the 200WHET plume in Figs. 18 and 19.The ion beamcurrent ofGITs andHETs is calculated from far-field
plume measurements of ion current density in Eq. (5) integrated over
the axisymmetric, hemispherical surface for the fixed sweep radiusR:
IBeam � 2πR2
Zπ∕20
j�θ� κDκA
sin�θ� dθ (8)
0.001
0.01
0.1
1
10
Nor
mal
ized
Cur
rent
Den
sity
Extrapolation to Vacuum 3.1x10 torr 1.0x10 torr 3.4x10 torr
-6
-5
-5
8 TDD
20 TDD
-90 -60 -30 0 30 60 90
Nor
mal
ized
Ion
Cur
rent
Den
sity
(-)
Angular Position (deg)
Fig. 18 Normalized ion current density of a 200 W HET.
20
15
10
5
0
-5
-10 0.0001
0.001
0.01
0.1
1
Line Style Line Color 8 TDD Slope 12 TDD 16 TDD 20 TDD
-90 -60 -30 0 30 60 90
Slop
e (A
/tor
r)
Angular Position (deg)
R-Squared (-)
R-SquaredSlope
Fig. 19 Linear regression slope and coefficient of determination of ioncurrent for a 200W HET.
-40 -30 -20 -10 0 10 20 30 40 50 60
100
10-1
10-2
10-3
10-4
10-5
10-6
10-7
Angular Position (deg)
Ion
Cur
rent
Den
sity
(m
A/c
m2 )
Fig. 20 Ion current density of the T5 GIT at 1.18 m downstream,recreated from [87].
594 BROWN ETAL.
Dow
nloa
ded
by G
EO
RG
IA I
NST
OF
TE
CH
NO
LO
GY
on
Janu
ary
19, 2
018
| http
://ar
c.ai
aa.o
rg |
DO
I: 1
0.25
14/1
.B35
696

Since Faraday probe plume measurements using hemispherical
coordinates are often conducted from θ � 0 to 90 deg on both the leftand right sides of the plume in Fig. 7, the ion beam current in Eq. (8)
may be calculated for each side of the plume and averaged. Twospatial correction factors, κD and κA, are introduced to account for
systematic error associated with the hemispherical coordinate
system, where measurements are with respect to a point source as
opposed to the thruster discharge geometry. The angular correction
factor κA and the distance correction factor κD are formulated by
approximating the thruster ions as originating from two pointsources, as shown in Fig. 21. These point sources are located on the
channel centerline at the exit plane of an annular HET in Fig. 21a. For
GIT geometry, the point sources may be located at the midpoint
between the GIT centerline and the outer diameter of the acceleration
grid, as shown in Fig. 21b. Although the spatial correction factors κDand κA will not eliminate the systematic error introduced with the
hemispherical coordinate system, the approximations serve to
quantify the effect and reduce measurement error.The correction factor κA accounts for variations in probe anglewith
respect to the point sources, which affects the ion angle of incidence
to the probe face and changes with angular position and distance. Inaddition, the ion angle of incidence is different for each point source.
An average cosine loss in probe collection area is defined in Eq. (9),
where the ion angles of incidence from the near- and far-point sources
are calculated in Eq. (10) as αN and αF, respectively. As shown in
Fig. 21, the angle αN refers to the ion angle of incidence from the nearsource and will alternate from the left to right sides of the diagram in
Fig. 21 as the probe crosses thruster centerline. The width of theplasma discharge is denotedw, which is thewidth of the channel in anannular HET or w � DT∕2 in a GIT:
κA � cos
�αN � αF
2
�(9)
αN;F�θ; R;DT � � ��θ − tan−1
�sin�θ�∓ DT−w
2R
cos���
(10)
The correction κD accounts for differences in path length from thenear- and far-point sources to the probe, which would introduce asystematic error in the R2 term in Eq. (8). Probe collector distancesfrom the near- and far-point sources are characterized as RN and RF,respectively. Similar to the analysis of ion angle of incidence, the pathlength will vary with probe angular position, and RN and RF willalternate from the left to right sides of the diagram in Fig. 21 as theprobe crosses thruster centerline. The exception is on the thrustercenterline, where the distance from the probe to each point source isequal and greater thanR. Using the geometry in Fig. 21, κD is definedin Eq. (11) based on the lengths RN and RF, shown in Eq. (12):
κD ��1
2
�RN
R� RF
R
��2
(11)
RN;F�θ; R;DT �R
���������������������������������������������������������������������cos��2 �
�sin�θ�∓DT −w
2R
�2
s(12)
The ratio of spatial correction factors (κD∕κA) is displayed forGITs(w � 0.5DT) and HETs (w � 0.15DT) as a function of probeangular position in Fig. 22 in terms TDD, calculated as R∕DT . Thevalue of w � 0.15DT is a representative value for the HET channelwidth; however, a smaller channel will further increase the ratio(κD∕κA). The overall effect of κD∕κA is to increase current density inthe plume central core, where ion current density is greatest, and thusthe spatial corrections increase the calculated ion beam current inEq. (8). The variation in κD∕κA decreases rapidly with downstreamdistance in the far-field, where the approximation of a point sourcemeasurement improves for hemispherical coordinate system. InFig. 23, the correction on the thruster centerline shows the ratio ofκD∕κA rapidly approaches unity with the downstream measurementdistance, and it is less than 1.02 for distances greater than four TDD.The spatial corrections are valid for beam ions originating near the
exit plane. In addition, the correction only increases the ion sourcemodel from one to two, and it does not directly account for theaccelerated ions across the full grid diameter or the channel width.This is expected to have a small effect on far-field measurementstaken beyond four TDD, as evidenced by the comparison of w �0.15DT and 0.50DT in Fig. 23. Although the corrections areformulated assuming equal contribution of beam ions from each sideof the channel or grid, this should also not be a significant source oferror in the far-field plume.The axial component of ion beam current is necessary for
calculations of beam divergence, as discussed in Sec. V.E, and isformulated as
IAxial � 2πR2
Zπ∕20
j�θ� κDκA
cos�αA� sin�θ� dθ (13)
where the angle αA is introduced to calculate plume divergence withrespect to the channel centerline in HETs or the grid radius midpointinGITs as opposed to thruster centerline, as shown in Fig. 24 forHETgeometry. Although this approach has not been applied to GITplumes, the geometrywill be equivalent to the grid radiusmidpoint ofw � 0.5DT . If the GITouter grid diameter or the HETouter channel
a)
b)
R
Probe
Channel Centerline
DT
θ αN αFR cos(θ)
R sin(θ)
θ
θ=90°Φ=180°
θ=90°Φ=0°
Thruster Centerline, θ = 0°
RFRN
w
R
Probe
Outer Grid Diameter
DT
θ αNαFR cos(θ)
R sin(θ)
θ
θ=90°Φ=180°
θ=90°Φ=0°
Thruster Centerline, θ = 0°
RF RN
w
Fig. 21 Measurement coordinate geometry showing probe distanceand angular location in a two-point source model for a) annular HETgeometry or b) GIT geometry.
BROWN ETAL. 595
Dow
nloa
ded
by G
EO
RG
IA I
NST
OF
TE
CH
NO
LO
GY
on
Janu
ary
19, 2
018
| http
://ar
c.ai
aa.o
rg |
DO
I: 1
0.25
14/1
.B35
696
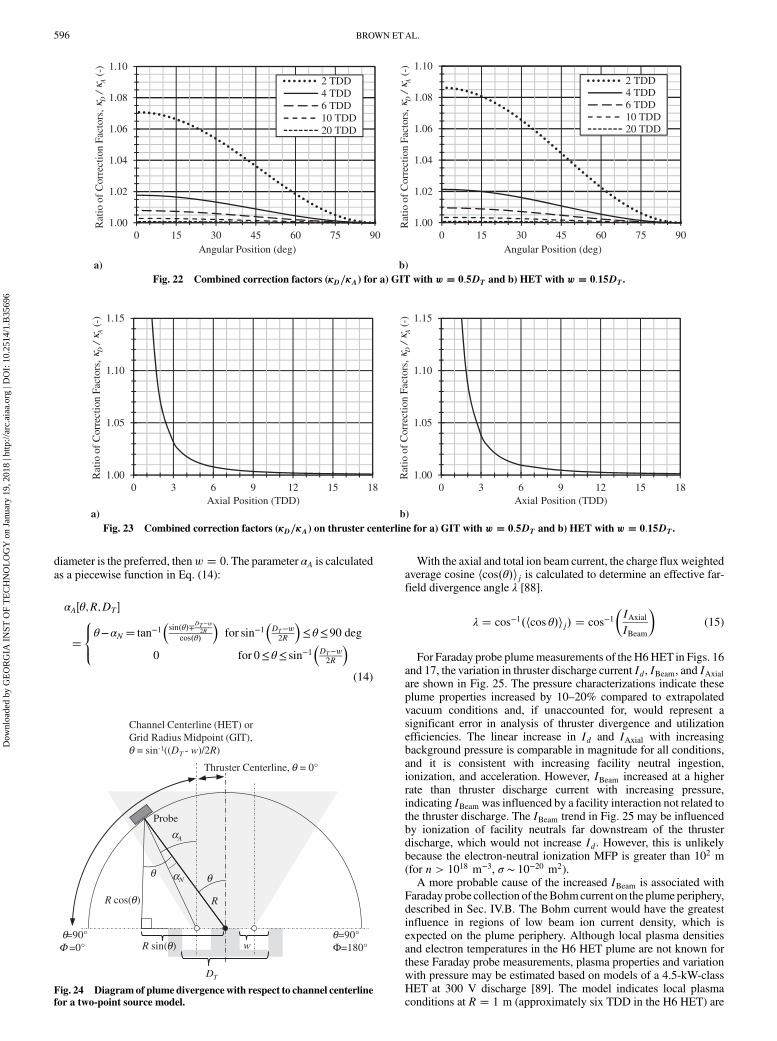
diameter is the preferred, thenw � 0. The parameter αA is calculatedas a piecewise function in Eq. (14):
αA�θ;R;DT �
�8<:θ−αN � tan−1
�sin�θ�∓DT−w
2R
cos��
for sin−1�DT−w2R
�≤θ≤90 deg
0 for 0≤θ≤ sin−1�DT−w2R
�(14)
With the axial and total ion beam current, the charge flux weightedaverage cosine hcos�θ�ij is calculated to determine an effective far-field divergence angle λ [88].
λ � cos−1�hcos θ�ij� � cos−1�IAxialIBeam
�(15)
For Faraday probe plumemeasurements of the H6HET in Figs. 16and 17, the variation in thruster discharge current Id, IBeam, and IAxialare shown in Fig. 25. The pressure characterizations indicate theseplume properties increased by 10–20% compared to extrapolatedvacuum conditions and, if unaccounted for, would represent asignificant error in analysis of thruster divergence and utilizationefficiencies. The linear increase in Id and IAxial with increasingbackground pressure is comparable in magnitude for all conditions,and it is consistent with increasing facility neutral ingestion,ionization, and acceleration. However, IBeam increased at a higherrate than thruster discharge current with increasing pressure,indicating IBeam was influenced by a facility interaction not related tothe thruster discharge. The IBeam trend in Fig. 25 may be influencedby ionization of facility neutrals far downstream of the thrusterdischarge, which would not increase Id. However, this is unlikelybecause the electron-neutral ionization MFP is greater than 102 m(for n > 1018 m−3, σ ∼ 10−20 m2).A more probable cause of the increased IBeam is associated with
Faraday probe collection of theBohmcurrent on the plume periphery,described in Sec. IV.B. The Bohm current would have the greatestinfluence in regions of low beam ion current density, which isexpected on the plume periphery. Although local plasma densitiesand electron temperatures in the H6 HET plume are not known forthese Faraday probe measurements, plasma properties and variationwith pressure may be estimated based on models of a 4.5-kW-classHET at 300 V discharge [89]. The model indicates local plasmaconditions at R � 1 m (approximately six TDD in the H6 HET) are
b)a)
1.00
1.02
1.04
1.06
1.08
1.10
0 15 30 45 60 75 90
2 TDD4 TDD6 TDD10 TDD20 TDD
Rat
io o
f C
orre
ctio
n Fa
ctor
s, κ
D/ κ
A(-
)
Angular Position (deg)
1.00
1.02
1.04
1.06
1.08
1.10
0 15 30 45 60 75 90
2 TDD4 TDD6 TDD10 TDD20 TDD
Rat
io o
f C
orre
ctio
n Fa
ctor
s, κ
D/ κ
A(-
)
Angular Position (deg)
Fig. 22 Combined correction factors (κD∕κA) for a) GIT with w � 0.5DT and b) HET with w � 0.15DT.
a) b)
1.00
1.05
1.10
1.15
0 3 6 9 12 15 18Axial Position (TDD)
Rat
io o
f C
orre
ctio
n Fa
ctor
s, κ
D/ κ
A(-
)
1.00
1.05
1.10
1.15
0 3 6 9 12 15 18Axial Position (TDD)
Rat
io o
f C
orre
ctio
n Fa
ctor
s, κ
D/ κ
A(-
)
Fig. 23 Combined correction factors (κD∕κA) on thruster centerline for a) GIT with w � 0.5DT and b) HET with w � 0.15DT.
R
Probe
θ αN
αA
R cos(θ)
R sin(θ)
θ
θ=90°Φ =0°
θ=90°Φ=180°
Thruster Centerline, θ = 0°
Channel Centerline (HET) or Grid Radius Midpoint (GIT), θ = sin-1((DT - w)/2R)
DT
w
Fig. 24 Diagramof plume divergencewith respect to channel centerlinefor a two-point source model.
596 BROWN ETAL.
Dow
nloa
ded
by G
EO
RG
IA I
NST
OF
TE
CH
NO
LO
GY
on
Janu
ary
19, 2
018
| http
://ar
c.ai
aa.o
rg |
DO
I: 1
0.25
14/1
.B35
696

approximately 1.2 to 1.6 eV and 1014 to 1016 m−3 on the plumeperiphery over a range of high background pressure conditionscomparable to the H6 HET measurements in Figs. 16 and 17. Basedon Eq. (3), jBohm would be 0.001 − 0.1 mA∕cm2, which may be asignificant fraction of the measured ion current density on the plumeperiphery beyond approximately �30 deg from centerline inFig. 16. Confirming this cause for increased IBeam with increasingbackground pressure requires experimental data, such as localLangmuir probe measurements of plasma density and electrontemperature to subtract jBohm from Faraday probe measurements.These trends are further examined in Sec. V.E with respect to thebeam divergence and thruster utilization efficiencies.
C. Near-Field Hall Thruster Plume
A systematic investigation of facility interactions on the near-fieldHET ion current density has not been conducted, though there areseveral Faraday probe studies on the spatial variation of ion currentdensity in this region for multiple HET technologies [7,41,44,45,90].Characterization of the near-fieldHET plume atmultiple backgroundpressures is recommended to enable extrapolation of ion currentdensity to zero pressure, similar to the linear regression of far-fieldion current density in Sec. V.B.The near-field ion current density measurements from four HET
designs are shown in Fig. 26, with thruster operation ranging from 2to 50 kW. This includes the NASA-457Mv2 at 500 V∕50 kW [54] inFig. 26a, the NASA-300M at 500 V∕20 kW [54] in Fig. 26b, the H6at 300 V∕6 kW [44] in Fig. 26c, and the NASA-173Mv2 at500 V∕2.2 kW [41] in Fig. 26d. These near-field measurementsillustrate features common to the annular HET designs, and theyrange from less than 0.1 TDD to beyond two TDD. For all fourthruster designs, the plume merges at approximately 0.5–1.0 TDD.Downstream of the transitional region of plume merging, the plumeinteractions are complex and complicate data analysis. Negativecollected current near the thruster was observed in Fig. 26d near100 mm radial distance and 25 mm downstream of the exit. Thenegative current was attributed to a region of reduced plasmapotential where the electrons were 5–10 eV; thus, the probe biaspotential was insufficient to achieve ion saturation [41]. Although amore negative bias may mitigate the effect, it may also affect probesheath expansion and induce thruster perturbations. These issueswere minimal at greater than 0.2 TDD in Figs. 26b and 26d. In thesestudies, the recommended near-field measurement range wouldextend from 0.2 to 0.5 TDD downstream of the thruster exit. Near-field HET plume measurements outside of this range may bedesirable for model validation and investigation of ion acceleration
processes or the transition region; however, the probe perturbations,sheath effects, and plume merging effects should be addressed.A commonHET feature is the region of high ion current density on
thruster centerline, which is often visually observed and described asthe “center spike” or “dovetail” [72]. This is evident in Fig. 26 for allthrusters upstream of the region of beam merging, including thosewith a centrally mounted cathode or external cathode configuration.The center spike contains beam ions,whereas the cathode plume doesnot. As stated in Sec. III.B, in the case of an externally mountedcathode, the recommended approach is to sweep the Faraday probe ina plane orthogonal to the plane containing the cathode. In the case of acentrally mounted cathode, the recommended approach is to removethe contributions of the cathode plume from the Faraday proberesults, as shown in Appendix B.The total ion beam current from near-field plumemeasurements of
ion current density is calculated with Eq. (5) for a fixed downstreamdistance Z, written as
IBeam � 2π
Z∞0
j�r�r dr (16)
Note the measured ion current density j�r� in near-fieldmeasurements is simply the axial component of current density;therefore, IBeam � IAxial as the radial integration limit approachesinfinity. In contrast to Eq. (8) used for the hemispherical coordinatesystem, no correction factors associated with coordinate systemgeometry are necessary in Eq. (16). Since near-field Faradayprobe measurements are typically conducted across the entirethruster, the ion beam current in Eq. (16) may be calculated for eachside of the plume and averaged. The radial integration in Eq. (16) islimited in practice by low signal strength and probe proximity to thefacility walls. A 0.2% threshold-based integration limit may beused, as described in Sec. IV.D. The integrated ion beam current issensitive to integration limit; therefore, it is recommended tocharacterize IBeam as a function of the integration limit [45] andcorrelate the results to far-field Faraday probe results or assess witha thruster efficiency analysis [45,88], if resources allow. Therecommended radial span of 1.5DT from thruster centerline wassufficient for the 0.2% threshold-based limit from 0.2 to 0.5 TDD inFig. 26b.Evaluation of HET beam divergence from near-field Faraday
probe data is complicated by the proximity to the thruster exit plane,since the ion current point of origin cannot be assumed at the channelmidpoint or outer channel diameter, nor emanating from the exitplane.Although the bulkHETplasma is directed along the firing axis,the local plasma jet from the annular channelmay be traveling towardor away from the thruster centerline. The iterative path-findingmethod may be used to determine the effective origin of the plasmaplume within the channel, and thereby used as a reference for ionbeam divergence. The points of origin from each side of the HETchannel are illustrated as a two-dimensional channel cross section inFig. 27, where the variables θj and δj are the travel angle anddivergence angle of the jet, and r0 and z0 are the radial and axialcoordinates of the jet point of origin, respectively.The iterative path-finding method starts with the assumption that
the near-field annular HET plasma plume can be treated as a free-expanding jet, such that the travel and divergence angles do notchange as a function of axial distance downstream. Based on pastexperiments, this assumption was only valid downstream of theevolving jet structure (greater than 0.2 TDD) and the region upstreamof merging beams from opposite sides of the annular channel (lessthan 0.5 TDD) [45].The iterative path-findingmethod iterates between two calculation
steps. In the first step, an initial estimate of the point of origin isapplied to expressions of the travel angle in Eq. (17) and thedivergence angle in Eq. (18):
tan�θj� �2π
R∞0 j�r; z� r−r0z−z0
r dr
2πR∞0 j�r; z�r dr
(17)
5
6
7
8
9
10
11
12C
urre
nt(A
)
Pressure (torr-xenon)
0 1 2 3x10⁻⁵
Id IBeam IAxial
300 V 300 V 300 V150 V 150 V 150 V120 V 120 V 120 V
Fig. 25 Plume properties of the H6 HET at six TDD.
BROWN ETAL. 597
Dow
nloa
ded
by G
EO
RG
IA I
NST
OF
TE
CH
NO
LO
GY
on
Janu
ary
19, 2
018
| http
://ar
c.ai
aa.o
rg |
DO
I: 1
0.25
14/1
.B35
696

cos�δj� �2π
R∞0 j�r; z� cos
�tan−1
�r−r0z−z0
�− θjr dr
�2π
R∞0 j�r; z�r dr (18)
In contrast to the expression for ion beam current in Eq. (16), the
iterative path-finding method in Eqs. (17) and (18) is generally
insensitive to changes in the choice of integration limit.In the second step, variations in the travel and divergence angles
with axial distance are used to compute the error metrics and update
the point of origin location on each side of the plume. Equations (19)
and (20) are feedback equations that are used to update the point of
origin and may be reinserted into Eqs. (17) and (18). Equations (21)
and (22) are the error metrics for radial and axial coordinates,
respectively:
r0;m�1 � r0;m − β1 sin
�r0;m−1 − r0;mEθ;m−1 − Eθ;m
�Eθ;m (19)
z0;m�1 � z0;m − β2 sin
�z0;m−1 − z0;mEδ;m−1 − Eδ;m
�Eδ;m (20)
Eθ ��1
N
X�θj − �θj�4
�1∕4
(21)
Eδ ��1
N
X�δj − �δj�4
�1∕4
(22)
z0
r0
δj
θjδj
Point of Origin
zThruster Centerline, r=0
r
Fig. 27 Illustration of free-expanding jet emanating from theaxisymmetric annular HET channel.
b)a)
d)c)
-1.0
-0.5
0.0
0.5
1.0
0 0.5 1 1.5 2
Rad
ial D
ista
nce
from
Cen
terl
ine
(r/D
T)
Axial Distance from Exit Plane (z/DT)
Ion
Cur
rent
Den
sity
, mA
/cm
2
150
100
50
0 -1.0
-0.5
0.0
0.5
1.0
0 0.5 1 1.5 2
Rad
ial D
ista
nce
from
Cen
terl
ine
(r/D
T)
Axial Distance from Exit Plane (z /DT)
Ion
Cur
rent
Den
sity
, mA
/cm
2
150
100
50
0
0.0
0.5
1.0
1.5
2.0
0 1 2 3 4 5
Ion Current Density, mA/cm2
200502052
Rad
ial D
ista
nce
from
Cen
terl
ine
( r/D
T)
Axial Distance from Exit Plane (z/DT)
20 mg/s
Fig. 26 Ion current density measurements of the a) NASA-457Mv2 [54], b) NASA-300M [54], c) H6 [44], and d) NASA-173Mv2 [41] HETs.
598 BROWN ETAL.
Dow
nloa
ded
by G
EO
RG
IA I
NST
OF
TE
CH
NO
LO
GY
on
Janu
ary
19, 2
018
| http
://ar
c.ai
aa.o
rg |
DO
I: 1
0.25
14/1
.B35
696

where the subscriptm indicates themth iteration, β1 and β2 are tuningparameters to control the speed of convergence, Eθ;m is the error
metric of the travel angle, Eδ;m is the error metric of the divergence
angle, �θj is the mean travel angle, �δpj is the mean divergence angle,
and N is the number of axial positions over which the angles were
calculated. This process is typically repeated on both sides of the
measurement sweep, for r greater than zero and r less than zero.Convergence of the iterative path-finding method for the point of
origin within the channel is shown for the NASA-300M operating at
500 V, 20 kW in Fig. 28 [45], where the black lines represent the
origin for the jet in the channel for r greater than zero and the red lines
represent the opposite channel where r is less than zero [45]. The
corresponding integrated total ion beam current, travel angles, and
divergence angles are shown in Fig. 29, where dashed vertical lines
indicate the boundaries of the jet analysis zone for near-field plume
[45]. Although this dataset extends beyond the defined near-field
plume, the expansive range shows the variation in parameters outside
of the 0.2–0.5 TDD region. The trends were consistent for near-
field Faraday probe measurements over a wide range of operating
conditions for the both NASA-300M and NASA-457Mv2
HETs [45].To calculate the overall beam divergence angle as a global plume
parameter of annular HETs, the jet momentum is assumed to be
decomposed into the momenta of two collimated beams from the
channel. The beams each carry half of the momentum of the
associated jet and radiate outward from the jet travel angle at plus/
minus the jet divergence angle, as shown in Fig. 27. This approach is
represented mathematically in Eq. (23):
δ � jθj � δjj � jθj − δjj2
(23)
For Faraday probe sweeps across the channel, the divergence angle
should be averaged from each side of the thruster, where r is greaterthan zero and r is less than zero. The near-field HET divergence half-
angle δ is suitable for evaluation of thrust loss, and ideally is
equivalent to the effective far-field divergence angle λ. The HET
beam divergence using the iterative path-finding method was
compared to evaluations of the outer beam threshold limit and to
far-field Faraday probe measurements [45,54]. The iterative
path-finding method generally provided good agreement with far-
field measurements and expected divergence based on thruster
performance, whereas the outer beam threshold limits consistently
underpredicted divergence.
D. Near-Field Gridded Ion Thruster Plume
As with the near-field HET plume, a systematic investigation offacility interactions on the near-field GIT ion current density has notbeen conducted. Facility effects associated with backgroundpressure, such asCEX collisions and propellant ingestion, on theGITplume may be characterized similar to far-field characterizations.However, there are unique considerations for GITs. Near-field testrecommendations described in Secs. IV.D and IV.E are expected toprovide the necessary data to predict time-averaged ion currentdensity properties in the space vacuum environment.In the near-field GIT plume, a Faraday probe can be used to
evaluate ion plume properties, infer plasma uniformity, and resolvefeatures of the ion beamlet structure in the very near-field. Ion plumeprofilesmay be integrated according to Eq. (16) to estimate the actualextracted beam current and compare to the beam current measuredby the ion optics. In many cases, the integrated ion beam currentmeasured by Faraday probes is greater than 10% larger thanmeasured by ion optics [61,91–93],whichmay be associatedwith notusing corrections described in Sec. V.A, such as κG for the effectiveprobe collection area.However, the integration is also complicated byasymmetry in the near-field ion current density beam profile,specifically near the thruster centerline axis [94]. The location of peakion current density is often specific to a particular engine. Thephysical origin of this effect is not well understood, although it hasbeen speculated to be associated with peculiarities in cathodeoperation and coupling to the anode. Figure 30 illustrates typical ioncurrent measurements of a nude Faraday probe ranging fromapproximately 0.16 to 1.7 TDD (∼5 to 50 cm) downstream of the ionoptics of anNSTAR thruster at 1.76A beam current and 2.3 kWinputpower [92,95]. In these measurements, the peak ion current densityprofile is left of the thrust axis, and the left and right plume profilesshow slight asymmetry about the peak. Similar behaviors wereobserved in the NEXT near-field ion current density profiles [21,93].In cases of plume asymmetry, past studies have calculated differencesin integrated ion beam current exceeding 20% on the left or right sideof the plume [92]. To mitigate the asymmetry, the ion current density
Fig. 28 Convergence of the iterative path-finding method of the NASA-300M plume [45].
Fig. 29 Calculated parameters for the NASA-300M plume using theiterative path-finding method [45].
BROWN ETAL. 599
Dow
nloa
ded
by G
EO
RG
IA I
NST
OF
TE
CH
NO
LO
GY
on
Janu
ary
19, 2
018
| http
://ar
c.ai
aa.o
rg |
DO
I: 1
0.25
14/1
.B35
696

profilewas shifted radially to align the peak to thruster centerline. The
plume divergence and ion beam current were then averaged from
each side of the redefined profile [61,92]. This approach can lead to
large error, and it should be included in error analysis if it is
implemented.Similar to Faraday probe measurements of the near-field HET
plume in Sec. V.C, the radial extent of integration limits for GIT
plumes using Eq. (16) is uncertain. Additional studies are necessary
to determine the suitable limits of integration.However, since theGIT
beam current is known based on ion optics, the integrated ion beam
current from near-field plume measurements is often scaled and, in
many cases, the radial measurement range is limited to the central
beam. Traditionally, the primary use of Faraday probe measurements
of GIT plumes has been to determine the plume divergence for
calculations of thrust. To this end, near-field Faraday probe measure-
ments at fixed axial location are used to calculate the fraction of total
ion beam current enclosed within a given radius, shown in Eq. (24)
for the 95% fraction:
0.95IBeam � 2π
Zr950
j�r�r dr (24)
Note that the value of IBeam in Eq. (24) is typically the beam current
measured by ion optics, but it could also be the integrated ion beam
current fromFaraday probemeasurements. If the integrated ion beam
current is used, the radial integration limits will impact the radius
enclosing a given fraction of the beam.In Fig. 31, the enclosed current fractions from20 to 99%are shown
for the ion current density profiles in Fig. 30, where IBeam is
determined by GIT ion optics. This GIT dataset reveals the spatial
distribution of calculated enclosed current fractions yields a linear
relationship in the near-field plume, where the arctangent of the
best-fit linear regression slope Sf of each enclosed current fractionmay be used to determine an effective divergence half-angle β of theGIT near-field plume as defined in Eq. (25):
β � tan−1�1
Sf
�(25)
For this method to be meaningful, the Faraday probe radialmeasurement sweeps must extend beyond the beam central core andmultiple axial distances are required. Figure 32 shows is the enclosedcurrent fractions from Fig. 31 relative to thruster beam current andcorresponding β. The relevant enclosed current fractions used forevaluation of thrust loss parameter are often 90, 95, or 99%. Ideally,the near-field GIT divergence β should be equal to the effective far-field divergence half-angle λ if facility pressure interactions aresuitably isolated and mitigated in data analysis.This approach was used for the 30 cm GITs on the Dawn ion
propulsion system and demonstrated good agreement between flightthrust levels and predictions using the 90% beam divergence half-angles from ground measurements [75]. Nevertheless, the methodrequires further analysis and the assumptions should be evaluated forfuture systems. For example, it is not clear that the 90% enclosedcurrent fraction is the most suitable nor whether the integrated totalion beam current should be used instead of the beam current from ionoptics for this calculation. In addition, the results may benefit fromplume characterization at multiple background pressures to improveconsistency between the total ion beam current calculated withFaraday probe plume measurements and the values determined fromthe ion optics. Unlike far-field Faraday probemeasurements, Faradayprobemeasurements of the near-field GIT plume are not significantlyaffected by CEX collisions due to the large mean free path relativeto the plume region of interest. Instead, background pressurecharacterizations of the near-field GIT plume may enable evaluationof processes associated with facility neutral ingestion and featuresassociated with the beamlets. For example, Faraday probe studies ofthe very near-field plume region of the NEXT indicated beamletfocusing was a better indicator of far-field GIT beam divergence thanthe near-field region downstream of beamlet merging. Alternativeapproaches should also be considered, such as the iterative path-findingmethoddescribed for near-fieldHETplumes inSec.V.D.Thus,a systematic evaluation of background pressure effects on the GITnear-field plume and the advantages, or limitations, of the differentanalysis techniques should be conducted to establish standard testpractices for Faraday probe measurements of near-field GIT plumes.
E. Global Plume Properties
Thruster plume properties calculated with Faraday probemeasurements may be used to quantify thruster performance lossmechanisms and determine utilization efficiencies. The developmentand derivation of these parameters may be found elsewhere in theliterature [6,88].
0.0
1.0
2.0
3.0
4.0
5.0
6.0
7.0
-400 -300 -200 -100 0 100 200 300 400Radial Position (mm)
Ion
Cur
rent
Den
sity
(m
A/c
m2 ) 49 mm
199 mm
274 mm
349 mm
499 mm
Fig. 30 Ion current density profiles of the 30 cm NSTAR thruster,recreated from [92].
0
100
200
300
400
500
600
0 100 200 300 400 500 600Radial Position (mm)
Axi
al L
ocat
ion
(mm
)
0.200.400.600.800.900.950.980.99
Fig. 31 Fractions of total integrated beam current of the 30 cmNSTARthruster, recreated from [92].
0
20
40
60
80
100
0 5 10 15 20 25 30 35 40Divergence Half Angle (deg)
Frac
tion
of
Enc
lose
d B
eam
Cur
rent
(%)
Fig. 32 Fraction of enclosed ion beam current and correspondingdivergence half-angle of the 30 cmNSTAR thruster, recreated from [92].
600 BROWN ETAL.
Dow
nloa
ded
by G
EO
RG
IA I
NST
OF
TE
CH
NO
LO
GY
on
Janu
ary
19, 2
018
| http
://ar
c.ai
aa.o
rg |
DO
I: 1
0.25
14/1
.B35
696

Current utilization is defined by the ratio of ion beam current toinput discharge current as
ηCurrent �IBeamId
(26)
The thrustermass utilizationmay be calculatedwith Eq. (27) as theratio of the ion mass flow rate to the total thruster mass flow rate,which includes both anode and cathode propellant flows. The ionmass flow rate is calculated using ion beam current and the averageion charge Q from measurements of ion species charge fractions inthe plume in Eq. (28):
ηMass �IBeam_mTQ
Mi
e(27)
where
Q ��X
k�1
Ωk
Zk
�−1(28)
The beam utilization, also known as divergence utilization, is ameasure ofmomentum losses in axial thrust due to plume divergence.Losses in directed thrust may be estimated using divergence of ionbeam current. A past analysis indicated the differences in divergencein momentum and divergence of ion current are primarily affected byspatial variation in ion charge species fractionswithin the central coreof the plume [88]. Variation in the ion charge state within the ionbeam is small and, typically,Qmay vary less than 5% [96]; thus, theassumption that divergence in ion current is representative ofdivergence in momentum is suitable. The beam utilization may beexpressed in Eq. (29) with λ for far-field plume measurements.Replacing divergence half-angle λ with δ or β enables calculation ofbeam utilization for near-field HET measurements or near-field GITmeasurements, respectively:
ηBeam � cos2�λ� ������Ft
p(29)
The thrust loss parameter Ft in Eq. (29) is often used to calculatethrust in Eq. (30), where α represents thrust reduction due tomultiplycharged ions, Mi is the ion mass, and VBeam is the average ionacceleration voltage [6]. In practice, the uncertainty in measuredglobal plume parameters has higher uncertainty than directmeasurements of thrust. This approach is used more often for GITs,since IBeam and VBeam are known from the ion optics:
T � αFtIBeam
���������������������2MiVBeam
e
r(30)
Calculated values of ηCurrent, ηMass, and ηBeam are shown in Fig. 33for H6 HET operation at 10mg∕s anode flow and 7% cathode flow,based on plume properties in Fig. 25. The mass utilization wascalculated with Eq. (27), using measurements of ion species currentfractions measured at 1 m on the H6 HET channel centerline [88].The trends in Fig. 33 over the range of 1 × 10⁻⁵ to 3 × 10⁻⁵ torr-Xewere primarily associated with increased IBeam in Fig. 25, and theyrevealed ηCurrent increased by 0.1, ηMass increased by 0.16–0.21, andηBeam decreased by 0.09–0.16. The extrapolations of ηCurrent, ηMass,and ηBeam to zero pressure provided R-squared greater than 0.99 forall operating conditions. In addition, these values at zero pressurewere consistent with analysis of H6 HET utilization efficiencies in[88], which were calculated with a combination of ion energydiagnostics in the plume and performance measurements. Thus, theextrapolation of Faraday probe ion current density to zero pressuremay be partially mitigating the effect of the Bohm current, and thisincreases confidence in the approach to estimate global properties inthe space environment.The global far-field plume properties of a 200WHETwith variation
in facility pressure and downstream distance are shown in Figs. 34–36,based on plumemeasurements in Figs. 18 and 19. This unique dataset
included all corrections in Secs. V.A and V.B, and it was conducted
with a nested Faraday probe that enabled simultaneous measurements
of the HET plumewith four probe collector and guard ring geometries
[18]. The precision inmeasured ion current density profiles, calculated
0.5
0.6
0.7
0.8
0.9
1.0
1.1
1.2
1.3
Uti
lizat
ion
Eff
icie
ncy
(-)
Pressure (torr-xenon)
0 1 2 3x10⁻⁵
ηCurrent ηBeam ηMass
300 V 300 V 300 V150 V 150 V 150 V120 V 120 V 120 V
Fig. 33 Current utilization, beamutilization, andmass utilization of theH6 HET at six TDD.
a)
b)
40
35
30
25
20
Div
erge
nce,
deg
4x10-53210
Chamber Pressure, torr
8 TDD 12 TDD 16 TDD 20 TDD
Pressure (torr-xenon)
Div
erge
nce
(deg
)
40
35
30
25
20
Div
erge
nce,
deg
20181614121086420
Measurement Distance, TDDs
Vacuum Extrapolation 3.1x10 torr 1.0x10 torr 3.4x10 torr
-6-5-5
Axial Distance (TDD)
Div
erge
nce
(deg
)
Fig. 34 Beam divergence of a 200 W HET as a function of a) facilitypressure and b) measurement distance.
BROWN ETAL. 601
Dow
nloa
ded
by G
EO
RG
IA I
NST
OF
TE
CH
NO
LO
GY
on
Janu
ary
19, 2
018
| http
://ar
c.ai
aa.o
rg |
DO
I: 1
0.25
14/1
.B35
696

global plume properties, and extrapolations to zero pressure between
four probe geometries and over a wide range of background pressure
and regions of the far-field plume in [18] increased confidence in the
results and test methodologies. No such dataset is known for GITs or
near-field HET plumes.The data in Figs. 34–36 reveal several key considerations for
Faraday probe measurements of a far-field HET plume. First, the
variations in global plume properties with pressure show the impact of
facility background particles are nonnegligible at all far-field distances
and angular locations. Second, the extrapolations to zero pressure in
Figs. 34a, 35a, and 36ayieldeddifferent results at fixedR. These trendssuggest a natural evolution of the plume unrelated to facility effects,
whichmay be associatedwithHET plumemerging or CEX collisional
processes between beam ions and neutral propellant from the thruster
and cathode. This outcome is in agreement with results in Figs. 34b,
35b, and 36b, where the global plume properties (at fixed pressure)
extrapolated to the thruster exit plane at zero TDD yielded consistent
values of λ, ηCurrent, and ηBeam; this was true for the three backgroundpressures characterized and the values extrapolated to zero pressure.The reduction in ηBeam with increasing pressure for the 200WHET
in Fig. 35a was associated with ion scattering, and it was consistent
with the reduction shown for the H6 HET in Fig. 33, and it was
associated with ion scattering. However, the extrapolation of 200 W
HET ηBeam to zero TDD in Fig. 35b reveals the beam utilization
increases near the thruster exit plane, ranging from0.81 at eightTDD to
0.89 at zeroTDDfor the lowest pressure condition3.1 × 10−6 torr-Xe.Thevalue ηBeam extrapolated to zero TDD ranged from0.88 to 0.89 for
all facility pressure conditions in Fig. 35a, and the corresponding
divergence half-angle λ at zero TDD ranged from 20 to 21 deg for
all facility pressure conditions in Fig. 34a. The consistent estimates ofηBeam and λ at zero TDD from Faraday probe measurements
demonstrate the value of characterizing the HET plume across a widerange of facility pressures and measurement distances. Based on thisresult, the values of ηBeam for H6HET in Fig. 33 at a single distance arelikely underestimating the true plume divergence as a thruster
performance loss mechanism [88].The reduction in 200 W HET ηCurrent with increasing pressure in
Fig. 36a is opposite to the H6 trends in Fig. 33. However, the 200 WHET trend has been observed in other thrusters [97], and differentHET behaviors have been observed with increasing facility pressure
inmultiple past studies [73,98,99]. These inconsistent trends indicatecomplex physics between the facility neutrals with thruster plasma orthe Faraday probe that are not fully understood. Although the effectmay be related to additional electron current fraction in the HET
discharge, another possibility is related to probe sheath expansionwhen Rp∕λD is less than 50, as discussed in Sec. IV.B and in [59,60].The ratio ofRp∕λD (whereRp is the biased guard ring outer diameter)in Faraday probe measurements of the 200 W HET plume were
estimated based on past studies [100]. The estimated ratio Rp∕λDvaried from 21 at eight TDD to 15 at 20 TDD at 3 × 10⁻⁶ torr-Xe,and it increased to 64 at eight TDD and to 49 at 20 TDD at
3 × 10⁻⁵ torr-Xe. Although this is still in the thin-sheath regime, it ispossible that sheath expansion artificially increased Faraday probemeasured ion current density at lowpressure by several percent on theplume periphery; thus, the value of ηCurrent extrapolated to zero
pressure in Fig. 36a is overestimating the true current utilization as athruster performance loss mechanism. It is noteworthy that theextrapolation of ηCurrent to zero TDD in Fig. 36b resulted in consistent
a)
b)
0.9
0.8
0.7
0.6
Bea
m U
tiliz
atio
n E
ffic
ienc
y
4x10-53210
Chamber Pressure, torr
8 TDD 12 TDD 16 TDD 20 TDD
Pressure (torr-xenon)
Bea
m U
tiliz
atio
n E
ffic
ienc
y (-
)
0.9
0.8
0.7
0.6
Bea
m U
tiliz
atio
n E
ffic
ienc
y
20181614121086420
Measurement Distance, TDDs
Vacuum Extrapolation 3.1x10 torr 1.0x10 torr 3.4x10 torr
-6-5-5
Axial Distance (TDD)
Bea
m U
tiliz
atio
n E
ffic
ienc
y (-
)
Fig. 35 Beam utilization efficiency of a 200 W HET as a function ofa) facility pressure and b) measurement distance.
a)
b)
0.88
0.86
0.84
0.82
0.80
Cur
rent
Util
izat
ion
Eff
icie
ncy
4x10⁻⁵
3210
Chamber Pressure, torr
8 TDD 12 TDD 16 TDD 20 TDD
Pressure (torr-xenon)
Cur
rent
Uti
lizat
ion
Eff
icie
ncy
(-)
0.88
0.86
0.84
0.82
0.80
Cur
rent
Util
izat
ion
Eff
icie
ncy
20181614121086420
Measurement Distance, TDDs
Vacuum Extrapolation 3.1x10 torr 1.0x10 torr 3.4x10 torr
-6-5-5
Axial Distance (TDD)
Cur
rent
Util
izat
ion
Eff
icie
ncy
(-)
Fig. 36 Current utilization efficiency of a 200 W HET as a function ofa) facility pressure and b) measurement distance.
602 BROWN ETAL.
Dow
nloa
ded
by G
EO
RG
IA I
NST
OF
TE
CH
NO
LO
GY
on
Janu
ary
19, 2
018
| http
://ar
c.ai
aa.o
rg |
DO
I: 1
0.25
14/1
.B35
696

values for all background pressures, and it is further indication thatthe Faraday probe plume characterization with distance is necessaryto determine global plume properties.Based on the nature of facility effects on the plasma plume (i.e., ion
scattering, ingestion) and Faraday probe (i.e., Bohm current, sheathexpansion)measurements of far-fieldHETplumeproperties, the issuesare expected to apply generally to the near-field and far-field of theHETand GIT plumes. Hence, the guidelines and recommendations inSecs. IVand V were aimed to characterize and correct for the overallfacility pressure effects, including Faraday probe collection of Bohmcurrent, ingested and ionized facility neutrals, ion scattering, and probecollector sheath expansion. If Faraday probe plume characterizationwith distance and facility pressure is a valid approach to correct and/ormitigate the overall facility effects, then a complete understanding ofthe individual processes may not be necessary. This result warrantsfurther investigation, including different thruster technologies andthruster models, different facilities, and measurement region.
VI. Measurement Error and Uncertainty
The total measurement error is the difference between a measuredvalue and the true value, and it may be separated into a random errorand a systematic error. Random error is stochastic or unpredictable innature and may be associated with equipment sensitivity or signalnoise; it may be reduced through repeated measurement, but noteliminated. The systematic error, or statistical bias, may be predictableand is typically constant or proportional to the true value. Thesystematic error may be known or unknown, and it may be associatedwith imperfect calibration, imperfect observation, or interference of themeasurement process by the environment (i.e., facility effects). If theknown systematic error is significant relative to the required mea-surement accuracy, a correction factor is appropriate to minimize theimpact. Ideally, the systematic error is zero after correction factors areimplemented; however, errors arising from imperfect correctionscannot be exactly quantified. Thus, there will be inherent errors in thecorrection factors, such as κG, κSEE, κD, and κA. The error in thesecorrections contributes to overall measurement uncertainty. A detaileddescription of measurement error, uncertainty, and definition of termsand concepts may be found in [101,102].In Faraday probe measurements of ion current density in EP
plumes, the random error is typically minimal compared to sys-tematic error. The exception is on the plume periphery where the ioncurrent density is orders of magnitude less than the central core andrandom error may be nonnegligible. The correction factors, testmethodologies, and recommended analytical techniques in this guidehave been established to allow characterizations and corrections thatminimize systematic error and improve estimates of local charge fluxand global EP plume properties in the space environment. A list of theprimary systematic errors is provided in Table 2, along with thelocation of discussion. The magnitude of systematic measurementerrors may vary for different experiments due to thruster technology,
operating condition, experimental setup, and/or facility test condi-tions. In addition, there are limited flight comparisons with grounddata and insufficient Faraday probe plume measurement in the spaceenvironment to rigorously determine the fidelity of linear regressionto vacuum conditions or to zero TDD.Based on this knowledge, experiments that follow the guidelines in
Secs. III–V, as well as Appendix A, are expected to have less thanapproximately �5% uncertainty in far-field measurements and�10% uncertainty in near-field measurements. Local Langmuirprobe measurements at the Faraday probe location enable directcalculation of the Bohm current and evaluation of the probe sheath,and theymaybe used to reducemeasurement uncertainty. Comparingcalculated global plume properties from Faraday probe measure-ments with other plasma diagnostics and evaluation with a thrusterperformance analysis may further increase confidence in results. Forexample, the GIT ion beam current measured by ion optics may beused to evaluate the Faraday probe integrated ion current densityresults. For a HET, the total ion beam current measured by a Faradayprobe may be bounded by the thruster discharge current (maximum)and the lower limit based on evaluation of total thruster efficiencyand utilization efficiencies [88]; this approach necessitates thrustmeasurements and other plasma diagnostics, such as electrostaticanalyzers [103] or ExB probes [81].
VII. Probe Design Considerations
A. Design Guidelines
Numerous investigations have evaluated Faraday probe designsand modifications aimed to form a uniform collector sheath and toprevent collection of low-energy ions generated through facilityeffects, such as CEX ions and ingested neutral particles [1,30,32].These ion filtering mechanisms include collimators, electricallybiased grids, or magnetic fields. Although these filtering approacheswill successfully attenuate low-energy ions, they do not selectivelyisolate facility effects from the ionization of thruster and cathodeneutrals downstreamof the primary acceleration zone. For example, acollimated Faraday probe collects the low-energy thruster beam ionpopulation, CEX ions, and ingested facility neutrals that are ionizedand accelerated near the thruster exit. In contrast, the magneticallyfilteredFaradayprobeorgriddedFaradayprobeeliminates all low-energyion populations. Thus, the filtering mechanisms may not accuratelydetermine theon-orbit plumecharacteristics. The recommendeddesign isa nude Faraday probe with a guard ring, based on design simplicity andpast systematic experiments that increase confidence in the ability tocharacterize systematic measurement errors.A typical nude Faraday probe consists of a collector, guard ring,
ceramic isolator, probe housing, and necessary fasteners andelectrical wiring. The collector and guard ring are oftenmade ofmetalwith low sputter yield and low SEE, such asmolybdenum, tungsten, orgraphite [49,78,79,104,105].Althoughmaterials spray coatedwith 2%thoriated tungsten have been used, it is not recommended due to alower work function that leads to increased thermionic emission at agiven temperature [65]. High-purity (≥99%) collector and guard ringmaterials should be used due to availability of literature on materialproperties. The collector and guard ring should be the samematerial tominimize differences associated with material properties, such as SEEand thermionic emission. The collector and/or guard ring electricalconnections internal to the probe housingmay be a suitable location tomonitor a representative probe temperature for evaluation of effectsassociated with heating, such as thermionic emission.The collector diameter is determined based on the expected range
of ion current density, which may span microamperes per squarecentimeter in the far-field plume to milliamperes per squarecentimeter in the near-field plume of HETs and GITs; ion currentdensity may exceed amperes per square centimeter in the far-fieldplume of pulsed electromagnetic thruster concepts, as discussed inSec. VIII.C. Thus, the collector diameter should be scaled to achievethe necessary signal strength over the measured ion current densityrange in the near-field and far-field plumes for the experiment DAQsystem capabilities, or voltage should be measured across a shuntresistor as described in Sec. III.D. In addition, the lowest achievable
Table 2 Systematic errors in Faraday probe measurements
Parameter Section
Probe positioning and alignment III.CProbe leakage current III.DDAQ system and electrical configuration III.D, III.ECollector surface contamination III.EThermionic emission IV.BBias voltage and ion saturation IV.BSheath expansion IV.B, V.EBohm current collection IV.B, V.BIon collection in collector–guard ring gap V.ACollector secondary electron emission V.AHemispherical coordinate system V.BCEX collisions with facility neutrals V.BFacility neutral ingestion V.BDivergence angle reference V.B,V.C,V.DLinear regression (to zero pressure, zero TDD) V.B, V.ECathode plume Appendix B
BROWN ETAL. 603
Dow
nloa
ded
by G
EO
RG
IA I
NST
OF
TE
CH
NO
LO
GY
on
Janu
ary
19, 2
018
| http
://ar
c.ai
aa.o
rg |
DO
I: 1
0.25
14/1
.B35
696

measurement resolution is set by the collector diameter 2RC; thus, the
collector diameter should be scaled to satisfy the experimental
guidelines in Secs. IV.C and IV.D.
The gap width between the collector and guard ringmay be less than
5 to 10λD to create a flat, uniform sheath over the collector surface. Past
experiments demonstrated that ions entering the gap between the nude
Faraday probe collector and guard ring were collected by thewalls, and
they were a nonnegligible fraction of the measured collector current
[77]. Although the effective ion collection area of nude Faraday probes
is larger than cross-sectional geometric area of the collector, the area
correction factor κA, as defined inSec.V.B, has demonstrated consistent
results for different nude probe configurations over a range of
measurement distances and background pressures, where the isolator
base of the gap between collector and guard ring was ceramic [18].
The ratio RP∕λD is an important consideration in determining the
range of plasma conditions where the thin-sheath assessment is valid.
In a nude Faraday probe, the probe radiusRP is equal to the guard ring
outer diameter. The ratio RP∕λD � 50 in Fig. 37 for RP from 0 to
100 mm over a wide range of plasma densities and electron
temperatures is based on Eq. (2), showing the conditions where
sheath expansion is negligible. Large RP enables Faraday probe
measurements at larger λD while satisfying RP∕λD greater than 50,
thereby enabling studies of lower plasma density at a given Te. For
example,RP of 40 mm enables Faraday probe measurements of 1 eV
plasma at density 1014 m−3, and RP of 100 mm is insufficient to
measure a 1 eV plasma at density of 1013 m−3.
There are two circumstances when a guard ringmay not be viable. In
regions of highplasmadensity, such as near-fieldmeasurementsclose to
the plasma discharge, the gap between the collector and guard ringmay
be less than 5 to 10λD and the gap design criteria is not satisfied. For
instance, plasmadensity in thevery near-field ofHETs andGITs is1017
to 1018 m−3, and the corresponding λD is 17–50 μm in a 5 eV plasma
based on Eq. (2). Thus, the gap between the collector and guard ring
must be less than 0.1 to 0.5 mm to satisfy the 5 to 10λD gap criteria.
Under these conditions, there may be practical limits to the minimum
gap width and significant challenges associated with probe fabrication,
construction, assembly, alignment, and/or tolerance. A second situation
where a guard ring may not be practical is one in which the physical
probe diameter is largewith respect to the region of interest, such as the
near-field of a very small thruster, within or very near a HET discharge
channel, or directly downstream of GIT grids before beamlet merging.
Evaluation of gap widths larger than 5 to 10λD was conducted in [77].
These experimental results indicated the 5 to 10λD design criterionmay
be relaxed if the gap correction factor κG was applied. It is
recommended to evaluate these challenges and errors, as well as to
compare to errors associatedwith collector sheath expansion if no guard
ring is implemented. In the absence of plasma properties to estimate the
range of λD, it is recommended to use a guard ring. Both approaches
necessitate careful analysis and should be accounted for in the erroranalysis.The isolator is intended to electrically isolate the collector and
guard ring, and it is typically a dielectric, such as boron nitride (BN),Macor®, or aluminum oxide (Al2O3). A comparison of dielectricmaterials used in probe construction for use in an EP plasma wasprovided elsewhere in the literature [106,107]. Boron nitride isavailable in multiple grades with high thermal conductivity, atemperature limit exceeding 3000K (forXP gradeBN), and excellentthermal shock resistance [108,109]. Aluminum oxide, also known asalumina, has sufficient thermal conductivity and maximum temper-ature for most EP plasma plume environments, and it has a higherelastic modulus that is advantageous for applications with highmechanical and vibrational loads [110]. Macor is an easily machin-able glass ceramicwith the low thermal conductivity, no porosity, andno outgassing [111]. In general, the ceramic isolator SEE and sputteryields should be minimized; these properties may be found in theliterature [48,50,107,112]. However, other test considerations maydrive material selection. For example, BN may have advantagesassociated with thermal properties and alumina may have beneficialmechanical properties for rapid probe positioning.The probe housing should be capable of withstanding the plasma
environment, and thus it is made from a material with a low sputteryield, such as graphite [55,105]. Alternative materials such as alumi-num may have advantages for probe construction; however, thealuminum sputter yield due to xenon bombardment is approximatelyfive times higher than graphite [105]. Kapton [48] may be used tocover the housing material, but it will undergo degradation in theplasma environment. As stated in Sec. III.E, Faraday probe electricalwiring and fasteners should not be exposed to the plasma in order tominimize sputtering, deposition, and degradation. A shield may beimplemented to limit direct ion beam impingement.
B. Recommended Probe Design
Based on the design guidelines in Sec. VII.A, a recommendednude Faraday probe design is shown in Fig. 38. The diagram showsmajor components of the probe design and includes key featuresbased on past test campaigns. It should be noted that this design isnotional, and it has not been fabricated or evaluated with thrusterplasma in a ground test environment. The collector, guard ring,isolator, and probe housing are shown in Fig. 38a. Probe materialsdiscussed in Sec. VII.A would suffice for the design. However, forconsistency in results associated with material properties (i.e., SEE,sputter yield, work function), it is advised to use tungsten due to anextensive knowledge of material properties and plasma interactions.The recommended isolator material in Fig. 38 is BN due to thermalcharacteristics and knowledge of material properties based on paststudies [48,50,108,109]. Alternative isolator ceramics may be usedfor specific advantages, such as mechanical properties.Probe manufacturability has been considered, including separating
the isolator into two components for alignment and the notched isolatorbase as shown in Fig. 38b. The notched isolator base is to reduce thebuildup of deposited material, and thereby reduce the possibility ofelectrical leakage current caused by a conductive path between thecollector and guard ring. In addition, there are through holes in theisolator and tapped holes in the collector and guard ring, which enableoptions for probe assembly and electrical connections at fastenersinternal to the probe housing. This configuration is also expected toallow adjustments in component alignment, including concentricitybetween the collector and guard ring. The diagram does not specify anattachment between the isolator and probe housing. Vent holes areincluded at the base of the ceramic isolator in Fig. 38a to reduce thebuildup of neutral particles in the gap; however, this may not benecessary for low particle flux in the far-field plume.Critical design dimensions for the probe in Fig. 38 are shown in
Fig. 39a with respect to recommendations for near-field and far-fieldmeasurements in Sec. IV, including the collector diameter, the gapwidth between the collector and guard ring, and the guard ring outerdiameter. These critical dimensions should be evaluated and satisfiedthroughout the plume measurement range. For a given investigation,
101710151014 10160 10 20 30 40 50 60 70 80 90 100
Plas
ma
Den
sity
(m
-3)
10-15
10-14
10-13
10-12
Probe Radius (mm)
10 eV3 eV
1 eV
0.3 eV
0.1 eV
0.03 eV0.01 eV
Fig. 37 Minimum plasma density measureable for a probe radiussatisfying RP∕λD greater than 50, with manifolds of fixed electrontemperature.
604 BROWN ETAL.
Dow
nloa
ded
by G
EO
RG
IA I
NST
OF
TE
CH
NO
LO
GY
on
Janu
ary
19, 2
018
| http
://ar
c.ai
aa.o
rg |
DO
I: 1
0.25
14/1
.B35
696
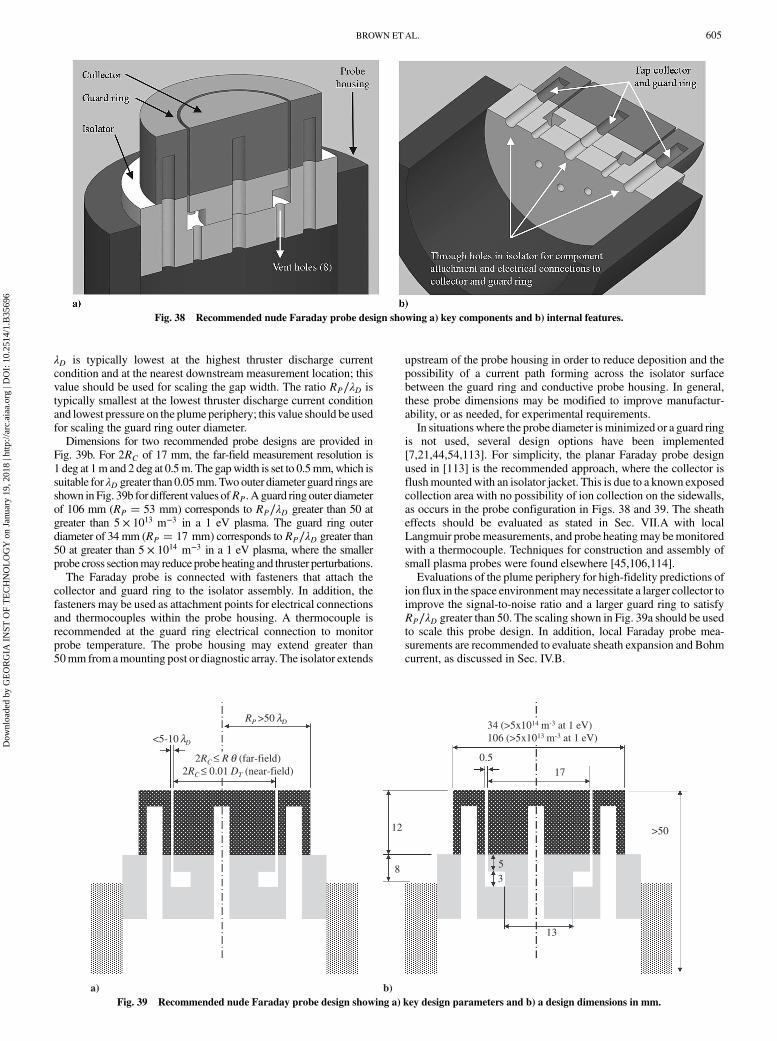
λD is typically lowest at the highest thruster discharge current
condition and at the nearest downstream measurement location; this
value should be used for scaling the gap width. The ratio RP∕λD is
typically smallest at the lowest thruster discharge current condition
and lowest pressure on the plume periphery; this value should be used
for scaling the guard ring outer diameter.
Dimensions for two recommended probe designs are provided in
Fig. 39b. For 2RC of 17 mm, the far-field measurement resolution is
1 deg at 1m and 2 deg at 0.5m. The gapwidth is set to 0.5mm,which is
suitable for λD greater than 0.05mm.Twoouter diameter guard rings are
shown in Fig. 39b for different values ofRP. A guard ring outer diameter
of 106 mm (RP � 53 mm) corresponds to RP∕λD greater than 50 at
greater than 5 × 10¹³ m−3 in a 1 eV plasma. The guard ring outer
diameter of 34 mm (RP � 17 mm) corresponds to RP∕λD greater than
50 at greater than 5 × 10¹⁴ m−3 in a 1 eV plasma, where the smaller
probe cross sectionmay reduce probe heating and thruster perturbations.
The Faraday probe is connected with fasteners that attach the
collector and guard ring to the isolator assembly. In addition, the
fasteners may be used as attachment points for electrical connections
and thermocouples within the probe housing. A thermocouple is
recommended at the guard ring electrical connection to monitor
probe temperature. The probe housing may extend greater than
50mm from amounting post or diagnostic array. The isolator extends
upstream of the probe housing in order to reduce deposition and the
possibility of a current path forming across the isolator surface
between the guard ring and conductive probe housing. In general,
these probe dimensions may be modified to improve manufactur-
ability, or as needed, for experimental requirements.
In situations where the probe diameter isminimized or a guard ring
is not used, several design options have been implemented
[7,21,44,54,113]. For simplicity, the planar Faraday probe design
used in [113] is the recommended approach, where the collector is
flushmountedwith an isolator jacket. This is due to a known exposed
collection area with no possibility of ion collection on the sidewalls,
as occurs in the probe configuration in Figs. 38 and 39. The sheath
effects should be evaluated as stated in Sec. VII.A with local
Langmuir probemeasurements, and probe heatingmay bemonitored
with a thermocouple. Techniques for construction and assembly of
small plasma probes were found elsewhere [45,106,114].
Evaluations of the plume periphery for high-fidelity predictions of
ion flux in the space environmentmay necessitate a larger collector to
improve the signal-to-noise ratio and a larger guard ring to satisfy
RP∕λD greater than 50. The scaling shown in Fig. 39a should be used
to scale this probe design. In addition, local Faraday probe mea-
surements are recommended to evaluate sheath expansion and Bohm
current, as discussed in Sec. IV.B.
Fig. 38 Recommended nude Faraday probe design showing a) key components and b) internal features.
b)a)
<5-10 λD
RP >50 λD
2RC ≤ R θ (far-field)2RC ≤ 0.01 DT (near-field) 17
0.5
12
8 53
>50
13
34 (>5x10¹⁴ m-3 at 1 eV)106 (>5x10¹³ m-3 at 1 eV)
Fig. 39 Recommended nude Faraday probe design showing a) key design parameters and b) a design dimensions in mm.
BROWN ETAL. 605
Dow
nloa
ded
by G
EO
RG
IA I
NST
OF
TE
CH
NO
LO
GY
on
Janu
ary
19, 2
018
| http
://ar
c.ai
aa.o
rg |
DO
I: 1
0.25
14/1
.B35
696

VIII. Considerations for Other EP Technologies
The Faraday probe experimental apparatus, test methodologies, andanalysis techniques presented in Secs. III, IV, and V, respectively, areapplicable to many EP technologies. Multiple criteria in Table A1 ofAppendixA are common to all EP devices. These are primarily relatedto probe considerations and experimental apparatus. However, there islimited information in the literature on Faraday probe measurementsfor the EP devices in this section, and it is undetermined if additionalmeasurement considerationsor analysis techniques arewarranted.Thisis especially true for issues related to thruster interactions and plumecharacterizations with distance and pressure. Limitations of theguidelines inTableA1andmodifications for selectEP technologies aredescribed in the following.
A. Electrospray Thrusters
Electrospraypropulsion technologies,which includes field emissionelectric propulsion and colloid thrusters, typically use a small number(less than 10) of emission sites and small emission area for low-powersub-millinewton thrust applications [115,116]. There is limitedinformation in the literature of Faraday probe measurements for singleemitter experiments or electrospray arrays with a small number ofemitters; thus, it is unclear if additional Faraday probe considerationswill arise in measurements of large electrospray arrays for greater thanmicroampere-level devices [117].Plume measurements of the colloid micronewton thruster (CMNT)
system, a nine-emitter array, were conducted for the NASA SpaceTechnology 7-Disturbance Reduction System (ST7-DRS) flown on theLaser Interferometer Space Antenna Pathfinder mission. The CMNTbeam was not evaluated with a traditional Faraday probe; however, asegmented plume target in the far-field plumeprovideddetails of the ioncurrent density profiles approximately 34 cm downstream of thethruster [115,117]. The plume target consisted of 64 electrometers in across configuration along the x axis and y axis, as shown in Fig. 8 for thecylindrical coordinate system. There were minimal details on theexperimental apparatus or facility configuration, and the plumemeasurements were not consistent with the test methods in this paper.However, the reported ion flux and divergence half-angles in Fig. 40indicate the electrospray ion beam is similar to GIT and HET plumes.Figure 40b demonstrate the 99.9% divergence half-angles were within50 deg from the thruster centerline, and the 95.5% half-angle was nogreater than 24 deg in any operational condition [115]. The integratedion beam current was not compared to electrospray emitted current.Based on the ST7-DRM dataset, Faraday probe guidelines in this
paper should be used as a starting point for measurements ofelectrospray plumes. The influence of facility background pressure orfacility electrical environment has not been established for electrospraythruster technologies. However, the plume characterization withmultiple background pressures and measurement distances areadvised, as listed in Table A1, to isolate facility effects associated withCEX collisions, Bohm current collection, and probe sheath expansion.Electrosprays may be operated in several configurations to achievebeam neutralization, including with a neutralizer cathode, with bothpositive and negative emitters, or operated in a bipolar fashion withalternating positive and negative particles. The latter two approachesmay require additional considerations that are beyond the scope of thispaper. In addition, Faraday probe design should be evaluated formeasurements of the electrospray plasma with charged droplets,including guidelines for the guard ring and gap spacing. As stated inSec. II.A, the effect of propellant on the Faraday probe surfaces shouldbe considered if an ionic liquid or condensable propellant is used.
B. Arcjet Thrusters
Electrothermal thrusters, such as arcjets and resistojets, use electricheating to impart energy to the propellant and accelerate through a nozzleto produce thrust [118,119]. In the arcjet, an arc originating from thecathode attaches to the anode nozzle to heat the propellant, which canthen be accelerated through the nozzle to produce thrust. The arcjet flowconditions evolve from nearly fully ionized plasma near the cathode to arelatively cold plasma near the anode surface, and a weakly ionizedplasma in the exhaust plume. Arc current density near the arcjet cathode
has been estimated at 104 A∕cm2, and peak current density along the
anode surface was measured to be greater than 10 A∕cm2 [118,120].
There have been multiple studies of the arcjet exit plane, near-field
plasma, and far-field plasma [121–124]; however, there is a dearth of
information on ion current density in the arcjet plume due to thevery low
ionization fractionof less than10−3. Plasmaproperties in the arcjet plumeare an electron temperature less than 1 eVand electron density ranging
fromless than1013 cm−3 in thenear-fieldplume to less than109 cm−3 in
the far-field plume [118,121]. Thus, the signal-to-noise ratio may be a
challenge and the orbital-motion-limited sheath assessment may be
necessary, as opposed to the thin-sheath assessment, due to the large λD at
low plasma density. Neutral propellant temperaturesmay approach 3000
to 5000K near the arcjet exit plane, and the exhaust velocity ranges from
hundreds of kilometers per second up to approximately 1000 km∕s onthe thruster centerline, depending on propellant, where the ratio of ion
velocity to neutral exhaust velocity is ∼1.5 [122,125].The Faraday probe guidelines and recommendations in this paper
may be used as a starting point; however, an examination of the arcjet
near-field and far-field plumes is necessary to determine whether the
guidelines and recommendations are suitable. It is not known to what
extent facility effects influence the arcjet plume; they may be minimal
because most of the acceleration is within the nozzle area and the
ionization fraction is very low in the plume. To establish guidelines for
Faraday probe measurements of arcjet thrusters, examination of ion
current density with characterization of background pressure and
downstream distance is advised. These data should be correlated to
measurements of plasma properties near the exit plane and far-field
plume, and they should be considered with respect to Faraday probe
design requirements and design applicability throughout the plume.
For example, theDebye lengthmay range from 3 × 104 cm [122] near
the arcjet exit plane to the order of10−2 cm in the far-fieldplume [126].
To accommodate these conditions, the gap width of a nude Faraday
probe collector must be less than 0.03 mm and is not practical. Based
on past plasma measurements of the arcjet plume, probe heating must
b)
0.0
10.0
20.0
30.0
40.0
50.0
2 3 4 5 6 7 8 9Beam Voltage (kV)
Enc
losi
ng H
alf-
Ang
le o
f E
xhau
st B
eam
(°)
Electrodes
Beam Current (µA)95.5% 99.9%2.25 2.253.0 3.04.0 4.05.0 5.05.4 5.4
ST7 Thruster, 9 Emitters
95.5%
99.9%
a)
Fig. 40 Far-field plume measurements of the ST7-DRS electrospraythruster a) normalized ion flux recreated from [117] and b) divergence
half-angle recreated from [115].
606 BROWN ETAL.
Dow
nloa
ded
by G
EO
RG
IA I
NST
OF
TE
CH
NO
LO
GY
on
Janu
ary
19, 2
018
| http
://ar
c.ai
aa.o
rg |
DO
I: 1
0.25
14/1
.B35
696
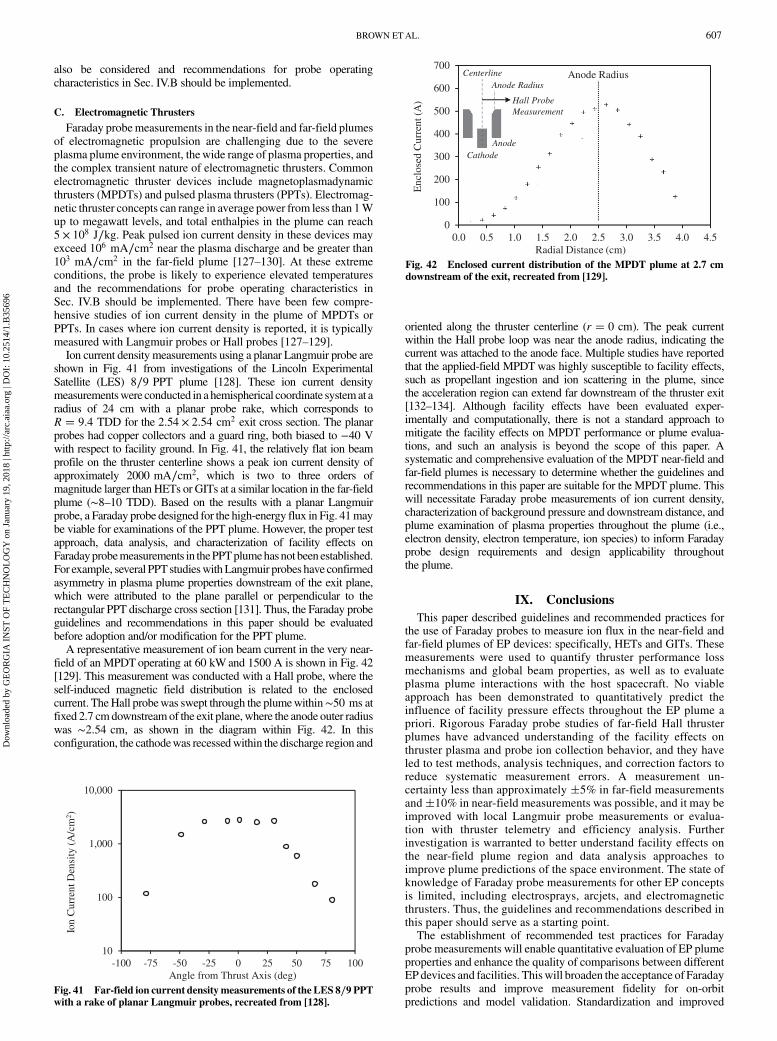
also be considered and recommendations for probe operatingcharacteristics in Sec. IV.B should be implemented.
C. Electromagnetic Thrusters
Faraday probemeasurements in the near-field and far-field plumesof electromagnetic propulsion are challenging due to the severeplasma plume environment, thewide range of plasma properties, andthe complex transient nature of electromagnetic thrusters. Commonelectromagnetic thruster devices include magnetoplasmadynamicthrusters (MPDTs) and pulsed plasma thrusters (PPTs). Electromag-netic thruster concepts can range in average power from less than 1Wup to megawatt levels, and total enthalpies in the plume can reach5 × 108 J∕kg. Peak pulsed ion current density in these devices mayexceed 106 mA∕cm2 near the plasma discharge and be greater than103 mA∕cm2 in the far-field plume [127–130]. At these extremeconditions, the probe is likely to experience elevated temperaturesand the recommendations for probe operating characteristics inSec. IV.B should be implemented. There have been few compre-hensive studies of ion current density in the plume of MPDTs orPPTs. In cases where ion current density is reported, it is typicallymeasured with Langmuir probes or Hall probes [127–129].Ion current density measurements using a planar Langmuir probe are
shown in Fig. 41 from investigations of the Lincoln ExperimentalSatellite (LES) 8∕9 PPT plume [128]. These ion current densitymeasurementswere conducted in a hemispherical coordinate systemat aradius of 24 cm with a planar probe rake, which corresponds toR � 9.4 TDD for the 2.54 × 2.54 cm2 exit cross section. The planarprobes had copper collectors and a guard ring, both biased to −40 Vwith respect to facility ground. In Fig. 41, the relatively flat ion beamprofile on the thruster centerline shows a peak ion current density ofapproximately 2000 mA∕cm2, which is two to three orders ofmagnitude larger thanHETs or GITs at a similar location in the far-fieldplume (∼8–10 TDD). Based on the results with a planar Langmuirprobe, a Faraday probe designed for the high-energy flux in Fig. 41maybe viable for examinations of the PPT plume. However, the proper testapproach, data analysis, and characterization of facility effects onFaradayprobemeasurements in thePPTplumehasnot been established.For example, several PPT studieswithLangmuir probes have confirmedasymmetry in plasma plume properties downstream of the exit plane,which were attributed to the plane parallel or perpendicular to therectangular PPT discharge cross section [131]. Thus, the Faraday probeguidelines and recommendations in this paper should be evaluatedbefore adoption and/or modification for the PPT plume.A representative measurement of ion beam current in the very near-
field of an MPDToperating at 60 kWand 1500 A is shown in Fig. 42[129]. This measurement was conducted with a Hall probe, where theself-induced magnetic field distribution is related to the enclosedcurrent. TheHall probewas swept through the plumewithin∼50 ms atfixed 2.7 cmdownstreamof the exit plane, where the anode outer radiuswas ∼2.54 cm, as shown in the diagram within Fig. 42. In thisconfiguration, the cathodewas recessedwithin the discharge region and
oriented along the thruster centerline (r � 0 cm). The peak currentwithin the Hall probe loop was near the anode radius, indicating thecurrent was attached to the anode face. Multiple studies have reportedthat the applied-field MPDTwas highly susceptible to facility effects,such as propellant ingestion and ion scattering in the plume, sincethe acceleration region can extend far downstream of the thruster exit[132–134]. Although facility effects have been evaluated exper-imentally and computationally, there is not a standard approach tomitigate the facility effects on MPDT performance or plume evalua-tions, and such an analysis is beyond the scope of this paper. Asystematic and comprehensive evaluation of the MPDT near-field andfar-field plumes is necessary to determine whether the guidelines andrecommendations in this paper are suitable for the MPDT plume. Thiswill necessitate Faraday probe measurements of ion current density,characterization of background pressure and downstream distance, andplume examination of plasma properties throughout the plume (i.e.,electron density, electron temperature, ion species) to inform Faradayprobe design requirements and design applicability throughoutthe plume.
IX. Conclusions
This paper described guidelines and recommended practices forthe use of Faraday probes to measure ion flux in the near-field andfar-field plumes of EP devices: specifically, HETs and GITs. Thesemeasurements were used to quantify thruster performance lossmechanisms and global beam properties, as well as to evaluateplasma plume interactions with the host spacecraft. No viableapproach has been demonstrated to quantitatively predict theinfluence of facility pressure effects throughout the EP plume apriori. Rigorous Faraday probe studies of far-field Hall thrusterplumes have advanced understanding of the facility effects onthruster plasma and probe ion collection behavior, and they haveled to test methods, analysis techniques, and correction factors toreduce systematic measurement errors. A measurement un-certainty less than approximately �5% in far-field measurementsand�10% in near-field measurements was possible, and it may beimproved with local Langmuir probe measurements or evalua-tion with thruster telemetry and efficiency analysis. Furtherinvestigation is warranted to better understand facility effects onthe near-field plume region and data analysis approaches toimprove plume predictions of the space environment. The state ofknowledge of Faraday probe measurements for other EP conceptsis limited, including electrosprays, arcjets, and electromagneticthrusters. Thus, the guidelines and recommendations described inthis paper should serve as a starting point.The establishment of recommended test practices for Faraday
probe measurements will enable quantitative evaluation of EP plumeproperties and enhance the quality of comparisons between differentEP devices and facilities. Thiswill broaden the acceptance of Faradayprobe results and improve measurement fidelity for on-orbitpredictions and model validation. Standardization and improved
10
100
1,000
10,000
-100 -75 -50 -25 0 25 50 75 100Angle from Thrust Axis (deg)
Ion
Cur
rent
Den
sity
(A
/cm
2 )
Fig. 41 Far-field ion current densitymeasurements of the LES 8∕9 PPTwith a rake of planar Langmuir probes, recreated from [128].
0
100
200
300
400
500
600
700
0.0 0.5 1.0 1.5 2.0 2.5 3.0 3.5 4.0 4.5Radial Distance (cm)
Enc
lose
d C
urre
nt (A
)
Anode Radius
Anode
Hall Probe Measurement
Centerline
Cathode
Anode Radius
Fig. 42 Enclosed current distribution of the MPDT plume at 2.7 cmdownstream of the exit, recreated from [129].
BROWN ETAL. 607
Dow
nloa
ded
by G
EO
RG
IA I
NST
OF
TE
CH
NO
LO
GY
on
Janu
ary
19, 2
018
| http
://ar
c.ai
aa.o
rg |
DO
I: 1
0.25
14/1
.B35
696

predictive capabilities have broad application to laboratory
researchers, satellite designers, and operators, and they ultimately
advance the utilization of EP for flight.
Appendix A: Summary of Recommended Practices
The numerous guidelines and recommendations for Faraday probe
test practices are summarized in Table A1 for HETs and GITs,
including the relevant section where additional information is
provided.
Appendix B: Method of Cathode Plume Removal
In the case of a centrally mounted cathode, the recommended
approach is to remove the contributions of the cathode plume from the
Faraday probe results. One approach is to evaluate the cathode plume
as an expanding jet into vacuum that does not interact with itself or the
thruster ion beam. The approach will be demonstrated based on
analysis of theNASA-300Mat 500V, 20 kWinFigs. B1–B3 [45]. The
first step is to identify a regionnear the cathodewhere themeasured ion
current is dominated by the cathode plume. In past studies, the cathode
plume region was defined as Z less than 0.2 TDD in the radial vicinity
Table A1 Summary of Faraday probe guidelines and recommendations for HETs and GITs
Experimental parameter/section Guideline
Coordinate geometry/III.A, III.B 1) Channel or grid outer diameter DT should be used for HETs and GITs, respectively.a
2) External cathode should be located at Φ � 90 deg (or 270 deg) for measurement in Φ � 0 deg, 180 deg plane.3) Hemispherical coordinate system should be used in far-field.4) Cylindrical coordinate system should be used in near-field.
Background pressure characterization/IV.E
1) Measurements should be conducted at a minimum four background pressures.2) Pressure characterization should include plumemeasurements at the lowest achievable facility pressure during thrusteroperation.3) Pressure should follow recommendations in [57].b
Measurement distance/IV.C, IV.D 1) Far-field measurements should be greater than four TDD.2) Near-field measurements should be less than four TDD.3) Near-field HET analysis should be upstream of the transitional region and may be greater than 0.2 TDD.
Spatial characterization/IV.E Measurements should be conducted at a minimum four distances at all background pressures.c
Measurement span/IV.C, IV.D 1) Far-fieldmeasurements at fixedR should span θ � 0 to 90 deg, for fixedΦ and atΦ� 180 deg for the opposite side ofthe plume (e.g., θ � 0 to 90 deg at Φ � 0 and 180 deg).d
2) Near-field measurements at fixedZ should extend to the locationwhere measured ion current density is less than 0.2%of the maximum value along the radial profile, for fixedΦ and at Φ� 180 deg for the opposite side of the plume (e.g.,Φ � 0 and 180 deg).
Measurement resolution/IV.C, IV.D 1) Far-field angular resolution should be �2RC∕R� ≤ dθ ≤ 2 deg.e
2) Near-field radial resolution should be 2RC ≤ dr ≤ 0.01DT or ≤ 1 mm, whichever is greater.Probe materials/VII.A 1) Probe collector, guard ring, and side surfaces should be ≥99% purity molybdenum, graphite, or tungsten.
2) Isolator materials may be boron nitride, aluminum oxide, or Macor.f
Collector bias voltage/IV.B 1) Probe collector and guard ring should be biased voltage relative to ground to achieve ion saturation throughout themeasurement region.2) Bias voltage to achieve ion saturation should be characterized at multiple locations in the plume to span the maximumand minimum n and Te (e.g., minimum R at θ � 0 deg and the maximum R at θ � 90 deg in the far-field).3) Collector and guard ring bias voltage should be equal.
Probe electrical resistance/III.D, III.E 1) Collector resistance to ground and RC-GR should be measured before testing, and they should exceed 100 MΩ.2) Collector shunt resistor may range from 10 to 1000Ω.
Diagnostic alignment/III.E 1) Probe alignment should be conducted before pumping the facility to vacuum conditions.2) Collector face should be oriented parallel to the thruster exit planewithin 1 deg, when positioned on thruster centerline.3) Probe position accuracy should be within 1 mm or within 0.5% R (or Z) at the maximummeasurement distance (e.g.,5 mm at R � 1 m), whichever is greater.
Bohm current/IV.B Bohm current density to the collector should be less than 1% of the measured ion current density.Thermionic emission current/IV.B Collector thermionic emission current should be less than 1% of the measured ion current density.Probe checkout/III.E, IV.B 1) No obstructions should be in the line of sight of the Faraday probe to any point of the thruster plasma discharge.
2) All probe mounting structures and cables near the probe should be downstream of the probe collection surface.3) Probemounting structure that experiences direct beam ion impingement should be shieldedwith low-sputtermaterials,such as Kapton or graphite.4)May conduct visual inspection and electrical verification of the probe at the beginning and end of a test campaign, or ifthere is a change in measurement repeatability over time.
Probe cabling/III.E 1) Probe cabling should be coaxial cable or twisted shielded pair, with no electrical leads or connections exposed toplasma.2) Cable shielding should be grounded to the facility walls in ground testing.
Thruster operation/IV.A 1) Thruster discharge should reach operational steady state before conducting measurements (user defined).2) Thruster telemetry should be monitored for perturbation during measurements.
Probe design dimensions/VII 1) Collector to guard ring gap should be less than 5λD to 10λD.2) Ratio RP∕λD should be greater than 50.3) 2RC should be less than or equal to Rθ in the far-field.4) 2RC should be less than or equal to 0.01DT in the near-field.
Correction for collector SEE/V.A Measurements should be corrected for collector SEE with κSEE.Corrections for hemisphericalcoordinate system/V.B
Far-field measurements in a hemispherical coordinate system should be corrected with κA and κD.
Correction for probe collectionarea/V.A
Probe ion collection area should be corrected for ions entering gap between the collector and guard ring with κG.
aNote that alternative definitions of DT may be used, such as midchannel diameter for HETs.bNote that pressure recommendations are the same for all working gases. For increased accuracy, recommend lower background pressure and additional pressure characterizations.
Qualitative assessment of plume profile may be conducted at a single background pressure.cNote that, for increased accuracy, recommend additional distances and additional background pressures. Qualitative assessment of plume may be conducted at a single distance.dNote that, for increased accuracy, recommend �100 deg for far-field measurements.eNote that, for increased accuracy, recommend ≤1 deg resolution for far-field measurements.fNote that recommended probe design lists specific materials for consistency in Sec. VII.B. Alternative materials may be selected for specific applications.
608 BROWN ETAL.
Dow
nloa
ded
by G
EO
RG
IA I
NST
OF
TE
CH
NO
LO
GY
on
Janu
ary
19, 2
018
| http
://ar
c.ai
aa.o
rg |
DO
I: 1
0.25
14/1
.B35
696

of the cathode plume [45,54], which is within approximately 0.1DT in
Fig. B1a, although the range can be modified. The dashed lines in
Fig. B1a are overlaid to show the approximate boundaries of the
cathode plume region in the analysis of [45].Analyses of the NASA-457Mv2 in Fig. 26a and NASA-300M in
Fig. B1a demonstrated that an exponential decay function of the form
in Eq. (B1) yielded an excellent fit to the radial cathode plume profile
at fixed Z [45]:
f�r� � C1e−jrj∕C2 (B1)
The cathode plume expands as it travels downstream, where the
parametersC1 andC2 are constant for a given radial plume profile at a
fixed Z but may vary with axial location in the cathode plume region.
The recommended approach is to fit Eq. (B1) at multiple axial
positions within the measured cathode plume region. Past studies
used a method of least squares to determine C1 and C2 at each axial
measurement location, indicated by markers in Figs. B2a and B2b.
Based on the values of C1 and C2 for the exponential decay function
in Eq. (B1), the radial cathode current density profiles may be
integrated to calculate the total cathode plume current at each
downstream distance, as indicated by markers in Fig. B2c. This
calculation allows determination of a mean plume current in the
expanding cathode jet, which is assumed constant with downstream
distance in the cathode plume region. The mean cathode plume
current is approximately 0.684A, as shown in Fig. B2c. To determine
the cathode plume ion current density throughout the Faraday probe
measurement region, it is necessary to develop an expression for
parameters C1 and C2 as a function of axial location in the cathode
plume. To this end, a second-order polynomial is used to evaluate
variation ofC2 as a function ofZ in Fig. B2b.Using this second-order
polynomial expression forC2 and the mean cathode plume current in
Fig. B2c, an expression for C1 can be determined as a function of Zwith Eq. (B1), shown as a dashed line in Fig. B2a. The calculated
values ofC1 for an expanding cathode jet (dashed line) in Fig. B2a are
consistent with the values determined with least-squares analyses
(markers), thereby indicating the approach is suitable to evaluate the
cathode plume ion current density throughout the measurement
domain.The cathode plume profile developed using Eq. (B1) and Fig. B2
may then be subtracted from the Faraday probe ion current density
measurements. Based on the total cathode plume current in Fig. B2c,
the cathode plume contributed ∼0.68 A current to the integrated
thruster ion beam current, which was ∼2% of the thruster discharge
current. However, removal of the cathode plume has a larger impact
on evaluation of beam divergence, including the iterative path-
finding method described in Sec. V.C. This is due to the elevated
current density outside of the channel, which would alter values of r0and z0 in the free-expanding jet in Fig. 27.
The cathode plume model is shown for the NASA-300M HET at
various axial positions in Fig. B3, where solid black lines indicate the
raw trace, and dashed red lines indicate the curve-fit results [45]. The
flooded ion current density plots after cathode plume removal are
shown inFig.B1b,wheredashed lines indicate the limitsof integration.
Spurious spikesmaybepresent in thepostsubtraction datadue tominor
a) b)
-1.0
-0.5
0.0
0.5
1.0
0 0.5 1 1.5 2
Rad
ial D
ista
nce
from
Cen
terl
ine
(r/D
T)
Axial Distance from Exit Plane (z/DT)
Ion
Cur
rent
Den
sity
, mA
/cm
2
150
100
50
0
BEFORE
Cathode Plume Region
-1.0
-0.5
0.0
0.5
1.0
0 0.5 1 1.5 2
Rad
ial D
ista
nce
from
Cen
terl
ine
(r/D
T)
Axial Distance from Exit Plane (z/DT)
Ion
Cur
rent
Den
sity
, mA
/cm
2
150
100
50
0
AFTER
Fig. B1 Ion current density from a) plume measurements and b) with cathode plume removal, recreated from [45].
a)
b)
c)
0
500
1,000
1,500
2,000
0.05 0.10 0.15 0.20 0.25
Fit C
onst
ant C
1
Exponential Decay Fit Expanding Jet (calculated)
Axial Distance (z/DT)
0
500
1,000
1,500
0.05 0.10 0.15 0.20 0.25
8
6
4
2
Fit C
onst
ant C
2
Exponential Decay FitExpanding Jet (Second-Order Poly)
Axial Distance (z/DT)
0
500
1,000
1,500
0.05 0.10 0.15 0.20 0.25
0.70
0.68
0.64
0.66
Tot
al C
atho
de P
lum
e C
urre
nt (A
)
Axial Distance (z/DT)
Fit ConstantsExpanding Jet (mean, fixed)
Fig. B2 Curve-fit parameters a)C1, b)C2, and c) the integrated cathodeplume current, recreated from [45].
BROWN ETAL. 609
Dow
nloa
ded
by G
EO
RG
IA I
NST
OF
TE
CH
NO
LO
GY
on
Janu
ary
19, 2
018
| http
://ar
c.ai
aa.o
rg |
DO
I: 1
0.25
14/1
.B35
696
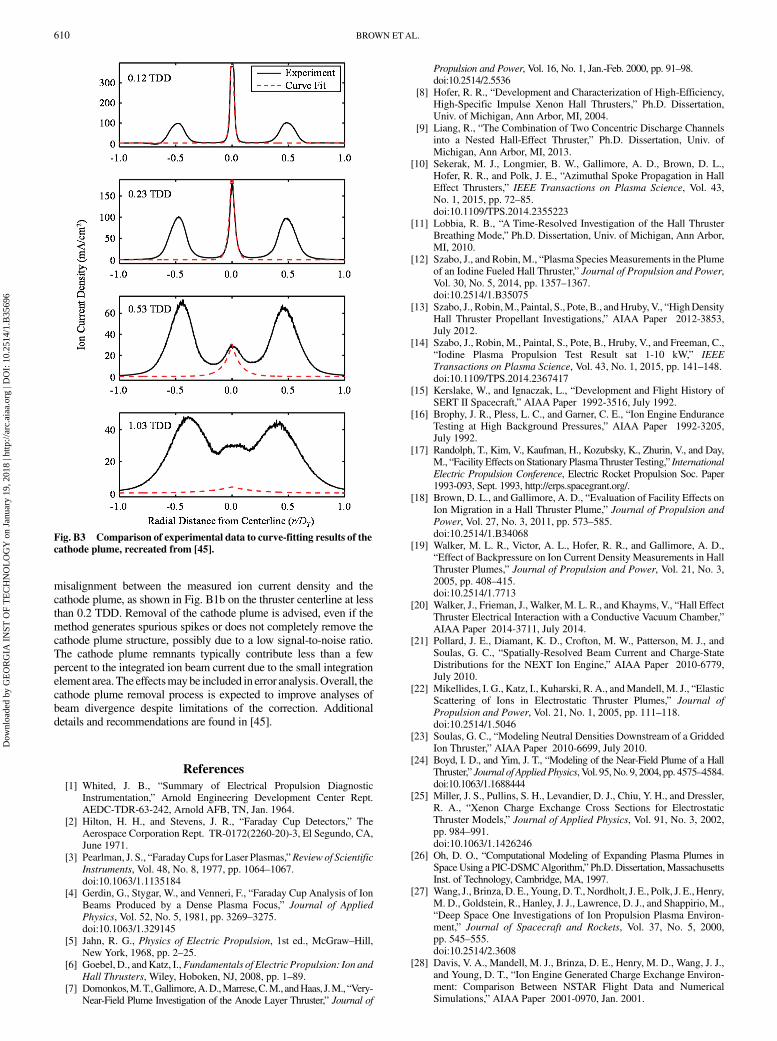
misalignment between the measured ion current density and the
cathode plume, as shown in Fig. B1b on the thruster centerline at less
than 0.2 TDD. Removal of the cathode plume is advised, even if the
method generates spurious spikes or does not completely remove the
cathode plume structure, possibly due to a low signal-to-noise ratio.
The cathode plume remnants typically contribute less than a few
percent to the integrated ion beam current due to the small integration
element area.The effectsmaybe included in error analysis.Overall, the
cathode plume removal process is expected to improve analyses of
beam divergence despite limitations of the correction. Additional
details and recommendations are found in [45].
References
[1] Whited, J. B., “Summary of Electrical Propulsion DiagnosticInstrumentation,” Arnold Engineering Development Center Rept.AEDC-TDR-63-242, Arnold AFB, TN, Jan. 1964.
[2] Hilton, H. H., and Stevens, J. R., “Faraday Cup Detectors,” TheAerospace Corporation Rept. TR-0172(2260-20)-3, El Segundo, CA,June 1971.
[3] Pearlman, J. S., “FaradayCups for Laser Plasmas,”Review of Scientific
Instruments, Vol. 48, No. 8, 1977, pp. 1064–1067.doi:10.1063/1.1135184
[4] Gerdin, G., Stygar, W., and Venneri, F., “Faraday Cup Analysis of IonBeams Produced by a Dense Plasma Focus,” Journal of Applied
Physics, Vol. 52, No. 5, 1981, pp. 3269–3275.doi:10.1063/1.329145
[5] Jahn, R. G., Physics of Electric Propulsion, 1st ed., McGraw–Hill,New York, 1968, pp. 2–25.
[6] Goebel, D., andKatz, I.,Fundamentals of Electric Propulsion: Ion andHall Thrusters, Wiley, Hoboken, NJ, 2008, pp. 1–89.
[7] Domonkos,M.T.,Gallimore,A.D.,Marrese,C.M., andHaas, J.M.,“Very-Near-Field Plume Investigation of the Anode Layer Thruster,” Journal of
Propulsion and Power, Vol. 16, No. 1, Jan.-Feb. 2000, pp. 91–98.doi:10.2514/2.5536
[8] Hofer, R. R., “Development and Characterization of High-Efficiency,High-Specific Impulse Xenon Hall Thrusters,” Ph.D. Dissertation,Univ. of Michigan, Ann Arbor, MI, 2004.
[9] Liang, R., “The Combination of Two Concentric Discharge Channelsinto a Nested Hall-Effect Thruster,” Ph.D. Dissertation, Univ. ofMichigan, Ann Arbor, MI, 2013.
[10] Sekerak, M. J., Longmier, B. W., Gallimore, A. D., Brown, D. L.,Hofer, R. R., and Polk, J. E., “Azimuthal Spoke Propagation in HallEffect Thrusters,” IEEE Transactions on Plasma Science, Vol. 43,No. 1, 2015, pp. 72–85.doi:10.1109/TPS.2014.2355223
[11] Lobbia, R. B., “A Time-Resolved Investigation of the Hall ThrusterBreathing Mode,” Ph.D. Dissertation, Univ. of Michigan, Ann Arbor,MI, 2010.
[12] Szabo, J., and Robin,M., “Plasma SpeciesMeasurements in the Plumeof an Iodine Fueled Hall Thruster,” Journal of Propulsion and Power,Vol. 30, No. 5, 2014, pp. 1357–1367.doi:10.2514/1.B35075
[13] Szabo, J., Robin,M., Paintal, S., Pote, B., andHruby,V., “HighDensityHall Thruster Propellant Investigations,” AIAA Paper 2012-3853,July 2012.
[14] Szabo, J., Robin, M., Paintal, S., Pote, B., Hruby, V., and Freeman, C.,“Iodine Plasma Propulsion Test Result sat 1-10 kW,” IEEE
Transactions on Plasma Science, Vol. 43, No. 1, 2015, pp. 141–148.doi:10.1109/TPS.2014.2367417
[15] Kerslake, W., and Ignaczak, L., “Development and Flight History ofSERT II Spacecraft,” AIAA Paper 1992-3516, July 1992.
[16] Brophy, J. R., Pless, L. C., and Garner, C. E., “Ion Engine EnduranceTesting at High Background Pressures,” AIAA Paper 1992-3205,July 1992.
[17] Randolph, T., Kim, V., Kaufman, H., Kozubsky, K., Zhurin, V., and Day,M., “FacilityEffects on Stationary PlasmaThruster Testing,” InternationalElectric Propulsion Conference, Electric Rocket Propulsion Soc. Paper1993-093, Sept. 1993, http://erps.spacegrant.org/.
[18] Brown, D. L., and Gallimore, A. D., “Evaluation of Facility Effects onIon Migration in a Hall Thruster Plume,” Journal of Propulsion and
Power, Vol. 27, No. 3, 2011, pp. 573–585.doi:10.2514/1.B34068
[19] Walker, M. L. R., Victor, A. L., Hofer, R. R., and Gallimore, A. D.,“Effect of Backpressure on Ion Current Density Measurements in HallThruster Plumes,” Journal of Propulsion and Power, Vol. 21, No. 3,2005, pp. 408–415.doi:10.2514/1.7713
[20] Walker, J., Frieman, J., Walker, M. L. R., and Khayms, V., “Hall EffectThruster Electrical Interaction with a Conductive Vacuum Chamber,”AIAA Paper 2014-3711, July 2014.
[21] Pollard, J. E., Diamant, K. D., Crofton, M. W., Patterson, M. J., andSoulas, G. C., “Spatially-Resolved Beam Current and Charge-StateDistributions for the NEXT Ion Engine,” AIAA Paper 2010-6779,July 2010.
[22] Mikellides, I. G., Katz, I., Kuharski, R. A., andMandell, M. J., “ElasticScattering of Ions in Electrostatic Thruster Plumes,” Journal of
Propulsion and Power, Vol. 21, No. 1, 2005, pp. 111–118.doi:10.2514/1.5046
[23] Soulas, G. C., “Modeling Neutral Densities Downstream of a GriddedIon Thruster,” AIAA Paper 2010-6699, July 2010.
[24] Boyd, I. D., and Yim, J. T., “Modeling of the Near-Field Plume of a HallThruster,” Journal of AppliedPhysics, Vol. 95,No. 9, 2004, pp. 4575–4584.doi:10.1063/1.1688444
[25] Miller, J. S., Pullins, S. H., Levandier, D. J., Chiu, Y. H., and Dressler,R. A., “Xenon Charge Exchange Cross Sections for ElectrostaticThruster Models,” Journal of Applied Physics, Vol. 91, No. 3, 2002,pp. 984–991.doi:10.1063/1.1426246
[26] Oh, D. O., “Computational Modeling of Expanding Plasma Plumes inSpace Using a PIC-DSMCAlgorithm,” Ph.D. Dissertation,MassachusettsInst. of Technology, Cambridge, MA, 1997.
[27] Wang, J., Brinza,D. E., Young,D.T.,Nordholt, J. E., Polk, J. E.,Henry,M. D., Goldstein, R., Hanley, J. J., Lawrence, D. J., and Shappirio, M.,“Deep Space One Investigations of Ion Propulsion Plasma Environ-ment,” Journal of Spacecraft and Rockets, Vol. 37, No. 5, 2000,pp. 545–555.doi:10.2514/2.3608
[28] Davis, V. A., Mandell, M. J., Brinza, D. E., Henry, M. D., Wang, J. J.,and Young, D. T., “Ion Engine Generated Charge Exchange Environ-ment: Comparison Between NSTAR Flight Data and NumericalSimulations,” AIAA Paper 2001-0970, Jan. 2001.
Fig. B3 Comparison of experimental data to curve-fitting results of thecathode plume, recreated from [45].
610 BROWN ETAL.
Dow
nloa
ded
by G
EO
RG
IA I
NST
OF
TE
CH
NO
LO
GY
on
Janu
ary
19, 2
018
| http
://ar
c.ai
aa.o
rg |
DO
I: 1
0.25
14/1
.B35
696
[29] Oh, D. O., “Computational Modeling of Expanding Plasma Plumesin Space Using a PIC-DSMC Algorithm,” Ph.D. Dissertation,Massachusetts Inst. of Technology, Cambridge, MA, 1997.
[30] Byers, D. C., “Angular Distribution of Kaufman Ion Thruster Beams,”NASA TN D-5844, June 1970.
[31] Rovey, J. L., Walker, M. L. R., Gallimore, A. D., and Peterson, P. Y.,“Magnetically Filtered Faraday Probe for Measuring the Ion CurrentDensity Profile of a Hall Thruster,” Review of Scientific Instruments,Vol. 77, No. 1, 2006, Paper 013503.doi:10.1063/1.2149006
[32] Hofer, R. R., Walker, M. L. R., and Gallimore, A. D., “AComparison ofNude and Collimated Faraday Probes for Use with Hall Thrusters,”International Electric Propulsion Conference, Electric RocketPropulsion Soc. Paper 2001-020, Oct. 2001, http://erps.spacegrant.org/.
[33] Boyd, I. D., and Dressler, R. A., “Far-Field Modeling of the PlasmaPlume of a Hall Thruster,” Journal of Applied Physics, Vol. 92, No. 4,2002, pp. 1764–1774.doi:10.1063/1.1492014
[34] Mikellides, I. G., Jongeward, G. A., Katz, I., and Manzella, D. H.,“PlumeModeling of Stationary PlasmaThrusters and Interactionswiththe Express—A Spacecraft,” Journal of Spacecraft and Rockets,Vol. 39, No. 6, 2002, pp. 894–903.doi:10.2514/2.3896
[35] Passaro, A., Vicini, A., Nania, F., and Biagioni, L., “NumericalRebuilding of SMART-1 Hall Effect Thruster Plasma Plume,” Journalof Propulsion and Power, Vol. 26, No. 1, 2010, pp. 149–158.doi:10.2514/1.36821
[36] Mikellides, I. G., Kuharski, R. A., Mandell, M. J., and Gardner, B. M.,“Assessment of Spacecraft Systems Integration Using the ElectricPropulsion Interactions Code (EPIC),” AIAA Paper 2002-3667,July 2002.
[37] Wang, J., Brinza, D., Goldstein, R., Polk, J., Henry, M., Young, D. T.,Hanley, J. J., Nordholt, J., Lawrence, D., and Shappirio, M., “DeepSpace One Investigations of Ion Propulsion Plasma Interactions:Overview and Initial Results,” AIAA Paper 1999-2971, June 1999.
[38] Pollard, J. E., Diamant, K. D., Khayms, V.,Werthman, L., King, D. Q.,and deGrys,K.H., “IonFlux, Energy, andCharge-StateMeasurementsfor the BPT-4000 Hall Thruster,” AIAA Paper 2001-3351, July 2001.
[39] Azziz, Y., Martinez-Sanchez, M., and Szabo, J. J., “Determination ofIn-Orbit Plume Characteristics from Laboratory Measurements,”AIAA Paper 2006-4484, July 2006.
[40] Beyer, W. H., CRC Standard Mathematical Tables, 28th ed., CRCPress, Boca Raton, FL, 1987, pp. 242–245.
[41] Hofer, R. R., and Gallimore, A. D., “Recent Results from Internal andVery-Near-Field Plasma Diagnostics of a High Specific Impulse HallThruster,” International Electric Propulsion Conference, ElectricRocket Propulsion Soc. Paper 2003-037, March 2003, http://erps.spacegrant.org/.
[42] Manzella, D., Jankovsky, R., Elliot, F., Mikellides, I., Jongeward, G.,and Allen, D., “Hall Thruster Plume Measurements On-Board theRussian Express Satellites,” International Electric Propulsion
Conference, Electric Rocket Propulsion Soc. Paper 2001-044,Oct. 2001, http://erps.spacegrant.org/.
[43] Haas, J. M., Gallimore, A. D., McFall, K., and Spanjers, G.,“Development of a High-Speed, Reciprocating Electrostatic ProbeSystem for Hall Thruster Interrogation,” Review of Scientific Instru-
ments, Vol. 71, No. 11, 2000, pp. 4131–4138.doi:10.1063/1.1318921
[44] Reid, B. M., and Gallimore, A. D., “Near-Field Ion Current DensityMeasurements of a 6-kW Hall Thruster,” International Electric
Propulsion Conference, Electric Rocket Propulsion Soc. Paper 2009-124, Sept. 2009, http://erps.spacegrant.org/.
[45] Huang, W., Shastry, R., Herman, D. A., Soulas, G. C., and Kamhawi,H., “A New Method for Analyzing Near-Field Faraday Probe Data inHall Thrusters,” AIAA Paper 2013-4118, July 2013.
[46] Horowitz, P., and Hill, W., The Art of Electronics, 3rd ed., CambridgeUniv. Press, New York, 2015, p. 474.
[47] Yalin, A. P., Williams, J. D., Surla, V., and Zoerb, K. A., “Differ-ential Sputter Yield Profiles of Molybdenum Due to Bombardmentby Low Energy Xenon Ions at Normal and Oblique Incidence,”Journal of Physics D: Applied Physics, Vol. 40, No. 10, 2007,pp. 3194–3202.doi:10.1088/0022-3727/40/10/025
[48] Yalin,A. P., Rubin,B.,Domingue, S.R.,Glueckert, Z., andWilliams, J.D., “Differential Sputter Yields of Boron Nitride, Quartz, and KaptonDue to Low Energy Xe+ Bombardment,” AIAA Paper 2007-5314,July 2007.
[49] Zoerb, K. A., Williams, J. D., Williams, D. D., and Yalin, A. P.,“Differential Sputter Yields of Refractory Metals by Xenon, Krypton,
and Argon Ion Bombardment at Normal and Oblique Incidences,”International Electric Propulsion Conference, Electric RocketPropulsion Soc. Paper 2005-293, Oct. 2005, http://erps.spacegrant.org/.
[50] Tondu, T., Chardon, J., and Zurbach, S., “Sputtering Yield of PotentialCeramics for Hall Effect Thruster Discharge Channel,” InternationalElectric Propulsion Conference, Electric Rocket Propulsion Soc.Paper 2011-106, Sept. 2011, http://erps.spacegrant.org/.
[51] Thomas, T. L., and Battle, E. L., “Effects of Contamination onLangmuir Probe Measurements in Glow Discharge Plasmas,” Journalof Applied Physics, Vol. 41, No. 8, 1970, pp. 3428–3432.doi:10.1063/1.1659435
[52] Szuszczewicz, E. P., and Holmes, J. C., “Surface Contamination ofActive Electrodes in Plasmas: Distortion of Conventional LangmuirProbe Measurements,” Journal of Applied Physics, Vol. 46, No. 12,1975, pp. 5134–5139.doi:10.1063/1.321572
[53] Mikellides, I. G., Katz, I., Hofer, R. R., and Goebel, D. M., “MagneticShielding ofWalls from theUnmagnetized IonBeam in aHall Thruster,”Applied Physics Letters, Vol. 102, No. 2, 2013, Paper 023509.doi:10.1063/1.4776192
[54] Huang, W., Shastry, R., Herman, D. A., Soulas, G. C., and Kamhawi,H., “Ion Current Density Study of the NASA-300M and NASA-457Mv2 Hall Thrusters,” AIAA Paper 2012-3870, July 2012.
[55] Williams, J. D., Johnson, M. L., and Williams, D. D., “DifferentialSputtering Behavior of Pyrolytic Graphite and Carbon-CarbonComposite Under Xenon Bombardment,” AIAA Paper 2004-3788,July 2004.
[56] Chapman, B., Glow Discharge Processes: Sputtering and Plasma
Etching, Wiley, New York, 1980, p. 45.[57] Dankanich, J. W., Walker, M. L. R., Swiatek, M. W., and Yim, J. T.,
“Recommended Practice for PressureMeasurement andCalculation ofEffective Pumping Speed in Electric Propulsion Testing,” Journal ofPropulsion and Power (accepted for publication).
[58] Chen, F. F., “Electric Probes,” Plasma Diagnostic Techniques, editedbyHuddlestone, R.H., and Leonard, S. L., Academic Press, NewYork,1965, pp. 113–200.
[59] Malik, S. M., Fetherston, R. P., Sridharan, K., and Conrad, J. R.,“Sheath Dynamics and Dose Analysis for Planar Targets in PlasmaSource Ion Implantation,” Plasma Sources Science and Technology,Vol. 2, No. 2, 1993, 1993, pp. 81–85.doi:10.1088/0963-0252/2/2/002
[60] Lobbia, R. B., and Beal, B. E., “Recommended Practice for Use ofLangmuir Probes in Electric Propulsion Testing,” Journal of
Propulsion and Power (accepted for publication).[61] Foster, J. E., Soulas, G. C., and Patterson,M. J., “Plume and Discharge
Plasma Measurements of an NSTAR-type Ion Thruster,” AIAA Paper2000-3812, July 2000.
[62] Incropera, F. P., and DeWitt, D. P., Fundamentals of Heat and Mass
Transfer, 5th ed., Wiley, Hoboken, NJ, 2002, p. 691.[63] Dushman, S., “Electron Emission from Metals as a Function of
Temperature,” Physical Review, Vol. 21, No. 6, 1923, pp. 623–636.doi:10.1103/PhysRev.21.623
[64] Swanson, L. W., and Schwind, G. A., “Review of ZrO/W SchottkyCathode,”Handbook of Charged Particle Optics, 2nd ed., CRC Press,Boca Raton, FL, 2009, pp. 5–6.
[65] Lassner, E., and Schubert, W. D., Tungsten: Properties, Chemistry,Technology of the Element, Alloys, andChemical Compounds, KluwerAcademic/Plenum, New York, 1999, pp. 40–42.
[66] Nottingham,W.B., “Thermionic Emission fromTungsten and ThoriatedTungsten Filaments,” Physical Review, Vol. 49, No. 1, 1936, pp. 78–97.doi:10.1103/PhysRev.49.78
[67] Murphy, E. L., and Good, R. H., Jr., “Thermionic Emission, FieldEmission, and the Transition Region,” Physical Review, Vol. 102,No. 6, 1956, pp. 1464–1473.doi:10.1103/PhysRev.102.1464
[68] Nakles,M.R., andHargus,W.A., Jr., “BackgroundPressure Effects onIon Velocity Distribution Within a Medium-Power Hall Thruster,”Journal of Propulsion and Power, Vol. 27, No. 4, 2011, pp. 737–743.doi:10.2514/1.48027
[69] Foster, J. E., Williams, G. J., and Patterson, M. J., “Characterization ofan Ion Thruster Neutralizer,” Journal of Propulsion and Power,Vol. 23, No. 4, 2007, pp. 828–835.doi:10.2514/1.22591
[70] Brown, D. L., “Investigation of Low Discharge Voltage Hall ThrusterCharacteristics and Evaluation of Loss Mechanisms,” Ph.D.Dissertation, Univ. of Michigan, Ann Arbor, MI, 2009.
[71] Brown, D. L., and Gallimore, A. D., “Investigation of Low DischargeVoltage Hall Thruster Operating Modes and Ionization Processes,”
BROWN ETAL. 611
Dow
nloa
ded
by G
EO
RG
IA I
NST
OF
TE
CH
NO
LO
GY
on
Janu
ary
19, 2
018
| http
://ar
c.ai
aa.o
rg |
DO
I: 1
0.25
14/1
.B35
696

International Electric Propulsion Conference, Electric Rocket PropulsionSoc. Paper 2009-074, Sept. 2009, http://erps.spacegrant.org/.
[72] Sekerak, M. J., “Plasma Oscillations and Operational Modes in HallEffect Thrusters,” Ph.D. Dissertation, Univ. of Michigan, Ann Arbor,MI, 2014.
[73] Brown, D. L., Lobbia, R. B., and Blakely, J. M., “Low-Voltage HallThruster Mode Transitions,” AIAA Paper 2014-3510, July 2014.
[74] Polk, J. E., Kakuda, R. Y., Anderson, J. R., and Brophy, J. R.,“Demonstration of the NSTAR Ion Propulsion System on the DeepSpace One Mission,” International Electric Propulsion Conference,Electric Rocket Propulsion Soc. Paper 2001-075, Jan. 2001, http://erps.spacegrant.org/.
[75] Brophy, J. R., Garner, C. E., and Mikes, S., “Dawn Ion PropulsionSystem: Initial Checkout After Launch,” Journal of Propulsion and
Power, Vol. 25, No. 6, 2009, pp. 1189–1202.doi:10.2514/1.40480
[76] Brophy, J. R., Pless, L. C., and Garner, C. E., “Ion Engine EnduranceTesting at High Background Pressures,” AIAA Paper 1992-3205,July 1992.
[77] Brown,D. L., andGallimore,A.D., “Evaluation of IonCollectionAreain Faraday Probes,” Review of Scientific Instruments, Vol. 81, No. 6,2010, Paper 063504.doi:10.1063/1.3449541
[78] Hagstrum, H. D., “Auger Ejection of Electrons from Tungsten byNoble Gas Ions,” Physical Review, Vol. 96, No. 2, 1954, pp. 325–335.doi:10.1103/PhysRev.96.325
[79] Hagstrum, H. D., “Auger Ejection of Electrons from Molybdenumby Noble Gas Ions,” Physical Review, Vol. 104, No. 3, 1956,pp. 672–683.doi:10.1103/PhysRev.104.672
[80] Hagstrum, H. D., “Auger Ejection of Electrons from Tungsten byNoble Gas Ions,”Physical Review, Vol. 104, No. 2, 1956, pp. 317–318.doi:10.1103/PhysRev.104.317
[81] Shastry, R., Hofer, R. R., Reid, B. M., and Gallimore, A. D., “Methodfor Analyzing ExB Probe Spectra from Hall Thruster Plumes,” Reviewof Scientific Instruments, Vol. 80, No. 6, 2009, Paper 063502.doi:10.1063/1.3152218
[82] Reid, B.M., Shastry, R., Gallimore,A.D., andHofer, R.R., “AngularlyResolved ExB Probe Spectra in the Plume of a 6-kW Hall Thruster,”AIAA Paper 2008-5287, July 2008.
[83] Draper, N. D., and Smith, H., “Chapter 1 Fitting a Straight Line byLeast Squares,” Applied Regression Analysis, 3rd ed., Wiley, NewYork, 1998, pp. 15–46.
[84] de Grys, K. H., Tilley, D. L., and Aadland, R. S., “BPT Hall ThrusterPlume Characteristics,” AIAA Paper 1999-2283, June 1999.
[85] Reid,B.M., “The Influence ofNeutralFlowRate in theOperationofHallThrusters,”Ph.D.Dissertation, Univ. ofMichigan,AnnArbor,MI, 2009.
[86] Azziz, Y., “Experimental and Theoretical Characterization of a HallThruster Plume,” Ph.D. Dissertation,Massachusetts Inst. of Technology,Cambridge, MA, 2007.
[87] Mundy, D. H., “Factors Affecting the Beam Divergence of a T5 IonEngine,” International Electric Propulsion Conference, ElectricRocket Propulsion Soc. Paper 1997-095, Oct. 1997, http://erps.spacegrant.org/.
[88] Brown, D. L., Larson, C. W., Beal, B. E., and Gallimore, A. D.,“Methodology and Historical Perspective of a Hall Thruster EfficiencyArchitecture,” Journal of Propulsion and Power, Vol. 25, No. 6, 2009,pp. 1163–1177.doi:10.2514/1.38092
[89] Boyd, I.D., andCrofton,M.W., “NumericalMomentumTracking for aHall Thruster Plume,” AIAA Paper 2014-3428, July 2014.
[90] Kim, S., Foster, J. E., and Gallimore, A. D., “Very-Near-Field PlumeStudy of a 1.35 kW SPT-100,” AIAA Paper 1996-2972, July 1996.
[91] Myers, R.M., Pencil, E. J., Rawlin, V.K., Kussmaul,M., andOden,K.,“NSTAR Ion Thruster Plume Impacts Assessments,” AIAA Paper1995-2825, July 1995.
[92] Soulas, G. C., Foster, J. E., and Patterson, M. J., “Performance ofTitanium Optics on a NASA 30 cm Ion Thruster,” AIAA Paper 2000-3814, July 2000.
[93] Soulas, G. C., Haag, T. W., and Patterson, M. J., “PerformanceEvaluation of 40 cm Ion Optics for the NEXT Ion Engine,” AIAAPaper 2002-3834, July 2002.
[94] Polk, J. E., Kakuda, R.Y., Anderson, J. R., Brophy, J. R., Rawlin, V.K.,Patterson, M. J., Sovey, J., and Hamley, J., “Validation of the NSTARIon Propulsion System on Deep Space One Mission: Overview andInitial Results,” AIAA Paper 1999-2274, June 1999.
[95] Foster, J. E., Soulas, G. C., and Patterson,M. J., “Plume and DischargePlasmaMeasurements of an NSTAR-Type Ion Thruster,”AIAA Paper2000-3812, July 2000.
[96] Reid, B. M., Shastry, R., Gallimore, A. D., and Hofer, R. R.,“Angularly-Resolved ExB Probe Spectra in the Plume of a 6-kW HallThruster,” AIAA Paper 2008-5287, July 2008.
[97] Huang, W., Kamhawi, H., and Haag, T., “Effect of BackgroundPressure on the Performance and Plume of theHiVHAcHall Thruster,”International Electric Propulsion Conference, Electric RocketPropulsion Soc. Paper 2013-058, Oct. 2013, http://erps.spacegrant.org/.
[98] Byers, D., and Dankanich, J. W., “AReview of Facility Effects on HallEffect Thrusters,” International Electric Propulsion Conference,Electric Rocket Propulsion Soc. Paper 2009-076, Sept. 2009, http://erps.spacegrant.org/.
[99] Hofer, R. R., Peterson, P. Y., and Gallimore, A. D., “CharacterizingVacuum Facility Backpressure Effects on the Performance of a HallThruster,” International Electric Propulsion Conference, ElectricRocket Propulsion Soc. Paper 2001-045, Oct. 2001, http://erps.spacegrant.org/.
[100] Nakles, M. R., Brieda, L., Reed, G. D., Hargus, W. A., Jr., andSpicer, R. L., “Experimental and Numerical Examination ofthe BHT-200 Hall Thruster Plume,” AIAA Paper 2007-5305,July 2007.
[101] “Evaluation of Measurement Data—Guide to the Expression ofUncertainty in Measurement,” 1st ed., Joint Committee for Guides inMetrology Rept. JCGM 100:2008, 2008, pp. 1–51, http://www.bipm.org/en/publications/guides/ [retrieved Oct. 2015].
[102] “International Vocabulary ofMetrology—Basic andGeneral Conceptsand Associated Terms,” 3rd ed., Joint Committee for Guides inMetrology Rept. JCGM 200:2008, 2008, pp. 1–34, http://www.bipm.org/en/publications/guides/ [retrieved Oct. 2015].
[103] Farnell, Casey C., Farnell, Cody C., Farnell, S. C., andWilliams, J. D.,“Recommended Practice for Use of Electrostatic Analyzers in ElectricPropulsion Testing,” Journal of Propulsion and Power (accepted forpublication).
[104] Yamamura,Y., “Theory of Sputtering andComparison toExperimentalData,” Nuclear Instruments and Methods in Physics Research,Vol. 194, Nos. 1–3, 1982, pp. 515–522.doi:10.1016/0029-554X(82)90575-4
[105] Boyd, I. D., and Falk, M. L., “A Review of Spacecraft MaterialSputtering By Hall Thruster Plumes,” AIAA Paper 2001-3353,July 2001.
[106] Reid, B.M., and Gallimore, A. D., “Plasma PotentialMeasurements inthe Discharge Channel of a 6-kW Hall Thruster,” AIAA Paper 2008-5185, July 2008.
[107] Dunaevsky, A., Raitses, Y., and Fisch, N. J., “Secondary ElectronEmission from Dielectric Materials of a Hall Thruster with SegmentedElectrodes,” Physics of Plasmas, Vol. 10, No. 6, 2003, pp. 2574–2577.doi:10.1063/1.1568344
[108] “COMBAT®Boron Nitride Solids,” Saint-Gobain CeramicMaterials,Product Datasheet, SGBN-Combat Solids-DS1-0214-R03, Amherst,NY, 2011, http://www.bn.saint-gobain.com/uploadedFiles/SGbn/Documents/Solids/Combat-Solids-DS1.pdf, [retrieved Oct. 2015].
[109] “Boron Nitride XP Grade Material Properties,” Accuratus CeramicCorp., Produce Datasheet, Phillipsburg, NJ, http://accuratus.com/pdf/BNXPprops.pdf [retrieved Oct. 2015].
[110] Hussey, R. J., and Wilson, J., Advanced Technical Ceramics
Directory and Databook, 1st ed., Chapman and Hall, NewYork, 1998,pp. 106–109.doi:10.1007/978-1-4419-8662-7
[111] “MACOR® Machinable Glass Ceramic for Industrial Applications,”Corning, Inc., Avon, France, http://www.corning.com/media/worldwide/csm/documents/71759a443535431395eb34ebead091cb.pdf [retrievedOct. 2015].
[112] Tartz, M., Heyn, T., Bundesmann, C., and Neumann, H., “MeasuringSputter Yields of Ceramic Materials,” International Electric
Propulsion Conference, Electric Rocket Propulsion Soc. Paper2009-240, Sept. 2009, http://erps.spacegrant.org/.
[113] Hofer, R. R., and Gallimore, A. D., “Recent Results from Internal andVery-Near-Field Plasma Diagnostics of a High Specific Impulse HallThruster,” International Electric Propulsion Conference, ElectricRocket Propulsion Soc. Paper 2003-037, March 2003, http://erps.spacegrant.org/.
[114] Haas, J. M., Gallimore, A. D., McFall, K., and Spanjers, G.,“Development of a High-Speed, Reciprocating Electrostatic ProbeSystem for Hall Thruster Interrogation,” Review of Scientific Instru-
ments, Vol. 71, No. 11, 2000, pp. 4131–4138.doi:10.1063/1.1318921
[115] Ziemer, J. K., “Performance of Electrospray Thrusters,” InternationalElectric Propulsion Conference, Electric Rocket Propulsion Soc.Paper 2009-242, Sept. 2009, http://erps.spacegrant.org/.
612 BROWN ETAL.
Dow
nloa
ded
by G
EO
RG
IA I
NST
OF
TE
CH
NO
LO
GY
on
Janu
ary
19, 2
018
| http
://ar
c.ai
aa.o
rg |
DO
I: 1
0.25
14/1
.B35
696

[116] Martinez-Sanchez, M., Fernandez de la Mora, J., Hruby, V., Gamero-Castaño, M., and Khayms, V., “Research on Colloid Thrusters,”International Electric Propulsion Conference, Electric Rocket PropulsionSoc. Paper 1999-014, Oct. 1999, http://erps.spacegrant.org/.
[117] Demmons, N., Hruby, V., Spence, D., Roy, T., Ehrbar, E., Zwahlen, J.,and Martin, R., “ST7-DRS Mission Colloid Thruster Development,”AIAA Paper 2008-4823, July 2008.
[118] Wilbur, P. J., Jahn, R. G., and Curran, F. C., “Space Electric PropulsionPlasmas,” IEEE Transactions on Plasma Science, Vol. 19, No. 6, 1991,pp. 1167–1179.doi:10.1109/27.125039
[119] Pugmire, T. K., Shaw, R., and Enos, G. R., “Applied ResistojetTechnology,” Journal of Spacecraft and Rockets, Vol. 8, No. 1, 1971,pp. 63–68.doi:10.2514/3.30218
[120] Tiliakos, N. T., Burton, R. L., and Krier, H., “Arcjet Anode PlasmaMeasurements Using Electrostatic Probes,” Journal of Propulsion andPower, Vol. 14, No. 4, 1998, pp. 560–567.doi:10.2514/2.5315
[121] Gallimore, A. D., Kim, S., Foster, J. E., King, L. B., and Gulczinski, F.S., “Near- and Far-Field Plume Studies of a One-Kilowatt Arcjet,”Journal of Propulsion and Power, Vol. 12, No. 1, 1996, pp. 105–111.doi:10.2514/3.23997
[122] Bufton, S. A., and Burton, R. L., “Velocity and TemperatureMeasurements in a Low-Power Hydrazine Arcjet,” Journal of Propul-sion and Power, Vol. 13, No. 6, 1997, pp. 768–774.doi:10.2514/2.5231
[123] Crofton, M. W., Moore, T. A., Boyd, I. D., Masuda, I., and Gotoh, Y.,“Near-Field Measurement and Modeling Results for Flight-TypeArcjet: NH Molecule,” Journal of Spacecraft and Rockets, Vol. 38,No. 1, 2001, pp. 79–86.doi:10.2514/2.3657
[124] Crofton, M. W., Moore, T. A., Boyd, I. D., Masuda, I., and Gotoh, Y.,“Near-Field Measurement and Modeling Results for Flight-TypeArcjet: Hydrogen Atom,” Journal of Spacecraft and Rockets, Vol. 38,No. 3, 2001, pp. 417–425.doi:10.2514/2.3700
[125] Butler, G. W., and Cassady, R. J., “Directions for Arcjet TechnologyDevelopment,” Journal of Propulsion andPower, Vol. 12,No. 6, 1996,
pp. 1026–1034.doi:10.2514/3.24140
[126] Carney, L. M., and Sankovic, J. M., “The Effects of Arcjet ThrusterOperating Conditions and Constrictor Geometry on the PlasmaPlume,” AIAA Paper 1989-2723, July 1989.
[127] Lau, M., Manna, S., Herdrich, G., Schonherr, T., and Komurasaki, K.,“Experimental Investigation of the Current Density in theDischarge Plasma of ADD SIMP-LEX,” AIAA Paper 2012-4275,July 2012.
[128] Myers, R. M., Arrington, L. A., Pencil, E. J., Carter, J., Heminger, J.,and Gatsonis, N., “Pulsed Plasma Thruster Contamination,” AIAAPaper 1996-2729, July 1996.
[129] Myers, R. M., “Plume Characteristics of MPD Thrusters: APreliminary Investigation,” AIAA Paper 1989-2832, July 1989.
[130] Sankaran, K., Choueiri, E. Y., and Jardin, S. C., “Comparison ofSimulated Magnetoplasmadynamic Thruster Flowfields to Exper-imental Measurements,” Journal of Propulsion and Power, Vol. 21,No. 1, 2005, pp. 129–138.doi:10.2514/1.5340
[131] Eckman, R., Byrne, L., Gatsonis, N. A., and Pencil, E. J., “TripleLangmuir Probe Measurements in the Plume of a Pulsed PlasmaThruster,” Journal of Propulsion and Power, Vol. 17, No. 4, 2001,pp. 762–771.doi:10.2514/2.5831
[132] Kodys, A. D., and Choueiri, E. Y., “A Critical Review of the State-of-the-Art in the Performance of Applied-Field MagnetoplasmadynamicThrusters,” AIAA Paper 2005-4247, July 2005.
[133] Krulle, G., Auweter-Kurtz, M., and Sasoh, A., “Technology andApplication Aspects of Applied Field MagnetoplasmadynamicPropulsion,” Journal of Propulsion and Power, Vol. 14, No. 5, 2005,pp. 754–763.doi:10.2514/2.5338
[134] Sovie, R. J., and Connolly, D. J., “Effects of Backgrounds Pressure onMagnetoplasmadynamic Thruster Operation,” Journal of Spacecraft
and Rockets, Vol. 7, No. 3, 1970, pp. 255–258.doi:10.2514/3.29916
J. BlandinoAssociate Editor
BROWN ETAL. 613
Dow
nloa
ded
by G
EO
RG
IA I
NST
OF
TE
CH
NO
LO
GY
on
Janu
ary
19, 2
018
| http
://ar
c.ai
aa.o
rg |
DO
I: 1
0.25
14/1
.B35
696