Reappraisal of the Anatomical Landmarks of Motor and Premotor Cortical Regions for Image-Guided...
13
Reappraisal of the Anatomical Landmarks of Motor and Premotor Cortical Regions for Image-Guided Brain Navigation in TMS Practice Rechdi Ahdab, 1,2,3 Samar S. Ayache, 1,2 Wassim H. Farhat, 1,2 Veit Mylius, 1,4 Sein Schmidt, 5 Pierre Brugie ` res, 6 and Jean-Pascal Lefaucheur 1,2 * 1 EA 4391, Excitabilit e Nerveuse et Th erapeutique, Universit e Paris-Est-Cr eteil, Cr eteil, France 2 Service de Physiologie–Explorations Fonctionnelles, H^ opital Henri Mondor, Assistance Publique–H^ opitaux de Paris, Cr eteil, France 3 Neuroscience Department, University Medical Center Rizk Hospital, Beirut, Lebanon 4 Department of Neurology, Philipps University Marburg, Germany 5 Department of Neurology, Charit e Campus, Berlin, Germany 6 Service de Neuroradiologie, H^ opital Henri Mondor, Assistance Publique–H^ opitaux de Paris, Cr eteil, France r r Abstract: Image-guided navigation systems dedicated to transcranial magnetic stimulation (TMS) have been recently developed and offer the possibility to visualize directly the anatomical structure to be stimulated. Performing navigated TMS requires a perfect knowledge of cortical anatomy, which is very variable between subjects. This study aimed at providing a detailed description of sulcal and gyral anatomy of motor cortical regions with special interest to the inter-individual variability of sulci. We attempted to identify the most stable structures, which can serve as anatomical landmarks for motor cortex mapping in navigated TMS practice. We analyzed the 3D reconstruction of 50 consecutive healthy adult brains (100 hemispheres). Different variants were identified regarding sulcal morphol- ogy, but several anatomical structures were found to be remarkably stable (four on dorsoventral axis and five on rostrocaudal axis). These landmarks were used to define a grid of 12 squares, which cov- ered motor cortical regions. This grid was used to perform motor cortical mapping with navigated TMS in 12 healthy subjects from our cohort. The stereotactic coordinates (x-y-z) of the center of each of the 12 squares of the mapping grid were expressed into the standard Talairach space to determine the corresponding functional areas. We found that the regions whose stimulation produced almost con- stantly motor evoked potentials mainly correspond to the primary motor cortex, with rostral extension to premotor cortex and caudal extension to posterior parietal cortex. Our anatomy-based approach should facilitate the expression and the comparison of the results obtained in motor mapping studies using navigated TMS. Hum Brain Mapp 35:2435–2447, 2014. V C 2013 Wiley Periodicals, Inc. Key words: motor cortex; premotor cortex; sulcal anatomy; transcranial magnetic stimulation r r *Correspondence to: J.P. Lefaucheur, Service de Physiologie– Explorations Fonctionnelles, H^ opital Henri Mondor, 51 avenue de Lattre de Tassigny, 94010 Cr eteil, France. E-mail: [email protected] Received for publication 18 February 2013; Revised 14 April 2013; Accepted 20 May 2013. DOI: 10.1002/hbm.22339 Published online 3 September 2013 in Wiley Online Library (wileyonlinelibrary.com). r Human Brain Mapping 35:2435–2447 (2014) r V C 2013 Wiley Periodicals, Inc.
Transcript of Reappraisal of the Anatomical Landmarks of Motor and Premotor Cortical Regions for Image-Guided...

Reappraisal of the Anatomical Landmarksof Motor and Premotor Cortical Regions for
Image-Guided Brain Navigation in TMS Practice
Rechdi Ahdab,1,2,3 Samar S. Ayache,1,2 Wassim H. Farhat,1,2 Veit Mylius,1,4
Sein Schmidt,5 Pierre Brugieres,6 and Jean-Pascal Lefaucheur1,2*
1EA 4391, Excitabilit�e Nerveuse et Th�erapeutique, Universit�e Paris-Est-Cr�eteil, Cr�eteil, France2Service de Physiologie–Explorations Fonctionnelles, Hopital Henri Mondor, Assistance
Publique–Hopitaux de Paris, Cr�eteil, France3Neuroscience Department, University Medical Center Rizk Hospital, Beirut, Lebanon
4Department of Neurology, Philipps University Marburg, Germany5Department of Neurology, Charit�e Campus, Berlin, Germany
6Service de Neuroradiologie, Hopital Henri Mondor, Assistance Publique–Hopitaux de Paris,Cr�eteil, France
r r
Abstract: Image-guided navigation systems dedicated to transcranial magnetic stimulation (TMS) havebeen recently developed and offer the possibility to visualize directly the anatomical structure to bestimulated. Performing navigated TMS requires a perfect knowledge of cortical anatomy, which is veryvariable between subjects. This study aimed at providing a detailed description of sulcal and gyralanatomy of motor cortical regions with special interest to the inter-individual variability of sulci. Weattempted to identify the most stable structures, which can serve as anatomical landmarks for motorcortex mapping in navigated TMS practice. We analyzed the 3D reconstruction of 50 consecutivehealthy adult brains (100 hemispheres). Different variants were identified regarding sulcal morphol-ogy, but several anatomical structures were found to be remarkably stable (four on dorsoventral axisand five on rostrocaudal axis). These landmarks were used to define a grid of 12 squares, which cov-ered motor cortical regions. This grid was used to perform motor cortical mapping with navigatedTMS in 12 healthy subjects from our cohort. The stereotactic coordinates (x-y-z) of the center of each ofthe 12 squares of the mapping grid were expressed into the standard Talairach space to determine thecorresponding functional areas. We found that the regions whose stimulation produced almost con-stantly motor evoked potentials mainly correspond to the primary motor cortex, with rostral extensionto premotor cortex and caudal extension to posterior parietal cortex. Our anatomy-based approachshould facilitate the expression and the comparison of the results obtained in motor mapping studiesusing navigated TMS. Hum Brain Mapp 35:2435–2447, 2014. VC 2013 Wiley Periodicals, Inc.
Key words: motor cortex; premotor cortex; sulcal anatomy; transcranial magnetic stimulation
r r
*Correspondence to: J.P. Lefaucheur, Service de Physiologie–Explorations Fonctionnelles, Hopital Henri Mondor, 51 avenue deLattre de Tassigny, 94010 Cr�eteil, France.E-mail: [email protected]
Received for publication 18 February 2013; Revised 14 April 2013;Accepted 20 May 2013.
DOI: 10.1002/hbm.22339Published online 3 September 2013 in Wiley Online Library(wileyonlinelibrary.com).
r Human Brain Mapping 35:2435–2447 (2014) r
VC 2013 Wiley Periodicals, Inc.

INTRODUCTION
Transcranial magnetic stimulation (TMS) is a neurophys-iological technique that offers the possibility to study vari-ous neural functions and to map their corticalrepresentation. The accuracy of TMS mapping is thoughtto be improved by the use of recently developed naviga-tion systems that integrate cerebral imaging data, magneticresonance imaging (MRI), or positron emission tomogra-phy [Lefaucheur, 2010]. However, to perform navigatedTMS requires a perfect knowledge of the anatomical land-marks of the cortical surface and the location of some ofthese landmarks may be highly variable from one brain toanother. In this work, we studied the anatomy of themotor and premotor cortical regions in a series of normalbrain MRIs and we sought to identify the most stablestructures, which could serve as anatomical landmarks formapping motor cortical regions in navigated TMS practice.
SUBJECTS AND METHODS
Anatomical Study of Motor Cortical
Regions on Normal Brain MRIs
For this study, we analyzed 50 healthy adult brains (100hemispheres) from 15 women and 35 men, aged from 23 to88 years (mean 45 years). These brains were extracted fromour navigated TMS database and the study was approvedby the local IRB. Three-dimensional (3D) brain reconstruc-tions were generated with a TMS-dedicated navigation sys-tem (eXimia NBS, Nexstim Oy, Helsinki, Finland) byloading 160 1 mm-thick T1-weighted native MRI slicesacquired with the following parameters: TR 5 2250.00 ms,TE 5 2.60 ms, TI: 900 ms, FOV: 240.000, Flip Angle 5 9�,240 3 256 matrix, voxel size 1.0 3 1.0 3 1.0 mm.
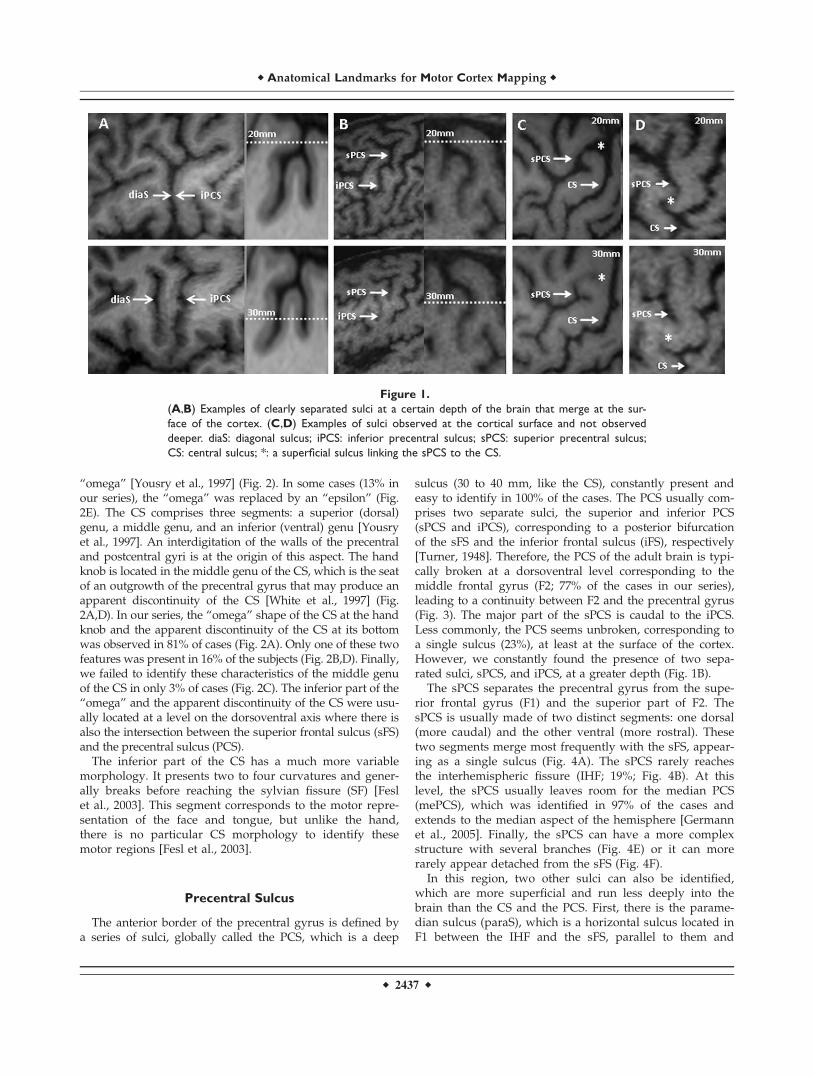
Analysis of the morphology of the sulci and identificationof the anatomical variants were performed on 3D brainreconstructions viewed at a peeling depth ranging from 2 to3 cm. Working at this depth offers various advantages. First,some important sulci are merged at the surface and can beindividualized only at a certain depth [Chiavaras and Pet-rides, 2000; Ono et al., 1990] (Fig. 1A,B). Conversely, somesuperficial secondary sulci, which are too variable to beretained as anatomical landmarks, are superficial and disap-pear in depth (Fig. 1C,D). Instead of proposing a detailedanatomical description of the cortical surface, we sought toidentify the most stable structures that might serve as ana-tomical landmarks in motor mapping using navigated TMS.Consequently, our description of the gyri and sulci mayseem quite different from what anatomists usually report.
Motor Evoked Potentials
and Stereotactic Normalization
From the anatomical study, we determined the existence ofstable landmarks in the motor cortical region, from which a
grid was drawn. This grid was used to perform TMS map-ping in a standardized way. To illustrate the value of thisapproach, motor cortical mapping was performed in 12healthy subjects from our cohort, 5 women and 7 men, aged24–45 years (mean 28 years). TMS was delivered using a fig-ure-8 coil type B65 connected to a MagOption 3100 stimula-tor [MagVenture (Mag2Health), Farum, Denmark]. Thestimulation coil was positioned tangentially to the scalp andoriented perpendicular to the central sulcus (CS). Electro-myographic recordings were made using self-adhesive sur-face electrodes placed over the first dorsal interosseus muscleof the right hand (left hemisphere stimulation). Motor evokedpotentials (MEPs) were filtered, amplified and stored foranalysis using a device (ME6000, Mega Electronics Inc., Kuo-pio, Finland) dedicated to MEP recording and coupled withthe navigation system. The stimulation intensity was set at120% of rest motor threshold, which was determined accord-ing to usual method [Rossini et al., 1994].
The TMS mapping grid we created consisted of 12 squares.The 3D-space anatomical coordinates (x-y-z) of the center ofeach of these 12 squares were recorded. The Eximia NBS sys-tem provides anatomical coordinates in the so-called “MRIcoordinate” system, based on a bounding box for the brain of200 3 250 3 250 mm with an origin (0, 0, 0) located at the rightinferior-posterior edge of the box. The x-axis is oriented fromthe right (0) to the left ear. The y-axis is oriented from the neck(0) to the top of the head. The z-axis is oriented from inion (0)to nasion. Then, brain coordinates were transformed from the“MRI coordinate system” into the space defined by the ICBMNIH, P-20 project space that approximates the space definedby the Talairach and Tournoux atlas [Talairach and Tournoux,1988]. A 12-parameter affine transformation of the individualcoordinates was estimated through the spatial normalizationof each MRI sequence within a Bayesian framework using dis-crete cosine transform basis functions as implemented in thesoftware package SPM8 [Ashburner and Friston, 1999]. In theTalairach space system, the x coordinates are defined on theright=left (1=2) axis, the y coordinates on the rostral=caudal(1=2) axis, and the z coordinates on the dorsal=ventral(1=2) axis, with the anterior commissure serving as the refer-ence point (x 5 y 5 z 5 0) [Talairach and Tournoux, 1988].According to the Talairach and Tournoux atlas, we deter-mined the anatomical correspondence of each square of ourmapping grid in terms of Brodmann area (BA).
RESULTS
Central Sulcus
The CS represents the anatomical limit between the frontallobe and the parietal lobe. Its anterior margin is occupied bythe primary motor cortex (M1). This structure, remarkably sta-ble, was identified in 100% of the brains we studied. Its depthranged from 34 to 44 mm (mean 6 SD: 37.8 6 2.7). Within theCS, the representation of the hand, called the “hand knob,”presents a very specific morphology, like an inverted
r Ahdab et al. r
r 2436 r
“omega” [Yousry et al., 1997] (Fig. 2). In some cases (13% inour series), the “omega” was replaced by an “epsilon” (Fig.2E). The CS comprises three segments: a superior (dorsal)genu, a middle genu, and an inferior (ventral) genu [Yousryet al., 1997]. An interdigitation of the walls of the precentraland postcentral gyri is at the origin of this aspect. The handknob is located in the middle genu of the CS, which is the seatof an outgrowth of the precentral gyrus that may produce anapparent discontinuity of the CS [White et al., 1997] (Fig.2A,D). In our series, the “omega” shape of the CS at the handknob and the apparent discontinuity of the CS at its bottomwas observed in 81% of cases (Fig. 2A). Only one of these twofeatures was present in 16% of the subjects (Fig. 2B,D). Finally,we failed to identify these characteristics of the middle genuof the CS in only 3% of cases (Fig. 2C). The inferior part of the“omega” and the apparent discontinuity of the CS were usu-ally located at a level on the dorsoventral axis where there isalso the intersection between the superior frontal sulcus (sFS)and the precentral sulcus (PCS).
The inferior part of the CS has a much more variablemorphology. It presents two to four curvatures and gener-ally breaks before reaching the sylvian fissure (SF) [Feslet al., 2003]. This segment corresponds to the motor repre-sentation of the face and tongue, but unlike the hand,there is no particular CS morphology to identify thesemotor regions [Fesl et al., 2003].
Precentral Sulcus
The anterior border of the precentral gyrus is defined bya series of sulci, globally called the PCS, which is a deep
sulcus (30 to 40 mm, like the CS), constantly present andeasy to identify in 100% of the cases. The PCS usually com-prises two separate sulci, the superior and inferior PCS(sPCS and iPCS), corresponding to a posterior bifurcationof the sFS and the inferior frontal sulcus (iFS), respectively[Turner, 1948]. Therefore, the PCS of the adult brain is typi-cally broken at a dorsoventral level corresponding to themiddle frontal gyrus (F2; 77% of the cases in our series),leading to a continuity between F2 and the precentral gyrus(Fig. 3). The major part of the sPCS is caudal to the iPCS.Less commonly, the PCS seems unbroken, corresponding toa single sulcus (23%), at least at the surface of the cortex.However, we constantly found the presence of two sepa-rated sulci, sPCS, and iPCS, at a greater depth (Fig. 1B).
The sPCS separates the precentral gyrus from the supe-rior frontal gyrus (F1) and the superior part of F2. ThesPCS is usually made of two distinct segments: one dorsal(more caudal) and the other ventral (more rostral). Thesetwo segments merge most frequently with the sFS, appear-ing as a single sulcus (Fig. 4A). The sPCS rarely reachesthe interhemispheric fissure (IHF; 19%; Fig. 4B). At thislevel, the sPCS usually leaves room for the median PCS(mePCS), which was identified in 97% of the cases andextends to the median aspect of the hemisphere [Germannet al., 2005]. Finally, the sPCS can have a more complexstructure with several branches (Fig. 4E) or it can morerarely appear detached from the sFS (Fig. 4F).
In this region, two other sulci can also be identified,which are more superficial and run less deeply into thebrain than the CS and the PCS. First, there is the parame-dian sulcus (paraS), which is a horizontal sulcus located inF1 between the IHF and the sFS, parallel to them and
Figure 1.
(A,B) Examples of clearly separated sulci at a certain depth of the brain that merge at the sur-
face of the cortex. (C,D) Examples of sulci observed at the cortical surface and not observed
deeper. diaS: diagonal sulcus; iPCS: inferior precentral sulcus; sPCS: superior precentral sulcus;
CS: central sulcus; *: a superficial sulcus linking the sPCS to the CS.
r Anatomical Landmarks for Motor Cortex Mapping r
r 2437 r

present in 91% of the cases (Fig. 3). Second, there is themarginal PCS (maPCS), which is a vertical sulcus locatedin the precentral gyrus between the sPCS and the CS, par-allel to them and present in 61% of the cases (Fig. 3).
The iPCS separates the precentral gyrus from the infe-rior part of F2 and the inferior frontal gyrus (F3). It com-prises three segments: one dorsal and one ventral, more orless vertical, and one horizontal. These three segmentswere merged into a single structure in 75% of the cases.The dorsal segment of the iPCS is fairly long and mean-ders over a variable distance in F2, most frequently rostralto the ventral segment of the sPCS but caudal to the ven-tral segment of the iPCS. The horizontal segment of theiPCS (hiPCS) extends over a variable distance rostrally inF2 and therefore may be mistaken for the iFS. We wereable to clearly distinguish between these two sulci in 72%of the cases, the hiPCS being more dorsal and caudal thanthe iFS (Fig. 5A,B). In the other cases, these sulci appearedto be continuous (Fig. 5C).
The correct identification of the dorsal and horizontalbranches of the iPCS may be difficult due to the presenceof a middle frontal sulcus, between the sFS and the iFS, inthe posterior part of F2. In contrast, the ventral branch ofthe iPCS has a perfectly constant linear morphology. Itscourse is roughly parallel to the CS and ends at a variabledistance of the SF. In some cases, it merges inferiorly withthe diagonal sulcus (diaS; Fig. 1A).
Inferior (IFS) and Superior (SFS) Frontal Sulci
Only the caudal parts of the frontal sulci were analyzedin this study, since these sulci extend rostrally far beyond
the motor areas. The sFS has a course parallel to the IHF.Caudally, it merges into the sPCS forming a T-shapedbranching in 77% of the cases (Fig. 4D). Less commonly, itcrosses the sPCS and briefly continues posterior to it (15%;Fig. 4E), or it breaks prematurely without reaching thesPCS (8%; Fig. 4F). Although this sulcus is generally con-tinuous, it can be broken in its middle or caudal segment(33%).
Figure 2.
Morphology of the CS at the level of hand representation, usually characterized by an inverted “omega”
aspect (A,B). In some cases, an interruption of the CS can be observed at a depth of 30 mm (A,D). In
other cases, the “omega” aspect is absent (C,D) or replaced by an “epsilon” aspect (E).
Figure 3.
Break of the PCS between its superior (sPCS) and inferior
(iPCS) segments (*). paraS: paramedian sulcus; mePCS: median
precentral sulcus; maPCS: marginal precentral sulcus; F1: supe-
rior frontal gyrus; F2: middle frontal gyrus; sFS: superior frontal
sulcus; iFS: inferior frontal sulcus; CS: central sulcus.
r Ahdab et al. r
r 2438 r

The iFS has a course almost parallel to the SF. Caudally,it merges into the iPCS (Fig. 5B,C) or breaks prematurelywithout reaching it (Fig. 5A). There is sometimes one ortwo brief breaks in the iFS (22%), complicating itsidentification.
Ventral to the iFS and rostral to the iPCS, the posteriorpart of F3 presents a particular segmentation, defined bythe ascending and horizontal branches of the SF (aSF and
hSF), which subdivide this cortical region into three parts:pars orbitalis (POr), pars triangularis (PTr), and pars oper-cularis (POp) of F3 (from anterior to posterior; Fig. 6). ThePOp (between the aSF and the iPCS) is sometimes dividedinto two parts by a vertical sulcus, the diaS. The PTr(between the hSF and the aSF) may also be divided by avertical sulcus, the triangular sulcus. The POr is locatedrostrally to the hSF and is limited anteriorly by the orbital
Figure 4.
The morphological variants of the superior precentral sulcus (sPCS), especially regarding its dor-
sal and ventral branches (A–C) and its relationship with the superior frontal sulcus (sFS) (D–F).
mePCS: median precentral sulcus.
r Anatomical Landmarks for Motor Cortex Mapping r
r 2439 r

sulcus. The functional importance of this region lies in thefact that it corresponds to the language center (Broca’sarea) in the dominant hemisphere.
Stable Anatomical Landmarks
Thus, the gyri and sulci in the motor cortical region arefar from being constant between individuals. We wereeven able to observe a certain degree of interhemisphericasymmetry in these structures in more than 90% of thesubjects. However, we found that some sulcus segmentsshowed a remarkable stable morphology. For example, theCS with its “omega” shape was remarkably constant at thelevel of the hand knob, unlike other segments of the CS.The ventral segments of the sPCS and iPCS also showed avery stable morphology: they were almost linear, with acourse parallel to the CS and no ramifications (at least atthe depth at which this work was done). Thus, we wereable to define four stable and easily identifiable corticallandmarks on the dorsoventral axis and five on the rostro-caudal axis (Fig. 7).
On the dorsoventral axis, the most dorsal of the four sta-ble landmarks was the paraS, which is a horizontal sulcuslocated halfway between the IHF and the sFS. This sulcuswas identified in 91% of the cases. The second landmarkwas the intersection between the sPCS and the sFS (or itscaudal prolongation). This region was identified in 100%of the cases. The third landmark was the bottom of the
median genu of the hand knob (“omega”) of the CS or theapparent break of this latter (identifiable in 97% of thecases). Finally, the most ventral stable landmarks was theintersection between the iPCS and the iFS (or its caudalprolongation), present in 100% of the cases.
Similarly, five stable landmarks were defined on the rostro-caudal axis. These landmarks were from front to back: (i) theaSF; (ii) the intersection between the iPCS and the iFS (or itscaudal prolongation); (iii) the intersection between the sPCSand the sFS (or its caudal prolongation); (iv) the bottom ofthe hand knob (“omega”) of the CS (or its apparent break);and (v) the postcentral sulcus (poCS) at a dorsoventral levelcorresponding to the bottom of the motor hand knob.
Probabilistic Map of the Motor Cortical Region
Using the anatomical landmarks as described above, wewere able to draw a grid covering the motor corticalregion in each individual (Fig. 7). The purpose of this gridwas to help perform TMS mapping in a more standar-dized manner. We then studied the ability to produceMEPs by delivering navigated TMS pulses at 120% of restmotor threshold in each square of the cortical grid. Thepercentage of patients in whom MEPs could be obtainedin a contralateral hand muscle at the stimulation of a givensquare was calculated (Fig. 8). Depending on the square,MEPs were obtained in 16–100% of subjects. Finally, wecollected the stereotactic coordinates (x, y, and z) of the
Figure 5.
Relationship between the posterior segment of the inferior frontal sulcus (iFS) and the horizontal
branch of the inferior precentral sulcus (hiPCS).
r Ahdab et al. r
r 2440 r

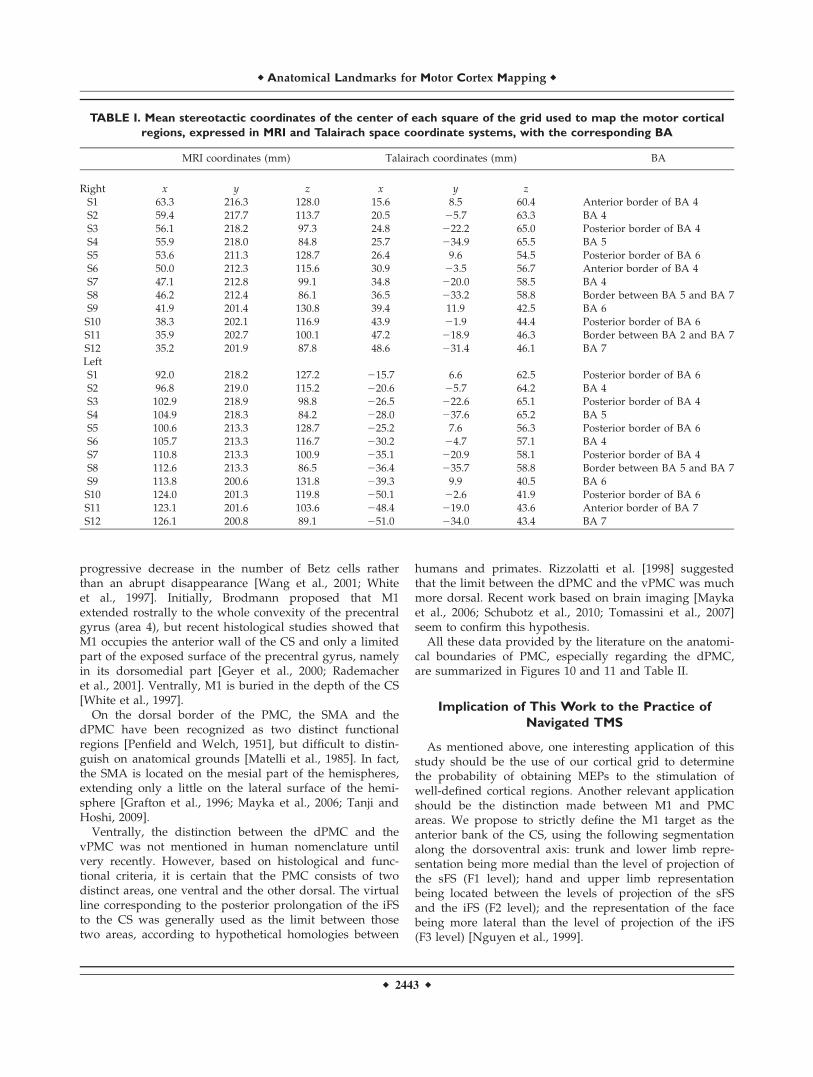
center of each square of the grid in the “MRI coordinate”system provided by the navigation system. Then we trans-ferred these coordinates into the “Talairach atlas” systemto determine their anatomical correspondence in terms ofBA. The mean x-y-z values of the center of each square ofthe grid in both coordinate systems and the correspondingBAs are presented in Table I. These results were rathersymmetrical. The squares providing the highest percen-tages of hand MEPs were centered on M1=BA 4 (S6–S7),the premotor cortex (PMC)=BA 6 (S10), or the posteriorparietal cortex=BA 7 (S11). Although centered on M1, theexcitable motor cortical region included large areas of thePMC and portions of the postcentral gyrus.
DISCUSSION
This study highlights the variability of sulcus anatomy inthe motor cortical region, except for a few very stable land-marks. The identification of these landmarks (four on thedorsoventral axis and five on the rostrocaudal axis) in indi-vidual brains offers the possibility to draw an individual-ized anatomical grid dividing the cortical surface intosquares corresponding to well-defined regions. This seg-mentation is of great help to overcome the inter-individualvariability of brain sulci and to standardize motor corticalmapping with navigated TMS. Indeed, the ability to pro-duce MEPs in response to the stimulation of each of these
Figure 7.
Segmentation of the motor cortex based on stable anatomical
landmarks observed at the cortical surface. paraS: paramedian sul-
cus; I1: intersection between the superior frontal sulcus (sFS) and
the superior precentral sulcus (sPCS); hkCS: hand knob of the CS;
I2: intersection between the inferior frontal sulcus (iFS) and the
inferior precentral sulcus (iPCS); aSF: ascending branch of the syl-
vian fissure; PoCS: postcentral sulcus. [Color figure can be viewed
in the online issue, which is available at wileyonlinelibrary.com.]
Figure 6.
Organization of the posterior part of the inferior frontal gyrus,
including the pars orbitalis (Por), pars triangularis (PTr), and pars
opercularis (Pop) separated by the horizontal (hSF) and ascending
(aSF) branches of the SF. iFS: inferior frontal sulcus; iPCS: inferior
precentral sulcus; CS: central sulcus; PoCS: postcentral sulcus.
r Anatomical Landmarks for Motor Cortex Mapping r
r 2441 r

regions can be determined at individual level, and then, fora group of subjects, the probability of producing MEPs tothe stimulation of a given region can be calculated. Thisprocedure can help study parallel groups or follow a cohortlongitudinally by comparing the probability of producingMEPs to the stimulation of each square of the cortical grid.An increased probability of obtaining MEPs to the stimula-tion of a given square would imply a greater involvement ofthis cortical region in motor commands, whereas a reducedprobability would imply less motor involvement of thisregion. This can be an interesting approach to demonstratechanges in cortical motor representations and to study corti-cal plasticity. However, other factors change the susceptibil-ity of the cortex to be activated by the TMS pulse andshould be taken into account, such as the interactionbetween the spatial diffusion of the electrical field generatedinto the brain and the intrinsic excitability of the cerebral tis-sue. Another important point is the influence of varioustechnical parameters of TMS, such as stimulation intensity,coil type, and coil orientation, on the motor maps providedby this technique, as illustrated in Figure 9.
We applied the mapping procedure as described abovein a series of healthy subjects using the proposed grid. Wefound that the generation of MEPs was not restricted tothe stimulation of M1. This is related to several factorsincluding those inherent to the technique of TMS, such asthe diffusion of the induced currents into the brain andthe propensity of TMS to activate axons of neural circuitsrather than local cell bodies [Lefaucheur, 2008, 2012]. Arecent study comparing motor cortical mapping using navi-gated TMS and movement-related fMRI signal changesshowed that the information provided by TMS does not onlyreflect motor function at the stimulation site but also interac-tions with remote areas in the entire motor system [Sarfeld
et al., 2012]. In a previous study, we found that the site ofcortical stimulation producing MEPs of maximal amplitudein contralateral hand muscles (hand motor hotspot) waslocated in the precentral gyrus, often more anterior thanhand knob location [Ahdab et al., 2010]. In this study, thecortical regions whose stimulation was most constantly asso-ciated with MEPs corresponded to M1, including the handknob. However, MEPs could be obtained to the stimulationof a large cortical region, with a caudal extension to PPCand a rostral extension to PMC, according to Talairach andTournoux atlas [Talairach and Tournoux, 1988]. In thisregard, the border between M1 and PMC is a particularlydebated matter in the literature. Therefore, defining the ana-tomical limits of PMC deserves an updated review.
Anatomical Limits of the PMC
The PMC is divided into six functional areas, four ofwhich occupy the lateral surface of the frontal lobe: the dor-sal (dPMC) and ventral (vPMC) PMC, the supplementarymotor area (SMA), and the area anterior to the SMA (pre-SMA) [Rizzolatti and Luppino, 2001].
Anatomically, the rostral limit of the PMC is anterior tothe PCS in humans, variable from one individual toanother, and does not actually correspond to any identifia-ble anatomical landmark [Geyer, 2004]. The rostral exten-sion of the PMC is even larger on the medial side of thehemispheres [Amunts et al., 1999].
The definition of the caudal limit of the PMC, which isthe rostral limit of M1, is also controversial, even at thecytoarchitectonic level [Roland and Zilles, 1996]. The pres-ence of large pyramidal cells (Betz cells, in layer V) charac-terizes M1. However, from M1 to PMC, there is a
Figure 8.
Segmentation of the motor cortex in 12 squares, based on stable anatomical landmarks. (A)
Numbered squares of the grid (from S1 to S12). (B) Percentages of motor evoked potentials
obtained in contralateral hand muscle for the stimulation of each square of the grid in a series
of 12 healthy subjects.
r Ahdab et al. r
r 2442 r
progressive decrease in the number of Betz cells ratherthan an abrupt disappearance [Wang et al., 2001; Whiteet al., 1997]. Initially, Brodmann proposed that M1extended rostrally to the whole convexity of the precentralgyrus (area 4), but recent histological studies showed thatM1 occupies the anterior wall of the CS and only a limitedpart of the exposed surface of the precentral gyrus, namelyin its dorsomedial part [Geyer et al., 2000; Rademacheret al., 2001]. Ventrally, M1 is buried in the depth of the CS[White et al., 1997].
On the dorsal border of the PMC, the SMA and thedPMC have been recognized as two distinct functionalregions [Penfield and Welch, 1951], but difficult to distin-guish on anatomical grounds [Matelli et al., 1985]. In fact,the SMA is located on the mesial part of the hemispheres,extending only a little on the lateral surface of the hemi-sphere [Grafton et al., 1996; Mayka et al., 2006; Tanji andHoshi, 2009].
Ventrally, the distinction between the dPMC and thevPMC was not mentioned in human nomenclature untilvery recently. However, based on histological and func-tional criteria, it is certain that the PMC consists of twodistinct areas, one ventral and the other dorsal. The virtualline corresponding to the posterior prolongation of the iFSto the CS was generally used as the limit between thosetwo areas, according to hypothetical homologies between
humans and primates. Rizzolatti et al. [1998] suggestedthat the limit between the dPMC and the vPMC was muchmore dorsal. Recent work based on brain imaging [Maykaet al., 2006; Schubotz et al., 2010; Tomassini et al., 2007]seem to confirm this hypothesis.
All these data provided by the literature on the anatomi-cal boundaries of PMC, especially regarding the dPMC,are summarized in Figures 10 and 11 and Table II.
Implication of This Work to the Practice of
Navigated TMS
As mentioned above, one interesting application of thisstudy should be the use of our cortical grid to determinethe probability of obtaining MEPs to the stimulation ofwell-defined cortical regions. Another relevant applicationshould be the distinction made between M1 and PMCareas. We propose to strictly define the M1 target as theanterior bank of the CS, using the following segmentationalong the dorsoventral axis: trunk and lower limb repre-sentation being more medial than the level of projection ofthe sFS (F1 level); hand and upper limb representationbeing located between the levels of projection of the sFSand the iFS (F2 level); and the representation of the facebeing more lateral than the level of projection of the iFS(F3 level) [Nguyen et al., 1999].
TABLE I. Mean stereotactic coordinates of the center of each square of the grid used to map the motor cortical
regions, expressed in MRI and Talairach space coordinate systems, with the corresponding BA
MRI coordinates (mm) Talairach coordinates (mm) BA
Right x y z x y zS1 63.3 216.3 128.0 15.6 8.5 60.4 Anterior border of BA 4S2 59.4 217.7 113.7 20.5 25.7 63.3 BA 4S3 56.1 218.2 97.3 24.8 222.2 65.0 Posterior border of BA 4S4 55.9 218.0 84.8 25.7 234.9 65.5 BA 5S5 53.6 211.3 128.7 26.4 9.6 54.5 Posterior border of BA 6S6 50.0 212.3 115.6 30.9 23.5 56.7 Anterior border of BA 4S7 47.1 212.8 99.1 34.8 220.0 58.5 BA 4S8 46.2 212.4 86.1 36.5 233.2 58.8 Border between BA 5 and BA 7S9 41.9 201.4 130.8 39.4 11.9 42.5 BA 6
S10 38.3 202.1 116.9 43.9 21.9 44.4 Posterior border of BA 6S11 35.9 202.7 100.1 47.2 218.9 46.3 Border between BA 2 and BA 7S12 35.2 201.9 87.8 48.6 231.4 46.1 BA 7LeftS1 92.0 218.2 127.2 215.7 6.6 62.5 Posterior border of BA 6S2 96.8 219.0 115.2 220.6 25.7 64.2 BA 4S3 102.9 218.9 98.8 226.5 222.6 65.1 Posterior border of BA 4S4 104.9 218.3 84.2 228.0 237.6 65.2 BA 5S5 100.6 213.3 128.7 225.2 7.6 56.3 Posterior border of BA 6S6 105.7 213.3 116.7 230.2 24.7 57.1 BA 4S7 110.8 213.3 100.9 235.1 220.9 58.1 Posterior border of BA 4S8 112.6 213.3 86.5 236.4 235.7 58.8 Border between BA 5 and BA 7S9 113.8 200.6 131.8 239.3 9.9 40.5 BA 6
S10 124.0 201.3 119.8 250.1 22.6 41.9 Posterior border of BA 6S11 123.1 201.6 103.6 248.4 219.0 43.6 Anterior border of BA 7S12 126.1 200.8 89.1 251.0 234.0 43.4 BA 7
r Anatomical Landmarks for Motor Cortex Mapping r
r 2443 r

Concerning the dPMC, fMRI data showed that its centerof activation corresponds to the dorsal segment of the sPCS[Amiez et al., 2006; Grol et al., 2006; Toni et al., 2001]. Thisis also consistent with some TMS data [Johansen-Berg et al.,2002; Schluter et al., 1998]. Consequently, we propose tochoose the dorsal portion of the sPCS (above the sFS) as thelandmark for targeting the dPMC (Fig. 11).
Concerning the vPMC, fMRI data showed that its centerof activation corresponds to the ventral segment of theiPCS [Binkofski et al., 1999; de Jong et al., 2001, Ehrssonet al., 2003]. Consequently, we propose to choose the ven-tral portion of the iPCS (below the iFS) as the landmarkfor targeting the vPMC (Fig. 11).
Concerning the SMA and pre-SMA, the problem ismuch more complicated. These two structures are mostlysituated in the mesial part of the hemispheres and extendonly a little onto the lateral surface of the hemispheres. Atthis level, the SMA would be situated at a rostrocaudallevel corresponding to the paracentral branch of the cingu-late sulcus [Fink et al., 1997; Grafton et al., 1996] while thepre-SMA would be situated immediately anterior to theventral anterior commissural line. Since the degree of lat-eral extension of the SMA is impossible to determine, wepropose to consider only a narrow band of the lateral
Figure 9.
Influence of coil orientation (postero-anterior, 45�, or latero-medial) and stimulation intensity
(100% or 120% of rest motor threshold, RMT) on motor maps on the left hemisphere of two
subjects. The squares whose stimulation produced motor evoked potentials are shown in red,
and those whose stimulation produced no responses are shown in green. [Color figure can be
viewed in the online issue, which is available at wileyonlinelibrary.com.]
Figure 10.
Definition of the anatomical limits of the dPMC (red shade)
according to literature data. Numbers refer to references listed
in Table II. [Color figure can be viewed in the online issue,
which is available at wileyonlinelibrary.com.]
r Ahdab et al. r
r 2444 r
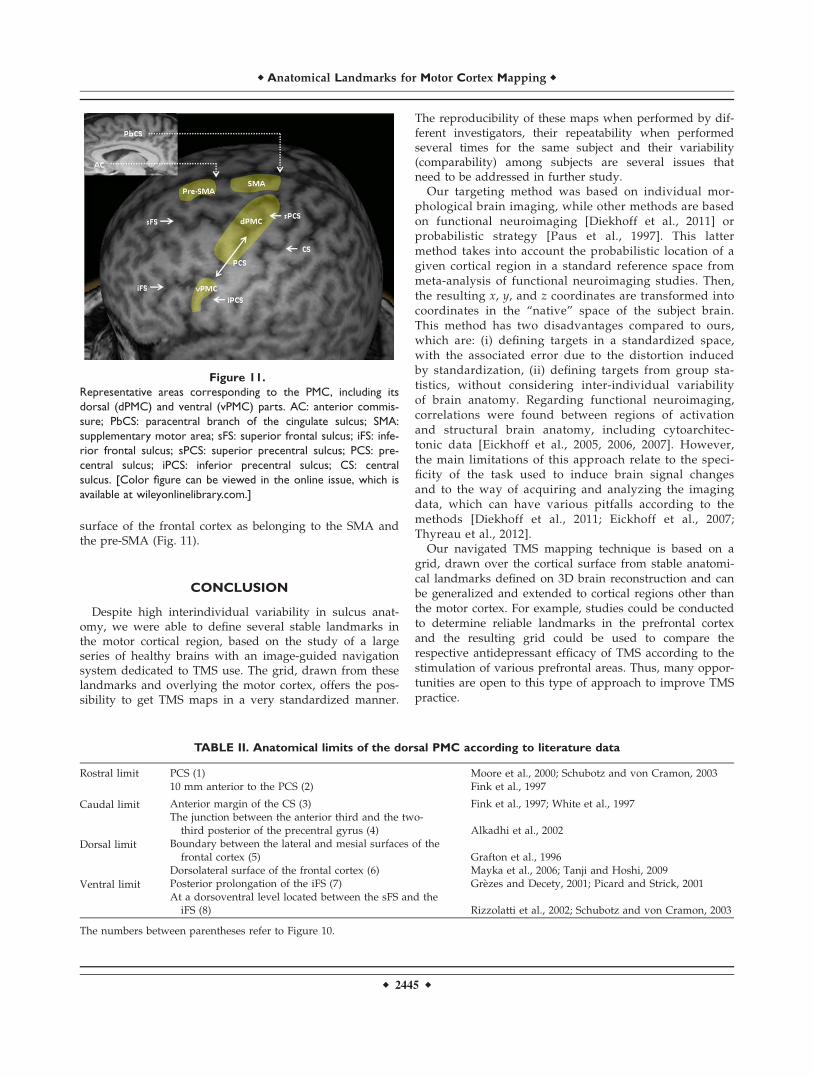
surface of the frontal cortex as belonging to the SMA andthe pre-SMA (Fig. 11).
CONCLUSION
Despite high interindividual variability in sulcus anat-omy, we were able to define several stable landmarks inthe motor cortical region, based on the study of a largeseries of healthy brains with an image-guided navigationsystem dedicated to TMS use. The grid, drawn from theselandmarks and overlying the motor cortex, offers the pos-sibility to get TMS maps in a very standardized manner.
The reproducibility of these maps when performed by dif-ferent investigators, their repeatability when performedseveral times for the same subject and their variability(comparability) among subjects are several issues thatneed to be addressed in further study.
Our targeting method was based on individual mor-phological brain imaging, while other methods are basedon functional neuroimaging [Diekhoff et al., 2011] orprobabilistic strategy [Paus et al., 1997]. This lattermethod takes into account the probabilistic location of agiven cortical region in a standard reference space frommeta-analysis of functional neuroimaging studies. Then,the resulting x, y, and z coordinates are transformed intocoordinates in the “native” space of the subject brain.This method has two disadvantages compared to ours,which are: (i) defining targets in a standardized space,with the associated error due to the distortion inducedby standardization, (ii) defining targets from group sta-tistics, without considering inter-individual variabilityof brain anatomy. Regarding functional neuroimaging,correlations were found between regions of activationand structural brain anatomy, including cytoarchitec-tonic data [Eickhoff et al., 2005, 2006, 2007]. However,the main limitations of this approach relate to the speci-ficity of the task used to induce brain signal changesand to the way of acquiring and analyzing the imagingdata, which can have various pitfalls according to themethods [Diekhoff et al., 2011; Eickhoff et al., 2007;Thyreau et al., 2012].
Our navigated TMS mapping technique is based on agrid, drawn over the cortical surface from stable anatomi-cal landmarks defined on 3D brain reconstruction and canbe generalized and extended to cortical regions other thanthe motor cortex. For example, studies could be conductedto determine reliable landmarks in the prefrontal cortexand the resulting grid could be used to compare therespective antidepressant efficacy of TMS according to thestimulation of various prefrontal areas. Thus, many oppor-tunities are open to this type of approach to improve TMSpractice.
Figure 11.
Representative areas corresponding to the PMC, including its
dorsal (dPMC) and ventral (vPMC) parts. AC: anterior commis-
sure; PbCS: paracentral branch of the cingulate sulcus; SMA:
supplementary motor area; sFS: superior frontal sulcus; iFS: infe-
rior frontal sulcus; sPCS: superior precentral sulcus; PCS: pre-
central sulcus; iPCS: inferior precentral sulcus; CS: central
sulcus. [Color figure can be viewed in the online issue, which is
available at wileyonlinelibrary.com.]
TABLE II. Anatomical limits of the dorsal PMC according to literature data
Rostral limit PCS (1) Moore et al., 2000; Schubotz and von Cramon, 200310 mm anterior to the PCS (2) Fink et al., 1997
Caudal limit Anterior margin of the CS (3) Fink et al., 1997; White et al., 1997The junction between the anterior third and the two-
third posterior of the precentral gyrus (4) Alkadhi et al., 2002
Dorsal limit Boundary between the lateral and mesial surfaces of thefrontal cortex (5) Grafton et al., 1996
Dorsolateral surface of the frontal cortex (6) Mayka et al., 2006; Tanji and Hoshi, 2009
Ventral limit Posterior prolongation of the iFS (7) Grezes and Decety, 2001; Picard and Strick, 2001At a dorsoventral level located between the sFS and the
iFS (8) Rizzolatti et al., 2002; Schubotz and von Cramon, 2003
The numbers between parentheses refer to Figure 10.
r Anatomical Landmarks for Motor Cortex Mapping r
r 2445 r

REFERENCES
Ahdab R, Ayache SS, Brugieres P, Goujon C, Lefaucheur JP(2010): Comparison of "standard" and "navigated" proceduresof TMS coil positioning over motor, premotor and prefrontaltargets in depressive patients. Neurophysiol Clin 40:27–36.
Alkadhi H, Crelier GR, Boendermaker SH, Golay X, Hepp-Reymond MC, Kollias SS (2002): Reproducibility of primarymotor cortex somatotopy under controlled conditions. AJNRAm J Neuroradiol 23:1524–1532.
Amiez C, Kostopoulos P, Champod AS, Petrides M (2006): Localmorphology predicts functional organization of the dorsal pre-motor region in the human brain. J Neurosci 26:2724–2731.
Amunts K, Schleicher A, B€urgel U, Mohlberg H, Uylings HBM,Zilles K (1999): Broca’s region revisited: cytoarchitecture andintersubject variability. J Comp Neurol 412:319–341.
Ashburner J, Friston KJ (1999): Nonlinear spatial normalizationusing basis functions. Hum Brain Mapp 7:254–266.
Binkofski F, Buccino G, Posse S, Seitz R, Rizzolatti G, Freund J(1999): A frontoparietal circuit for object manipulation in man:evidence from an fMRI study. Eur J Neurosci 11:3276–3286.
Chiavaras MM, Petrides M (2000): Orbitofrontal sulci of thehuman and macaque monkey brain. J Comp Neurol 422:35–54.
de Jong BM, van der Graaf FH, Paans AM (2001): Brain activationrelated to the representations of external space and bodyscheme in visuomotor control. Neuroimage 14:1128–1135.
Diekhoff S, Uluda�g K, Sparing R, Tittgemeyer M, Cavuso�glu M,von Cramon DY, Grefkes C (2011): Functional localization inthe human brain: Gradient-Echo, Spin-Echo, and arterial spin-labeling fMRI compared with neuronavigated TMS. HumBrain Mapp 32:341–357.
Ehrsson HH, Geyer S, Naito E (2003): Imagery of voluntary move-ment of fingers, toes, and tongue activates correspondingbody-part-specific motor representations. J Neurophysiol 90:3304–3316.
Eickhoff SB, Stephan KE, Mohlberg H, Grefkes C, Fink GR,Amunts K, Zilles K (2005): A new SPM toolbox for combiningprobabilistic cytoarchitectonic maps and functional imagingdata. NeuroImage 25:1325–1335.
Eickhoff SB, Amunts K, Mohlberg H, Zilles K (2006): The humanparietal operculum. II. Stereotaxic maps and correlation withfunctional imaging results. Cereb Cortex 16:268–279.
Eickhoff SB, Paus T, Caspers S, Grosbras MH, Evans AC, Zilles K,Amunts K (2007): Assignment of functional activations toprobabilistic cytoarchitectonic areas revisited. Neuroimage 36:511–521.
Fesl G, Moriggl B, Schmid UD, Naidich TP, Herholz K, YousryTA (2003): Inferior central sulcus: variations of anatomy andfunction on the example of the motor tongue area. Neuro-image 20:601–610.
Fink GR, Frackowiak RS, Pietrzyk U, Passingham RE (1997): Mul-tiple nonprimary motor areas in the human cortex. J Neuro-physiol 77:2164–2174.
Germann J, Robbins S, Halsband U, Petrides M (2005): Precentralsulcal complex of the human brain: Morphology and statisticalprobability maps. J Comp Neurol 493:334–356.
Geyer S (2004): The microstructural border between the motorand the cognitive domain in the human cerebral cortex. AdvAnat Embryol Cell Biol 174, I-VIII:1–89.
Geyer S, Matelli M, Luppino G, Zilles K (2000): Functional neuro-anatomy of the primate isocortical motor system. AnatEmbryol (Berl) 202:443–474.
Grafton ST, Fagg AH, Woods RP, Arbib MA (1996): Functionalanatomy of pointing and grasping in humans. Cereb Cortex 6:226–237.
Grezes J, Decety J (2001): Functional anatomy of execution, mentalsimulation, observation, and verb generation of actions: Ameta-analysis. Hum Brain Mapp 12:1–19.
Grol MJ, de Lange FP, Verstraten FA, Passingham RE, Toni I(2006): Cerebral changes during performance of overlearnedarbitrary visuomotor associations. J Neurosci 26:117–125.
Johansen-Berg H, Rushworth MF, Bogdanovic MD, Kischka U,Wimalaratna S, Matthews PM (2002): The role of ipsilateralpremotor cortex in hand movement after stroke. Proc NatlAcad Sci USA 99:14518–14523.
Lefaucheur JP (2008): Principles of therapeutic use of transcranialand epidural cortical stimulation. Clin Neurophysiol 119:2179–2184.
Lefaucheur JP (2010): Why image-guided navigation becomesessential in the practice of transcranial magnetic stimulation.Neurophysiol Clin 40:1–5.
Lefaucheur JP (2012): Neurophysiology of cortical stimulation. IntRev Neurobiol 107:57–85.
Matelli M, Luppino G, Rizzolatti G (1985): Patterns of cytochromeoxidase activity in the frontal agranular cortex of the macaquemonkey. Behav Brain Res 18:125–136.
Mayka MA, Corcos DM, Leurgans SE, Vaillancourt DE (2006):Three-dimensional locations and boundaries of motor and pre-motor cortices as defined by functional brain imaging: a meta-analysis. Neuroimage 31:1453–1474.
Moore CI, Stern CE, Corkin S, Fischl B, Gray AC, Rosen BR, DaleAM (2000): Segregation of somatosensory activation in thehuman rolandic cortex using fMRI. J Neurophysiol 84:558–569.
Nguyen JP, Lefaucheur JP, Decq P, Uchiyama T, Carpentier A,Fontaine D, Brugi�eres P, Pollin B, F�eve A, Rostaing S, CesaroP, Keravel Y (1999): Chronic motor cortex stimulation in thetreatment of central and neuropathic pain. Correlationsbetween clinical, electrophysiological and anatomical data.Pain 82:245–251.
Ono M, Kubik S, Abernathey CD (1990): Atlas of the CerebralSulci. New York: Georg Thieme Verlag.
Paus T, Jech R, Thompson CJ, Comeau R, Peters T, Evans AC(1997): Transcranial magnetic stimulation during positronemission tomography: A new method for studying connectiv-ity of the human cerebral cortex. J Neurosci 17:3178–3184.
Penfield W, Welch K (1951): The supplementary motor area of thecerebral cortex; a clinical and experimental study. AMA ArchNeurol Psychiatry 66:289–317.
Picard N, Strick PL (2001): Imaging the premotor areas. CurrOpin Neurobiol 11:663–672.
Rademacher J, Burgel U, Geyer S, Schormann T, Schleicher A,Freund HJ, Zilles K (2001): Variability and asymmetry in thehuman precentral motor system. A cytoarchitectonic and mye-loarchitectonic brain mapping study. Brain 124:2232–2258.
Rizzolatti G, Luppino G (2001): The cortical motor system. Neuron31:889–901.
Rizzolatti G, Luppino G, Matelli M (1998): The organization of thecortical motor system: New concepts. Electroencephalogr ClinNeurophysiol 106:283–296.
Rizzolatti G, Fogassi L, Gallese V (2002): Motor and cognitivefunctions of the ventral premotor cortex. Curr Opin Neurobiol12:149–154.
Roland PE, Zilles K (1996): Functions and structures of the motorcortices in humans. Curr Opin Neurobiol 6:773–781.
r Ahdab et al. r
r 2446 r
Rossini PM, Barker AT, Berardelli A, Caramia MD, Caruso G,Cracco RQ, Dimitrijevic MR, Hallett M, Katayama Y, L€uckingCH, Maertens de Noordhout AL, Marsden CD, Murray NMF,Rothwell JC, Swash M, Tomberg C (1994): Non-invasive electricaland magnetic stimulation of the brain, spinal cord and roots:Basic principles and procedures for routine clinical application.Report of an IFCN committee. Electroencephalogr Clin Neuro-physiol 91:79–92.
Sarfeld AS, Diekhoff S, Wang LE, Liuzzi G, Uluda�g K, EickhoffSB, Fink GR, Grefkes C (2012): Convergence of human brainmapping tools: neuronavigated TMS parameters and fMRIactivity in the hand motor area. Hum Brain Mapp 33:1107–1123.
Schluter ND, Rushworth MF, Passingham RE, Mills KR (1998):Temporary interference in human lateral premotor cortex sug-gests dominance for the selection of movements. A studyusing transcranial magnetic stimulation. Brain 121:785–799.
Schubotz RI, von Cramon DY (2003): Functional-anatomical con-cepts of human premotor cortex: Evidence from fMRI and PETstudies. Neuroimage 20 Suppl 1:S120–131.
Schubotz RI, Anwander A, Kn€osche TR, von Cramon DY,Tittgemeyer M (2010): Anatomical and functional parcellationof the human lateral premotor cortex. Neuroimage 50:396–408.
Talairach J, Tournoux P (1988): Co-planar Stereotactic Atlas of theHuman Brain: 3-Dimensional Proportional System: An approachto Cerebral Imaging. New York: Thieme Medical Publishers.
Tanji J, Hoshi E (2009): Premotor Areas. In: Binder MD, HirokawaN, Windhorst U, editors. Encyclopedia of Neuroscience. BerlinHeidelberg: Springer-Verlag. p 925–33.
Thyreau B, Schwartz Y, Thirion B, Frouin V, Loth E, Vollst€adt-Klein S, Paus T, Artiges E, Conrod PJ, Schumann G, Whelan R,Poline JB; IMAGEN Consortium (2012): Very large fMRI studyusing the IMAGEN database: sensitivity-specificity and popu-lation effect modeling in relation to the underlying anatomy.Neuroimage 61:295–303.
Tomassini V, Jbabdi S, Klein JC, Behrens TE, Pozzilli C, MatthewsPM, Rushworth MF, Johansen-Berg H (2007): Diffusion-weighted imaging tractography-based parcellation of thehuman lateral premotor cortex identifies dorsal and ventralsubregions with anatomical and functional specializations. JNeurosci 27:10259–10269.
Toni I, Rushworth MF, Passingham RE (2001): Neural correlatesof visuomotor associations. Spatial rules compared with arbi-trary rules. Exp Brain Res 141:359–369.
Turner OA (1948): Growth and development of the cerebral corti-cal pattern in man. Arch Neurol Psychiatry 59:1–12.
Wang Y, Shima K, Sawamura H, Tanji J (2001): Spatial distribu-tion of cingulate cells projecting to the primary, supplemen-tary, and presupplementary motor areas: a retrograde multiplelabeling study in the macaque monkey. Neurosci Res 39:39–49.
White LE, Andrews TJ, Hulette C, Richards A, Groelle M,Paydarfar J, Purves D (1997): Structure of the human sensori-motor system. I: Morphology and cytoarchitecture of the cen-tral sulcus. Cereb Cortex 7:18–30.
Yousry TA, Schmid UD, Alkadhi H, Schmidt D, Peraud A,Buettner A, Winkler P (1997): Localization of the motor handarea to a knob on the precentral gyrus. A new landmark. Brain120:141–157.
r Anatomical Landmarks for Motor Cortex Mapping r
r 2447 r