Verification of AROME- MetCoOp reanalysis for 2010 METreport

tters 243 (2006) 390–399www.elsevier.com/locate/epsl
Earth and Planetary Science Le
Reanalysis of ancient eclipse, astronomic and geodetic data:A possible route to resolving the enigma
of global sea-level rise
Jerry X. Mitrovica a,⁎, John Wahr b, Isamu Matsuyama c,Archie Paulson b, Mark E. Tamisiea d
a Department of Physics, University of Toronto, 60 St. George Street, Toronto, Canada M5S 1A7b Department of Physics and CIRES, Campus Box 390, University of Colorado, Boulder, CO, 80309, USA
c Department of Terrestrial Magnetism, Carnegie Institution of Washington, 5241 Broad Branch Road, Washington, DC, 20015, USAd Harvard-Smithsonian Center for Astrophysics, 60 Garden Street MS42, Cambridge MA, 02138, USA
Received 17 August 2005; received in revised form 23 December 2005; accepted 27 December 2005Available online 15 February 2006
Editor: S. King
Abstract
Predictions of the Earth's response to the ice age appear to simultaneously reconcile a set of astronomical, geodetic and ancienteclipse observations related to changes in rotation, thus ruling out ice melting as a major contributor to 20th century sea-level rise.We demonstrate that the reconciliation disappears when an improved theory of rotational stability is applied. Furthermore, ourreanalysis of longer satellite records renders previous estimates of the secular change in rotation rate suspect. The updated ice-agepredictions and observations permit an anomalous 20th century ice flux of ∼1 mm/yr equivalent sea-level rise. Thus, the full suiteof Earth rotation observations are consistent with a connection between climatic warming and recent melting of ice reservoirs.© 2006 Elsevier B.V. All rights reserved.
Keywords: ancient eclipses; polar wander; Earth rotation; global sea level; glacial rebound
1. Introduction
The potentially strong connection between climatechange and global sea-level rise has motivated efforts toconstrain the mean amplitude and individual sources ofthe rise. Direct estimates of the amplitude have come fromanalyses of tide gauge records which extend, at some sites,several centuries [1], satellite-altimetric data spanning justover one decade [2,3], or combinations of the two data sets[4]. The tide gauge studies suggest a mean 20th century
⁎ Corresponding author.E-mail address: [email protected] (J.X. Mitrovica).
0012-821X/$ - see front matter © 2006 Elsevier B.V. All rights reserved.doi:10.1016/j.epsl.2005.12.029
sea-level rise in the range ∼1.5–2.0 mm/yr [1,5]. Thistrend is dominated by a combination of the steric effect ofocean thermal expansion and mass flux from icereservoirs, including polar ice sheets (Greenland, Antarc-tica) and small glacier systems. However, despitesignificant progress toward mapping both ocean heatcontent [6–8] and the melting of ice complexes, inparticular mountain glaciers [9], the detailed partitioningof sea-level change amongst these contributions remains amatter of ongoing debate [10].
The rapid melting of any ice complex yields a distinctgeographic pattern in sea-level change [11–14]. This sen-sitivity suggests a method for analyzing sea-level

391J.X. Mitrovica et al. / Earth and Planetary Science Letters 243 (2006) 390–399
observations, once they are corrected for the ongoingimpact of the last ice age, or glacial isostatic adjustment(GIA), to constrain the individual sources of meltwater. Asan example, a so-called fingerprint analysis of GIA-corrected tide gauge records [13] has inferred a mean 20thcentury mass loss from the Greenland ice complexequivalent to ∼0.5 mm/yr of eustatic sea-level (ESL)rise. (We use the term ESL to denote the globally averagedsea-level change that would arise from the meltwater fluxinto the ocean.) This type of analysismay also be applied tosatellite-based constraints on sea-surface changes, butrobust estimates will ultimately require the geographicpattern associated with ocean thermal expansion [15].
The redistribution of mass within the Earth systemwillperturb both the gravitational field of the planet and, viachanges in the inertia tensor, the rotation vector. OngoingGIA, for example, is known to contribute to a broad suiteof observations associated with this class of perturbation.These include: astronomical [16,17] measurements of thereorientation of the rotation vector; the accumulatedchange in the length-of-day over the last three millenniainferred from ancient eclipse records [18]; and space-geodetic [19–21] constraints on secular trends in thespherical harmonic coefficients of the geopotential (thetrend in the degree two zonal harmonic, or J̇2J
.2, implies a
steady redistribution of mass; any such redistributionwould cause a linearly proportional trend in the rotationrate [22]). Contemporary melting from global ice reser-voirs also implies a mass redistribution, both at thesurface and via the associated solid Earth deformation,and this redistribution will contribute to anomalies in thegravitational field and rotational state. Indeed, analyses ofvarious subsets of these observations have, after correc-tion or simultaneous solution for the GIA signal, provideda second method for constraining the amplitude andsources of the non-steric signal in global sea-level rise.
Present-day melting from the Antarctic and Green-land polar ice complexes are almost equally efficient atperturbing the J ˙2J
.2 observable [23] and thus this long-
standing datum [19] provides a potential constraint onthe net mass balance within these regions. Efforts toseparate these contributions have invoked, in addition toJ ˙2J.2, observations of a suite of low order zonal harmonics[24,25] (mass fluxes of the same sign in the two highlatitude regions yield signals of opposite sign in the oddharmonics [23]), and secular rates of true polar wander(henceforth TPW; off-axis Greenland melting is likely toexcite a larger TPW for a given ESL change than meltingfrom the Antarctic) [24,26].
In an influential extension of this philosophy, Munk[27] considered J2̇J
.2 (or equivalently the secular change in
rotation rate), TPWand ancient eclipse observations, and
he described an enigma that serves as the focus of thisstudy. Specifically, Munk argued that estimates of 20thcentury ocean heat storage are significantly less thanrequired to explain the tide-gauge inferred sea-level risein terms of ocean thermal expansion. Moreover, the GIApredictions he adopted were able to simultaneouslyreconcile the three rotation data sets, and this ‘tripleaccord’ ruled out significant contemporary melting fromglobal ice reservoirs. Even if the GIA models were tunedso that the J ˙2J
.2 and TPWobservations could accommodate
sufficient present-day melting to explain the tide gaugeestimates, a consistency between the J̇2J
.2 observation and
the eclipse data [27] would require roughly that sameamount of melting over the last several thousand years,in violation of geological sea-level records [28].
In this paper we revisit the sea-level enigma in lightof a new theory [29] for the rotational stability of an ice-age Earth. Furthermore, we propose a route to recon-ciling the enigma which makes use of a new obser-vational constraint on the J2̇J
.2 datum.
2. The sea-level enigma
The ‘sea-level enigma’ argument is summarized inFig. 1. The figure shows a comparison of traditionalnumerical predictions of GIA-induced perturbations inthe Earth's rotational state with a suite of observationscommonly cited within the GIA literature. The GIApredictions adopt spherically symmetric, self-gravitating,viscoelastic Earth models and a global ice model that isbased on the ICE-5G history of Late Pleistocene icecover [30] (we have also performed calculations usingthe ICE-3G [31] history and none of the conclusions inthe paper are altered by this change.) The Earth modelshave the elastic and density structure of the seismic modelPREM [32], an elastic lithospheric plate of thickness100 km, an upper mantle viscosity of 1021 Pa s, and auniform lower mantle viscosity (νLM) that serves as thefree parameter of the modelling. The predictions in Fig. 1are based on standard normal mode theories for GIA-induced perturbations in the Earth's rotational state [22].
GIA predictions of the normalized present-day rate ofchange of the Earth's axial rotation rate, Ω ˙Ω
./Ω, or alter-
natively the J̇2J.2 datum, exhibit a relatively simple, and
well known [22,23,33] sensitivity to variations in νLM(solid line; Fig. 1A). Models with a weak lower mantle(νLMb5×1021 Pa s) yield small signals because theyhave relaxed close to equilibrium in the periodsubsequent to the end of the ice age cycles. Moreover,models with a stiff lower mantle (νLMN5×1022 Pa s)adjust slowly throughout the post-glacial period, andthus also yield relatively small changes in rotation rate.
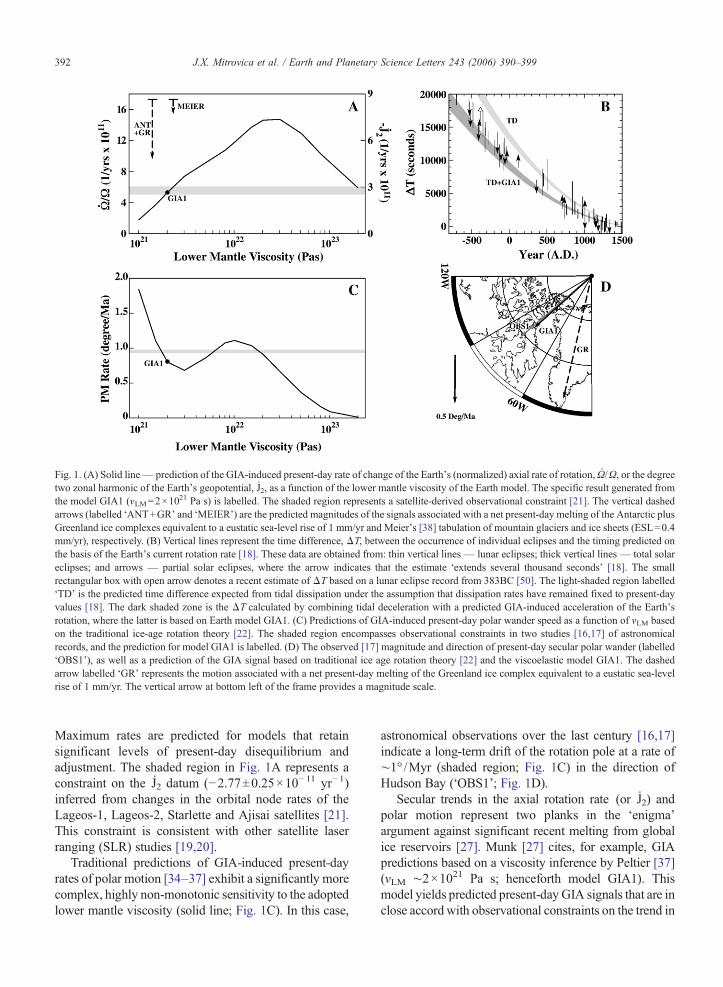
Fig. 1. (A) Solid line— prediction of the GIA-induced present-day rate of change of the Earth's (normalized) axial rate of rotation,Ω˙Ω./Ω, or the degree
two zonal harmonic of the Earth's geopotential, J̇2J.2, as a function of the lower mantle viscosity of the Earth model. The specific result generated from
the model GIA1 (νLM=2×10²¹ Pa s) is labelled. The shaded region represents a satellite-derived observational constraint [21]. The vertical dashedarrows (labelled ‘ANT+GR’ and ‘MEIER’) are the predicted magnitudes of the signals associated with a net present-day melting of the Antarctic plusGreenland ice complexes equivalent to a eustatic sea-level rise of 1 mm/yr and Meier's [38] tabulation of mountain glaciers and ice sheets (ESL=0.4mm/yr), respectively. (B) Vertical lines represent the time difference, ΔT, between the occurrence of individual eclipses and the timing predicted onthe basis of the Earth's current rotation rate [18]. These data are obtained from: thin vertical lines— lunar eclipses; thick vertical lines — total solareclipses; and arrows — partial solar eclipses, where the arrow indicates that the estimate ‘extends several thousand seconds’ [18]. The smallrectangular box with open arrow denotes a recent estimate of ΔT based on a lunar eclipse record from 383BC [50]. The light-shaded region labelled‘TD’ is the predicted time difference expected from tidal dissipation under the assumption that dissipation rates have remained fixed to present-dayvalues [18]. The dark shaded zone is the ΔT calculated by combining tidal deceleration with a predicted GIA-induced acceleration of the Earth'srotation, where the latter is based on Earth model GIA1. (C) Predictions of GIA-induced present-day polar wander speed as a function of νLM basedon the traditional ice-age rotation theory [22]. The shaded region encompasses observational constraints in two studies [16,17] of astronomicalrecords, and the prediction for model GIA1 is labelled. (D) The observed [17] magnitude and direction of present-day secular polar wander (labelled‘OBS1’), as well as a prediction of the GIA signal based on traditional ice age rotation theory [22] and the viscoelastic model GIA1. The dashedarrow labelled ‘GR’ represents the motion associated with a net present-day melting of the Greenland ice complex equivalent to a eustatic sea-levelrise of 1 mm/yr. The vertical arrow at bottom left of the frame provides a magnitude scale.
392 J.X. Mitrovica et al. / Earth and Planetary Science Letters 243 (2006) 390–399
Maximum rates are predicted for models that retainsignificant levels of present-day disequilibrium andadjustment. The shaded region in Fig. 1A represents aconstraint on the J2̇J
.2 datum (−2.77±0.25×10⁻¹¹ yr−1)
inferred from changes in the orbital node rates of theLageos-1, Lageos-2, Starlette and Ajisai satellites [21].This constraint is consistent with other satellite laserranging (SLR) studies [19,20].
Traditional predictions of GIA-induced present-dayrates of polar motion [34–37] exhibit a significantly morecomplex, highly non-monotonic sensitivity to the adoptedlower mantle viscosity (solid line; Fig. 1C). In this case,
astronomical observations over the last century [16,17]indicate a long-term drift of the rotation pole at a rate of∼1°/Myr (shaded region; Fig. 1C) in the direction ofHudson Bay (‘OBS1’; Fig. 1D).
Secular trends in the axial rotation rate (or J̇2J.2) and
polar motion represent two planks in the ‘enigma’argument against significant recent melting from globalice reservoirs [27]. Munk [27] cites, for example, GIApredictions based on a viscosity inference by Peltier [37](νLM ∼2×1021 Pa s; henceforth model GIA1). Thismodel yields predicted present-day GIA signals that are inclose accordwith observational constraints on the trend in

393J.X. Mitrovica et al. / Earth and Planetary Science Letters 243 (2006) 390–399
rotation rate (‘GIA1’; Fig. 1A) and both the magnitude(Fig. 1C,D) and direction (Fig. 1D) of polar motion.
The third plank in the enigma argument involves theintegrated slowing of the Earth's rotation as inferredfrom Babylonian, Chinese, Arabic and Greek eclipseobservations [18]. The data in Fig. 1B (short verticallines) represent the total time difference, ΔT, betweenthe recorded occurrence of various eclipses and thepredicted time of occurrence under the assumption thatthe Earth's rotation rate has remained fixed to thepresent-day value. These data reflect a gradual slowingof the rotation which is largely a consequence of energydissipation due to ocean tides. Under the assumptionthat this dissipation has remained constant over the lastthree millennia, the process would have led to thepredicted trend shown by the light-shaded regionlabelled ‘TD’ in Fig. 1B [18]. The discrepancy betweenthis trend and the time difference inferred from ancienteclipse records reflects the so-called ‘non-tidal acceler-ation’ of the Earth's axial rotation.
Since the end of the last deglaciation phase, the GIAprocess has been characterized by a gradual reduction inthe oblateness of the planet, and hence an acceleration ofthe Earth's rotation. The time difference associated withGIA can be computed by double integrating (in time) thepredicted rate of change in the rotation rate; oneintegration yields the change in the so-called length-of-day (i.e., the period of rotation) and the second integrationprovides the accumulated time shift, ΔT. When this in-tegration is applied to predictions based on the modelGIA1, the net time difference (TD plus GIA1 prediction)is given by the dark-shaded region in Fig. 1B, which is inagreement with the ancient eclipse observations. Note thata double integration using a constant value ofΩΩ̇
./Ω equal
to the observational constraint in Fig. 1A, ∼6×10⁻¹¹
yr−1, provides a similar net time difference, indicating arough consistency between this datum and the ancienteclipse record [27].
The fit between the GIA1 predictions and observationsin Fig. 1A–D defines the ‘remarkable’ triple accord citedby Munk [27], which ‘leaves little room for an eustaticrise in sea level’ (p. 6553) from recent melting events. Asdiscussed in the Introduction, melting of either Antarcticor Greenland ice will lead to a similar perturbation in therotation rate (or J̇2J
.2). A net present-day mass flux from
these regions equal to an ESL rise of 1 mm/yr yields apredicted slowing of magnitude Ω˙Ω
./Ω ∼8×10⁻¹¹ yr−1
(dashed arrow ‘ANT+GR’; Fig. 1A) [23]. Furthermore,melting from the suite of mountain glaciers and small icesheets tabulated byMeier [38] (ESL=0.4 mm/yr) leads toa reduction of ΩΩ̇
./Ω ∼2×10⁻¹¹ yr−1 (arrow ‘MEIER’;
Fig. 1A) [23]. Moreover, off-axis melting of polar ice
sheets can have a large impact on polar motion; the resultslabelled ‘GR’ in Fig. 1D represent the TPW predicted formelting from Greenland equivalent to an ESL=1 mm/yr.Thus, if the viscoelastic model GIA1, and predictionsbased upon it, are accurate, any significant recent meltingfrom the polar ice complexes would clearly violate theobservational constraints on the secular trend in rotationrate (Fig. 1A) and, if this mass flux involved any non-negligible off-axis contribution (e.g., from Greenland),polar motion (Fig. 1C,D).
As Munk points out, the triple accord evident in Fig. 1means that the ∼1.2 mm/yr of 20th century sea-level risehe infers from tide gauge results after subtracting esti-mates of the steric contributions remains unaccounted for.Even if one adopts a different GIA model that requires∼1.2 mm/yr of meltwater to match the observed value ofΩΩ̇./Ω shown in Fig. 1A, the consistency noted above be-
tween this observed value and the eclipse record (Fig. 1B)would imply∼1.2 mm/yr of eustatic sea-level rise duringthe last three millennia, which would violate geologicalsea-level records [28].
3. The enigma revisited: a reanalysis of GIA andgeodetic data
3.1. GIA and present-day TPW
Is this triple accord robust? To answer this question weconsider each datum in turn, beginningwith polar motion.The traditional formulation [22] for computing GIA-induced polar wander on viscoelastic Earth models (solidline Fig. 1C; the solid black arrow in 1D) has recentlybeen shown [29] to introduce significant error into thesepredictions. The physical assumptions underlying thetraditional theory, and a newly revised theory [29], areillustrated in Fig. 2A. The GIA-induced reorientation ofthe rotation vector is governed by a balance between theeffects of the surface mass load, which acts to push therotation pole away (or move the load toward the equator;Fig. 2 A2,A5) and the stabilizing influence of the rota-tional bulge, which resists excursions of the pole from itsinitial state. The time-dependent response of the Earthmodel to both the surface mass loading and the per-turbation in the centrifugal potential associated with thepolar motion is treated in both the new and traditionalformulations using the same, viscoelastic Love numbertheory [39]. However, these two formulations differsignificantly in their treatment of the initial (or back-ground) oblateness of the Earth (compare Fig. 2A1 andA4). Specifically, traditional GIA predictions assume thatthe background oblateness, which should be connected tothe observed ellipticity of the planet, can be accurately

Fig. 2. (A) A schematic illustrating differences between the load-induced perturbation in the orientation of the rotation vector predicted on the basis oftraditional GIA rotation theory [22] (top row) and a revised theory [29] that accurately incorporates the magnitude and stabilizing influence of theplanetary oblateness (bottom row). The three columns represent, from left, the initial rotational state prior to loading, and the polar motion (shown byblue arrows) during the loading (note the green disk load) and after load removal. In the traditional theory, the initial oblateness is given by theequilibrium form that would result by taking a stationary planet with an elastic lithosphere (given by the blue planetary shell) and introducing an axialrotation equal to the Earth's current rate (frame A1). In the new theory, the oblateness is tied to the observed value and includes the excess ellipticityassociated with mantle convection (shown symbolically by the red flow lines). Since the new theory involves a greater background oblateness, ityields a more stable rotation pole; polar motion is thus larger in frames A2 and A3 than A5 and A6. (B) Solid line — as in Fig. 1C, except thepredictions of GIA-induced polar wander are generated using the new rotation theory [29]. To simplify comparison, the predictions generated usingthe old theory [22] are given by the dashed line on the figure (reproduced from Fig. 1C). The subscript ‘new’ is added to avoid confusion insubsequent discussion. The results GIA2new and GIA3new are described in the text. (C) As in Fig. 1D, except predictions of GIA-induced polarwander amplitude and direction are shown for both the traditional rotation theory (dashed line labelled GIA1, reproduced from Fig. 1D) and the newrotation theory (GIA1new). In frames B and C, the observational constraint on polar motion relative to the mean lithosphere frame (OBS1) [17] isreproduced from Fig. 1 and shown by dashed shading. An updated observational constraint on polar motion relative to the hotspot reference frame(OBS2) [41] is given by solid shading.
394 J.X. Mitrovica et al. / Earth and Planetary Science Letters 243 (2006) 390–399
replaced in the rotation theory by the equilibrium rotatingform of the same Earth model used to compute theresponse to the surface mass loading (Fig. 2A1). Thisassumption introduces two errors. First, the background
oblateness is implicitly, and incorrectly, assumed to be afunction of the adopted thickness of the elastic lithosphere(that is, the thicker the blue shell in Fig. 2A1, the smallerthe background oblateness adopted in the calculations).

Fig. 3. Results for J̇2J.2 estimated from the monthly J2 values derived
from SLR data by: (A) Cox and Chao [42]; and (B) Cheng and Tapley[43]. The four curves in each panel show results after removingdifferent estimates of the 18.6-year tide from the J2 values. Thepreferred solution, and the upper and lower bounds, refer to 18.6-yearvalues inferred by Benjamin et al. [44]. Each point on each curverepresents a different time span used for the ΔT; each span starts in1979 and ends at the time shown on the x-axis. Each curve thusillustrates the degree of convergence of the ΔT.
395J.X. Mitrovica et al. / Earth and Planetary Science Letters 243 (2006) 390–399
Second, the approach neglects all dynamic (non-GIA)contributions to the observed oblateness, including anyexcess ellipticity associated with internal, mantle con-vective flow [40] (shown symbolically by the red flowlines in the bottom frames). A correct formulation [29]avoids these assumptions by connecting, a priori, thebackground oblateness to the observed flattening of theplanet (Fig. 2A4).
The traditional theory thus underestimates the back-ground oblateness and hence the rotational stability of theEarth system in response to the GIA forcing. To quantifythis error, we have repeated the calculations shown inFig. 1C,D using the corrected rotation theory (Fig. 2B,C).(These latter figures also show a newly updated obser-vational constraint [41], labelled ‘OBS2’, which refer-ences the secular polar motion to the hotspot referenceframe, rather than the less stable ‘mean lithosphere’ frame[17]. The new estimate has a magnitude 14% largerthan, and a direction 11° counter-clockwise (i.e., towardGreenland) of, the earlier constraint ‘OBS1’[17].)
The revised predictions are characterized by signif-icantly lower rates of present-day polar wander. Indeed,the new calculation for model GIA1 (denoted GIA1new)is ∼65% smaller than the prediction based on the tra-ditional rotation theory, and is now far too small toreconcile the secular trend inferred from astronomicalobservations (Fig. 2B,C); the triple accord noted byMunk [27] disappears.
3.2. J˙2J.2 Estimates and the 18.6 year tide
Next, we turn to the present-day secular trend in rota-tion rate, as inferred from observations of J̇2J
.2. The revision
to the rotation theory outlined in Fig. 2 has no bearing onGIA predictions of J̇2J
.2 (or ofΔT). However, a reanalysis of
two sets of newly available, monthly, J2 values inferredfrom SLR observations, suggests that the commonly citedobservational results for J̇2J
.2 (Fig. 1A) are more uncertain
than previously believed.We refer to these data sets as CC(after Cox and Chao [42]), which runs from 1979 throughthe fall of 2004, and CT (after Cheng and Tapley [43]),which extends from 1979 through the beginning of 2004.Benjamin et al. [44] used these data to determine a rangeof values for the amplitude and phase of the 18.6-yearbody tide. We remove these tidal values from each J2 dataset, and fit a linear trend to the residuals. To test forconvergence of our trend solutions, we construct fits overmany different time intervals, each beginning in 1979 butending at times varying between 1994 and the end of thetime series. We do this for CC and CT separately, andshow the results in Fig. 3A and B. Each panel shows fourresults, computed by removing different 18.6-year values:
the upper bound, lower bound, and preferred value fromBenjamin et al. [44], and a valuewhich is not based on any18.6-year tidal observations, but which has been adoptedas a standard by the International Earth Rotation Service[45]. Note that the J̇2J
.2 results have not yet converged, that
they depend on which 18.6-year tide values are removed,and that they are different for CC and CT. The implicationis that the SLR data span is still short enough that it isdifficult to separate decadal-scale fluctuations from truesecular variability. We estimate that the secular trend in J2could be anywhere between − 1.0 × 10− 11 and−3.0×10⁻¹¹ yr−1, a conclusion consistent with thefindings of Cox et al. [46]. This corresponds to a rangefor ΩΩ̇
./Ω of ∼2–6×10⁻¹¹ yr−1 (Fig. 4A).
4. Resolving the enigma? — some examples
One argument which definesMunk's sea-level enigmais that GIA predictions based on models such as GIA1 areable, when coupled with a realistic ice sheet history, tosimultaneously satisfy the observational constraints onEarth rotation. A comparison of the revised predictions(solid lines) and updated observations in Figs. 2B and 4A

Fig. 4. (A) As in Fig. 1A, a plot of GIA-induced J̇2J.2 and Ω˙ /Ω as a function of lower mantle viscosity, with an updated observational constraint based
on the analysis in Fig. 3. GIA2 and GIA3 refer to results for Earth models with νLM=3×10²¹ Pa s and 1023 Pa s, respectively. Also shown is the netperturbation when the GIA predictions for these models are augmented by a signal from post-ice-age melting. This melt model (MM) is comprised of:(1) melting from mountain glaciers and small ice sheets [38] (ESL rise=0.4 mm/yr) and polar ice sheets (ESL=0.4 mm/yr) beginning in the 20thcentury; (2) Late Holocene melting of polar ice sheets (ESL=0.3 mm/yr). The signal associated with the latter is a function of the lower mantleviscosity (the former is not) and thus the MM signal in Fig. 3 is different for the GIA2 and GIA3 cases. (B,C) As in Fig. 1B, except the results labelled‘TD+GIA2+MM’ (frame B) and ‘TD+GIA3+MM’ (frame C) represent the total time shift, ΔT, predicted from tidal deceleration, and signals fromboth GIA and the melt history MM. The component of the MM model that involves the onset of melting in the 20th century has negligible effect onthese predictions; however, the Late Holocene component of the MM loading (ESL=0.3 mm/yr) contributes a slowing of rotation that is a function ofthe adopted viscosity model. (D,E) GIA2new (frame D) and GIA3new (frame E) are predictions of the GIA-induced present-day magnitude anddirection of polar motion computed using the new rotation theory [29] and viscoelastic models with νLM=3×10²¹ Pa s and 1023 Pa s, respectively. Ineach frame, the vector MM represents the signal associated with the Late Holocene/20th century melt model defined above. In this case, the melting ofpolar ice sheets is either partitioned evenly between the south Greenland and Antarctic complexes (frames A-GIA2,B,D) or in the ratio 3 :1 (A-GIA3,C,E).
396 J.X. Mitrovica et al. / Earth and Planetary Science Letters 243 (2006) 390–399

397J.X. Mitrovica et al. / Earth and Planetary Science Letters 243 (2006) 390–399
indicates that no choice of lower mantle viscosity yields afit to both the J̇2J
.2 (or secular trend in rotation rate) and
polar motion data. Thus, for the class of GIA models wehave explored, which are consistent with those consideredby Munk [27], contributions other than GIA must beinvoked to reconcile these observations.
As we have discussed, the original constraint onchanges in the rotation rate shown in Fig. 1A and the timeshift inferred from eclipse records (Fig. 1B) are consistentin the sense that a GIA model that fits one will fit the other(e.g.,GIA1 in Fig. 1A,B) [27]. The broader bound on ournew, revised estimate of rotation rate changes (or J ˙2J
.2;
Fig. 4A) allows this consistency to be broken, andprovides room for a present-day meltwater signal that dif-fers from the 3000-year average. As an example, themaximum discrepancy between the rotation rate change,Ω̇Ω./Ω, consistentwith the eclipse data (∼6×10⁻¹¹ yr−1, see
above) and the observational constraint implied by the J̇2J.2
datum (∼2–6×10⁻¹¹ yr−1; Fig. 4A), or ∼4×10⁻¹¹ yr−1,permits an increased 20th century meltwater signal fromMeier's sources [38] and polar ice sheets of approximately0.7 mm/yr equivalent ESL rise (see dashed arrows, Fig.1A). (The minimum discrepancy would, in contrast, returnus to a situation where the 20th century value of Ω̇Ω
./Ω is
consistent with the eclipse data, as in Fig. 1A,B, and inthis case an increased meltwater signal over the lastcentury would be difficult to accommodate.)
The inferred 3000-year and 20th century averages ofmelting, rather than the difference between the two,would be a strong function of the adopted GIA model.Once a choice for the uncertain lower mantle viscosity[47] is prescribed, a maximum discrepancy between theGIA prediction and the observed trend in the rotationrate, and thus a maximum signal from ongoing melting,can be established (Fig. 4A). However, the larger themagnitude of the GIA-induced acceleration of rotation,the greater the integrated ΔT due to this process. Toretain an acceptable fit to the eclipse records, a fractionof the ongoing melting would have to be extendedthrough the Late Holocene to contribute a slowing of therotation rate over that period. The partitioning of anyongoing melting between the polar ice complexes can bevaried to best-fit the polar motion constraints.
Fig. 4 summarizes the application of this proce-dure for two example models, GIA2 and GIA3, definedby νLM=3×10²¹ and 1023 Pa s, respectively. Thepredictions are generated by combining GIA calcula-tions based on these models with the signal from amelting model (‘MM’) defined by: (1) ice mass fluxwith an onset in the 20th century comprised of meltingfromMeier's sources [38] (ΩΩ̇
./Ω∼2×10−11 yr−1) and a
net retreat of grounded polar ice sheets with an ESL of
0.4 mm/yr (ΩΩ̇./Ω ∼3.2×10⁻¹¹ yr−1); (2) an additional
0.3 mm/yr of melting from the polar ice sheets duringthe Late Holocene to the present (note that rotationalsignals predicted on the basis of the Late Holocenemelting component are dependent on the adoptedviscosity). The melting of polar ice sheets is eitherpartitioned evenly between the south Greenland andAntarctic complexes (model GIA2 predictions) or in theratio 3 :1 (GIA3 predictions). Both scenarios provide afit to the rotation observations (Fig. 4) which is as goodas the GIA1 fit that defined the original sea-levelenigma (Fig. 1). Moreover, this fit is obtained with anongoing melting of global ice reservoirs equivalent to anet ESL rise of 1.1 mm/yr, with 0.8 mm/yr of this totalbeginning in the 20th century.
This level of Late Holocene melting (0.3 mm/yr) iswithin the bound inferred on the basis of sea-levelrecords in the far-field of the Late Pleistocene icecomplexes by Fleming et al. (see their Fig. 7d) [28].Moreover, the total rate of Greenland melting (∼0.4mm/yr for GIA2 and ∼0.5 mm/yr for GIA3) isconsistent with a fingerprint analysis of modern tidegauge records [13]. As we have discussed, a greaterlevel of ongoing melting would be required if weadopted a viscosity value that yielded a higher residualbetween the GIA prediction of ΩΩ̇
./Ω and the observed,
e.g, νLM=1022 Pa s; however, in this case, more of themelting would have to extend through the LateHolocene to reconcile the eclipse record.
5. Final remarks
Our reanalysis of space-geodetic, astronomical andarchaeological constraints on Earth rotation has yieldeda route to resolving the sea-level enigma discussed byMunk [27]. The GIA models we have considered areincapable of simultaneously reconciling the suite ofconstraints on the Earth's rotational state. However, forsmall but plausible values of J2̇J
.2, this reconciliation is
possible via a combination of GIA and ongoing icemelting of order 1 mm/yr ESL. The details of themelting model MM are not unique, in part because ofuncertainties in the deep mantle viscosity and meltgeometries, and because it is possible that both polarmotion and rotation rate have been significantlyimpacted by internal Earth processes [48,49]. Forexample, a non-negligible polar motion signal frommantle convection [48] would alter the inferredpartitioning of recent melting between the Greenlandand Antarctic ice complexes. Nevertheless, ancienteclipse, modern astronomical and space geodeticconstraints on Earth rotation are compatible with a

398 J.X. Mitrovica et al. / Earth and Planetary Science Letters 243 (2006) 390–399
significant mass loss from global ice reservoirs inresponse to recent climate change.
Acknowledgement
We thank C. Cox and M.K. Cheng for providing theirmonthly J2 estimates, M. Dumberry for providing a copyof his submitted manuscript, Erik Ivins and ananonymous reviewer for their constructive comments,and Andrew M Por for discussions related to this work.We acknowledge support from the Natural Sciences andEngineering Research Council, the Canadian Institutefor Advanced Research and the Miller Institute for BasicResearch in Science (JXM), NSF grant EAR-0087567 tothe University of Colorado (JW, AP), and NASA grantNNG04GF09G (MET).
References
[1] B.C. Douglas, Global sea rise: a redetermination, Surv. Geophys.18 (1997) 279–292.
[2] A. Cazenave, K. Dominh, M.C. Gennero, B. Ferret, Global meansea level changes observed by TOPEX-Poseidon and ERS-1,Phys. Chem. Earth 23 (1998) 1069–1075.
[3] R.S. Nerem, G.T. Mitchum, Observations of sea level changefrom satellite altimetry, in: B.C. Douglas, M.S. Kearney, S.P.Leatherman (Eds.), Sea Level Rise: history and consequences,2001, pp. 121–163.
[4] J. Church, N. White, R. Coleman, K. Lambeck, J. Mitrovica,Estimates of the regional distribution of sea-level rise over the1950 to 2000 period, J. Clim. 17 (2004) 2609–2625.
[5] S.J. Holgate, P.L. Woodworth, Evidence for enhanced coastal sealevel rise during the 1990s, Geophys. Res. Lett. 31 (2004), doi:10.1029/2004GL019626.
[6] S. Levitus, J.I. Antonov, T.P. Boyer, C. Stephens, Warming of theworld ocean, Science 287 (2000) 2225–2229.
[7] J.I. Antonov, S. Levitus, T.P. Boyer, Thermosteric sea level rise,1995–2003, Geophys. Res. Lett. 32 (2005), doi: 10.1029/2005GL023112.
[8] J.K. Willis, D. Roemmich, B. Cornuelle, Interannual variabilityin upper ocean heat content, temperature, and thermostericexpansion on global scales, J. Geophys. Res. 109 (2004), doi:10.1029/2003JC002260.
[9] M.B. Dyurgerov, M.F. Meier, Glaciers and the changing Earthsystem: a 2004 snapshot, Institute of Arctic and Alpine Research,Occasional Paper 58 (2005).
[10] A. Cazenave, R.S. Nerem, Present-day sea level change:cbservations and causes, Rev. Geophys. 42, doi: 10.1029/2003RG000139.
[11] R.S. Woodward, On the form and position of mean sea level, U.S.Geol. Surv. Bull. 48 (1888) 87–170.
[12] J.A. Clark, J.A. Primus, Sea-level changes resulting from futureretreat of ice sheets: an effect of CO2 warming of the climate, in:M.J. Tooley, I. Shennan (Eds.), Sea-Level Changes, Institute ofBritish Geographers, London, 1987, pp. 356–370.
[13] J.X. Mitrovica, M.E. Tamisiea, J.L. Davis, G.A. Milne, Polar icemass variations and the geometry of global sea level change,Nature 409 (2001) 1026–1029.
[14] H.-P. Plag, H.-U. Jüttner, Inversion of global tide gauge data forpresent-day ice load changes, Proc. 2nd Int. Symp. Environ. Res.Arctic 54 (2001) 301–317.
[15] M.E. Tamisiea, J.X. Mitrovica, G.A. Milne, J.L. Davis, Globalgeoid and sea level changes due to present-day ice massfluctuations, J. Geophys. Res. 106 (2001) 30,849–30,863.
[16] D.D. McCarthy, B.J. Luzum, Path of the mean rotation pole from1899 to 1994, Geophys. J. Int. 125 (1996) 623–629.
[17] R.S. Gross, J. Vondrak, Astrometric and space-geodeticobservations of polar wander, Geophys. Res. Lett. 26 (1999)2085–2088.
[18] F.R. Stephenson, L.V. Morrison, Long-term fluctuations in theEarth's rotation: 700 BC to AD 1990, Philos. Trans. R. Soc.Lond. A 351 (1995) 165–202.
[19] C.F. Yoder, J.G. Williams, J.O. Dickey, B.E. Schutz, R.J. Eanes,B.D. Tapley, J̇2J
.2 from LAGEOS and the non-tidal acceleration of
Earth rotation, Nature 303 (1983) 757–762.[20] M.K. Cheng, C.K. Shum, B.D. Tapley, Determination of long-
term changes in the Earth's gravity field from satellite laserranging observations, J. Geophys. Res. 102 (1997)22377–22390.
[21] R.S. Nerem, S.M. Klosko, Secular variations of the zonalharmonics and polar motion as geophysical constraints, in: R.Rapp, A.A. Cazenave, R.S. Nerem (Eds.), Global Gravity Fieldand its Variations, IAG Symp. Int. Assoc. of Geod., vol. 116,1996, pp. 152–163.
[22] P. Wu, W.R. Peltier, Pleistocene deglaciation and the Earth'srotation: a new analysis, Geophys. J. R. Astron. Soc. 76 (1984)753–791.
[23] J.X. Mitrovica, W.R. Peltier, Present-day secular variations in thezonal harmonics of the Earth's geopotential, J. Geophys. Res. 98(1993) 4509–4526.
[24] T.S. James, E.R. Ivins, Global geodetic signatures of theAntarctic ice sheet, J. Geophys. Res. 102 (1997) 605–633.
[25] N. Tosi, R. Sabadini, A.M. Marotta, L.L.A. Vermeersen,Simultaneous inversion for the Earth's mantle viscosity and icemass imbalance in Antarctica and Greenland, J. Geophys. Res.110 (2005), doi: 10.1029/2004JB003236.
[26] P. Johnston, K. Lambeck, Postglacial rebound and sea levelcontributions to changes in the geoid and the Earth's rotationaxis, Geophys. J. Int. 136 (1999) 537–558.
[27] W. Munk, Twentieth century sea level: an enigma, Proc. Natl.Acad. Sci. 99 (2002) 6550–6555.
[28] K. Fleming, P. Johnston, D. Zwartz, Y. Yokoyama, K. Lambeck,J. Chappell, Refining the eustatic sea-level curve since the LastGlacial Maximum using farand intermediate-field sites, EarthPlanet. Sci. Lett. 163 (1998) 327–342.
[29] J.X. Mitrovica, J. Wahr, I. Matsuyama, A. Paulson, The rotationalstability of an ice age Earth, Geophys. J. Int. 161 (2005)491–506.
[30] W.R. Peltier, Global glacial isostasy and the surface of the ice-ageEarth: the ICE-5G (VM2) Model and GRACE, Annu. Rev. EarthPlanet. Sci. 32 (2003) 111–149.
[31] A.M. Tushingham, W.R. Peltier, ICE-3G: a new global model oflate Pleistocene deglaciation based upon geophysical predictionsof postglacial relative sea level change, J. Geophys. Res. 96(1991) 4497–4523.
[32] A.M. Dziewonski, D.L. Anderson, Preliminary reference Earthmodel (PREM), Phys. Earth Planet. Int. 25 (1981) 297–356.
[33] E.R. Ivins, C.G. Sammis, C.F. Yoder, Deep mantle viscousstructure with prior estimate and satellite constraint, J. Geophys.Res. 98 (1993) 4579–4609.

399J.X. Mitrovica et al. / Earth and Planetary Science Letters 243 (2006) 390–399
[34] D.A. Yuen, R. Sabadini, E.V. Boschi, Viscosity of the lowermantle as inferred from rotational data, J. Geophys. Res. 87(1982) 10745–10762.
[35] G.A. Milne, J.X. Mitrovica, Postglacial sea-level change on arotating Earth: first results from a gravitationally self-consistentsea-level equation, Geophys. J. Int. 126 (1996) F13–F20.
[36] W.R. Peltier, X. Jiang, Glacial isostatic adjustment and Earthrotation: re-fined constraints on the viscosity of the deep mantle(correction), J. Geophys. Res. 102 (1997) 10101–10103.
[37] W.R. Peltier, Postglacial variations in the level of the sea:implications for climate dynamics and solid-Earth geophysics,Rev. Geophys. 36 (1998) 603–689.
[38] M.F. Meier, Contribution of small glaciers to global sea level,Science 226 (1984) 1418–1421.
[39] W.R. Peltier, The impulse response of a Maxwell Earth, Rev.Geophys. Space Phys. 12 (1974) 649–669.
[40] S.M. Nakiboglu, Hydrostatic theory of the Earth and its mechanicalimplications, Phys. Earth Planet. Int. 28 (1982) 302–311.
[41] D.F. Argus, R.S. Gross, An estimate of motion between the spinaxis and the hotspots over the past century, Geophys. Res. Lett.31 (2004), doi: 10.1029/2004GL019657.
[42] C.M. Cox, B.F. Chao, Detection of a large-scale massredistribution in the terrestrial system since 1998, Science 297(2002) 831–832.
[43] M. Cheng, B.D. Tapley, Variations in the Earth's oblatenessduring the past 28 years, J. Geophys. Res. 109 (2004) B09402.
[44] D. Benjamin, J. Wahr, R. Ray, G. Egbert, S.D. Desai, Constraintsonmantle anelasticity from geodetic observations, and implicationsfor the J2 anomaly, Geophys. J. Int., (in press).
[45] D.D. McCarthy, G. Petit (Eds.), IERS Conventions (2003),International Earth Rotation and Reference Service (IERS)Technical Note No. 32, 2004.
[46] C.M. Cox, A. Boy, B.F. Chao, Time-variable gravity: usingsatellite-laser-ranging as a tool for observing long-term changesin the earth system, in: R. Noomen, S. Klosko, C. Noll, M.Pearlman (Eds.), Proceed. 13th Int. Workshop on Laser Ranging,NASA/CP-2003-212248, 2003, pp. 9–19.
[47] J.X. Mitrovica, Haskell [1935] revisited, J. Geophys. Res. 101(1996) 555–569.
[48] B. Steinberger, R.J. O'Connell, Changes of the Earth's rotationaxis owing to advection of mantle density heterogeneities, Nature387 (1997) 169–173.
[49] M. Dumberry, J. Bloxham, Azimuthal flows in the Earth's coreand changes in length of day at millennial timescales, Geophys. J.Int., (in press).
[50] J.M. Steele, Ptolemy, Babylon and the rotation of the Earth,Astron. Geophys. 46 (2005) 5.11–5.15.
Copyright © 2022 FDOKUMEN