Real Versus Sample-Based Differences in Comparative Family Business Research
18
Real Versus Sample-Based Differences in Comparative Family Business Research Ann Jorissen, Eddy Laveren, Rudy Martens, Anne-Mie Reheul This article analyzes the impact of not controlling for “demographic sample” differences on research results in the area of comparative family/nonfamily business research. Using different statistical methods with and without control for “demographic sample” differ- ences, the results show that controlling for these firm demographics in a bivariate as well as a multivariate framework is very important to discover “real” differences between family and nonfamily firms. We found “real” differences for export, budgeting, variable reward systems, profitability and gender, educational degree, and tenure of the CEO. Strategy, networking, long-term planning and control systems, perceived environmental uncertainty, growth, and management training, classified by prior empirical research as different between family and nonfamily firms, do not differ. Introduction Over the past 15 years, notable contributions have been made in identifying the different character- istics of family and nonfamily firms. These con- tributions are based on a number of theoretical frameworks. According to agency theory, family firms are different because they demonstrate overlapping owner/manager relationships. This implies a lower need to monitor opportunistic managers and reduces agency costs (Williamson, 1981). Also, the theory of transaction cost eco- nomics assigns cost advantages to family firms as a result of better communication flows, higher trust, lower monitoring costs, and consolidated decision making (Williamson, 1996). Others attribute the differences between family and non- family firms to the contradictions between family and business systems. Ward states that the very nature of business often seems to contradict the nature of the family. Families tend to be emo- tional, businesses are objective. Families are protec- tive of their members, non-family businesses much less so. Families grant acceptance unconditionally. Businesses grant it according to one’s contribution. (Ward, 1987, p. 54) According to Kets de Vries (1993), the dual char- acteristics of family and business are a source of both benefit (long-term orientation, strong com- mitment, less bureaucratic, less impersonal) and disadvantage (confusing organization, nepotism, family disputes, autocracy leading to secrecy and resistance to change, succession dramas). FAMILY BUSINESS REVIEW, vol. XVIII, no. 3, September 2005 © Family Firm Institute, Inc. 229
Transcript of Real Versus Sample-Based Differences in Comparative Family Business Research

Real Versus Sample-Based Differences inComparative Family Business ResearchAnn Jorissen, Eddy Laveren, Rudy Martens, Anne-Mie Reheul
This article analyzes the impact of not controlling for “demographic sample” differences
on research results in the area of comparative family/nonfamily business research. Using
different statistical methods with and without control for “demographic sample” differ-
ences, the results show that controlling for these firm demographics in a bivariate as well
as a multivariate framework is very important to discover “real” differences between
family and nonfamily firms. We found “real” differences for export, budgeting, variable
reward systems, profitability and gender, educational degree, and tenure of the CEO.
Strategy, networking, long-term planning and control systems, perceived environmental
uncertainty, growth, and management training, classified by prior empirical research as
different between family and nonfamily firms, do not differ.
Introduction
Over the past 15 years, notable contributions have
been made in identifying the different character-
istics of family and nonfamily firms. These con-
tributions are based on a number of theoretical
frameworks. According to agency theory, family
firms are different because they demonstrate
overlapping owner/manager relationships. This
implies a lower need to monitor opportunistic
managers and reduces agency costs (Williamson,
1981). Also, the theory of transaction cost eco-
nomics assigns cost advantages to family firms as
a result of better communication flows, higher
trust, lower monitoring costs, and consolidated
decision making (Williamson, 1996). Others
attribute the differences between family and non-
family firms to the contradictions between family
and business systems. Ward states that
the very nature of business often seems to contradictthe nature of the family. Families tend to be emo-tional, businesses are objective. Families are protec-tive of their members, non-family businesses muchless so. Families grant acceptance unconditionally.Businesses grant it according to one’s contribution.(Ward, 1987, p. 54)
According to Kets de Vries (1993), the dual char-
acteristics of family and business are a source of
both benefit (long-term orientation, strong com-
mitment, less bureaucratic, less impersonal) and
disadvantage (confusing organization, nepotism,
family disputes, autocracy leading to secrecy and
resistance to change, succession dramas).
FAMILY BUSINESS REVIEW, vol. XVIII, no. 3, September 2005 © Family Firm Institute, Inc. 229
Methodological concerns have been expressed
in the literature in relation to the compar-
ative family/nonfamily business research
(Gudmundson, Hartman, & Tower, 1999; Westhead
& Cowling, 1998; Westhead, 1997). Many differ-
ences between family and nonfamily firms found
in prior studies could be due to demographic
sample differences (firm size and age, industry
and location type, “prosperous vs. declining”)
instead of “real” differences between the groups.
In this article we address these methodological
concerns. First, we analyze the existing compara-
tive family/nonfamily business studies. We derive
hypotheses about the differences between family
and nonfamily firms concerning strategy and
environment, management information systems,
performance, and CEO characteristics. Second, we
test these hypotheses with the use of bivariate and
multivariate tests, both without and with control
for firm demographics. Comparing the outcomes
of the uncontrolled and the controlled tests allows
us to investigate the impact of not controlling for
firm demographics on research results. Only the
controlled tests identify real differences between
family and nonfamily firms.
We find that control for demographic differ-
ences is very important, but that the choice for a
bivariate or multivariate setting is of less impor-
tance. Further, family and nonfamily firms are
found to differ less than generally assumed. The
latter finding implies that concepts and tech-
niques elaborated for firms of a certain size, age,
and industry are applicable to family as well as to
nonfamily firms.
The article is structured as follows. First, we
formulate testable hypotheses derived from the
theoretical and empirical literature. Second,
we present the research data and methodology.
Third, we analyze the empirical results, and finally,
we discuss the results.
Literature Review and HypothesisDevelopment
Previous studies have tried to unravel differences
between family and nonfamily firms with regard
to a number of variables (strategy, export, net-
working, perceived environmental uncertainty
[PEU], the use of planning, control, and reward
systems, growth, profitability, and several CEO
characteristics). For each of these variables we
provide a literature review. We present the theo-
retical and the empirical literature and indicate
whether these studies have controlled for demo-
graphic differences between the types of firms.
Our choice of demographic control variables
(firm size, industry, firm age, and location type) is
based on Storey (1994), Porter (1980), and
Risseeuw and Masurel (1994), who found a
significant influence of these firm demographics
on management practices and firm performance.
On the basis of the theoretical arguments and the
empirical findings we develop hypotheses.
Strategy and Environment
Interactions between family and business systems
cause the strategies of family firms to differ from
those of nonfamily firms (Harris, Martinez,
& Ward, 1994; Ward, 1987, 1988). Family firms
adopt strategies that allow them to accomplish
family goals like continuity, stability, maintain-
ing control, and self-sufficiency (Mishra &
McConaughy, 1999). Further, P. Davis (1983)
argues that the family firm’s relation to the busi-
ness environment is affected by its inward orien-
tation and its resistance toward information not
Jorissen, Laveren, Martens, Reheul
230
matching the family’s core beliefs. Therefore,
family and nonfamily firms are expected to differ
regarding PEU, networking, and export behavior.
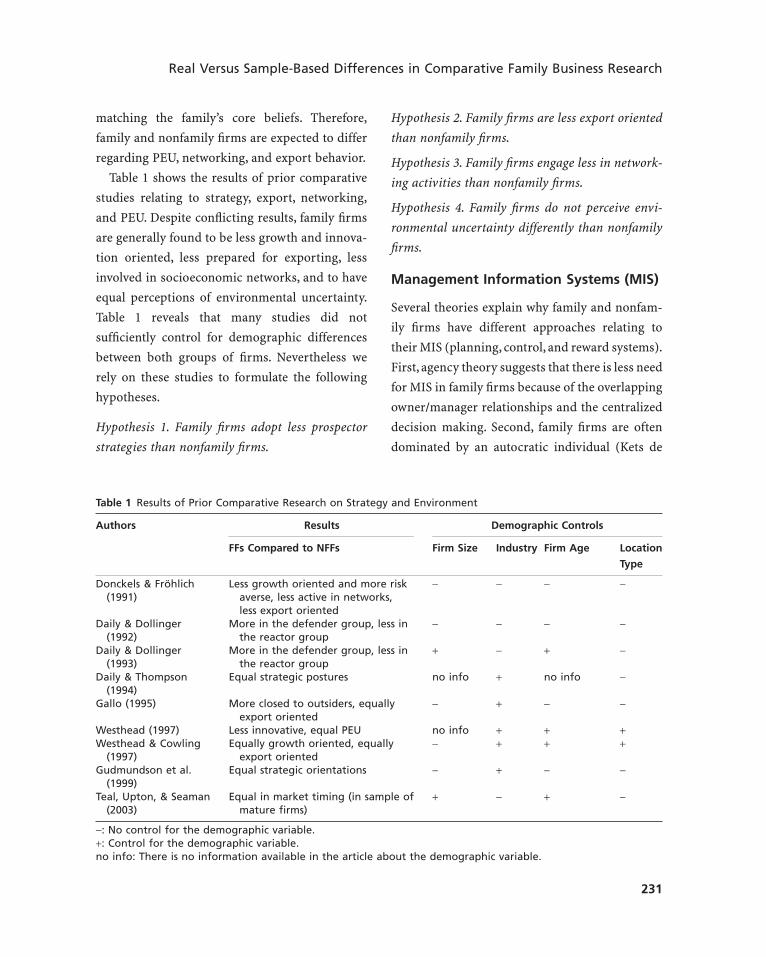
Table 1 shows the results of prior comparative
studies relating to strategy, export, networking,
and PEU. Despite conflicting results, family firms
are generally found to be less growth and innova-
tion oriented, less prepared for exporting, less
involved in socioeconomic networks, and to have
equal perceptions of environmental uncertainty.
Table 1 reveals that many studies did not
sufficiently control for demographic differences
between both groups of firms. Nevertheless we
rely on these studies to formulate the following
hypotheses.
Hypothesis 1. Family firms adopt less prospector
strategies than nonfamily firms.
Hypothesis 2. Family firms are less export oriented
than nonfamily firms.
Hypothesis 3. Family firms engage less in network-
ing activities than nonfamily firms.
Hypothesis 4. Family firms do not perceive envi-
ronmental uncertainty differently than nonfamily
firms.
Management Information Systems (MIS)
Several theories explain why family and nonfam-
ily firms have different approaches relating to
their MIS (planning, control, and reward systems).
First, agency theory suggests that there is less need
for MIS in family firms because of the overlapping
owner/manager relationships and the centralized
decision making. Second, family firms are often
dominated by an autocratic individual (Kets de
231
Real Versus Sample-Based Differences in Comparative Family Business Research
Table 1 Results of Prior Comparative Research on Strategy and Environment
Authors Results Demographic Controls
FFs Compared to NFFs Firm Size Industry Firm Age Location
Type
Donckels & Fröhlich Less growth oriented and more risk - - - -(1991) averse, less active in networks,
less export orientedDaily & Dollinger More in the defender group, less in - - - -
(1992) the reactor groupDaily & Dollinger More in the defender group, less in + - + -
(1993) the reactor groupDaily & Thompson Equal strategic postures no info + no info -
(1994)Gallo (1995) More closed to outsiders, equally - + - -
export orientedWesthead (1997) Less innovative, equal PEU no info + + +Westhead & Cowling Equally growth oriented, equally - + + +
(1997) export orientedGudmundson et al. Equal strategic orientations - + - -
(1999)Teal, Upton, & Seaman Equal in market timing (in sample of + - + -
(2003) mature firms)
-: No control for the demographic variable.+: Control for the demographic variable.no info: There is no information available in the article about the demographic variable.

Vries, 1993) who prefers personal or social
methods of planning and control to formal MIS.
Third, the interaction between family and busi-
ness systems complicates the development of fair
reward systems in family firms.
Most prior findings (see Table 2) show that
family firms use less planning, control, and reward
systems. Firm demographics were, however, often
not controlled for. We hypothesize that:
Hypothesis 5. Family firms rely to a lesser extent on
formal planning systems than do nonfamily firms.
Hypothesis 6. Family firms rely to a lesser extent on
formal control systems than do nonfamily firms.
Hypothesis 7. Family firms rely to a lesser extent on
variable reward systems than do nonfamily firms.
Profitability and Growth
Several theories relate profitability and growth to
the type of ownership. The agency theory expects
nonfamily firms to perform worse because the
separation of management and control allows
managers to maximize their own utility function
at the expense of firm profits (Demetz & Lehn,
1985). Moreover, the personal stake of family
members in their firm makes family firms more
committed to business success (J. A. Davis, 1982).
Growth will often not be the primary objective of
family firms due to the family system’s wish to
retain control.
Prior research (see Table 3) revealed conflicting
results, but most studies found no profitability or
growth differences between family and nonfamily
firms. Firm demographics were insufficiently con-
trolled for. Based on the theoretical arguments, we
hypothesize that:
Hypothesis 8. Family firms achieve higher
profitability levels compared to nonfamily firms.
Hypothesis 9. Family firms achieve lower growth
levels compared to nonfamily firms.
CEO Characteristics
The influence of the family system causes CEOs of
family firms to have characteristics that are
markedly different from those of nonfamily firm
CEOs.
CEOs of family firms are found to be older, to
have lower educational degrees and longer
Jorissen, Laveren, Martens, Reheul
232
Table 2 Results of Prior Comparative Research on MISs
Authors Results Demographic Controls
FFs Compared to NFFs Firm Industry Firm Location
Size Age Type
Donckels & Fröhlich (1991) Equal use of planning systems - - - -Daily & Dollinger (1992) Less use of control systems - - - -Daily & Dollinger (1993) Less use of control systems + +/- + -Cromie et al. (1995) Less use of formal appraisal systems - - - -Westhead (1997) Less use of planning systems and no info` + + +
formal MISReid et al. (2000) More use of flat rate, less use of - - no info -
merit-based rewards
-: No control for the demographic variable.+: Control for the demographic variable.no info: There is no information available in the article about the demographic variable.

tenures, to attend less training, and to be relatively
more female (see Table 4). Despite the lack of
demographic controls, our hypotheses are based
on these prior findings.
Hypothesis 10. CEOs of family firms are older than
CEOs of nonfamily firms.
Hypothesis 11. CEOs of family firms have lower
educational degrees than CEOs of nonfamily firms.
Hypothesis 12. CEOs of family firms enjoy longer
tenures in the firm than CEOs of nonfamily firms.
Hypothesis 13. Family firms have more female
CEOs than do nonfamily firms.
Hypothesis 14. CEOs of family firms follow less
training than CEOs of nonfamily firms.
Research Methodology
We first describe the sample selection and the
data-collection process. Second, we present the
measurement of the variables, and third, we
explain the data analysis.
Sample Selection and Data Collection
In May 2001 a large-scale survey was sent to the
managing directors of 8,367 companies in the
Flanders region (northern part of Belgium) of
western Europe. The survey population was con-
structed along the following lines. Based on the
size, industry, and location (province) character-
istics of all firms that have published financial
statements over the years 1993–1999 (all compa-
233
Real Versus Sample-Based Differences in Comparative Family Business Research
Table 3 Results of Prior Comparative Research on Firm Performance
Authors Results Demographic Controls
FFs Compared to NFFs Firm Size Industry Firm Age Location Type
Daily & Dollinger (1992) Equal growth levels - - - -Gallo (1995) Lower growth levels - + - -Westhead (1997) Less profit oriented no info + + +Westhead & Cowling (1997) Equal profitability levels, - + + +
equal growth levelsColeman & Carsky (1999) Higher profitability levels - - - -Teal et al. (2003) Equal growth levels ns - + -
-: No control for the demographic variable.+: Control for the demographic variable.no info: There is no information available in the article about the demographic variable.
Table 4 Results of Prior Comparative Research on CEO Characteristics
Authors Results Demographic Controls
FFs’ CEOs Compared to NFFs’ Firm Industry Firm Location
CEOs Size Age Type
Cromie et al. (1995) Longer tenure, less training - - - -Gallo (1995) Older, longer tenure - + - -Reid et al. (2000) Older, lower degree, longer tenure, - - no info -
less training Smyrnios & Odgers (2002) Older, lower degree, more female - - - -
-: No control for the demographic variable.+: Control for the demographic variable.no info: There is no information available in the article about the demographic variable.
nies, private as well as public, with limited liabil-
ity of the shareholders have to publish their
financial statements in Belgium), a three-dimen-
sional matrix was designed. In a second step, 10%
of that population was chosen at random accord-
ing to the percentages of the three-dimensional
matrix. Within that group of 21,640 companies,
those with at least five full-time employees
received a questionnaire (8,367 companies). This
implies that startups and micro-firms are
excluded from the study. A total of 839 usable
responses (10.03%) was received. The respondents
described themselves either as managing director
(50%), CEO (34%), financial director (8%), or
other manager (8%). No follow-up mailings
or calls were performed for three reasons. First,
a response rate of 10% is normal for surveys
conducted in western Europe aimed at smaller
companies. Second, statistical analyses on the
characteristics of the 100 earliest versus the
100 latest respondents did not reveal a nonre-
sponse bias. Third, the respondents matched
the total survey population with respect to
industry and location (province); with respect
to size, the respondents were found to be
significantly (p < 1%) larger than the original
8,367 firms.
Variable Measurement
Family and nonfamily firms. In line with
Westhead (1997), we classify firms as family firms
if they perceive themselves as family firms and if
a family possesses the majority of the shares. Non-
family firms are defined as firms that do not per-
ceive themselves as family firms and in which a
family does not own the majority of the shares.
Due to mixed ownership/perception patterns, 82
firms from the population of respondents could
not be identified as family or nonfamily firms.
Consequently, 757 firms remain in the data set.
Strategy. Strategy is measured using the Miles
and Snow typology (1978), which includes two
growth- and innovation-oriented strategies:
“prospector” (P) and “analyzer” (A), and two non-
growth- and noninnovation-oriented strategies:
“defender” (D) and “reactor” (R).
Networking activities. The networking activ-
ities of firms are captured by three variables. The
variable “number of contacts” is measured as
the sum of eight types of contacts (dummies):
contacts with local, national, and international
entrepreneurs, lawyers, consultants, auditors,
accountants, and competitors. The variable “fre-
quency of contacts” (1 Æ 4) measures the average
frequency (yearly, half-yearly, monthly, weekly) at
which these contacts take place. The “number of
activities participated in” is calculated as the sum
of seven activities (dummies) in which the firm
participates: seminars, congresses, specialized
fairs, initiatives of industry federations, service
clubs, chambers of commerce, and employer’s
organizations.
Perceived environmental uncertainty(PEU). PEU is measured by asking the respon-
dents, using a five-point scale, about the pre-
dictability of the following environmental
elements: competitors, suppliers, customers, the
public, technology, financial markets, govern-
ment, regulatory agencies, and unions; and by
asking them to what extent their environment
offers market opportunities and is characterized
by stability and controllability. We developed the
measure “PEU” (1: low Æ 5: high) by averaging
these questions (Cronbach a = 0.72).
Jorissen, Laveren, Martens, Reheul
234

Use of planning, control and rewardsystems. A formal plan is a plan that is fully
written out and approved. The variable “number
of formal short-term plans” ranges from zero to
five, respectively indicating the use of none versus
all of these five formal short-term plans: sales,
production, cost, investment, and liquidity. The
“number of formal long-term plans” varies from
zero to six, respectively referring to the use of
none versus all of these six formal long-term
plans: sales, production, personnel, R&D, invest-
ment, and financing. The “financial performance
indicators” (PIs) comprise 21 ratios measuring
profitability, liquidity, solvency, and value added.
The “nonfinancial PIs” include 19 measures
assessing market research, product development,
distribution, sales, and production. The variable
“types of variable reward systems” ranges from
zero to four, referring to the use of none versus all
types of variable rewards: based on profit versus
other performance for (1) managers and (2) other
personnel.
Profitability and growth. Profitability and
growth are captured by the four-year average net
return on assets and the three-year average yearly
growth of total assets, value added, and employ-
ment (1996–1999).
Data Analysis
We study the impact of sample-based differences
on the results of comparative family/nonfamily
firm research using bivariate and multivariate
analyses. We consider the following firm demo-
graphics: size, age, industry, and location type of
the firm. Table 5 presents the values of these
demographic variables for the 757 responding
family and nonfamily firms. It is revealed that the
family and nonfamily firms in our data set demon-
strate size and industry differences, with the
family firms being smaller and less active in the
services industry. There are no differences for firm
age, and location type differences are controlled
for since we restricted our survey to the “prosper-
ous” Flemish region of western Europe.
Bivariate analyses: matched-pairs ap-proach. To control for demographic differences
in the case of bivariate tests, we use a matched-
pairs approach. As age and location type differ-
ences are already minimal in our data set, we only
explicitly control for the impact of size and indus-
235
Real Versus Sample-Based Differences in Comparative Family Business Research
Table 5 Age, Size, and Industry Differences Between Family and Nonfamily Firms—Population of Respondents
Family Firms Nonfamily Firms p
N Mean SD N Mean SD MW + W
Employment (fte) 627 29 64 130 200 771 ***Assets (million €) 627 3.6 10.5 130 61.4 278.2 ***Firm age (years) 617 24.0 13.9 128 25.2 17.3 ns
N Mnf Trd Srv N Mnf Trd Srv c2 + McN
Industry 627 51% 40% 9% 130 46% 35% 19% ***
N represents the number of firms that answered the question.ns: Not statistically significant.*/**/***: Statistically significant at the 0.1/0.05/0.01 level of significance.Tests: MW: Mann Whitney; W: Wilcoxon signed rank; c2: chi-square; McN: McNemar.Mnf = manufacturing; Trd = trade; Srv = services.

try differences. Industry is measured using four-
digit NACE codes (equivalent of SIC codes). The
matched-pairs population is created out of the
original research population of 757 firms as
follows. For each of the original 130 nonfamily
firms, we choose a family firm with the same
NACE code (73% of the matched pairs have equal
NACE codes at the full four-digit level, 27% at the
three-digit level). Within the same industry, the
most closely related family firm in terms of firm
size is chosen. We allowed for a deviation of no
more than 35% on both total assets and number
of employees. Due to these stringent matching cri-
teria, we only found well-matching family firms
for 89 of the original 130 nonfamily firms, result-
ing in a population size of 178 cases.
Table 6 shows that the size and industry differ-
ences between family and nonfamily firms are
effectively controlled for in the matched-pairs
population. Bivariate tests will be performed on
both the total population of respondents and the
matched-pairs population. Table 7 shows the com-
position of these two populations.
Multivariate analyses: logistic regressionanalysis. Besides the bivariate analyses we also
perform maximum likelihood logistic regression
analyses (Menard, 1995) on the original represen-
tative data set of 757 companies. Logistic regres-
sion analyses explain the variation in a
dichotomous dependent variable (family (1) vs.
nonfamily (0) firm) from a set of independent
variables. We perform analyses both without and
with control variables for firm demographics
(size, age, and industry of the firm). Industry is
controlled for using a dummy with three values:
manufacturing (NACE codes from 0 . . . to
5 . . .), trade (NACE codes 6 . . . and 7 . . .), and
services (NACE codes 8 . . . and 9 . . .). As in none
of the logistic regression analyses the variance
Jorissen, Laveren, Martens, Reheul
236
Table 6 Age, Size, and Industry Differences Between Family and Nonfamily Firms—Matched-Pairs Population
Family Firms Nonfamily Firms p
N Mean SD N Mean SD MW + W
Employment (fte) 89 46 103 89 40 53 nsAssets (million €) 89 7.6 16.5 89 6.9 14.9 nsFirm age (years) 89 25.4 14.2 89 23.6 14.2 ns
N Mnf Trd Srv N Mnf Trd Srv c2 + McN
Industry 89 48% 37% 15% 89 48% 37% 15% ns
N represents the number of firms that answered the question.ns: Not statistically significant.*/**/***: Statistically significant at the 0.1/0.05/0.01 level of significance.Tests: MW: Mann Whitney; W: Wilcoxon signed rank; c2: chi-square; McN: McNemar.Mnf = manufacturing; Trd = trade; Srv = services.
Table 7 Composition of the Total (TP) and Matched-Pairs (MP) Research Population
Research Population Number of Family Firms Number of Nonfamily Firms Total
TP 627 cases (82.8%) 130 cases (17.2%) 757 casesMP 89 cases (50%) 89 cases (50%) 178 cases

inflation factors (not shown) ever exceed the cut-
off value of 2.5 (Allison, 1999), we are sure that
there are no multicollinearity problems. Real dif-
ferences between family and nonfamily firms are
those differences that remain significant across
the matched pairs and the controlled logistic
regression analyses.
Empirical Results
The hypotheses developed earlier in this article
are tested with the statistical approaches pre-
sented in the preceding section.
Strategy and Environment
The results of the bivariate and multivariate analy-
ses concerning strategy, export, networking, and
PEU are presented in, respectively, Tables 8 and 9.
The bivariate uncontrolled analyses (TP) reveal
that family firms are less engaged in prospective
strategies, export, and networking and have equal
perceptions of environmental uncertainty com-
pared to nonfamily firms. Under the uncontrolled
multivariate framework, the same results are
found, except that there is no difference regarding
strategy. These “uncontrolled” findings are largely
similar to prior research findings. The matched-
237
Real Versus Sample-Based Differences in Comparative Family Business Research
Table 8 Bivariate Tests of Differences Relating to Strategy, Export, Networking, and PEU
Strategy Family Firms Nonfamily Firms p
N P A D R N P A D R c2 + McN
TP 586 27% 18% 36% 19% 125 38% 17% 30% 15% ++MP 82 35% 15% 15% 35% 82 33% 15% 20% 32% ns
Export N 0–20% 21–60% >60% N 0–20% 21–60% >60% c2 + W
(% of sales)
TP 601 74.9% 15.1% 10.0% 125 70.4% 16.5% 13.1% +++MP 79 65.1% 21.7% 13.3% 79 51.8% 23.5% 24.7% ++
Family Firms Nonfamily Firms p
RP N Mean N Mean t + paired t
Number of Contacts TP 627 4.86 130 5.61 +++(0 Æ 8) MP 89 5.28 89 5.26 ns
Frequency of contacts TP 612 2.33 130 2.28 ns(1:yearly Æ 4:weekly) MP 89 2.34 89 2.20 - -
Number of activities TP 627 2.65 130 3.08 +++participated in (0 Æ 7) MP 89 2.85 89 2.89 ns
PEU (1:low Æ 5:high) TP 627 2.62 130 2.6 nsMP 89 2.52 89 2.6 ns
N represents the number of firms that answered the question.ns: not significant.+/++/+++ (-/- -/- - -): Significant relation in line (+) or in contrast (-) with our hypotheses (p < 0.1/0.05/0.01).*/**/***: Significant relation without specified hypothesized direction (p < 0.1/0.05/0.01).t/MW/c2: t test/Mann Whitney test/chi-square test.paired t/W/McN: paired t test/Wilcoxon signed rank test/McNemar test.P = prospector; A = analyzer; D = defender; R = reactor.

pairs analyses (MP) and controlled multivariate
analyses reveal many fewer differences than the
uncontrolled analyses. Both controlled analyses
reveal that family firms export less (confirms
Hypothesis 2), engage more frequently in net-
working contacts (rejects Hypothesis 3), adopt
similar strategies (rejects Hypothesis 1), and have
equal perceptions of the environmental uncer-
tainty (confirms Hypothesis 4) in comparison
with nonfamily firms. In contrast with Hypothesis
3, family firms seem to have strong relationships
with suppliers, customers, and other stakeholders,
probably because of their integration in the local
environment (Lyman, 1991).
Unlike Hypothesis 1, family firms seem to be
quite innovative, which might be due to their great
local market knowledge and financial indepen-
dence (McCann, Leon-Guerrero, & Haley, 2001).
The differences regarding strategy and the
number of contacts found in our uncontrolled
analyses and in prior research are not “real” dif-
ferences between family and nonfamily firms, but
are due to the demographic differences between
both groups of firms.
Management Information Systems
Tables 10 and 11, respectively, present the results
of the bivariate and multivariate tests on the plan-
ning, control, and variable reward practices. The
bivariate uncontrolled tests reveal that family
firms make less use of formal short- and long-
term planning, less use of financial and
nonfinancial performance indicators (PIs), and
less use of variable reward systems than do non-
Jorissen, Laveren, Martens, Reheul
238
Table 9 Logistic Regression of Strategic and Environmental Variables Associated With Family or Nonfamily Firms
Family firm = 1; Nonfamily firm = 0
Variables Without Control Variables With Control Variables
B S.E. Sign. B S.E. Sign.
Strategy 0.128 0.100 ns -0.005 0.111 nsExport (% of sales) -0.643 0.129 +++ -0.352 0.160 ++Number of contacts (0 Æ 8) -0.137 0.069 ++ 0.003 0.079 nsFrequency of contacts (1 Æ 4) 0.178 0.200 ns 0.369 0.227 -Number of activities (0 Æ 7) -0.037 0.073 ns -0.031 0.081 nsPEU (1 Æ 5) -0.073 0.208 ns 0.234 0.005 nsFirm age (years) 0.015 0.005 ***Industry ***Industry (manufacturing) 1.491 0.375 ***Industry (trade) 0.993 0.364 ***Firm size: ln total assets (EUR) -0.707 0.106 ***Constant 2.877 0.803 *** 9.489 1.596 ***c2 model and significance 43.794 0.00% 118.287 0.00%-2log likelihood 485.863 481.049
N represents the number of firms that answered the question.ns: not significant.+/++/+++ (-/- -/- - -): Significant relation in line (+) or in contrast (-) with our hypotheses (p < 0.1/0.05/0.01).*/**/***: Significant relation without specified hypothesized direction (p < 0.1/0.05/0.01).t/MW/c2: t test/Mann Whitney test/chi-square test.paired t/W/McN: paired t test/Wilcoxon signed rank test/McNemar test.P = prospector; A = analyzer; D = defender; R = reactor.

family firms. These findings are in line with prior
research findings and with the Hypotheses 5, 6,
and 7. According to the matched-pairs analyses,
however, family firms are found to make less use
only of formal budgets, financial PIs, and variable
reward systems. No differences are found con-
cerning the use of formal long-term plans or the
use of nonfinancial PIs.
Applying the uncontrolled and controlled mul-
tivariate analyses (see Table 11), even fewer dif-
ferences remain. The results only support
Hypothesis 7 about variable reward practices and
Hypothesis 5 as far as short-term formal planning
is concerned. Hypothesis 6 about control practices
is rejected.
Profitability and Growth
Tables 12 and 13 show the results of the impact of
ownership on performance. The “uncontrolled”
analyses reveal conflicting findings. The uncon-
trolled bivariate analyses show that family firms
are less profitable than nonfamily firms and that
both groups of firms demonstrate no growth dif-
ferences. The uncontrolled multivariate analysis
reveals that family firms achieve lower net ROA
combined with higher growth of employment, but
lower growth of total assets. The “controlled”
analyses reveal consistent results. Unlike Hypoth-
esis 8, family firms appear to have lower net ROA
levels, which supports Dyer’s (1994) claim that
239
Real Versus Sample-Based Differences in Comparative Family Business Research
Table 10 Bivariate Tests of Differences Relating to Management Information Systems
RP Family Firms Nonfamily Firms p
N Mean N Mean MW + W
Number of formal budgets used TP 627 1.10 130 2.89 +++(0 Æ 5) MP 89 1.78 89 2.42 ++
Number of formal long-term TP 627 0.70 130 1.75 +++plans used (0 Æ 6) MP 89 0.91 89 1.33 ns
N Mean N Mean t + paired t
Number of financial TP 627 7.02 130 8.74 +++performance indicators used MP 89 8.18 89 9.82 +++(0 Æ 21)
Number of nonfinancial TP 627 5.09 130 6.80 +++performance indicators used MP 89 5.70 89 6.27 ns(0 Æ 19)
Types of variable reward TP 627 0.59 130 1.25 +++systems (0 Æ 4) MP 89 0.75 89 1.07 ++
N represents the number of firms that answered the question.ns: not significant.+/++/+++ (-/- -/- - -): Significant relation in line (+) or in contrast (-) with our hypotheses (p < 0.1/0.05/0.01).*/**/***: Significant relation without specified hypothesized direction (p < 0.1/0.05/0.01).t/MW/c2: t test/Mann Whitney test/chi-square test.paired t/W/McN: paired t test/Wilcoxon signed rank test/McNemar test.P = prospector; A = analyzer; D = defender; R = reactor.

Jorissen, Laveren, Martens, Reheul
240
Table 11 Logistic Regression of Management Information Systems Associated With Family or Nonfamily Firms
Family firm = 1; Nonfamily firm = 0
Variables Without Control Variables With Control Variables
B S.E. Sign. B S.E. Sign.
Number of formal budgets used -0.411 0.067 +++ -0.317 0.075 +++Number of formal LT plans used -0.029 0.067 ns 0.033 0.075 nsNumber of financial PIs used 0.007 0.033 ns 0.041 0.037 nsNumber of nonfinancial PIs used -0.006 0.033 ns -0.011 0.037 nsTypes of variable reward systems -0.281 0.096 +++ -0.188 0.104 +Firm age (years) 0.009 0.005 **Industry **Industry (manufacturing) 0.926 0.352 ***Industry (trade) 0.635 0.344 **Firm size: ln total assets -0.525 0.095 ***Constant 2.637 0.242 *** 8.814 1.314 ***c2 model and significance 101.983 0.00% 138.630 0.00%-2log likelihood 592.367 524.402
N represents the number of firms that answered the question.ns: not significant.+/++/+++ (-/- -/- - -): Significant relation in line (+) or in contrast (-) with our hypotheses (p < 0.1/0.05/0.01).*/**/***: Significant relation without specified hypothesized direction (p < 0.1/0.05/0.01).t/MW/c2: t test/Mann Whitney test/chi-square test.paired t/W/McN: paired t test/Wilcoxon signed rank test/McNemar test.P = prospector; A = analyzer; D = defender; R = reactor.
Table 12 Bivariate Tests of Profitability and Growth Differences
RP Family Firms Nonfamily Firms p
N Mean N Mean MW + W
Net TP 627 3.31 130 6.7 - - -ROA (%) MP 89 4.18 89 6.33 -Growth of employment (%) TP 627 8.99 130 7.61 ns
MP 89 7.91 89 8.47 nsGrowth of total assets (%) TP 627 -4.27 130 3.37 ns
MP 89 -2.22 89 4.71 nsGrowth of value added (%) TP 627 6.59 130 8.56 ns
MP 89 3.82 89 3.63 ns
N represents the number of firms that answered the question.ns: not significant.+/++/+++ (-/- -/- - -): Significant relation in line (+) or in contrast (-) with our hypotheses (p < 0.1/0.05/0.01).*/**/***: Significant relation without specified hypothesized direction (p < 0.1/0.05/0.01).t/MW/c2: t test/Mann Whitney test/chi-square test.paired t/W/McN: paired t test/Wilcoxon signed rank test/McNemar test.P = prospector; A = analyzer; D = defender; R = reactor.
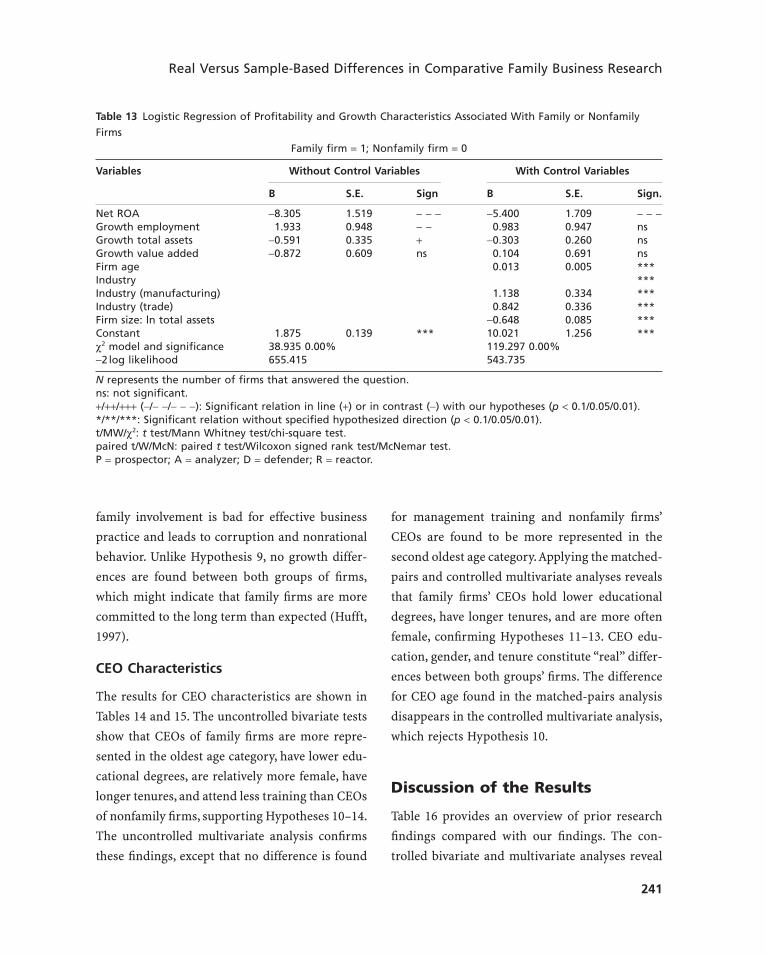
family involvement is bad for effective business
practice and leads to corruption and nonrational
behavior. Unlike Hypothesis 9, no growth differ-
ences are found between both groups of firms,
which might indicate that family firms are more
committed to the long term than expected (Hufft,
1997).
CEO Characteristics
The results for CEO characteristics are shown in
Tables 14 and 15. The uncontrolled bivariate tests
show that CEOs of family firms are more repre-
sented in the oldest age category, have lower edu-
cational degrees, are relatively more female, have
longer tenures, and attend less training than CEOs
of nonfamily firms, supporting Hypotheses 10–14.
The uncontrolled multivariate analysis confirms
these findings, except that no difference is found
for management training and nonfamily firms’
CEOs are found to be more represented in the
second oldest age category.Applying the matched-
pairs and controlled multivariate analyses reveals
that family firms’ CEOs hold lower educational
degrees, have longer tenures, and are more often
female, confirming Hypotheses 11–13. CEO edu-
cation, gender, and tenure constitute “real” differ-
ences between both groups’ firms. The difference
for CEO age found in the matched-pairs analysis
disappears in the controlled multivariate analysis,
which rejects Hypothesis 10.
Discussion of the Results
Table 16 provides an overview of prior research
findings compared with our findings. The con-
trolled bivariate and multivariate analyses reveal
241
Real Versus Sample-Based Differences in Comparative Family Business Research
Table 13 Logistic Regression of Profitability and Growth Characteristics Associated With Family or Nonfamily
Firms
Family firm = 1; Nonfamily firm = 0
Variables Without Control Variables With Control Variables
B S.E. Sign B S.E. Sign.
Net ROA -8.305 1.519 - - - -5.400 1.709 - - -Growth employment 1.933 0.948 - - 0.983 0.947 nsGrowth total assets -0.591 0.335 + -0.303 0.260 nsGrowth value added -0.872 0.609 ns 0.104 0.691 nsFirm age 0.013 0.005 ***Industry ***Industry (manufacturing) 1.138 0.334 ***Industry (trade) 0.842 0.336 ***Firm size: ln total assets -0.648 0.085 ***Constant 1.875 0.139 *** 10.021 1.256 ***c2 model and significance 38.935 0.00% 119.297 0.00%-2log likelihood 655.415 543.735
N represents the number of firms that answered the question.ns: not significant.+/++/+++ (-/- -/- - -): Significant relation in line (+) or in contrast (-) with our hypotheses (p < 0.1/0.05/0.01).*/**/***: Significant relation without specified hypothesized direction (p < 0.1/0.05/0.01).t/MW/c2: t test/Mann Whitney test/chi-square test.paired t/W/McN: paired t test/Wilcoxon signed rank test/McNemar test.P = prospector; A = analyzer; D = defender; R = reactor.

that a number of often-cited differences between
family and nonfamily firms are not “real”
differences.
Prior research claiming that family firms adopt
less prospective strategies (Donckels & Fröhlich,
1991; Westhead, 1997), are less involved in net-
working (Donckels & Fröhlich, 1991), are less
engaged in formal long-term planning and
control practices (Cromie, Stephenson, &
Monteith, 1995; Daily & Dollinger, 1992), and grow
less (Gallo, 1995) detected “demographic” differ-
ences rather than “real” differences. The same is
true for studies that found that CEOs of family
firms attend less management training than the
CEOs of nonfamily firms (Cromie et al., 1995;
Reid, Morrow, Kelly, Adams, & McCartan, 2000).
Relating to these elements the uncontrolled analy-
ses, particularly those using the bivariate setting,
always yielded results in line with the prior
research findings (prior research primarily
applied uncontrolled bivariate tests). The con-
trolled analyses, detecting “real” differences,
however, could never fully confirm the prior
research results. In the controlled analyses, only
the following characteristics turned out to be
significantly different between family and non-
Jorissen, Laveren, Martens, Reheul
242
Table 14 Bivariate Tests Relating to Differences Regarding CEO Characteristics
Age RP Family Firms Nonfamily Firms p
(years)N <35 35–50 51–60 >60 N <35 35–50 51–60 >60 c2 + W
TP 620 10% 55% 27% 8% 129 11% 52% 36% 1% +++MP 88 7% 56% 25% 12% 88 11% 58% 30% 1% ++
Education N Secondary Higher N Secondary Higher c2 + W
Education or Education Education or Education
Lower Lower
TP 618 35.8% 64.2% 129 10.9% 89.1% +++MP 88 28.1% 71.9% 88 15.9% 84.1% +
RP Family Firms Nonfamily Firms p
N % N % c2 + McN
% of firms led by a female CEO TP 613 6.5% 130 1.5% ++MP 88 8.0% 88 1.1% ++
N Mean N Mean MW + W
Management training (days per year) TP 590 7.04 120 8.60 +++MP 82 7.12 83 7.80 ns
N Mean N Mean t + paired t
Tenure in the current firm (years) TP 619 18.8 129 11.94 +++MP 87 18.9 87 12.16 +++
N represents the number of firms that answered the question.ns: not significant.+/++/+++ (-/- -/- - -): Significant relation in line (+) or in contrast (-) with our hypotheses (p < 0.1/0.05/0.01).*/**/***: Significant relation without specified hypothesized direction (p < 0.1/0.05/0.01).t/MW/c2: t test/Mann Whitney test/chi-square test.paired t/W/McN: paired t test/Wilcoxon signed rank test/McNemar test.P = prospector; A = analyzer; D = defender; R = reactor.

243
Real Versus Sample-Based Differences in Comparative Family Business Research
Table 15 Logistic Regression of CEO Characteristics Associated With Family or Nonfamily Firms
Family firm = 1; Nonfamily firm = 0
Variables Without Control Variables With Control Variables
B S.E. Sign B S.E. Sign
Age CEO ns nsAge CEO (<35 years old) -0.687 1.099 ns -0.791 1.120 nsAge CEO (36–50 years old) -1.123 1.054 ns -1.029 1.064 nsAge CEO (51–60 years old) -1.911 1.060 - -1.470 1.073 nsGender CEO (male) -1.418 0.751 + -1.442 0.844 +Degree CEO (≥secondary education) 1.356 0.340 +++ 0.894 0.374 ++Management training (days per year) -0.016 0.013 ns -0.017 0.15 nsTenure in current firm (no. of years) 0.091 0.015 +++ 0.076 0.016 +++Firm age 0.007 0.005 nsIndustry ***Industry (manufacturing) 1.072 0.353 ***Industry (trade) 0.798 0.360 **Firm size: ln total assets -0.564 0.090 ***Constant 2.724 1.304 ** 10.15 1.917 ***c2 model and significance 98.104 0.00% 143.976 0.00%-2log likelihood 533.983 461.074
N represents the number of firms that answered the question.ns: not significant.+/++/+++ (-/- -/- - -): Significant relation in line (+) or in contrast (-) with our hypotheses (p < 0.1/0.05/0.01).*/**/***: Significant relation without specified hypothesized direction (p < 0.1/0.05/0.01).t/MW/c2: t test/Mann Whitney test/chi-square test.paired t/W/McN: paired t test/Wilcoxon signed rank test/McNemar test.P = prospector; A = analyzer; D = defender; R = reactor.
Table 16 Overview of Prior Empirical Findings and Our Research Findings
Prior Logistic Regression
Variables H Research Bivariate Analysis Analysis
No Control Control No Control Control
Strategy and EnvironmentStrategy NFF: prosp. +/ns + ns ns nsExport activity NFF > FF +/ns + + + +Networking NFF > FF + + ns/- + ns/-PEU FF = NFF ns ns ns ns ns
Management Information SystemsPlanning systems NFF > FF +/ns + +/ns +/ns +/nsControl systems NFF > FF + + +/ns ns nsReward systems NFF > FF + + + + +
Profitability and GrowthFirm profitability FF > NFF ns/+ - - - -Firm growth NFF > FF ns/+ ns ns +/- ns
CEO CharacteristicsAge FF > NFF + + + - nsGender FF: female + + + + +Education NFF > FF + + + + +Training NFF > FF + + ns ns nsTenure FF > NFF + + + + +
ns: not significant; + (-): significant difference consistent (in contrast) with the hypothesis (H).

family firms: family firms export less, are less
engaged in formal short-term planning and vari-
able reward systems, and obtain lower profitabil-
ity levels. Further, CEOs of family firms hold lower
educational degrees, enjoy longer tenures, and are
more often female compared to nonfamily firms’
CEOs.
Conclusion
Given methodological concerns raised in the lit-
erature, the aim of this article was to analyze the
impact of not controlling for demographic sample
differences in comparative family/nonfamily busi-
ness research.We were able to illustrate the impact
of this methodological issue on research results by
testing several hypotheses on the differences
between both groups of firms with the use of four
statistical approaches (bivariate and multivariate
analyses with and without control for firm demo-
graphics). The analysis reveals that often-cited
differences with regard to strategy, networking,
long-term planning and control practices, growth,
and management training are due to the different
demographic characteristics of family and non-
family firms. Real differences were only found in
relation to export, formal short-term planning
systems, variable reward systems, and CEO char-
acteristics such as age, education, tenure, and
gender.
The results indicate that it is very important to
control for demographic differences. The choice of
the control approach is of secondary importance
given the fact that the matched-pairs and the con-
trolled multivariate approach very often lead to
similar results.
This study provides evidence that family and
nonfamily firms of a certain size, age, and in the
same industry are not that different with regard to
strategy, networking, perception of the environ-
ment, long-term planning, nonfinancial control,
growth, and management training. For practi-
tioners and consultants these results imply that
more management concepts and techniques are
applicable to family firms than assumed.
References
Allison, P. D. (1999). Logistic regression using the SASsystem. SAS Institute.
Coleman, S., & Carsky, M. (1999). Sources of capital forsmall family-owned businesses: Evidence from theNational Survey of Small Business Finances. FamilyBusiness Review, 12(1), 73–85.
Cromie, S., Stephenson, B., & Monteith, D. (1995). Themanagement of family firms: An empirical investiga-tion. International Small Business Journal, 13(4),11–34.
Daily, C. M., & Dollinger, M. J. (1992). An empiricalexamination of ownership structure in familymanaged and professionally managed firms. FamilyBusiness Review, 5(2), 117–136.
Daily, C. M., & Dollinger, M. J. (1993). Alternativemethodologies for identifying family- versus non-family-managed businesses. Journal of Small Busi-ness Management, 31(2),79–90.
Daily, C. M., & Thompson, S. S. (1994). Ownership structure, strategic posture and firm growth: Anempirical examination. Family Business Review, 7,237–249.
Davis, J. A. (1982). The influence of life stage on father-son work relationships in family companies. Doctoraldissertation, Harvard Business School, cited in Dyer& Handler. (1994). Entrepreneurship and family busi-ness: Exploring the connections. EntrepreneurshipTheory and Practice, 19(1), 71–83.
Davis, P. (1983). Realizing the potential of the familybusiness. Organizational Dynamics, 12, 47–56.
Demetz, H., & Lehn, K. (1985). The structure of corpo-rate ownership: Causes and consequences. Journal ofPolitical Economy, 93, 1155–1184.
Donckels, R., & Fröhlich, E. (1991). Are family busi-nesses really different? European experiences fromSTRATOS. Family Business Review, 4(2), 149–160.
Dyer, W. G. (1994). Potential contributions of organiza-tional behavior to the study of family owned busi-nesses. Family Business Review, 7(2), 109–131.
Jorissen, Laveren, Martens, Reheul
244

Dyer, W., Jr., & Handler, W. G. (1994). Entrepreneurshipand family business: Exploring the connections.Entrepreneurship: Theory and Practice, 19(1), 71–84.
Gallo, M. A. (1995). The role of family business and itsdistinctive characteristic behavior in industrial activ-ity. Family Business Review, 8(2), 83–97.
Gudmundson, D., Hartman, E. A., & Tower, C. B. (1999).Strategic orientation: Differences between family andnonfamily firms. Family Business Review, 12(1),27–39.
Harris, D., Martinez, J. I., & Ward, J. L. (1994). Is strategydifferent for the family-owned business? Family Busi-ness Review, 7(2), 159–174.
Hufft, J. E. M. (1997). Comparison of the ownership and growth of family businesses and small firms.Presented at the 42nd ICSB World Conference. SanFrancisco, CA.
Kets de Vries, M. F. R. (1993). The dynamics of familycontrolled firms: The good and the bad news. Orga-nization Dynamics, 21(3), 59–72.
Lyman, A. R. (1991). Customer service: Does familyownership make a difference? Family BusinessReview, 4(3), 303–324.
Menard, S. (1995). Applied logistic regression analysis.Sage Publications Series: Quantitative Applications inthe Social Sciences. No 106. Thousand Oaks, CA: SagePublications.
McCann, J. E., III, Leon-Guerrero, A. Y., & Haley Jr., J. D.(2001). Strategic goals and practices of innovativefamily businesses. Journal of Small Business Manage-ment, 39(1), 50–59.
Miles, R. E., & Snow, C. C. (1978). Organizational strat-egy, structure and process. New York: McGraw-Hill.
Mishra, C. S., & McConaughy, D. L. (1999). Foundingfamily control and capital structure: The risk of lossof control and the aversion to debt. Entrepreneurship:Theory and Practice, 23(4), 53–64.
Porter, M. (1980). Competitive strategy. Techniques foranalyzing industries and competitors. New York: FreePress.
Reid, R., Morrow, T., Kelly, B., Adams, J., & McCartan, P.(2000). Human resource management practices inSMEs: A comparative analysis of family and non-family businesses. Journal of the Irish Academy ofManagement, 21(2), 157–181.
Risseeuw, P., & Masurel, E. (1994). The role of planningin small firms: Empirical evidence from a serviceindustry. Small Business Economics, 6(4), 313–332.
Smyrnios, K., & Odgers, J. (2002). An exploration ofowner and organizational characteristics, and rela-tional marketing and opportunity search variablesassociated with fast-growth family versus nonfamilyfirms. In Proceedings of the Family Business Network
13th Annual World Conference, Helsinki, Finland (pp.239–256). Lausanne, Switzerland: FBN.
Storey, D. J. (1994). Understanding the small businesssector. London: Routledge.
Teal, E. J., Upton, N., & Seaman, S. L. (2003). A compar-ative analysis of strategic marketing practices ofhigh-growth U.S. family and non-family firms.Journal of Developmental Entrepreneurship, 8(2),177–195.
Ward, J. L. (1987). Keeping the family business healthy.San Francisco, CA: Jossey-Bass.
Ward, J. L. (1988). The special role of strategic planningfor family businesses. Family Business Review, 1(1),105–117.
Westhead, P. (1997). Ambitions, external environmentand strategic factor differences between family and non-family companies. Entrepreneurship andRegional Development, 9(2), 127–158.
Westhead, P., & Cowling, M. (1997). Performance con-trasts between family and non-family unquoted companies in the UK. International Journal of Entre-preneurial Behaviour and Research, 3(1), 30–52.
Westhead, P., & Cowling, M. (1998). Family firmresearch: The need for a methodological rethink.Entrepreneurship: Theory and Practice, 23(1), 31–56.
Williamson, O. E. (1981). The modern corporation:Origins, evolution, attributes. Journal of EconomicLiterature, 19, 1537–1568.
Williamson, O. E. (1996). Transaction cost economicsand the Carnegie connection. Journal of EconomicBehavior and Organization, 31(2), 149–155.
Dr. Jorissen is Professor of Accounting in theDepartment of Accounting and Finance at the Uni-versity of Antwerp, Belgium. Her research interestsfocus on financial reporting and managementaccounting and control systems. Correspondencemay be addressed to University of Antwerp,Department of Accounting and Finance,Prinsstraat 13, B-2000 Antwerp, Belgium; phone:32-3-220-40-92; fax: 32-3-220-40-64; email:[email protected].
Dr. Laveren is Associate Professor of Finance andEntrepreneurship in the Department of Accountingand Finance at the University of Antwerp, Belgium.His research interests include financial manage-ment and growth management of small firms and family businesses. Correspondence may beaddressed to University of Antwerp, Department ofAccounting and Finance, Prinsstraat 13, B-2000Antwerp, Belgium; phone: 32-3-220-40-86; fax: 32-3-220-40-64; email: [email protected].
245
Real Versus Sample-Based Differences in Comparative Family Business Research
Dr. Martens is Professor of Strategic Manage-ment in the Department of Management at theUniversity of Antwerp, Belgium. His research inter-ests include strategic decision-making processes,knowledge management, and competitive strate-gies. Correspondence may be addressed to Univer-sity of Antwerp, Department of Management,Prinsstraat 13, B-2000 Antwerp, Belgium; phone:32-3-275-50-56; fax: 32-3-275-50-84; email:[email protected].
Dr. Reheul is an assistant in accounting for theDepartment of Accounting and Finance at the Uni-
versity of Antwerp, Belgium. Her current researchinterests are contingency research on managementaccounting systems and comparative family/non-family business research. Correspondence may beaddressed to University of Antwerp, Department ofAccounting and Finance, Prinsstraat 13, B-2000Antwerp, Belgium; phone: 32-3-220-40-45; fax: 32-3-220-40-64; email: [email protected].
The authors thank the Fund for ScientificResearch Flanders for its financial assistance(Project Number G.0186.00N).
Jorissen, Laveren, Martens, Reheul
246