
Dr Liliana Oprea HVDC Back-to-Back Interconnections – Enabling reliable integration of power system
Upload
khangminh22Category
view
0download
0
RCEM2017 BACK TO ITALY10th Symposium on River, coastal and estuarine morphodynamicsTrento - PadovaSeptember 15 – 22, 2017
Department of Civil, Environmentaland Mechanical Engineering
DIPARTIMENTO DI INGEGNERIA CIVILE, EDILE E AMBIENTALEDEPARTMENT OF CIVIL, ARCHITECTURAL AND ENVIRONMENTAL ENGINEERING
RC
EM
20
17
Tren
to -
Pado
va
Sept
embe
r 15
- 22,
201
7

RCEM 2017 - Back to Italy
The 10th Symposium on River, Coastal and
Estuarine Morphodynamics
Trento-Padova15-22 September 2017
Book of Abstracts
Edited by:
Stefano Lanzoni, Marco Redolfi
and Guido Zolezzi

All rights reserved. No part of this book may be reproduced in any form, by photostat, micro-form, retrieval system, or any other means, without prior written permission of the editors.Proceedings of the event RCEM2017 10th Symposium on River, Coastal and Estuarine Mor-phodynamics – Trento – Padova 15-22 September 2017/ editors Stefano Lanzoni, Marco Redolfiand Guido Zolezzi
ISBN: 978-88-8443-752-5© 2017 by RCEM2017 Organizing Commitee
II

RCEM 2017 - Back to ItalyThe 10th Symposium on River, Coastal and Estuarine Morphodynamics
Organizing Committee Co-Chairs
Stefano Lanzoni1
Guido Zolezzi2
Local organizing committee
Adami Luca2
Bertoldi Walter2
Carniello Luca1
Chinellato SaraCrestani Elena1
D’Alpaos Andrea3
Defina Andrea1
Ghinassi Massimiliano3
Marani Marco1
Redolfi Marco2
Ruol Piero1
Surian Nicola3
Toffolon Marco2
Tubino Marco2
Viero Daniele Pietro1
Welber Matilde2
Zen Simone2
1 Department of Civil, Environmental and Architectural Engineering, University of Padova,Italy2 Department of Civil Environmental and Mechanical Engineering, University of Trento, Italy3 Department of Geosciences, University of Padova, Italy4 Communication and Events Service, University of Trento, Italy
III

IV

INDEX
This index is organized as follows:
• first, abstract selected for oral contributions and keynotes are listed, following thechronological order of the conference presentations;
• afterwards, abstracts selected for poster presentations are listed, grouped by broadthematic areas, and in alphabetical order by first author within each thematic area.
The broad thematic areas are: “Coasts”, “Estuaries”, “Rivers”, “Tidal environments”.A complete list of all contributors to RCEM 2017 in alphabetical order is reported atthe end of the book.
ORAL PRESENTATIONS
Monday, 18 September
Keynote: Integrating models and data toward a comprehensive characteri-zation of hydro-eco-morpho-dynamics in a system of shallow coastal baysPatricia L. Wiberg 3
COASTAL MORPHODYNAMICS
Shoreline changes along the coast of the Sanquianga Natural Park, Colombian Pa-
cific Ocean
Cuervo G.V. and Castrillon C. 35
A Preliminary Investigation of Spit Dynamics at Pagham Harbour, UKTownend I.H., Scott C.R. and Warken N. 36
Laboratory experiments on the hysteresis of wave-generated ripplesJin C., Coco G. and Tinoco R.O. 37
Formation and destruction events of shoreline sand wavesArriaga J., Falques A. and Ribas F. 38
On sand waves and sandy moundsPorcile G., Blondeaux P. and Vittori G. 39
Vegetation impact on bed morphology: Laboratory studies on arrays of rigidcylinders on a sandy bed under combined flowsTinoco R.O. and Coco G. 40
Linear Stability Analysis of Bed Waves Formed by Turbidity Currents withthe Simple Mixing Length Turbulent ModelIzumi N. and Hagisawa S. 41
Coastal recovery: a numerical investigationLeonardi N., Li X. and Donatelli C. 42
V
BARS AND MIXED SEDIMENT TRANSPORT
Morphodynamics of Downstream Fining in Rivers with a Unimodal Sand-Gravel FeedSyvitski J.P., Cohen S. and Best J.L. 43
Gravel motion and channel evolution due to sand supply to gravel-beds:preliminary resultsMiwa H. and Yamada K. 44
Dynamics of a fine and coarse sediment mixture using a medical CT scanCamenen B., Perret E., Brunelle C.B., Francus P., Des Roches M. and Daigle L.F. 45
Stochastic bedload transport model in mountain streamsAncey C. and Bohorquez P. 46
Bedload Transport and Particle Motion Statistics: Insights from Direct Nu-merical Simulations and Stochastic ModelsGonzalez C., Richter D.H, Bolster D., Calantoni J. and Escauriaza C. 47
Interaction of dunes and bars in lowland riversde Ruijsscher T.V., Naqshband S. and Hoitink A.J.F. 48
Stratigraphic Feedbacks on Alternate Bar MorphologyBrown R.A. and Nelson P.A. 49
Influence of the graded sediment distribution and sediment supply on riverbar patterns and dynamicsCordier F., Tassi P., Claude N., Crosato A., Rodrigues S. and Pham van Bang D. 50
ESTUARIES
The shape of alluvial estuariesSavenije H.H.G. 51
Estuary scale experiments with saltmarsh vegetationLokhorst I.R., van Buiten G., de Lange S.I., Braat L., Leuven J.R.F.W.
and Kleinhans M.G. 52
Finescale turbulence within mangrove root systems: A comparison betweentropical and subtropical environmentsMullarney J.C., Horstman E.M., Bryan K.R., Norris B.K. and Henderson S.M. 53
Scaling of estuary biogeomorphodynamics in the Metronome tidal facilityKleinhans M.G., Braat L., Leuven J.R.F.W. and Lokhorst I.R. 54
Coupling Effects of Unsteady River Discharges and Wave Energy on MouthBar MorphodynamicsGao W., Shao D. and Wang Z.B. 55
VI
Modelling Morphodynamics in Mixed Sediment Environments: Manage-ment of the Morphological Factor Allowing Forcing Variability and ProcessesInside the Sediment, Application to the Seine EstuaryLe Hir P., Lemoine J.-P. and Grasso F. 56
Tidally averaged sediment transport in a semi-enclosed tidal basin: influenceof tidal flatsBoelens T., De Mulder T., Schuttelaars H.M. and Schramkowski G. 57
A modified hydrodynamic of shallow tidal systems may temporarily slowdown the local sea level rise facilitating the survival of salt marshesSilvestri S., D’Alpaos A. and Cainello L. 58
MEANDERING AND BEDROCK MORPHODYNAMICS
Interactions between Hydrodynamics, Bed Morphodynamics and Bank Ero-sion on a Low Sinuosity Meander Bend: Goodwin Creek, MississippiLangendoen E.J., Ursic M.E., Mendoza A., Abad J.D., Ata R., El kadi Abderrezzak K. andTassi P. 59
Effects of Systematic Variation of Width, Bank Properties and DownstreamSediment Routing on Meander Evolution using Linearized ModelsHoward A.D., Bryk A.B. and Dietrich W.E. 60
Width variation meandering evolution with a Physic Mathematical and Sta-tistical based modelLopez Dubon S., Viero D., Bogoni D. and Lanzoni S. 61
Using time-lapse LiDAR to quantify river bend change on the coastal TrinityRiver, TXMason J. and Mohrig D. 62
Experimental Study of Bedrock Degradation in Annular Flume FlowTaguchi S., Ozawa H., Lima A.C. and Izumi N. 63
Tracing Bank Erosion in a Mixed Bedrock-Alluvial MeanderInoue T., Mishra J. and Shimizu Y. 64
Morphodynamics of bedrock canyons carved by megafloodsLamb M.P., Lapotre M.G.A., Larsen I.J. and Williams R.M.E. 65
Dynamics of migrating alternate bars in large meandering rivers: combiningremote sensing and theoretical approachesMonegaglia F., Tubino M. and Zolezzi G. 66
Keynote: Shining New Light, Literally, on River MorphodynamicsJames Brasington 5
VII
Tuesday, 19 September
Keynote: Connectivity in river deltas: Observations, modeling, and implications tocoastal resiliencePaola Passalacqua 9
DELTAS
On the Exceptional Sediment Load of the Huanghe (Yellow River), and its Capacity
to Produce Subaerial Deltaic Landscape
Nittrouer J.A., Ma H., Carlson B., Moodie A. and Parker G. 67
Congruent Bifurcation Angles in River Delta and Tributary Channel Net-worksShaw J.B., Coffey T. and Ke W. 68
Geomorphology of scour holes at tidal channel confluenceFerrarin C., Mardricardo F.M., Rizzetto F., Mc Kiver W., Bellafiore D., Umgiesser G., Kruss
A., Foglini F. and Trincardi F. 69
Delta Morphodynamics: Coupling River Avulsions, Coastal Sediment Trans-port, and Sea-Level RiseMurray A.B., Ratliff K. and Hutton E. 70
NOVEL TRENDS IN MORPHODYNAMICS
Evidence of River Morphodynamics on Mars: observations in Gale Craterwith the Curiosity RoverDietrich W.E. 71
Rivers under temperate valley glaciers: does sediment transport matter?Lane S.N., Egli P., Ruttiman S., Perolo P., Irving J., Mankoff K. and Rennie C.D. 72
Do we need thermal-dynamic transport models?Syvitski J.P., Cohen S. and Best J.L. 73
Sediment bed stability re-distributed by bacterial biofilmsChen X.D., Zhang C.K., Gong Z., Zhou Z. and Feng Q. 74
ECOMORPHODYNAMICS
Eco-Morphodynamics for Environmental Water Allocation in Non-PerennialRivers: Challenges and OpportunitiesGrenfell M.C. 75
A mechanism of seeds dispersion and its effects on bed morphodynamicsKyuka T., Yamaguchi S., Watanabe K. and Shimizu Y. 76
VIII

A Simple Dynamic Model for Describing the Effects of Plant Root Systemson River MorphodynamicsCaponi F., Siviglia A. and Boes R.M. 77
Experimental investigations on riparian vegetation uprootingCalvani G., Francalanci S., Solari L. and Gumiero B. 78
Morphological effects of plant colonization of near-bank barsVargas-Luna A., Duro G., Crosato A. and Uijttewaal W.S.J. 79
Secondary instability of vegetated patterns in river bedsBertagni M.B., Perona P. and Camporeale C. 80
Numerical modelling of bio-morphodynamics in braided rivers: applicationsto a laboratory test configurationStecca G., Fedrizzi D., Hicks M., Measures R.J., Zolezzi G., Bertoldi W. and Tal M. 81
Temporal-spatial variation of sediment and vegetation on sand and gravelbeach located between inner bay and open seaUno K., Nakanishi H., Tujimoto G. and Kakinoki T. 82
Keynote: Small-scale process as driver of large-scale dynamics in coastalvegetation: an ecologist view on biogeomorphologyTjeerd J. Bouma 13
Keynote: The thin blue line: shoreline dynamics as a unifying theme acrosstime and across disciplinesChris Paola 17
Wednesday, 20 September
Keynote: Effect of sediment sorting on river morphologyHiroshi Takebayashi 19
TIDAL MORPHODYNAMICS
Resilience signatures reveal tipping elements in tidal marshes
van Belzen J., van de Koppel J., van der Wal D., Herman P.M.J. and Bouma T.J. 83
On the initial formation and long-term equilibrium of tidal channelsXu F., Coco G., Tao J., Zhou Z. and Zhang C. 84
Physical Modelling of Tidal Network Evolution: the influence of Tide Asym-metryGong Z., Geng L., Zhang C., Lanzoni S. and D’Alpaos A. 85
Impact of bended channels on tidal inlet migration: a modelling studyBertin X., Guerin T. and de Bakker A. 86
Modeling the role of storms on tidal flat sorting dynamicsZhou Z., Xu M., Zhang C.K. and Coco G. 87
Tidal point bar sedimentation: modern and ancient examplesGhinassi M., D’Alpaos A., Oms O. and Fondevilla V. 88
IX

Towards ecosystem-based coastal defence: How bio-physical interactions de-termine wave and storm surge protection by tidal marshesTemmerman S., Silinski A., Heuner M., Schoutens K., Stark J., Meire P. and Troch P. 89
Morphodynamic equilibria of double inlet systemsMeerman C., Olabarrieta M., Rottschaffer V., Valle Levinson A. and Schuttelaars H.M. 90
BIFURCATIONS-BRAIDING
The incipient development of topographic expansionsTambroni N., Seminara G. and Paola C. 91
How do Alpine braided rivers respond to sediment-laden flow events?Bakker M., Antoniazza G., Costa A., Silva T.A.A., Stutenbecker L., Girardclos S. and Loizeau
J.L. 92
Free and forced morphodynamics of river bifurcations: a novel theoreticalframeworkRedolfi M., Zolezzi G., Tubino M. and Bertoldi W. 93
A gravel-sand bifurcation: a simple model and the stability of the equilib-rium statesSchielen R.M.J. and Blom A. 94
NUMERICAL AND PHYSICAL MODELLING
MORSPEED: a new concept for the speedup of morphological simulationsCarraro F., Siviglia A., Vanzo D., Caleffi V. and Valiani A. 95
Numerical Modeling of Morphodynamics at Diversions: assessing the levelof complexity required for capturing the inherent physicsDutta S., Tassi P., Fischer P., Wang D. and Garcia M.H. 96
Laboratory study on bedforms generated by solitary wavesLa Forgia G., Adduce C., Falcini F. and Paola C. 97
Issues in Laboratory Experiments of River MorphodynamicsCrosato A. 98
Keynote: Wave-forced sediment dynamics in the nearshore and estuariesMaurizio Brocchini 23
Keynote: Twenty years after RCEM 1999Paolo Blondeaux 25
X

Thursday, 21 September
River, Coastal and Estuarine Morphodynamic change due to Earthquakes. Canter-
bury, New Zealand examples
Smart G. 99
Keynote: Some morphodynamics of atolls, reef flats, and the islands atopthemAndrew Ashton 29
POSTER PRESENTATIONS
COASTS
Modelling And Tracing of a Sub-Sea robot Geometry in Deep Caspian Seausing Neuro-fuzzy systems And Genetic AlgorithmsAlaeipour A., Harounabadi A. and Morovvati H. 100
Sensitivity of foreland cuspate migration to wave climateBarkwith A., Hurst M.D., Payo A. and Ellis M.A. 101
Shoreline Dynamics Under the Presence of a Rip-Channel SystemCalvete D., Kakeh N. and Falques A. 102
A methodological regional approach for bed-load yield extimation to rivermouths along the Emilia-Romagna coastCilli S., Billi P., Ciavola P. and Schippa L. 103
The role of oblique wave incidence on crescentic bar dynamicsde Swart R.L., Ribas F. and Calvete D. 104
Groin effects on artificial nourishments performance: Laboratory testsGuimaraes A., Coelho C., Veloso-Gomes F. and Silva P.A. 105
Channel sedimentation causing by grouping waves and wind waves at thefishing port, JapanHorie T., Sasaki T., Nozaka Y., Kawamori A. and Tanaka H. 106
Linear Stability Analysis of Bed Waves Formed by Turbidity Currents withthe Simple Mixing Length Turbulent ModelIzumi N. and Hagisawa S. 107
Coupled topographic and vegetation patterns in coastal dunes from remotesensingLalimi F.Y., Silvestri S., Moore L.J. and Marani M. 108
A mechanism for long-runout turbidity currentsLuchi R., Balachandar S., Seminara G. and Parker G. 109
A new shoreline instability mechanism related to high-angle wavesKakeh N., Falques A. and Calvete D. 110
Laboratory study on bedforms generated by solitary wavesLa Forgia G., Adduce C., Falcini F. and Paola C. 111
XI
Numerical simulation of dredging and sediment disposal in fluvial and coastalareasLouyot M., Glander B., Kopmann R., Tassi P. and Brivois O. 112
Modelling multi-bar system at decadal scaleMarinho B., Larson M., Coelho C. and Hanson H. 113
Coastal Eco-morphological Real-time Forecasting tool to predict hydrody-namic, sediment and nutrient dynamic in Coastal LouisianaMessina F., Meselhe E., Twight D. and Buckman L. 114
Response of engineered beaches to sequences of stormsMusumeci R.E., Stancanelli L.M., Romano A., Besio G. and Briganti R. 115
Understanding the Primary Drivers of Atoll Morphometrics on a GlobalScaleOrtiz A.C. 116
Circulation and fine sediment transport patterns in the Montevideo BaySantoro P., Fossati M., Tassi P., Huybrechts N., Pham van Bang D. and Piedra-Cueva I. 117
Emergence of complex behaviour of marine natural processes: engineeringand environmental implicationsSchinaia S.A. 118
Experimental investigation of subaqueous sediment density flowsSfouni-Grigoriadou M., Juez C., Spinewine B. and Granca M. 119
Channeling regimes in cohesive coastal sedimentsTsakiris A.G., Papanicolaou A.N. and Mooneyham C.D. 120
Evolution of sand banks in the fully-nonlinear regimeVittori G. and Blondeaux P. 121
ESTUARIES
Morphological evolution of estuary mouths with wave-current interactionsmodelled over centuriesAlbernaz M.B., Braat L., de Haas T., van der Spek A.J.F. and Kleinhans M.G. 122
Suspended sediment transport and concentration in the delta area of theMagdalena river based on USP-61 and ADCP measurementsAvila H. and Amaris G. 123
Velocity profile and stratigraphy analisys in experimental prograding deltasBateman A., Medina V. and Galera D. 124
Flow regime changes in Vietnamese Mekong Delta due to river-dammingBinh D.V., Kantoush S., Sumi T., Mai N.T.P., Ata R., El kadi Abderrezzak K. and Trung L.V.
125
Cohesive sediment in scale-experiments of estuariesBraat L., Leuven J.R.F.W. and Kleinhans M.G. 126
XII
Large-scale river and estuary modeling with mud and vegetationBruckner M.Z.M., Lokhorst I.R., Selakovic S., van Oorschot M., de Vries B.M.L., Braat L. and
Kleinhans M.G. 127
Avulsion frequency on backwater-influenced deltas with relative sea-levelriseChadwick A.J. 128
Using pacific oyster Crassostrea gigas for sediment stabilization: how theireffectiveness depends on biological and environmental settingde Paiva J.S., Walles B., Ysebaert T. and Bouma T.J. 129
What internal length scale determines the tidal bar length in estuaries?Hepkema T.M., de Swart H.E. and Schuttelaars H.M. 130
Do distributaries in a delta plain resemble an ideal estuary? Results fromthe Kapuas Delta, IndonesiaKastner K., Hoitink A.J.F., Geertsema T.J. and Vermeulen B. 131
Cyclic behavior of ebb-tidal deltas from model simulations: the role of wavesand tidesLenstra K.J.H., Ridderinkhof W. and van der Vegt M. 132
Ebb- and flood tidal channels in scale-experiments of estuariesLeuven J.R.F.W., Braat L., van Dijk W.M. and Kleinhans M.G. 133
Formation of Islands on Deltas from Radially Symmetric Flow ExpansionMcElroy B.J., Shaw J.B. and Miller K. 134
Ecologic and Morphologic Analysis of a Proposed Network of Sediment Di-versionsMeselhe E., Sadid K., Jung H., Messina F., Esposito C. and Liang M. 135
What makes a delta tide-dominated?Nienhuis J.H., Tornqvist T.E. and Hoitink A.J.F. 136
Descriptions of field measurements for bedforms under combined flow atGediz and B. Menderes river mouthsOguz Kaboglu S., Kisacik D. and Kaboglu G. 137
Importance and Challenges of Calculating Initial Sediment Distribution forSediment- and Morphodynamic Modelling in EstuariesPluss A. 138
Characterizing morphological process connectivity in a river delta using in-formation theorySendrowsky A., Passalacqua P., Sadid K. and Meselhe E. 139
Satellite Retrieval and Numerical Modeling of Sediment Dynamics in theYongjiang Estuary, ChinaTao J., Kuai Y. and Kang Y. 140
Modeling Morphological Changes due to Multiple Typhoons in the DanshuiRiver EstuaryTung-Chou H., Keh-Chia Y. and Yan D. 141
XIII
The influence of shoal margin collapses on the morphodynamics of the West-ern scheldt Estuaryvan Dijk W.M. and Kleinhans M.G. 142
Spin-up phenomenon in morphodynamic modellingWang Z.B. and van der Werf J. 143
Modeling the impact of spatially-variable vegetation on hydrological connec-tivity in river deltasWright K., Hiatt M. and Passalacqua P. 144
Field Observations of Short-term Sediment Dynamic Processes on IntertidalZone of Jiangsu Coast, ChinaXu B., Gong Z., Zhang Q., Zhou J., Zhou Z. and Zhang C. 145
Analysis of channel deposition and erosion in Yongjiang River, ChinaZhang Q. 146
RIVERS
Contrasting alternate bar patterns under sub- and super-resonant morpho-dynamic regimes in the Alpine Rhine riverAdami L., Zolezzi G. and Bertoldi W. 147
Discharge measurment and analysis of flow resistance at large-scale floodAkiyama Y., Sasaki Y., Hashiba M. and Yorozuya A. 148
Bankfull paleodepth scaling from clinoforms: a unique dataset from thesandy, braided Missouri National Recreational River, USAAlexander J.S., McElroy B.J. and Murr M.L. 149
Temporal variability of deposition and erosion in a strongly regulated reser-voir of the upper Rhine RiverAntoine G., Henault F., Le-Brun M. and Clutier A. 150
A space-marching model to assess the morphodynamic equilibrium behaviourin a river’s backwater dominated reachesArkesteijn L., Labeur R.J. and Blom A. 151
Sediment transport in vegetated channel: the case of submerged vegetation.Armanini A. and Nucci E. 152
Numerical modeling of meandering migration including the effect of slumpblocks in river bank erosionArnez K., Kimura I., Patsinghasanee S. and Shimizu Y. 153
Sediment transport processes on transverse bed slopesBaar A.W., Weisscher S.A.H., Uijttewaal W.S.J. and Kleinhans M.G. 154
Hydrologic control on the root growth of Salix cuttings at the laboratoryscaleBau V., Calliari B. and Perona P. 155
XIV
Study of the 3D flow patterns developed in a bend near a bifurcation inMezcalapa River, MexicoBerezowsky M., Rivera F., Soto G. and Mendoza A. 156
River restoration: a strategy to flush fine clogged sediments?Berni C., Herrero A., Perret E., Buffet A., Thollet F. and Camenen B. 157
The dynamics of a gravel-sand transitionBlom A., Chavarrıas V. and Viparelli E. 158
Numerical modeling of meander morphodynamics affected by internal bound-ary conditionsBogoni M., Nittrouer J.A., Cantelli A. and Lanzoni S. 159
Sediment transport study for rough sand bed using CT scan and PIV mea-surementsBrunelle C.B., Francus P., Des Roches M., Daigle L.F., Perret E. and Camenen B. 160
The sand dunes of the Colorado River, Grand Canyon, USABuscombe D., Kaplinski M., Grams P.E., Ashley T., McElroy B.J. and Rubin D.M. 161
Contemporaneity between floods and storms: the case study of the provinceof Reggio Calabria (Italy)Canale C., Barbaro G., Foti G. and Puntorieri P. 162
Low-energy stream morphodynamicsCandel J.H.J., Makaske B., Storms J.E. A., Kamstra B.R.W., Kijm N. and Wallinga J. 163
Basin-scale temporal evolution of the discharge and angular momentum ra-tios at confluences: The case of the Upper-Rhone watershedCardot R., Moradi G., Fatichi S., Molnar P., Mettra F. and Lane S.N. 164
Field-based gravel fluxes measurements in a wandering river to assess sedi-ment mobility downstream a dam (Durance River, Southern French Alps)Chapuis M., Legreve K., Kateb L., Dufour S., Couvert B., Doddoli C. and Provansal M. 165
A strategy to avoid ill-posedness in mixed sediment morphodynamicsChavarrıas V., Stecca G., Labeur R.J. and Blom A. 166
Limiting the development of riparian vegetation in the Isere River: a phys-ical and numerical modelling studyClaude N., El kadi Abderrezzak K., Duclercq M., Tassi P. and Leroux C. 167
Sorting waves in heterogeneous sediment mixturesColombini M. and Carbonari C. 168
Bedload tranport rate fluctuations in a flume with alternate bars understeady state conditionsDhont B. and Ancey C. 169
Cohesive bank erosion processes identified from UAV imagery during an ex-ceptional low water level eventDuro G., Crosato A., Kleinhans M.G. and Uijttewaal W.S.J. 170
XV
Comparision of Flow and Sediment Transport between a Symmetric andAsymmetric Bifurcation: searching for Bulle-Effect at assymetric bifurca-tionsDutta S., Fischer P. and Garcia M.H. 171
The Response of Braiding Intensity to Varying DiscahrgeEgozi R. and Ashmore P. 172
Dam-break flow over mobile bed: detailed velocity field measurementsFent I. and Soares-Frazao S. 173
Quadrant analysis of high-turbulent flowsFernandez C., Bateman A. and Medina V. 174
Velocity estimation of high-concentrated flows: sensitivity analysis withmain parameters included in the Bagnold equationFichera A., Termini D. and Castelli F. 175
Equilibrium width for sand and gravel bed rivers with cohesive erodiblebanksFrancalanci S., Lanzoni S., Solari L. and Papanicolaou A.N. 176
Dam-break induced sediment transport in a channel with a 90° bendFranzini F., Abou-Habib M., Michaux J. and Soares-Frazao S. 177
Long term effects of water mills on the longitudinal river profile and thetrapping efficiency of floodplainsFrings R.M., Maaß A.L., Schuttrumpf H. and Blom A. 178
Effect of cross-channel variation on the uncertainty of bed-load measure-ments: Universal guidelines for sampling bed-load in sand- and gravel-bedriversFrings R.M. and Vollmer S. 179
Backwater development by wood in lowland streamsGeertsema T.J., Torfs P.J.J.F., Teuling A.J., Eekhout J.P.C. and Hoitink A.J.F. 180
Bedload Transport and Particle Motion Statistics: Insights from Direct Nu-merical Simulations and Stochastic ModelsGonzalez C., Richter D.H, Bolster D., Calantoni J. and Escauriaza C. 181
Multiscale challenges in bio-geomorphic modeling of tidal marshesGourgue O., van Belzen J., Schwarz C., Bouma T.J., van de Koppel J., Meire P. and Temmer-
man S. 182
Sand Pulses and Sand Patches on the Colorado River in Grand CanyonGrams P.E., Buscombe D., Topping D.J. and Mueller E.R. 183
Morphological influences on grain-scale roughness across a gravel bar in afluvial environmentGroom J. and Friedrich H. 184
Encontro das Aguas, Manaus, Brazil: Twenty years laterGualtieri C., Ianniruberto M., Filizola N., Laraque A. and Best J.L. 185
XVI
Bed Load transport of sediment mixtures in laboratory flume: Synchronizedmeasuring with ADCP and Digital CameraGuerrero M., Conevski S., Bombardier J., Ruther N. and Rennie C.D. 186
Bedforms-ATM, a free software aimed to standardize the analysis of bed-formsGutierrez R.R., Mallma J.A., Abad J.D. and Nunez-Gonzalez F. 187
River morphology and river regime alteration after dam construction in theKor River, Sothern IranHaghighi A.T., Yilmaz N., Darabi H. and Kløve B. 188
On the sediment scour-deposition mechanism around a new structure formanagement of river bend bank erosionHajibehzad M.S. and Shafai Bajestan M. 189
Influence of riverbed deformation on flood flow in the Omoto river flooddisaster 2016, JapanHarada D., Egashira S., Yorozuya A. and Iwami Y. 190
Setting the Stage for Levee Building ProcessesHassenruck-Gudipati H.J., Mohrig D. and Passalacqua P. 191
Initiated Natural Bank Erosion for River Bed Stabilization, Prediction andRealityHengl M. 192
Insight gained from Principal Component Analysis in the analysis of rivermorphodynamics and associated sediment fluxesHeyman J., Dhont B., Ancey C. and Lague D. 193
Influence of bed-load transport on the stability of step-pool systemsHohernuth B. and Weitbrecht V. 194
Estimation of Riverbed Deformation by Assimilating Water-Level and Dis-charge Data into Quasi-2D Fixed Bed Hydraulic ModelHoshino T. and Yasuda H. 195
Coastal System Resiliance Under Increased StorminessHouseago R.C., Parsons D.R. and McLelland S. 196
Development and application of real-time scour monitoring techniques ingravel-bed riverHsu S., Chang Y., Sun C. and Hung P. 197
Operational monitoring of turbidity in rivers - Validation of remote sensingdataHucke D., Hillebrand G., Bascheck B. and Winterscheid A. 198
Damping Effect of Growth of Alternate Bars by Regularly Arranging Struc-tures along both Side Walls in Constant-width Straight ChannelIgarashi T., Hoshino T., Tonegawa A. and Yasuda H. 199
Morphological evolution of an artificial spawning pad: Field monitoring andnumerical modelingJodeau M., Besmier A.L. and Vandewalle F. 200
XVII
Morphodynamics of the Mezcalapa Bifurcation, in Tabasco, MexicoJoselina E.A., Jose Alfredo G.V. and Jorge B.Z. 201
Impact of flow fluctuations on suspended transport under the presence oflateral embaymentsJuez C., Thalmann M., Schleiss A.J. and Franca M.J. 202
Studies on Weak Secondary Flows in Sharply Curved Bends Using 3D CFDModelKang T., Kimura I. and Shimizu Y. 203
Linking Fluvial and Aeolian Morphodynamics in the Grand Canyon, USAKasprak A., Bangen S., Buscombe D., Caster J., East A., Grams P.E. and Sankey J. 204
Crystalline Travertine Ripple Bedforms in Ancient Rome’s AqueductsKeenan-Jones D., Motta D., Shosted R.K., Perillo M., Garcia M.H. and Fouke B. 205
Sediment yield estimation in the Upper Kebir catchment, northeast of Al-geriaKhanchoul K. and Tourki M. 206
Numerical modeling of sediment deposition around a finite patch of emer-gent vegetationKim H.S., Kimura I., Park M. and Choi J. 207
Study on Bed Variation at a River Confluence Associated with the BarrageWaterKubo H., Takata S., Okamoto Y., Kanda K. and Michioku K. 208
Influence of Flow Resistance Change on Hydrographs in a BasinKudo S., Yorozuya A., Harada D. and Fueta T. 209
1D-numerical modelling of suspended sediment dynamics in a regulated riverLaunay M., Dugue V., Le Coz J. and Camenen B. 210
Fine sediment transport dynamics in a heavily urbanised UK river system:a challenge for the ’First-Flush’ modelLawler D. and Wilkes M. 211
Stability of parallel river channels created by a longitudinal training wallLe T.B., Crosato A. and Uijttewaal W.S.J. 212
Study on bedrock river migration and stable countermeasures in the reachof bridgeLiao C.T., Yeh K.C., Jhong R.K. and Li K.W. 213
Alluvial point bars above a simulated bedrock in annular flume flowLima A.C., Taguchi S., Ozawa H. and Izumi N. 214
Hydraulic evaluation of longitudinal training damsLinge B.W., van Vuren S., Rongen G.W.F., Mosselman E. and Uijttewaal W.S.J. 215
3D Morphodynamic Modeling of River Bends in the Lower Mississippi RiverLu Q., Kurum O. and Nairn R.B. 216
Morphological effects of a large flood in a step-pool Andean streamMao L. and Carrillo R. 217
XVIII
Distribution of grain-related parameters in collisional transport layer of in-tense bed loadMatousek V., Zrostlık S., Fraccarollo L., Prati A. and Larcher M. 218
Evaluation of streamflow in Pastora Meander bend with semipermeablebendway weirsMelendez M., Abad J.D. and Cabrera J. 219
Migration of meandering rivers junction modeled numericallyMendoza A., Abad J.D., Li Z. and Arroyo-Gomez M. 220
Stationary alternate bars from theoryMewis P. 221
SAR remote sensing of river morphodynamic on a monthly basisMitidieri F., Papa M.P., Amitrano D. and Ruello P. 222
A 2 Dimensional Study and Comparision of Migration and Skewness in Al-luvial and Bedrock MeandersMishra J., Inoue T. and Shimizu Y. 223
Flow structure at low momentum ratio river confluencesMoradi G., Rennie C.D., Cardot R., Mettra F. and Lane S.N. 224
The combined effects of local slope and pressure gradient on bed instabilityMorales R.B. and Izumi N. 225
Estimation of sediment yield using RUSLE in JapanMorita K. and Udo K. 226
Theoretical bifurcation stability for rivers with adjusting widthsMosselman E. 227
Effects of dam construction on the Ribb River bed topographyMulatu C.A. and Crosato A. 228
River dune morphodynamics at the grain scaleNaqshband S., Hoitink A.J.F. and McElroy B.J. 229
Numerical experiments on the effect of channel curvature and unsteady flowon bed morphology and bed-surface sortingNelson P.A. and Brown R.A. 230
Role of Grainsize Sorting in the Long-term Morphodynamics of Sedimen-tary SystemsNones M. and Di Silvio G. 231
Discharge and Sediment: Dominating factors influencing the path of river -A Case study on Otofuke River in JapanOkabe K., Mishra J., Shimizu Y., Hasegawa K., Shinjo K., Muranaka T. and Sumitomo H. 232
Insights on Morphological Patterns at River ContractionsOliveto G. 233
Equilibrium scour morphology downstream of rock sills under unsteady flowconditionsPagliara S. and Palermo M. 234
XIX
Hydraulic jump in curved rivers: analysis of the dissipative processPalermo M. and Pagliara S. 235
Bed Instability with the Effect of Density StratificationPen S., Izumi N. and Lima A.C. 236
Quantifying the active channel dynamics in gravel bed rivers: a laboratoryinvestigationRedolfi M., Bertoldi W. and Tubino M. 237
Impact of the Weir Geesthacht on bedload transport of the River Elbe be-tween Neu Darchau and HamburgRiedel A., Reiss M. and Winterscheid A. 238
Vegetation generated turbulence and 3D coherent structures on oscillatoryflows through aquatic vegetationSan Juan J. and Tinoco R.O. 239
Experimental investigations on free surface steady dry granular flowsSarno L., Papa M.P. and Carleo L. 240
A flume study on the effects of flow depth on local scour and deposition atsubmerged obstaclesSchloemer H. and Herget J. 241
Effects of grain size and supply rate on the transition between external andinternal clogging of immobile gravel beds with sandSchruff T., Schuttrumpf H. and Frings R.M. 242
Combining analytical theories and aerial image analysis to investigate of al-ternate bars in the channelized Isere river, SE FranceSerlet A., Zolezzi G. and Gurnell A. 243
Experimental evidence for climate-driven knickpoints on an evolving land-scapeSingh A., Tejedor A., Grimaud J. and Foufoula-Georgiou E. 244
Downstream morphological effects of sediment bypass tunnel operations: a1D numerical studySiviglia A., Facchini M. and Boes R.M. 245
Sand movement in bed-rock channels impacted by damsSloff K.J. and Lighthart D. 246
Evolution of a river bifurcation formed in a postglacial area: implicationsfor river restoration and flood protectionS lowik M. 247
Porosity Measurement of Gravel-Sand Mixtures using 3D PhotogrammetryTabesh M., Frings R.M. and Schuttrumpf H. 248
Longitudinal dispersion in straight alluvial riversTambroni N., Ferdousi A. and Lanzoni S. 249
Channel and floodplain evolution in the Tapuaeroa River, East Cape, NZTunnicliffe J. 250
XX

Investigation of sediment supply effects on pool-riffle self-maintenance mech-anismsVahidi E., Bayat E., Rodrıguez J.F. and Saco P. 251
Mechanisms for sediment fining in a side channel systemvan Denderen R.P., Schielen R.M.J. and Hulscher S.J.M.H. 252
The Role of Numerical Diffusion in River Alternate Bar SimulationsVanzo D., Adami L., Siviglia A., Zolezzi G. and Vetsch D.F. 253
Estimates of bedload transport capacities and its relative controls on a reach-by-reach basis along the Rhone river, FranceVazquez-Tarrıo D., Tal M., Camenen B. and Piegay H. 254
Quantifying shape and multiscale structure of meanders with waveletsVermeulen B., Hoitink A.J.F., Zolezzi G., Abad J.D. and Aalto R. 255
Stochastic bar stability analysisVesipa R., Camporeale C. and Ridolfi L. 256
Experimental investigation of braided river bed-elevation dynamicsVesipa R., Camporeale C. and Ridolfi L. 257
Morphological Response to Sediment Replenishment in Confined Meander-ing RiversVetsch D.F., Vonwiller L., Vanzo D. and Siviglia A. 258
Response of Free Migrating Bars to Sediment Supply ReductionVonwiller L., Vanzo D., Siviglia A., Zolezzi G., Vetsch D.F. and Boes R.M. 259
Hydraulic Experiments on Influence of Bank Height to the Relationship be-tween Bank Erosion and Bar DevelopmentWatanabe Y., Yamaguchi S., Kawakami M. and Kon N. 260
Translational Bank Migration Rate in Non-Cohesive Bank Materials Mobi-lized as Bedload in Bends of Low to Moderate CurvatureWaterman D.M. and Garcia M.H. 261
Sediment cover dynamics in semi-alluvial urban channelsWelber M. and Ashmore P. 262
Determination of stable channel for a bedrock erosion river reach in TaiwanWu K, Yeh K.C., Liao C.T. and Hsieh T.C. 263
Modeling Kayak Surfing Waves using Structure-from-Motion and Compu-tational Fluid DynamicsXu Y., Smithgall K.R. and Liu X. 264
Survey and Experiment of Knickpoint Migration Caused by Gravels Trans-ported from UpstreamYamaguchi S., Inoue T., Maeda I., Sato D. and Shimizu Y. 265
Experiments on the influence of sediment supply by the bank erosion tochannel plane formYamaguchi S., Watanabe Y., Takebayashi H. and Kyuka T. 266
XXI
Analysis on Morphodynamics and Evolution of Bed Forms in the OrinocoRiverYepez S., Castellanos B., Christophoul F., Gualtieri C., Lopez J.L. and Laraque A. 267
Relationship between Precipitation, River Flow and Its Turbidity: Fine-Structure of Water and Turbidity Data at an Upper-most ReachYokoo Y. and Udo K. 268
Study on Sediment Runoff in a Catchment AreaYorozuya A., Egashira S. and Fueta T. 269
Qualitative Characterization of Gravel Clusters in an Ephemeral River: aCase Study on Kordan RiverZarei M., Mohajeri S.H. and Samadi A. 270
Quantifying the effect of valley confinements on the long-term evolution ofmeandering riversZen S., Bogoni M., Zolezzi G. and Lanzoni S. 271
Experimental study on individual step-pool stabilityZhang C., Li Z., Xu M. and Wang Z. 272
Effect of bimodal bed load segregation on velocity distribution in transportlayer at high bed shearZrostlık S. and Matousek V. 273
TIDAL ENVIRONMENTS
Tidal network morphology: unravelling the potential role of the marsh geo-morphic settingBelliard J.-P., Temmerman S., Carniello L. and Toffolon M. 274
A modified hydrodynamic of shallow tidal systems may temporarily slowdown the local sea level rise facilitating the survival of salt marshesBoelens T., De Mulder T., Schuttelaars H.M. and Schramkowski G. 275
Tidal propagation across a muddy mangrove forest in the Firth of Thames,New ZealandBryan K.R., Haughey R., Horstman E.M. and Mullarney J.C. 276
Morphodynamic evolution and stratal architercure of tidal channels in theVenice LagoonD’Alpaos A., Ghinassi M., Merlo G., Finotello A., Roner M. and Rinaldo A. 277
Morphodynamics of ebb-delta sandbars at a mixed-energy tidal inletde Bakker A., Guerin T. and Bertin X. 278
The Inhomogeneous Impact of Low-water Storms on Intertidal Flatsde Vet P.L.M., van Prooijen B.C., Walles B., Ysebaert T., Schrijver M.C. and Wang Z.B. 279
Morphodynamic Modelling of the Inlet Closure of the Albufeira LagoonDodet G., Guerin T., Bertin X. and Fortunato A.B. 280
XXII
Tidal asymmetries, lateral tributaries and overtides: implication for tidalmeander morphodynamicsFinotello A., Canestrelli A., Carniello L., Brivio L., Ghinassi M. and D’Alpaos A. 281
Benthic morphologies and sediment distribution in a shallow highly humanimpacted tidal inletFogarin S., Madricardo F., Zaggia L., Ferrarin C., Kruss A., Lorenzetti G., Manfe G., Monte-
reale Gavazzi G., Sigovini M. and Trincardi F. 282
Applying geospatial models to investigate the impact of sea level rise oncoastal wetland ecosystems: a comparison of two climatically contrastingwetlandsGrenfell S.E., Callaway R.M. and Fortune F. 283
Impacts of bed slope factor on large scale fluvio-deltaic morphodynamic de-velopmentGuo L., He Q., Zhu C. and Wang Z.B. 284
Scour hole development in tidal areas with a heterogenous subsoil lithologyKoopmans H., Huismans Y. and Uijttewaal W.S.J. 285
Autogenic Cohesivity: Modeling Vegetation Effects on Delta Morphologyand Channel Network CharacteristicsLauzon R., Murray A.B., Piliouras A. and Kim W. 286
The pervasive human impacts on the tidal channel seafloor of the VeniceLagoonMadricardo F., Ferrarin C., Rizzetto F., Sigovini M., Foglini F., Sarretta A., Trincardi F. and
the ISMAR Team 287
Processes creating and maintaining non-estuarine river-mouth lagoons (ha-pua)Measures R.J., Cochrane T.A., Hart D.E. and Hicks M. 288
Salt marsh retreat mechanism at different time scalesMel R., Bendoni M., Steffinlongo D., Solari L. and Lanzoni S. 289
Water and soil temperature dynamic in very shallow tidal environments: therole of the heat flux at the soil-water interfacePivato M., Carniello L., Gardner J., Silvestri S. and Marani M. 290
What drives salt-marsh retreat?Roner M., Tommasini L., Ghinassi M., Finotello A. and D’Alpaos A. 291
Modelling the plano-altimetric equilibrium morphology of tidal channels:interplay between sediment supply, sea-level rise, and vegetation growthSgarabotto A., D’Alpaos A. and Lanzoni S. 292
Modelling changes in the wind-wave field within the Venice Lagoon in thelast four centuriesTommasini L., Carniello L., Roner M., Ghinassi M. and D’Alpaos A. 293
Do algae boost landscape formation?van de Vijsel R.C., van Belzen J., Bouma T.J., van der Wal D. and van de Koppel J. 294
XXIII

Modeling tidal morphodynamics at the channel-mudflat interfacevan der Wegen M., de Vet L., Zhou Z., Coco G. and Jaffe B. 295
On the initial formation and long-term equilibrium of tidal channelsXu F., Coco G., Tao J., Zhou Z. and Zhang C. 296
Characteristics and evolution of ebb-dominated creeksZarzuelo C., D’Alpaos A., Carniello L., Lopez-Ruiz A. and Ortega-Sanchez M. 297
XXIV

KEYNOTE SPEAKERS
1

2
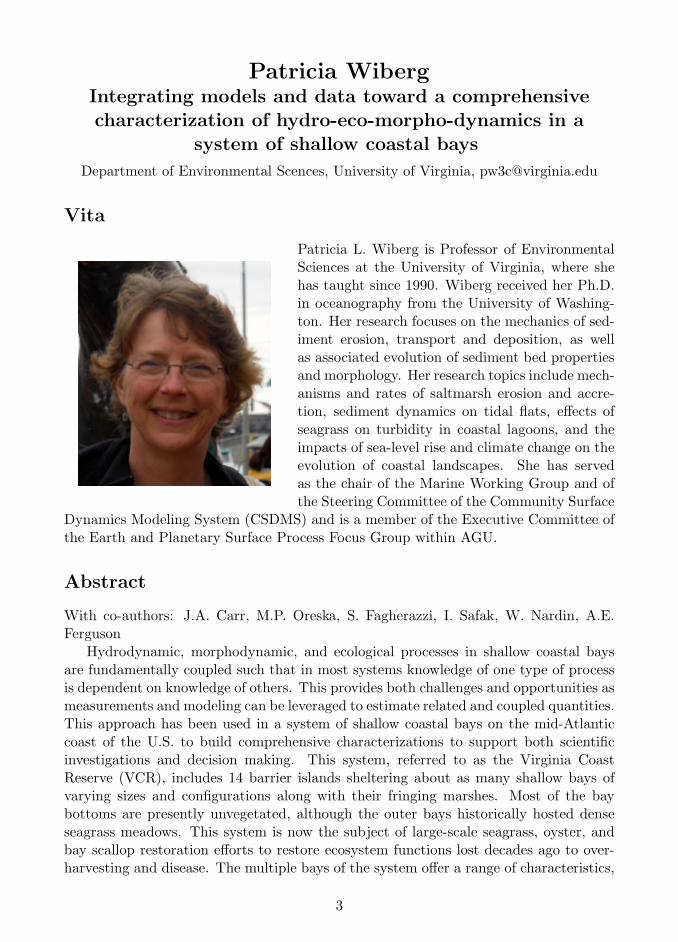
Patricia WibergIntegrating models and data toward a comprehensive
characterization of hydro-eco-morpho-dynamics in a
system of shallow coastal bays
Department of Environmental Scences, University of Virginia, [email protected]
Vita
Patricia L. Wiberg is Professor of EnvironmentalSciences at the University of Virginia, where shehas taught since 1990. Wiberg received her Ph.D.in oceanography from the University of Washing-ton. Her research focuses on the mechanics of sed-iment erosion, transport and deposition, as wellas associated evolution of sediment bed propertiesand morphology. Her research topics include mech-anisms and rates of saltmarsh erosion and accre-tion, sediment dynamics on tidal flats, effects ofseagrass on turbidity in coastal lagoons, and theimpacts of sea-level rise and climate change on theevolution of coastal landscapes. She has servedas the chair of the Marine Working Group and ofthe Steering Committee of the Community Surface
Dynamics Modeling System (CSDMS) and is a member of the Executive Committee ofthe Earth and Planetary Surface Process Focus Group within AGU.
Abstract
With co-authors: J.A. Carr, M.P. Oreska, S. Fagherazzi, I. Safak, W. Nardin, A.E.Ferguson
Hydrodynamic, morphodynamic, and ecological processes in shallow coastal baysare fundamentally coupled such that in most systems knowledge of one type of processis dependent on knowledge of others. This provides both challenges and opportunities asmeasurements and modeling can be leveraged to estimate related and coupled quantities.This approach has been used in a system of shallow coastal bays on the mid-Atlanticcoast of the U.S. to build comprehensive characterizations to support both scientificinvestigations and decision making. This system, referred to as the Virginia CoastReserve (VCR), includes 14 barrier islands sheltering about as many shallow bays ofvarying sizes and configurations along with their fringing marshes. Most of the baybottoms are presently unvegetated, although the outer bays historically hosted denseseagrass meadows. This system is now the subject of large-scale seagrass, oyster, andbay scallop restoration efforts to restore ecosystem functions lost decades ago to over-harvesting and disease. The multiple bays of the system offer a range of characteristics,
3

e.g., marsh-to-open-water ratios, while being generally comparable in terms of depth(average depths are 1.0 m below mean sea level), tides and climatic drivers. As a result,they provide a valuable test set for hypotheses about the responses of shallow coastalbays, fringing marshes and related ecosystems to changes in forcing and disturbance.To fully realize this potential requires consistent and comprehensive characterizationof a range of system properties including surface elevation, sediment characteristics,vegetation, water quality, circulation, storm waves and storm surge. Owing to thescale of the system and the shallow depths, neither field sampling, remote sensing,nor modeling alone can provide the necessary accuracy and resolution. Coupling theseapproaches, however, has allowed us to develop a relatively high resolution, consistentcharacterization of many key system properties. This integrative approach allows us toexplore many difficult questions that depend on the coupled nature of these systems suchas: what is the potential seagrass habitat distribution when including meadow feedbackson flow, morphology, and sediment properties?; what are the impacts of storms and sea-level rise on sediment budgets and marsh loss?; and what is the efficacy of reef and marshrestoration for shoreline stabilization?
4
James BrasingtonShining New Light, Literally, on River Morphodynamics
Department of Geography, Queen Mary University of London UK,[email protected]
Vita
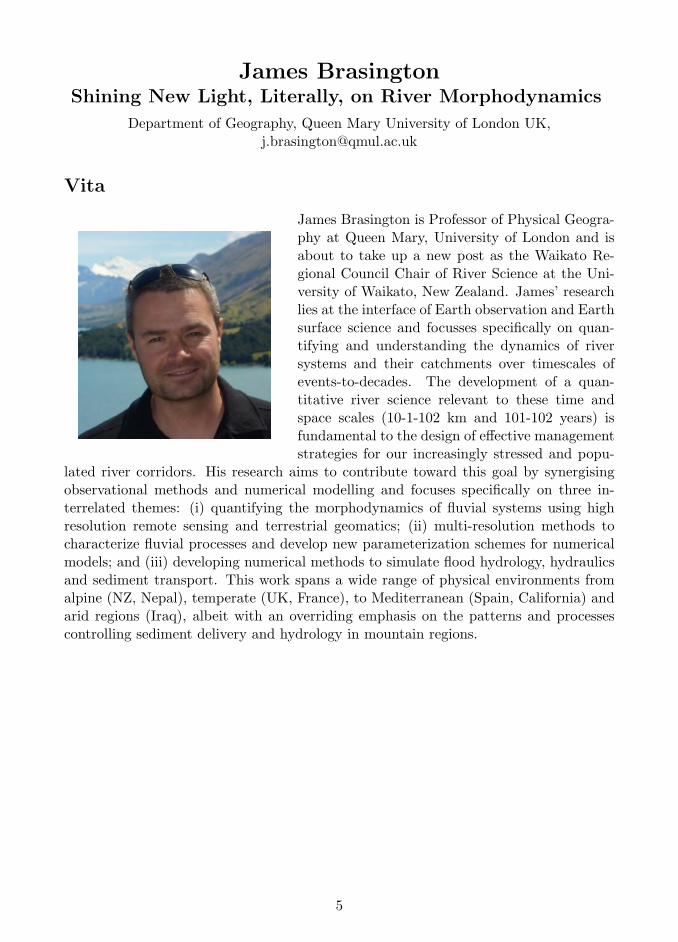
James Brasington is Professor of Physical Geogra-phy at Queen Mary, University of London and isabout to take up a new post as the Waikato Re-gional Council Chair of River Science at the Uni-versity of Waikato, New Zealand. James’ researchlies at the interface of Earth observation and Earthsurface science and focusses specifically on quan-tifying and understanding the dynamics of riversystems and their catchments over timescales ofevents-to-decades. The development of a quan-titative river science relevant to these time andspace scales (10-1-102 km and 101-102 years) isfundamental to the design of effective managementstrategies for our increasingly stressed and popu-
lated river corridors. His research aims to contribute toward this goal by synergisingobservational methods and numerical modelling and focuses specifically on three in-terrelated themes: (i) quantifying the morphodynamics of fluvial systems using highresolution remote sensing and terrestrial geomatics; (ii) multi-resolution methods tocharacterize fluvial processes and develop new parameterization schemes for numericalmodels; and (iii) developing numerical methods to simulate flood hydrology, hydraulicsand sediment transport. This work spans a wide range of physical environments fromalpine (NZ, Nepal), temperate (UK, France), to Mediterranean (Spain, California) andarid regions (Iraq), albeit with an overriding emphasis on the patterns and processescontrolling sediment delivery and hydrology in mountain regions.
5
Abstract
The development of science and technology are inextricably entwined. While noveltechnology is traditionally regarded as a dividend of scientific progress, the historian ofscience Nicholas Rescher offers a counterfactual perspective on this relationship. Rescherargues that technology provides the fundamental means to improve on our evolutionaryheritage and expand our sensory and cognitive apparatus in order to ‘enlarge the windowthrough which we look upon nature’s parametric space’ (Rescher, 1999, p. 33). Thisview is most emphatically illustrated by the revolutionary impact of glass and lenstechnology as a catalyst for the Scientific Renaissance of the 15th and 16th centuries.Arguably, the science of Geomorphology now sits on the cusp of a such a technologicallyinspired wave of progress.
Innovations in sensor technology, image analysis and remotely piloted platforms arenow well-placed to shed new light, literally, on the form, structure and processes thatdrive the evolving topography of our planet. These technologies have been pivotal inthe emergence of ‘high-resolution topography’ or HRT datasets, that have radicallyrevised the dimensionality of our science over the last two decades. Landscapes oncedepicted by hard-fought cross-section surveys in the form of levelled traverses have grad-ually been replaced by 2.5D digital terrain models captured by distributed GNSS androbotic tacheometric measurements. More recently, these raster data models are beingaugmented and superseded by sub-metre, even sub-centimetre, 3D point cloud dataacquired pseudo-synoptically by laser scanning and semi-automated photogrammetry.
In the context of river science, these latest data offer tantalizing scale-free, seamlessperspectives on the form and structure of fluvial systems. With the capacity to capture3D data at the resolution of individual particles and over extents that span not just barsand channels but entire watersheds, we now have an unparalleled opportunity to analyzelandforms and their organization from the scale of their fundamental building blocksupwards. This analysis has the potential to transcend conventional scale boundariesthat reflect arguably historic constraints on sampling design and observational methodsrather than natural length scales. Indeed, Miller and Goodchild (2014) have suggestedthat the emergence of such geospatial ‘Big Data’ could herald a new approach, or asthey put it, a fourth phase of science, across a wide range of spatial disciplines. Theypoint to a future increasingly characterized by exploratory abduction of theory from thegrowing wealth of data at our fingertips. While we have yet to see this approach becomeestablished in Geomorphology, recent work by Redolfi et al. (2016) and Sangireddy etal. (2017) has demonstrated how the interrogation of dense terrain data can yield newinsights into the structure of fluvial and catchment topography.
High Resolution Topography is more typically used to provide ever more detailedboundary conditions for numerical models and to develop novel parameterizations forconventionally sub-grid properties such as roughness and particle size. However, perhapsthe most significant untapped opportunity arising from the emergence of HRT is theability to quantify geomorphic change directly, accurately and contextually, through thecomparison of digital terrain models through time. This approach is well-establishedmethodologically (Vericat et al., 2017), but is rarely used to significant effect due tothe difficulties of obtaining repeat surveys at frequencies tuned effectively to the key
6
geophysical forcing processes. Additionally, and somewhat less commonly reported,comparison of terrain models through time also often reveals the presence of complexsystematic errors, such as datum shifts, navigation track bias and errors arising fromblock bundle adjustment that might otherwise go undetected in a single terrain model.
There are however, good reasons to expect at least the former constraint to relax.Remotely piloted vehicles, carrying improved navigation systems, cameras and evenlightweight laser scanners, provide increasingly affordable systems to acquire data flex-ibly and frequently. At the same time, a growing number of open-data portals arenow offering access to data routinely captured through regional and national mappingprogrammes. With this prospect in mind, this presentation aims to explore the op-portunities and challenges associated with repeat or 4D high resolution topographicmodelling, drawing on unique datasets that provide insights into the morphodynamicsof large, labile braided rivers and their response to unsteady discharge and sedimentsupply.
References
Miller, H. J., and Goodchild, M. F. (2015). Data-driven geography. GeoJournal, 80(4), 449-461.Redolfi, M., Tubino, M., Bertoldi, W., and Brasington, J. (2016). Analysis of reach-scale eleva-tion distribution in braided rivers: Definition of a new morphologic indicator and estimation ofmean quantities. Water Resources Research, 52(8), 5951-5970.Rescher, N. (1999). The Limits of Science. University of Pittsburgh Press, 282 pp.Sangireddy, H., C. P. Stark, and P. Passalacqua (2017). Multiresolution analysis of characteris-tic length scales with high-resolution topographic data, Journal of Geophysical Research: EarthSurface, 122, 1296–1324.Vericat, D., Wheaton, J. M., and Brasington, J. (2017). Revisiting the Morphological Ap-proach: Opportunities and Challenges with Repeat High-Resolution Topography. Gravel-BedRivers: Process and Disasters, 121.
7

8
Paola PassalacquaConnectivity in river deltas: Observations, modeling, and
implications to coastal resilience
Affiliation: Department of Civil, Architectural and Environmental Engineering,University of Texas at Austin, [email protected]
Vita
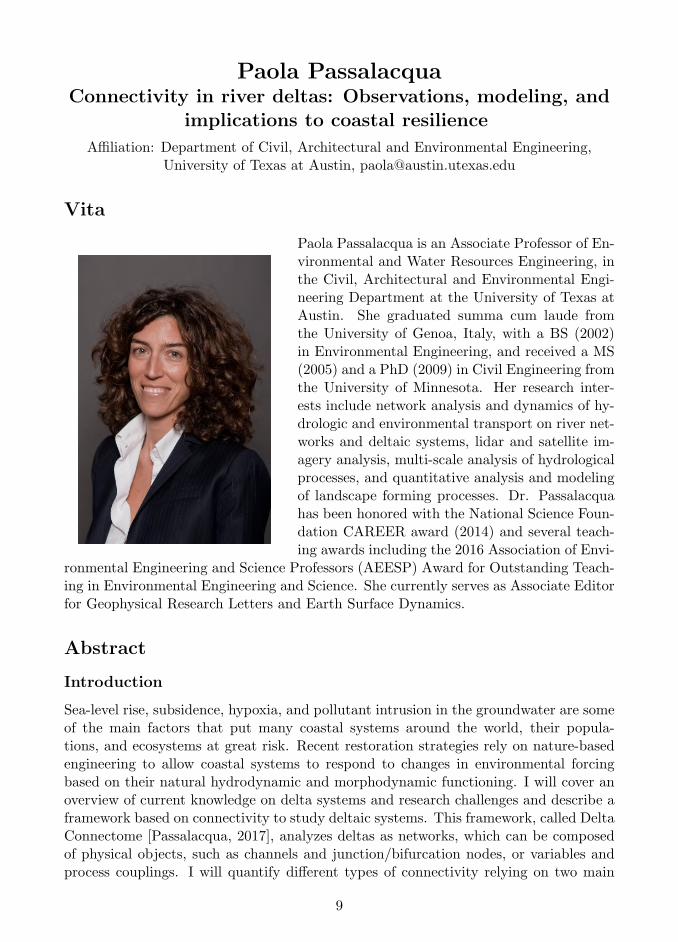
Paola Passalacqua is an Associate Professor of En-vironmental and Water Resources Engineering, inthe Civil, Architectural and Environmental Engi-neering Department at the University of Texas atAustin. She graduated summa cum laude fromthe University of Genoa, Italy, with a BS (2002)in Environmental Engineering, and received a MS(2005) and a PhD (2009) in Civil Engineering fromthe University of Minnesota. Her research inter-ests include network analysis and dynamics of hy-drologic and environmental transport on river net-works and deltaic systems, lidar and satellite im-agery analysis, multi-scale analysis of hydrologicalprocesses, and quantitative analysis and modelingof landscape forming processes. Dr. Passalacquahas been honored with the National Science Foun-dation CAREER award (2014) and several teach-ing awards including the 2016 Association of Envi-
ronmental Engineering and Science Professors (AEESP) Award for Outstanding Teach-ing in Environmental Engineering and Science. She currently serves as Associate Editorfor Geophysical Research Letters and Earth Surface Dynamics.
Abstract
Introduction
Sea-level rise, subsidence, hypoxia, and pollutant intrusion in the groundwater are someof the main factors that put many coastal systems around the world, their popula-tions, and ecosystems at great risk. Recent restoration strategies rely on nature-basedengineering to allow coastal systems to respond to changes in environmental forcingbased on their natural hydrodynamic and morphodynamic functioning. I will cover anoverview of current knowledge on delta systems and research challenges and describe aframework based on connectivity to study deltaic systems. This framework, called DeltaConnectome [Passalacqua, 2017], analyzes deltas as networks, which can be composedof physical objects, such as channels and junction/bifurcation nodes, or variables andprocess couplings. I will quantify different types of connectivity relying on two main
9
study areas and numerical modeling. Most of the field observations have been collectedat the Wax Lake Delta (WLD), a naturally prograding delta in coastal Louisiana formedby a river diversion for flood control. Another study area is the Ganges-Brahmaputra-Meghna Delta (GBMD), characterized by a complex surface channel network, significantenvironmental forcing and human modifications. Numerical modeling is used for iden-tifying the factors controlling connectivity among surface patterns, the surface and thesubsurface, and under scenarios of changing forcing.
Connectivity analysis
The Wax Lake Delta (WLD), a O(100) km2 delta formed in the last 40 years from aflood control diversion of the Atchafalaya River, is considered a prototype of river diver-sion. Thus, this system offers the opportunity to quantify the connectivity of channelsand islands in a naturally prograding delta. Based on Acoustic Doppler Current Profiler(ADCP) measurements we have quantified the hydrological exchange of channels andislands and found that the channel network of deltaic systems can be leaky. At WLD,channels can transfer up to 50island [Hiatt and Passalacqua, 2015] as the flow transitionsfrom confined to unconfined [Hiatt and Passalacqua, 2017]. Hydrodynamic modelingshows that the transition from confined to unconfined flow is mainly controlled by therelative roughness of channels and islands. This exchange of water has implications todelta ecology and morphology. Increased hydraulic residence times within the islandscould lead to increased potential for denitrification. Water transports sediment, leadingto sediment deposition in the island interior [e.g., Shaw et al., 2016]. We also collectedwater level measurements every 15 minutes in most of the WLD islands, and discharge,wind, and tides data from nearby measurement stations. Using information theory, wemeasured transfer entropy and mutual information among variables to quantify processcouplings [Sendrowski and Passalacqua, 2017]. We found that the relative roughnessof channels and islands plays an important role in process connectivity, confirming theresults described above; changes through time show a decrease in hydrological connectiv-ity as vegetation cover increases in the summer months. Through numerical modeling,we quantified this connectivity threshold and explained it with percolation theory. Thegeometry and connectivity of surface networks could be used for quantitative modelingof the subsurface. This is important in particular for large and heterogeneous systemsas the GBMD where pollutants are present in the groundwater. The model DeltaRCMis used under different environmental forcing scenarios [Liang et al., 2016] to understanddelta response and mechanisms of translation of surface information into the subsurface.
Conclusions
Using network representations, field observations, and modeling, we have quantifieddifferent types of connectivity in deltas: (i) channel-island, (ii) process couplings, (iii)surface-subsurface. The delta emerges as a leaky network that evolves over time andis characterized by continuous exchanges of fluxes of matter, energy, and information.Connectivity has implications to delta functioning, land growth, and nutrient removal.
10
Acknowledgements
This work was supported by the U.S. National Science Foundation (EAR-1350336,FESD/OCE-1135427, OCE-1600222). A special thank you to Matt Hiatt, AliciaSendrowski, Man Liang, Kyle Wright, and David Mohrig.
References
Hiatt, M. and P. Passalacqua (2015), Hydrological connectivity in river deltas: The first-orderimportance of channel-island exchange, Water Resources Research, 51, 2264-2282,doi:10.1002/2014WR016149.Hiatt, M. and P. Passalacqua (2017), What controls the transition from confined to unconfinedflow? Analysis of hydraulics in a coastal river delta, Journal of Hydraulic Engineering, 143, 6,doi:10.1061/(ASCE)HY.1943-7900.0001309.Liang, M., W. Kim, P. Passalacqua (2016), How much subsidence is enough to change the mor-phology of river deltas?, Geophysical Research Letters, 43, 19, 10266-10276,doi:10.1002/2016GL070519.Passalacqua, P. (2017), The Delta Connectome: A network-based framework for studying con-nectivity in river deltas, Geomorphology, 277, 50-62, doi:10.1016/j.geomorph.2016.04.001.Sendrowski, A. and P. Passalacqua (2017), Process connectivity in a naturally prograding riverdelta, Water Resources Research, 53, doi:10.1002/2016WR019768.Shaw, J. B., Mohrig, D., and Wagner, R. W. (2016). Flow patterns and morphology of a prograd-ing river delta, Journal of Geophysical Research, 121, 2, 372–391, doi: 10.1002/2015JF003570.
11

12
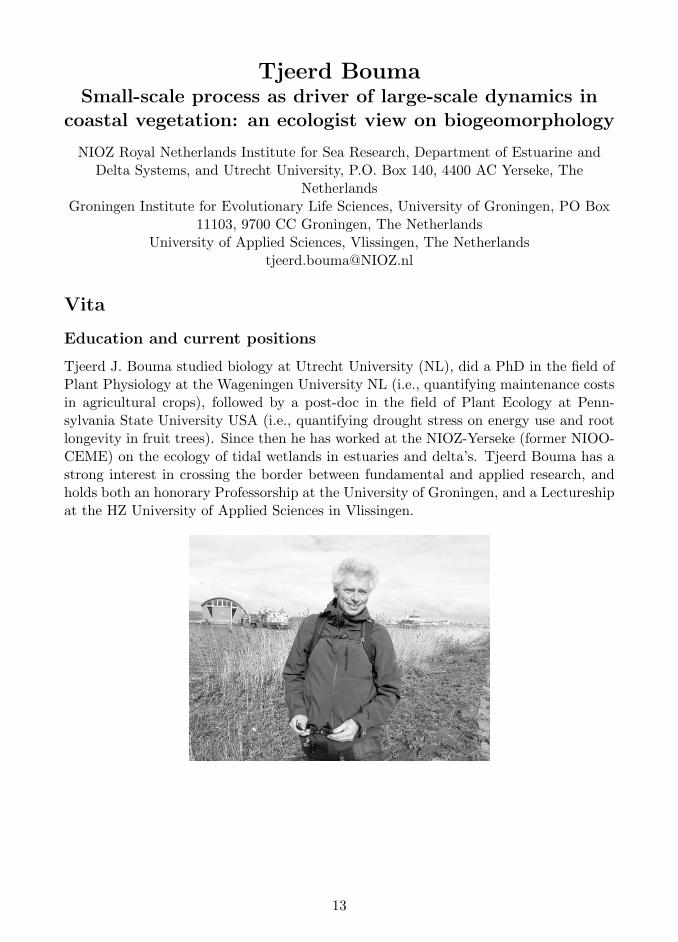
Tjeerd BoumaSmall-scale process as driver of large-scale dynamics in
coastal vegetation: an ecologist view on biogeomorphology
NIOZ Royal Netherlands Institute for Sea Research, Department of Estuarine andDelta Systems, and Utrecht University, P.O. Box 140, 4400 AC Yerseke, The
NetherlandsGroningen Institute for Evolutionary Life Sciences, University of Groningen, PO Box
11103, 9700 CC Groningen, The NetherlandsUniversity of Applied Sciences, Vlissingen, The Netherlands
Vita
Education and current positions
Tjeerd J. Bouma studied biology at Utrecht University (NL), did a PhD in the field ofPlant Physiology at the Wageningen University NL (i.e., quantifying maintenance costsin agricultural crops), followed by a post-doc in the field of Plant Ecology at Penn-sylvania State University USA (i.e., quantifying drought stress on energy use and rootlongevity in fruit trees). Since then he has worked at the NIOZ-Yerseke (former NIOO-CEME) on the ecology of tidal wetlands in estuaries and delta’s. Tjeerd Bouma has astrong interest in crossing the border between fundamental and applied research, andholds both an honorary Professorship at the University of Groningen, and a Lectureshipat the HZ University of Applied Sciences in Vlissingen.
13

Research interest
During the last 10 years, I focussed my research on bio-physical interactions between theforces originating from tidal currents and waves, and species that alter these forces andthereby the environment (i.e., ecosystem engineers). Biophysical interactions by ecosys-tem engineers (e.g. vegetation like salt marshes, mangroves, seagrass, aquatic waterplants, reef forming animals, bioturbating animals) can have major consequences forthe functioning and development of the estuarine and coastal landscape. I’m interestedin obtaining a better understanding of ecosystem engineering as a strategy (fundamentalecology), the thresholds ecosystem engineers encounter in establishing (overcoming bot-tle necks in ecosystem restoration), the influence ecosystem engineers have on ecosystemfunctioning by altering resource fluxes, biodiversity, ecosystem resilience and landscapeevolution (management implications) and especially the opportunities this offer for ben-efiting from ecosystem services (e.g., nature based coastal defence).
Abstract
There is a growing desire to manage (and even create) coastal vegetation such as e.g.salt marshes, mangroves and seagrasses for coastal defense. Such application howeverrequires in depth understanding of the dynamic horizontal extent (i.e., width) of theseecosystems. Especially understanding the factors affecting the minimum vegetationwidth is important. This presentation will highlight how process-based studies can helpto provide insight in which factors affect the long-term large-scale development of saltmarsh and other coastal vegetation. Recently it was found that vegetation establishmentcan be described by the Windows of Opportunity theory. Having this mechanisticunderstanding enables us to develop means to restore coastal ecosystems. Moreover, itallows us to gain a basic insight in which factors determine the minimum-width of asalt marsh, and how dredging material may potential be used to initiate marsh growth.Recent insights explaining that the short-term vertical sediment dynamics on the baretidal flat is a key driver of the lateral vegetation dynamics, emphasizes that we shouldstart with continuous monitoring of such sediment-dynamics. The vegetation responseto the short-term vertical sediment dynamics can however be highly species specific,resulting in species-specific large-scale ecosystem dynamics. Experimental process-basedstudies remain of key importance for understanding ecosystem dynamics in addition tothe rapidly developing earth observation techniques and modeling capabilities.
14
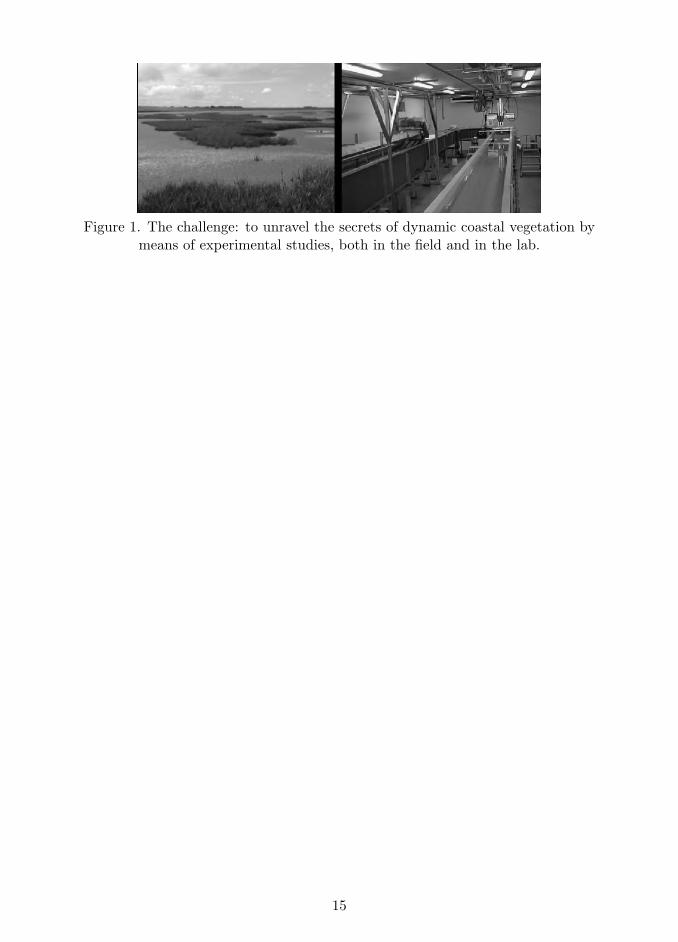
Figure 1. The challenge: to unravel the secrets of dynamic coastal vegetation bymeans of experimental studies, both in the field and in the lab.
15

16
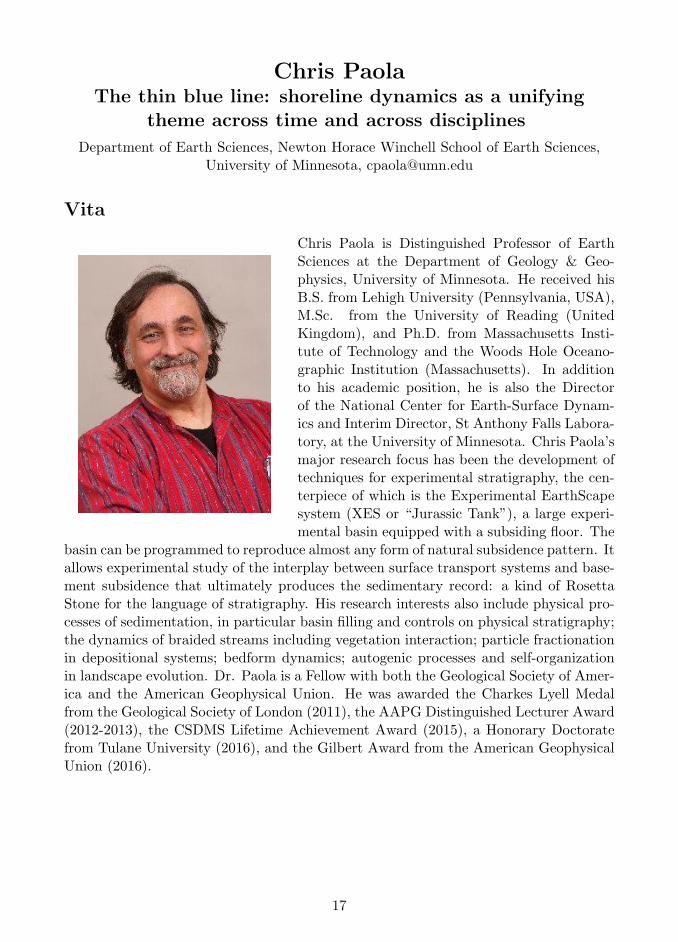
Chris PaolaThe thin blue line: shoreline dynamics as a unifying
theme across time and across disciplines
Department of Earth Sciences, Newton Horace Winchell School of Earth Sciences,University of Minnesota, [email protected]
Vita
Chris Paola is Distinguished Professor of EarthSciences at the Department of Geology & Geo-physics, University of Minnesota. He received hisB.S. from Lehigh University (Pennsylvania, USA),M.Sc. from the University of Reading (UnitedKingdom), and Ph.D. from Massachusetts Insti-tute of Technology and the Woods Hole Oceano-graphic Institution (Massachusetts). In additionto his academic position, he is also the Directorof the National Center for Earth-Surface Dynam-ics and Interim Director, St Anthony Falls Labora-tory, at the University of Minnesota. Chris Paola’smajor research focus has been the development oftechniques for experimental stratigraphy, the cen-terpiece of which is the Experimental EarthScapesystem (XES or “Jurassic Tank”), a large experi-mental basin equipped with a subsiding floor. The
basin can be programmed to reproduce almost any form of natural subsidence pattern. Itallows experimental study of the interplay between surface transport systems and base-ment subsidence that ultimately produces the sedimentary record: a kind of RosettaStone for the language of stratigraphy. His research interests also include physical pro-cesses of sedimentation, in particular basin filling and controls on physical stratigraphy;the dynamics of braided streams including vegetation interaction; particle fractionationin depositional systems; bedform dynamics; autogenic processes and self-organizationin landscape evolution. Dr. Paola is a Fellow with both the Geological Society of Amer-ica and the American Geophysical Union. He was awarded the Charkes Lyell Medalfrom the Geological Society of London (2011), the AAPG Distinguished Lecturer Award(2012-2013), the CSDMS Lifetime Achievement Award (2015), a Honorary Doctoratefrom Tulane University (2016), and the Gilbert Award from the American GeophysicalUnion (2016).
17

Abstract
The shoreline, which seems so simple and obvious, is a fascinating and complex movingboundary whose morphology encodes process information about the two realms that itdivides. As a moving boundary, its meandering path through time and space, writtenin the record of strata, can be a sensitive gauge of changes in sea level, subsidence,and sediment supply. But to read this record accurately, we must understand how itresponds to the push and pull of land and sea, and how this response changes with timescale. We will review and synthesize research on shoreline dynamics starting with theground-breaking work of Walter Pitman and including examples from experiments aswell as modern and ancient sediments.
18
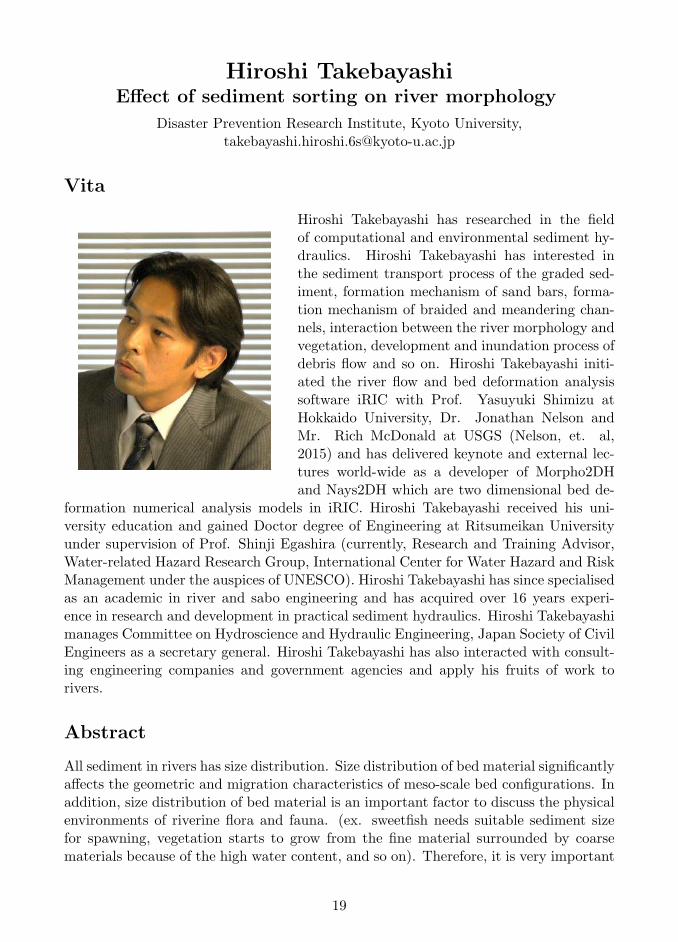
Hiroshi TakebayashiEffect of sediment sorting on river morphology
Disaster Prevention Research Institute, Kyoto University,[email protected]
Vita
Hiroshi Takebayashi has researched in the fieldof computational and environmental sediment hy-draulics. Hiroshi Takebayashi has interested inthe sediment transport process of the graded sed-iment, formation mechanism of sand bars, forma-tion mechanism of braided and meandering chan-nels, interaction between the river morphology andvegetation, development and inundation process ofdebris flow and so on. Hiroshi Takebayashi initi-ated the river flow and bed deformation analysissoftware iRIC with Prof. Yasuyuki Shimizu atHokkaido University, Dr. Jonathan Nelson andMr. Rich McDonald at USGS (Nelson, et. al,2015) and has delivered keynote and external lec-tures world-wide as a developer of Morpho2DHand Nays2DH which are two dimensional bed de-
formation numerical analysis models in iRIC. Hiroshi Takebayashi received his uni-versity education and gained Doctor degree of Engineering at Ritsumeikan Universityunder supervision of Prof. Shinji Egashira (currently, Research and Training Advisor,Water-related Hazard Research Group, International Center for Water Hazard and RiskManagement under the auspices of UNESCO). Hiroshi Takebayashi has since specialisedas an academic in river and sabo engineering and has acquired over 16 years experi-ence in research and development in practical sediment hydraulics. Hiroshi Takebayashimanages Committee on Hydroscience and Hydraulic Engineering, Japan Society of CivilEngineers as a secretary general. Hiroshi Takebayashi has also interacted with consult-ing engineering companies and government agencies and apply his fruits of work torivers.
Abstract
All sediment in rivers has size distribution. Size distribution of bed material significantlyaffects the geometric and migration characteristics of meso-scale bed configurations. Inaddition, size distribution of bed material is an important factor to discuss the physicalenvironments of riverine flora and fauna. (ex. sweetfish needs suitable sediment sizefor spawning, vegetation starts to grow from the fine material surrounded by coarsematerials because of the high water content, and so on). Therefore, it is very important
19
to clarify the dynamic characteristics of meso-scale bed configuration with heterogeneousbed materials.
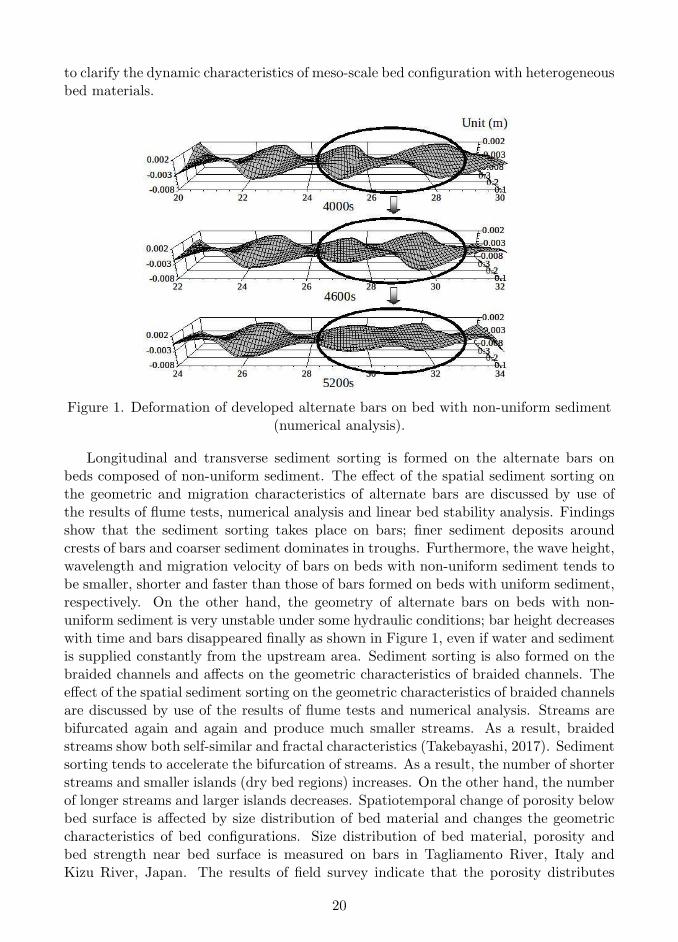
Figure 1. Deformation of developed alternate bars on bed with non-uniform sediment(numerical analysis).
Longitudinal and transverse sediment sorting is formed on the alternate bars onbeds composed of non-uniform sediment. The effect of the spatial sediment sorting onthe geometric and migration characteristics of alternate bars are discussed by use ofthe results of flume tests, numerical analysis and linear bed stability analysis. Findingsshow that the sediment sorting takes place on bars; finer sediment deposits aroundcrests of bars and coarser sediment dominates in troughs. Furthermore, the wave height,wavelength and migration velocity of bars on beds with non-uniform sediment tends tobe smaller, shorter and faster than those of bars formed on beds with uniform sediment,respectively. On the other hand, the geometry of alternate bars on beds with non-uniform sediment is very unstable under some hydraulic conditions; bar height decreaseswith time and bars disappeared finally as shown in Figure 1, even if water and sedimentis supplied constantly from the upstream area. Sediment sorting is also formed on thebraided channels and affects on the geometric characteristics of braided channels. Theeffect of the spatial sediment sorting on the geometric characteristics of braided channelsare discussed by use of the results of flume tests and numerical analysis. Streams arebifurcated again and again and produce much smaller streams. As a result, braidedstreams show both self-similar and fractal characteristics (Takebayashi, 2017). Sedimentsorting tends to accelerate the bifurcation of streams. As a result, the number of shorterstreams and smaller islands (dry bed regions) increases. On the other hand, the numberof longer streams and larger islands decreases. Spatiotemporal change of porosity belowbed surface is affected by size distribution of bed material and changes the geometriccharacteristics of bed configurations. Size distribution of bed material, porosity andbed strength near bed surface is measured on bars in Tagliamento River, Italy andKizu River, Japan. The results of field survey indicate that the porosity distributes
20
well spatially on bars and it is considered that the porosity is affected by the history ofpast bed deformation. Spatiotemporal change of porosity is considered in the numericalanalysis model and the effect of spatiotemporal change of porosity on bed geometry isdiscussed.
References
Nelson, J.M., Shimizu, Y., Abe, T., Asahi, K., Gamou, M., Inoue, T., Iwasaki, T., Kakinuma,T., Kawamura, S., Kimura, I., Kyuka, T., McDonald, R.R., Nabi, M., Nakatsugawa, M., Simoes,F.R., Takebayashi, H., Watanabe, Y. The international river interface cooperative: Public do-main flow and morphodynamics software for education and applications, Advances in WaterResources, Vol.93, 62-74, 2016.Takebayashi, H. Modelling braided channels under unsteady flow and the effect of spatiotempo-ral change of vegetation on bed and channel geometry, GBR, Vol.8, 671-702, 2017.
21

22
Maurizio BrocchiniWave-forced sediment dynamics in the nearshore and
estuaries
Dipartimento di Ingegneria Civile, Edile e di Architettura, Universita Politecnica delleMarche, [email protected]
Vita
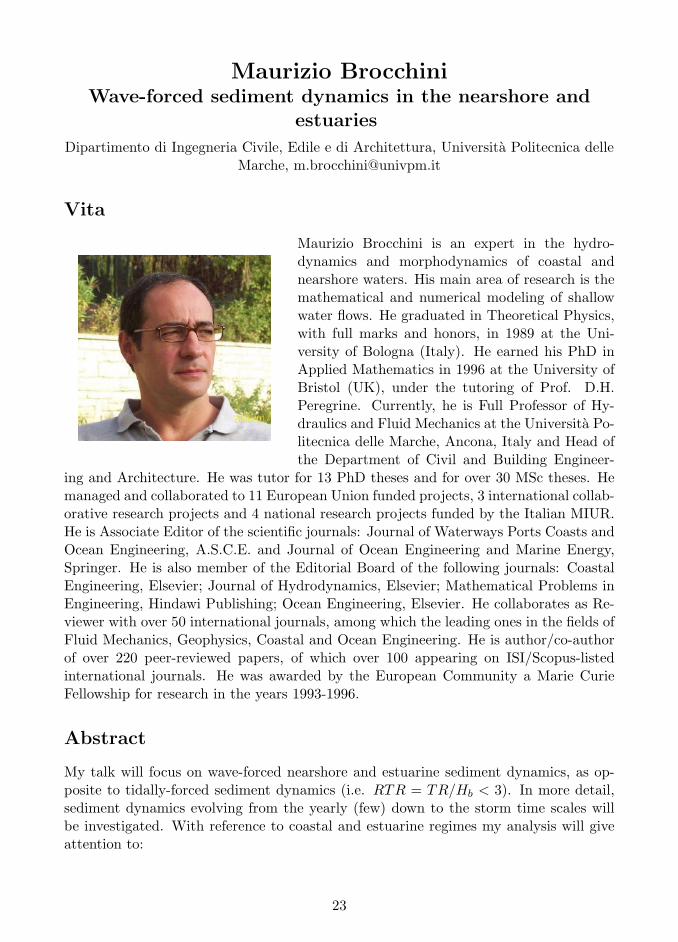
Maurizio Brocchini is an expert in the hydro-dynamics and morphodynamics of coastal andnearshore waters. His main area of research is themathematical and numerical modeling of shallowwater flows. He graduated in Theoretical Physics,with full marks and honors, in 1989 at the Uni-versity of Bologna (Italy). He earned his PhD inApplied Mathematics in 1996 at the University ofBristol (UK), under the tutoring of Prof. D.H.Peregrine. Currently, he is Full Professor of Hy-draulics and Fluid Mechanics at the Universita Po-litecnica delle Marche, Ancona, Italy and Head ofthe Department of Civil and Building Engineer-
ing and Architecture. He was tutor for 13 PhD theses and for over 30 MSc theses. Hemanaged and collaborated to 11 European Union funded projects, 3 international collab-orative research projects and 4 national research projects funded by the Italian MIUR.He is Associate Editor of the scientific journals: Journal of Waterways Ports Coasts andOcean Engineering, A.S.C.E. and Journal of Ocean Engineering and Marine Energy,Springer. He is also member of the Editorial Board of the following journals: CoastalEngineering, Elsevier; Journal of Hydrodynamics, Elsevier; Mathematical Problems inEngineering, Hindawi Publishing; Ocean Engineering, Elsevier. He collaborates as Re-viewer with over 50 international journals, among which the leading ones in the fields ofFluid Mechanics, Geophysics, Coastal and Ocean Engineering. He is author/co-authorof over 220 peer-reviewed papers, of which over 100 appearing on ISI/Scopus-listedinternational journals. He was awarded by the European Community a Marie CurieFellowship for research in the years 1993-1996.
Abstract
My talk will focus on wave-forced nearshore and estuarine sediment dynamics, as op-posite to tidally-forced sediment dynamics (i.e. RTR = TR/Hb < 3). In more detail,sediment dynamics evolving from the yearly (few) down to the storm time scales willbe investigated. With reference to coastal and estuarine regimes my analysis will giveattention to:
23
• open-coast, mildly sloping, barred (Ω = Hb/wsT > 2), dissipative(ǫ = Abω
2/gtan2β > 20), sandy beaches;
• river-dominated and wave-modified, which feed sediments to sea, or wave-dominatedestuaries.
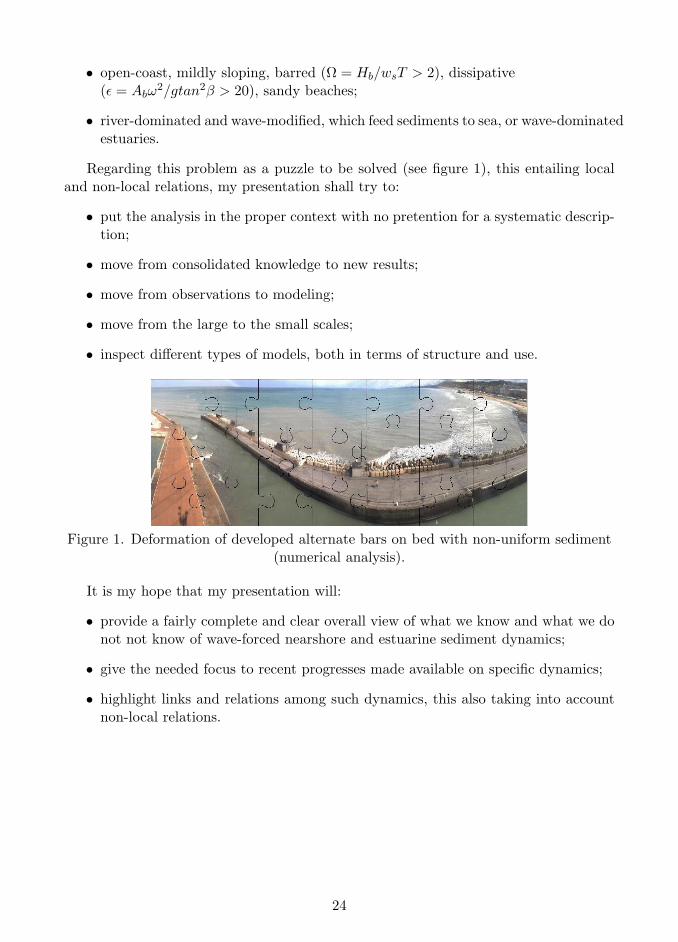
Regarding this problem as a puzzle to be solved (see figure 1), this entailing localand non-local relations, my presentation shall try to:
• put the analysis in the proper context with no pretention for a systematic descrip-tion;
• move from consolidated knowledge to new results;
• move from observations to modeling;
• move from the large to the small scales;
• inspect different types of models, both in terms of structure and use.
Figure 1. Deformation of developed alternate bars on bed with non-uniform sediment(numerical analysis).
It is my hope that my presentation will:
• provide a fairly complete and clear overall view of what we know and what we donot not know of wave-forced nearshore and estuarine sediment dynamics;
• give the needed focus to recent progresses made available on specific dynamics;
• highlight links and relations among such dynamics, this also taking into accountnon-local relations.
24
Paolo BlondeauxTwenty years after RCEM 1999
Department of Civil, Chemical and Environmental Engineering, University of Genoa,Italy, [email protected]
Vita
Degree
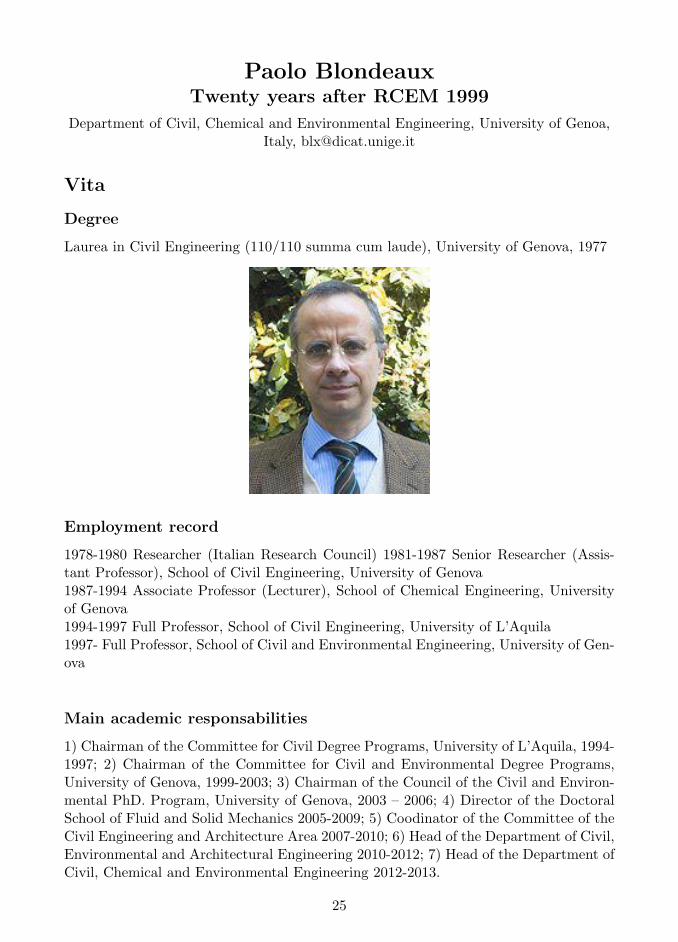
Laurea in Civil Engineering (110/110 summa cum laude), University of Genova, 1977
Employment record
1978-1980 Researcher (Italian Research Council) 1981-1987 Senior Researcher (Assis-tant Professor), School of Civil Engineering, University of Genova1987-1994 Associate Professor (Lecturer), School of Chemical Engineering, Universityof Genova1994-1997 Full Professor, School of Civil Engineering, University of L’Aquila1997- Full Professor, School of Civil and Environmental Engineering, University of Gen-ova
Main academic responsabilities
1) Chairman of the Committee for Civil Degree Programs, University of L’Aquila, 1994-1997; 2) Chairman of the Committee for Civil and Environmental Degree Programs,University of Genova, 1999-2003; 3) Chairman of the Council of the Civil and Environ-mental PhD. Program, University of Genova, 2003 – 2006; 4) Director of the DoctoralSchool of Fluid and Solid Mechanics 2005-2009; 5) Coodinator of the Committee of theCivil Engineering and Architecture Area 2007-2010; 6) Head of the Department of Civil,Environmental and Architectural Engineering 2010-2012; 7) Head of the Department ofCivil, Chemical and Environmental Engineering 2012-2013.
25
Main scientific responsabilities
1) Member of the Council of the European Mechanics Society (Governing body of theEuropean Mechanics Society), 1999-2003; 2) Chairman of Euromech 395 Coastal, Es-tuarine and River Forms, Enschede (NL)2 June 1999 – 4 June 1999; 3) Co-chairmanI.A.H.R. Symposium on River, Coastal and Esuarine Morphodynamics, Genoa (Italy)September, 6th-10th 1999; 4) Member of the Scientific Committee of XII, XVIII, XXIIAIMETA (Italian Association of Applied Mathematics and Theoretical Physics) Con-ferences; 5) Member of the Scientific Committee of 4th and 5th European Conferenceof Fluid Mechanics; 6) Member of the Scientific Commitee of the XXVII, XXX, XXXII,XXXVI Italian Congresses of Hydraulic Engineering; 7) Member of the OrganizingCommitee of the XV Italian Congress of Computational Mechanics (Meccanica Com-putazionale), 2004; 8) Member of the Scientific Committee of the Two-phase Modellingof Sediment Transport Symposia THESIS-2011, THESIS-2013, THESIS-2016; 9) Mem-ber of the International Scientific Committee of RCEM-2015 (River, Coastal and Es-tuarine Morphodynamics); 10) Chairman of the Scientific Committee of the XXXVIConvegno di Idraulica e Costruzioni Idrauliche – Ancona 2018
Invited lectures
2nd European Conference of Fluid Mechanics, Warsaw (Poland), 1994; Workshop Non-linear aspects of wave-generation and wave-interaction, Utrecht, (The Netherlands),1995; 16th Congres Francais de Mechanique, Nice (France), 2003; 10th AnniversaryEngineering Academy of Spain, Barcelona (Spain), 2003; 29th Italian Congress of Hy-draulic Engineering, Trento (Italy), 2004; Two-phase modelling of sediment dynamicsSymposium (THESIS-2011), Paris (France), 2011.
Scientific interests
The research interests of Paolo Blondeaux range over many aspect of basic and appliedfluid mechanics such as vorticity dynamic, unsteady boundary layers, surface gravitywaves and coastal morphodynamics.
Abstract
The major aim of the series of RCEM Conferences, which started in Genoa in 1999, wasto enhance the interaction among the communities of hydraulic engineers, geomorphol-ogists, applied mathematicians and physicists working in the field of Morphodynamics.
After about 20 years, significant progress has been made even though the interactionis still neither easy nor fully satisfactory. Indeed, the major concern of geomorpholo-gists is the functioning of the system as a whole and their approach is often holisticand based mainly on field observations. The engineering approach is reductionist andthe understanding of the system is pursued through a detailed analysis of its variouscomponents. Applied mathematicians and physicists tend to reduce the complexity ofthe system to make the problem amenable to theoretical treatments but it is not obviousto what extent the introduced simplifications can be accepted.
26
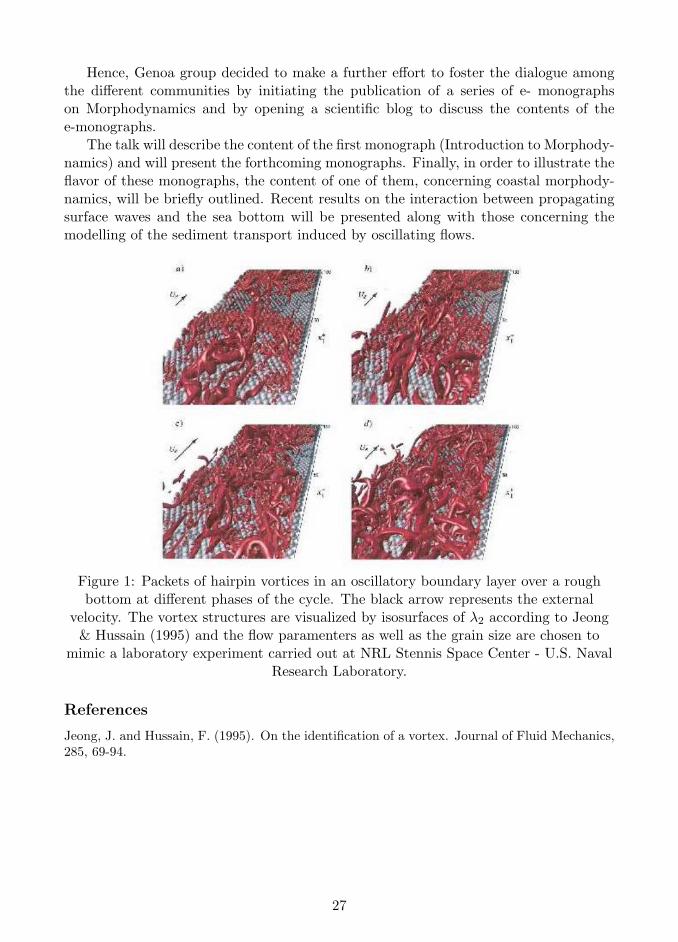
Hence, Genoa group decided to make a further effort to foster the dialogue amongthe different communities by initiating the publication of a series of e- monographson Morphodynamics and by opening a scientific blog to discuss the contents of thee-monographs.
The talk will describe the content of the first monograph (Introduction to Morphody-namics) and will present the forthcoming monographs. Finally, in order to illustrate theflavor of these monographs, the content of one of them, concerning coastal morphody-namics, will be briefly outlined. Recent results on the interaction between propagatingsurface waves and the sea bottom will be presented along with those concerning themodelling of the sediment transport induced by oscillating flows.
Figure 1: Packets of hairpin vortices in an oscillatory boundary layer over a roughbottom at different phases of the cycle. The black arrow represents the external
velocity. The vortex structures are visualized by isosurfaces of λ2 according to Jeong& Hussain (1995) and the flow paramenters as well as the grain size are chosen to
mimic a laboratory experiment carried out at NRL Stennis Space Center - U.S. NavalResearch Laboratory.
References
Jeong, J. and Hussain, F. (1995). On the identification of a vortex. Journal of Fluid Mechanics,285, 69-94.
27

28
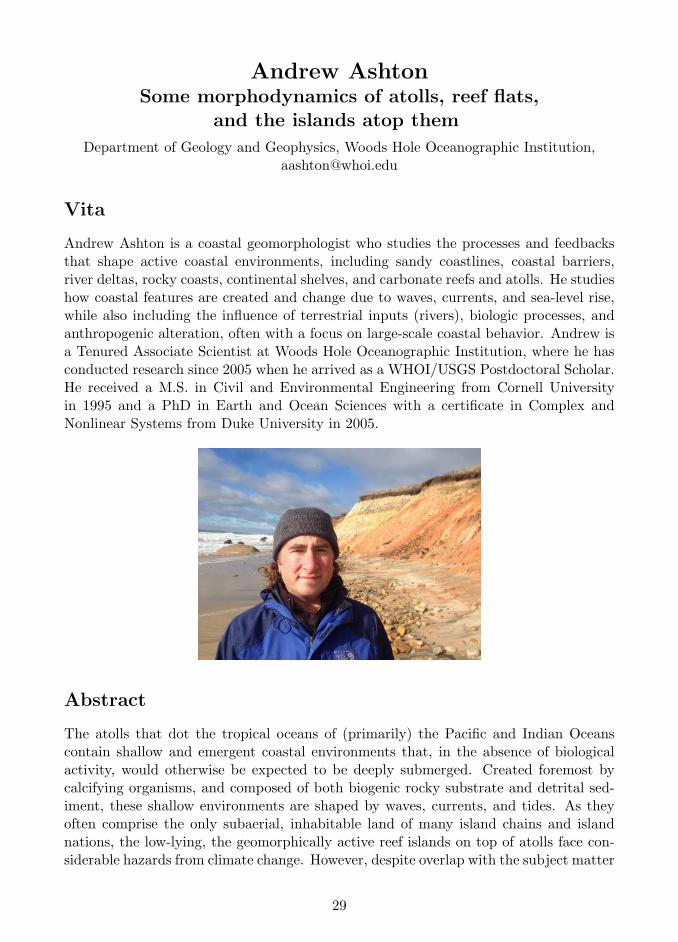
Andrew AshtonSome morphodynamics of atolls, reef flats,
and the islands atop them
Department of Geology and Geophysics, Woods Hole Oceanographic Institution,[email protected]
Vita
Andrew Ashton is a coastal geomorphologist who studies the processes and feedbacksthat shape active coastal environments, including sandy coastlines, coastal barriers,river deltas, rocky coasts, continental shelves, and carbonate reefs and atolls. He studieshow coastal features are created and change due to waves, currents, and sea-level rise,while also including the influence of terrestrial inputs (rivers), biologic processes, andanthropogenic alteration, often with a focus on large-scale coastal behavior. Andrew isa Tenured Associate Scientist at Woods Hole Oceanographic Institution, where he hasconducted research since 2005 when he arrived as a WHOI/USGS Postdoctoral Scholar.He received a M.S. in Civil and Environmental Engineering from Cornell Universityin 1995 and a PhD in Earth and Ocean Sciences with a certificate in Complex andNonlinear Systems from Duke University in 2005.
Abstract
The atolls that dot the tropical oceans of (primarily) the Pacific and Indian Oceanscontain shallow and emergent coastal environments that, in the absence of biologicalactivity, would otherwise be expected to be deeply submerged. Created foremost bycalcifying organisms, and composed of both biogenic rocky substrate and detrital sed-iment, these shallow environments are shaped by waves, currents, and tides. As theyoften comprise the only subaerial, inhabitable land of many island chains and islandnations, the low-lying, the geomorphically active reef islands on top of atolls face con-siderable hazards from climate change. However, despite overlap with the subject matter
29

addressed by much of the research presented at RCEM meetings, including increasinginterest with ecogeomorphic processes, research focused on the morphodynamics of reefenvironments remains surprisingly limited in scope within this community (althoughthis number is quickly growing).
Here, I present a series of recent and ongoing research projects addressing the mor-phodynamics of carbonate environments, with a focus on shallow, wave-affected regions,spanning the environments from the offshore fore-reef, to the shallow reef flat, uponwhich reef islands are often emplaced, to the back-barrier lagoon (if present). For eachexample, a simplified morphodynamic modeling approach is used, in some cases themodeling approach is informed by more detailed hydrodynamic modeling.
Figure 1. Aerial view of atoll environment, Marshall Islands
Over long timescales, the gross morphology of atolls that reach modern sea level,including the depth of internal lagoons, is affected by the history of sea-level change, sed-iment production, and dissolution. Long-term mass balances are affected by carbonateproduction rates and detrital sediment mass fluxes. Zooming in, the relatively steeplysloping fore-reefs of most atolls exhibit a channel-like morphology, where rocky high“spurs” alternate with low “grooves”. These grooves are typically sediment-mantled,and I will discuss a hypothesized set of feedbacks that can form this “spur and groove”topography, and discuss how these features offer an effective mechanism for offshoresediment transport into the deep ocean.
Moving landwards, atolls shoal to a reef flat, typically only a meter or so deep, thancan extend for 100’s of meters to kilometers. On some atolls, reef islands, carbonatedetrital landforms, are perched atop these shallow reef flats. Parameterizations of sedi-ment transport pathways and feedbacks using hydrodynamic profile modeling motivatea conceptual model whereby reef islands accrete towards the ocean surface until bedstresses increase such that active sediment mobilization should both drive sediment offthe flat and drive local abrasion. As the reef flat grows lagoonwards, shear stressesdecrease across the flat, providing a mechanism for mid-flat accretion of either storm-driven detritus or even a self-organizing process of island emergence. With a reef island
30
(motu) present upon a reef flat, this island should grown oceanwards until a few hundredmeters from the active coast.
Sea-level rise and wave climate change will affect sediment transport and shorelinedynamics, including the possibility for wholesale reorganization of the islands them-selves. Parameterizing previous results using machine learning techniques, a simplemodel of reef flat and island morphodynamics shows that during rising sea levels, thereef flat can serve as a sediment trap, starving reef islands of detrital sediment that couldotherwise fortify the shore against sea-level-rise-driven erosion. On the other hand, ifreef flats are currently shallow (likely due to geologic inheritance or biologic cementa-tion processes) such that sea-level rise does not result in sediment accumulation on theflat, reef island shorelines may be more resilient to rising seas. This simplified mod-eling approach, focusing on boundary dynamics and mass fluxes, including carbonatesediment production, provides a quantitative tool to predict the response of reef islandenvironments to climate change.
31

32

ABSTRACTS
33

34
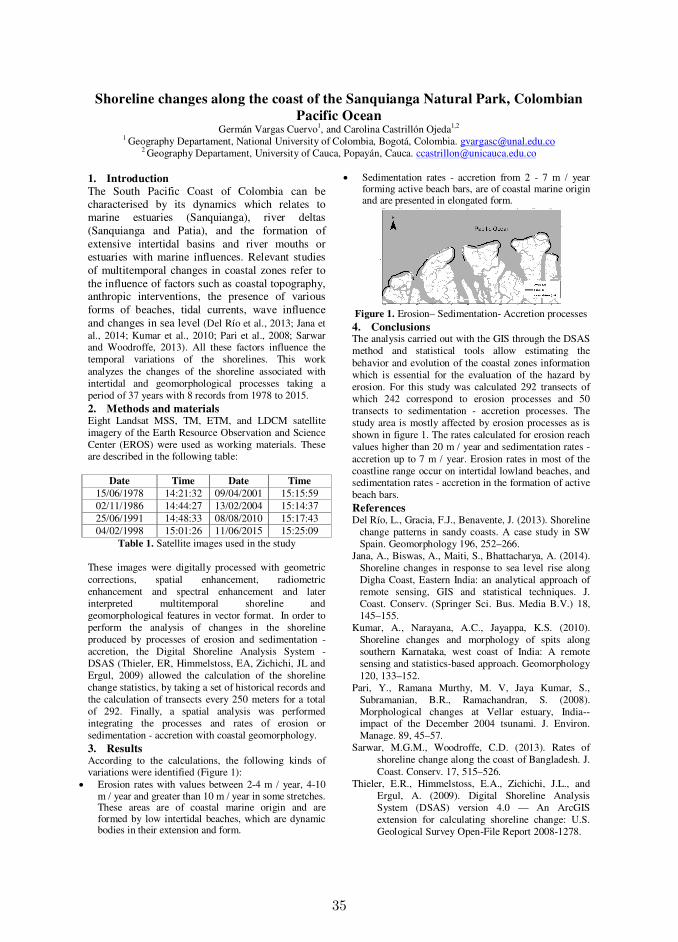
35
Shoreline changes along the coast of the Sanquianga Natural Park, Colombian
Pacific Ocean Germán Vargas Cuervo1, and Carolina Castrillón Ojeda1,2
1 Geography Departament, National University of Colombia, Bogotá, Colombia. [email protected] 2 Geography Departament, University of Cauca, Popayán, Cauca. [email protected]
1. Introduction The South Pacific Coast of Colombia can be characterised by its dynamics which relates to marine estuaries (Sanquianga), river deltas (Sanquianga and Patia), and the formation of extensive intertidal basins and river mouths or estuaries with marine influences. Relevant studies of multitemporal changes in coastal zones refer to the influence of factors such as coastal topography, anthropic interventions, the presence of various forms of beaches, tidal currents, wave influence and changes in sea level (Del Río et al., 2013; Jana et al., 2014; Kumar et al., 2010; Pari et al., 2008; Sarwar and Woodroffe, 2013). All these factors influence the temporal variations of the shorelines. This work analyzes the changes of the shoreline associated with intertidal and geomorphological processes taking a period of 37 years with 8 records from 1978 to 2015. 2. Methods and materials Eight Landsat MSS, TM, ETM, and LDCM satellite imagery of the Earth Resource Observation and Science Center (EROS) were used as working materials. These are described in the following table:
Date Time Date Time
15/06/1978 14:21:32 09/04/2001 15:15:59 02/11/1986 14:44:27 13/02/2004 15:14:37 25/06/1991 14:48:33 08/08/2010 15:17:43 04/02/1998 15:01:26 11/06/2015 15:25:09
Table 1. Satellite images used in the study These images were digitally processed with geometric corrections, spatial enhancement, radiometric enhancement and spectral enhancement and later interpreted multitemporal shoreline and geomorphological features in vector format. In order to perform the analysis of changes in the shoreline produced by processes of erosion and sedimentation - accretion, the Digital Shoreline Analysis System - DSAS (Thieler, ER, Himmelstoss, EA, Zichichi, JL and Ergul, 2009) allowed the calculation of the shoreline change statistics, by taking a set of historical records and the calculation of transects every 250 meters for a total of 292. Finally, a spatial analysis was performed integrating the processes and rates of erosion or sedimentation - accretion with coastal geomorphology. 3. Results According to the calculations, the following kinds of variations were identified (Figure 1):
Erosion rates with values between 2-4 m / year, 4-10 m / year and greater than 10 m / year in some stretches. These areas are of coastal marine origin and are formed by low intertidal beaches, which are dynamic bodies in their extension and form.
Sedimentation rates - accretion from 2 - 7 m / year forming active beach bars, are of coastal marine origin and are presented in elongated form.
Figure 1. Erosion– Sedimentation- Accretion processes 4. Conclusions The analysis carried out with the GIS through the DSAS method and statistical tools allow estimating the behavior and evolution of the coastal zones information which is essential for the evaluation of the hazard by erosion. For this study was calculated 292 transects of which 242 correspond to erosion processes and 50 transects to sedimentation - accretion processes. The study area is mostly affected by erosion processes as is shown in figure 1. The rates calculated for erosion reach values higher than 20 m / year and sedimentation rates - accretion up to 7 m / year. Erosion rates in most of the coastline range occur on intertidal lowland beaches, and sedimentation rates - accretion in the formation of active beach bars. References Del Río, L., Gracia, F.J., Benavente, J. (2013). Shoreline
change patterns in sandy coasts. A case study in SW Spain. Geomorphology 196, 252–266.
Jana, A., Biswas, A., Maiti, S., Bhattacharya, A. (2014). Shoreline changes in response to sea level rise along Digha Coast, Eastern India: an analytical approach of remote sensing, GIS and statistical techniques. J. Coast. Conserv. (Springer Sci. Bus. Media B.V.) 18, 145–155.
Kumar, A., Narayana, A.C., Jayappa, K.S. (2010). Shoreline changes and morphology of spits along southern Karnataka, west coast of India: A remote sensing and statistics-based approach. Geomorphology 120, 133–152.
Pari, Y., Ramana Murthy, M. V, Jaya Kumar, S., Subramanian, B.R., Ramachandran, S. (2008). Morphological changes at Vellar estuary, India--impact of the December 2004 tsunami. J. Environ. Manage. 89, 45–57.
Sarwar, M.G.M., Woodroffe, C.D. (2013). Rates of shoreline change along the coast of Bangladesh. J. Coast. Conserv. 17, 515–526.
Thieler, E.R., Himmelstoss, E.A., Zichichi, J.L., and Ergul, A. (2009). Digital Shoreline Analysis System (DSAS) version 4.0 — An ArcGIS extension for calculating shoreline change: U.S. Geological Survey Open-File Report 2008-1278.
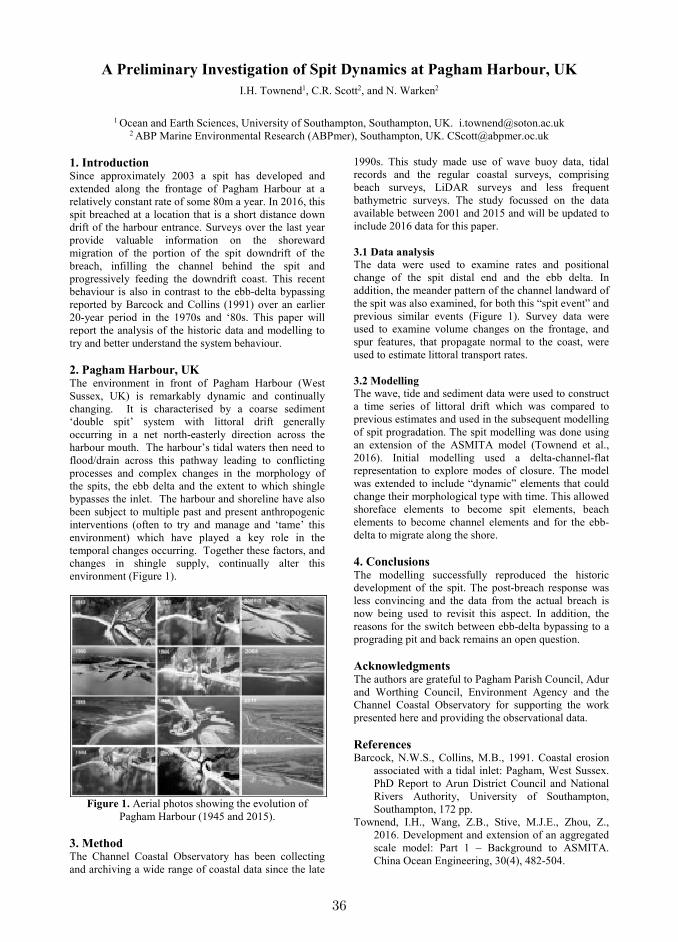
36
A Preliminary Investigation of Spit Dynamics at Pagham Harbour, UK I.H. Townend1, C.R. Scott2, and N. Warken2
1 Ocean and Earth Sciences, University of Southampton, Southampton, UK. [email protected]
2 ABP Marine Environmental Research (ABPmer), Southampton, UK. [email protected]
1. Introduction Since approximately 2003 a spit has developed and extended along the frontage of Pagham Harbour at a relatively constant rate of some 80m a year. In 2016, this spit breached at a location that is a short distance down drift of the harbour entrance. Surveys over the last year provide valuable information on the shoreward migration of the portion of the spit downdrift of the breach, infilling the channel behind the spit and progressively feeding the downdrift coast. This recent behaviour is also in contrast to the ebb-delta bypassing reported by Barcock and Collins (1991) over an earlier 20-year period in the 1970s and ‘80s. This paper will report the analysis of the historic data and modelling to try and better understand the system behaviour. 2. Pagham Harbour, UK The environment in front of Pagham Harbour (West Sussex, UK) is remarkably dynamic and continually changing. It is characterised by a coarse sediment ‘double spit’ system with littoral drift generally occurring in a net north-easterly direction across the harbour mouth. The harbour’s tidal waters then need to flood/drain across this pathway leading to conflicting processes and complex changes in the morphology of the spits, the ebb delta and the extent to which shingle bypasses the inlet. The harbour and shoreline have also been subject to multiple past and present anthropogenic interventions (often to try and manage and ‘tame’ this environment) which have played a key role in the temporal changes occurring. Together these factors, and changes in shingle supply, continually alter this environment (Figure 1).
Figure 1. Aerial photos showing the evolution of
Pagham Harbour (1945 and 2015). 3. Method The Channel Coastal Observatory has been collecting and archiving a wide range of coastal data since the late
1990s. This study made use of wave buoy data, tidal records and the regular coastal surveys, comprising beach surveys, LiDAR surveys and less frequent bathymetric surveys. The study focussed on the data available between 2001 and 2015 and will be updated to include 2016 data for this paper. 3.1 Data analysis The data were used to examine rates and positional change of the spit distal end and the ebb delta. In addition, the meander pattern of the channel landward of the spit was also examined, for both this “spit event” and previous similar events (Figure 1). Survey data were used to examine volume changes on the frontage, and spur features, that propagate normal to the coast, were used to estimate littoral transport rates. 3.2 Modelling The wave, tide and sediment data were used to construct a time series of littoral drift which was compared to previous estimates and used in the subsequent modelling of spit progradation. The spit modelling was done using an extension of the ASMITA model (Townend et al., 2016). Initial modelling used a delta-channel-flat representation to explore modes of closure. The model was extended to include “dynamic” elements that could change their morphological type with time. This allowed shoreface elements to become spit elements, beach elements to become channel elements and for the ebb-delta to migrate along the shore. 4. Conclusions The modelling successfully reproduced the historic development of the spit. The post-breach response was less convincing and the data from the actual breach is now being used to revisit this aspect. In addition, the reasons for the switch between ebb-delta bypassing to a prograding pit and back remains an open question. Acknowledgments The authors are grateful to Pagham Parish Council, Adur and Worthing Council, Environment Agency and the Channel Coastal Observatory for supporting the work presented here and providing the observational data. References Barcock, N.W.S., Collins, M.B., 1991. Coastal erosion
associated with a tidal inlet: Pagham, West Sussex. PhD Report to Arun District Council and National Rivers Authority, University of Southampton, Southampton, 172 pp.
Townend, I.H., Wang, Z.B., Stive, M.J.E., Zhou, Z., 2016. Development and extension of an aggregated scale model: Part 1 – Background to ASMITA. China Ocean Engineering, 30(4), 482-504.
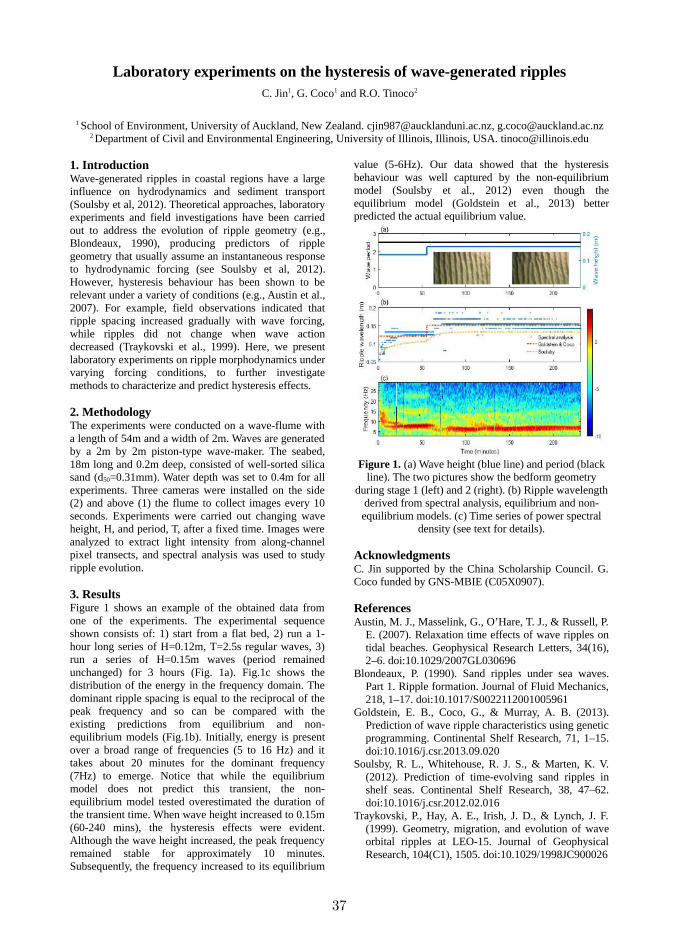
37
Laboratory experiments on the hysteresis of wave-generated ripples
C. Jin1, G. Coco1 and R.O. Tinoco2
1 School of Environment, University of Auckland, New Zealand. [email protected], [email protected] Department of Civil and Environmental Engineering, University of Illinois, Illinois, USA. [email protected]
1. IntroductionWave-generated ripples in coastal regions have a large
influence on hydrodynamics and sediment transport
(Soulsby et al, 2012). Theoretical approaches, laboratory
experiments and field investigations have been carried
out to address the evolution of ripple geometry (e.g.,
Blondeaux, 1990), producing predictors of ripple
geometry that usually assume an instantaneous response
to hydrodynamic forcing (see Soulsby et al, 2012).
However, hysteresis behaviour has been shown to be
relevant under a variety of conditions (e.g., Austin et al.,
2007). For example, field observations indicated that
ripple spacing increased gradually with wave forcing,
while ripples did not change when wave action
decreased (Traykovski et al., 1999). Here, we present
laboratory experiments on ripple morphodynamics under
varying forcing conditions, to further investigate
methods to characterize and predict hysteresis effects.
2. MethodologyThe experiments were conducted on a wave-flume with
a length of 54m and a width of 2m. Waves are generated
by a 2m by 2m piston-type wave-maker. The seabed,
18m long and 0.2m deep, consisted of well-sorted silica
sand (d50=0.31mm). Water depth was set to 0.4m for all
experiments. Three cameras were installed on the side
(2) and above (1) the flume to collect images every 10
seconds. Experiments were carried out changing wave
height, H, and period, T, after a fixed time. Images were
analyzed to extract light intensity from along-channel
pixel transects, and spectral analysis was used to study
ripple evolution.
3. ResultsFigure 1 shows an example of the obtained data from
one of the experiments. The experimental sequence
shown consists of: 1) start from a flat bed, 2) run a 1-
hour long series of H=0.12m, T=2.5s regular waves, 3)
run a series of H=0.15m waves (period remained
unchanged) for 3 hours (Fig. 1a). Fig.1c shows the
distribution of the energy in the frequency domain. The
dominant ripple spacing is equal to the reciprocal of the
peak frequency and so can be compared with the
existing predictions from equilibrium and non-
equilibrium models (Fig.1b). Initially, energy is present
over a broad range of frequencies (5 to 16 Hz) and it
takes about 20 minutes for the dominant frequency
(7Hz) to emerge. Notice that while the equilibrium
model does not predict this transient, the non-
equilibrium model tested overestimated the duration of
the transient time. When wave height increased to 0.15m
(60-240 mins), the hysteresis effects were evident.
Although the wave height increased, the peak frequency
remained stable for approximately 10 minutes.
Subsequently, the frequency increased to its equilibrium
value (5-6Hz). Our data showed that the hysteresis
behaviour was well captured by the non-equilibrium
model (Soulsby et al., 2012) even though the
equilibrium model (Goldstein et al., 2013) better
predicted the actual equilibrium value.
Figure 1. (a) Wave height (blue line) and period (black
line). The two pictures show the bedform geometry
during stage 1 (left) and 2 (right). (b) Ripple wavelength
derived from spectral analysis, equilibrium and non-
equilibrium models. (c) Time series of power spectral
density (see text for details).
AcknowledgmentsC. Jin supported by the China Scholarship Council. G.
Coco funded by GNS-MBIE (C05X0907).
ReferencesAustin, M. J., Masselink, G., O’Hare, T. J., & Russell, P.
E. (2007). Relaxation time effects of wave ripples on
tidal beaches. Geophysical Research Letters, 34(16),
2–6. doi:10.1029/2007GL030696
Blondeaux, P. (1990). Sand ripples under sea waves.
Part 1. Ripple formation. Journal of Fluid Mechanics,
218, 1–17. doi:10.1017/S0022112001005961
Goldstein, E. B., Coco, G., & Murray, A. B. (2013).
Prediction of wave ripple characteristics using genetic
programming. Continental Shelf Research, 71, 1–15.
doi:10.1016/j.csr.2013.09.020
Soulsby, R. L., Whitehouse, R. J. S., & Marten, K. V.
(2012). Prediction of time-evolving sand ripples in
shelf seas. Continental Shelf Research, 38, 47–62.
doi:10.1016/j.csr.2012.02.016
Traykovski, P., Hay, A. E., Irish, J. D., & Lynch, J. F.
(1999). Geometry, migration, and evolution of wave
orbital ripples at LEO-15. Journal of Geophysical
Research, 104(C1), 1505. doi:10.1029/1998JC900026

38
Formation and destruction events of shoreline sand waves
Jaime Arriaga, Albert Falqués and Francesca Ribas
Departament de Física, Universitat Politècnica de Catalunya, Catalonia, Spain. [email protected]
1. Introduction Alongshore rhythmic morphological patterns at different length scales are quite common along sandy beaches. Well known examples are mega-cusps and crescentic bars/rip channel systems with alongshore wavelengths ~ 100-1000 m. At larger scales (~1-10 km or more) there are the km-scale shoreline sand waves (KSSW). During the last two decades there has been much research to unravel the origin of such intriguing patterns and to get insight into their dynamics. The hypothesis that they are self-organized and they emerge out of positive feedbacks between hydrodynamics and morphology has been amply confirmed by mathematical modelling. In particular, the potential role of high-angle wave incidence (HAWI) has been investigated (Ashton et al., 2001; van den Berg et al., 2012; Kaergaard & Fredsoe, 2013). However, the large spatial and temporal scales of these patterns have proven a major constraint to contrast the hypothesis with nature. This is because these tests would require detailed measurements of the bathymetry and the wave conditions during their formation from a featureless morphology. Such data are not reported in the literature and at best there are sites, such as the coast of Namibia, with already fully formed KSSW. The aim of this contribution is to test the HAWI mechanism by comparing model results with high-quality observations of KSSW along a stretch of coast in England. 2. Site
Dungeness is a cuspate foreland at the English shore of the Dover straight. It is a quite steep gravel beach without shore-parallel bars. Data from a wave buoy at 43 m depth show a bimodal wave climate with incident waves mainly from the South-West (SW) and from the North-East (NE). The former are dominant (Fig. 1, left), 35% vs 65% from 2006 to 2015). Focusing on the NE coast (green square in Fig. 1, left) and because of the shape of the cape, the SW waves are very oblique (high-angle waves) and the NE waves are nearly shore-normal (low-angle waves).
Fig. 1 Study site, wave rose and 5-m-depth bathymetries
on 2013 and 2014. 3. Formation and destruction events
The formation of shoreline undulations has been clearly observed in the NE coast by means of bathymetric
surveys between October 2013 and December 2014 (Fig. 1, right). There are bathymetric surveys roughly every year and three/four profile surveys every year. We extract 36 shorelines from profile surveys between 2003 and 2016 at the NE shoreline. These data are obtained from the U.K. Channel Coastal Observatory. Shoreline undulations appear in 2007 and 2014 with a wavelength of about 0.5 km. The 2007 undulations ended up being smoothed while the 2014 ones persist until 2016 migrating to the N. To quantify the dominance of SW waves at the NE shoreline, i.e., high-angle waves relative to this shoreline, we compute the SW/NE wave-energy-ratio as a function of time, t0, (Fig. 2) during the interval between two extracted shorelines, ∆t: R(t0)=ESW(t0)/ENE(t0) where
∫∫∆+
=tt
tSW dtHdtE
0
0
2/5315
1350 )( θ
and a similar expression is used for ENE with an integral from -45o to 135o. It is found that the formation events correlate with large R values (e.g., 2007 and 2014) and for low R values the shoreline remains relatively smooth with only small-scale undulations (e.g., 2009-2011). This suggests that HAWI is playing an important role in the formation of the large-scale undulations. The clear formation events and the 2007-destruction event provide a unique opportunity to compare observations with the outputs of morphodynamic models (e.g., van den Berg et al., 2012). This comparison is under way in order to test the self-organization hypothesis (HAWI).
Fig. 2 SW/NE wave-energy-ratio during the intervals of extracted shorelines.
Acknowledgements
Funding by the Mexican CONACyT and the Spanish Ministerio under projects CTM2012-35398/CTM2015-66225-C2-1-P is gratefully acknowledged.
References
Ashton, A., Murray, A. B., Arnault, O., 2001. Nature, 414: 296-300. Kaergaard, K, Fredsoe, 2013. Coastal Engineering, 75, 64–76. van den Berg, N., Falqués, A., Ribas, F., 2012. J. Geophys. Res., 117 (F03019), doi:10.1029/2011JF002177.

39
On sand waves and sandy mounds
G. Porcile1, P. Blondeaux2 and G. Vittori3
1 Department of Civil, Chemical and Environmental Engineering, University of Genoa, Genoa, Italy.
[email protected] Department of Civil, Chemical and Environmental Engineering, University of Genoa, Genoa, Italy.
[email protected] Department of Civil, Chemical and Environmental Engineering, University of Genoa, Genoa, Italy.
1. IntroductionSand waves are periodic bedforms, often observed in tidal
environments where sand is abundant. Sand waves have
crests perpendicular to the main direction of the tide and
the spacing of the crests is of the order of hundreds of
metres, their height is of several metres and they migrate
at a speed of a few metres per year.
In the regions where shortage of sand does not allow the
formation of typical sand waves, the field observations
show sandy mounds that, for similar hydrodynamic and
morphodynamic conditions, are characterized by crest-to-
crest distances which are larger than the wavelengths of
the sand waves which form where sand is abundant. In
particular, sandy mounds were observed by Le Bot and
Trentesaux (2004) in the English Channel close to the
strait of Calais-Dover.
2. The modelThe model by Besio et al. (2006) has been extended to
take into account that the sediment transport rate is modi-
fied in sediment-starved environments and to describe the
dynamics of the sandy mounds. The sediment transport
is computed following the approach by Blondeaux et al.
(2016), who studied the formation of ripples by an os-
cillatory flow when only a thin layer of sediment covers
the rigid substratum. Indeed in sediment-starved environ-
ments, the local sediment transport rate depends both on
the local shear stress and on the upstream value of the
sediment transport rate.
3. The resultsA comparison of the model predictions with the field data
collected by Le Bot and Trentesaux (2004) supports the
reliability of the idealized model.
The time development of the bottom configuration is
computed by integrating Exner (sediment continuity)
equation and the results suggest that the sandy mounds
have wavelengths which are larger than those observed
in environments with abundance of sand (sand waves), in
accordance with field observations.
Figures (1) and (2) show the formation of sand waves (fig-
ure 1) and sandy mounds (figure 2), respectively.
The results show that both sand waves and sandy mounds
migrate when the symmetry of the flow, due to the M2-
constituent, is broken by the presence of more tide con-
stituents. The migration of the bottom forms takes place
in the direction of the residual current when only the Z0
constituent is added to the semidiurnal constituent. How-
ever, the bottom forms can migrate even in the opposite
direction if the M4-constituent is also added with an ap-
propriate phase.
Figure 1. Time development of sand waves in an
environment with abundance of sand.
Figure 2. Time development of sandy mounds in a
sediment-starved environment. At the beginning there is
a layer of sand of 30 cm over a rigid substratum.
ReferencesBesio, G., Blondeaux, P., and Vittori, G. (2006). On the
formation of sand waves and sand banks. Journal of
Fluid Mechanics, 557:1–27.
Blondeaux, P., Vittori, G., and Mazzuoli, M. (2016). Pat-
tern formation in a thin layer of sediment. Marine Ge-
ology, 376:39–50.
Le Bot, S. and Trentesaux, A. (2004). Types of inter-
nal structure and external morphology of submarine
dunes under the influence of tide-and wind-driven pro-
cesses (dover strait, northern france). Marine Geology,
211(1):143–168.
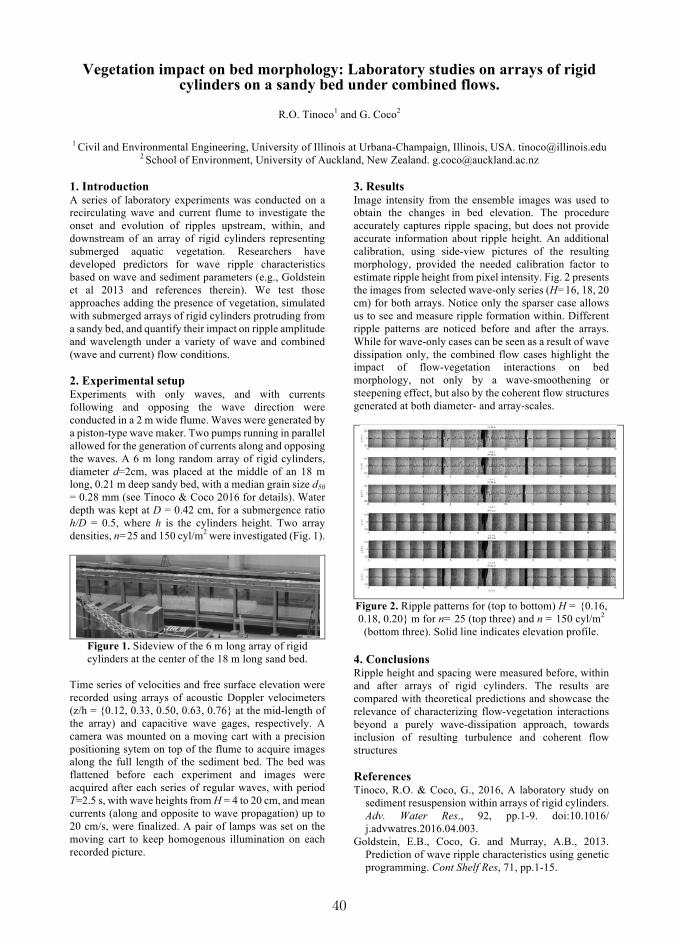
40
Vegetation impact on bed morphology: Laboratory studies on arrays of rigid cylinders on a sandy bed under combined flows.
R.O. Tinoco
1 and G. Coco
2
1 Civil and Environmental Engineering, University of Illinois at Urbana-Champaign, Illinois, USA. [email protected]
2 School of Environment, University of Auckland, New Zealand. [email protected]
1. Introduction A series of laboratory experiments was conducted on a
recirculating wave and current flume to investigate the
onset and evolution of ripples upstream, within, and
downstream of an array of rigid cylinders representing
submerged aquatic vegetation. Researchers have
developed predictors for wave ripple characteristics
based on wave and sediment parameters (e.g., Goldstein
et al 2013 and references therein). We test those
approaches adding the presence of vegetation, simulated
with submerged arrays of rigid cylinders protruding from
a sandy bed, and quantify their impact on ripple amplitude
and wavelength under a variety of wave and combined
(wave and current) flow conditions.
2. Experimental setup Experiments with only waves, and with currents
following and opposing the wave direction were
conducted in a 2 m wide flume. Waves were generated by
a piston-type wave maker. Two pumps running in parallel
allowed for the generation of currents along and opposing
the waves. A 6 m long random array of rigid cylinders,
diameter d=2cm, was placed at the middle of an 18 m
long, 0.21 m deep sandy bed, with a median grain size d50
= 0.28 mm (see Tinoco & Coco 2016 for details). Water
depth was kept at D = 0.42 cm, for a submergence ratio
h/D = 0.5, where h is the cylinders height. Two array
densities, n=25 and 150 cyl/m2 were investigated (Fig. 1).
Figure 1. Sideview of the 6 m long array of rigid
cylinders at the center of the 18 m long sand bed.
Time series of velocities and free surface elevation were
recorded using arrays of acoustic Doppler velocimeters
(z/h = 0.12, 0.33, 0.50, 0.63, 0.76 at the mid-length of
the array) and capacitive wave gages, respectively. A
camera was mounted on a moving cart with a precision
positioning sytem on top of the flume to acquire images
along the full length of the sediment bed. The bed was
flattened before each experiment and images were
acquired after each series of regular waves, with period
T=2.5 s, with wave heights from H = 4 to 20 cm, and mean
currents (along and opposite to wave propagation) up to
20 cm/s, were finalized. A pair of lamps was set on the
moving cart to keep homogenous illumination on each
recorded picture.
3. Results Image intensity from the ensemble images was used to
obtain the changes in bed elevation. The procedure
accurately captures ripple spacing, but does not provide
accurate information about ripple height. An additional
calibration, using side-view pictures of the resulting
morphology, provided the needed calibration factor to
estimate ripple height from pixel intensity. Fig. 2 presents
the images from selected wave-only series (H=16, 18, 20
cm) for both arrays. Notice only the sparser case allows
us to see and measure ripple formation within. Different
ripple patterns are noticed before and after the arrays.
While for wave-only cases can be seen as a result of wave
dissipation only, the combined flow cases highlight the
impact of flow-vegetation interactions on bed
morphology, not only by a wave-smoothening or
steepening effect, but also by the coherent flow structures
generated at both diameter- and array-scales.
Figure 2. Ripple patterns for (top to bottom) H = 0.16,
0.18, 0.20 m for n= 25 (top three) and n = 150 cyl/m2
(bottom three). Solid line indicates elevation profile.
4. Conclusions Ripple height and spacing were measured before, within
and after arrays of rigid cylinders. The results are
compared with theoretical predictions and showcase the
relevance of characterizing flow-vegetation interactions
beyond a purely wave-dissipation approach, towards
inclusion of resulting turbulence and coherent flow
structures
References Tinoco, R.O. & Coco, G., 2016, A laboratory study on
sediment resuspension within arrays of rigid cylinders.
Adv. Water Res., 92, pp.1-9. doi:10.1016/
j.advwatres.2016.04.003.
Goldstein, E.B., Coco, G. and Murray, A.B., 2013.
Prediction of wave ripple characteristics using genetic
programming. Cont Shelf Res, 71, pp.1-15.
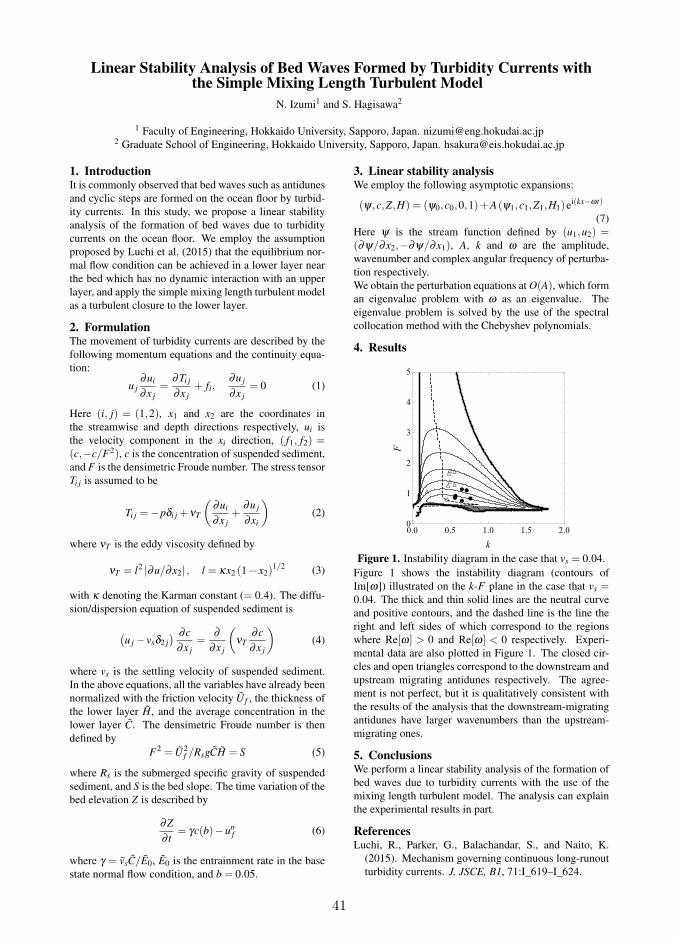
41
Linear Stability Analysis of Bed Waves Formed by Turbidity Currents withthe Simple Mixing Length Turbulent Model
N. Izumi1 and S. Hagisawa2
1 Faculty of Engineering, Hokkaido University, Sapporo, Japan. [email protected] Graduate School of Engineering, Hokkaido University, Sapporo, Japan. [email protected]
1. IntroductionIt is commonly observed that bed waves such as antidunes
and cyclic steps are formed on the ocean floor by turbid-
ity currents. In this study, we propose a linear stability
analysis of the formation of bed waves due to turbidity
currents on the ocean floor. We employ the assumption
proposed by Luchi et al. (2015) that the equilibrium nor-
mal flow condition can be achieved in a lower layer near
the bed which has no dynamic interaction with an upper
layer, and apply the simple mixing length turbulent model
as a turbulent closure to the lower layer.
2. FormulationThe movement of turbidity currents are described by the
following momentum equations and the continuity equa-
tion:
u j
∂ui
∂x j
=∂Ti j
∂x j
+ fi,∂u j
∂x j
= 0 (1)
Here (i, j) = (1,2), x1 and x2 are the coordinates in
the streamwise and depth directions respectively, ui is
the velocity component in the xi direction, ( f1, f2) =(c,−c/F2), c is the concentration of suspended sediment,
and F is the densimetric Froude number. The stress tensor
Ti j is assumed to be
Ti j =−pδi j +νT
(
∂ui
∂x j
+∂u j
∂xi
)
(2)
where νT is the eddy viscosity defined by
νT = l2 |∂u/∂x2| , l = κx2 (1− x2)1/2
(3)
with κ denoting the Karman constant (= 0.4). The diffu-
sion/dispersion equation of suspended sediment is
(
u j − vsδ2 j
) ∂c
∂x j
=∂
∂x j
(
νT
∂c
∂x j
)
(4)
where vs is the settling velocity of suspended sediment.
In the above equations, all the variables have already been
normalized with the friction velocity U f , the thickness of
the lower layer H, and the average concentration in the
lower layer C. The densimetric Froude number is then
defined by
F2 = U2f /RsgCH = S (5)
where Rs is the submerged specific gravity of suspended
sediment, and S is the bed slope. The time variation of the
bed elevation Z is described by
∂Z
∂ t= γc(b)−un
f (6)
where γ = vsC/E0, E0 is the entrainment rate in the base
state normal flow condition, and b = 0.05.
3. Linear stability analysisWe employ the following asymptotic expansions:
(ψ,c,Z,H) = (ψ0,c0,0,1)+A(ψ1,c1,Z1,H1)ei(kx−ωt)
(7)
Here ψ is the stream function defined by (u1,u2) =(∂ψ/∂x2,−∂ψ/∂x1), A, k and ω are the amplitude,
wavenumber and complex angular frequency of perturba-
tion respectively.
We obtain the perturbation equations at O(A), which form
an eigenvalue problem with ω as an eigenvalue. The
eigenvalue problem is solved by the use of the spectral
collocation method with the Chebyshev polynomials.
4. Results
Figure 1. Instability diagram in the case that vs = 0.04.
Figure 1 shows the instability diagram (contours of
Im[ω]) illustrated on the k-F plane in the case that vs =0.04. The thick and thin solid lines are the neutral curve
and positive contours, and the dashed line is the line the
right and left sides of which correspond to the regions
where Re[ω] > 0 and Re[ω] < 0 respectively. Experi-
mental data are also plotted in Figure 1. The closed cir-
cles and open triangles correspond to the downstream and
upstream migrating antidunes respectively. The agree-
ment is not perfect, but it is qualitatively consistent with
the results of the analysis that the downstream-migrating
antidunes have larger wavenumbers than the upstream-
migrating ones.
5. ConclusionsWe perform a linear stability analysis of the formation of
bed waves due to turbidity currents with the use of the
mixing length turbulent model. The analysis can explain
the experimental results in part.
ReferencesLuchi, R., Parker, G., Balachandar, S., and Naito, K.
(2015). Mechanism governing continuous long-runout
turbidity currents. J. JSCE, B1, 71:I_619–I_624.
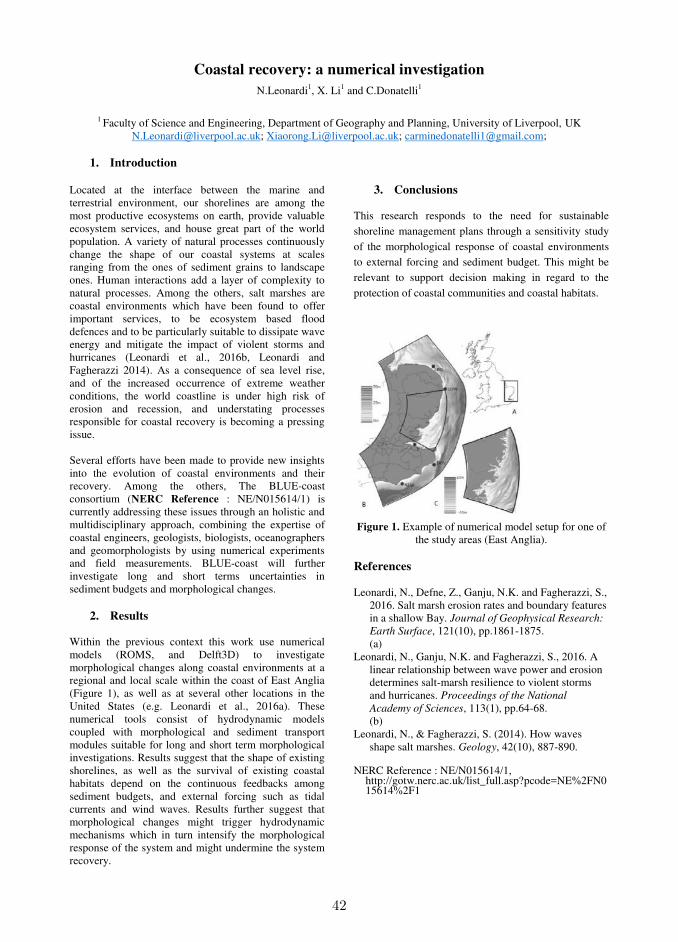
42
Coastal recovery: a numerical investigation
N.Leonardi1, X. Li1 and C.Donatelli1
1 Faculty of Science and Engineering, Department of Geography and Planning, University of Liverpool, UK
[email protected]; [email protected]; [email protected];
1. Introduction
Located at the interface between the marine and terrestrial environment, our shorelines are among the most productive ecosystems on earth, provide valuable ecosystem services, and house great part of the world population. A variety of natural processes continuously change the shape of our coastal systems at scales ranging from the ones of sediment grains to landscape ones. Human interactions add a layer of complexity to natural processes. Among the others, salt marshes are coastal environments which have been found to offer important services, to be ecosystem based flood defences and to be particularly suitable to dissipate wave energy and mitigate the impact of violent storms and hurricanes (Leonardi et al., 2016b, Leonardi and Fagherazzi 2014). As a consequence of sea level rise, and of the increased occurrence of extreme weather conditions, the world coastline is under high risk of erosion and recession, and understating processes responsible for coastal recovery is becoming a pressing issue. Several efforts have been made to provide new insights into the evolution of coastal environments and their recovery. Among the others, The BLUE-coast consortium (NERC Reference : NE/N015614/1) is currently addressing these issues through an holistic and multidisciplinary approach, combining the expertise of coastal engineers, geologists, biologists, oceanographers and geomorphologists by using numerical experiments and field measurements. BLUE-coast will further investigate long and short terms uncertainties in sediment budgets and morphological changes.
2. Results Within the previous context this work use numerical models (ROMS, and Delft3D) to investigate morphological changes along coastal environments at a regional and local scale within the coast of East Anglia (Figure 1), as well as at several other locations in the United States (e.g. Leonardi et al., 2016a). These numerical tools consist of hydrodynamic models coupled with morphological and sediment transport modules suitable for long and short term morphological investigations. Results suggest that the shape of existing shorelines, as well as the survival of existing coastal habitats depend on the continuous feedbacks among sediment budgets, and external forcing such as tidal currents and wind waves. Results further suggest that morphological changes might trigger hydrodynamic mechanisms which in turn intensify the morphological response of the system and might undermine the system recovery.
3. Conclusions This research responds to the need for sustainable
shoreline management plans through a sensitivity study
of the morphological response of coastal environments
to external forcing and sediment budget. This might be
relevant to support decision making in regard to the
protection of coastal communities and coastal habitats.
Figure 1. Example of numerical model setup for one of
the study areas (East Anglia). References Leonardi, N., Defne, Z., Ganju, N.K. and Fagherazzi, S.,
2016. Salt marsh erosion rates and boundary features in a shallow Bay. Journal of Geophysical Research:
Earth Surface, 121(10), pp.1861-1875. (a)
Leonardi, N., Ganju, N.K. and Fagherazzi, S., 2016. A linear relationship between wave power and erosion determines salt-marsh resilience to violent storms and hurricanes. Proceedings of the National
Academy of Sciences, 113(1), pp.64-68. (b)
Leonardi, N., & Fagherazzi, S. (2014). How waves shape salt marshes. Geology, 42(10), 887-890.
NERC Reference : NE/N015614/1,
http://gotw.nerc.ac.uk/list_full.asp?pcode=NE%2FN015614%2F1
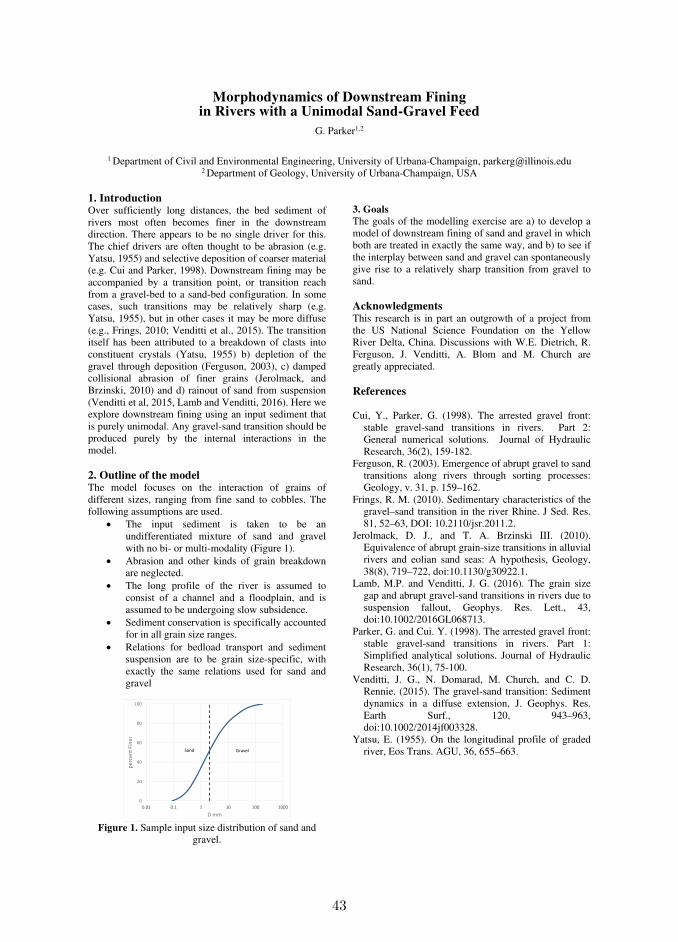
43
Morphodynamics of Downstream Fining in Rivers with a Unimodal Sand-Gravel Feed
G. Parker1,2
1 Department of Civil and Environmental Engineering, University of Urbana-Champaign, [email protected]
2 Department of Geology, University of Urbana-Champaign, USA
1. Introduction Over sufficiently long distances, the bed sediment of rivers most often becomes finer in the downstream direction. There appears to be no single driver for this. The chief drivers are often thought to be abrasion (e.g. Yatsu, 1955) and selective deposition of coarser material (e.g. Cui and Parker, 1998). Downstream fining may be accompanied by a transition point, or transition reach from a gravel-bed to a sand-bed configuration. In some cases, such transitions may be relatively sharp (e.g. Yatsu, 1955), but in other cases it may be more diffuse (e.g., Frings, 2010; Venditti et al., 2015). The transition itself has been attributed to a breakdown of clasts into constituent crystals (Yatsu, 1955) b) depletion of the gravel through deposition (Ferguson, 2003), c) damped collisional abrasion of finer grains (Jerolmack, and Brzinski, 2010) and d) rainout of sand from suspension (Venditti et al, 2015, Lamb and Venditti, 2016). Here we explore downstream fining using an input sediment that is purely unimodal. Any gravel-sand transition should be produced purely by the internal interactions in the model. 2. Outline of the model The model focuses on the interaction of grains of different sizes, ranging from fine sand to cobbles. The following assumptions are used.
The input sediment is taken to be an undifferentiated mixture of sand and gravel with no bi- or multi-modality (Figure 1).
Abrasion and other kinds of grain breakdown are neglected.
The long profile of the river is assumed to consist of a channel and a floodplain, and is assumed to be undergoing slow subsidence.
Sediment conservation is specifically accounted for in all grain size ranges.
Relations for bedload transport and sediment suspension are to be grain size-specific, with exactly the same relations used for sand and gravel
0
20
40
60
80
100
0.01 0.1 1 10 100 1000
pe
rce
nt F
ine
r
D mm
Sand Gravel
Figure 1. Sample input size distribution of sand and
gravel.
3. Goals
The goals of the modelling exercise are a) to develop a model of downstream fining of sand and gravel in which both are treated in exactly the same way, and b) to see if the interplay between sand and gravel can spontaneously give rise to a relatively sharp transition from gravel to sand. Acknowledgments This research is in part an outgrowth of a project from the US National Science Foundation on the Yellow River Delta, China. Discussions with W.E. Dietrich, R. Ferguson, J. Venditti, A. Blom and M. Church are greatly appreciated. References Cui, Y., Parker, G. (1998). The arrested gravel front:
stable gravel-sand transitions in rivers. Part 2: General numerical solutions. Journal of Hydraulic Research, 36(2), 159-182.
Ferguson, R. (2003). Emergence of abrupt gravel to sand transitions along rivers through sorting processes: Geology, v. 31, p. 159–162.
Frings, R. M. (2010). Sedimentary characteristics of the gravel–sand transition in the river Rhine. J Sed. Res. 81, 52–63, DOI: 10.2110/jsr.2011.2.
Jerolmack, D. J., and T. A. Brzinski III. (2010). Equivalence of abrupt grain-size transitions in alluvial rivers and eolian sand seas: A hypothesis, Geology, 38(8), 719–722, doi:10.1130/g30922.1.
Lamb, M.P. and Venditti, J. G. (2016). The grain size gap and abrupt gravel-sand transitions in rivers due to suspension fallout, Geophys. Res. Lett., 43, doi:10.1002/2016GL068713.
Parker, G. and Cui. Y. (1998). The arrested gravel front: stable gravel-sand transitions in rivers. Part 1: Simplified analytical solutions. Journal of Hydraulic Research, 36(1), 75-100.
Venditti, J. G., N. Domarad, M. Church, and C. D. Rennie. (2015). The gravel-sand transition: Sediment dynamics in a diffuse extension, J. Geophys. Res. Earth Surf., 120, 943–963, doi:10.1002/2014jf003328.
Yatsu, E. (1955). On the longitudinal profile of graded river, Eos Trans. AGU, 36, 655–663.
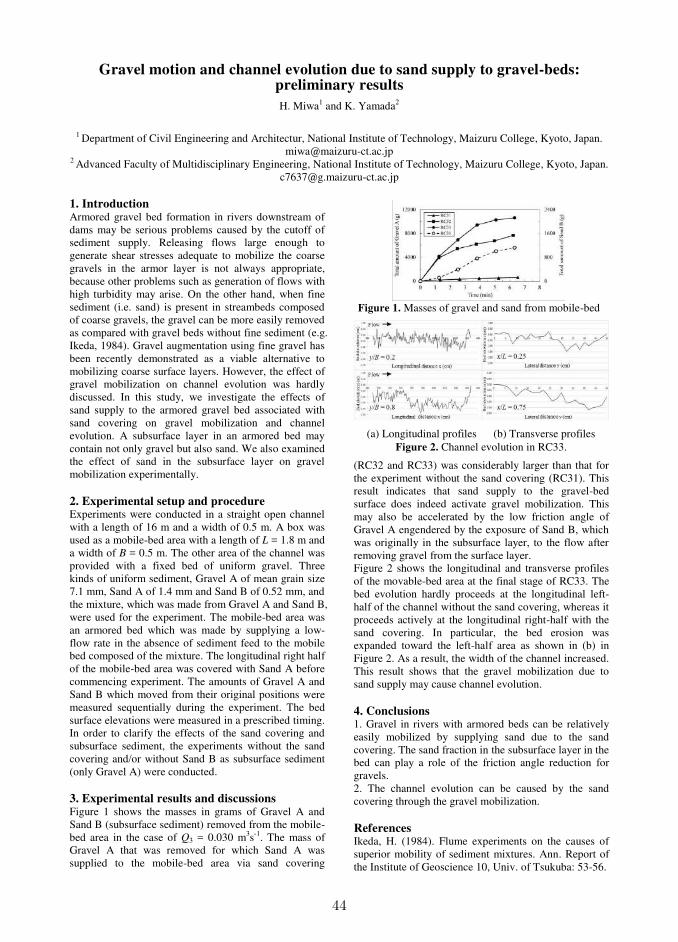
44
Gravel motion and channel evolution due to sand supply to gravel-beds: preliminary results
H. Miwa1 and K. Yamada2
1 Department of Civil Engineering and Architectur, National Institute of Technology, Maizuru College, Kyoto, Japan.
[email protected] 2 Advanced Faculty of Multidisciplinary Engineering, National Institute of Technology, Maizuru College, Kyoto, Japan.
1. Introduction Armored gravel bed formation in rivers downstream of dams may be serious problems caused by the cutoff of sediment supply. Releasing flows large enough to generate shear stresses adequate to mobilize the coarse gravels in the armor layer is not always appropriate, because other problems such as generation of flows with high turbidity may arise. On the other hand, when fine sediment (i.e. sand) is present in streambeds composed of coarse gravels, the gravel can be more easily removed as compared with gravel beds without fine sediment (e.g. Ikeda, 1984). Gravel augmentation using fine gravel has been recently demonstrated as a viable alternative to mobilizing coarse surface layers. However, the effect of gravel mobilization on channel evolution was hardly discussed. In this study, we investigate the effects of sand supply to the armored gravel bed associated with sand covering on gravel mobilization and channel evolution. A subsurface layer in an armored bed may contain not only gravel but also sand. We also examined the effect of sand in the subsurface layer on gravel mobilization experimentally. 2. Experimental setup and procedure Experiments were conducted in a straight open channel with a length of 16 m and a width of 0.5 m. A box was used as a mobile-bed area with a length of L = 1.8 m and a width of B = 0.5 m. The other area of the channel was provided with a fixed bed of uniform gravel. Three kinds of uniform sediment, Gravel A of mean grain size 7.1 mm, Sand A of 1.4 mm and Sand B of 0.52 mm, and the mixture, which was made from Gravel A and Sand B, were used for the experiment. The mobile-bed area was an armored bed which was made by supplying a low-flow rate in the absence of sediment feed to the mobile bed composed of the mixture. The longitudinal right half of the mobile-bed area was covered with Sand A before commencing experiment. The amounts of Gravel A and Sand B which moved from their original positions were measured sequentially during the experiment. The bed surface elevations were measured in a prescribed timing. In order to clarify the effects of the sand covering and subsurface sediment, the experiments without the sand covering and/or without Sand B as subsurface sediment (only Gravel A) were conducted. 3. Experimental results and discussions Figure 1 shows the masses in grams of Gravel A and Sand B (subsurface sediment) removed from the mobile-bed area in the case of Q3 = 0.030 m3s-1. The mass of Gravel A that was removed for which Sand A was supplied to the mobile-bed area via sand covering
(RC32 and RC33) was considerably larger than that for the experiment without the sand covering (RC31). This result indicates that sand supply to the gravel-bed surface does indeed activate gravel mobilization. This may also be accelerated by the low friction angle of Gravel A engendered by the exposure of Sand B, which was originally in the subsurface layer, to the flow after removing gravel from the surface layer. Figure 2 shows the longitudinal and transverse profiles of the movable-bed area at the final stage of RC33. The bed evolution hardly proceeds at the longitudinal left-half of the channel without the sand covering, whereas it proceeds actively at the longitudinal right-half with the sand covering. In particular, the bed erosion was expanded toward the left-half area as shown in (b) in Figure 2. As a result, the width of the channel increased. This result shows that the gravel mobilization due to sand supply may cause channel evolution. 4. Conclusions 1. Gravel in rivers with armored beds can be relatively easily mobilized by supplying sand due to the sand covering. The sand fraction in the subsurface layer in the bed can play a role of the friction angle reduction for gravels. 2. The channel evolution can be caused by the sand covering through the gravel mobilization. References Ikeda, H. (1984). Flume experiments on the causes of superior mobility of sediment mixtures. Ann. Report of the Institute of Geoscience 10, Univ. of Tsukuba: 53-56.
(a) Longitudinal profiles (b) Transverse profiles Figure 2. Channel evolution in RC33.
Figure 1. Masses of gravel and sand from mobile-bed

45
Dynamics of a fine and coarse sediment mixture using a medical CT scan
B. Camenen1, E Perret1, C. B. Brunelle2, P. Francus2, M. Des Roches2 and L.-F. Daigle2
1 Irstea, UR HHLY, Lyon-Villeurbanne Center, 5 rue de la Doua, BP32108, 69616 Villeurbanne, France.
[email protected], [email protected], 2 INRS, 490 rue de la Couronne, Québec, G1K 9A9, QC, Canada.
Pierre. [email protected], [email protected], [email protected], [email protected]
1. Introduction The dynamics of a sediment mixture is a typical issue for alpine rivers where poorly sorted sediments are found (Camenen et al., 2015). There exist some studies on the interaction between the two classes of a bimodal mixture (Wilcock et al., 2001, among others) but there are generally based on an initial well-mixed mixture. In nature, one often observes layers of sediments with different grain size distribution. In this study, we specifically focus on the dynamics of fine sand propagating over a bed made of coarse sand. One originality of this work is that we used high resolution imaging techniques to better describe the mechanisms at the fluid-sediment interface. 2. Experimental set-up Experiments were conducted at the multidisciplinary laboratory of CT-scan for non-medical use (INRS, Québec). A small horizontal channel (0.305x0.30x7m) was used with a 5 cm thick bed made of coarse sand (Dc50=1.5 mm) (Figure 1, left). A bed made of fine sand (Df50=0.2 mm) was set in the upstream part of the channel (Figure 1, right). The first part of the experiment consists in propagating the fine sand over the coarse matrix with a steady discharge not sufficient to transport coarse sand. Then, the flow is increased step by step to study sediment transport and the interaction between the two classes of sediments.
Figure 1. Photos of the experimental set-up.
The flow was characterised using a PIV system fixed on the CT-scan as well as a Vectrino II positioned downstream (Figure 1, left). Sediment transport was measured using a trap on the downstream part of the flume (bedload) and water samples were taken at different positions above the bed. The CT-scan measures 3D attenuation of X-rays, which can be related to matter density. It was used to evaluate the fine sediment infiltration in the coarse matrix and the dynamics of the bed surface interface using the dune-tracking technics.
2. Results Preliminary results on the bedload dynamics are presented in Figure 2. Compared to the Camenen & Larson (2005) formula that yields consistent results for each class of sediment alone, one can observe a clear increase of the coarse sediment transport capacity due to lubrification effects of the fine fraction. On the other hand, trapping effects reduce significantly the fine sand transport capacity.
Figure 2. Fine and coarse sediment bedload transport as
a function of the Shields parameter. 3. Conclusions A laboratory experiments is presented on the dynamics of a fine and coarse sediment mixture using high resolution imaging techniques. Classical lubrication and trapping effects were identified. An analysis of the flow and sediment dynamics close the bed thanks to PIV and CT-scan measurements should provide more detailed information on the observed phenomena. Acknowledgments This study was supported by the Rhône-Alpes region through the CMIRA ExploraPro financial support. References Camenen, B.; Herrero, A.; Dramais, G.; Thollet, F.; Le
Bescond, C.; Perret, E. & Berni, C. (2015). Field experiment on the dynamics of fine sediments over a gravel bar in an alpine gravel-bed river. 9th RCEM
symposium, 4p. Camenen, B. & Larson, M. (2005). A bedload sediment
transport formula for the nearshore. Estuarine,
Coastal & Shelf Science, 63: 249-260 Wilcock, P. R., Kenworthy, S. T. & Crowe, J. C. (2001).
Experimental study of the transport of mixed sand and gravel. Water Resources Res., 37: 3349-3358
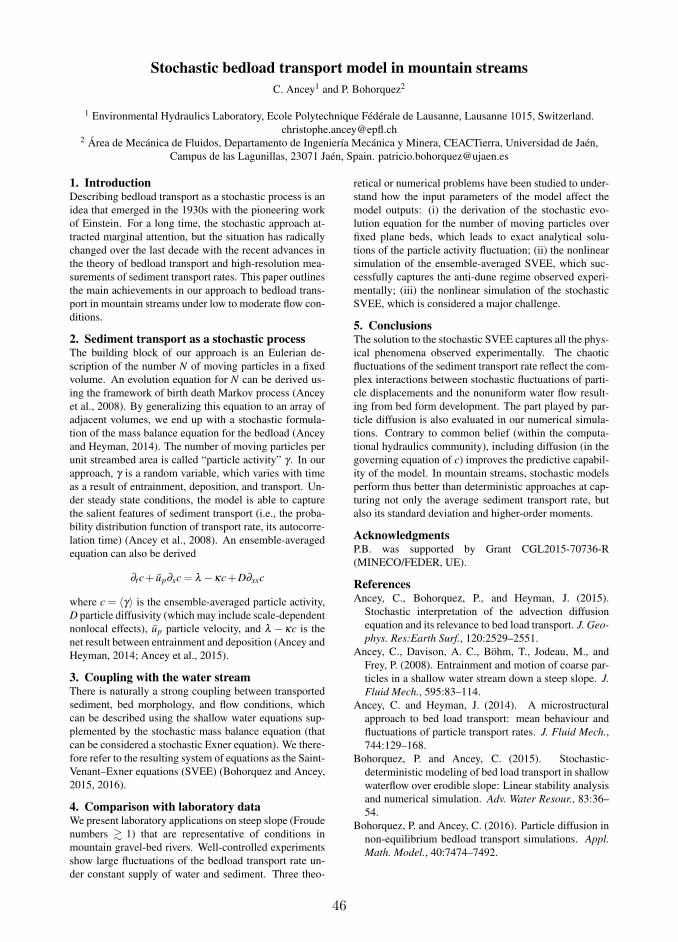
46
Stochastic bedload transport model in mountain streams
C. Ancey1 and P. Bohorquez2
1 Environmental Hydraulics Laboratory, Ecole Polytechnique Fédérale de Lausanne, Lausanne 1015, [email protected]
2 Área de Mecánica de Fluidos, Departamento de Ingeniería Mecánica y Minera, CEACTierra, Universidad de Jaén,Campus de las Lagunillas, 23071 Jaén, Spain. [email protected]
1. IntroductionDescribing bedload transport as a stochastic process is anidea that emerged in the 1930s with the pioneering workof Einstein. For a long time, the stochastic approach at-tracted marginal attention, but the situation has radicallychanged over the last decade with the recent advances inthe theory of bedload transport and high-resolution mea-surements of sediment transport rates. This paper outlinesthe main achievements in our approach to bedload trans-port in mountain streams under low to moderate flow con-ditions.
2. Sediment transport as a stochastic processThe building block of our approach is an Eulerian de-scription of the number N of moving particles in a fixedvolume. An evolution equation for N can be derived us-ing the framework of birth death Markov process (Anceyet al., 2008). By generalizing this equation to an array ofadjacent volumes, we end up with a stochastic formula-tion of the mass balance equation for the bedload (Anceyand Heyman, 2014). The number of moving particles perunit streambed area is called “particle activity” γ . In ourapproach, γ is a random variable, which varies with timeas a result of entrainment, deposition, and transport. Un-der steady state conditions, the model is able to capturethe salient features of sediment transport (i.e., the proba-bility distribution function of transport rate, its autocorre-lation time) (Ancey et al., 2008). An ensemble-averagedequation can also be derived
∂tc+ up∂xc = λ −κc+D∂xxc
where c = 〈γ〉 is the ensemble-averaged particle activity,D particle diffusivity (which may include scale-dependentnonlocal effects), up particle velocity, and λ − κc is thenet result between entrainment and deposition (Ancey andHeyman, 2014; Ancey et al., 2015).
3. Coupling with the water streamThere is naturally a strong coupling between transportedsediment, bed morphology, and flow conditions, whichcan be described using the shallow water equations sup-plemented by the stochastic mass balance equation (thatcan be considered a stochastic Exner equation). We there-fore refer to the resulting system of equations as the Saint-Venant–Exner equations (SVEE) (Bohorquez and Ancey,2015, 2016).
4. Comparison with laboratory dataWe present laboratory applications on steep slope (Froudenumbers & 1) that are representative of conditions inmountain gravel-bed rivers. Well-controlled experimentsshow large fluctuations of the bedload transport rate un-der constant supply of water and sediment. Three theo-
retical or numerical problems have been studied to under-stand how the input parameters of the model affect themodel outputs: (i) the derivation of the stochastic evo-lution equation for the number of moving particles overfixed plane beds, which leads to exact analytical solu-tions of the particle activity fluctuation; (ii) the nonlinearsimulation of the ensemble-averaged SVEE, which suc-cessfully captures the anti-dune regime observed experi-mentally; (iii) the nonlinear simulation of the stochasticSVEE, which is considered a major challenge.
5. ConclusionsThe solution to the stochastic SVEE captures all the phys-ical phenomena observed experimentally. The chaoticfluctuations of the sediment transport rate reflect the com-plex interactions between stochastic fluctuations of parti-cle displacements and the nonuniform water flow result-ing from bed form development. The part played by par-ticle diffusion is also evaluated in our numerical simula-tions. Contrary to common belief (within the computa-tional hydraulics community), including diffusion (in thegoverning equation of c) improves the predictive capabil-ity of the model. In mountain streams, stochastic modelsperform thus better than deterministic approaches at cap-turing not only the average sediment transport rate, butalso its standard deviation and higher-order moments.
AcknowledgmentsP.B. was supported by Grant CGL2015-70736-R(MINECO/FEDER, UE).
ReferencesAncey, C., Bohorquez, P., and Heyman, J. (2015).
Stochastic interpretation of the advection diffusionequation and its relevance to bed load transport. J. Geo-
phys. Res:Earth Surf., 120:2529–2551.Ancey, C., Davison, A. C., Böhm, T., Jodeau, M., and
Frey, P. (2008). Entrainment and motion of coarse par-ticles in a shallow water stream down a steep slope. J.
Fluid Mech., 595:83–114.Ancey, C. and Heyman, J. (2014). A microstructural
approach to bed load transport: mean behaviour andfluctuations of particle transport rates. J. Fluid Mech.,744:129–168.
Bohorquez, P. and Ancey, C. (2015). Stochastic-deterministic modeling of bed load transport in shallowwaterflow over erodible slope: Linear stability analysisand numerical simulation. Adv. Water Resour., 83:36–54.
Bohorquez, P. and Ancey, C. (2016). Particle diffusion innon-equilibrium bedload transport simulations. Appl.
Math. Model., 40:7474–7492.
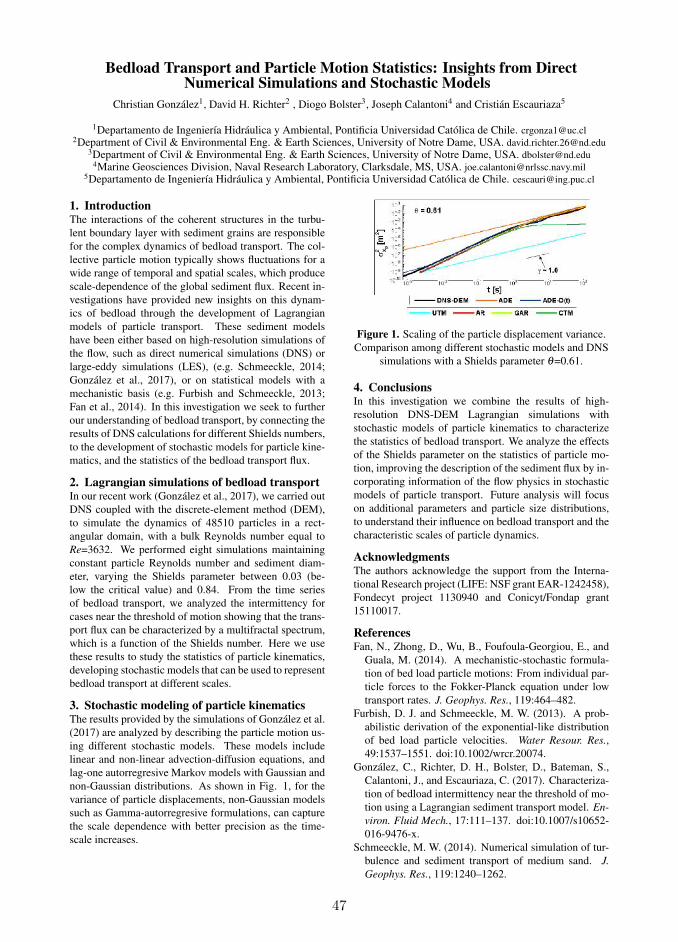
47
Bedload Transport and Particle Motion Statistics: Insights from DirectNumerical Simulations and Stochastic Models
Christian González1, David H. Richter2 , Diogo Bolster3, Joseph Calantoni4 and Cristián Escauriaza5
1Departamento de Ingeniería Hidráulica y Ambiental, Pontificia Universidad Católica de Chile. [email protected] of Civil & Environmental Eng. & Earth Sciences, University of Notre Dame, USA. [email protected]
3Department of Civil & Environmental Eng. & Earth Sciences, University of Notre Dame, USA. [email protected] Geosciences Division, Naval Research Laboratory, Clarksdale, MS, USA. [email protected]
5Departamento de Ingeniería Hidráulica y Ambiental, Pontificia Universidad Católica de Chile. [email protected]
1. IntroductionThe interactions of the coherent structures in the turbu-
lent boundary layer with sediment grains are responsible
for the complex dynamics of bedload transport. The col-
lective particle motion typically shows fluctuations for a
wide range of temporal and spatial scales, which produce
scale-dependence of the global sediment flux. Recent in-
vestigations have provided new insights on this dynam-
ics of bedload through the development of Lagrangian
models of particle transport. These sediment models
have been either based on high-resolution simulations of
the flow, such as direct numerical simulations (DNS) or
large-eddy simulations (LES), (e.g. Schmeeckle, 2014;
González et al., 2017), or on statistical models with a
mechanistic basis (e.g. Furbish and Schmeeckle, 2013;
Fan et al., 2014). In this investigation we seek to further
our understanding of bedload transport, by connecting the
results of DNS calculations for different Shields numbers,
to the development of stochastic models for particle kine-
matics, and the statistics of the bedload transport flux.
2. Lagrangian simulations of bedload transportIn our recent work (González et al., 2017), we carried out
DNS coupled with the discrete-element method (DEM),
to simulate the dynamics of 48510 particles in a rect-
angular domain, with a bulk Reynolds number equal to
Re=3632. We performed eight simulations maintaining
constant particle Reynolds number and sediment diam-
eter, varying the Shields parameter between 0.03 (be-
low the critical value) and 0.84. From the time series
of bedload transport, we analyzed the intermittency for
cases near the threshold of motion showing that the trans-
port flux can be characterized by a multifractal spectrum,
which is a function of the Shields number. Here we use
these results to study the statistics of particle kinematics,
developing stochastic models that can be used to represent
bedload transport at different scales.
3. Stochastic modeling of particle kinematicsThe results provided by the simulations of González et al.
(2017) are analyzed by describing the particle motion us-
ing different stochastic models. These models include
linear and non-linear advection-diffusion equations, and
lag-one autorregresive Markov models with Gaussian and
non-Gaussian distributions. As shown in Fig. 1, for the
variance of particle displacements, non-Gaussian models
such as Gamma-autorregresive formulations, can capture
the scale dependence with better precision as the time-
scale increases.
Figure 1. Scaling of the particle displacement variance.
Comparison among different stochastic models and DNS
simulations with a Shields parameter θ=0.61.
4. ConclusionsIn this investigation we combine the results of high-
resolution DNS-DEM Lagrangian simulations with
stochastic models of particle kinematics to characterize
the statistics of bedload transport. We analyze the effects
of the Shields parameter on the statistics of particle mo-
tion, improving the description of the sediment flux by in-
corporating information of the flow physics in stochastic
models of particle transport. Future analysis will focus
on additional parameters and particle size distributions,
to understand their influence on bedload transport and the
characteristic scales of particle dynamics.
AcknowledgmentsThe authors acknowledge the support from the Interna-
tional Research project (LIFE: NSF grant EAR-1242458),
Fondecyt project 1130940 and Conicyt/Fondap grant
15110017.
ReferencesFan, N., Zhong, D., Wu, B., Foufoula-Georgiou, E., and
Guala, M. (2014). A mechanistic-stochastic formula-
tion of bed load particle motions: From individual par-
ticle forces to the Fokker-Planck equation under low
transport rates. J. Geophys. Res., 119:464–482.
Furbish, D. J. and Schmeeckle, M. W. (2013). A prob-
abilistic derivation of the exponential-like distribution
of bed load particle velocities. Water Resour. Res.,
49:1537–1551. doi:10.1002/wrcr.20074.
González, C., Richter, D. H., Bolster, D., Bateman, S.,
Calantoni, J., and Escauriaza, C. (2017). Characteriza-
tion of bedload intermittency near the threshold of mo-
tion using a Lagrangian sediment transport model. En-
viron. Fluid Mech., 17:111–137. doi:10.1007/s10652-
016-9476-x.
Schmeeckle, M. W. (2014). Numerical simulation of tur-
bulence and sediment transport of medium sand. J.
Geophys. Res., 119:1240–1262.

48
Interaction of dunes and bars in lowland rivers
T.V de Ruijsscher1, S. Naqshband1 and A.J.F. Hoitink1
1 Hydrology and Quantitative Water Management Group, Wageningen University & Research, Wageningen, theNetherlands. [email protected]
1. IntroductionSince long, bed forms are a popular research topic in flu-vial morphodynamics. In this context, there appears tobe a clear separation between 1) a dune community and2) a bar community. The dune community focusses one.g. the relation between dune dimensions and flow char-acteristics (Shields, 1936) three-dimensionality of dunes(Venditti et al., 2005) and the transition to upper stageplane bed (Naqshband et al., 2016). The bar communityfocusses on e.g. the (slower) evolution of alternate bars(Lanzoni, 2000), the regime change from meandering tobraiding (Crosato and Mosselman, 2009) and the relationbetween bars and sediment supply (Nelson et al., 2015).Interestingly, both communities operate largely indepen-dently, filtering out bed forms of other spatial scales as afirst step. In the dune community, the study of superim-posed bed forms (dunes and ripples) is a topic of interest(Best, 2005), yet the interaction with larger scale featuresis relatively unexplored. Dunes and alternate bars oftencoexist and will therefore most probably have an influ-ence on each other’s evolution. In the present study, theauthors aim to quantify this relationship using an exten-sive dataset of multi-beam echo-sounding measurementson a large domain both in space and in time.
2. MethodsThe used dataset consists of fortnightly bed level scans ofthe fairway of the Waal River in the Netherlands, availablefrom 2005 onwards. The spatial resolution of the griddeddata is 1m×1m with at least 95% of the cells consistingof 5 hits or more. For this study a transect of 40km alongthe river axis is taken into account. Besides the morpho-logical data, water levels at three points and dischargesat one point in the study area are available on a daily ba-sis. A zoom of the middle 10km is shown in Figure 1,showing the de-trended bed level and the hydrograph.A first quick analysis using a moving average with a win-dow of 3km shows that an alternate bar pattern exists inthe Waal River, but that the bars hardly move over the pe-riod of one year (Figure 2). Dunes however, can easily beseen propagating through the river (not shown).
3. OutlookComplementary mathematical methods are considered toquantify and study the link between dune behaviour andthe bar regime, including wavelet and principle compo-nent analysis. The resulting synoptic overview of bedform dynamics across the spatial scales from dunes tobars will set a benchmark used in a later stage to inves-tigate the influence of river engineering measures on hy-draulic roughness.
AcknowledgmentsThis research is part of the research programme River-Care, supported by the Dutch Technology Foundation
Figure 1. De-trended bed level over 10km in the WaalRiver. Inset: hydrograph over the dashed cross-section.
Figure 2. Bed level after moving average procedure with∆s = 3km, from 23/03/2011 to 12/04/2012. Two
transects are shown: to the left/right of the river axis.
STW, which is part of the Netherlands Organization forScientific Research (NWO), and which is partly fundedby the Ministry of Economic Affairs under grant numberP12-14 (Perspective Programme).
ReferencesBest, J. (2005). The fluid dynamics of river dunes: A re-
view and some future research directions. J. Geophys.
Res., 110:F04S02.Crosato, A. and Mosselman, E. (2009). Simple physics-
based prpredict for the number of river bars and thetransition between meandering and braiding. Water Re-
sour. Res., 45(3):W03424.Lanzoni, S. (2000). Experimental on bar formation in
a straight flume. 1. Uniform sediment. Water Resour.
Res., 36:3337–3349.Naqshband, S., van Duin, O., Ribberink, J., and Hulscher,
S. (2016). Modeling river dune development and dunetransition to upper stage plane bed. Earth Surf. Process.
Landforms, 41:323–335.Nelson, P. A., Brew, A. K., and Morgan, J. A. (2015).
Morphodynamic response of a variable-width channelto changes in sediment supply. Water Resour. Res.,51:5717–5734.
Shields, A. (1936). Anwendung der Ähn-lichkeitsmechanik und der Turbulenzforschung auf dieGeschiebebewegung. Preussische Versuchsanstalt für
Wasserbau und Schiffbau, 26:1–26.Venditti, J. G., Church, M., and Bennett, S. J. (2005). On
the transition between 2d and 3d dunes. Sedimentology,52:1343–1359.
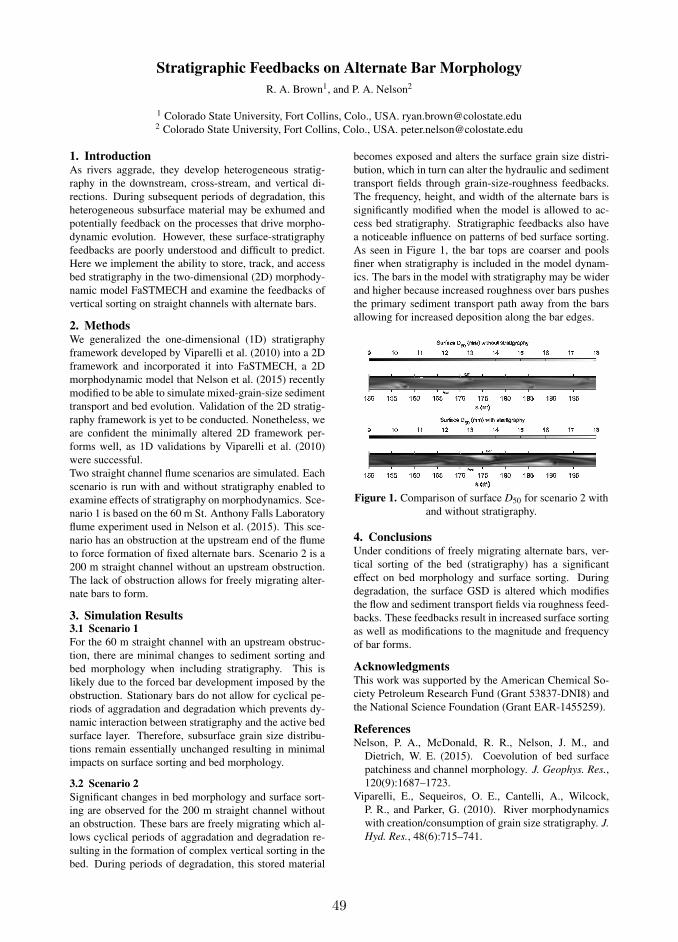
49
Stratigraphic Feedbacks on Alternate Bar Morphology
R. A. Brown1, and P. A. Nelson2
1 Colorado State University, Fort Collins, Colo., USA. [email protected] Colorado State University, Fort Collins, Colo., USA. [email protected]
1. IntroductionAs rivers aggrade, they develop heterogeneous stratig-
raphy in the downstream, cross-stream, and vertical di-
rections. During subsequent periods of degradation, this
heterogeneous subsurface material may be exhumed and
potentially feedback on the processes that drive morpho-
dynamic evolution. However, these surface-stratigraphy
feedbacks are poorly understood and difficult to predict.
Here we implement the ability to store, track, and access
bed stratigraphy in the two-dimensional (2D) morphody-
namic model FaSTMECH and examine the feedbacks of
vertical sorting on straight channels with alternate bars.
2. MethodsWe generalized the one-dimensional (1D) stratigraphy
framework developed by Viparelli et al. (2010) into a 2D
framework and incorporated it into FaSTMECH, a 2D
morphodynamic model that Nelson et al. (2015) recently
modified to be able to simulate mixed-grain-size sediment
transport and bed evolution. Validation of the 2D stratig-
raphy framework is yet to be conducted. Nonetheless, we
are confident the minimally altered 2D framework per-
forms well, as 1D validations by Viparelli et al. (2010)
were successful.
Two straight channel flume scenarios are simulated. Each
scenario is run with and without stratigraphy enabled to
examine effects of stratigraphy on morphodynamics. Sce-
nario 1 is based on the 60 m St. Anthony Falls Laboratory
flume experiment used in Nelson et al. (2015). This sce-
nario has an obstruction at the upstream end of the flume
to force formation of fixed alternate bars. Scenario 2 is a
200 m straight channel without an upstream obstruction.
The lack of obstruction allows for freely migrating alter-
nate bars to form.
3. Simulation Results3.1 Scenario 1
For the 60 m straight channel with an upstream obstruc-
tion, there are minimal changes to sediment sorting and
bed morphology when including stratigraphy. This is
likely due to the forced bar development imposed by the
obstruction. Stationary bars do not allow for cyclical pe-
riods of aggradation and degradation which prevents dy-
namic interaction between stratigraphy and the active bed
surface layer. Therefore, subsurface grain size distribu-
tions remain essentially unchanged resulting in minimal
impacts on surface sorting and bed morphology.
3.2 Scenario 2
Significant changes in bed morphology and surface sort-
ing are observed for the 200 m straight channel without
an obstruction. These bars are freely migrating which al-
lows cyclical periods of aggradation and degradation re-
sulting in the formation of complex vertical sorting in the
bed. During periods of degradation, this stored material
becomes exposed and alters the surface grain size distri-
bution, which in turn can alter the hydraulic and sediment
transport fields through grain-size-roughness feedbacks.
The frequency, height, and width of the alternate bars is
significantly modified when the model is allowed to ac-
cess bed stratigraphy. Stratigraphic feedbacks also have
a noticeable influence on patterns of bed surface sorting.
As seen in Figure 1, the bar tops are coarser and pools
finer when stratigraphy is included in the model dynam-
ics. The bars in the model with stratigraphy may be wider
and higher because increased roughness over bars pushes
the primary sediment transport path away from the bars
allowing for increased deposition along the bar edges.
Figure 1. Comparison of surface D50 for scenario 2 with
and without stratigraphy.
4. ConclusionsUnder conditions of freely migrating alternate bars, ver-
tical sorting of the bed (stratigraphy) has a significant
effect on bed morphology and surface sorting. During
degradation, the surface GSD is altered which modifies
the flow and sediment transport fields via roughness feed-
backs. These feedbacks result in increased surface sorting
as well as modifications to the magnitude and frequency
of bar forms.
AcknowledgmentsThis work was supported by the American Chemical So-
ciety Petroleum Research Fund (Grant 53837-DNI8) and
the National Science Foundation (Grant EAR-1455259).
ReferencesNelson, P. A., McDonald, R. R., Nelson, J. M., and
Dietrich, W. E. (2015). Coevolution of bed surface
patchiness and channel morphology. J. Geophys. Res.,
120(9):1687–1723.
Viparelli, E., Sequeiros, O. E., Cantelli, A., Wilcock,
P. R., and Parker, G. (2010). River morphodynamics
with creation/consumption of grain size stratigraphy. J.
Hyd. Res., 48(6):715–741.
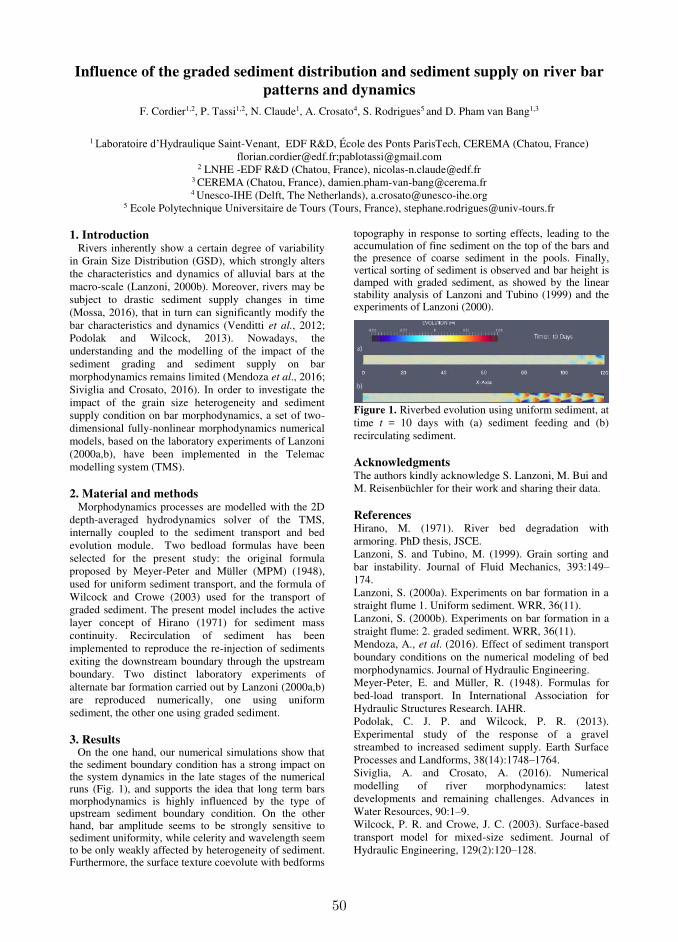
50
Influence of the graded sediment distribution and sediment supply on river bar
patterns and dynamics
F. Cordier1,2, P. Tassi1,2, N. Claude1, A. Crosato4, S. Rodrigues5 and D. Pham van Bang1,3
1 Laboratoire d’Hydraulique Saint-Venant, EDF R&D, École des Ponts ParisTech, CEREMA (Chatou, France)
[email protected];[email protected] 2 LNHE -EDF R&D (Chatou, France), [email protected]
3 CEREMA (Chatou, France), [email protected] 4 Unesco-IHE (Delft, The Netherlands), [email protected]
5 Ecole Polytechnique Universitaire de Tours (Tours, France), [email protected]
1. Introduction Rivers inherently show a certain degree of variability in Grain Size Distribution (GSD), which strongly alters the characteristics and dynamics of alluvial bars at the macro-scale (Lanzoni, 2000b). Moreover, rivers may be subject to drastic sediment supply changes in time (Mossa, 2016), that in turn can significantly modify the bar characteristics and dynamics (Venditti et al., 2012; Podolak and Wilcock, 2013). Nowadays, the understanding and the modelling of the impact of the sediment grading and sediment supply on bar morphodynamics remains limited (Mendoza et al., 2016; Siviglia and Crosato, 2016). In order to investigate the impact of the grain size heterogeneity and sediment supply condition on bar morphodynamics, a set of two-dimensional fully-nonlinear morphodynamics numerical models, based on the laboratory experiments of Lanzoni (2000a,b), have been implemented in the Telemac modelling system (TMS). 2. Material and methods Morphodynamics processes are modelled with the 2D depth-averaged hydrodynamics solver of the TMS, internally coupled to the sediment transport and bed evolution module. Two bedload formulas have been selected for the present study: the original formula proposed by Meyer-Peter and Müller (MPM) (1948), used for uniform sediment transport, and the formula of Wilcock and Crowe (2003) used for the transport of graded sediment. The present model includes the active layer concept of Hirano (1971) for sediment mass continuity. Recirculation of sediment has been implemented to reproduce the re-injection of sediments exiting the downstream boundary through the upstream boundary. Two distinct laboratory experiments of alternate bar formation carried out by Lanzoni (2000a,b) are reproduced numerically, one using uniform sediment, the other one using graded sediment. 3. Results On the one hand, our numerical simulations show that the sediment boundary condition has a strong impact on the system dynamics in the late stages of the numerical runs (Fig. 1), and supports the idea that long term bars morphodynamics is highly influenced by the type of upstream sediment boundary condition. On the other hand, bar amplitude seems to be strongly sensitive to sediment uniformity, while celerity and wavelength seem to be only weakly affected by heterogeneity of sediment. Furthermore, the surface texture coevolute with bedforms
topography in response to sorting effects, leading to the accumulation of fine sediment on the top of the bars and the presence of coarse sediment in the pools. Finally, vertical sorting of sediment is observed and bar height is damped with graded sediment, as showed by the linear stability analysis of Lanzoni and Tubino (1999) and the experiments of Lanzoni (2000).
Figure 1. Riverbed evolution using uniform sediment, at time t = 10 days with (a) sediment feeding and (b) recirculating sediment. Acknowledgments The authors kindly acknowledge S. Lanzoni, M. Bui and M. Reisenbüchler for their work and sharing their data. References Hirano, M. (1971). River bed degradation with armoring. PhD thesis, JSCE. Lanzoni, S. and Tubino, M. (1999). Grain sorting and bar instability. Journal of Fluid Mechanics, 393:149–174. Lanzoni, S. (2000a). Experiments on bar formation in a straight flume 1. Uniform sediment. WRR, 36(11). Lanzoni, S. (2000b). Experiments on bar formation in a straight flume: 2. graded sediment. WRR, 36(11). Mendoza, A., et al. (2016). Effect of sediment transport boundary conditions on the numerical modeling of bed morphodynamics. Journal of Hydraulic Engineering. Meyer-Peter, E. and Müller, R. (1948). Formulas for bed-load transport. In International Association for Hydraulic Structures Research. IAHR. Podolak, C. J. P. and Wilcock, P. R. (2013). Experimental study of the response of a gravel streambed to increased sediment supply. Earth Surface Processes and Landforms, 38(14):1748–1764. Siviglia, A. and Crosato, A. (2016). Numerical modelling of river morphodynamics: latest developments and remaining challenges. Advances in Water Resources, 90:1–9. Wilcock, P. R. and Crowe, J. C. (2003). Surface-based transport model for mixed-size sediment. Journal of Hydraulic Engineering, 129(2):120–128.
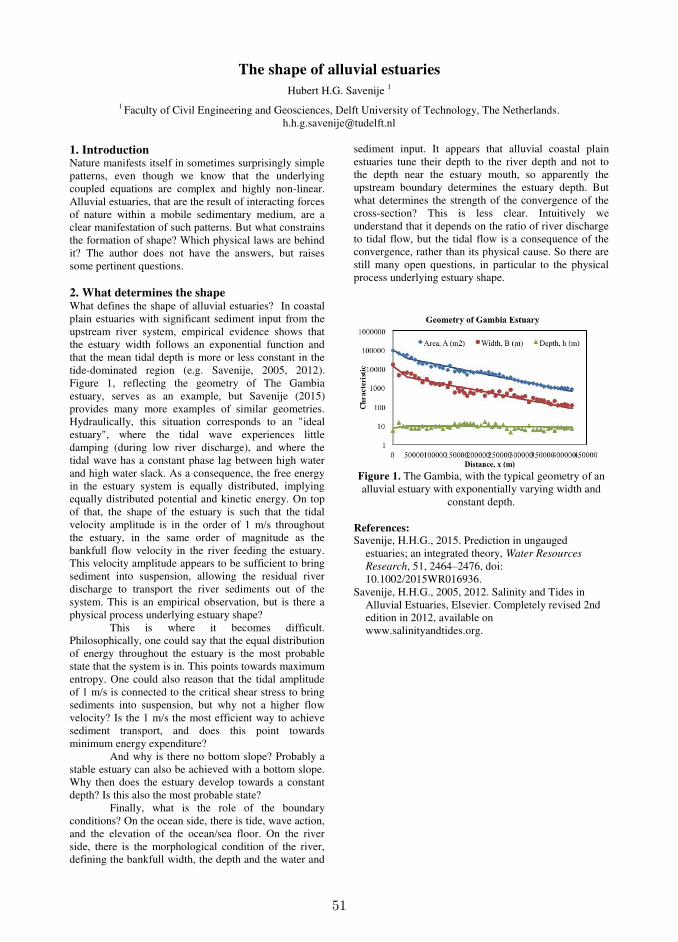
51
The shape of alluvial estuaries
Hubert H.G. Savenije 1
1 Faculty of Civil Engineering and Geosciences, Delft University of Technology, The Netherlands. [email protected]
1. Introduction Nature manifests itself in sometimes surprisingly simple patterns, even though we know that the underlying coupled equations are complex and highly non-linear. Alluvial estuaries, that are the result of interacting forces of nature within a mobile sedimentary medium, are a clear manifestation of such patterns. But what constrains the formation of shape? Which physical laws are behind it? The author does not have the answers, but raises some pertinent questions. 2. What determines the shape What defines the shape of alluvial estuaries? In coastal plain estuaries with significant sediment input from the upstream river system, empirical evidence shows that the estuary width follows an exponential function and that the mean tidal depth is more or less constant in the tide-dominated region (e.g. Savenije, 2005, 2012). Figure 1, reflecting the geometry of The Gambia estuary, serves as an example, but Savenije (2015) provides many more examples of similar geometries. Hydraulically, this situation corresponds to an "ideal estuary", where the tidal wave experiences little damping (during low river discharge), and where the tidal wave has a constant phase lag between high water and high water slack. As a consequence, the free energy in the estuary system is equally distributed, implying equally distributed potential and kinetic energy. On top of that, the shape of the estuary is such that the tidal velocity amplitude is in the order of 1 m/s throughout the estuary, in the same order of magnitude as the bankfull flow velocity in the river feeding the estuary. This velocity amplitude appears to be sufficient to bring sediment into suspension, allowing the residual river discharge to transport the river sediments out of the system. This is an empirical observation, but is there a physical process underlying estuary shape? This is where it becomes difficult. Philosophically, one could say that the equal distribution of energy throughout the estuary is the most probable state that the system is in. This points towards maximum entropy. One could also reason that the tidal amplitude of 1 m/s is connected to the critical shear stress to bring sediments into suspension, but why not a higher flow velocity? Is the 1 m/s the most efficient way to achieve sediment transport, and does this point towards minimum energy expenditure?
And why is there no bottom slope? Probably a stable estuary can also be achieved with a bottom slope. Why then does the estuary develop towards a constant depth? Is this also the most probable state?
Finally, what is the role of the boundary conditions? On the ocean side, there is tide, wave action, and the elevation of the ocean/sea floor. On the river side, there is the morphological condition of the river, defining the bankfull width, the depth and the water and
sediment input. It appears that alluvial coastal plain estuaries tune their depth to the river depth and not to the depth near the estuary mouth, so apparently the upstream boundary determines the estuary depth. But what determines the strength of the convergence of the cross-section? This is less clear. Intuitively we understand that it depends on the ratio of river discharge to tidal flow, but the tidal flow is a consequence of the convergence, rather than its physical cause. So there are still many open questions, in particular to the physical process underlying estuary shape.
Figure 1. The Gambia, with the typical geometry of an alluvial estuary with exponentially varying width and
constant depth. References: Savenije, H.H.G., 2015. Prediction in ungauged
estuaries; an integrated theory, Water Resources
Research, 51, 2464–2476, doi: 10.1002/2015WR016936.
Savenije, H.H.G., 2005, 2012. Salinity and Tides in Alluvial Estuaries, Elsevier. Completely revised 2nd edition in 2012, available on www.salinityandtides.org.
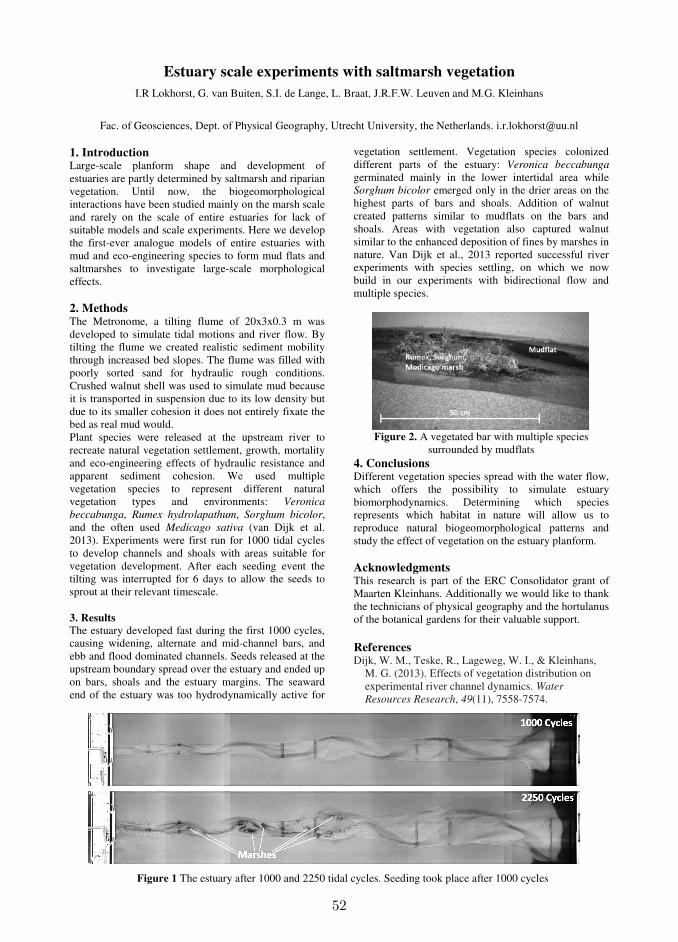
52
Estuary scale experiments with saltmarsh vegetation
I.R Lokhorst, G. van Buiten, S.I. de Lange, L. Braat, J.R.F.W. Leuven and M.G. Kleinhans
Fac. of Geosciences, Dept. of Physical Geography, Utrecht University, the Netherlands. [email protected]
1. Introduction Large-scale planform shape and development of estuaries are partly determined by saltmarsh and riparian vegetation. Until now, the biogeomorphological interactions have been studied mainly on the marsh scale and rarely on the scale of entire estuaries for lack of suitable models and scale experiments. Here we develop the first-ever analogue models of entire estuaries with mud and eco-engineering species to form mud flats and saltmarshes to investigate large-scale morphological effects. 2. Methods The Metronome, a tilting flume of 20x3x0.3 m was developed to simulate tidal motions and river flow. By tilting the flume we created realistic sediment mobility through increased bed slopes. The flume was filled with poorly sorted sand for hydraulic rough conditions. Crushed walnut shell was used to simulate mud because it is transported in suspension due to its low density but due to its smaller cohesion it does not entirely fixate the bed as real mud would. Plant species were released at the upstream river to recreate natural vegetation settlement, growth, mortality and eco-engineering effects of hydraulic resistance and apparent sediment cohesion. We used multiple vegetation species to represent different natural vegetation types and environments: Veronica
beccabunga, Rumex hydrolapathum, Sorghum bicolor, and the often used Medicago sativa (van Dijk et al. 2013). Experiments were first run for 1000 tidal cycles to develop channels and shoals with areas suitable for vegetation development. After each seeding event the tilting was interrupted for 6 days to allow the seeds to sprout at their relevant timescale.
3. Results
The estuary developed fast during the first 1000 cycles, causing widening, alternate and mid-channel bars, and ebb and flood dominated channels. Seeds released at the upstream boundary spread over the estuary and ended up on bars, shoals and the estuary margins. The seaward end of the estuary was too hydrodynamically active for
vegetation settlement. Vegetation species colonized different parts of the estuary: Veronica beccabunga germinated mainly in the lower intertidal area while Sorghum bicolor emerged only in the drier areas on the highest parts of bars and shoals. Addition of walnut created patterns similar to mudflats on the bars and shoals. Areas with vegetation also captured walnut similar to the enhanced deposition of fines by marshes in nature. Van Dijk et al., 2013 reported successful river experiments with species settling, on which we now build in our experiments with bidirectional flow and multiple species.
Figure 2. A vegetated bar with multiple species
surrounded by mudflats 4. Conclusions Different vegetation species spread with the water flow, which offers the possibility to simulate estuary biomorphodynamics. Determining which species represents which habitat in nature will allow us to reproduce natural biogeomorphological patterns and study the effect of vegetation on the estuary planform. Acknowledgments This research is part of the ERC Consolidator grant of Maarten Kleinhans. Additionally we would like to thank the technicians of physical geography and the hortulanus of the botanical gardens for their valuable support.
References Dijk, W. M., Teske, R., Lageweg, W. I., & Kleinhans, M. G. (2013). Effects of vegetation distribution on experimental river channel dynamics. Water
Resources Research, 49(11), 7558-7574.
Figure 1 The estuary after 1000 and 2250 tidal cycles. Seeding took place after 1000 cycles

53
Finescale turbulence within mangrove root systems: A comparison betweentropical and subtropical environments
J.C. Mullarney1, E.M. Horstman 1, K.R. Bryan1, B.K. Norris1, and S.M. Henderson2
1Coastal Marine Group, University of Waikato, New Zealand. [email protected],
[email protected], [email protected], [email protected] School of the Environment, Washington State University,Washington, USA. [email protected]
1. IntroductionMangrove forests provide many ecosystem services in ad-
dition to acting as a protective barrier against waves and
tidal currents (e.g. Horstman et al., 2014). These versatile
trees inhabit intertidal landscapes across the subtropics
and tropics and exhibit a wide variety in tree characteris-
tics, such as root type and tree height. Mangroves are also
exposed to a broad range of hydrodynamic conditions.
In general however, mangrove roots generate stem-scale
turbulence, which has been shown to both promote sedi-
ment deposition and also erosion. However, the balance
between the two regimes is not clear (Mullarney et al.,
2017). Here, we examine the dependence of the small
scale turbulence generation and sediment deposition pro-
cesses on environmental factors across a range of man-
grove ecosystems.
2. Field MeasurementsExperiments were conducted in tropical and subtropical
environments. The tropical site was a mangrove for-
est in the Mekong Delta, predominantly inhabited by
large (∼10 m high) Sonneratia caseolaris and exposed
to moderate waves (heights up to 1 m). This system is
compared with an Avicennia marina mangrove forest in
Whangapoua estuary in New Zealand (Figure 1), which
is close to the southernmost limit of mangrove habitation.
In this subtropical environment, trees are only exposed to
small wind waves and heights are generally less than 2 m.
(a) (b)
Figure 1. Contrasting mangrove environments: (a)
tropical mangrove environment in Vietnam, (b)
subtropical mangrove environment in New Zealand.
2.1 Data acquisition and analysis
Deployments included arrays of acoustic instruments to
measure water velocities. Instruments included Nortek
Vectrino Profilers, which measured velocities at 50 Hz,
with 1 mm vertical resolution over a 35 mm profile within
the pneumatophore (root) canopies. Structure function
methods were used to obtain estimates of the dissipation
rate of turbulent kinetic energy, ε (Wiles et al., 2006).
Vegetation densities as a function of height were obtained
using photogrammetry techniques (Liénard et al., 2016)
and manual quadrat surveys.
3. Results and ConclusionsPneumatophores in New Zealand were thinner (basal di-
ameters around 7 mm), shorter (mean heights around
150 mm and maximum 250 mm) and more flexible than
those in Vietnam (diameters around 15 mm and mean
heights of 0.5 m with maximum heights of 0.8 m), al-
though in general, densities (number of stems m−2) were
higher in New Zealand. Turbulent dissipation rates within
the pneumatophore canopies were highly variable at both
sites, although values in the lower energy (New Zealand)
environment did not often exceed 10−4 W kg−1. In Viet-
nam, values were consistently higher and on occasion, re-
markably high values were recorded, (ε ∼ 0.1 W kg−1),
which is comparable to rates observed in surf zones.
Consequences for sediment trapping and transport within
these contrasting environments will be discussed.
AcknowledgmentsThis work was supported by the Office of Naval Research
grant numbers N62909-14-1-N028 (JM, KB, BN) and
N00014-14-10112 (SH) and the Marsden Fund of New
Zealand (JM, EH, KB, grant number 14-UOW-011). We
thank Dean Sandwell for invaluable assistance with field-
work in all locations, and the sediment dynamics lab from
the University of Washington, Dr Vo-Luong and students
from the University of Science (Ho Chi Minh City), and
Rich Nguyen from ONR for logistical and field support in
Vietnam.
ReferencesHorstman, E. M., Dohmen-Janssen, C. M., Narra, P.
M. F., van den Berg, N. J. F., Siemerink, M., and
Hulscher, S. J. M. H. (2014). Wave attenuation in man-
groves: A quantitative approach to field observations.
Coastal Engineering, 94:47–62.
Liénard, J., Lynn, K., Strigul, N., Norris, B. K., Gatzio-
lis, D., Mullarney, J. C., Bryan, K. R., and Henderson,
S. M. (2016). Efficient three-dimensional reconstruc-
tion of aquatic vegetation geometry: Estimating mor-
phological parameters influencing hydrodynamic drag.
Estuarine, Coastal and Shelf Science, 178:77–85.
Mullarney, J. C., Henderson, S. M., Norris, B. K., Bryan,
K. R., Fricke, A. T., and Sandwell, D. (2017). A ques-
tion of scale: The role of turbulence within mangrove
roots in shaping the Mekong Delta. Oceanography.
Submitted.
Wiles, P. J., Rippeth, T. P., Simpson, J. H., and Hendricks,
P. J. (2006). A novel technique for measuring the rate of
turbulent dissipation in the marine environment. Geo-
physical Research Letters, 33.
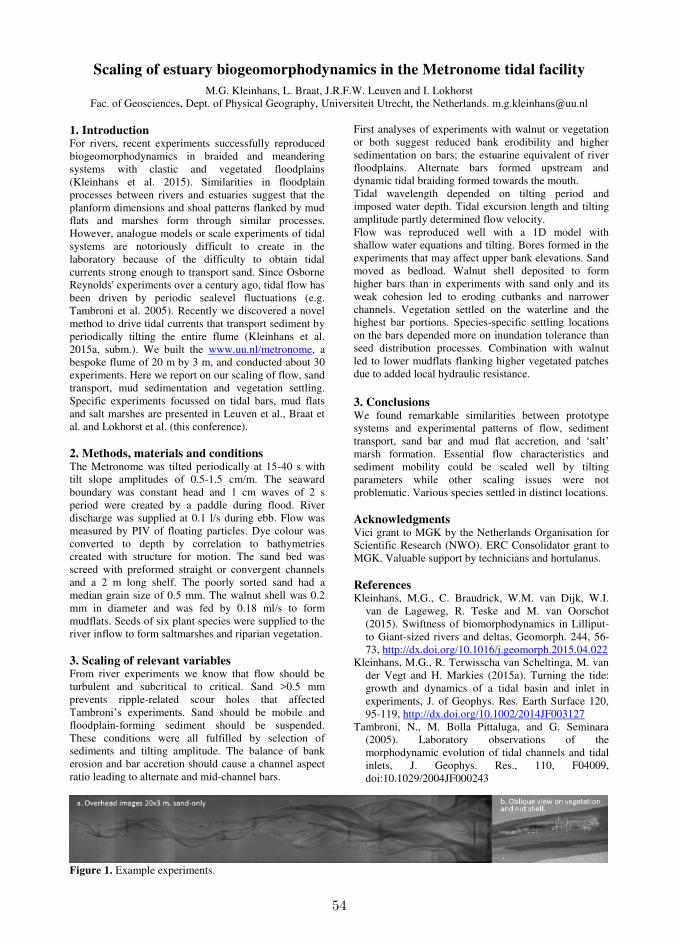
54
Scaling of estuary biogeomorphodynamics in the Metronome tidal facility
M.G. Kleinhans, L. Braat, J.R.F.W. Leuven and I. Lokhorst Fac. of Geosciences, Dept. of Physical Geography, Universiteit Utrecht, the Netherlands. [email protected]
1. Introduction For rivers, recent experiments successfully reproduced biogeomorphodynamics in braided and meandering systems with clastic and vegetated floodplains (Kleinhans et al. 2015). Similarities in floodplain processes between rivers and estuaries suggest that the planform dimensions and shoal patterns flanked by mud flats and marshes form through similar processes. However, analogue models or scale experiments of tidal systems are notoriously difficult to create in the laboratory because of the difficulty to obtain tidal currents strong enough to transport sand. Since Osborne Reynolds' experiments over a century ago, tidal flow has been driven by periodic sealevel fluctuations (e.g. Tambroni et al. 2005). Recently we discovered a novel method to drive tidal currents that transport sediment by periodically tilting the entire flume (Kleinhans et al. 2015a, subm.). We built the www.uu.nl/metronome, a bespoke flume of 20 m by 3 m, and conducted about 30 experiments. Here we report on our scaling of flow, sand transport, mud sedimentation and vegetation settling. Specific experiments focussed on tidal bars, mud flats and salt marshes are presented in Leuven et al., Braat et al. and Lokhorst et al. (this conference). 2. Methods, materials and conditions The Metronome was tilted periodically at 15-40 s with tilt slope amplitudes of 0.5-1.5 cm/m. The seaward boundary was constant head and 1 cm waves of 2 s period were created by a paddle during flood. River discharge was supplied at 0.1 l/s during ebb. Flow was measured by PIV of floating particles. Dye colour was converted to depth by correlation to bathymetries created with structure for motion. The sand bed was screed with preformed straight or convergent channels and a 2 m long shelf. The poorly sorted sand had a median grain size of 0.5 mm. The walnut shell was 0.2 mm in diameter and was fed by 0.18 ml/s to form mudflats. Seeds of six plant species were supplied to the river inflow to form saltmarshes and riparian vegetation. 3. Scaling of relevant variables From river experiments we know that flow should be turbulent and subcritical to critical. Sand >0.5 mm prevents ripple-related scour holes that affected Tambroni’s experiments. Sand should be mobile and floodplain-forming sediment should be suspended. These conditions were all fulfilled by selection of sediments and tilting amplitude. The balance of bank erosion and bar accretion should cause a channel aspect ratio leading to alternate and mid-channel bars.
Figure 1. Example experiments.
First analyses of experiments with walnut or vegetation or both suggest reduced bank erodibility and higher sedimentation on bars; the estuarine equivalent of river floodplains. Alternate bars formed upstream and dynamic tidal braiding formed towards the mouth. Tidal wavelength depended on tilting period and imposed water depth. Tidal excursion length and tilting amplitude partly determined flow velocity. Flow was reproduced well with a 1D model with shallow water equations and tilting. Bores formed in the experiments that may affect upper bank elevations. Sand moved as bedload. Walnut shell deposited to form higher bars than in experiments with sand only and its weak cohesion led to eroding cutbanks and narrower channels. Vegetation settled on the waterline and the highest bar portions. Species-specific settling locations on the bars depended more on inundation tolerance than seed distribution processes. Combination with walnut led to lower mudflats flanking higher vegetated patches due to added local hydraulic resistance. 3. Conclusions We found remarkable similarities between prototype systems and experimental patterns of flow, sediment transport, sand bar and mud flat accretion, and ‘salt’ marsh formation. Essential flow characteristics and sediment mobility could be scaled well by tilting parameters while other scaling issues were not problematic. Various species settled in distinct locations. Acknowledgments Vici grant to MGK by the Netherlands Organisation for Scientific Research (NWO). ERC Consolidator grant to MGK. Valuable support by technicians and hortulanus. References Kleinhans, M.G., C. Braudrick, W.M. van Dijk, W.I.
van de Lageweg, R. Teske and M. van Oorschot (2015). Swiftness of biomorphodynamics in Lilliput- to Giant-sized rivers and deltas, Geomorph. 244, 56-73, http://dx.doi.org/10.1016/j.geomorph.2015.04.022
Kleinhans, M.G., R. Terwisscha van Scheltinga, M. van der Vegt and H. Markies (2015a). Turning the tide: growth and dynamics of a tidal basin and inlet in experiments, J. of Geophys. Res. Earth Surface 120, 95-119, http://dx.doi.org/10.1002/2014JF003127
Tambroni, N., M. Bolla Pittaluga, and G. Seminara (2005). Laboratory observations of the morphodynamic evolution of tidal channels and tidal inlets, J. Geophys. Res., 110, F04009, doi:10.1029/2004JF000243
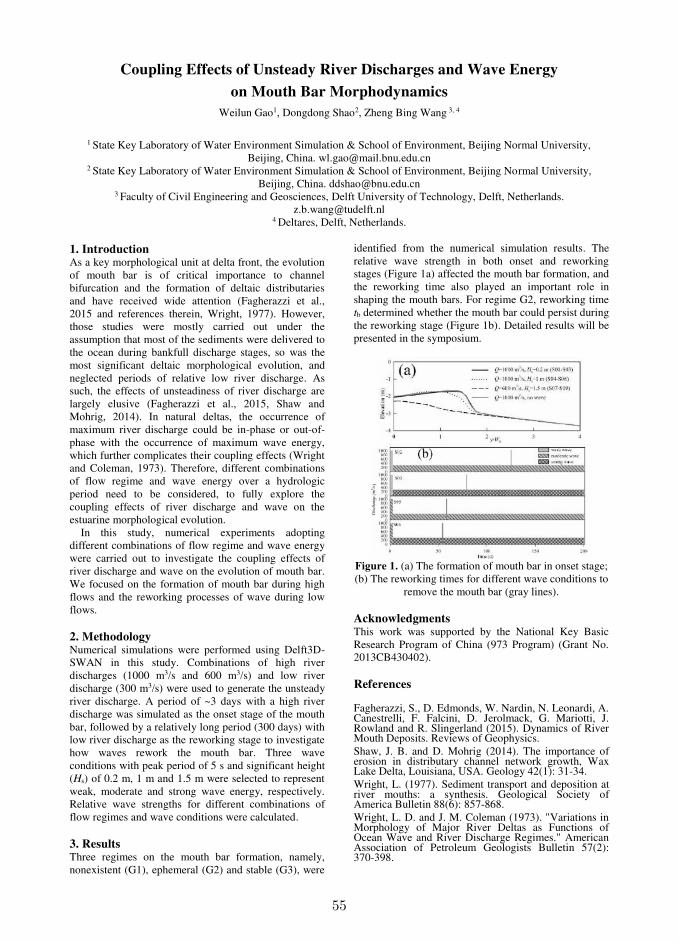
55
Coupling Effects of Unsteady River Discharges and Wave Energy
on Mouth Bar Morphodynamics
Weilun Gao1, Dongdong Shao2, Zheng Bing Wang 3, 4
1 State Key Laboratory of Water Environment Simulation & School of Environment, Beijing Normal University,
Beijing, China. [email protected] 2 State Key Laboratory of Water Environment Simulation & School of Environment, Beijing Normal University,
Beijing, China. [email protected] 3 Faculty of Civil Engineering and Geosciences, Delft University of Technology, Delft, Netherlands.
[email protected] 4 Deltares, Delft, Netherlands.
1. Introduction As a key morphological unit at delta front, the evolution of mouth bar is of critical importance to channel bifurcation and the formation of deltaic distributaries and have received wide attention (Fagherazzi et al., 2015 and references therein, Wright, 1977). However, those studies were mostly carried out under the assumption that most of the sediments were delivered to the ocean during bankfull discharge stages, so was the most significant deltaic morphological evolution, and neglected periods of relative low river discharge. As such, the effects of unsteadiness of river discharge are largely elusive (Fagherazzi et al., 2015, Shaw and Mohrig, 2014). In natural deltas, the occurrence of maximum river discharge could be in-phase or out-of-phase with the occurrence of maximum wave energy, which further complicates their coupling effects (Wright and Coleman, 1973). Therefore, different combinations of flow regime and wave energy over a hydrologic period need to be considered, to fully explore the coupling effects of river discharge and wave on the estuarine morphological evolution.
In this study, numerical experiments adopting different combinations of flow regime and wave energy were carried out to investigate the coupling effects of river discharge and wave on the evolution of mouth bar. We focused on the formation of mouth bar during high flows and the reworking processes of wave during low flows. 2. Methodology Numerical simulations were performed using Delft3D-SWAN in this study. Combinations of high river discharges (1000 m3/s and 600 m3/s) and low river discharge (300 m3/s) were used to generate the unsteady river discharge. A period of ~3 days with a high river discharge was simulated as the onset stage of the mouth bar, followed by a relatively long period (300 days) with low river discharge as the reworking stage to investigate how waves rework the mouth bar. Three wave conditions with peak period of 5 s and significant height (Hs) of 0.2 m, 1 m and 1.5 m were selected to represent weak, moderate and strong wave energy, respectively. Relative wave strengths for different combinations of flow regimes and wave conditions were calculated. 3. Results Three regimes on the mouth bar formation, namely, nonexistent (G1), ephemeral (G2) and stable (G3), were
identified from the numerical simulation results. The relative wave strength in both onset and reworking stages (Figure 1a) affected the mouth bar formation, and the reworking time also played an important role in shaping the mouth bars. For regime G2, reworking time tb determined whether the mouth bar could persist during the reworking stage (Figure 1b). Detailed results will be presented in the symposium.
Figure 1. (a) The formation of mouth bar in onset stage; (b) The reworking times for different wave conditions to
remove the mouth bar (gray lines). Acknowledgments This work was supported by the National Key Basic Research Program of China (973 Program) (Grant No. 2013CB430402). References Fagherazzi, S., D. Edmonds, W. Nardin, N. Leonardi, A. Canestrelli, F. Falcini, D. Jerolmack, G. Mariotti, J. Rowland and R. Slingerland (2015). Dynamics of River Mouth Deposits. Reviews of Geophysics. Shaw, J. B. and D. Mohrig (2014). The importance of erosion in distributary channel network growth, Wax Lake Delta, Louisiana, USA. Geology 42(1): 31-34. Wright, L. (1977). Sediment transport and deposition at river mouths: a synthesis. Geological Society of America Bulletin 88(6): 857-868. Wright, L. D. and J. M. Coleman (1973). "Variations in Morphology of Major River Deltas as Functions of Ocean Wave and River Discharge Regimes." American Association of Petroleum Geologists Bulletin 57(2): 370-398.
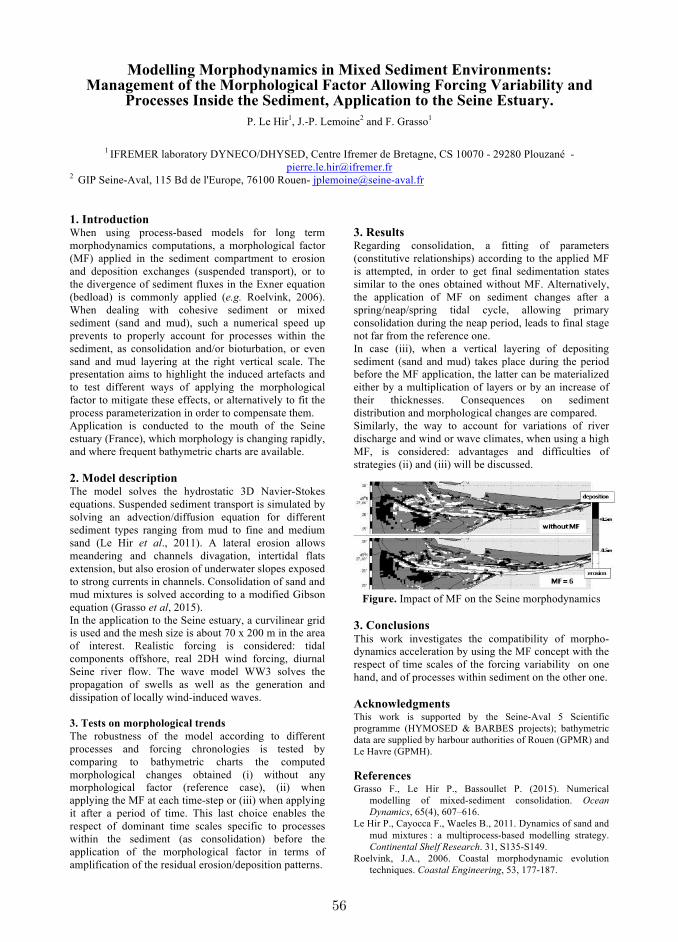
56
Modelling Morphodynamics in Mixed Sediment Environments: Management of the Morphological Factor Allowing Forcing Variability and
Processes Inside the Sediment, Application to the Seine Estuary.
P. Le Hir1, J.-P. Lemoine
2 and F. Grasso
1
1 IFREMER laboratory DYNECO/DHYSED, Centre Ifremer de Bretagne, CS 10070 - 29280 Plouzané -
[email protected] 2 GIP Seine-Aval, 115 Bd de l'Europe, 76100 Rouen- [email protected]
1. Introduction When using process-based models for long term
morphodynamics computations, a morphological factor
(MF) applied in the sediment compartment to erosion
and deposition exchanges (suspended transport), or to
the divergence of sediment fluxes in the Exner equation
(bedload) is commonly applied (e.g. Roelvink, 2006).
When dealing with cohesive sediment or mixed
sediment (sand and mud), such a numerical speed up
prevents to properly account for processes within the
sediment, as consolidation and/or bioturbation, or even
sand and mud layering at the right vertical scale. The
presentation aims to highlight the induced artefacts and
to test different ways of applying the morphological
factor to mitigate these effects, or alternatively to fit the
process parameterization in order to compensate them.
Application is conducted to the mouth of the Seine
estuary (France), which morphology is changing rapidly,
and where frequent bathymetric charts are available.
2. Model description The model solves the hydrostatic 3D Navier-Stokes
equations. Suspended sediment transport is simulated by
solving an advection/diffusion equation for different
sediment types ranging from mud to fine and medium
sand (Le Hir et al., 2011). A lateral erosion allows
meandering and channels divagation, intertidal flats
extension, but also erosion of underwater slopes exposed
to strong currents in channels. Consolidation of sand and
mud mixtures is solved according to a modified Gibson
equation (Grasso et al, 2015).
In the application to the Seine estuary, a curvilinear grid
is used and the mesh size is about 70 x 200 m in the area
of interest. Realistic forcing is considered: tidal
components offshore, real 2DH wind forcing, diurnal
Seine river flow. The wave model WW3 solves the
propagation of swells as well as the generation and
dissipation of locally wind-induced waves.
3. Tests on morphological trends
The robustness of the model according to different
processes and forcing chronologies is tested by
comparing to bathymetric charts the computed
morphological changes obtained (i) without any
morphological factor (reference case), (ii) when
applying the MF at each time-step or (iii) when applying
it after a period of time. This last choice enables the
respect of dominant time scales specific to processes
within the sediment (as consolidation) before the
application of the morphological factor in terms of
amplification of the residual erosion/deposition patterns.
3. Results Regarding consolidation, a fitting of parameters
(constitutive relationships) according to the applied MF
is attempted, in order to get final sedimentation states
similar to the ones obtained without MF. Alternatively,
the application of MF on sediment changes after a
spring/neap/spring tidal cycle, allowing primary
consolidation during the neap period, leads to final stage
not far from the reference one.
In case (iii), when a vertical layering of depositing
sediment (sand and mud) takes place during the period
before the MF application, the latter can be materialized
either by a multiplication of layers or by an increase of
their thicknesses. Consequences on sediment
distribution and morphological changes are compared.
Similarly, the way to account for variations of river
discharge and wind or wave climates, when using a high
MF, is considered: advantages and difficulties of
strategies (ii) and (iii) will be discussed.
Figure. Impact of MF on the Seine morphodynamics
3. Conclusions This work investigates the compatibility of morpho-
dynamics acceleration by using the MF concept with the
respect of time scales of the forcing variability on one
hand, and of processes within sediment on the other one.
Acknowledgments This work is supported by the Seine-Aval 5 Scientific
programme (HYMOSED & BARBES projects); bathymetric
data are supplied by harbour authorities of Rouen (GPMR) and
Le Havre (GPMH).
References Grasso F., Le Hir P., Bassoullet P. (2015). Numerical
modelling of mixed-sediment consolidation. Ocean
Dynamics, 65(4), 607–616.
Le Hir P., Cayocca F., Waeles B., 2011. Dynamics of sand and
mud mixtures : a multiprocess-based modelling strategy.
Continental Shelf Research. 31, S135-S149.
Roelvink, J.A., 2006. Coastal morphodynamic evolution
techniques. Coastal Engineering, 53, 177-187.
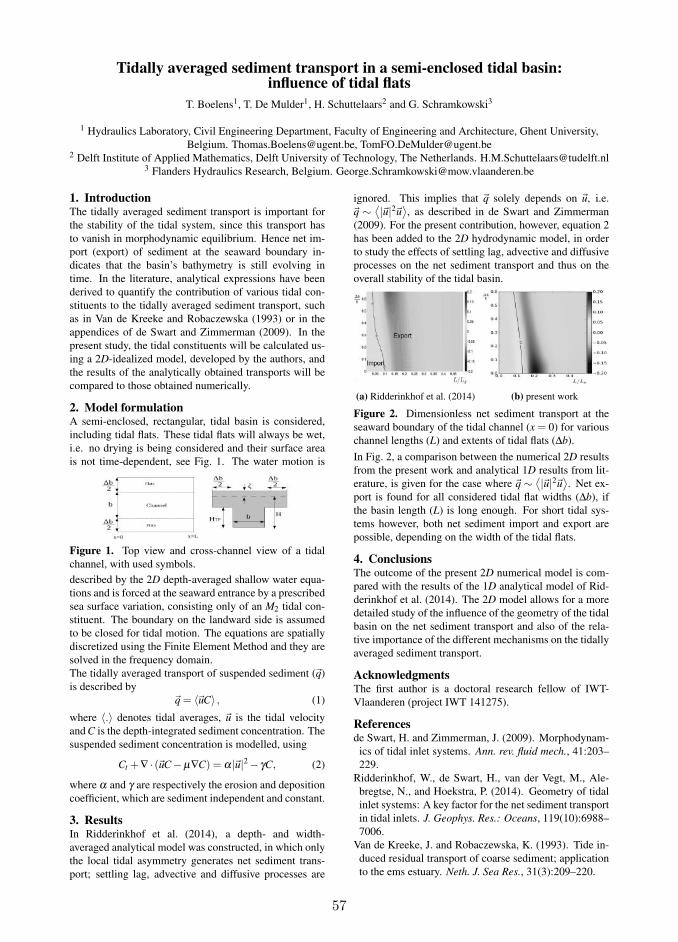
57
Tidally averaged sediment transport in a semi-enclosed tidal basin:influence of tidal flats
T. Boelens1, T. De Mulder1, H. Schuttelaars2 and G. Schramkowski3
1 Hydraulics Laboratory, Civil Engineering Department, Faculty of Engineering and Architecture, Ghent University,
Belgium. [email protected], [email protected] Delft Institute of Applied Mathematics, Delft University of Technology, The Netherlands. [email protected]
3 Flanders Hydraulics Research, Belgium. [email protected]
1. IntroductionThe tidally averaged sediment transport is important for
the stability of the tidal system, since this transport has
to vanish in morphodynamic equilibrium. Hence net im-
port (export) of sediment at the seaward boundary in-
dicates that the basin’s bathymetry is still evolving in
time. In the literature, analytical expressions have been
derived to quantify the contribution of various tidal con-
stituents to the tidally averaged sediment transport, such
as in Van de Kreeke and Robaczewska (1993) or in the
appendices of de Swart and Zimmerman (2009). In the
present study, the tidal constituents will be calculated us-
ing a 2D-idealized model, developed by the authors, and
the results of the analytically obtained transports will be
compared to those obtained numerically.
2. Model formulationA semi-enclosed, rectangular, tidal basin is considered,
including tidal flats. These tidal flats will always be wet,
i.e. no drying is being considered and their surface area
is not time-dependent, see Fig. 1. The water motion is
Figure 1. Top view and cross-channel view of a tidal
channel, with used symbols.
described by the 2D depth-averaged shallow water equa-
tions and is forced at the seaward entrance by a prescribed
sea surface variation, consisting only of an M2 tidal con-
stituent. The boundary on the landward side is assumed
to be closed for tidal motion. The equations are spatially
discretized using the Finite Element Method and they are
solved in the frequency domain.
The tidally averaged transport of suspended sediment (~q)
is described by
~q = 〈~uC〉 , (1)
where 〈.〉 denotes tidal averages, ~u is the tidal velocity
and C is the depth-integrated sediment concentration. The
suspended sediment concentration is modelled, using
Ct +∇ · (~uC−µ∇C) = α|~u|2 − γC, (2)
where α and γ are respectively the erosion and deposition
coefficient, which are sediment independent and constant.
3. ResultsIn Ridderinkhof et al. (2014), a depth- and width-
averaged analytical model was constructed, in which only
the local tidal asymmetry generates net sediment trans-
port; settling lag, advective and diffusive processes are
ignored. This implies that ~q solely depends on ~u, i.e.
~q ∼⟨
|~u|2~u⟩
, as described in de Swart and Zimmerman
(2009). For the present contribution, however, equation 2
has been added to the 2D hydrodynamic model, in order
to study the effects of settling lag, advective and diffusive
processes on the net sediment transport and thus on the
overall stability of the tidal basin.
(a) Ridderinkhof et al. (2014) (b) present work
Figure 2. Dimensionless net sediment transport at the
seaward boundary of the tidal channel (x = 0) for various
channel lengths (L) and extents of tidal flats (∆b).
In Fig. 2, a comparison between the numerical 2D results
from the present work and analytical 1D results from lit-
erature, is given for the case where ~q ∼⟨
|~u|2~u⟩
. Net ex-
port is found for all considered tidal flat widths (∆b), if
the basin length (L) is long enough. For short tidal sys-
tems however, both net sediment import and export are
possible, depending on the width of the tidal flats.
4. ConclusionsThe outcome of the present 2D numerical model is com-
pared with the results of the 1D analytical model of Rid-
derinkhof et al. (2014). The 2D model allows for a more
detailed study of the influence of the geometry of the tidal
basin on the net sediment transport and also of the rela-
tive importance of the different mechanisms on the tidally
averaged sediment transport.
AcknowledgmentsThe first author is a doctoral research fellow of IWT-
Vlaanderen (project IWT 141275).
Referencesde Swart, H. and Zimmerman, J. (2009). Morphodynam-
ics of tidal inlet systems. Ann. rev. fluid mech., 41:203–
229.
Ridderinkhof, W., de Swart, H., van der Vegt, M., Ale-
bregtse, N., and Hoekstra, P. (2014). Geometry of tidal
inlet systems: A key factor for the net sediment transport
in tidal inlets. J. Geophys. Res.: Oceans, 119(10):6988–
7006.
Van de Kreeke, J. and Robaczewska, K. (1993). Tide in-
duced residual transport of coarse sediment; application
to the ems estuary. Neth. J. Sea Res., 31(3):209–220.

58
A modified hydrodynamics of shallow tidal systems may temporarily slow down the local sea level rise facilitating the survival of salt marshes
S. Silvestri1, A. D’Alpaos2 and L. Carniello3
1 Nicholas School of the Environment, Duke University, Durham, North Carolina, USA. [email protected]
2 Dip. di GEOSCIENZE, Università di Padova. [email protected] 3 Dip. ICEA Ingegneria Civile, Edile e Ambientale, Università di Padova, Italy. [email protected]
1. Introduction Several studies have recently described the tight link between Local Relative Sea Level Rise (LRSLR), tidal amplitude, availability of suspended sediments and existence/survival of salt marshes in coastal estuaries and lagoons (Marani et al., 2010). However, most studies do not consider the large spatial and temporal variability that these variables may have within a basin, often affected by human interventions. In this work, we explore the impact that a modified hydrodynamic field may have on the existence and survival of salt marshes using, as a case study, the anthropic interventions performed in the northern basin of the Venice Lagoon at the end of the 19th century/early 20th century. 2. Method
Figure 1. Map of the North basin of the Venice Lagoon and the marsh extent in 1932 (dark grey) overlapping the marsh surfaces present in 1901 (white-squared pattern). The black circles connected through a line are, respectively, points and trajectory considered for the hydrodynamic model simulations. Plot A: marsh surface elevation at the Ca' Zane study site. Dashed grey line: Local Relative Mean Sea Level (LMSL). Dotted line: elevation of the salt marsh if the reed barriers would have not been removed, maintaining a sediment concentration C0=50 mg/l. Black line: salt marsh surface elevation in the hypothesis that sediment concentration decreased from C0=50 mg/l to C0=20 mg/l after the removal of reed fences. Plot B: marsh surface elevation at the San Felice study site. Dashed grey line: LMSL. Black line and grey line: salt marsh surface elevation considering sediment concentration C0=10 mg/l and C0=20 mg/l respectively.
Two major human interventions deeply modified the hydrodynamics of the northern basin of the Venice Lagoon (Fig. 1) in the past: 1) the construction of the jetties at the northern inlet (1882-1982) and 2) the removal of the reed barrier (1910) that for decades delimited a fishing farm (see zigzag line in Fig. 1). We used a 2D numerical hydrodynamic model that incorporates different historical lagoon configurations (1887, 1901, 1932, 2003 and 2012) to investigate the effect that the considered interventions had on the hydrodynamics. To describe the vertical evolution of the marsh surface we numerically implemented the analytical model described in D’Alpaos et al. (2011) with different assumptions specifically thought for the Venice Lagoon. 3. Conclusions The jetties increased the depth of the inlet of more
than 250% in less than 15 years. The increased depth at the inlet had a positive
feedback on the stability of nearby marshes, by lowering the local mean sea level and increasing the tidal amplitude, thus locally contrasting the eustatic sea level rise and the natural subsidence for more than 30 years.
On the contrary, salt marshes far from the inlet could not take advantage of this effect due to tidal wave dissipation occurring along shallow canals. In these inner areas, the marsh elevation at the equilibrium state is highly reduced due to the low tidal excursion, making these marshes extremely vulnerable to changes in suspended sediment concentration and sea level rise.
The removal of reed barriers delimiting the fish farm may have reduced the sediments available to the already low marshes thus contributing to their drowning.
Acknowledgments We thank Giovanna Nordio for her collaboration. References D’Alpaos, A., Mudd, S.M., Carniello, L. (2011).
Dynamic response of marshes to perturbations in suspended sediment concentrations and rates of relative sea level rise. J. Geophys. Res., 116, F04020.
Marani, M., A. D’Alpaos, S. Lanzoni, L. Carniello, and A. Rinaldo (2010). The importance of being coupled: Stable states and catastrophic shifts in tidal biomorphodynamics. J. Geophys. Res., 115, F04004, doi:10.1029/2009JF001600
59
Interactions between Hydrodynamics, Bed Morphodynamics and Bank Erosionon a Low Sinuosity Meander Bend: Goodwin Creek, Mississippi
E.J. Langendoen1, M.E. Ursic2, A. Mendoza3, J.D. Abad4, R. Ata5, K. El kadi Abderrezzak6 and P. Tassi7
1 U.S. Department of Agriculture, Agricultural Research Service, Oxford, MS, USA. [email protected] U.S. Department of Agriculture, Agricultural Research Service, Oxford, MS, USA. [email protected]
3 Department of Basic Sciences and Engineering, Metropolitan Autonomous University, Lerma, Mexico.
[email protected] Department of Environmental Engineering, University of Engineering and Technology, Lima, Peru.
[email protected] EDF R&D, National Laboratory for Hydraulics and Environment & Saint Venant Laboratory for Hydraulics, Chatou,
France. [email protected] EDF R&D, National Laboratory for Hydraulics and Environment & Saint Venant Laboratory for Hydraulics, Chatou,
France. [email protected] EDF R&D, National Laboratory for Hydraulics and Environment & Saint Venant Laboratory for Hydraulics, Chatou,
France. [email protected]
1. IntroductionFor the Beatton River, Canada, Nanson and Hickin (1983)
demonstrated that short-term meander migration rates are
not representative of the long-term averages, as two al-
most identical bends had significantly different short-term
migration rates but very similar long-term migration rates.
They postulated that this was caused by the asynchronous
interactions between erosion of the cut bank along the
outside of a bend and accretion on the point bar along
the inside of a bend. Recently, the processes controlling
this discontinuous behavior have been labeled ‘bank pull’
(i.e., faster migration of the outer bank) and ‘bar push’
(i.e., faster migration of the point bar), for example van de
Lageweg et al. (2014) and Eke et al. (2014).
Using a new framework of the coevolution of planform
and channel width in a freely meandering river, Eke et al.
(2014) found that overall migration patterns are domi-
nated by bar push, that is point-bar accretion rate exceeds
the bank erosion rate. On the other hand, van de Lageweg
et al. (2014) found experimentally that point-bar ridge-
and-swale topography (or scroll bars) is a consequence of
channel widening due to bank pull.
The findings of Nanson and Hickin (1983) have important
implications for modeling the morphodynamics of mean-
dering streams. For example, most widely-used models of
river meandering assume a temporally and spatially con-
stant channel width (e.g., Ikeda et al., 1981) and there-
fore cannot be used to simulate the short term mean-
der planform dynamics. Only, recently have such mod-
els been extended to allow varying width (among others,
Zolezzi et al., 2012; Eke et al., 2014). Further, the role
of bank pull on scroll-bar formation indicates the impor-
tance of incorporating cut-bank erosion processes in nu-
merical models of river meandering to improve the sim-
ulation of long term (geologic scale) planform dynamics
(van de Lageweg et al., 2014).
2. MethodsAn 11-year (1996-2007) study on bank erosion mechan-
ics was conducted at a low sinuosity bend on the Goodwin
Creek, MS (Simon et al., 2000). As part of this study
56 repeat surveys of 10 cross sections were performed
that show the timing between point bar accretion events
and bank erosion events. Discharge at the site is avail-
able from 1982-2016. To explain the spatial and temopral
variations in point bar accretion and bank erosion, these
data were complemented with numerical simulations us-
ing the TELEMAC2D/SISYPHE computer models of the
TELEMAC-MASCARET Suite of Solvers (TMSS) EDF-
R&D (2015). These models were recently enhanced with
riverbank erosion algorithms to also simulate bank ero-
sion along cut banks (Langendoen et al., 2016).
ReferencesEDF-R&D (2015). open TELEMAC-MASCARET
(http://opentelemac.org).
Eke, E. C., Czapiga, M. J., Viparelli, E., Shimizu, Y., Im-
ran, J., Sun, T., and Parker, G. (2014). Coevolution of
width and sinuosity in meandering rivers. Journal of
Fluid Mechanics, 760:127–174.
Ikeda, S., Parker, G., and Sawai, K. (1981). Bend theory
of river meanders. Part 1. Linear development. Journal
of Fluid Mechanics, 112:363–377.
Langendoen, E. J., Mendoza, A., Abad, J. D., Tassi, P.,
Wang, D., Ata, R., El kadi Abderrezzak, K., and Her-
vouet, J.-M. (2016). Improved numerical modeling of
morphodynamics of rivers with steep banks. Advances
in Water Resources, 93(Part A):4–14.
Nanson, G. C. and Hickin, E. J. (1983). Channel mi-
gration and incision on the Beatton River. J. Hydraul.
Eng., 109(3):327–337.
Simon, A., Curini, A., Darby, S. E., and Langendoen, E. J.
(2000). Bank and near-bank processes in an incised
channel. Geomorphology, 35(3-4):193–217.
van de Lageweg, W. I., van Dijk, W. M., Baar, A. W., Rut-
ten, J., and Kleinhans, M. G. (2014). Bank pull or bar
push: What drives scroll-bar formation in meandering
rivers? Geology, 42(4):319–322.
Zolezzi, G., Luchi, R., and Tubino, M. (2012). Mod-
eling morphodynamic processes in meandering rivers
with spatial width variations. Reviews of Geophysics,
50(4):RG4005.
60
Effects of Systematic Variation of Width, Bank Properties and Downstream Sediment Routing on Meander Evolution using Linearized Models
A.D.Howard1, A.B. Bryk2 and W.E. Dietrich2
1 Department of Environmental Sciences, University of Virginia, Charlottesville, VA. [email protected] .
2 Department of Earth and Planetary Science, University of California, Berkeley, Berkeley, CA, USA [email protected], [email protected].
1. Introduction The ~30 year global coverage of the Earth by Landsat has provided an unprecedented record of migration of long reaches of large, sinuous rivers. This provides the opportunity to evaluate the relative success of models of flow, sediment transport, and bank migration. Meander evolution models vary in their complexity and fidelity to flow, transport, and erosional processes, ranging from linearized 1-D models to fully 3-D models of coupled flow and sediment transport. Most of the highly-sinuous, actively meandering, pristine meandering rivers occur in nearly inaccessible locations (such as in the Amazon basin) where the information necessary to fully parameterize the more evolved models of meandering is lacking. Our approach is to test the ability of linearized models to predict the observed record of meander evolution. We explore the effects on patterns of migration of several modifications of the usual assumptions of constant channel width and bank erosion proportional to the velocity perturbation. 2. Modifications of standard linear models We utilize the Johanneson-Parker (1989) model of flow and bed topography as realized in Howard (1992), as well as the Frascati and Lanzoni (2013) linearized model. At present we restrict the application of the model to simulate highly sinuous meandering with only neck cutoffs. 2.1 Relationship between near-bank flow and migration rate Optional modifications of the program include: a) shared weighting of the depth perturbation and the velocity perturbation in determining migration rate; b) a critical shear stress for bank migration; c) variation in friction coefficient, and d) migration rate as a power function of the velocity perturbation, e.g., a square-root weighting to account for the need to erode slumped bank material. 2.2. Channel width variation Channel width is assumed to have a linear relationship to centreline curvature. Weighting can be either positive, zero, or negative. This affects local the channel aspect ratio and its effect on flow perturbation. 2.3. Downstream sediment routing Bed sediment is routed downstream with a specified flux at the upstream end and a fixed downstream bed elevation. Local channel gradients change as the planform evolves and large temporary increases occur at sites of neck cutoffs. This affects local flow velocity as well as the aspect ratio. In addition, migration rate can be assumed to depend jointly on the velocity
perturbation and channel width narrowing under high sediment flux, under the assumption that high flux encourages point bar growth and a narrower channel. Runs were made under both near-critical and high transport stages. Simulations are restricted to subcritical flow. 3. Results Changes to meander pattern evolution from these modifications are subtle, because of the strong effect local planform on meander evolution that can, for example, variably cause sites of cutoff loops to regrow, rapidly translate, or migrate backward. For initial evaluation of the effects of these modifications we simulate long-term planform evolution of long channel reaches (40+ whole loops) and use the multivariate statistical characterization techniques of Howard and Hemberger (1991) through discriminant and factor analyses. In simulations with downstream sediment transport meanders develop slowly but often develop convoluted shapes. By contrast, when the depth and velocity perturbations are equally weighted with a square-root dependency, new loops develop rapidly after cutoff, have less complex morphology and experience more frequent cutoffs. For meander evolution with a critical shear stress broad, long loops form that are nearly stationary, but rapid bend evolution occurs near sites of cutoff, 4. Conclusions The various modifications of the linear flow model can have appreciable effects on meander evolution. We are presently testing the ability of linear models with different assumptions to replicate migration and cutoff history of natural channels using the Landsat database. References Frascati, A. and Lanzoni, S. (2013). A mathematical
model of meandering, J. Geophys. Res. Earth Surf. 118, 1641-1657.
Howard, A.D. (1992), Modelling channel evolution and floodplain morphology, In Carling, P.A and Peggs, G. E., editors., Floodplain Process, pages 15-62, John Wiley, New York.
Howard, A.D. and Hemberger, A. T. (1991). Multivariate characterization of Meandering, Geomorph. 4, 161-186.
Johannesson, H. and Parker, G (1989), Linear theory of river meanders. In S. Ikeda and G. Parker, editors, River Meandering, Water. Resourc. Monogr. ser. 12, Pages 181-212, AGU, Washington, D. C.
61
Width variation meandering evolution with a Physic Mathematical andStatistical based model
S. Lopez Dubon1, D. Viero1, M. Bogoni1 and S.Lanzoni1
1 Department of Civil, Environmental and Architectural Engineering, University of Padua, Padua, Italy.
1. IntroductionWe can consider meandering rivers as a dynamic sys-
tem that migrates and evolve along flood plains as a con-
sequence of complex interactions involving the channel
forms, flow and sediment transport (Seminara, 2006).
Traditionally, the models proposed to simulated the dis-
placement of the center line for this type of systems, used
a linear interaction between the velocity and a coefficient
of bank erosion, considering a constant width, showing a
weakly physical base.
We proposed a physical - statistical based approach to
solve the river bank evolution, considering the erosion and
depositing processes independent among them and with
an individual shear stress threshold that makes as trigger
for each process. Finally we link the width evolution with
a parametric probability distribution (PPD) based on the
original width configuration.
2. Hydraulic ModelThe hydraulic behavior of a meandering river is a complex
process that entails three-dimensional helicoidally flow
structures. This problem is commonly analyzed with dif-
ferent approaches, from 1D and 2D simplified models to
3D models using computational fluid dynamics (Hooke,
2013). Here we use the mathematical model developed
by (Frascati and Lanzoni, 2013), which accounts for both
width and curvature variations along the river. The model
considers four main equations: the 2D momentum equa-
tion, the continuity equation, and the Exner equation.
This set of equations, describes both the laterally asym-
metric flow field due to the channel curvature and the lat-
erally symmetrical pattern due to width variations.
3. River Bank modelFor the erosion process we implement an approach for
fine grained materials to estimate the erosion rate.
ξ ∗
E = M∗
E
(
τ∗− τ∗cτ∗c
)
(1)
Where ξ ∗
E is the erosion rate, M∗
E is the dimensional ero-
sion rate coefficient, τ∗ is the near bank shear stress and
the τ∗c is the critical shear stress which works as threshold.
The critical shear stress could be computed or obtained by
field measurements. Here, we computed the critical shear
stress testing different models, that goes from empirical
and semi empirical relations to probabilistic approaches.
For the deposition process we used:
ξ ∗
D = M∗
D
(
τ∗b − τ∗
τ∗b
)
(2)
Where ξ ∗
D is the deposition rate, M∗
D is the dimensional
deposition rate coefficient and τ∗b is the critical shear
stress for deposition. The critical shear stress deposition
threshold, could be computed or obtained by field mea-
surements as in the case of the erosion. For the compu-
tation of the critical shear stress deposition threshold we
consider that the deposition occurs until all the sediment
transport is in suspension, based on this we used the criti-
cal shear stress threshold for suspension as the one for de-
position. Once again we tested different models that goes
from relations between the shear velocity and the set-
tling velocity of sediment, relations based on the shields
Reynolds number and the probabilistic approaches.
4. Statistical modelBased on the analysis of more than 50 river’s configura-
tions spread around the world and taken in different time
windows, it seems that river width responds to a PDD. We
analyzed through 15 different PDD, being the generalized
extreme value distribution (GEV) the most come fit PDD.
According to the above described, to link the evolution of
both banks, we estimated through the 15 PDD the best fit
one for original width channel configuration (in this case
the configuration used to start the evolution). After that,
using an algorithm and the cumulative distribution func-
tion we pondered the displacements of the river banks. In
this way we are able to control the narrowing and widen-
ing problems allowing the long term simulations.
5. ConclusionsThe statistical analysis revels that river’s width respond
to a certain PDD, that have slightly changes in their pa-
rameters over the time, this is in concordance with the
assumptions of mean constant width.
The first results suggest a good performance in middle
term simulation, periods that were around 30 years, since
the observed and simulated configuration have significant
similarities, being the most significant aspect the simi-
larities between the observed and simulated width’s his-
tograms.
For long term simulations, periods over 100 years, there
is no data to confront with, nerveless the model was able
to keep the width in reasonable values without narrowing
and widening problems.
ReferencesFrascati, A. and Lanzoni, S. (2013). A mathemati-
cal model for meandering rivers with varying width.
Journal of Geophysical Research: Earth Surface,
118(3):1641–1657.
Hooke, J. (2013). River Meandering. In Shroder, J. F., ed-
itor, Treatise on Geomorphology, chapter River Mean,
pages 260–288. Elsevier.
Seminara, G. (2006). Meanders. Journal of Fluid Me-
chanics, 554:271–297.
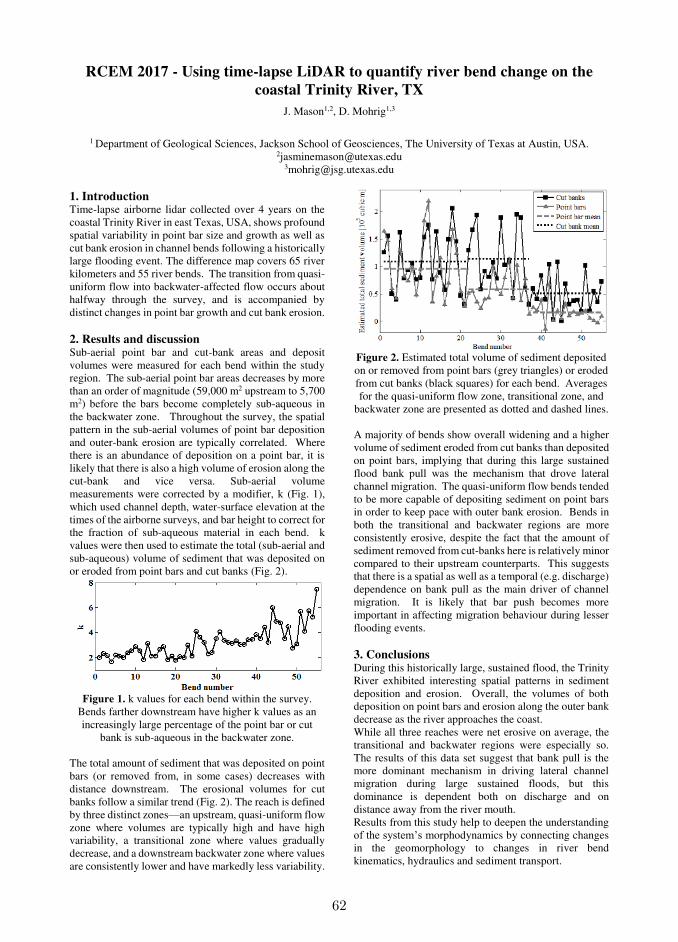
62
RCEM 2017 - Using time-lapse LiDAR to quantify river bend change on the
coastal Trinity River, TX
J. Mason1,2, D. Mohrig1,3
1 Department of Geological Sciences, Jackson School of Geosciences, The University of Texas at Austin, USA.
[email protected] [email protected]
1. Introduction Time-lapse airborne lidar collected over 4 years on the coastal Trinity River in east Texas, USA, shows profound spatial variability in point bar size and growth as well as cut bank erosion in channel bends following a historically large flooding event. The difference map covers 65 river kilometers and 55 river bends. The transition from quasi-uniform flow into backwater-affected flow occurs about halfway through the survey, and is accompanied by distinct changes in point bar growth and cut bank erosion.
2. Results and discussion Sub-aerial point bar and cut-bank areas and deposit volumes were measured for each bend within the study region. The sub-aerial point bar areas decreases by more than an order of magnitude (59,000 m2 upstream to 5,700 m2) before the bars become completely sub-aqueous in the backwater zone. Throughout the survey, the spatial pattern in the sub-aerial volumes of point bar deposition and outer-bank erosion are typically correlated. Where there is an abundance of deposition on a point bar, it is likely that there is also a high volume of erosion along the cut-bank and vice versa. Sub-aerial volume measurements were corrected by a modifier, k (Fig. 1), which used channel depth, water-surface elevation at the times of the airborne surveys, and bar height to correct for the fraction of sub-aqueous material in each bend. k values were then used to estimate the total (sub-aerial and sub-aqueous) volume of sediment that was deposited on or eroded from point bars and cut banks (Fig. 2).
Figure 1. k values for each bend within the survey.
Bends farther downstream have higher k values as an increasingly large percentage of the point bar or cut
bank is sub-aqueous in the backwater zone.
The total amount of sediment that was deposited on point bars (or removed from, in some cases) decreases with distance downstream. The erosional volumes for cut banks follow a similar trend (Fig. 2). The reach is defined by three distinct zones—an upstream, quasi-uniform flow zone where volumes are typically high and have high variability, a transitional zone where values gradually decrease, and a downstream backwater zone where values are consistently lower and have markedly less variability.
Figure 2. Estimated total volume of sediment deposited on or removed from point bars (grey triangles) or eroded from cut banks (black squares) for each bend. Averages for the quasi-uniform flow zone, transitional zone, and
backwater zone are presented as dotted and dashed lines. A majority of bends show overall widening and a higher volume of sediment eroded from cut banks than deposited on point bars, implying that during this large sustained flood bank pull was the mechanism that drove lateral channel migration. The quasi-uniform flow bends tended to be more capable of depositing sediment on point bars in order to keep pace with outer bank erosion. Bends in both the transitional and backwater regions are more consistently erosive, despite the fact that the amount of sediment removed from cut-banks here is relatively minor compared to their upstream counterparts. This suggests that there is a spatial as well as a temporal (e.g. discharge) dependence on bank pull as the main driver of channel migration. It is likely that bar push becomes more important in affecting migration behaviour during lesser flooding events.
3. Conclusions During this historically large, sustained flood, the Trinity River exhibited interesting spatial patterns in sediment deposition and erosion. Overall, the volumes of both deposition on point bars and erosion along the outer bank decrease as the river approaches the coast. While all three reaches were net erosive on average, the transitional and backwater regions were especially so. The results of this data set suggest that bank pull is the more dominant mechanism in driving lateral channel migration during large sustained floods, but this dominance is dependent both on discharge and on distance away from the river mouth. Results from this study help to deepen the understanding of the system’s morphodynamics by connecting changes in the geomorphology to changes in river bend kinematics, hydraulics and sediment transport.
63
Experimental Study of Bedrock Degradation in Annular Flume Flow S. Taguchi
1, H. Ozawa
2, A. C. Lima
3 and N. Izumi
4
1 Graduate School of Egineering, Hokkaido University, Sapporo, Japan.
[email protected] 2 School of Engineering, Hokkaido University, Sapporo, Japan.
[email protected] 3 Graduate School of Engineering, Hokkaido University, Sapporo, Japan.
[email protected] 4 Graduate School of Engineering, Hokkaido University, Sapporo, Japan.
1. Introduction Degradation of bedrock river channels can result in
changes in river morphology up to large distances
downstream from the degraded reach. Specifically, how
erosion and deposition take place in curving bedrock
channels, where secondary flow takes place, has
received little attention, although this knowledge is
highly relevant for evolutionary river morphology and
river management, and despite the fact that bedrock
rivers worldwide often exhibit meanders.
The main process of bedrock degradation in rivers is
abrasion. Erosion by abrasion takes place only in
portions of moderately covered sediment (Sklar et al.,
2004). In curved channels, the bedrock near the inner
bank is completely covered by sediment, due to the
sediment transport caused by secondary flow. On the
other hand, the bedrock near the outer bank is
completely exposed. It is expected, therefore, that the
bed in the vicinity of the inner and the outer bank will
not be eroded, and that erosion by abrasion is likely to
occur only around the boundary between them.
In this study, we focused on bedrock incision and bed
configuration in curved channels. Bedrock degradation
was simulated experimentally and the preferential zone
of erosion by abrasion could be clearly observed.
Moreover, regular deposition patterns were observed.
2. Experiments We employed annular acrylic flume of average radius 45
cm and width 10 cm. The flow was generated by the
rotation of an annular acrylic plate installed at the top of
the flume in contact with the surface of the water.
The bedrock was simulated by means of mortar mixes of
cement, water, and sand at the ratios 3:42:150, named
Case 1, and 3:24:100, named Case 2. The initial height
of the bedrock was about 6.5 cm and the depth of water
was about 4.5 cm. The angular velocity of the rotating
lid was 40 rpm. The total rotation time of Case 1 was 22
h and that of Case 2 was 25 h. We measured the height
of the bed every 2 h or 4 h by moving a laser
displacement sensor along nineteen circumferences
concentric with the flume. The radii of the
circumferences ranged from the inner to the outer wall at
0.5 cm increments. In Case 1 there was initially no sand
cover on the bedrock and free sediment was neither
supplied nor removed during the experimental runs. The
sediment that gradually covered the bed was totally
released from the mortar. In Case 2, 2.5 kg of sand were
supplied to the flume at 22 h.
3. Results and Discussion In both Case 1 and Case 2, movable sediment was
gradually generated by erosion. The zone of preferential
bed incision by abrasion, initially near the inner wall,
gradually migrated towards the outer wall. Erosion
progressed more rapidly in Case 1 than in Case 2, as the
mortar was stronger in the latter case.
Erosion by abrasion was active in the boundary between
covered and exposed bedrock. In Case 2, after 25 h,
sediment was deposited up to 5 cm from the inner wall
and the simulated bedrock was eroded mainly at the
middle area of the flume. The vicinity of the boundary
between covered and exposed bedrock is described as
moderately covered by sediment
In both Case 1 and Case 2, we correlated the erosion rate
(eroded volume per time interval) and the ratio of the
covered bed. Sediment deposition was not completely
uniform along the tangential direction, but alternately
with the presence of sediment and with no sediment on
the same circumference of the annular flume. In the
annular flume, the ratio of the covered bed was more
significant around the inner wall than the outer wall due
to sediment transport caused by secondary flow. At the
portion where the ratio of the covered bed was
significant, the magnitude of the erosion rate
decreased because the bedrock was protected from
impacts resulting in abrasion. At the portion where the
ratio of the covered bed was insignificant, the magnitude
of the erosion rate also decreased because few sediments
struck the bedrock. The magnitude of the erosion rate
was most significant at the vicinity where the ratio of the
covered bed was moderate. This is because erosion by
abrasion frequently took place at the vicinity.
4. Conclusions The conclusions of this study are stated as follows.
• Preference zone of abrasion was around the
boundary between covered and exposed bedrock.
• The relationship between the erosion rate and the
ratio of the covered bed was observed. Erosion by
abrasion frequently occurred at the portion where the
ratio of the covered bed was moderate.
References
Sklar, L. S., & Dietrich, W. E. (2004). A mechanistic
model for river incision into bedrock by saltating bed
load. Water Resources Research, 40(6).
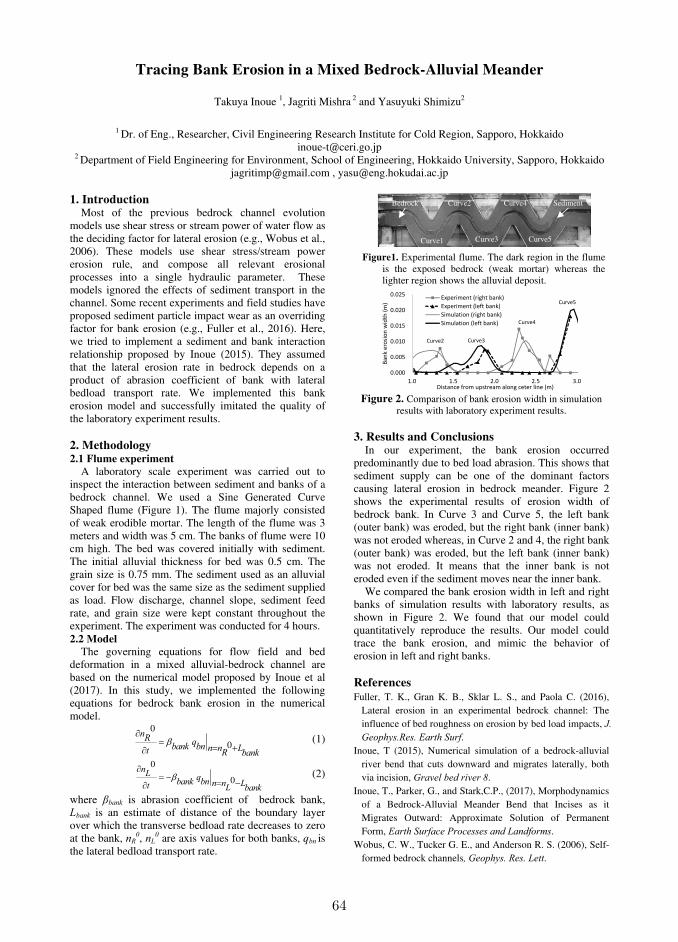
64
Tracing Bank Erosion in a Mixed Bedrock-Alluvial Meander
Takuya Inoue 1, Jagriti Mishra 2 and Yasuyuki Shimizu2
1 Dr. of Eng., Researcher, Civil Engineering Research Institute for Cold Region, Sapporo, Hokkaido
[email protected] 2 Department of Field Engineering for Environment, School of Engineering, Hokkaido University, Sapporo, Hokkaido
[email protected] , [email protected]
1. Introduction Most of the previous bedrock channel evolution
models use shear stress or stream power of water flow as the deciding factor for lateral erosion (e.g., Wobus et al., 2006). These models use shear stress/stream power erosion rule, and compose all relevant erosional processes into a single hydraulic parameter. These models ignored the effects of sediment transport in the channel. Some recent experiments and field studies have proposed sediment particle impact wear as an overriding factor for bank erosion (e.g., Fuller et al., 2016). Here, we tried to implement a sediment and bank interaction relationship proposed by Inoue (2015). They assumed that the lateral erosion rate in bedrock depends on a product of abrasion coefficient of bank with lateral bedload transport rate. We implemented this bank erosion model and successfully imitated the quality of the laboratory experiment results. 2. Methodology 2.1 Flume experiment
A laboratory scale experiment was carried out to inspect the interaction between sediment and banks of a bedrock channel. We used a Sine Generated Curve Shaped flume (Figure 1). The flume majorly consisted of weak erodible mortar. The length of the flume was 3 meters and width was 5 cm. The banks of flume were 10 cm high. The bed was covered initially with sediment. The initial alluvial thickness for bed was 0.5 cm. The grain size is 0.75 mm. The sediment used as an alluvial cover for bed was the same size as the sediment supplied as load. Flow discharge, channel slope, sediment feed rate, and grain size were kept constant throughout the experiment. The experiment was conducted for 4 hours. 2.2 Model
The governing equations for flow field and bed deformation in a mixed alluvial-bedrock channel are based on the numerical model proposed by Inoue et al (2017). In this study, we implemented the following equations for bedrock bank erosion in the numerical model.
0
0nR q
bank bn n n Lt R bank
(1)
0
0nL q
bank bn n n Lt L bank
(2)
where βbank is abrasion coefficient of bedrock bank, Lbank is an estimate of distance of the boundary layer over which the transverse bedload rate decreases to zero at the bank, nR
0, nL0 are axis values for both banks, qbn is
the lateral bedload transport rate.
0.000
0.005
0.010
0.015
0.020
0.025
1.0 1.5 2.0 2.5 3.0B
an
k e
rosi
on w
idth (m
)Distance from upstream along ceter line (m)
Experiment (right bank)
Experiment (left bank)
Simulation (right bank)
Simulation (left bank)
Curve2 Curve3
Curve4
Curve5
Figure 2. Comparison of bank erosion width in simulation
results with laboratory experiment results. 3. Results and Conclusions
In our experiment, the bank erosion occurred predominantly due to bed load abrasion. This shows that sediment supply can be one of the dominant factors causing lateral erosion in bedrock meander. Figure 2
shows the experimental results of erosion width of bedrock bank. In Curve 3 and Curve 5, the left bank (outer bank) was eroded, but the right bank (inner bank) was not eroded whereas, in Curve 2 and 4, the right bank (outer bank) was eroded, but the left bank (inner bank) was not eroded. It means that the inner bank is not eroded even if the sediment moves near the inner bank.
We compared the bank erosion width in left and right banks of simulation results with laboratory results, as shown in Figure 2. We found that our model could quantitatively reproduce the results. Our model could trace the bank erosion, and mimic the behavior of erosion in left and right banks. References Fuller, T. K., Gran K. B., Sklar L. S., and Paola C. (2016),
Lateral erosion in an experimental bedrock channel: The influence of bed roughness on erosion by bed load impacts, J.
Geophys.Res. Earth Surf. Inoue, T (2015), Numerical simulation of a bedrock-alluvial
river bend that cuts downward and migrates laterally, both via incision, Gravel bed river 8.
Inoue, T., Parker, G., and Stark,C.P., (2017), Morphodynamics of a Bedrock-Alluvial Meander Bend that Incises as it Migrates Outward: Approximate Solution of Permanent Form, Earth Surface Processes and Landforms.
Wobus, C. W., Tucker G. E., and Anderson R. S. (2006), Self-formed bedrock channels, Geophys. Res. Lett.
Figure1. Experimental flume. The dark region in the flume is the exposed bedrock (weak mortar) whereas the lighter region shows the alluvial deposit.
Bedrock Sediment
Curve1
Curve2
Curve3
Curve4
Curve5
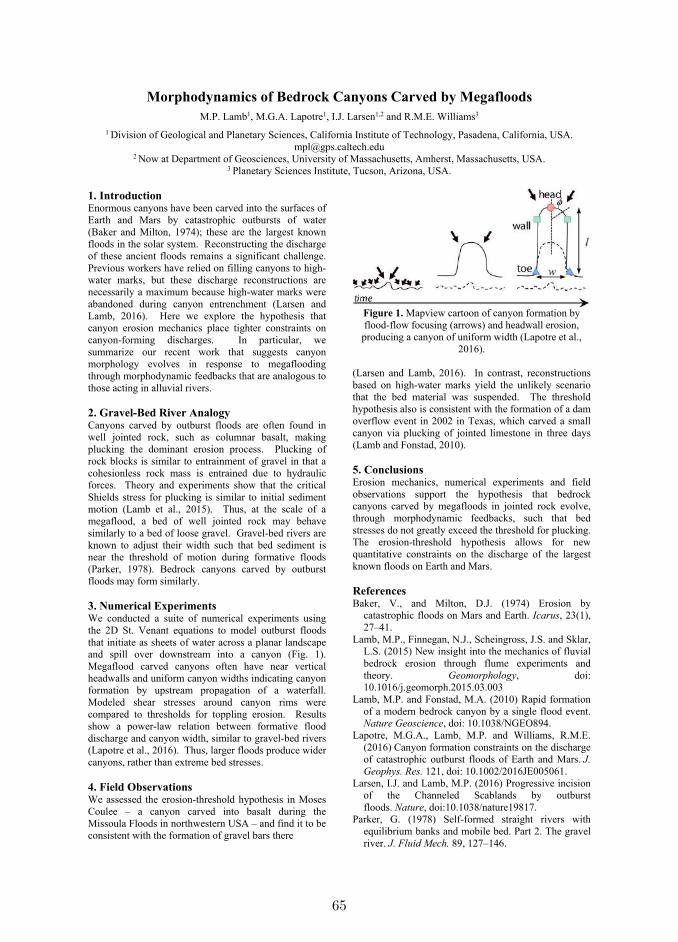
65
Morphodynamics of Bedrock Canyons Carved by Megafloods
M.P. Lamb1, M.G.A. Lapotre1, I.J. Larsen1,2 and R.M.E. Williams3
1 Division of Geological and Planetary Sciences, California Institute of Technology, Pasadena, California, USA.
[email protected] 2 Now at Department of Geosciences, University of Massachusetts, Amherst, Massachusetts, USA.
3 Planetary Sciences Institute, Tucson, Arizona, USA.
1. Introduction Enormous canyons have been carved into the surfaces of
Earth and Mars by catastrophic outbursts of water
(Baker and Milton, 1974); these are the largest known
floods in the solar system. Reconstructing the discharge
of these ancient floods remains a significant challenge.
Previous workers have relied on filling canyons to high-
water marks, but these discharge reconstructions are
necessarily a maximum because high-water marks were
abandoned during canyon entrenchment (Larsen and
Lamb, 2016). Here we explore the hypothesis that
canyon erosion mechanics place tighter constraints on
canyon-forming discharges. In particular, we
summarize our recent work that suggests canyon
morphology evolves in response to megaflooding
through morphodynamic feedbacks that are analogous to
those acting in alluvial rivers.
2. Gravel-Bed River Analogy Canyons carved by outburst floods are often found in
well jointed rock, such as columnar basalt, making
plucking the dominant erosion process. Plucking of
rock blocks is similar to entrainment of gravel in that a
cohesionless rock mass is entrained due to hydraulic
forces. Theory and experiments show that the critical
Shields stress for plucking is similar to initial sediment
motion (Lamb et al., 2015). Thus, at the scale of a
megaflood, a bed of well jointed rock may behave
similarly to a bed of loose gravel. Gravel-bed rivers are
known to adjust their width such that bed sediment is
near the threshold of motion during formative floods
(Parker, 1978). Bedrock canyons carved by outburst
floods may form similarly.
3. Numerical Experiments We conducted a suite of numerical experiments using
the 2D St. Venant equations to model outburst floods
that initiate as sheets of water across a planar landscape
and spill over downstream into a canyon (Fig. 1).
Megaflood carved canyons often have near vertical
headwalls and uniform canyon widths indicating canyon
formation by upstream propagation of a waterfall.
Modeled shear stresses around canyon rims were
compared to thresholds for toppling erosion. Results
show a power-law relation between formative flood
discharge and canyon width, similar to gravel-bed rivers
(Lapotre et al., 2016). Thus, larger floods produce wider
canyons, rather than extreme bed stresses.
4. Field Observations We assessed the erosion-threshold hypothesis in Moses
Coulee – a canyon carved into basalt during the
Missoula Floods in northwestern USA – and find it to be
consistent with the formation of gravel bars there
Figure 1. Mapview cartoon of canyon formation by
flood-flow focusing (arrows) and headwall erosion,
producing a canyon of uniform width (Lapotre et al.,
2016).
(Larsen and Lamb, 2016). In contrast, reconstructions
based on high-water marks yield the unlikely scenario
that the bed material was suspended. The threshold
hypothesis also is consistent with the formation of a dam
overflow event in 2002 in Texas, which carved a small
canyon via plucking of jointed limestone in three days
(Lamb and Fonstad, 2010).
5. Conclusions Erosion mechanics, numerical experiments and field
observations support the hypothesis that bedrock
canyons carved by megafloods in jointed rock evolve,
through morphodynamic feedbacks, such that bed
stresses do not greatly exceed the threshold for plucking.
The erosion-threshold hypothesis allows for new
quantitative constraints on the discharge of the largest
known floods on Earth and Mars.
References Baker, V., and Milton, D.J. (1974) Erosion by
catastrophic floods on Mars and Earth. Icarus, 23(1),
27–41.
Lamb, M.P., Finnegan, N.J., Scheingross, J.S. and Sklar,
L.S. (2015) New insight into the mechanics of fluvial
bedrock erosion through flume experiments and
theory. Geomorphology, doi:
10.1016/j.geomorph.2015.03.003
Lamb, M.P. and Fonstad, M.A. (2010) Rapid formation
of a modern bedrock canyon by a single flood event.
Nature Geoscience, doi: 10.1038/NGEO894.
Lapotre, M.G.A., Lamb, M.P. and Williams, R.M.E.
(2016) Canyon formation constraints on the discharge
of catastrophic outburst floods of Earth and Mars. J.
Geophys. Res. 121, doi: 10.1002/2016JE005061.
Larsen, I.J. and Lamb, M.P. (2016) Progressive incision
of the Channeled Scablands by outburst
floods. Nature, doi:10.1038/nature19817.
Parker, G. (1978) Self-formed straight rivers with
equilibrium banks and mobile bed. Part 2. The gravel
river. J. Fluid Mech. 89, 127–146.

66
Dynamics of migrating alternate bars in large meandering rivers: combiningremote sensing and theoretical approaches
F. Monegaglia1, M. Tubino1 and G. Zolezzi1
1 Department of Civil, Environmentale and Mechanical Engineering, University of Trento, Trento, Italy.
1. IntroductionBars in meandering rivers are known to develop in the
form of point bars along the inner banks of river bends,
which keep steady with respect to the channel planform.
Theoretical and laboratory work has also shown that mi-
grating alternate bars can occur in meandering rivers, giv-
ing rise to nonlinear interactions with point bars. The in-
teraction between steady and migrating bars in a regular
sequence of meanders has been investigated through lab-
oratory experiments (Kinoshita and Miwa, 1974) and the-
oretical models (Tubino and Seminara, 1990), that high-
lighted the existence of a threshold value of meander cur-
vature above which migrating bars are suppressed. On the
other hand, theories for migrating bars (e.g. Colombini
et al. 1987) suggest that bar amplitude positively corre-
lates with the aspect ratio of the channel.
Few evidence, however, has been provided so far of the
occurrence of migrating alternate bars in real meandering
rivers from the Amazon basin. In this work we document
the systematic occurrence of such process in several large
natural meandering rivers. We perform a multitemporal
analysis of remotely sensed data to characterize the phys-
ical conditions controlling the formation of migrating bars
in such rivers and to measure their morphometric proper-
ties. The observed dependency of bar length and migra-
tion speed on channel curvature and width agrees at least
qualitatively with theoretical findings.
2. Materials and methodsWe use a multitemporal analysis of remotely sensed
Landsat data to quantify the distributions of lengths and
celerities of bars in some large meandering rivers. The
analysis is performed through the newly developed soft-
ware PyRIS (Monegaglia et al., view), which performs
morphodynamic analysis on large datasets in an auto-
mated fashion. Sediment bars are identified and tracked
through space and time in order to compute their lengths
and rates of change. We correlate bar length, migration
and rates of change with the local planform properties and
we seek an interpretation of the field data on the basis of
the theoretical outcomes of Tubino and Seminara (1990).
3. ResultsWe present results for several large, natural meandering
rivers from the Amazon basin including the Rio Xingu,
the Rio das Mortes and Rio Branco. In the analyzed
reaches we observe that bar length and migration speed
correlate well with the local planform properties. In
agreement with the theoretical results of Tubino and Sem-
inara (1990), channel curvature affects both bar migration
rate and bar wavenumber: increasing channel curvature
results in long steady sediment bars prevailing on alter-
nate migrating bars and vice versa. On the other hand,
the effect of the channel width appears to be twofold:
(i) in agreement with theoretical outcomes of Colombini
et al. (1987) there is an increasing migration speed with
increasing channel width, and (ii) above a certain channel
width range, the decrease in flow speed hampers the bar
migration rate.
Figure 1. Bar migration rates as a function of the
normalized dimensionless channel curvature for the Rio
Xingu (Brasil) between 1987 and 2011.
4. DiscussionThe study provides a clear evidence of the systematic oc-
currence of migrating alternate bars in real meandering
rivers. Results from our data analysis are in good agree-
ment with the theoretical outcomes of Colombini et al.
(1987); Tubino and Seminara (1990) and with the labo-
ratory experiments of Kinoshita and Miwa (1974). They
suggest that alternate migrating bars are promoted where
the channel is wide and weakly curved, while point bars
prevail where the channel is narrow and the curvature is
higher. However, there is an intermediate range of chan-
nel widths and curvatures in which there is a strong inter-
action between the two types of bars (steady and migrat-
ing), which affects the observed bar length and migration
properties.
ReferencesColombini, M., Seminara, G., and Tubino, M. (1987).
Finite-amplitude alternate bars. Journal of Fluid Me-
chanics, (181):213–232.
Kinoshita, R. and Miwa, H. (1974). River channel forma-
tion which prevents downstream translation of trans-
verse bars. Shinsabo, (94):12–17 (in japanese).
Monegaglia, F. Güneralp, I., Henshaw, A., Tubino, M.,
and Zolezzi, G. (under review). Automating extraction
of meandering river morphodynamics from multitem-
poral remotely sensed data. Remote Sensing of Envi-
ronment.
Tubino, M. and Seminara, G. (1990). Free–forced inter-
actions in developing meanders and suppression of free
bars. Journal of Fluid Mechanics, 214:131–159.
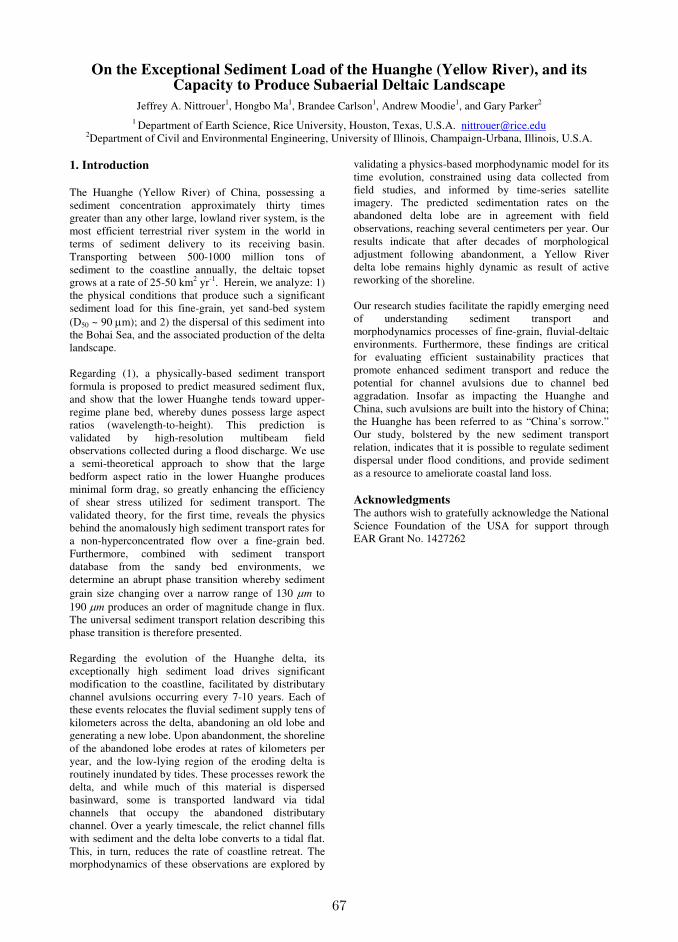
67
On the Exceptional Sediment Load of the Huanghe (Yellow River), and its Capacity to Produce Subaerial Deltaic Landscape
Jeffrey A. Nittrouer1, Hongbo Ma1, Brandee Carlson1, Andrew Moodie1, and Gary Parker2 1 Department of Earth Science, Rice University, Houston, Texas, U.S.A. [email protected]
2Department of Civil and Environmental Engineering, University of Illinois, Champaign-Urbana, Illinois, U.S.A.
1. Introduction
The Huanghe (Yellow River) of China, possessing a sediment concentration approximately thirty times greater than any other large, lowland river system, is the most efficient terrestrial river system in the world in terms of sediment delivery to its receiving basin. Transporting between 500-1000 million tons of sediment to the coastline annually, the deltaic topset grows at a rate of 25-50 km2 yr-1. Herein, we analyze: 1) the physical conditions that produce such a significant sediment load for this fine-grain, yet sand-bed system (D50 ~ 90 µm); and 2) the dispersal of this sediment into the Bohai Sea, and the associated production of the delta landscape. Regarding (1), a physically-based sediment transport formula is proposed to predict measured sediment flux, and show that the lower Huanghe tends toward upper-regime plane bed, whereby dunes possess large aspect ratios (wavelength-to-height). This prediction is validated by high-resolution multibeam field observations collected during a flood discharge. We use a semi-theoretical approach to show that the large bedform aspect ratio in the lower Huanghe produces minimal form drag, so greatly enhancing the efficiency of shear stress utilized for sediment transport. The validated theory, for the first time, reveals the physics behind the anomalously high sediment transport rates for a non-hyperconcentrated flow over a fine-grain bed. Furthermore, combined with sediment transport database from the sandy bed environments, we determine an abrupt phase transition whereby sediment grain size changing over a narrow range of 130 µm to 190 µm produces an order of magnitude change in flux. The universal sediment transport relation describing this phase transition is therefore presented. Regarding the evolution of the Huanghe delta, its exceptionally high sediment load drives significant modification to the coastline, facilitated by distributary channel avulsions occurring every 7-10 years. Each of these events relocates the fluvial sediment supply tens of kilometers across the delta, abandoning an old lobe and generating a new lobe. Upon abandonment, the shoreline of the abandoned lobe erodes at rates of kilometers per year, and the low-lying region of the eroding delta is routinely inundated by tides. These processes rework the delta, and while much of this material is dispersed basinward, some is transported landward via tidal channels that occupy the abandoned distributary channel. Over a yearly timescale, the relict channel fills with sediment and the delta lobe converts to a tidal flat. This, in turn, reduces the rate of coastline retreat. The morphodynamics of these observations are explored by
validating a physics-based morphodynamic model for its time evolution, constrained using data collected from field studies, and informed by time-series satellite imagery. The predicted sedimentation rates on the abandoned delta lobe are in agreement with field observations, reaching several centimeters per year. Our results indicate that after decades of morphological adjustment following abandonment, a Yellow River delta lobe remains highly dynamic as result of active reworking of the shoreline. Our research studies facilitate the rapidly emerging need of understanding sediment transport and morphodynamics processes of fine-grain, fluvial-deltaic environments. Furthermore, these findings are critical for evaluating efficient sustainability practices that promote enhanced sediment transport and reduce the potential for channel avulsions due to channel bed aggradation. Insofar as impacting the Huanghe and China, such avulsions are built into the history of China; the Huanghe has been referred to as “China’s sorrow.” Our study, bolstered by the new sediment transport relation, indicates that it is possible to regulate sediment dispersal under flood conditions, and provide sediment as a resource to ameliorate coastal land loss. Acknowledgments The authors wish to gratefully acknowledge the National Science Foundation of the USA for support through EAR Grant No. 1427262
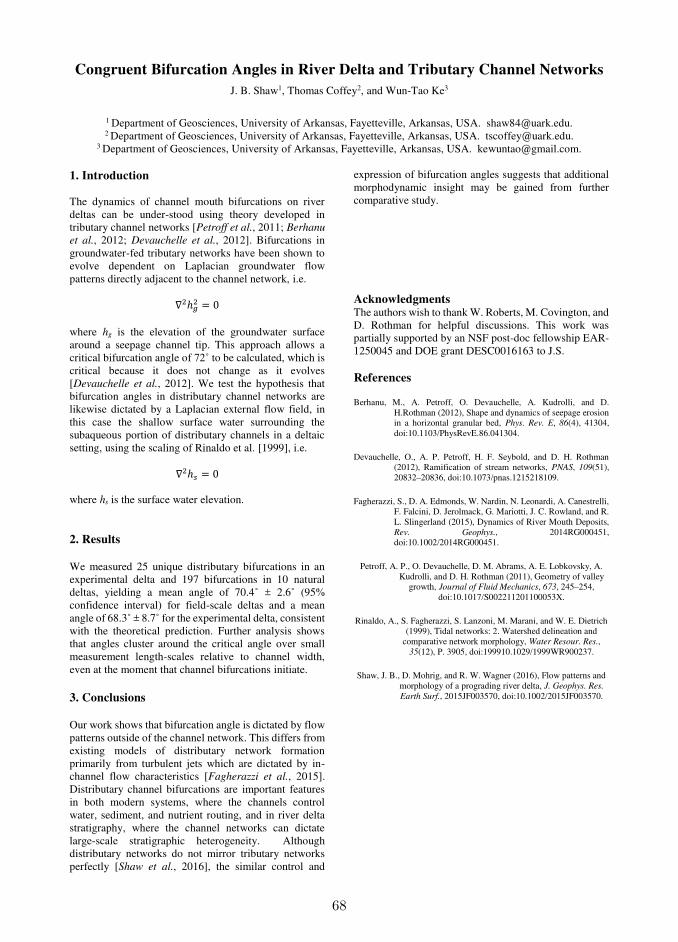
68
Congruent Bifurcation Angles in River Delta and Tributary Channel Networks
J. B. Shaw1, Thomas Coffey2, and Wun-Tao Ke3
1 Department of Geosciences, University of Arkansas, Fayetteville, Arkansas, USA. [email protected]. 2 Department of Geosciences, University of Arkansas, Fayetteville, Arkansas, USA. [email protected].
3 Department of Geosciences, University of Arkansas, Fayetteville, Arkansas, USA. [email protected].
1. Introduction The dynamics of channel mouth bifurcations on river deltas can be under-stood using theory developed in tributary channel networks [Petroff et al., 2011; Berhanu
et al., 2012; Devauchelle et al., 2012]. Bifurcations in groundwater-fed tributary networks have been shown to evolve dependent on Laplacian groundwater flow patterns directly adjacent to the channel network, i.e. ∇2ℎ2 = 0 where hg is the elevation of the groundwater surface around a seepage channel tip. This approach allows a critical bifurcation angle of 72˚ to be calculated, which is critical because it does not change as it evolves [Devauchelle et al., 2012]. We test the hypothesis that bifurcation angles in distributary channel networks are likewise dictated by a Laplacian external flow field, in this case the shallow surface water surrounding the subaqueous portion of distributary channels in a deltaic setting, using the scaling of Rinaldo et al. [1999], i.e. ∇2ℎ = 0 where hs is the surface water elevation. 2. Results
We measured 25 unique distributary bifurcations in an experimental delta and 197 bifurcations in 10 natural deltas, yielding a mean angle of 70.4˚ ± 2.6˚ (95% confidence interval) for field-scale deltas and a mean angle of 68.3˚ ± 8.7˚ for the experimental delta, consistent with the theoretical prediction. Further analysis shows that angles cluster around the critical angle over small measurement length-scales relative to channel width, even at the moment that channel bifurcations initiate.
3. Conclusions
Our work shows that bifurcation angle is dictated by flow patterns outside of the channel network. This differs from existing models of distributary network formation primarily from turbulent jets which are dictated by in-channel flow characteristics [Fagherazzi et al., 2015]. Distributary channel bifurcations are important features in both modern systems, where the channels control water, sediment, and nutrient routing, and in river delta stratigraphy, where the channel networks can dictate large-scale stratigraphic heterogeneity. Although distributary networks do not mirror tributary networks perfectly [Shaw et al., 2016], the similar control and
expression of bifurcation angles suggests that additional morphodynamic insight may be gained from further comparative study.
Acknowledgments The authors wish to thank W. Roberts, M. Covington, and D. Rothman for helpful discussions. This work was partially supported by an NSF post-doc fellowship EAR-1250045 and DOE grant DESC0016163 to J.S. References Berhanu, M., A. Petroff, O. Devauchelle, A. Kudrolli, and D.
H.Rothman (2012), Shape and dynamics of seepage erosion in a horizontal granular bed, Phys. Rev. E, 86(4), 41304, doi:10.1103/PhysRevE.86.041304.
Devauchelle, O., A. P. Petroff, H. F. Seybold, and D. H. Rothman (2012), Ramification of stream networks, PNAS, 109(51), 20832–20836, doi:10.1073/pnas.1215218109.
Fagherazzi, S., D. A. Edmonds, W. Nardin, N. Leonardi, A. Canestrelli, F. Falcini, D. Jerolmack, G. Mariotti, J. C. Rowland, and R. L. Slingerland (2015), Dynamics of River Mouth Deposits, Rev. Geophys., 2014RG000451, doi:10.1002/2014RG000451.
Petroff, A. P., O. Devauchelle, D. M. Abrams, A. E. Lobkovsky, A. Kudrolli, and D. H. Rothman (2011), Geometry of valley
growth, Journal of Fluid Mechanics, 673, 245–254, doi:10.1017/S002211201100053X.
Rinaldo, A., S. Fagherazzi, S. Lanzoni, M. Marani, and W. E. Dietrich (1999), Tidal networks: 2. Watershed delineation and
comparative network morphology, Water Resour. Res., 35(12), P. 3905, doi:199910.1029/1999WR900237.
Shaw, J. B., D. Mohrig, and R. W. Wagner (2016), Flow patterns and morphology of a prograding river delta, J. Geophys. Res.
Earth Surf., 2015JF003570, doi:10.1002/2015JF003570.
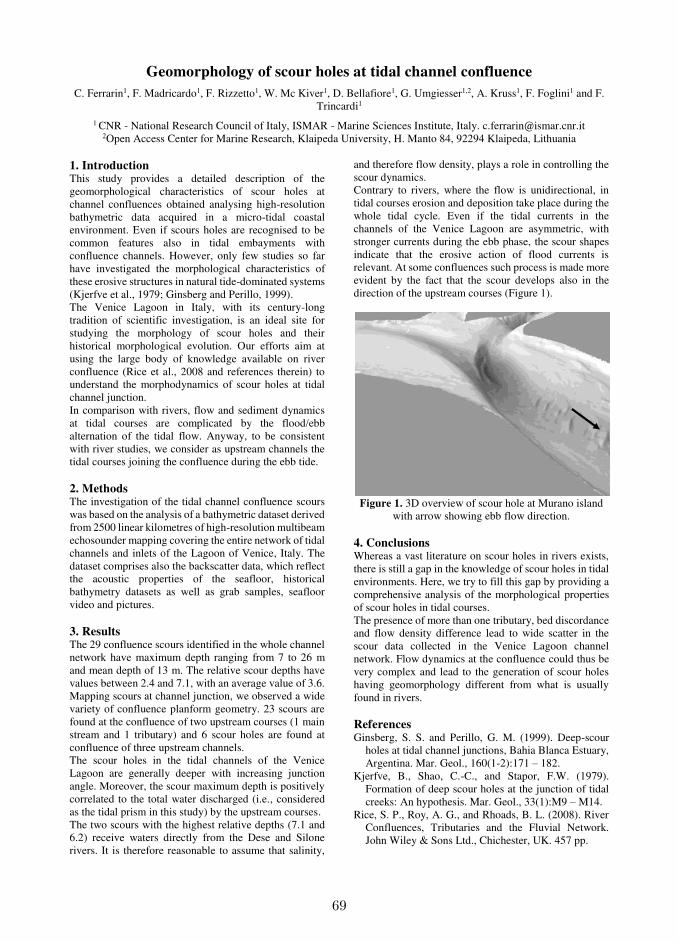
69
Geomorphology of scour holes at tidal channel confluence
C. Ferrarin1, F. Madricardo1, F. Rizzetto1, W. Mc Kiver1, D. Bellafiore1, G. Umgiesser1,2, A. Kruss1, F. Foglini1 and F. Trincardi1
1 CNR - National Research Council of Italy, ISMAR - Marine Sciences Institute, Italy. [email protected] 2Open Access Center for Marine Research, Klaipeda University, H. Manto 84, 92294 Klaipeda, Lithuania
1. Introduction This study provides a detailed description of the geomorphological characteristics of scour holes at channel confluences obtained analysing high-resolution bathymetric data acquired in a micro-tidal coastal environment. Even if scours holes are recognised to be common features also in tidal embayments with confluence channels. However, only few studies so far have investigated the morphological characteristics of these erosive structures in natural tide-dominated systems (Kjerfve et al., 1979; Ginsberg and Perillo, 1999). The Venice Lagoon in Italy, with its century-long tradition of scientific investigation, is an ideal site for studying the morphology of scour holes and their historical morphological evolution. Our efforts aim at using the large body of knowledge available on river confluence (Rice et al., 2008 and references therein) to understand the morphodynamics of scour holes at tidal channel junction. In comparison with rivers, flow and sediment dynamics at tidal courses are complicated by the flood/ebb alternation of the tidal flow. Anyway, to be consistent with river studies, we consider as upstream channels the tidal courses joining the confluence during the ebb tide. 2. Methods The investigation of the tidal channel confluence scours was based on the analysis of a bathymetric dataset derived from 2500 linear kilometres of high-resolution multibeam echosounder mapping covering the entire network of tidal channels and inlets of the Lagoon of Venice, Italy. The dataset comprises also the backscatter data, which reflect the acoustic properties of the seafloor, historical bathymetry datasets as well as grab samples, seafloor video and pictures. 3. Results The 29 confluence scours identified in the whole channel network have maximum depth ranging from 7 to 26 m and mean depth of 13 m. The relative scour depths have values between 2.4 and 7.1, with an average value of 3.6. Mapping scours at channel junction, we observed a wide variety of confluence planform geometry. 23 scours are found at the confluence of two upstream courses (1 main stream and 1 tributary) and 6 scour holes are found at confluence of three upstream channels. The scour holes in the tidal channels of the Venice Lagoon are generally deeper with increasing junction angle. Moreover, the scour maximum depth is positively correlated to the total water discharged (i.e., considered as the tidal prism in this study) by the upstream courses. The two scours with the highest relative depths (7.1 and 6.2) receive waters directly from the Dese and Silone rivers. It is therefore reasonable to assume that salinity,
and therefore flow density, plays a role in controlling the scour dynamics. Contrary to rivers, where the flow is unidirectional, in tidal courses erosion and deposition take place during the whole tidal cycle. Even if the tidal currents in the channels of the Venice Lagoon are asymmetric, with stronger currents during the ebb phase, the scour shapes indicate that the erosive action of flood currents is relevant. At some confluences such process is made more evident by the fact that the scour develops also in the direction of the upstream courses (Figure 1).
Figure 1. 3D overview of scour hole at Murano island
with arrow showing ebb flow direction. 4. Conclusions Whereas a vast literature on scour holes in rivers exists, there is still a gap in the knowledge of scour holes in tidal environments. Here, we try to fill this gap by providing a comprehensive analysis of the morphological properties of scour holes in tidal courses. The presence of more than one tributary, bed discordance and flow density difference lead to wide scatter in the scour data collected in the Venice Lagoon channel network. Flow dynamics at the confluence could thus be very complex and lead to the generation of scour holes having geomorphology different from what is usually found in rivers. References Ginsberg, S. S. and Perillo, G. M. (1999). Deep-scour
holes at tidal channel junctions, Bahia Blanca Estuary, Argentina. Mar. Geol., 160(1-2):171 – 182.
Kjerfve, B., Shao, C.-C., and Stapor, F.W. (1979). Formation of deep scour holes at the junction of tidal creeks: An hypothesis. Mar. Geol., 33(1):M9 – M14.
Rice, S. P., Roy, A. G., and Rhoads, B. L. (2008). River Confluences, Tributaries and the Fluvial Network. John Wiley & Sons Ltd., Chichester, UK. 457 pp.

70
Delta Morphodynamics: Coupling River Avulsions, Coastal Sediment Transport, and Sea-Level Rise
A. Brad Murray1, K. Ratliff1 and E. Hutton2
1 Division of Earth & Ocean Sciences, Nicholas School of the Environment, Duke University, Durham, NC, USA.
[email protected], [email protected] 2 Community Surface Dynamics Modeling System, Boulder, CO, USA. [email protected]
1. Introduction Models in which wave-driven alongshore sediment transport distributes river delivered sediment have recently revealed basic insights about how the shapes of wave-influenced deltas evolve (Ashton and Giosan, 2011; Ashton et al., 2013; Nienhuis et al., 2015). These ground-breaking exploratory efforts have featured static river locations and fixed sea level. Here we present a new coupled model featuring dynamic river avulsions, to explore how river dynamics interact with alongshore sediment processes and sea-level rise, over timescales of multiple avulsions and associated delta lobe-building episodes. Results of initial experiments reveal new insights about: 1) how the angular distribution of wave influences (the ‘wave climate’) can affect river avulsions (as well as delta shape); and 2) how sea-level rise may have considerably less influence on avulsions than is typically assumed. 2. Methods Our modelling framework couples the Coastline Evolution Model (CEM; Ashton and Murray, 2006) with the recently developed River Avulsion and Floodplain Module (RAFEM), via the Community Surface Dynamics Modeling System (CSDMS). CEM treats changes in shoreline shape resulting from gradients in wave-driven alongshore sediment flux. Inspired by Jerolmack and Paola (2007), RAFEM treats diffusive evolution of a river longitudinal profile, and determines when and where avulsions can occur based on river bed super-elevation relative to the surrounding floodplain. RAFEM adds another criterion for a successful avulsion: an alternate path to base level that is shorter than the existing channel course. When the super-elevation criterion is satisfied but the shorter-path criterion is not, a crevasse-splay deposit results. Sea-level rise induces a landward translation of the shoreline representing the results of cross-shore sediment fluxes, constrained by and conservation of mass (e.g. Bruun, 1962; Wolinksy and Murray, 2009). 3. Model Experiments and Results In a suite of model runs we hold river characteristics constant, and independently vary three coastal variables: Wave size (expressed as the ratio of wave height and channel depth); wave angular distribution (the proportion, U, of influences on alongshore sediment transport from ‘high angle’ waves that tend to exaggerate rather than blunt coastline protuberances); and relative sea-level-rise rate (RSLRR, normalized by a proxy for the maximum rate that a river mouth can aggrade).
When waves are relatively small, and the river delivers sediment faster than waves can distribute it alongshore (i.e. ‘river dominated’), waves do not inhibit progradation. The river aggradation associated with progradation causes avulsions to happen sooner than they do when waves are relatively more effective at spreading sediment alongshore. Surprisingly, in the river-dominated cases, increasing RSLRR has little to no effect on the rate of avulsions. This behavior contrasts with laboratory experiments, and leads to insights about potentially important geometrical differences between prototype and laboratory deltas (as we will discuss; Wolinsky and Murray, 2009). For model runs featuring progressively higher proportions of influences from high-angle waves, in which waves have diminishing delta-blunting effects, even when wave heights are large river dynamics approach those of river-dominated deltas. In these cases, although cuspate delta shapes reflect significant wave influence, progradation and avulsions are only weakly inhibited. When high-angle wave influences dominate a wave climate, avulsion timescales mimic those of river dominated deltas exactly. References Ashton, A., and Murray, A. (2006). High-angle wave
instability and emergent shoreline shapes: 1. Modeling of sand waves, flying spits, and capes. J.
Geophys. Res. 111., F04011, doi:10.1029/2005JF000422.
Ashton, A., and Giosan, L. (2011). Wave-angle control of delta evolution. Geophys. Res. Letters. 38(13). L13405, doi:10.1029/2011GL047630.
Ashton, A., Hutton, E., Kettner, A., Xing, F., Kallumadikal, J., Nienhuis, J., Giosan, L. (2013). Progress in coupling models of coastline and fluvial dynamics. Computers & Geocsiences. 53. doi:10.1016/j.cageo.2012.04.004.
Bruun, P. (1962). Sea-level rise as a cause of coastal erosion. J. Waterw. Harbors Coastal Eng. Div. Am.
Soc. Civ. Eng., (88) 117-130. Jerolmack, D., Paola, C. (2007). Complexity in a
cellular model of river avulsion. Geomorphology. 91(3). doi:10.1016/j.geomorph.2007.04.022.
Nienhuis, J., Ashton, A., Giosan, L. (2015). What makes a delta wave-dominated? Geology. 43(6). doi:10.1130/G36518.1.
Wolinsky, M., Murray, A. (2009). A unifying framework for shoreline migration: 2. Application to wave-dominated coasts. J. Geophys. Res. 114. F01009. doi:10.1029/2007JF000856.

71
Evidence of River Morphodynamics on Mars: observations in Gale Crater with the Curiosity Rover
William E. Dietrich1
Department of Earth and Planetary Sciences, University of California, Berkeley [email protected]
1. Introduction Satellite photographic imagery of Mars has revealed what are interpreted to be channel networks, gullies, giant outburst channels, meandering rivers, fans, and deltas. Until the Curiosity Rover landed in Gale Crater, none of these features had been observed on the ground. This matters because the presence of these features calls for liquid water runoff, and in many cases a sustained hydrologic cycle. Climate models have not been able to predict such hydrologic cycles beyond early Mars time, and, consequently, the geomorphic evidence is constantly challenged: couldn’t these features be due to wind blown processes or gasses or volcanic eruptions? Here I review observations obtained from the Curiosity Rover that definitively shows evidence of surface water runoff, but also raises questions that we haven’t asked about systems on Earth. 2. Fluvial gravels on Mars Curiosity Rover cameras obtained the first photographs of sorted, rounded gravel on Mars, providing definitive evidence of surface water transport (Williams et al., 2013). Our now 15 km journey has revealed distinct gravel deposits that have been interpreted as part of a prograding fan-delta system towards the center of the crater relatively soon after impact (Grotzinger et al. 2015). The gravels are crudely stratified and no cross-stratification is available to provide a scale for the flow. How can one estimate river discharge just from grain size? Correlations on data from rivers on Earth between grain size and slope, slope and channel depth, slope and channel width, and width and bankfull discharge enable crude estimates of formative discharges (Dietrich et al. 2017). The first correlate- grain size and slope is key and yet is the weakest. More theoretical approaches gave poorer results.
Figure 1. First rounded, sorted fluvial gravels observed
on Mars
3. Fans and Deltas Ancient fans and deltas have been identified in craters across Mars (e.g. Morgan et al., 2014). The Curiosity Rover sampled the distal deposits of an 80 km2 fan which was bordered by lake sediments. This led to the question of how much water was needed to build the fan: not a question we have asked about fans on Earth. We concluded that up to 6 km of water from the 730 km2 catchment was needed to build the fan, demanding a sustained hydrologic cycle and climate conditions difficult to predict on Mars (Morgan et al, 2014 reached similar conclusions). We are now driving towards a sequence of deposits that have been interpreted as fan-deltas (Palucis et al., 2016). Confirmation of the deltaic origin of the deposits would have broad implications about the climate history of Mars. 4. Conclusions The satellite-based interpretations of fluvial activity on Mars, now being confirmed with direct observations by rovers, is perhaps the strongest evidence for wet periods in the climate history of Mars. This now motivates us to ask what relationships are there between climate and morphology of river systems of Earth. Acknowledgments This research was supported by a contract to Malin Space Sciences Systems with NASA through the Jet Propulsion Laboratory, California Institute of Technology. Alan Howard provided much guidance. References Dietrich, W. E. (and 5 co-authors) (2017) Fluvial
Gravels on Mars: Analysis and Implications, in
Tsutsumi, D. and Laronne, J. (edits) Gravel-Bed
Rivers: Processes and Disasters, John Wiley &Sons. Grotzinger, J. P. (+47 co-authors) (2015) Deposition,
exhumation, and paleoclimate of an ancient lake deposit, Gale crater, Mars, Science, Volume 350 (6257), aac7575 [DOI:10.1126/science.aac7575].
Morgan, A.M., (+9 co-authors), (2014) Sedimentology and climatic environment of alluvial fans in the Martian Saheki Crater and a comparison with terrestrial fans in the Atacama Desert, Icarus, doi: http://dx.doi.org/10.1016/j.icarus.2013.11.007.
Palucis, M. C. (and 8 co-authors) (2016) Sequence and relative timing of large lakes in Gale crater (Mars) after the formation of Mount Sharp, J. Geophys. Res. Planets, 121, 472–496, doi:10.1002/ 2015JE004905.
Williams, R.M.E. (+36 others) (2013) Martian fluvial conglomerates at Gale crater, Science, V. 340 (1068).
72
Rivers under temperate valley glaciers: does sediment transport matter?
Stuart N. Lane1, Pascal Egli1, Sébastien Ruttiman1, Pascal Perolo1, James Irving1, Ken Mankoff 2, Colin Rennie3
1 Faculty of Geosciences and Environment, University of Lausanne, Switzerland, [email protected]
2 Department of Geosciences, Pennsylvania State University, USA 3 Department of Civil Engineering, University of Ottawa, Canada
1. Introduction Since ground-breaking work in the late 1960s and 1970s, both numerical models and field experiments have sought to quantify subglacial drainage under temperate valley glaciers. Following work by Röthlisberger, Shreve and Weertman, field experiments using dye breakthrough curves (e.g., Nienow et al.) suggested that subglacial drainage evolves through time with distance up-glacier as meltwater forces evolution from a distributed to a channelized drainage network. Yet, glaciers are extremely effective sediment-producing agents. Geological deposits reveal that they leave behind thick sequences of till and that these can appear to be water-worked. If the beds of glaciers comprise sediment, then fluvial processes and associated morphodynamics could also pay a critical role in the evolution of subglacial drainage. Here, we test this possibility. 2. Methodology The focus of the work is the Haut Glacier d’Arolla, Switzerland. Collaboration with a hydropower company gave access to a high quality 2 minute discharge record. A Japanese hydrophone and turbidity probe, installed in the stream at the glacier snout, were calibrated using direct sampling. The morphology of subglacial channels was estimated using ground penetrating radar (GPR). Terrestrial laser scanning was used to measure glacier surface melt and hydraulic jacking (short term glacier surface uplift). A hydraulic model for sediment transport capacity (Lane et al., 2017, Geomorphology) was modified to deal with a dendritic network of subglacial conduits, driven by meltwater production. 3. Results 2.1 The morphology of subglacial streams
GPR data from close to the glacier margin suggest that subglacial channels are deeply incised into bed sediment, to greater degrees than they are eroded into the ice. They also reveal short, meter-scale distance, variability in bed slope (including reverse slopes) and subglacial channel cross-sectional area. 2.2 Bedload and suspended load export from the
glacier Data suggest that sediment export from underneath the glacier is threshold controlled. In the late melt season, efficient subglacial drainage overnight causes shear stress to fall below the critical threshold required for sediment entrainment and transport. During the morning rising limb of the hydrograph, suspended bed material transport was found to begin before bedload transport, and it also showed clockwise hysteresis, suggesting early morning flushing of finer bed material.
2.3 Hydraulic jacking at the wrong time of year
Terrestrial laser scanning in the near glacier margin zone showed late morning uplift of the glacier surface of up to 0.15 m late in the meltwater season. It implies a distributed layer of pressurised water at the glacier bed, and hydraulic jacking. Whilst this has previously been measured in the spring when flow at the glacier bed is likely to be distributed, a mechanism is required to explain its occurrence late in the meltwater season. One possibility is that falling sediment transport capacity overnight blocks channels with water forced laterally under pressure as discharge rises the following day. 2.4 Hydraulic modelling
At any one time, hydraulic efficiency considerations suggest that network bifurcation with distance up-glacier causes a more rapid decrease in subglacial sediment transport than in discharge. The hydraulic model showed that early melt season snowmelt leads to upstream propagation of a wave of rising sediment transport capacity. This could explain the observed: (1) incision of subglacial channels into bed sediment that propagates upstream through time; and (2) the associated development of a more efficient subglacial drainage network as snowline recession occurs. Later in the melt season, progressive decrease in the baseflow component of discharge occurs due to greater subglacial hydrological efficiency. Minimum flows become lower than those required for sediment entrainment and transport. Such conditions may lead to overnight sediment deposition on subglacial channel bed and the reductions in channel capacity necessary to create channel blockage and hydraulic jacking during the rising limb of the next day’s hydrograph. 4. Conclusions This research provides circumstantial evidence for a very different model for transience in the development of subglacial drainage networks, which treats subglacial channels as rivers. River morphodynamics under glaciers have tended to be treated over simplistically. Here we present field data and hydraulic modelling that show that there could be progressive development of a drainage network by sediment erosion earlier in the melt season, of the sort inferred from dye breakout curves. We also show that the impacts of daily variability in discharge could lead to the channel blocking needed to explain measured hydraulic jacking. Acknowledgments Support from Ludovic Baron, the Canton de Vaud, Hydroexploitation SA, Alpiq SA, and Grande Dixence SA is acknowledged.

73
Do we need thermal-dynamic transport models?
JP Syvitski1, Sagy Cohen
2 and James L Best
3
1 CSDMS, University of Colorado, Boulder CO, USA. [email protected]
2 Department of Geography, University of Alabama, Tuscaloosa AL, USA. [email protected]
3 Departments of Geology, Geography and GIS, Mechanical Science and Engineering and Ven Te Chow Hydrosystems
Laboratory, University of Illinois at Urbana-Champaign, Champaign, IL, USA. [email protected]
1. River temperature and sediment transport The temperature of river water influences its sediment
transport through controls on water viscosity and thus
grain settling velocity (Gibbs et al 1971), boundary layer
dynamics through Manning’s coefficient, the laminar
sublayer thickness (Colby and Scott 1965) and the von
Kármán parameter (Akalin 2002), and water density
(Syvitski et al., 2017):
1) Particles with a diameter >1000µm are least impacted
by water temperature, as wake dynamics dominate
particle settling. For smaller particles (<1000µm), cold
temperatures slow grain settling, an effect non-linearly
increasing for smaller sand sizes. Silt and clay particles
receive the largest viscosity-temperature impact, but at
these grain sizes the magnitude is nearly constant (Gibbs
et al 1971).
2) A 10°C temperature change at 5°-15°C has twice the
impact (~50% increase in fine sand settling rates) than at
the warmer 20°-30°C range.
3) A water temperature increase of 1°C causes a 3.1%
decrease in suspended fine-sand transport, with coarse-
sand and very-fine-sand transport being less sensitive to
temperature fluctuations (1.5% and 2.8%, respectively)
(Akalin 2002). Downstream variations in temperature
can therefore influence the character of bed material.
4) Water temperature can affect the vertical distribution
of suspended material (Colby and Scott 1965).
5) Water temperature and sediment concentration are
dominant controls on fluid density, and control river
mouth dynamics (hyperpycnal vs. surface plume entry)
(Syvitski et al., 2017).
6) The effect on viscosity of a fluid temperature
decrease from 15° to 1°C is equivalent of adding 20,000
mg/L of clay to water (Colby and Scott, 1965).
7) Manning’s parameter can increase 60% from n=0.02
at 1°C to n=0.035 at 27°C (Colby and Scott 1965).
2. River water temperature patterns From observations and from models of global freshwater
temperature (van Beek et al., 2012, Wollheim et al.,
2008, Cohen et al., 2014), seasonal fluctuations may
locally range by 10° to 30°C: 10°C on the Mekong River
(GRDC station 2969095), 14°C on the Lena (GRDC
2903420), 22°C on the Yangtze (GRDC 2181600), 23°C
on the Delaware (Trenton), and 26°C on the Missouri
(GRDC 4122900). Along the length of a river, many
different fluid temperature patterns exist. A river warms
(by ~30°C for the Amazon; by <10°C for the Yukon) as
the flow travels down elevation draining highlands and
mountains. Across floodplains, river water may cool if
the flow is into colder latitudes (e.g. Lena), or
substantively warm if the flow is directed towards
warmer latitudes (e.g. Mississippi). Our study
investigates how temporal or spatial fluctuations in river
temperature influence global patterns of sediment
transport and morphodynamics, and contribute to the
common hysteresis pattern within sediment rating
curves.
3. Conclusions We strongly suggest the need for the development of a
new suite of thermal-dynamic sediment transport
models, as supported by field studies, to investigate
global freshwater temperature patterns. For example,
the BQART transport model of Syvitski et al. (2017)
takes into account basin-averaged air temperature, but
perhaps it should be recast to account for water
temperature and its spatial and temporal variations.
References
Akalin, S, 2002, Water temperature effect on sand
transport by size fraction in the Lower Mississippi
River. Ph.D. Dissertation Colorado State U, Fort
Collins, Colorado, USA
Cohen, S, Kettner AJ,
Syvitski, JPM, 2014, Spatio-
temporal dynamics in riverine sediment and water
discharge between 1960-2010 based on the WBMsed
v.2.0 Distributed Global Model. Global & Planetary
Change 115: 44-58.
Colby, BR, Scott, CH, 1965, Effects of water
temperature on the discharge of bed material.
Geological Survey Prof Paper 462-G (30 pp).
Gibbs, RJ, Matthews, MD, Link, DA, 1971. The
relationship between sphere size and settling velocity.
J. Sediment. Petrol., 44: 7–18.
Syvitski JP, AJ Kettner, I Overeem, GR Brakenridge, S
Cohen, 2017, Latitudinal controls on siliciclastic
sediment production and transport, SEPM Special
Issue Latitudinal Controls on Stratigraphic Models
and Sedimentary Concepts
van Beek, LPH, T Eikelboom, MTH. van Vliet, and
MFP Bierkens 2012, A physically based model of
global freshwater surface temperature, Water Resour.
Res., 48, W09530, doi:10.1029/2012WR011819
Wollheim, WM, CJ Vörösmarty, BJ Peterson, PA
Green, S Seitzinger, J Harrison, AF Bouwman, and
JPM Syvitski, 2008, Global N removal by freshwater
aquatic systems: a spatially distributed within basin
approach, Global Biogeochem. Cycles, 22, GB2026,
doi:10.1029/2007GB002963.
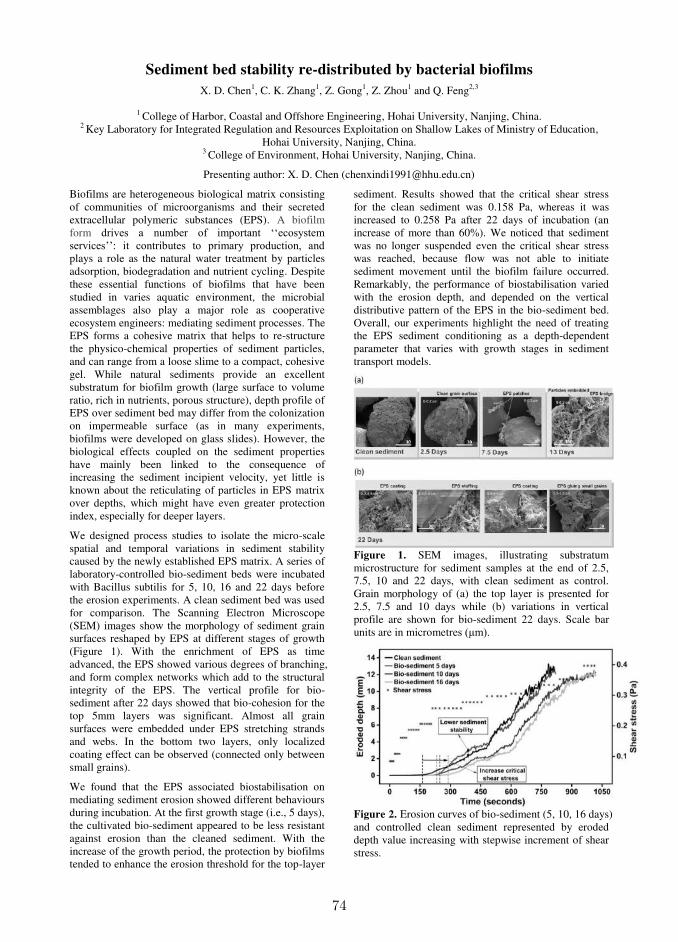
74
Sediment bed stability re-distributed by bacterial biofilms
X. D. Chen1, C. K. Zhang1, Z. Gong1, Z. Zhou1 and Q. Feng2,3
1 College of Harbor, Coastal and Offshore Engineering, Hohai University, Nanjing, China. 2 Key Laboratory for Integrated Regulation and Resources Exploitation on Shallow Lakes of Ministry of Education,
Hohai University, Nanjing, China. 3 College of Environment, Hohai University, Nanjing, China.
Presenting author: X. D. Chen ([email protected])
Biofilms are heterogeneous biological matrix consisting of communities of microorganisms and their secreted extracellular polymeric substances (EPS). A biofilm form drives a number of important ‘‘ecosystem services’’: it contributes to primary production, and plays a role as the natural water treatment by particles adsorption, biodegradation and nutrient cycling. Despite these essential functions of biofilms that have been studied in varies aquatic environment, the microbial assemblages also play a major role as cooperative ecosystem engineers: mediating sediment processes. The EPS forms a cohesive matrix that helps to re-structure the physico-chemical properties of sediment particles, and can range from a loose slime to a compact, cohesive gel. While natural sediments provide an excellent substratum for biofilm growth (large surface to volume ratio, rich in nutrients, porous structure), depth profile of EPS over sediment bed may differ from the colonization on impermeable surface (as in many experiments, biofilms were developed on glass slides). However, the biological effects coupled on the sediment properties have mainly been linked to the consequence of increasing the sediment incipient velocity, yet little is known about the reticulating of particles in EPS matrix over depths, which might have even greater protection index, especially for deeper layers.
We designed process studies to isolate the micro-scale spatial and temporal variations in sediment stability caused by the newly established EPS matrix. A series of laboratory-controlled bio-sediment beds were incubated with Bacillus subtilis for 5, 10, 16 and 22 days before the erosion experiments. A clean sediment bed was used for comparison. The Scanning Electron Microscope (SEM) images show the morphology of sediment grain surfaces reshaped by EPS at different stages of growth (Figure 1). With the enrichment of EPS as time advanced, the EPS showed various degrees of branching, and form complex networks which add to the structural integrity of the EPS. The vertical profile for bio-sediment after 22 days showed that bio-cohesion for the top 5mm layers was significant. Almost all grain surfaces were embedded under EPS stretching strands and webs. In the bottom two layers, only localized coating effect can be observed (connected only between small grains).
We found that the EPS associated biostabilisation on mediating sediment erosion showed different behaviours during incubation. At the first growth stage (i.e., 5 days), the cultivated bio-sediment appeared to be less resistant against erosion than the cleaned sediment. With the increase of the growth period, the protection by biofilms tended to enhance the erosion threshold for the top-layer
sediment. Results showed that the critical shear stress for the clean sediment was 0.158 Pa, whereas it was increased to 0.258 Pa after 22 days of incubation (an increase of more than 60%). We noticed that sediment was no longer suspended even the critical shear stress was reached, because flow was not able to initiate sediment movement until the biofilm failure occurred. Remarkably, the performance of biostabilisation varied with the erosion depth, and depended on the vertical distributive pattern of the EPS in the bio-sediment bed. Overall, our experiments highlight the need of treating the EPS sediment conditioning as a depth-dependent parameter that varies with growth stages in sediment transport models.
Figure 1. SEM images, illustrating substratum microstructure for sediment samples at the end of 2.5, 7.5, 10 and 22 days, with clean sediment as control. Grain morphology of (a) the top layer is presented for 2.5, 7.5 and 10 days while (b) variations in vertical profile are shown for bio-sediment 22 days. Scale bar units are in micrometres (μm).
Figure 2. Erosion curves of bio-sediment (5, 10, 16 days) and controlled clean sediment represented by eroded depth value increasing with stepwise increment of shear stress.
75
Eco-Morphodynamics for Environmental Water Allocation in
Non-Perennial Rivers: Challenges and Opportunities
M.C. Grenfell1
1 Institute for Water Studies, University of the Western Cape, Bellville, South Africa. [email protected]
1. Introduction Environmental water allocation (EWA) addresses the magnitude and temporal dynamics of flows required to sustain a characteristic or desired ecology and/or set of ecosystem services. The role of geomorphology in this process is to define the natural reference conditions of a physical river habitat template (Rowntree, 2013), and to broaden the ecological gaze beyond flows to consider interactions between valley structure and the feed and fate of flow-sediment mixtures. While fluvial eco-hydraulics has a rich environmental application history, and progress is being made in bio-morphodynamics (interactions between biota and morphodynamics), developments in eco-morphodynamics (environmental applications of morphodynamics) are less coherently represented in the literature. This paper aims to evaluate how eco-morphodynamics can inform the EWA process, and to elucidate key challenges and opportunities for eco-morphodynamics research focused on non-perennial river systems. 2. Morphodynamics and River Habitat Geomorphological analyses are applied in river management to provide a frame of reference for the state of the physical fluvial habitat template. Recognising that this reference state is neither singular, nor static in its characteristics, processes and behaviour, it is common to evaluate the historical range of variability (HRV) of a river or reach of interest. Common approaches to documenting the HRV involve time-series historical image analysis, or field analyses of similar systems in ‘better’ condition, in some cases supplemented by chronologies of geomorphic change, to apply space-for-time substitution. These approaches suffer from the underdetermination typical of empirical work (Kleinhans, 2010), but could be supplemented by morphodynamic modelling of the potential range of variability (PRV) in habitat characteristics, given specified historical, prevailing, or likely future flow/sediment feeds. An example of such an approach is presented. 3. Morphodynamics of Non-Perennial Rivers Although non-perennial rivers comprise more than half the global river network, their ecological and economic values are poorly understood and consequently under-appreciated (Datry et al., 2017). There is a good knowledge base on the geomorphology of non-perennial rivers, but this is derived predominantly from empirical analyses, and would benefit from greater integration of computational model-based enquiry (Jaeger et al., 2017). For example, while it is understood that the primary distinctive hydrological feature of non-perennial rivers – high flow variability – can interact with other features of the physical setting to generate a diverse array of
flow/sediment feeds and fluvial styles at multiple scales of space and time (Jaeger et al., 2017), necessary
conditions for the development of particular physical habitat assemblages have eluded researchers. From an EWA perspective, this makes it impossible to distinguish between the flow/sediment feed required within a given valley structural setting to sustain particular habitat conditions, from that required to restore former, or to improve or establish desired future conditions. 4. Challenges for Eco-Morphodynamics Given the above, there are clear opportunities for eco-morphodynamics research, if certain challenges are addressed. Those discussed include:
Selecting or developing a modelling framework that is sympathetic to environments with highly variable flow/sediment feeds (at times approaching hyper-concentration), complex and poorly-sorted particle mixtures, patchy and dynamic roughness and bed sediment thickness characteristics, and large differences in the inlet and outlet fluxes of water due to transmission losses;
Accessing field flow and sediment transport data for model calibration and confirmation in rivers that may experience no flow for several concurrent years, and;
Defining, in consultation with ecologists, and extracting from model output, geomorphological metrics of physical habitat quality and diversity, such that changes in geomorphology may be translated into the ecological terms that typically form the basis of river management practice. Examples of such metrics are provided.
Acknowledgments I would like to thank the Institute for Water Studies at the University of the Western Cape for funding my attendance at RCEM 2017. References Datry, T., Bonada, N., Boulton, A. (Eds.) (2017).
Intermittent Rivers and Ephemeral Streams: Ecology
and Management. Elsevier, 496pp. Jaeger, K.L., Sutfin, N.A., Tooth, S., Michaelides, K.,
Singer, M. (2017). Geomorphology and sediment regimes of intermittent rivers and ephemeral streams. In: Datry, T. Bonada, N., Boulton, A. (Eds.), Intermittent Rivers and Ephemeral Streams: Ecology
and Management. Elsevier, Ch. 2.1. Kleinhans, M.G. (2010). Sorting out river channel
patterns. Prog. Phys. Geog. 34: 287-326. doi: 10.1177/0309133310365300.
Rowntree, K. (2013). Geomorphology Driver Assessment Index. WRC, Pretoria, Report TT 551/13.
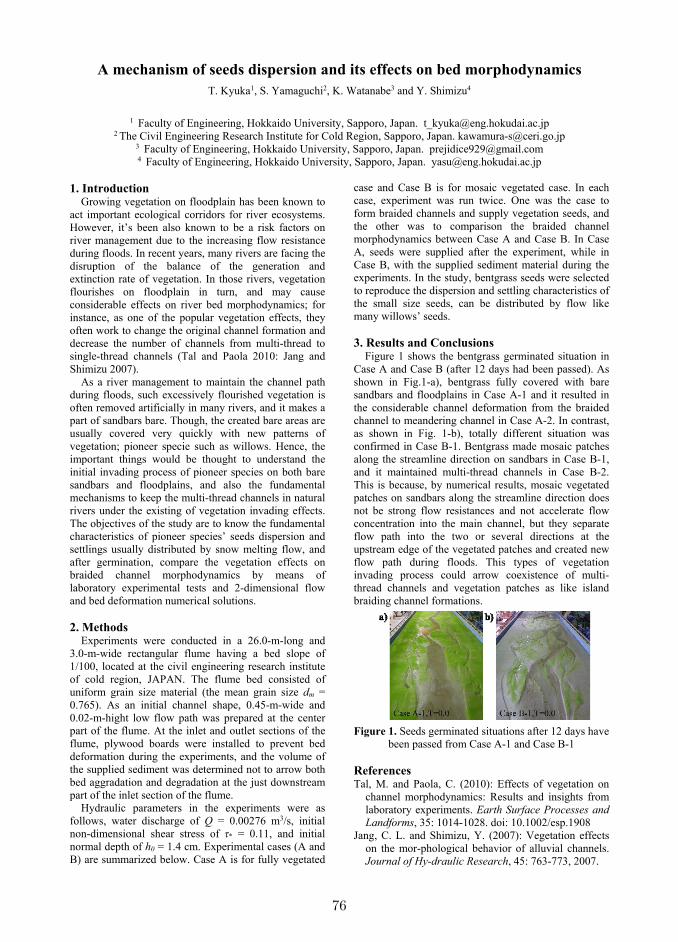
76
A mechanism of seeds dispersion and its effects on bed morphodynamics T. Kyuka1, S. Yamaguchi2, K. Watanabe3 and Y. Shimizu4
1 Faculty of Engineering, Hokkaido University, Sapporo, Japan. [email protected]
2 The Civil Engineering Research Institute for Cold Region, Sapporo, Japan. [email protected] 3 Faculty of Engineering, Hokkaido University, Sapporo, Japan. [email protected] 4 Faculty of Engineering, Hokkaido University, Sapporo, Japan. [email protected]
1. Introduction
Growing vegetation on floodplain has been known to act important ecological corridors for river ecosystems. However, it’s been also known to be a risk factors on river management due to the increasing flow resistance during floods. In recent years, many rivers are facing the disruption of the balance of the generation and extinction rate of vegetation. In those rivers, vegetation flourishes on floodplain in turn, and may cause considerable effects on river bed morphodynamics; for instance, as one of the popular vegetation effects, they often work to change the original channel formation and decrease the number of channels from multi-thread to single-thread channels (Tal and Paola 2010: Jang and Shimizu 2007).
As a river management to maintain the channel path during floods, such excessively flourished vegetation is often removed artificially in many rivers, and it makes a part of sandbars bare. Though, the created bare areas are usually covered very quickly with new patterns of vegetation; pioneer specie such as willows. Hence, the important things would be thought to understand the initial invading process of pioneer species on both bare sandbars and floodplains, and also the fundamental mechanisms to keep the multi-thread channels in natural rivers under the existing of vegetation invading effects. The objectives of the study are to know the fundamental characteristics of pioneer species’ seeds dispersion and settlings usually distributed by snow melting flow, and after germination, compare the vegetation effects on braided channel morphodynamics by means of laboratory experimental tests and 2-dimensional flow and bed deformation numerical solutions. 2. Methods
Experiments were conducted in a 26.0-m-long and 3.0-m-wide rectangular flume having a bed slope of 1/100, located at the civil engineering research institute of cold region, JAPAN. The flume bed consisted of uniform grain size material (the mean grain size dm = 0.765). As an initial channel shape, 0.45-m-wide and 0.02-m-hight low flow path was prepared at the center part of the flume. At the inlet and outlet sections of the flume, plywood boards were installed to prevent bed deformation during the experiments, and the volume of the supplied sediment was determined not to arrow both bed aggradation and degradation at the just downstream part of the inlet section of the flume.
Hydraulic parameters in the experiments were as follows, water discharge of Q = 0.00276 m3/s, initial non-dimensional shear stress of τ* = 0.11, and initial normal depth of h0 = 1.4 cm. Experimental cases (A and B) are summarized below. Case A is for fully vegetated
case and Case B is for mosaic vegetated case. In each case, experiment was run twice. One was the case to form braided channels and supply vegetation seeds, and the other was to comparison the braided channel morphodynamics between Case A and Case B. In Case A, seeds were supplied after the experiment, while in Case B, with the supplied sediment material during the experiments. In the study, bentgrass seeds were selected to reproduce the dispersion and settling characteristics of the small size seeds, can be distributed by flow like many willows’ seeds. 3. Results and Conclusions
Figure 1 shows the bentgrass germinated situation in Case A and Case B (after 12 days had been passed). As shown in Fig.1-a), bentgrass fully covered with bare sandbars and floodplains in Case A-1 and it resulted in the considerable channel deformation from the braided channel to meandering channel in Case A-2. In contrast, as shown in Fig. 1-b), totally different situation was confirmed in Case B-1. Bentgrass made mosaic patches along the streamline direction on sandbars in Case B-1, and it maintained multi-thread channels in Case B-2. This is because, by numerical results, mosaic vegetated patches on sandbars along the streamline direction does not be strong flow resistances and not accelerate flow concentration into the main channel, but they separate flow path into the two or several directions at the upstream edge of the vegetated patches and created new flow path during floods. This types of vegetation invading process could arrow coexistence of multi-thread channels and vegetation patches as like island braiding channel formations.
Figure 1. Seeds germinated situations after 12 days have
been passed from Case A-1 and Case B-1
References Tal, M. and Paola, C. (2010): Effects of vegetation on
channel morphodynamics: Results and insights from laboratory experiments. Earth Surface Processes and
Landforms, 35: 1014-1028. doi: 10.1002/esp.1908 Jang, C. L. and Shimizu, Y. (2007): Vegetation effects
on the mor-phological behavior of alluvial channels. Journal of Hy-draulic Research, 45: 763-773, 2007.

77
A Simple Dynamic Model for Describing the Effects of Plant Root Systems onRiver Morphodynamics
F. Caponi1, A. Siviglia1 and R. Boes1
1 Laboratory of Hydraulics, Hydrology and Glaciology (VAW), ETH Zürich. [email protected]
1. IntroductionPlant root system has a key role in controlling erosion
processes via increased soil cohesion, while river mor-
phodynamics affects in turn plant survival by uprooting.
Bertoldi et al. (2014) developed a mathematical model ac-
counting for (i) effects of vegetation on threshold for sedi-
ment motion and (ii) plant removal by flow erosion, which
are oversimplified.
Our aim is thus to better describe such processes through
the development of a simple model which couples plant
roots dynamics with sediment transport and introduces a
dynamic description of plant removal by uprooting.
We tested the model through simple 2D numerical experi-
ments to investigate the effects of different plant root sys-
tems on sediment transport processes and to analyse how
different erosion rates affect the uprooting mechanism.
2. Vegetation modelingVegetation dynamics and its effects on river morphol-
ogy are described using the above-ground biomass den-
sity, B(t), which represents the plant’s canopy (sum of
stems and leaves) and the below-ground biomass, Br(t),which indicates the plant roots system. The latter is fur-
ther defined by a rooting depth, D(t), namely the soil
depth reached by roots at certain time, and a dimension-
less function B∗
r (zs), which describes the root distribution
over the soil depth zs ∈ [0,D(t)], according to the model
developed by Tron et al. (2014).
The above-ground biomass B(t) follows a Verhulst-
logistic model, while the rooting depth grows with an ex-
ponential rate up to a maximum value Dmax. The below-
ground biomass is derived as function of B, that reads as
Br(t) = aBb, with parameters, a and b, representing the
plant’s specific allometry.
Vegetation feedbacks on river morphodynamics are mod-
eled both increasing flow resistance due to vegetation
canopy (Ks ∝ B(t)), where Ks denotes the Strickler co-
efficient, and soil cohesion (θcr(zs) ∝ Br(zs, t)), with θcr
representing the critical value of the Shields number, with
respect to the bare soil configuration. Mortality occurs by
uprooting when bed level changes (i.e. scours) exceed the
rooting depth D(t), or the residual below-ground biomass
(buried part of the roots) decreases until it reaches a
threshold value.
3. Numerical experimentsHydro-morphodynamic processes are simulated us-
ing BASEMENT (www.basement.ethz.ch), a numerical
model which solves the depth-average shallow-water
equations for fluid flow and adopts the Exner equation for
sediment continuity on 2D unstructured grid.
We performed 2D numerical simulations in a straight rect-
angular channel with a initial bed slope S0 = 0.005 and
length L = 1000 m. Upstream (x/L = 0) erosion process
is reproduced reducing sediment supply rate (qb,in/qb,0 =
Figure 1. Bed level changes along longitudinal profile.
Results with vegetation (V1,V2) are compared with
reference cases (Ref) for different erosion rates.
0.55,0.35) with respect to bed load transport capacity
qb,0. First, simulations without vegetation are performed
as reference case until bed slope equilibrium is reached
(t = T ). Then, plant roots are allowed to grow until they
reached Dmax = 0.5 m over the entire domain. In partic-
ular, two root distributions (V1, V2) with different mean
rooting depth are used. Shallow roots (V1) exhibit max-
imum increased soil cohesion near the surface (zs = 0),
while deep roots (V2) at mid-soil depth (zs = Dmax/2).
4. Results and conclusionsBed level changes are largely affected by the presence
of vegetation and show different responses depending on
roots configuration (Fig. 1). Plant root systems reduce
erosion and stabilize the river bed with larger effects for
smaller erosion rate (Fig. 1a). On the other hand, higher
erosion rate (Fig. 1b) enhances uprooting with a sensi-
ble reduction of vegetated soil. Besides its simplicity,
the model can reproduce the effects of plant root systems
on morphodynamics according to experimental evidences
and, even though applied on simple configuration, exhibit
a range of not intuitive results. For instance, we found
that deep roots (V2) are more vulnerable than shallow one
(V1) to uprooting mechanism.
Further research questions can be answered by the model
considering more complex river morphologies (e.g. alter-
nate bars and wandering).
ReferencesBertoldi, W., Siviglia, A., Tettamanti, S., Toffolon, M.,
Vetsch, D., and Francalanci, S. (2014). Modeling veg-
etation controls on fluvial morphological trajectories.
Geophysical Research Letters, 41(20):7167–7175.
Tron, S., Laio, F., and Ridolfi, L. (2014). Effect of wa-
ter table fluctuations on phreatophytic root distribution.
Journal of Theoretical Biology, 360:102 – 108.

78
Experimental investigations on riparian vegetation uprooting
G. Calvani1, S. Francalanci
1, L. Solari
1 and B. Gumiero
2
1 Department of Civil and Environmental Engineering, University of Florence, Florence, Italy. [email protected]
2 Department of Biological, Geological and Environmental Sciences, Bologna University, Bologna, Italy.
1. Introduction River evolution depends on three key processes: the
hydrological regime, the motion of sediment and the
establishment, growth and decay of vegetation. Flooding
events can cause young vegetation mortality by
uprooting (Solari et al., 2015). Despite their implications
on river morphodynamics, only recently research started
focusing on the mechanisms of root failure and on the
vegetation resistance to uprooting. In this work, we
focused on vegetation uprooting due to both flow and
bed erosion. In particular, we considered the root pull-
out mechanism, which can be commonly observed for
the uprooting of juvenile seedlings (Ennos, 1990).
2. Materials and method We developed a simple theoretical model for predicting
plant uprooting due to root pull-out. The model is based
on force balance between total resisting force exerted by
soil on the roots and destabilizing forces exerted by flow
drag on the above ground plant including buoyancy. We
hypothesised that forces are transmitted between above-
and below- ground by a frictionless pulley constraint
acting at the edge of the soil (see Figure 1).
Thus, the force balance reads:
τsLR−Δ
cr( ) = τ b HP+Δ
cr( )+B HP+ L
R( ) (1)
where is the averaged shear strength of the soil, τb is
the bed shear stress, B is the buoyancy effect for unit
length of the plant, LR is the length of root, HP is the
height of the plant and Δcr is the critical value of erosion
for which type II uprooting occurs.
Figure 1. Draft of frictionless pulley constraint acting
between above- and below- ground forces.
We considered two different types of vegetation: Avena
Sativa and Salix Purpurea. Moreover, we
experimentally investigated the uprooting considering
two conditions, namely, instantaneous (or type I) and
delayed uprooting (or type II according to Edmaier et
al., 2011). We investigated, by increasing the flow
discharge, type I uprooting with Avena Sativa due to the
action of hydrodynamic forces only. Conversely, we
considered constant discharge scenarios both for Avena
Sativa and Salix Purpurea to investigate the effects of a
general bed degradation.
The experiments were performed at the Hydraulic
Laboratory in Florence in a 5 m long flume. Here we
built a 2 m long mobile bed where seedlings were
arranged according to several configurations. Bed
erosion was obtained by lowering the downstream
boundary condition at a rate of 2 mm/min, in a similar
way as proposed by Edmaier et al. (2015). We
measured flow velocity, discharge and water depth
and vegetation geometry (both root and stem).
The theoretical model is here applied to predict the
critical value of bed erosion Δcr for type II uprooting in
the case of Salix Purpurea. Results in Figure 2 show the
agreement between predicted and measured erosion in
the experiment with flow discharge Q=8.5 L/s.
Figure 2. Comparison between predicted versus
measured erosion Δcr in the experiment with Salix
Purpurea and flow discharge Q=8.5 L/s. Line of perfect
agreement (solid) ±30% (dashed) are also shown.
3. Conclusions In this work, we tested a simple theoretical model in
predicting the critical condition for which uprooting of
juvenile seedlings occurs. The comparison showed good
agreement between predicted and measured conditions
at the time of uprooting.
References Edmaier, K., P Burlando, and P. Perona. 2011.
‘Mechanisms of Vegetation Uprooting by Flow in
Alluvial Non-Cohesive Sediment’. Hydrology and
Earth System Sciences 15(5): 1615–1627.
Edmaier, K., B. Crouzy, and P. Perona. 2015.
‘Experimental Characterization of Vegetation
Uprooting by Flow’. J. Geophys. Res. Biogeosc., 120.
Ennos AR. 1990. The anchorage of leek seedlings: the
effect of root length and soil strength. Annals of
Botany 65: 409–416.
Solari, L., Van Oorschot, M., Belletti, B., Hendriks, D.,
Rinaldi, M., and Vargas-Luna, A. (2016) Advances
on Modelling Riparian Vegetation—
Hydromorphology Interactions. River Res. Applic.,
32: 164–178. doi: 10.1002/rra.2910.
LR -
Δ c
r
HP + Δcr
τs
τs
τb
U

79
Morphological effects of plant colonization of near-bank bars A. Vargas-Luna 1,2, G. Duró2, A. Crosato2, 3 and W.S.J. Uijttewaal2
1 Pontificia Universidad Javeriana, Bogotá D.C., Colombia. [email protected]
2 Faculty of Civil Engineering and Geosciences, Delft University of Technology, Delft, the Netherlands. [email protected], [email protected]
3 Department of Water Engineering, UNESCO-IHE, Delft, the Netherlands. [email protected]
1. Introduction New floodplain formation starts with the development of near-bank sediment deposits such as alternate bars and point bars (e.g. Hickin, 1984). An important step of this process is the colonization of the areas emerging during low flow by plants. Vegetation protects local soil from erosion during subsequent high flows and enhances local sedimentation, increasing the vertical growth of colonized areas. The morphological effects of bar colonization by plants has been studied using numerical models (e.g. Crosato and Samir Saleh, 2011), but laboratory experiments have so far focused on the effects of floodplain vegetation (e.g. Tal and Paola, 2010). This work describes the effects of alternate bar colonization by plants on channel morphology in a large-scale laboratory setting with variable discharge and sediment recirculation. Three situations are analysed and compared: without vegetation (a), with vegetated floodplains only (b) and with vegetation colonizing also the areas emerging during low flows (c). 2. Experimental setup The experiments were carried out in the Laboratory of Fluid Mechanics of Delft University of Technology in a 5m wide and 45 m long flume. The experiments followed the evolution of an initial straight rectangular channel, 0.80 m wide and 0.15 m deep, with floodplains of 1 m at both sides excavated in graded sand with median diameter of 1 mm. A transverse plate near the upstream boundary created a permanent forcing to assure the formation of alternate bars at fixed locations. Plastic plants of grassy type represented vegetation. The selection of both sediment and vegetation was based on the results of preliminary experiments (Byishimo et al., 2014; Vargas-Luna et al., 2016). The discharge regime included alternating low (22 l/s) and high (45 l/s) flows, with a difference of 5 cm in water level at the downstream boundary. Water levels, bed levels, superficial flow velocities and sediment transport rates were regularly measured during the experiments. The channel evolution was recorded with a camera placed above the central area of the flume. Starting from the excavated channel, a sequence of low and high discharge was imposed during 31 hours until alternate bars formed. This first part of the experiment defined the starting point of all scenarios and was repeated three times. Thanks to the transverse plate, the scenarios had an almost identical starting morphology. 3. Results Figure 1 shows the plan view of the channels after 86 hours for the three considered scenarios. In the tests with vegetated floodplains, scenarios b and c, an extra bar is
present in the channels (shorter bar wavelength), which are both narrower than in the un-vegetated case. a)
b)
c)
Figure 1. Plan view of the channels after 86 hours for
the three scenarios a, b and c. The measured bed levels at the end of each scenario showed that bank erosion is substantially reduced in scenario b due to the vegetated floodplains. Higher sediment bars and deeper channels are obtained in scenario c as well as increased bank erosion. This was due to opposite bank push resulting in flow concentration near the eroding bank and channel incision due to sediment loss within the plants occurring during high flows. 3. Conclusions The combined effects of bar colonization by plants and floodplain vegetation resulted in channel narrowing, increased sinuosity and longitudinal bed slope, leading to noticeable changes in the bar pattern. Secondary channels formed due to flow outflanking of vegetated bars. Sediment deposition on vegetated bars and flow concentration near the opposite side resulted in general channel incision. References Byishimo, P. (2014). Effects of variable discharge on
width formation and cross-sectional shape of sinuous rivers. MSc. Thesis, UNESCO-IHE, The Netherlands.
Crosato A. and Samir Saleh M., 2011. Numerical study on the effects of floodplain vegetation on river planform style. Earth Surf. Proc. and Landforms, 36(6), 711-720. doi: 10.1002/esp.2088
Hickin, E.J. (1984). Vegetation and river channel dynamics. Canadian Geographer, 28, 111-126. doi: 10.1111/j.1541-0064.1984.tb00779.x
Tal M. and Paola C. (2010). Effects of vegetation on channel morphodynamics: results and insights from laboratory experiments. Earth Surf. Proc. And
Landforms, doi: 10.1002/esp.1908. Vargas-Luna, A. et al. (2016). Representing plants as
rigid cylinders in experiments and models. Adv.
Water Resour. 93, Part B, 205-222. doi: 10.1016/j.advwatres.2015.10.004
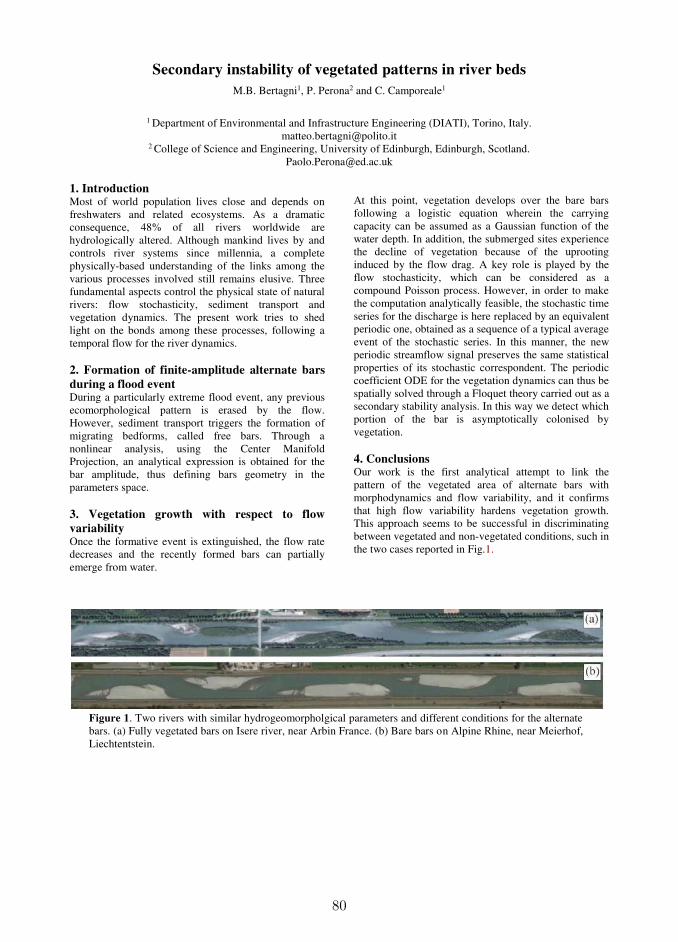
80
Secondary instability of vegetated patterns in river beds
M.B. Bertagni1, P. Perona2 and C. Camporeale1
1 Department of Environmental and Infrastructure Engineering (DIATI), Torino, Italy.
[email protected] 2 College of Science and Engineering, University of Edinburgh, Edinburgh, Scotland.
1. Introduction Most of world population lives close and depends on freshwaters and related ecosystems. As a dramatic consequence, 48% of all rivers worldwide are hydrologically altered. Although mankind lives by and controls river systems since millennia, a complete physically-based understanding of the links among the various processes involved still remains elusive. Three fundamental aspects control the physical state of natural rivers: flow stochasticity, sediment transport and vegetation dynamics. The present work tries to shed light on the bonds among these processes, following a temporal flow for the river dynamics. 2. Formation of finite-amplitude alternate bars
during a flood event During a particularly extreme flood event, any previous ecomorphological pattern is erased by the flow. However, sediment transport triggers the formation of migrating bedforms, called free bars. Through a nonlinear analysis, using the Center Manifold Projection, an analytical expression is obtained for the bar amplitude, thus defining bars geometry in the parameters space. 3. Vegetation growth with respect to flow
variability Once the formative event is extinguished, the flow rate decreases and the recently formed bars can partially emerge from water.
At this point, vegetation develops over the bare bars following a logistic equation wherein the carrying capacity can be assumed as a Gaussian function of the water depth. In addition, the submerged sites experience the decline of vegetation because of the uprooting induced by the flow drag. A key role is played by the flow stochasticity, which can be considered as a compound Poisson process. However, in order to make the computation analytically feasible, the stochastic time series for the discharge is here replaced by an equivalent periodic one, obtained as a sequence of a typical average event of the stochastic series. In this manner, the new periodic streamflow signal preserves the same statistical properties of its stochastic correspondent. The periodic coefficient ODE for the vegetation dynamics can thus be spatially solved through a Floquet theory carried out as a secondary stability analysis. In this way we detect which portion of the bar is asymptotically colonised by vegetation. 4. Conclusions Our work is the first analytical attempt to link the pattern of the vegetated area of alternate bars with morphodynamics and flow variability, and it confirms that high flow variability hardens vegetation growth. This approach seems to be successful in discriminating between vegetated and non-vegetated conditions, such in the two cases reported in Fig.1.
Figure 1. Two rivers with similar hydrogeomorpholgical parameters and different conditions for the alternate bars. (a) Fully vegetated bars on Isere river, near Arbin France. (b) Bare bars on Alpine Rhine, near Meierhof, Liechtentstein.

81
Numerical modelling of bio-morphodynamics in braided rivers: applications toa laboratory test configuration.
G. Stecca1,2, D. Fedrizzi1, M. Hicks2, R. Measures2, G. Zolezzi1, W. Bertoldi1, M. Tal3
1 Department of Civil, Environmentale and Mechanical Engineering, University of Trento, Trento, Italy.
[email protected] National Institute of Water and Atmospheric Research (NIWA), Christchurch, New Zealand
3 CEREGE UMR 7330, Aix - Marseille University
1. IntroductionRiver planform results from the complex interaction be-
tween flow, sediment transport and vegetation, and can
evolve following a change in these controls. The braided
planform of New Zealand’s Lower Waitaki River, for
instance, is endangered by the action of artificially-
introduced alien vegetation, which spread across the
braidplain following the reduction in frequency and mag-
nitude of floods due to hydropower dam construction.
This vegetation, by encouraging flow concentration into
the main channel, would likely promote a shift towards
a single-thread morphology if it was not artificially re-
moved within a central fairway.
2. Numerical modelThe purpose of this work is to study the evolution of
braided rivers such as the Waitaki under different man-
agement scenarios through two-dimensional numerical
modelling. The construction of a suitable model repre-
sents a task in itself, since a modelling framework cou-
pling all the relevant processes is not yet readily avail-
able. Our starting point is the physics-based GIAMT2D
numerical model (Siviglia et al., 2013), which solves
two-dimensional shallow flows and bedload transport in
wet/dry domains. We recently improved this model by
including a rule-based bank erosion module inspired by
that of Sun et al. (2015), and by adding a vegetation mod-
ule which develops the concepts put forward by Bertoldi
et al. (2014). The vegetation module accounts in a sim-
plified manner for time-evolving biomass density, and ad-
justs the local flow roughness, critical shear stress for sed-
iment transport and bank erodibility accordingly.
3. ApplicationsHere we present the results of test applications of the nu-
merical model to reproduce the morphodynamic evolu-
tion of a braided channel in a set of flume experiments that
used alfalfa as vegetation (Tal and Paola, 2010). The ex-
periments began with a braided morphology (Figure 1b)
that spontaneously formed at constant high flow over a
bed of bare uniform sand with an initially straight single
channel (Figure 1a). The planform transitioned to single-
thread when this discharge was repeatedly cycled with pe-
riods of low flow and vegetation growth (Figure 1c). The
model proves capable to predict such a planform evolu-
tion in agreement with the experimental data.
4. Conclusions and future workWe have built a physics-based 2D numerical bio-
morphodynamic model and tested it in application to a
laboratory experiment to reproduce observed planform
changes due to vegetation spread. Our current and future
a) t = 0
b) t ∼ 21h.10′
c) t ∼ 34d.06h
Figure 1. Results of our numerical reproduction of the
physical experiment of Tal and Paola (2010): detrended
DEMs with overlain flow depth and (c) vegetation
density. a) Initial condition: a straight channel dug in a
bare sand plain. b) Development of a braiding network
under high flow conditions. c) Transition to meandering
after 11 vegetation cycles (each one featuring a three-day
vegetation growth phase at low flow followed by a
one-hour high-flow phase).
work aims to study decadal-scale evolution of a reach on
the Waitaki River and predict planform characteristics un-
der different vegetation management scenarios.
AcknowledgementsG. Stecca is funded by a Marie Curie International Out-
going Fellowship within the 7th European Community
Framework Programme (grant PIOF-GA-2013-621886).
D. Fedrizzi’s visit to NIWA was partially supported by the
same grant, and by student international mobility funds of
the University of Trento. The involvement of R. Measures
and M. Hicks was supported by NIWA under the Sustain-
able Water Allocation Programme.
ReferencesBertoldi, W., Siviglia, A., Tettamanti, S., Toffolon, M.,
Vetsch, D., and Francalanci, S. (2014). Modeling veg-
etation controls on fluvial morphological trajectories.
Geophysical Research Letters, 41:7167–7175.
Siviglia, A., Stecca, G., Vanzo, D., Zolezzi, G., Toro,
E. F., and Tubino, M. (2013). Numerical modelling
of two-dimensional morphodynamcs with applications
to river bars and bifurcations. Advances in Water Re-
sources, 53:243–260.
Sun, J., Lin, B., and Yang, H. (2015). Development
and application of a braided river model with non-
uniform sediment transport. Advances in Water Re-
sources, 81:62–74.
Tal, M. and Paola, C. (2010). Effects of vegetation on
channel morphodynamics: results and insights from
laboratory experiments. Earth Surface Processes and
Landforms, 35(9):1014–1028.

82
TEMPORAL-SPATIAL VARIATION OF SEDIMENT AND VEGETATION ON SAND AND GRAVEL BEACH LOCATED BETWEEN INNER BAY AND
OPEN SEA
K. Uno1, H. Nakanishi2, G. Tujimoto3 and T. Kakinoki4
1 Department of Civil Engineering, Kobe City College of Technology, Kobe, Japan. [email protected]
2 CTI Engineering Co, Osaka, Japan. [email protected] 3 Department of Civil and Environmental Engineering, Kumnamoto University, Kumamoto, Japan.
[email protected] 4 Department of Civil Engineering, Kobe City College of Technology, Kobe, Japan. [email protected]
1. Introduction Narugashima Island which is located in the southeast of
Awaji Island in west Japan is part of Seto Inland Sea
national park area. The coast of this island is a sanctuary
for many animals and plants such as Uca lactea (fiddler
crab), Caretta caretta (sea turtle) and Suaeda maritime
(a kind of seaside plant). On the other hand, many items
of litter are drifted down to the coast line of this island
by tidal currents and ocean waves. It is feared that such
drifted litter has a bad effect on the ecosystem of this
island. It is expected that the beach at east coast of this
island undertakes a role of shore protection facilities,
however, the temporal-spatial change of sediment
property of this beach still remains poorly understood.
In this study, to clarify the relationship between the
seasonal change of sediment property on this beach and
that of plant community, field observation, statistics
analysis and laboratory experiment on the blown sand
were carried out.
2. Methods & Reslts
2.1 Field observations
4 lines were set in longshore direction at the beach of
east coast of Narugashima Island. From July 2009 to
January 2011 with the exception of December 2010, the
digital photo image of the sediment on the surface of
beach was taken once a month by close-up mode of
digital camera at 10m intervals for each line. The
location of camera station was recorded by field-
portable GPS. Using the method which is proposed by
Rubin (2004), the median diameter of each image was
determined. However, the location of camera station
didn’t overlap with that of other month strictly. Therefore, the corresponding value of the fixed point on
grid was calculated by the two dimensional interpolation
equation (Sloan,1987). From the space distribution of
sediment property (Figure 1), we can see the sediment
in the vicinity of backshore where seaside plants grow
thickly becomes fine and it remains unchanged during
any season.
2.2 Statistics Analysis The method of spatial analysis applied to the result of
field observations, the Moran’s Index was obtained. This index corresponds to Pearson's correlation coefficient. In
the case of positive correlation, Moran’s Index shows the positive value 1 or less. From the results of space
analysis, space distance is an assumed one which is need
to calculated Moran’s Index. In the case of space diameter 50 m, Moran’s Index is lower than space diameter 10 m. This means the relativity of sediment
distribution is not so high in longshore direction.
2.3 Laboratory Experiment on Blown Sand
In the field observation, we confirmed the accumulation
of the fine sediment in the vicinity of back beach.
Therefore we examine the effect of decreasing the
blown sand by vegetation. 2m movable bed was set in
air channel and was vented in 30 minutes. Sediment
property and topography change was measured before
and after the experiment. From the result of laboratory
experiment, we can see the denudation and remaining
coarse sediment in the windward side due to blown sand.
Moreover, when the vegetation density is high, it is
clarified the amount of blown sand tends to be minimum
due to trapping the fine sediment.
3. Conclusions In conclusion, through this study, the trapping effect of
fine sediment by marine vegetation which is grow
thickly in the vicinity of backshore beach and the
sediment around shoreline keeps a state of dynamic
equilibrium are clarified.
References
Bagnold, R. A. (1954):The Physics of Blown Sand and
Desert Dunes,Methuen & Co. Ltd., 265p.
Rubin, D.M. (2004) : A simple autocorrelation
algorithm for determining grain size from digital
images of sediment, Journal of Sedimentary Research,
Vol.74, No.1, pp.160-165.
0
2
4
6
8
10
12
14
16
18
20
22
24
26
0
1
2
3
4
5
6
7
8
9
10
11
0
1
2
3
4
5
6
7
0
0.1
0.2
0.3
0.4
0.5
0.6
0.7
0.8
0.9
1
maximum diameter[mm] mean diameter[mm] standard deviation[mm] variation coefficient
Figure 1. Space distribution of sediment property
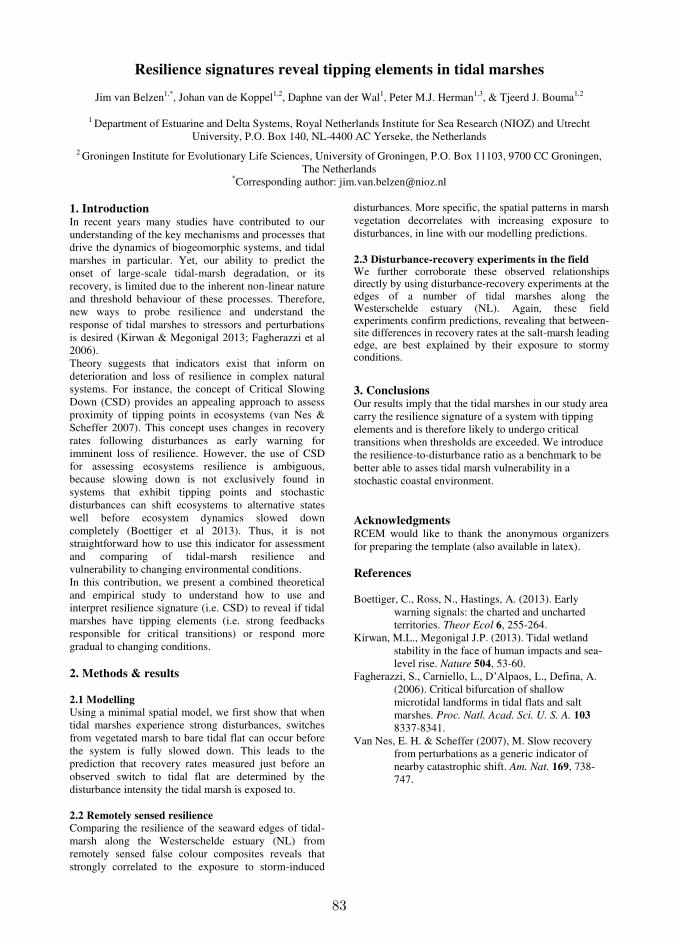
83
Resilience signatures reveal tipping elements in tidal marshes
Jim van Belzen1,*, Johan van de Koppel1,2, Daphne van der Wal1, Peter M.J. Herman1,3, & Tjeerd J. Bouma1,2
1 Department of Estuarine and Delta Systems, Royal Netherlands Institute for Sea Research (NIOZ) and Utrecht University, P.O. Box 140, NL-4400 AC Yerseke, the Netherlands
2 Groningen Institute for Evolutionary Life Sciences, University of Groningen, P.O. Box 11103, 9700 CC Groningen, The Netherlands
*Corresponding author: [email protected]
1. Introduction In recent years many studies have contributed to our understanding of the key mechanisms and processes that drive the dynamics of biogeomorphic systems, and tidal marshes in particular. Yet, our ability to predict the onset of large-scale tidal-marsh degradation, or its recovery, is limited due to the inherent non-linear nature and threshold behaviour of these processes. Therefore, new ways to probe resilience and understand the response of tidal marshes to stressors and perturbations is desired (Kirwan & Megonigal 2013; Fagherazzi et al 2006). Theory suggests that indicators exist that inform on deterioration and loss of resilience in complex natural systems. For instance, the concept of Critical Slowing Down (CSD) provides an appealing approach to assess proximity of tipping points in ecosystems (van Nes & Scheffer 2007). This concept uses changes in recovery rates following disturbances as early warning for imminent loss of resilience. However, the use of CSD for assessing ecosystems resilience is ambiguous, because slowing down is not exclusively found in systems that exhibit tipping points and stochastic disturbances can shift ecosystems to alternative states well before ecosystem dynamics slowed down completely (Boettiger et al 2013). Thus, it is not straightforward how to use this indicator for assessment and comparing of tidal-marsh resilience and vulnerability to changing environmental conditions. In this contribution, we present a combined theoretical and empirical study to understand how to use and interpret resilience signature (i.e. CSD) to reveal if tidal marshes have tipping elements (i.e. strong feedbacks responsible for critical transitions) or respond more gradual to changing conditions. 2. Methods & results 2.1 Modelling
Using a minimal spatial model, we first show that when tidal marshes experience strong disturbances, switches from vegetated marsh to bare tidal flat can occur before the system is fully slowed down. This leads to the prediction that recovery rates measured just before an observed switch to tidal flat are determined by the disturbance intensity the tidal marsh is exposed to. 2.2 Remotely sensed resilience
Comparing the resilience of the seaward edges of tidal-marsh along the Westerschelde estuary (NL) from remotely sensed false colour composites reveals that strongly correlated to the exposure to storm-induced
disturbances. More specific, the spatial patterns in marsh vegetation decorrelates with increasing exposure to disturbances, in line with our modelling predictions.
2.3 Disturbance-recovery experiments in the field We further corroborate these observed relationships directly by using disturbance-recovery experiments at the edges of a number of tidal marshes along the Westerschelde estuary (NL). Again, these field experiments confirm predictions, revealing that between-site differences in recovery rates at the salt-marsh leading edge, are best explained by their exposure to stormy conditions.
3. Conclusions Our results imply that the tidal marshes in our study area carry the resilience signature of a system with tipping elements and is therefore likely to undergo critical transitions when thresholds are exceeded. We introduce the resilience-to-disturbance ratio as a benchmark to be better able to asses tidal marsh vulnerability in a stochastic coastal environment. Acknowledgments RCEM would like to thank the anonymous organizers for preparing the template (also available in latex). References Boettiger, C., Ross, N., Hastings, A. (2013). Early
warning signals: the charted and uncharted territories. Theor Ecol 6, 255-264.
Kirwan, M.L., Megonigal J.P. (2013). Tidal wetland stability in the face of human impacts and sea-level rise. Nature 504, 53-60.
Fagherazzi, S., Carniello, L., D’Alpaos, L., Defina, A. (2006). Critical bifurcation of shallow microtidal landforms in tidal flats and salt marshes. Proc. Natl. Acad. Sci. U. S. A. 103 8337-8341.
Van Nes, E. H. & Scheffer (2007), M. Slow recovery from perturbations as a generic indicator of nearby catastrophic shift. Am. Nat. 169, 738-747.
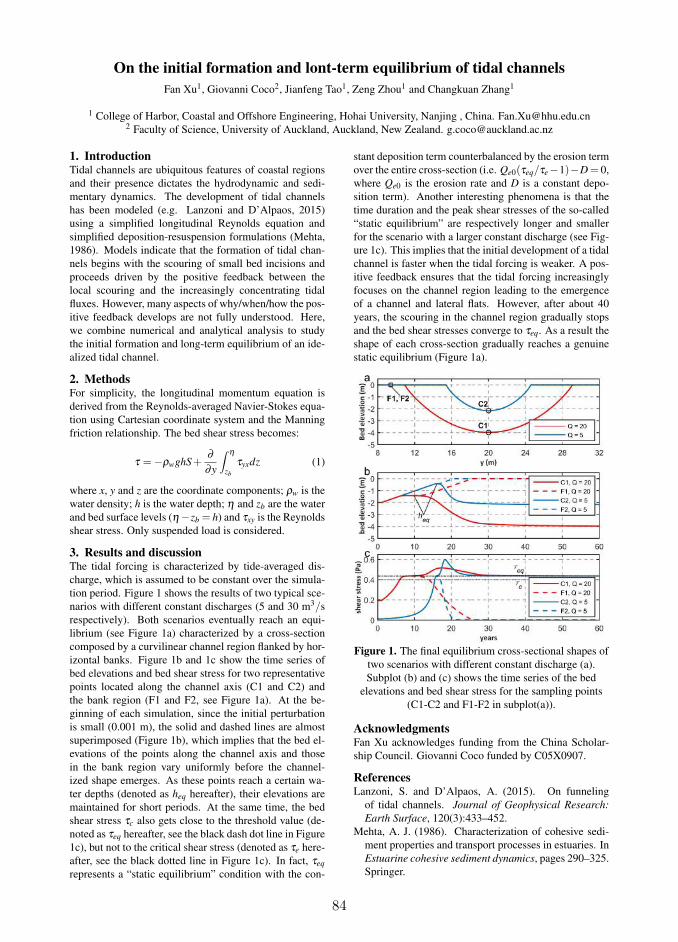
84
On the initial formation and lont-term equilibrium of tidal channels
Fan Xu1, Giovanni Coco2, Jianfeng Tao1, Zeng Zhou1 and Changkuan Zhang1
1 College of Harbor, Coastal and Offshore Engineering, Hohai University, Nanjing , China. [email protected] Faculty of Science, University of Auckland, Auckland, New Zealand. [email protected]
1. IntroductionTidal channels are ubiquitous features of coastal regions
and their presence dictates the hydrodynamic and sedi-
mentary dynamics. The development of tidal channels
has been modeled (e.g. Lanzoni and D’Alpaos, 2015)
using a simplified longitudinal Reynolds equation and
simplified deposition-resuspension formulations (Mehta,
1986). Models indicate that the formation of tidal chan-
nels begins with the scouring of small bed incisions and
proceeds driven by the positive feedback between the
local scouring and the increasingly concentrating tidal
fluxes. However, many aspects of why/when/how the pos-
itive feedback develops are not fully understood. Here,
we combine numerical and analytical analysis to study
the initial formation and long-term equilibrium of an ide-
alized tidal channel.
2. MethodsFor simplicity, the longitudinal momentum equation is
derived from the Reynolds-averaged Navier-Stokes equa-
tion using Cartesian coordinate system and the Manning
friction relationship. The bed shear stress becomes:
τ =−ρwghS+∂
∂y
∫ η
zb
τyxdz (1)
where x, y and z are the coordinate components; ρw is the
water density; h is the water depth; η and zb are the water
and bed surface levels (η−zb = h) and τxy is the Reynolds
shear stress. Only suspended load is considered.
3. Results and discussionThe tidal forcing is characterized by tide-averaged dis-
charge, which is assumed to be constant over the simula-
tion period. Figure 1 shows the results of two typical sce-
narios with different constant discharges (5 and 30 m3/s
respectively). Both scenarios eventually reach an equi-
librium (see Figure 1a) characterized by a cross-section
composed by a curvilinear channel region flanked by hor-
izontal banks. Figure 1b and 1c show the time series of
bed elevations and bed shear stress for two representative
points located along the channel axis (C1 and C2) and
the bank region (F1 and F2, see Figure 1a). At the be-
ginning of each simulation, since the initial perturbation
is small (0.001 m), the solid and dashed lines are almost
superimposed (Figure 1b), which implies that the bed el-
evations of the points along the channel axis and those
in the bank region vary uniformly before the channel-
ized shape emerges. As these points reach a certain wa-
ter depths (denoted as heq hereafter), their elevations are
maintained for short periods. At the same time, the bed
shear stress τc also gets close to the threshold value (de-
noted as τeq hereafter, see the black dash dot line in Figure
1c), but not to the critical shear stress (denoted as τe here-
after, see the black dotted line in Figure 1c). In fact, τeq
represents a “static equilibrium” condition with the con-
stant deposition term counterbalanced by the erosion term
over the entire cross-section (i.e. Qe0(τeq/τe−1)−D= 0,
where Qe0 is the erosion rate and D is a constant depo-
sition term). Another interesting phenomena is that the
time duration and the peak shear stresses of the so-called
“static equilibrium” are respectively longer and smaller
for the scenario with a larger constant discharge (see Fig-
ure 1c). This implies that the initial development of a tidal
channel is faster when the tidal forcing is weaker. A pos-
itive feedback ensures that the tidal forcing increasingly
focuses on the channel region leading to the emergence
of a channel and lateral flats. However, after about 40
years, the scouring in the channel region gradually stops
and the bed shear stresses converge to τeq. As a result the
shape of each cross-section gradually reaches a genuine
static equilibrium (Figure 1a).
Figure 1. The final equilibrium cross-sectional shapes of
two scenarios with different constant discharge (a).
Subplot (b) and (c) shows the time series of the bed
elevations and bed shear stress for the sampling points
(C1-C2 and F1-F2 in subplot(a)).
AcknowledgmentsFan Xu acknowledges funding from the China Scholar-
ship Council. Giovanni Coco funded by C05X0907.
ReferencesLanzoni, S. and D’Alpaos, A. (2015). On funneling
of tidal channels. Journal of Geophysical Research:
Earth Surface, 120(3):433–452.
Mehta, A. J. (1986). Characterization of cohesive sedi-
ment properties and transport processes in estuaries. In
Estuarine cohesive sediment dynamics, pages 290–325.
Springer.
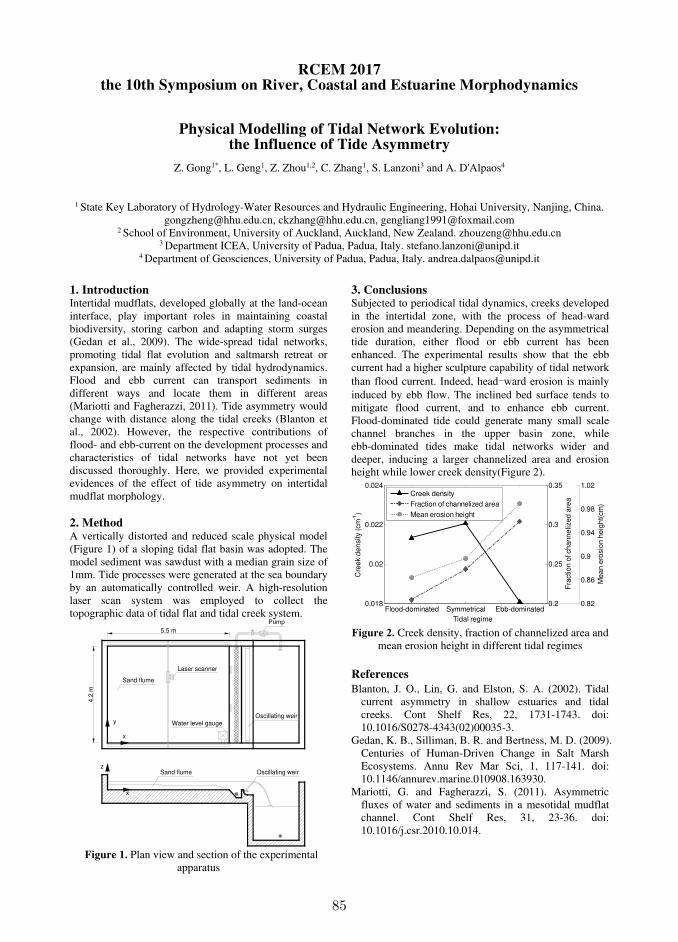
85
RCEM 2017 the 10th Symposium on River, Coastal and Estuarine Morphodynamics
Physical Modelling of Tidal Network Evolution: the Influence of Tide Asymmetry
Z. Gong1*, L. Geng1, Z. Zhou1,2, C. Zhang1, S. Lanzoni3 and A. D'Alpaos4
1 State Key Laboratory of Hydrology-Water Resources and Hydraulic Engineering, Hohai University, Nanjing, China.
[email protected], [email protected], [email protected] 2 School of Environment, University of Auckland, Auckland, New Zealand. [email protected]
3 Department ICEA, University of Padua, Padua, Italy. [email protected] 4 Department of Geosciences, University of Padua, Padua, Italy. [email protected]
1. Introduction Intertidal mudflats, developed globally at the land-ocean interface, play important roles in maintaining coastal biodiversity, storing carbon and adapting storm surges (Gedan et al., 2009). The wide-spread tidal networks, promoting tidal flat evolution and saltmarsh retreat or expansion, are mainly affected by tidal hydrodynamics. Flood and ebb current can transport sediments in different ways and locate them in different areas (Mariotti and Fagherazzi, 2011). Tide asymmetry would change with distance along the tidal creeks (Blanton et al., 2002). However, the respective contributions of flood- and ebb-current on the development processes and characteristics of tidal networks have not yet been discussed thoroughly. Here, we provided experimental evidences of the effect of tide asymmetry on intertidal mudflat morphology. 2. Method A vertically distorted and reduced scale physical model (Figure 1) of a sloping tidal flat basin was adopted. The model sediment was sawdust with a median grain size of 1mm. Tide processes were generated at the sea boundary by an automatically controlled weir. A high-resolution laser scan system was employed to collect the topographic data of tidal flat and tidal creek system.
Figure 1. Plan view and section of the experimental
apparatus
3. Conclusions Subjected to periodical tidal dynamics, creeks developed in the intertidal zone, with the process of head-ward erosion and meandering. Depending on the asymmetrical tide duration, either flood or ebb current has been enhanced. The experimental results show that the ebb current had a higher sculpture capability of tidal network than flood current. Indeed, head-ward erosion is mainly induced by ebb flow. The inclined bed surface tends to mitigate flood current, and to enhance ebb current. Flood-dominated tide could generate many small scale channel branches in the upper basin zone, while ebb-dominated tides make tidal networks wider and deeper, inducing a larger channelized area and erosion height while lower creek density(Figure 2).
Figure 2. Creek density, fraction of channelized area and
mean erosion height in different tidal regimes
References
Blanton, J. O., Lin, G. and Elston, S. A. (2002). Tidal current asymmetry in shallow estuaries and tidal creeks. Cont Shelf Res, 22, 1731-1743. doi: 10.1016/S0278-4343(02)00035-3.
Gedan, K. B., Silliman, B. R. and Bertness, M. D. (2009). Centuries of Human-Driven Change in Salt Marsh Ecosystems. Annu Rev Mar Sci, 1, 117-141. doi: 10.1146/annurev.marine.010908.163930.
Mariotti, G. and Fagherazzi, S. (2011). Asymmetric fluxes of water and sediments in a mesotidal mudflat channel. Cont Shelf Res, 31, 23-36. doi: 10.1016/j.csr.2010.10.014.
Sand flume
Oscillating weir
Laser scanner
z
x
y
x
Water level gauge
5.5 m
4.2
m
Oscillating weirSand flume
Flood-dominated Symmetrical Ebb-dominated0.018
0.02
0.022
0.024
Cre
ek d
en
sity (
cm
-1)
0.82
0.86
0.9
0.94
0.98
1.02
Me
an
ero
sio
n h
eig
ht(
cm
)0.2
0.25
0.3
0.35
Fra
ctio
n o
f ch
an
ne
lize
d a
rea
Tidal regime
Creek density
Fraction of channelized area
Mean erosion height
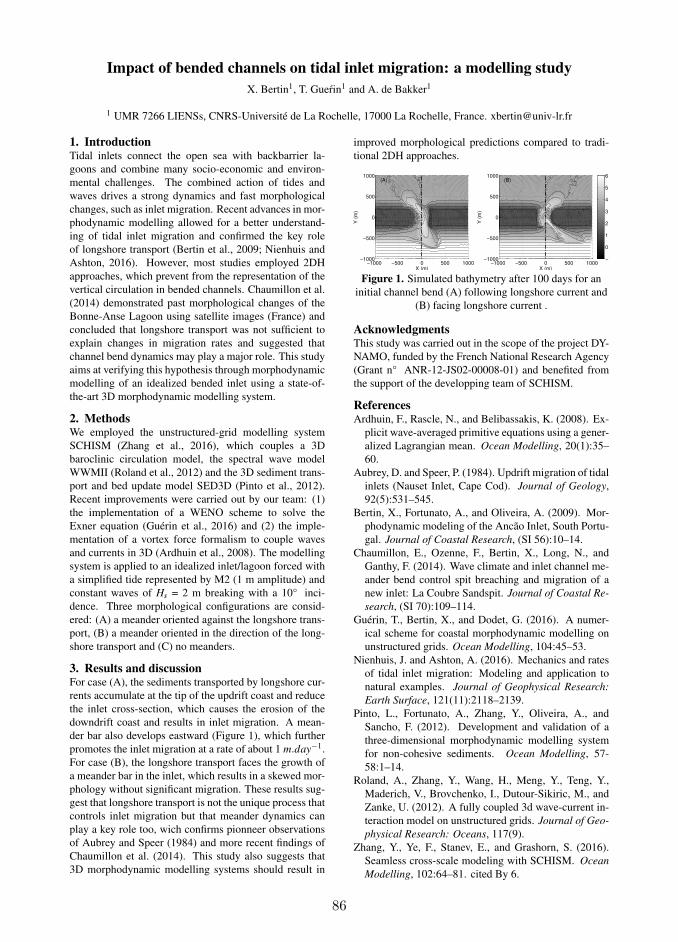
86
Impact of bended channels on tidal inlet migration: a modelling study
X. Bertin1, T. Guerin1 and A. de Bakker1
1 UMR 7266 LIENSs, CNRS-Université de La Rochelle, 17000 La Rochelle, France. [email protected]
1. IntroductionTidal inlets connect the open sea with backbarrier la-
goons and combine many socio-economic and environ-
mental challenges. The combined action of tides and
waves drives a strong dynamics and fast morphological
changes, such as inlet migration. Recent advances in mor-
phodynamic modelling allowed for a better understand-
ing of tidal inlet migration and confirmed the key role
of longshore transport (Bertin et al., 2009; Nienhuis and
Ashton, 2016). However, most studies employed 2DH
approaches, which prevent from the representation of the
vertical circulation in bended channels. Chaumillon et al.
(2014) demonstrated past morphological changes of the
Bonne-Anse Lagoon using satellite images (France) and
concluded that longshore transport was not sufficient to
explain changes in migration rates and suggested that
channel bend dynamics may play a major role. This study
aims at verifying this hypothesis through morphodynamic
modelling of an idealized bended inlet using a state-of-
the-art 3D morphodynamic modelling system.
2. MethodsWe employed the unstructured-grid modelling system
SCHISM (Zhang et al., 2016), which couples a 3D
baroclinic circulation model, the spectral wave model
WWMII (Roland et al., 2012) and the 3D sediment trans-
port and bed update model SED3D (Pinto et al., 2012).
Recent improvements were carried out by our team: (1)
the implementation of a WENO scheme to solve the
Exner equation (Guérin et al., 2016) and (2) the imple-
mentation of a vortex force formalism to couple waves
and currents in 3D (Ardhuin et al., 2008). The modelling
system is applied to an idealized inlet/lagoon forced with
a simplified tide represented by M2 (1 m amplitude) and
constant waves of Hs = 2 m breaking with a 10° inci-
dence. Three morphological configurations are consid-
ered: (A) a meander oriented against the longshore trans-
port, (B) a meander oriented in the direction of the long-
shore transport and (C) no meanders.
3. Results and discussionFor case (A), the sediments transported by longshore cur-
rents accumulate at the tip of the updrift coast and reduce
the inlet cross-section, which causes the erosion of the
downdrift coast and results in inlet migration. A mean-
der bar also develops eastward (Figure 1), which further
promotes the inlet migration at a rate of about 1 m.day−1.
For case (B), the longshore transport faces the growth of
a meander bar in the inlet, which results in a skewed mor-
phology without significant migration. These results sug-
gest that longshore transport is not the unique process that
controls inlet migration but that meander dynamics can
play a key role too, wich confirms pionneer observations
of Aubrey and Speer (1984) and more recent findings of
Chaumillon et al. (2014). This study also suggests that
3D morphodynamic modelling systems should result in
improved morphological predictions compared to tradi-
tional 2DH approaches.
−1000 −500 0 500 1000−1000
−500
0
500
1000
X (m)
Y (
m)
(A)
−1000 −500 0 500 1000−1000
−500
0
500
1000
X (m)
Y (
m)
(B)
−1
0
1
2
3
4
5
6
Figure 1. Simulated bathymetry after 100 days for an
initial channel bend (A) following longshore current and
(B) facing longshore current .
AcknowledgmentsThis study was carried out in the scope of the project DY-
NAMO, funded by the French National Research Agency
(Grant n° ANR-12-JS02-00008-01) and benefited from
the support of the developping team of SCHISM.
ReferencesArdhuin, F., Rascle, N., and Belibassakis, K. (2008). Ex-
plicit wave-averaged primitive equations using a gener-
alized Lagrangian mean. Ocean Modelling, 20(1):35–
60.
Aubrey, D. and Speer, P. (1984). Updrift migration of tidal
inlets (Nauset Inlet, Cape Cod). Journal of Geology,
92(5):531–545.
Bertin, X., Fortunato, A., and Oliveira, A. (2009). Mor-
phodynamic modeling of the Ancão Inlet, South Portu-
gal. Journal of Coastal Research, (SI 56):10–14.
Chaumillon, E., Ozenne, F., Bertin, X., Long, N., and
Ganthy, F. (2014). Wave climate and inlet channel me-
ander bend control spit breaching and migration of a
new inlet: La Coubre Sandspit. Journal of Coastal Re-
search, (SI 70):109–114.
Guérin, T., Bertin, X., and Dodet, G. (2016). A numer-
ical scheme for coastal morphodynamic modelling on
unstructured grids. Ocean Modelling, 104:45–53.
Nienhuis, J. and Ashton, A. (2016). Mechanics and rates
of tidal inlet migration: Modeling and application to
natural examples. Journal of Geophysical Research:
Earth Surface, 121(11):2118–2139.
Pinto, L., Fortunato, A., Zhang, Y., Oliveira, A., and
Sancho, F. (2012). Development and validation of a
three-dimensional morphodynamic modelling system
for non-cohesive sediments. Ocean Modelling, 57-
58:1–14.
Roland, A., Zhang, Y., Wang, H., Meng, Y., Teng, Y.,
Maderich, V., Brovchenko, I., Dutour-Sikiric, M., and
Zanke, U. (2012). A fully coupled 3d wave-current in-
teraction model on unstructured grids. Journal of Geo-
physical Research: Oceans, 117(9).
Zhang, Y., Ye, F., Stanev, E., and Grashorn, S. (2016).
Seamless cross-scale modeling with SCHISM. Ocean
Modelling, 102:64–81. cited By 6.

87
Modeling the role of storms on tidal flat sorting dynamics
Z. Zhou1,2, M. Xu3, C.K. Zhang3 and G. Coco2
1 Jiangsu Key Laboratory of Coast Ocean Resources Development and Environment Security, Hohai University,
Nanjing, China, [email protected] 2 School of Environment, University of Auckland, Auckland, New Zealand
3 College of Harbour, Coastal and Offshore Engineering, Hohai University, Nanjing, China
1. Introduction The sediment sorting of tidal flats is governed by a variety of processes operating over different temporal and spatial scales, e.g., tides, waves, biological activities, sea level rise and storms. Based on a bed stratigraphy model, Zhou et al. (2016) demonstrated that the sediment grain size displayed a “landward fining” characteristic (i.e., mud tended to distribute on the upper tidal flat while sand on the middle or lower flat. Strong wind waves could highly erode tidal flats resulting in a concave profile near the high water mark (Figure 1a). The role of salt marshes was later included as a further extension of this model. It showed that a considerable amount of mud could still remain in the vegetated zone even when waves were strong (Zhou et al., 2016, Figure 1b). Meanwhile, a steep transition zone formed at the marsh edge because of the differential sediment deposition in vegetated and bare flats. Overall, model results suggested that the sorting behavior was sensitive to hydrodynamics, sediment properties and vegetation conditions. As an important process affecting tidal flat morphology, storms are found to significantly alter the spatial and temporal distribution of multiple sediments over tidal flats, both horizontally and vertically. However, to our knowledge, the impacts caused by storms have been rarely addressed by numerical models.
Figure 1. Modeled cross-shore profiles and sand/mud distribution on a schematic tidal flat with strong wind waves: (a) un-vegetated; (b) vegetated; Adapted from Zhou et al. (2016). Color indicates the percentage of
mud fraction.
2. Methods Building upon the current modeling system of Zhou et al. (2016), this ongoing study aims to gain more in-depth insight into the sediment sorting dynamics of tidal flats under alternating stormy and calm weather conditions. 3. Conclusions Preliminary model results suggest several important physical indications. On the one hand, the high bed shear stress induced by storm waves can initiate the motion of relatively coarse sediments which are transported shoreward with the flooding current, changing the previously-mentioned “landward fining” phenomenon during the calm weather condition. Both the hydrodynamics-damping and sediment-trapping effects of marshes favor sediment deposition, resulting in an elevated upper tidal flat with potentially coarser sediments. On the other hand, over longer time scales (e.g., months to decades), the alternating stormy and calm weather conditions may drive the formation of a layered bed stratigraphy which has been commonly observed in the field (e.g., the Jiangsu tidal flat). During calm weather, the bed shear stress is mostly flow-induced and relatively small, so the sediment put in motion is mostly clay to silt (or very fine sand). The flood-dominated characteristics of tidal currents can generally cause the landward transport of these fine sediments, leading to the formation of mud-dominated layers (shorted as “MDLs”). During storm weather, the combined bed shear stress of waves and tides can suspend seaward coarser sediments (e.g., fine sand or sand) which may be brought to the upper tidal flat, forming sand-dominated layers (shorted as “SDLs”). Owing to the much shorter duration of storms, the SDLs are usually much thinner than the MDLs. Overall, this study highlights the non-negligible impacts of storms on tidal flat sorting dynamics, which are reflected by the evident signature of both horizontal and vertical sedimentary structures. Acknowledgments This study is supported by the National Natural Science Foundation of China (NSFC, Grant Nos. 41606104, 51620105005) and the Jiangsu Provincial Natural Science Foundation (Grant No. BK20160862). References Zhou, Z., Ye, Q. and Coco, G. (2016). A one-
dimensional biomorphodynamic model of tidal flats: Sediment sorting, marsh distribution, and carbon accumulation under sea level rise. Advances in Water Resources, 93, Part B: 288-302.
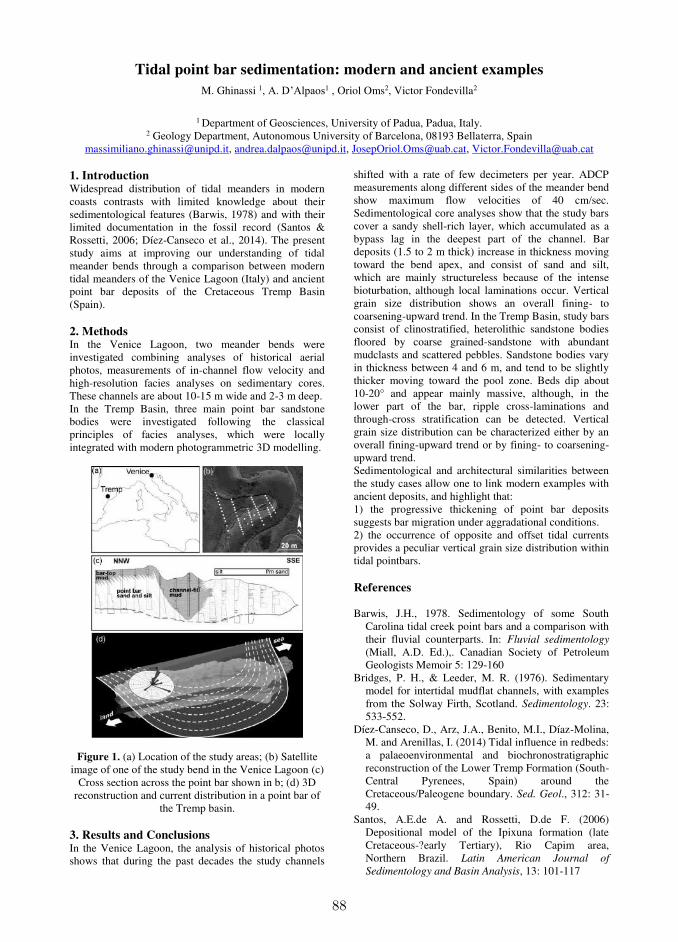
88
Tidal point bar sedimentation: modern and ancient examples
M. Ghinassi 1, A. D’Alpaos1 , Oriol Oms2, Victor Fondevilla2
1 Department of Geosciences, University of Padua, Padua, Italy.
2 Geology Department, Autonomous University of Barcelona, 08193 Bellaterra, Spain [email protected], [email protected], [email protected], [email protected]
1. Introduction Widespread distribution of tidal meanders in modern coasts contrasts with limited knowledge about their sedimentological features (Barwis, 1978) and with their limited documentation in the fossil record (Santos & Rossetti, 2006; Díez-Canseco et al., 2014). The present study aims at improving our understanding of tidal meander bends through a comparison between modern tidal meanders of the Venice Lagoon (Italy) and ancient point bar deposits of the Cretaceous Tremp Basin (Spain). 2. Methods In the Venice Lagoon, two meander bends were investigated combining analyses of historical aerial photos, measurements of in-channel flow velocity and high-resolution facies analyses on sedimentary cores. These channels are about 10-15 m wide and 2-3 m deep. In the Tremp Basin, three main point bar sandstone bodies were investigated following the classical principles of facies analyses, which were locally integrated with modern photogrammetric 3D modelling.
Figure 1. (a) Location of the study areas; (b) Satellite image of one of the study bend in the Venice Lagoon (c)
Cross section across the point bar shown in b; (d) 3D reconstruction and current distribution in a point bar of
the Tremp basin. 3. Results and Conclusions In the Venice Lagoon, the analysis of historical photos shows that during the past decades the study channels
shifted with a rate of few decimeters per year. ADCP measurements along different sides of the meander bend show maximum flow velocities of 40 cm/sec. Sedimentological core analyses show that the study bars cover a sandy shell-rich layer, which accumulated as a bypass lag in the deepest part of the channel. Bar deposits (1.5 to 2 m thick) increase in thickness moving toward the bend apex, and consist of sand and silt, which are mainly structureless because of the intense bioturbation, although local laminations occur. Vertical grain size distribution shows an overall fining- to coarsening-upward trend. In the Tremp Basin, study bars consist of clinostratified, heterolithic sandstone bodies floored by coarse grained-sandstone with abundant mudclasts and scattered pebbles. Sandstone bodies vary in thickness between 4 and 6 m, and tend to be slightly thicker moving toward the pool zone. Beds dip about 10-20° and appear mainly massive, although, in the lower part of the bar, ripple cross-laminations and through-cross stratification can be detected. Vertical grain size distribution can be characterized either by an overall fining-upward trend or by fining- to coarsening-upward trend. Sedimentological and architectural similarities between the study cases allow one to link modern examples with ancient deposits, and highlight that: 1) the progressive thickening of point bar deposits suggests bar migration under aggradational conditions. 2) the occurrence of opposite and offset tidal currents provides a peculiar vertical grain size distribution within tidal pointbars. References Barwis, J.H., 1978. Sedimentology of some South
Carolina tidal creek point bars and a comparison with their fluvial counterparts. In: Fluvial sedimentology (Miall, A.D. Ed.),. Canadian Society of Petroleum Geologists Memoir 5: 129-160
Bridges, P. H., & Leeder, M. R. (1976). Sedimentary model for intertidal mudflat channels, with examples from the Solway Firth, Scotland. Sedimentology. 23: 533-552.
Díez-Canseco, D., Arz, J.A., Benito, M.I., Díaz-Molina, M. and Arenillas, I. (2014) Tidal influence in redbeds: a palaeoenvironmental and biochronostratigraphic reconstruction of the Lower Tremp Formation (South-Central Pyrenees, Spain) around the Cretaceous/Paleogene boundary. Sed. Geol., 312: 31-49.
Santos, A.E.de A. and Rossetti, D.de F. (2006) Depositional model of the Ipixuna formation (late Cretaceous-?early Tertiary), Rio Capim area, Northern Brazil. Latin American Journal of
Sedimentology and Basin Analysis, 13: 101-117
89
Towards ecosystem-based coastal defence: How bio-physical interactions determine wave and storm surge protection by
tidal marshes S. Temmerman1, A. Silinski1,2, M. Heuner3, K. Schoutens1, J. Stark1, P. Meire1, P. Troch4, T.J. Bouma5,
1 Ecosystem Management research group, University of Antwerp, Antwerp, Belgium. [email protected]; [email protected]; [email protected];
[email protected]; [email protected] 2 Georg-August-Universität Göttingen, Göttingen, Germany
3 Department Ecological Interactions, Federal Institute of Hydrology, Koblenz, Germany, [email protected] 4 Department of Civil Engineering, Ghent University, Ghent, Belgium, [email protected]
5 Royal Netherlands Institute for Sea Research, Yerseke, The Netherlands, [email protected]
1. Introduction Climate change necessitates novel approaches to protect coastal and estuarine shorelines against risks imposed by sea level rise and increasing storm activity. In this context, there is increasing interest in the conservation and restoration of coastal and estuarine ecosystems that have the natural capacity to reduce shoreline erosion, to attenuate waves and storm surges, and to adapt to sea level rise by sediment accretion (e.g. Temmerman & Kirwan 2015). However, key questions remain on the effectiveness of ecosystem-based shoreline protection. Here we present some recent results on how bio-physical interactions between tidal marsh vegetation, hydrodynamics and sediment dynamics determine the effectiveness of ecosystem-based shore-line protection, in terms of attenuation of waves and storm surges. 2. Methods (1) In terms of wind wave attenuation, we present results on mutual plant-wave interactions, i.e. how plant morphological properties (traits) determine their effectiveness to attenuate waves, but also vice versa, how the impacts of waves on plant growth depend on the same plant traits. Results are based on experiments in laboratory wave flumes with two tidal marsh species typical for NW European estuaries, i.e. Scirpus maritimus and S. tabernaemontani (see details in Heuner et al. 2015; Silinski et al. 2015; 2016). (2) Concerning storm surge attenuation, we performed field observations and numerical modelling of tidal and storm surge propagation along a 4 km long marsh transect in the Scheldt estuary, SW Netherlands. Model simulations were done with a 2D hydrodynamic model of the estuary using the Telemac model package (see details in Stark et al. 2015; 2016). 3. Results and conclusions (1) We show that the two investigated Scirpus species differ in morphological traits, especially in plant stiffness and plant surface area, and that these plant traits determine their effectiveness in wave attenuation, but also their effectiveness in coping with waves. The stiffer species with more plant surface area per shoot, is more effective in wave attenuation as compared to the other species. However, the stiffer species suffers more from the waves, as it feels more drag force from waves
and therefore it is likely to be less effective in growing on wave-exposed locations. This suggests that the effectiveness of vegetation-based wave attenuation ultimately depends on mutual plant-wave interactions. (2) Both the field- and model-based results on storm surge propagation along a 4 km marsh transect, show that the effectiveness of peak water level reduction is dependent on marsh geometric properties, such as the marsh size, marsh elevation and width of channels dissecting the marsh platform, and on the height of the incoming peak water level. The attenuation rate was found to be highest for peak water levels that are ca. 0.5 m above the average marsh platform elevation, while lower and higher high water level events are less effectively attenuated. References Heuner M., A. Silinski, J. Schoelynck, T. J. Bouma, S.
Puijalon, P. Troch, E. Fuchs, B. Schröder, U. Schröder, P. Meire & S. Temmerman (2015). Ecosystem engineering by plants on wave-exposed intertidal flats is governed by relationships between effect and response traits. Plos One 10:e0138086.
Silinski A., M. Heuner, J. Schoelynck, S. Puijalon, U. Schröder, E. Fuchs, P. Troch, T. J. Bouma, P. Meire & S. Temmerman (2015). Effects of Wind Waves versus Ship Waves on Tidal Marsh Plants: A Flume Study on different Life Stages of Scirpus maritimus. Plos One, 10:e0118687.
Silinski A., M. Heuner, P. Troch, S. Puijalon, T. J. Bouma, J. Schoelynck, U. Schröder, E. Fuchs, P. Meire & S. Temmerman (2016). Effects of contrasting wave conditions on scour and drag on pioneer tidal marsh plants. Geomorph., 255:49-62.
Stark J., Y. Plancke, S. Ides, P. Meire & S. Temmerman (2016). Coastal flood protection by a combined nature-based and engineering approach: modeling the effects of marsh geometry and surrounding dikes. Estuarine Coastal and Shelf Science, 175:34-45.
Stark J., T. Van Oyen, P. Meire & S. Temmerman (2015). Observations of tidal and storm surge attenuation in a large tidal marsh. Limnology and Oceanography 60:1371-1381.
Temmerman S. & M. L. Kirwan (2015). Building land with a rising sea. Science, 349:588-589.
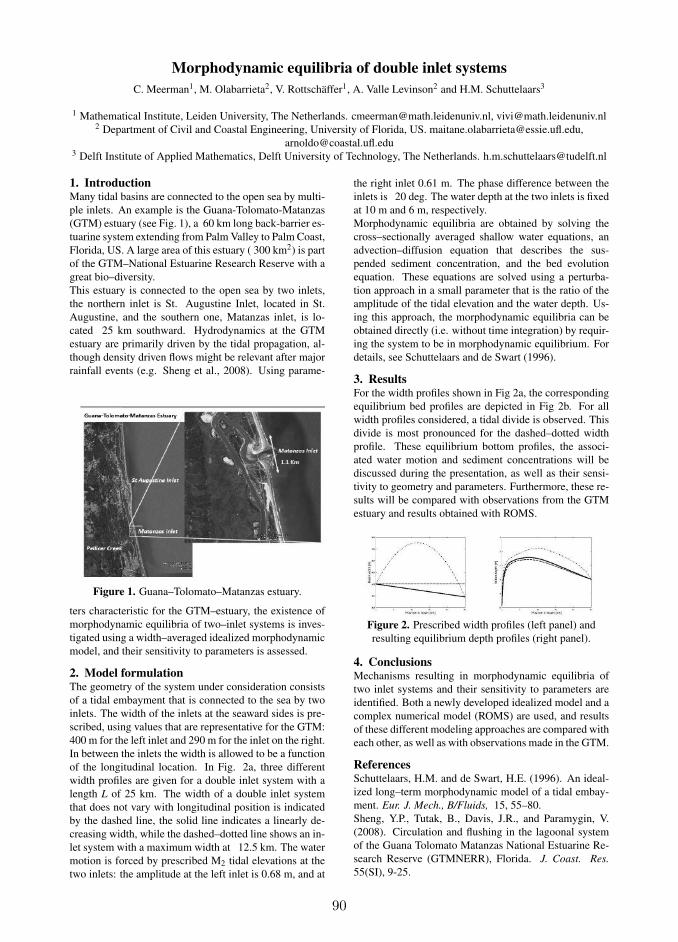
90
Morphodynamic equilibria of double inlet systems
C. Meerman1, M. Olabarrieta2, V. Rottschäffer1, A. Valle Levinson2 and H.M. Schuttelaars3
1 Mathematical Institute, Leiden University, The Netherlands. [email protected], [email protected] Department of Civil and Coastal Engineering, University of Florida, US. [email protected],
[email protected] Delft Institute of Applied Mathematics, Delft University of Technology, The Netherlands. [email protected]
1. IntroductionMany tidal basins are connected to the open sea by multi-
ple inlets. An example is the Guana-Tolomato-Matanzas
(GTM) estuary (see Fig. 1), a 60 km long back-barrier es-
tuarine system extending from Palm Valley to Palm Coast,
Florida, US. A large area of this estuary ( 300 km2) is part
of the GTM–National Estuarine Research Reserve with a
great bio–diversity.
This estuary is connected to the open sea by two inlets,
the northern inlet is St. Augustine Inlet, located in St.
Augustine, and the southern one, Matanzas inlet, is lo-
cated 25 km southward. Hydrodynamics at the GTM
estuary are primarily driven by the tidal propagation, al-
though density driven flows might be relevant after major
rainfall events (e.g. Sheng et al., 2008). Using parame-
Figure 1. Guana–Tolomato–Matanzas estuary.
ters characteristic for the GTM–estuary, the existence of
morphodynamic equilibria of two–inlet systems is inves-
tigated using a width–averaged idealized morphodynamic
model, and their sensitivity to parameters is assessed.
2. Model formulationThe geometry of the system under consideration consists
of a tidal embayment that is connected to the sea by two
inlets. The width of the inlets at the seaward sides is pre-
scribed, using values that are representative for the GTM:
400 m for the left inlet and 290 m for the inlet on the right.
In between the inlets the width is allowed to be a function
of the longitudinal location. In Fig. 2a, three different
width profiles are given for a double inlet system with a
length L of 25 km. The width of a double inlet system
that does not vary with longitudinal position is indicated
by the dashed line, the solid line indicates a linearly de-
creasing width, while the dashed–dotted line shows an in-
let system with a maximum width at 12.5 km. The water
motion is forced by prescribed M2 tidal elevations at the
two inlets: the amplitude at the left inlet is 0.68 m, and at
the right inlet 0.61 m. The phase difference between the
inlets is 20 deg. The water depth at the two inlets is fixed
at 10 m and 6 m, respectively.
Morphodynamic equilibria are obtained by solving the
cross–sectionally averaged shallow water equations, an
advection–diffusion equation that describes the sus-
pended sediment concentration, and the bed evolution
equation. These equations are solved using a perturba-
tion approach in a small parameter that is the ratio of the
amplitude of the tidal elevation and the water depth. Us-
ing this approach, the morphodynamic equilibria can be
obtained directly (i.e. without time integration) by requir-
ing the system to be in morphodynamic equilibrium. For
details, see Schuttelaars and de Swart (1996).
3. ResultsFor the width profiles shown in Fig 2a, the corresponding
equilibrium bed profiles are depicted in Fig 2b. For all
width profiles considered, a tidal divide is observed. This
divide is most pronounced for the dashed–dotted width
profile. These equilibrium bottom profiles, the associ-
ated water motion and sediment concentrations will be
discussed during the presentation, as well as their sensi-
tivity to geometry and parameters. Furthermore, these re-
sults will be compared with observations from the GTM
estuary and results obtained with ROMS.
Figure 2. Prescribed width profiles (left panel) and
resulting equilibrium depth profiles (right panel).
4. ConclusionsMechanisms resulting in morphodynamic equilibria of
two inlet systems and their sensitivity to parameters are
identified. Both a newly developed idealized model and a
complex numerical model (ROMS) are used, and results
of these different modeling approaches are compared with
each other, as well as with observations made in the GTM.
ReferencesSchuttelaars, H.M. and de Swart, H.E. (1996). An ideal-
ized long–term morphodynamic model of a tidal embay-
ment. Eur. J. Mech., B/Fluids, 15, 55–80.
Sheng, Y.P., Tutak, B., Davis, J.R., and Paramygin, V.
(2008). Circulation and flushing in the lagoonal system
of the Guana Tolomato Matanzas National Estuarine Re-
search Reserve (GTMNERR), Florida. J. Coast. Res.
55(SI), 9-25.
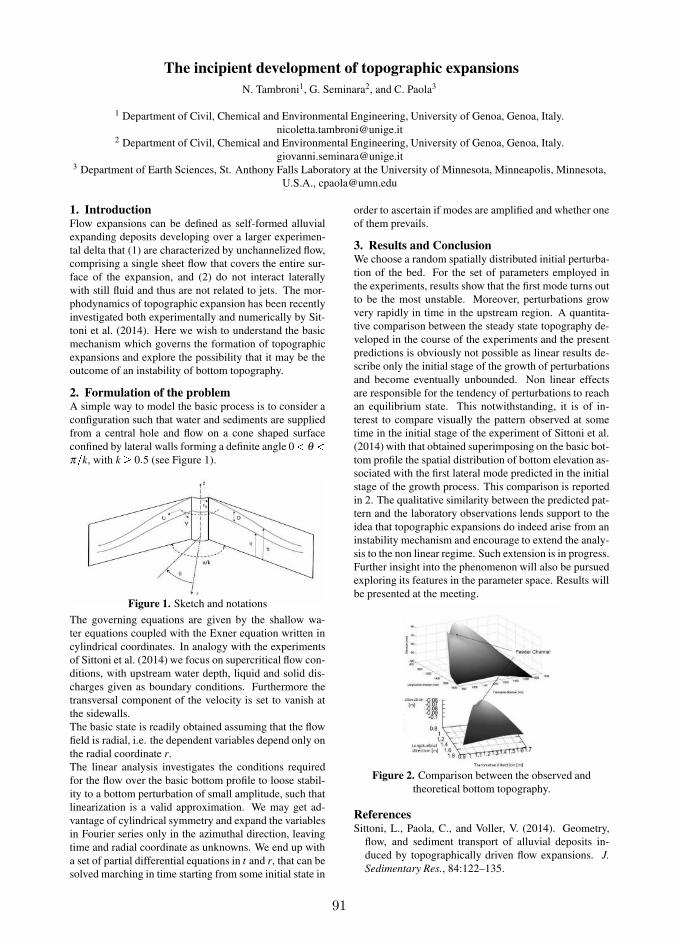
91
The incipient development of topographic expansions
N. Tambroni1, G. Seminara2, and C. Paola3
1 Department of Civil, Chemical and Environmental Engineering, University of Genoa, Genoa, Italy.
[email protected] Department of Civil, Chemical and Environmental Engineering, University of Genoa, Genoa, Italy.
[email protected] Department of Earth Sciences, St. Anthony Falls Laboratory at the University of Minnesota, Minneapolis, Minnesota,
U.S.A., [email protected]
1. IntroductionFlow expansions can be defined as self-formed alluvial
expanding deposits developing over a larger experimen-
tal delta that (1) are characterized by unchannelized flow,
comprising a single sheet flow that covers the entire sur-
face of the expansion, and (2) do not interact laterally
with still fluid and thus are not related to jets. The mor-
phodynamics of topographic expansion has been recently
investigated both experimentally and numerically by Sit-
toni et al. (2014). Here we wish to understand the basic
mechanism which governs the formation of topographic
expansions and explore the possibility that it may be the
outcome of an instability of bottom topography.
2. Formulation of the problemA simple way to model the basic process is to consider a
configuration such that water and sediments are supplied
from a central hole and flow on a cone shaped surface
confined by lateral walls forming a definite angle 0 < θ <
π=k, with k 0:5 (see Figure 1).
Figure 1. Sketch and notations
The governing equations are given by the shallow wa-
ter equations coupled with the Exner equation written in
cylindrical coordinates. In analogy with the experiments
of Sittoni et al. (2014) we focus on supercritical flow con-
ditions, with upstream water depth, liquid and solid dis-
charges given as boundary conditions. Furthermore the
transversal component of the velocity is set to vanish at
the sidewalls.
The basic state is readily obtained assuming that the flow
field is radial, i.e. the dependent variables depend only on
the radial coordinate r.
The linear analysis investigates the conditions required
for the flow over the basic bottom profile to loose stabil-
ity to a bottom perturbation of small amplitude, such that
linearization is a valid approximation. We may get ad-
vantage of cylindrical symmetry and expand the variables
in Fourier series only in the azimuthal direction, leaving
time and radial coordinate as unknowns. We end up with
a set of partial differential equations in t and r, that can be
solved marching in time starting from some initial state in
order to ascertain if modes are amplified and whether one
of them prevails.
3. Results and ConclusionWe choose a random spatially distributed initial perturba-
tion of the bed. For the set of parameters employed in
the experiments, results show that the first mode turns out
to be the most unstable. Moreover, perturbations grow
very rapidly in time in the upstream region. A quantita-
tive comparison between the steady state topography de-
veloped in the course of the experiments and the present
predictions is obviously not possible as linear results de-
scribe only the initial stage of the growth of perturbations
and become eventually unbounded. Non linear effects
are responsible for the tendency of perturbations to reach
an equilibrium state. This notwithstanding, it is of in-
terest to compare visually the pattern observed at some
time in the initial stage of the experiment of Sittoni et al.
(2014) with that obtained superimposing on the basic bot-
tom profile the spatial distribution of bottom elevation as-
sociated with the first lateral mode predicted in the initial
stage of the growth process. This comparison is reported
in 2. The qualitative similarity between the predicted pat-
tern and the laboratory observations lends support to the
idea that topographic expansions do indeed arise from an
instability mechanism and encourage to extend the analy-
sis to the non linear regime. Such extension is in progress.
Further insight into the phenomenon will also be pursued
exploring its features in the parameter space. Results will
be presented at the meeting.
Figure 2. Comparison between the observed and
theoretical bottom topography.
ReferencesSittoni, L., Paola, C., and Voller, V. (2014). Geometry,
flow, and sediment transport of alluvial deposits in-
duced by topographically driven flow expansions. J.
Sedimentary Res., 84:122–135.
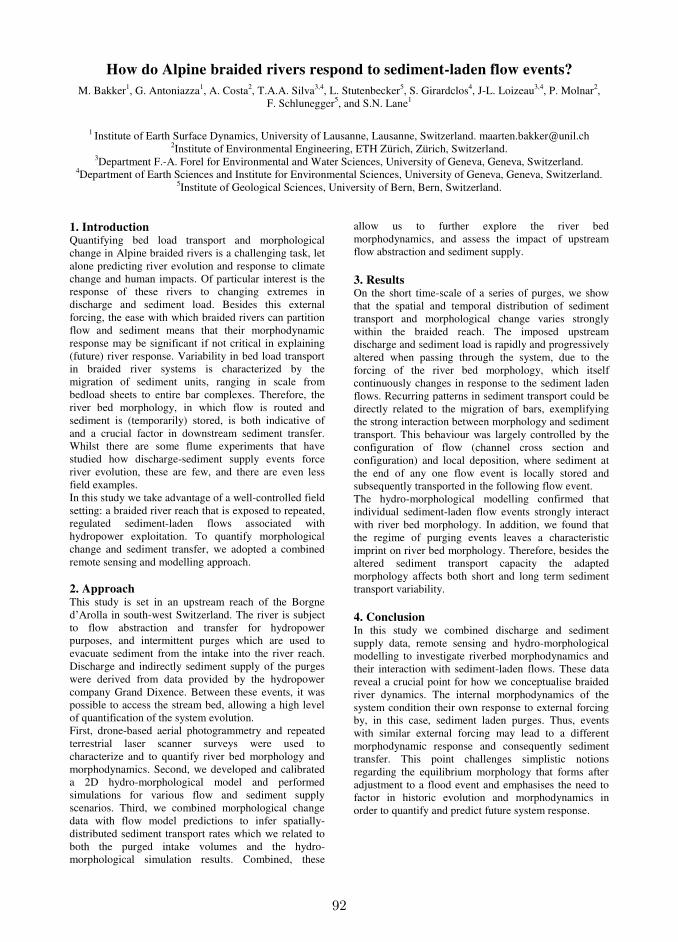
92
How do Alpine braided rivers respond to sediment-laden flow events?
M. Bakker1, G. Antoniazza1, A. Costa2, T.A.A. Silva3,4, L. Stutenbecker5, S. Girardclos4, J-L. Loizeau3,4, P. Molnar2, F. Schlunegger5, and S.N. Lane1
1 Institute of Earth Surface Dynamics, University of Lausanne, Lausanne, Switzerland. [email protected]
2Institute of Environmental Engineering, ETH Zürich, Zürich, Switzerland. 3Department F.-A. Forel for Environmental and Water Sciences, University of Geneva, Geneva, Switzerland.
4Department of Earth Sciences and Institute for Environmental Sciences, University of Geneva, Geneva, Switzerland. 5Institute of Geological Sciences, University of Bern, Bern, Switzerland.
1. Introduction Quantifying bed load transport and morphological change in Alpine braided rivers is a challenging task, let alone predicting river evolution and response to climate change and human impacts. Of particular interest is the response of these rivers to changing extremes in discharge and sediment load. Besides this external forcing, the ease with which braided rivers can partition flow and sediment means that their morphodynamic response may be significant if not critical in explaining (future) river response. Variability in bed load transport in braided river systems is characterized by the migration of sediment units, ranging in scale from bedload sheets to entire bar complexes. Therefore, the river bed morphology, in which flow is routed and sediment is (temporarily) stored, is both indicative of and a crucial factor in downstream sediment transfer. Whilst there are some flume experiments that have studied how discharge-sediment supply events force river evolution, these are few, and there are even less field examples. In this study we take advantage of a well-controlled field setting: a braided river reach that is exposed to repeated, regulated sediment-laden flows associated with hydropower exploitation. To quantify morphological change and sediment transfer, we adopted a combined remote sensing and modelling approach. 2. Approach This study is set in an upstream reach of the Borgne d’Arolla in south-west Switzerland. The river is subject to flow abstraction and transfer for hydropower purposes, and intermittent purges which are used to evacuate sediment from the intake into the river reach. Discharge and indirectly sediment supply of the purges were derived from data provided by the hydropower company Grand Dixence. Between these events, it was possible to access the stream bed, allowing a high level of quantification of the system evolution. First, drone-based aerial photogrammetry and repeated terrestrial laser scanner surveys were used to characterize and to quantify river bed morphology and morphodynamics. Second, we developed and calibrated a 2D hydro-morphological model and performed simulations for various flow and sediment supply scenarios. Third, we combined morphological change data with flow model predictions to infer spatially-distributed sediment transport rates which we related to both the purged intake volumes and the hydro-morphological simulation results. Combined, these
allow us to further explore the river bed morphodynamics, and assess the impact of upstream flow abstraction and sediment supply.
3. Results On the short time-scale of a series of purges, we show that the spatial and temporal distribution of sediment transport and morphological change varies strongly within the braided reach. The imposed upstream discharge and sediment load is rapidly and progressively altered when passing through the system, due to the forcing of the river bed morphology, which itself continuously changes in response to the sediment laden flows. Recurring patterns in sediment transport could be directly related to the migration of bars, exemplifying the strong interaction between morphology and sediment transport. This behaviour was largely controlled by the configuration of flow (channel cross section and configuration) and local deposition, where sediment at the end of any one flow event is locally stored and subsequently transported in the following flow event. The hydro-morphological modelling confirmed that individual sediment-laden flow events strongly interact with river bed morphology. In addition, we found that the regime of purging events leaves a characteristic imprint on river bed morphology. Therefore, besides the altered sediment transport capacity the adapted morphology affects both short and long term sediment transport variability.
4. Conclusion In this study we combined discharge and sediment supply data, remote sensing and hydro-morphological modelling to investigate riverbed morphodynamics and their interaction with sediment-laden flows. These data reveal a crucial point for how we conceptualise braided river dynamics. The internal morphodynamics of the system condition their own response to external forcing by, in this case, sediment laden purges. Thus, events with similar external forcing may lead to a different morphodynamic response and consequently sediment transfer. This point challenges simplistic notions regarding the equilibrium morphology that forms after adjustment to a flood event and emphasises the need to factor in historic evolution and morphodynamics in order to quantify and predict future system response.

93
Free and forced morphodynamics of river bifurcations:a novel theoretical framework
M. Redolfi1, G. Zolezzi1, M. Tubino1 and W. Bertoldi1
1Department of Civil, Environmental and Mechanical Engineering, University of Trento, Italy ([email protected])
1. IntroductionChannel bifurcation is a key process in many fluvial sys-
tems, such as braiding and anabranching rivers, river
deltas and alluvial fans. Natural bifurcations often ex-
hibit asymmetrical configurations, with an uneven parti-
tion of the discharge and the formation of a bed eleva-
tion gap between the downstream anabranches. Theoret-
ical models, flume experiments and numerical simulation
demonstrated that a geometrically symmetrical bifurca-
tion, with initially uniform bed elevation tends to develop
an asymmetrical configuration as the result of an instabil-
ity mechanism. In a recent study (Redolfi et al., 2016) we
have theoretically analysed the close connection between
the bifurcation instability and the theory of morphody-
namic influence (Zolezzi and Seminara, 2001). The study
is based on an analytical two-dimensional solution for a
geometrically simple bifurcation, and provides a physi-
cal explanation to the experimental results of Bertoldi and
Tubino (2007), who observed that the resonant value of
the upstream channel aspect ratio (Blondeaux and Semi-
nara, 1985) is the key parameter discriminating between
stable and unstable bifurcations. However, natural river
bifurcations often exhibit a significantly more complex
planform structure (Kleinhans et al., 2008), so that it is
necessary to extend the theory towards more realistic ge-
ometrical configurations.
2. MethodsWe consider a geometrically asymmetric bifurcation,
where the main channel is curved and the downstream
anabranches have different angles and longitudinal gra-
dients (Figure 1). We solve analytically a shallow water
morphodynamic model through an innovative application
of a perturbative approach to multi-thread channel config-
urations.
Figure 1. Sketch of the asymmetric bifurcation
configuration.
Specifically, we solve the differential system for the main
channel and the two anabranches separately, and than we
impose an internal boundary condition that ensures the
continuity of all the variables across the joining channels.
In this way we obtain a linear solution in closed form that
is formally valid when the geometrical variations are rel-
atively small (e.g., weak curvature).
3. ResultsThanks to the analytical approach it is possible to isolate
the role of the basic processes that are driving the bifur-
cation morphodynamics. Specifically, two fundamental
mechanisms can be identified: (i) the free autogenic in-
stability, and (ii) the forced, externally driven response to
different geometrical configurations.
Figure 2. Dimensionless bed elevation for a bifurcation
with curved inlet channel (analytical solution).
The model illustrates how a bifurcation that is intrinsi-
cally stable can be unbalanced by the forcing effect of
the geometrical asymmetry. For example, this is evident
when there is curvature of the main channel that tends to
deviate the flow and the sediment flux towards the outer
bank (Figure 2). The model allows predictions of the
water and sediment distribution of discharge between the
downstream anabranches, depending on channel geome-
try and flow characteristics. The outputs are tested against
a wide dataset including field, laboratory, and numerical
data of both gravel and sand bed bifurcations.
KeywordsBifurcations, instability, 2D modelling, analytical solu-
tion
ReferencesBertoldi, W. and Tubino, M. (2007). River Bifurcations:
Experimental observations on equilibrium configura-
tions. Water Resources Research, 43(10):1–10.
Blondeaux, P. and Seminara, G. (1985). A unified bar-
bend theory of river meanders. Journal of Fluid Me-
chanics, 157:449–470.
Kleinhans, M. G., Jagers, H. R. A., Mosselman, E., and
Sloff, C. J. (2008). Bifurcation dynamics and avulsion
duration in meandering rivers by one-dimensional and
three-dimensional models. Water Resources Research,
44(8):1–31.
Redolfi, M., Zolezzi, G., and Tubino, M. (2016). Free
instability of channel bifurcations and morphodynamic
influence. Journal of Fluid Mechanics, 799:476–504.
Zolezzi, G. and Seminara, G. (2001). Downstream and
upstream influence in river meandering. Part 1. General
theory and application to overdeepening. Journal of
Fluid Mechanics, 438:183–211.

94
A gravel-sand bifurcation: a simple model and
the stability of the equilibrium states Ralph M. J. Schielen1, and Astrid Blom2
1 Faculty of Engineering Technology, University of Twente, Enschede, Netherlands
[email protected] 3 Faculty of Engineering Technology and Geoscienses, Delft University of Technology, Delft, Netherlands
1. Introduction A river bifurcation, can be found in, for instance, a river delta, in braided or anabranching reaches, and in manmade side channels in restored river reaches. Depending on the partitioning of water and sediment over the bifurcating branches, the bifurcation develops toward (a) a stable state with two downstream branches or (b) a state in which the water discharge in one of the branches continues to increase at the expense of the other branch (Wang et al., 1995). This may lead to excessive deposition in the latter branch that eventually silts up. For navigation, flood safety, and river restoration purposes, it is important to assess and develop tools to predict such long-term behavior of the bifurcation. A first and highly schematized one-dimensional model describing (the development towards) the equilibrium states of two bifurcating branches was developed by Wang et al (1995). The use of a one-dimensional model implies the need for a nodal point relation that describes the partitioning of sediment over the bifurcating branches. Wang et al (1995) introduce a nodal point relation as a function of the partitioning of the water discharge. They simplify their nodal point relation to the following form: s*=q*
k, where s* denotes the ratio of the sediment discharges per unit width in the bifurcating branches, q* denotes the ratio of the water discharges per unit width in the bifurcating branches, and k is a constant. The Wang et al. (1995) model is limited to conditions with unisize sediment and application of the Engelund & Hansen (1967) sediment transport relation. They assume the same constant base level for the two bifurcating branches, and constant water and sediment discharges in the upstream channel. A mathematical stability analysis is conducted to predict the stability of the equilibrium states. Depending on the exponent k they find a stable equilibrium state with two downstream branches or a stable state with one branch only (i.e. the other branch has silted up). Here we extend the Wang et al. (1995) model to conditions with gravel and sand and study the stability of the equilibrium states. 2. Extension to mixed sediment Considering a two-fraction sediment mixture requires two nodal point relations, one for sand and one for gravel: sg*=g q*
l and ss*=s q*
m, where sg* (ss*) is the ratio of the gravel (sand) transport rates per unit width in the two bifurcating branches, and l, m, g, and s are constants. Following Wang et al.’s (1995) analysis for unisize sediment, we derive a system of ordinary differential equations for the flow depths in the
bifurcating branches and perform a stability analysis of the equilibrium solutions. The extension to mixed sediment reveals more complex behavior than the unisize case. Depending on the values for l and m we find 2 to 5 solutions for the combination of flow depths in the bifurcating branches. Two of these solutions are ones in which one of the branches silts up, yet their stability depends on the values for l and m. Furthermore, we find that whether the stable state consists of one or two branches (for the same values of l and m) depends on the initial conditions. The analysis also reveals the time scales of the approach toward the equilibrium state. The form of the nodal point relations (for gravel and sand) appears to determine the outcomes of our analysis. As our nodal point relations neglect several physical mechanisms (for instance bend flow upstream from the bifurcation), the results of our analysis likely have limited predictive value. Using measured data of a large bifurcation in the Dutch Rhine River, we provide a preliminary assessment of the stability of the bifurcation point in the long term. 3. Conclusions Our extension of the one-dimensional bifurcation model developed by Wang et. al (1995) to two sediment size fractions increases the number of unstable and stable equilibrium solutions with respect to the unisize case. The time scale of the evolution towards the equilibrium state appears to be in the order of decades. The form of the nodal point relations for the sediment size fractions largely affects the outcomes of our analysis and requires further research to allow for physically based predictions. This is worthwhile, as one-dimensional models are computationally cheap compared to two-dimensional models and provide a rapid assessment of the river’s development on the long term. Yet two-dimensional models represent some of the physical processes in an improved manner and do not suffer from the burden of the requirement of nodal point relations. Efforts to improve the nodal point relations should focus on including the effects of bend flow and lateral sediment transport upstream from the bifurcation, which will improve the validity of the one-dimensional model. References Wang, Z.B., R.J. Fokking, De Vries, M. and A.
Langerak (1995) Stability of river bifurcations in 1D morphodynamic models, J. Hydr. Res., 33 (6).
Engelund, F., and E. Hansen (1967), Monograph on sediment transport in alluvial streams, Tech. Rep., 63 pp., Hydraul. Lab., Tech. Univ. of Denmark.
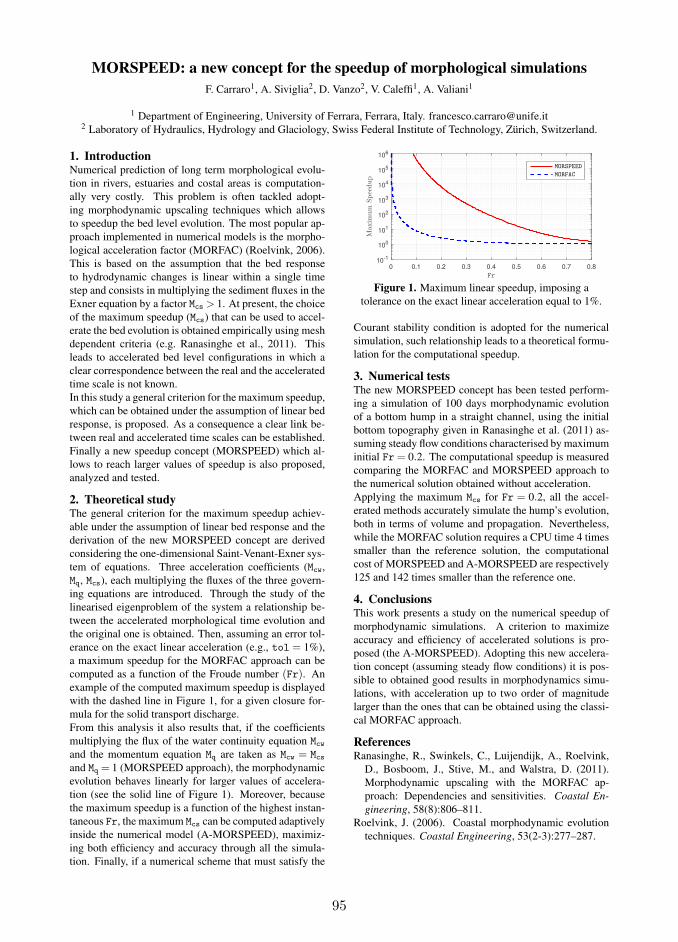
95
MORSPEED: a new concept for the speedup of morphological simulations
F. Carraro1, A. Siviglia2, D. Vanzo2, V. Caleffi1, A. Valiani1
1 Department of Engineering, University of Ferrara, Ferrara, Italy. [email protected] Laboratory of Hydraulics, Hydrology and Glaciology, Swiss Federal Institute of Technology, Zürich, Switzerland.
1. IntroductionNumerical prediction of long term morphological evolu-
tion in rivers, estuaries and costal areas is computation-
ally very costly. This problem is often tackled adopt-
ing morphodynamic upscaling techniques which allows
to speedup the bed level evolution. The most popular ap-
proach implemented in numerical models is the morpho-
logical acceleration factor (MORFAC) (Roelvink, 2006).
This is based on the assumption that the bed response
to hydrodynamic changes is linear within a single time
step and consists in multiplying the sediment fluxes in the
Exner equation by a factor Mcs > 1. At present, the choice
of the maximum speedup (Mcs) that can be used to accel-
erate the bed evolution is obtained empirically using mesh
dependent criteria (e.g. Ranasinghe et al., 2011). This
leads to accelerated bed level configurations in which a
clear correspondence between the real and the accelerated
time scale is not known.
In this study a general criterion for the maximum speedup,
which can be obtained under the assumption of linear bed
response, is proposed. As a consequence a clear link be-
tween real and accelerated time scales can be established.
Finally a new speedup concept (MORSPEED) which al-
lows to reach larger values of speedup is also proposed,
analyzed and tested.
2. Theoretical studyThe general criterion for the maximum speedup achiev-
able under the assumption of linear bed response and the
derivation of the new MORSPEED concept are derived
considering the one-dimensional Saint-Venant-Exner sys-
tem of equations. Three acceleration coefficients (Mcw,
Mq, Mcs), each multiplying the fluxes of the three govern-
ing equations are introduced. Through the study of the
linearised eigenproblem of the system a relationship be-
tween the accelerated morphological time evolution and
the original one is obtained. Then, assuming an error tol-
erance on the exact linear acceleration (e.g., tol = 1%),
a maximum speedup for the MORFAC approach can be
computed as a function of the Froude number (Fr). An
example of the computed maximum speedup is displayed
with the dashed line in Figure 1, for a given closure for-
mula for the solid transport discharge.
From this analysis it also results that, if the coefficients
multiplying the flux of the water continuity equation Mcw
and the momentum equation Mq are taken as Mcw = Mcs
and Mq = 1 (MORSPEED approach), the morphodynamic
evolution behaves linearly for larger values of accelera-
tion (see the solid line of Figure 1). Moreover, because
the maximum speedup is a function of the highest instan-
taneous Fr, the maximum Mcs can be computed adaptively
inside the numerical model (A-MORSPEED), maximiz-
ing both efficiency and accuracy through all the simula-
tion. Finally, if a numerical scheme that must satisfy the
0 0.1 0.2 0.3 0.4 0.5 0.6 0.7 0.8
Fr
10-1
100
101
102
103
104
105
106
Maxim
um
Speedup
MORSPEED
MORFAC
Figure 1. Maximum linear speedup, imposing a
tolerance on the exact linear acceleration equal to 1%.
Courant stability condition is adopted for the numerical
simulation, such relationship leads to a theoretical formu-
lation for the computational speedup.
3. Numerical testsThe new MORSPEED concept has been tested perform-
ing a simulation of 100 days morphodynamic evolution
of a bottom hump in a straight channel, using the initial
bottom topography given in Ranasinghe et al. (2011) as-
suming steady flow conditions characterised by maximum
initial Fr= 0.2. The computational speedup is measured
comparing the MORFAC and MORSPEED approach to
the numerical solution obtained without acceleration.
Applying the maximum Mcs for Fr = 0.2, all the accel-
erated methods accurately simulate the hump’s evolution,
both in terms of volume and propagation. Nevertheless,
while the MORFAC solution requires a CPU time 4 times
smaller than the reference solution, the computational
cost of MORSPEED and A-MORSPEED are respectively
125 and 142 times smaller than the reference one.
4. ConclusionsThis work presents a study on the numerical speedup of
morphodynamic simulations. A criterion to maximize
accuracy and efficiency of accelerated solutions is pro-
posed (the A-MORSPEED). Adopting this new accelera-
tion concept (assuming steady flow conditions) it is pos-
sible to obtained good results in morphodynamics simu-
lations, with acceleration up to two order of magnitude
larger than the ones that can be obtained using the classi-
cal MORFAC approach.
ReferencesRanasinghe, R., Swinkels, C., Luijendijk, A., Roelvink,
D., Bosboom, J., Stive, M., and Walstra, D. (2011).
Morphodynamic upscaling with the MORFAC ap-
proach: Dependencies and sensitivities. Coastal En-
gineering, 58(8):806–811.
Roelvink, J. (2006). Coastal morphodynamic evolution
techniques. Coastal Engineering, 53(2-3):277–287.
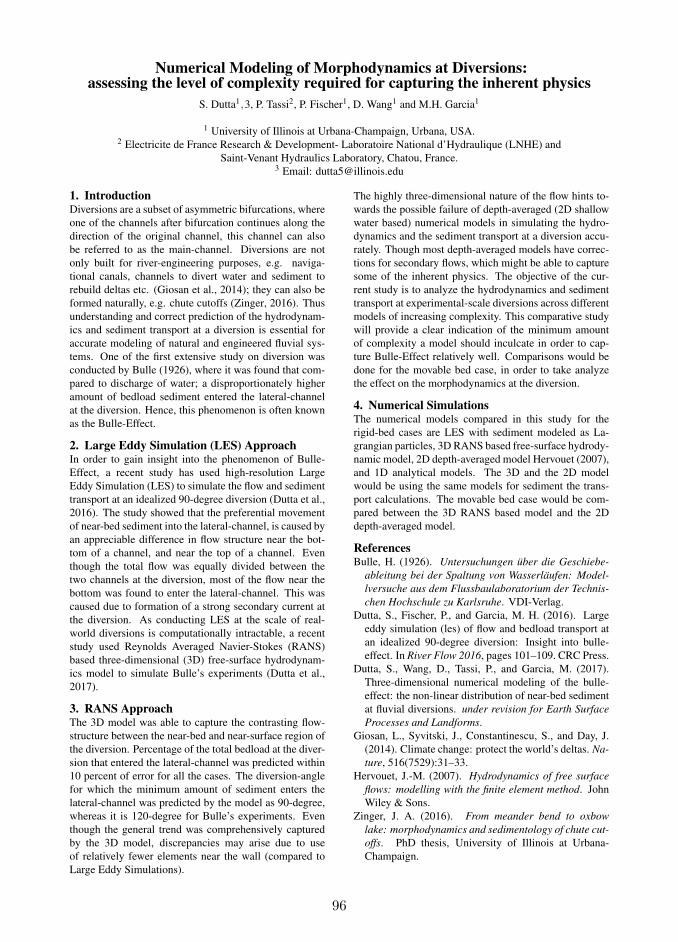
96
Numerical Modeling of Morphodynamics at Diversions:assessing the level of complexity required for capturing the inherent physics
S. Dutta1,3, P. Tassi2, P. Fischer1, D. Wang1 and M.H. Garcia1
1 University of Illinois at Urbana-Champaign, Urbana, USA.2 Electricite de France Research & Development- Laboratoire National d’Hydraulique (LNHE) and
Saint-Venant Hydraulics Laboratory, Chatou, France.3 Email: [email protected]
1. IntroductionDiversions are a subset of asymmetric bifurcations, where
one of the channels after bifurcation continues along the
direction of the original channel, this channel can also
be referred to as the main-channel. Diversions are not
only built for river-engineering purposes, e.g. naviga-
tional canals, channels to divert water and sediment to
rebuild deltas etc. (Giosan et al., 2014); they can also be
formed naturally, e.g. chute cutoffs (Zinger, 2016). Thus
understanding and correct prediction of the hydrodynam-
ics and sediment transport at a diversion is essential for
accurate modeling of natural and engineered fluvial sys-
tems. One of the first extensive study on diversion was
conducted by Bulle (1926), where it was found that com-
pared to discharge of water; a disproportionately higher
amount of bedload sediment entered the lateral-channel
at the diversion. Hence, this phenomenon is often known
as the Bulle-Effect.
2. Large Eddy Simulation (LES) ApproachIn order to gain insight into the phenomenon of Bulle-
Effect, a recent study has used high-resolution Large
Eddy Simulation (LES) to simulate the flow and sediment
transport at an idealized 90-degree diversion (Dutta et al.,
2016). The study showed that the preferential movement
of near-bed sediment into the lateral-channel, is caused by
an appreciable difference in flow structure near the bot-
tom of a channel, and near the top of a channel. Even
though the total flow was equally divided between the
two channels at the diversion, most of the flow near the
bottom was found to enter the lateral-channel. This was
caused due to formation of a strong secondary current at
the diversion. As conducting LES at the scale of real-
world diversions is computationally intractable, a recent
study used Reynolds Averaged Navier-Stokes (RANS)
based three-dimensional (3D) free-surface hydrodynam-
ics model to simulate Bulle’s experiments (Dutta et al.,
2017).
3. RANS ApproachThe 3D model was able to capture the contrasting flow-
structure between the near-bed and near-surface region of
the diversion. Percentage of the total bedload at the diver-
sion that entered the lateral-channel was predicted within
10 percent of error for all the cases. The diversion-angle
for which the minimum amount of sediment enters the
lateral-channel was predicted by the model as 90-degree,
whereas it is 120-degree for Bulle’s experiments. Even
though the general trend was comprehensively captured
by the 3D model, discrepancies may arise due to use
of relatively fewer elements near the wall (compared to
Large Eddy Simulations).
The highly three-dimensional nature of the flow hints to-
wards the possible failure of depth-averaged (2D shallow
water based) numerical models in simulating the hydro-
dynamics and the sediment transport at a diversion accu-
rately. Though most depth-averaged models have correc-
tions for secondary flows, which might be able to capture
some of the inherent physics. The objective of the cur-
rent study is to analyze the hydrodynamics and sediment
transport at experimental-scale diversions across different
models of increasing complexity. This comparative study
will provide a clear indication of the minimum amount
of complexity a model should inculcate in order to cap-
ture Bulle-Effect relatively well. Comparisons would be
done for the movable bed case, in order to take analyze
the effect on the morphodynamics at the diversion.
4. Numerical SimulationsThe numerical models compared in this study for the
rigid-bed cases are LES with sediment modeled as La-
grangian particles, 3D RANS based free-surface hydrody-
namic model, 2D depth-averaged model Hervouet (2007),
and 1D analytical models. The 3D and the 2D model
would be using the same models for sediment the trans-
port calculations. The movable bed case would be com-
pared between the 3D RANS based model and the 2D
depth-averaged model.
ReferencesBulle, H. (1926). Untersuchungen über die Geschiebe-
ableitung bei der Spaltung von Wasserläufen: Model-
lversuche aus dem Flussbaulaboratorium der Technis-
chen Hochschule zu Karlsruhe. VDI-Verlag.
Dutta, S., Fischer, P., and Garcia, M. H. (2016). Large
eddy simulation (les) of flow and bedload transport at
an idealized 90-degree diversion: Insight into bulle-
effect. In River Flow 2016, pages 101–109. CRC Press.
Dutta, S., Wang, D., Tassi, P., and Garcia, M. (2017).
Three-dimensional numerical modeling of the bulle-
effect: the non-linear distribution of near-bed sediment
at fluvial diversions. under revision for Earth Surface
Processes and Landforms.
Giosan, L., Syvitski, J., Constantinescu, S., and Day, J.
(2014). Climate change: protect the world’s deltas. Na-
ture, 516(7529):31–33.
Hervouet, J.-M. (2007). Hydrodynamics of free surface
flows: modelling with the finite element method. John
Wiley & Sons.
Zinger, J. A. (2016). From meander bend to oxbow
lake: morphodynamics and sedimentology of chute cut-
offs. PhD thesis, University of Illinois at Urbana-
Champaign.

97
Laboratory study on bedforms generated by solitary waves
G. la Forgia1,2, C. Adduce1, F. Falcini2 and C. Paola3
1 Department of Engineering, University Roma Tre, Rome, Italy. [email protected]
[email protected] 2 Institute of Atmospheric Sciences and Climate, National Research Council, Rome, Italy.
[email protected] 3 Saint Anthony Falls Laboratory, University of Minnesota, Minneapolis, MN. [email protected]
1. Introduction The role of solitary waves on sand-wave field formation is a topic of great interest nowadays (Droghei et al., 2016). We present results of a laboratory study of bedforms produced in sand by surface solitary waves (SSW). Our main focus is to investigate the dynamics of bedform generation induced by solitary waves. 2. The experimental setting We performed a series of laboratory experiments at the Saint Anthony Falls Laboratory in Minneapolis, in a 12 m long, 0.15 m wide and 0.5 m high flume. Figure 1 shows the initial experimental setting. The flume, filled with fresh water (ρ=1 g/cm3), has a movable gate on the left hand-side, placed to generate a displacement η0 between the free surfaces on either side of the gate. We used the lock-release method, essentially just a quick removal of the gate, to induce formation of a single solitary wave. SSW features depend on three parameters: the lock length x0, and the water depths h1 and h2. The bottom of the flume is rigid in the wave generation region. The domain of interest, in which the SSWs propagate, has a horizontal sand bed (D50=0.64), 2 cm thick (hs).
Figure 1. Schematic view of the experimental set up.
A high-resolution acoustic velocimeter and a digital pressure gauge locally measured both 3D water velocity and pressure induced on the bottom by each SSW. We measured the main wave features (i.e. amplitude, wavelength, and celerity) by image analysis. 3. Results For each experiment we generated 400 successive waves with the same features, in order to study their effect on the sandy bottom (Figure 2). The wave main action is to apply shear stress on the sandy bed, causing particle transport in the same direction of the wave. Depending on velocity and pressure fields induced by the wave, immediately after its passage, a back flow occurs near the bottom (Dutykh and Clamond, 2014). The experiments show that the reverse flow is induced by boundary layer separation due to the adverse horizontal pressure gradient as the wave passes. Both hydrostatic and dynamic pressure act simultaneously to influence
the boundary layer horizontal velocity. The boundary shear stress induced by the reverse flow can exceed the critical value, inducing backwards motion of the sand particles. This process is localized in one or more regions along the tank, depending on the wave features and on the wave steepening process. Initial erosion and accumulation zones form in these regions. The repeated action of successive SSWs causes the generation of the first isometric bedforms, which tend to migrate in the direction of wave propagation, increasing their number at the same time. The generation mechanism depends on the adverse pressure gradient and on the velocity field at the bottom during the wave passage.
Figure 2. A SSW propagating over the wave-induced
bedforms. 3. Conclusions Our laboratory experiments on solitary waves prove that the bedform generation depends on the reverse flow induced by the horizontal adverse pressure gradient. The pressure field induced at the bottom does not uniquely depend on the SSWs shape (i.e. amplitude and wavelength). The dynamic pressure also increases the adverse pressure gradient. The velocity field beneath the solitary wave and the water depth both affect the reverse shear stress at the bottom. References Droghei, R., Falcini, F., Casalbore, D., Martorelli, E.,
Mosetti, R., Sannino, G., Santoleri, R. a Chiocci, F. L. (2016) The role of Internal Solitary Waves on deep-water sedimentary processes: the case of up-slope migrating sediment waves off the Messina Strait. Nature, Scientific Reports 6, Article number: 36376, doi:10.1038/srep36376.
Dutykh, D. and Clamond, D. (2014). Efficient computation of steady solitary gravity waves. Wave
Motion. 51(1), doi:10.1016/j.wavemoti.2013.06.007.

98
Issues in Laboratory Experiments of River Morphodynamics
A. Crosato
Department of Water Science and Engineering, UNESCO-IHE, and Faculty of Civil Engineering and Geosciences, Delft University of Technology, Delft, the Netherlands. [email protected]
1. Introduction Laboratory experiments are key tools for the study of morphodynamic processes in rivers, complementary to numerical models and analytical descriptions. River systems are reproduced in the laboratory under strongly controlled conditions. This allows studying the effects of changing single variables on channel morphology. Because of their reduced scale, laboratory experiments present also reduced time scales and for this they also allow reproducing several scenarios in a relatively short time. Shortcomings are mostly related to the interpretation of the results at the real river scale, but also to the difficulty to properly measure some variables in strongly reduced settings. The present abstract presents these issues on the basis of personal experience gained in the laboratory at Delft Hydraulics and at the Technical University of Technology. 2. Experimental set-up design The design of experimental set-ups includes selecting flume geometry, sediment (size, gradation, density), vegetation (type, density, flexibility), boundary conditions, upstream (discharge regime, sediment inputs) and downstream, as well as initial configuration. Previous works have shown that sediment gradation strongly affects the channel width and depth evolution in the laboratory. Uniform sediment produces wider channels than graded sediment, since the latter results in less erodible banks (Byishimo, 2014). Suspension of sand requires velocities that are often difficult to obtain in laboratory settings, especially if at the same time the Froude number has to be small (Tewolde, 2015). This means that sediment should be carefully selected. The success of experiments depends also on flume size. Wider flumes are necessary with sediment feeding and variable discharge (Singh, 2015) and if vegetation is placed on emerging bars (Vargas-Luna, 2016). Measuring techniques and instruments often need appropriate geometries and hydraulic conditions, such as minimum water depths. Fulfilling those conditions often requires a larger channel and therefore a larger flume. Important morphodynamic characteristics, such as bed roughness and longitudinal slope, cannot be accurately predicted beforehand, but the geometry of the channel and the flow characteristics depend on their value. This means that mobile-bed experiments cannot be well designed without carrying out several explorative tests (e.g. Vargas-Luna et al., 2015). 3. Interpretation of observations Similarly to numerical models, also morphodynamic experiments require a spin-up period. The longitudinal slope always gradually adjusts to the boundary conditions, with consequent adaptation of the 2D bed topography. These 1D and 2D morphological adjustments may take hours to days, depending on the
size of the flume. Analytical studies have provided simple formulas for the assessment of their time scales (e.g. de Vries, 1975; Crosato, 2008). The theory of equilibrium gives an insight into the final configuration (Jansen et al., 1979) and is therefore useful to interpret the observed developments. Certain processes, such as bar formation, may require long-duration experiments. Stopping an experiment when the evolution is not complete may lead to important misinterpretations (Crosato et al, 2012). 4 Upscaling of results An important issue regards the interpretation of experimental results at the real river scale. Upscaling rules are suggested by Kleinhans et al. (2014), among others. Analytical studies have provided parameters to scale the 2D bed topography response, such as the interaction parameter (Struiksma et al., 1985) and the bar mode (as in Tewolde, 2015). Upscaling of vegetated systems remains an unsolved issue and can be only (partly) achieved using appropriate numerical models. References Byishimo, P. (2014). Effects of variable discharge on
width formation and cross-sectional shape of sinuous
rivers. MSc Thesis, UNESCO-IHE, Institute for Water Education, Delft, the Netherlands.
Crosato A. (2008). Analysis and modelling of river
meandering. PhD Thesis, TU Delft, the Netherlands. Crosato A. et al. (2012). Experimental and numerical
findings on the long-term evolution of migrating alternate bars in alluvial channels. Water Res. Res., 48, W06524, doi: 10.1029/2011WR011320.
De Vries M. (1975). A morphological time scale for rivers. In: Proc. 16th Congr. IAHR, São Paulo, vol. 2, B3, 17-23.
Jansen P. Ph. et al. (1979). Principles of river
engineering. The non-tidal alluvial river. Reprint Delft Academic Press (1994), Delft, the Netherlands.
Kleinhans M.G. et al. (2014). Quantifiable effectiveness of experimental scaling of river- and delta morphody-namics and stratigraphy. Earth-Sci. Rev., 133, 43-61.
Singh U. (2015). Controls on and morphodynamic
effects of width variations in bed-load dominated
alluvial channels: experimental and numerical study. PhD Thesis, Univ. of Trento and Queen Mary Univ.
Tewolde M.S. et al. (2015) Effects of suspended sediment on river bars. In: E-proc. 36th IAHR World
Congress, 28June-3July, the Hague, the Netherlands. Vargas-Luna et al. (2015). Laboratory investigation on
the hydrodynamic characterization of artificial grass. In: E-proc. 36th IAHR World Congress, 28June-3July, the Hague, the Netherlands.
Vargas-Luna A. (2016). Role of vegetaion on river bank
accretion. PhD Thesis, TU Delft, Delft, the Netherlands.
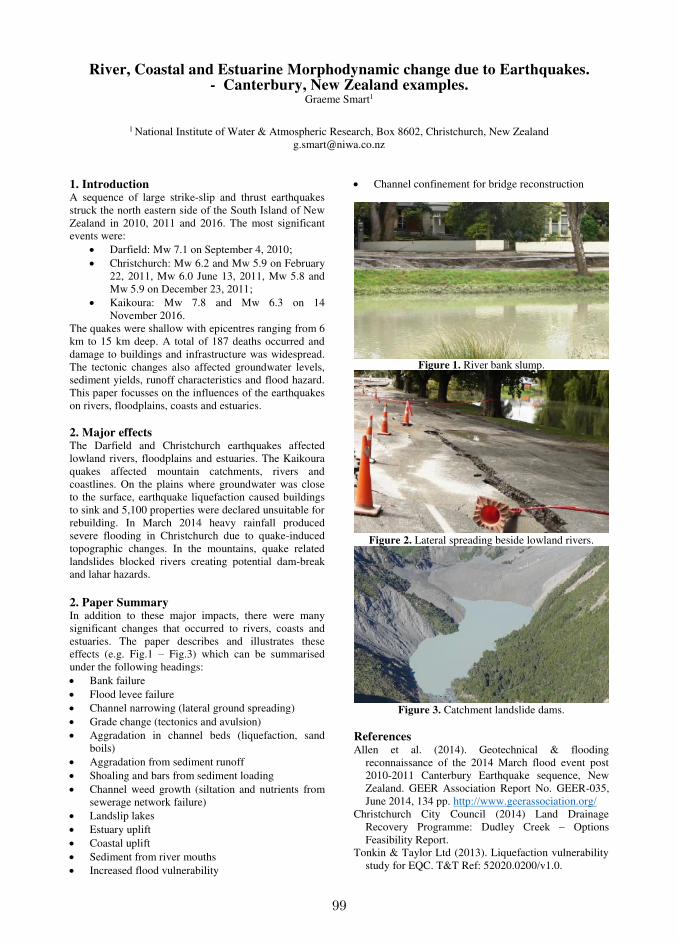
99
River, Coastal and Estuarine Morphodynamic change due to Earthquakes. - Canterbury, New Zealand examples.
Graeme Smart1
1 National Institute of Water & Atmospheric Research, Box 8602, Christchurch, New Zealand
1. Introduction A sequence of large strike-slip and thrust earthquakes struck the north eastern side of the South Island of New Zealand in 2010, 2011 and 2016. The most significant events were:
Darfield: Mw 7.1 on September 4, 2010; Christchurch: Mw 6.2 and Mw 5.9 on February
22, 2011, Mw 6.0 June 13, 2011, Mw 5.8 and Mw 5.9 on December 23, 2011;
Kaikoura: Mw 7.8 and Mw 6.3 on 14 November 2016.
The quakes were shallow with epicentres ranging from 6 km to 15 km deep. A total of 187 deaths occurred and damage to buildings and infrastructure was widespread. The tectonic changes also affected groundwater levels, sediment yields, runoff characteristics and flood hazard. This paper focusses on the influences of the earthquakes on rivers, floodplains, coasts and estuaries. 2. Major effects The Darfield and Christchurch earthquakes affected lowland rivers, floodplains and estuaries. The Kaikoura quakes affected mountain catchments, rivers and coastlines. On the plains where groundwater was close to the surface, earthquake liquefaction caused buildings to sink and 5,100 properties were declared unsuitable for rebuilding. In March 2014 heavy rainfall produced severe flooding in Christchurch due to quake-induced topographic changes. In the mountains, quake related landslides blocked rivers creating potential dam-break and lahar hazards.
2. Paper Summary In addition to these major impacts, there were many significant changes that occurred to rivers, coasts and estuaries. The paper describes and illustrates these effects (e.g. Fig.1 – Fig.3) which can be summarised under the following headings: Bank failure Flood levee failure Channel narrowing (lateral ground spreading) Grade change (tectonics and avulsion) Aggradation in channel beds (liquefaction, sand
boils) Aggradation from sediment runoff Shoaling and bars from sediment loading Channel weed growth (siltation and nutrients from
sewerage network failure) Landslip lakes Estuary uplift Coastal uplift Sediment from river mouths Increased flood vulnerability
Channel confinement for bridge reconstruction
Figure 1. River bank slump.
Figure 2. Lateral spreading beside lowland rivers.
Figure 3. Catchment landslide dams.
References Allen et al. (2014). Geotechnical & flooding
reconnaissance of the 2014 March flood event post 2010-2011 Canterbury Earthquake sequence, New Zealand. GEER Association Report No. GEER-035, June 2014, 134 pp. http://www.geerassociation.org/
Christchurch City Council (2014) Land Drainage Recovery Programme: Dudley Creek – Options Feasibility Report.
Tonkin & Taylor Ltd (2013). Liquefaction vulnerability study for EQC. T&T Ref: 52020.0200/v1.0.

100
Modelling And Tracing of a Sub-Sea robot Geometry in Deep Caspian Sea using Neuro-fuzzy systems And Genetic Algorithms
A. Alaeipour11, A. Harounabadi22 and H. Morovvati33
1 Department of Computer, Kish International Branch, Islamic Azad University, Kish Island, IRAN.
[email protected] 2 Department of Computer, Kish International Branch, Islamic Azad University, Kish Island, IRAN.
[email protected] 3 Faculty of ocean science, Islamic Azad University, North-Tehran, IRAN.
1. Introduction The Depth of Caspian Sea which is located in North of Iran is about 1025m. Research works and Technical activities in such Depth is very difficult and sensitive. By progressing high-Technology in Sub Sea, we can use the special geometry of Robots and smart Rov’s for inspection support sampling and recognize. In controlling and stability the Sub-Sea Robot, The
effect of Ekman depth and spiral also hydrodynamic
pressure and using of sea column energy for Robot
motion are very important. because in the surface layers
of Caspian sea orbital currents, Path-Lines, and
Stream-Lines due to waves ,currents and high
turbulence of this layers should be considered.
Understanding the Bathymetry of Caspian Sea, robot
should have at least four-characteristics such as S4
(small, smart, strong, speed systems). Construction,
Modelling and Tracing such systems is very difficult .we
can use the cable system or smart system. Because of
Caspian Sea, salinity and Depth-Environment geometry
and dimension are needed to control the pipeline and
platform systems. Neural and fuzzy Methods have been
used in computer Modelling .Robots can sink about
1025m depth to check the oil and gas sea bed systems
and environmental research. Bathymetry, sampling of
sediment, marine heritage tracing and biology research
are very important for such unmanned systems. In this
paper, by introducing a new high-tech Sub-Sea Smart
Robot by Neural and fuzzy Methods, we understand new
Techniques of complexity of such systems. In many
applications, Sub-Sea Robots needs to be flexible to any
given depth, properties of sea waters, hydrodynamics
forces and used energy .Tracing of a special Path-lines
in sea waters for Robots and stability the balance of
geometry are important. Controlling and guiding the
Robot to special points of Sea bed is a must.
Performance evaluation system is done in two method,
modelling and simulation as one of the most efficient
methods of modelling approach is considered. Smart
robots need to have the proper path along the way. In
addition to precision routing, non-functional
characteristics such as response time are also
considered. In the current research using neural network
and Mamdani fuzzy system for robot the right path
recognized. Effective factors are identifying in routing
underwater robot as input to the neural network and the
ability of the robot to be considerate as a parameter is
considered. Formation of the linguistic variables used in
Mamdani system. Effective parameters in undersea
robot used in fuzzy system. Mamdani fuzzy rules
resulting from the system resulting in increased accuracy
and efficiency. With regard to the uncertainty on the
parameters have been identified, the proposed approach
provides better accuracy compared with previous works.
References
Hossein Morovvati (2007). Fluid Mechanics.Kabe-Del
Publisher. Hossein Morovvati (2005). Hydraulic principles coastal
estuaries.Darya-Sar Publisher. Hossein Morovvati (2007). Coastal Engineering.Kabe-
Del Publisher. S. Kodogiannis, P. J. G. Lisboa And J. Lucas (1996).
Neural network modelling and control for Underwater vehicles.Artificial Intelligence in Engineering. Vol. 10, Issue 3, pp. 203-212.
Javadi-Moghaddam And A. Bagheri (2010). An adaptive neuro-fuzzy sliding mode based genetic algorithm. Control system for under water remotely operated vehicle, Vol. 37. Issue 1. pp. 647-660.
Bagheri Ahmad And Javadi Moghaddam Jalal (2009). Simulation and tracking control based on Neural-network strategy and sliding-mode control for underwater remotely operated vehicle. Neurocomputing, Vol. 72. Issues 7–9. pp. 1934-1950.
Hossein Morovvati (2005). Introduction to Physical Oceanography and Ocean.First Edition.Tehran.Abzian Publisher.

101
Sensitivity of foreland cuspate migration to wave climateA. Barkwith1, M.D. Hurst2, A. Payo1 and M.A. Ellis1
1 British Geological Survey, Keyworth, Nottingham, United Kingdom. [email protected] School of Geographical and Earth Sciences, University of Glasgow, Glasgow, United Kingdom.
Abstract
Hazard and risk associated with coastal erosion are
anticipated to increase on coastlines during the twenty-
first century due to rising sea level, increases in the
frequency and intensity of storms, and changes in
nearshore wave climate (Nicholls and Cazenave, 2010).
These processes and their consequent interactions can be
complex and non-linear, making future predictions
based on past erosion rates highly uncertain. To reduce
the risk associated with coastal erosion there is a need
to base predictions of coastal change on quantitative
methods.
At the mesoscale (101 to 102 km at annual to decadal
timescales) relatively small changes in coastal position
can have major social and economic consequences.
Some of the most dynamic coastal features at these
scales are sand waves, cuspate forelands and spits,
formed by oblique waves transporting sediment along
the coast. These features offer protection to soft
sediment coastlines and their loss can lead to instances
of increased erosion, while their addition can afford a
temporary or quasi-permanent (on the human timescale)
halt in erosion. At theses scales, numerical models
provide a tool to quantitatively assess the impacts of
climate and environmental change on coastal
morphology. They have been shown to reproduce the
range of coastal features formed under high-angle wave
climate, with model output matching observed coastal
features and their rates of migration (see for example
Ashton et al., 2001; Ashton and Murray, 2006; van den
Berg et al., 2012; Kaergaard and Fredsoe, 2013).
The focus of modelling studies has been on matching
geometry under differing wave climates; recreating sand
waves, cuspate bumps, flying spits and reconnecting
spits. Although the form of coastal features has been
explored in detail there has been little investigation into
the rate of migration, growth or loss under differing
wave modes. The evolution of these features is
important when considering the future risk associated
with coastal erosion for a particular location under a
changing climate or environment. To address this we use
the one-line Coastal Vector Evolution model (COVE:
Hurst et al. (2014) ) to quantitatively assess the impact
of current and future wave climate on the evolution of a
foreland cuspate feature. Taking Benacre Ness, UK, as
a case study, the model is calibrated against fifty years
of geo-referenced ariel photography. The influence of
past wave mode characteristics on migration is
elucidated before future migration up to 2100 is
assessed.
References
Ashton, A.D., Murray, A.B., (2006). High-age wave
instability and emergent shoreline shapes: 1.
Modeling of sand waves, flying spits, and capes. J.
Geophys. Res. Earth Surf., 111, F04011.
Ashton, A., Murray, A.B., Arnoult, O., (2001).
Formation of coastline features by largescale
instabilities induced by high-angle waves. Nature,
414, 296-300.
Hurst, M.D., Barkwith, A., Ellis, M.A., Thomas, C.W.,
Murray, B.A., (2015). Exploring the sensitivities of
crenulate bay shorelines to wave climates using a new
vectorbased one-line model. J. Geophys. Res. Earth
Surf., 120, 2586e2608.
Kaergaard, K., Fredsoe, J., (2013). Numerical modeling
of shoreline undulations part 1: Constant wave
climate, Coast. Eng., 75, 64–76.
Nicholls, R.J., and Cazenave, A., (2010). Sea-Level Rise
and Its Impact on Coastal Zones. Science, 5985 (328),
1517-1520.
Van den Berg, N., Falqués, A., Ribas F., (2012).
Modeling large scale shoreline sand waves under
oblique wave incidence. J. Geophys. Res., 117,
F03019.
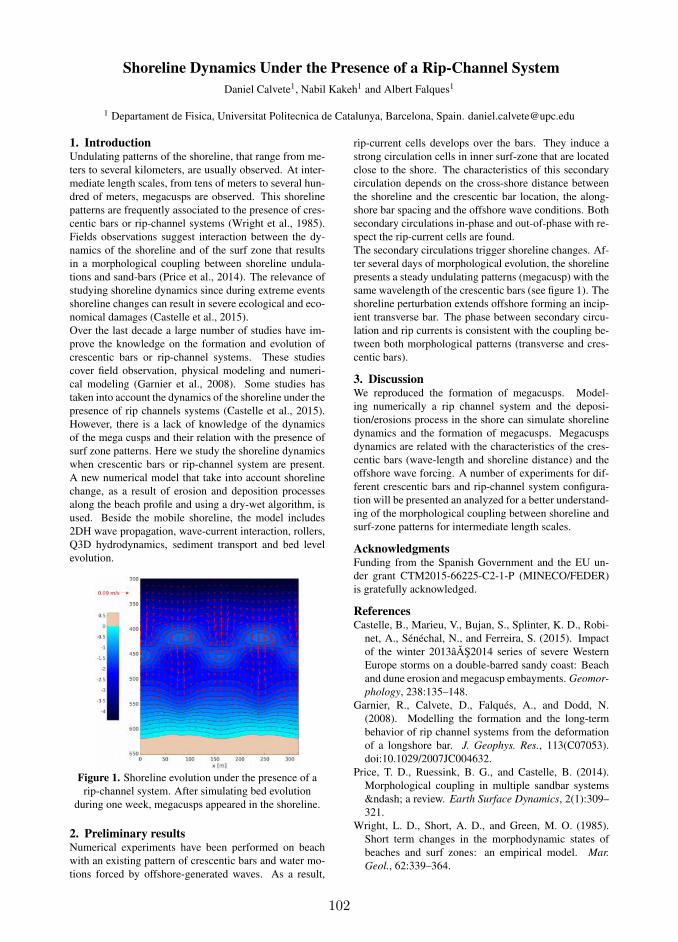
102
Shoreline Dynamics Under the Presence of a Rip-Channel System
Daniel Calvete1, Nabil Kakeh1 and Albert Falques1
1 Departament de Fisica, Universitat Politecnica de Catalunya, Barcelona, Spain. [email protected]
1. IntroductionUndulating patterns of the shoreline, that range from me-
ters to several kilometers, are usually observed. At inter-
mediate length scales, from tens of meters to several hun-
dred of meters, megacusps are observed. This shoreline
patterns are frequently associated to the presence of cres-
centic bars or rip-channel systems (Wright et al., 1985).
Fields observations suggest interaction between the dy-
namics of the shoreline and of the surf zone that results
in a morphological coupling between shoreline undula-
tions and sand-bars (Price et al., 2014). The relevance of
studying shoreline dynamics since during extreme events
shoreline changes can result in severe ecological and eco-
nomical damages (Castelle et al., 2015).
Over the last decade a large number of studies have im-
prove the knowledge on the formation and evolution of
crescentic bars or rip-channel systems. These studies
cover field observation, physical modeling and numeri-
cal modeling (Garnier et al., 2008). Some studies has
taken into account the dynamics of the shoreline under the
presence of rip channels systems (Castelle et al., 2015).
However, there is a lack of knowledge of the dynamics
of the mega cusps and their relation with the presence of
surf zone patterns. Here we study the shoreline dynamics
when crescentic bars or rip-channel system are present.
A new numerical model that take into account shoreline
change, as a result of erosion and deposition processes
along the beach profile and using a dry-wet algorithm, is
used. Beside the mobile shoreline, the model includes
2DH wave propagation, wave-current interaction, rollers,
Q3D hydrodynamics, sediment transport and bed level
evolution.
Figure 1. Shoreline evolution under the presence of a
rip-channel system. After simulating bed evolution
during one week, megacusps appeared in the shoreline.
2. Preliminary resultsNumerical experiments have been performed on beach
with an existing pattern of crescentic bars and water mo-
tions forced by offshore-generated waves. As a result,
rip-current cells develops over the bars. They induce a
strong circulation cells in inner surf-zone that are located
close to the shore. The characteristics of this secondary
circulation depends on the cross-shore distance between
the shoreline and the crescentic bar location, the along-
shore bar spacing and the offshore wave conditions. Both
secondary circulations in-phase and out-of-phase with re-
spect the rip-current cells are found.
The secondary circulations trigger shoreline changes. Af-
ter several days of morphological evolution, the shoreline
presents a steady undulating patterns (megacusp) with the
same wavelength of the crescentic bars (see figure 1). The
shoreline perturbation extends offshore forming an incip-
ient transverse bar. The phase between secondary circu-
lation and rip currents is consistent with the coupling be-
tween both morphological patterns (transverse and cres-
centic bars).
3. DiscussionWe reproduced the formation of megacusps. Model-
ing numerically a rip channel system and the deposi-
tion/erosions process in the shore can simulate shoreline
dynamics and the formation of megacusps. Megacusps
dynamics are related with the characteristics of the cres-
centic bars (wave-length and shoreline distance) and the
offshore wave forcing. A number of experiments for dif-
ferent crescentic bars and rip-channel system configura-
tion will be presented an analyzed for a better understand-
ing of the morphological coupling between shoreline and
surf-zone patterns for intermediate length scales.
AcknowledgmentsFunding from the Spanish Government and the EU un-
der grant CTM2015-66225-C2-1-P (MINECO/FEDER)
is gratefully acknowledged.
ReferencesCastelle, B., Marieu, V., Bujan, S., Splinter, K. D., Robi-
net, A., Sénéchal, N., and Ferreira, S. (2015). Impact
of the winter 2013âAS2014 series of severe Western
Europe storms on a double-barred sandy coast: Beach
and dune erosion and megacusp embayments. Geomor-
phology, 238:135–148.
Garnier, R., Calvete, D., Falqués, A., and Dodd, N.
(2008). Modelling the formation and the long-term
behavior of rip channel systems from the deformation
of a longshore bar. J. Geophys. Res., 113(C07053).
doi:10.1029/2007JC004632.
Price, T. D., Ruessink, B. G., and Castelle, B. (2014).
Morphological coupling in multiple sandbar systems
– a review. Earth Surface Dynamics, 2(1):309–
321.
Wright, L. D., Short, A. D., and Green, M. O. (1985).
Short term changes in the morphodynamic states of
beaches and surf zones: an empirical model. Mar.
Geol., 62:339–364.
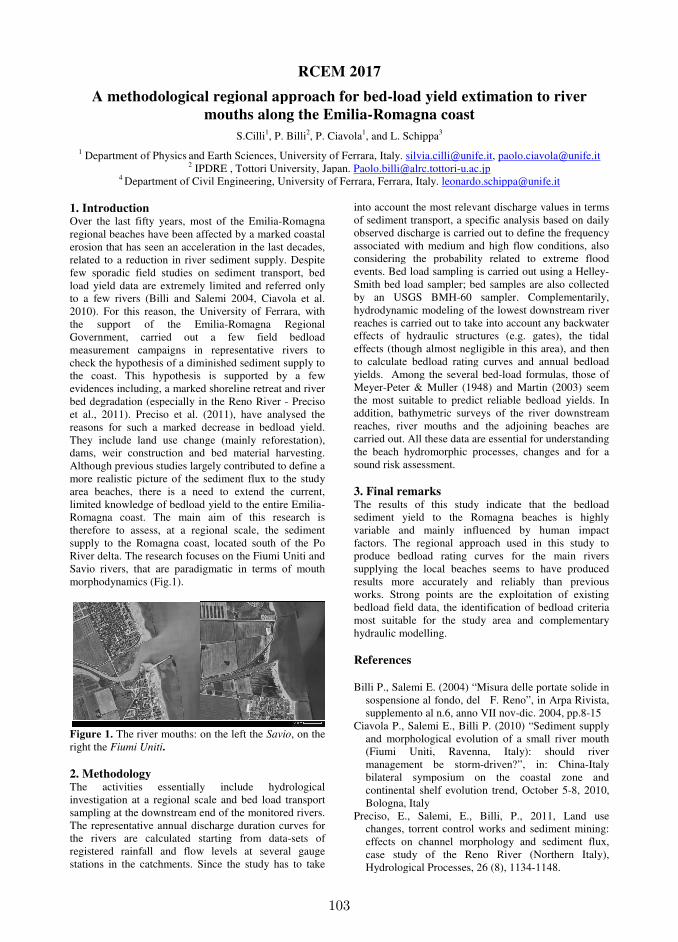
103
A methodological region
mouth
S.C1 Department of Physics and Earth Scie
2 IPDRE , Tot4 Department of Civil Enginee
1. Introduction Over the last fifty years, most of the Eregional beaches have been affected by erosion that has seen an acceleration in related to a reduction in river sedimentfew sporadic field studies on sedimenload yield data are extremely limited ato a few rivers (Billi and Salemi 20042010). For this reason, the University the support of the Emilia-RomGovernment, carried out a few measurement campaigns in represencheck the hypothesis of a diminished sethe coast. This hypothesis is suppoevidences including, a marked shorelinebed degradation (especially in the Renoet al., 2011). Preciso et al. (2011), hareasons for such a marked decrease inThey include land use change (mainldams, weir construction and bed matAlthough previous studies largely contrimore realistic picture of the sediment farea beaches, there is a need to extelimited knowledge of bedload yield to thRomagna coast. The main aim of therefore to assess, at a regional scalsupply to the Romagna coast, located River delta. The research focuses on theSavio rivers, that are paradigmatic in morphodynamics (Fig.1).
Figure 1. The river mouths: on the left right the Fiumi Uniti. 2. Methodology The activities essentially includeinvestigation at a regional scale and besampling at the downstream end of the The representative annual discharge durthe rivers are calculated starting froregistered rainfall and flow levels astations in the catchments. Since the s
RCEM 2017
ional approach for bed-load yield extim
ths along the Emilia-Romagna coast
S.Cilli1, P. Billi2, P. Ciavola1, and L. Schippa3
ciences, University of Ferrara, Italy. [email protected] University, Japan. [email protected]
neering, University of Ferrara, Ferrara, Italy. leonardo.sc
e Emilia-Romagna y a marked coastal in the last decades, ent supply. Despite ent transport, bed and referred only
004, Ciavola et al. ty of Ferrara, with magna Regional
w field bedload entative rivers to sediment supply to ported by a few
ine retreat and river eno River - Preciso have analysed the in bedload yield. inly reforestation), aterial harvesting. tributed to define a t flux to the study xtend the current, o the entire Emilia-f this research is cale, the sediment ed south of the Po the Fiumi Uniti and in terms of mouth
ft the Savio, on the
ude hydrological bed load transport
monitored rivers. duration curves for from data-sets of at several gauge study has to take
into account the most relevantof sediment transport, a specifobserved discharge is carried oassociated with medium and hconsidering the probability revents. Bed load sampling is cSmith bed load sampler; bed by an USGS BMH-60 sahydrodynamic modeling of thereaches is carried out to take ineffects of hydraulic structureeffects (though almost negligito calculate bedload rating cuyields. Among the several beMeyer-Peter & Muller (1948)the most suitable to predict raddition, bathymetric surveysreaches, river mouths and thcarried out. All these data are the beach hydromorphic procsound risk assessment. 3. Final remarks The results of this study insediment yield to the Romvariable and mainly influenfactors. The regional approacproduce bedload rating curvsupplying the local beaches results more accurately andworks. Strong points are thebedload field data, the identifmost suitable for the study hydraulic modelling. References
Billi P., Salemi E. (2004) “Mis
sospensione al fondo, del supplemento al n.6, anno VI
Ciavola P., Salemi E., Billi P.and morphological evolutio(Fiumi Uniti, Ravenna,management be storm-drbilateral symposium on continental shelf evolution Bologna, Italy
Preciso, E., Salemi, E., Bichanges, torrent control woeffects on channel morphocase study of the Reno Hydrological Processes, 26
timation to river
e.it, [email protected] .jp [email protected]
ant discharge values in terms cific analysis based on daily d out to define the frequency d high flow conditions, also y related to extreme flood s carried out using a Helley-
samples are also collected sampler. Complementarily, the lowest downstream river e into account any backwater tures (e.g. gates), the tidal igible in this area), and then curves and annual bedload bed-load formulas, those of 48) and Martin (2003) seem t reliable bedload yields. In
s of the river downstream the adjoining beaches are re essential for understanding rocesses, changes and for a
indicate that the bedload omagna beaches is highly uenced by human impact oach used in this study to urves for the main rivers
seems to have produced nd reliably than previous the exploitation of existing tification of bedload criteria y area and complementary
isura delle portate solide in l F. Reno”, in Arpa Rivista, VII nov-dic. 2004, pp.8-15 P. (2010) “Sediment supply tion of a small river mouth
, Italy): should river driven?”, in: China-Italy
n the coastal zone and n trend, October 5-8, 2010,
illi, P., 2011, Land use works and sediment mining: phology and sediment flux, no River (Northern Italy), 6 (8), 1134-1148.

104
The role of oblique wave incidence on crescentic bar dynamics R. L. de Swart1, F. Ribas1, D. Calvete1
1 Department of Physics, Universitat Politècnica de Catalunya, c/ Jordi Girona 1-3, 08034 Barcelona, Spain.
[email protected], [email protected], [email protected]
1. Introduction Crescentic sand bars have been studied intensively during the last decades, resulting in a relatively good knowledge of their characteristics and dynamics (Price and Ruessink, 2011; Garnier et al., 2013; and references therein). However, the role of wave obliquity in crescentic bar formation and destruction is not yet clear. Crescentic bar destruction, also called bar straightening, was previously associated primarily with high-energy wave conditions, but recent observational and model studies have shown that crescentic bars can straighten in both intermediate- and high-energy wave conditions if the waves are obliquely incident (Price and Ruessink, 2011; Garnier et al., 2013). However, crescentic bars have also been observed to form under oblique waves (Price and Ruessink, 2011). This paper aims at increasing our understanding on the role of wave obliquity on the dynamics of crescentic bars, combining observations at an open, Mediterranean beach and numerical simulations with a morphodynamic model. 2. Study site and observational methods The studied sandy beach is located at Castelldefels city (20 km southwest of Barcelona, northeast Spain). Its shoreline is oriented east-west and the median grain size is 270 µm. During the study period (October 2010 to December 2014), six bathymetric surveys were conducted, which show the presence of an outer bar and an inner bar or terrace. The long-term average values of Hrms, Tp and (absolute) θ at 10 m depth are 0.32 m, 4.4 s and 37°, respectively, so obliquely incident waves are common. During the study period, crescentic bar events were detected using a dataset of time-exposure video images (e.g., Figure 1), paying special attention to formation and destruction moments. The barlines were extracted from the planview images and the characteristics were computed: alongshore-averaged cross-shore position, wavelength, amplitude and alongshore migration rate.
3. Preliminary results of the observations The inner bar of Castelldefels showed a crescentic shape during 48% of the study period. The formation of crescentic bars was strongly influenced by the initial configuration of the bathymetry since most of the events occurred during periods when the bar was located relatively far offshore, at about x=190 m. This happened up to April 2011 and during 2013 and 2014 (Figure 1). The characteristics of the crescentic bars detected during 2013 and 2014 were analysed in more detail. The bars contained up to 9 undulations and showed a large variability in wavelength (from 100 to 500 m), with an averaged value of 245 m. The amplitude (ranging from 3 to 18 m) and the migration rate (ranging from 0 to 20 m/d) showed less variation. In 2013-2014, crescentic
bars typically developed during periods with low- to intermediate-energy wave conditions (Hrms≤0.8 m) and both oblique and shore-normal angles of incidence. Sandbar straightening at Castelldefels was preferably observed in case of oblique waves (for both intermediate- and high-energy conditions). 4. Preliminary conclusions and further work The observations at Castelldefels confirm the important role of the wave angle in crescentic bar destruction since most of straightening moments occurred under oblique waves (of intermediate to high energy). Oblique waves (of low to intermediate energy) were also present during bar formation of some of the events, with normal waves being present during the formation of the other events. A more detailed analysis of the observations is needed in order to distinguish and characterize the two scenarios (formation versus destruction). Moreover, a morphodynamic model based on linear stability analysis (Ribas et al., 2011) will be applied to the Castelldefels site in order to understand how wave obliquity affects crescentic bar formation and destruction. Particular attention will be paid to the role of wave rollers, which are known to affect crescentic bar dynamics (Ribas et al., 2011). Acknowledgments This research is part of the Spanish Government project CTM2015-66225-C2-1-P (MINECO/FEDER). References Ribas, F., de Swart, H. E., Calvete, D. and Falqués, A.
(2011). Modeling waves, currents and sandbars on natural beaches: The effect of surface rollers. J. Mar.
Syst., 88: 90–101. doi:10.1016/j.jmarsys.2011.02.016. Garnier, R., Falqués, A., Calvete, D., Thiebot, J., and
Ribas, F., 2013. A mechanism for sandbar straightening by oblique wave incidence. Geophys.
Res. Letters, 40(11): 2726-2730. doi:10.1002/grl.50464.
Price, T. D., and Ruessink, B. G., 2011. State dynamics of a double sandbar system. Cont. Shelf Res., 31(6): 659-674. doi:10.1016/j.csr.2010.12.018.
Figure 1. Planview time-exposure video image of
Castelldefels beach with a crescentic bar (August 2014).

105
Groin effects on artificial nourishments performance: Laboratory tests
A. Guimarães1, C. Coelho2, F. Veloso-Gomes3, and P.A. Silva4
1 RISCO and Civil Engineering Department, Aveiro University, Aveiro, Portugal. [email protected]
2 RISCO and Civil Engineering Department, Aveiro University, Aveiro, Portugal. [email protected] 3 Civil Engineering Department, Faculty of Engineering of the University of Porto, Porto, Portugal. [email protected]
4 CESAM and Physics Department, Aveiro University, Aveiro, Portugal. [email protected]
1. Introduction Assessment criteria for designing nourishment projects should take into consideration the presence of coastal structures and their influence on sediment transport and hydrodynamic processes. Thus, this work aimed to monitor the sediment transport characteristics and beach morphological evolution in the laboratory, at model scale, when combining artificial nourishments operations with the presence of groins. The laboratory tests were performed at a wave basin located in the Faculty of Engineering of the University of Porto, Portugal between September and December 2016. The model was defined taking in consideration the most common hydrodynamic and sediment transport characteristics of the Portuguese NW coast. 2. Laboratory tests Two main scenarios were defined, each one divided in two stages, one with and another without the presence of an artificial nourishment: scenario A, represent a beach without the presence of hard coastal interventions (Figure 1); and scenario B, corresponds to a beach extension located updrift of a groin (Figure 2). For each scenario, an artificial nourishment was placed over the existing beach after a stable configuration (equilibrium) had been reached.
Figure 1. Scenario A, laboratory configuration.
Figure 2. Scenario B, laboratory configuration (groin
placed downdrift).
The model scales were defined by considering the Froude scaling relations. The modelled beach presents both longshore and cross-shore extensions of 10m. The sediments were characterized by a median grain size of 0.27mm. The submerged cross-shore profile was defined with Dean’s (1991) equilibrium profile shape, while a slope of 0.03 characterized the emerged extension. The wave climate was defined through a JONSWAP spectrum with a significant wave height of 12.5cm and a peak period of 2.13s. The nourishment was designed to increase the beach width in 2.5m and it had an extension of 6.5m in the longshore direction. Three Acoustic Doppler Velocimeter (ADV’s), 2 Optical Backscatters (OBS’s), and 1 optical fibre concentration sensor (it has a smaller control volume than the OBS) were deployed at several positions over the middle cross-shore profile. The bathymetry was monitored over 7 profiles using a profiler with a mechanical probe. 3. Data analysis The velocities (ADV) and the suspended sediment concentrations (OBS) measurements allowed to estimate the total longshore transport and its cross-shore distribution. This, combined with the morphodynamic data allowed to quantify both the impact of the groin and nourishment in the sediment transport. From the he spreading of the nourishment, the erosion or accretion rates and the shoreline movement over time it is possible to identify which nourishment configuration works the best (higher increase in efficiency and maintenance cost reduction).
4. Conclusions The groin appears to lead to a slower spreading of the nourishment and to a higher increase of the beach width with the nourishment. The shoreline retreat was greater and faster for scenario A after the nourishment. Nevertheless, the cross-shore morphological evolution (berm and the offshore profile limit) seems to have been similar for both scenarios. The groin blocked almost all of the longshore sediment transport. Acknowledgments André Guimarães is supported by the Foundation for Science and Technology through the PhD Grant SFRH/BD/103694/2014. The laboratory facilities and Nuno Oliveira, from Watgrid Solutions are also acknowledged. References Dean, R.G. (1991). Equilibrium Beach Profiles:
Characteristics and Applications. Journal of Coastal
Research. 7(1): 53-84.
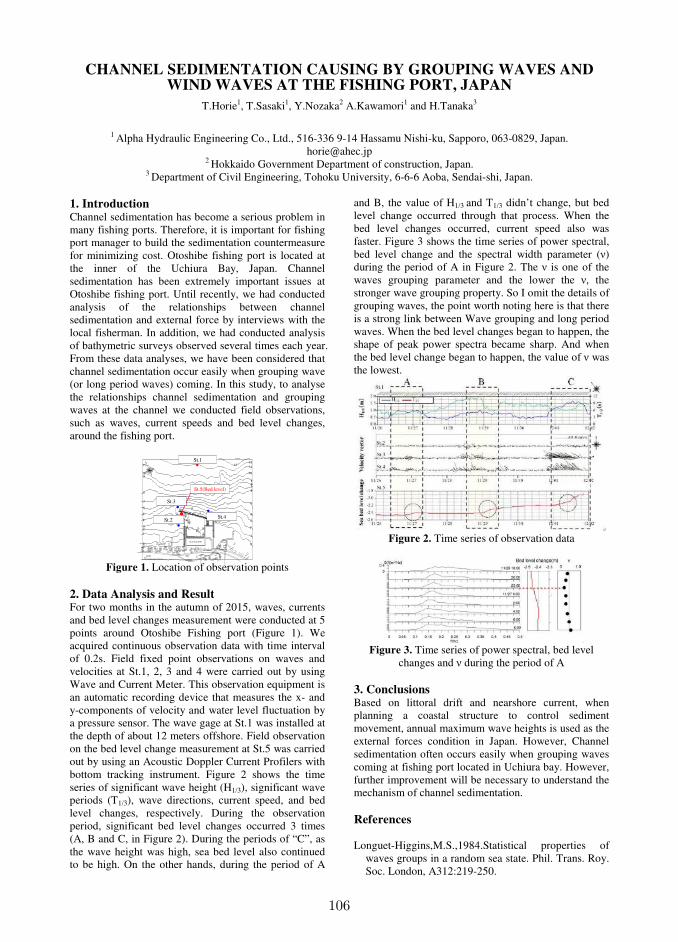
106
CHANNEL SEDIMENTATION CAUSING BY GROUPING WAVES AND WIND WAVES AT THE FISHING PORT, JAPAN
T.Horie1, T.Sasaki1, Y.Nozaka2 A.Kawamori1 and H.Tanaka3
1 Alpha Hydraulic Engineering Co., Ltd., 516-336 9-14 Hassamu Nishi-ku, Sapporo, 063-0829, Japan.
[email protected] 2 Hokkaido Government Department of construction, Japan.
3 Department of Civil Engineering, Tohoku University, 6-6-6 Aoba, Sendai-shi, Japan.
1. Introduction Channel sedimentation has become a serious problem in many fishing ports. Therefore, it is important for fishing port manager to build the sedimentation countermeasure for minimizing cost. Otoshibe fishing port is located at the inner of the Uchiura Bay, Japan. Channel sedimentation has been extremely important issues at Otoshibe fishing port. Until recently, we had conducted analysis of the relationships between channel sedimentation and external force by interviews with the local fisherman. In addition, we had conducted analysis of bathymetric surveys observed several times each year. From these data analyses, we have been considered that channel sedimentation occur easily when grouping wave (or long period waves) coming. In this study, to analyse the relationships channel sedimentation and grouping waves at the channel we conducted field observations, such as waves, current speeds and bed level changes, around the fishing port.
3
( )
流況観測 St.4
砂面観測 St.5
流況観測 St.3
流況観測 St.2
波浪観測 St.1
0
1
23
4
5
6
7
8
910
11
45
4
3
43
3
0
1
2
3
4
0
1
2
3
5
6789
10
11
1213
St.1
St.5(Bed level)
St.4St.2
St.3
Figure 1. Location of observation points
2. Data Analysis and Result For two months in the autumn of 2015, waves, currents and bed level changes measurement were conducted at 5 points around Otoshibe Fishing port (Figure 1). We acquired continuous observation data with time interval of 0.2s. Field fixed point observations on waves and velocities at St.1, 2, 3 and 4 were carried out by using Wave and Current Meter. This observation equipment is an automatic recording device that measures the x- and y-components of velocity and water level fluctuation by a pressure sensor. The wave gage at St.1 was installed at the depth of about 12 meters offshore. Field observation on the bed level change measurement at St.5 was carried out by using an Acoustic Doppler Current Profilers with bottom tracking instrument. Figure 2 shows the time series of significant wave height (H1/3), significant wave periods (T1/3), wave directions, current speed, and bed level changes, respectively. During the observation period, significant bed level changes occurred 3 times (A, B and C, in Figure 2). During the periods of “C”, as the wave height was high, sea bed level also continued to be high. On the other hands, during the period of A
and B, the value of H1/3 and T1/3 didn’t change, but bed level change occurred through that process. When the bed level changes occurred, current speed also was faster. Figure 3 shows the time series of power spectral, bed level change and the spectral width parameter (ν) during the period of A in Figure 2. The ν is one of the waves grouping parameter and the lower the ν, the stronger wave grouping property. So I omit the details of grouping waves, the point worth noting here is that there is a strong link between Wave grouping and long period waves. When the bed level changes began to happen, the shape of peak power spectra became sharp. And when the bed level change began to happen, the value of ν was the lowest.
Figure 2. Time series of observation data
Figure 3. Time series of power spectral, bed level
changes and ν during the period of A
3. Conclusions Based on littoral drift and nearshore current, when planning a coastal structure to control sediment movement, annual maximum wave heights is used as the external forces condition in Japan. However, Channel sedimentation often occurs easily when grouping waves coming at fishing port located in Uchiura bay. However, further improvement will be necessary to understand the mechanism of channel sedimentation. References Longuet-Higgins,M.S.,1984.Statistical properties of
waves groups in a random sea state. Phil. Trans. Roy. Soc. London, A312:219-250.
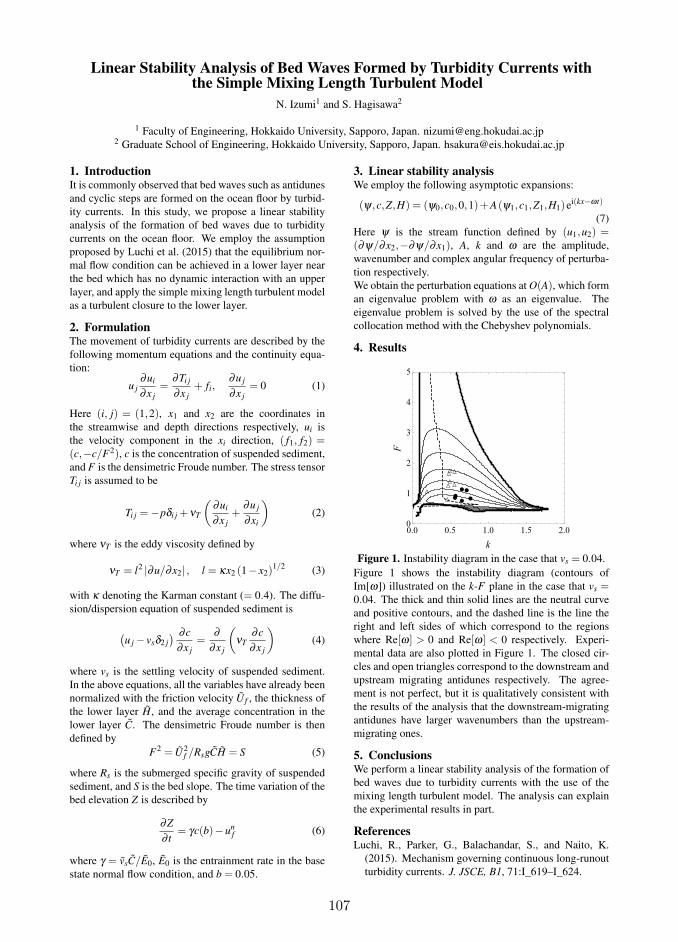
107
Linear Stability Analysis of Bed Waves Formed by Turbidity Currents withthe Simple Mixing Length Turbulent Model
N. Izumi1 and S. Hagisawa2
1 Faculty of Engineering, Hokkaido University, Sapporo, Japan. [email protected] Graduate School of Engineering, Hokkaido University, Sapporo, Japan. [email protected]
1. IntroductionIt is commonly observed that bed waves such as antidunes
and cyclic steps are formed on the ocean floor by turbid-
ity currents. In this study, we propose a linear stability
analysis of the formation of bed waves due to turbidity
currents on the ocean floor. We employ the assumption
proposed by Luchi et al. (2015) that the equilibrium nor-
mal flow condition can be achieved in a lower layer near
the bed which has no dynamic interaction with an upper
layer, and apply the simple mixing length turbulent model
as a turbulent closure to the lower layer.
2. FormulationThe movement of turbidity currents are described by the
following momentum equations and the continuity equa-
tion:
u j
∂ui
∂x j
=∂Ti j
∂x j
+ fi,∂u j
∂x j
= 0 (1)
Here (i, j) = (1,2), x1 and x2 are the coordinates in
the streamwise and depth directions respectively, ui is
the velocity component in the xi direction, ( f1, f2) =(c,−c/F2), c is the concentration of suspended sediment,
and F is the densimetric Froude number. The stress tensor
Ti j is assumed to be
Ti j =−pδi j +νT
(
∂ui
∂x j
+∂u j
∂xi
)
(2)
where νT is the eddy viscosity defined by
νT = l2 |∂u/∂x2| , l = κx2 (1− x2)1/2
(3)
with κ denoting the Karman constant (= 0.4). The diffu-
sion/dispersion equation of suspended sediment is
(
u j − vsδ2 j
) ∂c
∂x j
=∂
∂x j
(
νT
∂c
∂x j
)
(4)
where vs is the settling velocity of suspended sediment.
In the above equations, all the variables have already been
normalized with the friction velocity U f , the thickness of
the lower layer H, and the average concentration in the
lower layer C. The densimetric Froude number is then
defined by
F2 = U2f /RsgCH = S (5)
where Rs is the submerged specific gravity of suspended
sediment, and S is the bed slope. The time variation of the
bed elevation Z is described by
∂Z
∂ t= γc(b)−un
f (6)
where γ = vsC/E0, E0 is the entrainment rate in the base
state normal flow condition, and b = 0.05.
3. Linear stability analysisWe employ the following asymptotic expansions:
(ψ,c,Z,H) = (ψ0,c0,0,1)+A(ψ1,c1,Z1,H1)ei(kx−ωt)
(7)
Here ψ is the stream function defined by (u1,u2) =(∂ψ/∂x2,−∂ψ/∂x1), A, k and ω are the amplitude,
wavenumber and complex angular frequency of perturba-
tion respectively.
We obtain the perturbation equations at O(A), which form
an eigenvalue problem with ω as an eigenvalue. The
eigenvalue problem is solved by the use of the spectral
collocation method with the Chebyshev polynomials.
4. Results
Figure 1. Instability diagram in the case that vs = 0.04.
Figure 1 shows the instability diagram (contours of
Im[ω]) illustrated on the k-F plane in the case that vs =0.04. The thick and thin solid lines are the neutral curve
and positive contours, and the dashed line is the line the
right and left sides of which correspond to the regions
where Re[ω] > 0 and Re[ω] < 0 respectively. Experi-
mental data are also plotted in Figure 1. The closed cir-
cles and open triangles correspond to the downstream and
upstream migrating antidunes respectively. The agree-
ment is not perfect, but it is qualitatively consistent with
the results of the analysis that the downstream-migrating
antidunes have larger wavenumbers than the upstream-
migrating ones.
5. ConclusionsWe perform a linear stability analysis of the formation of
bed waves due to turbidity currents with the use of the
mixing length turbulent model. The analysis can explain
the experimental results in part.
ReferencesLuchi, R., Parker, G., Balachandar, S., and Naito, K.
(2015). Mechanism governing continuous long-runout
turbidity currents. J. JSCE, B1, 71:I_619–I_624.

108
Coupled topographic and vegetation patterns in
coastal dunes from remote sensing
F. Yousefi Lalimi1, S. Silvestri2, L. J. Moore3 and M. Marani4
1 Division of Earth and Ocean Sciences, Nicholas School of the Environment, Duke University, Durham, North
Carolina, USA. [email protected] 2 Nicholas School of the Environment, Duke University, Durham, North Carolina, USA, and Department of Land,
Environment, Agriculture, and Forestry, University of Padova, Padua, Italy. [email protected] 3 Department of Geological Sciences, University of North Carolina at Chapel Hill, Chapel Hill, North Carolina, USA.
[email protected] 4 Department of Civil, Environmental and Architectural Engineering, University of Padua, Padua, Italy, and Nicholas
School of the Environment, Duke University, Durham, North Carolina, USA. [email protected]
1. Introduction Vegetation plays a key role in barrier islands dynamics by moderating the effects of storms through sand stabilization and trapping. Vegetation establishment and growth are qualitatively known to depend on environmental factors that vary with elevation and distance from the shoreline (Young et al., 2011), but we lack an adequate characterization of the spatial distribution of barrier island vegetation in relation to topographic determinants. Here we develop and use remote sensing analyses to quantitatively characterize coastal dune eco-topographic patterns by simultaneously identifying the spatial distribution of topographic elevation and vegetation biomass.
Figure 1. Seaward side of the foredune (dune line closest to the shoreline) at Hog Island. (a) Vegetation cover is sparser on the seaward side of the dune and increases toward the dune crest. (b and c) The photos on the right illustrate the range of vegetation cover encountered in the area. 2. Methods The study area is located in Hog Island (Virginia, USA) and is characterized by multiple continuous dune ridges. The most abundant vegetation species are Ammophila breviligulata, Spartina patens, and Panicum amarum (Figure 1). We performed a field campaign in July 2015 to quantify vegetation cover along 3 transects, from shoreline to back dune area, to be used as ground-truthing for remote-sensing-inferred topographic and vegetation distributions. We use data from an airborne hyperspectral sensor to characterize the spatial distribution of vegetation biomass through the computation of the Normalized Difference Vegetation Index (NDVI). We then use airborne LiDAR data to generate an accurate digital terrain model (DTM), to be
used as a reference for the LiDAR-based estimation of the Leaf Area Index (LAI), a characterization of above-ground vegetation biomass and structure. LAI is estimated based on the probability that a laser beam will penetrate the canopy to reach the ground (Houldcroft et al., 2005), in turn estimated by analyzing LiDAR returns. Finally, we study the spatial distribution of LAI, as a proxy for biomass, as a function of different topographic metrics, such as distance fromt the shoreline and from the dune crest. 3. Conclusions Our results show that whereas mapping dune vegetation species using hyperspectral remote sensing is challenging, optical and lidar data can be successfully used to characterize overall vegetation density. A comparison between hyperspectral-derived NDVI and lidar-derived LAI shows a coherent relationship and the spatial distributions of estimated LAI and NDVI agree with the fractional vegetation cover observed in the field. The results also suggest that on the seaward side of foredune vegetation is sparser than in other areas, while it is densest on the back side of a dunes. This higher density is attributed to the sheltering effect of the dune crest line. The position of the foredune crestline is here proposed as a chief ecomorphodynamic determinant and feature, resulting from the two-way interaction between vegetation and topography.
Acknowledgments This work was supported by supported by National Science
Foundation, Geomorphology and Land- use Dynamics
Program (EAR-1530233). We would like to thank J. Zinnert
for providing the remotely-sensed data. We also thank Bijan
Seyednasrollah and E. deVries for fieldwork assistance.
References Houldcroft, C. J., C. L. Campbell, I. J. Davenport, R. J.
Gurney, and N. Holden (2005), Measurement of canopy
geometry characteristics using LiDAR laser altimetry: A
feasibility study, IEEE Trans. Geosci. Remote Sens.,
43(10), 2270–2282, doi:10.1109/Tgrs.2005.856639. Young, D. R., S. T. Brantley, J. C. Zinnert, and J. K. Vick
(2011), Landscape position and habitat polygons in a
dynamic coastal environment, Ecosphere, 2(6), 71.
109
A mechanism for long-runout turbidity currents
R. Luchi1, S. Balachandar2, G. Seminara3 and G. Parker1,4
1 Department of Civil and Environmental Engineering, University of Illinois at Urbana-Champaign, Urbana, Illinois,
USA. [email protected]
2 Department of Mechanical and Aerospace Engineering, University of Florida, Gainesville, Florida, USA. [email protected]
3 Department of Civil, Environmental and Architectural Engineering, University of Genova, Genova, Italy. [email protected]
4 Department of Geology, University of Illinois at Urbana-Champaign, Urbana, Illinois, USA. [email protected]
1. Abstract
Turbidity currents in lakes and oceans involve leveed channels that document coherent runouts of 100's and up to 1000's of km. They do so without dissipating themselves via excess entrainment of ambient water.
It is generally known that currents associated with stable stratification, such as thermohaline underflows, undergo dissipation as they entrain ambient water. Here we ask why some continuous turbidity currents do not follow this tendency, as they can run out extremely long distances while maintaining their coherency. A current that becomes ever thicker downstream due to ambient water entrainment cannot select the scales necessary to maintain a coherent, slowly-varying channel depth and width over 1000 km. It has been assumed that a turbidity current may tend to a state with a densimetric Froude so low that ambient water entrainment is largely suppressed.
Here, we show that such an argument is a case of special pleading. Instead, suspended sediment 'fights back’ against upward mixing through its fall velocity; the water may be entrained, but the sediment need not follow.
We use a formulation capturing the flow vertical structure to show the conditions under which a turbidity current can asymptotically partition itself into two layers. The lower 'driving layer’ approaches an asymptotic state with invariant flow thickness, velocity profile and suspended sediment concentration profile when traversing a constant bed slope under bypass conditions. This thickness provides a scale for channel characteristics. The upper 'driven layer' continues to entrain ambient water, but the concentration there becomes ever more dilute, and the layer ultimately has no interaction with near-bed processes (and by implication bed morphology). This partition is a likely candidate for the mechanism by which the driving layer is able to run out long distances, maintaining coherence and keeping confined, over repeated flow events, within a leveed subaqueous channel of its own creation.
110
A New Shoreline Instability Mechanism Related to High-Angle WavesNabil Kakeh1, Albert Falqués1 and Daniel Calvete1
1 Departament de Física, Universitat Politècnica de Catalunya, Spain. nabil.kakeh @upc.edu
1. Introduction
The alongshore wave driven sediment transport can
render a rectilinear coastline unstable in case of very
oblique wave incidence. This can be seen by looking at
the total alongshore transport rate Q (m3/s), which can
be parameterized, for instance, by the CERC formula:
)(2sin2/5 bbKHQ (1)
where K is an empirical constant, Hb is the wave height
at breaking, θb is the angle between wave fronts at
breaking and mean shoreline orientation and φ is the
angle of the local shoreline. For φ=0, keeping Hb
constant and varying θb, Q has a maximum for θb = 45o,
and this has been recognized as the source of the
instability for θb > 45o (Zenkovitz, 1959). But because of
wave refraction wave angle at breaking is hardly larger
than 45o and shoreline instability would rarely occur in
nature. If one assumes that a change of the shoreline is
linked to the same change on the bathymetric contours
up to deep water and that these contours are
approximately rectilinear, Q can be cast as a function of
the wave angle in deep water, θ0, in such a way that it
has a maximum for θ0=42o. As a result, the shoreline is
unstable if θ0>42o, which is not uncommon (Ashton et
al., 2001). The hypotheses of the latter study are very
strong but Falqués and Calvete (2005) (and others later
on) showed that realistic bathymetric changes linked to
shoreline changes could also lead to the instability
provided that they reach deep enough into the shoaling
zone. The aim of this contribution is: i) showing that
wave angle at breaking can be larger than 45o in some
cases, ii) showing that the instability can occur in this
case without involving bathymetric changes in the
shoaling zone (which are essential for the traditional
high-angle wave instability, where θb < 45o) and iii)
exploring the features emerging from the instability and
their typical length and time scales.
2. Preliminary results using a one-line type model
We have used a linear stability model (1D-morfo) based
on the one-line shoreline approximation that is capable
of describing shoreline instabilities associated to high-
angle waves (Falqués and Calvete, 2005). High angles at
breaking, θb, are more easily found in case of locally
generated wind waves in shallow enclosed water bodies.
Therefore, we focus in small short period waves with
high angles in relatively shallow water. We assume
waves of Hs=0.35 m, Tp=1.4 s with an angle θ=70o at a
water depth, D=1 m. By assuming γb = (Hrms)b/Db=0.5,
these waves break approximately at Db=0.34 m with an
angle θb = 45.1o . By assuming that the shoreline
perturbation does not reach beyond the surf zone, i.e.,
Dc=Db, we have computed the growthrate, σ, as a
function of the alongshore wavelength, L. It is seen that
shoreline undulations of any wavelength can emerge and
σ grows without bound when L→0. Thus, in contrast
with the traditional high-angle wave instability (θb < 45o,
Dc>Db) there is no preferred wavelength.
3. Discussion
Shoreline instability is driven by the alongshore
gradients in Q in case of an undulating shoreline. These
gradients come from the gradients in φ, Hb and θb in
equation (1). If Dc=Db, the waves do not feel any
bathymetric perturbation before breaking, with the result
that the undulations in the shoreline do not cause
gradients in Hb and θb. In this case, the governing
equation for the shoreline displacement (one-line
approximation) is a diffusion equation with positive
(negative) diffusivity if θb < 45o (θb > 45o) (Falqués,
2003). The free wave-like solutions of a diffusion
equation with negative diffusivity, ε <0, have a positive
real growthrate σ = − ε/L2, which is well reproduced by
the 1D-morfo model. But it is obvious that this
behaviour is unrealistic as the one-line approximation is
only valid at length scales larger than the surf zone
width. Thus, the 1Dmorfo instability curve is only valid
for L > ∼ 50 m and for smaller wavelengths surf zone
processes might interact with the basic instability driven
by the littoral drift described by 1D-morfo. As a result,
the σ(L) curve would have a maximum for some Lm,
hence determining a characteristic wavelength. This
requires, however, the use of a fully 2DH
morphodynamic model and work is in progress in this
line. The present research has been motivated by the fact
that complex morphologies are very frequent at the
shores of shallow enclosed water bodies as lakes, basins
and bays.
Acknowledgements
Funding from the Spanish Government and the EU
under grant CTM2015-66225-C2-1-P
(MINECO/FEDER) is gratefully acknowledged.
References
Ashton A., Murray A.B. and Arnault, O., 2001.
Formation of coastline features by large-scale
instabilities induced by high-angle waves. Nature, 414:
296-300.
Falqués A., 2003. On the diffusivity in coastline
dynamics. Geophys. Res. Lett., 30 (21),
doi:10.1029/2003GL017760.
Falqués A. and Calvete D., 2005. Large scale dynamics
of sandy coastlines. Diffusivity and instability. J.
Geophys. Res., 110, C03007,
doi:10.1029/2004JC002587.
Zenkovitch, V.P., 1959. On the genesis of cuspate spits
along lagoon shores. J. Geology, 67: 269-277.
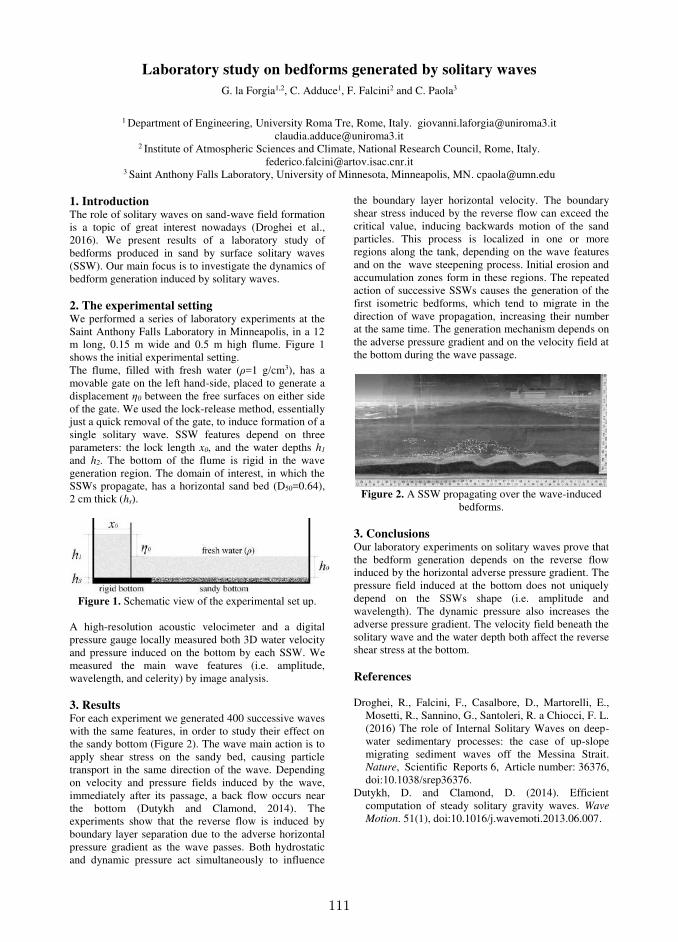
111
Laboratory study on bedforms generated by solitary waves
G. la Forgia1,2, C. Adduce1, F. Falcini2 and C. Paola3
1 Department of Engineering, University Roma Tre, Rome, Italy. [email protected]
[email protected] 2 Institute of Atmospheric Sciences and Climate, National Research Council, Rome, Italy.
[email protected] 3 Saint Anthony Falls Laboratory, University of Minnesota, Minneapolis, MN. [email protected]
1. Introduction The role of solitary waves on sand-wave field formation is a topic of great interest nowadays (Droghei et al., 2016). We present results of a laboratory study of bedforms produced in sand by surface solitary waves (SSW). Our main focus is to investigate the dynamics of bedform generation induced by solitary waves. 2. The experimental setting We performed a series of laboratory experiments at the Saint Anthony Falls Laboratory in Minneapolis, in a 12 m long, 0.15 m wide and 0.5 m high flume. Figure 1 shows the initial experimental setting. The flume, filled with fresh water (ρ=1 g/cm3), has a movable gate on the left hand-side, placed to generate a displacement η0 between the free surfaces on either side of the gate. We used the lock-release method, essentially just a quick removal of the gate, to induce formation of a single solitary wave. SSW features depend on three parameters: the lock length x0, and the water depths h1 and h2. The bottom of the flume is rigid in the wave generation region. The domain of interest, in which the SSWs propagate, has a horizontal sand bed (D50=0.64), 2 cm thick (hs).
Figure 1. Schematic view of the experimental set up.
A high-resolution acoustic velocimeter and a digital pressure gauge locally measured both 3D water velocity and pressure induced on the bottom by each SSW. We measured the main wave features (i.e. amplitude, wavelength, and celerity) by image analysis. 3. Results For each experiment we generated 400 successive waves with the same features, in order to study their effect on the sandy bottom (Figure 2). The wave main action is to apply shear stress on the sandy bed, causing particle transport in the same direction of the wave. Depending on velocity and pressure fields induced by the wave, immediately after its passage, a back flow occurs near the bottom (Dutykh and Clamond, 2014). The experiments show that the reverse flow is induced by boundary layer separation due to the adverse horizontal pressure gradient as the wave passes. Both hydrostatic and dynamic pressure act simultaneously to influence
the boundary layer horizontal velocity. The boundary shear stress induced by the reverse flow can exceed the critical value, inducing backwards motion of the sand particles. This process is localized in one or more regions along the tank, depending on the wave features and on the wave steepening process. Initial erosion and accumulation zones form in these regions. The repeated action of successive SSWs causes the generation of the first isometric bedforms, which tend to migrate in the direction of wave propagation, increasing their number at the same time. The generation mechanism depends on the adverse pressure gradient and on the velocity field at the bottom during the wave passage.
Figure 2. A SSW propagating over the wave-induced
bedforms. 3. Conclusions Our laboratory experiments on solitary waves prove that the bedform generation depends on the reverse flow induced by the horizontal adverse pressure gradient. The pressure field induced at the bottom does not uniquely depend on the SSWs shape (i.e. amplitude and wavelength). The dynamic pressure also increases the adverse pressure gradient. The velocity field beneath the solitary wave and the water depth both affect the reverse shear stress at the bottom. References Droghei, R., Falcini, F., Casalbore, D., Martorelli, E.,
Mosetti, R., Sannino, G., Santoleri, R. a Chiocci, F. L. (2016) The role of Internal Solitary Waves on deep-water sedimentary processes: the case of up-slope migrating sediment waves off the Messina Strait. Nature, Scientific Reports 6, Article number: 36376, doi:10.1038/srep36376.
Dutykh, D. and Clamond, D. (2014). Efficient computation of steady solitary gravity waves. Wave
Motion. 51(1), doi:10.1016/j.wavemoti.2013.06.007.
112
Numerical simulation of dredging and sediment disposal in fluvial and coastal areas
M. Louyot1, B. Glander2, R. Kopmann2, P. Tassi1, and O. Brivois3
1 EDF R&D Saint-Venant Laboratory for Hydraulics, Chatou, France. [email protected] / [email protected] 2 Bundesanstalt für Wasserbau, Karlsruhe, Germany. [email protected] / [email protected]
3 BRGM French Geological Survey, France. [email protected] 1. Introduction Maintenance of a minimum depth in ports, harbors and water intakes usually requires the removal and the disposal of the dredged material. In considering the environmental effects of maintenance dredging and disposal, the potential impact of these operations should not be overlooked. These include, for example, the removal of sediments and their relocation to the river, estuarine or marine environment, with possible consequences on the ecosystem. The selection of a site for sediment removal and disposal involves considerations of the natural environment and variability, and also economic and operational feasibility. A numerical model capable to predict the environmental effects of sediment dredging and disposal for both the short and long time scale at the site of dredging or disposal (near field) and the surrounding area (far field) would be beneficial not only for the assessment of potential effects but also to delimit the boundaries of the sediment removal and disposal sites, resulting in a selected area where the environmental disturbance and detriment are minimal. The module NESTOR, recently implemented into the Telemac-Mascaret modelling system (TMS, www.opentelemac.org), takes advantage of the existing two-dimensional hydrodynamic, sediment transport and bed evolution models to simulate sediment dredging and disposal operations for near and far field environments at the short and long time scales. 2. Numerical model Numerical simulations of dredging and sediment disposal operations can be modelled as discrete events of bottom changes. Flow, sediment transport and morphological changes interact with dredging and sediment disposal operations. All these processes are modelled with the hydrodynamics solver of the TMS, internally coupled to the sediment transport and bed evolution module and the dredging and disposal module. In this work, only passive transport-dispersion is considered. The hydrodynamics model is based on the solution of the 2D depth-averaged shallow-water equations. Forcing effects due to the wave’ action can also be considered. The evolution of the bottom is computed from the sediment mass balance equation and a sediment transport model, with an appropriate parameterization of relevant physical processes, such as bed slope and secondary currents effects. The suspended sediment transport is computed by solving an advection-diffusion equation, with a closure relationship for the entrainment of the non-cohesive sediment. For sediment dredging and disposal operations, each event must be described in the module NESTOR. The describing parameters are the time period, the rate (or volume) of dredged and disposed sediment, the location
and extension of the dredging and disposal areas, the composition of the disposed sediments and the choice between constant fill or constant bottom level in a disposal area. Furthermore, automatic dredging and disposal operations can be defined by a criteria (e.g. minimal water depth). 3. Model results 3.1 Dredging and disposal in a unidirectional flow
Dredged material dispersal was simulated at different placement regions in a channel with trapezoidal section, by considering both bedload and suspended sediment transport. The model was calibrated with experimental observations (Tanguy and Berni, 2015) and the instantaneous sediment removal and dumping operations were simulated for several hours. According to the main sediment transport process considered, it was found that (i) the bed deposit moves downstream of the channel and collapses progressively, and (ii) the material is completely dispersed at the end of the simulation. 3.2 Maintenance dredging in the Gironde estuary
The fate and behavior of the dumped material in the vicinity of the entrance of the Bordeaux harbor were evaluated with a model accounting for both tidal and wind induced currents. Preliminary results showed that the most active sediment transport process occurs during ebb, when tidal currents are combined with the discharge of the Garonne River, which is a conflux to the Gironde estuary. Numerical simulations showed that dumping downstream of the harbor during the ebb tide ensures that sediments will not be returned to the harbor. 3.3 Sediment dispersal in the Loire River
Assessment of the potential effects of dredged material is evaluated for different disposal areas and flow conditions at a reach of the Loire River. For low flow conditions, the disposal site exhibits a retentive characteristic, where the material remains deposited within the material discharge area. For high flow conditions, the disposal site exhibits a dispersive characteristic, with the material entirely dispersed and smothered in the shorter term. 4. Conclusions In this work, a tool for the accurate assessment of the fate of dumped sediments in rivers or coastal areas is presented. It enables rapid modifications of the dredging and dumping operations in order to optimize the selection of the site and flow conditions for disposal according to minimize the unwanted side effects on vulnerable ecosystems. References Tanguy, J.-M. & Berni C. (2015). ANSWER Evolution
des chenaux de navigation, Wiki (online).
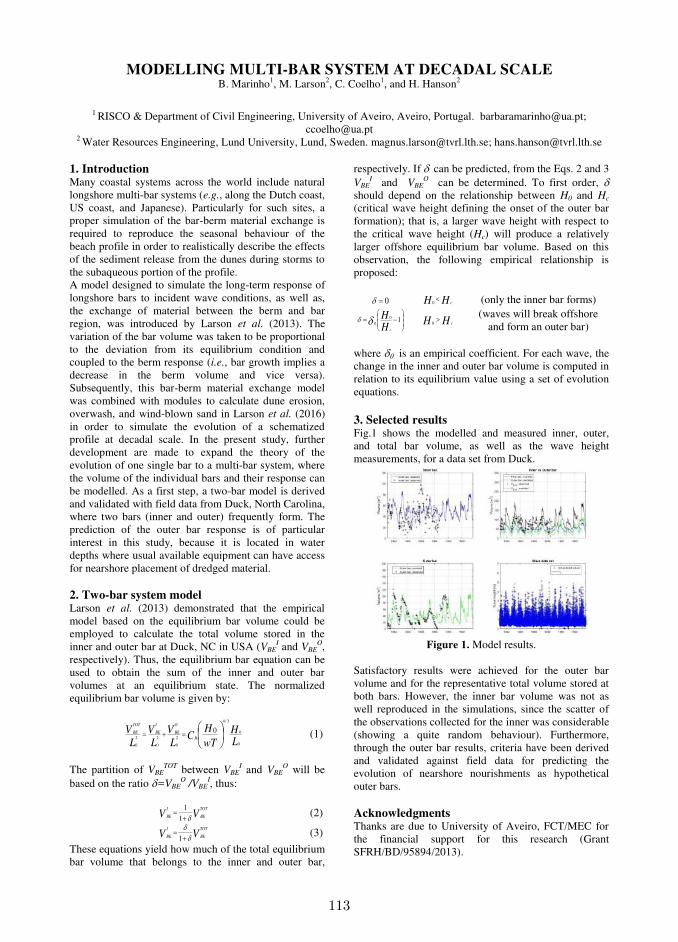
113
MODELLING MULTI-BAR SYSTEM AT DECADAL SCALE B. Marinho1, M. Larson2, C. Coelho1, and H. Hanson2
1 RISCO & Department of Civil Engineering, University of Aveiro, Aveiro, Portugal. [email protected];
[email protected] 2 Water Resources Engineering, Lund University, Lund, Sweden. [email protected]; [email protected]
1. Introduction Many coastal systems across the world include natural longshore multi-bar systems (e.g., along the Dutch coast, US coast, and Japanese). Particularly for such sites, a proper simulation of the bar-berm material exchange is required to reproduce the seasonal behaviour of the beach profile in order to realistically describe the effects of the sediment release from the dunes during storms to the subaqueous portion of the profile. A model designed to simulate the long-term response of longshore bars to incident wave conditions, as well as, the exchange of material between the berm and bar region, was introduced by Larson et al. (2013). The variation of the bar volume was taken to be proportional to the deviation from its equilibrium condition and coupled to the berm response (i.e., bar growth implies a decrease in the berm volume and vice versa). Subsequently, this bar-berm material exchange model was combined with modules to calculate dune erosion, overwash, and wind-blown sand in Larson et al. (2016) in order to simulate the evolution of a schematized profile at decadal scale. In the present study, further development are made to expand the theory of the evolution of one single bar to a multi-bar system, where the volume of the individual bars and their response can be modelled. As a first step, a two-bar model is derived and validated with field data from Duck, North Carolina, where two bars (inner and outer) frequently form. The prediction of the outer bar response is of particular interest in this study, because it is located in water depths where usual available equipment can have access for nearshore placement of dredged material. 2. Two-bar system model Larson et al. (2013) demonstrated that the empirical model based on the equilibrium bar volume could be employed to calculate the total volume stored in the inner and outer bar at Duck, NC in USA (VBE
I and VBEO,
respectively). Thus, the equilibrium bar equation can be used to obtain the sum of the inner and outer bar volumes at an equilibrium state. The normalized equilibrium bar volume is given by:
LH
wT
HC
LV
LV
LV
B
O
BE
I
BE
TOT
BE
0
0
3/4
2
0
2
0
2
0
0
(1)
The partition of VBE
TOT between VBEI and VBE
O will be based on the ratio =VBE
O /VBE
I, thus:
VVTOT
BE
I
BE
1
1 (2)
VVTOT
BE
I
BE
1
(3)
These equations yield how much of the total equilibrium bar volume that belongs to the inner and outer bar,
respectively. If can be predicted, from the Eqs. 2 and 3 VBE
I and VBEO can be determined. To first order,
should depend on the relationship between H0 and Hc (critical wave height defining the onset of the outer bar formation); that is, a larger wave height with respect to the critical wave height (Hc) will produce a relatively larger offshore equilibrium bar volume. Based on this observation, the following empirical relationship is proposed:
0 HH c
0 (only the inner bar forms)
10
0HH
c
HH c
0 (waves will break offshore
and form an outer bar) where is an empirical coefficient. For each wave, the change in the inner and outer bar volume is computed in relation to its equilibrium value using a set of evolution equations.
3. Selected results Fig.1 shows the modelled and measured inner, outer, and total bar volume, as well as the wave height measurements, for a data set from Duck.
Figure 1. Model results.
Satisfactory results were achieved for the outer bar volume and for the representative total volume stored at both bars. However, the inner bar volume was not as well reproduced in the simulations, since the scatter of the observations collected for the inner was considerable (showing a quite random behaviour). Furthermore, through the outer bar results, criteria have been derived and validated against field data for predicting the evolution of nearshore nourishments as hypothetical outer bars. Acknowledgments Thanks are due to University of Aveiro, FCT/MEC for the financial support for this research (Grant SFRH/BD/95894/2013).

114
Coastal Eco-morphological Real-time Forecasting tool to predict hydrodynamic,
sediment and nutrient dynamic in Coastal Louisiana Francesca Messina1, Ehab Meselhe2, Daniel Twight3 Lora Buckman4
1The Water Institute of the Gulf, Baton Rouge, Luisiana
fmessina@ thewaterinstitute.org 2 The Water Institute of the Gulf, Baton Rouge, Luisiana
emeselhe@ thewaterinstitute.org 3Deltares, Delft, Netherlands
[email protected] 4Deltares, Delft, Netherlands [email protected]
1. Introduction
Louisiana coastal area is among the most productive and dynamic eco-geomorphic systems in the world. This unique natural environment has been alternated by human activities and natural processes. Sea level rise, subsidence, dredging of canals for oil and gas production, the Mississippi River levees which don’t allow the river to distribute its sediment in a natural way, storms and hurricanes are some of the major reasons. As a consequence, Louisiana coastal zone is experiencing a tremendous rate of land loss and its vulnerability to flood events and other extreme weather events is increasing more and more. The effects and benefits of several restoration projects have been carefully investigated and studied by Louisiana authorities. Numerical models and field measurements are used to plan and analyze engineering solutions such as sediment and freshwater diversions from the Mississippi River into Barataria Bay and Breton Sound basin. The Water Institute of the Gulf, together with Deltares, has developed a forecasting and information system for a pilot location in Coastal Louisiana, specifically Barataria Bay and Breton Sound Basins in the Mississippi River Deltaic Plain. Currently, the Coastal Eco-morphological Real-time Forecasting system (CERF) forecasts water level, salinity, and water temperature for the next seven days. The system also forecasts nutrient distribution (e.g., Chlorophyll a and dissolved oxygen) and geomorphological processes (e.g., suspended sediment transport). The Flood Early Warning System FEWS is used as a platform to import, from several sources, multivariate environmental data, atmospheric and coastal forecasted conditions, such as freshwater riverine inflow, rainfall, evaporation/evapotranspiration, wind, and tide. The system uses these real time data and external forecast to monitor the pilot location and to provide boundary conditions to the model. A hindcast model is applied in order to compare the model outputs to the observed data and assess the model performance, and to provide the initial condition to the forecast model.
The Coastal Eco-morphological Real-time Forecasting system represents a unique tool which is able to provide valuable information regarding the overall conditions of the basins. It offers the opportunity to adaptively manage existing and planned diversions to meet certain salinity and water level targets or thresholds while maximizing land-building goals.
Figure 1. Example of the system output. Salinity, water temperature and water level (from top to bottom) at one of the USGS station. The time series show hindcast and forecast trends and real time data.
Figure 2. Salinity distribution map
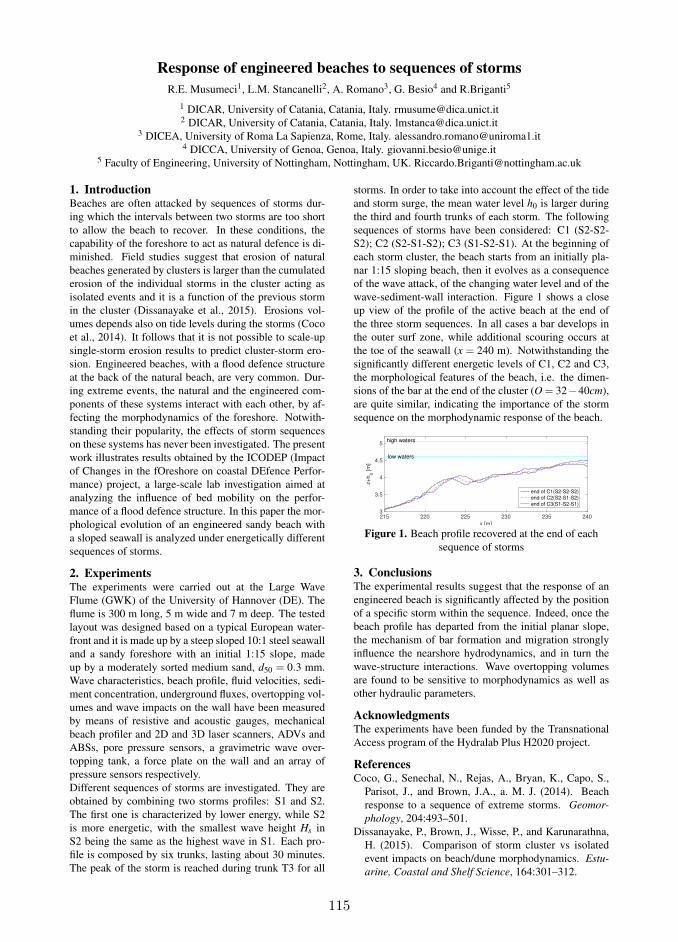
115
Response of engineered beaches to sequences of storms
R.E. Musumeci1, L.M. Stancanelli2, A. Romano3, G. Besio4 and R.Briganti5
1 DICAR, University of Catania, Catania, Italy. [email protected] DICAR, University of Catania, Catania, Italy. [email protected]
3 DICEA, University of Roma La Sapienza, Rome, Italy. [email protected] DICCA, University of Genoa, Genoa, Italy. [email protected]
5 Faculty of Engineering, University of Nottingham, Nottingham, UK. [email protected]
1. IntroductionBeaches are often attacked by sequences of storms dur-
ing which the intervals between two storms are too short
to allow the beach to recover. In these conditions, the
capability of the foreshore to act as natural defence is di-
minished. Field studies suggest that erosion of natural
beaches generated by clusters is larger than the cumulated
erosion of the individual storms in the cluster acting as
isolated events and it is a function of the previous storm
in the cluster (Dissanayake et al., 2015). Erosions vol-
umes depends also on tide levels during the storms (Coco
et al., 2014). It follows that it is not possible to scale-up
single-storm erosion results to predict cluster-storm ero-
sion. Engineered beaches, with a flood defence structure
at the back of the natural beach, are very common. Dur-
ing extreme events, the natural and the engineered com-
ponents of these systems interact with each other, by af-
fecting the morphodynamics of the foreshore. Notwith-
standing their popularity, the effects of storm sequences
on these systems has never been investigated. The present
work illustrates results obtained by the ICODEP (Impact
of Changes in the fOreshore on coastal DEfence Perfor-
mance) project, a large-scale lab investigation aimed at
analyzing the influence of bed mobility on the perfor-
mance of a flood defence structure. In this paper the mor-
phological evolution of an engineered sandy beach with
a sloped seawall is analyzed under energetically different
sequences of storms.
2. ExperimentsThe experiments were carried out at the Large Wave
Flume (GWK) of the University of Hannover (DE). The
flume is 300 m long, 5 m wide and 7 m deep. The tested
layout was designed based on a typical European water-
front and it is made up by a steep sloped 10:1 steel seawall
and a sandy foreshore with an initial 1:15 slope, made
up by a moderately sorted medium sand, d50 = 0.3 mm.
Wave characteristics, beach profile, fluid velocities, sedi-
ment concentration, underground fluxes, overtopping vol-
umes and wave impacts on the wall have been measured
by means of resistive and acoustic gauges, mechanical
beach profiler and 2D and 3D laser scanners, ADVs and
ABSs, pore pressure sensors, a gravimetric wave over-
topping tank, a force plate on the wall and an array of
pressure sensors respectively.
Different sequences of storms are investigated. They are
obtained by combining two storms profiles: S1 and S2.
The first one is characterized by lower energy, while S2
is more energetic, with the smallest wave height Hs in
S2 being the same as the highest wave in S1. Each pro-
file is composed by six trunks, lasting about 30 minutes.
The peak of the storm is reached during trunk T3 for all
storms. In order to take into account the effect of the tide
and storm surge, the mean water level h0 is larger during
the third and fourth trunks of each storm. The following
sequences of storms have been considered: C1 (S2-S2-
S2); C2 (S2-S1-S2); C3 (S1-S2-S1). At the beginning of
each storm cluster, the beach starts from an initially pla-
nar 1:15 sloping beach, then it evolves as a consequence
of the wave attack, of the changing water level and of the
wave-sediment-wall interaction. Figure 1 shows a close
up view of the profile of the active beach at the end of
the three storm sequences. In all cases a bar develops in
the outer surf zone, while additional scouring occurs at
the toe of the seawall (x = 240 m). Notwithstanding the
significantly different energetic levels of C1, C2 and C3,
the morphological features of the beach, i.e. the dimen-
sions of the bar at the end of the cluster (O = 32−40cm),
are quite similar, indicating the importance of the storm
sequence on the morphodynamic response of the beach.
x [m]
215 220 225 230 235 240
z+
h0 [m
]
3
3.5
4
4.5
5
end of C1(S2-S2-S2)
end of C2(S2-S1-S2)
end of C3(S1-S2-S1)
high waters
low waters
Figure 1. Beach profile recovered at the end of each
sequence of storms
3. ConclusionsThe experimental results suggest that the response of an
engineered beach is significantly affected by the position
of a specific storm within the sequence. Indeed, once the
beach profile has departed from the initial planar slope,
the mechanism of bar formation and migration strongly
influence the nearshore hydrodynamics, and in turn the
wave-structure interactions. Wave overtopping volumes
are found to be sensitive to morphodynamics as well as
other hydraulic parameters.
AcknowledgmentsThe experiments have been funded by the Transnational
Access program of the Hydralab Plus H2020 project.
ReferencesCoco, G., Senechal, N., Rejas, A., Bryan, K., Capo, S.,
Parisot, J., and Brown, J.A., a. M. J. (2014). Beach
response to a sequence of extreme storms. Geomor-
phology, 204:493–501.
Dissanayake, P., Brown, J., Wisse, P., and Karunarathna,
H. (2015). Comparison of storm cluster vs isolated
event impacts on beach/dune morphodynamics. Estu-
arine, Coastal and Shelf Science, 164:301–312.
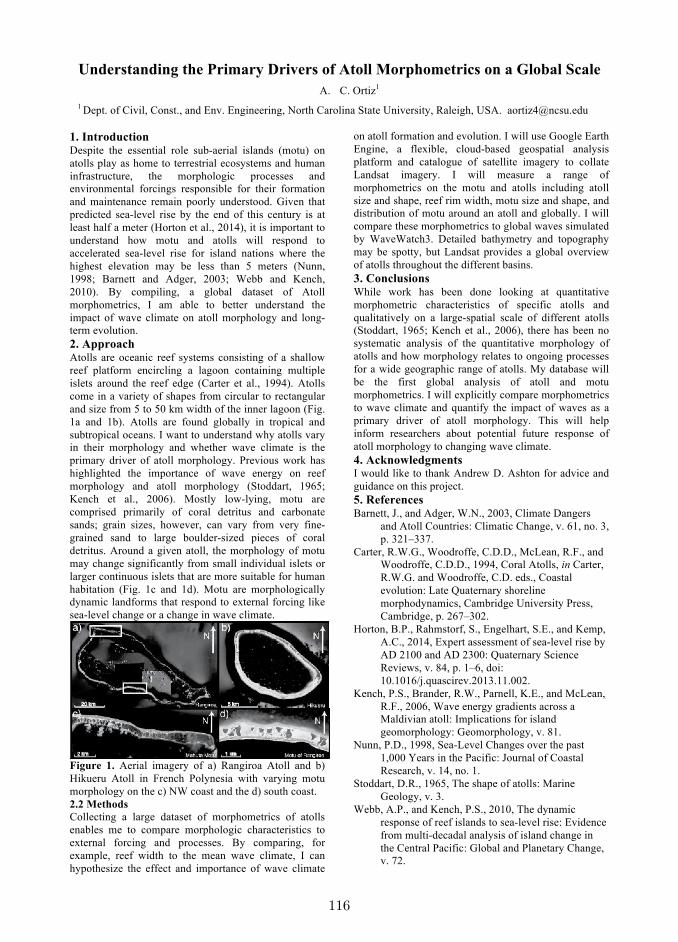
116
Understanding the Primary Drivers of Atoll Morphometrics on a Global Scale
A. C. Ortiz1
1 Dept. of Civil, Const., and Env. Engineering, North Carolina State University, Raleigh, USA. [email protected]
1. IntroductionDespite the essential role sub-aerial islands (motu) on
atolls play as home to terrestrial ecosystems and human
infrastructure, the morphologic processes and
environmental forcings responsible for their formation
and maintenance remain poorly understood. Given that
predicted sea-level rise by the end of this century is at
least half a meter (Horton et al., 2014), it is important to
understand how motu and atolls will respond to
accelerated sea-level rise for island nations where the
highest elevation may be less than 5 meters (Nunn,
1998; Barnett and Adger, 2003; Webb and Kench,
2010). By compiling, a global dataset of Atoll
morphometrics, I am able to better understand the
impact of wave climate on atoll morphology and long-
term evolution.
2. ApproachAtolls are oceanic reef systems consisting of a shallow
reef platform encircling a lagoon containing multiple
islets around the reef edge (Carter et al., 1994). Atolls
come in a variety of shapes from circular to rectangular
and size from 5 to 50 km width of the inner lagoon (Fig.
1a and 1b). Atolls are found globally in tropical and
subtropical oceans. I want to understand why atolls vary
in their morphology and whether wave climate is the
primary driver of atoll morphology. Previous work has
highlighted the importance of wave energy on reef
morphology and atoll morphology (Stoddart, 1965;
Kench et al., 2006). Mostly low-lying, motu are
comprised primarily of coral detritus and carbonate
sands; grain sizes, however, can vary from very fine-
grained sand to large boulder-sized pieces of coral
detritus. Around a given atoll, the morphology of motu
may change significantly from small individual islets or
larger continuous islets that are more suitable for human
habitation (Fig. 1c and 1d). Motu are morphologically
dynamic landforms that respond to external forcing like
sea-level change or a change in wave climate.
Figure 1. Aerial imagery of a) Rangiroa Atoll and b)
Hikueru Atoll in French Polynesia with varying motu
morphology on the c) NW coast and the d) south coast.
2.2 Methods
Collecting a large dataset of morphometrics of atolls
enables me to compare morphologic characteristics to
external forcing and processes. By comparing, for
example, reef width to the mean wave climate, I can
hypothesize the effect and importance of wave climate
on atoll formation and evolution. I will use Google Earth
Engine, a flexible, cloud-based geospatial analysis
platform and catalogue of satellite imagery to collate
Landsat imagery. I will measure a range of
morphometrics on the motu and atolls including atoll
size and shape, reef rim width, motu size and shape, and
distribution of motu around an atoll and globally. I will
compare these morphometrics to global waves simulated
by WaveWatch3. Detailed bathymetry and topography
may be spotty, but Landsat provides a global overview
of atolls throughout the different basins.
3. ConclusionsWhile work has been done looking at quantitative
morphometric characteristics of specific atolls and
qualitatively on a large-spatial scale of different atolls
(Stoddart, 1965; Kench et al., 2006), there has been no
systematic analysis of the quantitative morphology of
atolls and how morphology relates to ongoing processes
for a wide geographic range of atolls. My database will
be the first global analysis of atoll and motu
morphometrics. I will explicitly compare morphometrics
to wave climate and quantify the impact of waves as a
primary driver of atoll morphology. This will help
inform researchers about potential future response of
atoll morphology to changing wave climate.
4. AcknowledgmentsI would like to thank Andrew D. Ashton for advice and
guidance on this project.
5. ReferencesBarnett, J., and Adger, W.N., 2003, Climate Dangers
and Atoll Countries: Climatic Change, v. 61, no. 3,
p. 321–337.
Carter, R.W.G., Woodroffe, C.D.D., McLean, R.F., and
Woodroffe, C.D.D., 1994, Coral Atolls, in Carter,
R.W.G. and Woodroffe, C.D. eds., Coastal
evolution: Late Quaternary shoreline
morphodynamics, Cambridge University Press,
Cambridge, p. 267–302.
Horton, B.P., Rahmstorf, S., Engelhart, S.E., and Kemp,
A.C., 2014, Expert assessment of sea-level rise by
AD 2100 and AD 2300: Quaternary Science
Reviews, v. 84, p. 1–6, doi:
10.1016/j.quascirev.2013.11.002.
Kench, P.S., Brander, R.W., Parnell, K.E., and McLean,
R.F., 2006, Wave energy gradients across a
Maldivian atoll: Implications for island
geomorphology: Geomorphology, v. 81.
Nunn, P.D., 1998, Sea-Level Changes over the past
1,000 Years in the Pacific: Journal of Coastal
Research, v. 14, no. 1.
Stoddart, D.R., 1965, The shape of atolls: Marine
Geology, v. 3.
Webb, A.P., and Kench, P.S., 2010, The dynamic
response of reef islands to sea-level rise: Evidence
from multi-decadal analysis of island change in
the Central Pacific: Global and Planetary Change,
v. 72.
117
Circulation and fine sediment transport patterns in the Montevideo Bay
P. Santoro1, M. Fossati1, P. Tassi2, N. Huybrechts3, D. Pham Van Bang2 and I. Piedra-Cueva1
1 Instituto de Mecánica de los Fluidos e Ingeniería Ambiental, Universidad de la República, Montevideo, Uruguay.
[email protected], [email protected], [email protected] Saint Venant Laboratory for Hydraulics, EDF R&D, CEREMA, Chatou, France.
[email protected], [email protected] Roberval Laboratory, LHN (UTC), CEREMA, Compiègne, France. [email protected]
1. IntroductionThe objective of this work is to advance in the characteri-
zation of the Montevideo Bay (Uruguay) hydrodynamics
and fine sediment dynamics providing a reliable numeri-
cal model able to simulate them. This involves the sim-
ulation of a fluvial-estuarine environment, the Río de la
Plata, which shows complex hydrodynamic and transport
processes.
2. MethodologyThe methodology is based on the implementation of a
set of numerical models, able to represent the circulation,
waves and fine sediment transport in complex geometries
under the effect of several forcings (Santoro et al., 2016).
The hydrodynamics and fine sediment dynamics in the
bay were studied based on the 3D numerical model results
(TELEMAC Modelling System). The circulation patterns
were studied using the Empirical Orthogonal Functions
(EOF) technique. Santoro et al. (2013) have previously
studied the circulation in the bay using a simpler ap-
proach. The EOF technique provides a better descrip-
tion of the circulation patterns, and also allows to identify
their link with the main forcings. The water and sediment
exchange between the bay and adjacent coastal area was
analysed by computing the fluxes through the bay mouths.
An analysis of the sedimentation patterns in the bay was
performed, together with a sediment budget analysis. The
first one is based on the bottom evolution results after a
one year simulation using realistic forcings. The second
one is focused on the water and sediment exchange be-
tween the bay and the adjacent coastal area by analysing
the fluxes through the bay mouths. We finally connect
the previous analyses involving the water circulation in
the bay, the water and sediment fluxes through the bay
mouths and the bed evolution in order to explain the dy-
namics in the inner areas of the bay.
3. Results and ConclusionsThe main circulation patterns in the bay and their re-
lationship with the local forcings were identified. The
EOF method was applied to the depth-averaged currents
anomalies in the Montevideo Bay. Due to its different
time scales the analysis was performed both on the astro-
nomical and non-astronomical signals by separate. Dif-
ferent combinations of the patterns arising from the EOF
method reproduce the circulation patterns identified in
Santoro et al. (2013). Analysing the Principal Compo-
nents (PC) we found relationships among the different
contributions to the circulation patterns with the forcings.
The astronomical currents analysis showed two main
patterns both describing the main circulation conditions
through the bay mouths. The PCs series show a rela-
tionship between the circulation conditions and the tidal
phase. The non-astronomical tide events play a relevant
role in the water exchange between the bay and the coastal
area, generating important anomalies respect to the astro-
nomical behaviour. The first obtained EOF describes the
flux through the bay mouths and outer area inside the bay,
while the second EOF describes the circulation in the in-
ner are of the bay. Combinations of these two patterns al-
low to construct the circulation patterns identified in San-
toro et al. (2013). It was found a relationship between
the non-astronomical currents PC1 and the SW-NE wind
component, and also between the PC2 and the SE-NW
wind component.
At the larger scale of the estuary the currents induced
stress is relevant to represent the permanent suspended
sediment concentrations, while the wave induced stress
is essential to reproduce the main re-suspension events.
Inside the Montevideo Bay the wave forcing plays a rel-
evant role specially on the west area which is more ex-
posed to the wave forcing coming through its biggest
mouth. However, the advection of sediment coming from
the near coastal area and the circulation conditions are
determinant, and can for example change the bed evolu-
tion tendency for similar wave conditions. We found a
connection between this behaviour and the dominant cir-
culation conditions at the inner areas. The west mouth
plays a major role in the sediment exchange between the
bay and coastal area during the storm events, which is co-
herent with the water circulation characterization and its
relationship with the wind conditions. The highest sed-
iment fluxes take place during strong storm conditions.
Wind blowing from the SE and SW quadrants are mainly
responsible for these severe wave conditions. When the
storm are generated by SW winds water with high SSC
goes inwards the bay through the west mouth. Wind from
NE direction enhances the opposite water circulation, and
do not have fetch to generate waves and induce important
sediment re-suspension.
AcknowledgmentsThis work was conducted within the Uruguayan - French
cooperation project ECOS-Sud U014U01.
ReferencesSantoro, P., Fossati, M., and Piedra-Cueva, I. (2013).
Characterization of Circulation Patterns in Montevideo
Bay. Journal of Coastal Research, 29 (4):819–835.
Santoro, P., Fossati, M., Tassi, P., Huybrecths, N., Pham
Van Bang, D., and Piedra-Cueva, I. (2016). 2D and 3D
numerical study of the Montevideo Bay hydrodynam-
ics and fine sediment dynamics. In Proceedings of the
XXIII Telemac-Mascaret User Club.

118
Emergence of complex behaviour of marine natural processes: engineering and environmental implications.
Stefania A. Schinaia1,2
1Dept. of Civil, Geom. & Environ. Eng., University College London, London, UK, [email protected]
2Now at: Centre for Environment, Fisheries, and Aquaculture Science, Lowestoft, UK.
1. Introduction A good understanding of the processes involved in the morphological shaping of coastal sea beds is crucial for the management of coastal areas and the delivery of coastal engineering works. These areas are sensitive and complex systems and any activity carried out in this environment needs careful planning and an investigation of their impacts to reach a compromise between environmental equilibrium and the local economy. Too often engineering works (e.g. pipeline burial) fail because desk studies are not aimed at the long-term behaviour of the natural environment. The consequences of such a failure are then not only limited to industry, in terms of costs and benefits, but to local communities and the environment too. This paper describes the emergence of complex behaviour from a mathematical model of large-scale morphodynamics for coastal and shelf sea areas; the emergence of natural complex features is normally observed on free aeolian dunes in deserts and underwater dunes, although the manifestation (and consequently depiction) of the complex behaviour from the underwater world (especially on coastal and shelf sea areas) is often hindered by the lack of either sufficient evidences from long-term studies, or ad hoc and long-term surveying and monitoring: e.g. scientists and engineers only see one or more ‘snapshots’ of the seabed and miss the evolution of the interaction of the seabed morphology and sediment dynamics with both local and large scale hydrodynamics. This is true for both small- and large-scale projects. For this paper, only the interaction of the morphodynamics and sediment dynamics with the hydrodynamics are explored, without considering concurrent factors, such as the geological setting, the climate, and past human activities. 2. Methodology The model is part of the morphodynamics and sediment dynamics module of a more comprehensive model built for the study of the recovery of the sea bed morphology and associated benthic organisms after aggregate dredging works (Schinaia et al., 2009). The mathematical model is based on discrete dynamics approach with a combination of both simple Boolean algebra and first and second order equations. The seabed morphology is defined as a 2D coarse-grained lattice and sediment transport is modelled as movement of blocks. The rules governing the movement of blocks take account of sand transport distance, mainly dependent on the hydrodynamics strength and local height, and gravitational shaping.
3. Results and Conclusions The results shown in this paper are from the calibration process of the model and demonstrate that, even without the implementation of processes that become significant at larger scales, such as the deviation of tidal currents due to Coriolis forces, the model can depict complex behaviour, significant for engineering works as well as for environmental impact assessment studies and, consequently, policy makers (Figure 1) (Schinaia, 2010).
Figure 1. Bedforms generated by the model under
unidirectional currents. Acknowledgments The author would like to thank Doctor Helene Burningham and Professor David Huntley for the inspiring discussion during her viva voce. References Schinaia, S.A., Momiji, H., Bishop, S.R., Simons, R.R.
and Saunders, J. (2009). Predicting the recovery of biological communities on the seabed after marine aggregate dredging. In: McKee Smith, J. (Ed.), Proceedings 31st International Conference on Coastal Engineering 2008, Hamburg, Germany, World Scientific, ASCE, Singapore, 4537-4548.
Schinaia, S.A. (2010). Predictive modelling for the
recovery of biological communities after marine aggregate dredging. ENG.D. Environmental Engineering Science Thesis, University College London, University of London.

119
Experimental Investigation of Subaqueous Sediment Density Flows
Mariangela Sfouni-Grigoriadou1,2, Carmelo Juez3, Benoit Spinewine1,2 and Mario Granca3
1 Fugro GeoConsulting, Brussels, Belgium, e-mail: [email protected]
2 Department of Civil Engineering, Université catholique de Louvain, Louvain-la-Neuve, Belgium 3 Laboratory of Hydraulic Consructions, École Polytechnique Fédérale de Lausanne, Lausanne, Switzerland
1. Introduction Subaqueous mass movement events that are capable of mobilizing huge volumes of soil and develop significant velocities, impose a major geohazard on subsea infrastructure. The understanding of the internal processes governing the dynamics of these mass flows becomes important for the risk assessment of the impacts that they can cause. These events are characterized by their transient nature and internal stratification as they evolve from a dense debris flow to a dilute turbidity current while propagating downslope. 2. Experimental set-up and procedure An experimental campaign studied small scale subaqueous landslides of different grain size in a flume with variable bottom slope located in the Hydraulic Constructions Laboratory of the École Polytechnique Fédérale de Lausanne. Dense mixtures of plastic sediment (thermoplastic polyurethane) and water were released into the water-filled flume from an 8-litre head tank. Velocity fields were obtained using UVPs (Ultrasonic Velocity Profilers) at various points along the flume. A high speed camera was capturing the flow with a frequency of 10 frames per second. The frontal velocity and flow thickness data that were obtained after image analysis, allowed the characterization of the vertical stratification and layering during runout. The information about the dynamic behavior that governs the transition between different phases of subaqueous density sediment flows will provide a useful database for predictive numerical modelling of such flows. 3. Conclusions The formation of a dense layer at the bottom and a dilute layer on top was observed. The two layers were defined using the image brightness as an indication of concentration. The brightness thresholds used for the definition of each layer, were obtained after a correlation of the brightness profiles and the UVP velocity profiles, was established. The frontal velocity of each layer was tracked utilizing image processing. The dense bottom layer stopped its propagation and deposited much earlier than the top layer which continued propagating until the end of the flume. The maximum velocities reached were 50mm/s for the bottom layer and 72mm/s for the top layer. Velocity profiles obtained from the UVP measurements were in very good agreement with the respective brightness profiles at the location of the transducers. The height of the bottom layer as defined by the brightness threshold of 140 coincided with the height of the flow region characterized by its streamwise velocity, as seen in the UVP results.
The time-space evolution analysis reveals that the dense layer travels around 1200mm after its release. For a short period the dense layer was deposited but the propagation of the top layer quickly eliminates its thickness. The existence of back flow, in the form of vortical structures, resulted in the increase of the total flow thickness in the area close to the release point. Acknowledgments This work was funded by the ITN-Programme (Marie Curie Actions) of the European Union’s 36 Seventh Framework Programme FP7-PEOPLE 2013-ITN under REA grant agreement n 607394-37 SEDITRANS. References Felix M., Peakall J. (2006). Transformation of debris
flows into turbidity currents: mechanisms inferred from laboratory experiments. Sedimentology, 53,107-123.
Locat J., Lee H.J. (2005). Subaqueous debris flows Chapter 9. Debris-flows Hazards and Related Phenomena, Springer, 203-245.
Mohrig D., Marr J.G. (2003). Constraining the efficiency of turbidity current generation from submarine debris flows and slides using laboratory experiments. Marine and Petroleum Geology, Elsevier, 20 (6), 883-899.
Zakeri A., Si G., Marr J.G. and Høeg K. (2010). Experimental investigation of subaqueous clay-rich debris flows, turbidity generation and sediment deposition. Submarine Mass Movements and Their Consequences of the series Advances in Natural and Technological Hazards Research, 28, 105-115.
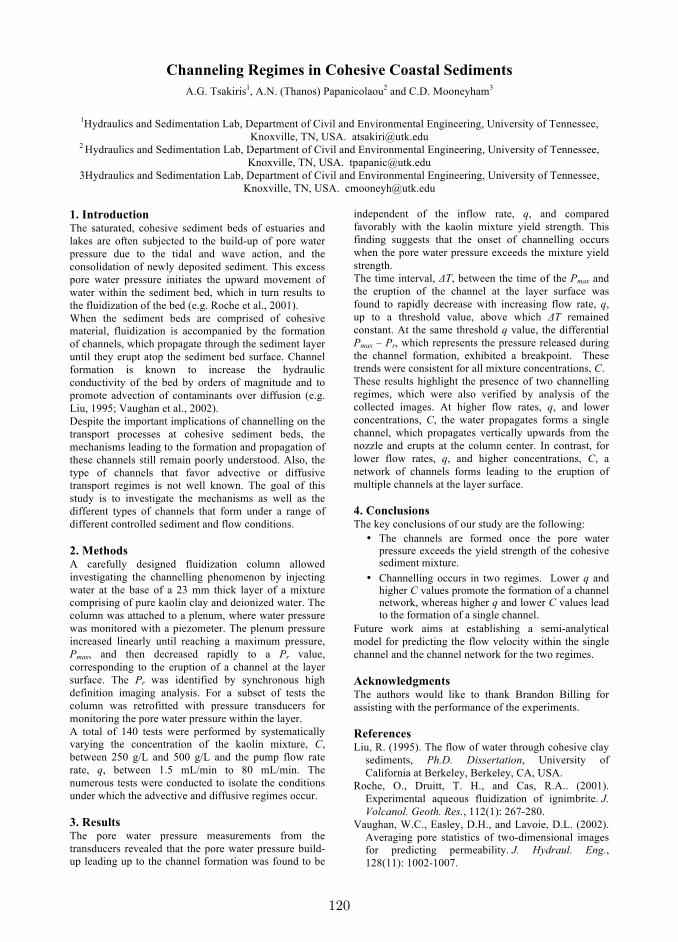
120
Channeling Regimes in Cohesive Coastal Sediments
A.G. Tsakiris1, A.N. (Thanos) Papanicolaou
2 and C.D. Mooneyham
3
1Hydraulics and Sedimentation Lab, Department of Civil and Environmental Engineering, University of Tennessee,
Knoxville, TN, USA. [email protected] 2 Hydraulics and Sedimentation Lab, Department of Civil and Environmental Engineering, University of Tennessee,
Knoxville, TN, USA. [email protected]
3Hydraulics and Sedimentation Lab, Department of Civil and Environmental Engineering, University of Tennessee,
Knoxville, TN, USA. [email protected]
1. Introduction The saturated, cohesive sediment beds of estuaries and
lakes are often subjected to the build-up of pore water
pressure due to the tidal and wave action, and the
consolidation of newly deposited sediment. This excess
pore water pressure initiates the upward movement of
water within the sediment bed, which in turn results to
the fluidization of the bed (e.g. Roche et al., 2001).
When the sediment beds are comprised of cohesive
material, fluidization is accompanied by the formation
of channels, which propagate through the sediment layer
until they erupt atop the sediment bed surface. Channel
formation is known to increase the hydraulic
conductivity of the bed by orders of magnitude and to
promote advection of contaminants over diffusion (e.g.
Liu, 1995; Vaughan et al., 2002).
Despite the important implications of channelling on the
transport processes at cohesive sediment beds, the
mechanisms leading to the formation and propagation of
these channels still remain poorly understood. Also, the
type of channels that favor advective or diffusive
transport regimes is not well known. The goal of this
study is to investigate the mechanisms as well as the
different types of channels that form under a range of
different controlled sediment and flow conditions.
2. Methods A carefully designed fluidization column allowed
investigating the channelling phenomenon by injecting
water at the base of a 23 mm thick layer of a mixture
comprising of pure kaolin clay and deionized water. The
column was attached to a plenum, where water pressure
was monitored with a piezometer. The plenum pressure
increased linearly until reaching a maximum pressure,
Pmax, and then decreased rapidly to a Pr value,
corresponding to the eruption of a channel at the layer
surface. The Pr was identified by synchronous high
definition imaging analysis. For a subset of tests the
column was retrofitted with pressure transducers for
monitoring the pore water pressure within the layer.
A total of 140 tests were performed by systematically
varying the concentration of the kaolin mixture, C,
between 250 g/L and 500 g/L and the pump flow rate
rate, q, between 1.5 mL/min to 80 mL/min. The
numerous tests were conducted to isolate the conditions
under which the advective and diffusive regimes occur.
3. Results The pore water pressure measurements from the
transducers revealed that the pore water pressure build-
up leading up to the channel formation was found to be
independent of the inflow rate, q, and compared
favorably with the kaolin mixture yield strength. This
finding suggests that the onset of channelling occurs
when the pore water pressure exceeds the mixture yield
strength.
The time interval, ΔT, between the time of the Pmax and
the eruption of the channel at the layer surface was
found to rapidly decrease with increasing flow rate, q,
up to a threshold value, above which ΔT remained
constant. At the same threshold q value, the differential
Pmax – Pr, which represents the pressure released during
the channel formation, exhibited a breakpoint. These
trends were consistent for all mixture concentrations, C.
These results highlight the presence of two channelling
regimes, which were also verified by analysis of the
collected images. At higher flow rates, q, and lower
concentrations, C, the water propagates forms a single
channel, which propagates vertically upwards from the
nozzle and erupts at the column center. In contrast, for
lower flow rates, q, and higher concentrations, C, a
network of channels forms leading to the eruption of
multiple channels at the layer surface.
4. Conclusions The key conclusions of our study are the following:
• The channels are formed once the pore water pressure exceeds the yield strength of the cohesive sediment mixture.
• Channelling occurs in two regimes. Lower q and higher C values promote the formation of a channel network, whereas higher q and lower C values lead to the formation of a single channel.
Future work aims at establishing a semi-analytical
model for predicting the flow velocity within the single
channel and the channel network for the two regimes.
Acknowledgments The authors would like to thank Brandon Billing for
assisting with the performance of the experiments.
References Liu, R. (1995). The flow of water through cohesive clay
sediments, Ph.D. Dissertation, University of
California at Berkeley, Berkeley, CA, USA.
Roche, O., Druitt, T. H., and Cas, R.A.. (2001).
Experimental aqueous fluidization of ignimbrite. J.
Volcanol. Geoth. Res., 112(1): 267-280.
Vaughan, W.C., Easley, D.H., and Lavoie, D.L. (2002).
Averaging pore statistics of two-dimensional images
for predicting permeability. J. Hydraul. Eng.,
128(11): 1002-1007.
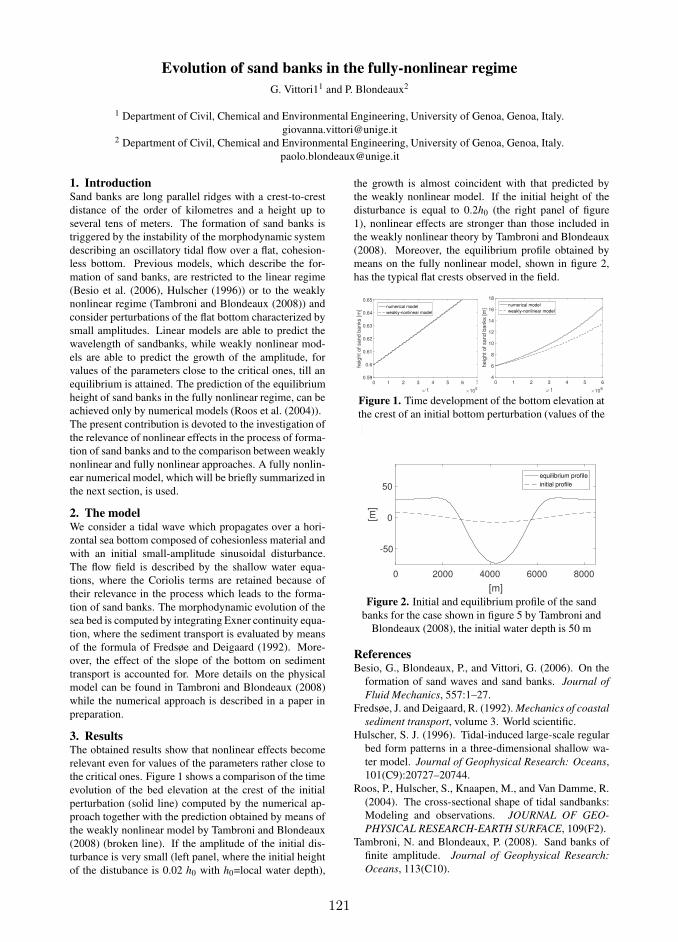
121
Evolution of sand banks in the fully-nonlinear regime
G. Vittori11 and P. Blondeaux2
1 Department of Civil, Chemical and Environmental Engineering, University of Genoa, Genoa, Italy.
[email protected] Department of Civil, Chemical and Environmental Engineering, University of Genoa, Genoa, Italy.
1. IntroductionSand banks are long parallel ridges with a crest-to-crest
distance of the order of kilometres and a height up to
several tens of meters. The formation of sand banks is
triggered by the instability of the morphodynamic system
describing an oscillatory tidal flow over a flat, cohesion-
less bottom. Previous models, which describe the for-
mation of sand banks, are restricted to the linear regime
(Besio et al. (2006), Hulscher (1996)) or to the weakly
nonlinear regime (Tambroni and Blondeaux (2008)) and
consider perturbations of the flat bottom characterized by
small amplitudes. Linear models are able to predict the
wavelength of sandbanks, while weakly nonlinear mod-
els are able to predict the growth of the amplitude, for
values of the parameters close to the critical ones, till an
equilibrium is attained. The prediction of the equilibrium
height of sand banks in the fully nonlinear regime, can be
achieved only by numerical models (Roos et al. (2004)).
The present contribution is devoted to the investigation of
the relevance of nonlinear effects in the process of forma-
tion of sand banks and to the comparison between weakly
nonlinear and fully nonlinear approaches. A fully nonlin-
ear numerical model, which will be briefly summarized in
the next section, is used.
2. The modelWe consider a tidal wave which propagates over a hori-
zontal sea bottom composed of cohesionless material and
with an initial small-amplitude sinusoidal disturbance.
The flow field is described by the shallow water equa-
tions, where the Coriolis terms are retained because of
their relevance in the process which leads to the forma-
tion of sand banks. The morphodynamic evolution of the
sea bed is computed by integrating Exner continuity equa-
tion, where the sediment transport is evaluated by means
of the formula of Fredsøe and Deigaard (1992). More-
over, the effect of the slope of the bottom on sediment
transport is accounted for. More details on the physical
model can be found in Tambroni and Blondeaux (2008)
while the numerical approach is described in a paper in
preparation.
3. ResultsThe obtained results show that nonlinear effects become
relevant even for values of the parameters rather close to
the critical ones. Figure 1 shows a comparison of the time
evolution of the bed elevation at the crest of the initial
perturbation (solid line) computed by the numerical ap-
proach together with the prediction obtained by means of
the weakly nonlinear model by Tambroni and Blondeaux
(2008) (broken line). If the amplitude of the initial dis-
turbance is very small (left panel, where the initial height
of the distubance is 0.02 h0 with h0=local water depth),
the growth is almost coincident with that predicted by
the weakly nonlinear model. If the initial height of the
disturbance is equal to 0.2h0 (the right panel of figure
1), nonlinear effects are stronger than those included in
the weakly nonlinear theory by Tambroni and Blondeaux
(2008). Moreover, the equilibrium profile obtained by
means on the fully nonlinear model, shown in figure 2,
has the typical flat crests observed in the field.
0 1 2 3 4 5 6 7
ω t ×105
0.59
0.6
0.61
0.62
0.63
0.64
0.65
heig
ht of sand b
anks [m
]
numerical model
weakly-nonlinear model
0 1 2 3 4 5 6
ω t ×106
4
6
8
10
12
14
16
18
heig
ht of sand b
anks [m
]
numerical model
weakly-nonlinear model
Figure 1. Time development of the bottom elevation at
the crest of an initial bottom perturbation (values of the
parameters as in figure 2 by Tambroni and Blondeaux
(2008) ).
0 2000 4000 6000 8000
[m]
-50
0
50
[m]
equilibrium profile
initial profile
Figure 2. Initial and equilibrium profile of the sand
banks for the case shown in figure 5 by Tambroni and
Blondeaux (2008), the initial water depth is 50 m
ReferencesBesio, G., Blondeaux, P., and Vittori, G. (2006). On the
formation of sand waves and sand banks. Journal of
Fluid Mechanics, 557:1–27.
Fredsøe, J. and Deigaard, R. (1992). Mechanics of coastal
sediment transport, volume 3. World scientific.
Hulscher, S. J. (1996). Tidal-induced large-scale regular
bed form patterns in a three-dimensional shallow wa-
ter model. Journal of Geophysical Research: Oceans,
101(C9):20727–20744.
Roos, P., Hulscher, S., Knaapen, M., and Van Damme, R.
(2004). The cross-sectional shape of tidal sandbanks:
Modeling and observations. JOURNAL OF GEO-
PHYSICAL RESEARCH-EARTH SURFACE, 109(F2).
Tambroni, N. and Blondeaux, P. (2008). Sand banks of
finite amplitude. Journal of Geophysical Research:
Oceans, 113(C10).
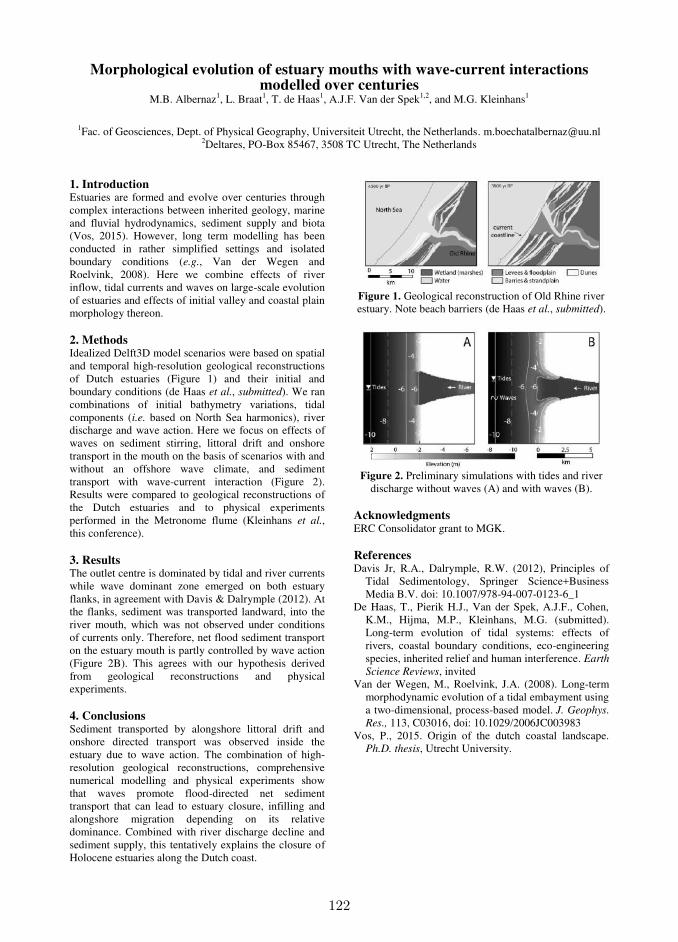
122
Morphological evolution of estuary mouths with wave-current interactions modelled over centuries
M.B. Albernaz1, L. Braat1, T. de Haas1, A.J.F. Van der Spek1,2, and M.G. Kleinhans1
1Fac. of Geosciences, Dept. of Physical Geography, Universiteit Utrecht, the Netherlands. [email protected]
2Deltares, PO-Box 85467, 3508 TC Utrecht, The Netherlands
1. Introduction Estuaries are formed and evolve over centuries through complex interactions between inherited geology, marine and fluvial hydrodynamics, sediment supply and biota (Vos, 2015). However, long term modelling has been conducted in rather simplified settings and isolated boundary conditions (e.g., Van der Wegen and Roelvink, 2008). Here we combine effects of river inflow, tidal currents and waves on large-scale evolution of estuaries and effects of initial valley and coastal plain morphology thereon. 2. Methods Idealized Delft3D model scenarios were based on spatial and temporal high-resolution geological reconstructions of Dutch estuaries (Figure 1) and their initial and boundary conditions (de Haas et al., submitted). We ran combinations of initial bathymetry variations, tidal components (i.e. based on North Sea harmonics), river discharge and wave action. Here we focus on effects of waves on sediment stirring, littoral drift and onshore transport in the mouth on the basis of scenarios with and without an offshore wave climate, and sediment transport with wave-current interaction (Figure 2). Results were compared to geological reconstructions of the Dutch estuaries and to physical experiments performed in the Metronome flume (Kleinhans et al., this conference). 3. Results
The outlet centre is dominated by tidal and river currents while wave dominant zone emerged on both estuary flanks, in agreement with Davis & Dalrymple (2012). At the flanks, sediment was transported landward, into the river mouth, which was not observed under conditions of currents only. Therefore, net flood sediment transport on the estuary mouth is partly controlled by wave action (Figure 2B). This agrees with our hypothesis derived from geological reconstructions and physical experiments. 4. Conclusions Sediment transported by alongshore littoral drift and onshore directed transport was observed inside the estuary due to wave action. The combination of high-resolution geological reconstructions, comprehensive numerical modelling and physical experiments show that waves promote flood-directed net sediment transport that can lead to estuary closure, infilling and alongshore migration depending on its relative dominance. Combined with river discharge decline and sediment supply, this tentatively explains the closure of Holocene estuaries along the Dutch coast.
Figure 1. Geological reconstruction of Old Rhine river estuary. Note beach barriers (de Haas et al., submitted).
Figure 2. Preliminary simulations with tides and river
discharge without waves (A) and with waves (B).
Acknowledgments ERC Consolidator grant to MGK. References Davis Jr, R.A., Dalrymple, R.W. (2012), Principles of
Tidal Sedimentology, Springer Science+Business Media B.V. doi: 10.1007/978-94-007-0123-6_1
De Haas, T., Pierik H.J., Van der Spek, A.J.F., Cohen, K.M., Hijma, M.P., Kleinhans, M.G. (submitted). Long-term evolution of tidal systems: effects of rivers, coastal boundary conditions, eco-engineering species, inherited relief and human interference. Earth
Science Reviews, invited
Van der Wegen, M., Roelvink, J.A. (2008). Long-term morphodynamic evolution of a tidal embayment using a two-dimensional, process-based model. J. Geophys.
Res., 113, C03016, doi: 10.1029/2006JC003983 Vos, P., 2015. Origin of the dutch coastal landscape.
Ph.D. thesis, Utrecht University.

123
Suspended sediment transport and concentration in the delta area of the Magdalena river based on USP-61 and ADCP measurements
Humberto Avila1 and Gloria Amaris2
1 Institute of Hydraulic and Environmental Engineering IDEHA - Department of Civil and Environmental Engineering,
Universidad del Norte, Barranquilla, Colombia. [email protected] 2 Institute of Hydraulic and Environmental Engineering IDEHA - Department of Civil and Environmental Engineering,
Universidad del Norte, Barranquilla, Colombia. [email protected]
1. Introduction This paper shows the results of analysing the suspended sediment transport and concentration in the delta area of the Magdalen River based on field measurements from 2006 to 2016 along 400 Km of the river. An equation relating the Average Backscatter (ABS) and the suspended sediment concentration (SST) was calibrated and validated with data collected from 1982 to 2016 with USP-61 and ADCP, with which was possible to compile more than 1,600 sections measured with ADCP for the last 10 years by the Institute of Hydraulic and Environmental Engineering IDEHA of Universidad del Norte. An annual concentration and sediment transport magnitude was estimated and related to the hydrologic regime, including El Niño and La Niña phenomena, occurred during the analysed time window. 2. Methodology and results Figure 1 shows the sectors measured with ADCP and USP-61 for calibrating the SST-ABS equation.
Figure 1. Sectors measured with ADCP and USP-61 for calibrating the SSC-ABS equation The equation for estimating the total suspended sediment concentration (SST) as a function of the Average Backscatter (Latosinski et al 2011, and other authors) was calibrated for the Magdalena River as follow:
[mg/L] 10 =SST 0.2724)+ABS(0.0272ABS
prom (1)
Where, SSTABS = total suspended sediment concentration based on ABS data ABSprom = Average Backscatter of the river section measured with ADCP rio Grande of 600 KHz
Other equations were determined for relating the ABS with the concentration of suspended sediment of sand (materials > 63 m) and wash load (materials < 63 m).
From the measured data, the Magdalen River has an average flow rate of 7,650 m3/s, a minimum of 2,100 m3/s, and a maximum of 18,000 m3/s in the delta area. The suspended sediment concentration varies from 147 and 1,900 mg/L with an average of 535 mg/L. The total suspended sediment transport varies from 26 KTon/day to 952 KTon/day, with an average of 375 KTon/day. The annual total suspended sediment transport obtained from the collected data from 2006 and 2016 is between 137 MTons/year and 200 MTons/year with a wash load of 85%. From 2006 to 2011 the tendency of flow rates, and therefore of the total sediment transport, was ascendant, related to an increment of frequency and magnitude of high flow rates during that time period and mainly associated with La Niña phenomenon. In contrast, from 2012 to 2016, low flow rates were predominant with low sediment transport rates, associated with El Niño phenomenon. 3. Conclusions The paper shows the field work methodology by using the ADCP and USP-61, and the calibration procedure for the SST equation. The interannual variation of the suspended sediment concentration for the years 2006-2016 based on field measurements is also presented, time during which minimum and maximum flow rates occurred in the Magdalena River. This research gives a robust understanding of the temporal sediment transport behavior of the Magdalena River.
Acknowledgments The authors would like to thank the Centro de
Investigaciones del Río Magdalena - CIRMAG which support this research. References Latosinski, F., Szupiany, R., García, C., Gallego, M.,
Amsler, M., & Pujol, A. (2011). Estimación de la concentración y transporte de sedimentos de fondo en suspensión con perfilador acústico doppler. Memorias del Quinto Simposio Regional sobre hidráulica de ríos.
Gartner, J. (2004). Estimating suspended solids concentrations from backscatter intensity measured by acoustic Doppler current profiler in San Francisco Bay, California. Marine Geology 211, 169–187.

124
Velocity profile and stratigraphy analisys in experimental prograding deltas
A. Bateman1; V. Medina1; D. Galera1
1 Sediment Transport Research Group, GITS Barcelona Tech [email protected]
1. AbstractIn the present work, a submerged granular flow is
characterized. An experimental setup was conducted in
order to analyze the phenomena. The formation of river
deltas in lakes or the sea is constructed by the deposition
of material that falls down the slope formed by the
sediment transport of the river bed into the water corps.
An intermittent dynamics was observed in the top of the
foreset forming pulses of sediment that falls down the
foreset as granular tongue (debris flow). The friction due
to this sediment layer induces a deep movement of the
sediment grains that were deposit in the past of the
precedent pulses. Once the pulse arrives at the toe at the
bottom set an instantaneous deceleration occurs that
propagates backward until the top of the foreset. A
sediment stratigraphy was observed in the final
deposition that depends deeply on the sediment
discharge transported by the river.
2. IntroductionSeveral studies were made in order to characterize dry
sediment flows, as related in Komatsu, T. S. et al.
(2000). It describes the creep motion as the movement
of the particles dragged by the falling tongue in which
the velocities decay exponentially with the depth. GDR
MiDi (2004), Pouliquen, O. et al. (2005), Courrech du
Pont et al. (2003), Gray & Ancey (2009), Viparelli et al.
(2014), had been worked on different aspects of
submerged granular flows. The present work adds new
observations on the topic.
3. Experimental set up
The experiments were carried out at the Morphodynamic
Laboratory conducted by GITS at the Hydraulic, Marine
and Environmental Department of Barcelona Tech. A
flume of 200cm length, 40 cm high and 5 cm width was
used in order to run the different tests. Uniform fine
sediment of 0.2 mm diameter was employed. Different
liquid and solid discharge was used to perform twelve
different experiments. A laser illumination and a
standard Cannon camera were installed for images
acquisition for posterior analysis.Test Qs (g/s) Ql (l/min) e (mm)
4 4.4 6 6
5 4.4 8 6
6 4.4 10 6
7 6.6 10 7
8 6.6 8 7
9 6.6 6 7
10 11.4 10 8
11 11.4 6 8
12 11.4 8 8
Table 1. Solid and liquid discharge used in the
experimental runs. Stratigraphic mean depths along the
deposit.
In table 1 it is shown the solid and water discharge used
in the experimental runs. Also the separation, e, between
stratigraphic lines.
4. Experimental Results
The characterization of the submerged granular flow
was placed in the middle of the foreset slope. 50 fps
videos were used for that flow; which only the 1% of the
images taken during the runs were analysed. An example
is shown in figure 1.
Fig. 1 Experimental optimal image of the foresettaken during an experimental run.Two different image techniques were applied for the
video data set. One of them is used to determine the
position of the surface and the other to evaluate the
velocity profile. Both techniques had to be calibrated
adequately. In figure 2 it can be seen both results for a
typical run. Two different behaviour have been seen, a
linear distribution forced driven upper one and an
exponential deep one.
Figure 2. Dimensionless
Velocity profile in the
foreset. Depth h (mm)
and velocity v (mm/s). h0
depth in which the
behaviour change and a
is the mean diameter of
the particle, a50 =0.2 mm
The final deposit present a series of stratigraphy lines
parallel to the slope of the foreset. Those lines are
separated a distance proportional to the sediment
discharge. The results show straight lines separated by 6,
7 and 8 mm in average for the three different solid
discharges.
5. ConclusionsAn experimental set up was implemented to evaluate the
granular flow in the foreset slope in a prograding delta.
A deep movement of the sediment were detected in the
foreset and a particular stratigraphy proportional to the
solid discharge was observed.
AcknowledgmentsThis work is founded by the Spain Ministry of Science
project CGL2015-71291-P.
ReferencesGDR MiDi, On dense granular flows (2004).
Pouliquen, O., Cassar, C., Jop, P., Forterre, Y., Nicolas,
M. (2006). Flow of dense granular material: towards
simple constitutive laws.
E. Viparelli1 , A. Blom , C. Ferrer-Boix , and R.
Kuprenas1 Comparison between experimental and
numerical stratigraphy emplaced by a prograding delta.
Earth Surface Dynamics (2014).
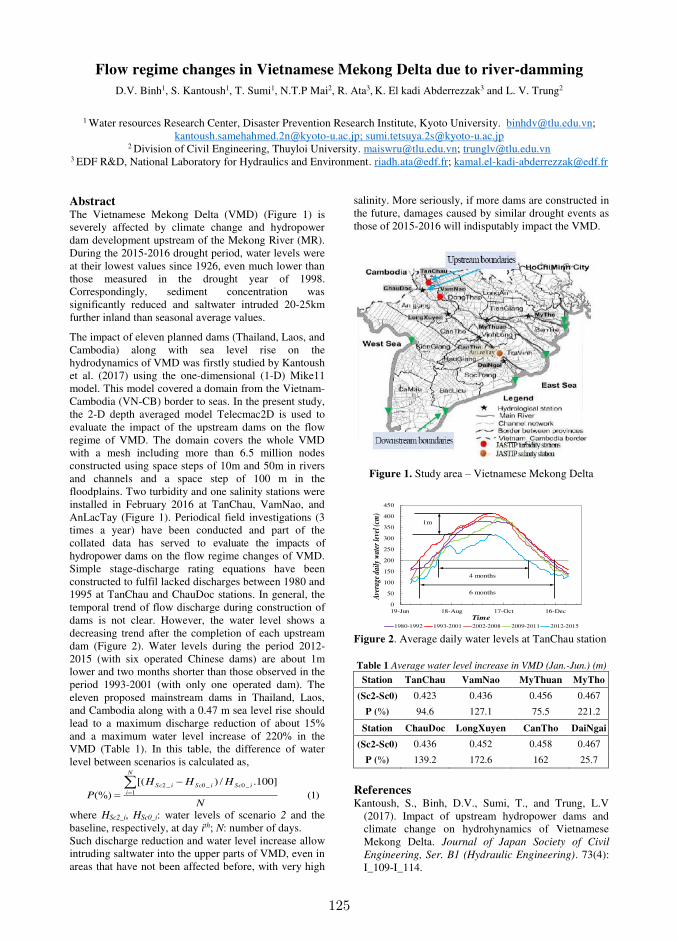
125
Flow regime changes in Vietnamese Mekong Delta due to river-damming
D.V. Binh1, S. Kantoush1, T. Sumi1, N.T.P Mai2, R. Ata3, K. El kadi Abderrezzak3 and L. V. Trung2
1 Water resources Research Center, Disaster Prevention Research Institute, Kyoto University. [email protected];
[email protected]; [email protected] 2 Division of Civil Engineering, Thuyloi University. [email protected]; [email protected]
3 EDF R&D, National Laboratory for Hydraulics and Environment. [email protected]; [email protected]
Abstract The Vietnamese Mekong Delta (VMD) (Figure 1) is severely affected by climate change and hydropower dam development upstream of the Mekong River (MR). During the 2015-2016 drought period, water levels were at their lowest values since 1926, even much lower than those measured in the drought year of 1998. Correspondingly, sediment concentration was significantly reduced and saltwater intruded 20-25km further inland than seasonal average values.
The impact of eleven planned dams (Thailand, Laos, and Cambodia) along with sea level rise on the hydrodynamics of VMD was firstly studied by Kantoush et al. (2017) using the one-dimensional (1-D) Mike11 model. This model covered a domain from the Vietnam-Cambodia (VN-CB) border to seas. In the present study, the 2-D depth averaged model Telecmac2D is used to evaluate the impact of the upstream dams on the flow regime of VMD. The domain covers the whole VMD with a mesh including more than 6.5 million nodes constructed using space steps of 10m and 50m in rivers and channels and a space step of 100 m in the floodplains. Two turbidity and one salinity stations were installed in February 2016 at TanChau, VamNao, and AnLacTay (Figure 1). Periodical field investigations (3 times a year) have been conducted and part of the collated data has served to evaluate the impacts of hydropower dams on the flow regime changes of VMD. Simple stage-discharge rating equations have been constructed to fulfil lacked discharges between 1980 and 1995 at TanChau and ChauDoc stations. In general, the temporal trend of flow discharge during construction of dams is not clear. However, the water level shows a decreasing trend after the completion of each upstream dam (Figure 2). Water levels during the period 2012-2015 (with six operated Chinese dams) are about 1m lower and two months shorter than those observed in the period 1993-2001 (with only one operated dam). The eleven proposed mainstream dams in Thailand, Laos, and Cambodia along with a 0.47 m sea level rise should lead to a maximum discharge reduction of about 15% and a maximum water level increase of 220% in the VMD (Table 1). In this table, the difference of water level between scenarios is calculated as,
)1(]100./)[(
(%) 1_0_0_2
N
HHH
P
N
i
iSciSciSc
where HSc2_i, HSc0_i: water levels of scenario 2 and the baseline, respectively, at day ith; N: number of days. Such discharge reduction and water level increase allow intruding saltwater into the upper parts of VMD, even in areas that have not been affected before, with very high
salinity. More seriously, if more dams are constructed in the future, damages caused by similar drought events as those of 2015-2016 will indisputably impact the VMD.
Figure 1. Study area – Vietnamese Mekong Delta
0
50
100
150
200
250
300
350
400
450
19-Jun 18-Aug 17-Oct 16-Dec
Ave
rage
dai
ly w
ater
leve
l (cm
)
Time
1980-1992 1993-2001 2002-2008 2009-2011 2012-2015
4 months
6 months
1m
Figure 2. Average daily water levels at TanChau station Table 1 Average water level increase in VMD (Jan.-Jun.) (m)
Station TanChau VamNao MyThuan MyTho
(Sc2-Sc0) 0.423 0.436 0.456 0.467
P (%) 94.6 127.1 75.5 221.2
Station ChauDoc LongXuyen CanTho DaiNgai
(Sc2-Sc0) 0.436 0.452 0.458 0.467
P (%) 139.2 172.6 162 25.7
References Kantoush, S., Binh, D.V., Sumi, T., and Trung, L.V
(2017). Impact of upstream hydropower dams and climate change on hydrohynamics of Vietnamese Mekong Delta. Journal of Japan Society of Civil
Engineering, Ser. B1 (Hydraulic Engineering). 73(4): I_109-I_114.
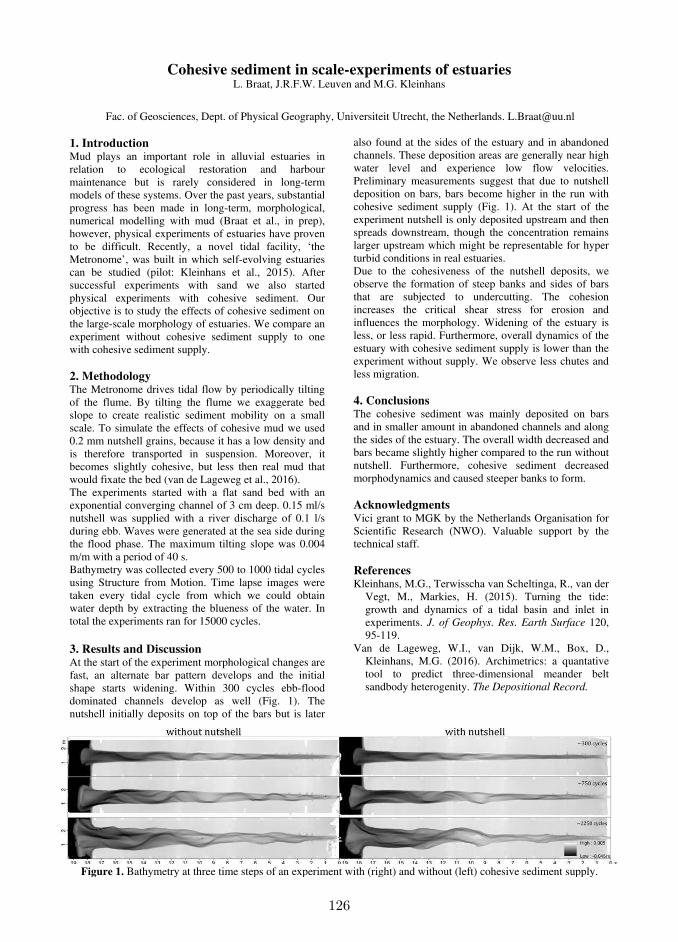
126
Cohesive sediment in scale-experiments of estuaries L. Braat, J.R.F.W. Leuven and M.G. Kleinhans
Fac. of Geosciences, Dept. of Physical Geography, Universiteit Utrecht, the Netherlands. [email protected]
1. Introduction Mud plays an important role in alluvial estuaries in relation to ecological restoration and harbour maintenance but is rarely considered in long-term models of these systems. Over the past years, substantial progress has been made in long-term, morphological, numerical modelling with mud (Braat et al., in prep), however, physical experiments of estuaries have proven to be difficult. Recently, a novel tidal facility, ‘the Metronome’, was built in which self-evolving estuaries can be studied (pilot: Kleinhans et al., 2015). After successful experiments with sand we also started physical experiments with cohesive sediment. Our objective is to study the effects of cohesive sediment on the large-scale morphology of estuaries. We compare an experiment without cohesive sediment supply to one with cohesive sediment supply. 2. Methodology The Metronome drives tidal flow by periodically tilting of the flume. By tilting the flume we exaggerate bed slope to create realistic sediment mobility on a small scale. To simulate the effects of cohesive mud we used 0.2 mm nutshell grains, because it has a low density and is therefore transported in suspension. Moreover, it becomes slightly cohesive, but less then real mud that would fixate the bed (van de Lageweg et al., 2016). The experiments started with a flat sand bed with an exponential converging channel of 3 cm deep. 0.15 ml/s nutshell was supplied with a river discharge of 0.1 l/s during ebb. Waves were generated at the sea side during the flood phase. The maximum tilting slope was 0.004 m/m with a period of 40 s. Bathymetry was collected every 500 to 1000 tidal cycles using Structure from Motion. Time lapse images were taken every tidal cycle from which we could obtain water depth by extracting the blueness of the water. In total the experiments ran for 15000 cycles.
3. Results and Discussion At the start of the experiment morphological changes are fast, an alternate bar pattern develops and the initial shape starts widening. Within 300 cycles ebb-flood dominated channels develop as well (Fig. 1). The nutshell initially deposits on top of the bars but is later
also found at the sides of the estuary and in abandoned channels. These deposition areas are generally near high water level and experience low flow velocities. Preliminary measurements suggest that due to nutshell deposition on bars, bars become higher in the run with cohesive sediment supply (Fig. 1). At the start of the experiment nutshell is only deposited upstream and then spreads downstream, though the concentration remains larger upstream which might be representable for hyper turbid conditions in real estuaries. Due to the cohesiveness of the nutshell deposits, we observe the formation of steep banks and sides of bars that are subjected to undercutting. The cohesion increases the critical shear stress for erosion and influences the morphology. Widening of the estuary is less, or less rapid. Furthermore, overall dynamics of the estuary with cohesive sediment supply is lower than the experiment without supply. We observe less chutes and less migration. 4. Conclusions The cohesive sediment was mainly deposited on bars and in smaller amount in abandoned channels and along the sides of the estuary. The overall width decreased and bars became slightly higher compared to the run without nutshell. Furthermore, cohesive sediment decreased morphodynamics and caused steeper banks to form. Acknowledgments Vici grant to MGK by the Netherlands Organisation for Scientific Research (NWO). Valuable support by the technical staff. References Kleinhans, M.G., Terwisscha van Scheltinga, R., van der
Vegt, M., Markies, H. (2015). Turning the tide: growth and dynamics of a tidal basin and inlet in experiments. J. of Geophys. Res. Earth Surface 120, 95-119.
Van de Lageweg, W.I., van Dijk, W.M., Box, D., Kleinhans, M.G. (2016). Archimetrics: a quantative tool to predict three-dimensional meander belt sandbody heterogenity. The Depositional Record.
Figure 1. Bathymetry at three time steps of an experiment with (right) and without (left) cohesive sediment supply.
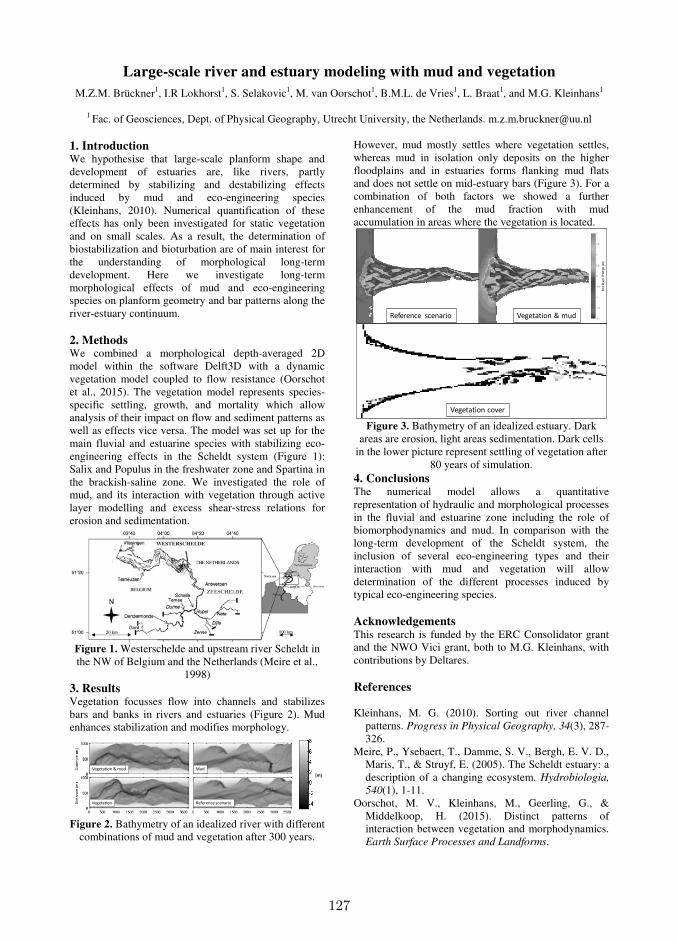
127
Large-scale river and estuary modeling with mud and vegetation
M.Z.M. Brückner1, I.R Lokhorst1, S. Selakovic1, M. van Oorschot1, B.M.L. de Vries1, L. Braat1, and M.G. Kleinhans1
1 Fac. of Geosciences, Dept. of Physical Geography, Utrecht University, the Netherlands. [email protected]
1. Introduction We hypothesise that large-scale planform shape and development of estuaries are, like rivers, partly determined by stabilizing and destabilizing effects induced by mud and eco-engineering species (Kleinhans, 2010). Numerical quantification of these effects has only been investigated for static vegetation and on small scales. As a result, the determination of biostabilization and bioturbation are of main interest for the understanding of morphological long-term development. Here we investigate long-term morphological effects of mud and eco-engineering species on planform geometry and bar patterns along the river-estuary continuum. 2. Methods We combined a morphological depth-averaged 2D model within the software Delft3D with a dynamic vegetation model coupled to flow resistance (Oorschot et al., 2015). The vegetation model represents species-specific settling, growth, and mortality which allow analysis of their impact on flow and sediment patterns as well as effects vice versa. The model was set up for the main fluvial and estuarine species with stabilizing eco-engineering effects in the Scheldt system (Figure 1): Salix and Populus in the freshwater zone and Spartina in the brackish-saline zone. We investigated the role of mud, and its interaction with vegetation through active layer modelling and excess shear-stress relations for erosion and sedimentation.
Figure 1. Westerschelde and upstream river Scheldt in the NW of Belgium and the Netherlands (Meire et al.,
1998) 3. Results Vegetation focusses flow into channels and stabilizes bars and banks in rivers and estuaries (Figure 2). Mud enhances stabilization and modifies morphology.
Vegetation & mud
Vegetation Reference scenario
Mud
[m]
Figure 2. Bathymetry of an idealized river with different
combinations of mud and vegetation after 300 years.
However, mud mostly settles where vegetation settles, whereas mud in isolation only deposits on the higher floodplains and in estuaries forms flanking mud flats and does not settle on mid-estuary bars (Figure 3). For a combination of both factors we showed a further enhancement of the mud fraction with mud accumulation in areas where the vegetation is located.
Vegetation & mudReference scenario
Vegetation cover
Figure 3. Bathymetry of an idealized estuary. Dark areas are erosion, light areas sedimentation. Dark cells
in the lower picture represent settling of vegetation after 80 years of simulation.
4. Conclusions The numerical model allows a quantitative representation of hydraulic and morphological processes in the fluvial and estuarine zone including the role of biomorphodynamics and mud. In comparison with the long-term development of the Scheldt system, the inclusion of several eco-engineering types and their interaction with mud and vegetation will allow determination of the different processes induced by typical eco-engineering species. Acknowledgements This research is funded by the ERC Consolidator grant and the NWO Vici grant, both to M.G. Kleinhans, with contributions by Deltares. References Kleinhans, M. G. (2010). Sorting out river channel
patterns. Progress in Physical Geography, 34(3), 287-326.
Meire, P., Ysebaert, T., Damme, S. V., Bergh, E. V. D., Maris, T., & Struyf, E. (2005). The Scheldt estuary: a description of a changing ecosystem. Hydrobiologia,
540(1), 1-11. Oorschot, M. V., Kleinhans, M., Geerling, G., &
Middelkoop, H. (2015). Distinct patterns of interaction between vegetation and morphodynamics. Earth Surface Processes and Landforms.
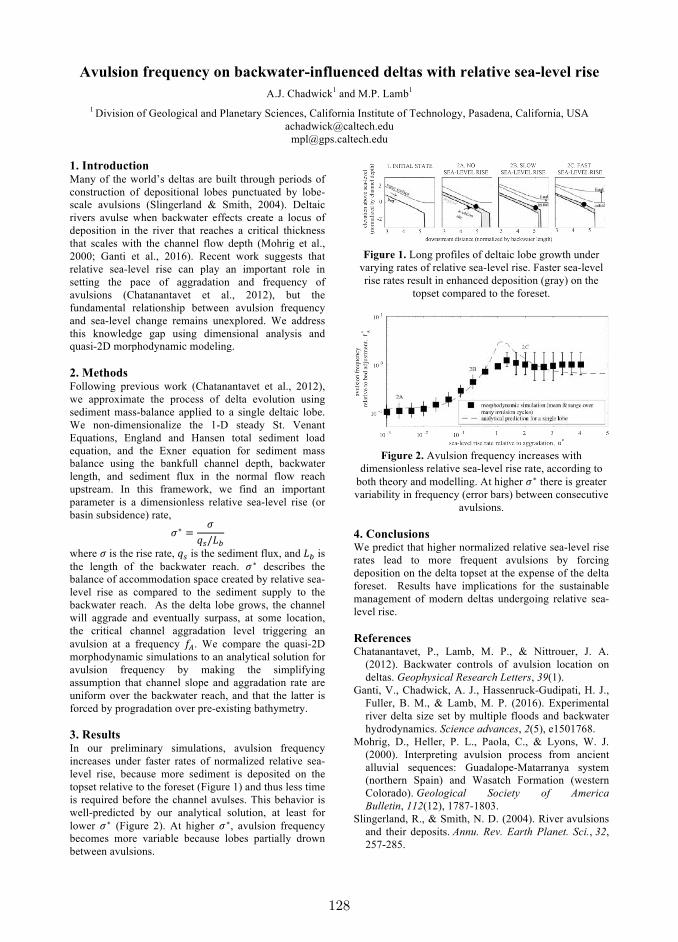
128
Avulsion frequency on backwater-influenced deltas with relative sea-level rise
A.J. Chadwick1 and M.P. Lamb
1
1 Division of Geological and Planetary Sciences, California Institute of Technology, Pasadena, California, USA
1. Introduction Many of the world’s deltas are built through periods of
construction of depositional lobes punctuated by lobe-
scale avulsions (Slingerland & Smith, 2004). Deltaic
rivers avulse when backwater effects create a locus of
deposition in the river that reaches a critical thickness
that scales with the channel flow depth (Mohrig et al.,
2000; Ganti et al., 2016). Recent work suggests that
relative sea-level rise can play an important role in
setting the pace of aggradation and frequency of
avulsions (Chatanantavet et al., 2012), but the
fundamental relationship between avulsion frequency
and sea-level change remains unexplored. We address
this knowledge gap using dimensional analysis and
quasi-2D morphodynamic modeling.
2. Methods Following previous work (Chatanantavet et al., 2012),
we approximate the process of delta evolution using
sediment mass-balance applied to a single deltaic lobe.
We non-dimensionalize the 1-D steady St. Venant
Equations, England and Hansen total sediment load
equation, and the Exner equation for sediment mass
balance using the bankfull channel depth, backwater
length, and sediment flux in the normal flow reach
upstream. In this framework, we find an important
parameter is a dimensionless relative sea-level rise (or
basin subsidence) rate,
∗=
!/!
where is the rise rate, ! is the sediment flux, and ! is
the length of the backwater reach. ∗ describes the
balance of accommodation space created by relative sea-
level rise as compared to the sediment supply to the
backwater reach. As the delta lobe grows, the channel
will aggrade and eventually surpass, at some location,
the critical channel aggradation level triggering an
avulsion at a frequency !. We compare the quasi-2D
morphodynamic simulations to an analytical solution for
avulsion frequency by making the simplifying
assumption that channel slope and aggradation rate are
uniform over the backwater reach, and that the latter is
forced by progradation over pre-existing bathymetry.
3. Results In our preliminary simulations, avulsion frequency
increases under faster rates of normalized relative sea-
level rise, because more sediment is deposited on the
topset relative to the foreset (Figure 1) and thus less time
is required before the channel avulses. This behavior is
well-predicted by our analytical solution, at least for
lower ∗ (Figure 2). At higher ∗, avulsion frequency
becomes more variable because lobes partially drown
between avulsions.
Figure 1. Long profiles of deltaic lobe growth under
varying rates of relative sea-level rise. Faster sea-level
rise rates result in enhanced deposition (gray) on the
topset compared to the foreset.
Figure 2. Avulsion frequency increases with
dimensionless relative sea-level rise rate, according to
both theory and modelling. At higher ∗ there is greater
variability in frequency (error bars) between consecutive
avulsions.
4. Conclusions We predict that higher normalized relative sea-level rise
rates lead to more frequent avulsions by forcing
deposition on the delta topset at the expense of the delta
foreset. Results have implications for the sustainable
management of modern deltas undergoing relative sea-
level rise.
References Chatanantavet, P., Lamb, M. P., & Nittrouer, J. A.
(2012). Backwater controls of avulsion location on
deltas. Geophysical Research Letters, 39(1).
Ganti, V., Chadwick, A. J., Hassenruck-Gudipati, H. J.,
Fuller, B. M., & Lamb, M. P. (2016). Experimental
river delta size set by multiple floods and backwater
hydrodynamics. Science advances, 2(5), e1501768.
Mohrig, D., Heller, P. L., Paola, C., & Lyons, W. J.
(2000). Interpreting avulsion process from ancient
alluvial sequences: Guadalope-Matarranya system
(northern Spain) and Wasatch Formation (western
Colorado). Geological Society of America
Bulletin, 112(12), 1787-1803.
Slingerland, R., & Smith, N. D. (2004). River avulsions
and their deposits. Annu. Rev. Earth Planet. Sci., 32,
257-285.

129
Using pacific oyster Crassostrea gigas for sediment stabilization: how their
effectiveness depends on biological and environmental setting
João Salvador de Paiva1 , Brenda Walles 2, Tom Ysebaert2,3, Tjeerd Boumaa1,2
1Delta Academy Applied Research Centre, HZ University of Applied Sciences, Vlissingen, the Netherlands
[email protected] 2 NIOZ Yerseke, Royal Netherlands Institute for Sea Research and Utrecht University, Yerseke, the Netherlands
3 IMARES Wageningen, Institute for Marine Resources and Ecosystem Studies, Yerseke, the Netherlands
1. Introduction The realization of a storm surge barrier and two secondary dams not only changed the hydrodynamics, but also the geomorphological characteristics of the Oosterschelde estuary (The Netherlands), creating a disequilibrium between erosion and sedimentation processes. Over the past 30 years, this has led to erosion of the tidal flats(Louters et al., 1998; Nienhuis and Smaal, 1994; Smaal and Nienhuis, 1992). Due to this erosional trend habitat for intertidal soft-bottom benthic fauna slowly disappears, and with it, foraging grounds and food sources for estuarine birds. Furthermore, intertidal areas play a role in wave energy dissipation. As a consequence, disappearance of adjacent tidal flats will increase the risk of dike failures and flooding during storm surges, since dikes will become more exposed to wave action(Mulder and Louters, 1994). Ecosystem-based coastal defense is a promising way to climate proof estuaries and coastlines. One of the advocated methodologies is creation, restoration or conservation of intertidal ecosystem engineering species that stabilize shorelines and attenuate waves. The Pacific oyster (Crassostrea gigas) is an ecosystem engineer known for its wave attenuating, sediment trapping and stabilization capacity(Borsje et al., 2009, 2009; Bouma et al., 2007; Temmerman et al., 2013). 2. Aim The aim of this research is 1) to quantify to what extent oysters’ ability to stabilize sediment is conditional, and 2) if this effect can be predicted based on physical forcing, morphological characteristics of the tidal flat, and biological characteristics of the oyster reef. 3. Methodology This was investigated by correlating long-term sediment accretion patterns of tidal flats covered by natural intertidal oyster reefs to reef characteristics and abiotic conditions. Long-term morphological developments of areas with and without oysters were derived from detailed bathymetric measurements, between 1987 and 2013, at different cross-sections on several tidal flats. The transects, done by walking, measured the sediment altitude with respect to NAP. 4.Results Results showed that stabilization of sediment by oysters increases under erosional conditions. Furthermore, our results showed that tidal flat shape determine the strength of the engineering , as larger elevation changes were found in convex tidal flats versus concave tidal
flats. Additionally, there is a relation between sediment stabilization and reef characteristics, as a lower width to length ratio and higher patch or oyster densities increase the ability to accrete and stabilize sediment within the reef. 5.Conclusions The ability of C. gigas to shape its environment depends both on biotic and abiotic conditions. Stabilizing effects of oyster reefs on tidal flats stress their importance as ecosystem engineers in erosion dominated estuaries and coastlines. Conservation of oyster reefs, as well as construction of artificial reefs could be an important management tool for tidal flat protection and conservation. References Borsje, B.W., de Vries, M.B., Bouma, T.J., Besio, G.,
Hulscher, S.J.M.H., Herman, P.M.J., 2009. Modeling bio-geomorphological influences for offshore sandwaves. Cont. Shelf Res. 29, 1289–1301. doi:10.1016/j.csr.2009.02.008
Bouma, T.J., van Duren, L.A., Temmerman, S., Claverie, T., Blanco-Garcia, A., Ysebaert, T., Herman, P.M.J., 2007. Spatial flow and sedimentation patterns within patches of epibenthic structures: Combining field, flume and modelling experiments. Cont. Shelf Res. 27, 1020–1045. doi:10.1016/j.csr.2005.12.019
Louters, T., Berg, J.H. van den, Mulder, J.P.M., 1998. Geomorphological Changes of the Oosterschelde Tidal System During and After the Implementation of the Delta Project. J. Coast. Res. 14.
Mulder, J.P., Louters, T., 1994. Changes in basin geomorphology after implementation of the Oosterschelde estuary project. Hydrobiologia 282, 29–39.
Nienhuis, P.H., Smaal, A.C. (Eds.), 1994. The Oosterschelde Estuary (The Netherlands): a Case-Study of a Changing Ecosystem. Springer Netherlands, Dordrecht.
Smaal, A.C., Nienhuis, P.H., 1992. The eastern Scheldt (The Netherlands), from an estuary to a tidal bay: A review of responses at the ecosystem level. Neth. J. Sea Res. 30, 161–173. doi:10.1016/0077-7579(92)90055-J
Temmerman, S., Meire, P., Bouma, T.J., Herman, P.M.J., Ysebaert, T., De Vriend, H.J., 2013. Ecosystem-based coastal defence in the face of global change. Nature 504, 79–83. doi:10.1038/nature12859
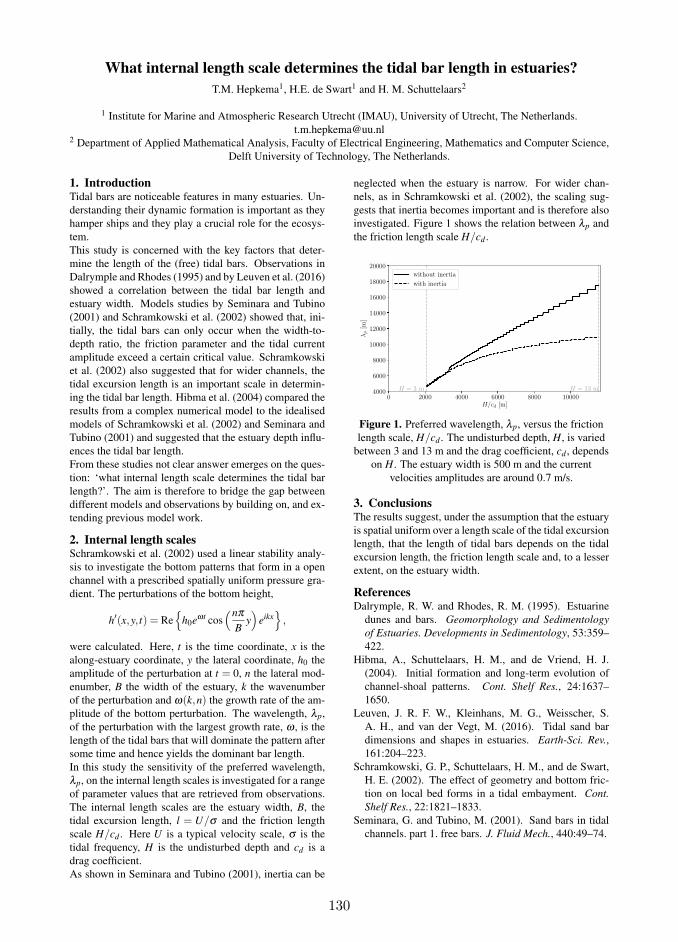
130
What internal length scale determines the tidal bar length in estuaries?
T.M. Hepkema1, H.E. de Swart1 and H. M. Schuttelaars2
1 Institute for Marine and Atmospheric Research Utrecht (IMAU), University of Utrecht, The Netherlands.
[email protected] Department of Applied Mathematical Analysis, Faculty of Electrical Engineering, Mathematics and Computer Science,
Delft University of Technology, The Netherlands.
1. IntroductionTidal bars are noticeable features in many estuaries. Un-
derstanding their dynamic formation is important as they
hamper ships and they play a crucial role for the ecosys-
tem.
This study is concerned with the key factors that deter-
mine the length of the (free) tidal bars. Observations in
Dalrymple and Rhodes (1995) and by Leuven et al. (2016)
showed a correlation between the tidal bar length and
estuary width. Models studies by Seminara and Tubino
(2001) and Schramkowski et al. (2002) showed that, ini-
tially, the tidal bars can only occur when the width-to-
depth ratio, the friction parameter and the tidal current
amplitude exceed a certain critical value. Schramkowski
et al. (2002) also suggested that for wider channels, the
tidal excursion length is an important scale in determin-
ing the tidal bar length. Hibma et al. (2004) compared the
results from a complex numerical model to the idealised
models of Schramkowski et al. (2002) and Seminara and
Tubino (2001) and suggested that the estuary depth influ-
ences the tidal bar length.
From these studies not clear answer emerges on the ques-
tion: ‘what internal length scale determines the tidal bar
length?’. The aim is therefore to bridge the gap between
different models and observations by building on, and ex-
tending previous model work.
2. Internal length scalesSchramkowski et al. (2002) used a linear stability analy-
sis to investigate the bottom patterns that form in a open
channel with a prescribed spatially uniform pressure gra-
dient. The perturbations of the bottom height,
h′(x,y, t) = Re
h0eωt cos(nπ
By)
eikx
,
were calculated. Here, t is the time coordinate, x is the
along-estuary coordinate, y the lateral coordinate, h0 the
amplitude of the perturbation at t = 0, n the lateral mod-
enumber, B the width of the estuary, k the wavenumber
of the perturbation and ω(k,n) the growth rate of the am-
plitude of the bottom perturbation. The wavelength, λp,
of the perturbation with the largest growth rate, ω , is the
length of the tidal bars that will dominate the pattern after
some time and hence yields the dominant bar length.
In this study the sensitivity of the preferred wavelength,
λp, on the internal length scales is investigated for a range
of parameter values that are retrieved from observations.
The internal length scales are the estuary width, B, the
tidal excursion length, l = U/σ and the friction length
scale H/cd . Here U is a typical velocity scale, σ is the
tidal frequency, H is the undisturbed depth and cd is a
drag coefficient.
As shown in Seminara and Tubino (2001), inertia can be
neglected when the estuary is narrow. For wider chan-
nels, as in Schramkowski et al. (2002), the scaling sug-
gests that inertia becomes important and is therefore also
investigated. Figure 1 shows the relation between λp and
the friction length scale H/cd .
0 2000 4000 6000 8000 10000H/cd [m]
4000
6000
8000
10000
12000
14000
16000
18000
20000
λp[m
]
H = 3 m H = 13 m
without inertia
with inertia
Figure 1. Preferred wavelength, λp, versus the friction
length scale, H/cd . The undisturbed depth, H, is varied
between 3 and 13 m and the drag coefficient, cd , depends
on H. The estuary width is 500 m and the current
velocities amplitudes are around 0.7 m/s.
3. ConclusionsThe results suggest, under the assumption that the estuary
is spatial uniform over a length scale of the tidal excursion
length, that the length of tidal bars depends on the tidal
excursion length, the friction length scale and, to a lesser
extent, on the estuary width.
ReferencesDalrymple, R. W. and Rhodes, R. M. (1995). Estuarine
dunes and bars. Geomorphology and Sedimentology
of Estuaries. Developments in Sedimentology, 53:359–
422.
Hibma, A., Schuttelaars, H. M., and de Vriend, H. J.
(2004). Initial formation and long-term evolution of
channel-shoal patterns. Cont. Shelf Res., 24:1637–
1650.
Leuven, J. R. F. W., Kleinhans, M. G., Weisscher, S.
A. H., and van der Vegt, M. (2016). Tidal sand bar
dimensions and shapes in estuaries. Earth-Sci. Rev.,
161:204–223.
Schramkowski, G. P., Schuttelaars, H. M., and de Swart,
H. E. (2002). The effect of geometry and bottom fric-
tion on local bed forms in a tidal embayment. Cont.
Shelf Res., 22:1821–1833.
Seminara, G. and Tubino, M. (2001). Sand bars in tidal
channels. part 1. free bars. J. Fluid Mech., 440:49–74.

131
Do distributaries in a delta plain resemble an ideal estuary? Results from theKapuas Delta, Indonesia
K. Kästner1, A.J.F. Hoitink1, T.J. Geertsema1, B. Vermeulen2
[email protected], [email protected], [email protected] [email protected] Wageningen University and Research, Droevendaalsesteeg 3, 6708 PB Wageningen, The Netherlands
2 University of Twente, Drienerlolaan 5, 7522 NB Enschede
1. IntroductionCoastal lowland plains under mixed fluvial-tidal in-
fluence can form complex channel networks, where dis-tributaries blend the characteristics of mouth bar chan-nels, avulsion channels and tidal creeks. These networksare shaped by the interplay of river flow and tides. Ourgoal is to increase the general understanding of physicalprocesses in the fluvial-tidal transition. Here we presentfirst results of an extensive field survey of the Kapuasriver and give insight into the along channel trends ofcross section geometry and bed material grain size.
2. Field siteThe Kapuas river is a large tropical river in West Ka-
limantan, Indonesia. Discharge ranges between 10^3m^3/s in the wet and 10^4 m^3/s in the dry season. TheKapuas consists of one main distributary from whichthree smaller distributaries branch off along the alluvialplain (Fig. 1a). Tides are mainly diurnal, with an averagespring range of 1.5m at the mouth.
Figure 1: Map of the Kapuas river delta plain
3. MethodsBetween 2013 and 2015 we surveyed the Kapuas
from the sea to upstream km 300. Bankfull river widthwas extracted from Landsat images. Bathymetry was sur-veyed with a single beam each sounder. Bed material wassampled with a van Veen grabber.
4. ResultsAll distributaries of the Kapuas consist of a short tidal
funnel that terminate in shallow mouth bars. The distrib-utaries reach their maximum depth at the apex of the tidalfunnels. From the apex of the tidal funnel to the upstreamend of the alluvial plain, the bed level rises again to nor-mal flow depth (Fig. 2b) and the river widens (Fig. 2a).During high flow the contrasting trends of width anddepth cause the cross sectional area to remain constantalong the alluvial plain, but during low flow the crosssectional area decreases along the alluvial plain in up-stream direction.
The bed of the Kapuas consists mainly of sand. Bedmaterial is downstream fining from 0.3 to 0.25mm alongthe alluvial plain within the main distributary. The trendof downstream fining does not break at the transition tothe tidal funnel. There is a rapid downstream fining fromthe transition of the upstream valley to the alluvial plain.The grain size of the side distributaries differs from the
main distributary and slightly increases in downstreamdirection (Fig. 2c).
Figure 2: a) Bankfull width, b) Bed and mean surface
level, c) Median grain size
5. Discussion and conclusionThe geometry of the Kapuas river deviates from that
of an idealized estuary, as it does not converge to anequilibirum width and depth. Such a break in scaling waspreviously found in the Mahakam Delta by Sassi et al.2012, which suggests this may be a general characteristicin the fluvial to tidal transition. There is no simple rela-tion between bed material grain size and channel geo-metry.
The particular geometry of the Kapuas also leads toparticular hydrodynamics in the fluvial-tidal transition.Thus the draw-down curve during high flow and backwa-ter curve at flow are much less pronounced in theKapuas, and tides propagate far up the river.
At the moment we investigate the consequences forriver discharge-tide interaction. In particular we focus onpropagation of the tide depending on the river dischargeas well as consequences for delta morphology.
6. ReferencesSassi, M.G., Hoitink, A.J.F., Brye, B. and Deleersnijder, E., 2012.
Downstream hydraulic geometry of a tidally influenced river delta.
Journal of Geophysical Research: Earth Surface, 117(F4).
K. Kästner, A.J.F. Hoitink, B. Vermeulen, T.J. Geertsema, N.S.
Ningsih, Distributary channels in the fluvial to tidal transition zone,
(submitted)
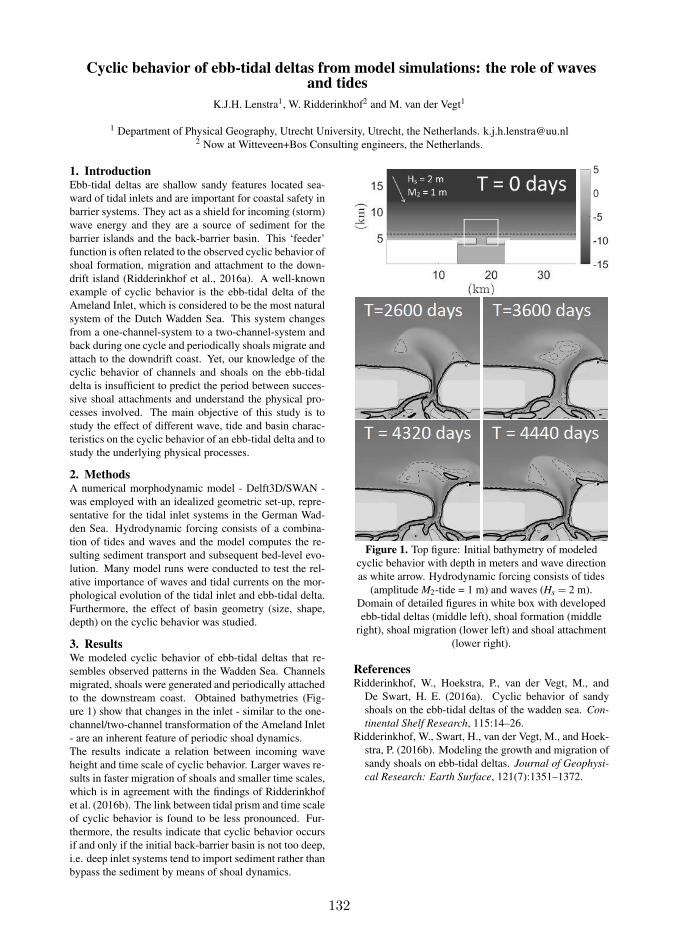
132
Cyclic behavior of ebb-tidal deltas from model simulations: the role of wavesand tides
K.J.H. Lenstra1, W. Ridderinkhof2 and M. van der Vegt1
1 Department of Physical Geography, Utrecht University, Utrecht, the Netherlands. [email protected] Now at Witteveen+Bos Consulting engineers, the Netherlands.
1. IntroductionEbb-tidal deltas are shallow sandy features located sea-
ward of tidal inlets and are important for coastal safety in
barrier systems. They act as a shield for incoming (storm)
wave energy and they are a source of sediment for the
barrier islands and the back-barrier basin. This ‘feeder’
function is often related to the observed cyclic behavior of
shoal formation, migration and attachment to the down-
drift island (Ridderinkhof et al., 2016a). A well-known
example of cyclic behavior is the ebb-tidal delta of the
Ameland Inlet, which is considered to be the most natural
system of the Dutch Wadden Sea. This system changes
from a one-channel-system to a two-channel-system and
back during one cycle and periodically shoals migrate and
attach to the downdrift coast. Yet, our knowledge of the
cyclic behavior of channels and shoals on the ebb-tidal
delta is insufficient to predict the period between succes-
sive shoal attachments and understand the physical pro-
cesses involved. The main objective of this study is to
study the effect of different wave, tide and basin charac-
teristics on the cyclic behavior of an ebb-tidal delta and to
study the underlying physical processes.
2. MethodsA numerical morphodynamic model - Delft3D/SWAN -
was employed with an idealized geometric set-up, repre-
sentative for the tidal inlet systems in the German Wad-
den Sea. Hydrodynamic forcing consists of a combina-
tion of tides and waves and the model computes the re-
sulting sediment transport and subsequent bed-level evo-
lution. Many model runs were conducted to test the rel-
ative importance of waves and tidal currents on the mor-
phological evolution of the tidal inlet and ebb-tidal delta.
Furthermore, the effect of basin geometry (size, shape,
depth) on the cyclic behavior was studied.
3. ResultsWe modeled cyclic behavior of ebb-tidal deltas that re-
sembles observed patterns in the Wadden Sea. Channels
migrated, shoals were generated and periodically attached
to the downstream coast. Obtained bathymetries (Fig-
ure 1) show that changes in the inlet - similar to the one-
channel/two-channel transformation of the Ameland Inlet
- are an inherent feature of periodic shoal dynamics.
The results indicate a relation between incoming wave
height and time scale of cyclic behavior. Larger waves re-
sults in faster migration of shoals and smaller time scales,
which is in agreement with the findings of Ridderinkhof
et al. (2016b). The link between tidal prism and time scale
of cyclic behavior is found to be less pronounced. Fur-
thermore, the results indicate that cyclic behavior occurs
if and only if the initial back-barrier basin is not too deep,
i.e. deep inlet systems tend to import sediment rather than
bypass the sediment by means of shoal dynamics.
Figure 1. Top figure: Initial bathymetry of modeled
cyclic behavior with depth in meters and wave direction
as white arrow. Hydrodynamic forcing consists of tides
(amplitude M2-tide = 1 m) and waves (Hs = 2 m).
Domain of detailed figures in white box with developed
ebb-tidal deltas (middle left), shoal formation (middle
right), shoal migration (lower left) and shoal attachment
(lower right).
ReferencesRidderinkhof, W., Hoekstra, P., van der Vegt, M., and
De Swart, H. E. (2016a). Cyclic behavior of sandy
shoals on the ebb-tidal deltas of the wadden sea. Con-
tinental Shelf Research, 115:14–26.
Ridderinkhof, W., Swart, H., van der Vegt, M., and Hoek-
stra, P. (2016b). Modeling the growth and migration of
sandy shoals on ebb-tidal deltas. Journal of Geophysi-
cal Research: Earth Surface, 121(7):1351–1372.

133
Ebb- and flood tidal channels in scale-experiments of estuaries
J.R.F.W. Leuven*, L. Braat, W.M. van Dijk and M.G. Kleinhans
Department of Physical Geography, faculty of Geosciences, Utrecht University, Utrecht, The Netherlands
* Presenting author, [email protected]
1. Introduction The occurrence of mutually evasive ebb- and flood tidal channels is one of the most typical features in tidal basins and estuaries (Fig. 1). While Van Veen already observed and described these striking elements in the 1950s, their forming mechanism is still largely unknown because of the challenges in numerical modelling and physical models of tidal systems. Recently, it was showed that a periodically tilting flume can generate dynamic tidal morphology (Kleinhans et al., 2015). In this study we investigate the formation and evolution of mutually evasive ebb- and flood tidal channels with measurements of water levels and tidal currents. We define the confluences of ebb- and flood channels as nodes, for which we will show that they behave as asymmetric stable bifurcations.
2. Methodology We created estuaries in a tilting flume of 20 m long and 3 m wide. The maximum tilting slope was 0.004 m∙m-1 with a period of 40 s. The typical amplitude of tidal flow velocity was 0.3 m∙s-1 and water depths were 0.02-0.05 m. The experiment started with an initial converging channel at the centreline of the flume and was subsequently tilted for 15,000 tidal cycles. Detailed measurements of bathymetry, water levels and flow velocities were made during 12 stages of the experiment. Bathymetry was created using Structure for Motion software (Agisoft) (Fig. 2a). Flow velocities were measured using Particle Image Velocimetry (PIV) and water levels were measured with echo sounders. Overhead cameras collected time-lapse imagery to monitor the evolution of the experiment. The water was dyed blue and the blueness was used as a proxy for water depth (Fig. 2b).
Fig. 1. Mutually evasive tidal channels.
3. Results & discussion Dynamic channels and shoals evolved during the experiment. In the first 500 tidal cycles, an alternate bar pattern developed. This stage was followed by widening of the estuary, formation of flood tidal channels with a sill at their upstream end, and an increase in the number of channels and shoals (Braiding Index) in cross-section.
Water levels and tidal currents varied considerable in along-channel and cross-channel direction, creating cross-bar water level gradients. At these locations, cross-bar channels formed, because water levels and flow velocities in the ebb channel were generally larger than in the flood channel (Fig. 2). A growing cross-bar channel often reversed the role of the ebb- and flood channels.
Fig. 2. Bathymetry (a) with measurements of water level
(b) and tidal current (c) during the experiment.
4. Conclusions Within 500 tidal cycles, mutually evasive ebb- and flood tidal channels formed in our experimental setup. Measurements of water level, bed level and flow velocities show that tidal bifurcations evolve into asymmetric stable bifurcations. After the formation of a flood tidal channel, gradients in water level generate cross-bar flow, which eventually cross-cuts the tidal bar that formed between the flood channel and the parallel ebb tidal channel.
Acknowledgments We are grateful to C. Roosendaal, A. van Eijk, H. Markies and M. van Maarseveen for their technical support. This research was supported by the Dutch Technology Foundation STW (grant Vici 016.140.316/13710 to MGK).
References Kleinhans, M.G., Scheltinga, R.T., Van der Vegt, M.
and Markies, H. (2015). Turning the tide: growth and dynamics of a tidal basin and inlet in experiments. J.
Geophys. Res. Earth Surf., 120 (1):, 95–119. Van Veen, J. (1950). Ebb and flood channel systems in
the Netherlands tidal waters, reprint of the original text. J. the Royal Dutch Geogr. Society, 67, 303-325.
ebb
flood
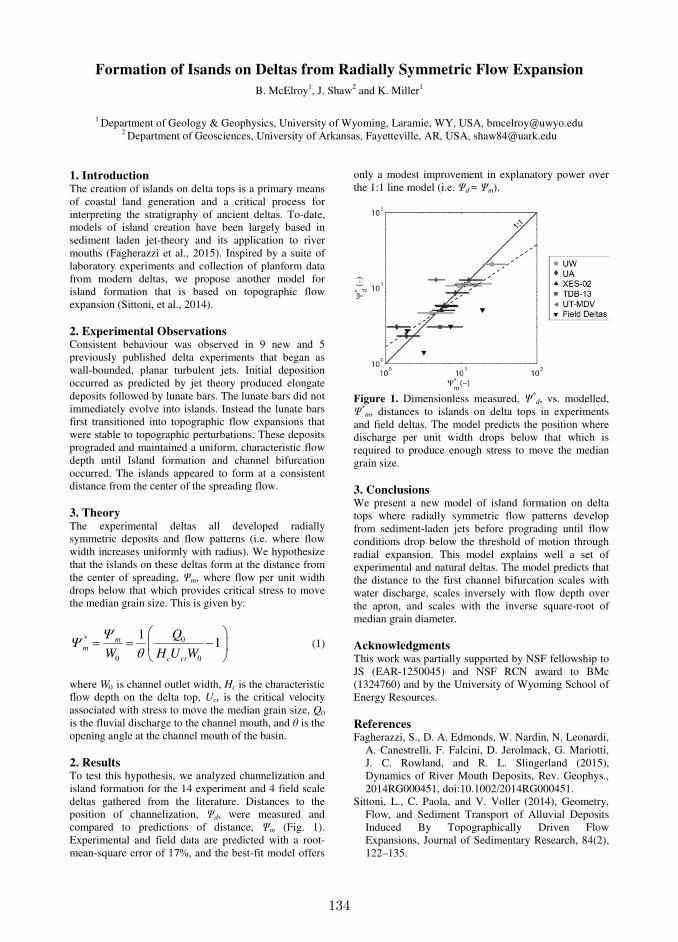
134
Formation of Isands on Deltas from Radially Symmetric Flow Expansion
B. McElroy1, J. Shaw2 and K. Miller1
1 Department of Geology & Geophysics, University of Wyoming, Laramie, WY, USA, [email protected]
2 Department of Geosciences, University of Arkansas, Fayetteville, AR, USA, [email protected]
1. Introduction The creation of islands on delta tops is a primary means of coastal land generation and a critical process for interpreting the stratigraphy of ancient deltas. To-date, models of island creation have been largely based in sediment laden jet-theory and its application to river mouths (Fagherazzi et al., 2015). Inspired by a suite of laboratory experiments and collection of planform data from modern deltas, we propose another model for island formation that is based on topographic flow expansion (Sittoni, et al., 2014). 2. Experimental Observations Consistent behaviour was observed in 9 new and 5 previously published delta experiments that began as wall-bounded, planar turbulent jets. Initial deposition occurred as predicted by jet theory produced elongate deposits followed by lunate bars. The lunate bars did not immediately evolve into islands. Instead the lunate bars first transitioned into topographic flow expansions that were stable to topographic perturbations. These deposits prograded and maintained a uniform, characteristic flow depth until Island formation and channel bifurcation occurred. The islands appeared to form at a consistent distance from the center of the spreading flow. 3. Theory The experimental deltas all developed radially symmetric deposits and flow patterns (i.e. where flow width increases uniformly with radius). We hypothesize that the islands on these deltas form at the distance from the center of spreading, Ψm, where flow per unit width drops below that which provides critical stress to move the median grain size. This is given by:
* 0
0 0
11m
m
c cr
Q
W H U W
ΨΨθ
= = −
(1)
where W0 is channel outlet width, Hc is the characteristic flow depth on the delta top, Ucr is the critical velocity associated with stress to move the median grain size, Q0 is the fluvial discharge to the channel mouth, and θ is the opening angle at the channel mouth of the basin. 2. Results To test this hypothesis, we analyzed channelization and island formation for the 14 experiment and 4 field scale deltas gathered from the literature. Distances to the position of channelization, Ψd, were measured and compared to predictions of distance, Ψm (Fig. 1). Experimental and field data are predicted with a root-mean-square error of 17%, and the best-fit model offers
only a modest improvement in explanatory power over the 1:1 line model (i.e. Ψd = Ψm).
Figure 1. Dimensionless measured, Ψ*
d, vs. modelled, Ψ*
m, distances to islands on delta tops in experiments and field deltas. The model predicts the position where discharge per unit width drops below that which is required to produce enough stress to move the median grain size. 3. Conclusions We present a new model of island formation on delta tops where radially symmetric flow patterns develop from sediment-laden jets before prograding until flow conditions drop below the threshold of motion through radial expansion. This model explains well a set of experimental and natural deltas. The model predicts that the distance to the first channel bifurcation scales with water discharge, scales inversely with flow depth over the apron, and scales with the inverse square-root of median grain diameter. Acknowledgments This work was partially supported by NSF fellowship to JS (EAR-1250045) and NSF RCN award to BMc (1324760) and by the University of Wyoming School of Energy Resources. References Fagherazzi, S., D. A. Edmonds, W. Nardin, N. Leonardi,
A. Canestrelli, F. Falcini, D. Jerolmack, G. Mariotti, J. C. Rowland, and R. L. Slingerland (2015), Dynamics of River Mouth Deposits, Rev. Geophys., 2014RG000451, doi:10.1002/2014RG000451.
Sittoni, L., C. Paola, and V. Voller (2014), Geometry, Flow, and Sediment Transport of Alluvial Deposits Induced By Topographically Driven Flow Expansions, Journal of Sedimentary Research, 84(2), 122–135.
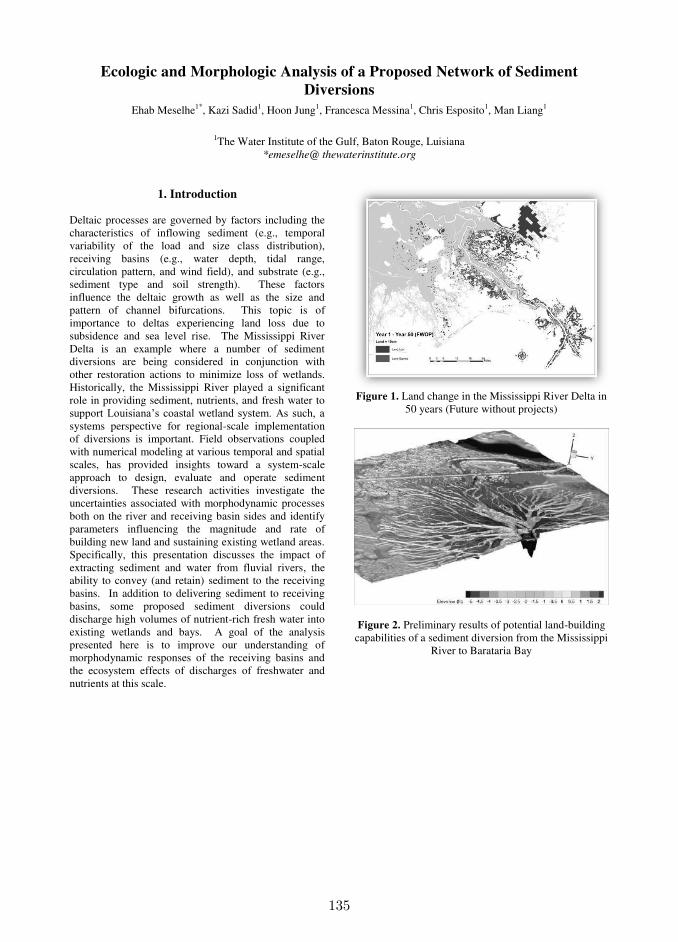
135
Ecologic and Morphologic Analysis of a Proposed Network of Sediment
Diversions
Ehab Meselhe1*, Kazi Sadid1, Hoon Jung1, Francesca Messina1, Chris Esposito1, Man Liang1
1The Water Institute of the Gulf, Baton Rouge, Luisiana
*emeselhe@ thewaterinstitute.org
1. Introduction
Deltaic processes are governed by factors including the characteristics of inflowing sediment (e.g., temporal variability of the load and size class distribution), receiving basins (e.g., water depth, tidal range, circulation pattern, and wind field), and substrate (e.g., sediment type and soil strength). These factors influence the deltaic growth as well as the size and pattern of channel bifurcations. This topic is of importance to deltas experiencing land loss due to subsidence and sea level rise. The Mississippi River Delta is an example where a number of sediment diversions are being considered in conjunction with other restoration actions to minimize loss of wetlands. Historically, the Mississippi River played a significant role in providing sediment, nutrients, and fresh water to support Louisiana’s coastal wetland system. As such, a systems perspective for regional-scale implementation of diversions is important. Field observations coupled with numerical modeling at various temporal and spatial scales, has provided insights toward a system-scale approach to design, evaluate and operate sediment diversions. These research activities investigate the uncertainties associated with morphodynamic processes both on the river and receiving basin sides and identify parameters influencing the magnitude and rate of building new land and sustaining existing wetland areas. Specifically, this presentation discusses the impact of extracting sediment and water from fluvial rivers, the ability to convey (and retain) sediment to the receiving basins. In addition to delivering sediment to receiving basins, some proposed sediment diversions could discharge high volumes of nutrient-rich fresh water into existing wetlands and bays. A goal of the analysis presented here is to improve our understanding of morphodynamic responses of the receiving basins and the ecosystem effects of discharges of freshwater and nutrients at this scale.
Figure 1. Land change in the Mississippi River Delta in
50 years (Future without projects)
Figure 2. Preliminary results of potential land-building capabilities of a sediment diversion from the Mississippi
River to Barataria Bay

136
What makes a delta tide-dominated?
J.H. Nienhuis1, T.E. Törnqvist1, and A.J.F. Hoitink2
1 Department of Earth and Environmental Sciences, Tulane University, New Orleans, United States. [email protected], [email protected]
2 Department of Environmental Sciences, Wageningen University and Research, Wageningen, Netherlands. [email protected]
1. Introduction Tides move water and sediments in the coastal zone and affect river delta morphology. Galloway (1975) characterized deltas with estuarine geometry as tide-dominated and quantified this dominance using the tide-energy flux. This description is useful for broad characterizations of modern deltas and their global variability, but is challenging to use in a predictive framework of delta morphology and delta change because a vital link is missing: what magnitude of tidal forces results in which measurable feature of delta geometry? Here we aim to establish that link. We use the observation that the first order effect of tides on deltas is downstream channel widening (Fig. 1) (Langbein, 1963). We hypothesize that this increase in channel width is a signature of the downstream increase in tidal discharge. Therefore, we define the effect of tides on deltas by the non-dimensional metric T:
river
tide
Q
QT , (1)
where Qtide is the tidally driven discharge at the river mouth (m3s-1), and Qriver is the fluvial discharge at the river mouth (m3s-1). If T > 1, the channel will widen significantly and the delta is tide-dominated (e.g. Fly, Fig. 1b), if T < 1, the channel does not widen significantly and the delta is wave- or river-dominated (e.g. Mississippi, Fig. 1b). 2. Methods To test our hypothesis, we developed a simple a-priori predictor of tidal discharge based on a set of independent variables: upstream river discharge, channel bed slope, and offshore tidal range. We rewrite Qtide as a function of the offshore tidal range and the water surface area of the delta assuming a simple sinusoidal tidal motion. Combined with hydraulic geometry (e.g., D’Alpaos et al., 2010), Qtide then gives us a prediction of channel mouth width that we can test in the field. For 71 deltas (from Syvitski and Saito, 2007, supplemented with 20 other, mostly smaller deltas), we retrieved their tidal characteristics, fluvial discharge, and delta slope. We also measured upstream channel width and downstream channel width. In the case of a distributary network, we correct the sum of the river mouth widths by n-0.5, where n is the number of distributary channels and ½ is a scaling factor (Leopold and Maddock, 1953), to only investigate widening in response to tides. 3. Results and conclusions For 71 deltas globally, we find that our predicted river mouth width matches the observed river mouth width (R=0.9). This gives us confidence in our predicted
tidal discharge as an a priori indicator of the effect of tides on delta morphology. Our metric can be applied globally and give insight into the distribution of deltas in different environments in the modern and in the past. Simple predictive metrics like the one proposed here can also be applied to study how delta morphology might adjust in the future in response to climate change and human impacts.
Figure 1. (A) The Fly River Delta, annotated are approximations of the river mouth width, the tidal
prism area, and the sediment fluxes. Image NOAA. (B) The width of the Mississippi River and the Fly
River between the river mouth and 550 km upstream.
References D’Alpaos, A., Lanzoni, S., Marani, M., Rinaldo, A.,
2010. On the tidal prism–channel area relations. J. Geophys. Res. 115, F01003. doi:10.1029/2008JF001243
Galloway, W.D., 1975. Process Framework for describing the morphologic and stratigraphic evolution of deltaic depositional systems, in: Broussard, M.L. (Ed.), Deltas, Models for Exploration. Houston Geological Society, Houston, TX, pp. 86–98.
Langbein, W.B., 1963. The hydraulic geometry of a shallow estuary. Int. Assoc. Sci. Hydrol. Bull. 8, 84–94. doi:10.1080/02626666309493340
Leopold, L.B., Maddock, T.J., 1953. The Hydraulic Geomtry of Stream Channels and Some Physiographic Implications, Geological Survey Professional Paper 252.
Syvitski, J.P.M., Saito, Y., 2007. Morphodynamics of deltas under the influence of humans. Glob. Planet. Change 57, 261–282. doi:10.1016/j.gloplacha.2006.12.001
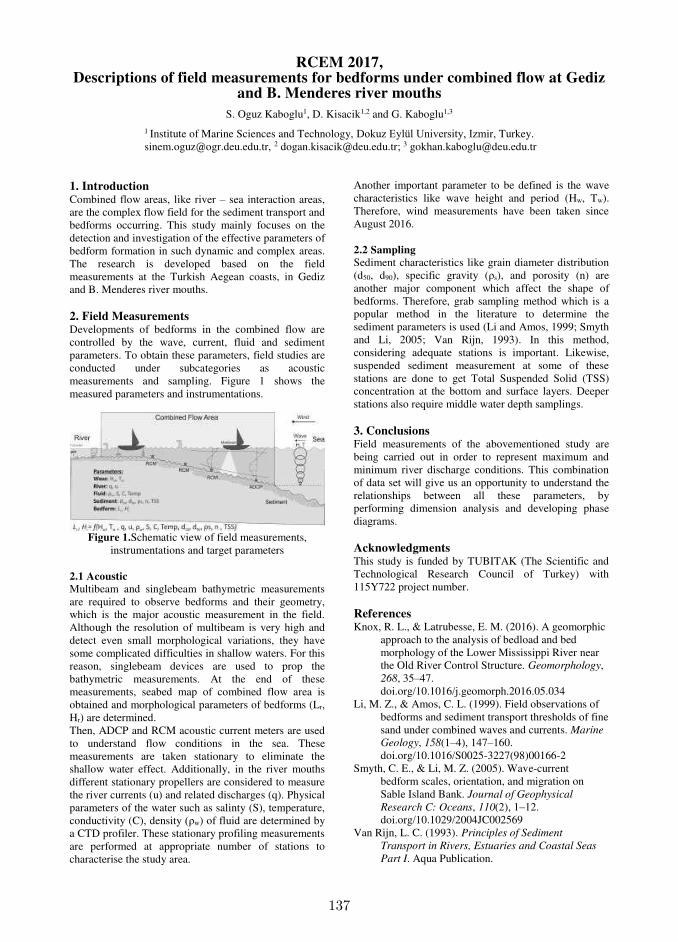
137
RCEM 2017, Descriptions of field measurements for bedforms under combined flow at Gediz
and B. Menderes river mouths
S. Oguz Kaboglu1, D. Kisacik1,2 and G. Kaboglu1,3
1 Institute of Marine Sciences and Technology, Dokuz Eylül University, Izmir, Turkey. [email protected], 2 [email protected]; 3 [email protected]
1. Introduction Combined flow areas, like river – sea interaction areas, are the complex flow field for the sediment transport and bedforms occurring. This study mainly focuses on the detection and investigation of the effective parameters of bedform formation in such dynamic and complex areas. The research is developed based on the field measurements at the Turkish Aegean coasts, in Gediz and B. Menderes river mouths. 2. Field Measurements Developments of bedforms in the combined flow are controlled by the wave, current, fluid and sediment parameters. To obtain these parameters, field studies are conducted under subcategories as acoustic measurements and sampling. Figure 1 shows the measured parameters and instrumentations.
Figure 1.Schematic view of field measurements,
instrumentations and target parameters 2.1 Acoustic
Multibeam and singlebeam bathymetric measurements are required to observe bedforms and their geometry, which is the major acoustic measurement in the field. Although the resolution of multibeam is very high and detect even small morphological variations, they have some complicated difficulties in shallow waters. For this reason, singlebeam devices are used to prop the bathymetric measurements. At the end of these measurements, seabed map of combined flow area is obtained and morphological parameters of bedforms (Lr, Hr) are determined. Then, ADCP and RCM acoustic current meters are used to understand flow conditions in the sea. These measurements are taken stationary to eliminate the shallow water effect. Additionally, in the river mouths different stationary propellers are considered to measure the river currents (u) and related discharges (q). Physical parameters of the water such as salinty (S), temperature, conductivity (C), density (ρw) of fluid are determined by a CTD profiler. These stationary profiling measurements are performed at appropriate number of stations to characterise the study area.
Another important parameter to be defined is the wave characteristics like wave height and period (Hw, Tw). Therefore, wind measurements have been taken since August 2016. 2.2 Sampling
Sediment characteristics like grain diameter distribution (d50, d90), specific gravity (ρs), and porosity (n) are another major component which affect the shape of bedforms. Therefore, grab sampling method which is a popular method in the literature to determine the sediment parameters is used (Li and Amos, 1999; Smyth and Li, 2005; Van Rijn, 1993). In this method, considering adequate stations is important. Likewise, suspended sediment measurement at some of these stations are done to get Total Suspended Solid (TSS) concentration at the bottom and surface layers. Deeper stations also require middle water depth samplings. 3. Conclusions Field measurements of the abovementioned study are being carried out in order to represent maximum and minimum river discharge conditions. This combination of data set will give us an opportunity to understand the relationships between all these parameters, by performing dimension analysis and developing phase diagrams. Acknowledgments This study is funded by TUBITAK (The Scientific and Technological Research Council of Turkey) with 115Y722 project number. References Knox, R. L., & Latrubesse, E. M. (2016). A geomorphic
approach to the analysis of bedload and bed morphology of the Lower Mississippi River near the Old River Control Structure. Geomorphology, 268, 35–47. doi.org/10.1016/j.geomorph.2016.05.034
Li, M. Z., & Amos, C. L. (1999). Field observations of bedforms and sediment transport thresholds of fine sand under combined waves and currents. Marine
Geology, 158(1–4), 147–160. doi.org/10.1016/S0025-3227(98)00166-2
Smyth, C. E., & Li, M. Z. (2005). Wave-current bedform scales, orientation, and migration on Sable Island Bank. Journal of Geophysical
Research C: Oceans, 110(2), 1–12. doi.org/10.1029/2004JC002569
Van Rijn, L. C. (1993). Principles of Sediment
Transport in Rivers, Estuaries and Coastal Seas
Part I. Aqua Publication.
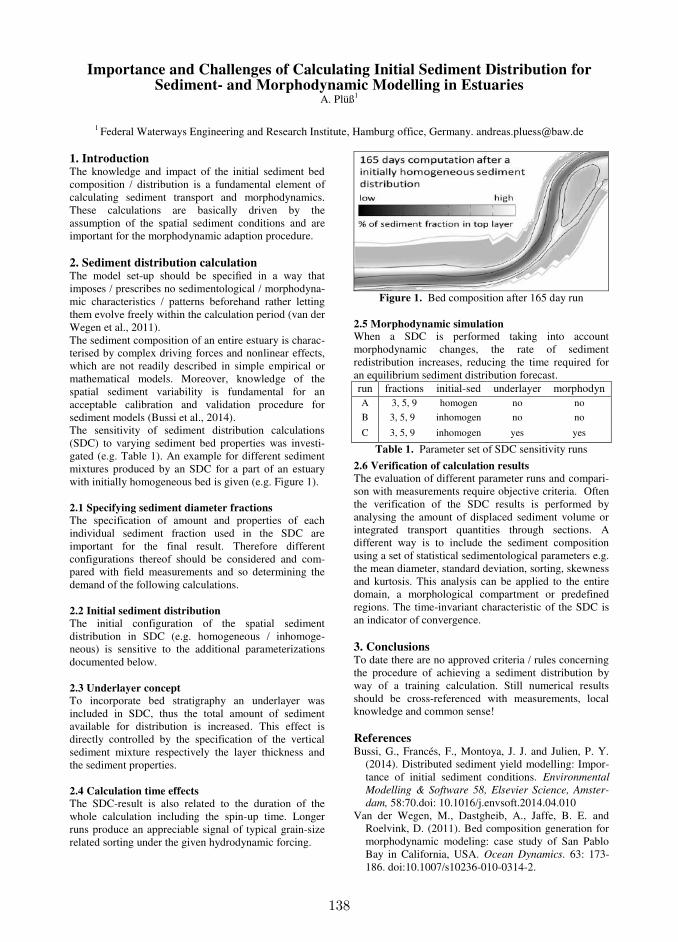
138
Importance and Challenges of Calculating Initial Sediment Distribution for Sediment- and Morphodynamic Modelling in Estuaries
A. Plüß1
1 Federal Waterways Engineering and Research Institute, Hamburg office, Germany. [email protected]
1. Introduction The knowledge and impact of the initial sediment bed composition / distribution is a fundamental element of calculating sediment transport and morphodynamics. These calculations are basically driven by the assumption of the spatial sediment conditions and are important for the morphodynamic adaption procedure. 2. Sediment distribution calculation The model set-up should be specified in a way that imposes / prescribes no sedimentological / morphodyna-mic characteristics / patterns beforehand rather letting them evolve freely within the calculation period (van der Wegen et al., 2011). The sediment composition of an entire estuary is charac-terised by complex driving forces and nonlinear effects, which are not readily described in simple empirical or mathematical models. Moreover, knowledge of the spatial sediment variability is fundamental for an acceptable calibration and validation procedure for sediment models (Bussi et al., 2014). The sensitivity of sediment distribution calculations (SDC) to varying sediment bed properties was investi-gated (e.g. Table 1). An example for different sediment mixtures produced by an SDC for a part of an estuary with initially homogeneous bed is given (e.g. Figure 1). 2.1 Specifying sediment diameter fractions
The specification of amount and properties of each individual sediment fraction used in the SDC are important for the final result. Therefore different configurations thereof should be considered and com-pared with field measurements and so determining the demand of the following calculations.
2.2 Initial sediment distribution
The initial configuration of the spatial sediment distribution in SDC (e.g. homogeneous / inhomoge-neous) is sensitive to the additional parameterizations documented below. 2.3 Underlayer concept
To incorporate bed stratigraphy an underlayer was included in SDC, thus the total amount of sediment available for distribution is increased. This effect is directly controlled by the specification of the vertical sediment mixture respectively the layer thickness and the sediment properties. 2.4 Calculation time effects
The SDC-result is also related to the duration of the whole calculation including the spin-up time. Longer runs produce an appreciable signal of typical grain-size related sorting under the given hydrodynamic forcing.
Figure 1. Bed composition after 165 day run
2.5 Morphodynamic simulation When a SDC is performed taking into account morphodynamic changes, the rate of sediment redistribution increases, reducing the time required for an equilibrium sediment distribution forecast. run fractions initial-sed underlayer morphodyn A 3, 5, 9 homogen no no
B 3, 5, 9 inhomogen no no
C 3, 5, 9 inhomogen yes yes
Table 1. Parameter set of SDC sensitivity runs
2.6 Verification of calculation results
The evaluation of different parameter runs and compari-son with measurements require objective criteria. Often the verification of the SDC results is performed by analysing the amount of displaced sediment volume or integrated transport quantities through sections. A different way is to include the sediment composition using a set of statistical sedimentological parameters e.g. the mean diameter, standard deviation, sorting, skewness and kurtosis. This analysis can be applied to the entire domain, a morphological compartment or predefined regions. The time-invariant characteristic of the SDC is an indicator of convergence. 3. Conclusions To date there are no approved criteria / rules concerning the procedure of achieving a sediment distribution by way of a training calculation. Still numerical results should be cross-referenced with measurements, local knowledge and common sense! References Bussi, G., Francés, F., Montoya, J. J. and Julien, P. Y.
(2014). Distributed sediment yield modelling: Impor-tance of initial sediment conditions. Environmental
Modelling & Software 58, Elsevier Science, Amster-
dam, 58:70.doi: 10.1016/j.envsoft.2014.04.010 Van der Wegen, M., Dastgheib, A., Jaffe, B. E. and
Roelvink, D. (2011). Bed composition generation for morphodynamic modeling: case study of San Pablo Bay in California, USA. Ocean Dynamics. 63: 173-186. doi:10.1007/s10236-010-0314-2.

139
Characterizing morphological process connectivity in a river deltausing information theory
A. Sendrowski1, P. Passalacqua1, K. Sadid2, and E. Meselhe2
1 Department of Civil, Architectural, and Environmental Engineering, University of Texas at Austin, Austin, TX, USA.
[email protected], [email protected] The Water Institute of the Gulf, Baton Rouge, LA, USA.
[email protected], [email protected]
1. IntroductionRiver deltas are complex ecogeomorphic systems that dis-
play great variability in channel network structure and is-
land morphology. This variability arises due to the multi-
scale interactions between system drivers (e.g., discharge,
tides, and wind) and delta variables (e.g., water level,
sediment concentration, and nutrient concentration), also
referred to as process connectivity (Passalacqua, 2017).
While the importance of process connections has been
identified, these relationships are still poorly understood
(Paola et al., 2011). Deltas are also increasingly vulner-
able to anthropogenic disturbance and eustatic sea level
rise, which has led to deltaic land loss in many areas
worldwide (Ericson et al., 2006). River diversions have
been proposed to mitigate this loss, wherein the flood-
plain area is inundated with water and sediment allowing
"natural" land building processes to occur (Paola et al.,
2011). A better understanding of process connectivity
would provide insight into land building mechanisms and
predicting diversion outcomes. To this end, the objec-
tive of this study is to characterize morphological process
connectivity (couplings between sediment concentration
and discharge, tides, and wind) in strength, direction, and
scale in a river delta.
2. Analysis2.1 Study area and data collection
Our study area is Wax Lake Delta (WLD), a 150km2
river-dominated tidally-influenced delta in coastal
Louisiana that is building land naturally and is often cast
as an analogue of diversion systems. A Delft3D model
run on WLD bathymetry generated two years of sediment
concentration at multiple islands and channels over
2014-2015. Additionally, three optical backscatter (OBS)
point sensors deployed in the field from November
2013-January 2014 captured time series of sediment
concentration derived from turbidity data. River dis-
charge, tide, and wind measurements are collected from
the USGS and NOAA Tides and Currents databases,
respectively.
2.2 Information theory
We measure process connectivity using information the-
ory, a branch of mathematics quantifying the communica-
tion of information and uncertainty in a signal (Shannon,
1948). The flow of information (reduction in uncertainty)
among time series of variables are analyzed in terms of
their synchronization and information transfer using the
probability density functions (pdfs) of the data. Relation-
ships are quantified in strength, direction, timescale, and
significance using the Shannon entropy, mutual informa-
tion, and transfer entropy metrics. Couplings among vari-
ables are measured at multiple timescales (days, months,
years) to capture the multi-scale nature of process con-
nectivity (Sendrowski and Passalacqua, 2017).
3. ConclusionsThe process connections we measure are highly influ-
enced by the structural connectivity (physical link be-
tween locations) and functional connectivity (control of
fluxes) of the system. High hydrological connectivity be-
tween channels and islands exists in WLD (Hiatt and Pas-
salacqua, 2015), resulting in high synchronization among
sediment and driver variables. However, there are distinct
differences between channel and island sediment process
connections through time, related to wind and tidal forc-
ing and vegetation cover. These results are summarized
in a process network depicting the strength, direction, and
timescale of information flow among variables and reveal
delta-scale patterns related to the scale of forcing and sys-
tem morphology.
AcknowledgmentsThis material is based on work supported by the
National Science Foundation grants CAREER/EAR-
1350336, FESD-EAR-1135427, awarded to P.P., and a
National Science Foundation Graduate Research Fellow-
ship under grant DGE-1110007 awarded to A.S. The au-
thors thank Wayne Wagner, Brandon Minton, Matt Hiatt,
and Anastasia Piliouras for their assistance in the field.
ReferencesEricson, J. P., Vörösmarty, C. J., Dingman, S. L., Ward,
L. G., and Meybeck, M. (2006). Effective sea-level rise
and deltas: Causes of change and human dimension im-
plications. Global and Planetary Change, 50(1):63 –
82.
Hiatt, M. and Passalacqua, P. (2015). Hydrological con-
nectivity in river deltas: The first-order importance of
channel-island exchange. Water Resources Research,
51(4):2264–2282.
Paola, C., Twilley, R. R., Edmonds, D. A., Kim, W.,
Mohrig, D., Parker, G., Viparelli, E., and Voller, V. R.
(2011). Natural processes in delta restoration: applica-
tion to the Mississippi Delta. Ann Rev Mar Sci, 3:67–
91.
Passalacqua, P. (2017). The delta connectome: A
network-based framework for studying connectivity in
river deltas. Geomorphology, 277:50 – 62.
Sendrowski, A. and Passalacqua, P. (2017). Process con-
nectivity in a naturally prograding river delta. Water
Resources Research, accepted.
Shannon, C. E. (1948). A mathematical theory of com-
munication. Bell system technical journal, 27.
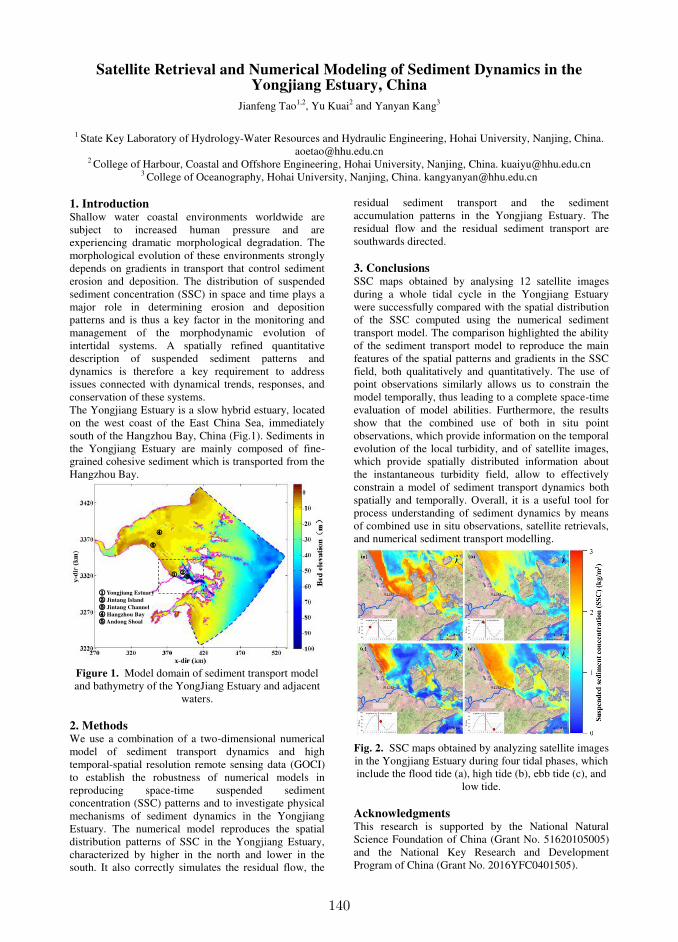
140
Satellite Retrieval and Numerical Modeling of Sediment Dynamics in the Yongjiang Estuary, China
Jianfeng Tao1,2, Yu Kuai2 and Yanyan Kang3
1 State Key Laboratory of Hydrology-Water Resources and Hydraulic Engineering, Hohai University, Nanjing, China.
[email protected] 2 College of Harbour, Coastal and Offshore Engineering, Hohai University, Nanjing, China. [email protected]
3 College of Oceanography, Hohai University, Nanjing, China. [email protected]
1. Introduction Shallow water coastal environments worldwide are subject to increased human pressure and are experiencing dramatic morphological degradation. The morphological evolution of these environments strongly depends on gradients in transport that control sediment erosion and deposition. The distribution of suspended sediment concentration (SSC) in space and time plays a major role in determining erosion and deposition patterns and is thus a key factor in the monitoring and management of the morphodynamic evolution of intertidal systems. A spatially refined quantitative description of suspended sediment patterns and dynamics is therefore a key requirement to address issues connected with dynamical trends, responses, and conservation of these systems. The Yongjiang Estuary is a slow hybrid estuary, located on the west coast of the East China Sea, immediately south of the Hangzhou Bay, China (Fig.1). Sediments in the Yongjiang Estuary are mainly composed of fine-grained cohesive sediment which is transported from the Hangzhou Bay.
Yongjiang Estuary
Jintang Island
Jintang Channel
Hangzhou Bay
Andong Shoal
Figure 1. Model domain of sediment transport model and bathymetry of the YongJiang Estuary and adjacent
waters.
2. Methods We use a combination of a two-dimensional numerical model of sediment transport dynamics and high temporal-spatial resolution remote sensing data (GOCI) to establish the robustness of numerical models in reproducing space-time suspended sediment concentration (SSC) patterns and to investigate physical mechanisms of sediment dynamics in the Yongjiang Estuary. The numerical model reproduces the spatial distribution patterns of SSC in the Yongjiang Estuary, characterized by higher in the north and lower in the south. It also correctly simulates the residual flow, the
residual sediment transport and the sediment accumulation patterns in the Yongjiang Estuary. The residual flow and the residual sediment transport are southwards directed. 3. Conclusions SSC maps obtained by analysing 12 satellite images during a whole tidal cycle in the Yongjiang Estuary were successfully compared with the spatial distribution of the SSC computed using the numerical sediment transport model. The comparison highlighted the ability of the sediment transport model to reproduce the main features of the spatial patterns and gradients in the SSC field, both qualitatively and quantitatively. The use of point observations similarly allows us to constrain the model temporally, thus leading to a complete space-time evaluation of model abilities. Furthermore, the results show that the combined use of both in situ point observations, which provide information on the temporal evolution of the local turbidity, and of satellite images, which provide spatially distributed information about the instantaneous turbidity field, allow to effectively constrain a model of sediment transport dynamics both spatially and temporally. Overall, it is a useful tool for process understanding of sediment dynamics by means of combined use in situ observations, satellite retrievals, and numerical sediment transport modelling.
Fig. 2. SSC maps obtained by analyzing satellite images in the Yongjiang Estuary during four tidal phases, which include the flood tide (a), high tide (b), ebb tide (c), and
low tide.
Acknowledgments This research is supported by the National Natural Science Foundation of China (Grant No. 51620105005) and the National Key Research and Development Program of China (Grant No. 2016YFC0401505).
141
Modeling Morphological Changes due to Multiple Typhoons in the Danshui River Estuary
Tung-Chou Hsieh1, Keh-Chia Yeh2 and Yan Ding3
1 Department of Civil Engineering, Nation Chiao Tung University, Hsinchu, Taiwan. [email protected] 2 Department of Civil Engineering, Nation Chiao Tung University, Hsinchu, Taiwan. [email protected]
3 National Center for Computational Hydroscience and Engineering, The University of Mississippi, University, MS, USA [email protected]
1. Abstract Tamsui river is the largest river in northern Taiwan. Spatio-temporal variation of morphology in the Tamsui River estuary and its adjacent coast is highly dynamic and therefore complex. Primary reason of the variations is the complicity of the hydrodynamic and morphodynamic processes in the area. Morphological changes often occur in a tropical storm or typhoon. Sediment releases from reservoirs at upstream can also contribute to the morphological changes in the estuary. To better understand hydrodynamic and morphodynamic processes in the estuary driven by river flood flows, waves, tides, and winds, an integrated coastal process model, CCHE2D-Coast, is used to simulate flows and morphological changes due to multiple typhoons. This paper introduces a study on morphological changes in the Danshui River estuary driven by tides, waves, and river floods during the period of three typhoons in 2008 using an integrated coastal process model. The submodels for wave, current, and sediment transport were validated by comparing the simulation results with available observation/survey data. Model validation results indicate that the simulated water levels, flow velocities, and wave heights are in good agreement with the measurements at gages, and the simulated bed changes have captured the major features of deposition and erosion in the river, the estuary, and adjacent coasts.
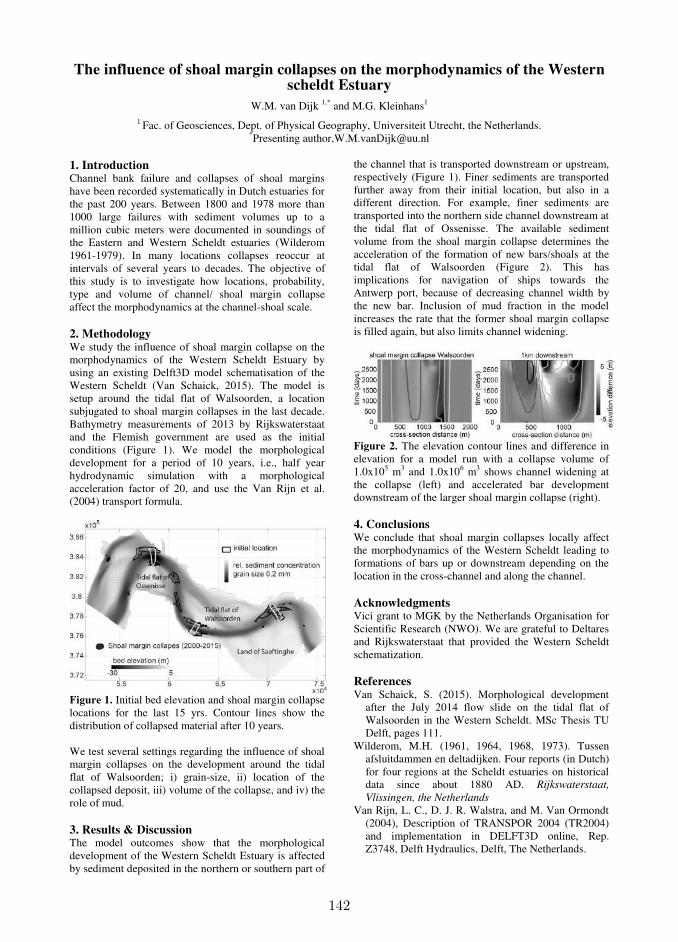
142
The influence of shoal margin collapses on the morphodynamics of the Western scheldt Estuary
W.M. van Dijk 1,* and M.G. Kleinhans1 1 Fac. of Geosciences, Dept. of Physical Geography, Universiteit Utrecht, the Netherlands.
*Presenting author,[email protected]
1. Introduction Channel bank failure and collapses of shoal margins have been recorded systematically in Dutch estuaries for the past 200 years. Between 1800 and 1978 more than 1000 large failures with sediment volumes up to a million cubic meters were documented in soundings of the Eastern and Western Scheldt estuaries (Wilderom 1961-1979). In many locations collapses reoccur at intervals of several years to decades. The objective of this study is to investigate how locations, probability, type and volume of channel/ shoal margin collapse affect the morphodynamics at the channel-shoal scale. 2. Methodology We study the influence of shoal margin collapse on the morphodynamics of the Western Scheldt Estuary by using an existing Delft3D model schematisation of the Western Scheldt (Van Schaick, 2015). The model is setup around the tidal flat of Walsoorden, a location subjugated to shoal margin collapses in the last decade. Bathymetry measurements of 2013 by Rijkswaterstaat and the Flemish government are used as the initial conditions (Figure 1). We model the morphological development for a period of 10 years, i.e., half year hydrodynamic simulation with a morphological acceleration factor of 20, and use the Van Rijn et al. (2004) transport formula.
Figure 1. Initial bed elevation and shoal margin collapse locations for the last 15 yrs. Contour lines show the distribution of collapsed material after 10 years.
We test several settings regarding the influence of shoal margin collapses on the development around the tidal flat of Walsoorden; i) grain-size, ii) location of the collapsed deposit, iii) volume of the collapse, and iv) the role of mud. 3. Results & Discussion The model outcomes show that the morphological development of the Western Scheldt Estuary is affected by sediment deposited in the northern or southern part of
the channel that is transported downstream or upstream, respectively (Figure 1). Finer sediments are transported further away from their initial location, but also in a different direction. For example, finer sediments are transported into the northern side channel downstream at the tidal flat of Ossenisse. The available sediment volume from the shoal margin collapse determines the acceleration of the formation of new bars/shoals at the tidal flat of Walsoorden (Figure 2). This has implications for navigation of ships towards the Antwerp port, because of decreasing channel width by the new bar. Inclusion of mud fraction in the model increases the rate that the former shoal margin collapse is filled again, but also limits channel widening.
Figure 2. The elevation contour lines and difference in elevation for a model run with a collapse volume of 1.0x10⁵ m3 and 1.0x10⁶ m3 shows channel widening at the collapse (left) and accelerated bar development downstream of the larger shoal margin collapse (right). 4. Conclusions We conclude that shoal margin collapses locally affect the morphodynamics of the Western Scheldt leading to formations of bars up or downstream depending on the location in the cross-channel and along the channel. Acknowledgments Vici grant to MGK by the Netherlands Organisation for Scientific Research (NWO). We are grateful to Deltares and Rijkswaterstaat that provided the Western Scheldt schematization. References Van Schaick, S. (2015). Morphological development
after the July 2014 flow slide on the tidal flat of Walsoorden in the Western Scheldt. MSc Thesis TU Delft, pages 111.
Wilderom, M.H. (1961, 1964, 1968, 1973). Tussen afsluitdammen en deltadijken. Four reports (in Dutch) for four regions at the Scheldt estuaries on historical data since about 1880 AD. Rijkswaterstaat,
Vlissingen, the Netherlands
Van Rijn, L. C., D. J. R. Walstra, and M. Van Ormondt (2004), Description of TRANSPOR 2004 (TR2004) and implementation in DELFT3D online, Rep. Z3748, Delft Hydraulics, Delft, The Netherlands.
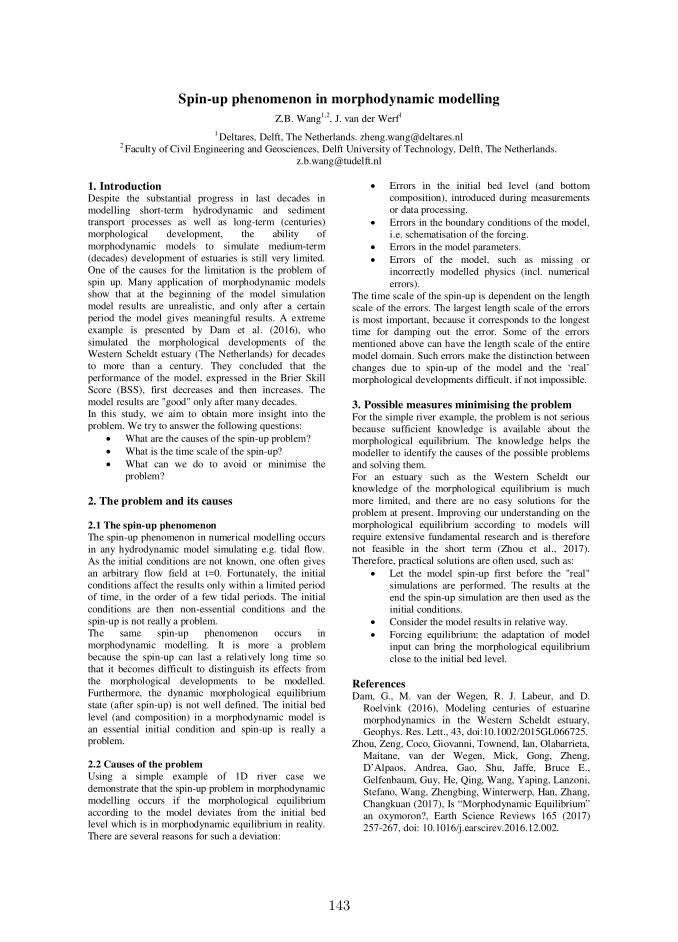
143
Spin-up phenomenon in morphodynamic modelling
Z.B. Wang1,2, J. van der Werf1
1 Deltares, Delft, The Netherlands. [email protected] Faculty of Civil Engineering and Geosciences, Delft University of Technology, Delft, The Netherlands.
1. IntroductionDespite the substantial progress in last decades inmodelling short-term hydrodynamic and sedimenttransport processes as well as long-term (centuries)morphological development, the ability ofmorphodynamic models to simulate medium-term(decades) development of estuaries is still very limited.One of the causes for the limitation is the problem ofspin up. Many application of morphodynamic modelsshow that at the beginning of the model simulationmodel results are unrealistic, and only after a certainperiod the model gives meaningful results. A extremeexample is presented by Dam et al. (2016), whosimulated the morphological developments of theWestern Scheldt estuary (The Netherlands) for decadesto more than a century. They concluded that theperformance of the model, expressed in the Brier SkillScore (BSS), first decreases and then increases. Themodel results are "good" only after many decades.In this study, we aim to obtain more insight into theproblem. We try to answer the following questions:
What are the causes of the spin-up problem?What is the time scale of the spin-up?What can we do to avoid or minimise theproblem?
2. The problem and its causes
2.1 The spin-up phenomenon
The spin-up phenomenon in numerical modelling occursin any hydrodynamic model simulating e.g. tidal flow.As the initial conditions are not known, one often givesan arbitrary flow field at t=0. Fortunately, the initialconditions affect the results only within a limited periodof time, in the order of a few tidal periods. The initialconditions are then non-essential conditions and thespin-up is not really a problem.The same spin-up phenomenon occurs inmorphodynamic modelling. It is more a problembecause the spin-up can last a relatively long time sothat it becomes difficult to distinguish its effects fromthe morphological developments to be modelled.Furthermore, the dynamic morphological equilibriumstate (after spin-up) is not well defined. The initial bedlevel (and composition) in a morphodynamic model isan essential initial condition and spin-up is really aproblem.
2.2 Causes of the problem
Using a simple example of 1D river case wedemonstrate that the spin-up problem in morphodynamicmodelling occurs if the morphological equilibriumaccording to the model deviates from the initial bedlevel which is in morphodynamic equilibrium in reality.There are several reasons for such a deviation:
Errors in the initial bed level (and bottomcomposition), introduced during measurementsor data processing.Errors in the boundary conditions of the model,i.e. schematisation of the forcing.Errors in the model parameters.Errors of the model, such as missing orincorrectly modelled physics (incl. numericalerrors).
The time scale of the spin-up is dependent on the lengthscale of the errors. The largest length scale of the errorsis most important, because it corresponds to the longesttime for damping out the error. Some of the errorsmentioned above can have the length scale of the entiremodel domain. Such errors make the distinction betweenchanges due to spin-up of the model and the ‘real’morphological developments difficult, if not impossible.
3. Possible measures minimising the problemFor the simple river example, the problem is not seriousbecause sufficient knowledge is available about themorphological equilibrium. The knowledge helps themodeller to identify the causes of the possible problemsand solving them.For an estuary such as the Western Scheldt ourknowledge of the morphological equilibrium is muchmore limited, and there are no easy solutions for theproblem at present. Improving our understanding on themorphological equilibrium according to models willrequire extensive fundamental research and is thereforenot feasible in the short term (Zhou et al., 2017).Therefore, practical solutions are often used, such as:
Let the model spin-up first before the "real"simulations are performed. The results at theend the spin-up simulation are then used as theinitial conditions.Consider the model results in relative way.Forcing equilibrium: the adaptation of modelinput can bring the morphological equilibriumclose to the initial bed level.
ReferencesDam, G., M. van der Wegen, R. J. Labeur, and D.
Roelvink (2016), Modeling centuries of estuarinemorphodynamics in the Western Scheldt estuary,Geophys. Res. Lett., 43, doi:10.1002/2015GL066725.
Zhou, Zeng, Coco, Giovanni, Townend, Ian, Olabarrieta,Maitane, van der Wegen, Mick, Gong, Zheng,D’Alpaos, Andrea, Gao, Shu, Jaffe, Bruce E.,Gelfenbaum, Guy, He, Qing, Wang, Yaping, Lanzoni,Stefano, Wang, Zhengbing, Winterwerp, Han, Zhang,Changkuan (2017), Is “Morphodynamic Equilibrium”an oxymoron?, Earth Science Reviews 165 (2017)257-267, doi: 10.1016/j.earscirev.2016.12.002.
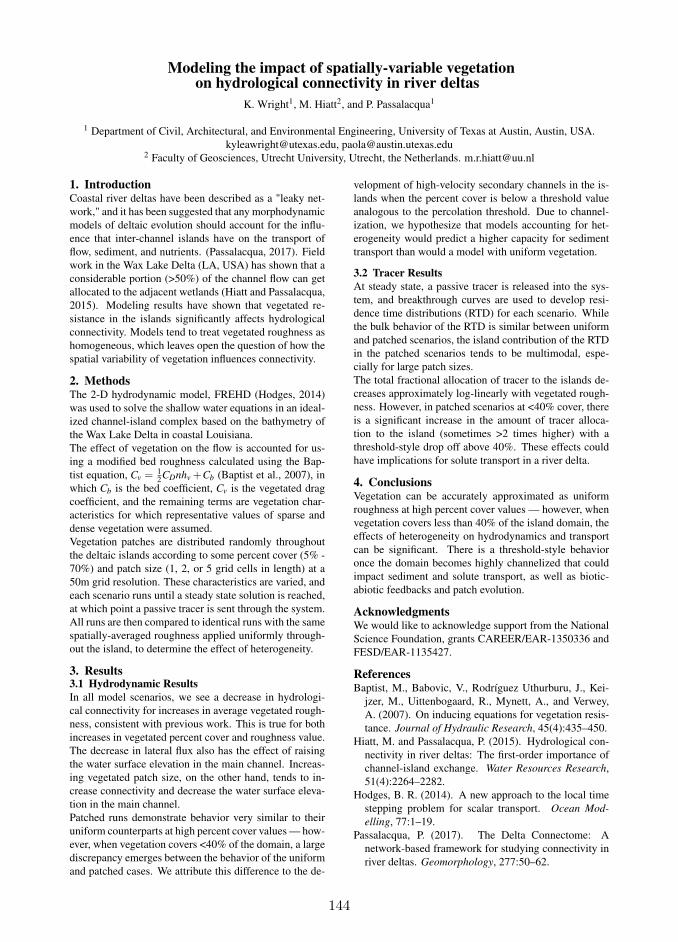
144
Modeling the impact of spatially-variable vegetationon hydrological connectivity in river deltas
K. Wright1, M. Hiatt2, and P. Passalacqua1
1 Department of Civil, Architectural, and Environmental Engineering, University of Texas at Austin, Austin, USA.
[email protected], [email protected] Faculty of Geosciences, Utrecht University, Utrecht, the Netherlands. [email protected]
1. IntroductionCoastal river deltas have been described as a "leaky net-
work," and it has been suggested that any morphodynamic
models of deltaic evolution should account for the influ-
ence that inter-channel islands have on the transport of
flow, sediment, and nutrients. (Passalacqua, 2017). Field
work in the Wax Lake Delta (LA, USA) has shown that a
considerable portion (>50%) of the channel flow can get
allocated to the adjacent wetlands (Hiatt and Passalacqua,
2015). Modeling results have shown that vegetated re-
sistance in the islands significantly affects hydrological
connectivity. Models tend to treat vegetated roughness as
homogeneous, which leaves open the question of how the
spatial variability of vegetation influences connectivity.
2. MethodsThe 2-D hydrodynamic model, FREHD (Hodges, 2014)
was used to solve the shallow water equations in an ideal-
ized channel-island complex based on the bathymetry of
the Wax Lake Delta in coastal Louisiana.
The effect of vegetation on the flow is accounted for us-
ing a modified bed roughness calculated using the Bap-
tist equation, Cv =12CDnhv +Cb (Baptist et al., 2007), in
which Cb is the bed coefficient, Cv is the vegetated drag
coefficient, and the remaining terms are vegetation char-
acteristics for which representative values of sparse and
dense vegetation were assumed.
Vegetation patches are distributed randomly throughout
the deltaic islands according to some percent cover (5% -
70%) and patch size (1, 2, or 5 grid cells in length) at a
50m grid resolution. These characteristics are varied, and
each scenario runs until a steady state solution is reached,
at which point a passive tracer is sent through the system.
All runs are then compared to identical runs with the same
spatially-averaged roughness applied uniformly through-
out the island, to determine the effect of heterogeneity.
3. Results3.1 Hydrodynamic Results
In all model scenarios, we see a decrease in hydrologi-
cal connectivity for increases in average vegetated rough-
ness, consistent with previous work. This is true for both
increases in vegetated percent cover and roughness value.
The decrease in lateral flux also has the effect of raising
the water surface elevation in the main channel. Increas-
ing vegetated patch size, on the other hand, tends to in-
crease connectivity and decrease the water surface eleva-
tion in the main channel.
Patched runs demonstrate behavior very similar to their
uniform counterparts at high percent cover values — how-
ever, when vegetation covers <40% of the domain, a large
discrepancy emerges between the behavior of the uniform
and patched cases. We attribute this difference to the de-
velopment of high-velocity secondary channels in the is-
lands when the percent cover is below a threshold value
analogous to the percolation threshold. Due to channel-
ization, we hypothesize that models accounting for het-
erogeneity would predict a higher capacity for sediment
transport than would a model with uniform vegetation.
3.2 Tracer Results
At steady state, a passive tracer is released into the sys-
tem, and breakthrough curves are used to develop resi-
dence time distributions (RTD) for each scenario. While
the bulk behavior of the RTD is similar between uniform
and patched scenarios, the island contribution of the RTD
in the patched scenarios tends to be multimodal, espe-
cially for large patch sizes.
The total fractional allocation of tracer to the islands de-
creases approximately log-linearly with vegetated rough-
ness. However, in patched scenarios at <40% cover, there
is a significant increase in the amount of tracer alloca-
tion to the island (sometimes >2 times higher) with a
threshold-style drop off above 40%. These effects could
have implications for solute transport in a river delta.
4. ConclusionsVegetation can be accurately approximated as uniform
roughness at high percent cover values — however, when
vegetation covers less than 40% of the island domain, the
effects of heterogeneity on hydrodynamics and transport
can be significant. There is a threshold-style behavior
once the domain becomes highly channelized that could
impact sediment and solute transport, as well as biotic-
abiotic feedbacks and patch evolution.
AcknowledgmentsWe would like to acknowledge support from the National
Science Foundation, grants CAREER/EAR-1350336 and
FESD/EAR-1135427.
ReferencesBaptist, M., Babovic, V., Rodríguez Uthurburu, J., Kei-
jzer, M., Uittenbogaard, R., Mynett, A., and Verwey,
A. (2007). On inducing equations for vegetation resis-
tance. Journal of Hydraulic Research, 45(4):435–450.
Hiatt, M. and Passalacqua, P. (2015). Hydrological con-
nectivity in river deltas: The first-order importance of
channel-island exchange. Water Resources Research,
51(4):2264–2282.
Hodges, B. R. (2014). A new approach to the local time
stepping problem for scalar transport. Ocean Mod-
elling, 77:1–19.
Passalacqua, P. (2017). The Delta Connectome: A
network-based framework for studying connectivity in
river deltas. Geomorphology, 277:50–62.
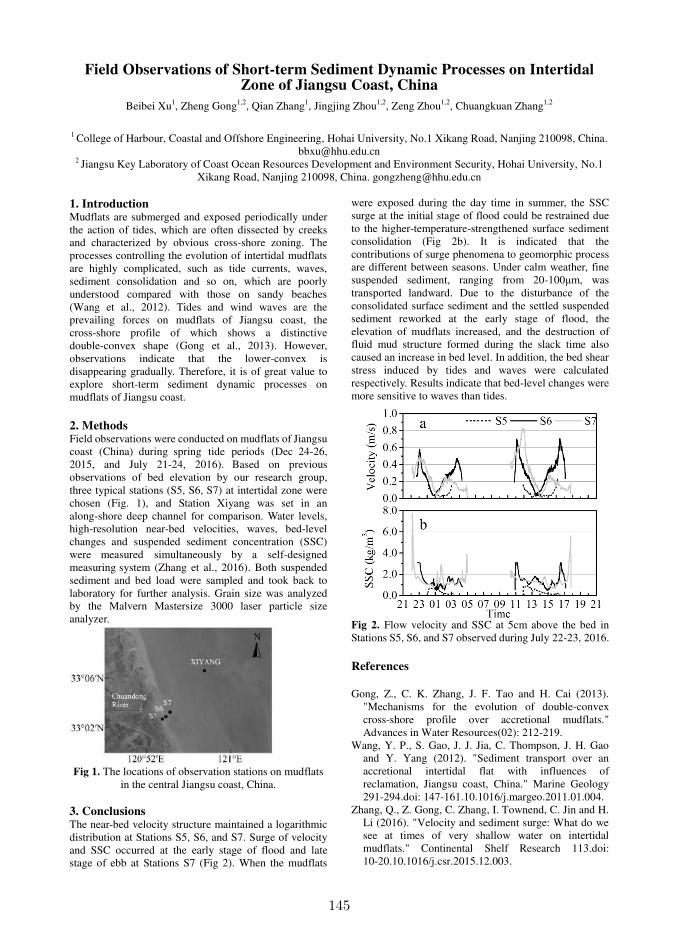
145
Field Observations of Short-term Sediment Dynamic Processes on Intertidal Zone of Jiangsu Coast, China
Beibei Xu1, Zheng Gong1,2, Qian Zhang1, Jingjing Zhou1,2, Zeng Zhou1,2, Chuangkuan Zhang1,2
1 College of Harbour, Coastal and Offshore Engineering, Hohai University, No.1 Xikang Road, Nanjing 210098, China.
[email protected] 2 Jiangsu Key Laboratory of Coast Ocean Resources Development and Environment Security, Hohai University, No.1
Xikang Road, Nanjing 210098, China. [email protected]
1. Introduction Mudflats are submerged and exposed periodically under the action of tides, which are often dissected by creeks and characterized by obvious cross-shore zoning. The processes controlling the evolution of intertidal mudflats are highly complicated, such as tide currents, waves, sediment consolidation and so on, which are poorly understood compared with those on sandy beaches (Wang et al., 2012). Tides and wind waves are the prevailing forces on mudflats of Jiangsu coast, the cross-shore profile of which shows a distinctive double-convex shape (Gong et al., 2013). However, observations indicate that the lower-convex is disappearing gradually. Therefore, it is of great value to explore short-term sediment dynamic processes on mudflats of Jiangsu coast.
2. Methods Field observations were conducted on mudflats of Jiangsu coast (China) during spring tide periods (Dec 24-26, 2015, and July 21-24, 2016). Based on previous observations of bed elevation by our research group, three typical stations (S5, S6, S7) at intertidal zone were chosen (Fig. 1), and Station Xiyang was set in an along-shore deep channel for comparison. Water levels, high-resolution near-bed velocities, waves, bed-level changes and suspended sediment concentration (SSC) were measured simultaneously by a self-designed measuring system (Zhang et al., 2016). Both suspended sediment and bed load were sampled and took back to laboratory for further analysis. Grain size was analyzed by the Malvern Mastersize 3000 laser particle size analyzer.
Fig 1. The locations of observation stations on mudflats
in the central Jiangsu coast, China. 3. Conclusions The near-bed velocity structure maintained a logarithmic distribution at Stations S5, S6, and S7. Surge of velocity and SSC occurred at the early stage of flood and late stage of ebb at Stations S7 (Fig 2). When the mudflats
were exposed during the day time in summer, the SSC surge at the initial stage of flood could be restrained due to the higher-temperature-strengthened surface sediment consolidation (Fig 2b). It is indicated that the contributions of surge phenomena to geomorphic process are different between seasons. Under calm weather, fine suspended sediment, ranging from 20-100μm, was transported landward. Due to the disturbance of the consolidated surface sediment and the settled suspended sediment reworked at the early stage of flood, the elevation of mudflats increased, and the destruction of fluid mud structure formed during the slack time also caused an increase in bed level. In addition, the bed shear stress induced by tides and waves were calculated respectively. Results indicate that bed-level changes were more sensitive to waves than tides.
Fig 2. Flow velocity and SSC at 5cm above the bed in Stations S5, S6, and S7 observed during July 22-23, 2016.
References
Gong, Z., C. K. Zhang, J. F. Tao and H. Cai (2013). "Mechanisms for the evolution of double-convex cross-shore profile over accretional mudflats." Advances in Water Resources(02): 212-219.
Wang, Y. P., S. Gao, J. J. Jia, C. Thompson, J. H. Gao and Y. Yang (2012). "Sediment transport over an accretional intertidal flat with influences of reclamation, Jiangsu coast, China." Marine Geology 291-294.doi: 147-161.10.1016/j.margeo.2011.01.004.
Zhang, Q., Z. Gong, C. Zhang, I. Townend, C. Jin and H. Li (2016). "Velocity and sediment surge: What do we see at times of very shallow water on intertidal mudflats." Continental Shelf Research 113.doi: 10-20.10.1016/j.csr.2015.12.003.
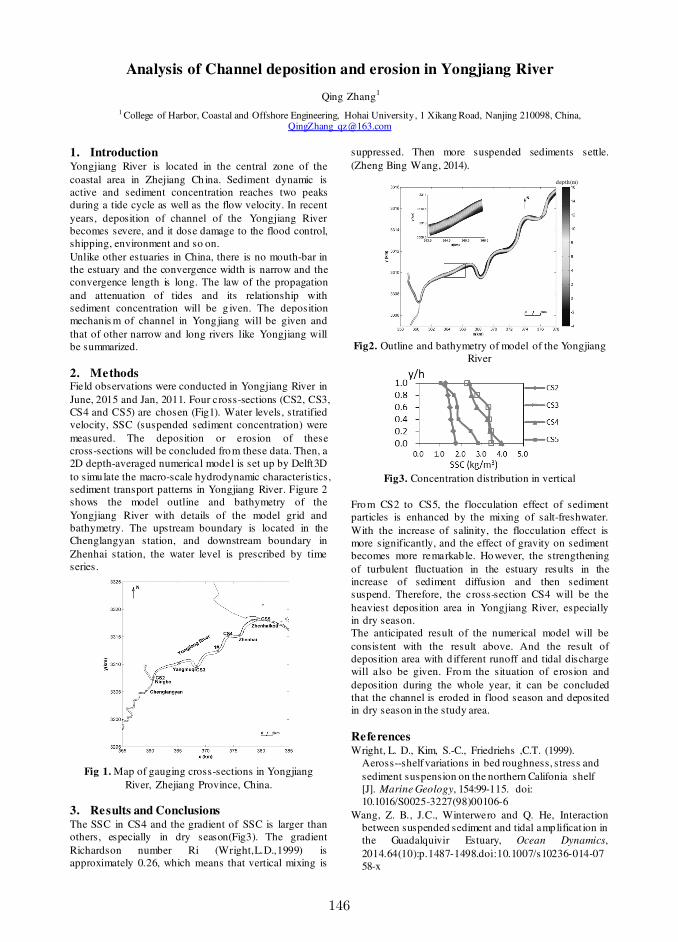
146
Analysis of Channel deposition and erosion in Yongjiang River
Qing Zhang1
1 College of Harbor, Coastal and Offshore Engineering, Hohai University, 1 Xikang Road, Nanjing 210098, China, [email protected]
1. Introduction Yongjiang River is located in the central zone of the coastal area in Zhejiang China. Sediment dynamic is active and sediment concentration reaches two peaks during a tide cycle as well as the flow velocity. In recent years, deposition of channel of the Yongjiang River becomes severe, and it dose damage to the flood control, shipping, environment and so on. Unlike other estuaries in China, there is no mouth-bar in the estuary and the convergence width is narrow and the convergence length is long. The law of the propagation and attenuation of tides and its relationship with sediment concentration will be g iven. The deposition mechanis m of channel in Yongjiang will be given and that of other narrow and long rivers like Yongjiang will be summarized. 2. Methods Field observations were conducted in Yongjiang River in June, 2015 and Jan, 2011. Four cross-sections (CS2, CS3, CS4 and CS5) are chosen (Fig1). Water levels, stratified velocity, SSC (suspended sediment concentration) were measured. The deposition or erosion of these cross-sections will be concluded from these data. Then, a 2D depth-averaged numerical model is set up by Delft3D to simulate the macro-scale hydrodynamic characteristics, sediment transport patterns in Yongjiang River. Figure 2 shows the model outline and bathymetry of the Yongjiang River with details of the model grid and bathymetry. The upstream boundary is located in the Chenglangyan station, and downstream boundary in Zhenhai station, the water level is prescribed by time series.
Fig 1. Map of gauging cross-sections in Yongjiang
River, Zhejiang Province, China.
3. Results and Conclusions The SSC in CS4 and the gradient of SSC is larger than others, especially in dry season(Fig3). The gradient Richardson number Ri (Wright,L.D.,1999) is approximately 0.26, which means that vertical mixing is
suppressed. Then more suspended sediments settle. (Zheng Bing Wang, 2014).
Fig2. Outline and bathymetry of model of the Yongjiang
River
Fig3. Concentration distribution in vertical
From CS2 to CS5, the flocculation effect of sediment particles is enhanced by the mixing of salt-freshwater. With the increase of salinity, the flocculation effect is more significantly, and the effect of gravity on sediment becomes more remarkab le. However, the strengthening of turbulent fluctuation in the estuary results in the increase of sediment diffusion and then sediment suspend. Therefore, the cross-section CS4 will be the heaviest deposition area in Yongjiang River, especially in dry season. The anticipated result of the numerical model will be consistent with the result above. And the result of deposition area with d ifferent runoff and tidal discharge will also be given. From the situation of erosion and deposition during the whole year, it can be concluded that the channel is eroded in flood season and deposited in dry season in the study area. References Wright, L. D., Kim, S.-C., Friedriehs ,C.T. (1999).
Aeross--shelf variations in bed roughness, stress and sediment suspension on the northern Califonia shelf [J]. Marine Geology, 154:99-115. doi: 10.1016/S0025-3227(98)00106-6
Wang, Z. B., J.C., Winterwero and Q. He, Interaction between suspended sediment and tidal amplificat ion in the Guadalquivir Estuary, Ocean Dynamics, 2014.64(10):p.1487-1498.doi:10.1007/s10236-014-0758-x
depth(m)
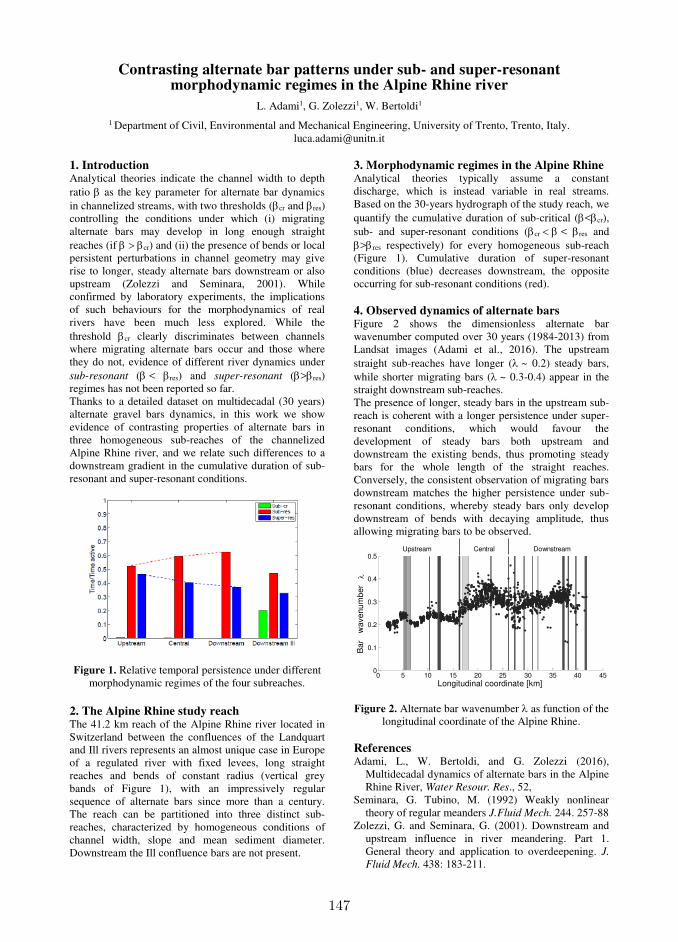
147
Contrasting alternate bar patterns under sub- and super-resonant morphodynamic regimes in the Alpine Rhine river
L. Adami1, G. Zolezzi1, W. Bertoldi1
1 Department of Civil, Environmental and Mechanical Engineering, University of Trento, Trento, Italy. [email protected]
1. Introduction Analytical theories indicate the channel width to depth ratio as the key parameter for alternate bar dynamics in channelized streams, with two thresholds (cr and res) controlling the conditions under which (i) migrating alternate bars may develop in long enough straight reaches (if cr) and (ii) the presence of bends or local persistent perturbations in channel geometry may give rise to longer, steady alternate bars downstream or also upstream (Zolezzi and Seminara, 2001). While confirmed by laboratory experiments, the implications of such behaviours for the morphodynamics of real rivers have been much less explored. While the threshold cr clearly discriminates between channels where migrating alternate bars occur and those where they do not, evidence of different river dynamics under sub-resonant (< res) and super-resonant (>res) regimes has not been reported so far. Thanks to a detailed dataset on multidecadal (30 years) alternate gravel bars dynamics, in this work we show evidence of contrasting properties of alternate bars in three homogeneous sub-reaches of the channelized Alpine Rhine river, and we relate such differences to a downstream gradient in the cumulative duration of sub-resonant and super-resonant conditions.
Figure 1. Relative temporal persistence under different
morphodynamic regimes of the four subreaches.
2. The Alpine Rhine study reach The 41.2 km reach of the Alpine Rhine river located in Switzerland between the confluences of the Landquart and Ill rivers represents an almost unique case in Europe of a regulated river with fixed levees, long straight reaches and bends of constant radius (vertical grey bands of Figure 1), with an impressively regular sequence of alternate bars since more than a century. The reach can be partitioned into three distinct sub-reaches, characterized by homogeneous conditions of channel width, slope and mean sediment diameter. Downstream the Ill confluence bars are not present.
3. Morphodynamic regimes in the Alpine Rhine Analytical theories typically assume a constant discharge, which is instead variable in real streams. Based on the 30-years hydrograph of the study reach, we quantify the cumulative duration of sub-critical (<cr), sub- and super-resonant conditions (cr< res and >res respectively) for every homogeneous sub-reach (Figure 1). Cumulative duration of super-resonant conditions (blue) decreases downstream, the opposite occurring for sub-resonant conditions (red). 4. Observed dynamics of alternate bars Figure 2 shows the dimensionless alternate bar wavenumber computed over 30 years (1984-2013) from Landsat images (Adami et al., 2016). The upstream straight sub-reaches have longer (~ 0.2) steady bars, while shorter migrating bars (~ 0.3-0.4) appear in the straight downstream sub-reaches. The presence of longer, steady bars in the upstream sub-reach is coherent with a longer persistence under super-resonant conditions, which would favour the development of steady bars both upstream and downstream the existing bends, thus promoting steady bars for the whole length of the straight reaches. Conversely, the consistent observation of migrating bars downstream matches the higher persistence under sub-resonant conditions, whereby steady bars only develop downstream of bends with decaying amplitude, thus allowing migrating bars to be observed.
0 5 10 15 20 25 30 35 40 450
0.1
0.2
0.3
0.4
0.5
Bar
w
avenum
ber
Longitudinal coordinate [km]
Upstream Central Downstream
Figure 2. Alternate bar wavenumber as function of the
longitudinal coordinate of the Alpine Rhine. References Adami, L., W. Bertoldi, and G. Zolezzi (2016),
Multidecadal dynamics of alternate bars in the Alpine Rhine River, Water Resour. Res., 52,
Seminara, G. Tubino, M. (1992) Weakly nonlinear theory of regular meanders J.Fluid Mech. 244. 257-88
Zolezzi, G. and Seminara, G. (2001). Downstream and upstream influence in river meandering. Part 1. General theory and application to overdeepening. J.
Fluid Mech. 438: 183-211.

148
Discharge measurment and analysis of flow resistance at large-scale flood
Y.AKIYAMA1,Y.SASAKI1,M. HASHIBA2, A.YOROZUYA3
1Ministry of Land,Infrastructure, Transport and Tourism Hokkaido Regional Development Bureau , JAPAN.
[email protected] , [email protected] 2 Fukuda Hydrologic Centre, JAPAN. [email protected]
3 Hydrologic Engineering Research Team, Hydraulic Engineering Research Group, Public Works Research Institute, Ibaraki, JAPAN. [email protected]
1. Introduction In order to design the hydraulic structure, maximum peak discharge values are usually implemented. Therefore, observation of the maximum peak discharge in the large-scale flood is important. However, observation conditions are not necessary appropriate because the large-scale flood sometimes involves the disaster. For example, they are an evacuation order from the observatory, or a destruction of the observation facility. This paper describes how the maximum peak discharge are estimated in such an adverse condition. 2. Flow velocity and discharge measurement Float measurements supposed to be conducted, since it is the Japanese standard method. However, the measurement cannot be conducted due to the distraction of the bridge. Therefore, the authors tried to obtain surface velocity using STIV (Space Time Image Velocimetry) method developed by Fujita et al (2013). Thereafter, we tried to calculate discharge values using DIEX (Dynamic Interpolation and Extrapolation) method developed by Nihei et al. (2007). Figure 1 shows the observed value by the STIV on the water surface, and velocity distribution with counter curves, which are evaluated by DIEX method. (Figure.1.) 3. Extrapolation of H-Q relationship considering
flow resistance Because of the evacuation order, extrapolation of the discharge values are necessary based on not observed one but the high water mark. For this purposes, the authors applied flow resistance analysis. Firstly, we calculated the dimensionless shear stress τ *(Eq(1)) and the dimensionless effective shear stress τ *’ (Eq(2)).
sd
RI*τ (1)
sd
IR ''
* τ (2)
sk
R
IgR
U 'ln
115.8
' (3)
where R= hydraulic radius, I=is water slope, s=water specific gravity of sand (1.65) ,d=sediment particle size, U=average velocity, R’=hydraulic radius due to skin friction, κ=0.4 Secondly, we plotted the calculated R’ and τ*-τ*’relation proposed by Kishi-Kuroki which is shown as Figure.2. The observed data could be plotted on the line where the riverbed form transitions from Dune to Dune . When the maximum peak discharge occurred,
it is considered that there was no transition. We calculated τ* from the high water mark and τ*’ from the Kishi-Kuroki’s chart. Finally, we calculated the maximum peak discharge from the average velocity as Eq(3).
4. Conclusions The authors succeeded in the discharge measurements using STIV and DIEX method at the situation that the float measurement was impossible and calculate the maximum peak discharge from extrapolation of H-Q relationship using the flow resistance of τ* and τ*. References Fujita, I., Kosaka, Y., Honda, M., Yorozuya, A. and
Motonaga, Y.:Day and Night Measurements of Snow Melt Floods by STIV with a Far Infrared Camera,Proceedings of 2013 IAHR Congress,on USB memory, A10458.pdf,2013.
Y. Nihei and Akira Kimizu: A new discharge monitoring system with an H-ADCP measurement and numerical simulation, Proc. of XXXII IAHR CONGRESS, 2007.
T. Kishi, M. Kuroki :Bed Forms and Resistance to Flow in Erodible-Bed Channels (I), Bulletin of the Faculty of Engineering,Hokkaido University, 67: 1-23, 1973.
流速コンター図 サンプル
0 30 60 90 120 150
cross section distance m
344
346
348
350
352
354
356
Hei
ght
E.L
.m
流速 m/s
0 5色を変える場合はクリック
Velocity(m/sec)
STIV calculated velocity
Transverse section distance(m)
Figure1. Discharge calculation using STIV and DIEX
0.01
0.1
1
0.01 0.1 1
τ*
τ*'
τ*-τ*'observed
Dune
DuneFlat
Transition
Transition
Antidune
Figure 2. τ*-τ*’relation proposed by Kishi-
Kuroki(1973)

149
Bankfull paleodepth scaling from clinoforms: a unique dataset from the sandy,braided Missouri National Recreational River, USA
J.S. Alexander1, B.J. McElroy1, S.Z. Huzurbazar2, and M.L. Murr1
1 Department of Geology and Geophysics, University of Wyoming, Laramie, Wyoming. [email protected] Department of Statistics, West Virginia University, Morgantown, West Virginia.
1. IntroductionFluvial paleo-depth (paleodepth) is a crucial parame-
ter used to estimate paleodischarge, paleoslope, channel
scaling, and sediment transport in ancient fluvial sys-
tems (Bhattacharya et al., 2016; Hajek and Heller, 2012;
Mohrig et al., 2000). Clinoforms exposed in rock out-
crop are commonly interpreted to be the preserved slip-
faces of ancient, migrating barforms, and the difference
in elevation between the crest and base of clinoforms (cli-
noform height) is widely used as a measure of bankfull
paleo-streamflow depth (Hajek and Heller, 2012). De-
spite the common use of clinoforms, field evidence of the
scaling between clinoform height and mean flow depth
ranges from 0.2 to greater than 1.0 (Mohrig et al., 2000;
Smith et al., 2009). We used a unique dataset to create
a probability density function (PDF) of clinoform height
and flow-depth scaling.
2. MethodsUnusual hydrologic conditions in 2011 forced dams on
the Missouri River to operate at full discharge capacity.
The 87-kilometer long, wide, sandy, braided segment of
the Missouri National Recreational River near Yankton,
South Dakota, experienced a steady bankfull flood lasting
two months. We extracted clinoform heights from a 1.5-
meter (m), LiDAR-derived digital elevation model taken
after flow recession. Clinoform heights were extracted
every 2m along approximately 10,300m of slipface from
46 sandbars, for a total of 5,166 observations. Approxi-
mately 37% of our observations had some censoring be-
cause water prevented LiDAR penetration. A monte-carlo
simulation of bed topography was used to assign uncer-
tainty bounds to our censored values, and build a PDF of
clinoform heights scaling relative to global mean channel
depth during the flood.
3. ResultsOur PDF of clinoform scaling is bi-modal, with most of
the density focused in the first mode, centered around 0.25
(Figure 1). The weaker second mode is centered at ap-
proximately 0.80. These modes are in reasonable agree-
ment with clinoform data from ground-penetrating radar
(Smith et al., 2009) and actively migrating dunes (Mohrig
et al., 2000), respectively. We speculate the two-mode
structure may be a consequence of most clinoforms initi-
ating in areas of flow expansion, or climbing over other
barforms, but occasionally migrating into deep channel
threads, where the slipface grows substantially, and mi-
gration may stall.
4. ConclusionsClinoform scaling has a wide range, may not be uni-
modal, and likely depends strongly on local bed topog-
raphy. Our data suggest caution in using single, mean cli-
Figure 1. Probability density function of clinoform
height scaling to global mean flow depth in a wide,
sandy, braided river. The density curves were generated
from a monte-carlo simulation of 100,000 possible
realizations of censored values.
noform height values for scaling fluvial paleo-flow depth.
We suggest that barforms climbing over other barforms
may be the most common clinoform realizations in sandy
braided rivers, and their heights are likely to be as little as
one third of the mean channel flow depth.
AcknowledgmentsThis work was funded by the U.S. Geological Survey and
the National Park Service. Data were graciously provided
by the United States Army Corps of Engineers.
ReferencesBhattacharya, J. P., Copeland, P., Lawton, T. F., and
Holbrook, J. (2016). Estimation of source area, river
paleo-discharge, paleoslope, and sediment budgets of
linked deep-time depositional systems and implications
for hydrocarbon potential. Earth-Science Reviews,
153:77–110.
Hajek, E. A. and Heller, P. L. (2012). Flow-Depth Scal-
ing In Alluvial Architecture and Nonmarine Sequence
Stratigraphy: Example from the Castlegate Sandstone,
Central Utah, U.S.A. Journal of Sedimentary Research,
82(2):121–130.
Mohrig, D., Heller, P. L., Paola, C., and Lyons, W. J.
(2000). Interpreting avulsion process from ancient allu-
vial sequences: Guadalope-Matarranya system (north-
ern Spain) and Wasatch Formation (western Colorado).
Geological Society of America Bulletin, 112(12):1787–
1803.
Smith, G. H. S., Ashworth, P. J., Best, J. L., Lunt, I. A.,
Orfeo, O., and Parsons, D. R. (2009). The Sedimentol-
ogy and Alluvial Architecture of a Large Braid Bar, Rio
Parana, Argentina. Journal of Sedimentary Research,
79(8):629–642.

150
Temporal variability of deposition and erosion in a strongly regulated reservoir of the upper Rhine River
G. ANTOINE1, 2, F. HENAULT1, M. LE-BRUN1 and A. CLUTIER3
1 National Laboratory for Hydraulics and Environment (LNHE), EDF R&D, Chatou, France. [email protected]
2 Saint Venant Laboratory for Hydraulics, Chatou, France. 3 Engineering Center for Hydraulics (CIH), EDF, Chambery, France. [email protected]
1. Introduction The upper Rhine River is a highly harnessed and regulated river. Its main channel is navigable and its water is used for agriculture, drinking water supply and electricity production. EDF (a French electricity company) is in charge of eight dams on the upper Rhine River for producing hydro-electricity. In order to increase the safety and the competiveness of the installations, but also to reduce their environmental impact, the sediment dynamic in these reservoirs has become a key factor to control and predict. In this study, we focused on the Marckolsheim reservoir, which is located 50 kilometres upstream the city of Strasbourg. Since its construction in 1961, this reservoir has been filled continuously with cohesive sediments. To keep the water level suitable for navigation, the dam is regulated with a high-frequency repositioning of its gates. This regulation, combined with the bifurcation configuration of the channel, leads to a complex and unsteady hydrodynamic in the reservoir. Furthermore, the high temporal variations of suspended sediment supply makes the deposition in the reservoir even more difficult to predict. 2. Field campaigns in 2015 and 2016 Two field campaigns were performed in 2015 and 2016, with the objectives of estimating hydraulic and suspended sediment transport variables. In 2015, the discharge of the Rhine was low enough to be entirely used for electricity production, so the dam gates were closed. In 2016, the campaign was performed during a large flood event, with a significant part of the discharge transferred downstream the dam. Velocity measurements were done with an acoustic Doppler celerity profiler (aDcp) along seven cross sections. Turbidity measurements were realized as well along the same cross sections in order to calibrate the backscattered signal from the aDcp. Additionally, a flying drone was used during the 2016 campaign for estimating the surface velocity field by using the LSPIV method. 3. Numerical modelling The numerical codes TELEMAC-2D and SISYPHE (http://www.opentelemac.org/) were used to simulate in 2D (integrated along the water depth) the hydrodynamic and the suspended sediment transport on this site. A ten kilometres long model was built and calibrated with the measured data of the 2015 and 2016 field campaigns (cf Figure 1), but also with measurements of sediment parameters that have been done previously, like erosion tests (Westrich, 2010). The originality of this model
consists in an explicit 3D representation of the dam gates. An algorithm was implemented in TELEMAC in order to adapt the gates position at each time step, in conformity with the real regulation rules followed by the dam operator.
Figure 1. Simulated velocity field in the reservoir.
Comparison with measured data (green light) By using upstream measured data of discharge and suspended sediment concentration as boundary conditions, a six months period was simulated thank to the EDF R&D clusters. The comparison of the simulated results with bathymetric surveys shows good agreements if specific properties of sediments related to settling processes are taken into account. 4. Conclusions This study has focused in great detail on the deposition and erosion dynamic in a strongly regulated reservoir of the upper Rhine River. The numerical work, combined with a detailed measured data set, shows that the sediment dynamic in the reservoir during a six months period can be well reproduced by the model if some hypothesis are made on the settling properties of the upstream suspended sediment supply. As a perspective, a SCAF device (Wendling, 2015) will be used in 2017 in order to measure the temporal dynamic of the incoming sediments settling properties. References Wendling, V. et al. (2015). Using an optical settling
column to assess suspension characteristics within the free, flocculation, and hindered settling regimes. J. of
Soils and Sediments. Westrich, B. (2010). Development of a numerical tool to establish a sediment management plan for the Upper River Rhine from Kembs to Strasbourg. EDF Internal
report.
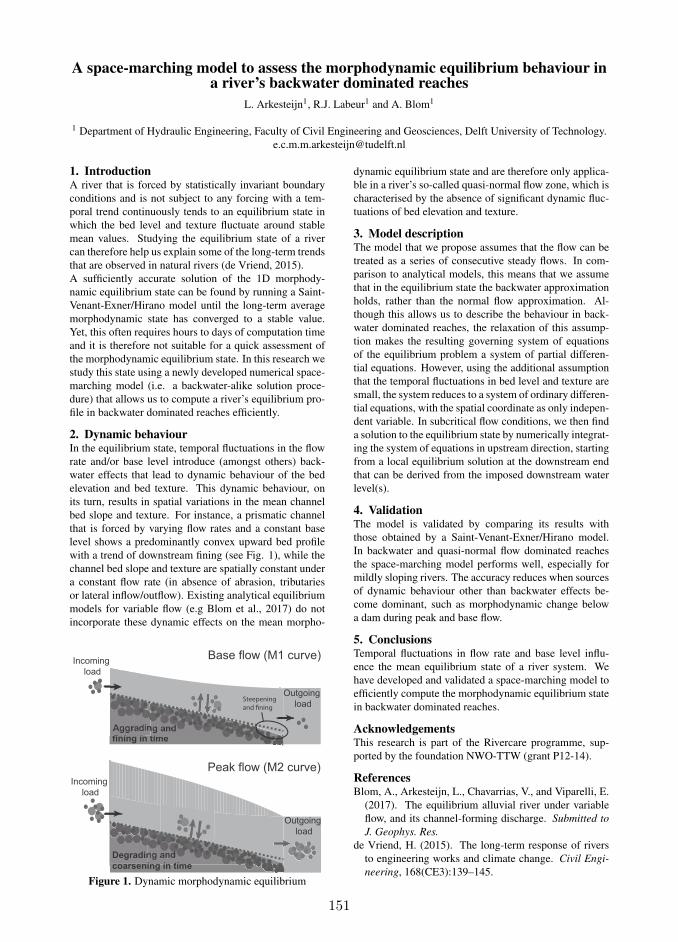
151
A space-marching model to assess the morphodynamic equilibrium behaviour ina river’s backwater dominated reaches
L. Arkesteijn1, R.J. Labeur1 and A. Blom1
1 Department of Hydraulic Engineering, Faculty of Civil Engineering and Geosciences, Delft University of Technology.
1. IntroductionA river that is forced by statistically invariant boundary
conditions and is not subject to any forcing with a tem-
poral trend continuously tends to an equilibrium state in
which the bed level and texture fluctuate around stable
mean values. Studying the equilibrium state of a river
can therefore help us explain some of the long-term trends
that are observed in natural rivers (de Vriend, 2015).
A sufficiently accurate solution of the 1D morphody-
namic equilibrium state can be found by running a Saint-
Venant-Exner/Hirano model until the long-term average
morphodynamic state has converged to a stable value.
Yet, this often requires hours to days of computation time
and it is therefore not suitable for a quick assessment of
the morphodynamic equilibrium state. In this research we
study this state using a newly developed numerical space-
marching model (i.e. a backwater-alike solution proce-
dure) that allows us to compute a river’s equilibrium pro-
file in backwater dominated reaches efficiently.
2. Dynamic behaviourIn the equilibrium state, temporal fluctuations in the flow
rate and/or base level introduce (amongst others) back-
water effects that lead to dynamic behaviour of the bed
elevation and bed texture. This dynamic behaviour, on
its turn, results in spatial variations in the mean channel
bed slope and texture. For instance, a prismatic channel
that is forced by varying flow rates and a constant base
level shows a predominantly convex upward bed profile
with a trend of downstream fining (see Fig. 1), while the
channel bed slope and texture are spatially constant under
a constant flow rate (in absence of abrasion, tributaries
or lateral inflow/outflow). Existing analytical equilibrium
models for variable flow (e.g Blom et al., 2017) do not
incorporate these dynamic effects on the mean morpho-
Base flow (M1 curve)
Peak flow (M2 curve)
Aggrading and
fining in time
Outgoing
load
Degrading and
coarsening in time
Outgoing
load
Incoming
load
Incoming
load
Steepening
and ning
Figure 1. Dynamic morphodynamic equilibrium
dynamic equilibrium state and are therefore only applica-
ble in a river’s so-called quasi-normal flow zone, which is
characterised by the absence of significant dynamic fluc-
tuations of bed elevation and texture.
3. Model descriptionThe model that we propose assumes that the flow can be
treated as a series of consecutive steady flows. In com-
parison to analytical models, this means that we assume
that in the equilibrium state the backwater approximation
holds, rather than the normal flow approximation. Al-
though this allows us to describe the behaviour in back-
water dominated reaches, the relaxation of this assump-
tion makes the resulting governing system of equations
of the equilibrium problem a system of partial differen-
tial equations. However, using the additional assumption
that the temporal fluctuations in bed level and texture are
small, the system reduces to a system of ordinary differen-
tial equations, with the spatial coordinate as only indepen-
dent variable. In subcritical flow conditions, we then find
a solution to the equilibrium state by numerically integrat-
ing the system of equations in upstream direction, starting
from a local equilibrium solution at the downstream end
that can be derived from the imposed downstream water
level(s).
4. ValidationThe model is validated by comparing its results with
those obtained by a Saint-Venant-Exner/Hirano model.
In backwater and quasi-normal flow dominated reaches
the space-marching model performs well, especially for
mildly sloping rivers. The accuracy reduces when sources
of dynamic behaviour other than backwater effects be-
come dominant, such as morphodynamic change below
a dam during peak and base flow.
5. ConclusionsTemporal fluctuations in flow rate and base level influ-
ence the mean equilibrium state of a river system. We
have developed and validated a space-marching model to
efficiently compute the morphodynamic equilibrium state
in backwater dominated reaches.
AcknowledgementsThis research is part of the Rivercare programme, sup-
ported by the foundation NWO-TTW (grant P12-14).
ReferencesBlom, A., Arkesteijn, L., Chavarrias, V., and Viparelli, E.
(2017). The equilibrium alluvial river under variable
flow, and its channel-forming discharge. Submitted to
J. Geophys. Res.
de Vriend, H. (2015). The long-term response of rivers
to engineering works and climate change. Civil Engi-
neering, 168(CE3):139–145.

152
RCEM 2017- Back to Italy, the 10th Symposium on River, Coastal and Estuarine Morphodynamics
Sediment transport in vegetated channel: the case of submerged vegetation.
A. Armanini1 and E. Nucci1 1 Department of Civil, Environmentale and Mechanical Engineering, University of Trento, Trento, Italy.
1. Introduction
The vegetation in rivers is of crucial importance for ecological, hydrodynamic and morphodynamic aspects related to the channel and the banks. In particular, the interaction among solid transport, riverbed and vegetation determines the altimetric and planimetric morphological evolutions of the riverbed. This research focuses on the effects of submerged vegetation on the altimetric behaviour of the bed. The influence of emerged vegetation on solid transport and morphology of the bed was already investigated by Armanini et al. (2010). These authors demonstrated that the stationary condition, (i.e. constant liquid and solid discharges), coincides with a uniform flow condition that is constant depth and depth-average velocity in the direction of the flow. This research aims to extend the analysis to the case of homogenous submerged vegetation. From a review of the literature on this topic and from the theoretical analysis results that, in case of submerged vegetation, the stationary condition does not imply a uniform flow profile, that is, the profiles are decelerated or accelerated according to different boundary conditions.
2. Experimental set up
In order to better understand the phenomenon we did a laboratory investigation on a channel 12 m long and 50 cm wide, feed with constant liquid and solid discharge. We did different test with different boundary conditions (downstream flow depth, and solid and liquid discharges). Rigid cylinders of 8 mm diameter represent the submerged vegetation. In each test we took constant the density of vegetation, but we tested different densities and different degrees of submergence. Figure 1 shows a sketch of the configuration of the channel, for a density of 200 cylinders/m2.
Figure 1.: Sketch of the configuration of the cylinders
simulating the vegetation.
3. Preliminary Results
Some preliminary results confirm the existence of stationary non-uniform profiles, that is the ratio between the height of cylinders and the height of the water depth resulted a function of space. Stationary but not uniform profiles were also found in the experimental investigation by Le Bouteiller & Venditti (2014). We are working on the theoretical demonstration, looking for an analytical simplified solution of these types of flow regimes. Besides, in certain condition we observed also the formation of large bars migrating downstream. Even in this case a similar result is present in Le Bouteiller & Venditti (2015).
Figure 2.: Example of the bed configuration.
Acknowledgments This research is related to STEEP STREAMS project, WaterWorks2014, ERANET cofounded call of WaterJPI. References Armanini A., Cavedon V., and Righetti M.. (2010)
"Evaluation of the flow resistance in mobile bed vegetated rivers." River Flow.
Le Bouteiller, C., & Venditti, J. G. (2014). Vegetation‐driven morphodynamic adjustments of a sand bed. Geophysical Research Letters, 41(11), 3876-3883.
Le Bouteiller, C., & Venditti, J. G. (2015). Sediment transport and shear stress partitioning in a vegetated flow. Water Resources Research, 51(4), 2901-2922.
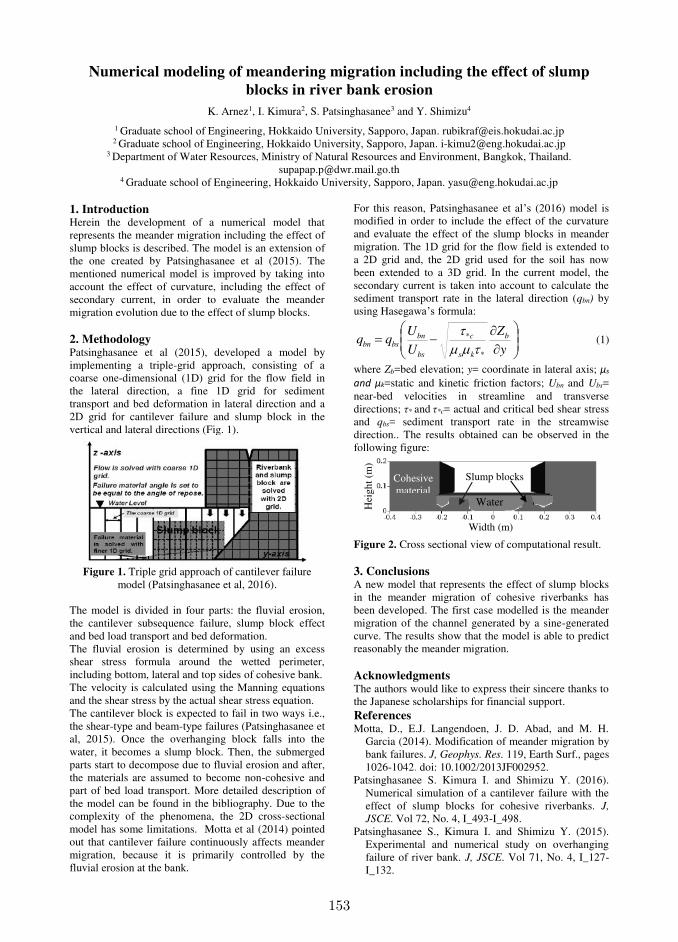
153
Numerical modeling of meandering migration including the effect of slump
blocks in river bank erosion
K. Arnez1, I. Kimura2, S. Patsinghasanee3 and Y. Shimizu4
1 Graduate school of Engineering, Hokkaido University, Sapporo, Japan. [email protected] 2 Graduate school of Engineering, Hokkaido University, Sapporo, Japan. [email protected]
3 Department of Water Resources, Ministry of Natural Resources and Environment, Bangkok, Thailand. [email protected]
4 Graduate school of Engineering, Hokkaido University, Sapporo, Japan. [email protected]
1. Introduction Herein the development of a numerical model that represents the meander migration including the effect of slump blocks is described. The model is an extension of the one created by Patsinghasanee et al (2015). The mentioned numerical model is improved by taking into account the effect of curvature, including the effect of secondary current, in order to evaluate the meander migration evolution due to the effect of slump blocks. 2. Methodology Patsinghasanee et al (2015), developed a model by implementing a triple-grid approach, consisting of a coarse one-dimensional (1D) grid for the flow field in the lateral direction, a fine 1D grid for sediment transport and bed deformation in lateral direction and a 2D grid for cantilever failure and slump block in the vertical and lateral directions (Fig. 1).
Figure 1. Triple grid approach of cantilever failure
model (Patsinghasanee et al, 2016).
The model is divided in four parts: the fluvial erosion, the cantilever subsequence failure, slump block effect and bed load transport and bed deformation. The fluvial erosion is determined by using an excess shear stress formula around the wetted perimeter, including bottom, lateral and top sides of cohesive bank. The velocity is calculated using the Manning equations and the shear stress by the actual shear stress equation. The cantilever block is expected to fail in two ways i.e., the shear-type and beam-type failures (Patsinghasanee et al, 2015). Once the overhanging block falls into the water, it becomes a slump block. Then, the submerged parts start to decompose due to fluvial erosion and after, the materials are assumed to become non-cohesive and part of bed load transport. More detailed description of the model can be found in the bibliography. Due to the complexity of the phenomena, the 2D cross-sectional model has some limitations. Motta et al (2014) pointed out that cantilever failure continuously affects meander migration, because it is primarily controlled by the fluvial erosion at the bank.
For this reason, Patsinghasanee et al’s (2016) model is modified in order to include the effect of the curvature and evaluate the effect of the slump blocks in meander migration. The 1D grid for the flow field is extended to a 2D grid and, the 2D grid used for the soil has now been extended to a 3D grid. In the current model, the secondary current is taken into account to calculate the sediment transport rate in the lateral direction (qbn) by using Hasegawa’s formula:
y
Z
U
Uqq b
ks
c
bs
bnbsbn
*
*
(1)
where Zb=bed elevation; y= coordinate in lateral axis; μs
and μk=static and kinetic friction factors; Ubn and Ubs= near-bed velocities in streamline and transverse directions; τ* and τ*c= actual and critical bed shear stress and qbs= sediment transport rate in the streamwise direction.. The results obtained can be observed in the following figure:
Figure 2. Cross sectional view of computational result. 3. Conclusions A new model that represents the effect of slump blocks in the meander migration of cohesive riverbanks has been developed. The first case modelled is the meander migration of the channel generated by a sine-generated curve. The results show that the model is able to predict reasonably the meander migration. Acknowledgments The authors would like to express their sincere thanks to the Japanese scholarships for financial support. References Motta, D., E.J. Langendoen, J. D. Abad, and M. H.
Garcia (2014). Modification of meander migration by bank failures. J, Geophys. Res. 119, Earth Surf., pages 1026-1042. doi: 10.1002/2013JF002952.
Patsinghasanee S. Kimura I. and Shimizu Y. (2016). Numerical simulation of a cantilever failure with the effect of slump blocks for cohesive riverbanks. J,
JSCE. Vol 72, No. 4, I_493-I_498. Patsinghasanee S., Kimura I. and Shimizu Y. (2015).
Experimental and numerical study on overhanging failure of river bank. J, JSCE. Vol 71, No. 4, I_127-I_132.
Cohesive material
Water
Width (m)
Hei
ght (
m)
Slump blocks
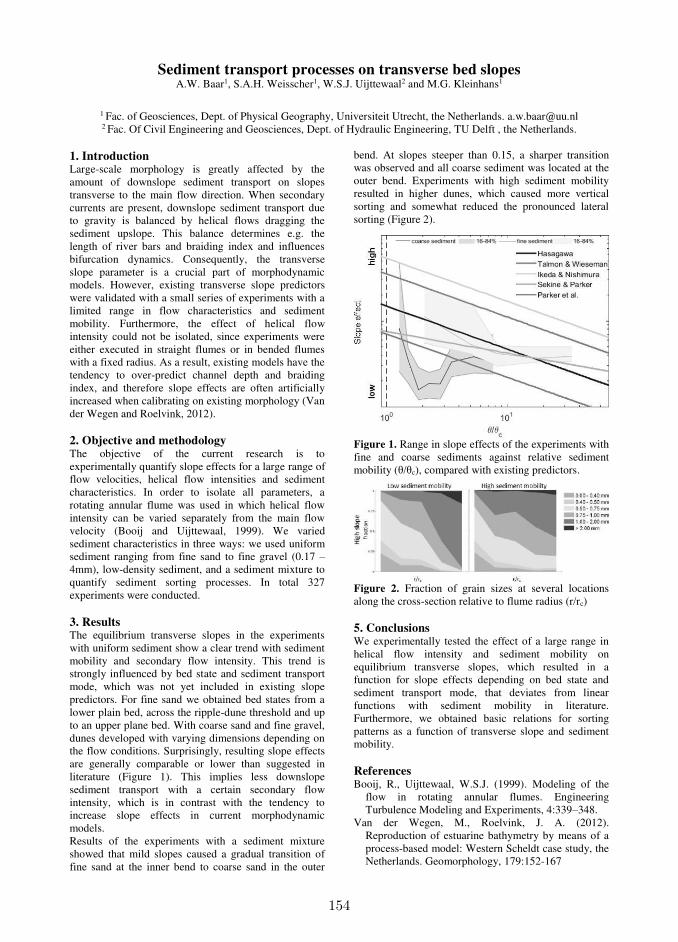
154
Sediment transport processes on transverse bed slopes A.W. Baar1, S.A.H. Weisscher1, W.S.J. Uijttewaal2 and M.G. Kleinhans1
1 Fac. of Geosciences, Dept. of Physical Geography, Universiteit Utrecht, the Netherlands. [email protected] 2 Fac. Of Civil Engineering and Geosciences, Dept. of Hydraulic Engineering, TU Delft , the Netherlands.
1. Introduction Large-scale morphology is greatly affected by the amount of downslope sediment transport on slopes transverse to the main flow direction. When secondary currents are present, downslope sediment transport due to gravity is balanced by helical flows dragging the sediment upslope. This balance determines e.g. the length of river bars and braiding index and influences bifurcation dynamics. Consequently, the transverse slope parameter is a crucial part of morphodynamic models. However, existing transverse slope predictors were validated with a small series of experiments with a limited range in flow characteristics and sediment mobility. Furthermore, the effect of helical flow intensity could not be isolated, since experiments were either executed in straight flumes or in bended flumes with a fixed radius. As a result, existing models have the tendency to over-predict channel depth and braiding index, and therefore slope effects are often artificially increased when calibrating on existing morphology (Van der Wegen and Roelvink, 2012). 2. Objective and methodology The objective of the current research is to experimentally quantify slope effects for a large range of flow velocities, helical flow intensities and sediment characteristics. In order to isolate all parameters, a rotating annular flume was used in which helical flow intensity can be varied separately from the main flow velocity (Booij and Uijttewaal, 1999). We varied sediment characteristics in three ways: we used uniform sediment ranging from fine sand to fine gravel (0.17 – 4mm), low-density sediment, and a sediment mixture to quantify sediment sorting processes. In total 327 experiments were conducted. 3. Results The equilibrium transverse slopes in the experiments with uniform sediment show a clear trend with sediment mobility and secondary flow intensity. This trend is strongly influenced by bed state and sediment transport mode, which was not yet included in existing slope predictors. For fine sand we obtained bed states from a lower plain bed, across the ripple-dune threshold and up to an upper plane bed. With coarse sand and fine gravel, dunes developed with varying dimensions depending on the flow conditions. Surprisingly, resulting slope effects are generally comparable or lower than suggested in literature (Figure 1). This implies less downslope sediment transport with a certain secondary flow intensity, which is in contrast with the tendency to increase slope effects in current morphodynamic models. Results of the experiments with a sediment mixture showed that mild slopes caused a gradual transition of fine sand at the inner bend to coarse sand in the outer
bend. At slopes steeper than 0.15, a sharper transition was observed and all coarse sediment was located at the outer bend. Experiments with high sediment mobility resulted in higher dunes, which caused more vertical sorting and somewhat reduced the pronounced lateral sorting (Figure 2).
Figure 1. Range in slope effects of the experiments with fine and coarse sediments against relative sediment mobility (θ/θc), compared with existing predictors.
Figure 2. Fraction of grain sizes at several locations along the cross-section relative to flume radius (r/rc) 5. Conclusions We experimentally tested the effect of a large range in helical flow intensity and sediment mobility on equilibrium transverse slopes, which resulted in a function for slope effects depending on bed state and sediment transport mode, that deviates from linear functions with sediment mobility in literature. Furthermore, we obtained basic relations for sorting patterns as a function of transverse slope and sediment mobility. References Booij, R., Uijttewaal, W.S.J. (1999). Modeling of the
flow in rotating annular flumes. Engineering Turbulence Modeling and Experiments, 4:339–348.
Van der Wegen, M., Roelvink, J. A. (2012). Reproduction of estuarine bathymetry by means of a process-based model: Western Scheldt case study, the Netherlands. Geomorphology, 179:152-167

155
Hydrologic control on the root growth of Salix cuttings at the laboratory scale
Valentina Bau’1, Baptiste Calliari 1, and Paolo Perona1
1 Institute for Infrastructure and Environment, School of Engineering, University of Edinburgh, Scotland.
1. IntroductionPlant roots influence the riparian ecosystem functioning
in various ways thanks to their ability to adapt to environ-
mental heterogeneity. Also, they affect fluvial morphody-
namics processes, e.g. sediment transport via mechani-
cal stabilization and trapping, which in turn determine the
resilience of plant uprooting by flow erosion processes.
Several flume experiments have started to address such a
dynamic using small scale vegetation, e.g. grass. Based
on previous experimental (Gorla et al., 2015) and mod-
elling (Tron et al., 2015) works, we developed an experi-
mental technique to grow desired root vertical density dis-
tribution of small-scale Salix cuttings that can be used to
make flume experiments more realistic.
2. MethodologyThe study has been carried out by forcing the growth of
the below (root vertical density distribution) and above-
-ground biomass of small-scale Salix cuttings of different
size and length under controlled water level conditions.
The latter variable has been changed to induce different
root depth profiles depending on the sediment size dis-
tribution and the cutting lengths. Four experiments have
been performed from May 2016 to August 2016 on cut-
tings of different length, namely 18 ‘long cuttings’ (30-
-35cm) and 16 ‘short cuttings’ (10-15cm). The below-
ground biomass was measured by scanning and analysing
the roots by means the root analysis software WinRhizo,
from which root morphology statistics and the empirical
vertical density distribution were obtained.
2.1 Long cuttings
Eighteen long willow cuttings were grown in a 25cm deep
sand bed with two different water table levels regardless
of cuttings’ dimension (30-35cm): i) high water table,
which is expected to maintain most roots near the sub-
strate surface, and ii) low water table, which forces roots
to grow deeper within the sand. Once set, these two wa-
ter table levels were maintained constant over the whole
growing period.
Figure 1. Low water level, averages
of root vertical density distribution
(cuttings 30-35cm).
2.2 Short cuttings
Sixteen short cuttings with two lengths (i.e., 10 and 15
cm) were used. In this case, they were planted 5 cm deep
in sand and the water table level, after having been set at
the soil limit for a week, was then decreased in five days
at a constant either high or low level.
3. ResultsAs far as the long cuttings are concerned, in the case of
a high water table, the root density is actually shallow
near the sediment surface, vice-versa for the case of the
lower table (see Figures). The difference in vertical root
density distribution was less evident for the short cut-
tings, which will therefore be subject of future experi-
ments. The model of Tron et al. (2015) for the verti-
cal density distribution of the below-ground biomass was
used to show that experimental conditions that allow to
develop the desired root density distribution can be fairly
well predicted. Results are good as far as long cuttings
are concerned, whereas would require a better specifica-
tion of the shooting/decay ratio function, θ(z) (see Tron
et al., 2015) to model the short ones.
4. ConclusionOur work is an attempt to test whether the analytical
model of Tron et al. (2015) for the root vertical density
distribution can be used to predict the water table experi-
mental conditions that allow cuttings to grow roots at a de-
sired depth. This being the case, the model increases the
flexibility and the applicability of the proposed method-
ology in view of using such plants for novel flow erosion
experiments.
4.1 References
Gorla, L., Signarbieux, C., Turberg, P., Buttler, A. and
P. Perona (2015). Transient response of Salix cuttings to
changing water level regimes. WRR, 51, 1–17
Tron, S., Perona, P., Gorla, L. Schwarz, M., Laio, F. and
L. Ridolfi (2015). The signature of randomness in riparian
plant root distributions. GRL, 42, 7098-7102.
Figure 2. High water level,
averages of root vertical density
distribution (cuttings 30-35cm).
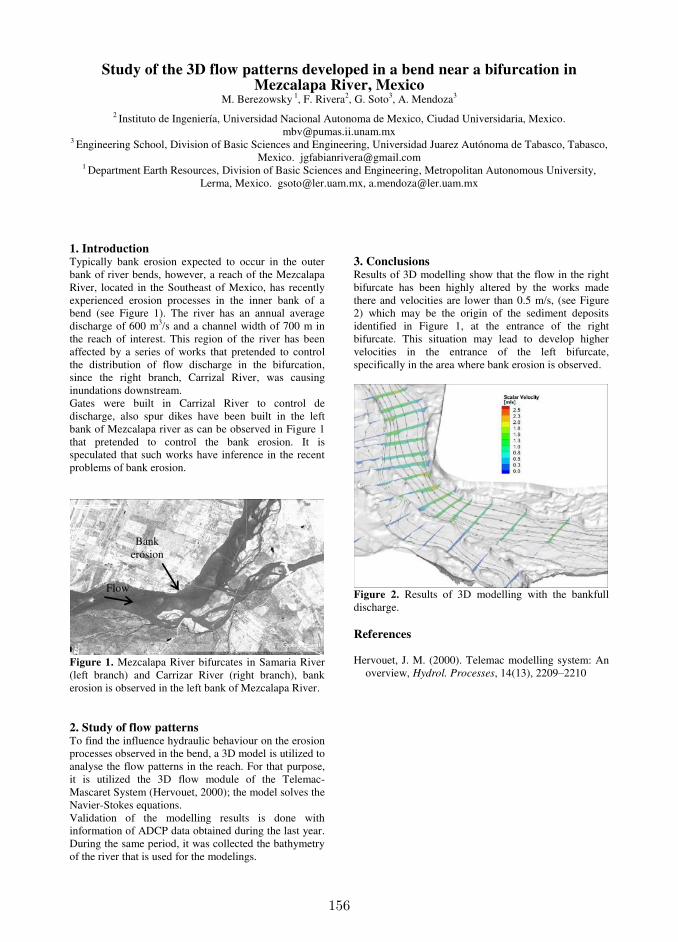
156
Study of the 3D flow patterns developed in a bend near a bifurcation in Mezcalapa River, Mexico
M. Berezowsky 1, F. Rivera2, G. Soto3, A. Mendoza3 2 Instituto de Ingeniería, Universidad Nacional Autonoma de Mexico, Ciudad Universidaria, Mexico.
[email protected] 3 Engineering School, Division of Basic Sciences and Engineering, Universidad Juarez Autónoma de Tabasco, Tabasco,
Mexico. [email protected] 1 Department Earth Resources, Division of Basic Sciences and Engineering, Metropolitan Autonomous University,
Lerma, Mexico. [email protected], [email protected]
1. Introduction Typically bank erosion expected to occur in the outer bank of river bends, however, a reach of the Mezcalapa River, located in the Southeast of Mexico, has recently experienced erosion processes in the inner bank of a bend (see Figure 1). The river has an annual average discharge of 600 m3/s and a channel width of 700 m in the reach of interest. This region of the river has been affected by a series of works that pretended to control the distribution of flow discharge in the bifurcation, since the right branch, Carrizal River, was causing inundations downstream. Gates were built in Carrizal River to control de discharge, also spur dikes have been built in the left bank of Mezcalapa river as can be observed in Figure 1 that pretended to control the bank erosion. It is speculated that such works have inference in the recent problems of bank erosion.
Figure 1. Mezcalapa River bifurcates in Samaria River (left branch) and Carrizar River (right branch), bank erosion is observed in the left bank of Mezcalapa River. 2. Study of flow patterns To find the influence hydraulic behaviour on the erosion processes observed in the bend, a 3D model is utilized to analyse the flow patterns in the reach. For that purpose, it is utilized the 3D flow module of the Telemac-Mascaret System (Hervouet, 2000); the model solves the Navier-Stokes equations. Validation of the modelling results is done with information of ADCP data obtained during the last year. During the same period, it was collected the bathymetry of the river that is used for the modelings.
3. Conclusions Results of 3D modelling show that the flow in the right bifurcate has been highly altered by the works made there and velocities are lower than 0.5 m/s, (see Figure 2) which may be the origin of the sediment deposits identified in Figure 1, at the entrance of the right bifurcate. This situation may lead to develop higher velocities in the entrance of the left bifurcate, specifically in the area where bank erosion is observed.
Figure 2. Results of 3D modelling with the bankfull discharge. References Hervouet, J. M. (2000). Telemac modelling system: An
overview, Hydrol. Processes, 14(13), 2209–2210
Bank erosion
Flow

157
River restoration : a strategy to flush fine clogged sediments ?
C. Berni1, A. Herrero1,2, E. Perret1, A. Buffet1, F. Thollet1 and B. Camenen1
1 Irstea, UR HHLY, Lyon-Villeurbanne Center, Villeurbanne, France. [email protected] Now at Catalan Institute for Water Research, Girona, Spain,
1. IntroductionWater management requires a good understanding of se-
diment dynamics. Dam management, sediment mining,
channel training works are all anthropogenic activities
that deeply affect this dynamics. In many areas of the
world, their level is such that fine-grained sediment fluxes
have been, or are being, modified significantly in magni-
tude and rate. This results in a complex evolution of the
river bed and banks that may alter living conditions for
fishes and might be detrimental for human activities (see
Wood and Armitage, 1997).
Fine sediment infiltration particularly affects the river bed
structure and permeability. Clogging depends both on hy-
draulic conditions and bed sediment grain size distribu-
tion (Gibson et al., 2009). The hydraulic conditions for
the deposition or erosion of fine and coarse sediment mix-
tures are poorly known. A better river management requi-
res further investigations, particularly on flushing event
efficiency and impacts in terms of restoration. Flushing
operations are already launched in the Durance river but
still needs to be optimized. In this paper, several expe-
riments are presented which aim at better understanding
the removal of a fine sediment clog by flows restoration.
2. Laboratory experimentsFour experiments have been conducted to flush previ-
ously infiltrated beds in the tilting flume of Irstea Lyon-
Villeurbanne (HH-Lab). Gravel bed (d50 = 6.8 mm) was
initially clogged with sand (d50 = 0.813 mm) and small
glass beads (d50 = 0.066 mm). To obtain such bed, fine
sediment-laden flows were recirculated over an initially
clean gravel bed. Fine sediment were inhomogeneously
distributed along the vertical in the bed as predicted by
Herrero and Berni (2016). The same amount of water was
released in the flume for each experiment but the shape of
the hydrograph was different (see figure 1). Bed shear
stress was estimated using water depth and velocity mea-
surement. As a reference, inception of movement of parti-
cles of a gravel bed starts for a flow discharge Q ≈ 35 L/s.
−500 0 500 1000 1500 2000 2500 3000−10
0
10
20
30
40
50
Time(s)
Flo
w d
isch
arg
e (
L/s
)
Exp 1
Exp 2
Exp 3
Exp 4
Figure 1. Water discharge for the four different
experiments.
3. ResultsPictures of the bed were taken at the beginning and at the
end of the experiments. The evolution of fine sediment
deposits (shape of the dunes, fine content within the bed)
was obtained from pictures analysis.
It was found that initial beds were not exactly the same for
each experiment as the infiltration process was undertaken
under different conditions. Initial bed of experiment 1
presented the largest ripples all along the flume whereas
ripples were quite flattened for experiments 3 and 4.
A laser scanner was used to obtain bed roughness along
the flume. Bed form roughness (ks f ) was estimated via
the standard deviation of a bed elevation profile of 10 cm
and grain roughness (kss) via the standard deviation of a
3.5 cm (≈ 5d50,gravels) detrended profile. As a reference,
the roughness of a flat gravel bed is about 3 mm.
Table 1. Average form (ks f ) and grain roughness (kss) of
the bed before and after each flushing experiment and
average erosion (E) all along the flume.
ks f (mm) kss (mm) E (mm)
initial final initial final
Exp 1 3.3 1.1 0.7 0.5 4.7
Exp 2 1.8 1.0 0.6 0.6 9.0
Exp 3 2.2 2.4 0.6 1.3 9.7
Exp 4 2.2 1.5 0.9 0.8 8.6
For experiments 1 and 2, the ripples were washed out
but the small grain roughness attests that fine sediment
mainly remains at the bed-surface. Hydrographs, and es-
pecially the experiment 3, better removed fine sediments
(higher grain roughness, closer to the one of gravels).
Both hydrographs slightly eroded the bed, similarly to the
experiment 2 but more than the experiment 1.
4. ConclusionsFrom these experiments, it appears that with a given
amount of water, the best strategy to wash fine sediment
from the surface with a limited mobilisation of the coarse
matrix is a rising hydrograph. An additional experiment
has shown that higher discharges do not better clean the
bed. None of the experiments results in a gravel bed free
of fines over a larger depth than one gravel grain. Ho-
wever, if the bed needs to be entirely preserved, lower
discharges can partially clean the surface.
AcknowledgmentsFrench Water agency (AERMC) is thanked for its support.
ReferencesGibson, S., Abraham, D., Heath, R., and Schoellha-
mer, D. (2009). Vertical gradational variability of fi-
nes deposited in a gravel framework. Sedimentology,
56(3):661–676.
Herrero, A. and Berni, C. (2016). Sand infiltration into a
gravel bed: A mathematical model. Water Resour. Res.,
52.
Wood, P. and Armitage, P. (1997). Biological effects of
fine sediment in the lotic environment. Environmental
Management, 21(2):203–217.
158
The dynamics of a gravel-sand transition
Astrid Blom1, Víctor Chavarrías1, and Enrica Viparelli2
1 Delft University of Technology, Delft, Netherlands. [email protected] Civil & Environmental Engineering, University of South Carolina at Columbia, USA.
1. IntroductionA special case of downstream fining associated with pro-
file concavity is the gravel-sand transition (GST), which
was first identified by Yatsu (1955) in several Japanese
rivers. Such a relatively abrupt transition between the
gravel-bed reach and the sand-bed reach is generally ac-
companied by a similarly abrupt transition in channel
slope. The correlation between these two characteristics
(i.e., bed surface grain size and slope) is explained by the
fact that coarser sediment requires a larger slope to be
transported downstream (Mackin, 1948). Yet the origin of
the formation of a GST seems to be a chicken or the egg
causality dilemma, which so far has remained unsolved.
Several ideas on the origin of a GST have been suggested:
sudden breakdown of gravel into sand, a river running
out of gravel (Paola et al., 1992), subsidence, sand in a
gravel-bed reach behaving as wash load, or, more specif-
ically, sand settling from suspended load, and tributaries.
Our objectives are (1) to describe the dynamics of GST
migration and (2) to develop a simple model describing
GST migration.
2. Gravel wedge progradation: the physicsHere we follow Paola et al. (1992) and assess the migra-
tion of a gravel wedge into a sand-bed reach. The gravel
supplied from upstream requires an increased bed slope to
be transported downstream. As such, the upstream gravel
supply builds a relatively steep gravel-bed reach, whose
length increases with time. Wedge front migration slows
down in time due to the increasing wedge length and
the associated increasing sediment volume required for
aggradation to make the wedge advance. In addition, the
prograding coarse wedge reduces the sand supply to the
downstream reach, as some sand is trapped in the wedge
deposit. This is because the bed surface in the gravel-bed
reach typically consists of about 10% sand to provide suf-
ficient mobility for sand transport down the gravel reach.
The reduced sand supply to the sand reach induces bed
degradation and reduces the sand-reach slope. The re-
sulting sharp transitions in slope and surface texture are
characteristic of a GST. The fact that a GST results from
the progradation of a gravel wedge seems to be confirmed
by the following phrase by Venditti and Church (2014):
‘The downstream front of the final gravel bar is like a
miniature Gilbert delta with the gravel face avalanching
into the deeper water downstream.’ Systems governed by
subsidence, delta progradation, or sea level rise create ac-
comodation space for the deposition of gravel in the up-
stream reach, which may cause the GST to halt and even
migrate upstream (Parker, 2004).
3. Gravel wedge progradation: a simple modelWe propose a simple model that provides an estimate of
the wedge progradation speed. The validation of the sim-
ple model was performed by comparing its results with
the outcomes of a numerical research code that solves
the Saint Venant-Hirano equations. The comparison il-
lustrates that the simple model is capable of predicting
the wedge progradation speed. The runs indicate that at
field scale such a wedge front migrates at an extremely
slow pace, of the order of a few meters per year or less.
This implies that so far we simply may not have noticed
GST migration in the field due to (1) the fact that its large
time scale makes our observation records merely a snap-
shot, (2) the large variation of the bed surface texture, and
(3) the difficulties of measuring the bed surface texture.
The model also provides a criterion for the onset of GST
halt or retreat.
4. ConclusionsA gravel-sand transition (GST) seems to be the result of
a gravel wedge. Such a wedge can prograde, halt, and
even retreat. It is typical of an ungraded or transient reach
(Blom et al., 2016), where profile concavity and down-
stream fining can be much stronger than in a graded or
equilibrium river reach. The GST migration speed de-
creases in time and is likely of the order of a few meters
or less per year. The effect of abrasion on GST migration
is limited to mainly affecting the sand and silt load trans-
ported into the sand-bed reach and so its slope. Our sim-
ple GST migration model describes GST dynamics fairly
well. It provides an estimate of the time scale of GST
migration and a criterion for the onset for a GST to halt
or retreat. We recommend analysis of temporal change in
bed elevation and bed surface texture in GST zones, and
the development of new techniques to measure the bed
surface texture to assess GST dynamics in the field.
ReferencesBlom, A., E. Viparelli, and V. Chavarrías (2016), The
graded alluvial river: Profile concavity and down-
stream fining, Geophys. Res. Lett., 43, 1–9.
Mackin, J. H. (1948), Concept of the graded river, Geol.
Soc. Am. Bull., 59(5), 463–512.
Paola, C., G. Parker, R. Seal, S. K. Sinha, J. B. Southard,
and P. R. Wilcock (1992), Downstream fining by se-
lective deposition in a laboratory flume, Science, 258,
1757–1760.
Parker, G. (2004), 1D Sediment transport mor-
phodynamics with applications to rivers
and turbidity currents., E-book, available at
http://hydrolab.illinois.edu/people/parkerg/morphodynamics_e-book.htm.
Venditti, J. G., and M. Church (2014), Morphology
and controls on the position of a gravel-sand transi-
tion: Fraser River, British Columbia, J. Geophys. Res.,
119(9), 1959–1976.
Yatsu, E. (1955), On the longitudinal profile of the graded
river, Eos, Trans. Am. Geophys. Un., 36(4), 655–663.

159
Numerical modeling of meander morphodynamicsaffected by internal boundary conditions
M. Bogoni1, J.A. Nittrouer2, A. Cantelli3, and S. Lanzoni1
1 Department of Civil, Environmental and Architectural Engineering, University of Padova, Padova, Italy
[email protected] Department of Earth Science, William Marsh Rice University, Houston, TX (US)
3 Shell Exploration and Production, Houston, TX (US)
1. IntroductionModeling of long-term evolution of meander planforms
is usually characterized by the assumption of a uniform
flow perturbed by the effects of curvature and width dis-
tributions along the river. However, the hypothesis of a
sufficiently long reach having constant forcing character-
istics could limit the reliability of the numerical simula-
tions, as natural meandering rivers may be characterized
by localized changes in floodplain slope, tributary con-
fluences, or backwater effects. We introduced a mathe-
matical extension of the model developed by Frascati and
Lanzoni (2009) in order to manage internally localized
boundary conditions which affects the characteristics of
the flow field.
2. Mathematical frameworkWe considered the case of a meandering channel charac-
terized by the presence of an internal section where one or
more changes in the main flow field are introduced (Bo-
goni et al., 2016). As a consequence, not only the main
uniform flow, but also the secondary flow field driven by
the channel axis curvatures is affected by these changes
(Figure 1).
s = 0
s = L0
s = L1
u
d
Figure 1. Sketch of a meandering river affected by a
singular section (s = L0) which introduces variations in
the flow field, and splits the domain in a upstream
subreach u and in a downstream subreach d.
At the leading order of approximation (the main, uniform
flow), the required internal conditions are the conserva-
tion of the liquid and sediment fluxes upstream (super-
script u) and downstream (superscript d) of the internal
section (superscript s), accounting for the possible flux
variations in the correspondence of the section itself.
Analogous conditions are required for the curvature-
driven secondary flow, for which the coupling between
the upstream subreach and the downstream subreach in
correspondence of the internal section s = L0 has to be
considered. In particular, the four possible resonance
(subresonance or superresonance) combinations for each
couple of two subreaches has to be considered when im-
posing the coupling (Zolezzi and Seminara, 2001).
The resulting modular model computes the flow field in
the meandering subreaches determined by the presence
of an internal section experiencing changes in external
conditions, and simulates the long-term lateral migration
above the floodplain surface due to erosion and deposition
processes at the banks, allowing the possible occurrence
of neck cutoffs.
3. ApplicationWe applied the mathematical framework to situations
characterized by a localized variation in the flow field,
e.g. the part of the Mississippi River affected by the con-
fluence of the Arkansas River (Figure 2), as well as to
river reaches where the flow properties slowly vary along
the river reach, e.g. due to the backwater effect that arise
in the proximity to the river mouth.
Figure 2. Simulated planform dynamics of the reach of
Mississippi River from Memphis (Tennessee, US) to
Natchez (Mississippi, US), affected by the confluence of
the Arkansas River (dashed section).
4. ConclusionsThe model of Zolezzi and Seminara (2001), owing to the
presence of four particular solutions, ensures the coupling
of the main uniform flows and of the curvature-driven sec-
ondary flows that take place in two river subreaches. Sim-
ulations show that the different effects triggered by the
presence of internal boundary conditions are relatively lo-
calized and, rather than producing strong variation in the
overall river dynamics, determine variations at the mean-
der scale and in the short term (∼ 50−100 years).
ReferencesBogoni, M., Nittrouer, J., Cantelli, A., and Lanzoni, S.
(2016). Modeling the meander morphodynamics with
internal boundary conditions given by a localized vari-
ation in the flow field. In AGU Fall Meeting 2016.
EP53G-05.
Frascati, A. and Lanzoni, S. (2009). Morphodynamic
regime and long-term evolution of meandering rivers.
Journal of Geophysical Research: Earth Surface,
114(2):1–12.
Zolezzi, G. and Seminara, G. (2001). Downstream and
upstream influence in river meandering. Part 1. Gen-
eral theory and application to overdeepening. J. Fluid
Mech., 438:183–211.
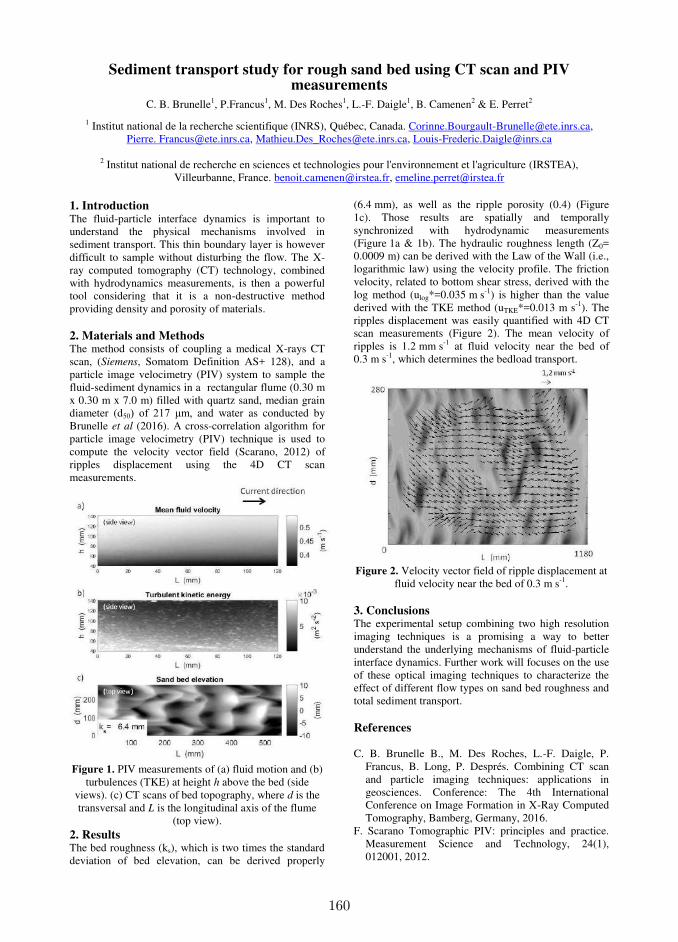
160
Sediment transport study for rough sand bed using CT scan and PIV measurements
C. B. Brunelle1, P.Francus1, M. Des Roches1, L.-F. Daigle1, B. Camenen2 & E. Perret2
1 Institut national de la recherche scientifique (INRS), Québec, Canada. [email protected],
Pierre. [email protected], [email protected], [email protected]
2 Institut national de recherche en sciences et technologies pour l'environnement et l'agriculture (IRSTEA), Villeurbanne, France. [email protected], [email protected]
1. Introduction The fluid-particle interface dynamics is important to understand the physical mechanisms involved in sediment transport. This thin boundary layer is however difficult to sample without disturbing the flow. The X-ray computed tomography (CT) technology, combined with hydrodynamics measurements, is then a powerful tool considering that it is a non-destructive method providing density and porosity of materials. 2. Materials and Methods The method consists of coupling a medical X-rays CT scan, (Siemens, Somatom Definition AS+ 128), and a particle image velocimetry (PIV) system to sample the fluid-sediment dynamics in a rectangular flume (0.30 m x 0.30 m x 7.0 m) filled with quartz sand, median grain diameter (d50) of 217 μm, and water as conducted by Brunelle et al (2016). A cross-correlation algorithm for particle image velocimetry (PIV) technique is used to compute the velocity vector field (Scarano, 2012) of ripples displacement using the 4D CT scan measurements.
Figure 1. PIV measurements of (a) fluid motion and (b)
turbulences (TKE) at height h above the bed (side views). (c) CT scans of bed topography, where d is the transversal and L is the longitudinal axis of the flume
(top view). 2. Results The bed roughness (ks), which is two times the standard deviation of bed elevation, can be derived properly
(6.4 mm), as well as the ripple porosity (0.4) (Figure 1c). Those results are spatially and temporally synchronized with hydrodynamic measurements (Figure 1a & 1b). The hydraulic roughness length (Z0= 0.0009 m) can be derived with the Law of the Wall (i.e., logarithmic law) using the velocity profile. The friction velocity, related to bottom shear stress, derived with the log method (ulog*=0.035 m s-1) is higher than the value derived with the TKE method (uTKE*=0.013 m s-1). The ripples displacement was easily quantified with 4D CT scan measurements (Figure 2). The mean velocity of ripples is 1.2 mm s-1 at fluid velocity near the bed of 0.3 m s-1, which determines the bedload transport.
Figure 2. Velocity vector field of ripple displacement at
fluid velocity near the bed of 0.3 m s-1.
3. Conclusions The experimental setup combining two high resolution imaging techniques is a promising a way to better understand the underlying mechanisms of fluid-particle interface dynamics. Further work will focuses on the use of these optical imaging techniques to characterize the effect of different flow types on sand bed roughness and total sediment transport. References C. B. Brunelle B., M. Des Roches, L.-F. Daigle, P.
Francus, B. Long, P. Després. Combining CT scan and particle imaging techniques: applications in geosciences. Conference: The 4th International Conference on Image Formation in X-Ray Computed Tomography, Bamberg, Germany, 2016.
F. Scarano Tomographic PIV: principles and practice. Measurement Science and Technology, 24(1), 012001, 2012.
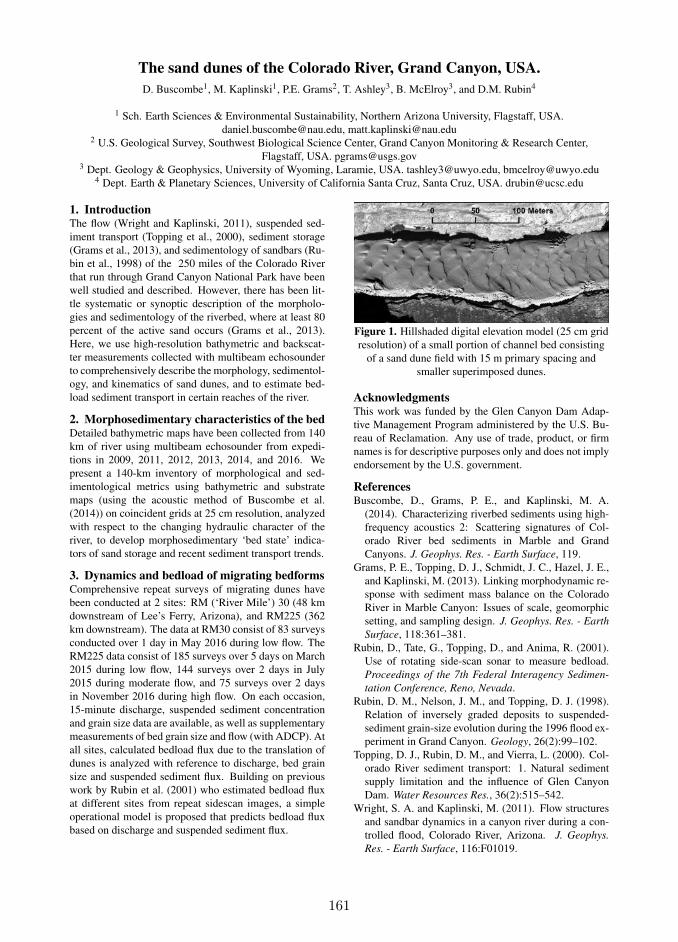
161
The sand dunes of the Colorado River, Grand Canyon, USA.
D. Buscombe1, M. Kaplinski1, P.E. Grams2, T. Ashley3, B. McElroy3, and D.M. Rubin4
1 Sch. Earth Sciences & Environmental Sustainability, Northern Arizona University, Flagstaff, USA.
[email protected], [email protected] U.S. Geological Survey, Southwest Biological Science Center, Grand Canyon Monitoring & Research Center,
Flagstaff, USA. [email protected] Dept. Geology & Geophysics, University of Wyoming, Laramie, USA. [email protected], [email protected]
4 Dept. Earth & Planetary Sciences, University of California Santa Cruz, Santa Cruz, USA. [email protected]
1. IntroductionThe flow (Wright and Kaplinski, 2011), suspended sed-
iment transport (Topping et al., 2000), sediment storage
(Grams et al., 2013), and sedimentology of sandbars (Ru-
bin et al., 1998) of the 250 miles of the Colorado River
that run through Grand Canyon National Park have been
well studied and described. However, there has been lit-
tle systematic or synoptic description of the morpholo-
gies and sedimentology of the riverbed, where at least 80
percent of the active sand occurs (Grams et al., 2013).
Here, we use high-resolution bathymetric and backscat-
ter measurements collected with multibeam echosounder
to comprehensively describe the morphology, sedimentol-
ogy, and kinematics of sand dunes, and to estimate bed-
load sediment transport in certain reaches of the river.
2. Morphosedimentary characteristics of the bedDetailed bathymetric maps have been collected from 140
km of river using multibeam echosounder from expedi-
tions in 2009, 2011, 2012, 2013, 2014, and 2016. We
present a 140-km inventory of morphological and sed-
imentological metrics using bathymetric and substrate
maps (using the acoustic method of Buscombe et al.
(2014)) on coincident grids at 25 cm resolution, analyzed
with respect to the changing hydraulic character of the
river, to develop morphosedimentary ‘bed state’ indica-
tors of sand storage and recent sediment transport trends.
3. Dynamics and bedload of migrating bedformsComprehensive repeat surveys of migrating dunes have
been conducted at 2 sites: RM (‘River Mile’) 30 (48 km
downstream of Lee’s Ferry, Arizona), and RM225 (362
km downstream). The data at RM30 consist of 83 surveys
conducted over 1 day in May 2016 during low flow. The
RM225 data consist of 185 surveys over 5 days on March
2015 during low flow, 144 surveys over 2 days in July
2015 during moderate flow, and 75 surveys over 2 days
in November 2016 during high flow. On each occasion,
15-minute discharge, suspended sediment concentration
and grain size data are available, as well as supplementary
measurements of bed grain size and flow (with ADCP). At
all sites, calculated bedload flux due to the translation of
dunes is analyzed with reference to discharge, bed grain
size and suspended sediment flux. Building on previous
work by Rubin et al. (2001) who estimated bedload flux
at different sites from repeat sidescan images, a simple
operational model is proposed that predicts bedload flux
based on discharge and suspended sediment flux.
Figure 1. Hillshaded digital elevation model (25 cm grid
resolution) of a small portion of channel bed consisting
of a sand dune field with 15 m primary spacing and
smaller superimposed dunes.
AcknowledgmentsThis work was funded by the Glen Canyon Dam Adap-
tive Management Program administered by the U.S. Bu-
reau of Reclamation. Any use of trade, product, or firm
names is for descriptive purposes only and does not imply
endorsement by the U.S. government.
ReferencesBuscombe, D., Grams, P. E., and Kaplinski, M. A.
(2014). Characterizing riverbed sediments using high-
frequency acoustics 2: Scattering signatures of Col-
orado River bed sediments in Marble and Grand
Canyons. J. Geophys. Res. - Earth Surface, 119.
Grams, P. E., Topping, D. J., Schmidt, J. C., Hazel, J. E.,
and Kaplinski, M. (2013). Linking morphodynamic re-
sponse with sediment mass balance on the Colorado
River in Marble Canyon: Issues of scale, geomorphic
setting, and sampling design. J. Geophys. Res. - Earth
Surface, 118:361–381.
Rubin, D., Tate, G., Topping, D., and Anima, R. (2001).
Use of rotating side-scan sonar to measure bedload.
Proceedings of the 7th Federal Interagency Sedimen-
tation Conference, Reno, Nevada.
Rubin, D. M., Nelson, J. M., and Topping, D. J. (1998).
Relation of inversely graded deposits to suspended-
sediment grain-size evolution during the 1996 flood ex-
periment in Grand Canyon. Geology, 26(2):99–102.
Topping, D. J., Rubin, D. M., and Vierra, L. (2000). Col-
orado River sediment transport: 1. Natural sediment
supply limitation and the influence of Glen Canyon
Dam. Water Resources Res., 36(2):515–542.
Wright, S. A. and Kaplinski, M. (2011). Flow structures
and sandbar dynamics in a canyon river during a con-
trolled flood, Colorado River, Arizona. J. Geophys.
Res. - Earth Surface, 116:F01019.
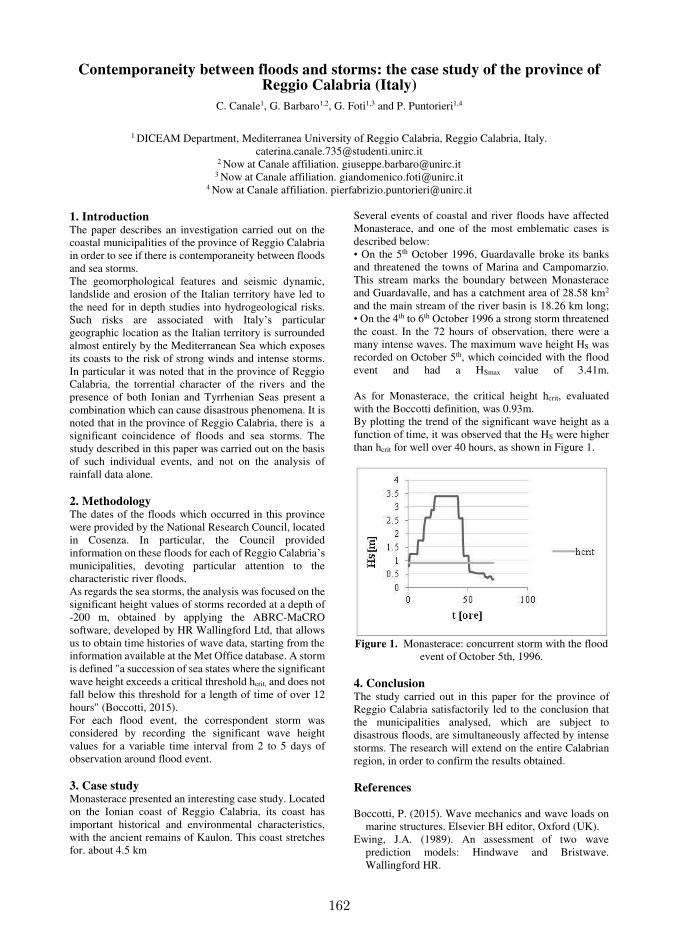
162
Contemporaneity between floods and storms: the case study of the province of Reggio Calabria (Italy)
C. Canale1, G. Barbaro1,2, G. Foti1,3 and P. Puntorieri1,4
1 DICEAM Department, Mediterranea University of Reggio Calabria, Reggio Calabria, Italy.
[email protected] 2 Now at Canale affiliation. [email protected]
3 Now at Canale affiliation. [email protected] 4 Now at Canale affiliation. [email protected]
1. Introduction The paper describes an investigation carried out on the coastal municipalities of the province of Reggio Calabria in order to see if there is contemporaneity between floods and sea storms. The geomorphological features and seismic dynamic, landslide and erosion of the Italian territory have led to the need for in depth studies into hydrogeological risks. Such risks are associated with Italy’s particular geographic location as the Italian territory is surrounded almost entirely by the Mediterranean Sea which exposes its coasts to the risk of strong winds and intense storms. In particular it was noted that in the province of Reggio Calabria, the torrential character of the rivers and the presence of both Ionian and Tyrrhenian Seas present a combination which can cause disastrous phenomena. It is noted that in the province of Reggio Calabria, there is a significant coincidence of floods and sea storms. The study described in this paper was carried out on the basis of such individual events, and not on the analysis of rainfall data alone. 2. Methodology The dates of the floods which occurred in this province were provided by the National Research Council, located in Cosenza. In particular, the Council provided information on these floods for each of Reggio Calabria’s municipalities, devoting particular attention to the characteristic river floods. As regards the sea storms, the analysis was focused on the significant height values of storms recorded at a depth of -200 m, obtained by applying the ABRC-MaCRO software, developed by HR Wallingford Ltd, that allows us to obtain time histories of wave data, starting from the information available at the Met Office database. A storm is defined "a succession of sea states where the significant wave height exceeds a critical threshold hcrit, and does not fall below this threshold for a length of time of over 12 hours" (Boccotti, 2015). For each flood event, the correspondent storm was considered by recording the significant wave height values for a variable time interval from 2 to 5 days of observation around flood event. 3. Case study Monasterace presented an interesting case study. Located on the Ionian coast of Reggio Calabria, its coast has important historical and environmental characteristics, with the ancient remains of Kaulon. This coast stretches for. about 4.5 km
Several events of coastal and river floods have affected Monasterace, and one of the most emblematic cases is described below: • On the 5th October 1996, Guardavalle broke its banks and threatened the towns of Marina and Campomarzio. This stream marks the boundary between Monasterace and Guardavalle, and has a catchment area of 28.58 km2
and the main stream of the river basin is 18.26 km long; • On the 4th to 6th October 1996 a strong storm threatened the coast. In the 72 hours of observation, there were a many intense waves. The maximum wave height HS was recorded on October 5th, which coincided with the flood event and had a HSmax value of 3.41m. As for Monasterace, the critical height hcrit, evaluated with the Boccotti definition, was 0.93m. By plotting the trend of the significant wave height as a function of time, it was observed that the HS were higher than hcrit for well over 40 hours, as shown in Figure 1.
Figure 1. Monasterace: concurrent storm with the flood
event of October 5th, 1996.
4. Conclusion The study carried out in this paper for the province of Reggio Calabria satisfactorily led to the conclusion that the municipalities analysed, which are subject to disastrous floods, are simultaneously affected by intense storms. The research will extend on the entire Calabrian region, in order to confirm the results obtained. References Boccotti, P. (2015). Wave mechanics and wave loads on
marine structures. Elsevier BH editor, Oxford (UK). Ewing, J.A. (1989). An assessment of two wave
prediction models: Hindwave and Bristwave. Wallingford HR.
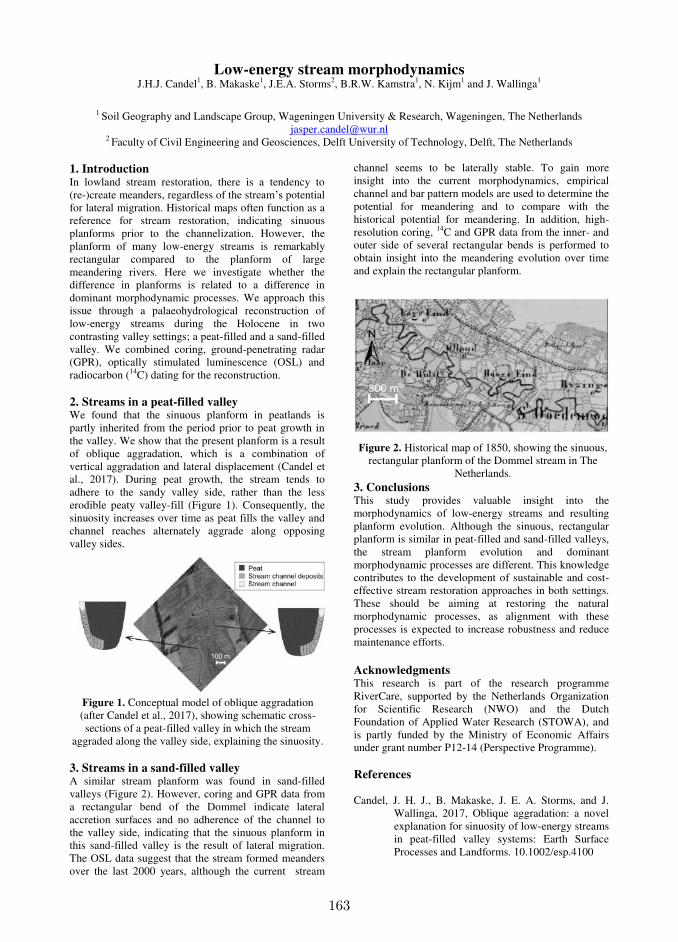
163
Low-energy stream morphodynamics J.H.J. Candel1, B. Makaske1, J.E.A. Storms2, B.R.W. Kamstra1, N. Kijm1 and J. Wallinga1
1 Soil Geography and Landscape Group, Wageningen University & Research, Wageningen, The Netherlands
[email protected] 2 Faculty of Civil Engineering and Geosciences, Delft University of Technology, Delft, The Netherlands
1. Introduction In lowland stream restoration, there is a tendency to (re-)create meanders, regardless of the stream’s potential for lateral migration. Historical maps often function as a reference for stream restoration, indicating sinuous planforms prior to the channelization. However, the planform of many low-energy streams is remarkably rectangular compared to the planform of large meandering rivers. Here we investigate whether the difference in planforms is related to a difference in dominant morphodynamic processes. We approach this issue through a palaeohydrological reconstruction of low-energy streams during the Holocene in two contrasting valley settings; a peat-filled and a sand-filled valley. We combined coring, ground-penetrating radar (GPR), optically stimulated luminescence (OSL) and radiocarbon (14C) dating for the reconstruction. 2. Streams in a peat-filled valley We found that the sinuous planform in peatlands is partly inherited from the period prior to peat growth in the valley. We show that the present planform is a result of oblique aggradation, which is a combination of vertical aggradation and lateral displacement (Candel et al., 2017). During peat growth, the stream tends to adhere to the sandy valley side, rather than the less erodible peaty valley-fill (Figure 1). Consequently, the sinuosity increases over time as peat fills the valley and channel reaches alternately aggrade along opposing valley sides.
3. Streams in a sand-filled valley A similar stream planform was found in sand-filled valleys (Figure 2). However, coring and GPR data from a rectangular bend of the Dommel indicate lateral accretion surfaces and no adherence of the channel to the valley side, indicating that the sinuous planform in this sand-filled valley is the result of lateral migration. The OSL data suggest that the stream formed meanders over the last 2000 years, although the current stream
channel seems to be laterally stable. To gain more insight into the current morphodynamics, empirical channel and bar pattern models are used to determine the potential for meandering and to compare with the historical potential for meandering. In addition, high-resolution coring, 14C and GPR data from the inner- and outer side of several rectangular bends is performed to obtain insight into the meandering evolution over time and explain the rectangular planform.
3. Conclusions This study provides valuable insight into the morphodynamics of low-energy streams and resulting planform evolution. Although the sinuous, rectangular planform is similar in peat-filled and sand-filled valleys, the stream planform evolution and dominant morphodynamic processes are different. This knowledge contributes to the development of sustainable and cost-effective stream restoration approaches in both settings. These should be aiming at restoring the natural morphodynamic processes, as alignment with these processes is expected to increase robustness and reduce maintenance efforts.
Acknowledgments This research is part of the research programme RiverCare, supported by the Netherlands Organization for Scientific Research (NWO) and the Dutch Foundation of Applied Water Research (STOWA), and is partly funded by the Ministry of Economic Affairs under grant number P12-14 (Perspective Programme). References Candel, J. H. J., B. Makaske, J. E. A. Storms, and J.
Wallinga, 2017, Oblique aggradation: a novel explanation for sinuosity of low-energy streams in peat-filled valley systems: Earth Surface Processes and Landforms. 10.1002/esp.4100
Figure 1. Conceptual model of oblique aggradation (after Candel et al., 2017), showing schematic cross-sections of a peat-filled valley in which the stream
aggraded along the valley side, explaining the sinuosity.
Figure 2. Historical map of 1850, showing the sinuous, rectangular planform of the Dommel stream in The
Netherlands.
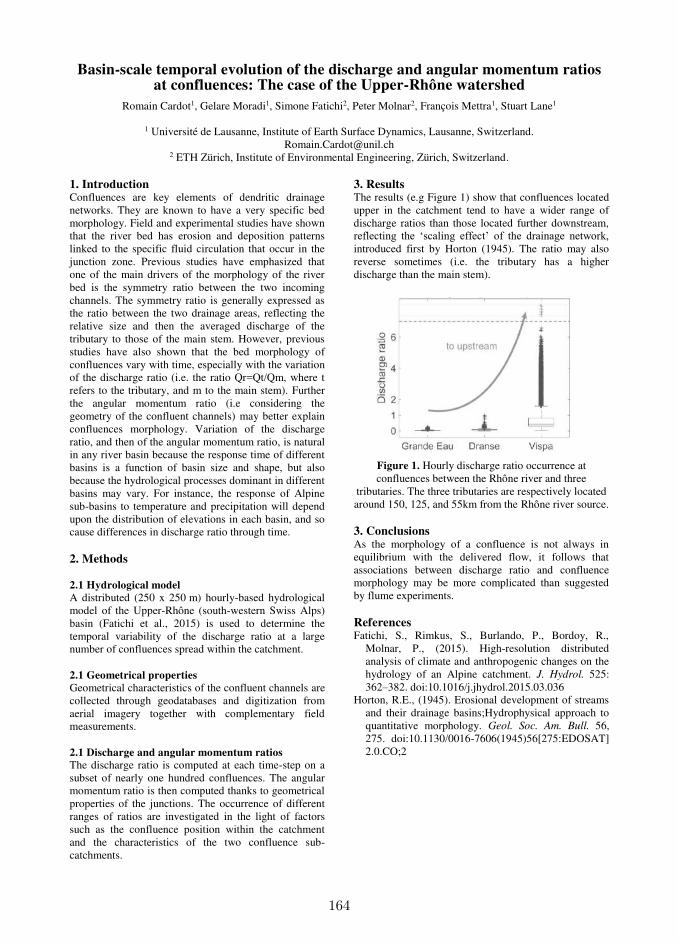
164
Basin-scale temporal evolution of the discharge and angular momentum ratios at confluences: The case of the Upper-Rhône watershed
Romain Cardot1, Gelare Moradi1, Simone Fatichi2, Peter Molnar2, François Mettra1, Stuart Lane1
1 Université de Lausanne, Institute of Earth Surface Dynamics, Lausanne, Switzerland. [email protected]
2 ETH Zürich, Institute of Environmental Engineering, Zürich, Switzerland.
1. Introduction Confluences are key elements of dendritic drainage networks. They are known to have a very specific bed morphology. Field and experimental studies have shown that the river bed has erosion and deposition patterns linked to the specific fluid circulation that occur in the junction zone. Previous studies have emphasized that one of the main drivers of the morphology of the river bed is the symmetry ratio between the two incoming channels. The symmetry ratio is generally expressed as the ratio between the two drainage areas, reflecting the relative size and then the averaged discharge of the tributary to those of the main stem. However, previous studies have also shown that the bed morphology of confluences vary with time, especially with the variation of the discharge ratio (i.e. the ratio Qr=Qt/Qm, where t refers to the tributary, and m to the main stem). Further the angular momentum ratio (i.e considering the geometry of the confluent channels) may better explain confluences morphology. Variation of the discharge ratio, and then of the angular momentum ratio, is natural in any river basin because the response time of different basins is a function of basin size and shape, but also because the hydrological processes dominant in different basins may vary. For instance, the response of Alpine sub-basins to temperature and precipitation will depend upon the distribution of elevations in each basin, and so cause differences in discharge ratio through time. 2. Methods
2.1 Hydrological model
A distributed (250 x 250 m) hourly-based hydrological model of the Upper-Rhône (south-western Swiss Alps) basin (Fatichi et al., 2015) is used to determine the temporal variability of the discharge ratio at a large number of confluences spread within the catchment. 2.1 Geometrical properties
Geometrical characteristics of the confluent channels are collected through geodatabases and digitization from aerial imagery together with complementary field measurements. 2.1 Discharge and angular momentum ratios
The discharge ratio is computed at each time-step on a subset of nearly one hundred confluences. The angular momentum ratio is then computed thanks to geometrical properties of the junctions. The occurrence of different ranges of ratios are investigated in the light of factors such as the confluence position within the catchment and the characteristics of the two confluence sub-catchments.
3. Results The results (e.g Figure 1) show that confluences located upper in the catchment tend to have a wider range of discharge ratios than those located further downstream, reflecting the ‘scaling effect’ of the drainage network, introduced first by Horton (1945). The ratio may also reverse sometimes (i.e. the tributary has a higher discharge than the main stem).
Figure 1. Hourly discharge ratio occurrence at confluences between the Rhône river and three
tributaries. The three tributaries are respectively located around 150, 125, and 55km from the Rhône river source. 3. Conclusions As the morphology of a confluence is not always in equilibrium with the delivered flow, it follows that associations between discharge ratio and confluence morphology may be more complicated than suggested by flume experiments. References Fatichi, S., Rimkus, S., Burlando, P., Bordoy, R.,
Molnar, P., (2015). High-resolution distributed analysis of climate and anthropogenic changes on the hydrology of an Alpine catchment. J. Hydrol. 525: 362–382. doi:10.1016/j.jhydrol.2015.03.036
Horton, R.E., (1945). Erosional development of streams and their drainage basins;Hydrophysical approach to quantitative morphology. Geol. Soc. Am. Bull. 56, 275. doi:10.1130/0016-7606(1945)56[275:EDOSAT] 2.0.CO;2
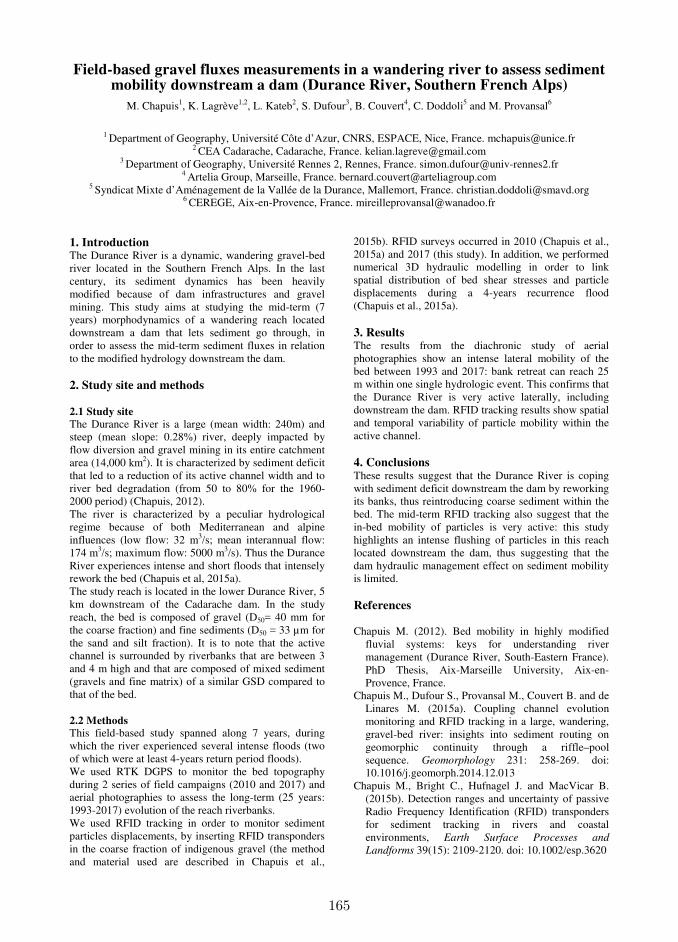
165
Field-based gravel fluxes measurements in a wandering river to assess sediment mobility downstream a dam (Durance River, Southern French Alps)
M. Chapuis1, K. Lagrève1,2, L. Kateb2, S. Dufour3, B. Couvert4, C. Doddoli5 and M. Provansal6
1 Department of Geography, Université Côte d’Azur, CNRS, ESPACE, Nice, France. [email protected]
2 CEA Cadarache, Cadarache, France. [email protected] 3 Department of Geography, Université Rennes 2, Rennes, France. [email protected]
4 Artelia Group, Marseille, France. [email protected] 5 Syndicat Mixte d’Aménagement de la Vallée de la Durance, Mallemort, France. [email protected]
6 CEREGE, Aix-en-Provence, France. [email protected]
1. Introduction The Durance River is a dynamic, wandering gravel-bed river located in the Southern French Alps. In the last century, its sediment dynamics has been heavily modified because of dam infrastructures and gravel mining. This study aims at studying the mid-term (7 years) morphodynamics of a wandering reach located downstream a dam that lets sediment go through, in order to assess the mid-term sediment fluxes in relation to the modified hydrology downstream the dam. 2. Study site and methods 2.1 Study site
The Durance River is a large (mean width: 240m) and steep (mean slope: 0.28%) river, deeply impacted by flow diversion and gravel mining in its entire catchment area (14,000 km2). It is characterized by sediment deficit that led to a reduction of its active channel width and to river bed degradation (from 50 to 80% for the 1960-2000 period) (Chapuis, 2012). The river is characterized by a peculiar hydrological regime because of both Mediterranean and alpine influences (low flow: 32 m3/s; mean interannual flow: 174 m3/s; maximum flow: 5000 m3/s). Thus the Durance River experiences intense and short floods that intensely rework the bed (Chapuis et al, 2015a). The study reach is located in the lower Durance River, 5 km downstream of the Cadarache dam. In the study reach, the bed is composed of gravel (D50= 40 mm for the coarse fraction) and fine sediments (D50 = 33 µm for the sand and silt fraction). It is to note that the active channel is surrounded by riverbanks that are between 3 and 4 m high and that are composed of mixed sediment (gravels and fine matrix) of a similar GSD compared to that of the bed. 2.2 Methods This field-based study spanned along 7 years, during which the river experienced several intense floods (two of which were at least 4-years return period floods). We used RTK DGPS to monitor the bed topography during 2 series of field campaigns (2010 and 2017) and aerial photographies to assess the long-term (25 years: 1993-2017) evolution of the reach riverbanks. We used RFID tracking in order to monitor sediment particles displacements, by inserting RFID transponders in the coarse fraction of indigenous gravel (the method and material used are described in Chapuis et al.,
2015b). RFID surveys occurred in 2010 (Chapuis et al., 2015a) and 2017 (this study). In addition, we performed numerical 3D hydraulic modelling in order to link spatial distribution of bed shear stresses and particle displacements during a 4-years recurrence flood (Chapuis et al., 2015a). 3. Results The results from the diachronic study of aerial photographies show an intense lateral mobility of the bed between 1993 and 2017: bank retreat can reach 25 m within one single hydrologic event. This confirms that the Durance River is very active laterally, including downstream the dam. RFID tracking results show spatial and temporal variability of particle mobility within the active channel. 4. Conclusions These results suggest that the Durance River is coping with sediment deficit downstream the dam by reworking its banks, thus reintroducing coarse sediment within the bed. The mid-term RFID tracking also suggest that the in-bed mobility of particles is very active: this study highlights an intense flushing of particles in this reach located downstream the dam, thus suggesting that the dam hydraulic management effect on sediment mobility is limited. References Chapuis M. (2012). Bed mobility in highly modified
fluvial systems: keys for understanding river management (Durance River, South-Eastern France). PhD Thesis, Aix-Marseille University, Aix-en-Provence, France.
Chapuis M., Dufour S., Provansal M., Couvert B. and de Linares M. (2015a). Coupling channel evolution monitoring and RFID tracking in a large, wandering, gravel-bed river: insights into sediment routing on geomorphic continuity through a riffle–pool sequence. Geomorphology 231: 258-269. doi: 10.1016/j.geomorph.2014.12.013
Chapuis M., Bright C., Hufnagel J. and MacVicar B. (2015b). Detection ranges and uncertainty of passive Radio Frequency Identification (RFID) transponders for sediment tracking in rivers and coastal environments, Earth Surface Processes and
Landforms 39(15): 2109-2120. doi: 10.1002/esp.3620
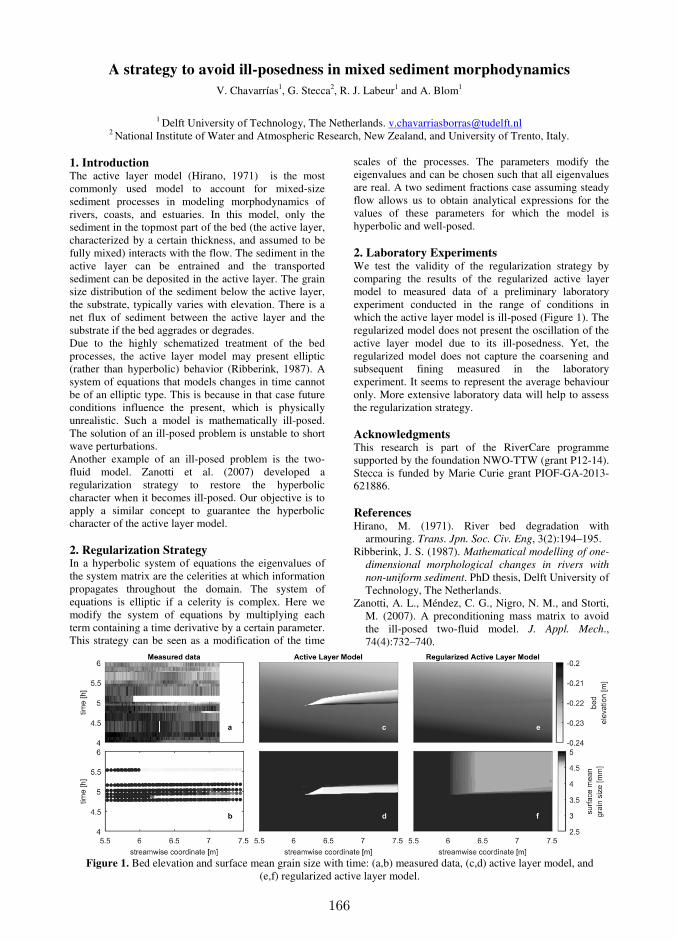
166
A strategy to avoid ill-posedness in mixed sediment morphodynamics
V. Chavarrías1, G. Stecca2, R. J. Labeur1 and A. Blom1
1 Delft University of Technology, The Netherlands. [email protected]
2 National Institute of Water and Atmospheric Research, New Zealand, and University of Trento, Italy. 1. Introduction The active layer model (Hirano, 1971) is the most commonly used model to account for mixed-size sediment processes in modeling morphodynamics of rivers, coasts, and estuaries. In this model, only the sediment in the topmost part of the bed (the active layer, characterized by a certain thickness, and assumed to be fully mixed) interacts with the flow. The sediment in the active layer can be entrained and the transported sediment can be deposited in the active layer. The grain size distribution of the sediment below the active layer, the substrate, typically varies with elevation. There is a net flux of sediment between the active layer and the substrate if the bed aggrades or degrades. Due to the highly schematized treatment of the bed processes, the active layer model may present elliptic (rather than hyperbolic) behavior (Ribberink, 1987). A system of equations that models changes in time cannot be of an elliptic type. This is because in that case future conditions influence the present, which is physically unrealistic. Such a model is mathematically ill-posed. The solution of an ill-posed problem is unstable to short wave perturbations. Another example of an ill-posed problem is the two-fluid model. Zanotti et al. (2007) developed a regularization strategy to restore the hyperbolic character when it becomes ill-posed. Our objective is to apply a similar concept to guarantee the hyperbolic character of the active layer model. 2. Regularization Strategy In a hyperbolic system of equations the eigenvalues of the system matrix are the celerities at which information propagates throughout the domain. The system of equations is elliptic if a celerity is complex. Here we modify the system of equations by multiplying each term containing a time derivative by a certain parameter. This strategy can be seen as a modification of the time
scales of the processes. The parameters modify the eigenvalues and can be chosen such that all eigenvalues are real. A two sediment fractions case assuming steady flow allows us to obtain analytical expressions for the values of these parameters for which the model is hyperbolic and well-posed. 2. Laboratory Experiments We test the validity of the regularization strategy by comparing the results of the regularized active layer model to measured data of a preliminary laboratory experiment conducted in the range of conditions in which the active layer model is ill-posed (Figure 1). The regularized model does not present the oscillation of the active layer model due to its ill-posedness. Yet, the regularized model does not capture the coarsening and subsequent fining measured in the laboratory experiment. It seems to represent the average behaviour only. More extensive laboratory data will help to assess the regularization strategy. Acknowledgments This research is part of the RiverCare programme supported by the foundation NWO-TTW (grant P12-14). Stecca is funded by Marie Curie grant PIOF-GA-2013-621886. References Hirano, M. (1971). River bed degradation with
armouring. Trans. Jpn. Soc. Civ. Eng, 3(2):194–195. Ribberink, J. S. (1987). Mathematical modelling of one-
dimensional morphological changes in rivers with
non-uniform sediment. PhD thesis, Delft University of Technology, The Netherlands.
Zanotti, A. L., Méndez, C. G., Nigro, N. M., and Storti, M. (2007). A preconditioning mass matrix to avoid the ill-posed two-fluid model. J. Appl. Mech., 74(4):732–740.
Figure 1. Bed elevation and surface mean grain size with time: (a,b) measured data, (c,d) active layer model, and (e,f) regularized active layer model.
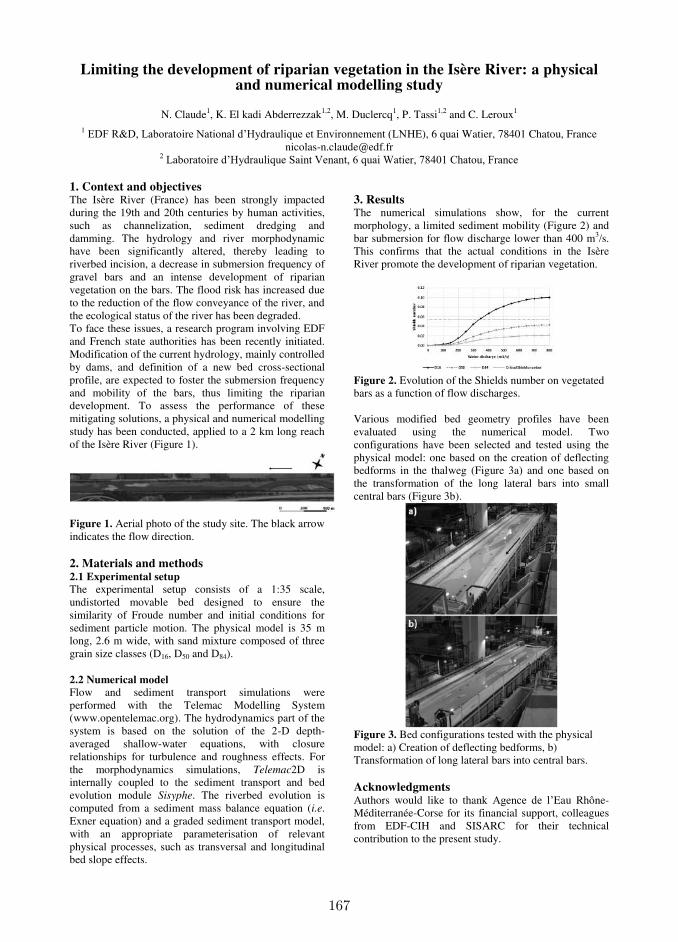
167
Limiting the development of riparian vegetation in the Isère River: a physical and numerical modelling study
N. Claude1, K. El kadi Abderrezzak1,2, M. Duclercq1, P. Tassi1,2 and C. Leroux1
1 EDF R&D, Laboratoire National d’Hydraulique et Environnement (LNHE), 6 quai Watier, 78401 Chatou, France [email protected]
2 Laboratoire d’Hydraulique Saint Venant, 6 quai Watier, 78401 Chatou, France
1. Context and objectives The Isère River (France) has been strongly impacted during the 19th and 20th centuries by human activities, such as channelization, sediment dredging and damming. The hydrology and river morphodynamic have been significantly altered, thereby leading to riverbed incision, a decrease in submersion frequency of gravel bars and an intense development of riparian vegetation on the bars. The flood risk has increased due to the reduction of the flow conveyance of the river, and the ecological status of the river has been degraded. To face these issues, a research program involving EDF and French state authorities has been recently initiated. Modification of the current hydrology, mainly controlled by dams, and definition of a new bed cross-sectional profile, are expected to foster the submersion frequency and mobility of the bars, thus limiting the riparian development. To assess the performance of these mitigating solutions, a physical and numerical modelling study has been conducted, applied to a 2 km long reach of the Isère River (Figure 1).
Figure 1. Aerial photo of the study site. The black arrow indicates the flow direction. 2. Materials and methods 2.1 Experimental setup
The experimental setup consists of a 1:35 scale, undistorted movable bed designed to ensure the similarity of Froude number and initial conditions for sediment particle motion. The physical model is 35 m long, 2.6 m wide, with sand mixture composed of three grain size classes (D16, D50 and D84). 2.2 Numerical model
Flow and sediment transport simulations were performed with the Telemac Modelling System (www.opentelemac.org). The hydrodynamics part of the system is based on the solution of the 2-D depth-averaged shallow-water equations, with closure relationships for turbulence and roughness effects. For the morphodynamics simulations, Telemac2D is internally coupled to the sediment transport and bed evolution module Sisyphe. The riverbed evolution is computed from a sediment mass balance equation (i.e. Exner equation) and a graded sediment transport model, with an appropriate parameterisation of relevant physical processes, such as transversal and longitudinal bed slope effects.
3. Results The numerical simulations show, for the current morphology, a limited sediment mobility (Figure 2) and bar submersion for flow discharge lower than 400 m3/s. This confirms that the actual conditions in the Isère River promote the development of riparian vegetation.
Figure 2. Evolution of the Shields number on vegetated bars as a function of flow discharges. Various modified bed geometry profiles have been evaluated using the numerical model. Two configurations have been selected and tested using the physical model: one based on the creation of deflecting bedforms in the thalweg (Figure 3a) and one based on the transformation of the long lateral bars into small central bars (Figure 3b).
Figure 3. Bed configurations tested with the physical model: a) Creation of deflecting bedforms, b) Transformation of long lateral bars into central bars.
Acknowledgments Authors would like to thank Agence de l’Eau Rhône-Méditerranée-Corse for its financial support, colleagues from EDF-CIH and SISARC for their technical contribution to the present study.
168
Sorting waves in heterogeneous sediment mixtures M. Colombini1 and C. Carbonari2
1 Dipartimento di Ingegneria Civile, Chimica e Ambientale, Università degli studi di Genova,
Via Montallegro 1,16145 Genova, Italy. [email protected] 2 Dipartimento di Ingegneria Civile e Ambientale, Università degli studi di Firenze,
Via di S. Marta 3, 50139 Firenze, Italy. [email protected]
1. Introduction
The presence on the bed of sediments of different sizes
is a ubiquitous feature of rivers. During bedload
transport, heterogeneous sediment mixtures undergo the
process of sorting, whereby the superficial concentration
of the sediment fractions develops a spatial pattern. In
particular, sorting waves result in an alternation of
patches of finer and coarser material, which propagates
downstream with a wave speed of the order of the flow
velocity.
In this work, we approach the problem of the formation
of sorting waves through the use of a 1D linear stability
analysis. The base state consists of a uniform flow in an
infinitely wide channel with active bed load transport.
2. Formulation of the problem
The governing equations describing the flow are the
steady 1D shallow-water and continuity equations.
Sediment transport is modelled making use of a three-
layer (substrate, active, bedload) model.
A discrete grain size distribution composed by just two
sizes in the same proportion is considered, whereby the
finest and the coarsest grain diameters are, in the
sedimentological phi-scale, equally distant from the
average grain size of the mixture.
Two Exner-like equations are thus obtained for the
sediment phase, which, after linearization, reduce to a
quadratic eigenrelationship that, in turn, provides two
eigenvalues, associated with the perturbation of the bed
elevation and of the superficial concentration of one of
the two species, respectively. The celerity and the
growth rate of these two eigenvalues are investigated for
different values of the flow and sediment parameters,
namely the Froude number, the Chézy coefficient (or the
relative submergence) and the standard deviation of the
grain size distribution. It is worth mentioning that the
above procedure can be straightforwardly generalized to
the case of a mixture of N sizes, providing one bed
eigenvalue and N-1 sorting eigenvalues.
2. Discussion of results
It is found that one of the two eigenvalues, named the
‘bed’ eigenvalue, recovers the behaviour of the single morphodynamic eigenvalue obtained in the
homogeneous sediment case. In particular, the
perturbation of the bed amplitude is characterized by a
slow downstream (upstream) propagation when the flow
is subcritical (supercritical), whereas the growth rate is
invariably negative, corresponding to a decay of the
perturbations. This result confirms the well-known
inability of the 1D shallow-water flow model to describe
the formation of bed forms (e.g. dunes and antidunes).
The second eigenvalue is named the ‘sorting’ eigenvalue, since it only appears if the sediment is
heterogeneous. The granulometric perturbation
associated with this eigenvalue propagates downstream
with a wave speed that is of the same order of magnitude
than the averaged flow velocity, in accordance with
Stecca, Siviglia and Blom (2014) who found that the
perturbations triggered by a local variation of the grain
size distribution propagate downstream at a faster pace
than the bed wave arising from the unisize-sediment
Saint-Venant-Exner model.
However, contrary to its bed counterpart, the sorting
eigenvalue is found to be unstable, so that the uniform
flow over a well-mixed heterogeneous bed loses stability
towards a perturbed configuration characterized by the
formation of sorting waves. Instability is confined to
subcritical flows and to relatively large values of the
Chézy coefficient, thus implying a small median
diameter of the sediment or a large flow depth or both.
The case of weak-sorting (i.e. of a mixture composed by
two sizes very close one another) is also considered,
allowing for an expansion of the eigenvalues in powers
of the geometric standard deviation of the grain size
distribution, which vanishes in the limit of weak sorting.
At leading order, the wave speed of the perturbation is
found to be inversely proportional to the active layer
thickness, as in Stecca, Siviglia and Blom (2014)
whereas instability appears at second order, in
accordance with the results of Seminara, Colombini and
Parker (1996). Instability is also shown to be strictly
connected to the process of hiding, disappearing if equal
mobility of the sediments is assumed
3. Conclusions
A linear stability analysis of flow over a bed composed
by a heterogeneous mixture is performed. The simplest
case of a mixture composed by two size fractions is
considered. Results confirm that the perturbations
associated with the sorting eigenvalue propagate much
faster than those associated with the bed eigenvalue.
Moreover, even a weak heterogeneity of the mixtures is
shown to produce instability, which leads to the
formation of sorting waves. Instability is suppressed for
relatively large median diameters of the mixture or for
shallow flows.
References
Seminara, G., Colombini, M., Parker, G., 1996. Nearly
pure sorting waves and formation of bedload sheets.
Journal of Fluid Mechanics 312, 253–278.
Stecca, G., Siviglia, A., Blom, A., 2014. Mathematical
analysis of the Saint-Venant-Hirano model for
mixed-sediment morphodynamics. Water Resources
Research.
169
Bedload tranport rate fluctuations in a flume with alternate bars under steady state conditions
B. Dhont1 and C. Ancey1
1 Laboratory of Environmental Hydraulics, École Polytechnique Fédérale de Lausanne, Lausanne, Switzerland.
[email protected], [email protected]
1. Introduction Bedload transport rate in gravel-bed rivers under steady flow conditions shows large fluctuations (Singh et al., 2009). The development, destruction and migration of bedforms (Gomez et al., 1989; Recking et al., 2009), in combination with grain sorting (Iseya and Ikeda, 1987), were identified as the main processes creating fluctuations. Past observations were often qualitative, and thus further investigations are required to better understand the role played by these processes in the intermittent character of the bedload transport (Church and Ferguson, 2015). In this study, we experimentally investigate the effect of alternate bars on the fluctuations of the bedload transport rates under steady state conditions. The experiments are performed during long periods of time (hundreds of hours) in order to account for long time scale processes and characterize any possible equilibrium state. 2. Methods Experiments were carried out in a 16-m long (usable) and 60-cm wide tilting flume. The bed was made of moderately sorted natural gravel (d50 = 6 mm) and was flattened before each experiment. During each experiment, the water discharge, the sediment feed rate and the flume angle were kept constant. The bedload transport rate was monitored continuously using six impact plates mounted vertically at the flume outlet. The water and the bed elevations are measured every ten minutes using two measurement systems mounted on a moving trolley that scans the bed:
• an array of eights ultrasonic probes, • a camera that takes top-view images of a laser
sheet projected from the trolley on the bed surface, through the water.
Three experiments were performed with a water discharge of 15 l/s. Each lasted at least 100 hours. The sediment feed rate and the flume angle were respectively:
• 2.5 g/s and 1.6% (experiment 1), • 5.0 g/s and 1.6% (experiment 2), • 7.5 g/s and 1.7% (experiment 3).
3. Results In each experiment, alternate bars develop in the bed. The number of pools varies from two to four. Once the bed is formed, the average bed slope varies slightly around a mean value that increases with the sediment feed rate. The alternate bar configuration fluctuates in time, although it can remain stable for relatively long periods of time.
The bedload transport rates are characterised by the alternation of strong and weak transport phases during the whole duration of the experiments. Fluctuations are within one order of magnitude. When the sediment feed rate is higher, sediment bursts are more frequent and of less relative amplitude (when compared to the mean rate). The bedload transport rate fluctuations are related to the migration of bedload sheets that move downward. The passage of these bedload sheets modifies the pool geometry, which controls their sediment transport capacity. 4. Conclusion In the experimental setup presented, and possibly in similar natural systems:
• An equilibrium state, regarding the bedload transport rate or the bed topography, is not reached.
• The bed seems to “breath”, i.e. to vary between different configurations which enable to store or evacuate sediments. These configurations are characterized by the geometry of the bar and pool system.
• The sediment bursts seem strongly linked to the migration of bedload sheets.
• It is crucial to study bedload transport over sufficiently long time scales given the potential effects of mesoscale morphological processes on it.
References Church, M., and Ferguson R. I. (2015), Morphodynamics: Rivers beyond steady state, Water
Resources Research, 51, 1883-1897. Gomez, B., Naff, R. L., and Hubbell, D. W. (1989). Temporal variations in bedload transport rates associated with the migration of bedforms. Earth
Surface Processes and Landforms, 14(2), 135-156. Iseya, F. and Ikeda, H. (1987). Pulsations in bedload transport rates induced by a longitudinal sediment sorting: A flume study using sand and gravel mixtures. Geografiska Annaler. Series A, Physical Geography, 69(1), 15-27. Recking, A., Frey, P., Paquier, A., and Belleudy, P. (2009). An experimental investigation of mechanisms involved in bed load sheet production and migration. Journal of Geophysical Research: Earth Surface, 114(F3). Singh, A., Fienberg, K., Jerolmack, D. J., Marr, J., and Foufoula-Georgiou, E. (2009). Experimental evidence for statistical scaling and intermittency in sediment transport rates. Journal of Geophysical Research: Earth
Surface, 114(F1) F01025.
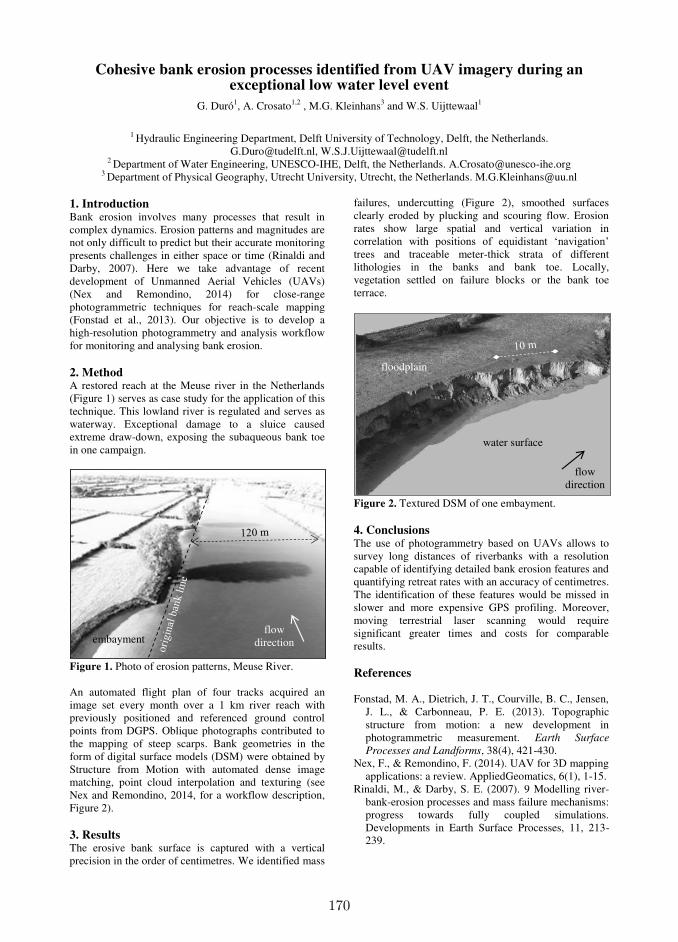
170
Cohesive bank erosion processes identified from UAV imagery during an exceptional low water level event
G. Duró1, A. Crosato1,2 , M.G. Kleinhans3 and W.S. Uijttewaal1
1 Hydraulic Engineering Department, Delft University of Technology, Delft, the Netherlands.
[email protected], [email protected] 2 Department of Water Engineering, UNESCO-IHE, Delft, the Netherlands. [email protected]
3 Department of Physical Geography, Utrecht University, Utrecht, the Netherlands. [email protected]
1. Introduction Bank erosion involves many processes that result in complex dynamics. Erosion patterns and magnitudes are not only difficult to predict but their accurate monitoring presents challenges in either space or time (Rinaldi and Darby, 2007). Here we take advantage of recent development of Unmanned Aerial Vehicles (UAVs) (Nex and Remondino, 2014) for close-range photogrammetric techniques for reach-scale mapping (Fonstad et al., 2013). Our objective is to develop a high-resolution photogrammetry and analysis workflow for monitoring and analysing bank erosion. 2. Method A restored reach at the Meuse river in the Netherlands (Figure 1) serves as case study for the application of this technique. This lowland river is regulated and serves as waterway. Exceptional damage to a sluice caused extreme draw-down, exposing the subaqueous bank toe in one campaign.
Figure 1. Photo of erosion patterns, Meuse River. An automated flight plan of four tracks acquired an image set every month over a 1 km river reach with previously positioned and referenced ground control points from DGPS. Oblique photographs contributed to the mapping of steep scarps. Bank geometries in the form of digital surface models (DSM) were obtained by Structure from Motion with automated dense image matching, point cloud interpolation and texturing (see Nex and Remondino, 2014, for a workflow description, Figure 2). 3. Results The erosive bank surface is captured with a vertical precision in the order of centimetres. We identified mass
failures, undercutting (Figure 2), smoothed surfaces clearly eroded by plucking and scouring flow. Erosion rates show large spatial and vertical variation in correlation with positions of equidistant ‘navigation’ trees and traceable meter-thick strata of different lithologies in the banks and bank toe. Locally, vegetation settled on failure blocks or the bank toe terrace.
Figure 2. Textured DSM of one embayment. 4. Conclusions The use of photogrammetry based on UAVs allows to survey long distances of riverbanks with a resolution capable of identifying detailed bank erosion features and quantifying retreat rates with an accuracy of centimetres. The identification of these features would be missed in slower and more expensive GPS profiling. Moreover, moving terrestrial laser scanning would require significant greater times and costs for comparable results. References Fonstad, M. A., Dietrich, J. T., Courville, B. C., Jensen,
J. L., & Carbonneau, P. E. (2013). Topographic structure from motion: a new development in photogrammetric measurement. Earth Surface
Processes and Landforms, 38(4), 421-430. Nex, F., & Remondino, F. (2014). UAV for 3D mapping
applications: a review. AppliedGeomatics, 6(1), 1-15. Rinaldi, M., & Darby, S. E. (2007). 9 Modelling river-
bank-erosion processes and mass failure mechanisms: progress towards fully coupled simulations. Developments in Earth Surface Processes, 11, 213-239.
water surface
flow direction surface
floodplain
flow direction surface
embayment
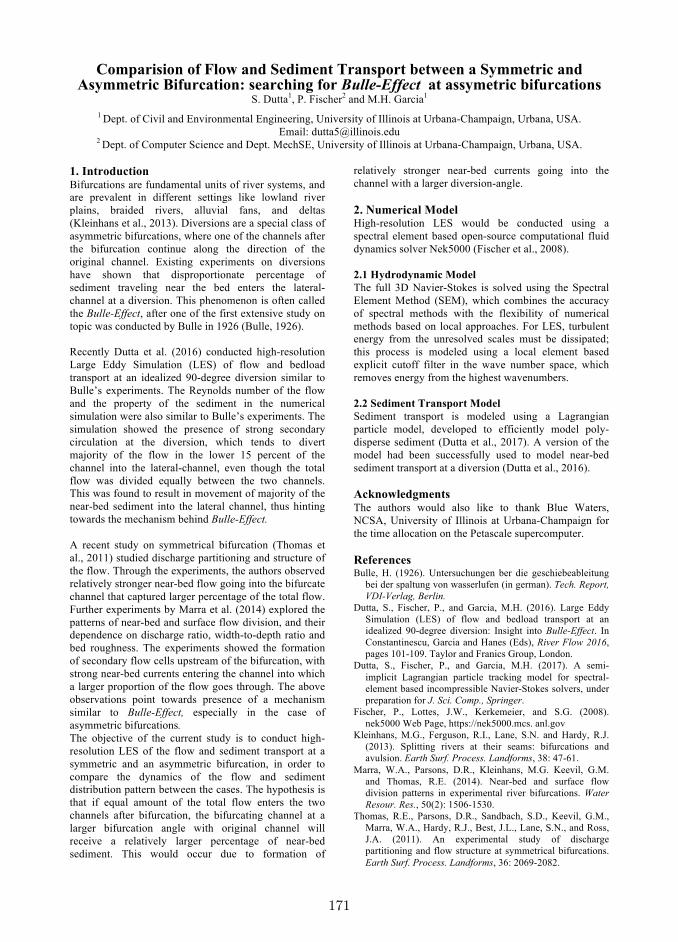
171
Comparision of Flow and Sediment Transport between a Symmetric and Asymmetric Bifurcation: searching for Bulle-Effect at assymetric bifurcations
S. Dutta1, P. Fischer
2 and M.H. Garcia
1
1 Dept. of Civil and Environmental Engineering, University of Illinois at Urbana-Champaign, Urbana, USA.
Email: [email protected] 2 Dept. of Computer Science and Dept. MechSE, University of Illinois at Urbana-Champaign, Urbana, USA.
1. Introduction Bifurcations are fundamental units of river systems, and
are prevalent in different settings like lowland river
plains, braided rivers, alluvial fans, and deltas
(Kleinhans et al., 2013). Diversions are a special class of
asymmetric bifurcations, where one of the channels after
the bifurcation continue along the direction of the
original channel. Existing experiments on diversions
have shown that disproportionate percentage of
sediment traveling near the bed enters the lateral-
channel at a diversion. This phenomenon is often called
the Bulle-Effect, after one of the first extensive study on
topic was conducted by Bulle in 1926 (Bulle, 1926).
Recently Dutta et al. (2016) conducted high-resolution
Large Eddy Simulation (LES) of flow and bedload
transport at an idealized 90-degree diversion similar to
Bulle’s experiments. The Reynolds number of the flow
and the property of the sediment in the numerical
simulation were also similar to Bulle’s experiments. The
simulation showed the presence of strong secondary
circulation at the diversion, which tends to divert
majority of the flow in the lower 15 percent of the
channel into the lateral-channel, even though the total
flow was divided equally between the two channels.
This was found to result in movement of majority of the
near-bed sediment into the lateral channel, thus hinting
towards the mechanism behind Bulle-Effect.
A recent study on symmetrical bifurcation (Thomas et
al., 2011) studied discharge partitioning and structure of
the flow. Through the experiments, the authors observed
relatively stronger near-bed flow going into the bifurcate
channel that captured larger percentage of the total flow.
Further experiments by Marra et al. (2014) explored the
patterns of near-bed and surface flow division, and their
dependence on discharge ratio, width-to-depth ratio and
bed roughness. The experiments showed the formation
of secondary flow cells upstream of the bifurcation, with
strong near-bed currents entering the channel into which
a larger proportion of the flow goes through. The above
observations point towards presence of a mechanism
similar to Bulle-Effect, especially in the case of
asymmetric bifurcations.
The objective of the current study is to conduct high-
resolution LES of the flow and sediment transport at a
symmetric and an asymmetric bifurcation, in order to
compare the dynamics of the flow and sediment
distribution pattern between the cases. The hypothesis is
that if equal amount of the total flow enters the two
channels after bifurcation, the bifurcating channel at a
larger bifurcation angle with original channel will
receive a relatively larger percentage of near-bed
sediment. This would occur due to formation of
relatively stronger near-bed currents going into the
channel with a larger diversion-angle.
2. Numerical Model High-resolution LES would be conducted using a
spectral element based open-source computational fluid
dynamics solver Nek5000 (Fischer et al., 2008).
2.1 Hydrodynamic Model
The full 3D Navier-Stokes is solved using the Spectral
Element Method (SEM), which combines the accuracy
of spectral methods with the flexibility of numerical
methods based on local approaches. For LES, turbulent
energy from the unresolved scales must be dissipated;
this process is modeled using a local element based
explicit cutoff filter in the wave number space, which
removes energy from the highest wavenumbers.
2.2 Sediment Transport Model
Sediment transport is modeled using a Lagrangian
particle model, developed to efficiently model poly-
disperse sediment (Dutta et al., 2017). A version of the
model had been successfully used to model near-bed
sediment transport at a diversion (Dutta et al., 2016).
Acknowledgments The authors would also like to thank Blue Waters,
NCSA, University of Illinois at Urbana-Champaign for
the time allocation on the Petascale supercomputer.
References Bulle, H. (1926). Untersuchungen ber die geschiebeableitung
bei der spaltung von wasserlufen (in german). Tech. Report,
VDI-Verlag, Berlin.
Dutta, S., Fischer, P., and Garcia, M.H. (2016). Large Eddy
Simulation (LES) of flow and bedload transport at an
idealized 90-degree diversion: Insight into Bulle-Effect. In
Constantinescu, Garcia and Hanes (Eds), River Flow 2016,
pages 101-109. Taylor and Franics Group, London.
Dutta, S., Fischer, P., and Garcia, M.H. (2017). A semi-
implicit Lagrangian particle tracking model for spectral-
element based incompressible Navier-Stokes solvers, under
preparation for J. Sci. Comp., Springer.
Fischer, P., Lottes, J.W., Kerkemeier, and S.G. (2008).
nek5000 Web Page, https://nek5000.mcs. anl.gov
Kleinhans, M.G., Ferguson, R.I., Lane, S.N. and Hardy, R.J.
(2013). Splitting rivers at their seams: bifurcations and
avulsion. Earth Surf. Process. Landforms, 38: 47-61.
Marra, W.A., Parsons, D.R., Kleinhans, M.G. Keevil, G.M.
and Thomas, R.E. (2014). Near-bed and surface flow
division patterns in experimental river bifurcations. Water
Resour. Res., 50(2): 1506-1530.
Thomas, R.E., Parsons, D.R., Sandbach, S.D., Keevil, G.M.,
Marra, W.A., Hardy, R.J., Best, J.L., Lane, S.N., and Ross,
J.A. (2011). An experimental study of discharge
partitioning and flow structure at symmetrical bifurcations.
Earth Surf. Process. Landforms, 36: 2069-2082.

172
The Response of Braiding Intensity to Varying Discahrge
R. Egozi1 , P. Ashmore2
1 The Soil Erosion Research Station, Ministry of Agriculture and Rural Development, Israel. [email protected]
2 Department of Geography, University of Western Ontario, London, Ontario, Canada. [email protected] of
1. Introduction Recent advances in braided river morphodynamic studies suggest that numerical models replicate adequately the morphological nature of braiding (e.g. Williams et al., 2016). However, at times, when computation results are validated against observed and measured flume and field studies data sets, some inconsistencies are reported, emphasizing the need for a better mechanistic understanding. Such is the case of the regime characteristic of braided network complexity (active and total braiding intensity, BIA and BIT, respectively) when discharge varies. This issue refers to the inundation of bars and vegetated islands and therefore affects braiding channel pattern indices (e.g. Egozi and Ashmore, 2008) but also ecological process (e.g. Bertoldi et al., 2009a; Surian et al., 2015). It is also strongly tied to bedload transport and active width (Egozi, 2006; Bertoldi et al., 2009b; Ashmore et al., 2011) and therefore to braiding morphodynamics. The questions addressed here are: (i) what are the changes in braiding intensity (BIA and BIT) under varying discharge? (ii) what is the nature of the relation between BIA and BIT over a range of competent discharges in a braided river? (iii) what braiding processes affect BIA and BIT during a typical hydrograph? We use both physical model experiments and field observations to describe the response of braiding intensity to varying discharge. The flume experiments had taken place at UWO (3 m wide, 18 m long, 0.3 m deep with 0.15 m layer of mixed sand) and a field campaign run in Sunwapta River, a gravel-bed pro-glacial river in Jasper National Park, Canada. The hydrograph simulation was based approximately on the daily melt-water flow cycle of the pro-glacial Sunwapta River. Sunwapta River discharge was monitored continuously during the summer of 2003. The hydrological data were used to determine the discharges for the model hydrograph (Figure 1). The results indicate that a hydro-geomorphic link exist between braiding intensity and glacial melt flood hydrograph (Figure 2) which can be explained based on stress history effect. 2. Figures Figure 1 is braiding intensity values over time. The vertical dashed line differentiates between the times of each experiment and the horizontal dashed lines mark 0.3-0.5 range that refers to the ratio between active braiding intensity and total braiding intensity like the ones reported in Egozi and Ashmore (2009) for constant discharge.
Figure 2. Temporal change of braiding intensity.
3. Conclusions Maximum BIT occurs below peak discharge. This stage is the channel forming discharge. BIA increases with discharge but the main active channel transports bed load also at very low flow stages relative to peak discharge. Stress history coincide with the diurnal flood event and explains the BIA/BIT constant value. References Ashmore, P., Bertoldi, W., & Tobias Gardner, J. (2011).
Active width of gravel-bed braided rivers. ESPL, 36(11), 1510–1521. https://doi.org/10.1002/esp.2182
Bertoldi, W., Zanoni, L., & Tubino, M. (2009). Planform dynamics of braided streams. ESPL, 34(4), 547-557.
Bertoldi, W., Gurnell, A., Surian, N., Tockner, K., Zanoni, L., Ziliani, L., & Zolezzi, G. (2009). Understanding reference processes: linkages between river flows, sediment dynamics and vegetated landforms along the Tagliamento River, Italy. River
Res. Appl., 25(5), 501-516.https://doi.org/10.1002/rra Egozi, R. 2006. Channel pattern variation in braided
rivers, PhD Thesis, University of Western Ontario, 196 p.
Egozi, R., & Ashmore, P. (2008). Defining and measuring braiding intensity. ESPL, 33(14), 2121–2138. https://doi.org/10.1002/esp.1658
Egozi, R., & Ashmore, P. (2009). Experimental analysis of braided channel pattern response to increased discharge. J. of Geophysical Research.
Surian, N., Barban, M., Ziliani, L., Monegato, G., Bertoldi, W., & Comiti, F. (2015). Vegetation turnover in a braided river: frequency and effectiveness of floods of different magnitude. ESPL, 40(4), 542-558.
Williams, R. D., Brasington, J., & Hicks, D. M. (2016). Numerical modelling of braided river morphodynamics: Review and future challenges. Geography Compass, 10(3), 102-127.
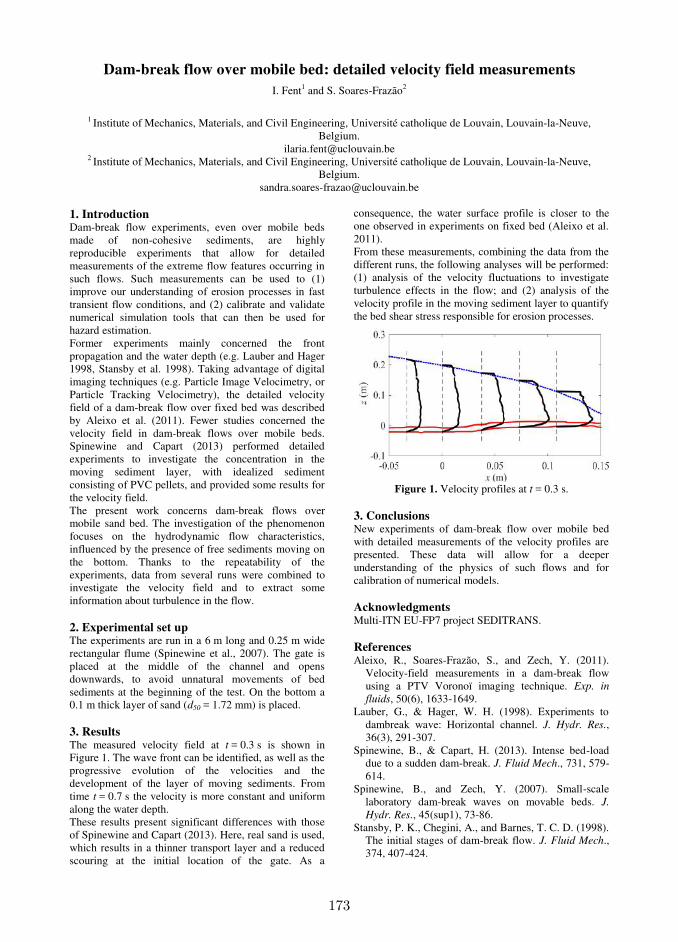
173
Dam-break flow over mobile bed: detailed velocity field measurements
I. Fent1 and S. Soares-Frazão2
1 Institute of Mechanics, Materials, and Civil Engineering, Université catholique de Louvain, Louvain-la-Neuve,
Belgium. [email protected]
2 Institute of Mechanics, Materials, and Civil Engineering, Université catholique de Louvain, Louvain-la-Neuve, Belgium.
1. Introduction Dam-break flow experiments, even over mobile beds made of non-cohesive sediments, are highly reproducible experiments that allow for detailed measurements of the extreme flow features occurring in such flows. Such measurements can be used to (1) improve our understanding of erosion processes in fast transient flow conditions, and (2) calibrate and validate numerical simulation tools that can then be used for hazard estimation. Former experiments mainly concerned the front propagation and the water depth (e.g. Lauber and Hager 1998, Stansby et al. 1998). Taking advantage of digital imaging techniques (e.g. Particle Image Velocimetry, or Particle Tracking Velocimetry), the detailed velocity field of a dam-break flow over fixed bed was described by Aleixo et al. (2011). Fewer studies concerned the velocity field in dam-break flows over mobile beds. Spinewine and Capart (2013) performed detailed experiments to investigate the concentration in the moving sediment layer, with idealized sediment consisting of PVC pellets, and provided some results for the velocity field. The present work concerns dam-break flows over mobile sand bed. The investigation of the phenomenon focuses on the hydrodynamic flow characteristics, influenced by the presence of free sediments moving on the bottom. Thanks to the repeatability of the experiments, data from several runs were combined to investigate the velocity field and to extract some information about turbulence in the flow. 2. Experimental set up The experiments are run in a 6 m long and 0.25 m wide rectangular flume (Spinewine et al., 2007). The gate is placed at the middle of the channel and opens downwards, to avoid unnatural movements of bed sediments at the beginning of the test. On the bottom a 0.1 m thick layer of sand (d50 = 1.72 mm) is placed. 3. Results The measured velocity field at t = 0.3 s is shown in Figure 1. The wave front can be identified, as well as the progressive evolution of the velocities and the development of the layer of moving sediments. From time t = 0.7 s the velocity is more constant and uniform along the water depth. These results present significant differences with those of Spinewine and Capart (2013). Here, real sand is used, which results in a thinner transport layer and a reduced scouring at the initial location of the gate. As a
consequence, the water surface profile is closer to the one observed in experiments on fixed bed (Aleixo et al. 2011). From these measurements, combining the data from the different runs, the following analyses will be performed: (1) analysis of the velocity fluctuations to investigate turbulence effects in the flow; and (2) analysis of the velocity profile in the moving sediment layer to quantify the bed shear stress responsible for erosion processes.
Figure 1. Velocity profiles at t = 0.3 s.
3. Conclusions New experiments of dam-break flow over mobile bed with detailed measurements of the velocity profiles are presented. These data will allow for a deeper understanding of the physics of such flows and for calibration of numerical models. Acknowledgments Multi-ITN EU-FP7 project SEDITRANS. References Aleixo, R., Soares-Frazão, S., and Zech, Y. (2011).
Velocity-field measurements in a dam-break flow using a PTV Voronoï imaging technique. Exp. in
fluids, 50(6), 1633-1649. Lauber, G., & Hager, W. H. (1998). Experiments to
dambreak wave: Horizontal channel. J. Hydr. Res., 36(3), 291-307.
Spinewine, B., & Capart, H. (2013). Intense bed-load due to a sudden dam-break. J. Fluid Mech., 731, 579-614.
Spinewine, B., and Zech, Y. (2007). Small-scale laboratory dam-break waves on movable beds. J.
Hydr. Res., 45(sup1), 73-86. Stansby, P. K., Chegini, A., and Barnes, T. C. D. (1998).
The initial stages of dam-break flow. J. Fluid Mech., 374, 407-424.
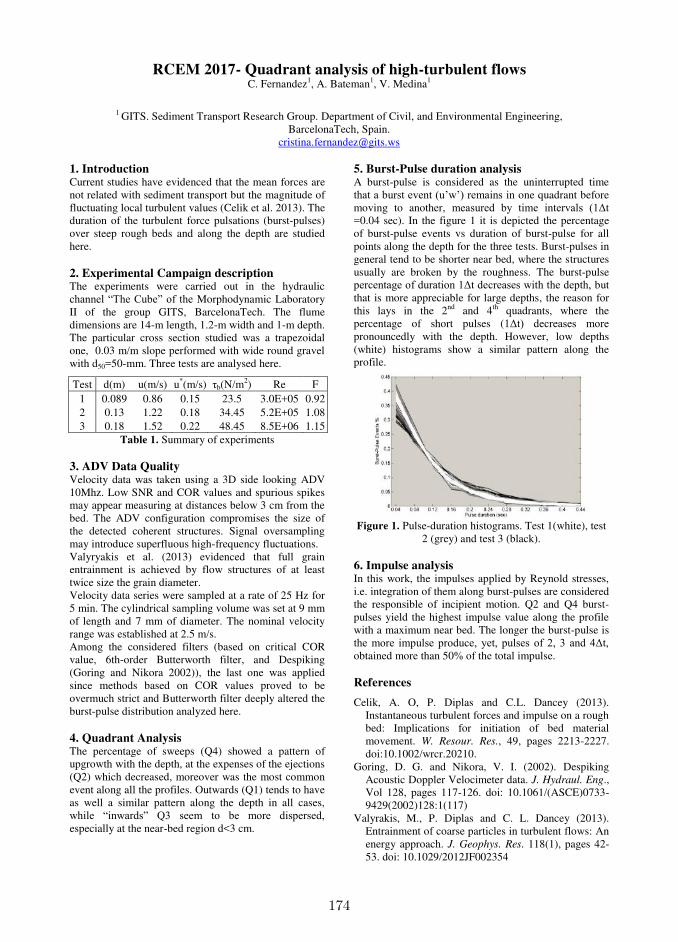
174
RCEM 2017- Quadrant analysis of high-turbulent flows C. Fernandez1, A. Bateman1, V. Medina1
1 GITS. Sediment Transport Research Group. Department of Civil, and Environmental Engineering,
BarcelonaTech, Spain. [email protected]
1. Introduction Current studies have evidenced that the mean forces are not related with sediment transport but the magnitude of fluctuating local turbulent values (Celik et al. 2013). The duration of the turbulent force pulsations (burst-pulses) over steep rough beds and along the depth are studied here. 2. Experimental Campaign description The experiments were carried out in the hydraulic channel “The Cube” of the Morphodynamic Laboratory II of the group GITS, BarcelonaTech. The flume dimensions are 14-m length, 1.2-m width and 1-m depth. The particular cross section studied was a trapezoidal one, 0.03 m/m slope performed with wide round gravel with d50=50-mm. Three tests are analysed here.
Test d(m) u(m/s) u*(m/s) τb(N/m2) Re F 1 0.089 0.86 0.15 23.5 3.0E+05 0.92 2 0.13 1.22 0.18 34.45 5.2E+05 1.08 3 0.18 1.52 0.22 48.45 8.5E+06 1.15
Table 1. Summary of experiments
3. ADV Data Quality Velocity data was taken using a 3D side looking ADV 10Mhz. Low SNR and COR values and spurious spikes may appear measuring at distances below 3 cm from the bed. The ADV configuration compromises the size of the detected coherent structures. Signal oversampling may introduce superfluous high-frequency fluctuations. Valyryakis et al. (2013) evidenced that full grain entrainment is achieved by flow structures of at least twice size the grain diameter. Velocity data series were sampled at a rate of 25 Hz for 5 min. The cylindrical sampling volume was set at 9 mm of length and 7 mm of diameter. The nominal velocity range was established at 2.5 m/s. Among the considered filters (based on critical COR value, 6th-order Butterworth filter, and Despiking (Goring and Nikora 2002)), the last one was applied since methods based on COR values proved to be overmuch strict and Butterworth filter deeply altered the burst-pulse distribution analyzed here. 4. Quadrant Analysis The percentage of sweeps (Q4) showed a pattern of upgrowth with the depth, at the expenses of the ejections (Q2) which decreased, moreover was the most common event along all the profiles. Outwards (Q1) tends to have as well a similar pattern along the depth in all cases, while “inwards” Q3 seem to be more dispersed, especially at the near-bed region d<3 cm.
5. Burst-Pulse duration analysis A burst-pulse is considered as the uninterrupted time that a burst event (u’w’) remains in one quadrant before moving to another, measured by time intervals (1Δt =0.04 sec). In the figure 1 it is depicted the percentage of burst-pulse events vs duration of burst-pulse for all points along the depth for the three tests. Burst-pulses in general tend to be shorter near bed, where the structures usually are broken by the roughness. The burst-pulse percentage of duration 1Δt decreases with the depth, but that is more appreciable for large depths, the reason for this lays in the 2nd and 4th quadrants, where the percentage of short pulses (1Δt) decreases more pronouncedly with the depth. However, low depths (white) histograms show a similar pattern along the profile.
Figure 1. Pulse-duration histograms. Test 1(white), test
2 (grey) and test 3 (black).
6. Impulse analysis In this work, the impulses applied by Reynold stresses, i.e. integration of them along burst-pulses are considered the responsible of incipient motion. Q2 and Q4 burst-pulses yield the highest impulse value along the profile with a maximum near bed. The longer the burst-pulse is the more impulse produce, yet, pulses of 2, 3 and 4Δt, obtained more than 50% of the total impulse.
References
Celik, A. O, P. Diplas and C.L. Dancey (2013). Instantaneous turbulent forces and impulse on a rough bed: Implications for initiation of bed material movement. W. Resour. Res., 49, pages 2213-2227. doi:10.1002/wrcr.20210.
Goring, D. G. and Nikora, V. I. (2002). Despiking Acoustic Doppler Velocimeter data. J. Hydraul. Eng., Vol 128, pages 117-126. doi: 10.1061/(ASCE)0733-9429(2002)128:1(117)
Valyrakis, M., P. Diplas and C. L. Dancey (2013). Entrainment of coarse particles in turbulent flows: An energy approach. J. Geophys. Res. 118(1), pages 42-53. doi: 10.1029/2012JF002354
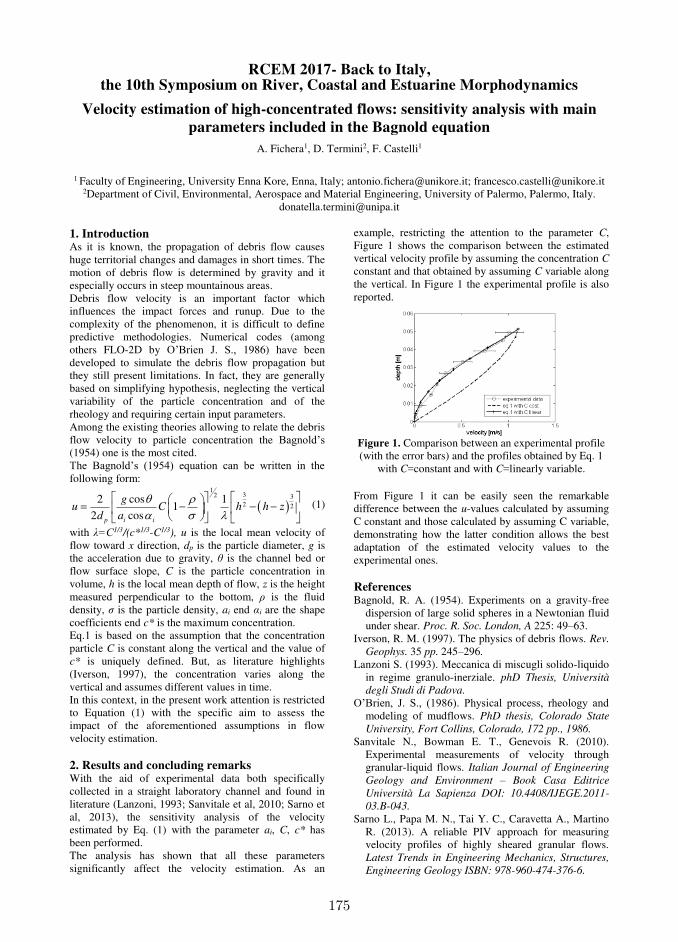
175
RCEM 2017- Back to Italy, the 10th Symposium on River, Coastal and Estuarine Morphodynamics
Velocity estimation of high-concentrated flows: sensitivity analysis with main
parameters included in the Bagnold equation
A. Fichera1, D. Termini2, F. Castelli1
1 Faculty of Engineering, University Enna Kore, Enna, Italy; [email protected]; [email protected]
2Department of Civil, Environmental, Aerospace and Material Engineering, University of Palermo, Palermo, Italy. [email protected]
1. Introduction As it is known, the propagation of debris flow causes huge territorial changes and damages in short times. The motion of debris flow is determined by gravity and it especially occurs in steep mountainous areas. Debris flow velocity is an important factor which influences the impact forces and runup. Due to the complexity of the phenomenon, it is difficult to define predictive methodologies. Numerical codes (among others FLO-2D by O’Brien J. S., 1986) have been developed to simulate the debris flow propagation but they still present limitations. In fact, they are generally based on simplifying hypothesis, neglecting the vertical variability of the particle concentration and of the rheology and requiring certain input parameters. Among the existing theories allowing to relate the debris flow velocity to particle concentration the Bagnold’s (1954) one is the most cited. The Bagnold’s (1954) equation can be written in the following form:
1
32 32 2
2 cos 11
2 cosp i i
gu C h h z
d a
(1)
with λ=C1/3/(c*1/3-C1/3), u is the local mean velocity of flow toward x direction, dp is the particle diameter, g is the acceleration due to gravity, θ is the channel bed or flow surface slope, C is the particle concentration in volume, h is the local mean depth of flow, z is the height measured perpendicular to the bottom, ρ is the fluid density, σ is the particle density, ai end αi are the shape coefficients end c* is the maximum concentration. Eq.1 is based on the assumption that the concentration particle C is constant along the vertical and the value of c* is uniquely defined. But, as literature highlights (Iverson, 1997), the concentration varies along the vertical and assumes different values in time. In this context, in the present work attention is restricted to Equation (1) with the specific aim to assess the impact of the aforementioned assumptions in flow velocity estimation. 2. Results and concluding remarks With the aid of experimental data both specifically collected in a straight laboratory channel and found in literature (Lanzoni, 1993; Sanvitale et al, 2010; Sarno et al, 2013), the sensitivity analysis of the velocity estimated by Eq. (1) with the parameter ai, C, c* has been performed. The analysis has shown that all these parameters significantly affect the velocity estimation. As an
example, restricting the attention to the parameter C, Figure 1 shows the comparison between the estimated vertical velocity profile by assuming the concentration C
constant and that obtained by assuming C variable along the vertical. In Figure 1 the experimental profile is also reported.
Figure 1. Comparison between an experimental profile (with the error bars) and the profiles obtained by Eq. 1
with C=constant and with C=linearly variable. From Figure 1 it can be easily seen the remarkable difference between the u-values calculated by assuming C constant and those calculated by assuming C variable, demonstrating how the latter condition allows the best adaptation of the estimated velocity values to the experimental ones.
References Bagnold, R. A. (1954). Experiments on a gravity-free
dispersion of large solid spheres in a Newtonian fluid under shear. Proc. R. Soc. London, A 225: 49–63.
Iverson, R. M. (1997). The physics of debris flows. Rev.
Geophys. 35 pp. 245–296.
Lanzoni S. (1993). Meccanica di miscugli solido-liquido in regime granulo-inerziale. phD Thesis, Università
degli Studi di Padova.
O’Brien, J. S., (1986). Physical process, rheology and modeling of mudflows. PhD thesis, Colorado State
University, Fort Collins, Colorado, 172 pp., 1986.
Sanvitale N., Bowman E. T., Genevois R. (2010). Experimental measurements of velocity through granular-liquid flows. Italian Journal of Engineering
Geology and Environment – Book Casa Editrice
Università La Sapienza DOI: 10.4408/IJEGE.2011-
03.B-043. Sarno L., Papa M. N., Tai Y. C., Caravetta A., Martino
R. (2013). A reliable PIV approach for measuring velocity profiles of highly sheared granular flows. Latest Trends in Engineering Mechanics, Structures,
Engineering Geology ISBN: 978-960-474-376-6.
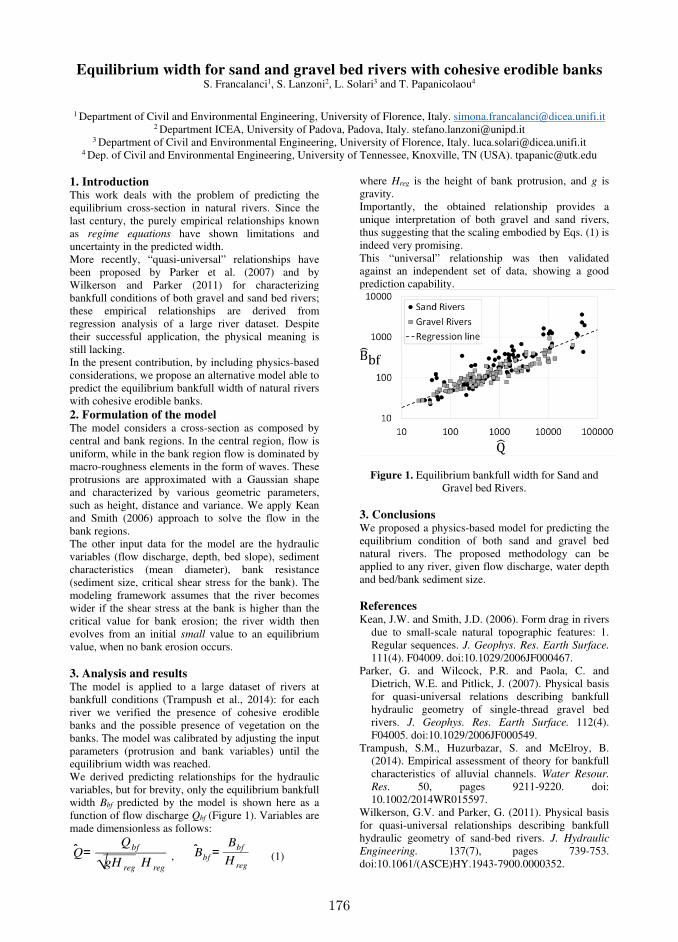
176
Equilibrium width for sand and gravel bed rivers with cohesive erodible banks S. Francalanci1, S. Lanzoni2, L. Solari3 and T. Papanicolaou4
1 Department of Civil and Environmental Engineering, University of Florence, Italy. [email protected]
2 Department ICEA, University of Padova, Padova, Italy. [email protected] 3 Department of Civil and Environmental Engineering, University of Florence, Italy. [email protected]
4 Dep. of Civil and Environmental Engineering, University of Tennessee, Knoxville, TN (USA). [email protected]
1. Introduction This work deals with the problem of predicting the equilibrium cross-section in natural rivers. Since the last century, the purely empirical relationships known as regime equations have shown limitations and uncertainty in the predicted width. More recently, “quasi-universal” relationships have been proposed by Parker et al. (2007) and by Wilkerson and Parker (2011) for characterizing bankfull conditions of both gravel and sand bed rivers; these empirical relationships are derived from regression analysis of a large river dataset. Despite their successful application, the physical meaning is still lacking. In the present contribution, by including physics-based considerations, we propose an alternative model able to predict the equilibrium bankfull width of natural rivers with cohesive erodible banks. 2. Formulation of the model The model considers a cross-section as composed by central and bank regions. In the central region, flow is uniform, while in the bank region flow is dominated by macro-roughness elements in the form of waves. These protrusions are approximated with a Gaussian shape and characterized by various geometric parameters, such as height, distance and variance. We apply Kean and Smith (2006) approach to solve the flow in the bank regions. The other input data for the model are the hydraulic variables (flow discharge, depth, bed slope), sediment characteristics (mean diameter), bank resistance (sediment size, critical shear stress for the bank). The modeling framework assumes that the river becomes wider if the shear stress at the bank is higher than the critical value for bank erosion; the river width then evolves from an initial small value to an equilibrium value, when no bank erosion occurs. 3. Analysis and results The model is applied to a large dataset of rivers at bankfull conditions (Trampush et al., 2014): for each river we verified the presence of cohesive erodible banks and the possible presence of vegetation on the banks. The model was calibrated by adjusting the input parameters (protrusion and bank variables) until the equilibrium width was reached. We derived predicting relationships for the hydraulic variables, but for brevity, only the equilibrium bankfull width Bbf predicted by the model is shown here as a function of flow discharge Qbf (Figure 1). Variables are made dimensionless as follows:
Q=Qbf
√gH regH reg
, Bbf=
Bbf
H reg (1)
where Hreg is the height of bank protrusion, and g is gravity. Importantly, the obtained relationship provides a unique interpretation of both gravel and sand rivers, thus suggesting that the scaling embodied by Eqs. (1) is indeed very promising. This “universal” relationship was then validated against an independent set of data, showing a good prediction capability.
Figure 1. Equilibrium bankfull width for Sand and Gravel bed Rivers.
3. Conclusions We proposed a physics-based model for predicting the equilibrium condition of both sand and gravel bed natural rivers. The proposed methodology can be applied to any river, given flow discharge, water depth and bed/bank sediment size. References Kean, J.W. and Smith, J.D. (2006). Form drag in rivers
due to small-scale natural topographic features: 1. Regular sequences. J. Geophys. Res. Earth Surface.
111(4). F04009. doi:10.1029/2006JF000467. Parker, G. and Wilcock, P.R. and Paola, C. and
Dietrich, W.E. and Pitlick, J. (2007). Physical basis for quasi-universal relations describing bankfull hydraulic geometry of single-thread gravel bed rivers. J. Geophys. Res. Earth Surface. 112(4). F04005. doi:10.1029/2006JF000549.
Trampush, S.M., Huzurbazar, S. and McElroy, B. (2014). Empirical assessment of theory for bankfull characteristics of alluvial channels. Water Resour.
Res. 50, pages 9211-9220. doi: 10.1002/2014WR015597.
Wilkerson, G.V. and Parker, G. (2011). Physical basis for quasi-universal relationships describing bankfull hydraulic geometry of sand-bed rivers. J. Hydraulic
Engineering. 137(7), pages 739-753. doi:10.1061/(ASCE)HY.1943-7900.0000352.

177
Dam-break induced sediment transport in a channel with a 90° bend
F. Franzini1, M. Abou-Habib2, J. Michaux3 and S. Soares-Frazão4
1 Fonds National de la Recherche Scientifique, 1000 Bruxelles, Belgium and Institute of Mechanics, Materials, and Civil
Engineering, Université catholique de Louvain, 1348 Louvain-la-Neuve, Belgium. [email protected]
2 Ecole Polytechnique de Louvain, Université catholique de Louvain, 1348 Louvain-la-Neuve, Belgium. [email protected]
3 Ecole Polytechnique de Louvain, Université catholique de Louvain, 1348 Louvain-la-Neuve, Belgium. [email protected]
4 Institute of Mechanics, Materials, and Civil Engineering, Université catholique de Louvain, 1348 Louvain-la-Neuve, Belgium.
[email protected] 1. Introduction Dam-breaks are catastrophic events that can have heavy consequences on the population. Numerical models can be used to study these events in order to better protect the population and decrease the damage caused. Before using these models in the field, it is important to validate them using well-document experimental tests. The objective of the present research is to study the sediment transport and morphological changes consecutive to a dam-break in a channel with an idealized 90° bend. The influence of the sediment transport on the flow will be analyzed and the results compared with those obtained by Soares-Frazão and Zech (2002) for the same canal but with fixed bed. In addition, the experimental results will be compared to the simulations of a two-dimensional finite-volume model. 2. Experiments The experimental setup, located in the Civil Engineering department of the Université Catholique de Louvain, Belgium, is composed of a 2.44 m x 2.39 m reservoir followed by a rectangular channel. The channel is 0.495 m wide with an upstream reach of approximately 4 m and a downstream reach, after the bend, of approximately 3 m. The mobile bed is composed of sand with a mean diameter (d50) of 1.8 mm and a specific weight (ρ) of 2615 kg/m3. Various measurement techniques have been used to capture the water and bed levels evolution and the free-surface velocities. These techniques include filming through a side window, laser-sheet technique (Soares-Frazão et al. 2007), ultrasonic gauges and Particle Tracking Velocimetry.
3. Comparison with 2D model The 2D finite-volume model solves the Shallow Water & Exner equations on unstructured triangular meshes, using a modify HLLC scheme to determine the fluxes (Soares-Frazão and Zech 2011). The results of the 2D model (Figure 1) have been compared with the experiments showing overall good agreement with the experimental results
Figure 1. 2D simulation of the bed level after 10 s
4. Conclusions New experiments of dam-break flows over mobile bed in a channel with a 90° bend have been presented. Differences in the flow between mobile bed and fixed bed experiments have been analyzed. Finally, the limits and capabilities of 2D models for this challenging case have been highlighted. Acknowledgments This work was supported by the Fonds National de la Recherche Scientifique, Belgium. References Soares-Frazão, S. and Zech, Y. (2002). Dam break in
channels with 90° bend. Journal of Hydraulic
Engineering 128, 956-968. doi: 10.1061/(ASCE)0733-9429(2002)128:11(956)
Soares-Frazão, S., Le Grelle, N., Spinewine, B., and Zech, Y. (2007) Dam-break induced morphological changes in a channel with uniform sediments: measurements by a laser-sheet imaging technique. Journal of Hydraulic Research 45: 13-16
Soares-Frazão, S. and Zech, Y. (2011). HLLC scheme with novel wave-speed estimators appropriate for two-dimensional shallow-water flow on erodible bed. International Journal for Numerical Methods in Fluids 66(8), 1019-1036
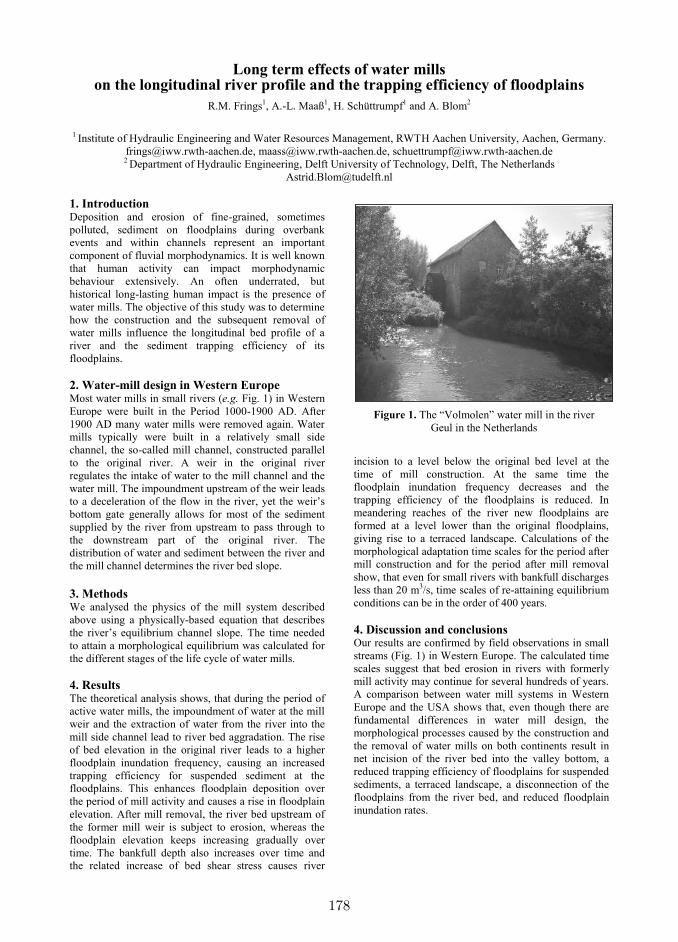
178
Long term effects of water mills on the longitudinal river profile and the trapping efficiency of floodplains
R.M. Frings1, A.-L. Maaß
1, H. Schüttrumpf
1 and A. Blom
2
1 Institute of Hydraulic Engineering and Water Resources Management, RWTH Aachen University, Aachen, Germany.
[email protected], [email protected], [email protected] 2 Department of Hydraulic Engineering, Delft University of Technology, Delft, The Netherlands
1. Introduction Deposition and erosion of fine-grained, sometimes
polluted, sediment on floodplains during overbank
events and within channels represent an important
component of fluvial morphodynamics. It is well known
that human activity can impact morphodynamic
behaviour extensively. An often underrated, but
historical long-lasting human impact is the presence of
water mills. The objective of this study was to determine
how the construction and the subsequent removal of
water mills influence the longitudinal bed profile of a
river and the sediment trapping efficiency of its
floodplains.
2. Water-mill design in Western Europe Most water mills in small rivers (e.g. Fig. 1) in Western
Europe were built in the Period 1000-1900 AD. After
1900 AD many water mills were removed again. Water
mills typically were built in a relatively small side
channel, the so-called mill channel, constructed parallel
to the original river. A weir in the original river
regulates the intake of water to the mill channel and the
water mill. The impoundment upstream of the weir leads
to a deceleration of the flow in the river, yet the weir’s
bottom gate generally allows for most of the sediment
supplied by the river from upstream to pass through to
the downstream part of the original river. The
distribution of water and sediment between the river and
the mill channel determines the river bed slope.
3. Methods We analysed the physics of the mill system described
above using a physically-based equation that describes
the river’s equilibrium channel slope. The time needed
to attain a morphological equilibrium was calculated for
the different stages of the life cycle of water mills.
4. Results The theoretical analysis shows, that during the period of
active water mills, the impoundment of water at the mill
weir and the extraction of water from the river into the
mill side channel lead to river bed aggradation. The rise
of bed elevation in the original river leads to a higher
floodplain inundation frequency, causing an increased
trapping efficiency for suspended sediment at the
floodplains. This enhances floodplain deposition over
the period of mill activity and causes a rise in floodplain
elevation. After mill removal, the river bed upstream of
the former mill weir is subject to erosion, whereas the
floodplain elevation keeps increasing gradually over
time. The bankfull depth also increases over time and
the related increase of bed shear stress causes river
incision to a level below the original bed level at the
time of mill construction. At the same time the
floodplain inundation frequency decreases and the
trapping efficiency of the floodplains is reduced. In
meandering reaches of the river new floodplains are
formed at a level lower than the original floodplains,
giving rise to a terraced landscape. Calculations of the
morphological adaptation time scales for the period after
mill construction and for the period after mill removal
show, that even for small rivers with bankfull discharges
less than 20 m3/s, time scales of re-attaining equilibrium
conditions can be in the order of 400 years.
4. Discussion and conclusions
Our results are confirmed by field observations in small
streams (Fig. 1) in Western Europe. The calculated time
scales suggest that bed erosion in rivers with formerly
mill activity may continue for several hundreds of years.
A comparison between water mill systems in Western
Europe and the USA shows that, even though there are
fundamental differences in water mill design, the
morphological processes caused by the construction and
the removal of water mills on both continents result in
net incision of the river bed into the valley bottom, a
reduced trapping efficiency of floodplains for suspended
sediments, a terraced landscape, a disconnection of the
floodplains from the river bed, and reduced floodplain
inundation rates.
Figure 1. The “Volmolen” water mill in the river
Geul in the Netherlands

179
Effect of cross-channel variation on the uncertainty of bed-load measurements: Universal guidelines for sampling bed-load in sand- and gravel-bed rivers
R.M. Frings1 and S. Vollmer
2
1 Institute of Hydraulic Engineering and Water Resources Management, RWTH Aachen University, Aachen, Germany.
[email protected] 2 Department of Groundwater, Geology and River Morphology, Federal Institute of Hydrology, Koblenz, Germany.
1. Introduction The stability of river channels and their suitability as
habitat for aqueous organisms is strongly controlled by
the rate of bed-load transport. Quantification of bed-load
transport rates in rivers is difficult, not only because of
the temporal variation in transport, but also because of
the cross-channel variation in transport. The objectives
of this study were: (1) to determine the effect of cross-
channel variation in bed-load transport on the
uncertainty of width-integrated transport rates, and to
use this knowledge (2) to improve guidelines for bed-
load sampling.
2. Methods To arrive at these objectives a thorough statistical
evaluation of stochastic and systematic uncertainties
involved in bed-load transport measurements was made.
3. A priori assessment of sampling uncertainty In the planning phase of a bed-load measurement, it is
often desired to set up a measuring scheme that produces
results with maximum accuracy at minimum efforts. To
do so, an a priori estimate of the uncertainty of the
outcomes is needed. Based on the statistical evaluation
we arrived at a new expression for the sampling
uncertainty. The expression relates to bed-load
measurements made with pressure-difference (Helley-
Smith type) samplers that require numerous bed-load
samples of short duration at several, equally-spaced
positions across the channel. The expression reads
(Frings and Vollmer, 2017):
erpolationstochastic RRR int (1a)
stochasticR1)(
1z
smknn
CV (1b)
skn
erpolation ezR 2int (1c)
where R (-) is the relative uncertainty of the cross-
channel integrated transport rate with Rstochastic (-) its
component due to stochastic uncertainties and Rinterpolation
(-) its component due to systematic interpolation errors.
It is assumed that other systematic sources of
uncertainty are accounted for by calibration factors and
appropriate sample durations. CV is a measure of the
stochastic variability of bed-load transport for which
empirical estimates exist and k represents the fraction of
the river width in which bed-load transport occurs, z1 (-)
and z2 (-) are theoretically derived coefficients, whereas
ns (-) and nm (-) represent the number of sampling
positions and the number of samples per sampling
position, respectively. Efficient sampling schemes for
bed-load measurements with a minimum number of
samples required can be generated using Eq. 1 by
minimizing the product ns x nm. Eq. 1 has a general
character and can be applied to most alluvial rivers.
Values for CV, k, z1 (-) and z2 (-) are provided by Frings
and Vollmer (2017).
4. Guidelines for sand-bed and gravel-bed rivers
Because gravel-bed rivers typically have wider grain
size distributions (and more variation in critical shear
stress) than sand-bed rivers and because the prevailing
shear stress is generally closer to incipient motion
conditions, many gravel bed rivers show much stronger
cross-channel variations in bed-load transport than sand-
bed rivers. This also comes to expression in the fact that
sand-bed rivers often show bed-load transport over the
full cross section, whereas gravel-bed rivers (including
sand-gravel bed rivers) often only show transport over a
limited part of the cross section. Application of Eq. 1
shows that generally more sampling positions across the
channel are required in gravel-bed rivers than in sand-
bed rivers. For gravel-bed rivers with unknown cross-
channel distribution of transport, at least 10 sampling
positions are recommended, whereas for most sand-bed
rivers 5 positions suffice. In addition, at least 12 short-
duration samples are required at each position to obtain
bed-load estimates with uncertainties below 20%. If the
same level of uncertainty is desired in the case of high
spatial and temporal variation in transport rates, the
number of short-duration samples needed per sampling
position increases to 40.
5. Conclusions In gravel-bed rivers with bed-load transport
concentrated in narrow (a priori unknown) lanes, more
sampling positions across the channel are needed than in
sand-bed rivers with bed-load transport occurring over
the full river width. We presented a universal expression
for the a priori assessment of sampling uncertainty to be
used for optimizing bed-load sampling.
Acknowledgments Christian Beckhausen, Kristin Bunte, Michael Church
and two anonymous reviewers.
References Frings, R.M. and Vollmer, S. (2017). Guidelines for
sampling bed-load transport with minimum
uncertainty. Sedimentology, in press.

180
Backwater development by wood in lowland streams T.J. Geertsema1, P.J.J.F. Torfs1, A.J. Teuling1, J.P.C. Eekhout2 and A.J.F.Hoitink1
1 Hydrology and Quantitative Water Management Group, Wageningen University, Wageningen, The Netherlands.
[email protected] 2Soil and Water Conservation Research Group, CEBAS-CSIC, Murcia, Spain.
1. Introduction Placement of wood is a common method for increasing ecological values in river and stream restoration projects, and is thus widely used in natural environments (Ralph et al., 1994; Crook and Robertson, 1999). Water managers, however, are afraid to introduce wood in channels draining agricultural and urban areas. Upstream, it may create backwater, depending on hydrodynamic characteristics including the obstruction ratio, the Froude number and the surface level gradient. Patches of wood may trigger or counter morphological activity, both laterally, through bank erosion and protection, and vertically, with pool and riffle formation (Piegay and Gurnell 1997; Curran and Wohl, 2003; Kail, 2003; Gurnell et al., 2006). Also, a permeable construction composed of wood will weather over time. Both morphodynamic activity and weathering cause backwater effects to change in time. The purpose of this study is to quantify the time development of backwater effects caused by wood. Hourly water levels gauged upstream and downstream of patches and discharge are collected for five streams in the Netherlands. 2. Results The water level drop over the wood patch relates to discharge in the streams. This relation is characterized by an increasing water level difference for an increasing discharge, up to a maximum. If the discharge increases beyond this level, the water level difference reduces to the value that may represent the situation without wood (Figure 1). This reduction depends primarily on the obstruction ratio of the wood in the channel cross-section. Morphologic adjustments in the stream and reorientation of the woody material reduce the water level drop over the patches in time. Our results demonstrate that backwater effects can be reduced by optimizing the location where wood is placed, and manipulating the obstruction ratio.
Figure 1. Relation between water level difference and discharge at Leerinkbeek. The black line indicates the
water level difference before the insertion of wood.
3. Conclusions • When the wood is placed at the bed of the stream,
the water level gradient decreases during high discharges.
• The morphology of the stream and the wood configuration changes in time, which results in smaller water level differences.
4. Perspective Current efforts are focused on representing wood in a one-dimensional numerical model, aiming to obtain a generic tool to achieve a stream design with wood patches that minimizes backwater. A numerical model of wood in streams is more sensitive to the friction coefficient then to the obstruction area. Acknowledgments This research is part of the research program RiverCare, supported by the Dutch Technology Foundation STW, which is part of the Netherlands Organization for Scientific Research (NWO), and which is partly funded by the Ministry of Economic Affairs under grant number P12-14 (Perspective Programme). The authors furthermore would like to thank Dutch water boards “De Dommel”, “Rijn en IJssel” and “Limburg” in collaboration with STOWA, Dutch Foundation of Applied Water Research, for providing discharge and water level data. References Crook, D. and A. Robertson. Relationships between riverine
fish and woody debris: Implications for lowland rivers. Marine and Freshwater Research, 50(8):941–953, 1999.
Curran, J. and E. Wohl. Large woody debris and flow resistance in step-pool channels, cascade range, washington. Geomorphology, 51(1-3):141–157, 2003.
Gurnell, A., I. Morrissey, A. Boitsidis, T. Bark, N. Clifford, G. Petts, and K. Thompson. Initial adjustments within a new river channel: Interactions between fluvial processes, colonizing vegetation, and bank profile development. Environmental Management, 38(4):580–596, 2006.
Kail, J. Influence of large woody debris on the morphology of six central european streams. Geomorphology, 51(1-3):207–223, 2003.
Piegay, H. and A. Gurnell. Large woody debris and river geomorphological pattern: Examples from S.E. France and S. England. Geomorphology, 19(1-2):99–116, 1997.
Ralph, S., G. Poole, L. Conquest, and R. Naiman. Stream channel morphology and woody debris in logged and unlogged basins of western washington. Canadian Journal of Fisheries and Aquatic Sciences, 51(1):37–51, 1994.

181
Bedload Transport and Particle Motion Statistics: Insights from DirectNumerical Simulations and Stochastic Models
Christian González1, David H. Richter2 , Diogo Bolster3, Joseph Calantoni4 and Cristián Escauriaza5
1Departamento de Ingeniería Hidráulica y Ambiental, Pontificia Universidad Católica de Chile. [email protected] of Civil & Environmental Eng. & Earth Sciences, University of Notre Dame, USA. [email protected]
3Department of Civil & Environmental Eng. & Earth Sciences, University of Notre Dame, USA. [email protected] Geosciences Division, Naval Research Laboratory, Clarksdale, MS, USA. [email protected]
5Departamento de Ingeniería Hidráulica y Ambiental, Pontificia Universidad Católica de Chile. [email protected]
1. IntroductionThe interactions of the coherent structures in the turbu-
lent boundary layer with sediment grains are responsible
for the complex dynamics of bedload transport. The col-
lective particle motion typically shows fluctuations for a
wide range of temporal and spatial scales, which produce
scale-dependence of the global sediment flux. Recent in-
vestigations have provided new insights on this dynam-
ics of bedload through the development of Lagrangian
models of particle transport. These sediment models
have been either based on high-resolution simulations of
the flow, such as direct numerical simulations (DNS) or
large-eddy simulations (LES), (e.g. Schmeeckle, 2014;
González et al., 2017), or on statistical models with a
mechanistic basis (e.g. Furbish and Schmeeckle, 2013;
Fan et al., 2014). In this investigation we seek to further
our understanding of bedload transport, by connecting the
results of DNS calculations for different Shields numbers,
to the development of stochastic models for particle kine-
matics, and the statistics of the bedload transport flux.
2. Lagrangian simulations of bedload transportIn our recent work (González et al., 2017), we carried out
DNS coupled with the discrete-element method (DEM),
to simulate the dynamics of 48510 particles in a rect-
angular domain, with a bulk Reynolds number equal to
Re=3632. We performed eight simulations maintaining
constant particle Reynolds number and sediment diam-
eter, varying the Shields parameter between 0.03 (be-
low the critical value) and 0.84. From the time series
of bedload transport, we analyzed the intermittency for
cases near the threshold of motion showing that the trans-
port flux can be characterized by a multifractal spectrum,
which is a function of the Shields number. Here we use
these results to study the statistics of particle kinematics,
developing stochastic models that can be used to represent
bedload transport at different scales.
3. Stochastic modeling of particle kinematicsThe results provided by the simulations of González et al.
(2017) are analyzed by describing the particle motion us-
ing different stochastic models. These models include
linear and non-linear advection-diffusion equations, and
lag-one autorregresive Markov models with Gaussian and
non-Gaussian distributions. As shown in Fig. 1, for the
variance of particle displacements, non-Gaussian models
such as Gamma-autorregresive formulations, can capture
the scale dependence with better precision as the time-
scale increases.
Figure 1. Scaling of the particle displacement variance.
Comparison among different stochastic models and DNS
simulations with a Shields parameter θ=0.61.
4. ConclusionsIn this investigation we combine the results of high-
resolution DNS-DEM Lagrangian simulations with
stochastic models of particle kinematics to characterize
the statistics of bedload transport. We analyze the effects
of the Shields parameter on the statistics of particle mo-
tion, improving the description of the sediment flux by in-
corporating information of the flow physics in stochastic
models of particle transport. Future analysis will focus
on additional parameters and particle size distributions,
to understand their influence on bedload transport and the
characteristic scales of particle dynamics.
AcknowledgmentsThe authors acknowledge the support from the Interna-
tional Research project (LIFE: NSF grant EAR-1242458),
Fondecyt project 1130940 and Conicyt/Fondap grant
15110017.
ReferencesFan, N., Zhong, D., Wu, B., Foufoula-Georgiou, E., and
Guala, M. (2014). A mechanistic-stochastic formula-
tion of bed load particle motions: From individual par-
ticle forces to the Fokker-Planck equation under low
transport rates. J. Geophys. Res., 119:464–482.
Furbish, D. J. and Schmeeckle, M. W. (2013). A prob-
abilistic derivation of the exponential-like distribution
of bed load particle velocities. Water Resour. Res.,
49:1537–1551. doi:10.1002/wrcr.20074.
González, C., Richter, D. H., Bolster, D., Bateman, S.,
Calantoni, J., and Escauriaza, C. (2017). Characteriza-
tion of bedload intermittency near the threshold of mo-
tion using a Lagrangian sediment transport model. En-
viron. Fluid Mech., 17:111–137. doi:10.1007/s10652-
016-9476-x.
Schmeeckle, M. W. (2014). Numerical simulation of tur-
bulence and sediment transport of medium sand. J.
Geophys. Res., 119:1240–1262.
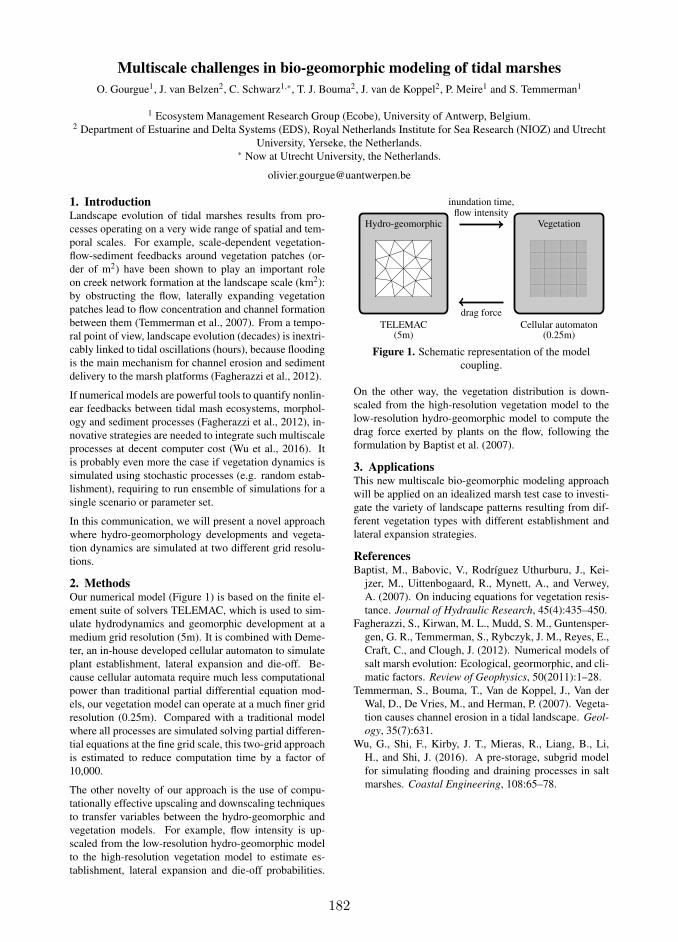
182
Multiscale challenges in bio-geomorphic modeling of tidal marshes
O. Gourgue1, J. van Belzen2, C. Schwarz1,∗, T. J. Bouma2, J. van de Koppel2, P. Meire1 and S. Temmerman1
1 Ecosystem Management Research Group (Ecobe), University of Antwerp, Belgium.2 Department of Estuarine and Delta Systems (EDS), Royal Netherlands Institute for Sea Research (NIOZ) and Utrecht
University, Yerseke, the Netherlands.∗ Now at Utrecht University, the Netherlands.
1. IntroductionLandscape evolution of tidal marshes results from pro-
cesses operating on a very wide range of spatial and tem-
poral scales. For example, scale-dependent vegetation-
flow-sediment feedbacks around vegetation patches (or-
der of m2) have been shown to play an important role
on creek network formation at the landscape scale (km2):
by obstructing the flow, laterally expanding vegetation
patches lead to flow concentration and channel formation
between them (Temmerman et al., 2007). From a tempo-
ral point of view, landscape evolution (decades) is inextri-
cably linked to tidal oscillations (hours), because flooding
is the main mechanism for channel erosion and sediment
delivery to the marsh platforms (Fagherazzi et al., 2012).
If numerical models are powerful tools to quantify nonlin-
ear feedbacks between tidal mash ecosystems, morphol-
ogy and sediment processes (Fagherazzi et al., 2012), in-
novative strategies are needed to integrate such multiscale
processes at decent computer cost (Wu et al., 2016). It
is probably even more the case if vegetation dynamics is
simulated using stochastic processes (e.g. random estab-
lishment), requiring to run ensemble of simulations for a
single scenario or parameter set.
In this communication, we will present a novel approach
where hydro-geomorphology developments and vegeta-
tion dynamics are simulated at two different grid resolu-
tions.
2. MethodsOur numerical model (Figure 1) is based on the finite el-
ement suite of solvers TELEMAC, which is used to sim-
ulate hydrodynamics and geomorphic development at a
medium grid resolution (5m). It is combined with Deme-
ter, an in-house developed cellular automaton to simulate
plant establishment, lateral expansion and die-off. Be-
cause cellular automata require much less computational
power than traditional partial differential equation mod-
els, our vegetation model can operate at a much finer grid
resolution (0.25m). Compared with a traditional model
where all processes are simulated solving partial differen-
tial equations at the fine grid scale, this two-grid approach
is estimated to reduce computation time by a factor of
10,000.
The other novelty of our approach is the use of compu-
tationally effective upscaling and downscaling techniques
to transfer variables between the hydro-geomorphic and
vegetation models. For example, flow intensity is up-
scaled from the low-resolution hydro-geomorphic model
to the high-resolution vegetation model to estimate es-
tablishment, lateral expansion and die-off probabilities.
Hydro-geomorphic
TELEMAC(5m)
Vegetation
Cellular automaton(0.25m)
inundation time,flow intensity
drag force
Figure 1. Schematic representation of the model
coupling.
On the other way, the vegetation distribution is down-
scaled from the high-resolution vegetation model to the
low-resolution hydro-geomorphic model to compute the
drag force exerted by plants on the flow, following the
formulation by Baptist et al. (2007).
3. ApplicationsThis new multiscale bio-geomorphic modeling approach
will be applied on an idealized marsh test case to investi-
gate the variety of landscape patterns resulting from dif-
ferent vegetation types with different establishment and
lateral expansion strategies.
ReferencesBaptist, M., Babovic, V., Rodríguez Uthurburu, J., Kei-
jzer, M., Uittenbogaard, R., Mynett, A., and Verwey,
A. (2007). On inducing equations for vegetation resis-
tance. Journal of Hydraulic Research, 45(4):435–450.
Fagherazzi, S., Kirwan, M. L., Mudd, S. M., Guntensper-
gen, G. R., Temmerman, S., Rybczyk, J. M., Reyes, E.,
Craft, C., and Clough, J. (2012). Numerical models of
salt marsh evolution: Ecological, geormorphic, and cli-
matic factors. Review of Geophysics, 50(2011):1–28.
Temmerman, S., Bouma, T., Van de Koppel, J., Van der
Wal, D., De Vries, M., and Herman, P. (2007). Vegeta-
tion causes channel erosion in a tidal landscape. Geol-
ogy, 35(7):631.
Wu, G., Shi, F., Kirby, J. T., Mieras, R., Liang, B., Li,
H., and Shi, J. (2016). A pre-storage, subgrid model
for simulating flooding and draining processes in salt
marshes. Coastal Engineering, 108:65–78.
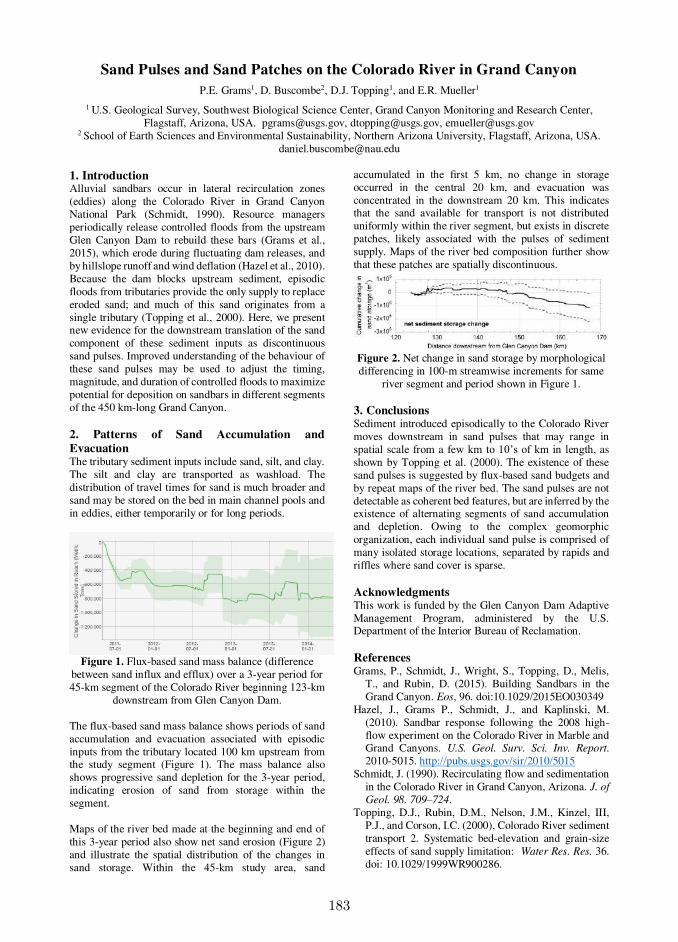
183
Sand Pulses and Sand Patches on the Colorado River in Grand Canyon
P.E. Grams1, D. Buscombe2, D.J. Topping1, and E.R. Mueller1 1 U.S. Geological Survey, Southwest Biological Science Center, Grand Canyon Monitoring and Research Center,
Flagstaff, Arizona, USA. [email protected], [email protected], [email protected] 2 School of Earth Sciences and Environmental Sustainability, Northern Arizona University, Flagstaff, Arizona, USA.
1. Introduction Alluvial sandbars occur in lateral recirculation zones (eddies) along the Colorado River in Grand Canyon National Park (Schmidt, 1990). Resource managers periodically release controlled floods from the upstream Glen Canyon Dam to rebuild these bars (Grams et al., 2015), which erode during fluctuating dam releases, and by hillslope runoff and wind deflation (Hazel et al., 2010). Because the dam blocks upstream sediment, episodic floods from tributaries provide the only supply to replace eroded sand; and much of this sand originates from a single tributary (Topping et al., 2000). Here, we present new evidence for the downstream translation of the sand component of these sediment inputs as discontinuous sand pulses. Improved understanding of the behaviour of these sand pulses may be used to adjust the timing, magnitude, and duration of controlled floods to maximize potential for deposition on sandbars in different segments of the 450 km-long Grand Canyon. 2. Patterns of Sand Accumulation and
Evacuation The tributary sediment inputs include sand, silt, and clay. The silt and clay are transported as washload. The distribution of travel times for sand is much broader and sand may be stored on the bed in main channel pools and in eddies, either temporarily or for long periods.
Figure 1. Flux-based sand mass balance (difference
between sand influx and efflux) over a 3-year period for 45-km segment of the Colorado River beginning 123-km
downstream from Glen Canyon Dam. The flux-based sand mass balance shows periods of sand accumulation and evacuation associated with episodic inputs from the tributary located 100 km upstream from the study segment (Figure 1). The mass balance also shows progressive sand depletion for the 3-year period, indicating erosion of sand from storage within the segment. Maps of the river bed made at the beginning and end of this 3-year period also show net sand erosion (Figure 2) and illustrate the spatial distribution of the changes in sand storage. Within the 45-km study area, sand
accumulated in the first 5 km, no change in storage occurred in the central 20 km, and evacuation was concentrated in the downstream 20 km. This indicates that the sand available for transport is not distributed uniformly within the river segment, but exists in discrete patches, likely associated with the pulses of sediment supply. Maps of the river bed composition further show that these patches are spatially discontinuous.
Figure 2. Net change in sand storage by morphological differencing in 100-m streamwise increments for same
river segment and period shown in Figure 1. 3. Conclusions Sediment introduced episodically to the Colorado River moves downstream in sand pulses that may range in spatial scale from a few km to 10’s of km in length, as shown by Topping et al. (2000). The existence of these sand pulses is suggested by flux-based sand budgets and by repeat maps of the river bed. The sand pulses are not detectable as coherent bed features, but are inferred by the existence of alternating segments of sand accumulation and depletion. Owing to the complex geomorphic organization, each individual sand pulse is comprised of many isolated storage locations, separated by rapids and riffles where sand cover is sparse. Acknowledgments This work is funded by the Glen Canyon Dam Adaptive Management Program, administered by the U.S. Department of the Interior Bureau of Reclamation. References Grams, P., Schmidt, J., Wright, S., Topping, D., Melis,
T., and Rubin, D. (2015). Building Sandbars in the Grand Canyon. Eos, 96. doi:10.1029/2015EO030349
Hazel, J., Grams P., Schmidt, J., and Kaplinski, M. (2010). Sandbar response following the 2008 high-flow experiment on the Colorado River in Marble and Grand Canyons. U.S. Geol. Surv. Sci. Inv. Report. 2010-5015. http://pubs.usgs.gov/sir/2010/5015
Schmidt, J. (1990). Recirculating flow and sedimentation in the Colorado River in Grand Canyon, Arizona. J. of
Geol. 98. 709–724. Topping, D.J., Rubin, D.M., Nelson, J.M., Kinzel, III,
P.J., and Corson, I.C. (2000), Colorado River sediment transport 2. Systematic bed-elevation and grain-size effects of sand supply limitation: Water Res. Res. 36. doi: 10.1029/1999WR900286.

184
Morphological influences on grain-scale roughness across a gravel bar in a fluvial environment
J. Groom1 and H. Friedrich1
1 Department of Civil and Environmental Engineering, University of Auckland, Auckland, New Zealand. [email protected]
1. Introduction River channel morphology responds to multiple mechanisms acting within the channel; including flow patterns and sedimentation. In turn, these processes influence the surface roughness, with grain-scale roughness synonymous of the microtopography of a surface (Smith, 2014). Roughness is parameterised for use in flow resistance equations, and developments to technology enables the acquisition of high-resolution topographic data facilitate the quantification of roughness. 2. Methods This study focuses on a small gravel-bed river located on North Island, New Zealand; called the Whakatiwai River. This is an active channel with sediment ranging from sand to boulders; with gravel size between 10 mm and 200 mm. Patch-scale topography of 14 patches across a gravel bar is obtained during low flows using the stereo-photogrammetry technique (Bertin and Friedrich, 2016). Grain size information was obtained using the image-analysis software Basegrain®; whereby a single vertical image is used to calculate the intermediate axis of > 400 grains per patch (Detert and Weitbrect, 2012). 3. Results and Discussion In the Whakatiwai River, several morphological features can further influence the sedimentation patterns, and therefore roughness of the surface. Rock revetments, man-made riffles, bank erosion, influence of animals and human activity through the presence of tyre marks on the surface were all observed (Figure 1). The presence of vegetation in patches is generally cropped out to avoid distortion of data. Removing vegetation from DEMs is completed in several applications, however it removes critical information regarding the sedimentation patterns on gravel bars; due to fine sediment depositing in vegetated areas.
Figure 1. Annotated photograph of key morphological influences at the gravel bar studied in the Whakatiwai
River.
These are features which are often not simulated in laboratory experiments; thereby plausible differences between roughness parameters obtained in a laboratory or field environment are expected. Contextualising these morphological influences is vital to understand differences in roughness across a gravel bar. Variations in grain size have been observed across gravel bars, due to differences in the deposition of sediment and formation of gravel bars (Rice & Church, 2010), therefore variations in the roughness parameters obtained across a bar are expected. 4. Conclusions Wider-scale morphology of river channels must be considered when conducting patch-scale field research. Natural morphology, artificial structures or interference and vegetation all influence the sedimentation patterns, and likely roughness patterns across a gravel surface. Contextualising patch-scale research is of importance and can contribute to observed differences between roughness parameters obtained in a laboratory environment, where often morphological influences are neglected or cannot be replicated. Acknowledgments The authors thank Stephane Bertin and Wei Li for their assistance in field data collection and processing. The study was partly funded by the Marsden Fund (Grant No. UOA1412), administered by the Royal Society of New Zealand. References Bertin, S. and Friedrich, H. (2016) Field application of
close-range digital photogrammetry (CRDP) for grain-scale fluvial morphology studies. Earth Surface
Processes and Landforms 41(10): 1358-1369. doi: 10.1002/esp.3906.
Detert, M. and Weitbrecht, V. (2012) Automatic object detection to analyze the geometry of gravel grains. Paper presented at River Flow 2012; San Jose, Costa
Rica. 595 – 600. Gimel’farb, G. (2002) Probabilistic regularisation and
symmetry in binocular dynamic programming stereo. Pattern Recog. Lett. 23: 431-442. doi: 10.1016/S0167-8655(01)00175-1.
Rice, S.and Church, M. (2010) Grain-szie sorting within river bars in relation to downstream fining along a wandering channel. Sedimentology 57: 232-251. doi: 10.1111/j.1365-3091.2009.01108.x.
Smith, M. (2014) Roughness in the Earth Sciences. Earth-Sci. Rev. 136: 202-225. doi: 10.1016/j.earscirev.2014.05.016.
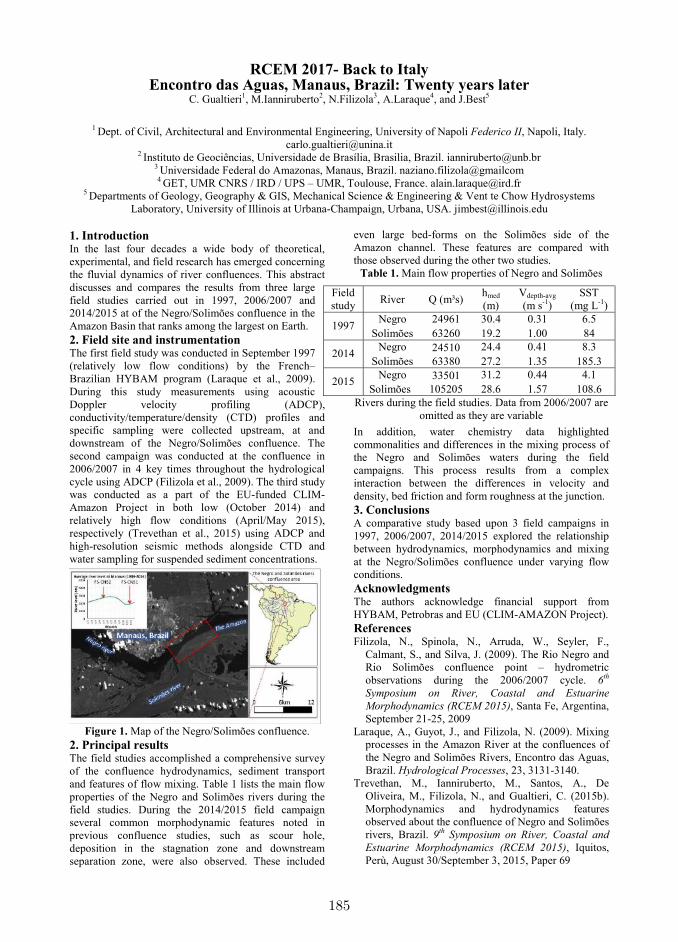
185
RCEM 2017- Back to Italy Encontro das Aguas, Manaus, Brazil: Twenty years later
C. Gualtieri1, M.Ianniruberto2, N.Filizola3, A.Laraque4, and J.Best5
1 Dept. of Civil, Architectural and Environmental Engineering, University of Napoli Federico II, Napoli, Italy.
[email protected] 2 Instituto de Geociências, Universidade de Brasília, Brasilia, Brazil. [email protected]
3 Universidade Federal do Amazonas, Manaus, Brazil. naziano.filizola@gmailcom 4 GET, UMR CNRS / IRD / UPS – UMR, Toulouse, France. [email protected]
5 Departments of Geology, Geography & GIS, Mechanical Science & Engineering & Vent te Chow Hydrosystems Laboratory, University of Illinois at Urbana-Champaign, Urbana, USA. [email protected]
1. Introduction In the last four decades a wide body of theoretical, experimental, and field research has emerged concerning the fluvial dynamics of river confluences. This abstract discusses and compares the results from three large field studies carried out in 1997, 2006/2007 and 2014/2015 at of the Negro/Solimões confluence in the Amazon Basin that ranks among the largest on Earth. 2. Field site and instrumentation The first field study was conducted in September 1997 (relatively low flow conditions) by the French–Brazilian HYBAM program (Laraque et al., 2009). During this study measurements using acoustic Doppler velocity profiling (ADCP), conductivity/temperature/density (CTD) profiles and specific sampling were collected upstream, at and downstream of the Negro/Solimões confluence. The second campaign was conducted at the confluence in 2006/2007 in 4 key times throughout the hydrological cycle using ADCP (Filizola et al., 2009). The third study was conducted as a part of the EU-funded CLIM-Amazon Project in both low (October 2014) and relatively high flow conditions (April/May 2015), respectively (Trevethan et al., 2015) using ADCP and high-resolution seismic methods alongside CTD and water sampling for suspended sediment concentrations.
Figure 1. Map of the Negro/Solimões confluence.
2. Principal results The field studies accomplished a comprehensive survey of the confluence hydrodynamics, sediment transport and features of flow mixing. Table 1 lists the main flow properties of the Negro and Solimões rivers during the field studies. During the 2014/2015 field campaign several common morphodynamic features noted in previous confluence studies, such as scour hole, deposition in the stagnation zone and downstream separation zone, were also observed. These included
even large bed-forms on the Solimões side of the Amazon channel. These features are compared with those observed during the other two studies.
Table 1. Main flow properties of Negro and Solimões
Rivers during the field studies. Data from 2006/2007 are omitted as they are variable
In addition, water chemistry data highlighted commonalities and differences in the mixing process of the Negro and Solimões waters during the field campaigns. This process results from a complex interaction between the differences in velocity and density, bed friction and form roughness at the junction. 3. Conclusions A comparative study based upon 3 field campaigns in 1997, 2006/2007, 2014/2015 explored the relationship between hydrodynamics, morphodynamics and mixing at the Negro/Solimões confluence under varying flow conditions. Acknowledgments The authors acknowledge financial support from HYBAM, Petrobras and EU (CLIM-AMAZON Project). References Filizola, N., Spinola, N., Arruda, W., Seyler, F.,
Calmant, S., and Silva, J. (2009). The Rio Negro and Rio Solimões confluence point – hydrometric observations during the 2006/2007 cycle. 6th Symposium on River, Coastal and Estuarine Morphodynamics (RCEM 2015), Santa Fe, Argentina, September 21-25, 2009
Laraque, A., Guyot, J., and Filizola, N. (2009). Mixing processes in the Amazon River at the confluences of the Negro and Solimões Rivers, Encontro das Aguas, Brazil. Hydrological Processes, 23, 3131-3140.
Trevethan, M., Ianniruberto, M., Santos, A., De Oliveira, M., Filizola, N., and Gualtieri, C. (2015b). Morphodynamics and hydrodynamics features observed about the confluence of Negro and Solimões rivers, Brazil. 9th Symposium on River, Coastal and Estuarine Morphodynamics (RCEM 2015), Iquitos, Perù, August 30/September 3, 2015, Paper 69
Field study River Q (m³s) hmed
(m) Vdepth-avg (m s-1)
SST (mg L-1)
1997 Negro 24961 30.4 0.31 6.5 Solimões 63260 19.2 1.00 84
2014 Negro 24510 24.4 0.41 8.3 Solimões 63380 27.2 1.35 185.3
2015 Negro 33501 31.2 0.44 4.1 Solimões 105205 28.6 1.57 108.6

186
Bed Load transport of sediment mixtures in laboratory flume: Synchronized
meassuring with ADCP and Digital Cameara M. Guerrero1, S.Conevski1, 2, J. Bombardier3, N. Ruther2 , C. D. Rennie4
1 Department of Civil, Chemical, Environmental, and Materials Engineering, University of Bologna, Italy. [email protected], [email protected]
2 Department of Civil and Environmental Engineering, Norwegian University of Science and Technology, Trondheim, Norway. [email protected], [email protected]
3 MSc degree candidate in Engineering at Grenoble INP ENSE3, France. 4 Department of Civil Engineering, University of Ottawa, Canada.
1. Introduction Measuring the transport rate and apparent velocity of the bedload is notoriously hard and there is not a certain technique that would obtain continues data. There are many empirical models, based on the estimation of the shear stress (Parker, 2004), but only few involve direct measurement of the bed load velocity. The bottom tracking (BT) mode of an acoustic Doppler current profiler (ADCP) has been used many times to estimate the apparent velocity of the bed load (Rennie, 2004, Latosinski et al. 2017). Herein is the basic idea to exploit the bias of the BT signal towards the bed load movement and to calibrate this signal with traditional measuring techniques (Rennie, 2011). These measurements are quite scarce and their reliability is site specific. So far, no confirmation has been conducted in laboratory-controlled conditions in order to confirm the assumptions made in the estimation of the bed load average velocity nor in the calibration of the empirical equations. In relation, the bias degree of the immobile particles and the change of the backscattering strength due to the particle size on the ADCP signal has not been clearly identified under bedload condition. Therefore, this study explores several experiments under stationary conditions, where the signal of the ADCP BT mode is recorded and compared to the bed load motion recorded by digital camera videography. 2. Experimental set up and Methodology The experiments have been performed in the 70 cm wide-flume at the University of Ottawa, with maximum water velocity of 1.1 m/s, using two different cameras and SonTek M9, ADCP. The different ranges of the bed load velocity and transport rate were reached by changing the sediment particle size distribution(PSD). Starting with only fine gravel(4mm), finishing with sand (1mm). These rather poor PSDs were mixed in 4 different proportions. 2.1 ADCP BT and Image velocimetry After synchronizing the ADCP and the videography, an average velocity of the particles was calculated in the Region of Interest (ROI), that actually overlaps with the sample area of the ADCP beams aligned with flow. The same velocity was acoustically estimated in the flow direction. Additionally, the video data delivered an information about the percentage of the mobile particles. Furthermore, using these data, the sediment transport was calculated applying the kinematic model. 2.2 Bed Load transport rate The total volume of the transported material was weighted and correlated with results from the kinematic model. In some of the experiments a bedload sampler was used in order to calculate directly the transport rate and validate the calibration. The correlation between the measured transported material and the calculated using the kinematic
model, delivered an information about the active layer thickness and porosity. 3. Results and Discussion In general, a good match has been achieved between the average bed load velocity measured by the ADCP and the videography(Fig.1). The slight deviation in single experiments can be explained by difficult in reproducing the same hydro-sedimentological conditions and the randomness of backscattering strength. The qualitative evaluation of the videos also demonstrates strong heterogeneous motion of the particles in all mixed bed load sediments. The bursts of only gravel or only sand caused significant variability of the velocities in the mixtures with more than 25% of sand.
Figure 1. Particles average velocity ADCP vs Videography
As expected, the transport correlation graph showed that the finest material delivers the maximum volumetric void ratio. However, it has to be notified that there is a strong dependence between the porosity and the thickness of the active layer. Therefore, it remains unknown how the hiding effects and particle saltation influence the active layer changes in the sediment mixtures. 4. Conclusions The results gave a strong confirmation that the stationary ADCP measurements of the bedload can acquire not only an information about the average velocity of the moving particles, but also a rough estimation of the moving particles in the sampling volume and the local transport rate. References Jamieson, E.C., Rennie, C.D., Jacobson, R.B., Townsend, R.D.
(2011). "Evaluation of ADCP apparent bed load velocity in a large sand-bed river: Moving versus stationary boat conditions". J. Hydraul. Eng-ASCE, 137 (9), 1064-1071.
Latosinski, F.G., Szupiany, R.N., Guerrero, M., Amsler, M.L., Vionnet, C. (2017). “The ADCP's bottom track capability for bedload prediction: Evidence on method reliability from sandy river applications”. Flow Meas. Instr., 54, 124-135.
Parker G. (2004) ,1D Sediment Sransport Morphodynamics with Applications on Rivers and Turbidity Currents,e-book.
Rennie, C. D., Villard, P. V. (2004). “Site specificity of bed load measurement using an acoustic Doppler current profiler.” J. Geophys. Res., 109 (F03003), 1-15.
187
Bedforms-ATM, a free software aimed to standardize the analysis of bedforms Ronald R. Gutierrez1, José A. Mallma2, Jorge D. Abad3 and Francisco Nuñez-Gonzalez4
1 School of Civil Engineering, Pontifical Catholic University of Peru, Lima, Peru. [email protected] 2 School of Civil Engineering, Pontifical Catholic University of Peru, Lima, Peru. [email protected]
3 School of Environmental Engineering, Universidad de Ingeneria y Tecnologia, Lima, Peru. [email protected] 4 Leichtweiß-Institute for Hydraulic Engineering and Water Resources, Braunschweig University, Braunschweig,
Germany. [email protected]
1. Introduction Currently the community of river geomorphologists lacks a standard frame to systematically analyze the scale and magnitude of bed (Gutierrez et al., 2013). Thereby, the techniques used by many researchers to discriminate such sedimentary features in field and laboratory studies are to some extent unclear (Jerolmack & Mohrig, 2005). Likewise, although two and three dimensional bed form features have been observed in many sedimentary environments, there is not a quantitative metric to characterize their dimensionality
(Nuñez-Gonzalez et al., 2014). Even though code used to analyze and process data is a fundamental requirement for research transparency and reproducibility (McNutt et al., 2016), computer programs to analyze bed form data is not publicly available. In this contribution, we present Bedforms Analysis Toolkit for Multiscale Modeling (Bedforms-ATM), an open source MATLAB software which is proposed to standardize the scale-based discrimination and dimensionality of bed forms in a single platform. 2. Software features and supporting resources
2.1 Features
Bedforms-ATM V1.1 comprises four applications, namely: [1] Bed forms wavelet analysis, which mainly obtains the wavelength spectrum of bed form fields based on the one-dimensional continuous wavelet transform; [2] Power Hovmöller analysis, which locates the population whose wavelength lays inside a user-specified interval; [3] Bed forms multiscale discrimination, which discriminates bed form fields into three scale-based hierarchies; and [4] Three-dimensionality analysis, which quantifies the three-dimensionality of bed form fields. 2.2 Supporting test data and software features
Two types of data accompany Bedforms-ATM, namely: a water-depth-defined bed form data from the Parana River (Argentina), and bed-elevation-defined synthetic bed form fields for both rectangular and curved stretches. These synthetic bed forms fields were built by using the mathematical definitions presented by Gutierrez et al, 2013 and Gutierrez & Abad, 2014. The efficiency of Application 3 was quantified by using the synthetic data. To this end, the Nash-Sutcliff and alpha index were estimated. Likewise, the normalized Taylor diagram was built. Under the light of the results, the method successfully discriminates the hierarchies that comprise the synthetic data (Gutierrez et al., 2017).
The code, the user guide and error report of Bedforms-ATM can be obtained from the link below: https://sourceforge.net/projects/bedforms-atm/ An instructional video can be found at the following post link: www.pucp.edu.pe/tnbVV8. The software is being downloaded by users from all over the world, although most of the downloads are registered in the United States. 3. Conclusions We believe that Bedforms-ATM has the potential to become the standard platform to analyze the variability and dimensionality of bed forms from any natural sedimentary environment. It was built to be able to accept new applications through the contribution of the users’ community. It also encourages the transparency and reproducibility of techniques in the community of river geomorphologists. Acknowledgments We thank the Pontifical Catholic University of Peru and the Katholischer Akademischer Ausländer-Dienst for funding the development of Bedforms-ATM. References Gutierrez, R.R., Abad, J.D., Parsons, D. and Best, J.
(2013). Discrimination of bedform scales using robust spline filters and wavelet transforms: Methods and application to synthetic signals and the Rio Parana, Argentina. J. Geophys. Res., 118(3), 14001418. DOI: 10.1002/jgrf.20102.
Gutierrez, R. R., Mallma, J.A., Nuñez-Gonzalez, F. and Link, O. (2017). Bedforms-ATM, a wavelet-based toolkit to analyze the hierarchies and dimensionality of bed forms. Submitted to Computer and Geosciences.
Jerolmack, D. and D. Mohrig (2006). Interactions between bed forms: Topography, turbulence, and transport. J. Geophys. Res., 110. doi: 10.1029/2004JF000126.
McNutt, M., Lehnert, K., Hanson, B., Nosek, B., Ellison, A., and King, L. (2016). Liberating field sciences samples and data. Science, 351 (6277). Doi: 10.1126/science.aad7048.
Nuñez-Gonzalez, F., Hesse, D., Ettmer, B., Kume, E., Link, O. (2014). Objective method for ranking bedforms with a 3-dimensionality-index. In Schleiss, J., Cesare J. et al., editors, River Flow 2014. Croydon, UK. CPI Group. doi: 10.1201/b17133.

188
River morphology and river regime alteration after dam construction in The Kor River, Sothern Iran
A. Torabi Haghighi1, NeseYilmaz 2, Hamid Darabi 1,3 and B. Kløve1,4
1 Water Resources and Environmental Engineering Research Unit, University of Oulu, Finland. 1 [email protected]
2 Department of Freshwater Biology, Faculty of Fisheries, Istanbul University, Istanbul, Turkey. [email protected]
3 [email protected] 4 [email protected]
1. Introduction River regulation and land use development influence channel morphology and fluvial processes directly and indirectly. Major impacts can be expected to river flow regimes, sediment transport and river bed morphology. The present paper aims to evaluate the morphological changes including planform and cross-section caused by river modification on Kor River in Sothern Iran. To evaluate the Morphological change, the alteration of riverbanks, river width, wavelength and sinuosity index were estimated along the river by using remote sensing techniques. 2. Study area, data and method Kor River is one of major river in southern Iran. About 170 km of Kor river is located between two storage dams: Mollasadra (0.44 km3, 2006) and Doroudzan (0.993 km3, 1972). Both dams were constructed to flood control, hydropower generation and increasing the irrigated area (Fig. 1).
Figure 1. Study area.
Due to construction of Mollasadra dam and other reasons, the flow regime has been significantly changed (Fig. 2). Here we compare the river morphology before (before 2006) and after construction (after 2006) of Mollasadra dam. The Landsat images consist of Landsat 5 Thematic Mapper (TM) and Landsat 8 Operational Land Imager (OLI) acquired for 1987, 1995, 2009 and 2016.
Figure 2. Flow regime alteration below Mollasadra dam.
The study has two major parts: I) by using the normalized difference water index (NDWI) proposed by McFeeters (1996) the planform of Kor rive were prepared (Fig. 3), and II) by developing a software tempo-spatial change in left and right of riverbank, major meander and the width of river were evaluated. 3. Results
The summary of major results are demonstrated in the following Table:
Time % (M+S) W CLB CRB 1987 64 70(19) --- --- 1995 67 90(23) 2.8 6.54
Rate-pre a-1 0.37% +2.5 0.35 0.81 2009 66 62(14) 2016 64 46(11.8) 0.46 -1.86
Rate-post a-1 -0.29% -2.3 0.068 -.026 CRB and CLB: Mean move in right and left bank (m), % M+S: % of river which are classified as Meandering or Sinuous, W: average width, a-1: per year 4. Conclusions Due to construction Mollasadra dam and flow regime alteration, the positive rate of side erosion has changed to a negative rate. The flood plains have significantly decreased in size and most meanders have stabilized and the average of sinus ratio have decreased.
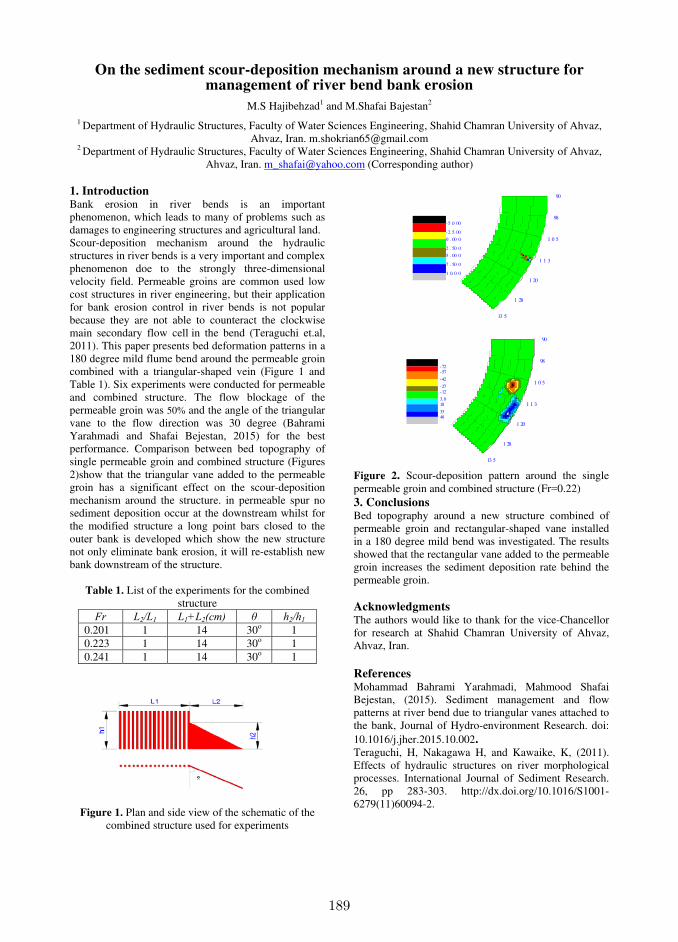
189
On the sediment scour-deposition mechanism around a new structure for management of river bend bank erosion
M.S Hajibehzad1 and M.Shafai Bajestan2 1 Department of Hydraulic Structures, Faculty of Water Sciences Engineering, Shahid Chamran University of Ahvaz,
Ahvaz, Iran. [email protected] 2 Department of Hydraulic Structures, Faculty of Water Sciences Engineering, Shahid Chamran University of Ahvaz,
Ahvaz, Iran. [email protected] (Corresponding author)
1. Introduction Bank erosion in river bends is an important phenomenon, which leads to many of problems such as damages to engineering structures and agricultural land. Scour-deposition mechanism around the hydraulic structures in river bends is a very important and complex phenomenon doe to the strongly three-dimensional velocity field. Permeable groins are common used low cost structures in river engineering, but their application for bank erosion control in river bends is not popular because they are not able to counteract the clockwise main secondary flow cell in the bend (Teraguchi et.al, 2011). This paper presents bed deformation patterns in a 180 degree mild flume bend around the permeable groin combined with a triangular-shaped vein (Figure 1 and Table 1). Six experiments were conducted for permeable and combined structure. The flow blockage of the permeable groin was 50% and the angle of the triangular vane to the flow direction was 30 degree (Bahrami Yarahmadi and Shafai Bejestan, 2015) for the best performance. Comparison between bed topography of single permeable groin and combined structure (Figures 2)show that the triangular vane added to the permeable groin has a significant effect on the scour-deposition mechanism around the structure. in permeable spur no sediment deposition occur at the downstream whilst for the modified structure a long point bars closed to the outer bank is developed which show the new structure not only eliminate bank erosion, it will re-establish new bank downstream of the structure.
Table 1. List of the experiments for the combined structure
Fr L2/L1 L1+L2(cm) θ h2/h1
0.201 1 14 30o 1 0.223 1 14 30o 1 0.241 1 14 30o 1
Figure 1. Plan and side view of the schematic of the combined structure used for experiments
90
98
1 0 5
1 1 3
1 20
1 28
13 5
-5 .0 00
-2 .5 00
0 . 00 0
2 . 50 0
5 . 00 0
7 . 50 0
1 0. 0 0
90
98
1 0 5
1 1 3
1 20
1 28
13 5
-72-57
-42
-27-12
3. 018
3348
Figure 2. Scour-deposition pattern around the single permeable groin and combined structure (Fr=0.22) 3. Conclusions Bed topography around a new structure combined of permeable groin and rectangular-shaped vane installed in a 180 degree mild bend was investigated. The results showed that the rectangular vane added to the permeable groin increases the sediment deposition rate behind the permeable groin. Acknowledgments The authors would like to thank for the vice-Chancellor for research at Shahid Chamran University of Ahvaz, Ahvaz, Iran.
References Mohammad Bahrami Yarahmadi, Mahmood Shafai Bejestan, (2015). Sediment management and flow patterns at river bend due to triangular vanes attached to the bank, Journal of Hydro-environment Research. doi: 10.1016/j.jher.2015.10.002. Teraguchi, H, Nakagawa H, and Kawaike, K, (2011). Effects of hydraulic structures on river morphological processes. International Journal of Sediment Research. 26, pp 283-303. http://dx.doi.org/10.1016/S1001-6279(11)60094-2.
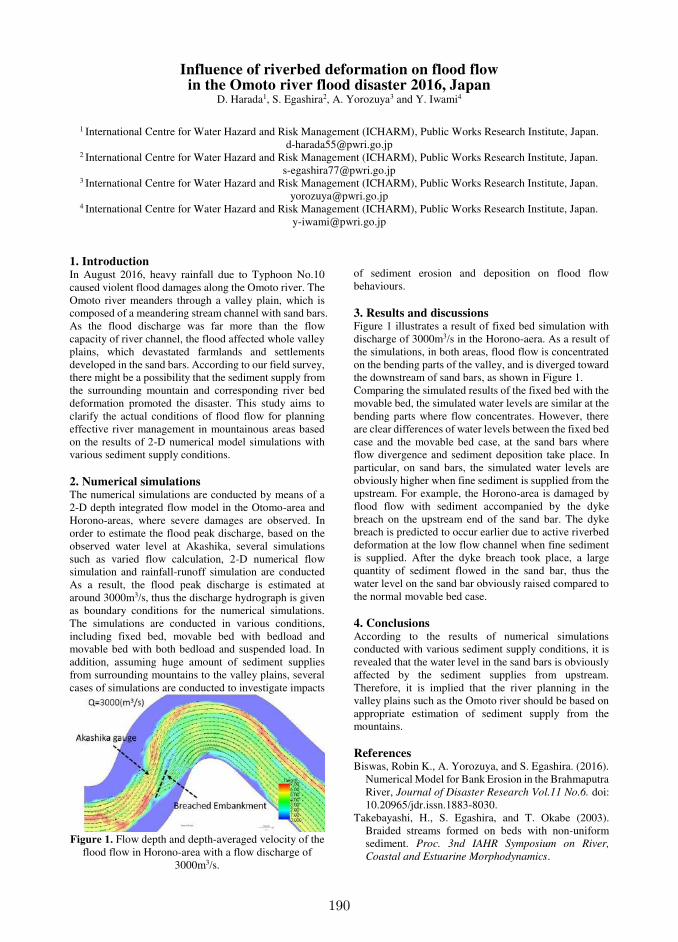
190
Influence of riverbed deformation on flood flow in the Omoto river flood disaster 2016, Japan
D. Harada1, S. Egashira2, A. Yorozuya3 and Y. Iwami4
1 International Centre for Water Hazard and Risk Management (ICHARM), Public Works Research Institute, Japan.
[email protected] 2 International Centre for Water Hazard and Risk Management (ICHARM), Public Works Research Institute, Japan.
[email protected] 3 International Centre for Water Hazard and Risk Management (ICHARM), Public Works Research Institute, Japan.
[email protected] 4 International Centre for Water Hazard and Risk Management (ICHARM), Public Works Research Institute, Japan.
1. Introduction In August 2016, heavy rainfall due to Typhoon No.10 caused violent flood damages along the Omoto river. The Omoto river meanders through a valley plain, which is composed of a meandering stream channel with sand bars. As the flood discharge was far more than the flow capacity of river channel, the flood affected whole valley plains, which devastated farmlands and settlements developed in the sand bars. According to our field survey, there might be a possibility that the sediment supply from the surrounding mountain and corresponding river bed deformation promoted the disaster. This study aims to clarify the actual conditions of flood flow for planning effective river management in mountainous areas based on the results of 2-D numerical model simulations with various sediment supply conditions. 2. Numerical simulations The numerical simulations are conducted by means of a 2-D depth integrated flow model in the Otomo-area and Horono-areas, where severe damages are observed. In order to estimate the flood peak discharge, based on the observed water level at Akashika, several simulations such as varied flow calculation, 2-D numerical flow simulation and rainfall-runoff simulation are conducted As a result, the flood peak discharge is estimated at around 3000m3/s, thus the discharge hydrograph is given as boundary conditions for the numerical simulations. The simulations are conducted in various conditions, including fixed bed, movable bed with bedload and movable bed with both bedload and suspended load. In addition, assuming huge amount of sediment supplies from surrounding mountains to the valley plains, several cases of simulations are conducted to investigate impacts
Figure 1. Flow depth and depth-averaged velocity of the
flood flow in Horono-area with a flow discharge of 3000m3/s.
of sediment erosion and deposition on flood flow behaviours. 3. Results and discussions Figure 1 illustrates a result of fixed bed simulation with discharge of 3000m3/s in the Horono-aera. As a result of the simulations, in both areas, flood flow is concentrated on the bending parts of the valley, and is diverged toward the downstream of sand bars, as shown in Figure 1. Comparing the simulated results of the fixed bed with the movable bed, the simulated water levels are similar at the bending parts where flow concentrates. However, there are clear differences of water levels between the fixed bed case and the movable bed case, at the sand bars where flow divergence and sediment deposition take place. In particular, on sand bars, the simulated water levels are obviously higher when fine sediment is supplied from the upstream. For example, the Horono-area is damaged by flood flow with sediment accompanied by the dyke breach on the upstream end of the sand bar. The dyke breach is predicted to occur earlier due to active riverbed deformation at the low flow channel when fine sediment is supplied. After the dyke breach took place, a large quantity of sediment flowed in the sand bar, thus the water level on the sand bar obviously raised compared to the normal movable bed case. 4. Conclusions According to the results of numerical simulations conducted with various sediment supply conditions, it is revealed that the water level in the sand bars is obviously affected by the sediment supplies from upstream. Therefore, it is implied that the river planning in the valley plains such as the Omoto river should be based on appropriate estimation of sediment supply from the mountains. References Biswas, Robin K., A. Yorozuya, and S. Egashira. (2016).
Numerical Model for Bank Erosion in the Brahmaputra River, Journal of Disaster Research Vol.11 No.6. doi: 10.20965/jdr.issn.1883-8030.
Takebayashi, H., S. Egashira, and T. Okabe (2003). Braided streams formed on beds with non-uniform sediment. Proc. 3nd IAHR Symposium on River,
Coastal and Estuarine Morphodynamics.

191
Setting the Stage for Levee Building Processes Hima J. Hassenruck-Gudipati1, David Mohrig1 and Paola Passalacqua3
1 Department of Geological Sciences, The University of Texas at Austin.
[email protected], [email protected] 3Department of Civil, Architectural and Environmental Engineering, The University of Texas at Austin.
1. Introduction Levees are depositional features along rivers that mark the boundary between a river and its floodplain. It is important to study levees to better understand floodplain evolution, which has implications for ecology, geomorphology, and paleo-environmental reconstructions. Furthermore, levee building can lead to a feedback loop that elevates the riverbed—an inherently unstable position—and can help explain levee breaching and channel avulsion processes. 2. Geological Setting and Methods The lower Trinity River in Texas is a meandering river with a sand bed and a low slope (~1.4x10⁻⁴). It is bound downstream by the Trinity Bay and the Gulf of Mexico. The river and its floodplain are located within a Pleistocene valley. Analysis of levee morphology was completed on airborne lidar acquired in 2015. The DEM used has a 1x1m grid size with a vertical accuracy of ~5cm. To characterize levee morphologies along ~88km river (centerline distance), we analyzed the cutbank side of the river-floodplain transects spaced every 100m. Levee crests were defined as the highest point along each transect and levee widths were determined by the pinchout (e.g. the inflection) point of levee deposits. 3. Results and Discussion 3.1 Levee width and water drainage on floodplains Floodplain topography has been hypothesized and shown to affect avulsion and floodplain sedimentation (i.e. Hajek and Edmonds, 2014; Jerolmack and Paola, 2007). However, little has been said about how floodplains influence levee sediment transport. Adams et al. (2004) show that levee morphology can be a function floodplain drainage. They analyzed levees from two rivers and showed that the river with the better-drained floodplain had wider, lower sloping levees. We find that levee morphology varies dramatically along a river. Wider levees occur on three floodplain reaches that are especially low. One reason for these floodplain lows on the Trinity River might be protruding terraces directly upstream that pin the river location. 3.2 Levee height and channel water surface slope Studies of levee morphology have focused on the levee crest; the position where sediment deposition is greatest relative to any erosion. It has been shown that levee crest building depends on grain size (settling velocity), sediment concentration, and flow velocity and depth (i.e. Pizzuto, 1987). On the Trinity River, the levee crest profile is linear in the downstream direction. 1D modeling of river stage
demonstrates that this linearity is related to the flood water surface slope. Furthermore, the variability of levee crest height around this linear trend drops off with distance downstream. This variability in local crest elevation is correlated to a downstream decreasing standard deviation in water surface height for the same range of discharges. 3.3 Recognizing levees as time integrated features Sediment availability and inundation duration play a role in shaping levees. Over the past 1.5 years, we have monitored a levee at one specific river bend on the Trinity River. Sediment transport was observed from both suspension settling of grains and bedload transport down the levees that can result in lobe deposition at the end of a levee channel. Therefore, two end members of floods are those that deposits sediment on floodplain and levees versus those that rework existing deposits. 4. Conclusion The variability of levees documented here highlight how river-floodplain connectivity changes spatially. Levees that are wider represent conditions of reduced river-floodplain stage connectivity due to lower floodplain elevation and increased water accommodation space. The downstream linearity of levee crest elevation can be explained by river hydraulics, which also explains why levee crest variability drops off downstream. Overall, levee building is the aggregate of different sediment transport processes that are controlled by both antecedent and flood-specific conditions. Acknowledgments Lidar data was acquired by NCLAM through NSF RAPID Grant EAR-1547200. H.H.-G. is supported by an NSF Graduate Research Fellowship. References Adams, P.N., Slingerland, R.L. and Smith, N.D. (2004).
Variations in natural levee morphology in anastomosed channel flood plain complexes, Geomorphology, 61(1-2): 127-142, doi:10.1016/
j.geomorph.2003.10.005. Hajek, E.A. and Edmonds, D.A. (2014). Is river avulsion
style controlled by floodplain morphodynamics?, Geology, 42:199-202, doi:10.1130/G35045.1
Jerolmack, D.J. and Paola, C. (2007). Complexity in a cellular model of river avulsion, Geomorphology, 91(3-4):259-270, doi:10.1016/j.geomorph.2007.04.022
Pizzuto, J.E. (1987): Sediment diffusion during overbank flows, Sedimentology, 34: 301–317, doi:10.1111/j.1365-3091.1987.tb00779.x

192
Initiated Natural Bank Erosion for River Bed Stabilization, Prediction and Reality
M. Hengl1
1 Institute for Hydraulic Engineering and Calibration of Hydrometrical Current-Meters,
Federal Agency for Water Management, Wien, Austria. [email protected]
1. Introduction The river Salzach at the border between Austria and Germany has a huge erosion problem. From the end of the 19th century till now the river bed lowered several meters. In winter 2009/2010 about 15 km north of the city of Salzburg a ramp was built to stabilize the river bed. Simultaneous at an about 3 km long river reach downstream of the ramp on both sides of the river the bank protections were removed to initiate a natural bank erosion process. This measure had 3 aims. First: bed stabilization by widening the river bed, second: covering the temporary bed load deficit caused by aggradation upstream of the ramp and last but not least ecological improvement of the river. One important boundary condition for this measure was that the flood protection should not be impaired. Therefore it was necessary to predict the bank erosion process as good as possible to avoid flood damages. 2. Prediction To predict the possible morphological development after building the ramp and removing the bank protections two models were used. The first one was a physical model and the second one a two dimensional numerical model. Results of these models were the bank shift and the volume of bed load input from the bank erosion as functions of hydrology and time. 3. Reality and Comparison In the first year after implementation of the measures a flood with a return period of 30 years occurred. Only 3 years later a more than 100 year flood with a peak of 3600 m³/s followed (mean flow is 237 m³/s). Regularly surveyed cross sections were compared with the morphological prediction from both models using the observed hydrology. It was found that the real bank erosion agreed quite well with the forecast (Figure 1). Since 2013 no relevant flood occurred. Therefore the banks remained quite stable. In addition to the bank shifting process, from the observations valuable insights regarding the morphological development could be gained. E.g. the geometry of the banks changed to a much more ecological shape. 4. Conclusions Natural bank erosion can be predicted, but the effort is still high. Models (physical and numerical) can describe only parts of the natural process. The prediction quality depends not only on the models but also on the available data (especially the geology of bank erosion areas). To cover remaining uncertainties expert knowledge is still
needed to improve the prediction quality. After 6 years of observation it can be said that natural morphological river development creates a win-win situation for flood protection, ecology and recreation.
initiatedduring
implemen-tation
Afterflood 2010
Afterflood 2013
0
5
10
15
20
25
30
35
0 1 2 3 4 5 6
Ban
k er
osio
n (
m)
Time in nature (years)
MeasuredPhysical modelNumerical model
1 year 3 years
Figure 1. Comparison of predicted and observed
bank erosion (mean values) Acknowledgments All models, measurements and measures mentioned in this article were financed by the water management authorities in Austria and Bavaria. The physical model investigations were carried out in Vienna by the Federal Water Management Agency in collaboration with the Vienna University of Technology. The numerical model was developed by Tobias Hafner at Technische Universität München. References Hafner, T (2008). Uferrückbau und eigendynamische
Gewässerentwicklung – Aspekte der Modellierung und Abschätzungsmöglichkeiten in der Praxis. Berichte des Lehrstuhls und der Versuchsanstalt für Wasserbau und Wasserwirtschaft der TU München – Nr. 117. In German.
Hengl, M.; Aufleger, M.: de Mas, V.; Eggertsberger, J.; Hafner, T.; Michor, K.; Mühlbauer, M.; Raudaschl, S.; Schuardt, W.; Spannring, M.; Unterlercher, M.; Wiesenegger, Ch. (2012). Eigendynamische Aufweitungen an der Unteren Salzach - vom Konzept bis zu den ersten Erfahrungen. Österr. Wasser und Abfallwirtschaft, Heft 7-8/12, S 401-410. DOI 10.1007/s00506-012-0009-7. In German.
WRS (2002). Physikalisches Modell Sohlrampe mit Mäanderstrecke. Wasserwirtschaftliche Rahmenuntersuchung Salzach. Amt der Salzburger Landesregierung, Salzburg. In German.
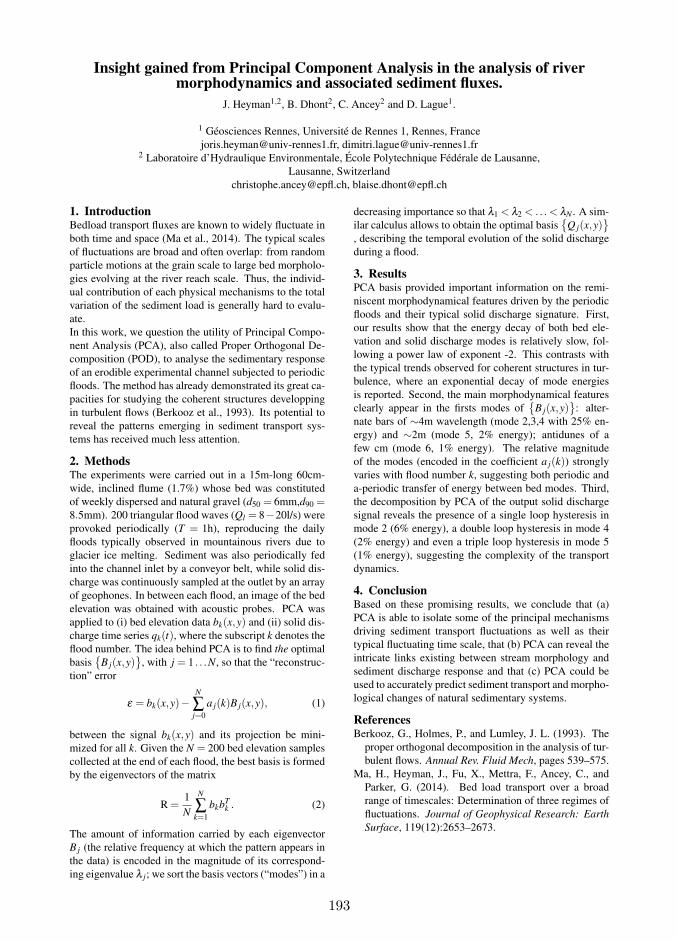
193
Insight gained from Principal Component Analysis in the analysis of rivermorphodynamics and associated sediment fluxes.
J. Heyman1,2, B. Dhont2, C. Ancey2 and D. Lague1.
1 Géosciences Rennes, Université de Rennes 1, Rennes, [email protected], [email protected]
2 Laboratoire d’Hydraulique Environmentale, École Polytechnique Fédérale de Lausanne,Lausanne, Switzerland
[email protected], [email protected]
1. IntroductionBedload transport fluxes are known to widely fluctuate inboth time and space (Ma et al., 2014). The typical scalesof fluctuations are broad and often overlap: from randomparticle motions at the grain scale to large bed morpholo-gies evolving at the river reach scale. Thus, the individ-ual contribution of each physical mechanisms to the totalvariation of the sediment load is generally hard to evalu-ate.In this work, we question the utility of Principal Compo-nent Analysis (PCA), also called Proper Orthogonal De-composition (POD), to analyse the sedimentary responseof an erodible experimental channel subjected to periodicfloods. The method has already demonstrated its great ca-pacities for studying the coherent structures developpingin turbulent flows (Berkooz et al., 1993). Its potential toreveal the patterns emerging in sediment transport sys-tems has received much less attention.
2. MethodsThe experiments were carried out in a 15m-long 60cm-wide, inclined flume (1.7%) whose bed was constitutedof weekly dispersed and natural gravel (d50 = 6mm,d90 =8.5mm). 200 triangular flood waves (Ql = 8−20l/s) wereprovoked periodically (T = 1h), reproducing the dailyfloods typically observed in mountainous rivers due toglacier ice melting. Sediment was also periodically fedinto the channel inlet by a conveyor belt, while solid dis-charge was continuously sampled at the outlet by an arrayof geophones. In between each flood, an image of the bedelevation was obtained with acoustic probes. PCA wasapplied to (i) bed elevation data bk(x,y) and (ii) solid dis-charge time series qk(t), where the subscript k denotes theflood number. The idea behind PCA is to find the optimalbasis
B j(x,y)
, with j = 1 . . .N, so that the “reconstruc-tion” error
ε = bk(x,y)−N
∑j=0
a j(k)B j(x,y), (1)
between the signal bk(x,y) and its projection be mini-mized for all k. Given the N = 200 bed elevation samplescollected at the end of each flood, the best basis is formedby the eigenvectors of the matrix
R =1N
N
∑k=1
bkbTk . (2)
The amount of information carried by each eigenvectorB j (the relative frequency at which the pattern appears inthe data) is encoded in the magnitude of its correspond-ing eigenvalue λ j; we sort the basis vectors (“modes”) in a
decreasing importance so that λ1 < λ2 < .. . < λN . A sim-ilar calculus allows to obtain the optimal basis
Q j(x,y)
, describing the temporal evolution of the solid dischargeduring a flood.
3. ResultsPCA basis provided important information on the remi-niscent morphodynamical features driven by the periodicfloods and their typical solid discharge signature. First,our results show that the energy decay of both bed ele-vation and solid discharge modes is relatively slow, fol-lowing a power law of exponent -2. This contrasts withthe typical trends observed for coherent structures in tur-bulence, where an exponential decay of mode energiesis reported. Second, the main morphodynamical featuresclearly appear in the firsts modes of
B j(x,y)
: alter-nate bars of ∼4m wavelength (mode 2,3,4 with 25% en-ergy) and ∼2m (mode 5, 2% energy); antidunes of afew cm (mode 6, 1% energy). The relative magnitudeof the modes (encoded in the coefficient a j(k)) stronglyvaries with flood number k, suggesting both periodic anda-periodic transfer of energy between bed modes. Third,the decomposition by PCA of the output solid dischargesignal reveals the presence of a single loop hysteresis inmode 2 (6% energy), a double loop hysteresis in mode 4(2% energy) and even a triple loop hysteresis in mode 5(1% energy), suggesting the complexity of the transportdynamics.
4. ConclusionBased on these promising results, we conclude that (a)PCA is able to isolate some of the principal mechanismsdriving sediment transport fluctuations as well as theirtypical fluctuating time scale, that (b) PCA can reveal theintricate links existing between stream morphology andsediment discharge response and that (c) PCA could beused to accurately predict sediment transport and morpho-logical changes of natural sedimentary systems.
ReferencesBerkooz, G., Holmes, P., and Lumley, J. L. (1993). The
proper orthogonal decomposition in the analysis of tur-bulent flows. Annual Rev. Fluid Mech, pages 539–575.
Ma, H., Heyman, J., Fu, X., Mettra, F., Ancey, C., andParker, G. (2014). Bed load transport over a broadrange of timescales: Determination of three regimes offluctuations. Journal of Geophysical Research: Earth
Surface, 119(12):2653–2673.
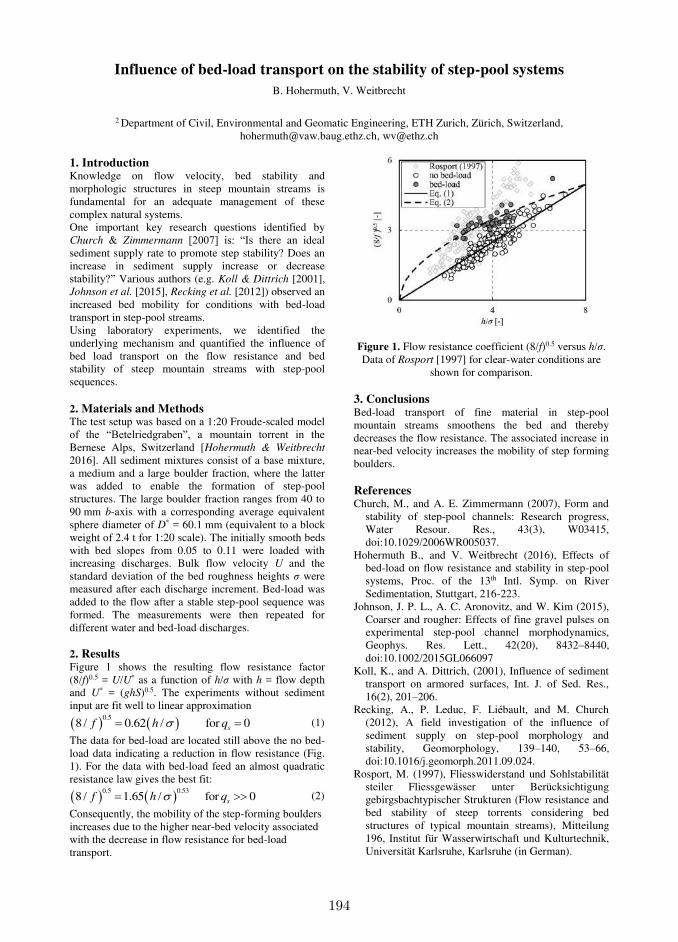
194
Influence of bed-load transport on the stability of step-pool systems
B. Hohermuth, V. Weitbrecht
2 Department of Civil, Environmental and Geomatic Engineering, ETH Zurich, Zürich, Switzerland,
[email protected], [email protected]
1. Introduction Knowledge on flow velocity, bed stability and morphologic structures in steep mountain streams is fundamental for an adequate management of these complex natural systems. One important key research questions identified by Church & Zimmermann [2007] is: “Is there an ideal sediment supply rate to promote step stability? Does an increase in sediment supply increase or decrease stability?” Various authors (e.g. Koll & Dittrich [2001], Johnson et al. [2015], Recking et al. [2012]) observed an increased bed mobility for conditions with bed-load transport in step-pool streams. Using laboratory experiments, we identified the underlying mechanism and quantified the influence of bed load transport on the flow resistance and bed stability of steep mountain streams with step-pool sequences. 2. Materials and Methods The test setup was based on a 1:20 Froude-scaled model of the “Betelriedgraben”, a mountain torrent in the Bernese Alps, Switzerland [Hohermuth & Weitbrecht 2016]. All sediment mixtures consist of a base mixture, a medium and a large boulder fraction, where the latter was added to enable the formation of step-pool structures. The large boulder fraction ranges from 40 to 90 mm b-axis with a corresponding average equivalent sphere diameter of D* = 60.1 mm (equivalent to a block weight of 2.4 t for 1:20 scale). The initially smooth beds with bed slopes from 0.05 to 0.11 were loaded with increasing discharges. Bulk flow velocity U and the standard deviation of the bed roughness heights σ were measured after each discharge increment. Bed-load was added to the flow after a stable step-pool sequence was formed. The measurements were then repeated for different water and bed-load discharges. 2. Results Figure 1 shows the resulting flow resistance factor (8/f)0.5 = U/U* as a function of h/σ with h = flow depth and U* = (ghS)0.5. The experiments without sediment input are fit well to linear approximation
0.58 / 0.62 / for 0sf h q (1)
The data for bed-load are located still above the no bed-load data indicating a reduction in flow resistance (Fig. 1). For the data with bed-load feed an almost quadratic resistance law gives the best fit:
0.5 0.538 / 1.65 / for 0sf h q (2)
Consequently, the mobility of the step-forming boulders increases due to the higher near-bed velocity associated with the decrease in flow resistance for bed-load transport.
Figure 1. Flow resistance coefficient (8/f)0.5 versus h/σ. Data of Rosport [1997] for clear-water conditions are
shown for comparison. 3. Conclusions Bed-load transport of fine material in step-pool mountain streams smoothens the bed and thereby decreases the flow resistance. The associated increase in near-bed velocity increases the mobility of step forming boulders. References Church, M., and A. E. Zimmermann (2007), Form and
stability of step-pool channels: Research progress, Water Resour. Res., 43(3), W03415, doi:10.1029/2006WR005037.
Hohermuth B., and V. Weitbrecht (2016), Effects of bed-load on flow resistance and stability in step-pool systems, Proc. of the 13th Intl. Symp. on River Sedimentation, Stuttgart, 216-223.
Johnson, J. P. L., A. C. Aronovitz, and W. Kim (2015), Coarser and rougher: Effects of fine gravel pulses on experimental step-pool channel morphodynamics, Geophys. Res. Lett., 42(20), 8432–8440, doi:10.1002/2015GL066097
Koll, K., and A. Dittrich, (2001), Influence of sediment transport on armored surfaces, Int. J. of Sed. Res., 16(2), 201–206.
Recking, A., P. Leduc, F. Liébault, and M. Church (2012), A field investigation of the influence of sediment supply on step-pool morphology and stability, Geomorphology, 139–140, 53–66, doi:10.1016/j.geomorph.2011.09.024.
Rosport, M. (1997), Fliesswiderstand und Sohlstabilität steiler Fliessgewässer unter Berücksichtigung gebirgsbachtypischer Strukturen (Flow resistance and bed stability of steep torrents considering bed structures of typical mountain streams), Mitteilung 196, Institut für Wasserwirtschaft und Kulturtechnik, Universität Karlsruhe, Karlsruhe (in German).
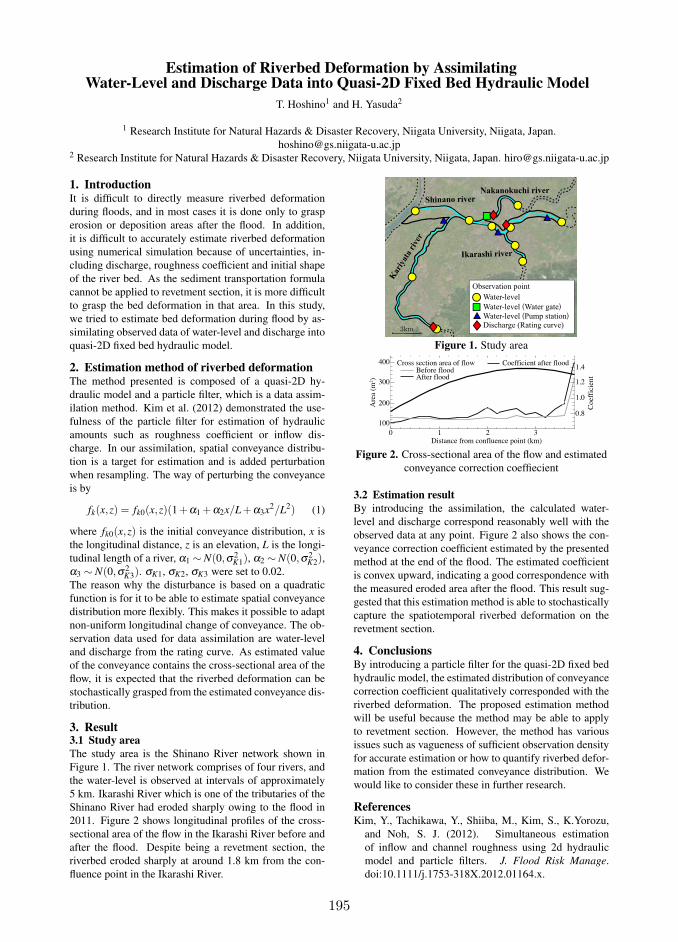
195
Estimation of Riverbed Deformation by AssimilatingWater-Level and Discharge Data into Quasi-2D Fixed Bed Hydraulic Model
T. Hoshino1 and H. Yasuda2
1 Research Institute for Natural Hazards & Disaster Recovery, Niigata University, Niigata, Japan.
[email protected] Research Institute for Natural Hazards & Disaster Recovery, Niigata University, Niigata, Japan. [email protected]
1. IntroductionIt is difficult to directly measure riverbed deformation
during floods, and in most cases it is done only to grasp
erosion or deposition areas after the flood. In addition,
it is difficult to accurately estimate riverbed deformation
using numerical simulation because of uncertainties, in-
cluding discharge, roughness coefficient and initial shape
of the river bed. As the sediment transportation formula
cannot be applied to revetment section, it is more difficult
to grasp the bed deformation in that area. In this study,
we tried to estimate bed deformation during flood by as-
similating observed data of water-level and discharge into
quasi-2D fixed bed hydraulic model.
2. Estimation method of riverbed deformationThe method presented is composed of a quasi-2D hy-
draulic model and a particle filter, which is a data assim-
ilation method. Kim et al. (2012) demonstrated the use-
fulness of the particle filter for estimation of hydraulic
amounts such as roughness coefficient or inflow dis-
charge. In our assimilation, spatial conveyance distribu-
tion is a target for estimation and is added perturbation
when resampling. The way of perturbing the conveyance
is by
fk(x,z) = fk0(x,z)(1+α1 +α2x/L+α3x2/L2) (1)
where fk0(x,z) is the initial conveyance distribution, x is
the longitudinal distance, z is an elevation, L is the longi-
tudinal length of a river, α1 ∼ N(0,σ2K1), α2 ∼ N(0,σ2
K2),α3 ∼ N(0,σ2
K3). σK1, σK2, σK3 were set to 0.02.
The reason why the disturbance is based on a quadratic
function is for it to be able to estimate spatial conveyance
distribution more flexibly. This makes it possible to adapt
non-uniform longitudinal change of conveyance. The ob-
servation data used for data assimilation are water-level
and discharge from the rating curve. As estimated value
of the conveyance contains the cross-sectional area of the
flow, it is expected that the riverbed deformation can be
stochastically grasped from the estimated conveyance dis-
tribution.
3. Result3.1 Study area
The study area is the Shinano River network shown in
Figure 1. The river network comprises of four rivers, and
the water-level is observed at intervals of approximately
5 km. Ikarashi River which is one of the tributaries of the
Shinano River had eroded sharply owing to the flood in
2011. Figure 2 shows longitudinal profiles of the cross-
sectional area of the flow in the Ikarashi River before and
after the flood. Despite being a revetment section, the
riverbed eroded sharply at around 1.8 km from the con-
fluence point in the Ikarashi River.
Shinano river
Kar
iyat
a ri
ver
Ikarashi river
Nakanokuchi river
3km
Water-level
Discharge (Rating curve)
Water-level (Water gate)Water-level (Pump station)
Observation point
Figure 1. Study area
Before floodAfter flood
Coefficient after floodCross section area of flowA
rea
(m2)
Distance from confluence point (km)
Coef
fici
ent
400
300
200
100
0.8
1.0
1.2
1.4
0 1 2 3
Figure 2. Cross-sectional area of the flow and estimated
conveyance correction coeffiecient
3.2 Estimation result
By introducing the assimilation, the calculated water-
level and discharge correspond reasonably well with the
observed data at any point. Figure 2 also shows the con-
veyance correction coefficient estimated by the presented
method at the end of the flood. The estimated coefficient
is convex upward, indicating a good correspondence with
the measured eroded area after the flood. This result sug-
gested that this estimation method is able to stochastically
capture the spatiotemporal riverbed deformation on the
revetment section.
4. ConclusionsBy introducing a particle filter for the quasi-2D fixed bed
hydraulic model, the estimated distribution of conveyance
correction coefficient qualitatively corresponded with the
riverbed deformation. The proposed estimation method
will be useful because the method may be able to apply
to revetment section. However, the method has various
issues such as vagueness of sufficient observation density
for accurate estimation or how to quantify riverbed defor-
mation from the estimated conveyance distribution. We
would like to consider these in further research.
ReferencesKim, Y., Tachikawa, Y., Shiiba, M., Kim, S., K.Yorozu,
and Noh, S. J. (2012). Simultaneous estimation
of inflow and channel roughness using 2d hydraulic
model and particle filters. J. Flood Risk Manage.
doi:10.1111/j.1753-318X.2012.01164.x.

196
Coastal System Resiliance Under Increased Storminess
Robert C. Houseago1, Daniel R. Parsons1 and Stuart McLelland1
1 School of Environmental Sciences, University of Hull, Hull, HU6 7RX, UK. Tel: 01482 465385
1. Background Changing climate, sea-level rise, and increased storminess are combining to escalate the vulnerability of many coastal areas worldwide. In response to this changing risk there is now a recognised need to evolve coastal management strategies that provide robust, cost-effective and sustainable solutions. As a result, a migration from traditional ‘grey’ hard engineering approaches to incorporate ‘green’ solutions, which includes utilising vegetation and coastal wetland areas as coastal buffer zones. However, there is a knowledge gap concerning the role of aquatic vegetation and associated buffer zones in inhibiting coastal erosion and the longer-term evolution of ‘green’ strategies are largely unquantified or tested. 2. Research Outline This research focuses on aquatic seagrasses which have a recognised capability to act as a bio-protective buffer against coastal erosion. Recent research has identified the varying capacity of seagrass in attenuating waves under a range of scenarios. However, the understanding of hydrodynamics within and around seagrass stems and patches, and the critical links with sediment dynamics and deposition is limited due to difficulties in conducting in-situ field measurements. Moreover the interactions between storm event frequency and seagrass resilience and recovery are also unknown. This research aims to improve knowledge of how seagrass can be utilised as a bio-protective buffer along coastlines under a changing climate. 3. Aims and Objectives Objective: Acquire high resolution hydrodynamic data for various types of surrogate vegetation canopies to inform sediment mobility patterns under variable and extreme wave forgings; while also providing a direct data comparison to current field research (Rodsand Lagoon, Denmark) and forthcoming large scale flume experiments (GWK Flume, Hanover, Germany). (A1): Quantify flow velocity and TKE within and surrounding surrogate vegetation canopies for various stem flexibilities and densities, under regular and extreme wave forcing’s. (A2): Identify critical boundary thresholds of change in TKE associated with variability in stem flexibility, density and wave forcing: thus developing a sediment motion threshold framework. (A3): Predict seasonal variation in sediment motion within a seagrass patches, to assess capacity for coastal protection.
4. Methodology Quantification of hydrodynamics within ridged and flexible vegetation surrogates will be conducted at the University of Aberdeen’s Random Wave Flume facility, with consideration of varying vegetation density to replicate natural seasonality. Wave parameters will be replicable, but not constrained, to that of the associated study field site (Denmark). Measurements will be taken through the use of PIV and ADV measuring techniques. Methodological parameters will be informed by previous work of Bouma et al (2007) in order to promote comparability between flume and field research. This experimental work will be complimented by seasonal field study analysis of natural eelgrass patches found within Rødsand Lagoon, Denmark. Finally, building upon the findings from Aberdeen and Rødsand Lagoon, large scale modelling of flexible vegetation with a mobile bed will be conducted in the Hanover Flume facility. This will further aid the understanding of seagrass controls on sediment mobility, providing comparison against findings from the Aberdeen flume, and that of the field (Rødsand). 5. Intended Outcomes In its entity, this research will compounded the understanding of sediment mobility in aquatic vegetation of varying characteristics, expanding to assess impact of increased wave forgings. This will ultimately aid understanding of the seagrass capacity to act as a natural coastal defence, thus informing policy and management of coasts. Acknowledgments The first author would like to thank the University of Hull for providing the associated PhD Studentship. All authors would like to thank the grant support provided under the EU Hydralab+ project. Thanks also goes to the collaborative partners, notably the University of Aberdeen for access to their flume facilities. References Bouma, T., van Duren, L., Temmerman, S., Claverie, T.,
Blanco-Garcia, A., Ysebaert, T. and Herman, P. (2007). Spatial flow and sedimentation patterns within patches of epibenthic structures: Combining field, flume and modelling experiments. Continental
Shelf Research, 27(8), pp.1020-1045.
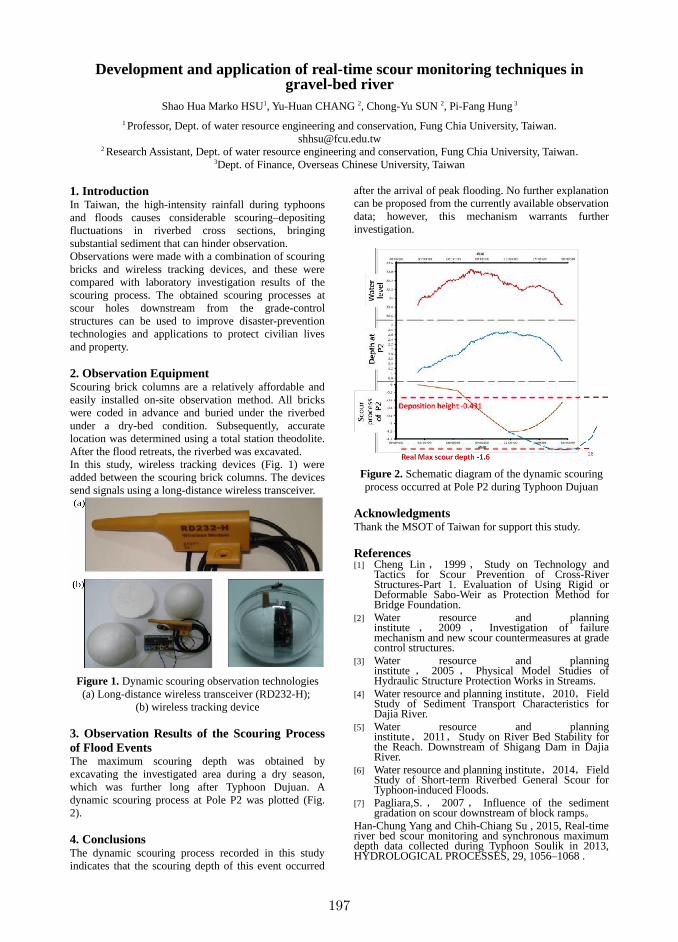
197
Development and application of real-time scour monitoring techniques ingravel-bed river
Shao Hua Marko HSU1, Yu-Huan CHANG 2, Chong-Yu SUN 2, Pi-Fang Hung 3
1 Professor, Dept. of water resource engineering and conservation, Fung Chia University, Taiwan.
[email protected] Research Assistant, Dept. of water resource engineering and conservation, Fung Chia University, Taiwan.
3Dept. of Finance, Overseas Chinese University, Taiwan
1. IntroductionIn Taiwan, the high-intensity rainfall during typhoons
and floods causes considerable scouring–depositing
fluctuations in riverbed cross sections, bringing
substantial sediment that can hinder observation.
Observations were made with a combination of scouring
bricks and wireless tracking devices, and these were
compared with laboratory investigation results of the
scouring process. The obtained scouring processes at
scour holes downstream from the grade-control
structures can be used to improve disaster-prevention
technologies and applications to protect civilian lives
and property.
2. Observation EquipmentScouring brick columns are a relatively affordable and
easily installed on-site observation method. All bricks
were coded in advance and buried under the riverbed
under a dry-bed condition. Subsequently, accurate
location was determined using a total station theodolite.
After the flood retreats, the riverbed was excavated.
In this study, wireless tracking devices (Fig. 1) were
added between the scouring brick columns. The devices
send signals using a long-distance wireless transceiver.
Figure 1. Dynamic scouring observation technologies
(a) Long-distance wireless transceiver (RD232-H);
(b) wireless tracking device
3. Observation Results of the Scouring Processof Flood EventsThe maximum scouring depth was obtained by
excavating the investigated area during a dry season,
which was further long after Typhoon Dujuan. A
dynamic scouring process at Pole P2 was plotted (Fig.
2).
4. ConclusionsThe dynamic scouring process recorded in this study
indicates that the scouring depth of this event occurred
after the arrival of peak flooding. No further explanation
can be proposed from the currently available observation
data; however, this mechanism warrants further
investigation.
Figure 2. Schematic diagram of the dynamic scouring
process occurred at Pole P2 during Typhoon Dujuan
AcknowledgmentsThank the MSOT of Taiwan for support this study.
References[1] Cheng Lin , 1999 , Study on Technology and
Tactics for Scour Prevention of Cross-RiverStructures-Part 1. Evaluation of Using Rigid orDeformable Sabo-Weir as Protection Method forBridge Foundation.
[2] Water resource and planninginstitute , 2009 , Investigation of failuremechanism and new scour countermeasures at gradecontrol structures.
[3] Water resource and planninginstitute , 2005 , Physical Model Studies ofHydraulic Structure Protection Works in Streams.
[4] Water resource and planning institute,2010,FieldStudy of Sediment Transport Characteristics forDajia River.
[5] Water resource and planninginstitute,2011,Study on River Bed Stability forthe Reach. Downstream of Shigang Dam in DajiaRiver.
[6] Water resource and planning institute,2014,FieldStudy of Short-term Riverbed General Scour forTyphoon-induced Floods.
[7] Pagliara,S. , 2007 , Influence of the sedimentgradation on scour downstream of block ramps。
Han-Chung Yang and Chih-Chiang Su , 2015, Real-timeriver bed scour monitoring and synchronous maximumdepth data collected during Typhoon Soulik in 2013,HYDROLOGICAL PROCESSES, 29, 1056–1068 .

198
Operational monitoring of turbidity in rivers – Validation of remote sensing data
D. Hucke1, G. Hillebrand1, B. Baschek1 and A. Winterscheid1
1 Federal Institute of Hydrology (BfG), Am Mainzer Tor 1, 56068 Koblenz, Germany
1. Introduction The turbidity of water is an important parameter to determine the quality and ecological status of a waterbody. Although turbidity itself is often not the main parameter of interest, it serves as proxy for suspended sediment concentrations in waterbodies, which are usually determined by time-consuming gravimetric methods in a laboratory (Landers and Sturm 2013; Rügner et al. 2013; Minella et al. 2008). The Copernicus project WasMon-CT makes use of this proxy and aims at the integration of satellite-derived (esp. Sentinel-2 and Landsat8) turbidity data into the existing operational in-situ measuring network of Germany’s federal waterways, especially the rivers Rhine, Elbe and the estuaries of the rivers Elbe, Ems and Weser. 2. Methods and results After the extraction of two-dimensional near-surface turbidity distributions from remote sensing data by an adjustable automated processing chain, the satellite-derived turbidity data are validated with existing in-situ measurements of turbidity. The extensive data base of highly frequent, but spatially sparse in-situ measurements (every 15 minutes) is used for a validation of the underlying algorithms after Nechad, Ruddick, and Neukermans (2009) and Dogliotti et al. (2015) of the automated processing chain. The characteristics of the different river catchments as well as extreme runoff events can affect the relationship between the satellite-derived and the in-situ turbidity data, hence influencing the representability of the in-situ measurement stations. Significant variance in relationships e.g. for river catchments or discharge conditions is tested. Considering the validation results and these dependencies, the algorithms will be adapted to achieve the best fit of satellite-derived and in-situ turbidity data. These results will be applied to the federal waterways chosen within the project WasMon-CT. Based on the validated satellite data, enhanced products, such as longitudinal profiles, can be derived and provide a spatially extensive database for the analysis of gradients, time-series, the location and extent of the turbidity zone in estuaries and the effects of the relocation of sediments along the Elbe estuary or the river Rhine. 3. Conclusions The validation of turbidity data from remote sensing with in-situ measurements provides a better estimation of the qualitative and quantitative accuracy of the derived products and of the representability of the in-situ measurement stations. The adapted algorithms enhance the automated processing chain and create an improved
standard to be applied to different river catchments and runoff conditions. This supports, as one aim of the project WasMon-CT, the preparation of an operational monitoring service to enhance the federal consulting activities in the waterways of Germany. Acknowledgments The authors would like to thank the executing organization, the German Aerospace Center (DLR), for the smooth project coordination of WasMon-CT. Further, the funding by the Federal Ministry of Transport and Digital Infrastructure (BMVI) within the funding program Copernicus (project code: 50EW1510) is gratefully acknowledged. The provision of Landsat data by the U.S. Geological Survey is also strongly appreciated. References Dogliotti, A. I., K. G. Ruddick, B. Nechad, D. Doxaran,
and E. Knaeps. 2015. 'A single algorithm to retrieve turbidity from remotely-sensed data in all coastal and estuarine waters', Remote
Sensing of Environment, 156: 157-68. Landers, Mark N., and Terry W. Sturm. 2013.
'Hysteresis in suspended sediment to turbidity relations due to changing particle size distributions', Water Resources Research, 49: 5487-500.
Minella, Jean P. G., Gustavo H. Merten, José M. Reichert, and Robin T. Clarke. 2008. 'Estimating suspended sediment concentrations from turbidity measurements and the calibration problem', Hydrological Processes, 22: 1819-30.
Nechad, B., K. G. Ruddick, and G. Neukermans. 2009. 'Calibration and validation of a generic multisensor algorithm for mapping of turbidity in coastal waters', Remote Sensing of the
Ocean, Sea Ice, and Large Water Regions,
Proc. of SPIE, 7473. Rügner, Hermann, Marc Schwientek, Barbara
Beckingham, Bertram Kuch, and Peter Grathwohl. 2013. 'Turbidity as a proxy for total suspended solids (TSS) and particle facilitated pollutant transport in catchments', Environmental Earth Sciences, 69: 373-80.
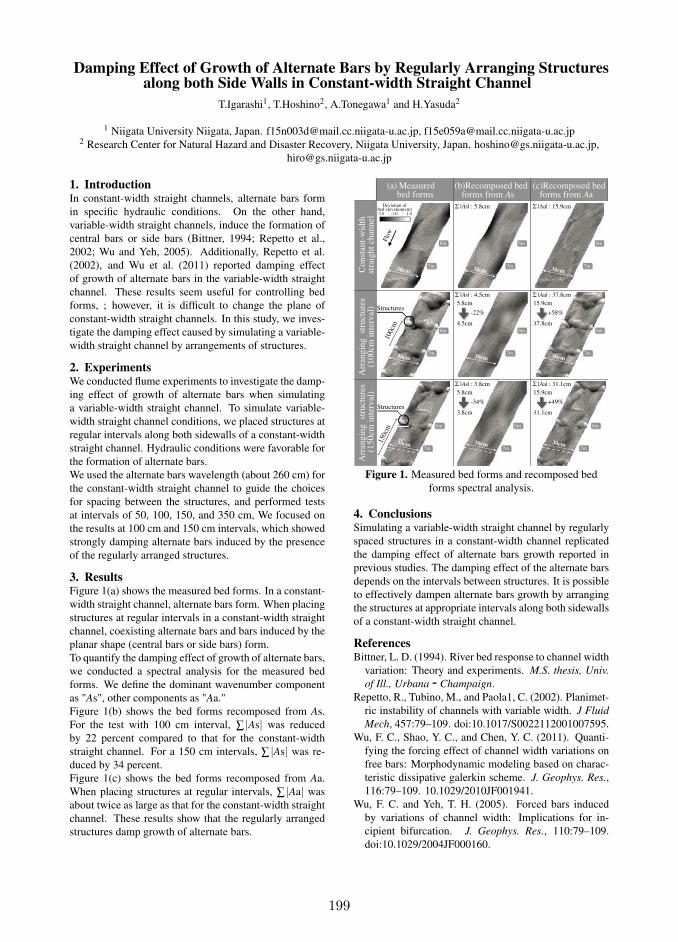
199
Damping Effect of Growth of Alternate Bars by Regularly Arranging Structuresalong both Side Walls in Constant-width Straight Channel
T.Igarashi1, T.Hoshino2, A.Tonegawa1 and H.Yasuda2
1 Niigata University Niigata, Japan. [email protected], [email protected] Research Center for Natural Hazard and Disaster Recovery, Niigata University, Japan. [email protected],
1. IntroductionIn constant-width straight channels, alternate bars form
in specific hydraulic conditions. On the other hand,
variable-width straight channels, induce the formation of
central bars or side bars (Bittner, 1994; Repetto et al.,
2002; Wu and Yeh, 2005). Additionally, Repetto et al.
(2002), and Wu et al. (2011) reported damping effect
of growth of alternate bars in the variable-width straight
channel. These results seem useful for controlling bed
forms, ; however, it is difficult to change the plane of
constant-width straight channels. In this study, we inves-
tigate the damping effect caused by simulating a variable-
width straight channel by arrangements of structures.
2. ExperimentsWe conducted flume experiments to investigate the damp-
ing effect of growth of alternate bars when simulating
a variable-width straight channel. To simulate variable-
width straight channel conditions, we placed structures at
regular intervals along both sidewalls of a constant-width
straight channel. Hydraulic conditions were favorable for
the formation of alternate bars.
We used the alternate bars wavelength (about 260 cm) for
the constant-width straight channel to guide the choices
for spacing between the structures, and performed tests
at intervals of 50, 100, 150, and 350 cm, We focused on
the results at 100 cm and 150 cm intervals, which showed
strongly damping alternate bars induced by the presence
of the regularly arranged structures.
3. ResultsFigure 1(a) shows the measured bed forms. In a constant-
width straight channel, alternate bars form. When placing
structures at regular intervals in a constant-width straight
channel, coexisting alternate bars and bars induced by the
planar shape (central bars or side bars) form.
To quantify the damping effect of growth of alternate bars,
we conducted a spectral analysis for the measured bed
forms. We define the dominant wavenumber component
as "As", other components as "Aa."
Figure 1(b) shows the bed forms recomposed from As.
For the test with 100 cm interval, ∑ |As| was reduced
by 22 percent compared to that for the constant-width
straight channel. For a 150 cm intervals, ∑ |As| was re-
duced by 34 percent.
Figure 1(c) shows the bed forms recomposed from Aa.
When placing structures at regular intervals, ∑ |Aa| was
about twice as large as that for the constant-width straight
channel. These results show that the regularly arranged
structures damp growth of alternate bars.
Const
ant-
wid
thst
raig
ht
chan
nel
Arr
angin
g st
ruct
ure
s(1
00cm
inte
rval
)A
rran
gin
g st
ruct
ure
s (
150cm
inte
rval
)
Flo
w10
0cm
150c
m
6m
7m30cm30cm 30cm
30cm30cm 30cm
30cm30cm 30cm
|As| : 5.8cm |Aa| : 15.9cm
|As| : 3.8cm
6m
7m
6m
7m
6m
7m
6m
7m
6m
7m
6m
7m
6m
7m
6m
7m
Structures
Structures
|As| : 4.5cm
-22%
|Aa| : 31.1cm
|Aa| : 37.8cm
5.8cm
4.5cm
Deviation ofbed elevation(cm)
1.0-3.0 -1.0
(a) Measured bed forms
(b)Recomposed bed forms from As
(c)Recomposed bed forms from Aa
44 5
+58%
15.9cm
37.8cm
+
-34%
5.8cm
3.8cm
+49%
15.9cm
31.1cm
+
Figure 1. Measured bed forms and recomposed bed
forms spectral analysis.
4. ConclusionsSimulating a variable-width straight channel by regularly
spaced structures in a constant-width channel replicated
the damping effect of alternate bars growth reported in
previous studies. The damping effect of the alternate bars
depends on the intervals between structures. It is possible
to effectively dampen alternate bars growth by arranging
the structures at appropriate intervals along both sidewalls
of a constant-width straight channel.
ReferencesBittner, L. D. (1994). River bed response to channel width
variation: Theory and experiments. M.S. thesis, Univ.
of Ill., Urbana‐Champaign.
Repetto, R., Tubino, M., and Paola1, C. (2002). Planimet-
ric instability of channels with variable width. J Fluid
Mech, 457:79–109. doi:10.1017/S0022112001007595.
Wu, F. C., Shao, Y. C., and Chen, Y. C. (2011). Quanti-
fying the forcing effect of channel width variations on
free bars: Morphodynamic modeling based on charac-
teristic dissipative galerkin scheme. J. Geophys. Res.,
116:79–109. 10.1029/2010JF001941.
Wu, F. C. and Yeh, T. H. (2005). Forced bars induced
by variations of channel width: Implications for in-
cipient bifurcation. J. Geophys. Res., 110:79–109.
doi:10.1029/2004JF000160.
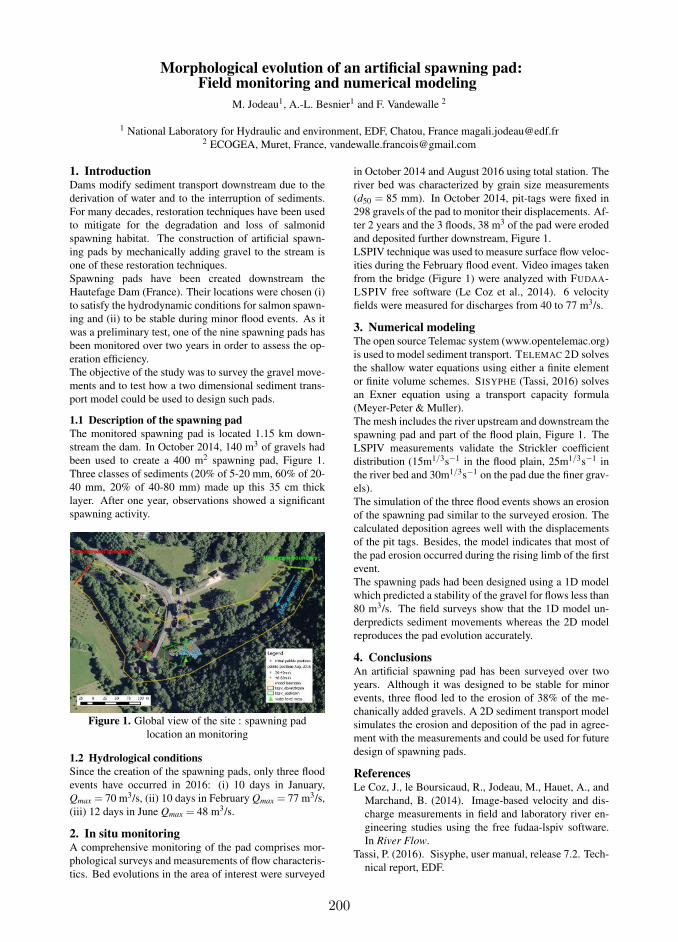
200
Morphological evolution of an artificial spawning pad:Field monitoring and numerical modeling
M. Jodeau1, A.-L. Besnier1 and F. Vandewalle 2
1 National Laboratory for Hydraulic and environment, EDF, Chatou, France [email protected] ECOGEA, Muret, France, [email protected]
1. IntroductionDams modify sediment transport downstream due to the
derivation of water and to the interruption of sediments.
For many decades, restoration techniques have been used
to mitigate for the degradation and loss of salmonid
spawning habitat. The construction of artificial spawn-
ing pads by mechanically adding gravel to the stream is
one of these restoration techniques.
Spawning pads have been created downstream the
Hautefage Dam (France). Their locations were chosen (i)
to satisfy the hydrodynamic conditions for salmon spawn-
ing and (ii) to be stable during minor flood events. As it
was a preliminary test, one of the nine spawning pads has
been monitored over two years in order to assess the op-
eration efficiency.
The objective of the study was to survey the gravel move-
ments and to test how a two dimensional sediment trans-
port model could be used to design such pads.
1.1 Description of the spawning pad
The monitored spawning pad is located 1.15 km down-
stream the dam. In October 2014, 140 m3 of gravels had
been used to create a 400 m2 spawning pad, Figure 1.
Three classes of sediments (20% of 5-20 mm, 60% of 20-
40 mm, 20% of 40-80 mm) made up this 35 cm thick
layer. After one year, observations showed a significant
spawning activity.
Figure 1. Global view of the site : spawning pad
location an monitoring
1.2 Hydrological conditions
Since the creation of the spawning pads, only three flood
events have occurred in 2016: (i) 10 days in January,
Qmax = 70 m3/s, (ii) 10 days in February Qmax = 77 m3/s,
(iii) 12 days in June Qmax = 48 m3/s.
2. In situ monitoringA comprehensive monitoring of the pad comprises mor-
phological surveys and measurements of flow characteris-
tics. Bed evolutions in the area of interest were surveyed
in October 2014 and August 2016 using total station. The
river bed was characterized by grain size measurements
(d50 = 85 mm). In October 2014, pit-tags were fixed in
298 gravels of the pad to monitor their displacements. Af-
ter 2 years and the 3 floods, 38 m3 of the pad were eroded
and deposited further downstream, Figure 1.
LSPIV technique was used to measure surface flow veloc-
ities during the February flood event. Video images taken
from the bridge (Figure 1) were analyzed with FUDAA-
LSPIV free software (Le Coz et al., 2014). 6 velocity
fields were measured for discharges from 40 to 77 m3/s.
3. Numerical modelingThe open source Telemac system (www.opentelemac.org)
is used to model sediment transport. TELEMAC 2D solves
the shallow water equations using either a finite element
or finite volume schemes. SISYPHE (Tassi, 2016) solves
an Exner equation using a transport capacity formula
(Meyer-Peter & Muller).
The mesh includes the river upstream and downstream the
spawning pad and part of the flood plain, Figure 1. The
LSPIV measurements validate the Strickler coefficient
distribution (15m1/3s−1 in the flood plain, 25m1/3s−1 in
the river bed and 30m1/3s−1 on the pad due the finer grav-
els).
The simulation of the three flood events shows an erosion
of the spawning pad similar to the surveyed erosion. The
calculated deposition agrees well with the displacements
of the pit tags. Besides, the model indicates that most of
the pad erosion occurred during the rising limb of the first
event.
The spawning pads had been designed using a 1D model
which predicted a stability of the gravel for flows less than
80 m3/s. The field surveys show that the 1D model un-
derpredicts sediment movements whereas the 2D model
reproduces the pad evolution accurately.
4. ConclusionsAn artificial spawning pad has been surveyed over two
years. Although it was designed to be stable for minor
events, three flood led to the erosion of 38% of the me-
chanically added gravels. A 2D sediment transport model
simulates the erosion and deposition of the pad in agree-
ment with the measurements and could be used for future
design of spawning pads.
ReferencesLe Coz, J., le Boursicaud, R., Jodeau, M., Hauet, A., and
Marchand, B. (2014). Image-based velocity and dis-
charge measurements in field and laboratory river en-
gineering studies using the free fudaa-lspiv software.
In River Flow.
Tassi, P. (2016). Sisyphe, user manual, release 7.2. Tech-
nical report, EDF.
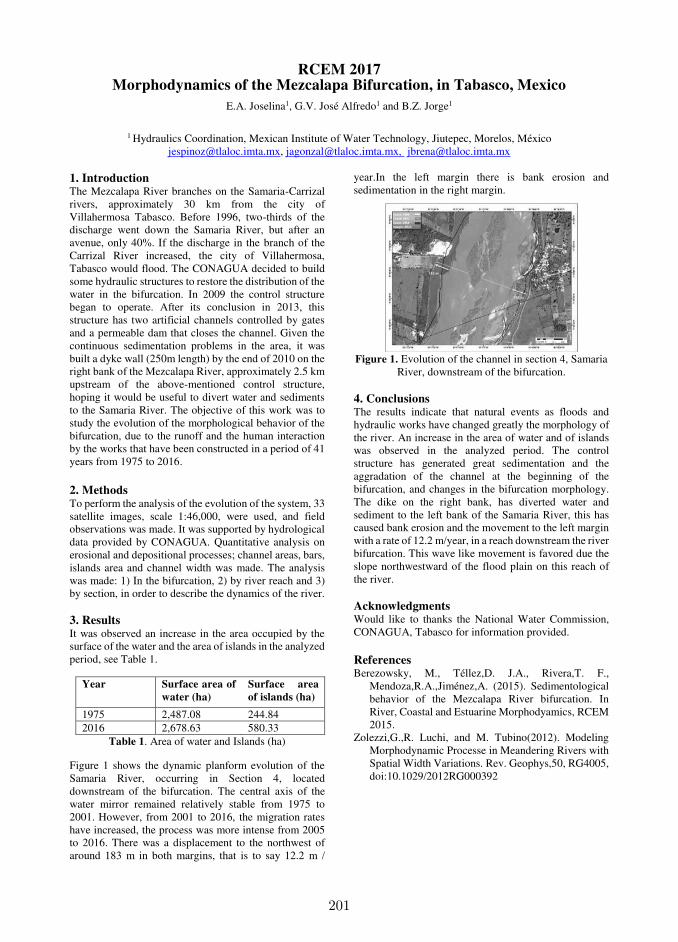
201
RCEM 2017 Morphodynamics of the Mezcalapa Bifurcation, in Tabasco, Mexico
E.A. Joselina1, G.V. José Alfredo1 and B.Z. Jorge1
1 Hydraulics Coordination, Mexican Institute of Water Technology, Jiutepec, Morelos, México
[email protected], [email protected], [email protected]
1. Introduction The Mezcalapa River branches on the Samaria-Carrizal rivers, approximately 30 km from the city of Villahermosa Tabasco. Before 1996, two-thirds of the discharge went down the Samaria River, but after an avenue, only 40%. If the discharge in the branch of the Carrizal River increased, the city of Villahermosa, Tabasco would flood. The CONAGUA decided to build some hydraulic structures to restore the distribution of the water in the bifurcation. In 2009 the control structure began to operate. After its conclusion in 2013, this structure has two artificial channels controlled by gates and a permeable dam that closes the channel. Given the continuous sedimentation problems in the area, it was built a dyke wall (250m length) by the end of 2010 on the right bank of the Mezcalapa River, approximately 2.5 km upstream of the above-mentioned control structure, hoping it would be useful to divert water and sediments to the Samaria River. The objective of this work was to study the evolution of the morphological behavior of the bifurcation, due to the runoff and the human interaction by the works that have been constructed in a period of 41 years from 1975 to 2016.
2. Methods To perform the analysis of the evolution of the system, 33 satellite images, scale 1:46,000, were used, and field observations was made. It was supported by hydrological data provided by CONAGUA. Quantitative analysis on erosional and depositional processes; channel areas, bars, islands area and channel width was made. The analysis was made: 1) In the bifurcation, 2) by river reach and 3) by section, in order to describe the dynamics of the river. 3. Results It was observed an increase in the area occupied by the surface of the water and the area of islands in the analyzed period, see Table 1.
Year Surface area of
water (ha)
Surface area
of islands (ha)
1975 2,487.08 244.84 2016 2,678.63 580.33
Table 1. Area of water and Islands (ha)
Figure 1 shows the dynamic planform evolution of the Samaria River, occurring in Section 4, located downstream of the bifurcation. The central axis of the water mirror remained relatively stable from 1975 to 2001. However, from 2001 to 2016, the migration rates have increased, the process was more intense from 2005 to 2016. There was a displacement to the northwest of around 183 m in both margins, that is to say 12.2 m /
year.In the left margin there is bank erosion and sedimentation in the right margin.
Figure 1. Evolution of the channel in section 4, Samaria
River, downstream of the bifurcation. 4. Conclusions The results indicate that natural events as floods and hydraulic works have changed greatly the morphology of the river. An increase in the area of water and of islands was observed in the analyzed period. The control structure has generated great sedimentation and the aggradation of the channel at the beginning of the bifurcation, and changes in the bifurcation morphology. The dike on the right bank, has diverted water and sediment to the left bank of the Samaria River, this has caused bank erosion and the movement to the left margin with a rate of 12.2 m/year, in a reach downstream the river bifurcation. This wave like movement is favored due the slope northwestward of the flood plain on this reach of the river. Acknowledgments Would like to thanks the National Water Commission, CONAGUA, Tabasco for information provided.
References Berezowsky, M., Téllez,D. J.A., Rivera,T. F.,
Mendoza,R.A.,Jiménez,A. (2015). Sedimentological behavior of the Mezcalapa River bifurcation. In River, Coastal and Estuarine Morphodyamics, RCEM 2015.
Zolezzi,G.,R. Luchi, and M. Tubino(2012). Modeling Morphodynamic Processe in Meandering Rivers with Spatial Width Variations. Rev. Geophys,50, RG4005, doi:10.1029/2012RG000392

202
Impact of flow fluctuations on suspended transport under the presence of lateral embayments
C. Juez1, M. Thalmann2, A. J. Schleiss1 and M. J. Franca1,3
1 Laboratory of Hydraulic Constructions, École Polytechnique Fédéral de Lausanne, Lausanne, Switzerland.
1. Introduction Local widening in a channelized river is a common practice in restoration projects (Uijttewaal, 2014). The lateral embayments built for this purpose in the river banks are partially filled up by fine sediments creating potential for riparian habitat. However, the design of these lateral cavities may be compromised by the fluctuations in the water discharge (Poff et al., 1997, Meile et al., 2011). Pursuing a better understanding on the design of lateral embayments, systematic experimental investigations have been carried out with five different fluctuating hydrograph scenarios. Water depth, sediment concentration and area covered by the settled sediments are analysed in each experiment. The process of sedimentation in the lateral embayments proofed to be resilient to peaking. However, there are considerable differences in what happens during the peaking event, see Figure 1, depending on the geometric con-figuration of the embayments and the flushing hydrograph applied: (i.) a higher peak in discharge means that more sediments are resuspended and the risk of a complete flushing increases. (ii.) Long and short cavities retain their depositions more efficiently from resuspension than cavities of intermediate length. Long cavities have large dead water zones with well sheltered depositions. Short cavities have skimming flow type, i.e. the dynamics within the cavities widely decoupled from the main flow, and are therefore able to retain the sediments.
Figure 1. Normalised time decay concentration for two
experiments. The thick solid lines represent the concentration at two measurement stations. Thin grey
line refers to the peaking event applied.
2. Conclusions The results of this study show that the sediment deposits in lateral embayments of a channel are highly resilient to flushing. Starting from a certain initial sediment concentration at constant discharge, the system gets into a certain equilibrium state. If this equilibrium is disturbed by an increased discharge, after a certain period of time, a new equilibrium is reached. For practical applications, long and short lateral embayments seem to be most suitable. They have the highest resistance against the flushing of the sediments out of their cavities and thereby provide the most stable bedforms. Acknowledgments This work was funded by the ITN-Programme (Marie Curie Actions) of the European Union's Seventh Framework Programme FP7-PEOPLE-2013-ITN under REA grant agreement 607394-SEDITRANS. The experiments were funded by FOEN (Federal Office for the Environment, Switzerland). References Meile, T., Boillat, J.-L., Schleiss, A.J. (2011). Hydro-
peaking indicators for characterization of the Upper-Rhone River in Switzerland. Aquatic Sciences, 73:171-182, doi: 10.1007/s00027-010-0154-7.
Poff, N., Allan, J., Bain, M., Karr, J., Prestegaard, K., Richter, B., Sparks, R., Stromberg, J. (1997). The natural flow regime. Bioscience, 47:769-784.
Uijttewaal, W.S.J. (2014). Hydrodynamics of shallow flows: application to rivers. Journal of Hydraulic Research. 52, 157- 172. doi: 10.1080/00221686.2014
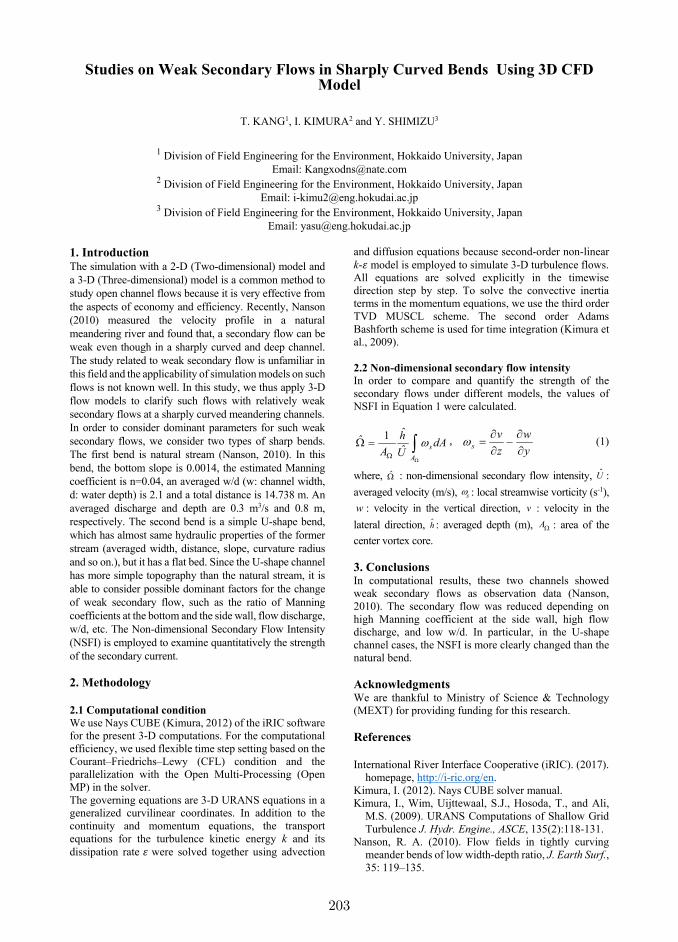
203
Studies on Weak Secondary Flows in Sharply Curved Bends Using 3D CFD Model
T. KANG1, I. KIMURA2 and Y. SHIMIZU3
1 Division of Field Engineering for the Environment, Hokkaido University, Japan
Email: [email protected] 2 Division of Field Engineering for the Environment, Hokkaido University, Japan
Email: [email protected] 3 Division of Field Engineering for the Environment, Hokkaido University, Japan
Email: [email protected]
1. Introduction The simulation with a 2-D (Two-dimensional) model and
a 3-D (Three-dimensional) model is a common method to
study open channel flows because it is very effective from
the aspects of economy and efficiency. Recently, Nanson
(2010) measured the velocity profile in a natural
meandering river and found that, a secondary flow can be
weak even though in a sharply curved and deep channel.
The study related to weak secondary flow is unfamiliar in
this field and the applicability of simulation models on such
flows is not known well. In this study, we thus apply 3-D
flow models to clarify such flows with relatively weak
secondary flows at a sharply curved meandering channels.
In order to consider dominant parameters for such weak
secondary flows, we consider two types of sharp bends.
The first bend is natural stream (Nanson, 2010). In this
bend, the bottom slope is 0.0014, the estimated Manning
coefficient is n=0.04, an averaged w/d (w: channel width,
d: water depth) is 2.1 and a total distance is 14.738 m. An
averaged discharge and depth are 0.3 m3/s and 0.8 m,
respectively. The second bend is a simple U-shape bend,
which has almost same hydraulic properties of the former
stream (averaged width, distance, slope, curvature radius
and so on.), but it has a flat bed. Since the U-shape channel
has more simple topography than the natural stream, it is
able to consider possible dominant factors for the change
of weak secondary flow, such as the ratio of Manning
coefficients at the bottom and the side wall, flow discharge,
w/d, etc. The Non-dimensional Secondary Flow Intensity
(NSFI) is employed to examine quantitatively the strength
of the secondary current.
2. Methodology
2.1 Computational condition
We use Nays CUBE (Kimura, 2012) of the iRIC software
for the present 3-D computations. For the computational
efficiency, we used flexible time step setting based on the
Courant–Friedrichs–Lewy (CFL) condition and the
parallelization with the Open Multi-Processing (Open
MP) in the solver.
The governing equations are 3-D URANS equations in a
generalized curvilinear coordinates. In addition to the
continuity and momentum equations, the transport
equations for the turbulence kinetic energy k and its
dissipation rate were solved together using advection
and diffusion equations because second-order non-linear
k- model is employed to simulate 3-D turbulence flows.
All equations are solved explicitly in the timewise
direction step by step. To solve the convective inertia
terms in the momentum equations, we use the third order
TVD MUSCL scheme. The second order Adams
Bashforth scheme is used for time integration (Kimura et
al., 2009).
2.2 Non-dimensional secondary flow intensity
In order to compare and quantify the strength of the
secondary flows under different models, the values of
NSFI in Equation 1 were calculated.
ˆ1ˆˆ s
A
hdA
A U
,s
v w
z y
(1)
where, : non-dimensional secondary flow intensity, U :
averaged velocity (m/s), s : local streamwise vorticity (s-1),
w : velocity in the vertical direction, v : velocity in the
lateral direction, h : averaged depth (m), A : area of the
center vortex core.
3. Conclusions In computational results, these two channels showed
weak secondary flows as observation data (Nanson,
2010). The secondary flow was reduced depending on
high Manning coefficient at the side wall, high flow
discharge, and low w/d. In particular, in the U-shape
channel cases, the NSFI is more clearly changed than the
natural bend.
Acknowledgments We are thankful to Ministry of Science & Technology
(MEXT) for providing funding for this research.
References
International River Interface Cooperative (iRIC). (2017).
homepage, http://i-ric.org/en.
Kimura, I. (2012). Nays CUBE solver manual.
Kimura, I., Wim, Uijttewaal, S.J., Hosoda, T., and Ali,
M.S. (2009). URANS Computations of Shallow Grid
Turbulence J. Hydr. Engine., ASCE, 135(2):118-131.
Nanson, R. A. (2010). Flow fields in tightly curving
meander bends of low width-depth ratio, J. Earth Surf.,
35: 119–135.

204
Linking Fluvial and Aeolian Morphodynamics in the Grand Canyon, USA
A. Kasprak1, S. Bangen2, D. Buscombe3, J. Caster1, A. East4, P. Grams1, J. Sankey1
1 U.S. Geological Survey, Southwest Biological Science Center, Grand Canyon Monitoring and Research Center, Flagstaff, Arizona, USA. [email protected], [email protected], [email protected], [email protected] 2 Department of Watershed Sciences, Utah State University, Logan, Utah, USA. [email protected]
3 School of Earth Sciences, Northern Arizona University, Flagstaff, Arizona, USA. [email protected] 4 U.S. Geological Survey, Pacific Coastal and Marine Science Center, Santa Cruz, California, USA. [email protected].
1. Introduction In river valleys, fluvial and upland landscapes are intrinsically linked through sediment exchange between the active channel, near-channel fluvial deposits, and higher elevation upland deposits. During floods, sediment is transferred from channels to low-elevation near-channel deposits [Schmidt and Rubin, 1995]. Particularly in dryland river valleys, subsequent aeolian reworking of these flood deposits redistributes sediment to higher elevation upland sites, thus maintaining naturally-occurring aeolian landscapes [Draut, 2012]. 2. Quantifying System-Scale Morphodynamics By differencing digital elevation models derived from repeat surveys, the transport processes driving topographic changes and sediment connectivity can be inferred, a method termed ’mechanistic segregation.’ Unfortunately, mechanistic segregation relies on subjective and time consuming manual classification, which may limit its reproducibility and the practical scale of its application. We have developed a novel computational workflow that uses metrics of land cover and landscape morphometry to predict the occurrence of geomorphic transport processes in spatial datasets. The workflow performs well when compared to field observations in Grand Canyon, with an overall predicative accuracy of 84% across 113 validation points. The approach most accurately predicts changes due to fluvial processes (100% accuracy) and aeolian processes (96%), with reduced accuracy in predictions of alluvial and colluvial processes (64% and 73%, respectively).
Figure 1. Predicted mechanisms of geomorphic change at a site in Grand Canyon, USA from 2002 – 2009. 3. Upland Response to Fluvial Morphodynamics Glen Canyon Dam, immediately upstream of Grand Canyon on the Colorado River, has resulted in a 95%
reduction in pre-dam sediment supply to downstream channel reaches, causing widespread incision and erosion of near-channel sandbars. To counteract this, periodic high-flow experiments (HFEs), or floods, are conducted to redistribute sediment from the channel bed to sandbars, while also providing sediment for aeolian transport of sediment upslope to sustain upland landscapes and source-bordering dunefields. Since 2012, HFEs have been conducted on a near-annual basis in Grand Canyon, a marked increase in flood frequency compared to the preceding 48 years since the dam was completed. Here we use digital elevation model differencing (Kasprak et al., 2015) in conjunction with the computational workflow described in Section 2 to understand geomorphic response along more than 300 km of the Colorado River to this increase in HFE frequency. Analysis of coupled morphodynamic processes indicates that at locations where fluvial sand storage increased following HFEs, subsequent deposition, particularly by aeolian processes, was observed in adjacent uplands. Site response was also modulated by vegetation abundance and local topographic complexity.
4. Conclusions This work demonstrates (a) the utility of novel software for understanding coupled fluvial-hillslope morphodynamic processes in river valleys from large datasets, and (b) the site-scale linkages between river morphodynamics and upland sediment transport using high-resolution remote sensing data. Acknowledgments This work is funded by the U.S. Bureau of Reclamation’s Glen Canyon Dam Adaptive Management Program. References Draut, A. (2012). Effects of river regulation on aeolian landscapes, Colorado River, southwestern USA. Jour.
Geophy. Res. 117. F02022, doi: 10.1029/2011JF002329 Schmidt, J. and Rubin, D. (1995). Regulated streamflow,
fine-grained deposits, and effective discharge in canyons with abundant debris fans. In Costa, J., Miller, A., Potter, K., and Wilcock, P. (eds.), Natural and
Anthropogenic Influences in Fluvial Geomorphology, pages 177-195, Washington. American Geophysical Union. doi: 10.1029/GM089p0177.
Kasprak, A., Ashmore, P.E., Hensleigh, J., Peirce, S., and Wheaton, J.M. (2015) The relationship between particle travel distance and channel morphology: results from physical models of braided rivers. Jour.
Geophy. Res. Earth Surf. 120. doi: 10.1002/2014JF003310.

205
Crystalline Travertine Ripple Bedforms in Ancient Rome’s Aqueducts
Duncan Keenan-Jones1,2,6, Davide Motta2,7, Ryan K. Shosted4, Mauricio Perillo1,8 , Marcelo H. Garcia5 and Bruce Fouke1,5
1Department of Geology, University of Illinois at Urbana-Champaign, Champaign, USA 2Department of the Classics and Illinois Program for Research in the Humanities, University of Illinois at
Urbana-Champaign, Champaign, USA 3Ven Te Chow Hydrosystems Laboratory, Department of Civil and Environmental Engineering, University
of Illinois at Urbana-Champaign, Champaign, USA. [email protected] 4Department of Linguistics, University of Illinois at Urbana-Champaign, Champaign, USA, [email protected] 5Department of Microbiology, University of Illinois at Urbana-Champaign, Champaign, USA, [email protected]
6Now at Classics, School of Humanities, University of Glasgow, Glasgow, UK, [email protected] 7Now at Amec Foster Wheeler plc, [email protected]
8Now at ExxonMobil Research Company, [email protected]
1. Introduction Calcium carbonate deposits (CaCO3, called travertine) that coat the Anio Novus, ancient Rome’s largest aqueduct, exhibit multi-scale bedding characteristics. These include mm-cm scale crystalline ripple bedforms - previously unreported in aqueduct travertine - formed not by sediment transport (Coleman et al., 2003) but by chemical precipitation (Hanratty, 1981).
2. Methods Travertine samples from three locations along a 140 m-long transect of the Anio Novus channel at Roma Vecchia (Keenan-Jones et al., 2015) were analysed parallel to the down flow direction. A wavelength analysis was performed on 21 digitally-captured ripple horizons, with peaks tested for significance according to a white or red noise null hypothesis. A subsample was checked by visual analysis and measurement.
Average bedform wavelengths (λ) were measured at two further locations in the Anio Novus upstream of Roma Vecchia: the Empiglione Bridge and Galleria Egidio (Motta et al., 2017). These λ values were compared to a length scale given by the ratio between the kinematic viscosity ν of water and the boundary-averaged friction velocity (u*), determined from measurements of slope (s) and hydraulic radius (Rh):
sgRu h* ,
where g is gravitational acceleration. The critical friction Reynolds number for the formation of bedforms (Re*c) was calculated from the slope of the plot of λ vs ν/u* (Coleman et al., 2003, Thomas 1979). 3. Results and Discussion Characteristics (including 3D shape, wavelength, and amplitude) in ripples in the Anio Novus travertine occur in multiple, superimposed scales and vary vertically (and hence over time) up sample cross-sections (upsection). Bedforms change shape upsection from lunate to transverse or longitudinal. Asymmetric ripples with long, gentle convex stoss sides and short, steep lee sides are more common where wavelength is increasing upsection than where it is constant or decreasing.
Despite expected uncertainties associated with data collection challenges and shear velocity estimates, Re*c in the Anio Novus compares well to the few previously-studied systems of bedforms formed by chemical
processes (Thomas, 1979), falling within the range 750≤Re*c≤3000 (Meakin and Jamtveit, 2010).
3. Conclusions Digital analysis revealed that the bedform characteristics in the Anio Novus aqueduct travertine varied over time. The most likely explanation for this variation is the change in flow shear velocity, resulting from ancient Roman management of flow within the Anio Novus and the chronological variation of the channel geometry due to travertine formation. Preliminary data suggest that the formation of these bedforms is governed by a critical friction Reynolds number. Validation by travertine precipitation experimentation, under controlled water chemistry, flow and microbial conditions, may produce a simple method of palaeo-flow rate reconstruction.
Acknowledgments Support from the Soprintendenze per i Beni Archeologici del Lazio and di Roma, the Andrew W. Mellon Foundation, the British Academy, and the M. T. Geoffrey Yeh Chair in Civil Engineering (University of Illinois at Urbana-Champaign) are acknowledged.
References Coleman, S.E., Fedele, J.J., and Garcia, M.H. (2003).
Closed-conduit bed-form initiation and development, J. of Hydr. Eng., ASCE, Vol. 129, No. 12, 956-965.
Hanratty, T.J., (1981). Stability of susfaces that are dissolving or being formed by convective diffusion. Annual Review of Fluid Mechanics, 13:231-52.
Keenan-Jones, D., Motta, D., Garcia, M. H. and Fouke, B. W. (2015). Travertine-based estimates of the amount of water supplied by ancient Rome’s Anio Novus aqueduct. J. Archaeol. Sci. Rep. 3, 1–10. doi:10.1016/j.jasrep.2015.05.006.
Meakin, P. and Jamtveit, B. (2010). Geological pattern formation by growth and dissolution in aqueous systems. Proc. R. Soc. Math. Phys. Eng. Sci. 466, 659–694. doi:10.1098/rspa.2009.0189.
Motta, D., Keenan-Jones, D., Fouke, B. W. and Garcia, M. H. (2017, in press). Hydraulic evaluation of the design and operation of ancient Rome’s Anio Novus aqueduct. Archaeometry.
Thomas, R. M. (1979). Size of scallops and ripples formed by flowing water. Nature 277, 281–283. doi:10.1038/277281a0.
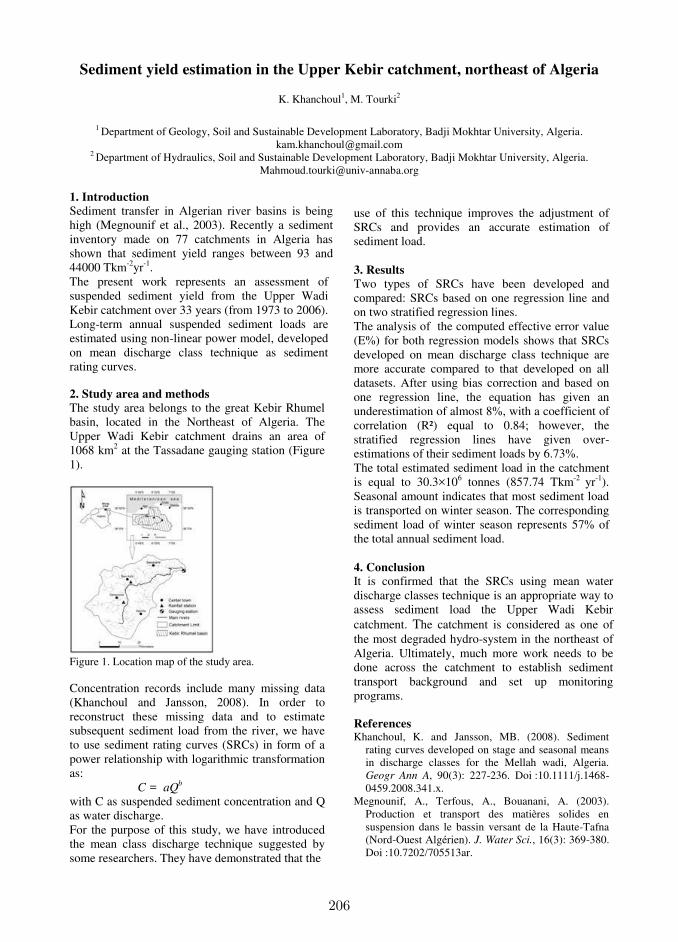
206
Sediment yield estimation in the Upper Kebir catchment, northeast of Algeria
K. Khanchoul1, M. Tourki2
1 Department of Geology, Soil and Sustainable Development Laboratory, Badji Mokhtar University, Algeria.
[email protected] 2 Department of Hydraulics, Soil and Sustainable Development Laboratory, Badji Mokhtar University, Algeria.
1. Introduction
Sediment transfer in Algerian river basins is being high (Megnounif et al., 2003). Recently a sediment inventory made on 77 catchments in Algeria has shown that sediment yield ranges between 93 and 44000 Tkm-2yr-1. The present work represents an assessment of suspended sediment yield from the Upper Wadi Kebir catchment over 33 years (from 1973 to 2006). Long-term annual suspended sediment loads are estimated using non-linear power model, developed on mean discharge class technique as sediment rating curves. 2. Study area and methods
The study area belongs to the great Kebir Rhumel basin, located in the Northeast of Algeria. The Upper Wadi Kebir catchment drains an area of 1068 km2 at the Tassadane gauging station (Figure 1).
Figure 1. Location map of the study area. Concentration records include many missing data (Khanchoul and Jansson, 2008). In order to reconstruct these missing data and to estimate subsequent sediment load from the river, we have to use sediment rating curves (SRCs) in form of a power relationship with logarithmic transformation as: C = aQ
b
with C as suspended sediment concentration and Q as water discharge. For the purpose of this study, we have introduced the mean class discharge technique suggested by some researchers. They have demonstrated that the
use of this technique improves the adjustment of SRCs and provides an accurate estimation of sediment load. 3. Results
Two types of SRCs have been developed and compared: SRCs based on one regression line and on two stratified regression lines. The analysis of the computed effective error value (E%) for both regression models shows that SRCs developed on mean discharge class technique are more accurate compared to that developed on all datasets. After using bias correction and based on one regression line, the equation has given an underestimation of almost 8%, with a coefficient of correlation (R²) equal to 0.84; however, the stratified regression lines have given over-estimations of their sediment loads by 6.73%. The total estimated sediment load in the catchment is equal to 30.3×10⁶ tonnes (857.74 Tkm-2 yr-1). Seasonal amount indicates that most sediment load is transported on winter season. The corresponding sediment load of winter season represents 57% of the total annual sediment load.
4. Conclusion It is confirmed that the SRCs using mean water discharge classes technique is an appropriate way to assess sediment load the Upper Wadi Kebir catchment. The catchment is considered as one of the most degraded hydro-system in the northeast of Algeria. Ultimately, much more work needs to be done across the catchment to establish sediment transport background and set up monitoring programs.
References Khanchoul, K. and Jansson, MB. (2008). Sediment
rating curves developed on stage and seasonal means in discharge classes for the Mellah wadi, Algeria. Geogr Ann A, 90(3): 227-236. Doi :10.1111/j.1468-0459.2008.341.x.
Megnounif, A., Terfous, A., Bouanani, A. (2003). Production et transport des matières solides en suspension dans le bassin versant de la Haute-Tafna (Nord-Ouest Algérien). J. Water Sci., 16(3): 369-380. Doi :10.7202/705513ar.
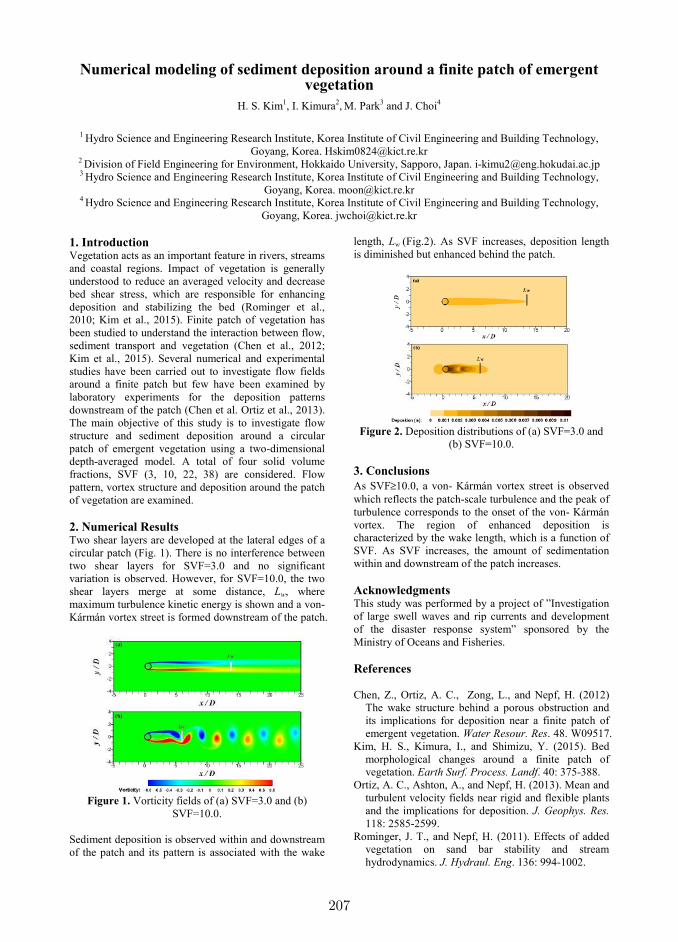
207
Numerical modeling of sediment deposition around a finite patch of emergent vegetation
H. S. Kim1, I. Kimura2, M. Park3 and J. Choi4
1 Hydro Science and Engineering Research Institute, Korea Institute of Civil Engineering and Building Technology,
Goyang, Korea. [email protected] 2 Division of Field Engineering for Environment, Hokkaido University, Sapporo, Japan. [email protected] 3 Hydro Science and Engineering Research Institute, Korea Institute of Civil Engineering and Building Technology,
Goyang, Korea. [email protected] 4 Hydro Science and Engineering Research Institute, Korea Institute of Civil Engineering and Building Technology,
Goyang, Korea. [email protected]
1. Introduction Vegetation acts as an important feature in rivers, streams and coastal regions. Impact of vegetation is generally understood to reduce an averaged velocity and decrease bed shear stress, which are responsible for enhancing deposition and stabilizing the bed (Rominger et al., 2010; Kim et al., 2015). Finite patch of vegetation has been studied to understand the interaction between flow, sediment transport and vegetation (Chen et al., 2012; Kim et al., 2015). Several numerical and experimental studies have been carried out to investigate flow fields around a finite patch but few have been examined by laboratory experiments for the deposition patterns downstream of the patch (Chen et al. Ortiz et al., 2013). The main objective of this study is to investigate flow structure and sediment deposition around a circular patch of emergent vegetation using a two-dimensional depth-averaged model. A total of four solid volume fractions, SVF (3, 10, 22, 38) are considered. Flow pattern, vortex structure and deposition around the patch of vegetation are examined. 2. Numerical Results Two shear layers are developed at the lateral edges of a circular patch (Fig. 1). There is no interference between two shear layers for SVF=3.0 and no significant variation is observed. However, for SVF=10.0, the two shear layers merge at some distance, Lw, where maximum turbulence kinetic energy is shown and a von- Kármán vortex street is formed downstream of the patch.
Figure 1. Vorticity fields of (a) SVF=3.0 and (b) SVF=10.0.
Sediment deposition is observed within and downstream of the patch and its pattern is associated with the wake
length, Lw (Fig.2). As SVF increases, deposition length is diminished but enhanced behind the patch.
Figure 2. Deposition distributions of (a) SVF=3.0 and (b) SVF=10.0.
3. Conclusions As SVF≥10.0, a von- Kármán vortex street is observed which reflects the patch-scale turbulence and the peak of turbulence corresponds to the onset of the von- Kármán vortex. The region of enhanced deposition is characterized by the wake length, which is a function of SVF. As SVF increases, the amount of sedimentation within and downstream of the patch increases. Acknowledgments This study was performed by a project of ”Investigation of large swell waves and rip currents and development of the disaster response system” sponsored by the Ministry of Oceans and Fisheries. References Chen, Z., Ortiz, A. C., Zong, L., and Nepf, H. (2012)
The wake structure behind a porous obstruction and its implications for deposition near a finite patch of emergent vegetation. Water Resour. Res. 48. W09517.
Kim, H. S., Kimura, I., and Shimizu, Y. (2015). Bed morphological changes around a finite patch of vegetation. Earth Surf. Process. Landf. 40: 375-388.
Ortiz, A. C., Ashton, A., and Nepf, H. (2013). Mean and turbulent velocity fields near rigid and flexible plants and the implications for deposition. J. Geophys. Res. 118: 2585-2599.
Rominger, J. T., and Nepf, H. (2011). Effects of added vegetation on sand bar stability and stream hydrodynamics. J. Hydraul. Eng. 136: 994-1002.
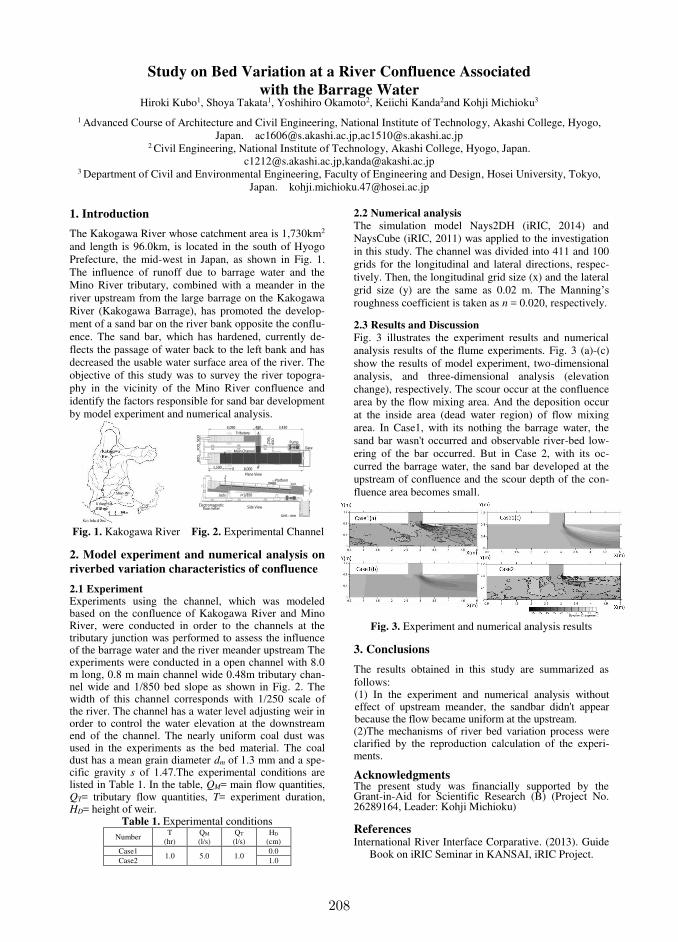
208
Study on Bed Variation at a River Confluence Associated
with the Barrage Water Hiroki Kubo1, Shoya Takata1, Yoshihiro Okamoto2, Keiichi Kanda2and Kohji Michioku3
1 Advanced Course of Architecture and Civil Engineering, National Institute of Technology, Akashi College, Hyogo,
Japan. [email protected],[email protected] 2 Civil Engineering, National Institute of Technology, Akashi College, Hyogo, Japan.
[email protected],[email protected] 3 Department of Civil and Environmental Engineering, Faculty of Engineering and Design, Hosei University, Tokyo,
Japan. [email protected]
1. Introduction The Kakogawa River whose catchment area is 1,730km2 and length is 96.0km, is located in the south of Hyogo Prefecture, the mid-west in Japan, as shown in Fig. 1. The influence of runoff due to barrage water and the Mino River tributary, combined with a meander in the river upstream from the large barrage on the Kakogawa River (Kakogawa Barrage), has promoted the develop-ment of a sand bar on the river bank opposite the conflu-ence. The sand bar, which has hardened, currently de-flects the passage of water back to the left bank and has decreased the usable water surface area of the river. The objective of this study was to survey the river topogra-phy in the vicinity of the Mino River confluence and identify the factors responsible for sand bar development by model experiment and numerical analysis.
Fig. 1. Kakogawa River Fig. 2. Experimental Channel 2. Model experiment and numerical analysis on
riverbed variation characteristics of confluence 2.1 Experiment Experiments using the channel, which was modeled based on the confluence of Kakogawa River and Mino River, were conducted in order to the channels at the tributary junction was performed to assess the influence of the barrage water and the river meander upstream The experiments were conducted in a open channel with 8.0 m long, 0.8 m main channel wide 0.48m tributary chan-nel wide and 1/850 bed slope as shown in Fig. 2. The width of this channel corresponds with 1/250 scale of the river. The channel has a water level adjusting weir in order to control the water elevation at the downstream end of the channel. The nearly uniform coal dust was used in the experiments as the bed material. The coal dust has a mean grain diameter dm of 1.3 mm and a spe-cific gravity s of 1.47.The experimental conditions are listed in Table 1. In the table, QM= main flow quantities, QT= tributary flow quantities, T= experiment duration, HD= height of weir.
Table 1. Experimental conditions Number
T QM QT HD (hr) (l/s) (l/s) (cm)
Case1 1.0 5.0 1.0
0.0 Case2 1.0
2.2 Numerical analysis
The simulation model Nays2DH (iRIC, 2014) and NaysCube (iRIC, 2011) was applied to the investigation in this study. The channel was divided into 411 and 100 grids for the longitudinal and lateral directions, respec-tively. Then, the longitudinal grid size (x) and the lateral grid size (y) are the same as 0.02 m. The Manning’s roughness coefficient is taken as n = 0.020, respectively. 2.3 Results and Discussion
Fig. 3 illustrates the experiment results and numerical analysis results of the flume experiments. Fig. 3 (a)-(c) show the results of model experiment, two-dimensional analysis, and three-dimensional analysis (elevation change), respectively. The scour occur at the confluence area by the flow mixing area. And the deposition occur at the inside area (dead water region) of flow mixing area. In Case1, with its nothing the barrage water, the sand bar wasn't occurred and observable river-bed low-ering of the bar occurred. But in Case 2, with its oc-curred the barrage water, the sand bar developed at the upstream of confluence and the scour depth of the con-fluence area becomes small.
Fig. 3. Experiment and numerical analysis results 3. Conclusions The results obtained in this study are summarized as follows: (1) In the experiment and numerical analysis without effect of upstream meander, the sandbar didn't appear because the flow became uniform at the upstream. (2)The mechanisms of river bed variation process were clarified by the reproduction calculation of the experi-ments.
Acknowledgments The present study was financially supported by the Grant-in-Aid for Scientific Research (B) (Project No. 26289164, Leader: Kohji Michioku) References International River Interface Corparative. (2013). Guide
Book on iRIC Seminar in KANSAI, iRIC Project.
Tributary
Main ChannelGate
Pump
4,090 3,430480
8,000
50
08
00
70
0 45
0
75
0
Plane View
A
A’1,500X
Electromagnetic flow meter
Platform
Jack
Side View
D
Unit : mm
i=1/850
Z
Y
10.0
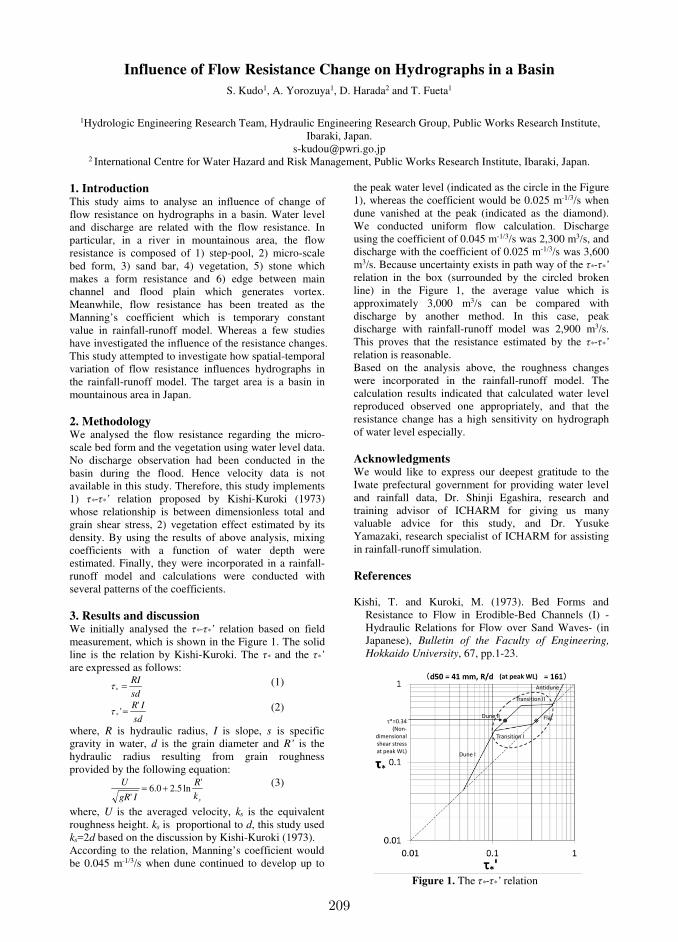
209
Influence of Flow Resistance Change on Hydrographs in a Basin
S. Kudo1, A. Yorozuya1, D. Harada2 and T. Fueta1
1Hydrologic Engineering Research Team, Hydraulic Engineering Research Group, Public Works Research Institute,
Ibaraki, Japan. [email protected]
2 International Centre for Water Hazard and Risk Management, Public Works Research Institute, Ibaraki, Japan.
1. Introduction This study aims to analyse an influence of change of flow resistance on hydrographs in a basin. Water level and discharge are related with the flow resistance. In particular, in a river in mountainous area, the flow resistance is composed of 1) step-pool, 2) micro-scale bed form, 3) sand bar, 4) vegetation, 5) stone which makes a form resistance and 6) edge between main channel and flood plain which generates vortex. Meanwhile, flow resistance has been treated as the Manning’s coefficient which is temporary constant value in rainfall-runoff model. Whereas a few studies have investigated the influence of the resistance changes. This study attempted to investigate how spatial-temporal variation of flow resistance influences hydrographs in the rainfall-runoff model. The target area is a basin in mountainous area in Japan. 2. Methodology We analysed the flow resistance regarding the micro-scale bed form and the vegetation using water level data. No discharge observation had been conducted in the basin during the flood. Hence velocity data is not available in this study. Therefore, this study implements 1) τ*-τ*’ relation proposed by Kishi-Kuroki (1973) whose relationship is between dimensionless total and grain shear stress, 2) vegetation effect estimated by its density. By using the results of above analysis, mixing coefficients with a function of water depth were estimated. Finally, they were incorporated in a rainfall-runoff model and calculations were conducted with several patterns of the coefficients. 3. Results and discussion We initially analysed the τ*-τ*’ relation based on field measurement, which is shown in the Figure 1. The solid line is the relation by Kishi-Kuroki. The τ* and the τ*’ are expressed as follows:
sd
RI=*τ (1)
sd
IR''* =τ (2)
where, R is hydraulic radius, I is slope, s is specific gravity in water, d is the grain diameter and R’ is the hydraulic radius resulting from grain roughness provided by the following equation:
sk
R
IgR
U 'ln5.20.6
'+= (3)
where, U is the averaged velocity, ks is the equivalent roughness height. ks is proportional to d, this study used ks=2d based on the discussion by Kishi-Kuroki (1973). According to the relation, Manning’s coefficient would be 0.045 m-1/3/s when dune continued to develop up to
the peak water level (indicated as the circle in the Figure 1), whereas the coefficient would be 0.025 m-1/3/s when dune vanished at the peak (indicated as the diamond). We conducted uniform flow calculation. Discharge using the coefficient of 0.045 m-1/3/s was 2,300 m3/s, and discharge with the coefficient of 0.025 m-1/3/s was 3,600 m3/s. Because uncertainty exists in path way of the τ*-τ*’ relation in the box (surrounded by the circled broken line) in the Figure 1, the average value which is approximately 3,000 m3/s can be compared with discharge by another method. In this case, peak discharge with rainfall-runoff model was 2,900 m3/s. This proves that the resistance estimated by the τ*-τ*’ relation is reasonable. Based on the analysis above, the roughness changes were incorporated in the rainfall-runoff model. The calculation results indicated that calculated water level reproduced observed one appropriately, and that the resistance change has a high sensitivity on hydrograph of water level especially. Acknowledgments We would like to express our deepest gratitude to the Iwate prefectural government for providing water level and rainfall data, Dr. Shinji Egashira, research and training advisor of ICHARM for giving us many valuable advice for this study, and Dr. Yusuke Yamazaki, research specialist of ICHARM for assisting in rainfall-runoff simulation. References Kishi, T. and Kuroki, M. (1973). Bed Forms and
Resistance to Flow in Erodible-Bed Channels (I) -Hydraulic Relations for Flow over Sand Waves- (in Japanese), Bulletin of the Faculty of Engineering,
Hokkaido University, 67, pp.1-23.
Dune I
Transition II
Dune II
Transition I
Flat
Antidune
τ*=0.34(Non-
dimensional
shear stress
at peak WL)
(at peak WL)
Figure 1. The τ*-τ*’ relation
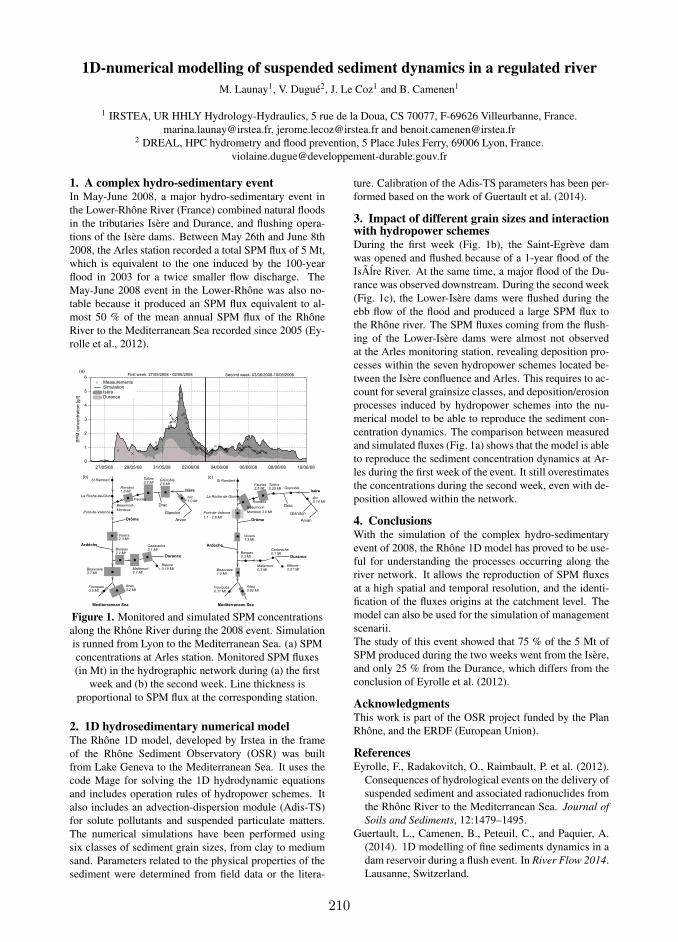
210
1D-numerical modelling of suspended sediment dynamics in a regulated river
M. Launay1, V. Dugué2, J. Le Coz1 and B. Camenen1
1 IRSTEA, UR HHLY Hydrology-Hydraulics, 5 rue de la Doua, CS 70077, F-69626 Villeurbanne, [email protected], [email protected] and [email protected]
2 DREAL, HPC hydrometry and flood prevention, 5 Place Jules Ferry, 69006 Lyon, [email protected]
1. A complex hydro-sedimentary eventIn May-June 2008, a major hydro-sedimentary event inthe Lower-Rhône River (France) combined natural floodsin the tributaries Isère and Durance, and flushing opera-tions of the Isère dams. Between May 26th and June 8th2008, the Arles station recorded a total SPM flux of 5 Mt,which is equivalent to the one induced by the 100-yearflood in 2003 for a twice smaller flow discharge. TheMay-June 2008 event in the Lower-Rhône was also no-table because it produced an SPM flux equivalent to al-most 50 % of the mean annual SPM flux of the RhôneRiver to the Mediterranean Sea recorded since 2005 (Ey-rolle et al., 2012).
(c)St Rambert
Drôme
Ardèche
Drac
Glandon
Arvan
Isère
Arc1.0 Mt
Durance
Romans1.8 Mt
Tullins3.7 Mt
Grenoble2.6 Mt
Viviers2.3 Mt
Bonpas2.2 Mt
Beaucaire3.7 Mt
Fourques0.5 Mt
Arles3.2 Mt
Mallemort2.7 Mt
Cadarache2.1 Mt
Bléone0.19 Mt
La Roche-de-Glun
Pont-de-Valence
Beaumont-
Monteux
Fauries
(b)
First week: 27/05/2008 - 02/06/2008 Second week: 03/06/2008-10/06/2008
SP
M c
oncentr
atio
n [g/l]
27/05/08 29/05/08 31/05/08 02/06/08 04/06/08 06/06/08 08/06/08 10/06/08
(a)
MeasurementsSimulationIsèreDurance
0
1
2
3
4
5
6
Mediterranean Sea Mediterranean Sea
St Rambert
Drôme
Ardèche
Drac
Glandon
Arvan
Isère
Arc0.14 Mt
Durance
Romans
Tullins0.25 Mt Grenoble
Viviers1.3 Mt
Bonpas0.3 Mt
Beaucaire1.0 Mt
Fourques0.11 Mt
Arles0.92 Mt
Mallemort0.3 Mt
Cadarache0.1 Mt
Bléone0.01 Mt
La Roche-de-Glun
Pont-de-Valence
1.1 - 2.6 Mt
Beaumont-
Monteux 3.5 Mt
Fauries2.5 Mt
Figure 1. Monitored and simulated SPM concentrationsalong the Rhône River during the 2008 event. Simulationis runned from Lyon to the Mediterranean Sea. (a) SPMconcentrations at Arles station. Monitored SPM fluxes(in Mt) in the hydrographic network during (a) the first
week and (b) the second week. Line thickness isproportional to SPM flux at the corresponding station.
2. 1D hydrosedimentary numerical modelThe Rhône 1D model, developed by Irstea in the frameof the Rhône Sediment Observatory (OSR) was builtfrom Lake Geneva to the Mediterranean Sea. It uses thecode Mage for solving the 1D hydrodynamic equationsand includes operation rules of hydropower schemes. Italso includes an advection-dispersion module (Adis-TS)for solute pollutants and suspended particulate matters.The numerical simulations have been performed usingsix classes of sediment grain sizes, from clay to mediumsand. Parameters related to the physical properties of thesediment were determined from field data or the litera-
ture. Calibration of the Adis-TS parameters has been per-formed based on the work of Guertault et al. (2014).
3. Impact of different grain sizes and interactionwith hydropower schemesDuring the first week (Fig. 1b), the Saint-Egrève damwas opened and flushed because of a 1-year flood of theIsÃlre River. At the same time, a major flood of the Du-rance was observed downstream. During the second week(Fig. 1c), the Lower-Isère dams were flushed during theebb flow of the flood and produced a large SPM flux tothe Rhône river. The SPM fluxes coming from the flush-ing of the Lower-Isère dams were almost not observedat the Arles monitoring station, revealing deposition pro-cesses within the seven hydropower schemes located be-tween the Isère confluence and Arles. This requires to ac-count for several grainsize classes, and deposition/erosionprocesses induced by hydropower schemes into the nu-merical model to be able to reproduce the sediment con-centration dynamics. The comparison between measuredand simulated fluxes (Fig. 1a) shows that the model is ableto reproduce the sediment concentration dynamics at Ar-les during the first week of the event. It still overestimatesthe concentrations during the second week, even with de-position allowed within the network.
4. ConclusionsWith the simulation of the complex hydro-sedimentaryevent of 2008, the Rhône 1D model has proved to be use-ful for understanding the processes occurring along theriver network. It allows the reproduction of SPM fluxesat a high spatial and temporal resolution, and the identi-fication of the fluxes origins at the catchment level. Themodel can also be used for the simulation of managementscenarii.The study of this event showed that 75 % of the 5 Mt ofSPM produced during the two weeks went from the Isère,and only 25 % from the Durance, which differs from theconclusion of Eyrolle et al. (2012).
AcknowledgmentsThis work is part of the OSR project funded by the PlanRhône, and the ERDF (European Union).
ReferencesEyrolle, F., Radakovitch, O., Raimbault, P. et al. (2012).
Consequences of hydrological events on the delivery ofsuspended sediment and associated radionuclides fromthe Rhône River to the Mediterranean Sea. Journal of
Soils and Sediments, 12:1479–1495.Guertault, L., Camenen, B., Peteuil, C., and Paquier, A.
(2014). 1D modelling of fine sediments dynamics in adam reservoir during a flush event. In River Flow 2014.Lausanne, Switzerland.

211
Fine sediment transport dynamics in a heavily urbanised UK river
system: a challenge for the ‘First-Flush’ model
D.M. Lawler and M. Wilkes
Centre for Agroecology, Water and Resilience, Coventry University, CV1 5FB, UK
1. Introduction and research gap Over 50% of the world’s population is urbanised, and this is projected to rise to 60% by 2020. It is vital, therefore, that we develop understanding of how urban processes, and related hydrological changes, impact on water and sediment transport dynamics and pollution systems. However, little is known of the dynamics of storm-event sediment and pollutant transport in urban rivers. In many catchments, it is often assumed that fine sediment fluxes are delivered early in the storm, peaking before the flow maximum, i.e. the ‘First-Flush’ effect. 2. Aims and methodology However, this paper tests the ubiquity and validity of the First-Flush Model in the most urbanised river in the UK (the River Tame, Birmingham: 42% urbanised). The paper presents high-resolution hysteresis analyses of key water quality responses to flow events, based on datasets obtained at 2 monitoring stations (upstream and downstream), using 15-minute data available for several years. Determinands include: storm-event Rainfall intensity; River Discharge; Turbidity; Suspended Sediment Concentration; Ammonia; Conductivity; pH and Dissolved Oxygen and River water temperature. Gross and Specific Stream power data calculated at a 50-70m spatial resolution through the entire mainstem river place the monitoring stations in downstream hydraulic context. A simple Hysteresis Index was developed to quantify the magnitude and direction of hysteretic response patterns in sediment transport for over 70 storm events.
3. Results Crucially, in 90% of storm events, turbidity peaks occurred after river flow peaks, i.e. anticlockwise hysteresis. This is contrary to
‘normal’ First-Flush model predictions. Of 10 hypotheses tested, three are focused on here: (a) role of Combined Sewer Overflow surcharges during storm events; (b) delayed bed sediment destabilization effects using a developed BASS (Biofilm Adhesion of Sediment Supplies) model; (c) road-derived particulates generated by some of the heaviest traffic loads in Europe. 4. Conclusion This unusual storm behaviour suggests that urban river quality impacts are much more significant and complex than thought, including negative hysteresis behaviour, as discussed in a ‘Senile Cities’ model.
Reference Lawler, D.M. and Wilkes, M. 2015. Improved Fluvial Sediment Impact Assessment (FSIA) approaches within Environmental Impact Assessments, Croatian Geographical Journal; 77 (2), pp 7-31.
Acknowledgements: EA for raw dataset.
Figure 1. Strong anticlockwise hysteresis in
river turbidity in FTU (Y) and River Tame
discharge in m3/s (X), for a spring flow event.
0
50
100
150
200
250
300
350
400
0 0.5 1 1.5 2 2.5
Q (cumecs)
Tu
rbid
ity (
FT
U)
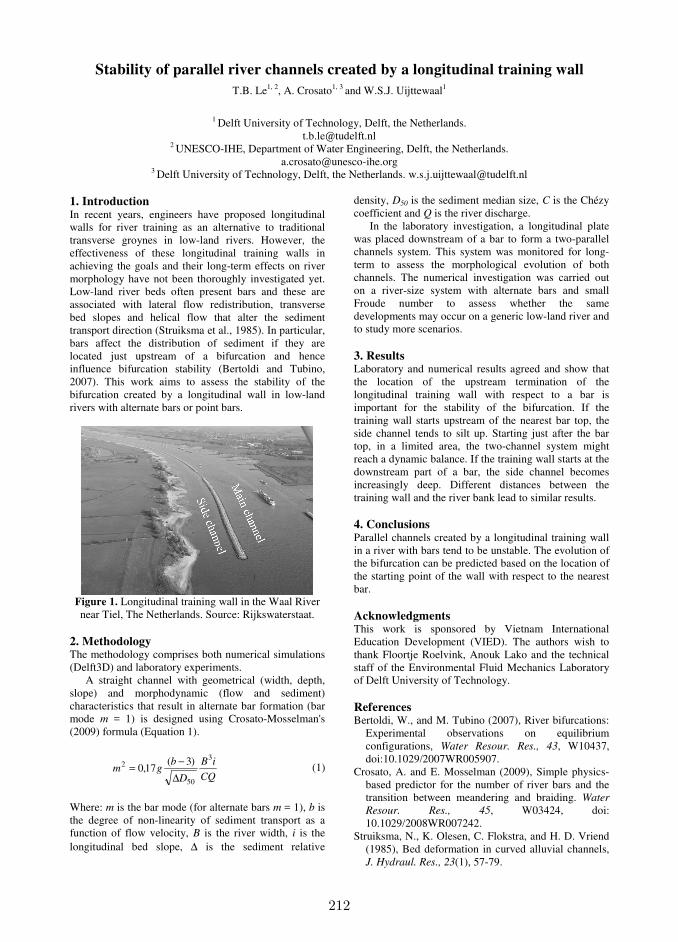
212
Stability of parallel river channels created by a longitudinal training wall
T.B. Le1, 2, A. Crosato1, 3 and W.S.J. Uijttewaal1
1 Delft University of Technology, Delft, the Netherlands.
[email protected] 2 UNESCO-IHE, Department of Water Engineering, Delft, the Netherlands.
[email protected] 3 Delft University of Technology, Delft, the Netherlands. [email protected]
1. Introduction In recent years, engineers have proposed longitudinal walls for river training as an alternative to traditional transverse groynes in low-land rivers. However, the effectiveness of these longitudinal training walls in achieving the goals and their long-term effects on river morphology have not been thoroughly investigated yet. Low-land river beds often present bars and these are associated with lateral flow redistribution, transverse bed slopes and helical flow that alter the sediment transport direction (Struiksma et al., 1985). In particular, bars affect the distribution of sediment if they are located just upstream of a bifurcation and hence influence bifurcation stability (Bertoldi and Tubino, 2007). This work aims to assess the stability of the bifurcation created by a longitudinal wall in low-land rivers with alternate bars or point bars.
Figure 1. Longitudinal training wall in the Waal River near Tiel, The Netherlands. Source: Rijkswaterstaat.
2. Methodology The methodology comprises both numerical simulations (Delft3D) and laboratory experiments.
A straight channel with geometrical (width, depth, slope) and morphodynamic (flow and sediment) characteristics that result in alternate bar formation (bar mode m = 1) is designed using Crosato-Mosselman's (2009) formula (Equation 1).
CQ
iB
D
bgm
3
50
2 )3(17,0
∆
−= (1)
Where: m is the bar mode (for alternate bars m = 1), b is the degree of non-linearity of sediment transport as a function of flow velocity, B is the river width, i is the longitudinal bed slope, ∆ is the sediment relative
density, D50 is the sediment median size, C is the Chézy coefficient and Q is the river discharge.
In the laboratory investigation, a longitudinal plate was placed downstream of a bar to form a two-parallel channels system. This system was monitored for long-term to assess the morphological evolution of both channels. The numerical investigation was carried out on a river-size system with alternate bars and small Froude number to assess whether the same developments may occur on a generic low-land river and to study more scenarios. 3. Results Laboratory and numerical results agreed and show that the location of the upstream termination of the longitudinal training wall with respect to a bar is important for the stability of the bifurcation. If the training wall starts upstream of the nearest bar top, the side channel tends to silt up. Starting just after the bar top, in a limited area, the two-channel system might reach a dynamic balance. If the training wall starts at the downstream part of a bar, the side channel becomes increasingly deep. Different distances between the training wall and the river bank lead to similar results. 4. Conclusions Parallel channels created by a longitudinal training wall in a river with bars tend to be unstable. The evolution of the bifurcation can be predicted based on the location of the starting point of the wall with respect to the nearest bar. Acknowledgments This work is sponsored by Vietnam International Education Development (VIED). The authors wish to thank Floortje Roelvink, Anouk Lako and the technical staff of the Environmental Fluid Mechanics Laboratory of Delft University of Technology. References Bertoldi, W., and M. Tubino (2007), River bifurcations:
Experimental observations on equilibrium configurations, Water Resour. Res., 43, W10437, doi:10.1029/2007WR005907.
Crosato, A. and E. Mosselman (2009), Simple physics-based predictor for the number of river bars and the transition between meandering and braiding. Water
Resour. Res., 45, W03424, doi: 10.1029/2008WR007242.
Struiksma, N., K. Olesen, C. Flokstra, and H. D. Vriend (1985), Bed deformation in curved alluvial channels, J. Hydraul. Res., 23(1), 57-79.

213
Study on bedrock river migration and stable countermeasures in the reach of bridge
C.T. Liao1, K.C. Yeh2, R.K. Jhong2 and K.W. Li2
1 Disaster Prevention & Water Environment Research Center, National Chiao Tung University, Hsinchu, Taiwan.
[email protected] 2 Department of Civil Engineering, National Chiao Tung University, Hsinchu, Taiwan.
Abstract Due to the steep slope, huge discharge and flushing water, there are significant river migration and erosion problems in Taiwan’s rivers. A bridge in the river often affects the channel migration, and then leads to severe bed change and local scour. Bedrock river lacks a continuous cover of alluvial sediments over the long term. When the bed armor layer flushed away, it makes the bedrock exposed, and then increases the channel incision. In this study, the Chungcheng Bridge in Touchien River, Taiwan is chosen as the study site. In 2013, the 9th pier of Chungcheng Bridge was destroyed after the typhoon Soulik, and a new flow path was formed along the right bank side of main channel. There are serious bedrock bank erosion and local scour around this area (shown as Figure 1). However, the Chungcheng Bridge is rebuilt in 2015 (shown as Figure 2), the trends of bedrock river migration in study reach are important for the planning of stable countermeasures. A two-dimensional mobile-bed model, called CCHE2D, is adopted to simulate the bedrock erosion and channel migration in the nearby area of Chungcheng Bridge (shown as Figure 3). The bedrock erosion mechanism proposed by Liao et al. (2014) is considered in the model. Data associated with suspended sediment concentration, bed materials, erodibility index of bedrock and digital surface model are collected and established. These basic data are used to calibrate the numerical model. Different stable countermeasures include the dredging in the upstream reach, remove or lower the protection work are considered in the model to investigate the channel migration and erosion trends in the river. It can be used as the reference for river management planning.
Figure 1. Aerial photo of destroyed Chungcheng Bridge
(taken in 2013).
Figure 2. Aerial photo of rebuilt Chungcheng Bridge
(taken in 2015).
Figure 3. Simulated flow velocity in the nearby area of
Chungcheng Bridge. References Jia, Y. and Wang, S.S.Y. (1999). Numerical model for
channel flow and morphological change studies. Journal of Hydraulic Engineering, ASCE, Vol. 125, No. 9, pp. 924-933.
Liao, C.T., Yeh, K.C. and Huang, M.W. (2014). Development and application of 2-D mobile-bed model with bedrock river evolution mechanism. Journal of Hydro-Environment Research, Vol. 8, Issue 3, 210-222.
Chungcheng Bridge
Protection work
Chungcheng Bridge
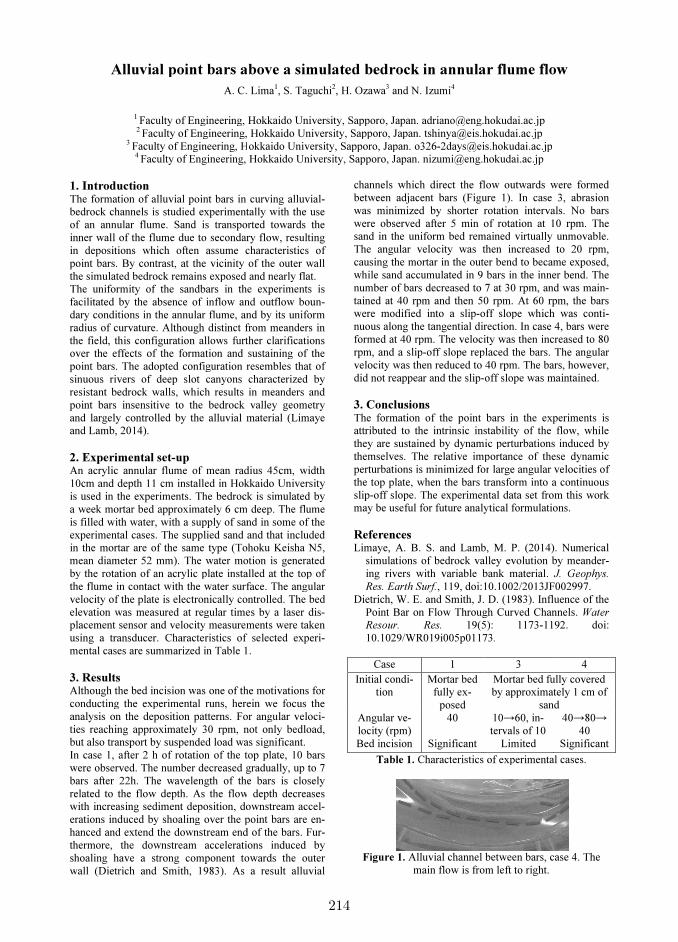
214
Alluvial point bars a
A. C.
1 Faculty of Engineering, 2 Faculty of Engineering,
3 Faculty of Engineering, H4 Faculty of Engineering,
1. Introduction The formation of alluvial point bars in bedrock channels is studied experimentof an annular flume. Sand is transporinner wall of the flume due to secondarin depositions which often assume cpoint bars. By contrast, at the vicinity the simulated bedrock remains exposed The uniformity of the sandbars in thefacilitated by the absence of inflow andary conditions in the annular flume, anradius of curvature. Although distinct fthe field, this configuration allows furtover the effects of the formation and point bars. The adopted configuration rsinuous rivers of deep slot canyons resistant bedrock walls, which results point bars insensitive to the bedrock and largely controlled by the alluvial mand Lamb, 2014).
2. Experimental set-up An acrylic annular flume of mean radi10cm and depth 11 cm installed in Hokis used in the experiments. The bedrocka week mortar bed approximately 6 cm is filled with water, with a supply of sanexperimental cases. The supplied sand ain the mortar are of the same type (Tohmean diameter 52 mm). The water motby the rotation of an acrylic plate instathe flume in contact with the water surfvelocity of the plate is electronically coelevation was measured at regular timeplacement sensor and velocity measuremusing a transducer. Characteristics of mental cases are summarized in Table 1.
3. Results Although the bed incision was one of thconducting the experimental runs, hereanalysis on the deposition patterns. Forties reaching approximately 30 rpm, nbut also transport by suspended load waIn case 1, after 2 h of rotation of the top were observed. The number decreased gbars after 22h. The wavelength of therelated to the flow depth. As the flowwith increasing sediment deposition, doerations induced by shoaling over the poihanced and extend the downstream end thermore, the downstream accelerationshoaling have a strong component towall (Dietrich and Smith, 1983). As
bove a simulated bedrock in annular
C. Lima1, S. Taguchi2, H. Ozawa3 and N. Izumi4
, Hokkaido University, Sapporo, Japan. [email protected], Hokkaido University, Sapporo, Japan. [email protected] University, Sapporo, Japan. o326-2days@eis.
, Hokkaido University, Sapporo, Japan. [email protected]
curving alluvial-tally with the use
sported towards the ry flow, resulting characteristics of of the outer wall
d and nearly flat. e experiments is nd outflow boun-nd by its uniform from meanders in ther clarifications
d sustaining of the resembles that of
s characterized by s in meanders and valley geometry material (Limaye
dius 45cm, width okkaido University ock is simulated by
deep. The flume nd in some of the
d and that included ohoku Keisha N5, otion is generated alled at the top of rface. The angular ontrolled. The bed es by a laser dis-ments were taken
f selected experi-1.
he motivations for rein we focus the or angular veloci-not only bedload,
was significant. top plate, 10 bars gradually, up to 7 e bars is closely depth decreases
downstream accel-point bars are en-d of the bars. Fur-ions induced by owards the outer
s a result alluvial
channels which direct the flobetween adjacent bars (Figurwas minimized by shorter rotwere observed after 5 min osand in the uniform bed remaThe angular velocity was thcausing the mortar in the outewhile sand accumulated in 9 banumber of bars decreased to 7tained at 40 rpm and then 50were modified into a slip-ofnuous along the tangential direformed at 40 rpm. The velocitrpm, and a slip-off slope replavelocity was then reduced to 40did not reappear and the slip-o
3. Conclusions The formation of the point baattributed to the intrinsic instthey are sustained by dynamicthemselves. The relative impperturbations is minimized forthe top plate, when the bars trslip-off slope. The experimentmay be useful for future analy
References Limaye, A. B. S. and Lamb,
simulations of bedrock valling rivers with variable baRes. Earth Surf., 119, doi:10.
Dietrich, W. E. and Smith, J. DPoint Bar on Flow ThroughResour. Res. 19(5)10.1029/WR019i005p01173
Case 1
Initial condi-tion
Mortar bed fully ex-
posed Angular ve-locity (rpm)
40
Bed incision Significant
Table 1. Characteristics of
Figure 1. Alluvial channel bemain flow is from
r flume flow
hokudai.ac.jp okudai.ac.jp
s.hokudai.ac.jp hokudai.ac.jp
ow outwards were formed re 1). In case 3, abrasion
rotation intervals. No bars of rotation at 10 rpm. The ained virtually unmovable. hen increased to 20 rpm, er bend to became exposed,
9 bars in the inner bend. The 7 at 30 rpm, and was main-
50 rpm. At 60 rpm, the bars off slope which was conti-rection. In case 4, bars were ity was then increased to 80
placed the bars. The angular 40 rpm. The bars, however, off slope was maintained.
bars in the experiments is stability of the flow, while ic perturbations induced by portance of these dynamic r large angular velocities of transform into a continuous ntal data set from this work ytical formulations.
, M. P. (2014). Numerical lley evolution by meander-bank material. J. Geophys.
10.1002/2013JF002997. D. (1983). Influence of the h Curved Channels. Water
): 1173-1192. doi: 3.
3 4
Mortar bed fully covered by approximately 1 cm of
sand 10→60, in-tervals of 10
40→80→ 40
Limited Significant
s of experimental cases.
between bars, case 4. The m left to right.
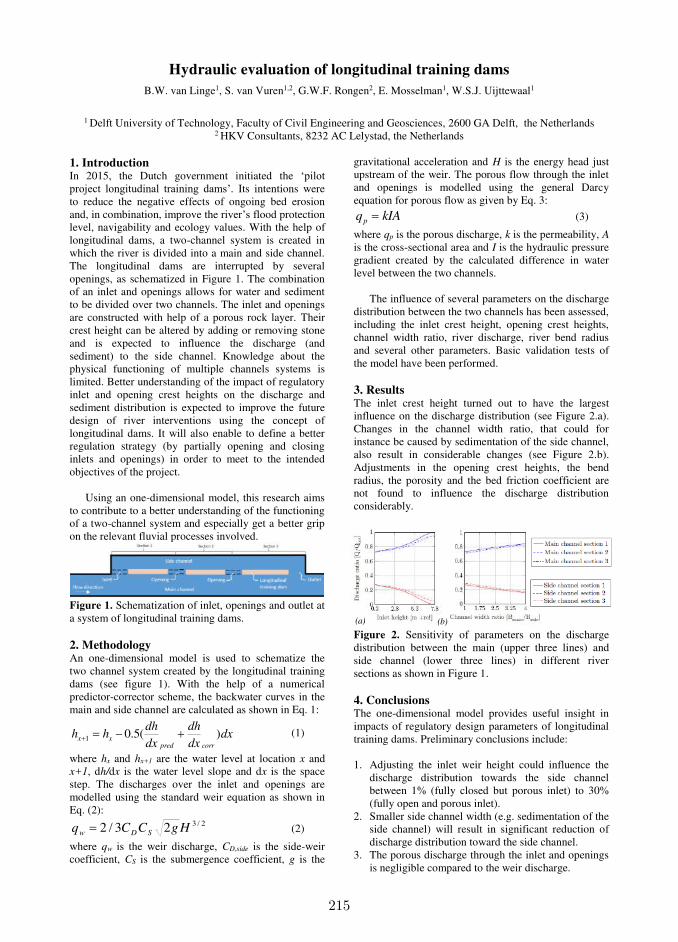
215
Hydraulic evaluation of longitudinal training dams
B.W. van Linge1, S. van Vuren1,2, G.W.F. Rongen2, E. Mosselman1, W.S.J. Uijttewaal1
1 Delft University of Technology, Faculty of Civil Engineering and Geosciences, 2600 GA Delft, the Netherlands
2 HKV Consultants, 8232 AC Lelystad, the Netherlands
1. Introduction In 2015, the Dutch government initiated the ‘pilot project longitudinal training dams’. Its intentions were to reduce the negative effects of ongoing bed erosion and, in combination, improve the river’s flood protection level, navigability and ecology values. With the help of longitudinal dams, a two-channel system is created in which the river is divided into a main and side channel. The longitudinal dams are interrupted by several openings, as schematized in Figure 1. The combination of an inlet and openings allows for water and sediment to be divided over two channels. The inlet and openings are constructed with help of a porous rock layer. Their crest height can be altered by adding or removing stone and is expected to influence the discharge (and sediment) to the side channel. Knowledge about the physical functioning of multiple channels systems is limited. Better understanding of the impact of regulatory inlet and opening crest heights on the discharge and sediment distribution is expected to improve the future design of river interventions using the concept of longitudinal dams. It will also enable to define a better regulation strategy (by partially opening and closing inlets and openings) in order to meet to the intended objectives of the project.
Using an one-dimensional model, this research aims to contribute to a better understanding of the functioning of a two-channel system and especially get a better grip on the relevant fluvial processes involved.
Figure 1. Schematization of inlet, openings and outlet at a system of longitudinal training dams. 2. Methodology An one-dimensional model is used to schematize the two channel system created by the longitudinal training dams (see figure 1). With the help of a numerical predictor-corrector scheme, the backwater curves in the main and side channel are calculated as shown in Eq. 1:
dxdx
dh
dx
dhhh
corrpredxx )(5.01 (1)
where hx and hx+1 are the water level at location x and x+1, dh/dx is the water level slope and dx is the space step. The discharges over the inlet and openings are modelled using the standard weir equation as shown in Eq. (2):
2/323/2 HgCCq SDw (2)
where qw is the weir discharge, CD,side is the side-weir coefficient, CS is the submergence coefficient, g is the
gravitational acceleration and H is the energy head just upstream of the weir. The porous flow through the inlet and openings is modelled using the general Darcy equation for porous flow as given by Eq. 3:
kIAqp (3)
where qp is the porous discharge, k is the permeability, A is the cross-sectional area and I is the hydraulic pressure gradient created by the calculated difference in water level between the two channels.
The influence of several parameters on the discharge distribution between the two channels has been assessed, including the inlet crest height, opening crest heights, channel width ratio, river discharge, river bend radius and several other parameters. Basic validation tests of the model have been performed. 3. Results The inlet crest height turned out to have the largest influence on the discharge distribution (see Figure 2.a). Changes in the channel width ratio, that could for instance be caused by sedimentation of the side channel, also result in considerable changes (see Figure 2.b). Adjustments in the opening crest heights, the bend radius, the porosity and the bed friction coefficient are not found to influence the discharge distribution considerably. Figure 2. Sensitivity of parameters on the discharge distribution between the main (upper three lines) and side channel (lower three lines) in different river sections as shown in Figure 1.
4. Conclusions The one-dimensional model provides useful insight in impacts of regulatory design parameters of longitudinal training dams. Preliminary conclusions include: 1. Adjusting the inlet weir height could influence the
discharge distribution towards the side channel between 1% (fully closed but porous inlet) to 30% (fully open and porous inlet).
2. Smaller side channel width (e.g. sedimentation of the side channel) will result in significant reduction of discharge distribution toward the side channel.
3. The porous discharge through the inlet and openings is negligible compared to the weir discharge.
(b) (a)
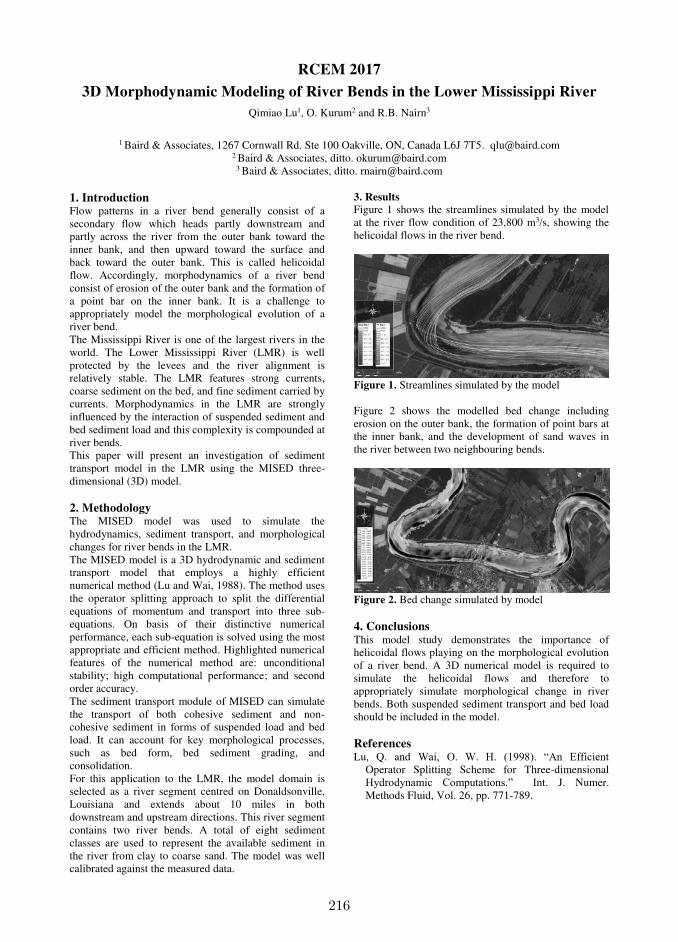
216
RCEM 2017
3D Morphodynamic Modeling of River Bends in the Lower Mississippi River
Qimiao Lu1, O. Kurum2 and R.B. Nairn3
1 Baird & Associates, 1267 Cornwall Rd. Ste 100 Oakville, ON, Canada L6J 7T5. [email protected]
2 Baird & Associates, ditto. [email protected] 3 Baird & Associates, ditto. [email protected]
1. Introduction Flow patterns in a river bend generally consist of a secondary flow which heads partly downstream and partly across the river from the outer bank toward the inner bank, and then upward toward the surface and back toward the outer bank. This is called helicoidal flow. Accordingly, morphodynamics of a river bend consist of erosion of the outer bank and the formation of a point bar on the inner bank. It is a challenge to appropriately model the morphological evolution of a river bend. The Mississippi River is one of the largest rivers in the world. The Lower Mississippi River (LMR) is well protected by the levees and the river alignment is relatively stable. The LMR features strong currents, coarse sediment on the bed, and fine sediment carried by currents. Morphodynamics in the LMR are strongly influenced by the interaction of suspended sediment and bed sediment load and this complexity is compounded at river bends. This paper will present an investigation of sediment transport model in the LMR using the MISED three-dimensional (3D) model. 2. Methodology The MISED model was used to simulate the hydrodynamics, sediment transport, and morphological changes for river bends in the LMR. The MISED model is a 3D hydrodynamic and sediment transport model that employs a highly efficient numerical method (Lu and Wai, 1988). The method uses the operator splitting approach to split the differential equations of momentum and transport into three sub-equations. On basis of their distinctive numerical performance, each sub-equation is solved using the most appropriate and efficient method. Highlighted numerical features of the numerical method are: unconditional stability; high computational performance; and second order accuracy. The sediment transport module of MISED can simulate the transport of both cohesive sediment and non-cohesive sediment in forms of suspended load and bed load. It can account for key morphological processes, such as bed form, bed sediment grading, and consolidation. For this application to the LMR, the model domain is selected as a river segment centred on Donaldsonville, Louisiana and extends about 10 miles in both downstream and upstream directions. This river segment contains two river bends. A total of eight sediment classes are used to represent the available sediment in the river from clay to coarse sand. The model was well calibrated against the measured data.
3. Results
Figure 1 shows the streamlines simulated by the model at the river flow condition of 23,800 m3/s, showing the helicoidal flows in the river bend.
Figure 1. Streamlines simulated by the model Figure 2 shows the modelled bed change including erosion on the outer bank, the formation of point bars at the inner bank, and the development of sand waves in the river between two neighbouring bends.
Figure 2. Bed change simulated by model 4. Conclusions This model study demonstrates the importance of helicoidal flows playing on the morphological evolution of a river bend. A 3D numerical model is required to simulate the helicoidal flows and therefore to appropriately simulate morphological change in river bends. Both suspended sediment transport and bed load should be included in the model. References Lu, Q. and Wai, O. W. H. (1998). “An Efficient
Operator Splitting Scheme for Three-dimensional Hydrodynamic Computations.” Int. J. Numer. Methods Fluid, Vol. 26, pp. 771-789.

217
Morphological effects of a large flood in a step-pool Andean streamL. Mao1, R. Carrillo2
1 Department of Ecosystem and Environments, Pontificia Universidad Católica de Chile, Santiago, Chile.
[email protected]; [email protected]
1. IntroductionHigh-gradient mountain streams are usually narrow,
confined, and commonly characterized by very coarse
sediments, and cascade or step-pool morphology. Step
sequences are quite stable geomorphic units, but high
magnitude floods (i.e. RI>50 years) can destroy and
reform these features and lead to significant channel
changes (e.g. Molnar et al., 2010). However, our current
knowledge of channel changes due to floods of different
magnitude is still limited to few field sites, and limited
evidence are available for high-gradient streams.
However, the increased use of unmanned aerial systems
(UASs) to collect photos, and structure-from-motion
(SfM) algorithms able to generate high resolution point
clouds from photos, provided unprecedented chances for
acquiring multi-temporal sets of digital terrain models
(Westoby et al., 2012).
2. Materials and methodsThe study was conducted on the Estero Morales, a 27
km2 glacierized Andean catchment located in central
Chile. Runoff is dominated by snowmelt in late spring,
and glacier melt from December to March. Autumn
rainfall events can also generate infrequent but high-
magnitude flood events. The study site is a 150-m long,
step-pool/cascade reach (mean slope 0.11 m m-1).
A high-magnitude flood occurred between April 13 to
19, 2016, and was generated by an ENSO event (El
Niño South Oscillation) coupled by an unusually high
zero isotherms. The flood destroyed a bridge and
removed turbidity meters and pipe hydrophones
installed since 2013 (Mao & Carrillo, in press).
Detailed topographical surveys of the reach were taken
before and after the flood (March 17th and April 28th
2016). Multiple photos were taken with a Phantom 3
Professional UAS. Approximately 300 and 570 photos
were taken before and after the flood event. Several
ground control points were surveyed with a dGPS.
Digital Elevation Models (DEM) with 1 cm resolution
were derived using the SFM method (software
PhotoScan by Agisoft). Geomorphological changes due
to the flood event were assessed by comparing the pre-
and post-flood DEMs using the Geomorphic Change
Detection software developed by Wheaton et al. (2010)
that calculate Difference of DEMs (DoDs) and
associated uncertainty.
3. Preliminary resultsThe flood event, which is estimated to have recurrence
interval higher than 30 years, was able to move boulders
up to 2 m, and caused remarkable changes in the study
sites. The channel avulsed in several points, and the
morphology changed considerably. The number of steps
along the study sited were 25 and 17 before and after the
flood event, respectively. However, only 4 of the
original 25 steps remained stable in the channel. The
number of pools remained constant before and after the
flood, but only 9 of the 26 pools remained in their place.
Figure 1. Orthophotos of the Estero Morales pre- and
post-event, and difference of DEMs.
A preliminary version of the DoD revealed that the study
reach experienced vertical changes up to 1m, especially
due to bank erosion. Overall, the volume eroded and
deposited within the study reach was about 1140 and
1820 m3, respectively, for a net volumetric change of
680 m3.
4. ConclusionsA high-magnitude flood in occurred in a glacierized
mountain basin due to a late rainfall event caused
considerable channel changes in a high-gradient, step-
pool stream. The reach experienced avulsions, and most
steps were destroyed, even if the channel soon
developed new step-pool sequences. More detailed
analysis of changes in step-pool geometry and cross-
sections are ongoing, along with modelling efforts.
ReferencesMao, L. and Carrillo, R. (in press). Temporal dynamics
of suspended sediment transport in a glacierized
Andean basin. Geomorphology.
Molnar, P., Densmore A.L., McArdell B.W., Turowski
J.M. and Burlando P. (2010). Analysis of changes in
the step-pool morphology and channel profile of a
steep mountain stream following a large flood.
Geomorphology 124, 85-94.
Westoby, M., Brasington, J., Glasser, N.F., Hambrey,
M.J. and Reynolds, J.M. (2012). Structure-from-
Motion photogrammetry: a novel, low-cost tool for
geomorphological applications. Geomorphology 179,
300-314.
Wheaton, J.M., Brasington, J., Darby, S.E. and Sear,
D.A. (2010). Accounting for uncertainty in DEMs
from repeat topographic surveys: Improved sediment
budgets. Earth Surf. Proc. Land. 35(2), 136-156.
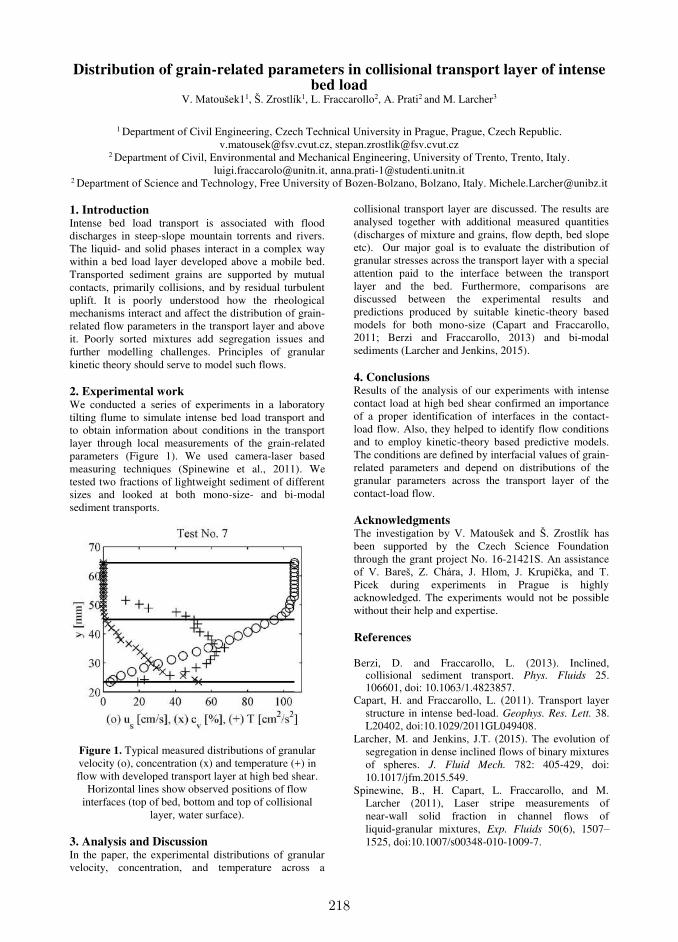
218
Distribution of grain-related parameters in collisional transport layer of intense bed load
V. Matoušek11, Š. Zrostlík1, L. Fraccarollo2, A. Prati2 and M. Larcher3
1 Department of Civil Engineering, Czech Technical University in Prague, Prague, Czech Republic.
[email protected], [email protected] 2 Department of Civil, Environmental and Mechanical Engineering, University of Trento, Trento, Italy.
[email protected], [email protected] 2 Department of Science and Technology, Free University of Bozen-Bolzano, Bolzano, Italy. [email protected]
1. Introduction Intense bed load transport is associated with flood discharges in steep-slope mountain torrents and rivers. The liquid- and solid phases interact in a complex way within a bed load layer developed above a mobile bed. Transported sediment grains are supported by mutual contacts, primarily collisions, and by residual turbulent uplift. It is poorly understood how the rheological mechanisms interact and affect the distribution of grain-related flow parameters in the transport layer and above it. Poorly sorted mixtures add segregation issues and further modelling challenges. Principles of granular kinetic theory should serve to model such flows. 2. Experimental work We conducted a series of experiments in a laboratory tilting flume to simulate intense bed load transport and to obtain information about conditions in the transport layer through local measurements of the grain-related parameters (Figure 1). We used camera-laser based measuring techniques (Spinewine et al., 2011). We tested two fractions of lightweight sediment of different sizes and looked at both mono-size- and bi-modal sediment transports.
Figure 1. Typical measured distributions of granular velocity (o), concentration (x) and temperature (+) in flow with developed transport layer at high bed shear.
Horizontal lines show observed positions of flow interfaces (top of bed, bottom and top of collisional
layer, water surface). 3. Analysis and Discussion In the paper, the experimental distributions of granular velocity, concentration, and temperature across a
collisional transport layer are discussed. The results are analysed together with additional measured quantities (discharges of mixture and grains, flow depth, bed slope etc). Our major goal is to evaluate the distribution of granular stresses across the transport layer with a special attention paid to the interface between the transport layer and the bed. Furthermore, comparisons are discussed between the experimental results and predictions produced by suitable kinetic-theory based models for both mono-size (Capart and Fraccarollo, 2011; Berzi and Fraccarollo, 2013) and bi-modal sediments (Larcher and Jenkins, 2015). 4. Conclusions Results of the analysis of our experiments with intense contact load at high bed shear confirmed an importance of a proper identification of interfaces in the contact-load flow. Also, they helped to identify flow conditions and to employ kinetic-theory based predictive models. The conditions are defined by interfacial values of grain-related parameters and depend on distributions of the granular parameters across the transport layer of the contact-load flow. Acknowledgments The investigation by V. Matoušek and Š. Zrostlík has been supported by the Czech Science Foundation through the grant project No. 16-21421S. An assistance of V. Bareš, Z. Chára, J. Hlom, J. Krupička, and T. Picek during experiments in Prague is highly acknowledged. The experiments would not be possible without their help and expertise. References Berzi, D. and Fraccarollo, L. (2013). Inclined,
collisional sediment transport. Phys. Fluids 25. 106601, doi: 10.1063/1.4823857.
Capart, H. and Fraccarollo, L. (2011). Transport layer structure in intense bed-load. Geophys. Res. Lett. 38. L20402, doi:10.1029/2011GL049408.
Larcher, M. and Jenkins, J.T. (2015). The evolution of segregation in dense inclined flows of binary mixtures of spheres. J. Fluid Mech. 782: 405-429, doi: 10.1017/jfm.2015.549.
Spinewine, B., H. Capart, L. Fraccarollo, and M. Larcher (2011), Laser stripe measurements of near‐wall solid fraction in channel flows of liquid‐granular mixtures, Exp. Fluids 50(6), 1507–1525, doi:10.1007/s00348-010-1009-7.
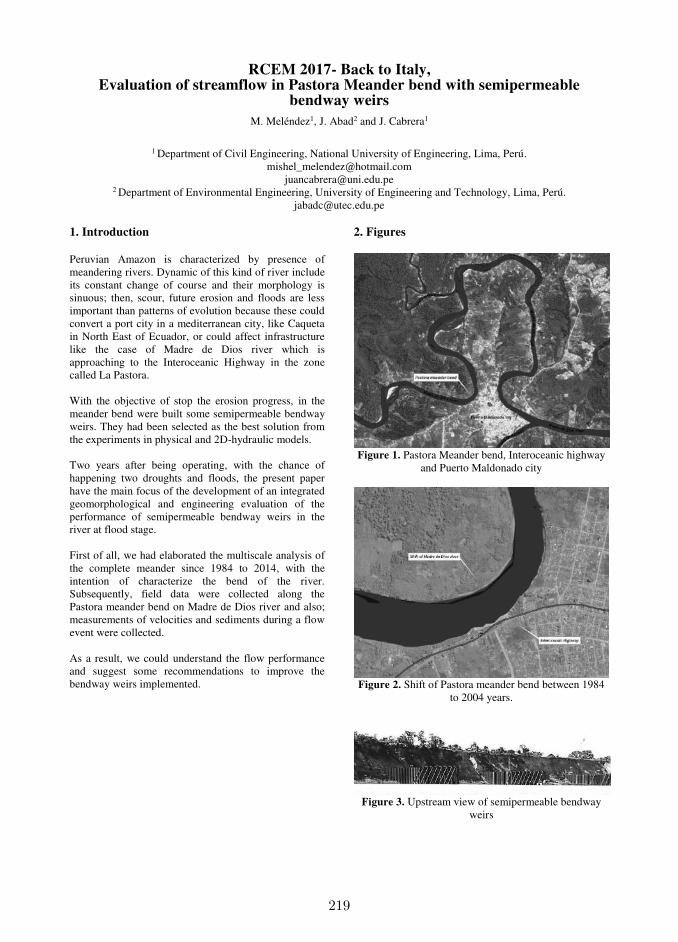
219
RCEM 2017- Back to Italy, Evaluation of streamflow in Pastora Meander bend with semipermeable
bendway weirs
M. Meléndez1, J. Abad2 and J. Cabrera1
1 Department of Civil Engineering, National University of Engineering, Lima, Perú.
[email protected] [email protected]
2 Department of Environmental Engineering, University of Engineering and Technology, Lima, Perú. [email protected]
1. Introduction
Peruvian Amazon is characterized by presence of meandering rivers. Dynamic of this kind of river include its constant change of course and their morphology is sinuous; then, scour, future erosion and floods are less important than patterns of evolution because these could convert a port city in a mediterranean city, like Caqueta in North East of Ecuador, or could affect infrastructure like the case of Madre de Dios river which is approaching to the Interoceanic Highway in the zone called La Pastora. With the objective of stop the erosion progress, in the meander bend were built some semipermeable bendway weirs. They had been selected as the best solution from the experiments in physical and 2D-hydraulic models. Two years after being operating, with the chance of happening two droughts and floods, the present paper have the main focus of the development of an integrated geomorphological and engineering evaluation of the performance of semipermeable bendway weirs in the river at flood stage. First of all, we had elaborated the multiscale analysis of the complete meander since 1984 to 2014, with the intention of characterize the bend of the river. Subsequently, field data were collected along the Pastora meander bend on Madre de Dios river and also; measurements of velocities and sediments during a flow event were collected. As a result, we could understand the flow performance and suggest some recommendations to improve the bendway weirs implemented.
2. Figures
Figure 1. Pastora Meander bend, Interoceanic highway
and Puerto Maldonado city
Figure 2. Shift of Pastora meander bend between 1984
to 2004 years.
Figure 3. Upstream view of semipermeable bendway
weirs
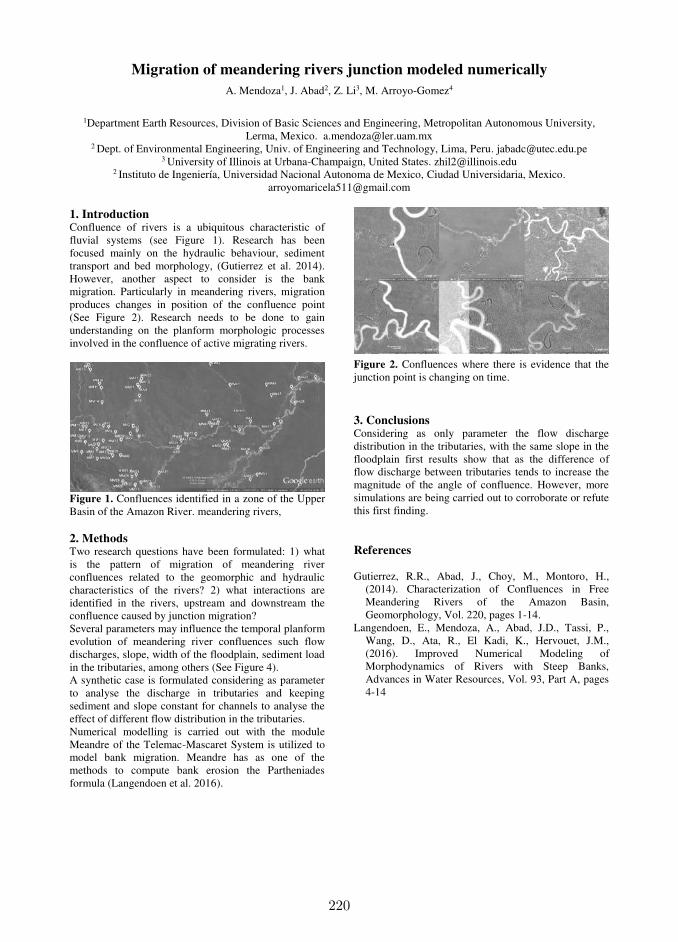
220
Migration of meandering rivers junction modeled numerically
A. Mendoza1, J. Abad2, Z. Li3, M. Arroyo-Gomez4
1Department Earth Resources, Division of Basic Sciences and Engineering, Metropolitan Autonomous University,
Lerma, Mexico. [email protected] 2 Dept. of Environmental Engineering, Univ. of Engineering and Technology, Lima, Peru. [email protected]
3 University of Illinois at Urbana-Champaign, United States. [email protected] 2 Instituto de Ingeniería, Universidad Nacional Autonoma de Mexico, Ciudad Universidaria, Mexico.
1. Introduction Confluence of rivers is a ubiquitous characteristic of fluvial systems (see Figure 1). Research has been focused mainly on the hydraulic behaviour, sediment transport and bed morphology, (Gutierrez et al. 2014). However, another aspect to consider is the bank migration. Particularly in meandering rivers, migration produces changes in position of the confluence point (See Figure 2). Research needs to be done to gain understanding on the planform morphologic processes involved in the confluence of active migrating rivers.
Figure 1. Confluences identified in a zone of the Upper Basin of the Amazon River. meandering rivers, 2. Methods Two research questions have been formulated: 1) what is the pattern of migration of meandering river confluences related to the geomorphic and hydraulic characteristics of the rivers? 2) what interactions are identified in the rivers, upstream and downstream the confluence caused by junction migration? Several parameters may influence the temporal planform evolution of meandering river confluences such flow discharges, slope, width of the floodplain, sediment load in the tributaries, among others (See Figure 4). A synthetic case is formulated considering as parameter to analyse the discharge in tributaries and keeping sediment and slope constant for channels to analyse the effect of different flow distribution in the tributaries. Numerical modelling is carried out with the module Meandre of the Telemac-Mascaret System is utilized to model bank migration. Meandre has as one of the methods to compute bank erosion the Partheniades formula (Langendoen et al. 2016).
Figure 2. Confluences where there is evidence that the junction point is changing on time.
3. Conclusions Considering as only parameter the flow discharge distribution in the tributaries, with the same slope in the floodplain first results show that as the difference of flow discharge between tributaries tends to increase the magnitude of the angle of confluence. However, more simulations are being carried out to corroborate or refute this first finding. References Gutierrez, R.R., Abad, J., Choy, M., Montoro, H.,
(2014). Characterization of Confluences in Free Meandering Rivers of the Amazon Basin, Geomorphology, Vol. 220, pages 1-14.
Langendoen, E., Mendoza, A., Abad, J.D., Tassi, P., Wang, D., Ata, R., El Kadi, K., Hervouet, J.M., (2016). Improved Numerical Modeling of Morphodynamics of Rivers with Steep Banks, Advances in Water Resources, Vol. 93, Part A, pages 4-14
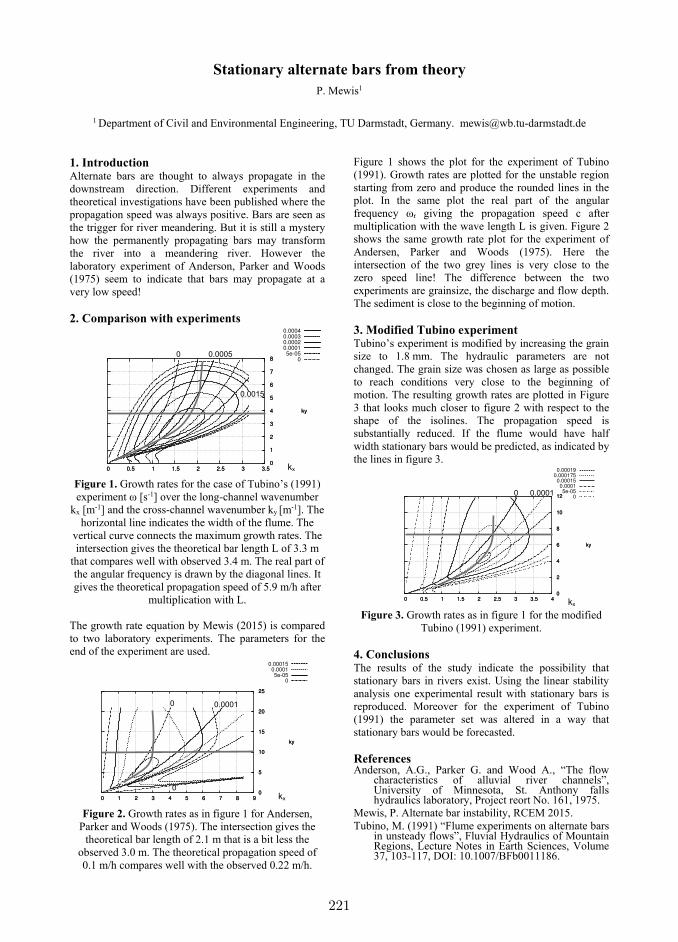
221
Stationary alternate bars from theory P. Mewis1
1 Department of Civil and Environmental Engineering, TU Darmstadt, Germany. [email protected]
1. Introduction Alternate bars are thought to always propagate in the downstream direction. Different experiments and theoretical investigations have been published where the propagation speed was always positive. Bars are seen as the trigger for river meandering. But it is still a mystery how the permanently propagating bars may transform the river into a meandering river. However the laboratory experiment of Anderson, Parker and Woods (1975) seem to indicate that bars may propagate at a very low speed! 2. Comparison with experiments
0 0.5 1 1.5 2 2.5 3 3.5 0
1
2
3
4
5
6
7
8
0.0004 0.0003 0.0002 0.0001 5e-05
0
ky
0 0.5 1 1.5 2 2.5 3 3.5 0
1
2
3
4
5
6
7
8
ky
Figure 1. Growth rates for the case of Tubino’s (1991) experiment ω [s-1] over the long-channel wavenumber
kx [m-1] and the cross-channel wavenumber ky [m-1]. The horizontal line indicates the width of the flume. The
vertical curve connects the maximum growth rates. The intersection gives the theoretical bar length L of 3.3 m
that compares well with observed 3.4 m. The real part of the angular frequency is drawn by the diagonal lines. It gives the theoretical propagation speed of 5.9 m/h after
multiplication with L. The growth rate equation by Mewis (2015) is compared to two laboratory experiments. The parameters for the end of the experiment are used.
0 1 2 3 4 5 6 7 8 9 0
5
10
15
20
25
0.00015 0.0001 5e-05
0
ky
0 1 2 3 4 5 6 7 8 9 0
5
10
15
20
25
ky
Figure 2. Growth rates as in figure 1 for Andersen,
Parker and Woods (1975). The intersection gives the theoretical bar length of 2.1 m that is a bit less the
observed 3.0 m. The theoretical propagation speed of 0.1 m/h compares well with the observed 0.22 m/h.
Figure 1 shows the plot for the experiment of Tubino (1991). Growth rates are plotted for the unstable region starting from zero and produce the rounded lines in the plot. In the same plot the real part of the angular frequency ωr giving the propagation speed c after multiplication with the wave length L is given. Figure 2 shows the same growth rate plot for the experiment of Andersen, Parker and Woods (1975). Here the intersection of the two grey lines is very close to the zero speed line! The difference between the two experiments are grainsize, the discharge and flow depth. The sediment is close to the beginning of motion. 3. Modified Tubino experiment Tubino’s experiment is modified by increasing the grain size to 1.8 mm. The hydraulic parameters are not changed. The grain size was chosen as large as possible to reach conditions very close to the beginning of motion. The resulting growth rates are plotted in Figure 3 that looks much closer to figure 2 with respect to the shape of the isolines. The propagation speed is substantially reduced. If the flume would have half width stationary bars would be predicted, as indicated by the lines in figure 3.
0 0.5 1 1.5 2 2.5 3 3.5 4 0
2
4
6
8
10
12
0.000190.000175 0.00015 0.0001 5e-05
0
ky
0 0.5 1 1.5 2 2.5 3 3.5 4 0
2
4
6
8
10
12
ky
Figure 3. Growth rates as in figure 1 for the modified
Tubino (1991) experiment. 4. Conclusions The results of the study indicate the possibility that stationary bars in rivers exist. Using the linear stability analysis one experimental result with stationary bars is reproduced. Moreover for the experiment of Tubino (1991) the parameter set was altered in a way that stationary bars would be forecasted. References Anderson, A.G., Parker G. and Wood A., “The flow
characteristics of alluvial river channels”, University of Minnesota, St. Anthony falls hydraulics laboratory, Project reort No. 161, 1975.
Mewis, P. Alternate bar instability, RCEM 2015. Tubino, M. (1991) “Flume experiments on alternate bars
in unsteady flows”, Fluvial Hydraulics of Mountain Regions, Lecture Notes in Earth Sciences, Volume 37, 103-117, DOI: 10.1007/BFb0011186.
0
0.0015
0.0005
0 0.0001
0
0
kx
kx
kx
0.0001
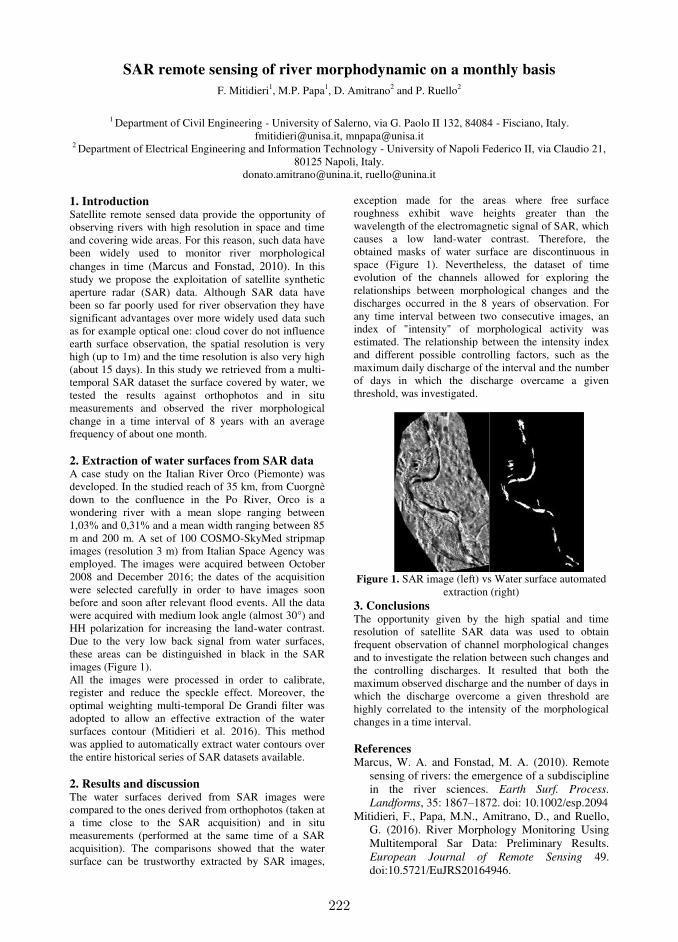
222
SAR remote sensing of river morphodynamic on a monthly basis
F. Mitidieri1, M.P. Papa1, D. Amitrano2 and P. Ruello2
1 Department of Civil Engineering - University of Salerno, via G. Paolo II 132, 84084 - Fisciano, Italy.
[email protected], [email protected] 2 Department of Electrical Engineering and Information Technology - University of Napoli Federico II, via Claudio 21,
80125 Napoli, Italy. [email protected], [email protected]
1. Introduction Satellite remote sensed data provide the opportunity of observing rivers with high resolution in space and time and covering wide areas. For this reason, such data have been widely used to monitor river morphological changes in time (Marcus and Fonstad, 2010). In this study we propose the exploitation of satellite synthetic aperture radar (SAR) data. Although SAR data have been so far poorly used for river observation they have significant advantages over more widely used data such as for example optical one: cloud cover do not influence earth surface observation, the spatial resolution is very high (up to 1m) and the time resolution is also very high (about 15 days). In this study we retrieved from a multi-temporal SAR dataset the surface covered by water, we tested the results against orthophotos and in situ measurements and observed the river morphological change in a time interval of 8 years with an average frequency of about one month. 2. Extraction of water surfaces from SAR data A case study on the Italian River Orco (Piemonte) was developed. In the studied reach of 35 km, from Cuorgnè down to the confluence in the Po River, Orco is a wondering river with a mean slope ranging between 1,03% and 0,31% and a mean width ranging between 85 m and 200 m. A set of 100 COSMO-SkyMed stripmap images (resolution 3 m) from Italian Space Agency was employed. The images were acquired between October 2008 and December 2016; the dates of the acquisition were selected carefully in order to have images soon before and soon after relevant flood events. All the data were acquired with medium look angle (almost 30°) and HH polarization for increasing the land-water contrast. Due to the very low back signal from water surfaces, these areas can be distinguished in black in the SAR images (Figure 1). All the images were processed in order to calibrate, register and reduce the speckle effect. Moreover, the optimal weighting multi-temporal De Grandi filter was adopted to allow an effective extraction of the water surfaces contour (Mitidieri et al. 2016). This method was applied to automatically extract water contours over the entire historical series of SAR datasets available. 2. Results and discussion The water surfaces derived from SAR images were compared to the ones derived from orthophotos (taken at a time close to the SAR acquisition) and in situ measurements (performed at the same time of a SAR acquisition). The comparisons showed that the water surface can be trustworthy extracted by SAR images,
exception made for the areas where free surface roughness exhibit wave heights greater than the wavelength of the electromagnetic signal of SAR, which causes a low land-water contrast. Therefore, the obtained masks of water surface are discontinuous in space (Figure 1). Nevertheless, the dataset of time evolution of the channels allowed for exploring the relationships between morphological changes and the discharges occurred in the 8 years of observation. For any time interval between two consecutive images, an index of "intensity" of morphological activity was estimated. The relationship between the intensity index and different possible controlling factors, such as the maximum daily discharge of the interval and the number of days in which the discharge overcame a given threshold, was investigated.
Figure 1. SAR image (left) vs Water surface automated
extraction (right) 3. Conclusions The opportunity given by the high spatial and time resolution of satellite SAR data was used to obtain frequent observation of channel morphological changes and to investigate the relation between such changes and the controlling discharges. It resulted that both the maximum observed discharge and the number of days in which the discharge overcome a given threshold are highly correlated to the intensity of the morphological changes in a time interval. References Marcus, W. A. and Fonstad, M. A. (2010). Remote
sensing of rivers: the emergence of a subdiscipline in the river sciences. Earth Surf. Process.
Landforms, 35: 1867–1872. doi: 10.1002/esp.2094 Mitidieri, F., Papa, M.N., Amitrano, D., and Ruello,
G. (2016). River Morphology Monitoring Using Multitemporal Sar Data: Preliminary Results. European Journal of Remote Sensing 49. doi:10.5721/EuJRS20164946.
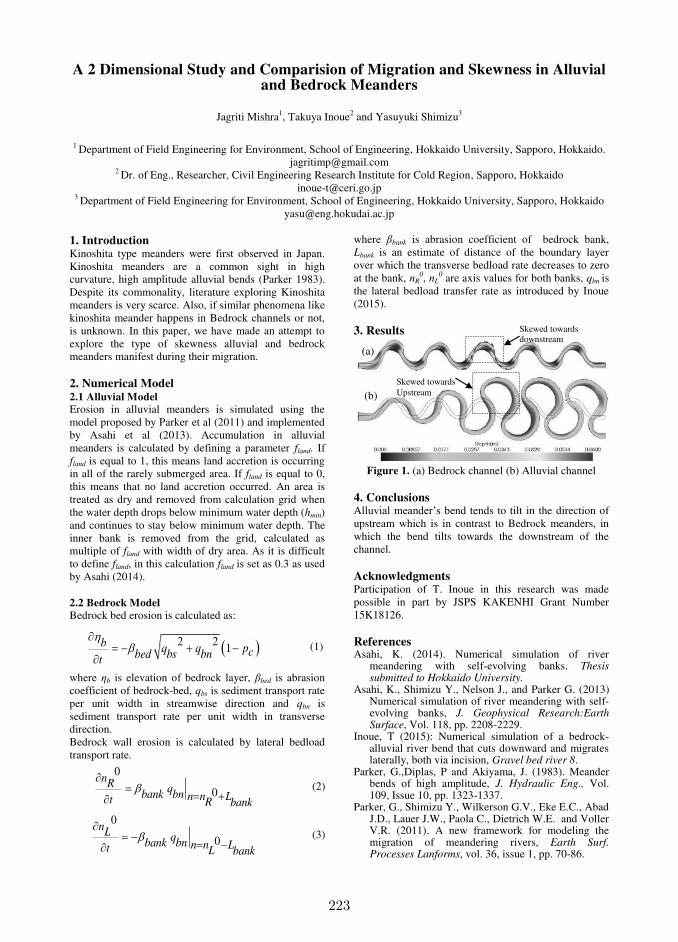
223
A 2 Dimensional Study and Comparision of Migration and Skewness in Alluvial and Bedrock Meanders
Jagriti Mishra1, Takuya Inoue2 and Yasuyuki Shimizu3
1 Department of Field Engineering for Environment, School of Engineering, Hokkaido University, Sapporo, Hokkaido.
[email protected] 2 Dr. of Eng., Researcher, Civil Engineering Research Institute for Cold Region, Sapporo, Hokkaido
3 Department of Field Engineering for Environment, School of Engineering, Hokkaido University, Sapporo, Hokkaido [email protected]
1. Introduction Kinoshita type meanders were first observed in Japan. Kinoshita meanders are a common sight in high curvature, high amplitude alluvial bends (Parker 1983). Despite its commonality, literature exploring Kinoshita meanders is very scarce. Also, if similar phenomena like kinoshita meander happens in Bedrock channels or not, is unknown. In this paper, we have made an attempt to explore the type of skewness alluvial and bedrock meanders manifest during their migration. 2. Numerical Model 2.1 Alluvial Model Erosion in alluvial meanders is simulated using the model proposed by Parker et al (2011) and implemented by Asahi et al (2013). Accumulation in alluvial meanders is calculated by defining a parameter fland. If fland is equal to 1, this means land accretion is occurring in all of the rarely submerged area. If fland is equal to 0, this means that no land accretion occurred. An area is treated as dry and removed from calculation grid when the water depth drops below minimum water depth (hmin) and continues to stay below minimum water depth. The inner bank is removed from the grid, calculated as multiple of fland with width of dry area. As it is difficult to define fland, in this calculation fland is set as 0.3 as used by Asahi (2014).
2.2 Bedrock Model
Bedrock bed erosion is calculated as:
2 2 1b q q pcbed bs bnt
(1)
where ηb is elevation of bedrock layer, βbed is abrasion coefficient of bedrock-bed, qbs is sediment transport rate per unit width in streamwise direction and qbn is sediment transport rate per unit width in transverse direction. Bedrock wall erosion is calculated by lateral bedload transport rate.
0
0nR q
bank bn n n Lt R bank
(2)
0
0nL q
bank bn n n Lt L bank
(3)
where βbank is abrasion coefficient of bedrock bank, Lbank is an estimate of distance of the boundary layer over which the transverse bedload rate decreases to zero at the bank, nR
0, nL0 are axis values for both banks, qbn is
the lateral bedload transfer rate as introduced by Inoue
(2015). 3. Results
Figure 1. (a) Bedrock channel (b) Alluvial channel
4. Conclusions Alluvial meander’s bend tends to tilt in the direction of upstream which is in contrast to Bedrock meanders, in which the bend tilts towards the downstream of the channel. Acknowledgments Participation of T. Inoue in this research was made possible in part by JSPS KAKENHI Grant Number 15K18126. References Asahi, K. (2014). Numerical simulation of river
meandering with self-evolving banks. Thesis submitted to Hokkaido University.
Asahi, K., Shimizu Y., Nelson J., and Parker G. (2013) Numerical simulation of river meandering with self-evolving banks, J. Geophysical Research:Earth Surface, Vol. 118, pp. 2208-2229.
Inoue, T (2015): Numerical simulation of a bedrock-alluvial river bend that cuts downward and migrates laterally, both via incision, Gravel bed river 8.
Parker, G.,Diplas, P and Akiyama, J. (1983). Meander bends of high amplitude, J. Hydraulic Eng., Vol. 109, Issue 10, pp. 1323-1337.
Parker, G., Shimizu Y., Wilkerson G.V., Eke E.C., Abad J.D., Lauer J.W., Paola C., Dietrich W.E. and Voller V.R. (2011). A new framework for modeling the migration of meandering rivers, Earth Surf. Processes Lanforms, vol. 36, issue 1, pp. 70-86.
(a)
(b)
Skewed towards downstream
Skewed towards Upstream
224
RCEM 2017- Back to Italy,
Flow structure at low momentum ratio river confluences
G. Moradi1, C.D. Rennie
2, R. Cardot
1, F. Mettra
1 and S. N. Lane
1
1 Institute of Earth Surface Dynamics, University of Lausanne, Lausanne, Switzerland.
[email protected] 2 Department of Civil Engineering, University of Ottawa, Ottawa, Canada.
1. Introduction The flow structure at river confluences is a complex
pattern of fluid motion and can be characterized by the
formation of secondary circulation. As river confluences
play an essential role on flow hydrodynamics and
control the movement of sediment through river
networks, there was an increase in the attention given to
this subject during recent decades. However, there is
still much debate over how momentum ratio and
sediment transport can control secondary circulation and
mixing processes. The secondary circulation is formed
by streamwise oriented vortical cells. These cells are
produced by the convergence of surface flow in to the
center of the main channel, which provides a descending
motion through the bed. Once flow arrives to the bed, it
converges and completes its rotation by an upwelling
motion through the surface (Bradbrook, K. F., Lane, S.
N. and Richards, K. S. 2000). This flow motion shapes
the channel bed and forms a scour hole. 3-D secondary
circulation numerical models as well as laboratory
experiments have been confirmed by field
measurements in river confluences with momentum
ratio close to one but there is a lack of investigation in
those, with low momentum ratio and the effect of
sediment transport on the formation of secondary
circulation.
This study shows field investigations in two upper
Rhône river confluences in Switzerland, using an
acoustic Doppler current profiler (aDcp). These two
confluences are characterized by low momentum ratio
and different sediment transport rates. Results show that
the rate of sediment transport plays an important role in
the formation of secondary circulation and mixing
processes and confirm that where the rate of sediment
transported from the tributary to the main channel is
high, the formation of the bed discordance at the mouth
of the tributary is evident. This discordant bed forms a
two-layer flow and the water from the tributary
penetrates at the upper part of the water column, into the
main river. This results a mixing interface which is
shifted toward the outer bank. When this mixing layer
detaches from the outer bank, it forms a large
recirculation region at the upper part of the water
column and a pronounced scour hole at this bank. In
contrast, a low rate of sediment transported from the
tributary into the main river leads to a bigger stagnation
zone at the upstream junction corner. This point bar acts
as an obstacle and produces two separated shear layers
within the mixing zone at the inner bank of the main
channel. These shear layers detach downstream of the
junction apex and induce the alternate shedding of
eddies with positive and negative vorticity and an
intermittent sense of rotation. However, because of the
different velocities across the mixing interface,
secondary streamwise oriented vortical cells will be
formed and produce a scour hole at the inner bank of the
main channel. The mixing processes in this case may
take quite a distance downstream of the junction, to be
happened.
This field investigation provides a reliable dataset which
is used to simulate flow structure and mixing processes
under a wider range of forcing conditions, to validate or
modify existing numerical models.
References
Bradbrook, K. F., Lane, S. N. and Richards. K. S.
(2000). Numerical simulation of three-dimensional,
time-averaged flow structure at river channel
confluences. J. Water resource research 36: 2732-
2746. doi: 10.1029/2000WR900011.
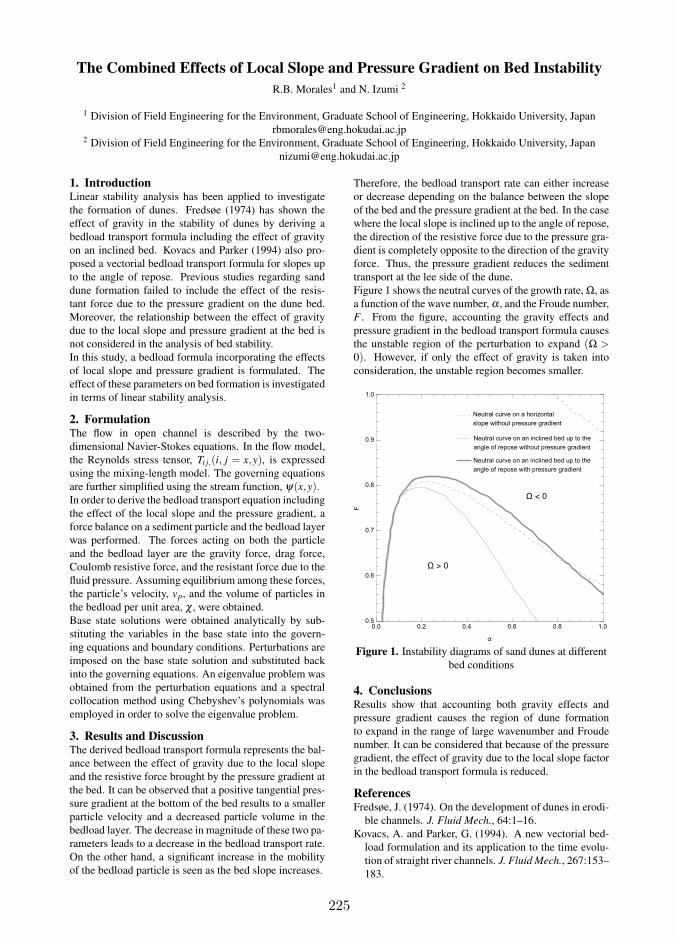
225
The Combined Effects of Local Slope and Pressure Gradient on Bed Instability
R.B. Morales1 and N. Izumi 2
1 Division of Field Engineering for the Environment, Graduate School of Engineering, Hokkaido University, Japan
[email protected] Division of Field Engineering for the Environment, Graduate School of Engineering, Hokkaido University, Japan
1. IntroductionLinear stability analysis has been applied to investigate
the formation of dunes. Fredsøe (1974) has shown the
effect of gravity in the stability of dunes by deriving a
bedload transport formula including the effect of gravity
on an inclined bed. Kovacs and Parker (1994) also pro-
posed a vectorial bedload transport formula for slopes up
to the angle of repose. Previous studies regarding sand
dune formation failed to include the effect of the resis-
tant force due to the pressure gradient on the dune bed.
Moreover, the relationship between the effect of gravity
due to the local slope and pressure gradient at the bed is
not considered in the analysis of bed stability.
In this study, a bedload formula incorporating the effects
of local slope and pressure gradient is formulated. The
effect of these parameters on bed formation is investigated
in terms of linear stability analysis.
2. FormulationThe flow in open channel is described by the two-
dimensional Navier-Stokes equations. In the flow model,
the Reynolds stress tensor, Ti j,(i, j = x,y), is expressed
using the mixing-length model. The governing equations
are further simplified using the stream function, ψ(x,y).In order to derive the bedload transport equation including
the effect of the local slope and the pressure gradient, a
force balance on a sediment particle and the bedload layer
was performed. The forces acting on both the particle
and the bedload layer are the gravity force, drag force,
Coulomb resistive force, and the resistant force due to the
fluid pressure. Assuming equilibrium among these forces,
the particle’s velocity, vp, and the volume of particles in
the bedload per unit area, χ , were obtained.
Base state solutions were obtained analytically by sub-
stituting the variables in the base state into the govern-
ing equations and boundary conditions. Perturbations are
imposed on the base state solution and substituted back
into the governing equations. An eigenvalue problem was
obtained from the perturbation equations and a spectral
collocation method using Chebyshev’s polynomials was
employed in order to solve the eigenvalue problem.
3. Results and DiscussionThe derived bedload transport formula represents the bal-
ance between the effect of gravity due to the local slope
and the resistive force brought by the pressure gradient at
the bed. It can be observed that a positive tangential pres-
sure gradient at the bottom of the bed results to a smaller
particle velocity and a decreased particle volume in the
bedload layer. The decrease in magnitude of these two pa-
rameters leads to a decrease in the bedload transport rate.
On the other hand, a significant increase in the mobility
of the bedload particle is seen as the bed slope increases.
Therefore, the bedload transport rate can either increase
or decrease depending on the balance between the slope
of the bed and the pressure gradient at the bed. In the case
where the local slope is inclined up to the angle of repose,
the direction of the resistive force due to the pressure gra-
dient is completely opposite to the direction of the gravity
force. Thus, the pressure gradient reduces the sediment
transport at the lee side of the dune.
Figure 1 shows the neutral curves of the growth rate, Ω, as
a function of the wave number, α , and the Froude number,
F . From the figure, accounting the gravity effects and
pressure gradient in the bedload transport formula causes
the unstable region of the perturbation to expand (Ω >
0). However, if only the effect of gravity is taken into
consideration, the unstable region becomes smaller.
Figure 1. Instability diagrams of sand dunes at different
bed conditions
4. ConclusionsResults show that accounting both gravity effects and
pressure gradient causes the region of dune formation
to expand in the range of large wavenumber and Froude
number. It can be considered that because of the pressure
gradient, the effect of gravity due to the local slope factor
in the bedload transport formula is reduced.
ReferencesFredsøe, J. (1974). On the development of dunes in erodi-
ble channels. J. Fluid Mech., 64:1–16.
Kovacs, A. and Parker, G. (1994). A new vectorial bed-
load formulation and its application to the time evolu-
tion of straight river channels. J. Fluid Mech., 267:153–
183.

226
Estimation of sediment yield using RUSLE in Japan K. Morita1 and K. Udo2
1 Department of Civil engineering, Tohoku University, Miyagi, Japan, [email protected]
2 International Research Institute of Disaster Science, Tohoku University, Miyagi, Japan, [email protected]
1. Introduction It is projected that the global warming will cause characteristic changes in temperature rise, sea level rise and precipitation (IPCC, 2013). These characteristic changes affect the sediment transportation from mountains to coasts; for example, the characteristic change of precipitation affects sediment yield, sediment transport in rivers, and consequently sediment supply from the rivers to the coasts. The decrease of sediment supply from river to coast causes coastal erosion. Furthermore, it was reported that sea level rise will cause up to 90% of sandy beach loss in Japan in the future (Udo and Takeda, 2014). It is necessary to estimate the amounts of sediment supply from the rivers to the coasts, however, an estimation method of sediment yield considering the precipitation characteristics has not been established in Japan. In this research, we aim to estimate the sediment yield all over Japan using RUSLE. 2. Methodology The Revised Universal Soil Loss Equation (RUSLE; Renard et al., 1997) is an erosion model designed to predict the average annual soil loss carried by runoff from specific field slopes. The annual soil loss is expressed by a linear relation with the major erosion factors such as rainfall, soil erodibility, slope length, slope steepness, soil and crop management, and supporting conservation as follows:
A = R K LS C P (1) where A is the mass of annual soil erosion [ton/km2 year], R is rainfall and runoff erodibility [kJ mm/ km2 h year], K is soil erodibility [ton km2 h/ km2 kJ mm], LS is slope parameter, C is soil and crop management, and P is conservation practice-erosion inhibition factor. We estimate the mass of annual soil erosion all over Japan from 2008 to 2014. Here we assumed the mass of soil erosion as the sediment yield and validated the estimated value using the dam deposit data which is assumed to be the actual sediment yield.
3. Results Figure 1 shows the spatial distribution of sediment yield calculated using RUSLE. The sediment yield is larger in the western part of Japan, especially near coastal areas where R-factor is also larger. Figure 2 shows that the sediment yield calculated using RUSLE approximately corresponded with the actual sediment yield. 4. Conclusions This study estimated sediment yield all over Japan using RUSLE. The results suggest that RUSLE is applicable for estimation of sediment yield in a nationwide scale of Japan.
Figure 1. Spatial distribution of average annual
sediment yield using RUSLE from 2008 to 2014.
Figure 2. Validation of the sediment yield calculated
using RUSLE. References Intergovernmental Panel on Climate Change (2013).
The Physical Science Basis Contribution of Working Group I to the Fifth Assessment Report of the Intergovernmental Panel on Climate Change.
Udo. K. and Takeda. Y. (2014). Evaluation of uncertainty in the future prediction of the disappearance of sandy beaches through sea level rise, Proceedings of the Japan Society of Civil Engineers,
G (Environment), vol. 70, No. 5, pp. 101-110. Renard K.G., Foster G.R., Weesies G.A., McCool D.K.,
and Yoder D.C. (1997). Predicting soil erosion by water: a guide to conservation planning with the Revised Universal Soil Loss Equation (RUSLE). Handbook No. 703. US Department of Agriculture, 404pp.
227
Theoretical bifurcation stability for rivers with adjusting widths
Erik Mosselman1,2
1 Department of Hydraulic Engineering, Faculty of Civil Engineering and Geosciences, Delft University of Technology,Delft, The Netherlands. [email protected]
2 Department of River Dynamics and Inland Waterway Transport, Deltares, Delft, The [email protected]
1. IntroductionWang et al (1995) studied the stability of riverbifurcations theoretically in a nonlinear phase-planestability analysis. They represented the systemmathematically in one dimension by Chézy’s equationfor steady uniform flow, continuity equations for waterdischarge and sediment load, a capacity-based sedimenttransport predictor qs = mu
b and an empirical nodal pointrelation Qs1/Qs2 = (Q1/Q2)
k(B1/B2)1-k for the division of
sediment transport over branches 1 and 2 downstream ofthe bifurcation. Here qs denotes sediment transport rateper unit width, m is a coefficient, u denotes depth-averaged flow velocity, Qs denotes sediment transportrate, Q denotes discharge, B denotes river width and b
and k are exponents. Physical realism requires p > 0 andb > 3. River width was assumed constant in all riverbranches. In further elaboration, Wang et al (1995)simplified the nodal point relation into Qs1/Qs2 =(Q1/Q2)
k. The present abstract extends their analysis to asystem in which river width responds instantaneously todischarge according to B = Q in the downstreambranches and according to B0 = 21- Q0 in the riverupstream. Traditional regime width predictors use =0.5 whereas = 0 represents constant widths as in theoriginal analysis by Wang et al (1995). The factor 21- inthe relation for B0 conveniently arranges that the flowdepth of two identical bifurcated branches in theequilibrium state equals the flow depth upstream, h0.
2. Linearized set of equationsSediment balances are formulated for the downstreamriver branches by assuming a rigid lid at the watersurface and by assuming that erosion and sedimentationare spread evenly over the bed area of a branch withlength L and width B. The nodal point relation governsthe input of sediment into each branch whereas thecapacity-based sediment transport predictor governs theoutput. Linearization of the equations around theequilibrium or critical point (h0, h0) results in temporalevolution equations for flow depth, h, in the twobranches:
0 0
1
1 002
2 02 0 0
,
d
dd 2 1
d
s
h h
h
h hR SQt
h hh S RB Lh
t
(1)with
3 3R b k b (2)
3 3 3 1S b k b (3)
3. SolutionsThe set of linear equations has nontrivial solutions if the
determinant ofR S
rIS R
equals zero. This yields
roots r1,2 = 2R ± 2S. As the roots are real, no periodicsolutions arise. At least one of the roots is negative,representing stability, if R < 0. This corresponds tok > – (1- )b/3. Any combination of k > 0 and b > 3satisfies this relation as long as ½, which means thatthe equilibrium or critical point can only be anasymptotically stable node or an unstable saddle point,not an unstable repeller. Unstable repellers do becomepossible, however, for certain combinations of k and b if
> ½.Assuming at least one root negative, the second root isalso negative if the determinant of the original equationis positive: R
2 – S2 > 0. The equilibrium or critical point
is then an asymptotically stable node. For = 0 thisleads to the original stability condition of Wang et al(1995): k > b/3. For = ½ the stability conditionbecomes k > b(10b – 6)/(15b-9). This implies that morecombinations of b and k produce an unstable saddlepoint and fewer combinations produce an asymptoticallystable node. Bifurcations in rivers with adjusting widthsare hence less stable than bifurcations in rivers withconstant width.
4. DiscussionThe assumption of instantaneous width adjustment is asimplification. In particular narrowing in response todecreasing discharges may exhibit time lags. Theanalysis is valid for assessing initial stability, because k
often changes as a bifurcation evolves.
5. ConclusionsThe nonlinear phase-plane stability analysis of riverbifurcations by Wang et al (1995) has been extended torivers with adjusting widths. Bifurcations are found tobe less stable in rivers with adjusting widths than inrivers with constant widths.
References
Wang, Z.B., R.J. Fokkink, M. de Vries & A. Langerak(1995), Stability of river bifurcations in 1Dmorphodynamic models. J. Hydr. Res., IAHR,Vol.33, No.6, pp.739-750.

228
Effects of dam construction on the Ribb River bed topography
C.A. Mulatu1, 2 and A. Crosato1, 3
1 Department of Water Science Engineering, UNESCO-IHE, Delft, The Netherlands.
2 Faculty of Civil and Water Resources Engineering, Bahir Dar University, Bahir Dar, Ethiopia. [email protected]/[email protected]
3 Faculty of Civil Engineering and Geoscience, Delft University of Technology, Delft, The Netherlands. [email protected]
1. Introduction Dam construction affects the discharge regime and the sediment transport of rivers (e. g. Williams & Wolman, 1984). Dams reduce the annual peak discharges (Graf, 2006) and may store all sediment or a large part of it. The downstream river reach adjusts its morphology to the new conditions. This involves changes in planform, slope, width, depth and sediment characteristics through time. The Ribb River is located in the North Western part of Ethiopia where it drains to Lake Tana. A 73 m high dam and a diversion weir 30 km downstream are under construction to irrigate 15,000 ha of land (WWDSE & TAHAL, 2007). The river reach downstream of the dam is 77 km long. This part of the river is strongly affected by flooding, pump irrigation, sand mining and backwater effects from Lake Tana and will be even more impacted by Ribb Dam operations. Lake Tana level was regulated for hydropower production at a higher elevation between the years 1995 and 2001, at a lower elevation between the years 2001 and 2010 and then to a higher elevation again. Embankments have been constructed in the lower part of the river for flood prevention. The objective of this study is to analyse the effects of the dam on downstream river bed topography and channel alignment. This work presents the assessment of pre-dam morphological trends of the river. 2. Methodology The work involves new field data collection and analysis as well as the study of past morphological changes based on historical maps, satellite images and aerial photographs. The time series staff gauge height versus discharge data and bed level at the old automatic water level measuring station near the Ribb Bridge are used to determine river bed and levee development at that location. The time scale formula derived by de Vries ( 1975) is applied to analyse the effects of lake level regulation on river channel elevation along the river reach. The physics-based numerical model MIANDRAS (Crosato, 1987) is applied to compare the theoretical 2D equilibrium bed topography with the observed one and to analyse planimetric change trends. A solution of the De St Venant equations for curved flow are used for the mathematical description of flow velocity and water depth. Planimetric changes are simulated assuming that the lateral shift of the channel centreline is a function of near-bank water depth and flow velocity excess with respect to reach-averaged uniform flow.
3. Preliminary results Downstream of the dam location, the Ribb is a meandering river having a sinuosity of 1.75. The slope ranges from 0.18% to 0.03%. In the last 46 km, the river is characterized by a sand bed with D50 varying from 0.035 mm to 1 mm. The discharge hydrograph at the Ribb Bridge shows that 88 % of the flow occurs between the months of June and September with a yearly average discharge of 15 m3/s. The bankfull discharge of 115 m3/s has been estimated based on the frequency analysis with a return period of 1.5. However, field data show that the bankfull condition occurs for higher values of the discharge, namely 145 to 165 m3/s. Data show that the river bed rose by 2.2 m and 0.7 m between 1980 and 1995 and between 1995 and 2010, respectively. One of the reasons for high river bed aggradation between the years 1980 and 1995 may be the occurrence of new channel excavation (small-scale avulsion) 18 km upstream of the gauging station. Satellite image analysis shows that the Ribb River channel shifted 19 km upstream of Lake Tana forming a new outlet in 2008. This may be associated with Lake Tana level variation as 50% of its effect already reached that location in the year De Vries (1975). 4. Acknowledgements The first author would like to thank NUFFIC for financial support. He is currently working his PhD at UNESCO-IHE, Delft. Reference Crosato, A. (1987). Simulation model of meandering
processes of rivers. Euromech 215 Conference,
Univ. of Genoa, Genoa, Italy. De Vries. (1975). A morphological time scale for
rivers. Paper presented at the In Proc. 16th Congr.
IAHR, São Paulo, Brazil. Graf. (2006). Downstream hydrologic and
geomorphic effects of large dams on American rivers. Geomorphology, 79(3), 336-360.
Williams, & Wolman. (1984). Downstream effects of dams on alluvial rivers. Washington, D.C. 20402: U.S. Government Printing Office.
WWDSE, & TAHAL. (2007). Ribb Dam Hydrological Study (Final Report). Addis Ababa,
Ethiopia: Water Works Design and Supervision Enterprise and TAHAL Consulting Engineers Ltd.

229
River dune morphodynamics at the grain scale
S. Naqshband1, A.J.F. Hoitink2 and B.McElroy3
1 Department of Environmental Sciences, Wageningen University, Wageningen, Netherlands.
[email protected] 2 Department of Environmental Sciences, Wageningen University, Wageningen, Netherlands. [email protected]
3 Department of Geology and Geophysics, University of Wyoming, Laramie, USA. [email protected]
1. Introduction Dunes are common bedforms in sand bed rivers and estuaries. During floods in several rivers (e.g., the Elkhorn, Missouri, Niobrara, and Rio Grande), dunes are observed to grow rapidly as flow strength increases, undergoing an unstable transition regime, after which they are washed out in what is called upper stage plane bed. This morphological evolution of dunes to upper stage plane bed is the strongest bed-form adjustment during time-varying flow and is associated with a significant change in hydraulic roughness and water levels (Nelson et al., 2011; Van Duin, 2015). Much work has been done historically and recently to understand and quantify dune morphology and dune evolution. A majority of these studies has focused on dune morphodynamics under relatively low flow conditions with saltation being the dominant mode of sediment transport. Dune transition to upper stage plane bed, however, is associated with sediment transport that occurs predominantly in suspension (Naqshband et al., 2014). In addition, the distribution of suspended grain travel distances (excursion lengths) are expected to play an important role in determining dune morphology and dune transition to upper stage plane bed (Naqshband et al., under review). In contrast to saltating grains that hop over relatively short distances close to the bed (up to hundreds of grain diameters), grains in suspension travel much larger distances, once they are picked up from the bed (typically several meters in flumes, and potentially up to hundreds of kilometres in natural rivers). This makes direct measurements of suspended grain motions very challenging. Therefore, empirical relationships between suspended grain travel distances (excursion lengths) and flow conditions remain largely unexplored. In the present study, we were able to quantify the exact motion of suspended grains and their travel distances by using a series of 8 video cameras. Experiments were carried out in a recirculating plexiglass flume at the University of Wyoming (Figure 1).
Preliminary results Our measurements of particle motion over a fixed, flat bed showed that excursion lengths increase with increasing flow strength (decreasing Rouse numbers P). Furthermore, distributions of excursion lengths are observed to become wider with decreasing Rouse numbers. For relatively high Rouse numbers indicating a bedload dominant transport regime, measured excursion lengths closely follow a Gaussian distribution, with distributions being symmetric around their mean values,
and mean values, coinciding with the modes. For P=2.5, bedload and suspended load transport modes are equally represented and particle motion is governed both by turbulence and gravity (via settling velocities). Consequently, measured excursion lengths exhibit a bi-modal distribution with two distinct peaks. As turbulent fluctuations increase and dominate the particle motion over gravity, distributions of excursion lengths return to unimodal and become negatively-skewed with mean values deviating from the modes.
Figure 1. Experimental set-up of the Plexiglas flume (top) and installed series of 8 synchronized video cameras recording travel paths of fluorescent painted particles under black light (bottom), after Naqshband et al. (under review). References
Naqshband S., J. S. Ribberink, and S. J. M. H. Hulscher
(2014). Using both free surface effect and sediment transport mode parameters in defining the morphology of river dunes and their evolution to upper stage plane beds. J. of Hydrauli. Eng., 140(6), 06014010. 10.1061/(ASCE)HY.1943-7900.0000873.
Naqshband, S., McElroy, B. and Mahon, R.M (under review). Validating a universal model of particle transport lengths with laboratory measurements of suspended grain motions.
Nelson, J. M., B. L. Logan, P. J. Kinzel, Y. Shimizu, S. Giri, R. L. Shreve, and S. R. McLean (2011). Bedform response to flow variability. Earth. Surf.
Landforms, 36 (14), 1938-1947. Van Duin, O.J.M. (2015). Sediment transport processes
in dune morphology and the transition to upper-plane stage bed. PhD Thesis, University of Twente, Enschede, The Netherlands.

230
Numerical experiments on the effect of channel curvature and unsteady flow onbed morphology and bed-surface sorting
Peter A. Nelson1 and Ryan A. Brown2
1 Department of Civil and Environmental Engineering, Colorado State University, Fort Collins, Colorado, USA.
[email protected] Department of Civil and Environmental Engineering, Colorado State University, Fort Collins, Colorado, USA.
1. IntroductionMeandering gravel-bed rivers tend to develop point bars
on the insides of their bends. The surface of these bars
tends to be fine grained, while the adjacent pools tend
to be coarse grained, a phenomenon generally thought
to be due to curvature-generated helical flow patterns.
Here, our objectives are to build upon this understand-
ing by systematically exploring how channel curvature
and unsteady flow affect patterns of bed topography and
bed surface sorting in meandering channels. We do this
by conducting a series of numerical experiments using a
two-dimensional morphodynamic model where we sup-
ply steady and unsteady flows to channels of varying cur-
vature and compare the equilibrium topographic and sort-
ing patterns.
2. MethodsWe conducted numerical simulations with the two-
dimensional morphodynamic model Nays2DH, which is
included in the iRIC suite of models (Nelson et al., 2016).
Simulations were performed for meandering channels
with centerlines that follow a sine-generated trace, with
crossing angles ranging from 0 (straight) to 40. The
channels have a constant width of 1.35 m, and consist of
six complete meander wavelengths of 12.15 m, as well as
3-meter-long straight entrance and exit reaches. The sed-
iment mixture in the models was a unimodal distribution
ranging from 1 mm to 8 mm, with a D50 of 4 mm and ge-
ometric standard deviation of 1.6. Water discharge (Qw)
was either held constant at 0.07 m3/s or was a repeated tri-
angular hydrograph linearly varying between 0.0026 and
0.13 m3/s and back over 1800 s.
Figure 1. Elevation change from an initially flat bed, for
the channel with crossing angle ω = 20. (a) - (c) are
from the unsteady flow run ((a) Qw = 0.026 m3/s, (b)
Qw = 0.07 m3/s, Qw = 0.13 m3/s) and (d) is from the
constant-discharge run (Qw = 0.07 m3/s).
3. Results and DiscussionAll simulations conducted in meandering channels devel-
oped point bars downstream of the apex of the inner bend.
In general, as the crossing angle ω increased in the con-
stant discharge runs, the amplitude of the point bars in-
creased, but the bed surface sorting patterns did not differ
appreciably between channels.
The bed morphology did not substantially change over the
course of an individual hydrograph (Figure 1a - 1c). The
overall amplitude of the bars that developed during un-
steady flow runs was similar to that of bars that devel-
oped during constant flow runs (Figure 1d), but the bars
in the constant discharge run are located slightly upstream
of those from the hydrograph runs, and the bar tops are
not as flat.
During the hydrograph runs, the bed-surface grain size
exhibited more dynamism than the bed topography (Fig-
ure 2a - 2c). As the discharge increased during the
rising limb of the hydrograph, zones of fine sediment
expanded and then shrank, while coarse zones became
slightly wider at peak discharge.
Figure 2. Mean surface grain size, for the channel with
crossing angle ω = 20. (a) - (c) are from the unsteady
flow run ((a) Qw = 0.026 m3/s, (b) Qw = 0.07 m3/s,
Qw = 0.13 m3/s) and (d) is from the constant-discharge
run (Qw = 0.07 m3/s).
4. ConclusionsOur numerical simulations suggest that meandering chan-
nels can quickly adjust to unsteady flow conditions by ad-
justing the bed surface grain size while leaving bar mor-
phology largely unchanged. The next step will be to see
how these channels accommodate changes in upstream
sediment supply, which we plan to address with ongoing
numerical modeling and flume experiments.
AcknowledgmentsThis work was supported by the U.S. National Science
Foundation (Grant EAR-1455259).
ReferencesNelson, J. M., Shimizu, Y., Abe, T., Asahi, K., Gamou,
M., Inoue, T., Iwasaki, T., Kakinuma, T., Kawamura,
S., Kimura, I., Kyuka, T., McDonald, R. R., Nabi, M.,
Nakatsugawa, M., Simões, F. R., Takebayashi, H., and
Watanabe, Y. (2016). The international river interface
cooperative: Public domain flow and morphodynamics
software for education and applications. Advances in
Water Resources, 93:62–74.
231
Role of Grainsize Sorting in the Long-term Morphodynamics of Sedimentary
Systems
M. Nones1, G. Di Silvio2
1 Research Centre for Constructions - Fluid Dynamics Unit, University of Bologna, Italy; via del Lazzaretto 15/5, 40131
Bologna, Italy, [email protected] 2 Department of Civil, Architectural and Environmental Engineering, University of Padua, Italy
1. Extended abstract A long-standing question of fluvial morphology is the typical configuration of rivers exhibiting (apart from possible lithological discontinuities) a concave profile associated to a granulometric fining in the downstream direction. Neglecting the (rarely plausible) abrasion phenomenon, the accepted description for such a configuration is represented by the structure of any transport formula, indicating - for a given water and sediment discharge - a direct relationship between the sediment grainsize and the bottom slope. However, while this relationship is compatible with the overall mass balance of sediments along the river, it doesn't satisfy the continuity of each single grainsize fraction in morphological equilibrium conditions. Indeed, as shown by experiments in laboratory flumes, a concave and progressively finer bottom profile tends eventually to evolve towards a uniform slope and a uniform grainsize composition. Although perforce in non-equilibrium, the ordinary concave profile and fining granulometry of rivers show an extremely slow evolution at historical and even geological scale, namely a quasi-equilibrium configuration. The modelling of this evolution needs a simplified approach, which should address the involved physical processes to ensure a reliable estimation of grainsize classes movements along rivers at basin scale, assuring, at the same time, a reduced computational effort. In the present work, a physically-based, 0-D, two-reaches, two-grain-size hydro-morphological model (Franzoia, 2014) is presented, describing the simplifications adopted and highlighting the importance to study the long-term evolution of river basins. This modelling approach gives reason of the extremely slow evolution of alluvial rivers and provides a quantitative approach to evaluate their response time to changing boundary conditions. Differently from previous 1-D formulations applied by the same authors (Di Silvio and Nones, 2014), the response time appears here to be affected, among others, by the grain-size composition of the sediment input. The model is applied to many watercourses to evaluate strengths and weaknesses in reproducing the long-term evolution of real alluvial rivers, and to point out the fining processes that affect sediments during their path from the mountain slopes to the sea or the lagoon. 2. Conclusions The model points out the basin-scale long-term evolution of two significant morphological quantities:
the non-dimensional concavity and fining as a function of the non-dimensional time. For all the rivers, regardless their size, morphometry and input of water and sediments, the model confirms that the evolution presents three phases: first, a relatively short adaptation phase following the orogeny; second, a much longer phase of quasi-equilibrium, characterised by the concavity and fining in the present conditions; third, an even longer phase of slow evolution towards the theoretical equilibrium conditions of the river (uniform slope and uniform granulometry, corresponding to an hypothetical constant input of sediments and water from the watershed slopes). It is interesting to note that the grainsize sorting plays a fundamental role in the long-term evolution of other sedimentary systems, besides the alluvial rivers. For instance, tidal lagoons with negligible water-and sediment-input from inland, like the Lagoon of Venice, generally present a negative spatial gradient in the inland direction of both the time-averaged sediment concentration and the granulometric bottom composition. However, in the hypothesis of sediment fluxes controlled by intertidal dispersion, the presence of a gradient cannot represent a real equilibrium condition. In fact, in analogy with the alluvial rivers, the actual tidal lagoons correspond to a quasi-equilibrium condition. And, like the rivers, they will evolve, at an extremely long time-scale, towards a theoretical equilibrium condition represented by a uniform sediment concentration and bottom granulometry. This, again, under the assumption that the external forcing (in this case the conditions at the sea boundary) will remain constant in time (Bonaldo and Di Silvio, 2013) References Bonaldo, D. and Di Silvio, G. (2013). Historical
evolution of a micro-tidal lagoon simulated by a 2-D schematic model. Geomorphology 201, 380-396. doi: 10.1016/j.geomorph.2013.07.012
Di Silvio, G. and Nones, M. (2014). Morphodynamic reaction of a schematic river to sediment input changes: analytical approaches. Geomorphology 215, 74-82. doi: 10.1016/j.geomorph.2013.05.021.
Franzoia, M. (2014). Sediment yield in rivers at different time-scales. PhD Thesis, University of Padua, Italy. http://paduaresearch.cab.unipd.it/6382.
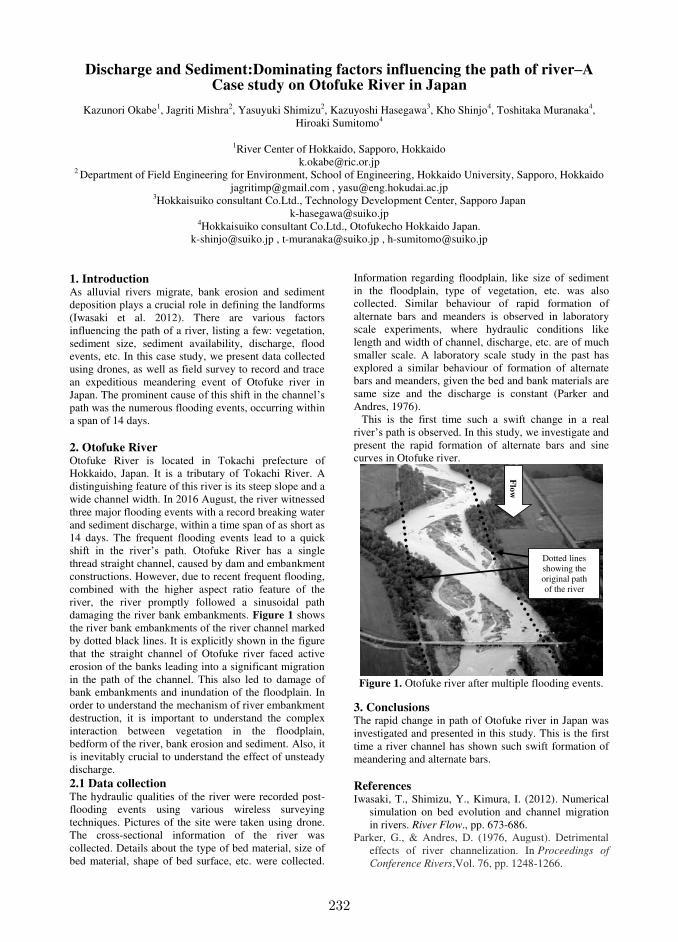
232
Discharge and Sediment:Dominating factors influencing the path of river–A Case study on Otofuke River in Japan
Kazunori Okabe1, Jagriti Mishra2, Yasuyuki Shimizu2, Kazuyoshi Hasegawa3, Kho Shinjo4, Toshitaka Muranaka4,
Hiroaki Sumitomo4
1River Center of Hokkaido, Sapporo, Hokkaido [email protected]
2 Department of Field Engineering for Environment, School of Engineering, Hokkaido University, Sapporo, Hokkaido [email protected] , [email protected]
3Hokkaisuiko consultant Co.Ltd., Technology Development Center, Sapporo Japan [email protected]
4Hokkaisuiko consultant Co.Ltd., Otofukecho Hokkaido Japan. [email protected] , [email protected] , [email protected]
1. Introduction As alluvial rivers migrate, bank erosion and sediment deposition plays a crucial role in defining the landforms (Iwasaki et al. 2012). There are various factors influencing the path of a river, listing a few: vegetation, sediment size, sediment availability, discharge, flood events, etc. In this case study, we present data collected using drones, as well as field survey to record and trace an expeditious meandering event of Otofuke river in Japan. The prominent cause of this shift in the channel’s path was the numerous flooding events, occurring within a span of 14 days.
2. Otofuke River Otofuke River is located in Tokachi prefecture of Hokkaido, Japan. It is a tributary of Tokachi River. A distinguishing feature of this river is its steep slope and a wide channel width. In 2016 August, the river witnessed three major flooding events with a record breaking water and sediment discharge, within a time span of as short as 14 days. The frequent flooding events lead to a quick shift in the river’s path. Otofuke River has a single thread straight channel, caused by dam and embankment constructions. However, due to recent frequent flooding, combined with the higher aspect ratio feature of the river, the river promptly followed a sinusoidal path damaging the river bank embankments. Figure 1 shows the river bank embankments of the river channel marked by dotted black lines. It is explicitly shown in the figure that the straight channel of Otofuke river faced active erosion of the banks leading into a significant migration in the path of the channel. This also led to damage of bank embankments and inundation of the floodplain. In order to understand the mechanism of river embankment destruction, it is important to understand the complex interaction between vegetation in the floodplain, bedform of the river, bank erosion and sediment. Also, it is inevitably crucial to understand the effect of unsteady discharge. 2.1 Data collection The hydraulic qualities of the river were recorded post- flooding events using various wireless surveying techniques. Pictures of the site were taken using drone. The cross-sectional information of the river was collected. Details about the type of bed material, size of bed material, shape of bed surface, etc. were collected.
Information regarding floodplain, like size of sediment in the floodplain, type of vegetation, etc. was also collected. Similar behaviour of rapid formation of alternate bars and meanders is observed in laboratory scale experiments, where hydraulic conditions like length and width of channel, discharge, etc. are of much smaller scale. A laboratory scale study in the past has explored a similar behaviour of formation of alternate bars and meanders, given the bed and bank materials are same size and the discharge is constant (Parker and Andres, 1976).
This is the first time such a swift change in a real river’s path is observed. In this study, we investigate and present the rapid formation of alternate bars and sine curves in Otofuke river.
Figure 1. Otofuke river after multiple flooding events.
3. Conclusions The rapid change in path of Otofuke river in Japan was investigated and presented in this study. This is the first time a river channel has shown such swift formation of meandering and alternate bars. References Iwasaki, T., Shimizu, Y., Kimura, I. (2012). Numerical
simulation on bed evolution and channel migration in rivers. River Flow., pp. 673-686.
Parker, G., & Andres, D. (1976, August). Detrimental effects of river channelization. In Proceedings of
Conference Rivers,Vol. 76, pp. 1248-1266.
Flo
w
Dotted lines showing the original path of the river

233
Insights on Morphological Patterns at River Contractions
G. Oliveto1
1 School of Engineering, University of Basilicata, Potenza, Italy. [email protected]
1. Introduction River contractions typically occur as a result of either natural restraints (e.g. landslides, debris accumulations, longitudinal bars, confluences) or hydraulic works (e.g. bridge embankments, lateral banks, spur dikes). In case of subcritical flows, the flow velocity increases through the contraction reach and scouring processes and bed degradation can develop. Straub in 1934 was probably the first to suggest a one-dimensional model for long contractions based on the DuBoys’ transport formula and the Manning’s equation. Many equations have been suggested afterwards, most of which were derived from Straub’s approach (e.g. Komura 1966; Gill 1981). More recently, Dey and Raikar (2005) considered long contractions with uniform and non-uniform sediments. They provided the experimental data for 131 runs under clear-water scour. However, the available experimental data to support the existing predictive models are still limited and, more importantly, the majority of literature studies focuses on the maximum scour depth lacking a more detailed characterization of the bed morphology. Based on several experiments at laboratory scale, this paper aims to provide new insights on the spatial and temporal changes of the bed morphology with emphasis on: the local scour at inlet contraction, morphological features of the thalweg line that typically develops along the channel axis, and the potential bed degradation downstream of the contracted region. 2. Experiments Experiments were carried out at University of Basilicata, Italy, in a 1 m wide and 20 m long rectangular channel. The working section was up to 16 m long depending on the contraction model length. Two nearly-uniform bed materials were tested, sand with median grain size d50=1.7 mm and gravel with d50=9.0 mm. The sand was used to simulate transition conditions in the field at the interface sediment-water while the gravel hydraulically rough conditions, according to the Shields’ diagram. The contraction model was made of three parts. The middle one was straight-lined and either 0.5, 1.0, 2.0, or 3.0 m long, entrance and outlet parts were almost streamlined to minimize energy losses and reduce local scour effects. Three contraction ratios β= b/B=0.9, 0.8, and 0.7 were tested with b width of the contracted reach (in its middle part) and B width of the uncontracted approach channel. All the experiments were conducted under initial plane bed, steady flow, and clear-water approach flow. Runs typically lasted some days to achieve well-deepen bed morphologies, but runs of short duration (few hours) were also carried out to obtain reliable experimental data at the earlier scour stages. A total of 22 runs were performed. Figure 1 shows free surface characteristics for a run with long contraction and the observed bed forms at the contraction inlet at the earlier stages of the same run.
Figure 1. (Top) Free surface characteristics for a run
with long contraction. The direction of the flow is from the bottom to the top; (bottom) bed forms at the
contraction inlet at the earlier stages of the same run. The direction of the flow is from left to right.
3. Analysis of data and Conclusions
Experimental observations revealed that the channel contraction would induce a single thalweg line that normally develops along the channel axis, and could extend significantly downstream of the contracted region for a length up to three times the contraction length mainly depending on the approach densimetric Froude number Fd and the relative submergence h/d50, with h approach flow depth. Moreover, the thalweg line tends to be deeper as the contracted reach is longer, and this facet has not received much attention in literature so far. Also the magnitude of the scour holes at the contraction inlet would amplify as the contraction length increases, and this effect could be explained by the interaction between the local and contraction scour phenomena. Finally, based on multi-regression analysis straightforward equations are proposed in terms of governing dimensionless parameters to predict the temporal development of the main morphological patterns.
References Dey, S. and Raikar, R.V. (2005). Scour in long
contractions. J. Hydraul. Eng.-ASCE 131(12): 1036-1049. doi: 10.1061/(ASCE)0733-9429(2005)131:12 (1036).
Gill, M.A. (1981). Bed erosion in rectangular long contraction. Journal of the Hydraulics Division 107(3): 273-284.
Komura, S. (1966). Equilibrium depth of scour in long constrictions. Journal of the Hydraulics Division 92(5): 17-37.
234
Equilibrium scour morphology downstream of rock sills under unsteady flow conditions
S. Pagliara1 and M. Palermo2
1 DESTEC-Department of Energy Systems, Territory and Construction Engineering, University of Pisa, Pisa, Italy.
[email protected] 2 DESTEC-Department of Energy Systems, Territory and Construction Engineering, University of Pisa, Pisa, Italy.
1. Introduction The analysis of scour mechanism downstream of grade-control structures is one of the most important topic for a river engineer. Grade-control structures are generally used to control sediment transport and at the same time they are able to create suitable conditions for fish species. The conjugation of these last two aspects is one of the main problems that in the last decades have become more and more significant due to the increasing sensibility for environmental sustainability. Therefore, beside of the traditional concrete grade-control structures, low-environmental impact structures (e.g., block ramps, rock weirs, W-weir, J-hook, rock sills, etc.) have become more and more popular. This occurrence led scientists to develop strategies and find criteria to correctly design such type of structures. In particular, hydraulic engineers’ efforts aimed to understand the complex hydraulic functioning of structures made of stones and to provide relationships by which it could be possible to foresee the main lengths of the equilibrium scour morphologies (among others, Bormann and Julien, 1991; D’Agostino and Ferro, 2004; Pagliara and Palermo 2013; Pagliara et al., 2016). They showed that the scour geometry mainly depends on the following parameters: structure geometry, hydraulic conditions, channel bed configuration and stilling basin material. Furthermore, they showed that rock-structures generally determines advantages in terms of energy dissipation, i.e., the dissipative mechanisms are different from traditional concrete structures (e.g., dams or check dams), resulting in an increase of the energy dissipation for identical hydraulic conditions. Nevertheless, all the mentioned studies are relative to steady flow conditions, i.e., to the authors’ knowledge there are no studies in literature dealing with the analysis of the scour morphology evolution under unsteady flow conditions in the presence of low-environmental impact structures. Therefore, the aim of the present paper is to compare and discuss both the scour evolution and the equilibrium scour morphology downstream of rock sills (both straight and arch-shaped), by putting in evidence the similitudes and differences characterizing the final scour configurations due to unsteady flow conditions and steady flow conditions (i.e., under constant discharge equal to the peak discharge of the respective unsteady cases). 2. Experimental set-up Experimental tests were conducted in a dedicated flume in which different rock sills were located. Namely, the adopted rock sills were made of crushed stones and
shaped differently (i.e., straight and arch-shaped). Both hydraulic conditions and downstream water level effects on scour morphology were investigated. Furthermore, preliminary tests were conducted under constant discharge, allowing for the estimation of the reference values of the main scour characteristics, i.e., zmax (maximum scour hole depth) and ls (axial scour hole length). In addition, the scour evolution was also monitored, by measuring the maximum scour depth at different instants (zmax(t)) from the test beginning. Once the reference tests had been performed (i.e., tests under constant discharge), experiments were repeated varying the inflow conditions, i.e., under unsteady flow conditions, keeping the peak discharge equal to that of the corresponding reference base tests. This methodology allowed for a direct comparison of the obtained equilibrium morphologies revealing both the similitudes and differences due to different inflow conditions. 3. Conclusions The experimental evidences allowed to establish that equilibrium scour morphology under unsteady flow conditions can exhibit substantial similitudes with the corresponding morphologies obtained under steady flow conditions when the total hydrograph duration is enough long. Namely, it was observed that there is a minimum time for the peak discharge to occur in order to get the same equilibrium morphology of an event with constant discharge equal to peak discharge. References Bormann, E., and Julien, P. Y. (1991). Scour
downstream of grade control structures. J. Hydraul.
Eng.-ASCE 117: 579-594. doi: 10.1061/(ASCE)0733-9429(1991)117:5(579).
D’Agostino, V., and Ferro, V. (2004). Scour on alluvional bed downstream of grade-control structures. J. Hydraul. Eng.-ASCE 130: 1-14. doi: 10.1061/(ASCE)0733-9429(2004)130:1(24).
Pagliara, S., Mahmoudi Kurdistani, S., Palermo, M., and Simoni, D. (2016). Scour due to rock sills in straight and curved horizontal channels. J. Hydro-environ.
Res. 10: 12-20. doi: 10.1016/j.jher.2015.07.002. Pagliara, S., and Palermo, M. (2013). Rock grade
control structures and stepped gabion weirs: scour analysis and flow features. Acta Geophys. 61: 126-150. doi: 10.2478/s11600-012-0066-0.
235
Hydraulic jump in curved rivers: analysis of the dissipative process
M. Palermo1 and S. Pagliara2
1 DESTEC-Department of Energy Systems, Territory and Construction Engineering, University of Pisa, Pisa, Italy.
[email protected] 2 DESTEC-Department of Energy Systems, Territory and Construction Engineering, University of Pisa, Pisa, Italy.
1. Introduction Hydraulic jump is an important phenomenon which usually occurs in correspondence with hydraulic structures. Its features should be carefully analysed due to its capacity to dissipate a huge amount of energy, which can eventually lead to a collapse or serious damage of the structure. Therefore, this phenomenon has received a particular attention (Pagliara and Palermo, 2010; Pagliara et al., 2009). Although it is one of the most classical and (apparently) known hydraulic phenomenon, there are still several issues which require a detailed and specific analysis. In fact, most of the predicting relationships are valid for particular cases, which are not covering all the possible configurations for which the mentioned phenomenon can occur (Pagliara and Palermo, 2011). Furthermore, the bi-phasic nature of the hydraulic phenomenon amplifies the uncertainties in evaluating and estimating the hydraulic jump features. For example, the air entrainment process contributes to modify the effective conjugate depths resulting, in general, in a reduction of the conjugate depth ratio respect to that predicted by adopting mono-phasic approach. This last aspect has been put in evidence only by recent studies (Pagliara and Palermo, 2015; Palermo and Pagliara, 2017), which analysed the hydraulic jump on rough beds in several configurations, i.e., hydraulic jump occurring both on sloping and adverse-sloped beds. Another aspect which still requires a relevant effort is the understanding of the dissipative process for hydraulic jumps occurring in curved rivers. Namely, very few studies analysed this aspect, as they mainly focused on the prediction of the conjugate depth ratio and hydraulic jump length (Carollo et al., 2007). In addition, the hydraulic jump features were only analysed in correspondence with fixed curved channel bed, i.e., a condition which is quite far from that occurring downstream of a hydraulic structure located in a curved river branch. 2. Experimental set-up The present paper probably constitutes the first attempt to analyse the dissipative phenomenon occurring in curved channels in the presence of a mobile bed. Therefore, a dedicated laboratory model was built and several structures were located in it. Namely, four block ramps were located in a channel characterized by three different curved branches, i.e., a first curved branch (whose curvature radius is R1=11 m), a second straight branch (whose curvature radius R2 is equal to infinity) and a third curved branch (whose curvature radius is R3=6 m). The water discharge and tailwater levels were varied in order to test different hydraulic conditions and
both the water level and bed morphology were surveyed when the scour equilibrium morphology was reached. 3. Conclusions The analysis of experimental evidences allowed to establish that the hydraulic jump properties are significantly affected by both upstream flow conditions (i.e., they depend on the upstream branch curvature) and by the stilling basin curvature. Namely, an increase of the hydraulic jump three-dimensionality was observed in correspondence with lower channel branch curvature, resulting in a more prominent three-dimensionality of the equilibrium scour morphology. The analysis was extended to the dissipative mechanism, focusing on the development of a predicting relationship by which it is possible to estimate the energy dissipation between the upstream and the downstream sections of the jump. Finally, a comparison between the dissipative mechanisms occurring in straight and curved channel in the presence of mobile bed was conducted. The results of the present paper could be helpful for stilling basin design and optimization. References Carollo, F. G., Ferro, V., and Pampalone, V. (2007).
New solution of classical hydraulic jump. J. Hydraul.
Eng.-ASCE 135: 527-531. doi: 10.1061/(ASCE)HY.1943-7900. 0000036.
Pagliara, S., Palermo, M., and Carnacina, I. (2009). Scour and hydraulic jump downstream of block ramps in expanding stilling basins. J. Hydraul. Res. 47: 503-511. doi: 10.1080/00221686.2009.9522026.
Pagliara, S., and Palermo, M. (2010). Influence of tailwater depth and pile position on scour downstream of block ramps. J. Irrig. Drainage Eng-ASCE. 136: 120-130. doi: 10.1061/(ASCE)IR.1943-4774.0000132.
Pagliara, S., and Palermo, M. (2011). Effect of Stilling Basin Geometry on Clear Water Scour Morphology Downstream of a Block Ramp. J. Irrig. Drainage
Eng-ASCE. 137: 593-601. doi: 10.1061/(ASCE)IR.1943-4774.0000331.
Pagliara, S., and Palermo, M. (2015). Hydraulic jumps on rough and smooth beds: Aggregate approach for horizontal and adverse-sloped beds. J. Hydraul. Res.
53: 243-252. doi: 10.1080/00221686.2015.1017778. Palermo, M., and Pagliara, S. (2017). D-jump in rough
sloping channels at low Froude numbers. J. Hydro-
environ. Res. 14: 150-156. doi: 10.1016/j.jher.2016.10.002.
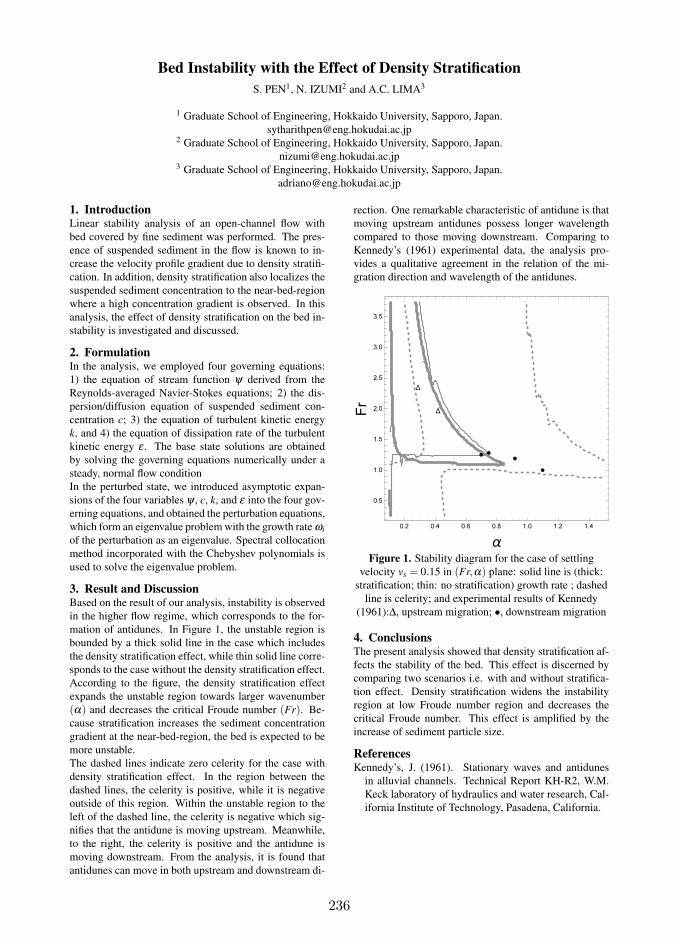
236
Bed Instability with the Effect of Density Stratification
S. PEN1, N. IZUMI2 and A.C. LIMA3
1 Graduate School of Engineering, Hokkaido University, Sapporo, Japan.
[email protected] Graduate School of Engineering, Hokkaido University, Sapporo, Japan.
[email protected] Graduate School of Engineering, Hokkaido University, Sapporo, Japan.
1. IntroductionLinear stability analysis of an open-channel flow with
bed covered by fine sediment was performed. The pres-
ence of suspended sediment in the flow is known to in-
crease the velocity profile gradient due to density stratifi-
cation. In addition, density stratification also localizes the
suspended sediment concentration to the near-bed-region
where a high concentration gradient is observed. In this
analysis, the effect of density stratification on the bed in-
stability is investigated and discussed.
2. FormulationIn the analysis, we employed four governing equations:
1) the equation of stream function ψ derived from the
Reynolds-averaged Navier-Stokes equations; 2) the dis-
persion/diffusion equation of suspended sediment con-
centration c; 3) the equation of turbulent kinetic energy
k, and 4) the equation of dissipation rate of the turbulent
kinetic energy ε . The base state solutions are obtained
by solving the governing equations numerically under a
steady, normal flow condition
In the perturbed state, we introduced asymptotic expan-
sions of the four variables ψ , c, k, and ε into the four gov-
erning equations, and obtained the perturbation equations,
which form an eigenvalue problem with the growth rate ωi
of the perturbation as an eigenvalue. Spectral collocation
method incorporated with the Chebyshev polynomials is
used to solve the eigenvalue problem.
3. Result and DiscussionBased on the result of our analysis, instability is observed
in the higher flow regime, which corresponds to the for-
mation of antidunes. In Figure 1, the unstable region is
bounded by a thick solid line in the case which includes
the density stratification effect, while thin solid line corre-
sponds to the case without the density stratification effect.
According to the figure, the density stratification effect
expands the unstable region towards larger wavenumber
(α) and decreases the critical Froude number (Fr). Be-
cause stratification increases the sediment concentration
gradient at the near-bed-region, the bed is expected to be
more unstable.
The dashed lines indicate zero celerity for the case with
density stratification effect. In the region between the
dashed lines, the celerity is positive, while it is negative
outside of this region. Within the unstable region to the
left of the dashed line, the celerity is negative which sig-
nifies that the antidune is moving upstream. Meanwhile,
to the right, the celerity is positive and the antidune is
moving downstream. From the analysis, it is found that
antidunes can move in both upstream and downstream di-
rection. One remarkable characteristic of antidune is that
moving upstream antidunes possess longer wavelength
compared to those moving downstream. Comparing to
Kennedy’s (1961) experimental data, the analysis pro-
vides a qualitative agreement in the relation of the mi-
gration direction and wavelength of the antidunes.
Figure 1. Stability diagram for the case of settling
velocity vs = 0.15 in (Fr,α) plane: solid line is (thick:
stratification; thin: no stratification) growth rate ; dashed
line is celerity; and experimental results of Kennedy
(1961):∆, upstream migration; •, downstream migration
4. ConclusionsThe present analysis showed that density stratification af-
fects the stability of the bed. This effect is discerned by
comparing two scenarios i.e. with and without stratifica-
tion effect. Density stratification widens the instability
region at low Froude number region and decreases the
critical Froude number. This effect is amplified by the
increase of sediment particle size.
ReferencesKennedy’s, J. (1961). Stationary waves and antidunes
in alluvial channels. Technical Report KH-R2, W.M.
Keck laboratory of hydraulics and water research, Cal-
ifornia Institute of Technology, Pasadena, California.

237
Quantifying the active channel dynamics in gravel bed rivers:a laboratory investigation
M. Redolfi1, W. Bertoldi1 and M. Tubino1
1Department of Civil, Environmental and Mechanical Engineering, University of Trento, Italy ([email protected])
1. IntroductionBraided rivers are highly dynamic environments, charac-
terized by a complex network of unstable channels and
ephemeral bars (Ashmore, 2013). The development of
remote sensing techniques allows for relatively easy, and
highly accurate morphological surveys at the reach scale
(e.g., Marcus and Fonstad, 2010). However, the pos-
sibility to obtain temporally frequent measurements, as
needed to capture the rapid morphological variations, is
still limited, especially at high flow.
Consequently, quantitative information about the dy-
namic properties of braided rivers is scarce. Specifically,
it is not clear to what extent the planform configuration
changes in time depending on the channel characteristics
and the flow conditions, and how to properly define the
associated timescales. With this work, we address this
problem through a set of laboratory experiments, taking
advantage to the more recent monitoring techniques.
2. MethodsWe used a 23 m-long mobile bed flume at the Hydraulic
Laboratory of the University of Trento. The channel gra-
dient was 0.01 and the bottom formed by a layer of well-
sorted sand with median diameter of 1 mm. We run
ten long-lasting experiments (duration between 20 h and
104 h), with two channel widths (0.8 m and 1.6 m) and
five different discharges (from 0.8 L/s to 2.4 L/s).
Time-lapse images were taken at regular intervals of
1 min using two SLR camera. Images were were automat-
ically orthorectified on the basis of ground-based control
points, and then fused to obtain a series of images that
covered a 7 m-long reach with resolution of 1 mm.
0
10
20
30
40
50
60
70
0 20 40 60 80 100 120 140
Flow
Figure 1. Result from the automatic image analysis
algorithm, showing: (i) the active area map (shaded
area); (ii) confluences and bifurcations (spots); (iii) the
active channel width (segments).
A recently method we developed (Redolfi et al., sub-
mitted) provided high-resolution maps of the active (i.e.
transporting sediment) area from the time-lapse images.
The method is based on differencing subsequent images,
is fully automated, and needs only minor calibration. We
then built a code that automatically identifies relevant
morphodynamic features, such as active channels, bifur-
cations, confluences (see Figure 1), and their evolution in
time.
3. Preliminary resultsWe first analyse how classic braiding indexes (Egozi and
Ashmore, 2008) such as the number of channels, bifurca-
tions and confluences, depend on channel width and water
discharge. This reveals how the braiding intensity tends
to increase with the flow, until the confinement due to the
presence of fixed banks begins to prevail.
Moreover, the continuous, long-term monitoring of the
braided network enables quantitative measurements of the
channel network dynamics. The associated metrics, such
as the bank erosion rate and the time interval between the
creation of new bifurcations, turn out to be highly fluc-
tuating in time. However, by averaging on a sufficiently
long time period it is possible to build sufficiently robust
statistics, which consistently respond to varying experi-
mental conditions. For example, as illustrated in Figure
2, the activation rate of new bed area, once averaged in
time, increases regularly with the discharge.
The observed timescales are comparable with the typi-
cal duration of a flood, which suggest that morphological
changes and driving flow needs to be studied in a coupled
way.
5
10
15
20
00.8 1.2 1.6 2.0 2.4
Figure 2. Boxplot indicating the activation rate of new
bed area depending on the water discharge.
KeywordsBraided rivers, image analysis, active area, channel mor-
phodynamics, bifurcations
ReferencesAshmore, P. (2013). Morphology and Dynamics of
Braided Rivers. In Treatise on Geomorphology, vol-
ume 9, pages 289–312. Elsevier.
Egozi, R. and Ashmore, P. (2008). Defining and mea-
suring braiding intensity. Earth Surface Processes and
Landforms, 33(14):2121–2138.
Marcus, W. A. and Fonstad, M. A. (2010). Remote sens-
ing of rivers: The emergence of a subdiscipline in the
river sciences. Earth Surface Processes and Land-
forms, 35(15):1867–1872.
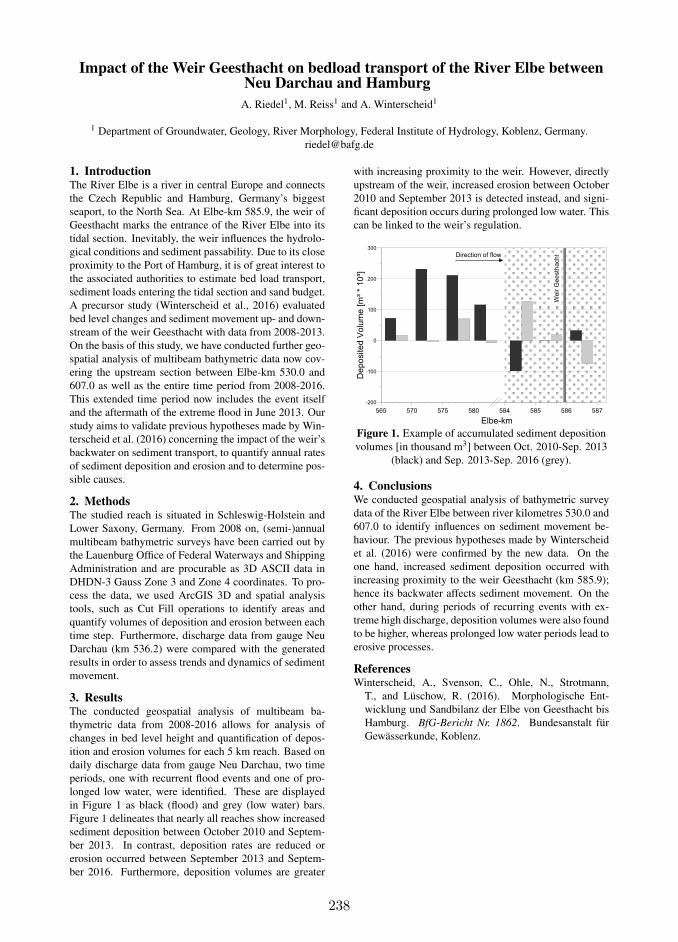
238
Impact of the Weir Geesthacht on bedload transport of the River Elbe betweenNeu Darchau and Hamburg
A. Riedel1, M. Reiss1 and A. Winterscheid1
1 Department of Groundwater, Geology, River Morphology, Federal Institute of Hydrology, Koblenz, Germany.
1. IntroductionThe River Elbe is a river in central Europe and connects
the Czech Republic and Hamburg, Germany’s biggest
seaport, to the North Sea. At Elbe-km 585.9, the weir of
Geesthacht marks the entrance of the River Elbe into its
tidal section. Inevitably, the weir influences the hydrolo-
gical conditions and sediment passability. Due to its close
proximity to the Port of Hamburg, it is of great interest to
the associated authorities to estimate bed load transport,
sediment loads entering the tidal section and sand budget.
A precursor study (Winterscheid et al., 2016) evaluated
bed level changes and sediment movement up- and down-
stream of the weir Geesthacht with data from 2008-2013.
On the basis of this study, we have conducted further geo-
spatial analysis of multibeam bathymetric data now cov-
ering the upstream section between Elbe-km 530.0 and
607.0 as well as the entire time period from 2008-2016.
This extended time period now includes the event itself
and the aftermath of the extreme flood in June 2013. Our
study aims to validate previous hypotheses made by Win-
terscheid et al. (2016) concerning the impact of the weir’s
backwater on sediment transport, to quantify annual rates
of sediment deposition and erosion and to determine pos-
sible causes.
2. MethodsThe studied reach is situated in Schleswig-Holstein and
Lower Saxony, Germany. From 2008 on, (semi-)annual
multibeam bathymetric surveys have been carried out by
the Lauenburg Office of Federal Waterways and Shipping
Administration and are procurable as 3D ASCII data in
DHDN-3 Gauss Zone 3 and Zone 4 coordinates. To pro-
cess the data, we used ArcGIS 3D and spatial analysis
tools, such as Cut Fill operations to identify areas and
quantify volumes of deposition and erosion between each
time step. Furthermore, discharge data from gauge Neu
Darchau (km 536.2) were compared with the generated
results in order to assess trends and dynamics of sediment
movement.
3. ResultsThe conducted geospatial analysis of multibeam ba-
thymetric data from 2008-2016 allows for analysis of
changes in bed level height and quantification of depos-
ition and erosion volumes for each 5 km reach. Based on
daily discharge data from gauge Neu Darchau, two time
periods, one with recurrent flood events and one of pro-
longed low water, were identified. These are displayed
in Figure 1 as black (flood) and grey (low water) bars.
Figure 1 delineates that nearly all reaches show increased
sediment deposition between October 2010 and Septem-
ber 2013. In contrast, deposition rates are reduced or
erosion occurred between September 2013 and Septem-
ber 2016. Furthermore, deposition volumes are greater
with increasing proximity to the weir. However, directly
upstream of the weir, increased erosion between October
2010 and September 2013 is detected instead, and signi-
ficant deposition occurs during prolonged low water. This
can be linked to the weir’s regulation.
565 570 575 580
Elbe-km
-200
-100
0
100
200
300
Deposited V
olu
me [m
³ *
10³]
584 585 586 587
We
ir G
ee
sth
ach
tDirection of flow
Figure 1. Example of accumulated sediment deposition
volumes [in thousand m3] between Oct. 2010-Sep. 2013
(black) and Sep. 2013-Sep. 2016 (grey).
4. ConclusionsWe conducted geospatial analysis of bathymetric survey
data of the River Elbe between river kilometres 530.0 and
607.0 to identify influences on sediment movement be-
haviour. The previous hypotheses made by Winterscheid
et al. (2016) were confirmed by the new data. On the
one hand, increased sediment deposition occurred with
increasing proximity to the weir Geesthacht (km 585.9);
hence its backwater affects sediment movement. On the
other hand, during periods of recurring events with ex-
treme high discharge, deposition volumes were also found
to be higher, whereas prolonged low water periods lead to
erosive processes.
ReferencesWinterscheid, A., Svenson, C., Ohle, N., Strotmann,
T., and Lüschow, R. (2016). Morphologische Ent-
wicklung und Sandbilanz der Elbe von Geesthacht bis
Hamburg. BfG-Bericht Nr. 1862. Bundesanstalt für
Gewässerkunde, Koblenz.
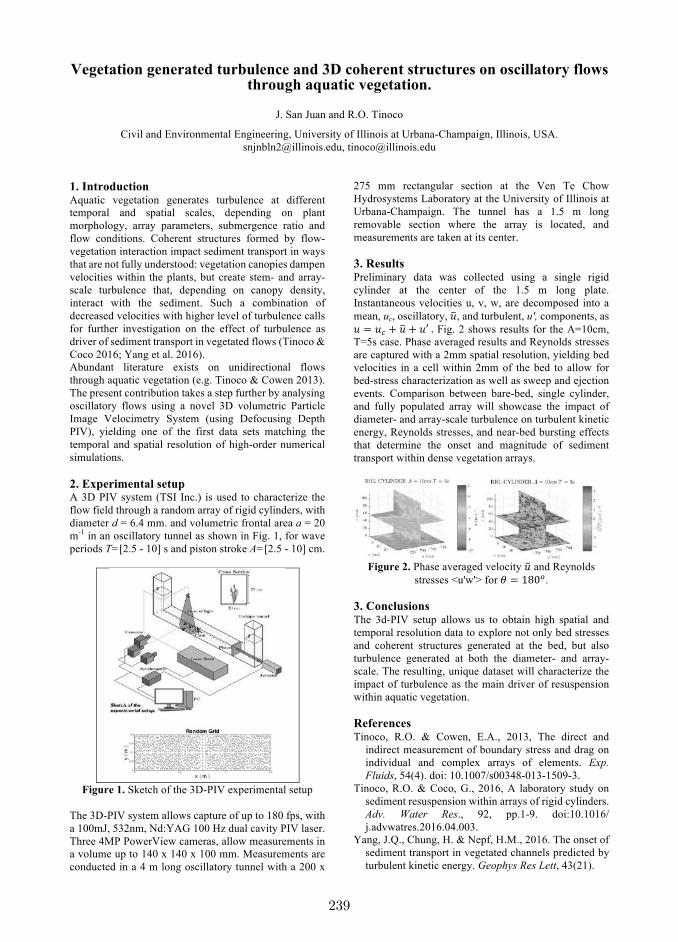
239
Vegetation generated turbulence and 3D coherent structures on oscillatory flows through aquatic vegetation.
J. San Juan and R.O. Tinoco
Civil and Environmental Engineering, University of Illinois at Urbana-Champaign, Illinois, USA.
[email protected], [email protected]
1. Introduction Aquatic vegetation generates turbulence at different
temporal and spatial scales, depending on plant
morphology, array parameters, submergence ratio and
flow conditions. Coherent structures formed by flow-
vegetation interaction impact sediment transport in ways
that are not fully understood: vegetation canopies dampen
velocities within the plants, but create stem- and array-
scale turbulence that, depending on canopy density,
interact with the sediment. Such a combination of
decreased velocities with higher level of turbulence calls
for further investigation on the effect of turbulence as
driver of sediment transport in vegetated flows (Tinoco &
Coco 2016; Yang et al. 2016).
Abundant literature exists on unidirectional flows
through aquatic vegetation (e.g. Tinoco & Cowen 2013).
The present contribution takes a step further by analysing
oscillatory flows using a novel 3D volumetric Particle
Image Velocimetry System (using Defocusing Depth
PIV), yielding one of the first data sets matching the
temporal and spatial resolution of high-order numerical
simulations.
2. Experimental setup A 3D PIV system (TSI Inc.) is used to characterize the
flow field through a random array of rigid cylinders, with
diameter d = 6.4 mm. and volumetric frontal area a = 20
m-1
in an oscillatory tunnel as shown in Fig. 1, for wave
periods T=[2.5 - 10] s and piston stroke A=[2.5 - 10] cm.
Figure 1. Sketch of the 3D-PIV experimental setup
The 3D-PIV system allows capture of up to 180 fps, with
a 100mJ, 532nm, Nd:YAG 100 Hz dual cavity PIV laser.
Three 4MP PowerView cameras, allow measurements in
a volume up to 140 x 140 x 100 mm. Measurements are
conducted in a 4 m long oscillatory tunnel with a 200 x
275 mm rectangular section at the Ven Te Chow
Hydrosystems Laboratory at the University of Illinois at
Urbana-Champaign. The tunnel has a 1.5 m long
removable section where the array is located, and
measurements are taken at its center.
3. Results Preliminary data was collected using a single rigid
cylinder at the center of the 1.5 m long plate.
Instantaneous velocities u, v, w, are decomposed into a
mean, uc, oscillatory, !, and turbulent, u', components, as
! = !# + ! + !′&. Fig. 2 shows results for the A=10cm,
T=5s case. Phase averaged results and Reynolds stresses
are captured with a 2mm spatial resolution, yielding bed
velocities in a cell within 2mm of the bed to allow for
bed-stress characterization as well as sweep and ejection
events. Comparison between bare-bed, single cylinder,
and fully populated array will showcase the impact of
diameter- and array-scale turbulence on turbulent kinetic
energy, Reynolds stresses, and near-bed bursting effects
that determine the onset and magnitude of sediment
transport within dense vegetation arrays.
Figure 2. Phase averaged velocity ! and Reynolds
stresses <u'w'> for ( = 180,.
3. Conclusions The 3d-PIV setup allows us to obtain high spatial and
temporal resolution data to explore not only bed stresses
and coherent structures generated at the bed, but also
turbulence generated at both the diameter- and array-
scale. The resulting, unique dataset will characterize the
impact of turbulence as the main driver of resuspension
within aquatic vegetation.
References Tinoco, R.O. & Cowen, E.A., 2013, The direct and
indirect measurement of boundary stress and drag on
individual and complex arrays of elements. Exp.
Fluids, 54(4). doi: 10.1007/s00348-013-1509-3.
Tinoco, R.O. & Coco, G., 2016, A laboratory study on
sediment resuspension within arrays of rigid cylinders.
Adv. Water Res., 92, pp.1-9. doi:10.1016/
j.advwatres.2016.04.003.
Yang, J.Q., Chung, H. & Nepf, H.M., 2016. The onset of
sediment transport in vegetated channels predicted by
turbulent kinetic energy. Geophys Res Lett, 43(21).
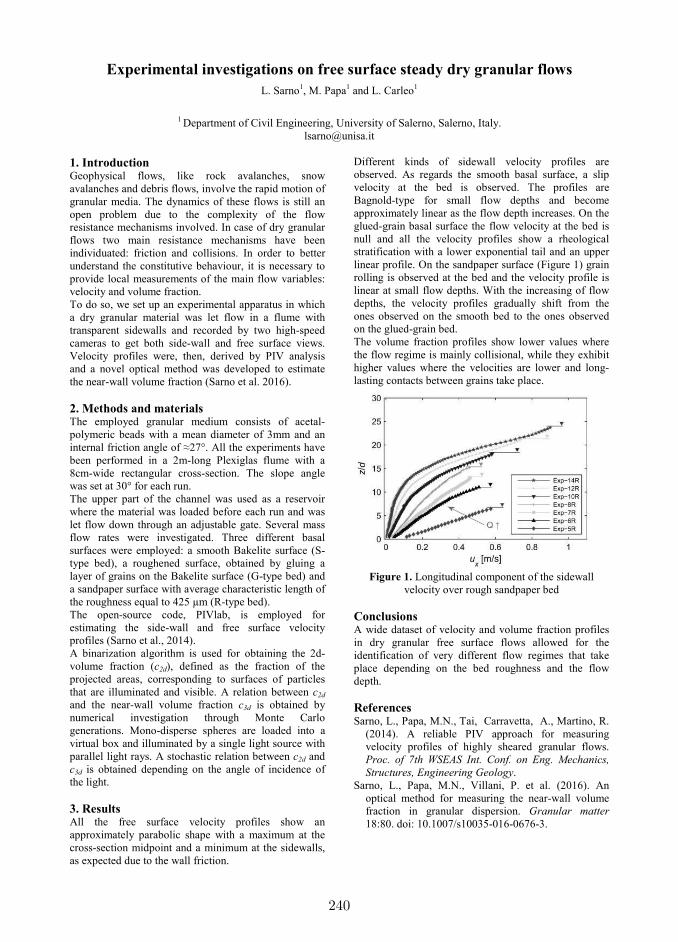
240
Experimental investigations on free surface steady dry granular flows
L. Sarno1, M. Papa
1 and L. Carleo
1
1 Department of Civil Engineering, University of Salerno, Salerno, Italy.
1. Introduction Geophysical flows, like rock avalanches, snow
avalanches and debris flows, involve the rapid motion of
granular media. The dynamics of these flows is still an
open problem due to the complexity of the flow
resistance mechanisms involved. In case of dry granular
flows two main resistance mechanisms have been
individuated: friction and collisions. In order to better
understand the constitutive behaviour, it is necessary to
provide local measurements of the main flow variables:
velocity and volume fraction.
To do so, we set up an experimental apparatus in which
a dry granular material was let flow in a flume with
transparent sidewalls and recorded by two high-speed
cameras to get both side-wall and free surface views.
Velocity profiles were, then, derived by PIV analysis
and a novel optical method was developed to estimate
the near-wall volume fraction (Sarno et al. 2016).
2. Methods and materials The employed granular medium consists of acetal-
polymeric beads with a mean diameter of 3mm and an
internal friction angle of ≈27°. All the experiments have
been performed in a 2m-long Plexiglas flume with a
8cm-wide rectangular cross-section. The slope angle
was set at 30° for each run.
The upper part of the channel was used as a reservoir
where the material was loaded before each run and was
let flow down through an adjustable gate. Several mass
flow rates were investigated. Three different basal
surfaces were employed: a smooth Bakelite surface (S-
type bed), a roughened surface, obtained by gluing a
layer of grains on the Bakelite surface (G-type bed) and
a sandpaper surface with average characteristic length of
the roughness equal to 425 µm (R-type bed).
The open-source code, PIVlab, is employed for
estimating the side-wall and free surface velocity
profiles (Sarno et al., 2014).
A binarization algorithm is used for obtaining the 2d-
volume fraction (c2d), defined as the fraction of the
projected areas, corresponding to surfaces of particles
that are illuminated and visible. A relation between c2d
and the near-wall volume fraction c3d is obtained by
numerical investigation through Monte Carlo
generations. Mono-disperse spheres are loaded into a
virtual box and illuminated by a single light source with
parallel light rays. A stochastic relation between c2d and
c3d is obtained depending on the angle of incidence of
the light.
3. Results All the free surface velocity profiles show an
approximately parabolic shape with a maximum at the
cross-section midpoint and a minimum at the sidewalls,
as expected due to the wall friction.
Different kinds of sidewall velocity profiles are
observed. As regards the smooth basal surface, a slip
velocity at the bed is observed. The profiles are
Bagnold-type for small flow depths and become
approximately linear as the flow depth increases. On the
glued-grain basal surface the flow velocity at the bed is
null and all the velocity profiles show a rheological
stratification with a lower exponential tail and an upper
linear profile. On the sandpaper surface (Figure 1) grain
rolling is observed at the bed and the velocity profile is
linear at small flow depths. With the increasing of flow
depths, the velocity profiles gradually shift from the
ones observed on the smooth bed to the ones observed
on the glued-grain bed.
The volume fraction profiles show lower values where
the flow regime is mainly collisional, while they exhibit
higher values where the velocities are lower and long-
lasting contacts between grains take place.
Figure 1. Longitudinal component of the sidewall
velocity over rough sandpaper bed
Conclusions A wide dataset of velocity and volume fraction profiles
in dry granular free surface flows allowed for the
identification of very different flow regimes that take
place depending on the bed roughness and the flow
depth.
References Sarno, L., Papa, M.N., Tai, Carravetta, A., Martino, R.
(2014). A reliable PIV approach for measuring
velocity profiles of highly sheared granular flows.
Proc. of 7th WSEAS Int. Conf. on Eng. Mechanics,
Structures, Engineering Geology.
Sarno, L., Papa, M.N., Villani, P. et al. (2016). An
optical method for measuring the near-wall volume
fraction in granular dispersion. Granular matter
18:80. doi: 10.1007/s10035-016-0676-3.
241
A flume study on the effects of flow depth on local scour and deposition at submerged obstacles
O. Schloemer1 and J. Herget1
1 Department of Geography, University of Bonn, Germany.
[email protected]; [email protected]
1. Introduction In fluvial systems a large number of obstructions like boulders appear, which have the capability to create characteristic sedimentary bedforms termed as “obstacle marks” (Allen, 1982). These bedforms are the result of a turbulent and complex flow field, which emerges around the obstacle due to flow separation of the approaching current, generating areas of accelerated and decelerated flow. The approaching flow is pushed downwards in front and gets accelerated at the lateral parts of the obstacle resulting in rotating vortex system, which increases bed shear stress and induce sediment mobilization in front and lateral to the obstacle. The vortex system is stretching around the obstacle base in a horseshoe-like pattern and moves eroded sediment out of the scour hole into the wake region of the obstacle. Therefore the morphology of a typical obstacle mark consists of a frontal, crescent-shaped scour hole and an adjacent sediment accumulation in the wake region, denoted as “sediment ridge” (Euler and Herget, 2012). However, different morphological patterns may arise due to dynamic interactions of hydraulic and sedimentary processes at different independent boundary conditions since the formation of obstacle marks depends on flow, obstacle and sediment properties as well as on temporal dynamics. Many of these properties have been investigated systematically in the past decades, especially in engineering science with an emphasis on local scouring at emergent bridge piers aiming to estimate maximal frontal scour depths (e.g. Melville and Coleman, 2000); while systematic investigations on the effects of different boundary conditions on the process dynamics at submerged obstacles are readily comprehensible (e.g. Sarkar, 2014). Particular flow depth seems to be an effective boundary condition to alter hydraulic and sedimentary processes and vice versa the morphological patterns of an obstacle mark at submerged obstacles as flow regimes vary by submergence ratio (Shamloo et al., 2010). The objective of the present study was therefore to systematically investigate the influence of different flow depths on the dimensions and morphological patterns of obstacle marks at different shaped obstacles by a series of experiments in a laboratory flume. 2. Methodology 30 physical modelling experiments were conducted at rectangular flume of 5 m length, 0.32 m width and 0.27 m high working section, filled with a 0.055 m thick layer of uniform sand (D50 = 0.0055 m). The slope was fixed at 0.003 m/m. Three types of obstacle with different shapes and nearly identical in size (height = 0.035-0.037 m and width = 0.04-0.045 m) were used: glass cube (angular), sandstone pebble (elliptical) and
glass sphere (spherical). The obstacles were immobile during the course of the experiments, which were conducted over 24 h at stationary discharge to reach a near steady state condition of the obstacle marks (e.g. Melville and Coleman 2000). While mean flow velocity (0.20 ms-1) was kept constant, flow depth ranged from (0.02 m to 0.14 m) producing different degrees of submergence (ratio of flow depth to length of frontal area) at clear-water conditions from non to deep submerged (submergence ratios 0.79 to 3.83). 3. Results and Conclusion Flow depth has a quantifiable effect on the dimensions of scour hole (depth, width, length) and sediment ridge (height, width, length) in a near steady state despite obstacle shape. Generally the obstacle marks were bigger at the angular obstacle than at streamlined obstacles, but with increasing submergence (= increasing flow depth) the dimensions of scour and ridge at each obstacle type decrease due to a weaker vortex system at the obstacles. During deep submergence a different morphological pattern arose at the streamlined obstacles (pebble and sphere). Instead of a frontal scour hole, the morphological pattern consists of two downstream scour holes, laterally aligned to the obstacle in the plane of symmetry. This morphological pattern was caused by circulating currents formed at the obstacles top, which laterally and vertically reattach to the bed in the wake, while the frontal horseshoe vortex system was too weak to initiate frontal scouring at high flow depths. Therefore the transition from frontal to wake scouring at more streamlined obstacles is controlled by a threshold in respect to the degree of submergence, denoting a system change, altering the interaction of hydraulic and sedimentary processes. The results provide a data basis for further investigations to improve the hydraulic interpretation of obstacle marks. References Allen, J.R.L. (1982). Sedimentary structures. Their
character and physical basis. Volume 2. Developments in Sedimentology 30B. Amsterdam: Elsevier.
Euler, T. and Herget, J. (2012). Controls on local scour and deposition induced by obstacles in fluvial enviroments. Catena 91: 35-46.
Melville, B. and Coleman, S.E. (2000). Bridge scour. Highlands Ranch: Water Resources Publication.
Sarkar, A. (2014). Scour and flow around submerged structures. Water Management 167: 65-78.
Shamloo, H., Ratartnam, N. and Katopodis, C. (2001). Hydraulics of simple habitat structures. Journal of
Hydraulic Research 39(4): 351-366.
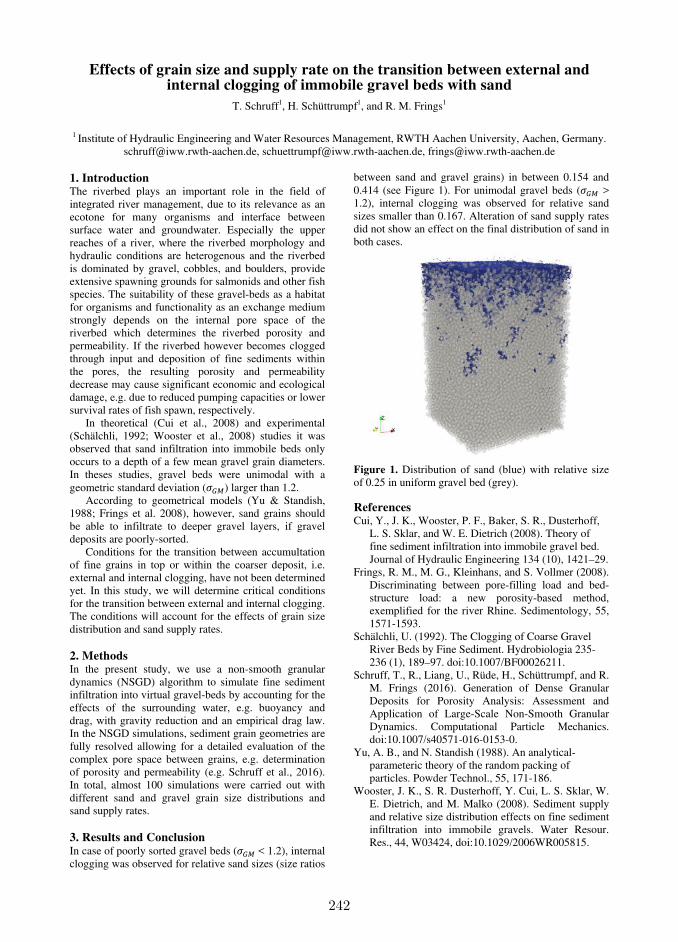
242
Effects of grain size and supply rate on the transition between external and internal clogging of immobile gravel beds with sand
T. Schruff1, H. Schüttrumpf1, and R. M. Frings1
1 Institute of Hydraulic Engineering and Water Resources Management, RWTH Aachen University, Aachen, Germany.
[email protected], [email protected], [email protected]
1. Introduction The riverbed plays an important role in the field of integrated river management, due to its relevance as an ecotone for many organisms and interface between surface water and groundwater. Especially the upper reaches of a river, where the riverbed morphology and hydraulic conditions are heterogenous and the riverbed is dominated by gravel, cobbles, and boulders, provide extensive spawning grounds for salmonids and other fish species. The suitability of these gravel-beds as a habitat for organisms and functionality as an exchange medium strongly depends on the internal pore space of the riverbed which determines the riverbed porosity and permeability. If the riverbed however becomes clogged through input and deposition of fine sediments within the pores, the resulting porosity and permeability decrease may cause significant economic and ecological damage, e.g. due to reduced pumping capacities or lower survival rates of fish spawn, respectively.
In theoretical (Cui et al., 2008) and experimental (Schälchli, 1992; Wooster et al., 2008) studies it was observed that sand infiltration into immobile beds only occurs to a depth of a few mean gravel grain diameters. In theses studies, gravel beds were unimodal with a geometric standard deviation ( ) larger than 1.2.
According to geometrical models (Yu & Standish, 1988; Frings et al. 2008), however, sand grains should be able to infiltrate to deeper gravel layers, if gravel deposits are poorly-sorted.
Conditions for the transition between accumultation of fine grains in top or within the coarser deposit, i.e. external and internal clogging, have not been determined yet. In this study, we will determine critical conditions for the transition between external and internal clogging. The conditions will account for the effects of grain size distribution and sand supply rates. 2. Methods In the present study, we use a non-smooth granular dynamics (NSGD) algorithm to simulate fine sediment infiltration into virtual gravel-beds by accounting for the effects of the surrounding water, e.g. buoyancy and drag, with gravity reduction and an empirical drag law. In the NSGD simulations, sediment grain geometries are fully resolved allowing for a detailed evaluation of the complex pore space between grains, e.g. determination of porosity and permeability (e.g. Schruff et al., 2016). In total, almost 100 simulations were carried out with different sand and gravel grain size distributions and sand supply rates. 3. Results and Conclusion In case of poorly sorted gravel beds ( < 1.2), internal clogging was observed for relative sand sizes (size ratios
between sand and gravel grains) in between 0.154 and 0.414 (see Figure 1). For unimodal gravel beds ( > 1.2), internal clogging was observed for relative sand sizes smaller than 0.167. Alteration of sand supply rates did not show an effect on the final distribution of sand in both cases.
Figure 1. Distribution of sand (blue) with relative size of 0.25 in uniform gravel bed (grey).
References Cui, Y., J. K., Wooster, P. F., Baker, S. R., Dusterhoff,
L. S. Sklar, and W. E. Dietrich (2008). Theory of fine sediment infiltration into immobile gravel bed. Journal of Hydraulic Engineering 134 (10), 1421–29.
Frings, R. M., M. G., Kleinhans, and S. Vollmer (2008). Discriminating between pore-filling load and bed-structure load: a new porosity-based method, exemplified for the river Rhine. Sedimentology, 55, 1571-1593.
Schälchli, U. (1992). The Clogging of Coarse Gravel River Beds by Fine Sediment. Hydrobiologia 235-236 (1), 189–97. doi:10.1007/BF00026211.
Schruff, T., R., Liang, U., Rüde, H., Schüttrumpf, and R. M. Frings (2016). Generation of Dense Granular Deposits for Porosity Analysis: Assessment and Application of Large-Scale Non-Smooth Granular Dynamics. Computational Particle Mechanics. doi:10.1007/s40571-016-0153-0.
Yu, A. B., and N. Standish (1988). An analytical-parameteric theory of the random packing of particles. Powder Technol., 55, 171-186.
Wooster, J. K., S. R. Dusterhoff, Y. Cui, L. S. Sklar, W. E. Dietrich, and M. Malko (2008). Sediment supply and relative size distribution effects on fine sediment infiltration into immobile gravels. Water Resour. Res., 44, W03424, doi:10.1029/2006WR005815.
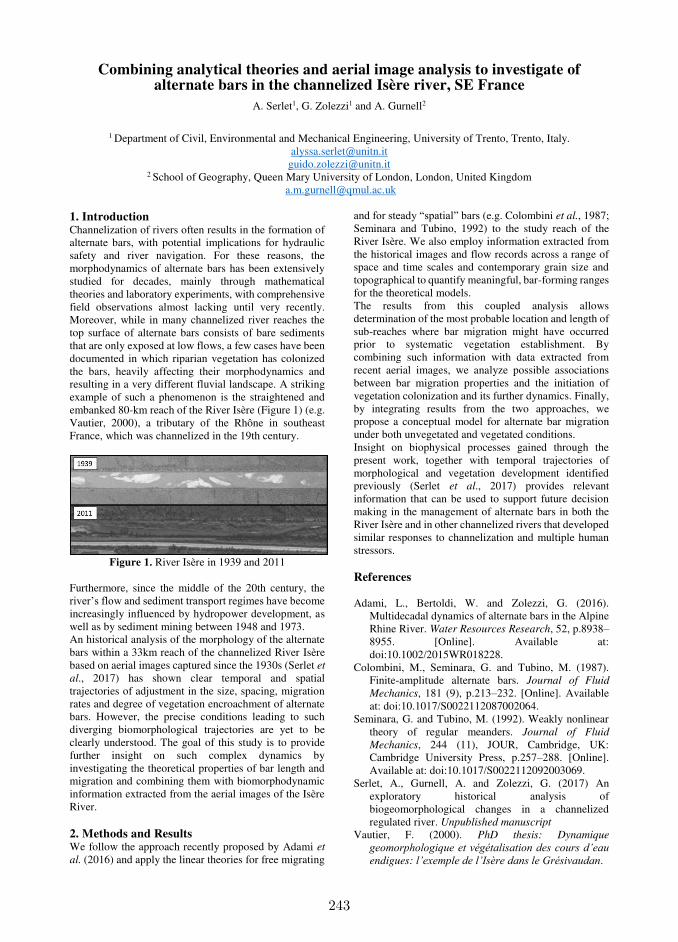
243
Combining analytical theories and aerial image analysis to investigate of alternate bars in the channelized Isère river, SE France
A. Serlet1, G. Zolezzi1 and A. Gurnell2
1 Department of Civil, Environmental and Mechanical Engineering, University of Trento, Trento, Italy.
[email protected] [email protected]
2 School of Geography, Queen Mary University of London, London, United Kingdom [email protected]
1. Introduction Channelization of rivers often results in the formation of alternate bars, with potential implications for hydraulic safety and river navigation. For these reasons, the morphodynamics of alternate bars has been extensively studied for decades, mainly through mathematical theories and laboratory experiments, with comprehensive field observations almost lacking until very recently. Moreover, while in many channelized river reaches the top surface of alternate bars consists of bare sediments that are only exposed at low flows, a few cases have been documented in which riparian vegetation has colonized the bars, heavily affecting their morphodynamics and resulting in a very different fluvial landscape. A striking example of such a phenomenon is the straightened and embanked 80-km reach of the River Isère (Figure 1) (e.g. Vautier, 2000), a tributary of the Rhône in southeast France, which was channelized in the 19th century.
Figure 1. River Isère in 1939 and 2011
Furthermore, since the middle of the 20th century, the river’s flow and sediment transport regimes have become increasingly influenced by hydropower development, as well as by sediment mining between 1948 and 1973. An historical analysis of the morphology of the alternate bars within a 33km reach of the channelized River Isère based on aerial images captured since the 1930s (Serlet et
al., 2017) has shown clear temporal and spatial trajectories of adjustment in the size, spacing, migration rates and degree of vegetation encroachment of alternate bars. However, the precise conditions leading to such diverging biomorphological trajectories are yet to be clearly understood. The goal of this study is to provide further insight on such complex dynamics by investigating the theoretical properties of bar length and migration and combining them with biomorphodynamic information extracted from the aerial images of the Isère River. 2. Methods and Results We follow the approach recently proposed by Adami et
al. (2016) and apply the linear theories for free migrating
and for steady “spatial” bars (e.g. Colombini et al., 1987; Seminara and Tubino, 1992) to the study reach of the River Isère. We also employ information extracted from the historical images and flow records across a range of space and time scales and contemporary grain size and topographical to quantify meaningful, bar-forming ranges for the theoretical models. The results from this coupled analysis allows determination of the most probable location and length of sub-reaches where bar migration might have occurred prior to systematic vegetation establishment. By combining such information with data extracted from recent aerial images, we analyze possible associations between bar migration properties and the initiation of vegetation colonization and its further dynamics. Finally, by integrating results from the two approaches, we propose a conceptual model for alternate bar migration under both unvegetated and vegetated conditions. Insight on biophysical processes gained through the present work, together with temporal trajectories of morphological and vegetation development identified previously (Serlet et al., 2017) provides relevant information that can be used to support future decision making in the management of alternate bars in both the River Isère and in other channelized rivers that developed similar responses to channelization and multiple human stressors. References Adami, L., Bertoldi, W. and Zolezzi, G. (2016).
Multidecadal dynamics of alternate bars in the Alpine Rhine River. Water Resources Research, 52, p.8938–8955. [Online]. Available at: doi:10.1002/2015WR018228.
Colombini, M., Seminara, G. and Tubino, M. (1987). Finite-amplitude alternate bars. Journal of Fluid
Mechanics, 181 (9), p.213–232. [Online]. Available at: doi:10.1017/S0022112087002064.
Seminara, G. and Tubino, M. (1992). Weakly nonlinear theory of regular meanders. Journal of Fluid
Mechanics, 244 (11), JOUR, Cambridge, UK: Cambridge University Press, p.257–288. [Online]. Available at: doi:10.1017/S0022112092003069.
Serlet, A., Gurnell, A. and Zolezzi, G. (2017) An exploratory historical analysis of biogeomorphological changes in a channelized regulated river. Unpublished manuscript
Vautier, F. (2000). PhD thesis: Dynamique
geomorphologique et végétalisation des cours d’eau endigues: l’exemple de l’Isère dans le Grésivaudan.
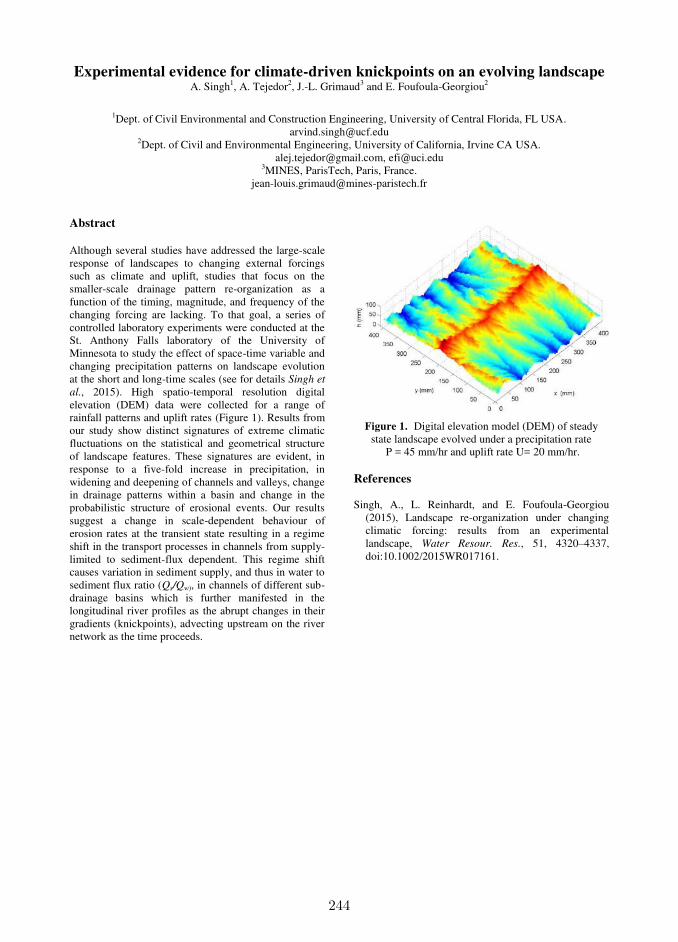
244
Experimental evidence for climate-driven knickpoints on an evolving landscape A. Singh1, A. Tejedor2, J.-L. Grimaud3 and E. Foufoula-Georgiou2
1Dept. of Civil Environmental and Construction Engineering, University of Central Florida, FL USA.
[email protected] 2Dept. of Civil and Environmental Engineering, University of California, Irvine CA USA.
[email protected], [email protected] 3MINES, ParisTech, Paris, France.
Abstract
Although several studies have addressed the large-scale response of landscapes to changing external forcings such as climate and uplift, studies that focus on the smaller-scale drainage pattern re-organization as a function of the timing, magnitude, and frequency of the changing forcing are lacking. To that goal, a series of controlled laboratory experiments were conducted at the St. Anthony Falls laboratory of the University of Minnesota to study the effect of space-time variable and changing precipitation patterns on landscape evolution at the short and long-time scales (see for details Singh et
al., 2015). High spatio-temporal resolution digital elevation (DEM) data were collected for a range of rainfall patterns and uplift rates (Figure 1). Results from our study show distinct signatures of extreme climatic fluctuations on the statistical and geometrical structure of landscape features. These signatures are evident, in response to a five-fold increase in precipitation, in widening and deepening of channels and valleys, change in drainage patterns within a basin and change in the probabilistic structure of erosional events. Our results suggest a change in scale-dependent behaviour of erosion rates at the transient state resulting in a regime shift in the transport processes in channels from supply-limited to sediment-flux dependent. This regime shift causes variation in sediment supply, and thus in water to sediment flux ratio (Qs/Qw), in channels of different sub-drainage basins which is further manifested in the longitudinal river profiles as the abrupt changes in their gradients (knickpoints), advecting upstream on the river network as the time proceeds.
Figure 1. Digital elevation model (DEM) of steady
state landscape evolved under a precipitation rate P = 45 mm/hr and uplift rate U= 20 mm/hr.
References Singh, A., L. Reinhardt, and E. Foufoula-Georgiou
(2015), Landscape re-organization under changing climatic forcing: results from an experimental landscape, Water Resour. Res., 51, 4320–4337, doi:10.1002/2015WR017161.
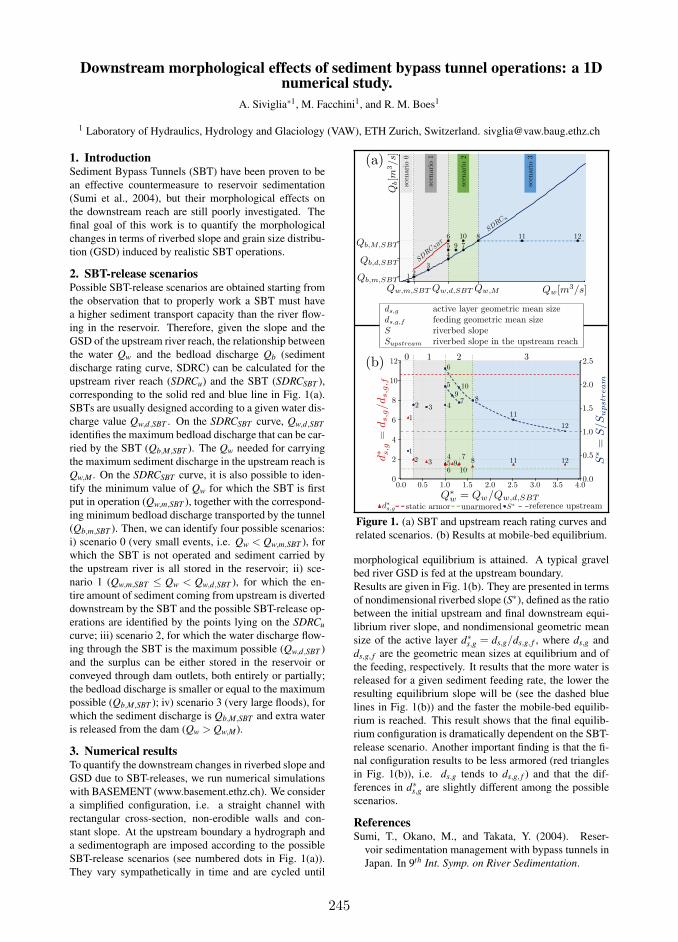
245
Downstream morphological effects of sediment bypass tunnel operations: a 1Dnumerical study.
A. Siviglia∗1, M. Facchini1, and R. M. Boes1
1 Laboratory of Hydraulics, Hydrology and Glaciology (VAW), ETH Zurich, Switzerland. [email protected]
1. IntroductionSediment Bypass Tunnels (SBT) have been proven to be
an effective countermeasure to reservoir sedimentation
(Sumi et al., 2004), but their morphological effects on
the downstream reach are still poorly investigated. The
final goal of this work is to quantify the morphological
changes in terms of riverbed slope and grain size distribu-
tion (GSD) induced by realistic SBT operations.
2. SBT-release scenariosPossible SBT-release scenarios are obtained starting from
the observation that to properly work a SBT must have
a higher sediment transport capacity than the river flow-
ing in the reservoir. Therefore, given the slope and the
GSD of the upstream river reach, the relationship between
the water Qw and the bedload discharge Qb (sediment
discharge rating curve, SDRC) can be calculated for the
upstream river reach (SDRCu) and the SBT (SDRCSBT ),
corresponding to the solid red and blue line in Fig. 1(a).
SBTs are usually designed according to a given water dis-
charge value Qw,d,SBT . On the SDRCSBT curve, Qw,d,SBT
identifies the maximum bedload discharge that can be car-
ried by the SBT (Qb,M,SBT ). The Qw needed for carrying
the maximum sediment discharge in the upstream reach is
Qw,M . On the SDRCSBT curve, it is also possible to iden-
tify the minimum value of Qw for which the SBT is first
put in operation (Qw,m,SBT ), together with the correspond-
ing minimum bedload discharge transported by the tunnel
(Qb,m,SBT ). Then, we can identify four possible scenarios:
i) scenario 0 (very small events, i.e. Qw < Qw,m,SBT ), for
which the SBT is not operated and sediment carried by
the upstream river is all stored in the reservoir; ii) sce-
nario 1 (Qw,m,SBT ≤ Qw < Qw,d,SBT ), for which the en-
tire amount of sediment coming from upstream is diverted
downstream by the SBT and the possible SBT-release op-
erations are identified by the points lying on the SDRCu
curve; iii) scenario 2, for which the water discharge flow-
ing through the SBT is the maximum possible (Qw,d,SBT )
and the surplus can be either stored in the reservoir or
conveyed through dam outlets, both entirely or partially;
the bedload discharge is smaller or equal to the maximum
possible (Qb,M,SBT ); iv) scenario 3 (very large floods), for
which the sediment discharge is Qb,M,SBT and extra water
is released from the dam (Qw > Qw,M).
3. Numerical resultsTo quantify the downstream changes in riverbed slope and
GSD due to SBT-releases, we run numerical simulations
with BASEMENT (www.basement.ethz.ch). We consider
a simplified configuration, i.e. a straight channel with
rectangular cross-section, non-erodible walls and con-
stant slope. At the upstream boundary a hydrograph and
a sedimentograph are imposed according to the possible
SBT-release scenarios (see numbered dots in Fig. 1(a)).
They vary sympathetically in time and are cycled until
0
1
1.5
2
0
6
10
12
0 0.5 1 1.5 2 2.5 3 3.5 4
S*
Dg
*
Qw*
4
600 700
Figure 1. (a) SBT and upstream reach rating curves and
related scenarios. (b) Results at mobile-bed equilibrium.
morphological equilibrium is attained. A typical gravel
bed river GSD is fed at the upstream boundary.
Results are given in Fig. 1(b). They are presented in terms
of nondimensional riverbed slope (S∗), defined as the ratio
between the initial upstream and final downstream equi-
librium river slope, and nondimensional geometric mean
size of the active layer d∗s,g = ds,g/ds,g, f , where ds,g and
ds,g, f are the geometric mean sizes at equilibrium and of
the feeding, respectively. It results that the more water is
released for a given sediment feeding rate, the lower the
resulting equilibrium slope will be (see the dashed blue
lines in Fig. 1(b)) and the faster the mobile-bed equilib-
rium is reached. This result shows that the final equilib-
rium configuration is dramatically dependent on the SBT-
release scenario. Another important finding is that the fi-
nal configuration results to be less armored (red triangles
in Fig. 1(b)), i.e. ds,g tends to ds,g, f ) and that the dif-
ferences in d∗s,g are slightly different among the possible
scenarios.
ReferencesSumi, T., Okano, M., and Takata, Y. (2004). Reser-
voir sedimentation management with bypass tunnels in
Japan. In 9th Int. Symp. on River Sedimentation.

246
Sand movement in bed-rock channels impacted by dams
C.J. Sloff1,2, and D. Lighthart3
1 Department of Hydraulic Engineering, Delft University of Technology, Delft, Netherlands. [email protected] Deltares, Delft, Netherlands. [email protected]
3 Delft University of Technology. [email protected]
1. IntroductionHydropower dams largely impact sand and gravelmovement in rivers. The reservoirs and their operationtrap the sediment and dampen the flow hydrograph. Infully alluvial rivers, this causes bed degradation,coarsening and change of channel patterns. However, inmany cases these dams are located in bed-rock channelswith under-supplied conditions. Bed-rock channels aregenerally steep with high velocities, and sand is onlysettling in wakes and eddies behind rocks or along banksin sand bars (some sand is stored in pores and pockets inthe exposed river bed as well). Without dams, deposition(during floods) and erosion of the sand bars is balanced,but a dam disturbs this balance and causes gradualdegradation of the bars. A well referenced and importantexample of these conditions is the Colorado River in theGrand Canyon in the USA (Grams et al, 2015). Theexistence of sand bars is crucial for environmental andsocial functions of the river.
In this paper the results of a study to develop apractical approach to simulate the impacts ofhydropower dams on sand bars, and to assess the effectsof mitigation measures. The origin of this study comesfrom the present plans of constructing several dams inthe main stream of the Mekong in Laos and Cambodia.Previous work of the author for sand-bar modelling inthe Grand Canyon using Delft3D (Sloff et al, 2009),showed that with 3D high-resolution Delft3D models,the sand bar development during artificial floods can bequantified to some extent. However, for assessment oflarge stretches of rivers, such techniques require toomuch computational effort. Instead, a coarser modellingapproach has been developed, that mimics thedevelopments of sand bars and associated processes, butonly in an approximate way. The main aim of thisapproach is to quantify the impacts of modified flowsand sediment loads downstream of dams.
Figure 1. Sand bar in Mekong River near Pak Beng
2. Modelling work and resultThe lack of data for the Mekong hampers thedevelopment of empirical approaches for this river thatquantify the exchange of sediment to the sand bars and
the movement of sediment in the flow. To be able tomake a sensible impact assessment, a process-basedmodelling approach is developed that uses scientificknowledge on the processes as much as possible, still ina coarse and approximate way. It uses a quasi-3Dmodelling approach (Delft3D) because that allows thesimulation of lateral sand bars in stagnation zones.
HWL
Figure 2. Modelled lateral sand bars for a section of theMekong River. Black/grey areas are lateral sand bars
The components included in this approach are 1)movement of sediment over non-erodible layers (i.e.under-supplied conditions); 2) transport of multiplefractions, different models for different fractions; 3)variable discharges; 4) storage of sediment in sand barsalong the banks and behind rocks. Various layouts andsub-models have been tested. The study results showthat this approach allows not only the gradual decay ofthe sand bars downstream of the dams, but alsodeposition and bar patterns in the reservoirs. Althoughdetailed processes of bar formation are not reproduced,the model results mimic the temporary sand storage inlateral zones and there decay after modified hydrographsand sediment supply. The approach allows for long-termsimulations over long periods (decades), as well as thedevelopment of mitigation measures such as reservoirflushing and sluicing operations.
AcknowledgmentsThe applied part of this research is funded by theMekong River Commission, for preparing guidelines formitigation of environmental impacts (MRC, 2017).
ReferencesGrams, P., J. Schmidt, S. Wright, D. Topping, Th.
Melis, and D. Rubin (2015) Building Sandbars in theGrand Canyon. EOS, AGU. 3 June 2015.
MRC, Mekong River Commission (2017) Guidelines forhydropower environmental impact mitigation and riskmanagement in the Lower Mekong mainstream andtributaries (ISH0306) http://www.mrcmekong.org.
Sloff, C.J., S. Wright and M. Kaplinski (2009) Highresolution three dimensional modeling of river eddysandbars, Grand Canyon, U.S.A., RCEM 2009.
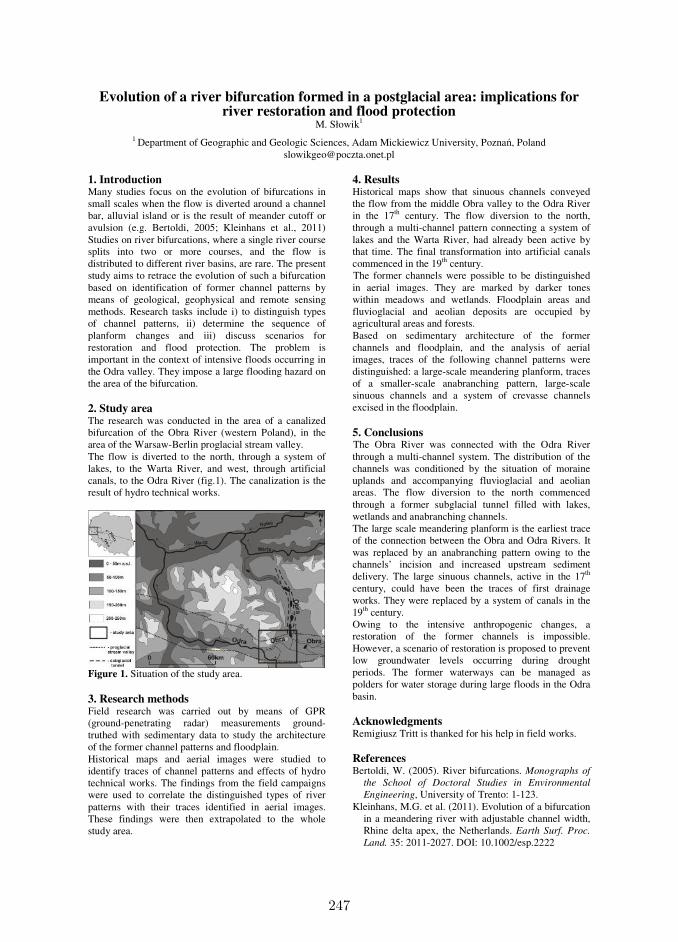
247
Evolution of a river bifurcation formed in a postglacial area: implications for river restoration and flood protection
M. Słowik1
1 Department of Geographic and Geologic Sciences, Adam Mickiewicz University, Pozna, Poland
1. Introduction Many studies focus on the evolution of bifurcations in
small scales when the flow is diverted around a channel
bar, alluvial island or is the result of meander cutoff or
avulsion (e.g. Bertoldi, 2005; Kleinhans et al., 2011)
Studies on river bifurcations, where a single river course
splits into two or more courses, and the flow is
distributed to different river basins, are rare. The present
study aims to retrace the evolution of such a bifurcation
based on identification of former channel patterns by
means of geological, geophysical and remote sensing
methods. Research tasks include i) to distinguish types
of channel patterns, ii) determine the sequence of
planform changes and iii) discuss scenarios for
restoration and flood protection. The problem is
important in the context of intensive floods occurring in
the Odra valley. They impose a large flooding hazard on
the area of the bifurcation.
2. Study area The research was conducted in the area of a canalized
bifurcation of the Obra River (western Poland), in the
area of the Warsaw-Berlin proglacial stream valley.
The flow is diverted to the north, through a system of
lakes, to the Warta River, and west, through artificial
canals, to the Odra River (fig.1). The canalization is the
result of hydro technical works.
Figure 1. Situation of the study area.
3. Research methods Field research was carried out by means of GPR
(ground-penetrating radar) measurements ground-
truthed with sedimentary data to study the architecture
of the former channel patterns and floodplain.
Historical maps and aerial images were studied to
identify traces of channel patterns and effects of hydro
technical works. The findings from the field campaigns
were used to correlate the distinguished types of river
patterns with their traces identified in aerial images.
These findings were then extrapolated to the whole
study area.
4. Results Historical maps show that sinuous channels conveyed
the flow from the middle Obra valley to the Odra River
in the 17th
century. The flow diversion to the north,
through a multi-channel pattern connecting a system of
lakes and the Warta River, had already been active by
that time. The final transformation into artificial canals
commenced in the 19th
century.
The former channels were possible to be distinguished
in aerial images. They are marked by darker tones
within meadows and wetlands. Floodplain areas and
fluvioglacial and aeolian deposits are occupied by
agricultural areas and forests.
Based on sedimentary architecture of the former
channels and floodplain, and the analysis of aerial
images, traces of the following channel patterns were
distinguished: a large-scale meandering planform, traces
of a smaller-scale anabranching pattern, large-scale
sinuous channels and a system of crevasse channels
excised in the floodplain.
5. Conclusions The Obra River was connected with the Odra River
through a multi-channel system. The distribution of the
channels was conditioned by the situation of moraine
uplands and accompanying fluvioglacial and aeolian
areas. The flow diversion to the north commenced
through a former subglacial tunnel filled with lakes,
wetlands and anabranching channels.
The large scale meandering planform is the earliest trace
of the connection between the Obra and Odra Rivers. It
was replaced by an anabranching pattern owing to the
channels’ incision and increased upstream sediment
delivery. The large sinuous channels, active in the 17th
century, could have been the traces of first drainage
works. They were replaced by a system of canals in the
19th
century.
Owing to the intensive anthropogenic changes, a
restoration of the former channels is impossible.
However, a scenario of restoration is proposed to prevent
low groundwater levels occurring during drought
periods. The former waterways can be managed as
polders for water storage during large floods in the Odra
basin.
Acknowledgments Remigiusz Tritt is thanked for his help in field works.
References
Bertoldi, W. (2005). River bifurcations. Monographs of
the School of Doctoral Studies in Environmental
Engineering, University of Trento: 1-123.
Kleinhans, M.G. et al. (2011). Evolution of a bifurcation
in a meandering river with adjustable channel width,
Rhine delta apex, the Netherlands. Earth Surf. Proc.
Land. 35: 2011-2027. DOI: 10.1002/esp.2222
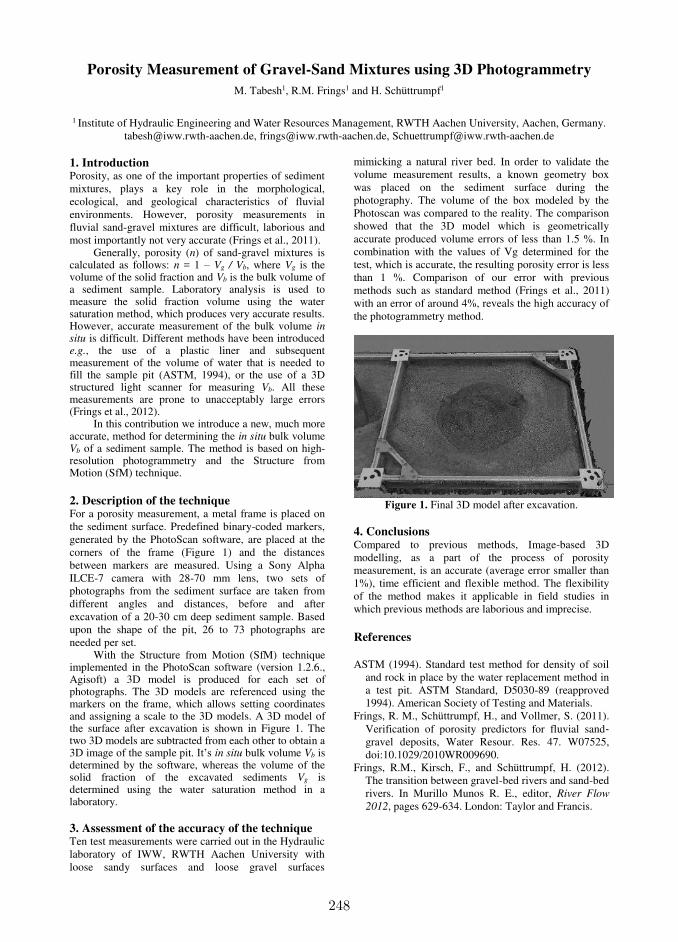
248
Porosity Measurement of Gravel-Sand Mixtures using 3D Photogrammetry
M. Tabesh1, R.M. Frings1 and H. Schüttrumpf1
1 Institute of Hydraulic Engineering and Water Resources Management, RWTH Aachen University, Aachen, Germany.
[email protected], [email protected], [email protected]
1. Introduction Porosity, as one of the important properties of sediment mixtures, plays a key role in the morphological, ecological, and geological characteristics of fluvial environments. However, porosity measurements in fluvial sand-gravel mixtures are difficult, laborious and most importantly not very accurate (Frings et al., 2011).
Generally, porosity (n) of sand-gravel mixtures is calculated as follows: n = 1 – Vg / Vb, where Vg is the volume of the solid fraction and Vb is the bulk volume of a sediment sample. Laboratory analysis is used to measure the solid fraction volume using the water saturation method, which produces very accurate results. However, accurate measurement of the bulk volume in situ is difficult. Different methods have been introduced e.g., the use of a plastic liner and subsequent measurement of the volume of water that is needed to fill the sample pit (ASTM, 1994), or the use of a 3D structured light scanner for measuring Vb. All these measurements are prone to unacceptably large errors (Frings et al., 2012).
In this contribution we introduce a new, much more accurate, method for determining the in situ bulk volume Vb of a sediment sample. The method is based on high-resolution photogrammetry and the Structure from Motion (SfM) technique.
2. Description of the technique For a porosity measurement, a metal frame is placed on the sediment surface. Predefined binary-coded markers, generated by the PhotoScan software, are placed at the corners of the frame (Figure 1) and the distances between markers are measured. Using a Sony Alpha ILCE-7 camera with 28-70 mm lens, two sets of photographs from the sediment surface are taken from different angles and distances, before and after excavation of a 20-30 cm deep sediment sample. Based upon the shape of the pit, 26 to 73 photographs are needed per set.
With the Structure from Motion (SfM) technique implemented in the PhotoScan software (version 1.2.6., Agisoft) a 3D model is produced for each set of photographs. The 3D models are referenced using the markers on the frame, which allows setting coordinates and assigning a scale to the 3D models. A 3D model of the surface after excavation is shown in Figure 1. The two 3D models are subtracted from each other to obtain a 3D image of the sample pit. It’s in situ bulk volume Vb is determined by the software, whereas the volume of the solid fraction of the excavated sediments Vg is determined using the water saturation method in a laboratory. 3. Assessment of the accuracy of the technique Ten test measurements were carried out in the Hydraulic laboratory of IWW, RWTH Aachen University with loose sandy surfaces and loose gravel surfaces
mimicking a natural river bed. In order to validate the volume measurement results, a known geometry box was placed on the sediment surface during the photography. The volume of the box modeled by the Photoscan was compared to the reality. The comparison showed that the 3D model which is geometrically accurate produced volume errors of less than 1.5 %. In combination with the values of Vg determined for the test, which is accurate, the resulting porosity error is less than 1 %. Comparison of our error with previous methods such as standard method (Frings et al., 2011) with an error of around 4%, reveals the high accuracy of the photogrammetry method.
Figure 1. Final 3D model after excavation.
4. Conclusions Compared to previous methods, Image-based 3D modelling, as a part of the process of porosity measurement, is an accurate (average error smaller than 1%), time efficient and flexible method. The flexibility of the method makes it applicable in field studies in which previous methods are laborious and imprecise.
References
ASTM (1994). Standard test method for density of soil
and rock in place by the water replacement method in a test pit. ASTM Standard, D5030-89 (reapproved 1994). American Society of Testing and Materials.
Frings, R. M., Schüttrumpf, H., and Vollmer, S. (2011). Verification of porosity predictors for fluvial sand‐gravel deposits, Water Resour. Res. 47. W07525, doi:10.1029/2010WR009690.
Frings, R.M., Kirsch, F., and Schüttrumpf, H. (2012). The transition between gravel-bed rivers and sand-bed rivers. In Murillo Munos R. E., editor, River Flow
2012, pages 629-634. London: Taylor and Francis.
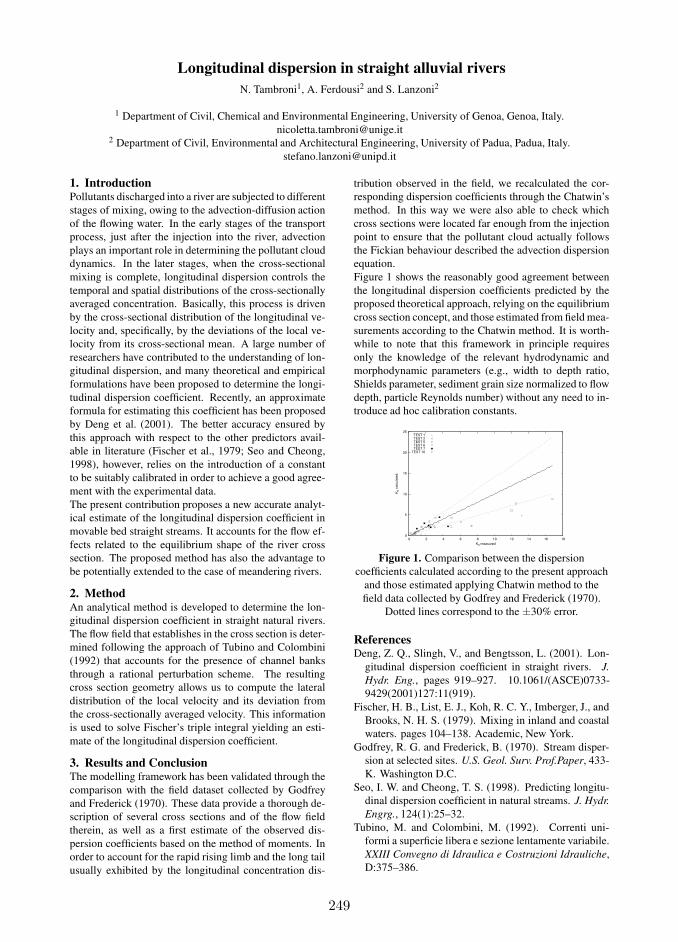
249
Longitudinal dispersion in straight alluvial rivers
N. Tambroni1, A. Ferdousi2 and S. Lanzoni2
1 Department of Civil, Chemical and Environmental Engineering, University of Genoa, Genoa, Italy.
[email protected] Department of Civil, Environmental and Architectural Engineering, University of Padua, Padua, Italy.
1. IntroductionPollutants discharged into a river are subjected to different
stages of mixing, owing to the advection-diffusion action
of the flowing water. In the early stages of the transport
process, just after the injection into the river, advection
plays an important role in determining the pollutant cloud
dynamics. In the later stages, when the cross-sectional
mixing is complete, longitudinal dispersion controls the
temporal and spatial distributions of the cross-sectionally
averaged concentration. Basically, this process is driven
by the cross-sectional distribution of the longitudinal ve-
locity and, specifically, by the deviations of the local ve-
locity from its cross-sectional mean. A large number of
researchers have contributed to the understanding of lon-
gitudinal dispersion, and many theoretical and empirical
formulations have been proposed to determine the longi-
tudinal dispersion coefficient. Recently, an approximate
formula for estimating this coefficient has been proposed
by Deng et al. (2001). The better accuracy ensured by
this approach with respect to the other predictors avail-
able in literature (Fischer et al., 1979; Seo and Cheong,
1998), however, relies on the introduction of a constant
to be suitably calibrated in order to achieve a good agree-
ment with the experimental data.
The present contribution proposes a new accurate analyt-
ical estimate of the longitudinal dispersion coefficient in
movable bed straight streams. It accounts for the flow ef-
fects related to the equilibrium shape of the river cross
section. The proposed method has also the advantage to
be potentially extended to the case of meandering rivers.
2. MethodAn analytical method is developed to determine the lon-
gitudinal dispersion coefficient in straight natural rivers.
The flow field that establishes in the cross section is deter-
mined following the approach of Tubino and Colombini
(1992) that accounts for the presence of channel banks
through a rational perturbation scheme. The resulting
cross section geometry allows us to compute the lateral
distribution of the local velocity and its deviation from
the cross-sectionally averaged velocity. This information
is used to solve Fischer’s triple integral yielding an esti-
mate of the longitudinal dispersion coefficient.
3. Results and ConclusionThe modelling framework has been validated through the
comparison with the field dataset collected by Godfrey
and Frederick (1970). These data provide a thorough de-
scription of several cross sections and of the flow field
therein, as well as a first estimate of the observed dis-
persion coefficients based on the method of moments. In
order to account for the rapid rising limb and the long tail
usually exhibited by the longitudinal concentration dis-
tribution observed in the field, we recalculated the cor-
responding dispersion coefficients through the Chatwin’s
method. In this way we were also able to check which
cross sections were located far enough from the injection
point to ensure that the pollutant cloud actually follows
the Fickian behaviour described the advection dispersion
equation.
Figure 1 shows the reasonably good agreement between
the longitudinal dispersion coefficients predicted by the
proposed theoretical approach, relying on the equilibrium
cross section concept, and those estimated from field mea-
surements according to the Chatwin method. It is worth-
while to note that this framework in principle requires
only the knowledge of the relevant hydrodynamic and
morphodynamic parameters (e.g., width to depth ratio,
Shields parameter, sediment grain size normalized to flow
depth, particle Reynolds number) without any need to in-
troduce ad hoc calibration constants.
0
5
10
15
20
25
0 2 4 6 8 10 12 14 16 18
K0 c
alc
ula
ted
K0 measured
TEST 1TEST 2TEST 5TEST 6TEST 7
TEST 10
Figure 1. Comparison between the dispersion
coefficients calculated according to the present approach
and those estimated applying Chatwin method to the
field data collected by Godfrey and Frederick (1970).
Dotted lines correspond to the ±30% error.
ReferencesDeng, Z. Q., Slingh, V., and Bengtsson, L. (2001). Lon-
gitudinal dispersion coefficient in straight rivers. J.
Hydr. Eng., pages 919–927. 10.1061/(ASCE)0733-
9429(2001)127:11(919).
Fischer, H. B., List, E. J., Koh, R. C. Y., Imberger, J., and
Brooks, N. H. S. (1979). Mixing in inland and coastal
waters. pages 104–138. Academic, New York.
Godfrey, R. G. and Frederick, B. (1970). Stream disper-
sion at selected sites. U.S. Geol. Surv. Prof.Paper, 433-
K. Washington D.C.
Seo, I. W. and Cheong, T. S. (1998). Predicting longitu-
dinal dispersion coefficient in natural streams. J. Hydr.
Engrg., 124(1):25–32.
Tubino, M. and Colombini, M. (1992). Correnti uni-
formi a superficie libera e sezione lentamente variabile.
XXIII Convegno di Idraulica e Costruzioni Idrauliche,
D:375–386.
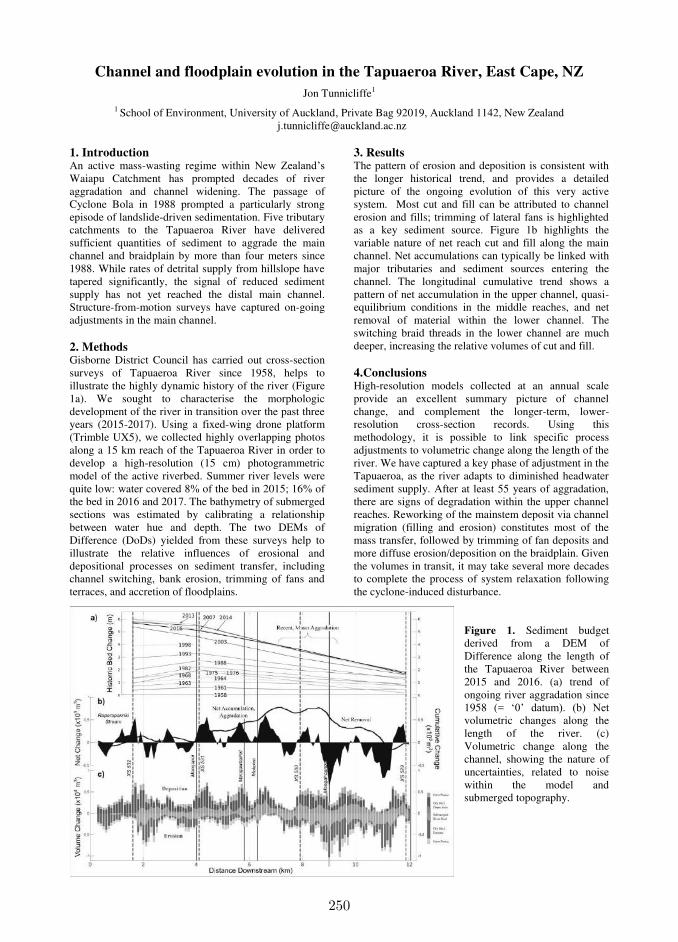
250
Channel and floodplain evolution in the Tapuaeroa River, East Cape, NZ
Jon Tunnicliffe1 1 School of Environment, University of Auckland, Private Bag 92019, Auckland 1142, New Zealand
1. Introduction An active mass-wasting regime within New Zealand’s Waiapu Catchment has prompted decades of river aggradation and channel widening. The passage of Cyclone Bola in 1988 prompted a particularly strong episode of landslide-driven sedimentation. Five tributary catchments to the Tapuaeroa River have delivered sufficient quantities of sediment to aggrade the main channel and braidplain by more than four meters since 1988. While rates of detrital supply from hillslope have tapered significantly, the signal of reduced sediment supply has not yet reached the distal main channel. Structure-from-motion surveys have captured on-going adjustments in the main channel. 2. Methods Gisborne District Council has carried out cross-section surveys of Tapuaeroa River since 1958, helps to illustrate the highly dynamic history of the river (Figure 1a). We sought to characterise the morphologic development of the river in transition over the past three years (2015-2017). Using a fixed-wing drone platform (Trimble UX5), we collected highly overlapping photos along a 15 km reach of the Tapuaeroa River in order to develop a high-resolution (15 cm) photogrammetric model of the active riverbed. Summer river levels were quite low: water covered 8% of the bed in 2015; 16% of the bed in 2016 and 2017. The bathymetry of submerged sections was estimated by calibrating a relationship between water hue and depth. The two DEMs of Difference (DoDs) yielded from these surveys help to illustrate the relative influences of erosional and depositional processes on sediment transfer, including channel switching, bank erosion, trimming of fans and terraces, and accretion of floodplains.
3. Results The pattern of erosion and deposition is consistent with the longer historical trend, and provides a detailed picture of the ongoing evolution of this very active system. Most cut and fill can be attributed to channel erosion and fills; trimming of lateral fans is highlighted as a key sediment source. Figure 1b highlights the variable nature of net reach cut and fill along the main channel. Net accumulations can typically be linked with major tributaries and sediment sources entering the channel. The longitudinal cumulative trend shows a pattern of net accumulation in the upper channel, quasi-equilibrium conditions in the middle reaches, and net removal of material within the lower channel. The switching braid threads in the lower channel are much deeper, increasing the relative volumes of cut and fill. 4.Conclusions High-resolution models collected at an annual scale provide an excellent summary picture of channel change, and complement the longer-term, lower-resolution cross-section records. Using this methodology, it is possible to link specific process adjustments to volumetric change along the length of the river. We have captured a key phase of adjustment in the Tapuaeroa, as the river adapts to diminished headwater sediment supply. After at least 55 years of aggradation, there are signs of degradation within the upper channel reaches. Reworking of the mainstem deposit via channel migration (filling and erosion) constitutes most of the mass transfer, followed by trimming of fan deposits and more diffuse erosion/deposition on the braidplain. Given the volumes in transit, it may take several more decades to complete the process of system relaxation following the cyclone-induced disturbance.
Figure 1. Sediment budget derived from a DEM of Difference along the length of the Tapuaeroa River between 2015 and 2016. (a) trend of ongoing river aggradation since 1958 (= ‘0’ datum). (b) Net volumetric changes along the length of the river. (c) Volumetric change along the channel, showing the nature of uncertainties, related to noise within the model and submerged topography.

251
Investigation of sediment supply effects on pool-riffle self-maintenance mechanisms
E. Vahidi1, E. Bayat1, J.F. Rodríguez1 and P. Saco1
1 Civil, Surveying and Environmental Engineering, University of Newcastle, Callaghan, Australia.
1. Introduction Pool-riffle (PR) morphodynamics has been traditionally described based on the cross-sectional averaged flow characteristics, using episodic shifts in higher shear stress or velocities from riffles to pools (i.e. reversal conditions) as an indication of the long term self-maintenance of the structures (Thompson et al. 1999, Harrison and Keller 2007). However, less attention has been paid to the interactions of flow unsteadiness, sediment supply and sedimentological contrasts as the drivers for maintaining PR sequences. Here we investigate the effects of changing sediment size distribution and sediment supply on self-maintenance mechanisms in PRs.
2. Methodology We conducted experiments on a scaled-down PR sequence of an existing gravel bed river within a 13-meter long and two-meter wide experimental flume (Fig. 1). Froude similitude and equality of Shields’ number were applied to scale one to four year recurrence flood events and sediment size distributions, respectively.
Figure 1. Schematic of experimental flume
We focus in this paper on two similar hydrographs with different sediment size distributions, fine and coarse, introduced at the upstream end of the flume. For each case we measured bed levels (using a bed profiler) and bed grain size distribution (using an automatic digital technique on the painted bed sediments) during the hydrographs. 3. Results Figs. 2a,b show alterations to the bed profile after running hydrographs with a) fine and b) coarse upstream sediment supply. With fine sediment supply most deposition occurred in the pool, but for the coarse sediment significant erosion occurred in the same location. Fig. 3a,b compares longitudinal sorting during the rising and falling limbs of the hydrograph for the coarse supply experiment. As a result of coarse sediment supply, there was less mobility of upstream sediment towards the pool centre, so finer sediment had a chance to relocate from pool to riffle. This resulted in pool erosion (Figure 2b) and, particularly during the falling limb, a finer sediment size distribution in the riffle than in the pool.
(a)
(b)
Figure 2. Bed profiles before and after running the
hydrograph with a) fine and b) coarse sediment supply.
Figure 3. Bed grain size distribution during a) rising and b) falling limb of the test with coarse sediment supply.
4. Conclusions Our experimental data provides a unique opportunity to analyse the effects of upstream sediment supply and longitudinal sorting on the stability of PR sequences. The coarse sediment supply test presented evidence of self-maintenance mechanisms, with erosion of the pool and finning of the riffle sediment. References Harrison, L. and E. Keller (2007). Modeling forced
pool–riffle hydraulics in a boulder-bed stream, southern California. Geomorphology 83: 232-248.
Thompson, D., E. Wohl and R. Jarrett (1999). Velocity reversal and sediment sorting in pools and riffles controlled by channel constrictions. Geomorphology 27: 229-241.
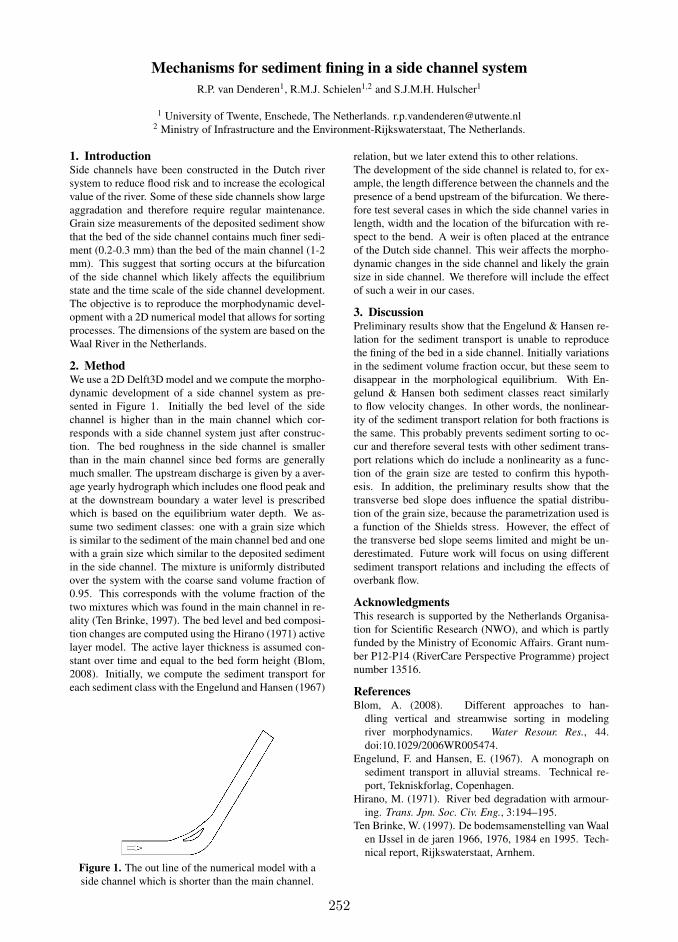
252
Mechanisms for sediment fining in a side channel system
R.P. van Denderen1, R.M.J. Schielen1,2 and S.J.M.H. Hulscher1
1 University of Twente, Enschede, The Netherlands. [email protected] Ministry of Infrastructure and the Environment-Rijkswaterstaat, The Netherlands.
1. IntroductionSide channels have been constructed in the Dutch river
system to reduce flood risk and to increase the ecological
value of the river. Some of these side channels show large
aggradation and therefore require regular maintenance.
Grain size measurements of the deposited sediment show
that the bed of the side channel contains much finer sedi-
ment (0.2-0.3 mm) than the bed of the main channel (1-2
mm). This suggest that sorting occurs at the bifurcation
of the side channel which likely affects the equilibrium
state and the time scale of the side channel development.
The objective is to reproduce the morphodynamic devel-
opment with a 2D numerical model that allows for sorting
processes. The dimensions of the system are based on the
Waal River in the Netherlands.
2. MethodWe use a 2D Delft3D model and we compute the morpho-
dynamic development of a side channel system as pre-
sented in Figure 1. Initially the bed level of the side
channel is higher than in the main channel which cor-
responds with a side channel system just after construc-
tion. The bed roughness in the side channel is smaller
than in the main channel since bed forms are generally
much smaller. The upstream discharge is given by a aver-
age yearly hydrograph which includes one flood peak and
at the downstream boundary a water level is prescribed
which is based on the equilibrium water depth. We as-
sume two sediment classes: one with a grain size which
is similar to the sediment of the main channel bed and one
with a grain size which similar to the deposited sediment
in the side channel. The mixture is uniformly distributed
over the system with the coarse sand volume fraction of
0.95. This corresponds with the volume fraction of the
two mixtures which was found in the main channel in re-
ality (Ten Brinke, 1997). The bed level and bed composi-
tion changes are computed using the Hirano (1971) active
layer model. The active layer thickness is assumed con-
stant over time and equal to the bed form height (Blom,
2008). Initially, we compute the sediment transport for
each sediment class with the Engelund and Hansen (1967)
Figure 1. The out line of the numerical model with a
side channel which is shorter than the main channel.
relation, but we later extend this to other relations.
The development of the side channel is related to, for ex-
ample, the length difference between the channels and the
presence of a bend upstream of the bifurcation. We there-
fore test several cases in which the side channel varies in
length, width and the location of the bifurcation with re-
spect to the bend. A weir is often placed at the entrance
of the Dutch side channel. This weir affects the morpho-
dynamic changes in the side channel and likely the grain
size in side channel. We therefore will include the effect
of such a weir in our cases.
3. DiscussionPreliminary results show that the Engelund & Hansen re-
lation for the sediment transport is unable to reproduce
the fining of the bed in a side channel. Initially variations
in the sediment volume fraction occur, but these seem to
disappear in the morphological equilibrium. With En-
gelund & Hansen both sediment classes react similarly
to flow velocity changes. In other words, the nonlinear-
ity of the sediment transport relation for both fractions is
the same. This probably prevents sediment sorting to oc-
cur and therefore several tests with other sediment trans-
port relations which do include a nonlinearity as a func-
tion of the grain size are tested to confirm this hypoth-
esis. In addition, the preliminary results show that the
transverse bed slope does influence the spatial distribu-
tion of the grain size, because the parametrization used is
a function of the Shields stress. However, the effect of
the transverse bed slope seems limited and might be un-
derestimated. Future work will focus on using different
sediment transport relations and including the effects of
overbank flow.
AcknowledgmentsThis research is supported by the Netherlands Organisa-
tion for Scientific Research (NWO), and which is partly
funded by the Ministry of Economic Affairs. Grant num-
ber P12-P14 (RiverCare Perspective Programme) project
number 13516.
ReferencesBlom, A. (2008). Different approaches to han-
dling vertical and streamwise sorting in modeling
river morphodynamics. Water Resour. Res., 44.
doi:10.1029/2006WR005474.
Engelund, F. and Hansen, E. (1967). A monograph on
sediment transport in alluvial streams. Technical re-
port, Tekniskforlag, Copenhagen.
Hirano, M. (1971). River bed degradation with armour-
ing. Trans. Jpn. Soc. Civ. Eng., 3:194–195.
Ten Brinke, W. (1997). De bodemsamenstelling van Waal
en IJssel in de jaren 1966, 1976, 1984 en 1995. Tech-
nical report, Rijkswaterstaat, Arnhem.
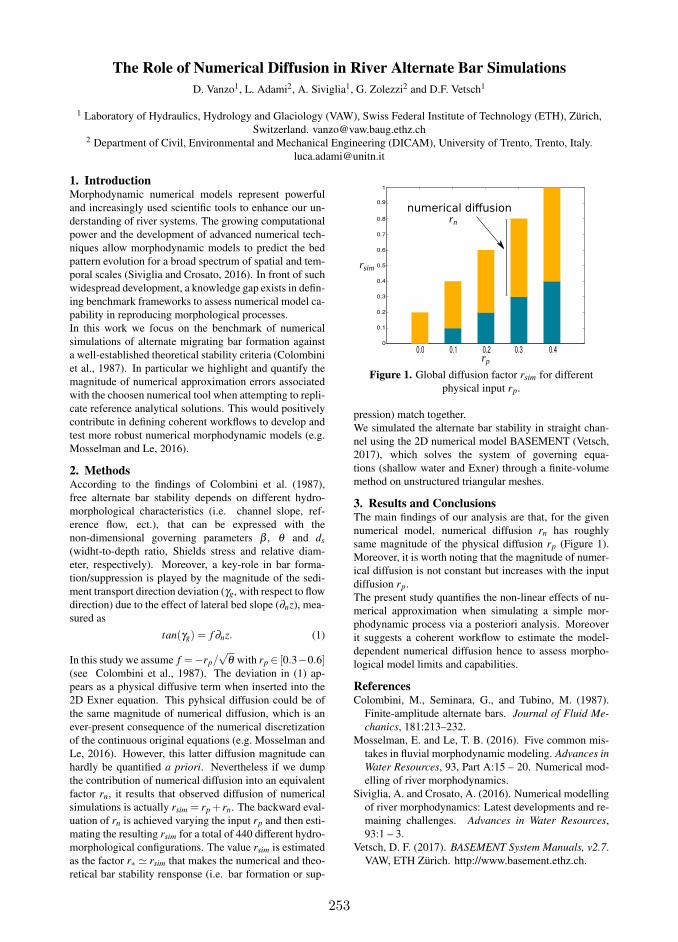
253
The Role of Numerical Diffusion in River Alternate Bar Simulations
D. Vanzo1, L. Adami2, A. Siviglia1, G. Zolezzi2 and D.F. Vetsch1
1 Laboratory of Hydraulics, Hydrology and Glaciology (VAW), Swiss Federal Institute of Technology (ETH), Zürich,
Switzerland. [email protected] Department of Civil, Environmental and Mechanical Engineering (DICAM), University of Trento, Trento, Italy.
1. IntroductionMorphodynamic numerical models represent powerful
and increasingly used scientific tools to enhance our un-
derstanding of river systems. The growing computational
power and the development of advanced numerical tech-
niques allow morphodynamic models to predict the bed
pattern evolution for a broad spectrum of spatial and tem-
poral scales (Siviglia and Crosato, 2016). In front of such
widespread development, a knowledge gap exists in defin-
ing benchmark frameworks to assess numerical model ca-
pability in reproducing morphological processes.
In this work we focus on the benchmark of numerical
simulations of alternate migrating bar formation against
a well-established theoretical stability criteria (Colombini
et al., 1987). In particular we highlight and quantify the
magnitude of numerical approximation errors associated
with the choosen numerical tool when attempting to repli-
cate reference analytical solutions. This would positively
contribute in defining coherent workflows to develop and
test more robust numerical morphodynamic models (e.g.
Mosselman and Le, 2016).
2. MethodsAccording to the findings of Colombini et al. (1987),
free alternate bar stability depends on different hydro-
morphological characteristics (i.e. channel slope, ref-
erence flow, ect.), that can be expressed with the
non-dimensional governing parameters β , θ and ds
(widht-to-depth ratio, Shields stress and relative diam-
eter, respectively). Moreover, a key-role in bar forma-
tion/suppression is played by the magnitude of the sedi-
ment transport direction deviation (γg, with respect to flow
direction) due to the effect of lateral bed slope (∂nz), mea-
sured as
tan(γg) = f ∂nz. (1)
In this study we assume f =−rp/√
θ with rp ∈ [0.3−0.6](see Colombini et al., 1987). The deviation in (1) ap-
pears as a physical diffusive term when inserted into the
2D Exner equation. This pyhsical diffusion could be of
the same magnitude of numerical diffusion, which is an
ever-present consequence of the numerical discretization
of the continuous original equations (e.g. Mosselman and
Le, 2016). However, this latter diffusion magnitude can
hardly be quantified a priori. Nevertheless if we dump
the contribution of numerical diffusion into an equivalent
factor rn, it results that observed diffusion of numerical
simulations is actually rsim = rp + rn. The backward eval-
uation of rn is achieved varying the input rp and then esti-
mating the resulting rsim for a total of 440 different hydro-
morphological configurations. The value rsim is estimated
as the factor r∗ ≃ rsim that makes the numerical and theo-
retical bar stability rensponse (i.e. bar formation or sup-
0.0 0.1 0.2 0.3 0.40
0.1
0.2
0.3
0.4
0.5
0.6
0.7
0.8
0.9
1
rp
rsim
rn
numerical diffusion
Figure 1. Global diffusion factor rsim for different
physical input rp.
pression) match together.
We simulated the alternate bar stability in straight chan-
nel using the 2D numerical model BASEMENT (Vetsch,
2017), which solves the system of governing equa-
tions (shallow water and Exner) through a finite-volume
method on unstructured triangular meshes.
3. Results and ConclusionsThe main findings of our analysis are that, for the given
numerical model, numerical diffusion rn has roughly
same magnitude of the physical diffusion rp (Figure 1).
Moreover, it is worth noting that the magnitude of numer-
ical diffusion is not constant but increases with the input
diffusion rp.
The present study quantifies the non-linear effects of nu-
merical approximation when simulating a simple mor-
phodynamic process via a posteriori analysis. Moreover
it suggests a coherent workflow to estimate the model-
dependent numerical diffusion hence to assess morpho-
logical model limits and capabilities.
ReferencesColombini, M., Seminara, G., and Tubino, M. (1987).
Finite-amplitude alternate bars. Journal of Fluid Me-
chanics, 181:213–232.
Mosselman, E. and Le, T. B. (2016). Five common mis-
takes in fluvial morphodynamic modeling. Advances in
Water Resources, 93, Part A:15 – 20. Numerical mod-
elling of river morphodynamics.
Siviglia, A. and Crosato, A. (2016). Numerical modelling
of river morphodynamics: Latest developments and re-
maining challenges. Advances in Water Resources,
93:1 – 3.
Vetsch, D. F. (2017). BASEMENT System Manuals, v2.7.
VAW, ETH Zürich. http://www.basement.ethz.ch.

254
Estimates of bedload transport capacities and its relative controls on a reach-by-reach basis along the Rhône river, France
D. Vázquez-Tarrío1, M. Tal1, B. Camenen2 and H. Piégay3
1 Aix-Marseille Univ, CNRS, CEREGE UMR 7330, Aix en Provence, France
[email protected]; [email protected]
2 IRSTEA, UR HHLY 5 rue de la Doua – BP 32108– F-69616 Villeurbanne, France [email protected]
3 University of Lyon, CNRS UMR 5600 EVS, Site ENS, 15 parvis René Descartes, BP 7000 69342 Lyon, France. [email protected]
1. Introduction The Rhône River represents a highly complex fluvial system owing to its basin characteristics and tectonic and climate histories. Superimposed on this natural complexity are intense changes in land use within the basin and management works in the main channel and tributaries over the past 150 years. The present-day Rhône is characterised by almost continuous embankments along its lowermost 300 km and 19 hydropower dams to which flow is delivered by canals that bypass the channel (Parrot, 2015). The sum of these modifications has drastically altered the delivery of sediments to the main stem and their transfer downstream. We present preliminary results of a large-scale multidisciplinary study aimed at understanding how sediment is mobilised and transferred between successive reaches along the 500 km from Lake Geneva to the Mediterranean Sea. A reach is defined here as being between two successive dams (excluding the upstream reach bounded by Lake Geneva and the downstream reach bounded by the Mediterranean Sea). The main goals of the study are to establish a physically-based classification of reaches based on transport dynamics for targeting restoration projects, and to gain a better understanding of longitudinal connectivity with clear knowledge of the main nodes of discontinuity. 2. Materials and methods An exceptionally comprehensive data set for a large river system exists for the Rhône owing to its long and important role in navigation and hydropower. These data include numerous bathymetric surveys and discharge records. More recently, the “Plan Rhône” - an integrative management framework, via the Rhône Sediment Observatory (OSR), provided the resources to conduct a large-scale field campaign to sample and measure bed grain size every 5 km along the mainstem (Parrot, 2015) and the development of a 1D hydraulic model for the entire river. The model is based on the code MAGE and has been calibrated for a large range of water discharges and dam operation (Dugué et al., 2015). The available data coupled with the newly calibrated hydraulic model represents an unprecedented opportunity to conduct a quantitative physically-based study of the Rhône. Our first step has been to compile all available gauging records along the main stem and tributaries and relative drainage basin areas to produce a flow duration curve through each reach. Next, we will run the 1D-hydraulic
model for flows with different recurrence intervals to obtain water surface slopes and velocities and use these to estimate basal shear stresses. Finally, we will use empirical bed load equations based with measured grain sizes to estimate transport capacities along different reaches to produce a map of transport capacities on a reach-by-reach basis over a range of discharges. In Section 2, the format for figures, tables, equations, items and citations is presented. 3. Perspectives We will compare the results of our analysis with changes in bed elevation and sediment volumes estimated from differential bathymetry over the last century (e.g., Provansal, 2014; Parrot, 2015). The analysis will also be carried out using historic bed elevations and discharges. The results of the study are expected to highlight the variables controlling transport capacities and bed evolution through time on a reach-by reach basis and shed light on the relative influences of natural inheritance and various periods of human modifications on the Rhône's evolution. Acknowledgments This study is being carried out by a postdoc funded through the OSR4. It takes advantage of a large data base made available by the CNR and data collected and compiled by Elsa Parrot during her PhD with the help of the CNR and numerous interns. The thesis of E. Parrot and postdoc of V. Dugué were also funded by the OSR. References Dugué, V., Walter, C., Andries, E., Launay, M., LeCoz,
J., Camenen, B. And Faure, J. B. (2015). Accounting for hydropower schemes’ operation rules in the 1D hydrodinamic modelinf of the Rhône river from Lake Geneva to the Mediterranean Sea. E-proceedings of
the 36th IAHR World Congress 28 June – 3 July, 2015, The Hague, the Netherlands , 9 p.
Parrot, E. (2015). Analyse spatiale et temporelle de la morphologie du chenal du Rhône du Léman à la Méditerranée. Ph.D. Thesis, Aix-Marseille Univ., Aix-en-Provence, France.
Provansal, M., Dufour, S., Sabatier, F., Anthony, E.J., Raccasi, G., Robresco, S. (2014). The geomorphic evolution and sediment balance of the lower Rhône River (southern France) over the last 130 years: Hydropower dams versus other control factors. Geomorphology, 219 27–41.
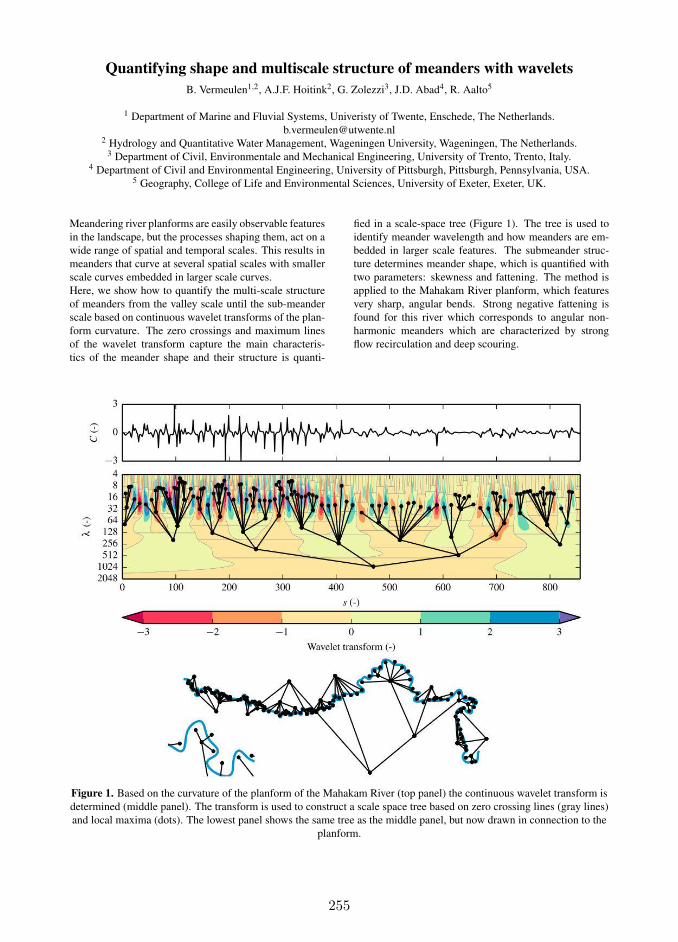
255
Quantifying shape and multiscale structure of meanders with wavelets
B. Vermeulen1,2, A.J.F. Hoitink2, G. Zolezzi3, J.D. Abad4, R. Aalto5
1 Department of Marine and Fluvial Systems, Univeristy of Twente, Enschede, The Netherlands.
[email protected] Hydrology and Quantitative Water Management, Wageningen University, Wageningen, The Netherlands.
3 Department of Civil, Environmentale and Mechanical Engineering, University of Trento, Trento, Italy.4 Department of Civil and Environmental Engineering, University of Pittsburgh, Pittsburgh, Pennsylvania, USA.
5 Geography, College of Life and Environmental Sciences, University of Exeter, Exeter, UK.
Meandering river planforms are easily observable features
in the landscape, but the processes shaping them, act on a
wide range of spatial and temporal scales. This results in
meanders that curve at several spatial scales with smaller
scale curves embedded in larger scale curves.
Here, we show how to quantify the multi-scale structure
of meanders from the valley scale until the sub-meander
scale based on continuous wavelet transforms of the plan-
form curvature. The zero crossings and maximum lines
of the wavelet transform capture the main characteris-
tics of the meander shape and their structure is quanti-
fied in a scale-space tree (Figure 1). The tree is used to
identify meander wavelength and how meanders are em-
bedded in larger scale features. The submeander struc-
ture determines meander shape, which is quantified with
two parameters: skewness and fattening. The method is
applied to the Mahakam River planform, which features
very sharp, angular bends. Strong negative fattening is
found for this river which corresponds to angular non-
harmonic meanders which are characterized by strong
flow recirculation and deep scouring.
Figure 1. Based on the curvature of the planform of the Mahakam River (top panel) the continuous wavelet transform is
determined (middle panel). The transform is used to construct a scale space tree based on zero crossing lines (gray lines)
and local maxima (dots). The lowest panel shows the same tree as the middle panel, but now drawn in connection to the
planform.
256
Stochastic bar stability analysis
R. Vesipa1, C. Camporeale1 and L. Ridolfi1
1 Department of Environment, Land and Infrastructure Engineering, Politecnico di Torino, Torino, Italy.
Over the last decades, stability analysis has become a
crucial mathematical tool to understand landscape
morphogenesis processes. Examples range from river
and coastal geomorphology to glacial patterns, from
magma shaping to dissolution/precipitation chemical
processes.
The key steps of stability analysis are: (i) to select an
unperturbed basic state, (ii) to introduce small
perturbations superimposed to the basic state, (iii) to
linearize the perturbation dynamics around the basic
state, (iv) to study the eigen-structure of the linear
differential operator. Usually, the asymptotic fate of
perturbations (decay or amplification) is investigated by
detecting possible instability regions in the parameter
space. Additional insights about the system dynamics
can be gained by the non-modal analysis, the assessment
of the absolute/convective nature of instability, and
weakly- or fully-nonlinear stability analyses. In
particular, non-modal analysis plays an important role
when eigenvectors are not normal. In those cases,
perturbation energy can exhibit strong transient growths,
although perturbations disappear when t→∞ (i.e., the
dynamical system is asymptotically stable).
So far, researchers have focused only on deterministic
cases, regardless the specific approach adopted.
In particular, the basic state was considered either steady
(this happens in the most studies) or periodic (in this
case the Floquet analysis is adopted), but random
fluctuations were never considered. This was done
although the morphogenesis processes occur in
environments where randomness is pervasive and
external disturbances are very frequent.
In this work, we shed light on this gap. Our aim is to
consider the effect of small random fluctuations of the
basic state on the stability analysis, and, in particular, we
focus on the interplay between a stochastic external
forcing and the (deterministic) non-normality of the
linearized morphodynamics. To this aim, we consider a
typical and well-known geomorphological pattern of
river landscapes: free bars.. In a previous work (Vesipa
et al., 2012), we elucidated the non-normal character of
bar dynamics and demonstrated the occurrence of
relevant transient perturbation growths in the stability
region of the parameter space. These features, along
with frequent occurrence in rivers, make bars an optimal
candidate to explore which the stochastic (non-normal)
instability of morphogenesis phenomena. Our specific
purpose is to demonstrate how small random
disturbances of the basic state can excite long lasting
giant transient growths of perturbations that induce bar
patterns in regions of the parameter space classified
stable according to the classical (asymptotical and
deterministic) stability analysis.
Due to the explorative nature of our work, we focus on
small random fluctuations (i) affecting a steady basic
state and (ii) modelled as a white Gaussian noise;
namely, no correlation structure is considered in the
external stochastic forcing. These modelling choices
allow us to develop a fully analytical theory, where the
pivotal role of randomness on inducing patterns is
described by the noise intensity, σ. Our results suggest that the spectacular variety of
patterns exhibited by river landscapes is prone to host
very interesting noise-induced phenomena.
References
Vesipa R., Camporeale C., Ridolfi L. (2012) Transient
growths of stable modes in riverbed dynamics,
Europhys. Letts., 100(6), 64002-p1-64002-p6PL.
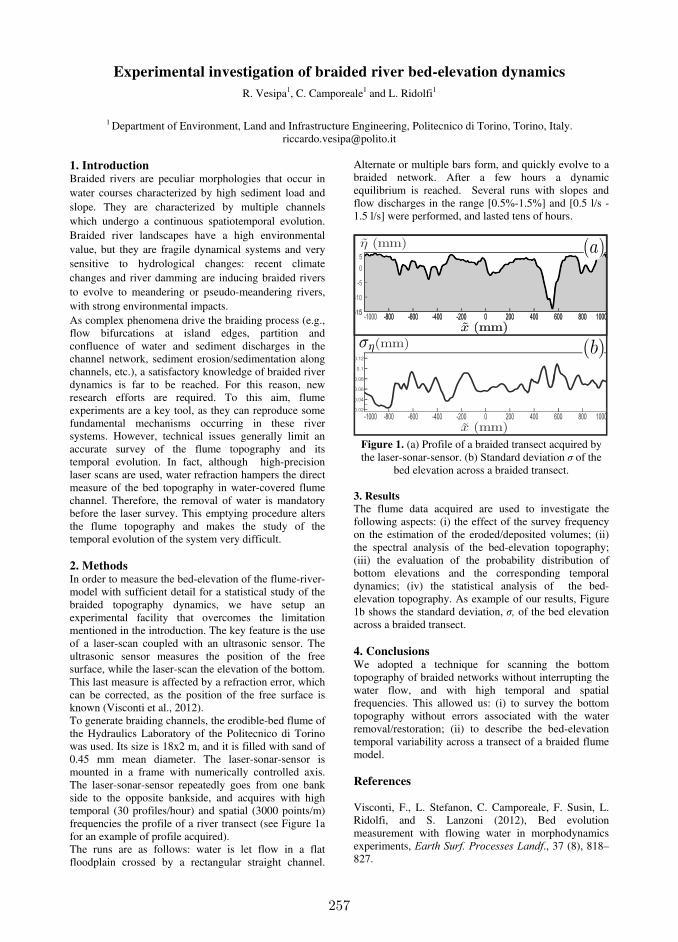
257
Experimental investigation of braided river bed-elevation dynamics
R. Vesipa1, C. Camporeale1 and L. Ridolfi1
1 Department of Environment, Land and Infrastructure Engineering, Politecnico di Torino, Torino, Italy.
1. Introduction Braided rivers are peculiar morphologies that occur in water courses characterized by high sediment load and slope. They are characterized by multiple channels which undergo a continuous spatiotemporal evolution. Braided river landscapes have a high environmental value, but they are fragile dynamical systems and very sensitive to hydrological changes: recent climate changes and river damming are inducing braided rivers to evolve to meandering or pseudo-meandering rivers, with strong environmental impacts. As complex phenomena drive the braiding process (e.g., flow bifurcations at island edges, partition and confluence of water and sediment discharges in the channel network, sediment erosion/sedimentation along channels, etc.), a satisfactory knowledge of braided river dynamics is far to be reached. For this reason, new research efforts are required. To this aim, flume experiments are a key tool, as they can reproduce some fundamental mechanisms occurring in these river systems. However, technical issues generally limit an accurate survey of the flume topography and its temporal evolution. In fact, although high-precision laser scans are used, water refraction hampers the direct measure of the bed topography in water-covered flume channel. Therefore, the removal of water is mandatory before the laser survey. This emptying procedure alters the flume topography and makes the study of the temporal evolution of the system very difficult. 2. Methods In order to measure the bed-elevation of the flume-river-model with sufficient detail for a statistical study of the braided topography dynamics, we have setup an experimental facility that overcomes the limitation mentioned in the introduction. The key feature is the use of a laser-scan coupled with an ultrasonic sensor. The ultrasonic sensor measures the position of the free surface, while the laser-scan the elevation of the bottom. This last measure is affected by a refraction error, which can be corrected, as the position of the free surface is known (Visconti et al., 2012). To generate braiding channels, the erodible-bed flume of the Hydraulics Laboratory of the Politecnico di Torino was used. Its size is 18x2 m, and it is filled with sand of 0.45 mm mean diameter. The laser-sonar-sensor is mounted in a frame with numerically controlled axis. The laser-sonar-sensor repeatedly goes from one bank side to the opposite bankside, and acquires with high temporal (30 profiles/hour) and spatial (3000 points/m) frequencies the profile of a river transect (see Figure 1a for an example of profile acquired). The runs are as follows: water is let flow in a flat floodplain crossed by a rectangular straight channel.
Alternate or multiple bars form, and quickly evolve to a braided network. After a few hours a dynamic equilibrium is reached. Several runs with slopes and flow discharges in the range [0.5%-1.5%] and [0.5 l/s -1.5 l/s] were performed, and lasted tens of hours.
Figure 1. (a) Profile of a braided transect acquired by the laser-sonar-sensor. (b) Standard deviation σ of the
bed elevation across a braided transect.
3. Results
The flume data acquired are used to investigate the following aspects: (i) the effect of the survey frequency on the estimation of the eroded/deposited volumes; (ii) the spectral analysis of the bed-elevation topography; (iii) the evaluation of the probability distribution of bottom elevations and the corresponding temporal dynamics; (iv) the statistical analysis of the bed-elevation topography. As example of our results, Figure 1b shows the standard deviation, σ, of the bed elevation across a braided transect. 4. Conclusions We adopted a technique for scanning the bottom topography of braided networks without interrupting the water flow, and with high temporal and spatial frequencies. This allowed us: (i) to survey the bottom topography without errors associated with the water removal/restoration; (ii) to describe the bed-elevation temporal variability across a transect of a braided flume model. References Visconti, F., L. Stefanon, C. Camporeale, F. Susin, L. Ridolfi, and S. Lanzoni (2012), Bed evolution measurement with flowing water in morphodynamics experiments, Earth Surf. Processes Landf., 37 (8), 818–827.
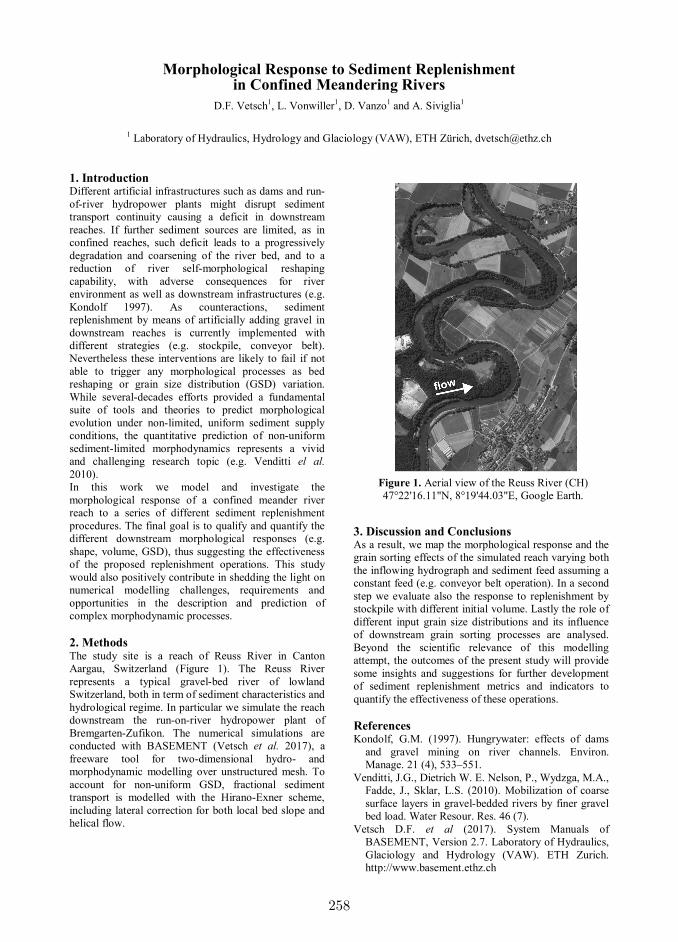
258
Morphological Response to Sediment Replenishment in Confined Meandering Rivers
D.F. Vetsch1, L. Vonwiller
1, D. Vanzo
1 and A. Siviglia
1
1 Laboratory of Hydraulics, Hydrology and Glaciology (VAW), ETH Zürich, [email protected]
1. Introduction Different artificial infrastructures such as dams and run-
of-river hydropower plants might disrupt sediment
transport continuity causing a deficit in downstream
reaches. If further sediment sources are limited, as in
confined reaches, such deficit leads to a progressively
degradation and coarsening of the river bed, and to a
reduction of river self-morphological reshaping
capability, with adverse consequences for river
environment as well as downstream infrastructures (e.g.
Kondolf 1997). As counteractions, sediment
replenishment by means of artificially adding gravel in
downstream reaches is currently implemented with
different strategies (e.g. stockpile, conveyor belt).
Nevertheless these interventions are likely to fail if not
able to trigger any morphological processes as bed
reshaping or grain size distribution (GSD) variation.
While several-decades efforts provided a fundamental
suite of tools and theories to predict morphological
evolution under non-limited, uniform sediment supply
conditions, the quantitative prediction of non-uniform
sediment-limited morphodynamics represents a vivid
and challenging research topic (e.g. Venditti el al.
2010).
In this work we model and investigate the
morphological response of a confined meander river
reach to a series of different sediment replenishment
procedures. The final goal is to qualify and quantify the
different downstream morphological responses (e.g.
shape, volume, GSD), thus suggesting the effectiveness
of the proposed replenishment operations. This study
would also positively contribute in shedding the light on
numerical modelling challenges, requirements and
opportunities in the description and prediction of
complex morphodynamic processes.
2. Methods The study site is a reach of Reuss River in Canton
Aargau, Switzerland (Figure 1). The Reuss River
represents a typical gravel-bed river of lowland
Switzerland, both in term of sediment characteristics and
hydrological regime. In particular we simulate the reach
downstream the run-on-river hydropower plant of
Bremgarten-Zufikon. The numerical simulations are
conducted with BASEMENT (Vetsch et al. 2017), a
freeware tool for two-dimensional hydro- and
morphodynamic modelling over unstructured mesh. To
account for non-uniform GSD, fractional sediment
transport is modelled with the Hirano-Exner scheme,
including lateral correction for both local bed slope and
helical flow.
3. Discussion and Conclusions As a result, we map the morphological response and the
grain sorting effects of the simulated reach varying both
the inflowing hydrograph and sediment feed assuming a
constant feed (e.g. conveyor belt operation). In a second
step we evaluate also the response to replenishment by
stockpile with different initial volume. Lastly the role of
different input grain size distributions and its influence
of downstream grain sorting processes are analysed.
Beyond the scientific relevance of this modelling
attempt, the outcomes of the present study will provide
some insights and suggestions for further development
of sediment replenishment metrics and indicators to
quantify the effectiveness of these operations.
References Kondolf, G.M. (1997). Hungrywater: effects of dams
and gravel mining on river channels. Environ.
Manage. 21 (4), 533–551.
Venditti, J.G., Dietrich W. E. Nelson, P., Wydzga, M.A.,
Fadde, J., Sklar, L.S. (2010). Mobilization of coarse
surface layers in gravel-bedded rivers by finer gravel
bed load. Water Resour. Res. 46 (7).
Vetsch D.F. et al (2017). System Manuals of
BASEMENT, Version 2.7. Laboratory of Hydraulics,
Glaciology and Hydrology (VAW). ETH Zurich.
http://www.basement.ethz.ch
Figure 1. Aerial view of the Reuss River (CH)
47°22'16.11"N, 8°19'44.03"E, Google Earth.
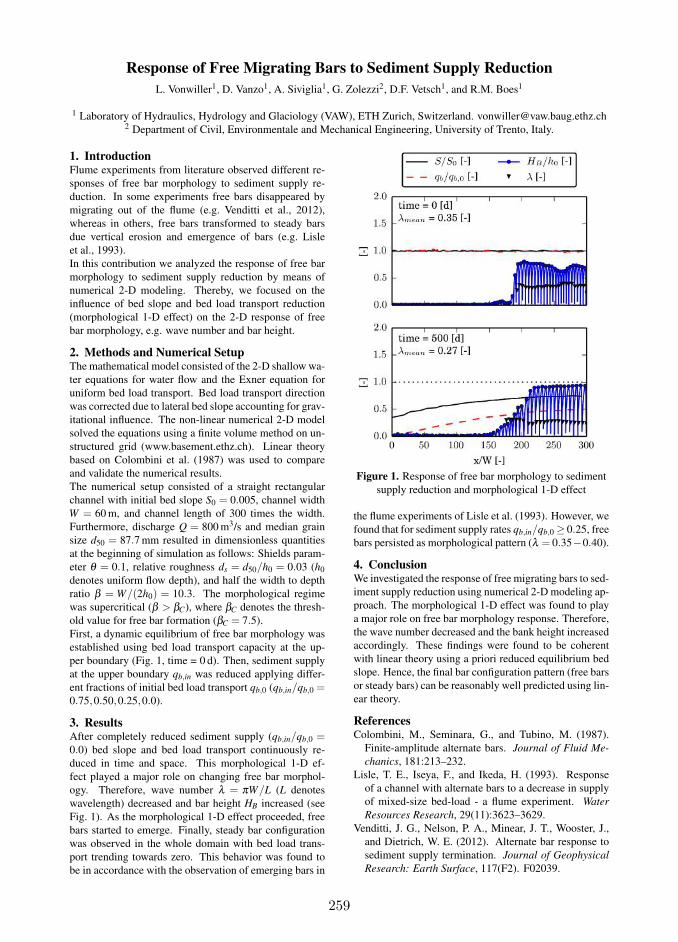
259
Response of Free Migrating Bars to Sediment Supply Reduction
L. Vonwiller1, D. Vanzo1, A. Siviglia1, G. Zolezzi2, D.F. Vetsch1, and R.M. Boes1
1 Laboratory of Hydraulics, Hydrology and Glaciology (VAW), ETH Zurich, Switzerland. [email protected] Department of Civil, Environmentale and Mechanical Engineering, University of Trento, Italy.
1. IntroductionFlume experiments from literature observed different re-
sponses of free bar morphology to sediment supply re-
duction. In some experiments free bars disappeared by
migrating out of the flume (e.g. Venditti et al., 2012),
whereas in others, free bars transformed to steady bars
due vertical erosion and emergence of bars (e.g. Lisle
et al., 1993).
In this contribution we analyzed the response of free bar
morphology to sediment supply reduction by means of
numerical 2-D modeling. Thereby, we focused on the
influence of bed slope and bed load transport reduction
(morphological 1-D effect) on the 2-D response of free
bar morphology, e.g. wave number and bar height.
2. Methods and Numerical SetupThe mathematical model consisted of the 2-D shallow wa-
ter equations for water flow and the Exner equation for
uniform bed load transport. Bed load transport direction
was corrected due to lateral bed slope accounting for grav-
itational influence. The non-linear numerical 2-D model
solved the equations using a finite volume method on un-
structured grid (www.basement.ethz.ch). Linear theory
based on Colombini et al. (1987) was used to compare
and validate the numerical results.
The numerical setup consisted of a straight rectangular
channel with initial bed slope S0 = 0.005, channel width
W = 60 m, and channel length of 300 times the width.
Furthermore, discharge Q = 800 m3/s and median grain
size d50 = 87.7 mm resulted in dimensionless quantities
at the beginning of simulation as follows: Shields param-
eter θ = 0.1, relative roughness ds = d50/h0 = 0.03 (h0
denotes uniform flow depth), and half the width to depth
ratio β = W/(2h0) = 10.3. The morphological regime
was supercritical (β > βC), where βC denotes the thresh-
old value for free bar formation (βC = 7.5).
First, a dynamic equilibrium of free bar morphology was
established using bed load transport capacity at the up-
per boundary (Fig. 1, time = 0 d). Then, sediment supply
at the upper boundary qb,in was reduced applying differ-
ent fractions of initial bed load transport qb,0 (qb,in/qb,0 =0.75,0.50,0.25,0.0).
3. ResultsAfter completely reduced sediment supply (qb,in/qb,0 =0.0) bed slope and bed load transport continuously re-
duced in time and space. This morphological 1-D ef-
fect played a major role on changing free bar morphol-
ogy. Therefore, wave number λ = πW/L (L denotes
wavelength) decreased and bar height HB increased (see
Fig. 1). As the morphological 1-D effect proceeded, free
bars started to emerge. Finally, steady bar configuration
was observed in the whole domain with bed load trans-
port trending towards zero. This behavior was found to
be in accordance with the observation of emerging bars in
Figure 1. Response of free bar morphology to sediment
supply reduction and morphological 1-D effect
the flume experiments of Lisle et al. (1993). However, we
found that for sediment supply rates qb,in/qb,0 ≥ 0.25, free
bars persisted as morphological pattern (λ = 0.35−0.40).
4. ConclusionWe investigated the response of free migrating bars to sed-
iment supply reduction using numerical 2-D modeling ap-
proach. The morphological 1-D effect was found to play
a major role on free bar morphology response. Therefore,
the wave number decreased and the bank height increased
accordingly. These findings were found to be coherent
with linear theory using a priori reduced equilibrium bed
slope. Hence, the final bar configuration pattern (free bars
or steady bars) can be reasonably well predicted using lin-
ear theory.
ReferencesColombini, M., Seminara, G., and Tubino, M. (1987).
Finite-amplitude alternate bars. Journal of Fluid Me-
chanics, 181:213–232.
Lisle, T. E., Iseya, F., and Ikeda, H. (1993). Response
of a channel with alternate bars to a decrease in supply
of mixed-size bed-load - a flume experiment. Water
Resources Research, 29(11):3623–3629.
Venditti, J. G., Nelson, P. A., Minear, J. T., Wooster, J.,
and Dietrich, W. E. (2012). Alternate bar response to
sediment supply termination. Journal of Geophysical
Research: Earth Surface, 117(F2). F02039.

260
Hydraulic Experiments on Influence of Bank Height to the Relationship between Bank Erosion and Bar Development
Y. Watanabe1, S. Yamaguchi2, M. Kawakami3 and N. Kon1
1 Department of Civil and Environmental Engineering, Kitami Institute of Technology, Kitami, Japan.
[email protected] 2 Civil Engineering Research Institute for Cold Region, Sapporo, Japan.
[email protected] 3 Fukuda Hydrologic Centre, Sapporo, Japan. [email protected]
1. Introduction The characteristics of bank erosion and bar formation directly connect with river channel disasters and a river ecosystem. For this reason, many researches on bank erosion and bar formation. However, there is an incomplete understanding of the relationship between bank erosion and bar development. In recent years, many flood disasters by bank erosions due to development of bars have occurred. For this reason, the relationship between bank erosion and bar development needs to be grasped. In this study, the hydraulic experiments on this relationship were conducted. 2. Hydraulic Experiment 2.1 Experimental set-up A straight flume used for the experiment is 7m in length, and 0.2m in width. In order to generate bank erosion, the 20cm wide extension part was added to the left bank side of the middle section as a flood plain. The experimental flume is shown in Figure 1. The reason that limited the extension part to a section of flume is for preventing a channel meandering by bank erosion. The flume is set with a gradient of 1/100 after the flume is covered with silica sand (dm = 0.765mm) at 0.10m in thickness. The extension part is covered with the same sand. As for this portion, three kinds of bank height were set up (2cm in Case1, 3cm in Case2 and 4cm in Case3. 2.2 Hydraulic conditions Two patterns to which the starting time of bank erosion was changed were implemented in each case. One is that bank erosion was allowed after forming bars in straight channel with setting partition between flood plain and channel (Case*-1). Another is that bank erosion was allowed from the beginning (Case*-2). The initial water depth was set as 7 mm in each case so that alternate bars might be formed. The discharge was adjusted so that initial water depth (7mm) might become the same in each case. 2.3 Measurements The locations of the front tips and the height of the bars and bank erosion part were measured every 5 minutes during water flow in the flume. 2.4 Results of Experiment In one example, time variations of the bar front edge and the bank erosion part in Case3 are shown in Figure 2. In the case where bank erosion (Case*-1) was allowed after the bar grew enough, migration of bars became slow and riverbank erosion advanced to the transverse direction. On the other hand, in the case which formation of bars and the bank erosion advance simultaneously, migration
of bars continued and bank erosion advanced in the longitudinal direction. The lower a bank is, the clearer characteristics are. The time variations of bar height after forming bars are shown in Figure 3. The height of bar becomes low by sediment supply from banks. Final bar height is the same even if the height of a bank is changed. 3. Conclusions The influence of the height of a bank works directly to progress of bank erosion, and affects development of the bar through bank erosion. The situation of bank erosion changes with the development stage of bars. And the migration of bars is affected by the development of bank erosion. Thus, strong impact is received to each other.
Case2-1
Case2-2
Figure 2. Time variations of the bar front edge and the bank erosion part in Case3
Flood Plain
Head Tank Reservoir
4m 2m2m
0.2m
0.2m
Flow
Flood Plain
Channel
0.2m 0.2m
0.1m
Bank Height
Planform
Cross section
Figure 1. Experimental flume
.
.
.
Bar H
eight c
Ti e i .)
Case ‐ Case ‐
Case ‐ Case ‐
Case ‐ Case ‐
Figure 3. Time variations of bar height
261
Translational Bank Migration Rate in Non-Cohesive Bank Materials Mobilized as Bedload in Bends of Low to Moderate Curvature
D.M. Waterman1 and M.H. García1
1 Ven Te Chow Hydrosystems Laboratory, Department of Civil and Environmental Engineering, University of Illinois
at Urbana-Champaign, Urbana, IL, USA. [email protected]; [email protected]
1. Introduction The banks of alluvial rivers commonly consist of a basal
layer of non-cohesive material that is overlain by finer-
grained material with some cohesion, a configuration
referred to as a composite bank (Thorne and Tovey,
1981). The more readily mobilized non-cohesive layer is
recognized to have a disproportionately large effect on
bank migration rate (Thorne, 1982), and yet physically-
based bank erosion sub-models commonly impose bank
deformation rate formulations that are suitable only for
the cohesive bank layers, as described by Waterman and
García (2016). The physically sound method to model
bank deformation in the non-cohesive basal layer is the
proper implementation of the sediment mass
conservation equation (Exner equation). Previous
methods used to overcome the computational expense
associated with finite difference solution of the Exner
equation have involved integration over the bank region
using a similarity assumption for bank shape
(Hasegawa, 1989; Parker et al., 2011). In such
treatments, the bank profile is generally estimated as a
rather steep and constant transverse slope, whereby the
transverse component of bedload flux is associated with
the downslope gravitational force. However, in concave-
upward shaped basal bank profiles (Waterman and
García, 2016), the transverse slope at the base of the
bank (considered to be the thalweg herein) may be quite
small. The main driver of the transverse component of
bedload flux at the base of the bank is thus likely the
transverse component of the boundary shear stress
associated with the secondary flow. This issue is
explored in the present analysis.
2. Analytical and Numerical Treatment The problem is distilled into its most basic form:
uniform, developed bend-flow (bend of infinite length)
in a channel bounded by uniform coarse alluvium
mobilized as bedload. The goal is to identify the
transverse component of bedload flux at the base of the
bank that is the key variable in the integrated Exner
equation. The condition of translational migration is
sought, whereby the entire cross-section migrates
laterally without changing shape under constant
discharge. A single radial slice of the channel is
considered; all divergence terms in the streamwise
direction are eliminated. Simplified numerical modelling
techniques are sought, to capture the most important
physical principles and inform the analytical formulation
for bank migration rate. The streamwise component of
the boundary shear stresses are solved using the rapid
and simple method of Khodashenas and Pacquier
(1999). The deviation of the shear stress vector from the
streamwise direction is calculated using the ratio of flow
depth to radius of curvature based on van Bendegom
(1947). Both numerical and analytical results indicate
that the transverse slope at the base of the bank will
equal zero under the assumptions of the problem. This
provides the similarity shape locally at the limits of
integration for the bank region that is critical to
implementing the integrated Exner equation. The
integrated Exner equation then yields a straight-forward
expression for steady-state bank migration rate that takes
into account both the excess boundary shear stress and
the radius of curvature.
3. Conclusions The dimensionless migration rate formula is physically-
based, using the sediment-mass conservation equation
with a justifiable shape constraint and a constitutive
relationship for bedload transport rate applied to the
basal bank layer. The formulation represents an upper
limit on actual migration rates based on basal layer
migration alone that can be expected to be mitigated by
the influence of the upper cohesive layer and the
different rates of over-bar deposition and bank
deformation not accounted for in the assumption of
steady translational migration.
References Hasegawa, K. (1989). Universal bank erosion coefficient
for meandering rivers. Journal of Hydraulic
Engineering, 115(6), 744-765.
Khodashenas, S.R., and Paquier, A. (1999). A
geometrical method for computing the distribution of
boundary shear stress across irregular straight open
channels. Journal of Hydraulic Research, 37(3), 381-
388
Parker, G., Shimizu, Y., Wilkerson, G.V., Eke, E.C.,
Abad, J.D., Lauer, J.W., Paola, C., Dietrich, W.E.,
and Voller, W.E. (2011). A new framework for
modeling the migration of meandering rivers. Earth
Surface Processes and Landforms, 36(1), 70-86.
Thorne, C.R. (1982). Processes and mechanisms of river
bank erosion, in R.D. Hey, J.C. Bathurst, C.R. Thorne
editors, Gravel-bed Rivers, Wiley, Chichester, 227–
271.
Thorne, C.R. and Tovey, N.K. (1981). Stability of
composite river banks, Earth Surface Processes and
Landforms, 6(5), 469-484.
van Bendegom, L. (1947). Some considerations on river
morphology and river improvement. De Ingenieur,
59(4), 1-11 (in Dutch; English transl.: Nat. Res.
Counc. Canada, Technical Translation 1054, 1963).
Waterman, D.M. and García, M.H. (2016). Concave-
upward composite river bank profile shape at
migrating meander bends. In Constantinescu, G.,
García, M., and Hanes, D., editors, River Flow 2016,
pages 1098-1105. CRC Press.
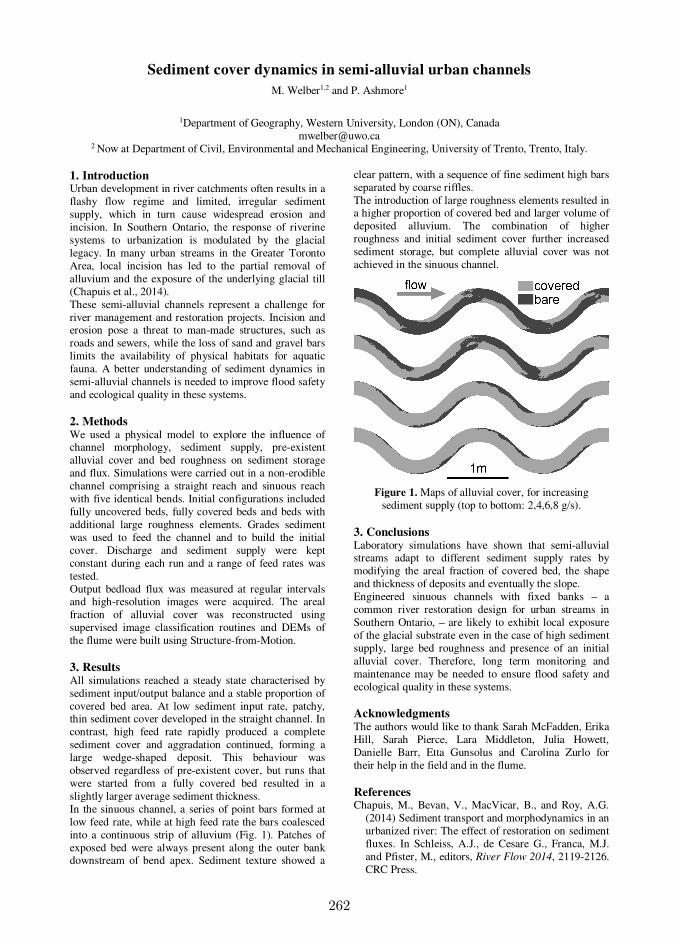
262
Sediment cover dynamics in semi-alluvial urban channels M. Welber1,2 and P. Ashmore1
1Department of Geography, Western University, London (ON), Canada
[email protected] 2 Now at Department of Civil, Environmental and Mechanical Engineering, University of Trento, Trento, Italy.
1. Introduction Urban development in river catchments often results in a flashy flow regime and limited, irregular sediment supply, which in turn cause widespread erosion and incision. In Southern Ontario, the response of riverine systems to urbanization is modulated by the glacial legacy. In many urban streams in the Greater Toronto Area, local incision has led to the partial removal of alluvium and the exposure of the underlying glacial till (Chapuis et al., 2014). These semi-alluvial channels represent a challenge for river management and restoration projects. Incision and erosion pose a threat to man-made structures, such as roads and sewers, while the loss of sand and gravel bars limits the availability of physical habitats for aquatic fauna. A better understanding of sediment dynamics in semi-alluvial channels is needed to improve flood safety and ecological quality in these systems. 2. Methods We used a physical model to explore the influence of channel morphology, sediment supply, pre-existent alluvial cover and bed roughness on sediment storage and flux. Simulations were carried out in a non-erodible channel comprising a straight reach and sinuous reach with five identical bends. Initial configurations included fully uncovered beds, fully covered beds and beds with additional large roughness elements. Grades sediment was used to feed the channel and to build the initial cover. Discharge and sediment supply were kept constant during each run and a range of feed rates was tested. Output bedload flux was measured at regular intervals and high-resolution images were acquired. The areal fraction of alluvial cover was reconstructed using supervised image classification routines and DEMs of the flume were built using Structure-from-Motion. 3. Results All simulations reached a steady state characterised by sediment input/output balance and a stable proportion of covered bed area. At low sediment input rate, patchy, thin sediment cover developed in the straight channel. In contrast, high feed rate rapidly produced a complete sediment cover and aggradation continued, forming a large wedge-shaped deposit. This behaviour was observed regardless of pre-existent cover, but runs that were started from a fully covered bed resulted in a slightly larger average sediment thickness. In the sinuous channel, a series of point bars formed at low feed rate, while at high feed rate the bars coalesced into a continuous strip of alluvium (Fig. 1). Patches of exposed bed were always present along the outer bank downstream of bend apex. Sediment texture showed a
clear pattern, with a sequence of fine sediment high bars separated by coarse riffles. The introduction of large roughness elements resulted in a higher proportion of covered bed and larger volume of deposited alluvium. The combination of higher roughness and initial sediment cover further increased sediment storage, but complete alluvial cover was not achieved in the sinuous channel.
Figure 1. Maps of alluvial cover, for increasing
sediment supply (top to bottom: 2,4,6,8 g/s). 3. Conclusions Laboratory simulations have shown that semi-alluvial streams adapt to different sediment supply rates by modifying the areal fraction of covered bed, the shape and thickness of deposits and eventually the slope. Engineered sinuous channels with fixed banks – a common river restoration design for urban streams in Southern Ontario, – are likely to exhibit local exposure of the glacial substrate even in the case of high sediment supply, large bed roughness and presence of an initial alluvial cover. Therefore, long term monitoring and maintenance may be needed to ensure flood safety and ecological quality in these systems. Acknowledgments The authors would like to thank Sarah McFadden, Erika Hill, Sarah Pierce, Lara Middleton, Julia Howett, Danielle Barr, Etta Gunsolus and Carolina Zurlo for their help in the field and in the flume. References Chapuis, M., Bevan, V., MacVicar, B., and Roy, A.G.
(2014) Sediment transport and morphodynamics in an urbanized river: The effect of restoration on sediment fluxes. In Schleiss, A.J., de Cesare G., Franca, M.J. and Pfister, M., editors, River Flow 2014, 2119-2126. CRC Press.
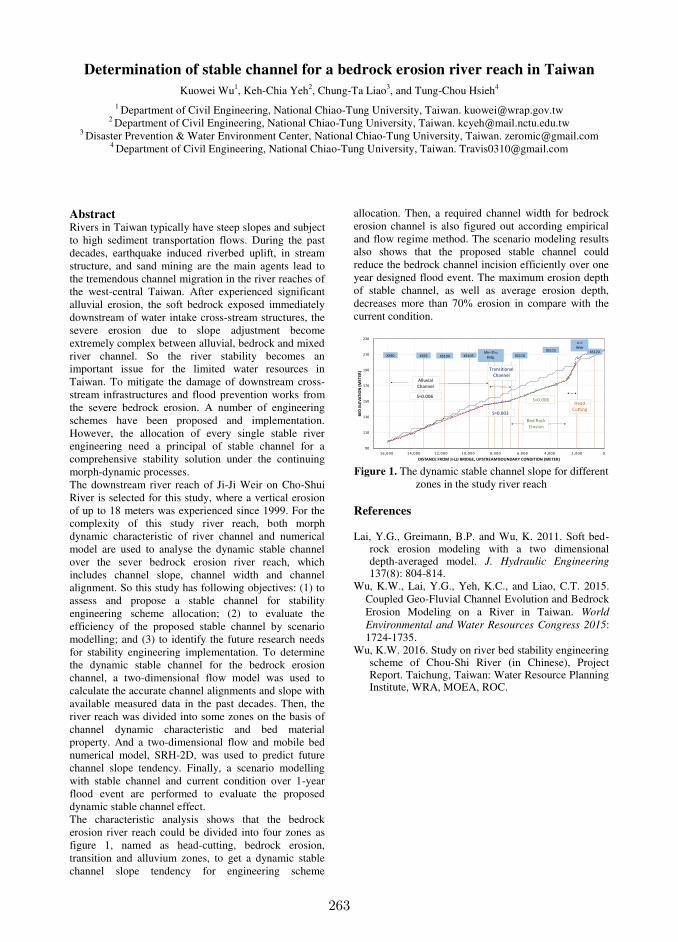
263
Determination of stable channel for a bedrock erosion river reach in Taiwan
Kuowei Wu1, Keh-Chia Yeh2, Chung-Ta Liao3, and Tung-Chou Hsieh4 1 Department of Civil Engineering, National Chiao-Tung University, Taiwan. [email protected]
2 Department of Civil Engineering, National Chiao-Tung University, Taiwan. [email protected] 3 Disaster Prevention & Water Environment Center, National Chiao-Tung University, Taiwan. [email protected]
4 Department of Civil Engineering, National Chiao-Tung University, Taiwan. [email protected]
Abstract Rivers in Taiwan typically have steep slopes and subject to high sediment transportation flows. During the past decades, earthquake induced riverbed uplift, in stream structure, and sand mining are the main agents lead to the tremendous channel migration in the river reaches of the west-central Taiwan. After experienced significant alluvial erosion, the soft bedrock exposed immediately downstream of water intake cross-stream structures, the severe erosion due to slope adjustment become extremely complex between alluvial, bedrock and mixed river channel. So the river stability becomes an important issue for the limited water resources in Taiwan. To mitigate the damage of downstream cross-stream infrastructures and flood prevention works from the severe bedrock erosion. A number of engineering schemes have been proposed and implementation. However, the allocation of every single stable river engineering need a principal of stable channel for a comprehensive stability solution under the continuing morph-dynamic processes. The downstream river reach of Ji-Ji Weir on Cho-Shui River is selected for this study, where a vertical erosion of up to 18 meters was experienced since 1999. For the complexity of this study river reach, both morph dynamic characteristic of river channel and numerical model are used to analyse the dynamic stable channel over the sever bedrock erosion river reach, which includes channel slope, channel width and channel alignment. So this study has following objectives: (1) to assess and propose a stable channel for stability engineering scheme allocation; (2) to evaluate the efficiency of the proposed stable channel by scenario modelling; and (3) to identify the future research needs for stability engineering implementation. To determine the dynamic stable channel for the bedrock erosion channel, a two-dimensional flow model was used to calculate the accurate channel alignments and slope with available measured data in the past decades. Then, the river reach was divided into some zones on the basis of channel dynamic characteristic and bed material property. And a two-dimensional flow and mobile bed numerical model, SRH-2D, was used to predict future channel slope tendency. Finally, a scenario modelling with stable channel and current condition over 1-year flood event are performed to evaluate the proposed dynamic stable channel effect. The characteristic analysis shows that the bedrock erosion river reach could be divided into four zones as figure 1, named as head-cutting, bedrock erosion, transition and alluvium zones, to get a dynamic stable channel slope tendency for engineering scheme
allocation. Then, a required channel width for bedrock erosion channel is also figured out according empirical and flow regime method. The scenario modeling results also shows that the proposed stable channel could reduce the bedrock channel incision efficiently over one year designed flood event. The maximum erosion depth of stable channel, as well as average erosion depth, decreases more than 70% erosion in compare with the current condition.
90
110
130
150
170
190
210
230
0 2 ,000 4 ,000 6 ,000 8 ,000 10 ,000 12 ,000 14 ,000 16 ,000
BE
D E
LEV
AT
ION
(M
ET
ER
)
DISTANCE FROM JI-LU BRIDGE, UPSTREAM BOUNDARY CONDITION (METER)
XS115
Ji-Ji
Weir
XS95XS90 XS100 XS105 XS110Min-Zhu
Brdg.
XS120
Alluvial
Channel
Bed Rock
Erosion
S=0.006S=0.006
Head
CuttingS=0.003
Transitional
Channel
Figure 1. The dynamic stable channel slope for different
zones in the study river reach
References Lai, Y.G., Greimann, B.P. and Wu, K. 2011. Soft bed-
rock erosion modeling with a two dimensional depth-averaged model. J. Hydraulic Engineering 137(8): 804-814.
Wu, K.W., Lai, Y.G., Yeh, K.C., and Liao, C.T. 2015. Coupled Geo-Fluvial Channel Evolution and Bedrock Erosion Modeling on a River in Taiwan. World
Environmental and Water Resources Congress 2015: 1724-1735.
Wu, K.W. 2016. Study on river bed stability engineering scheme of Chou-Shi River (in Chinese), Project Report. Taichung, Taiwan: Water Resource Planning Institute, WRA, MOEA, ROC.
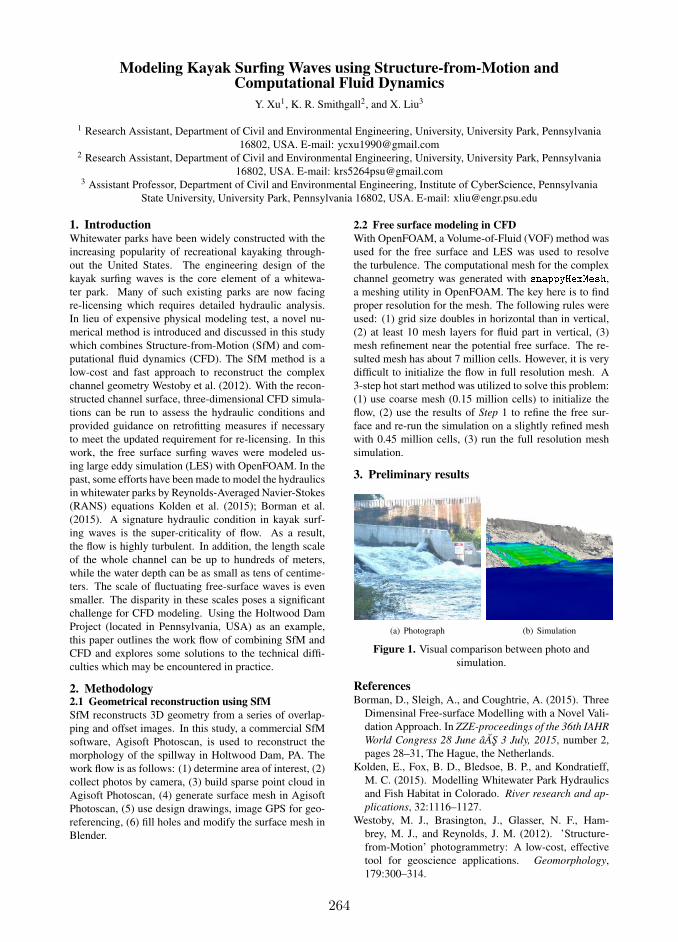
264
Modeling Kayak Surfing Waves using Structure-from-Motion andComputational Fluid Dynamics
Y. Xu1, K. R. Smithgall2, and X. Liu3
1 Research Assistant, Department of Civil and Environmental Engineering, University, University Park, Pennsylvania
16802, USA. E-mail: [email protected] Research Assistant, Department of Civil and Environmental Engineering, University, University Park, Pennsylvania
16802, USA. E-mail: [email protected] Assistant Professor, Department of Civil and Environmental Engineering, Institute of CyberScience, Pennsylvania
State University, University Park, Pennsylvania 16802, USA. E-mail: [email protected]
1. IntroductionWhitewater parks have been widely constructed with the
increasing popularity of recreational kayaking through-
out the United States. The engineering design of the
kayak surfing waves is the core element of a whitewa-
ter park. Many of such existing parks are now facing
re-licensing which requires detailed hydraulic analysis.
In lieu of expensive physical modeling test, a novel nu-
merical method is introduced and discussed in this study
which combines Structure-from-Motion (SfM) and com-
putational fluid dynamics (CFD). The SfM method is a
low-cost and fast approach to reconstruct the complex
channel geometry Westoby et al. (2012). With the recon-
structed channel surface, three-dimensional CFD simula-
tions can be run to assess the hydraulic conditions and
provided guidance on retrofitting measures if necessary
to meet the updated requirement for re-licensing. In this
work, the free surface surfing waves were modeled us-
ing large eddy simulation (LES) with OpenFOAM. In the
past, some efforts have been made to model the hydraulics
in whitewater parks by Reynolds-Averaged Navier-Stokes
(RANS) equations Kolden et al. (2015); Borman et al.
(2015). A signature hydraulic condition in kayak surf-
ing waves is the super-criticality of flow. As a result,
the flow is highly turbulent. In addition, the length scale
of the whole channel can be up to hundreds of meters,
while the water depth can be as small as tens of centime-
ters. The scale of fluctuating free-surface waves is even
smaller. The disparity in these scales poses a significant
challenge for CFD modeling. Using the Holtwood Dam
Project (located in Pennsylvania, USA) as an example,
this paper outlines the work flow of combining SfM and
CFD and explores some solutions to the technical diffi-
culties which may be encountered in practice.
2. Methodology2.1 Geometrical reconstruction using SfM
SfM reconstructs 3D geometry from a series of overlap-
ping and offset images. In this study, a commercial SfM
software, Agisoft Photoscan, is used to reconstruct the
morphology of the spillway in Holtwood Dam, PA. The
work flow is as follows: (1) determine area of interest, (2)
collect photos by camera, (3) build sparse point cloud in
Agisoft Photoscan, (4) generate surface mesh in Agisoft
Photoscan, (5) use design drawings, image GPS for geo-
referencing, (6) fill holes and modify the surface mesh in
Blender.
2.2 Free surface modeling in CFD
With OpenFOAM, a Volume-of-Fluid (VOF) method was
used for the free surface and LES was used to resolve
the turbulence. The computational mesh for the complex
channel geometry was generated with s♥♣♣②①s,
a meshing utility in OpenFOAM. The key here is to find
proper resolution for the mesh. The following rules were
used: (1) grid size doubles in horizontal than in vertical,
(2) at least 10 mesh layers for fluid part in vertical, (3)
mesh refinement near the potential free surface. The re-
sulted mesh has about 7 million cells. However, it is very
difficult to initialize the flow in full resolution mesh. A
3-step hot start method was utilized to solve this problem:
(1) use coarse mesh (0.15 million cells) to initialize the
flow, (2) use the results of Step 1 to refine the free sur-
face and re-run the simulation on a slightly refined mesh
with 0.45 million cells, (3) run the full resolution mesh
simulation.
3. Preliminary results
(a) Photograph (b) Simulation
Figure 1. Visual comparison between photo and
simulation.
ReferencesBorman, D., Sleigh, A., and Coughtrie, A. (2015). Three
Dimensinal Free-surface Modelling with a Novel Vali-
dation Approach. In ZZE-proceedings of the 36th IAHR
World Congress 28 June âAS 3 July, 2015, number 2,
pages 28–31, The Hague, the Netherlands.
Kolden, E., Fox, B. D., Bledsoe, B. P., and Kondratieff,
M. C. (2015). Modelling Whitewater Park Hydraulics
and Fish Habitat in Colorado. River research and ap-
plications, 32:1116–1127.
Westoby, M. J., Brasington, J., Glasser, N. F., Ham-
brey, M. J., and Reynolds, J. M. (2012). ’Structure-
from-Motion’ photogrammetry: A low-cost, effective
tool for geoscience applications. Geomorphology,
179:300–314.
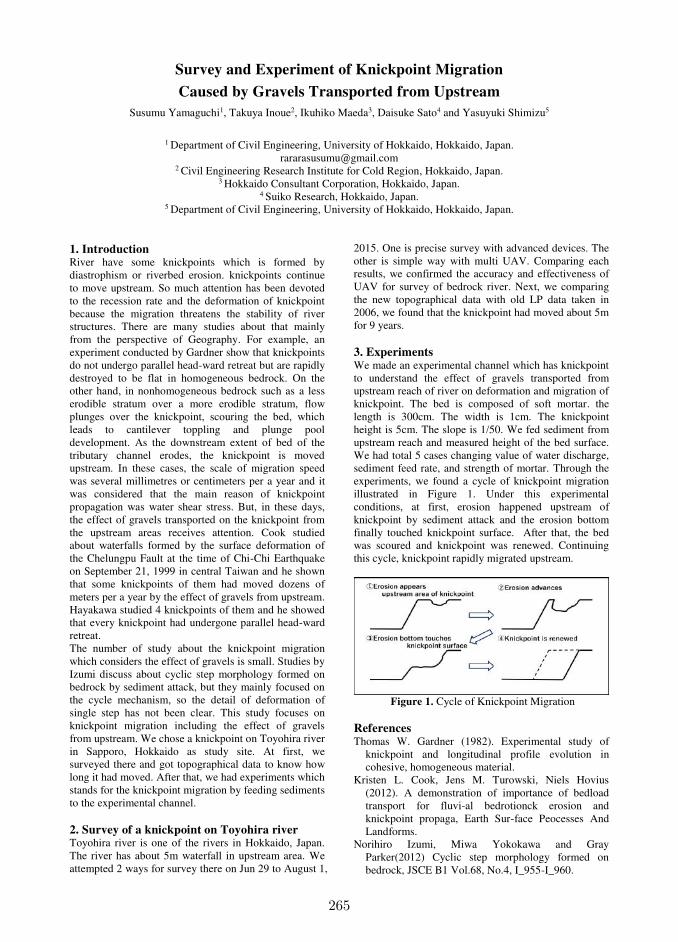
265
Survey and Experiment of Knickpoint Migration
Caused by Gravels Transported from Upstream
Susumu Yamaguchi1, Takuya Inoue2, Ikuhiko Maeda3, Daisuke Sato4 and Yasuyuki Shimizu5
1 Department of Civil Engineering, University of Hokkaido, Hokkaido, Japan.
[email protected] 2 Civil Engineering Research Institute for Cold Region, Hokkaido, Japan.
3 Hokkaido Consultant Corporation, Hokkaido, Japan. 4 Suiko Research, Hokkaido, Japan.
5 Department of Civil Engineering, University of Hokkaido, Hokkaido, Japan.
1. Introduction River have some knickpoints which is formed by diastrophism or riverbed erosion. knickpoints continue to move upstream. So much attention has been devoted to the recession rate and the deformation of knickpoint because the migration threatens the stability of river structures. There are many studies about that mainly from the perspective of Geography. For example, an experiment conducted by Gardner show that knickpoints do not undergo parallel head-ward retreat but are rapidly destroyed to be flat in homogeneous bedrock. On the other hand, in nonhomogeneous bedrock such as a less erodible stratum over a more erodible stratum, flow plunges over the knickpoint, scouring the bed, which leads to cantilever toppling and plunge pool development. As the downstream extent of bed of the tributary channel erodes, the knickpoint is moved upstream. In these cases, the scale of migration speed was several millimetres or centimeters per a year and it was considered that the main reason of knickpoint propagation was water shear stress. But, in these days, the effect of gravels transported on the knickpoint from the upstream areas receives attention. Cook studied about waterfalls formed by the surface deformation of the Chelungpu Fault at the time of Chi-Chi Earthquake on September 21, 1999 in central Taiwan and he shown that some knickpoints of them had moved dozens of meters per a year by the effect of gravels from upstream. Hayakawa studied 4 knickpoints of them and he showed that every knickpoint had undergone parallel head-ward retreat. The number of study about the knickpoint migration which considers the effect of gravels is small. Studies by Izumi discuss about cyclic step morphology formed on bedrock by sediment attack, but they mainly focused on the cycle mechanism, so the detail of deformation of single step has not been clear. This study focuses on knickpoint migration including the effect of gravels from upstream. We chose a knickpoint on Toyohira river in Sapporo, Hokkaido as study site. At first, we surveyed there and got topographical data to know how long it had moved. After that, we had experiments which stands for the knickpoint migration by feeding sediments to the experimental channel. 2. Survey of a knickpoint on Toyohira river Toyohira river is one of the rivers in Hokkaido, Japan. The river has about 5m waterfall in upstream area. We attempted 2 ways for survey there on Jun 29 to August 1,
2015. One is precise survey with advanced devices. The other is simple way with multi UAV. Comparing each results, we confirmed the accuracy and effectiveness of UAV for survey of bedrock river. Next, we comparing the new topographical data with old LP data taken in 2006, we found that the knickpoint had moved about 5m for 9 years. 3. Experiments We made an experimental channel which has knickpoint to understand the effect of gravels transported from upstream reach of river on deformation and migration of knickpoint. The bed is composed of soft mortar. the length is 300cm. The width is 1cm. The knickpoint height is 5cm. The slope is 1/50. We fed sediment from upstream reach and measured height of the bed surface. We had total 5 cases changing value of water discharge, sediment feed rate, and strength of mortar. Through the experiments, we found a cycle of knickpoint migration illustrated in Figure 1. Under this experimental conditions, at first, erosion happened upstream of knickpoint by sediment attack and the erosion bottom finally touched knickpoint surface. After that, the bed was scoured and knickpoint was renewed. Continuing this cycle, knickpoint rapidly migrated upstream.
Figure 1. Cycle of Knickpoint Migration
References Thomas W. Gardner (1982). Experimental study of
knickpoint and longitudinal profile evolution in cohesive, homogeneous material.
Kristen L. Cook, Jens M. Turowski, Niels Hovius (2012). A demonstration of importance of bedload transport for fluvi-al bedrotionck erosion and knickpoint propaga, Earth Sur-face Peocesses And Landforms.
Norihiro Izumi, Miwa Yokokawa and Gray Parker(2012) Cyclic step morphology formed on bedrock, JSCE B1 Vol.68, No.4, I_955-I_960.
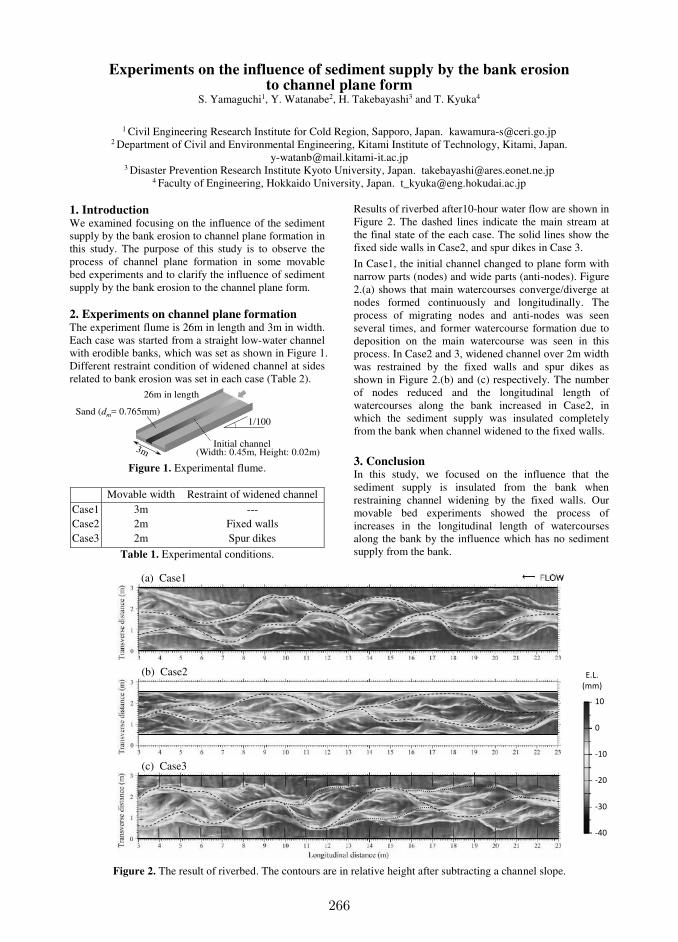
266
Experiments on the influence of sediment supply by the bank erosion to channel plane form
S. Yamaguchi1, Y. Watanabe2, H. Takebayashi3 and T. Kyuka4
1 Civil Engineering Research Institute for Cold Region, Sapporo, Japan. [email protected]
2 Department of Civil and Environmental Engineering, Kitami Institute of Technology, Kitami, Japan. [email protected]
3 Disaster Prevention Research Institute Kyoto University, Japan. [email protected] 4 Faculty of Engineering, Hokkaido University, Japan. [email protected]
1. Introduction We examined focusing on the influence of the sediment supply by the bank erosion to channel plane formation in this study. The purpose of this study is to observe the process of channel plane formation in some movable bed experiments and to clarify the influence of sediment supply by the bank erosion to the channel plane form. 2. Experiments on channel plane formation The experiment flume is 26m in length and 3m in width. Each case was started from a straight low-water channel with erodible banks, which was set as shown in Figure 1. Different restraint condition of widened channel at sides related to bank erosion was set in each case (Table 2).
26m in length
Sand (dm= 0.765mm)
Initial channel(Width: 0.45m, Height: 0.02m)
1/100
Figure 1. Experimental flume.
Movable width Restraint of widened channel
Case1 3m --- Case2 2m Fixed walls Case3 2m Spur dikes
Table 1. Experimental conditions.
Results of riverbed after10-hour water flow are shown in Figure 2. The dashed lines indicate the main stream at the final state of the each case. The solid lines show the fixed side walls in Case2, and spur dikes in Case 3.
In Case1, the initial channel changed to plane form with narrow parts (nodes) and wide parts (anti-nodes). Figure 2.(a) shows that main watercourses converge/diverge at nodes formed continuously and longitudinally. The process of migrating nodes and anti-nodes was seen several times, and former watercourse formation due to deposition on the main watercourse was seen in this process. In Case2 and 3, widened channel over 2m width was restrained by the fixed walls and spur dikes as shown in Figure 2.(b) and (c) respectively. The number of nodes reduced and the longitudinal length of watercourses along the bank increased in Case2, in which the sediment supply was insulated completely from the bank when channel widened to the fixed walls.
3. Conclusion In this study, we focused on the influence that the sediment supply is insulated from the bank when restraining channel widening by the fixed walls. Our movable bed experiments showed the process of increases in the longitudinal length of watercourses along the bank by the influence which has no sediment supply from the bank.
(a) Case1
(b) Case2
(c) Case3
Figure 2. The result of riverbed. The contours are in relative height after subtracting a channel slope.
10
0
-10
-20
-30
-40
E.L.
(mm)
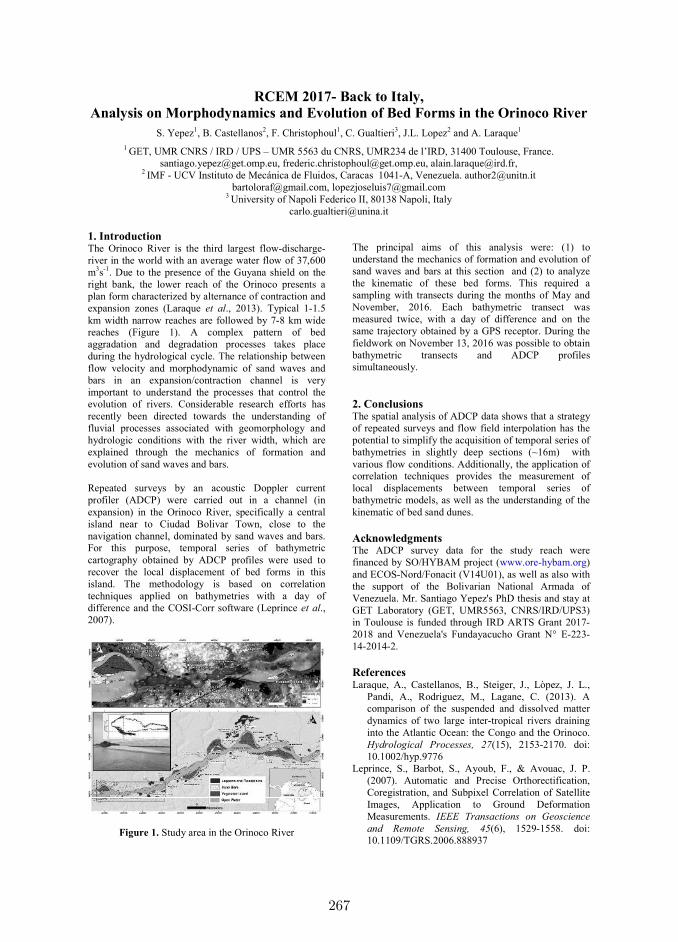
267
RCEM 2017- Back to Italy, Analysis on Morphodynamics and Evolution of Bed Forms in the Orinoco River
S. Yepez1, B. Castellanos2, F. Christophoul1, C. Gualtieri3, J.L. Lopez2 and A. Laraque1 1 GET, UMR CNRS / IRD / UPS – UMR 5563 du CNRS, UMR234 de l’IRD, 31400 Toulouse, France.
[email protected], [email protected], [email protected], 2 IMF - UCV Instituto de Mecánica de Fluidos, Caracas 1041-A, Venezuela. [email protected]
[email protected], [email protected] 3 University of Napoli Federico II, 80138 Napoli, Italy
1. Introduction The Orinoco River is the third largest flow-discharge-river in the world with an average water flow of 37,600 m3s-1. Due to the presence of the Guyana shield on the right bank, the lower reach of the Orinoco presents a plan form characterized by alternance of contraction and expansion zones (Laraque et al., 2013). Typical 1-1.5 km width narrow reaches are followed by 7-8 km wide reaches (Figure 1). A complex pattern of bed aggradation and degradation processes takes place during the hydrological cycle. The relationship between flow velocity and morphodynamic of sand waves and bars in an expansion/contraction channel is very important to understand the processes that control the evolution of rivers. Considerable research efforts has recently been directed towards the understanding of fluvial processes associated with geomorphology and hydrologic conditions with the river width, which are explained through the mechanics of formation and evolution of sand waves and bars. Repeated surveys by an acoustic Doppler current profiler (ADCP) were carried out in a channel (in expansion) in the Orinoco River, specifically a central island near to Ciudad Bolivar Town, close to the navigation channel, dominated by sand waves and bars. For this purpose, temporal series of bathymetric cartography obtained by ADCP profiles were used to recover the local displacement of bed forms in this island. The methodology is based on correlation techniques applied on bathymetries with a day of difference and the COSI-Corr software (Leprince et al., 2007).
Figure 1. Study area in the Orinoco River
The principal aims of this analysis were: (1) to understand the mechanics of formation and evolution of sand waves and bars at this section and (2) to analyze the kinematic of these bed forms. This required a sampling with transects during the months of May and November, 2016. Each bathymetric transect was measured twice, with a day of difference and on the same trajectory obtained by a GPS receptor. During the fieldwork on November 13, 2016 was possible to obtain bathymetric transects and ADCP profiles simultaneously. 2. Conclusions The spatial analysis of ADCP data shows that a strategy of repeated surveys and flow field interpolation has the potential to simplify the acquisition of temporal series of bathymetries in slightly deep sections (~16m) with various flow conditions. Additionally, the application of correlation techniques provides the measurement of local displacements between temporal series of bathymetric models, as well as the understanding of the kinematic of bed sand dunes. Acknowledgments The ADCP survey data for the study reach were financed by SO/HYBAM project (www.ore-hybam.org) and ECOS-Nord/Fonacit (V14U01), as well as also with the support of the Bolivarian National Armada of Venezuela. Mr. Santiago Yepez's PhD thesis and stay at GET Laboratory (GET, UMR5563, CNRS/IRD/UPS3) in Toulouse is funded through IRD ARTS Grant 2017-2018 and Venezuela's Fundayacucho Grant N° E-223-14-2014-2. References Laraque, A., Castellanos, B., Steiger, J., Lòpez, J. L.,
Pandi, A., Rodriguez, M., Lagane, C. (2013). A comparison of the suspended and dissolved matter dynamics of two large inter‐tropical rivers draining into the Atlantic Ocean: the Congo and the Orinoco. Hydrological Processes, 27(15), 2153-2170. doi: 10.1002/hyp.9776
Leprince, S., Barbot, S., Ayoub, F., & Avouac, J. P. (2007). Automatic and Precise Orthorectification, Coregistration, and Subpixel Correlation of Satellite Images, Application to Ground Deformation Measurements. IEEE Transactions on Geoscience and Remote Sensing, 45(6), 1529-1558. doi: 10.1109/TGRS.2006.888937
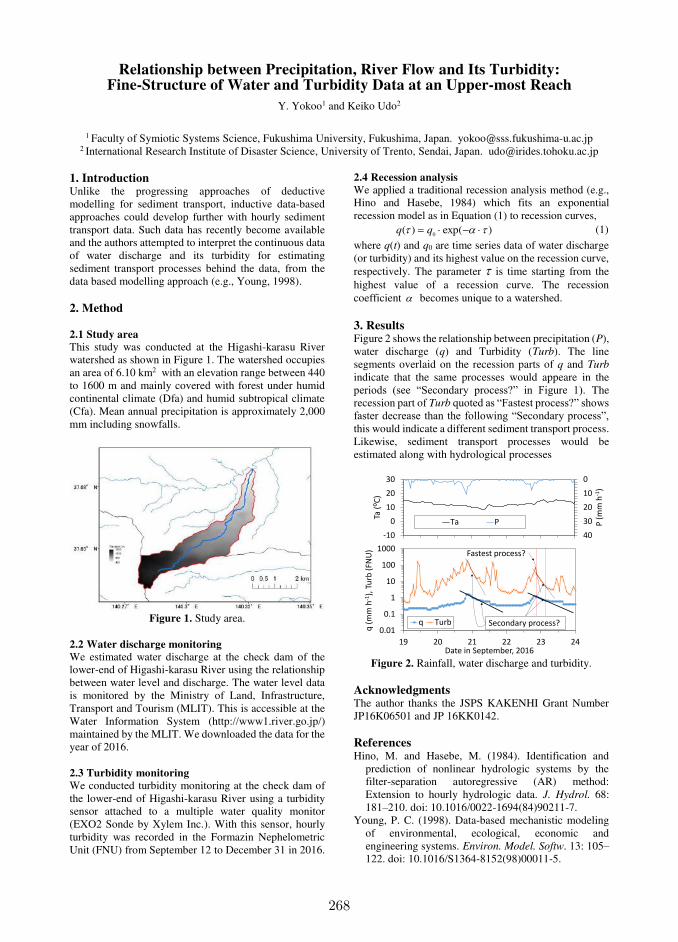
268
Relationship between Precipitation, River Flow and Its Turbidity: Fine-Structure of Water and Turbidity Data at an Upper-most Reach
Y. Yokoo1 and Keiko Udo2
1 Faculty of Symiotic Systems Science, Fukushima University, Fukushima, Japan. [email protected]
2 International Research Institute of Disaster Science, University of Trento, Sendai, Japan. [email protected]
1. Introduction Unlike the progressing approaches of deductive modelling for sediment transport, inductive data-based approaches could develop further with hourly sediment transport data. Such data has recently become available and the authors attempted to interpret the continuous data of water discharge and its turbidity for estimating sediment transport processes behind the data, from the data based modelling approach (e.g., Young, 1998). 2. Method 2.1 Study area
This study was conducted at the Higashi-karasu River watershed as shown in Figure 1. The watershed occupies an area of 6.10 km2 with an elevation range between 440 to 1600 m and mainly covered with forest under humid continental climate (Dfa) and humid subtropical climate (Cfa). Mean annual precipitation is approximately 2,000 mm including snowfalls.
Figure 1. Study area.
2.2 Water discharge monitoring
We estimated water discharge at the check dam of the lower-end of Higashi-karasu River using the relationship between water level and discharge. The water level data is monitored by the Ministry of Land, Infrastructure, Transport and Tourism (MLIT). This is accessible at the Water Information System (http://www1.river.go.jp/) maintained by the MLIT. We downloaded the data for the year of 2016.
2.3 Turbidity monitoring
We conducted turbidity monitoring at the check dam of the lower-end of Higashi-karasu River using a turbidity sensor attached to a multiple water quality monitor (EXO2 Sonde by Xylem Inc.). With this sensor, hourly turbidity was recorded in the Formazin Nephelometric Unit (FNU) from September 12 to December 31 in 2016.
2.4 Recession analysis
We applied a traditional recession analysis method (e.g., Hino and Hasebe, 1984) which fits an exponential recession model as in Equation (1) to recession curves, )exp()( 0 qq (1)
where q(t) and q0 are time series data of water discharge (or turbidity) and its highest value on the recession curve, respectively. The parameter is time starting from the highest value of a recession curve. The recession coefficient becomes unique to a watershed. 3. Results Figure 2 shows the relationship between precipitation (P), water discharge (q) and Turbidity (Turb). The line segments overlaid on the recession parts of q and Turb indicate that the same processes would appeare in the periods (see “Secondary process?” in Figure 1). The recession part of Turb quoted as “Fastest process?” shows faster decrease than the following “Secondary process”, this would indicate a different sediment transport process. Likewise, sediment transport processes would be estimated along with hydrological processes
Figure 2. Rainfall, water discharge and turbidity.
Acknowledgments The author thanks the JSPS KAKENHI Grant Number JP16K06501 and JP 16KK0142. References Hino, M. and Hasebe, M. (1984). Identification and
prediction of nonlinear hydrologic systems by the filter-separation autoregressive (AR) method: Extension to hourly hydrologic data. J. Hydrol. 68: 181–210. doi: 10.1016/0022-1694(84)90211-7.
Young, P. C. (1998). Data-based mechanistic modeling of environmental, ecological, economic and engineering systems. Environ. Model. Softw. 13: 105–122. doi: 10.1016/S1364-8152(98)00011-5.
0.01
0.1
1
10
100
1000
19 20 21 22 23 24
q (
mm
h-1
), T
urb
(FN
U)
Date in September, 2016
q Turb
0
10
20
30
40-10
0
10
20
30
P (
mm
h-1
)
Ta (⁰C
)
Ta P
Fastest process?
Secondary process?
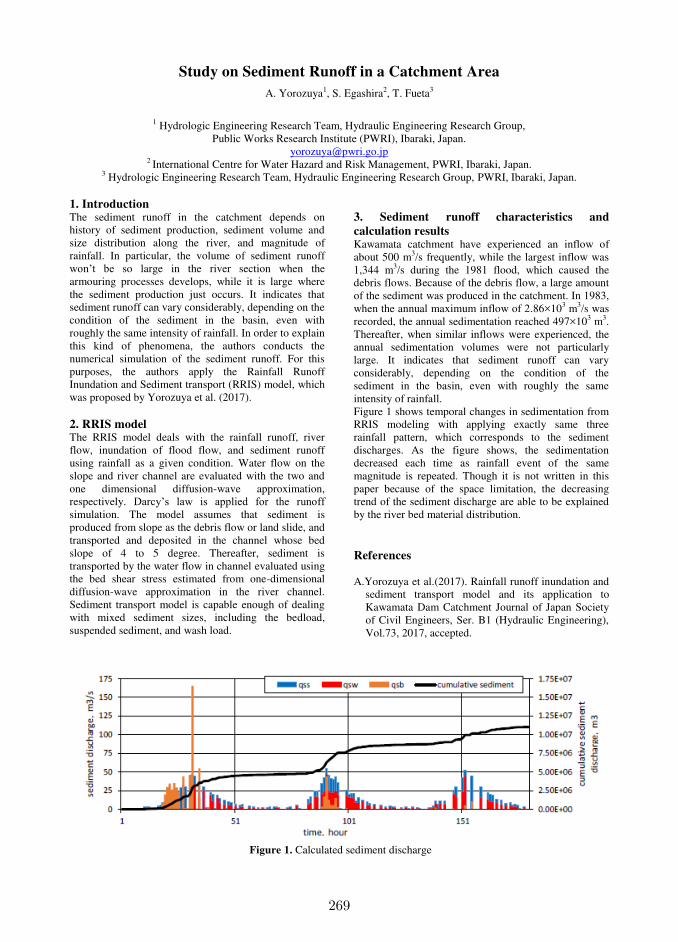
269
Study on Sediment Runoff in a Catchment Area
A. Yorozuya1, S. Egashira2, T. Fueta3
1 Hydrologic Engineering Research Team, Hydraulic Engineering Research Group,
Public Works Research Institute (PWRI), Ibaraki, Japan. [email protected]
2 International Centre for Water Hazard and Risk Management, PWRI, Ibaraki, Japan. 3 Hydrologic Engineering Research Team, Hydraulic Engineering Research Group, PWRI, Ibaraki, Japan.
1. Introduction The sediment runoff in the catchment depends on history of sediment production, sediment volume and size distribution along the river, and magnitude of rainfall. In particular, the volume of sediment runoff won’t be so large in the river section when the armouring processes develops, while it is large where the sediment production just occurs. It indicates that sediment runoff can vary considerably, depending on the condition of the sediment in the basin, even with roughly the same intensity of rainfall. In order to explain this kind of phenomena, the authors conducts the numerical simulation of the sediment runoff. For this purposes, the authors apply the Rainfall Runoff Inundation and Sediment transport (RRIS) model, which was proposed by Yorozuya et al. (2017). 2. RRIS model The RRIS model deals with the rainfall runoff, river flow, inundation of flood flow, and sediment runoff using rainfall as a given condition. Water flow on the slope and river channel are evaluated with the two and one dimensional diffusion-wave approximation, respectively. Darcy’s law is applied for the runoff simulation. The model assumes that sediment is produced from slope as the debris flow or land slide, and transported and deposited in the channel whose bed slope of 4 to 5 degree. Thereafter, sediment is transported by the water flow in channel evaluated using the bed shear stress estimated from one-dimensional diffusion-wave approximation in the river channel. Sediment transport model is capable enough of dealing with mixed sediment sizes, including the bedload, suspended sediment, and wash load.
3. Sediment runoff characteristics and
calculation results Kawamata catchment have experienced an inflow of about 500 m3/s frequently, while the largest inflow was 1,344 m3/s during the 1981 flood, which caused the debris flows. Because of the debris flow, a large amount of the sediment was produced in the catchment. In 1983, when the annual maximum inflow of 2.86×10³ m3/s was recorded, the annual sedimentation reached 497×103 m3. Thereafter, when similar inflows were experienced, the annual sedimentation volumes were not particularly large. It indicates that sediment runoff can vary considerably, depending on the condition of the sediment in the basin, even with roughly the same intensity of rainfall. Figure 1 shows temporal changes in sedimentation from RRIS modeling with applying exactly same three rainfall pattern, which corresponds to the sediment discharges. As the figure shows, the sedimentation decreased each time as rainfall event of the same magnitude is repeated. Though it is not written in this paper because of the space limitation, the decreasing trend of the sediment discharge are able to be explained by the river bed material distribution.
References A.Yorozuya et al.(2017). Rainfall runoff inundation and
sediment transport model and its application to Kawamata Dam Catchment Journal of Japan Society of Civil Engineers, Ser. B1 (Hydraulic Engineering), Vol.73, 2017, accepted.
Figure 1. Calculated sediment discharge
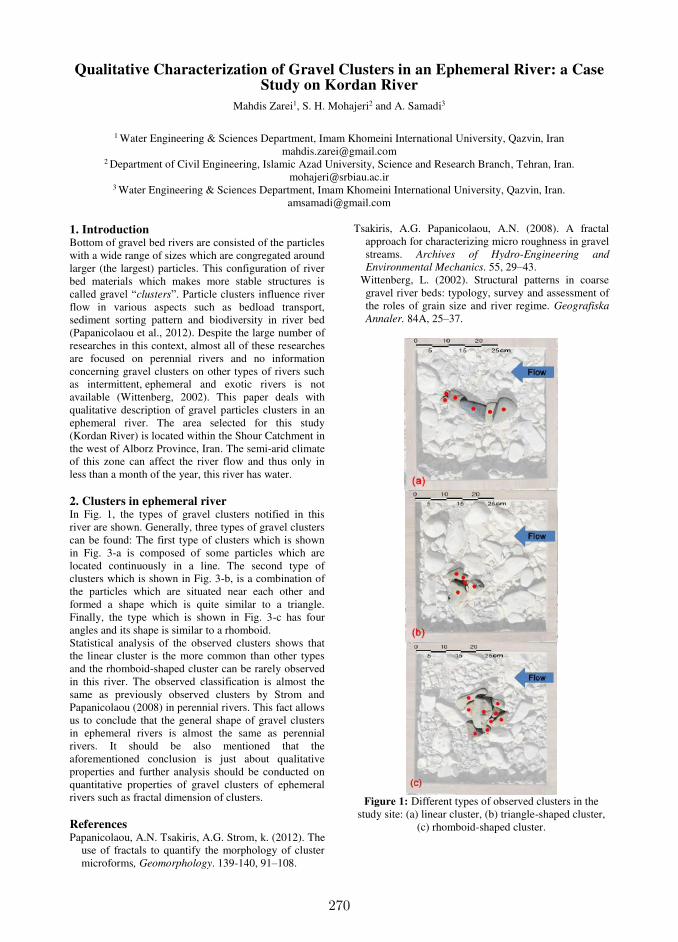
270
Qualitative Characterization of Gravel Clusters in an Ephemeral River: a Case Study on Kordan River
Mahdis Zarei1, S. H. Mohajeri2 and A. Samadi3
1 Water Engineering & Sciences Department, Imam Khomeini International University, Qazvin, Iran
[email protected] 2 Department of Civil Engineering, Islamic Azad University, Science and Research Branch, Tehran, Iran.
[email protected] 3 Water Engineering & Sciences Department, Imam Khomeini International University, Qazvin, Iran.
1. Introduction Bottom of gravel bed rivers are consisted of the particles with a wide range of sizes which are congregated around larger (the largest) particles. This configuration of river bed materials which makes more stable structures is called gravel “clusters”. Particle clusters influence river flow in various aspects such as bedload transport, sediment sorting pattern and biodiversity in river bed (Papanicolaou et al., 2012). Despite the large number of researches in this context, almost all of these researches are focused on perennial rivers and no information concerning gravel clusters on other types of rivers such as intermittent, ephemeral and exotic rivers is not available (Wittenberg, 2002). This paper deals with qualitative description of gravel particles clusters in an ephemeral river. The area selected for this study (Kordan River) is located within the Shour Catchment in the west of Alborz Province, Iran. The semi-arid climate of this zone can affect the river flow and thus only in less than a month of the year, this river has water. 2. Clusters in ephemeral river In Fig. 1, the types of gravel clusters notified in this river are shown. Generally, three types of gravel clusters can be found: The first type of clusters which is shown in Fig. 3-a is composed of some particles which are located continuously in a line. The second type of clusters which is shown in Fig. 3-b, is a combination of the particles which are situated near each other and formed a shape which is quite similar to a triangle. Finally, the type which is shown in Fig. 3-c has four angles and its shape is similar to a rhomboid. Statistical analysis of the observed clusters shows that the linear cluster is the more common than other types and the rhomboid-shaped cluster can be rarely observed in this river. The observed classification is almost the same as previously observed clusters by Strom and Papanicolaou (2008) in perennial rivers. This fact allows us to conclude that the general shape of gravel clusters in ephemeral rivers is almost the same as perennial rivers. It should be also mentioned that the aforementioned conclusion is just about qualitative properties and further analysis should be conducted on quantitative properties of gravel clusters of ephemeral rivers such as fractal dimension of clusters. References Papanicolaou, A.N. Tsakiris, A.G. Strom, k. (2012). The
use of fractals to quantify the morphology of cluster microforms, Geomorphology. 139-140, 91–108.
Tsakiris, A.G. Papanicolaou, A.N. (2008). A fractal approach for characterizing micro roughness in gravel streams. Archives of Hydro-Engineering and
Environmental Mechanics. 55, 29–43. Wittenberg, L. (2002). Structural patterns in coarse
gravel river beds: typology, survey and assessment of the roles of grain size and river regime. Geografiska
Annaler. 84A, 25–37.
Figure 1: Different types of observed clusters in the
study site: (a) linear cluster, (b) triangle-shaped cluster, (c) rhomboid-shaped cluster.

271
Quantifying the effect of valley confinements on the long-term evolution ofmeandering rivers
S. Zen1, M. Bogoni2, G. Zolezzi1 and S. Lanzoni2
1 Department of Civil, Environmental and Mechanical Engineering, University of Trento, Trento, Italy.
[email protected] Department of Civil, Environmental and Architectural Engineering, University of Padua, Padua, Italy.
1. IntroductionValley confinements, by preventing the full development
of meander bends, induce changes in the overall plan-
form of meandering rivers. When a river channel im-
pinges on the less erodible valley walls the meander bend
becomes flat and form angles in correspondence of the
contact point, varying its curvature as well as its sinu-
osity. As a consequence the meander migrate laterally
faster and through a direction almost parallel to the main
axis of the alluvial valley. The magnitude of such ef-
fect, besides confinements physical characteristics, seems
to depend on the ratio between alluvial valley and chan-
nel width (Nicoll and Hickin, 2010). On the long time
scale the occurrence of cutoffs limit the portion of alluvial
floodplain occupied by the river while spanning back and
forth the valley, generating an active meander belt which
width can be related to the mean meander wavelength of
the free evolving channel (Camporeale et al., 2005). Once
assigned channel geometry and flow characteristics it is
therefore possible to know whether valley constraints will
interact with the river or not. Because during a long-term
evolution river channel axis geometry keep varying, river
metrics that characterize meandering patterns, e.g. mean
meander wavelength, has to refer to the statistical steady
state reached by the river (Camporeale et al., 2005).
In this work we aim to investigate the effect of valley con-
finements on i) the meandering channel pattern and ii) the
floodplain structure generated by the river during its long-
term evolution.
2. MethodWe apply the model for meandering rivers evolution pro-
posed by Zolezzi and Seminara (2001). The model lin-
early solves the 2D momentum equation along with the
continuity equation for the liquid and solid phase. The
lateral migration of the channel axis is described trough
the relation
ζ = EU, (1)
where E is the erodibility coefficient and U is the excess
near-bank velocity estimated as
U = f
(
ν ,β ,θ ,C f ,C,
∫ s
so
C(l)eλ (s−l)dl
)
. (2)
In equation (2) s is the longitudinal coordinate, l indicates
a precise position along the axis, C is the channel cur-
vature, C f is the friction coefficient and ν , β , θ are the
dimensionless parameter that describe the flow field in a
2B-wide curve channel. To simulate the presence of less
erodible valley walls the coefficient E of equation (1) was
opportunely modified.
Valley confinements were assigned at a distance from the
initial central axis proportional to the mean intrinsic me-
ander length computed at the steady state for the case of
unconfined evolution. By increasing or decreasing such a
distance we explored a set of different scenarios.
3. ResultsThe comparison between metrics computed at the steady
state conditions reveal that the decreasing of the portion of
alluvial floodplain available for meanders evolution result
in a decrease of meander mean intrinsic length and sinu-
osity. Furthermore, changes in meander bends dynamic
affect also the occurrence of neck cutoffs.
0 200 400 600 800 1000 1200
−200
−100
0
100
200
300
X/B
Y/B
Figure 1. Example of long-term confined evolution.
0 2 4 6 8 10 120
50
100
150
200
250
300
t/tic
Lc/B
Wratio
= Inf
Wratio
= 1.25
Wratio
= 1
Wratio
= 0.75
Wratio
= 0.5
Wratio
= 0.3
Alluvial Valley Width
Figure 2. Temporal variation of the mean meander
intrinsic length for different alluvial floodplain width.
ReferencesCamporeale, C., Perona, P., Porporato, A., and Ri-
dolfi, L. (2005). On the long-term behavior
of meandering rivers. Water Resour. Res., 41.
doi:10.1029/2005WR004109.
Nicoll, T. J. and Hickin, E. J. (2010). Planform geometry
and channel migration of confined meandering rivers
on the canadian prairies. Geomorphology, 116:37–47.
doi:10.1016/j.geomorph.2009.10.005.
Zolezzi, G. and Seminara, G. (2001). Down-
stream and upstream influence in river meander-
ing. part 1. general theory and application to
overdeepening. J. Fluid Mech., 438:183–211.
doi:10.1017/S002211200100427X.
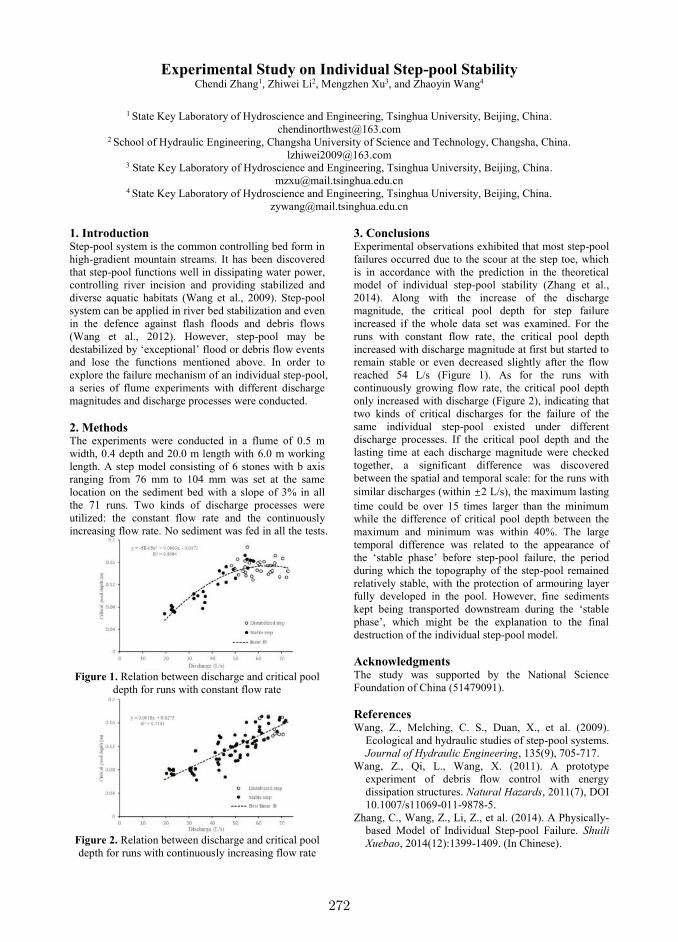
272
Experimental Study on Individual Step-pool Stability Chendi Zhang1, Zhiwei Li2, Mengzhen Xu3, and Zhaoyin Wang4
1 State Key Laboratory of Hydroscience and Engineering, Tsinghua University, Beijing, China.
[email protected] 2 School of Hydraulic Engineering, Changsha University of Science and Technology, Changsha, China.
[email protected] 3 State Key Laboratory of Hydroscience and Engineering, Tsinghua University, Beijing, China.
[email protected] 4 State Key Laboratory of Hydroscience and Engineering, Tsinghua University, Beijing, China.
1. Introduction Step-pool system is the common controlling bed form in
high-gradient mountain streams. It has been discovered
that step-pool functions well in dissipating water power,
controlling river incision and providing stabilized and
diverse aquatic habitats (Wang et al., 2009). Step-pool
system can be applied in river bed stabilization and even
in the defence against flash floods and debris flows
(Wang et al., 2012). However, step-pool may be
destabilized by ‘exceptional’ flood or debris flow events and lose the functions mentioned above. In order to
explore the failure mechanism of an individual step-pool,
a series of flume experiments with different discharge
magnitudes and discharge processes were conducted.
2. Methods The experiments were conducted in a flume of 0.5 m
width, 0.4 depth and 20.0 m length with 6.0 m working
length. A step model consisting of 6 stones with b axis
ranging from 76 mm to 104 mm was set at the same
location on the sediment bed with a slope of 3% in all
the 71 runs. Two kinds of discharge processes were
utilized: the constant flow rate and the continuously
increasing flow rate. No sediment was fed in all the tests.
Figure 1. Relation between discharge and critical pool
depth for runs with constant flow rate
Figure 2. Relation between discharge and critical pool
depth for runs with continuously increasing flow rate
3. Conclusions Experimental observations exhibited that most step-pool
failures occurred due to the scour at the step toe, which
is in accordance with the prediction in the theoretical
model of individual step-pool stability (Zhang et al.,
2014). Along with the increase of the discharge
magnitude, the critical pool depth for step failure
increased if the whole data set was examined. For the
runs with constant flow rate, the critical pool depth
increased with discharge magnitude at first but started to
remain stable or even decreased slightly after the flow
reached 54 L/s (Figure 1). As for the runs with
continuously growing flow rate, the critical pool depth
only increased with discharge (Figure 2), indicating that
two kinds of critical discharges for the failure of the
same individual step-pool existed under different
discharge processes. If the critical pool depth and the
lasting time at each discharge magnitude were checked
together, a significant difference was discovered
between the spatial and temporal scale: for the runs with
similar discharges (within ±2 L/s), the maximum lasting
time could be over 15 times larger than the minimum
while the difference of critical pool depth between the
maximum and minimum was within 40%. The large
temporal difference was related to the appearance of
the ‘stable phase’ before step-pool failure, the period
during which the topography of the step-pool remained
relatively stable, with the protection of armouring layer
fully developed in the pool. However, fine sediments
kept being transported downstream during the ‘stable
phase’, which might be the explanation to the final
destruction of the individual step-pool model.
Acknowledgments The study was supported by the National Science
Foundation of China (51479091).
References Wang, Z., Melching, C. S., Duan, X., et al. (2009).
Ecological and hydraulic studies of step-pool systems.
Journal of Hydraulic Engineering, 135(9), 705-717.
Wang, Z., Qi, L., Wang, X. (2011). A prototype
experiment of debris flow control with energy
dissipation structures. Natural Hazards, 2011(7), DOI
10.1007/s11069-011-9878-5.
Zhang, C., Wang, Z., Li, Z., et al. (2014). A Physically-
based Model of Individual Step-pool Failure. Shuili
Xuebao, 2014(12):1399-1409. (In Chinese).
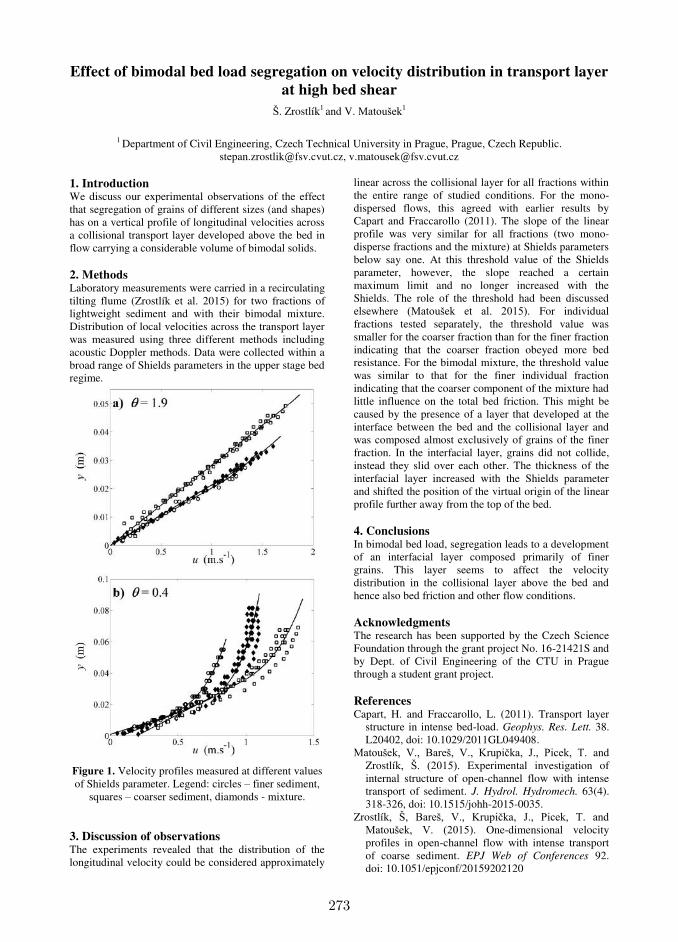
273
Effect of bimodal bed load segregation on velocity distribution in transport layer
at high bed shear
Š. Zrostlík1 and V. Matoušek1
1 Department of Civil Engineering, Czech Technical University in Prague, Prague, Czech Republic.
[email protected], [email protected]
1. Introduction We discuss our experimental observations of the effect that segregation of grains of different sizes (and shapes) has on a vertical profile of longitudinal velocities across a collisional transport layer developed above the bed in flow carrying a considerable volume of bimodal solids. 2. Methods Laboratory measurements were carried in a recirculating tilting flume (Zrostlík et al. 2015) for two fractions of lightweight sediment and with their bimodal mixture. Distribution of local velocities across the transport layer was measured using three different methods including acoustic Doppler methods. Data were collected within a broad range of Shields parameters in the upper stage bed regime.
Figure 1. Velocity profiles measured at different values of Shields parameter. Legend: circles – finer sediment,
squares – coarser sediment, diamonds - mixture. 3. Discussion of observations The experiments revealed that the distribution of the longitudinal velocity could be considered approximately
linear across the collisional layer for all fractions within the entire range of studied conditions. For the mono-dispersed flows, this agreed with earlier results by Capart and Fraccarollo (2011). The slope of the linear profile was very similar for all fractions (two mono-disperse fractions and the mixture) at Shields parameters below say one. At this threshold value of the Shields parameter, however, the slope reached a certain maximum limit and no longer increased with the Shields. The role of the threshold had been discussed elsewhere (Matoušek et al. 2015). For individual fractions tested separately, the threshold value was smaller for the coarser fraction than for the finer fraction indicating that the coarser fraction obeyed more bed resistance. For the bimodal mixture, the threshold value was similar to that for the finer individual fraction indicating that the coarser component of the mixture had little influence on the total bed friction. This might be caused by the presence of a layer that developed at the interface between the bed and the collisional layer and was composed almost exclusively of grains of the finer fraction. In the interfacial layer, grains did not collide, instead they slid over each other. The thickness of the interfacial layer increased with the Shields parameter and shifted the position of the virtual origin of the linear profile further away from the top of the bed. 4. Conclusions In bimodal bed load, segregation leads to a development of an interfacial layer composed primarily of finer grains. This layer seems to affect the velocity distribution in the collisional layer above the bed and hence also bed friction and other flow conditions. Acknowledgments The research has been supported by the Czech Science Foundation through the grant project No. 16-21421S and by Dept. of Civil Engineering of the CTU in Prague through a student grant project. References Capart, H. and Fraccarollo, L. (2011). Transport layer
structure in intense bed-load. Geophys. Res. Lett. 38. L20402, doi: 10.1029/2011GL049408.
Matoušek, V., Bareš, V., Krupička, J., Picek, T. and Zrostlík, Š. (2015). Experimental investigation of internal structure of open-channel flow with intense transport of sediment. J. Hydrol. Hydromech. 63(4). 318-326, doi: 10.1515/johh-2015-0035.
Zrostlík, Š, Bareš, V., Krupička, J., Picek, T. and Matoušek, V. (2015). One-dimensional velocity profiles in open-channel flow with intense transport of coarse sediment. EPJ Web of Conferences 92. doi: 10.1051/epjconf/20159202120
274
Tidal network morphology: unravelling the potential role of the marsh geomorphic setting
J.-P. Belliard1, S. Temmerman1, L. Carniello2 and M. Toffolon3
1 Ecosystem Management research group, University of Antwerp, Antwerp, Belgium.
[email protected]; [email protected] 2 Department of Civil, Environmental and Architectural Engineering, University of Padua, Padua, Italy.
[email protected] 3 Department of Civil, Environmental and Mechanical Engineering, University of Trento, Trento, Italy.
1. Introduction Tidal networks consist of a complex system of branching, usually blind-ended, tidal channels and creeks that provide the flow route for water, sediments, nutrients, etc. to and from tidal wetlands. They are thus essential to the functioning of tidal marshes and tidal flats to which they are tightly coupled. Tidal networks show a great spatial diversity in geometrical and topological forms. This diversity entails differences in network drainage efficiency with consequences for ecosystem functioning including marsh biogeochemical cycling and vegetation productivity (Kearney and Fagherazzi, 2016). Despite a number of studies have revealed the influence of several linked controlling variables, there are currently no clear theories that explain this diversity in channel network morphology. In this contribution, we intend to bring further insights into this research topic by investigating the role of the marsh geomorphic setting on tidal network morphology and drainage efficiency. 2. Methods Numerical simulations are performed using a two-dimensional modelling framework introduced by Belliard et al. (2015), following the work of Defina (2000) and Carniello et al. (2011, 2012). The model explicitly simulates the co-evolution of the marsh platform with the embedded tidal networks on the basis of the ecomorphodynamic approach, i.e., the modelling framework considers interactions and feedbacks between the hydrodynamics and the morphology, driven by sediment transport and mediated by vegetation growth through related ecogeomorphic processes. Model scenarios consist of simulating long-term marsh evolution starting from three initial schematised domain geometries representative of open coast, island and back-barrier marsh geomorphic settings, using same dimensions. The choice for adopting a modelling approach here is further motivated by the fact that the majority of previous modelling studies only accounted for the same type of domain geometry, i.e., referred to as a filled tidal basin (Coco et al. 2013). To isolate the role of the geomorphic setting, all scenarios are forced with similar tidal water levels and suspended sediment concentrations; other physical parameters are kept identical correspondingly.
3. Analysis and results Measures of channel and network size and shape such as network length, area, outlet width, tributary count, Strahler stream order, channel sinuosity, drainage area, density, and efficiency are computed for the simulated tidal networks for every model scenario and compared against those of natural tidal networks. Pronounced differences in these properties allow to differentiate between network morphologies as a function of the underlying marsh geomorphic setting. Moreover, results may further help restoration practitioners to design artificial tidal networks with relevant geometries and topologies, toward successful tidal marsh restoration. References Belliard, J.-P., Toffolon, M., Carniello, L., and
D’Alpaos, A. (2015). An ecogeomorphic model of tidal channel initiation and elaboration in progressive marsh accretional contexts. J. Geophys. Res. – Earth
Surface 120. 1-24, doi:10.1002/2015JF003445. Carniello, L., D’Alpaos, A., and Defina, A. (2011).
Modelling wind waves and tidal flows in shallow micro-tidal basins. Estuar. Coast. Shelf. Sci. 92, 263-276, doi:10.1016/j.ecss.2011.01.001.
Carniello, L., D’Alpaos, A., and Defina, A. (2012). Modelling sand-mud transport induced by tidal currents and wind waves in shallow microtidal basins: Applications to the Venice Lagoon (Italy). Estuar.
Coast. Shelf. Sci. 102. 105-115, doi:10.1016/j.ecss.2012.03.016.
Coco, G., Zhou, Z., van Maanen, B., Olabarrieta, M., Tinoco, R., and Townend I. (2013). Morphodynamics of tidal networks: Advances and challenges. Mar.
Geol. 346. 1-16, doi:10.1016/j.margeo.2013.08.005. Defina, A. (2000). Two-dimensional shallow flow
equations for partially dry areas. Water Resour. Res. 36, 3251-3264, doi:10.1029/2000WR900167.
Kearney, W.S., and Fagherazzi, S. (2016). Salt marsh vegetation promotes efficient tidal channel networks. Nat Commun. 7:12287 doi:10.1038/ncomms12287.
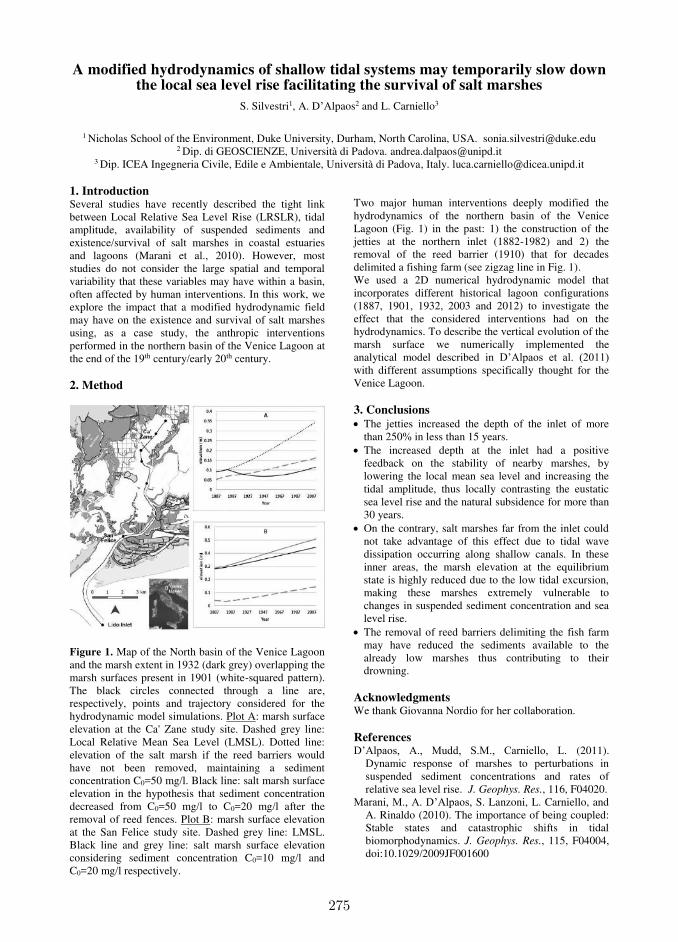
275
A modified hydrodynamics of shallow tidal systems may temporarily slow down the local sea level rise facilitating the survival of salt marshes
S. Silvestri1, A. D’Alpaos2 and L. Carniello3
1 Nicholas School of the Environment, Duke University, Durham, North Carolina, USA. [email protected]
2 Dip. di GEOSCIENZE, Università di Padova. [email protected] 3 Dip. ICEA Ingegneria Civile, Edile e Ambientale, Università di Padova, Italy. [email protected]
1. Introduction Several studies have recently described the tight link between Local Relative Sea Level Rise (LRSLR), tidal amplitude, availability of suspended sediments and existence/survival of salt marshes in coastal estuaries and lagoons (Marani et al., 2010). However, most studies do not consider the large spatial and temporal variability that these variables may have within a basin, often affected by human interventions. In this work, we explore the impact that a modified hydrodynamic field may have on the existence and survival of salt marshes using, as a case study, the anthropic interventions performed in the northern basin of the Venice Lagoon at the end of the 19th century/early 20th century. 2. Method
Figure 1. Map of the North basin of the Venice Lagoon and the marsh extent in 1932 (dark grey) overlapping the marsh surfaces present in 1901 (white-squared pattern). The black circles connected through a line are, respectively, points and trajectory considered for the hydrodynamic model simulations. Plot A: marsh surface elevation at the Ca' Zane study site. Dashed grey line: Local Relative Mean Sea Level (LMSL). Dotted line: elevation of the salt marsh if the reed barriers would have not been removed, maintaining a sediment concentration C0=50 mg/l. Black line: salt marsh surface elevation in the hypothesis that sediment concentration decreased from C0=50 mg/l to C0=20 mg/l after the removal of reed fences. Plot B: marsh surface elevation at the San Felice study site. Dashed grey line: LMSL. Black line and grey line: salt marsh surface elevation considering sediment concentration C0=10 mg/l and C0=20 mg/l respectively.
Two major human interventions deeply modified the hydrodynamics of the northern basin of the Venice Lagoon (Fig. 1) in the past: 1) the construction of the jetties at the northern inlet (1882-1982) and 2) the removal of the reed barrier (1910) that for decades delimited a fishing farm (see zigzag line in Fig. 1). We used a 2D numerical hydrodynamic model that incorporates different historical lagoon configurations (1887, 1901, 1932, 2003 and 2012) to investigate the effect that the considered interventions had on the hydrodynamics. To describe the vertical evolution of the marsh surface we numerically implemented the analytical model described in D’Alpaos et al. (2011) with different assumptions specifically thought for the Venice Lagoon. 3. Conclusions The jetties increased the depth of the inlet of more
than 250% in less than 15 years. The increased depth at the inlet had a positive
feedback on the stability of nearby marshes, by lowering the local mean sea level and increasing the tidal amplitude, thus locally contrasting the eustatic sea level rise and the natural subsidence for more than 30 years.
On the contrary, salt marshes far from the inlet could not take advantage of this effect due to tidal wave dissipation occurring along shallow canals. In these inner areas, the marsh elevation at the equilibrium state is highly reduced due to the low tidal excursion, making these marshes extremely vulnerable to changes in suspended sediment concentration and sea level rise.
The removal of reed barriers delimiting the fish farm may have reduced the sediments available to the already low marshes thus contributing to their drowning.
Acknowledgments We thank Giovanna Nordio for her collaboration. References D’Alpaos, A., Mudd, S.M., Carniello, L. (2011).
Dynamic response of marshes to perturbations in suspended sediment concentrations and rates of relative sea level rise. J. Geophys. Res., 116, F04020.
Marani, M., A. D’Alpaos, S. Lanzoni, L. Carniello, and A. Rinaldo (2010). The importance of being coupled: Stable states and catastrophic shifts in tidal biomorphodynamics. J. Geophys. Res., 115, F04004, doi:10.1029/2009JF001600
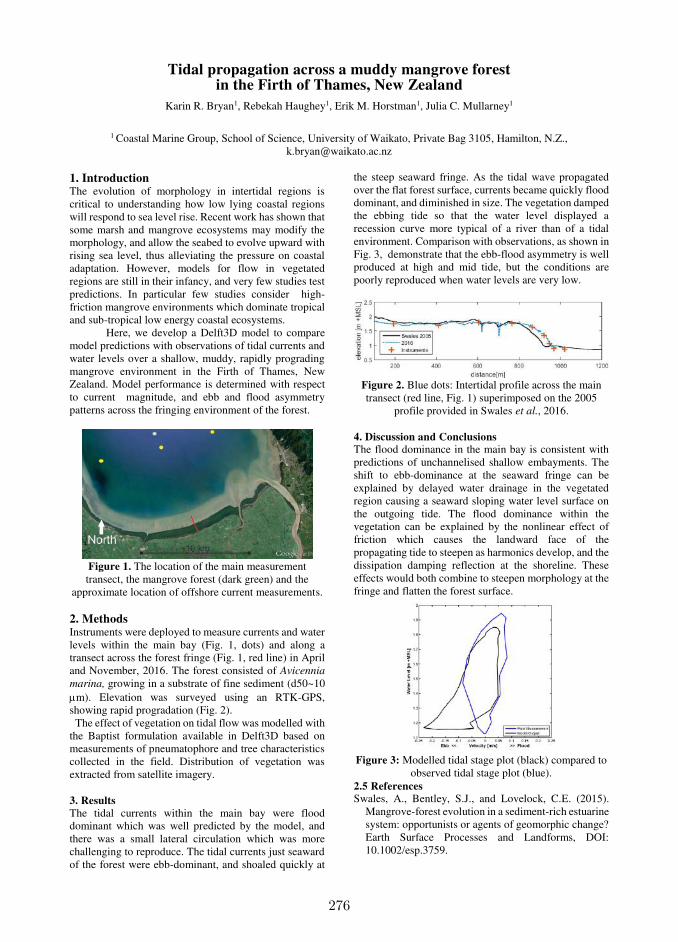
276
Tidal propagation across a muddy mangrove forest in the Firth of Thames, New Zealand
Karin R. Bryan1, Rebekah Haughey1, Erik M. Horstman1, Julia C. Mullarney1
1 Coastal Marine Group, School of Science, University of Waikato, Private Bag 3105, Hamilton, N.Z.,
1. Introduction The evolution of morphology in intertidal regions is critical to understanding how low lying coastal regions will respond to sea level rise. Recent work has shown that some marsh and mangrove ecosystems may modify the morphology, and allow the seabed to evolve upward with rising sea level, thus alleviating the pressure on coastal adaptation. However, models for flow in vegetated regions are still in their infancy, and very few studies test predictions. In particular few studies consider high-friction mangrove environments which dominate tropical and sub-tropical low energy coastal ecosystems. Here, we develop a Delft3D model to compare model predictions with observations of tidal currents and water levels over a shallow, muddy, rapidly prograding mangrove environment in the Firth of Thames, New Zealand. Model performance is determined with respect to current magnitude, and ebb and flood asymmetry patterns across the fringing environment of the forest.
Figure 1. The location of the main measurement transect, the mangrove forest (dark green) and the
approximate location of offshore current measurements.
2. Methods Instruments were deployed to measure currents and water levels within the main bay (Fig. 1, dots) and along a transect across the forest fringe (Fig. 1, red line) in April and November, 2016. The forest consisted of Avicennia
marina, growing in a substrate of fine sediment (d50~10 m). Elevation was surveyed using an RTK-GPS, showing rapid progradation (Fig. 2). The effect of vegetation on tidal flow was modelled with the Baptist formulation available in Delft3D based on measurements of pneumatophore and tree characteristics collected in the field. Distribution of vegetation was extracted from satellite imagery. 3. Results
The tidal currents within the main bay were flood dominant which was well predicted by the model, and there was a small lateral circulation which was more challenging to reproduce. The tidal currents just seaward of the forest were ebb-dominant, and shoaled quickly at
the steep seaward fringe. As the tidal wave propagated over the flat forest surface, currents became quickly flood dominant, and diminished in size. The vegetation damped the ebbing tide so that the water level displayed a recession curve more typical of a river than of a tidal environment. Comparison with observations, as shown in Fig. 3, demonstrate that the ebb-flood asymmetry is well produced at high and mid tide, but the conditions are poorly reproduced when water levels are very low.
Figure 2. Blue dots: Intertidal profile across the main transect (red line, Fig. 1) superimposed on the 2005
profile provided in Swales et al., 2016.
4. Discussion and Conclusions The flood dominance in the main bay is consistent with predictions of unchannelised shallow embayments. The shift to ebb-dominance at the seaward fringe can be explained by delayed water drainage in the vegetated region causing a seaward sloping water level surface on the outgoing tide. The flood dominance within the vegetation can be explained by the nonlinear effect of friction which causes the landward face of the propagating tide to steepen as harmonics develop, and the dissipation damping reflection at the shoreline. These effects would both combine to steepen morphology at the fringe and flatten the forest surface.
Figure 3: Modelled tidal stage plot (black) compared to
observed tidal stage plot (blue). 2.5 References Swales, A., Bentley, S.J., and Lovelock, C.E. (2015).
Mangrove-forest evolution in a sediment-rich estuarine system: opportunists or agents of geomorphic change? Earth Surface Processes and Landforms, DOI: 10.1002/esp.3759.
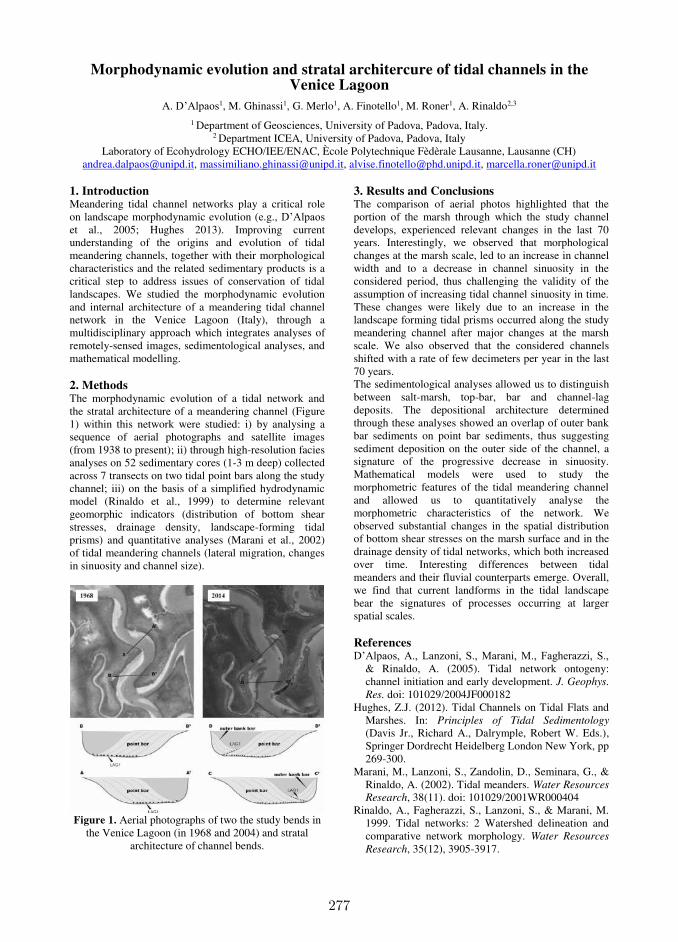
277
Morphodynamic evolution and stratal architercure of tidal channels in the Venice Lagoon
A. D’Alpaos1, M. Ghinassi1, G. Merlo1, A. Finotello1, M. Roner1, A. Rinaldo2,3
1 Department of Geosciences, University of Padova, Padova, Italy. 2 Department ICEA, University of Padova, Padova, Italy
Laboratory of Ecohydrology ECHO/IEE/ENAC, Ècole Polytechnique Fèdèrale Lausanne, Lausanne (CH) [email protected], [email protected], [email protected], [email protected]
1. Introduction Meandering tidal channel networks play a critical role on landscape morphodynamic evolution (e.g., D’Alpaos et al., 2005; Hughes 2013). Improving current understanding of the origins and evolution of tidal meandering channels, together with their morphological characteristics and the related sedimentary products is a critical step to address issues of conservation of tidal landscapes. We studied the morphodynamic evolution and internal architecture of a meandering tidal channel network in the Venice Lagoon (Italy), through a multidisciplinary approach which integrates analyses of remotely-sensed images, sedimentological analyses, and mathematical modelling. 2. Methods The morphodynamic evolution of a tidal network and the stratal architecture of a meandering channel (Figure 1) within this network were studied: i) by analysing a sequence of aerial photographs and satellite images (from 1938 to present); ii) through high-resolution facies analyses on 52 sedimentary cores (1-3 m deep) collected across 7 transects on two tidal point bars along the study channel; iii) on the basis of a simplified hydrodynamic model (Rinaldo et al., 1999) to determine relevant geomorphic indicators (distribution of bottom shear stresses, drainage density, landscape-forming tidal prisms) and quantitative analyses (Marani et al., 2002) of tidal meandering channels (lateral migration, changes in sinuosity and channel size).
Figure 1. Aerial photographs of two the study bends in
the Venice Lagoon (in 1968 and 2004) and stratal architecture of channel bends.
3. Results and Conclusions The comparison of aerial photos highlighted that the portion of the marsh through which the study channel develops, experienced relevant changes in the last 70 years. Interestingly, we observed that morphological changes at the marsh scale, led to an increase in channel width and to a decrease in channel sinuosity in the considered period, thus challenging the validity of the assumption of increasing tidal channel sinuosity in time. These changes were likely due to an increase in the landscape forming tidal prisms occurred along the study meandering channel after major changes at the marsh scale. We also observed that the considered channels shifted with a rate of few decimeters per year in the last 70 years. The sedimentological analyses allowed us to distinguish between salt-marsh, top-bar, bar and channel-lag deposits. The depositional architecture determined through these analyses showed an overlap of outer bank bar sediments on point bar sediments, thus suggesting sediment deposition on the outer side of the channel, a signature of the progressive decrease in sinuosity. Mathematical models were used to study the morphometric features of the tidal meandering channel and allowed us to quantitatively analyse the morphometric characteristics of the network. We observed substantial changes in the spatial distribution of bottom shear stresses on the marsh surface and in the drainage density of tidal networks, which both increased over time. Interesting differences between tidal meanders and their fluvial counterparts emerge. Overall, we find that current landforms in the tidal landscape bear the signatures of processes occurring at larger spatial scales. References D’Alpaos, A., Lanzoni, S., Marani, M., Fagherazzi, S.,
& Rinaldo, A. (2005). Tidal network ontogeny: channel initiation and early development. J. Geophys.
Res. doi: 101029/2004JF000182 Hughes, Z.J. (2012). Tidal Channels on Tidal Flats and
Marshes. In: Principles of Tidal Sedimentology (Davis Jr., Richard A., Dalrymple, Robert W. Eds.), Springer Dordrecht Heidelberg London New York, pp 269-300.
Marani, M., Lanzoni, S., Zandolin, D., Seminara, G., & Rinaldo, A. (2002). Tidal meanders. Water Resources
Research, 38(11). doi: 101029/2001WR000404 Rinaldo, A., Fagherazzi, S., Lanzoni, S., & Marani, M.
1999. Tidal networks: 2 Watershed delineation and comparative network morphology. Water Resources
Research, 35(12), 3905-3917.
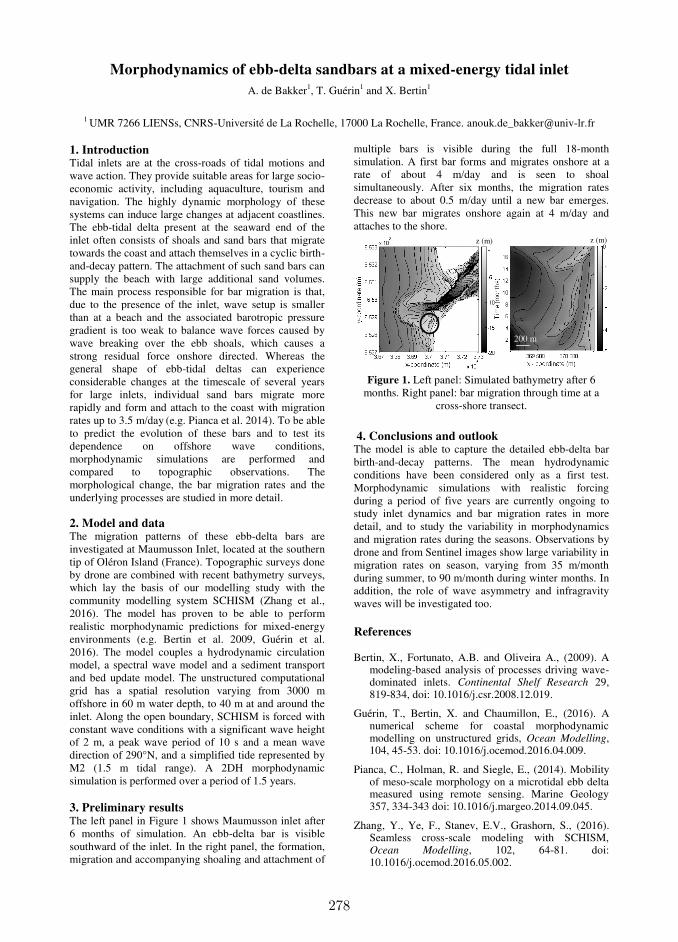
278
Morphodynamics of ebb-delta sandbars at a mixed-energy tidal inlet
A. de Bakker1, T. Guérin1 and X. Bertin1
1 UMR 7266 LIENSs, CNRS-Université de La Rochelle, 17000 La Rochelle, France. [email protected]
1. Introduction Tidal inlets are at the cross-roads of tidal motions and wave action. They provide suitable areas for large socio-economic activity, including aquaculture, tourism and navigation. The highly dynamic morphology of these systems can induce large changes at adjacent coastlines. The ebb-tidal delta present at the seaward end of the inlet often consists of shoals and sand bars that migrate towards the coast and attach themselves in a cyclic birth-and-decay pattern. The attachment of such sand bars can supply the beach with large additional sand volumes. The main process responsible for bar migration is that, due to the presence of the inlet, wave setup is smaller than at a beach and the associated barotropic pressure gradient is too weak to balance wave forces caused by wave breaking over the ebb shoals, which causes a strong residual force onshore directed. Whereas the general shape of ebb-tidal deltas can experience considerable changes at the timescale of several years for large inlets, individual sand bars migrate more rapidly and form and attach to the coast with migration rates up to 3.5 m/day (e.g. Pianca et al. 2014). To be able to predict the evolution of these bars and to test its dependence on offshore wave conditions, morphodynamic simulations are performed and compared to topographic observations. The morphological change, the bar migration rates and the underlying processes are studied in more detail. 2. Model and data The migration patterns of these ebb-delta bars are investigated at Maumusson Inlet, located at the southern tip of Oléron Island (France). Topographic surveys done by drone are combined with recent bathymetry surveys, which lay the basis of our modelling study with the community modelling system SCHISM (Zhang et al., 2016). The model has proven to be able to perform realistic morphodynamic predictions for mixed-energy environments (e.g. Bertin et al. 2009, Guérin et al. 2016). The model couples a hydrodynamic circulation model, a spectral wave model and a sediment transport and bed update model. The unstructured computational grid has a spatial resolution varying from 3000 m offshore in 60 m water depth, to 40 m at and around the inlet. Along the open boundary, SCHISM is forced with constant wave conditions with a significant wave height of 2 m, a peak wave period of 10 s and a mean wave direction of 290°N, and a simplified tide represented by M2 (1.5 m tidal range). A 2DH morphodynamic simulation is performed over a period of 1.5 years. 3. Preliminary results The left panel in Figure 1 shows Maumusson inlet after 6 months of simulation. An ebb-delta bar is visible southward of the inlet. In the right panel, the formation, migration and accompanying shoaling and attachment of
multiple bars is visible during the full 18-month simulation. A first bar forms and migrates onshore at a rate of about 4 m/day and is seen to shoal simultaneously. After six months, the migration rates decrease to about 0.5 m/day until a new bar emerges. This new bar migrates onshore again at 4 m/day and attaches to the shore.
Figure 1. Left panel: Simulated bathymetry after 6
months. Right panel: bar migration through time at a cross-shore transect.
4. Conclusions and outlook The model is able to capture the detailed ebb-delta bar birth-and-decay patterns. The mean hydrodynamic conditions have been considered only as a first test. Morphodynamic simulations with realistic forcing during a period of five years are currently ongoing to study inlet dynamics and bar migration rates in more detail, and to study the variability in morphodynamics and migration rates during the seasons. Observations by drone and from Sentinel images show large variability in migration rates on season, varying from 35 m/month during summer, to 90 m/month during winter months. In addition, the role of wave asymmetry and infragravity waves will be investigated too.
References Bertin, X., Fortunato, A.B. and Oliveira A., (2009). A
modeling-based analysis of processes driving wave-dominated inlets. Continental Shelf Research 29, 819-834, doi: 10.1016/j.csr.2008.12.019.
Guérin, T., Bertin, X. and Chaumillon, E., (2016). A numerical scheme for coastal morphodynamic modelling on unstructured grids, Ocean Modelling, 104, 45-53. doi: 10.1016/j.ocemod.2016.04.009.
Pianca, C., Holman, R. and Siegle, E., (2014). Mobility of meso-scale morphology on a microtidal ebb delta measured using remote sensing. Marine Geology 357, 334-343 doi: 10.1016/j.margeo.2014.09.045.
Zhang, Y., Ye, F., Stanev, E.V., Grashorn, S., (2016). Seamless cross-scale modeling with SCHISM, Ocean Modelling, 102, 64-81. doi: 10.1016/j.ocemod.2016.05.002.
z (m)
200 m
z (m)
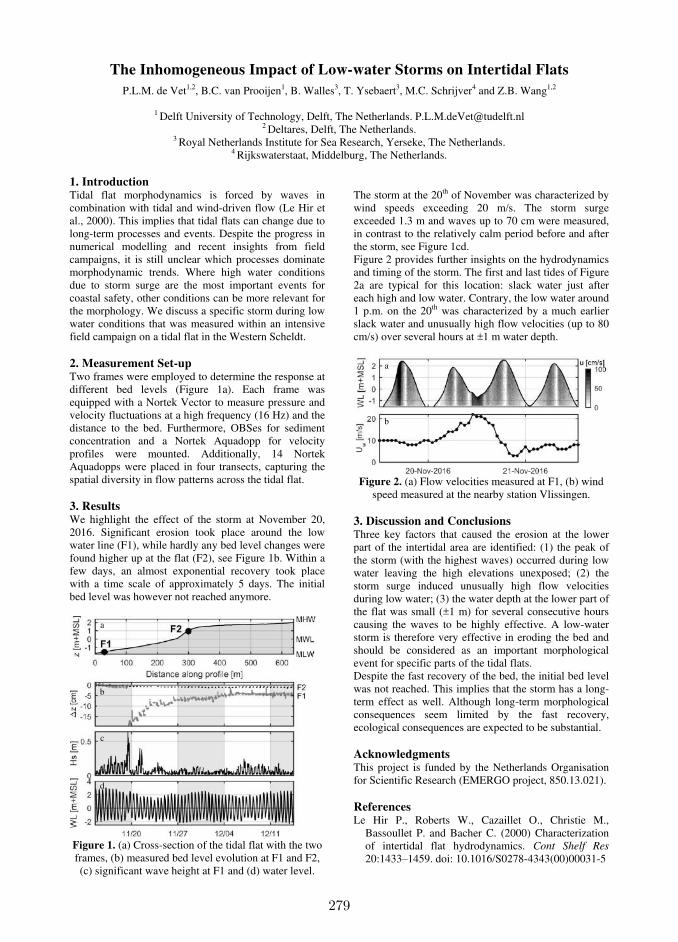
279
The Inhomogeneous Impact of Low-water Storms on Intertidal Flats
P.L.M. de Vet1,2, B.C. van Prooijen1, B. Walles3, T. Ysebaert3, M.C. Schrijver4 and Z.B. Wang1,2
1 Delft University of Technology, Delft, The Netherlands. [email protected] 2 Deltares, Delft, The Netherlands.
3 Royal Netherlands Institute for Sea Research, Yerseke, The Netherlands. 4 Rijkswaterstaat, Middelburg, The Netherlands.
1. Introduction Tidal flat morphodynamics is forced by waves in combination with tidal and wind-driven flow (Le Hir et al., 2000). This implies that tidal flats can change due to long-term processes and events. Despite the progress in numerical modelling and recent insights from field campaigns, it is still unclear which processes dominate morphodynamic trends. Where high water conditions due to storm surge are the most important events for coastal safety, other conditions can be more relevant for the morphology. We discuss a specific storm during low water conditions that was measured within an intensive field campaign on a tidal flat in the Western Scheldt. 2. Measurement Set-up Two frames were employed to determine the response at different bed levels (Figure 1a). Each frame was equipped with a Nortek Vector to measure pressure and velocity fluctuations at a high frequency (16 Hz) and the distance to the bed. Furthermore, OBSes for sediment concentration and a Nortek Aquadopp for velocity profiles were mounted. Additionally, 14 Nortek Aquadopps were placed in four transects, capturing the spatial diversity in flow patterns across the tidal flat. 3. Results We highlight the effect of the storm at November 20, 2016. Significant erosion took place around the low water line (F1), while hardly any bed level changes were found higher up at the flat (F2), see Figure 1b. Within a few days, an almost exponential recovery took place with a time scale of approximately 5 days. The initial bed level was however not reached anymore.
Figure 1. (a) Cross-section of the tidal flat with the two frames, (b) measured bed level evolution at F1 and F2, (c) significant wave height at F1 and (d) water level.
The storm at the 20th of November was characterized by wind speeds exceeding 20 m/s. The storm surge exceeded 1.3 m and waves up to 70 cm were measured, in contrast to the relatively calm period before and after the storm, see Figure 1cd. Figure 2 provides further insights on the hydrodynamics and timing of the storm. The first and last tides of Figure 2a are typical for this location: slack water just after each high and low water. Contrary, the low water around 1 p.m. on the 20th was characterized by a much earlier slack water and unusually high flow velocities (up to 80 cm/s) over several hours at ±1 m water depth.
Figure 2. (a) Flow velocities measured at F1, (b) wind
speed measured at the nearby station Vlissingen. 3. Discussion and Conclusions Three key factors that caused the erosion at the lower part of the intertidal area are identified: (1) the peak of the storm (with the highest waves) occurred during low water leaving the high elevations unexposed; (2) the storm surge induced unusually high flow velocities during low water; (3) the water depth at the lower part of the flat was small (±1 m) for several consecutive hours causing the waves to be highly effective. A low-water storm is therefore very effective in eroding the bed and should be considered as an important morphological event for specific parts of the tidal flats. Despite the fast recovery of the bed, the initial bed level was not reached. This implies that the storm has a long-term effect as well. Although long-term morphological consequences seem limited by the fast recovery, ecological consequences are expected to be substantial. Acknowledgments This project is funded by the Netherlands Organisation for Scientific Research (EMERGO project, 850.13.021). References Le Hir P., Roberts W., Cazaillet O., Christie M.,
Bassoullet P. and Bacher C. (2000) Characterization of intertidal flat hydrodynamics. Cont Shelf Res 20:1433–1459. doi: 10.1016/S0278-4343(00)00031-5
a
b
c
b
a
d
280
Morphodynamic Modelling of the Inlet Closure of the Albufeira Lagoon
G. Dodet1, T. Guérin2, X. Bertin2 and A.B. Fortunato3
1 UMR 6554 LETG Brest Géomer, CNRS-Université de Bretagne Occidentale, Plouzané - France.
[email protected] UMR 7266 LIENSs, CNRS-Universite de La Rochelle, La Rochelle, France. [email protected]
3 Estuaries and Coastal Zones Division, National Laboratory of Civil Engineering, Lisbon, Portugal. [email protected].
1. IntroductionWave-dominated tidal inlets are very dynamic coastal sys-
tems, whose morphology is continuously shaped by the
combined action of the waves and the tides. The rapid
morphological changes they experience impact directly
their ecological and socio-economic environments, and
thus require further investigation for their sustanaible ma-
nagement. The main objective of this study is to gain a
better understanding of the physical processes that control
the morphological evolutions of an ephemeral tidal inlet
in Portugal, the Albufeira Lagoon inlet. A morphodyna-
mic modelling system is applied to the lagoon-inlet sys-
tem over a two-month period, during which the inlet ex-
perienced infilling and closure. The results of the model
are analyzed to investigate the impact of the forcings on
the morphological evolution of the inlet.
2. MethodsThe numerical modelling system SCHISM (Zhang et al.,
2016) is used in this study. SCHISM (Semi-implicit
Cross-scale Hydroscience Integrated System Model) is a
derivative product built from the original SELFE (Zhang
and Baptista, 2008), based on unstructured grids, and de-
signed for seamless simulation of 3D baroclinic circu-
lation across creek-lake-river-estuary-shelf-ocean scales.
The sediment transport and the updates of the morpho-
logy are ensured by the SED2D module, originally de-
velopped by Dodet (2013) and later improved by Gue-
rin (2016). The fully coupled wave-current-sediment-
transport modelling system was set up to simulate the
morphological changes at the Albufeira Lagoon inlet bet-
ween November 5 and December 27, 2010. The model-
ling system used a single computational grid with a reso-
lution ranging from 1000 m to 3.5 m. Wave spectra com-
puted with a North Atlantic regional wave model (Dodet
et al., 2010) were used to force the spectral wave mo-
dule at its ocean boundaries. The circulation module ran
in depth-averaged (2DH) barotropic mode and was for-
ced at its ocean boundary with time-series of sea surface
elevation measured at a nearby tide gauge.
3. ResultsThe comparisons of the morphological evolutions com-
puted with the morphodynamic modelling system and the
topographic measurements show that the model is able
to reproduce the dominant morphological changes indu-
ced by the combined action of the tides and the waves. In
particular the southward migration of the main channel in
November and the spit growth in December were reprodu-
ced by the model. The water levels in the lagoon were also
correctly simulated by the model. The physical processes
controlling the morphological changes of the inlet du-
ring fair weather conditions were investigated by forcing
the model with synthetic tidal forcings. In the absence of
waves, the sediment transport in the inlet was shown to
be strongly ebb-dominated. This ebb-dominance was at-
tenuated when the tidal range was increased or when the
mean oceanic water level was higher than average. Mo-
del simulations including the wave forcing revealed the
strong impact of the waves on the circulation and the
sediment dynamics of the inlet. Indeed, winter-average
wave conditions were able to invert the direction of the
net transport through the inlet from ebb-dominance to
flood dominance, causing the infilling of the inlet. The
main processes responsible for this wave-induced shore-
ward transport were the development of net forces with
strong onshore component in front of the inlet, the deve-
lopment of lateral gradients of barotropic pressure along
the inlet margins focusing the transport through the in-
let, and the blocking of wave propagation during ebb tide
(Dodet et al., 2013), reducing seaward sediment transport.
AcknowledgmentsWe thank all the participants in the field cam-
paigns at the Albufeira Lagoon. These experiments
were carried out within the project 3D-MOWADI
(PTDC/ECM/103801/2008). GD is funded by the re-
search program PROTEVS (research contract 12CR6)
conducted by SHOM.
RéférencesBertin, X., Fortunato, A. B., and Oliveira, A. (2009). A
modeling-based analysis of processes driving wave-
dominated inlets. Continental Shelf Research, 29(5-
6) :819–834.
Dodet, G. (2013). Morphodynamic modelling of a wave-
dominated tidal inlet : the Albufeira lagoon. PhD the-
sis, Université de La Rochelle.
Dodet, G., Bertin, X., Bruneau, N., Fortunato, A. B., Na-
hon, A., and Roland, A. (2013). Wave-current interac-
tions in a wave-dominated tidal inlet. Journal of Geo-
physical Research : Oceans, 118 :1587–1605.
Dodet, G., Bertin, X., and Taborda, R. (2010). Wave cli-
mate variability in the North-East Atlantic Ocean over
the last six decades. Ocean Modelling, 31(3–4) :120–
131.
Guerin, T. (2016). Modélisation morphodynamique plu-
ridécennale des côtes dominées par la marée et les
vagues. PhD thesis, Université de La Rochelle.
Zhang, Y. and Baptista, A. M. (2008). SELFE : A
semi-implicit Eulerian–Lagrangian finite-element mo-
del for cross-scale ocean circulation. Ocean Modelling,
21(3–4) :71–96.
Zhang, Y. J., Ye, F., Stanev, E. V., and Grashorn, S. (2016).
Seamless cross-scale modeling with SCHISM. Ocean
Modelling, pages 64–81.
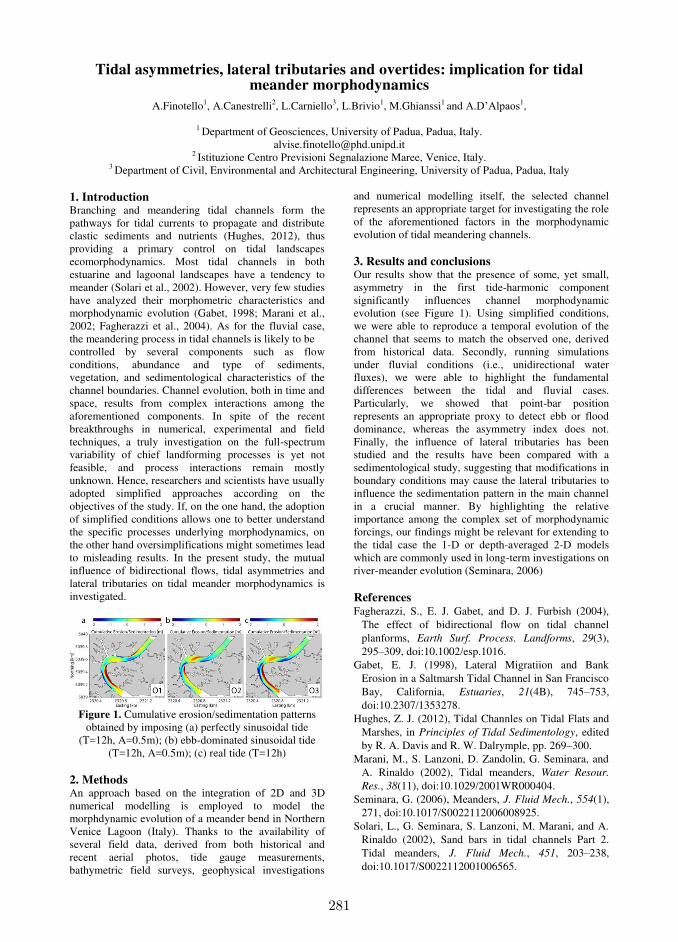
281
Tidal asymmetries, lateral tributaries and overtides: implication for tidal meander morphodynamics
A.Finotello1, A.Canestrelli2, L.Carniello3, L.Brivio1, M.Ghianssi1 and A.D’Alpaos1,
1 Department of Geosciences, University of Padua, Padua, Italy. [email protected]
2 Istituzione Centro Previsioni Segnalazione Maree, Venice, Italy. 3 Department of Civil, Environmental and Architectural Engineering, University of Padua, Padua, Italy
1. Introduction Branching and meandering tidal channels form the pathways for tidal currents to propagate and distribute clastic sediments and nutrients (Hughes, 2012), thus providing a primary control on tidal landscapes ecomorphodynamics. Most tidal channels in both estuarine and lagoonal landscapes have a tendency to meander (Solari et al., 2002). However, very few studies have analyzed their morphometric characteristics and morphodynamic evolution (Gabet, 1998; Marani et al., 2002; Fagherazzi et al., 2004). As for the fluvial case, the meandering process in tidal channels is likely to be controlled by several components such as flow conditions, abundance and type of sediments, vegetation, and sedimentological characteristics of the channel boundaries. Channel evolution, both in time and space, results from complex interactions among the aforementioned components. In spite of the recent breakthroughs in numerical, experimental and field techniques, a truly investigation on the full-spectrum variability of chief landforming processes is yet not feasible, and process interactions remain mostly unknown. Hence, researchers and scientists have usually adopted simplified approaches according on the objectives of the study. If, on the one hand, the adoption of simplified conditions allows one to better understand the specific processes underlying morphodynamics, on the other hand oversimplifications might sometimes lead to misleading results. In the present study, the mutual influence of bidirectional flows, tidal asymmetries and lateral tributaries on tidal meander morphodynamics is investigated.
Figure 1. Cumulative erosion/sedimentation patterns
obtained by imposing (a) perfectly sinusoidal tide (T=12h, A=0.5m); (b) ebb-dominated sinusoidal tide
(T=12h, A=0.5m); (c) real tide (T=12h) 2. Methods An approach based on the integration of 2D and 3D numerical modelling is employed to model the morphdynamic evolution of a meander bend in Northern Venice Lagoon (Italy). Thanks to the availability of several field data, derived from both historical and recent aerial photos, tide gauge measurements, bathymetric field surveys, geophysical investigations
and numerical modelling itself, the selected channel represents an appropriate target for investigating the role of the aforementioned factors in the morphodynamic evolution of tidal meandering channels. 3. Results and conclusions Our results show that the presence of some, yet small, asymmetry in the first tide-harmonic component significantly influences channel morphodynamic evolution (see Figure 1). Using simplified conditions, we were able to reproduce a temporal evolution of the channel that seems to match the observed one, derived from historical data. Secondly, running simulations under fluvial conditions (i.e., unidirectional water fluxes), we were able to highlight the fundamental differences between the tidal and fluvial cases. Particularly, we showed that point-bar position represents an appropriate proxy to detect ebb or flood dominance, whereas the asymmetry index does not. Finally, the influence of lateral tributaries has been studied and the results have been compared with a sedimentological study, suggesting that modifications in boundary conditions may cause the lateral tributaries to influence the sedimentation pattern in the main channel in a crucial manner. By highlighting the relative importance among the complex set of morphodynamic forcings, our findings might be relevant for extending to the tidal case the 1-D or depth-averaged 2-D models which are commonly used in long-term investigations on river-meander evolution (Seminara, 2006)
References Fagherazzi, S., E. J. Gabet, and D. J. Furbish (2004),
The effect of bidirectional flow on tidal channel planforms, Earth Surf. Process. Landforms, 29(3), 295–309, doi:10.1002/esp.1016.
Gabet, E. J. (1998), Lateral Migratiion and Bank Erosion in a Saltmarsh Tidal Channel in San Francisco Bay, California, Estuaries, 21(4B), 745–753, doi:10.2307/1353278.
Hughes, Z. J. (2012), Tidal Channles on Tidal Flats and Marshes, in Principles of Tidal Sedimentology, edited by R. A. Davis and R. W. Dalrymple, pp. 269–300.
Marani, M., S. Lanzoni, D. Zandolin, G. Seminara, and A. Rinaldo (2002), Tidal meanders, Water Resour.
Res., 38(11), doi:10.1029/2001WR000404. Seminara, G. (2006), Meanders, J. Fluid Mech., 554(1),
271, doi:10.1017/S0022112006008925. Solari, L., G. Seminara, S. Lanzoni, M. Marani, and A.
Rinaldo (2002), Sand bars in tidal channels Part 2. Tidal meanders, J. Fluid Mech., 451, 203–238, doi:10.1017/S0022112001006565.
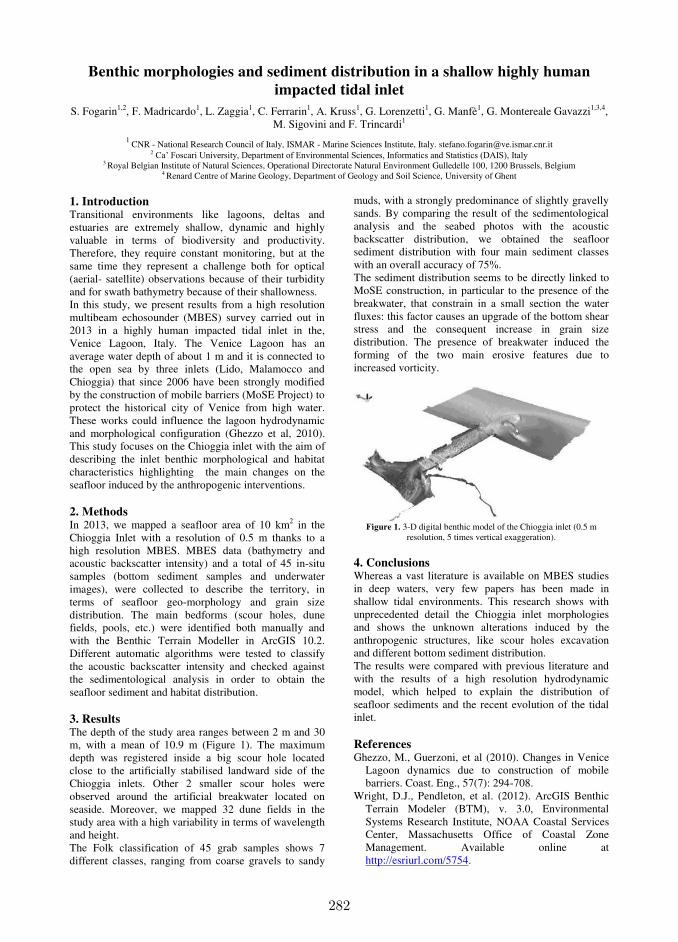
282
Benthic morphologies and sediment distribution in a shallow highly human
impacted tidal inlet
S. Fogarin1,2, F. Madricardo1, L. Zaggia1, C. Ferrarin1, A. Kruss1, G. Lorenzetti1, G. Manfè1, G. Montereale Gavazzi1,3,4, M. Sigovini and F. Trincardi1
1 CNR - National Research Council of Italy, ISMAR - Marine Sciences Institute, Italy. [email protected]
2 Ca’ Foscari University, Department of Environmental Sciences, Informatics and Statistics (DAIS), Italy 3 Royal Belgian Institute of Natural Sciences, Operational Directorate Natural Environment Gulledelle 100, 1200 Brussels, Belgium
4 Renard Centre of Marine Geology, Department of Geology and Soil Science, University of Ghent
1. Introduction Transitional environments like lagoons, deltas and estuaries are extremely shallow, dynamic and highly valuable in terms of biodiversity and productivity. Therefore, they require constant monitoring, but at the same time they represent a challenge both for optical (aerial- satellite) observations because of their turbidity and for swath bathymetry because of their shallowness. In this study, we present results from a high resolution multibeam echosounder (MBES) survey carried out in 2013 in a highly human impacted tidal inlet in the, Venice Lagoon, Italy. The Venice Lagoon has an average water depth of about 1 m and it is connected to the open sea by three inlets (Lido, Malamocco and Chioggia) that since 2006 have been strongly modified by the construction of mobile barriers (MoSE Project) to protect the historical city of Venice from high water. These works could influence the lagoon hydrodynamic and morphological configuration (Ghezzo et al, 2010). This study focuses on the Chioggia inlet with the aim of describing the inlet benthic morphological and habitat characteristics highlighting the main changes on the seafloor induced by the anthropogenic interventions. 2. Methods In 2013, we mapped a seafloor area of 10 km2 in the Chioggia Inlet with a resolution of 0.5 m thanks to a high resolution MBES. MBES data (bathymetry and acoustic backscatter intensity) and a total of 45 in-situ samples (bottom sediment samples and underwater images), were collected to describe the territory, in terms of seafloor geo-morphology and grain size distribution. The main bedforms (scour holes, dune fields, pools, etc.) were identified both manually and with the Benthic Terrain Modeller in ArcGIS 10.2. Different automatic algorithms were tested to classify the acoustic backscatter intensity and checked against the sedimentological analysis in order to obtain the seafloor sediment and habitat distribution. 3. Results The depth of the study area ranges between 2 m and 30 m, with a mean of 10.9 m (Figure 1). The maximum depth was registered inside a big scour hole located close to the artificially stabilised landward side of the Chioggia inlets. Other 2 smaller scour holes were observed around the artificial breakwater located on seaside. Moreover, we mapped 32 dune fields in the study area with a high variability in terms of wavelength and height. The Folk classification of 45 grab samples shows 7 different classes, ranging from coarse gravels to sandy
muds, with a strongly predominance of slightly gravelly sands. By comparing the result of the sedimentological analysis and the seabed photos with the acoustic backscatter distribution, we obtained the seafloor sediment distribution with four main sediment classes with an overall accuracy of 75%. The sediment distribution seems to be directly linked to MoSE construction, in particular to the presence of the breakwater, that constrain in a small section the water fluxes: this factor causes an upgrade of the bottom shear stress and the consequent increase in grain size distribution. The presence of breakwater induced the forming of the two main erosive features due to increased vorticity.
Figure 1. 3-D digital benthic model of the Chioggia inlet (0.5 m
resolution, 5 times vertical exaggeration). 4. Conclusions Whereas a vast literature is available on MBES studies in deep waters, very few papers has been made in shallow tidal environments. This research shows with unprecedented detail the Chioggia inlet morphologies and shows the unknown alterations induced by the anthropogenic structures, like scour holes excavation and different bottom sediment distribution. The results were compared with previous literature and with the results of a high resolution hydrodynamic model, which helped to explain the distribution of seafloor sediments and the recent evolution of the tidal inlet. References Ghezzo, M., Guerzoni, et al (2010). Changes in Venice
Lagoon dynamics due to construction of mobile barriers. Coast. Eng., 57(7): 294-708.
Wright, D.J., Pendleton, et al. (2012). ArcGIS Benthic Terrain Modeler (BTM), v. 3.0, Environmental Systems Research Institute, NOAA Coastal Services Center, Massachusetts Office of Coastal Zone Management. Available online at http://esriurl.com/5754.
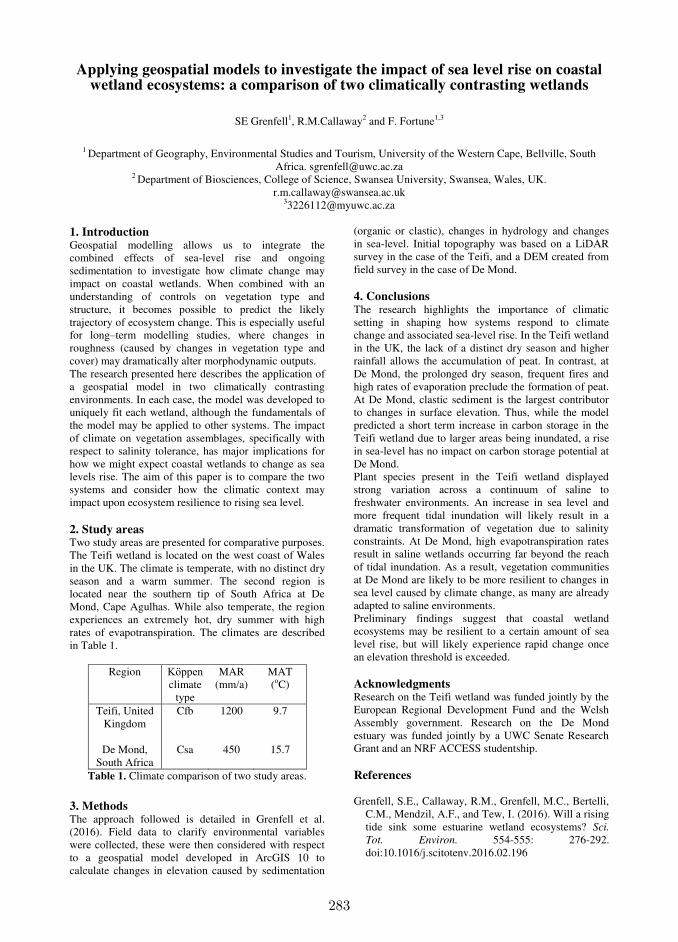
283
Applying geospatial models to investigate the impact of sea level rise on coastal wetland ecosystems: a comparison of two climatically contrasting wetlands
SE Grenfell1, R.M.Callaway2 and F. Fortune1,3
1 Department of Geography, Environmental Studies and Tourism, University of the Western Cape, Bellville, South
Africa. [email protected] 2 Department of Biosciences, College of Science, Swansea University, Swansea, Wales, UK.
[email protected] [email protected]
1. Introduction Geospatial modelling allows us to integrate the combined effects of sea-level rise and ongoing sedimentation to investigate how climate change may impact on coastal wetlands. When combined with an understanding of controls on vegetation type and structure, it becomes possible to predict the likely trajectory of ecosystem change. This is especially useful for long–term modelling studies, where changes in roughness (caused by changes in vegetation type and cover) may dramatically alter morphodynamic outputs. The research presented here describes the application of a geospatial model in two climatically contrasting environments. In each case, the model was developed to uniquely fit each wetland, although the fundamentals of the model may be applied to other systems. The impact of climate on vegetation assemblages, specifically with respect to salinity tolerance, has major implications for how we might expect coastal wetlands to change as sea levels rise. The aim of this paper is to compare the two systems and consider how the climatic context may impact upon ecosystem resilience to rising sea level. 2. Study areas Two study areas are presented for comparative purposes. The Teifi wetland is located on the west coast of Wales in the UK. The climate is temperate, with no distinct dry season and a warm summer. The second region is located near the southern tip of South Africa at De Mond, Cape Agulhas. While also temperate, the region experiences an extremely hot, dry summer with high rates of evapotranspiration. The climates are described in Table 1.
Region Kӧppen climate
type
MAR (mm/a)
MAT (oC)
Teifi, United Kingdom
Cfb 1200 9.7
De Mond, South Africa
Csa 450 15.7
Table 1. Climate comparison of two study areas.
3. Methods The approach followed is detailed in Grenfell et al. (2016). Field data to clarify environmental variables were collected, these were then considered with respect to a geospatial model developed in ArcGIS 10 to calculate changes in elevation caused by sedimentation
(organic or clastic), changes in hydrology and changes in sea-level. Initial topography was based on a LiDAR survey in the case of the Teifi, and a DEM created from field survey in the case of De Mond. 4. Conclusions The research highlights the importance of climatic setting in shaping how systems respond to climate change and associated sea-level rise. In the Teifi wetland in the UK, the lack of a distinct dry season and higher rainfall allows the accumulation of peat. In contrast, at De Mond, the prolonged dry season, frequent fires and high rates of evaporation preclude the formation of peat. At De Mond, clastic sediment is the largest contributor to changes in surface elevation. Thus, while the model predicted a short term increase in carbon storage in the Teifi wetland due to larger areas being inundated, a rise in sea-level has no impact on carbon storage potential at De Mond. Plant species present in the Teifi wetland displayed strong variation across a continuum of saline to freshwater environments. An increase in sea level and more frequent tidal inundation will likely result in a dramatic transformation of vegetation due to salinity constraints. At De Mond, high evapotranspiration rates result in saline wetlands occurring far beyond the reach of tidal inundation. As a result, vegetation communities at De Mond are likely to be more resilient to changes in sea level caused by climate change, as many are already adapted to saline environments. Preliminary findings suggest that coastal wetland ecosystems may be resilient to a certain amount of sea level rise, but will likely experience rapid change once an elevation threshold is exceeded. Acknowledgments Research on the Teifi wetland was funded jointly by the European Regional Development Fund and the Welsh Assembly government. Research on the De Mond estuary was funded jointly by a UWC Senate Research Grant and an NRF ACCESS studentship. References Grenfell, S.E., Callaway, R.M., Grenfell, M.C., Bertelli,
C.M., Mendzil, A.F., and Tew, I. (2016). Will a rising tide sink some estuarine wetland ecosystems? Sci.
Tot. Environ. 554-555: 276-292. doi:10.1016/j.scitotenv.2016.02.196

284
RCEM 2017- Back to Italy Impacts of bed slope factor on large scale fluvio-deltaic morphodynamic
development
Leicheng GUO 1, Qing HE 2 , Chunyan ZHU 3, Zheng Bing WANG 4
1 State Key Lab of Estuarine and Coastal Research, East China Normal University, Shanghai, China.
leicheng120@@126.com 2 State Key Lab of Estuarine and Coastal Research, East China Normal University, Shanghai, China.
[email protected] 3 Faculty of Civil Engineering and Geosciences, Delft University of Technology, [email protected]
4 Faculty of Civil Engineering and Geosciences, Delft University of Technology /Deltares, [email protected]
1. Introduction Long-term, large scale estuarine and deltaic morphodynamic modeling is increasingly used to examine morphodynamic development. With coupled hydrodynamic, sediment transport and morphodynamics, the numerical model results can be sensitive to the sediment transport module in terms of sediment transport mode (suspension or bed load or both), and the parameters in them. One such parameter is the bed-slope factor exerting on bed-load transport. So far there are some literatures showing that a larger lateral bed slope factor can lead to shallower and wider channels (van der Wegen, 2010; Dissanayake, 2011). Our experience is that using the default value in e.g. Delft3D can lead to unexpected morphology. Systematic work is still needed to unravel the impacts of the bed-slope factor on channel pattern development. 2. Methodology We used Delft3D software to construct a 2D basin consisting of a fluvial reach and a receiving sea basin. The model is forced by a river discharge of 10000 m3/s and a tidal range of 4 m. Long-term morphodynamic development is achieved by a morphological factor approach. Sensitivity to the longitudinal and lateral bed-slope factor as well as the choices of sediment transport mode is tested.
(a)
(b)
Figure 1. Modeled morphodynamics after 200 years with a lateral bed slope factor of (a) 5 and (b) 20 in a
basin with river discharge of 10000 m3/s and tidal range of 4 m
3. Results Morphodynamic simulations at the end of 200 years show well-developed deltas with braided and meandering channels (Figure 1).
The impacts of longitudinal bed-slope factor on the channel pattern are limited. Moreover, the effects of the bed-slope factors are substantially influenced by the choices of different sediment transport modes and formulas. The effect of the lateral bed-slope factor is much more significant (Fig.1). With a smaller lateral bed-slope factor, the formed channels are narrow and deep, thus a smaller width-to-depth ratio. The sand bars are more accreted and the channel pattern over the delta region is more braided. The formed channel pattern mimics that of Lena delta. To the contrast, under a larger lateral bed slope factor, the tidal channels are wider and shallower; the sand bars are larger in space and less accreted in elevation. More sediment is flushed to the sea, showing a more seaward advanced delta. 4. Conclusions Model results suggest that 1) varying lateral bed-slope factor has strong impacts; larger value leads to gentler channel-shoal interface or smaller lateral channel bed-slope. 2) Different sediment transport formulas lead to considerable differences in morphodynamic patterns. 3) Sediment transport formulas considering both suspension and bed load transport tolerate a smaller morphological acceleration factor and requires a larger bed-slope factor. Acknowledgments The study is supported by NSFC via projects 51320105005 and 41505105. References Dissanayake, P.H. (2011) Modelling Morphological
Response of Large Tidal Inlet Systems to Sea Level Rise. PhD. dissertation of Delft University of Technology and UNESCO-IHE, Delft, the Netherlands.
Engelund, F. and Hansen, E. (1967). A monograph on sediment transport in alluvial streams. Teknisk Forlag, Copenhagen.
van der Wegen, M. (2010). Long-term morphodynamic modeling of alluvial estuaries. PhD. dissertation of Delft University of Technology and UNESCO-IHE, Delft, the Netherlands.
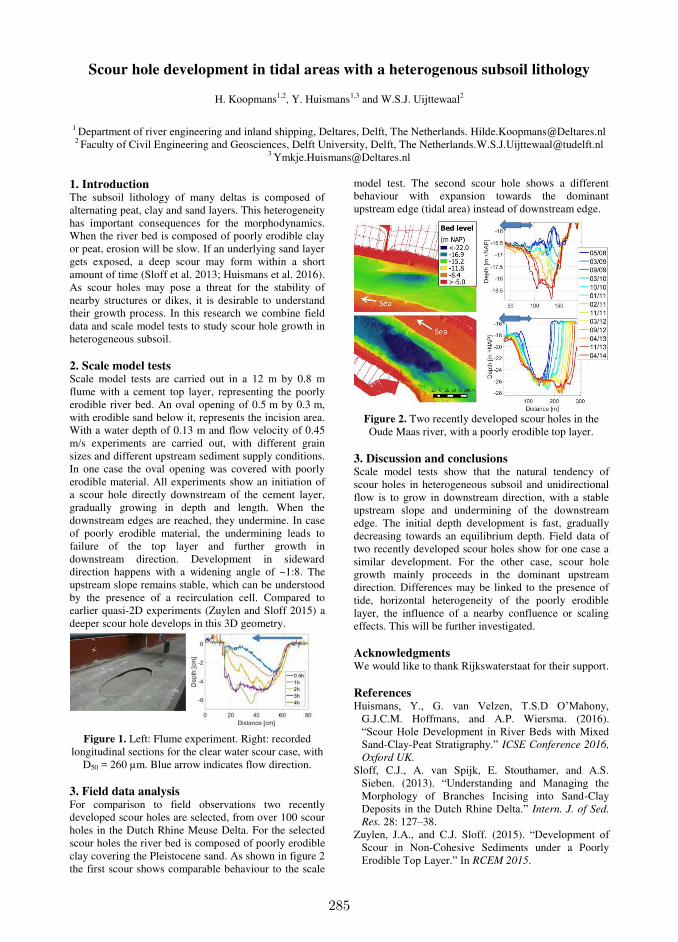
285
Scour hole development in tidal areas with a heterogenous subsoil lithology
H. Koopmans1,2, Y. Huismans1,3 and W.S.J. Uijttewaal2
1 Department of river engineering and inland shipping, Deltares, Delft, The Netherlands. [email protected] 2 Faculty of Civil Engineering and Geosciences, Delft University, Delft, The [email protected]
1. Introduction The subsoil lithology of many deltas is composed of alternating peat, clay and sand layers. This heterogeneity has important consequences for the morphodynamics. When the river bed is composed of poorly erodible clay or peat, erosion will be slow. If an underlying sand layer gets exposed, a deep scour may form within a short amount of time (Sloff et al. 2013; Huismans et al. 2016). As scour holes may pose a threat for the stability of nearby structures or dikes, it is desirable to understand their growth process. In this research we combine field data and scale model tests to study scour hole growth in heterogeneous subsoil. 2. Scale model tests Scale model tests are carried out in a 12 m by 0.8 m flume with a cement top layer, representing the poorly erodible river bed. An oval opening of 0.5 m by 0.3 m, with erodible sand below it, represents the incision area. With a water depth of 0.13 m and flow velocity of 0.45 m/s experiments are carried out, with different grain sizes and different upstream sediment supply conditions. In one case the oval opening was covered with poorly erodible material. All experiments show an initiation of a scour hole directly downstream of the cement layer, gradually growing in depth and length. When the downstream edges are reached, they undermine. In case of poorly erodible material, the undermining leads to failure of the top layer and further growth in downstream direction. Development in sideward direction happens with a widening angle of ~1:8. The upstream slope remains stable, which can be understood by the presence of a recirculation cell. Compared to earlier quasi-2D experiments (Zuylen and Sloff 2015) a deeper scour hole develops in this 3D geometry.
Figure 1. Left: Flume experiment. Right: recorded
longitudinal sections for the clear water scour case, with D50 = 260 µm. Blue arrow indicates flow direction.
3. Field data analysis For comparison to field observations two recently developed scour holes are selected, from over 100 scour holes in the Dutch Rhine Meuse Delta. For the selected scour holes the river bed is composed of poorly erodible clay covering the Pleistocene sand. As shown in figure 2 the first scour shows comparable behaviour to the scale
model test. The second scour hole shows a different behaviour with expansion towards the dominant upstream edge (tidal area) instead of downstream edge.
Figure 2. Two recently developed scour holes in the Oude Maas river, with a poorly erodible top layer.
3. Discussion and conclusions Scale model tests show that the natural tendency of scour holes in heterogeneous subsoil and unidirectional flow is to grow in downstream direction, with a stable upstream slope and undermining of the downstream edge. The initial depth development is fast, gradually decreasing towards an equilibrium depth. Field data of two recently developed scour holes show for one case a similar development. For the other case, scour hole growth mainly proceeds in the dominant upstream direction. Differences may be linked to the presence of tide, horizontal heterogeneity of the poorly erodible layer, the influence of a nearby confluence or scaling effects. This will be further investigated. Acknowledgments We would like to thank Rijkswaterstaat for their support. References Huismans, Y., G. van Velzen, T.S.D O’Mahony,
G.J.C.M. Hoffmans, and A.P. Wiersma. (2016). “Scour Hole Development in River Beds with Mixed Sand-Clay-Peat Stratigraphy.” ICSE Conference 2016,
Oxford UK. Sloff, C.J., A. van Spijk, E. Stouthamer, and A.S.
Sieben. (2013). “Understanding and Managing the Morphology of Branches Incising into Sand-Clay Deposits in the Dutch Rhine Delta.” Intern. J. of Sed.
Res. 28: 127–38. Zuylen, J.A., and C.J. Sloff. (2015). “Development of
Scour in Non-Cohesive Sediments under a Poorly Erodible Top Layer.” In RCEM 2015.
286
Autogenic Cohesivity: Modeling Vegetation Effects on Delta Morphology and Channel Network Characteristics
R. Lauzon1, A. B. Murray1, A. Piliouras2 and W. Kim3
1 Division of Earth and Ocean Sciences, Nicholas School of the Environment, Duke University, Durham, NC, USA.
[email protected], [email protected] 2Earth and Environmental Sciences Division, Los Alamos National Laboratory, Los Alamos, NM, USA
[email protected] 3Department of Geological Sciences, University of Texas at Austin, Austin, TX, USA
1. Introduction Deltas are governed by complex interactions between coastal, wetland and fluvial dynamics, and many of the processes that control delta evolution are not well understood. One such process is the formation of channel networks on deltas, from highly dynamic networks of many intertwined channels to networks with fewer, more stable distributary channels. The patterns of distributary channels are influenced by many factors, such as water and sediment discharge, grain size, sea level rise rates, and vegetation type. In turn, many characteristics of deltas such as their shape, how they evolve, and what types of plant and animal life – including humans – they can support depend on the types of channels and networks that emerge. Previous field observations and flume and numerical-modelling experiments (e.g. Murray and Paola, 2003; Tal et al., 2004) in fluvial environments have shown that interactions between sediment and vegetation that allow or impede lateral transport of sediment play a fundamental role in determining the morphology of the resulting channel network. Vegetation reinforces existing channels by strengthening channel banks (either directly or by introducing cohesive sediment), tending to stabilize flow patterns and reduce channel migration rates. On the other hand, sediment transport processes result in lateral migration and frequent channel switching, which can inhibit vegetation development. These interactions likely shape flow patterns on deltas as well. While recent delta studies have indirectly explored the cohesive effects of vegetation through the introduction of cohesive sediment (e.g. Edmonds and Slingerland, 2010), we incorporate key effects of vegetation directly into DeltaRCM (Liang et al., 2015) to explore the interactions between vegetation and sediment transport and under what conditions each plays a more important role in determining delta channel network morphology. 2. Model Development DeltaRCM consists of a cellular flow routing scheme and a set of sediment transport rules which route water and sediment parcels using a weighted random walk calculated using the average downstream direction, water surface gradient, and resistance to flow. We establish an additional set of rules for vegetation. Represented as a fractional cover value, vegetation establishes in any cell with sufficiently shallow depth (< 0.5 m in experiments presented here) and a sufficiently
low rate of bed elevation change (using the rooting depth as a characteristic length scale for the vegetation). It grows logistically between floods and can die during floods, with a mortality rate proportional to the ratio of bed elevation change and the rooting depth. Vegetation acts to increase the flow resistance and inhibit lateral transport of sediment. 3. Results Initial results support the hypothesis that the ability for lateral transport of sediment to occur plays an important role in shaping delta channel networks. In otherwise identical model experiments with and without vegetation, deltas with vegetation have more rugose shorelines and channels which are narrower, deeper, and less dynamic. Here we present the results of additional experiments: we vary sediment and water discharge and proportion of cohesive sediment to determine under which conditions delta channel networks exhibit cohesive and non-cohesive traits. We quantify the similarities and differences in channel networks when cohesivity results from vegetation versus the composition of the input sediment. We also explore the effects of climate on delta channel network morphology through varying vegetation traits including growth rate, rooting depth, and stem morphology. References Edmonds, D.A., and Slingerland, R.J. (2010).
Significant effect of sediment cohesion on delta morphology, Nat. Geosci. 3(2): 105-109
Liang, M., Voller, V.R., and Paola, C. (2015). A reduced-complexity model for river delta formation – Part 1: Modeling deltas with channel dynamics, Earth
Surf. Dynam. 3(1): 87-104 Murray, A.B., and Paola, C. (2003). Modeling the effect
of vegetation on channel pattern in bedload rivers, Earth Surface Processes and Landforms 28: 131-143.
Tal, M., Gran, K., Murray, A.B., Paola, C., and Hicks, D.M. (2004). Riparian vegetation as a primary control on channel characteristics in noncohesive sediments. In Bennett, S.J. and Simon, A., editors Riparian
Vegetation and Fluvial Geomorphology, pages 43-58. American Geophysical Union.
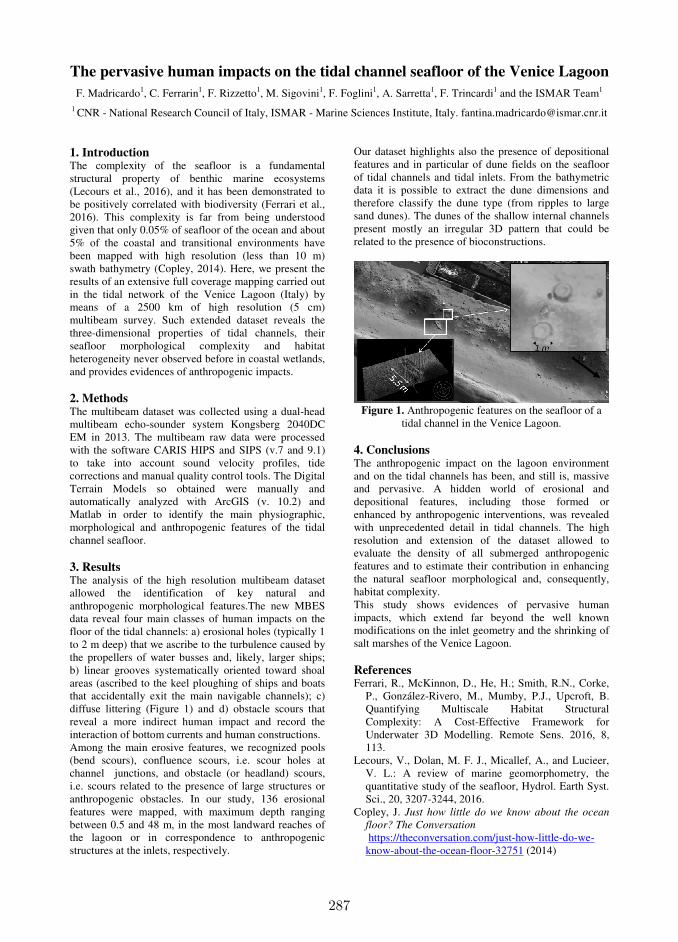
287
The pervasive human impacts on the tidal channel seafloor of the Venice Lagoon
F. Madricardo1, C. Ferrarin
1, F. Rizzetto
1, M. Sigovini
1, F. Foglini
1, A. Sarretta
1, F. Trincardi
1 and the ISMAR Team
1
1 CNR - National Research Council of Italy, ISMAR - Marine Sciences Institute, Italy. [email protected]
1. Introduction The complexity of the seafloor is a fundamental
structural property of benthic marine ecosystems
(Lecours et al., 2016), and it has been demonstrated to
be positively correlated with biodiversity (Ferrari et al.,
2016). This complexity is far from being understood
given that only 0.05% of seafloor of the ocean and about
5% of the coastal and transitional environments have
been mapped with high resolution (less than 10 m)
swath bathymetry (Copley, 2014). Here, we present the
results of an extensive full coverage mapping carried out
in the tidal network of the Venice Lagoon (Italy) by
means of a 2500 km of high resolution (5 cm)
multibeam survey. Such extended dataset reveals the
three-dimensional properties of tidal channels, their
seafloor morphological complexity and habitat
heterogeneity never observed before in coastal wetlands,
and provides evidences of anthropogenic impacts.
2. Methods The multibeam dataset was collected using a dual-head
multibeam echo-sounder system Kongsberg 2040DC
EM in 2013. The multibeam raw data were processed
with the software CARIS HIPS and SIPS (v.7 and 9.1)
to take into account sound velocity profiles, tide
corrections and manual quality control tools. The Digital
Terrain Models so obtained were manually and
automatically analyzed with ArcGIS (v. 10.2) and
Matlab in order to identify the main physiographic,
morphological and anthropogenic features of the tidal
channel seafloor.
3. Results The analysis of the high resolution multibeam dataset
allowed the identification of key natural and
anthropogenic morphological features.The new MBES
data reveal four main classes of human impacts on the
floor of the tidal channels: a) erosional holes (typically 1
to 2 m deep) that we ascribe to the turbulence caused by
the propellers of water busses and, likely, larger ships;
b) linear grooves systematically oriented toward shoal
areas (ascribed to the keel ploughing of ships and boats
that accidentally exit the main navigable channels); c)
diffuse littering (Figure 1) and d) obstacle scours that
reveal a more indirect human impact and record the
interaction of bottom currents and human constructions.
Among the main erosive features, we recognized pools
(bend scours), confluence scours, i.e. scour holes at
channel junctions, and obstacle (or headland) scours,
i.e. scours related to the presence of large structures or
anthropogenic obstacles. In our study, 136 erosional
features were mapped, with maximum depth ranging
between 0.5 and 48 m, in the most landward reaches of
the lagoon or in correspondence to anthropogenic
structures at the inlets, respectively.
Our dataset highlights also the presence of depositional
features and in particular of dune fields on the seafloor
of tidal channels and tidal inlets. From the bathymetric
data it is possible to extract the dune dimensions and
therefore classify the dune type (from ripples to large
sand dunes). The dunes of the shallow internal channels
present mostly an irregular 3D pattern that could be
related to the presence of bioconstructions.
Figure 1. Anthropogenic features on the seafloor of a
tidal channel in the Venice Lagoon.
4. Conclusions The anthropogenic impact on the lagoon environment
and on the tidal channels has been, and still is, massive
and pervasive. A hidden world of erosional and
depositional features, including those formed or
enhanced by anthropogenic interventions, was revealed
with unprecedented detail in tidal channels. The high
resolution and extension of the dataset allowed to
evaluate the density of all submerged anthropogenic
features and to estimate their contribution in enhancing
the natural seafloor morphological and, consequently,
habitat complexity.
This study shows evidences of pervasive human
impacts, which extend far beyond the well known
modifications on the inlet geometry and the shrinking of
salt marshes of the Venice Lagoon.
References Ferrari, R., McKinnon, D., He, H.; Smith, R.N., Corke,
P., González-Rivero, M., Mumby, P.J., Upcroft, B.
Quantifying Multiscale Habitat Structural
Complexity: A Cost-Effective Framework for
Underwater 3D Modelling. Remote Sens. 2016, 8,
113.
Lecours, V., Dolan, M. F. J., Micallef, A., and Lucieer,
V. L.: A review of marine geomorphometry, the
quantitative study of the seafloor, Hydrol. Earth Syst.
Sci., 20, 3207-3244, 2016.
Copley, J. Just how little do we know about the ocean
floor? The Conversation
https://theconversation.com/just-how-little-do-we-
know-about-the-ocean-floor-32751 (2014)

288
Processes creating and maintaining non-estuarine river-mouth lagoons (hapua)
R.J. Measures1,2, T.A. Cochrane2, D. E. Hart3 and M. Hicks1
1 National Institute of Water and Atmospheric Research (NIWA), Christchurch, New Zealand.
[email protected] and [email protected] 2 Dept. of Civ. and Nat. Res. Eng., Uni. of Canterbury, Christchurch, New Zealand. [email protected]
3 Dept. of Geography, University of Canterbury, Christchurch, New Zealand. [email protected]
1. Introduction Non-estuarine river mouth lagoons, known as hapua, are common on the East Coast of the South Island, New Zealand. Hapua form where gravel-bed rivers emerge onto high wave energy, micro/meso-tidal coastlines. Hapua have highly dynamic outlet channels, which migrate rapidly along shore in response to river flows and waves. Constricted or closed outlets, occurring during periods of low river flow and high waves, cause backshore flooding and interfere with river-ocean fish migration. In order to develop a model of the impacts of river flow regime modification, sea level rise and artificial mouth openings on hapua, it is first necessary to develop a detailed understanding of the processes controlling them. Previous studies have described some of the processes influencing lagoon outlet channel morphology and their drivers (Hart, 2007; Kirk, 1991, Paterson et. al. 2000), but little is known about the mechanisms by which space for the lagoon waterbody is carved out and maintained. 2. Data collection and analysis Monitoring of the ~1.5km long Hurunui Hapua (Figure 1) since July 2015 has included time-lapse cameras, water level and salinity recorders, and repeat surveys of lagoon and barrier topography. To gain insight into hapua processes, several post-processing techniques have been applied:
Water balance modelling of the lagoon to hindcast outlet flow rates. Combined with salinity data this also identifies periods of wave overtopping.
Image processing to identify and map the outlet channel and barrier backshore position.
Automated optimisation of a simple hydraulic model used to hindcast outlet channel dimensions
3. Findings Survey and time-lapse imagery of the Hurunui Hapua records for the first time its frequency of wave overtopping events, and the significant loss of lagoon width resulting from the lobes of gravel these wash into
the lagoon. The observed processes which counteract such losses by widening the lagoon all relate to outlet channel migration. The imagery shows a range of processes initiating and propagating outlet channel migration. These include: onshore movement of shore-parallel gravel bars, long-shore transport of gravel into the mouth, fluvial bank erosion in the outlet channel, and truncation of the outlet channel by wave events or lagoon overtopping. As the outlet migrates it erodes and removes much of the wide barrier built up by wave overtopping, replacing it with a new narrower barrier and wider lagoon. In addition, river floods occurring while the mouth is offset cause scour of the banks and bed of the lagoon, helping to enlarge and maintain space for the lagoon. This is the first time these lagoon enlarging processes have been systematically observed and documented. These processes are important to include in any model of hapua, and also have important implications for decision making regarding hapua management interventions. For example, in many other hapua, artificial outlet channel opening is widely used to re-open closed lagoons and re-align their outlet channels with the river. However, regular realignment of an outlet channel prevents its migration to the end of the lagoon, likely resulting in reductions to lagoon area over time. Acknowledgments This research has been funded by NIWA’s Sustainable Water Allocation research programme. References Hart, D. E. (2007). River-mouth lagoon dynamics on
mixed sand and gravel barrier coasts. Journal of Coastal Research, (Special Issue 50), 927–931.
Kirk, R. M. (1991). River-beach interaction on mixed sand and gravel coasts: a geomorphic model for water resource planning. Applied Geography, 11, 267–287.
Paterson, A., Hume, T. M., & Healy, T. R. (2001). River Mouth Morphodynamics on a Mixed Sand-Gravel Coast. Journal of Coastal Research, (34), 288–294.
Figure 1. Aerial photo of the Hurunui Hapua (Sourced from the LINZ Data Service).
lagoon river
outlet channel
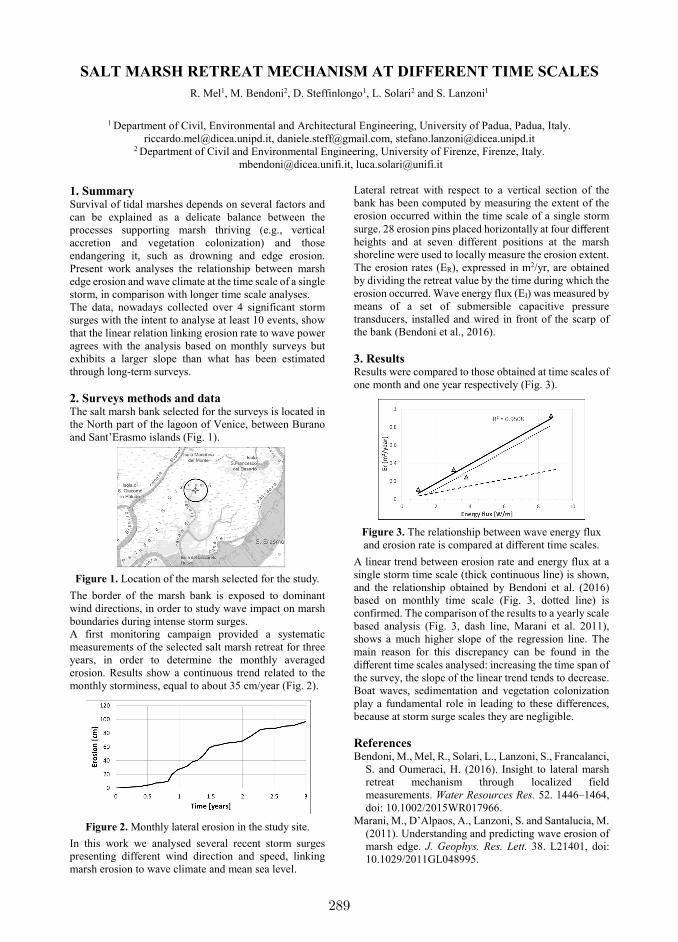
289
SALT MARSH RETREAT MECHANISM AT DIFFERENT TIME SCALES
R. Mel1, M. Bendoni2, D. Steffinlongo1, L. Solari2 and S. Lanzoni1
1 Department of Civil, Environmental and Architectural Engineering, University of Padua, Padua, Italy.
[email protected], [email protected], [email protected] 2 Department of Civil and Environmental Engineering, University of Firenze, Firenze, Italy.
[email protected], [email protected]
1. Summary Survival of tidal marshes depends on several factors and
can be explained as a delicate balance between the
processes supporting marsh thriving (e.g., vertical
accretion and vegetation colonization) and those
endangering it, such as drowning and edge erosion.
Present work analyses the relationship between marsh
edge erosion and wave climate at the time scale of a single
storm, in comparison with longer time scale analyses.
The data, nowadays collected over 4 significant storm
surges with the intent to analyse at least 10 events, show
that the linear relation linking erosion rate to wave power
agrees with the analysis based on monthly surveys but
exhibits a larger slope than what has been estimated
through long-term surveys.
2. Surveys methods and data The salt marsh bank selected for the surveys is located in
the North part of the lagoon of Venice, between Burano
and Sant’Erasmo islands (Fig. 1).
Figure 1. Location of the marsh selected for the study.
The border of the marsh bank is exposed to dominant
wind directions, in order to study wave impact on marsh
boundaries during intense storm surges.
A first monitoring campaign provided a systematic
measurements of the selected salt marsh retreat for three
years, in order to determine the monthly averaged
erosion. Results show a continuous trend related to the
monthly storminess, equal to about 35 cm/year (Fig. 2).
Figure 2. Monthly lateral erosion in the study site.
In this work we analysed several recent storm surges
presenting different wind direction and speed, linking
marsh erosion to wave climate and mean sea level.
Lateral retreat with respect to a vertical section of the
bank has been computed by measuring the extent of the
erosion occurred within the time scale of a single storm
surge. 28 erosion pins placed horizontally at four different
heights and at seven different positions at the marsh
shoreline were used to locally measure the erosion extent.
The erosion rates (ER), expressed in m2/yr, are obtained
by dividing the retreat value by the time during which the
erosion occurred. Wave energy flux (EI) was measured by
means of a set of submersible capacitive pressure
transducers, installed and wired in front of the scarp of
the bank (Bendoni et al., 2016).
3. Results Results were compared to those obtained at time scales of
one month and one year respectively (Fig. 3).
Figure 3. The relationship between wave energy flux
and erosion rate is compared at different time scales.
A linear trend between erosion rate and energy flux at a
single storm time scale (thick continuous line) is shown,
and the relationship obtained by Bendoni et al. (2016)
based on monthly time scale (Fig. 3, dotted line) is
confirmed. The comparison of the results to a yearly scale
based analysis (Fig. 3, dash line, Marani et al. 2011),
shows a much higher slope of the regression line. The
main reason for this discrepancy can be found in the
different time scales analysed: increasing the time span of
the survey, the slope of the linear trend tends to decrease.
Boat waves, sedimentation and vegetation colonization
play a fundamental role in leading to these differences,
because at storm surge scales they are negligible.
References Bendoni, M., Mel, R., Solari, L., Lanzoni, S., Francalanci,
S. and Oumeraci, H. (2016). Insight to lateral marsh
retreat mechanism through localized field
measurements. Water Resources Res. 52. 1446–1464,
doi: 10.1002/2015WR017966.
Marani, M., D’Alpaos, A., Lanzoni, S. and Santalucia, M.
(2011). Understanding and predicting wave erosion of
marsh edge. J. Geophys. Res. Lett. 38. L21401, doi:
10.1029/2011GL048995.
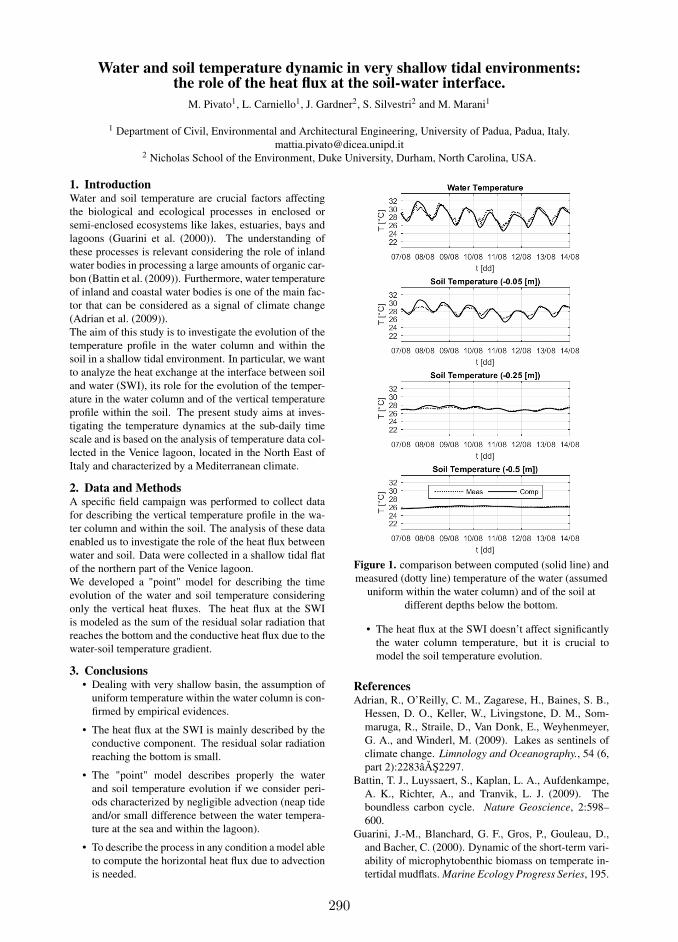
290
Water and soil temperature dynamic in very shallow tidal environments:the role of the heat flux at the soil-water interface.
M. Pivato1, L. Carniello1, J. Gardner2, S. Silvestri2 and M. Marani1
1 Department of Civil, Environmental and Architectural Engineering, University of Padua, Padua, Italy.
[email protected] Nicholas School of the Environment, Duke University, Durham, North Carolina, USA.
1. IntroductionWater and soil temperature are crucial factors affecting
the biological and ecological processes in enclosed or
semi-enclosed ecosystems like lakes, estuaries, bays and
lagoons (Guarini et al. (2000)). The understanding of
these processes is relevant considering the role of inland
water bodies in processing a large amounts of organic car-
bon (Battin et al. (2009)). Furthermore, water temperature
of inland and coastal water bodies is one of the main fac-
tor that can be considered as a signal of climate change
(Adrian et al. (2009)).
The aim of this study is to investigate the evolution of the
temperature profile in the water column and within the
soil in a shallow tidal environment. In particular, we want
to analyze the heat exchange at the interface between soil
and water (SWI), its role for the evolution of the temper-
ature in the water column and of the vertical temperature
profile within the soil. The present study aims at inves-
tigating the temperature dynamics at the sub-daily time
scale and is based on the analysis of temperature data col-
lected in the Venice lagoon, located in the North East of
Italy and characterized by a Mediterranean climate.
2. Data and MethodsA specific field campaign was performed to collect data
for describing the vertical temperature profile in the wa-
ter column and within the soil. The analysis of these data
enabled us to investigate the role of the heat flux between
water and soil. Data were collected in a shallow tidal flat
of the northern part of the Venice lagoon.
We developed a "point" model for describing the time
evolution of the water and soil temperature considering
only the vertical heat fluxes. The heat flux at the SWI
is modeled as the sum of the residual solar radiation that
reaches the bottom and the conductive heat flux due to the
water-soil temperature gradient.
3. Conclusions• Dealing with very shallow basin, the assumption of
uniform temperature within the water column is con-
firmed by empirical evidences.
• The heat flux at the SWI is mainly described by the
conductive component. The residual solar radiation
reaching the bottom is small.
• The "point" model describes properly the water
and soil temperature evolution if we consider peri-
ods characterized by negligible advection (neap tide
and/or small difference between the water tempera-
ture at the sea and within the lagoon).
• To describe the process in any condition a model able
to compute the horizontal heat flux due to advection
is needed.
Figure 1. comparison between computed (solid line) and
measured (dotty line) temperature of the water (assumed
uniform within the water column) and of the soil at
different depths below the bottom.
• The heat flux at the SWI doesn’t affect significantly
the water column temperature, but it is crucial to
model the soil temperature evolution.
ReferencesAdrian, R., O’Reilly, C. M., Zagarese, H., Baines, S. B.,
Hessen, D. O., Keller, W., Livingstone, D. M., Som-
maruga, R., Straile, D., Van Donk, E., Weyhenmeyer,
G. A., and Winderl, M. (2009). Lakes as sentinels of
climate change. Limnology and Oceanography., 54 (6,
part 2):2283âAS2297.
Battin, T. J., Luyssaert, S., Kaplan, L. A., Aufdenkampe,
A. K., Richter, A., and Tranvik, L. J. (2009). The
boundless carbon cycle. Nature Geoscience, 2:598–
600.
Guarini, J.-M., Blanchard, G. F., Gros, P., Gouleau, D.,
and Bacher, C. (2000). Dynamic of the short-term vari-
ability of microphytobenthic biomass on temperate in-
tertidal mudflats. Marine Ecology Progress Series, 195.

291
What drives salt-marsh retreat?
M. Roner 1, L. Tommasini1, M. Ghinassi1, A. Finotello1 and A. D’Alpaos1
1 Department of Geosciences, University of Padua, Padua, Italy.
[email protected], [email protected], [email protected], [email protected], [email protected]
1. Introduction Salt marshes are typical morphological features of the Venice Lagoon, as well as in many other tidal systems worldwide. Among numerous benefits to the environment, salt marshes furnish a shoreline buffer between the mainland and the sea dissipating waves and mitigating erosion during storms, filter nutrients and pollutants, serve as an organic carbon sink, host characteristic plant and animal species. Salt marshes are currently exposed to possibly irreversible transformations due to the effect of climate change and human pressure and their extent has dramatically decreased worldwide over the last centuries. In the Venice Lagoon salt-marsh area decreased of more than 70% in the last 200 years. For decades the disappearance of salt marshes has been ascribed to the effect of the rising sea level and lack of sediments, but more recent studies have been carried out considering the erosion triggered by wind waves as the primary driver for salt-marsh retreat (Marani et al., 2011; Bendoni et al., 2016). In this work we analysed the contribution of different sediment types in increasing, or decreasing, the resistance of salt-marsh margins to wave processes. Our results are compared with outcomes by Feagin et al. (2009), who suggested that the soil type is the primary variable that influences the lateral erosion rate. 2. Methods We collected 20 undisturbed sediment cores along marsh boundaries in different sites of the Venice Lagoon (Figure 1a). Each core, recovered through a steel frame 50x10x10 cm (Figure 1b) vertically pushed into the soil, was analysed in order to estimate the vertical distribution of:
organic matter content, through Loss On Ignition technique;
grain size of the inorganic fraction, through a Mastersizer, after removal of the organic component with hydrogen peroxide;
dry bulk density of the sediments. To detect the marsh retreat in each core site, we compared the aerial photographs acquired in 1978 and 2010 (Figure 1c). The wave power impacting each marsh edge was computed on the basis of a fully coupled wind-wave tidal model (Carniello et al., 2011). Finally, physical soil characteristics were correlated with the rate of lateral erosion and with the magnitude of wave power.
Figure 1. (a) Bathymetric map of the Venice Lagoon. The black circles indicate the location of the recovered cores. (b) Example of core collected by the steel frame. (c) Example of marsh retreat between 1978 and 2010.
3. Results and Conclusions Our results suggest that the salt-marsh retreat is strongly correlated with the incident wave power density. On the contrary, erosion is almost independent from soil physical characteristics such as organic matter content, inorganic fraction grain size, and dry bulk density. It is therefore not possible to establish a direct correlation between retreat rates and soil physical characteristics, and consequently our results do not confirm the outcomes obtained by Feagin et al. (2009). Additionally, at several wind-sheltered sites, we observed that the erosion of marsh edges shows rates of marsh retreat similar to the other sites. This behaviour can be due to the presence of boat waves and/or to the influence of tidal fluxes. References Bendoni, M., Mel, R., Solari, L., Lanzoni, S.,
Francalanci, S. and Oumeraci, H. (2016). Insights into lateral marsh retreat mechanism through localized field measurements. Water Resour. Res. 52: 1-19.
Carniello, L., D’Alpaos., A. and Defina, A. (2011). Modeling wind waves and tidal flows in shallow micro-tidal basin. Estuar. Coast. Shelf Sci. 114, F04002.
Feagin, R.A., Lozada-Bernard, S.M., Ravens, T.M., Moller, I., Yeager, K.M. and Baird, A.H. (2009). Does vegetation prevent wave erosion of salt marsh edges? PNAS 106: 109-113.
Marani, M., D’Alpaos, A., Lanzoni, S. and Santalucia, M. (2011). Understanding and predicting wave erosion of marsh edges. Geophys. Res. Lett. 38, L21401.
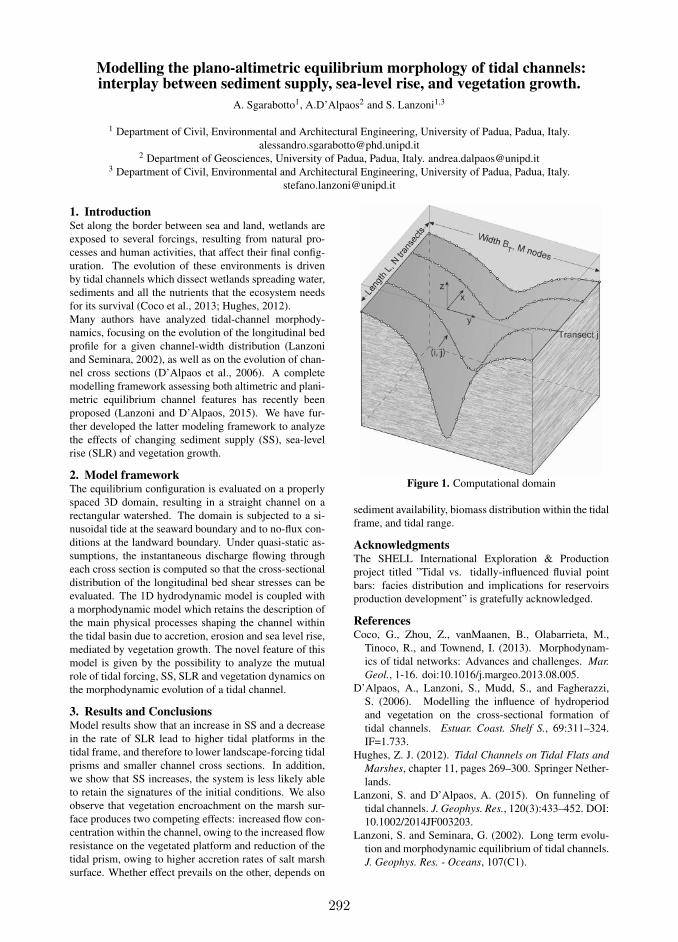
292
Modelling the plano-altimetric equilibrium morphology of tidal channels:interplay between sediment supply, sea-level rise, and vegetation growth.
A. Sgarabotto1, A.D’Alpaos2 and S. Lanzoni1,3
1 Department of Civil, Environmental and Architectural Engineering, University of Padua, Padua, Italy.
[email protected] Department of Geosciences, University of Padua, Padua, Italy. [email protected]
3 Department of Civil, Environmental and Architectural Engineering, University of Padua, Padua, Italy.
1. IntroductionSet along the border between sea and land, wetlands are
exposed to several forcings, resulting from natural pro-
cesses and human activities, that affect their final config-
uration. The evolution of these environments is driven
by tidal channels which dissect wetlands spreading water,
sediments and all the nutrients that the ecosystem needs
for its survival (Coco et al., 2013; Hughes, 2012).
Many authors have analyzed tidal-channel morphody-
namics, focusing on the evolution of the longitudinal bed
profile for a given channel-width distribution (Lanzoni
and Seminara, 2002), as well as on the evolution of chan-
nel cross sections (D’Alpaos et al., 2006). A complete
modelling framework assessing both altimetric and plani-
metric equilibrium channel features has recently been
proposed (Lanzoni and D’Alpaos, 2015). We have fur-
ther developed the latter modeling framework to analyze
the effects of changing sediment supply (SS), sea-level
rise (SLR) and vegetation growth.
2. Model frameworkThe equilibrium configuration is evaluated on a properly
spaced 3D domain, resulting in a straight channel on a
rectangular watershed. The domain is subjected to a si-
nusoidal tide at the seaward boundary and to no-flux con-
ditions at the landward boundary. Under quasi-static as-
sumptions, the instantaneous discharge flowing through
each cross section is computed so that the cross-sectional
distribution of the longitudinal bed shear stresses can be
evaluated. The 1D hydrodynamic model is coupled with
a morphodynamic model which retains the description of
the main physical processes shaping the channel within
the tidal basin due to accretion, erosion and sea level rise,
mediated by vegetation growth. The novel feature of this
model is given by the possibility to analyze the mutual
role of tidal forcing, SS, SLR and vegetation dynamics on
the morphodynamic evolution of a tidal channel.
3. Results and ConclusionsModel results show that an increase in SS and a decrease
in the rate of SLR lead to higher tidal platforms in the
tidal frame, and therefore to lower landscape-forcing tidal
prisms and smaller channel cross sections. In addition,
we show that SS increases, the system is less likely able
to retain the signatures of the initial conditions. We also
observe that vegetation encroachment on the marsh sur-
face produces two competing effects: increased flow con-
centration within the channel, owing to the increased flow
resistance on the vegetated platform and reduction of the
tidal prism, owing to higher accretion rates of salt marsh
surface. Whether effect prevails on the other, depends on
Figure 1. Computational domain
sediment availability, biomass distribution within the tidal
frame, and tidal range.
AcknowledgmentsThe SHELL International Exploration & Production
project titled ”Tidal vs. tidally-influenced fluvial point
bars: facies distribution and implications for reservoirs
production development” is gratefully acknowledged.
ReferencesCoco, G., Zhou, Z., vanMaanen, B., Olabarrieta, M.,
Tinoco, R., and Townend, I. (2013). Morphodynam-
ics of tidal networks: Advances and challenges. Mar.
Geol., 1-16. doi:10.1016/j.margeo.2013.08.005.
D’Alpaos, A., Lanzoni, S., Mudd, S., and Fagherazzi,
S. (2006). Modelling the influence of hydroperiod
and vegetation on the cross-sectional formation of
tidal channels. Estuar. Coast. Shelf S., 69:311–324.
IF=1.733.
Hughes, Z. J. (2012). Tidal Channels on Tidal Flats and
Marshes, chapter 11, pages 269–300. Springer Nether-
lands.
Lanzoni, S. and D’Alpaos, A. (2015). On funneling of
tidal channels. J. Geophys. Res., 120(3):433–452. DOI:
10.1002/2014JF003203.
Lanzoni, S. and Seminara, G. (2002). Long term evolu-
tion and morphodynamic equilibrium of tidal channels.
J. Geophys. Res. - Oceans, 107(C1).
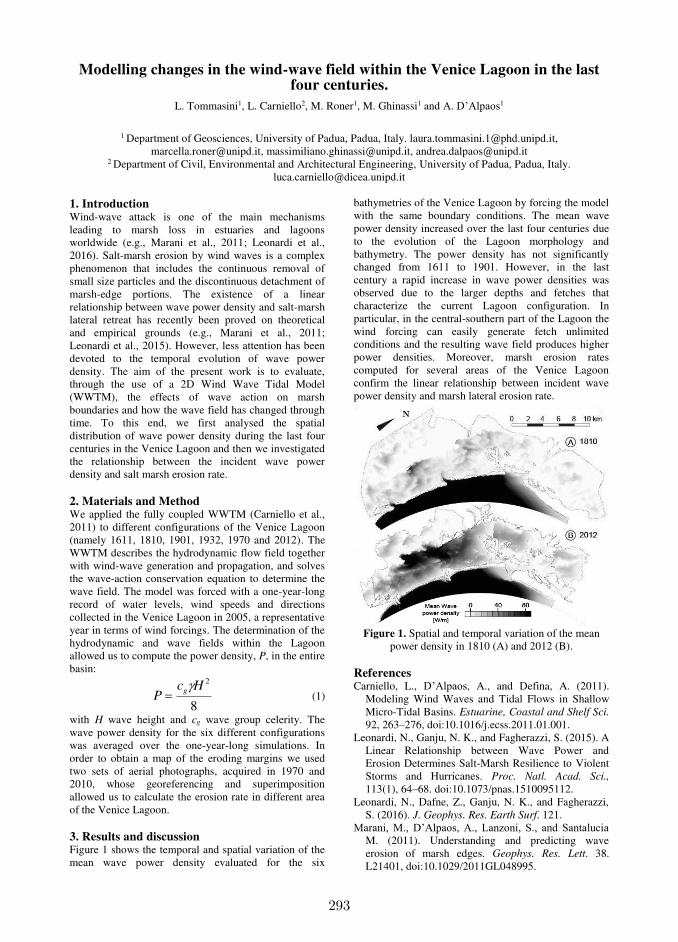
293
Modelling changes in the wind-wave field within the Venice Lagoon in the last four centuries.
L. Tommasini1, L. Carniello2, M. Roner1, M. Ghinassi1 and A. D’Alpaos1
1 Department of Geosciences, University of Padua, Padua, Italy. [email protected],
[email protected], [email protected], [email protected] 2 Department of Civil, Environmental and Architectural Engineering, University of Padua, Padua, Italy.
1. Introduction Wind-wave attack is one of the main mechanisms leading to marsh loss in estuaries and lagoons worldwide (e.g., Marani et al., 2011; Leonardi et al., 2016). Salt-marsh erosion by wind waves is a complex phenomenon that includes the continuous removal of small size particles and the discontinuous detachment of marsh-edge portions. The existence of a linear relationship between wave power density and salt-marsh lateral retreat has recently been proved on theoretical and empirical grounds (e.g., Marani et al., 2011; Leonardi et al., 2015). However, less attention has been devoted to the temporal evolution of wave power density. The aim of the present work is to evaluate, through the use of a 2D Wind Wave Tidal Model (WWTM), the effects of wave action on marsh boundaries and how the wave field has changed through time. To this end, we first analysed the spatial distribution of wave power density during the last four centuries in the Venice Lagoon and then we investigated the relationship between the incident wave power density and salt marsh erosion rate. 2. Materials and Method We applied the fully coupled WWTM (Carniello et al., 2011) to different configurations of the Venice Lagoon (namely 1611, 1810, 1901, 1932, 1970 and 2012). The WWTM describes the hydrodynamic flow field together with wind-wave generation and propagation, and solves the wave-action conservation equation to determine the wave field. The model was forced with a one-year-long record of water levels, wind speeds and directions collected in the Venice Lagoon in 2005, a representative year in terms of wind forcings. The determination of the hydrodynamic and wave fields within the Lagoon allowed us to compute the power density, P, in the entire basin:
8
2HcP
g (1)
with H wave height and cg wave group celerity. The wave power density for the six different configurations was averaged over the one-year-long simulations. In order to obtain a map of the eroding margins we used two sets of aerial photographs, acquired in 1970 and 2010, whose georeferencing and superimposition allowed us to calculate the erosion rate in different area of the Venice Lagoon. 3. Results and discussion Figure 1 shows the temporal and spatial variation of the mean wave power density evaluated for the six
bathymetries of the Venice Lagoon by forcing the model with the same boundary conditions. The mean wave power density increased over the last four centuries due to the evolution of the Lagoon morphology and bathymetry. The power density has not significantly changed from 1611 to 1901. However, in the last century a rapid increase in wave power densities was observed due to the larger depths and fetches that characterize the current Lagoon configuration. In particular, in the central-southern part of the Lagoon the wind forcing can easily generate fetch unlimited conditions and the resulting wave field produces higher power densities. Moreover, marsh erosion rates computed for several areas of the Venice Lagoon confirm the linear relationship between incident wave power density and marsh lateral erosion rate.
Figure 1. Spatial and temporal variation of the mean
power density in 1810 (A) and 2012 (B). References Carniello, L., D’Alpaos, A., and Defina, A. (2011).
Modeling Wind Waves and Tidal Flows in Shallow Micro-Tidal Basins. Estuarine, Coastal and Shelf Sci. 92, 263–276, doi:10.1016/j.ecss.2011.01.001.
Leonardi, N., Ganju, N. K., and Fagherazzi, S. (2015). A Linear Relationship between Wave Power and Erosion Determines Salt-Marsh Resilience to Violent Storms and Hurricanes. Proc. Natl. Acad. Sci.,
113(1), 64–68. doi:10.1073/pnas.1510095112.
Leonardi, N., Dafne, Z., Ganju, N. K., and Fagherazzi, S. (2016). J. Geophys. Res. Earth Surf. 121.
Marani, M., D’Alpaos, A., Lanzoni, S., and Santalucia M. (2011). Understanding and predicting wave erosion of marsh edges. Geophys. Res. Lett. 38. L21401, doi:10.1029/2011GL048995.
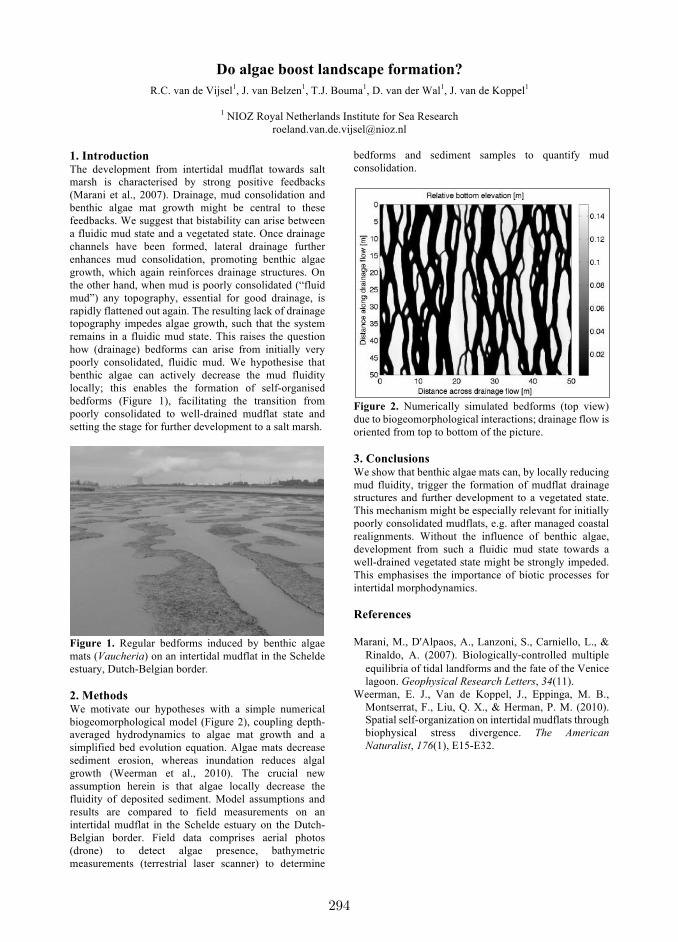
294
Do algae boost landscape formation?
R.C. van de Vijsel1, J. van Belzen
1, T.J. Bouma
1, D. van der Wal
1, J. van de Koppel
1
1 NIOZ Royal Netherlands Institute for Sea Research
1. Introduction The development from intertidal mudflat towards salt
marsh is characterised by strong positive feedbacks
(Marani et al., 2007). Drainage, mud consolidation and
benthic algae mat growth might be central to these
feedbacks. We suggest that bistability can arise between
a fluidic mud state and a vegetated state. Once drainage
channels have been formed, lateral drainage further
enhances mud consolidation, promoting benthic algae
growth, which again reinforces drainage structures. On
the other hand, when mud is poorly consolidated (“fluid
mud”) any topography, essential for good drainage, is
rapidly flattened out again. The resulting lack of drainage
topography impedes algae growth, such that the system
remains in a fluidic mud state. This raises the question
how (drainage) bedforms can arise from initially very
poorly consolidated, fluidic mud. We hypothesise that
benthic algae can actively decrease the mud fluidity
locally; this enables the formation of self-organised
bedforms (Figure 1), facilitating the transition from
poorly consolidated to well-drained mudflat state and
setting the stage for further development to a salt marsh.
Figure 1. Regular bedforms induced by benthic algae
mats (Vaucheria) on an intertidal mudflat in the Schelde
estuary, Dutch-Belgian border.
2. Methods We motivate our hypotheses with a simple numerical
biogeomorphological model (Figure 2), coupling depth-
averaged hydrodynamics to algae mat growth and a
simplified bed evolution equation. Algae mats decrease
sediment erosion, whereas inundation reduces algal
growth (Weerman et al., 2010). The crucial new
assumption herein is that algae locally decrease the
fluidity of deposited sediment. Model assumptions and
results are compared to field measurements on an
intertidal mudflat in the Schelde estuary on the Dutch-
Belgian border. Field data comprises aerial photos
(drone) to detect algae presence, bathymetric
measurements (terrestrial laser scanner) to determine
bedforms and sediment samples to quantify mud
consolidation.
Figure 2. Numerically simulated bedforms (top view)
due to biogeomorphological interactions; drainage flow is
oriented from top to bottom of the picture.
3. Conclusions We show that benthic algae mats can, by locally reducing
mud fluidity, trigger the formation of mudflat drainage
structures and further development to a vegetated state.
This mechanism might be especially relevant for initially
poorly consolidated mudflats, e.g. after managed coastal
realignments. Without the influence of benthic algae,
development from such a fluidic mud state towards a
well-drained vegetated state might be strongly impeded.
This emphasises the importance of biotic processes for
intertidal morphodynamics.
References
Marani, M., D'Alpaos, A., Lanzoni, S., Carniello, L., &
Rinaldo, A. (2007). Biologically-controlled multiple
equilibria of tidal landforms and the fate of the Venice
lagoon. Geophysical Research Letters, 34(11).
Weerman, E. J., Van de Koppel, J., Eppinga, M. B.,
Montserrat, F., Liu, Q. X., & Herman, P. M. (2010).
Spatial self-organization on intertidal mudflats through
biophysical stress divergence. The American
Naturalist, 176(1), E15-E32.
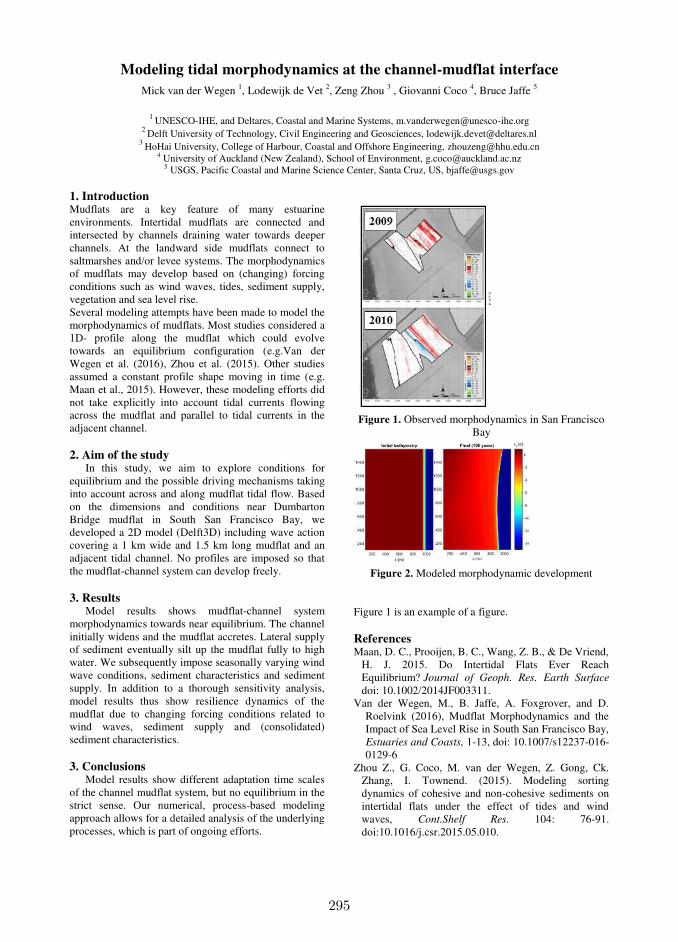
295
Modeling tidal morphodynamics at the channel-mudflat interface
Mick van der Wegen 1, Lodewijk de Vet 2, Zeng Zhou 3 , Giovanni Coco 4, Bruce Jaffe 5
1 UNESCO-IHE, and Deltares, Coastal and Marine Systems, [email protected]
2 Delft University of Technology, Civil Engineering and Geosciences, [email protected] 3 HoHai University, College of Harbour, Coastal and Offshore Engineering, [email protected]
4 University of Auckland (New Zealand), School of Environment, [email protected] 5 USGS, Pacific Coastal and Marine Science Center, Santa Cruz, US, [email protected]
1. Introduction Mudflats are a key feature of many estuarine environments. Intertidal mudflats are connected and intersected by channels draining water towards deeper channels. At the landward side mudflats connect to saltmarshes and/or levee systems. The morphodynamics of mudflats may develop based on (changing) forcing conditions such as wind waves, tides, sediment supply, vegetation and sea level rise. Several modeling attempts have been made to model the morphodynamics of mudflats. Most studies considered a 1D- profile along the mudflat which could evolve towards an equilibrium configuration (e.g.Van der Wegen et al. (2016), Zhou et al. (2015). Other studies assumed a constant profile shape moving in time (e.g. Maan et al., 2015). However, these modeling efforts did not take explicitly into account tidal currents flowing across the mudflat and parallel to tidal currents in the adjacent channel. 2. Aim of the study
In this study, we aim to explore conditions for equilibrium and the possible driving mechanisms taking into account across and along mudflat tidal flow. Based on the dimensions and conditions near Dumbarton Bridge mudflat in South San Francisco Bay, we developed a 2D model (Delft3D) including wave action covering a 1 km wide and 1.5 km long mudflat and an adjacent tidal channel. No profiles are imposed so that the mudflat-channel system can develop freely.
3. Results
Model results shows mudflat-channel system morphodynamics towards near equilibrium. The channel initially widens and the mudflat accretes. Lateral supply of sediment eventually silt up the mudflat fully to high water. We subsequently impose seasonally varying wind wave conditions, sediment characteristics and sediment supply. In addition to a thorough sensitivity analysis, model results thus show resilience dynamics of the mudflat due to changing forcing conditions related to wind waves, sediment supply and (consolidated) sediment characteristics. 3. Conclusions
Model results show different adaptation time scales of the channel mudflat system, but no equilibrium in the strict sense. Our numerical, process-based modeling approach allows for a detailed analysis of the underlying processes, which is part of ongoing efforts.
Figure 1. Observed morphodynamics in San Francisco
Bay
Figure 2. Modeled morphodynamic development
Figure 1 is an example of a figure. References Maan, D. C., Prooijen, B. C., Wang, Z. B., & De Vriend,
H. J. 2015. Do Intertidal Flats Ever Reach Equilibrium? Journal of Geoph. Res. Earth Surface
doi: 10.1002/2014JF003311. Van der Wegen, M., B. Jaffe, A. Foxgrover, and D.
Roelvink (2016), Mudflat Morphodynamics and the Impact of Sea Level Rise in South San Francisco Bay, Estuaries and Coasts, 1-13, doi: 10.1007/s12237-016-0129-6
Zhou Z., G. Coco, M. van der Wegen, Z. Gong, Ck. Zhang, I. Townend. (2015). Modeling sorting dynamics of cohesive and non-cohesive sediments on intertidal flats under the effect of tides and wind waves, Cont.Shelf Res. 104: 76-91. doi:10.1016/j.csr.2015.05.010.
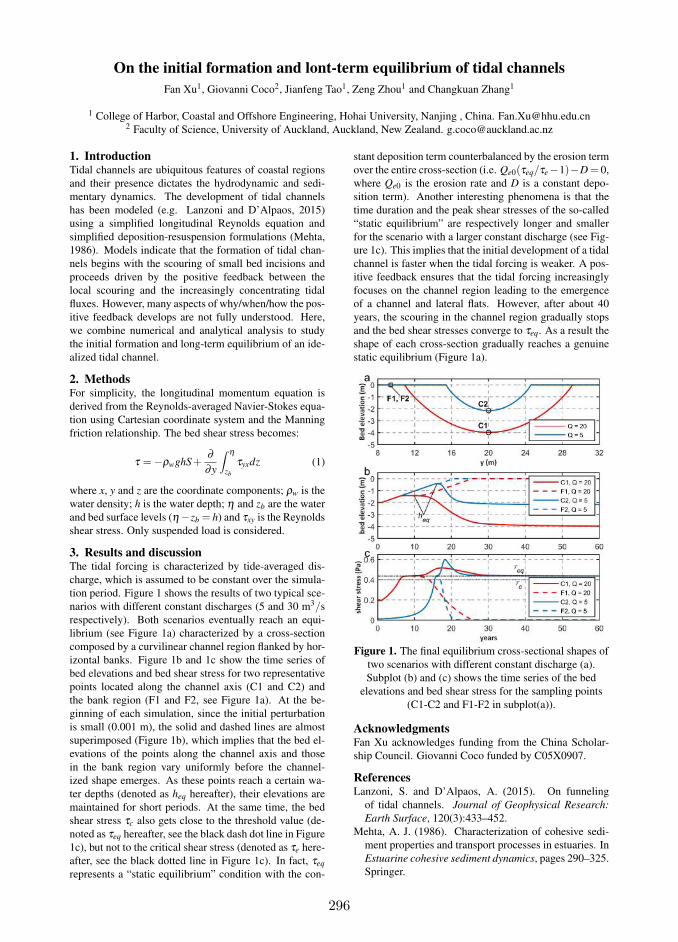
296
On the initial formation and lont-term equilibrium of tidal channels
Fan Xu1, Giovanni Coco2, Jianfeng Tao1, Zeng Zhou1 and Changkuan Zhang1
1 College of Harbor, Coastal and Offshore Engineering, Hohai University, Nanjing , China. [email protected] Faculty of Science, University of Auckland, Auckland, New Zealand. [email protected]
1. IntroductionTidal channels are ubiquitous features of coastal regions
and their presence dictates the hydrodynamic and sedi-
mentary dynamics. The development of tidal channels
has been modeled (e.g. Lanzoni and D’Alpaos, 2015)
using a simplified longitudinal Reynolds equation and
simplified deposition-resuspension formulations (Mehta,
1986). Models indicate that the formation of tidal chan-
nels begins with the scouring of small bed incisions and
proceeds driven by the positive feedback between the
local scouring and the increasingly concentrating tidal
fluxes. However, many aspects of why/when/how the pos-
itive feedback develops are not fully understood. Here,
we combine numerical and analytical analysis to study
the initial formation and long-term equilibrium of an ide-
alized tidal channel.
2. MethodsFor simplicity, the longitudinal momentum equation is
derived from the Reynolds-averaged Navier-Stokes equa-
tion using Cartesian coordinate system and the Manning
friction relationship. The bed shear stress becomes:
τ =−ρwghS+∂
∂y
∫ η
zb
τyxdz (1)
where x, y and z are the coordinate components; ρw is the
water density; h is the water depth; η and zb are the water
and bed surface levels (η−zb = h) and τxy is the Reynolds
shear stress. Only suspended load is considered.
3. Results and discussionThe tidal forcing is characterized by tide-averaged dis-
charge, which is assumed to be constant over the simula-
tion period. Figure 1 shows the results of two typical sce-
narios with different constant discharges (5 and 30 m3/s
respectively). Both scenarios eventually reach an equi-
librium (see Figure 1a) characterized by a cross-section
composed by a curvilinear channel region flanked by hor-
izontal banks. Figure 1b and 1c show the time series of
bed elevations and bed shear stress for two representative
points located along the channel axis (C1 and C2) and
the bank region (F1 and F2, see Figure 1a). At the be-
ginning of each simulation, since the initial perturbation
is small (0.001 m), the solid and dashed lines are almost
superimposed (Figure 1b), which implies that the bed el-
evations of the points along the channel axis and those
in the bank region vary uniformly before the channel-
ized shape emerges. As these points reach a certain wa-
ter depths (denoted as heq hereafter), their elevations are
maintained for short periods. At the same time, the bed
shear stress τc also gets close to the threshold value (de-
noted as τeq hereafter, see the black dash dot line in Figure
1c), but not to the critical shear stress (denoted as τe here-
after, see the black dotted line in Figure 1c). In fact, τeq
represents a “static equilibrium” condition with the con-
stant deposition term counterbalanced by the erosion term
over the entire cross-section (i.e. Qe0(τeq/τe−1)−D= 0,
where Qe0 is the erosion rate and D is a constant depo-
sition term). Another interesting phenomena is that the
time duration and the peak shear stresses of the so-called
“static equilibrium” are respectively longer and smaller
for the scenario with a larger constant discharge (see Fig-
ure 1c). This implies that the initial development of a tidal
channel is faster when the tidal forcing is weaker. A pos-
itive feedback ensures that the tidal forcing increasingly
focuses on the channel region leading to the emergence
of a channel and lateral flats. However, after about 40
years, the scouring in the channel region gradually stops
and the bed shear stresses converge to τeq. As a result the
shape of each cross-section gradually reaches a genuine
static equilibrium (Figure 1a).
Figure 1. The final equilibrium cross-sectional shapes of
two scenarios with different constant discharge (a).
Subplot (b) and (c) shows the time series of the bed
elevations and bed shear stress for the sampling points
(C1-C2 and F1-F2 in subplot(a)).
AcknowledgmentsFan Xu acknowledges funding from the China Scholar-
ship Council. Giovanni Coco funded by C05X0907.
ReferencesLanzoni, S. and D’Alpaos, A. (2015). On funneling
of tidal channels. Journal of Geophysical Research:
Earth Surface, 120(3):433–452.
Mehta, A. J. (1986). Characterization of cohesive sedi-
ment properties and transport processes in estuaries. In
Estuarine cohesive sediment dynamics, pages 290–325.
Springer.
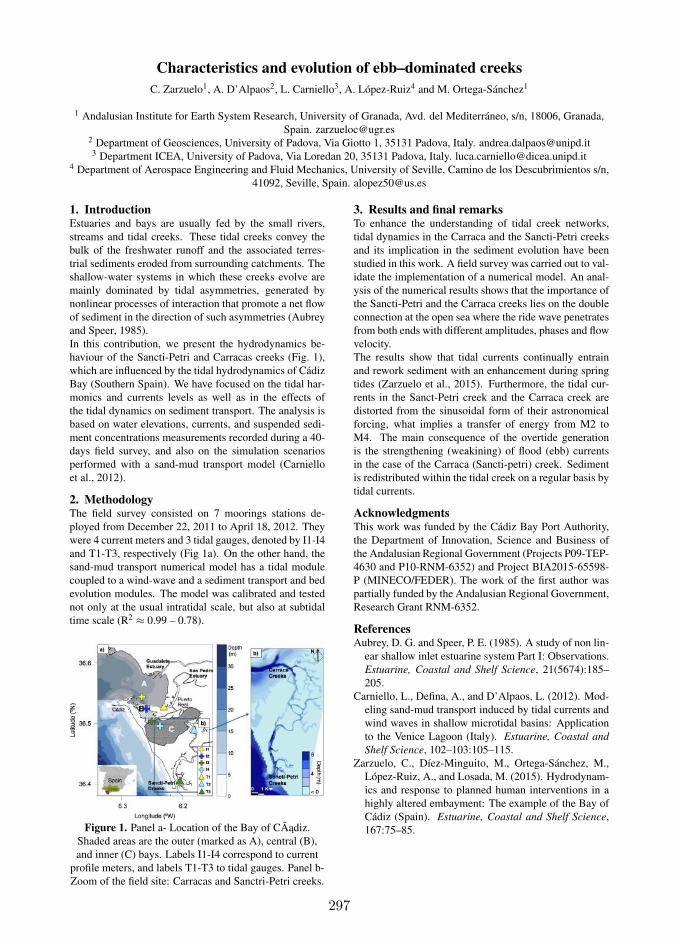
297
Characteristics and evolution of ebb–dominated creeks
C. Zarzuelo1, A. D’Alpaos2, L. Carniello3, A. López-Ruiz4 and M. Ortega-Sánchez1
1 Andalusian Institute for Earth System Research, University of Granada, Avd. del Mediterráneo, s/n, 18006, Granada,Spain. [email protected]
2 Department of Geosciences, University of Padova, Via Giotto 1, 35131 Padova, Italy. [email protected] Department ICEA, University of Padova, Via Loredan 20, 35131 Padova, Italy. [email protected]
4 Department of Aerospace Engineering and Fluid Mechanics, University of Seville, Camino de los Descubrimientos s/n,41092, Seville, Spain. [email protected]
1. IntroductionEstuaries and bays are usually fed by the small rivers,streams and tidal creeks. These tidal creeks convey thebulk of the freshwater runoff and the associated terres-trial sediments eroded from surrounding catchments. Theshallow-water systems in which these creeks evolve aremainly dominated by tidal asymmetries, generated bynonlinear processes of interaction that promote a net flowof sediment in the direction of such asymmetries (Aubreyand Speer, 1985).In this contribution, we present the hydrodynamics be-haviour of the Sancti-Petri and Carracas creeks (Fig. 1),which are influenced by the tidal hydrodynamics of CádizBay (Southern Spain). We have focused on the tidal har-monics and currents levels as well as in the effects ofthe tidal dynamics on sediment transport. The analysis isbased on water elevations, currents, and suspended sedi-ment concentrations measurements recorded during a 40-days field survey, and also on the simulation scenariosperformed with a sand-mud transport model (Carnielloet al., 2012).
2. MethodologyThe field survey consisted on 7 moorings stations de-ployed from December 22, 2011 to April 18, 2012. Theywere 4 current meters and 3 tidal gauges, denoted by I1-I4and T1-T3, respectively (Fig 1a). On the other hand, thesand-mud transport numerical model has a tidal modulecoupled to a wind-wave and a sediment transport and bedevolution modules. The model was calibrated and testednot only at the usual intratidal scale, but also at subtidaltime scale (R2
≈ 0.99 – 0.78).
Figure 1. Panel a- Location of the Bay of CÃadiz.Shaded areas are the outer (marked as A), central (B),and inner (C) bays. Labels I1-I4 correspond to current
profile meters, and labels T1-T3 to tidal gauges. Panel b-Zoom of the field site: Carracas and Sanctri-Petri creeks.
3. Results and final remarksTo enhance the understanding of tidal creek networks,tidal dynamics in the Carraca and the Sancti-Petri creeksand its implication in the sediment evolution have beenstudied in this work. A field survey was carried out to val-idate the implementation of a numerical model. An anal-ysis of the numerical results shows that the importance ofthe Sancti-Petri and the Carraca creeks lies on the doubleconnection at the open sea where the ride wave penetratesfrom both ends with different amplitudes, phases and flowvelocity.The results show that tidal currents continually entrainand rework sediment with an enhancement during springtides (Zarzuelo et al., 2015). Furthermore, the tidal cur-rents in the Sanct-Petri creek and the Carraca creek aredistorted from the sinusoidal form of their astronomicalforcing, what implies a transfer of energy from M2 toM4. The main consequence of the overtide generationis the strengthening (weakining) of flood (ebb) currentsin the case of the Carraca (Sancti-petri) creek. Sedimentis redistributed within the tidal creek on a regular basis bytidal currents.
AcknowledgmentsThis work was funded by the Cádiz Bay Port Authority,the Department of Innovation, Science and Business ofthe Andalusian Regional Government (Projects P09-TEP-4630 and P10-RNM-6352) and Project BIA2015-65598-P (MINECO/FEDER). The work of the first author waspartially funded by the Andalusian Regional Government,Research Grant RNM-6352.
ReferencesAubrey, D. G. and Speer, P. E. (1985). A study of non lin-
ear shallow inlet estuarine system Part I: Observations.Estuarine, Coastal and Shelf Science, 21(5674):185–205.
Carniello, L., Defina, A., and D’Alpaos, L. (2012). Mod-eling sand-mud transport induced by tidal currents andwind waves in shallow microtidal basins: Applicationto the Venice Lagoon (Italy). Estuarine, Coastal and
Shelf Science, 102–103:105–115.Zarzuelo, C., Díez-Minguito, M., Ortega-Sánchez, M.,
López-Ruiz, A., and Losada, M. (2015). Hydrodynam-ics and response to planned human interventions in ahighly altered embayment: The example of the Bay ofCádiz (Spain). Estuarine, Coastal and Shelf Science,167:75–85.

298

INDEX OF AUTHORS
Aalto, R. 255Abad, J.D. 59, 187, 219, 220, 255Abou-Habib, M. 177Adami, L. 147, 253Adduce, C. 97, 111Akiyama, Y. 148Alaeipour, A. 100Albernaz, M.B. 122Alexander J.S. 149Amaris, G. 123Amitrano, D. 222Ancey, C. 46, 169, 193Antoine, G. 150Antoniazza, G. 92Arkesteijn, L. 151Armanini, A. 152Arnez, K. 153Arriaga J. 38Arroyo-Gomez, M. 220Ashley, T. 161Ashmore, P. 172, 262Ashton, A. 29Ata, R. 59, 125Avila, H. 123Baar, A.W. 154Bakker, M. 92Balachandar, S. 109Bangen, S. 204Barbaro, G. 162Barkwith, A. 101Bascheck, B. 198Bateman, A. 124, 174Bau, V. 155Bayat, E. 251Bellafiore, D. 69Belliard, J.-P. 274Bendoni, M. 289Berezowsky, M. 156Berni, C. 157Bertagni, M.B. 80Bertin, X. 86, 278, 280Bertoldi, W. 81, 93, 147, 237Besio, G. 115Besmier, A.L. 200Best, J.L. 43, 73, 185Billi, P. 103Binh, D.V. 125
Blom, A. 94, 151, 158, 166, 178Blondeaux, P. 25, 39, 121Boelens, T. 57, 275Boes, R.M. 77, 245, 259Bogoni, D. 61Bogoni, M. 159, 271Bohorquez, P. 46Bolster, D. 47, 181Bombardier, J. 186Bouma, T.J. 13, 83, 129, 182, 294Braat, L. 52, 54, 122, 126, 127, 133Brasington, J. 5Briganti, R. 115Brivio, L. 281Brivois, O. 112Brocchini, M. 23Brown, R.A. 49, 230Brunelle, C.B. 45, 160Bryan, K.R. 53, 276Bryk, A.B. 60Bruckner, M.Z.M. 127Buckman, L. 114Buffet, A. 157Buscombe, D. 161, 183, 204Cabrera, J. 219Cainello, L. 58Calantoni, J. 47, 181Caleffi, V. 95Callaway, R.M. 283Calliari, B. 155Calvani, G. 78Calvete, D. 102, 104, 110Camenen, B. 45, 157, 160, 210, 254Camporeale, C. 80, 256, 257Canale, C. 162Candel, J.H.J. 163Canestrelli, A. 281Cantelli, A. 159Caponi, F. 77Carbonari, C. 168Cardot, R. 164, 224Carleo, L. 240Carlson, B. 67Carniello, L. 274, 281, 290, 293, 297Carraro, F. 95Carrillo R. 217Castellanos, B. 267
299
Castelli, F. 175Caster, J. 204Castrillon, C. 35Chadwick, A.J. 128Chang, Y. 197Chapuis, M. 165Chavarrıas, V. 158, 166Chen, X.D. 74Choi, J. 207Christophoul, F. 267Ciavola, P. 103Cilli, S. 103Claude, N. 50, 167Clutier, A. 150Cochrane, T.A. 288Coco, G. 37, 40, 84, 87, 295, 296Coelho, C. 105, 113Coffey, T. 68Cohen, S. 43, 73Colombini, M. 168Conevski, S. 186Cordier, F. 50Costa, A. 92Couvert, B. 165Crosato, A. 50, 79, 98, 170, 212, 228Cuervo, G.V. 35D’Alpaos, A. 58, 85, 88, 277, 281, 291, 292,293, 297Daigle, L.F. 45, 160Darabi, H. 188de Bakker, A. 86, 278de Haas, T. 122de Lange, S.I. 52De Mulder, T. 57, 275de Paiva, J.S. 129de Ruijsscher, T.V. 48de Swart, H.E. 130de Swart, R.L. 104de Vet, L. 295de Vet, P.L.M. 279de Vries, B.M.L. 127Des Roches, M. 45, 160Dhont, B. 169, 193Di Silvio, G. 231Dietrich, W.E. 60, 71Doddoli, C. 165Dodet G. 280Donatelli, C. 42Duclercq, M. 167Dufour, S. 165Dugue, V. 210
Duro, G. 79, 170Dutta, S. 96, 171East, A. 204Eekhout, J.P.C. 180Egashira, S. 190, 269Egli, P. 72Egozi, R. 172El kadi Abderrezzak, K. 59, 125, 167Ellis, M.A. 101Escauriaza, C. 47, 181Esposito, C. 135Facchini, M. 245Falcini, F. 97, 111Falques, A. 38, 102, 110Fatichi, S. 164Fedrizzi, D. 81Feng, Q. 74Fent, I. 173Ferdousi, A. 249Fernandez, C. 174Ferrarin, C. 69, 282, 287Fichera, A. 175Filizola, N. 185Finotello, A. 277, 281, 291Fischer, P. 96, 171Fogarin, S. 282Foglini, F. 69, 287Fondevilla, V. 88Fortunato, A.B. 280Fortune, F. 283Fossati, M. 117Foti, G. 162Foufoula-Georgiou, E. 244Fouke, B. 205Fraccarollo, L. 218Franca, M.J. 202Francalanci, S. 78, 176Francus, P. 45, 160Franzini, F. 177Friedrich, H. 184Frings, R.M. 178, 179, 242, 248Fueta, T. 209, 269Galera, D. 124Gao, W. 55Garcia, M.H. 96, 171, 205, 261Gardner, J. 290Geertsema, T.J. 131, 180Geng, L. 85Ghinassi, M. 88, 277, 281, 291, 293Girardclos, S. 92Glander, B. 112
300

Gong, Z. 74, 85, 145Gonzalez, C. 47, 181Gourgue, O. 182Grams, P.E. 161, 183, 204Granca, M. 119Grasso, F. 56Grenfell, M.C. 75Grenfell, S.E. 283Grimaud, J. 244Groom, J. 184Gualtieri, C. 185, 267Guerin, T. 86, 280Guerrero, M. 186Guimaraes, A. 105Gumiero, B. 78Guo, L. 284Gurnell, A. 243Gutierrez, R.R. 187Guerin, T. 278Haghighi, A.T. 188Hagisawa, S. 41, 107Hajibehzad, M.S. 189Hanson, H. 113Harada, D. 190, 209Harounabadi, A. 100Hart, D.E. 288Hasegawa, K. 232Hashiba, M. 148Hassenruck-Gudipati, H.J. 191Haughey, R. 276He, Q. 284Henault, F. 150Henderson, S.M. 53Hengl, M. 192Hepkema, T.M. 130Herget, J. 241Herman, P.M.J. 83Herrero, A. 157Heuner, M. 89Heyman, J. 193Hiatt, M. 144Hicks, M. 81, 288Hillebrand, G. 198Hohernuth, B. 194Hoitink, A.J.F. 48, 131, 136, 180, 229, 255Horie, T. 106Horstman, E.M. 53, 276Hoshino, T. 195, 199Houseago, R.C. 196Howard, A.D. 60Hsieh, T.C. 263
Hsu, S. 197Hucke, D. 198Huismans, Y. 285Hulscher, S.J.M.H. 252Hung, P. 197Hurst, M.D. 101Hutton, E. 70Huybrechts, N. 117Ianniruberto, M. 185Igarashi, T. 199Inoue, T. 64, 223, 265Irving, J. 72Iwami, Y. 190Izumi, N. 41, 63, 107, 214, 225, 236Jaffe, B. 295Jhong, R.K. 213Jin, C. 37Jodeau, M. 200Jorge, B.Z. 201Joselina, E.A. 201Jose Alfredo, G.V. 201Juez, C. 119, 202Jung, H. 135Kaboglu, G. 137Kakeh, N. 102, 110Kakinoki, T. 82Kamstra, B.R.W. 163Kanda, K. 208Kang, T. 203Kang, Y. 140Kantoush, S. 125Kaplinski, M. 161Kasprak, A. 204Kateb, L. 165Kawakami, M. 260Kawamori, A. 106Ke, W. 68Keenan-Jones, D. 205Keh-Chia, Y. 141Khanchoul, K. 206Kijm, N. 163Kim, H.S. 207Kim, W. 286Kimura, I. 153, 203, 207Kisacik, D. 137Kleinhans, M.G. 52, 54, 122, 126, 127, 133,142, 154, 170Kløve, B. 188Kon, N. 260Koopmans, H. 285Kopmann, R. 112
301

Kruss, A. 69, 282Kuai, Y. 140Kubo, H. 208Kudo, S. 209Kurum, O. 216Kyuka, T. 76, 266Kastner, K. 131La Forgia, G. 97, 111Labeur, R.J. 151, 166Lague, D. 193Lalimi, F.Y. 108Lamb, M.P. 65Lane, S.N. 72, 164, 224Langendoen E.J. 59Lanzoni, S. 61, 85, 159, 176, 249, 271, 289, 292Lapotre, M.G.A. 65Laraque, A. 185, 267Larcher M. 218Larsen, I.J. 65Larson, M. 113Launay, M. 210Lauzon, R. 286Lawler, D. 211Le Coz, J. 210Le Hir, P. 56Le, T.B. 212Le-Brun, M. 150Legreve, K. 165Lemoine, J.-P. 56Lenstra, K.J.H. 132Leonardi, N. 42Leroux, C. 167Leuven, J.R.F.W. 52, 54, 126, 133Li, K.W. 213Li, X. 42Li, Z. 220, 272Liang, M. 135Liao, C.T. 213, 263Lighthart, D. 246Lima, A.C. 63, 214, 236Linge, B.W. 215Liu, X. 264Loizeau, J.L. 92Lokhorst, I.R. 52, 54, 127Lopez Dubon, S. 61Lopez, J.L. 267Lopez-Ruiz, A. 297Lorenzetti, G. 282Louyot, M. 112Lu, Q. 216Luchi, R. 109
Ma, H. 67Maaß, A.L. 178Madricardo, F. 282, 287Maeda, I. 265Mai, N.T.P. 125Makaske, B. 163Mallma, J.A. 187Manfe, G. 282Mankoff, K. 72Mao, L. 217Marani, M. 108, 290Mardricardo, F.M. 69Marinho, B. 113Mason, J. 62Matousek, V. 218, 273Mc Kiver, W. 69McElroy, B.J. 134, 149, 161, 229McLelland, S. 196Measures, R.J. 81, 288Medina, V. 124, 174Meerman, C. 90Meire, P. 89, 182Mel, R. 289Melendez, M. 219Mendoza, A. 59, 156, 220Merlo, G. 277Meselhe, E. 114, 135, 139Messina, F. 114, 135Mettra, F. 164, 224Mewis, P. 221Michaux, J. 177Michioku, K. 208Miller, K. 134Mishra, J. 64, 223, 232Mitidieri, F. 222Miwa, H. 44Mohajeri, S.H. 270Mohrig, D. 62, 191Molnar, P. 164Monegaglia, F. 66Montereale Gavazzi, G. 282Moodie, A. 67Mooneyham, C.D. 120Moore, L.J. 108Moradi, G. 164, 224Morales, R.B. 225Morita, K. 226Morovvati, H. 100Mosselman, E. 215, 227Motta, D. 205Mueller, E.R. 183
302

Mulatu, C.A. 228Mullarney, J.C. 53, 276Muranaka, T. 232Murr, M.L. 149Murray, A.B. 70, 286Musumeci, R.E. 115Nairn, R.B. 216Nakanishi, H. 82Naqshband, S. 48, 229Nelson, P.A. 49, 230Nienhuis, J.H. 136Nittrouer, J.A. 67, 159Nones, M. 231Norris, B.K. 53Nozaka, Y. 106Nucci, E. 152Nunez-Gonzalez, F. 187Oguz Kaboglu, S. 137Okabe, K. 232Okamoto, Y. 208Olabarrieta, M. 90Oliveto, G. 233Oms, O. 88Ortega-Sanchez, M. 297Ortiz, A.C. 116Ozawa, H. 63, 214Pagliara, S. 234, 235Palermo, M. 234, 235Paola, C. 17, 91, 97, 111Papa, M.P. 222, 240Papanicolaou, A.N. 120, 176Park, M. 207Parker, G. 67, 109Parsons, D.R. 196Passalacqua, P. 9, 139, 144, 191Patsinghasanee, S. 153Payo, A. 101Pen, S. 236Perillo, M. 205Perolo, P. 72Perona, P. 80, 155Perret, E. 45, 157, 160Pham van Bang, D. 50, 117Piedra-Cueva, I. 117Piliouras, A. 286Pivato, M. 290Piegay, H. 254Pluss, A. 138Porcile, G. 39Prati, A. 218Provansal, M. 165
Puntorieri, P. 162Ratliff, K. 70Redolfi, M. 93, 237Reiss, M. 238Rennie, C.D. 72, 186, 224Ribas, F. 38, 104Richter, D.H 47, 181Ridderinkhof, W. 132Ridolfi, L. 256, 257Riedel, A. 238Rinaldo, A. 277Rivera, F. 156Rizzetto, F. 69, 287Rodrigues, S. 50Rodrıguez, J.F. 251Romano, A. 115Roner, M. 277, 291, 293Rongen, G.W.F. 215Rottschaffer, V. 90Rubin, D.M. 161Ruello, P. 222Ruther, N. 186Ruttiman, S. 72Saco, P. 251Sadid, K. 135, 139Samadi, A. 270San Juan, J. 239Sankey, J. 204Santoro, P. 117Sarno, L. 240Sarretta, A. 287Sasaki, T. 106Sasaki, Y. 148Sato, D. 265Savenije, H.H.G. 51Schielen, R.M.J. 94, 252Schinaia, S.A. 118Schippa, L. 103Schleiss, A.J. 202Schloemer, H. 241Schoutens, K. 89Schramkowski, G. 57, 275Schrijver, M.C. 279Schruff, T. 242Schuttelaars, H.M. 57, 90, 130, 275Schwarz, C. 182Schuttrumpf, H. 178, 242, 248Scott, C.R. 36Selakovic, S. 127Seminara, G. 91, 109Sendrowsky, A. 139
303

Serlet, A. 243Sfouni-Grigoriadou, M. 119Sgarabotto, A. 292Shafai Bajestan, M. 189Shao, D. 55Shaw, J.B. 68, 134Shimizu, Y. 64, 76, 153, 203, 223, 232, 265Shinjo, K. 232Shosted, R.K. 205Sigovini, M. 282, 287Silinski, A. 89Silva, P.A. 105Silva, T.A.A. 92Silvestri, S. 58, 108, 290Singh, A. 244Siviglia, A. 77, 95, 245, 253, 258, 259Sloff, K.J. 246Smart G. 99Smithgall, K.R. 264Soares-Frazao, S. 173, 177Solari, L. 78, 176, 289Soto, G. 156Spinewine, B. 119Stancanelli, L.M. 115Stark, J. 89Stecca, G. 81, 166Steffinlongo, D. 289Storms, J.E. A. 163Stutenbecker, L. 92Sumi, T. 125Sumitomo, H. 232Sun, C. 197Syvitski, J.P. 43, 73S lowik, M. 247Tabesh, M. 248Taguchi, S. 63, 214Takata, S. 208Takebayashi, H. 19, 266Tal, M. 81, 254Tambroni, N. 91, 249Tanaka, H. 106Tao, J. 84, 140, 296Tassi, P. 50, 59, 96, 112, 117, 167Tejedor, A. 244Temmerman, S. 89, 182, 274Termini, D. 175Teuling, A.J. 180Thalmann, M. 202Thollet, F. 157Tinoco, R.O. 37, 40, 239Toffolon, M. 274
Tommasini, L. 291, 293Tonegawa, A. 199Topping, D.J. 183Torfs, P.J.J.F. 180Tourki, M. 206Townend, I.H. 36Trincardi, F. 69, 282, 287Troch, P. 89Trung, L.V. 125Tsakiris, A.G. 120Tubino, M. 66, 93, 237Tujimoto, G. 82Tung-Chou, H. 141Tunnicliffe, J. 250Twight, D. 114Tornqvist, T.E. 136Udo, K. 226, 268Uijttewaal, W.S.J. 79, 154, 170, 212, 215, 285Umgiesser, G. 69Uno, K. 82Ursic, M.E. 59Vahidi, E. 251Valiani, A. 95Valle Levinson, A. 90van Belzen, J. 83, 182, 294van Buiten, G. 52van de Koppel, J. 83, 182, 294van de Vijsel, R.C. 294van Denderen R.P. 252van der Spek, A.J.F. 122van der Vegt, M. 132van der Wal, D. 83, 294van der Wegen, M. 295van der Werf, J. 143van Dijk, W.M. 133, 142van Oorschot, M. 127van Prooijen, B.C. 279van Vuren, S. 215Vandewalle, F. 200Vanzo, D. 95, 253, 258, 259Vargas-Luna, A. 79Veloso-Gomes, F. 105Vermeulen, B. 131, 255Vesipa, R. 256, 257Vetsch, D.F. 253, 258, 259Viero, D. 61Viparelli, E. 158Vittori, G. 39, 121Vollmer, S. 179Vonwiller, L. 258, 259Vazquez-Tarrıo, D. 254
304

Walles, B. 129, 279Wallinga J. 163Wang, D. 96Wang, Z. 272Wang, Z.B. 55, 143, 279, 284Warken, N. 36Watanabe, K. 76Watanabe, Y. 260, 266Waterman, D.M. 261Weisscher, S.A.H. 154Weitbrecht, V. 194Welber, M. 262Wiberg, P.L. 3Wilkes, M. 211Williams, R.M.E. 65Winterscheid, A. 198, 238Wright, K. 144Wu, K, 263Xu, B. 145Xu, F. 84, 296Xu, M. 87, 272Xu, Y. 264Yamada, K. 44Yamaguchi, S. 76, 260, 265, 266
Yan, D. 141Yasuda, H. 195, 199Yeh, K.C. 213, 263Yepez, S. 267Yilmaz, N. 188Yokoo, Y. 268Yorozuya, A. 148, 190, 209, 269Ysebaert, T. 129, 279Zaggia, L. 282Zarei, M. 270Zarzuelo, C. 297Zen, S. 271Zhang, C. 84, 85, 145, 272, 296Zhang, C.K. 74, 87Zhang, Q. 145, 146Zhou, Z. 74Zhou, J. 145Zhou, Z. 84, 87, 145, 295, 296Zhu, C. 284Zolezzi, G. 66, 81, 93, 147, 243, 253, 255, 259,271Zrostlık, S. 218, 273
305

Information and contacts
Under the patronage of:
http://events.unitn.it/en/rcem17
RC
EM
20
17
Tren
to -
Pado
va
Sept
embe
r 15
- 22,
201
7
Copyright © 2022 FDOKUMEN