
Back to Basics - Revista Portuguesa de Marketing
847
Pedro Ferreira & André Vieira (eds) Back to Basics: consumer-centric marketing or target-centric marketing
-
Upload
khangminh22 -
Category
Documents
-
view
0 -
download
0
Transcript of Back to Basics - Revista Portuguesa de Marketing

Pedro Ferreira & André Vieira (eds)
Back to Basics:
consumer-centric marketing or
target-centric marketing
International Conference on Marketing & Consumer Behaviour – 2013 Back to Basics: consumer-centric marketing or target-centric marketing
Porto, 16-17 May 2013
Title: Back to Basics: consumer-centric marketing or target-centric marketing
1st Edition: July, 2013
Editors: Pedro Ferreira, André Vieira
Edition and Property: Edições IPAM
Av. Boavista, 1102, 1ºDto
4000 - 113 Porto, Portugal
Design: André Vieira
ISBN: 978-989-98442-4-7
All rights reserved
The contents of the papers are the sole responsibility of their respective authors

ORGANIZING COMMITTEE MEMBERS
Conference Manager
Pedro Ferreira
Themes Supervisor
Irina Saur-Amaral
Submissions Coordinator
André Vieira
Conference Secretariat Supervisor
Diana Barradas
SCIENTIFIC COMMITTEE
Name Affiliation
Angel Herrero Crespo Universidad de Cantabria, Spain
Carlos Melo Brito Universidade do Porto, Portugal
Cláudia Simões UM, Portugal
Daniel Sá IPAM – The Marketing School, Portugal
Elisa Alen González Universidade de Vigo, Spain
Elizabeth Real Universidade Lusíada de VNF, Portugal
Ferrão Filipe IPAM – The Marketing School, Portugal
Helena Alves UBI, Portugal
João Leitão IST, Portugal
Luísa Agante Universidade Nova de Lisboa, Portugal
Maria José Silva UBI, Portugal
Maria Teresa Heath University of Nottingham, UK
Miguel Martin D’Ávila Universidad Complutense de Madrid, Spain
Osmud Rahman School of Fashion, Ryerson University, Canada
Paula Vicente ISCTE, Portugal
Raquel Reis Universidade Lusíada de VNF, Portugal
Vanessa Apaolaza Ibáñez Universidad del País Vasco, Spain

REVIEWERS
Name Affiliation
Adriana Brambilla
UFPB-Brasil
Adrienne Steffen
Hochschule für Internationales Management Heidelberg
Alicia Blanco
Universidade Rey Juan Carlos
Angel Herrero Crespo
Universidad de Cantabria
Aruna Mesquita e Noronha
S.S.Dempo College of Commerce and Economics
Bruno Sousa
Universidade do Minho / IPCA
Carmen Marques
Universidade de Aveiro
Cigdem Sahin
Okan University
Cláudia Carvalho
Universidade Portucalense
Cláudia Simões
Universidade do Minho
Conceição Santos
ISCTE-IUL
Daniel Sá
IPAM - The Marketing School
Danilo de Oliveira Sampaio
Universidade Federal de Juiz de Fora/UFJF/Brasil
Elídio Vanzella
ESTÁCIO E ENSINE
Elisa Alen González
Universidade de Vigo
Elizabeth Real
Universidade Lusíada
Emine Özen OKAT ÖZDEM
Ege University Faculty of Communication
Helena Alves
Universidade da Beira Interior
Ilham Uludag
Yalova University
Inês Veiga Pereira
ISCAP
Irina Saur-Amaral
IPAM - The Marketing School
Isabell Koinig
Alpen-Adria University of Klagenfurt
Ivonne Serna
Ryerson University
João Leitão
Instituto Superior Técnico
Jolanta Tkaczyk
Akademia Leona Koźmińskiego
Jorge Marques
Faculdade de Economia da Universidade de Coimbra
Kalender Özcan ATILGAN
University of Mersin
Luísa Agante
Universidade Nova de Lisboa
Maria Fátima Salgueiro
ISCTE-IUL
Marek Prymon
University of Economics, Wrocław
Margarida Cardoso
ISCTE-IUL
Maria José Silva
Universidade da Beira Interior
Maria Puelles
Universidade Complutense
Mark Ng
Hong Kong Shue Yan University
Martín Dávila
IPAM - The Marketing School
Nagy Katalin
University of Miskolc, Faculty of Economics

Name Affiliation
Osmud Rahman School of Fashion, Ryerson University
Özgür Atilgan
Istanbul Kultur University
Paula Odete
Instituto Politécnico de Bragança
Paula Vicente
ISCTE-IUL
Pedro Ferreira
IPAM - The Marketing School
Pedro Mendes
IPAM - The Marketing School
Peter Atorough
Robert Gordon University Aberdeen
Raquel Meneses
Universidade do Porto (Faculdade de Economia)
Raquel Reis
Universidade Lusíada de VNF
Ricardo Correia
Instituto Politécnico de Bragança
Rosa Conde
IPAM - The Marketing School
Rui Pascoal
Faculdade de Economia da Universidade de Coimbra
Sally McKechnie
Nottingham University Business School
Sandra Filipe
Universidade de Aveiro
Sara Neves
Faculdade de Economia da UP
Serap ÇABUK
University of Cukurova
Sérgio Dominique
IPCA
Silvia Faria
IPAM - The Marketing School
Susana Marques
ISAG - Instituto Superior de Administração e Gestão
Susana Romero
Universidade Rey Juan Carlos
Teresa Pereira Heath
Nottingham University Business School
Ugur Bakir
Ege Üniversitesi
Vanessa Apaolaza Ibáñez
Universidad del País Vasco
Verónica Rosendo
Colégio de Estudos Financeiros

Back to Basics: consumer-centric marketing or target-centric marketing
IPAM – The Marketing School
Porto
16-17 May 2013
CONFERENCE PROCEEDINGS

Back to Basics: consumer-centric marketing or target-centric marketing
Groups of consumers have been the main focus of marketing activity. As an example, the basic idea behind
segmentation, one of the most important marketing processes, is that consumers are not all alike. They have
different characteristics and lifestyles, which calls for the need to group them (and the market they
represent for a respective good) in homogeneous segments so that marketing actions can be better targeted
and obtain more effective results. We may call this type of marketing, target-centric marketing.
More recently there has been a growing concern with the consumer as an individual. Expressions such as
“personalization”, “relationship marketing”, and “co-creation” among others have gained considerable
attention from researchers and practitioners. The assumption that “consumers are not alike” takes a step
further and consumers are seen as human beings with very specific needs and desires, almost unique or
unrepeatable. Each consumer should feel that the marketing action targeted to reach him/her was designed
specifically for him/her. This may be called consumer-centric marketing.
These two approaches have significant (and different) impacts on marketing practices and marketing
management.
In target-centric marketing, approaching consumers as a “market” means that companies need to look for
characteristics that group consumers and try to know them very well, as a group. In this context, operational
marketing tasks are directed to an “anonymous” mass, although a targeted one.
In consumer-centric marketing, seeing consumers as unique human beings, whose specific needs and desires
need to be fulfilled, demands for a different, more “surgical” approach, even in more operational marketing
tasks.
Although the latter is gaining supporters, the operational support is much more demanding in terms of
processes, human and even financial resources, leaving it difficult for companies to being capable of
implementing such a marketing philosophy.
This duality was the main focus of our conference as it rises very important questions still unanswered that
we invited participants to address.
Pedro Ferreira & André Vieira (Editors)

8
Summary
SESSION 1 ........................................................................................................................................................................................................ 11
MODELING BRAND EQUITY IN RETAIL BANKING THROUGH COGNITION AND EMOTION...................................................................................12 SOME ASPECTS OF INTEGRATED MARKETING COMMUNICATIONS IN BUILDING BRAND EQUITY...................................................................24 PERCEPTION OF SOURCES OF BRAND VALUE TAP PORTUGAL BY THE PERSPECTIVE OF ITS USERS ...............................................................................30
SESSION 2 ........................................................................................................................................................................................................ 43
USING THE EYE TRACKING FOR ANALYSIS OF PREFERENCE FOR VEHICLES......................................................................................................44 ANALYSIS OF THE USAGE AND ATTITUDES OF PAYMENT CARDS USERS IN BOSNIA AND HERZEGOVINA .........................................................55 COMÉRCIO ELETRÔNICO: PERFIL DO CONSUMIDOR DE BELO HORIZONTE/BRASIL QUE REALIZA COMPRAS ONLINE .....................................68 THE EFFECTS OF REVENUE MANAGEMENT STRATEGIES IN CONSUMERS BEHAVIOUR .....................................................................................79
SESSION 3 ........................................................................................................................................................................................................ 89
INTENT TO PURCHASE AND CONSUMPTION OF ORGANIC FOOD IN BRAZIL ....................................................................................................90 RECENT TRENDS IN CONSUMER BEHAVIOR CONCERNING FOODS WITH HEALTH BENEFITS IN RUSSIA .................................................... 104 THE IMPORTANCE OF COUNTRY OF ORIGIN (COO) ON CONSUMERS PREFERENCE: STUDY ON PACKAGED BUTTER IN THE FOOD MARKET OF
AZERBAIJAN .................................................................................................................................................................................................. 115
SESSION 4 ..................................................................................................................................................................................................... 125
DETERMINANTS FOR PURCHASES OF AGRICULTURAL PESTICIDES: A STUDY ON THE BUYING BEHAVIOR OF RURAL PRODUCER OF COFFEE IN
BRAZIL .......................................................................................................................................................................................................... 126 MOBILE PHONE SURVEYS TO MEASURE CONSUMER BEHAVIOR: EFFECTS ON DATA QUALITY ...................................................................... 140 COMPETING RESEARCH METHODS: WHAT’S BEHIND IT? ............................................................................................................................ 147
SESSION 5 ..................................................................................................................................................................................................... 157
MARKETING IN PUBLIC SERVICES: THE CITIZEN SERVICE POINTS IN PORTUGAL....................................................................................... 158 AVALIAÇÃO DA QUALIDADE DOS SERVIÇOS EM UMA ORGANIZAÇÃO PÚBLICA BRASILEIRA ........................................................................ 170 TERRITORIAL MARKETING: A KEY CONCEPT FOR THE PLANNING AND MANAGEMENT OF CITIES ................................................................ 181
SESSION 6 ..................................................................................................................................................................................................... 193
EVALUATING THE USE OF AVATARS AS SOCIABILITY FACTOR IN E-COMMERCE........................................................................................... 194 INFLUENCES OF SOCIAL MEDIA MARKETING ON PRE-ADULT CONSUMERS.................................................................................................... 208 CONSUMERS’ MOTIVATIONS AND ATTITUDE TOWARD THE USE OF SOCIAL MEDIA MARKETING IN HONG KONG......................................... 220
SESSION 7 ..................................................................................................................................................................................................... 232
MODELING ELECTRONIC AND TOTAL COMMERCE BY INNOVATION DIFFUSION GROWTH MODELS ............................................................... 233 INNOVATION, DYNAMIC CAPABILITIES AND PERFORMANCE IN EXPORT MARKETS ....................................................................................... 240 AN ANALYSIS OF THE DECISION STRUCTURE FOR FOOD INNOVATION ON THE BASIS OF CONSUMER AGE................................................. 255 MARKETING EVALUATION APPROACH IN THE HUNGARIAN MIDDLE-SIZED AND LARGE COMPANIES........................................................... 269
SESSION 8 ..................................................................................................................................................................................................... 283
SOCIAL RESPONSIBILITY CAMPAIGNS AND CONSUMER-CENTRIC MARKETING, ARE THEY IN COHESION? THE PRACTICES OF TOP TEN
ORGANIZATIONS IN TURKEY......................................................................................................................................................................... 284 A MULTI-STAGE STUDY TO MEASURE CUSTOMER PERCEPTIONS OF CSR ..................................................................................................... 296 ROLE OF PRICE OFFER FAIRNESS IN WILLINGNESS TO PAY FOR ENVIRONMENTALLY FRIENDLY PRODUCTS ................................................ 308 BENEFITS AND MOTIVATIONS FOR COMPANIES TO IMPLEMENT SOCIALLY RESPONSIBLE PRACTICES.......................................................... 317
SESSION 9 ..................................................................................................................................................................................................... 326
UNDERSTANDING CROSS-BORDER TOURIST REGIONS: A PRELIMINARY APPROACH TO THE CONSUMER PERSPECTIVE ............................... 327 TERRORISM AND INTERNATIONAL TOURISTS .............................................................................................................................................. 334 THE CHOICE OF THE UNIVERSITY ABROAD: A CONCEPTUAL MODEL.......................................................................................................... 342

9
THE IMPACT OF LOW COST AIRLINES ON TOURISM DEVELOPMENT ............................................................................................................ 352
SESSION 10 .................................................................................................................................................................................................. 361
THE ELDERLY GO THE GYM: A LOOK AT MARKETING .................................................................................................................................... 362 THE "MADE IN PORTUGAL" CONSUMPTION AND COUNTRY-OF-ORIGIN (C.O.O.) PERCEPTION IN THE CONTEXT OF CRISIS AND AUSTERITY371 CUSTOMER RESPONSE TO MESSAGE FRAMING IN CAUSE RELATED MARKETING ....................................................................................... 394
SESSION 11 .................................................................................................................................................................................................. 404
O QUE TEM SE FALADO POR AÍ SOBRE MARKETING INTERNO? UM ESTUDO SOBRE A PRODUÇÃO BRASILEIRA NA ÁREA.............................. 405 CONSUMER BEHAVIOUR, CONSUMPTION AND SYMBOLISM: A THEORETICAL DEVELOPMENT ..................................................................... 419 SOCIAL SUPPORT EXPECTATIONS FROM HEALTH CARE SYSTEMS- ANTECEDENTS AND EMOTIONS........................................................... 430
SESSION 12 .................................................................................................................................................................................................. 439
REVITALIZATION OF OUTSIDE COMMERCIAL AREAS AS STRATEGY TO ATTRACT CONSUMERS AND GET COMPETITIVENESS........................ 440 THE APPLICATION OF MARKET BASKET ANALYSIS TO A FASHION RETAILER............................................................................................ 449 CONSUMER BEHAVIOR IN RETAIL: ONLINE AND OFFLINE – WHAT IS THE FUTURE? .................................................................................... 458
SESSION 13 .................................................................................................................................................................................................. 475
THE LEVEL OF TECHNOLOGY ON SOCIAL CUSTOMER RELATIONSHIP MANAGEMENT.................................................................................. 476 HOW ONLINE FASHION VIDEOS AFFECT CONSUMERS’ PERCEPTION OF BRANDS – EYE TRACKING EXPLORATORY STUDY ...................... 490 THE INFLUENCE OF EWOM GENERATED BY THE REFERENCE GROUPS ON FACEBOOK, IN PORTUGAL. ....................................................... 500
SESSION 14 .................................................................................................................................................................................................. 511
ATRIBUTOS INFLUENCIADORES DA ESCOLHA POR VEÍCULOS: ASPECTOS EXPERIENCIAIS E SIMBÓLICOS ..................................................... 512 THE OTHER CUSTOMER’S PRESENCE IN THE SHOPPING EXPERIENCE: A CONCEPTUAL APPROACH .......................................................... 524 EXPERIENCE MARKETING AND HOSPITALITY INDUSTRY: SOCIAL MEDIA AS A TOOL TO ENHANCE CUSTOMER EXPERIENCE........................ 535
SESSION 15 .................................................................................................................................................................................................. 543
DRIVERS OF INNOVATION UNDER TURBULENT TIMES IN THE HOTEL INDUSTRY.......................................................................................... 544 INDIVIDUAL AND SOCIAL MARKETING IN CULTURAL ROUTES OPERATION................................................................................................. 561 HOW TO MEASURE BRAND PERSONALITY OF A NATURE-BASED TOURIST DESTINATION ......................................................................... 573 SERVICE QUALITY MEASUREMENT IN THERMAL SPAS’ TOURISM ............................................................................................................... 581
SESSION 16 .................................................................................................................................................................................................. 593
A IMPORTÂNCIA RELATIVA DA EMOÇÃO E DA RAZÃO NO PROCESSO DE TOMADA DE DECISÃO DO CONSUMIDOR......................................... 594 HEDONIC CONSUMPTION AND DEPRESSED MOOD: HOW DOES DEPRESSION INFLUENCE CONSUMER BEHAVIOR? .................................. 608 MAIN DRIVERS FOR PURCHASE DECISION IN THE PHARMACEUTICAL MARKET FOR MANDATORY PRESCRIPTION DRUGS ....................... 616 THE INFLUENCE OF ETHNOCENTRICITY IN PURCHASE BEHAVIOR AND ETHNOCENTRIC ATTITUDES ........................................................... 632
SESSION 17 .................................................................................................................................................................................................. 639
RECEPTIVITY TO ADVERTISING IN SOCIAL NETWORKS: AN EMPIRICAL REPLICATION WITH PORTUGUESE USERS....................................... 640 A STUDY OF FASHION MOBILE MARKETING FROM THE USERS’ PERSPECTIVE ........................................................................................... 651 INTERNET AND CONSUMER EMPOWERMENT: THE ROLE OF DECISION AIDS AND SOCIAL MEDIA ................................................................. 663
SESSION 18 .................................................................................................................................................................................................. 674
STANDARDIZATION VS. LOCALIZATION OF PHARMACEUTICAL ADS: EVIDENCE FROM GERMANY/AUSTRIA AND THE UNITED STATES .... 675 LIMITS TO TRANSPARENCY IN CORPORATE COMMUNICATION: A REFLECTION ON NEED TO EMBRACE SACRED IN SECULAR SPACE OF B-
SCHOOLS ....................................................................................................................................................................................................... 691 LOCATION BASED SALES PROMOTION STRATEGIES..................................................................................................................................... 697 SEX AND THE CITY AND BRANDS. AN EXPLORATORY STUDY OF THE EFFECTS OF PRODUCT PLACEMENT IN YOUNG PORTUGUESE VIEWERS709
SESSION 19 .................................................................................................................................................................................................. 721
MARKETING STRATEGY AND THE FLOWERS TRADE WITH PORTUGAL ........................................................................................................ 722 THE MARKETING PLAN IN THE WINE PRODUCING COMPANIES IN PORTUGAL .............................................................................................. 734

10
INFLUENCIA DE LAS ORIENTACIONES DE LA EMPRESA EN EL DESEMPEÑO DEL VENDEDOR DE PRODUCTOS FINANCIEROS ...................... 745 DEVELOING A MODEL OF SUPERIOR MARKETING STRATEGY TO SUSTAINED COMPETITIVENESS AND BUSINESS SUCCESS ...................... 756
SESSION 20 .................................................................................................................................................................................................. 772
COSTUMER’S VIEWS ON FOOD SAFETY IN FOOD SERVICES: A BRAZILIAN STUDY .......................................................................................... 773 THE EFFECT OF SERVICE CONTEXT IN CONSUMER RELATIONSHIP PRONENESS AND BEHAVIOR ............................................................... 785 THE ROLE OF OPERATIONS MANAGEMENT AND MARKETING IN THE PLANNING OF VENDING MACHINES ............................................... 795
SESSION 21 .................................................................................................................................................................................................. 803
THE EFFECT OF SERVICESCAPE ON CUSTOMER PERCEIVED QUALITY, SATISFACTION AND DESIRE TO RETURN TO A SPORTS SERVICE: THE
ESTÁDIO DO DRAGÃO (DRAGON STADIUM) CASE........................................................................................................................................ 804 A INFLUÊNCIA DO PATROCÍNIO NO COMPORTAMENTO DOS ADEPTOS: O CASO DO FUTEBOL PROFISSIONAL PORTUGUÊS........................ 817 THE DILLEMAS OF STARTUPS IN THE CREATIVE INDUSTRIES- TENSION BETWEEN ARTISTIC AND MARKET GOALS ..................................... 839

11
Session 1

12
Modeling brand equity in retail banking
through cognition and emotion Brand Equity; Brand Knowledge; Cognition; Emotions; Customer Satisfaction; Customer Loyalty.
Meena Rambocas, The University of the West Indies, [email protected]
Vishnu Kirpalani, The University of the West Indies, [email protected]
Errol Simms, The University of the West Indies, [email protected]
Abstract
Objectives: Through brand equity, brand owners can uplift public perceptions of products and services regarded as
commodities in saturated markets. But, how can brand equity be created? There is already an established relationship
between brand equity and customer knowledge, but to date, very little is known about how different aspects of knowledge
contribute to brand equity. This study addressed this theoretical deficit by investigating the influence of two aspects on
knowledge (thought processes-cognition, and feelings-emotion) on brand equity. Specifically, the study investigated: what
are the determinants of brand equity and how important are these determinants in explaining brand equity?
Methodology: Data were collected from two hundred and eighty-three (283) retail banking customers in Trinidad and
Tobago (T&T) through personally administered structured questionnaires and analyzed using Confirmatory Factor
Analysis (CFA) and Structural Equation Modeling (SEM).
Conclusions: The findings revealed that brand equity is a multidimensional construct created through a series of
interrelated relationships between cognitive and emotional knowledge structures. Cognitive knowledge through customer
loyalty and customer satisfaction mediated the relationships between brand equity and emotional aspects of knowledge.
The study concluded with a discussion on the impact of these findings on retail banks and other service providers.
Limitations: Our data collection efforts were limited to one country in one service sector and investigated only two
dimensions of customer knowledge. Future research can consider extending this research context to other countri es and
service sectors as well as investigating the moderating impact of customer characteristics.
1. Introduction
Retail banking service is a distinctive service category in Trinidad and Tobago (T&T) primarily because of the size and
history. It is the largest service sector in the T&T economy accounting for nearly forty percent (40%) of total financial
assets (CSO, 2010). It contributes fourteen percent (14%) to T&T's Gross Domestic Product and employs approximately
eight percent (8%) of the T&T labor force. The sector operations have been stable with most services revolving on
traditional loans, deposits, and short-term credit facilities. In terms of internet banking, most banks offer the opportunity
to conduct approved transactions over the internet, but the consumer public makes very little use of this facility (Robinson
and Moore, 2010; Rambocas and Arjoon, 2012). The facility is most appealing to higher educated, younger customers for
basic services such as checking balances (Robinson and Moore, 2010). Customers mainly rely on personal interface to
conduct most of their transactions. However, the market is now facing challenges ranging from regulations to consumers
lifestyle. Additionally, the market is also changing structurally with recent acquisitions, and diminishing distinction with
other financial providers (insurance companies and credit unions). These changes coupled with the challenges from the
2008 financial crisis are propelling banks to find innovative ways of communicating with customers, build trust, and
maintain consumer confidence. Such changes can create new opportunities for banks but it can also lead to a threat of
commoditization. Successful branding can reduce this threat. The interest in branding is not only limited to banking but
extends to every facet of commerce, from software firms like Google to fast moving consumer goods like Nestle. However,
for services, branding plays a special role because it adds a face to an invisible purchase. Strong service brands create

13
favorable associations, reduce consumption risks, stimulate confidence, build loyalty, and generate trust. The value
customers assign to brands refers to brand equity (Keller, 1993). Brand equity exists when consumers prefer specific
brands and pay more for them just because of the name appeal.
However, while the consequences of brand equity are well established, there is little consensus on how this marketing
phenomenon is created. Some academics argue that brand equity developed through a combination of cognitive elements
such as, awareness, association, loyalty, and perceived quality (Aaker, 1991; Keller, 1993; Yoo and Donthu, 2001). Others
look at the social and personal elements of attachment and trustworthiness (Belen del Río, Vázquez, and Iglesias, 2001); as
well as brand image and brand attitude (Kim and Kim 2005). Nevertheless, despite the variation, the crucial role of brand
knowledge is common to all arguments (Keller, 1993). This study builds on this academic consensus and examines the
concept of brand equity through the lenses of consumer behavior and psychology theories. It decomposed consumer
brand knowledge into a dichotomous construct driven by ongoing cognitive (intelligent and rational) and emotional
(subjective) evaluation of marketing stimuli. There is a strong suspicion that both cognitive and emotional aspects play
different roles in predicting and explaining brand equity, but to date the nature of this relationship remains under
explored. This study addresses this theoretical deficit by investigating what are the determinants of brand equity, and how
important are these determinants in explaining and predicting brand equity? Specifically, the study examines the impact of
six specific aspects of cognition and emotion (brand awareness, perceived service quality, customer satisfaction, customer
loyalty, service experience and brand affinity) on brand equity.
The structure of our paper follows four main sections. Firstly, we examined the theoretical relationship between consumer
brand knowledge and brand equity. Secondly, we presented the conceptual model that guided our research design and our
research hypotheses. Thirdly, we presented the methodology and data analysis techniques and finally a discussion on the
implications of our findings and make recommendations for future research initiatives.
2. Literature Review
Branding is a widely researched topic in marketing (Berry, 2000). However, recent calls for a more integrative perspective
on the psychology of successful brands have brought the concept back to the forefront (Schmitt, 2012). This study
conceptualizes successful brands as the favorable association customers assign to a brand, referred to as brand equity
(Keller, 1993). Specifically, brand equity is the value a brand name brings to all stakeholders including producers, retailers,
and consumers. It exists when consumers gravitate towards a specific brand, or are willingly to pay more for the same
level of quality just because of the attractiveness of the name. The concept of brand equity draws on multiple constructs,
but common to all definitions is the fundamental value-added to a firm, or value-added to the customer (Aaker, 1991;
Simon and Sullivan, 1993; Keller, 1993; Kim et al., 2003). To the firm, brand equity presents a financial opportunity based
on the incremental cash flow or revenue over unbranded products (Simon and Sullivan, 1993). To the customer, brand
equity creates benefit by positive differential responses (Aaker, 1991; Keller 1993; Kim et al., 2003).
This study defines brand equity from a customer perspective. Our study builds on the premise that the power of a brand
lies on what customers learn, feel, see and hear about brands overtime. Our interest in brand equity from a customer
perspective is twofold. Firstly, motivated by the perspectives of Lasser et al. (1995) and Keller (2001) we believe that
customer brand equity is the driving force of economic and financial performance. Secondly, given escalating costs,
stagnated demand and increasing competition companies are seeking ways to maximize their returns from marketing
spend (Keller, 2001). We believe that understanding brand behavior from a psychological perspective can help. Studying
brand equity from a psychological perspective provides firms with the necessary tools to adopt tactical and
comprehensive marketing programs. We define brand equity as the aggregated benefits customers derive from a brand.
Brand equity helps customers interpret, store and retrieve large amount of information from memory. While the
marketing literature has already established a direct and positive link between brand equity and knowledge (Aaker, 1991;
Keller, 1993), there is general disagreement on the composition of brand equity. Some academics argue that brand equity
is developed through a combination of cognitive elements (Aaker, 1991; Keller, 1993), others look at the social and
personal elements (Belen del Río, Vázquez, and Iglesias, 2001), brand image and brand attitude (Kim and Kim 2005, Low
and Lamb, 2007). Lasser et al. (1995) suggested that consumers create brand equity through intangible and perceptual
dimensions like perceived performance, perceived value, image, trustworthiness, and commitment. On the other hand, Yoo
et al. (2001), proposed behavioral determinant of loyalty, perceived quality and brand awareness/association. Other
authors argue a more integrative hierarchical approach to brand equity. For instance, Keller (2001) suggested that brand
equity is a hierarchical phenomenon created through a sequential process that integrates brand salience, brand
14
performance, imagery, judgment, feelings, and resonance. Other studies (Netemeyer et al., 2004) suggested that brand
equity is behavioral, created by consumer willingness to pay extra for a specific brand and key brand related respons e
variables such as perceived service quality, perceived brand value for the cost and brand uniqueness. Recently, Taylor et
al. (2007) extended the Netemeyer (2004) model in the context of financial services to include customer satisfaction given
its strong correlation with customer repeat purchase intention in service markets (Oliver, 1997, 1999; Zeithaml and
Bitner, 2003). The authors admitted that the behavioral and attitudinal intentions (hedonic and utilitarian) influence
brand value.
According to the theory of cognitive psychology, the human mind engages in a series of sequential and systematic
information processing tasks, which starts with absorption of sensory input and ends with the way these inputs are used.
According to Osterlind (2006), sensory inputs are absorbed and elaboration into neurological energy, which are then
stored, recovered, and later used to shape human attitudes and behaviors. Knowledge is the outcome of this elaborated
process. Knowledge represents the structured collection of information obtained from experiences and exposure to
stimuli, base on senses and perception through learning and reasoning. Keller (1993) interpreted brand knowledge as a
brand node, linked to product attributes, benefits, and affective associations, created through ongoing cognitive and
affective evaluation of brand related information. This view suggests that brand knowledge is rational deductive
processing (cognition) as well as subjective personal meaning, feelings, and passions (emotion). Schmitt (2012) purported
a brand psychology model that addresses consumers underlining perceptions and judgments. Through integrating
cognitive and emotional knowledge components, the author presented different levels of psychological engagement
between the consumer and their brands, which depended on customer need, motivation, and goal.
However, the relationship between cognitions and emotions is complicated. Zajonc (1980) postulated that emotions and
cognitions are separate mental states. Emotions are autonomous responses that occur without cognition or conscious
interpretation of stimuli. Separate independent neurons control emotional outcomes like affection, admiration, hate, and
anger without extensive cognitive encoding. On the other hand, Lazarus (1984) argued that the autonomous relationship
between both structures reflect an oversimplification of the human mind. According to this argument, the relationship
between cognition and emotions is far more complex given their recursive relations. This view suggests that humans
engage in continuous evaluation of environmental stimuli from the perspective of their own interest and wellbeing, such
evaluation is subjective and guided by feelings and emotions. The section below presents a discussion on cognitive and
emotional aspects of knowledge.
2.1 Cognitive Knowledge
Cognitive knowledge promotes conscious evaluation of information and addresses the intelligent, systematic selection of
information for rational thought. Cognition requires retrieving knowledge from memory for intelligent judgment. Thinking
link elements of knowledge and beliefs and influence the type of inferences formed. Our conceptualization of cognitive
knowledge structure is motivated by Aaker (1991, 1993), Pappu, and Quester (2006) contributions to brand equity, and
view knowledge structures as an amalgamation of four constructs namely brand awareness, perceived service quality,
customer satisfaction, and customer loyalty.
2.1.1 Brand Awareness
Brand awareness is a rudimentary level of knowledge that ranges from basic recognition of a brand name to highly
developed cognitive structures based on detailed information (Hoyer and Brown, 1990). It reflects a combination of the
ability to recognize a brand among competing alternatives as well as the ability and motivation to remember exactly what
the brand stands for. Through brand awareness, customers gather information about brands and make purchases. Schmit
(2012) defined brand awareness as an important category in brand psychology. The relationship between brand
awareness and brand equity is supported theoretically (Aaker 1991) but the nature and magnitude of this relationship are
not clear. For instance, Yoo and Donthu (2001) support the positive and direct association between consumer brand
awareness and brand equity by pointing out that customers who remember and recognize a brand are more likely to
assign positive associations towards that brand. However, others have discounted this direct relationship by arguing that
while brand awareness is essential for brand equity, it is insufficient. Keller (2001), for instance conceptualized brand
awareness (and brand association) as the foundation for building brand equity by arguing that its presence create identity

15
and meaning, but brand awareness alone will not support brand equity. This argument contradicts the view purported by
Aaker (1991), Yoo and Donthu (2001), and motivated the construction of our first research hypothesis.
H1: Brand Awareness directly and positively predicts the level of Brand Equity customers assign to retail banks,
the greater the level of brand awareness the more brand equity customers will assign to retail banks.
2.1.2. Perceived Service Quality
Perceived service quality reflect short-term judgment of service attributes. A positive perception of service quality
increases the likelihood that future purchases and an essential determinant of the value assign to post purchase
evaluations (Aaker, 1991). Aaker (1991) suggested that perceived quality directly and positively relates to brand equity.
He argued that brands high quality brands are more attractive. However, not all theorists agree with this relationship. In
contrast, Bloemer et al, (1997) argued that the role of quality and brand equity is not direct but mediated by other
marketing outcomes like customer satisfaction and customer loyalty. This contradiction provided the motivation for our
second research hypothesis. Specifically, we expect:
H2: Perceived Service Quality directly and positively predicts the level of Brand Equity customers assign to
retail banks, the greater the level of perceived service quality the more brand equity customers will assign
to retail banks.
2.1.3. Customer Satisfaction
Satisfaction is a mental state of pleasurable fulfillment derived from consumption (Oliver, 1999). Satisfaction reflects the
overall judgment on a product superiority compared to others, a judgment that occurs only after consumption but based
on reference points set before consumption. Although satisfaction is related to perceived quality, it is considered
distinctive as it represents a more long-term evaluative state (Sureshchander et al. 2002; Gustafsson, Johnson and Roos,
2005). Empirical evidence already link customer satisfaction to a firm’s economic performance through profitability,
market share and return on investments (Oliver, 1999). Additionally, there is also evidence that link customer satisfaction
to intangible marketing outcomes such as, behavioral and attitudinal loyalty. Satisfied customers are likely to create and
sustain deep psychological bonds with their preferred brand. Given the strong and positive relationship, we expect
satisfaction to have a similar influence on other marketing phenomena like brand equity. Pappu and Quester (2006)
supported this assertion. However, the empirical model focused on aspects of cognitive knowledge structures such as
loyalty, awareness, and perceived quality and did not include emotional structures. Therefore, the influence of customer
satisfaction on brand equity is unclear when modeling emotional knowledge structure. This provided the motivation for
our third research hypothesis:
H3: Customer Satisfaction directly and positively predicts the level of Brand Equity customers assign to retail
banks, the greater the level of customer satisfaction the more brand equity customers will assign to retail
banks.
2.1.4. Customer Loyalty
Loyalty is a mental state driven by attitudinal and behavioral motives (Oliver, 1999). Behavioral motives reflect inertia
manifested through commitment and repeat purchase. Attitudinal motives are more involved; develop through intensive
cognition and affection. Attitudinal loyalty reflects a mental state that project a deep commitment towards brands (Keller,
2001). Cognitive aspect of brand loyalty suggests conscious commitment. It is more than habitual purchase or inertia, but
is a psychological bond that reduces brand vulnerability. The psychological bond contributes to brand value, predictable
sales, and lower marketing costs (Chaudhuri and Holbrook, 2001). However, the relationship between brand loyalty and
brand equity is not consensual. Lasser et al. (1995) for instance, suggest that brand equity determines brand loyalty. Brand
equity reflects the strength of one brand over competing brands and translates into customer confidence, loyalty, and
willingness to pay a price premium (Lasser et al., 1995; Tylor et. al, 2004). Aaker (1991) argued that brand loyalty is an
antecedent to brand equity given that loyal leads to marketing advantages of expanded customer base, positive word of
mouth with lower marketing cost. For Aaker (1991), loyalty reflects the probability of customer churn. Keller (2001) on
the other hand emphasized that the emotional aspects or resonance. Brand resonance reflects a deep psychologic al bond

16
with the brand, which manifest into attitudinal and behavioral loyalty, sense of community and active engagement. This
lack of consensus motivated the construction of our fourth research hypothesis:
H4: Customer Loyalty directly and positively predicts the level of Brand Equity customers assign to retail
banks, the greater the level customer loyalty the more brand equity customers will assign to retail banks.
2.2. Emotional Knowledge
Emotions are automatic responses to environment stimuli and reflect feelings of love, affection, hate, anger, and hurt.
Emotions are associated with a wide variety of “psychological factors such as temperament, personality, motivation and
categorical knowledge customers use to process and understand information regarding the benefit or consequences of
using a brand” (Ruth, 2001 p. 99). This automatic processing of environmental stimuli leads to sensual engagement and
cultivates affection and resentment. This study investigates two sources of emotional engagement (Berry , 2000; Ruth,
2001): emotions from service experience and emotions from brand affinity.
2.2.1. Service Experience
Experiences are “processes that include sensory perception of a brand, brand affect, and participatory experiences that a
consumer may seek from a brand” (Schmitt, 2012 p. 10). Epstein (1998) summarized experiential system as “a cognitive
system driven by emotions” (p. 125). He argued that although the rational system and experiential system of cognitive
processing are independent they influence each other. Emotional experiences feed into intellectual knowledge and
influence behavior. Emotional experiences depend on service encounters (Berry, 2000). Service experiences invoke
emotional connections, harness trust, and fulfillment. The evaluation of service experience affects the emotional and
psychological response towards the brand, which in turn influence attitudes and behaviors. This conclusion was supported
by Grace and O’cass (2004) who examined the impact of service experiences on the customer evaluation and concluded
that during a service experience, both behavioral and the emotional elements are evoked which ultimately affect the way
consumers rate the overall service encounter. The authors concluded that emotional enticement created through positive
service experiences lead to favorable dispositions towards a service brand and consequently lead to a greater amount of
equity assigned to preferred brands. Therefore, our fifth hypothesis is:
H5: Service Experience directly and positively predicts the level of Brand Equity customers assign to retail
banks, the greater the level of service experience the more brand equity customers will assign to retail
banks.
2.2.2. Brand Affinity
Consumers interact with hundreds of brands but consciously develop connections with only a few of them. Conscious
connection towards a brand refers to brand affinity. The level of brand affinity towards a brand is a result of two main
elements (1) affinity towards service attributes, and (2) affinity towards service benefits (Berry, 2000). Affinity towards
service attributes refers to the core service sought by consumers and attitude towards service benefits reflect the symbolic
aspects derived from consumption (Tuominen, 1999). Symbolic benefits relate to underlying need for social approval or
personal expression. Symbolic benefits are especially relevant for socially visible consumption, with value built on prestige
and exclusivity (Keller, 1993; Tuominen, 1999). Brands that are high on attributes and symbolic benefits will have high
levels of equity since both these elements influence the processes consumers employ in information processing, provide a
point of differentiation and a reason to buy (Keller, 1993). This study investigates this link between between brand affinity
and brand equity. We expect that brand affinity is a directly related to brand equity. Our sixth research hypothesis is:
H6: Brand Affinity directly and positively predicts the level of Brand Equity customers assign to retail banks, the
greater the level of brand affinity the more brand equity customers will assign to retail banks.
This study conceptualizes brand equity as a linear first-order model, predicted by six aspects of knowledge. Figure 1
presents our research model and six research hypotheses.

17
Figure 1: Research Model - Brand Equity Model
3. Methodology
The population of interest was citizens of Trinidad and Tobago who were eighteen (18) years and over and had a
preference towards a specific bank for service encounters. To collect data, the study used personal intercepts at randomly
selected banks and shopping malls. Data were collected using standardized questionnaires that consisted of fifty -(50)
items. The questionnaire comprised two sections. The first section solicited responses on six aspects of knowledge and
brand equity on a 5-point likert scale that ranged from 1-Strongly Disagree to 5- Strongly Agree. To measure each
construct, the study utilized scales developed and tested by previous studies (Parasuraman, et. al 1988; Las ser et al., 1995;
Yoo and Donthu, 2000; Grace and O’cass, 2004; Taylor et al. 2004; and Aziz and Yasin, 2010) but modified to fit the context
of the study using a pilot study of fifty-(50) banking customers. The second section solicited information on demographics.
From the three hundred and fifteen (315) questionnaires completed, we eliminated thirty -two (32) because of missing
data. Therefore, the effective sample consisted of two hundred and eighty-three (283) participants. In terms of profile,
fifty-one percent (51%) of the participants were male and forty-nine percent (49%) were female. The majority of
participants were between 25-44 years old (47%). Almost twenty-seven percent (27%) were between 45-64 years old,
eighteen percent (18%) were under 25 and the remaining eight percent (8%) were 65 years and older.
3.1. Data Analysis
The analysis of data followed two stages. Firstly, we used Confirmatory Factor Analysis (CFA) to test the nature of each
construct in the research model. The measurement scale for Brand Awareness, the first aspect of knowledge consisted of
four (4) items. Both the MSA (0.742) and Bartlette test of Sphericity (p<0.05) were acceptable to warrant factor analysis.
From the CFA a single factor solution was generated which explained 56.5% of total variance with an acceptable reliability
coefficient (Cronbach’s α = 0.742). The measurement scale for Service Experience consisted of six (6) items. The MSA
(0.799) and Bartlett test of Sphericity (p<0.05) were acceptable, but two (2) items were deleted from further analysis
because of low factor communalities. These items were “my preferred bank has a modern layout” (0.434); and “The service
offered by my preferred bank is superior compared to alternative banks” (0.462). The retained items explained sixty-seven
percent (67%) of variance with strong reliability statistic (Cronbach’s α = 0.829). The third construct “Brand Affinity”
comprise six (6) indicators. The MSA (0.846) and Bartlett test of Sphericity (p<0.05) were also acceptable but two (2)
items were deleted from this scale because of low factor communalities. These items were “I feel emotionally connected to
my preferred bank” (0.497); and “I am happy with my preferred bank” (0.443). The retained indicators explained sixty-eight
percent (68%) of total variance and had strong reliability coefficient (Cronbach’s α = 0.839). The fourth construct labeled

18
“Perceived Service Quality” measured using nine (9) items. We deleted six (6) items because of insufficient shared variance
(factor communality < 0.50). These items were: “My preferred bank has a strong reputation” (0.348); “My bank perform
services right the first time” (0.402); “My preferred bank only makes promises it can achieve” (0.421); “I have confidence in
my preferred bank” (0.496); “I receive all the information I need from my preferred bank” (0.488); and “I get all the attention
I need from my preferred bank” (0.429). The retained explained 68.2% of total variance and had strong reliability
coefficient (Cronbach’s α = 0.764). The fifth construct labeled “Customer Satisfaction” measured using an eight (8)-item
scale. The MSA (0.908) and Bartlett test of Sphericity (p<0.05) were also acceptable. All eight items were retained and
explained 61.8% of total variance, which is above the minimum requirement (50%) in social science research. These eight
(8) items had strong reliability coefficient (Cronbach’s α = 0.909). The sixth construct “Customer Loyalty” measured on a
seven (7)-item scale. The MSA (0.846) and Bartlett test of Sphericity (p<0.05) were acceptable. Two items were dropped
from further analysis because of low factor communalities (p<0.50). These items were “If I have to do it all over again, I
would choose a different bank” (0.209); and “I would not switch banks even though the cost of services may be lower” (0.356).
The retained items explained approximately sixty-three percent (63%) of total variance and (Cronbach’s α = 0.822). The
seventh construct (the dependent construct in this model) was “Brand Equity” was measured with a four (4) item scale.
The MSA (0.777) and Bartlett test of Sphericity (p<0.05) were acceptable and items explained 63.7% of total variance with
strong reliability coefficient (Cronbach’s α = 0.792). The factor loadings for each construct are shown in Table 1.
Table 1: Factor Loadings from Confirmatory Factor Analysis
Loadings
Cronbach’s
α
% of
variance
Extracted
FACTOR 1: BRAND AWARENESS
Recognition .759
0.742 56.5 Knowledge .722
Recall .802
Identification .722
FACTOR 2: SERVICE EXPERIENCE
Prompt .820
.829 66.6 Helpful .811
Busy .805
Trust .719
FACTOR 3: BRAND AFFINITY
Like .801
.839 67.6 Unique .779
Personality Fit .841
Social Acceptance .749
FACTOR 4: PERCEIVED SERVICE QUALITY
Interest .785
.764 68.20 Courteous .746
Service Quality .784
FACTOR 5: CUSTOMER SATISFACTION
Expectations .725
0.909 61.8
Overall satisfaction .830
Variety of Banking Services .746
Perfect .818
Contentment .803
Delight .836
Right Bank .764
FACTOR 6: CUSTOMER LOYALTY
Continue .780
0.822 63.3
Best Choice .799
Loyal .738
Recommend .826
Relationship .834
FACTOR 7: BRAND EQUITY
Attractive .788
0.792 63.7 Respect .707
Affection .847
Logical .843 The second stage in the analysis involved using Structural Equation Modeling (SEM) to specify the brand equity model on
AMOS 18. The specified model only explained only 47% of total brand equity variance, less than the recommended 50%
(Hair et al. 2010) Additionally, the chi-square (χ2 = 1168.68) was relatively high compared to degree of freedom (15) and
the goodness of fit indices (GFI, AGFI, NFI) were all less than acceptable level. This suggested that the data collected did not
fit the theoretical model tested. In order to improve the model, we re-specified the model through a series of iterative
procedures. Figure 2 presents the re-specified model.

19
Figure 2: Re-Specified SEM Model Using Factor Scores
From on the fit indices, the re-specified model achieved an acceptable fit since approximately 58% of brand equity
variance was explained and the model displayed accpetable fit indices (GFI 0.983, AFGI 0.947, NFI 0.988). The model maps
twelve (12) statistically significant (p<0.05) relationships. It shows brand equity as a direct and positive function of two
knowledge determinants: customer satisfaction (0.297) and customer loyalty (0.511), with customer loyalty having a
greater impact on brand equity than customer satisfaction. The model maps brand awareness as an indirect contributor to
brand equity, mediated by customer loyalty (0.51). The model also shows brand awareness, previously conceptualized as
an exogenous variable, as endogenous to these brand equity relationships. The level of awareness customers exhibited
towards their preferred bank is dependent on the level of brand affinity towards a bank (0.393) and perception of the
bank’s service quality (0.269). This suggests that brand awareness is not only determined by marketing communication
strategies (exogenous to this study) but is also a function of customer love, and perception of services offered by the bank.
The re specified model did not support our hypothesis that perceived service quality have a direct and positive
relationship to brand equity. The re-specified model mapped perceived service quality as an indirect contributor to brand
equity, mediated through brand awareness and customer loyalty. Additionally, model shows perceived service quality as
highly dependent on service experiences (0.416), customer satisfaction (0.333) and customer loyalty (0.135), suggesting
that customer evaluation of service encounters are driven by both rational judgmental and emotions during service
encounters. Customer satisfaction was hypothesized to have a. The re-specified model supported the direct and positive
relationship between customer satisfaction and brand equity (0.297). This suggests that T&T banking customers
perpetually compare their actual experiences with banking services to their expected experiences when deciding how
attractive one bank is to another. The more aligned actual experiences are to expected experiences, the more attractive
banks appear to customers, the more brand equity these customers will assign to their preferred bank. However, this find
maps customer satisfaction as a function of brand affinity and customer service experience. This suggests that cognitive
evaluation of actual and expected service encounters depends on emotional influences. The final hypothesis tested was the
relationship between customer loyalty and brand equity. The re-specified model supports a positive and direct
relationship. In fact, customer loyalty is the strongest predictor of brand equity (0.511). Unlike the conceptual model, the
revised model showed customer loyalty determined by two constructs customer satisfaction and brand awareness.
Relative to emotional influences, the re-specified model mapped service experience as an indirect determinant of brand
equity, mediated by customer satisfaction. The re-specified model shows that service experience has a direct and positive
impact on brand affinity and perception of the service quality. Service experience has the greatest impact on brand affinity
(0.662), followed by customers perception of service quality of retail banks (0.416) and the level of satisfaction with their
banking operations (0.336). Furthermore, the re-specified did not support the direct relationship between brand equity
20
and brand affinity, but maps brand affinity as an indirect predictor, mediated by customer satisfaction (0.57) and brand
awareness (0.393).
In summary, the results show that brand equity is a multifaceted, multilayered construct determined through a
combination of direct and indirect relationships. Brand equity is determined through several inter-dependent
relationships mediated by two cognitive component of knowledge: customer satisfaction and customer loyalty. This
indicates that brand equity is a marketing outcome linked to both cognitions and emotions.
4. Discussion and Conclusions
There is no doubt, that the financial crisis of 2008 has an effect on the economic sustainability of many Caribbean
countries including T&T. Although the possible threat is still looming, the impact of the financial crisis on T&T's retail
banking institutions has been mild compared to its Caribbean neighbors. The abili ty of the sector to withstand this
economic challenge is still not clear. Many industry experts explained the stability of this sector by drawing on arguments
pertinent to the industry’s oligopolistic structure, bank’s management practices and government regulation (PECU, 2009;
BATT, 2008). However, the possible contributions customers make to the sector’s stability is underexplored. This study
addresses this gap. Through cognitive and emotive brand knowledge structures, the study concluded that brand equity is a
complex, multi-dimensional, hierarchical marketing phenomenon, created through a series of interdependent
relationships. The brand building block pyramid in Keller (2001) contribution supports this conclusion. However, unlike
previous contributions, our findings show the interdependent role of emotions and cognitions in creating and maintaining
brand attractiveness. The re-specified model mapped brand knowledge as a function of both direct and indirect
relationships created before, during and after service encounters and concludes that brand equity is a direct and positive
function of two cognitive knowledge determinants: customer loyalty and customer satisfaction. Other cognitive knowledge
dimensions such as perceived quality and brand awareness had an indirect and marginal impact on brand equity. The re-
specified model mapped the two emotional knowledge sources of brand affinity and service experience as indirect
predictors of brand equity. However, aspects of cognition mediated this impact, suggesti ng that strong brands reflect both
rational and emotional evaluation of marketing stimuli. It also suggests that cultivating feelings and emotions through
service experiences and brand relationships are essential building blocks for creating brand equity. This finding is
especially significant for banks, given that the service is classified as highly involved, driven by deliberate and rational
processing. Our findings suggest that emotional influences form the foundation for building brand equity and have direct
influences on how consumers deliberately process marketing stimuli.
This study provides meaningful insights into the relationship between knowledge and brand equity from a banking
perspective. However, we collected data in one country (T&T), in one service sector (retail banking). Future research can
consider extending this study to other countries including Portugal and other European countries. This expansion would
also allow comparisons from both a cultural and operational perspective. It is a widely held view that individual
demographic and socio-economic traits can affect information processing and acquisition (Zurawicki, 2010). However, to
date, very little published material look at the impact of these differences on marketing outcomes and in particular brand
equity. Pertinent research questions relating to the extent to which consumer psychographic and demographic
characteristics on brand equity remain unanswered. Future research can build on this theoretical contribution by
examining the extent to which customer personal differences can affect the way they assign preferential value to brands.
Additionally, given that, we examined brand equity from a customer perception (Lasser, 1995); future researchers can
segment the distinctive antecedents into behavioral, attitudinal, and perceptual and examine the effects of each dimension
on brand equity process.
However, despite these limitations, our findings present relevant and practical implications for brand specialist and
marketing managers. By dissecting brand equity in retail banks, the study provides invaluable insights for managing long-
term brand relationships with customers. For instance, if marketers invest in providing systems and infrastructure, that
encourages an environment of customer friendliness, staff responsiveness, care and courtesies, customers will assign
positive emotional appeals and stronger emotional connections. Such appeal will have a lasting influence on what
customers think and associate to the specific brand. Marketers should focus on making the service experience enjoyable to
customers. Critical to service experience is service delivery. Customers judge their experience by the efficiency and speed
of processing transactions. Bankers and by extension all service providers, should invest in systems that facilitate a quick
and convenient consumption of service. This will make banking services easier and less costly to consume. The evidence
suggested that customer emotional arousal is a function of the appearance and layout of a bank physical environment. The

21
perceived attractiveness of the service provider’s layout, physical surroundings and space are key contributors to the
overall customer experience. Customers rely on these non-service related cues in addition to other core service elements
when assigning meanings and associations to retail banks.
In conclusion, success in today’s challenging market space demands a customer centered approach to business. Businesses
should recognize the contribution customers make to their overall success. However, what factors explain the value
customers assign to brands? Framed within the context of retail banking in T&T, the study investigated factors that predict
and explain brand equity. We argue that customers assign value to brands through a rational appraisal of the brand’s
performance; however, feelings and affections drive this evaluation. Brand equity is emotionally driven and based on the
customer experiences, which in turn influence cognitive appraisals of the overall brand performance.
The authors have a keen interest in replicating a comparison study in Portugal and other European countries pending
contributions and support from interested stakeholders.
References
Aaker, D. A. (1991). Managing Brand Equity. New York: The Free Press.
Aaker, D. A. (1996). Building Strong Brands. Free Press: New York.
Anderson, J. R., & Bower, G.H. (1974). A Proposition Theory of Recognition Memory. Memory and Cognition, 2 (3), 406-412.
Aziz, N.A., & Yasin, N.M. (2010). Analysing the Brand Equity and Resonance of Banking Services: A Malaysian Perspective.
International Journal of Marketing Studies, 2 (2), 180-189.
Bankers Association of Trinidad and Tobago (BATT). 2008. Financial Crisis on Trinidad and Tobago.
http://www.batt.org.tt (Accessed on February 16, 2012).
Belen del Río, A., Vázquez, R., & Iglesias, V. (2001). The Effects of Brand Associations on Consumer Response. Journal of
Consumer Marketing, 18 (5), 410-425.
Berry, Leonard. (2000). Cultivating Service Brand Equity. Journal of the Academy of Marketing Science 28 (1), 128-137.
Bitner, M. (1990). Evaluating Service Encounters: The Effects of Physical Surroundings and Employee Responses. Journal
of Marketing, 54 (2), 69-82.
Bloemer, J. M, & Kasper, H.D.P. (1995). The Complex Relationship between Consumer Satisfaction and Brand Loyalty.
Journal of Economic Psychology, 16 (2), 311-329.
Bloemer, J., Ruyter, K., & Wetzels, M. (1997). On the Relationship Between Perceived Service Quality, Service Loyalty and
Switching Costs. International Journal of Service Industry Management, 9 (5), 436-53.
Central Statistical Office of Trinidad and Tobago (CSO). (2010). Business Statistics. http://www.cso.gov.tt. (Accessed on
March 18, 2012).
Chaudhuri, A., & Holbrook, M.B. (2001). The Chain of Effects from Brand Trust and Brand Affect to Brand Performance: The
Role of Brand Loyalty. Journal of Marketing, 65 (2), 81-93.
Epstein, S. (1998). Cognitive-Experiential Self-Theory: A Dual Process Personality Theory with Implications for Diagnosis
and Psychotherapy. In Empirical perspectives on the psychoanalytic unconscious edited by Robert Bornstein and
Joseph M. Masling, 99–140. Washington, DC: American Psychological Association.
Gustafsson, Anders, Johnson M.D., & Roos, Inger (2005). The Effects of Customer Satisfaction, Relationship Commitment
Dimensions, and Triggers on Customer Retention. Journal of Marketing, 69 (October), 210-218.
Grace, D. & O ’ Cass, A. (2004). Examining Experiences and Post-Consumption Evaluations. Journal of Services Marketing, 18
(6), 450-461.
Hair, J. F., Black, W., Babin B., & Anderson, R. (2010). Multivariate Data Analysis. (7th ed.). New Jersey: Pearson Education
Inc.

22
Hoyer, W. D., & Brown, S.P. (1990). Effects of Brand Awareness on Choice for a Common, Repeat-Purchase Product. Journal
of Consumer Research, 17 (2), 141-148.
Keller, K. L. (1993). Conceptualizing, Measuring and Managing Customer-Based Brand Equity. Journal of Marketing, 57(1),
1-22.
Keller, K. L. (2001). Building Customer Based Brand Equity: A Blue Print for Creating Strong Brands. Marketing Science
Institute Cambridge, MA. http://mktg.unisvishtov.bg/ivm/ resources/customerbasedbrandequitymodel.pdf.
((Accessed on January12, 2010).
Kim, H.B., & Kim, W.G. (2005). The Relationship Between Brand Equity and Firms Performance in Luxury Hotels and Chain
Restaurants. Tourism Management, 26 (4), 549-560.
Lassar, Walfried, Banwari, Mittal, & Sharma, Arun. (1995). Measuring Consumer Based Brand Equity. Journal of Consumer
Marketing 12 (4), 11-19.
Lazarus, R. S. (1984). On the Primacy of Cognition. American Psychologist, 39 (2), 124-129.
Netemeyer, Richard G., Balaji Krishnan, Chris Pullig, Guangping Wang., M. Yagci, D. Dean, J. Ricks, and F. Wirth. (2004).
Developing and Validating Measures of Facets of Customer-Based Brand Equity. Journal of Business Research 57
(2): 209-224.
Oliver, R. L. (1999). Whence Consumer Loyalty? Journal of Marketing, 63 (1), 33-44.
Osterlind, S. J. (2006). Modern Measurement Theory, Principles and Applications of Mental Appraisals . New Jersey: Pearson.
Parasuraman, A., Valarie Zeitham, & Leonard L. Berry. (1985). A Conceptual Model of Services Quality and its Implication
for Future Research. Journal of Marketing 49 (4), 41-50.
Pappu, R., and Quester, Pascale. (2006). Does Customer Satisfaction Lead to Improved Brand Equity: An Empirical
Evaluation of Two Categories of Retail Brands. Journal of Product and Brand Management, 15 (1), 4-14.
PECU Credit Union. 2009. Financial Crisis Trinidad and Tobago. http://pecutt.com/index.php/latest-news/65-financial-
crisis-trinidad-and-tobago ( Accessed on February 20, 2010).
Rambocas, M. and Arjoon, S. (2012). Using Diffusion of Innovation Theory to Model Customer Loyalty for Internet
Banking: A TT Millennial Perspective. International Journal of Business and Commerce , 1 (8), 1-14.
Robinson, J. and Moore, W. (2010). Customer Attitudes and Preferences in Internet Banking in the Caribbean. Retrieved
from http://www.cavehill.uwi.edu/bdoffice/documents/
AttitudesandPreferencesinRelationtoInternetBankingintheCaribbean.pdf (Accessed on February 7, 2012)
Ruth, J. A. 2001. Promoting a Brand’s Emotion Benefits: The Influence of Emotion Categorization Process on Consumer
Evaluation. Journal of Consumer Psychology, 11 (2), 99-113.
Schmitt, B. (2012). The consumer psychology of brands. Journal of Consumer Psychology, 22 (1), 7-17.
Sureshchander, G.S., Rajendran, C., & Kamalanabhan, T.J. (2002). Customer Perceptions of Service Quality: A Critique. Total
Quality Management, 12 (1), 111-124.
Taylor, Steven, Celuch, Kevin, & Goodwin, Stephen. (2004). The Importance of Brand Equity to Customer Loyalty. Journal of
Product and Brand Management 13 (4), 217-227.
Taylor, S. A., Hunter, G. L., and Lindberg, D. L. (2007). Understanding (customer-based) brand equity in financial services.
Journal of Services Marketing, 21 (4): 241-252.
Tuominen, P. (1999). Managing Brand Equity. http://lta.hse.fi/1999/1/lta_1999_01_a4.pdf (Accessed June 15, 2011).
Wanke, M., Herrmann, A. & Schaffner. D. (2007). Brand Name Influence on Brand Perception.” Psychology and Marketing,
24 (1), 1-24.
Yoo, B., Donthu, N., and Lee, S. (2000). An examination of selected marketing mix elements and brand equity. Journal of the
Academy of Marketing Science, 28 (2), 195-211.

23
Yoo, B. & Donthu, N. (2001). Developing and Validating a Multidimensional Consumer-Based Brand Equity Scale. Journal of
Business Research, 52 (1), 1-14.
Zajonc, R. B. (1980). Feelings and Thinking. Preferences Need No Inferences. American Psychologist, 35 (2), 151-175.
Zurawicki, Leon. (2010). NeuroMarketing. Exploring the Brain of the Customer Boston: Springer.

24
Some aspects of Integrated Marketing
Communications in Building Brand Equity Integrated marketing communication (IMC), Brand equity, Building brands.
Reza Safarinejad Fard, University Technology Malaysia, [email protected]
Abu Bakar Bin Abdul Hamid, University Technology Malaysia, [email protected]
Rozita Saadatmand, University Technology Malaysia, [email protected]
Abstract
Over the past decades business strategies face drastic changes. Modern technologies have been influential in many fields
and the field of business and marketing are not an exception. Validity of the old marketing strategies in today’s world is
dubious. Modern approaches have become critical for effective marketing strategies. Integrated Marketing
Communications (IMC) is one of these new emerging strategies which we are going to discuss about it in the proceeding.
This new approach of marketing is currently practising at the all big multinationals, and it plays an important role in
enhancing business. A process in which organizations make a beneficial and genuine relationship with their stakeholders
and customers is called IMC.
However, many factors have influence on brand equity such as, product, price, promotion and sale, but during this paper
we tend to considering the effect of IMC on Brand equity. During this paper we tend to provided a discussion about the
positive linkage between integrated marketing communication and brand equity. In this paper according to impact of IMC
on brand equity, we provide the details of the role of IMC in building and maintaining strong brand equity.
Introduction
Prior studies have widely accepted IMC or integrated marketing communication. Basically, marketing is a dynamic and
evolving process that develops on the basis of a vision cantered on service (Vargo, Maglio, & Akaka, 2008) . Also, they
proposed that integrated marketing communication is replacing the manifold in a commercial focus and limited
management tools of the trade mark must be used to initiate and maintain an on going dialogue with customers and to
improve relations. The means for the development of strong, customer oriented brand equity can be provided by
marketing communications as Keller (2003) stated. In this study, the main focus is on the influence of IMC in creating
brand equity.
Integrated marketing communications (IMC)
There are various definitions of IMC and all of them enlighten some of the aspects of this subject. According to (Kliatchko,
2005) there is no single agreeable definition that covers all aspects of IMC. Two different reasons are the responsible for
such discrepancy, first confined number of researches in this field and second general disagreements toward the
emergence of IMC.
By the time past and IMC drew many attentions and thus researchers tried to reassess the basic notion and eventually the
today’s term was created. In order to have a comprehensive definition of varied applications of IMC, new ideas were added
to the sooner definitions of IMC. A general misunderstanding about IMC is that any organizations only require single
message and brand which is despite of implication of it. IMC, make managers capable of dealing with many targets and
guide them to attain integration of various brands and functions among only one company. (Fill, 2001; Grove, Carlson, &
Dorsch, 2002; Hartley & Picton, 1999; Lee, 2002; Phelps, Harris, & Johnson, 1996).

25
According to Shimp (2003), definition of IMC is a communication process that implies the integration, planning, creation
and implementation of various forms of adverts, publicity, sales promotion; those are delivered over time to a brand’s
targeted customers and prospects. In order to achieve a strong brand image and moving people to action, communications
should speak in one voice. Hence, coordination is crucial. Acting despite of aforementioned fact will lead to different things.
Building a relationship between brand and consumer requires regarding having a successful marketing communications.
It means all messages which issued by organizations should be closely supervised and controlled to make sure from their
effects, thus it urges to apply data driven technique. To state the matter differently, Duncan(2002) believed that IMC is the
fundamental part of the relationships that build brands. From aforementioned facts it concludes that IMC is considered as
part of marketing field which is the source of data correspondent to brands in such a way that create a mutual relationship
between stakeholders and customers.
Since that customer will only trust that particular organization this relationship not only secures a customer but it
guarantees the profitability of the relationship. In fact, voice of a brand is represented by marketing communications
(Keller, 2001). The aim of all IMC processes is a better understanding of the relationship between customer and
organization thus, discussion on IMC would remain incomplete without talking about brand because it is the same goal as
brand building process. Basically, IMCs’ strategies help to create and build brands. Accordi ng to the published literature
by Danziger (2006), happiness of the costumers should be on the centre of attention particularly during designing and
developing of marketing messages and products.
The evolution of IMC, regarding strategic role in brand equity plus its conceptual development and its significance is
overviewed in this section. In terms of its ability to strengthen brand equity there are two methods with which to evaluate
firms’ implementation of IMC including process control and output control (Duncan & Moriarty, 1998). The evaluation of
outside performance of firms such as the organization impact on brand awareness or on customer satisfaction, and its
sales outcomes has been referred to as output control.
Integrated marketing communication (IMC) has become generally avowed, has outspread varied levels inside the firms,
and has become an impartible component of brand. In the competitive market in 21 century, archive to a systematic brand
communication is the way to moving forward and increase the performance of the firms. Marketing communication has
important role to building and maintaining the shareholders communications and affect them on the terms of brand
equity. For the integrated marketing communication we can mention to brands as central IMC. Marketing communication
recognizes as voice of the brand and it is a way for any organization to make contact with consumers to introduce their
product. For developing the brand equity the best way is marketing communication, more ever marketing communication
help to the firms to receive the desirable responds from consumers.
Importance of Brand Equity
Definition of the concept brand equity was provided at the beginning of this section, followed by arguments for why it is
important to study the determinants of brand value. However, before turning to the comparable context of the work, it is
also important to answer the questions: what is determinant of brand equity? And what is customer-based brand equity.
Basically, brand equity embraces the following dimensions: brand loyalty, brand awareness, perceived quality of brand,
brand image and brand association (Hosseini & Zareebaf, 2011; Mihaela, 2012).
A priority for many firms based on Keller’s (2003) investigations is building and properly managing brand equity. He
stated that internal brand identity efforts are necessary to build brand equity. Afterwards, integration of brand identities
into the corporations marketing plans should be executed. In addition, he believed that the process of integration of brand
identities into the supporting marketing platforms is closely connected to the powerful of the corporations brand equity
from communications. Furthermore, he recomended having an efficient strategy for integrating marketing
communications in building and maintaining brand equity is kind of necessary.
All of the mentioned elements determine how the customer perceives a particular brand. Subsequently, customer-based
brand equity reflects the customers’ reactions to the marketing mix elements and activity of a particular brand (Keller,
1993). Keller (1993) further adds that consumer-based brand equity takes place solely when the consumer is well
acquainted with the brand and so holds sturdy brand associations in memory. With these definitions, it is known that a
valid measurement of customers’ perceptions can occur only provided that the individual has favourable and unique brand
associations in mind (Mihaela, 2012).

26
Camarero, Garrido, and Vicente (2010) aim to explore determinants of brand equity for cultural activities from the angle of
internal along with external visitors. Their analysis advocates four components for brand equity in inventive and cultural
activities (loyalty, brand image, perceived quality and brand values) and assesses them for the case of an itinerant art
exhibition staged over the past twenty years. Findings recommend that external visitors attach bigger significance to
brand image as a determinant of value than do internal visitors, whiles for the recent brand values are the principal source
of price.
Based on the published literatures, different marketing communications influence brand equity including sponsorship and
advertising as well as various alternative communication options (Aaker & Bid, 1993; Cobb-Walgren, Cathy J., Cynthia A.
Ruble, & Donthu, 1995; Cornwell, T. Bettina, Roy, & II, 2001; Joachimsthaler, Erich, & Aaker, 1997). The most advantage of
the brand equity is its positive impact on demand. It is predicted that the awareness, complete quality and the brand
loyalty causes the rise of brand market productivity. This facet of brand equity helps the organizations attract the
purchasers and keep them (Baldauf Artur, S, & Gudrun, 2003; chirani, Taleghani, & Moghadam, 2012). Some researchers
conjointly believe that the studies connected to the brand equity have a lot of established conceptual logic with the brand
performance as compared with various areas that creates it a viable phase for considering to organisational productivity.
(Baldauf Artur et al., 2003; chirani et al., 2012).
Customers could be a lot of eager to attend to extra communications for a brand . The power and equity of brand
advertising can completely influence the participation of customers in additional communication for that terribly brand.
Customers can process these communications in an approval manner and thus, they will have a larger capability to recall
the communications or their accompaniment cognitive or emotional reactions in the future. As a mediator or goal to
achieve alternative goals brand equity has the central role in advertising. Benefits of these communications only develop
under situation that company has a strong brand, thus it can be concluded that building powerful brand is a management
preference (Aaker, 1991, 1996; Kapferer & Jean-Noel, 1997). The correct data structure is the prospective consumers,
hence it is quite important to build a strong brand. Marketing communications have a vital role in determining that
knowledge of the customers because they are going to reaction positively to marketing actions of a well -known brand.
Brand equity and also the importance untouchable worth that brand bring to companies are became standard subjects of
studies lately. There are a few agreements amongst academics, this means brand equity ought to determine at conditions
of marketing influences and its distinctive registered to a brand. However, this concept may be approached by scholars in
different ways.
The majority of researchers believe that brand equity reflects the actual fact that brand plays a vital role in marketing of a
service or product delivered by organisation. There are also, general agreements like: brand equity delivers a possessed in
common denominator for rationalization promoting methods and measuring the value of a brand, value differentiation
among products and services are based on the past investments in the marketing for the brand, these values will be made
for a brand through several totally different ways and in the last, so as to profit of the organisation there are various way s
as to how the worth of a brand will be appear or exploited.
Thus, for maintain a position within the market and be easily recognizable and differentiated from the competition, brand
equity is necessary for a company. Brand equity can reduce search costs and the risk associated with purchasing the
product by representing value and quality to the consumer.
Some aspects of IMC in Brand equity
The challenge in marketing communications is to create the selling messages related, vital and supportive of a wider range
of reasons to place a buyer's confidence in an exceeedingly product or service. Some corporations, as revealed by analysis,
perceive this higher than most by supporting their complete message as a product message and an organizational
reputational message: their message is incorporated into an overall strategy of integrated communications (Caywood,
1997).
IMC, according to Kitchen et al. (2004), is no longer just a communication process. In fact, it is a progression that related to
management and brands. In addition, Kitchen et al. (2004) suggested that IMC involves managing marketing
communications to achieve strategic objectives by stress on functionality of the various part of an organization. The
published literature by Mcarthur et al. (1997) toward the responsibility for marketing communications and its role in an

27
interior, higher management affair recommended that IMC is developing to be strategically oriented instead of tactically
oriented.
The idea that IMC offers several advantages for businesses has been supported by several researches (Naik & Raman,
2003; Reid, 2003). IMC is helping to create brand equity for companies’ products and render services through synergies
(Naik & Raman, 2003). Similarly, Reid (2003) recommended that the integration of marketing communications to brand
positively connected performance-based company.
Furthermore, it was indicated that the success of the IMC to generate desirable customer responses (Grove et al., 2002).
The conclusion of these researches propose that in order to achieve the potential business become more effective in
communicating with their target markets plus being able to help companies to superior financial results through higher
brand value, IMC plays the centric role. The strategy and brand identity as the vital components of IMC strategy have been
discussed in the following section.
Keller (2008) implied that brand knowledge is all regarding to the emotions, awareness, images, understandings and so on
that become linked to the brand within the awareness of customers, and it is not about the facts about the brand. These
types of information will be considered as a collection of associations data of brand in consumers’ minds. Janiszewski and
Osselaer (2000) defined he essential evidence of the customer based brand equity model. They believed the strong brand
equity in the minds of consumers and which means that the brand has accomplished in the widest common sense.
Integrated marketing communication has been extensively accepted by companies around the world. This may be a
marketing communications system that enables organizations to higher manage their brand pictures . Integrated
marketing communication ways are aimed toward combining or integrating the elements of the communication mix, like
advertising and public relations so as to make a balanced and constant marketing communications massage that
strengthens the brand. Integrated marketing communication, if managed properly provides a corporation a competitive
advantage because of its value efficiency and its ability to take full advantage of the impact of its product and services
development and also the communication of the organization's massages within the marketplace.
In the latest study Shown below with universities branding process about creating value through integrated marketing
communications by Omer et al. (2012). These variables were determined as organization resistance, brand development,
message consistency, strategic planning and staff development.
Figure1. IMC and Branding, Omer et al. (2012)
According to the published literatures it is firmly accepted that numerous marketing communications have an effect on
brand equity, as well as sponsorship, advertising and several various communication options (Walgren et al. 1995;
Joachimsthaler et al. 1997). This may be a marketing communications structure that enables organizations to higher
manage their brand images. It is quite clear that marketers access to varied marketing communication options which have
not been available in the past. In fact, a universal model of brand equity is required to perceive the role of all the various
sorts of marketing communications in building brand equity. Keller (2001, 2008) proposed a model as the customer based
brand equity, based on this model, brand equity is basically specific by the brand knowledge and marketing strategy are
responsible. Definition of brand equity according to this model is the derivative effects that customer knowledge has about
brand equity. Fanally we can consider, customers are absolutely in charge with the info they have or varied offerings that
they are inquisitive about. Regarding this situation, marketers may drop some management over what customers will do
with their action.

28
Summary
This study tried to show the dramatic changes which have happened in integrated marketing communications in recent
years, hence there are new challenges for build and manage their brands for marketers. In this complex new marketing
world the brand equity model that accentuates on significance of the customer brand awareness arrangements, measured
as means to assistance marketers explain the building brand special effects of marketing communications.
The brand resonance pyramid was determined means that to trace how marketing communications will make powerful,
dynamic loyalty connections and positive brand equity to provide better understanding of consumer brand knowledge
structures. Consumer brand knowledge can be affected in one or more ways by any marketing communication which
implies effects of marketing communication on brand equity. In order to create the favourite awareness and image in
understanding of customers, integrating marketing communications includes mixing and matching different
communication options. A significant development area in marketplace is identified as online, interactive marketing
communications. Any perspective of brand building will be just about addressed by collaborating marketing
communications to probably influence brand equity, and that is why collaborating marketing communications offers
marketers great versatility.
Refrences
Aaker, David A. (1991). Managing Brand Equity. New York: The Free Press.
Aaker, David A. (1996). Building Strong Brands. The Free Press / Simon and Schuster.
Aaker, David A., & Bid, Alexander L. (1993). Brand Equity and Advertising: Advertising's Role in Building Strong Brands . NJ:
Lawrence Erlbaum.
Baldauf Artur, S, Cravens Karen, & Gudrun, Binder. (2003). Performance Consequences of Brand Equity Management
Evidence from Organization in the Value Chain. Journal of Product & Brand Management, 12(4), 220-236.
Camarero, Carmen, Garrido, Marı´a Jose´, & Vicente, Eva. (2010). Components of art exhibition brand equity for internal
and external visitors. Tourism Management, 31, 495–504.
Caywood, C. . (1997). Handbook of Strategic Public Relations & Integrated Communication . New York: McGraw Hill.
chirani, Ebrahim, Taleghani, Mohammad, & Moghadam, Nasim Esmailie. (2012). Brand Performance and Brand Equity.
INTERDISCIPLINARY JOURNAL OF CONTEMPORARY RESEARCH IN BUSINESS, 3(9).
Cobb-Walgren, Cathy J., Cynthia A. Ruble, & Donthu, Naveen. (1995). Brand Equity, Brand Preference, and Purchase Intent.
Journal of Advertising, 24(Fall), 25–40.
Cornwell, T. Bettina, Roy, Donald R., & II, Edward A. Steinard. (2001). Exploring Managers’ Perceptions of the Impact of
Sponsorship on Brand Equity. Journal of Advertising, 30(2), 41-52.
Danziger, Pam. (2006). Why We Love It and How Retailers Can Create the Ultimate Customer Experience : Kaplan Publishing.
Duncan, Tom. (2002). IMC using Advertising & Promotion to Build Brands . New York: MCGraw-Hill.
Duncan, Tom, & Moriarty, S. E. (1998). A communication based marketing model for managing relationships,. Journal of
Marketing, 62(2).
Fill, Chris. (2001). Essentially a Matter of Consistency: Integrated Marketing Communications. The Marketing Review, 1(4),
409-425.
Grove, S. J. , Carlson, L., & Dorsch, M. J. . (2002). Services Advertising and Integrated Marketing Communications: An
Empirical Examination. Journal of Current Issues and Research in Advertising, 2 , 69-82.
Hartley, B. , & Picton, D. (1999). Integrated marketing communications requires a new way of thinking. . Journal of
marketing communications(5).
Hoeffler, S, & Keller, K.L. (2003). The marketing advantages of strong brands. Journal of Brand Management, 10(6), 45-421

29
Hosseini, Seyed Reza, & Zareebaf, Mehdi. (2011). Effect of Selected Marketing Mix Elements on Brand Equity Extended
Aacker’s Model: Evidence Agriculture‐ Bank in Mazandaran Province. Paper presented at the The Second Asian
Business and Management Conference, Osaka, Japan.
Janiszewski, c , & Osselaer, S.M.J. van. (2000). A connectionist model of brand-quality associations. Journal of Marketing
Research (37), 50-331.
Joachimsthaler, Erich, & Aaker, David A. (1997). Building Brands Without Mass Media. Harvard Business Review, 75
(January/February), 39–50.
Kapferer, & Jean-Noel. (1997). Strategic Brand Management: Creating and Sustaining Brand Equity Long Term . London:
Kogan Page.
Keller, Kevin Lane. (1993). Conceptualizing, measuring, and managing consumer-based brand equity. Journal of Marketing,
57, 1-22.
Keller, Kevin Lane. (2001). Mastering the marketing communicationsmix: micro andmacro perspectives on integrated
marketing communications programs. Journal of Marketing Management, 819-847.
Keller, Kevin Lane. (2008). Strategic Brand Management (3 ed.). Upper Saddle River, NJ: Prentice Hall.
Kitchen, E, Schultz Don, Ilchul, Kim, Dongsub, Han, & Tao, Li. (2004). Will agencies ever “get” (or understand) IMC.
European Journal of Marketing, 38(11/12), 1417-1437.
Kliatchko, J. . (2005). Towards a New Definition of Integrated Marketing Communications (IMC). International Journal of
Advertising, 24, 7-34.
Kotler, P. , & Keller, K. . (2006). Marketing Management (12 ed.). New Jersey: Prentice-Hall.
Lee, T.J. (2002). Integration, say hello to Integrity. Strategic Communication Management, 6(5).
McArthur, David N., & Griffin, Tom. (1997). A Marketing Management View of Integrated Marketing Communications,.
Journal of Advertising Research, 37(September/October), 19-26.
Mihaela, Mihova. (2012). Determinants of brand equity in the confectionary industry:
A cross-cultural comparison between the Danish and the Bulgarian market. (Bsc), Aarhus University, Business and Social
Sciences.
Naik, P. A. , & Raman, K. . (2003). Understanding the Impact of Synergy in Multimedia
Communications. journal of Marketing Research, 40, 375-388.
Omer Kursad Tufekci, & Tufekci, Nezihe. (2012). Universities Branding Process about Creating Value through Integrated
Marketing Communications. Paper presented at the 3rd International Symposium on Sustainable Development,
Sarajevo.
Phelps, J.E., Harris, T.E., & Johnson, E. (1996). Exploring decision-making approaches and responsibility for developing
marketing communications strategy. Journal of Business Research, 37(3), 17-23.
Reid, M. . (2003). IMC-performance relationship: Further insight and evidence from the Australian marketplace.
International Journal of Advertising, 22, 227-248.
Shimp, T.A. . (2003). Advertising, Promotion & Supplemental Aspects of Integrated Marketing Communications : Thomson
South-Western.
Vargo, S. L., Maglio, P. P. , & Akaka, M. A. . (2008). On Value and Value Co-Creation: A Service Systems and Service Logic
Perspective. European Management Journal 26.
30
Perception of sources of brand value TAP Portugal
by the perspective of its users Brand Equity, Sources of Value, Loyalty, Perceived Quality, Reputation, Associations
Sara Alexandra Soares da Mata Nunes, Escola Secundária D. Pedro V - Agrupamento de Escolas das Laranjeiras
Júlia Fragoso da Fonseca, Escola Superior de Turismo e Tecnologia Do Mar – GITUR- IPL
Abstract
In a global economy subject to changes in market dynamics and increasing competition, the role of brands has never been so im portant.
In recent years, we witnessed the apparent triumph of the brand concept: all are encouraged to self-identify. Its economic and social
importance in the national and international scene is absolutely undeniable.
The map marks serve as advisor to the buying behavior and, when managed correctly, result in significant value for their owne rs. There
are currently two approaches that direct studies in this area, determining the financial value of the brand and perceived value of a brand
by consumers and on this second approach is that we will address in this article.
The airlines face nowadays challenges, moreover they have been constant since the 80's, this has led to many companies adhere to
concentrations integrating into global alliances, thereby strengthening its position, thus also face competition of low -cost airlines.
Our study falls on the airline TAP Portugal, which is currently the Portuguese flag carrier and largest airline in Portugal thus occupying a
privileged position in commercial aviation landscape.
Despite fierce competition from low-cost airlines, charter flights and competition from large interna tional companies already
positioned, which is very conservative, the company continues to dominate, but how? What are the factors valued by consumers that
makes this company to choose and assign greater value? This is a question we want to answer with this study.
1. Objectives of the Study
The aim of this study focuses on the topic of brand value TAP Portugal, so we intend to get a response with regard to the cor relation
between good results and the company's vision of its customers with respect to sources of value your brand, or brand equity. That is, we
intend to identify and assess the factors explaining the brand equity of a successful brand as TAP Portugal, applying the con ceptual
model of David Aaker (1991), in order to investigate the relationship of brand equity with its dimensions, loyalty brand, perceived
quality, brand awareness and brand associations. The choice of this model is due to the fact that one of the referenced at va rious studies
and have often been tested by scholars (Yoo et al, 2000; Faircloth et al, 2001; Washburn and Plank, 2002; Atilgan et al, 2005) to verify
the dimensions of brand equity.
TAP Portugal is currently the Portuguese flag carrier and largest airline in Portugal thus occupying a privileged position in commercial
aviation landscape. In 1948 becomes member of IATA (International Air Transport Association) and in 2005 became a member of Star
Alliance, the first and largest group of airlines. Performs flights to Europe, North America, Latin America and Africa, in ad dition to
domestic flights. Throughout its existence was awarded in several areas, from medals and titles awarded by public entities. T he
company also stands out from the others by promoting initiatives among its consumers and the general public. Noted that TAP h ad at
the end of 2010, a dimension above double that seen in 2000, as its supply increased during this period, about 136%. Despite the
competition from low-cost and charter flights, the traditional companies continue to dominate on the number of passengers l anded at
Portuguese airports, as in the following graph shows.

31
Graphic nº 1.1 – Debark, type of flight - no, thousands (2nd quarter)
Source: Tourism of Portugal (2nd quarter 2011)
With regard to commercial traffic for companies, TAP Portugal ranks first with 9,298,073 million passengers, followed by two lowcost
airlines, Easyjet Airlines Co Ltd, with about 2,380,693 million passengers and Ryanair Ltd, with about 1,781,134 million pass engers,
according to the Annual Statistical Traffic, Airports ANA (2010).
Any investigation, beyond the general objective, as shown above, also has specific objectives fruits of empirical research, a s:
Objective 1. To study the relationship between the dimensions of brand equity according to the model of Aaker (1991, 1996) selected on
the brand equity of the brand of the airline TAP Portugal;
Objective 2. Identify the variables that best explain the brand equity of the brand of the airline TAP Portugal;
Objective 3. Assess the impact of brand loyalty on brand equity of the brand of the airline TAP Portugal;
Objective 4. To assess the impact of perceived quality on brand equity of the brand of the airline TAP Portugal;
Objective 5. Evaluate the impact of reputation and brand associations in the brand equity of the bra nd of the airline TAP Portugal;
Objective 6. To characterize the demographic variables of respondents;
Objective 7. Knowing the reasons why travel carry passengers;
Objective 8. Understanding what causes the passengers prefer to travel by TAP Portugal;
Objective 9. Understand whether passengers are always faithful to the company chosen and if they are not, understand why this
situation occurs;
Objective 10. Knowing the emotional connection between the TAP Portugal airline and its passengers;
Thus, for response to general objective and specific obejctivos, will present the relevant methodology to be used, which will allow us to
reach the desired results.
2. Methodology
According to Hill and Hill (2002:19), "an empirical investigation is an investigation in which they make observations to better understand
the phenomenon to study," the steps are of an empirical investigation "from the literature review establishes the General Hypothesis work,
and it becomes necessary, from here, to operationalize this hypothesis and select the methods of research. Only then will it be possible to
pass the collection and analysis of data and presentation of results. These will confirm or deny the hypothesis established a nd is operating
this confirmation or denial that will provide the conclusions of the work. "(Hill and Hill, 2002:32). There are however, many different steps
to consider in conducting empirical research, and to Quivy Campenhoudt (2003), there are about seven steps to follow, these b eing the
starting question, exploitation, problematic building a model of analysis, observation, information analysis and findings, and this will be
the methodology used for this work.
As regards the question of departure, according Quivy and Campenhoudt (2003:44) "the best way to get a job in social science research is
to endeavor to spell out the project in the form of a question starting. With this, the researcher tries to express as exactl y as possible what
you want to know”. Based on all this our starting question is: Does the good results of the company TAP Portugal are due to the
perception of its users, with regard to the sources of value of your brand?
Then the goal is to collect a certain quality of information about the object under study, so as to perform the exploratory w ork.
According Quivy and Campenhoudt (2003) it is composed of two parts conducted in parallel, these being a work of reading and

32
interviews or other appropriate methods. The preparatory readings allow the researcher to acknowledge about the investigation s
already carried out on the topic of your research, and do so to emphasize his new perspective and approach. Our review of the lite rature
was performed according to appropriate criteria. Then we have the exploratory interviews that will complement the readings a nd will
"allow the researcher to become aware of aspects of the issue for which his own experience and his reading, by itself, would not have
touched" Quivy and Campenhoudt (2003: 85). Some interviews were conducted so as to enrich the whole process to some customers
and employees of TAP Portugal.
According Quivy and Campenhoudt (2003:89) "the problem is the approach or theoretical perspective that we decided to adopt to treat
the problem posed by the question of departure. One way is to examine the phenomena being studied”. This study is of paramount
importance these days, due to fierce competition from low-cost airlines, as these have a high competitive level to flagship companies,
such as TAP Portugal. A study conducted by the company, published in Público newspaper on 23/06/2011, highlights the estimated
long-term losses, pointing to a revenue shortfall, "based on a year-cruise, the impact on future income can-will translate into a reduction of
more than billion, considering only the base of Easyjet, and more than two billion euros, if there is the entry of Ryanair, "says the study,
therefore, is to analyze all relevant the sources of brand value can cause the flagship companies stand out from the others, thus
implementing marketing strategies accordingly.
The authors Quivy and Campenhoudt state that (2003:150) "the analysis model is the natural extension of the problem, articulating in
operational milestones and the clues that will ultimately be retained to guide the work of observation and analysis consis tent." It consists of
the construction of concepts and the definition of falsifiable hypotheses, thereby achieving a coherent analytical framework. Quivy
Campenhoudt and show that (2003:136) "a hypothesis is a ratio that provides a relation between two ter ms, which, as the case may be
concepts or phenomena. One hypothesis is therefore a proportion provisional an assumption must be verified. " The hypothesis presents
itself as a provisional answer to the question of departure and that will confirm or deny the operational hypothesis (Hill and Hill, 1998).
So, we introduce the general hypothesis and the respective working hypothesis of our research.
General Hypothesis: The good results of the company TAP Portugal are due to the perception of its users, with rega rd to the
sources of its brand value or brand equity.
Then the general hypothesis should be translated into operational hypotheses, and these will be more specific and written to indicate
the nature of statistical operations necessary for the statistical a nalysis required, so that we achieve the goals we set ourselves for this
investigation (Hill and Hill, 1998). Before enumerating the working hypothesis of this research should provide some informati on about
the topic in question, which allowed us to thus arrive at the formulation of hypotheses presented later, which as we have said, will be
based on the conceptual model of David Aaker (1991), which examines the value of a mark second set of perceptions obtained by
consumers, which is the analysis to be developed in this investigation.
It is quite important to distinguish between product and brand. According to Cravens et al (1987:375) "a product is something that is
potentially valuable for a target market due to the benefits or satisfaction it provides, inc luding objects, services, organizations, places,
people and ideas," while a "brand is a name, term, sign, symbol or design, or a combination of them, intended to identify the goods or
services of one seller or group of sellers and to differentiate them fro m their competitors," according to the American Marketing
Association.
In view of Holt (2005) considering a new product just released, although it has a name, a logo and own traits, characteristic signs of a
brand, this fact does not exist yet, because despite the signs, these are empty, because the product has not yet absorbed the history and
experiences of consumers. According to the same author, consumers value brands primarily by its identity value, ie, those cap able of
embodying the ideals they admire and brands that help them express what they want to be. A brand then arises when several "authors",
these being, companies, industries, intermediaries and consumers, tell stories about the same. According to Keller (1998) has a brand
value when consumers react more favorably to the product from the time they know and identify the brand. This differential effect
occurs at cognitive, affective and behavioral and facilitates the process of consumer decision.
According to Aaker (1991, 1996) the value of the brand is a set of assets, as, loyalty or brand loyalty, brand loyalty, which is the degree
of connection with the consumer and the brand that makes the client prefers not choose other competing brands, the reputation , brand
awareness, is the degree of brand awareness among consumers, the perceived quality, perceived quality, which is the value that the
consumer gives the product beyond the physical attributes and real good and which is reflected in the amount you're willing t o pay and
associations, brand associations, the set of meanings that the consumer attaches to the brand revealed in the ability to evoke a feeling in
the mind of the consumer. Thus the management of brand value has to contemplate investment strategies that create and maintai n
these assets (Aaker and Joachimstraler, 2000; Kotler and Keller, 2006). The strength of the mark depends on the integrated
management of all elements of the mark. These elements must be associated with the name and symbol of the brand. A change in one
can affect all other assets of the brand (Keller, 1998).

33
According to Caldas and Godinho (2007) fewer consumers choose their investments and acquisitions based on the technical
characteristics and specific to products or services. Due to the fact that nowadays it is possibl e to virtually all competitors rely on
technologies for the development and production of their products and services.
A listing of working hypotheses were prepared taking into account the four incorporating the active sources of the value of t he mark
previously made.
H1: There is a positive relationship between the perceived quality of the brand and brand equity TAP Portugal TAP Portugal brand.
Zeithaml et al (1996) argue that the perceived quality of a service is a result of the comparison of perceptions with customer
expectations. The perceived quality is related to the level of customer satisfaction, customer satisfaction logo is a functio n of perceived
performance and expectations (Kotler, 1998). To Grönroos (1995) perceived quality of a service may hav e two dimensions: technical
and functional dimension, for example, in the case of TAP Portugal, transport a client from one location to another is the re sult of a
service (technical dimension) and the perception of quality will depend on how the service wa s provided (functional dimension).
According to Chen and Green (2009) perceived quality is identified as a component of brand value and hence the high perceived quality
leads consumers to choose one brand over other competitors. Therefore, the level of qua lity that the brand is perceived positively
contributes to brand equity.
H2: There is a positive relationship between brand loyalty and brand equity TAP Portugal TAP Portugal brand.
The goal of any marketing manager is the value that represents your brand in the market, make your users become faithful (Bolton and
Kannan, 2000), thus bringing benefits to both parties (Zineldin, 2006, The 'O'Brien and Jones, 1995; Kivetz and Simonson, 200 2;
Dowling and Uncles, 1997 to Duffy, 2002). The main goal is that users increase the use / purchase of the products / services offered by
the company and accelerate the lifecycle of loyalty (to encourage customers with one or two years to behave like the older cl ients and
profitable) by value your brand, and it is therefore a ppropriate to examine this correlation exists, although this is advocated by
numerous authors who have studied this phenomenon (Reichheld and Kenny, 1990, Reichheld and Sasser, 1990; Bidault and Jarillo ,
1995; Keaveney, 1995 , O'Brien and Jones, 1995; Reichheld and Teal, 1996; Oliver, 1997; Anderson and Mittal, 2000; Brito and Ramos,
2000; Ganesh, Arnold and Reynolds, 2000; Lara and Casado, 2002; Felvey apud Kumar et al. 2,008; LaBarbera and Mazursky, 1983,
Taylor and Baker, 1994, Zeithaml et al.1996, Bolton, 1998; Hart and Johnson, 1999). Thus, to the extent that consumers are brand loyal
to provide an increase of brand equity (Datta, 2003).
H3: There is a positive relationship between reputation and brand associations and brand equity TAP Portugal TAP Port ugal brand.
The notoriety refers to "the strength of a brand's presence in the consumer's mind" (Aaker, 1996:10). The reputation (brand awareness)
is measured according to the different ways the consumer remembers the brand (Aaker, 1996). According to Kell er (1993, 2003), brand
awareness plays an important role in consumer decision making. The associations, according to Aaker (1996:25) "may include product
attributes, a famous spokesperson, or a particular symbol (...) and are from brand identity - what the organization wants the brand means
in the minds their consumers.” The author also believes that an association will be stronger, the more we rely on our experiences or
exposures to communications and more supported by other links, including the reputation or brand loyalty. Therefore, brand
associations underlie the phenomenon of brand image and has influence at the time of purchase. Soon companies will have to bu ild a
solid foundation in defining the value of brands, since they have an active role in making purchasing decisions and stay on brand loyalty
(Aaker, 1991; Keller, 1993, 1998; Kotler, 2005 ). The brand associations that result in high brand awareness are positively r elated to
brand equity (Walsh and Mitchell, 2005).
With respect to the observation Quivy and Campenhoudt say (2003:205) "Observation comprise all the operations by which the analysis
model is confronted with observable". In this step of research will have to be answered to 4 fundamental questions, these being what?
Who? How? Observe what? In our research we used the method of indirect observation, questionnaire survey which "consists in placing
a set of respondents, (...) a series of questions relating to their social, professional or family, their opinions, their att itude toward options or
human and social issues, their expectations, their level of knowledge or awareness of an event or condition "( Quivy and Campenhoudt,
2003:188) because all of this is doubtless , the one that is most used and the easiest to implement and analyze in a qu antitative manner
(Hill and Hill, 1998).
The preparation of a questionnaire is a difficult task, because for "adequately test the hypotheses that these Operational should be
specified prior to conducting the data collection. This implies that, when prepari ng the questionnaire, should have to take on General
Assumptions and decide not only which questions used to measure the variables associated with it, but also what kind of respo nse is most
appropriate for each question, what kind of measurement scale is associated with answers and methods are correct to analyze the data
"(Hill and Hill 2002:83, 84).

34
As such, and after analyzing the above items, for the construction and presentation of the questionnaire for this investigati on, some key
rules were followed, these being the questions were prepared according to a logical sequence and theme, placing more general
questions at the beginning, where it is desired to obtain information about the characteristics of cases and more detailed qu estions at
the end, the existence of several types of questions throughout the questionnaire, these being identified questions, question information
and questions of rest, the number of QB answer is, enough and appropriate for the type of research required; were avoided mos t
sensitive issues to respondents, the issues included are clear and easy to understand terms with, the absence of hypothetical questi ons,
the instructions are clear and fill where necessary present, the level of presentation were taken into account aesthetic care with spacing
issues with the font and the type of question, placed in different sections depending on its nature, an introduction was plac ed at the
beginning the questionnaire to solicit a request for cooperation, the reason for its application, the applic ation of the nature of the
questionnaire, the name of the educational institution, the formal declaration of confidentiality and anonymous nature of the
questionnaire.
Regarding the type of questions used were used close and semi-closed questions, due to the numerous advantages they offer in the
treatment of information collected, as the respondent have a limited number of typical responses that can choose. Some questi ons were
raised in the form of scales of attitudes, as the analysis of the reasons for the preference of TAP Portugal and the degree of satisfaction
and behavior towards the company, through Likert scales (presentation of a series of propositions that respondent indicates y our
agreement or inconcordância for each of them), being distributed in 5 points, strongly disagree, disagree, neither disagree nor agree,
agree and strongly agree, that will give the researcher the possibility to measure attitudes and opinions respondents and all ow the
qualitative characteristics are worked quantitative.
It has also prepared a pre-test questionnaire to ensure their applicability and determine if it is in accordance with the objectives set, poi
and second Carmo Ferreira (1998:145) "when a first version of the questionnaire is drafted, it is necessary to ensure its applicability in the
field and determine if it is in accordance with the objectives initially formulated by the investigator "working well with a pretest, which will
allow to establish whether all questions are understood by respondents, if the alterna tive responses to closed questions covering all the
answers possible if there are no issues useless, inadequate, too difficult, tendentious, if not lacking relevant issues and f inally test
whether the respondents do not consider the questionnaire too long, boring or difficult.
Our questionnaire was divided into two parts, the analysis of brand value or brand equity TAP Portugal and questions of perso nal
character. With regard to the value of the brand, are studied concepts such as loyalty, trust and commitment, organizational reputation
and image, perceived quality and associations. Perceived quality was studied through a closed question assessed on a Likert s cale of five
points, brand loyalty, through a semi-open question, notoriety and brand associations with a closed question assessed on a Likert scale
of five points and reasons why carry passengers travel with a semi-open question. The goals are to determine the degree of satisfaction
and user behavior in relation to the airline TAP Portugal, whether user s will always travel by TAP and reasons for performing the
journey. With regard to questions of a general nature, they serve to meet the sociodemographic characteristics of the members in the
obejtivo is knowing the age, sex, education level, occupation, monthly income and area of residence were studied through six questions,
five closed and one open question.
With regard to sampling the investigator has no effectively time nor resources sufficient to analyze each instance of the uni verse,
therefore, one should consider cases which constitute said universe, namely should choose a sample (Vilares and Coelho, 2005).
According to Ferreira and Carmo (1998) there are two major types of sampling techniques, the causal and probabilistic or non -
probabilistic causal or not, and, in our research we resort to a probabilistic sampling method does not / not causal, convenience
sampling, to we can get the results. The size of our sample of 201 responses, data were collected between February 15 and Mar ch 16,
2012, via internet, thus capturing a wider range of individuals and their characteristics.
Then we have the information analysis where we treat the information obtained in order to be able to compare the observed res ults
with those expected from the hypothesis. According Quivy and Campenhoudt (2003) this analysis comprises three operations, these
being the description of data, measurement of relationships between variables and finally, compare the observed relationships with
those expected from the hypothesis and measure the difference between the two, according to the authors (2003:239) "if it is zero or
very low, we conclude that the hypothesis is confirmed."
2.1. Characteristics of Users
With regard to issues of personal and for age, 3.1% of the sample has less than 20 years, 10.4% have more than 50 years, 24.4% are
between 41 and 50 years, 28.5 % is between 21 and 30 years and 33.7% between 31 and 40 years of age. Regarding the sex of the
sample is 47.7% male and 52.3% are female. According to the academic qualificat ions, 0.5% of the sample have basic education /
teaching other types of lower, 14.9% have a PhD / MSc, 19.6% have secondary education and 64.9% has the qualifications the

35
undergraduate level / bachelor. Finally, in terms of yield, 9% of the sample enjoys a monthly income of more than € 3,000, boasts 13.2%
between 2000 € and 3000 €, 19.6% enjoys an income between 1000 € and 2000 €, 27 5% gave no reference value and 30.7% of the
sample occupies less than 1000 € per month.
With regard to questions of a personal nature, we can conclude that most users are between 31-40 years, are female, have a qualification
to degree level / bachelor, have a monthly income of less than € 1,000 monthly and live primarily in large cities. Regarding occupation
72.5% are salaried workers, 7% are self-employed, 13% are students, 3.5% are unemployed and last about 4% are retired. This
question allowed the study objectives 6 and 9.
For the analysis of brand value TAP Portugal, began by studying the question always travels by the company, so check for the first
element that constitutes the brand value, loyalty and verified 42.6% of the sample presented always travels by TAP while the remaining
(57.4%), not always travel by this airline. As reasons for this situation are shown several, but the most mentioned is the price, with
42.5%. This question allowed the study objective 3.
2.2. Characterization of the reasons for members traveling by TAP
Regarding the reasons for traveling by the company, the main reason is the leisure with 58.5%, foll owed by business reason to 25.1%,
with 10.3% educational reasons, to visit relatives with 5.6% other reasons not listed with about 0.5%, this data will allow u s to study the
objective # 1. Then, we intend to know what are the main reasons for users to choose to travel to TAP, as elucidated in the next table
presented.
Table nº 1.1- Statistics that examine the reasons for traveling by TAP
Nº Average Standard Deviation Variation coefficient
4.1. High safety and confidence conveyed by the company. 198 4,19 0,59 14%
4.2. Quality of service aboard. 197 4,14 0,45 11%
4.3. Quality of Meals. 196 4,03 0,65 16%
4.4. Prestige Company's aviation market. 198 4,29 0,57 13%
4.5. For the price charged by the company. 199 3,04 0,91 30%
4.6. Relationship between quality and price. 198 3,64 0,70 19%
4.7. Relationship of customer proximity. 198 3,75 0,67 18%
4.8. I get benefits outweigh the costs. 198 3,57 0,76 21%
4.9. For the good image that is present in the minds of all consumers. 193 4,01 0,54 13%
4.10. Compliance and respect for timetables. 199 3,88 0,64 16%
4.11. Effective treatment of baggage. 198 3,57 0,85 24%
4.12. Modernity and conservation status of its fleet. 197 4,12 0,56 14%
4.13. Competence and efficiency of pilots. 197 4,31 0,56 13%
4.14. High coverage of destinations. 195 3,73 0,75 20%
4.15. Stocks of 2 different classes on their aircraft. 197 3,76 0,71 19%
4.16. Speed in solving any problems and complaints management. 196 3,32 0,86 26%
Note: The values refer to the measurement scale: 1 - Strongly Disagree 2 - Disagree 3 - Neither Agree nor Disagree, 4 - Agree, 5 - Strongly Agree. Source: Author's Own
The two reasons are more marked 4.14 and 4.5. so we can conclude that the reasons to travel by company relate to the privileg ed place
that it occupies, or the notoriety, perceived quality and associations that customers are the brand. The analysis of this question al lowed
the study objective 2.
2.3. Analysis of patient satisfaction and behavior of members Victoria
It is also important to know the behavior of the users face the situations presented reveal that important data concerning the fairness
shown in the following table.

36
Table nº 1.2 – Results of the views of members on behaviors presented
Nº Average Standard Deviation
Variation coefficient
7.1. I believe that, at the time, TAP Portugal, has offers greater value and higher quality compared with its competitors.
193 3,81 0,65 17%
7.2. I will continue to travel by TAP Portugal is as profitable for me. 193 4,36 0,63 14%
7.3. I am particularly attached to this company compared to its other competitors. 195 3,86 0,87 22%
7.4. When I need to travel TAP Portugal is my first choice, although there are other companies that offer more attractive prices.
195 3,19 1,23 38%
7.5. Whenever my friends or family ask me for advice on airlines, I recommend TAP Portugal. 194 3,79 0,80 21%
7.6. I intend to continue in the coming years to take advantage of the services offered by the current airline. 196 3,98 0,51 13%
Note: The values refer to the measurement scale: 1 - Strongly Disagree 2 - Disagree 3 - Neither Agree nor Disagree, 4 - Agree, 5 - Strongly Agree.
Source: Author's Own
For average values, all items have a value higher than the average midpoint of the scale, which shows a behavior very positive view of
the company. The degree of agreement is thus superior to 7.2. I will continue to travel by TAP Portugal is as profitable for me, 7.6. I
intend to continue in the coming years to take advantage of the serv ices offered by the current airline and 7.3. I feel particularly
connected to this company compared to its other competitors. This question allowed the study objective # 4, so we may conclud e that
commitment that this relationship exists, since all items have an average value above the midpoint of the scale, as indeed we had
mentioned earlier.
2.4. Principal Component Factor Analysis
This method analyzes a set of variables in order to check whether it is possible to group the answers are interpreted identi cally by the
elements, determining your position in this set of variables. If so, the factors resulting from the analysis are associated w ith a set of
variables. Factor analysis allows proceed to the transformation of the variables that make up a scale in a smaller number of factors: the
major components. It becomes thus a set of initial variables correlated, in another set of uncorrelated variables, called the principal
components.
Factor Analysis Principal Component-Reasons to Choose TAP: We begin by performing tests KMO and Bartlett test according to the
reasons for choosing the degree of TAP and behavior of members and concluded that the data are suitable for the application o f factor
analysis. Regarding the reasons for the choice of TAP, justified the establishment of six factors presented in the following table. For each
of the components can present a designation that reflects the summary of the content of the variables that constitute it. Fac tor 1
referred to as Quality, Safety and Prestige (4.2, 4.3, 4.4, 4.5 e 4.14), is associated with variables related to safety, quality of pilots and
aircraft and transmitted by the trust company. Factor 2 titled Benefits and Image (4.1, 4.9, 4.10 e 4.13), adds variables that relate to
income that consumers can get when traveling on TAP and the very image of the company. Regarding the third factor is bound attributes
relating to the company's ability to meet deadlines and effective treatment of luggage, considering this factor as efficacy (4.11 e 4.12).
Factor 4 was designated price (4.6 e 4.7), because here are grouped variables linked to the price of the company and value for money.
For the Factor 5 relates to the coverage of destinations and proximity (4.8 e 4.15) to customers. Finally got the Factor 6, designated as
Classes and Post-sale (4.16 e 4.17), where it is shown the existence of infrastructures that allow you to have two types of passengers
on planes, as well as infrastructure that relate to the ability to solve problems quickly manage complaints. Analyzing in isolation we find
that the attributes that passengers raise more agreement, is without doubt the existence of two classes in aircraft, baggage and effective
treatment of high coverage of destinations, as revealed in the next table.

37
Table nº 1.3 – Results of exploratory factor analysis - reasons choice of TAP
Components Communalities
1 2 3 4 5 6
4.2. High safety and confidence conveyed by the company. ,737 0,57
4.3. Quality of service aboard. ,748 0,69
4.4. Quality of Meals. ,570 0,589
4.5. Prestige Company's aviation market. ,658 0,586
4.14. Competence and efficiency of pilots. ,625 0,61
4.1. The advantages and benefits of the accumulation of miles are quite high. ,683 0,558
4.9. I get benefits outweigh the costs. ,515 0,654
4.10. For the good image that is present in the minds of all consumers. ,686 0,707
4.13. Modernity and conservation status of its fleet. ,617 0,706
4.11. Compliance and respect for timetables. ,781 0,696
4.12. Effective treatment of baggage. ,830 0,73
4.6. For the price charged by the company. ,735 0,641
4.7. Relationship between quality and price. ,736 0,682
4.8. Relationship of customer proximity. ,563 0,61
4.15. High coverage of destinations. ,803 0,679
4.16. Stocks of 2 different classes on their aircraft. ,870 0,802
4.17. Speed in solving any problems and complaints management. ,504 0,601
% Explained variance 15,7 12,4 10,6 9,9 8,8 8,0
Total variance explained 65,4
Note: Rotation Method: Varimax with Kaiser normalization. Rotation converged in 11 iterations. N = 200. The saturations great er than 0.4 are bolded.
Source: Author's Own
Factor Analysis Principal Component-Behavior Program members TAP Victoria: Regarding the behavior of members, justified the
creation of two factors presented in the following table. For each of the components can present a designation that reflects the summary
of the content of the variables that constitute it. Factor 1 called Loyalty (7.3, 7.4, 7.5 e 7.6), is associated with variable connection to
the company, either by repeat purchase intention and continuity, either by recommendation from friends and family. Factor 2 t itled
Opportunities (7.1 e 7.2), adds variables offer greater customer value offered by the company and an intention to continue to enjoy the
services of the company since it is justified. Analyzing in isolation we find that the attributes that passengers raise more agreement, is
without doubt continue to travel around while TAP is profitable for me when I need to travel and TAP Portugal is my first choice
although there are other companies that offer lower prices attractive, as revealed in the next table.
Table nº 1.4. - Results of exploratory factor analysis - behavior of members
Components Communa
lities 1 2
7.3. I am particularly attached to this company compared with other competitors. ,848 0,752
7.4. When I need to travel TAP Portugal is my first choice, although there are other companies that offer more attrac tive prices. ,856 0,762
7.5. Whenever my friends or family ask me for advice about companies, I recommend TAP Portugal. ,855 0,748
7.6. I intend to continue in the coming years to take advantage of the services offered by the company today. ,696 0,616
7.1. I believe that, at the time, TAP Portugal / TAP Victoria Programme, has offers greater value and higher quality compared with
its competitors. ,543 0,485
7.2. I will continue to travel by TAP Portugal is as profitable for me. ,932 0,874
% Explained variance 47,7 22,9
Total variance explained 70,6
Note: Rotation Method: Varimax with Kaiser normalization. Rotation converged in 3 iterations. Source: Author's Own
After collecting and analyzing the data should be analyzed to confirm or deny whether the general hypothesis or hypotheses of
operational, so that will provide the conclusions of this research, as such, is present then the analysis of each hypothesis.

38
H1: There is a positive relationship between the perceived quality of the brand and bra nd equity TAP Portugal TAP Portugal brand.
To test Hypothesis 1 is necessary to perform the following analysis: checking the reasons that lead the public to travel with the company
to understand whether they relate to the asset value of the perceived quality of the brand.
Conclusions: All items analyzed have an average value above the midpoint of the scale, indicating that they all show satisfactory and
relevant. The reasons most marked related to perceived quality are 4.3. quality of service aboard, 4.4. q uality of meals and 4.13.
modernity and conservation status of its fleet. Perceived quality creates satisfaction and value for the customer consistentl y and
profitably. Kotler (2000) and Kotler and Keller (2006) draw attention to the close connection betwe en the product and service quality,
customer satisfaction and profitability.
H2: There is a positive relationship between brand loyalty and brand equity TAP Portugal TAP Portugal brand.
To test Hypothesis 2 is necessary to perform the following analyzes: check the behavior of the public in relation to the company and
examine whether customers often travel always by TAP Portugal. We can also test if customer loyalty is related to the fact th at the same
hold a loyalty card loyalty program of the airline, TAP Victoria (Miles card, Silver and Gold Winner).
Conclusions: The percentage traveling by TAP is always inferior to the card holders Miles Winner and top for card holders and Gold
Winner Silver Winner. This analysis reinforces the hypothesis H2, because the holders of loyalty cards with more privileges are
traveling more than ever for TAP, then the benefits that are offered to customers, which are higher as the type of card incre ases, make
that retention is a reality. (Zineldin, 2006; O'Brien and Jones, 1995; Dowling and Uncles, 1997 to Duffy, 2002).
As regards the behavior of the members, all items have an average value greater than the midpoint of the scale, which shows a very good
behavior against the company. The degree of agreement is thus superior to the 7.2.continuarei while traveling by TAP Portugal is
profitable for me, 7.6 I intend to continue in the coming years to take advantage of the services offered by the company and 7.3 present
me feel particularly connected to this company compared with other competitors. The concept of commitment, which is the type of
behavior expected by any organization "is a psychological force that binds the customer to the organization with which it does business"
(Fullerton, 2005:100) and Wong and Sohal (2002:35) say in which "compromising appears to be one of the most important variables to be
used for understanding the strength of a relationship marketing, and is a useful concept to measure the likelihood of a custo mer loyalty, as
well as to predict the frequency of future purchase" . This attitude of commitment is reflected in the desire and intention of the partners in
the relationship of the organization and continue to feel emotionally attached to it, relying on the stability of this relati onship (Morgan
and Hunt, 1994). From what we can affirm that confirms Hypothesis 2.
H3: There is a positive relationship between reputation and brand associations and brand equity TAP Portugal TAP Portugal brand.
To test Hypothesis 3 is necessary to perform the following analysis: the reasons why the public to travel with the company to
understand whether they relate to assets representing the value of the brand, reputation and associations.
Conclusions: All items analyzed have an average value above the midpoint of the scale, indicating that they all show satisfactory and
relevant. The reasons are more marked 4.14. competence and efficiency of the pilots and 4.5. company's reputation in the avia tion
market, 4.2. high security and confidence conveyed by the company and 4.10. the good image that is present in the minds of all
consumers. These can be grouped according to the assets constituting the brand value, the notoriety (4.14, 4.5, 4.2) and asso ciations
(4.10).
According to Nguyen and LeBlanc (2001:228), the image of an organization can be "described as the overall impression established in the
public mind about a company". Which is related to several physical and behavioral attributes of the organization such as the company
name, organizational structure, the variety of products / services, tradition, ideology and sense of quality communicated by each person
who interacts with the customers of the company "among other aspects. The consumer to choose their supplier does so based on the
evaluation of image / corporate positioning (Deschamps and Nayak, 1996), as such, the picture is "one of the most valuable assets that an
organization can have" (Gomes and Shapiro, 1993:84) and whose competitive advantage resulting from this form of differentiation of
the product / service "is virtually impossible for a competitor to duplicate it" (Webster, 1994:104).
We can thus conclude that it is clear the weight of importance of the company in the aviation market, thus giving a high impo rtance on
organizational image (associations), which is much more powerful, the more the remaining sources of value if prenunciarem. From what
we can affirm that all confirm the hypotheses presented, which incidentally come so reinforce previous studies (Aaker, 1991, 1996;

39
Atilgan et al., 2005; Rundle-Thiele and Bennett, 2001; Bharadwaj, Varadarajan and Fahy , 1993; Alba and Hutchinson, 1987, Walsh and
Mitchell, 2005).
For the general hypothesis, which is that good results will be the company TAP Portugal are due to the perception of its user s, with
regard to the sources of value of your brand, as occur most operating assumptions, we can conclude that this is checks. Especially
because it has been proven that users exhibit high degrees of loyalty or brand loyalty, perceived quality, reputation and ass ociations,
which are assets that constitute the value of a brand, through positive references that carry the willingness to pay a price high whe n the
uncertainties are reduced or eliminated, value the quality factor and its relationship with the price, have intentions to con tinue enjoying
the services of the company and value the organizational image as it is mainly for these reasons that choose to travel by TAP Portugal.
3. Conclusion
The evaluation of brand equity is important for all business managers, as well as giving insights about brands, it is also a starting point
for the development of a specific system for monitoring them (Aaker, 1996). Due to this fact, there are several academic stud ies on the
problem of the evaluation of brand equity, but the models Aaker (1991) and Keller (1993) are the most referenced and used by
academic studies (Anselmsson et al., 2007), because, and according to these same authors, there are similarities between thes e two
models, with regard to the importance of brand awareness, quality and brand associations. As such, our study was focused on these
models and in four dimensions, these being, perceived quality, brand loyalty and reputation and brand associations.
Comparing the results obtained with the proposed objectives, we can conclude tha t there is a relationship between the dimensions of
brand equity, according to the model of Aaker (1991, 1996), with the brand equity of the brand TAP Portugal, where the variab les
concerned explain the success of the brand, as proven in the results presented above in that the main reasons why passengers choose
TAP relate to the influence that the company is in the aviation market, for more items listed relate to the competence and ef ficiency of
the pilots (4.14), the company's reputation in the aviation ma rket (4.5) and high security and confidence conveyed by the company
(4.2). Regarding the behavior of members concordance was highest for the items, I will continue to travel by TAP Portugal is as
profitable for me (7.2), I intend to continue in the coming years to take advantage of the services offered by the current airline (7.6) and
I feel particularly connected to this company compared to its other competitors (7.3). The last two items presented show an e motional
connection to the brand, because they reveal a strong connection and continuity.
According to several authors, brands are a combination of several elements like name, symbol, or design that identifies one o r a set of
products and / or services. All these elements will define the brand, ie, will g ive an identity to the brand, which in turn will give a
direction, a purpose and a meaning to the brand and that will serve to try to influence consumers to prefer our brand . In a review of a
brand, certain characteristics are always evaluated by consumers: brand loyalty, brand awareness, perceived quality and brand image,
so this was the philosophy that governed the construction of the questionnaires. Tried to assess these four points in order t o meet the
author who based my study.
Through all the presented results we can conclude that the good results presented by TAP Portugal relate to the sources of its brand
value, especially when active loyalty, because according to Aaker (1991), brand loyalty is a core dimension of brand equity i f customers
continue to buy the same brand, even when competitors improve the characteristics of their products, their price or convenience, then it
means that there is substantial value in this brand, its symbol and slogans.
A large number of loyal consumers is a heritage of the brand, and has been identified as a major determinant of Brand Value (Rundle -
Thiele and Bennett, 2001). It is she who will ensure that forecasts of future earnings and cash flows will be realized. The c hallenge for
management is therefore to transform the consumer's emotional connection with the repeated mark on purchases over time. Thus,
marketers are responsible for creating lifestyles, not just products or services, because every purchase is generated by emot ional
factors. From the standpoint of management, brand equity provides sustainable competitive advantage for the firm (Bharadwaj,
Varadarajan and Fahy, 1993). In fact, this study has demonstrated the importance of marketing efforts on building strong bran ds. The
top managers should improve their performance in marketing strategies aimed at strengthening the determinants of brand equity of its
brands, including loyalty, because that way will ensure the sustainability of its core asset, the brand.
4. Limitations and conclusions implications.
The study has some limitations, which offer opportunities for future research to improve the work done, which are now presented. We
can then call the limitations found throughout and after the completion of this investigation, as such, were not distinguishe d in the

40
study, the different categories of clients, individuals and corporate, the study only focused on users residing in Portugal a nd the
limitation of sample size 200 answers.
The fact that in this study have opted for a quantitative approach does not pre clude future studies will not adopt methodologies with
qualitative in-depth interviews with consumers and marketing managers, to better characterize the dimensions of the model and the
actual situation of different lovebrands, which would serve to deepen the theme. Also interesting would be the study of the impact of the
marketing mix variables in building a lovebrand may constitute an important step in the development of the work presented.
References
AAKER, D. (1996). Building strong brands. New York: The Free Press.
AAKER, D. (1991). Managing brand equity: capitalizing on the value of a brand Name . New York: The Free Press.
AAKER, D.; JOACHIMSTRALER, E. (2000). Brand leadership. New York: The Free Press.
ALBA, J.; HUTCHINSON, J. (1987),. Dimensions of Consumer Expertise, Journal of Consumer Research, 13 (4): 411-454.
ANA, Aeroportos de Portugal (2010), “Relatório Anual de Estatística de Tráfego, 2010”,
http://www.ana.pt/ngt_server/attachfileu.jsp?look_parentBoui=112474551&att_display=y&att_download=y . Consultado em
08 de junho de 2011.
ANDERSON, E. W. & MITTAL, V. (2000). Strengthening the satisfaction: profit chain. Journal of Service Research, Nº 3, pp. 107-120.
ATILGAN, E.; AKSOY, S. & AKINCI, S. (2005). Determinants of the brand equity: A verification approach in the beverage industry in
Turkey, Marketing Intelligence & Planning,23 (3): 237- 248.
BHARADWAJ, S.; VARADARAJAN, P. & FAHY, J. (1993). Sustainable Competitive Advantage in Service Industries: A Conceptual Model and
Research Propositions, Journal of Marketing, 57(4): 83-99.
BASTOS, S. (2011). “Como a TAP é vista pelos especialistas do sector” (Versão Eletrónica), Jornal Expresso de 13/06/2011, disponível
em http://www.lowcostportugal.net/viajar/aeroportos/tap-analisada-a-lupa-pelo-expresso-concorrencia-low-cost-em-
lisboa-e-uma-ameaca/2011/06/#a xzz1vufGzLkw. Consultado em janeiro de 2012.
BOLTON, R. (1998). A dynamic model of the duration of the customer’s relationship with a continuous service provider: the role o f
satisfaction. Marketing Science, Vol.17, nº 1, (1998), pp. 45-65.
BOLTON, R. N. & KANNAN, P.K. (2000). Implications of loyalty program membership and service experiences for customer retentio n and
value. Journal of the Academy of Marketing Science, Vol. 28, N. 1, pp. 95 – 108.
BRITO, C. & RAMOS, C. (2000). Comércio eletrónico: relação com parceiros de Negócio. Porto: Sociedade Portuguesa de Inovação.
CALDAS, A. E GODINHO, L. (2007). A Perceção Quanto ao Valor da Marca . Dissertação de Pós-Graduação, Centro Universitário de Belo
Horizonte UNI-BH. http://www.webartigos.com/artigos/a-percepcao-quanto-ao-valor-da marca/2783/#ixzz2GME4i05C.
Acedido em 10 de fevereiro de 2013.
CARMO, H. & FERREIRA, M. (1998). Metodologia da Investigação. Guia para Autoaprendizagem, Universidade Aberta, pp. 138-197.
CHEN, H. & GREEN, R. (2009). Marketing Mix and Branding: Competitive Hypermarket Strategies, International Journal of Management
and Marketing Research, 2 (1): 17-34.
CRAVENS, D. W.; GERALD, E. & WOODRUFF, R. (1987). Marketing Management. Homewood IL: Richard D. Irwin, pp.375.
DESCHAMPS, J. & NAYAK, P. (1996). Produtos irresistíveis - como operacionalizar um fluxo perfeito de produtos do produtor ao
consumidor. São Paulo: Makron Books.
DOWLING, G. & UNCLES, M. (1997). Do customer loyalty programs really work. Sloan Management Review, Vol. 38, pp. 71-82.
DUFFY, D. (2002). Do Something! Guia prático para fidelização de clientes. São Paulo: Prentice Hall.
FAIRCLOTH, J.; CAPELLA, L. & ALFORD, B. (2001). The effect of brand attitude and brand image on brand equity, Journal of Marketing
Theory & Practice, 9 (3): 61-75.
FULLERTON, G. (2005). The service quality-loyalty relationship in retail services: Does commitment matter? Journal of Retailing and
Consumer Services, Vol. 12, n. 2, pp. 83-102.

41
GANESH, J.; ARNALD M. & REYNOLDS, K. (2000). Understanding the customer base of service providers: an examination of the
differences between switchers and stayers. Journal of Marketing, Vol. 64, pp. 65-87.
GRONROOS, C. (1995). Marketing : gerenciamento e serviços : a competição por serviços na hora da verdade . Rio de Janeiro.
GOMES, M. & SHAPIRO, A. (1993). Imagem corporativa - uma vantagem competitiva sustentável. Revista de Administração de Empresa,
Vol. 33, n. 6, pp. 84-96.
HART, C. & JOHNSON, M. (1999). Marketing management. American Marketing Association, pp. 9.
HILL, M. & HILL, A. (1998). A construção de um questionário. Dinâmia – Centro de Estudos sobre a Mudança Socioeconómica, Fundação
para a Ciência e Tecnologia.
HILL, M. & HILL, A. (2002). Investigação por Questionário. Edições Sílabo, pp.2-164.
HOLT, D. (2005). Como as Marcas se tornam ícones: os princípios do branding cultural; Tradução Gilson César Cardoso de Sousa, São
Paulo: Cultrix.
JARILLO, J. & BIDAULT, F. (1995). Trust in economic transactions. Genebra: European Science Foundation Conference.
KEAVENEY, S. (1995). Customer switching behavior in service industries: an exploratory study. Journal of Marketing, Vol. 59, pp. 71-82.
KELLER, K. (1993). Conceptualizing, Measuring, and Managing Customer-Based Brand Equity. Journal of Marketing. Chicago: American
Marketing Association. Vol. 57, pp. 1-22.
KELLER, K. (1998). Strategic Brand Management: Building, Measuring and Managing Brand Equity.
KIVETZ, R. & SIMMONSON, I. (2002). Earning the right to indulge: effort as determinant of customer preferences toward frequency
program reward. Journal of Marketing Research, Vol. 39, pp. 155-170.
KOTLER, P. (1998). Administração de marketing: análise, planeamento, implementação e controle. Tradução Ailton Bonfim Brandão, 5ª
edição, São Paulo: Atlas.
KOTLER, P. (2000). Administração de Marketing, 10ª. ed. São Paulo: Prentice Hall.
KOTLER, P. & KELLER, K. (2006). Administração de Marketing: A Bíblia do Marketing. 12ª Edição. São Paulo: Pearson Prentice Hall.
KOTLER, P.; WONG, V.; SAUNDERS, J. & ARMSTRONG, G. (2005). Principles of Marketing (4th European Edition), Edinburg: Prentice
Education Limited,.
KUMAR, A.; GEORGE, M. & PANCRAS, J. (2008). Cross-buying in retailing: Drivers and consequences. Journal of Retailing, Vol. 84, Nº. 1, pp.
15-27.
LARA, P. & CASADO, J. (2002). Marketing relacional”, Madrid: Pearson Educación, pp. 147-152.
LABARBERA, P. & MAZURSKY, D. (1983). A longitudinal assessment of consumer satisfaction / dissatisfaction: the dynamic aspect of the
cognitive process. Journal of Marketing Research, Vol. 20, pp. 393-404.
MORGAN, R. & HUNT, S. (1994). The commitment-tr ust theory of relationship marketing. Journal of Marketing, Vol. 58, N. 3, pp. 20-38.
NGUYEN, N. & LEBLANC, G. (2001). Corporate image and corporate reputation in customers retention decisions in services. Journal of
Retailing and Consumer Services, Vol. 8, N. 2, pp. 227-236.
O´BRIEN, L. & JONES, C. (1995). Do rewards really create loyalty? Harvard Business Review, Vol. 73, pp. 75-83.
OLIVER, R. L. (1997). Satisfaction: a behavioral perspective on the consumer. Boston: McGraw-Hill.
QUIVY, R. & CAMPEBHOUDT, L. (2003). Manual de Investigação em Ciências Sociais. Gradiva, pp.25-239.
REICHHELD, F. & KENNY, D. (1990). The hidden advantages of customer retention. Journal of Retail Banking, Vol. 4, nº 1, pp. 19-23.
REICHHELD F. & SASSER, W. (1990). Zero defections: quality comes to services. Harvard Business Review, Vol. 68, pp. 105-111.
REICHHELD, F. & TEAL, T. (1996). The loyalty effect. Boston: Harvard Business School Press.
TAYLOR, S. & BAKER, T. (1994). An assessment of the relationship between service quality and customer satisfaction in the formation of
customer´purchase intentions. Journal of Retailing. Vol. 70, nº2, pp.163-78.
42
RUNDLE-THIELE, S. & BENETT, R. (2001). A brand for all season? A discussion of brand loyalty approaches and their applicability for
different markets, Journal of Product & Brand Management, 10 (1): 25-37.
TAP PORTUGAL (2010). “Relatório Anual de 2010”,
http://new.flytap.com/prjdir/flytap/mediaRep/editors/Contentimages/INSTITUTIONAL/PDF/TAP/Relatorios/anual/2010
/TAP_RA_2010.pdf. Consultado em 08 de junho de 2011;
TAP PORTUGAL (2011), “História e Frota da Tap, Destinos, Produtos, Programas e Iniciativas da Companhia, Cartazes Publicitários,
Serviços de Bordo, Evolução dos Logotipos da Companhia, Fardas, Grupo TAP, Informações acerca da GroundForce e Jornal TAP
nº 84”, www.tapportugal.com; www.tap-airportugal.com e www.flytap.pt .Consultado em 23 de abril de 2011.
TURISMO DE PORTUGAL (2011). “Os Resultados do Turismo”, 2º Semestre 2011,
http://www.turismodeportugal.pt/Portugu%C3%AAs/ProTurismo/estat%C3%ADsticas/an%C3%A1lises estat%C3%ADstic
as/osresultadosdoturismo/Anexos/2%C2%BAT%202011%20-%20%20Os%20resultados%20do%20Turismo.pdf.
Consultado em 01 de outubro de 2011.
TAP VICTORIA (2001). “Informações acerca do Funcionamento do Programa, Acumulação e Utilização de Milhas”,
http://www.tapvictoria.com. Consultado em 15 de abril de 2011.
VILARES, M. & COELHO, P. (2005). Satisfação e Lealdade do cliente, Metodologias de avaliação, gestão e análise. Escolar Editora, pp. 21.
WALSH, G. & MITCHELL, V. (2005). Demographic Characteristics of Consumers Who Find It Difficult to Decide, Marketing Intelligence
and Planning, 23 (2/3): 281-295.
WASHBURN, J. & PLANK, R. (2002). Measuring brand equity: an evaluation of a consumerbased brand equity scale, Journal of Marketing
Theory and Practice, 10 (1): 46-62.
WEBSTER, J. & FREDERICK, E. (1994). Marketing driven management. New York: John Wiley & Sons.
WONG, A. & SOHAL, A. (2002). An examination of the relationship between trust, commitment and relationship quality. International
Journal of Retail and Distribution Management, Vol. 30, N.1 , pp. 34-50.
YOO, B.; DONTHU, N. & LEE, S. (2000), An examination of selected marketing mix elements and brand equity, Journal of Academy of
Marketing Science, 28 (2): 195-211.
ZEITHAML, V.; BERRY, L. & PARASURANAM, A. (1996). The behavioral consequences of service quality. Journal of Marketing, Nº 60, pp.
31-46.
ZINELDIN, M. (2006). The royalty of loyalty: CRM, quality and retention. Journal of Consumer Marketing, Vol.23, N. 7, pp. 430-437.

43
Session 2
44
Using the eye tracking for analysis of
preference for vehicles Neuromarketing; Neuroeconomics; eye tracking; declared preference
Caissa V. Sousa, Faculdade Novos Horizontes, [email protected]
José Edson Lara, Faculdades Pedro Leopoldo, [email protected]
Erico Castro-Costa, Centro de Pesquisa Rene Rachou/Fiocruz, [email protected]
Carlos Alberto Gonçalves, Universidade Federal de Minas Gerais - UFMG/CEPEAD, [email protected]
Henrique T. Akiba, Universidade de São Paulo – USP, [email protected]
Rodrigo A. Bressan, Universidade Federal de São Paulo – UNIFESP, [email protected]
Álvaro M. Dias, Universidade Federal de São Paulo – UNIFESP, [email protected]
Abstract
From the early 1980 on, the Neuroscience showed significant advances regarding the knowledge and analysis of the brain
in vivo. Among these possibilities, the eye tracking, the ability to infer the relativ e role of different parts of the same object
in the sensory appropriation carried out, providing suggestions about the establishment of preference, which may lie
beyond the conscious domain and cannot therefore be prospected by means of questionnaires. Therefore, the present
research aimed to identify the main points of high valence and salience when observing three photos of brand /model
vehicles, allowing to infer the preferred points or the points to be rejected in each vehicle. 30 volunteers were selected
through accessibility in the city of São Paulo Brasil. They were exposed to Visual stimuli of the vehicles – Fiat Bravo, Ford
Focus and Hyndai I30. Utilizing the ViewPoint equipment Tracker, the map of the eye movements of individuals were
captured, identifying points of higher valence - i.e. points observed per region and higher salience, which is the analysis of
the pupil diameter. The data was presented with a questionnaire filled out manually by volunteers, allowing the crossing
of the data observed through the analysis of the eye tracking and the information stated. Among the study findings, the
inter cars analysis does not allow to infer that there is relationship between the car observed and the mean of the pupil
diameter, however, there is a relationship between the pupil diameter mean and the result of each projected item.
1 Introduction
From the late 1980 on and, more markedly, the early 1990, the neurosciences presented advances in the
development of new techniques of evaluation of the brain in vivo, enabling to capture the changes in the brain functioning
during mental stimulation, from non-invasive techniques. Besides representing benefits related to its initial proposal
which is the medical science, such advances have also contributed to the development of various fields of knowledge,
especially those related to the human and social sciences, notably in the areas of Economics and Marketing.
Specifically in respect of the identification of the attributes related to the decision-making of the individuals.
Recent studies have proved to be important contributions of Neurosciences, broadening the scope of the researchers’
evaluations. This new research approach, which broadens the possibilities for the study commonly used, such as
questionnaires and focal groups, it is named by the marketing researchers, neuromarketing (Braidot, 2005, 2009;
Lindstrom, 2008, 2009; Zaltman, 2003, 2008).
When compared to the conventional research methods used in the areas of business administration and
economics, as quantitative and qualitative research, it is possible to affirm that the Neuroeconomics and Neuromarketing
is a new field of knowledge to be reaffirmed as a transdisciplinary research space, involving the interaction of areas such

45
as: Anthropology, Psychology, Sociology, Marketing, Economics, and, especially, the Neurosciences for the study of
consumer behavior (Dias, 2010b; Soares Neto, 2007; Zaltman, 2003).
According to Zaltman (2003) it is necessary to recognize that mental activity arises from the i nteraction between
social processes and biological processes, so it is possible to imagine new ways of collecting and processing the data from
the understanding of the importance and the complexity of the human brain in decision-making. In this sense, the
contribution of Neuroscience to assist in identifying difficult aspects of expression and knowledge rather than other
research techniques, due to its unconscious aspect to the consumer.
Among the most used techniques it is cited the neuroimaging methods such as functional magnetic resonance
imaging (fMRI) (Harlé and Sanfey, 2012; McCabe et al., 2001; McClure et al., 2004; Venkatraman et al., 2012; Xue, 2009),
electromyography (EMG) (Dias, 2010a; Ohme, Matukin & Pacula-Lesniak, 2011; Soleymani et al., 2009) and the
magnetoencephalography (MEG) (Lee et al., 2009; Trinity, 2004); central neurophysiology techniques, such as the
electroencephalogram (EEG) (Dias, 2012; Ariely & Berns, 2010); In addition to the peripheral, neurophysiology techniques
involving the electrocardiogram and the measurement of the heart rate variability (HRV) (Crozet, 2009; Dias, 2010a,
2010b, 2012), Galvanic Skin Response (GSP) (Crozet, 2009; Dias, 2010a, 2012) and the eye tracking (López-Gil et al., 2010;
Schiessl, 2003, Theuner, 2008), which is the method proposed for assessment in this study.
The eye tracking consists in tracing the iris to identify what draws the consumer's attention in a particular
advertisement - object, picture, web site, or any other point chosen by the consumer. The method enables to identify the
areas of greatest interest of the observer (López-Gil et al., 2010; Schiessl, 2003). The eye tracker cameras are able to
monitor any movement of the eyes during the visual process. This technology allows to measure the time that the
individual spends looking at each specific part of the object in question and to check what region draws more attention
and the order of observation of the regions of interest (Theuner, 2008).
Considering that every second 11 million bits of information is received by all the senses, of which only 50 are
processed (Wilson, 2002), the understanding of which factors are responsible for the capture of attention is fundamental
to the establishment of the preference in the case of visually analyzed objects (Plassman, 2012). In this study, more
specifically, the objects elected for analysis were three cars with distinct brands and models: Fiat Bravo, Ford Focus and
Hyundai I30, all of them were Hatch models and they are marketed in Brazil.
It is believed that the technique when applied to the analysis of preference for cars allows the suggestions about
the relative role on the different parts of the object (headlight, front glass, mirror, etc.) in the sensory appropriation
carried out, providing suggestions about the leitmotiv of the establishment of the preference, which may be placed beyond
the conscious domain and cannot, therefore be prospected by means of questionnaires.
Starting from the arguments presented, the present study had as the main objective to identify the points of
valence and salience on the observation of the photos of three brand/models vehicles allowing to infer the preference
points or the points to be rejected in each vehicles.
2 Metrics based on the eye tracking as the support for the consumer behavior study
In this section the assumptions supporting the use of eye tracking as the metric of the research in the social
sciences, more specifically, in the study of consumer behavior are developed.
2.1 The development of consumer behavior studies
With the end of the Second World War, some factors such as the rapid overcoming of the repressed demand, the
spread of television as a mean of communication and access to advertisements, the emergence of shopping malls and
discount stores and the economic growth have led to new arrangements in the development of Marketing strategies. In the
new scenario, consumers went on to play a more active role. It is appropriate to know the consumers’ profile and
understand the motivations and the expectations about the products and services. This led the Marketing theory to emerge
in 1950 at the school of consumer behavior (Engel, Blackwell & Miniard, 2000; Sheth, Gardner & Garret, 1998).
Two groups distinguish in elaborating models to analyze consumer behavior: stimulus-reaction models, which are
mathematical models and aim to answer a specific question; and the explanatory models which study the reasons involved

46
in consumer decision-making (Goldstein & Adams, 2000). According to the authors, despite the important contributions,
the integrative models of consumer behavior are still considered unknown phenomena. Thus, there is a holistic and
holographic integration trend that along with the support of the consumer behavior theory and other theories, s uch as
neural networks and mental processes, will be able to broaden the understanding of factors yet unknown.
In this context, Mowen and Minor (2003), even without addressing the term "Neuromarketing", specifically, have
already indicated the importance to pay attention to physiological aspects to the measurement of the level of attention
given to a stimulus. The authors state that the measurement of the level of excitement generated by the stimulus can be an
important measurement to assess the impact of advertising campaigns, a context in which the eye tracking is portrayed by
Zikmund and Babin (2011) as a technique capable of revolutionizing the process of gathering information for the research
in marketing. In this respect, it should be noted that the authors understand the neurophysiological measurements as
promising techniques, although still embryonic. Somehow, it can be justified by the cost of the application when comparing
the cost of the traditional research methods such as the qualitative interviews or the surveys.
2.2 measurement of neurophysiology peripheral: eye tracking
The interest in discoveries about visual system is not new. According to Li, Munn and Pelz (2008), since the
beginning of the 19th century researchers have undertaken efforts to develop techniques to describe the movement of the
eyes. However, it was in the last thirty years that such studies developed more. It may be indicated among these studies:
electrooculography development, reflection of the cornea, pupil dilatation and the development of contact lenses (Joyce et
al., 2002).
In the case of eye tracking, specifically, its use in research of cognitive processes has already exceeded 100 years.
Currently, it is considered a great power of prediction (Brown, Jay & Harper, 2010; López-Gil et al., 2010), especially when
used in conjunction with other techniques, allowing the researcher to identify which areas of the figure presented are
more salient — that is, attract more attention – and which areas are less salient (Brown, Jay & Harper, 2010). It should be
noted that the salience represents the importance assigned to an attribute, indicating the importance for the consumers,
unlike the valence, representing the fact of an attitude toward something (goods, service, brand, advertising campaign,
etc.) be positive, negative or neutral (Engel, Blackwell & Miniard, 2000).
The eye tracking is based on the use of cameras that detect the position, direction and the diameter of the pupil.
These cameras can be set in the ambient, in front of the participant or a pair of glasses. The mapping of eye movements
provides information relevant to the study of preference for objects, giving precise information about the most interesting
(salient) of a given stimulus.
The conventional model of eye tracker is composed of cameras that are set on a pair of sunglasses fixed on the face
of the observer. An infrared light diode is set beside the camera attached next to the eye (about 30-40 mm away from the
eye). The eye camera captures these images while the central camera captures the scene that the observer is seeing.
Infrared light is invisible to the human eye and do not disturb or distract the observer. It has the advantage of reflecting
strongly the iris, regardless of their color. There is a cable attached to the glass that transmits the information to the
software for later transcription and analysis of the data (Read, Munn & Pelz, 2010).
2.3 Research Hypotheses
From the theoretical development presented, it was possible to formulate the followi ng research hypotheses
tested from the experiment proposed in the third section:
H1- It is possible from the eye tracking to identify areas of interest that are differentially met and they are
statistically significant in each of the cars.
H2- It is possible from the eye tracking to identify regions of interest that produce different patterns on the
peripheral neurophysiological activity, statistically significant, measured through levels of pupil dilatation.

47
3 Experimental Design and method
In order to the conduct the experiment 30 volunteers were randomly selected and the following exclusion criteria:
under the age of 18 years; employees of any of the organizations responsible for the brands surveyed; and individuals who
claim to possess at the time of the study any of the three vehicles researched.
Since the measure of the salience presents the point that most caught the attention of the individuals, given the
presented stimuli, it was wise to include at this stage of the research a measurement of qualitative character, in order to
make it possible to compare the subjects declarative information about preferences, with the points observed from the eye
tracking. This provides greater reliability for the data submitted since it enables to argue about points of highest salience
as preferred or rejected by the individuals.
Thus, the eye tracking was divided into two moments. At first, the data collection of the tracking experiment itself,
and in the second, the volunteers filled out a questionnaire intended to identify parameters of preference between the
vehicles analyzed. The eye tracking data collection took place in the Department of Experimental Psychology (PSE) of the
University of São Paulo (USP), Brazil.
The equipment used was the ViewPoint of Arrington Tracker Research, composed by a pair of glasses equipped
with three cameras, two pointing at each of the individual's eyes capturing what he is watching (stimulus). Two led were
positioned just below the cameras, which film the eye, projecting an infrared light in the eyeball allowing the distinction
between the iris and the pupil. The center of the pupil can be detected in three different ways: by reflection of the cornea,
the difference in light between the iris and the pupil or a combination of both. The adjustment of the cameras to the
correct image capture of the eye is done manually. This process is carried out through mathematical algorithms that
automatically calibrate the location of the center of the pupil and provide information about its diameter, direction and
time of fixation. This data is stored by the program and exported in ‘txt’ format, capable of being opened in Excel program.
ViewPoint Eye Tracker also generates a video which features points showing the eye movement of each of the indiv iduals'
eyes as well as the time of the video in milliseconds, and presents the look fixation regions, distinct by the colors red and
yellow, for the left and right eyes respectively. It is noticed that there is a larger concentration of the look fixation in some
regions rather than in others.
In order to create the maps related to eye movements and subsequent the segmentation of those parts of the
stimulus in the regions of interest, a software using the MATLAB 2010 has been developed. Through the data provided by
ViewPoint Eye Tracker, the interface of the analysis program produces the map of eye movements of the individual that is
plotted on the static image of the screen seen by the individual. This procedure is done screen by screen selecting the data
according to the time interval in which was presented to the screen (10 seconds for images with three cars and 15 for
these individually), obtaining specific maps of eye movements during that period in which it was presented to the screen.
Once the maps were plotted on the screen, the program allows the adjustment of the dispersion of the points in
the image, thus preventing any calibration error, individual to individual. One adjustable mask makes the selection of the
points within the region of interest, which are added up and pre-tabled. Thus, it is obtained the data related to the
frequency of the points in the region and the mean the pupil diameter for each eye inside it. The height and the width of
the masks are also tabled as well as the time interval in which the data were obtained which can be readily exported and
then statistically analyzed. For the calculations, the software uses the look fixation time (time that the individual shall not
make saccadic movements calculated through algorithms) and the direction. The time varies according to each individual.
Figure 1 presents an example of selecting points tracked at a given time of the measurement. The color red
represents the left eye and the yellow the right eye. On the right side of the figure the exported data for the software
reading is presented and the export in Excel-compatible format.

48
Figure 1 – analysis of eye tracking inter stimuli and export to set the tables
Source: survey data
Before starting the observation of the images effectively, the volunteers were asked to observe the screen, where
black squares appeared at different points in order to calibrate the equipment. In order to the conduct of the experiment,
the photos of the three vehicle models analyzed were used, following these parameters: the photographs were produced
for use in the research with the help of a professional photographer; all vehicles photographed were brand new, 2012
model; the similarity between the angles were kept; the vehicles had similar colors, keeping the specifications of each car
manufacturers.
Each volunteer observed a sequence of nine images, presented randomly, having one sequence with the three
vehicles showed separately, totaling three photos, plus a sequence with three vehicles displayed at the same time, for
which the order is reversed, comprising six more photos. The time of observation was10 seconds for images with three
simultaneous cars and 15 seconds for these individually.
Soon after ended the experiment data collection, a questionnaire was given to the volunteers in order to be filed
out. The purpose of the questionnaire was to collect information of those involved in the research, so that the data
observed through the eye tracking could be confronted. This procedure was adopted to have clarity on the salient points to
confront them with the points declared as preferred or rejected by the individuals of the research.
During the filling out of the questionnaire, the photos were again available for viewing, avoiding the need to evoke
memory, which could incur inconsistencies regarding the memories. The first question involved marking a point on a
continuous line, in a graphic rating scale, without attribution of values and with the extremes "did not like" and "liked a
lot". According to Cooper and Schindler (2011), the graphics rating scale allows the identification of the subtle differences
based on the record of the respondent. The markup should reflect the point that most approached the opinion about each
vehicle. Then, it was asked to point out three attributes the individual had most enjoyed and three attributes that he had
least enjoyed for each one of the vehicles. Some people said they ‘couldn’t find’ three attributes for marking, whether in
terms of "Most liked", "Least liked", or both. For these cases, it was allowed the markup of a smaller number of attributes.
In order to analyze the questionnaires, the quantitative content analysis technique was utilized. George (2006)
uses simple statistical techniques such as survey of frequency and percentages, allowing data to be presented in tables,
figures or models.
The results finding on the measurement of eye tracking were analyzed through Multivariate analysis of data. Hair
Jr. et al. (2005, p. 26), "refers to all statistical methods that simultaneously analyze multiple measures on each individual
or object of investigation. Any simultaneous analysis of more than two variables in a certain way can be considered
multivariate analysis ".

49
4 Results
4.1 Analysis of the self filled questionnaires
30 individuals were randomly chosen, respecting the exclusion criteria established. Of this total, 24 filled out the
‘age’ in the questionnaire. The composition has a minimum age of 18 years and a maximum of 59 years old. The age mean
was 26.96 and the standard deviation was 8.222.
On the scale of preference for each vehicle, there was an unnumbered straight line, ranging from 0 to 10
centimeters, for which the respondent should mark its level of preference. It may vary from one extreme to another. The
analysis of this scale consisted of marking (in centimeters), according to the measure pointed out by the respondent.
Regarding the preference, Hyundai I30 was the vehicle that obtained the highest mean, followed by Ford Focus and Fiat
Bravo. The highest minimum value was also observed for Hyundai I30 (4 cm), it was the only vehicle that got maximum
value of 10 centimeters, recalling that the 0 cm mark means that ‘didn't like’ anything and that the marking 10 cm means
you ‘liked it’ a lot.
Following the questionnaire, each individual was asked about the items that most enjoyed in each vehicle keeping
the descending order of what you liked the most to least. Considering the information for the Fiat Bravo, the items
declared as preferred, when grouping the three positions were: headlights (15.6); fog light (10) and design (7.8).
Concerning the items declared preferred for the Ford Focus: headlights (28.9); fog lights (13.3); and hood (10). For the
Hyundai I30, on the same note, we have: headlights (26.7) and design (20). It should be noted that the third classification,
in the case of Hyundai I30, appeared more pulverized: front design, logo, bumper and rearview mirror, with 6.7 markings
for each item.
Considering the question "didn't like it", for the Fiat Bravo, we have the following: 17.8 marked the rearview
mirror; 13.3% did not indicate any item; and 11.1% indicated the headlights (11.1%). For the Ford Focus remained the
rearview mirror as item that more displeases (16.7%), followed by the bumper (10%), and the front grille (6.7%).
The Hyundai I30 was the vehicle upon which more people abstained from presenting a rejected call. It is noted a
pulverization in markings when asked to indicate three items. For this vehicle, 24.4% of the respondents did not indicate
one or more items; the hood, the fog lights, the front grille and the rear view mirror were featured items indicated by 5.6%
of then people (each item).
4.2 eye tracking experiment analysis
The results of the measurement of the peripheral neurophysiology through eye tracking have involved intra and
inter cars analysis in relation to both, the heat maps and the pupil dilatation. The integration of both provides important
benefits to the definition of the aspects that most drew attention in the figures presented and through the crossing of the
data from the questionnaires, it was possible the "drawing" of the preferred or the rejected aspects in each one of the
vehicles. Before starting the presentation of the results, some clarifications are important to facilitate the understanding of
the metrics presented:
Eye1 – refers to the number of points traced into the mask (region of interest), in relation to all points
observed in the range of exposure of the image to the right eye (these points are shown in red).
Eye2 – number of points traced into the mask (region of interest), in relation to all points noted in the image
interval presented to the left eye (these points are shown in yellow).
Eye1P – pupil diameter mean into the mask in relation to the pupil diameter mean in the full sequence (all
images) for the right eye.
Eye2P – pupil diameter mean into the mask in relation to the pupil diameter mean in the full sequence (all
images) for the left eye.
From the descriptive statistical data, it is possible to observe the data close to both eyes the right and the left, for
the three vehicles. In order to verify the existence of comparable patterns between variables Eye1, Eye2, mean %, P eye 1,
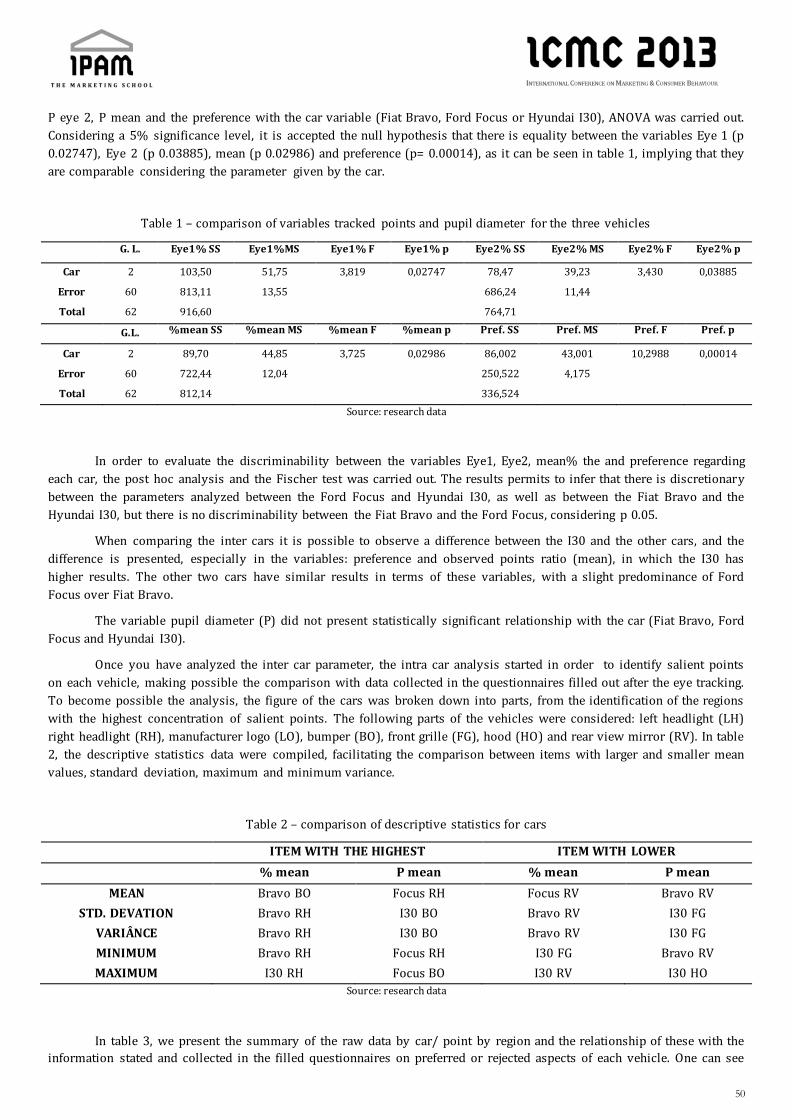
50
P eye 2, P mean and the preference with the car variable (Fiat Bravo, Ford Focus or Hyundai I30), ANOVA was carried out.
Considering a 5% significance level, it is accepted the null hypothesis that there is equality between the variables Eye 1 (p
0.02747), Eye 2 (p 0.03885), mean (p 0.02986) and preference (p= 0.00014), as it can be seen in table 1, implying that they
are comparable considering the parameter given by the car.
Table 1 – comparison of variables tracked points and pupil diameter for the three vehicles
G. L. Eye1% SS Eye1%MS Eye1% F Eye1% p Eye2% SS Eye2% MS Eye2% F Eye2% p
Car 2 103,50 51,75 3,819 0,02747 78,47 39,23 3,430 0,03885
Error 60 813,11 13,55 686,24 11,44
Total 62 916,60 764,71
G.L. %mean SS %mean MS %mean F %mean p Pref. SS Pref. MS Pref. F Pref. p
Car 2 89,70 44,85 3,725 0,02986 86,002 43,001 10,2988 0,00014
Error 60 722,44 12,04 250,522 4,175
Total 62 812,14 336,524
Source: research data
In order to evaluate the discriminability between the variables Eye1, Eye2, mean% the and preference regarding
each car, the post hoc analysis and the Fischer test was carried out. The results permits to infer that there is discretionary
between the parameters analyzed between the Ford Focus and Hyundai I30, as well as between the Fiat Bravo and the
Hyundai I30, but there is no discriminability between the Fiat Bravo and the Ford Focus, considering p 0.05.
When comparing the inter cars it is possible to observe a difference between the I30 and the other cars, and the
difference is presented, especially in the variables: preference and observed points ratio (mean), in which the I30 has
higher results. The other two cars have similar results in terms of these variables, with a slight predominance of Ford
Focus over Fiat Bravo.
The variable pupil diameter (P) did not present statistically significant relationship with the car (Fiat Bravo, Ford
Focus and Hyundai I30).
Once you have analyzed the inter car parameter, the intra car analysis started in order to identify salient points
on each vehicle, making possible the comparison with data collected in the questionnaires filled out after the eye tracking.
To become possible the analysis, the figure of the cars was broken down into parts, from the identification of the regions
with the highest concentration of salient points. The following parts of the vehicles were considered: left headlight (LH)
right headlight (RH), manufacturer logo (LO), bumper (BO), front grille (FG), hood (HO) and rear view mirror (RV). In table
2, the descriptive statistics data were compiled, facilitating the comparison between items with larger and smaller mean
values, standard deviation, maximum and minimum variance.
Table 2 – comparison of descriptive statistics for cars
ITEM WITH THE HIGHEST ITEM WITH LOWER
% mean P mean % mean P mean
MEAN Bravo BO Focus RH Focus RV Bravo RV
STD. DEVATION Bravo RH I30 BO Bravo RV I30 FG
VARIÂNCE Bravo RH I30 BO Bravo RV I30 FG
MINIMUM Bravo RH Focus RH I30 FG Bravo RV
MAXIMUM I30 RH Focus BO I30 RV I30 HO
Source: research data
In table 3, we present the summary of the raw data by car/ point by region and the relationship of these with the
information stated and collected in the filled questionnaires on preferred or rejected aspects of each vehicle. One can see

51
that for the Fiat Bravo, the item "most liked" refers to the headlights, when putting together the right and left headlights,
they have obtained the highest mean points per region and pupil diameter. The same relationship was analyzed for the
Ford Focus, it appears in this case that the headlights reach higher scores on the salient points, and they were mostly
stated as preferred. As for the Fiat Bravo, the rear view mirrors also feature a level of rejection. In the case of Hyundai I30,
as already identified in the qualitative questionnaires, there seems to be greater dispersion among the categories "most
liked" and "didn't like it".
Table 3 - Summary of the raw data: points per parts versus stated preference
LIST OF ITEMS BY REGION MEAN PUPIL DIAMETER STATED IN RELATION TO PREFERENCE QUESTIONNAIRE
BRAVO FOCUS I 30 BRAVO FOCUS I 30 BRAVO FOCUS I30
ITEM % mean %
mean
%
mean P mean P mean P mean
Relat.
w/ +
liked
Relat.
w/ -
liked
Relat.
w/ +
liked
Relat.
w/ -
liked
Relat.
w/ +
liked
Relat.
w/ -
liked
LEFT
HEADLIGHT
5,23507
8
7,0041
5
9,502
117
104,344
6
103,66
9
106,61
59 0,555556
0,22222
2
0,8888
89
0,1111
11
0,66666
7
0,2222
22
HIGHT
HEADLIGHT
8,75513
9
7,7356
22
8,974
806
108,435
7
109,42
61
107,69
23 0,555556
0,22222
2
0,8888
89
0,1111
11
0,66666
7
0,2222
22
LOGO 7,13945
6
4,9195
67
9,196
217
100,752
9
104,34
75
103,57
42 0,111111 0 0
0,1111
11
0,22222
2
0,3333
33
BUMPER 16,7187
6
11,285
39
12,47
758
107,935
9
107,92
75
104,36
07 0 0 0
0,2222
22
0,11111
1 0
FRONT
GRILLE
11,3342
3
9,1665
72
14,78
871
101,542
5
105,12
86
104,20
28 0,333333
0,33333
3
0,2222
22
0,3333
33
0,22222
2 0
HOOD 8,73152
2
12,846
13
15,68
577
102,110
8
102,05
06
104,34
1 0,222222
0,33333
3
0,3333
33
0,1111
11
0,11111
1
0,2222
22
REARVIEW 4,47867
2
4,1829
33
8,105
828
99,8336
5
103,67
95
103,55
96 0,111111
0,77777
8
0,3333
33
0,4444
44
0,33333
3 0
Source: research data
Factorial Anova was performed to compare the mean% and the mean P with the variables car and item
separately, and together. It was found relationship between mean % and cars, mean% and item separately and mean P and
item according to the results shown in table 4.
Table 4 – Comparative Factorial ANOVAf for mean% and Mean P versus car and isolate items
gl %mean SS %mean MS %mean F %mean p P mean SS P mean MS P mean F P men p
CAR 2 326,01 163,00 5,3180 0,005762 94 47 1,95 0,145921
ITEM 6 1533,80 255,63 8,3400 0,000000 864 144 5,98 0,000011
CARRO*
ITEM 12 444,42 37,03 1,2083 0,281017 283 24 0,98 0,471261
ERROR 168 5149,42 30,65
4046 24
TOTAL 188 7453,64 5287
Source: research data
It is observed that at the level of 5% of significance when factorial Anova compares car, items and these combined
items demonstrated a statistically significant relationship between the variable mean %, mean and cars; and mean% and
cars, when examined in isolation, but not when conjugated. In practice, this implies that it is possible, for example, to
compare the Hyundai I30 with the Fiat Bravo and the bumper with the front grille, but not Fiat Bravo bumper with the

52
front grille of the Hyundai I30. As in the inter car analysis, there is no relationship between the car and mean P. However,
there is a relationship of this with the results of each item.
The post hoc analysis along with the Fischer test was carried out, showing the discriminability between the
Hyundai I30 and the other cars regarding the variable mean %.
Using the same method, the item-by-item comparison analysis of the discriminability between items was
performed LH x BO; LH x FG; LH x HO; RH x BO; RH x FG; RH x HO; LO x BO; LO x FG; LO x HO; BO x RT; FG x RV; and HO x
RV, considering the variable mean. Yet, it was analyzed the discriminability between items LH x RH; RH x LO; RH x FG; RH
x HO; RH x RV; LO x BO; BO x FG; BO x HO; BO x RV regarding the P mean.
Of the test results of Fischer for the items, he noted the existence of three groups with regard to average variable:
(i) BO x LH x RH x LO x RV; (ii) FG x LH x RH x LO x RV; and (iii) HO x LH x RH x LO x RV. With regard to variable p average,
two groups were observed: (i) RH x LH x LO x FG x HO x RV and, (ii) BO x LO x FG x HO x RV.
The cluster analysis was performed, observing the existence of two independent groups: (1) car, preference and
mean%; and (2) item and P mean. This analysis pointed out the existence of two distinct sampling universes. One
composed by the variables car, preference and mean; and the other composed by the variables item and P mean. Due to its
approach with the preference, it can be inferred that the mean % is correlated to the stimulus of valence, whereas mean P
is a measure correlated to salience.
5 final considerations
Although the eye tracking experiment did not provide information on the profile designed for the vehicles
consumers, it can largely contribute when the purpose to be reached includes the identification of physical attri butes with
high engagement that are represented by high levels of salience. What makes this measurement interesting is the
possibility to identify aspects that may not easily be stated by individuals, as the different parts that compose each one of
the vehicles analyzed.
Managerial implications related to this type of analysis can reveal aspects not reported in focus groups, in-depth
interviews or surveys. This possible non- statement would not be on purpose but it would occur because of the difficulty in
decomposing into pieces the object analyzed by the respondents. It is as if it were offered a piece of apple to an individual .
Only by observing this "piece", it is already possible to know what this is about, even if the whole object is not effectivel y
observed. In this case, the image would be formed, from an external stimulus, with representations in different localities of
the cerebral cortex. Given that the image can be formed through personal experiences, recalls or perception, this could be
distorted, or rather, not quite remembered, before a question about it.
As Braidot (2005; 2009), Lindstrom (2009) and Zaltman (2003) state, some aspects are difficult to measure for
people. Yet, some memories are fragile and the methods used to identify them can change them (Zaltman, 2003).
Making a connection with the object of the research- the vehicles It is possible to infer that these may evoke the
memory of individuals, either presented in part or as a whole. However, these can at the same time evoke memories
related to brand and past experiences, which can represent both a positive and negative point for the vehicle.
From the analysis of the results, it is possible to conclude that the research hypothesis H1 and H2 were supported, as
followed:
H1- It is observed that at the level of 5% of significance when factorial Anova compares car, items and these
combined items demonstrated a statistically significant relationship between the variable mean %, mean and
cars; and mean% and cars, when examined separately, but not when conjugated. As in the inter car analysis,
there is no relationship between car and mean P. However, there is a relationship of this with the results of
each salient item.
H2 – there was a relationship between the salient points and preference information stated or not declared to
the vehicles analyzed.
As well as in other research, regardless of the attention needed to methodological formulation, limiting
implications can be explained. Among these limitations, the ones were were spotted in the course of the work and deserve
to be highlighted are:

53
The study comprises a cross-sectional analysis. However, it does not focus on the perception changes of the
individuals in the course of the study or a posteriori.
Marketing efforts of any of the brands tested can involve a change in the perception of its attributes.
There was a need to limit a part of each vehicle analyzed. The front was chosen. An analysis of the back or the
side of the vehicle may result in different results concerning the preference.
In addition to conducting longitudinal studies and the analysis of different parts of the vehicles, it is suggested for
future studies the comparison with groups of individuals from other parts of the country or in other countries where the
same vehicles are marketed.
References
ARIELY, D. & BERNS, G. S. (2010). Neuromarketing: the hope and hype of neuroimaging in business. Nat. Rev.
Neurosci. 11(4): 284-292.
BRAIDOT, N. P. (2005). Neuromarketing: neuroeconomia y negocios. Madrid: puertoNorte-SUR.
BRAIDOT, N. P. (2009). Neuromarketing: ¿Por qué tus clientes se acuestan con outro si dicen que les gustas tu?
Barcelona: Ediciones Gestión.
BROWN, A., JAY, C. & HARPER, S. (2010). Using qualitative eye-tracking data to inform audio presentation of
dinamic Web content. New Review of Hypermedia and Multimedia . vol. 16 (3): 281-301.
COOPER, D. R. & SCHINDLER, P. S. (2011). Métodos de Pesquisa em Administração. Porto Alegre/Brazil: Bookman.
CROZET, G. C. (2009). Emotion assessment for affective computing based on brain and peripheral signals. 194 p.
These Universite de Geneve - Faculte Des Sciences.
DIAS, A. M. (2010a). Processo Não Declarativos em Tomadas de Decisão: modelos e experimentos. 245 p. Tese de
doutorado apresentada ao Instituto de Psicologia da Universidade de São Paulo – USP. São Paulo/Brazil.
DIAS, A. M. (2010b). The foundations of neuroanthropology. Front. Evol. Neurosci. 2:5. doi:
10.3389/neuro.18.005.2010. Disponível em:
http://www.frontiersin.org/evolutionary_neuroscience/10.3389/neuro.18.005.2010/full . Acesso em 10/02/2013.
DIAS, A. M. (2012). Das ‘Neurociências Aplicadas ao Marketing’ ao ‘Neuromarketing Integrativo’. Ciências &
Cognição. vol 17 (1): 178-189.
ENGEL, J. F., BLACKWELL, R. D. & MINIARD, P. W. (2001). Comportamento do Consumidor. 8ª edição. Rio de
Janeiro/Brazil: Livros Técnicos e Científicos Editora S.A.
GOLDSTEIN, M. & ALMEIDA, H. S. (2002). Crítica dos Modelos Integrativos do Comportamento do Consumidor.
Revista de Administração. São Paulo/Brazil. v. 35 (1): 14-22.
GOULART, I. B. (2006). Análise de Conteúdo. Cap. 5. In: Temas de Psicologia e Administração. Íris Barbosa Goulart
(org.). São Paulo/Brazil: Casa do Psicólogo.
HARLÉ, K. M. & SANFEY, A. G. (2012). Social economic decision-making across the lifespan: an fMRI investigation.
Neuropsychogia. v. 50: 1416-1424.
JOYCE, C. A. et al. (2002). Tracking eye fixations with eletroocular and electroencephalographic recordings.
Psychophysiology, v. 39: 607-618.
LEE, N., BRODERICK, A. J. & CHAMBERLAIN, L. (2009). What is “neuromarketing’? A discussion and agenda for
future research. International Journal of Psychophysiology. v. 63: 199-204.
LI, F., MUNN, S. & PELZ, J. (2008). A Model-Based Approach to Video-Based Eye Tracking. Journal of Modern Optics.
v. 55 (4–5): 503–531.
LINDSTROM, M. (2007). Brand sense: a marca multissensorial. Porto Alegre/Brazil: Bookman.

54
LINDSTROM , M. (2008). Buy.Ology: how everything we believe about why we buy is wrong. London: Random
House Business Books.
LÓPEZ-GIL, J. M. et al. (2010). Análisis de la arquitectura de webs mediante tests de estrés de navegación, de
usabilidade y eye tracking. El Professional de la Información, v. 19 (4): 359-368.
McCABE, K. et al. (2011). A functional imaging study of cooperation in two-person reciprocal exchange. Proc. Natl.
Acad. Sci. U.S.A. 98: 11832-11835.
MOWEN, J. C. & MINOR, M. S. Comportamento do consumidor. São Paulo/Brazil: Pearson Prentice Hall, 2003.
OHME, R., MATUKIN, M. e PACULA-LESNIAK, B. (2011). Biometric Measures for Interactive Advertising Research.
Journal of Interactive Advertising, v. 11 (2): 60-72.
PLASSMAN, H. et al.(2012). Branding the brain: A critical review and outlook. Journal of Consumer Psychology: 1-
19.
SCHIESSL, M. et al. (2003). Eye tracking and its application in usability and media research. MMIInteraktiv. v. 6,
(6), 1-10. Disponível em: http://dee-square.com/mediapool/120/1207353/data/Eye_Tracking_Application_Duda.pdf.
Acesso em 27/01/13.
SHETH, J. N., GARDNER, D. M. & GARRETT, D. E. (1998). Marketing Theory: Evolution and Evaluation. Chichester:
Jonh Wiley & Sons.
SOARES NETO, J. B. & ALEXANDRE, M. L. (2007). Neuromarketing: Conceitos e técnicas de análise do cérebro de
consumidores. XXXI Encontro da ANPAD. Rio de Janeiro/Brazil.
THEUNER, G., PISCHKE, K. & BLEY, T. (2008). Analysis of Advertising Effectiveness with Eye Tracking. Proceedings
of Measuring Behavior (Maastricht, The Netherlands): 26-29.
TRINDADE, M. (2004). A Magnetoencefalografia: Aplicações clínicas. Acta Méd Port, v. 17: 231-240.
VENKATRAMAN, V, et al. (2012). New scanner data for brand marketers: how neuroscience can help better
understand differences in brand preferences. Journal of Consumer Psychology, v. 22: 143-153.
XUE, G. et al. (2009). Functional Dissociations of Risk and Reward Processing in the Medial Prefrontal Cortex.
Cerebral Cortex. 19: 1019-1027.
ZALTMAN, G. (2003). Afinal, o que os clientes querem? O que os consumidores não contam e os concorrentes não
sabem? 2ª ed. Rio de Janeiro/Brazil: Elsevier.
ZALTMAN G.& ZALTMAM, L. (2008). Marketing metaphoria: what seven deep metaphors reveal about the minds of
consumers. Boston, Massachusetts: Harvard Business Press.
ZIKMUND, W.G. e BABIN, B. J. (2011). Princípios da pesquisa de marketing. São Paulo/Brazil: Cengage Learning.
Nota: Os autores agradecem a FAPEMIG – Fundação de Amparo à Pesquisa do Estado de Minas Gerais e a Fiat Automóveis
S.A. (Brasil), pelo apoio financeiro para realização dessa pesquisa.

55
Analysis of the usage and attitudes of payment
cards users in Bosnia and Herzegovina Payment cards, credit cards, debit cards, payment card market, Bosnia and Herzegovina, consumer behavior
Almir Pestek, School of Economics and Business in Sarajevo, [email protected]
Lejla Helic-Dizdarevic, Intesa Sanpaolo bank BH, [email protected]
Abstract
In most countries of the world usage of payment cards is constantly growing, same as a number of payment cards. Card
business in Bosnia and Herzegovina (B&H) began to develop more than 40 years ago. In that time card users could choose
between two payment card issuers, today there are 25 card issuers of many types of payment cards (Central Bank of
Bosnia and Herzegovina, 2011).
Since the beginning of 1970’s there has been a growing interest in the study of marketing in the payment card industry.
Already, there are many studies that analyze the relationship between the usage of payment cards or card selections and
attitudes of card users, and the demographic and socio-economic characteristics of the card user. But, the conclusions of
these studies are often different, which disables generalizations about the behaviour of credit cards users.
The aim of this study was to investigate the current situation in B&H card market, establish payment card user profiles and
to explore opinions and attitudes of payment card users related to the card products they use. Except secondary data,
primary data were collected through the organization of two focus groups and through on-line questionnaire during 2012.
Payment card market of B&H is characterized by steady growth of number of payment cards and spending with payment
cards, but with 0.5 cards per capita, compared with countries in the region, B&H is a country with less number of cards,
and certainly represents a great potential for the payment card issuers. Among others, it was concluded that on the
payment card market of B&H leading payment cards brands are presented and the most common brand is Visa. The
respondents have one or two credit cards and they use all cards that they posses. The credit cards are mainly used for cash
withdrawals at ATMs and for payment at retail stores and least for online shopping. As most important benefits of using
credit cards are payment at retail stores and ATM cash withdrawals.
1. Introduction
Payment cards are important part of the financial and payment system of modern society. Payments cards are an
instrument of cashless payment, which allows the user to pay for goods and services, as well as to wi thdraw cash. Payment
cards are often referred to as credit cards, although not all cards offer the possibility of credit.
Wonglimpiyarat (2005) defines payment cards as variable repayment cards that offer a line of credit to its user; a payment
card user can spend money up to the pre-arranged spending limit. The payment card thus offers a self-service credit
without standard bank procedures. The spent amount must be repaid within a given period, or else an interest on the
remaining balance will be charged (Paxson and Wood, 1998). Lindsey (1994) defines the payment card as a plastic
payment card that has access to the revolving credit and cash. Accordingly, payment cards may also be used as an
identification document that identifies the user who has a credit account and allows him to make and accumulate
purchases, and pay the entire bill or part of it afterwards (Frazer, 1985). A contract on card use regulates terms of using
the card between the issuer and holder. Besides, the card-issuing bank also signs the contract on card acceptance with
retail outlets (Lindsey, 1994).
There are a few classifications of payment cards. According to Cirovic (2001), payment cards can be classified into three
groups:

56
1. Debit cards – are used so that the user can use the resources on their current account. They can be used in shops
that have the POS devices, or at ATM’s.
2. Credit cards – contain a defined credit limit that the holder can use when buying goods and services or
withdrawing cash. If the card holder does not pay off the debit balance at the end of the month, an interest is
charged.
3. Prepaid cards – cards with a money amount paid-in in advance.
Similar to Cirovic, Worthington (1996) also distinguished three types of payment cards: the ‘pay later’ cards (credit cards),
‘pay now’ cards (debit cards), and ‘pay in advance’ cards (prepaid cards).
Card business is dealt with by banks which, in cooperation with leading payment systems MasterCard Worldwide and Visa
International issue various types of debit, charge and revolving cards. Besides banks, there are also non-bank card systems
in the market, such as American Express and Diners, which also issue different types of payment cards.
Since the holding and use of cards have increased considerably over the past few years, payment cards have become the
main source of financing/lending and method of payment (Ausbel, 1991, Slocum and Matthews, 1970, Brito and Hartley,
1995, Stavins, 2000, Bar-Gill 2004). The popularity of payment cards as a means of payment is due to the convenience of
not carrying cash, limited liability in case of card loss or theft, additional benefits such as dispute resolution (Chakravorti
1997, 2003, Chakravorti and Emmons 2001, Whitesell 1992).
Originally, cards were used for paying for luxury goods such as travel and accommodation However, cards are now
increasingly used for everyday shopping (Lee, 2000).
Payment cards satisfy two different needs: they are a means of payment and a source of credit (Ausbel 1991, Slocum and
Matthews, 1970, Brito and Hartley, 1995, Stavins 2000, Lee and Kwon 2002, Bar-Gill 2004).
2. Usage of payment cards
Despite the financial crisis, the usage of cards in most countries has grown to 9.7% (Capgenini,The Royal Bank of Scotland
and Efma, 2011).
Although payment cards are becoming more and more frequent in global economy, there are still differences in the
number of card users in individual countries. In general, the number of users is larger in developed countries, where
income per capita and spending power are high, and in the countries with more developed infrastructure for electronic
payment processing (Kaynak and Harcar, 2001). Almost 80% of the payment card market consists of cards by three
issuers (O’Connell, 2011):
1. UnionPay 29.2%,
2. Visa 28.6% and
3. MasterCard 20.0%
UnionPay is a new card issuer in the market, which started issuing cards in 2002 (UnionPay, 2012) and, over less than ten
years, has become the largest card issuer in the world, with over $ 2.5 billion issued cards (Harper, 2012). The reason is
that it is a card issuer in the most populated world country – China, and 99.5% issued cards is in China itself (Harper,
2012).
3. Card business in Bosnia and Herzegovina
The first payment cards in B&H, i.e. former Yugoslavia, appeared in the 1960s. They were charge cards, Diners and
American Express (Novac.net, 2012), while the first Visa card was issued in 1984 (Rts, 2010).
Due to the dissolution of Yugoslavia and war events, card business was interrupted in 1992, and re-established as late as in
1999, when Turkish Ziraat Bank started issuing Visa credit cards (Turkish Ziraat Bank, 2012). It marked the re-
development of card business in B&H, although the business had to be re-started from scratch, since it required both
issuing cards and establishing the entire infrastructure that was to allow the acceptance of cards at retail outlets and
withdrawing cash at ATMs.

57
B&H registers the presence of leading payment card brands: Visa, MasterCard, American Express, Diners, as well as two
local cards, BamCard and Moja kartica, which are issued by as many as 25 banks (Central Bank of Bosnia and Herzegovina,
2011). Over the past six years, there has been a significant increase in the number of users in B&H , as well as in spending
using the cards. However, the number of issued cards per capita (about 0.5 cards) is below the region’s average. For
instance, the number of issued cards per capita in Croatia is 2.2, and the average for the region is 0.74 (Babic, 2008).
At the end of 2005, the number of users amounted to 942,874, and in 2010 – to 1,693,466, which is almost double. The
largest number of issued cards was registered at the end of 2009, 1,773,758, which is a 10% increase compared to the
previous year (1,612,219). Unfortunately, the growth trend was stopped in 2010, when a decrease in the number of cards
of 4.7% compared to the previous year was recorded. The main reason for the decrease is the world economic crisis. The
value of transactions in the observed period increased 3.7 times, from 1.47 billion KM (751 million EUR) at the end of
2005 to 5.47 billion KM (2,8 billion EUR) at the end of 2010 (Central Bank of Bosnia and Herzegovina, 2011).
Card business parameters include the development of acceptance network, i.e. the number of ATMs and POS terminals,
which also increased considerably. At the end of 2005, the number of ATMs amounted to 397, and of POS terminals to
8,947, while in 2010 the number increased considerably and amounted to 1098 ATMs and 17,834 POS terminals. Still, the
number of ATMs in 2010 decreased by 257 compared to 2009, which was due to the crisis and consequences of bank
restructuring (Simic, 2011). An interesting fact is that the number of POS terminals records permanent growth despite the
crisis and retail outlets closures.
With respect to the brand presence, the most frequently issued cards are Visa cards (about 70% cards), with the note that
data on the number of Visa debit and credit cards are not available. However, if we take into account the fact that 83%
issued cards are debit cards, we can conclude that most Visa cards are debit cards, i.e. Visa Electron cards. The second
largest card issuer in B&H is MasterCard with a 29% share, while other issuers are represented only with 1%.
In 2010, B&H citizens used payment cards to make payments amounting to 5,469,028,587 KM (2,796,269,915 EUR), which
is an increase of 594,568,227 KM (303,997,907 EUR) compared to 2009. By the structure of ATM/POS spending, the value
of spending is: ATM 4,679,626,544 KM (2,392,655,059 EUR), i.e. 85%, and POS only 789,402,042 KM (403,614,855 EUR),
i.e. 15%. This fact tells us that payment cards still mostly serve to withdraw cash, and are insufficiently used to pay for
goods and services at retail outlets.
The average value of a transaction amounted to 138 KM (70,55 EUR) and was 3 KM (1,53 EUR) lower than in the last year,
when it amounted to 141 KM (72,1 EUR). The average annual turnover per card amounted to 3,229 KM (1,651 EUR) and
was by 450 KM (230 EUR) higher than in 2009, when it amounted to 2,779 KM (1,421 EUR). The increase in annual
turnover was due to a decrease in the number of cards, while the decrease in the average transaction value was caused by
the crisis, due to which citizens use cards for lower amounts.
Out of the overall spending amount of 5,469,028,587 KM (2,796,269,915 EUR), B&H citizens spent 271,290,278 KM
(138,708,517 EUR) abroad. Interestingly, the ATM/POS spending structure abroad is quite different compared to spending
in B&H. Citizens tend to use cards abroad more than in the country, 59% for payments at retail outlets, and 41% for cash
withdrawals.
4. Literature review
Since the 1970s, due to the accelerated growth of card industry, a growing interest is noticeable in marketing research in
card business, i.e. in payment card users’ behaviour. Consequently, we can now reliably say that consumers, when paying
with payment cards:
Make larger purchases in shops (Hirschman 1979),
Give higher tips (Feiberg 1986),
Underestimate or forget amounts of previous purchases (Soman 1999) and
Are more willing to purchase and have greater spending intent (Feinberg 1986).
Numerous studies showed that payment card users spend more compared to those who use cash or checks (Soman, 2001;
Feinberg, 1986; Hirschman, 1979). Feinberg (1986) concluded that payment cards make spending easier in terms of
motivation, probability and spent amounts. Besides, he concluded that the time of making the purchasing decision is
shorter when paying with a card compared to paying by cash. Chan (1997) discovered that for card users in Hong Kong,

58
when making a decision on using the card, the most important economic factors are: long interest-free term of payment
and low annual fee. Canner and Cyrnak (1986) showed that the main reason for using payment cards is convenience,
which in turn is in positive correlation with income and age. Kinsey (1981) established that the simplicity of payment and
risk of carrying cash are main reasons for using payment cards. Durkin (2001) observed that cards are favoured both due
to convenient use and as a source of revolving credit.
According to research conducted in Greece, there are five main factors that affect the selection of card: convenience of use
in Greece, security, cost-effectiveness, prestige and purchases abroad (Meidan and Davo, 1994). Gan et al. (2006)
concluded that in Singapore a low interest rate and absence of annual fee are the two factors that are valued the most
when selecting a credit card.
In the research conducted by Toner (1996), respondents were supposed to rank the most important characteristics when
choosing a new card. Results were as follows:
1. Free annual membership,
2. Competitive interest rate,
3. Choice of the way of payment,
4. Balance check at ATMs,
5. Added value and convenience of card,
6. Discount when switching to another card, and
7. Balance check over the phone.
When a user wants to pay for his purchase, he should both make a decision on the selection of paying with card, and decide
about the card he will use. The selection of card is conditioned by the following factors (Hirschman, 1979):
Personal characteristics (income, age, lifestyle, stage of lifecycle),
Payment card characteristics (interest rate, prestige, limit, debt repayment),
Characteristics of the object of purchase (price, size, complexity),
Retail outlet’s policy on the way of payment and
Characteristics of the moment of purchase (time needed for the purchase, available resources on the card,
other short-term foreseeable card benefits).
There are many studies that analyze the relationship between the payment card usage or the selection of card and user
attitudes, and demographic and users’ socio-economic characteristics, such as Slocum and Matthews (1969, 1970), who
discovered that social class affects users’ views when using payment cards.
Income is one of demographic variables that has a significant correlation with payment cards and their usage. Thus, for
instance, Kinsey (1981) discovered that high income is the most important determinant in holding the number of cards.
Besides, studies by Gan et al. (2008), Barker and Sekerkaya (1992), Wasberg et al. (1992), Heck (1987), Arora (1987) and
Mandell (1972) showed that the number of cards held by a user and greater card usage depends on the user’s income.
Chan (1997) compared active and inactive bank card users in Hong Kong and discovered that inactive users have lower
income than active ones.
Although most authors found that income significantly correlated with cards, Awh and Waters (1974), Choi and DeVaney
(1995) found out that the level of income is not a significant determinant when using payment cards , while Danes and Hira
(1990) showed that medium-income families use payment cards more than high-income ones. Persons with high income
attach greater significance to the card convenience than to the credit feature (Barker and Sekerkaya, 1992). Kaynak,
Kucukemiroglu and Ozmen (1995) found that lower and medium-income users value the credit feature more than card
security and convenient use.
Sex and marital status are determinants that have a significant correlation with cards (Kinsey, 1981; Slocum and
Matthews, 1970; Gan et al., 2008). White (1975) learned that single males use cards more than females. Besides, Adcock,
Hirschman and Goldstucker (1977) found that bank card users are mostly males.
On the contrary, Kinsey (1981) and Arora (1987) in their studies showed that females use cards more. Armstrong and
Craven (1993) studied the average number of cards relative to sex and established that females have a larger average
number of cards than males. In their research conducted in Turkey, Kaynak and Harcar (2001) concluded that there is no
significant difference between males and females in terms of holding a card. Ingra, and Pugh (1981) concluded that the
lowest number of cards is held by singles, young couples and retirees.

59
Some studies showed that there is a significant correlation between the sex and the type of purchase. Lindley, Rudolph and
Selby (1989) found a positive correlation between card usage for purchasing household items and clothes in females.
Hayhoe et al. (2000) studied consumer habits and card usage in student population and learned that females use cards to
pay for clothes, while males use them for buying electronics and entertainment.
Numerous researchers found that education is one of the most important demographic variables that is in pos itive
correlation with card usage. Canner and Luckett (1992) found that users’ monthly spending increases with the degree of
education. Danes and Hira (1990) and Barker and Sekerkaya (1992) found that persons with higher education use cards
more often.
Slocum and Matthews (1969) found that persons of lower socio-economic class typically use their payment cards for
installment financing, while persons in higher socio-economic groups use payment cards for convenient usage – daily
payments.
Research conducted by Dosen and Vajda (2011) on the card usage in student population in Croatia concluded that the
number of cards held by students does not imply higher monthly spending. Besides, they concluded that cards are mostly
used for withdrawing cash at ATMs, and least for online shopping.
Carow and Staten (1993) conducted research on the way of consumer payment at gasoline stations, i.e. whether the
consumers pay in cash or with a card. They learned that a person with higher degree of education, higher income and a
larger number of cards tend to pay with a card rather than in cash.
6. Paper aim and methodology
Studies dealing with the analysis of payment cards and individual factors’ impact have not so far been conducted in B&H .
The paper is aimed at studying the existing conditions in the B&H card market, and research users’ views and attitudes
related to the card products they use. This research provides basic information on the card market, and serves as a starting
basis for further research in the area.
The field research of card market in B&H was conducted by means of focus groups and questioning by correspondence,
using the structured questionnaire:
- Two focus groups were organized in Sarajevo. Respondent groups with 7 and 6 participants respectively were
formed so as to include men and women who use payment cards and who belong to 18-35 and 36-60 age groups
respectively. The interviews were audio and video recorded. The average duration of the interviews was 90
minutes. In order to collect data, an identification questionnaire for socio-demographic data on participants and
their habits was designed and used, as well as a guide for focus group moderator.
- The structured questionnaire developed by the authors based on the presented theoretical concepts was available
to all B&H payment car users who have Internet access, and was distributed via website www.surveymonkey.com.
Out of the 344 collected questionnaires, a total of 312 were assessed as valid. Sampling was done using the
snowball method. The research was conducted in June 2012.
7. Presentation of research results and discussion
The sample structure by socio-demographic characteristics:
- Respondents of both sexes were represented, with female respondents prevailing (66.4%).
- Most respondents were in the 26-35 age group (59.9%), followed by 36-45 (24.3%). The least represented age
group included respondents aged 55 to 65 (2.2%) and over 66 (2.6%).
- Most respondents live with a partner/spouse and children (47%), followed by singles who live with parents
(17%). Out of the total number of respondents, 17.0% live with a partner/spouse without children, 14.1% are
singles who live in their own households, and only 4.1% respondents are single parents.
- Most respondents are employed full-time (84.1%), followed by those employed occasionally (6.3%), unemployed
(4.1%), and the least represented groups are students (1.9%) and retirees (3.7%).

60
- Most respondents have monthly income between 1,001 KM (512 EUR) and 1,500 KM (752 EUR) (29.6%), followed
by those with income between 501 KM (256 EUR) and 1,000 KM (512 EUR) (24.7%), and over 2,000 KM (1,002
EUR) (22.1%). The least represented respondents are those with income below 500 KM (255 UR) (3.7%).
According to official statistics, an average monthly salary in Bosnia and Herzegovina was 819 KM (418 EUR)
(Federal Office of Statistics, 2012).
- Most respondents have university education (51.1%), then secondary education (21.5%). The percentage of
respondents with a master’s degree is 13.7%, and with vocational qualifications – 11.1%. Respondents with a PhD
were the least numerous (2.6%).
7.1. Number and type of payment cards
Analyzing the number of payment cards held by the respondents, it was concluded that over 60% respondents hold one or
two cards, i.e. one card is held by 33.7% and two by 33.7% respondents. Three payment cards are held by 20.2%
respondents, while fewest respondents hold more than five payment cards (1.6%). About 69.0% respondents claim to
actively use all the payment cards they hold.
Most respondents in the sample became users of their first card over five years ago (68.1%), followed by 3-5 year long
card users (23.3%), while fewest respondents have used their card for less than a year (1.1%).
As shown by data by Central Bank of B&H, the most represented card in the B&H market is Visa Electron, held by 85.9%
respondents. Maestro is held by 30.7%, while only 15.1% respondents hold the BamCard debit. Similar to debit cards, Visa
credit cards are again the most common. Thus most respondents use Visa credit card (65.3%), fol lowed by MasterCard
(44.4%), and American Express (25%). The least represented cards include Diners, with only 1.5% respondents, and
BamCard – 4.6%.
The analysis of the category of payment cards held by respondents revealed that most respondents have only a debit card
(49.8%), credit card is held only by 3.5% respondents, while 46.6% respondents have both types of card.
We were interested in the information as to whether the type of card (debit, credit) is affected by an independent variable,
and the application of linear regression to the dependent variable type of card concluded that respondents’ monthly
income has the strongest effect on the type of card they hold.
7.2. Analysis of factors affecting respondents’ satisfaction
Based on the results when assessing satisfaction with the card-issuing bank’s services, a ranking list of the service
importance can be created:
1. Number of retail outlets
2. Customer service (kindness, attention paid, accuracy and speed of providing information …),
3. Number and spread of ATMs,
4. Staff’s expertise,
5. Procedure of card issuance
6. Additional card benefits, and
7. Costs of card issuance.
T-test showed that there is a statistically significant difference in average rankings of the satisfaction with the bank and its
services, t=3.58; p=0.006.
Using the non-parameter Kruskal Wallis test, the analysis was performed of factors that affect satisfaction with the card-
issuing bank’s service. Most respondents who have held the card for over 5 years are statistically significantly satisfied
with the number and spread of ATMs, while respondents with secondary education are less satisfied with additional card
benefits compared to respondents with other types of education. There is dissatisfaction with costs of card issuance
compared to the number of cards the respondents hold. The type of card does not affect satisfaction with the card-issuing
bank, while higher-income respondents are more satisfied with the number of retail outlets compared to respondents with
lower average monthly income. Frequency of card usage and the number of active cards does not affect user satisfaction
with the card-issuing bank’s service.

61
7.3. Analysis of the correlation between card usage and socio-demographic characteristics
Some of important findings follow:
- Hi-square test (χ2=1.200; p=0.273) did not reveal a significant correlation between the employment status and the
number of cards, though the highest percentage of respondents has two payment cards.
- Hi-square test (χ2=10.03; p=0,002) revealed a statistically significant difference in the number of payment card
the respondents hold and the respondent’s sex. Most male respondents hold two or three cards, while female
respondents hold one or two cards.
- Hi-square test (χ2=44.38; p=0,002) revealed statistical significance between the number of cards respondents
hold and their monthly income. The number of cards held by respondents increases together with the increase in
monthly income. Most cards are held by respondents with income over 2,000 KM (1,002 EUR).
- Hi-square test (χ2=7.36; p=0.007) confirmed the statistically significant difference in the number of payment cards
and education level, where respondents with a higher education level hold a greater number of payment cards.
- Hi-square test (χ2=20.45; p=0.000) showed that there is a statistically significant difference in the number of cards
held by a respondent and the period of holding a card. Respondents who have held the card for over five years
also hold a greater number of cards.
- Hi-square test (χ2=3.84; p=0.05) showed that there is no statistically significant difference in the number of cards
held by respondents and age groups, and that respondents in the 26-35 hold the greatest number of cards
(59.9%); the number of cards from one to five are held by this group of respondents while the highest percentage
of those who hold over five cards includes respondents in the 36-45 age group.
- Hi-square test (χ2=1.606; p=0.205) revealed that there is no statistically significant difference between the
number of cards held by respondents and their marital status, and confirmed that the number of cards is the
greatest in respondents who are married and have children.
Application of linear regression to the dependent variable “number of cards” led to the conclusion that the greatest impact
on the number of cards is exerted by monthly income and time passed from obtaining the first card; other socio -
demographic factors do not have a statistically significant effect on the number of cards held by respondents.
7.4. Analysis of the way of card usage
Analysis of the place of using payment cards revealed that 60% respondents use the card both in B&H and abroad, 38.9%
use card only in B&H while only 1.1% respondents use the card only abroad.
The analysis found that most respondents (95.5%) use the debit card to withdraw cash at ATM, then for paying at retail
outlets (84.7%), while 28.0% respondents use the debit card for online shopping. Interestingly, as many as 84.7%
respondents use the debit card for payments at retail outlets. It is well known that card issuers pay a lot of attention to
educating users on the advantages of using debit cards at retail outlets, since debit cards are mostly used for withdrawing
cash at ATMs. Therefore, although research results are above expectations, they should be taken with a grain of salt since
data by the Central Bank of B&H show the opposite.
Analysis also included the most common usage of respondents’ credit card. The analysis established that most
respondents (83.6%) use the credit card for payments at the retail outlets, while the same number of respondents uses the
credit card for online shopping (37.4%) and withdrawing cash at ATMs (37.4%).
Viewed by the frequency of card usage, the sample includes most respondents who use their card 2-3 times a week
(38.0%), then a few times a month (35.5%). A total of 20.1% use the card daily, 6.1% once a month, while only 0.4% use
the card a few times a year.
Hi-square test (χ2=3.68; p=0.045) showed that there is a statistically significant difference between the frequency of
payment card usage and monthly income, and that respondents with higher income use payment cards more frequently.
Application of linear regression on the dependent variable “frequency of card usage” concluded that the greatest effect on
the frequency of card usage is exerted by respondents’ age, employment status, average monthly income and education
level, while marital status and time passed from obtaining the first card have no effect.
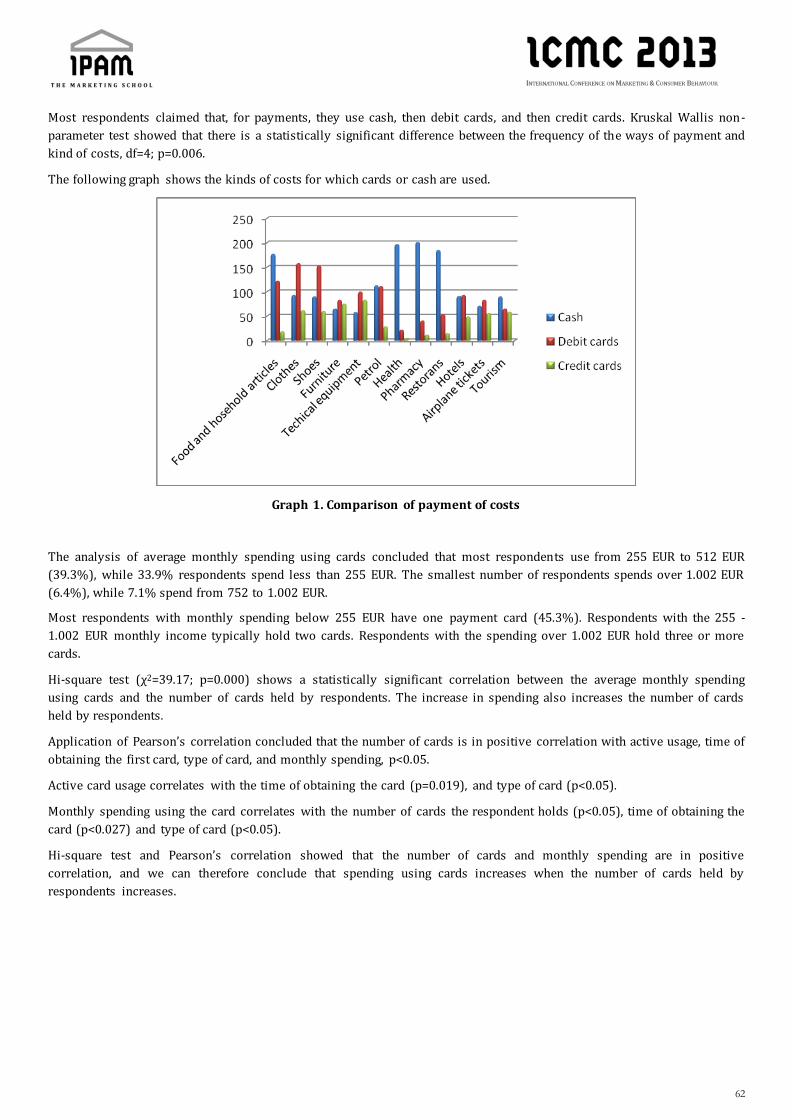
62
Most respondents claimed that, for payments, they use cash, then debit cards, and then credit cards. Kruskal Wallis non-
parameter test showed that there is a statistically significant difference between the frequency of the ways of payment and
kind of costs, df=4; p=0.006.
The following graph shows the kinds of costs for which cards or cash are used.
Graph 1. Comparison of payment of costs
The analysis of average monthly spending using cards concluded that most respondents use from 255 EUR to 512 EUR
(39.3%), while 33.9% respondents spend less than 255 EUR. The smallest number of respondents spends over 1.002 EUR
(6.4%), while 7.1% spend from 752 to 1.002 EUR.
Most respondents with monthly spending below 255 EUR have one payment card (45.3%). Respondents with the 255 -
1.002 EUR monthly income typically hold two cards. Respondents with the spending over 1.002 EUR hold three or more
cards.
Hi-square test (χ2=39.17; p=0.000) shows a statistically significant correlation between the average monthly spending
using cards and the number of cards held by respondents. The increase in spending also increases the number of cards
held by respondents.
Application of Pearson’s correlation concluded that the number of cards is in positive correlation with active usage, time of
obtaining the first card, type of card, and monthly spending, p<0.05.
Active card usage correlates with the time of obtaining the card (p=0.019), and type of card (p<0.05).
Monthly spending using the card correlates with the number of cards the respondent holds (p<0.05), time of obtaining the
card (p<0.027) and type of card (p<0.05).
Hi-square test and Pearson’s correlation showed that the number of cards and monthly spending are in positive
correlation, and we can therefore conclude that spending using cards increases when the number of cards held by
respondents increases.
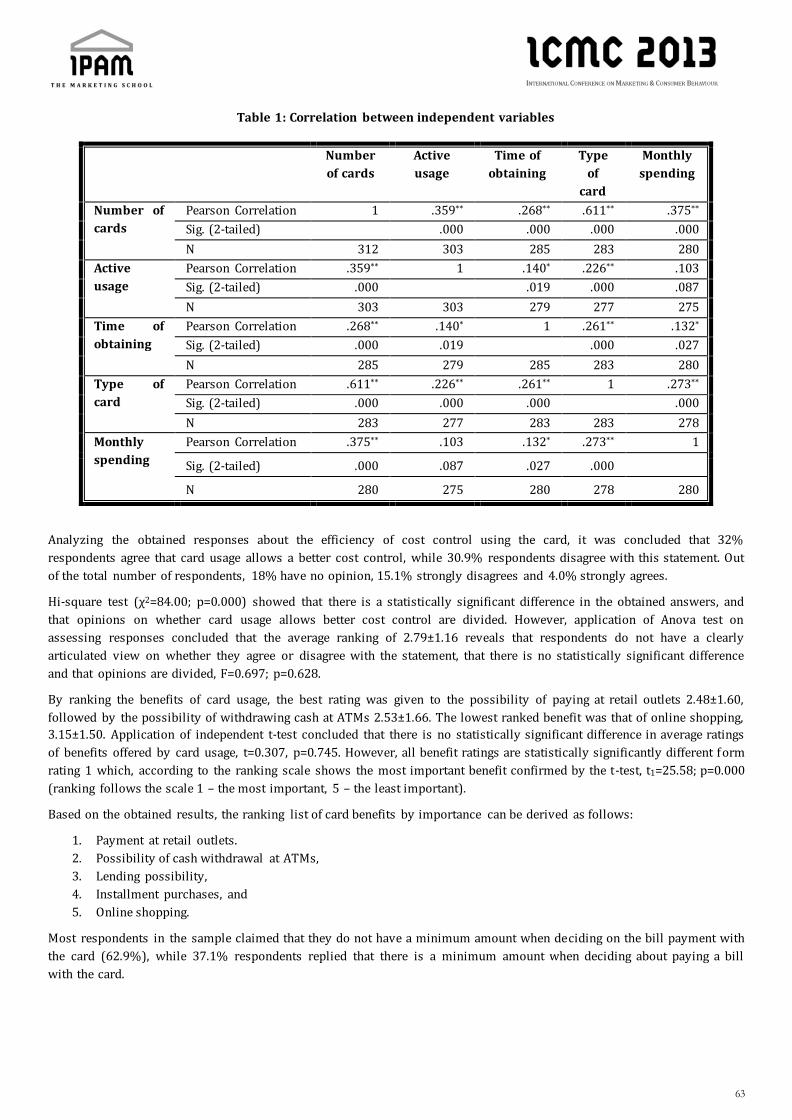
63
Table 1: Correlation between independent variables
Number
of cards
Active
usage
Time of
obtaining
Type
of
card
Monthly
spending
Number of
cards
Pearson Correlation 1 .359** .268** .611** .375**
Sig. (2-tailed) .000 .000 .000 .000
N 312 303 285 283 280
Active
usage
Pearson Correlation .359** 1 .140* .226** .103
Sig. (2-tailed) .000 .019 .000 .087
N 303 303 279 277 275
Time of
obtaining
Pearson Correlation .268** .140* 1 .261** .132*
Sig. (2-tailed) .000 .019 .000 .027
N 285 279 285 283 280
Type of
card
Pearson Correlation .611** .226** .261** 1 .273**
Sig. (2-tailed) .000 .000 .000 .000
N 283 277 283 283 278
Monthly
spending
Pearson Correlation .375** .103 .132* .273** 1
Sig. (2-tailed) .000 .087 .027 .000
N 280 275 280 278 280
Analyzing the obtained responses about the efficiency of cost control using the card, it was concluded that 32%
respondents agree that card usage allows a better cost control, while 30.9% respondents disagree with this statement. Out
of the total number of respondents, 18% have no opinion, 15.1% strongly disagrees and 4.0% strongly agrees.
Hi-square test (χ2=84.00; p=0.000) showed that there is a statistically significant difference in the obtained answers, and
that opinions on whether card usage allows better cost control are divided. However, application of Anova test on
assessing responses concluded that the average ranking of 2.79±1.16 reveals that respondents do not have a clearly
articulated view on whether they agree or disagree with the statement, that there is no statistically significant difference
and that opinions are divided, F=0.697; p=0.628.
By ranking the benefits of card usage, the best rating was given to the possibility of paying at retail outlets 2.48±1.60,
followed by the possibility of withdrawing cash at ATMs 2.53±1.66. The lowest ranked benefit was that of online shopping,
3.15±1.50. Application of independent t-test concluded that there is no statistically significant difference in average ratings
of benefits offered by card usage, t=0.307, p=0.745. However, all benefit ratings are statistically significantly different f orm
rating 1 which, according to the ranking scale shows the most important benefit confirmed by the t-test, t1=25.58; p=0.000
(ranking follows the scale 1 – the most important, 5 – the least important).
Based on the obtained results, the ranking list of card benefits by importance can be derived as follows:
1. Payment at retail outlets.
2. Possibility of cash withdrawal at ATMs,
3. Lending possibility,
4. Installment purchases, and
5. Online shopping.
Most respondents in the sample claimed that they do not have a minimum amount when deciding on the bill payment with
the card (62.9%), while 37.1% respondents replied that there is a minimum amount when deciding about paying a bill
with the card.

64
8. Conclusions
Payment card market has a permanent growth tendency across the world and in B&H as well. The number of cards issued
in B&H has doubled since 2005, and the value of transactions increased 3.7 times, which was accompanied by the
development of acceptance network.
The development of card industry has been accompanied by the interest in research of marketing in card business, i.e.
interest in collecting and systematizing data on payment card users and their behaviour. In B&H, there is a lack of studies
on payment card usage, while international studies are mainly focused on, e.g. only on a given type of cards or on a special
population of card users. With respect to research on the topic, it can be claimed that payment card users spend more
compared to those who use cash, that they are more willing to buy and that they have a greater i ntent to spend and make
larger purchases in shops.
As the research reveals, the leading brands of payment cards are present in the card market of B&H. Patterns of card users’
behaviour are same or similar to patterns of behaviour in the global market, which is presented in the overview of
available literature. Respondents hold one or two cards and actively use mostly all the cards. Cards are used for
withdrawing cash at ATMs and for paying at retail outlets, and least for online shopping. Cards are used two to three times
a week, and are used both in B&H and abroad. Respondents have mostly held the cards for over five years. Monthly
spending using cards amounts to between 255 and 512 EUR. The most represented brand is Visa, and payments at retail
outlets and withdrawing cash at ATMs were rated as the most important card benefits.
B&H is a great potential for card issuers. Therefore, bank and card company managers should regularly conduct research
on payment card users’ habits, in order to adjust their marketing strategies to individual user segments.
References
ADCOCK, W.O., HIRSCHMAN, E.C. and GOLDSTUCKER, J.L. (1977). Bank credit card users: An update profile. Advances in
Consumer Research, Vol. 4, pp. 236-241
ARMSTRONG, C.J. and CRAVEN, M.J. (1993). Use and payment practices among a sample of college students. Proceedings of
the 6th Annual Conference of theAssociation for Financial Counseling and Planning Education, pp. 48-159.
ARORA, R. (1987). Consumer knowledge of finance charges on credit card purchases ,in Hawes, J. (Ed.), Development in
Marketing Science, Vol. 10, Proceedings of the11th Annual Conference of the Academy of Marketing Science,
Florida, pp. 15-18.
AWH, R. and WATERS, D. (1974), A Discriminant Analysis of Economic, Demographic, and Attitudinal Characteristics of
Bank Charge-Card Holders: A Case Study, Journal of Finance, 29 (June), pp. 973-980.
BABIC, B. (2008). U zadnjih 6 godina broj kartica u Hrvatskoj gotovo je udvostrucen. Poslovni dnevnik. [online]. Available
at:: http://www.poslovni.hr/vijesti/u-zadnjih-sest-godina-broj-kartica-u-hrvatskoj-gotovo-je-udvostrucen-
68562.aspx. [Accessed 11. august 2012.]
BAR-GILL, O. (2004). Seduction by Plastic.Northwestern University Law Review: Volume 98, Issue 4
BARKER, T and SEKERKAYA, A. (1992). Globalisation of credit card usage: The case of a developing economy, International
Journal of Bank Marketing, Vol. 10 No. 6, pp.27-31.
BRITO,D.L and HARTLEY,P.R. (1995). Consumer Rationality and Credit Cards. Journal of Political Economy. Vol 103. No 2,
pp. 400-433.
CANNER, G.B. and CYRNAK, A.W. (1986). Determinants of consumer credit card usage patterns, Journal of Retail Banking,
Vol. 8 No. 1 and 2, pp. 9-18.
CANNER, G.B. and LUCKETT, C.A. (1992) Development in the pricinig of credit card services. Credit World. Vol. 83, No. 5,
pp. 13-15.
CAPGEMINI, The Royal Bank of Scotland and Efma. (2011) The World Payments Report 2011. Available at:
http://www.capgemini.com/insights -and-resources/by-publication/world-payments-report-2011/.
[Accessed 12.septembar 2012].

65
CAROW, K.A. and STATEN, M.E. (1999) Debit, Credit or Cash: Survey Evidence on Gasoline Purchases. Journal of Economics
and Business. Elsevier, vol. 51 No.5, pp. 409-421
CENTRAL BANK OF BOSNIA AND HERZEGOVINA (2011). Karticarstvo u BiH u 2010. godini, Press relase, 05.05.2011.
CHAKRAVORTI, S. (1997) How do we pay? Federal Reserve Bank of Dallas Financial Industry Issues, First Quarter.
CHAKRAVORTI, S. (2003) Theory of Credit Card Networks: A Survey of the Literature Review of Network Economics Vol.2,
Issue 2 – June 2003, pp.50-68
CHAKRAVORTI, S. and EMMONS, W.R. (2001). Who pays for credit cards? Federal Reserve Bank of Chicago, Policy Studies
EPS: 2001-1
CHAN, R.Y. (1997). Demographic and attitudinal differences between active and inactive credit card holders - the case of
Hong Kong, International Journal of BankMarketing, Vol. 15 No. 4, pp. 117-125.
CHOI, H.N. and DEVANEY, S. (1995). Factors associated with the use of bank and retail credit cards. In McKenzie, S.B. and
Stayman, D.M. (Eds), Proceeding of the Society for Consumer Psychology, American Psychology Association,
LaJolla, CA. pp. 152-159.
CIROVIC, M. (2001): Bankarstvo, Bridge Company, Beograd
DANES, S.M. and HIRA, T.K. (1990). Knowledge, beliefs, and practices in the use of credit cards, Home Economics Research
Journal, Vol. 18, pp. 223-235.
DINERS CLUB INTERNATIONAL (2012). The Story Behind The Card. Diners Club International. [online]. Available at:
https://www.dinersclubus.com/home/about/dinersclub/company-history?nav=left [Accessed 27. januar 2012].
DOSEN, O. D. and VAJDA, B. (2011). Koliko studenti koriste karticne proizvode i kako dozivljavaju marketnšku
komunikaciju izdavatelja kartica. Highbeam. Available at: http://www.highbeam.com/doc/1P3-
2413048251.html [Accessed 01. juni 2012]
DURKIN, T.A. (2000). Credit cards: use and consumer attitudes, 1970-2000, Federal Reserve Bulletin, September 2000.
FEDERAL OFFICE OF STATISTICS (2012). Employment, unemployment and wages in Federation of Bosnia and
Herzegovina, Statistical Bulletin, Sarajevo
FEINBERG, R.A. (1986), Credit Cards as Spending Facilitating Stimuli: A Conditioning Interpretation, Journal of Consumer
Research, 13, pp. 348–356.
FRAZER, P. (1985). Plastic and Electronic Money. Cambridge: Woodhead-Faulkner
GAN, L., MAYSAMI, R.C. and KOH, H.C. (2006). Credit card selection criteria among Singaporean consumers. Economic
Growth Centre working paper. School of Humanities and Social Sciences, Nanyang Technological University,
Singapore.
GAN, L.L., MAYSAMI, R.C. and KOH, H.C. (2008) Singapore credit cardholders: ownership, usage patterns, and perceptions,
Journal of Services Marketing, Vol. 22 Iss: 4, pp.267 - 279
HARPER, J. (2012). China opens door to foreign credit cards. The Telegraph. [online]. Available at:
http://www.telegraph.co.uk/finance/personalfinance/offshorefinance/9443299/China-opens-door-to-foreign-
credit-cards.html [Accessed 10.septembar 2012].
HAYHOE C.R., LEACH L.J., TURNER P.R., BRUIN M.J. and LAWRENCE, F.C. (2000). Differences in Spending Habits and Credit
Use of College Students. Journal of Consumer Affairs. Vol. 34, Iss. 1,pp. 113–133
HECK, R.K.Z. (1987). Differences in utilization behaviour among types of credit card, The Service Industries Journal, Vol. 7
No.1, pp. 41-65.
HIRSCHMAN, E. C. (1979). Differences in Consumer Purchase Behaviour by Credit Card Payment System, Journal of
Consumer Research 6, 58-66.
INGRAM, F.J. and PUGH, O.S. (1981). EFT and bank cards: household attitudes and practices, Journal of Retail Banking, Vol.
3 No. 4, pp. 45-51.

66
KAYNAK, E. and HARCAR, T. (2001). Consumers’ attitudes and intentions towards credit card usage in an advanced
developing country, Journal of Financial Services Marketing, Vol. 6, No. 1, pp.24-39.
KAYNAK, E., KUCUKEMIROGLU, O. and OZMEN, A. (1995). Correlates of credit acceptance and usage in an advanced
developing Middle Eastern country. Journal of Services Marketing, Vol. 9, Issue 40, pp 52-63.
KINSEY, J. (1981). Determinants of credit card accounts: an application of tobit analysis, Journal of Consumer Research,
Vol. 8 No. 2, pp. 177-82.
LEE, J. and HOGARTH, J. (1999). The price of money: consumers’ understanding of APRs and contract interest rates,
Journal of Public Policy and Marketing, Vol. 18 No. 1, pp. 66-76.
LEE, J. and KWON, K.N. (2002). Consumers use of credit cards: Store credit card usage as an alternative payment and
financing medium. The Journal of Consumer Affairs. Vol.36 No.2. pp. 248.
LEE, S. P. (2000). Credit Card Considerations.The Star.
LINDLEY, J.T., RUDOLPH, P. And SELBY E.B.Jr. (1989). Credit Card possession and use: Changes over time. Journal of
Economics and Business. Vol.42, pp.127-142
LINDSEY, I., (1994). Credit Cards: The Authoritative Guide to Credit and Payment Cards,Bedfordshire: Rushmere Wynne
Ltd
MANDELL, L. (1972). Credit card use in the US. Institute of Socail Research University of Michigan. Internal Report,
Michigan.
MEIDAN, A. and DAVO, D. (1994). Credit and Charge Cards Selection Criteria in Greece, International Journal of Bank
Marketing, Vol. 12 Iss: 2, pp.36 - 44
NOVAC.NET (n.d.). Brandovi kreditnih kartica. Novac.net.[online] Available at: http://novac.net/help-info/brandovi-
kreditnih-kartica/
[Accessed: 17.septembar 2012.]
O'CONNELL, B. (2011)Chinese Credit Card Issuer Now World's Biggest. Main Street. [online].Available at:
http://www.mainstreet.com/article/moneyinvesting/credit/debt/chinas-unionpay-overtakes-visa-global-
credit-card-leader [Accessed 10.septembar 2012].
PAXSON, D., and WOOD, D. (1998). Encyclopaedic Dictionary of Finance. Oxford: Blackwell
RTS. (2010). Šest decenija kreditne kartice. RTS.[online]. Available at:
http://www.rts.rs/page/stories/sr/story/13/Ekonomija/489891/%C5%A0est+decenija+kreditne+kartice.htm
l. [Accessed: 17. septembar 2012.]
SIMIC, B. (2011). Karticarsko poslovanje još nedovoljno razvijeno. Indikator. [online]. Available at:
http://www.indikator.ba/komentari-i-analize/1866-snaan-rast-kartiarskog-poalovanja-u-bih [Accessed 03.februar 2012].
SLOCUM, J.W. and MATTHEWS, H.L. (1969). Social class and commercial bank credit card usage, Journal of Marketing, Vol.
33 No. 1, pp. 71-78.
SLOCUM, J.W. and MATTHEWS, H.L. (1970). Social class and income as indicators of consumer credit behaviour, Journal of
Marketing, Vol. 34 No. 2, pp.69-74.
SOMAN, D. (1999). Effects of Payment Mechanism on Spending Behaviour: The Illusion of Liquidity. Working Paper, Hong
Kong University of Science and Technology, Hong Kong.
SOMAN, D. (2001). Effects of payment mechanism on spending behaviour: the role of rehearsal and immediacy of
payments, Journal of Consumer Research, Vol. 27 No. 4, pp. 460-74.
STAVINS, J. (1996). Can demand elasticities explain sticky credit card rates? Federal Reserve Bank of Boston. New England
Economic Review, pp.43-45
TONER, C. (1996). The future is plastic. Credit Control;1996; 17, 3; ProQuest

67
TURKISH ZIRAAT BANK BOSNIA (n.d.). O banci. Turkish Ziraat Bosnia Bank. [online].Available at:
http://www.ziraatbosnia.com/bos/obanci.htm#1999 [Accessed 03.februar 2012].
UNIONPAY. (2012). About UnionPay. UnionPay. [online].Available at:
http://en.unionpay.com/comInstr/aboutUs/file_4912292.html
[Accessed 10.septembar 2012].
WASBERG, C.A., HIRA, T.K. and FANSLOW, A.M. (1992). Credit card usage and consumer debt of households, Journal of
Consumer Studies and Home Economics,Vol. 16, pp. 19-32.
WHITE, K.J. (1975). Consumer choice and use of bank credit cards: A model and cross -section results. Journal of Consumer
Research. Vol. 2, No. 1, pp. 10-18
WHITESELL, W.C. (1992). Deposits banks and market for payment media. Journal of Mones, Credit and Banking. Vol. 24,
No.4. pp. 246-250.
WONGLIMPIYARAT, J., (2005). Strategies of Competition in the Bank Card Business:Innovation Management in a Co mplex
Economics Environment. Brighton: Sussex Academic Press
WORTHINGTON, S. (1996). Smart Cards and Retailers – Who Stands to Benfit? International Journal of Retail&Distribution
Management. 24(9): 27-34
WORTHINGTON, S., and EDWARDS, V. (2000). Changes in Payment Markets, Past, Presentand Future: A Comparison
Between Australia and the UK., International Journal of Bank Marketing, Vol.18, No. 5, pp:212-221

68
Comércio eletrônico: perfil do consumidor de
Belo Horizonte/Brasil que realiza compras
online Comércio Eletrônico, Internet, Oportunidades de Negócios, Comportamento do Consumidor, compras on line
Caissa V. Sousa, Faculdade Novos Horizontes, [email protected]
Stephanie S. Nunes, Faculdade FEAD, [email protected]
André F. A. Fagundes, Universidade Federal de Uberlândia/UF, [email protected]
Danilo De O. Sampaio, Universidade Federal de Juiz de Fora/UFJF, [email protected]
Erich V. Sousa, Pontifícia Universidade Católica de Minas Gerais/PUC-MG, [email protected]
Gustavo R. Cunha, Faculdade Novos Horizontes, [email protected]
Abstract
Desde o início do século XXI o uso da internet como forma de conhecer e concomitantemente atender as necessidades dos
consumidores tem se mostrado relevante para as organizações que usam a rede como meio de comercialização. Assim, a
confiança nesse meio de transmissão de informações e o relacionamento com o cliente se destacam como papel
fundamental para a manutenção e a ampliação do canal de comunicação. Portanto, faz-se interessante ampliar o
conhecimento acerca do perfil do consumidor que utiliza a internet para realizar suas compras, bem como a identificação
de estímulos que o motivam a utilizar o e-commerce. No presente trabalho, realizou-se uma pesquisa online na cidade de
Belo Horizonte/Brasil, a partir de um questionário composto por 29 questões, subdivididas em três partes: (i) a primeira
destinada a identificar os hábitos dos respondentes em relação ao uso da internet; (ii) a segunda em relação aos hábitos de
compras pela internet; e (iii) a terceira trata-se da caracterização do respondente. Dentre os entrevistados, 93,7%
afirmaram já ter comprado por meio da internet e pretendem continuar comprando, 5,7% nunca compraram e 0,6% já
compraram e não pretendem comprar mais. Entre os motivos destacado para nunca terem comprado, ou optado por não
comprar mais pela internet, destacam-se o medo que as informações sejam utilizadas de maneira indevida e
impossibilidade de experimentar o produto/serviço. Os respondentes consideram de maior importância ao optar por uma
loja virtual a segurança (55,5%), o preço (48,8%) e a variedade de opções de produtos (38,4%).
1 INTRODUÇÃO
No atual cenário econômico, a evolução tecnológica impõe às organizações a necessidade de reformulação ou
adaptação de suas estratégias, com o propósito de adequar suas práticas de negócios à nova realidade comercial. Para
Kendzerki (2009), o final da década de 1990 marcou o início de uma nova era, na qual as empresas pas saram a conviver
com a utilização e disseminação do Marketing Digital, podendo esse representar um aliado à construção de
relacionamentos com os clientes e ampliação de seus negócios, independente de seu porte.
Desde o início do século XXI o uso da internet como forma de conhecer e concomitantemente atender as
necessidades dos consumidores tem se mostrado relevante para as organizações que usam a rede como meio de
comercialização, levando essas a investir em técnicas de marketing digital. (Duarte, 2002).
O Brasil configura como o 5º país com maior número de conexões à internet, com aproximadamente 76.000.000
usuários conectados à rede. A sua frente estão a China, os Estados Unidos, a Índia e o Japão (e-commerce, 2012a). O

69
faturamento do setor alcançou R$22,5 bilhões em 2012, o que representa um crescimento de 26% em relação ao ano
anterior e 2400% em relação ao ano de 2002 (e-commerce, 2012b).
Segundo Lindgreen Jr. (2001), a causa primária para a expansão do comércio eletrônico foi o grande impacto que
este causou em áreas cruciais nas práticas empresariais, entre as quais a melhoria dos serviços ao cliente, as
oportunidades de desenvolvimento de mercado e a redução de custos e estoques.
Costa e Marques (2011) afirmam que a necessidade de se reconhecer o caráter diferenciado da internet ao
proporcionar maior interação com o usuário, especialmente se considerada a velocidade de transmissão das informações e
a facilidade de uso, dada a disseminação desse tipo de conhecimento.
Nesse prisma, a confiança nesse meio de transmissão de informações e relacionamento com o cliente se destaca
como papel fundamental para manutenção e ampliação do canal, o que segundo Hernandez, Ambrosina e Groh (2009, p.
13) as vezes pode ser dificultado, uma vez que “o comércio eletrônico é marcado pela natureza impessoal da internet em
que há pouca ou nenhuma presença física e contato pessoal, gerando pouca oportunidade para a criação e manutenção da
confiança”.
A partir das argumentações apresentadas, faz-se interessante ampliar o conhecimento acerca do perfil do
consumidor que utiliza a internet para realizar suas compras, bem como a identificação de estímulos que o motivam a
utilizar o e-commerce como meio de satisfazer suas necessidades de consumo (COSTA, 2009). Assim, limitando-se ao
estado de Minas Gerais, que é o segundo mais populoso do Brasil e sua capital, Belo Horizonte, compõe a terceira maior
aglomeração urbana do país, com aproximadamente 4,9 milhões de habitantes, em sua região metropolitana (Prefeitura de
Belo Horizonte, 2012), emerge a pergunta orientadora do trabalho: “Qual a percepção dos usuários da internet da região
de Belo Horizonte, em relação ao comércio eletrônico?”
O presente artigo tem como objetivo geral identificar as percepções relacionadas ao e-commerce, dos
consumidores da região metropolitana de Belo Horizonte. Para atingir tal objetivo, o trabalho propõe os seguintes
objetivos específicos: (a) identificar e caracterizar o perfil do consumidor virtual na região metropolitana de Belo
Horizonte; (b) investigar as razões que motivam o consumidor a comprar pela internet; (c) analisar as razões pelas quais
os usuários não utilizam o e-commerce; (d) conhecer os hábitos de consumo dos e-consumers da região de Belo Horizonte.
2 REFERENCIAL TEÓRICO
2.1 A Transição do Mecanicismo para Informacionalismo e o surgimento da internet
Como aborda Castells (2006), desde o início do século XX, o modelo tecnicista predominava nas organizações, no
qual o homem era considerado parte da máquina e sua função nas organizações era estritamente mecânica. As habilidades
intelectuais não eram interessantes para a organização, que por sua vez procurava extrair ao máximo sua capacidade em
realizar tarefas repetitivas que exigiam pouco do intelectual de cada indivíduo.
Para o autor esse modelo prevaleceu até meados da década de 1980, quando o modelo tecnicista/mecanicista deu
lugar a um novo paradigma, o informacionalismo. O desenvolvimento das tecnologias de informação e comunicação é visto
por Castells (1999; 2001; 2003) como o divisor de aguas entre um e outro paradigma, sendo o informacionalismo
essencial para o que chama de sociedade em rede. A sociedade em rede seria, nesse aspecto, uma sociedade conectada,
tanto cultural como economicamente.
Para Castells (2001) todo esse movimento conduziu as empresas a um modelo de gestão configurado pela
organização em redes. Nesse sentido, “a inovação tecnológica e a transformação organizacional com enfoque na
flexibilidade e na adaptabilidade foram absolutamente cruciais para garantir a velocidade e a eficiência da reestruturação”
(CASTELLS, 2006, p. 55).
Apesar de a internet não ser a o único representante desse novo paradigma caracterizado pelas tecnologias de
informação e comunicação, pode-se inferir que seja um dos mais importantes. Seu surgimento, – ou pelo menos a ideia do
que viria a ser internet – data do período compreendido entre a II Guerra Mundial, nos Estados Unidos. Na época o
engenheiro elétrico Vannevar Bush foi indicado para o escritório de Pesquisa e Desenvolvimento Científico, o qual era
responsável por reunir cientistas a fim de descobrir formas de criar operações de guerra modernas por meio da ciência. Ao
final da guerra, Vannevar Bush empenhou-se em formas de compartilhar informações mundialmente por meio da
comunidade científica (LINDGREN JR., 2001).

70
Quatro anos mais tarde a internet foi criada pelo Departamento de Defesa dos Estados Unidos como uma rede
denominada ARPANET (Advanced Research Projects Agency Network). Segundo Ellsworth e Ellsworth (1995), a rede
utilizava um protocolo que possibilitava a disseminação de dados por meio de vários caminhos de comunicações entre
diferentes sistemas. Como é conhecido atualmente, o TCP/IP (Protocolo de Controle de Transmissão/Protocolo Internet),
foi adotado por outras redes tendo em vista seu grande êxito na década de 1970 (CASTELLS, 1999).
No início da década de 1980, usando a tecnologia desenvolvida pela ARPANET, a Fundação Nacional de Ciências
criou uma rede semelhante, a NSFNet, a qual tinha o propósito de permitir que pesquisadores e acadêmicos pudessem
acessar a rede. Contudo, suas conexões começaram a ser usadas para transferência de informações e correio eletrônico
entre localidades. Esse fato trouxe à luz a necessidade de estabelecer e aprimorar os objetivos da internet e de quais
pessoas ou grupos deveriam acessá-la (CASTELLS, 1999).
A internet no Brasil teve seu marco em 1991, com o início de um sistema acadêmico chamado RNP (Rede Nacional
de Pesquisa), ligado ao MCT (Ministério de Ciência e Tecnologia). Três anos mais tarde, a empresa Embratel lançou o
acesso online, de forma experimental, porém somente em 1995 ocorreu a liberação de acesso à internet ao setor privado a
fim de estudar como explorar seus benefícios comerciais (MENDES, 2008).
Para Castells (2003) as relações entre as empresas e seus fornecedores e consumidores, a administração, o
processo de produção e cooperação com outras empresas estão passando por transformações ocasionadas pela internet.
Seu uso adequado resulta em produtividade e competitividade para os negócios atuais, sendo pequenos ou grandes
negócios.
Como resultante desse processo de desenvolvimento, o comércio eletrônico passou a representar importante
canal de comunicação entre as empresas e seu público consumidor, seja ele composto por pessoas físicas, outras empresas
ou governo. A seção que segue tem por propósito apresentar características desse canal emergente.
2.2 Comércio Eletrônico: características e emergência
Segundo Novaes (2004, p. 75) o “comércio é a troca de produtos e de serviços por dinheiro”. Esse envolve
iniciativas de promoção do produto ou serviço ofertado, de capitação e fidelização de clientes por meio do relacionamento
estabelecido entre comprador e vendedor, envolve o pós-venda e o atendimento ao cliente. Nesse sentido, o comércio
engloba uma série de ações que as empresas utilizam, não somente como forma de vender o produto em si, mas conquistar
a confiança do cliente, para que este compre mais e possa contribuir como forma de propagação dos seus serviços
(marketing boca a boca).
Assim como as atividades envolvidas com o comércio sobrepõem a venda em si, o comércio online de mercadorias
e serviços abrange uma gama de atividades mais abrangente do que a troca, especificamente. Nesse aspecto, diversos
elementos como: o marketing, as vendas, o faturamento, os pedidos de compra, a escolha da forma de pagamento, e,
representando um caráter importante, a logística, estão envolvidos nesse tipo de comércio (MORAES, 2002).
Alguns elementos principais distinguem o comércio eletrônico do tradicional, e segundo Novaes (2004), podem
ser classificados em:
Comunicação – fornece suporte às trocas de informações entre vendedores e compradores;
Dados – permitem a criação e manutenção de bases de dados necessárias para o cliente, além de permitir o
levantamento e captação de informações sobre os consumidores;
Segurança – autentica a fonte da informação e garante a integridade e privacidade dos clientes. Ao contrário da
tradicional, nessa modalidade de comércio a segurança é de vital importância, uma vez que não há a proximidade
física entre consumidor e vendedor.
Na atualidade, a internet abrange a maior parte do comércio eletrônico. Segundo Turban, Rainer e Potter (2003),
existem vários tipos de comércio eletrônico, sendo os mais comuns o B2B (Business-to-business), o B2C (Business-to-
consumer), o C2B (Consumers-to-business) e o C2C (Consumer-to-consumer).
O comércio B2B, segundo Novaes (2004, p. 82), “[...] se caracteriza por ter pessoas jurídicas nas duas pontas do
processo, ou seja, a comercialização não é dirigida às pessoas físicas.” Nesse tipo de comércio eletrônico, são desenvolvidos

71
sites na internet por empresas fornecedoras, possibilitando a troca de informações e obtenção de produtos pelas empresas
consumidoras.
Para Felipini (2006), o comércio eletrônico B2B tende a se tornar uma necessidade nos mercados competitivos,
tendo em vista que a capacidade de proporcionar benefícios tangíveis, tais como: redução de custos na realização de
pedidos; redução do preço da matéria-prima; maior controle dos processos licitatórios; e, a diminuição de erros nesses
processos, além da maior agilidade nos procedimentos de escolha de fornecedores ou compradores.
O comércio eletrônico B2C se caracteriza por transações entre empresa e consumidor - pessoa física, o qual efetua
buscas em relação a um determinado bem e/ou serviço ofertado (NOVAES, 2004). Para o autor, este tipo de comércio é
altamente volátil, o que pode ser explicado por ser uma forma de compras, ainda recente – e por que não nova, para alguns
consumidores -, que atrai clientes por motivos variados. O cliente do comércio eletrônico B2C geralmente procura por
preço e qualidade do produto/serviço, além de dar grande importância aos fatores logísticos ao efetuar seu pedido de
compras.
Ao contrário da B2C, a transação C2B ocorre quando os consumidores vendem para empresas. É uma modalidade
não tão conhecida como as demais. Nela, uma empresa anuncia na internet a intenção sobre algo que deseja adquirir,
dessa forma, o consumidor que possui o que a empresa necessita faz uma oferta de venda (MENDES, 2008). Por outro lado,
o comércio C2C já constitui uma modalidade de negociação mais comum. Geralmente abrange várias negociações de
valores pequenos, tendo como exemplos sites como o mercadolivre.com.
Os negócios C2C são realizados por meio de uma plataforma eletrônica na internet e intermediados por uma empresa que
oferece a infra-estrutura tecnológica e administrativa. Tanto o comprador quanto o vendedor devem estar cadastrados no
sistema e podem ser avaliados por todos os membros da comunidade de negócios pela quantidade de transações que já
realizaram e pelas notas que receberam em cada transação, numa espécie de ranking dos bons negociadores (FELIPINI,
2006).
O comércio eletrônico pode propiciar vantagens quando comparado ao comércio tradicional. Entre as principais
tem-se: a inserção instantânea no mercado – os produtos/serviços são expostos imediatamente, em nível nacional ou
internacional; relações mais ágeis – permite relações entre consumidores e vendedores de forma mais ágil; a redução da
assimetria informacional – a web possibilita análise rápida e abrangente de ofertas; redução da burocracia – diminuição do
uso de papéis, o que possibilita ganho de tempo, redução de custos e diminuição de erros; e por fim, análise mercadológica
facilitada – uso de informações dos clientes e transações possibilitam benefícios como definição de estratégias e
desenvolvimento de novos produtos/serviços (NOVAES, 2004).
Para Palácios e Sousa (2009, p. 207), as grandes vantagens dessa modalidade de comercialização são:
Capacidade de universalização das fontes de abastecimento;
Acesso pelo consumidor a todos os produtos de forma semelhante, independentemente de barreiras físicas;
Conveniência do canal, que está disponível 24 horas por dia;
Capacidade de aumento de sortimentos através de colaboração entre empresas;
Capacidade de acesso/comparação rápida, em tempo real, às diversas ofertas pelos consumidores,
possibilitando maiores opções de escolha;
Desenvolvimento de atividades de logística como elemento fundamental de todo o processo.
Novaes (2004) destaca possíveis problemas relacionados às transações eletrônicas dentre as quais tem -se as
fraudes, impostos (especialmente relacionados as transações que extrapolam fronteiras nacionais), risco à propriedade
intelectual, violação da confidencialidade e o afrouxamento da relação de confiança entre comprador e vendedor.
Entender a ascensão do comércio eletrônico não é uma tarefa trivial, dada a multiplicidade de fatores que podem
envolvê-la. No caso específico do Brasil, o e-commerce ganha destaque, especialmente, com a ascensão do poder aquisitivo
da classe C (considera-se classe C no Brasil a população com renda mensal entre 3 a 5 salários mínimos, o equivalente a
aproximadamente U$1030,0 a U$1720,0 mensais). Por meio do crédito fácil, os consumidores encontram na modalidade
de compra online conveniência, o que pode representar oportunidade para os empreendimentos (FELIPINI, 2010). Tal fato
é corroborado por Kayano (2008), que afirma que dado ao pouco tempo livre que as pessoas geralmente têm, a
modalidade de comércio eletrônico pode representar uma solução para o acesso às lojas, uma vez que, virtualmente,
permanecem abertas 24 horas por dias, durante todos os dias do ano.

72
Ressalta-se que o alto grau de penetração do e-commerce no varejo brasileiro está intimamente relacionado ao
acesso da população à internet , que apresentou significativo aumento nos últimos 10 anos, passando de 13,98 milhões de
internautas, em 2002, para aproximadamente 79,9 milhões, em janeiro de 2012 (e-commerce, 2012a).
Apesar do mercado em expansão para o canal, não se pode deixar de enfatizar os possíveis transtornos desse
comércio. Segundo Lopes (2011) foram registradas quase cinco mil reclamações relacionadas a problemas de entrega,
entre novembro de 2010 e janeiro de 2011. Kayano (2008) destaca a falta de normas de em vigor, no país, que versem
sobre o comércio eletrônico. Nesse aspecto, as leis que regulamentam o setor, via de regra, seguem os padrões das mesmas
normas de proteção ao consumidor para o comércio tradicional.
O autor ainda destaca o receio daqueles que não acessam a internet para promover suas compras por receios
relacionados às questões de segurança, como ação de hackers, pragas virtuais, como spywares e cavalos de troia, difíceis de
serem detectados por usuários comuns e que podem lesar o usuário a partir da cópia de senhas e dados pessoais.
Na última década diversas pesquisas foram desenvolvidas com o intuito de estudar as variáveis envolvidas na
intenção de compra online. Entre esses estudos destaca-se os trabalhos de Pavlou (2003), que investigou a confiança
relacionada aos construtos: facilidade de uso percebida, utilidade percebida e risco percebido, como determinantes da
intenção comportamental.
Nakagawa (2008) adaptou o modelo de Pavlou (2003) e investigou a percepção de confiança como decorrente das
variáveis: facilidade de uso percebida, utilidade percebida, risco percebido e influência social, sendo que todas essas
variáveis levariam a intenção de compra online.
A facilidade de uso e a percepção de risco também foram variáveis encontradas por Heidjen, Verhagen e Creemers
(2003) como influenciadoras da atitude em relação às compras online.
Fernandes e Ramos (2010), em pesquisa realizada no Brasil, encontraram que as percepções de facilidade de uso,
de utilidade, de risco, confiança e influência social influenciam a intenção de compra online. Ainda segundo os autores, a
confiança influencia a facilidade de uso percebida, a percepção de utilidade e o risco percebido.
Na seção que segue é apresentada a modalidade de compras coletivas, representante de um novo segmento do
mercado de compras online.
2.4 As Compras Coletivas
Representante de um novo segmento de negócios, as compras coletivas encaixam-se em uma lógica conhecida e
praticada anteriormente, na qual, produtos são ofertados com descontos com o intuito de conseguir uma quantidade
maior de compradores. Assim, o vendedor tem uma menor margem de lucro em cada unidade de produto, contudo, ao
final, o lucro é maior, pois maiores quantidades de unidades são vendidas (FELIPINI, 2011).
Apesar de ser um setor de compras novo, principalmente no Brasil, aonde se registra vendas em sites de compras
coletivas há aproximadamente dois anos, o seu crescimento está ocorrendo de forma rápida. Felipini (2011) afirma que
em seu primeiro ano, o setor registrou mais de mil sites operando nesta modalidade, tendo sido investidos centenas de
milhões de reais por ano em recursos no setor, além da entrada de players como Facebook e Google, empresas que estão
estabelecidas solidamente na internet e possuem acesso a milhões de usuários.
Contudo, como toda relação de compra e venda, as compras coletivas também possuem revezes. No último ano,
alguns dos principais sites de compras coletivas receberam mais de 12 mil queixas no Reclame Aqui – um dos principais
sites para registrar reclamações a respeito de produtos e serviços do Brasil. As principais reclamações inerentes às
compras coletivas relacionam-se à qualidade dos serviços ofertados (LOPES, 2011).
Para Ladeira et al. (2012), dado aos escassos estudos sobre o tema, não se tem claro os motivos que influenciam os
consumidores a aderirem a esse tipo de demanda, contudo, algumas hipóteses podem ser elaboradas, se relacionando a:
comodidade, menor preço e agilidade. Os autores testaram um modelo, em consumidores brasileiros, que avaliou a
influência de alguns construtos na adesão as compras coletivas: comportamento impulsivo, estilo perfeccionista, consumo
conspícuo, busca por exclusividade e influências pessoais. Como resultados, os autores confirmaram a hipótese de que o
comportamento impulsivo está diretamente relacionado à adesão as compras coletivas. Apesar de mostrar uma pequena
relação, o estilo perfeccionista também foi observado como relacionado à adesão as compras por esse canal. O consumo
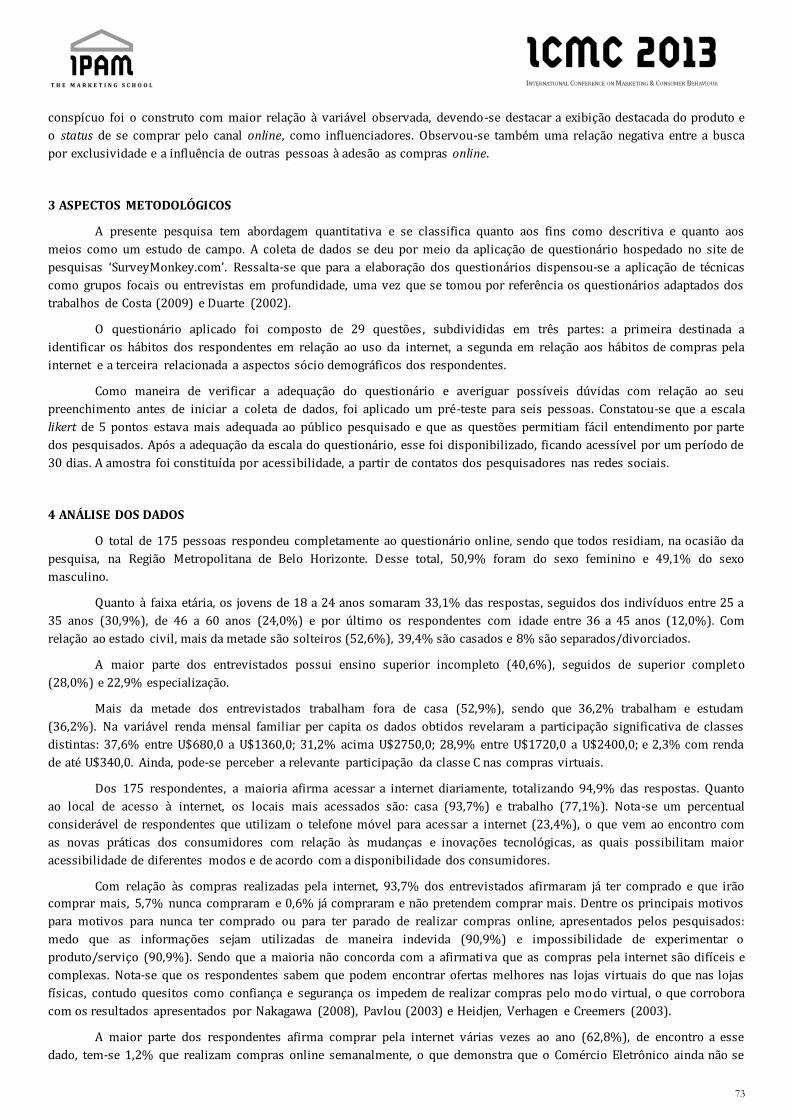
73
conspícuo foi o construto com maior relação à variável observada, devendo-se destacar a exibição destacada do produto e
o status de se comprar pelo canal online, como influenciadores. Observou-se também uma relação negativa entre a busca
por exclusividade e a influência de outras pessoas à adesão as compras online.
3 ASPECTOS METODOLÓGICOS
A presente pesquisa tem abordagem quantitativa e se classifica quanto aos fins como descritiva e quanto aos
meios como um estudo de campo. A coleta de dados se deu por meio da aplicação de questionário hospedado no site de
pesquisas ‘SurveyMonkey.com’. Ressalta-se que para a elaboração dos questionários dispensou-se a aplicação de técnicas
como grupos focais ou entrevistas em profundidade, uma vez que se tomou por referência os questionários adaptados dos
trabalhos de Costa (2009) e Duarte (2002).
O questionário aplicado foi composto de 29 questões, subdivididas em três partes: a primeira destinada a
identificar os hábitos dos respondentes em relação ao uso da internet, a segunda em relação aos hábitos de compras pela
internet e a terceira relacionada a aspectos sócio demográficos dos respondentes.
Como maneira de verificar a adequação do questionário e averiguar possíveis dúvidas com relação ao seu
preenchimento antes de iniciar a coleta de dados, foi aplicado um pré-teste para seis pessoas. Constatou-se que a escala
likert de 5 pontos estava mais adequada ao público pesquisado e que as questões permitiam fácil entendimento por parte
dos pesquisados. Após a adequação da escala do questionário, esse foi disponibilizado, ficando acessível por um período de
30 dias. A amostra foi constituída por acessibilidade, a partir de contatos dos pesquisadores nas redes sociais.
4 ANÁLISE DOS DADOS
O total de 175 pessoas respondeu completamente ao questionário online, sendo que todos residiam, na ocasião da
pesquisa, na Região Metropolitana de Belo Horizonte. Desse total, 50,9% foram do sexo feminino e 49,1% do sexo
masculino.
Quanto à faixa etária, os jovens de 18 a 24 anos somaram 33,1% das respostas, seguidos dos indivíduos entre 25 a
35 anos (30,9%), de 46 a 60 anos (24,0%) e por último os respondentes com idade entre 36 a 45 anos (12,0%). Com
relação ao estado civil, mais da metade são solteiros (52,6%), 39,4% são casados e 8% são separados/divorciados.
A maior parte dos entrevistados possui ensino superior incompleto (40,6%), seguidos de superior completo
(28,0%) e 22,9% especialização.
Mais da metade dos entrevistados trabalham fora de casa (52,9%), sendo que 36,2% trabalham e estudam
(36,2%). Na variável renda mensal familiar per capita os dados obtidos revelaram a participação significativa de classes
distintas: 37,6% entre U$680,0 a U$1360,0; 31,2% acima U$2750,0; 28,9% entre U$1720,0 a U$2400,0; e 2,3% com renda
de até U$340,0. Ainda, pode-se perceber a relevante participação da classe C nas compras virtuais.
Dos 175 respondentes, a maioria afirma acessar a internet diariamente, totalizando 94,9% das respostas. Quanto
ao local de acesso à internet, os locais mais acessados são: casa (93,7%) e trabalho (77,1%). Nota-se um percentual
considerável de respondentes que utilizam o telefone móvel para acessar a internet (23,4%), o que vem ao encontro com
as novas práticas dos consumidores com relação às mudanças e inovações tecnológicas, as quais possibilitam maior
acessibilidade de diferentes modos e de acordo com a disponibilidade dos consumidores.
Com relação às compras realizadas pela internet, 93,7% dos entrevistados afirmaram já ter comprado e que irão
comprar mais, 5,7% nunca compraram e 0,6% já compraram e não pretendem comprar mais. Dentre os principais motivos
para motivos para nunca ter comprado ou para ter parado de realizar compras online, apresentados pelos pesquisados:
medo que as informações sejam utilizadas de maneira indevida (90,9%) e impossibilidade de experimentar o
produto/serviço (90,9%). Sendo que a maioria não concorda com a afirmativa que as compras pela internet são difíceis e
complexas. Nota-se que os respondentes sabem que podem encontrar ofertas melhores nas lojas virtuais do que nas lojas
físicas, contudo quesitos como confiança e segurança os impedem de realizar compras pelo modo virtual, o que corrobora
com os resultados apresentados por Nakagawa (2008), Pavlou (2003) e Heidjen, Verhagen e Creemers (2003).
A maior parte dos respondentes afirma comprar pela internet várias vezes ao ano (62,8%), de encontro a esse
dado, tem-se 1,2% que realizam compras online semanalmente, o que demonstra que o Comércio Eletrônico ainda não se

74
tornou um hábito nas compras dos consumidores da região estudada. Com relação ao gasto médio nas compras online,
48,2% gasta em média de U$50,0 a U$150,0, sendo que as compras acima de U$500,00 resultam na minoria das respostas
(6,1%). Pode-se inferir com base nestes dados que, sendo o Comércio Eletrônico um novo meio de comercialização de
produtos e serviços no país, possui barreiras com relação à mudança de hábitos e cultural, causando obstáculos a compras
de valores mais elevados.
Quanto aos sites utilizados para realizar compras pela internet, a questão deixou livre para assinalar quais e
quantos tipos de sites o respondente utiliza. Destes, 72,0% afirmam utilizar sites de compras que vendem produtos
generalizados, não pertencendo a uma loja específica; 61,6% realizam suas compras nos sites das próprias lojas; e, 41,5%
utilizam sites de compras coletivas. Os resultados permitem visualizar um número relati vamente importante de pessoas
que realizam compras por meio de sites de compras coletivas, especialmente por ser este um canal compra online
relativamente novo no Brasil.
Quando solicitado aos respondentes que indicassem o quanto concordam com algumas ass ertivas relacionadas à
internet e as compras realizadas por esse meio, 61,6% concordam totalmente que quando fazem compras não rotineiras
gostam de pesquisar na internet; 57,9% afirmam que compram pela internet se esta oferecer preço mais baixo do que a
loja física; e, 50,0% afirmam que compram pela internet se esta oferecer promoções e/ou descontos.
Dentre os produtos mais comprados pela internet tem-se: passagens aéreas (57,9%); artigos de informática
(55,5%); e eletrônicos (54,9%), para essa questão os entrevistados poderiam marcar mais de uma opção. Outros produtos
não especificados entre as opções disponíveis também foram citados, como: instrumentos musicais, lentes de contato e
hospedagem em hotel. Em relação aos produtos que não compraria pela internet, 62,8% dos entrevistados não
comprariam veículos; 48,2% produtos alimentícios; 43,9% sapatos; e 41,5% vestuário. Os dados completos sobre as
categorias de produtos que poderiam ou não ser comprados pela internet se encontram disponíveis na tabela 1.
Tabela 1 – Produtos que costuma comprar versus que não compraria pela internet
Categoria de produto que costuma
comprar pela Internet
Categoria de produto que não
compraria pela Internet
Opções de Respostas % Respostas Total % Respostas Total
Artigos de informática 55,5% 91 5,5% 9
Artigos para saúde & beleza 25,6% 42 15,9% 26
Artigos para bebês 2,4% 4 11,0% 18
Brinquedos 12,2% 20 4,9% 8
Cama e banho 10,4% 17 11,0% 18
CD's & DVD's 28,0% 46 2,4% 4
Cine & foto 18,3% 30 4,3% 7
Esporte & lazer 17,1% 28 4,9% 8
Eletrônicos 54,9% 90 5,5% 9
Eletrodomésticos 38,4% 63 6,7% 11
Games 11,0% 18 2,4% 4
Livros e Revistas 47,0% 77 2,4% 4
Passagens aéreas 57,9% 95 1,8% 3
Produtos alimentícios 5,5% 9 48,2% 79
Sapatos 8,5% 14 43,9% 72
Telefonia 18,9% 31 5,5% 9
Utilidades domésticas 26,2% 43 6,7% 11
Vestuário 15,9% 26 41,5% 68
Veículos 1,2% 2 62,8% 103
Outro (especifique) 3,7% 6 5,5% 9
Fonte: Dados da pesquisa
Quando categorizado em relação ao gênero, as passagens aéreas continuam como o produto mais comprado, com
27,4% das marcações para o feminino e 30,5% para o masculino. Dentre produtos que não comprariam por esse canal, os
veículos continuam os mais rejeitados, com 31,7% para o feminino e 31,1% para o masculino. Os artigos de saúde e beleza

75
são predominantemente comprados pelas mulheres (22,0%), quando comparados aos homens que fazem esse tipo de
compra (3,7%).
A estratificação pela faixa etária permite identificar que os entrevistados com idades entre 18 a 24 anos compram
mais produtos eletrônicos e artigos de informática (17,7%); com idades entre 25 a 35 (18,3%) e entre 46 a 60 anos (8,5%)
compram mais passagens aéreas; e para os entrevistados com idades entre 36 a 45 anos predominam as compras de
passagens aéreas (8,5%) e livros e revistas (8,5%).
Os entrevistaram relataram dar muita importância a quesitos como informações sobre o produto disponíveis no
site (90,2%); prazo de entrega (75,6%); e conveniência (49,4%). Com relação a ser conveniente poder comprar pela
internet e retirar o produto em uma loja física 23,8% concordam parcialmente com a afirmativa e 66,5% concordam
totalmente que é conveniente poder devolver em uma loja física um produto comprado pela internet. 49,4% concordam
totalmente que a apresentação visual do site faz a diferença na hora de escolher a loja virtual, o que novamente remonta a
pesquisas anteriores (Heidjen, Verhagen & Creemers, 2003; Hor-Meyll, 2006; Nakagawa, 2008; Pavlou, 2003; Silva Jr.,
Figueiredo & Araújo, 2011) que discutem a segurança percebida como relacionada a intenção de comprar pelo canal
online.
Sobre o caráter planejado das compras online, 37,8% dos entrevistados afirmaram que às vezes (porém nem
sempre) suas compras pela internet são planejadas; 27,4% afirmaram que fazem algum tipo de planejamento; 15,2%
afirmaram que raramente planejam; 12,8% afirmam que suas compras pela internet são sempre bem planejadas; e 6,7%
nunca planejam. Se somados os percentuais daqueles que às vezes (porém nem sempre) planejam, daqueles que
raramente planejam e daqueles que afirmam nunca planejar suas compras pela internet, tem-se o equivalente a 59,7%, o
que permite inferir que há relação positiva entre a impulsividade e a realização de compras pela internet, corroborando os
achados de Ladeira et al. (2008).
Dentre os principais motivos para comprar pela internet encontram-se: gostar de aproveitar as promoções
(36,6%) e conveniência (35,4%). Quando correlacionados os dados com o gênero dos respondentes, pode-se perceber que
para as mulheres, o principal motivo para comprar pela internet são as promoções (21,3%) e para os homens, a
conveniência é o principal motivo (20,1%). A tabela 2 apresenta os resultados estratificados pelo gênero.
Tabela 2 – Principal motivo para se comprar pela internet segundo o gênero
Opções de Respostas Sexo
Feminino % Masculino %
Pouco tempo livre 9 5,5% 2 1,2%
Não gostar de ir à loja física 4 2,4% 2 1,2%
Pela conveniência 25 15,2% 33 20,1%
Gostar de aproveitar as promoções 35 21,3% 25 15,2%
Gostar de analisar as informações disponíveis 10 6,1% 19 11,6%
Total 83 50,6% 81 49,4%
Fonte: Dados da pesquisa
Ao serem questionados os itens mais importantes na escolha de uma loja virtual, os entrevistados consideram de
maior importância a segurança (55,5%), o preço (48,8%) e a variedade de produto (38,4%), ressalta-se que para essa
questão havia a opção de marcação de mais de uma opção.
Foi perguntado para os entrevistados quais seriam, em uma opinião pessoal, os principais fatores que
conduziriam ao sucesso de uma loja virtual. Segurança e confiabilidade foi o item mais marcado na opção ‘concordo
totalmente’, com 67,1% de concordância; em sequência tem-se a credibilidade do fornecedor junto ao mercado com
64,6%. Percebe-se novamente a importância dada à segurança e confiabilidade as quais devem ser fornecidas pelo
vendedor. A tabela 3 apresenta os resultados compilados para o questionamento evidenciado.
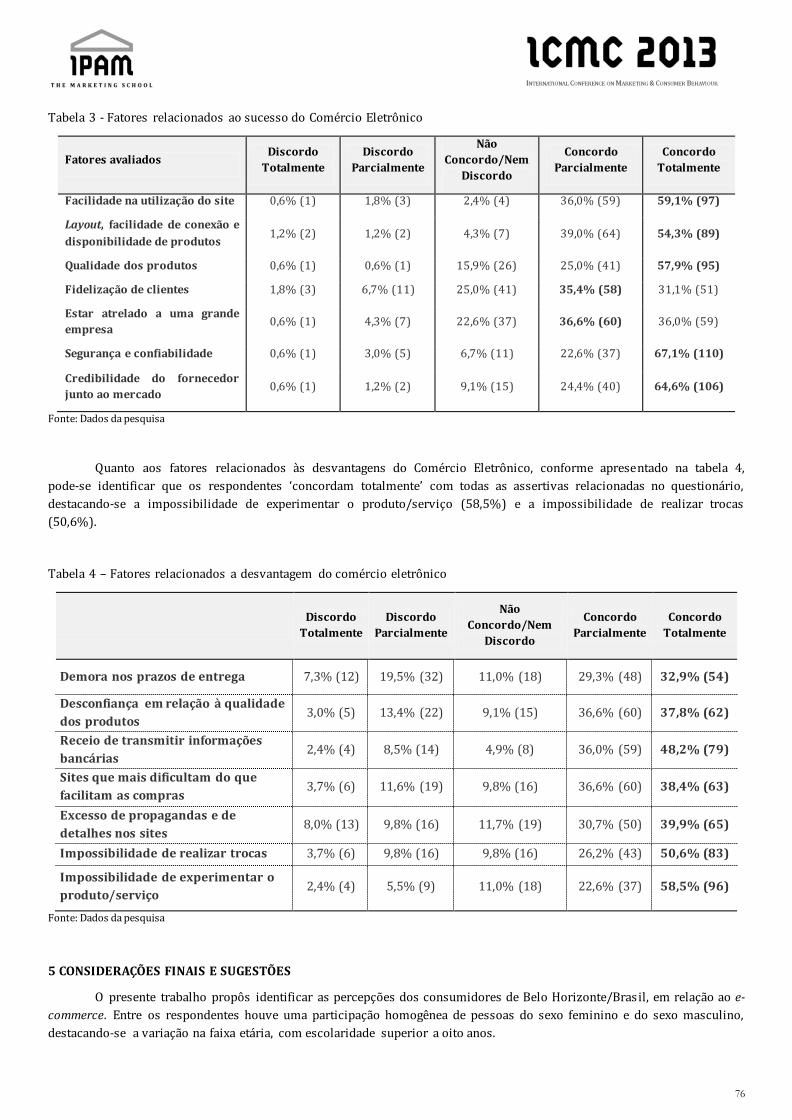
76
Tabela 3 - Fatores relacionados ao sucesso do Comércio Eletrônico
Fatores avaliados Discordo
Totalmente
Discordo
Parcialmente
Não
Concordo/Nem
Discordo
Concordo
Parcialmente
Concordo
Totalmente
Facilidade na utilização do site 0,6% (1) 1,8% (3) 2,4% (4) 36,0% (59) 59,1% (97)
Layout, facilidade de conexão e
disponibilidade de produtos 1,2% (2) 1,2% (2) 4,3% (7) 39,0% (64) 54,3% (89)
Qualidade dos produtos 0,6% (1) 0,6% (1) 15,9% (26) 25,0% (41) 57,9% (95)
Fidelização de clientes 1,8% (3) 6,7% (11) 25,0% (41) 35,4% (58) 31,1% (51)
Estar atrelado a uma grande
empresa 0,6% (1) 4,3% (7) 22,6% (37) 36,6% (60) 36,0% (59)
Segurança e confiabilidade 0,6% (1) 3,0% (5) 6,7% (11) 22,6% (37) 67,1% (110)
Credibilidade do fornecedor
junto ao mercado 0,6% (1) 1,2% (2) 9,1% (15) 24,4% (40) 64,6% (106)
Fonte: Dados da pesquisa
Quanto aos fatores relacionados às desvantagens do Comércio Eletrônico, conforme apresentado na tabela 4,
pode-se identificar que os respondentes ‘concordam totalmente’ com todas as assertivas relacionadas no questionário,
destacando-se a impossibilidade de experimentar o produto/serviço (58,5%) e a impossibilidade de realizar trocas
(50,6%).
Tabela 4 – Fatores relacionados a desvantagem do comércio eletrônico
Discordo
Totalmente
Discordo
Parcialmente
Não
Concordo/Nem
Discordo
Concordo
Parcialmente
Concordo
Totalmente
Demora nos prazos de entrega 7,3% (12) 19,5% (32) 11,0% (18) 29,3% (48) 32,9% (54)
Desconfiança em relação à qualidade
dos produtos 3,0% (5) 13,4% (22) 9,1% (15) 36,6% (60) 37,8% (62)
Receio de transmitir informações
bancárias 2,4% (4) 8,5% (14) 4,9% (8) 36,0% (59) 48,2% (79)
Sites que mais dificultam do que
facilitam as compras 3,7% (6) 11,6% (19) 9,8% (16) 36,6% (60) 38,4% (63)
Excesso de propagandas e de
detalhes nos sites 8,0% (13) 9,8% (16) 11,7% (19) 30,7% (50) 39,9% (65)
Impossibilidade de realizar trocas 3,7% (6) 9,8% (16) 9,8% (16) 26,2% (43) 50,6% (83)
Impossibilidade de experimentar o
produto/serviço 2,4% (4) 5,5% (9) 11,0% (18) 22,6% (37) 58,5% (96)
Fonte: Dados da pesquisa
5 CONSIDERAÇÕES FINAIS E SUGESTÕES
O presente trabalho propôs identificar as percepções dos consumidores de Belo Horizonte/Brasil, em relação ao e-
commerce. Entre os respondentes houve uma participação homogênea de pessoas do sexo feminino e do sexo masculino,
destacando-se a variação na faixa etária, com escolaridade superior a oito anos.

77
Quanto às razões que levam os consumidores a comprar pela internet, encontram-se principalmente as
promoções e descontos oferecidos, os preços mais baixos em relação a produtos vendidos em lojas físicas e comodidade
que esse modo de compra oferece. Uma vez que, realizando suas compras pela internet, o consumidor evita trânsito e filas,
além de poder comprar com mais facilidade em razão da sua falta de tempo diária. Em contrapartida, os usuários não
utilizam o e-commerce principalmente por receio de que as informações expostas sejam utilizadas de forma inadequada,
além de aspectos intangíveis relacionados às compras online, como a impossibilidade de ver (presencialmente) e tocar o
produto que está sendo comprado.
Considera-se que o lócus da pesquisa compreendeu uma limitação do estudo e sugere-se, nesse aspecto, que novas
pesquisas sejam realizadas, tanto em caráter longitudinal quanto em comparação a outras cidades e/ou países distintos,
uma vez que dada a facilidade de acesso, as compras online não estão restritas a um ambiente específico.
Sendo o Comércio Eletrônico um tema inovador e instigante, sugere-se para pesquisas futuras novas abordagens,
com relação às empresas (no âmbito de pequenas e grandes), que estão buscando no e-commerce novas oportunidades de
negócios. Concomitantemente estudar e analisar a preocupação em atender às demandas crescentes, em gerar e manter a
segurança nas transações, na qualidade dos produtos e serviços e no compromisso em realizar as entregas nos prazos
determinados. Neste contexto, cabe o estudo de treinamentos e capacitação dos novos perfis de empregados que o
Comércio Eletrônico exige. Outra vertente proposta seria a realização de estudos referentes às possibilidades que o
marketing agrega às organizações que têm o intuito de usar a plataforma eletrônica como canal de venda.
REFERÊNCIAS
CASTELLS, M. (1999). A Sociedade em Rede. 9ª ed. São Paulo/Brasil: Paz e Terra.
CASTELLS, M. (2001). O informacionalismo e a sociedade em rede. In: HIMANEM, Pekka. A ética dos hackers e o
espírito da era da informação. Prólogo. Rio de Janeiro/Brasil: Ed. Campus.
CASTELLS, M. (2003). A Galáxia da internet: reflexões sobre a internet, os negócios e a sociedade. Rio de Janeiro:
Jorge Zahar.
COSTA, E. M. & MARQUES, E. V. (2001). Usabilidade: um estudo da percepção de qualidade no comércio eletrônico
brasileiro. XXXV ENCONTRO NACIONAL DA ANPAD. Rio de Janeiro/Brasil.
COSTA, F. L. (2009). Comércio Eletrônico: Hábitos do Consumidor na Internet. 2009. 113f. Dissertação (Pós -
graduação em Administração) – Faculdades Pedro Leopoldo, Pedro Leopoldo/Brasil..
DUARTE, F. R. (2002). Uma Análise do Comércio Eletrônico Business-to-Consumer. 2002. 120 f. Dissertação (Pós-
graduação em Administração) – Universidade Estadual de Londrina e Universidade Estadual de Maringá, Londrina.
E-commerce.org. (2013a). Evolução da internet e do e-commerce: pesquisa sobre mercado na internet. Disponível
em: < http://www.e-commerce.org.br/stats.php> Acesso em 02/03/2013.
E-commerce.org. (2013b). Evolução da internet e do e-commerce: vendas comércio eletrônico no Brasil – bilhões.
Disponível em: < http://www.e-commerce.org.br/stats.php> Acesso em 02/03/2013.
FELIPINI, D. (2011). A Consolidação do Mercado de Compra Coletiva. E-commerce.org, São
Paulo/Brasil. Disponível em: <http://www.e-commerce.org.br/artigos>. Acesso: 19/02/2013.
FELIPINI, D. (2010). Empreendedorismo na Internet, o momento é agora. E-commerce.org, São Paulo/Brasil.
Disponível em: <http://www.e-commerce.org.br/artigos>. Acesso: 19/02/2013.
FELIPINI, D. O (2006). Comércio Eletrônico B2B . E-commerce.org, São Paulo/Brasil. Disponível em:
<http://www.e-commerce.org.br/artigos>. Acesso: 19/02/2013.
FELIPINI, D. (2006). O Comércio Eletrônico C2C. E-commerce.org, São Paulo, 2006. Disponível em: <http://www.e-
commerce.org.br/artigos>. Acesso: 19/02/2013.
FELIPINI, D. (2011). Razões para o Sucesso da Compra Coletiva. E-commerce.org, São Paulo, 2011. Disponível em:
<http://www.e-commerce.org.br/artigos>. Acesso: 19/02/2013.

78
FERNANDES, L. O. & RAMOS, A. S. M. (2012). Intenção de compra online: aplicação de um modelo adaptado de
aceitação da tecnologia para o comércio eletrônico. Revista Eletrônica de Sistemas de Informação . v. 11 (1): artigo 6, p. 1-22.
HEIDJEN, H., VERHAGEN, T. & CREEMERS, M. (2003). Understanding online purchase intentions: contributions
from technology and trust perspectives. European Journal of Information Systems, 12: 41-38.
HERNANDEZ, J. M. C., AMBROSINA, C. A. & GROH, C. A. (2009). Satisfação ou Confiança: quem determina as
intenções futuras no contexto do comércio eletrônico? XXXII ENCONTRO NACIONAL DA ANPAD. São Paulo/Brasil.
MEYLL-HOR, L. F. (2006). Serviços e Produtos: que riscos os consumidores percebem quando compram online? II
Encontro de Marketing da ANPAD/EMA. Rio de Janeiro/Brasil.
KAYANO, E. H. (2008). Comércio eletrônico: tendências e desafios no Brasil. Desafio: Revista de Economia e
Administração de Campo Grande, MS. v. 9 (18): 65-68.
LADEIRA, W. J. et al. (2012). Por que metade dos sites de compras coletivas no Brasil não estão mais funcionando?
Uma análise da adesão de novos consumidores. V Encontro de Marketing da ANPAD/EMA. Curitiba/Brasil.
LINDGREN, J. H. Marketing na Internet. (2001). In: CIZINKOTA, M. R. et al. Marketing as melhores práticas. Porto
Alegre/Brasil: Bookman.
MENDES, M. (2008) O comércio eletrônico no Brasil. Porto Alegre. Disponível em:
<http://www.ufpa.br/rcientifica/artigos_cientificos/ed_08/pdf/marcos_mendes3.pdf>. Acesso: 20/02/2013.
MORAES, M. A. (2002). Comércio Eletrônico: uma análise da qualidade, satisfação e intenções comportamentais
dos consumidores de supermercados virtuais de Minas Gerais. 2002. 136 f. Dissertação (Pós -graduação em Administração)
– Universidade Federal de Minas Gerais, Belo Horizonte/Brasil.
NAKAGAWA, S. S. Y. (2008). A lealdade dos consumidores nos ambientes de comércio online e off-line. Tese
(doutorado). Universidade de São Paulo/USP. São Paulo/Brasil.
NOVAES, A. G. (2004). Logística e Gerenciamento da Cadeia de Distribuição. 2a ed. Rio de Janeiro/Brasil: Elsevier.
PALACIOS, T. M. B. & SOUSA, J. M. M. (2009). Estratégias de Marketing Internacional. São Paulo: Atlas.
PAVLOU, P. A. (2003). Consumer Acceptance of Eletronic Commerce – Integrating Trust and Riski with the
Technology Acceptance Model. International Journal of Eletronic Commerce, v. 73: 69-103.
SILVA JR. G. F., FIGUEIREDO, K. F. & ARAÚJO, C. A. S. (2011). Tipos de Risco Percebido e o Processo de Compra
Online de Passagens Aéreas. XXXV Encontro da ANPAD. Rio de Janeiro/Brasil.
TURBAN, E., RAINER, R. K. & POTTER, R. E. (2003). Administração de Tecnologia da Informação. 2 ed. Rio de
Janeiro/Brasil: Elsevier.

79
The effects of revenue management strategies
in consumers behaviour Revenue management; consumer behavior; loyalty; decision confidence; satisfaction with price.
María-Encarnación Andrés Martínez, UNIVERSIDAD DE CASTILLA-LA MANCHA, [email protected]
Miguel-Ángel Gómez Borja, UNIVERSIDAD DE CASTILLA-LA MANCHA, [email protected]
Juan-Antonio Mondéjar Jiménez, UNIVERSIDAD DE CASTILLA-LA MANCHA, [email protected]
Abstract
The use of revenue management strategies has lead to an increased overall in the tourist sector and concretely in the
airlines and hotel. In this paper we consider the case of an online hotel booking studing different revenue management
strategies used in this sector to analyse the effect of these strategies in the consumer behavior measure in terms of
satisfaction with price, loyalty and decision confidence, that is, our analysis considers the effect of the consumer rate
election in the consumer behaviour.
Analyzing the web of different hotels that used revenue management strategies, we have devel oped a simulated context
where some Internet users have make an online simulated process of hotel booking and after they answer some questions
in relation to aspects related with the satisfaction with price, loyalty and decision confidence. The results show that the
hotel election considering the different revenue management strategies has an important effect in the consumer loyalty
and in the satisfaction with price. However, the effect over the decision confidence is not statistically significant. Moreov er,
the best results in terms of the three dimensions of consumer behavior considered have been obtained by the hotel that
used a strategy based on the length of stay, that is, the hotel in which the price of room decreases from a certain number of
nights onwards. Without doubt these aspects are very important to the hotel manager in order to take decision around the
revenue management strategies used in this company.
1. Introduction
In the last years, the use of revenue management strategies has lead to an increase. The main reason for this has been the
consolidation of the Internet as sale channel and the objective to maximize profit by sellers as consequence of the decline
in demand caused by the current economic crisis. The main sector where these strategies are more used is the tourist
sector overall in the airlines and hotel.
Furthermore, the situation of the economy has seen product prices take on a very important role in consumer purchase
decisions. In this sense, consumers spend more time trying to gain a more accurate knowledge of the price of the products
they buy. As a result, price rate has become a much more relevant factor. As a starting point, prices can be considered the
monetary effort that consumers must make in order to obtain the right to consume or to use a product or service,
however, prices sometimes act as an indication of quality. The prices, sometimes, regulate supply and demand, as a
qualitative property of the product (Velasco, 1994). Although prices are one of the costs faced by c onsumers in a purchase
decision, there are others, such as the time of purchase, displacement costs and psychological costs. Nevertheless, prices
are among the easiest for consumers to analyze, which is why they play such an important role in consumer purc hase
decisions. The findings of Agárdi and Bauer (2000) showed that buyers selected at a point of sale and a rate to make a
purchase considered the price of a product to be the most decisive factor in their purchase decision.
Thus, we consider different revenue management strategies used in the hotel sector to analyse the effect of these
strategies in the consumer behavior measure in terms of satisfaction with price, loyalty and decision confidence.
Concretely, we consider the change in the price as consequence of the application of these strategies distinguished
strategies that alter price on the basis of accepting certain restrictions (consumers benefit from lower prices if they accept

80
that the booking cannot be changed), day of week (prices are lower when the booking is made on week days), location
(prices are lower when the hotel room does not have a special location, such as sea views) and the length of stay (from a
certain number of nights onwards, the price of the room decreases). Therefore, our analys is considers the effect of the
consumer rate election in the consumer behavior.
Section 2 of this paper analyses the revenue management strategy from a theoretical viewpoint, as well as the main
strategies used in the hotel sector. Section 3 considers the factors that most influence consumer behavior and the
hypotheses to be tested in relation to the influence that the revenue management strategy has on consumer behavior.
Section 4 conducts an empirical application, which makes it possible to test the veracity of the hypotheses considered and
the main results obtained. Finally, the conclusion section includes the main conclusions and the future research lines.
2. Revenue management strategies
Revenue management strategy began to be popular in airlines but now, the demand situation has motivated to adapt this
strategy to their business in many companies such as hotels, wholesale tourism operators, catering and restaurants; urban
and suburban transport; long-distance passenger rail transport; electricity supply and generation, infrastructure for
commodity transport, use of roads and public streets. One definition of revenue management can be seen in Kimes (1994)
that consider this as a “method that helps to sell the correct product to the appropriate consumer, at the suitable moment
and price”, allowing in this way to maximise income (Kimes, 1994). The revenue management application entails
understanding consumers’ purchasing behaviour in order to compare present demand with the demand that is anticipated
in the future. This strategy identifies sales opportunities and using the price, adjustments are made in order to secure the
balance between supply and demand (Relihan, 1989).
Revenue management techniques imply the allocation of a fixed capacity to different prices to segments of consumers with
the purpose of maximizing income. These consumers, in order to benefit from price discounts, need to accept restrictions,
as well as penalties if they decide to make any change in relation to the purchase. This strategy can be used in several
sectors with some elements in common: limited capacity, perishable products or services, the possibility of segmenting
demand and high overheads.
Thus, Berman (2005) defines revenue management as an effective mechanism to assign a service that fixes capacity and a
great scale of discounts. Therefore, the main goal of revenue management is to fit prices with the purpose of completing
available capacity, because the marginal cost of considering one more consumer in many services is small . This practice
usually divides time into two periods: one with discounts on prices for bookings in advance; and another where the rest of
capacity is set aside for consumers who are less sensitive to prices, this strategy working better with non-sensitive
consumers (Desiraju and Shugan, 1999).
Revenue management techniques are based on the prior segmentation of the market aiming to later establish different
prices according to each segment and thereby maximise income and available capacity (Selmi, 2010). T herefore, the
success of revenue management depends mainly on consumers, as they are the basis. Consequently, decision making is
also consumer-based (Shaw, 1992). This means that is very important to study the consumer behavior in order to know
the possible impact of use this strategy for the company in both the short term and also the long term.
By analysing previous research, such as Kimes (1994), Kimes (2002), Kimes and Wirtz (2002) and Selmi (2010) and hotel
websites, it is possible to consider different types of revenue management strategies on the basis of accepting conditions
to obtain a lower price. When several restrictions are imposed to obtain a lower price, the strategy is normally referred to
as revenue management based on restrictions. The most frequent restrictions are based on penalising changes or
cancellations or not returning money. This paper considers that consumers can benefit from lower prices if they accept
that the booking cannot be changed, therefore we have named this strategy as revenue management based on no changes.
The second type are the revenue management strategies based on day of week, that is, prices are different if the booking is
on weekdays or at weekends. Analysing hotel websites, we have observed that most hotels set lower prices when the
booking is made on weekdays, so that is the scenario considered in this paper.
The third type of strategy implies lower prices on the basis of location. In this case, consumers can obtain lower prices
when the hotel room does not have a special location, for example, sea views. This strategy is named revenue management
based on location. Finally, revenue management based on the length of stay implies that from a certain number of nights

81
onwards, the price of the room decreases. Therefore, consumers can obtain a discount if the booking exceeds a minimum
purchase amount.
The table 1 summarizes the main revenue management strategies considered in this paper.
Table 1. Revenue management strategies according to different criteria
No changes
Day of week
Location
Length of stay
Source: own elaboration
3. Consumer behavior
In the online purchasing process it is possible distinguish two phases (Cao et al., 2003). In the first phase, customers seek a
product in different pages and then they compare features, make a selection and finally order. This is known as ordering
process. Secondly, once done the order, when it comes to customers they can keep it or return it. This is known as
fulfillment process. In this paper we focus on the ordering process since although the information collection process
collects the entire purchase process, we never got to assess the situation once the reserve is made.
It should take into account that the channel in which the product is bought has a clear influence in the process price
perception (Yu 2008), tending online buyers to perceive higher prices in a more negative way than offline buyers. This
work has been developed in an online context so it must be taken into account that online buyers are well aware of the
price value, have a higher level of price awareness and have more propensities for buy than offline buyers.
The price perception generates a consumer behavior that it manifests in different responses and emotional reactions,
reactions which, in some cases can have consequences for the seller. In this paper we analyse the consumer behavior in
terms of satisfaction with price, loyalty and decision confidence measure since the price perception affects so consumer
satisfaction as in purchase intentions and actions (claims) developed against the seller (Campbell, 1999).
3.1. Decision confidence
Consumer confidence is defined as people feeling of being capable and safe regarding the decisions they made and their
behavior. It is the consequence of beliefs such as self-esteem, perception of control and dominion, as well as previous
experience.
Confidence is characterized for being multidimensional and consists of multiple levels. Thus, two factors can be
distinguished: on the one hand, the decision confidence considered as the ability to take decisions at the time of purchase
and use information; and, on the other hand, the protection defined as the ability to protect themselves from scams and
situations of unfairness (Bearden et al., 2001).
Consumer confidence is a variable that has more importance in the online channel than in the traditional channel due to
the fact that consumers make purchase decisions online always guided by the confidence (Urban et al., 2000). Anderson
and Srinivasan (2003) highlight decision confidence acquires great relevance on the Internet. It is because of that this
channel has greater risk to make purchases.
Garbarino and Lee (2003) conducted a study on the Internet to analyze consumer reactions to the use of dynamic pricing
and its influence on confidence. The results show that, as it had been noted in other studies (Dickson and Kalapurakal,
1994; Kahneman et al., 1986), consumers do not generally accept the changes in prices that are set according to demand,
considering how unfair and impacting negatively on confidence. Therefore, if customers come to believe that the price of a
product might go down in the very near future, and perhaps even on the same day, it is possible that some of them would
decide to hold off on a purchase. This reasoning allows us to establish the following hypothesis:
H1: The used revenue management strategy has an important effect in the decision confidence.

82
To measure decision confidence, we have used items for the different levels this variable comprises, namely: acquisition
and processing of information; formation of the set to consider and, finally, personal and social outcomes (Bearden et al.,
2001), using a seven-point likert scale (Chelminski and Coulter, 2007), these items appear in Table 2.
Table 2. Items used to measure: decision confidence, loyalty and satisfaction with price
Decision Confidence
Item Description Scale Source
DC1 I am confident about the decision Seven-point
Likert scale
(Strongly
Disagree (1)
and Strongly
Agree (7))
Adapted from
Bearden et al.
(2001) and
Chelminski
and Coulter
(2007)
DC2 It was not very difficult for me to decide
DC3 I think that I have managed to find the best
option for me
DC4 I think that I have managed to gather all the
relevant information
DC5 I have made the right decision
DC6 I quickly identified the best option
Loyalty
L1 I would recommend the hotel I have chosen
Seven-point
Likert scale
(Strongly
Disagree (1)
and Strongly
Agree (7))
Adapted from
Zeithaml et
al. (1996);
Maxham and
Netemeyer
(2002);
Söderlund
(2006); Cater
and Zabkar
(2009).
L2 If my friends or relatives were looking, I
would recommend this decision
L3 If I had to choose again, I would choose the
same hotel
Adapted from
Zeithaml et
al. (1996);
Maxham and
Netemeyer
(2002)
L4 Although others offer lower prices, I think I
would still choose this hotel
Satisfation with price
SP1 In general, I am satisfied with the purchase I
have made Seven-point
Likert scale
(Strongly
Disagree (1)
and Strongly
Agree (7))
Adapted from
Voss et al.
(1998);
Ordóñez et al.
(2000);
Kauffman et
al. (2010)
SP2 I am satisfied with the price paid for the room
SP3 I think that I have got the best possible
conditions for the price paid
SP4 I am happy with the price paid
SP5 The price paid makes me feel the product is
cheap
SP6 The price paid makes me feel good about my
purchase
Source: own elaboration
We have used Likert-type scales as quantitative measurement because the scale’s points are equally spaced and the results
in Table 3 verify the fulfillment of conditions related with inter-ítems correlation higher than 0.3, correlations between
items and the average higher than 0.5 and a value of Cronbach alpha higher than 0.7 in the development of factorial
exploratory analysis.

83
Table 3. Conditions to use a summated scale for decision confidence
DC1 DC2 DC3 DC4 DC5 DC6 Correlation
items-average
DC1 1 0.825**
DC2 0.577** 1 0.745**
DC3 0.636** 0.497** 1 0.838**
DC4 0.537** 0.442** 0.661** 1 0.792**
DC5 0.692** 0.498** 0.698** 0.629** 1 0.855**
DC6 0.607** 0.615** 0.630** 0.610** 0,701** 1 0.850**
Cronbach alpha 0.900
Source: own elaboration. Note: ** statistically significant at 1%1.
3.2. Loyalty
Loyalty can be defined as the desire to purchase again. This concept is particularly important for companies on the virtual
channel because loyal customers are the most profitable (Reichheld et al., 2000). As competition is increasing, companies
have to improve to maintain their customers’ loyalty (Bruhn and Grund, 2000).
Two types of loyalty can be distinguished: behavioural and attitudinal. Behavioral loyalty refers to the experience that has
been previously, while the attitudinal loyalty refers to the future behaviour (Zins, 2001). Auh et al. (2007) consider
attitudinal loyalty as the intentions to remain and the commitment to the organization. While behavioral loyalty refers
more to an effective behavior of repeat purchases. Thus, the attitudinal loyalty focuses more on the commitment of the
individual in relation to the behavior that will have in the future in relation with a brand or a service provider.
The use of these concepts of loyalty depends on the type of product concerned. Thus, in common consumer products it
uses behavioral loyalty, whereas products sporadic purchasing and services are convenient to use as measures of loyalty
both dimensions (Moliner and Berenguer, 2010). In this paper, we have considered the attitudinal loyalty that can be
linked to factors like word-of-mouth and repatronage (Söderlund, 2006).
Reynolds and Arnold (2000) pointed out that consumers tend to spread positive word-of mouth and make repeat
purchases when they feel they have a good relationship with the service provider. Benefits gained from such a relationship
include the discounts obtained with several revenue management strategies (Leisen and Prosser, 2004). Moreover,
Karkhanis (2013) established in the airline context that pricing play a moderating role in the process of building customer
loyalty. Chapuis (2005) showed that the revenue management strategy impacts on consumer’s loyalty. In this sense,
Shoemaker (2003) considered that revenue management destroys customer loyalty due to adverse effects on guests'
perception of the hotel because revenue management appears to be the type of opportunistic behavior that inhibits guests'
trust and loyalty. Therefore, the following hypotheses are proposed in this study
H2: The used revenue management strategy has an important effect in the loyalty.
Although some authors have distinguished three loyalty dimensions, namely word of mouth, price tolerance and
intentions to purchase again, we have focused on word of mouth and purchase intentions to measure loyalty, as in
Söderlund (2006). More specifically, we have used the items shown in Table 2. Moreover, Table 4 shows the compliance
with the conditions necessary to use a summated scale for loyalty.
1 The significant values in tables are indicative since the sample is non-probabilistic.

84
Table 4. Conditions to use a summated scale for loyalty
L1 L2 L3 L4 Correlation
items-average
L1 1 0.886**
L2 0.908** 1 0.877**
L3 0.652** 0.635** 1 0.840**
L4 0.484** 0.471** 0.551** 1 0.770**
Cronbach alpha 0.856
Source: own elaboration. Note: ** statistically significant at 1%.
3.3. Satisfation with price
Consumer satisfaction emerges when expectations prior to purchasing are fulfilled or surpassed. Satisfaction also refers to
an emotional state that occurs as a result of interaction between the customer and the service provider (Crosby et al.,
1990).
Zielke (2008) defines satisfaction with price as "an emotional reaction resulting from the interaction of cognitive and
affective mental processes that are caused and activated by specific experiences that take place in the presence of different
dimensions of price perception".
Satisfaction with the price, in some studies, is regarded as a construct that consists of multiple dimensions, which are:
price transparency; price-quality ratio; relative price; confidence in the price; price reliability and price fairness (Matzler
et al., 2006). However, Campbell (1999) focuses only on price fairness; Fornell et al. (1996) consider the price-quality ratio
and Varki and Colgate (2001) analyze the effect that price perception has on satisfaction and behavior.
Bolton and Lemon (1999) made a study on two services to learn how influences consumer satisfaction with price
customer in general satisfaction. The results show them that satisfaction with price has a positive impact on satisfaction
with the service provided.
Chapuis (2012) explores the effects of perceptions of fairness and trust in the relationshi ps between the practice of
revenue management and consumer satisfaction. The main conclusion is that the consumer’s satisfaction, when
confronting discriminations during the buying process or the selling period, may decrease. Thus, we formulate the
following hypothesis:
H3: The used revenue management strategy has an important effect in satisfation with price.
To measure satisfaction, we have focused on satisfaction with price, using the items shown in Table 2 adapted from Voss et
al. (1998), Ordóñez et al. (2000) and Kauffman et al.. (2010). Furthermore, table 5 shows as the inte-ítems correlation is
higher than 0.3, the correlations between items and the average higher than 0.5 and a value of Cronbach alpha of 0.928.
Table 5. Conditions to use a summated scale for satisfaction with price
SP1 SP2 SP3 SP4 SP5 SP6 Correlation
items-average
SP1 1 0.838**
SP2 0.784** 1 0.895**
SP3 0.711** 0.696** 1 0.854**
SP4 0.733** 0.932** 0.734** 1 0.913**
SP5 0.447** 0.554** 0.562** 0.613** 1 0.755**
SP6 0.686** 0.753** 0.699** 0.785** 0.672** 1 0.895**
Cronbach alpha 0.928
Source: own elaboration. Note: ** statistically significant at 1%.

85
4. Empirical application
Analyzing the web of different hotels that used revenue management strategies, we have developed a simulated context in
order to obtain the sample information. Some Internet users purchase online have made an online simulated process of
hotel booking and after they answer some questions in relation to the perception of price fairness and aspects related with
the satisfaction with price, loyalty and decision confidence.
The study was undertaken by means of an online self-administered survey carried out between February, 29th 2012 and
March, 27th 2012 to a sample of 600 users. These users took the decision to book a hotel room in a simulated context of
five hotels with different revenue management strategies. The final number of questionnaires deemed valid once
incomplete ones had been ruled out was 541. The sample selection of individuals has been made considering quotas based
on the socio-demographic profile of Internet users who have bought sometimes on the Internet with aged between 16 and
74 years.
Taking into account the main objective of this paper we have calculated an indicator of deci sion confidence, loyalty and
satisfaction with price using an unweighted average of the value of each items used in order to measure these dimensions.
Using these averages we have used an univariate analysis of variance (ANOVA) to ascertain the differences in these
dimensions for hotels that use the different revenue management strategies analyzed in section 2. This analysis is a highly
versatile and powerful method of analysis in these cases and can be applied in different situations and with different
objectives.
In the first place, Table 6 includes the homogeneity test of the variance within groups, a necessary requisite in order to
select the statistics that we can use to compare their averages (ANOVA). We can see how for decision confidence and
satisfaction with price the null hypothesis of homogeneity is rejected. Therefore, we have used in these cases the Welch
statistic and for loyalty the F statistic to compare the averages.
Table 6. Test of homogeneity of variance. Levene’s statistic.
Variable Levene’s
statistic df1 df2 Sig.
Decision Confidence 3.474 4 536 0.008
Loyalty 1.964 4 536 0.099
Satisfaction with price 4.081 4 536 0.003
Source: own elaboration
The Welch or F statistics displayed in Table 7, at the critical level of 0.05, verify the existence of significant differences
between the groups of consumer established in base of the revenue strategy selected in the hotel booking for loyalty and
satisfaction with price. However, the differences in terms of decision confidence are not statistically significant and
therefore, we can consider that there are not a clear difference in decision confidence on the base of the rate selected.
Table 7. Test of average equality (ANOVA). F or Welch statistic.
Variable Statistic Statistics
value Sig.
Decision Confidence Welch 1.754 0.142
Loyalty F 3.262 0.012
Satisfaction with price Welch 3.713 0.007
Source: own elaboration
These results indicate that consumers have archive different level of loyalty and satisfaction based on the rate selected.
Therefore, the hotel election considering the different revenue management strategies has an important effect in the
consumer loyalty and in the satisfaction with price, therefore we must accept the hypotheses two and three. However, the
effect over the decision confidence is not statistically significant, thus the first hypothesis is rejected. Furthermore, we are
interested in comparing each strategy to the rest in order to ascertain which strategies are the furthest apart and which
record the highest levels on average for each variable. For this, the Table 8 shows the average of loyalty and satisfaction
for each revenue management strategy.

86
Table 8. Average for each revenue management strategy.
Revenue Management
Strategy based on
Decision
Confidence
Loyalty
average
Satisfation with
price average
No changes 4.8884 4.6545 4.4571
Day of week 4.9211 4.5395 4.5263
Location 4.5714 4.4571 4.3857
No revenue management 4.8617 4.8936 4.6348
Length of stay 5.1117 5.0745 4.9787 Source: own elaboration
Moreover, the best results in terms of the three dimensions of consumer behavior considered have been obtained by the
hotel that used a strategy based on the length of stay, that is, the hotel in which the price of room decreases from a certai n
number of nights onwards.
5. Conclusions and future research lines
The increase in the use of different revenue management strategies in the hotel sector makes neccesary consider the effect
of this strategies in consumer behaviour. In an effort to understand consumers’ behaviors, th is paper explores the
influences of different revenue management strategies on consumer behavior in terms of decision confidence, loyalty and
satisfation with price.
The results of the study indicate that the hotel election considering the different revenue management strategies has an
important effect in the consumer loyalty and in the satisfaction with price. However, the effect over the decision
confidence is not statistically significant. Moreover, the best results in terms of the three dimensions of co nsumer behavior
considered have been obtained by the hotel that used a strategy based on the length of stay, that is, the hotel in which the
price of room decreases from a certain number of nights onwards. Without doubt these aspects are very important to the
hotel manager in order to take decision around the revenue management strategies used in this company.
This paper opens new future research lines such as: considering others elements related with the consumer behavior
besides decision confidence, loyalty and satisfaction with price, taking into account this study for other products or
services different of hotels and include one element so important as familiarity in order to make clear if the best results
obtained for the hotel whose strategy is based on the length of stay is conditioned by the familiarity of consumers with this
rate.
References
AGÀRDI, I. and BAUER, A. (2000). Az élelmiszer-kiskereskedelem szerkezeti változásai és kialakult vállalatcsoportok Magyarországon
(Structural Changes and Strategic Groups in the Hungarian Grocery Retailing). Marketing & Menedzsment, 3, 8-14.
ANDERSON, R.E. and SRINIVASAN, S. (2003). E-satisfaction and e-loyalty: a contingency framework. Psychology & Marketing, 20(2), 123-
138.
AUH, S., BELL, S.J., MCLEOD, C.S. and SHIH, E. (2007). Co-production and customer loyalty in financial services. Journal of Retailing, 83(3),
359-370.
BEARDEN, W.O.; HARDESTY, D. and ROSE, R. (2001). Consumer self -confidence: refinements in conceptualization and measurement.
Journal of Consumer Research, 28(1), 121-134.
BERMAN, B. (2005). Applying yield management pricing to your service business. Business Horizons, 48(2), 169-179.
BOLTON, R.N. and LEMON, K.N. (1999). A dynamic model of customers´usage of services: usage as an antecedent and consequence.
Journal of Marketing Research, 36(2), 171-186.
BRUHN, M. and GRUND, M.A. (2000). Theory, development, and implementation of national customer satisfaction indices: the Swis s
index of customer satisfaction (SWICS). Total Quality Management, 11(7), 1017–1028.
CAMPBELL, M.C. (1999). Perceptions of price unfairness: antecedents and consequences. Journal of Marketing Research, 36(2), 187-199.

87
CAO, Y., GRUCA, T.S. and KLEMZ, B.R. (2003). Internet pricing, price satisfaction and customer satisfaction. International Journal of
Electronic Commerce, 8(2), 31-50.
CATER, B. and ZABKAR, V. (2009). Antecedents and consequences of commitment in marketing research services: The client's
perspective. Industrial Marketing Management, 38, 785-795.
CHAPUIS, J.M. (2005). Impacts of Consumer's Loyalty on Revenue Management Fairness Perceptions: an Explanatory Analysis in
Tourism Industry. Proceeds of AGIFORS Reservation and Yield Management Study Group, Cancùn.
CHAPUIS, J.M. (2012). Perceived fairness and trust in consumer’s reactions to revenue management.International Journal of Revenue
Management, 6 (3/4), 145-157.
CHELMINSKI, P. and COULTER, R.A. (2007). On market mavens and consumer self -confidence: a cross-cultural study. Psychology &
Marketing, 24(1), 69-91.
CROSBY, L.A., EVANS, K.R. and COWLES, D. (1990). Relationship quality in services selling: An interpersonal influence perspect ive.
Journal of Marketing, 54(3), 68–81.
DESIRAJU, R. and SHUGAN, S. (1999). Strategic service and yield management, Journal of Marketing, 63(1), 44-56.
DICKSON, P.R. and KALAPURAKAL, R. (1994). The use and perceived price fairness of price-setting rules in the bulk electricity market.
Journal of Economic Psychology, 15(3), 427-448.
FORNELL, C., JOHNSON, M., ANDERSON, E.W., CHA, J. and EVERITT, B. (1996). The American customer satisfaction index: nature,
purpose, and findings. Journal of Marketing, 60, 7-18.
GARBARINO, E. and LEE, O.F. (2003). Dynamic pricing in Internet retail: effects on consumer trust. Psychology & Marketing, 20(6), 495-
513.
KAHNEMAN, D.; KNETSCH, J.L. and THALER, R.H. (1986). Fairness and the assumptions of economics. Journal of Business, 59(4), 285-
300.
KARKHANIS, T. (2013). Impact of dynamic pricing on customer loyalty. Tenth AIMS International Conference on Management. Available
at: http://www.aims-international.org/aims10/AIMS10Proceedings/PDF/P382-done.pdf [Accessed 20 February].
KAUFFMAN, R.J., LAI, H. and HO, C.-T. (2010). Incentive mechanisms, fairness and participation in online group-buying auctions.
Electronic Commerce Research and Applications , 9, 249–262.
KIMES, S.E. (1994). Perceived fairness of yield management. The Cornell Hotel and Restaurant Administration Quarterly, 35(1), 22-29.
KIMES, S.E. (2002). Perceived fairness of yield management. Cornell Hotel and Restaurant Administration Quarterly, 43(1), 21-30.
KIMES, S. E. and WIRTZ, J. (2002). Perceived fairness of demand-based pricing for restaurants. Cornell Hotel and Restaurant
Administration Quarterly, 43(1), 31-37.
LEISEN, B. and PROSSER, E. (2004). Customers' perception of expensiveness and its impact on loyalty behaviors. Services Marketing
Quarterly, 25(3), 35-52.
MATZLER, K., WÜRTELE, A. and RENZL, B. (2006). Dimensions of price satisfaction: a study in the retail banking industry. International
Journal of Bank Marketing, 24(4), 216-231.
MAXHAM, J.G. and NETEMEYER, R.G. (2002). Modeling customer perceptions of complaint handling over time: the effects of perceived
justice on satisfaction and intent. Journal of Retailing, 78, 239-255.
MOLINER, B. and BERENGUER, G. (2010). La lealtad como base de segmentación de clientes en el comercio minorista. Tribuna de
Economía, 855, 139-152.
ORDÓÑEZ, L.D., CONNOLLY, T. and COUGHLAN R. (2000). Multiple reference points in satisfaction and fairness assessment. Journal of
Behavioral Decision Making, 13(3), 329–344.
REICHHELD, F.F.; MARKEY, R.G. and HOPTON, C. (2000). E-customer loyalty-applying the traditional rules of business for online success.
European Business Journal, 12(4), 173-179.
RELIHAN, W.J. (1989). The yield-management approach to hotel-room pricing. The Cornell Hotel and Restaurant Administration
Quarterly, 30(1), 40-45.
REYNOLDS, K.E. and ARNOLD, M.J. (2000). Customer loyalty to the salesperson and the store: Examining relationship customers in an
upscale retail context. The Journal of Personal Selling & Sales Management, 20(2), 89-98.
SELMI, N. (2010). Effects of culture and service sector on customer’s perceptions of the practice of yield management. International
Journal of Marketing Studies, 2(1), 245-253.

88
SHAW, M. (1992). Positioning and price: Merging theory, strategy, and tactics. Journal of Hospitality & Tourism Research, 15(2), 31-39.
SHOEMAKER, S. (2003). The future of pricing in services. Journal of Revenue and Pricing Management, 2, 271-279.
SÖDERLUND, M. (2006). Measuring customer loyalty with multi-item scales. International Journal of Service Industry Management, 17(1),
76-98.
URBAN, G.L., SULTAN, F. and QUAILS, W.J. (2000). Placing trust at the center of your internet strategy. Sloan Management Review, 42 (1),
39-48.
VARKI, S. and COLGATE, M. (2001). The role of price perceptions in an integrated model of behavioral intentions. Journal of Service
Research, 3(3), 232-240.
VELASCO, E. (1994). El precio: variable estratégica de marketing. Madrid, McGraw-Hill.
VOSS, G.B., PARASURAMAN, A. and GREWAL, D. (1998). The roles of price, performance, and expectations in determining satisfact ion in
service exchanges. Journal of Marketing, 62(4), 46–61.
YU, S.F. (2008). Price perception of online airline ticket shoppers. Journal of Air Transport Management, 14(2), 66-69.
ZEITHAML, V.A., BERRY, L.L. and PARASURAMAN, A. (1996). The behavioral consequences of service quality. Journal of Marketing, 60,
31-46.
ZIELKE, S. (2008). Exploring asymmetric effects in the formation of retail price satisfaction. Journal of Retailing and Consumer Services ,
15, 335-347.
ZINS, A.H. (2001). Relative attitudes and commitment in customer loyalty models. International Journal of Service Industry Management,
12(3), 269-294.

89
Session 3

90
Intent to Purchase and Consumption of Organic
Food in Brazil Consumer Behaviour. Organic Food. Sustainability. Marketing Research.
Danilo Sampaio, Federal University of Juiz de Fora, [email protected]
Marlusa Gosling, Federal University of Minas Gerais, [email protected]
Abstract
The objective of the research was to propose and test a model to assess the impact of variables affecting the intention to
purchase/consumption of organic food from the perspective of the consumer of this type of food. To meet the goals and
hypotheses of this research was developed two focus groups and a transverse survey with 560 consumers of organic food
in Brazil. After the construction of the adjusted scale to the purposes of this research, a model of consumer behavior of
organic food has been prepared based on the technique of structural equation modeling (HAIR et al., 2012). It can be
concluded that the only endogenous construct this model, intent to purchase/consumption, showed a correlation
coefficient (R2) of 41%, indicating that 41% of their variations are explained by exogenous constructs and the other 59%
reflect other things that influence the intention to purchase / consumption, but were not addressed in the model. With
respect to academic and managerial contributions, there is the rescue of a theoretical updated on the consumer behavior
of organic foods and suggestions for improvements to create actions that retails for advertising and sales promotion
including a message of appreciation to the environment the quality and availability of organic food. As a suggestion for
future research, while differentiating marketing strategy can be used in view of the various types of organic foods, pointing
purchasing behavior and consumer product-specific (both fresh and processed) enabling the improvement of the
proposed model.
1. Introduction
What makes a person to buy a organic food? What are the variables that are considered by supporters of organic
food? The objective of this paper: What are the factors that determine significantly the intention to purchase/consumption
of organic food and what the relationship of these factors with each other? The consumer of organic food is in line with the
concept of sustainable development. For the United Nations (UN, 2012), sustainability is defined as "a principle of a society
that maintains the characteristics necessary for a fair social system, environmentally balanced and economically
prosperous for a long period of time and indefinitely".
Organic food has a supply chain, which brings agroecological concepts, protecting the environment, rural workers
and providing a fair income. The organic consumer is considered a green consumer with more rigidity principles.
According to Jia et al. (2002), there are differences in the standards used to define hazard free, green and organic food. Chu
and Rahman (2012) organizations are appealing to the concept "green" in the sense that there is greater synergy between
associate the color to factor ecological awareness. The authors conclude that there is a relationship between association of
color and marketing strategy, including environmental issues.
With respect to the statistics, there is the increased production and consumption of foods organic worldwide. In
the United States, organic food and beverage sales increased from $3.6 billion in 1997 to $26.7 billion in 2010. Just
considering the year 2010, U.S. organic food sales grew 8% (OTA - Organic Trade Association, 2012). In Europe, Germany
is pointed out as an important market, totalling 6.6 billion euros, followed by France with 3.8 billion euros. With respect to
organic farms, 80% of them (1.8 million properties) are in developing countries, like India, Mexico, Argentina and Brazil
(IFOAM - International Federation of Organic Agriculture Movements, 2013).

91
2. Hypotheses and Constructs
Before starting the theoretical framework, it is important to mention the hypotheses of this research, which are
based on the studies of internationally renowned authors and, to a lesser extent, based on focus groups (figure 1).
Hypotheses Authors
H1: Concern for the environment has a positive impact on belief in
the buying of organic food
Archanjo et al. (2001), Ceschim and Marchetti (2009), Kim and
Chung (2011), Krischke and Tomiello (2009), Madaets (2003),
Sluzzs et al. (2008), Smith et al. (2009)
H2: Healthy eating habits have positive impact on belief in the
buying of organic food
Aertsens et al. (2011), Giddens (1996), Tarkiainen and Sundqvist
(2005), Pino et al. (2012)
H3: The perception of the price paid for organic food has a positive
impact on the attribute
Stringheta e Muniz (2003), Vilas Boas et al. (2008), Yin et al. (2010) e
Zakowska-Biemans (2011)
H4: The perception of the brand of product of organic origin has a
positive impact on the attribute
Della Lucia et al. (2007), Krischke and Tomiello (2009)
H5: The perception of quality has a positive impact on the attribute Janssen e Hamm (2012), OECD (2011), Ribeiro (2010), Thorton
(2002), Pimenta e Vilas Boas (2008), Yin et al. (2010)
H6: The availability of organic food has a positive impact on the
attribute
Aertsens et al. (2011), Hoppe et al. (2010), Tarkiainen e Sundqvist
(2005)
H7: Media and health professionals have a positive impact on
reference groups
Della Lucia et al. (2007), Guivant, (2003), Madaets (2003),
Cuperschmid e Tavares (2002)
H8: The household has a positive impact on reference groups Della Lucia et al. (2007), Guivant, (2003), Madaets (2003),
Cuperschmid e Tavares (2002)
H9: Acquaintances of the consumers of organic food have a positive
impact on reference groups
Cuperschmid e Tavares (2002), Della Lucia et al. (2007), Guivant,
(2003), Madaets (2003) e Zakowska-Biemans (2011)
H10: The belief of consumers of organic food has a positive impact
on the intent to purchase/consume food
Aertsens et al. (2011), Giddens (1996), Tarkiainen e Sundqvist
(2005), Pino et al. (2012)
H11: The attitude of consumers of organic food has a positive impact
on the intent to purchase/consume this kind of food
Janssen e Hamm (2012), Thorton (2002), Vilas Boas et al.(2006), Yin
et al. (2010) e Zakowska-Biemans (2011)
H12: The reference groups of consumers of organic foods have a
positive impact on their intent to purchase/consume this kind of
food
Della Lucia et al. (2007), Guivant, (2003), Madaets (2003),
Cuperschmid e Tavares (2002)
Figure 1 – Hypotheses and authors studied.
Source: Prepared by the authors of the research.
3 Literature Review
3.1 Behaviour of the Organic Food Consumer
The consumer behaviour researches usually studying variables such as attitudes, beliefs, values and intentions of
purchase and consumption. Yin et al. (2010) developed a survey with 432 organic food consumers in China. The Chinese
purchase intention is strongly affected by factors such as income, level of confidence in the organic food, degree of
acceptance regarding price and health concerns. The consumers call themselves confident on the concept of organic food
and believe that this type of food results in a healthier life. The authors also mention that the purchase intention of organic
food is slightly affected by age, level of education and environmental concern.
Another contemporary research can be seen in Tarkiainen and Sundqvist (2005). The authors investigated the
behaviour of organic food consumers (bread and organic flour) in Finland. The authors appli ed the structural equation
modelling technique to understand the relationship between subjective norms, attitudes and purchase intentions of
organic food consumers. Aertsens et al. (2011) developed their survey in Belgium and found that the attitudes of
consumers towards the consumption of organic vegetables are generally positive, and the most positive factor was that the
consumers recognize that the organics are produced without synthetic pesticides.

92
Hsieh and Stiegert (2011), in the United States, report that the organic consumers are susceptible to price changes,
are more concerned with the quality of the food when compared to traditional consumers and purchase organics both in
specialty stores and in supermarkets. The authors mention that large organizations have increased their organic food
sales. In Brazil, research on consumer behavior of organic food is limited. The few studies are mostly developed in the
south and southeast. Regarding the research approach in this country, qualitative studies were prioritized in articles from
journals. In articles presented at scientific meetings, some authors have used quantitative methods along with qualitative
ones. The research methods most used by Brazilian researchers are in-depth interviews, content analysis, scaling /
laddering, survey, and lastly, focal groups.
Some of the major Brazilian researchers of consumer behavior of organic foods are Archanjo et al. (2001),
Cuperschmid and Tavares (2002), Ruchinski and Brandenburg (2002), Zamberlan et al., Büttenbender (2006), Sluzzs et al.
(2008), Ceschim and Marchetti (2009) and Krischke and Tomiello (2009). These authors researching consumer behavior
in order especially as variable attributes and values.
Ruchinski and Brandenburg (2002) report that consumers of organic food internalizes the movement in favor of
ecology and has awareness of environmental preservation, a fact that was verified when consumers found that is willing to
pay a higher price for organic. Krischke and Tomiello (2009) found that this type of consumer has average income of
around 4.000 U.S. dollars, representing in Brazil, a premium segment of the market.
Zamberlan et al. (2006) and Rucinski and Brandenburg (2002) point out that organic food consumers have a
higher income and a higher educational level when compared to organic food non-consumers, and are also more aware in
terms of environmental preservation. For the authors, consumers of organic foods appreciate the care with personal and
family health, being guided by values terminals as longevity, happiness and tranquillity.
3.2 Constructs Research
Considering the importance of hypotheses, they are flagged according to the explanations of each construct of the
model, as well as contributions from the focus groups. The central constructs studied were: Beliefs, Attributes, Reference
Groups and Intent to Purchase/Consume. Each of these constructs is indicated in terms of conceptual and operational
definition below (figure 2).
Constructs Conceptual Definition Operational Definition
Beliefs of the consumer of
organic foods buying /
consuming this type of food
"[...] of the consumer beliefs come from cognitive
learning" The belief for the consumer is that they
have knowledge about objects, their attributes and
benefits (MOWEN; MINOR, 2003, p. 141)
The belief in organic food was measured by Hoppe et
al. (2012) with seven-point Likert scale. The belief by
organic food was measured by Chryssohoidis and
Krystallis (2005) with five-point Likert scale
Attributes that consumers
of organic foods judges as
needed for the purchase /
consumption of the same
Attributes are characteristics of a product that
consumers can store in memory or not knowledge of
such attributes. Attributes can be tangible (physical
and tangible as a type of wood for a particular
product) or abstract (intangible subjective
characteristics such as quality) (PETER; OLSON,
2009)
The variable attribute in relation to organic food was
measured by Hoppe et al. (2012) from a seven-point
Likert scale. The variable attribute in relation to
organic food was measured by Chryssohoidis and
Krystallis (2005) from five-point Likert scale. The
variable attribute in relation to organic food was
measured by Zakowska-Biemans (2011) from a seven-
point Likert scale
Reference groups that
influence the consumer of
organic foods in the
purchase / consumption of
the same
A reference group influential in a given society may suggest to the consumer that this change your attitude or behavior (SCHIFFMAN; KANUK, 2009)
Variable Reference Groups in relation to organic food
was measured by Chryssohoidis and Krystallis (2005)
with five-point Likert scale. Variable Reference Groups
in relation to organic food was measured by Kim and
Chung (2011) with seven-point Likert scale
Intention to purchase /
consumption of organic
foods
"The intentions of behavior are defined as expectations to behave in a certain way in relation to the acquisition, disposal, and use of products and services" (MOWEN; MINOR, 2003)
"The intentions of behavior are defined as
expectations to behave in a certain way in relation to
the acquisition, disposal, and use of products and
services" (MOWEN; MINOR, 2003)
Figure 2 – Constructs and conceptual/operational definition.
Source: Prepared by the authors of the research.

93
Regarding construct belief, a consumer who is concerned about health in terms of eating habits and the
preservation of the environment (VILAS BOAS et al. 2008). The construct belief finds support in Alternative Medicine and
Nutrition, because these sciences point, according Zanoli and Naspetti (2001), that organic food has nutrients and vitamins
that help fight disease and provide better quality of life to people.
In this research, the construct attribute is related to four variables: price perception, brand awareness, perceived
quality and availability. As for the variable price, in the case of organic food, its higher price compared to non-organic
foods impacts greater market segmentation and positioning involves a related individuals belonging to the higher social
classes in terms of income (ZAKOWSKA-BIEMANS, 2011).
The variable perception of price is related to the symbolic issue that involves organic food, as this differentiated
food that favours because of their cropping system, ecology, respect the proper methods of handling and production, with
the call to provide a healthier life for consumers (STRINGHETA; MUNIZ, 2003; VILAS BOAS, 2005).
The brand or origin of organic food is a motivating factor in consumer purchase. Della Lucia et al. (2007) found
that consumers of organic coffee notes, in the area of retail sales, the brand of the product and its origin, pointing this fact
as important in the acquisition process. According Krischke and Tomiello (2009), trust in the brand is present in more
mature consumers and the elderly, who affirm that the brand generates a value important tradition at the time of
purchase. For Thorton et al. (2002), consuming organic food, ecological and certified means having an attitude and correct
behavior, i.e., the consumer in this case feels like a social actor essential to the preservation of the environment.
The organic food, in respect of their chemical and nutritional characteristics, positions as a nutritionally superior
food. The nutritional quality and certification of organic food are factors identified in the research as fundamental as it
consolidates the consumer's perception of the quality you are looking for is audited and monitored (VILAS BOAS et al.,
2006; KRISCHKE; TOMIELLO, 2009; RIBEIRO, 2010; ZAKOWSKA-BIEMANS, 2011).
So important to the consumer, as realizing the value of organic food is finding it on the shelves of supermarkets,
open-air markets and specialty stores. For Hoppe et al. (2010), availability is a critical factor in the purchase decision of
the consumer. In developed countries such as in Holland and England, organic foods are offered in many open-air markets
and retails traditional and specialized. Aertsens et al. (2011) corroborate Hoppe et al. (2010) and indicate the availability
factor of objective intention to purchase organic foods. Tarkiainen and Sundqvist (2005) indicate how necessary the
availability of organic food in supermarkets. The authors while researching the purchase intention of consumers in
relation to organic tomato, referred to the variable availability as critical to consumers.
The central construct Reference Groups is appointed in view of the close relationship of the consumer of organic
food with people and organizations around you, like relatives, friends, media and professional somehow connected to the
issue of health. According Madaets (2003), consumers of organic food feels more comfortable as a member of a targeted
group of consumers, aware of ecological responsibility. Noteworthy is the construct Reference Groups as a form of
socialization. The research of consumer behaviour must once again take a special look at trends in social groups and the
objects of desire of these groups. Consumers of organic foods develop a relationship group around the concept of a healthy
lifestyle and even alternative in order to be recognized as consumers that protect the environment and preserve health
(ZAKOWSKA-BIEMANS, 2011).
Dahl et al. (2001) conducted a survey on how the consumer is confused to make purchases due to the influences of
family and social presence. For the authors, the confusion (or embarrassment) means the social interaction and the forces
involved in the action of purchase. The embarrassment or confusion can occur before, during and after purchase. The
authors conducted focus groups and field tests purchase to individuals, which received a sum of money to carry out
specific acquisitions. As a result, it was found that the presence of family and social groups influence the purchase,
confusing the consumer in the sense that some issues were raised - What I really (consumer) desire? What I (the
consumer) actually bought?
Influences of parents and relatives, friends, colleagues, media and other organic consumers have no power of
decision-making, but have supporting role in encouraging consumers to buy organic food (GUIVANT, 2003; DELLA LUCIA
et al., 2007). The organic consumer can make a purchase decision, both based on the relationship you have with the people
around you, as to the power of the media that reinforces daily information about organic foods that can be stored in the
memory of the consumer. Cuperschmid and Tavares (2002) pointed out that the consumer of organic food it is also
considered a green consumer, with strong ecological awareness, influencing even others to raise awareness of the issue of
the ecological organic food.
94
4. Methodological Aspects
The conception of this research is considered to be descriptive, but also includes an exploratory phase. Regarding
the methods of research, two focus groups were developed in the qualitative phase, and then used a cross-sectional survey
in quantitative research.
In the qualitative phase of this study, two focus groups were worked, one with seven participants (Focus Group A -
FGA: organic food consumers) and the other with six participants (Focus Group B - FGB: non-organic, traditional food
consumers). The purpose of choosing two different focus groups was to compare and verify the groups' knowledge of
organic food and their characteristics. In both FGA and FGB, a term of free consent and authorization for participants' data,
voice and image was written in, which allowed for filming, voice recording and collection of socio-economic data of all
invited consumers. The city of Juiz de Fora, in the state of Minas Gerais, Brazil, city with 517,872 inhabitants, was chosen
for the implementation of the focus groups, due to the convenience for the researcher and the appropriateness of the site
for the work. An advantage in choosing the focus group was the rapidity in providing results and the opportunity to c ollect
data from the interaction of groups (KRUEGER, 1994; MORGAN, 1988).
In the quantitative study, from the total of 560 elements randomly choose, three of them were excluded, since they
presented data from the questionnaires with validation problems. Therefore, 557 elements were considered. The survey
was limited to the city of Belo Horizonte, state of Minas Gerais, Brazil, with about 2,375 million inhabitants, in Brazil (IB GE,
2012), which in fact made the survey viable due to the easy access of the researcher in being close to the phenomenon
(COLLIS; HUSSEY, 2005; MALHOTRA, 2006; MARCONI; LAKATOS, 2009; VIEIRA, 2002). The survey occurred during the
months of September to November of the year 2011.
The proposed scale was based on the conceptual and operational definitions of the variables and the perusal of the
authors mentioned in this thesis, referred to the behaviour of consumers of organic food. Reference groups also
contributed to the elaboration of the items that formed the survey questionnaire. The final questionnaire contains itens
regarding the addition of variables, issues-filter and socioeconomic issues in order to characterize the respondent.
The agreement scale used in the questionnaire of the survey was the eleven point Likert scale (0 = strongly
disagree to 11 = strongly agree). This scale considered unforced (no type options do not know if any of the above) means
that presupposed that the respondents were buyers of organic food (Malhotra, 2006). In this way, it is worth informing the
interviewers approached the respondents when they caught organic food and put it in the shopping cart. With regard to
the scale of the questionnaire items, it was decided to implement the 11-point Likert scale, because, according to Monteiro
(2010), this can reduce measurement errors. As the research was conducted in Brazil, the decimal system facilitates
understanding by the respondent.
5. Data Analysis and Results: Focus Groups
In the reports of the focus groups (FGs), the frequent words and terms, which were selected and grouped under
the following categories: (a) terms: health, nutrition, quality of life, (b) values: human, economic, (c) opinion: favorable,
unfavorable. Prior to the tabulation of the data, participants' speech and debates were verified by means of the recording.
We developed a report with the transcriptions of both FGs, which gave a good cross section of data with the recordings
and images generated in the group meetings. Regarding the frequency with which the words most frequently mentioned
by participants are measured (Stone et al., 1970; Bardin, 1977), can note FGA's situation 65 words/terms were mentioned
by participants.
Regarding the frequency of words/terms used in the FGA, we observe that the habit of organic food consumption
was the most mentioned by the interviewees (f = 53), followed by the importance of small organic food producers (f = 13),
the need for certification of organic food (f = 12), organic food is good for health (f = 12), and the importance of having
retail/access/variety of organic food (f = 12).
In the case of the word/term: habit of organic food consumption, it was cited by participants who pointed out the
preference for this type of food knowing the benefits that organic food offers for human health. By analyzing the frequency
of the FGA participants' words selected from the voice recording, we can infer that the organic food consumer investigated
in this study is concerned with: (i) the term organic food, (ii) who produces organic food, (iii) the organic food quality, (iv)
how good organic food is for health and, (v) access to organic food retail and the fact that there could be a wider variety o f
organic food available.

95
The organic foods most often mentioned by the FGA participants were sugar, green vegetables, chocol ate and
brown rice. For the interviewees organic food is not easily found in retail establishments in Brazil. Participants referred to
certified organic foods, with a quality seal and both industrialized and non-industrialized organic products.
Participants also mentioned people's and retail staff's (employees) lack of knowledge about the concept of organic
food, its characteristics, as well as the location / availability of organic food in the retail outlet.
When asked if they consume industrialized organic products other than those found in open markets or in the
supermarket green vegetable section, the FGA participants mentioned that they consume these foods from different kinds
of retail establishments: supermarkets, specialized stores or open markets. The FGA participants pointed out that they
look for different types of organic food, such as fruits, vegetables, green vegetables, pasta, among others.
The participants also commented that when travelling abroad she brings back all types of organic food which, in
Brazil, are more expensive or not easily found. Both by means of the video and voice recording, and by observing the
participants, we found that all participants’ attitudes go beyond the use of organic food only, that is, participants live their
lives in a conscious way, concerned with their eating habits and with their education, as well as with the preservation of
nature and quality of life.
Participants also complain about the location of organic products in retail outlets, or mention that organi c food
has no specific location like other products in the retail outlet layout. It is difficult to find a section specifically for organic
products. For the consumers participating in the FGA, organic foods are even mixed with other foods such as light and diet
ones.
When asked by the moderator about the most important features of organic food, participants indicated in
decreasing order: (a) health, (b) quality of life/wellness/lifestyle, (c) respect for the environment/respect for
others/respect for the ecosystem. Regarding the FGB, that is, the FG composed of consumers who do not have the habit of
consuming organic food, a greater number of words/terms was transcribed when compared with the FGA. While the FGA
mentioned 65 words/terms, the FGB mentioned 77. The most often mentioned products by the FGB participants were
sweets (regardless of flavour) coffee, bread and sugar.
The FGB participants showed lack of knowledge about the meaning of organic food, however, some consumers
said that organic food is the one that has no pesticides. The FGB participants did not mention factors such as
environmental protection and ecosystem, the importance of agro ecological agriculture and concern for the rural
population working with crops.
In the FGB health problems regarding high cholesterol (f = 16) was the most common term, followed by the habit
of consuming traditional sweets (f = 10); the exchange of a food brand occurs when the price is high (f = 8); habit of
consumption regarding traditional coffee (f = 7); and lack of knowledge about organic food (f = 7). Besides these most
common terms, matters concerning fast food meals in cafeterias, such as fast food chains, were also highlighted in the FGB
participants' speech.
At the beginning of the FGB meeting, participants also emphasized problems related to poor health, sometimes
due to hereditary issues, other times because of an unhealthy diet. The major diseases mentioned by the consumers
interviewed were related to high cholesterol and a predisposition to hypertension. For the FGB participants it is important
to have a healthier diet, as is the case of people who eat organic products and play sports more regularly.
The fact that most FGB consumers have high cholesterol contributed to a greater interest in the present study,
since, according to the participants themselves, they are considering changing their eating habits to include the
consumption of organic food. Another fact observed when filming the FGB, was that participants are willing to eat organic,
however, the price variable should be observed. When FGB participants were asked about how much more they would pay
for organic food, they mentioned that they could afford up to 20% more to eat better.
Both in the FGA and FGB, participants indicate a greater need to learn more about organic food, or better
understand the concept and characteristics of such food, as well as what organic food can mean for people's health and
quality of life. Regarding the socio-economic profile, comparing the two FGs, it was found that FGA participants had a
higher family monthly income than the participants in the FGB, which corroborates other studies already conducted on the
consumption of organic food (COLTRO, 2006; KRISCHKE; TOMIELLO, 2009). Out of the seven participants of the FGA, one
is attending higher education, two have completed postgraduate studies, another has a higher specialization course and
three others have finished higher education. Such information indicates that in the present study all organic food

96
consumers are highly educated.
It is important to mention that before beginning the discussions in the FGs, the researcher distributed and then
collected the socioeconomic questionnaire filled in by all participants. Even though the FG is a simplified picture of the
reality in terms of sampling and taking into account that the FG should not be considered a conclusive result as a
qualitative research technique (Malhotra, 2006), the fact that consumers with better education have better financial
conditions and information on diet, indicates that the organic food consumer is educated, conscious, critical and concerned
about his or her own health and well being.
The relationship between education, family income and organic food consumption is also addressed in research
by Ceschim and Marchetti (2009) and Coltro (2006), where the authors cite that high education levels and family income
awaken consumer's consciousness for the better quality of life provided by organic food. Rucinski and Brandenburg
(2002), Shepherd et al. (2005), Tarkiainen and Sundqvist (2005), and Zamberlan et al. (2006) point out that organic food
consumers have a higher income and a higher educational level when compared to organic food non-consumers and are
also more aware in terms of environmental preservation.
When studying the behaviour of organic food consumers, Pimenta and Vilas Boas (2008) noted that consumption
was higher among those aged over 30 with advanced education and a monthly income of more than four times the
minimum wage. Krischke and Tomiello (2009) also revealed in their research that the better education of organic food
consumers favours the extent of knowledge regarding the agro ecological benefits of organic food. When checking the
second focus group, the FGB, we note that the educational level is lower than in the focus group of consumers who eat
organic food (FGA). Such information may influence the income variable as previously seen.
Regarding gender, of the seven participants in the FGA, two of them are male (28.57%) and five of them are female
(71.43%). In the FGB there are two males (33.33%) and four females (66.67%) out of a total of six participants.
In conclusion, when analysing the factors that lead to a certain type of consumer, in the FGA a greater awareness
regarding the importance of organic food as a source of better quality of life was observed. On the other hand, despite
perceiving organic food as being healthier, participants of the FGB are not aware of the concept of organic food and of the
fact that this kind of food provides a better quality of life.
6. Data Analysis and Results: Survey
A conceptual and operational definition of variables allowed the construction of the proposed model of consumer
behaviour of organic food. According to Malhotra (2006), the correct definition of variables allows researchers to the
creation of a scale and questionnaires that are faithful to the purpose of the research. In this way, the four variables that
were studied are: beliefs; attributes; reference groups; intent to purchase/consumption.
Firstly, it is important to show the sample profile in this study. The survey was limited to the city of Belo
Horizonte, in Brazil, with about 2,4 million inhabitants (IBGE, 2012). This research occurred during the months of
September to November of the year 2011, comprising 560 food consumers, and three of them were excluded, since they
presented data from the questionnaires with validation problems.
About the gender of the respondents, 74% were women and 26% were men. The frequency distribution with
respect to the age of the interviewees pointed out those between ages 46 to 55 (27%) as prevalent followed by the range
between 36 and 45 (21%) and 56-65 years old (19%). In the education level, 37% respondents had completed a college
degree, 63% were postgraduates, including master and doctoral degrees. About marital status, 52% were married, 29%
were single, 13% were divorced or separated and only 6% consumers of organic food are widowed. About income
question, 34% have a household income monthly above 10,375.01 BRL (5,239 U.S. dollars in Feb. 28, 2013) and 32% with
incomes between 6,225.01 (3,143 U.S. dollars) to 10,375.00 BRL (5,239 U.S. dollars).
In this item each variable and its corresponding descriptive statistics are presented. All tables were generated by
the SPSS® software, version 13.0. With respect to the 'belief' construct, one can notice that the means for the scale were
elevated, showing a positive positioning of consumers of organic foods. Moreover, the standard deviation, which is the
average of the variability data, was above 2.50, which is considered high by the scale used, indicating there is some degree
of divergence of opinion among the respondents.

97
The variables with the greatest distance from the average values were: HAS2 (I usually eat portions of meals at
short intervals throughout the day), MA2 (I avoid using plastic bags when I buy/consume food at retailers); MA3 (When I
know that a company pollutes the environment, I avoid buying/consuming their products) MA4 (I separate packages made
of metal, glass and plastic for recycling).
Out of the 14 variables of the 'attribute' construct studied, the six which showed high standard deviation above
2.50, were: PQ2 (the smell of the organic food is different from non-organic food); FP4 (the appearance of organic food is
better than non-organic food); PM1 (I have a habit of buying/consuming organic food of known brands or sources), PM2 (I
have a habit of buying/consuming organic food from companies that associate their brand with the environment); PM3 (I
prefer to buy/consume organic food from companies that associate the brand/source to health); D4 (if there is a
restaurant specializing in organic food in my town I intend to go there). With respect to 'attribute' construct, it was found
that the averages were also high, being closer to the maximum scale value.
By analysing the 'reference group' construct, the variables GR5 (I usually ask people who eat organic products
before purchasing/consuming) and GR6 (most of my friends are people who also feed on organic products, not those that
feed on non-organic foods) showed averages near the minimum of the scale and with high standard deviation compared to
other variables. Variables GR5 and GR6 indicate that consumers of organic foods tend not to ask other individuals that feed
on organic food and is not necessarily friends with such individuals.
The GR4 variables (health professionals, such as doctors or nutritionists approve of my purchase/consumption of
organic food) and GR7 (I am interested in news stories about organic foods) had lower standard deviation and average
values closer to the maximum of the scale. These facts indicate that the consumers of organic food surveyed place high
importance in the views of health professionals and the media as they are providing information and advice on the use of
organic food.
Three other variables demonstrate an average close to the maximum range and standard deviation above 2.50.
They are: GR1 (in my family there are other people like me who feed on organic foods); GR2 (influential people such as
athletes, political leaders and renowned artists who advocate the consumption/purchase of organic food approve my
purchase/consumption); GR3 (my parents, relatives and friends would approve of my purchase/consumption of organic
food). Thus, it is understood that, despite there being variables accepted by consumers as influencing the purchase and
consumption of organic foods, they do not have the same degree of significance as the GR4 and GR7 variables. In the 'intent
to purchase/consume' construct, the averages of the three variables were close to the maximum value of the scale, with a
standard deviation lower than 2.50. Therefore, the intent to purchase/consume is one of the most significant constructs
indicated in the survey.
7. Structural model
After verifying the Outer Model of the constructs of the first and second orders, it was possible to attest that they
have adequate validity and reliability. That is because it only makes sense to evaluate the Inner Path Model after ensuring
that the Outer Model has validity (convergent and discriminant) and reliability because if the measures representing the
constructs of interest are inadequate, there is no reason to examine relationships between the constructs (HAIR, RINGLE;
SARSTEDT, 2011). Thus, further analysis of the Inner Path Model was carried out.
The structural model of this study, also defined by the Behaviour Model of the Consumer of Organic Food
(MCCAO) can be seen in figure 3. In this model, loads for each exogenous construct in relation to intent to
purchase/consume of organic food (endogenous construct) are presented, as well as the correlation coefficients between
each exogenous construct.

98
Figure 3 - Inner Path Model (structural model) - Behaviour Model of the Consumer of Organic Food (MCCAO).
Source: Prepared by the authors of the research with data from the survey worked in SmartPLS.
(i) ** p value <1%, (ii) * p value <5%; Ɨ p value <10%, the dotted arrow indicates that the relationship showed
a p value> 10%, (iii) caption: CI = intent to purchase/consume - questionnaire items).
The only endogenous construct of MCCAO, 'Intent to Purchase/Consume', presented a R² of 41% (table 1),
indicating that 41% of their variations are explained by exogenous constructs, and the other 59% reflect other things that
influence the intent to purchase/consume, but were not addressed in the model. This size of R² indicates a moderate to
substantial power of prediction, according to Chin (1998), who highlights that the construct is explained by only one or
two variables, therefore, a moderate value is acceptable. According to Lohmöller (1984), an appropriate model should
provide an R² of at least 50% (DIAS, 2004). The MCCAO proposed in this study showed a value very close to that, which
can be justified because it is an exploratory research on the subject.
Construct Exogenous Construct Endogenous Sample Pop. Dev. Error T Value Sig.
Attitude Intent to
Purchase/Consume
R² = 41%
0,50 0,50 0,05 0,05 9,56 <1%
Belief 0,20 0,20 0,05 0,05 3,82 <1%
Reference Group 0,05 0,06 0,04 0,04 1,26 > 10%
Table 1 - Results of the hypotheses of the Inner Path Model proposed.
Source: Prepared by the authors of the research with data from the survey worked on in SmartPLS.
a) Sample: standard weight obtained for the full sample, b) Pop.: is the average weight obtained in the population c)Dev.: the standard
deviation of the estimate d)Error: the error is estimated from the estimate e)T Value: the ratio of weight not standardized by its standard error.
Out of the three exogenous constructs, only two showed statistically significant impact, and these were the Belief
and Attribute constructs. Both loads were positive, and the impact of the Attribute construct (standardized loads of 0.50, p
value <1%) was greater than the magnitude of the impact of the Belief construct (loads standardized 0.20, p value <1 %),
for being closer to one. The Reference Groups construct had an impact of 0.05 (load very close to zero, although positive),
not significant at 10%, indicating it does not exert influence on the intent to Purchase/Consume.
In the case of the Belief construct, the Environment variable has a greater weight than the Healthy Eating Habits
variable. This indicates that the Beliefs construct undergoes major changes when the consumer has a tendency to worry
about the environment if this concern is similar to his/her health. Apparently, the belief linked to the environment has a
greater weight than the belief related to the consumer’s own health, which indirectly impacts the Intent to
Purchase/Consume.

99
As for the case of the Attribute construct, there is the perception of price, and availabili ty has greater weight than
the perception of the brand and quality. This reveals that changes in the Attribute construct are more perceived when
there is less concern about the price and an increased habit of buying/consuming in places that sell/offer organic
products, than the importance given to smell, taste, brand or origin of the organic food. Indirectly, the first two (Perceived
Price and Availability) are also more closely attached to the intent to purchase/consume.
The major variable in the Reference Groups construct was Media and Health Professionals, followed by Family
Unity, and then Acquaintances. This reveals that despite the media, health professionals, family and acquaintances
approving of or consuming organic foods, this is not reflected in a higher intention on the part of the respondent to
generate an intention to buy/consume this type of food.
Besides verifying the relationships between exogenous and endogenous constructs, Hair et al. (2012) also
suggest examining the relationships between the exogenous constructs of the model through correlation coefficients. All
pairs of exogenous constructs of the model show significant correlations at the 1% level. The highest ratios were observed
for the pairs P1, between the Belief and Attribute constructs, 46%, and P3, between the Attribute and Reference Groups
constructs, with a coefficient of 45%. However, the relationship between Belief and Reference Groups was lower (24%),
although it was also significant. Note that all coefficients were positive, indicating that the variables are correlated in the
same direction.
Besides the nomological validity, it is also important to check the quality of the fit, and the prediction ability of the
model. In order to check the goodness of the adjustment the Goodness of fit (GoF) was used, and it can be calculated using
the formula proposed by Amato, Esposito Vinzi and Tenenhaus (2004), according to which the averages of AVEs and R² of
the constructs of the model should be checked and the geometric sequence verified. This measure ranges from 0% to
100% and, so far, there are no limits for considering a fit as good or bad. However, the closer to 100%, the better the fit,
and the GoF model was 48%.
In order to check the predictive ability of the model the measure called Stone-Geisser's (Q²) was used. This
measure reflects whether the model was able to adequately predict the endogenous constructs as suggested by Hair,
Ringle, and Sarstedt (2011). In SmartPLS, this measure is obtained through the procedure called blindfolding, where the
value d requested by the test should be between five (5) and ten (10), as the authors suggest. Furthermore, the authors
point out that the measure must check the cross-validated redundancy measure and not the so-called cross validated
communality measure. The endogenous variable has an adequate predictive capacity when Q² has a value greater than zero
(HENSELER et al., 2009). Therefore, we adopted a d of seven (7) and performed such analysis for the only endogenous
construct of MCCAO, the Intent to Purchase/Consume, which presented a Q² of 0.31 (> 0.00), indicating that MCCAO was
able to adequately predict the construct.
About the twelve hypotheses tested proposed by MCCAO, only the H12 has not been confirmed. The others were
accepted. All correlation coefficients between the exogenous constructs (first order) were positive. The most significant
correlation coefficients occurred between the Belief and Attribute (46%) constructs, and Attribute Groups and Reference
(45%), whereas the correlation between Belief and Reference Groups was less pronounced (24%). Accordingly, with
respect to Beliefs construct, both the hypothesis H1 and H2 are confirmed, but the weight was greater in H1, as consumers
of organic food are more prone to consume/buy this type of food, more motivated by a belief in preserving and respecting
the environment than in improving their health.
With regard to the Attribute construct, the Perception of Price (H3) and availability (H6) influence over the
consumer of organic foods to acquire/consume such foods at the expense of quality perception variables (H4) and brand
(H5), even though these influence the consumer decision process, however, to a lesser degree.
Regarding the Reference Groups construct, it did not have the same satisfactory results compared to the other
constructs of the MCCAO. The statistics of the Reference Groups construct were less striking than the other constructs of
the first order. The influence of the media, health professionals, the family core and acquaintances to the consumer of
organic foods occurs, however, it is less impressive than the other constructs (Belief and Attributes). Thus, the H7, H8 and
H9 hypotheses were confirmed by the MCCAO.
With respect to the latter construct and, in this case considered endogenous of the model proposed, the Intent to
purchase/consume proved to have a stronger correlation with the Attribute construct (50%) and (20%) with the Belief
construct. With the Reference Groups construct, the correlation was not considered in terms of explanation (5%). In this

100
case, the H10 and H11 hypotheses of this construct, Intent to purchase/consume, were considered confirmed, while the
H12 hypothesis, due to the low correlation with that construct, was not confirmed.
8. Conclusions
This descriptive study that included a qualitative phase was adequate to the purpose of this work. The model
proposed to assess the impact of variables affecting the intention to purchase/consumption of organic food from the
perspective of the consumer of this type of food was valid. Only one of twelve hypotheses of this research wasn't
confirmed. The focus groups provided important information for the development of the questionnaire used in the survey.
Studies on the consumer behaviour of organic foods mentioned in the theoretical framework contribute to a review of
research on the topic and provide opportunities for researchers in future research advances.
The endogenous construct Intent to purchase/consume showed a correlation coefficient of 41% (R ² = 41%),
indicating that 41% of their variations are explained by the exogenous constructs which, according to Chin (1998), is
justified in view of this being an exploratory survey on the topic at hand.
It can be considered that one of the academic contributions of this research was to develop a model that could
drive how the purchasing behaviour/consumer consumption of organic food in Brazil occurs. Another important
contribution was a revision of a theoretical framework on consumer behaviour, most especially, the behaviour of
consumers of organic food. Other researchers interested in the subject can use this framework developed here and apply it
in their surveys.
The profile of the consumer of organic food identified in the survey, as well as the analysis of their buying
behaviour/consumption can contribute to the formulation of marketing actions related to current and prospective
customers. Retailers can create advertising campaigns that have the appreciation for the environment and quality and
availability in relation to organic food as the message content, because these variables motivate the consumer's intent to
purchase, as seen in this study.
It is also suggested that the layout of the sales area in the retailers highlights the organic food on the shelves and
places that allow access to materials that show the consumer information and data on the benefits of this type of food. It is
the retailer's job to define the associations to the brands of organic foods and choose brands that value health and well -
being. According to the research, the customers' intent to purchase/consume organic food takes into account the
perceived value and brand awareness.
Since this is a descriptive survey with an exploratory phase aiming to reveal new insights about the consumer of
organic food, it is noteworthy that the proposed Behaviour Model of the Consumer of Organic Food (MCCAO) has a
predictive power assessed as moderate to substantial. It should then be considered a valid model in view of the objective
of this survey (CHIN, 1998).
One of limitations refers to the period of conducting the survey. A longitudinal research in this direction can be a
good alternative. Doing this research in other cities, even in different countries, may reveal specifics not found in the
present study. Extending the research to other countries is crucial to compare data.
It is also advisable to develop a research aimed at targeting different types of organic foods. In this survey we
studied organic foods without specifying the types. A final suggestion for further studies rests with the selection of more
variables and constructs that might engage or develop and refine the model proposed in this work. One of the possible
options is to increase the number of individuals surveyed, thereby having a sample that allows making new correlations
between variables.
References
AERTSENS, J.; MONDELAERS, K.; VERBEKE, W.; BUYSSE, J.; HUYLENBROECK. (2011). The influence of subjective and
objective knowledge on attitude, motivations, and consumption of organic food. British Food Journal, Bingley, v.
113, n. 11, p. 1.353-78.
AJZEN, I. FISHBEIN, M. (1975). Belief, attitude, intention and behavior: an introduction to theory and research. Reading, MA:
Addison-Wesley.

101
AJZEN, I.; FISHBEIN, M. (2005). The influence of attitudes on behavior. In: ALBARRACÍN, D; JOHNSON, B. T.; ZANNA, M. P.
(Eds). The handbook of attitudes, p. 173-221. Mahwah, NJ: Erlbaum.
AMATO, S., ESPOSITO VINZI, V., TENENHAUS, M. (2004). A global goodness-of-fit index for PLS structural equation modeling.
Oral Communication. PLS Club, HEC School of Management, France, March 24.
ARCHANJO, L. R.; BRITO, K. F. W.; SAUERBECK, S. (2001). Alimentos orgânicos em Curitiba: consume e significado. Revista
Caderno de Debates, Campinas, v. 8.
BARDIN, L. (1977). Content analysis. Lisbon: Issues 70.
COLTRO, A. (2006). O comportamento do consumidor consciente como fonte de estímulos de mercado às ações
institucionais sócio-ambientais. I Seminário sobre Sustentabilidade, Centro Universitário FAE, Curitiba, PR,
out.
COLLIS, J.; HUSSEY, R. (2005). Pesquisa em administração: um guia prático para alunos de graduação e pós-graduação. 2 ed.
Porto Alegre: Bookman.
CUPERSCHMID, N. R. M.; TAVARES, M. C. (2002). Attitudes towards the environment and its influence in the process of
buying food. Rhyme - Interdisciplinary Journal of Marketing, v.1, n.3, p. 5-14, Sep., Dec.
CESCHIM, G.; MARCHETTI, R. Z. (2009). O comportamento inovador entre consumidores de produtos orgânicos: uma
abordagem qualitativa. In: XXXIII Encontro Nacional da Associação Nacional de Pós-Graduação e Pesquisa em
Administração, 2009. São Paulo. Anais..., São Paulo: ANPAD.
CHIN, W. W. (1998). Issues and opinion on structure equation modeling. MIS Quarterly, University of Minnesota,
Minneapolis, v. 22.
CHRYSSOHOIDIS, G. M.; KRYSTALLIS, A. (2005). Organic consumer’s personal values research: testing and validating the list
of values (LOV) scale and implementing a value based segmentation task. Food Quality and Preference vol 16, 7
October 2005, Pages 585-599.
CHU, A.; RAHMAN, O. (2012). Colour, clothing, and the concept of ‘green’: Colour trend analysis and professionals’
perspectives, Journal of Global Fashion Marketing , 3(4), 147-157.
DELLA LUCIA, S. M.; MINIM, V. P. R.; SILVA, C. H. O.; MINIM, L. A. (2007). Fatores da embalagem de café orgânico torrado e
moído na intenção de compra do consumidor. Revista Ciência e Tecnologia de Alimentos, Campinas, v. 27, n. 3, p.
485-91, jul./set.
DIAS, A. T. (2004). Competição, orientação estratégica e desempenho em ambiente turbulento : uma abordagem empírica.
Tese (Doutorado em Administração). Faculdade de Ciências Econômicas - FACE. Universidade Federal de Minas
Gerais (UFMG). Belo Horizonte.
ENGEL, J. F.; KOLLAT, D. T.; BLACKWELL, R. D. (1968). A model of consumer motivation and behaviour. Consumer
behaviour. New York: Holt, Rinehart and Winston.
FISHBEIN, M.; AJZEN, I. (1975). Belief, attitude, intention and behavior: an introduction to theory and research. Reading.
Massachusetts: Adison – Wesley.
GIDDENS, A. As consequências da modernidade. São Paulo: UNESP, 1991.
GUIVANT, J. S. (2003). Os supermercados na oferta de alimentos orgânicos: apelando ao estilo de vida ego-trip. Ambiente &
Sociedade, São Paulo, v. 6, n. 2, p. 63-82.
HAIR, J. F.; SARSTEDT, M.; RINGLE, C. M.; MENA, J. A. (2012). An assessment of the use of partial least squares structural
equation modeling in marketing research. Journal of the Academy of Marketing Science, Thousand Oaks,
forthcoming.
HAIR, J. F.; RINGLE, C. M.; SARSTEDT, M. (2011). PLS-SEM: Indeed a silver bullet. Journal of Marketing Theory and Practice,
Winter Park, v. 19, n. 2, p. 139-51.
HENSELER, J.; RINGLE, C., M.; SINKOVICS, R. R. (2009). The use of Partial Least Squares Path Modeling in international
marketing. Advances in International Marketing, West Yorkshire, v. 20, p. 277-319.
102
HOLBROOK, M. B. (1987). What is consumer research? Journal of Consumer Research, Chicago, v. 14, p. 128-132.
HOPPE, A.; BARCELLOS, M. D.; VIEIRA, L. M.; MATOS, C. A. (2010). Comportamento do Consumidor de Produtos Orgânicos:
uma aplicação da teoria do comportamento planejado. XXXIV ENCONTRO NACIONAL DA ASSOCIAÇÃO
NACIONAL DE PÓS-GRADUAÇÃO E PESQUISA EM ADMINISTRAÇÃO, 2010. Anais..., Rio de Janeiro: ANPAD.
HOWARD, J. A. (1963). Marketing management analysis and planning. Homewood, Ill: Richard D. Irwin.
HOWARD, J. A.; SHETH, J. (1969). The theory of buyer behaviour. New York: John Wiley.
HSIEH, MING-FENG; STIEGERT, K. W. (2011). Store format choice in organic food consumption. Journal of Agricultural and
Applied Economics, College Station, v. 92, n. 2, p. 307-313.
IBGE. (2012). Instituto Brasileiro de Geografia e Estatística. BRASIL. Disponível online:
http://www.ibge.gov.br/home/estatistica/pesquisas/pesquisa_resultados.php?id_pesquisa=1 (acessado em 04
fevereiro de 2012).
IFOAM (2013). International Federation of Organic Agriculture Movements. Available online:
http://ifoam.org/public/Press_Release_IFOAM_FiBL_final_EN.pdf (accessed Jan. 12, 2013).
JANSSEN, M.; HAMM, U. (2012). The mandatory EU logo for organic food: consumer perceptions. British Food Journal, West
Yorkshire, v. 114, n. 3, p. 335-352.
JIA, N. X.; LIU H. F.; WANG, X. P; LIU Y. (2002). Discussion on the development of organic food, green food and hazard free
food Journal of China Agricultural Resources and Regional Planning , 23, v. 5, p. 60–62.
KIM, H. Y.; CHUNG, Jae-Eun. Consumer purchase intention for organic personal care products. Journal of Consumer
Marketing, Chicago, v. 28, n. 1, p. 40-7, 2011.
KRISCHKE, P. J.; TOMIELLO, N. (2009). O comportamento de compra dos consumidores de alimentos orgânicos: um estudo
exploratório. Cadernos de Pesquisa Interdisciplinar de Ciências Humanas . Florianópolis, v. 10, n. 96, p. 27-43.
KRUEGER, R. A. (1994). Focus group: a practical guide for applied research. (2 th. ed). Thousand Oaks, CA: Sage.
LOHMÖLLER, J. (1984). LVPLS Program Manual: latent variables path analysis with Partial Least Squares estimation. Köln:
Zentralarchiv für Empirische Sozialforschung, Universitst zu Köln.
MADAETS, J. P. P. (2003). A construção da qualidade na produção agrícola familiar: sistemas de certificação de produtos
orgânicos. Tese (Doutorado em Gestão e Política Ambiental). Universidade de Brasília (UnB): Brasília.
MALHOTRA, N. (2006). Marketing research: an applied orientation. (5 th. ed). Upper Saddle River, NJ: Prentice Hall.
MARCONI, M. de A.; LAKATOS, E. M. (2009). Técnicas de pesquisa: planejamento e execução de pesquisas, amostragens e
técnicas de pesquisa, elaboração, análise e interpretação de dados. 7. ed. São Paulo: Atlas.
MOWEN, J.; MINOR, M. S. (2003). Comportamento do consumidor. São Paulo: Prentice Hall.
NICOSIA, F. M. (1966). Consumer decision processes: marketing and advertising implications. Englewood Cliffs, NJ: Prentice-
Hall.
NICOSIA, F. M. (1970). La decisión del consumidor: y sus implicaciones en marketing y publicidad. Barcelona: ed. Gustavo
Gili.
MORGAN, D. L. (1988). Focus group as qualitative research. Sage university paper series. In: Qualitative research methods.
Newbury Park: Sage Publications.
OTA, Organic Trade Association. (2012). Organic industry survey in 2011. Available online: http://www.ota.com (accessed
Nov. 25, 2012).
PETER, J. P.; OLSON, J. C. (2009). Comportamento do consumidor e estratégia de marketing. 8. ed. São Paulo: McGraw-Hill.
PIMENTA, M. L.; VILAS BOAS, L. H. B. (2008). Percepção de consumidores de alimentos orgânicos na cidade de Uberlândia
na perspectiva de valores: uma aplicação da laddering e cadeia de meios e fins. In: III Encontro de Marketing da
Anpad. Curitiba. Anais... Curitiba: Ema.

103
PINO, G.; PELUSO, A. M.; GUIDO G. (2012). Determinants of regular and occasional consumers’ intentions to buy organic
food. The Journal of Consumer Affairs, Hoboken, v. 46, n. 1, p. 157-69.
RIBEIRO, J. de A. (2010). Personalidade e consumo ecologicamente consciente. Dissertação (Mestrado em Administração).
Centro de Pós-Graduação e Pesquisas em Administração. Faculdade de Ciências Econômicas. Universidade
Federal de Minas Gerais, Belo Horizonte.
RUCHINSKI, J.; BRANDENBURG, A. (2002). Consumidores de orgânicos em Curitiba. I Encontro da Associação Nacional de
Pós-Graduação em Ambiente e Sociedade. Indaiatuba. Anais..., Indaiatuba.
SHEPHERD, R.; MAGNUSSON, M.; SJÖDÉN, Per-Olow. (2005). Determinants of consumer behavior related to organic foods .
Ambio, v. 34, n. 4-5, p. 352-59.
SHETH, J. N.; GARDNER, D. M.; GARRETT, D. E. (1988). Marketing Theory: evolution and evaluation. Chichester: John Wiley
& Sons.
UN, United Nations. (2012). UN and sustainability. Available online: http://www.un.org/en/sustainability/index.shtml
(accessed Nov. 20, 2012).
SLUZZS, T.; PADILHA, A. C. M.; MATTOS, P. (2008). Inovações em organizações do agronegócio: análise em uma
organização produtora de chá orgânico. XXV SIMPOI. Brasília. Anais..., Brasília: SIMPOI-Anpad, 2008.
SMITH, T. A.; LIN, B-H; HUANG, C. L. (2009). Growth and development in the U.S. retail organic food sector. Sustainability, v.
1, p. 573-591, sept.
STONE, P. J.; DUNPHY, D.C.; KIRSCH, J. (1970). The general inquirer: a computer approach to content analysis. Cambridge,
MA: Harvard University Press.
STRINGHETA, P. C.; MUNIZ, J. R. (2003). Alimentos orgânicos: produção, tecnologia e certificação. Ed. UFV: Viçosa.
TARKIAINEN, A.; SUNDQVIST, S. (2005). Subjective norms, attitudes and intentions of Finnish consumers in buying organic
food. British Food Journal, Bingley, v. 107, n. 11, p. 808-22.
THORTON, R. (2002). Percepção dos consumidores orgânicos em La Pampa, Argentina. IN : I Congresso Brasileiro de
Agroecologia. 2002. Porto Alegre. Anais... Porto Alegre.
VIEIRA, V. A. (2002). As tipologias, variações e características da pesquisa de marketing. Revista FAE, Curitiba, v. 5, n. 1, p.
61-70, jan./abr.
VILAS BOAS, L. H. B; SETTE, R. S.; PIMENTA, M. L. (2008). Comportamento do consumidor de alimentos orgânicos na
cidade de Uberlândia: uma aplicação da técnica laddering. IN: XLVI Congresso da SOBER. Londrina. Anais…,
Londrina.
YIN, S.; WU, L.; DU, L.; CHEN, M. (2010). Consumers’ purchase intention of organic food in China. Journal Sci Food
Agricultural, v. 90, p. 1361-67.
ZAMBERLAN, L.; BÜTTENBENDER, P. L.; SPAREMBERGER, A. (2006). XXX Encontro Nacional da Associação Nacional de
Pós-Graduação e Pesquisa em Administração . 2006. Salvador. Anais..., Salvador: ANPPAS.
ZAKOWSKA-BIEMANS, S. (2011). Polish consumer food choices and beliefs about organic food. British Food Journal, v. 113,
n. 1, p.122 – 137.
ZANOLI, R.; NASPETTI, S. (2001). Consumer motivations in the purchase of organic food: a means-end approach. IN: LXXII
EAAE SEMINAR, ORGANIC FOOD MARKETING TRENDS, Papers…Chania, Greece.

104
Recent Trends in Consumer Behavior
Concerning Foods with Health Benefits in
Russia Consumer behavior, transitional economy, Russia, food with health benefits, functional food, health.
Irina Dolgopolova, Leibniz Institute of Agricultural Development in Central and Eastern Europe, [email protected]
Ramona Teuber, Leibniz Institute of Agricultural Development in Central and Eastern Europe, [email protected]
Viola Bruschi, Leibniz Institute of Agricultural Development in Central and Eastern Europe, [email protected]
Abstract
Developing Russian food market and the transitional character of Russian economy requires timely knowledge
about Russian consumers’ behavior and nutrition patterns. Until now very little research has been done on the topic.
Besides, the potential of Russian market for functional foods poses additional questions for marketing of such products.
We feel this gap by discussing recent trends in consumer behavior concerning functional products in an emerging post-
soviet economy.
Four semi-structured focus group interviews were performed in two Russian cities (Moscow and Irkutsk) in
December 2012. In total 30 people participated in the discussions. Topics discussed included general patterns in food
consumption behavior, connection between food and health, and consumers’ perception of health-related products.
Results of our study suggest the following hypotheses that describe trends in consumer behavior concerning
health-related foods in Russia:
1. Existing income inequality does not change nutrition patterns significantly.
2. Institutional uncertainty in the food sector led to consumers’ loss of trust in formal institutions.
3. Russian consumers have little knowledge about functional foods and determine healthiness by sensory
characteristics, norms and traditions, and family members’ recommendations.
4. Regional differences in consumption behavior are created by the level of market development, income
inequality and natural conditions.
In general, Russian consumers’ behavior reflects the transitional character of the economy. Consumers are still
developing preferences and attitudes, allocating to the different parts of the market, creating strategies to keep traditional
diet and maximize utility that arise country specific questions for food marketing.

105
Introduction
“…food is the most important and frequently
encountered material object that translates
regulatory regimes and power relationships
into lived experience. Thus food has the
almost magical property of jumping scale:
as it moves, it links the global economy
and household economies, political bodies
and the bodies of individuals, the world and the self”
(Dunn, 2009).
Emerging economies are characterized by profound changes in economic and social order of a country that
involve transformations in life-styles and life quality for all segments of the society. Major socio-economic trends
influencing consumer behavior in Russia which have developed during the transition process are: growing income
inequality, deteriorating health, increasing variety of food with prevalence of imported products and institutional
uncertainty. These processes were complemented by few country-specific idiosyncrasies which resulted in a complex still-
evolving behavior at consumer markets.
Although some research has been done about Russian consumers’ behavior, nonetheless its transitional character
requires constant monitoring. Besides, Russian food market in general and specifically market for functional foods (or
foods with health benefits) are reported to grow in the future, which poses additional questions for marketing of health-
related products. We feel this gap by discussing socio-economic factors influencing consumer behavior concerning
functional products in an emerging post-soviet economy.
The structure of this article is as follows. It opens with an overview of recent research concerning soci o-economic
factors of consumer behavior in transitional economies that is followed by the description of methods in this research. The
third section demonstrates the main hypotheses that were created from the analysis of literature and results and section
five concludes.
An overview of recent research concerning socio-economic factors influencing consumer behavior in
transitional economies
Studies about food patterns in transitional post-Soviet economies show similar trends in adjusting to economic
and institutional uncertainties at the food markets. Most important factors that influence shifts in food demand in a
transitional economy were pointed out by Brosig & Ratinger (1999) in their study of Czech households. Those factors
include: “a) the range of food products available on the market; b) changed purchasing power and relative prices; c)
continuous changes in consumer preferences; and d) structural breaks in consumer preferences”. Other evidence suggests
that since transitional countries in post-Soviet sphere share socio-economic characteristics like low incomes and income
inequality the economic determinants of food choice (price, income) become very important (Petrovici, Ritson, & Ness,
2002).
Indeed, huge inequality gap stayed high during the transition period and even increased recently in Russia. This
inequality is formed by the difference between the top decile that gets 30% of total monetary income and the rest of the
population (Denisova, 2012). According to Credit Suisse Emerging Consumer survey 39% of households in Russia have
income of less than 1000 USD per month, besides one third of the household income is spent on food (Credit Suisse, 2011).
Although many aspects of Russian economic growth and improvements in life-quality of Russian citizens seem to
be controversial, statistical reports show growth in the disposable income and food consumption (Rosstat, IMF). Together
with the income increases the demand for more expensive and quality goods. Russians spent US $142.0 bn on food in 2009
and in 2014 they are expected to spend US $204 bn, or 43.7% more (Agriculture and Agri-Food Canada, 2010).

106
Also, the range of available food products has changed dramatically during transition. Decrease in food production
was compensated by imports. In 1996 imported food accounted for 35% of all the food consumption in the country
(Овчарова, 2008). Recently, food production is concentrated in the central Russia with Moscow and St. Petersburg regions
as producers of most food products (Kotilainen, Rajalahti, Ragasa, & Pehu, 2006), although 40% of total food consumption
is still imported (Kotilainen et al., 2006).
Besides, first years of liberalization process were characterized by very quick prices growth. However, prices
were growing not in equal proportions. More quick growth was reported for dairy and bread when prices for vegetables
and potatoes were growing more slowly because people started to produce them in their own garden plots (Овчарова,
2008).
Influenced by these factors and often faced with scarce resources consumers in transition economies can apply
two basic strategies: increasing their incomes or optimizing their consumption. In general Russian consumers
demonstrate the same way of adjusting to new economic conditions as other post-Soviet countries like Hungary and
Poland. Consumers in all these three countries have very strong positive consensus on changing consumption basket and
becoming more price conscious although Russian consumers stand out by demonstrating more strong opinion than Poles
and Hungarians on the topic of using informal networks for getting products and services (Shama, 1992).
Studies about household behavior in Bulgaria and Russia demonstrate that consumers apply similar strategies to
keep the dietary patterns during transition times. They tend to produce more food in the household, especially at the
private garden plots – the tradition that seems to be very persistent in the times of change (see e.g. Seeth, Chachnov,
Surinov, & Von Braun, 1998; Kostov & Lingard, 2002; Ivanova, Dimitrov, Ovcharova, Dellava, Hoffman, 2006) . Same
tendency was also observed for Czech Republic (Dofkova, Kopriva, Resova, Rehurkova, & Ruprich, 2007).
Despite significant common characteristics some country-specific idiosyncrasies also influence the developments
at the Russian food market. One of them is rapidly growing market of functional foods or foods with health benefits that is
usually connected with the deterioration of health in Russia. Although some studies on this topic have been completed, the
results and factors influencing health-related behavior in Russia still seem to be controversial.
Health crisis of Russian population introduced itself in the late 1990’s and has deep historical and cultural roots,
some of which are also responsible for the current attitude of Russians towards health in general and health food in
particular. As Tragakes & Lessof (2003) point out: “The paternalistic Soviet philosophy did not encourage the development
of responsibility of the individual with respect to lifestyle issues that have a major bearing on health (alcohol use, smoking,
diet, etc.), a situation exacerbated by the heavy dependence on alcohol sales as a means of circulating currency in a country
with little access to consumer goods”.
The deterioration of health that accompanied economic growth in Russia was reported to have as the leading
cause of death non-communicable diseases followed by external causes of injury and poisoning all being consequences of
poor diet, smoking and alcohol consumption (see e.g. Tragakes & Lessof, 2003; Marquez, Suhrcke, McKee, & Rocco, 2007).
Alarming health statistic therefore is reflected in Russians’ self-rated health that also does not change a lot over
the years, keeping high-rates of average and poor health (see table 1).
Table 1. Russians' self-rated health (%)
Bobak (1998) Perlman (2008) Rosstat (2008) VCIOM
Men Women Men Women 2009 2010 2011
Very good 6 3 3.2 1.1 28.8
5 6 5
Good 33 19 35.2 20.1 37 38 39
Average 45 49 50.3 58.5 59 46 44 46
Poor 15 25 9.7 16.9 10.8 10 10 9
Very poor 2 5 1.6 3.5 2 2 1
No answer 1.4
Sources: VCIOM (ВЦИОМ) monitoring “Russians’ Health Status”, press issue No. 1912 http://wciom.ru/index.php?id=459&uid=112205; Bobak, Pikhart, Hertzman, Rose, & Marmot (1998); Perlman & Bobak (2008); Goskomstat http://www.gks.ru/free_doc/2008/demo/zdr08.htm.

107
Transitional character of Russians’ perception of their health is reflected in several recent studies that report
growing interest and more care about health. Federal Service of State Statistics (Rosstat) in 2008 performed selective
survey “The influence of behavioral factors on health status of the population”. The results show that good health is now
one of the most important values for Russian people. Most respondents (84,2%) realize that their health status mostly
depend on themselves. This is consistent with the results of consumer focus group interviews by (Popova, Frewer, Jonge,
Fischer, & Kleef, 2010) that recently Russians are more attentive to their health and health-related food issues than in the
past. Agriculture and Agri-Food Canada (2010) also identifies that in 2007-2009 82% of Russians started to pay more
attention to their health.
Although, according to the same Rosstat survey, most Russians do not care about their health in a way of
sustaining healthy life-style, visiting doctor regularly or eating healthy foods. Most people are not used to the healthy life-
style, and are influenced by negative social norms and traditions. Typical answers to the questions like: “Why do you
smoke?” or “Why do you drink alcohol?” are: “Out of habit” or “Because of traditions”. When feeling sick, 62,7% of Russians
prefer self-treatment with the use of medicine or folk methods and 24,9% of people who prefer self-treatment consider
alcohol as folk medicine for cold or other sicknesses.
Contradiction of results demonstrates that Russian consumers still heavily depend on Soviet norms and traditions
and at the same are not excluded from the global trends of food consumption that emphasize more healthy nutrition. Sales
of functional foods in Russia are increasing with bakery and dairy being products sold the most (see table 2). Russians
demonstrated extremely quick adaptation to functional ingredients in dairy products, although the demand is mostly
concentrated at higher income group (Kotilainen et al., 2006), which is logical considering the fact that people with higher
incomes are more involved in global food consumption trends.
Table 2. Functional Foods Sales in Russia, 2006-2010 bn rubles (bn euros)2
2006 2007 2008 2009 2010
Functional foods
sales
41.19 (1.2) 49.73 (1.4) 65.79 (1.6) 61.12 (1.4) 65.81 (1.6)
By product type:
Bakery
27.78 (0.8)
33.39 (0.93)
44.62 (1.08)
36.74 (0.85)
40.56 (0.99)
Dairy 8.90 (0.26) 11.00 (0.31) 13.64 (0.33) 16.37 (0.38) 15.58 (0.38)
Cereals 0.40 (0.01) 0.32 (0.01) 0.45 (0.01) 0.49 (0.01) 0.61 (0.01)
Other 4.12 (0.12) 5.02 (0.14) 7.07 (0.17) 7.51 (0.17) 9.06 (0.22)
Source: BusinesStat (2011)
Rapid market growth caused some consumer behavior research at the functional food market. For example, the
survey of consumer preferences in Altai region demonstrated very little knowledge of consumers about functional foods
and enriched foods. 56% of respondents consider their knowledge about functional foods as insufficient and 10% as non-
existent. 44% of respondents know about enriched products. Mostly people consider functional products as products with
unclear ingredients and low quality. Also people mention that advertised product characteristics are very often not
present in reality. Survey also shows low frequency of functional and enriched product purchases, so that they are not a
part of normal diet. Most popular functional products are: dairy products, beverages, and bakery. Due to the lack of
knowledge people consider alcohol as enriched product. Most popular information source about functional foods are
friends and acquaintances (29%), although respondents show low trust for this group. More people trust doctors (52%),
but only 9% get information from this source (Маюрникова, Новоселов, & Болховитина, 2010) .
Another research about consumer behavior at functional foods market was conducted at the city Nakhodka in
Primorskiy Kray. At first, respondents were asked to evaluate their health status: only 24% think they are healthy, 61%
confirm the presence of some diseases and 15% do not have clear opinion about that. Among the reasons for poor health
2 Numbers are converted into euros according to yearly exchange rate.

108
63% of respondents mention bad ecological situation and 24% - unbalanced diet. Most of the respondents (88%) agree
that balanced diet can help reducing unfavorable environmental influence and reduce the risk of some diseases.
Surprisingly big difference exists between consumers’ understanding of the connection between diet and health and
practical steps about it: 47% do not pay attention to the information on the food labels, only 18% buy vitamins, 16% -
minerals and 12% - food supplements; 36% of respondents never buy any micronutrients. Respondents also show little
knowledge about what micronutrients contained in food products can prevent diseases: 54% had information only about
the lack of iodine; 23% about ferrum as a source of hemoglobin and 20% about calcium for bone structure (Табакаева,
2011).
In light of growing incomes and forming attitudes functional foods show a good potential at Russian market. But
since these products are somehow innovative for Russian consumers the main constraints for market growth will
probably be lack of knowledge and informal institutions of food consumption.
Methods
Since the knowledge about Russian consumers’ behavior is still scarce we’ve attempted to get more insights into
recent trends and performed qualitative study in the form of focus groups. This method has proved to be effective at the
first stages of research for gaining preliminary overview of general aspects.
Four focus group interviews were conducted in two Russian cities, Moscow and Irkutsk, with 30 participants in
total. The selection of the cities was aimed at representing the difference between capital city and periphery. Participants
were recruited through personal connections. The following criteria were used to select participants: gender, age,
educational and income levels. The structure of the groups was heterogeneous, displaying differences in main selection
criteria (see table). The number of participants in the groups varied from 5 to 9. Participants were asked to identify their
income level according to the following income groups: up to 750 euros per month, 751-1500 euros per month, 1501-2250
euros per month, more than 2251 rubles per month. Respectively, we can identify 4 societal classes: low income class, low
middle income class, middle income class, and high income class.
Table 3. Focus Groups Characteristics
Moscow Irkutsk
M.1. M.2. I.1. I.2.
Participants 9 5 8 8
Gender
(male/female)
5/4 2/3 4/4 4/4
Range of
participants’ age
from 26 to 61 years old from 24 to 44 years old from 25 to 73 years old from 22 to 70 years old
Educational
level
Graduate Undergraduate/Graduate Undergraduate/Graduate Undergraduate/Graduate
Range of
participants’
income level3
from up to 750 to more
than 2251 euros per
month
from up to 750 to 2251
euros per month
from up to 750 to 2251
euros per month
from up to 750 to 2251
euros per month
Besides, participants were asked to complete short questionnaire before the interviews with questions about the
presence of children, food-related chronic diseases, smoking and alcohol consumption.
The interviews were semi-structured and performed using the guide based on (Barrios, Bayarri, Carbonell,
Izquierdo, & Costell, 2008; Chambers, Lobb, & Mortimer, 2006; Honkanen, 2006). Topics discussed included general
3 Participants were asked about their income level in rubles. Corresponding amount in euros is presented in the table and in the text
below.

109
patterns in consumption behavior, connection between food and health, and consumers’ perception of foods with health
benefits.
Each interview took 70 to 90 minutes and was video and audio recorded. All the interviews were conducted in
Russian by one of the authors who is a native Russian speaker. All recorded data were transcribed and translated from
Russian into English.
Data were analyzed using classical content and comparative analysis and contextualized counts of categories.
Results of the analysis were organized as research hypotheses that possibly define consumer behavior trends.
Discussion of results
Hypothesis 1: Despite existing income inequality consumers seem to share tradition al preferences for food
and nutrition patterns do not differ much between different income groups.
In times of economic uncertainty and growing income inequality price is usually considered to be one of the most
important factors that influence food consumption behavior. For example, price was proved to be one of the most
important factors for food choice in Russia by Honkanen (2006), Honkanen & Frewer (2009). Another important food
choice factor coming from changing economic conditions is avai lability of food. In particular (Liefert, 2004) shows that
there exist inadequate access to food by certain socio-economic groups caused by low-income, garden plot availability and
high income inequality.
All that being true, decrease of income does not necessarily imply diet changes. Soviet norms of healthy nutrition
were not based on expensive products, but rather on a basic livestock products and cereals. These products are still low-
priced and available for production at the garden plots. Consequently, when faced with the decreased income, consumers
do not change their diet – they change the strategies of household food supply. Dore, Adair, Popkin, & Al (2003)
demonstrate that income and healthy diet are not directly related for some consumers, who switch to cheaper foods and
household food preparation to keep existing eating patterns.
Therefore, while strategies vary, the composition of diet for different income groups is the same. Irrelevant of the
income level, focus group participants mentioned the same range of products they usually consume, that mostly included:
meat, vegetables, fruits, dairy, and cereals. Price as the most important factor influencing food choice was named by only
one participant. Among the other most important factors of food choice were: time, presence of children, healthiness of
food, diversity of food, climate and traditions (see table 4).
“My choice of products depends mostly on traditions, Russian traditions and price and I prefer more healthy food:
soups, porridges, lard, meat – everything that is necessary in our region… Also my family eats a lot of self -grown food. We eat
our own meat, vegetables, so I don’t pay for it” – female, 25 years old, graduate, income up to 750 euros per month.
Table 4. Diet, factors of food choice, and income level of focus groups participants
Participants List of Products Factors influencing food choice (in a
descending order)
Income Level
(euros per month)
Moscow
M.1.1. cereals, porridge, dairy products health 1501-2250
M.1.2. pasta, bread, cereals, pizza, vegetables price up to 750
M.1.4. meat, fish, soups, porridges family 751-1500
M.1.5. vegetables, meat and fruits healthy lifestyle, philosophy more than 2251
M.1.7. different, less fatty, fried diversity, healthy lifestyle 751-1500
M.1.9. pasta, bread, cabbage, potatoes, fruits, beer diversity 751-1500
M.2.1 meat, vegetables, cheese, bread taste 751-1500
M.2.2 same as M.2.4.
M.2.3 meat, grains, vegetables, fruits quality, price 751-1500
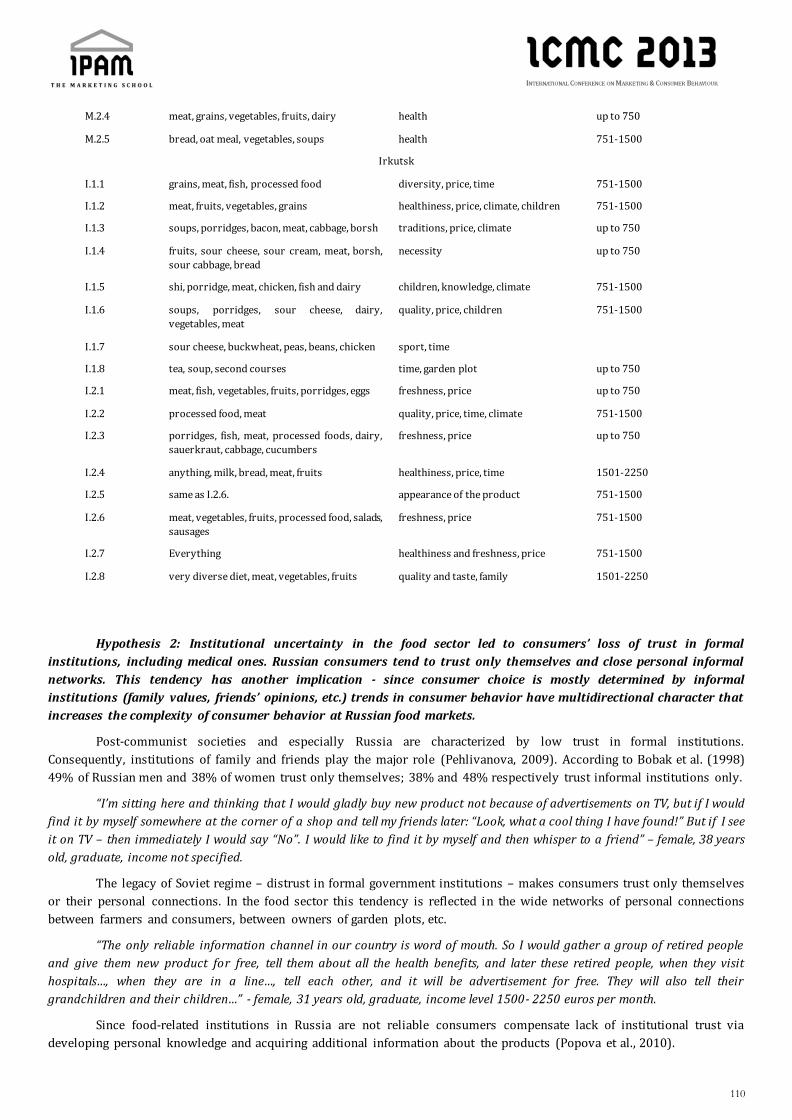
110
M.2.4 meat, grains, vegetables, fruits, dairy health up to 750
M.2.5 bread, oat meal, vegetables, soups health 751-1500
Irkutsk
I.1.1 grains, meat, fish, processed food diversity, price, time 751-1500
I.1.2 meat, fruits, vegetables, grains healthiness, price, climate, children 751-1500
I.1.3 soups, porridges, bacon, meat, cabbage, borsh traditions, price, climate up to 750
I.1.4 fruits, sour cheese, sour cream, meat, borsh,
sour cabbage, bread
necessity up to 750
I.1.5 shi, porridge, meat, chicken, fish and dairy children, knowledge, climate 751-1500
I.1.6 soups, porridges, sour cheese, dairy,
vegetables, meat
quality, price, children 751-1500
I.1.7 sour cheese, buckwheat, peas, beans, chicken sport, time
I.1.8 tea, soup, second courses time, garden plot up to 750
I.2.1 meat, fish, vegetables, fruits, porridges, eggs freshness, price up to 750
I.2.2 processed food, meat quality, price, time, climate 751-1500
I.2.3 porridges, fish, meat, processed foods, dairy,
sauerkraut, cabbage, cucumbers
freshness, price up to 750
I.2.4 anything, milk, bread, meat, fruits healthiness, price, time 1501-2250
I.2.5 same as I.2.6. appearance of the product 751-1500
I.2.6 meat, vegetables, fruits, processed food, salads,
sausages
freshness, price 751-1500
I.2.7 Everything healthiness and freshness, price 751-1500
I.2.8 very diverse diet, meat, vegetables, fruits quality and taste, family 1501-2250
Hypothesis 2: Institutional uncertainty in the food sector led to consumers’ loss of trust in formal
institutions, including medical ones. Russian consumers tend to trust only themselves and close personal informal
networks. This tendency has another implication - since consumer choice is mostly determined by informal
institutions (family values, friends’ opinions, etc.) trends in consumer behavior have multidirectional character that
increases the complexity of consumer behavior at Russian food markets.
Post-communist societies and especially Russia are characterized by low trust in formal institutions.
Consequently, institutions of family and friends play the major role (Pehlivanova, 2009). According to Bobak et al. (1998)
49% of Russian men and 38% of women trust only themselves; 38% and 48% respectively trust informal institutions only.
“I’m sitting here and thinking that I would gladly buy new product not because of advertisements on TV, but if I would
find it by myself somewhere at the corner of a shop and tell my friends later: “Look, what a cool thing I have found!” But if I see
it on TV – then immediately I would say “No”. I would like to find it by myself and then whisper to a friend” – female, 38 years
old, graduate, income not specified.
The legacy of Soviet regime – distrust in formal government institutions – makes consumers trust only themselves
or their personal connections. In the food sector this tendency is reflected in the wide networks of personal connections
between farmers and consumers, between owners of garden plots, etc.
“The only reliable information channel in our country is word of mouth. So I would gather a group of retired people
and give them new product for free, tell them about all the health benefits, and later these retired people, when they visit
hospitals…, when they are in a line…, tell each other, and it will be advertisement for free. They will also tell their
grandchildren and their children…” - female, 31 years old, graduate, income level 1500- 2250 euros per month.
Since food-related institutions in Russia are not reliable consumers compensate lack of institutional trust via
developing personal knowledge and acquiring additional information about the products (Popova et al., 2010).

111
“…we don’t buy anything in the supermarket, but my husband goes to the market and also makes social contacts
there – this is very comfortable… he has stable contacts to buy better products at lower prices, sometimes sellers even call him
and say when certain product arrives and at which price” – female, 62 years old, graduate, income level 750-1500 euros per
month.
Hypothesis 3: Russian consumers have little knowledge about foods with health benefits. The healthiness of
food for Russians is mostly determined by sensory characteristics, Soviet norms and traditions, and family members’
recommendations.
When asked about functional foods or about health effects of food products almost no participant could give a
complete response. One exception was a woman with medical background. Mostly the knowledge of foods with health
benefits is limited to dairy and cereal products that are the most developed sectors at Russian functional foods market.
Perhaps, Soviet recommended “norms” of food consumption have strengthened the tradition of livestock products
(meat, eggs, dairy products) oriented diet preferences of Russian consumers (as mentioned by Liefert, 2004) and being
transferred through family institution take responsibility for the understanding of healthy food by Russian consumers.
“Porridges are healthy because we were taught from the childhood – you should eat porridge, it is healthy!” – female,
31 years old, graduate, income level 1501-2250 euros per month.
“Our parents were feeding us with this food, and we are used to it now. People who now go abroad more, they try
something new, who lives such a life… globalization, you know… Those who don’t go, they still eat potatoes with meatballs.” –
female 39 years old, graduate, income up to 750 euros per month.
Sensory motives as the most important determinant of food choice for Russian consumers are noted by Honkanen
(2006), Honkanen & Frewer (2009). Results of our focus group study show that participants emphasize taste as a product
attribute that is most attractive for them and sometimes can be even a criterion of the product healthiness.
“I suppose that the more nutritious is the food and the tastier, the better it is metabolized and influence moral and
physical health. If the food is tasty then it doesn’t matter if it is soup, meat, fish or anything else. The point is for it to be tasty
and look good”. – male, 60 years old, graduate, income 1501-2250 euros per month.
“Taste is a criterion of product’s healthiness” – male, 61 years old, graduate, income up to 750 euros per month.
It is also interesting how the connection between food and health is perceived by Russian consumers. The
connection with health is mostly defined by avoiding fatty and sugar foods in order not to gain weight and avoiding foods
with a lot of additives (Honkanen, 2006).
“I try to buy healthy food, not processed somewhere at the factory. To say so, products in their clean form, clean meat
without fat, preferably beef, grains, vegetables, fruits, dairy, also without any additives. I also try to watch my weight, not to
buy sweets… I tend more to natural products” – female, 39 years old, graduate, income up to 750 euros per month.
The fact that health considerations are far not the main motives for food choice (Honkanen, 2010) supports the
idea that food is not seen by Russian consumers as a way to improve health.
“You know, to me the main criteria for grain products are physical characteristics. Elasticity, how fresh it is. If I see a
bread like a stone, there can be a picture of anyone on its label, I will not take it. More important is that it is crispy, so that I
feel it… So, if it really would be fresh and with these physical characteristics – I would choose it. And would pay more. May be”
– male, 52 years old, graduate, income more than 2251 euros per month.
One more important characteristic is the fact that Russians are also cautious in their consumption of imported
foods, despite (or because of) significant share of imported product at the market. Thelen & Ford (2006)demonstrate that
Russian consumers tend to prefer domestic products over imported ones. Domestic food is considered to be more natural,
contain less chemicals and preservatives and appeal to Russian traditions.
“I think that it is better to orient on traditional products because they are checked by time, by tens, hundreds of years.
With new products you should be careful” – male, 52 years old, graduate, income more than 2251 euros per month.
Hypothesis 4: Regional differences in consumption behavior are created by the level of market development,
income inequality and natural conditions.

112
Recent economic situation in Russia is characterized by notable difference in incomes between geographical
areas, where Moscow presents the exceptional case of higher incomes and diversified consumer choices (Kotilainen et al.,
2006). Projections for market growth of organic and healthy foods also show that markets for health-related food will
most probably stay limited to high-income groups of consumers in Moscow and St. Petersburg (Agriculture and Agri-Food
Canada, 2010). And although our data show that price was not the most important food choice factor both in Moscow and
Irkutsk, it is clear that consumers in Irkutsk region have less purchasing power and food choice. This makes them create
specific strategies for expenditure reduction.
“I prefer to buy less… I can buy only 3 apples and divide it for my children, but they will smell like real apples…” –
female, 34 years old, graduate, income 751-1500 euros per month
“If you can buy grains by kilos or in a package, it’s better to buy by kilos, because why would you pay more money fo r
a package?” – male, 36 years old, undergraduate, income not specified.
Living in a difficult natural conditions make Irkutsk consumers more aware about the specific nutrition needs and
their diet is more livestock products oriented (see table 1).
“As my grandfather used to say the best fruit is a sausage, or meat. We live in a cold climate, we need a lot of energy
and positive spirit, so the more proteins – the better, so it’s meat” – male, 23 years old, graduate, income 751-1500 euros per
month.
Due to lower incomes and greater place of traditions consumers at the periphery markets show more skeptical
perception of functional foods and new products in general. Compared to metropolitan area, periphery consumers lean
more towards domestically produced traditional Russian food.
Conclusions
In general, Russian consumers’ behavior reflects the transitional character of the economy. Consumers are still
developing preferences and attitudes, allocating to the different parts of the market, creating strategies to keep traditional
diet and maximize utility.
The results of our focus group study show that price might play not as important role as is usually assumed for
transitional economy with high income inequality. In the case of post-communist countries where the role of Soviet norms
and institutions is still high, healthy nutrition is perceived as a combination of not expensive products that are also
available for production at the garden plots, like grains and vegetables. Consequently, when faced by decreasing income,
instead of changing diet consumers change strategies of household food production.
Our research also shows that despite the fact that Russian consumers share some behavioral trends with other
transitional post-Soviet counties, there also exist some country-specific trends. First, consumers are highly diversified by
incomes, regions, nationalities, cultures. Attempts to distinguish segments among Russian consumers show that different
groups significantly vary in their preferences (see e.g. Honkanen, 2010). Second, important role of informal institutions
that highly influence consumer behavior make this behavior more complex and pose additional challenges for marketing
strategies. Third, the success of new food products at the periphery markets will mostly depend on the ability to fit
traditional diet and face such barriers as low incomes and conservatism of consumers.
Next steps of our research involve performing quantitative analysis to prove the above-mentioned hypotheses.
References
AGRICULTURE AND AGRI-FOOD CANADA. (2010). Packaged Food Sales In Russia. Ottawa: Marketing Research Bureau
BARRIOS, E. X., BAYARRI, S., CARBONELL, I., IZQUIERDO, L., & COSTELL, E. (2008). Consumer Attitudes and Opinions
Toward Functional Foods: A Focus Group Study. Journal of Sensory Studies, 23(4), pp. 514–525.
BOBAK, M., PIKHART, H., HERTZMAN, C., ROSE, R., & MARMOT, M. (1998). Socioeconomic factors, perceived control and
self-reported health in Russia. A cross-sectional survey. Social science & medicine, 47(2), pp. 269–279.
BROSIG, S., & RATINGER, T. (1999). Shifts in Food Demand Of Czech Housholds During Transition. European Agriculture
Facing the 21 st Century in a Global Context (pp. 1–19). Warsaw, Poland.
113
BUSINESSTAT. (2011). Анализ рынка функциональных продуктов в России в 2005-2010 годах, прогноз на 2011-2015
год. Москва: Бизнес статистика.
CHAMBERS, S. A., LOBB, A. E., & MORTIMER, D. T. (2006). Attitudes and Behaviour towards Functional Foods : Focus Groups
(No. 3). Reading: The University of Reading.
CREDIT SUISSE. (2011). Emerging Consumer Survey (p. 36). Zurich: Credit Suisse AG.
DENISOVA, I. (2012). Income Distribution and Poverty in Russia. OECD Social, Employment and Migration Working Papers,
No. 132. OECD Publishing
DOFKOVA, M., KOPRIVA, V., RESOVA, D., REHURKOVA, I., & RUPRICH, J. (2007). The development of food consumption in
the Czech Republic after 1989. Public Health Nutrition, 4(05).
DORE, A. R., ADAIR, L. S., POPKIN, B. M., & AL, D. E. T. (2003). Low Income Russian Families Adopt Effective Behavioral
Strategies to Maintain Dietary Stability in Times of Economic Crisis. The Journal of Nutrition (August), pp. 3469–
3475.
DUNN, E. C. (2009). Afterword. Turnips and Mangos. Food & Everyday Life in the Post-socialist World (pp. 206–222).
Indiana University Press.
HONKANEN, P. (2006). Russian consumers’ food habits. Report 27/2006. Tromsø: Fiskeriforskning.
HONKANEN, P. (2010). Food preference based segments in Russia. Food Quality and Preference, 21(1), pp. 65–74.
HONKANEN, P., & FREWER, L. (2009). Russian consumers’ motives for food choice. Appetite, 52(2), pp. 363–71.
KOTILAINEN, L., RAJALAHTI, R., RAGASA, C., & PEHU, E. (2006). Health Enhancing Foods. Opportunities for Strengthening
the Sector in Developing. Agriculture and Rural development Discussion Paper 30. Washington: World Bank.
LIEFERT, W. (2004). Food Security in Russia: Economic Growth and Rising Incomes are Reducing Insecurity. Food Security
Assessment/GFA-15, (May), pp. 35–43.
PEHLIVANOVA, P. (2009). The Decline of Trust in Post-communist Societies: The Case of Bulgaria and Russia.
Contemporary Issues, 2(1), pp. 32–47.
PERLMAN, F., & BOBAK, M. (2008). Determinants of self-rated health and mortality in Russia - are they the same?
International journal for equity in health, 7, 19.
PETROVICI, D. A., RITSON, C., & NESS, M. (2002). Determinants of Food Choice in a Transitional Economy : Insights from
the Theory of Reasoned Action. Xth EAAE Congress “Exploring Diversity in the European Agri -Food System”,
Zaragoza (Spain), 28-31 August.
POPOVA, K., FREWER, L. J., JONGE, J. D., FISCHER, A., & KLEEF, E. V. (2010). Consumer evaluations of food risk management
in Russia. British Food Journal, 112(9), pp. 934–948.
SEETH, H. T., CHACHNOV, S., SURINOV, A., & VON BRAUN, J. (1998). Russian poverty: Muddling through economic
transition with garden plots. World Development, 26(9), pp. 1611–1624.
SHAMA, A. (1992). Transforming the Consumer in Russia and Eastern Europe. International Marketing Review, 9(5).
THELEN, S., & FORD, J. B. (2006). Assessing Russian Consumers ’ Imported Versus Domestic Product Bias . International
Business, 48(October), pp. 687–704.
TRAGAKES, E., & LESSOF, S. (2003). Health Care Systems in Transition: Russian Federation . Copenhagen, European
Observatory on Health Systems and Policies, 2003: 5(3).
МАЮРНИКОВА, Л. А., НОВОСЕЛОВ, С. В., & БОЛХОВИТИНА, Е. Н. (2010). Формирование потребительских
предпочтений к новационным продуктам питания в региональных условиях. Ползуновский вестник,
(4/2), pp. 13–19.
ОВЧАРОВА, Л. Н. (2008). Динамика основных характеристик питания населения россии (рф). Россия: путь к
социальному государству (pp. 1–21). Москва.

114
ТАБАКАЕВА, О. В. (2011). Потребительское поведение на рынке функциональных пищевых продуктов
Приморского края. III Международная научно-практическая интернет-конференция “Рыночное
пространство современной России: реклама и связи с общественностью, коммерция, маркетинг” (25 - 29
апреля 2011 г., г. Новосибирск, СибУПК) (pp. 1–7).

115
The Importance of Country of Origin (COO) on
Consumers Preference: Study on Packaged
Butter in the Food Market of Azerbaijan PROPOSAL FOR MASTER THESIS
Country of Origin (COO), Conjoint Analysis, Butter Brands, Purchase Decision Making.
Kanan Amirov, University of Bonn, [email protected]
Abstract
The consumer decision making process is real complex system that requires a lot of factors such as economical, social,
personal and demographical to be taking account. In last decades, an importance of country of origin is increasing
relatively to other factor in the perception of consumers. It is one of the most investigated concepts in the field of
marketing as well as in consumer behavior. Basically, the role of country of origin becomes paramount important in
purchase decisions and often it is also considered as a fifth element of product mix.
In spite of fact that several scientists pay remarkable attention to the factor of country of origin (COO), no final conclusi on
was made regarding to the exact effect of COO on product evaluations in previous studies. The most of these studies
provide evidence that COO’s influence on product evaluations and perception is moderated when encountered alongside
with other extrinsic cues (Price, brand, packaging and so on). However, it is really difficult to consider also intrinsic cues
such as quality, taste, and smell with extrinsic cues in the same research work.
In this paper, I will find out the importance of country of origin among other extrinsic attributes of product. The second
hypothesis is to determine the relationship between social-economic furthers and preference of consumers for COO.
Butter was selected as an objected product because of high usage of it in Azerbaijan (author’s home country).
Nevertheless, only packaged butter brand are involved in this research because of incomparability of packaged and
unpackaged brands. Five well-know characteristics of packaged butter brands were determined as a main product cues;
they are weight, price, package type, COO and brand name.
As a method, conjoint (trade off) analysis is used in order to offer respondents a situation that contain multi-attributed
judgments. This method allows measuring the degree that consumer value among all of given butter attributes in the Food
Market of Azerbaijan. On this purpose, questionnaire is made regarding to several butter brands that contains various
extrinsic attributes and asked to targeted sample. Afterwards, software program SPSS is used to analyze the data and make
final conclusion regarding to the research questions.
Problem Background
The effect of country-of-origin on consumer’s preference became the main objective of researches after the first known
article of Robert Schooler on this topic in 1965. Later on, different studies have shown that country of origin (briefly as
COO) effect plays paramount role on purchase decision making process and scholars started to pay more attention on it in
the context of product perception and evaluation (BAUGHN and YAPRAK 1993). The concept of COO was defined by
NAGASHIMA (1970) as
“The picture, the reputation, the stereotype that businessmen and consumers attach to products of a specific country”.
In spite of the fact that several scientists pay remarkable attention to the factor of country of origin (COO), no final
conclusion had been made regarding to the exact effect of COO on product evaluations in previous studies. Most of these
studies provide evidence that the influence of COO’s on product evaluations and perception is moderated when encoun-
116
tered with other extrinsic cues such as price, brand, packaging (URBONAVIČIUS and GINEIKIENĖ 2009). However, it is really
difficult to consider also intrinsic cues such as quality, taste, and smell with extrinsic cues in the same research work.
In last decades, researchers have suggested that cues affecting decision processes are product specific. This issue puts
forward that all products contain a set of specific attributes as well as COO that affect consumer’s choice. It is on this
rationale that several scientists including HAN and TERPSTRA made a suggestion that the examination of the effect of
country of origin on consumer’s choice be done in the term of specific products and attributes (HAN and TERPSTRA 1988).
However, the search for relevant information about cues of the chosen product would require further search for
information which originates not from the implicit or explicit nature of a product. Usually, consumers collect this required
information cues from various sources including media (advertisements), social environment and different agencies. This
group of information includes the search for other information, where the product originated from or ‘place of origin’ of
the objected product (GUDERO 2001). More concretely, a specific product and its characteristics have to be identified and
rated (or ranked) for making conclusion on importance of them to consumers. For this purpose, this study being
conducted to determine the importance of COO in the purchase process of butter in the food market of Azerbaijan.
Theoretical background and state of the art
Plenty of analyses were implemented on the purpose of COO in the last few decades. Based on the main purposes of these
papers, the importance of country of origin was analyzed in three types of studies, which also reveal the chronological
development of researches in the area of marketing: Single-cue; Multiple-cue; High complexity studies (SULAIMAN 2008, p.
33).
Single-cue study was the first method that proves the existence of country of origin effect on the consumer’s preference.
General products, different classes of products (NAGASHIMA 1970&1977), as well as specific products (TONGBERG 1972;
WHITE 1979) were analyzed by this study.
The country of origin effect was investigated by CAI and coworkers (2004) and final conclusion was that COO is better
implemented and understood in a multi-cue study. The multi-cue environment became the essential option in today’s
marketplace because of the fact that consumers have various accesses to required information regarding existent products
(CAI et al. 2004). More realistically, KNIGHT demonstrated that image of country acts as just one of known extrinsic cues of
product that buyers take account on the perception of product quality (KNIGHT et al. 2007).
In the literature, the big share of the previous studies on COO was conducted in different developed countries including
USA and Canada. This issue implies that inferences drawn from such studies may suffer lack of cross -cultural
considerations; in this case, it limits the validity and generalization of final results (BAKER and BALLINGTON, 2002).
In spite of several scientific studies on COO, only few of such studies were conducted on food products in literature; they
have mostly been on cars, TV channels, etc. Industrial products and appliances were the main focus of such studies. KNIGHT
et al. (2007) stated that people usually purchase food products with “low involvement” because of product durability.
Differently, HOYER and MACINNIS (2000) was not satisfied with this statement; in low involved products, usually purchas er
don’t engage in long information processing (in COO as well). However, the majority of scholars indicate that food
products category contains the most important product that requires frequent purchases. Indirectly, it implies that small
change in the COO perception as a result of changes in the economic and political conditions as well as in several other
issues will strongly affect purchase intention of consumers (PHILIPPIDIS and HUBBARD 2003).
1. Main Objectives
Azerbaijan is one of the countries that basically meet its demand for food products by imports. In this situation, consumers
have various perceptions regarding local and foreign brands depending on which country they come from. However, COO
is not the only cue that consumers take into account in the period of decision making and this is why other essential
product cues were also considered in this research. Basically, the main objective of my thesis was to define the role of
country of origin as essential factor in the decision of consumers in Azerbaijani on butter brands.
Initially, it seemed much more complex to measure this effect in terms of all food products. Due to this issue and literature
preference, this study concentrates on a specific product. Packaged butter is selected because of its high consumption and

117
existence of several foreign brands in Azerbaijan. According to statistics, 60 grams of butter is consumed per person per
day on average in Azerbaijan (HAYDAROVA 2012). In relevant food market, there are various packaged and unpackaged
butter brands available for sale. Moreover, only packaged butter is considered in this study because of its inherent
packaging cost that makes it incomparable with unpackaged butter brands in the market. Therefore, only packaged butter
brands are being selected as the products on interest for this study, with concept of “packaged” been emphasized in the
title of the thesis as well.
In the course of time, the main attributes of packaged butter and their existing alternatives would be selected in the
market. On this point, different cues believed to effect the decision of consumers are portrayed in the Figure 1 as below.
Figure 1. The important attributes in butter purchase
Source: Constructed by author
Generally, the study claims that COO is one of the essential cues in the evaluation and perception of butter purchase;
however, the main objective is to figure out how strong this effect is in presence of other attributes. Secondly, qualitative
analysis would be performed to investigate the relationship between consumer’s choice and their social-demographic and
personal characteristics. Due to the multi-cues nature of this research, conjoint analysis is selected as the most appropriate
method that allows making judgment among several attributes.
Hypothesis and Research questions
This research aims to define the extent to which COO is important for consumers among other attributes of butter brands
in purchasing process. More concretely, two research questions are considered;
1. What is the real effect of COO on buyers in the process of decision making for butter brands? This question is
based on quantitative analysis.
2. What is the interrelation between social-demographic and personal characteristics of consumers and their choice
regarding the factor COO? Quantitative analysis is conducted for this part as well.
Firstly, based on a pilot survey with few respondents, general information and the main extrinsic cues of butter brands
were collected in Azerbaijan. On this purpose, more cues were considered in the list of important attributes in purchase
process of butter. For instance, brand name, COO, organic, weight, protein and fat content, price, packaging types was
included in the first list of main product attributes of butter. Afterwards, small qualitative analysis was conducted with 20
people in order to determine the most important attributes among them in Azerbaijan. Respondents were asked “what
attributes are important for you when you purchase butter?” and 4 product attributes were determined as the most
important cues at the end. Moreover, conjoint analysis is usually done with 4 (ideal) or 5 (max.) attributes in SPSS
program. The eliminated attributes and their reasons are described below:
Consumer’s
choice
Brand
Price
COO Packagin
g

118
Table 1. Eliminated attributes
Eliminated Attributes Reasons
Weight Possible interaction between price and weight
Protein and fat content Not having standard measurement on packages. On different brands, it is indicated
with gram or percentage (%).
Organic and Inorganic All selected brands are produced naturally.
Source: Constructed by author.
The remaining cues namely country of origin (COO), brands, price, and packaging were selected as the main product
attributes for butter. Subsequently, alternatives of each attributes were found and added to the final list.
Table 2. Attributes and alternatives
Attributes Number Alternatives
COO 5 Azerbaijan (local), New Zealand, France, Russia, Finland
Brands names 5 PalSud, Anchor, President, Doyarushka, Fin
Price 4 1.8; 1.9; 2.0; 2.1 (AZN)
Packaging 2 Plastic; Waxed paper
Source: Constructed by author.
Methodology
As mentioned above, conjoint analysis is the quantitative analytical tool for this research. Simply, this analysis is a metho d
that allows measuring consumer preferences regarding the attributes of service or a product. By conjoint analysis,
researchers usually can find answers to questions such as: “What product attributes are important or unimportant to the
consumer?, What levels of product attributes are the most or least desirable in the consumer’s mind?” (SPSS INC. 1997).
Here, the main interest is to know how the various constructs would be traded off in different combinations; for example
to decide whether one feature of product is desirable enough to sacrifice another (MALHOTRA and BIRKS 2003).
Basically, a research aims to follow the stages for constructing conjoint analysis as below: formulate the problem,
construct the stimuli, decide the form of input data, select conjoint analysis procedure, interpret the results and assess
reliability and validity (MALHOTRA and BIRKS 2003).
On purpose of data collection, the content and design of questionnaire was done in line with the basic requirements of
conjoint analysis. Generally, SPSS uses the “full-concept approach” for conjoint analysis. In this approach, respondents have
to rate or rank given alternative products defined by selected alternatives of all attributes (SPSS INC. 1997). In my case,
having 4 attributes; COO, brand names, price and packaging and respectively, 5, 5, 4, 2 alternativ es in each, 200 (5*5*4*2)
cards or profiles can be made as different combinations in full concept approach. More realistically, “ fractional factorial
designs” can be used and it presents a suitable fraction and number of all possible combinations. This des ign helps to
prevent problems associated with high time-consuming, high cost, fatigue with respondent and thereby potentially
invalidating responses. In SPSS, the “Generate Orthogonal Design” automatically generates the certain number of
orthogonal fractional plans. Using this procedure, 25 different product profiles of butter were generated. Each product
profiles contained different combination of attributes. On the second hand, 25 profiles also seem ideal when it is calculated
according to formula established by AUTY (1995).
Cards/parameters ≥ 1.5
Parameter= number of alternatives-number of attributes= (5+5+4+2) - 4= 12

119
If we assume card/parameters ratio is equal to 2, then number of cards has to be equal to 24 (12*2). Dues to generation of
orthogonal design, 25 cards were included in the quantitative part of the questionnaire in order to collect the respondent’s
preference. Nevertheless, these profiles don’t mean that all of described products exist in the market.
Each profile contains four attributes and it will be asked of the respondents to rate profile on a 7 point scale. Due to the
fact that a normal a 9 point scale used for previous studies were problematic for respondents in terms of rating their
preferences, a 7 point scale has been chosen.
In qualitative analysis, I included 8 questions concerning to social, demographical, personal characteristics of respondents
to questionnaire. Initially, questions about sex, age, education and occupation were added to question list. Then, the
following questions were constructed based on different hypothesis:
-How much do you spend on food products per month? Number of households in the family? The intervals for these
questions were taken from the master thesis that was done by GULIYEV (2007) on the similar topic.
-How often do you purchase butter? It aims to figure out a relationship between purchase frequency and decisions made
on butter brands.
-Are you basically weekend shopper? This question is based on idea that people can evaluate and consi der more factors
(attributes) in the purchase decision making process at weekends than in regular days.
In contrast to several related research I did not include question regarding the income level of respondents; objected
country has a problem of corruption and usually people do not have stable monthly income.
Totally, questionnaire contains 33 questions and its preliminary list is attached at the end of this document. At least 150
respondents will be interviewed online via the internet. Unfortunately, it is not possible to make identical sampling for an
online survey. However, questions concerning social demographic characteristics of people help to make conclusion on
population characteristics.
In SPSS, the procedure of conjoint analysis uses the ordinary least-squares estimation. It was found that this method
performs as well as other methods, and additionally it has the advantage of being easier to use and interpret (SPSS INC.
1997). The data coding and process of analysis is elaborated on at the end of data collection. Coded data would be entered
in the software package SPSS in order to get output of conjoint analysis. Finally, the program will guide me in making a
final conclusion on importance of COO in the midst of other 3 attributes of butter in the food market of Azerbaijan.
Expected Result
Using procedure of conjoint analysis, part worth utility will be calculated for each level of attributes in selected profiles. By
SPSS program, coefficients of variables and utility scores can be used to make comment on the relative importance of each
attributes for all attributes. More detailed, utility scores (or ratings) in outputs shows how important each product
characteristic is to the respondent’s overall preference of a product. Afterwards, it will enable the researcher to make a
conclusion on extent of attention people attach to COO in buying process of butter brands.
The final result of this research will help me to conclude as to whether or not country of origin (COO) plays an important
role in effecting the attitudinal change of the consumers by creating perceptional competitive differences between
products in the mind of a consumer.

120
QUESTIONNAIRE
Below questionnaire is designed in order to investigate in important factors of purchasing process in the food
market of Azerbaijan. The main objective of research is butter brands.
Collected data will be used only for this research.
Thanks for your valuable time.
1. Questions concerning to different product profiles.
Please, cross the name on the scale that best reflects the extent you prefer the product described. You can use one
number between “1” and “7” to indicate your preference. In product profiles, “COO” is abbreviation of Country of
Origin factor.
Please, notice that there is not any true or false answer.
Profile 1.
Brand- Palsud; COO- New Zealand; Price- 2.1; Packaging- Plastic
Least Preferred Most Preferred 1 2 3 4 5 6 7
Profile 2.
Brand- Fin; COO- France; Price- 2.0; Packaging- Waxed Paper
Least Preferred Most Preferred 1 2 3 4 5 6 7
Profile 3.
Brand- President; COO- Azerbaijan; Price- 2.1; Packaging- Waxed Paper
Least Preferred Most Preferred 1 2 3 4 5 6 7
Profile 4.
Brand- Palsud; COO- Finland; Price- 2.0; Packaging- Waxed Paper
Least Preferred Most Preferred 1 2 3 4 5 6 7
Profile 5.
Brand- Fin; COO- Azerbaijan; Price- 1.9; Packaging- Waxed Paper
Least Preferred Most Preferred 1 2 3 4 5 6 7
Profile 6.
Brand- Anchor; COO- France; Price- 1.8; Packaging- Waxed Paper
Least Preferred Most referred 1 2 3 4 5 6 7
Profile 7.
Brand- Doyarushka; COO- Azerbaijan; Price- 2.0; Packaging- Plastic
Least Preferred Most Preferred 1 2 3 4 5 6 7
Profile 8.

121
Brand- Fin; COO- Finland; Price- 2.1; Packaging- Plastic
Least Preferred Most Preferred 1 2 3 4 5 6 7
Profile 9.
Brand- Anchor; COO- Azerbaijan; Price- 1.8; Packaging- Plastic
Least Preferred Most Preferred 1 2 3 4 5 6 7
Profile 10.
Brand- Doyarushka; COO- Russia; Price- 1.9; Packaging- Waxed Paper
Least Preferred Most Preferred 1 2 3 4 5 6 7
Profile 11.
Brand- Doyarushka; COO- France; Price- 2.1; Packaging- Waxed Paper
Least Preferred Most referred 1 2 3 4 5 6 7
Profile 12.
Brand- Palsud; COO- France; Price- 1.9; Packaging- Plastic
Least Preferred Most Preferred 1 2 3 4 5 6 7
Profile 13.
Brand- President; COO- France; Price- 1.8; Packaging- Plastic
Least Preferred Most Preferred 1 2 3 4 5 6 7
Profile 14.
Brand- Palsud; COO- Azerbaijan; Price- 1.9; Packaging- Waxed Paper
Least Preferred Most Preferred 1 2 3 4 5 6 7
Profile 15.
Brand- President; COO- Russia; Price- 2.0; Packaging- Plastic
Least Preferred Most Preferred 1 2 3 4 5 6 7
Profile 16.
Brand- Fin; COO- New Zealand; Price- 1.8; Packaging- Waxed Paper
Least Preferred Most Preferred 1 2 3 4 5 6 7
Profile 17.
Brand- President; COO- New Zealand; Price- 1.9; Packaging- Waxed Paper
Least Preferred Most Preferred 1 2 3 4 5 6 7
Profile 18.
Brand- Doyarushka; COO- New Zealand; Price- 1.8; Packaging- Plastic
Least Preferred Most Preferred 1 2 3 4 5 6 7

122
Profile 19.
Brand- Anchor; COO- New Zealand; Price- 2.0; Packaging- Waxed Paper
Least Preferred Most Preferred 1 2 3 4 5 6 7
Profile 20.
Brand- Palsud; COO- Russia; Price- 1.8; Packaging- Waxed Paper
Least Preferred Most Preferred 1 2 3 4 5 6 7
Profile 21.
Brand- President; COO- Finland; Price- 1.8; Packaging- Waxed Paper
Least Preferred Most Preferred 1 2 3 4 5 6 7
Profile 22.
Brand- Anchor; COO- Russia; Price- 2.1; Packaging- Waxed Paper
Least Preferred Most Preferred 1 2 3 4 5 6 7
Profile 23.
Brand- Anchor; COO- Finland; Price- 1.9; Packaging- Plastic
Least Preferred Most Preferred 1 2 3 4 5 6 7
Profile 24.
Brand- Fin; COO- Russia; Price- 1.8; Packaging- Plastic
Least Preferred Most Preferred 1 2 3 4 5 6 7
Profile 25.
Brand- Doyarushka; COO- Finland; Price- 1.8; Packaging- Waxed Paper
Least Preferred Most Preferred 1 2 3 4 5 6 7
2. Questions concerning to Social, Demographical, Personal characteristics of respondents.
Please, cross one of the boxes in order to give answer to following questions. And write down your occupation in 4 th
question.
1.
Sex: Male Female
2.
Age: 16- 25 26-35 36- 45 46- 55 56 ≤
3.

123
6.
REFERENCES
AUTY, S. (1995): “Using Conjoint Analysis in Industrial Marketing, The Role of Judgement”, Industrial Marketing
Management, Vol. 24, p. 191-206.
BAUGHN, C. C. AND YAPRAK, A., (1993): Product-Country Images: Impact and Role in International Marketing. New York,
Business Press.
BAKER, M., AND BALLINGTON, L. (2002): "Country of Origin as a Source of Competitive Advantage." Journal of Strategic
Marketing, Vol. 10, No. 2, p. 157-168.
CAI, Y., CUDE, B. AND SWAGLER, R. (2004): "Country-of-Origin Effects on Consumers' Willingness to Buy Foreign Products: An
Experiment in Consumer Decision Making." Consumer Interests Annual, Vol. 50, p. 98-105.
GUDERO, F. (2001): The effect of Country of Origin of a Product on Consumer’s Buying Behavior, Master degree, Oklahoma
State University, 2009.
GULIYEV, O. (2007): The Importance of Country of Origin Factor of Azerbaijan consumers’ Preference of Local and Foreign
Brands, Master Thesis, University of Sakarya, Turkey.
HAN, M. AND TERPSTRA, V. (1988): ‘Country-Of-Origin Effects for Uni-National and Bi-National’,Journal of International
Business Studies, Vol. 19, No. 2, p. 235.
HAYDAROVA. (2012): http://wap.big.az/bigcms.php?op=ArticleFull&sid=45318, last accessed: 05.02.2013
HOYER, W., AND MACINNIS, D. (2000): Consumer Behavior, 2nd Ed., Houghton Mifflin Company.
Education High School; Bachelor; Master Doctoral
Occupation: ………………
How much do you spend on food products per month?
≤50 51-100 101-150 151-200 200≤
Number of Hauseholds in the family?
1 2 3 4 5≤
How often do you purchase butter?
Less than once in a month 1-2 times in a month
Once in a week More than 1 time in a week
Are you weekend shopper?
Yes No I am not sure

124
KNIGHT, J., HOLDSWORTH, D. AND MATHER, D. (2007): "Country-of-Origin and Choice of Food Imports: An In-depth Study of
European Distribution Channel Gatekeepers." Journal of International Business Studies, Vol. 38, No. 1, p. 107-125.
MALHOTRA, K AND BIRKS, F. (2003): Marketing Reasearch, and appliad approach, 3rd edition, Pearson Education Limited.
NAGASHIMA, A. (1977): "A Comparative 'Made in' Product Image Survey Among Japanese Businessmen." Journal of
Marketing, Vol. 41, No. 3, p. 95-100.
NAGASHIMA, A. (1970): "A Comparison of Japanese and U.S. Attitudes Towards Foreign Products."Journal of Marketing ,
34(Jan): p. 68-74.
PHILIPPIDIS, G., AND HUBBARD, L. (2003): "Modelling Hierarchical Consumer Preferences: an Application to Global food
Markets." Applied Economics 35: p.1679-1687.
SPSS INC. (1997): “SPSS Conjoint™ 8.0”, Marketing Development, Printed in the USA, www.spss.com, last accessed:
05.02.2013
SULAIMAN, K Al-RAJHI (2008): The effects of brands and country of origin on consumers' buying intention in Saudi Arabia.
PhD thesis, University of Glasgow.
TONGBERG, R. C. (1972): "An Empirical Study of Relationships Between Dogmatism and Consumer Attitudes Toward Foreign
Products." PhD. Dissertation, Pennsylvania State University.
URBONAVIČIUS, S. AND GINEIKIENĖ, J. (2009): “Importance of the product country-of-origin factor on purchasing progress in
the context of globalization”, Vilnius University Faculty of Economics, Ekonomika, 2009.
WHITE, P. D. (1979): "Attitudes of U.S. Purchasing Managers Toward Industrial Products Manufactured in Selected
European Nations." Journal of International Business Studies Spr/Sum, p. 81-90.

125
Session 4

126
Determinants for Purchases of Agricultural
Pesticides: a study on the buying behavior of
rural producer of coffee in Brazil Consumer. Organizational consumer behavior. Agriculture. Coffee Producer. Attributes of Buying.
Wendel Alex Castro Silva, Faculdade Novos Horizontes, [email protected]
Ricardo William Pinheiro, UNICERP, [email protected]
Gustavo Rodrigues Cunha, Faculdade Novos Horizontes, [email protected]
Abstract
This research is driven by the existence of a theoretic gap which gathers studies on the behavior of an
organizational consumer. Having the Sheth, Mittal and Newman (2001) model, a research instrument was developed and
applied in a survey considering the agriculture consumer behavior of an organizational consumer. The univariate statistic
analysis was conducted to describe the subjects’ characteristics establishing relation among these characteristics.
Individual components which formed the instrument were divided into 5 parts, obeying the model proposed.
Subsequently to this division, a cluster analysis was applied to obtain the best variables possible, contained in each part –
according to its similarities. Once the results of cluster analysis came up, was possible to elaborate the hypothesis of the
research. Afterwards, the qui square test was performed to judge formulated hypothesis and to valid the formation of
clusters. To verify the level of similarity contained in the attributes analyzed on the research, especially the ones presented
in the hypothesis, simple and multiple correspondences analysis were done. Throughout this procedure, was possible to
consider the model of Sheth, Mittal and Newman (2001) as being suitable. Therefore, was viable to identify, based on
Alpert rating scale (1971), the determining attributes of purchase of coffee producers in the region of Patrocínio/MG. The
results of the research showed that the attributes linked to the salesperson are meaningful to a coffee producer and must
to taken into account by distributors of defensive products. Finally, the model can be helpful for investigate the consumer
behavior in agribusiness.
1. AGRIBUSINESS IS A MAJOR PILLAR OF THE ECONOMY
It recognized its importance to the Brazilian trade balance and the economy as a whole, because moves billions of dollars
per year in various supply chains, highlighting those in which there is worldwide recognition, such as beef, soy, corn, milk
and coffee.
One of the most prominent cities in the Brazilian agribusiness – Patrocínio - is Located 400 kilometers from Belo
Horizonte state of Minas Gerais (MG). Agribusiness generated for the city in 2006, something around 22% of its Gross
Domestic Product (GDP), which represents over 100% of GDP generated by local industry. Among the activities of
agribusiness in the city are dairy farming and cutting, production of corn, soybeans and coffee production, which is
featured on the national level. Coffee plantations in Patrocínio occupying 29,000 hectares produced 672,000 sacks in 2008
- it brought as the first city to the country - generating approximately R$ 119 million in production value (IBGE, 2008).
Due to the presence of many coffee growers, Patrocínio receives the largest companies in the field of
agrochemicals in the world with high value billing and product diversification. This provides ideal conditions for this
research that focuses on the consumer agricultural producer of coffee while buyer of agrochemicals used in its production.
The farmer, for the purpose of purchase inputs required for the production of coffee, should resemble the buyer of
an industry with regard to their purchasing behavior. Therefore, to assume the position of buyer for a rural business, your

127
property, should assume a professional role in analyzing the alternatives very carefully at all stages of the buying process,
making it one of the best examples of customer organization. See Martins (2001), Rossi, Neves and Carvalho (2003), Castro
naves (2007), Silva, Scare and Casanova (2008).
A crucial aspect to consider this assumption is emergence of doubt about what are the most important attributes
for these producers. The intuition behind has several implications, particularly, creating the need to understand how the
coffee farmer behaves in the process of buying pesticides. Moreover, it is also important to include this analysis in
scientific discussions, basing research on buying behavior and contributing to strengthening business. Thus, the problem
focus of this research is delineated from the following question: What are the attributes of factors in the decision to
purchase pesticides by farmers in the coffee region of Patrocínio - MG?
In this paper aims to identify and describe the attributes that are decisive for the purchase of pesticides by
farmers of the region's coffee of Patricínio - MG, and also verify that the buying behavior of rural producer of coffee in this
region can be explained from the perspective of theoretical Sheth, Mittal and Newman (2001), exposed in its model of
buying behavior of the customer organization.
2. Consumer Behavior
Consumer behavior is defined by Engel, Blackwell and Miniard (1995) as those activities directly involved in
obtaining, consuming and disposing of products and services, including the decision process that precedes and follows
these actions. Seeks to show how people make decisions, what the factors that guide their behavior are and what the
attributes that influence them are.
Studies of consumer behavior analysis focus not only on the purchase, but everything that can somehow interfere
with it. The analysis is done prior to purchase, to show the consumer that led to this act and after this acquisition, to sho w
how it behaves before using the product. See Holbrok (1987) and Engel and Miniard Blackwell (1995).
From a physical or mental activity, the customer gives signals whether will behave as before the supply. Physical
activities are performed, for example, when a customer goes to a store, talking to vendors and issue purchase orders.
Example of mental activity is the association of quality to a particular brand, due to its previous experience with it (Sheth,
Mittal and Newnan, 2001).
2.1 Organizational Purchases
Often, one has used the term consumer to set only those who are part of the consumer market, excluding the
organizational market, for which is the term more applied client. In general, the client is a person or organizational unit
that plays a role in the consummation of a transaction with the marketer or an entity (Sheth, Mittal and Newman, 2001).
The consumer is the one who acquires a product or service that will be consumed or used in some other way. The
market organization is formed by all organizations that produce goods and services used in the production of other goods
or services that are sold, leased or given to third parties. The company dedicated to agriculture is a classic example of a
component of this type of market (Sheth, Mittal and Newman, 2001).
The purchasing organization is defined by Webster and Wind (1972) as the decision-making process through
which organizations establish the need for purchased products and services and identify, evaluate and choose between
brands and suppliers available what is the best option. The organizational purchase has character more professional than
the purchase made by the consumer. There is a higher number of procedures and expertise of those involved in the
process. Indeed, it happens according to a standardization of procedures, providi ng the strategic and operational
requirements of the organization.
The organizational buyer makes decisions in relation to the complex problem to be solved by analyzing whether
the purchase is made for the first time, considering the number of people involved and the deadline to be met (Candido,
2004).

128
2.2 Attributes and purchase their classification
When a consumer wants to describe a product, he does it reporting its characteristics, particularities, utilities and
accessories that are purchased together. In short, discriminates product attributes. When he is processing information
with respect to the purchase, the product attributes are the main stimuli that influence this process. For this reason, will
always advantageous to work these attributes in order to make customers perceive a real need of purchase (Joas, 2002,
Tibola, Sanzovo and Vieira, 2004). A peculiar issue stands out clearly, that is, by analyzing the background consumer
perceptions regarding the attributes of a product is possible to understand how the customer feels about him (Assael,
1992).
In the specific case of agricultural consumers, the package size is, for example, an attribute that can reflect the
benefit of avoiding residue or facilitate handling. These benefits can only be realized after using the package (Rossi, Neves
and Carvalho, 2003). A set of attributes highly valued by consumers farming is the full solution, that is, the possibility of
acquiring a set of inputs in a single resale, which may increase their bargaining power, incurring assistance in the
application and subsequently facilitate marketing (Neves et al., 2001).
There are several classifications of attributes, with many different classifications, but with the same coverage. The
classification of Alpert (1971), to be widely used in various studies on consumer behavior, was chosen for this study.
Alpert (1971) argues that consumers do not realize all the attributes in the same way, and they attach greater importance
to some as their beliefs and values.
There are several classifications of attributes, with many different classifications, but with the same coverage. The
classification of Alpert (1971), to be widely used in various studies on consumer behavior, is also relevant for this study.
Alpert (1971) argues that consumers do not realize all the attributes in the same way, and they attach greater importance
to some as their beliefs and values.
He assumed key concepts to compare the predictive validity of this assumption and dealing with issues of
determinant attributes in purchasing. According to him, ‘salient attributes’ are easily perceived by the consumer, not
influence the process of purchase and will only be used as a tiebreaker. That is, if all other attributes equate themselves.
‘Important attributes’ are not taken into consideration by some consumers, because they believe are present in all offers.
Other groups consider important when choosing the product, but exert little or no influence in determining the purchase.
‘Attributes determinants’ are the most important to the goal of marketers. In the consumers' eyes, make a difference and
are crucial in making purchasing decision. In the eyes of customers, means satisfaction.

129
2.3 Model of organizational buying behavior Sheth, Mittal and Newman
Figure 1 - Model of customer behavior encompassing organizational
Source: Sheth, Mittal and Newman (2001)
Sheth, Mittal and Newman (2001) proposed a model, shown in Figure 1, assembling the individual components of
industrial acquisition system, which helps to understand the relationships within that system and its impact on buying
behavior of the customer organization. According Candido (2004), the model proposed by Sheth, Mittal and Newman
(2001) is considered comprehensive concepts by showing multiple other theoretical models. Silveira (2000) states that
the original version of Sheth, Mittal and Newman, published in 1999, this is a more complete and systematic than its
predecessors, depicting an evolution of the academic understanding of the subject. Perhaps the only shortcoming of the
model of Sheth, Mittal and Newman (2001) is the fact stop staring macro environmental relations, including economic,
political, legal, cultural, technological and market (Silveira, 2000 and Candido, 2004).
Precisely because it is more recent and complete their proposals on organizational buying behavior, we decided to
test the hypotheses in this research model Sheth, Mittal and Newman (2001) for the coffee farmers of the region of
Patrocínio below.
3. Research Hypotheses and Methodological Aspects
The main hypothesis of this research can be presented as follows:
Ho: The theoretical perspective of Sheth, Mittal and Newman is appropriate to analyze and describe the attributes
determinants for the purchase of pesticides by farmers Coffee of Patrocínio region.
To be able to achieve the goals of the research, the analyzes were performed according to blocks A, B, C, D and E
shown in Table 1, which tried to find greatest similarity relationship between the components of the questionnaire and a
set of variables descriptive that were associated through multiple correspondence analysis.

130
Assumption A.1 Type of buyer refers to anyone who makes purchases for application of pesticides in the
cultivation of coffee - in other words - owner, employee, family members and another. Amount of properties refers to the
number of farms each producer, being 1, 2, 3, 4 and 5 or more.
Assumption A.2 Centralized purchasing refers to the degree of centralization of purchases of chemicals for the
properties of a single grower, either; the purchase can be performed separately for each property or for all properties in
together.
Assumption A.3 By means of the adoption of rules and procedure, you can identify if the buyer of pesticides
follows rules or procedures when making purchases.
Assumption B.1 Speed in attendance refers to the speed of service perceived by the producer in relation to the
resale of pesticides. Service in general refers to care provided by the retail coffee producer in all its aspects, namely in
product sales, negotiating financial and technical assistance.
Assumption B.2 Service-level property relates to service done on the farm producer of coffee, which is a type of
care usually provided by the resale of pesticides to their customers. The tracking and monitoring of applications and
results of products is a service provided by the reseller when sending a technician to monitor the implementation of
products in the fields and to measure the results after such application.
Assumption B.3 In the event the price charged in general refers to the vision of the producer of coffee in relation to
prices for resale, i.e., whether it is a resale that adopts a policy of low prices or high prices. Price (SRP) refers to the
product value. Discount for cash payment refers to the special conditions given to producers effecting their payments upon
purchase.
Assumption B.4 Payment deadline concerns the payment deadline for the reseller offers the producer called
normal negotiations, negotiations with deadlines that are small, usually 30 days, to purchase in small quantities. Payment
deadline extended refers to the payment terms for purchases of larger volumes, when retailers offer extended deadlines
for payments after harvest, called the "harvest plans." A variety of forms of payment refers to diversity in the way the
producer can pay for their purchases, so credit card payments, check and bank in duplicate, among others.
Assumptions C.1 and C.2 refer to sources of information and arising direct relationship with the sellers at the time
of purchase. D.1 In the event the active product used is the substance of pesticide that will exert the expected effect
according to your specifications. The concern with environmental aspects of resale refers to the level of attention of
producer in relation to the shares of resale to combat the misuse of pesticides to avoid contamination of people and the
environment.
Assumptions E.1 experience with previous use concerns that the producer had experience in the past when it used
the pesticide in its plantations. Technical assistance linked to the sale of product refers to conditions of technical support
offered to purchase some pesticides. Assumption E.2 to coffee producer satisfaction with the resale is the level of
satisfaction with the service producer of resale in general, not only in selling products. Service quality refers to the ability
to distinguish a resale service provided by another. Product quality relates only to the product approval and product
acceptance.
3.1 Characterization and Research Instruments
This research aims to expose the buying behavior of rural producer of coffee and provide greater familiarity with
this behavior in order to make it explicit. It is also a study aimed hypothetical-deductive, because by supporting the
theoretical analysis and the results of quantitative evaluations, test the research hypotheses presented earlier (Martins
and Teófilo, 2009).
The instrument used for this research was built on the model of Sheth, Mittal and Newman (2001) and divided
into 3 parts with the first consisting of 14 questions designed to characterize the unit of analysis. We sought to identify the
size of the organization, the orientation of purchase, the existence of rules and procedures and the level of centralization in
the buying process.
The second part consists of three issues in which the respondents are prompted to assign importance level
attributes through ordinal scales staggered type and interval of ten points, with the higher the value the greater the

131
numerical value. To facilitate the visualization of these levels, these subcategories were grouped into categories, such as:
no importance (level zero); little importance (levels 1, 2 and 3); average importance (levels 4, 5, 6 and 7) and very
importance (levels 8, 9 and 10). The attributes of the second half were related based on the application of the concepts of
technical and educational background, satisfaction / dissatisfaction with previous experience of purchasing, buying and
nature of information sources, also exposed in the model of Sheth, Mittal and Newman (2001). The third part consists of
the same attributes of the second part, but that the subject is asked to select those attributes that are necessary for the
purchase of pesticides used in coffee production.
The population consists of farmers who purchase their products at the dealerships of Patrocínio, whose properties
are also located in the same municipality or in smaller municipalities that are part this grower pole. The probability
sampling methods allows the sample to establish the basis of a predetermined measure of accuracy (Mattar, 2001). Thus,
according to IBGE (2006), there are 1,421 agricultural establishments which have coffee plantation in the municipalities
that are part of the productive pole Coffee of Patrocínio (Patrocínio, Serra do Salitre, Guimarânia and Coromandel).
Proceeding to the calculations came up with a sampling of 107 instruments that were applied between 01 August and 30
September 2009, which, with a margin of error of 5% resulting in 85.4% confidence.
Table 1 shows the separation of the individual components that comprised the research instrument in five blocks.
Bloc A – Organizational Characteristics
Bloc C – Sources of Information
Variable Code Variable Code
Number of properties Nº PROPERTIES View of other producers OPN
Type of Purchase TYPE OF PURCHASE Time of performance in the market TAM
Size SIZE What are the multinationals that represents
MULT
Quantity Production QUANTITY
PRODUCTION View of other producers OOP
Purchaser PURCHASER Availability of information to the producer
DIP
Rules RULES Mark MAR
Strategy STRATEGY Honesty HON
Bloc B – Nature of Purchase Practical knowledge of techniques CPT
Variable Code Product Knowledge COPR
Packing EMB Education EDUC
Variety of Products VARP Competency COMP
Price charged (generally) PREP Simplicity SIDE
Deadline for Payment PRAP Seriousness SERI
Attendance at the level of property ANP Experience EXP
Location LOC Bloc D – Technical Background and Educational
Treatment (generally) ATE Variable Code
Variety of products that offers VPO Concern with environmental aspects PAA
Price PRE Type of application TAPL
Fast in attendance RAPA Recommendations RECO
Delivery takes place in the farm ENTR Active Principle PA
Speed in invoice issuance and recipe RENF
Deadline for payment extended PPE Bloc E – Satisfaction/dissatisfaction with previous
experience of buying
Discount for cash payment DPAV Variable Code
Variety of methods of payment VMP Quality QUAL
Ease in the release of credit FLC Easy to find it on the market FEM
Quickly in the release of credit RLC Experience with previous use EUA
Promotion PROM Technical assistance related to the sale of the product
ATVP
Ease in the release of the product FLP Fact is satisfied with the resale SATR
Hours of operation HOFU Service Quality QA
Table 1 - Description of Blocks Origination: Prepared by the author on the basis of the research

132
In data analysis, the univariate and bivariate descriptive statistics describes the characteristics of Coffee farms and
its owners, focusing in establishing relationships between them and determinants of purchase. The model of Sheth, Mittal
and Newman (2001) is consisting of individual components which were separated into five sections, Table 1:
organizational characteristics, nature of purchase, sources information, technical and educational background, and
satisfaction / dissatisfaction with experiences previous purchase. Thus, after selecting only relevant variables (presented
in blocks) used the analysis of clusters. After forming clusters, it was held the Chi -square test between pairs of variables
contained in the groups or classes resulting from step before. The goal was to validate the formation of these obtained
clusters and, thus, confirm the existence of a possible association of the main variables of interest contained in each
grouping formed.
The aim was to get a better grouping of possible variables contained in each block, according to their major
similarities. The chi-square test was used in order to judge the assumptions made for, then check whether it was
recommended to use correspondence analysis.
In this sense, the similarity levels contained in attributes relating to organizational characteristics and the degree
of importance that each respondent gave to each attribute is related to pesticide used in the cultivation of coffee, resale
and the seller. Particularly, aims showing the similarity degree in the variables displayed in the hypotheses.
4. Results and Discussion
4.1 Formulation, validation and testing of hypotheses of the research
The results presented were obtained from cluster analysis of the variables of the blocks A, B, C, D and E (see Table
1).
For block A, composed of the variables related to organizational characteristics, the final partition results in four
clusters. “Size” refers to the number of acres of property, joined or associated “quantity”, which is related to the amount of
coffee trees planted on the property, forms a small cluster.
The variables "buyer" which relates to the person who does the buying defensives, "rules" if the buyer informs
that follows rules and procedures for purchase, "property number" number of farms each respondent and "kind of
purchase" if the purchase is made for each property separately or for all, unite in another cluster. “Number of bags of
coffee” produced on the farm, alone constitutes a cluster, so does the “strategy”, which shows whether the respondent
believes that the purchase of pesticides is a strategic function.
The clusters formed from the association between the variables related to the nature of the purchase, that
compose the block B, showed that “packaging”, “location” (resale), and “promotion variety of products” (offered by resale)
in separate clusters and other block B variables are together in another cluster.
Regarding the clusters formed with the variables in block C, connected to sources of information, the variables
related to the seller: “honesty”, “information”, “friendliness”, “product knowledge”, “education”, “competence”, “simplicity”,
“reliability”, “experience”, for resale: availability of information the producer, and the product: the company's “reputation”
and “manufacturer” formed a cluster.
“Operating time on the market” and “multinational representative”, both related to the resale, are associated with
other body as brand (product) and the opinion of other producers (in relation to resale). The variable opinion of other
producers (for the product) is isolated in another grouping.
The groupings for the variables that make up the D block, linked to technical and educational background, showed
that concern about environmental issues (for resale) and active ingredient (product) are l inked and form a cluster. The
variables type of application and recommendations, both related to the product, are isolated each in its cluster.
Regarding the E block, consisting of variables related to satisfaction with previous purchase experiences, the
results were: “facility of finding it in the market” (product) is in a separate cluster. “Experience with prior use” (product)
and “technical assistance” linked to the sale of the product are in another cluster. Quality (for the product), the fact of
being satisfied with resale and “quality service” (provided by resale) are contained in a third cluster.
Based on the results of cluster analysis are formulated hypotheses of the research listed in section 3. After the
formation of clusters of hypotheses and construction preceded the Chi-square test, from which it was concluded that the

133
10% significance level, there is an association between the variables described in the hypotheses, because the p-values
were lower above this level. After confirming the existence of association between variables, we used the simple
correspondence analysis and multiple correspondence analyses, to verify the type of pattern similarity contained in the
variables listed in the events. Based on analyzes of correspondence, one can summarize the results of the verifications
hypothesis presented in Table 2.
Table 2 - Result of the Chi-square test for the variables described in the hypotheses
variables Test
Qui-quadrado
Degree
of liberty P-Value
Type of buyer in relation to Nº. property 79.3714 12 0,01349
The quantity of properties in relation to the
Buyer 79.3714 12 0,01349
Type of
purchase
72.1842 4 0,0004998
The number of properties in relation to the
Type of
purchase
72.1842 4 0,0004998
Rule 8.796 4 0,09245
The rapidity in the service in relation to QA 171.9313 16 0,0004998
PRE 81.8912 20 0,001999
The service in terms of property in relation to MAAP 276.5529 49 0,0004998
The price (in general) in relation to PRE 123.7598 20 0,00049
DPAV 118.3092 16 0,001999
The deadline for payment for the PPE 292.1094 30 0,0004098
VMP 119.0174 54 0,09445
The education of the seller for the SIDE 69.3341 4 0,01199
SERI 69.33 4 0,002499
The experience of the seller for the SIMP 90.8906 24 0,01249
COPR 25.6035 8 0,05047
The active principle of the product used in relation to PAA 274.9257 30 0,0004998
Experience with previous use in relation to ATVP 65.5383 25 0,05897
The importance given to the satisfaction of the
producer of coffee with the resale in relation to
QA 53.1721 18 0,01749
QUAL 230.5585 24 0,0004998
Source: Prepared by the authors using simulation by means of the method of Monte Carlo suggested by Maroco (2007)
Based on these results we observe that the assumptions are acceptable from 1.1 to 5.2, due to the existence of an
association between the variables that compose them. It also accepts the hypothesis, since the proof of existence of an
association between the variables analyzed, constructed based on the theoretical perspective of Sheth, Mittal and Newman
(2001), makes the appropriate model to analyze and describe the attributes determinants for the purchase of pesticides
agricultural by coffee farmers in the region of Patrocínio.
4.2 Levels of importance given to the attributes of buying pesticides used in the cultivation of coffee
Following will be the presentation of the results collected through the survey regarding the level of importance
given by farmers to purchase attributes of agrochemicals used in its activity. According to the sum of concordant opinions,
attributes were classified as follows: unimportant (level 0), minor (levels 1, 2 and 3), medium importance (levels 4, 5, 6
and 7) and very important (levels 8, 9 and 10). Among the attributes that were classified as very important are considered
extremely important those who obtained more than 80% agreement among respondents.
4.2.1 Levels of importance given to product attributes
Farmers consider the attributes of price, quality, recommendation, reputation of the manufacturer, active
ingredient, using previous experience and technical assistance linked to the sale, all related to the product, as extremely
important. Quality showed the highest proportion of concordant: 98.13%, among the attributes of great importance.
Opinion by other producers showed the lowest proportion of concordant: 55.14%.
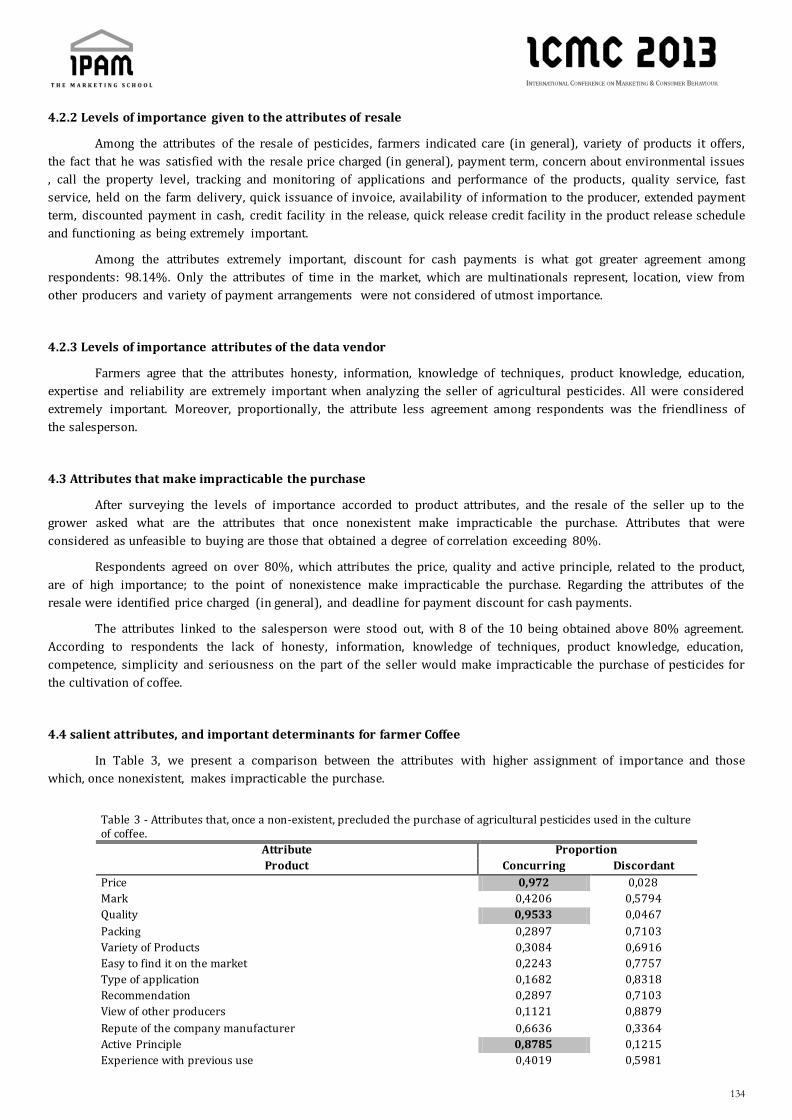
134
4.2.2 Levels of importance given to the attributes of resale
Among the attributes of the resale of pesticides, farmers indicated care (in general), variety of products it offers,
the fact that he was satisfied with the resale price charged (in general), payment term, concern about environmental issues
, call the property level, tracking and monitoring of applications and performance of the products, quality service, fast
service, held on the farm delivery, quick issuance of invoice, availability of information to the producer, extended payment
term, discounted payment in cash, credit facility in the release, quick release credit facility in the product release schedule
and functioning as being extremely important.
Among the attributes extremely important, discount for cash payments is what got greater agreement among
respondents: 98.14%. Only the attributes of time in the market, which are multinationals represent, location, view from
other producers and variety of payment arrangements were not considered of utmost importance.
4.2.3 Levels of importance attributes of the data vendor
Farmers agree that the attributes honesty, information, knowledge of techniques, product knowledge, education,
expertise and reliability are extremely important when analyzing the seller of agricultural pesticides. All were considered
extremely important. Moreover, proportionally, the attribute less agreement among respondents was the friendliness of
the salesperson.
4.3 Attributes that make impracticable the purchase
After surveying the levels of importance accorded to product attributes, and the resale of the seller up to the
grower asked what are the attributes that once nonexistent make impracticable the purchase. Attributes that were
considered as unfeasible to buying are those that obtained a degree of correlation exceeding 80%.
Respondents agreed on over 80%, which attributes the price, quality and active principle, related to the product,
are of high importance; to the point of nonexistence make impracticable the purchase. Regarding the attributes of the
resale were identified price charged (in general), and deadline for payment discount for cash payments.
The attributes linked to the salesperson were stood out, with 8 of the 10 being obtained above 80% agreement.
According to respondents the lack of honesty, information, knowledge of techniques, product knowledge, education,
competence, simplicity and seriousness on the part of the seller would make impracticable the purchase of pesticides for
the cultivation of coffee.
4.4 salient attributes, and important determinants for farmer Coffee
In Table 3, we present a comparison between the attributes with higher assignment of importance and those
which, once nonexistent, makes impracticable the purchase.
Table 3 - Attributes that, once a non-existent, precluded the purchase of agricultural pesticides used in the culture of coffee.
Attribute Proportion
Product Concurring Discordant
Price 0,972 0,028
Mark 0,4206 0,5794
Quality 0,9533 0,0467
Packing 0,2897 0,7103
Variety of Products 0,3084 0,6916
Easy to find it on the market 0,2243 0,7757
Type of application 0,1682 0,8318
Recommendation 0,2897 0,7103
View of other producers 0,1121 0,8879
Repute of the company manufacturer 0,6636 0,3364
Active Principle 0,8785 0,1215
Experience with previous use 0,4019 0,5981
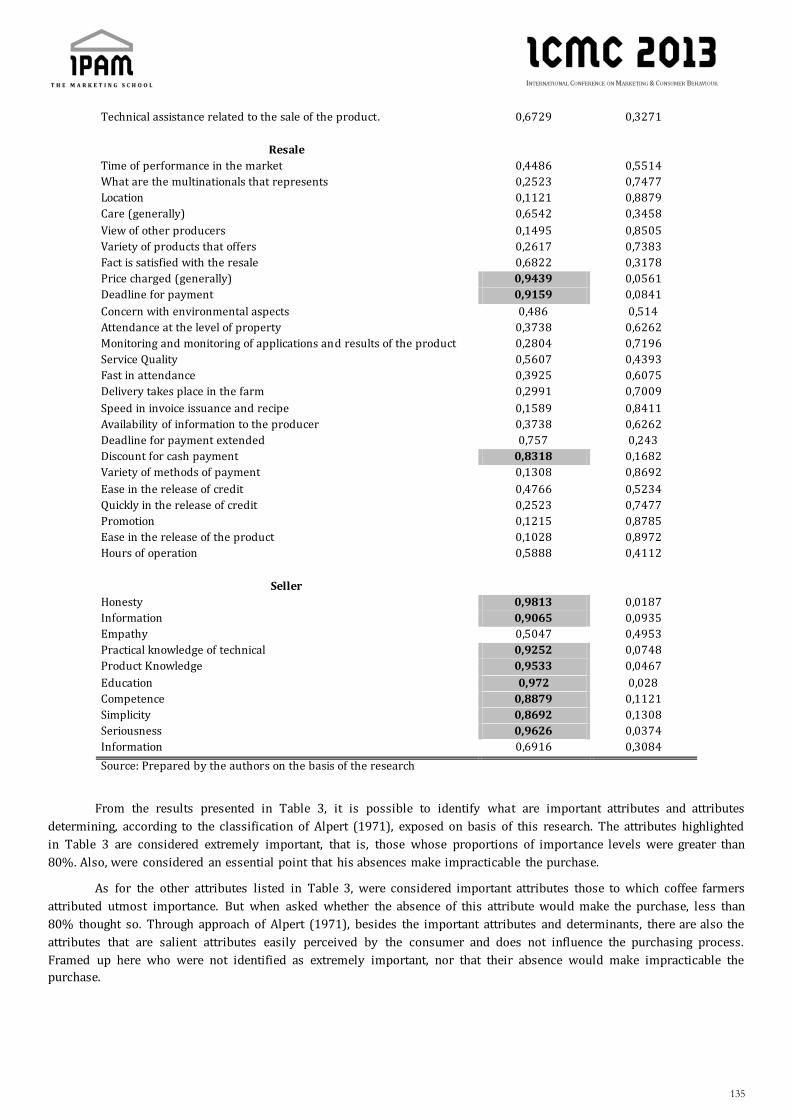
135
Technical assistance related to the sale of the product. 0,6729 0,3271
Resale
Time of performance in the market 0,4486 0,5514
What are the multinationals that represents 0,2523 0,7477
Location 0,1121 0,8879
Care (generally) 0,6542 0,3458
View of other producers 0,1495 0,8505
Variety of products that offers 0,2617 0,7383
Fact is satisfied with the resale 0,6822 0,3178
Price charged (generally) 0,9439 0,0561
Deadline for payment 0,9159 0,0841
Concern with environmental aspects 0,486 0,514
Attendance at the level of property 0,3738 0,6262
Monitoring and monitoring of applications and results of the product 0,2804 0,7196
Service Quality 0,5607 0,4393
Fast in attendance 0,3925 0,6075
Delivery takes place in the farm 0,2991 0,7009
Speed in invoice issuance and recipe 0,1589 0,8411
Availability of information to the producer 0,3738 0,6262
Deadline for payment extended 0,757 0,243
Discount for cash payment 0,8318 0,1682
Variety of methods of payment 0,1308 0,8692
Ease in the release of credit 0,4766 0,5234
Quickly in the release of credit 0,2523 0,7477
Promotion 0,1215 0,8785
Ease in the release of the product 0,1028 0,8972
Hours of operation 0,5888 0,4112
Seller
Honesty 0,9813 0,0187
Information 0,9065 0,0935
Empathy 0,5047 0,4953
Practical knowledge of technical 0,9252 0,0748
Product Knowledge 0,9533 0,0467
Education 0,972 0,028
Competence 0,8879 0,1121
Simplicity 0,8692 0,1308
Seriousness 0,9626 0,0374
Information 0,6916 0,3084
Source: Prepared by the authors on the basis of the research
From the results presented in Table 3, it is possible to identify what are important attributes and attributes
determining, according to the classification of Alpert (1971), exposed on basis of this research. The attributes highlighted
in Table 3 are considered extremely important, that is, those whose proportions of importance levels were greater than
80%. Also, were considered an essential point that his absences make impracticable the purchase.
As for the other attributes listed in Table 3, were considered important attributes those to which coffee farmers
attributed utmost importance. But when asked whether the absence of this attribute would make the purchase, less than
80% thought so. Through approach of Alpert (1971), besides the important attributes and determinants, there are also the
attributes that are salient attributes easily perceived by the consumer and does not influence the purchasing process.
Framed up here who were not identified as extremely important, nor that their absence would make impracticable the
purchase.

136
4.5 Analysis of the classification of salient, important and determinants attributes
Table 4, allows us to observe that among the 14 attributes considered determinants, 8 attributes are linked to the
seller of agricultural pesticides; 3 connected to the product and other 3 connected to the resale.
From a total of 10 attributes related to the seller of pesticides, 8 were considered determinants, demonstrating
that the coffee farmer values the information received by the seller (i.e., the technical knowledge about the product).
Those 25 attributes related to the resale of pesticides only 3 were considered crucial by coffee farmers, being
delivery price, deadline for payment and discount for cash payment. All three linked to economic factors.
Of the 13 attributes related to the product, only 3 were considered crucial, and 2 refer to technical factors, and
quality active and 1 to economic factors, the price of the product. Considering the attributes determinants related to resale
and the product together, it is observed that most, 4 to 6 is on the offered price and payment terms, which reflects a major
concern to the rural producer of coffee with economic factors as for purchasing pesticides.
Among the 48 attributes analyzed in the study, 22 were classified as "important", 4 linked to the product, 16
linked to 2 other resale and the seller. Attributes related to product, 1 refers to technical factors, recommendations, 2 the
factors of supply, adequacy of the manufacturer and technical assistance linked to the sale of the product, and 1 refers to
factors of satisfaction and dissatisfaction with previous experience of buying, experience with previous use. Notice that
none of the four are linked to economic factors. With regard to the attributes Associated with resale, of a total of 25, 16
were classified the Significant, noting That the Majority Refers to factors of care and only 2 refer to economic factors,
Which are extended the deadline for payment and credit facility in the release. Only two attributes linked to the seller
were rated the important: experience and sympathy.
Classification Attribute
Attributes Determinants
Product
Price
Quality
Active Principle
Resale
Price charged (generally)
Deadline for payment
Discount for cash payment
Seller
Practical knowledge of technical
Product Knowledge
Education
Competence
Simplicity
Seriousness
Honesty
Information
Important Attributes
Product
Recommendations
Repute of the company manufacturer
Experience with previous use
Technical assistance related to the sale of the product
Resale
Care (generally)
Variety of products that offers
Fact is satisfied with the resale
Concern with environmental aspects
Attendance at the level of property
Monitoring and monitoring of applications and results of the
product
Service Quality
Fast in attendance

137
Delivery takes place in the farm
Speed in invoice issuance and recipe
Availability of information to the producer
Deadline for payment extended
Ease in the release of credit
Quickly in the release of credit
Ease in the release of the product
Hours of operation
Seller
Empathy
Experience
Salient Attributes
Production
Mark
Package
Easy to find it on the market
Type of application
View of other producers
Resale
Variety of Products
Time of performance in the market
What are the multinationals that represents
Location
View of other producers
Variety of methods of payment (can i pay with a check card,
duplicate in bank, etc.)
Promotion
Table 4 – Classification of attributes analyzed in the study in salient, important and crucial
Source: Prepared by the authors on the basis of the research
Among the attributes classed as "salient", none is connected to the seller, which proves that the vendor factor is
highly valued by farmers of coffee. Of the total of 12 attributes this classification, 5 are connected to the product and 7 are
connected to resale. Linked to product attributes, 4 are linked to market factors: branding, packaging, ease of finding it in
the market and opinion from other producers. The rest is on the technical factors of the product, type of application.
Among the seven attributes related to resale, only 1 Refers to economic factors, variety of payment arrangements (e.g., can
I pay by check, card, bank bills).
For studies of buying behavior of the consumer farm, although I agree that the consumer should professionalize,
some studies have shown different results (Martins, 2001 and Silva, Scare and Casanova, 2008). The first states that the
consumer has already farming resembles industrial consumer when it comes to buying process, while the latter argue that
the professionalization of rural enterprises still do not occur in a structured and effective. Rossi, Neves and Carvalho
(2003) had already wounded to a conclusion similar to Silva, Scare and Casanova (2008), stating that the small and
medium producers have a purchasing behavior characteristics much closer to buying individual than organizational. They
admit that this can be explained by the familiar character and centralize the management of these properties. In our study
we showed that for agricultural users during the evaluation of alternatives, commercial aspects tend to exert more
influence than technical, because it does not seem to be consolidated in the minds of the producer. The producers seem to
have difficulty answering about which attributes are most important in choosing the product to be purchased, no choice of
parameters. Some emphasize aspects of the company manufacturing the product, other aspects of the product and its
features, and other prices. But, most of the evidence was the value assigned to the professional rather than technical
specifications resale.
5. Conclusion
Based on data collected with the survey and shown in Table 5, it was possible to answer the research problem,
defining which attributes are determinants of purchase for the coffee farmers of the region of Patrocínio. This delineation

138
was based on the definition of determinant attribute exposed by Alpert (1971) that classifies this type of attribute as
extremely important enough to that their absence makes impractical a purchase. From the theoretical perspective of
Sheth, Mittal and Newman (2001) exposed in its comprehensive model of buying behavior of the customer organization
was possible to get search results, better understanding the buying behavior of rural producer of coffee.
The analysis based on this approach was adequate and can generate, through a qualitative and exploratory
research, the development of a specific model that has focused on the buying behavior of consumers agricultural. Such a
model would be of great relevance for Brazilian agribusiness and fill a theoretical gap, currently busy with adaptations of
imported models that focus on the consumer industry. Regarding the model used, this research is limited because it is not
developed an etymological analysis of the concepts presented, restricting the analysis of the results of the theoretical
perspective Sheth, Mittal and Newman (2001). The most anticipated academic implication is that this study serves as a
means to instigate and motivate other researchers to develop studies on rural producers in general. It is hoped that this
study can serve as a model for research involving farmers in their various activities. With the instrument used in this
research, scholars can study this reproof for other agricultural consumers, since it is a general questionnaire and consists
of attributes common to most farmers, regardless of their activity. Although some authors suggest that the purchasing
decisions of consumers being confused agricultural and behavior resemble the behavior of the consumer rather than the
consumer behavior intermediary (ROSSI; NEVES and CARVALHO, 2003), in this study the determinant variables could be
adjusted in an interesting theoretical construct. Consumer agricultural is still far from the professionalism achieved by the
consumer industrial. However, the determinants represent a way of organizing themselves adaptable to social and
environmental condition of these farmers.
A recurring challenge for the development of this research was the lack of publications that have focused on
agriculture consumer behavior. Were rare research found that the main objective is to study this type of client. For this
reason, it is expected that this research should encourage research to understand the peculiarities of this important
consumer not only for Brazil but for all countries that have a significant agricultural base constituting its economy. Finally,
the analysis developed in this study indicate that there is a vast field to be investigated to better understanding about
consumer behavior agriculture, especially in business to business relations or organizational buying model.
References
ALPERT, M. (1971). Identification of determinant attributes: a comparison of methods. Journal of marketing research, 8(2).
ASSAEL, H. (1992). Consumer Behavior and Marketing Action (4th ed.). Boston: BWS Kent.
CANDIDO, J. C. X. (2004). O processo de decisão de compra de caminhões pesados. Dissertação de Mestrado, Universidade
Federal do Rio Grande do Sul, Porto Alegre, RS, Brasil.
ENGEL, J., BALCKWELL, R., & MINIARD, P. (1995). Consumer Behavior (8th ed.). Chicago: Dryden-Press.
IBGE - INSTITUTO BRASILEIRO DE GEOGRAFIA E ESTATÍSTICA. (2008). Pesquisa Agrícola Municipal 2007. Retrieved 7
march 2009, from:
http://www.ibge.gov.br/home/presidencia/noticias/noticia_visualiza.php?id_noticia=12 90&id_pagina=1
IBGE - INSTITUTO BRASILEIRO DE GEOGRAFIA E ESTATÍSTICA. (2006). Censo Agropecuário. Retrieved 7 march 2009,
from: http://www.ibge.gov.br
JOAS, L.F.K. (2002). Atributos Determinantes para Compra de Medicamentos Via Internet. Dissertação de Mestrado,
Universidade Federal do Rio Grande do Sul, Porto Alegre, RS, Brasil.
MARTINS, A. C. C. (2001). Valor para o cliente: uma análise no ramo de agronegócios. Dissertação de Mestrado em
Administração, Universidade Federal do Rio Grande do Sul, Porto Alegre, RS, Brasil.
MARTINS, G. A., & THEÓPHILO, A. R. (2009). Metodologia da investigação científica para ciências sociais aplicadas. 2ª ed.
São Paulo: Atlas.
MATTAR N. F. (2001). Pesquisa de Marketing. 3ª ed. São Paulo: Atlas.
NEVES, M. F.(org.), & CASTRO, Luciano T. e (org.). (2007). Marketing e estratégias em agronegócios e alimentos. São Paulo:
Editora Atlas.

139
NEVES, M.F. et al. (2001). Mudanças no Ambiente de Vendas de Insumos Agropecuários . In: XXXIX Congresso Brasileiro de
Economia e Sociologia Rural – SOBER - Recife - PE.
ROSSI, R.M., NEVES, M.F., & CARVALHO, D.T. (2003). Características do processo de decisão de compra de citricultores
paulistas em relação a fertilizantes foliares. In: XLI SOBER, Juiz de Fora - MG: Sociedade Brasileira de Economia,
Administração e Sociologia Rural, Retrevied 7 may 2009, from http://www.favaneves.org/arquivos/pdf37.pdf
SHETH, J.N. (1973). A model of industrial buyer behavior, Journal of Marketing, 37.
SHET, J. N., MITTAL, B., & NEWMAN, B. I. (2001). Comportamento do cliente: indo além do comportamento do consumidor.
Tradução de Lenita M. R. Esteves. Revisão de Rubens da Costa Santos. São Paulo: Editora Atlas.
SILVA, A. P., SCARE, R. F. & CASANOVA, A. C. P. Análise do processo de compra do consumidor agropecuário. In: XLVI SOBER,
2008, Rio Branco - AC: Sociedade Brasileira de Economia, Administração e Sociologia Rural. Retrieved 7 mai.
2009, from http://www.sober.org.br/palestra/9/663.pdf.
SILVEIRA, R. F. (2000). Análise das variáveis organizacionais do comportamento de compra das grandes empresas industriais
do Rio Grande do Sul. Dissertação de Mestrado em Administração, Programa de Pós-Graduação em
Administração, Escola de Administração da Universidade Federal do Rio Grande do Sul, Porto Alegre, RS, Brasil.
SPADOTTO, C. A importância da agricultura brasileira. (2007). 2009, from
http://www.fca.unesp.br/noticia_detalhes.php?vID=13.
TIBOLA, F., VIEIRA, V., & SANZOVO, J. (2004). Atributos importantes na compra de notebooks: um estudo exploratório . In:
VII SEMEAD, São Paulo: FEA – Faculdade de Economia, Administração e Contabilidade. Retrieved from
http://www.ead.fea.usp.br/Semead/7semead/paginas/artigos%20recebidos/marketing/MKT10_-
_Atributos_compra_Notebook.PDF
VERGARA, S.C. (2005). Projetos e relatórios de pesquisa em administração. 6 ed. São Paulo: Atlas, 2005.
WEBSTER, F.E., & WIND, Y. (1972). A general model for understanding organizational buying behavior, Journal of
Marketing, 36.

140
Mobile phone surveys to measure consumer
behavior: effects on data quality Consumer behavior, mobile phones, surveys, data quality
Paula Vicente, ISCTE-IUL, BRU-IUL, [email protected]
Inês Lopes, BRU-IUL, [email protected]
Abstract
The rapid growth of mobile phone ownership has opened up new opportunities for collecting data about
consumers. Mobile phones are increasingly used to conduct surveys and this trend is likely to continue. However, the use
of mobile phones to conduct surveys may pose some problems to data quality due to the specific characteristics of mobile
phone communications.
This paper evaluates the effect of mobile phones on data quality. Specifically, it is investigated whether the
respondent’s location at the time of the interview - at home vs. elsewhere - affects the accuracy of response, completeness
and interview length.
Evidence was found that when the respondent is not at home during the interview data quality may be negatively
affected. The study also highlights the importance of considering several indicators of response quality when assessing
data quality.
1. Introduction
Marketing researchers strive to find the best way to reach consumers in order to collect information that allows
their choices and attitudes to be analyzed (Adamowicz et al. 2008). Over time, data collection methods have changed but
telephone surveys have become the dominant mode in the marketing survey field since the mid 1980s, especially in North
America and Western European countries where high rates of telephone coverage have been achieved. The preference for
telephone over face-to-face surveys is justified for several reasons: low cost, speed, simplicity of control, homogeneity in
completing the questionnaire and elimination of difficulties in contacting people or households being surveyed (Zickmund
& Babin 2007). The use of fixed phone as a tool to conduct surveys implies that the households equipped with fixed
telephones are representative of the whole population; in other words, on one hand it assumes that the fixed telephone
equipment rate is high, and on the other that households not equipped with a fixed telephone do not demonstrate atypical
behavior for the variables under study.
Changes in the configuration of telephone coverage reveal that telephone surveys are becoming less viable.
Statistics on telephone access show that the coverage provided by fixed phone in some European countries has already
fallen below 60% and is tending to decrease (European Commission 2008). In a scenario of decreased validity of fixed
phone surveys mobile phones appear as a “natural” alternative to fixed phones. Communication is essentially the same
both modes rely on oral conversation , CATI systems developed for fixed phone surveys are applicable to mobile phones
and the speed of fieldwork completion, which is given as the major advantage of telephone surveys, is likely to be
maintained with mobile phones (Kuusela et al. 2008). Although the cost of calling mobile phones is even higher than
calling fixed phones, it is going down. Additionally, the mobile phone is a personal device carried at all times, thus making
the person accessible at any moment of the day. As a result, consumers who were previously difficult to reach may now be
more accessible (Kuusela & Simpanen 2002, Döring 2009). Given that mobile phone surveys are likely to become
increasingly prevalent as a marketing research tool, it is relevant to investigate the methodological issues associated with
this survey mode.

141
The use of mobile phones to conduct surveys may pose some problems for data quality which result for example
from audio quality, the location of the respondent at the time of the interview or other activities in which the mobile phone
respondents may be engaged during the interview (AAPOR 2010). Whereas a person who answers the telephone at a fixed
number is almost certainly at home, possibly available and even willing to give the time required to answer the survey
questions, someone contacted by mobile phone may be in the street, in a public place or in an environment with many
distractions. The noise and the surrounding people can be the cause of confusion and a lack of privacy that interferes with
concentration and may consciously or unconsciously inhibit responses (Steeh 2004). Furthermore, as people engage in
more multitasking when speaking on mobile phones, respondents give the question-answering task less attention and this
may encourage satisficing in mobile surveys (Lavrakas et al. 2007). Additionally, if respondents are in a public place
surrounded by others, they may also feel pressured to give socially desirable answers (Brick et al. 2007, Lynn & Kaminska
2011). Concern for data quality may also be heightened by the bad quality of the connection due to poor network coverage
in certain areas or by sudden interruptions to conversations due to battery failure. These specific characteristics of mobile
phone communications are sufficient to hypothesize that data quality may be affected in mobile phone surveys.
Prior research on data quality in mobile phone surveys has focused on making a comparison with fixed phone
surveys in order to reveal mode differences. A number of studies have found few differences between data collected via
mobile phones and fixed phones. Roy and Vanheuverzwyn (2002) found consistency in results between mobile and fixed
phone surveys in a survey comparing radio listening estimates. The level of detail and richness of information in open-
ended responses was studied by Dipko et al. (2005) and no significant differences were found between mobile and fixed
phone responses. Brick et al. (2007) investigated duration of the interviews, response to sensitive questions, the
percentage of items with missing data and response to open-ended questions and found significant differences only for the
first two issues. The comparison of survey estimates from the mobile and fixed phone survey in the research by Link et al.
(2007) revealed significant differences in only two of the ten variables examined.
Although the existing research suggests that the mobile phone can be treated in the same way as the fixed phone
when designing and implementing surveys, there has not yet been enough research into the mobile phone as an
interviewing device (Callegaro & Poggio 2004; Brick et al. 2007; Lavrakas et al. 2007) to permit conclusive knowledge
about it effects on data quality.
Surveys are of great importance in marketing and consumer behavior research but in most cases the investigation
is more focused on response rates and its determinants and less on the accuracy and usefulness of the data (e.g. Furse et al.
1982, Fox et al. 1988, Deutskens et al. 2004). The particular characteristics of mobile phone surveys and mobile phone
respondents can lead to specific results and influence data quality. This study evaluates how the use of mobile phones to
conduct surveys affects data quality. Specifically, it is investigated whether the respondent’s location at the time of the
interview - at home vs. elsewhere - affects the responses to a set of behavior and attitudinal items. If differences are found,
decision-makers should give careful thought to the use of data from mobile phone interviews, especially when the location
of the respondent at the time of the interview is not controlled.
2. Methodology
A mobile phone survey was conducted in 2012 to collect information on the use and attitudes towards mobile
phones of Portuguese mobile phone users (aged 15 years). Sample selection was not list-assisted as there is no database
of listed mobile phone numbers. Instead, the numbers to contact were randomly generated. Among the 11,470 numbers
dialed, 1,808 were found to non eligible (because they were not working, were disconnected or not attributed or were
owned/used by someone aged below 15 years).
Marktest was identified as the survey sponsor and this had a positive effect on cooperation since Marktest is one
of the most well known survey companies operating in Portugal. The interviews were conducted from the company’s CATI
centre. A total of n=1,501 completed interviews was obtained, 1,083 of which were conducted with mobile phone users
that were at home at the time of interview.
The questionnaire included: (1) a section on mobile phone ownership with questions about the number of mobile
phones owned/used, type of contract, monthly expense, (2) a section on mobile phone use with questions about number of
calls and SMS sent and received, and a battery of 13 items using an ordinal scale of 4 categories (never to always)
regarding the frequency of turning the mobile phone off or setting on silent mode, (3) a section on attitudes towards
mobile phones which included a battery of 20 attitudinal items using an ordinal scale of 4 categories (totally disagree to

142
totally agree), and (4) a section of demographics. The questionnaire also contained the question: “Are you at home or
somewhere else at this moment?” A response of “somewhere else” was followed up with the question “Where are you?”
The answers obtained included at work, in someone else’s home, in the car, in the street, in the shopping center, at a
restaurant...
Data quality was analyzed considering two types of indicator of response quality: (1) indicators of satisficing,
which reveal the respondent’s failure either to devote sufficient attention to the interview or to make sufficient effort to
fully complete the questionnaire and (2) indicators of socially desirable answers, which reveal the respondent’s
unwillingness to give true answers (Lynn & Kaminska 2011). The indicators of satisficing examined were: (a) item
omissions, (b) agreeing, i.e., the tendency to answer “agree” in ordinal measured items, (c) rounding answers, i.e., the
tendency to give round answers instead of accurate answers and (d) interview length.
Item omission has frequently been used as an indicator of poor data quality as it is measured by the “don’t know”
or “no opinion” responses (De Leeuw & van der Zouwen 1988). Item omissions was estimated by the proportion of “don’t
know” or “no opinion” responses that each respondent gave to the monthly expense question, to the 4 items of mobile
phone use (open-ended questions), to the 13 items of mobile phone use (ordinal scale questions) and to the 20 attitudinal
items.
The questions with ordinal scale response categories in a battery of “agree/disagree” items were found to be
particularly susceptible to acquiescence bias, in which respondents tended to agree with assertions in the question,
irrespective of their content (Krosnick et al. 2005). Therefore, agreeing was estimated as the proportion of “agree”
answers across the 20 attitudinal items.
The tendency to round answers was measured by a binary indicator of whether the response to the monthly
expense question was a multiple of five Euros; for the 2 items concerning the number of calls made and received per day
the proportion of answers multiple of ten was computed; the same computation was made for the 2 items regarding the
number of SMS’s sent and received per day. Interview length was measured in minutes.
Ten indicators of social desirability bias based on 10 questionnaire items were evaluated. A dichotomous indicator
of the (more) socially desirable answer was constructed for each item believed to have social desirability connotations.
The proportion of socially desirable answers was computed for each item.
The analysis began by comparing the demographic characteristics of mobile phone users interviewed at home and
mobile phone users interviewed elsewhere. The latter group included respondents that were in the street, at work, in
another person’s home, shopping, in the car (not driving), on public transport.
Second, the various response quality indicators were analyzed across the two groups of respondents. In general, it
was expected to see more satisficing and more socially desirable answers in interviews conducted somewhere other than
at home. Several binary logistic regression models were estimated using as dependent variable the “interview location”,
coded as 1 for at home and 0 for elsewhere, and each of the data quality indicators as independent variables.
3. Results
3.1 Demographic characteristics of mobile phone users
Our analysis began with an evaluation of subsample equivalence in terms of demographic characteristics of
mobile phone users at home and elsewhere. Table 1 shows the percentage distribution of five demographic characteristics
for each sample.
A significant association was found between interview location and demographics (p<0.01), concerning sex, age
and occupation. Overall, the associations are summarized as follows:
Sex – a higher percentage of males (61.5%) was found in the elsewhere group; in the at home group only
46.5% are males;
Age – the at home group has a higher percentage of older people (26.1%) than the elsewhere group (19.1%)
and a lower percentage of 25-34 year old people (18.5% vs. 25.5%);

143
Occupation – the elsewhere group has higher percentages of people with an occupation, either boss (6.7% vs.
4.1% in the at home group), self-employed (10.8% vs. 7.7% in the at home group) or employed (60.3% vs.
46.8% in the at home group); a lower percentage of people in another situation (retired people, housewives,
students) was found in the elsewhere group than in the at home group (22.2% vs. 41.5%).
Table 1 – Selected demographic characteristics of mobile phone users interviewed at home
vs. elsewhere (%)
At home
(n=1,083)
Elsewhere
(n=418) Significance
Sex 2(1)=27.00; p=0.000
Male 46.5 61.5
Female 53.5 38.5
Age 2(4)=16.12; p=0.003
15-24 14.3 11.5
25-34 18.5 25.5
35-44 22.1 24.4
45-54 19.0 19.4
55+ 26.1 19.1
Educational level 2(2)=4.12; p=0.128
Elementary 45.4 39.7
Secondary 32.7 36.8
University 21.9 23.4
Occupation 2(3)=49.42; p=0.000
Boss (with employees) 4.1 6.7
Self-employed 7.7 10.8
Employed 46.8 60.3
Other situation 41.5 22.2
Region of residence 2(5)=2.70; p=0.747
Metropolitan Area of Lisbon 20.8 19.9
Metropolitan Area of Porto 10.8 13.2
North 37.7 36.8
Center 15.8 15.6
South 10.6 9.3
Archipelagos of Madeira and
Azores 4.3 5.3
Because there are compositional differences between at home and elsewhere respondents it will be necessary to
account for those differences when making the comparisons regarding data qual ity. Occupation is the demographic
characteristic more strongly associated with interview location (2(3)=49.42; p=0.000) and in consequence will be included
as a covariate in all subsequent analyses. Despite the significant association found between interview location and sex and
age, these variables will not be included as covariates because a significant correlation was detected between them and
occupation.
3.2 Response quality
Significant differences were found between the two groups in four indicators of satisficing (Table 2): the
proportion of don’t knows regarding monthly expense of the mobile phone was lower in at home interviews (p<0.1), the
proportion of don’t knows across the 13 items on the frequency with which the mobile phone is set on silent mode or
turned off was higher in at home interviews (p<0.1), the proportion of “agree” responses was lower in at home interviews
(p<0.1) and the proportion of rounded answers about the number of calls made and received per day items was lower in
at home interviews. These indicators suggest less satisficing in at home interviews, with the exception of the proportion of
don’t knows across the 13 ordinal items.

144
Table 2 – Differences in indicators of satisficing between interviews at home and elsewhere
Indicator B s.e. Sig. R2
Don’t knows “monthly expense” item 0.395 0.220 0.072 0.052
Don’t knows “4 items of mobile phone use” 0.086 0.402 n.s. 0.049
Don’t knows “13 ordinal scale items of mobile phone use” +0.675 0.388 0.082 0.052
Don’t knows “20 attitudinal items” +3.026 1.880 n.s. 0.052
Agreeing 0.678 0.397 0.088 0.051
Rounding “calls made/received” 0.500 0.170 0.003 0.056
Rounding “SMS’s sent/received” 0.156 0.148 n.s. 0.049
Rounding “monthly expense” +0.025 0.159 n.s. 0.043
Interview length (minutes) 0.010 0.012 n.s. 0.051
When comparing indicators of socially desirable answers, differences were found in four items (Table 3). The
proportion of mobile phone users saying the bill of the mobile phone is paid by the company in which they work
(p<0.001), the proportion of mobile phone users saying they are intensive/heavy users of the mobile phone (p<0.1), the
proportion of mobile phone users that reported a high number (more than 6) of calls made per day (p<0.001) and the
proportion of mobile phone users that reported a high number (more than 8) of calls received per day (p<0.01) is lower
among at home interviews, suggesting a tendency to give more socially desirable answers in elsewhere interviews.
Table 3 – Differences in indicators of socially desirable answers between interviews at home and elsewhere
Indicator B s.e. Sig. R2
Number of mobile phones used regularly: 2+ 0.077 0.121 n.s. 0.049
Type of contract : monthly 0.133 0.148 n.s. 0.048
Mobile phone expenses: paid by the company 0.942 0.198 0.000 0.069
Type of use of mobile phone: “intensive or heavy” 0.421 0.228 0.065 0.051
Main contributor to household income: the respondent 0.172 0.128 n.s. 0.051
Expense per month (> 3rd quartile = 20 euros) 0.091 0.125 n.s. 0.049
Number of calls made/day (> 3rd quartile = 6 calls) 0.517 0.133 0.000 0.062
Number of calls received/day (> 3rd quartile = 8 calls) 0.400 0.135 0.003 0.052
Number of SMS sent/day (> 3rd quartile = 10 SMS) 0.154 0.136 n.s 0.048
Number of SMS received/day (> 3rd quartile = 10 SMS) 0.171 0.134 n.s. 0.050
4. Conclusions and Implications
The outcomes suggest that there are differences between the demographic characteristics of people interviewed
at home and those interviewed outside home. The tests conducted reveal that respondents who were not at home at the
time of the interview were more likely to have an occupation than those interviewed at home.
The outcomes suggest that there are differences between the data quality of interviews conducted at home and
those conducted elsewhere. The tests revealed significant differences in terms of indicators of satisficing and suggest that
data quality tends to be lower in interviews conducted outside the respondent’s home: there was a greater tendency for
elsewhere respondents to round answers about the number of calls made and received, not to give the monthly mobile
phone expenses and to agree with attitudinal items. Contrary to expectations, interview length did not vary with interview
location. We expected elsewhere interviews to take longer to complete due to communication problems which could cause
difficulties for example in hearing and answering questions but this was not verified. This probably indicates that, when
taking a call, respondents move to a quieter place at the start of the interview, or only agree to cooperate with the survey if
they feel they are somewhere that does not hinder conversation.
The differences found suggest a greater social desirability bias in elsewhere interviews. Despite a correlation
between the four items of socially desirable answers and occupation has been detected, the analysis reveals that the
differences in data quality between at home and elsewhere interviews are beyond occupation differences. This suggests
that the characteristics of the interview setting are different at home and out of home, and this affects the way people
answer the questions.
The differences identified suggest that, when collecting data in mobile phone surveys, data quality issues warrant
at least as much attention as response rate issues. The fact that there were significant differences in several data quality

145
indicators indicates that researchers should consider multiple indicators when assessing data quality and that reliance
upon a single indicator may lead to simplistic and inaccurate conclusions.
Acknowledgements
This work received financial support from Fundação para a Ciência e Tecnologia through the PTDC/EGE-
GES/116934/2010 project.
References
AAPOR (2010). Cell Phone Task Force Report. Available at: http://www.aapor.org/2010_Cell_Phone_Report1.html [05-01-
2013].
ADAMOWICZ, W., BUNCH, D., CAMERON, T., DELLAERT, B., HANNEMAN, M., KEANE, M., LOUVIENE, J., MEYER, R.,
STEENCURGH, T. & SWAIT, J. (2008). Behavioral frontiers in choice modeling. Marketing Letters, 19, 215-228.
BRICK, M., BRICK, P., DIPKO, S., PRESSER, S., TUCKER, C. & YUAN, Y. (2007). Cell phone survey feasibility in the US:
sampling and calling cell numbers versus landline numbers. Public Opinion Quarterly, 71, 23-29.
CALLEGARO, M. & POGGIO, T. (2004) Where Can I Call You?: The Mobile Phone Revolution and Its Impact on Survey
Research and Coverage Error – A Discussion of the Italian Case. Paper presented at the 6th International
Conference on Logic and Methodology, Amsterdam, Netherlands.
DE LEEUW, E., & VAN DER ZOUWEN, J. (1988). Data quality in telephone and face-to-face surveys: a comparative analysis.
Telephone survey methodology (pp. 283-299). New York: Wiley.
DEUTSKENS, E., DE RUYTER, K., WETZELS, M. & OOSTERVELD, P. (2004). Response rate and response quality of internet-
based surveys: an experimental study. Marketing Letters, 15(1), 21-36.
DIPKO, S., BRICK, P., BRICK, J. & PRESSER, S. (2005) An Investigation of Response Di fference Between Cell Phone and
Landline Interviews. Paper presented at the Annual Conference of the American Association for Public Opinion
Research, Miami Beach, Florida, USA.
DÖRING, N. (2009). Psychological aspects of interviewing by cellular telephone. Mobile market research. Köln: Herbert von
Halem.
EUROPEAN COMMISSION (2008). Eurobarometer 293, European Commission, Brussels.
FOX, R. J., CRASK, M. R. & KIM, J. (1988). Mail survey response rates. Public Opinion Quarterly, 52(4), 467-491.
FURSE, D. H. & STEWART, D. W. (1982). Monetary incentives versus promised contribution to charity: new evidence on
mail survey research. Journal of Marketing Research, 19(3), 375-380.
KROSNICK, J. A., JUDD, C. M. & WITTENBRINK, B. (2005). The measurement of attitudes. The handbook of attitudes.
Mahwah, N J: Lawrence Erlbaum Associates, Inc.
KUUSELA, V. & SIMPANEN, M. (2002). Effects of mobile phones on telephone survey practices and results. Paper presented
at the International Conference on Intelligent Computing , Copenhagen, Denmark.
KUUSELA, V., CALLEGARO, M. & VEHOVAR, V. (2008). The influence of mobile telephones on telephone surveys. Advances
in telephone survey methodology. New York: Wiley.
LAVRAKAS, P., SHUTTLES, C. STEEH, C. & FIENBERG, H. (2007). The state of surveying cell phone numbers in the United
States: 2007 and beyond. Public Opinion Quarterly, 71, 840-854.
LINK, M., BATTAGLIA, M., FRANKEL, M., OSBORN, L. & MOKDAD, A. (2007). Reaching the U.S. Cell Phone Generation:
Comparison of Cell Phone Survey Results with an Ongoing Landline Telephone Survey. Public Opinion Quarterly,
71, 814-839.

146
LYNN, P. & KAMINSKA, O. (2011). The impact of mobile phones on survey measurement error. Institute for Social and
Economic Research, Working paper. Available at:
http://poq.oxfordjournals.org/content/early/2012/12/07/poq.nfs046.short?rss=1 [10-01-2013].
ROY, G. & VANHEUVERZWYN, A. (2002) Mobile Phone in Sample Surveys. Paper presented at the International Conference
on Intelligent Computing, Copenhagen, Denmark.
STEEH, C. (2004). A new era for telephone surveys. Paper presented at the Annual Conference of the American Association
for Public Opinion Research, Phoenix, Arizona, USA.
ZICKMUND, W. & BABIN, B. (2007). Exploring marketing research (9th ed.). Mason: Thomson South-Western.

147
Competing Research Methods: What’s behind
it? Methodology; Research Methods; Qualitative; Quantitative; Triangulation.
Ivo Cardoso, Universidades Lusíada, [email protected]
Raquel Reis, Universidades Lusíada, [email protected]
Abstract
Researchers can choose between three types of methods: qualitative, quantitative or triangulation. However, there is some
controversy among those preferring either qualitative or quantitative research approaches. Undoubtedly, each one has its
own advantages and disadvantages. So, the main question is to understand which methodology is preferred by researchers
and what the main motivation behind it is. Therefore, this paper aims to find out what is the research method, or methods,
employed by researchers from a University in the North of Portugal. Moreover, this study aims to find out if there is any
relation between participants’ preferences and their respective background.
In this exploratory research, it was used a qualitative methodology, 9 semi-structured interviews being conducted with
lecturers in the management and marketing field.
It was found that quantitative research is the most applied methodology. However, interviewees would theoretically
prefer either qualitative research or triangulation. This seems to be explained by lecturers when arguing that quantitative
research is “easier” to conduct and, generally, more accepted in academic journals and conferences. Thus, lecturers who
would prefer to employ qualitative methods decide to do triangulation. At same time, it was noticeable that lecturers who
prefer quantitative methods also start to employ triangulation since they believe that academia needs to move on from the
“quantitative only research”.
Thus, these findings indicate that qualitative research is not so used due to some constraints, such as time and financ ial
resources to conduct the research and difficulty in organizing data and access.
Introduction
Companies focused on customers’ needs should have a good marketing management. This means that they should collect
much information as possible from their customers and their competitors.
Only this way, organizations can plan, execute, control and outline strategies to pursue in order to obtain maximum
efficiency. In this context, market studies play a key role as a process of providing the information necessary and essential
to the achievement of marketing objectives.
This study aims to find out what is the most used research method by lecturers from a University in North of Portugal,
particularly, if they prefer to use qualitative research, quantitative research or the triangulation method.
Thus, this paper starts with a literature review on market research, followed by the description of the methodology
applied in this study, results achieved and discussion, research limitations, future research and, finally, the conclusions.

148
2. Literature Review
2.1. Market Research
The increasingly competitive markets lead to the need of establishment and achievement of clear goals by enterprises. As
such, the market research, also known as marketing research, is an essential tool to collect the information necessary to
achieve these goals.
According to Mattar (1995) the first market studies are from 1910 in the U.S.A,. as a result of the Industrial Revolution.
Thereafter, the market studies evolved registering a higher growth in the 50 and 60 decades (Mattar, 1995). Various
authors had contributed to this development, among which are Evrard, Pras & Roux (1993), Churchill (1987), Lambin
(1990) and Marchetti (1996).
According to the American Marketing Association (1987, 1, 14), Marketing research is defined as:
“the function that links the consumer, customer, and public to the marketer through information --information used to identify
and define marketing opportunities and problems; generate, refine, and evaluate marketing a ctions; monitor marketing
performance; and improve understanding of marketing as a process. Marketing research specifies the information required to
address these issues, designs the method for collecting information, manages and implements the data collec tion process,
analyzes the results, and communicates the findings and their implications. ”
Green & Tull (1974) had concisely defined the process of marketing research as the collection and analysis of relevant data
to the identification and resolution of marketing problems of an organization.
2.2. Phases of Market research
Accordingly to Kotler & Keller (2008), the development of a market study should consist of four key steps:
1) definition of the market study problem and aims
2) development of the research plan for data collection.
3) implementation of market research - Collection and analysis of data.
4) interpretation and presentation of results.
Although many other authors have proposed other methods in the specification of each stage, all of them turn out to be
quite similar.
2.2.1. Definition of market study problem and aims
To Mcdaniel & Gates (2005) the crucial step of the process is the correct definition of the problem. A wrongly defined
problem means that the remaining developed process will be incorrect, causing poorly defined objectives and
consequently a loss of financial resources and time. Malhotra, Rock, Laudisio, Altheman, & Borges (2005) add that the
research can be made after both, researcher and marketer, correctly define and agree on the problem for research.
Lopes (2010) also refers that the lack of information that allows marketers to take appropriate decisions are, in most
cases, the reasons and problems that lead to the market study execution. The problems may be related to the consumer,
packaging, product, distribution channels, advertising or market itself. After defining the problem it should be set the
goal(s) of the market study.
2.2.2. Types of market research
Even during the 1st phase, the researcher should choose the type of research that best fits his objectives: exploratory
research, descriptive research or causal research. According to Vieira (2002) exploratory research aims to improve the
relationship between the researcher and the problem under investigation, trying to simplify complex problems through
the exploration of ideas. To Malhotra et al (2005) the exploratory research aims at the discovery of ideas and information.
For these authors the main features of exploratory research are flexibility and versatility. The methods used to conduct
this type of research are surveys and pilot studies, case studies, secondary data and qualitative research.
149
To Churchill (1987) descriptive research consists of understanding and interpreting reality as it is, without interfering or
modifying it. Vieira (2002) adds that descriptive research is typically used for large samples and is based on the use of
questionnaires. Malhotra et al (2005) state that the purpose of descriptive research is to describe features or functions of
the market, which has as main characteristics the previous formulation of specific hypotheses (pre-planned and structured
model). The methods used to conduct this type of research are secondary data, surveys, panels and observation data.
For Vieira (2002: 65) the causal/experimental research "deliberately manipulates some aspect of reality. It is used to obtain
evidence of cause and effect.” Malhotra et al (2005) argues that the goal is to determine relationships of cause - effect and
that its main features are the manipulation of one or more independent variables and the control of other measurement
variables. The most used method for performing this type of research are the formulations and testing of hypotheses.
After the description of these three types of research modes the following question could be raised: What type of research
is currently used predominantly by researchers? In this sense, Sampaio, Perin,, Luce, Saints, Santini, Oliveira and Lenz
(2012: 463, fig. 2) conducted a study in order to get an answer to this question in Brazil. Their results showed that in the
90s the descriptive and exploratory studies were the most used empirical studies. However, from 2000 causal studies
began gaining preference. As a result of this change, nowadays it seems that the three types of research are similar in
terms of preference of marketing researchers.
2.3. Implementation of market research - data collection and analysis
At this stage, the 3rd phase of the process of the market study preparation, the researcher must choose one of the forms of
primary data collection. He should choose between quantitative research, qualitative research or triangulation (mix of
qualitative / quantitative methods).
2.3.1. Qualitative research
Lopes (2010), Malhotra et al (2005) and Mcdaniel & Gates (2005) stated that qualitative research is the one that is based
on understanding. It seeks information through interviews and group discussions. The interviews generally do not have a
pre-defined structure, i.e. the researcher may choose to use structured, semi-structured or unstructured interviews in
accordance with the objectives and purpose of the research. Thus, using semi-structured or unstructured interviews the
researcher can change the questions as the interview proceeds, in order to achieve greater efficiency in data collection.
This freedom allows the researcher to perceive the thoughts, behaviors and attitudes of interviewees. Sometimes, there is
the need to employ qualitative research methods due to the need to understand the factors underlying the research
problem. This kind of research usually explores small sample sizes typically ranging from 10 to 30 interviews.
2.3.2. Quantitative research
According to Lopes (2010) and Malhotra et al (2005) this research method is based on facts. It attends to quantify data
resulting from large samples using statistical analysis. In this research method, unlike qualitative method, it may be harder
to understand thoughts, opinions, behaviors and attitudes of interviewees. The same questions are made to all
interviewees, generalizing the results obtained.
2.3.3. Quantitative versus qualitative research
Malhotra et al (2005) and Mcdaniel & Gates (2005) summarize the main differences between these research methods
(Tables 1 and 2). However, Mcdaniel & Gates (2005) go deeper over the theme since they compare a bigger number of
research characteristics compared to Malhotra et al (2005).

150
Table 1: Differences between qualitative and quantitative research according to Malhotra et al (2005: 114, table 6.1)
Qualitative Research Quantitative Research
Aim Obtain a qualitative understanding of the
reasons and the basic motives Quantify the data and generalize sample
results to the population of interest
Sample Number of non-representative cases Great number of representative cases
Data collection Non-structured Structured
Data analysis Non-statistical Statistical
Result Develop an initial understanding Recommend a course of action end
Table 2: Differences between qualitative and quantitative research according to Mcdaniel & Gates (2005: 46, table 4.1)
Qualitative Research Quantitative Research
Question type Investigative Narrowly investigative
Sample size Small Large
Amount of information from each interviewee
Substantial Variable
Management requirements Interviewer with special abilities Interviewer with less special abilities
Type of analysis Subjective, interpretive Statistical, calculations
Equipments Tape recorders, projection devices, video,
pictures, discussion guides Questionnaires, computers, printed, book
post
Level of replicability Low High
Researcher Training Psychology, sociology, consumer behavior,
marketing, marketing research
Statistical, decision models, decision support systems, computer programming,
marketing, marketing research
Research type Exploratory Descriptive or causal
2.3.4. Triangulation
According Mcdaniel & Gates (2005) the combination of qualitative and quantitative research in a single study is becoming
common for marketing researchers. This is due to the fact that both methods, used in the same study, improve the
efficiency of both. The use of quantitative research, preceding the qualitative research, allows the researcher to develop
smaller and targeted questionnaires, obtaining greater research efficiency and less costly. However, depending on the
research objectives, the two methods can be employed in reverse order. To Malhotra et al (2005: 115), "quantitative
research needs to be preceded by the appropriate qualitative research ... Sometimes qualitative re search is undertaken to
explain the findings obtained by quantitative research ." In contrast, Mcdaniel & Gates (2005: 47) consider that "the patterns
shown in quantitative research can be enriched with the addition of qualitative information on the reasons and motivations of
consumers."
3. Methodology
3.1. Research Design
The purpose of this study is to show which research methods, qualitative research, quantitative and / or triangulation is
the most employed by researchers from a University in the North of Portugal. Likewise, this study aims to find out if there
is any relation between participants’ preferences and their respective background. In order to obtain information about
the researchers’ perceptions and opinions on this issue, this exploratory research was applied a qualitative methodology,
including 9 semi-structured interviews.
3.2. Definition and sample selection
Data was collected from the university academic services, the total population size being 27 researchers. The sample was
purposeful and consisted of 9 researchers who were selected by the researcher to obtain as much information as possible
about the purpose of the study (Saunders, Lewis and Thornhill, 2000).

151
The researchers selected were invited to participate in this study by e-mail in which the interview guide was attached.
Therefore, all the selected researchers had the opportunity to be familiarized with the topic of the interview. After
confirmation of acceptance by researchers it was scheduled individual interviews with each participant.
Thus, this study was focused on a non-probabilistic sample, purposeful and included 33.3% of the total population, which
corresponds to 9 professors, 5 females and 4 males, all with a PhD degree.
3.3. Data Collection
For the collection of data an individual and semi-structured interview with each participant was conducted. The interview
was recorded for further analysis. In order to safeguard the identity of each participant a numeric code was used for each
interviewee. The interview guide included the following questions:
1. What are the courses that you are currently teaching as a professor in the Faculty of Economic Sciences of the
University?
2. What is your training area in graduation?
3. What is your training area in the Master?
4. What is your training area in PhD?
5. Which of the research methods presented did you use in your master's thesis?
6. Which of the research methods presented did you use in your PhD thesis?
7. If the interviewee has changed the research method used in the master's thesis for the PhD thesis, ask why this change.
8. If the interviewee method was the same in both ask why the maintenance method of study?
9. What is your preference in terms of research methods: quantitative research, qualitative research or triangulation?
Why?
10. What is the research method that can be more effectively to obtain the necessary information for the identification of
customer needs?
3.4. Analysis of data collected
The information collected was analyzed in order to contemplate the research aims. The information was treated following
the tables of data reduction proposed by Miles and Huberman (1994), following these steps: a) reduction of information,
b) disposal and transformation of information, c) results achievement.
3.5. Public policy and ethics
To ensure confidentiality and ethics of this study, participants were asked if they would allow the use of their identity and
agree to record the interview in audio format. All participants authorized both. However, in order to guarantee the
identities of participants interviewed it was decided to replace their names by numerical references.
4. Results
In table 3 the summarized data on the interviewees is presented. Below, the summary of each interview is presented.
Table 3: Summary of interviewees information
Interviewee Degree in: Master in: PhD in: Master thesis PhD thesis
1 Sociology Economic sociology
Economy Triangulation Quantitative
2 International
relations
Commercial management and
Marketing Communication Quantitative Triangulation
3 Computer
science Management Management Quantitative Qualitative

152
4 Industrial
engineering management
Industrial engineering
management
Industrial engineering
management Quantitative Quantitative
5 Management Marketing Marketing Qualitative Qualitative
6 Economy Economy and social policy
Social economy and professional
training Triangulation Triangulation
7 Management
Environmental management and
social responsibility
Environmental management and
social responsibility
Quantitative Quantitative
8 Economy European economy
International economy and international
strategic management
Quantitative Quantitative
9 Economy Economy Management Quantitative Quantitative
1 – The interviewee # 1 states that the research methods "are like a toolbox", so you must use the research method that
best suits the purpose, the object of the problem and the constraints of the research, as time and resources available. He
also states that "has no membership card of any search method", i.e. he does not have preference for any of the methods, he
uses that or those methods that are more convenient for the study in order to obtain the maximum possible information
needed. As a reflex of this viewpoint there was a change in the method of research between master's thesis and the PhD
thesis since, according to the interviewee, the circumstances demanded it. The interviewee recognizes that he feels most
comfortable in the use of quantitative methods. He also states that his training in sociology allowed him to experience the
use of various methods and he acknowledges that the training area is undoubtedly a very strong influence in the
use/choice of research methods. In the current market context, the interviewee mentions that the best way to obtain
customer information is through qualitative research since "the consumer lies" when answering to quantitative
questionnaires. So, the only way to avoid this is through the use of qualitative research methods, such as observation in the
"consumers´ habitat, at the time of purchase, in the act of consuming the product."
During the interview the interviewee was always very comfortable and very secure in his opinions. He proved to be always
available and reported several examples.
2 – The interviewee #2 refers that his preference is the use of triangulation because he considers it to be the most
comprehensive research method. However, states that if due to constraints, such as time and resources, he will choose to
use just one research method. In this case, he would use the quantitative method. The interviewee says that "in marketing
we have to make decisions based on actual data, quantified goals" and therefore one should not exclude the use of the
quantitative method. However, when possible it should be used triangulation. The interviewee also notes that the
academic training has influence in the use and preference of a research method. In the current market context, the
participant states that to internally analyze an organization it will be enough the use of qualitative research. But, to analyze
the external market it will be required the use of triangulation or quantitative research due to the size of the
universe/population.
The interviewee was always very confident, sure of his opinions and sincere.
3 – To the interviewee # 3 the preferred research method to use is the qualitative research because this method is more
focused to his areas of interest: the Management. He refers that firstly the investigator should identify the purpose of the
study and then define the methodology to use. The interviewee mentions that "there is the idea that qualitative research is
not scientific, it is to talk about some things without scientific rigor." He also states that in England, unlike in Portugal,
qualitative research has a more "scientific" credibility and acceptance by academic community and publishers.
Interestingly, he also mentions that, in some universities of Portugal, the students in a doctoral program have classes of
quantitative methods but not on qualitative methods. Thus, these students are somehow being influenced to follow the
quantitative method which is harming science by making it less rich and more uniform. Thus, the academic area and even
the country of graduation, appears to influence the preference for the research method. It is also noticed that some
students choose to use the quantitative research because they consider it easier for analysis and processing. In the current

153
market context, the interviewee states that, “depending on the sample size, the qualitative research or triangulation are the
most appropriate methods due to new market trends such as co-creation of value.”
Throughout the interview the interviewee showed interest in this study, showing a preference for qualitative research.
4 - The interviewee #4 refers that the first degree? has a high influence on the use/choice of the research method. In
engineering everything has to be quantified, everything has to be measured, because it is based on those measurements
that one can make decisions. He considers that in the engineering field there are not many opportunities for the use of
qualitative methods. "The numbers are measurable, they are forever." However, the interviewee also referred that "it really
depends on the background?; we should not be too closed." He agues that lecturers with degrees in math areas have default
preference for quantitative research, while researchers with social sciences degrees have per si a preference for qualitative
methods. The participant also says that there is an additional difficulty in publishing articles entirely qualitative. In the
current market context, the interviewee understands the use of the method of qualitative research by the marketers, but
believes that triangulation might be more appropriate, as it contains quantified data that support the decisions. So, the
preference of using the research method by this participant falls on quantitative research methods.
During the interview, the participant showed up interested, convinced of his opinions but also flexible to other points of
view.
5 - The interviewee #5 has a preference towards qualitative research, but recognizes that “we cannot always do what we
prefer due to constraints, such as time”. It also acknowledges that "there are surveys that ask purely quantitative methods."
The choice of method can be "influenced by personality, by involvement between the investigator and the research ".
Researchers with more relational personalities may feel more comfortable with qualitative research. The participant
demonstrates some concern about the quality of research that students tend to do – the "research fast food". Sometimes,
students choose more the quantitative method because it is quicker and easier to analyze. The interviewee emphasizes
that the trend of marketing research in other countries is the qualitative method. Nevertheless, Portugal is still a little
behind and, therefore, it has been highlighted the use of triangulation, a result of a "fashion" that is being installed. It´ s
common the difficulty in publish articles entirely qualitative and therefore researchers feel obliged to use triangulation.
The “quantitative researchers” want to follow this fashion and they will also want to use the triangulation method. This
situation will continue until the researchers realize that they must do what they like and what is more appropriate for the
research aims. In the current market context, the interviewee stated that "I would be very unfair if I said that the ideal
method of research to identify customer needs is the qualitative method”. Therefore, it seems that it all depends on the
purpose of the study. The marketer should use the research method that best suits his goals, the theme and the respective
constraints.
During the interview, the interviewee expressed himself with some emotion that reveals his appreciation and interest in
this topic. He was confident and comfortable in addressing the issues discussed.
6 – The interviewee #6 refers the difficulty in publishing qualitative data in scientific journals, noting that to have
quantitative data is always a requisite to publish. Therefore, it seems that it is easier to publish quantitative than
qualitative research. He argues that "any good scientific work should contain both parts: the quantitative and qualitative"
and that "a lecturer must always do research because he is not satisfied with what just come in manuals prepared by others."
The interviewee says that "creation is a profoundly human thing.... Scientific articles are not emotional; they are rational and
always try to prove something". It was noted that the participant have a preference for the use of triangulation. However,
that the participant highlights that he uses several research methods, using the one that is more appropriate regarding the
purpose and object of the study.
7 – To participant #7 the preferred research method is the qualitative because he considers it to be the most
comprehensive research method and because he "likes dealing with people". In quantitative research data is obtained
faster. Yet he considers that these studies are always limited and has doubts in the honesty of respondents’ answers. In
addition to the researchers’ background, he also believes that personality and personal characteristics are important in the

154
selection of the research method. Whenever possible, this researcher likes to use the triangulation method, since he
considers that the mix of two research methods complement each other. Regarding the difficulty in publishing, the
interviewee admits that "sometimes we have to submit ourselves to the game rules and we must draw up articles containing
quantitative data”. The interviewee gives an example concerning the identification of consumer needs, considering that the
best method to be used is the qualitative since only through direct observation the researcher can ensure that consumers
do not lie.
Throughout the interview the participant always maintained a confident and participative attitude.
8 - The interviewee # 8 argues that the research method to be applied in a study depends on the purpose of the same. For
example, macroeconomic studies with data from reputable international databases need to be worked through the
quantitative research method. For queries related to consumer perceptions, the qualitative method is more appropriate.
However, the use of triangulation enriches the study given that both methods are complementary. He also says that "there
is no fundamental method or one better than the other". The use of research methods depend on the scope of the study
itself, depend on whether “we study the level of human behavior or if we study the level of a sector activity”. The participant
also notes that by using the triangulation method, if the results of both research methods are very different, the
investigator should formulate a new research question; i.e. he should do more research and find out the reasons for those
results. Also she refers that, mainly in economic databases, the statisticians need to use qualitative studies to formulate
and create indexes. This seems to reflect that both research methods are essential and they both complement each other.
The interviewee also says that, in fact, there is pressure, by the journals where researchers attempt to publish, to use
quantitative methods. However, he considers that this situation will change whereas the trend is the use of triangulation
and also that qualitative methods will gain greater acceptance in scientific journals.
Throughout the interview the participant always maintained a confident stance, always giving opinions based on a lot of
examples, including examples of studies prepared by him.
9 – The researcher # 9 prefers to use quantitative methods due to his background area being closely related to
mathematics and statistics. Also, he justifies his choice saying that he is better able to use these methods and also believes
that these methods are easier to treat. Despite this, the interviewee argues that there is no better method than the other,
but that nowadays he feels the need to work the qualitative methods, using whenever possible the triangulation "lately I
consider that all methods should work complementarily". The use of this method is a result of current market needs, "human
behavior has a very large degree of unpredictability". Thus, it seems that the use of qualitative methods helps in addressing
gaps that arise in the use of quantitative methods. "I try to pass the idea to my students that whenever possible they should
take the questionnaires", since the collected data will be worked out to improve a product or service in order to create
value for both parts. The interviewee also refers the difficulty in publishing articles 100% qualitative.
Throughout the interview the interviewee showed to have a high experience in the use of quantitative methods and was
confident and comfortable in addressing the suggested topics.
5. Discussion
5.1. The research method most used and why
With the data obtained it appears that the most used study method is the quantitative method due to the following factors:
- Lack of time and financial resources available for the development of the qualitative research.
- Difficulty in publishing qualitative articles.
- Personality of the researcher.
- Object of study, research aims, sample size and data to be analyzed.
- Ease in data analysis (quantitative seems to be easier than qualitative)
- Background area of the researcher.

155
- Researcher´s personal skills in the use of various research methods.
5.2. The use of triangulation and why it is becoming a trend
It is important to note that it seems that researchers who choose a quantitative methodology recognize that nowadays it is
also required to use qualitative methods due to the current needs of the market. In turn, researchers who opt for a
qualitative methodology recognize the need of using quantitative methods to get their articles published. Thus, there is a
tendency to use the triangulation method both to “quantitative researchers” and “qualitative researchers”.
5.3. The influence of first degree? area in the use of a particular research method
It is possible to verify that researchers who have a background in the field of mathematics and statistics (interviewees # 4
and # 9) prefer the use of quantitative methods. Instead, the researchers who have an area in the field of management
(interviewees # 3, # 5 and # 7) prefer to use qualitative methods. Researchers who have an education level in the field of
economy (interviewees # 1, # 6 and # 8) do not have a preference for the use of methods, i.e. they use the method(s)
required for the development of an effective and enriching research. They consider all research methods as indispensable
tools to be used. The interviewee # 2, despite having a training area related to management, prefers to use the
triangulation method. However, if there is the requisite to choose just one method, he prefers the quantitative research.
Thus, one can consider that scientific areas related to mathematics induce the use of quantitative research method, while
the scientific areas related to social sciences and humanities induce the use of qualitative research and triangulation
method.
6. Research limitations
The main limitations of this research are the time needed to have an answer from the sample in order to arrange the
interviews at a convenient time for both parts, interviewer and interviewee. Moreover, the data analysis was a slow
process due to the high amount of data, as usual in qualitative research. Another limitation was the small sample size due
to the small number of available researchers with a PhD degree. Finally, there was insufficient time available to use the
triangulation method, namely in other Universities in the North of Portugal due to lack of time to analyze all the data
collected in the 9 semi-structured interviews.
7. Future Research
It seems crucial to continue this research on the type of methodologies preferred and used by researchers. From this
study, some important issues emerge that should be considered in future research, such as:
-Fast food research.
-Difficulty in publishing articles that is purely qualitative.
-Quantitative methods are easier to handle.
-Why some training areas do not include qualitative methods in their study plan? What is the reason for the focus on
quantitative research in Portugal?
8. Conclusion
The objective of this study was to identify which research method – qualitative research, quantitative or triangulation – is
the most used by researchers from a University in the North of Portugal. Also, it was aimed to find out any relationship
between the preference of research method by researchers and their background areas. It is clear in this study that the
most advocated methodology is the use of triangulation, mixing qualitative and quantitative methods in order to get the
best of both worlds. However, it seems important to understand better if this choice is considered the most “effective” or
the most “convenient”. It seems that the difficulty in publishing qualitative research is a crucial factor for avoiding
choosing qualitative research. Given this scenario, all the interviewees, regardless of their academic background, think that

156
the best choice is to perform a research based on triangulation, which can overcome the shortcomings of each
methodology mentioned. It also seems that researchers are not doing exactly what they consider more appropriate in
terms of research aims but what is more accepted by the academic community. It is intended to continue this important
and innovative research, using the triangulation method, to investigate other Universities in the North of Portugal.
Acknowledgments
The work reported in this paper was co-financed by FCT - Fundação para a Ciência e a Tecnologia, Portugal (PEst-
OE/EME/UI4005/2011) and carried out within the research centre Centro Lusíada de Investigação e Desenvolvimento em
Engenharia e Gestão Industrial (CLEGI).
9. References
American Marketing Association, “New Marketing Research Definition Approved,” Marketing News (January 2, 1987), pp.
1, 14.
Churchill Jr., G.A. (1987) Marketing research: methodological foundations. Chicago: The Dryden Press.
Evrard, Y.; Pras, B.; Roux, E. (1993) Market: étudos et recherché en marketing. Paris: Nathan.
Green, P. E. & Tull, P. S. (1974) Recherche et décisions en marketing. Presses Universitaires de Grenoble.
Lambin, J. J. (1990) La recherché marketing. Paris: McGraw-Hill.
Lopes, J. L. P. (2010). Fundamental dos Estudos de Mercado, 2ª edição, Sílabo.
Malhotra, N. K., Rocha, I., Laudisio, M. C., Altheman, E. & Borges, F. M. (2005). Introdução à PESQUISA DE MARKETING,
Pearson Prentice Hall.
Marchetti, R. Z. (1996) Globalização e análise do consumidor: aspectos metodológicos da pesquisa de marketing
intercultural. Tese (Professor Titular), Universidade Federal do Paraná (UFPR), Curitiba.
Mattar, N. F. (1995). Pesquisa de marketing, 2ª edição, São Paulo: Atlas, V. 2.
Mcdaniel, C. & Gates, R. (2005). FUNDAMENTOS DE PESQUISA DE MARKETING, 4ª edição, LTC.
Miles, M.B, and Huberman, A.M. (1994). Qualitative Data Analysis, 2nd Ed., p. 10-12. Newbury Park, CA: Sage.
Sampaio, C. H., Perin, M. G., Luce, F. B., Santos, M. J., Santini, F. O., Oliveira, M. O. R., Lenz, G. S. (2012) Pesquisa Científica da
Área de Marketing no Brasil: uma Revisão da Primeira Década do Século 21, RAC, Rio de Janeiro, V. 16, n. 3, pp.
459-478.
Saunders, M., Lewis, P. and Thornhill, A. (2000) Research methods for business students. 2nd Ed. Harlow: Financial Times
Prentice Hall.
Vieira, V. A. (2002). As tipologias, variações e características da pesquisa de marketing, Rev. FAE, Curitiba, V.5, n.1, p.61-70.

157
Session 5

158
Marketing in Public Services: The Citizen
Service Points in Portugal
Public Service; Citizen Service Points; Efficacy; Interoperability; Satisfaction.
Maria De Fátima Fontoura, Polytechnic Institute of Bragança, [email protected]
Paula Odete Fernandes, Polytechnic Institute of Bragança; NECE (UBI), [email protected]
Abstract
The Agency for Administrative Modernisation, IP is integrated in indirect Administration and aims to operationalize
initiatives to modernize and boost the participation and involvement of different stakeholders, whether internally or in
their relationship with citizens, aimed the simplification and innovation in achieving the change Public Admini stration.
The Citizen Service Points (PAC) are multiservice with personalized service, installed in Local Municipalities, as extensions
of Citizen Shops, which equip the regions of greatest interiority of a multichannel network ensuring greater proximity with
the requirements and due diligence for Public Administration.
In this respect, with the assumption the paradigm change in the delivery of public services, the objective of this study was
based on measuring citizen satisfaction regarding the services provided in the PAC. To this end, descriptive univariate and
bivariate analysis was performed for the treatment of data collected and in order to meet the main goal of the present
research. All inference analysis was carried to determine if the differences and/or relationships found between the
features in the sample are extrapolated to the population, considering a significance level of 5%. For this purpose, the
object of study focused on Citizen, a sample of 306 users, that go to the 54 PAC distributed by Portugal.
According to the results achieved, it can be said that citizens are very satisfied with the efficacy of the PAC. Also showed
that the variables related to Accessibility, Products and Services and Involvement and Participation of the citizen have the
greatest weight when we trying to measure global satisfaction of the citizen while PAC users.
INTRODUCTION
In the context of actions leading to a greater proximity from citizens to the state appeared in 2002, in the wake of Citizens ’
Shops, a new awareness: The Citizen Service Points (PAC). The Citizen Service Points implemented in Portugal reflect the
actions of various governments for the implementation of the new paradigm of decentralized public services, closer to the
citizen and all economic agents. Additionally, the analysis of the public service value to society made clear the relevance of
the physical distribution model focused public services, in a complementary logic in relation to other distribution
channels. It also allowed understanding their own catalytic role in administrative modernization, as well as the direct and
indirect effects for citizens, businesses and the own image of the country.
In this context arises the present research work which intends to analyse the impact and proficiency of this channel of
public services, the Citizen Service Points with increasing importance in everyday life and quality of life of the populations
they serve. Strategically located in regions with lower population density and installed in municipalities, but still very little
studied, despite the multiplicity of interests and material available for research. Thus, the objective of this study is based
on certifying the satisfaction of citizens using PAC, in its many valences. It was understood also to investigate on this
subject would be a disclosure of the PAC and the services provided therein, because, unfortunately, it appears that there is
still a lack of knowledge of this type of service in one part of population. Thus, it is believed that the reach of this study is a
way to validate and promote what has been done and is being done in the administrative modernization in Portugal, as
well as to identify how the public perceives the good practices and how these positively influence their relationship with
the state and their quality of life.

159
The purpose of this research study was focused on citizens who used one of the 54 Citizen Service Points in Portugal
Continental. The PAC on the islands of Madeira and Azores not included in this study because of speci fic circumstances of
coordination of respective Regional Governments what would take much more time to collect data.
We chose to use a descriptive and quantitative methodology. The instrument for data collection was based on the model
CAF (Common Assessment Framework), builds on the excellence model of EFQM (European Foundation for Quality
Management) and in order to contribute to the public services improvement through self-assessment based on a model
consisting of criteria based on principles of excellence. We applied a questionnaire titled “Satisfaction Questionnaire for
Citizens/Clients”, divided into 4 components with which it was intended to obtain information on the Global Image
Organization, Involvement and Participation, Accessibility, Products and Services. The set of information collected identify
the importance attached to the service, the satisfaction of citizens and consequently the perceived quality of the PAC.
In this sense, this study is organized into six points. After this point where it is made a brief introduction to the topic under
study, in the following section it will be studied the public services specificity. In the third section is presented the
organizational model adopted for decentralization and public service improvement. Subsequently the fourth point
addresses the issue of the Citizen Service Points impact in Portugal. Under points five and six, it is made, the empirical
analysis on the study subject, is intended to meet the target of empirical study and validate the research hypotheses, will
be described the data collection methods instruments and research techniques, data collection process and the procedure
for its collection and sample selection, processing, analysis, discussion and interpretation of results. Lastly will b e
presented the main conclusions of this study.
1. PUBLIC SERVICES SPECIFIC FEATURES
Currently, there is a wide range of services available to citizens, whose choice left to fall back on the amount, to give
importance to aspects such as the quality and satisfaction that they get from those services.
The most classical vision of the aspects that characterize the services is based on five essential characteristics to qualify
them (Coelho, 1998; Lopes, 2006):
Intangibility: translates into the inability of the customer to experience or enjoy a service before the purchase,
originating insecurity moments and uncertainty in its acquisition. As regards Lopes (2006), to prevent these levels
of indecision, organizations should develop a perception about safety and quality of service, trying to turn his offer
intangible, tangible as possible in some aspects that represent the service, particularly in what concerns the contact
with the customer, such as pleasant physical infrastructure, staff professionalism, proper equipment, catchy
advertising, etc.
Inseparability: production, distribution and consumption are made in a single process the service cannot be
separated from the person who is consuming nor the person who is paying. This fact underlines the importance that
the physical and human factors have to services, including the customer, the employees involved and the entire
physical environment in which the service occurs. Lopes (2006), underlines that the success of this feature requires
organizations to remember that employees who provide services are an integral part of that service. In this sense,
should be formed competent: people, not neglecting the physical environment appearance which is one aspect that
determines the quality of that service.
Heterogeneity: is defined, according to Lopes (2006), by the variability of services may be different each time
they are rendered. The level of quality of a service is strongly influenced by: who, when, where and how it is
provided. The level of quality of a service is strongly influenced by: who, when, where and how it is provided. The
parties concerned are able to introduce service changes, varying depending on the service provider, the customer
and the environment, which has impact on the quality of service, and affects all agents.
Perishability: In turn, perishability, demonstrates the fact that services, by their nature, cannot be stored in stock
they are extinguished at the moment of its realization (Coelho, 1998). Consequently, organizations have to cope
with situations of seasonality, between periods of high and low demand. Information technologies can completely
change this situation and conceive other ways to better serve the customer.
Lack of ownership: considers not having an ownership sense, because the client only has access or benefit but
doesn’t possess the installation or activity property as referred by Lopes (2006).
160
Correia and Brito (2007), consider that the practical results of these characteristics are manifested in the complexity
analysis of the process of consumption by each user. In this evaluation the user account only with their expectations,
resulting in a variety of information sources (experience, past experiences, etc.). In turn, from the perspective of the
organization, this can only anticipate promises that may or may not be fulfilled. We conclude, therefore, that the effects of
service depend on the shape and intensity of the expectations created by the client and the promises made by the
Organization are in harmony.
Services that have no direct substitutes (competition) put the Public Administration in a monopoly situation, susceptible
to benefits and, often, inertia in providing efficient and effective services to the citizens (Carapeto & Fonseca, 2006).
However, the role of public administration is based on providing services that satisfy the citizen, i.e., that fulfil their needs
and expectations regardless the level of complexity of the service, supply and demand, because the citizen cannot be
harmed.
Due to what was described, it is concluded that the concept and measurement of perceptions of service quality is one of
the most controversial issues in the services marketing literature (Brady & Cronin, 2001). Indeed, measuring the quality of
services is an issue more complex than in the context of products, because “it is not due to statistical measures of quality,
including physical defects or judgments of management, conversely, is a function of customer perceptions about services”
(Cunningham & Young, 2002, p.5).
Furthermore, services are in essence behaviours rather than physical entities as described by Berry (1980), as 'deeds, acts
or performances' (shares, acts and performances), which makes it fairly complex to measure their quality. In fact, this
added difficulty stems from the outset of the actual characteristics of the services identified above, and widely reported in
the literature of marketing services. In public services the task is even more difficult given the complexity and specificity of
the whole machine that provides these services.
2. PUBLIC SERVICES DESCENTRALIZATION
One of the main conclusions of ‘Putting Citizens First’, a study conducted by the Public Administration Committee of the
OECD (1996), on administrative modernization in Portugal, showed that the orientation of the citizen was the engine of
change management. One of the most successful examples of the close relations between citizens and the administration
was the creation of local services, including the Citizen Shop and Citizen Service Points, at the level of central government
and the Municipal Services Assistance, at local government.
In this context, the municipal service comes embodied in a new organizational unit to facilitate the relationship between
citizens and the municipality, providing better access to information. This new unit, commonly known as Municipal
Services Assistance, or even the Citizen Office, functions as the municipality ‘front office’.
Its main tasks are: the treatment of various issues related to licensing and payment of fees and licens es, assignments
within the city, the receipt and delivery of documents and several citizen requests, forwarding all applications to the
various municipal services , providing information on the status of specific processes and other matters useful to citiz ens,
as in the case of the valences of the Citizen Service Points and other branches or portals that are normally installed in these
physical spaces, it is therefore within the municipal service that develops throughout the service Public Administration
(PA ) decentralized services.
There is no doubt, however, that local government became more coordinator and less service provider and operates in a
more increasingly competitive and dynamic environment. The coordination calls for new policy instruments and
strategies, such as public/private partnerships and networks participation among politicians, employees and citizens.
It is time for the Public Administration to convince himself that his existence is justified by citizens and not by its mere
existence. It exists to help promote the citizens and economic agents’ initiative in constructing a dynamic and social
entrepreneur environment. A civically engaged society requires facilitator Administration in what concerns the initiative
of citizens and economic agents.
It is in this context that the progressive implementation of new information technologies is constituted as a crucial lever
for creating an environment conducive to universal infrastructure for e-Government, allowing the society to encourage the
sharing of public responsibilities. The construction of this new society involves the continuous production of new
knowledge.
161
Based on all the above, and based on the information the Agency for Administrative Modernisation (AMA), was establish to
enunciate some Portals in operation or being implemented nationwide:
Citizen's Portal and Portal Enterprise;
BMS - Multiservice Counter;
Citizen Shop Mobile;
One Stop Shop - Let's Have A Child;
Balcony I Lost my Wallet;
Simplex MAR;
Senior Balcony;
Entrepreneur Balcony.
As Junqueiro (2002) states “The e-government, besides and providing a significant reduction in public expenditure, also
means greater transparency in relations between citizens and civil society” (pp. 336-337). This author also notes, with
emphasis, that the start of digital technologies in Public Administration offers a real opportunity to increase efficiency,
quality and cost-effectiveness. Also believes that states need to invest heavily in how public services are provided, using
new tools and digital technologies and reshaping its inner workings, breaking interdepartmental barriers and redesigning
new methods and organizational forms.
3. THE IMPACT OF CITIZEN SERVICE POINTS IN PORTUGAL
According to information released by the General Agency for Administrative Modernisation, through various channels you
have access to the image of the PAC and its impact on the lives of citizens and businesses is very relevant, the services near
to economic and social agents is extremely important and qualitatively changes qualitatively the lives of everyone.
Without knowing a study concerning this subject, it is known that the PAC has inferred a degree of quality public services.
A good perception of the service is created, not only by a technically correct work, but also by the successful interaction
between user and employee. Even though there are among the population very different reasons for evaluating the PAC,
the new service units are cosy, unlike the old public office, the new are characterized by a healthy, cl ean and ventilated
environment which provides comfort and welfare to the citizen, with high functionality and structured to allow the
integration of various organizational services installed on them, to all this it is added the standardization of clothing and
identification of officials/employees. The location in strategic areas is one of the key factors, it is intended for citizen easy
access to the service, near parking areas served by public transport, and these are very relevant indicators to the
population who uses the PAC and for Local Authorities that received them.
The access to services for people with special needs, particularly with regard to architectural barriers is also a factor of
quality and equity of services to all citizens. Modern computer technology allows rapid communication between different
actors in the network and access to databases, which gives citizens a feeling of security and certainty that their process is
not simply on paper. The fact that users can make payments electronically is one of the advantages pointed to this service.
People who integrate these units are selected for their expertise and sensitivity to serve. The continuous training equally
concerns the use of knowledge, as in the behavioural area.
The citizen/user perceives the review and continuous improvement, a permanent search for greater efficiency, simplicity,
speed and quality of service, with attitudes and innovative procedures, example of this is the extended hours of service in
some existing PAC and highly valued by citizens, so that it can serve a greater number of people, in their spare time, it is
imperative to extend the opening hours beyond the normal working hours of the vast majority of the population.
Disclosure of services is definitely the weak point of this service, through information provided by the AMA, it appears that
a portion of the population does not know the existence of such a service in his area, so the strong use of the media, with
extensive informative advertising that enables the citizen to be informed of all the features and types of services offered in
the PAC, that was never properly implemented, it remains a bad example for the process that the AMA is to be undertaken
and already in very advanced stage, that is transforming the PAC in Multiservice Counter-Citizen Shops 2nd Generation, in

162
order to a proper disclosure will be made. Since this type of service is even more important for the citizen, the number of
valences in BMS more than doubled compared to the PAC, so, disclosure is vital for citizens.
When the services provided meet or exceed the desires and needs, responding to their expectations with value many times
higher than expected, the user is satisfied and acknowledges what is being provided, such as 'Dazzling of Customer'
(Kotler, 2009). Thus, the citizens' satisfaction with public services is improved governance in order to place it in the centre
of attention of the public organization. Thus, the citizen is anyone (person or entity) seen as the beginning and end of
public sector activity. Another very important aspect to understand the complexity of the role of public administration, are
the periodic changes of leadership, which requires greater effort to manage public machine.
Relevant also is to involve stakeholders in the process, either in the internal environment (those within the organization,
whether departments or employees) and external environment (those receiving services: citizens, public partnerships,
etc.) , is an important strategy to achieve the desired results (Drucker, 2001), since, as is well known face of so many
unfulfilled promises many citizens were inflexible, suspicious and resistant to discourses of a public sector more
interested in services more modern efficient (Klibsberg, 2009).
In this respect, the public organization must disclose to the society in fact what can be done and, in particular, what it has
done to achieve citizen satisfaction, attract him to participate in the change process to improve it, for it is through him that
many disorders are identified, and thus coherent measures can be applied.
However satisfy the requirements of its users has been an on-going concern of private and public organizations, which
come from the late twentieth century, to adapt their structures, changing their management practices and invest in
training their employees.
In this context, appear each time administrative and technological innovations that result in improved quality of products
and services offered to citizens who are increasingly demanding and aware of their rights, especially in developing
countries.
As regards the public sector, the Portuguese government, according to a retrospective compiled from the Citizen Shops,
initiated efforts to enter the public administration in the context of quality management through a number of initiatives
where the most outstanding successive openings of Citizen Service Points, Citizen Shops and Portals, managing sow some
methods and techniques of Quality Management, which served to sensitize public organizations to focus on the citizen.
The PAC project arose to dictate alternatives , to change the image of public administration characterized by excessive
formalism, units unable to meet the demand for services, poor and uncomfortable physical facilities attendance by
privilege and servers disinterested and unmotivated. This outlook reflects what was characterized as the dysfunctions of
bureaucracy. Too much formality and impersonality bring as a result an inefficient system, dominated by paperwork and
narrow minded professionals, unable to make decisions and think for themselves.
The increasing demand for services and the public satisfaction and compliment signalised the feasibility of transforming
what was temporary into permanent. The PAC project has become an organizer and conductor of a proximity public
service to citizens who perceived their quality.
The first PAC was inaugurated in the municipality of Cascais in July 2004. This type of service has become a showcase
where the successes and mistakes are common knowledge. Transparency strengthens the commitment of employees and
partners, and alert to the need to review and adapt the adopted procedures.
Networks are new forms of organizational life that are incorporated into all organizational levels, to meet the challenges of
today, since traditional forms of organization, hierarchy and bureaucracy, are not sufficient to overcome them, as said
Lipnack (1994).
The Citizen Service Points cover the whole Portuguese territory, as already mentioned this study included the referenced
posts in Portuguese mainland. These multiservice posts with personalized service are located in places with lower
population density. The services available at the PAC want to respond to the specific needs of populations in relation to
services provided by central authorities.
The PAC are installed in autarchies, they indicate in which physical space the citizen can take added value service, as
already mentioned, with the creation of the Municipal Assistance Offices, the two services have appreciated even more
because the Municipal services centralization also began also to contemplate, in the same space, the central state services.
163
Employees assigned to PAC service are human resources from the entities that receive the PAC, i.e. Local Administratio n
human resources, these people are who, because of their proximity to the citizen, do a remarkable job of answering and
routing, some training gaps , unfamiliarity with new tools in portals, imprecise information about some central services
and poor leadership, do not prevent them from turning the gaps into challenges and in favour of the best citizen interests,
provide a friendly and effective work, in which citizens perceive the quality and effort and apprehends satisfaction.
This is another example of how the People Management not being brought to its real meaning, which is to work with
people and not use them passively as mere objects to obtain results, makes this large set of collaborators overcome many
constraints, and being themselves aware of their responsibilities and public function, take the initiative to equip
themselves with skills to serve the citizen.
4. THE CITIZEN SERVICE POINTS EFFECTIVENESS: THE PORTUGUESE MAINLAND CASE
4.1. Study aim and research hypothesis
The main objective of this work is based on assure the satisfaction of citizens using PAC, in its many valences, studying in a
systematic way what the actual impacts of implementing a set of services in Citizen Service Points are reflected in citizens
satisfaction . To such, it was opted to select as its subject one of the 54 Citizen Service Points users in Portuguese mainland.
Emphasized that the services offered through the Citizen Service Points reflect the concern to answer to the needs felt by
most people living in areas far from the Central Administration.
In order to assist and guide the empirical study and taking into account the above objectives as a way to respond to the
latent variable, overall satisfaction with the services provided, it was made up a division by 4 of the same components,
namely: Global Image Organization, Involvement and Participation, Accessibility and Products and Services.
In this sense and to meet the main goal of the study were formulated and tested the following research hypotheses:
Research Hypothesis 1: The citizens are generally satisfied with the services provided in the PAC.
Research Hypothesis 2: The components of Global Image Organization, Involvement and Participation, Accessibility
and Products and Services are correlated with Citizens Global Satisfaction.
4.2. Methods and methodology
The data collection instrument used in this study was the CAF Model 2006, Common Assessment Framework, for Quality
Public Administrations Quality on the European Union. Note that the CAF analyses the organization from different
perspectives, providing a holistic analysis of its performance. In the present study was based on the perspective of
citizens/customers.
The application of the questionnaire survey allowed the collection a sample of the knowledge, attitudes, values and
behaviours of the respondents. The questionnaire consists of 40 questions and is divided into two large groups, one group
is composed by all the 4 components (total of 35 items) and related items, namely: Global Organization Image with 7
items, Involvement and Participation with 5 items, Accessibility with 15 items and Products and Services with 8 items. A
2nd group with 5 socio demographic questions, which aims to characterize the citizens, name, age, sex, occupation and
qualifications.
Aiming the measurement of different items it was used the Likert five points scale that is to say 5 possible answers. Thus,
the scale requires respondents to indicate their level of satisfaction or dissatisfaction with statements regarding the
situation that is being measured through numeric values, since the answers reflect the strength and direction of the
respondent's reaction to the statement. The statements of satisfaction should receive positive values or high while the
statements of dissatisfaction should receive low or negative values, so the scale in this questionnaire comprises: 1 = Very
Dissatisfied, 2 = Dissatisfied, 3 = Moderately Satisfied, 4 = Satisfied and 5 = Very Satisfied. It should be noted that all items
were directed in the same direction, so there was no need to reverse the scale to compare results.
As for the process of data collection, it took place between April and December 2011. The questionnaires were distributed
proportionally in districts where they are installed the 54 PAC. In total 306 inquiries (nf) were collected corresponding
approximately to 57% of the 557 (n2) and 70% of the initial sample of 450 inquiries (n1), according to data presented in
Table 1. Note that a first approach to the issue of the size of the initial sample of 450 citizens having taken was a sample

164
error of 4.62% and a confidence interval of 95%. Later and since it was not possible to collect the 450 questionnaires but
only 306, the final sample error was 5.6% assuming a significance level of 5%.
Table1. Population and sample under study.
Municipalities No. PAC Population Initial Sample Final Sample
N % n1 n2 nf
Aveiro 2 713.575 8,00% 36 34 13
Beja 1 161.211 1,81% 8 10 0
Braga 3 831.366 9,32% 42 39 22
Bragança 1 148.883 1,67% 8 12 12
Castelo Branco 1 208.063 2,33% 10 10 0
Coimbra 10 441.204 4,94% 22 100 53
Guarda 1 179.961 2,02% 9 10 11
Leiria 4 459.426 5,15% 23 24 12
Lisboa 9 2.136.013 23,94% 108 108 66
Porto 12 1.781.836 19,97% 90 120 68
Santarém 4 454.527 5,09% 23 24 16
Setúbal 3 788.459 8,84% 40 36 13
Vila Real 1 223.729 2,51% 11 10 0
Viseu 2 394.925 4,43% 20 20 20
TOTAL 54 8.923.178 100,0% 450 557 306
After the data collection and its creation of the database was necessary to assess the degree of internal consistency of data
collection (Hill & Hill, 2002). For this we used the Cronbach's alpha, having been obtained for the present study an internal
consistency coefficient of 0.958, which according to the authors Gageiro and Pestana (2008) is a very good internal
consistency allowing to note that the reliability of the questionnaire is very good.
Descriptive univariate analysis was performed, bivariate for the treatment of data collected and in order to meet the
primary objective of the present study. Univariate analysis focused on descriptive statistical results related to the study
sample socio demographic variables (e.g. gender, age, occupation, region and educational attainment). Moreover, the
bivariate descriptive analysis aimed to explore the relationship between certain pairs of variables to realize the level of
citizen involvement with the PAC. All inference analysis is performed to determine whether the differences and/or
relationships between features found in the sample are extrapolated to the population, considering a confidence interval
of 95%.
4.3. Sample Characterization
Regarding the distribution of the sample by geographic zone the data can be identified reading Fig. 1, where one can
observe that the area of Portuguese Mainland with increased demand for services from what is demonstrated by the
highest concentration of Citizen Service Points is the centre, with a percentage of 62.4%, clearly more than the sum of the
other two zones, the North with 3,3% and the South with 4.2%.

165
33,3%
62,4%
4,2%
0,0%
10,0%
20,0%
30,0%
40,0%
50,0%
60,0%
70,0%
North Centre South
%
Geographical zone
Figure 1. Percentage of citizens by geographical area.
Regarding the gender of users who demand the services of the PAC (Fig. 2), it can be seen that the sample consists of
58.1% female users and 41.9% male users.
41,9%
58,1%
0,0%
10,0%
20,0%
30,0%
40,0%
50,0%
60,0%
70,0%
Male Female
%
Gender
Figure 2. Percentage of citizens by gender.
The majority of the interviewed 41% have secondary education, including the ancient courses of Commercial and
Industrial Schools and High Schools. Interestingly the fact that 24.3% of respondents have degrees or higher education or
are attending university. Holders of basic education accounted 34.7%% of respondents (Fig. 3).
34,7%
41,0%
24,3%
0,0%
5,0%
10,0%
15,0%
20,0%
25,0%
30,0%
35,0%
40,0%
45,0%
Primary High school Higher education
%
Qualifications
Figure 3. Percentage of citizens per academic qualifications.
According to the results it can be seen a diversified distribution of age of respondents (Fig. 4). Thus, the age bracket whic h
has a higher concentration of respondents is between 31 to 40 years, 24.2%, followed by ages 41 to 50 years, with 22.1%
the echelon 51to 60 registers 17.7% and the opposite between 21 to 30 points out 16%. The age of 61-70 shows a

166
considerable percentage of users, 11.7%, and from 71 years and between 18 and 20 years are those who have a lower
value, 6.5% and 1.7% respectively.
Regarding the professions socio-demographic variable to be noted that the set of occupations is 65. It was given some
evidence only to those of greater numerical relevance. The number of respondents who did not answer this question was
99, which represents 32.4% of the total. The retired characterizes 10.5% with a number of 32 users, the administrative
profession is represented by 8.5% with a value of 27 users, the public official has a significance of 4.9% in demand for
services with number 15 individuals, the teacher and the domestic have the same weight in the professions, 3.3% with 10
participants. The remaining jobs are distributed with numbers and percentages indicated below.
1,7%
16,0%
24,2%
22,1%
17,7%
11,7%
6,5%
0,0%
5,0%
10,0%
15,0%
20,0%
25,0%
30,0%
Less than 20 21-30 31-40 41-50 51-60 61-70 Greater than71
%
Age group
Figure 4. Percentage of citizens by age group.
5. DISCUSSION AND RESULTS INTERPRETATION
5.1. The citizen’s global satisfaction
In response to the latent variable global satisfaction of citizens with the PAC, the main hypothesis of this research study -
hypothesis 1, it can be said that the analysis and interpretation of the data presented in Fig. 5, it is considered that the
summary of a Mean value of 3.99 and standard deviation (SD) of 0.619, shows satisfactory results with respect to the
satisfaction of citizens using the PAC.
In fact, the idea of a generalized inability of public entities to respond promptly and appropriately to requests from citizens
seems to persist, partly attributed to the persistence of bureaucratic constraints and, in some cases, of abuse of power.
Although it has been observed an increase in the level of demand from users for services provided by PAC, there is still the
existence of a certain degree of compromise in situations less satisfactory, because users find that certain service aspects,
including the physical concentration of services and the courtesy of the staff service, compensate, to some extent, the most
unsatisfactory factors.
However the citizens of a country, as a whole, are able to identify, or at least feel the quality of its service delivery system,
when it is perceived and result on common benefits, derives also from this factor requirement of accessible, fair and
equitable, quality, effective management in problem solving and efficient use of public resources, which the AP responds as
it is an example the PAC model although it displays a set of standard features, seeks to adapt to characteristics of the
localities in which it operates, particularly in terms of physical facilities, type of care and communication, the results of all
the synergies is that the citizen/customer wants and recognizes the public service.
The result referred to in the previous paragraph are the outcomes of the 4 components, especially those with higher
averages, such as the component Products and Services and Global Image Organization that have a greater weight in
satisfaction, which respectively have an mean of 4.29 and 4.26, with a SD of 0.77 and 0.82.
Thus, all the analysis described above and displayed briefly in Fig. 5 allows us to confirm the first research hypothesis.
Allows also to state that the optimum result of the satisfaction of PAC users shows that this study is indeed the result of a

167
concentrated presence attendance model with an important place in the distribution of public service. As well as the
distribution model focused public service that reveals itself a catalyst for administrative modernization at various levels:
promoting transparency and efficiency of public action, citizen orientation, promotion of technological innovation and
working methods and adopting new models of leadership.
0,0
1,0
2,0
3,0
4,0
5,0
Global ImageOrganization
Involvement andParticipation
Accessibility
Products and Services
Mean Standard Deviation
Figure 5. Summary of the Global Mean and Global Standard Deviation of Components.
Table 2 complements and enhances the overall satisfaction of citizens and translates a result that shows positively their
satisfaction, with higher values considered in its presentation. In this sense, and once again through this analysis attests to
the first hypothesis. Well, it turns out that the empirical averages are higher than the theoretical average in all
components, which shows that citizens make a very positive and supportive appreciation of the PAC. Still, the deviations
are small which shows a reasonable agreement of responses. In Global Satisfaction scores for the empirical average is
128.657 (SD=25.405) than the predicted value for the theoretical average is 105, then the values make a right answer to
the main question of this study, it was important to get a demonstration that could meet the Citizen Service Points users
satisfaction and that associated with other evidence could complete its effectiveness.
Table 2. Descriptive Results for Global Satisfaction and for Components.
Minimum Maximum
Possible
Empirical
Mean
Standard
Deviation
Theoretical
Mean Z score
Global Image Organization 7 35 29,418 4,847 21 1,737
Involvement and
Participation 1 25 18,037 4,732 15 0,642
Accessibility 12 75 54,327 12,707 45 0,734
Products and Services 1 40 32,722 6,662 24 0,859
Global Satisfaction 41 175 128,657 25,405 105 0,931
This research was guided by the purpose of reaching values of Global Satisfaction clearly identifiers from what the
citizens think about the PAC, from these derive: positive perception of services, assertive behaviours, the notion of service
quality and above all customer satisfaction and effectiveness.

168
5.2. Analysis of Existing Relationship between Components and Global Satisfaction.
In order to answer the second research hypothesis examined the correlation between the four major components that
enabled investigation of citizens' satisfaction and ascertain the weight that each one contributes to the Global Satisfaction
of citizens (Table 3). After the analysis of normality, where there was a violation of this assumption, it was necessary to
resort to the Spearman correlation coefficient to measure the strength and direction of the relationship between the
components, the closer to 1 are more correlated. All correlation coefficients are shown in Table 3 significant (p-value
<0.001). Thus, the values shown in Table 3, it can be said that there is a strong correlation between all components,
particularly between variables Accessibility and Involvement and Participation (r=0.7076), Products and Services with
Global Image Organization (r=0.6595) and the Accessibility (r=0.6413).
Although one can observe that any of the components have strong and statistically significant correlations with the Global
Satisfaction, and the accessibility component (r=0.8908) is the largest contributor and which has a strong and direct
correlation followed by component Products and Services (r=0.805). It should be noted that as the accessibility component
that has the highest weight is the global component and that citizens are less satisfied, the PAC must begin to pay more
attention to this component so that to not go against the citizens expectations .
On the other hand the component with the lowest weight is the Global Satisfaction is the Global Image Organization
because as we have found citizens showed a very high level of satisfaction, but should not overlook this situation because
the image of an organization leads to reputation and brand and that is what is in the mind and ears of citizens. Still, this set
of information should be used to plot a strategy for quality improvement and to implement actions that actually improve
citizen satisfaction generating a greater return on Global Image Organization. Contributes to effect a good measurement
and monitoring system of citizen satisfaction, which can pass through, identification of expectation, satisfaction
measurement, preparation of quality improvement strategies and their implementation of improvements. This study
revealed that only the existence of a system of management of the effectiveness of services and satisfaction of its users
allows the sustainability of implemented measures and implement administrative modernization.
Moreover, the study also reveals that what is intended is nothing more than working with a new management culture
focused for the citizen and for the improvement of organizational performance.
Table 3. Spearman Correlation Coefficient.
Involvement and
Participation Accessibility
Global Image
Organization
Products and
Services
Global
Satisfaction
Involvement and Participation 1 0,7076 0,5011 0,5492 0,7826
Accessibility 1 0,5338 0,6413 0,8908
Global Image Organization 1 0,6595 0,6849
Products and Services 1 0,8050
Global Satisfaction 1
MAIN CONCLUSIONS
The empirical study accomplished infers that at this time is not possible, just, make the legislative initi ative the only engine
of change in the public service, is the way of good management and proximity to the citizen who gives this, trust us
services and in public institutions. In addition to building a modern legal structure, implement, monitor and promote good
practices and invest in the training of human resources, it is necessary to reassess their own administrative processes and
procedures, build networks to support modernization initiatives, share knowledge and join it to new technologies, the
simplification of regulatory environments and streamlining administrative practices.
Thus, all the analysis described above and displayed briefly proves the first research hypothesis and allows also to state
that the optimum result for the satisfaction of users of PAC this study shows that this is indeed the result of a model
focused to an important place in the distribution of public service, as well as the concentrated distribution model utility
that reveals itself a catalyst for administrative modernization at various levels: promoting transparency and efficiency of
public action, citizen orientation, promotion of innovation technology and working methods and adopting new models of
leadership.

169
The results declared also that the variables related to Accessibility, Products and Services and Involvement and
Participation have the greatest weight when you want to measure PAC user Citizen Global Satisfaction.
From the research now ended, and by the results obtained, it can be said that the effectiveness of the Citizen Service
Points, spread across Portuguese mainland, determine the satisfaction of their clients and that the path for the public
administration modernization must continue to be considered as an essential part of the growth strategy for the country, a
tool that should help to improve the relationship with citizens and reduce the costs of context for all interveners. The
results are very satisfactory with citizens who use the PAC.
The present study reinforces the idea that is not new, a Brand Image for Public Administration, an image translated above
all, in a new attitude. The main objective should be a culture of service determined by the effectiveness and quality of what
is offered as a final product. The brand 'Public Administration' that would enhance its recognition should to be identical to
that of other renowned brands from the private sector, as is the case of wine, oil, shoes, textiles, among others. The concept
of branding 'Public Administration' assume a strategic dimension, not only as a way to honour the mission of public
administration, but also as a way to attract the best human resources to carry out the strategies and objectives defined in
different sectors.
References
BERRY, L. (1980). Services Marketing is Different. Business. 30(3), 24-29.
BRADY, M., & CRONIN, J. (2001). Some new thoughts on conceptualizing perceived service quality. A hierarchical approach.
Journal of Marketing, 65, 34-49.
CARAPETO, C., & FONSECA, F. (2006). Administração Pública – Modernização, Qualidade e Inovação . (2ª Edição). Editora
Sílabo: Lisboa.
COELHO, H. (1998). Satisfação dos consumidores de cuidados de saúde: Avaliação dos pais e acompanhantes de crianças
internadas. Tese de Mestrado em Gestão de Empresas. Universidade do Minho: Braga.
CORREIA, R., & BRITO, C. (2007). Quo Vadis Marketing de Serviços? Uma Visão Integrada de Produtos e Serviços. XVII
Jornadas Hispano Lusas de Gestión Científica. Universidad de La Rioja. Logroño.
CUNNINGHAM, L., & YOUNG, C. (2002). Cross-Cultural Perspectives of Service Quality and Risk in Air Transportation.
Journal of Air Transportation, 7(1), 3-26.
DRUCKER, P. (2001). Parcerias, Fundamentos e benefícios para o terceiro sector. Edições. Futura: São Paulo.
HILL, M., & HILL, A. (2002). Investigação por Questionário. Edições Sílabo: Lisboa.
JUNQUEIRO, R. (2002). A Idade do Conhecimento. A Era Digital. Notícias Editorial: Lisboa.
KLIBSBERG, B. (2009). Rapprochement entre Le Marketing Et L’Administration Publique: Vers une comprehension global
du Potentiel du Marketing Public. Revue Française du Marketing, 224, 49-66.
KOTLER, P. (2009). Marketing para o Século XXI. Editora Ediouro: São Paulo.
LIPNACK, G. (1994). Rede de informações. Editora Makron Books: São Paulo.
LOPES, S. (2006). Aplicação do Modelo Servqual na Avaliação da Qualidade do Serviço. Monografia em Gestão. Universidade
do Minho: Braga.
OECD (1996). Portuguese experience in Public Management Reform. Public Management Occasional Papers, 13, 1-160.
PESTANA, M., & GAGEIRO, J. (2008). Análise de Dados para Ciências Sociais. A complementaridade do SPSS. (5ª Edição);
Lisboa: Edições Sílabo, Lda.

170
Avaliação da Qualidade dos Serviços em uma
Organização Pública Brasileira Qualidade do Serviço. Percepção. Expectativa. Satisfação. SERVQUAL. Choque de Gestão.
Caissa Sousa, Faculdade Novos Horizontes, [email protected]
Cristiane A. Santos, Faculdade FEAD, [email protected]
Danilo De O. Sampaio, Universidade Federal de Juiz de Fora / UFJF, [email protected]
Andre F. A. Fagundes, Universidade Federal de Uberlândia / UFU, [email protected]
Erich V. Sousa, Pontifícia Universidade Católica de Minas Gerais / PUC-MG, [email protected]
Abstract
A reflexão sobre a qualidade dos serviços prestados pelas organizações públicas tem se apresentado como um tema de
interesse acadêmico e de gestão, a medida que alguns setores transpõem para o campo público parâmetros de
atendimento e mensuração de seus resultados, utilizados pela gestão das organizações privadas. Nesse âmbito, o presente
trabalho tem como tema a percepção da qualidade dos serviços prestados por uma organização pública brasileira,
responsável pelo licenciamento e fiscalização de veículos e trânsito. Para atender ao objetivo formulado, a presente
pesquisa, de cunho quantitativo, utilizou o instrumento validado por Parasuraman, Zeithaml e Berry (1988), cunhado de
escala SERVQUAL, que avalia cinco dimensões: tangibilidade, confiabilidade, atendimento, segurança e empatia. Dadas as
características da organização em análise, elegeu-se as dimensões tangibilidade, atendimento e empatia para composição
da pesquisa. Os resultados permitem inferir que as dimensões “atendimento” e “empatia” apresentam resultados
satisfatórios quando comparados expectativas e percepções. Contudo, ressalta-se que a análise dos dados deve envolver
outros critérios de igual importância, tais como a análise da expectativa e da percepção em separado, uma vez que a baixa
expectativa quanto a qualidade do serviço pode incorrer em valores similares entre expectativa e percepção. Como
sugestão para estudos futuros, acredita-se ser relevante aplicar a escala em outras organizações do setor público, inclusive
em órgãos públicos que prestam o mesmo serviço em estados ou municípios distintos no território brasileiro, ou ainda em
comparação com a prestação de serviços similares em distintos países.
1 Introdução
O presente trabalho tem como tema a qualidade do atendimento aos clientes nas organizações públicas
brasileiras. De acordo com Lovelock, Wright e Hemzo (2011), as organizações, sejam estas públicas ou privadas, vêm
passando ao longo dos últimos anos por constantes mudanças na prestação de serviços. Algumas dessas mudanças se
originam do maior nível de exigência dos clientes, principalmente devido ao aumento da concorrência, globalização e
desenvolvimento tecnológico (Castells, 2007; Keen, 2009).
No que diz respeito às organizações públicas, a reflexão sobre a qualidade dos serviços prestados tem se
apresentado como um tema de interesse acadêmico e dos gestores envolvidos, a medida que alguns setores transpõem
para o campo público parâmetros de atendimento e mensuração de seus resultados, utilizados pela gestão das
organizações privadas, o que para Borges, Freitas Júnior e Oliveira (2008) pode ser feito por meio de abordagens distintas.
No caso específico do Brasil, os autores associam o processo de redemocratização, ocorrido a partir da década de
1980, como promotor de intensos movimentos de reforma do Estado, “que levou à construção de um modelo de gestão
pública capaz de atender, de modo mais adequado, às necessidades da sociedade, voltado ao interesse público e à
eficiência na coordenação da economia e dos serviços públicos” (Borges, Freitas Júnior & Oliveira, 2008, p. 81). Para os

171
autores, o movimento de reestruturação da gestão pública, visa, especialmente, a redução dos gastos públicos e o aumento
da amplitude da prestação dos serviços à população.
Como exemplo tem-se no estado de Minas Gerais, que é o segundo mais populoso do Brasil, a reforma gerencial
promovida desde 2003, conhecida como “Choque de Gestão” (Rodrigues et al., 2008). O Choque de Gestão, que apesar de
não promover um consenso sobre sua eficácia, pode, em determinados aspectos, ser considerado uma ação inovadora do
governo (Queiroz & Ckagnazaroff, 2009), ao trazer para a gestão pública modernas técnicas de gestão originárias das
organizações privadas, o que contribuiu para intensificar as cobranças sobre o quadro gerencial dessas organizações,
especialmente na eminência de uma realidade operacional mais competitiva (Paiva & Couto, 2008).
Ainda nesse preâmbulo é possível observar, sobre o prisma do consumidor ou usuário dos serviços públicos, uma
exigência maior pela prestação de serviços de melhor qualidade, o diretamente influencia a satisfação. Segundo Lovelock e
Wright (2011), a organização, seja essa pública ou privada, com ou sem fins lucrativos, deve trabalhar tendo o cliente como
o foco das suas ações, adequando-se às mudanças de perfil dos seus consumidores. Ademais, torna-se primordial que a
organização invista em criatividade, inovação e, principalmente, treinamento, para aperfeiçoar os seus processos e
oferecer serviços de melhor qualidade e que atendam de forma efetiva às necessidades do seu público alvo.
Muitas empresas públicas não possuem concorrentes em suas áreas de atuação, sendo que essa nula ou pequena
competição implica, muitas vezes, em um baixo comprometimento com a satisfação dos seus usuários, ou melhor, clientes.
Assim, não é raro se encontrar funcionários – servidores públicos – pouco preparados e motivados, o que acaba por
influenciar na insatisfação dos usuários desses serviços.
Para Gil (2009), a qualidade no atendimento começa, principalmente, dentro da própria instituição, pois os
funcionários são peças fundamentais para um bom desempenho da organização, a satisfação desses normalmente
influencia no resultado dos seus trabalhos. Nesse sentido, destaca-se, de acordo com Tachizawa (2004), que o treinamento
é um recurso comumente utilizado para aperfeiçoar o desempenho do funcionário, mas que também apresenta res ultados
motivacionais, com isto pode impactar no aumentando da produtividade do funcionário, e, por conseguinte, da
organização. Assim, de acordo com a autora, a excelência no atendimento se traduz pela busca da economia de tempo,
dinheiro e esforço do cliente, com a oferta de informações corretas, atualizadas e com o objetivo de gerar satisfação ao
usuário. Compreender as necessidades do consumidor para atendê-lo com qualidade implica, além de um tratamento
adequado, acrescentar benefícios aos serviços, atendendo ou superando as suas expectativas (Albrecht, 2002; Sebrae,
2010).
Considerando-se a relevância das organizações públicas prestarem serviços de qualidade, desenvolveu-se no
presente trabalho um estudo de caso de uma organização pública do estado de Minas Gerais/Brasil, responsável pelo
licenciamento e fiscalização de veículos e trânsito, aqui denominada de empresa Alfa. A escolha da organização e do locus
do trabalho se justificam dada a intensificação das políticas desse estado da federal brasileira, correlatas à implantação do
“Choque de Gestão”, que tem, entre outros propósitos, ofertar serviços de melhor qualidade aos usuários. Para tanto,
elaborou-se, como questão norteadora o seguinte questionamento: “como é percebida pelos usuários qualidade da
prestação dos serviços na Empresa Pública Alfa?”.
Para atender ao problema de pesquisa, elaborou-se um questionário, a partir das dimensões propostas na escala
SERVQUAL (Parasuraman, Zeithalm & Berry, 1985 & 1988), que foi aplicada a usuários Organização Pública Alfa, que teve
como objetivo principal identificar variáveis em que os usuários apresentem percepções distintas de suas expectativas em
relação aos serviços prestados pela organização, além de identificar fatores críticos, passíveis de revisão pela instituição,
no que tange à prestação do serviço.
2 Desenvolvimento teórico
2.1 Serviços, qualidade dos serviços e satisfação do consumidor
Conforme Lovelock e Wright (2003), serviços são atividades econômicas que criam valor e fornecem benefícios
aos clientes, contudo o foco não é a transferência de um bem ou produto tangível, uma vez que o serviço é intangível.
O setor de Serviços é a parte da economia de uma nação representada por serviços de todos os
tipos, incluindo os oferecidos por organização publicas e sem fins lucrativos (LOVELOCK;
WRIGHT, 2003, p. 5).

172
Kotler, Hayes e Bloom (2002, p. 283), definem serviço como “uma ação, desempenho ou ato que é essencialmente
intangível e não acarreta necessariamente a propriedade do que quer que seja. Sua criação pode ou não estar vinculada a
um produto material”.
Nesse sentido, cabe-se destacar o significado de bens, que são objetos tangíveis – físicos – que garantem benefício
por meio de sua propriedade. Conforme Lovelock e Wright (2003, 2011), bens são objetos ou dispositivos físicos que
propiciam benefícios aos clientes por meio de sua propriedade ou uso. O bem pode ser demonstrado antes da compra,
podendo inclusive ser estocado. Ao contrário, os serviços são intangíveis e podem ou não acompanhar um bem, co ntudo
não são passíveis de serem estocados ou armazenados. Para os autores, serviços são atividades nas quais, geralmente, há
um envolvimento entre clientes, funcionários e prestador de serviços para o atendimento das necessidades dos clientes.
De acordo com Corrêa e Caon (2002) e Hoffman e Bateson (2003), o setor de serviços tem ocupado posição de
destaque na economia mundial, pois, além de ser responsável pela maior parcela do Produto Interno Bruto (PIB) mundial,
sua participação no PIB e o número de empregos no setor crescem a taxas mais elevadas do que nos demais setores da
economia.
No Brasil, essa tendência não é diferente, a maioria da população dedica-se a atividades relacionadas ao setor de
serviços – 54,2% da mão de obra empregada – e substancial parcela da riqueza gerada no País advém deste setor,
responsável por 58,7% do PIB do Brasil em 2012 (Boletim de Conjuntura, 2012).
Os principais fatores responsáveis por esse crescimento são de ordem político-social e tecnológica, quais sejam:
(a) urbanização – que torna indispensável alguns serviços; (b) mudanças demográficas – que apontam para o aumento do
número de crianças e/ou idosos, que, por sua vez, demandam maior variedade de serviços; (c) mudanças socioeconômicas
–aumento da participação da mulher no mercado de trabalho e pressões sobre o tempo pessoal, que criam a necessidade
de serviços domésticos prestados por terceiros; (d) avanço da sofisticação dos consumidores – que leva a necessidades
mais amplas de serviços; e (e) mudanças tecnológicas – que induzem ao aumento da qualidade dos serviços, e, ainda, à
criação de serviços completamente novos (Corrêa & Caon, 2002; Hoffman & Bateson, 2003).
Parasuraman, Zeithaml e Berry (1988), Hoffman e Bateson (2003), Lovelock e Wright (2003) e Zeithaml & Bitner
(2003) definem quatro características principais dos serviços que afetam a elaboração de programas de marketing das
organizações: (i) intangibilidade – o serviço não pode ser tocado ou sentido; (ii) inseparabilidade – a produção é
simultânea à entrega do serviço; (iii) variabilidade – a qualidade dos serviços é heterogênea; e (iv) perecibilidade – o
serviço não pode ser estocado, ou seja, ele é consumido assim que produzido.
Diferentemente de quando se comercializa um bem, para o qual se consideram basicamente os 4Ps – elementos
que compõem o mix de marketing: preço, praça, promoção e produto – a estratégia de serviços envolve o cliente com o
meio de produção, com isto pode-se incluir outros elementos nesse composto, chegando-se a formulação de 8Ps. De uma
forma mais detalhada, os 8 Ps dos serviços envolvem: (i) elementos do produto – todos os componentes do desempenho
do serviço que criam valor para os clientes; (ii) lugar e tempo – decisões gerenciais sobre quando, onde e como entregar os
serviços ao cliente; (iii) processo – estratégia de como entregar elementos dos produtos aos clientes; (iv) produtividade e
qualidade – grau de eficiência em que os insumos são transformados em produtos que agregam valor aos clientes; (v)
pessoas – são os colaboradores da empresa e os clientes, que interagem na produção do serviço; (vi) promoção e educação
– sendo a promoção um meio de comunicação para um público alvo que tende a aumentar e atrair a preferência dos
clientes para um determinado produto; (vii) evidência física – como a aparência de toda infraestrutura do fornecedor do
serviço, como estrutura física, equipamentos, quadro de funcionários, material de marketing e outras indicações visíveis
ao cliente sobre qualidade do serviço na organização; e (viii) preço e outros custos do serviço – componentes do serviço
que remetem administração aos custos incorridos pelos clientes para obterem um determinado beneficio ou serviço
(Kotler, Hayes & Bloom, 2002).
Normalmente, as empresas buscam constantes melhorias na prestação de serviços, sendo os clientes peças chave
para a implementação de mudanças nas organizações, tanto nas organizações públicas como as privadas. Quando se trata
de organizações prestadoras de serviços, o cliente (ou usuário) passa a apresentar um papel ai nda mais importante do que
o exercido em organizações de outros setores, pois ele também participa do serviço, sendo, assim, peça fundamental para
o a eficácia de seus resultados (Zeithaml & Bitner, 2003).
Conforme os mesmos autores, a expectativa do cliente sobre o serviço pode variar em três etapas: (a) serviço
desejado – representa o nível de serviço que o cliente almeja receber ou nível de serviço que o cliente acredita que poderia
estar recebendo da empresa; (b) serviço adequado – nível do serviço que o cliente aceitará em receber, pois suas
173
expectativas em relação ao serviço eram altas, mas ao recebê-lo notou que atingir a sua expectativa naquele momento não
seria possível; e (c) zona de tolerância – região formada entre a variação do nível de serviço desejado e o nível de serviço
adequado, representa a margem na qual os clientes não percebem a forma como o serviço é prestado.
Pelo fato de os serviços apresentarem predominância de atributos de experiência – que podem ser avaliados pelo
consumidor somente na utilização – e credenciamento – que são difíceis de avaliar mesmo depois da utilização – sua
aquisição representa um risco maior. Desse modo, torna-se essencial a criação de diferenciais que sejam claramente
percebidos pelos consumidores (Bronze Jr. et al., 2012; Churchill Jr. & Peter, 2005; Neves & Mota, 2008).
Apesar da dificuldade de se perceber uma qualidade homogênea dos serviços, os administradores de marketing
podem manusear uma forma de buscar tal diferenciação com base na ênfase na qualidade da oferta. Existem cinco fatores
que são determinantes para o melhor desempenho dessa dimensão: confiabilidade – desempenhar o serviço exatamente
como prometido; presteza – atender com agilidade; garantia – transmitir confiança e segurança aos clientes por meio do
conhecimento e cortesia dos funcionários; empatia – dar atenção individualizada aos clientes; e aspectos tangíveis –
prover instalações físicas, equipamentos, funcionários e material de comunicação com boa aparência e funcionalidade
(Parasuraman, Zeithaml & Berry, 1988).
Empresas prestadoras de serviços podem ganhar vantagem competitiva ao executarem um serviço com qualidade
superior à dos concorrentes, superando as expectativas dos clientes, o que pode influenciá-los a procurar novamente a
mesma empresa (Hoffman & Bateson, 2003; Vieira, Troccoli & Silva, 2012).
Por se tratar de uma oferta no qual o produto principal é incontrolável, as organizações que promovem serviços
devem ter um cuidado especial com as pessoas que contratam, pois são elas que estarão em contato direto com o cliente,
influenciando, assim, a percepção deles com relação à qualidade do serviço recebido (Theodorakis et al., 2001; Troccoli &
Guerra, 2012).
Os clientes estabelecem expectativas referentes ao serviço que estão adquirindo considerando as experiências
passadas ou recomendações de terceiros. Se o serviço for além do esperado, ficará acima das expectativas, sendo o
contrário também verdade. Ao superar a expectativa do consumidor, segundo Lovelock e Wright (2003, 2011), o serv iço é
considerado de qualidade superior. Caso a qualidade do serviço seja inferior ao esperado, o cliente criará expectativas
negativas sobre a empresa que o prestou. Nesse aspecto, discutir a qualidade da prestação de um serviço envolve mais do
que simples mensurações, uma vez que essa é, em grande parte, percebida subjetivamente (Grönroos, 2009).
Ainda a respeito da qualidade, cabe ressaltar os três tipos de qualidade sugeridos por Spiller et al. (2004):
qualidade técnica, qualidade de relacionamento e qualidade intelectual. A primeira é de caráter mensurável, a qualidade
de relacionamento é impactada pela competência emocional, tanto dos funcionários da organização como do cliente, e a
terceira – qualidade intelectual – envolve questões e crenças referentes a ética e valores.
Nesse sentido, cabe ressaltar que a percepção da qualidade afetará a satisfação do consumidor, que é definida por
Oliver (1997, p. 13) como “a resposta ao contentamento do consumidor. É o julgamento de que uma característica do
produto ou serviço, ou o produto ou serviço em si, proporcionou (ou está proporcionando) um nível prazeroso de
contentamento relacionado ao consumo, incluindo níveis menores ou maiores de contentamento”.
McCarthy e Perreault (1997) corroboram com esse pensamento, ao afirmarem que a eficácia de marketing deve
ser mensurada pelo grau de satisfação do consumidor, pois esse deve ser o principal objetivo da organização. Contudo, os
autores destacam a dificuldade de se mensurar a satisfação dos consumidores.
Dessa forma, pode-se considerar que uma instituição pública, ao desempenhar um bom atendimento e com
agilidade nos serviços prestados, contribuirá para garantir a satisfação dos cidadãos que utilizam os seus serviços. Nesse
sentido, ainda destaca-se o fato que, conforme Lovelock e Wright (2011), clientes altamente satisfeitos disseminam
informações positivas da empresa e se tornam um exemplo positivo de propaganda boca-a-boca.
Assim, Spiller et al. (2004) ressaltam que para a empresa se manter competitiva é importante apresentarem altos
níveis de motivação dos seus funcionários. Para tanto, ela deve proporcionar um ambiente harmônico, com qualidade de
vida para o funcionário, pois este – chamado de cliente interno – reflete a imagem da empresa para o cliente externo.
Lovelock e Wright (2003) destacam que o papel do pessoal de linha de frente nas organizações é muito importante, ainda
mais nas organizações do setor de serviço, pois estes passam a ser parte da oferta. Portanto, a avaliação final do
consumidor/usuário do serviço, geralmente considerará aspectos que transcendem os resultados obtidos com o serviço,
como por exemplo, o atendimento prestado pelos funcionários.

174
Considerando esse preâmbulo, apesar de alguns autores defenderem o atendimento (P de pessoa) como o fator
essencial para o entendimento da percepção dos consumidores relacionada à qualidade dos serviços e, por consequinte,
sua satisfação em relação a essa oferta, acredita-se ser importante também considerar outros aspectos relacionados à
avaliação do consumidor. Dessa forma, esta pesquisa optou por utilizar a escala SERVQUAL (Parasuramen, Zeithaml e
Berry, 1985 & 1988) para se compreender esses aspectos relacionados aos usuários do serviço público, aqui pesquisados.
2.2 Mensurando a qualidade dos serviços: a escala SERVQUAL
A percepção da qualidade do serviço não é um tema recente, e dado a sua importância, tem sido extensamente
estudado nas duas últimas décadas. Segundo Grönroos (2009), a maioria desses estudos se concentra na ideia de
desconfirmação, ou seja, uma comparação entre as expectativas e as experiências relativas a uma série de atributos de
qualidade. Entre as medições da percepção da qualidade dos serviços mais conhecidas, tem-se a escala SERVQUAL, que
segundo Parasuramen, Zeithaml e Berry (1988), responsáveis por sua concepção, proporciona a identificação de pontos
fortes e fracos da organização observada.
Cabe ressaltar nesse ponto que a qualidade do serviço envolve a comparação de expectativas com a performance,
ainda, ela é uma medida de quão bem um nível de serviço atende, de forma consistente, as expectativas do consumidor
com (Lewis & Booms, 1983; Silva, 2009; Troccoli & Guerra, 2012; Vieira, Troccoli & Silva, 2009).
Assim, o consumidor tende a comparar as suas expectativas relacionadas a um serviço com a percepção da
qualidade desse serviço. Ou seja, o cliente compara o que ele sente que a organização poder oferecer, que se refere às suas
expectativas, com o que ele percebe relacionado à performance dessa organização. Dessa forma, a percepção da qualidade
de serviço é vista como um nível de discrepância entre a percepção do consumidor e suas espectativas (Parasuramen,
Zeithaml & Berry, 1985; Grönroos, 1982).
De acordo com os autores, a expectativa, quando se considera a satisfação de serviços, deve ser entendida como
previsões feitas pelos consumidores sobre o que deveria ocorrer durante a transação de aquisição do serviço e seu efetivo
uso. Assim, é possível o estabelecimento de expectativas negativas e positivas, as primeiras quando o cliente preve
situações desagradáveis relacionadas a esse consumo e a segunda relacinada a aspectos agradáveis.
A SERVQUAL foi elaborada a partir de duas seções, cada uma com 22 itens, totalizando 44 itens. Esses itens
mensuram as expectativas dos clientes em relação a empresas que prestam serviços excelentes em determinado setor de
interesse e as percepções sobre a empresa desse setor que está sendo avaliada. Utiliza-se para tanto uma escala Likert de
sete pontos, com as extremidades marcadas em “de maneira alguma essencial” e “absolutamente essencial”, para as
expectativas e “concordo plenamente” e “discordo plenamente” para as percepções (Parasuramen, Zeithaml & Berry,
1988).
A SERVQUAL proporciona a avaliação de cinco dimensões, a saber (Parasuramen, Zeithaml & Berry, 1988).
Tangíveis - em virtude da ausência de um produto físico, é possível que os clientes ou usuários de
determinado serviço observem aspectos do ambiente no qual o serviço é prestado, como: mobiliário,
equipamentos, limpeza, aparência do prestador do serviço, etc.
Confiabilidade – refere-se a confiança que o desempenho do serviço de determinada organização inspira.
Atendimento – disposição ou prontidão dos funcionários de determinado ramo de atividade ou organização
para prestar o serviço.
Segurança – se refere a competência percebida da organização que presta o serviço.
Empatia – capacidade da organização de entender as necessidades do cliente ou usuário, proporcionando a
prestação de serviços de maior qualidade percebida.
3 Aspectos Metodológicos
O presente estudo foi realizado em uma repartição pública do estado de Minas Gerais/Brasil – aqui denominada
Empresa Pública Alfa. O objetivo do estudo foi mesurar a qualidade dos serviços prestados, avaliando a diferença entre
expectativa do cliente – o que ele esperava receber – e percepção – o que os clientes sentem que receberam.

175
Quanto aos fins, a pesquisa em questão é de natureza descritiva, pois pretende observar e identificar os fatos sem
propor interferências (Churchill, 1987). Nesse sentido, foi desenvolvida uma pesquisa de campo, que atendeu ao propósito
da obtenção de dados primários para o estudo descritivo, por meio da aplicação de um questionário.
A coleta de dados foi realizada por meio de questionários aplicados aos usuários dos serviços prestados pela
organzição. A amostra foi selecionada por conveniência, tendo em vista que nem todos os usuários se prontificaram a
responder o questionário, ficando, portanto, limitada à concordância dos respondentes. Para a elaboração do instrumento
de coleta de dados utilizou-se a escala SERVQUAL, que, de acordo com Hoffman et al. (2009), é uma ferramenta de
diagnóstico, que revela os pontos fortes e fracos de uma empresa com relação a qualidade do serviço prestado.
Nesta pesquisa optou-se por analisar três dimensões da qualidade testadas na escala SERVQUAL: tangibilidade,
atendimento e empatia. A limitação da escolha às três dimensões se deu por dois fatores específicos. Primeiro considerou-
se o tempo de resposta do questionário, uma vez que diante de um questionário extenso alguns entrevistados poderiam se
recusar a participar da pesquisa – destaca-se que a coleta de dados foi realizada na própria organização. O segundo fator,
se explica uma vez que dada a característica da organização estudada, que é a única no estado a prestar o serviço para os
cidadãos, não se justificava a aplicação e análise das dimensões confiabilidade e segurança.
As entrevistas foram realizadas no espaço físico da organização, área interna, logo após prestado o serviç o, o que
permitiu uma mensuração mais fidedigna em relação a lembrança do respectivo serviço.
4 Análise dos Dados
Foram aplicados 100 questionários para os usuários da Empresa Pública Alfa. Destes, seis foram invalidados, dado
ao fornecimento incompleto das informações. Portanto, do total de questionários aplicados, 94 foram considerados
validados para participarem da amostra.
O questionário foi composto por 31 perguntas, sendo que as sete primeiras relacionavam-se ao perfil sócio
demográfico dos usuários que utilizam os serviços. As demais questões buscavam analisar as expectativas e percepções do
cliente no atendimento. Foi realizado um pré teste, com 8 voluntários, a fim de adequar melhor as questões ao
entendimento dos entrevistados. Nessa fase constatou-se que a escala likert de 5 pontos proporcionava maior
entendimento quanto comparada a mesma escala de 7 pontos, que no caso em questão induziu a marcações
predominantes nas extremidades.
Do total de entrevistados, 61% já haviam utilizado os serviços da Organização Pública Alfa. Quanto à faixa etária,
73% dos entrevistados possuem até 34 anos de idade, 23% entre 35 e 54 anos e 3% acima de 55 anos. Com relação a
renda média familiar, 43 indivíduos, perfazendo um total de 46% da amostra, possuem renda média familiar até U$765,0;
24 pessoas (26%) possuem renda entre U$766,0 e U$1.530,0; 11 pessoas (12%) possuem renda entre U$1.531,0 e
U$2.550,0; 11 pessoas (12%) possuem renda acima de U$2.551,0 e 5 pessoas (5%) se recusaram a responder a pergunta,
ou disseram não saber a renda familiar.
Do total de entrevistados 57% foram do sexo masculino, a maior parte (54%) solteiros ou casados (36%). Quanto
à escolaridade 63% possuem até o ensino médio, 28% possuem ensino superior (completo ou em curso e 9% são pós
graduados (strictu ou latu sensu).
A segunda parte do questionário, composta pelas questões de 8 a 31, avaliou a expectativa e a percepção dos
usuários em relação ao serviço e a organização em questão, considerando-se as dimensões: tangibilidade, atendimento e
empatia, da escala SERVQUAL. Foram consideradas quatro questões para cada dimensão para expectativas e quatro para
percepções.
As médias das expectativas dos entrevistados para as expectativas variaram entre 3,46 a 3,96, sendo as questões
Q8 (empresas públicas que prestam serviços excelentes têm equipamentos modernos), Q9 (as instalações das empresas
públicas que prestam serviços excelentes são visualmente atrativas) e Q11 (materiais relacionados com o serviço, como
formulários, folders ou panfletos são atrativos) as que apresentaram as menores médias.
Na dimensão tangível, quando perguntados sobre a infraestrutura e meios de comunicação de organizações
públicas que prestam serviços de qualidade, considerando as cinco possíveis opções de resposta, a maio ria dos
entrevistados optou pela posição de neutralidade – nem discorda e nem concorda – que tal atributo corresponda a
empresas públicas que prestam excelentes serviços. Contudo, 53% dos respondentes apontam que esse item influencia

176
positivamente em organizações que prestam serviços de qualidade excelente – 32% concordam totalmente e 21%
concordam parcialmente.
Na perspectiva da expectativa para o atendimento nas organizações públicas que prestam serviços excelentes
notou-se que a maioria dos entrevistados (50%) consideram fortemente – escolheram a opção concorda totalmente – que
o atendimento interfere na prestação de serviços de qualidade. Ademais, nota-se que outros 17% concordam parcialmente
com esse pensamento, mesmo percentual dos entrevistados que apresentaram opinião de neutralidade.
Ainda analisando-se a expectativa dos clientes, agora considerando a última dimensão pesquisada, “Empatia”,
notou-se que a maioria dos clientes, mais uma vez, aponta concordância em relação à importância desta na expectativa do
serviço prestado ser de qualidade – 31% afirmaram concordar totalmente e 23% parcialmente. Contudo, essa dimensão,
dentro da análise de expectativa, foi o que apresentou maior percentual de discordância 22% – em parcelas iguais para os
que discordam parcialmente e os que discordam totalmente.
Finalizada a análise da expectativa, passa-se a considerar o nível da percepção dos clientes sobre os serviços
prestados pela Empresa Pública Alfa. As médias variaram de 3,36, na Q21 (As instalações “da empresa Alfa” são
visualmente atrativas) a 4,19 na Q25 (Funcionários “da empresa Alfa” prestam prontamente o serviço aos clientes).
A dimensão tangível, relativa a percepção dos entrevistados com relação aos serviços prestados pela organização,
foi superior à expectativa, sendo que 44% dos entrevistados concordam totalmente com a afirmativa e 17% concordam
parcialmente. Também foi possível identificar um nível de neutralidade menor que o da expectativa, para o mesmo critério
de avaliação. Enquanto na percepção teve-se 24% dos entrevistados apontando que nem concordam e nem discordam, na
expectativa esse percentual chegou a 34%.
A percepção do atendimento na Empresa Pública Alfa também foi superior à expectativa que os entrevistados
tinham, sendo que essa dimensão obteve 52% das marcações em concordo totalmente, seguido de 21% que afirmaram
concordar parcialmente. Contudo, notou-se um leve aumento da opinião neutra, pois 18% dos entrevistados escolheram
essa opção ao analisar a percepção enquanto 17% haviam a escolhido na expectativa referente ao serviço.
Conforme demonstrado na Figura 6, a maioria dos respondentes considera que a empatia influencia na qualidade
do serviço da empresa pesquisada – 45% concordam totalmente e 23% parcialmente. Esse índice também é superior à
expectativa que esses entrevistados tinham referente ao serviço, portanto, novamente tiveram sua expectativa excedida.
Considerando que a escala SERVQUAL é uma ferramenta utilizada para mensurar o grau de satisfação do cliente
na empresa, comparando o resultado da sua percepção com o resultado da sua expectativa, faz-se possível inferir que se
essa subtração (expectativa menos percepção) for negativa, a organização precisa melhorar os seus serviços, pois a
expectativa do cliente referente ao serviço é maior que sua real percepção da qualidade do serviço prestado. Por outro
lado, caso esse resultado seja positivo, pode-se concluir que a qualidade do serviço prestado superou a expectativa do
cliente, possibilitando assim a sua satisfação.
Nesse sentido, são apresentados na tabela 1 os resultados da diferença entre percepção e expectativas. Esses
sugerem que os serviços prestados pela Organização Pública Alfa superaram as expectativas dos clientes, pois para a
maioria das comparações o resultado foi positivo. Nota-se que apenas em dois quesitos a percepção foi inferior à
percepção, mesmo assim apresentando resultados muito próximos. Esses itens foram referentes à dimensão tangível, e
correspondem às instalações e aos meios de comunicação serem atrativos na empresa pesquisada.
Tabela 1 – Diferença entre expectativa e percepção dos entrevistados
Q= P-E Média Desvio padrão
Q20-Q8 0,21 1,36
Q21-Q9 -0,10 1,54
Q22-Q10 0,27 1,41
Q23-Q11 -0,02 1,37
Q24-Q12 0,18 1,36
Q25-Q13 0,26 1,50
Q26-Q14 0,37 1,44
Q27-Q15 0,26 1,48
177
Q28-Q16 0,44 1,45
Q29-Q17 0,14 1,51
Q30-Q18 0,20 1,33
Q31-Q19 0,27 1,28
Fonte: Dados da pesquisa
5 Considerações Finais
As mudanças econômicas e sociais dos últimos anos, em conjunto com o aumento do acesso às informações e, por
consequência, a maior conhecimento dos direitos e possibilidades de questionamentos por parte dos consumidores e
usuários de serviços públicos impactaram no aumento do nível de exigência por parte desses indivíduos. Ademais, o
desenvolvimento econômico do Brasil possibilitou a criação de novas empresas no país, inclusive atraindo organizações
oriundas de outras nações, o que, acredita-se também apresente impactos no nível de exigência dos clientes ou usuários de
serviços. Tal fato se daria mesmo que a organização não possua concorrentes diretos, pois de alguma forma, existe a
possibilidade de comparação com outras organizações, de segmentos distintos. Por conseguinte, o nível de
competitividade entre as organizações também aumentou. Dessa forma, tem-se de um lado o consumidor mais exigente e
informado, de outro lado um número maior de opções e maior competitividade das organizações para atender esse
consumidor. Assim, para conquistar, ou até mesmo manter seus mercados, as organizações precisam se preparar para
atender o consumidor agregando valor aos seus produtos e serviços, buscando assim superar a expectativas de seus
clientes. Apesar de possuírem particularidades que as diferem das demais organizações, as empresas do setor público
também se incluem nessa realidade, pois mesmo que algumas delas não tenham concorrentes diretos, os seus usuários
tornaram-se mais informados e exigentes sobre os seus direitos. (Lovelock & Wright, 2011; 2011; Urdan & Urdan, 2006).
Contudo, ainda deve-se considerar outro aspecto da economia que impacta nessa realidade: a tendência do
crescimento do setor de serviços em países cuja economia apresenta um desenvolvimento satisfatório. Com isso, as
organizações necessitam estarem ainda mais atentas à forma na qual seus consumidores são atendidos, quais suas
expectativas com relação aos serviços contratados e, principalmente, qual a percepção deles após a execução do serviço.
Nesse preâmbulo delimitou-se o objetivo desse estudo, que é analisar como os clientes de uma empresa pública
avaliam os serviços dessa organização. Destaca-se que a opção por uma organização pública deve-se, principalmente, pelo
fato desse tipo de estudo, que corresponde a avaliação de um serviço por parte do seu usuário, ser pouco pesquisado em
organizações desse tipo, especialmente no Brasil. Ademais, a organização estudada desenvolveu nos últimos anos uma
série de ações objetivando melhorar os seus serviços, algumas dessas motivadas pelo chamado “Choque de Gestão”,
implementado no estado de Minas Gerais/Brasil, a partir do ano de 2003. Nesse sentido acredita-se ser importante
analisar como os usuários desses serviços o percebem em relação a sua qualidade, sendo que esse pode representar para a
organização um parâmetro de êxito acerca das ações implementadas.
No estudo utilizou-se a escala SERVQUAL (Parasuraman, Zeithalm & Berry, 1988) para se mensurar tanto a
expectativa dos usuários do serviço como a percepção acerca da qualidade dos serviços prestados. Os resultados podem
ser considerados positivos para a organização pesquisada, uma vez que na maioria dos quesitos pesquisados – que
envolveram as dimensões tangibilidade, atendimento e empatia da escala supracitada – os clientes perceberam o serviço
realizado como superior às suas expectativas.
Os únicos itens que apresentaram percepção de qualidade do serviço inferior à expectativa foram dois dos quatro
avaliados na dimensão tangibilidade, correspondentes às instalações físicas e aos meios de comunicação da organização.
Contudo, esse resultado, de certa forma, era esperado, pois ele corrobora com o fato da organização possuir equipamentos
envelhecidos e estar localizada em um prédio antigo, que não oferece conforto aos usuários. Todavia, nota-se que a
diferença entre a expectativa e a percepção foi relativamente pequena nesses dois casos. Mas, mesmo assim, esse resultado
sugere a necessidade da organização investir nos seus aspectos tangíveis, mesmo sendo predominantemente uma
empresa prestadora de serviços. Esse investimento pode ser tanto na forma de atualização dos seus equipamentos, como
também na reforma predial e aperfeiçoamento dos seus canais de comunicação com os clientes, incluindo nesse aspecto as
campanhas promocionais que a organização desenvolve.
Ao se analisar as dimensões em separado, nota-se que tanto o atendimento como a empatia apresentaram
resultados próximos. Nos dois casos, os quatro itens que avaliavam cada dimensão apresentaram como resultado a

178
percepção que o serviço foi de melhor qualidade do que o esperado. O mesmo ocorreu com a terceira dimensão, que
analisa os aspectos tangíveis, contudo com resultados menos contundentes e inferiores aos das outras duas dimensões.
Esse resultado sugere que a “qualidade do atendimento”, que envolve fatores como: se os clientes são informados
corretamente sobre quando os seus pedidos serão executados, se os funcionários prestam prontamente os serviços, a
disposição em ajudar dos funcionários e se os funcionários respondem às solicitações dos clientes, apresentam resultados
satisfatórios. Em análise similar, a “empatia”, cujos principais fatores avaliados são: se a organização oferece atenção
individualizada aos seus clientes, a adequação dos horários de atendimento, o comprometimento com o atendimento ao
cliente, e, o atendimento as necessidades específicas, também apresentaram resultados satisfatórios.
Contudo, apesar de se observar mensuradores positivos para as variáveis, a organização continua passível de
melhoras no atendimento. Cabe aqui ressaltar que o fato de os usuários apresentarem níveis similares entre expectativa e
percepção pode-se dar devido à baixa expectativa para o setor de atividade analisado – organizações públicas. Tal fato
ensejaria estudos para avaliarem se as expectativas para o setor de atividade são similares ou inferiores às formuladas
para setores correlatos, sejam esses públicos ou privados.
Acredita-se que esta pesquisa possa colaborar no sentido de ressaltar a importância de se analisar a expectativa e
a efetiva percepção acerca da qualidade de um serviço. Ademais, tem-se a contribuição de se desenvolver um estudo
referente à opinião de consumidores de serviços públicos, área relativamente pouco pesquisada academicamente no
Brasil, pois a maioria dos estudos referentes ao comportamento do consumidor e sua satisfação versam sobre
organizações privadas. Ainda, acredita-se que o entendimento dos anseios de uma população sobre os serviços prestados
pelos órgãos governamentais possa contribuir com a elaboração de políticas públicas mais consistentes e assertivas,
capazes de melhor atender as expectativas da população que utiliza esses serviços.
Ao se considerar as contribuições gerenciais, uma vez que neste estudo se pesquisou uma organização de serviço
real, pode-se apontar algumas implicações práticas. Entre elas, a necessidade da organização aprimorar as questões
referentes à dimensão tangibilidade, especificamente a instalação física e os meios de comunicação. Esses dois aspectos
são, normalmente, negligenciados pelas organizações públicas brasileiras. Nesse caso específico, a instutição tem co mo
principal veículo de comunicação o seu endereço eletrônico na internet, que apresenta um design antiquado e
desatualizado, ademais, é difícil encontrar informações específicas, mesmo as mais procuradas pelos usuários do serviço.
O outro aspecto, relacionado ao espaço físico, é materializado por um edífício que não foi construído com o objetivo de
atender ao público, tendo apenas passado por adaptações para essa tarefa. Tal fato, aliado ao aspecto antiquado e mal
cuidado do local, acabam por impactar negatividamente na percepção do usuário, levando-o a não ter suas expectativas
atendidas de forma assertiva.
Por fim, o estudo sugere a importância de se buscar entender qual a percepção da qualidade de serviços não
apenas em empresas privadas, com fins lucrativos, mas também em órgãos públicos, que tem como objetivo primordial
atender às demandas dos cidadãos. Nesse sentido, passa a ser importante para os gestores dessas instituições utilizarem
de ferramentas capazes de mensurar a opinião dos seus clientes, como a SERVQUAL, empregada nesse estudo. Acredita-se
que tal ação pode possibilitar um melhor entendimento das necessidades e anseios dos usuários desses serviços,
permitindo assim que os gestores responsáveis por esse atendimento aprimorem os serviços pres tados para que a
qualidade deles seja percebida como superior.
References
ALBRECHT, K. (2002). Revolução nos serviços: como as empresas podem revolucionar a maneira de tratar os seus clientes.
5ª ed. São Paulo/Brasil: Pioneira Thomoson Learninig.
BORGES, F. A., FREITAS JR., D. B. & OLIVEIRA, E. R. Estratégia e Administração Pública: o caso do programa “Choque de
Gestão” do governo do Estado de Minas Gerais. (jul./set. 2008). Revista Pretexto. Belo Horizonte, MG/Brasil, v. 9
(3): 79/106.
BRASIL – Portal do Governo Federal. (2013). Setores da Economia: Comércio e Serviços. Disponível em:
<http://www.brasil.gov.br/sobre/economia/setores-da-economia/comercio-e-servicos>. Acessado em: 10 de
mar. 2013.

179
BRONZE JR., J. C. F. et al. O setor hoteleiro e o Marketing de Relacionamento: um estudo de caso na cidade de Belo
Horizonte – Minas Gerais, Brasil. Turismo & Sociedade, v. 5 (2): 489-506, out. 2012.
CASTELLS, M. (2001). O informacionalismo e a sociedade em rede. In: P. HIMANEN, A ética dos hackers e o espírito da era
da informação. Rio de Janeiro, Ed. Campus.
CASTELLS, M. (2007). A sociedade em rede. 11ª ed. São Paulo/Brasil: Paz e Terra.
CHURCHILL Jr., G. A. (1987). Marketing research: methodological foundations . Chicago: The Dryden Press.
CHURCHILL Jr., G. A. & PETER, J. P. (2005). Marketing: criando valor para os clientes. 2. ed. São Paulo: Saraiva.
CNS – Confederação Nacional de Serviço. Boletim de Conjuntura. Disponível em:
<http://www.cnservicos.org.br/documentos/economia/002/Dezembro_2012.pdf>. Acesso em 02 fev. 2013.
CORRÊA, H. L. & CAON, M. (2002). Gestão de serviços: lucratividade por meio de operações e de satisfação dos clientes . São
Paulo: Atlas.
GIL, A. C. Gestão de Pessoas. São Paulo/Brasil: Atlas. 2009.
GRÖNROOS, C. (2009). Marketing: gerenciamento e serviços. Rio de Janeiro/Brasil: Elsevier.
GRÖNROOS, C. (1982), Strategic Management and Marketing in the Service Sector, Helsingfors: Swedish School of
Economics and Business Administration.
HOFFMAN, K. D. et al. (2009). Princípios de Marketing de Serviços. 3ª ed. São Paulo/Brasil: Cengage Learning,
KENN, A. (2009). O culto do amador. Rio de Janeiro/Brasil: Zahar.
KOTLER, P., HAYES, T. & BLOOM, P. N. (2002). Marketing de Serviços Profissionais: estratégias inovadoras para impulsionar
sua atividade, sua imagem e seus lucros. 2ª ed. Barueri/Brasil: Manole.
LEWIS, R. C. & BOOMS, B. H. (1983) The Marketing Aspects of Service Quality, in Emerging Perspectives on Services
Marketing. Chicago: American Marketing, 99-107.
LOVELOCK, C. & WRIGHT, L. (2003). Serviços, Marketing e Gestão. São Paulo/Brasil: Saraiva.
LOVELOCK, C., WRIGHT, L. & HEMZO, M. A. (2011). Marketing de Serviços: pessoas tecnologia e Estratégia. São
Paulo/Brasil: Prentice Hall.
MCCARTHY, E. J. & PERREAULT JR., W. D. (1997). Marketing Essencial: Uma abordagem gerencial e global. São Paulo: Atlas.
NEVES, J. A. D. & MOTA, M. O. Estratégias de Marketing de Serviços Religiosos em Fortaleza. Revista de Administração da
UNIMEP, v. 6 (2), mai./ago. 2008.
OLIVER, R. L. (1997). Satisfaction: A Behavioral Perspective on the Consumer. Singapura: McGraw-Hill.
PAIVA, K. C. M. & COUTO, J. H. (nov./dez. 2008). Qualidade de vida e estresse gerencial “pós -choque de gestão”: o caso da
Copasa-MG. Revista de Administração Pública – RAP, v. 42 (6): 1189-211, Rio de Janeiro, RJ/Brasil.
PARASURAMAN, A., ZEITHAML, V. A. & BERRY, L. L. (1988). SERVQUAL: A Multiple-Item Scale for Measuring Consumer
Perceptions of Service Quality. Journal of Retailing, v. 64, n. 01, p. 12-37, Spring.
PARASURAMAN, A., ZEITHAML, V. A. & BERRY, L. L. (1985). A Conceptual Model of Service Quality and Its Implications for
Future Research. Journal of Retailing, v. 49, p. 41-50, Fall.
QUEIROZ, R. G. & CKAGNAZAROFF, I. B. (2009). Inovação no setor público: uma análise do Choque de Gestão (2003-2010)
sob a ótica dos servidores e dos preceitos teóricos envoltos à temática inovação no setor público. XXXII Encontro
da ANPAD – EnANPAD. São Paulo, SP/Brasil.
RODRIGUES, M. A. et al. (2008). Choque de Gestão, certificação ocupacional e competências: o caso do estado de Minas
Gerais. Encontro de Administração Pública e Governança – EnAPG. Salvador, BA/Brasil.
SEBRAE – Serviço de Brasileiro de Apoio às Micro e Pequenas Empresas. Disponível em:
<http://www.sebraemg.com.br/geral/dica_det.aspx?coddica=1&codigo=164&navegacao=dicas/atendimento_ao
_cliente/como_atender_bem_o_cliente>. Acesso: 12 fev. 2013.

180
SILVA, J. M. C. Dimensões mais relevantes da qualidade percebida por parte dos alunos em serviços prestados por uma
instituição de ensino superior: o caso do curso de Medicina do Unifeso. Dissertação (Mestrado em Administração
e Desenvolvimento Empresarial) – Universidade Estácio de Sá, Rio de Janeiro, 2009, 213f.
SPILLER, E. S. et al. (2004). Gestão de Serviços e marketing interno. Rio de Janeiro/Brasil: FGV.
TACHIZAWA,T (Org.). Gestão com Pessoas: Uma abordagem aplicada às estratégicas de negócios. 3ª ed.. Rio de
Janeiro/Brasil: FGV, 2004.
THEODORAKIS, N., KAMBITSIS, C., LAIOS, A. & KOUSTELIOS, A. (2001). Relationship between measures of service quality
and satisfaction of spectators in Professional sports. Managing Service Quality, v. 11, n. 6, p. 431-438.
TROCCOLI, I, & GUERRA, L. A. R. Emoções e Responsabilidades Compartilhadas: relevância em um modelo de prestação de
serviços baseado na ótica relacional. Reuna, Belo Horizonte, v. 17 (1): 47-60, Jan./Abr. 2012.
URDAN, F. & URDAN, A. (2006). Gestão do composto de Marketing. São Paulo/Brasil: Atlas.
VIEIRA, P. R. C., TROCCOLI, I. R. & SILVA, J. M. C. Percepções de clientes de ensino superior: um estudo de validação de
escala. Revista ADM. MADE, Rio de Janeiro, ano 12, v. 16 (1): 45-68, jan./abr., 2012.
ZEITHAML, V. A. & BITNER, M. J. (2003). Marketing de Serviços: a empresa com foco no cliente. 2ª ed. Porto Alegre/Brasil:
Bookman, 2003.

181
Territorial Marketing: a key concept for the
planning and management of cities Marketing Territorial, Marketing das Cidades, Sustentabilidade, Stakeholders, Marca
Teresa Aragonez, IPAM – The Marketing School, teresaaragonez@ gmail.com
Gonçalo Caetano Alves, IPAM – The Marketing School, [email protected]
Resumo
As estratégias de desenvolvimento das cidades e dos territórios têm seguido ciclos eleitorais, que em Portugal são de
quatro anos. Na elaboração dos planos estratégicos, o Marketing Territorial tem ganho destaque, sem que no entanto
houvesse fundamentação académica para isso, e sem que as estratégias fossem implementadas ou sequer concretizadas
em planos estratégicos com vista à sustentabilidade das cidades.
A motivação para este artigo prende-se com a necessidade de compreender quais as tendências da investigação académica
sobre o tema, com vista ao desenvolvimento de um modelo conceptual e à identificação de áreas promissoras de
investigação futura, construção e implementação eficaz de estratégias de Marketing Territorial.
No presente artigo faz-se uma revisão da literatura sobre Marketing Territorial recorrendo a artigos científicos, bem como
a apresentação de uma proposta de modelo conceptual com vista à elaboração de uma estratégia que indica o caminho do
sucesso das cidades que se querem sustentáveis.
Abstract
The development strategies of cities and territories have followed election cycles, which are of four years in Portugal. In
the elaboration of strategic plans, Territorial Marketing has gained prominence, however, without academic substantiation
for that and without strategies being implemented or even materialized in strategic plans aiming the sustainability of
cities.
The motivation of this paper relates with the need to understand the tendencies of academic research on Territorial
Marketing, to develop a conceptual model on it and the future of sustainable cities, identifying promising areas for future
research, construction and effective implementation of Territorial Marketing strategies.
In the present paper, we review the literature on Territorial Marketing, using scientific articles, as well as the presentati on
of a conceptual model proposal, pursuing the formulation of a strategy which indicates the path to success of cities
wanting to be sustainable.
1. Introdução
Actualmente a globalização e crescente competição entre os territórios, sejam cidades ou países, bem como a tendência de
stakeholders cada vez mais informados e exigentes fazem com que as cidades enfrentem novos desafios. É imperioso gerir
e planear a cidade de uma forma racional, promovendo e valorizando o território.
O Marketing Territorial assume, neste campo, especial relevo não só na elaboração das estratégias, mas também na
identificação das necessidades, desejos e interesses dos diferentes stakeholders, de forma a conseguir manter a cidade
competitiva, sem nunca perder de vista a qualidade de vida dos indivíduos e dos lugares.

182
Almeida (2004) diz-nos que é atribuído às Câmaras Municipais e demais instituições públicas um papel fundamental na
medida em que deles depende a criação de infra-estruturas físicas e sociais, políticas fiscais e monetárias, bem como as
políticas de investimento, industrialização, entre outras, que podem ou não agradar aos diferentes públicos-alvo.
Esta relevância é justificada pelo facto das autarquias servirem de intermediário entre os potenciais investidores e os
vários serviços autárquicos. Ou seja, os dirigentes políticos devem entender o Marketing Territorial como uma ferramenta
de enorme valor e vantagem competitiva para o planeamento e desenvolvimento de estratégias das cidades, assim como
para uma gestão urbana que se pretende mais sustentável.
No modelo que apresentamos, entende-se o Marketing Territorial como fundamental no planeamento, desenvolvimento e
gestão das cidades, em interacção com o marketing estratégico tendo como finalidade promover o desenvolvimento de
uma cidade sustentável, sempre com uma visão a longo prazo, pensando a cidade como um produto ou serviço para a qual
se ambiciona sucesso e competitividade.
Os principais beneficiários dos resultados são: a) investigadores que pretendam testar empiricamente aspectos
relacionados com o Marketing Territorial, b) políticos que pretendam desenvolver e aplicar estratégias de Marketing
Territorial, c) gestores de entidades públicas e d) agentes turísticos.
O presente artigo está estruturado por secções, sendo que na primeira é feita a apresentação dos principais objectivos do
estudo, destacando-se a importância do marketing territorial no planeamento e gestão das cidades e elaboração de planos
estratégicos. Na segunda secção é feita uma revisão da literatura com a perspectiva histórica e crítica do conceito de
marketing territorial, apresentando-se diferentes teorias. Na terceira procura-se destacar a importância da estratégia de
marketing territorial aplicada às cidades e na quarta secção procede-se à apresentação de uma proposta de modelo
conceptual à luz do Marketing Territorial. Por último, na quinta secção, apresentam-se as principais conclusões, bem como
as limitações do estudo e as considerações futuras.
2. Revisão da Literatura
2.1. Marketing Territorial – Origem e autores de referência
O conceito de Marketing Territorial foi introduzido por Kotler, Haider e Rein (1993), que apresentam uma nova
abordagem designada de Marketing Estratégico de Lugares, comparando, pela primeira vez na literatura, as cidades a um
produto. Seguiram-se os estudos e artigos de Kanter (1995), que afirma que as cidades de sucesso estão a revelar-se
centros de excelência em três C’s (conceitos, competências e conexões) e de Porter (1990 e 1995) que fala na importância
dos clusters como forma de diferenciação competitiva e da necessidade de funcionamento em rede, com o objectivo de
reforçar ligações e criar condições para a competitividade dos países.
Kotler et al (1993) defendem que o seu objectivo é o de desenhar uma comunidade que satisfaça as necessidades dos
diversos grupos de utilizadores que os autores identificam e definem como sendo são quatro grupos compostos pelos
residentes e trabalhadores, visitantes e turistas, negócios e indústria e mercados de exportação desse mesmo local. Nesta
investigação teremos como ponto de partida esta definição de público-alvo e stakeholders (residentes e trabalhadores;
visitantes e turistas; negócios e industria e mercados exportadores).
Para Kotler et al (1993) a cidade deve conquistar o apoio dos munícipes, dos líderes e das instituições, de forma a torná-los
acolhedores e receptivos aos novos desafios, bem com às novas empresas e ou investimentos que possam ser atraídos,
devendo apostar numa diferenciação e englobar a elaboração de uma estratégia de marketing adequada às características
específicas do local.
As capacidades e potencialidades das cidades não ocorrem pela sua localização. Quem o defende é Kanter (1995) na sua
publicação “World Class – Thriving Locally in the Global Economy”, que apresenta como fundamental a capacidade de
operar os três activos intangíveis – conceitos, competências e conexões. Para a autora, as cidades competitivas são aquelas
que dominam os três C’s sendo estas as formas de poder da economia global.

183
Tabela 1 – Modelo dos três C’S de Kanter
Componente do
modelo Definição
Implicações/contributos para o
marketing territorial
Conceitos Inovadores Ambiente inovador para as empresas,
cria valor para os consumidores
Competências Aplicabilidade das ideias
inovadoras, trabalho qualificado
Valor acrescentado e excelência na
mão-de-obra qualificada
Conexões Criar conexões para as redes
globais
Elo de ligação/relação com o mundo
externo e economia global, pode
funcionar como parceiro
Fonte: adaptado de Kanter, (1995)
Numa primeira referência de competição entre países e as suas vantagens competitivas, Porter (1990), na sua publicação
“The competitive advantage of nations” investiga quais os atributos de um país que contribuem para uma vantagem
competitiva relativamente às empresas que se estabelecem nesse território. Porter (1990) afirma que nenhum país é
competitivo em todas as áreas de negócio, ou seja, cada nação é competitiva apenas em determinadas áreas, as quais são as
características específicas que determinam essa vantagem. O autor defende que existem quatro atributos que um país
deverá ter de forma a moldar o ambiente no qual as suas empresas competem e que são vitais para promover ou impedir a
criação de vantagem competitiva. Os atributos são as condições de factores (são criados e não herdados), as condições da
procura (a exigência dos consumidores), a relação entre as indústrias (o trabalho em rede), e a rivalidade, estrutura e
estratégia das empresas (competição aumenta a produção e grau de inovação).
2.2. Desenvolvimento de Políticas de Marketing
A evolução ao nível económico e social resultou no desenvolvimento de um novo conceito de marketing que orienta
estratégias no sentido da satisfação das necessidades e desejos dos consumidores, mas que exige uma maior preocupação
das sociedades modernas em diversos aspectos, nomeadamente na actuação ambiental e responsabilidade social das
organizações (Salgado e Leitão, 2011).
Ramos (2003) afirma que um planeamento estratégico de marketing proporciona às cidades instrumentos e
oportunidades para estarem à altura do desafio, quer ao nível da atracção como da fixação. Para o autor, no actual
ambiente competitivo o Marketing Territorial funciona como uma mais-valia ao nível da divulgação de uma imagem de
forma a atingir o público-alvo identificado, defendendo a necessidade de uma nova abordagem em termos de planeamento
das cidades, sendo exigido um reposicionamento dos espaços urbanos de forma a conseguirem sistemas territoriais
competitivos por efeitos de proximidade geográfica, bem como através de parcerias ao nível social, político, institucional
ou económico.
De acordo com Rodríguez (2006) o marketing das cidades surgiu como resposta a uma problemática, comum a várias
cidades, que se prende com o facto de depois de diversos anos de esplendor, com registos de enorme crescimento,
registar-se uma situação de estagnação. Esse forte crescimento, registado em décadas anteriores, pode ser caracterizado
pela falta de planeamento, dando origem a cidades desorganizadas, com reduzidos ou inexistentes espaços verdes e
diversos congestionamentos de trânsito, tendo em conta os traçados das vias públicas.
Garcia (2010) apresenta a distinção entre as cidades tradicionais - que se preocupam com a expansão periférica, a qual se
manifesta no crescimento de diversos tipos de edifícios na procura de bons acessos e infra-estruturas para atrair mais
população – e as cidades modernas – geridas para satisfazer as necessidades dos clientes e utentes, empresas e
investidores públicos e privados, ou visitantes, proporcionando uma maior interacção entre sector público e privado.
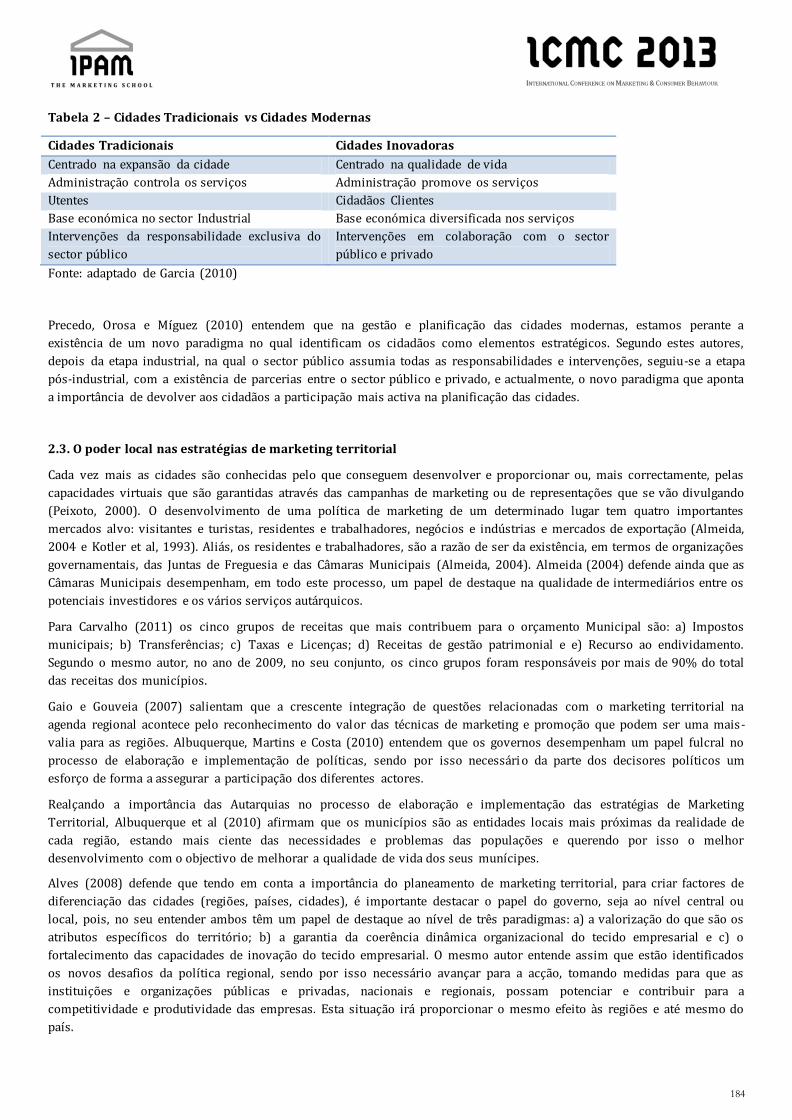
184
Tabela 2 – Cidades Tradicionais vs Cidades Modernas
Cidades Tradicionais Cidades Inovadoras
Centrado na expansão da cidade Centrado na qualidade de vida
Administração controla os serviços Administração promove os serviços
Utentes Cidadãos Clientes
Base económica no sector Industrial Base económica diversificada nos serviços
Intervenções da responsabilidade exclusiva do
sector público
Intervenções em colaboração com o sector
público e privado
Fonte: adaptado de Garcia (2010)
Precedo, Orosa e Míguez (2010) entendem que na gestão e planificação das cidades modernas, estamos perante a
existência de um novo paradigma no qual identificam os cidadãos como elementos estratégicos. Segundo estes autores,
depois da etapa industrial, na qual o sector público assumia todas as responsabilidades e intervenções, seguiu-se a etapa
pós-industrial, com a existência de parcerias entre o sector público e privado, e actualmente, o novo paradigma que aponta
a importância de devolver aos cidadãos a participação mais activa na planificação das cidades.
2.3. O poder local nas estratégias de marketing territorial
Cada vez mais as cidades são conhecidas pelo que conseguem desenvolver e proporcionar ou, mais correctamente, pelas
capacidades virtuais que são garantidas através das campanhas de marketing ou de representações que se vão divulgando
(Peixoto, 2000). O desenvolvimento de uma política de marketing de um determinado lugar tem quatro importantes
mercados alvo: visitantes e turistas, residentes e trabalhadores, negócios e indústrias e mercados de exportação (Almeida,
2004 e Kotler et al, 1993). Aliás, os residentes e trabalhadores, são a razão de ser da existência, em termos de organizações
governamentais, das Juntas de Freguesia e das Câmaras Municipais (Almeida, 2004). Almeida (2004) defende ainda que as
Câmaras Municipais desempenham, em todo este processo, um papel de destaque na qualidade de intermediários entre os
potenciais investidores e os vários serviços autárquicos.
Para Carvalho (2011) os cinco grupos de receitas que mais contribuem para o orçamento Municipal são: a) Impostos
municipais; b) Transferências; c) Taxas e Licenças; d) Receitas de gestão patrimonial e e) Recurso ao endividamento.
Segundo o mesmo autor, no ano de 2009, no seu conjunto, os cinco grupos foram responsáveis por mais de 90% do total
das receitas dos municípios.
Gaio e Gouveia (2007) salientam que a crescente integração de questões relacionadas com o marketing territorial na
agenda regional acontece pelo reconhecimento do valor das técnicas de marketing e promoção que podem ser uma mais-
valia para as regiões. Albuquerque, Martins e Costa (2010) entendem que os governos desempenham um papel fulcral no
processo de elaboração e implementação de políticas, sendo por isso necessári o da parte dos decisores políticos um
esforço de forma a assegurar a participação dos diferentes actores.
Realçando a importância das Autarquias no processo de elaboração e implementação das estratégias de Marketing
Territorial, Albuquerque et al (2010) afirmam que os municípios são as entidades locais mais próximas da realidade de
cada região, estando mais ciente das necessidades e problemas das populações e querendo por isso o melhor
desenvolvimento com o objectivo de melhorar a qualidade de vida dos seus munícipes.
Alves (2008) defende que tendo em conta a importância do planeamento de marketing territorial, para criar factores de
diferenciação das cidades (regiões, países, cidades), é importante destacar o papel do governo, seja ao nível central ou
local, pois, no seu entender ambos têm um papel de destaque ao nível de três paradigmas: a) a valorização do que são os
atributos específicos do território; b) a garantia da coerência dinâmica organizacional do tecido empresarial e c) o
fortalecimento das capacidades de inovação do tecido empresarial. O mesmo autor entende assim que estão identificados
os novos desafios da política regional, sendo por isso necessário avançar para a acção, tomando medidas para que as
instituições e organizações públicas e privadas, nacionais e regionais, possam potenciar e contribuir para a
competitividade e produtividade das empresas. Esta situação irá proporcionar o mesmo efeito às regiões e até mesmo do
país.

185
Todavia, Alves (2008) alerta para um facto relevante, afirmando que este objectivo só será alcançável com o
desenvolvimento e implementação de políticas inovadoras, apoiadas em redes de conhecimento. Lourenço (2011) defende
que a gestão e a promoção do território foram, desde sempre, um dos principais focos da organização s ocial e política,
principalmente pela forte influência no modo de vida e pelo impacto no crescimento e desenvolvimento dos locais.
Contudo, e apesar do pensamento consensual da importância das marcas no mundo empresarial, Correia e Brito (2011)
afirmam que é recente a preocupação dos municípios portugueses desenvolverem o seu trabalho com uma orientação para
o mercado.
Para a construção de uma marca é necessária consistência bem como o desenvolvimento de um trabalho de gestão feito de
forma continuada. Um trabalho que Correia e Brito (2011) entendem não ser de fácil execução para as Autarquias uma vez
que a maioria delineia as estratégias de acordo com os ciclos políticos, ou mudanças de executivo, situação que dificulta
um dos principais objectivos do Marketing Territorial que é a diferenciação dos locais. Com efeito, afirmam que para que
este objectivo seja alcançado é imperioso que o factor diferenciação assente em valores que consigam gerar o
envolvimento de todos os agentes territoriais.
Para os autores, as marcas que não tenham definido os seus valores de uma forma clara e exacta, não vão alcançar um
relacionamento eficaz com os turistas. Com efeito, defendem ser indispensável que as cidades ou regiões saibam
identificar quais os valores que vão integrar a sua identidade que será depois divulgada de forma a criar uma determinada
imagem desse mesmo local junto dos stakeholders.
Carvalho (2011) identifica a flexibilidade das organizações municipais, como um factor determinante para a governação
local. A complexidade de uma organização é caracterizada pela diversidade e necessidade de estabelecer, de forma
constante, múltiplas relações com diversas entidades quer com os cidadãos, na qual a sedimentação cultural e peso da
história local agudizam os vectores já de si habitualmente complexos.
2.4. Stakeholders activos na elaboração da estratégia
Elizagarate (2007) partilha da opinião de Kotler et al (1993), defendendo a necessidade de ir mais além da promoção do
espaço, procurando entender as necessidades dos clientes, dos cidadãos, das empresas, dos investidores públicos e
privados, dos visitantes, porque isso permite fomentar uma maior interacção entre o poder local e o sector privado, de
forma a conseguir unir sinergias na defesa do interesse público e da comunidade.
Para Precedo et al (2010), os actuais instrumentos da planificação estratégica mostram-se insuficientes para poder
enfrentar os novos desafios das cidades. Os autores defendem ser necessário procurar ferramentas inovadoras, nas quais
atribuem ao marketing das cidades especial destaque, pois afirmam que o posicionamento externo constitui um ponto
importante na internacionalização das economias urbanas neste novo cenário global.
Defendendo a mesma ideia da necessidade da participação activa dos diferentes stakeholders, Cidrais (2006) afirma que
uma estratégia valiosa deverá assentar no desenvolvimento de modelos participativos e auto-consciencializadores, que
visem a promoção do bem-estar e desenvolvimento sustentável. Para Cidrais (2006) o envolvimento de todos os
stakeholders permite a construção de uma base de envolvimento que possibilita aos territórios mais vantagens e poder
pois quando as organizações e as pessoas, com especial destaque para os seus líderes, criam mecanismos de construção e
aproveitamento da capacidade criativa, envolvendo todos os parceiros, reforçam os laços de relacionamento, as redes e as
trocas.
Metaxas (2010) argumenta que a atracção de investimentos estrangeiros directos constitui, actualmente, um dos
principais objectivos dos países ou cidades. Na nova economia global, Metaxas (2010) afirma que o papel do planeamento
estratégico, bem como do marketing e branding local assumem cada vez mais relevância, defendendo, todavia, que se trata
de processos diferentes que abrangem diferentes metodologias e técnicas.
2.5. A competitividade das cidades e dos territórios
Na actual economia, para que as cidades e países consigam ser competitivas e desta forma conseguirem atrair as empresas
e o capital, têm que orientar a sua estratégia na união dos factores tradicionais, como os recursos naturais e a mão-de-
obra, com os factores decorrentes da globalização, o conhecimento e a inovação (Alves, 2008). O autor defende que da
união dos factores nasce o chamado paradigma de competitividade dos territórios e que estes devem apostar no que têm

186
em específico, que não possa ser facilmente transferível, abdicando da tradicional diferenciação territorial do mercado
assente no factor crítico de distância.
Alves (2008) refere que a competitividade assume, cada vez mais, um papel determinante para o futuro dos territórios,
sendo que essa competitividade se alterou em quatro vertentes: a) competitividade acontece à escala global; b)
competitividade entre empresas proporciona o aumento da inovação; c) inovação é fruto da dinâmica da informação
cruzada entre o conhecimento codificado e conhecimento técnico e d) globalização dos mercados bem como o aumento da
concorrência contribuem para o aumento da capacidade organizacional do território e potencia a dinâmica da região.
Elizaragate (2006) afirma que a origem do conceito de competitividade das cidades não é urbano, na medida em que o seu
início reside no paradigma da competitividade empresarial e das nações defendido por Porter, sendo por isso cada vez
mais importante que as cidades identifiquem os seus concorrentes, que efectuem análise da sua vantagem competitiva, de
forma a conseguirem aumentar o crescimento, a rentabilidade económica e social.
Na opinião de Cidrais (2006) o desenvolvimento da estratégia de competitividade assenta em quatro linhas de orientação
como a focalização em áreas específicas de oferta; a construção de uma rede de contactos e de aprendizagem; a
governação ágil e distribuída segundo os princípios da subsidiariedade, parceria, cidadania e autonomia empreendedora e
a construção e desenvolvimento de capital social. De acordo com o mesmo autor, esta abordagem pressupõe uma sincronia
estratégica de carácter territorial que é alcançada, habitualmente, pelo chamado projecto territorial ou projecto cidade, um
sistema de diagnóstico, negociação e planeamento que assenta na instituição de combinações entre os diversos actores.
2.6. A marca das cidades
Kotler e Armstrong (2007) e Brito (2008) defendem que as marcas são mais do que nomes e símbol os. Para os autores as
marcas são um elemento fundamental nas relações com os consumidores, que representam as percepções e os
sentimentos destes para com o produto e o seu desempenho, ou seja, é tudo o que o produto significa para os
consumidores.
Os autores afirmam que o valor real da marca forte é exactamente o poder que esta tem em conquistar a preferência e a
fidelidade dos consumidores. Kotler e Armstrong (2007) e Nilson (1998) estão de acordo ao afirmarem que uma marca
competitiva é uma marca de sucesso, sendo também a base para o desenvolvimento de sólidos e lucrativos
relacionamentos com o cliente.
Para Martins (2007) o trunfo das marcas de sucessos está na base da associação da essência do produto com a emoção
existente no imaginário colectivo. Para o autor, todos os produtos ou serviços são relacionados a um espirito natural,
resultado da associação entre imagens e sentimentos presentes no inconsciente do consumidor. Existe uma predisposição
natural dos consumidores em atribuir mais valor ao que os agrada. Ou seja, se as marcas forem compostas por elementos
emotivos adequados ao seu posicionamento, os restantes factores que envolvem a marca vão agregar uma maior
percepção do seu valor. O autor conclui que falar em marcas é falar em emoção, na medida em que os produtos são
racionais mas as marcas evocam sentimentos e ligações que, em determinadas situações, levam o consumidor a optar por
determinado produto ou serviço sem ter grande explicação para a sua escolha.
Na mesma linha de pensamento, Atkin (2008) afirma que existem poucas emoções mais fortes do que a necessidade de
pertencer e de criar um sentido, sendo que cabe às marcas explorar essa necessidade. Barbosa (2006) afirma que a
estratégia de marca para uma cidade implica um plano, de longo prazo, obedecendo a uma visão estratégica para o futuro
dessa mesma cidade. Para o autor a visão deve ser traduzida em objectivos e acções que devem ser comunicadas aos
diferentes stakeholders e segmentos de mercado identificados pela cidade.
Para Lencastre e Côrte-Real (2007) a marca assenta em três pilares entendidos como fundamentais que são: o pilar da
identidade (engloba os sinais de identidade da marca, tal como são entendidos na definição Jurídica, e das marcas que a ele
estão associadas), o pilar do objecto (engloba as diferentes ofertas da marca, a organização e acções de marketing que as
suportam) e o pilar do mercado (engloba os públicos-alvo e as suas diferentes respostas à marca).
Margarida (2000) defende que a marca permite que o consumidor possa comunicar quem é ou quem pretende ser, bem
como a possibilidade de se definir a si próprio, ocupando assim a função de personalização. Para o autor a marca permite
ao consumidor retirar prazer das suas escolhas, adquirindo uma função lúdica. O autor conclui que se o valor da marca for

187
elevado consegue exercer, de forma mais eficiente, as suas funções tornando-se numa situação mais vantajosa para o
consumidor.
2.7. A identidade da marca das cidades
A identidade de uma marca concede-lhe sentido, finalidade e significado, quem o afirma é Aaker (2007, p.74), que defende
ainda que “a identidade de uma marca é um conjunto exclusivo de associações com a marca que o estratega de marcas
ambiciona criar ou manter. Essas associações representam aquilo que a marca pretende realizar e implicam uma promessa
aos clientes feita pelos membros da organização”.
Para o autor a identidade da marca deve ajudar a estabelecer um relacionamento entre a marca e o cliente, através de uma
proposta de valor que deverá envolver benefícios funcionais, emocionais e de auto-expressão. De acordo com Aaker
(2007) a identidade de uma marca consiste em 12 dimensões organizadas sob as quatro perspectiva de marca como
produto, como organização, como pessoa e como símbolo.
Aaker (2007) afirma que a estrutura da identidade da marca inclui uma identidade central e outra expandida, sendo a
identidade central a essência atemporal da marca, ou seja, é mais viável de se manter constante à medida que a marca se
desloca para novos mercados e produtos. Por sua vez a identidade expansiva inclui os elementos da identidade da marca,
que se encontram organizados em agrupamentos que se querem coesos e significativos, para desta forma proporcionarem
a textura e integridade da marca. O autor salienta ainda que a posição da marca é a fracção da identidade e da proposta de
valor, sendo que esta deve ser comunicada activamente aos consumidores apresentando uma vantagem em relação às suas
concorrentes.
Tabela 3 – Imagem, identidade e posição da marca
Imagem da marca Como é actualmente percebida pelo público
Identidade da marca Como se pretende que a marca seja percebida
Posição da marca A parcela da identidade de valor da marca que
deve ser comunicada aos consumidores
Fonte: adaptado de Aaker (2007)
2.8. O valor da marca das cidades
O valor da marca começa, segundo Rodríguez (2006) a ser desenvolvido na década de 80, dando assim início a duas
correntes distintas entre si, sendo que uma defende a vertente mais financeira, dando especial destaque ao valor para a
empresa ou organização possuidora da marca, e outra de natureza mais focalizada nos clientes, que analisa o impacto nas
suas atitudes e comportamentos.
Nesta investigação partimos do pressuposto que irá para além do valor financeiro e seguimos a definição de Keller (1998)
que sustenta que o valor da marca é o efeito diferencial que o conhecimento desta tem sobre a resposta do consumidor à
marca em causa. Ou seja, a marca é possuidora de valor quando o consumidor reage de modo diferente pelo facto de estar
na presença desta.
Para Aaker (2007) a proposta de valor de uma marca é uma afirmação dos benefícios funcionais, emocionais e de auto -
expressão que são oferecidos pela marca e que proporcionam valor ao cliente. Essa proposta de valor deve encaminhar
para um relacionamento marca – cliente e impulsionar as decisões de escolha.
Fetscherin (2010) defende que um país ou região com uma marca forte pode ter como vantagem o aumento das
exportações, bem como conseguir atrair o turismo e o investimento, afirmando que se relevou um ponto fundamental para
o desenvolvimento sustentável de um país desenvolvido. Trata-se de um processo complexo que envolve vários níveis,
componentes e áreas de actuação, sendo por isso indispensável a existência de um envolvimento colectivo nesta mes ma
gestão.
Ashworth e Kavaratzis (2009) afirmam que a marca das cidades é cada vez mais um trunfo importante para o
desenvolvimento e uma ferramenta eficaz para as cidades se destacarem das demais concorrentes e reforçarem o seu

188
posicionamento. Contudo, estes autores referem que na prática existe uma confusão entre uma estratégia de marca e o
design de um novo logotipo ou slogan, que é apenas um dos seus componentes.
Brito (2008) defende que existem três fontes de valor da marca que merecem destaque:
Tabela 4 – Fontes de valor da marca
Notoriedade Depende do nível de presença o espírito do cliente, resultando em larga medida do sentimento de
familiaridade que proporciona
Imagem
Ou conjunto de “percepções que o consumidor faz dela (Keller, 1993, p.3, como c itado por Brito,
2008, p. 6). A força da marca depende quer da quantidade quer da qualidade de informação sobre
a marca que é dada ao cliente
Fidelidade ou
Envolvimento
Acontece com a atitude de ligação. Mais do que repetir a compra, o cliente revela uma atitude
positiva em relação a ela.
Fonte: Adaptado de Brito (2008)
Gaio e Gouveia (2007) referem que através da marca territorial pode-se fomentar a atractividade, a conquista de confiança
e a credibilidade da cidade, posicionando-a e contribuindo para uma dinâmica de desenvolvimento. Face aos novos
paradigmas de competitividade, as cidades sem capacidades para se posicionarem no mercado e enfrentar os novos
desafios entram em declínio, saindo vitorioso o território que aplicar correctamente as ferramentas de marketing.
Garcia (2009) adianta que as cidades promovem a imagem a partir do marketing territorial com o objectivo de despertar
interesse do cliente para que os visitem. Segundo a autora, as cidades podem criar necessidades sociais a partir da
indústria cultural e da capacidade para definir imagens virtuais na mente dos consumidores, levando os diferentes púbicos
alvos a interessar-se pelo seu espaço e atraídos por essa imagem criada decidir-se a visitar o território, defendendo que os
produtos territoriais são imagens percebidas pelos actores e agentes sociais, que são posteriormente difundidos, sem
esquecer o contributo das novas tecnologias de comunicação e informação e que o marketing territorial é uma ferramenta
extremamente valiosa.
2.9. O posicionamento da marca das cidades
Reis e Trout (2009, p. 16) afirmam que o posicionamento não é o que é feito com o produto mas sim o que se consegue
fazer com a mente do potencial cliente, ou seja, a forma como conseguimos posicionar o produto na mente do c onsumidor.
Os autores defendem que este “é o primeiro sistema de pensamento que dá conta da dificuldade de se fazer ouvir na
sociedade super comunicativa”. Kotler e Armstrong (2007) vão mais longe e defendem que as marcas fortes vão além do
posicionamento por atributos ou benefícios uma vez que se posicionam sobre fortes crenças e valores. Para os autores, as
marcas incorporam uma forte carga emocional e envolvem os seus clientes a um nível mais profundo e emocional e no
processo de posicionamento da marca deve ser definida uma missão e uma visão do que deve ser e fazer, ou seja, do que
pretende representar. Os autores entendem que a marca é a promessa do fornecimento consistente de um conjunto
específico de características, benefícios, serviços e experiências. Esta promessa da marca deve ser simples e honesta, ou
seja, não deve prometer o impossível.
Caetano e Rasquilha (2010) entendem que o posicionamento corresponde à definição da forma como a marca pretende ser
percepcionada na mente do consumidor, sendo para isso necessário: a) Temos o objectivo de satisfazer as suas
necessidades; b) Pretendemos superar as suas expectativas e c) Faremos melhor que as alternativas existentes.
Para Rodríguez (2006) o posicionamento da cidade segue um processo idêntico à da imagem, sendo por isso necessário ter
em linha de conta as posições de outras cidades concorrentes. Ou seja, deve partir-se da análise do actual posicionamento,
e uma vez conhecido esse posicionamento importa identificar igualmente o posicionamento ideal dos diferentes
stakeholders, decidindo assim como se deve situar a cidade.
Simões e Carneiro (2010) defendem que o processo de posicionamento das cidades tem como objectivo distinguir, na
mente dos potenciais consumidores, um local em relação aos seus concorrentes, fazendo assim com que o “nosso” local
seja reconhecido como superior aos seus concorrentes.

189
3. Proposta de modelo conceptual
Este modelo pretende ser uma ferramenta de trabalho para todos os dirigentes locais, no sentido da criação de um
documento explicativo e de orientação estratégica, de forma a evitar que as cidades se desenvolvam apenas de acordo com
os ciclos eleitorais (que em Portugal são de quatro anos). Pretende-se que seja um documento de trabalho, com
aplicabilidade pratica mas suportado pelos contributos académicos, devendo contudo ir sofrendo as alterações necessárias
de acordo com a envolvência e possíveis aspectos externos. Entende-se que este modelo é um contributo para o trabalho
de planeamento e desenvolvimento das cidades, numa junção de várias teorias e conceitos, de forma a guiar e orientar o
crescimento e desenvolvimento das cidades sustentáveis e competitivas.
Com um competente planeamento e a elaboração prévia de uma estratégia, as cidades que adoptarem este modelo
conceptual (que poderá ter adaptado à realidade local) tenderá a ser mais sustentável e competitiva com as demais rivais,
proporcionando maior qualidade de vida aos seus cidadãos, bem como criar melhores condições às empresas e negócios
atraindo novos públicos-alvo de acordo com os objectivos delineados na estratégia. Entendemos que este modelo pode
contribuir para uma gestão e utilização mais eficiente e racional dos recursos e potencialidades dos lugares, trazendo uma
mais-valia no âmbito do Marketing Territorial e às cidades que elaborarem uma estratégia ou documento de trabalho
tendo como base este modelo.
Figura 1 - Proposta de Modelo Conceptual
Fonte: elaboração própria

190
Tabela 5 - Explicação do modelo
Componente do modelo Definição Autores que referem esta
componente
Marketing Territorial e
Estratégico aplicado aos
países, Cidades e Lugares
Planear e desenvolver estratégias de marketing
tornando as cidades competitivas e apelativas de
forma a satisfazer as necessidades dos públicos-alvo,
numa linha de orientação das cidades sustentáveis e
de sucesso
Koltler et al (1993), Kanter (1995),
Garcia, 2010), Porter (1990 e
1995), Almeida (2004), Elizagarate
(2007), Metaxas (2010) e Garcia
(2009)
Definição de:
- Visão; Missão;
Posicionamento;
Identidade; Valores
Entender a cidade, conceitos bem definidos e
posicionamento e imagem concretos que se pretende
transmitir
(Kotler et al, 1993), Kanter (1995),
Garcia (2010), Precedo et al
(2010), Garcia (2009), Elizagarate
(2007),
Plano estratégico da
cidade
Documento de trabalho das autarquias com as linhas
orientadoras de acção na vertente do
desenvolvimento e planeamento da cidade
Orientação para o
mercado
Estratégias delineadas e orientadas para o mercado
das cidades
Kotler et al (1993), Garcia (2010),
Kanter (1995),
Cidade como produto ou
serviço
Sem esquecer a qualidade de vida, ser trabalhada
como um produto a vender ou serviço a
disponibilizar
Garcia (2010), Precedo et al
(2010), Kotler et al (1993)
Satisfação das
necessidades do mercado
e públicos-alvo
Criar condições para que as necessidades do
mercado e públicos-alvo (residentes e trabalhadores,
visitantes e turistas, negócios e indústria e mercados
de exportação) sejam satisfeitas de forma garantir e
atrair públicos.
Elizagarate (2007), Kotler et al
(1993), Garcia (2010),
Definição dos mercados
alvo estratégicos para a
cidade
Identificar, com base nas vantagens competitiva das
cidades quais os mercados e públicos-alvo (são
residentes e trabalhadores, visitantes e turistas,
negócios e indústria e mercados de exportação) para
os quais devemos trabalhar
Porter (1990 e 1995), Kanter
(1995), Almeida (2004),
Fetscherin (2010), Elizagarate
(2007)
Marketing interno e
externo
Acções de marketing para atrair novos públicos mas
também manter para os que já estão na cidade
(residentes e trabalhadores, visitantes e turistas,
negócios e indústria e mercados de exportação)
Cidade competitiva,
economicamente
sustentável e conceituada
Cidade moderna, sustentável e competitiva (Elizagarate, 2007), Kanter (1995),
Porter (1990 e 1995), Precedo et
al (2010)
4. Conclusões
É necessário que os governos (Regionais e Nacionais) entendam a importância da correcta elaboração de um plano
estratégico com base na ferramenta de marketing territorial bem como do desenvolvimento de um projecto para uma
cidade, que se quer vencedora e competitiva, não poder incluir unicamente a promoção do espaço em concreto.
É essencial criar condições para que as empresas, trabalhadores e demais stakeholders se apaixonem pela cidade e
queiram viver, trabalhar ou investir nela, gerando assim uma vantagem competitiva em relação às demais concorrentes.
Porém, não se pode cair no erro de apenas idealizar uma estratégia. Ao desenvolver as estratégias para uma cidade é
necessário perceber essa mesma cidade, recorrendo a uma análise e avaliação de todas as suas características, não só a

191
nível económico mas também demográficas e culturais. É necessário fazer uma análise SWOT, definindo bem as suas
ameaças e oportunidades e os pontos fracos e fortes. É preciso tratar a cidade como um produto que precisa de ser
desejado pelos consumidores.
O marketing das cidades deve apostar numa diferenciação e englobar a elaboração de uma estratégia de marketing
adequada às características específicas do lugar, o estabelecimento de incentivos que possam manter os actuais e captar
novos compradores e utilizadores, trocando os produtos e serviços da cidade de um modo eficiente e acessível e
promovendo os valores e a imagem da cidade, salientando as suas vantagens distintivas aos potenciais Stakeholders.
Na vertente financeira, é preciso ter uma abordagem das cidades de uma forma mais racional, destacando-se a necessidade
de adoptar estratégias economicamente racionais eliminando os custos incomportáveis de abordagens anteriores. O actual
endividamento das autarquias portuguesas aponta exactamente nessa necessidade, pelo que a elaboração ou actualização
dos existentes planos estratégicos das cidades podem funcionar como uma mais-valia para os territórios no sentido de ser
tornarem mais competitivos e sustentáveis.
Pensar a cidade como um produto para o qual é ambicionado o sucesso e competitividade é, no nosso entender, a forma
mais correcta de, num mundo cada vez mais competitivo e global, criar e gerir cidades vencedoras e sustentáveis. O
Marketing territorial é uma poderosa ferramenta de trabalho que deverá estar presente nas estratégias de
desenvolvimento e planeamento das cidades, sejam elas grandes aglomerados populacionais ou “pequenas maravilhas” da
natureza. Identificar as vantagens competitivas e apostar naquelas que mais se destacam e maior valor podem trazer à
cidade, será a estratégia correcta para gerir e desenvolver cidades modernas que se querem competitivas e sustentáveis.
As principais limitações deste artigo prendem-se com as suas características apenas teóricas bem como a limitada revisão
que deverá ser mais consistente nas áreas específicas que estão a ser estudadas, especialmente no que diz respeito ao
Marketing Territorial. Como recomendações para futuros estudos deixamos a necessidade de incluir mais autores, bem
como a possibilidade de testar o modelo numa cidade, e a realização de um estudo quantitativo.
Referências
AAKER, David (2007) “Construindo Marcas fortes”. Porto Alegre – Bookman
ALBUQUERQUE, Helena; MARTINS, Filomena e COSTA, Carlos (2010) “O Turismo como factor de Gestão Integrada da Ria
de Aveiro”. Revista Turismo e Desenvolvimento, nº 13/14, pág. 163-174
ALMEIDA, Clarinda. (2004) “Marketing das cidades”. Revista de Gestão e Desenvolvimento, nº 12, pág. 9-45
ALVES, António (2008) “ A competitividade dos territórios num contexto de globalização: Uma estratégia ou uma
realidade?”. VI Congresso Português de Sociologia – Universidade Nova de Lisboa – Faculdade de Ciências Sociais
e Humanas, 25 a 28 de Junho
ASHWORTH, Gregory e KAVARATZIS, Mihalis (2009) “Beyond the logo: Brand management for cities”. Journal of Brand
Management, nº 16, pág. 520-531
ATKIN, Douglas (2008) “The Culting of Brands. When Customers Become True Believeis”. Edição Tinta-da-China
BARBOSA, João (2006) “Atractividade e imagem de cidades estrangeiras para a captação de turismo”. Revista Portuguesa
de Marketing, nº 19, pág. 63-75
BRITO, Carlos (2008) “Uma abordagem relacional ao valor da marca”. Working paper nº 297 – Outubro – Faculdade de
Economia, Universidade do Porto
CAETANO, Joaquim e RASQUILHA, Luís (2010) “Gestão de Marketing”. Escolar Editora – Lisboa
CARVALHO, Manuel (2011) “Gestão Pública: Um novo paradigma para a governação da Administração Local em Portugal”
– 8º Congresso Nacional de Administração Pública, 21 e 22 de Novembro, pág. 309-333
CIDRAIS, Álvaro (2006) “Marketing Territorial dos territórios inteligentes: instrumentos para uma nova visão”. Revista
Portuguesa de Marketing, nº 19, pág. 23-34
CORREIA, Ricardo e BRITO, Carlos (2011) “A importância do Marketing para o desenvolvimento turístico: O caso de
Montalegre”. Revista Turismo e Desenvolvimento, nº 16, pág. 127-143

192
ELIZAGARATE, Victoria (2006) “Estratégias de Marketing para las ciudades: El turismo y la organización de eventos em la
Europa del S. XXI”. Revista Portuguesa de Marketing, nº 19, pag 55-61
ELIZAGARATE, Victoria (2007) “Comercio y ciudad, la missión del Marketing de Ciudades en el desarollo de la
competitividade del comercio urbano”. Colección Mediterráneo Económico “nuevos enfoques del marketing e la
criacion de valor”, nº 11
FETSCHERIN, Marc (2010) “The determinants and measurement of a country brand: the country brand strength index.
International Marketing Review, Vol 27, nº 4
GAIO, Sofia e GOUVEIA, Luís, B. (2007) “O Branding Territorial: uma abordagem mercadológica à Cidade” Revista A Obra
Nasce. Edições Universidade Fernando Pessoa, pág 27-36
GARCIA, José (2010) “Marketing para ciudades: las ciudades también se venden, las ciudades también son productos".
Pensar La Publicidad, Vol IV, nº 1
GARCIA, Yolanda (2009) “La ciudad como espectáculo. Marketing territotial, iternet y atración turística en Santiago de
Compostela. Éxito o fracasso?”. Revista sobre la sociedad del conocimiento, Universitat Oberta de Catalunya, nº 6
KANTER, Rosabeth (1995) “World Class – Thriving Local in the Global Economy”. Prentice-Hall.
KELLER, Kevin (1998) “Strategic Brand Management: Building, Measuring, and Managing Brand Equity”, Pretence-Hall,
New Jersey
KOTLER, Philip e ARMSTRONG, Gary (2007) “Princípios de Marketing”. Pearson, Prentice Hall – São Paulo, 12º Edição
KOTLER, Philip; HAIDER. Donald H. e REIN, Irving. (1993) “Marketing Places – Attracting Investment, Industry, and
Tourim to Cities, States, and Nations”. Free Press, New York
LENCASTRE, Paulo e CÔRTE-REAL, Ana (2007) “Um triângulo de marca para evitar a branding miopia: contribuição
semiótica para um modelo integrado da compreensão da marca”, Organicom, ano 4 – 2º semestre, pág. 101-113
LOURENÇO, Elsa (2011) “Boas Práticas de Inovação e Planeamento em Turismo – O Caso da Golegã”. Revista Turismo e
Desenvolvimento, nº 16, pág. 175-187
MARGARIDA, Pedro (2000) “O Valor da Marca”, Revista Portuguesa de Marketing, nº 9, pág. 99-106
MARTINS, José (2007) “A natureza emocional da marca: construção de empresas ricas”. 6ª Edição – Rio de Janeiro
METAXAS, Theodore (2010) “Place Marketing, place branding and foreign direct investments: Defining their relationship
in the frame of local economic development process”. Place Branding and Public Diplomacy, nº 6, pág. 228-243
NILSON, T. (1998) “Competitive Branding”. John Wiliey@ Sons, Lda
PEIXOTO, Paulo (2000) “Gestão estratégica das imagens das cidades: Análise de mensagens promocionais e de estratégias
de Marketing Urbano”. Revista Critica de Ciências Sociais, nº 56, pág. 99-122
PORTER, Michael (1990) “The Competitive Advantage of Nations”. Harvard Business Review – Março-Abril
PORTER, Michael (1995) “The Competitive Advantage of the Inner City”. Harvard Business Review – Maio- Junho
PRECEDO, Andrés; OROSA, José e MÍGUEZ, Alberto (2010) “Marketing de ciudades y producto ciudad: una propuesta
metodológica”. Revista de Economia Pública Urbana
RAMOS, George (2003) “O Marketing e as estratégias de atractividade e sustentabilidade local”. Actas do Encontro
Nacional da Associação Portuguesa de Desenvolvimento Regional, Évora, 26 a 28 de Junho
RIES, Al e TROUT, Jack (2009) “Posicionamento: a batalha por sua mente”. São Paulo – M. Books do Brasil, Lda.
RODRÍGUEZ, P. (2006) “Marketing em Sectores Específicos”. Ediciones Piramide, Cap. 8 – Marketing das Cidades, pág.
265-299
SALGADO, Manuel e LEITÃO, Maria (2011) “Estratégias de desenvolvimento turístico da Serra da Estrela”. Revista de
Turismo e Desenvolvimento, nº 16, pág. 97-113
SIMÕES, Ana e CARNEIRO, Maria João (2010) “Posicionamento da cidade de Coimbra face a potenciais concorrentes”.
Revista Turismo e Desenvolvimento, nº 13/14, pág. 287-298

193
Session 6

194
Evaluating the use of Avatars as Sociability
Factor in e-commerce Avatars, Online Consumer Behavior, E-Commerce, Trust, Credibility, Sociability and Human Warmth
António Alves, University of Minho, [email protected]
Ana Maria Soares, University of Minho, [email protected]
Abstract
The lack of sociability and warmth of human interaction coupled with the lack of consumer trust has been identified as one
of the main obstacles to the widespread adoption of e-commerce. Such lack of trust can be largely attributed to the absence
of personal face-to-face interactions between the consumer and the seller. Personal interactions provide human contact
and create opportunities for the development of personal services in contrast with the impersonal e-commerce interaction
between the consumer and a Web server. Several studies have shown that the inclusion of social stimuli in electronic
stores increases perceived trust and credibility. These factors have a decisive impact on the adoption of purchase
behaviors and consumer loyalty.
This paper addresses the introduction of avatars (virtual characters with human characteristics created by technology) as
sociability and human warmth stimuli in e-commerce and its implications for purchase and repurchase intention. We
report an experiment with online stores with three levels of sociability. Overall, findings show that the introduction of
avatars at EC sites, particularly photo-realistic avatars, has visible practical effects in sociability and human warmth
perceptions, in trust towards the seller and in the credibility of the online store.
1. Introduction
The lack of consumer trust, particularly in the B2C segment, has been recognized as one of the greatest barriers for the
development of electronic commerce (Aldiri, Hobbs, & Qahwaji, 2010). This lack of trust can be largely attributed to the
absence of personal face-to-face interactions between the consumer and the seller. In traditional commerce, trust between
parties builds in these interactions (Aldiri et al, 2010) which constitute one of its main comparative advantages. Such
interactions provide human contact and create opportunities for the development of personal services in contrast with the
impersonal e-commerce interaction between the consumer and a Web server (Otto & Chung, 2001). E-commerce
operators have already realized that human contact is important in order to establish meaningful relationships with their
customers (Qiu & Benbasat, 2005).
The literature suggests that the use of avatars (virtual characters with human characteristics created by technology) can
increase the persuasiveness of online sales channels (Wang, Baker, Wagner, & Wakefield, 2007) by increasing their
credibility, perceived trust, and allowing for social stimuli and human warmth in online stores interactions. Consequently
avatars lead to greater consumer satisfaction with the seller, a better attitude toward the product and increased purchase
intent (Holzwarth, Janiszewski, & Neuman, 2006).
The technology now available allows equipping a website with animated 3D avatars with high level of interactivity and
multiple graphic options. Avatars can be built from real human beings images, endowed with synthesized voice through
text to speech technology (TTS), with real human voice and even with Artificial Intelligence (AI) based on a knowledge
library with tens of thousands of topics that can be tailored to the specific online store specifications. Such technology
allows consumers to engage in a two-way conversation with the virtual character and find answers in a more intuitive and
enjoyable manner.

195
In this paper, we report an experiment designed to test the impact of avatars. We compared an online store with a photo
realistic avatar endowed with real human voice, and an online store with a naturalistic avatar endowed with TTS voice,
with an online store without an avatar.
This paper is organized as follows: In the following section, we conduct a literature review about the introduction of social
factors and the use of avatars in e-commerce (E.C.). Section three presents the empirical study describing methodological
considerations and study design. Subsequently, we present the findings of the experiment. The results are discussed on
section five. Finally, we present the study’s conclusions including the implications for management, limitations and further
research directions.
2. Literature Review and hypothesis development
2.1. The introduction of social factors and the use of avatars in e-commerce
According to the literature, despite its consistent and continued growth, e-commerce is limited by the fact that many
online stores tend to produce little social or emotional appeal and can be perceived as impersonal and empty of human
warmth (Hassanein & Head, 2005/6; Holzwarth et al, 2006). Inducing the feeling of warmth and sociability on a website
can be achieved by providing means for a real interaction with other human beings (through virtual communities, forums,
chats, etc.) or stimulating imagined interactions through socially rich texts, images, custom greetings, audio and video
featuring human beings acting intelligently (Hassanein & Head, 2005/6; 2007).
Using avatars to provide consumer information about products on sale has been suggested in recent years in order to
overcome the impersonal nature, lack of sociability and lack of human warmth of internet-based retail-sale (Holzwarth et
al, 2006). The word 'avatar' has its origins in the hindu Sanskrit and in this context refers to a graphical representation
which can be animated by means of computer technology (Op. cit).
Nowak and Rauth (2005) conducted a study to evaluate avatars in a static context in terms of their androgyny,
anthropomorphism, credibility, homophilia, attraction and the possibility of being chosen during an interaction. Their
results sustain that the responses to the images were consistent with the Uncertainty Reduction Theory. According to this
theory, in an interaction, the first objective of an individual is to reduce uncertainty about the person with whom he is
interacting. The findings of this study demonstrated that the anthropomorphism as well as the masculinity or femininity of
avatars (the absence of androgyny) reduces uncertainty about the characteristics of the character represented by the
avatar and influences people's perceptions about it. Anthropomorphic avatars were perceived as more attractive, credible
and susceptible of being chosen by people to represent them. Female avatars were considered by the participants in the
study as more attractive than male ones. The majority preferred avatars of their own gender (Nowak & Rauth, 2005). The
results of this study contrast, in part, with previous studies that supported the idea that anthropomorphism would be the
biggest predictor of credibility of an avatar (Koda, 1996 and Wexelblat, 1997 apud Nowak and Rauth, 2005). However, the
study of Nowak and Rauth (2005) concluded that the most influential factor is the degree of masculinity or femininity of
the avatar (the absence of androgyny). Furthermore, results showed that images with strong features of masculinity or
femininity were perceived as more anthropomorphic than images without strong indication of gender.
In any case, since avatars are used to represent the seller in a online shop, consumers will use the information about
virtual agent similarly to their experiences in natural non-mediated environments; However, contrary to face to face
interactions, in a computer mediated environment, the characteristics of an avatar can be tailored to promote any kind of
impressions and reactions (Nowak & Rauth, 2005).
The potential roles avatars can play in e-commerce sites were studied in depth by McGoldrick, Keeling and Beatty (2008).
Three main roles were acknowledged by consumers: (1) the role of helper that solves problems; (2) the friendly, sociable,
the receptionist who welcomes; and (3) the personal shop assistant, the recommendation agent. The results also indicate
that women are more likely to appreciate the interaction of avatars in any of their roles; that the preference for avatars is
inversely proportional to the age of consumers and the more experienced the consumer, the more he is likely to dismiss
virtual seller help (McGoldrick et al, 2008). These relationships between age, gender and experience with online shop, as
well as the consumer involvement with the product (Holzwarth et al, 2006) and the type of the product (Hassanein &
Head, 2005/2006), suggest that avatars can play a relevant role in online consumer segmentation (McGoldrick et al,
2008). The very nature of the avatar and its level of anthropomorphism can be adapted to individual preferences. A

196
potentially huge database (A.I.) can inform the avatar about the actions to be taken up rivaling with the best offline
relationship marketing systems (McGoldrick et al, 2008).
Given the persuasion ability of avatars in online sales channels (Holzwarth et al 2006), Wang, Baker, Wagner and
Wakefield, (2007) focused on the influence of avatars’ social stimuli on the affection of consumers and on the value
attributed to purchases. These authors showed that some of the characteristics of consumer-seller interaction in a
traditional bricks and mortar store can be induced in a website using social stimuli that are inherent to the avatars. Their
studies show that the induced social stimuli can improve the perception of the sociability of the website. This effect has an
indirect, but critical, influence on perceptions of the hedonic value and utility assigned by the consumer to the online store.
Consequently it influences the continued adoption of the web store by the consumer (Wang et al, 2007). This confirms
what was also previously suggested by Monsuwé, Dellaert and Ruyter (2004).
A recent study by Wang and Fodness (2010) revealed that consumers’ perceptions of sociability, the emotional answers,
and the trust toward the online seller, are more positive when an avatar with the capacity to be likeable and to create
empathy with the consumer is present on the online store. If avatars are absent, or the avatar is not able to generate
affection and empathy with the consumer, those perceptions are less positive.
This result, associated with the findings of Nowak and Rauth (2005) and Nowak, Hamilton, and Hammond (2008) suggests
that drawing photo-realistic likeable avatars which are able to generate empathy with the consumers can, in fact, generate
positive emotions and induce consumer trust toward the online trader. Trust in commerce/e-commerce is normally
defined as the conviction for acting in accordance with the recommendations of the seller and/or website (Cugelman,
Thelwall, & Dawes, 2009). It is the willingness to depend on the goodwill of the trader; and to become vulnerable to the
seller (McKnight, Choudhury & Kacmar, 2002). Trust has been vastly reported as the first mediating factor between
consumer perceptions and intention to buy online (Cugelman et al, 2009). Thus the following hypotheses are proposed:
H1 - Avatars based on real images of human beings and with real human voice induce trust towards the online seller.
H1a –Trust towards the seller increases the purchase and repurchase intention.
Website credibility has also been identified as an important dimension of online shopping. Credibility has been defined as
the psychological judgment that the content, the message and its aims are credible (Cugelman et al, 2009). Although
credibility and trust are sometimes used interchangeably, these constructs should not be considered synonymous. Trust
refers to a set of beliefs, dispositions and behaviors associated with the acceptance of risk and vulnerability (Rieh &
Danielson, 2007, p. 6). Credibility, which precedes Trust (Cugelman et al, 2009), refers to a perceived quality of a source,
media or message, may or may not result in associated trusting behaviors (Rieh & Danielson, 2007, p. 6).
Credibility is also intimately tied to persuasion. But these are also distinct constructs. Persuasion is an outcome of
credibility and can be operationalized, for instance, by message acceptance (Rieh & Danielson, 2007). Source credibility is
a critical determinant of message acceptance (Petty & Cacioppo, 1981 apud Rieh & Danielson, 2007).
Two studies carried out simultaneously by Holzwarth et al. (2006) suggest that the use of avatars to provide informati on
about products increases sale channel effectiveness based on the Internet. The first study showed that adding an avatar to
an online sale channel increases customer satisfaction with the dealer, and has a positive impact in attitude towards the
product and purchase intention. The second study showed that the manipulation of the avatar’s attractiveness and
expertise makes it more persuasive to certain consumer segments depending on their involvement with the product. More
attractive avatars are more effective for all levels of product involvement; more expert avatars are more effective only for
high levels of product involved customers. The second study also showed that the avatar attractiveness influences the
perception of comparability of the avatar with the person with which it interacts. This comparability mediates the
influence of the avatar attractiveness on consumer’s persuasion; Similarly, avatar expertise influences the perception of
credibility and this mediates the influence of avatar’s expertise in consumer’s persuasion (Holzwarth et al, 2006; Culgman
et al 2009). Therefore, the following hypotheses are proposed:
H2 - Avatars based on images of real human beings and with real voice induce credibility in the online store.
H2a - Credibility in online store increases the purchase and repurchase intention.

197
2.2 Social Presence and Social Response Theories
In the seventies of the last century John Short, Ederyn Williams and Bruce Christie suggested in their work "The Social
Psychology of Telecommunications" that different media allow for different levels of social presence and sensitive human
contact (Short, Williams and Christie, 1976 apud Wang & Fodness, 2010). The social response theory, for its part, argues
that the use of human characteristics such as language, voice, interactivity and social role in computers can enhance users'
social responses despite the fact that users are aware that machines are not human beings (Steuer and Nass, 1993; Reeves
& Nass, 1996 apud Wang and Fodness, 2010).
Although there are no humans on the Internet, these two theories, sustain that avatars can induce feelings of sociability on
consumers during their interactions with the computer (Wang and Fodness, 2010). This implies that avatars exert a social
influence similar to the one sellers have on brick-and-mortar stores. In a laboratory experiment carried out by Qiu and
Benbasat (2009), results showed that the use of recommendation agents in humanoid form communicating via voice in
online stores strongly influenced perceptions of social presence among consumers. In return, consumers’ feelings of trust,
perception of fun and, finally, the intention to adopt the virtual agent as a decision aid increased.
Another experiment developed by Wang and Fodness (2010) with a primitive form of avatar, displaying limited
interaction and low emotional expression (without body movements and facial expression) proved that it was able to
boost consumer trust and affection when the avatar was perceived as friendly and could mimic the pers onal interactions
in a human-computer environment thus inducing a greater perception of sociability in online consumers. In short:
consumers reflexively apply the rules associated with social interactions with real salespeople to avatars when they have
the ability to be kind (Wang & Fodness, 2010).
The use of avatars can increase the persuasiveness of online sales channels (Wang et al, 2007) increasing their credibility,
perceived trust and introducing social stimuli and human warmth in interactions. Furthermore, it improves consumer
satisfaction with the dealer and the attitude toward the product and increases purchase intention (Holzwarth et al, 2006).
Hence, the following hypotheses are proposed:
H3 - Avatars based on images of real human beings with real voice induce the development of relationships with greater
sociability and human warmth (social presence) similar to those normally achieved in traditional commerce.
H3a – Sociability and human warmth (social presence) increase the intention to purchase and repurchase in the online
store.
2.3. Conceptual model
Image 1: Conceptual Model
Adapted from Wang and Fodness (2010)

198
2.3.1. Variable description
Sociability Level - It is the differentiating factor in our model. It consists of three increasing levels of sociability. The first
level corresponds to a reduced level of sociability and human warmth stimuli. It consists of an online store displaying only
photographs of the products and descriptive texts. The second level corresponds to an online store equipped with a
naturalist avatar endowed with TTS voice that presents the company and describes the products. The third level of
sociability corresponds to an online store similar to the previous one, but equipped with a photo-realistic avatar endowed
with previously recorded real human voice.
Trust - Mediator variable. It refers to the conviction to act in accordance with the recommendations of the seller and/or
website (Cugelman et al, 2009). The willingness to depend on the goodwill of the trader and become vulnerable in relation
to the seller (McKnight et al, 2002).
Credibility - Mediator variable. What makes someone or something worthy to be believed. The concept of credibility is
complex and multidimensional and carries with it many subliminal dimensions such as reliability, expertise, dynamism,
competence and goodwill (Rieh & Danielson, 2007). On a website, the credibility is above all the psychological judgment
that the content, the message and its purposes are credible (Cugelman et al, 2009).
Sociability and Human Warmth - Mediator variable. Perception of social presence and sensitive human contact through
the medium (Wang & Fodness, 2010). Perception of social stimuli as a courtesy, kindness, empathy and sympathy.
Purchase and Repurchase intention - Dependent variable. This variable is the core of our study which captures the
change of behavior by the presence of avatars in online stores.
3. Research Design
This study followed an experimental design. This approach was adopted since only an experiment can ensure the
maximum possible control of external variables such as the influence of design and degree of sophistication of the website,
the influence of the type of product, price and the always important factor of influence that is the brand.
3.1. Experimental plan
The experimental plan was organized on the form of three groups (X1; X2; X3) with control group and post-test. This
experimental design, although simple, is robust both in terms of internal validity and in terms of external validity.
X1 – In this experience the participants visited a simulated online store (Shop 1) without any kind of avatar. This online
shop presented reduced sociability factors such as photographs and texts. This group worked as the control group
(Sociability Level 1).
X 2- In this experience the participants visited a simulated online store (Shop 2) containing a purely virtual (naturalistic)
avatar with TTS voice (Sociability Level 2).
X 3- In this experience the participants visited a simulated online store (Shop 3) displaying an avatar based on the image of
a real human being (photo-realistic with real voice) representing the trader or one employee (Sociability Level 3).
After the treatment (experiments with the three different simulated online shops), the post-test was administrated
(questionnaire) to all groups.
3.2. Online Stores
The three online stores had a technically simple design as similar as possible to a real online store. The chosen products
for sale were sports shoes since these are shopping goods which do not require a very complex decision making process.
There was an entry page where all products were visible (six in total). For each product there was also a specific page
where the product was described in detail. The Web Design of the three stores was exactly the same with the only
exception of the introduction of the avatar in stores 2 and 3.
199
The first store (Shop 1) was a simple interface showing only photographs and text descriptions of the products. The
second store (Shop 2) included a naturalist female avatar with synthesized TTS voice. On the entry page the avatar
presented the store and the company. On the specific product pages the avatar verbalized the products’ features and
characteristics; the third store (Shop 3) was in all similar to Shop 2. The only difference was that it was equipped with a
photo realistic avatar (based on a real human being) and endowed with pre recorded real human voice.
The Web Design of these interfaces was deliberately kept simple to minimize its influence on the attitudes of the subjects
of the experiment. The information transmitted orally by avatars in Shops 2 and 3 were exactly the same as the text of
Store 1 and product prices were the same.
In accordance with the findings of Nowak and Rauth (2005), female avatars were chosen to appear in Online Shops
because they are perceived by consumers to be more attractive.
Before entering into the main page of the stores, subjects were presented with a set of pages with instructions about the
experiment and about technical features of the websites to ensure perfect navigation. The technology used for the
construction of the avatars was provided by Oddcast Inc4. and is available at SitePal5 Website.
3.3 Questionnaire
A questionnaire was developed and presented to each of the subjects after the experiment. This questionnaire included
seven-points scales to measure "Trust" (5 items rating scale, adapted from the study of Bart, Shankar, Sultan and Urban,
2005, "Credibility" (4 items rating scale, adapted from the study of Cugelman et al, 2009), " Sociability and human warmth"
(9 items rating scale, adapted from Wang and Fodness, 2010) and "Purchase and Repurchase Intention" (3 items rating
scale, also adapted from the study of Wang and Fodness,2010).
3.4 Sample
The subjects of the experiment were recruited online through social media (Facebook and Linkedin) and Electronic Mail.
Participants were randomly assigned to the three groups and subsequently they were contacted by email and social media
websites with instructions to carry out the experiment and to answer the questionnaire.
The restriction of the recruitment process to the Internet aimed to control external variables like 'technology acceptance
level' in order to ensure all subjects recruited were skilled in Internet Technologies.
98 subjects have participated in the experiment. Each of the three groups comprised a sample above thirty elements in
order to preserve the external validity of the experiment: In the X1 experiment (Control group) have parti cipated 34
subjects, 31 in X2 and 33 in X3.
4. Findings
4.1 Sample Profile
The majority of the subjects were college graduates (57%), 23% had completed secondary education and 13% had
incomplete secondary education. Finally 7% of the subjects had only primary education. About gender, 54% of the subjects
were male and 46% were female. The most represented age group was the 25 - 34 years old with 32% of the sample,
followed by the group of 35 - 44 with 31%. The group 15 - 24 years old had 20% of the subjects. Finally, elements between
45 – 54 years old accomplished 13% of the total and between 55 - 64 about 5%. There were no subjects over the age of 64.
In what concerns occupation, 23% of the participants were students, 16% belonged to the professional -managerial group
and 15% were Industrial/Skilled workers.
Regarding usage of internet, 86% of the subjects reported having already purchased at least once on the Internet, 56%
reported purchasing on the Internet several times a year and 13% reported doing it ev ery month. Online banking
operations are performed by 60% of the subjects. If we consider the simultaneous use of the Internet to perform banking
4 http://www.oddcast.com 5 http://www.sitepal.com

200
operations and to buy goods or services to be an "advanced usage", we should then consider that 58% of the subjects fall
into this category.
The analysis of the data for the three samples shows that there are no significant differences regarding the main
demographic characteristics.
Table 1 – sample profile for each group
Gender Group 1 Group 2 Group 3 Total - n
Male 16 18 19 53
Female 18 13 14 45
Age
15-24 10 3 6 19
25-34 12 9 10 31
35 – 44 9 12 9 30
45-54 3 5 5 13
55-64 0 2 3 5
Advanced use
Yes 15 18 24 57
No 19 13 9 41
4.2 Data Analysis
4.2.1. Reliability tests of the measurement scales
The reliability of scales used measure the latent constructs "Trust”, “Credibility", "Sociability and human warmth" and
"Purchase and repurchase intention" was tested using Cronbach's Alpha. The results confirm their internal consistency:
0,94, 0,92, 0,96 and 0,96 respectively.
Given these results, four new composite variables were created using the arithmetic mean of each group of items
corresponding to the latent constructs "Trust", "Credibility", "Sociability and Human Warmth", " Purchase and Repurchase
Intention".
4.2.2. Test of Hypothesis
To test hypotheses H1, H2, H3 we performed an analysis of variance (one factor ANOVA). We tested the variance of the
variables’ mean ("Trust", "Credibility", "Sociability and human Warmth") as a function of the factor “Sociability Level". This
factor, a qualitative independent variable that we manipulated, contains three levels corresponding to each type of
treatment that each group was submitted to. The "Sociability Level 1" corresponds to the simple store without avatar
(Store 1), the “Sociability Level 2” (Store 2) corresponds to the store with the presence of a naturalistic avatar with TTS
voice and the "Sociability Level 3” (Store 3) corresponds to the store with the presence of photo-realistic avatar with real
human voice.
Structural equation modeling (SEM) has become a quasi-standard in marketing and management research when it comes
to analyzing the cause-effect relations between latent constructs. Partial Least Squares – SEM (PLS-SEM) is a causal
modeling approach aimed at maximizing the explained variance of the endogenous latent constructs (Hair, Ringle, &

201
Sarstedt, 2011). Its ability to model latent constructs under conditions of non normality, no strong assumptions about the
multicollinearity and in small to medium samples is well known among researchers (Chin, Marcolin, & Newsted, 2003;
Maroco, 2010). For the specified reasons we choose PLS-SEM to weigh the individual importance of our latent constructs
“Trust”, “Credibility”, “Sociability and Human Warmth” as predictors of “Purchase and Repurchase Intention”, i.e., our
hypothesis H1a, H2a and H3a.
4.2.2.1 One Factor ANOVA
One factor ANOVA was used to test for differences for trust, credibility and sociability and human warmth. Results show
that trust differs significantly among groups, F (2, 95) =6,48, p=0,002. Similarly differences regarding credibility are
statistically significant, F (2, 95)= 8,37, p=0,00. Finally, differences for Sociability and Human Warmth are also significant,
F (2,95)= 11,50, p=0,00.
Scheffé post-hoc comparisons of the three groups indicate that the means for the three variables are arranged in ascending
order, the lowest one being Group 1, followed by Group 2 and Group 3 which displays the highest mean.
In what concerns trust, results for Group I are significantly lower (M=3,66, 95% CI [3,11-4,21]), than for group III
(M=4,81, 95% CI [4,46-5,16]). Comparisons between group II (M=4,43, 95% CI [3,93-4,92]) and the other two groups were
not statistically significant at p<0,05.
In what concerns credibility, results for Group I are significantly lower (M=3,70, 95% CI [4,07-5,10]), than for group II
(M=4,58, 95% CI [4,76-5,31]) and group III (M=5,03, 95% CI [4,76-5,31]). Comparisons between group II and group III
were not statistically significant at p<0,05.
Finally, regarding Sociability and human warmth, Group I present results significantly lower (M=3,74, 95% CI [3,12-
4,36]), than group II (M=5,02, 95% CI [4,55-5,48] and group III (M=5,28, 95% CI [4,91-5,65]). Comparisons between group
II and group III were not statistically significant at p<0,05.
In sum, the difference of means was always statistically significant between Group I and Group III. That is, the presence of
photo-realistic Avatar with real voice always influences consumer perceptions when compared to the website without
avatar in all variables under study. The presence of the naturalistic avatar with TTS voice (Group II) had a significant
impact in "Credibility" and "Sociability and Human Warmth" but is not significant in what concerns trust. The differences
between avatars with TTS voice and the photo-realistic avatars with real voice were not statistically significant.
4.2.2.2 Partial Least Squares Analysis PLS-SEM
Data was analysed using Partial Least Squares (PLS) with SmartPLS 2.0.M.3 (Ringle, Wende, & Will, 2005).
Although the measurement and structural parameters are estimated together, a PLS path modelling approach is a two step
process that involves (1) the assessment of the reliability and validity of the measurement model and (2) the assessment
of the structural model.
All latent constructs are reflective. Reflective measurement models must be assessed with regard to their reliability and
validity. In what concerns reliability and validity of measurement scales, all absolute standardized values of each indicator
and all constructs’ composite reliability values exceed 0.70, evidencing an excellent good level of internal consistency in
the responses (Hair, Ringle, & Sarstedt, 2011). Similarly, the AVE for all constructs is adequate (above 0.50), which
indicates an acceptable convergent validity of each construct meaning that each latent variable explains more than half of
its’ the indicators variance (op. cit.).
With regard to discriminant validity, we tested if all indicator loadings were higher than all its cross loadings (Chin W. W.,
1998) and if the square roots of AVE of all latent constructs were greater than the correlations between latent constructs
in the model (Fornell-Lacker Criterion) (Fornell & Larcker, 1981; Hair, Ringle, & Sarstedt, 2011; Götz, Liehr-Gobbers, &
Krafft, 2010). One indicators’ loading (‘Polished’, from the construct ‘Sociability and Human Warmth’) did not satisfy the
first condition and was removed. Regarding to the square root of AVE all latent constructs satisfied the second condition.

202
Table 2: Summary of statistics
Items for each construct Indicator loadings
ρca ρveb
Credibility 0.96 0.86 1 - The product information provided on this electronic shop is credible. 0.94
2 - The product information provided on this electronic shop is correct. 0.93
3 - Is the seller a specialist in their business? 0.92
4 – This electronic shop seems professional to you? 0.92
Sociability and human Warmth 0.98 0.84* - Friendly 0.91
- Warm 0.91
- Helpful 0.94
- Polished 0.85
- Informational 0.87
- Intelligent 0.93
- Pleased 0.95
- Satisfied 0.95
- relaxed 0.85
Trust 0.97 0.86 1 - This electronic shop seems to me more trust inspiring than others I've visited.
0.90
2 - This electronic shop belongs to a company that will fulfill what is committed.
0.94
3 - The information exposed in this electronic store deserves my confidence. 0.95
4 - I trust on the recommendations that are made on this electronic shop. 0.92
5 - I think this company is honest. 0.94
Purchase/repurchase intention 0.98 0.95 1 - The atmosphere created by this store convinced me to buy a product. 0.97
2 - The atmosphere created at this store makes me feel comfortable to recommend a friend to buy a product on it.
0.98
3 - I will become a customer of this store and come back whenever you need to buy new products.
0.98
Table 2 (Continued)
√AVE Credibility Purchase/Repurchase
Intention
Sociability/Human
Warmth
Trust
Credibility 0.93 0.85 0.88 0.88
Purchase/Repurchase
Intention
0.85 0.97 0.91 0.88
Sociability/Human
Warmth
0.88 0.91 0.92 0.85
Trust 0.88 0.88 0.85 0.93
Notes: aρc(Composite reliability: 0.70 ≤ ρc ≤ 1); b ρve (AVE): 0.50 ≤ ρve ≤ 1); the diagonal (in bold) shows the square roots of the AVE; * after removing ‘Polished’
This analysis shows that our constructs have adequate measurement properties. Subsequently, we assess whether the
structural model supported the proposed theoretical model.

203
The goal of the prediction oriented PLS-SEM approach is to explain the endogenous latent variables’ variance. To
accomplish that objective, the key targets constructs’ level of R2 should be high. In marketing studies, R2 values of 0.75,
0.50 and 0.25 can be described respectively as substantial, moderate or weak (Hair, Ringle, & Sarstedt, 2011). The
endogenous variable in our model shows a R2 = 0.866, which means that more than 86% of the endogenous construct’s
variance is explained by the model. This is a substantial result. The larger R2 is , the larger the percentage of the
endogenous construct variance is explained for is exogenous variables (Götz et al, 2010).
For assessing the predictive relevance of the model we must apply a blindfolding procedure to the endogenous variable.
The Stone-Geisser Q2 is the predominant measure of predictive relevance and comes in two forms: the cross validated
redundancy and communality (Stone, 1974; Geisser, 1974). As recommended by Hair, Ringle, & Sarstedt (2011) we chose
the cross-validated redundancy because it uses the PLS-SEM estimates of both the structural model and the measurement
models for data prediction. As so it fits perfectly the PLS-SEM approach. A Q² > 0 is indicative of predictive relevance (Chin
W. W., 1998). The Q2 for the endogenous variable ‘Purchase/repurchase Intention’ is equal to 0.815. Therefore we can
postulate that its explanatory latent constructs have predictive relevance.
Hypotheses H1a, H2a and H3a were tested by assessing the path coefficients significance. For that purpose we used
bootstrapping: 5000 samples, 98 cases as recommended by Hair, Ringle, & Sarstedt (2011).
The individual path can be interpreted as standardized beta coefficients (β) of ordinary least squares regressions. Paths
that are nonsignificant or show signs contrary to the hypothesized direction do not support a prior hypothesis; significant
paths showing the hypothesized sustain the anticipated causal relationship. (Hair, Ringle, & Sarstedt, 2011, p. 147). Critical
t-values for a two-tailed test are 1.62 for a significance level of 0.1, 1.96 for a significance level of 0.05 and 2.58 for a
significance level of 0.01 (op. cit, p. 145).
Performed the bootstrapping, the results showed for the path Trust Purchase/Repurchase Intention (β=0.372),
hypothesis H1a, a t-value equal to 4.36; for the path Credibility Purchase/Repurchase Intention (β=0.034), hypothesis
H2a, a t-value equal to 0.62; and for the path Sociability/Human Warmth Purchase/Repurchase Intention (β=0.562),
hypothesis H3a, a t-value equal to 6.89. Therefore we must reject de hypothesis H2a. Credibility has no predictive capacity
over Purchase and Repurchase Intention. The other two paths (Hypothesis H1a, H3a) are significant and accepted.
Image 2: PLS path estimates

204
To assess the influence strength (Effect size ) of each latent exogenous variable on a particular latent endogenous
variable one must estimate twice the structural model: once with and once without the independent latent variable. The
“effect size” is calculated by means of the Cohen’s coefficient (Cohen, 1988).
.
Values for of 0.02, 0.15, or 0.35 indicate respectively a weak, moderate or substantial influence of the exogenous
variable on the endogenous latent variable (Cohen, 1988; Götz, Liehr-Gobbers, & Krafft, 2010). The results were
for Trust, a moderate but significant effect, for Credibility, an absolute null effect, and
for Sociability and Human Warmth, which is a very substantial effect over Purchase and Repurchase Intention.
5. Discussion
Overall, the results confirm the proposed hypotheses (H1, H2 and H3): photo-realistic avatars endowed with pre recorded
real human voice in a online store have a direct positive effect in trust, credibility and sociability and human warmth.
Naturalistic avatars endowed with TTS voice did not confirm the generality of the existing literature about the capacity of
avatars to induce feelings of trust. However they confirmed previous studies in what concerns credibility and sociability
and human warmth. This result may be due to the fact that our TTS avatar did not present the necessary ability to be
likeable and to evoke empathy with the subjects giving them increased feelings of trust towards the seller (Wang &
Fodness, 2010).
Although the means obtained were higher, photo-realistic avatars did not seem to induce notable differences in
perceptions of consumers when compared with the naturalistic TTS voice avatars with the exception of "Trust" in relation
to Group I. The differences in the evaluations made by the subjects of the experiment, which were in all cases favorable to
the photo-realistic avatar, are not statistically significant. Again, a possible explanation for this result may be the fact that
our photo-realistic avatar was not perceived as significantly different from the TTS avatar in order to be perceived as more
likeable and capable to generate increased empathy. Another explanation may be the fact that advances in TTS technology
nowadays have rendered it is so similar to human voice that it can create generally the same feelings of empathy and
perception of sociability as photo-realist avatars with real human voice. However, Qiu and Benbasat (2009) concluded that
TTS voice does not carry significant social stimulations when compared with real human voice. It should also be taken into
account that the subjects may have not perceived the photo-realistic avatar as a representation of a real human being.
Concerning the predictive capacity of "Trust", "Credibility" and "Sociability and Human Warmth" of consumers’ "Purchase
and Repurchase Intention" (hypotheses H1a, H2a, H3a) the results confirm the importance of the induced active feelings of
trust and sociability and human warmth with special significance for the later. This result is, in general, consistent with
previous studies (Wang & Fodness, 2010; Hassanein & Head, 2005/06; 2007).
Unlike the other two variables, “Credibility” has no influence on the consumers’ purchase and repurchase intention. This
result contradicts, in part, the studies developed by Cugelman et al (2009 ) who conclude that the credibility of a web site,
although mediates "Trust", has a significant direct impact on consumer behavior. Our result may be due to the fact of
concepts of credibility and trust are related and in general credibility precedes trust. In fact, humans trust on what they
first consider to be credible. The data seems to confirm it. If we remove the direct path from Credibility to Purchase and
Repurchase Intention, and move it toward Trust, it has a strong path coefficient (β = 0.883) and Credibility explains 78% of
Trust variance. An alternative explanation may be the type of product: simple sports shoes do not involve such technical
complexity or price level that their purchase requires superior levels of credibility for the average consumer.
In sum, the variable with the most positively effect in "Purchase and Repurchase Intention" is "Sociability and Human
Warmth", which demonstrates the importance of sociability factors in E.C. sites. As sustained by the literature, “Trust”, has
also a significant positive effect on "Purchase and Repurchase Intention".
205
6. Conclusions
This article focuses on the introduction of avatars as sociability and human warmth stimuli in sites of electronic commerce
and its implications in consumer behavior. Overall, the study validates the all proposed hypothesis except one (H2a). We
can conclude that the introduction of avatars at EC sites, particularly photo-realistic avatars, has visible practical effects in
sociability and human warmth perceptions, in trust towards the seller, in the credibility of the online store and can
enhance costumers’ purchase and repurchase intention.
Underpinned on this study, as also on the findings of Wang and Fodness (2010) and Qiu and Benbasat (2009), we can say
that animated avatars exert an influence on online consumers similar to real salespeople in brick and mortar shops.
Avatar technology, that can be combined with A.I., is also promising in the field of Customer Relationship Management
(now transformed into e-CRM), in the market segmentation and in lead generation. A.I., based on libraries of knowledge
about customers can equip avatars with the ability to recognize the customer with whom they are dealing with and create
a personalized relationship making suggestions about products based on their purchase history. Companies can take
advantage from this capability providing as much information as possible to their client, improving their shopping
experience and reducing operating costs (Dionísio, Rodrigues, Faria, Canhoto, & Nunes, 2009, p. 41)
6.1. Implications for management
The results emphasize the importance of building relationships in e-commerce similar to those existing in physical stores
between salespeople and customers. Managers should look at this technology as a powerful way to achieve it.
Despite the fact that purchases can occur in other channels, nowadays, Internet has a major influence in purchase
decisions. Consumers search for information about products and prices before buying online. An attractive internet
presence inducing trust, credibility, sociability and human warmth, and capable of creating imagined rich social relations
with the costumer, can also increase demand in physical stores (Paulo, 2012).
6.2. Limitations and directions for further research
This research is not without limitations. A single experiment conducted online has limited generability to assess all the
implications of the introduction of photo-realistic avatars endowed with real human voice as a sociability factor in e-
commerce sites. New experiments with larger samples should be conducted. Conducting a similar experiment in a strict
laboratory environment in order to ensure the homogeneity of technical conditions among subjects (monitors, processing
speed, Internet access, loading speed of applications, quality and volume of audio and the use headphones to ensure
subjects concentration on the experiment) could also be considered.
The difficulty to operationalize, and even distinguish constructs such as "credibility", "Trust" and "Sociability and Human
Warmth” also presents some limitations. These constructs have idiosyncratic implications and are interpreted differently
by consumers depending on their ages and cultures (Wang & Fodness, 2010).
Despite the fact that the recruitment of our sample has been performed in a universe much larger than a college campus,
and thereby tried to escape is the so- called “science of university students" we still must acknowledge that it is wounded
with the sample convenience due to the fact that subjects were recruited only through the Internet. This methodology was
suitable for controlling the variable "Technology acceptance level", but prevents us from generalizing the results to those
not accustomed to dealing with the Internet and the Electronic Commerce. Broader samples, in order to obtain a better
representation of the population, should be tried.
One aspect that has not been assessed by us is the interaction between avatars (which must vary their expertise and even
their appearance: age, gender, etc.), type of product and online stores design. Trust and credibility towards the seller or a
store that sells basic clothes or footwear and high end stores are distinct. The manipulation of avatars’ attractiveness and
expertise makes them more effective for different types of consumers. Expertise, for example, has positive effects on more
involved consumers with the product. This is prevalent when it comes to expensive and technically advanced products.
Thus we can also assess the possible contributions of the avatars for customer segmentation. This functionality can be
achieved by equipping them with A.I. That was not considered in our study. A.I. also allows introducing a higher level of
206
interactivity and achieving a two-way interaction between the avatar and the consumer. That was not possible in our
study either.
Another path of research is the use of photo-realistic avatars based on the image of opinion leaders. This may lead to a
greater identification between the consumer and the virtual entity and consequently have implications on consumers
purchase and repurchase intentions.
References
Aldiri, K., Hobbs, D., & Qahwaji, R. (2010). Putting the Human Back into e-Business: Building Consumer Initial Trust
through the Use of Media-Rich Social Cues on e-Commerce Websites. In Transforming E-Business Practices and
Applications: Emerging Technologies and Concepts (pp. 13 - 43). Western Illinois University, EUA: In Lee.
Bart, Y., Shankar, V., Sultan, F., & Urban, G. L. (October de 2005). Are the Drivers and Role of Online Trust the Same for Al l
Web Sites and Consumers? A Large-Scale Exploratory Empirical Study. Journal of Marketing, 69, 133-152.
Chin, W. W. (1998). The partial least squares approach to structural. In G. A. (Ed.), Modern methods for business research
(pp. 295–336). Mahwah, New Jersey: Lawrence Erlbaum Associates.
Chin, W. W., Marcolin, B. L., & Newsted, P. R. (2003). A Partial Least Squares Latent Variable Modeling Approach for
Measuring Interaction Effects: Results from a Monte Carlo Simulation Study and an Electronic -Mail
Emotion/Adoption Study. Information Systems Research, 14(2), 189-217.
Cohen, J. (1988). Statistical power analysis for the behavioral. Hillsdale, New Jersey: Lawrence Erlbaum Associates.
Cugelman, B., Thelwall, M., & Dawes, P. (2009). The Dimensios of Website Credibility and their Relation to Active Trust and
Behavioural Impact. Comunications of the Association for Information Systems, 24(26), 455-472.
Dionísio, P., Rodrigues, J. V., Faria, H., Canhoto, R., & Nunes, R. C. (2009). b-Mercator. blended marketing. Alfragide: Dom
Quixote.
Fornell, C. G., & Larcker, D. F. (1981). Evaluating structural equation models with unobservable variables and
measurement error. Journal of Marketing Research, 18(1), 39 - 50.
Geisser, S. (1974). A predictive approach to the random effects model. Biometrika, 61(1), 101–107.
Götz, O., Liehr-Gobbers, K., & Krafft, M. (2010). Evaluation of Structural Models Using the Partial Least Squares (PLS)
Approach. In V. Esposito Vinzi, W. Chin, J. Henseler, & H. (. Wang, Handbook of Partial Least Squares (pp. 691 -
711). Springer Handbooks.
Hair, J. F., Ringle, C. M., & Sarstedt, M. (2011, Spring). PLS-SEM: Indeed a Silver Bullet. Journal of Marketing Theory and
Practice, 19(2), 139 - 151.
Hassanein, K., & Head, M. (2005/2006, Winter). The Impact of Infusing Social Presence in the Web Interface: An
Investigation Across Different Products. International Journal of Electronic Commerce, 10(2), 31-55.
Hassanein, K., & Head, M. (2007). Manipulating perceived social presence through the web interface and its impact on
attitude towards online shopping. International Journal of Human-Computer Studies, 65(8), 689-708.
Holzwarth, M., Janiszewski, C., & Neuman, M. M. (2006, October). The Influence of Avatars on Online Consumer Shopping
Behavior. Journal of Marketing, 70, 19-36.
Malhotra, N. K. (2006). Pesquisa de Marketing: uma orientação Aplicada. Porto Alegre: Bookman.
Maroco, J. (2010). Análise de Equações Estruturais: Fundamentos teóricos, Software & Aplicacoes. Pero Pinheiro:
ReportNumber.
McGoldrick, P. J., Keeling, K. A., & Beatty, S. F. (2008). A Tipology of Roles for Avatars in Online Reatailing. Journal of
Marketing Management, 24(3), 433 - 461.
McKnight, D. H., Choudhury, V., & Kacmar, C. (2002). The impact of initial consumer trust on intentions to transact with a
web site: a trust building model. Journal of Strategic Information Systems, 11, 297-323.

207
Monsuwé, T. P., Dellaert, B. G., & Ruyter, K. d. (2004). What drives consumers to shop online? A literature review.
International Journal of Service Industry Management, 11(1), 102 - 121.
Nowak, K. L., & Rauh, C. (2005). The Influence of The Avatar on Online Perceptions of Antropomorphism, Androgyny,
Credibility, Homophily, and Atraction. Journal of Computer-Mediated Communication, 11(1), article 8.
Nowak, K. L., Hamilton, M. A., & Hammond, C. C. (2008). The Effect of Viewer Perceptions of Avatar Anthropomorphism
and Realism on Judgments of Credibility and Homophily, and Avatar Choice. Proceedings of the 11th Annual
International Workshop on Presence. Pádua.
Otto, J. R., & Chung, Q. B. (2001). A Framework for Cyber-enhanced Retailing: Integrating E-Commerce Retailing with
Brick-and-Mortar Retailing. Electronic Markets - The International Journal on Networked Business, 10(3), pp. 185 -
191.
Paulo, C. (2012, março 29). O retalho online em Portugal. Retrieved abril 20, 2012, from Marketeer Online:
http://www.marketeer.pt/2012/03/29/o-retalho-online-em-portugal/
Qiu, L., & Benbasat, I. (2005). An Investigation into the Effects of Text-to-Speach Voice and 3D Avatars on the Perception of
Presence and Flow of Live Help in Electronic Commerce. ACM Transactions on Computer-Human Interaction,
12(4), 329-355.
Qiu, L., & Benbasat, I. (2009). Evaluating Anthropomorphic Product Recommendation Agentes: A Social Relationship
perspective to Designing Information Systems. Journal of management Information Systems, 25(4), 145-182.
Rieh, S. Y., & Danielson, D. R. (2007). Credibility: A Multidisciplinary Framework. Annual Review of Information Science and
Technology, 41, 307-364.
Ringle, C. M., Wende, S., & Will, A. (2005). SmartPLS, 2.0.M3. Obtido de http://www.smartpls.de
Stone, M. (1974). Cross-validatory choice and assessment of statistical. Journal of the Royal Statistical Society, 36(2), 111–
147.
Wang, L. C., & Fodness, D. (2010). Can avatars enhance consumer trust and emotion in online retail sales? Int. J. Electronic
Marketing and Retailing, 3(4), 341 - 362.
Wang, L. C., Baker, J., Wagner, J. A., & Wakefield, K. (2007, Julho). Can a Retail Web Site Be Social? Journal of marketing,
71(3), 143-157.

208
Influences of social media marketing on pre-
adult consumers Relationship marketing, social media marketing, web 2.0, pre-adults consumers.
Sandra Filipe, University of Aveiro, [email protected]
Dora Simões, University of Aveiro, [email protected]
Abstract
This paper reports on the use of social media marketing by pre-adults, setting off from a case study of students of different
courses at one Portuguese higher education school. Data were collected through a questionnaire available online and
analysed with descriptive statistical techniques. Based on the pointed outlines, this research explores and analyses four
key issues: (1) what are the types of social media that students are using?; (2) in which contexts are they using each social
media type?; (3) what are their opinions about the persuasive intentions of social media marketing?; and (4) how does
social media marketing influence their brand knowledge, attitude and behaviour?. Within the research questions
proposed, the study points towards some understanding of how the young at this age and education level see social media
marketing. Furthermore, in this paper, tendencies around the concepts, the tools and levels of attraction by the audiences,
with focus on relationship marketing in the 2.0 era, are revisited. This study, by focusing on this age group, contributes
with critical information that might help cast light over recent theories and practices of social media marketing. The main
results show that the pre-adults are fans of several brands, although they do not follow them continuously, or follow only a
few of those in which they are more interested; also show that they consider the use of social media for dissemination and
promotion of brands and products useful, however some have indicated that sometimes they feel that their privacy is
invaded.
1. Introduction
Nowadays, companies are driven by a new environment characterized by highly intense competition, high concern for
quality, excess production capacity and strong technological development. Therefore, the marketing professionals have
felt the need to satisfy, retain and engage their customers through an orientation towards long-term relationships. The
relationship marketing paradigm and the requirement for its implementation on business organizations, to improve
customer retention levels, is clearly recognized in the academic literature.
On the other hand, the higher speed of internet access and the emergence of the web 2.0 era (and now of web 3.0), giving
users the possibility to read and write, in par with the use of mobile equipment, are providing a cheaper and faster form
for the organizations to establish contact with customers and, also, potential ones. Social media is part of the phenomenon
known as web 2.0, building on its ideological and technological foundations, which allow the creation and exchange of
user-generated content (Kaplan & Haenlein, 2010; Peixoto, 2010; Zarrella, 2009). It has become a platform that is easily
accessible to anyone with internet access; in addition, it has increased communication for organizations, fostered brand
awareness and often improved customer service, and it also serves as a relatively inexpensive platform for organizations
to implement marketing plans (p.e., Evans & McKee, 2010; Greenberg, 2010; Wikström & Wigmo, 2010). However, will it
be as straightforward as it appears to be? Indeed, it is an interesting area that we consider should be further explored and
better understood in order to provide concrete guidance in the future.
In the context of customer relationship management, social media marketing provides an opportunity for brands to
optimize interactions with actual and potential consumers; however, a deep knowledge of the consumer side is required
(Egan, 2011; Greenberg, 2010; Peppers & Rogers, 2011). Due to the fact that the consumer side is too wide, we decided to
opt for the consumer segment constituted only by pre-adults, based on the following two reasons: data analysis already
conducted by consumer segments demonstrates that pre-adults are active users of social networks; additionally, pre-

209
adults are the future target segments of different brands. Thus, by focusing on this age group, this study contributes with
critical information that might help cast light over recent theories and practices of social media marketing.
Thereby, the paper reports on the use of social media marketing by pre-adults, setting off from a case study of students of
different courses at one Portuguese higher education school. Based on the pointed outlines, the study points towards some
understanding of how the young at this age and education level see social media marketing. We intend to understand and
analyse in detail (1) the types of social media used by students; (2) the contexts in which they use each social media type;
(3) the students’ opinions about the persuasive intentions of social media marketing; and (4) the influences of social media
marketing on their brand knowledge, attitude and behaviour.
After this introduction, the paper follows with a state-of-the-art on the changing paradigm of relationship marketing on
the web, stressing the youngsters with an active user profile of web. The next section focuses on the methodological
aspects of the study, including the context of the case study used in the research and techniques for collecting and
processing data. The fourth section is devoted to presenting the main results obtained. The paper ends with a discussion of
the results and the main conclusions and limitations of the study.
2. The changing paradigm of relationship marketing on the web
The term relationship marketing was first introduced by Berry in 1983, who stated that relationship marketing is a
marketing orientation to attract, maintain and enhance relationships with customers (Berry, 2002). It begins to be
recognized as a new reality oriented towards value creation, which results in the development of personalised marketing
to meet the needs of consumers (p.e., Peterson, 1995; Sheth & Parvatiyar, 1995). The emergence of relationship marketing
is therefore interpreted as a paradigm shift required for all marketing situations, not just restricted to services marketing
to services marketing and industrial marketing, where previously this long-term perspective had been clearly recognized.
2.1. Relationship marketing
In fact, since the 1990s, academic literature has been putting a notorious emphasis over the concept of relationship
marketing (p.e., Cristopher et al., 1994; Grönroos, 1997; Morgan & Hunt, 1994). Relationship marketing is presented as a
new paradigm, focusing on the construction of stable relationships with its customers, in contrast to the traditional
approach to promote oriented transactions (Grönroos, 1997; Gummesson, 1998). According to Nevin (1995, p. 327) the
concept of relationship marketing has been used to reflect four different perspectives: (1) assumes a promotional
approach and emphasises that relationship marketing will direct the flow of promotional monies towards targeted
customers; (2) focuses on individual customers and on building a close relationship with individual customers or treating
each customer as a segment of one; (3) concerned about keeping or retaining customers by using a variety of customers
bonding techniques and staying in touch with the customer after the sale is made; (4) takes a more strategic perspective
by putting the customer first and shifting the role of marketing from manipulating the customer (telling and selling) to
genuine customer involvement (communicating and sharing the knowledge). The definitions of relationship marketing go
in the same direction, i.e., enhancing marketing on the relationship with the customer in order to extend this period, and
supporting it on mutual benefits. However, if first definitions focus on the relations hips with customers, the most recent
definitions focus on the relationships with all business partnerships (Payne, 2005; Sheth & Parvatiyar, 2002).
Relationship marketing is more recently cited as the philosophical foundation of Customer Relationship Management
(CRM). Berry (2002, p. 73) defined it as “a philosophy, not just a strategy, a way of thinking about customers, marketing
and value creation, not just a set of techniques, tools, and tactics”. Buttle (2009) and Payne (2005) uphold that CRM is a
strategy supported on technology. Although the concept of CRM has arisen associated with the implementation and put
into practice the philosophy of relationship marketing, in some literature these two concepts continue to be used
interchangeably. However, considering the dates, we find that the references to the concept of CRM are all recent. Despite
the definition of relationship marketing, the definitions given for CRM are far from a consensus. Essentially, it is difficul t to
tell whether it is a strategy, a process, a technology, and some people still refer to it as a philosophy. Nevertheless,
Greenberg (2010) clarifies all these ambiguities pointing that CRM is (or should be) all that, a philosophy and a strategy
that encompasses a set of processes and that is supported by technology. From his definition of traditional CRM,
Greenberg develops a social CRM concept, as: “a philosophy and a business strategy, supported by a technology platform,
business rules, processes, and social characteristics, designed to engage the customer in a collaborative conversation in

210
order to provide mutually beneficial value in a trusted and transparent business environment” (p. 34). Along with the
management of customer information should always be present the formation of relationships, whose ultimate goal of
quality is the generation and sustain of confidence.This state is the ultimate result that is expected from the formation of a
successful relationship, going through other constructs, such as symmetry, equity, dependence, satisfaction, and
commitment (Britton & Rose in Peppers & Rogers (2011)).
2.2. Social media marketing supporting relationship marketing on the web
The Internet used to be a static place, but recently it has become more flexible and increasingly its content is user
generated. In a conference brainstorming, Tim O'Reilly and Dale Dougherty noted that the web, far from having crashed
after the dot-com collapse in the fall of 2001, was more important than ever, with exciting new applications and sites
popping up with surprising regularity (O'Reilly, 2007). The concept of web 2.0 quickly spread worldwide.
Currently, there are numerous definitions of web 2.0; some are broader, others are more generic , but all agree on the fact
that the whole structure of the platform is targeted to the user's browsing experience, to sharing and creating knowledge,
leaving the user to be a mere receiver of information (Hayes, 2006; O'Reilly, 2007). Moreover, according to O'Reilly
(2007): "Web 2.0 is the network as the platform, spanning all connected devices”. Hayes (2006) denies that the future is in
the web 3.0, real-time collaborative web. However, it is not yet a general consensus definition.
Social media is part of the web 2.0 phenomenon, building on its ideological and technologic al foundations, which allow the
creation and exchange of user-generated content (Kaplan & Haenlein, 2010; Peixoto, 2010; Zarrella, 2009). It has become a
platform that is easily accessible to anyone with internet access; additionally, it has increased comm unication for
organizations, fostered brand awareness and often improved customer service, and served as a relatively inexpensive
platform for organizations to implement marketing plans (p.e. Evans & McKee, 2010; Greenberg, 2010; Wikström &
Wigmo, 2010). Social media includes various types of internet communications. Mangold & Faulds (2009) identified the
following several types: social networking sites (MySpace, Facebook, etc.); creativity works sharing sites (YouTube, Flickr,
etc.); user-sponsored blogs (Cnet.com, etc.); collaborative sites (Wikipedia); virtual worlds (Second Life); commercial
communities (eBay, Amazon.com, etc.); and business networks (LinkedIn).
These new web sites have become increasingly popular with hundreds of millions of users worl dwide, and are a new
powerful marketing tool. Moreover, with social media, marketing is a two-way communication (Eley & Tilley, 2009). Social
media provides new ways to connect, interact and learn; it allows people with no special knowledge to post and share
content with the world instantly; it is a place where customers set the rules and the word-of-mouth makes or breaks the
product; it represents a diverse source of online information created, driven and used by consumers intending to inform
each other about products, brands, services as well as problems they have encountered. According to Kim & Ko (2012)
social media can have a dramatic impact on a brand's reputation. An increasingly important role of social media for
business is evident today. It is possible to perform integrated marketing activities faster and in a cheaper way. However,
before accepting the social media practice, companies need to know what they want and/or what they do not want to
achieve. Therefore, a strategy is needed on how to produce the social media content (Chiang & Hsieh, 2011).
McAlister-Holand (2012) refers that social media marketing (SMM) is very different from marketing on social networks
(MSN): SMM requires a specific strategy to social channels and content tailored to thos e platforms; MSN is simply
distributing traditional marketing messages through social media and a way to push out company offerings to anyone who
can hear them. This is in line with social CRM strategies. Lawrence (2011) and Woodcock et al. (2011) warn that, to
develop a good social media strategy, the managers should realise that technologies are now allowing people to quickly
connect, converse, create, and collaborate with each other. Moreover, it is a consensus that successful organizations in an
emerging economy of virtual/online networks and information will be those able to identify, enhance, create, and evolve
their knowledge assets. The online social networks could be a good tool to do it. This idea was already sustained by
Gerbert et al. (2003) who claimed that to build good relationships with customers, it is necessary to serve each customer
according to their preferences, which requires management of customer information. Additionally, the emerging
capabilities of customer relationship management systems enabling both reading as well as writing in online collaborative
environments are putting tremendous challenges on organisations and their human resources (Greenberg, 2010; Peppers
& Rogers, 2011). It is therefore important that agents involved be able to recognise it, a priori, as a philosophy and a
strategy that must be understood and accepted, to be implemented (Buttle, 2009). In a broad s ense, social media
marketing can contribute significantly to this, as it refers to the process of gaining website traffic or attention through

211
social media sites. Social media marketing programs usually centre on efforts to create content that attracts attention and
encourages readers to share it with their social networks (Evans & McKee, 2010).
2.3. The youngsters and pre-adults with an active user profile of web
At the beginning of the third millennium, millions of youngsters and pre-adults are daily connected in social media as
sharing sites, wikis, blogs, and social networks, among others. Research findings suggest that more than 70% of internet
users worldwide, aged over 15 years, are members of at least one social network website, and also that mobile is the
perfect accelerator for social media usage (Belleghem et al., 2012; Lenhart et al., 2010). Therefore, it is important to note
that consumers have different levels of participation in the online platforms of web 2.0 services and require different
levels of attention from marketers. Li & Bernoff (2008) identify six user profiles: (1) creators - create publications on a
blog/website, upload personal videos and music, and write articles and stories; (2) critics - comment on blogs and forums,
publish and contribute to wikis and articles; (3) collectors - use RSS feeds, adding photos and links to websites; (4) joiners
- conserve his profile/account; (5) spectators - feature a passive posture, taking behaviours such as reading blogs and
comments, viewing videos and photos, and listening to podcasts; and (6) inactive - do not perform any of the activities
described above. Of the six profiles identified, the creators stand out as the most appealing to marketers, because they
easily tend to turn into opinion leaders. Therefore, it is necessary to optimize the efforts of social media marketing in this
consumer profile.
The results of a study developed in Europe context by Gray & Jennings (2008) highlighted that young people are online
every day, and are more likely to visit sharing and social network sites or use instant messaging. One in four youngsters
are bloggers and daily users of social networking, and engagement with social media is high amongst young people (nearly
half are creators and nearly half are critics), while the other users have adopted a more passive profile (spectators).
Particularly, in Portugal, a study by Bareme Marktest reported that in 2012: 73.4% of households had at least one
computer in use; 62.3% of residents aged 15 and over used the Internet (with higher penetration among men and people
between 18 and 24 years); and 83.8% of residents accessing the internet from their homes had accessed sites related to
social networks (people between 15 to 24 years showed higher affinity)
(http://www.marktest.com/wap/a/n/id~1a6a.aspx accessed 14.01.2013).
3. Methodology
The main goal of this study is to contribute to a better understanding of the use of social media marketing by a target
population consisting of pre-adults. With this objective in mind, we set off from a case study of students of different
courses at one Portuguese higher education school. Data were collected through a questionnaire available online by
institutional mailing list, and analysed with descriptive statistical techniques (SPSS software).
Based on the pointed outlines, we intended to understand and analyse the types of social media used by students, the
contexts in which they use each social media type, the students’ opinions about the persuasive intentions of social media
marketing, and the influences of social media marketing on their brand knowledge, attitude and behaviour. Within the
proposed research, the study points towards some understanding of how the young at this age and education level see
social media marketing.
The case study circumscribes the research on the students between the ages of 18 and 24 (completed till the end of the
year 2012) attending the courses taught at Higher Institute of Accounting and Administration of University of Aveiro
(ISCA-UA). The universe of 598 students was encouraged to answer to an anonymous, online questionnaire to register
their opinions about the use of internet and social media and other related concepts.
The questionnaire was titled “social media marketing and young university students” and was organised in four parts, in
the following order: (1) characterization of internet usage; (2) characterization of social media usage; (3) characterization
of attitudes towards social media marketing programs; and (4) characterization of the young university students. It is also
important to note that we consider that in diverse situations the student did not have a negative or positive position about
his own perceptions but a neutral position, thus the answers are pre-oriented on a Likert scale with 5 points.

212
4. Results
Following the methodology previously defined, we obtained a total of 195 answers. Out of these, 21 were outside of the
age range taken into account in this study, and 35 were incomplete; therefore, we considered only 139 answers valid for
analysis. Thus, the 139 valid answers represent 23.2% of the universe.
4.1 The young university students’ characterization
The young university students frequenting ISCA-UA who responded to the questionnaire are currently attending the
courses as shown in Table 1.
Course versus Gender Gender
Total Female Male
Course
Degree in Finance 17 9 26
Degree in Marketing 18 13 31
Degree in Accounting 33 9 42
Specialization in Finance 4 2 6
Master in Marketing 9 7 16
Master in Accounting & Accounting and Public Administration 13 5 18
Total 94 45 139
Table 1 –Absolute frequency of the valid students by course and gender.
In the light of the answers given, the households of the students are composed mainly by 3, 4 or 5 members representing
87.8% of them, with a mode of 4. Moreover, 73.2% indicated that there are no children (aged 6 to 16) in the households.
The mode of zero confirms the cumulative frequency.
Concerning the family residence, the results indicate that 60.1% of the respondents live in the district of the university
(Aveiro). This result is not surprising, since in recent years the tendency is for the young to lookup a course in a universi ty
near their area of residence. Regarding the enrollment status, the results evidence that 77.7% of the students are students
in full time and 22.3% are employed students.
The results also show that, in the majority of cases, the educational level of the parents is undergraduate (87.1% either for
father as for mother). However, considering the parents with post-graduation, the results show that 11.5% of mothers
have a bachelor's degree while only 7.2% of fathers hold the same degree. In spite of this, we have to highlight the fact that
4.3% of fathers have master’s or doctorate degrees, contrasting to only 0.7% of mothers with the equivalent level.
Finally, the data demonstrate that almost half (42.4%) of the households have a net monthly income between 1000€ and
1999€. Highlight yet that 29.5% have incomes of only 499€ to 999€ and 7.9% below 499€. Sign up that the monthly
minimum wage in Portugal is 485€ (www.pordata.pt in 14.01.2013) and the average monthly wage is currently of 1014€
(http://expresso.sapo.pt accessed 10.11.12). Nevertheless, 6.9% of the students declared that their household earns
between 3000€ to 4999€.
4.2. Characterization of internet usage
Although the study is mainly focused on the use of social media, we start by asking the students some questions about the
kind of devices and their frequency of Internet access. This information will help us to better understand the results on the
use of social media and its receptivity with respect to social media marketing.
With regard to the number of times and time spent on the internet, the results confirm that most young (80.6%) access the
internet daily, several times a day, and 89.2% of respondents spend between 1 to over 6 hours a day surfing (see Table 2).

213
How often do you access the Internet? versus What time do
you spend, on average, using the internet?
Occasionally Weekly (1-6 days a
week)
Daily (1 time a day)
Daily (several times
a day) Total
[6, …] hours a day 0 0 0 25 25 (18.0%)
[3, …, 6[ hours a day 0 0 2 39 41 (29.5%)
[1, …, 3[ hours a day 0 0 14 44 58 (41.7%)
[…, 1[ hour a day 1 0 2 2 5 (3.6%)
[2, …, 6[ hours a week 0 2 2 1 5 (3.6%)
[…, 2[ hours a week 1 1 2 1 5 (3.6%)
Total 2 (1.4%) 3 (2.2%) 22 (15.8%) 112 (80.6%) 139
Table 2 – Absolute and relative frequencies of students relatively to internet access.
When asked what devices they have and which of those they typically use to access the Internet, the answers show that
almost all students have a notebook (99.3%) and preferably use this device to surf on the internet (96.4%). In second
order appears the mobile with 77.0% confirming to have, despite only 40.3% saying they use it to access the internet.
Nevertheless, this value is significant representing that a considerable number of users use mobile devices to access the
internet. Highlight the fact that a considerable number of respondents signed to having game consoles and portable music
players, very few claim to use those to access the internet (see Table 3).
Device What devices do you have?
What devices do you typically use to access the Internet?
Personal computer 48 (34.5%) 30 (21.6%)
Notebook 138 (99.3%) 134 (96.4%)
Tablet 16 (11.5%) 12 (8.6%)
Mobile 107 (77.0%) 56 (40.3%)
Game console (p. e. PlayStation or Wii) 35 (25.2%) 8 (5.8%)
Handheld game console (p. e. PSP) 15 (10.8%) 5 (3.6%)
Portable music player 44 (31.7%) 2 (1.4%)
Table 3 – Absolute and relative frequencies of students about devices they have and use to access the internet.
Furthermore, we asked about the services that the pre-adults use when they access the internet. Using the scale from 1 (“I
do not use”) to 5 (“I use very often”), the issues most signed, representing an average between 4.28 and 4.70 and a mode of
5, were: display and use the email; study or do research for the study; use social media (e.g. social networks, sharing sites ,
blogs, wikis, virtual worlds, etc.); and obtain information of a different nature. Following, appear: download music files,
videos, games, etc.; chat online by text or voice; and listen to music or some radio station, representing an average
between 3.62 and 3.78 and also a mode of 5 which indicates that those services were signed as used very often. The other
sentences were classified in lower levels, showing that the services such as to read a newspaper, to search in brand
websites (with average and mode around 3), to watch TV, to play games, to purchase new or used products (with average
around 2 and mode of 1) are the least used. In the context of this study, highlight the fact that the purchase of products
must be less practiced between the younger students.
Finally, in this section we wanted to know the opinion of our respondents regarding the use of small mobile devices
(mobile phones, tablets, etc.) to access internet services. Based on a scale of 1 (“I strongly disagree”) to 5 (“I strongly
agree”), the answers showed that most strongly agree that the use of these devices has substantial benefits (average 4 and
mode 5). The early opinion is reinforced by the fact that respondents agreed that the advantage of the portability feature
overcomes any limitations related to the small size (average and mode 3). Nevertheless, the pre-adults consider that most
of the services that interest them do not yet provide appropriate applications for small mobile devices. In general, the

214
respondents disagree with the opinion of “I don’t feel the need to use them and have difficulty in using them for the
purpose of internet access”. Thus, small devices are viewed as an asset for their lives.
4.3. Characterization of social media usage
Centered now on research questions exposed early, the inquiry showed that relatively to social media activities performed,
the view of social network websites (e.g. Facebook, Twitter, LinkedIn, etc.) is definitely the activity most frequently
performed (average of 4.29 and mode of 5). To view photos or shared videos (e.g. YouTube, SlideShare, etc.) is another
activity often performed (average of 3.71 and mode of 5). To post on social network websites or blogs is an activity
moderately executed by the respondents (average of 2.90 and mode of 5). The other activities such as to create and
manage blogs or social network pages; to participate in discussion forums or communities; to share something created
(e.g. YouTube, Flickr, etc.); to visit virtual second worlds (e.g. Second Life, etc.); or to collaborate on wikis are less practiced
(averages between 2.40 and 1.39, respectively, and mode of 1 for all). It was used a Likert scale of 5 points, from 1 (“I do
not”) to 5 (“I do very often”).
When inquired if they currently have a profile in some social network websites, not including Facebook, it is verified as we
can see in Figure 1 that less than 25% have a profile in some of these, with Google+ (24.5%) being the most signed,
followed by LinkedIn, Twitter, Hi5 and Myspace. The Pinterest and Orkut are the least marked, with a frequency of 5.8%
(8) and 1.4% (2), respectively. Furthermore, despite some respondents having claimed to have a profile in some of these
websites, few seem to perform activities with some regularity. It was used a scale of 1 (“I do not”) to 5 (“I do very often”).
The average scores are between a minimum of 1.0 and a maximum of 2.06, and mode is 1 for all cases.
Figure 1 Absolute and relative frequencies of students that have a profile in social network websites.
Nevertheless, concerning the social network website Facebook, the picture is very different, with the answers showing
that 92.9% (129) of pre-adults have a profile. Only 10 (7.2%) claimed not to have one. Furthermore, when inquired about
the frequency of performing activities on this website, 89.2% claimed to performing them from regularly to very often, still
having 60.5% affirmed to performing them very often. Only 10.1% refer to perform them rarely or very rarely. It was used
a Likert scale of 5 points, from 1 (“Very rarely”) to 5 (“Very often”).
With regards to the activities practiced on the social network website Facebook by our pre-adults, the results evidence
that sending private messages to friends is the activity most performed (average 3.78 and mode 4), soon followed by
following, without posting the pages of friends; following, without posting, the news in pages of brands that they like; and
posting and sharing of news in the pages of friends (average, respectively, between 3.32 e 3.02, and mode 3). In last,
appear posting in pages of brands that they like and sending private messages in pages of brands with products that they
215
like (average, respectively, of 2.38 e 1.54, and mode 1). Again, a Likert scale of 5 points, from 1 (“Very rarely”) to 5 ( “Very
often”), was used.
Yet about Facebook, 43.4% of the respondents acclaimed to having between 100 and 400 friends. Above of 700 friends,
almost the same number (35.7%) referred to having more than 700 friends, being of these (16.3%) above of 1000.
Nevertheless, 7% signed to having less than 100 friends.
Finally, regarding characterization of social media usage, the 139 respondents to the questionnaire cited the following
activities they practice on Facebook, described in descending order:
(122) – “I belong to groups created by friends.”
(92) – “I am a fan of personal pages related to music, film, television, theater, sports, etc.”
(82) – “I adhere to themed events by invitation of my friends.”
(76) – “I am a fan of brand pages.”
(40) – “I am administrator of a group and invite my friends.”
(25) – “I create themed events and invite my friends.”
(25) – “I adhere to themed events by invitation of brands.”
Thus, we can conclude that essentially the pre-adults manage their profiles by belonging to groups created by friends; by
being fans of personal pages related to music, films, television, sports, etc.; by adhering to themed events; and by being
fans of brand pages. A minority practices activities of administration of some groups or creation of themed events.
4.4 Attitudes towards social media marketing programs
The last section of the questionnaire focused on obtaining responses to what the students’ opinions are regarding the
persuasive intentions of social media marketing, and how social media marketing influences their brand knowledge,
attitude and behaviour. To do so, the students were initially inquired about their situation towards brand pages on social
networking websites. The analysis shows that most students are fans of some or several brands, although they do not
follow them continuously, or follow only a few brands that have bigger interest (89.1%). Highlight the fact that 5%
mentioned that they follow continuously several brands. Nevertheless, 15.8% claimed not to follow any brand. The main
motivations for becoming a fan of a brand are the following, described in descending order:
(101) – “Own initiative, because I am an admirer of the brand or I am a client.”
(39) – “Attracted by the possibility of obtaining a prize or promotional discount.”
(31) – “Tip of an online friend.”
(28) – “A link that I meet spontaneously while I surf the internet.”
(27) – “The fact that the brand is common to and followed by my friends.”
(23) – “Tip of a friend personally.”
(20) – “Inspired by a competition launched by the brand with no prize winning.”
Looking at the most voted sentences (in this question it was possible to sign several sentences), we can determine that in
most cases one student becomes a fan of a brand by his/her own initiative, because he/she is an admirer or customer of
the brand (72.7% signed this sentence). The second most voted motivation was “Attracted by the possibility of obtaining a
prize or promotional discount”, representing 28.1% of respondents. Nevertheless, despite much less signed, the other
sentences were equally chosen, with frequencies between 22.3% and 14.4%.
Additionally, the students were inquired about their opinion on the influence of social media marketing on brand
awareness and customer retention. Having three alternatives, 53.3% signed “I think that it has advantages, but must be
applied following a marketing plan carefully delineated” and 46.0% signed “I think that it has many advantages, because
people love to share what they do, and thus can more easily leverage the desire for a product or brand on other people”.
Only one person considered “I don’t see any advantage because if anything goes wrong, the news spreads very quickly and
can be disastrous for the brand”. Therefore, almost all students see advantages on the use, by the business organizations,

216
of social media marketing to brand awareness and customer retention, despite some of them enhancing the importance of
adequately planning the strategy to implement.
The results exposed above are corroborated by the answers about the opinion on the use of social networking websites
and other social media for dissemination and promotion of brands and products. Once more, almost all pre-adults consider
these useful (92.8%), although some of them indicate that they sometimes feel that their privacy is invaded as
well(46.0%). Yet, 7.2% feel very concerned, because they cannot even imagine that what they think and do on the Internet
can be used to "hold" them to a brand.
Finally, the students were inquired about their level of interest in brands on the Internet (see Figure 2). Once again, a
Likert scale of 5 points, from 1 (“None”) to 5 (“Very high”) was used. The analysis shows that the interests are higher in
music (mode 5), followed by fashion and sports (mode 4), and by traveling, telecommunications, reading and food (mode
3). The remaining are all classified with no or very low interest (mode 1).
Figure 2 - Level of interest of students in brands on the Internet.
5. Discussion and conclusions
Revisiting the research questions presented at the beginning of the paper, we determine, grouping the sentences in two,
the conclusions presented below.
“Which types of social media are students using?”
&
“In which contexts are they using each social media type?”
The social media activities performed more frequently are, in descending order:
1. To view social network websites (e.g. Facebook, Twitter, LinkedIn, etc.);
2. To view photos or shared videos (e.g. YouTube, SlideShare, etc.);
3. To post on social network websites or blogs;
4. To create and manage blogs or social network pages;
5. To participate in discussion forums or communities;

217
6. To share something created (e.g. YouTube, Flickr, etc.);
7. To visit virtual second worlds (e.g. Second Life, etc.);
8. To collaborate on wikis.
Moreover, Facebook is considerably the most used social network website, followed by Google+, LinkedIn and Twitter, but
with significantly lower scores.
Concerning the activities practiced on the social network website Facebook by our pre-adults, the results evidence that
sending private messages to friends is the activity most performed; soon followed by following, without posting the pages
of friends; following, without posting, the news in pages of brands that they like; and posting and sharing of news in the
pages of friends. In last, appear posting in pages of brands that they like and sending private messages in the pages of
brands with products that they like.
Essentially, the pre-adults manage their profiles by belonging to groups created by friends; by being fans of personal pages
related to music, films, television, sports, etc.; by adhering to themed events; and by being fans of brand pages. A minority
practices activities of administration of some groups or creation of themed events.
“What are their opinions about the persuasive intentions of social media marketing?”
&
“How does social media marketing influence their brand knowledge, attitude and behaviour?”
The results show that the majority of pre-adults are fans of some or several brands, although they do not follow them
continuously, or follow only a few of those in which they are more interested. Furthermore, we can determine that in most
cases one pre-adult becomes a fan of a brand by his/her own initiative, because he/she is an admirer or customer of the
brand. The second most pointed motivation was, although with much lower values, the attraction to the possibility of
obtaining a prize or promotional discount.
Regarding their opinion on the influence of social media marketing on brand awareness and customer retention, almost all
see advantages on the use, by the business organizations, of social media marketing to brand awareness and customer
retention, despite some of them enhancing the importance of adequately planning the strategy before implementing it.
Furthermore, the majority of young students consider the use of social networking websites and other social media for
dissemination and promotion of brands and products useful, although some have indicated that sometimes they feel that
their privacy is invaded as well.
Finally, the students demonstrate higher level of interest in brands related to music, followed by fashion and sports, and
by traveling, telecommunications, reading and food. The thematic of lower interest seems to be computers, games, banking
and business, cosmetics, animals, theater, decor and DIY, dance and toys.
The main limitation of this study was our inability to cover all students of the high school. Future researchers may try to
replicate the study to a representative sample of Portuguese students of this age and, also, trace their profile according to
the six profiles identified in the review bibliographic. In addition, cross studies with pre-adults who are not students might
be conducted to extend the scope of this study. Furthermore, future researchers may try to explore more impacts from
social media marketing and try to perceive why pre-adults do not do on-line purchases.
References
Belleghem, S., Thijs, D., & De Ruyck, T. (2012). Social media around the word 2012. Available at:
http://www.slideshare.net/InSitesConsulting/social-media-around-the-world-2012-by-insites-consulting
(accessed 15.01.2013).
Berry, L. (2002). Relationship marketing of services: perspectives from 1983 and 2000. Journal of Relationship Marketing,
1(1), 59-77.
Buttle, F. (2009). Customer Relationship Management (2nd ed.). Burlington: A Butterworth-Heinemann Title.
Chiang, I. & Hsieh, C. (2011). Exploring the impacts of blog marketing on consumers. Social Behavior & Personality: An
International Journal, 39(9), 1245-1250.

218
Cristopher, M., Payne, A. & Ballantine, D. (1994). Relationship marketing: Butterworth-Heinemann, Ltd.
Egan, J. (2011). Relationship marketing (4th ed.). Harlow: Pearson Educational Limited.
Eley, B. & Tilley, S. (2009). Online marketing inside out. Melbourne: SitePoint.
Evans, D. & McKee, J. (2010). Social media marketing: The next generation of business engagement. Indianopolis, Indiana:
John Wiley & Sons, Inc.
Gray, S., & Jennings, R. (2008). How are young people using social media? Available at:
http://www.slideshare.net/diusgovuk/how-are-young-people-using-social-media-presentation (accessed
20.01.2013).
Greenberg, P. (2010). CRM at the speed of light: social CRM strategies, tools, and techniques for engaging your customers (4th
ed.). USA: The McGraw-Hill Companies.
Grönroos, C. (1997). Keynote paper from marketing mix to relationship marketing - towards a paradigm shift in marketing.
Management Decision, 35(4), 322.
Gummesson, E. (1998). Implementation requires a relationship marketing paradigm. Academy of Marketing Science.
Journal, 26(3), 242-249.
Hayes, G. (2006). Virtual worlds, web 3.0 and portable profiles. Available at: http://www.personalizemedia.com/virtual-
worlds-web-30-and-portable-profiles (Accessed 10.01.2013).
Kaplan, A. & Haenlein, M. (2010). Users of the world, unite! The challenges and opportunities of social media. Business
Horizons, 53(1), 59-68.
Kim, A. & Ko, E. (2012). Do social media marketing activities enhance customer equity? An empirical study of luxury
fashion brand. Journal of Business Research, 65(10), 1480-1486.
Lawrence, A. (2011). Is SCRM really a good social media strategy? Journal of Database Marketing & Customer Strategy
Management, 18(3), 149-153.
Lenhart, A., Purcell, K., Smith, A., & Zickuhr, K. (2010). Social media & mobile internet use among teens and young adults,
Washington: Pew Research Center.
Li, C. & Bernoff, J. (2008). Groundswell: winning in the world transformed by social technologies . Boston, Massachusetts:
Harvard Business Press.
Mangold, W. G. & Faulds, D. J. (2009). Social media: The new hybrid element of the promotion mix. Business Horizons,
52(4), 357-365.
McAlister-Holand, D. (2012). Social media marketing: Or marketing on social networks ? Sales & Service Excellence, 12(9),
1-2.
Morgan, R. & Hunt, S. (1994). The commitment-trust theory of relationship marketing. Journal of Marketing, 58, 20-38.
Nevin, J. (1995). Relationship marketing and distribution channels: Exploring fundamental issues. Journal of Academy of
Marketing Science, 23(4), 327-334.
O'Reilly, T. (2007). What is web 2.0: Design patterns and business models for the next generation of software.
Communications & Strategies, 65, 16-37.
Payne, A. (2005). Handbook of CRM: Achieving excellence through customer management, A Butterworth-Heinemann Title.
Peixoto, S. (2010). Web Trends - 10 cases made in web 2.0. Gaia: Comunicarte Publishing.
Peppers, D. & Rogers, M. (2011). Managing customer relationships: a strategic framework (2nd ed.). Hoboken, New Jersey:
John Wiley & Sons, Inc.
Peterson, R. (1995). Relationship marketing and the consumer. Journal of the Academy of Marketing Science. 23(4), 278-
278.
Sheth, J. & Parvatiyar, A. (1995). Relationship marketing in consumer markets: Antecedents and consequences. Journal of
the Academy of Marketing Science, 23(4), 255-271.

219
Sheth, J. & Parvatiyar, A. (2002). Evolving relationship marketing into a discipline. Journal of Relationship Marketing, 1(1),
3-16.
Wikström, E. & Wigmo, J. (2010). Social media marketing: What role can social media play as a marketing tool? Bachelor,
Linnaeus University.
Woodcock, N., Green, A. & Starkey, M. (2011). Social CRM as a business strategy. Journal of Database Marketing & Customer
Strategy Management, 18(1), 50-64.
Zarrella, D. (2009). The Social Media Marketing Book. Sebastopol, Canada: O'Reilly Media, Inc.

220
Consumers’ motivations and attitude toward
the use of social media marketing in Hong Kong Relationship maintenance, information seeking, enjoyment, perceived risks, self-disclosure, participation of commercial
activities
Mark Ng, Hong Kong Shue Yan University, [email protected]
Abstract
Objectives: The use of the Facebook and other social media in marketing has become very prevalent. Major objectives of
this article included: To analyze the motivation of users’ self-disclosure on Facebook. To analyze the motivation of users’
participation of commercial activities on Facebook. To develop some practical implications for marketers on the use of
Facebook as a marketing tool.
Methodology: A sample of 586 (264 males and 322 females) young Facebook users in Hong Kong recruited online was
chosen. Self-administered questionnaire was used to measure different determinants of satisfaction, behavioral intention
and usage of Facebook. A partial least squares (PLS) procedure was conducted to test the hypotheses.
Conclusion: Our results show that Facebook users’ perceived convenience to maintain relationship, enjoyment of using
Facebook, and benefits of getting up-to-date information enhanced their satisfaction of using Facebook. The positive
experience of using Facebook and perceived risks of privacy invasion would determine their self-disclosure, use of
Facebook and participation of commercial activities online.
Limitation: Major limitations of this study include sampling procedure and self-administrative nature of the survey used.
Implications: To enhance consumers’ engagement with company’s fan page, marketer should provide some useful and
interesting information for customers regularly. The commercial activities should avoid collecting too much personal
information. Male customers put stronger emphasis on the enjoyment of your activities while female users are more
concerned about the risks of privacy invasion on Facebook.
1. Introduction
Facebook is the largest social network in the world with more than 850 million users of whom 50% log in on a daily basis.
The strong growth of smart-phone and other mobile devices has also enhanced the use of Facebook and different online
social networks (OSNs). The number of OSN users in China has increased dramatically since 2009. The number of active
Chinese OSN users reached 265 million in 20116 and more than 95% Internet users in China have OSN accounts.7 As of Jan
2013, there are 3.9 million Facebook users in Hong Kong, which constitute more than 53% of its population and 78% of its
online population.8 The prevalence of Facebook and other OSNs has significantly expanded the landscape of interactive
marketing. Many major brands have established their ‘Facebook pages’ to connect with target markets , build brand image,
and implement sales promotions in Hong Kong.
In Feb 2013, the fan pages of Starbucks Hong Kong, Estee Lauder, H&M, Samsung mobile successfully connected with more
than 100,000 fans. The fan page becomes one of the major platforms for these brands to release new information, organize
events, and connect with their consumers. In recent years, many researchers have started examining viral marketing as a
6 http://www.emarketer.com/Article.aspx?R=1008235
7 Lau J. M. “nei di wang min shang wang xu qiu yu xiao fei mu shi” (Internet demand and online buying pattern of internet users in China), Hong
Kong Economic Journal, 2012 Jan 31, B15.
8 http://www.socialbakers.com/facebook-statistics/hong-kong

221
tool for marketing communications (For example, De Bruyn & Lilien, 2008; Godes & Mayzlin, 2009). However, in the social
media marketing literature, there are few studies about attracting Internet users’ participation in commercial activities,
such as joining a fan page and sharing company activities. Thus, this paper contributes to the literature on social media
marketing by examining the key motivating factors that determine consumers’ participation in commercial activities on
social media, which can provide some insights on how marketers can make use of the Facebook to engage with customers
effectively. Considering the growing importance of the Chinese market and the significant influence of online WOM on
Chinese customers (Xue & Zhou, 2010), it is also worthwhile to examine the key motivating factors that determine how
Chinese customers use social media.
2. Theoretical Framework
The social exchange theory is based on the premise that social interaction is an exchange of activities, particularly of costs
and benefits (Homans, 1958). With strong emphasis on reciprocity on Internet behaviors, the social exchange theory has
been applied to account for different Internet consumer behaviors. For example, Chen, Chen and Farn (2010) suggested
that information quality, service quality and social climate are the key determinants of members’ prosocial behavior
online. Some research study also used social exchange theory to examine the major motivators of using internet (Stafford,
Stafford & Schkade, 2004).
Many studies identified the major determinants of using social media. In sum, the key motivations for using social media
and disclosing personal information online identified by previous studies included information exchange, social
interaction, pleasure seeking and entertainment, self-image enhancement and needs of self-expression and self-
actualization (Boyd, 2007; Ellison, Steinfield & Lampe, 2009; Hui, Tan, & Goh, 2006; Rosen & Sherman, 2006; Shao, 2009).
In contrast, the major barrier to disclosing personal information online is the perceived privacy risk (Malhotra, Kim &
Agarwal, 2004).
2.1 Convenience of maintaining relationships
OSN has allowed users to effectively maintain their relationship ties with their relatives, friends, and even strangers. They
can have the most updated news of their friends and in exchange, tell their friends about their statuses easily. The
convenience in connecting with family and friends and communicating with them has motivated users to use OSNs
(Dwyer, Hiltz & Passerini, 2007; Hann, Hui, Lee & Pang, 2007; Young, 2009). Thus, the convenience of relationship
maintenance may motivate people for using Facebook to communicate with their friends, share personal information and
interact with them.
2.2 Enjoyment
Many Facebook users use it as a hedonic platform which allows them to know the latest entertaining posts, news, music
videos, films and games. Enjoyment is the intrinsic reward derived from the use of Internet (Igbaria, Parasuraman &
Baroudi, 1996; Igbaria, Schiffma, & Wicckowshi, 1994). After receiving pleasure and fun, the audience gets actively
involved in the mass communication process (Wearden & Harper, 2000). Thus, enjoyment is a powerful predictor of users’
participation on Facebook (Rosen & Sherman, 2006).
2.3 Knowledge function (Information Seeking)
Besides entertainment, Facebook is a platform for users to gain knowledge and information from their friends and
different virtual communities. Chang et al. (1999) suggested that there were three factors related to the development of a
virtual community: Continuously updated information, protection of privacy risks, and good membership system. Virtual
community provides useful and interesting information content could stimulate people’s participation of that comm unity
(Armstrong & Hagel, 1997). Thus, the information and knowledge gained from Facebook can enhance users’ satisfaction of
using Facebook and participation of Facebook activities.

222
2.4 Perceived risks of privacy
After disclosing personal information online, there are high risks associated with users’ personal information and
information shared with other parties (Acquisti & Gross, 2006; Hogben, 2007). Examples of privacy problems include
identity fraud (Haddadi & Hui, 2010; Young & Quan-Haase, 2009), demographics and face re-identification (Gross,
Acquisti, & Heinz, 2005), online harassment and cyber bullying such as posting problematic messages on users’ Facebook
walls (Valkenburg & Jochen, 2009). Users who are concerned about privacy issues tend to avoid using OSN, disclose less
information and refuse to allow businesses to access their personal information (Gao, Sultan, & Rohm 2010; Hugl 2011;
Krasnova et al. 2010).
2.5 Social presence
The primary motivation of using social media is to connect with friends. Users of Facebook would become more active if
they find their friends are presence and interact with each other (Sachdev, 2011). Friends’ recommendations are
appealing as they share similar interests and background and are perceived as genuine and relevant (Diffley et al. 2011).
Thus, user’s perceived social presence on Facebook is directly related to their self-disclosure and participation of various
activities on Facebook.
In sum, these factors shape users’ experience of using Facebook, which affect their satisfaction of Facebook, their usage of
Facebook, their intention to disclose information about themselves and their participation of commercial activities online.
Thus, I propose the following hypotheses in this paper:
H1a: Perceived convenience of maintaining relationship is positively related to users’ satisfaction of using Facebook.
H1b: Perceived convenience of maintaining relationship is positively related to users’ self-disclosure on Facebook.
H2: Perceived benefit of knowledge and information obtained is positively related to users’ satisfaction of using
Facebook.
H3a: Enjoyment of using Facebook is positively related to users’ satisfaction of using Facebook.
H3b: Enjoyment of using Facebook is positively related to users’ self-disclosure on Facebook.
H4a: Perceived risk of using Facebook is negatively related to users’ satisfaction on Facebook.
H4b: Perceived risk of using Facebook is negatively related to users’ self-disclosure on Facebook.
H4c: Perceived risk of using Facebook is negatively related to users’ participation of commercial activities on
Facebook.
H5a: Satisfaction of using Facebook is positively related to users’ self-disclosure on Facebook.
H5b: Satisfaction of using Facebook is positively related to users’ participation of commercial activities on Facebook.
H6a: Perceived social presence is positively related to users’ self-disclosure on Facebook.
H6b: Perceived social presence is positively related to users’ participation of commercial activities on Facebook.
H7a: User’s self-disclosure is positively related to their participation of commercial activities on Facebook.
H7b: User’s self-disclosure is positively related to their frequency of updating their information on Facebook.
2.6 Gender differences
Factors determining the use and self-disclosure on Facebook are quite different between men and women. Specifically,
women tend to be more relationship-oriented than men (Minton & Schneider, 1980). They tend to use OSNs as tools to
connect with each other and communicate with their friends. Females are more likely to use OSNs than males (Hargittai,
2007) and they use it to strengthen and nurture existing relationship (Mazman & Usluel, 2011). Thus, convenience of using
Facebook to maintain relationship is a stronger concern for women than men, while enjoyment of using Facebook is more
important motives for male as male users tend to use it for playing games and entertaining themselves (Lin & Yu, 20008).

223
H8: Relationship maintenance is a stronger motive for female users to disclose their information on Facebook.
H9: Enjoyment of using Facebook is a stronger motive for male users to use Facebook and disclose their information
on Facebook.
Female users perceive more risks online and report more privacy concerns than male users do (Fogel & Nehmad, 2009).
Sheehan (1999) suggested that to protect their privacy, women tend to disclose less information when registering for a
website. Female users are more likely to read privacy notices and trust website notices than male us ers do (Milne &
Culnan, 2004). Besides, female users find their ability to control privacy settings of their OSN account was very important
(Hoy & Milne, 2010).
H10: Perceived risk of privacy is a stronger motive for female to avoid disclosing information on Facebook.
3. Research design
3.1 Participants
The participants of this study are students from two universities in Hong Kong. There were 252 men (44.5%) and 314
women (55.5%). The majority of the participants were below 35 years old (94.9%) and most of them were students. More
than 75% of the participants had online shopping experiences. They are active users of Facebook. More than 80% of them
would log in to their Facebook account every day.
3.2 Instrument and measures
The questionnaire consisted of three sections. The first part was intended to collect participants’ attitudes and motivation
toward the use of Facebook. The second section consisted of scales measuring their behavioral pattern of using Facebook.
The last one was about the participants’ personal backgrounds. The questionnaire was prepared in both Chinese and
English. Back translation procedure was adopted to ensure equivalence of Chinese and English versions.
Previously validated scales were used to measure all constructs of the research model. Some of the scale items were
slightly reworded to reflect the current research context. Unless stated, all measures adopted a seven-point Likert scale,
described by “Strongly agree” (= 7) and “Strongly disagree” (= 1). Major measures used in the study were described in the
following table.
Table 1
Source of measurement for different constructs
Construct Number of item and source Example of item Cronbach’s alpha
Perceived convenience
Three-item Krasnova et al. (2010)
Facebook is convenient to inform all my friends about my ongoing activities
0.753
Enjoyment Three-item Nambisan & Baron (2007) and Krasnova et al. (2010)
I spend enjoyable and relaxing time on Facebook
0.790
Knowledge function (Information seeking)
Four-item scale Armstrong & Hagel (1997) and Ducoffe (1996)
Facebook allows me to receive a lot of new information.
0.778
Perceived privacy risk
Four-item scale Malhotra, et al. (2004)
I feel safe publishing my personal information on Facebook (reversed) Overall, I find it risky to publish my personal information on Facebook
0.753

224
Social presence Four-item scale Self-developed
My friends are active users of Facebook. My friends always updated their status on Facebook.
0.869
Satisfaction of using Facebook
Two-item scale Bhattacherjee (2001)
Overall, I like to use Facebook. 0.787
Self-disclosure Four-item scale Krasnova et al. (2010)
I find time to keep my profile up-to-date. I keep my friends updated about what is going on in my life through Facebook.
0.875
Participation of commercial activities
Four-item scale Self-developed
I always share some shopping privileges on Facebook. I have participated in groups established by some brands.
0.800
3.3 Data collection and analysis
To test the hypotheses a self-administered survey was developed and administered online. The questionnaire was
administered through Google Docs. The questionnaire was sent to 620 youngsters online in Hong Kong. After excluding
extreme outliners or those with missing data, 586 questionnaires in total went through the data coding and cleaning
process for use in the final analysis.
The objective of this study is to further develop theory in predicting users’ participation of commercial activities and usage
of Facebook. In order to examine the impact of the motivational factors to users’ participation of commercial activities and
usage of Facebook, partial least squares path modeling (PLS) with reflective indicators was applied in this study , utilizing
the software package SmartPLS. While other methods of structural equation modeling are more widespread indeed, PLS
was used due to its enhanced ability to process complicated models and does not require distributional assumptions of the
sample (Chin, 1998).
PLS is a general technique for estimating path models, involving latent constructs indirectly observed by multiple
indicators. A PLS model is specified by two set of liner relations: The outer model and Inner model. Outer model refers to
the relationships between the latent and observed variables; while the inner model concerns the hypothesized
relationship between latent variables (Chin, 1998). Just like other structural equation modeling methods, PLS is also
capable of calculating key outputs such as factor loadings, average variance explained and composite reliabilities to
establish the validity and reliability of models (Fornell and Cha, 1994).
To overcome the problem of no formal significance tests for the estimated parameters in non-parametric method, the t-
statistic and standard deviation of each parameter is calculated by bootstrap technique (Chin, 1998). Bootstrapping was
used to draw 2000 random bootstrap set to obtain stable standard errors and low differences between entire sample
estimates and means of subsamples (Leger, Politis & Romano, 1992). After establ ishing the validity and reliability of
measurement and structural model, a parametric multi-group analysis was used to examine the differences between male
and female Facebook users.
4. Finding
4.1 Measurement model (Outer model)
There are several analyses to assess the adequacy of the measurement model: Evaluation of component loadings of the
items for each measure, the reliability of the measures, convergent validity, and the discriminant validity of the constructs .
Table 2 summarizes the results concerning quality of each construct and Table 3 provides the square root of AVE and
inter-construct correlations.
4.1.1 Reliability of the measures
Reliability of the measures is evaluated by both Cronbach’s alpha and composite reliabilities (CR). Cronbach’s al pha is
estimated using reliability analysis procedure in SPSS and composite analysis are obtained from principal component
analysis procedure in PLS (Chin, 1998). Table 1 shows that the Cronbach’s alpha and composite reliabilities of each
construct met the desired criteria of 0.70 as recommended by Nunnally (1978).

225
4.1.2 Convergent validity and discriminant validity
Convergent validity of the model is assessed by the average variance explained (AVE) by their respective constructs is
greater than the variance unexplained (Fornell & Larcker, 1981). Table 2 indicates that all constructs have achieved an
AVE greater than 0.50, thus meeting the recommended criteria for convergent validity.
Discriminant validity was assessed by the procedures outlined by O’Cass (2002) and Fornell and Larcker (1981). O’Cass
(2002) suggested that the correlation between two constructs should not be higher than their respective reliabilities.
Fornell and Larcker (1981) suggested that the correlation between two constructs should not be higher than the square
root of their respective AVE.
The validity and reliability of the outer model parameters were estimated using PLS. An examination of the outer model
was undertaken via AVE and bootscrap t-values. Table 2 shows that the items in the model had loadings ranging from
0.671 to 0.931, which were above Shi and Wright’s (2001) criteria of 0.35. With composite reliability ranging from 0.851
to 0.923 and Cronbach alphas ranging from 0.753 to 0.875, which were all above the 0.70 criteria, i ndicating good
reliability of all scales. All constructs had an AVE greater than 0.50. Table 3 shows the inter-correlations of constructs and
respective AVE, which also indicates that the correlations were not higher than their respective square root of AVE (0.775
to 0.906). Thus, the measurement model shows a high level of convergent validity.
Table 2
Quality criteria of the constructs
Latent Variable Item Mean Standard Deviation
Standardized Outer loading
AVE Composite reliability
Cronbach’s alpha
Convenience in relationship maintenance
CON1 5.843 0.939 0.854 0.672 0.860 0.757 CON2 5.529 1.070 0.748
CON3 5.662 0.986 0.853
Enjoyment EN1 5.722 1.218 0.795 0.703 0.876 0.790
EN2 4.903 1.118 0.855 EN3
5.256 1.191 0.864
Perceived privacy risk RISK1 4.655 1.457 0.878 0.659 0.851 0.753
RISK3 4.814 1.300 0.870
RISK4 4.812 1.248 0.671
Knowledge function KF1 4.620 1.162 0.764 0.601 0.857 0.778 KF2 5.162 1.083 0.854
KF3 5.620 0.913 0.756 KF4 5.294 1.012 0.722
Social presence FS1 5.594 1.078 0.802 0.717 0.910 0.869 FS2 5.691 0.903 0.874
FS3 5.657 0.871 0.894 FS4 5.567 0.894 0.815
Satisfaction SAT1 5.022 1.137 0.931 0.821 0.902 0.787 SAT2 4.927 1.087 0.881
Self-disclosure SD1 4.362 1.485 0.889 0.801 0.923 0.875
SD2 4.807 1.357 0.930 SD3 4.707 1.393
0.864
Update
Update 4.695 0.776 1.0 -- -- --
Participation of commercial activities on Facebook
PC1 3.664 1.508 0.844 0.679 0.864 0.766 PC2 3.720 1.676 0.784 PC3 3.328 1.576 0.842
Recommended criteria of acceptance of composite reliability and Cronbach’s Alpha is 0.7 (Hair, 1997), and criteria of AVE
is 0.5 (Fornell and Larcker, 1981).
Table 3

226
Square root of AVE (diagonal elements) and inter-construct correlations
Variables Con Know Enjoy Risk Social Sat SD PC Usage
Convenience 0.820
Knowledge 0.540 0.775
Enjoyment 0.460 0.493 0.838
Risk -0.145 -0.161 -0.254 0.812
Social 0.342 0.422 0.327 -0.003 0.847
Satisfaction 0.515 0.532 0.580 -0.324 0.336 0.906
Self-disclosure 0.462 0.491 0.500 -0.311 0.282 0.547 0.895
PC 0.228 0.245 0.351 -0.331 0.222 0.404 0.427 0.824
Update 0.250 0.161 0.300 -0.199 0.034 0.367 0.568 0.329 1.0
After examining the inter-construct correlations, the factor loadings between each item are examined. According to Chin
(2010), to provide evidence for convergent and discriminant validity, the item loadings of each construct should be higher
than those cross loadings. In this study, the range of factor loading is from 0.671 to 0.931 while the range of cross loadings
is from 0.027 to 0.589. The measure of each item strongly related to the construct it attempts to reflect and did not have a
strong connection with another construct. Thus, this measurement model provides acceptable convergent and
discriminant validity.
4.2 Structural Model (Inner model)
After establishing the appropriateness of the measures, the next step is to provide evidence supporting the theoretical
model proposed. The proposed model of the study, presented in Figure 1, suggests relationships among a group of latent
constructs. PLS modeling is adopted to test the model specified the relationships between several latent predictors and
predicted variables (Bollen and Long, 1993). The assessment of the structural model and hypotheses is done by using
multiple indices as suggested by Lohmoller (1989) and O’Cass (2002) , which included r-square (R2) for exogenous-
endogenous relationships, average variance accounted for, regression weights and critical ratios.
The predictive power of PLS is assessed by R2 values of the endogenous constructs (Chin, 2006). Table 4 shows the
explained variance R2 of different endogenous variables for the model proposed. The structural model proposed
demonstrates moderate predictive power. The variance explained in key endogenous constructs was 0.477 for
satisfaction, 0.410 for self-disclosure, 0.285 for participation of commercial activities on Facebook, and 0.323 for
frequency of updating Facebook. The structural model demonstrates acceptable predictive power as the average explained
variance R2 is 0.359.
To reflect the predictive power of estimated inner and outer model relationships, goodness -of-fit (GoF) is being used as an
index for validating the PLS model. GoF is the geometric mean of the average communality and the average explained
variance R2 (Tenenhaus et al., 2005). The GoF index of the propose model is 0.526, which is at satisfactory level.
Table 4
PLS results for the theoretical model
Predicted variable
Predictor variable
Hypotheses Path t-statistics R2
Satisfaction Convenience H1a 0.215 3.715** 0.477
Knowledge H2 0.225 3.643**
Enjoyment H3a 0.320 5.519**
Risk H4a -0.167 3.787**
Self-disclosure Convenience H1b 0.176 3.016**
Enjoyment H3b 0.180 2.948**
Risk H4b -0.114 2.095*
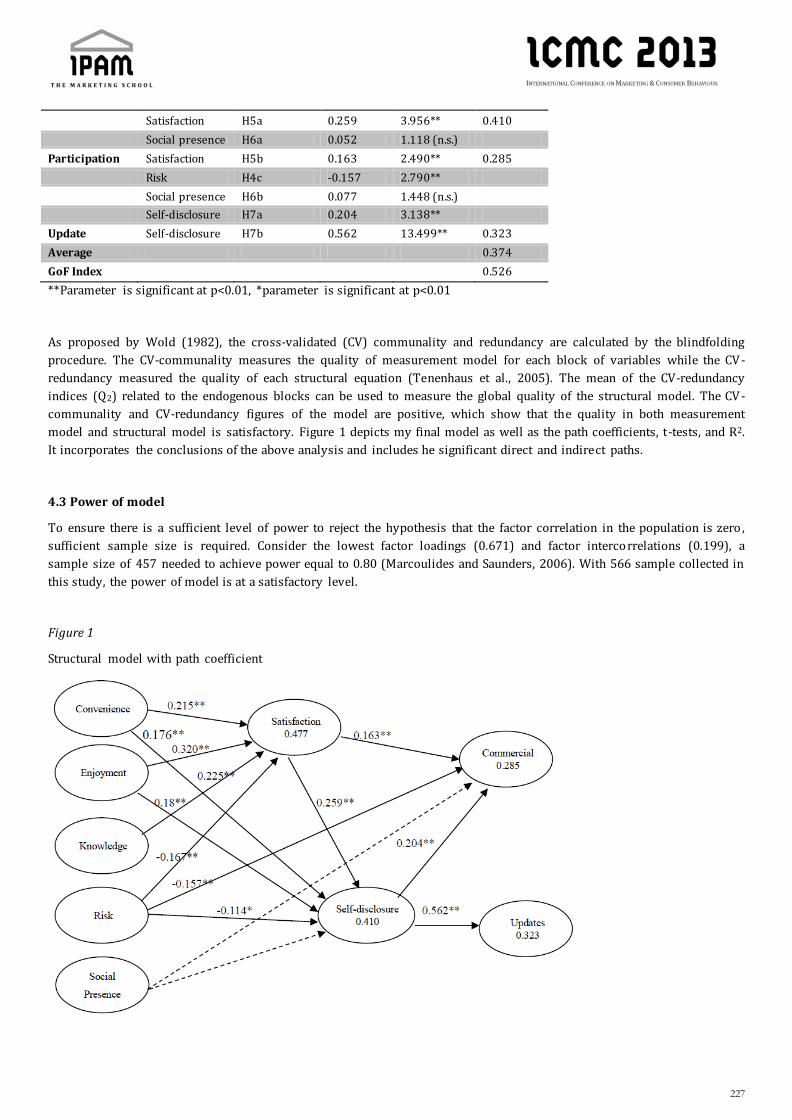
227
Satisfaction H5a 0.259 3.956** 0.410
Social presence H6a 0.052 1.118 (n.s.)
Participation Satisfaction H5b 0.163 2.490** 0.285
Risk H4c -0.157 2.790**
Social presence H6b 0.077 1.448 (n.s.)
Self-disclosure H7a 0.204 3.138**
Update Self-disclosure H7b 0.562 13.499** 0.323
Average 0.374
GoF Index 0.526
**Parameter is significant at p<0.01, *parameter is significant at p<0.01
As proposed by Wold (1982), the cross-validated (CV) communality and redundancy are calculated by the blindfolding
procedure. The CV-communality measures the quality of measurement model for each block of variables while the CV-
redundancy measured the quality of each structural equation (Tenenhaus et al., 2005). The mean of the CV-redundancy
indices (Q2) related to the endogenous blocks can be used to measure the global quality of the structural model. The CV -
communality and CV-redundancy figures of the model are positive, which show that the quality in both measurement
model and structural model is satisfactory. Figure 1 depicts my final model as well as the path coefficients, t-tests, and R2.
It incorporates the conclusions of the above analysis and includes he significant direct and indirect paths.
4.3 Power of model
To ensure there is a sufficient level of power to reject the hypothesis that the factor correlation in the population is zero ,
sufficient sample size is required. Consider the lowest factor loadings (0.671) and factor intercorrelations (0.199), a
sample size of 457 needed to achieve power equal to 0.80 (Marcoulides and Saunders, 2006). With 566 sample collected in
this study, the power of model is at a satisfactory level.
Figure 1
Structural model with path coefficient

228
4.4 Gender differences
After establishing the validity of the structural model, multi-group analysis was adopted to examine the gender differences
in their use of Facebook. Following the parametric approach introduced by Keil et al. (2000), I first run the s tandard PLS
path modeling algorithm for each group, followed by obtaining standard errors of each group by bootstrapping procedure
(Henseler, Ringle & Sinkovics, 2009). An empirical t-value was obtained to see whether it is larger than the critical value
from a t-distribution.
The results show that there are three significant path differences between the male and female Facebook users. Firstly, the
convenience of maintaining relationship have stronger impact to satisfaction for female users (p<.05), that is , female users
of Facebook have higher level of satisfaction of using Facebook if they found Facebook is useful for them to connect and
strengthen their relationship with friends. Secondly, enjoyment of using Facebook has direct effect on the self -disclosure of
male users on Facebook but not that of female users (p<.05). Thus, male users enjoying using Facebook are more willing to
share and post message related to themselves and others on their wall. Finally, the perceived risk of privacy invasion has
direct effect on the self-disclosure of female users but not that of male users (p<.05), which reflected that female users are
more on concern about the risk of privacy invasion on internet than male users do.
5. Discussion and Implications
One challenge for companies using Facebook is to get their customers not only to ‘like’ their Fan Page but also make them
to share the posts on their walls. Taken together, the results indicate that the perceived convenience of maintaining
relationship, knowledge and information received from Facebook, enjoyment from the entertaining activities of Facebook,
and perceived risk of privacy invasion are significantly related to their usage of Facebook, self -disclosure online and
participation of commercial activities on Facebook. Among youngsters in Hong Kong, their satisfaction mediates these
effects. My data also shows self-disclosure leads to more frequent updates of their status and participation of commercial
activities on Facebook. However, the findings suggest that social presence has only very limited effect on their attitudes
toward Facebook and their behavioral intentions.
This study shows that the entertainment motive was the most powerful predictor of satisfaction of using Facebook and
disclosure of personal information on Facebook. Besides, convenience of maintaining relationship and information seeking
are strong driving forces for using Facebook. In other words, many users are using Facebook as a major platform for
entertainment and in a similar fashion as blog (Hunt, Atkin & Krishnan, 2012). The proposed research model contributes
to the body of knowledge of OSNs users’ motivation theoretically and has some practical insights. Theoretically, the results
of this study extend the use of social exchange theory, play theory and use and gratification theory to Facebook behavior.
From a practical standpoint, a company using Facebook to market its brand and products should understand the nature of
social media. The primary motive of users is to connect with their friends effectively. A company should use its Page to
connect with consumers as ‘friends’ and gain their trust in the brand, instead of just providing some brand information
online (Diffley et al. 2011). The company should not use Facebook or other OSNs to push mess ages onto their customers.
Instead, they should engage consumers in conversations directly. With a true dialogue between consumers and the
company, they can create a trustful and committed relationship (Heinonen 2011). Some companies may also arrange for
employees to directly interact with their fans to impart a human touch and ensure involvement. Through these activities,
consumers may develop strong commitment to the brand community.
Enjoyment is the most important factors affecting the self-disclosure and participation of commercial activities on
Facebook. Thus, branded entertainment can be an effective way to enhance brand awareness, stimulate traffic, build brand
loyalty and engage with brand profile pages (Zhang 2010). Marketers may make use of the social media to launch some
innovative and attractive experiential activities to strengthen the affective link between the customers and the brand.
Finally, as perceived risks of privacy invasion is a barrier to self-disclosure and participation in commercial activities,
companies should reduce the collection of information and enhance the users’ perceived control over their personal
information (Hugl 2011; Krasnova et al. 2010). The requests of personal information should be fair and justified to avoid
the feeling of privacy invasion (Poddar, Mosteller, and Ellen 2009).

229
6. Conclusion and limitations
To conclude, this study examined the key motivational determinants of OSN users and identified some implications for
how a company can use its fan page to stimulate their customers to participate in their activities and build closer
relationships with the company. Despite the above contributions, this study has several limitations. The present research
is based on a snowball sample in Hong Kong. Future research should expand to a more representative sample of a
population, besides testing in other countries or markets. Besides, some other factors may also influence the dependent
variables in this study, which include perceived anonymity (Joinson and Paine 2007), users’ perceived control of their
information (Krasnova et al. 2010) and trust in OSN providers (McKnight, Choudhury, and Kacmar 2002). Thus, future
studies should extend the model to gain a more comprehensive picture of participation in commercial activities on
Facebook. Moreover, in addition, this study only focused on the use of Facebook but failed to examine the use of other OSN
vehicles such as Weibo in China. Future studies should extend to compare and contrast the use of different OSN vehicles.
References
Acquisti, A., & Gross, R. (2006). Imagined communities: Awareness, information sharing, and privacy on the facebook . Paper
presented at the 6th Workshop in Privacy Enhancing Technologies.
Armstrong, A. G. & Hagel, J. (1997). Net gain: Expanding markets through virtual communities, McKinsey & Company, 1997.
Bhattacherjee, A. (2001). Understanding information systems continuance: An expectation-confirmation model. MIS
Quarterly, 25, 351-370.
Bollen, K. & Long, J. (1993). Testing Structural Equation Models. Sage Publications, Newbury Park, CA.
Boyd, D. (2007). Why youth (heart) social network sites: The role of networked publics in teenage social life. In D.
Buckingham (Ed.), Youth, Identity, and Digital Media (pp. 119-142). Cambridge: MIT Press.
Chang, A. M., Kannan, P. K., & Whinston, A. B. (1999). Consumers’ extent of evaluation in brand choice. The Journal of
Business, 72(2), 229-251.
Chen, M. J., Chen, C. D., & Farn, C. K. (2010). Exploring determinants of citizenship behavior on virtual communities of
consumption: The perspective of social exchange theory. International Journal of Electronic Business
Management, 8(3), 195-205.
Chin, W. (1998). Issues and opinion on structural equation modeling. MIS Quarterly, 22(1), 7-16.
Chin, W. (2010). How toWrite Up and Report PLS Analyses. In Wynne W. In V. Esposito Vinzi et al. (eds.), Handbook of
Partial Least Squares, Springer Handbooks of Computational Statistics, DOI 10.1007/978-3-540-32827-8 29,
De Bruyn, A. & Lilien, G. (2008). A multi-stage model of word-ofmouth influence through viral marketing. International
Journal of Research in Marketing 25(3) 151.
Diffley, S., Kearns, J., Bennett, W., & Kawalek, P. (2011). Consumer behavior in social networking sites: Implications for
marketers. Irish Journal of Management, 64, 47-65.
Ducoffe, R. H. (1996). Advertising value and advertising on the web. Journal of Advertising Research, 21-35.
Dwyer, C., Hiltz, S. R., & Passerini, K. (2007). Trust and privacy concern within social networking sites: A comparison of
facebook and myspace. Paper presented at the The Thirteenth Americas Conference on Information Systems,
Keystone, Colorado.
Ellison, N. B., Steinfield, C., & Lampe, C. (2007). The benefits of Facebook "friends" social capital and college students' use of
online social network. Journal of Computer-Mediated Communication, 12(4), 1143-1168.
Fogel, J. & Nehmad, E. (2009). Internet social network communities: Risk taking, trust and privacy concerns, Computers in
Human Behavior, 25, 153-60.
Fornell, C. & Cha, J. (1994). Partial least squares, in Bagozzi, R.P. (Ed.), Advanced Methods of Marketing Research, Basil
Blackwell, Oxford.

230
Fornell, C. & Larcker, D. (1981). Evaluating structural equation models with unobservable variables and measurement
error. Journal of Marketing Research, 18, 39-50.
Gao, T. T. Sultan, F., & Rohm, A. J. (2010). Factors influencing Chinese youth consumers' acceptance of mobile marketing.
The Journal of Consumer Marketing, 27(7), 574-583.
Godes, D. & Mayzlin, D. (2009). Firm-created word-of-mouth communication: Evidence from a field test. Marketing Science
28(4) 721-739,803-804.
Gross, R., Acquisti, A., & Heinz, H. J. (2005, 5-7 November). Information revealation and privacy in online social networks
(The Facebook case). Paper presented at the 2005 ACM Workshop on Privacy in the Electronic Society (WPES),
Alexandria, VA.
Haddadi, H. & Pan, H. (2010). To add or not to add: privacy and social honeypots In Proceedings of the ICC 2010: IEEE
International Conference on Communications, May, 23-27, 2010. Capetown, South Africa.
Hann, I. H., Hui, K. L., Lee, S. Y. T., & Pang, I. P. L. (2007). Overcoming information privacy concerns: An information
processing theory approach. Journal of Management Information Systems, 24(2), 13-42.
Hargittai, E. (2007). Whose space? Differences among users and non-users of social network sites. Journal of Computer-
Mediated Communication, 13(1): article 14.
Henseler, J., Ringle, C. M., & Sinkovics, R. R. (2009). The use of partial least squares path modeling in international
marketing. Advances in international marketing, 20, 277-320.
Hogben, Giles. 2007. Security issues and recommendations for online social networks. Position Paper. ENISA, European
Network and Information Security Agency.
Homans, G. C. (1958). Social behavior as exchange. American Journal of Sociology, 63, 597-600.
Hugl, U. (2011). Reviewing person's value of privacy of online social networking. Internet Research 21(4), 384-407.
Hui, K. L., Tan, B. C. Y., & Goh, C. Y. (2006). Online information disclosure: M otivation and measurement. ACM Transactions
on Internet Technology, 6(4), 415-441.
Hunt, D., Atkin, D. & Krishnan, A. (2012). The influence of computer-mediated communication apprehension on motives
for Facebook use. Journal of Broadcasting & Electronic Media, 56(2), 187-202.
Igbaria, M., Schiffman, S. J., & Wieckowski, T. J. (1994). The respective roles of perceived usefulness and perceived fun in
the acceptance of microcomputer technology. Behavior & Information Technology, 13(6), 349-361.
Igbaria, M., Parasuraman, S. & Baroudi, J. J. (1996). A motivational model of microcomputer usage. Journal of Management
Information Systems, 13(1), 127-143.
Joinson, A. N., & Paine, C. B. (Eds.). (2007). Self-disclosure, privacy, and the internet. Oxford: Oxford University Press.
Keil, M., Saarinen, T., Tan, B. C. Y., Tuunainen, V., Wassenaar, A., & Wei, K. K. (2000). A cross -cultural study on escalation of
commitment behavior in software projects. MIS Quarterly, 24(2), 299-325.
Krasnova, H., Spiekermann, S., Koroleva, K., & Hildebrand, T. (2010). Online social networks: Why we disclose. Journal of
Informatoin Technology, 25, 109-125.
Le´ger, C., Politis, D., & Romano, J.P. (1992). Bootstrap technology and applications. Technometrics, 34, 378-98.
Lohmoller, J. (1989). Latent Variable Path Modelling with Partial Least Squares. Physica Verlag, Heidelberg
Malhotra, N. K., Kim, S. S., & Agarwal, J. (2004). Internet users' information privacy concerns (IUIPC): The construct, the
scale, and a causal model. Information Systems Research, 15(4), 336-355.
Marcoulides, G. A. & Saunders, C. (2006). PLS: A silver bullet? MIS Quarterly, 30 (2), iii-ix.
Mazman, S. G. & Usluel, Y. K. (2011). Gender differences in using social networks. The Turkish Online Journal of Educational
Technology, 10(2), 133-139.
McKnight, D. H., Choudhury, V., & Kacmar, C. (2002). The impact of initial consumer trust on intentions to transact with a
web site: A trust building model. Journal of Strategic Information Systems, 11 , 297-323.
231
Milne, George R. & Mary J. Culnan (2004). Strategies for Reducing Online Privacy Risks: Why Consumers Read (or Don't
Read) Online Privacy Notices, Journal of Interactive Marketing, 18 (3), 15-29.
Minton, H.L. & Schneider, F.W. (1980). Differential Psychology, Prospect Heights. IL: Waveland Press.
Nambisan, S. & Baron, R. A. (2007). Interactions in virtual customer environments: Implications for product support and
customer relationship management. Journal of Interactive Marketing, 21, 42-62.
Nunnally, J. (1978). Psychometric Theory. McGraw Hill, New York, NY
O’Cass, A. (2002). Political advertising believability and information source value during elections. Journal of Advertising,
31(1), 63-74.
Poddar, A. Mosteller, J. & Pam, S. E. (2009). Consumers' rules of engagement in online information exchanges. The Journal
of Consumer Affairs, 43(3), 419-448.
Rosen, P., & Sherman, P. (2006). Hedonic information systems: Acceptance of social networking websites. Paper presented at
the AMCIS.
Sachdev, V. (2011). Motivation for social networking. IT Pro, 18-23.
Shao, G. (2009). Understanding the appeal of user-generated media: A uses and gratification perspective. Internet
Research, 19(1), 7-25.
Stafford, T. F., Stafford, M., & Schkade, L. L. (2004). Determining uses and gratifications for the internet. Decision Sciences,
35(2), 259-288.
Sheehan, K. B. (1999). An investigation of gender differences in on-line privacy concerns and resultant behavior. Journal of
Interactive Marketing, 13 (4), 24-38.
Tenenhaus, M., Amato, S., & Esposito Vinzi, V. (2004). A global goodness-of-fit index for PLS structural equation modelling,
In Proceedings of the XLII SIS Scientific Meeting (pp. 739–742). Contributed Papers, CLEUP, Padova.
Valkenburg, P. M. & Jochen, P. (2009). Social consequences of the internet for adolescents: A decade of research. Current
Directions in Psychological Science 18, (1): 1-5.
Wearden, S. T., & Harper, J. M. (2000). Play theory revisited: Dimensions of play in television and internet use. Paper
presented at the Association for Eucation in Journalism and Mass Communication.
Wold, H. O. A. (1982). Soft modeling: The basic design and some extensions. In K. G. J¨oreskog & H. O. A. Wold (Eds.),
Systems under indirect observations: Causality, structure, prediction, Part 2 (pp. 1–54). Amsterdam, The
Netherlands: North-Holland.
Xue, F. & Zhou, P. (2010). The effects of product involvement and prior experience on Chinese consumers’ responses to
online word of mouth. Journal of International Consumer Marketing 23(1), 45-58.
Young, A. & Quan-Haase, A. (2009). Information revelation and internet privacy concerns on social network sites: A case
study of Facebook. 4th International Conference on Communities and Technologies (C & T 2009) (Jun 25).
Young, K. (2009). Online social networking: An Australian Perspective. International Journal of Emerging Technologies and
Society, 7(1), 39-57.
Zhang, J. (2010). To play or not to play: An exploratory content analysis of branded entertainment in Facebook. American
Journal of Business, 25(1), 53-64.

232
Session 7

233
Modeling electronic and total commerce by
innovation diffusion growth models Electronic commerce, consumer behavior, web-based marketing, increasing returns, innovation diffusion, aggregate
diffusion models.
Rui Pascoal, Faculty of Economics, University of Coimbra, [email protected]
Jorge Marques, Faculty of Economics, University of Coimbra, [email protected]
Abstract
This paper focuses on the consumer's behavior modeling in the environment of electronic and total commerce. For
economic agents who are used to the traditional commerce, e-commerce is an innovative service mode, which is similar to
the adoption of an innovation. The diffusion of electronic commerce is influenced by the effects of marketing strategy,
market-centric marketing or consumer-centric marketing, in order to agents gain advantages in the market competition.
Since the mid-1990s the electronic commerce is a business phenomenon that has been growing rapidly. We analyze the
evolution of commerce, considering two time series of U. S. retail adjusted sales, that is, total and electronic commerce
sales, from the 4th quarter 1999 to the 3th quarter 2012. The pattern of evolution is estimated by fitting several aggregate
diffusion models to the series, such as exponential, Gompertz, Logistic, Bass and Michaelis -Menten, which are powerful
tools to explain and forecast the process of innovation diffusion over time.
We fit the models to the data by nonlinear least squares, except in the exponential and Bass models where the linearized
version is fitted by ordinary least squares, using the internet freely available program R. Our results seem to agree with the
fact that the first wave of electronic commerce ended in 2000. There is a high growth rhythm, still far from the saturation
level. Moreover, word to mouth effect seems to vanish in favor of mass media effect. As a final result we show that the
economic principle of diminishing returns doesn’t hold for advertising costs.
1. Introduction
The electronic commerce, e-commerce for short, has been changing the traditional market of products and services since
consumers and suppliers are using information and communication technologies. While the Internet is considered the
principal mean of communication offering the possibility of interaction, the web has turned into a primary information
resource. For economic agents who are used to the traditional shopping, e-commerce is an innovative service mode, which
is similar to the adoption of an innovation. Hence the diffusion of e-commerce is influenced by the effects of marketing
strategy, market-centric marketing or consumer-centric marketing, in order to agents gain advantages in the market
competition. In this context it is a relevant question to know whether the diminishing returns of marketing costs is
overcome by web-based marketing as mentioned by Sharma and Sheth (2004).
The diverse nature of web-based marketing with respect to traditional marketing should be reflected into a different
rhythm of evolution of total commerce and e-commerce, starting from the faster evolution of this last one. In this paper we
analyze two time series of U. S. retail adjusted sales, that is, total and e-commerce sales, from the 4th quarter 1999 to the
3th quarter 2012
(52 quarterly observations, Source: http://www.census.gov/retail/ecommerce/historic_releases.html).
We are also interested in studying the interaction between these series, in particular concerning the following question:
does web-based marketing avoid the diminishing returns of marketing costs? The analysis employed is in according to
Romer (1986).
We consider the following decomposition:

234
where ES denote electronic sales, TS denote total sales, EC denote electronic advertising costs and TC denotes total
advertising costs. That way we explain the evolution of the proportion of electronic sales in total sales. In face of the
greater evolution of EC with respect to TC (from 3% to 37 % between 1997 and 2007) and of greater evolution of TC with
respect to TS, it´s only natural to raise the question whether the ratio ES/EC would increase at a diminishing rate.
The pattern of evolution is estimated by fitting several aggregate diffusion models to the series, such as exponential,
Gompertz, Logistic, Bass and Michaelis-Menten. We fit the models to the data by nonlinear least squares except in the
exponential and Bass models. In the estimations we use the internet freely available program R. This comparative study is
in line with many others on the diffusion of new products innovations (Peres, Muller and Mahajan, 2010).
We analyze the question of diminishing returns using regressions based on linear (or log-linear) model of electronic sales
on accumulated Intranet advertising costs (Source: http://purplemotes.net/2009/02/16/us-advertising-expenditure-
1998-2007). Our results confirm the faster emergent growth of e-commerce as compared with total commerce and
increasing returns of electronic advertising costs.
The paper is organized as follows. In section 2 we present the mathematical formulation of growth models enumerated
above. In section 3 we give the estimation results in table form for e-commerce, total commerce and the ratio between
both these commerce. Section 4 includes two graphics that shows curves fitting to the data series and section 5 is
dedicated to a final remarks.
2. Growth Models
Some diffusion models compatible with rational, exponential and S-shaped form are used to fit the data. The pattern of
evolution for each of the models is described through a differential equation in which the growth rate of the dependent
variable is a function of the saturation level, the other parameters and the variable itself.
In the following table we have the functional form the corresponding differential equation for the following growth
models: exponential, logistic, Gompertz, Bass and Michaelis-Menten.
Originally, Bass (1969) and Michaelis-Menten models were introduced respectively in the study of the diffusion of durable
goods and in the study of the kinetics of enzymes in Chemistry. The last one is also used in growth models in Biology (see
for instance Lopez, France, Gerrits, Dhanoa, Humphries and Dijkstra, (2000)). As far as the authors are aware this model
hasn't be used before to study the diffusion of goods or services.

235
Table 1 provides the theoretical characterization of growth models.
Models Functional Form Differential Equation
Exponential
Logistic
Gompertz
Bass
Michaelis-Menten
The exponential model is characterized by a constant growth rate. There will be a saturation level only if that rate is
negative. In the logistic model the growth rate depends on the proportion of potential consumers which did not yet join
the service. The Gompertz model can be written as a limit case of the generalized logistic given by the
differential equation:
The Bass model assumes that the population of consumers is divided in two groups constituted by innovators and
imitators. The group of innovators is influence only by the mass media communication (external influence given by the
parameter p) and the group of imitators is influence only by the word to mouth communication (internal influence given
by the parameter q). There is a distinction between new adoptions of the product as a result of the influence of advertising
and information (mass media effects) and new adoptions resulting from the influence of others consumers (word to mouth
effects). Note that the logistic model can be seen as a particular case of Bass model: if we make p = 0 and we
obtain the differential equation of the logistic model, so this is a model without innovation part. In this model it’s not easy
to visually identity the take-off moment and, as y increases, the growth rate decreases faster than the logistic model. These
features are adequate for the characterization of a network service where the knowledge, potentiated by marketing, offer
made available is acquired in block by consumers, suppressing the usual word to mouth diffusion effect.
3. Fitting and Forecasting
We fit the growth models to the data by nonlinear least squares except in the exponential and Bass models. In these
models we use the linear and log-linear versions which are fitted by ordinary least squares. Namely, in the Bass model we
consider the discrete version of Satoh (2001). Estimations are made using the Internet freely available program R.
For each model we present the estimated coefficients and the corresponding value of the t-statistics, the residual standard
deviation, R2, saturation level and inflection point.
In Table 2 we try to capture the pattern of evolution in e-commerce sales. In the exponential model the rate of growth is
increasing over time. In the Bass model, only in the first regression of Satoh's version the coefficients have the right signs

236
except for the diffusion q that we assumed to be zero by approximation. This would be well explained by the small
influence of imitation in a mean of information such as the web, where most customers became almost immediately aware
of the existence of new services without need of intermediation of other customers. Nonetheless, the coefficients are not
statistically significant and the resulting exponential pattern has decreasing rates of growth which does not happen when
we fit the exponential model directly. For the other models, logistic and Gompertz, there is an inflexion in the growth
rhythm which leads to a saturation level given by parameter A.
Table 2 reports estimations concerning e-commerce sales.
Models Parameters
(n=52)
T-statistic Res. Standard Deviation R2 Saturation Level Inflection Point
Exponential a = 4.234
b = 0.044
95.01
30.07
0.158
(log-linear version)
0.903
No limit No inflection point
Logistic A = 676.203
ν = 33.883
σ = 14.618
14.49
14.49
14.43
22.05 0.959 676.203 338.102
Gompertz A = 986.2
a = 2.997
b = 0.9701
7.524
35.749
286.501
20.02 0.979 986.2 362.803
Bass A = 744.0909
p = 0.022
q = - 0.022 ≃ 0
The parameters are
indirectly obtained
after those of the
linear regression.
12.95
(linearized version)
0.946 744.091 No inflection point
In Table 3 we try to capture the pattern of evolution in total commerce sales. We see that in the exponential model there is
also an increasing rate of growth over time. Note that the coefficient b is smaller than in table 2 reflecting a slower rhythm
of evolution. Here we consider a generalized version of Michaelis-Menten model where we introduce a new parameter for
a meaningful starting point of evolution, which allows to determine a saturation level much greater than the current level.
This point represents the initial moment of evolution which better fits the observations.
In the logistic and Gompertz models the saturation level is closer to the last series data than in table 2 which suggests that
in total commerce there is a more advanced stage of evolution.
Table 3 reports estimations concerning total commerce sales.
Models Parameters (n=52)
T-statistic Res. Standard Deviation
R2 Saturation Level Inflection Point
Exponential a = 6.606 b = 0.007
487.34 16.40
0.048 (log-linear version)
0.825 No limit No inflection point
Logistic A = 1120.126 ν = -12.604 σ = 25.483
18.466 -5.815 4.141
41.14 0.859 1120.126 560.063
Gompertz A = 1152 a = 0.5057 b = 0.9697
14.264 9.051 108.883
41.18 0.860 1152 423.797
Michaelis-Menten
A=1519.52 k=38.26 t0=32.05
5.910 1.524 2.525
41.28 0.858 1519.52 No inflection point

237
The following point will be to fit the evolution of the proportion of the e-commerce in total commerce, instead of the level
as we did before. We start with the linear model taking time as the explanatory variable for which we find a positive
coefficient, b, as expected. Next we fit models with the saturation level that we report in table 4. As we see this is estimated
between 60 and 78 per cent of total commerce. The exception is the Michaelis-Menten model where we find a 1.96 level.
This may be explained by considering a 100 per cent level will be attained at some finite time horizon estimated to be such
that
We have approximately t equal to 158, that is, the first quarter of 2039.
Table 4 reports estimations concerning the ratio between electronic and total commerce sales.
Models Parameters T-statistic Res. Standard Deviation
Linear a=0.048 b=0.009
19.89 113.67
0.008
Exponential a = -2.372 b = 0.037
-65.74 30.98
0.128 (log-linear version)
Logistic A = 0.6 ν = 28.466 σ = 14.711
46.73 37.33 36.14
0.008
Gompertz A = 0.788 a = 2.475 b = 0.967
27.43 99.22 757.12
0.007
Michaelis-Menten A= 1.966 k= 152.511
7.110 5.714
0.019
We fit the linear and log-linear regressions of e-commerce sales, y, on accumulated value of a series of simple indexes of
advertising costs in Internet, s. The results are as follows:
(13.45) (70.18)
(49.00) (27.89)
F-statistic are respectively 4926 and 778.1. The values in parenthesis below the parameters are the corresponding t-
statistics indicating the overall significance of all parameters. There is a good linear adjustment. As for the exponential
model, the adjustment is also good, but the explanatory variable coefficient is small although significant. So we conclude
that there are not indeed diminishing returns of marketing costs even when considering its accumulated level.
4. Graphic Representation of curves fitting to data
We present the joint plot of the estimated curves and the observations.

238
Figure 1 – Electronic Sales Figure 2 – Total Sales
The crucial highlight arising from the figures is the different nature of curves. On one side, the Gompertz and logistic ones
are better fitting the data, on the other side, the Bass and Michaelis-Menten curves match mostly a general long term
movement of data. Both of them forecast the saturation level. The main feature of exponential model is the fact that it
captures the faster rhythm of e-commerce growth, however it doesn´t present a saturation level.
5. Final Remarks
In this paper we analyze and forecast the cumulative value of online shopping using several aggregate diffusion models.
The results obtained with logistic and Gompertz models show that the process of innovation diffusion for e-commerce
sales is represented by a sigmoid shape curve so that it allows determining the saturation level.
Despite some limitations in the parameter estimations using Bass and Michaelis-Menten models, we remark that some
aspects should be improved. Particularly, here we concluded that imitation coefficient q is approximately equal to zero,
this means the Bass model is represented by an exponential curve, but also with a saturation level. In future work we can
use others generalized versions of Bass model with more variables.
The Michaelis-Menten model is introduced for the first time in this approach. We may assume that advertising costs play
the same role as enzymes in Chemistry because it triggers an increase in sales (the product in Chemistry) all owing to
sustain the enterprise value (the substrate in Chemistry).
In our approach only pure growth models are considered referring to internal influences which are related to the inner
process of evolution, and potentially convergence towards a saturation level. So we aim at capturing the long term pattern
and forecasting. In the paper of Mukhopadhya, Samaddar and Nargundkar (2008) external influences were considered and
analyzed through neural networks, allowing capture also short term movements. In turn, Shan and Liu (2009) considered
several factors of business to business and business to consumers e-commerce, but without endogenous growth.

239
References
Bass, F. M. (1969). A new product growth for model consumer durables. Management Science,15 (5), 215–227.
Lopez, S., J. France, W.J. Gerrits, M.S. Dhanoa, D.J. Humphries, J. Dijkstra (2000). A generalized Michaelis --Menten equation
for the analysis of growth. Journal of Animal Science, 78, 1816—1828.
Mukhopadhyay, S., Samaddar, S., Nargundkar, S. (2008). Predicting Electronic Commerce Growth: An integration of
Diffusion and Neural Network Models . Journal of Electronic Commerce Research, 9 (4), 280-295.
Peres, R., E. Muller, V. Mahajan (2010). Innovation diffusion and new product growth models: A critical review and
research directions. Intern. J. of Research in Marketing, 27 91–106.
Romer, P. M. (1986). Increasing Returns and Long-Run Growth. The Journal of Political Economy, 94 (5), 1002-1037.
Satoh, D. (2001). A discrete Bass model and its parameter estimation. Journal of the Operations Research Society of Japan ,
44 (1), 1-18.
Schneider, G. (2007). Electronic Commerce (7th edition). Boston: Thomson Course Technology.
Shan, S., Liu, L. (2009). A growth model of e-commerce market: an empirical research in China. MASS - International
Conference on Management and Service Science, 1-4.
Sharma, A, J. N. Sheth (2004). Web-based marketing: The coming revolution in marketing thought and strategy. Journal of
Business Research, 57 (7), 696–702.
Srinivasan, V., C. H. Mason (1986). Nonlinear least squares estimation of new product diffusion models. Marketing Science,
5, 169–178.
U. S. Census Bureau (2012). E-Stats. September 14. Retrieved from
http://purplemotes.net/2009/02/16/us-advertising-expenditure-1998-2007
U. S. Census Bureau (2012). E-Stats. November 16. Retrieved from
http://www.census.gov/retail/ecommerce/historic_rel eases.html

240
Innovation, dynamic capabilities and
performance in export markets Resource-based view; Innovativeness; Innovation strategy; Technological capabilities; Dynamic capabilities; Performance
Margarida Vicente, Polytechnic Institute of Viseu, [email protected]
José Luís Abrantes, Polytechnic Institute of Viseu, [email protected]
Cláudia Seabra, Polytechnic Institute of Viseu, [email protected]
Mário Sérgio Teixeira, University of Trás-os-Montes e Alto Douro, [email protected]
Abstract
This paper discusses the connections between innovation, dynamic capabilities and performance in export markets, and
derives hypothesis from the resource-based view of the firm. We intent to demonstrate that dynamic capabilities are
significant in transforming innovation resources into performance, also that they are an intermediate variable between
innovation and firms’ export performance. First, we examine three sets of innovation resources as antecedents of dynamic
capabilities: innovativeness, innovation strategy and technological capabilities. Secondly, we examine the relation between
dynamic capabilities and market effectiveness in export markets. Although the export literature proposes a direct impact
of resources on performance, we suggest dynamic capabilities as an intermediate variable for the relationship between
innovation (as a resource) and performance. The conceptual framework was estimated in a structural equation model,
using a sample of 471 Portuguese exporting manufacturers. The findings establish that dynamic capabilities contribute
significantly to leverage innovation resources to benefit performance in export markets. The results also demonstrate that
innovativeness, innovation strategy and technological capabilities affect market effectiveness, but its influence is
intermediated by dynamic capabilities. Implications for scholars and practitioners are discussed along with suggestions
for future research.
1. Introduction
The globalization of the world economy, the systems of economic integration, and the transmission of technologies a cross
borders awoken the interest of firms in internationalization (Levitt, 1983). Internationalization is construed as referring to
the expansion of activities to other geographical locations (Hitt, Hoskisson, and Kim, 1997) hoping to explore new possibilities
of profit (Kyläheiko et al., 2011). In this context, exporting is an important means of internationalization (Dhanaraj and
Beamish, 2003), and a cost-effective way of penetrating new foreign markets quickly (Leonidou, 1995). It is considered to
involve minimum business risks, and low commitment of resources (Leonidou et al., 2007). This activity allows firms to (i)
utilize inactive operational capabilities and improve their productive efficiency (ii) improve technological quality and the
standard of their services, and (iii) increase their profits and obtain higher rates of return (Guan and Ma, 2003). The growing
export activity emerges as the response to a new dynamic and changing environment, and its importance increases as markets
become more globalized (Pla-Barber and Alegre, 2007).
The factors that affect export performance continue to show a growing importance for investigation, which has been
dominated by the resource-based view (RBV) (e.g., Murray, Kotabe, and Zhou, 2005; Stoian, Rialp, and Rialp, 2011). According
to RBV, firms in the same industry perform differently because they control different resources and capabilities (Barney, 1991;
Newbert, 2007). Those resources and capabilities can generate sustainable competitive advantage and thus a greater
performance (Barney, 1991; Peteraf, 1993).
The increasing pressure of global competitiveness, shorter product life cycles and the easiness of imitation impel exporting
firms to use one important resource to adapt to this new business environment - innovation (Wang, Lu, and Chen, 2008).

241
Innovation has become firm’s productivity improvement, growth and competitiveness base (e.g., Salomon and Shaver, 2005a;
Wang, Lu, and Chen, 2008).
Nevertheless, valuable resources accumulation does not guarantee on its own the firm’s success (Eisenhardt and Martin, 2000;
Teece, Pisano, and Shuen, 1997). The ability to deploy resources through organizational capabilities may be more critical,
than the resources themselves, in helping a firm to obtain desirable success (DeSarbo, Di Benedetto, and Song, 2007).
Additionally, existing capabilities may serve as leverage points for the development of new ones that contribute to superior
firm’s performance (Danneels, 2002).
Dynamic capabilities emphasize the process of transforming the firm’s resources and capabilities into products that provide
superior value to its customers (Wang and Ahmed, 2007). Innovation is recognized as organization’s special asset (Guan and
Ma, 2003) that allows firms to successfully adopt new processes and methods and develop new and improved products to
compete more effectively in a rapidly changing environment (Lawson and Samson, 2001).
It is necessary to research more deeply the relationship between innovation, dynamic capabilities, and organizational
performance (Weerawardena and Mavondo, 2011). Dynamic capabilities is an evolving concept (Newbert, 2007), which has to
be studied as an integrated model that establishes the connection between its antecedents and effects (Hung et al., 2010;
Wang and Ahmed, 2007). Investigation in this field is particularly focused on conceptual analyses (e.g., Prange and Verdier,
2011; Teece, 2007; Winter, 2003), while empirical studies are still fairly sparse (e.g., Wu, 2010; Wu, 2007).
Using the RBV theory, this study intends to understand how firms using their dynamic capabilities identify and acquire their
needed resources, namely innovation, and transform them to achieve a better performance (Grant, 1991; Teece, Pisano, and
Shuen, 1997).
This investigation proposes to contribute to the understanding of dynamic capabilities and innovation on firms’ performance.
As a result, is also our aim to increase the comprehension of the resource-based view in exporting markets. This study main
goal is to demonstrate that dynamic capabilities are significant in transforming innovation resources and capabilities into
performance, also that they are an intermediate variable between innovation and firms’ export performance. First, we
examine three sets of innovation assets as antecedents of dynamic capabilities: innovativeness, technological capabilities and
innovation strategy. Secondly, we examine the relation between dynamic capabilities and market effectiveness in export
markets. Although the export literature proposes a direct impact of resourc es and capabilities on performance (Kaleka, 2012),
we suggest dynamic capabilities as an intermediate variable for the relationship between innovation assets and performance.
The paper is organized as follows: the next section offer the theoretical foundation for five hypotheses regarding the
connection between innovation, dynamic capabilities and export performance. The methodology section includes the
procedures used to test the hypotheses. In the results section, the empirical results are discussed in detail, and in the fol lowing
section, limitations and suggestions for the future research are presented. Finally, i n the last two sections, conclusions and
theoretical and practical implications are considered.
2. Theoretical background and hypotheses
The RBV of the firm (Barney, 1991; Newbert, 2007) consider that companies with valuable, rare, inimitable and non-
substitutable resources and capabilities can generate sustainable competitive advantage by implementing strategies that
create value and which are difficult to imitate by competitors (Barney, 1991). Resources are stocks of tangibles and
intangibles assets semi-permanently tied to the firms (Wernerfelt, 1984). Capabilities are the complex coordinated
patterns of skills and knowledge that become embedded as organizational routines and practices and enable firms to make
the best use of its resources (Teece, Pisano, and Shuen, 1997).
In this context, firms are subject to a process of identification and selection of relevant resources and capabilities to
implement effective programs in order to meet the market future needs, and thus outperform competitors (Aaker, 1989).
Innovation is one key resource in creating firms’ competitive advantage (Barney, 1991; Grant, 1991).
In dynamic markets, where assets are constantly subject to change (Prange and Verdier, 2011), the mere ownership of
specific resources is insufficient (Eisenhardt and Martin, 2000; Teece, Pisano, and Shuen, 1997). Competitive advantages
may be ephemeral (Wu, 2007), and the accelerated technological progress can quickly become products obsolete. Dynamic
capabilities enables the firm “to integrate, build, and reconfigure internal and external competences to address rapidly
changing environments” (Teece, Pisano, and Shuen, 1997, p. 516).

242
This approach challenges the previous static view of the firm, and extends RBV to dynamic markets (Acedo, Barroso, and
Galan, 2006; Helfat and Peteraf, 2003). Dynamic capabilities are based on the combination and coordination of assets to
create skills and knowledge, which become new organizational processes and routines that contributes to the firm’s
competitive advantage and superior performance (Eisenhardt and Martin, 2000; Grant, 1996; Newbert, 2005; Zollo and
Winter, 2002).
In sum, the leverage of resources favors the firm’s strength enabling it to coordinate activities and respond rapidly, in a
flexible manner, to global competitors’ strategies (Eisenhardt and Martin, 2000; Griffith and Harvey, 2001; Teece, Pisano,
and Shuen, 1997). Without dynamic capabilities, innovation resource-rich firms may be rapidly drained and withdrawn
from the market (Wu, 2007).
Previous literature typically hypothesized the existence of linear relationships between innovation resources and
capabilities, and performance outcomes (e.g., Terziovski, 2010). We propose the existence of an intermediate variable -
dynamic capabilities - between the innovation assets and performance (Figure 1).
Our model includes market effectiveness as the endogenous variable, three exogenous variables ( innovativeness,
technological capabilities, and innovation strategy), as well as an intervening variable (dynamic capabilities). The model
considers that the resources and capabilities associated with firms’ innovation precede their dynamic capabilities and
their market effectiveness. Dynamic capabilities intermediate the influence of innovation assets on firms’ performance in
export markets.
Fig. 1. Hypothesized relationships.
Innovativeness
Innovation
strategy
Technological
capabilities
Dynamic
capabilities
Market
effectiveness
H3
H1
H2 H4
2.1. Innovativeness and dynamic capabilities
Innovativeness relates to “the firm’s capacity to engage in innovation” (Hult, Hurley, and Knight, 2004, p. 429). Therefore,
workers’ participation in improvement activities, along with the creation of new ideas, are important factors when
evaluating the firm’s innovative capacity (Martínez-Román, Gamero, and Tamayo, 2011). Innovativeness is conceptualized
as an aspect of firm’s culture that motivates innovative behaviors and outcomes (Hurley and Hult, 1998).
Innovativeness can mean a simple willingness to try a new product line or a strong commitment to master the
technological advances (Lumpkin and Dess, 1996). It reflects the capacity to effectively introduce some new process,
product, or idea within the firm (Damanpour, 1991; Hurley and Hult, 1998). Thus, innovativeness is a key element for
innovation achievement (e.g., Akman and Yilmaz, 2008; Martínez-Román, Gamero, and Tamayo, 2011) and industrial
firms’ success (Hult, Hurley, and Knight, 2004).
Facing the challenge of a competitive and turbulent environment requires the transformation of products, processes,
forms of organization and methods of market the products supplied by exporting firms (Roper and Love, 2002; Roper et
al., 2010). Innovation is a response to changes that occur in firm’s internal or external environment (Hult, Hurley, and
Knight, 2004). Since environments change continuously, firms must continually adopt innovations over time (Damanpour,
1992).

243
The dynamic capabilities perspective can provide a useful theoretical lens for examini ng innovation practices and
behaviors at the firm level. Dynamic capabilities emphasize the importance of adaptation, integration and reconfiguration
of firm’s innovation assets to respond to market opportunities (Teece, Pisano, and Shuen, 1997).
In order to respond to the competitive and changing environment, it is important to stimulate innovativeness (Hult,
Hurley, and Knight, 2004). Innovativeness describes “a firm’s propensity to engage in and support new ideas, novelty,
experimentation, and creative processes that may result in new products, services, or technological processes” (Lumpkin and
Dess, 1996, p. 142). Firms with an organizational culture characterized by a high degree of innovativeness demonstrate a
greater receptivity to new ideas and innovation. This leads to a superior capacity to innovate and to a successful
adaptation to environmental changes (Hurley and Hult, 1998).
Dynamic capabilities are conceptualize as antecedents of organizational and strategic routines by which managers
transform their resources and capabilities into value-creating strategies (Eisenhardt and Martin, 2000; Zollo and Winter,
2002). Innovativeness promotes experimentation and represents a greater receptivity to new ideas and procedures, which
contributes to the renewal of organizational and strategic routines. These innovative routines allow the firm to make
strategic changes that give it the flexibility to operate in dynamic markets (Eisenhardt and Martin, 2000). In line with the
above, it is proposed the following hypothesis:
Hypothesis 1. Innovativeness is positively related to dynamic capabilities.
2.2. Innovation strategy and dynamic capabilities
Innovation is presented as an important strategic tool to ensure competitiveness (Tomiura, 2007), and capture market share
in international markets (Chadha, 2009). The relationship between innovation and strategy is essential for an efficient
management of innovation (Akman and Yilmaz, 2008; Saleh and Wang, 1993). The innovation strategy indicates to what
extent and in what ways the firm uses innovation to execute i ts business strategy (Gilbert, 1994).
Dynamic capabilities enable firms to address the demands of highly changing business environments, and include the ability to
(i) sense opportunities, (ii) seize opportunities, and (iii) sustain competitiveness through the acquisition, combination,
protection and reconfiguration of their resources and capabilities (Teece, 2007). Innovation promotes the continuous renewal
of firms (Danneels, 2002; Szeto, 2000). It allows the creation and implementation of new or improved processes, services,
products and production methods, which aim to increase the firms’ competitiveness (Forsman, 2011). Thus, innovation
strategies have a great impact on the building and evolution of dynamic capabilities (Gebauer, 2011; Lawson and Samson,
2001). In line with the above, it is proposed the following hypothesis:
Hypothesis 2. Innovation strategy is positively related to dynamic capabilities.
2.3. Technological capabilities and dynamic capabilities
In global markets, the firms’ competitive advantages result from the ability to develop new technologies more rapidly than
their competitors, and to create and disseminate technological innovations (Guan and Ma, 2003). Technological capabilities is
the technological knowledge accumulation that firms can use to develop new products or to improve existent ones (Kyläheiko,
et al., 2011).
The literature usually evaluates firms’ technological capabilities through their Research and Development (R&D) activities
(e.g., Krasnikov and Jayachandran, 2008). Technological investments carried out by firms include internal expenses in R&D
and the costs of obtaining technology from external sources (Zahra, 1996). R&D activity is a resource-based investment
(Roper and Love, 2002) and represents the most important intangible innovation expenditure (Evangelista et al., 1997). A
firm’s involvement in R&D enables it to develop and introduce new products in the market, reduce production costs and ensure
more competitive prices (Kafouros et al., 2008).
R&D reveals an internal effort to develop technological knowledge (Quintana-García and Benavides-Velasco, 2008), and
contributes to the firms’ absorptive capacity (Cohen and Levinthal, 1990). This means that R&D is not simply an internal
learning measure, but also a prerequisite for effective external learning. Firms must develop a certain level of internal
knowledge, i.e., absorptive capacity, to recognize, assimilate, and apply external information (Cohen and Levinthal, 1990;
Zahra and George, 2002).
Exporting firms investing in R&D tend to be more productive than those that only export (Aw, Roberts, and Winston, 2007; Aw,
Roberts, and Xu, 2011). This is because global operating units devote more resources to assimilate external knowledge,
namely regarding customers and suppliers, and consequently achieving more innovation outputs (Criscuolo, Haskel, and
244
Slaughter, 2010). R&D investment increases the ability to acquire and use technologies and ideas obtained from their contacts
abroad, which benefits the firm’s exposure to the export market (Aw, Roberts, and Winston, 2007).
In dynamic environments, firms must invest heavily in R&D, in order to influence the direction and speed of technological
change, and to monitor the competences of their competitors (Zahra, 1996). The organization’s R&D activities increase its
absorptive capacity, that is to say, external knowledge acquisition and intra-firm knowledge dissemination (Liao, Welsch, and
Stoica, 2003). This means that firms have greater flexibility to address specific customer needs and effectively communicate
across their departments, responding quickly to changing in export markets. More specifically, the firm’s technological
capabilities increase its dynamic capabilities. In line with the above, we propose the following hypothe sis:
Hypothesis 3. Technological intensity is positively related to dynamic capabilities.
2.4. Dynamic capabilities and export performance
Dynamic capabilities are organizational and strategic routines through which managers change their resources to gener ate
value-creating strategies (Eisenhardt and Martin, 2000). By promoting new strategic paths, dynamic capabilities contribute
to competitive advantage (Taylor and Helfat, 2009; Zahra, Sapienza, and Davidsson, 2006), and improve overall firm
performance (Teece, Pisano, and Shuen, 1997; Wu, 2007; Zollo and Winter, 2002; Zott, 2003).
The dynamic view of capabilities is particularly important in international markets (e.g., Griffith and Harvey, 2001; Prange
and Verdier, 2011; Teece, 2007), where firms are completely exposed to opportunities and threats associated to rapid changes
in customers, technology and competitors (Teece, 2007). Success depends on the firm’s ability to constantly renew and
reconfigure its resources, and adjust them to international constraints (Li, 1995). It is therefore essential that firms ensure the
convergence of their internal resources to match the demand (Camuffo and Volpato, 1996).
Dynamic capabilities are reflected through a firm’s adaptive capability in terms of strategic flexibility of resources and the
alignment between the firm’s assets, its organizational form and the constantly shifting strategic needs (Rindova and Kotha,
2001). Therefore, superior dynamic capabilities enable firms to respond more easily to opportunities in the marketplace
(Eisenhardt and Martin, 2000; Teece, Pisano, and Shuen, 1997), contributing to the improvement of performance in export
markets (e.g., Kaleka, 2002; Lisboa, Skarmeas, and Lages, 2011). In line with the above, we propose the following hypothesis:
Hypothesis 4. Dynamic capabilities are positively related to market effectiveness.
3. Methodology
3.1. Sample and data collection procedure
The study was conducted in 2012, using a sample of Portuguese exporting manufacturers. Portugal was selected because
of the existence of a small domestic market putting pressure on firms to export (Sousa and Bradley, 2008a). Since Portugal
joined the European Union (EU) in 1986, Portuguese exports have been growing exponenti ally. Portugal’s economic
growth depends critically on the success of its firms’ exporting activities (Lages, Jap, and Griffith, 2008; Lisboa, Skarmeas,
and Lages, 2011).
This study focuses exclusively on export manufacturing firms (e.g., Morgan, Kaleka, and Katsikeas, 2004). Service exporters
were excluded because of their idiosyncratic features regarding international expansion, legal regulations and performance
(Erramilli and Rao, 1993; Morgan, Kaleka, and Katsikeas, 2004; Zou and Cavusgil, 2002). Exporting manufacturers of
different industries were selected in order to increase observed variance and reinforce the extrapolation of the results
obtained (Morgan, Kaleka, and Katsikeas, 2004).
Firms normally export more than one product and apply different strategies to distinct products and/or markets (Douglas
and Wind, 1987). Therefore, an analysis was carried out at the export venture level, which is defined as the export of a
single product (or product line) to a single market (Cavusgil and Zou, 1994). Export venture is the main unit of analysis in
the most recent studies on export (e.g., Kaleka, 2012; Lages, Jap, and Griffith, 2008; Lages, Silva, and Styles, 2009; Sousa
and Bradley, 2008a). To avoid confusion and ensure relevant replies, all questions in the questionnaire asked an
assessment of the different items, by reference to the previously selected export.
A random sample of 3000 firms from the Trade & Investment Agency (AICEP Portugal Global) government database was
selected. To ensure the reliability of the data source, the person more engaged in the firm’s export operations was
indicated as key respondent. The use of a single informant is appropriate when he has exclusive access to the necessary

245
information or he is more likely to provide accurate information (Sousa, Martínez-López, and Coelho, 2008b). Additionally,
by using a single key informant, potential sources of systematic and random errors are reduced (Huber and Power, 1985).
The data used to test the model were obtained through an online questionnaire, developed from the open source software
“LimeSurvey”. The firms were invited to participate in the project by e-mail. The e-mail included the study details and a
link to the questionnaire. This method was chosen because of the difficulty in directly contacting the firms , especially when
they are geographically dispersed (e.g., Sousa, Martínez-López, and Coelho, 2008b). The person more engaged in export
operations was asked to complete the questionnaire.
Of the 3000 e-mails sent, 159 bounced back to the recipient’s mail server, 3 firms informed they were no longer in business
and 98 firms informed that they were not interested in participating. Therefore, the sample size was cut down to 2740.
After the initial invitation, three reminders were sent to all non-respondents, spaced one week apart. We obtained 471
valid questionnaires, which corresponds to a response rate of 17%. This is a very satisfactory response rate, given that
average top management survey response rates are in the range of 15% to 20 % (Menon, Bharadwaj, and Howell, 1996).
3.2. Measures
The items used to operationalize each construct were adapted on the basis of existing literature. Constructs were first
order, and we measured them with multi-item scales (see Appendix A). Some of the original items-scale were eliminated,
based on item-to total correlations and coefficient alphas used as a preliminary evaluation of and for refining our
measures.
Firm’s innovativeness. To measure innovativeness we used a six-item scale, derived from Calantone, Cavusgil and Zhao
(2002) and based on the earlier work of Hurt, Joseph and Cook (1977), Hurt and Teigen (1977) and Hollenstein (1996).
Respondents rated their level of agreement (1-strongly disagree; 5-strongly agree) with statements regarding the
introduction of new ideas, methods and behaviors related to innovation.
Innovation strategy. This construct was operationalized using a six-item scale derived from Terziovski (2010).
Respondents rated their level of agreement (1-strongly disagree; 5-strongly agree) with statements related to the
improvement of administrative routines, internal cooperation, customer satisfaction, quality improvement and
commitment to strategy.
Technological capabilities. To measure this construct we used a four-item scale, derived from Kyläheiko et al. (2011).
Respondents rated their level of agreement (1-strongly disagree; 5-strongly agree) regarding their overall view on the
level of technological knowledge and investment in long-span R&D activity.
Dynamic capabilities. To measure dynamic capabilities we used a eleven-item scale of Hung et al. (2010). Respondents
rated their level of agreement (1-strongly disagree; 5-strongly agree) with statements regarding the organizational
strategic, R&D innovative and organizational management dynamic capabilities.
Market effectiveness. This topic was operationalized using a four-item scale tapping managers’ perceptions (1-much worse
than competitors; 5-much better than competitors) of how well their export venture performed relative to major export
market competitors in terms of market share growth, sales revenue growth, acquisition of new export customers and
increased sales to current export customers (e.g., Morgan, Vorhies, and Schlegelmilch, 2006; Vorhies and Morgan, 2005).
Perceptual performance measures have been demonstrated to be valid indicators of objective performance (Venkatraman
and Ramanujam, 1986).
3.3. Survey Instrument Development
The research instrument was created based on a vast literature review on the major subjects pertaining to this study. The
translation was performed using the method of back translation. To improve content validity and questionnaire clarity, a
pre-test was conducted on a sample of 10 managers responsible for the export operations of their companies. The results
contributed to the refinement of the questionnaire.
3.4. Data profile
Exporting firms from all regions participated in the study. The size of the firm was measured by the number of full-time
employees. 26% of the firms employed less than 10 people, 18% had between 10 and 19 employees, 25% had between 20
and 49 employees, 15% between 50 and 99, 12% between 100 and 500, and 4% had more than 500 employees. The
average age of the firms included in the sample is approximately 28 years (SD=25.48, range=1-350). The vast majority of

246
the firms had considerable exporting experience. The average number of years that firms were involved with the export
activity is 16 (SD=13.84, range=1-112). Regarding the number of export markets in which firms operated, 9% exported to
a single country, 34% between 2 and 4 countries, 27% between 5 and 9, 18% between 10 and 25 and 12% to more than 25
countries. European markets were presented as the main destination of the product selected by the respondent firms
(61%).
The main distribution patterns of industries in the sample are as follows: 19% of the firms the sample were active in the
textile, clothing and leather products industries; 17% in the food and drink products industries; 15% in the machinery and
equipment industries; 10% in the glass and ceramics products industry; 10% in the metallic products industry; 9% in the
wood and cork products industry, and 9% in the chemicals and rubber products industries.
Most of the respondents held positions such as managing director (30%), exporting director (21%), president (11%), and
marketing director (6%). The average number of years they had been responsible for exporting operations in their firm is
10 (SD=8.53, range=0-44). This shows that respondents have considerable expertise about the selected export venture.
4. Results
To assess the validity of the measures, the items were subjected to a confirmatory factor analysis, using full -information
maximum likelihood (FIML) estimation procedures in LISREL 8.8 (Jöreskog and Sörbom, 1993).
4.1. Measurement model
In this model, each item is restricted to load on its priori specified factor, with the factors themselves allowed to correlate
with one another. The overall chi-square for this model is significant ( 2=215.13, df=94, p<.00). Since the chi-square
statistic is sensitive to sample size, additional fit indices were examined: the comparative fit Index (CFI=0.98), the
Incremental fit index (IFI=0.98), the Tucker-Lewis fit index (TLI=0.97) and the root mean square error of approximation
(RMSEA=0.052). The results suggest that the scale measures were internally consistent, able to discriminate and provide a
good fit of the factor model to the data.
Item reliabilities were assessed examining the loadings of the individual items in the respective constructs. The majority of
the loadings are greater than 0.7 (which is the minimum value for many researchers). There are two exceptions: for the
first item of innovation strategy construct (loading 0.64) and in the third item of dynamic capabilities construct (loading
0.56). However, a factor loading less than 0.7 but greater than 0.5 can be accepted if the other items in the same construct
present high scores, which is the case (Chin, 1998). The average loading size for all constructs was 0.77.
Convergent validity was assessed by calculating the average variance extracted (AVE) (Fornell and Larcker, 1981). It is
recommended that the AVE should be greater than 0.5, meaning that 50% or more variance of the indicators should be
taken into account (Hair et al., 2010). All values are greater than 0.51, indicating convergent validity (see Appendix A).
Composite reliabilities (Bagozzi, 1980) were also calculated for all constructs with multiple indicators. All constructs met
the suggested minimum acceptable value for composite reliability of 0.7 (Nunnally, 1978). In this research, all constructs
are reliable, with measures of internal consistency that exceed 0.75 (see Appendix A).
Discriminant validity was assessed by observing the construct intercorrelations. The root of AVE for each construct was
compared with the shared variance between constructs. The square root of the AVE should be greater than the correlation
between a construct and any other construct (Chin, 1998). Table 1 provides an overview of the construct means, standard
deviations, and correlation matrix among the five constructs. Adequate discriminant validity is evident since the square
root of AVE between any two constructs (diagonal) is greater than the correlation between those constructs (diagonal).

247
Table 1
Means, standard deviations, and correlations among constructs a,b
Construct Mean Standard deviation 1 2 3 4 5
1. Innovativeness 4.02 0.65 0.78
2. Innovation strategy 3.98 0.60 0.51 0.74
3. Technological capabilities 3.46 0.78 0.62 0.47 0.76
4. Dynamic capabilities 3.98 0.55 0.47 0.54 0.48 0.72
5. Market effectiveness 3.32 0.66 0.22 0.26 0.26 0.34 0.83
a All correlations are significant at the 0.05 level.b The diagonal (in bold) shows the square roots of the average variance extracted.
4.2. Structural equation model
The conceptual framework of Fig. 1 was estimated in a structural equation model using FIML estimation procedures in
LISREL 8.8. Specifically, this model contains five constructs, sixteen observable indicators, measurement and latent
variable errors, and intercorrelations between the latent constructs. The results of the structural equation model testing
suggest a good fit of the model to the data ( 2=221.47, df=97, p<.00, 2/df=2.28, CFI=0.98, IFI=0.98, TLI=0.97,
RMSEA=0.052). Table 2 presents standardized parameter estimates, t-values, and significance levels for the hypothesized
paths.
Table 2
Testing results
Causal path Hypothesis
Standardized
loading
(t-value)
Innovativeness → Dynamic capabilities H1 0.15 (2.06*)
Innovation strategy → Dynamic capabilities H2 0.37 (5.67**)
Technological capabilites → Dynamic capabilities H3 0.23 (3.13**)
Dynamic capabilities → Market effectiveness H4 0.36 (6.50**)
**p<0.01, *p<0.05
All four hypotheses gained support. Specifically, consistent with H1, innovativeness significantly influences dynamic
capabilities (β=0.15, t-value=2.06). In line with H2, innovation strategy has a significant positive impact on dy namic
capabilities (β=0.37, t-value=5.67). In support of H3, technological capabilities have a significant positive impact on
dynamic capabilities (β=0.23, t-value=3.13). Finally, consistent with H4, dynamic capabilities significantly influences
market effectiveness (β=0.36, t-value=6.50).
One of the key advantages of using a path model is the possibility of estimating not only the direct effects, but also the
indirect and total effects among latent variables (Lages and Montgomery, 2005). The indirect effect is determined by
understanding the product of a particular variable on a second variable through its effect on a third intervening or
mediating variable (Hair, et al., 2010). Table 3 shows that all possible indirect effects are statistically significant, which
reinforces in a more sustained way the final model.

248
Table 3
Effects of exogenous and prior endogenous constructs
Effect of/on
Dynamic capabilities Market effectiveness
Direct Indirect Total Direct Indirect Total
Innovativeness0.15*
(2.07)
0.15*
(2.07)
0.05*
(1.99)
0.05*
(1.99)
Innovation strategy0.37**
(5.68)
0.37**
(5.68)
0.13**
(4.51)
0.13**
(4.51)
Technological capabilities0.23**
(3.13)
0.23**
(3.13)
0.08**
(2.89)
0.08**
(2.89)
Dynamic capabilities 0.35**
(6.51)
0.35**
(6.51)
**p<0.01, *p<0.05 (two-tailed tests)
Notes: values in upper rows are completely standardized estimates; values in lower rows are t-values.
The indirect effects of innovativeness, innovation strategy and technological capabilities on market effectiveness highlight
the intervening role of dynamic capabilities. The results indicate that, although the direct impacts of innovativeness,
innovation strategy and technological capabilities on export performance are not significant, the indirect effects are found
to be significant (0.05, p<0.05; 0.13, p<0.01 and 0.08, p<0.01, respectively).
5. Limitations and directions for future research
This study has theoretical and methodological limitations. A limited number of predictor variables were used.
Researchers should try to include not only resources and capabilities internal to firms but also those external to firms that
represent opportunities and threats that may influence their performance (Sousa, Martínez-López, and Coelho, 2008b)
(e.g., competitive intensity, technological turbulence, market turbulence).
Dynamic capabilities were conceptualized using three measurement items. Research can continue by consulting other
scholars’ interpretations of dynamic capabilities. Moreover, it is probable that different industries have different dynamic
capabilities. This is also a subject that is worthy of further investigation.
The measures in this study were collected using a self-report online questionnaire. Therefore, relationships among
variables might be inflated by common method bias. Although we take several measures to reduce the threat of common
method variance, it remains one of the limitations of this study.
The cross-sectional data used in the present study may not be adequate for identifying fundamental relationships among
variables. Longitudinal data may improve this type of research, in that the linkage between dynamic capabilities, its
antecedents, and firms’ performance is established over time.
Finally, the generalizability of results is another limitation in this research. In order to increase generalizability, it may
prove helpful to carry out a comparative study between of two or more countries.
6. Conclusions
In this study, we demonstrate that innovativeness, technological capabilities and innovation strategy have a positive and
direct impact on dynamic capabilities. We confirm the results of the previous study of Gebauer (2011) that management
innovation contributes to the evolution of dynamic capabilities. We also demonstrate that dynamic capabilities influence
positively export firms’ market effectiveness. This enforces the RBV results, that firms with valuable, rare, inimitable and
non-substitutable resources and capabilities can achieve higher performance (Barney, 1991; Newbert, 2007).
However, without dynamic capabilities to convert resources into an advantage, the innovation assets do not translate into
performance (e.g., Wu, 2007; Zollo and Winter, 2002). Dynamic capabilities have a significant positive and direct impact
on market effectiveness. Although innovativeness, technological capabilities and innovation strategy do not directly

249
influence market effectiveness, there is a significant indirect positive impact on market effectiveness. This indirect impact
results from the fact that more dynamic capabilities are developed from innovation, which in turn leads firms to a better
market effectiveness.
Export firms with dynamic capabilities can manage innovation resources and capabilities to outperform rivals.
Consequently, this study improves the understanding firms’ performance and innovation particularly on export markets.
Firms need to develop creative ways to execute and modify their management innovation routines to improve their
dynamic capabilities and, thus, improve their market effectiveness. The most important indicator of dynamic capabilities is
innovation strategy, which is twice as important as innovativeness and technological capabi lities. Organizations with more
formal innovation strategies implement and adopt tools and techniques linked to innovation activities that are more
efficient (Nijssen and Frambach, 2000) and improve their dynamic capabilities.
Therefore, it can be reasoned that innovativeness, technological capabilities and innovation strategy alone would not
generate superior performance. Instead, firms have to be flexible in understanding customers’ needs and in
communicating among departments to make innovation effective.
7. Implications
Using the RBV theory, this study intended to understand how a set of three innovation assets (innovativeness,
technological capabilities and innovation strategy) influences dynamic capabilities and performance in export markets.
The findings offer insights into these issues and provide significant implications for international marketing theory and
practice.
Improving innovation assets is extremely important since dynamic capabilities must act on those assets in place to ensure
a successful performance. When firm’s managers develop innovativeness, technological capabilities and innovation
strategy, should also consider developing dynamic capabilities in order to influence the firm’s market performance
effectively.
Innovation strategy appears as the most important factor for the development of firm’s dynamic capabilities. Managers
must implement a formal innovation strategy, and guarantee employees cooperation and commitment to its successful
implementation. This, in turn, will lead to a higher capability do respond and anticipate changes in the export markets.
Managers must also emphasize the importance of innovativeness and technological capabilities for firm’s success .
Stimulating creativity and promoting R&D activities, firm is more apt to respond to the competitive and turbulent
environment in foreign markets.
This study also provides valuable recommendations on how to evaluate the quality of export firms by assessing their
dynamic capabilities. Specifically, one should focus the firm’s flexibility to understand specific needs of customers, to
communicate and coordinate effectively among departments and to helps employees to balance the life of work and family.
Acknowledgments
The authors kindly acknowledge the support from the Portuguese Foundation for Science and Technology (FCT) through
the project PEst-OE/CED/UI4016/2011, and Center for Studies in Education, Technologies and Health (CI&DETS).
References
Aaker, D.A. (1989). The key to a sustainable competitive advantage. California Management Review, 31(2), 91-106.
Acedo, F.J., Barroso, C., and Galan, J.L. (2006). The resource-based theory: dissemination and main trends. Strategic
Management Journal, 27(7), 621-636.
Akman, G. and Yilmaz, C. (2008). Innovative capability, innovation strategy and market orientation: an empirical analysis
in turkish software industry. International Journal of Innovation Management, 12(1), 69-111.
Aw, B.Y., Roberts, M.J., and Winston, T. (2007). Export market participation, investments in R&D and worker training, and
the evolution of firm productivity. World Economy, 30(1), 83-104.

250
Aw, B.Y., Roberts, M.J., and Xu, D.Y. (2011). R&D investment, exporting, and producti vity dynamics. American Economic
Review, 101(4), 1312–1344.
Bagozzi, R.P. (1980). Causal Models in Marketing. New York: John Wiley & Sons.
Barney, J.B. (1991). Firm resources and sustained competitive advantage. Journal of Management, 17(1), 99-120.
Calantone, R.J., Cavusgil, S.T., and Zhao, Y. (2002). Learning orientation, firm innovation capability, and firm performance.
Industrial Marketing Management, 31(6), 515-524.
Camuffo, A. and Volpato, G. (1996). Dynamic capabilities and manufacturing automation: organizational learning in the
Italian automobile industry. Industrial and Corporate Change, 5(3), 813-838.
Cavusgil, S.T. and Zou, S. (1994). Marketing Strategy-Performance Relationship: An Investigation of the Empirical Link in
Export Market Ventures. Journal of Marketing, 58(1), 1-21.
Chadha, A. (2009). Product cycles, innovation, and exports: a study of indian pharmaceuticals. World Development, 37(9),
1478-1483.
Chin, W.W. (1998). The partial least squares approach for structural equation modeling, in G. A. Marcoulides (ed.), Modern
Methods for Business Research, Mahwah, NJ: Lawrence Erlbaum Associates. 295-336.
Cohen, W.M. and Levinthal, D.A. (1990). Absorptive Capacity: A New Perspective on Learning and Innovation.
Administrative Science Quarterly, 35(1), 128-152.
Criscuolo, C., Haskel, J.E., and Slaughter, M.J. (2010). Global engagement and the innovation activities of firms. International
Journal of Industrial Organization, 28(2), 191-202.
Damanpour, F. (1991). Organizational Innovation: A Meta-Analysis of Effects of Determinants and Moderators. The
Academy of Management Journal, 34(3), 555-590.
Damanpour, F. (1992). Organizational Size and Innovation. Organization Studies, 13(3), 375-402.
Danneels, E. (2002). The dynamics of product innovation and firm competences. Strategic Management Journal, 23(12),
1095-1121.
DeSarbo, W.S., Di Benedetto, C.A., and Song, M. (2007). A heterogeneous resource based view for exploring relationships
between firm performance and capabilities. Journal of Modeling in Management, 2, 103-130.
Dhanaraj, C. and Beamish, P.W. (2003). A Resource-Based Approach to the Study of Export Performance. Journal of Small
Business Management, 41(3), 242-261.
Douglas, S.P. and Wind, Y. (1987). The Myth of Globalization. Columbia Journal of World Business, 22(4), 19-29.
Eisenhardt, K.M. and Martin, J.A. (2000). Dynamic capabilities: what are they? Strategic Management Journal, 21(10-11),
1105-1121.
Erramilli, M.K. and Rao, C.P. (1993). Service firms' international entry-mode choice: A modified transaction-cost analysis
approach. Journal of Marketing, 57(3), 19-38.
Evangelista, R., Perani, G., Rapiti, F., and Archibugi, D. (1997). Nature and impact of innovation in manufacturing industry:
some evidence from the Italian innovation survey. Research Policy, 26(4-5), 521-536.
Fornell, C. and Larcker, D.F. (1981). Evaluating Structural Equation Models with Unobservable Variables and Measurement
Error. Journal of Marketing Research, 18(1), 39-50.
Forsman, H. (2011). Innovation capacity and innovation development in small enterprises. A comparison between the
manufacturing and service sectors. Research Policy, 40(5), 739-750.
Gebauer, H. (2011). Exploring the contribution of management innovation to the evolution of dynamic capabilities.
Industrial Marketing Management, 40(8), 1238-1250.
Gilbert, J. (1994). Choosing an innovation strategy: Theory and practice: Business Horizons.
Grant, R.M. (1991). The resource-based theory of competitive advantage: implications for strategy formulation. California
Management Review, 33(3), 114-135.

251
Grant, R.M. (1996). Toward a knowledge-based theory of the firm. Strategic Management Journal, 17(Winter Special Issue),
109-122.
Griffith, D.A. and Harvey, M.G. (2001). A resource perspective of global dynamic capabilities. Journal of International
Business Studies, 32(3), 597-606.
Guan, J. and Ma, N. (2003). Innovative capability and export performance of Chinese firms. Technovation, 23(9), 737-747.
Hair, J.F., Black, W.C., Babin, B.J., and Anderson, R.E. (2010). Multivariate data analysis (7th ed.). Upper Saddle River:
Pearson Prentice Hall.
Helfat, C.E. and Peteraf, M.A. (2003). The dynamic resource-based view: capability lifecycles. Strategic Management
Journal, 24(10), 997-1010.
Hitt, M.A., Hoskisson, R.E., and Kim, H. (1997). International diversification: effects on innovation and firm performance in
product-diversified firms. Academy of Management Journal, 40(4), 767-798.
Hollenstein, H. (1996). A composite indicator of a firm's innovativeness. An empirical analysis based on survey data for
Swiss manufacturing. Research Policy, 25(4), 633-645.
Huber, G.P. and Power, D.J. (1985). Retrospective reports of strategic-level managers: Guidelines for increasing their
accuracy. Strategic Management Journal, 6(2), 171-180.
Hult, G.T.M., Hurley, R.F., and Knight, G.A. (2004). Innovativeness: Its antecedents and impact on business performance.
Industrial Marketing Management, 33(5), 429-438.
Hung, R.Y.Y., Yang, B., Lien, B.Y.-H., McLean, G.N., and Kuo, Y.-M. (2010). Dynamic capability: Impact of process alignment
and organizational learning culture on performance. Journal of World Business, 45(3), 285-294.
Hurley, R.F. and Hult, G.T.M. (1998). Innovation, Market Orientation, and Organizational Learning: An Integration and
Empirical Examination. Journal of Marketing, 62(3), 42-54.
Hurt, H.T., Joseph, K., and Cook, C.D. (1977). Scales for the measurement of innovativeness. Human Communication
Research, 4(1), 58-65.
Hurt, T. and Teigen, C. (1977). The development of a measure of perceived organizational innovativeness. Communication
yearbook, 1(1), 377-385.
Jöreskog, K.G. and Sörbom, D. (1993). LISREL 8: Structural equation modeling with the SIMPLIS command language .
Chicago: Lawrence Erlbaum Associates.
Kafouros, M.I., Buckley, P.J., Sharp, J.A., and Wang, C. (2008). The role of internationalization in explaining innovation
performance. Technovation, 28(1-2), 63-74.
Kaleka, A. (2002). Resources and capabilities driving competitive advantage in export markets: guidelines for industrial
exporters. Industrial Marketing Management, 31(3), 273-283.
Kaleka, A. (2012). Studying resource and capability effects on export venture performance. Journal of World Business,
47(1), 93-105.
Krasnikov, A. and Jayachandran, S. (2008). The Relative Impact of Marketing, Research-and-Development, and Operations
Capabilities on Firm Performance. Journal of Marketing, 72(4), 1-11.
Kyläheiko, K., Jantunen, A., Puumalainen, K., Saarenketo, S., and Tuppura, A. (2011). Innovation and internationalization as
growth strategies: The role of technological capabilities and appropriability. International Business Review,
20(5), 508-520.
Lages, L.F., Jap, S.D., and Griffith, D.A. (2008). The role of past performance in export ventures: a short-term reactive
approach. Journal of International Business Studies, 39(2), 304-325.
Lages, L.F. and Montgomery, D.B. (2005). The relationship between export assistance and performance improvement in
Portuguese export ventures: An empirical test of the mediating role of pricing strategy adaptation. European
Journal of Marketing, 39(7/8), 755-784.

252
Lages, L.F., Silva, G., and Styles, C. (2009). Relationship Capabilities, Quality, and Innovation as Determinants of Export
Performance. Journal of International Marketing, 17(4), 47-70.
Lawson, B. and Samson, D. (2001). Developing Innovation Capability in Organisations: A Dynamic Capabilities Approach.
International Journal of Innovation Management, 5(3), 377-400.
Leonidou, L.C. (1995). Export barriers: non-exporters' perceptions. International Marketing Review, 12(1), 4-25.
Leonidou, L.C., Katsikeas, C.S., Palihawadana, D., and Spyropoulou, S. (2007). An analytical review of the factors stimulating
smaller firms to export: Implications for policy-makers. International Marketing Review, 24(6), 735-770.
Levitt, T. (1983). The Globalization of Market. Harward Business Review, 61(3), 92-102.
Li, J. (1995). Foreign entry and survival: Effects of strategic choices on performance in international markets. Strategic
Management Journal, 16(5), 333-351.
Liao, J., Welsch, H., and Stoica, M. (2003). Organizational Absorptive Capacity and Responsiveness: An Empirical
Investigation of Growth-Oriented SMEs. Entrepreneurship Theory and Practice, 28(1), 63-85.
Lisboa, A., Skarmeas, D., and Lages, C. (2011). Entrepreneurial orientation, exploitative and explorative capabilities, and
performance outcomes in export markets: A resource-based approach. Industrial Marketing Management, 40(8),
1274-1284.
Lumpkin, G.T. and Dess, G.G. (1996). Clarifying the entrepreneurial orientation construct and linking it to performance. The
Academy of Management Review, 21(1), 135-172.
Martínez-Román, J.A., Gamero, J., and Tamayo, J.A. (2011). Analysis of innovation in SMEs using an innovative capability -
based non-linear model: A study in the province of Seville (Spain). Technovation, 31(9), 459-475.
Menon, A., Bharadwaj, S., and Howell, R. (1996). The quality and effectiveness of marketing strategy: Effects of functional
and dysfunctional conflict in intraorganizational relationships. Journal of the Academy of Marketing Science,
24(4), 299-313.
Morgan, N., Vorhies, D., and Schlegelmilch, B. (2006). Resource-performance relationships in industrial export ventures:
The role of resource inimitability and substitutability. Industrial Marketing Management, 35(5), 621-633.
Morgan, N.A., Kaleka, A., and Katsikeas, C.S. (2004). Antecedents of Export Venture Performance: A Theoretical Model and
Empirical Assessment. Journal of Marketing, 68(1), 90-108.
Murray, J.Y., Kotabe, M., and Zhou, J.N. (2005). Strategic alliance-based sourcing and market performance: evidence from
foreign firms operating in China. Journal of International Business Studies, 36(2), 187-208.
Newbert, S.L. (2005). New Firm Formation: A Dynamic Capability Perspective. Journal of Small Business Management,
43(1), 55-77.
Newbert, S.L. (2007). Empirical research on the resource-based view of the firm: an assessment and suggestions for future
research. Strategic Management Journal, 28(2), 121-146.
Nijssen, E.J. and Frambach, R.T. (2000). Determinants of the Adoption of New Product Development Tools by Industrial
Firms. Industrial Marketing Management, 29(2), 121-131.
Nunnally, J.C. (1978). Psychometric theory (2nd ed.). New York: McGraw-Hill.
Peteraf, M.A. (1993). The cornerstones of competitive advantage: A resource-based view. Strategic Management Journal,
14(3), 179-191.
Pla-Barber, J. and Alegre, J. (2007). Analysing the link between export intensity, innovation and firm size in a science-based
industry. International Business Review, 16(3), 275-293.
Prange, C. and Verdier, S. (2011). Dynamic capabilities, internationalization processes and performance. Journal of World
Business, 46(1), 126-133.
Quintana-García, C. and Benavides-Velasco, C.A. (2008). Innovative competence, exploration and exploitation: The
influence of technological diversification. Research Policy, 37(3), 492-507.

253
Rindova, V.P. and Kotha, S. (2001). Continuous "Morphing": Competing through Dynamic Capabilities, Form, and Function.
The Academy of Management Journal, 44(6), 1263-1280.
Roper, S. and Love, J.H. (2002). Innovation and export performance: evidence from the UK and German manufacturing
plants. Research Policy, 31(7), 1087–1102.
Roper, S., Youtie, J., Shapira, P., and Fernández-Ribas, A. (2010). Knowledge, Capabilities and Manufacturing Innovation: A
USA–Europe Comparison. Regional Studies, 44(3), 253 - 279.
Saleh, S.D. and Wang, C.K. (1993). The management of innovation: strategy, structure, and organizational climate. IEEE
Transactions on Engineering Management, 40(1), 14-21.
Salomon, R.M. and Shaver, J.M. (2005a). Learning by Exporting: New Insights from Examining Firm Innovation. Journal of
Economics & Management Strategy, 14(2), 431-460.
Sousa, C.M.P. and Bradley, F. (2008a). Antecedents of international pricing adaptation and export performance. Journal of
World Business, 43(3), 307-320.
Sousa, C.M.P., Martínez-López, F.J., and Coelho, F. (2008b). The determinants of export performance: A review of the
research in the literature between 1998 and 2005. International Journal of Management Reviews, 10(4), 343-374.
Stoian, M.-C., Rialp, A., and Rialp, J. (2011). Export performance under the microscope: A glance through Spanish lenses.
International Business Review, 20(2), 117-135.
Szeto, S.Y.E. (2000). Innovation capacity: Working towards a mechanism for improving innovation within an inter-
organisational network. The TQM Magazine, 12(2), 149-157.
Taylor, A. and Helfat, C.E. (2009). Organizational Linkages for Surviving Technological Change: Complementary Assets,
Middle Management, and Ambidexterity. Organization Science, 20(4), 718-739.
Teece, D.J. (2007). Explicating dynamic capabilities: the nature and microfoundations of (sustainable) enterprise
performance. Strategic Management Journal, 28(13), 1319-1350.
Teece, D.J., Pisano, G., and Shuen, A. (1997). Dynamic capabilities and strategic management. Strategic Management
Journal, 18(7), 509-533.
Terziovski, M. (2010). Innovation practice and its performance implications in small and medium enterprises (SMEs) in
the manufacturing sector: a resource-based view. Strategic Management Journal, 31(8), 892-902.
Tomiura, E. (2007). Effects of R&D and networking on the export decision of Japanese firms. Research Policy, 36(5), 758-
767.
Venkatraman, N. and Ramanujam, V. (1986). Measurement of Business Performance in Strategy Research: A Comparison
of Approaches. Academy of Management Review, 11(4), 801-814.
Vorhies, D. and Morgan, N. (2005). Benchmarking marketing capabilities for sustained competitive advantage. Journal of
Marketing, 69(1), 80-94.
Wang, C., Lu, I., and Chen, C. (2008). Evaluating firm technological innovation capability under uncertainty. Technovation,
28(6), 349-363.
Wang, C.L. and Ahmed, P.K. (2007). Dynamic capabilities: A review and research agenda. International Journal of
Management Reviews, 9(1), 31-51.
Weerawardena, J. and Mavondo, F.T. (2011). Capabilities, innovation and competitive advantage. Industrial Marketing
Management, 40(8), 1220-1223.
Wernerfelt, T.B. (1984). A resource-based view of the firm. Strategic Management Journal, 5(2), 171-180.
Winter, S.G. (2003). Understanding dynamic capabilities. Strategic Management Journal, 24(10), 991-995.
Wu, L.-Y. (2010). Applicability of the resource-based and dynamic-capability views under environmental volatility. Journal
of Business Research, 63(1), 27-31.

254
Wu, L. (2007). Entrepreneurial resources, dynamic capabilities and start-up performance of Taiwan's high-tech firms.
Journal of Business Research, 60(5), 549-555.
Zahra, S.A. (1996). Technology strategy and financial performance: Examining the moderating role of the firm's
competitive environment. Journal of Business Venturing, 11(3), 189-219.
Zahra, S.A. and George, G. (2002). Absorptive capacity: a review, reconceptualization, and extension. Academy of
Management Review, 27(2), 185-203.
Zahra, S.A., Sapienza, H.J., and Davidsson, P. (2006). Entrepreneurship and Dynamic Capabilities: A Review, Model and
Research Agenda*. Journal of Management Studies, 43(4), 917-955.
Zollo, M. and Winter, S.G. (2002). Deliberate Learning and the Evolution of Dynamic Capabilities. Organization Science,
13(3), 339-351.
Zott, C. (2003). Dynamic capabilities and the emergence of intraindustry differential firm performance: insights from a
simulation study. Strategic Management Journal, 24(2), 97-125.
Zou, S. and Cavusgil, S.T. (2002). The GMS: A Broad Conceptualization of Global Marketing Strategy and Its Effect on Firm
Performance. Journal of Marketing, 66(4), 40-56.
Appendix A
Constructs, scale items, and reliabilities.
Construct/items Standardized
loadings
t-value
Innovativeness (α=0.81, ρvc(n)=0.61, ρ=0.82)
Scale: 1-strongly disagree; 5-strongly agree
1.Our company frequently tries out new ideas
2.Our company seeks out new ways to do things
3.Our company is creative in its methods of operation
0.70
0.86
0.78
16.17
21.16
18.53
Innovation strategy (α=0.77, ρvc(n)=0.55, ρ=0.79)
Scale: 1-strongly disagree; 5-strongly agree
1. Internal cooperation is an important part of innovation strategy implementation
2. Formulating innovation strategy increases employee skills
3. Improving employee commitment, morale, or both is part of our innovation
strategy monitoring
0.64
0.79
0.79
14.13
18.20
18.09
Technological capabilities (α=0.80, ρvc(n)=0.57, ρ=0.80)
Scale: 1-strongly disagree; 5-strongly agree
1. Our technological capabilities are top class
2. The success of our R&D activities is based on long-term know-how
3. We have invested heavily in certain R&D projects
0.72
0.73
0.82
16.56
16.78
19.37
Dynamic capabilities (α=0.72, ρvc(n)=0.51, ρ=0.75)
Scale: 1-strongly disagree; 5-strongly agree
1. My organization has the flexibility to understand the specific needs of
customers
2. My organization has the flexibility to communicate and coordinate effectively
among departments
3. My organization helps employees to balance the life of work and family
0.73
0.83
0.56
16.21
18.77
12.01
Market effectiveness (α=0.89, ρvc(n)=0.69, ρ=0.90)
Scale: 1-much worse than competitors; 5-much better than competitors
1. Export venture’s market share growth
2. Growth in export venture sales revenue
3. Acquiring new export venture customers
4. Increasing sales to current export customers
0.86
0.92
0.76
0.76
22.57
25.13
18.84
18.89
α=internal reliability; ρvc(n)= variance extracted; ρ=composite reliability.

255
An Analysis of the Decision Structure for Food
Innovation on the Basis of Consumer Age Consumer behavior, novel foods, age, means-end chain, laddering, coffee.
Ramo Barrena, Universidad Pública de Navarra, [email protected]
Teresa García, Universidad Pública de Navarra, [email protected]
Dena Camarena, Universidad de Sonora, [email protected]
Abstract
In recent years, market globalization and greater competition plus ever increasing consumer sophistication have driven
the food industry to innovate in search of improved market positions. Food innovations, however, have a high failure rate.
Among other reasons, this is due to failure to understand the benefits consumers look for in the products they buy or
which traits of their own personality they project through these products.
This study analyzes the decision structures of consumers in different age ranges (one of the variables traditionally seen as
significant when it comes to adopting innovations) in relation to a novel food product in order to determine potential
differences among these structures. Our research was carried out applying means-end chain theory that allows us to
establish relationships between attributes of a product with the benefits they symbolize and the personal values
consumers try to achieve through them.
Two products were selected to determine the role played by consumers’ ages in the acceptance of food innovations and
the potential differences in decision structure when consumers of different ages are presented with a novel food product.
We chose a traditional product as the control product (coffee) and a novel coffee-derived product (Nespresso type coffee
capsules). Results show that consumption decisions were similar regardless of consumers’ age when they are presented
with a traditional consumer product. However, the structure becomes more complex in the case of a novel food item,
especially among young consumers.
1. Introduction and objectives
The food market has high levels of competition and saturation, which means companies have to keep developing strategies
in order to improve or even sustain their position or even to survive (Baregheh et al., 2009; Naidoo, 2010). One of those
strategies is product innovation aimed at satisfying consumers’ needs, and targeting market niches with specific needs.
While product innovation is important in terms of business strategy and growth, the fact is that the success rate for newly
launched products is relatively low, with failure rates in the 40%-90% range (Gourville 2006, Gresham and et al., 2006).
This is often caused by failure to understand consumers and by a lack of market orientation on the part of businesses.
Consumers are getting more and more variable and less predictable due, among other reasons, to significant changes in
lifestyles, demographic changes, cultural exchange and high communication levels. (Imram, 1999; Capitanio et al., 2009;
Fortuin and Omta, 2009; Kühne et al., 2010). In view of this, better knowledge of what consumers want, of their changing
needs, and how these changes can be immediately addressed, in other words, market orientation, becomes not only a key
to success but a key to survival too for agro-food industries (Costa et al., 2004). Innovation success is based on
understanding consumers, what features and benefits they look for in the products they buy and consume and the aspects
of their own personalities they project through these products.
Means-end chain (MEC) theory allows us to establish relationships between the features or specifications considered in a
given product with the benefits they symbolize and the personal values consumers try to achieve through them. Thus, this
approach gives us an idea of the aspects consumers take into account when it comes to buying a given product. This means
that understanding consumers’ adoption process and cognitive structure can help improve positioning and launch

256
strategies related to food innovations. Consumer behavior oriented research on innovations has focused on the analysis of
the mental, behavior and demographic traits associated with willingness to adopt novel products. Some studies relate
adoption of novel products to consumers’ personal traits (Dickerson and Gentry, 1983; Michon et al., 2010). The variables
normally included are income, age, family group size, education level, etc. Although some studies show that the effect of
demographic variables tends to be mild, there is general agreement on the fact that consumers who innovate generally
have high income and education levels, are young, have higher social mobility, are more prone to making risky decisions,
and have higher opinion leadership (Dickerson and Gentry, 1983; Gatignon and Robertson, 1991; Rogers, 1995; Im, Bayus,
Mason, 2003).
The age variable generally appears in marketing literature dealing with market segmentation and consumer behavior. The
specific phase in the cycle of life that people are going through accounts for the general structure of certain consumer
choices (Grande, 1993), which means that companies cannot work in the same way for all age segments if they want to
succeed at getting consumers to adopt new goods and services. There is a broad-based consensus in the literature on the
fact that age has an adverse effect over consumers’ innovation drive. Younger consumers tend to be more innovative
(Rogers, 2003) and older consumers are more reluctant to innovate (Leek et al., 2001, Tellis, Yin and Bell, 2009).
Age generally affects innovation; young people are less risk-averse (Assael, 1987; Burgess and Steenkamp, 2006). This
trend is seen in the ecological food market (Rimal and Moon, 2005; Tsakiridou et al., 2008; Bartels and Reinders, 2010,
among others), the functional food market (Leek et al., 2001; Krystallis et al., 2010, and others) and the ethnic food market
(Pelchat and Pliner, 1995; Xu et al., 2004).
Lunsford and Burnett (1992) considered a series of potential barriers to the adoption of novel products among older
consumers and suggested that there are a number of incompatibility limitations with these products from the
psychological point of view as older consumers fail to see clear benefits in them and the brand image or that of the product
may be inconsistent with older consumers’ self-image. Our study attempts to analyze consumers’ decision strategies
according to their age and in relation to a novel food product in order to determine differentiating elements. This
knowledge will help us identify the key elements for each age group and establish guidelines leading to improved rates of
novel food product adoption. Although the age factor in relation to the adoption of novel food products has been widely
analyzed, there are currently no studies establishing differences in decision structure according to age using means -end
chain theory. That is to say, there are no studies analyzing the extent to which the desired specifications in a product, the
benefits pursued and the personal values in play vary according to consumers’ age when a novel food product is bought;
this is the differentiating element in our study.
Means-end chain theory, the theoretical basis of our research is presented in the next section. Section 3 explains the
methodology used and Section 4 gives shows the main results. Finally, the main conclusions and implications are
presented, as well as the limitations of the study.
2. Theoretical framework. Means-end chain (MEC)
Gutman (1982) introduced means-end chain (MEC) theory into the field of marketing and consumer research, as a way of
explaining the relationship between consumer knowledge and consumer behavior. MEC is a cognitive structure that links
consumers’ knowledge of products to their knowledge of certain consequences and values connected with those products
(Ter Hofstede et al., 1998).
The main premise of MEC is that consumers learn to select those products that feature the attributes that allow them to
achieve their desired ends (Reynolds and Gutman, 1984, Ter Hofstede et al., 1998; Walker y Olson, 1991; Grunert y Valli,
2001; Olson y Reynolds, 2001). MEC theory assumes that people base their purchase choices not on the products
themselves but on the benefits to be gained from their consumption. A means-end chain begins with a product, service or
performance attribute and establishes a sequence of links with personal values through the consumer’s perceptions of the
consequences or benefits to be derived from it.
Means-end chain theory suggests that product knowledge in consumers is hierarchically organized by level of abstraction
(Young and Feigin, 1975; Howard, 1977, Gutman, 1982; Reynolds et al., 1995). The higher the level of abstraction, the
stronger and more direct the relationship with the person (Olson and Reynolds, 1983). In the analysis of mental images,
each basic level of abstraction can be subdivided into distinct categories of abstraction. In this respect, Walker and Olson
(1991) propose a six-level MEC. The three lower levels (concrete attributes, abstract attributes and functional

257
consequences) form the consumer’s product knowledge, while the three upper levels (psychosocial consequences,
instrumental values and terminal values) comprise the consumer’s self-knowledge. Concrete attributes are those
properties or characteristics of the product, service or performance that may be desired or pursued by consumers.
Abstract attributes are those that cannot be checked prior to consumption of the product and must therefore be inferred
from internal or external cues. Functional consequences are the tangible benefits that consumers derive from product or
service attributes as a direct result of consumption. Psychosocial consequences are benefits of a more personal, social and
less tangible nature. Instrumental values represent desirable modes of behavior for the attainment of desirable end-states,
and finally, terminal values represent desirable end-states. Having presented our theoretical framework, we will focus our
attention in the next section on the methodology used in this research.
3. Methodology
3.1. Product choice
Two products were selected to determine the role played by consumers’ ages in the acceptance of food innovations and
the potential differences in decision structure when consumers of different ages are presented with a novel food product.
We chose a traditional product as the control product (coffee) and a novel coffee-derived product (Nespresso type coffee
capsules). These two products were chosen bearing in mind that coffee - both in its traditional and innovative formats - is
a popular and widely consumed product among the Spanish population. According to data from the Spanish Ministerio de
Agricultura, Alimentación y Medio Ambiente (MARM) [Ministry of Agriculture, Food and the Environment] 82% of the
population drink coffee in its traditional format. The proposed innovation (coffee capsules) was launched in 2004-20059,
and its penetration in the Spanish market has tripled over the last two years to reach over 1.5 million regular consumers
(8% of the total coffee consumption volume). This product is expected to amount to 20% of total coffee sales in the next
five years (MARM, 2011).
3.2. Laddering interviews
The usual method used to obtain means-end chains is a qualitative interviewing technique known as laddering. Laddering
interviews are personal, individual, in-depth, semi-structured interviews aimed at revealing the attribute-consequence-
value associations made by consumers with respect to a particular product. Laddering interviews comprise a three-stage
process. In the first stage, the researcher identifies the relevant attributes of the test product. In the second stage, subjects
are invited through a series of questions of the type ‘Why is that important to you?’ to explain why the attributes chosen in
the first stage are relevant in terms of their associated consequences and values. In the third stage, the associations or
linkages are used to form an implication matrix from which to generate a hierarchical value map (HVM) (Nielsen et al.,
1998; Ter Hofstede et al., 1998; Miele and Parisi, 2000 et al.).
One of the key issues to be considered when constructing a HVM is the choice of cut-off level, as only associations above
this level will be mapped (Leppard et al., 2004). The method adopted to determine the cut-off point in our case is known as
‘top-down ranking’, originally proposed by Leppard et al. (2004). This method is based on the premise that all participants
in a survey will not necessarily make the same number of links between two levels of abstraction. Usually, larger numbers
of links are more common at lower levels of abstraction than at higher levels. Therefore, it may not be appropriate to use
the same cut-off point when the number of links varies between different levels of abstraction. The strategy underlining
this method fixes the cut-off point according to a concept known as the ‘importance link’. The most important link is the
one most often repeated. Using this approach, one obtains different HVMs for different orderings . HVM1 represents the
‘most important’ or ‘best’ linkages, in the sense that any other choice of cut-off value or values must produce a HVM based
on smaller and thus less strongly associated linkages between levels of abstraction. HVM1 is also the least co mplicated and
most easily interpreted of all possible HVMs as it has the least number of elements displayed. Similarly, a HVM2 is
constructed by repeating the above process but defining the relevant cut-off levels at the second largest cell entry at each
level of abstraction. Thus, additional linkages are created by using a less stringent requirement (second highest vs. first
highest) which results in a more complex HVM. Continuing in this way, choosing successively smaller cell entries in the
manner described above, a sequence of HVMs can be created. The advantage of this method is that it allows one to observe
9 Coffee capsules were launched in 1986, In Spain, however, it is a novel food product as it entered Spanish market much later (Nesspreso, 2012).

258
how the most important links between different levels of abstraction gradually emerge, while also allowing for the
comparison of groups with the same cut-off point. Furthermore, this cut-off level captures a reasonable amount of the
initial data shown in the final variance of the model.
3.3. Data collection
The data to achieve our objectives was collected by means of a personal survey carried out in Navarra in March-April,
2011. The three-section survey target was household food buyers. The first section comprised questions related to
consumption frequency for novel food products and their valued qualities when it comes to purchasing them. The second
part of the questionnaire focused on applying the methodology in order to find out the respondents’ means -end chains
(laddering interview). Finally, the third part was related to the respondents’ socio-demographic characteristics and
lifestyles.
This study uses hard laddering10 because, as noted by Russell et al. (2004), the technique is easier to apply, as the
interview is shorter and the respondent feels less pressure (Botschen and Hemetsberger, 1998). The specific technique
chosen for this part of the questionnaire was the ‘Association Pattern Technique’ (APT), which was introduced by Ter
Hofstede et al. (1998) and is generally approved for use with samples of more than 50 individuals (Russell et al., 2004).
This method comprises two independent matrices: an Attribute–Consequence (AC) matrix and a Consequence–Value (CV)
matrix; respondents have to establish relationships between these elements.
Table 1. Identification and classification of the attributes, consequences and values selected for the analyzed product
Attributes Consequences Values Concrete attributes
-Price -Taste -Aroma -Brand -Label information -Package -Geographic origin -Type of coffee
Functional consequences
-Appetizing and enjoyable to drink -It is a healthy food -Good value for money -I’m well informed -Easy to purchase -Appeals to all the family -it is familiar -It saves me time -My concentration is better and I feel more awake -It make me nervous -It helps me relax and rest
Instrumental value
-Provides fun, pleasure and enjoyment -Enhances my quality of life and security -Gives me an emotional boost -Makes me feel more successful
Abstract attributes
-Quality -Ease of preparation -Beneficial health effect -Caffeine content
Psychological consequences
-I’m consuming a quality product -Good eating habits -Provides me with happiness and satisfaction -Brings back memories -Gives me a sense of cultural identification -No health risk -Status symbol -I feel I’m doing the right -Makes me feel more cosmopolitan
Terminal values
-Gives me a sense of social belonging -Improves my relationships with others -Gives me a sense of self-fulfillment and accomplishment -Makes me feel more respected by others -Gives me peace of mind, dignity and self respect
The attributes selected for the attribute-consequence and value-consequence matrices were drawn from the reviewed
literature and consultation with experts (academic staff at the Universidad Pública de Navarra) and through a pilot survey
carried on people there. This produced a set of 12 attributes for coffee (Table 1). In the same way, we extracted what we
considered to be the 20 most relevant functional and psychological consequences associated with the consumption of
10 There are two types of laddering: hard and soft (Grunert and Grunert, 1995; Botschen and Thelen, 1998). Hard laddering includes all those techniques
in which subjects are required in a structured interview to generate or verify associations between elements on individual ladders in sequences showing
increasing levels of abstraction. Soft laddering respects the respondent’s natural flow of discourse throughout the interview and the attribute–
consequence–value linkages have to be reconstructed afterwards.

259
coffee. Finally, we used the list of values (LOV) proposed by Kahle (1985), which incorporated nine new consumption-
related instrumental and terminal personal values (Table 1).
The study used a convenience sample of coffee purchasers and consumers. Vannopen et al. (1999), approve the use of
convenience samples in laddering procedures, given the complexity of the process and the fact that respondents are
familiar with the product and therefore capable of expressing more ideas on the subject. In this case the final sample
consisted of 98 people in charge of buying household food who responded to a personal invitation sent by e-mail to
Universidad Pública de Navarra staff (academics, non-academic staff and students).This size of sample is in line with the
majority of the past surveys using this technique found in the review of the literature. The characteristics of the sample
and of the population of Navarre are shown below in Table 2.
Table 2. Characteristics of the sample and the Navarre (Spanish region) population as a whole
Coffee sample Spanish region Navarre
Gender Male Female
28.03% 71.97%
49.77% 50.23%
Average age 40.03 40.50
Size of household 3.06 2.90
Level of education Elementary Intermediate Higher
-
17.99% 82.10%
18.67% 52.24% 29.09%
Source: National Statistics Institute (INE; Spain) (2007) and authors’ own calculations
It shows that the biggest difference is the higher percentage of participants with higher education in the two samples
analyzed, because the surveys were conducted in the university. The table also shows a higher number of wom en in the
sample; this is probably due to the fact that the survey was responded to by people in charge of household purchases and
there are still a higher number of women in charge of this chore. However, even though the sample could be considered
biased in terms of its educational level, other elements, such as household composition, age and gender, are similar to
those in the population of Navarre as a whole. Interviewing was conducted in groups of approximately 10 subjects who
were given an explanation of the questionnaire content, its component parts and instructions for completion. Special
emphasis was placed on explaining the laddering technique and an example was given of the MEC relationship to ensure a
fuller understanding of the process. The duration of the interview ranged between 40 and 60 min. Mecanalyst Plus 1.0.8.
software was used to construct ladders for all the sample respondents. The main findings from the data analysis are
presented below.
4. Results
4.1. Segment characterization
In order to find out whether consumers’ decision structures with regard to food innovation vary
according to age, the sample was segmented based on this variable. Two age groups were established:
18-35 year old interviewees (the “young” group) and 36-65 year old interviewees (the “adult” group).
Table 3 shows the socio-demographic characteristics and lifestyles and the consumption frequency of the two groups
determined a priori as well as the corresponding statistics in order to determine significant differences between these two
segments. The young group constitutes almost 39% of the sample, the adult group being the biggest segment (61%). In
terms of socio-demographic characteristics, differences can be seen in family size; the adult group has bigger family sizes
(a logical result given the family life cycle stage each of the groups is going through). Differences are also observed in
terms of lifestyles; the adult group tends to be more participative in NGOs and more concerned about health related
matters (medical check-ups, eating additive-free food and reducing stress), which is consistent with results found by other
authors (Rimal, 2001; Verbeke, 2004 inter alia).

260
Table 3. Socio-demographic characteristics, lifestyles and consumption frequency by respondents’ ages
Young
38.8%
Adults
61.2%
Snedecor’s F Sig.
Household size *
Lifestyles
I reduce salt intake
I am a vegetarian
I exercise regularly
I try to avoid industrial products
I regularly eat fruit and vegetables
I eat red meat in moderation
I am member of a wildlife conservation association
I try to eat additive-free food
I have regular health check-ups
I try to reduce stress
I participate in NGOs
I see a dentist regularly
I try to lead an organized, methodical life
I try to balance work and prívate life
I read food products’ labels
2.72
3.18
1.41
3.54
2.87
4.09
3.39
1.06
2.40
2.46
2.62
1.68
3.28
3.43
3.75
3.54
3.19
3.11
1.65
3.21
3.28
4.33
3.46
1.20
2.89
3.27
3.19
2.50
3.71
3.49
3.99
3.95
2.831
0.066
1.157
1.179
1.954
1.290
0.063
0.968
2.839
5.963
5.122
6.076
2.135
0.054
1.120
2.653
0.096
0.798
0.285
0.280
0.165
0.259
0.802
0.328
0.095*
0.016**
0.026**
0.016**
0.147
0.817
0.293
0.107
Young Adults Chi-square test Sig.
Gender
Male
Female
Level of education
Secondary
Higher
25.8%
74.2%
23.2%
76.8%
29.3%
70.7%
25.9%
74.1%
0.123
0.020
0.726
0.808
Coffee
Do not consume
Occasional consumption
Regular consumption
Coffee capsules
Do not consume
Occasional consumption
Regular consumption
-
18.2%
81.8%
37.6%
37.3%
25.2%
6.3%
14.3%
79.4%
58.7%
19.0%
22.3%
2.322
5.730
0.313
0.038**
***, **, * show the existence of significant differences between groups for 1%, 5%, 10% maximum error level respectively.
Consumption levels for traditional coffee are very high; 80% of the population consumes this product regularly. In the case
of coffee capsules, the consumption frequency is much lower, which is consistent with the literature related to the
dissemination and adoption of innovations. In this case consumption frequency differences are significant and
consumption levels are clearly higher in the young segment. This is consistent with the literature related to adoption of
innovations, which holds that innovations have higher acceptance levels among young consumers (Leek et al., 2001, Tellis,
Yin and Bell, 2009).
4.2. Cut-off point of hierarchical value maps (HVM)
Having obtained the socio-demographic profile of each group and following the construction of the hierarchical value
maps, it was necessary to determine the cut-off point of the HVMs. All the maps constructed were level 6 maps; that is,
they show all the attribute-consequence and consequence-value linkages at and above the frequency of the one ranked
sixth in importance. The cut-off point obtained following the methodology proposed by Leppard et al. (2004) is different
for each level of abstraction and group of respondents, while allowing for comparison between maps. Almost all of these
linkages are made by over 50.0% of the group in each case, thus satisfying the minimum requirement suggested by the
majority of authors.

261
4.3 Effect of exposure to innovation by consumers’ ages
This section presents the HVM results for traditional coffee and coffee capsules both for the young and the adult groups.
This will allow us to determine whether or not consumers’ cognitive structures vary when exposed to a novel food product
(coffee capsules). Figure 1 shows the hierarchical value maps for both segments in relation to traditional coffee and Figure
2 shows the results for coffee capsules. Each element (attribute, consequence or value) in the chain appears on the maps
alongside the percentage of respondents who mentioned that linkage.
Figure 1 shows that the HVMs for the young and adult segments in the case of traditional coffee are quite similar in terms
of attributes, consequences and values considered. The most significant differences are related to the “caffeine content”
attribute in the case of the young group and the “aroma” attribute for adults. With regard to consequences, only one
difference was observed, “being more concentrated and awake”, which was valued by the young group; the same
happened with the terminal value “improves my relationship with others”.
Figure 2, which shows coffee capsules HVMs for the young and the adult segments respectively, indicate at a glance more
complexity in the novel food product maps than in the traditional coffee ones for each of the two segments considered. A
more detailed analysis of the HVMs for the young segment shows differences in the additional consideration of the
concrete attributes “aroma” and “packaging” and the abstract attributes “familiarity” and “ product preparation” in the
case of coffee capsules. In terms of consequences, those related to the convenience and user-friendliness of coffee capsules
(“make my life easier”, “they save me time) are noteworthy as well as those which give consumers a sense of being “more
cosmopolitan” and “having higher status”. It is worth mentioning that “no risk perception” does not appear on the coffee
capsules map, which implies that consumers somehow perceive that they are riskier than traditional coffee. In terms of
values, a higher number of values for the novel food product are observed in the young segment, values related to “being
more successful”, “a sense of social belonging” and “having peace of mind, dignity and self-respect”.
In the case of adult consumers, the maps differ in one specific attribute, “price” which only appears in the traditional coffee
HVM, and in “ease of preparation” as an abstract attribute in the case of coffee capsules. With regard to benefits or
consequences, perceptions of regular coffee as a “good value for money” product and as a product that “brings back
memories” are noteworthy. In the case of capsules, consumers identify a higher number of consequences, some of them
related to the fact that this innovation “makes consumers’ lives’ easier” and to the fact that they perceive themselves as
more cosmopolitan people when they consume it.
These results seem to indicate that in the case of a regularly consumed product consumers’ cognitive structures are similar
regardless of their age. When presented with a novel food product, consumers’ cognitive structure becomes more complex.
These differences are more patent in the young group.

262
Figure 1.
Level 6 Hierarchical Value Map for the Young Group and Traditional Coffee C
on
cre
te
att
rib
ute
s
Ab
str
act
att
rib
ute
sF
un
cti
on
al
co
nseq
uen
ces
Psych
olo
gic
al
co
nseq
uen
ces
Instr
um
en
tal
valu
es
Term
inal
valu
es
Attributes
Consequences
Values
taste
97.3%
enhances my quality of
life and security
it is a healthy
food
89.5%
price
good value for
money
86.8%
appetising and
enjoyable to
drink
Provides fun,
pleasure and
enjoyment
84.2%
good eating
habits
84.2%
label
information
I’m well
informed
81.5%
brand
it is familiar
81.5%
Provides me
with happiness
and satisfaction
81.6%
no
health risk
81.6%
brings back
memories
78.9%
gives me an
emotional boost
I’m consuming
a quality
producto
78.9%
quality
caffeine
content
my
concentration is
better and I feel
more awake
73.7%
improves my
relationships with others
73.6%
71.0%76.3%
68.4%
68.4%
Level 6 Hierarchical Value Map for the Adult Group and Traditional Coffee
appetising and
enjoyable to
drink
Co
ncre
te
att
rib
ute
s
Ab
str
act
att
rib
ute
sF
un
cti
on
al
co
nseq
uen
ces
Psych
olo
gic
al
co
nseq
uen
ces
Instr
um
en
tal
valu
es
Term
inal
valu
es
Attributes
Consequences
Values
93.3%
taste
100%
provides fun, pleasure
and enjoyment
price
good value for
money
85.0%
provides me
with happiness
and satisfaction
68,3%
it is familiar
brand
81.7%
it is a healthy
food
61.6%
Enhances my quality of
life and security
good eating
habits
label
information
I’m well
informed
78.3%
no health risk
63.3%
aroma
73.3%
I’m consuming
a quality
product
58.3%
quality
70.0%
brings back
memories
56.6%
gives me an
emotional boost
61.6%

263
Figure 2.
Level 6 Hierarchical Value Map for the Young Group and Coffee Capsules
appetising and
enjoyable to
drink
Co
ncre
te
att
rib
ute
s
Ab
str
act
att
rib
ute
sF
un
cti
on
al
co
nseq
uen
ces
Psych
olo
gic
al
co
nseq
uen
ces
Instr
um
en
tal
valu
es
Term
inal
valu
es
Attributes
Consequences
Values
78.9%
taste
81.6%
provides fun,
pleasure and
enjoyment
aroma
71.1%
status symbol
gives me a sense of social
belonging
68.4%
ease
of preparation
makes life
easierit is familiar
I’m consuming a
quality product
it saves me time
price
caffeine
content
my
concentration is
better and I feel
more awake
brand
quality
label
information
I’m well
informed
65.8%
enhances my quality
of life and security
it is a healthy
food
65.8%
63.2%
package
good eating
habits
60,5%
it makes
me nervous
57.9%
good value for
money
7
makes me
feel more
cosmopolitan
55.2%
gives me an
emotional
boost
provides me
with happiness
and satisfaction
55.2%
makes me feel more
successful
50.0% I feel I’m
doing the
right
gives me peace of mind,
dignity and self respect
71.1%
71.1%
71.1%
71.1%
65.8%
65.8%
63.2%
63.2%
57.9%
57.9%
55.2%
55.2%
55.2%
50.0% 50.0%
50.0%
Level 6 Hierarchical Value Map for the Adult Group and Coffee Capsules
Co
ncre
te
att
rib
utr
es
Ab
str
act
att
rib
ute
sF
un
cti
on
al
co
nseq
uen
ces
Psych
olo
gic
al
co
nseq
uen
ces
Instr
um
en
tal
valu
es
Term
inal
valu
es
Attributes
Consequences
Values
provides fun, pleasure
and enjoyment
86.7%
es apetecible,
disfruto
bebiéndolo
taste
86.6%
aroma
83.3%
provides me
with happiness
and satisfaction
81.7%
brand
80.0%
it is familiar
good eating
habits
enhances my quality of
life and security
76.6%
it is a healthy
food
70.0%
quality
I’m consuming a
quality product
75.0%
me siento
identificado
culturalmente
gives me a sense
of social belonging
65.0%
ease of
preparation
status
symbol
makes life
easier
71.6%
it saves me time
66.7%
label
information
I’m well
informed
66.7%
66.7%
makes me feel
more
cosmopolitan
60.0%
it helps me relax
and rest
60.0%
no health risk
60.0%70.0%65.0%

264
4.4. Effect of age on decision structure in food innovation
Once the fact that there actually exist differences in the cognitive structure when consumers are exposed to food
innovation has been determined, we need to find out whether or not the decision structure related to the novel product
differs according to consumers’ages. To this end the HVM for young and adult consumers in coffee capsu les are compared
(Figures 3 and 4).
The initial analysis of the results obtained in relation to attributes reveals some interesting similarities between the two
groups studied. Both segments are interested in concrete attributes such as “taste”, “brand”, “aroma” and “label
information” i.e. mostly product organoleptic aspects, brand and information. As authors such as Grunert et al. (2003)
have pointed out, sensory attributes, especially appearance and taste, have always been among the key factors influenci ng
consumers when rating food products. In the case of abstract attributes, both groups perceive coffee capsules as a
“quality”and “easy to prepare” product. In terms of differences in attributes, two concrete attributes are mentioned only by
the young group: “price” and “packaging”. The same happens with two abstract attributes: “caffeine content” and “product
familiarity”. These results show higher interest in packaging and caffeine content on the part of young consumers.
When the consequences or benefits mentioned by both groups are analyzed in more depth, functional consequences
related to pleasure (“it’s appetizing and enjoyable to drink”) as well as those related to convenience (“it makes my life
easier”, “it saves me time”) and being informed (“I’m well informed”) are the ones which stand out. Similarities also
emerge in terms of psychological consequences, specifically in those referring to consuming a quality product and having
good eating habits as well as perception of higher status and cosmopolitanism when consuming coffee capsules. It should
be noted that adults consume this product when they consider “it does not pose a risk to human health” while young
consumers “feel they do the right thing”, which shows that consumption of a novel food produc t is associated with the
perception of being presented with a risk-free product. Differences were found in the usefulness interviewees attribute to
this novel product; the young segment use coffee to improve their concentration and feel more awake while the adult
segment consumes it to relax and rest. Besides, the young segment mentions “good value for money”. The young group
also mentions a higher number of values. Both segments agree on instrumental values such as “I have good quality of life
and safety, “it provides fun, pleasure and enjoyment” and the terminal value “gives me a sense of social belonging”. The
young segment, however, is able to convey a higher number of values in the map and they indicate that coffee capsules
consumption gives them an emotional boost, makes them more successful and feel they have “peace of mind, dignity and
self respect”.
These initial findings could be analysed in more detail in a second stage of the analysis in order to gain a deeper
understanding of how purchasers’ means-end chains are formed. The ladders observed show three relationships common
to both segments. The first two refer to the “taste” and “aroma” of coffee capsules which are related to the consequence
“it’s appetizing and enjoyable to drink” and the value “it provides fun, pleasure and enjoyment”.
This suggests that one of the values that all groups pursue through the consumption of foods is the enjoyment of eating
them, an association that it is hardly surprising to observe in food consumption research. Another common pattern in the
groups is the chain linking the abstract attributes “quality” with the consequence “I am consuming a quality product” and
the instrumental value “enhances my quality of life and security”, all of these concepts being related to the quality of the
product.
Certain differences in terms of consumers’ age are observable given that the young segment is able to convey many more
complete ladders. For instance, three ladders associating “brand”, “packaging” and “price” of the product with
consumption of a quality product that provides them with good quality of life and safety are observed. Besides, the young
group associates “price” and “packaging” with a “status symbol” and this in turns makes them perceive a sense of social
belonging. Finally, the caffeine content of the novel food product is associated with better concentration and being more
awake, which leads to being more successful.
From the analysis of the various elements and ladders shown on the hierarchical value maps of these consumer segments,
it appears that the more complex cognitive structure underlying the decision making process with respect to innovations
is that of the young group, the one which shows higher consumption of the new product.

265
4.5. Degree of abstraction comparison
Results seem to suggest variations in the respondents’ cognitive structure as a function of exposure to innovations and
according to their age. Table 4 summarizes the complete ladders formed by each group in terms of the attributes,
consequences and values involved. In general, the innovative product shows a higher degree of abstraction and more
complex maps. Besides, this complexity becomes more patent with the young segment. Assuming that the degree of
abstraction increases as the cognitive structure is more heavily dominated by abstract attributes, psychological
consequences and terminal values than by concrete attributes, functional consequences and instrumental values, this
higher degree of abstraction indicates that young consumers include more personal associations in the purchase process
than adult consumers.
Table 4. Complete ladders for each group and product analyzed
Coffee Coffee capsules
Attributes Consequences Values Young Adult Young Adults
Concrete
Functional Instrumental 3 2 2 2
Terminal - - - -
Psychological Instrumental - - 3 1
Terminal - - 2 -
Abstract
Functional Instrumental 1 - 2 -
Terminal - - - -
Psychological Instrumental 1 - 1 1
Terminal - - - -
5. Conclusions
In recent years, market globalization and higher levels of competition have placed the food industry under ever greater
pressure. Added to this, consumers are becoming more and more demanding and are more aware of what to look for in
food products: quality, food safety, healthier products, etc. This reality has forced producers and processors to develop
new products to meet these new demands in order to achieve a competitive market position.
Despite the efforts on the part of the agro-food industry, the failure rate for novel food products is very high. This is due to
various reasons, but it is mainly connected to a lack of understanding of consumers. In societies where nutritional needs
are covered, the success of a given product in the market is related to acquiring knowledge about consumers, finding out
what they look for in a product and what personality traits they project through the food products they purchase and
consume. Consumers tend to put up barriers to novel products when they fail to find clear benefits in them or when they
do no match their self-image.
Traditionally, consumer behavior oriented research on innovations has focused on demographic traits associated with
willingness to adopt novel products. One of the variables generally considered is consumers’ age, giv en that studies show
that young consumers tend to be the more innovative ones. Our study attempted to analyze decision structures in
consumers within different age ranges in relation to novel food products in order to determine potential differences. This
knowledge will help identify the key elements for each age range to try and improve novel food adoption rates. These
issues were explored in an application based on means-end chain theory, enabling us to map attribute-consequence-value
linkages obtained through laddering interviews with two consumer segments (young and adult consumers) and two
products, traditional coffee (control product) and coffee capsules (food innovation).
The results show in the first place that young consumers have higher food innovation consumption levels, which is
consistent with the results in most of the literature, which show that young consumers rank higher when it comes to
adopting novel products.

266
Moreover, the hierarchical value maps allow us to conclude that consumers’ cognitive structures are similar regardless of
age when they are presented with a traditional product. However, this structure becomes more complex when they are
presented with a novel food product in both age ranges. In other words, the decision structure related to novel food
products projects a higher number of aspects connected to consumers’ personalities through the products’ attributes.
Likewise, when adult and young consumers’ decision structures for novel food products are compared, we find that
complexity is much more patent for young consumers. In brief, young consumers of the novel product analyzed perceive
more benefits in the novel food through its attributes and that said attributes reflect to a greater extent their personality .
Regardless of age, consumers adopt the novel product for hedonic reasons (taste, aroma and pleasure), due to ease of use
(a key aspect for the market success of this product) and also because it makes them feel more trendy (more
cosmopolitan) and gives them certain social status. Product search and experience attributes such as label information,
brand, taste and ease of use are key factors. However, product belief attributes such as product quality are also
noteworthy. This indicates that choice is not completely based on tangible product aspects; intangible or belief elements
also play a role, which become more relevant when consumers are faced with the novel food product.
Furthermore, the age of consumers is determinant in terms of certain benefits pursued in the novel food product analyzed;
young consumers look for success through caffeine content, which allows them to improve their concentration while adult
consumers aim at relaxation and rest. Finally, a further differentiating element is that young consumers attribute more
importance to the products’ image and packaging, brand and price, all of them perceived as quality and social status
symbols. These factors are worth taking into consideration when it comes to designing marketing strategies aimed at
boosting consumption among consumers of different ages.
Finally, we should mention a limitation of this study, which is that by focusing on one product, we were unable to
generalize the findings to other novel foods or the food market in general. It would be therefore useful to corroborate the
results by extending the scope of the research to other geographical areas, other food innovations or larger consumer
samples.
References
ASSAEL, H. (1987). Consumer Behavior and Marketing Action. 3rd Edition
AUDENAERT, A.; STEENKAMP, J-B.E.M. (1997). A Consumer-oriented Approach to the marketing of Food Products:
Application of Means-end Chain Theory to the Consumption of Beef. In Wierenga B.; Van Tilburg A.; Grunert, K.;
Steenkamp JB. E.M. & Wedel M. Agricultural Marketing and Consumer Behaviour in a Changing World. Kluwer
Academic Publishers.
BAREGHEH, A.; ROWLEY, J.; SAMBROOK, S. (2009). Towards a multidisciplinery definition of innovation. Journal of
Management Decision, 47 (8), 1323-1339.
BARTELS, J.; REINDERS, M.J. (2010). Social identification, social representations, and consumer innovativeness in an
organic food context: a cross-national comparison. Food quality and preference, 21, 347-352.
BOTSCHEN, G., & HEMETSBERGER, A. (1998). Disgnosing Means -End structures to determine the degree of potential
marketing program standardization. Journal of Business Research, 42, 151–159.
BOTSCHEN, G., & THELEN, E. (1998). Hard versus soft laddering: implications for appropriate use. In I. Balderjahn, C.
Mennicken, & E. Vernette (Eds.), New developments and approaches in consumer behaviour research (pp. 321–
339). Stuttgart, Houndmill &London: Scha¨ffer-Poeschel Verlag & Macmillan Press Ltd.
CAPITANIO, F., COPPOLA, A.; PASCUCCI, S. (2009). Indications for drivers of innovation in the food sector. British Food
Journal , 111 (8), 820-838.
CHIU, C-M. (2004). Applying means-end chain theory to eliciting system requirements and understanding users perceptual
orientations. Information & Management, 42, 455-468.
COSTA, A.I.A.; DEKKER, M.; JONGEN, W.M.F. (2004). An overview of means-end theory: potential application in consumer-
oriented food product design. Trends in Food Science & Technology, 15, 403-415.
DICKERSON, M.D.; GENTRY, J.W. (1983).. Characteristics of adopters and non-adopters of home computers”. Journal of
Consumer Research, 10 (2), 225-235.

267
FLIGHT, I.; LEPPARD, P.; COX, D. N. (2003). Food neophobia and associations with cultural diversity and socio -economic
status amongst rural and urban Australian adolescents. Appetite, 41, 51-59.
FORTUIN, F.T.J.M.; OMTA, S.W.F. (2009). Innovation drivers and barriers in food processing. British Food Journal, 111 (8).
839-851.
GATIGNON, H.; ROBERTSON, T. S. (1991). Innovative decision processes. Consumer Behavior (pgs. 316–348). Englewood
Cliffs, NJ: Prentice-Hall.
GOURVILLE, JOHN T. (2006),“Eager Sellers and Stony Buyers: Understanding the Psychology of New-Product Adoption.
Harvard Business Review, 84 (June), 98–106.
GRANDE, I. (1993). El comportamiento de los consumidores por grupos de edad. Implicaciones sobre el diseño del
marketing mix. Distribución y Consumo, 12, 40-58 (1993)
GRESHAM, G., HAFER, J., & MARKOWSKI, E. (2006). Inter-functional market orientation between marketing deparments
and technical deparments in the managemen of the new product development process. Journal of Behavioral and
Applied Management, 8(1), 53–65.
GRUNERT, K. G., BREDAHL, L., & SCHOLDERER, J. (2003). Four questions on European consumers’ attitudes toward the use
of genetic modification in food production. Innovative Food Science and Emerging Technologies , 4, 435–445.
GRUNERT; K.G.; VALLI, C. (2001). “Designer-made meat and dairy products: consumer-led product development”.
Livestock Production Science, 72, 83-98.
GUTMAN, J. (1982). “A means-end chain model based on consumer categorization processes”. Journal of Marketing, 46 (2),
60-72.
GUTMAN, J.; ALDEN, S.D. (1985). Adolescents’ cognitive structures of retail stores and fashion consumptio n: a means-end
chain analysis of quality. In: Jacoby, J.; Olson, J.C. (eds.). Perceived quality: how consumers view stores and
merchandise (99- 114). Lexington Books, Lexington.
HOWARD, J.A. (1977), Consumer behavior: application of theory, McGraw-Hill, New York.
IM, S.; BAYUS, B.L.; MASON, C.H. (2003). An empirical study of innate consumer innovativeness personal characteristics,
and new-product adoption behavior. Journal of the Academy of Marketing Science, winter.
IMRAM, N. (1999). The role of visual cues in consumer perception and acceptance of a new product. Nutrition & Food
Science, 5, 224-228.
KAHLE, L.R. (1985). The nine nations of North America and the value basis of geographic segmentation. Journal of
Marketing, 50, 37-47.
KRYSTALLIS, A.;LINARDAKIS, M.; MAMALIS, S. (2010). Usefulness of the discrete choice methodology for marketing
decision-making in new product development: an example from the European functional food market.
Agribusiness, 26, 1, 100-121.
KÜHNE, B.; VANHONACKER, F.; GELLYNCK, X.; VERBEKE, W. (2010). Innovation in traditional food products in Europe: Do
sector innovation activities match consumers’ acceptance?. Food Quality and Preference, 21, 629-638.
LEEK, S., SZMIGIN, I AND CARRIGAN, M. (2001). Older consumers and food innovation. Journal of International Food and
Agribusiness Marketing, 12 (1), 71-89.
LEPPARD, P.; RUSSEL, C.G.; COX, D.N. (2004). Improving means-end-chain studies by using a ranking method to construct
hierarchical value map. Food quality and preference, 15, 489-497.
LUNSFORD, D. A. & BURNETT, M. S. (1992) ‘Marketing Product Innovations to the Elderly: Understanding the Barriers to
Adoption, Journal of Consumer Marketing, 9, 4, Fall, 53-63.
MARM, Ministerio de Agricultura, Alimentación y Medio Ambiente de España (2011). La alimentación en España.
http://www.magrama.es
MIELE, M., & PARISI, V. (2000). Consumer concerns about animal welfare and food choice. Italian report on laddering
interviews. Pisa, Italy, University of Pisa, Department of Agricultural Economics.
268
NAIDOO, V. (2010). Firm survival through a crisis: The influence of market orientation, marketing innovation and business
strategy. Industrial Marketing Management, 39 (8). 1311-1320.
NIELSEN, N.A.; BECH-LARSEN,T.; GRUNERT, K.G. (1998). Consumer purchase motives and product perceptions: a
laddering study on vegetable oil in three countries. Food Quality and Preference, 9, 455-466.
OLSON, J.C.; REYNOLDS, T.J. (1983). Understanding Consumers’ Cognitive Structure: Implications for Advertising Strategy.
In L. Percy & A. Woodside (Eds.), Advertising and Consumer Psychology. Lexington, MA: Lexington Books.
OLSON, J.C.; REYNOLDS, T.J. (2001), The means-end approach to understanding consumer decision making, in Olson, J.C.
and Reynolds, T.J., Understanding consumer decision making: the means-end approach to marketing and
advertising strategy, Ed. Mahwah, NJ: Erlbaum,. 3-20.
PELCHAT, M. L., & PLINER, P. (1995). Try it. You'll like it. Effects of information on willingness to try novel foods. Appetite,
24, 153-165.
PIETERS, R.; BAUMGARTNER, H.; ALLEN, D. (1995). A means-end chain approach to consumer goal structures.
International Journal of Research in Marketing , 12, 227-244.
REYNOLDS, T.J.; GUTMAN, J. (1984). Laddering: extending the repertory grid methodology to construct attribute-
consequence-value hierarchies. In Personal Values and Consumer Psychology, vol. II, Pitts, R.; Woodside, A. Ed.
Lexington, MA: Lexington Books.
REYNOLDS, T.J.; GUTMAN, J. (2001). Advancements in laddering. In Olson, J.C.; Reynolds, T.J. (eds.). Understanding
consumer decision making: the means-end approach to marketing and advertising strategy (91-118). Mahwah,
NJ: Erlbaum.
RIMAL, A. (2001). Who buys reduced fat? A case of reduced fat peanut butter. Journal of International Food and
Agribusiness Marketing, 13, 27–40.
RIMAL, A.; MOON, W. (2005). Perceived risks of agro-biotechnology and organic food parchase in the United Status
Southern Agricultural Economics Association Annual Meeting, Little Rock Arkansas, 5-9 febrero.
ROGERS, E.M. (1995). Diffusion of Innovations. 4th edition, New York, The Free Press.
ROGERS, E. M. (2003). Diffusion of innovation, (5th ed.). New York: The Free Press.
RUSSELL, C.G., BUSSON, A., FLIGHT, I., BRYAN, J., VAN LAWICK, J.A.; COX, D.N. (2004), A comparison of three l addering
techniques applied to an example of a complex food choice, Food Quality and Preference, 15,. 569-583 .
TELLIS, G.J.; YIN, E.; BELL, S. (2009). Global consumer innovativeness: cross -country differences and demographic
commonalities. Journal of International Marketing, 17, 2, 1-22.
TER HOFSTEDE, F.; AUDENAERT, A.; STEENKAMP, J-B.E.M.; WEDEL, M. (1998). An investigation into the association
pattern technique as a quantitative approach to measuring means-end chain. International Journal of Research in
Marketing, 15, 37-50.
TSAKIRIDOU, E.; BOUTSOUKI, C.; ZOTOS, Y.; MATTAS, K. (2008). Attitudes and behaviour towards organic products: an
exploratory study. International Journal of Retail & Distribution Management, 26, 2, 158-175.
VANNOPPEN, J.; VERBEKE, W.; VAN HUYLENBROECK, G.,; VIAENE, J. (1999). Consumer valuation of short market channels
for fresh food through laddering. Journal of International Food & Agribusiness Marketing, 12, 41–69.
WALKER, B.A.; OLSON, J.C. (1991). Means-end chains: connecting products with self. Journal of Business Research, 22 (2),
111-118.
XU, J.; SHIM, S.; LOTZ, S.; ALMEIDA, D. (2004). Ethnic identity, socialization factors and culture-specific consumption
behaviour. Psychology and Marketing, 21(2), 93-112
YOUNG, S.; FEIGIN, B. (1975). “Using the benefit chain for improved strategy formulation”. Journal of Marketing,. 39, 72-74.

269
Marketing evaluation approach in the
Hungarian middle-sized and large companies Marketing evaluation, strategic and operative marketingcontrolling, contribution to corporate strategy, corporate
performance.
István Piskóti, University of Miskolc, [email protected]
Noémi Hajdú, University of Miskolc, [email protected]
Abstract
There is an increased demand of evaluating marketing activities. Because the lack of accountability marketing function
within the firm is threatened (Rust et al. 2004). Cutting short on marketing and general expenses seemed to be the
reaction in recession within the Hungarian companies (Mitev and Bauer, 2010). Traditional performance measurement
indicators cannot answer all the management’s questions (Clark 1999). Marketing expenses increased significantly over
the last 50 years (Sheth and Sisodia 2002).
Marketing Science Institute defined marketing metrics and ROI as top research priority in 2002, 2004 and 2006. There is a
new corporate trend for greater accountability of value-added. In time of crisis induced period of restrictions it is
necessary that all functional activities, including marketing being financially accountable. At the same time there is
discontent with traditional metrics. Financial-accounting device refers to the past and does not contain information that
affects long-term future results (Seggie et al. 2007). However, according to Li (2010) existence of these data is needed to
evaluate past performance to improve future strategy and implementation. Availability of IT and internet provides new
measurement opportunities, which resulted faster learning and spread of new methods.
Interest of this topic increases in Hungary as well. In light of these facts the aim of this article is to present marketing
evaluation approach and practice of the Hungarian corporations – according to an empirical, representative research –
controlling practice and relationship between marketing effectiveness and business success.
In our research model we tried to prove the next initial coherence: if a company has marketing evaluation sys tem, its
operation contributes to success of marketing activity and corporate performance (Homburg et al 1999, Moorman and
Rust 1999, Verhoef and Leeflang 2009, Merlo and Auh 2010). In our model, which evaluates the development of
marketingcontrolling, we studied the relationship between the discovered factors with the application of main component
analysis. We analyzed marketing evaluation system according to in controlling common used three subsystems –
information, planning and controlling system. In case of information system the areas of information analysis and its
sources were examined. In case of system of objectives which exists within planning system it was worth dealing with the
importance of psychographic aims besides the economic ones. Our initial hypotheses have been proved. Our research
revealed the obstructive factors of marketingcontrolling efficiency and the intervention points to improve marketing
performance and business success of the Hungarian corporations – especially in crisis situations.
1. Research problems, aims and methods
Before starting the research the undermentioned questions arised:
what kind of marketing evaluation aspects are applied in the Hungarian middle-sized companies and large
enterprises, and did they get over merely the use of financial methods?
outside the traditional methods whether the psychographics elements play an important part, including the
criteria of marketing controlling?
besides operative devices appear the ones with strategic aspect?

270
evaluations of marketing science has really begun to integrate, in which financial, operative and strategic
approaches are integrated?
Fundamental aims of researcher work:
examining the causal correlation between marketing activities and controlling applications,
creating a model, which evaluate the development of marketingcontrolling,
empirical testing of this theoretical model among the Hungarian middle-sized companies and large enterprises.
After studying international and national literature, which provides an excellent base to the further work and qualitative
and quantitativ marketing research has been done. Qualitative research methods were chosen for depth interviews in the
context of nine expert interviews were made. Regarding the companies, taken into the sample, it was important to be large
companies since we had previously assumed that they consciously apply marketingcontrolling system. Regarding the
industry, we tried to select from each type that has strategic importance. Concerning the title of the interviews our target
was to be able to study the operation of the marketingcontrolling system from different points of view, along the
hierarchic levels. Accordingly, we studied the opinion of the department store’s executive through the head of
department’s to the product and brand manager’s. The aim of carrying out the depth interviews was learning the working
system and sub-systems of the marketing controlling, understanding and revealing the relations between the sub-systems,
becoming familiar with the experts’ opinions and finalizing the questionnaire in the light of the results.
One of the methods of the quantitative marketing research we chose the questionnaire, which characteristics and
methodology can be read later. Our research examines in detail which indices , strategic and operative
marketingcontrolling tools used in the Hungarian middle-sized and large corporations.
2. Basic theoretical and research model
During the research we started from the assumption that the company’s marketing activity contributes to the corporate
performance, besides many factors one of the key to corporate competitiveness, can be the marketing success. However, in
order to consider the performance we need an objective evaluation procedure. Studying previous researches we tried to
find evidence that marketing significantly influences corporate performance.
According to Merlo and Auh (2010) due to the dual role of marketing within organizations – (marketing as an approach
and as concrete activities) – its influence manifests itself in two perspectives (Piercy (1986), Varadarajan (1992), Webster
(1992), Workman (1993)). The first is an „activity-based perspective, where marketing is treated as a set of activities
undertaken by different people throughout the whole organization” (Narver and Slater (1990), Deshpandé et al. (1993),
Jaworski and Kohli (1993)). Then permeates the entire organization of the market-oriented management culture. „Being
market-oriented is mostly associated with strong performance”(Jaworski and Kohli (1993), Kirca et al. (2005), Langerak
(2003), Slater and Narver (2000).
The research initially focused on this perception as an effect of marketing activity, it was easier to consider it than a
complex organizational unit. According to Merlo and Auh (2010), the followi ng research topics can be distinguished
(Merlo and Auh 2010):
„marketing effect on the strategy development and planning”(Anderson (1982), Hutt and Speh(1984), Piercy (1987),
Walker and Ruekert (1987), Frankwick et al. (1994),
„the interaction of marketing with other corporate functions” (Wind (1981), Hutt és Speh(1984),
Gupta et al. (1986), Walker és Ruekert (1987)),
„the role of marketing in product development” (Hutt et al. (1988), Workman (1993)),
„the coordination of inter-firm networks” (Achrol (1991), Webster (1992), Day (1994)).
But the biggest problem of the above mentioned research that they are mainly theoretical and not based on empirical
evidence (Homburg et al. (1999)).
The second approach is the functional group’s pespective, which is represented by Homburg et al. (1999), Moorman and
Rust (1999). They „view marketing as an independent and distinct organizational entity”. Lawrence and Lorsch (1967),

271
Perrow (1970), Hinings et al. (1974) among corporate functions marketing is thought to be the most powerful, primarily
its role plays in innovation and consumer involvement. According to Day (1997) marketing has a key position in the future
mainly during market sensing and customer acquisition. Homburg et al. (1999) defined marketing influence as the
practical power of marketing unit within the corporate, comparing to other units has a more significant role in achieving
business sucess. In his research the influence of marketing strategy was high, and he proved that „marketing’s role in
strategic planning is based on the value of the power resources which contributes to the firm’s operation”. In Moorman
and Rust’s study (1999) we can find that marketing department has a benefical effect on effeciency and „contributes to
financial performance, customer relationship performance and new product performance beyond the contribution of an
organization-wide market orientation. Verhoef and Leeflang (2009) defined marketing influence impact as „an outcome of
the marketing function’s own characteristics, such as accountability, innovativeness, customer connectivity, creativity, and
interdepartmental cooperation”. Similarly Homburg et al. (1999) empirical experiences Verhoef and Leeflang’s (2009)
results are proved that marketing has a contribution to corporate sucess and performance. This result is remarkable, while
the importance of marketing activity 10 years later also confirmed. But these two results can not be compared while the
two samples are different.
Merlo and Auh (2010) analyzed the marketing’ strategic influence at Australian firms. It has been observed that marketing
plays a significant strategic role in connection with other functions. The degree of influence is high, not only in general as
strategic power, but as a special decision element, which means an important contribution in the organizational success. 2
years later, in 2012 Merlo and Auh continued the studies in this direction, which showed that powerful marketing function
coupled with improved business performance. Thus, they advise the management to focus on simultaneously to maintain
the strong market orientation and marketing function, while the corporate internal responsible of market orientation is
the marketing organization.
Homburg et al. (1999) made his surveys in the United States of America and in Germany, Moorman and Rust (1999) also
did in the USA, Verhoef and Leeflang (2009) in the Netherlands, while Merlo and Auh (2010) in Australia. Thus, companies
operating in these countries managed to find a significant correlation with the performance of the marketing department
and the corporate performance.
Interest in the topic is increasing in Hungary. More domestic professionals succeed in supporting this relationship with
empirical experiences and statistical analysis.
Berács (1997) points out that the development of marketing tools and marketing-strategic aims are closely related to
corporate performance. Marketing function - cannot only be determined by the leaders' basis declaration - as one of the
source of the company's success, but modern marketing also automatically leads to competitiveness and corporate
profitability growth in Hungary.
Research of Kolos et al. (2005, p. 60) reveals that companies they have interviewed detect a close relationship between
their marketing activities and corporal success. Accordingly, marketing functions appear in the organization. At the same
time, marketing contributes rather to the long-term success of a company (Kolos et al. 2005, p. 61.). So the effects of
marketing activities prevail long-term. 5 years later a new research was made by Kenesei and Gyulavári (2010, p. 54.)
according to which this trend is maintained and further strengthened, since not only the marketing tools, but also
possessing marketing skills are closely related to performance. In our opinion marketing capabilities refer to the strategic
importance of marketing activities and to the market oriented mentality.
In conclusion it can be claimed that the evaluation of marketing is not an advantage any more, while it is a requirement
and condition of competitiveness. Marketing, both as an organization and set of activities, has a dominant role e.g. in
decision-making, strategy developing, planning, creating product development and customer relationships. Last but not
least is necessary to mention the coordination function of marketing between the organizational units within the firm.
About marketing performance evaluation Kotler (2000) writes the following: efficient marketing organizations apply
reliable assessing and controlling tools, which makes the result of evaluation, interpretation and adaptation, and the
regular supervising of marketing activities. Traditional financial performance measurement indicators can not answer all
the questions of the management (Clark (1999)), furthermore, marketing expenses increased significantly over the past 50
years (Sheth és Sisodia 1995), in our opinion it has a relevance to study the marketing evaluation approach in Hungary.
In the research model we tried to prove the next initial coherence: if a company has marketing evaluation system, its
operation contributes to the success of its marketing activity (Niven 2005 in case of Balanced ScoreCard, Reinecke 2004 in
272
case of marketing evaluation), and increases corporate performance (Homburg et al 1999, Moorman and Rust 1999,
Verhoef and Leeflang 2009, Merlo and Auh 2010, Berács 1997, -Kolos et al 2005, Kenesei and Gyulavári 2010.).
According to the above mentioned research results we regarded proven and accepted the coherence between marketing
and corporate performance, however, only a few studies has been dealing with the coherence between marketing
evaluating system and marketing success.
We made an initial theoretical – research model (it can be seen int he resulting model on Figure 4). In the model, under the
development of marketing – in dual approach (Merlo és Auh (2010)) – the contribution of marketing department and set
of activity to the corporate performance. During the research, the model will be tested as a result of which certain
elements can fall out without the evidence of the appropriate context, and new elements can be added to the system if
there is a connection.
In the model, which evaluates the development of marketingcontrolling, we studied the relationship with the application
of main component analysis between the discovered factors. Its purpose is to define the minimum number of those factors,
which will explain most of the variation (Malhotra 1999). We are going to analyze the marketing evaluation system
according to the three subsystems, known at controlling – information, planning and controlling system. In fact
development of marketingcontrolling is clearly determined by the operation of each subsystem. In case of information
system the areas of information analysis and its sources were examined. In case of system of objectives which exists within
planning system it was worth dealing with the importance of psychographic aims besides the economic ones. While in the
control system we will study each asset as groups. Our research revealed the obstructive factors of marketingcontrolling
efficiency and the intervention points to improve marketing performance and business success of the Hungarian
corporations.
3. Representative quantitative research and its results
3.1. Sample and research characteristics
The sample population is medium-sized companies operating in Hungary (with an employee number between 50 and 249)
and large enterprises (employee number over 250). The number of the base population is 4784 for medium -sized
companies and 917 for large enterprises.
As a feature of the base population I wanted to take the annual net revenue into consideration, but in the Law on
Accounting the upper limit of the medium-sized company’s annual net revenue is at most 50 million euro – which is the
lower limit for a large enterprise – and in our opinion this is too high a sum for the Hungarian market. For this reason the
KSH (Hungarian Central Statistical Office) ‘only’ examines the number of employees for the purpose of determining the
corporate size.
We have chosen the companies from the CÉG-KÓD-TÁR, issue 2009/3. The research technique was stratified sampling
from the random sampling methods. We tried to find connection to the marketing departments of the companies and
asked the questions from a previously well-structured questionnaire on phone. Features of the stratification were activity
and region. Confidence level of the total sample is 95 percent, accuracy level is ±9,7 percentage points, sample size is 100
companies (50 medium-sized, 50 large). According to the activity and region, distribution of the total sample accurately
reflects the basic population proportions. Stratification of Hungarian medium-sized companies and large enterprises is not
the same, but if we ask 50 medium and 50 large companies, the two samples are comparable with each other easily
without distorting weighting.
The four activity sectors are: agriculture, industry, trade and service. The seven regions of Hungary are: Southern Plain,
Southern Transdanubia, Northern Plain, Northern Hungary, Central Hungary, Central Transdanubia and Western
Transdanubia.
The majority - 53% of the Hungarian medium-sized companies and large enterprises operate in the industrial sector,
27.2% in the service sector, 14.6% in trade and 5.3% in agriculture.
The majority of the sampled companies operate in Central Hungary. In other regions, medium-sized and large companies
are represented in almost the same numbers.

273
3.2. Marketingcontrolling development
Development of marketincontrolling was analysed according to three variable groups, which was defined by the three
subsystems of marketingcontrolling: information-, planning- andcontrolsystem.
First, the correlation test must be done to find out the relevance of main component analysis on this variable groups.
According to the correlation matrix in case of all the three variable groups the relationship is significant at 1%, so there is a
reason to implement the main component analysis. The legitimacy of main component analysis and rejecting the
hypothesis of Bartlett’s fericity (sig. 0,000) were confirmed by KMO (0,601). Component vector suggests that in
manufacturing the component information- and controlsystem take part with nearly the same weight value of 0,830, and
0,832, while planning system has a smaller weight: 0,625. Final communalities of the original variables were as follows.
The manufactured main component 68,8% of the information subsystem, 69,2% of the control subsystem, while 39,1% of
the planning subsystem’s content information were compressed.
The development of control system were studied according to the applied indices and methods. We were interested in
how frequently employ the Hungarian middle-sized and large companies indices concerning marketing and sales (e1), and
strategic- (e2), operative- (e3), financial (e4) marketingcontrolling devices.
During the analysis first correlation analysis was made in order to find out the relevance of main component analysis is on
this variable groups. Correlation matrix shows that the relationship is significant at 1%. The legitimacy of main component
analysis and rejecting hypothesisof Bartlett’s fericity (sig. 0,000) were confirmed by KMO (0,760). The principal
component of the original variables obtained the information content of 69.2% of the total retained, so the data loss is
estimated to be only 30.8%. Component vector suggests that in manufacturing the component marketing and sales indices
takes part with the highest weight (value of 0,850), this is followed by operative marketingcontrolling tools (0,806), then
strategic marketingcontrolling tools (0,748), and finally the financial marketingcontrolling tools (0,744) are following. The
manufactured main component 72,2% of e1, 56,0% of e2, 65,0% of e3 and 55,3% of e4 component’s content information
were compressed. It can be concluded to the final communality of the original variables that the main component
condensed the 72.2% content of the information of e1, 56, 0% content of the information of e2, 65,0% content of the
information of e3, and 55,3% content of the information of e4.
Components of marketingcontrolling development
More professionals (including Hubert, Gyulavári, Malota (2012)) emphasize the priority of financial data from which we
can conclude that economic and financial goals are preferred. Therefore in the planning system I was interested in
whether the psychographic and economic goals are equal in corporate decision-making rank, or either one takes priority
over the other. Psychograpgic objects may alibi in practice, because of measurement difficulties come to the fore with the
intention of improving performance.
In the target system the target classification of Ulrich/Fluri (1995) and Meffert (2000) was considered, where in each
group there are more statements, mixed in the question. The respondents had to rank the answers from 1 till 7. In the
hierarchy the most important element was the aims regarding the market position, with an average value of 6.2, which
contains the increase of market share and the turnover, and the reaching of new markets. Second importance was the
profitability aims with an average value of 5.74 (increase of profit, reaching turnover and capital rentability).
Psychographic aims (reaching purchase intention, attention rising, prestige forming, increase satisfaction) got an average
value of 5.32. Despite the difficulty of measuring psychographic aims, the respondent considered them important. To the
financial targets belong the aims of market position and the profitability. From two of these are before the psychographic
aims in the importance hierarchy. The environmental objectives had 4.8, while the social ones had 4.75 avarage values. It
can be bewildering using the name of having a 3.44 market value goals-term According to Ulrich/Fluri (1995) and Meffert
(2000), the attaining of political and social influence and the achieving of independence belong to this group.
Grouping the toolsystem is based on a Swiss research from 2010 named ’Marketingcontrolling in the practice’, which was
made by Reinecke and Eberharter. As the target group of the two researches (the Swiss and the Hungarian) is different, It
was not my aim to compare the results with each other. Measuring marketing efficiency middle-sized and large companies
use mainly those indices regularly, which are refering to sales and finance, e.g. Turnover (94.8%) and its increase (84.9%),
net income (82.2%) and turnover rentability (65.9%). Indices related to customers, the above mentioned companies use

274
less frequently: customer satisfaction (54.5%), customer attechment rate (18.4%), financial customer value (19.4%) and
non-financial (11.6%). Indices related to competitors are hardly used regularly, except market share (56.4%).
Figure 3 How often does the company use the following indices in marketing and sales? (not at all, not regularly, regularly)
Source:The writers’ own drawing
Indices and index systems are only the pillars of a comprehensive marketingcontrolling system. They complement each
other, but in no way substitute the methods like gross margin calculation, or investment calculations in case of
indtroducing a new product. In marketing there are many areas, which cannot properly expressed in indicators. It raises
the question that marketing managers with what kind of tools and methods determine the success. The following part
contains strategic and financial marketingcontrolling methods.
Concerning strategic marketing controlling devices, Figure 2 shows that the Hungarian medium-sized companies and large
enterprises apply regularly the traditional tools: e.g. customer satisfaction (57.7%), strategic product portfolio (49.3%),
competitors’ analysis (42.9%) and industrial branch analysis (42.6%). It seems that in making important strategic
decisions these companies prefer well-proven methods.
Suprising results emerged in case of market segmentation, as there is a substantial difference between theory and practice.
While the necessity of market segmentation is indisputable in the literature, 38.8% of the Hungarian medi um-sized
companies and large enterprises do not take advantage of it, 34.7% waive its regular use, and only 26.5% apply it
regularly. It seems companies have difficulties in carrying out segmentation.

275
An unexpected development the sporadic practical use of Balanced Scorecard, since in the literature it is a much discussed
topic. 75.8% of the respondents do not use it at all, 18.0% do not use it regular and only 6.2% use it regularly. It is
conceivable this method is too innovative or too complex for companies to introduce it on a regular basis. Results show
that 78.8% of the companies do not use the scenario technique at all, 16.9% do not use it regularly, and only 4.3% apply it
regularly. In our opinion this method has a great advantage in that future events can be predicted.
Figure 4 How often does the company you work at use the following tools? (Strategic marketing controlling)
(NA: Not at all, NR: not regularly, R: regularly) Source: The writers’ own drawing
One of the most costly element of marketing activity is marketingcommunication, the cost of which is constantly
increasing, so it was important to assess this component. Previously it was assumed that the tracking was carried out by
less than one-third of the companies. Because of the high costs, companies try to save money on those activities, which
could be increased efficiency.
Concerning operative marketingcontrolling devices traditional methods like sales analysis (91.1%), quality analysis of
products and services (74.8%), price- (67.7%) and distribution analysis (50.0%) are regularly carried out by the
comapnies.
Despite the fact that marketing communication carries considerable costs, only few middle-sized companies and large
enterprises analyze regularly their results. Measuring the efficiency and effectiveness of marketing communication the
regularity is important, it cannot be occasionally (not regularly) performed, because it has, no sense. The process approach
is essential, because we can only heel the response of customers for each campaign.
In the XXI century, from communicational aspect, could also be called the ’Time of integrated marketing-communication’, it
is unexpected that the media-mix optimalization is used by less than one-fifth of the companies.

276
Figure 5 How often do you apply the following methods? (Operative marketingcontrolling)
(not at all, not regularly, regularly) Source: The writers’ own drawing
Finally, in case of the control system it is necessary to study financial marketingcontrolling tools, which can easier apply,
than strategic and operative devices. 63.8% of the companies use regular total cost calculation, 63.4% turnover-result
calculation, 54,8% profitability analysis, 54.7% gross margin calculation, 52.9% budget analysis, while 50.6% process cost
calculation. Positively noticed that many companies use the process (50.6%) and objectives cost calculation (44.4%).
However, nowadays among marketing theorists so often discussed topics such as regular application o f brand value
(29.9%) or client value analysis (20.9%) still less widespread in business practice.
During the analysis of the marketingcontrolling devices it is noticed that in Hungary the middle-sized and large enterprises
prefer to use the well-tried methodsl. It is possible that the ’new’ procedures are considered risky.
During the literature review it was found that by the evaluation of company’s marketing activity the biggest problem was
the lack of assessment method and the subjective elements in it. Finding the competent human resource may also cause a
problem. More universities and colleges have alrady started this training, therefore market supply and demand will be
resolved in time at the marketingcontroller training sector.
In the survey the companies were asked what kind of difficulties they had during the evaluation of the marketing process.
Next we describe the factors that hinder the operation of the marketingcontrolling system in business practice. These data
are suprising in the light of how much money, time and energy are spent on the various quality management and routine
reports from year to year in order to refine the methods. Marketing activities have significant costs comparing to other
company fields, nonetheless 43.9% of the companies have not got an evaluating method.
In our opinion, there is a connection between development of marketing and marketingcontrolling system. Indeed, if a
company deals with the evaluation of its marketing activities, it will contribute to the optimal functioning of marketing.
This is the second hypothesis, which stems from the research model.
The correlation test must be done to find out the relevance of main component analysis on this variable groups.
Correlation matrix shows that in case of six variable groups at 1%, 2 variable groups at 5% the relationship is significant,
so there is a reason to implement main component analysis.
The legitimacy of main component analysis and rejecting hypothesisof Bartlett’s fericity (szig. 0,000) were confirmed by
KMO (0,651). According to the component vector I can declare that the development of marketingcontrolling takes part in
the highest weight (0,826) in manufacturing of the component, this is followed by applied activities (0,805), then
expenditure or investment (0,659), and finally marketingbudget (0,496). Final communalities of the original variables
were as follows: the manufactured main component 68,1% of the 3. statement, 64,8% of the 1. statement, 43,5% of the 2.
statement and 24,6% of the 4. statement’s content information were compressed. Well the next statement has been
proven.
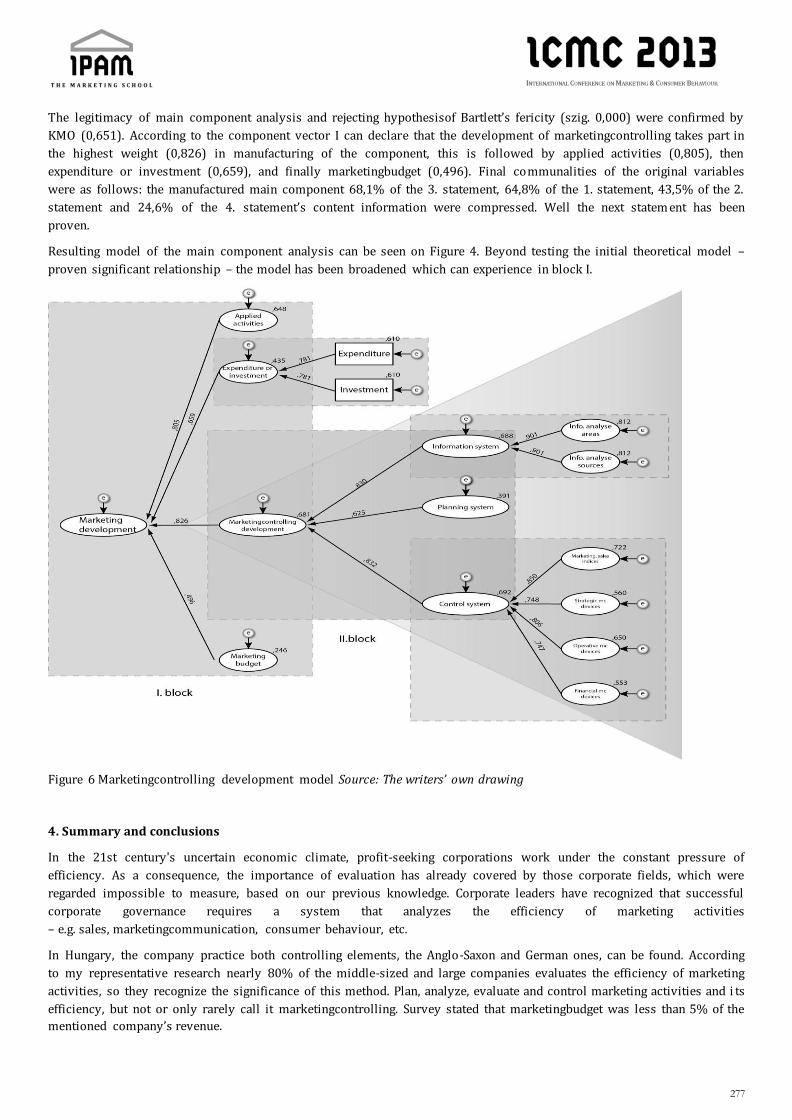
277
The legitimacy of main component analysis and rejecting hypothesisof Bartlett’s fericity (szig. 0,000) were confirmed by
KMO (0,651). According to the component vector I can declare that the development of marketingcontrolling takes part in
the highest weight (0,826) in manufacturing of the component, this is followed by applied activities (0,805), then
expenditure or investment (0,659), and finally marketingbudget (0,496). Final communalities of the original variables
were as follows: the manufactured main component 68,1% of the 3. statement, 64,8% of the 1. statement, 43,5% of the 2.
statement and 24,6% of the 4. statement’s content information were compressed. Well the next statem ent has been
proven.
Resulting model of the main component analysis can be seen on Figure 4. Beyond testing the initial theoretical model –
proven significant relationship – the model has been broadened which can experience in block I.
Figure 6 Marketingcontrolling development model Source: The writers’ own drawing
4. Summary and conclusions
In the 21st century's uncertain economic climate, profit-seeking corporations work under the constant pressure of
efficiency. As a consequence, the importance of evaluation has already covered by those corporate fields, which were
regarded impossible to measure, based on our previous knowledge. Corporate leaders have recognized that successful
corporate governance requires a system that analyzes the efficiency of marketing activities
– e.g. sales, marketingcommunication, consumer behaviour, etc.
In Hungary, the company practice both controlling elements, the Anglo-Saxon and German ones, can be found. According
to my representative research nearly 80% of the middle-sized and large companies evaluates the efficiency of marketing
activities, so they recognize the significance of this method. Plan, analyze, evaluate and control marketing activities and i ts
efficiency, but not or only rarely call it marketingcontrolling. Survey stated that marketingbudget was less than 5% of the
mentioned company’s revenue.

278
The three subsystems of marketingcontrolling – information-, planning and control system – are seperated in the
Hungarian corporate practice.
Creating the information system the studied companies use both internal and external sources. As external source mostly
the different market research reports, while as an internal own corporate market research, internal corporate statistics,
database, accounting are dominant.
During the objectives planning revealed that in the daily operation, decision-making of the Hungarian middle-sized and
large companies the psychograpgic objectives at least as important as economic ones.
We noticed during the depth interviews, in relation to the control system, that the measurement of the economic goals’
fulfillment is the dominant, but there are also psychographic objectives. Control system was studied separately with
regard to the strategic, operative and financial marketingcontrolling devices, and we concluded causal relationship the
frequency of use of these.
At the end of the research we asked what kind of difficulties arises during the using of marketingcontrolling. Not suprising
that the biggest problem is the cost, the subjectivity and the lack of the evaluation method and the lack of the competent
human resource.
Finally, we illustrate in a model what kind of factors have an effect on the development of marketing and
marketingcontrolling.
Draw the conclusion that the Hungarian middle-sized and large enterprises considerable attention is paid to the marketing
activities and its evaluation. However, a number of methods and procedures can also expand the existing tools. In our
opinion, in most companies to create a well-operating marketingcontrolling system not requires a large investment, since
the basis of this system have already existed.
It is succeed to prove in our research that if a company has marketing evaluation system, its operation contributes to
success of marketing activity.
Using a marketingcontrolling system several practical benefits can be realized. The controlling system of a multinational
company that distributing products in construction industry makes the horizontal flow of information possible. Executives
of the different stores in this chain in Hungary set up an internal information line in order to the effective communication.
With the expansion of the available information controlling activity can be modify, when the results are not what we
expected. Thus the system can continuously develop and specified.
This article is carried out as part of the TAMOP-4.2.2./B-10/1-2010-0008 project in the framework of the New Hungarian
Development Plan. The realization of this project is supported by the European Union, co-financed by the European Social
Fund.
References
Achrol, R.S. (1991): Evolution of the marketing organization: new forms for turbulent environments (Journal of Marketing
55. 77-93.)
Ambler, T. (1998): Why is marketing not measuring up? (Marketing (London), 24. September, No. 29., pp. 24-25.
Anderson, P.F. (1982): Marketing, strategic planning and the theory of the company (Journal of Marketing 46., 15-26.)
Auh, S. – Merlo, O. (2012): The power of marketing within the firm: Its contribution to business performance and the effect
of power asymmetry (Industrial Marketing Management 41. 861-873.)
Auerbach, H. (1994): Internationales Marketing-Controlling: Eine systemorientierte Betrachtung unter besonderer
Berücksichtigung strategischer Entscheidungsprobleme (Verlag für Wissenschaft und Forschung, Stuttgart)
Belz, C. (2004): Gefahren der „Marketing-Metrics”, in: Thexis, 21, H. 3, S. 60-63.
http://www.alexandria.unisg.ch/Publikationen/Zitation/Christian_Belz/48778

279
Berács, J. (1997): A marketing hozzájárulása a vállalati versenyképességhez: Vállalati részfunkciók, marketing – alprojekt
zárótanulmány ((BKE, Versenyben a világgal, Z16. kötet, 46.o.)
Bíró, P. (2011): http://kkvguru.hu/marketing-es-kommunikaco/marketing-kontrolling
Böcskei, E. (2006): A marketingcontrolling felértékelődése az információs iparágak piacán.
in: A Controller, 2006/11. 13-15.o.
Brávácz, I. (2008): A marketingkutatás szerepe a marketingcontrolling tervezési, eltéréselemzési és információkezelési
tevékenységében. in: A Controller, 2008/4. 22-24.o.
Clark, B. H. (1999): Marketing Performance Measures: History and Interrelationships (Journal of Marketing Management,
15 (8), pp. 711-732.
Day, G. S. (1992): Marketing’s contribution to the strategy dialogue. (Journal of the Academy of Marketing Science, 20. 323-
329.)
Day, G. S. (1994): The capibilities of market-driven organizations In: Journal of Marketing Volume 58., No.4.
Deshpandé, R.F.J.U. – Webstrer, Jr. F.E. (1993): Corporate culture, customer orientation, and innovativeness in Japanese
firms: a quadrad analysis (Journal of Marketing 57., 23-27.)
Eschenbach, R. (1986): Die Engliederung des Marketing-Controllers in die Unternehmensorganisation, in: Eschenbach, R.
(Hrsg.): Marketingcontrolling, Tagungsbericht Österreichischer Controllertag 1985, Wien, S. 31-55.
Frankwick, G.L., Ward, J.C, - Hutt, M.D. – Reingen, P.H. (1994): Evolving patterns of organizational beliefs int he formulation
of strategy (Journal of Marketing 58. 96-110.)
Gupta, A.K. – Raj, S.P.,- Wilemon, D.L. (1986): A model for studying R&D – marketing interface int he product innovation
process (Journal of Marketing 50., 7-17.) in: Merlo, O. – Auh, S. (2010)
Gritzmann, K. (1991): Kennzahlensysteme als entscheidungsorientierte Informationsinstrumente der
Unternehmensführung in Handelsunternehmen. (Dissertation, Göttingen)
Hinings, C.R. – Hickson, D.J. – Pennings, J.M. – Schneck, R.E. (1974): Structural conditions of intraorganizational power
(Administrative Science Quarterly 19. 22-44.) in: Merlo, O. – Auh, S. (2010)
Homburg, C. – Workman, Jr. J.P. – Krohmer, H. (1999): Marketing’s influence within the firm (Journal of Marketing 63. 1-17.
Horváth, P. – Stark, H. (1982): Controlling für das Marketing-Management, (in: Marketing, Zeitschrift für Forschung und
Praxis, 4. Jg. 1982, S. 183-194.)
Horváth, P. (1986): Die Aufgaben des Marketing-Controllers, in: Eschenbach, R. (Hrsg.): Marketingcontrolling,
Tagungsbericht Österreichischer Controllertag, Wien, S. 7-29.
Hubert, J. – Gyulavári, T. – Malota, E. (2012): Marketingmérés. In: MOK 2012 Miskolc, 16. sz. tanulmány
Hutt, M.D. – Speh, T.W. (1984): The marketing strategy center: diagnosing the industrial marketer’s interdisciplinary role
(Journal of Marketing 48., 53-61. in: Merlo, O. – Auh, S. (2010)
Hutt, M.D. – Reingen, P.H. – Ronchetto, Jr. J.R. (1988): Tracing emergent processes in marketing strategy formation (Journal
of Marketing 52. 4-19.) in: Merlo, O. – Auh, S. (2010)
Jaworski, B.J. – Kohli, A.K. (1993): Marketing orientation: Antecedents and consequences (Journal of Marketing, 57., 53-
71.)
Jenner, T. (1998): Controlling strategischer Erfolgspotentiale, in: Reinecke, S./Tomczak, T./Dittrich, S. (Hrsg.):
Marketingcontrolling, St.Gallen, S. 60-69.
Józsa, L. (2005): V. Marketing a társadalomban és a vállalkozásban: 19. Marketing és szervezet: 19.2. Marketingkontrolling
– marketngaudit 395.o.-398.o. in: Józsa, L./Piskóti, I./Rekettye, G./Veres, Z. (2005): A marketingmenedzsment
alapjai (KJK Kerszöv, Budapest)
Józsa, L. (2006): A marketingcontrolling döntéselőkészítő szerepe a vállalkozások marketingirányítási és –ellenőrzési
feladatainál. in: A Controller, 2006/1. 13-16.o.

280
Kandikó, J. (2006): Esettanulmányok a marketingcontrolling gyakorlatából, avagy a marketi ngcontrolling fogalmi
megközelítése. in: A Controller, 2006/9. 11-14.o.
Kenesei, Zs. – Gyulavári, T. (2010): A marketingeszközök alkalmazásának hatása a versenyképességre (BCE
Vállalatgazdaságtani Intézet, Versenyképesség Kutató Központ, TM 29. sz. műhelytanulmány, 54.o.)
Kiener, J. (1980): Marketingcontrolling, Darmstadt.
Kirca, A.H. – Satish, J.B.W.O. (2005): Market orientation: a meta-analytic review and assessment of its antecedents and
impact on performance (Journal of Marketing 69. 24-41.
Kolos, K. – Sz. Tóth, G. – Gyulavári, T. (2005): A marketing hozzájárulása a vállalati versenyképességhez (Versenyben a
világgal 2004 – 2006 gazdasági versenyképességünk vállalati nézőpontból című kutatás 21. sz.
műhelytanulmány, 60.o.-61.o.)
Kotler, P. (2004): Ten deadly marketing sins. Signs and solutions. (Hoboken, NJ: John Wiley & Sons)
Köhler, R. (1993): Beiträge zum Marketing-Management – Plannung, Organisation, Controlling, 3. Auflage (Stuttgart)
Köhler, R. (1996): Marketing-Controlling, in: Schulte, C. (Hrsg.)
Köhler, R. (1998): Marketingcontrolling – Konzepte und Methoden, in: Reinecke, S./Tomczak, T./Dittrich, S. (Hrsg.):
Marketingcontrolling, St.Gallen, S. 10-21.
Kumar, N. (2004): Marketing as strategy. Understanding the CEO’sagenda for driving growth and innovation (Harvard,
Business School Press, Boston)
Küpper, H.-U. (1997): Controlling. Konzeption, Aufgaben, Instrumente, 2. Aufl., Stuttgart.
Lambin, J.- J. – Schuiling, I. (2012): Market-Driven Management: Strategic and Operational Marketing 3. rd Edition
(Palgrave, Macmillan, England)
Langerak, F. (2003): The effect of market orientation on positional advantage and organizational performance (Journal of
Strategic Marketing 11. 93-115.)
Lawrence, P.R. – Lorsch, J.W. (1967): Differentation and integration in complex organizations (Administrative Science
Quarterly 12. 1-47.): Merlo, O. – Auh, S. (2010)
Li, L. (2010): Marketing metrics’ usage: Its predictors and implications for customer relationship management (Industrial
Marketing Management 40. 139-148.)
Malhotra, N.K. (1999): Marketingkutatás (KJK, Budapest)
Meffert, H. (1998, 2000): Marketing: Grundlagen marktorientierter Unternehmensführung: Konzepte – Instrumente –
Praxisbeispiele (Wiesbaden)
Merlo, O. – Auh, S. (2010): Marketing’s strategic influence in Australian firms: A review and survey (Australasian
Marketing Journal 18. 49-56)
Mitev, A. – Bauer, A. (2010): A válság hatása a vállalatok marketingtevékenységére (BCE Vállalatgazdaságtani Intézet,
Versenyképesség Kutató Központ, TM 6. sz. műhelytanulmány)
Moorman, C. – Rust, R.T. (1999): The role of marketing (Journal of Marketing, 63., 180-197.)
Narver, J. C. – Slater, S. F. (1990): The effect of market orientation on business profitability (Journal of Marketing, 54. 20-
36.)
Niven, P.R. (2005): Balanced Scorecard Diagnostics: Maintaining Maximum Performance (John Wiley & Sons, New Jersey)
Perrow, C. (1970): Departmental power and perspectives in industrial firms. In: Merlo, O. – Auh, S. (2010)
Piercy, N.F. (1986): The role and function of the chief marketing executive and the marketing department: a study of
medium-sized companies int he UK (Journal of Marketing Management 1.265-289.) In: Merlo, O. – Auh, S. (2010)
Piercy, N.F. (1987): The marketing budgeting process: marketing management implications. (Journal of Marketing 51. 45-
59.) In: Merlo, O. – Auh, S. (2010)

281
Piskóti, I. (2006): Marketingkampányok mérése (Kézirat)
Reichmann, T. (1997): Controlling mit Kennzahlen und Managementberichten, 5. Aufl., München.
Reinecke, S. (2004): Marketing Performance Management – Empirisches Fundament und Konzeption für ein integriertes
Marketingkennzahlensystem, Wiesbaden
Reinecke, S. (2006): in Reinecke, S. /Tomczak, T. (Hrsg.): Handbuch Marketingcontrolling: Effektivität und Effizienz einer
marktorientierten Unternehmensführung, (Wiesbaden, Gabler)/
Reinecke, S./Eberharter, J. (2010): Marketingcontrolling 2010: Einsatz von Methoden und Verfahren des
Marketingcontrollings in der Praxis in: Controlling 22. Jg. 2010, Nr. 8/9.
Rust, R. T. – Ambler, T. – Carpenter, G. S. – Kumar, V. – Srivastava, R. K. (2004): Measuring Marketing Productivity: Current
Knowledge and Future Directions (Journal of Marketing, 68 (4), pp. 76-89.
Sajtos, L. (2004): A vállalati marketingteljesítmény mérésének többdimenziós megközelítése és alkalmazása a
Magyarországon működő vállalatok körében, Ph.D. dolgozat
Sander, M. (2004): Marketing-Management – Märkte, Marktinformationen und Marktbearbeitung (Stuttgart)
Sheth, J.N. – Sisodia, R.S. (2002): Marketing productivity: Issues and analysis (Journal of Business Research, 55., 349-362.)
Seggie, S. H. – Cavusgil, E. – Phelan, S. E. (2007): Measurement of return on marketing investment: A conceptual framework
and the future of marketing metrics (Industrial Marketing Management, 36 (6), pp. 834-841.
Slater, S.F. – Narver, J.C. (2000): The positive effect of a market orientation on business profitability: a balanced replication
(Journal of Business Research 48., 69.73.
Srivastava, R.K. – Shervani, T. A. – Fahey, L. (1998): Market-Based Assets and Shareholder Value: A Framwork for Analysis
(Journal of Marketing 62. 2-18.)
Ulrich, P./Fluri, E. (1995): Management. Eine konzentrierte Einführung. 7. Auflage (Verlag Paul Haupt, Bern-Stuttgart-
Wien)
Uncles, M. (2005): Marketing Metrics: A Can of Worms or the Path to Enlightemet? in: Brand Management, 12, No. 6, pp.
412-418.
Varadarajan, R.P. (1992): Marketing’s contribution to the strategy dialogue: the view from different looking glass (Journal
of the Academy of Marketing Science 20. 335-344.)
Verhoef, P.C. – Leeflang, P.S.H. (2009): Understanding marketing department’s influence within the firm (-journal of
Marketing 73. 14-37.)
Walker, Jr. O.C. – Ruekert, R. (1987): Marketing’s role in the implementation of business strategies: a critical review and
conceptual framework (Journal of Marketing 51. 15-34.)
Weber, J. /Schäffer, U. (Hrsg.) (2005): Bereichscontrolling. Funktionsspezifische Anwendugsfelder, Methoden und
Instrumente (Stuttgart)
Weber, J. − Schäffer, U. (2006) in: Reinecke, S. /Tomczak, T. (Hrsg.): Handbuch Marketingcontrolling: Effektivität und
Effizienz einer marktorientierten Unternehmensführung, (Wiesbaden, Gabler)/ Erster Teil: Grundlagen: Weber,
J. − Schäffer, U.: Marketingcontrolling: Sicherstellung der Rationalität in einer marktorientierten
Unternehmensführung, S. 32-49.
Webster, F.E. Jr. (1992): The changing role of marketing int he corporation (Journal of Marketing 56., 1-17.)
Webster, F.E. Jr. – Malter, A. – Ganesan, S. (2003): Can marketing regain its seat at the table? (Marketing Science Institute
MSI Reports, Working paper series 03-113, 29-47.)
Webster, F.E. Jr. – Malter, A. – Ganesan, S. (2005): The decline and dispersion of marketing competence (MIT Sloan
Management Review, 46. 35-43.)
Wind, Y. (1981): Marketing and the other business functions. In: Sheth, J. (Ed.), Research in Marketing. JAI Press,
Greenwich, CT.

282
Workman Jr., J.P. (1993): Marketing’s limited role in new product development in one computer system fi rm (Journal of
Marketing Research 30., 405-421.)
Zerres, C. /Zerres, M. (2006): Handbuch Marketingcontrolling (3. Auflage, Berlin)

283
Session 8
284
Social Responsibility Campaigns and
Consumer-Centric Marketing, Are They in
Cohesion? The Practices of Top Ten
Organizations in Turkey Corporate, Social responsibility, consumer-centric marketing, social responsibility campaigns, Turkey.
Nilay Başok, Faculty of Communication University of Ege, [email protected]
Müjde Ker Dincer, Faculty of Communication University of Ege, [email protected]
Gül Coşkun, Faculty of Communication University of Ege, [email protected]
Abstract
In the field of marketing, with every passing day the value of creating consumer wise approaches and policies are
appreciated and applied more and more by many organizations since they can only differentiate on goods and services to
the extent they successfully cover the needs and expectations of their consumers. The situation mentioned brings about
the importance of consumer-centric marketing concept into the scene. Within the practices of consumer-centric
marketing, organizations place the expectations, needs, and desires of their consumers place in the core of all their
functions.
Contemporarily another highly increasing work area for organization is social responsibility practices. Varying and
developing of social structures seen all over the world brought into the scene of differentiating expectations of society
from the organizations, too. The way how the organzation handles social responsibility practices stands in the first place of
consumer preferences. The vital significance of sincere social responsibility practices are also seen and valued by Turkish
consumers, too. Due to this outcome, many conglomerate, medium and small sized business administrations in Turkey
hold various social responsibility campaigns on different areas . The practices stated sometimes can come up as
sophisticated campaigns, and sometimes as short termed activities. Organizations can also plan their social responsibility
practices purposive in different ways sometimes working with their consumers hand in hand and sometimes by
themselves for the behalf social benefits.
In this “Social Responsibility Campaigns and Consumer-Centric Marketing, Are They in Cohesion? The practices of top ten
organizations in Turkey” headed paper, the importance of social responsibility campaigns are examined from a consumer-
centric marketing perspective. As a case study to highlight the topic, the social responsibility practices of top ten leading
organizations announced by the Istanbul Chamber of Industry with their net sales among 500 organizations of Istanbul are
examined within the limits of the paper.
INTRODUCTION
In a time of economic uncertainty where customer trust eroding and purchase behaviors grows harder to predict,
mastering in consumer-organization trust based relations has become even more critical to staying relevant, competitive
and profitable. Consumer-centrism comes on the scene as a hero that builds long-term relations between organizations
and consumers. Through consumer-centric management understanding, organizations can create and sustain
relationships deeper than the “good, old-fashioned service” with consumers and get better returns from their marketing
funds.

285
The two-way communication flow among organizations and consumers influence not only the trust and loyalty in between
but also the way work is done. Social responsibility practice is defined as ‘the way organizations give back what they took
from the society’. Today social responsibility is an area regardless of the idea behind, it could be either for profit growth or
social contribution, organizations attach value to these kind of practices. Especially today consumers value the way
organizations face their responsibilities about their products, environmental issues, and charitable works. Also info rming
consumers about organizational SR practices performed is a highly expected duty of the organizations since consumers
during their purchasing process, consider them very much. For these reasons, uniting consumer-centric marketing
approach with social responsibility practices end up with trust-based, long termed, successful consumer-organization
relations.
In this paper the commissure of consumer-centrizm and social responsibility is considered on evaluating the data supplied
by the Istanbul Chamber of Industry. The web sites of top 10 organzations (from private sector) listed in the top 500 list
prescribed by Istanbul Chamber of Industry according to 2011 net profit on sales were observed according to the intensity
of information organizations share about their social responsibility performances via organizational web sites that meet
consumer expectations. Within this scope, the practices of the above mentioned 10 organizations placed on their
organizational websites were promiscuously examined within the context “what consumers look for from the
organizations to fulfill their expectations on SR practices as primary and secondary expectations” stated in the article ‘The
Expectations of Consumers about Social Responsibility: Identification of Priorities by Analytical Hierarchy Process’ is used
as a base of the research.
A NEW TENDENCY IN MARKETING: CONSUMER-CENTRICIZM
In today’s severely competitive business world where building, keeping, and expanding customer relationships and doing
it profitably, highly depends on the ability to deliver a customer experience tailored to changing customer needs and
values consistent with the brand promise, stands as the core concept of the overall approved tendency in marketing that is
called Consumer-Centric Marketing (CCM). CCM is a relatively new trend in marketing and it aims to streamline data used
by companies and also takes Customer Relationship Marketing (CRM) one step forward. Even though CCM is based on the
idea and the techniques designed for CRM, it takes the practice a step further with its advanced marketing philosophy that
perceiving the customer as the consumer and ‘placing the consumer in the middle’. To survive and even thrive in today’s
economic environment, many organizations should take a fresh look at their strategies and methods for retaining
customers, and if necessary renew their commitment to consumer centricity even to more human-centric management
understanding (Kotler, 2010, p. 4).
CCM as the subsequent step of CRM, can be basically defined as ‘the discipline of capturing and deploying consumer
insights to enhance marketing effectiveness and better serve those consumers that are a brand’s best prospects’ (Maney, et
al., 2002, p.3). CCM is based on the notion of augmenting deep insights into consumer habits, practices, attitudes,
motivations and expectations, and then make use of this information to build trust-based relationships with consumers
who most count on to a particular organization. Trust and dialogue based relationship is highly valued by today’s
organizations since it is the essential component of customer-loyalty, and the organization’s profitability and permanence
highly depends on it. In order to build trust based relationships, organizations must gather very detailed information by
improving a very deep understanding of consumers served and then deliver the right personalized messages suitable for
the consumers, through the right channels, at the right time, and placing the consumer demands in the center.
‘The personalized messages’ vital to CCM enable mass production of tailor-made products based on a positive cycle of
learning from consumers- allowing the consumers to take active roles in the design of the products by declaring their
preferences and customizing product features, offering consumers products with higher perceived value – increasing
customer life time value, customer loyalty, and customer-company relationship. In addition to that, CMM strategy lays the
basis for differentiation and greater value creation leading to loyalty and profitability; thus provides the organization with
long term return on their investment (Bolton, 2004; Mello, 2002; Wright, Stone and Abbott, 2002).
Above mentioned front-page CCM process can be enabled by telephone or postal requests, face-to-face communication,
etc. but today especially with high technology tenancies: networks, databases, data warehousing and data mining
applications. Especially the web is used to enable consumer interactions, data collection and analysis, enhancing the
potential of the identification and tracking of the consumers globally (Wang et al. 2000 and Daniel et al., 2003). Besides
technology not only multiplies the channels of communications but also provides tools for the organization to adapt

286
proactive and reactive marketing strategy towards customizing products and satisfying consumer demands (Buhalis,
2003).
In essence, the CCM is a three-step process with three main challenges to be covered since the balance between savings
from technological effectiveness and providing consumer-centered service atmosphere is not an easy one.
1) Knowing the consumer: the collection and arrangement of information and data on individual consumers,
2) Reaching the consumer: the utilization of that information to more effectively target those existing consumer and
3) Delivering a differentiated experience allowing the customer to customize and personalize the service to match their
own needs and preferences.
Figure 1: 3 Steps in CMM ( High Performance in the Age of Customer Centricity, 2008)
CMM with its role in orientating the organizational activities around the consumer, having a deep understanding of the
consumer and effectively responding to the needs of them, engaging all stakeholders in improving consumer
understanding, aligning the resources of the organization to the desired outcome is highly valued in business world. In the
light of the all mentioned exposés, CCM in today’s marketing drifts is on its way to create head waves in marketing; by
developing a good mutually beneficial relationship that will ensure positive consumer experiences and combining CCM
philosophy and technological advancements that allow for a more sophisticated data collection and manipulation as well
as personalization of products, services and experiences.
SOCIAL RESPONSIBILITY UNDERSTANDING
Today the stakeholders (consumers, local communities, employees, financial interest groups, media, and etc.) highly
expect organizations to strive for social and environmental issues. To fulfill these expectations, organizations have to
accomplish social responsibilities in areas such as environmental issues, business ethics, sponsorship and philanthropy,
cultural responsibilities, social activities in education, health, sports, and so on. Due to the mentioned reasons, Social
Responsibility (SR) mentioning the responsibilities and the role of organizations on social, economic and environmental
issues by adapting voluntary applications affecting external environments stands out as one of the eye-catching work
areas of business. Organizations with well-set SR policies and campaigns, have advantages in various aspects such as; (1)
learning and applying sufficient and effective ways to fulfill social and environmental duties stakeholders are expecting in
a two-way communication manner, (2) attaining and sustaining positive organizational reputation, (3) developing trust-
based and sincere relations with stakeholders, (4) affecting purchasing decisions and increasing customer satisfaction and

287
loyalty levels, (5) attracting qualified workforce to the organization, and (6) increasing employee motivation, moral,
efficiency, satisfaction and commitment levels. In this context, it is possible to state that organizations targeting
achievement in business must value the role and be in continuous interaction with the relevant stakeholders and external
environment. Furthermore, organizations have to integrate SR into economic, environmental, and social operations.
Therefore, organizations that adopt SR have to formulate a comprehensive set of policies, practices and programs that are
integrated into the business operations and decision-making processes throughout the organization focusing on the key
dimensions of SR that are stakeholders. SR, for that reason, is about how to manage these responsibilities (Ofori and
Hinson, 2007, p.179).
To gain deeper understanding of SR, the three gradual aspects of the relationship between the organization and the
stakeholders have to be mentioned. First of all, the way business is conducted reflects upon ethical considerations. Second,
the level business operations minimize or reduce negative impact on the environment, and finally, the outcome of
operations not interfering with established human rights (Valand and Heide, 2005, pp.495-496).Douglas et al. (2004,
p.388) SR generally refers to business decision-making linked to ethical values, compliance with legal requirements, and
respect for people, communities and the environment. A step further SR traditionally refers to the activities carried out by
organizations to enhance society in general. Therefore, for some experts SR is beyond profit activities, and is voluntary and
thus not required by law or any other form of governmental coercion.
On the other hand, according to Klein and Harford (2004, pp.1-2) beside all human, social and environment based,
virtuous approaches, organizations have economic based reasons to behave in a socially responsible way, too. First reason
of the organization adapting SR is simply that a corporate culture may value more than mere profit. Second social or
environmental action can increase the profits of the organization such as improving energy efficiency for example can
reduce the level of costs. And as the third reason SR is essentially a reputation game in which organizati ons behave better
in return for a better deal from various stakeholders. Sothe SR experts state that the investments in SR are believed to
create value not only for stakeholders of the organization, but also for the organization itself (Van de Ven, 2008, p.339).
Returning to the reputation building side of SR for organizations; organizational reputation among its economically
powerful stakeholders is a valuable asset which needs to be protected and developed. Today the key aspect of this
reputation building process is seen as stakeholders’ perceptions of the organization’s SR – or, more precisely, perceptions
of how well the organization’s SR policies, practices and outcomes meet stakeholders’ social and environmental values and
expectations (Unerman, 2008, p.362). The outcome of these expectations puts heavier responsibilities on the shoulders of
SR since consumers themselves frequently claim that the SR profile of an organization plays a large role in what brands
they choose to purchase (Castaldo et al., 2009, p.1). As an evident of this ‘profit based’ application of SR, most leading
organizations include a specific statement on their CSR policy within their annual reports. Indeed, changing societal
expectations, increasingly intrusive media reporting, and ever more sophisticated and powerful pressure groups have
caused all organizations to consider more carefully their wider social responsibilities not only out of altruistic reasons, but
because of the need to consider the potential impact of their policies on their wider stakeholder relationships (Bowd et al.,
2006, p.147).
Consequently, due to the importance gained by SR understanding, many organizations from almost all businesses are
endeavouring to find ways to integrate SR into their economic, environmental, and social operations. SR draws on the
notion that organizations bear the responsibility to give something back to the community. Organizations concerned with
SR seek to do well and attempt to project the image of a good corporate citizen. On the other hand, SR has proven to be
effective as a marketing and positioning tool to enhance organizational reputation or to proactively defend reputation
against public criticism. (Pollach, 2003, p.278). At the end the aimed outcome is both economic strength and social support
of the society in general.
SOCIAL RESPONSIBILTY CAMPAIGNS WITHIN THE SCOPE OF CONSUMER-CENTRIC MARKETING
Today consumer valued as the main agents affecting the entire in- and out-put of the organization. Through the history of
marketing the question of ‘what the organizations have to produce’ has changed to ‘to whom the organizations have to
produce” and a step further to ‘how to inform stakeholders about the outcomes’. In this age of marketing organizations
have to act according to the consumers’ desires and expectations even more than ever before and in the light of this act
comes the CMM understanding into the scene. In recent years the ‘value’ concept has also been added on to CMM, social
media and SR practices.

288
CMM discipline specifically focuses on retrieving information about consumers, determine individual desires, and
establish data pools for now and further tenancies. Organizations also formulate their SR practices on the outcomes of the
above mentioned issues. Especially differentiating from the competitors SR stands in the forefront.
Figure 2: 3i Model and Timberland's 3i
Reference: (Kotler, Kartajaya Seitawan, 2010, pp. 49-51)
Based on CMM but a step further approach valued by today’s organizations is the values -based marketing concept. Values-
based marketing as a subsequent dimension of CMM focuses on accessing not only to the consumers’ mind, also the heart,
and the soul at the same time.
Managing brand identity, brand integrity, and brand image brings forth the 3i Model, an integrated perception of the triad
(Figure 2). As seen in the Timberland example, SR must be used and mentioned the role of organizations acting according
to the global human rights, and responsible citizenship understandings. These components must feature in the overall SR
movement of the organization.
Figure 3:Values-Based Matrix Model
Reference: (Kotler, Kartajaya Seitawan, 2010, p.44)
Thereto CMM, today consumers value not just the quality of the products but also the way organizations contribute to the
overall social benefits and responsibilities. Placed in organizational mission, vision and values and supported by
organizational culture, SR sets a structure that appeal to the consumers’ heart and soul (Figure 2).
SR practices performed by organizations’ not solely depend on the budget and the opportunities supplied by the
organization but also designated profit gained from selling of products can be transferred to various SR campaigns or
NGOs. Organizations by doing so may end up with prompting and informing consumers and stakeholders on SR issues.

289
Also modern-day consumers support organizations that value and apply SR practices by preferring, buying and using their
products. Thus organizations can establish an environment that is based on mutual respect and trust, eventuate in
enhancing consumer loyalty that is targeted by CMM practices.
As being a universally approved and applied field of study, SR practices draw increasingly attention in Turkey especially
by large-scale enterprises. Many organizations nowadays share SR outcomes with their stakeholders by the help of various
technologies. Previously the activities organized as a part of SR, has altered. Organizations now adapt SR practices into
corporate strategies and cultures as inseparable parts and publicize what has committed to stakeholders. Especially the
growth and massive usage web sites made organizations pay ever increasing.
Ever-increasing attention on internet has SR made organizations necessitate the usage of web sites, too. Organizations by
placing specific buttons about SR practices on web sites of the organization, and share information on performed or will be
performing events. In addition to the peak usage of web sites, organizations also use social media on behalf of informing
stakeholders and consumers on SR practices. Herein since the sphere where organizations’ will perform SR practices
depends on the expectations of the society, so in the planning stage of SR practices these expectations always have to be
taken in consideration.
SOCIAL RESPONSIBILTY CAMPAINGS WITHIN THE SCOPE OF CONSUMER-CENTRIC MARKETING: EVALUTATION OF
TOP 10 ORGANIZATIONS IN TURKEY
Purpose of the Research: In this work, the SR practices of top 10 organizations (from private sector) listed in the top 500
list prescribed by Istanbul Chamber of Industry according to 2011 net profit on sales were evaluated in order to compare
how well and how much information shared about organizations via organizational web sites met consumer expectations
on social responsibility campaings.
The Scope of the Research: Within the research SR practices of top 10 organizations and the main topics dealt by these
practices were examined. In this context the organizations inspected were as listed (Istanbul Chamber of Industry*, 2012):
1. Tüpraş-Türkiye Petrol Rafinerileri A.Ş. (oil company)
2. Ford OtomotivSanayi A.Ş. (automotive)
3. Oyak-Renault OtomobilFabrikaları (automotive)
4. TofaşTürkOtomobilFabrikası A.Ş. (automotive)
5. Arçelik A.Ş. (domestic appliance)
6. EreğliDemirveÇelikFabrikaları A.Ş. (iron and steel plant)
7. İskenderun DemirveÇelik A.Ş. (iron and steel plant)
8. İçdaşÇelikEnerjiTersaneveUlaşımSanayi A.Ş. (steel, energy, dock and transportation)
9. Aygaz A.Ş. (bottled gas)
10. Mercedes-Benz T.A.Ş. (automotive)
Research Method:
When the method of the research is to be decided on the article named ‘The Expectations of Consumers about Social
Responsibility: Identification of Priorities by Analytical Hierarchy Process’ written by Gül Bayraktaroğlu and Özge Özgen
used as a guideline of the research. In the work of Bayraktaroğlu and Özgen, the basic 4 principles confessed by the work
of T.L Staay within Analytic Hierarchy Process that are decomposition, pairwise comparison, synthesis of priorities and
ultimate decision were selected as a baseline. Unlike the other methods comparing attitudes, reaching a comperative
importance level, and gathering more information on significance levels of variables puts the work of Staay in the highlight
of the article (Staay, 2001). Accordingly, in the work of Bayraktaroğlu and Özgen firstly by asking questions to the focus
group on social responsibility practices, the expectations of consumers on CSR were stated. The expectations were
analyzed on the basis of 4 principles step by step, set by Staay in the Analytical Hierachy Process. Following the Analytical
Hierachy Process, a proposal on the ways that can be used by organizations to satify consumer expectations (listed near
the top) was developed. The work of Bayraktaroğlu and Özgen included two sections, and they were on qualitative and
quantitative evaluation. In the qualitative section, the expectations of consumers were defined by asking the ideas of
* Istanbul Chamber of Industy is a NGO that has 13.000 members of small, medium and large scaled enterprises in business around Marmara Region of Turkey.

290
consumers that are in the focus group. In the quantitavie section the questionaire based on Analytical Hierarchy Process
was prepared. The set expectations were comparatively evaluated and prioritized by the subjects. The work of Griffin and
Hauser (1993) was taken as a reference and two stepped focus group studies were conducted in order to learn consumer
expectations. In this two stepped focus group studies the responsibilities of organizations on CSR were asked to the
subjects. The stated expections were grouped and defined as primary and secondary expecations by the help of clustering
and similarity analyzes. Within this framework, 5 primary and 19 secondary expectations were stated. According to the
above mentioned results, in this paper the primary and secondary expactations that were stated in ‘The Expectations of
Consumers about Social Responsibility: Identification of Priorities by Analytical Hierarchy Process’ was used as a base of
the research.
Sample of the under-researched organizations was based on the report published by Istanbul Chamber of Industry. In this
report500 organizations with the highest net profits in the year 2011 were stated and within the limits of this research the
web sites of the top 10 private sector organizations were taken into consideration. The article ‘The Expectations of
Consumers about Social Responsibility: Identification of Priorities by Analytical Hierarchy Process’ written by Gül
Bayraktaroğlu and Özge Özgen used as a base of the research. Web sites were promiscuously examined within the context
consumers expect from the organizations on SR as primary and secondary expectations (Bayraktaroğlu, Özgen, 2008,
pp.321-341).
Primary Expectations Secondary Expectations Ranking
Responsibilities related to the product
Healthy products 1
Safety of the product and product usage 2
Avoiding double standardization about the product in different countries.
5
Compensate level of material or emotional damage caused by the product or the waste-product.
8
Sensibility to environmental factors Sensitiveness to the environment 9
Keeping on the side of law 10
Responsibility toward employees 11
Conforming to the standards 12
Behaving accordingly to cultural values 17
Quality of the information shared about the product
Informing fully 3
Informing comprehensibly 4
Informing accurately 6
Responsibilities related with voluntariness
SR beyond law 7
Social Charitableness 14
Non-profit SR 15
Educational role of organizations on issues related to SR
Educating consumers on SR 13
Discouraging excessive consumption 16
Educating suppliers on SR 18
Educating distributors on SR 19
Table 1:Without making any business sector discrimination, primary and secondary expectations of consumers and
importance levels paid by the researched organizations adapted from the "Comparing Primary and Secondary Expectations
Performed by Organizations Excluded from Sector Discrimination’ table. (Bayraktaroğlu, Özgen, 2008, p. 332)
The top 10 organizations were examined within the context of the above mentioned table. In the table 1 point was given to
the every secondary expectation. Total score of the primary expectations were calculated over the total of secondary
expectations. Further on which expectations that lay in the top 10 expectations list shared by the organizations were
examined.

291
Primary Expectations Secondary Expectations Score table
Responsibilities related to the product
Healthy products 1
Safety of the product and its usage 1
Avoiding double standardization about the product in different countries.
1
Compensating the level of material or emotional damage caused by the product or the waste-product.
1
Total 4
Sensibility to environmental factors
Sensitiveness to the environment 1
Keeping on the side of law 1
Responsibility toward employees 1
Conforming to the standards 1
Behaving accordingly to cultural values 1
Total 5
Quality of the information shared about the product
Informing fully 1
Informing comprehensibly 1
Informing accurately 1
Total 3
Responsibilities related with voluntariness
SR beyond law 1
Social Charitableness 1
Non-profit SR 1
Total 3
Educational role of organizations on issues related to SR
Educating consumers on SR 1
Discouraging excessive consumption 1
Educating suppliers on SR 1
Educating distributors on SR 1
Total 4
SUM TOTAL 19
Table 2: The point score table on ‘Comparing Primary and Secondary Expectations Performed by Organizations Excluded
from Sector Discrimination’
Constraints of the Research: Research was done by data collecting from organizations’ web sites. The updating rate of
information placed in the sites was the main constraint of the research.
Findings: The statements of Istanbul Chamber of Industry were used in the research. During the evaluation on
prosecuting level of above mentioned primary and secondary expectations, the placing of information about each
expectation was examined
The organizations are listed in according to these numbers in Table 2:
1. Tüpraş-Türkiye Petrol Rafinerileri A.Ş. (http://www.tupras.com.tr/)
2. Ford OtomotivSanayi A.Ş. (http://www.fordotosan.com.tr/), (http://www.ford.com.tr/)
3. Oyak-Renault OtomobilFabrikaları (http://www.oyak-renault.com.tr/), (http://www.renault.com.tr/)
4. TofaşTürkOtomobilFabrikası A.Ş. (http://www.tofas.com.tr/tr/Pages/Default.aspx)
5. Arçelik A.Ş. (http://www.arcelikas.com/) , (http://www.arcelik.com.tr/default.aspx?lang=tr -TR)
6. EreğliDemirveÇelikFabrikaları A.Ş. (http://www.erdemir.com.tr/)
7. İskenderun DemirveÇelik A.Ş. (http://www.isdemir.com.tr/wps/wcm/connect/IsdemirLibrary/Isdemir)
8. İçdaşÇelikEnerjiTersaneveUlaşımSanayi A.Ş. (http://www.icdas.com.tr/icdas/indextr.asp)
9. Aygaz A.Ş. (http://www.aygaz.com.tr/)
10. Mercedes-Benz T.A.Ş (http://www.mercedes -benz.com.tr/)
The score of the organizations listed above related to prosecuting primary and secondary expectations can be summarized as:

292
Table 3: Score Table on ‘Comparing Primary and Secondary Expectations Performed by Organ izations Excluded from Sector
Discrimination’ that belong to the scope of the research.
When the organizations were examined on the information offered via organizational web sites and evaluated according
to the prepared score table listed outcomes can be seen:
o Organizations in general share the information consumers want to know about organizational SR practices.
o When the shared information is evaluated in direction of satisfying consumer expectations, 8 out of 10
organizations got 15 over 19 points. Two organizations got scores under 15. Organizations and their total scores
can be listed as below:
Name of the organization Total Score
TofaşTürkOtomobilFabrikası A.Ş. (automotive) 18
Arçelik A.Ş. (domestic appliance) 18
Aygaz A.Ş. (bottled gas) 18
İskenderun DemirveÇelik A.Ş. (iron and steel) 17
Türkiye Petrol Rafinerileri A.Ş. (oil) 16
Ford OtomotivSanayi A.Ş. (automotive) 16
Mercedes-Benz T.A.Ş (automotive) 16
EreğliDemirveÇelikFabrikaları A.Ş. (iron and steel) 15
Oyak-Renault OtomobilFabrikaları (automotive) 14
İçdaşÇelikEnerjiTersaneveUlaşımSanayi A.Ş. (steel, energy, dock and
transportation)
11
Primary
Expectations
Secondary Expectations Score
Table
1* 2 3 4 5 6 7 8 9 10
Responsibilitie
s related to the
product
Healthy products 1 1 1 1 1 1 1 1 1 1 1
Safety of the product and its usage 1 1 1 1 1 1 1 1 1 1 1
Avoiding double standardization about
the product in different countries.
1 - - - - - - - 1 - -
Compensating the level of material or
emotional damage caused by the product
or the waste-product.
1 1 1 1 1 1 1 1 - 1 1
Total 4 3 3 3 3 3 3 3 3 3 3
Sensibility to
environmental
factors
Sensitiveness to the environment 1 1 1 1 1 1 1 1 1 1 1
Keeping on the side of law 1 1 1 1 1 1 1 1 1 1 1
Responsibility toward employees 1 1 - 1 1 1 - 1 1 1 1
Conforming to the standards 1 1 1 1 1 1 1 1 1 1 1
Behaving accordingly to cultural values 1 1 - 1 1 1 1 1 1 1 1
Total 5 5 3 5 5 5 4 5 5 5 5
Quality of the
information
shared about
the product
Informing fully 1 1 1 1 1 1 1 1 1 1 1
Informing comprehensibly 1 1 1 1 1 1 1 1 1 1 1
Informing accurately 1 1 1 1 1 1 1 1 1 1 1
Total 3 3 3 3 3 3 3 3 3 3 3
Responsibilitie
s related with
voluntariness
SR beyond law 1 1 1 - 1 1 1 1 - 1 1
Social Charitableness 1 1 1 - 1 1 1 1 - 1 1
Non-profit SR 1 1 1 1 1 1 1 1 - 1 1
Total 3 3 3 1 3 3 3 3 - 3 3
Educational
role of
organizations
on issues
related to SR
Educating consumers on SR 1 1 1 1 1 1 1 1 - 1 1
Discouraging excessive consumption 1 1 1 1 1 1 - - - 1 1
Educating suppliers on SR 1 - 1 - 1 1 1 1 - 1 -
Educating distributors on SR 1 - 1 - 1 1 - 1 - 1 -
Total 4 2 4 2 4 4 2 3 - 4 1
SUM TOTAL 19 16 16 14 18 18 15 17 11 18 16

293
o All the organizations in the range of the research give information on health issues, attitude toward legal
issues, environmental consciousness, safety information on usage of the products, compliance with standards
in organizational web sites.
o The topic that comes in the first place is the organizations’ inability giving adequate information about
double-standard applications of products that are produced in and for global markets on their web sites.
o There are some topics that are not included on the web sites about SR practices are; 5 organizations didn’t
give any information on educating distributors on SR, 4 on educating suppliers, 3 not on preventing ways of
exaggerated consumption, 2 not on charity carried out on the behalf of society, and 1 not on educating
consumers on SR, not on applied non-profit SR practices, not on acting according to the cultural values, not on
compensating the level of material or emotional damage caused by the product or the waste-product.
ORGANIZATIONS
Expectations from SR 1 2 3 4 5 6 7 8 9 10
Imp
ort
an
ce L
ev
el
1 Healthy products + + + + + + + + + +
2 Safety of the product and its usage + + + + + + + + + +
3 Informing fully + + + + + + + + + +
4 Informing comprehensibly + + + + + + + + + +
5
Avoiding double standardization about the product in different countries.
- - - - - - - + - -
6 Informing accurately + + + + + + + + + +
7 SR beyond law + + - + + + + - + +
8
Compensating the level of material or emotional damage caused by the product or the waste-product
+ + + + + + + - + +
9 Sensitiveness to the environment + + + + + + + + + +
10 Keeping on the side of law + + + + + + + + + +
A second evaluation was done according to the organizations’ initiative placing which of the ten information stated in the
‘Comparing Primary and Secondary Expectations Performed by Organizations Excluded from Sector Discrimination” table
on the web sites. In this direction SR expectations according to the importance level and their placement in the web sites
were listed as below in the table:
As seen in the table, organizations include most of the top important information about SR valued by consumers on their
web sites. The main flaw on information sharing of organizations was found on informing on double-standards in global
productions of the products.
Conclusion
To survive and even thrive in today’s difficult economic environment, many organizations start taking a fresh look at
strategies and methods for retaining customers—and if necessary renew their commitment to customer centricity. CCM
discipline is adopted to create opportunities by the extensive use of technology to learn more and more about consumers
and tailor new ways to fulfill their needs and expectations. Also CMM, supporting the market position and position for
growth by building stronger customer trust, loyalty and integrity creates a two-way communication climate between
organizations and consumers.
SR like CMM becomes a topic in building strong consumer-organization relationships, after a number of surveys and
studies pointing out the fact that consumers see SR as a very important issue, and something they expect organizations to
engage in. By the help of technology consumers become conscious and informed on the various practices of organizations
and want to learn more about organizations on SR since the topic is seen as a responsibility to be covered not just on
societal, but also on economical, ethical and legal issues. It wouldn’t be wrong to say consumer satisfactions are now
shaping over the SR practices performed.
Within the limits of the paper,the SR practices of top 10 organizations (from private sector) listed in the top 500 list
prescribed by Istanbul Chamber of Industry according to 2011 net profit on sales were evaluated in order to compare how

294
well and how much information shared onorganizations via organizational web sites met consumer expectations. This
situation indicates that big-scaled organizations in Turkey pay attention to information needs on SR practices.
As an outcome of the research most of the organizations pay importance to SR practices. On the other hand, not just
planning and informing on organizations’ desires, consumers expectations have to be covered. If enough notice will be
paid to this situation a bridge among consumers and organizations can be built and will be key point of everlasting good
relations.
References
Bayraktaroğlu, G., Özgen,Ö., (2008).‘The Expectations of Consumers about Social Responsibility: Identification of Priorities by
Analytical Hierarchy Process’Atatürk Üniversitesi İktisadi ve İdari Bilimler Dergisi, 22 (1), pp. 321-341.
Bolton, M. (2004), “Customer centric business processing”, International Journal of Productivity and Performance
Management; Vol. 53 No. 1, p. 44 -51.
Bowd, R., Les B., Phil H. (2004), “Communicating Corporate Social Responsibility: An Exploratory Case Study of a Major UK
Retail Centre”, Journal of Public Affairs, Vol. 6, No. 2, pp.147–155.
Buhalis, D. (2003), eTourism: Information Technology for Strategic Tourism Management, Pearson Education.
Castaldo, S., Francesco P., Nicola M., Antonio T. (2009), “The Missing Link between Corporate Social Responsibility and
Consumer Trust: The Case of Fair Trade Products”, Journal of Business Ethics, Vol. 84, No.1, pp. 1–15.
Daniel, E., Wilson, H. and McDonald, M. (2003), “Towards a map of marketing information systems: an inductive study” ,
European Journal of Marketing; Vol. 37 No. 5, pp. 821-847.
Douglas, A., John D. and Brian J. (2004), “Corporate Social Reporting in Irish Financial Institutions”, The TQM Magazine, Vol.
16, No.6, pp.387-395.
Griffin, A. and John.R. Hauser (1993), “The Voice of the Customer”, Marketing Science, 12 (1), 1-27.
High Performance in the Age of Customer Centricity, customer satisfaction research, Accenture, 2008.
Istanbul Chamber of Industry), http://www.iso.org.tr/tr/web/besyuzbuyuk/turkiye-nin-500-buyuk-sanayi-kurulusu--iso-
500-raporunun-sonuclari.html, Accessed Date: December 2012
Ker-Dincer, M., Öksüz, B., (2011). "Corporate Social Responsibility As A Critical Duty of Public Relations Practitioners: All
Right But What About The Public Relations Students Ideas on the Subject?". 7th International Conference on
Business, Management and Economics, The Faculty of Economics and Administrative Sciences, Çeşme-İzmir.
Klein, M., Tim H. (2004), “Corporate Social Responsibility When Will Voluntary Reputation Building Improve Standards?”,
Public Policy for the Private Sector, Note Number 271, pp.1-4.
Kotler P., Kartajaya, H., Seitawan, I., (2010). Marketing 3.0: From Products to Customers to the Human Spirit, Wiley:US.
Maney,R., Flink, C., Lietz C, ( 2002) Consumer-Centric Marketing: How leading consumer packaged goods companies are
transforming the way they market, Seurat Company.
Mello, S. (2002) Customer Centric Product Definition, American Management Association; NY.
Ofori, Dan F., Robert E. Hinson (2007), “Corporate Social Responsibility (CSR) Perspectives of Leading Firms in Ghana”,
Corporate Governance: An International Review, Vol. 7, No. 2, pp.178-193
Pollach, I. (2003). “Communicating Corporate Ethics on the World Wide Web: A Discourse Analysis of Selected Company
Web Sites”, Business & Society, Vol. 42, No. 2, pp. 277-287.
Saaty, T. L. (1994), Fundamentals of Decision Making and Priority Theory with the Analytical Hierarchy Process, RWS
Publications. Pittsburg.
Staay, T.L. (2001). The Analytic Network Process: Decision Making With Dependece and Feedback , 2.nd Ed., RWS
Publications. Pittsburg.

295
Unerman, J. (2008), “Strategic Reputation Risk Management and Corporate Social Responsibility Reporting”, Accounting,
Auditing &Accountability Journal, Vol. 21, No. 3, pp.362-364.
Valand, T., Morten H. (2005), “Corporate Social Responsiveness: Exploring the Dynamics of Bad Episodes.” European
Management Journal, Vol. 23, No. 5, pp.495-506.
Van de Ven, B. (2008), “An Ethical Framework for the Marketing of Corporate Social Responsibility”, Journal of Business
Ethics, Vol. 82, pp.339–352.
Wang, F., Head, M. and Archer, N. (2000), “The relationship building model for the Web retail market place”, Internet
Research: Electronic Networking Applications and Policy, Vol. 10 NO. 5, pp. 374-384.
Wright L.T., Stone M. and Abbott J. (2002), “The CRM imperative— Practice vs theory in the telecommunications industry”,
The Journal of Database Marketing, Vol. 9, no. 4 (July), pp. 339-349.

296
A multi-stage study to measure customer
perceptions of CSR CSR; CSR image; perceptions; customers; measurement tool; scale development
Andrea Pérez, University of Cantabria, [email protected]
Ignacio Rodríguez del Bosque, University of Cantabria, [email protected]
Abstract
Objective(s) – The increasing academic interest in Corporate Social Responsibility (CSR) has also led to the proposition of
several methodologies to measure stakeholder perceptions. This methodological diversification derives in disconnected
literature which seems quite blurred nowadays. Based on these ideas, the CSR concept now requieres clarification and
new integrative approaches to the study of this variable are needed. In this paper, the purpose of the authors is to
concentrate on this flaw of academic literature to implement a multi-stage method to develop and validate a reliable scale
aimed at evaluating customer perceptions of CSR in the banking industry.
Methodology – Three studies are developed based on both qualitative and quantiative methods. Study 1 helps the authors
to generate and exploratorily test the content validity of the measurement scale. In Study 2 the authors test the reliability
and convergent and discriminant validity of the tool. Finally, the results of Study 3 allow the researchers to demonstrate
the potential of application of the scale to causal modeling.
Conclusion – Results demonstrate the reliability and validity of the new measurement scale for evaluating customer
perceptions of the CSR performance of their banking service providers. CSR image includes customer perceptions of
corporate obligations towards customers, shareholders, employees, society and a general dimension of ethical and legal
concerns. The scale is consistent among diverse customer cohorts with different gender, age and level of education.
Furthermore, results also confirm the applicability of this new scale to structural equation modeling.
1. Introduction
A comprehensive definition to understand Corporate Social Responsibility (CSR) refers to it as all “company activities
demonstrating the inclusion of social and environmental co ncerns in business operations, and in interactions with
stakeholders, also according to the ambition levels of corporate sustainability” (van Marrewijk 2003). This concept has
gained increasing attention in both business and academic spheres especially since these kinds of investments have been
demonstrated to lead to the recovery of corporate credibility in product and company crisis, the improvement of
employees’ motivation or the establishment of beneficial relationships with stakeholders.
Nevertheless, the increased of academic interest in this concept has also led to the development of divergent definitions
for CSR, the proposal of related yet different constructs such as sustainable development, cause-related marketing or
corporate social performance, and the proposition of several methodologies and scales to measure stakeholder
perceptions of this management strategy. Therefore, as it stands right now CSR literature seems disconnected and new
integrative approaches to the study of this variable are needed.
The purpose of the authors in this paper is to concentrate on the third flaw identified in academic literature. In this regard,
the authors have identified a growing interest of marketing academics in studying CSR image as perceived by customers.
These stakeholders have received special attention since their expectations and opinions are considered to directly
influence the design and effectiveness of corporate strategies (Selvi et al. 2010). According to their relevance, academics
have proposed a growing number of scales to measure customer perceptions. Nevertheless, the proposals are generally
applied to single studies and little effort has been devoted to their systematic validation. Thus, the scales cannot be appli ed
to different contexts and longitudinal studies. Studies devoted to fill this gap in literature are needed. Based on these ideas,

297
the authors propose studying CSR image from a broader perspective than the one used by most researchers in marketing.
In doing so, stakeholder theory is considered, as it has been proposed in recent studies on CSR (Clarkson 1995; Mercer
2003; Decker 2004; Turker 2009). Nevertheless, as pointed out by Mercer (2003), most studies focusing on this issue are
theoretical in nature, thus allowing academics and practitioners to only understand the normative definition of CSR.
However, research on the specific perceptions and opinions of corporate stakeholders has been scarce so far.
In order to provide further insight into this topic, in this paper a new measurement scale, solid and reliable, is developed
to evaluate the formation of CSR image from the point of view of customers. Three sequential studies are presented which
allow us to (1) assure the content validity of our scale by means of an item generation based on an extensive literature
review and three pretests involving CSR practitioners, academics and customers; (2) positively test the reliability,
convergent and discriminant validity of the scale by implementing several tests in diverse customer samples and ( 3)
confirm the adequacy of the scale to structural equation modelling by its inclusion in a traditional causal model evaluating
the effect of CSR image in identification with the company, repurchase behaviour and willingness to recommend the
company.
The paper starts by revising academic proposals for the measurement of CSR image among customers which lead to the
identification of several flaws that need to be addressed. The methodology of the study is presented next. Furthermore, an
explanation of each of the studies and their results is included. Finally, the paper concludes with an exposition of the main
conclusions, limitations and future lines of research.
2. The measurement of CSR image in academic literature
The strong development of academic research on the CSR concept has led to the proposal of different theories to address
its study. First, the most widely supported approach was proposed by Carroll (1979). This author proposes that an
exhaustive CSR definition should include corporate economic, legal, ethical and philanthropic initiatives. A second
perspective is that proposed by the sustainable development approach (van Marrewijk, 2003; Panapanaan et al., 2003;
Panwar et al., 2006). From this perspective, CSR is defined as a “context-specific, strategic, proactive, and synergistic
philosophy of doing business according to which corporations need to pay attention to economic, environmental and
social issues in a balanced way” (Panwar et al., 2006). Thus, CSR is found in the “triple bottom line” of the organization.
Finally, the third most frequent perspective for understanding the CSR concept is provided by stakeholder theory
(Freeman, 1984). According to this proposal, CSR activities should preferably be classified as a function of those
stakeholders who are most benefited by corporate initiatives. They are the main target audiences of corporate endeavours
and thus they are the ones that businesses want to please.
Based on these theoretical approaches, marketing scholars have long been interested in evaluating customer CSR
perceptions, described as their evaluation of corporate responses to the general social concerns of its stakeholders.
Nevertheless, the measurement of CSR image is still problematic and, although the literature provides several methods for
measuring customer perceptions, almost all of them have some limitations (Turker, 2009). The methodology of personal
interviews has been commonly applied by researchers in this area and both one-dimensional and multidimensional scales
are usually included in structural equation models design to understand customer perceptions and responses to CSR
initiatives. A review of the most relevant approaches to the measurement of CSR image in the commercial context is
included in Table 1.
First, it has been observed that when marketing scholars investigate CSR image, they have a tendency to focus on very
limited dimensions of this construct. For example, marketing has developed expertise on activities such as cause-related
and environmental marketing but has established little connection between these two research areas (Maignan and
Ferrell, 2004). Thus, when marketing scholars have examined customer responses to CSR, they have generally relied on
simplified indicators of CSR image and have considered only limited dimensions of this construct. As a result, a large
number of studies can be found that have proposed gathering customer CSR perceptions through one-dimensional
measurement scales which mostly represent ethical and philanthropic corporate responsibili ties (e.g., Brown and Dacin,
1997).
Nevertheless, “this fragmented view is certainly linked to the scarcity of comprehensive conceptual frameworks
originating from the marketing discipline” (Maignan and Ferrell, 2004). Based on this limitation, authors have started to
consider comprehensive and multidimensional approaches to the study of CSR image (e.g., García de los Salmones et al.,
2005). It is now well known that, at the time of forming an image of a corporation, customers use all the information

298
available about its features and activities. Consequently, corporate relationships with other stakeholders beyond society
are underrepresented in one-dimensional scales. Thus, CSR image is nowadays more commonly measured using
multidimensional tools (Maignan et al., 1999; Maignan, 2001; Mercer, 2003; Kim and Choi, 2007). However, current
multidimensional approaches also present limitations. In this sense, those studies which adopt this perspective are based
on different theories and social approaches to define the dimensions that compose CSR image, thus contributing to the
evident lack of consensus (Turker, 2009). Some examples are scales based on Carroll’s proposal or the sustainable
development theory.
For example, an extensive line of research has evolved around CSR image evaluated based on Carroll’s pyramidal model.
Along this line, authors such as Maignan (2001), García de los Salmones et al. (2005) or Podnar and Golob (2007) have
developed scales to analyse CSR image in different companies and sectors. However, these studies are not without critics
because there are several papers that have either failed to demonstrate this dimensioning (García de los Salmones et al.,
2005) or have pointed out its limitations (Schwartz and Carroll, 2003). Even Carroll (1979) assumes that the various facets
of the CSR concept are closely linked and that, in many cases, they even overlap. For example, the economic dimension
encompasses those corporate activities which are aimed at achieving a direct or indirect positive effect on the company,
including actions aimed at maximizing profits or corporate value for the stakeholders (Schwartz and Carroll, 2003). Taking
this last goal into account, any activity included in the CSR concept is economic in nature and falls into the first dimension
proposed by Carroll. This perspective would negate the value of distinguishing different dimensions of CSR.
Other multidimensional propositions measure CSR image as the combination of customer perceptions regarding economic,
environmental and social corporate endeavours (e.g., Bigné et al., 2005). This methodology aligns with the theoretical CSR
proposal of sustainable development theory. Nevertheless, this approach has been criticized as only being of application to
the study of CSR in industrial contexts where the environment is significantly exposed, such as tourism or agricultural
sectors (Panwar et al., 2006; Jamrozy, 2007; Timur and Getz, 2009).
To solve the problems identified in the diverse theoretical perspectives analysed in this paper, a more modern and
comprehensive approach to explain the multidimensional components of CSR image is proposed by the authors. We
suggest a dimensioning of CSR image according to the most influential audiences of organizations (stakeholders) (Turker,
2009). CSR for various stakeholders (customers, shareholders, employees, suppliers or the community) has a positive
effect on corporate marketing concepts such as global brand equity. Furthermore, even authors aligning with other
methodological approaches to the measurement of CSR image recognize the relevance of stakeholders when it comes to
understanding customer perceptions. For example, Carroll (1979) considers that there is a natural fit between the idea of
CSR and an organization’s stakeholders. In addition, Brown and Dacin (1997) believe that the broad nature of CSR
perceptions implies that this concept involves multiple initiatives relevant to multiple stakeholders.
TABLE 1. CSR image conceptualizations: dimensional perspectives
Methodological perspective Theoretical approach
selected Dimensionality References
One-dimensional concept Global CSR definition
(perceived) CSR (social,
environmental or
philanthropic perceptions)
Brown and Dacin (1997);
van Herpen et al. (2003);
Lichtenstein et al. (2004)
Multidimensional concept
CSR pyramidal model
(perceived) CSR (3-4 of the
following dimensions): (1)
Economic; (2) Legal; (3)
Ethical; (4) Philanthropic
Maignan (2001): García de
los Salmones et al. (2005);
Podnar and Golob (2007)
Sustainable development
theory
(perceived) CSR: (1)
Economic; (2)
Environmental; (3) Social
Bigné et al. (2005);
Martínez et al.
(forthcoming)
Stakeholder management
theory
CSR image / (perceived)
CSR: (1) Shareholders; (2)
Customers; (3) Employees;
(4) Society; (5) Others
Mercer (2004); Turker
(2009)
Source: Compiled by author

299
For the purpose of designing our new scale we base ourselves on the study of Maignan and Ferrell (2004) who take
stakeholder theory as a reference to develop an integrative framework to understand the interaction between CSR and
marketing. These authors realize that “starting in the mid-1990s, a number of scholars have contended that the notion of
social obligation is too broad to facilitate the effective management of CSR”. Clarkson (1995) posits that society is at a level
of analysis that is both more inclusive, more ambiguous and further the ladder of abstraction than a corporation itself.
Thus, businesses are not responsible towards society as a whole, but only towards those who directly or indirectly affec t
or are affected by the firm’s activities. If this is the case, then organizations “act in a socially responsible manner when they
align their behaviours with the norms and demands embraced by their main stakeholders” (Maignan and Ferrell, 2004).
Furthermore, Peloza and Shang (2011) consider that “by examining value from the perspective of stakeholders we outline
how CSR activities impact attitudes and behaviours, and the subsequent creating of firm value”. Thus, since the very
beginning of research on the CSR concept the debate has centred on stakeholders and their expectations of corporate
endeavours. This fact justifies the extension of the stakeholder debate to the arena of the methodological measurement of
CSR image.
Nevertheless, most of the papers presented here are theoretical in nature and little effort has been devoted to the
systematic application of their theory to the empirical study of customer perceptions. Authors such as Mercer (2003) or
Turker (2009) have developed measurement tools to empirically evaluate customer CSR perceptions. However, their
scales are specifically oriented to fit their own causal models which are designed to cover quite different research
purposes. Thus, little effort has been applied to the cross-validation of these tools to extend their applicability to different
studies and in different contexts. The goal we pursue with our new scale is to fill this gap in literature by providing an
efficient tool positively tested among different customer cohorts in a new context, the banking sector.
3. Method
The banking industry was selected as the context for the development of this new measurement scale. The selection of this
research context is based on two facts: (1) first, the management of corporate image is a critical activ ity for institutions in
the context of confidence crises, a fact that is especially relevant for the banking sector which currently faces one of the
worst crises of confidence worldwide and (2) when compared to other sectors banking instutions tend to have greater
visibility in the community (Mandell et al., 1981) since they play a significant role in daily routines of customers and
individuals show a high product involvement. This fact allows us to consider that their programs are more likely to be
familiar to customers. Thus, individuals are in a better position to evaluate the CSR activities of their banking providers.
Furthermore, the diverse studies which we carry out to develop and validate the scale are mostly based on personal
surveys to different types of banking service users in Spain. Our purpose when implementing the studies in diverse
samples is to provide greater validation for the scale by confirming its effectiveness to evaluate CSR image formed by
different kinds of customers (Barbarossa et al., 2012). The samples were segmented according to three demographic
variables: (a) gender, (b) age and (c) educational level. In this regard, studies trying to identify the socially responsible
consumer are traditionally based on their demographic characteristics (Anderson and Cunningham, 1972; Roberts, 1996;
Maignan and Ferrell, 2001). Thus, demographic factors have become the fundamental pillar of marketing segmentation
which makes their study essentially important to better understand customer behaviour. Thus, if the scale proposed in
this study is positively tested among cohorts with different perceptions and behaviours regarding CSR it would mean that
the scale is reliable in different contexts and it would provide useful assistance for researchers in Academia (Barbarossa et
al., 2012).
3.1. Study 1 – Item generation and pretest: analysis of content validity
Following Turker’s (2009) methodological proposal, based on a standard scale development process, a new multi -item
scale for measuring CSR image is designed that includes items previously used in marketing literature regarding CSR. The
objective of study 1 is to complete the first stage of Turker’s methodology: the production of a set of statements to define
indicators of CSR image from the point of view of customers. In doing so, our aim is to propose an initial scale with
significant content validity.
For this study we combine five methodologies: (1) first, we carried out a review of theorical and empirical CSR literature in
order to identify CSR dimensions and reliable items previously formulated and tested by marketing scholars; (2) we also

300
implemented a qualitative exploratory research based on in-depth interviews with CSR and Reputation managers of six of
the most important banking institutions in Spain (Pérez and Rodríguez del Bosque, 2012); (3) the items initially tested for
the scale were also independently revised and discussed by 5 marketing scholars (two of the academics were specialized
in CSR while the other three scholars analysed the adequacy of the items from a marketing perspective in order to
determine its potential to evaluate customer perceptions); (4) the scale was presented to three groups of customers in
order to assure that its purpose was correctly understood and that the items were not controversial or difficult to answer;
(5) finally, a pretest was implemented among 208 banking customers which allowed us to determine its potential for
reliability and validity before the real market research was launched.
First we carried out a literature review for which the results have been mostly presented in the background section of this
paper. In this regard, we perceived that most early dimensional proposals for the measurement of CSR image had been
extensively revised by academics and significant flaws had been highlighted. As a new technique, stakeholder theory
(Freeman, 1984) had been proposed as an interesting approach to segment the CSR concept and several authors have
defended its ideas from a theoretical perspective. Also according to van Herpen et al. (2003) and Mercer (2003),
customers mentally organise the CSR information they receive based on the stakeholder to which the CSR activities are
targeted to. Mercer (2003) suggests that, at the time of evaluating the importance of the diverse CSR components,
customers differentiate among the activities oriented towards customers, employees, shareholders and the community.
Furthermore, Maignan et al. (1999) identify another general dimension in which the activities are not relevant to just one
stakeholder but they are relevant to all of them to the same extent. As a summary, five dimensions are identified in
literature as an adequate approach to empirically analyse CSR image: (1) customers, (2) shareholders, (3) employees, (4)
society and (5) general dimension (legal and ethical corporate responsibilities) (Maignan et al., 1999; Mercer, 2003;
Decker, 2004).
A second step of the study consisted in analysing the approach of institutions to CSR in order to identify whether these
companies communicate their policies according to stakeholder theory and thus, if it would be easy or not for customers to
identify and evaluate CSR based on this structure. The most significant characteristics of this qualitative research, along
with its reliability and validity can be consulted in a previous publication of the authors in Journal of Business Ethics
(Pérez and Rodríguez del Bosque, 2012). The study demonstrated that all the institutions analysed use stakeholder theory
to disclose their CSR policies in annual CSR reports and on the Internet. This research also revealed that, because of their
legal status, building societies (the second largest kind of banking institutions in the country) do not have shareholders
although they still have to report to their supervising boards which evaluate their results and take decisions regarding the
investments to be made. As a consequence, the shareholder dimension originally proposed had to be reformulated to also
include this consideration. The dimension was labelled ‘shareholders and supervising boards’.
Items were also generated at this point (Table 2). For that purpose CSR studies by Maignan et al. (1999), Mercer (2003)
and García de los Salmones et al. (2005) were taken as references. 18 items were initially proposed at this point of the
study11.
The third step in this study consisted in a cross-revision of the items by several marketing and CSR scholars contacted at
the University of Cantabria (Spain). First, we asked two independent researches specialized in CSR to analyse our scale and
give us their suggestions. Furthermore, since our purpose is to provide a useful scale to measure customer perceptions, a
revision from a marketing perspective was also necessary. For this purpose, three new independent researchers were
contacted. Our colleagues revised the scale for one week after which we organized a meeting to discuss the results. The
scholars’ main concern about the scale was with the first three dimensions proposed by the authors: customers,
shareholders and employees. Our colleagues considered that the proposed items were incomplete since they did not
encompassed significant concerns of these stakeholders in a financial crisis. In this regard, the loss of customer trust, on
the one side, and the inefficiencies of companies in economic terms, on the other, have been revealed as the two most
significant concerns of stakeholders today. Thus, this procedure allowed us to identify 5 new items referring to complying
with customer complaints (CSR1) and analysing their commercial needs (CSR 2 and CSR3), honestly informing about the
corporate economic performance (CSR9) and paying fair salaries to employees (CSR10). The inclusion of these items is
also well supported in academic literature (e.g., Goirigolzarri, 2006).
11 CSR2, CSR3, CSR6, CSR7, CSR8, CSR11, CSR12, CSR13, CSR14, CSR15, CSR16, CSR17, CSR18, CSR19, CSR20, CSR21, CSR22, CSR23

301
A total of 23 statements were finally formatted in a 7-point Likert-type scale. First, items CSR1 to CSR5 refer to corporate
activities oriented to customers, basically concerning complete and honest communication of corporate products and
services and management of complaints (Maignan et al., 1999; Decker, 2004; García de los Salmones et al., 2005;
Goirigolzarri, 2006). Secondly, items CSR6 to CSR9 are related to corporate responsibilities towards shareholders and
supervising boards. These items are especially oriented to the evaluation of corporate profitability and information
transparency. Items CSR10 to CSR14 were taken from Mercer (2003) and relate to responsibilities towards employees.
These 5 items cover issues regarding job creation and employment opportunities. Corporate obligations towards society
are represented in items CSR15 to CSR20 and refer to issues such as charity, community development or environmental
protection. Finally, items CSR21 to CSR23 include ethical and legal concerns which refer to general corporate
responsibilities that do not benefit specific stakeholders but all of them to the same extent. These items were taken from
previous papers by Maignan (Maignan et al. 1999; Maignan 2001).
In a fourth step the items were discussed with banking customers in three focus groups organized according to the same
variables which would be afterwards used to segment the samples in our second study: customer gender, age and
educational level. Customers were selected according to a convenience procedure among users of a specific regional
banking institution, Caja Cantabria, which gathers the largest market share in the geographical scope of our research. Each
focus group was formed of 12 customers equally distributed among the three selected research criteria: (1) the first focus
group was formed of 6 female and 6 male customers; (2) the second focus group was compounded of 4 customers less
than 44 years of age, 4 customers between 44 and 64 and 4 customers over 64 and (3) finally the last focus groups
included 6 customers with a university degree and 6 customers with an educational level under the university status. The
results of these meetings allowed us to confirm that all the sentences were correctly understood by all kind of customers
and no individual showed concerns regarding the content of the scale or the confidentiality of their responses.
TABLE 2. Item list for CSR image12
Ítem References
Customers -Establishes procedures to comply with customers’ complaints (CSR1); Treats
its customers honestly (CSR2); Has employees that offer complete information about
corporate products/services to customers (CSR3); Uses customers’ satisfaction as an
indicator to improve the product/service marketing (CSR4); Make an effort to know
customers’ needs (CSR5)
Maignan et al. (1999); Mercer
(2003); Decker (2004); García
de los Salmones et al. (2005);
Singh et al. (2008)
Shareholders and supervising boards -Tries to maximize its profits (CSR6); Keep a strict
control over its costs (CSR7); Tries to insure its survival and long-term success (CSR8);
Honestly informs about its economic situation to its shareholders and/or supervising
boards (CSR9)
Maignan et al. (1999); Maignan
(2001); Mercer (2003); García
de los Salmones et al. (2005)
Employees -Pay fair salaries to its employees (CSR10); Offer safety at work to its
employees (CSR11); Treats its employees fairly (without discrimination or abuses)
(CSR12); Offers training and career opportunities to its employees (CSR13); Offers a
pleasant work environment (e.g. flexible hours, conciliation) (CSR14)
Maignan et al. (1999); Mercer
(2003); David et al. (2005)
Society - Helps solving social problems (CSR15); Uses part of its budget for donations and
social projects to advance the situation of the most unprivileged groups of the society
(CSR16); Contributes money to cultural and social events (e.g., music, sports) (CSR17);
Plays a role in the society beyond the economic benefits generation (CSR18); Is concerned
with improving the general well-being of society (CSR19); Is concerned with respecting
and protecting the natural environment (CSR20)
Maignan et al. (1999); Maignan
(2001); García de los Salmones
et al. (2005); David et al.
(2005); Singh et al. (2008)
General dimension (legal and ethical corporate responsibilities) - Always respects
rules and regulations defined by law (CSR21); Is concerned with fulfilling its obligations
vis-à-vis its shareholders, suppliers, distributors and other agents with whom it deals
(CSR22); Is committed to well established ethic principles (CSR23)
Maignan et al. (1999); Maignan
(2001); Mercer (2003); García
de los Salmones et al. (2005)
7-point Likert-scale (1=strongly disagree with the sentence; 7=strongly agree)
12 Items complete the sentence “I believe that this company…”

302
As a final step we tested the scale among 208 banking customers to determine if it was properly understood. Although the
sample was not selected according to statistical purposes this time, it allowed us to confirm that the items were
understandable and that customers acknowledge having enough information about their main banking institutions to
confidently give an answer to all the sentences.
3.2. Study 2 – Reliability and validity testing (analysis of reliability, convergent and discriminant validity)
The second validation step consisted of an analysis of the scale reliability and convergent and discriminant validity. For
this purpose, both first- and second-order confirmatory factor analyses (CFA) were performed according to the maximum
robust likelihood estimation procedure, using the statistical software EQS 6.1. Furthermore, this procedure was replicated
in six different samples of banking customers segmented according to their gender (male vs. female), age (under 44 vs 44
to 64 vs over 64) and educational level (university vs. non university). A total of 1,124 Spanish customers were
interviewed. A summary of the results of all these analyses is presented in Table 3. Even though results mostly confirm the
reliability and validity of the scale, when analysing the R2 of the items we observed deficiencies in reliability and validity
levels of CSR9, referring to how the company “honestly inform about its economic situation to its shareholders and/or
supervising boards”. In this regard, although its lambda was over 0.5, the R2 was under 0.4 in all samples and it was under
0.3 in three of them (Hair et al., 2010). Also its reliability was questionable according to the AVE analysis. Regarding the
shareholder dimension, in six out of the seven samples the AVE index was under 0.5 when CSR9 was included. Based on
these results we decided to delete this item and repeat the analysis. We observe that all parameters regarding
shareholders’ reliability, convergent validity and the scale’s goodness of fit improved so we decided to finally remove CSR9
from the scale and we moved on to the next validation step with the resulting 22-item scale.
The multidimensionality of CSR image was contrasted with a second-order confirmatory analysis. Chi-square values were
significant but the comparative fit indexes confirmed the validity of the proposed scale. Nevertheless, there was one cohort
for which the structural proposition of this scale did not seem to fit as well as in the other ones. In this regard, for older
customers (over 64) the goodness of fit levels were slightly below 0.9 –NIF=0.812; NNFI=0.815; CFI=0.877; IFI=0.879;
RMSEA=0.064– (Hair et al., 2010). This fact implies that older customers might think differently about CSR when
compared to younger individuals and it would be adequate to more deeply analyse their perceptions to propose a better
measurement scale in this cluster. It is also observed that the ‘shareholders and supervising boards’ dimension less
powerfully loads in the CSR concept in comparison with the other dimensions. This result is consistent with previous
findings in academic literature (García de los Salmones et al., 2005). In this regard, this dimension is closely related to
economic and financial issues of banking providers. Nevertheless, researchers have demonstrated that customers usually
think of these concerns as an inherent activity of organizations linked to corporate abilities (Brown and Dacin, 1997) so in
many studies they are not considered as a dimension of the CSR concept.

303
TABLE 3. Summary of results for the first-order CFA of the CSR image
Latent variable Measured variable Standardized Lambda R2 Cronbach’s AVE Goodness of fit
Customers
CSR1 0.663-0.780 0.440-0.608
0.816-0.870 0.473-0.574
343.81 < S-B2 < 532.06 (p=0.000)
0.822 < NFI < 0.898
0.909 < NNFI < 0.928
0.921 < CFI < 0.937
0.922 < IFI < 0.938
0.045 < RMSEA < 0.052
CSR2 0.695-0.777 0.525-0.604
CSR3 0.607-0.746 0.368-0.556
CSR4 0.703-0.798 0.494-0.636
CSR5 0.706-0.757 0.498-0.605
Shareholders and supervising boards
CSR6 0.609-0.720 0.371-0.519
0.744-0.781 0.450-0.503 CSR7 0.671-0.778 0.450-0.605
CSR8 0.773-0.810 0.598-0.656
CSR9 0.515-0.605 0.265-0.366
Employees
CSR10 0.722-0.775 0.510-0.600
0.857-0.882 0.562-0.623
CSR11 0.802-0.840 0.636-0.706
CSR12 0.791-0.861 0.626-0.742
CSR13 0.748-0.822 0.560-0.675
CSR14 0.642-0.717 0.412-0.514
Society
CSR15 0.719-0.810 0.517-0.657
0.857-0.875 0.549-0.589
CSR16 0.728-0.831 0.530-0.690
CSR17 0.698-0.764 0.488-0.583
CSR18 0.779-0.835 0.606-0.698
CSR19 0.762-0.844 0.623-0.713
CSR20 0.638-0.789 0.407-0.484
General
CSR21 0.669-0.776 0.480-0.602
0.789-0.838 0.559-0.631 CSR22 0.748-0.856 0.587-0.732
CSR23 0.744-0.827 0.554-0.684

304
3.3. Study 3 – Application of the scale to causal modelling (analysis of the potential for generalization)
Finally, to confirm the efficiency of the scale we performed one last study oriented to test the
applicability of the CSR image scale to one of the most common methodologies implemented in
marketing research: structural equation modelling (Barbarossa et al., 2012). For that purpose we
chosed a model well-grounded in literature and already positively tested by researchers (e.g.,
Currás et al., 2009). In doing so, we want to determine whether our scale fits well in this traditional
model (Figure 1). Since the model has been positively contrasted by scholars, we expect the
goodness of fit of our proposal to be adequate. If it was not, it would indicate that issues exist
regarding our measurement tool.
FIGURE 1. Scale application to structural equation modelling
Regarding the methodological procedure implemented in this study, we tested the causal model in
the total sample gathered in the second study. Nevertheless, we excluded older customers since in
the second study the inadequacy of the measurement scale to analyse these customer perceptions
was proven. 885 valid surveys were finally analysed. Measurement scales for C -C identification,
repurchase intentions and willingness to pay are presented in Table 4. The causal model was tested
using the statistical softwares SPSS v.18 and EQS 6.1.
TABLE 4. Measurement scales for the causal model
Ítem References
C-C identification -I strongly identify with this institution (Ident1); This institution fits
my personality (Ident2); I feel good being a customer of this institution (Ident3); I like
saying that I am a customer of this institution (Ident4); I feel closely linked to this
institution (Ident5); I have a strong feeling of membership to this institution (Ident6)
Bergami and Bagozzi (2000);
Homburg et al. (2009)
Repurchase behaviour - I usually contact this institution when I need a new banking
service (Repur1); The institution is always my first choice when I need to contract a new
banking service (Repur2)
Oliver (1997); Harris and
Goode (2004)
Willingness to recommend - When other people ask me for advice about any banking
service, I always recommend this institution (Recom1); I am usually positive about this
institution when other people ask me about it (Recom2)
Oliver (1997); Harris and
Goode (2004)
7-point Likert scale (1=strongly disagree, 7=strongly agree)
Results of the CFA performed with the global model demonstrate the validity and goodness of fit13 of the model. Thus
the scale proposed for measuring CSR image is also adequate for causal modelling purposes. Regarding the
relationships in the model, we observed that all connections were positively tested, results which are consistent with
previous academic literature. Thus, a positive CSR image is not only interesting to generate goodwill towards
companies among citizens, regulators and the media. It is also relevant in relationships with customers since it
13 S-BX2=820.14 (p=0.00); NFI=0.952; NNFI=0.952; CFI=0.962; IFI=0.963; RMSEA= 0.060

305
positively influences the identification of the customer with the organization and their conative actions reflected in
both repurchase behaviour and the recommendation of the company to other customers14.
4. Conclusions and future lines of research
A detailed review of academic literature shows that the identification of rigorous and complete measures of CSR image
from the point of view of customers is a complicated task. Nevertheless, a very common trend nowadays takes
stakeholder theory as a reference to propose diverse dimensions of corporate responsibilities oriented to each of the
company’s targets. However, this research venue is quite new and there are still few empirical studies testing reliable
scales to measure CSR image. The purpose of our paper has been to fill this gap in literature by providing a reliable,
valid and efficient scale to measure customer CSR perceptions based on stakeholder theory.
The first outstanding result is the confirmation of the multidimensionality of CSR image. This result is congruent with
previous studies even though some of them were based on different theoretical frameworks (e.g., Maignan et al. 1999;
Maignan 2001; Mercer 2003; Decker 2004; García de los Salmones et al. 2005; Kim and Choi 2007). Contrary to classical
propositions that consider CSR as the collection of economic, legal, ethical and philanthropic corporate responsibilities,
the scale tested in this paper devides CSR image according to the stakeholders who are considered to take advantage of
CSR activities. CSR image is then divided into 5 dimensions: customers, shareholders and supervising boards,
employees, society and one general dimension including all legal and ethical responsibilities which are oriented to
equally satisfy all stakeholders. By designing this scale, the authors have contributed to CSR knowledge since most
academic proposals regarding CSR have been developed at a theoretical level while few papers have empirically
analysed specific stakeholder perceptions.
Some of the strengths of this scale derive from its positive contrast in several samples involving customers with
significant differences regarding their social orientation and their behaviour towards CSR. In this regard, the scale
proved to be reliable when explaining customer perceptions of CSR in the following contexts: male and female
customers, individuals with a university and non-university degree, and customers under 44 and from 44 to 64 years of
age. This fact implies that the scale is a potent tool to be used when trying to describe the behaviour of most kinds of
customers.
Nevertheless, the scale proved to be inefficient when analysing older customers (over 64). These c ustomers seem to
think quite differently to younger individuals when evaluating CSR initiatives. Literature has demonstrated that the
attitudes towards this variable can be affected by age because, roughly speaking, as people age they tend to become
more conservative in their ethical thoughts (Serwinek, 1992; Quazi, 2003). Thus, a large number of studies have shown
that age is a clear predictor of the ethical attitudes of an individual (e.g., Serwinek, 1992; Quazi, 2003). Further research
should be devoted to the specific evaluation of the older cohort in order to identify the best measurement tool for
evaluating their perceptions.
Another strength of the scale derives from the possibility of applying it to the evaluation of CSR perceptions in
numerous sectors. In this regard, the items generated for this scale are generic and, thus, they do not represent specific
concerns which could be different in diverse industries. For example, to cover our generalization purpose we excluded
specific issues regarding the CSR of banking institutions such as financial inclusion represented in microfinances.
Nevertheless, our results do not allow us to prove the generalization potential of our scale since a single industry was
studied. Further research contrasting the adequacy of the measurement tool in diverse sectors and countries is needed.
The third strength comes from the identification of several dimensions of CSR image which proved to be independently
reliable and valid. This result has significant implications for academics. In this regard, researchers can use the diverse
dimensions as autonomous concepts so this scale provides us with more operative, short and easily applicable
measures to explain CSR image. For example, it has been demonstrated that customers especially care about CSR
initiatives which are directly connected to their needs and commercial goals (Pérez and Rodríguez del Bosque, 2012).
So, researchers could be interested in applying the specific ‘customer’ dimension to causal modelling in order to
identify how it affects customer behaviour and responses to CSR.
14 In order to comply with the number of tables specified by the scientific committee of ICMC 2013, we could not include tables to describe the goodness of fit and results of these analyses. We would like to apologize for this omission.

306
Finally, some research limitations should be admitted. First, despite the fact that the scale presented represents
balanced consideration of stakeholders and is a reliable tool to measure CSR image, it is necessary to highlight that not
all possible corporate stakeholders were included in the analysis. Second, the design of this research did not allow us to
gather longitudinal information. So, plausible variations in customer perceptions derived from the international
financial crisis could not be registered. For example, a significant issue that has arisen in the current financial crisis
relates to the rationing of the credit extended to users. Accordingly, new research in different temporal frames would
contribute to generating a better knowledge of the CSR concept and it would help clarifying the potential uses of our
scale. Also cross-cultural validation could be applied.
References
Anderson, W.T. and Cunningham, W. (1972). Socially conscious consumer. Journal of Marketing, 36(3), 23-31.
Barbarossa, C., Miceli, G. and de Pelsmacker, P. (2012). Measuring eco-friendly consumption motivation: development
and validation of an efficient measurement scale. In 41st EMAC Conference, 22-25 May, Lisbon.
Bergami, M. and Bagozzi, R.P. (2000). Self-categorization, affective commitment and group self-esteem as distinct
aspects of social identity in the organization. British Journal of Social Psychology, 39, 555-577.
Brown, T.J. and Dacin, P.A. (1997). The company and the product: Corporate associations and consumer product
responses. Journal of Marketing, 61(1), 68-84.
Carroll, A.B. (1979). A three-dimensional conceptual model of corporate performance. Academy of Management Review,
184, 497-505.
Clarkson, M.B.E. (1995). A stakeholder framework for analyzing and evaluating corporate social performance. Academy
of Management Review, 20(1), 92-117.
Currás, R., Bigné, E. and Alvarado, A. (2009). The role of self-definitional principles in consumer identification with a
socially responsible company. Journal of Business Ethics, 89, 547-564.
David, P., Kline, S. and Dai, Y. (2005). Corporate social responsibility practices, corporate identity, and purchase
intention: A dual-process model. Journal of Public Relations Research, 17(3), 291-.
Decker, O.S. (2004). Corporate social responsibility and structural change in financial services. Managerial Auditing
Journal, 19(6), 712-728.
Freeman, R.E. (1984). Strategic Management: A Stakeholder Approach. Boston, MA: Pittman.
García de los Salmones, M.M., Herrero, A. and Rodríguez del Bosque, I. (2005). Influence of corporate social
responsibility on loyalty and valuation of services. Journal of Business Ethics, 61, 369-385.
Goirigolzarri, J.I. (2006). La responsabilidad social en el sector financiero: el BBVA. Working paper, Fundación Carolina.
Hair, J.F., Black, W.C., Babin, B.J. and Anderson, R.E. (2010). Multivariate data analysis (7th edition). Upper Saddle River,
NJ: ). Pearson Prentice-Hall.
Harris, L.C. and Goode, M.M.H. (2004). The four levels of loyalty and the pivotal role of trust: A study of online service
dynamics. Journal of Retailing, 80(2), 139.
Homburg, C. and Giering, A. (2001). Personal characteristics as moderators of the relationship between customer
satisfaction and loyalty - an empirical analysis. Psychology & Marketing, 18(1), 43-66.
Jamrozy, U. (2007). Marketing of tourism: a paradigm shift toward sustainability. International Journal of Culture,
Tourism and Hospitality Research, 1(2), 117-130.
Kim, S.W. and Choi, C.J. (2007). Habits, self-control and social conventions: The role of global media and corporations.
Journal of Business Ethics, 76(2), 147-154.
Lichtenstein, D., Drumwright, M. and Braig, B. (2004). The effect of Corporate Social Responsibility on customer
donations to corporate-supported nonprofits. Journal of Marketing, 68, 16-32.
Maignan, I. (2001). Consumers’ perceptions of corporate social responsibilities: A cross -cultural comparison. Journal of

307
Business Ethics, 30, 57-72.
Maignan, I. and Ferrell, O.C. (2004). Antecedents and benefits of corporate citizenship: An investigation of french
businesses. Journal of Business Research, 51(1), 37-.
Maignan, I., Ferrell, O.C. and Hult, G.T. (1999), Corporate citizenship: Cultural antecedents and business benefits. Journal
of the Academy of Marketing Science, 27(4), 455-469.
Mandell, L., Lachman, R. and Orgler, Y. (1981). Interpreting the image of banking. Journal of Bank Research, summer, 96-
104.
Mercer, J.J. (2003). Corporate social responsibility and its importance to consumers. Doctoral Thesis. Claremont
Graduate University.
Oliver, R.L. (1997). Satisfaction: A behavioral perspective on the consumer. New York, NY: McGraw-Hill.
Panapanaan, V.M., Linnanen, L., Karvonen, M. and Phan, V.T. (2003). Roadmapping corporate social responsibility in
Finnish companies. Journal of Business Ethics, 44(2/3), 133-148.
Panwar, R., Rinne, T., Hansen, E. and Juslin H. (2006). Corporate responsibility: Balancing economic, environmental, and
social issues in the forest products industry. Forest Products Journal, 56(2), 4-12.
Pérez, A. and Rodríguez del Bosque, I. (2012). The role of CSR in the corporate identity of banking service providers.
Journal of Business Ethics. Available on-line: http://www.springerlink.com/content/f2031874707q0864/
Podnar, K. and Golob, U. (2007). CSR expectations: The focus of corporate marketing. Corporate Communications: An
International Journal, 12(4), 326-340.
Quazi, A.M. (2003). Identifying the determinants of corporate managers perceived social obligations. Management
Decision, 41(9), 822-831.
Roberts, J.A. (1996). Will the real socially responsible consumer please step forward?. Business Horizons, 39(1), 79-83.
Schwartz, M.S. and Carroll, A.B. (2003). Corporate social responsibility: A three-domain approach. Business Ethics
Quarterly, 13(4), 503-530.
Selvi, Y. Wagner, E. and Turiel, A. (2010). Corporate social responsibility in the time of financial crisis: Evidence from
Turkey. Annales Universitatis Apulensis Series Oeconomica, 12(1), 281-290.
Serwinek, P.J. (1992). Demographic & related differences in ethical views among small businesses. Journal of Business
Ethics, 11(7), 555-566.
Singh, J. García de los Salmones, M.M. and Rodríguez del Bosque, I. (2008). Understanding corporate social
responsibility and product perceptions in consumer markets: A cross-cultural evaluation. Journal of Business
Ethics, 80(3), 597-611.
Timur, S. and Getz, D. (2009). Sustainable tourism development: How do destination stakeholders perceive sustainable
urban tourism. Sustainable Development, 17, 220-232.
Turker, D. (2009). Measuring corporate social responsibility: A scale development study. Journal of Business Research,
85, 411-427.
van Herpen, E., Pennings, J. and Meulenberg, M. (2003). Consumers' evaluations of socially responsible activities in
retailing. Wageningen University Marketing and Consumer Behaviour Group.
van Marrewijk, M. (2003). Concepts and definitions of CSR and corporate sustainability: Between agency and
communion. Journal of Business Ethics, 44(2-3), 95-105.
308
Role of price offer fairness in willingness to
pay for environmentally friendly products Price offer fairness, consumer behaviour, environmentally friendly cleaning products
Serap CABUK, University of Cukurova, [email protected]
Kalender Ozcan ATILGAN, University of Mersin, [email protected]
Abstract
In today’s similar products/services jungle, price has become a main criteria in determining trans actional structure
between the customer’s sacrifice and the value offered by the seller. When consumers use price as a measure of
sacrifice and as an informational cue, psychological implications of pricing should be examined more in terms of the
impact of price on consumer evaluations and decisions. One stream of research attracting marketers has focused on
understanding price fairness as a price information perceived by consumers. Specifically, consumers are highly
fragmented in their level of willingness to pay for environmentally friendly products due to their premium price and
differences in perceptions of price fairness. This paper aims to examine the influence of price sensitivity, price
consciousness, price-quality schema on price offer fairness and price offer fairness on willingness to pay for
environmentally friendly household cleaning products.
Based on a theoretical conceptualization of the constructs, 410 consumers living in the city center of Mersin were
surveyed using a structured questionnaire. The proposed hypotheses were tested in a structural equation modelling
framework. The results suggest that besides the indirect effects of price sensitivity, price consciousness, price-quality
schema on willingness to pay through price offer fairness, price sensitivity also has direct effect on willingness to pay
for environmentally friendly household cleaning products. At the end, some practical prescriptions are provided for
managers and recommendations are offered for future studies.
1. Introduction
Of the four “P’s” of marketing, only pricing brings in revenue for an organization (Vaidyanathan & Aggarwal, 2003, p.
453). Price also has an important role in offering a sustainable development, because it has to assure in a transaction a
fair report between the customer’s sacrifice and the value offered by the seller (Cătoiu, Vrânceanu, & Filip, 2010, p.
116). From the marketing manager's perspective, the price is what the consumer is willing to pay for the value of the
bundle of attributes offered and is what produces the resources that cover all of the other activities of the firm. From
the consumer's perspective, the price represents what the consumer must sacrifice to gain the value of the bundle of
attributes in the product offering (Campbell, 1999, p. 145). Research shows that one important way in which
consumers can respond to a price is in terms of the perceived fairness of the price (Campbell, 1999, p. 145). Price
fairness as a new marketing approach evaluating the equity of seller-customer report during a transaction, is related
with how reasonable, acceptable, just or satisfactory a price is (Xia, Monroe, & Cox, 2004, p. 1). These perceptions
influence multiple important marketplace factors, such as intentions, willingness to pay, and willingness to engage in
business with a firm (Campbell, 2007, p. 261).
In a research, Daskalopoulou and Petrou (2006), specified number of factors that affect price fairness judgments. Diller
(2008, p. 354) explains seven components of price fairness as, distributive fairness, price honesty, price reliability,
influence/right of co-determination, fair dealing, personal respect and regard for the partner, and consistent behavior.
According to Diller (2008, p. 354), consumers see themselves right from the start in a weaker market position because
of the power asymmetry in price fairness. Fairness, then, is especially relevant in those business relations that involve
asymmetrical information or power balances (Diller, 2008, p. 354).

309
A critical challenge facing marketers nowadays is to identify price-based factors affecting the willing to pay more for
environmentally friendly products. Accordingly, the present study was an attempt to demonstrate that the effect of
price sensitivity, price consciousness, price-quality schema on willingness to pay for environmentally friendly
household cleaning products moderated by price offer fairness. By focusing on understanding of what causes
individuals to pay more for environmentally friendly products, marketers will be able to develop strategies specifically
targeted at these consumers (Laroche, Bergeron, & Barbaro-Forleo, 2001, p. 504).
2. Literature Review
2.1. Price Consciousness
Price consciousness is defined as ‘‘the degree to which the consumer focuses exclusively on paying a low price’’
(Lichtenstein, Ridgway, & Netemeyer, 1993, p. 235). Therefore, price conscious consumers are concerned about
searching for a low price in the marketplace, and they are engaged in higher levels of search and are more devoted to
the task of shopping to the extent that a better price exists elsewhere (Palazón & Delgado, 2009).
Due to their low involvement with prices, low price-conscious consumers’ search intentions, value perceptions and
buying intentions are more likely to be influenced by the level or magnitude of discount (Alford & Biswas, 2002, p. 777).
According to Sinha and Batra (1999, p. 241) no previous study has linked variable of perceived price unfairness with a
consumer’s price consciousness. Price conscious buyers tend to focus on the monetary sac rifice of a price (Xia, Monroe,
& Cox, 2004, p. 6). Thus;
H1. Price consciousness will have an impact on price offer fairness.
2.2. Price/Quality Schema
Since consumers are bombarded with product information and limited cognitive processing ability, cons umers develop
schemas and draw on experience to handle the information (McGowan & Sternquist, 1998, p. 52). Research shows that
there was a positive relationship between price and perceived quality (eg, Monroe, 1973; Rao & Monroe, 1989).
Consumers use price as both an indicator of sacrifice and as an indicator of quality (Lichtenstein, Ridgway, &
Netemeyer, 1993; Suri & Monroe, 2003). One factor is the consumers’ price-quality schema that consumers may look
for shortcuts in decision making (Lichtenstein & Burton, 1989, p. 431). Lichtenstein, Ridgway and Netemeyer (1993, p.
236) define price-quality schema as the generalized belief across product categories that the level of the price cue is
related positively to the quality level of the product. Accordingly, it can be predicted that price/quality schema will be
linked to price offer fairness. Thus;
H2. Price/quality schema will have an impact on price offer fairness.
2.3. Price Sensitivity
Price sensitivity describes how individuals respond to various prices and changes in price levels (Petrick, 2005, p. 754;
Goldsmith & Newell, 1997, p. 164). Differences in sensitivity to perceived prices explain many of the buying patterns
and pricing strategies observed in practice (Gijsbrechts, 1993, p. 143). When price sensitivity increases, consumer will
manifest less demand and consumers’ willing to pay fee reduces (Goldsmith & Newell, 1997, p. 164; Erdem, Keane, &
Sun, 2008; Clausen, 2005, p. 50).
Consumers are relatively price insensitive when facing a new existing innovation on these products (Yee & Xian, 2012,
p. 52). Environmentally friendly products can be seen as innovative products because of environmentally friendly
technologies used. Since the current study related with environmentally friendly household cleaning products, it can be
hypothesized as;

310
H3. Price sensitivity will have an impact on price offer fairness.
2.4. Price Offer Fairness
Traditional economic theories consider pricing in a mathematical, demand-based approaches such as ingredient costs,
overheads, target ROI, and the demand and supply conditions within an industry (Vaidyanathan & Aggarwal, 2003, p.
453). However, it should not be ignored that how consumers perceive a price or a price change is generally based on
psychological factors such as consumers’ judgments about quality and fairness that is sometimes irrational or non-
economic (Friesen, 2005; Maxwell, 2008).
Thus, it is critical for marketers to understand how consumers are likely to perceive a given price (Campbell, 1999, p.
145). Especially, price fairness is of growing interest to marketing researchers (Maxwell & Comer, 2010, p. 375).
Campbell (1999, p. 146) suggested that there was not yet an answer to the pivotal question of “what is fair?” and it is
needed to further explore the factors that affect perceptions of price fairness. Fairness has been defined as a judgement
of whether an outcome and/or the process to reach an outcome are reasonable, acceptable or just (Xia, Monroe, & Cox,
2004, p. 1).
Although there are many researches on price fairness, still there is no clear understanding on how the factors
purported to be associated with it contribute to its development or how these marketing factors can be managed to
promote the development of price fairness (Khandelwal & Bajpai, 2012, p. 95). Kahneman, Knetsch, and Thaler (1986)
were among the first economists to explore the antecedents and consequences of price fairness (dual entitlement
principle, prospect theory).
Previous research on price fairness has tended to focus on the nature of the cost (Bolton & Alba, 2006, p. 264). In this
study, price fairness is evaluated from consumer perspective. To measure price fairness, price offer fairness scale
developed by Herrmann et al. (2007) by drawing on literature sources related to procedural fairness is used. The initial
model of this study was represented in Figure 1.
Figure 1. Initial Conceptual Model
2.5. Willingness to Pay
Each customer has a maximum price they are willing to pay for a given product which equals the product’s value to
consumer (Kalish & Nelson, 1991, p. 328). A primary goal of marketers is to enhance target customers’ willingness to
pay for products (Agarwal & Teas, 2001, p. 1). It can be suggested that estimates for the lowest market prices reflect
perceived price fairness, whereas estimates for the highest market prices represent the upper boundary of willingness -
to pay (Miao & Mattila, 2007, p. 533).
Research shows that consumers’ willingness to pay is influenced by price fairness (eg, Kamen & Toman, 1970; Maxwel l,
2002). Maxwell (2002) tested the direct effect of a fair price on willingness to pay and results of this research
demonstrated that concerns for fairness influence the effect of price on willingness to pay. Specifically, an individual’s
perception about the severity of ecological problems might influence his/her willingness to pay more for ecologically
compatible products (Laroche, Bergeron, & Barbaro-Forleo, 2001, p. 507). Therefore, it can be hypothesized that price

311
offer fairness will be a significant driver of willingness to pay for environmentally friendly household cleaning products.
Accordingly;
H4. Price offer fairness will have an impact on willingness to pay for environmentally friendly household cleaning
products.
3. Methodology
3.1. Measures and Sample
Based on previous research, a structured questionnaire was formed including price sensitivity, price consciousness,
price-quality schema, price offer fairness and willingness to pay for environmentally friendly household cleaning
products.
The questionnaire was composed of 19 scale items. Price consciousness items were adapted from Donthu and
Gilliland’s (1996) four-item price consciousness scale. Price-quality schema was based on four items adapted from
Lichtenstein, Ridgway, and Netemeyer’s (1993) work. The four items measuring price sensitivity were adapted from a
scale used by Goldsmith and Newell (1997). Four-item price offer fairness scale was adapted from Herrmann, Xia,
Monroe, and Huber’s (2007) work. Following a study conducted by Laroche, Bergeron, and Barbaro-Forleo (2001),
where they tested the willingness to pay a higher price for environmentally friendly products, three similar items are
used to test willingness to pay for environmentally friendly household cleaning products.
Five point Likert scale was used to measure all these items (from 1=strongly disagree to 5= strongly agree). Using the
method of translation-back translation, the original English version of the questionnaire was translated into
the Turkish language. The questionnaire was pretested on 25 respondents in order to test the clarity of questions and
to determine the average completion time.
In structural equation modeling studies, the sample size above 200 can be accepted as reasonable (Barrett, 2007).
Besides model complexity leads to need for larger samples, the role of sample size is to produce more information and
greater stability (Hair et al., 2010, p. 643). Thus, 410 consumers living in the city center of Mersin were selected by
convenience sampling during spring 2012. Participants were surveyed by face-to-face interviews and their price
sensitivity, price consciousness, price-quality schema, price offer fairness and willingness to pay for environmentally
friendly household cleaning products were measured. 372 useful questionnaires were obtained after the evaluations
and eliminations. The sample included 131 males (35.2 %) and 241 females (64.8 %), the average age of the
respondents was 33.2 years and the average monthly household income of majority of respondents was between 1000
and 3000 Turkish Liras (64 %).
3.2. Analyses and Results
Before testing the hypotheses, reliability analysis was conducted by calculating the Cronbach's alpha for each scale.
Two of the items in the scale (one item from price sensitivity and one item from price offer fairness) had to
be deleted as they decrease the Cronbach’s Alpha value. After deleting two items, reliability analysis was conducted on
the remaining 17 items. Chronbach’s Alpha for each construct vary between 0.74 and 0. 87, that is well above the
threshold of 0.70.
After elimination of two items, four items for price consciousness, four items for price-quality schema, three items for
price sensitivity, three items for price offer fairness, and three items for willingness to pay were included in this study.
The proposed hypotheses are tested through structural equation modeling (SEM) analysis using SEM software. The
analysis is composed of two stages as confirmatory factor analysis (CFA) and structural equation model. Sinc e CFA
would be preferred where measurement models have a well-developed underlying theory for hypothesized patterns of
loadings (Hurley et al., 1997, p. 668), based on theoretically developed measures, confirmatory factor analysis was
conducted at first. Confirmatory factor analysis is a statistical technique used to verify the factor structure of a set of
observed variables (Moutinho, 2011, p. 110). Because t-values of each item well exceeds 2.56 value and all standard
coefficients are above 0.30, all items loaded significantly at the 0.01 level and items are adequately saturated by factors.

312
The rules of thumb in the area of fit indices is varying among experts. Thus, in this study, two studies are combined to
reach more generalizable results. First, Kline (2005, 2010) strongly recommends the use of the chi-squared test, the
root mean squared error of approximation (RMSEA), the Comparative Fit Index (CFI), and the Standardized Root
Mean Square Residual (SRMR). There exist a number of severe limitations in use of chi-squared test (Hooper, Coughlan,
& Mullen, 2008, p. 54). Thus, chi square to its degree of freedom ratio (χ2/df) is used as an alternative indice to chi-
squared test.Second, McDonald and Ho (2002), in a review, found that the most commonly reported fit indices are the
CFI, The goodness of fit Index (GFI), Normed Fit Index (NFI) and the Non-normed Fit Index (NNFI). Thus, in this study,
for the overall model goodness of fit, seven fit indices were used: chi-squared test, the RMSEA, the CFI, the SRMR, GFI,
NFI and the NNFI. As can be seen from Table 1, all indices indicated a good fit.
Table 1. Fit Indices and Confirmatory Factor Analysis Results
Criteria Acceptable Range Source(s) Proposed Model
RMSEA 0.05<RMSEA<0.08 Schermelleh-Engel, Moosbrugger
and Müller (2003)
0.059
²/df 2<²/df<3 Schermelleh-Engel, Moosbrugger
and Müller (2003)
2.29
CFI >0.90 Hu and Bentler (1999) 0.93
SRMR 0.05<SRMR<0.1 Schermelleh-Engel, Moosbrugger
and Müller (2003)
0.05
GFI >0.90 Hooper, Coughlan and Mullen (2008) 0.93
NFI >0.80 Hooper, Coughlan and Mullen (2008) 0.89
NNFI >0.80 Hooper, Coughlan and Mullen (2008) 0.92
The structural equation model specifies the relationships of the constructs to one another as posited by research
models (Selim, 2007, p. 403). Accordingly, the initial model shown in Figure 1 has been tested using SEM and goodness -
of-fit indices are presented in initial model column of Table 2. Goodness-of-fit indices for the initial model showed an
acceptable fit (eg, ²/df=2.80, RMSEA=0.070, CFI=0.91). The ratio of each parameter estimate is significant at the 0.05
level if its value exceeds 1.96 and at the 0.01 level if its value exceeds 2.56 (Moutinho, 2011, p. 111). The t values for all
paths were significant, thus all the hypotheses (H1, H2, H3, and H4) were supported.
Figure 2. Adjusted Structural Model
In order to obtain a better fitting model (adjusted model), initial SEM results were reexamined through an iterative
process. The iterative process continued without dropping any item until the changes in the goodness-of-fit indices are
sufficiently achieved. The results of SEM analysis of the adjusted model indicated that, adding a path between price
sensitivity and willingness to pay improved the fit of the overall model. Figure 2 presents the adjusted model. The
newly added path was not hypothesized in the initial model and the best fit comes from the adjusted model
(supplemented by the one direct path between price sensitivity and willingness to pay). Thus, besides the indirect

313
effects of price sensitivity, price consciousness, price-quality schema on willingness to pay through price offer fairness,
price sensitivity has a direct effect on willingness to pay for environmentally friendly household cleaning products
hypothesized as H5*.
Table 2. Goodness-of-Fit Indices and Comparisons of Models
Criteria Acceptable Range Initial Model Adjusted Model
²/df 2<²/df<3 2.80 2.58
RMSEA 0.05<RMSEA<0.10 0.070 0.065
CFI >0.90 0.91 0.92
SRMR 0.05<SRMR <0.10 0.067 0.058
GFI 0.90GFI0.95 0.91 0.92
NFI >0.80 0.87 0.88
NNFI >0.80 0.89 0.90
Both path analyses suggest that price sensitivity, price consciousness, price-quality schema have the influence on price
offer fairness and price offer fairness on willingness to pay for environmentally friendly household cleaning products.
The results show a positive and significant beta coefficient between price-quality schema and price offer fairness
(β=0.19, t=5.23), price sensitivity and price offer fairness (β=0.10, t=2.35), price offer fairness and willingness to pay
(β=1.38, t=5.53). However, the effect of price consciousness on price offer fairness is negative and signif icant (β=-0.21,
t=-4.64). Thus, H1, H2, H3, and H4 are supported.
Table 3. Results of Hypotheses for Adjusted Model
Path Hypothesis β coefficient t-value Result
Price Consciousness to Price Offer Fairness H1 -0.21 -4.64 Supported (<0.01)
Price-Quality Schema to Price Offer Fairness H2 0.19 5.23 Supported (<0.01)
Price Sensitivity to Price Offer Fairness H3 010 2.35 Supported (<0.05)
Price Offer Fairness to Willingness to Pay H4 1.38 5.53 Supported (<0.01)
Price Sensitivity to Willingness to Pay H5 -0.39 -5.89 Supported (<0.01)
Also, as projected in H5, price sensitivity showed a significant impact on willingness to pay (t=-5.89, p<0.01). The path
coefficient for the added path from price sensitivity to willingness to pay is negative (β=-0.38) which suggests that if
price sensitivity level increases, consumers’ willingness to pay for environmentally friendly household cleaning
products will decrease. In Table 3, summary of all hypotheses and results are displayed.
4. Conclusion
Product prices can mean more to consumers than just a monetary exchange of value (Campbell, 1999, p. 145). Also
“customer value” is increasingly being seen as the next source of competitive advantage in today’s global business
arena and just or fair price is a key component of value (Sinha & Batra, 1999, p. 249). When purchasing household
cleaning products, some consumers may want to consider using some of eco-friendly alternatives available on the
market. Companies may offer value to the consumers by designing their products compatible with nature for a long
term benefit. For example, being less harmful chemical composition of products or using packages made from
recyclable/reusable materials would decrease the negative effects of these products on nature.
This study contributes to the price fairness literature by incorporating the role of price consciousness, price-quality
schema and price sensitivity. The results of the study show that besides the indirect effects of price sensitivity, price

314
consciousness, price-quality schema on willingness to pay through price offer fairness, price sensitivity has a direct
effect on willingness to pay for environmentally friendly household cleaning products. Although not hypothesized, it
has found that price sensitivity appeared an important in influencing willingness to pay for environmentally friendly
household cleaning products. Because, people are less sensitive to price when the product is aimed to contribute to
charitable actions such as environmental improvement (Cătoiu, Vrânceanu, & Filip, 2010, p. 119). Thus, this study
provides insights to the advancement of research in the field of environmentally conscious consumer behav iour.
Since the fair price represents an instrument used to do, on a long term, a correct distribution, for both parties in a
transaction (Cătoiu, Vrânceanu, & Filip, 2010), it is necessary to evaluate the variables discussed in terms of the
industrial buyer-seller relationship.
For further research, a longitudinal study to investigate the effect of demographics on consumer price fairness
perception or various comparisons among other products or services would be recommended. It would be useful and
interesting to investigate the impact of income level on the price fairness or on willingness to pay.
References
AGARWAL, S., & Teas, R. K. (2001). Perceived value: Mediating role of perceived risk. Journal of Marketing Theory and
Practice, 9(4), 1-14.
ALFORD, B. L., & Biswas, A. (2002). The effects of discount level, price consciousness and sale proneness on consumers’
price perception and behavioral intention. Journal of Business Research, 55(9), 775-783.
BARRETT, P. (2007). Structural equation modelling: Adjudging model fit. Personality and Individual Differences, 42(5),
815-824.
BOLTON, L. E., & Alba, J. W. (2006). Price fairness: Good and service differences and the role of vendor costs. Journal of
Consumer Research, 33(2), 258-265.
CAMPBELL, M. C. (1999). “Why did you do that?” The important role of inferred motive in perceptions of price fairness.
Journal of Product & Brand Management, 8(2), 145-152.
CAMPBELL, M. C. (2007). “Says Who?!” How the source of price information and affect influence perceived price
(Un)fairness. Journal of Marketing Research, 44(2), 261-271.
CĂTOIU, I., Vrânceanu, D. M., & Filip, A. (2010). Setting fair prices -fundamental principle of sustainable marketing.
Amfiteatru Economic, 12(27), 115-128.
CLAUSEN, G. J. (2005). Price sensitivity for electronic entertainment: Determinants and consequences , Florida:
Dissertation.com.
DASKALOPOULOU, I., & Petrou, A. (2006). Consumers’ expenditures and perceived price fairness. International Journal
of Social Economics, 33(11), 766-780.
DILLER, H. (2008). Price fairness. Journal of Product & Brand Management, 17(5), 353-355.
DONTHU, N., & Gilliland, D. (1996). Observations: The infomercial shopper. Journal of Advertising Research, 36(2), 69-
76.
ERDEM, T., Keane, M. P., and Sun, B. (2008). The impact of advertising on consumer price sensitivity in experience
goods markets. Quantitative Marketing and Economics, 6(2), 139-176.
FRIESEN, M. (2005). Perceived price fairness in the airline industry: A customer perspective. Presented at the SiB
Kongress-Wirtschaftskongress der Hochschule Bremen Aviation Student Researc h Workshop (G.A.R.S. e.V.),
Bremen, 1-13.
GIJSBRECHTS, E. (1993). Prices and pricing research in consumer marketing: Some recent developments. International
Journal of Research in Marketing, 10(2), 115-151.
GOLDSMITH, R. E., & Newell, S. J. (1997). Innovativeness and price sensitivity: Managerial, theoretical and
methodological issues. Journal of Product & Brand Management, 6(3), 163-174.
HAIR, J.F., Black, W.C., Babin, B.J., & Anderson, R.E. (2010). Multivariate Data Analysis (7th ed.). New Jersey: Prentice

315
Hall.
HERRMANN, A., Xia, L., Monroe, K. B., & Huber, F. (2007). The influence of price fairness on customer satisfaction: An
empirical test in the context of automobile purchases. Journal of Product & Brand Management, 16(1), 49-58.
HOOPER, D., Coughlan, J., & Mullen, M. (2008). Structural equation modelling: Guidelines for determining model fit. The
Electronic Journal of Business Research Methods , 6(1), 53-60.
HU, L. T., & Bentler, P. M. (1999). Cutoff criteria for fit indexes in covariance structure analysis: Conventional criteria
versus new alternatives. Structural Equation Modeling, 6(1), 1-55.
HURLEY, A. E., Scandura, T. A., Schriesheim, C. A., Brannick, M. T., Seers, A., Vandenberg, R. J., & Williams, L. J. (1997).
Exploratory and confirmatory factor analysis: Guidelines, issues, and alternatives. Journal of Organizational
Behaviour, 18(6), 667-683.
KAHNEMAN, D., Knetsch, J. L., & Thaler, R. (1986). Fairness as a constraint on profit seeking: Entitlements in the market.
The American Economic Review, 76(4), 728-741.
KALISH, S., & Nelson, P., (1991). A comparison of ranking, rating and reservation price measurement in conjoint
analysis. Marketing Letters, 2(4), 327–335.
KAMEN, J. M., & Toman, R. J. (1970). Psychophysics of prices. Journal of Marketing Research, 7(1), 27-35.
KHANDELWAL, U., & Bajpai, N. (2012). Price fairness and its linear dependence on consumer attitude: A comparative
study in metro and non metro city. European Journal of Business and Management, 4(10), 94-101.
KLINE, R.B. (2005). Principles and Practice of Structural Equation Modeling (2nd ed.). New York: Guilford Press.
KLINE, R. B. (2010). Principles and Practice of Structural Equation Modeling (3rd ed.). New York: Guilford Press.
LAROCHE, M., Bergeron, J., & Barbaro-Forleo, G. (2001). Targeting consumers who are willing to pay more for
environmentally friendly products. Journal of Consumer Marketing, 18(6), 503-520.
LICHTENSTEIN, D. R., Ridgway, N. M., & Netemeyer, R. G. (1993). Price perceptions and consumer shopping behavior: A
field study. Journal of Marketing Research, 30(2), 234-245.
LICHTENSTEIN, D. R., & Burton, S. (1989). The relationship between perceived and objective price-quality. Journal of
Marketing Research, 26(4), 429-443.
MAXWELL, S. (2002). Rule-based price fairness and its effect on willingness to purchase. Journal of Economic
Psychology, 23(2), 191–212.
MAXWELL, S. (2008). Fair price: Research outside marketing. Journal of Product & Brand Management, 17(7), 497-503.
MAXWELL, S., & Comer, L. (2010). The two components of a fair price: social and personal. Journal of Product & Brand
Management, 19(5), 375-380.
MCDONALD, R. P., & Ho, M.-H. R. (2002). Principles and practice in reporting statistical equation analyses. Psychological
Methods, 7(1), 64-82.
MCGOWAN, K. M., & Sternquist, B. J. (1998). Dimensions of price as a marketing universal: A comparison of Japanese
and U.S. consumers. Journal of International Marketing, 6(4), 49-65.
MIAO, L., & Mattila, A. S. (2007). How and how much to reveal? The effects of price transparency on consumers’ price
perceptions. Journal of Hospitality & Tourism Research, 31(4), 530-545.
MONROE, K. B. (1973). Buyers’ subjective perceptions of price. Journal of Marketing Research, 10(1), 70-80.
MOUTINHO, L. (2011). The SAGE Dictionary of Quantitative Management Research (1st published). (Ed. Moutinho, L. and
Hutcheson, G.), London: SAGE Publications Ltd.
PALAZÓN, M., & Delgado, E. (2009). The moderating role of price consciousness on the effectiveness of price discounts
and premium promotions. Journal of Product & Brand Management, 18(4), 306-312.
PETRICK, J. F. (2005). Segmenting cruise passengers with price sensitivity. Tourism Management, 26(5), 753-762.
RAO, A. R., & Monroe, K. B. (1989). The effect of price, brand name, and store name on buy ers’ perceptions of product

316
quality: An integrated review. Journal of Marketing Research, 26(3), 351-357.
SCHERMELLEH-ENGEL, K., Moosbrugger, H., & Müller, H. (2003). Evaluating the fit of structural equation models: Tests
of significance and descriptive goodness-of-fit measures. Methods of Psychological Research Online, 8(2), 23-
74.
SELIM, H. M. (2007). Critical success factors for e-learning acceptance: Confirmatory factor models. Computers &
Education, 49(2), 396-413.
SINHA, I., & Batra, R. (1999). The effect of consumer price consciousness on private label purchase. International
Journal of Research in Marketing, 16(3), 237-251.
SURI, R., & Monroe, K. B. (2003). The effects of time constraints on consumers’ judgments of prices and products.
Journal of Consumer Research, 30(1), 92-104.
XIA, L., Monroe, K. B., & Cox, J. L. (2004). The price is unfair! A conceptual framework of price fairness perceptions. The
Journal of Marketing, 68(4), 1-15.
VAIDYANATHAN, R., & Aggarwal, P. (2003). Who is the fairest of them all? An attributional approach to price fairness
perceptions. Journal of Business Research, 56(6), 453-463.
YEE, W. F., & Xian, T. H. (2012). Price sensitivity-consumer satisfaction relationship towards electrical appliances.
World Journal of Social Sciences, 2(6), 49-66.

317
Benefits and motivations for companies to
implement socially responsible practices Corporate Social Responsibility, Benefits, Motivations, Stakeholders.
Carla Gabriel, IPAM – The Marketing School, [email protected]
Pedro Ferreira, IPAM – The Marketing School, [email protected]
Resumo
O tema Responsabilidade Social é um tema em forte crescimento e aceitação mas ainda de difícil definição. N o entanto,
é visível a crescente preocupação das organizações relativamente ao tema, fazendo nascer uma nova mentalidade na
sociedade, em que a valorização da cultura da boa conduta empresarial resulta da combinação entre eficácia, lucro,
cidadania, preservação ambiental e ética nos negócios. Essa preocupação dentro da gestão das organizações sobre os
temas sociais, ambientais e económicos que envolvem direta, e indiretamente, todos os stakeholders (partes
interessadas da empresa, público-alvo dos relatórios), levam a que as organizações, independentemente do sector de
atividade, adotem práticas com vista à promoção de um desempenho socialmente responsável.
Tendo em conta por um lado, as diferentes visões relativas à temática da Responsabilidade Social, e po r outro, a
necessidade das empresas adotarem uma postura interventiva na resolução dos problemas socias, assumindo
compromissos morais que estão para além do estrito cumprimento da lei e da busca do indispensável lucro económico,
surge a questão de como é que as suas práticas de responsabilidade social agregam benefícios às próprias empresas.
No presente artigo faz-se uma revisão da literatura sobre Responsabilidade Social, com o objetivo central de aferir
quais os benefícios percecionados e quais as motivações por parte das empresas na adoção destas práticas socialmente
responsáveis.
Abstract
Corporate Social Responsibility represents a globally accepted trend but also a hard definition. However it’s clear that
the majority of the organizations are concerned about the subject, making flourish a new mentality in society,
manifested trough a cultural positive and efficient business standards, more profit, more citizenship, ethical focus and
environmental preservation. This organizations management concern about social, environmental and economic
subjects involving directly and indirectly all stakeholders mean that organizations, regardless their activity area adopt,
as mentioned above, management standards socially responsible.
Focusing the perspective, by one hand, in the different Corporate Social Responsibility theories and, by other hand, in
the necessity of a wither adoption of this new approaches manifested in a social intervention, assuming moral
commitments who are beyond the strict legal overview, and the necessary profit purchase, arises of how their social
responsibility practices add benefits to the organizations themselves.
In this paper we review the literature about Corporate Social Responsibility and, also, we have as main drive, the
objective of measuring the perceived benefits and motivations that lies in the organizations that are socially
responsible.
1. Introdução
Numa época de mudança acelerada, marcada pela abertura de fronteiras comerciais e pela globalização de tendências e
de mercados, a competitividade das organizações modernas depende cada vez mais da natureza e da relação com o

318
ambiente envolvente.
Rompendo o velho paradigma de que o objetivo central das empresas é o de maximizar lucro para os seus acionistas,
obedecendo a leis, sem fraudes (Friedman, 1962), autores como Preston e Post (1975), Carroll (1979; 1991; 1999),
Wood (1991) e Schwartz e Carroll (2003; 2007) defendem que as empresas deveriam ser mais responsáveis em relação
às respostas dadas à sociedade.
O tema Responsabilidade Social Empresarial (RSE) ocupa um espaço relevante de discussão pelo mundo, tendo sido
lançados os primeiros contributos desta temática nos anos 50 (Carroll, 1999).
A RSE surge vinculada aos diferentes conceitos associados às responsabilidades existentes entre a organização e as
diferentes partes interessadas (stakeholders). Nesta relação, dita responsável, devem estar contemplados os impactos
económicos, sociais e ambientais por ela causados.
O presente estudo consistiu em fazer uma pesquisa bibliográfica, a partir de material já publicado, constituído
principalmente por livros, artigos científicos de diferentes bases de dados e jornais científicos. Em relação à abordagem,
caracteriza-se como uma pesquisa qualitativa.
A estrutura deste artigo divide-se em três secções, sendo a primeira a introdução, na qual é apresentado o tema em
estudo, bem como a introdução ao problema central da pesquisa, o seu âmbito e contextualização, a segunda apresenta
a revisão de literatura, onde se patenteiam conceitos e teorias de pesquisa que sustentam toda a investigação. Conclui-
se descrevendo as limitações do trabalho e implicações para futuros estudos.
2. Revisão de Literatura
2.1. Definição e Evolução do Conceito de Responsabilidade Social Empresarial
A responsabilidade social das empresas (RSE) é a nossa tradução para a língua portuguesa de corporate social
responsability (CSR). Não sendo um conceito consensual nem fácil de definir, o conceito de RSE assenta em algumas
características básicas: a) integração voluntária de preocupações sociais e ambientais nas operações quotidianas das
organizações e na interação com todas as partes interessadas, b) contribuir para a sociedade de forma positiva e c)
gerir os impactos sociais e ambientais da organização como forma de assegurar e aumentar competitividade.
Associado ao conceito de RSE surgem diversas designações afins como, cidadania empresarial, espírito empresarial
responsável e desenvolvimento sustentável.
A responsabilidade social das organizações recebeu atenção e conquistou espaço nos Estados Unidos na década de 50,
com o livro Social Responsabilities of the Businessman , de Howard Bowen (1953). O autor define RSE, como sendo as
obrigações dos homens de negócios de adotar orientações, tomar decisões e seguir linhas de ação, que sejam
compatíveis com os fins e valores da nossa sociedade.
Na década de 60, são vários os trabalhos publicados de autores como, Keith Davis (1960), William C. Frederick (1960),
e JosephW. McGuire (1963), que contribuíram para o desenvolvimento da literatura sobre RSE (Carroll, 1999).
Na década de 70, multiplicam-se as definições referentes à RSE. Se por um lado, se menciona cada vez mais o “Corporate
Social Performance”, por outro, o termo “Corporate Social Responsability” alcança maior projeção (Carroll, 1999).
Friedman (1970) argumenta enfaticamente que os negócios devem limitar a sua responsabilidade social à maximização
dos lucros e obedecer às leis, opinião que é expressa num artigo no New York Times Maganize. Na sua perspetiva,
retrata os negócios como uma autoprocura do lucro. Defende ainda, que a empresa não deverá envolver-se em projetos
que manifestamente não defendam os interesses dos acionistas. Existe apenas uma responsabilidade social do negócio.
Para Epstein (1987) a essência do conceito da responsabilidade social das empresas assenta na noção de que as
organizações têm obrigações sociais que transcendem as obrigações derivadas da função económica de produção e
distribuição de bens e serviços, gerando um nível de satisfação de proveitos para as suas partes interessadas.
Também para Davis (1973), uma empresa não está a ser socialmente responsável se apenas cumprir as exigências
mínimas da lei. A responsabilidade social consiste na aceitação voluntária por parte da empresa, de obrigações sociais
que vão para além dos normativos legais.
Um significado mais amplo da responsabilidade social surgiu em 1979 quando Carrol propõe um modelo conceptual,

319
onde inclui uma variedade de responsabilidades das empresas junto à sociedade, e esclarece os componentes de
responsabilidade social empresarial que estão além de gerar lucros e obedecer à lei. O modelo engloba quatro tipos
básicos de expectativas que refletem a visão de responsabilidade social: económica, legal, ética e discricionária,
conforme mostra a Figura 1:
Figura 1: Níveis da Responsabilidade Social
Fonte: adaptado de Carroll, (1979, p. 499)
Para Dawkins e Lewis (2003) as expectativas em torno das empresas têm-se tornado cada vez maiores. Se no passado
se considerava importante a qualidade do produto, a relação custo/benefício e o desempenho financeiro, hoje em dia a
organização tem também deveres e obrigações voltados para a RSE. Drucker (2002) argumenta que as empresas têm
direitos, deveres e obrigações, não se admitindo mais a produção e comercialização de bens e serviços sem o
cumprimento aos princípios morais, à postura ética e ao respeito aos conceitos de cidadania.
A nível mundial, empresas que têm adotado uma conduta de responsabilidade social evidenciaram ser um forte agente
de mudança, trabalhando lado a lado com os governos e a sociedade civil, conforme atesta o artigo de Neves (2006)
sobre responsabilidade social corporativa.
De acordo com o Business Social Responsible Institute (BSR, 2001), não existe uma definição unanimemente aceite para
o termo responsabilidade social corporativa, mas, de forma ampla, a expressão refere-se a decisões de negócios
tomadas com base em valores éticos que incorporam as dimensões legais, o respeito pelas pessoas, comunidades e
meio ambiente.
O Instituto Ethos, cuja missão é mobilizar, sensibilizar e ajudar as empresas a gerir os negócios de forma socialmente
responsável, reconhece a Responsabilidade Social Empresarial como sendo, “a forma de gestão que se define pela
relação ética e transparente da empresa com todos os públicos com os quais se relaciona e pelo estabelecimento de
metas empresariais compatíveis com o desenvolvimento sustentável da sociedade, preservando recursos ambientais e
culturais para gerações futuras, respeitando a diversidade e promovendo a redução de desigualdades sociais” (2006,
p.5)
Para o World Business Council for Sustainable Development, a RSE é “o compromisso contínuo adotado pelas empresas
de forma a contribuir para o desenvolvimento económico, melhorando a qualidade de vida dos trabalhadores e das
suas famílias, bem como da comunidade local e da sociedade em geral" (p.3)
Tal como é referido pela Comissão Europeia, no Livro Verde “Promover um quadro europeu para a responsabilidade
social das empresas” (publicado em 2001), “é cada vez maior o número de empresas europeias que promovem
estratégias de responsabilidade social como reação a diversas pressões de natureza social, ambiental e económica”
(2001, p.3). Define RSE como sendo, “essencialmente um conceito, segundo o qual as empresas decidem, numa base

320
voluntária, contribuir para uma sociedade mais justa e para um ambiente mais limpo” (2001, p.4).
Tabela 1: Síntese da Evolução da RSE
Década
1950 Dá-se o início à “era moderna da RSE” com a publicação do livro de Howard Bowen (1953) intitulado “Social Responsibilities of the
Businessman”.
1960
Expansão da literatura sobre RSE, com a contribuição de autores como: Keith Davis (1960), William C. Frederick (1960), e JosephW.
McGuire (1963).
Surgem definições mais profundas na tentativa de explicar significado de RSE.
1970
Multiplicam-se as definições referentes à RSE. Se por um lado, se menciona cada vez mais o “Corporate Social Performance”, por
outro, o termo “Corporate Social Responsability” alcança maior projeção.
Carrol (1979) propõe as quatro grandes responsabilidades inerentes ao desempenho social da empresa: económica, legal, ética e
discricionária.
1980
Assistimos a menos definições originais de RSE, mais tentativas de medir e realizar pesquisas sobre a RSE e surgem novas temáticas
alternativas.
(e.g. ética dos negócios; gestão dos stakeholders). Discute-se a interação entre ética e lei.
1990
Poucas contribuições teóricas no que se refere à definição de RSE
Desenvolvem-se temas alternativos (e.g., cidadania corporativa; stakeholders theory; ética nos negócios), sendo poucas as
contribuições teóricas no que se refere à definição de RSE.
Carrol propõe um modelo em pirâmide da RSE, no qual incorpora quatro responsabilidades sociais: a) Económicas; b) Legais; c)
Éticas e d) Filantrópicas.
2000 a
2005 Proliferação de organismos nacionais e internacionais dedicados à ética e à RSE
Fonte: Adaptado de Rego et al, 2007
2.2. Teorias da Responsabilidade Social
Para além de uma vasta variedade de teorias, o campo da responsabilidade social empresarial (RSE) apresenta também
uma proliferação de abordagens polémicas, complexas e imprecisas (Garriga e Melé, 2004).
No artigo intitulado “Corporate Social Responsibility Theories: Mapping the Territory”, os autores, consideram
quatro grandes tipos de teorias (figura 2).
Figura 2: Teorias da Responsabilidade Social
Fonte: Adaptado de Garriga e Melé (2004)

321
2.3. Teoria dos Stakeholders
Friedman (1998), considerado pai da Teoria dos Shareholders, defende que o gestor apenas tem a preocupação de
garantir a condução geral dos negócios de forma favorável e lucrativa para os acionistas.
Segundo ele, ações de responsabilidade social geram algumas consequências como custo adicional, o que traz redução
dos lucros e perda para todos os envolvidos (fornecedores, empregados e clientes). Conclui que o alvo da empresa é o
seu desenvolvimento e que esta, por si só, é capaz de gerar benefícios indiretos a toda a sociedade.
Donaldson e Preston (1995) reprovam o posicionamento de Friedman (1998), argumentando que os gestores têm que
considerar os interesses de todos os stakeholders e não apenas dos shareholders.
Freeman (1984) afirma que existem muitos outros integrantes da sociedade que devem ser levados em consideração na
tomada de decisão da empresa: organismos governamentais, grupos políticos, organizações não-governamentais, as
associações de empresas, os sindicatos de trabalhadores, associações de consumidores, os potenciais empregados, os
potenciais clientes, as comunidades em que elas existem ou das quais obtém recursos e, na verdade, a sociedade como
um todo.
A Comissão Europeia, no Livro Verde “Promover um quadro europeu para a responsabilidade social das empresas”
(publicado em 2001) referencia que, a “responsabilidade manifesta-se em relação aos trabalhadores e, mais
genericamente, em relação a todas as partes interessadas afetadas pela empresa e que, por seu turno, podem
influenciar os seus resultados”.
2.4. Motivações e Benefícios na Implementação de Práticas de Responsabilidade Social Empresarial
2.4.1. Motivações
Segundo a Comissão Europeia (2001), os fatores que motivam a evolução para a RSE pelas empresas são:
Novas preocupações e expectativas dos cidadãos, consumidores, autoridades públicas e investidores num
contexto de globalização e de mutação industrial em larga escala,
Critérios sociais que possuem uma influência crescente sobre as decisões individuais ou institucionais de
investimento, tanto na qualidade de consumidores como de investidores,
A preocupação crescente face aos danos provocados no meio ambiente pelas atividades económicas,
A transparência gerada nas atividades empresariais pelos meios de comunicação social e pelas modernas
tecnologias da informação e da comunicação.
Algumas das motivações básicas mais comuns subjacentes na implementação de práticas sociais, são as que se
relacionam com as questões éticas e o espirito de boa cidadania; a imagem no mercado e na comunidade; a
consciencialização das vantagens competitivas subjacentes à adoção de um comportamento ambiental e socialmente
responsável e a pressão exercida por parte das entidades reguladoras e das comunidades locais (Santos et al, 2006).
Em 2002, a PricewaterhouseCoopers realizou um estudo a 140 empresas sediadas nos EUA, com o intuito de
determinar se e como as empresas adoptam práticas organizacionais sustentáveis.
Os principais resultados publicados no Relatório de Sustentabilidade (2002) indicam que 75% dos inquiridos têm
implementado algum tipo de práticas organizacionais sustentáveis, essencialmente motivados por uma melhor
reputação, (90%), as vantagens competitivas (75%) e redução de custos (73%). Contrariamente, 25%
A não existência de um negócio claro (82%), falta de interesse dos stakholders (62%) e a falta de compromisso pelos
gestores de topo (53%), são as principais razões apontadas para justificar a não adoção de um comportamento
empresarial sustentável.
2.4.2. Benefícios
Os defensores da responsabilidade social corporativa (CSR) estão convencidos de que "vale a pena" para a empresa,
bem como para as partes interessadas da organização e da sociedade. Burke e Logsdon (1996) analisam programas de
responsabilidade social que criam benefícios estratégicos para as empresas. Identificam cinco dimensões da estratégia
que ajudam a avaliar o valor criado para a empresa: centralidade, especificidade, pro-atividade voluntarismo (ato

322
voluntário) e visibilidade.
Segundo McWilliams e Siegel (2001), existe um nível "ideal" de RSE que os gestores podem determinar através da
análise custo-benefício, e que não há uma relação neutra entre RSE e o desempenho financeiro. O nível de RSE de uma
empresa vai depender do seu tamanho, nível de diversificação, investigação e desenvolvimento, publicidade, vendas ao
governo, rendimento do consumidor, condições do mercado de trabalho e estágio no ciclo de vida da indústria.
Durante a última década, um número crescente de empresas tem reconhecido os benefícios comerciais resultantes das
práticas de responsabilidade social empresarial (RSE). Schiebel e Pochtrager (2003) demonstram que a
responsabilidade social das empresas (RSE) tem um impacto positivo no desempenho económico da empresa, e não é
prejudicial para o valor do acionista. As empresas que empregam a nova abordagem comercial baseada em valores
acham que ela permite melhorar o desempenho financeiro, aumentar a motivação dos colaboradores e o compromisso
com o trabalho, aumentar a fidelidade dos clientes e a reputação corporativa.
Branco e Rodrigues (2006), defendem que perspetivas baseadas em recursos (RBP) são úteis para entender o porquê
de as empresas se envolverem em atividades de responsabilidade social e da sua divulgação. A partir de uma perspetiva
baseada nos recursos, a RSE é vista como o aprovisionamento de benefícios internos ou externos, ou ambos.
Investimentos em atividades socialmente responsáveis podem ter benefícios internos, ajudando a empresa a
desenvolver novos recursos e capacidades que estão relacionados nomeadamente com know-how e a cultura
corporativa. Com efeito, o investimento em atividades de responsabilidade social e de divulgação tem consequências
importantes sobre a criação ou o esgotamento de recursos fundamentais intangíveis, ou seja, aqueles associados com os
empregados. Os benefícios externos da RSE estão relacionados com o efeito sobre a reputação corporativa. Esta pode
ser entendida como um recurso intangível fundamental, que pode ser criado ou empobrecido como consequência das
decisões de participar ou não em atividades de responsabilidade social e de divulgação. Empresas com uma boa
reputação de responsabilidade social podem melhorar as relações com atores externos.
Porter e Kramer (2006) advertem, que se tornará cada vez mais importante para o sucesso competitivo perceber a
responsabilidade social como uma oportunidade e não como controle de danos ou de uma campanha de relações
públicas.
A responsabilidade social empresarial é uma ideia básica para o desenvolvimento harmonioso das empresas, da
sociedade e da natureza. A sua implementação pode conduzir a custos adicionais para as empresas, mas os benefícios
de praticar a responsabilidade social são suscetíveis de compensar os custos (Lin e Ding, 2007).
As empresas podem obter a maximização do lucro se cumprirem as suas responsabilidades sociais e melhorarem a
imagem corporativa na criação de uma reputação responsável (Tian e Su,2007).
Alguns autores como Melo Neto e Fróes (2001) defendem que, além da sobrevivência do mercado, a organização
socialmente responsável, ao praticar ações sociais de forma responsável, ganhará competitividade por meio da
elevação da sua imagem defronte à sociedade, ganhando desta forma, maior visibilidade, aceitação e potencialidade.
Apesar da inclusão da Responsabilidade Social não ser de carácter obrigatório na gestão das organizações, traz
benefícios não só aos stakeholders, mas também à própria organização, aquando da implementação de ações
estratégicas.
Torras (2001), defende que uma organização socialmente sustentável obterá ganhos nas suas ações, ao praticar
Responsabilidade Social, uma vez que um terço das ações da bolsa são adquiridos pelos ativos intangíveis da
organização, e como Bollier (1997) afirma, os resultados advindos das organizações socialmente responsáveis são
intangíveis, as organizações socialmente responsáveis são mais lucrativas, têm maior visibilidade e melhor imagem no
mercado.
As empresas podem alcançar benefícios tangíveis e intangíveis. As que optam pelo caminho da sustentabilidade obtêm
os seguintes benefícios tangíveis: redução de custos, melhora da produtividade, crescimento de receitas, acesso a
mercados e capitais, melhora no processo ambiental e na gestão de recursos humanos. Valorização da imagem
institucional, maior lealdade do consumidor, maior capacidade de atrair e manter talentos, capacidade de adaptação,
longevidade e diminuição de conflitos são os benefícios considerados intangíveis (Young, 2008).
Neves e Pessoa (2006), na sua publicação “O Uso da Responsabilidade Social Corporativa Como Estratégia de Marketing” ,
investigam quais os principais benefícios advindos por meio de ações de responsabilidade social empresarial. Segundo
os resultados, os benefícios sugeridos pelos inquiridos são: o aumento da produtividade e melhoria no desempenho dos
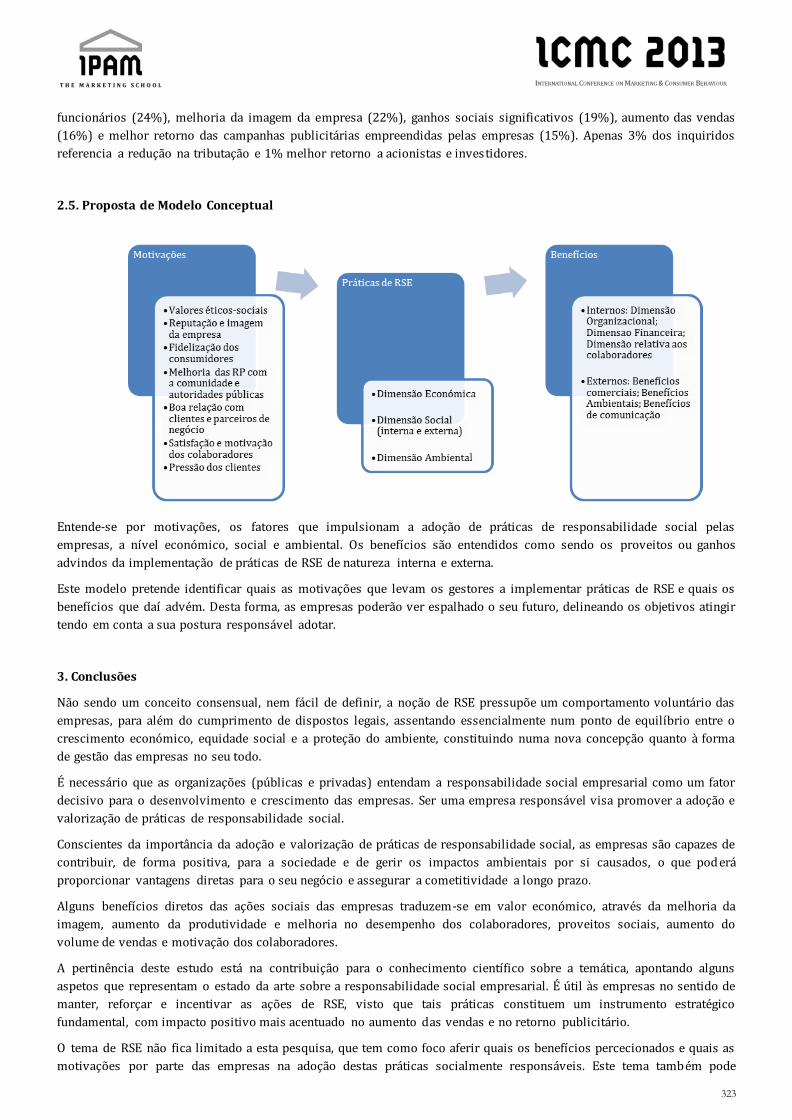
323
funcionários (24%), melhoria da imagem da empresa (22%), ganhos sociais significativos (19%), aumento das vendas
(16%) e melhor retorno das campanhas publicitárias empreendidas pelas empresas (15%). Apenas 3% dos inquiridos
referencia a redução na tributação e 1% melhor retorno a acionistas e investidores.
2.5. Proposta de Modelo Conceptual
Entende-se por motivações, os fatores que impulsionam a adoção de práticas de responsabilidade social pelas
empresas, a nível económico, social e ambiental. Os benefícios são entendidos como sendo os proveitos ou ganhos
advindos da implementação de práticas de RSE de natureza interna e externa.
Este modelo pretende identificar quais as motivações que levam os gestores a implementar práticas de RSE e quais os
benefícios que daí advém. Desta forma, as empresas poderão ver espalhado o seu futuro, delineando os objetivos atingir
tendo em conta a sua postura responsável adotar.
3. Conclusões
Não sendo um conceito consensual, nem fácil de definir, a noção de RSE pressupõe um comportamento voluntário das
empresas, para além do cumprimento de dispostos legais, assentando essencialmente num ponto de equilíbrio entre o
crescimento económico, equidade social e a proteção do ambiente, constituindo numa nova concepção quanto à forma
de gestão das empresas no seu todo.
É necessário que as organizações (públicas e privadas) entendam a responsabilidade social empresarial como um fator
decisivo para o desenvolvimento e crescimento das empresas. Ser uma empresa responsável visa promover a adoção e
valorização de práticas de responsabilidade social.
Conscientes da importância da adoção e valorização de práticas de responsabilidade social, as empresas são capazes de
contribuir, de forma positiva, para a sociedade e de gerir os impactos ambientais por si causados, o que poderá
proporcionar vantagens diretas para o seu negócio e assegurar a cometitividade a longo prazo.
Alguns benefícios diretos das ações sociais das empresas traduzem-se em valor económico, através da melhoria da
imagem, aumento da produtividade e melhoria no desempenho dos colaboradores, proveitos sociais, aumento do
volume de vendas e motivação dos colaboradores.
A pertinência deste estudo está na contribuição para o conhecimento científico sobre a temática, apontando alguns
aspetos que representam o estado da arte sobre a responsabilidade social empresarial. É útil às empresas no sentido de
manter, reforçar e incentivar as ações de RSE, visto que tais práticas constituem um instrumento estratégico
fundamental, com impacto positivo mais acentuado no aumento das vendas e no retorno publicitário.
O tema de RSE não fica limitado a esta pesquisa, que tem como foco aferir quais os benefícios percecionados e quais as
motivações por parte das empresas na adoção destas práticas socialmente responsáveis. Este tema também pode

324
despertar interesse em todos os que estão envolvidos no processo de consciencialização social.
Novos estudos podem envolver o argumento de RSE, procurando analisar como e em que condições as atividades
sociais de uma empresa podem beneficiar a sociedade.
References
BOLLIER, D. (1997). Aiming Higher: 25 Stories of How Companies Prosper by Combining Sound Management and Social
Vision. AMACON – American Management Association, New York, NY.
BOWEN, H. (1953). Responsabilidades Sociais dos homens de negócio. Tradução de Octávio Alves Velho. Rio de Janeiro,
Brasil: edição Civilizaçao Brasileira S.A.
BRANCO, M. C.; RODRIGUES, L. L. (2006). Responsabilidade social corporativa e baseada em recursos perspectivas.
Journal of Business Ethics, 69 (2), 111-132.
BURKE, L.; LOGSDON, J. M. (1996). Como a responsabilidade social corporativa compensa. Planejamento a Longo Prazo,
29 (4), 495-502.
BUSINESS SOCIAL RESPONSIBILITY (BSR). Social Responsibilit. Disponível: http://www.bsr.org [10/03/2012].
CARROLL, A. B. (1979). A three-dimensional conceptual model of corporate social perfor mance. Academy of
Management Review, 4, 497-505.
CARROLL, A. B. (1991). The pyramid of corporate social responsibility: Toward the moral management o f
organizational stakeholders. Business Horizons, 34, 39-48.
CARROLL, A. B. (1999). Corporate Social Responsibility: Evolution of a Definitional Construct. Business Society. 38 (3),
268-295.
COMISSÃO DAS COMUNIDADES EUROPEIAS (2001). Livro Verde – Promover um quadro europeu para a
responsabilidade social das empresas. Bruxelas: 1-35.
DAVIS, K. (1960). Can business afford to ignore social responsibilities? California Management Review, 2, 70-76.
DAVIS, K. (1973). The Case for and against Business Assumption of Social Responsabilities. Academy of Management
Journal, 16 (2): 312-322.
DAWKINS, J. ; LEWIS S. (2003). CSR in Stakeholder Expectations: and their Implication for Company Strategy, Journal of
Business Ethics 44: 185–193.
DONALDSON, T.; PRESTON, L. (1995). The stakeholders theory of the corporation: concepts, evidence and implications.
Academy of Management Review, 20 (1): 65-91.
DRUCKER, P. F. (2002). Factor humano e desempenho: o melhor de Peter Drucker sobre administração. São Paulo:
Pioneira.
EPSTEIN, E. M. (1987). The corporate social policy process and the process of corporate governance. Amenrican
Business Law Journal, 25 (3): 361-383.
FREDERICK, W. C. (1960). The growing concern over business responsibility. California Management Review, 2, 54-61.
FREEMAN, R.E. (1984). Strategic Management: A stakeholder approach. Boston: Pitman.
FRIEDMAN, M. (1962). Capitalism and Freedom, Chicago: University of Chicago Press.
FRIEDMAN, M. (1970). The social responsibility of business is to increase its profits. T he New York Times Magazine
FRIEDMAN, M. (1998). The social responsibility of business is to increase its profits. In L. P. Hartman (Ed.). Perspectives
in business ethics. New York: McGraw-Hill International Editions
GARRIGA, E.; MELÉ, D. (2004). Corporate Social Responsibility Theories: Mapping the Territory. Journal of Business
Ethics, 53: 51-71.
INSTITUTO ETHOS (2006). Indicadores Ethos - Sebrae de responsabilidade social empresarial para micro e pequenas

325
empresas. Edição Benjamin S. Gonçalves. São Paulo.
LIN, J., e DING, Y. (2007). CSR in Lenovo: A case of excellence.
MCGUIRE, J. W. (1963). Business and society. New York: McGraw-Hill.
MCWILLIAMS, A.; SIEGEL, D. (2001). Corporate social responsibility a theory of the firm perspective. Academy of
Management Review, 26 (1), 117-127.
MELO NETO, F.P; FRÓES, C. (2001). Gestão da responsabilidade social corporativa: o caso brasileiro. Rio de Janeiro,
Qualitymark Editora.
NEVES, J.; PESSOA, R. (2006). O Uso da Responsabilidade Social Corporativa Como Estratégia de Marketing. Revista
Portuguesa de Marketing, 18: 54-64.
PORTER, M. E.; KRAMER, M. R. (2006). Strategy and Society The Link Between Competitive Advantage and Corporate
Social Responsibility. Harvard Business Review, 84 (12), 78-92.
PRESTON, E.; POST, E. (1975). Private management and public policy: The principle of public responsibility . Englewood
Cliffs, NJ: Prentice Hall.
PWC PricewaterhouseCoopers (2002). Sustainability Survey Report. Disponível em
http://www.pwc.fr/2002_pricewaterhousecoopers_sustainability_survey_report1.html [12/02/2013].
REGO, A.; CUNHA, M. P.; COSTA, N. G.; GONÇALVES, H.; CABRAL-CARDOSO, C. (2007). Gestão Ética e Socialmente
Responsável. Rh Editora, Lisboa, Portugal.
SANTOS, A.; PEREIRA, E.; SILVA, J. (2006). Responsabilidade social nas PME: casos em Portugal. Rh Editora, Lisboa,
Portugal.
SCHIEBEL, W.; POCHTRAGER, S. (2003). Corporate ethics as a factor for success - the measurement instrument of the
University of Agricultural Sciences (BOKU), Vienna. Supply Chain Management-an International Journal, 8 (2),
116-121.
SCHWARTZ, M.; CARROLL, A. (2003). Corporate Social Responsibility: a three-domain approach. Business Ethics
Quarterly, 13 (I.4,) 503-530.
SCHWARTZ, M.; CARROLL, A. (2007). Integrating and Unifying Competing and Complementary Frameworks: The Search
for a Common Core in the Business and Society Field . Business & Society, 20 (10), 1-39.
TIAN, Z.; SU, M. (2007). Uma análise sobre os impactos de reputação corporativa de responsabilidade social.
TORRAS L., (2001). La Responsabilidad Social como Ventaja Competitiva. Disponível em
http://www.synethos.org/isbee/C2K/contributed%20papers/list_view.htm [12/12/2012].
WBCSD - World Business Council for Sustainable Development. Corporate Social Responsibility: Meeting changing
expectations. Disponível em: http://www.wbcsd.org/home.aspx [20-01-2013].
Prentice Hall
WOOD, D. J. (1991). Corporate social performance revisited. Academy of Management Review, 16, 691-718
YOUNG, R. (2008). Gestão da responsabilidade social e do desenvolvimento sustentável. Disponível em
http://www.ethos.org.br/DesktopDefault.aspx?TabID=3888&Alias=uniethos&Lang=pt -BR [10/01/2013].

326
Session 9

327
Understanding cross-border tourist regions: a
preliminary approach to the consumer
perspective Consumer Behavior, Cross Border Regions, Destination Loyalty, Motivations, Niche Marketing.
Bruno Sousa, Universidade do Minho/IPCA, [email protected]
Cláudia Simões, Universidade do Minho, [email protected]
Sérgio Lopes, IPCA, [email protected]
Abstract
This study aims at gaining a deeper understanding of customer profiling and behavior in cross-border tourism
destinations. Our research is conducted within a niche marketing perspective. It is our view that niche marketing is not
confined to the limits of national markets. In fact the marketing field faces increasing challenges triggered by the
diversity of markets, new technologies enabling new marketing approaches and the deterioration of large companies.
Niche marketing entails meeting customer needs through tailoring goods and services for small markets and could be
defined as positioning into small, profitable homogeneous market segments which have been ignored or neglected by
others.
Previous studies suggest that cross-border regions are an attractive and desirable idea, yet requiring further theoretical
and empirical research. The new configuration of many cross-border regions calls for a debate on issues concerning its
development, raising important dimensions, such as, organization and planning of common tourism destinations. There
is still a gap in the understanding of destination management in cross-border regions and the customer profile and
motivations. Overall this research aims at attaining a deeper understanding of the profile and behavior of consumers in
tourism settings, addressing the predisposition for the destination. The study specifies factors influencing customer
behavior and attitudes in the niche context of cross-border tourism destinations. To the endeavor we take an
interdisciplinary perspective bringing together inputs from marketing, tourism and local economics. We develop a
research model and suggest implications for future research.
1. Introduction
Tourism activities are amongst the most relevant drivers of economic development and growth in various economies.
Every year, competition increases amongst tourist destinations (Becken & Simmons, 2002), making it an increasingly
complex and geographically diverse range of activities (Okello, Manka & D’Amour, 2008). Such relevance is reflected in
the proliferation of studies conducted within the over-arching theme ‘tourism’, under various perspectives and
backgrounds. For example, previous research addressed tourism planning from a local development perspective,
environmental impact, destination branding and consumer loyalty (e.g. Getz, 1986; Embacher & Buttle, 1989; Backman
& Crompton, 1991). In the light of such multitude of insights our study aims at gaining a preliminary understanding of
customer profiling and behavior in the context of cross-border tourism regions. Our study is conducted within a niche
marketing perspective of cross-border regions.
The marketing field faces increasing challenges triggered by the diversity of markets, new technologies enabling new
marketing approaches and the deterioration of large companies and their traditional marketing approaches. Trends in
global tourism demand suggest the emergence of sophisticated consumers looking for new and specific tourist
experiences. In such context, niche marketing seems a relevant response. It entails meeting customer needs through
tailoring goods and services for small markets increasing revenues and enhancing a positive national image

328
(Studzieniecki & Mazurek, 2007). Niche marketing has been successfully applied to a wide range of businesses. Yet,
regardless of its rising attractiveness there is a paucity of research addressing the way niche marketing is applied to
tourist destinations. Publications in the area are, predominantly, practitioner oriented. Academic research seems to be
limited to textbooks references to the related notions of “segmentation” or “positioning” (Dalgic & Leeuw, 1994).
In particular in tourism, cross-border regions emerge as destinations capable of catering for specific market needs. In
fact, although, cross-border regions are an attractive and desirable idea, they require further theoretical and empirical
research. The new configuration of many cross-border regions calls for a debate on issues concerning its development,
raising important aspects, such as, the organization and planning of common tourism destinations. Responding to such
specific consumer demands, the market of cross-border tourist destinations is not yet fully understood. In particular,
there is still a gap in the understanding of destination management in cross-border regions and the customer profile
and motivations. Additionally, the performance of a tourist destination and visitors’ satisfaction are of paramount
importance to the destination competitiveness since the pleasantness of the experience is likely to influence visitors’
future behavior. There has been an increasingly noticeable attention from studies focusing on destination performance
and satisfaction and how they are related to revisit intention and positive word-of-mouth (Kozak & Rimmington, 2000).
Consequently, this study specifies factors influencing customer behavior and attitudes in the niche context of cross -
border tourism destinations. To the endeavor we take an interdisciplinary perspective bringing together inputs from
marketing, tourism and local economics. We develop a research model and suggest implications for future research.
2. Background
2.1. Niche Marketing
According to Stanton et al. (1991), niche marketing aims at meeting customer needs through tailoring goods and
services for small markets. Niche marketing could be defined “as positioning an offer in small, profitable homogeneous
market segments that have been ignored or neglected by competitors. There are five elements in niche marketing: (i)
positioning, (ii) profitability, (iii) distinctive competences, (iv) small market segments, (v) observance of the marketing
concept” (Dalgic & Leew, 1994: 42). According Dalgic and Leew (1994), focused marketing, concentrated marketing,
target marketing and micromarketing are used as synonyms for niche marketing. Although they exhibit substantial
similarities they differ to some extent. Table 1 presents some illustrative characteristics of niche activities.
Table 1: Basic characteristics of niche marketing
Niche Marketing characteristics Source
Thinking and acting small by offering small production volumes,
focusing on a few customers, and avoiding markets with many
competitors or a dominant competitor.
(Hammermesh et al., 1978; Hezar et al., 2006)
Focusing on customer needs. (Dalgic & Leeuw, 1994)
Segmenting the market creatively, focusing activities only on areas
where the firm has strengths that are especially valued.
(Hammermesh et al., 1978)
Building strong and long-term relationships. (Dalgic & Leeuw, 1994)
Offering superior customer value. (Doyle, 2002)
Applying specialisation and differentiation. (Dalgic & Leeuw, 1994; Kotler, 1991)
Also in tourism, niche products require further development and marketing in response to changing global tourism
demand, in order to increase revenues and enhance a positive national image (Hall, 1999). In particular, the idea of
niche marketing may be transposed to cross-border tourist regions. Such destinations are “characterised by
homogenous features and functional interdependencies because otherwise there is no need for cross-border co-operatin”’
(CoE, 1972: 29). A cross-border region is characterized by its geography, history, ecology, ethnic groups, economic
possibilities and so on (Perkmann, 2003).

329
According to Perkmann (2003), in its original sense, for example, Euroregions represents an agreement of cooperation
between local governments in neighboring territories in Europe. They are administrative-territorial structures
intended to promote cross-border cooperation between neighboring local or regional authorities of different countries
located along shared state borders.
2.2. Involvement, satisfaction and loyalty
Of particular interest to this study is the notion of involvement. According to Gursoy and Gavcar (2003), this construct
has received relevant attention in recent years. However, the majority of research on this topic has focused on internal
tourists, recreational activities participants, or associated services and products. From a consumer behavior
perspective, the involvement concept may be defined as the perceived personal importance and/or interest that
consumers attach to the purchase, consumption and disposition of a good, service or idea (Mowen & Minor, 1998).
According to Gursoy and Gavcar (2003), consumers’ level of involvement with an object, situation, or actions is
determined by the degree to which they perceive that concept to be personally relevant. This is represented by the
perceived linkage between their needs, goals, and values, and their product knowledge. Throughout the years, many
theoretical models for the conceptualization of involvement evolved resulting in the development of several different
definitions and scales that are intended to operationalize the construct.
When applied in leisure research, involvement has often consisted of three dimensions: attraction, self-expression and
centrality to lifestyle. Attraction is conceived as the perceived importance of an activity or product and pleasure derived
from participation or use (Funk, Ridinger, & Moorman, 2004). Self expression transmits the degree to which participants
express their self concept or individuality through the situation or object of study. Participation acts as a message of
who the subjects are, and the situation or object acts as a vehicle through which one projects and enhances self-image
(Selin & Howard, 1988). Centrality to lifestyle relates to the extent to which participants’ social networks revolve
around an activity, and whether participants’ lifestyles are significantly impacted by their participation (Dimanche &
Havitz, 1994).
A parallel stream of research concerns the study of customer satisfaction and loyalty. Parasuraman, Zeitmal and Berry
(1993) identify a simple principle of customer satisfaction: the satisfaction (S) of the client results from the difference
of the set of perceptions (P) and expectations (E), that is, [S = P - E]. There is, however, a wide variance in the
definitions of satisfaction (Giese & Cote, 2000). Theories and perspectives concerning the evaluation of customer
satisfaction, originating from the marketing field, served as input to several studies in tourism. Examples of these are
the models of expectation/disconfirmation (Chon, 1989; Oliver, 1980), equity (Fisk & Young, 1985, Oliver & Swan,
1989), norm (Cadotte, Woodruff & Jenkins, 1987) and perceived overall performance (Tse & Wilton, 1988).
Consumer loyalty, i.e., the repetition of a product purchase or the recommendation to others, became a critical indicator
in the measurement of the success of a marketing strategy (Cunningham, 1956; Flavian, Martinez & Polo, 2001). In a
tourist destination setting it means that destinations may be considered as products and tourists can revisit or
recommend a destination to other potential tourists as friends or family (Yoon & Uysal, 2005). Previous research has
incorporated the concept of consumer loyalty in the study of tourist products or destinations (e.g. Backman &
Crompton, 1991; Baloglu, 2001; Iwasaki & Havitz, 1998; Opperman, 2000; Yoon & Uysal, 2005). However, according to
Dimanche and Havitz (1994), the study of the usefulness of the concept of loyalty and its application to tourism is still
limited, in spite of the crucial role it may play in the market.
3. Research model
Various studies investigated the significant associations between involvement and other consumer-related variables,
including satisfaction and service quality (Hwang et al., 2005; Suh et al 1997). In the tourism field, there is still room to
further develop the causal relationships between, involvement, satisfaction and loyalty. As Kim (2008:309) explains,
“while past studies have frequently investigated tourists’ various behaviors such as motivation, involvement, satisfaction,
or likeliness to revisit, they have failed to test if their causal relationships exi st. Findings contribute to confirming the valid
existence of the cognitive and affective involvement constructs as well as their mediating roles between motivation and
satisfaction to predict travel demand (e.g., destination loyalty)” . Indeed, investigating causal relationships between
involvement and other related variables is beneficial for current researchers and marketers since results can help
predicting how and why individuals are involved in travel and how travel decision making process are made regarding

330
preferred destinations for vacation (Hwang et al. 2005). Based on such relevance we developed a research model
(Figure 1) that highlights the links between involvement, satisfaction and loyalty in the context of cross -border regions.
Figure 1: Research Model
Cross-border regions context
Previous studies in tourism and recreation contexts addressing the notion of involvement were mostly conducted on
North American tourists, recreational activities participants, or associated services and products (Gursoy & Gavcar,
2003). Similarly, Gross and Brown (2008) studied the involvement construct in a tourism context. They applied a survey
to tourists in five South Australian tourism regions measuring respondents’ attitudes towards tourism experiences in
South Australia. Consistent with previous consumer studies, the pattern of results suggests that involvement is an
antecedent of satisfaction (Bennett et al., 2007). Based on this discussion, we propose that in a cross-border region
destination:
H1: Involvement has a positive and direct effect in the satisfaction
A parallel stream of research concerns the study of customer satisfaction and loyalty in tourist destinations. Satisfaction
and loyalty of tourists has been playing a major role in the planning and marketing of tourism products and services
(Yoon & Uysal, 2005). In fact, an understanding of satisfaction appears to be a basic parameter for evaluating the
performance of products and services of the destination (Schofield, 2000). Given its strategic importance in the
management of destinations, satisfaction became a key element for the strategic management of tourist destinations
(Danaher & Arweiler, 1996; Kozak & Rimmington, 2000; Bowen, 2002).
Tourists may have different motivations for visiting a particular destination, as well as different levels of satisfaction
(Yoon & Uysal, 2005). Tourist satisfaction influences the buying decision, products and services’ consumption, and the
return to the destination (Baker & Crompton, 2000; Kozak & Rimmington, 2000). That is, ultimately, satisfaction may
influence consumer loyalty (Bitner, 1990; Nam, Ekinci and Whyhatt, 2011). Consumer satisfaction appears, thus, to be
an affective or emotional dimension and is different from other variables, such as, quality, price, and value (Bowen,
2001; Bowen & Clarke, 2002). Consumer satisfaction is an important factor positively influencing brand loyalty
(Bearden & Teel, 1983; Kozak & Rimmington, 2000; Peter & Olson, 1999; Tse & Wilton, 1988). According to Kim
(2008), consumer satisfaction is associated with ‘‘repeated sales”, ‘‘positive word-of-mouth,’’ and ‘‘brand loyalty’.’
Therefore, satisfied tourists are more likely to revisit the same destination and provide positive referrals to friends and
relatives indicating destination loyalty (Yoon & Uysal, 2005). Based on this discussion we propose that in a cross-
border region destination:
H2: Satisfaction has a direct effect on destination loyalty
4. Research implications
This paper intended to be a preliminary contribution to better understand the relationship between involvement and
the attitudes and feelings towards a destination, in the context of cross-border regions. The study focused on the
behavior and patterns of tourism consumption in emerging segments. We attempted to capture different individual
interests, motivations and determinants of demand in tourism applied to border regions. From interdisciplinary
H
2
H
1

331
perspective, this work included inputs from areas of marketing, tourism and local development.
Future research ought to develop an empirical study to test the relationships addressed in the research model. It would
be relevant to identify specific profiles of tourism consumers - exploring motivations, determinants and purchase
decision. An empirical study would further allow understanding how the constructs in the research model relate to
each other in the specified research context. The study of the proposed relationships permits gauging the impact of
certain factors in the predisposition towards the destination (e.g. likelihood of recommending a destination). Thus, an
empirical study would not only test the hypothesis of a relationship between variables, but also, test the predictive
value of the variables. Such endeavor tests and validates the assumptions of the theory, with strong deductive power
enabling the creation of a final model applicable to the context of (Elliot, 2003). cross-border regions Understanding
tourism consumer behavior in specific contexts may provide valuable information into destination planning and
decision making. Such knowledge would have managerial implicationsas, for example, improving the elements that
most influence the satisfaction of tourists. Consequently decision makers would be able to develop more directed
policies. Ultimately it would give insights into decisions regarding the effectiveness and efficiency of consumer
targeting and satisfaction.
References
Backman, S. & Crompton, J. (1991). The usefulness of selected variables for predicting activity loyalty. Leisure Science,
13, 205-220.
Baker, D. & Crompton, J. (2000). Quality, Satisfaction and Behavioral Intentions. Annals of Tourism Research, 27(3), 785-
804.
Baloglu, S. (2001). An investigation of a loyalty typology and the multidestination loyalty of international travelers.
Tourism Analysis, 6(1), 41-52.
Bearden, W. & Teel, J. (1983). Selected determinants of consumer satisfaction and complaint reports. Journal of
Marketing Research, 20(1), 21-28.
Becken, S. & Simmons, D. (2002). Understanding energy consumption patterns of tourist attractions and activities in
New Zealand, Tourism Management, 23, 343–354.
Bennett, R.; Kennedy, J. & Coote, L. (2007). Involvement, satisfaction, and brand loyalty in a small business services
setting, Journal of Business Research, 60, 1253–1260.
Bitner, M. (1990). Evaluating service encounter: the effects of physical surroundings and employee responses. Journal
of Marketing, 54, 69-82.
Bowen, D. (2001). Antecedents of consumer satisfaction and dis-satisfaction (CS/D) on long-haul inclusive tours: A
reality check of theoretical considerations, Tourism Management, 22(1), 49-61.
Bowen, D. (2002). Research through participant observation in tourism: A creative solution to the measurement of
consumer satisfaction/dissatisfaction (CS/D) among tourists. Journal of Travel Research, 41(1), 4-14
Bowen, D., & Clarke, J. (2002). Reflections on tourist satisfaction research past, present and future, Journal of Vacation
Marketing, 8(4), 297-308.
Cadotte, E.; Woodruff, R. & Jenkins, R. (1987). Expectations and norms in models of consumer satisfaction. Journal of
Marketing Research, 24, 305-314.
Chon, K. (1989). Understanding recreational travelers’ motivation, attitude and satisfaction. The Tourist Review, 44(1),
3-7.
CoE (1995). Manuel de coopération transfrontal iére à l’usage des collectivités locales et régionales en Europe.
Strasbourg: Council of Europe.
Cunningham, R.M. (1956). Brand loyalty - what where how much? Harvard Business Review, 34, 116-128.
Dalgic, T. & Leeuw, M. (1994). Niche Marketing Revisited: Concept, Applications and Some European Cases, European
Journal of Marketing, 28(4), 39-55.

332
Danaher P. & Arweiler N. (1996). Customer satisfaction in the tourist industry: a case study of visitors to New Zealand.
Journal of Travel Research, 35(1), 89-93.
Dimanche, F. & Havitz, M. (1994). Consumer behavior and tourism: Review and extension of four study areas. Journal of
Travel and Tourism Marketing, 3(3), 37-58.
Doyle, P. (2002). Marketing Management and Strategy, Financial Times/Prentice-Hall, Harlow.
Fisk, R. & Young, C. (1985). Disconfirmation of equity expectations: effects on consumer satisfaction with services. In
Hirschman, E. & Holbrook, M. (Eds.), Advances in Consumer Research, Association for Consumer Research,
340-345.
Flavian, C.; Martinez, E. & Polo, Y. (2001). Loyalty to grocery stores in the Spanish market of the 1990s. Journal of
Retailing and Consumer Services, 8, 85-93.
Funk, D.; Ridinger, L. & Moorman, A. (2004). Exploring origins of involvement: Understanding the relationship between
consumer motives and involvement with professional sport teams. Leisure Sciences, 26(1), 35-61.
Getz, D. (1986). Models in Tourism Planning: Towards Integration of Theory and Practice. Tourism Management, 7, 21–
32.
Giese, J. & Cote, J. (2000). Defining consumer satisfaction. Academy of Marketing Science Review, 2, 1-24.
Gross, M. & Brown, G. (2008). An empirical structural model of tourists and places: Progressing involvement and place
attachment into tourism. Tourism Management, 29(1), 1141-1151.
Gursoy, D. & Gavcar, E. (2003). International leisure tourists’ involvement profile. Annals of Tourism Research, 30 (4),
906–926.
Hall, D. (1999). Destination branding, niche marketing and national image projection in Central and Eastern Europe.
Journal of Vacation Marketing, 5(3), 227-237.
Hammermesh, T.; Anderson, M. & Harris, J. (1978). Strategies for low market share businesses”. Harvard Business
Review, 50(3), 95-102.
Hwang, S. N., Lee, C., & Chen, H. J. (2005). The relationship among tourists’ involvement, place attachment and
interpretation satisfaction in Taiwan’s national parks. Tourism Management, 26(2), 143-156.
Elliott, M. (2003). Causality and how to model it. BT Technology Journal, 21(2), 120-125.
Embacher, J. & Buttle, F. (1989). A repertory grid analysis of Austria’s image as a summer vacation destination. Journal
of Travel Research, Winter, 3-7.
Iwasaki, Y. & Havitz, M. (1998). A path analytic model of the relationships between involvement, psychological
commitment and loyalty. Journal of Leisure Research, 30(2), 256-280.
Kim, K. (2008). Analysis of Structural Equation Model for the Student Pleasure Travel Market: Motivation, Involvement,
Satisfaction, and Destination Loyalty, Journal of Travel & Tourism Marketing, 297-313.
Kozak, M. & Rimmington, M. (2000). Tourist satisfaction with Mallorca, Spain, as an off-season holiday destination.
Journal of Travel Research, 38(3), 260-269.
Mowen, J. & Minor, M. (1998). Consumer behavior, 5th ed., Upper Saddle River, New Jersey: Prentice-Hall.
Nam, J.; Ekinci, Y. & Whyatt, G. (2011). Brand equity, brand loyalty and consumer satisfaction. Annals of Tourism
Research, 38(3), 1009-1030.
Okello, M.; Manka, S. & D’Amour, D. (2008). The relative importance of large mammal species for tourism in Amboseli
National Park, Kenya, Tourism Management, 29, 751–760.
Oliver, R. (1980). A cognitive model of the antecedents and consequences of satisfaction decisions. Journal of Marketing
Research, 17, 46-49.
Oliver, R. & Swan, J. (1989). Consumer perceptions of interpersonal equity and satisfaction in transactions: a field
survey approach. Journal of Marketing, 53, 21-35.

333
Oppermann, M. (2000). Tourism Destination Loyalty. Journal of Travel Research, 39, 78-84.
Orsingher, C.; Valentini, S. & Angelis, M. (2010). A meta-analysis of satisfaction with complaint handling in services.
Journal of the Academy of Management Science, 38 , 169-186.
Peter, J. & Olson, J. (1999). Consumer behavior and marketing strategy (7th ed.). New York: McGraw-Hill.
Parasuraman, A.; Zeithaml, V. & Berry, L. (1993). Total quality in the management of services: How to balance the
perceptions and expectations of consumers. Madrid: Díaz de Santos.
Perkmann, M. (2003). Cross-Border Regions in Europe – Significance and drivers of regional cross-border co-operation.
European Urban and Regional Studies, 10(2), 153-171.
Schofield, P. (2000). Evaluating castlefield urban heritage park from the consumer perspective: Destination attribute
importance, visitor perception and satisfaction. Tourism Analysis, 5(2-4), 183-189.
Selin, S. & Howard, D. (1998). Ego involvement and leisure behavior: a conceptual specification. Journal of Leisure
Research, 20(3), 237-244.
Stanton, W.; Etzel, M. & Walker, B. (1991). Fundamentals of Marketing, McGraw-Hill, New York. Stokols, D., &
Shumacker, S. A. (1981). People in places: a transactional view of settings. In J. Harvey (Ed.), Cognition, social
behavior, and the environment, 441-448. Hillsdale, NJ: Erlbaum.
Studzieniecki, T. & Mazurek, T. (2007). How to promote a Cross-Border Region as a Tourism Destination: The case
study of the Bug Region. Tourism Review, 62(1), 34-38.
Suh, S. , Lee, Y., Park, Y., & Shin, G. (1997). The impact of consumer involvement on the consumers’ perception of service
quality: Focusing on the Korean hotel industry. Journal of Travel and Tourism Marketing, 6(2), 33-52.
Tse, D. & Wilton, P. (1988). Models of consumer satisfaction: An extension. Journal of Marketing Research, 25, 204-212.
Yoon, Y. & Uysal, M. (2005). An examination of the effects of motivation and satisfaction on destination loyalty: A
structural model. Tourism Management, 26(1), 45–56.

334
Terrorism and International Tourists Consumer Behavior in Tourism, Involvement, Media, Motivation to Safety, Risk Perception, Terrorism
Cláudia Seabra, Polytechnic Institute of Viseu, [email protected]
José Abrantes, Polytechnic Institute of Viseu, [email protected]
Elisabeth Kastenholz, University of Aveiro, [email protected]
Abstract
Using a sample of 600 international tourists travelling in Portugal, Spain and Italy, this study identifies key issues
related with terrorism, risk perception, involvement and motivation to safety of internati onal tourists. A structural
model reveals that tourists are motivated to acquire information about terrorism in the media, namely they show
attention and interest in that news and that influences directly their risk perception. The risk perception influenc es
directly the involvement of tourists in the trip planning, specifically information seeking before and during the trip.
Risk perception and tourists’ involvement influences the tourists’ motivation to safety. Discussion centers on the
implications of this model to theory and managerial development of tourism strategies. Recommendations for
destinations managers and promoters and tourist organizations administrators are addressed.
Acknowledgments: Portuguese Foundation for Science and Technology and Center for Studies in Education,
Technologies and Health.
1. Introduction
In today’s global economy, the effects of terrorist acts are affecting the society and the economy in general. However, no
other industry in the world is so affected by a crisis caused by terrorism, than the tourism industry (Evans & Elphick,
2005). The exposure of this industry to terrorist incidents and the consequent vulnerability is recognized by
investigators and was visible during the terrorist events that have been marked the first decade of the twenty-first
century (Evans & Elphick, 2005). The destinations that are exposed to this kind of danger have to manage the crisis, but
should also begin marketing efforts to rebuild its damaged image, and restore tourism (Sönmez, 1998). The challenge
embodies understanding how organizations should act to win back consumer’s confidence. This is possible only
understanding how tourists think and react to effective terrorism risk, or its perception.
The fear of terrorism may exist in tourists due to many factors: past experiences with terrorist attacks, conflict
proximity, tourist destination negative image, social interaction and influence of agents and tour operators (Sönmez &
Graefe, 1998a) and exposure to media information (Seabra, Abrantes & Lages, 2007). We are faced with both a complex
and multidisciplinary problem. It is essential to understand tourists’ processes of cognitive and affective responses
when they feel threatened. Travel, especially of leisure, should be a pleasurable experience. When negative elements
enter in the equation, the experience changes, the pleasure is replaced by apprehension and anxiety.
In this study we try to analyze the terrorism contact and risk perception as an antecedent of involvement with the
product buying, also what are the consequences of involvement, specially safety’s importance. No study exists with a
focus on the impact of the perceived risk of terrorism, depending on the levels of involvement and the consequently in
the safety importance in international tourists. The intention of this study is to help close this gap. It is necessary to
create more reliable tools to analyze this relationship (Sönmez, 1998). It is important to understand consumers’
involvement, the purchase and consumption behavior in the tourism market. It’s also important to analyze the

335
influence that the terrorism perceived risk may have on the decision to purchase travel, and especially international
travel.
2 Literature Review
The purchase of tourism products requires highly involving decision making processes, due to the before-mentioned
features of tourist services, generally implying multiple phases as well as impacted by a variety of variables
(Swarbrooke & Horner, 1999), with the final decision being a result of the combined influences of personal, social and
commercial variables (Sönmez & Graefe, 1998b).
When the consequences of travel decision are uncertain, this process is perceived as containing risk. Decision makers
compare costs and benefits and choose the less risky alternative. The inputs of the perception of risk and ways to
respond to their existence vary depending on many factors, such as situational, tourists’ characteristics and the way
consumers relate to the product (Sirakaya & Woodside, 2005).
In the conceptual model there are three major groups of factors related to each other in explaining the importance of
safety for international travel:
• Antecedents of Risk Perception: Contact Terrorism, Interest and Attention to Terrorism in the Media, Contact with
Crime in the daily life.
The perceived risk that tourists associate with destinations and international travel is based on a variety of factors
ranging from their experiences, the context in which incidents occur, to how the media spread those events and kept
them alive in people's minds (Fletcher & Morakabati, 2008). Therefore, the concept of terrorism was analyzed from two
different perspectives: the direct or indirect contact with terrorist attacks and the interest that tourists have on the
news about it. Previous exposure to crime influences also the general sense of security and safety for travelers, more
specifically, tourists who are exposed to crime before their trips have higher risk perceptions (Milmman & Bach, 1999).
• Perceptions of Risk in International Travel: Risk Perception and Unsafety Perceptions.
Tourists are seen as rational consumers who compare costs and benefits when choosing a tourist destination (Sönmez,
1998). Generally, tourists do not travel to seek risk. This factor is rather perceived as negative, a threat or possible
disaster to be avoided when on holidays (Law, 2006). Risk perception in this study was defined as the amount and
types of risk associated with travel by tourists and international tourism. This perception was measured with two
subscales: generic types of perceived risk and unsafety perceptions. We considered 10 dimensions of risk, in aggregate
form. A separate measure would add unnecessary complexity, as it was intended only to evaluate the effects of certain
independent variables on risk perception as in other studies (Laroche, Bergeron & Goutaland, 2003). The perceptions
of insecurity in general domestic or international travel are also part of risk perceptions that individuals associate with
tourist experience (Floyd & Pennington-Gray 2004).
• Purchase Involvement, analyzed in the four stages of the buying decision of tourism products: Involvement in Pre-
purchase or the product, with the Decision to Purchase, Consumption and the Post-Purchase.
Involvement is the degree of commitment in which consumers are committed in different aspects of the process of
consumption: product, demand for information, decision making and the purchase (Broderic & Mueller, 1999;
Zaichkowsky, 1985). It is the basis of the decision to purchase (Zaichkowsky, 1986a) and affects profoundly the
perceived value of products and its evaluation (Bolton & Drew, 1991). In this study the concept of involvement is
considered in all stages of the tourist buying process, according to the Theory of Information Processing (Bettman, Luce
& Payne, 1998) where the process is understood as an optimal alternative individual choice by a series of rational steps.
Many researchers studied the relationship between the risk perception and involvement, sometimes analyzing risk as
an antecedent (Bloch, 1981), a component (Laurent & Kapferer, 1985) or a consequence of involvement (Venkatraman,
1988). In this study, risk perception is perceived as an antecedent of involvement.
Risks have been identified as a major concern for international tourists in their decisions (Sönmez & Graefe, 1998b).
Therefore, the need for security is an innate feature of human nature (Maslow, 1954) and the concern for security is a
factor influencing the destination choice (Crotts, 2003). Nowadays international or domestic travelers’ safety is
becoming a global concern and the lack of safety is one of the factors affecting international tourism (Kozak, Crotts &
Law, 2007; Reisinger & Mavondo, 2005).
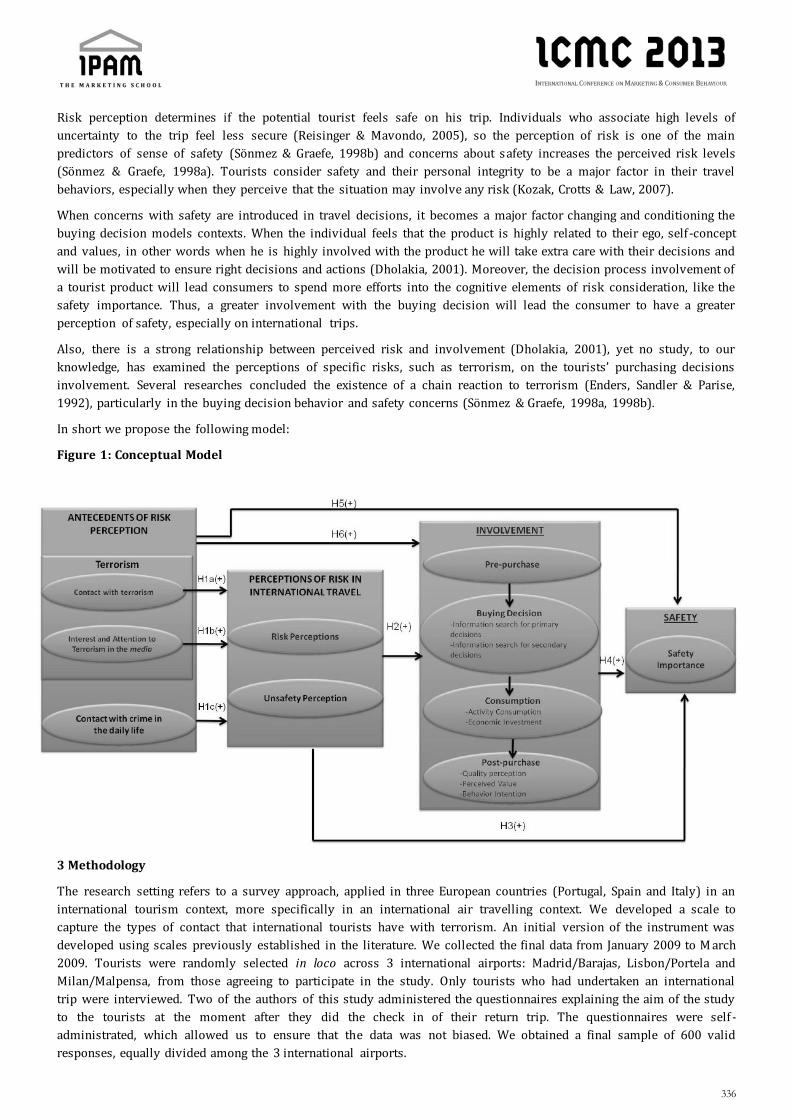
336
Risk perception determines if the potential tourist feels safe on his trip. Individuals who associate high levels of
uncertainty to the trip feel less secure (Reisinger & Mavondo, 2005), so the perception of risk is one of the main
predictors of sense of safety (Sönmez & Graefe, 1998b) and concerns about safety increases the perceived risk levels
(Sönmez & Graefe, 1998a). Tourists consider safety and their personal integrity to be a major factor in their travel
behaviors, especially when they perceive that the situation may involve any risk (Kozak, Crotts & Law, 2007).
When concerns with safety are introduced in travel decisions, it becomes a major factor changing and conditioning the
buying decision models contexts. When the individual feels that the product is highly related to their ego, self -concept
and values, in other words when he is highly involved with the product he will take extra care with their decisions and
will be motivated to ensure right decisions and actions (Dholakia, 2001). Moreover, the decision process involvement of
a tourist product will lead consumers to spend more efforts into the cognitive elements of risk consideration, like the
safety importance. Thus, a greater involvement with the buying decision will lead the consumer to have a greater
perception of safety, especially on international trips.
Also, there is a strong relationship between perceived risk and involvement (Dholakia, 2001), yet no study, to our
knowledge, has examined the perceptions of specific risks, such as terrorism, on the tourists’ purchasing decisions
involvement. Several researches concluded the existence of a chain reaction to terrorism (Enders, Sandler & Parise,
1992), particularly in the buying decision behavior and safety concerns (Sönmez & Graefe, 1998a, 1998b).
In short we propose the following model:
Figure 1: Conceptual Model
3 Methodology
The research setting refers to a survey approach, applied in three European countries (Portugal, Spain and Italy) in an
international tourism context, more specifically in an international air travelling context. We developed a scale to
capture the types of contact that international tourists have with terrorism. An initial version of the instrument was
developed using scales previously established in the literature. We collected the final data from January 2009 to M arch
2009. Tourists were randomly selected in loco across 3 international airports: Madrid/Barajas, Lisbon/Portela and
Milan/Malpensa, from those agreeing to participate in the study. Only tourists who had undertaken an international
trip were interviewed. Two of the authors of this study administered the questionnaires explaining the aim of the study
to the tourists at the moment after they did the check in of their return trip. The questionnaires were self -
administrated, which allowed us to ensure that the data was not biased. We obtained a final sample of 600 valid
responses, equally divided among the 3 international airports.
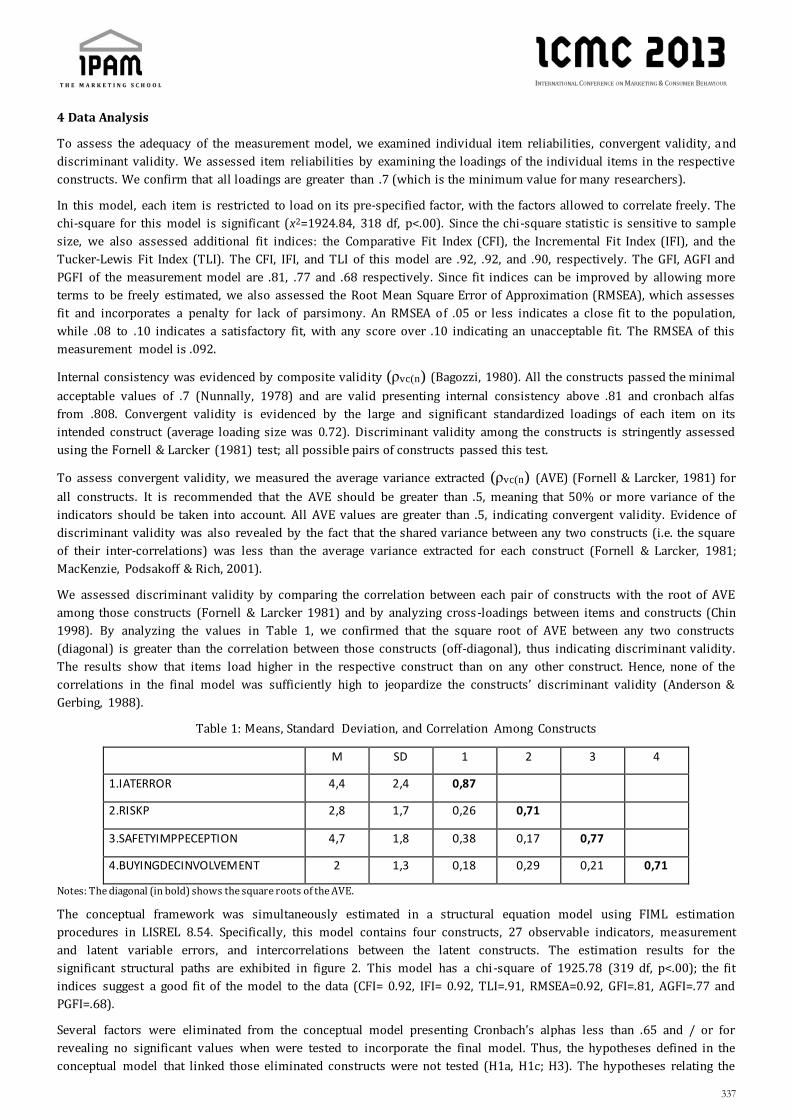
337
4 Data Analysis
To assess the adequacy of the measurement model, we examined individual item reliabilities, convergent validity, and
discriminant validity. We assessed item reliabilities by examining the loadings of the individual items in the respective
constructs. We confirm that all loadings are greater than .7 (which is the minimum value for many researchers).
In this model, each item is restricted to load on its pre-specified factor, with the factors allowed to correlate freely. The
chi-square for this model is significant (x2=1924.84, 318 df, p<.00). Since the chi-square statistic is sensitive to sample
size, we also assessed additional fit indices: the Comparative Fit Index (CFI), the Incremental Fit Index (IFI), and the
Tucker-Lewis Fit Index (TLI). The CFI, IFI, and TLI of this model are .92, .92, and .90, respectively. The GFI, AGFI and
PGFI of the measurement model are .81, .77 and .68 respectively. Since fit indices can be improved by allowing more
terms to be freely estimated, we also assessed the Root Mean Square Error of Approximation (RMSEA), which assesses
fit and incorporates a penalty for lack of parsimony. An RMSEA of .05 or less indicates a close fit to the population,
while .08 to .10 indicates a satisfactory fit, with any score over .10 indicating an unacceptable fit. The RMSEA of this
measurement model is .092.
Internal consistency was evidenced by composite validity (ρvc(n) (Bagozzi, 1980). All the constructs passed the minimal
acceptable values of .7 (Nunnally, 1978) and are valid presenting internal consistency above .81 and cronbach alfas
from .808. Convergent validity is evidenced by the large and significant standardized loadings of each item on its
intended construct (average loading size was 0.72). Discriminant validity among the constructs is stringently assessed
using the Fornell & Larcker (1981) test; all possible pairs of constructs passed this test.
To assess convergent validity, we measured the average variance extracted (ρvc(n) (AVE) (Fornell & Larcker, 1981) for
all constructs. It is recommended that the AVE should be greater than .5, meaning that 50% or more variance of the
indicators should be taken into account. All AVE values are greater than .5, indicating convergent validity. Evidence of
discriminant validity was also revealed by the fact that the shared variance between any two constructs (i.e. the square
of their inter-correlations) was less than the average variance extracted for each construct (Fornell & Larcker, 1981;
MacKenzie, Podsakoff & Rich, 2001).
We assessed discriminant validity by comparing the correlation between each pair of constructs with the root of AVE
among those constructs (Fornell & Larcker 1981) and by analyzing cross-loadings between items and constructs (Chin
1998). By analyzing the values in Table 1, we confirmed that the square root of AVE between any two constructs
(diagonal) is greater than the correlation between those constructs (off-diagonal), thus indicating discriminant validity.
The results show that items load higher in the respective construct than on any other construct. Hence, none of the
correlations in the final model was sufficiently high to jeopardize the constructs’ discriminant validity (Anderson &
Gerbing, 1988).
Table 1: Means, Standard Deviation, and Correlation Among Constructs
M SD 1 2 3 4
1.IATERROR 4,4 2,4 0,87
2.RISKP 2,8 1,7 0,26 0,71
3.SAFETYIMPPECEPTION 4,7 1,8 0,38 0,17 0,77
4.BUYINGDECINVOLVEMENT 2 1,3 0,18 0,29 0,21 0,71
Notes: The diagonal (in bold) shows the square roots of the AVE.
The conceptual framework was simultaneously estimated in a structural equation model using FIML estimation
procedures in LISREL 8.54. Specifically, this model contains four constructs, 27 observable indicators, measurement
and latent variable errors, and intercorrelations between the latent constructs. The estimation results for the
significant structural paths are exhibited in figure 2. This model has a chi-square of 1925.78 (319 df, p<.00); the fit
indices suggest a good fit of the model to the data (CFI= 0.92, IFI= 0.92, TLI=.91, RMSEA=0.92, GFI=.81, AGFI=.77 and
PGFI=.68).
Several factors were eliminated from the conceptual model presenting Cronbach's alphas less than .65 and / or for
revealing no significant values when were tested to incorporate the final model. Thus, the hypotheses defined in the
conceptual model that linked those eliminated constructs were not tested (H1a, H1c; H3). The hypotheses relating the

338
constructs fixed in the CFA model were tested. The following are the results (see Figure 2) through measures of
standardized coefficients and t-values.
The hypothesis H1b that related positively interest and attention to terrorism in the media by tourists and their
perception of risk in international travel has been proven. The results show the existence of a significant and positive
relationship between those constructs (γ11=.26 p<.05, t=5.59). The proposed relationship between perceived risk in
international travel and the level of involvement of tourists to the tourist decision process (H2) was confirmed in the
analysis: β21=.27 p<.05 (t=5.38). The hypothesis that the involvement of tourists with the buying decision could have a
positive impact on their perception of the importance of security in international travel was established (H5). The
relationship was significant and positive as evidenced by the results (β32 =. 15 p <.05, t = 3.23). Support was found for
the relationship between the contact of tourists with terrorism and its level of involvement with the tourist decision
process, as proposed in hypothesis H6. The results show that this relationship is significant and positive γ12=.11 p<.05
(t=2.47). The hypothesis that tourists' contact with terrorism increases the perception of the safety importance in
international travel has also been supported by the results (H7) γ31=.36 p<.05 (t=7.56).
Figure 2: Final Model
5 Conclusions and Results Discussion
This work had as main objective to analyze the consumers’ behavior in the tourism market, taking into account the
effect that terrorism might have on the decision to undertake international travel. It was intended to understand how
the contact of tourists with such events could influence the international travelling behavior. The purchase decision
models of tourists and theories of decision making were the foundation of this study. Several models and theories of
decision making were integrated and then adjusted to reflect the international tourism decisions, taking into account
the fear that tourists may have regarding terrorism.
From this study results we can draw some main conclusions:
• Terrorism influences the perceptions of risk that tourists associate with International travel. However, and
surprisingly, we could not confirm that the direct or indirect contact has a significant impact on risk perceptions. It has
been demonstrated, however, that the interest and attention on terrorism on media is an antecedent of risk perception
in international travel. This relationship confirms the important effect of mass media on perceptions of tourists (Baral,
Baral & Morgan, 2003; Sönmez, 1998; Taylor, 2006).
• It was demonstrated also the existence of a significant and positive relationship between Perceived Risk and
Involvement in International Travel, but only at the level of the buying decision, namely in information search. The
perceived risk is usually higher in tourist buying decisions, which suggests that tourists are more involved in seeking
information to reduce the uncertainty involved in this purchase. The greater the perceived risk by tourists, the more
they seek information and become more rational in decision making process. On the other hand, tourists have a
tendency to be permanently informed, when they see the product or its category is important or has a symbolic value,

339
which is the case for travel.
• It was likewise established the hypothesis that the involvement in tourists purchase decision could have a positive
impact on the safety importance perception in international travel. The results confirmed the significant relationship
between these two constructs reinforcing other studies that considered the importance of safety in travel decisions (see
Dholakia, 2001; George, 2003; Pearce, 1988).
• Finally, we settled several hypotheses of direct links between terrorism, risk perceptions in international travel and
involvement with the safety importance perception. The results revealed that the interest and attention to terrorism on
media and involvement in the purchase decision has a significant and positive impact on the safety importance
perception by international tourists, demonstrating again the critical importance of that factor by international tourists.
In summary, we concluded that the interest and attention given to terrorism on media by tourists increases the risk
perception in international travel, their involvement in seeking information for travel and the consequent emphasis on
safety. Moreover, this effect of attention and interest in the contents of mass media about terroris m raises the risk
perception by individuals in their international travel, which in turn contributes to a greater involvement of tourists
with the buying decision, namely with the information search.
6. IMPLICATIONS
Crisis management in face of terrorism is an area of particular importance to managers, since, unfortunately, contact
with terrorism occurs in nowadays daily life, directly, indirectly or trough media, influencing many consumers’ and
tourists’ decisions. The selection of a strategy for tourism depends on how tourists perceive the risk and the contact
that they had with terrorism. It is expected that through the application of this model results, in the context of market
studies, tourism firms may better understand the type of contact tourists have with terrorism and what its impact on
tourists’ decision making. They may as a consequence use a framework to develop and implement strategies that might
reduce perceived risk and increase the value associated with destinations and their services.
Our model gives an extended and integrated vision of the tourists risk perception of terrorism in tourist involvement
and motivation for safety. When marketers understand how consumers react to risk perception of terrorism, they can
create more effective campaigns to influence consumers’ expectations and decisions.
Along these lines we can state that tourist organizations must understand that the image that tourists have about
destinations can be influenced by incidents in other regions. Also they must consider the media as an important
indicator of their own image. Tourists search extensively for information when they feel risk, organizations must invest
in good communication materials that must be able to limit risk. Safety is a major concern for tourists. Organizations
and destinations must be able to give this feeling.
From a theoretical perspective, to our knowledge, no study exists with a focus on the impact of the perceived risk of
terrorism, depending on the levels of involvement and the consequently in the motivation for safety of international
tourists. The intention of this study is to help close this gap. Also this study analyzed the antecedents of risk perception
acquired on media, a topic that has been neglected in literature. In sum, at a time when marketing researchers are
challenged to provide research with practical implications, it is believed that this theoretical framework may be used as
a basis to pursue service-oriented destination and business strategies while taking into consideration the contact that
tourists have trough media with terrorism, risk perception and involvement.
7 References
Anderson, J., & Gerbing, D. (1988). Structural Equation Modeling in Practice: A Review and Recommended Two -Step
Approach. Psychological Bulletin, 103(3), 411-423.
Bagozzi, R. (1980). Causal Models in Marketing. New York: John Wiley.
Baral, A., Baral, S., & Morgan, N. (2003). Marketing Nepal in an Uncertain Climate: Confronting Perceptions of Risk and
Insecurity. Journal of Vacation Marketing, 10, 186-192.
Bettman, J., Luce, M., & Payne, J. (1998). Constructive Consumer Choice Processes. Journal of Consumer Research, 25,
187-217.

340
Bloch, P. (1981). An Exploration into the Scaling of Consumer's Involvement with a Product Class. Advances in
Consumer Research, 8, 61-65.
Broderick, A., & Mueller, R. (1999). Theorectical and Empirical Exegesis of the Consumer Involvement Construct: The
Psychology of the Food Shoper. Journal of Marketing Theory and Practice, 7, 97-108.
Crotts, J. (2003). Theorectical Perspectives on Tourist Criminal Victimization. Journal of Tourism Studies, 14(1), 92-98.
Dholakia, U. (2001). A Motivational Process Model of Product Involvement and Consumer Risk Perception. European
Journal of Marketing, 35(11/12), 1340-1360.
Enders, W., Sandler, T., & Parise, G. (1992). An Econometric Analysis of the Impact of Terrorism on Tourism. Kyklos, 45,
531-554.
Evans, N., & Elphick, S. (2005). Models of Crisis Management: An Evaluation of theirs Value for Strategic Planning in the
International Travel Industry. International Journal of Tourism Research, 7, 135-150.
Fletcher, J., & Morakabati, Y. (2008). Tourism Activity, Terrorism and Political Instability within Commonwealth: The
Cases of Fiji and Kenya. International Journal of Tourism Research, 10, 537-556.
Floyd, M., & Pennington-Gray, L. (2004). Profiling Risk Perceptions of Tourists. Annals of Tourism Research, 31(4),
1051-1054.
Fornell, C., & Larcker, D. (1981). Evaluating Structural Equation Models with Unobservable Variables and Measurement
Error. Journal of Marketing Research, 18(February), 39-50.
George, R. (2003). Tourists' Perceptions of Safety an Security While Visiting Cape Town. Tourism Management, 24, 575-
585.
Kozak, M., Crotts, J., & Law, R. (2007). The Impact of Perception of Risk on International Travellers. International
Journal of Tourism Research, 9, 233-242.
Laroche, M., Bergeron, J., & Goutaland, C. (2003). How Intangibility Affects Perceived Risk: The Moderating Role of
Knowledge and Involvement. The Journal of Services Marketing, 17(2/3), 122-140.
Laurent, G., & Kapferer, J. (1985). Measuring Consumer Involvement Profiles. Journal of Marketing Research, 22(2), 41-
53.
Law, R. (2006). The Perceived Impact of Risks on Travel Decisions. International Journal of Tourism Research, 8, 289-
300.
MacKenzie, S., Podsakoff, P., & Rich, G. (2001). Transformational and Transactional Leadership and Salesperson
Performance. Journal of Academy of Marketing Science, 29(2), 115-134.
Milman, A., & Bach, S. (1999). The Impact of Security Devices in Tourists' Perceived Safety: The Central Florida
Example. Journal of Hospitality and Tourism Research, 23(4), 371-386.
Nunnally, J. (1978). Psychometric Theory. New York: McGraw-Hill.
Pearce, P. (1988). The Ulysses Factor: Evaluating Visitors in Tourist Settings. New York: Verlag-Springer.
Reisinger, Y., & Mavondo, F. (2005). Travel Anxiety and Intentions to Travel Internationally: Implications of Travel Risk
Perception. Journal of Travel Research, 43, 212-225.
Seabra, C., Abrantes, J., & Lages, L. (2007). The Impact of External Information Sources in Expectations Formation and
Future Use of Media. Tourism Management, 28(6), 1541-1554.
Sirakaya, E., & Woodside, A. (2005). Building and Testing Theories of Decision Making by Travellers. Tourism
Management, 26(6), 815-832.
Sönmez, S. (1998). Tourism, Terrorism and Political Instability. Annals of Tourism Research, 25(2), 416-456.
Sönmez, S., & Graefe, A. (1998a). Influence of Terrorism Risk on Foreign Tourism Decisions. Annals of Tourism
Research, 25(1), 112-144.
Sönmez, S., & Graefe, A. (1998b). Determining Future Travel Behavior From Past Travel Experience and Perceptions of

341
Risk and Safety. Journal of Travel Research, 37(4), 171-177.
Swarbrooke, J., & Horner, S. (1999). Consumer Behavior in Tourism. Oxford: Butterworth-Heinemann.
Taylor, P. (2006). Getting Them to Forgive and Forget: Cognitive Based Marketing Responses to Terrorist Acts.
International Journal of Tourism Research, 8, 171-183.
Venkatraman, M. (1988). Investigating Differences in the Roles of Enduring and Instrumentally Involved Consumers in
the Diffusion Process. Advances in Consumer Research , 299-303.
Zaichkowsky, J. (1985). Measuring the Involvement Concept. Journal of Consumer Research, 12(December), 341-352.
Zaichkowsky, J. (1986a). Conceptualizing Involvement. Journal of Advertising, 15(3), 4-34.

342
The Choice of the University Abroad: A
Conceptual Model Academic Tourism, University, College Choice, Consumer Behavior, Differentiation, Studying Abroad.
Elisete Queijo, ISCTE IUL, [email protected]
Abstract
With the increasing number of Universities around the world, it is necessary to create differentiation and competitive
advantage in the marketplace. The aim of this study is to present a model with the main factors that appear in the
literature review in order to find which ones have the greatest impact on the decision-making process of the student by
the choice of the College abroad. Brand, University Context, Country Context, Student’s profile, Reference Group,
Communication from Media/Marketing are the main constructs that contains the variables that can influence the final
decision and are correlated with the University/Country abroad. The parametric tests and the Logit Model are the
statistical approaches suggested in this study after the application of a survey to under graduation and graduation
students located in Portugal. The model suggests that the Tourism is an important factor to involve the student in
his/her final decision. The limitations lie in the scarce literature on the subject and difficulty to access data from
Academic Tourism in Portugal and their economic representativeness. This knowledge will help the market players to
draw more assertive marketing strategies to better attract the target audience of academic tourism, a booming segment
in recent years.
1. Introduction:
With the increase in the number of universities in the world and the ease mobility of students it is necessary to create a
market differentiation which can be related not only with the school image itself, but also with its country location. The
segment of foreign students creates a new demand in the Educational context; it is a new niche of market (Henderson,
2004) and in addition to the economic profitability, it expands the University's brand image abroad as well as in the
host country. Important to remember that Universities, just like any other industry, have a primary purpose to satisfy
their customers (Vrontis, Thrasson and Melanthiou, 2007), knowing that and the main set of factors in the choice of the
University by the foreign candidate is an important tool to build efficient Communication Strategies (Heung, Kucukusta
and Song, 2010; Mello, Leão and Souza Neto, 2005).
An example of measures made in Portugal to tighten the relationship between higher education and tourism is the
agreement signed in May 2011 between the Luso-American Foundation for the Development, Tourism of Portugal, the
Fulbright Commission, CRUP and the AICEP. In the text we read that Portugal, until the date of signing, had 250
American students teaching and researching. Portugal were one of the areas with the greatest growth over the past 20
years, offering quality training with competitive values against those offered in other European countries to the
American families; it is an opportunity for students entry in the Portuguese world: Africa and Brazil; the Portuguese
language is the most spoken in the world and third in Europe.
If we consider that the investment made by the Erasmus program revolves around 450,000 euros and it acts only in 33
countries (source: Erasmus Mundus) and does not cover the entire amount of the population in mobility, we observe
that is a sizable booming market.
The purpose of this article is present a revision of literature with a list of the main factors that influence the process of
choosing the University abroad by the student, establish hypotheses and proposes a conceptual model for research to
be held in Portuguese universities, entering Portugal on academic tourism circuit.
The objective of the study is to know which factors exert greater attraction and impact on the decision-making process

343
of the student from the University abroad for creating more efficient marketing strategies, focused on attracting the
target for a particular University/Country.
This paper intends to contribute to the above challenges to the management of the actual universities. Portugal is a
European touristic country and its Universities are hosting an increasing number of Erasmus students as well as from
PALOP and Chinese students.
1.1. Research Objectives:
a) Define which are the primary influencers that attract students in mobility to a University;
b) Verify the influence of Tourism in the choice of the University abroad;
c) Verify the influence of the reference group (parents, teachers, colleagues and others) in the choice of the
University by foreign candidates.
d) Offer a Marketing strategy guideline useful to the universities.
1.2. Research Questions:
a) What are the variables that most influence in decision-making process of the University by the foreign
candidate?
b) What are the determinant factors of choice: The Tourism of the region, the classification of the University in
the ranking or other factors?
c) Social and Family reference group (Parents, Teachers, Colleagues, Other Significant) have influence in the
choice of the candidate by the University abroad?
1.3. Importance of the Study:
The main importance of this study is its applicability in the Marketing strategies to both s egments, Academic and
Tourism, to get an efficiently Communication to the audience, what enables to get more revenue by the foreign
students segment, what benefits all the society: the University with greater financial contribution has greater breadth
to researches and scientific discoveries in all areas; a country with the highest amount of money circulating can
enhance its development and sustainability.
This subject is extremely rewarding and has high potential to contribute as an income-generating source for a whole
country, adds value for developing knowledge to an academic object of study and emphasizes that all companies in
general should have a customer orientation as a way to gain competitive advantage in the marketplace. The knowledge
about which are the determinants of foreign student's choice by University is fundamental for an assertive
communication and directed to the increase of the Academic Tourism demand.
Crick (1999) emphasizes the Four S's'''-Sun, Sea and Sand-Sex, as appeals for the young students who seek their
education far away from parents and relatives abroad; also the facilities offered by the institution as location, social
camp, cultural activities on campus and in the surrounding areas, food, among others can function in additio n to the
importance of courses that are offered (Price, Matzdorf and Agahi, 2003).
2. Literature Review:
Some authors treat the subject of Academic Tourism through the Push/Pull factors (González, Mezanza and Mariel,
2011; Llewellyn, McCabe, 2008; Eder, Smith, Pitts, 2010; Lam, Ariffin, Ahmad, 2011). Push Factors play within the home
country initiating the student’s decision to study overseas and Pull Factors operate within the host country to make
that country relatively more attractive than other (Conzález, Mezanza and Mariel, 2011) as listed below:
Pull factors: as the main conditions in the destination countries motivating emigration such as price, cultural
attractions, climate, natural environment, sunny weather, good beaches, international recognized accreditation,
344
certification and reputation of the institution, better resourced facilities, professional growth opportunities (Fried and
Harris, 2008; Heung, Kucukusta and Song, 2010; Eder, Smith and Pitts, 2010).
Push factors: scape, adventure, social interaction, excitement and learning, to have a good time, meet new people, learn
a language, self-development, desire to travel, learn about the country, study opportunities not offered at home
university (Llewellyn-Smith and McCabe, 2008; Morgan and Xu, 2009); students who experience another culture can
became competent, sensitive global citizens and professionals (Jakson, 2008).
University factors: Academic reputation, campus atmosphere, quality and availability of courses and programs, extra-
curricular activities, number of international students already in the university, ease accommodation near campus,
campus attractiveness, facilities and courses taught in English (Llewellyn-Smith and McCabe, 2008).
Other factors are related with quality of services/studies, economy, study and tourism appeals: Morgan and Xu (2009)
say that travel produces experience formation through physical attributes by perception of service quality at the place
of destination by the image that relates the personality of the place and the overall impression of the destination in the
mind of the consumer.
Branding and Brand differentiation are powerful means for creating and sustaining competitive advantage (Aggarwal,
2004; Wilkins, Epps, 2011); mythical brand winners become icons (Martin, Woodside, 2011). The variable chosen was
Reputation, because it deals with Reputation of Country and University (Shanka, Quintal, Taylor, 2005; Kallio, 1995;
Moogan, 2011; Pinar, Trapp, Guirard, Boyt, 2011). Brand is the creation of a corporate identi ty and reputation; they
promote the Universities to attract international students (Pinar, Trapp, Girard & Boyt, 2011).
The student's first contact with the University is usually through Communication from the Media/Market or from the
University Institutional Communication by the prospectus or website with information about the required entry notes
and photos of the University in General with the courses of colleges (Moogan, Baron and Harris, 1999) as well as
Advertising and Promotion (Mazzarol, 1998), position of the university in the ranking (Long, 2003; Cantwell, Luca, Lee,
2009), what is related to Brand Reputation, how it is perceived by Market and how much it is important to the student
for the final choice.
The Institutional Communication made by Universities and Countries are presented in information brochures and
events, Website and the Advertising in Marketing Programs (Eder, Smith; Pitts, 2010; Moogan, 2011; Jong,
Scnusemberg, Goel, 2010).
If the students make uninformed, hasty decision on the choice of university they are more likely to experience cognitive
dissonance after enrollment when they realize that the reality is different from their expectations and the Universities
may be faced with low academic performance and/or high students turn over (Menon, Saiti and Socratous, 2007),
because of that is important to the university communicate a clear picture about what they offer and how they can
satisfy the needs of their customers. Indeed, communication is an essential activity for organizations, although many of
them do not give the importance it deserves. It addresses different messages to different events (Kotler and Levy,
2006).
In order to create Marketing strategies, we must know what is striking in people's minds about the place to emphasize
that image and which images and emotions are evoked by the target (Morgan and Xu, 2008). Our study will follow the
main appeals of the University and Country/City which evoke positive images, emotions, perceptions that can be
responsible to influence the foreign candidate in his/her university/country choice. It will add a competitive edge for
the University through the offering a strategy of Marketing oriented to the factors influencing the decision-making
process of the foreign candidate to the university and stresses the importance of Academic Tourism as a segment that
contributes to a country's economy: housing, food, clothing, tourism, cultural events, etc.
The student in mobility will choose the University whose widespread image on the market have better relationship
with his/her goals and aspirations and maximizes the utility of the service to be hired - get knowledge, develop skills to
apply a new career, in addition to the experience of living abroad in contact with a new culture, friends, colleagues ,
teachers and tasks. Preference of the consumer is composed by the association of brand attributes with total utilities of
a product; the consumer selects the product that maximizes his/her utility (Cooper and Inoue, 1996).
In the University, some variables have more impact than other as the case of tuition (Shanka, Quintal, Taylor, 2005) and
Social Environment or Atmosphere (Kallio, 1995; Cantwell, Luca, Lee, 2009).
Country is an item of influence when we think that students are tourists while studying (M ichael, Armstrong, King,

345
2003); linking tourism choices with education choices (Heoderson, 2004; Llewellyn, Mccabe, 2008, Moogan, Baron,
Harris, 1999); know a different culture (Morgan, Xu, 2009; Moogan, Baron, Harris, 1999) or simply because it shapes
the actions of the people with whom the foreign students interact (Eder, Smith, Pitts, 2010). For this study we will
consider the version of “to know a new culture” as the main purpose of Culture. Language is another factor important
for the decision process, here we talk about to learn or improve a new language (Llewellyn, McCabe, 2008; Moogan,
Baron, Harris, 1999).
In our model, student is contextualized here as a customer of the University. Student often pays Universities for
education, services and ultimately their degrees (Ivy, 2008 in Musa, Trapp, Girard, Boyt, 2011) and is important to
analyze his/her socio-demographic profile including sex, age, incoming, course and country of origin (Srinivasan,
Murthi, 1999).
The student has Tourism/Social Expectations (Menon, Saiti, Socrates, 2007; Gonzáles, Mezanza, Mariel, 2011), they
make up about 20% of international travelers and this number has been increasing dramatically. His/her social
demographic background is important (age, sex, country of origin, social level) to identify the target who is applying
Academic opportunities abroad. In the category “Study First” or in the category “Tourist First”, Llewellyn-Smith and
McCabe (2008) argue that both constitute a valuable market for countries and universities that receive them. The
driver forces are related to a mixture of exploration, increasing knowledge, social relationships as well as relaxation
(Morgan and Xu, 2009).
The Reference Group appears as an important source of information. Here we can consider it as the Worth of Mouth
Communication, where the opinion of leaders (family, friends or significant others) can exercise influence the student
in his/her decision process (Moogan, 2011; Michael, Armstrong, King, 2003; Moogan, Baron, Harris, 1999; Shanka,
Quintas, Taylor, 2005, Wilkins, Epps, 2011).
2.1. Education: a new trend in Tourism
Academic Tourism is an emergent concept in the tourism literature as the educators and students are foster
professional international relationships. Studying abroad is contributing to a new market tourism trend. International
Education is one of the more significant service industries that emerged in 1980s and 1990s (Mazzarol, 1998);
The mobility rate is increasing 5% annually on average between 2000 and 2006 in Bologna area and EU-27 (UNESCO,
2012). In 2025, the global demand for international higher education is estimate to reach 7, 2 million placements
(International Development Program of Australian Universities and Colleges, 2002 in Shanla, Quintal and Taylor, 2005).
The main players in the world are USA (490,933), United Kingdom (219,285), Australia (57,661), Canada (35,556) and
New Zealand (7,779) (Shanka, Quintal and Taylor, 2005).
The Knowledge and Tourism are the driving forces that attract a growing number of foreign customers generating a
new economy for the institutions and the countries that receive them. Thus, the communications of the brand, the
attributes of the services provided and uncover what are the most important variables who affect the choice of the
institution/country are fundamental to involve students and their families for the differentiation of the institutions in
the competitive market that has formed in recent years.
Some factors that contributed to the growth of the number of Exchange students can be reduced transport costs,
internet Marketing access, long waiting lists at home, new technology, extensive experience of the providers, safe
conditions and comfortable standard of living in the country as well as globalization (Connell, 2006; Bettcher, Yach and
Guindon, 2000; Herrick, 2007; Henderson, 2004; Heung, Kucukusta and Song, 2010).
Tourism is recognized by governments as a significantly contribute to local and national economies through spending
on accommodation, food, travel and leisure, as well their visitor: parent, families and friends (Heung, Kucukusta and
Song, 2010; Llewellyn-Smith and McCabe, 2008). Academic tourism creates a new demand for foreign persons in a
given country, for long period of time, contributing to the growth of its economy.
Tourism always has a positive side connected to the economy (Smith, Clark and Alcoks, 2009). Here let's focus on
financial increase that tourism can bring to the country and to the institution because it involves greater number of
people moving around them.
For example, sustains the acceptance that education and healthcare can be viewed as serious industries and attempts to

346
develop and market them as tourism products (Henderson, 2004); it is a niche industry which has tremendous
economic and social impact and represents a new research area (Heung, Kucukusta and Song, 2010).
In the context of the “Academic Tourism”, the student can go by tourism presented by country or for the quality and
specifications of the course in the University. In one case or another, knowing which appeals evoke greater impact on
the decision-making process of the student will help us to obtain greater understanding in the subject as well as a
better recall in Communication and it can result in countries and universities attracting more quantity of students from
abroad if it is accompanied by more efficient to Communication strategies with more rationalization of Marketing
investments; enhanced ability to design a more refined marketing mix (Mello, Leão and Souza Neto, 2005; Vrontis ,
Thrasson, Melanthiou, 2007). Just like any other industry, have a primary purpose to satisfy their customers (Vrontis,
Thrasson, Melanthiou, 2007).
3. Research Focus:
This study will address the process of choice and the elements that can have an influence to the decision of the foreign
candidate by the University/Country.
It will validate or not the concept of Tourism as a strong influencer in the decision of the student (Llewllyn-Smith and
McCabe, 2008; Moogan, Baron and Harris, 1999; Morgan and Xu, 1999) and it will provide tools to the Communication
strategies of the universities complementing the actual literature. Corporate Communication is linked
to protect or to enhance the image or reputation of the company (Hooghiemstra, 2000), which is the Uni versity. In this
study we will deal with communication in various sources and media, and the word of mouth from one brand will be
added to measure its impacts of how consumers react to other brands in their choice set (Webster, 1999).
The search fields of this study focuses on the impact of brand reputation and the tourist environment of the host
country. Although it is based on the scientific field of consumer behavior, with the sub-domain of the decision-making
process, also involves the Academic Tourism (a branch of tourism) and Image (Branding Management).
The conclusions of this study may also contribute for rising of other segments as Airlines, Travel Agents and other
Tourism organizations that deal with this target audience to accomplish the objectives above in order to better
promote and support this market (Taylor, Shanka, Pope, 2004).
4. Proposed Conceptual Model:
We considered Tourism as a leisure trip, visits to points of interest; it belongs to the social sciences and the Fine Arts,
Fun, Recreation, Sports; one of the most significant socioeconomic sectors in the world (Momm and Lessa, 2009;
Barreto, 2003).
The images, visual or mental impressions of a certain location on the part of the general public are paramount in the
decision-making process; places with positive images are most likely to be selected by consumers (Sousa and Simões,
2010; Rodrigues and Quelhas Brito, 2009).
Tourism as Academic Tourism can be to the student a ritual of escapement from the everyday life (Stronza, 2001). The
influence of information and experience of others has been extremely powerful. Many researchers have indicated that
perceptions and behaviors are influenced by others, particularly in perceived high-risk situations as go to another
country to study (Sheth and Parvatiyar, 1995; Llewellyn-Smith and McCabe, 2008; Moogan, Baron and Harris, 1999;
Mello, Leão and Souza Neto, 2005). So, the influence manifested by Parents, Relatives, Friends, and Teachers or
Professors will be considered as the “reference group”, and therefore as a variable.
The other independent variables of the model are derived from the studies of Llewellyn-Smith and McCabe (2008),
Moogan, Baron and Harris (1999), and Sheth and Parvatiyar (1995). In this study, these variables are divided or
grouped in: University, Country, Communication (institutional or not in all media), Foreign Student as described below
and all variables will be independent (Drewes and Michael, 2006); the only dependent variable will be the “Final
Decision University/Country”.

347
4.1. Conceptual Model
The constructs contain the variables in order to act on the decision-making process. The analysis of the individual
variables can give a strong complement to the existing theory today that favors only the countries which have a
tropical climate, and perhaps exist other influencers that are not only related to the sand, sun and sea as addressed by
Crick (1989).
4.2. Variables
The variables of the rectangles refer to concrete issues, Likert scales shall be in agreement or importance; latent
variable is already in the circle, it is not observed explicitly and result of analysis of the data of others.
4.3. Research Hypotheses
H1: The Communication made by the University and/or Country influences the formation of its/them Brand
Reputation;
H2: The Communication made by the Media/ Market influences the formation of its/them Brand Reputation;
H3: The Brand Reputation of the University/Country influences the University Choice;
H4: The University context Influences the University choice;
H5: The Country context influences the University choice;
H6: The profile of the student influences the University choice;
H7: The Reference Group influences the University choice;
5. Sample and Methodology options
5.1. Research Design
The study will start with a descriptive study in order to give a clear picture of the phenomenon before the data
collection (Saunders, Lewis and Thornhill, 2009) and an exploratory, to demand for new insights (Saunders, Lewis and
Thornill, 2009), with the combination of qualitative and quantitative approaches.
The Meta-analysis was chosen to integrate the results that validate the knowledge available in the current literature,
append data and provide continuity to this research area (documents the statistical significanc e, direction and
magnitude of the effects that can be expected on average (Szymanski and Henard, 2001). The goal of the choice of
quantitative method - method that generates or uses numerical data (Saunders, Lewis and Thornhill, 2009) - as the

348
central base of the research, is to offer the possibility of generalization of obtained results to the entire population of
foreign candidates in a case study.
The qualitative method will be used in one of the questions in the questionnaire that will be opened and wil l address
about what led the candidate to choose the one University abroad. It will be a complementation of results, since this
method is sensitive to subjective values of the decision-making process.
Will be used ordinary Logit model in order to estimate different weights of a dependent variable expressed in a Likert
scale and binary Logit regression to identify the most important variables that explain the choice for the university.
Logit regression it is suitable where a binary or dichotomous dependent v ariable exists because it estimates the
probabilistic model involving a set of independent variables that best predict the value of the dependent variable
(Mazzarol, 1998). This model is used in various Marketing studies (Menon, Saiti and Socratous, 2007; Punj and Staelin,
1978; Guadagni and Little, 2008, Mazzarol, 1998; Kalio, 1995 ).
5.2. Data Collection
The data collection instruments used will be done by doing the revision of the literature for the meta-analysis to
validate the existing knowledge and seeking for some news in this subject through a questionnaire that will be sent
randomly to the students already enrolled by email. The first question of the questionnaire will be open in order to get
more insights from those that were already pointed in this study, followed by closed questions that will ask about the
reasons why the candidate enrolled at that University, in that country in first place. The sample is formed by high
school candidates who will be inquired in two different moments (in the registration period and 2 months later) in
order to accomplish a paired sample analysis. We will try a probabilistic sample for inference reasons and will be done
the measures in two times in order to accomplish an analysis of paired samples.
In the Logit models, individuals choose the option that maximizes their utilities. This is the basic principle of research
that is based on models of utility maximization. The possibility to generalize the study for the wider population of
foreign high school candidates for the same universities and countries is heavily based on the random sample.
This study will contribute not only to secure the knowledge of Academic Tourism and strengthen the communication of
universities with their prospect customers to better take advantage of its benefits, but also will help in the knowledge
of the market potential of this and other existing segments or in the initial stage, consolidating Academic Tourism as a
generating source of economy for the countries.
A possible development of this project is a study in partnership with the Tourism of Portugal and their universities to
list what factors could differentiate them in the process of choosing among the several countries available to students
develop their undergraduate studies and measure the student satisfaction with the choice made. In this way, we will
have a complete project with the capture and maintenance of a growing demand for foreign students in order to settle
Academic tourism as an interesting and prosperous niche market.
The limitations lie in the difficulty of access the list of the same candidates to the random study in two different times
and to get some data from Academic tourism contribution in Portugal today and their economic representativeness, as
well as the lack of existing literature in Portugal, one of the countries selected for this research.
References
BARRETO, M. (2003). O Imprescindível aporte das Ciências Sociais para o Planejamento e Compreensão do Turismo.
Scielo Brasil. Horizontes Antropológicos, 9(20), 15-29, ISSN 0104-7183, retrieved from
http://dx.doi.org/10.1590/S0104-71832003000200002.
BETTCHER, D., YACH, D. & GUINDON, E. (2000). Global Trend and Health: Key Linkages and Future Challenges. Bulletin
of World Health Organization, 78(4), 521-534.
BROWN, J., BRODERICK, A.J. & LEE, N. (2007). Worth of Mouth within Online Communities: Conceptualizing the Online
Social Network. Journal of Interactive Marketing. 21( 3), 2-20, 2007.
CABRERA, A. & LA NASA, S. M. (2000). Understanding the College-Choice Process. New Directions for Institutional

349
Research, 107, 5-22.
CANTWELL, B., LUCA, S. & JEUNY, J. (2009). Exploring the Orientations of International Students in Mexico Different by
Region of Origin. Center for the Study of Higher Education, 57,335-354.
CRICK, M. (1989). Representations of Tourism in the Social Sciences: Sun, Sex, Sights, Savings, and Servility. Annual
Review of Anthropology. 18, 307-344.
CONNEL, J. (2006). Sea, Sun, Sand and…Surgery. Tourism Management, 27(6), 1093-1100.
COOPER, L. & INOUE, A. (1996). Building Market Structures from Consumer Preferences. Journal of Marketing Research,
33 ( 3), 293-306.
DESJARDINS, S., DUNDAR, H. & HENDEL (1999), D. Modeling the College Application Decision Process in a Land-Grand
University. Economics of Education Review, 18, 117-132.
DREWES, T. & MICHAEL, T. (2006). How do Students choose a University? An analysis of Applications to Universities in
Ontario, Canada. Research in High Education, 1-20.
EDER, J., SMITH, W. & PITTS, R. E. (2002). Explore Factors Influencing Students Study Abroad Destination Choice.
Journal of Teaching in Travel & Tourism, 10 , 232-250.
FRIED, B. & HARRIS, D. (2007). Managing Healthcare Services in the Global Marketplace , Frontiers of Health Services
Management, 24(2), 3-18.
GRACE, D. & O’CRASS A. (2005). Service Branding: Consumer Verdicts on Service Brands. Journal of Retailing and
Consumer. 12, 125-139.
GUADAGNI, P.M. & LITTLE, J.D.C. (1982). A Logit Model of Rand Choice Calibrated on Scanner Data. Marketing Science,
2(3), 203-238.
GONZÁLES, C. MEZANZA, R. & MARIEL, P. (2011). The Determinants of International Student Mobility Flows: na
Empirical Study on the Erasmus Programme. Journal of Higher Education, 62, 413-430.
HENDERSON, J. (2004). Paradigm Shifts: National Tourism Organization and Education and Healthcare Tourism. The
case of Singapore, Tourism and Hospitality Research, 5(2), 170-180.
HEUNG, V., KUCUKUSTA, D. & SONG, H. (2010). A Conceptual Model of Medical Tourism: Implications for Future
Research, Journal of Travel & Tourism Marketing, 27(3), 236-251.
HOOGHIEMSTRA, R. (2000). Social Reporting . Journal of Business Ethics. 27, 55-68.
JAKSON, J. (2008). Globalization, internationalization and short-term stays abroad. International Journal of Intercultural
Relations, 32, 349-358.
LAM, J., Ariffin, A.A. & Ahmad, A. (2011). Edutourism: Exploring the Push-Pull Factors in Selecting a University.
International Journal of Business and Society, 12(1), 63-78.
LLEWELLYN-SMITH, C. & MCCABE, V.S. (2008). What is the Attraction for Exchange Students: the Host Destination or
Host University? Empirical Evidence from a Study of an Australian University. International Journal of
Tourism Research, 593-607.
LONG, B.T.(2004). How have College Decisions Changed Over Time? An Application of the Condi tional Logistic Choice
Model. Journal of Econometrics, 121, 271-296.
KALLIO, R. E. (1995). Factors Influencing the College Choice Decisions of Graduate Students. Research in Higher
Education, 36 (1), 109-124.
KOTLER, P. & LEVY, S.J. Broadening the Concept of Marketing. Journal of Marketing, 33( 1), 10-15.
MAROCO, J. (2011). Análise Estatística com o SPSS Statistics.5.ed., Lisboa: Pero Pinheiro.
MARTIN, D. & WOODSIDE, A. (2011). Storytelling Research on International Visitors. Qualitative Marketing Research:
An International Journal, 14(1), 27-54.
MAZZAROL, T. (1998). Critical Success Factors for International Education. Marketing Journal of Education

350
Management, 12(4), 163-175.
MELLO, S., LEÃO, A. & SOUZA NETO, A. (2005). Uso conjunto de dois modelos cognitivos para a compreensão do
processo de escolha do consumidor. Scielo, 15(1), retrieved from http://dx.doi.org/10.1590/S0103-
65132005000100002.
MENON, M., SAITI, A. & SOCRATOUS, M.(2007). Rationality, information search and choice in higher education:
evidence from Greece. High Education , 54, 705-721.
MICHAEL, I., ARMSTRONG, A. & KING, B. (2003). The travel Behavior of Interaction Students. The Relationship Between
Studying Abroad and their Choice of Tourist Destination. Journal of Vacation Marketing, 10(1), 57-66.
MOMM, C. & LESSA, R. (2009). Sistema de Classificação Bibliográfica e a Conceituação do Turismo: Uma Visão da CDU.
Scielo, Ciência da Informação, 14(2), 141-154.
MONTGOMERY, M. (2002). A Nested Logit Model of the Choice of a Graduate Business School. Economics of Education
Review, 21, 471-480.
MOOGAN, Y. (2011). Can a Higher Education Institution’s Marketing Strategy improve the Student-Institution Match?
International Journal of Educational Management, 25(6), 570-589.
MOOGAN, Y., Baron, S., & Harris, K. (1999). Decision Making Behavior of Potential Higher Education Students. Higher
Education Quarterly, 53(3), 211-228.
MORGAN, M., & Xu, F. (2009). Student Travel Experiences: Memories and Dreams. Journal of Hospitality Marketing &
Management, 18(2-3), 216-236.
PERNA, L.W. (2006). Studying College Access and Choice: A proposed Conceptual Model. Higher Education: Handbook of
Theory and Research, XXI, 99-157.
PINAR, M.; TRAPP, P.; GIRARD, T & Boyt, T. (2011). Utilizing the Brand Ecosystem Framework in Designing Branding
Strategies for Higher Education. International Journal of Education Management, 25(7), 724-739.
PRICE, I., MATZDORF, L.S. & AGAHI, H. (2003). The impact of facilities on student choice of university. Facilities, 21(10),
212-222.
PUNJ, G. N. & STAELIN, N, R. (1978). The Choice Process for Graduate Business Schools . Journal of Marketing Research,
15(4), 588-598.
BRITO, P.Q. & Zaíla, R. (2009). A Imagem Turística de Portugal no Brasil. A Influência dos Atributos na Formação da
Imagem de um Destino Turístico. Scielo Portugal, Revista Portuguesa e Brasileira de Gestão, 8(2), Lisboa, 39-
50. ISSN 1645-4464.
RESEARCH OF ERASMUS MUNDUS (2012), retrieved from http://ec.europa.eu/education/lifelong-learning-
policy/higher_en.htm, accessed in 02/06/2012 at 3:00pm
RESEARCH OF STUDY IN PORTUGAL (2012) – Agreement Luso-American Foundation, retrieved from
http://www.studyinportugal.net/, accessed in 02/06/2012 at 9:00am.
RESEARCH OF UNESCO (2012), retrieved from http://www.uis.unesco.org/education/documents/ks-78-09-653-en.pdf,
accessed in 16/10/2012 at 10:27am.
RODRIGUEZ, X., MARTINEZ-ROGET, F. & PAWLOWSKA, E. (2012). Academic Tourism demand in Galicia, Spain. Tourism
Management, 33, 1583-1590.
SAUNDERS, M., LEWIS, P. & THORNHILL, A. (2009). Research Methods for Business Students. 5 ed., Essex: Prentice Hall.
SHETH, J. & PARVATIYAR, A. (1995). Relationship Marketing in Consumer Markets: Antecedents and Consequences.
Journal of the Academy of Marketing Science. 23(4), 255-271.
SHIV, B. & FEDORIKHIN, A. (1999). Heart and Mind in Conflict: The Interplay of Affect and Cognition in Consumer
Decision Making. Journal of Consumer Research, 26, 278-292.
SRINIVASAN, K. & MURTHI, B.P.S. (1999). Consumers’ Extend of Evaluation in Brand Choice. Journal of Business, 72(2),
229-256.
351
SRIVASAN, K. & GONUL, F. (1993). Modeling Multiple Sources of Heterogeneity in Multinomial Logit Models:
Methodological and Managerial Issues . Journal of Marketing Science, 12(3), 213-229.
SMITH, L., CLARKE, A. & ALCOCK, A. (1991). Teaching Cultural Tourism- some comments from the classroom.
Australian Archaeology, 34, 43-47.
SZUMANSKI, D.M. & HENARD, D.H. (2001). Customer Satisfaction: A Meta-Analysis of the Empirical Evidence. Journal of
the Academy of Marketing Science. 29(1), 16-35.
STRONZA, A. (2001). Anthropology of Tourism: Forgiving New Grounds for Ecotourism and Other Alternatives.
Anthropological Sciences, Stanford University, 30 , 261-283.
TAYLOR, R., SHANKA, T. & POPE, J. (2004). Investigating the Significance of VFR Visits to International Students. Journal
of Marketing for Higher Education, 14(1), 61-77.
THALER, R. (1985). Mental Accounting and Consumer Choice. Journal of Marketing Science, 4(3), 199-214.
TEKLE, S., QUINTAL, V. & TAYLOR, R.(2005). Factors Influenc ing International Students’ Choice of an Education
Destination – A Correspondence Analysis. Journal of Marketing for Higher Education, 15(2), 31-46.
TVERSKY, A. & KAHNEMAN, D. (1986). Rational Choice and the Framing of Decisions. The Journal of Business, 59(4),
part.2: The Behavioral Foundations of Economic Theory, S.251-S.278.
VRONTIS, D., THRASSON, A. & MELANTHIOU, Y. (2007). A Contemporary higher education student-choice model for
developed countries. Journal of Business Research, 60, 979-989.
WEBSTER, C. (1999). The role of brand familiarly on the impact of worth to mouth communication on Brand
Evaluation. Advances in Consumer Research, 26.
WILKINS, S. & EPPS, A. (2011). Student Evaluation Websites as Potential Sources of Consumer Information in the
United Arab Emirates. International Journal of Educational Management, 25 (5), 2011, 410-422.
WOODRUFF, R. B. (1997). Customer Value: The next Source for Competitive Advantage. Journal of the Academy of
Marketing Science. 25(2), 139-153.
ZEITHAML, V. A., BERRY, L.L. & PARASURAMAN, A. (1988). Communication and Control Process in the delivery of
Service Quality. Journal of Marketing, 52(2), 35-48.

352
The Impact of Low Cost Airlines on tourism
development Behavior, customer preference, Low Cost Airline, sports tourism, relationship between air transport and tourism
Michal Cervinka, Business School Ostrava, Plc., [email protected]
Lenka Svajdova, Business School Ostrava, Plc., [email protected]
Tomas Tykva, Business School Ostrava, Plc., [email protected]
Abstract
Transport is considered as one of the most important implementation factors of tourism development. It can be stated
that tourism and transport are inextricably linked. Increasing travel volume recorded in past years would therefore not
be possible without an adequate transport infrastructure development. After a period of recession at the end of the last
century, which was mainly due to low demand and high prices for tickets, the re- boom took place at the beginning of
the 21st century, mainly as a result of the expansion of low cost airlines.
The submitted article deals with the positive impact of aviation on tourism development on a regional scale. It focuses
on the acceleration of impact in relation to the Low Cost Airlines (LCA) entry on the air transport market. Growth and
development of LCA destinations have a positive influence on the development of local tourism.
Customers of LCA companies exhibit different behaviour patterns, habits and other preferences than customers of
„classic" Airlines. The relationship between the functioning air transport and tourism development is studied in the
specific example of the so-called "sports tourism" - the European Football Championship EURO 2012. This sporting
event was held last year in Poland and in the Ukraine. Benefits (including the improvement and completion of the
necessary infrastructure) connected with organizing this one-off event for the participating regions selected by the
Polish and Polish airports are another topic of this article. The article also deals with the occurrence of the so -called
Barcelona's effect on the organization of EURO 2012.
1. Objectives and Methodology
Transport is an important factor for the development of tourism and the regional economies of the country. The
present article deals with the relationship between air transport and tourism, specifically the impact of air transport
development on tourism and vice versa. It also deals with the changes in the behavior of air passengers in response to
the massive use of services of low-cost airlines; all this with application to EURO 2012, respectively, as well as to the
impact of holding EURO 2012 on attendance of tourist destination (Poland) and the share of air transport on this
attendance.
The basis of the research was the gathering of secondary information from electronic sources of selected airports,
particularly in the area of passenger traffic, as well as materials that are closely connected with the organization and
evaluation of EURO 2012. Moreover, a diagnostic mission to the international airport in Brno with obtaining primary
data about customer behavior of LCA follows.
2. Introduction
Air transport, as a part of the economy, encounters the new socio-economic and technological trends. The phenomenon
of air transport is low cost carriers. Commercial and marketing policy of the low-cost companies leads to a change not
only in the bahaviour of passengers, but also has a great impact on the development of tourism and regional economies.
This article focuses primarily on the carrier of LCA, the reason is their substantial boom in recent years and predictions,

353
which is one of the most promising in the aviation sector. Air traffic in Europe has been experiencing significant
changes caused by the liberalization of air transport in the last two decades. Among the effects of liberalization of air
transport may be ranked the changing of airline networks or the emergence of low-cost carriers. Low cost carriers are
often associated with the development of secondary airports. This secondary airports are often located outside the
main regions and thus have an impact on the development of tourism in the area and consequently also on the
development of the regional economy.
3. Statement of a problem and problem solving
3.1. Aviation transport in Europe
In the last thirty years we have seen significant changes in air traffic in Europe. With the l iberalization of air transport,
which ran from 1987 to 1997 by adopting liberalization packages not only the types of networks began to change, in
which the air transport took place, but also airline alliance began to emerge and a new type of airlines - low cost
carriers came to the market [5].
In addition to the liberalization of air transport has also changed people's attitudes to air travel, which became owing to
the liberalization affordable for more people. Having increased demand for air transport and with the emergence of
low-cost carriers, airlines offer routes have also changed. The increasing volume of air transport is evident from the
following graph, which demonstrates the increasing volume of passengers in the E-27 from 2007 to 2011 and also from
the graph, which predicts a growing market share just by LCC. This fact is evident in the statement of the European Low
Fares Airline Association (ELFAA); that year 2012 was a historic year for members of this association as for the first
time they carried more than 200 million passengers, thereby continuing their upward trend year-on-year despite the
difficult financial environment [11].
Figure n. 1: Number of Air Passengers (EU 27) - between 2007 - 2011
Source: authors according to Eurostat
The concept of low-cost carriers in Europe was first introduced in 1995, by Ryanair Airline. Ryanair together with
easyJet Airline are two of the most successful low-cost airlines in Europe. Currently, there are other strong players in
the LCC market - company Wizzair and then semi-LCA carriers such as Airberlin, Brusselair or Germanwings [9].
LCC input and influence on the market of air carriers indirectly forced changes in customer behavior, which cover a
range of areas such as pressure on the customers regarding the use of modern technologies, the use of new methods

354
of handling or actual experience of planning and trips associated with the use of LCC. Although a low-cost carrier is
characteristic that it flies mainly at secondary airports such as Ryanair, it's not always the rule for these transporters.
Among low-cost carriers are also those flying to the main / primary airports such as easyJet. There are even more
points that characterize the low cost carrier, which are no longer valid for all LCC companies. Even low-cost airlines are
trying their best to adapt to customer wishes and change the characteristics that were typical for them. Airport location
is another advantage that secondary airports have. Distance from secondary airports to the city center is usually larger
than the primary airports, but the price for the ticket is lower, and for this reason many passengers are willing to spend
a long time from the airport to the city center [17].
Graph n. 1:
3.2. Low-cost airline model
Low cost model is based on a significant reduction in costs in several areas. The most important are the following [4]:
direct online sales without intermediaries,
online check in, reduction of free-flight services (catering),
own PR and advertising,
point-to-point connection,
simple and nonrefundable tariffs,
single aircraft fleet,
low airport charges.
On the other side the carriers achieve their revenues in previously non-applied areas such as:
charges for checked baggage,
charging for airport check-in (excluding internet),
charging for onboard services (catering, entertainment),
commissions from advertising,
intermediation of car rentals, hotels, etc.
The use of their own resources (insourcing) with low-cost carriers not only allows significant cost savings, but it can
also bring additional revenues. All this requires changes in customer behavior by LCA compared to flying with 'classic'
airlines. Among the most significant changes in consumer behavior the ability to adapt to the use of the Internet in
almost all the steps that are associated with obtaining tickets and boarding passes subsequently can be ranked. The
current trend is to maximize the routine provision of selected services through the Internet and impose charges on
customers if they require the services of personnel through airports or airlines.
At a time when there was no internet check-in, all passengers had to attend the check-in counter, regardless of whether
they had checked baggage or not. As shown by the diagnostic mission at Brno, at the present time when the web check-
in works 100%, only about 30% of the total number of passengers come up to the counter with luggage. The process is
even easier and faster, because the airport does not issue a boarding pass. Most travelers now go straight to the
security check and into the departure lounge. Charging for extra baggage with checked baggage resulted in fewer
passengers, however, control of hand luggage (quantity, weight, size) is now even much stricter. The rules for carry -on
luggage are still the same. Differences are also seen in the boarding of passengers. In the past, passengers used to obtain
a Sequence Number at the check-counter, which determined the sequence of going aboard. The first 90 passengers
boarded the plane before the other half. Now that rule "the first to come, the first to board" cannot be used because of
the web check-in, which can be done more than 15 days prior to departure. Now passengers who purchase their
"Priority Boarding" at the earliest go aboard first. Experience shows that if the pas senger is experienced in flying
he/she travels with only hand luggage and meets all dimensional, weight and time rules, then he/she flies cheaply and
an airport does not have so much work with handling him/her.
3.3. Changes in customers’ behaviour
Air transport is a significant part of the economy not only by its performance, but also as an intermediator of
international trade. As a result of liberalization it encounters the effects of socio-economic trends and megatrends, to
355
which it has to respond. The effect of these phenomena is manifested by significant social, economic, political and
technological changes. The use of new pieces of knowledge leads to intellectualization, when the main factors of success
in the market are the knowledge, understanding and information. These changes are accompanied by the growth of
labor productivity, including computerization (by introducing and using information and communication technologies).
These trends have a direct impact on aviation, i.e. the aviation industry, airlines and airports, along with their economic
situation and their strategies in a variety of areas including business and sales strategies. Similarly, aviation is even
facing new problems and challenges these days. With the economic changes, there is al so an increase in wealth of
countries and their people, which increases the mobility of many millions of people. Despite the fact that the largest
increases in performance of air transport are forecast for developing regions such as China, India and Brazil , the
assumption of the development of air transport in Europe is also optimistic. Europe is expected to grow over the period
2009 - 2029 of up to 25% [1], [13]. From these projected increases in air traffic performance, it is clear that
stakeholders, airlines, i.e. airports, aircraft manufacturers and others will be forced to adapt its technology to both
quantitative and qualitative requirements of traffic. Given the possibility that meeting the needs by increasing the
volume of human resources are limited, also for reasons of labor costs, the importance of the use of modern
technologies including IT will increase. In the last decade, a new phenomenon low-cost carriers has developed, who
lead an aggressive price war with traditional air carriers, especially on shorter distances (up to two hours of flight
time). The synonym of low-cost carriers is for many passengers their low price. In order to achieve low prices, low cost
carriers reduce costs. One of the areas where the change in passenger behavior manifests itself most is the
computerization of business processes, which leads to a change in communication with airline passengers.
3.4. The importance of LCA for the development of tourism and regional economies
The region, which is appropriately connected to other parts of the country and abroad, has much fewer problems with
the spatial movement of human resources (the workers can commute from other regions or, conversely, local residents
without major difficulties, arising from transport accessibility, can work in other regions). Good transport accessibility
is also a factor which significantly influences the location and investment decisions of entrepreneurs. The region with
good transport links is attractive for foreign tourists and has a great influence for tourism development of such region.
As a result of that tourism is very often referred to as a cross-cutting sector, and has led to an increase in performance
of regional economies, along with a positive impact on the national economy of the entire country. Whether in the form
of increased GDP, balance of payments and the state, due to an increase in the "incoming" tourism [6].
The air transport influences the spatial population movements, and has many side-effects, which are showed in a study
presented by York Aviation and the Airports Council International, entitled "The Social and Economic Impact of
Airports in Europe".[21]
Airports are a part of the indispensable infrastructure for a wide range of economic activities. This important economic
role is known as the catalytic impact, arising from the effect that air service accessibility can have the positive
influence on the region served by the airport. Access to markets and external and international transport links are
regarded as absolutely essential to businesses making location decisions [21]. These effects are manifested in the field
of tourism. These effects are manifested in the area of tourism.
In addition to already mentioned advantages, one of the consequences of the emergence of low-cost carriers operating
in airports of lower hierarchical order can be seen in the restoration of some of the less traditional destinations, which,
thanks to the existence of low-cost airlines at the airport have improved their attractiveness as a tourist destination.
With increased demand for air travel in recent years, the capacity of the primary airport has been considered as
inconvenient and this fact together with a different business model of low cost carriers began gradually to lead to the
development of secondary airports. These factors have had a positive impact on the development of a number of
regional economies.
This fact results in development of LCA and to increasing the volume of their passengers. This number is rising faster
than in the case of classic carriers. LCA market share of air transport increases. This fact is reflected in Figure 2.

356
Figure n. 2: Airline Seat Capacity Market Share Forecast
Source: York Aviation analysis of OAG data
These trends are confirmed by the results of York Aviation study, which expects a similar trend till 2020. In this period,
it is assumed that the share of LCA in the aviation market will grow from 35% in 2010 to 42% in 2020.
In the case of EURO 2012, which was held in the Ukraine and Poland, Poland made a number of investments to
transport infrastructure, including the air infrastructure. All airports that have been affected by organizing EURO 2012
were subject to large reconstructions, terminals have been upgraded, as well as driveways, and airport hal ls. This had a
positive impact on the economy in specific regions. Already during the preparatory phase that preceded the
organization of EURO 2012 unemployment was reduced, and a modest GDP growth started. However, it can be
expected that the positive impact will persist even now, after EURO 2012 ended. The development of tourism through
better awareness of Poland in the minds of tourists was one of the most anticipated positive effects. Another positive
effect has been already mentioned several times such as better availability of selected regions as tourist destinations, as
a necessary condition for tourism development.
4. Discussion
4.1. The impact of EURO 2012 on selected tourist destinations in Poland
After Poland and the Ukraine were chosen by a vote of the UEFA Executive Committee as host countries for Euro 2012,
both of the countries had to deal with long-time periods of preparations, innovations, modernizations and especially
constructions of necessary infrastructure to meet the requirements of the UEFA executive committee.
EURO 2012 was set in Poland and in the Ukraine. In Poland cities which hosted 15 matches were Warsaw, Gdańsk,
Wroclaw and Poznań. The distribution of matches and capacity of stadiums was not equal as it can be seen in Table 1.
Table n. 1: The Summary of Polish hosted cities of EURO 2012
City Stadium Capacity Number of matches
Warsaw National Stadium 56,070 5
Gdańsk PGE Arena 39,150 3
Wroclaw Municipal Stadium 40,000 3
Poznań Municipal Stadium 39,550 3
Source: 19

357
The „tourist infrastructure“(sports facilities, accommodation possibilities, roads, railways and airport) of Poland was in
a better condition than in the Ukraine. Nevertheless, the huge investments had to come. For detailed information the
costs were predicted as follows: in 2010 Polish civil engineering investment totaled €65bn, and in 2013 Polish airport
investments would top €1.8bn and the whole organization of Euro 2012 in Poland would cost €23bn [10]. As this
paper deals with the impact of LCA on tourism development, the paper continues with the description of changes as far
as airport transport is concerned. Yet, at the outset it´s necessary to focus on one very important fact, which is the
relation between the number of passengers coming by planes, the capacity of stadiums, the number of matches and the
nationality of teams who were playing there. The National Stadium of Warsaw and Municipal Stadium of Wroclaw were
the places where all the matches of group A (Czech Republic, Greece, Russia and Poland) and the PGE Arena in Gdańsk
and the Municipal Stadium in Poznaň hosted teams of group C (Spain, Italy, Croatia and Republic of Ireland) [19].
According to the distribution of respective countries to matches in groups it is evident that almost all of fans of the
teams in Group C used air transport for transport to the place, this suggests primarily relatively large distances
between countries and Poland, for example 2800 km between Gdansk and Madrid. For Greek fans, in Group A, the use
of air transport could be the most common means of transport. In addition, based on the statistics available on the
websites of the airports it can be assumed that most visitors of EURO 2012 took for their transport one of the LCA
companies to the place. These operate at local airports most often Wizzari, Ryanair, airberlin TUIfly, Germanwings, etc..
The National Stadium in Warsaw was the place of most interest as for Poland’s stadiums, because of the opening match
of EURO 2012 and quarter-final and semi-final matches were held there. This fact together with its highest capacity
predicted this place and Warsaw’s would be the most visited and used [19].
The importance of air transport in attendance with these major sporting events is evidenced by the following statistics.
These data relates to the transportation capacity of Polish airports during EURO 2012. According to the available
information it can be deduced that approximately 60% of all visitors used LCA carriers for their way. It can thus clearly
demonstrate the relationship between the effects of LCA in the region and organizing sport events from the perspective
of tourism as well as the impact of the event on regional development (Table n. 2). In this way, the impact of EURO 2012
on the availability of accommodation capacities in visiting cities is completely demonstrable. In the days of matches,
that means one night after the game), the percentage of occupancy fluctuated around an average of 90% (table 3), as in
the days of rest when the occupancy was about 60%.
In total numbers over 1.44 million people attended the matches in the stadiums, ensuring a tournament average of
46,471 spectators, it´s clear that not all of them came to Poland or the Ukraine by plane, but as the statics shows most
of them did so [8], [20].
Table 2 Number of Passengers in Polish Airports
Number of passengers
Year Gdańsk Poznań Warsaw Wroclaw
2009 1,890,925 1,365,456 8,320,927 1,365,456
2010 2,232,590 1,654,439 8,712,384 1,654,439
2011 2,483,006 1,657,472 9,337,734 1,657,472
2012 2,906,000 1,996,552 9,608,331 1,996,552
06/2012 N/A 200,131 1,077,889 225,028
07/2012 N/A 239,068 1,084,359 239,068 Source: 2, 3, 7, 16

358
Table 3 Average Occupation of Accommodation Facilities in 2012 at Host Cities
City Average occupation
out of EURO 2012 (%)
Average occupation
out of match days of
EURO 2012 (%)
Average Occupation
rate at match days of
EURO 2012 (%)
Warsaw 39 58,5 90,5
Wroclaw 41 52,8 98,3
Poznań 34 53,8 94
Gdańsk 40 51,5 92
Total 38,5 55,5 90,5
Source: 18
4.2. Barcelona effect
Barcelona effect is the term that economists use for a positive long-term effect of major events such as the Olympic
Games or World Cup. When Poland and the Ukraine bid to host EURO 2012 they were aware of the enormous
investments that the organization of the European Football Championship would entail, and that any organization of
UEFA 2012 would require a relatively high debt ratio. Their decision to host the matches was certainly encouraged and
also exemplified by the Summer Olympic Games in Barcelona in 1992. Money is not the only measure of success, the
number of host cities is not afraid to borrow funds in anticipation of the "Barcelona effect".
The Catalan capital after the Olympic Games in 1992 showed a deficit of 1.4 billion U.S. dollars, however, thanks to
investments to tourism infrastructure (construction of hotels, catering facilities, improved transport facilities,
expansion of the airport with a new terminal, improvement and expansion of road routes) in Barcelona, Catalonia
became consequently a popular tourist destination. Currently, the Catalan capital is one of the most visited cities in the
world. The number of visitors began to climb 4 years, before organizing the Olympic Games , in 1991, 1,727,610 tourists
visited Barcelona, and in the year of the Olympic Games Barcelona it attracted around 2.21 million tourists, a year later,
almost 2, 500,000. From 1991 to 2003 the number of visitors doubled to nearly 4,000,000. Preliminary estimations
regarding the number of visitors in 2012 were exceeded by 7,000,000 [15].
Despite the above-mentioned numbers Polish representatives maintained that the positive impact of EURO 2012 on the
Polish economy would be even more noticeable than the impact of the Olympic Games in 1992 on the economy and
future development of Barcelona. The Polish representatives based on their contention that, in Barcelona, it was only a
rise in tourism, but in Poland it would be a positive impact on the whole economy, infrastructure and know-how.
A side effect of organizing the event is any significant increase of "brand" or awareness of a particular place, whether a
country, region or city. According to the Brand Finance Institute, Euro 2012 helped Poland strengthen its position in the
list of 100 countries and shifted it from 24 to 20 instead, and specifically the financial value of the brand "Poland"
increased by 75%. The Polish Ministry of Sports and Tourism also expected the number of visitors to Poland for 2020 of
about 766 000 more than it would have been without EURO2012.
Despite the positive assessment of the state administration, there are voices claiming the positive effects of organizing
Euro 2012 have not appeared in all areas by far. The Polish entrepreneurs argue that the positive effect for them was
either zero, or even negative. Championships according to research conducted by Keralla Research had no effect on
78% of Polish small and medium-sized enterprises and 60% of businesses surveyed think that the positive effect did
not occur even after EURO 2012 ended.
It should be borne in mind that too little time has elapsed since the holding EURO 2012 for the assessment of the actual
effect, whether positive or negative impact on the organization of EURO 2012 for the Polish economy. As in the case of
any other host country, it is necessary to wait and see because real effects will usually manifest themselves in the
longer term. However, it is quite certain that there was a positive impact of the organization of EURO 2012 on
infrastructure, but also on raising awareness among the general public of Poland.
5. Conclusion
Air transport is one of the essential factors in the development of tourism and consequently the economic development

359
of a particular region. This fact is mainly due to the fact that the presence of second order airports allows airports
improving the availability of a particular region, not only for those who seek investments from potential investors, but
also increases the attractiveness of the region as a tourist destination. Al l this can also be supported by the fact that a
particular region was chosen as the venue for major sporting and cultural events. Air transport reflects modern trends
in the world economy by technological changes and changes in business processes. An important phenomenon of the
air transport market is low cost airlines. Their use and operation at second order airports and allow the development of
tourism and regional economies. The basis of their business model is to reduce costs and low prices that have been
enabled by the use of Internet in the sales process and computerization handling process. Sales and marketing
approach to charging for airport check-in services, especially payments for checked baggage, gives passengers an
incentive to reduce this storage and travel with only hand luggage. This trend is changing passengers’ behavior and
calls for the need to change airport procedures and technologies of passengers’ and baggage’s check-in. These changes,
on the one hand, facilitate the process of check-in and check-handling of checked baggage due to reduction in their
number. On the other hand, it is increasing demands for security control of passengers due to the higher cabin luggage
and their number, and the need to identify the passenger before the security check. Changes in the check-in process
also place greater demands on the knowledge of laws, rules, experiences and skills of employees with check -in
companies.
With increased demand for air travel in recent years, the capacity of the primary airport has been considered as
inconvenient and this fact together with a different business model of low cost carriers began gradually to lead to the
development of secondary airports. These factors have had a positive impact on the development of selected regional
economies.
The specific impacts of EURO 2012 on LAC and the regional economy of Poland are currently still difficult to assess
objectively. The reason is a very small increment of time after the end of Euro 2012. Polish small and medium
entrepreneurs believe that the positive effect was negligible; however, it is certain, that the successful organization of
this extraordinary sporting event helped enhance the image of Poland as a tourist destination and for increasing the
number of passengers in the last two years, along with the modernization of the transport infrastructure, etc. Currently,
the biggest challenge, which the Polish government is facing, is to fully use the opportunities that Poland is offered by
the Barcelona effect, i.e. getting the best from organizing world class sporting events for the long-term development of
Poland and specific regions.
References
[1] AIRBUS INDUSTRIE. Global Market Forecast 2010 - 2029, December 2010 [Online]. Available at:
http://www.airbus.com/company/market/gmf2010/?eID=dam_frontend_push&docID=14868 [cit 2013-02-27].
[2] AIRPORT POZNAŇ. Year 2012. Airport Poznaň [Online]. Available at: http://www.airport-
poznan.com.pl/en/news/y2012 [cit 2013-02-22].
[3] AIRPORT-TECHNOLOGY. Gdansk Lech Walesa Airport, IATA: GDN, Poland. Airport-technology.com [Online].
Available at: http://www.airport-technology.com/projects/gdansk-lech-walesa-airport-poland/ [cit 2013-02-
22].
[4] BADÁNIK, B.; FAKIH, H.; ŠTEFÁNIK, M. (2009, 4). Skimming the market of on-board advertising. Service
Management: scientific journal. ISSN: 1640-6818. – Vol.4.
[5] BARBOT, C. Low cost carriers, secondary airports and state aid: an economic assessment of the Charleroi affair.
Porto, Protugal: CETE - Centro de Estudos de Economica Indsutrial, do Trabalho e da Empresa, Universidade do
Porto. 2004, pp. 16. Available at: http://www.fep.up.pt/investigacao/workingpapers/04.10.07WP159
cristina.pdf [cit. 2011-05-02].
[6] COOPER, CH. (2008). Tourism: Principles and Practice (4th ed.) Milan: Rotolito Lombarda.
[7] COPERNICUS AIRPORT WROCLAW. Traffic statistics. Copernicus Airport Wroclaw [Online]. Available at:
http://airport.wroclaw.pl/en/airport/about-the-airport/traffic-statistics/passengers/ [cit. 2013-2-26].
[8] DEPCZYK, I. (2012). Report finds Polish firms did not benefit from Euro 2012. Warsaw Business Journal [Online].
Available at: http://www.wbj.pl/article-60192-report-finds-polish-firms-did-not-benefit-from-euro-2012.html

360
[cit 2013-02-17].
[9] DOGANIS, R. (2006). The Airline Business (2nd ed.).Great Britain: MPG Book Ltd.
[10] EU INFRASTRUCTURE. Poland and Ukraine to spend big on Euro 2012. EU Infrastructure.com [Online]. Available
at: http://www.euinfrastructure.com/article/Pol and-and-Ukraine-to-spend-big-on-Euro-2012/
[11] EUROPEAN LOW FARES AIRLINE ASSOCIATION ELFA. A airlines break 200 million passenger mark for 2012 (press
releaset). 2013 [Online]. Available at: http://www.elfaa.com/130220_ELFAA_PressRelease_Statistics2012.pdf.
[cit. 2013-02-18]
[12] EUROPEAN LOW FARES AIRLINE ASSOCIATION. Market share of low fares airlines in europe – Final repor
February 2012 (report). York Aviation, 2012. [cit. 2013-02-18]
[13] EUROSTAT. Passenger transport statistics [Online]. Available at:
http://epp.eurostat.ec.europa.eu/statistics_explained/index.php/Passenger_transport_statistics [cit 2013-02-
21].
[14] LOCATE IN KENT. Economic Impacts of Olympic Games. Kent: Locate In Kent. [Online]. Available at:
http://www.locateinkent.com/images/assets/Economic%20Impacts%20of%20Olympic%20Games%20-
%2009.07.09.pdf [cit 2013-02-19].
[15] LONDON EAST RESEARCH INSTITUTE. (2007). A Lasting Legacy for London? London: London East Research
Institute [Online]. Available at: http://www.uel.ac.uk/londoneast/consultancy/documents/lasting-legacy.pdf [cit
2013-02-17].
[16] LOTNISKO CHOPINA. Statistics. Lotnisko-chopina.pl [Online]. Available at: http://www.lotnisko-
chopina.pl/en/airport/about-the-airport/statistics/passengers [cit 2013-02-19].
[17] RING, D.; DORING, D. (2009). The „No Frills“ Strategy of Low-Cost-Carries. Norderstedt, Druck un Bindung Book
on Demand GmbH.
[18] UEFA. (2012). EURO 2012 in Lviv – new history of the city. Uefaeuro2012.lviv.ua [Online]. Available at:
http://uefaeuro2012.lviv.ua/en/news/all_news/news_other/ievro-2012-u-l-vovi-_-nova-istoriia-mista/12994/
[cit 2013-02-22].
[19] UEFA. (2012). Finals. UEFA.com [Online]. Available at: http://www.uefa.com/uefaeuro/finals/index.html [cit
2013-02-19].
[20] UEFA. (2012). Polish pride at EURO success. UEFA.com [Online]. Available at:
http://www.uefa.com/uefaeuro/news/newsid=1841839.html [cit 2013-02-22].
[21] YORK AVIATION; AIRPORTS COUNCIL INTERNATIONAL. The social and economic impact of airports in Europe.
Study of York Aviation and Airports Council International. 2004. Available at:
http://temis.documentation.equipement.gouv.fr/documents/Temis/0017/Temis-0017789/12209.pdf [cit.
2013-1-26].

361
Session 10

362
The elderly go the gym: a look at marketing
Marketing, gymnastic, gyms; elderly, health, João Pessoa
Adriana Brambilla, University of Paraíba-UFPB, Researcher GCET/CNPq., [email protected]
Elídio Vanzella, Estácio and Ensine Universities, Researcher at GCET/CNPq., [email protected]
Abstract
The aging population has been seen with greater optimism and less prejudice, becoming the subject of discussions in
various sectors of Brazilian society. According to the Brazilian Institute of Geography and Statistics (IBGE), Brazilian
population projections indicate that between the period of 2000 and 2015, the share of the elderly population will
increase its importance, rising from 8.12% to 13.67% (IBGE, 2008). In the city of João Pessoa, in 2010, the elderly
accounted for 10.32% of the population, the proven increase in the proportion of the elderly population and income
growth, combined with the desire for a healthy lifestyle leads to formulation of the hypothesis that the seniors are a
segment of the population with potential and needs an attention of gyms. Thus, the overall goal is to investigate
whether the gyms are working on marketing strategies focused on the elderly client and to identify if there are specific
programs and activities designed especially for the elderly population. The study, exploratory -descriptive, was
developed from a quantitative approach and the research was conducted with gyms to verify the criteria of marketing
strategies to disseminate and to develop specific programs for the elderly population. Thus it was found that only
29.5% of companies conduct some investment in media, and that only 20.5% of surveyed gyms conduct any campaign
or service offering with special focus on the elderly client. Gyms with specific programs for the elderly have a great
opportunity because by attracting seniors, showing the importance of the quality of life, the gyms, in João Pessoa, will
be focusing on a market with an elderly population projected for the year 2015 with an approximate percentage of 12%
of the population. It´s a segment that can be seen as a different public for gyms and, of course, demands some special
services and training of human resources to be prepared to deal with these public, but as we highlight a public that
offers a growth to these businesses. We hope that with this paper, it will be possible to contribute with the gyms to
improve their services to these segment and with the seniors, so that they have more options to take care their health
and to conquest their rights, with a life that allows them to keep active and taking part of the modern society.
1. Introduction
Nowadays, with the stress of modern life and the demands of people to keep themselves connected 24 hours a day, is
indispensable that people become aware that this lifestyle can detrimental to the quality of life, and that is necessary to
have some habits healthier, like a good nutrition and physical activity.
The Aging has been every year, seen with optimism and less prejudice, becoming the subject of discussions in various
sectors of Brazilian society. According to the Brazilian Institute of Geography and Statistics (IBGE), between 2000 and
2015, the share of the elderly population will increase its importance, rising from 8.12% to 13.67% (IBGE, 2008).
It is indisputable improvement in the levels of survival of the population from the 1930s to the present day, with an
increase in life expectancy increasing over the decades. In 2008, the average life expectancy reached 72.7 years in
Brazil, with a view to reach 81.2 years in 2050 (Paschoal; Franco; Salles, 2007). Brazil has today more than 19 million
elderly and it´s projected that for the year 2020 a population of 207 million Brazilians, among which 28 million will be
60 or older (IBGE, 2008). Considering this statistical evidence, of that the aging of the population is an irreversible
phenomenon; we propose to discuss prospects for improving the quality of life of the elderly through physical activity
in gyms.
The aging process is often accompanied by a decrease in physical activity and consequently reduction capacity to
perform the tasks of daily life and this is an important concern for the elderly. The understanding that the ills of aging
related to sedentary lifestyle causes in the body, causes many seniors to seek the gyms to maintain or even improve the

363
physical conditions. Thus, it is important for professionals in physical education a thorough knowledge in relation to
exercises that are offered to seniors, so this way, your expectations are met.
In this context and considering that elderly are an important segment to the gyms, we propose as general objective to
investigate if the gyms of the João Pessoa city, are using marketing strategies with focus on elderly and, as specific
objective, we propose to identify if there is, in these gyms, programs and activities developed specially to the elderly
public.
2. Gyms and the elderly population: a market segment
The Ministry of Labor, with Resolution No. 104963, published in the Official Gazette on 10 February 1984, has defined
gym as a company that is dedicated to teaching classes in gymnastics, ballet, dance, weightlifting, wrestl ing and physical
culture of overall, taught by graduated teachers in courses in physical education (Capinussú, 1989). For Saba (2006) the
gyms are companies, for profit, offering adequate space for physical activity, and operating under the responsibility of
professionals in physical education and they have an obligation to assess, prescribe, guide and motivate the practice of
physical exercises, safely and ethically. A survey by the Data Popular Institute points out that in 10 years, the number of
gyms in Brazil increased by 21 times. In 2000, the country had 797 academies and according to information collected in
the last survey, done by the Federal Council of Physical Education (CFEF), in 2010 there were more than 16 000
establishments around the country (Economiasc, 2012). In João Pessoa, capital of Paraíba state, according to the
Regional Council of Physical Education (CREF) existed in the year 2012, a total of 122 registered gyms in town.
The gyms, in the current scenario, have an outstanding capacity for growth, highlighting the opportunity to lead to
academy specializing in bodybuilding and fitness to the elderly, taking account of the growth of this segment of the
population, its availability and free time, usually retirees.
For seniors, attending gyms can be embedded as a healthy habit, and can also find in this space, an opportunity to relate
socially, increasing their self-esteem. Understanding corroborated by Geis (2003), stating that physical activity is a fact
of our time, which affects all areas of society, for the elderly, is a means of relating and identifying with people with the
same characteristics, so as for establishing a group of friends. For the elderly, the physical activity is related to the
maintenance or improvement of quality of life and is associated with and understood as an activity that makes him/her
feel better and live independently, allowing to accomplish many tasks. As the quality of life, recreation is also part of
any activity, physical or intellectual, which provides the human sense of well -being (Diogo, 2006).
When physical activity is focused on the prevention of problems and deficiencies arising from age, should then be
practiced from childhood, which is not to say that will prevent aging of the body, but can cause this process be quite
time consuming. Finally, in the case of rehabilitation, it is sought after by those seniors who, for some reason, have
physical problems or injuries of own age, so the physical activity goal of rehabilitation is to obtain a general state of
health allows one to perform various activities essential (Geis, 2003).
So that the academies can offer their services to the elderly, it is necessary to adopt marketing strategies that target this
audience. According to the American Marketing Association (AMA, 2007) marketing is the activity, a set of instructions
and processes that creates, communicates and offers exchanges that have value for customers, partners and society at
large. Customer value is defined by Churchill and Peter (2000) as the difference between customer perceptions
regarding the benefits and costs of buying and use of goods and services. The marketing, according to Kotler and
Armstrong (2003), is an administrative and social process, in which individuals and groups obtain what they want and
need.
The set of controllable instruments through which they can obtain better matching of supply and demand is the
marketing mix (Rocha, Christensen, 1999). The structure of the compound allows that marketers decide about the
product and its features, define the price, how to distribute your product and choose the method to promote it (Kotler,
2009). Traditionally, the components of the marketing mix are known as the four P's proposed by McCarthy: product,
price, promotion and square (Cobra, 1997). The product or offering is the basis of any business, is a combination of
benefits that meet the needs of customers (Kotler, Armstrong, 2003). As for the price, say the same authors, decisions
are subject to a complex set of environmental forces and competitive and the company adjusts product prices in line
with changes in costs, demand and changes in buyers.
Covering advertising, public relations, sales promotion, personal selling and merchandising, we have the promotion, as

364
another component of the marketing mix (Cobra, 1997). Finally, the point of sale or the place involves all aspects of
distribution of goods and services, covering not only the sales channels as well as the availability of goods or services in
these channels.
To create value to the consumers and profits to the organizations, Kotler (2009) says that the marketers need to
understand the reasons that consumers opt for some products, so the study of the consumer´s behavior has as objective
a depth knowledge of the behavior of the people, their needs, desires and motivations (Samara; Morsch, 2005).
The consumer behavior is influenced, in the moment of buying, by a set of factors and according to Kotler e Keller
(2006), has five steps: recognition of the need, the search for informations, the evaluation of the alternatives, the
decision of buying and post-purchase behavior, but not all consumers pass through all these stages when buying a
product, they can jump some of these steps or to change this order.
According to Churchill and Peter (2000), the process for buying products and/or services begins with the recognition of
some need. Kotler e Keller (2006), argue that the needs can be caused by external or internal stimuli.
The recognize of a purchase need doesn´t active automatically an action, because for this happens, Engel, Blackwell e
Miniard (2000) explain that the need must be enough important and the consumers must believe that the solution to
their needs is on your means, such as ability to pay and timely manner to buy.
Once consumers identify a need, they seek information and how can satisfying it and as Churchill and Peter (2000)
claim the information can be stored in the memory of the person; obtained with others, such as friends and family,
obtained through marketing activities as packaging, sales, advertising, independent sources that include articles, in
magazines and newspapers, about products or classifications made by independent organizations and sources of
experimentation.
Several products may seem appropriate, at a time when consumers are still looking for information is the period that
occurs evaluation of available alternatives, because based on collected informations, consumers identify and evaluate
ways to satisfy their needs and desires (Churchill; Peter, 2000).
The consumer can classify the brands and his/her purchase intention in the evaluation stage, but two factors can
come between the purchase intention and decision, which are the attitudes and opinions of others and unexpected
situations (Kotler, Armstrong, 2003), then after pondering the options plausible, consumers decide to make a purchase
or not. Finally, after purchasing a product or service, consumers make an assessment of the result of purchase, and
wondered themselves whether they are satisfied or not. Understanding corroborated by Samara and Morsch (2005)
when they state that if the customer feels that the product did not meet expectations, he gets upset if met, is satisfied,
and if exceeded expectations, is delighted.
Moschis (1993, 2003) called Gerontographics, segmentation of the market that recognizes, besides of psychological
factors, others factors associated with biological aging with social and life experiences, the derivation of market
segments for seniors is based on the premise that people who have experienced circumstances Similar to an older age
have a tendency to exhibit similar patterns of consumer behavior. Certain segments respond differently to marketing
stimuli, which justifies the development of different marketing strategies to achieve each public. Moschis (2003)
defined four segments, the first being composed of people who usually have good health, are independent, active and
have stable financial condition. The second group consists of individuals who tend to have health conc erns and a
relatively physical fragile condition, but are socially active. They are interested in learning and doing new things and
want to remain financially independent. The individuals who make up the third group tend to have good health and are
psychologically introverted and reserved, they have few social contacts and little interest in staying active socially. This
group expressed little need for consumption, being, in an initial analysis, less susceptible to marketing strategies based
on age. The last group consists of people who tend to have poor health, being inactive and socially isolated. They are
more concerned with security than any other group, mainly physical security and of home. According to Beni (2007),
the heterogeneity of demand does not prevent that similar segments be identified, i.e., people with the same
motivations to attend a gym. In this sense, Kotler and Keller (2006), assert that market segment can be a group of
consumers which differ in several respects, but have the same preferences and therefore can be grouped according to
one or more common characteristics.

365
2.1 Services marketing and the gym
The service marketing is important to the success of the gym, because the service has many different characteristics in
relation to products: the service is intangible, you only realize, it´s variable, it is consumed during its production, its
consumer and production occur at the same time, and the service can´t be kept in stock (Kotler, Keller, 2006). Las
Casas (2002) summarizes by stating that services constitute a transaction performed by a company or by an individual,
whose aim is not associated with the transfer of goods and is in this moment that emerges the difficulty to the
marketing, for since in the service market the sale occurs before production, then the perception of risk tends to be very
high, it´s different of the product market where the consumer can have contact physical with the merchandise before
buy them. Services can´t be smelled, touched, tasted or even tested before purchasing. The intangibles are more
cunning, because they understand the level of service offered to support tangible, and image or beliefs surrounding the
product (Hooley, 2001).
The marketing of services is linked directly interactive marketing, the seller it has to have a good interaction with the
buyer during the execution of the service, so even if a business supplying quality services, she will be running the risk of
not meeting a customer also be thou not master the art of interactive marketing, because the service providers, the
customer and frontline employee interact during the execution of the service
3. Methodology
The study, exploratory-descriptive was developed from a quantitative approach taken in the gyms of the state capital of
Paraíba, João Pessoa, it was conducted with these companies to verify the criteria of marketing strategies for
dissemination of company both for seniors as for the general public and to know if they develop specific programs for
the elderly population.
It was used as an instrument, a questionnaire with closed questions prepared exclusively for this study, divided into
three sections that verified if the gym invests in advertising and marketing strategies and develops specific activities for
the elderly population.
The questionnaire was divided into three sections with the following format: no. 1: with sub questions 1.1 and 1.2,
investigates whether the academy makes its disclosure in the media, how often and in what way the media is
performed; the second section of the questionnaire consists of the question 2, investigates the promotional activities
carried out and wants to know if the gyms offer some kind of incentive or special service for the elderly;
Questions of 3.1 and 3.3 make up the third section of the questionnaire, and focused on identifying whether the gyms
perform specific activities for seniors. These questions are investigated if the company has qualified instructor and full -
time guiding the activities with groups composed solely of seniors and if these companies organize classes at varying
times, according to the needs of elderly.
3.1 Defining the target population and study.
The sample is a subset of the population, that is, a set of elements extracted from the population. Although consisting of
a part of the study population, the sample should allow obtaining data representative of this population, including the
population that is the set of all elements that have characteristics in common, (Tiboni, 2010). In order to get a random
sample, it was observed that the population of the gyms is composed of N elements, with that were listed from 1 to N
the population to be analyzed, and then a sample selected by lot.
3.2 Calculating the sample
Considering that, according to the information of CREF, there were 122 gyms in the city of João Pessoa, it was realized
the calculation of the sample for the proportion of finite population, which equation is:
, where:

366
= size of sample needed;
N = size of population;
= level of confidence of normal distribution at 95%;
= proportion of characteristic in study multiplied for the complementary proportion;
= pattern mistake of estimative elevated to square.
The confidence interval is calculated by:
The calculated sample, assuming a standard error of 5%, in a finite population of 122 academies were 44 companies
interviewed, in a confidence level of 95%. To ensure the randomness of the sample, the academies were listed,
enumerated and made it a draw for setting the 44 who were interviewed and data was then tabulated for organizing
the tables.
3.3 Analysis of results
The projections, conducted by IBGE (2012), allow us to know both the elderly population as the total population, to
Brazil, to Joao Pessoa Paraiba and for the period of study and are described in Table 1.
Projections of the elderly population and total were obtained by geometric function: , where:
Initial population (P0), Time interval in years (n1), Annual growth rate (r ), , where: initial population
(P0), Population final (Pf) and time interval in years (n1).
Table 1: Projections for the elderly population and the total population of Brazil, João Pessoa and Paraiba,
period 2011 to 2015.
Place Years 2010 2011 2012 2013 2014 2015 Rate
Brasil
Elderly Population
20.590.599 21.423.314 22.290.769 23.194.467 24.135.980 25.116.950 3,9
Total Population
190.755.799 193.285.613 195.848.977 198.446.336 201.078.142 203.744.851 1,3
Paraíba
Elderly Population
451.385 464.740 478.555 492.849 507.641 522.953 2,9
Total Population
3.766.528 3.804.888 3.843.638 3.882.783 3.922.326 3.962.273 1,0
João Pessoa
Elderly Population
74.635 78.365 82.289 86.416 90.758 95.326 4,8
Total Population
723.515 739.300 755.430 771.911 788.753 805.961 2,1
Source: IBGE, 2012.

367
In João Pessoa, in 2010, in a total population of 723,515 inhabitants, the elderly accounted for 10.32% and for the year
2015, for a projected population of 805,961 individuals, will be 11.83% of the share of those aged 60 years or more.
The growth rate of the elderly population will annually by 4.8% while the total population will grow at an annual rate of
2.1%.
Comparing these rates with the Paraíba State and with the Brazil (Table 1), it is verified that they are bigger, because in
Paraíba, the elderly population will increase in a rate of 2,9% and the total population 1,0% and in the Brazil the people
with 60 years or more, will increase in a rate of 3,9% and the total population will have a grow of 1,3%. This
observation explicits a peculiarity of the João Pessoa: the increasing of the elderly population in a rate bigger than in
the State and in the country with the consequent increasing of this market segment.
The adopted criteria in the calculating of the dimensioning of sample, that defined the need of 44 interviews, and the
realization of raffle to determine which gyms, in the João Pessoa, should be researched to compose the number
calculated of the sample, ensured the statistical trustworthiness of the research and the possibility of the realization of
the inference of the found results, in the sample, to the total population.
The inference is a process of inductive reasoning, that takes conclusions from the particular to the general, it is used
when it intends to study a population, studying some elements of the population, that´s a sample and it serves for, since
that the properties are verified in the sample, can be inferred properties for the population.
With the organized data, it was possible to show the results, where the table 2 demonstrates the findings in relation to
the criteria of promotion/divulgation of the gyms of João Pessoa, and in this we can observe that 29,5% of the
companies invest in promotion of their activities in the media and among these, 53,8% don´t have a defined criteria to
make propaganda. The form more used to make advertising is the flyers with 50% of choice, and in a second option is
the divulgation by radio (27,8%).
Table 2: Evaluation about promotion/divulgation of the gyms of João Pessoa, 2012.
Questions evaluated Yes (%) No (%) Total (%)
1. Does the gym invest in media? 29,5 70,5 100
1.2. If yes, how often?
All the year. 15,4
100
Any time 15,4
Only in the summer 7,7
Only when there is a event 7,7
There is no defined criteria 53,8
1.3. If yes, in which media?
Radio 27,8
100
Television 5,6
Flyers 50,0
Sponsorship of events 16,7
Others 0,0
Note: Values expressed in percentage
In relation to the results of the question about promotions offered to elderly, it was noted that, according to Table 3,
20,5% of the gyms makes some kind of promotion with focus on elderly costumer, and the special service offered to
these costumers are the medical orientation (77,8%).

368
Table 3: Evaluation of promotions offered to the elderly in the gyms of João Pessoa, 2012.
Evaluated questions Yes (%) No (%) Total (%)
2. Does the gym make some promotion focused on the elderly public?
20,5 79,5 100
2.1 If yes, what?
Discount on monthly fees 22,2
100 Medical guidance 77,8
Guidance of nutritionist 0,0
Other. 0,0
Note: Values expressed in percentage
The third point of evaluation described on Table 4, it was specific to identify if the companies have special programs to
the elderly public. It was found that 86,4% of the gyms do not have special groups for elderly and do not have a full time
instructor for the classes of this public. Finally, just 4,5% of these fitness centers said that have classes in different
timetables to the elderly, which shows a lack of attention to this public that grows each year.
Table 4: Evaluation about the activities offered to the elderly.
Evaluated questions Yes (%) No (%) Total (%)
3.1. Does the gym have exclusive groups composed only by elderly? 13,6 86,4 100
3.2. Does the gym have a full time instructor in the classes to elderly? 13,6 86,4 100
3.3. Do the classes/activities to the elderly are in various timetable? 4,5 95,5 100
Note: Values expressed in percentage
4. Final considerations
Studies show the growth of the elderly population in the city of João Pessoa, which is the capital of Paraíba state, in the
northeast of Brazil, and along with this increase in life expectancy, a change is occurring in the profile of this population
that is experiencing an increase in their participation and influence in the goods and services consumer. Based on these
findings, this study sought to investigate the marketing strategies of gymnastics gyms of João Pessoa and if there are
programs and activities designed especially for the elderly population. Thus it was found that only 29.5% of companies
conduct some investment in media, being the most used form of disclosure through pamphlets.
At the end of this study, we found that, just some gyms in João Pessoa understand the aging population as a market
segment with a consumption potential.
Some gyms (23.6%) stated that offer activities for people over 60, but do not offer diverse schedules. It was observed
that only 20.5% of surveyed gyms perform any campaign or service offering with special focus on the elderly client,
confirming the hypothesis that the seniors are not seen by the gyms of João Pessoa, as an important market segment
and potential. These companies need to learn to resist the instinctive idea that their publics are the young only, in the
range of 18 to 35 year, and evaluate all aspects of marketing to reach consumers in a different age group.
Gyms with specific programs for the elderly can have a chance of increasing their business, because by attracting
seniors to the fitness centers, these companies of João Pessoa, wil l be focusing on a market with an elderly population
projected for the year 2015 approximately with 95 thousand people, a percentage of approximately 12% of the total
population and with a growth trend.
The thought that people over 60 years cannot, or will not, do physical activity has been abolished in the past, today's
elderly population is in an active condition and wants to pay for this type of service. Therefore, represent an important
and potential market segment for gymnastics gyms.

369
References
AMERICAN MARKETING ASSOCIATION. Definition of Marketing. Available at:
<http://www.marketingpower.com/AboutAMA/Pages/DefinitionofMarketing.aspx>. (acess december, 2012)
BENI, M.C. (2007). Análise Estrutural do Turismo (12 ed.) São Paulo: SENAC/SP.
BRASIL, Ministério do Trabalho (1984). Resolução nº 104963 Diário Oficial da República Federativa do Brasil, Brasília,
DF, 12 de fev. 1984.
CAPINUSSÚ, J. M. (1989). Administração e marketing nas academias de ginástica. São Paulo: IBRASA.
CHURCHILL, G. A.; PETER, P. (2000). Marketing, Criando Valor para os Clientes. São Paulo: Saraiva.
COBRA, M. (1997). Marketing Básico: Uma Perspectiva Brasileira (4. Ed). São Paulo: Atlas.
CONSELHO REGIONAL DE EDUCAÇÃO FÍSICA – CREF 10. Lista de academias cadastradas. João Pessoa/ PB, 2012.
DIOGO, M. J. D. (2006) Saúde e Qualidade de vida na velhice (2. ed.) Campinas: Alinea.
ECONOMIASC. Disponible: < http://www.economiasc.com.br/index.php?cmd= comercio&id=6680> access 24 dec.
2012.
ENGEL, J. F.; BLACKWELL, R. D.; MINIARD, P. W. (2000). Comportamento do Consumidor (8. ed.) Rio de Janeiro: LTC.
FERNANDES, M. G. M.; FERNANDES, B. M. (2010). Unindo os fragmentos: construção de políticas públicas e garantia de
direitos para idosos no Brasil – A terceira idade. São Paulo, v.21 (n. 49), p.39-52.
FUNDAÇÃO INSTITUTO BRASILEIRO DE GEOGRAFIA E ESTATÍSTICA-IBGE (2008) – Projeção da população do Brasil
por sexo e idade: 1980-2050: Revisão 2008/IBGE, Coordenação de População e Indicadores Sociais. - Rio de
Janeiro: IBGE.
FUNDAÇÃO INSTITUTO BRASILEIRO DE GEOGRAFIA E ESTATÍSTICA-IBGE (2009a) – Indicadores Sociodemográficos e
de saúde no Brasil- 2009: IBGE, Coordenação de População e Indicadores Sociais, - Rio de Janeiro: IBGE.
FUNDAÇÃO INSTITUTO BRASILEIRO DE GEOGRAFIA E ESTATÍSTICA-IBGE (2009b) – Síntese de Indicadores Sociais:
uma análise das condições de vida da população brasileira, - IBGE, Coordenação de População e Indicadores
Sociais, - Rio de Janeiro: IBGE.
FUNDAÇÃO INSTITUTO BRASILEIRO DE GEOGRAFIA E ESTATÍSTICA-IBGE (2012). Censo 2010: primeiros resultados.
Available at: http://www.ibge.gov.br/home/ estatística/população/censo2010/default.shtm (Acessed
december, 2012).
GEIS, P.P. (2003). Atividade física e saúde na terceira idade: teoria e prática (5. ed.) Porto Alegre: Artmed.
HOOLEY, G. J. et al (2001). Estratégia de Marketing e Posicionamento Competitivo . 2 ed. São Paulo: Prentice Hall.
LAS CASAS, A. (2002). Marketing de Serviços. 3 ed. São Paulo: Atlas.
KOTLER, P.; ARMSTRONG, G. (2003). Princípios de Marketing (9. ed.). São Paulo: Pearson Prentice Hall.
KOTLER, P.; KELLER, K. (2006). Administração de marketing (12. ed.) São Paulo: Pearson Prentice Hall.
KOTLER, P. (2009). Marketing para o Século XXI: Como Criar, Conquistar e Dominar Mercados. São Paulo: Ediouro.
MOSCHIS, G. (1993). Gerontographics. Journal of Consumer Marketing, v. 10 (n. 3).
MOSCHIS, G. (2003). Marketing to older adults: an updated overview of present knowledge and practice. Journal of
Consumer Marketing, v. 20 (n.6).
PASCHOAL, S.M.P.; FRANCO, R.P.; SALLES, R.F.N. (2007). Epidemiologia do envelhecimento. Tratado de geriatria e
gerontologia. São Paulo: Atheneu.
ROCHA, A.; CHRISTENSEN, C. (1999). Marketing: Teoria e Prática no Brasil (2. ed.). São Paulo: Atlas.
SABA, F. (2006). Liderança e gestão: para academias e clubes esportivos. São Paulo: Phorte.
SAMARA, B. S.; MORSCH, M. A. (2005). Comportamento do Consumidor: Conceitos e Casos. São Paulo: Prentice Hall.

370
TIBONI, C.G.R. (2010). Estatística básica: para os cursos de administração, ciências contábeis, tecnológicos e de gestão.
São Paulo: Atlas.
TOWLE; MARTIN J. (1976). The elderly consumer: One segment or many? Advances in Consumer Research, v. 3 (n. 1).
371
The "Made in Portugal" consumption and
Country-Of-Origin (C.O.O.) perception in the
context of crisis and austerity Ethnocentrism; Country-Of-Origin; Country Image; Buy Local; Social Marketing.
Paula Arriscado, IPAM – The Marketing School, [email protected]
Bruno Galante, IPAM – The Marketing School, [email protected]
Rosa Conde, IPAM – The Marketing School, [email protected]
Abstract
The paper aims to reflect about the "Made in Portugal" consumption and the Country-Of-Origin (COO) perception in the
present Portugal`s economic context, contributing to change consumer behavior in a country where the trade balance
has been heavily dependent on imports of foreign goods.
We seek to comprehend whether Portuguese citizens have become more attentive on what they buy, with increasing
preference for "Made in Portugal" goods. This attitude can be a way to protect their country from economic crisis in
general and unemployment in particular (CETSCALE).
Our research is built on the concepts of Country Image, Buy Local, Country-Of-Origin, Ethnocentrism and product
preferences towards food, clothing, accessories, footwear and homeware products made in Portugal, associated with
mental and emotional activities undertaken in the selection, purchase and use of products / services to satisfy needs
and desires.
Based on a quantitative methodology, it seeks to detect different levels of Ethnocentric behavior (moderate or extreme)
and its impact on purchase behavior and Made in Portugal products evaluation, as well as foreign products perception
and its impact towards unemployment and “Be Portuguese” feeling.
As all this has a direct relationship with the changing consumer behaviour, we added concepts associ ated with Social
Marketing, a close relationship with the COO effect. There is a growing desire for consumption of national products and
a positive perception from their attributes, mostly in the food sector.
1. Introduction
The economic context of Portugal, following the request of external financial assistance, made in April 2011; the
situation of public finances and its impact on banking systems; as well as the economic consequences which a crisis of
public debt can generate in the Eurozone an opportunity to evaluate and understand the Country-Of-Origin (C.O.O.) and
the Buy Local trend at the current level of Ethnocentrism of the Portuguese consumer and obtain a more concrete
vision about their perceptions on products “Made in Portugal”.
As the adjustment program has led to a decline in purchasing power of the Portuguese and the insolvency of companies,
offering products with national label assumes greater presence on the shelves of consumption. The Portuguese report
being more attentive to what they acquire, with increasing preference by "Made in Portugal" goods, especially in certain
product categories, considering that this attitude can be a way to protect their country from economic crisis in general
and unemployment in particular (Kolar et al., 2010; Curtin, 2003; Ahmed et al., 2004; Luthy, 2007; Festervand and
Sokoya, 1994). Also in Portugal, the campaigns and movements that aim to develop feelings of belonging among
consumers are on the agenda to promote the quality, prestige and value of products of domestic origin

372
(Bandyopadhyay et al., 2001).
Several cultural and social factors influence the purchase, such as perceptions regarding what is produced in the
Country-Of-Origin, including the history, values and attitudes rooted, affecting self-esteem and confidence in relation to
certain products country.
This research is essentially based on the concepts of Ethnocentrism, Country-Of-Origin, Country Image, Product
Preferences and Buy Local, towards products “Made in Portugal”, in the area of food, clothing, footwear and accessories,
as well as homeware items, associated the mental and emotional activities undertaken in the selection, purchase and
use of products / services to satisfy needs and desires, taking into account the perspective of their own group and
rejection of other culturally different groups (Booth, 1979; Worchel and Cooper, 1991 ). Makes a parallel with the
change in consumer behaviour and therefore required to develop concepts associated with Social Marketing, a
relationship with the C.O.O. effect, in that way buying products from other countries can be seen as a negative act that
affects the economy of their own country, patriotism and promotes unemployment (Shimp and Sharma, 1987; Ahmed
et al., 2004; Luthy, 2007; Festervand and Sokoya, 1994). You are thus in the realm of choices for goods of particular
country in the field of beliefs associated with the country where the products are manufactured (Tse and Gorn, 1993;
Laroche et al., 2005), as well as perceptions towards the country in terms of politics, economy and culture (Roth and
Romeo, 1992).
Increase consumption of domestic products could result in a change of habits in response to the changes that the world
is suffering with implications for social behaviour, either by organizations or individuals (Kunsch, 2003), referring to a
new marketing approach more focused on the human spirit (Kotler, Kartajaya and Setiwan, 2011).
After nearly two decades of consumption and a strong appetite for imported products, Portugal is in a new stage of
consumption, with repercussions in Portuguese as consumers and producers, by facing some issues that we wanted to
understand with this research:
• "As a result of this contraction of the economy, Portuguese citizens are now more willing to consume Portuguese
products?";
• "Are Portuguese citizens willing to defend the consumption of products 'Made in Portugal' as a response to counter
the growing national unemployment rate, causing a change in behaviour based on social responsibility values?";
• "After a long experience of consumption of imported products to the detriment of nationals, Portuguese citizens will
defend the placement of barriers to imported goods?".
It became relevant to understand if less favourable economic situation is an incentive to buy products of national origin,
reflecting the level of the trade balance, the business dynamics and employment rate.
This research may be an academic and scientific advantageous, by the junction of two central theories - Consumer
Ethnocentric and Social Marketing - but also and especially at the enterprise level, thereby improving the conception of
new approaches in the market and create a new mindset on the Buy Local and Country-Of-Origin, pointing ways to
redesign sales strategies and communication in less favourable economic environments. The public level is a topic with
growing interest and may constitute a pole of reflection on the habits and behaviours of consumption over the "Made in
Portugal".
2. Literature review
Consumer behavior is based on the study of the processes related to the selection, purchase and use of products,
services, ideas or experiences by individuals or groups in order to satisfy needs or desires. This may be influenced by
individual variables of temporary or permanent nature or physiological or self-esteem (Maslow's Hierarchy of Needs),
as well as sociological variables or psychosocial (Solomon, 2002; Lindon et al., 2008). The consumer behavior is
therefore closely related to the sensitivity and willingness to purchase locally sourced produce (Buy Local) and the
perception and evaluation of the attributes of each country (C.O.O. -Country-Of-Origin) which therefore affects the
image about the country itself (Country Image), their assets, as well as its citizens, with repercussions on Ethnocentric
consume (Consumer Ethnocentrism), strongly focused on "our group" (Balabanis et al., 2004), understood as a
perspective more moderate or more radical.
This set of constructs refers to consumption "Made in" which, in a context of strong economic downturn, gains the

373
strength to generate a change in behavior, whose situation requires to be labeled by positive, responsible and desirable,
insofar that favors domestic companies and safeguard jobs (Ahmed et al., 2004; Luthy, 2007; Festervand and Sokoya,
1994; Kolar et al., 2010; Curtin, 2003). In this assumption, the present study also refers to the theories related to Social
Marketing seen as a strategy tool for the promotion of behavior change (Kotler and Roberto, 1992; Schiavo, 1998). This
is to determine the needs, wants and interests of consumers to ensure or enhance the welfare of the individual and
society (Kotler, 2000), from the adoption of behaviors, attitudes and practices of the individual or collective , guided by
ethical principles and social equity (Schiavo and Power, 1998) for the development of the community.
In this sense, the Social Marketing is also cause for reflection on the literature review, for theoretical support of this
work, although the empirical level term referred us only for scales related to Country-Of-Origin (C.O.O. Scale) and
Ethnocentrisms (CETESCALE). This also includes variables that indicate the potential for behavioral change associated
with unemployment.
2.1. From Ethnocentrism and Country-Of-Origin to Buy Local
Consumers, very early, are exposed to values, beliefs, traditions, lifestyles, preferences, perceptions and many other
factors not only from family but also from other influential groups, adopting autonomous choices or dependents from
their home place or other externals stimulus (Karsaklian, 2004).
The purchase of various goods, whether large involvement, such as cars and appliances, or low involvement, such as
food, clothing, footwear and homeware articles reveal trends and specific preferences and distinct social classes, but
also dependent on geographical locations and culture of a people, conditioning the choice of a particular product or
brand with which they identify (Kotler, 2000), because they mirror the feel of the group (Balabanis et al., 2001).
Ethnocentrism is focused on "we" (Adorno, 1950; Hogg, 2001; Balabanis and Diamantoupoulos, 2004; Granzin and
Painter, 2001), and all that is external to the group is judged, criticized and denied, may be related a very high level of
loyalty towards the Country-Of-Origin. The consumer feels thus motivated to help his country (Druckman, 1994),
reflecting upon the Buy Local, buying products made in their own country.
Turner (1999) puts emphasis on positive social identity, expressed through a desire to create, maintain, strengthen or
enhance differently your group, however, stresses that an individual can belong to several groups and its significance
may also vary from person to person.
Following this, Shimp and Sharma (1987) developed a multi item "CETSCALE" which allows grasping the Ethnocentric
tendencies of consumers and explaining why they tend to prefer the products of the Country-Of-Origin, demonstrating
a strong relationship between Ethnocentrism, assessment of quality and intentions to purchase domestic products. The
authors demonstrated the ability to lead the belief that it is inappropriate to buy foreign products and the urgent need
to support domestic companies by buying their products, and Ethnocentrism tend, indeed, to be more assertive in
regions where employment is threatened by foreign competition, leading to the practice of Buy Local.
But studies conducted in different countries (Belgium, Canada, India, Qatar, United Kingdom, Czech Republic, Australia,
Greece, among many others) show behavioral differences from country to country (Elliott and Cameron, 1994) and
from product to product ( Papadopoulos, Heslop and Bamossy, 1990; Roth and Romeo, 1992). Then, it is not possible to
generalize the effect of Ethnocentrism on consumer behavior, whether we are talking about moving consumer goods or
automobiles, chain saws, travel agency, TV's, toiletries, clothing, toys, tools and furniture, or other (Kaynak and Kara,
2002; Gürhan-Canli and Maheswaran, 2000; Ahmed, d'Astous and Benmiloud H. (2011); Kinra, 2006; Brunning , 1997,
Al-Sulaiti and Baker, 1998; Firbasova and Orth, 2003; Balabanis and Diamantoupoulos, 2004; Chryssochoidis et al.,
2007; Josiassen, Lukas and Whitwell, 2008).
The majority of studies show that food supplies are more Ethnocentric consumed (e.g. champagne from France or port
wine from Portugal, Italy pizza or tapas in Spain) than durable products associated with technology (Alden et al. 1 999).
With the proliferation of the global economy (Samiee, 1994; Agiomirgiankis and Zervoyinanni, 2001; Akhter, 2007),
competition between domestic and foreign products and the rapid growth of Asian markets and the BRIC countries, the
concepts associated with Ethnocentrism have gained strength, as well as assessing their perceptions against brands,
products, where nationality can enhance the acceptance or rejection of them (Kaynak and Kara, 2002; Rahman, 2000),
taking into account the beliefs in relation to the countries where the products are manufactured (Tse and Gorn, 1993).
The phenomenon of trial products may still accrue image of their Country-Of-Origin, often associated with the label

374
"Made In", the result of perceptions in relation to culture, economics and politics that consumers advocate of a
particular country ( Koubaa, 2008; Wu, 2011; Fetscherin and Toncar, 2009; Diamantopoulos et al., 2011). Even the
scrutiny of certain product attributes can be positive when consumers believe that certain countries have unique
capabilities in the development or construction of certain products such as the Swi ss watch industry, cheeses and
French wines and German cars, among other , affecting therefore intend to purchase, as well as the evaluation of
product characteristics such as quality, design, prestige, price, among other attributes (Roth and Romeo, 1992; Yarpak
and Baughan, 1991; Han, 1989; Wall, 1991, Smith, 1993; Balabanis and Diamantopolous, 2004; Lantz and Loeb, 1996;
Josiassen, Whitwell and Lukas, 2008). The judgments are formulated from the conception that there compared to
historical facts, political maturity, the dynamic economic, military conflicts, international relations, traditions, the level
of industrialization and technological development of a country (Askegaard and Ger, 1998 ; Billing, 1995; Askegaard
and Ger, 1998; Billing, 1995; Klein, 2002; Klein, Etterson and Morris, 1998). However, the trial may still arise from
specific product attributes (Supphellen and Rittenburgh, 2001; Juric and Worsley, 1998; Showers and Showers, 1993),
and also the lack of specific knowledge of the product, and consumers are more informed C.O.O. just for reference
(Maheswaran, 1994; Gürhan-Canli and Maheswaran, 2000; Hong and Wyer, 1989; Josiassen, Lukas and Whitwell,
2008).
The act of buying domestic products is especially observable in cultures with strong collective bond, which tend to
override the preference grounded in national denomination over the attributes of the product themselves, unlike
certain feelings with more individualistic cultures.
However, there are authors like Laroche et al. (2002) and Agrawal and Kamajura (1999) who demonstrated a
significant influence of C.O.O. in consumer choice, while Darley and Lim (1997), Liefeld (1993) and Ettenson (1988) a
large set of sensed variables affecting the behavior purchase. This confirms the need to develop specific studies by
country and by product category (Kinra, 2006, Laroche et al., 2002), to determine clues that help to define strategies
and operational plans and the level of product development , price, distribution and communication channels, a
consumer centric logic.
In this regard, Josiassen (sd) and Grunert and Valli (2001) see the age of consumers as an influential variable in
Ethnocentrism, denoting were differences depending on the context as well as, tendentiously, greater impact on older
consumers are more Ethnocentric than younger people, while Brodowski (1998), Gürhan- Canli and Maheswaran
(2000), Lantz and Loeb (1996), Josiassen, Lukas and Whitwell (2008) advocate the purchase option based on the
degree of involvement with the product category.
2.2. Patriotism versus Nationalism
There are different Ethnocentric behaviors, with more or less extreme positions, depending on the degree of
involvement with the country, community, or even depending on the degree of information (Balabanis et al., 2001).
Adorno (1950) found that there is a significant difference between "healthy patriotism" and "Ethnocentric patriotism",
the first of which reflects a very positive feeling towards the country, while the latter translates into a bond too strong
cultural values, rejecting external groups, on shared values nationalists.
In connection to feelings of loyalty towards the Country-Of-Origin, Feshbach (1990) stated that the “healthy patriots”
may be willing to sacrifice themselves for their country, sending personal interests to the background, thus protecting
the national economy, to prevent the entry of products from other countries.
"Healthy Ethnocentrism” by Adorno (1950), as well as moderate protectionist tendencies end up communing with the
concept of internationalism based on a more moderate attitude regarding what comes "from abroad", indicating that a
positive feeling toward people and nations (Kosterman and Feshbach, 1989), without reservation or prejudice for
acquisition of imported products (Baughn and Yaprak, 1993; Jobibert and Peterson, 1995).
It is a distinct behavior of the nationalists (corresponding to the "Ethnocentric Patriotism" concept by Adorno , 1950),
often due to lack of information about other countries and their products (Druckman, 1994).
The intensification of international competition, rising unemployment and the appearance of labor, cheaper labor lead
more consumers to purchase more protective behaviors, given the fear of harming the economy, and be subject to the
prejudices of morality and personal injury due to the acquisition of products from other countries (Engel et al., 1995;

375
Simonson, 1999; Watson and Wright, 2000).
The social and cultural connotations associated with domestic products can also help in demarcating a symbol of
national identity by not translate into a sense of belonging (Askegaard and Ger, 1998; Billing, 1995), which leads to the
need to protect the country's own economy and support them economically (Verlegh, 2007).
Within a conception of Ethnocentrism we find the most extreme positions of nationalism that overemphasize the
respective nation against the other. The Country-Of-Origin and their status is stated first, calling for restrictions on
immigration, as opposed to preferential treatment of the source population, for the labor force. Foreigners are regarded
as members "outside group" and imports are seen as something that harms the national economy and its workers
(Shimp and Sharma, 1987; Sharma et al., 1995, Schwartz 1977).
2.3. Social Marketing and Buy Local
The Social Marketing has gone through different definitions, and is currently associated with changing behavior,
attitudes and practices of the individual or collective, and guided by ethical principles, grounded in human rights and
social justice, to preserve or improve the welfare of consumers and society (Kotker and Roberto, 1999; Kotler 2000: 47;
Schiavo, 1999; Araújo, 2005). As advocates Araújo (2005), Social Marketing rediscovers consumers through interactive
dialogue, which gives conditions for participation in social change.
The Social Marketing today can be a solution to social and economic problems, consisting of an opportunity for
companies by adding value and excitement, differentiating their products and increasing both sales and customer
loyalty, a logic of socially active companies and civic heritage, for a socially responsible consumption in the belief that at
the time of purchase, beyond the rational benefits emerge from the emotional character motivations, including ethical
nature. This is a more holistic view of the consumer, because of their size reason, emotion and spirit (Kotler, Kartajaya
and Setiwan, 2011).
The latest business and corporate crimes, as well as the recent global financial crisis has revealed that it is imperative
for organizations responsible action to society, the environment and future generations, in order to change patterns of
consumption or developed countries both countries' development. It is increasingly common for organizations develop
their corporate social responsibility actions more visible, engaging in specific causes, increasing its positive impacts, as
well as consumer awareness, to the extent that they are providing a reference to an abstract wide range of activities
that can result in rewards to enhance reputation, get more loyalty from the customer and still register higher value by
the market (Sheikh and Beise-Zee, 2011).
Since the introduction of Social Marketing in the early 70s, which are witnessing a gradual increase in the application of
marketing principles and practices for the benefit of society with expertise in different areas, particularly in the fight
against smoking, alcohol, nutrition, environmental protection, among others (MacAskill et al., 2002; Mc Kenzie-Mohr
and Smith, 1999; Gordon, 2011; Rehm et al., 2010), being necessary to add other areas that require a citizen
mobilization around fundamental causes for balance and well-being of society, where we argue that fits the job
protection with impact on consumption to Buy Local.
Given the extensive role of marketing, urge, together with the application of principles and practices to generate social
good, realizing the impact of commercial and transactional marketing in society and address any discomfort caused by
this (Gordon, 2011; Rangoon and Karim , 1991; Andreasen, 1995; Leisure and Kelley, 1973; Moore and Wilkie, 1999;
Arnold and Fischer, 1996; Luck, 1969; Hastings, 2003).
Domegan (2008) explores the social and economic exchanges of Social Marketing to five levels - intrapersonal /
individual, interpersonal (family and friends provide social support), institutional / organizational, community (local or
regional social networks more distant from family and friends) , and public policy - and argues that the change in
consumer behavior can only occur when there is a significant and ongoing investment in the same motivation, resulting
in a better understanding of the social, political, environmental and contextual.
In interventional plan, Andreasen (2002) presents Social Marketing at three levels, which develop social change:
intervention focused on individual change (compared to major social problems); intervention focused on the
community, and the approach to those who believe that change social is constrained by social structures (laws,
institutions, available technology, public policy), and must be justice, policy, legislation, among other things, adequate

376
and modified to achieve social change at the structural, personal, or community.
For Social Marketing highly relevant in individual approaches as well as complementary approaches in community or
structural change in the social order and even the economic spectrum, its proponents will have to effectively
demonstrate the power of "approximation" through their actions.
The Social Marketing can act at the level of the public sector (government), private (commercial), as well as the level of
Non-Governmental Organizations (Zanone, 2006), intervening in several areas hitherto little regarded in their sphere of
intervention, as in the case of change of consumption patterns as a protective mechanism of employment and quality of
life of a given population (Laroche et al., 2005). The consumer rediscovers himself, thus by means of interactive
dialogue, reflecting and participating in social change (Araújo, 2005). His social conscience is awakened to give a
strategic transformation of attitudes and behaviors seen as acting for the welfare of society (Roberts, 2005; Pine II and
Gilmore, 1999), a holistic view of the consumer, understood as a person, driven by reason, emotion and spirit (Kotler,
Kartajaya and Setiwan, 2011), which can result in competitive advantages for businesses and the community (Ashley,
2003). Individuals are thus predisposed economies to pay more for products associated with social causes (Pringle and
Thompson, 2000; Levek et al., 2002; Sima and Assis, 3004), as well as the defense of their group membership (Booth,
1979; Worchel and C.O.O.per, 1991; Balabanis et al., 2001). This situation is especially present in a crisis and austerity
context (Kolar et al., 2005; Curtin, 2003) with implications for unemployment (Ahmed et al., 2004; Luthy, 2007;
Festervand and Sokoya, 1994).
3. Empirical research
3.1. Methodology
Based on a quantitative methodological approach, the research allowed to identify key perceptions for 'Made in
Portugal' products and point clues to understanding consumer behavior in a less favorable economic situation as well
as its impact on preferences for domestic goods, intensifying the feelings of Ethnocentrism and Patriotism, among
others, that link the relationship of national feelings.
To this end, we prepared a questionnaire consisting of several scales. In the first part, we intend to evaluate the
behavior of consumption / purchase of "Made in Portugal" for four sectors (food, clothing / accessories, footwear and
homewere products). In the second part, we intend to evaluate the products "Made in Portugal" in general using as
reference the C.O.O. scale (Tse and Gorn, 1993; Pisharodi and Parameswaran, 1994). We used 14 items, divided into
five dimensions: Quality, Prestige, Price, Availability, and Promotion. Some items were written positively others
negatively. The importance of each component was measured using a Likert scale of 6, ranging from "1 - strongly
disagree" to "6 - strongly agree." Then we evaluated the purchase, use and feelings face to products "Made in Portugal",
using the CETSCALE (Shimp and sharma, 1987). The first 16 items assess the extreme Ethnocentrism, five items to
assess moderate Ethnocentrism, three for the impact on unemployment and foreign consumption dimension, and three
for barriers / import taxes dimension.
Finally, we used six items for the evaluation of Generic Portuguese citizens (Pisharodi and Parameswaran, 1992).
Fieldwork took place between 13 May and 5 June 2012 (Table 1).
Table 1 - Study Sample Design
Characteristics Inquiry
Sample universe Portuguese population between 15 and 64 years (64% of the Portuguese population)
Sample Size 438
Sampling error 5%
Confidence level 95% Z=1,96; p=q=0,5
Method of collecting information Personal Interview
Dates of Fieldwork May 13 to June 5, 2012
The data was analyzed using exploratory factor analysis. This analysis used a rule of thumb from Hair et al. (2010)
which specifies that factor loads greater than 0.50 are generally considered necessary for practical significance.

377
In the present work we considered the following possibility of investigation:
H1- The effect of sociodemographic variables when evaluating products differs from Country-Of-Origin (C.O.O.) and
Ethnocentric behavior, whether moderate [healthy patriotism by Adorno (1950)] either extreme nationalist or
substantially [Ethnocentric Patriotism by Adorno (1950)].
The Ethnocentric behavior, as well as evaluation of products and brands according to the conception C.O.O. varies from
country to country, as well as the level of product category and may be influenced by individual variables of temporary
or permanent nature, physiological or esteem, as well as variables sociological or psycho (Solomon, 2002; Lindon et al.,
2008). Josiassen (s.d.) and Grunert and Valli (2001) found the influence of age on consumer Ethnocentrism.
They also impact the trends and specific preferences and distinct social classes, geographic locations of consumers, as
well as its culture and sense of belonging (Kotler, 2000; Balabanis et al., 2001).
H2- A mainly nationalist conception synonymous with extreme Ethnocentrism [(equivalent to "Ethnocentric
patriotism" in Adorno (1950)] has a positive relationship with the buying behavior.
The demarcation of a symbol of national identity may come from social and cultural connotations associated with
domestic products, which in turn may favor its acquisition by prolonging the feeling of belonging (Askegaard and Ger,
1998; Billing, 1995), and therefore the need to protect the country's own economy and support it economically
(Verlegh, 2007).
H3- A positive assessment of Portuguese products has a positive relationship with the buying behavior
The positive evaluation of certain product attributes may result from the belief of consumers in relation to skills
development in some specific country or construction of certain products, acting at the level of purchase intent as well
as the evaluation of product characteristics such as quality, design, prestige, price, among other attributes (Roth and
Romeo, 1992; Yarpak and Baughan, 1991; Han, 1989; Wall, 1991, Smith, 1993; Balabanis and Diamantopolous, 2004;
Lantz and Loeb, 1996; Josiassen, Lukas and Whitwell, 2008).
H4- A perception that the consumption of foreign products has an impact on unemployment has a positive relationship
with the buying behavior.
The consumer feels motivated to help his country (Druckman, 1994), reflecting upon the Buy Local, buying products
made in their own country, and Ethnocentrism tend to be more present in regions where employment is threatened by
foreign competition (Shimp and Sharma, 1987). In this sense, the intensification of international competition, rising
unemployment and the appearance cheaper labor lead more consumers to purchase more protective behaviors, given
the fear of harming the economy, and would be subject to prejudices and personal injury due to the acquisition of
products from other countries (Engel et al., 1995; Simonson, 1999; Watson and Wright, 2000).
H5- The creating barriers / import taxes has a positive relationship with the buying behavior.
The Country-Of-Origin and their status is stated first, calling for restrictions on immigration, as opposed to preferential
treatment of the source population, while the labor force. Foreigners are regarded as members of "outside groups" and
imports are seen as something that harms the national economy and its workers (Shimp and Sharma, 1987; Sharma et
al., 1995, Schwartz 1977).
Ethnocentrism is focused on "we" (Adorno, 1950; Hogg, 2001; Balabanis and Diamantoupoulos, 2004; Granzin and
Painter, 2001), and all that is external to the group is judged, criticized and denied.

378
4. Analysis of Results
4.1. Sample
Most respondents were men (59.4%), from Oporto region (54.69%), with an income exceeding EUR 30,000 (39.7%),
with an age between 35-44 years (44, 3%), with the qualifications to high degree education (59.9%).
4.2. Behavior of Consumption / Purchase of products "Made in Portugal"
Regarding the purchase behavior of products "Made in Portugal" in the food sector, it was found that 47% of surveyed
stated that more than half of the products consumed were Portuguese. Only 8.9% said that all the products consumed
were totally Portuguese and only 0.7% Portuguese didn’t bought products.
Regarding the clothing and accessories sector, there has been a trend opposite to the previous. Only 8% of the surveyed
said that more than half of their purchases in this sector were "Made in Portugal", and 15.5% of respondents did not
purchase any Portuguese items. It was also found that 20.3% of surveyed did not have any buying clothing /
accessories. The footwear sector had a behavior similar to that previously analyzed sector. Thus, 5.3% of surveyed, said
that more than half of their purchases of footwear was "Made in Portugal" and 19.2% did not purchase any Portuguese
items. Only 12.8% of respondents only bought Portuguese footwear. Another curious fact is that 42.7% of respondents
did not purchase footwear.
Products for the home also follow the trend of the last two sectors, given that it only 4.3% of respondents, all the
products for the home were "Made in Portugal" and 37.2% said they bought something and 10, 3% did not purchase
any Portuguese items. It was also found that 26.9% made no purchase of items for the home.
4.3. Analysis of Results
4.3.1. Validation of the Scale Country-Of-Origin for “Made in Portugal” products
This range corresponds to influence consumer taking into account the beliefs of the country of manufacture of the
products (Tse and Gorn, 1993). It also corresponds to the "Made in" due to stereotyped perceptions compared to
products from certain countries (Pisharodi and Parameswaran, 1992; Pisharodi and Parameswaran, 1994).
We begin this analysis with a brief description of the items that compose the scale.
Table 2 - Descriptive Statistics Scale C.O.O. for “Made in Portugal” products
Items In overall “Made in Portugal” products…
N M DP
Are intensely advertised
438
2,31 ,951
Are sold in many countries 2,82 1,13
Are prestigious products 3,23 1,18
Are advertising informative 3,27 1,19
Are trendy 3,36 1,23
Are difficult to identify 3,37 1,44
Have a good value for money 3,56 1,08 Have design 3,82 1,08
Are unreasonably expensive 3,92 1,22
Are not easily available 4,19 1,41 Are not attractive 4,34 1,23 Have high quality 4,47 1,01 Are imitations (of international brands) 4,71 1,06 Are short lasting time 4,79 ,98538
Likert scale of 6 points, ranging from "1 - strongly disagree" to "6 - strongly agree."
By analyzing Table 2 checks that the best items valued in terms of average are: products "Made in Portugal" are short
lasting time (M = 4.79, SD = 0.98), followed by products "Made in Portugal "are imitations of international brands” (M =
4.71, SD = 1.06), have high quality (M = 4.47, SD = 1.01), the products "Made in Portugal" are not attractive (M = 4.34,
SD = 1.232). In turn those surveyed found that the products "Made in Portugal" are not intensely advertised (M = 2.31,
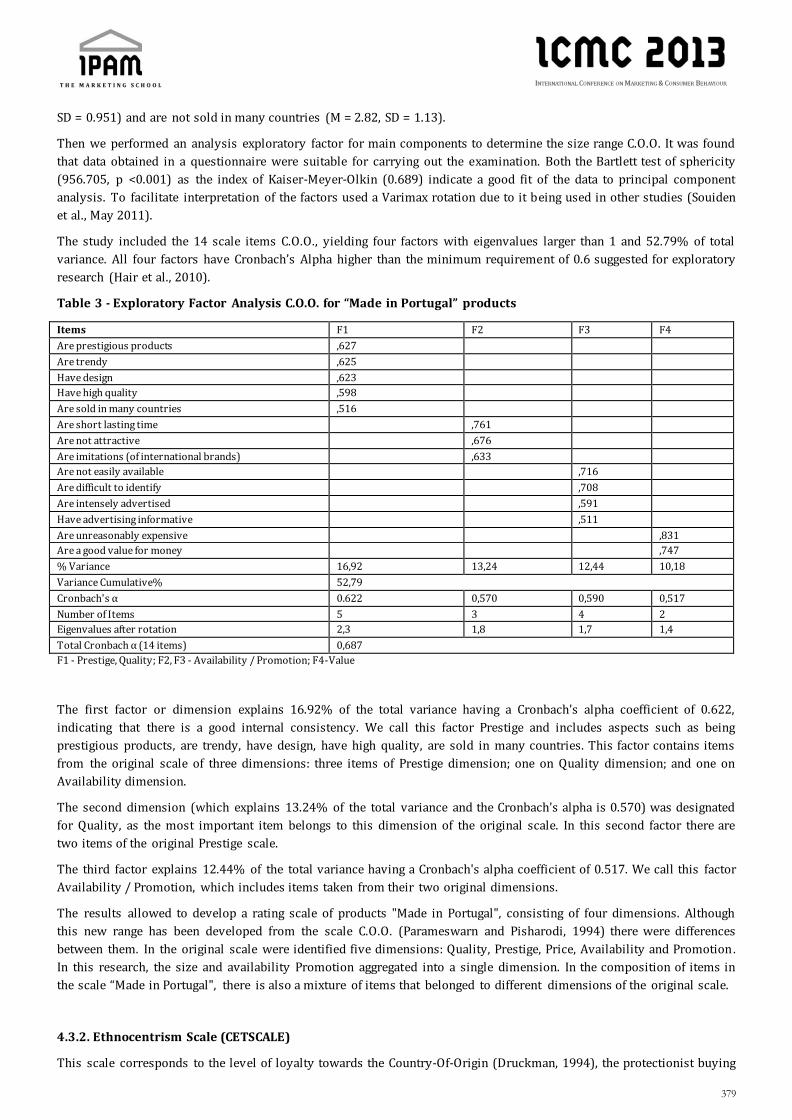
379
SD = 0.951) and are not sold in many countries (M = 2.82, SD = 1.13).
Then we performed an analysis exploratory factor for main components to determine the size range C.O.O. It was found
that data obtained in a questionnaire were suitable for carrying out the examination. Both the Bartlett test of sphericity
(956.705, p <0.001) as the index of Kaiser-Meyer-Olkin (0.689) indicate a good fit of the data to principal component
analysis. To facilitate interpretation of the factors used a Varimax rotation due to it being used in other studies (Souiden
et al., May 2011).
The study included the 14 scale items C.O.O., yielding four factors with eigenvalues larger than 1 and 52.79% of total
variance. All four factors have Cronbach’s Alpha higher than the minimum requirement of 0.6 suggested for exploratory
research (Hair et al., 2010).
Table 3 - Exploratory Factor Analysis C.O.O. for “Made in Portugal” products
Items F1 F2 F3 F4
Are prestigious products ,627
Are trendy ,625
Have design ,623
Have high quality ,598
Are sold in many countries ,516
Are short lasting time ,761
Are not attractive ,676
Are imitations (of international brands) ,633
Are not easily available ,716
Are difficult to identify ,708
Are intensely advertised ,591
Have advertising informative ,511
Are unreasonably expensive ,831
Are a good value for money ,747
% Variance 16,92 13,24 12,44 10,18
Variance Cumulative% 52,79
Cronbach's α 0.622 0,570 0,590 0,517
Number of Items 5 3 4 2
Eigenvalues after rotation 2,3 1,8 1,7 1,4
Total Cronbach α (14 items) 0,687
F1 - Prestige, Quality; F2, F3 - Availability / Promotion; F4-Value
The first factor or dimension explains 16.92% of the total variance having a Cronbach's alpha coefficient of 0.622,
indicating that there is a good internal consistency. We call this factor Prestige and includes aspects such as being
prestigious products, are trendy, have design, have high quality, are sold in many countries. This factor contains items
from the original scale of three dimensions: three items of Prestige dimension; one on Quality dimension; and one on
Availability dimension.
The second dimension (which explains 13.24% of the total variance and the Cronbach's alpha is 0.570) was designated
for Quality, as the most important item belongs to this dimension of the original scale. In this second factor there are
two items of the original Prestige scale.
The third factor explains 12.44% of the total variance having a Cronbach's alpha coefficient of 0.517. We call this factor
Availability / Promotion, which includes items taken from their two original dimensions.
The results allowed to develop a rating scale of products "Made in Portugal", consisting of four dimensions. Although
this new range has been developed from the scale C.O.O. (Parameswarn and Pisharodi, 1994) there were differences
between them. In the original scale were identified five dimensions: Quality, Prestige, Price, Availability and Promotion.
In this research, the size and availability Promotion aggregated into a single dimension. In the composition of items in
the scale “Made in Portugal", there is also a mixture of items that belonged to different dimensions of the original scale.
4.3.2. Ethnocentrism Scale (CETSCALE)
This scale corresponds to the level of loyalty towards the Country-Of-Origin (Druckman, 1994), the protectionist buying

380
behavior (Engel et al., 1995), the unfavorable attitude towards out-groups and favorable attitude of belonging to groups
(Summer, 1906).
We begin this analysis with a brief description of the items that compose the scale.
Table 4 - Descriptive Statistics Ethnocentrism Scale (CETSCALE)
Items N M DP
Portuguese people should always buy Portuguese-made products instead of imports
438
2,44 1,43
Only those products that are unavailable in Portugal should be imported 3,78 1,70
Buy Portugal-made products. Keep Portugal working 1,97 1,19
Portugal products, first, last and foremost 2,27 1,26
Purchasing foreign-made products is un-Portuguese 4,40 1,45
A real Portuguese should always buy Portuguese-made products 3,78 1,63
We should purchase products manufactured in Portugal instead of letting other countries get rich off us 3,17 1,62
It is always better to purchase Portuguese products 2,78 1,42
There should be very little trading or purchasing of goods from other countries unless out of necessity 3,24 1,64
Portuguese should not purchase foreign products, because this hurts business and causes unemployment 3,63 1,54
Curbs should be put on all imports 3,84 1,61
It may cost me in the long run but I prefer to support Portuguese products 2,94 1,24
Foreigners should not be allowed to put their products on our markets 5,08 1,21
Foreigners products should be taxed heavily to reduce their entry in Portugal 4,16 1,52
We should buy from foreign countries only those products that we cannot obtain within our own country 3,78 1,70
Portuguese consumers who purchase products made in other countries are responsible for putting their fellow Portuguese out of work
4,34 1,50
Likert scale of 6 points, ranging from "1 - strongly disagree" to "6 - strongly agree."
By analyzing Table 5, it appears that the best items valued in terms of average are: Foreigners should not be allowed to
put their products on our markets (M = 5.08, SD = 1.21), “Purchasing foreign-made products is un-Portuguese” (M =
4.40, SD = 1.45), “Portuguese consumers who purchase products made in other countries are responsible for putting
their fellow Portuguese out of work” (M = 4.34, SD = 1.50). The items that valued less were “Buy Portugal-made
products. Keep Portugal working” (M = 1.97, SD = 1.19), “Portugal products, first, last and foremost” (M = 2.27, SD =
1.26).
Then we perform a factor analysis exploratory for main components for determining the range of dimensions
CETSCALE. It was found that the data obtained through the questionnaire were adequate to perform the examination.
Both the Bartlett test of sphericity (4963.24, p <0.001) as the index of Kaiser-Meyer-Olkin (0.940) indicate a good fit of
the data to principal component analysis. To facilitate interpretation of the factors used a Varimax rotation due to it
being used in other studies (Souiden et al., 2011).
Initially, we included the 16 scale items CETSCALE, yielding two factors with values larger than 1 and with a variance
explained by these factors 63.97%. Then, the item was eliminated in the value of commonality was below 0.5: “Only
those products that are unavailable in Portugal should be imported”. After elimination of this item, there was obtained
a final solution (Table 5). A principal component analysis reveals two factors that explain 64.64% of the total variance,
which can be considered acceptable and indicating a good overall summary of the 15 scale items.
Table 5 - Analysis of Scale Exploratory factor Ethnocentrismo Scale (CETSCALE)
Items F1 F2
Portuguese consumers who purchase products made in other countries are responsible for putting their fellow Portuguese out of work
,797
Foreigners should not be allowed to put their products on our markets ,789
Curbs should be put on all imports ,775
We should buy from foreign countries only those products that we cannot obtain within our own country ,760
Foreigners products should be taxed heavily to reduce their entry in Portugal ,760
Portuguese should not purchase foreign products, because this hurts business and causes unemployment ,685
Purchasing foreign-made products is un-Portuguese ,665
A real Portuguese should always buy Portuguese-made products ,636
There should be very little trading or purchasing of goods from other countries unless out of necessity ,616
Portugal products, first, last and foremost ,850
Buy Portugal-made products. Keep Portugal working ,839

381
Portuguese people should always buy Portuguese-made products instead of imports ,785
It is always better to purchase Portuguese products ,726
We should purchase products manufactured in Portugal instead of letting other countries get rich off us ,616
It may cost me in the long run but I prefer to support Portuguese products ,568
% Variance 35,02 29,63
Variance Cumulative% 64,64
Cronbach's α 0,924 0,876
Number of Items 9 6
Eigenvalues after rotation 5,2 4,4
Total Cronbach α (15 items) 0,937
F1 - Protectionism [associated with "healthy patriotism" by Adorno (1950)]; F2-Nationalism [associated with the "Ethnocentric patriotism" in
Adorno (1950)].
The first factor or dimension explains 35.02% of the total variance having a Cronbach's alpha coefficient of 0.924,
indicating that there is a good internal consistency15. We call this factor Protectionism. This size was also verified in
other investigations, in particular in the work and Nien Hsu, 2008; Jakubanecs et al. 2005; Upadhyay and Singh, 2006;
John and Brady, 2011.
The second dimension (which explains 29.63% of the total variance and has a Cronbach's alpha coefficient of 0.876)
was called Nationalism. This size was also verified in other investigations, in particular in the work Hsu, N. (2008);
Jakubanecs et al. (2005); Upadhyay and Singh (2006) and John and Brady (2001).
The results allowed developing a scale for Consumer Ethnocentrism Portugal, consists of two dimensions. The number
of dimensions to this scale has not been consensual. There are studies that show the scale unidimensionality CETSCALE
(Shimp and Sharma, 1987; Luque-Martinez et al., 2000, Klein et al. 2,006; Netemeyer et al. 1991; Firbasová and Orth,
2003), other studies also have two dimensions (Saffu and Walker, 2005; Douglas and Nijssen, 2003; Nien and Hsu,
2008). Others have three (Jakubanecs et al., 2005) or even four dimensions (Upadhyay and Singh, 2006).
John and Brady (2011) following a confirmatory factor analysis concluded that a two-dimensional structure is
significantly better than four dimensions.
4.3.3. Scale C.O.O for Portuguese people evaluation
We begin this analysis with a brief description of the items that compose the scale.
Table 6 - Descriptive Statistics Scale For Portuguese people evaluation (C.O.O.)
Items N M DP
Portuguese are heading for poverty
438
2,51 1,20
Portuguese are not patriots 3,32 1,34
Portuguese have high levels of education 3,08 1,08
Portuguese have a good standard of living 2,56 1,01
Portuguese make sacrifices for the country 3,57 1,37
Portuguese will consume more Made in Portugal 3,67 1,21
Likert scale of 6 points, ranging from "1 - strongly disagree" to "6 - strongly agree."
By analyzing Table 6 there is better items valued in terms of average are: “The Portuguese will consume more Made in
Portugal” (M = 3.67, SD = 1.21) and “The Portuguese make sacrifices for the country” (M = 3 , 57, SD = 1.37), the least
valued item was the “Portuguese are heading into poverty” (M = 2.51, SD = 1.20).
15 Recommended level of Cronbach alpha second Nunnally (1078): Preliminary investigati on - 0.7; basic research - applied research and 0.8: 0.9 to 0.95

382
4.4. Verification of hypotheses
After reviewing the different scales, we will then proceed to verify the research hypotheses.
H1- The effect of social demographic variables differs in evaluating the products of the Country-Of-Origin
(C.O.O.), as well as the behaviour Ethnocentric, either moderate (Patriotism) or extreme (Nationalism).
The dimension Prestige and Value which are statistically significant differences between the gender of the respondents.
Prestige (p=0,003) and Value (p=0,017).
The other scales don’t have significant differences between the gender of the respondents. However, the female
appreciates the dimensions, Protectionism (Mmale = 26.66; Mfemale = 25.82), Nationalism (Mmale = 11.31; Mfemale =
10.93) and CETSCALE (Mmale = 37.97; Mfemale = 36.76).
Table 7 - Differences in average sizes for differences due to gender
Dimensions Gender N M DP T(436) p-value
Prestige Male Female
260 3,6 0,6 -3,035 0,003
178 3,8 0,74
Quality Male Female
260 4,2 0,74 -1,075 2,83
178 4,3 0,81
Availability / Promotion Male Female
260 3,3 0,83 ,048 0,962
178 3,3 0,91
Value Male Female
260 3,8 0,95 2,391 0,017
178 3,6 0,94
C.O.O Male Female
260 15,1 2,07 -1,380 0,169
178 15,4 2,09
Protectionism Male Female
260 26,66 7,5 1,070 ,285
178 25,82 8,34
Nationalism Male Female
260 11,31 4,6 ,808 ,420
178 10,93 4,91
CETSCALE Male Female
260 37,97 11,1 1,053 ,293
178 36,76 12,2
C.O.O. PORTUGAL Male Female
260 14,49 2,89 1,566 ,118
178 14,04 2,94
Just for the Value dimension [F (4.433) = 2.78, p = 0.026] are statistically significant differences depending on the age of
respondents. It was found that for dimensions Prestige [F (4.433) = 2.32, p = 0.056] and Quality [F (4.433) = 0.941, p =
0.446], respondents between 25 and 34 years are the ones who give more importance to these two dimensions. In turn,
individuals over 55 years value the Availability / Promotion [F (4.433) = 1.627, p = 0.166] and C.O.O. Portugal [F
(4.433) = 0.676, p = 0.609]. The C.O.O. [F (4.433) = 1.192, p = 0.313] is more important for individuals between 45 and
54 years. Finally, for those between 35 and 44 years appreciates the dimensions Protectionism [F (4.433) = 2.322, p =
0.056] and Nationalism [F (4.433) = 0.635, p = 0.638] and CETSCALE [F (4.433) = 1.753, p = 0.137].
Table 8 - Average difference for different scales depending on the age
Dimensions Between 15-24
(n=15) Between 25-34
(n=137) Between 35-44
(n=194) Between 45-54
(n=71) More than 55 years
(n=21)
Prestige 3,47 3,84 3,71 3,75 3,74
Quality 4,06 4,35 4,29 4,34 4,09
Availability / Promotion 3,16 3,28 3,29 3,46 3,69
Value 3,07* 3,73 3,74 3,95* 3,71
C.O.O 14,28 15,38 15,18 15,45 15,36
Protectionism 21,51 25,89 27,25 25,66 26,30
Nationalism 10,08 10,97 11,50 11,00 10,45
CETSCALE 31,60 36,86 38,75 36,66 36,75
C.O.O.Portugal 13,84 14,84 14,36 14,46 15,04
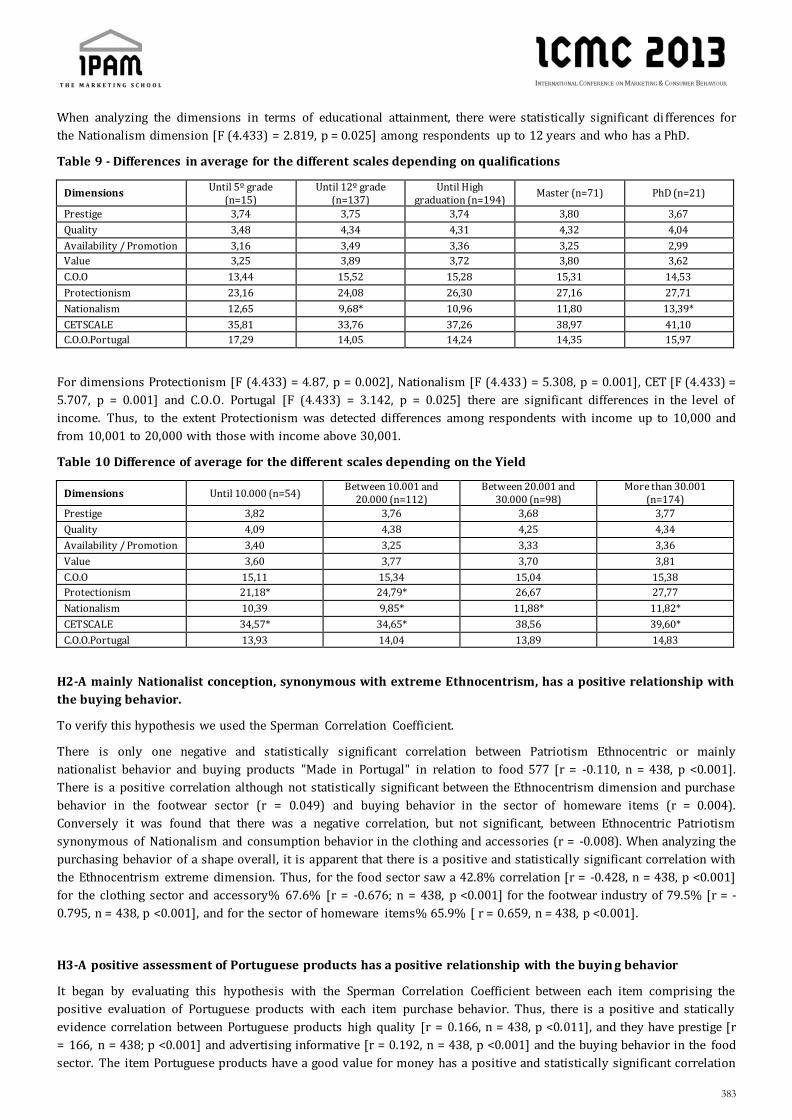
383
When analyzing the dimensions in terms of educational attainment, there were statistically significant di fferences for
the Nationalism dimension [F (4.433) = 2.819, p = 0.025] among respondents up to 12 years and who has a PhD.
Table 9 - Differences in average for the different scales depending on qualifications
Dimensions Until 5º grade
(n=15) Until 12º grade
(n=137) Until High
graduation (n=194) Master (n=71) PhD (n=21)
Prestige 3,74 3,75 3,74 3,80 3,67
Quality 3,48 4,34 4,31 4,32 4,04
Availability / Promotion 3,16 3,49 3,36 3,25 2,99
Value 3,25 3,89 3,72 3,80 3,62
C.O.O 13,44 15,52 15,28 15,31 14,53
Protectionism 23,16 24,08 26,30 27,16 27,71
Nationalism 12,65 9,68* 10,96 11,80 13,39*
CETSCALE 35,81 33,76 37,26 38,97 41,10
C.O.O.Portugal 17,29 14,05 14,24 14,35 15,97
For dimensions Protectionism [F (4.433) = 4.87, p = 0.002], Nationalism [F (4.433) = 5.308, p = 0.001], CET [F (4.433) =
5.707, p = 0.001] and C.O.O. Portugal [F (4.433) = 3.142, p = 0.025] there are significant differences in the level of
income. Thus, to the extent Protectionism was detected differences among respondents with income up to 10,000 and
from 10,001 to 20,000 with those with income above 30,001.
Table 10 Difference of average for the different scales depending on the Yield
Dimensions Until 10.000 (n=54) Between 10.001 and
20.000 (n=112) Between 20.001 and
30.000 (n=98) More than 30.001
(n=174)
Prestige 3,82 3,76 3,68 3,77
Quality 4,09 4,38 4,25 4,34
Availability / Promotion 3,40 3,25 3,33 3,36
Value 3,60 3,77 3,70 3,81
C.O.O 15,11 15,34 15,04 15,38
Protectionism 21,18* 24,79* 26,67 27,77
Nationalism 10,39 9,85* 11,88* 11,82*
CETSCALE 34,57* 34,65* 38,56 39,60*
C.O.O.Portugal 13,93 14,04 13,89 14,83
H2-A mainly Nationalist conception, synonymous with extreme Ethnocentrism, has a positive relationship with
the buying behavior.
To verify this hypothesis we used the Sperman Correlation Coefficient.
There is only one negative and statistically significant correlation between Patriotism Ethnocentric or mainly
nationalist behavior and buying products "Made in Portugal" in relation to food 577 [r = -0.110, n = 438, p <0.001].
There is a positive correlation although not statistically significant between the Ethnocentrism dimension and purchase
behavior in the footwear sector (r = 0.049) and buying behavior in the sector of homeware items (r = 0.004).
Conversely it was found that there was a negative correlation, but not significant, between Ethnocentric Patriotism
synonymous of Nationalism and consumption behavior in the clothing and accessories (r = -0.008). When analyzing the
purchasing behavior of a shape overall, it is apparent that there is a positive and statistically significant correlation with
the Ethnocentrism extreme dimension. Thus, for the food sector saw a 42.8% correlation [r = -0.428, n = 438, p <0.001]
for the clothing sector and accessory% 67.6% [r = -0.676; n = 438, p <0.001] for the footwear industry of 79.5% [r = -
0.795, n = 438, p <0.001], and for the sector of homeware items% 65.9% [ r = 0.659, n = 438, p <0.001].
H3-A positive assessment of Portuguese products has a positive relationship with the buyin g behavior
It began by evaluating this hypothesis with the Sperman Correlation Coefficient between each item comprising the
positive evaluation of Portuguese products with each item purchase behavior. Thus, there is a positive and statically
evidence correlation between Portuguese products high quality [r = 0.166, n = 438, p <0.011], and they have prestige [r
= 166, n = 438; p <0.001] and advertising informative [r = 0.192, n = 438, p <0.001] and the buying behavior in the food
sector. The item Portuguese products have a good value for money has a positive and statistically significant correlation

384
with the buying behavior dimension in food sector [r = 0.247, n = 438, p <0.001] and buying behavior in the clothing
and accessories sector [ r = 0.111, n = 438, p <0.001].
Table 11 - Correlation between the positive evaluation of products Portuguese and buying behavior
Portuguese products...
Having regard to the purchases made by me in the last month in the food sector
Having regard to the purchases made by me in the last month in clothing and accessory sector
Having regard to the purchases made by me in the last month in the footwear sector
Having regard to purchases I made last month in the homeware products sector
Have high quality
,166** ,020 ,011 ,035
Are prestigious products
,166** ,016 ,001 ,013
Are intensely advertised
0,035 0,077 0,001 0,079
Are sold in many countries
-0,074 -0,036 -0,15 0,006
Are trendy 0,066 -0,056 -0,059 0,074
Have advertising informative
0,192** -0,013 0,017 0,061
Have a good value for money
,247** ,111* ,064 ,088
have design ,076 -,008 -,024 ,007
* Correlation significant at the 5%; **Correlation significant at 1%.
After this analysis we calculated the correlation between purchasing behavior and the scale and dimensi ons C.O.O.
Prestige, Quality, Availability / Promotion and Value (Table 12).
Table 12- Correlation between purchasing behavior and C.O.O. scale and its dimensions
Scale
Having regard to the purchases made by me in the last month in the food sector
Having regard to the purchases made by me in the last month in clothing and accessory sector
Having regard to the purchases made by me in the last month in the footwear sector
Having regard to purchases I made last month in the homeware products sector
C.O.O ,216** ,069 ,081 ,131**
Prestige ,131** -,021 -,030 ,044
Quality ,136** ,058 ,151** ,122*
Availability / Promotion ,147** ,103* ,058 ,107*
Value ,252** ,148** ,121* ,106*
* Correlation significant at the 5%; **Correlation significant at 1%.
There is a positive and statistically significant correlation between C.O.O. factor and buying behavior in food sector [r =
0.216, n = 438, p <0.001] and homeware sector [r = 0.131, n = 438; p <0.001]. To the Prestige dimension there is only a
positive and significant correlation with the buying behavior in food sector [r = 0.131, n = 438, p <0.001]. As for the
Quality dimension there is a positive and significant correlation with the buying behavior for the food sector [r = 0.136,
n = 438, p <0.001], for the footwear [r = 0.151, n = 438, p <0.001] and for homeware products [r = 0.107, n = 438, p
<0.001]. The Value dimension is positively and statistically correlated with the C.O.O. scale and its three dimensions.
H4-A perception that the consumption of foreign products has an impact on unemployment has a positive
relationship with the buying behavior.
By analyzing this hypothesis, we found that there was a negative and statistically significant correlation between “Buy
Portugal-made products. Keep Portugal working” and buying behavior in the food industry [r = -0.096, n = 438, p
<0.001].

385
Table 13- perception that the consumption of foreign products has an impact on unemployment
* Correlation significant at the 5%; **Correlation significant at 1%.
This results may be influenced by the awareness initiative “Portugal, it’s me”, which aims at promoting the national
production and its consumption, for which its increase generates the perception on consumers to have impact on
employment. On other hand the Country-Of-Origin effect is different depending on the products category we are
analyzing.
The H5- Creating barriers / import taxes has a positive and intense with purchasing behavior.
It was found that there was a statistically significant positive correlation between “Buy Portugal-made products. Keep
Portugal working” r = 0.096, n = 438, p <0.001] in the Food Sector, “Foreigners should not be allowed to sell their
products in our market” in the Homeware sector [r = 0.097, n = 438, p <0.001] and in the footwear sector [r = 0,103, n =
438, p <0.001].
Table 14 - The creation of barriers / rates has a direct bearing on the buying behavior
Buy, use and feeling in relation to products "Made in Portugal
Having regard to the purchases made by me in the last month in the food sector
Having regard to the purchases made by me in the last month in clothing and accessory sector
Having regard to the purchases made by me in the last month in the footwear sector
Having regard to purchases I made last month in the homeware products sector
Curbs should be put on all imports. -,070 -,003 ,025 -,012
Foreigners should not be allowed to sell their products in our market
,042 ,021 ,103* ,097*
Foreigners products should be taxed heavily to reduce their entry in Portugal
,386 ,662 ,031 ,042
Buy Portugal-made products. Keep Portugal working
0,096* -0,014 0,025 0,000
Portuguese should not purchase foreign products, because this hurts business and causes unemployment
0,079 0,025 -0,019 -0,017
* Correlation significant at the 5%; **Correlation significant at 1%.
5. Result analysis
When analyzing the behavior of purchase / consumption of products "Made in" the food was what respondents
expressed a greater propensity to buy products with the "Made in Portugal", reverse to the other sectors analyzed. In
the clothing and footwear sector, only 8% of respondents indicated that half of their purchases were "Made in
Portugal", 5.3% for the footwear sector and only 4.3% for the articles for home.
In the C.O.O. scale, respondents feel that the products "Made in" are short lasting time and are mostly imitations of
international brands.
After exploratory factor analysis, it was found that the C.O.O scale. comprises only four of the five dimensions instead of
the original scale. In terms of dimensions that comprise the Availability and Promotion aggregated into a single
dimension.
Buy, use and feeling in relation to products "Made in Portugal
Having regard to the purchases made by me in the last month in the food sector
Having regard to the purchases made by me in the last month in clothing and accessory sector
Having regard to the purchases made by me in the last month in the footwear sector
Having regard to purchases I made last month in the homeware products sector
Buy Portugal-made products. Keep Portugal working
-,096* ,014 -,025
,000 Portuguese should not purchase foreign products, because this hurts business and causes unemployment
-,079 -,025 ,019 ,017
Portuguese consumers who purchase products made in other countries are responsible for putting their fellow Portuguese out of work
-,046 -,005 ,077 ,726
386
There was also a high level of loyalty towards the Country-Of-Origin, since the respondents said that foreigners should
not be allowed to sell the products in Portugal and buy products manufactured in other countries is not being
Portuguese.
The results allowed developing a scale for Consumer Ethnocentrism Portugal, consisting of two dimensions:
Protectionism and Nationalism.
The number of dimensions to this scale has not been consensual. There are studies that show the scale
unidimensionality CETSCALE (Shimp and Sharma, 1987; Luque-Martinez et al., 2000, Klein et al. 2,006; Netemeyer et al.
1991; Firbasová and Orth, 2003), other studies also have two dimensions (Saffu and Walker, 2005; Douglas and Nijssen,
2003; Nien and Hsu, 2008), although others have three (Jakubanecs et al., 2005) and even four (Upadhyay and Singh,
2006).
There are no significant differences by gender of respondents; however, the best female appreciates the dimensions
Prestige, Quality and C.O.O. The male gives more importance to Value, Protectionism and CETSCALE.
For the Value dimension, statistically significant differences were detected, thus, respondents between 45-54 years
better appreciate this dimension compared to respondents between 15 to 24 years. To the extent Nationalism,
individuals with more value studies this dimension better than those who have until the 12th grade. The income level
influences the dimensions of protectionism, nationalism, CETSCALE and C.O.O. Portugal.
It was found that there was a statistically significant negative correlation between Ethnocentrism and extreme buying
behavior in the food sector. When analyzing purchasing behavior as a whole, it was found that there are positive and
statistically significant correlations with the extreme Ethnocentrism.
For the food, it was found that there are positive and statistically significant correlations between the items. The
Portuguese products having high quality, being prestigious products and have advertising informative. The item
Portuguese products have a good price-quality ratio correlates positively and statistically with food, clothing and
accessories.
6. Conclusions
The context of crisis and increasing unemployment intensifies the feeling that we need to value the Portuguese
products (Kolar et al., 2010; Curtin, 200; Ahmed et al., 2004; Luthy, 2007; Fertervant and Sokoya, 1994) despite
perceptions vary by category, because the products have different level of Ethnocentrism (Papadopoulos, Heslop and
Bamossy, 1990; Roth and Romeo, 1992). In this respect, Alden (1999) argues that the preference for national food is
more intense than the technological products (durable goods).
The investigation revealed a tendency to purchase Portuguese products in the food sector, as opposed to the results
obtained in the sectors of clothing, accessories and footwear, in which Portugal has a relevant industrial history and
know-how.
However, the evaluation of what is produced in Portugal (COO Scale) showed us that the respondents consider that
national products are short lasting time, are especially imitations of foreign brands and are not attractive. They
underline the high quality of Portuguese products, although they are not sold in many countries and they are not
enough advertised.
In the evaluation of the Portuguese people (COO), they said that the Portuguese are increasingly willing to buy Made in
Portugal, because they are willing to make sacrifices for his country.
According to Heslop and Papadopoulos (1993), the C.O.O. effect is related with each type of products, being also one of
buying criteria. This effect occurs because products vary as they are related with were they are made. Any product
category can incorporate a local culture, as well as different products have cultural identity from its local of origin,
which is interpreted by consumers at the buying process (Ger, 1999).
Despite the crisis and rising unemployment, respondents do not agree that the Portuguese are moving towards poverty .
According to Druckman (1994), a consumer geographically and sentimentally attached is more motivated to help this
place. Then, this link should be enhanced in affective communication stimulus to Buy Local, even if there are behavioral
differences from country to country and person to person (Terhune, 1964), as well as between product categories.

387
The study didn’t allow us to prove this assumption, except in Prestige and Value dimensions that have evidence value
and showed us differences between man and female. The Ethnocentrism allow assessing the perception between “us”
and “them” concepts (Hogg, 1987; Grazin, Kent, 2001) and allow to detect the hostile positions towards stereotyped
groups that do not share the same opinions and attitudes (Hewstone 1986 ), motivating a strongly Ethnocentric
individual behaviors (Ray and Lovejoy 1986).
The research revealed that many Portuguese claims that "Foreigners should not be allowed to put their products on our
markets," as well as "Buy products manufactured in other countries is not being Portuguese putting their fellow
Portuguese out of work” by doing so.
"The Portuguese will consume more Made in Portugal" and “they are willing to sacrifice themselves for his country”,
showed this work. However, with regard to the impact of foreign products to unemployment, it was only possible to
verify a significant negative correlation between the statement "keep Portugal working" and the food consumption.
The world is experiencing transformations that are changing the individual and collective behavior (Kunsch, 2004). The
economic crisis Portuguese, because Eurozone crisis as well as the structural weaknesses, has led to a reduction in
consumption and, consequently, the business insolvency and rising unemployment. As a result, Portuguese people are
rethinking consumption patterns in quantity, quality and type. This reflection is part of the need to increase
consumption of homeware products, including for reasons of trade balance, and a relationship with the need to
increase or preserve domestic production, with the ensuing consequences.
In research conducted there was a statistically significant, but negative, between nationalist behavior and buying
products "Made in Portugal" in the food sector. In footwear, clothing and accessories, as well as in homeware products,
there was a positive correlation, although without evidence value.
When we analyze the purchasing behavior in a global way, interestingly, it appears that there is an evidence positive
correlation with the Ethnocentrism extreme dimension.
The quality evaluation of food product has evidence value, as well as the perception of that being prestigious products
and have information available. The results also proved a link between the perception of quality of food, footwear,
clothing / accessories and homeware products made in Portugal and their consumption.
In several countries, "buy national" leads citizens to help local workers who may have their jobs threatened in some
way because of imports products (Ahmed et al., 2004; Luthy, 2007; Festervand and Sokoya, 1994). So, the purchasing
behavior of national goods may increase if consumers feel that by doing so it may help employment, because they
believe that imports can be a threat (Granzin and Painter, 2001).
At the end, we believe that the key academic contribution from this research is the combination of two central
conceptual theories - Consumer Ethnocentric and Social Marketing - due to an economic and social context that is
changing consumer behaviors in a perspective responsible to the country and its citizens. For companies, it allowed to
improve the conception of new approaches on the marketplace and creating a new mindset on the Country Image, Buy
Local, Country-Of-Origin, as well as Social Marketing. Also, it pointed ways to overhaul sales strategies or
communication in less favorable economic environments. From a policy perspective, the results may provide pole of
reflection on habits and behaviors of consumption over 'Made in Portugal' goods and services.
References
ADORNO, T. W., Frenkel – Brunswick, E., Levinson, D. and Sanford, R. N. (1950): The Authoritarian Personality, New
York: Harper;
AHMED, Z.; Johnson, J.; Yang, X.; Fatt, C.; Teng, H.; Boon, L. (2004): “Does Country -Of-Origin matter for low-involvement
products?”, International Marketing Review, Vol. 21, Nº. 1, p.: 102-120;
AGIOMIRGIANKIS, G.; Zervoyinanni, A. (2001): “Globalization of labor markets and macroeconomic equilibrium”,
International Review of Economics and Finance , Vol. 10, Nº.2, p. 109-33;
AGRAWAL, J.; Kamakura, W.A. (1999): “Country-Of-Origin: a competitive advantage”, International Journal of Research
in Marketing, Vol. 16, Nº. 4, p. 255-67;
AHMED, S.A., A. d’Astous; H. Benmiloud Petersen (2011): “Product-Country Fit in the Canadian Context”, Journal of

388
Consumer Marketing, Vol. 28, Nº 4, p. 300-309;
AKHTER, Syed H. (2007): “Globalization, expectations model of economic nationalism, and consumer behavior”, Journal
of Consumer Marketing,Vol. 24, Nº. 3, p. 142–150;
ALDEN D.; Steenkamp J-B.; Batra R. (1999): “Brand positioning through advertising in Asia, North America, and Europe:
The role of global consumer culture”, Journal of Marketing, Vol. 63, p. 75-87;
AL-SULAITI, K. I.; Baker, M. J. (1998): “Country-Of-Origin effects: A literature review”, Journal of Marketing Intelligence
and Planning, Vol. 16, Nº 3, p. 150-199;
ANDREASEN, Alan R. (1995): Marketing for Social Change: Changing Behavior to Promote Public Health, Social
Development and the Environment. Jossey-Bass, San Francisco;
ANDREASEN, Alan R. (2005): “Marketing Social Marketing in the Social Change Marketplace”, Journal of Public Policy
and Marketing, Vol. 21, Nº. 1, p. 3-13;
ARAÚJO, Edgilson Tavares (2005): Estão “Assassinando” o Marketing Social? Uma Reflexão Sobre a Aplicabilidade deste
Conceito no Brasil. Brasil;
ARNOLD, M.; Fisher, J. (1996): “Counterculture, Criticisms and Crisis: Assessing the Effect of the Sixties on Marketing
Thought”, Journal of Macromarketing, Vol. 16, p. 118–33;
ASHLEY, Patricia Almeida (2003): Ética e responsabilidade social nos negócios. Saraiva, São Paulo;
ASKEGAARD, S.; Ger, G. (1998): “Product-country images: toward a contextualized approach”, European Advances in
Consumer Research, Vol. 3, p. 50-58;
BALABANIS, G.; Diamantopoulos, A. (2004): “Domestic country bias, Country-Of-Origin effects, and consumer
Ethnocentrism: a multidimensional unfolding approach”, Journal of the Academy of Marketing Science, Vol. 32,
Nº.1, p. 59-74;
BALABANIS, G.; Diamantopoulos, A.; Mueller, R. D.; Melewar, T. C. (2001): “The Impact of Nationalism, Patriotism and
Internationalism on Consumer Ethnocentric Tendencies”, Journal of International Business Studies, Vol. 32, Nº
1, p. 157–75;
BANDYOPADHYAY, Soumava; YELKUR, Rama; DACOSTA, Maria; COELHO, Francisco (2001): Product Country-Of-Origin
Perceptions of Portuguese Consumers. University of Wisconsin;
BAUGHN, C. Christopher; Yaprak, Attila (1993): “Mapping Country -Of-Origin Research: Recent Developments and
Emerging Avenues” In N. Papadopoulos and L. Heslop (editors), “Product Country Image: Impact and Role in
International Marketing” (p. 89-115), Haworth Press, New York;
BILLING, M. (1995): Banal Nationalism, Sage, London, UK;
BOOTH, K. (1979), Strategy and Ethnocentrism. Croom-Helm, Londres;
BRODOWSKI, Glen H. (1998): “The effects of country of design and country of assembly on evaluative beliefs and
attitudes toward buying them: A comparison between low and high Ethnocentric consumers”, Journal of
International Consumer Marketing, Vol. 10, Nº 3, p. 85-114;
BRUNING, E. R. (1997): “Country-Of-Origin, national loyalty and product choice”, International Marketing Review, Vol.
14, Nº. 1, p. 59-74;
CHRYSSOCHOIDIS, George; Krystallis, Athanassios; Perreas, Panagiotis (2007): "Ethnocentric Beliefs and Country -Of-
Origin (C.O.O.) Effect", European Journal of Marketing, Vol. XLI, Nº 11/12, p. 1518-1544;
CURTIN R. (2003): “What recession? What recovery? The arrival of the 21st century consumer”, Business Economics
April; Vol. 38, Nº. 2, p. 25-32;
DIAMANTOPOULOS, Adamantios; Schlegelmilch, Bodo; Palihawadana, Dayananda (2011): “The relationship between
country-of-origen image and brand image as drivers of purchase intentions. A test of alternative
perspectives”, International Marketing Review, Vol. 28, Nº. 5, p. 508-524;
DOMEGAN, Christine T. (2006). “Social marketing: implications for contemporary marketing practices classification
389
scheme”, Journal of Business and Industrial Marketing , Vol. 23, Nº. 2, p. 135-141;
DOUGLAS, S.R.; Nijssen, E.J.(2003): ”On the use of “ borrowed” scales in cross -national research”, International
Marketing Review, Vol.20, Nº6, p. 621-642;
DRUCKMAN, D. (1994): “Nationalism, patriotism, and group loyalty: A social psychological perspective”, International
Studies Quarterly, Vol. 38, Nº. 51, p. 43-68;
ELLIOTT, G. R.; Cameron, R. S. (1994): “Customer Perception Of Product Quality And The Country -of-Orign Effect”,
Journal of International Marketing, Vol. 2, Nº. 2, p. 49-62.
ENGEL, J.F.; Blackwell, R.D.; Miniard, P.W. (1995): Consumer Behavior. The Dryden Press, Orlando;
ETTENSON, R.; Wagner, J.; Gaeth, G. (1988): “Evaluating the effect of Country -Of-Origin and the ‘made in the USA’
campaign: a conjoint approach”, Journal of Retailing, Vol. 64, Nº. 1, p. 85-100;
FESHBACH, Seynour (1990): “Psychology, Human Violence and the Search for Peace: Issues in Science and Social
Values”. Journal of Social Issues, Vol. 46, p. 183-98;
FESTERVAND, T.; Sokoya, S. (1994, January): “Consumer Ethnocentrism in a Developing Economy: A Preliminary
Investigation”, Journal of International Business Research, Vol. 36, Nº. 1, p.: 95-105. (Retrieved March 10, 2013, from
http://www.freepatentsonline.com/article/Journal-International-Business-Research/235628403.html);
FETSCHERIN, Marc; Toncar, Mark (2009): “Country-Of-Origin Effect on U.S. Consumers`s Brand Personality Perception
of Automobiles from China and India”, Multivational Business Review, Vol. 17, Nº 2, p. 111-177;
GORDON, Ross (2011): "Critical social marketing: definition, application and domain", Journal of Social Marketing, Vol.
1, Nº 2, p. 82 – 99;
GER, G. (1999): “Localizing in the global village: local firms competing in global markets”, California Management
Review, Vol. 41, nº4, p.64-83.
GRANZIN, Kent L.; Painter, John (2001): “Motivational Influences on «By Domestic» Purchasing: Market ing
Management Implications from a Study of Two Nations”, Journal of International Marketing, Vol. 9, Nº. 2, p.
73-96;
GRUNERT, K. G.,; Valli, C. (2001): “Designer-made meat and dairy products: Consumer-led product development”,
Livestock Production Science, Vol. 72, Nº. 1–2, p. 83–98;
GURHAN-CANLI, Z.; Maheswaran, D (2000): "Cultural Variations in Country-Of-Origin Effects", Journal of Marketing
Research, Vol. 37, p. 309-317;
HAIR, J. F., Black, W. C., Babin, B. J., and Anderson, R. E. (2010). Multivariate data analysis (7th ed.). Englewood Cliffs:
Prentice Hall.
HAN, C.M. (1989): “Country image: halo or summary construct?”, Journal of Marketing Research, Vol. 26, p. 222- 229;
HASTINGS, G.; Saren, M. (2003): “The Critical Contribution of Social Marketing: Theory and Application”, Marketing
Theory, Vol. 3, Nº. 3, p. 305 – 322;
HESLOP, L.; Papadopoulos, N. (1999): “ But who knows where or whwn: reflection on the images of country and their
products” in N. Papadopoulos e L. Heslop (eds), Product-Country images. International Business Press, New
York.
HOGG, M. A. (2001). Social categorization, depersonalization, and group behavior. In M. A. Hogg and R. S. Tindale (Eds.),
Blackwell handbook of social psychology: Group processes (pp. 56–85), Blackwell, Oxford, England;
HONG, Sung-Tai; Robert S. Wyer, Jr. (1989): "Effects of Country-Of-Origin and Product-Attribute Information on
Product Evaluation: An Information Processing Perspective", Journal of Consumer Research, Vol. 16, p. 175-
187;
JOSIASSEN, A.; Lukas, B. A.; Whitwell, G. J. (2008): “Country-Of-Origin contingencies: Competing perspectives on
product familiarity and product involvement”, International Marketing Review, Vol. 25, Nº. 4, p. 423-440;

390
JOSIASSEN, Alexander (s.d.): “Are Young Consumers Still Susceptible to the Country-of-Origen Effect?”, Journal of
Business Systems, Governance and Ethics, Vol. 4, Nº. 2; p. 53-63, in:
http://www.jbsge.vu.edu.au/issues/vol04no2/Josiassen.pdf (online 02/02/2013)
JURIC, B.; Worsley, A. (1998): “Consumers’ attitudes towards imported food products”, Food Qual Pref, Vol. 9, No. 6, p.
431- 441;
KARSAKLIAN, Eliane (2004), Comportamento do consumidor. 2º edição. Atlas, São Paulo;
KAYNAK, E.; Kara, Ali (2002): “Consumer perceptions of foreign products: An analysis of product-country images and
Ethnocentrism”, European Journal of Marketing Research, Vol. 36, Nº. 7/8, p. 928-949;
KINRA, N. (2006), “The effect of Country-Of-Origin on foreign brand names in the
Indian market”, Marketing Intelligence and Planning, Vol. 24, Nº 1, p.15-30;
KOLAR, T.; Zabkar, V.; Brkic, N.; Omeragic, I. (2010): “How crisis affected consumer’s attitudes and values in Slovenia
and Bosnia and Herzegovina”, Paper presented at the 14-
1AG,2AG,3AG,4AG,5AG,6AG,7AG,8AG,9AG,10AG,11AG,12AG,13AG,14AG. (Retrieved March 10, 2013, from
http://search.proquest.com/docview/1017707887?accountid=34461);
KOSTERMAN, Rick; Feshbach, Seymour (1989): “Toward a Measure of Patriotic and Nationalistic Attitudes”, Political
Psychology, Vol. 10, Nº. 2, p. 257-74;
KOTLER, Philip. (2000): Administração de marketing: a edição do novo milênio. Prentice Hall, Sapiro, São Paulo;
KOTLER, P.; Kartajaya, H.; Setiwan I. (2011): Marketing 3.0 Do produto e do consume até ao espírito humano. Actual
Editora, Lisboa;
KOTLER, Philip; Roberto, Eduardo (1992): Marketing Social: Estratégias Para
Alterar o Comportamento Público. 1ª ed., Campos, Rio de Janeiro;
KOUBAA, Yamen (2008): “Country-Of-Origin, brand image perception, and brand image structure, Asia Pacific”, Journal
of Marketing and Logistics, Vol. 20, Nº. 2, p. 139-155;
KUNSCH, Margarida Maria Krohling (2003): Planejamento de Relações Públicas na Comunicação Integrada. Summus,
São Paulo;
LANTZ, G.; Loeb, S. (1996): “Country-Of-Origin and Ethnocentrism: An analysis of Canadian and American preferences
using social identity theory”, Advances in Consumer Research, Vol. 23, p. 374-378;
LAROCHE, M.; Papadopoulos, N; Heslop, L; Mourali, M. (2005): ‘The Influence of Country Image Structure on Consumer
Evaluations of Foreign Products”, International Marketing Review, Vol. 22, Nº1, p: 96-115;
LAROCHE, M.; Papadopoulos, N.; Heslop, L.; Bergeron, J. (2002): “Effects of sub-cultural differences on country and
product evaluations”, Journal of Consumer Behaviour, Vol. 2, Nº. 3, p. 232-47;
LAZER, W.; Kelley, E.J. (1973): Social Marketing: Perspectives and Viewpoints. Richard D. Irwin, Homewood, IL;
LEVEK, Andrea; Benazzi; Ana; Arnone, Janaina; Seguin, Janaina; Gerhardt,
Tatiana (2002): “A responsabilidade social e sua interface com o marketing social”,
Revista FAE., Vol. 5, Nº. 2), p. 1-11;
LIDON, Denis; Lendrevie, Jacques; Lévy, Julien; Dionisio, Pedro; Rodrigues, Joaquim (2008): Mercador XXI: Teoria e
prática do marketing. 11ª ed., Dom Quixote, Lisboa;
LIEFELD, J.P. (1993): "Experiments on Country-Of-Origin Effects: Review and Meta-Analysis of Effect Size," in “Product-
Country Images: Impact and Role in International Marketing”, N. Papadopoulos and L.A. Hestop eds. New
York: International Business Press, p. 117-156;
LIM, J.S.; Darley, W.K. (1997): “An assessment of demand artefacts in Country-Of-Origin studies using three
alternatives”, International Marketing Review, Vol. 14 Nº. 4, p. 201-17;

391
LUCK, David J. (1969): “Broadening the Concept of Marketing: Too Far,” Journal of Marketing, Vol. 33, p. 53–55;
LUQUE-MARTINEZ, T.; Ibabez-Zapata, J.A.; Bario-Garcia, S.D. (2000): “Wats Consumer Ethnocentrism measurement: an
assessment of the fiability and vality of the CETSCALE in Spain”, European Journal Marketing, Vol. 34, Nº
11/12, p. 1353-1374.;
LUTHY, M. (2007, June): “Conducting International Consumer Ethnocentrism Surveys”, Journal of International Business
Research, Vol. 6, Nº. 2, p.: 33-42. (Retrieved March 10, 2013, from http://www.freepatentsonline.com/article/Journal -
International-Business-Research/175065693.html);
MACASKILL, A; Maltby J; Day L. (2002): “Forgiveness of self and others and emotional empathy”, The Journal of Social
Psychology, Vol. 142, p. 663–665;
MAHESWARAN, D. (1994): “Country-Of-Origin as a Stereotype: Effects of Consumer Expertise and Attribute Strength on
Product Evaluations”, Journal of Consumer Research, Vol. 21, p. 354-365;
MCKENZIE-MOHR, D.; Nemiroff, L. S.; Beers, L.,; Desmarais, S. (1995): “Determinants of responsible environmental
behavior”, Journal of Social Issues, Vol. 51, p. 139-156;
NETEMEYER, R. G.; Durvasula, S.; Lichtenstein, D. R. (1991): “A cross -national assessment of the reliability and validity
of the CETSCALE”, Journal of Marketing Research, Vol. 28, Nº3, p.320-327;
ORTH, U.; Firbasová, Z. (2003): “The role of consumer Ethnocentrism in food product evaluation”, Agribusiness, Vol.19,
p.137-153
PARAMESWARAN, R; Pisharodi, R.M. (1994): “Facets of Country-Of-Origin image: an empirical assessment”, Journal of
Advertising, Vol. 23, Nº 1, p. 43-56.
PAPADOPOULOS N.; Heslop L.A.; Bamossy G. (19990): “A Comparative Image Analysis of Domestic Versus Imported
Products”, International Journal of Research in Marketing , Vol. 16, Nº. 7, p. 283-94;
PETERSON, Robert A.; JOLIBERT, Alain J.P., (1995): “A Meta-Analysis of Country-Of-Origin Effects”, Journal of
International Business Studies, Vol. 26, Nº. 4, p. 883-900;
PINE II, B. Joseph; GILMORE, James H. (1999): O espetáculo dos negócios. The experience economy. Desperte emoções
que seduzam os clientes. Sensações intensas determinam o valor do produto e serviços. Editora Campus, Rio
de Janeiro;
PISHARODI, R.M.; Parameswaran, R. (1992): “Confirmatory factor analysis of country origin scale: initial results”, in
Sherry, J. e Sternthal, B. (Eds), Advances in Consumer Research, Association for Consumer research, Ann Arbor,
MI, p.706-714.
PRINGLE, Hamish; THOMPSON, Marjorie (2002): Marketing Social: Marketing para causas sociais e a construção das
marcas. Makron Books, São Paulo;
RAHMAN, S. (2000): “Country-Of-Origin effect in a developing country: does it
really matter?”, Unpublished PhD Thesis, University of Western Sidney;
RANGUN, V.K.; S. Karim (1991): “Teaching Note: Focusing the Concept of Social Marketing”, Harvard Business School;
Cambridge;
REHM, J.; Taylor, B.; Mohapatra, S. (2010): “Alcohol as a risk factor for liver cirrhosis: A systematic review and meta-
analysis”, Drug and Alcohol Review, Vol. 29, Nº. 4), p. 437–445;
RICHERS, Raimar (1984): “O enigmático mas indispensável consumidor: teoria e prática”, Revista deAdministração,
V.19, Nº. 3, p.46-56;
ROBERTS, Kevin (CEO mundial da Saatchi and Saatchi) (2005): Lovemarks. O futuro para além das marcas. M. Books do
Brasil Editora, São Paulo;
ROTH, M.S; Romeo, J.B. (1992): “Matching product category and country image perceptions: a framework for managing
Country-Of-Origin effects”, Journal of International Business Studies, Vol. 23, Nº. 3, p. 199-204;
SAFFU, K.; Walker, J.H. (2005): “ An assessment of the consumer Ethnocentric scale (CETSCALE) in an advanced and

392
transitional country: The case of Canada and Russia”, International Journal of Management, Vol. 22, Nº4,
p.556-572.
SAMIEE, S. (1994): "Customer Evaluation of Products in a Global Market," Journal of International Business Studies, Vol.
25, Nº. 3, p. 579-603;
SANA-UR-REHMAN, Sheikh; Rian, Beise-Zee (2011): "Corporate social responsibility or cause-related marketing? The
role of cause specificity of CSR", Journal of Consumer Marketing, Vol. 28, Nº 1, p. 27-39;
SCHIAVO, M. R.; Fontes, M. B. (1998): Conceito e evolução do marketing social. Atlas, Rio de Janeiro;
SCHWARTZ, Rosalie (1977): “The Displaced and Disappointed: Cultural Nationalists and Black Activists in Cuba in the
1920s.”, Thesis (Ph.D.) University of California, San Diego;
SHOWERS, V.; Showers, L. (1993): “The effects of alternative Measures of Country-Of-Origin on objective product
quality”, International Marketing Review, Vol. 10, Nº. 4, p. 53-67;
SHARMA, Subash; SHIMP, Terence A. and SHIN, Jeongshin (1995):. “Consumer Ethnocentrism: A Test of Antecedents and
Moderators”. Journal of Academy of Marketing Science, Vol. 23, Nº. 1, p. 26-37;
SHIMO, T; Sharm, S. (1987): “Consumer Ethnocentrism: construction and validation of the CETSCALE”, Journal of
Marketing Research, Vol. 24, Nº3, p.280-289;
SHIMP, T.; Sharm, S. (1987): “Consumer Ethnocentrism: construction and validation of the CETSCALE”, Journal of
Marketing Research, Vol. 24, Nº7, p.280-289;
SIMA, Andréa; Assis, Sónia (2004): “Campanhas sociais e a influência na imagem da organização”, Jovens Pesquisadores,
Vol. 1, Nº. 1, p. 91-108;
SIMONSON, I. (1989): “Choosing based on reason: The case of attraction and compromise effects” , Journal of Consumer
Research, Vol. 16, p. 158-174;
SOLOMON, M. R. (2002): Comportamento do Consumidor. Bookman, Porto Alegre;
SOUIDEN, N.; M’Saad, B.; Pons, F. (2011): “ A Cross-Cultural Analysis of Consumers’ Conspicuous Consumption of
Branded Fashion Accessories”, Journal of International Consumer Marketing , Vol. 23, Nº5, p.329-343;
SMITH, W. (1993): “Country- of- origin bias: a regional labelling solution”, International Marketing Review, Vol. 10, Nº. 6,
p. 4- 12;
SUPPHELLEN, M.; Rittenburgh T. (2001): “Consumer Ethnocentrism When
Foreign Products Are Better”, Psych Mark, Vol. 18, Nº. 9, p. 907- 927;
SUMNER, W.G.(1906): Folkays . Boston;
TSE, D.K; Gorn, G.J. (1993): “ An experiment on the salience of Country-Of-Origin in the era of global brands”, Journal of
International marketing, Vol. 1, Nº 1, p.57-76;
VERGARA, S. C. (1998): Projetos e Relatórios de Pesquisa em Administração. 2ª ed., Atlas, São Paulo: Atlas;
VERLEGH, PEETER WJ (2007): “Home country bias in product evaluation: the complementary roles of economic and
socio-psychological motives”, Journal of International Business Studies, Vol. 38, p. 361-373;
WALL, M., Liefeld; J. and Heslop, L. (1991): “Impact of Country-Of-Origin cues
on consumer judgements in multi - cue situations: a covariance analysis”, Journal
Academy of Mark Sc, Vol. 19, p. 105- 113;
WATSON, J.; Wright, K. (2000): “Consumer Ethnocentrism and attitudes towards domestic and foreign products”,
European Journal of Marketing, Vol.34 Nº. 9/10, p. 1149-66;
WILKIE, William L.; Elizabeth S. Moore (1997): “Consortium Survey on Marketing and Society Issues: Summary and
Results”, Journal of Macromarketing, Vol. 17, Nº. 2, p. 89–95;
WORCHEL, Stephen; C.O.O.per, Joel. (1991): Understanding social psychology. Pacific Grove: Brooks/Cole;

393
WU, Gouhua (2011): “Country image, informational influence, collectivism/individualism, and brand loyalty: exploring
the automobile purchase patterns of Chinese Americans”, Journal of Consumer Marketing, Vol. 28, Nº. 3, p.
169-177;
YARPAK, A.; Baughan, C. (1991): “The Country-Of-Origin effect in cross - national consumer behaviour: emerging
research avenues”, Proceedings of the 5th bi- annual world marketing congress of the Academy of Marketing
Science , p. 263- 269;
ZENONE, Luiz Cláudio (2006): Marketing Social. Thomson Learning, São Paulo.

394
Customer Response to Message Framing in
Cause Related Marketing Cause Related Marketing, Message framing, Willingness to Pay, Reputation, Consumer Social Responsibility
Raina Pinto, G.V.M.’s G.G.P.R.College of Commerce & Economics , [email protected]
Nandakumar Mekoth Professor and Head Department of Management Studies Goa University, [email protected]
Abstract
Organizational campaigns promoting Cause Related Marketing (CRM) have gained significance with regard to consumer
participation. This is evident as business organizations have been found to express humanity and values in emotionally
compelling ways so as to meet the expectations set by customers, other stakeholders.
Objectives: The paper attempts (a) To examine whether association of a product with a cause affects customers
Willingness To Pay (WTP); (b) To ascertain whether message framing, reputation of the brand and Consumer Social
Responsibility have an impact on WTP;(c) To determine the impact of message framing on WTP as moderated by
reputation of the brand and Consumer Social Responsibility and the impact of Consumer Social Responsibility on WTP
as moderated by reputation of the brand.
Methodology: A laboratory experiment was conducted manipulating message framing and reputation of the company.
The experiment uses two levels of message framing and two levels of reputation and also measures Consumer Social
Responsibility and WTP of the respondents.
Conclusion: The study reveals that association of a product with a cause increases customers’ WTP. Consumer Social
Responsibility has an impact on WTP. The impact of Consumer Social Responsibility on WTP is moderated by
reputation of the brand.
Implications: The findings of this study may help the marketers as products linked to a cause have pricing
implications. Besides depending on the social responsibility of the target group, pricing can be varied by the marketer.
Differential pricing depending on the reputation for target groups with different Consumer Social Responsibility can be
adopted.
1. Background
Over the last decade, a number of enterprises have implemented Cause Related Marketing (CRM) thus CRM is gaining
in popularity, as marketers attempt to make a positive contribution to the communities on which they depend
(Demetriou, Papasolomou, & Vrontis, 2010). Marketing communications and promotions with social dimensions are
becoming mainstream was highlighted by Drumwright (1996) (as cited in Webb, D. J., & Mohr, L. A. ,1998). During the
year 1983, American Express Company launched a Cause-Related Marketing Program (CRMP) in support of the
renovation of the Statue of Liberty. American Express promised to donate a penny to the renovation for each use of its
charge card and a dollar for each new card issued in the U.S. during the fourth quarter of 1983. American Express had a
28% increase in card usage over the same period in 1982 and a sizeable increase in the number of new cards issued.
This $6million national promotion campaign resulted in a $1.7 million contribution by American Express to the Statue
of Liberty–Ellis Island Foundation. CRM gained popularity among brand managers as it offers dual benefits of
philanthropy and increased brand sales. CRM is defined as “ the process of formulating and implementing marketing
activities that are characterized by an offer from the firm to contribute a specified amount to a designated cause when
customers engage in revenue-providing exchanges that satisfy organizational and individual objectives” Varadarajan &
Menon (1988:60).
Since long corporations have used variety of marketing communications techniques for inducing compliance behaviour

395
among members of their target groups (Vaidyanathan & Aggarwal, 2005). CRM campaign’s require that firms and
partnering cause alliance must consider the factors that can encourage consumers to participate, since their behaviour
plays a crucial role in impacting company sales and nonprofit earnings (Grau & Garretson Folse, 2007).
The manner in which a message is framed in an advertisement linking a product to a cause can have an impact on the
campaign’s success. The influence of donation proximity and message framing on the less involved consumer was
studied by Grau & Garretson Folse (2007). How customers process cause-focused messages that contain emotional
appeals was investigated by Chang C.-T. (2011).
Primarily this study investigates whether association with a cause increases consumers’ Willingness To Pay (WTP).
Although impact of message framing on Willingness To Pay has been studied in the context of vague quantifiers by
Pracejus, Olsen, & Brown (2003), impact of message framing has not been studied in the context of consumer social
responsibility. This research also seeks to address this gap.
2. Research Objectives
This research attempts to find whether association with a cause increases WTP, how the message framed in an
advertisement could affect the customer’s Willingness To Pay for a product associated with a cause, when the
customer’s role is made manifest in a direct manner or when the role of the customer is made manifest in an indirect
manner (company direct).
Specifically this research strives –
a)To examine whether association of the product with a cause affects customers’ Willingness To Pay (WTP).
b) To ascertain whether message framing, reputation of the brand and Consumer Social Responsibility have an impact
on WTP.
c) To determine the impact of message framing on WTP as moderated by reputation of the brand and Consumer Social
Responsibility and to determine the impact of Consumer Social Responsibility on WTP as moderated by reputation of
the brand.
3. Concepts and development of hypotheses
Willingness To Pay
According to Anderson, Jain, & Chintagunta (1993) accurately gauging consumer’s Willingness To Pay (WTP) for a
product or service is critical for formulating competitive strategies, conducting value audits and developing new
products (as cited in Miller, Hofstetter, Krohmer, & Zhang, 2011).
Willingness To Pay (WTP) is defined as the maximum amount of money a customer is willing to pay for a product or
service (Krishna, 1991). The relationship between donation amount and WTP is of great significance because both have
an impact on company profitability. A higher donation magnitude should create more benefits for customers in terms of
contributions to social well being and creating a good feeling which in turn should lead to a higher WTP (Koschate-
Fischer, Stefan, & Hoyer, 2012).
According to Profitable Partnerships (2000) (as cited in Demetriou, Papasolomou, & Vrontis, 2010) consumers’
purchase patterns demonstrate the significant impact that CRM can have on their purchase habits which subsequently
influence their corporate and brand reputation, differentiation and the sale of the product, service or brand.
By linking small donations to purchase of products, marketers provide consumers a good feeling about making a
contribution irrespective of the amount of contribution, without making them feel bad that they are not giving more. It
is noteworthy that the amount donated is determined by the seller of the product rather than by the buyer, thus the
consumer is not likely to feel accountable for the amount contributed, only for the fact that a charity -linked product is
supported through the purchase made (Strahilevitz, 1999).
Drawing support from literature on association with cause and Willingness To Pay we can hypothesize that,

396
H1: Association of a product with a cause increases customer’s Willingness To Pay (WTP).
This implies that for the consumer cause is of significance and the consumer could be WTP in support of the cause.
Message Framing
CRM campaigns serve as a platform for gaining insights that help in understanding consumer’s interpretation of
promotions with social dimensions and exploring their behavioural responses to such corporate “do -gooding” (Webb &
Mohr, 1998). CRM campaigns to a large extent make use of print ads as a marketing communication tool was
highlighted by Lafferty & Edmondson (2009).
The manner in which the information within the CRM campaign is framed can appeal to the consumers, capture their
attention and thus make them respond to CRM campaign (Grau & Garretson Folse, 2007).
The positive effects of product type on CRM may only occur when donation information is framed in absolute dollar
terms or when the product has a lower price rather than information framed in a in a vague manner. The objectives of
marketers are to communicate superior deal value to consumers and expedite their purchase decisions in a CRM
context, and the essence of this strategy is that marketers stand to gain not just by changing the donation magnitude of
advertising package but by introducing appropriate “framing” of their offered products in a manner that increases the
probability of consumers purchasing a product linked to a cause (Chang & Lee, 2008).
Individualized messages from organizations are important to the consumers as they engage in purchasing goods from
the company and thus donate their time, money and efforts in relation to their purchasing activity (Adkins 1999).
Framing is a communication strategy frequently used by charity marketing campaigners was observed by Chang & Lee
(2010) (as cited in Chang, C.-T., 2012). The way information is labeled or framed may significantly influence
consumer’s judgments and decisions as noted by Levin,I.P., Schneider, S.L. & Gaeth, G.J. (1998) (as cited in Chang, C.-T.,
2012).
Message framing in previous studies takes into consideration donation framing (Grau & Garretson Folse,
2007;Pracejus, Olsen, & Brown, 2003), temporal framing (Tangari, Garretson Folse, Burton, & Kees, 2010), attribute
framing (Grau & Folse 2007).
However little is understood of how the message framed, incorporating the role of a consumer, company could impact
consumers Willingness To Pay. The success of CRM to a large extent depends on how the message is framed in a CRM
advertisement. The message framed can favourably incline the consumer to purchase a product linked to a cause based
on the consumer’ s perception of his/her role or the role of others besides taking into consideration the reputation of
the company.
H2: Message framing in which the role of the company is manifest will have higher WTP compared to the message
in which the customer’s role is manifest.
This implies that how the message is framed could favourably or otherwise impact the consumers’ WTP.
Reputation
Today large number of companies are using CRM as a strategic tool to build a positive corporate image in the minds of
the consumers that would aid in boosting the sales of a company’s products and increase its profits too.
According to Fombrun & Shanley (1990) (as cited in Chun, 2005) reputation is the accumulated impression that
stakeholders form of the firm, resulting from their interactions with and communications received about the firm and
thus information received by the public is vital in reputation building. Corporate reputation affects the stakeholders
expectations and how various stakeholders behave towards an organization, influencing factors such as employee
retention, customer satisfaction and customer loyalty (Chun, 2005). Popular brands that tie up with a charity would
create a positive interaction between the popular brand and the charity (Wymer & Samu, 2008). Supporting popular
and respected causes can help enhance the reputation of a sponsoring firm as a result of association. It affords the firm
an opportunity to gain national visibility, improve its corporate image, and convey social responsibility, public -
mindedness, patriotism and demonstrates its superiority (Varadarajan & Menon, 1988).
CRM is a communication tool used in marketing for increasing customer loyalty and building reputation (Agarwal,
Kumar, Gupta, & Tyagi, 2010).

397
Reputation is an intangible asset that companies strive to build and reputation helps a company to gain competi tive
advantage. Besides reputation gives visibility to a brand. However more needs to be understood of how communication
used in framing of messages could affect consumers Willingness to Pay based on the reputation of the company.
Thus we can hypothesize that,
H3: Reputation of the brand has a positive impact on customer’s WTP.
This implies that WTP would increase if the consumers perceives that the company is highly reputed.
Consumer Social Responsibility
Previous studies have attached great importance to the concept of Corporate Social Responsibility however the
‘Consumer Social Responsibility’ needs attention in the context of CRM which this study attempts to provide.
Adkins (1999) in his book on CRM highlights the fact that consumers are interested in knowing what the brand stands
for beyond the elements of price and quality. Consumers have much more expectations from business than before.
Extending support for social causes through a commercial activity of purchasing is a form of prosocial behaviours
because it promotes social norms. Consumers differ in terms of needs, expectations this also implies that there is a
distinctive segment that is passionate about consumer social responsibility. Highly public self-conscious consumers
would respond more favourably when publicly-consumed products are linked to social causes. These consumers are
conscious about making a positive impression and differentiate themselves from others by consuming products aligned
to social causes as means of enhancing their self-esteem or ego. Thus CRM would be a good option for the company
marketing a publicly visible product as it would meet the needs of highly public self-conscious consumers while also
offering benefits to the company (Youn & Kim, 2008).
Cause marketing programs allows the consumers to stand for the beliefs they hold and publicly express their belief in
and support for the causes that are dear to them. Cause marketing campaigns must recognize that its success and
effectiveness to a large extent depends on whether the target customers are able to quickly and easily identify
themselves with the core message of such a campaign (Agarwal, Kumar, Gupta, & Tyagi, 2010).
Webster, Jr. (1975:188) defines socially conscious consumer as “a consumer who takes into account the public
consequences of his or her private consumption or who attempts to use his or her purchasing power to bring about
social change”. Mohr, Webb, & Harris (2001:47) defines socially responsible consumer behaviour (SRCB) as “a person
basing his or her acquisition, usage, and disposition of products on a desire to minimize or eliminate any harmful
effects and maximize the long-run beneficial impact on society”. SCRB, then calls for the inclusion of Corporate Social
Responsibility as one of the criteria influencing a person’s consumption patterns. A socially responsible consumer
would, therefore, avoid buying products from companies that harm society and patronize products from companies
that help society.
In a competitive business environment, competition has increased as well as consumers’ expectations from companies
have also changed. Companies make efforts to meet the expectations of various consumers. This opens the way for
research in consumer social responsibility in the context of CRM. Consumers who would engage in purchasing products
linked to a cause.
We can thus hypothesize that,
H4: Consumer Social Responsibility has a positive impact on Willingness To Pay (WTP).
This implies that consumers who perceive that he/she has a greater degree of responsibility in solving social problems
or contributing to social well being would be Willing To Pay more for the product rather than those who perceive a
lower degree of responsibility.
To test the moderation effect we hypothesized the following-
Reputed brands are expected to support social causes. Therefore, when the company’s role is manifest in the message
the customers are likely to pay less for the reputed brand and more for non-reputed brand. Conversely, customers are
expected to pay more for products marketed by reputed companies compared to non-reputed companies when the
message is framed with the role of the customer made manifest.

398
H5: Impact of message framing on WTP is moderated by reputation.
Customers who are high on social responsibility are likely to feel that they should contribute to the cause than the
companies marketing the product. But those low on social responsibility are likely to feel that companies should
contribute to causes more than customers. Hence when the customers role is manifest in the message those with high
Consumer Social Responsibility are likely to pay more and when the role of the company is manifest in the message
customers with high Consumer Social Responsibility are likely to pay less.
H6: Impact of message framing on WTP is moderated by Consumer Social Responsibility.
Customers with high social responsibility are likely to support a non-reputed brand more than a reputed brand and
those with low social responsibility are likely to support a reputed brand more than a non-reputed brand and hence
their WTP is likely to differ between reputed and non-reputed brands.
H7: Impact of Consumer Social Responsibility on WTP is moderated by reputation of the brand.
Thus there are four main effects and three interaction effects hypothesized in this study in the context of Cause Related
Marketing.
4. Methodology
The purpose of experimental research is to allow the researcher to control the research situation so that causal
relationship among variables may be evaluated. The experimenter therefore manipulates a single variable in an
investigation and holds constant all other relevant, extraneous variables as stated by Zikmund (2010).
The study is conducted as a laboratory experiment in which message framing in an advertisement and reputation of the
company are manipulated. The experiment is conducted using two levels of message framing and two levels of
reputation. It also measures Consumer Social Responsibility of the respondents. Cause, message framing , reputatio n
and Consumer Social Responsibility were the independent variables while Willingness To Pay (WTP) was the
dependent variable.
Method and Data Collection - Participants, Experimental Design and Procedure
For the purpose of the experiment 84 subjects were divided into four groups each comprising of 21 subjects. The
subjects were students pursuing a degree in Education in India. The average age of the subjects was 21.54. The subjects
comprised of 19 males and 65 females. The average family income of the subjects was Rs.16132/-. The product
selected for the purpose of experiment was a 200 pages note book as a book would be an utilitarian product for the
subjects under the study. Each group was administered a treatment which is a combination of a brand and a message .
Thus the first group was given the message that the company pays with the reputed brand while the second group was
given the same message with the non reputed brand. Similarly, the third group was administered the treatment of the
message that the customer pays with a reputed brand while the last group was administered the same message with
the non-reputed brand. The books were compared with a non- cause, non-brand book. The reputed brand represented
ITC while the non-reputed brand represented ‘Priya’ (fictitious) . On close examination of the books the subjects were
asked to state the price they were Willing To Pay on page 1 of a questionnaire and on completion of the same, page 2
was administered which consisted of statements to be answered in the range of ‘Strongly Agree’ to ‘Strongly Disagree’
using a five-point Likert Scale to determine the level of Consumer Social Responsibility. Systematic random sampling
was used to select the subjects.
Division of Subjects for the experiment.
Company pays Customer Pays Total
ITC 21 21 42
Priya 21 21 42
Total 42 42 84
TABLE 1

399
5. Results
Table 2 represents the results of t-test for different combination of messages with reputed and non-reputed brands and
low and high Consumer Social Responsibility, as well as brands with different reputations with low and high Consumer
Social Responsibility the mean WTP of which are tested against the reference (control) price of Rs.15/-. All the
combinations had significantly high mean WTP compared to the reference price of Rs.15/- as represented by t values
significant at 1% level of significance.
The results indicated in table 3 are t-test for difference of means for different message framing, different reputations
and different levels of Consumer Social Responsibility. The t values for difference of means between different message
framing and the mean values of different reputations of brands were not significant. However consumers with low
social responsibility were found to have higher WTP compared to customers with higher social responsibility as
represented by a t value significant at 10% level.
Table 4 indicates the test of significance for moderation effects, the impact of message framing on WTP is neither
moderated by reputation nor moderated by Consumer Social Responsibility. The impact of Consumer Social
Responsibility on WTP was found to be moderated by reputation as represented by a f value significant at 10% level.
One sample t-test for WTP for combinations of independent variables with control value.
Sample size Mean WTP Standard Deviation T Value
Company pays * ITC 21 19.8810 2.085 10.727***
Company pays * Priya 21 20.1667 3.035 7.802***
Company pays * Low CSR 16 20.4062 2.067 10.460***
Company pays * High CSR 22 19.3864 2.609 7.885***
Customer pays * ITC 21 19.3000 2.929 6.727***
Customer pays * Priya 21 19.0952 3.093 6.068***
Customer pays * Low CSR 15 19.5867 2.667 6.661***
Customer pays * High CSR 20 18.6250 2.476 6.549***
ITC * Low CSR 30 21.6933 3.721 9.851***
ITC * High CSR 27 20.0926 4.024 6.576***
Priya * Low CSR 20 19.3000 2.364 8.134***
Priya * High CSR 32 19.2266 2.794 8.559***
***Significant at 1% level TABLE 2
The results of one sample t-test with the control value of 15 (printed on the book without message and brand name)
reveals that in all the combinations the test values were significantly high. Hence, it is evident that the cause makes a
difference and customers are Willing To Pay for the cause.
Test of Difference for WTP between levels of Independent variables.
Mean Standard Dev. T value Significance
Company Pays 20.0238 2.576
Customer Pays 19.1976 2.977 1.360 Not Significant
Reputed Brand (ITC) 19.5905 2.528
Non reputed Brand (Priya) 19.6310 3.074 -0.066 Not Significant
Low Consumer Social Responsibility 20.0097 2.373
High Consumer Social Responsibility 19.0238 2.545 1.683* 0.097
*Significant at 10% level TABLE 3
The t-test for difference of means of willingness to pay between the two different messages indicated no significant
difference and similarly Willingness To Pay for a reputed brand was not significantly different from non reputed brand.
However, the group with low Consumer Social Responsibility had a higher average Willingness To Pay compared to the
group with high Consumer Social Responsibility significant at 10 per cent level.

400
Test of Significance for Moderation Effect.
F Value Significance Significance
Message * Brand 0.159 0.691 Not Significant
Message * Consumer Social Responsibility 0.002 0.961 Not Significant
Consumer Social Responsibility * Brand 3.783 0.056* Significant at 10%
*Significant at 10% level
TABLE4
Moderation effect was observed only in the case of Consumer Social Responsibility reputation combination. While
customers with low levels of Consumer Social Responsibility were Willing To Pay more for reputed brand, customers
with high Consumer Social Resposibility were willing to pay more for non- reputed brand.
Figure 7
6. Discussion
One sample t-test for different combination of messages, reputation and Consumer Social Responsibility taken two at a
time indicate that the cause makes a difference to WTP hence the hypothesis (H1) that Association of a product with a
cause increases WTP is supported. WTP was not found to differ between reputed and non-reputed brands as well as
roles of customer and company manifest in the messages, hence (H2) and (H3) are not supported.
The significant difference between WTP between customers with low social responsibility and high social
responsibility support (H4).
The test for moderation effects indicates that the impact of message on WTP is neither moderated by reputation nor
moderated by Consumer Social Responsibility resulting in lack of support for (H5) and (H6). However (H7) is
supported by a significant moderation effect of reputation on the relation between Consumer Social Responsibility and
WTP.

401
Thus it appears that consumers are more sensitive to a cause and cause matters to them irrespective of brand
reputation and how the message is framed. It is evident from the fact that consumers WTP increases when a product
is linked or associated with a cause. The study depicts that consumers’ with low Social Responsibility showed
increased Willingness to Pay for a reputed brand and were Willing ToPay less for a non-reputed brand. Although it is
difficult to predict the exact reason for this behaviour it appears to be more of a stated intention, however the actual
purchase behaviour may be different.
7. Conclusion
The study demonstrates that association of a product with a cause helps to increase Willingness To Pay. Consumers
with lower social responsibility are Willing To Pay more if the brand is reputed while consumers with higher social
responsibility were Willing to Pay more for a non–reputed brand. The study also indicates that Consumer Social
Responsibility has an impact on WTP. It is thus evident that cause-related marketing campaigns to a large extent have
the potential of increasing consumer’s Willingness To Pay. The study depicts that cons umers ultimately bond and
establish a connect with the cause dimension regardless of the reputation of the company involved. Helping others
matters, as long as some donation is made. Besides the study also revealed that impact of Consumer Social
Responsibility on WTP is moderated by brand reputation. The study indicates that message framing does not have an
impact on WTP. Reputation of the brand does not have an impact on WTP. The impact of message framing on WTP is
not moderated by the reputation of the brand and the impact of message framing on WTP is not moderated by
Consumer Social Responsibility.
8. Limitations
This research faces the limitations common to many laboratory experiments in which student participants are used,
including the questions of generalization. Replication with the “real-world” sample is essential before extending the
results of this study. Results may indicate significant difference with the increase in the sample size.
9. Implications
The findings of this study may help the marketers as products linked to a cause have pricing implications. Besides
depending on the social responsibility of the target group, pricing can be varied by the marketer. Differential pricing
depending on the reputation for target groups with different Consumer Social Responsibility can be adopted.
References
ADKINS, SUE.(2011). Cause Related Marketing Who Cares Wins. New York: Routledge.
AGARWAL, P. K., KUMAR, P., GUPTA, S., & TYAGI, A. K. (2010). Cause Related Marketing in India: A Conceptual
Paradigm. Advances In Management, 3(12), 24-31.
ANDERSON, J. C., JAIN, DIPAK & CHINTAGUNTA, P.K. (1993). Understanding Customer Value in
Business Markets: Methods of Customer Value Assessment. Journal of Business -to-Business
Marketing.(cited in Miller, K. M., Hofstetter, R., Krohmer, H., & Zhang, Z. J. (2011:172)).
CHANG, C.-T. (2011). Guilt appeals in cause-related marketing. The subversive roles of product type and donation
magnitude. International Journal of Advertising, 30(4), 587-616.
CHANG, C.-T., & LEE, Y.-K. (2008). The Roles of Product Characteristics and Framing Effects in the Effectiveness of
Cause-Related Marketing. Advances in Consumer Research, 35, 780-781.
CHANG, C.T. & LEE, Y.K. (2010). Effects of message framing, vividness congruency, and statistical framing on responses
to charity advertising. International Journal of Advertising. (cited in Chang, C.-T. (2012:232)).
CHUN, R.(2005). Corporate reputation: Meaning and measurement. International Journal of Management Reviews, 7(2),
91-109.

402
CHANG,C.-T (2012). Missing ingredients in cause-related advertising. The right formula of execution style and cause
framing. International Journal of Advertising, 31(2), 231-256.
CONE. (2007). Cone Cause Evolution & Environmental Survey. Boston: Cone LLC. Retrieved September 17, 2011
DEMETRIOU, M., PAPASOLOMOU, I., & VRONTIS, D. (2010). Cause-related marketing: Building the corporate image
while supporting worthwhile causes. Journal of Brand Management, 17(4), 266-278.
DRUMWRIGHT,M.E. (1996). Company Advertising with Social Dimension: The Role of Noneconomic Criteria. Journal of
Marketing. (cited in Webb, D. J., & Mohr, L. A. (1998: 226))
FOMBRUN, C. J., & SHANLEY, M. (1990). What's in a name? Reputation building and corporate strategy. Academy of
Management Journal.(cited in Chun, R. (2005:92)).
GRAU, S. L., & GARRETSON FOLSE, J. A. (2007). Cause-Related Marketing (CRM). The Influence of Donation Proximity
and Message-Framing Cues on the Less-Involved Consumer. Journal of Advertising, 36(4), 19-33.
KOSCHATE-FISCHER, N., STEFAN, I. V., & HOYER, W. D. (2012). Willingness to Pay for Cause-Related Marketing: The
Impact of Donation Amount and Moderating Effects. Journal of Marketing Research, XLIX, (December 2012),
910-927.
KRISHNA, A. (1991). Effect of Dealing Patterns on Consumer Perceptions of Deal Frequency and Willingness to Pay.
Journal of Marketing Research, 28 (11), 441-451.
LAFFERTY, B. A., & EDMONDSON, D. R. (2009). Portraying The Cause Instead Of The Brand In Cause-Related Marketing
Ads: Does It Really Matter? Journal of Marketing Theory and Practice, 17 (2), 129-143.
LEVIN , I.P., Schneider, S.L. & Gaeth, G.J. (1998). All frames are not created equal: a typology and critical analysis of
framing effect. Organizational Behaviour and Human Decision Processes (cited in CHANG,C.-T. (2012:232)).
MILLER, K. M., HOFSTETTER, R., KROHMER, H., & ZHANG, Z. J. (2011). How Should Consumer's Willingness to Pay Be
Measured? An Empirical Comparison of State-of-the Art Approaches. Journal of Marketing Research, XLVIII,
(February 2011), 172-184.
MOHR, L. A., WEBB, D. J., & HARRIS, K. E. (2001). Do Consumers Expect Companies to be Socially Responsible? The
Impact of Corporate Social Responsibility on Buying Behavior. The Journal of Consumer Affairs, 35 (1), 45-72.
PRACEJUS, J. W., OLSEN,G. D., & BROWN, N. R. (2003). On The Prevalence And Impact Of Vague Quantifiers In The
Advertising Of Cause-Related Marketing (CRM). Journal of Advertising, 32(4), 19-28.
PROFITABLE PARTNERSHIPS . (2000). Business in the Community Quantitative Consumer Research, supported by
Research International (cited in Demetriou, M., Papasolomou, I., & Vrontis, D. (2010:270)).
STRAHILEVITZ, M. (1999). The Effects of Product Type and Donation Magnitude on Willingness to Pay More for a
Charity-Linked Brand. Journal of Consumer Pyschology, 8 (3), 215-241
TANGARI, A. H., GARRETSON FOLSE, J. A., BURTON, S., & KEES, J. (2010). The Moderating Influence Of Consumers'
Temporal Orientation On The Framing Of Societal Needs And Corporate Responses In Cause-Related
Marketing Campaigns. Journal of Advertising, 39 (2), 35-50.
VAIDYANATHAN, R., & AGGARWAL, P. (2005). Using Commitments to Drive Consistency: Enhancing the Effectiveness of
Cause-related Marketing Communications. Journal of Marketing Communications, 11 (4), 231-246.
VARADARAJAN, P. R., & MENON, A. (1988). Cause-Related Marketing: A Coalignment of Marketing Strategy and
Corporate Philanthropy. The Journal of Marketing, 52 (3), 58-74.
WEBB, D. J., & MOHR, L. A. (1998). A Typology of Consumer Responses to Cause-Related Marketing: From Skeptics to
Socially Concerned. Journal of Public Policy & Marketing, 17(2), 226-238.
WEBSTER. JR., F. E. (1975). Determining the Characteristics of the Socially Conscious Consumer. Journal of Consumer
Research, 2, 188-196.
WYMER, W., & SAMU, S. (2009). The influence of cause marketing associations on product and cause brand value.
International Journal of Nonprofit and Voluntary Sector Marketing ,14: 1-20.

403
YOUN, S., & KIM, H. (2008). Antecedents of Consumer Attitudes toward Cause-Related Marketing. Journal of Advertising
Research, 123-137.
ZIKMUND WILLIAM G. (2010) Buiness Research Methods. (7th edition). New Delhi : Cengage Learning India Private
Limited.

404
Session 11
405
O que tem se falado por aí sobre marketing
interno? Um estudo sobre a produção
brasileira na área Marketing interno, endomarketing, bibliometria, estado do conhecimento
Fernanda Roda Cassundé, Universidade Federal do Vale do Sao Francisco, [email protected]
Nildo Cassundé Junior, Universidade Federal do Vale do Sao Francisco, [email protected]
José Ricardo Costa de Mendonça, Universidade Federal de Pernambuco, [email protected]
Salomão Alencar Farias, Universidade Federal de Pernambuco, [email protected]
Abstract
Whereas there are several interpretations in Brazilian specialized literature of what is internal marketing given the
variety of terms (internal marketing, marketing applied to human resources, endomarketing), and that, however, the
international literature is clear on the use of a single term (internal marketing), it becomes important to understand
how the Brazilian research addressing this concept because since the Brazilian academy of marketing unify the term
and the concept of internal marketing, it can avoid confusion and even collaborate with the advancement of knowledge
in this field. Thus, based on the research aims proposed by Farias (2010), the aim of this study was therefore to conduct
a meta-analysis in the main journals of business and the events organized by the National Association of Postgraduate
Programs in Business - Anpad to see how the researchers are studying the internal marketing in the Brazilian context
and if the term "internal marketing" is adequate to represent the internal marketing in the academic literature. We
emphasize the importance of periodically monitoring the scope of the studies developed in a specific period of time,
therefore, the quantitative growth does not necessarily imply criteria for advancement in the field of research. In this
sense, a bibliometric study was done from the retrieved articles in the database of five journals and Anpad’s events,
totaling more than 50 years of publication. After an exhaustive search across historical data base of events adopted as a
corpus, were discovered and recovered twelve articles in the period between 1961 and 2012, which were analyzed
with respect to the following categories: terms, authorship and affiliation of the authors, references, profile
methodological and appropriateness of using the term internal marketing. The findings of this study shows that the
state of knowledge about internal marketing is very punctual and in some cases, such as journals, surprisingly
nonexistent. This allows to view several concerns among which the most significant of them is: for which reason the
internal marketing has received - at least when it comes to national journals and conferences of business - the attention
it deserves? This study also reveals that there is no significant predominance of references whose definitions of internal
marketing are indeed the most appropriate. Unveiling the apparent mistake in using the concept of endomarketing as a
synonym for internal marketing emphasizes the need to seek to avoid the use of the first one since the international
literature admits the use of a single term - internal marketing. Realize that there is a low frequency reference of seminal
authors on internal marketing serves as a warning to researchers. Thus, the results may be useful in the analysis of
current trends in scientific production but also in instigating the directions of future work. Expected to contribute to
the understanding of how academics are studying the internal marketing in the Brazilian context.
Introdução
Há na literatura especializada brasileira, várias interpretações sobre o que seja marketing interno, uma vez que são
vários os termos utilizados: endomarketing e marketing aplicado aos recursos humanos, conforme sugere Farias
(2012). No entanto, segundo este autor, a literatura internacional “é clara sobre a utilização de um único termo:
marketing interno (MI)” (p.119). Assim, torna-se importante compreender como as pesquisas brasileiras veem

406
abordando este conceito (inclusive destacando qual termo é mais utilizado), uma vez que se a academia de marketing
brasileira unificar o termo e o conceito de marketing interno, pode evitar confusão e ainda colaborar com o avanço do
conhecimento neste campo (FARIAS, 2012).
Nesse sentido, construir um estudo bibliométrico na tentativa de resgatar o que tem sido pesquisado sobre o assunto
permite mapear e identificar as ideias que estão sendo discutidas ao longo de todo o históri co banco de dados mais
reconhecidos eventos nacionais da área de administração. Deste modo, este artigo tem a pretensão de apresentar uma
perspectiva a respeito deste tema, pois, analisa os artigos publicados nos principais e reconhecidos periódicos
científicos brasileiros de Administração e nos eventos organizados pela Associação Nacional de Pós -Graduação e
Pesquisa em Administração (Anpad).
Considerando assim as proposições de pesquisa propostas por Farias (2010), este estudo foi guiado pelo seguinte
questionamento: como os acadêmicos estão estudando o marketing interno no contexto brasileiro? Desse modo, o
objetivo foi, portanto, o de conduzir uma pesquisa usando meta-análise, assim, o artigo levanta e analisa a temática,
orientação metodológica e demografia de autoria de todos os artigos recuperados, no total de doze (12), no sistema de
busca online dos eventos e periódicos.
Os resultados deste trabalho poderão ser utilizados na análise de tendências não apenas da atual, mas, da histórica
produção científica como também para assinalar os rumos de futuros trabalhos.
Qual o propósito de um estudo sobre a produção brasileira na área?
A “academia em Administração no Brasil tem muitos motivos para comemorar seu desempenho nos últimos anos: sua
produção acadêmica aumentou e o acadêmico tem se dedicado mais à pesquisa” (KIRSHBAUM; PORTO; FERREIRA,
2004, p.7). O aumento das pesquisas organizacionais e administrativas, cuja origem é dada a partir do início da década
de 80, atinge seu alto grau de desenvolvimento, especialmente, durante os anos 90 (DAVEL; ALCADIPANI, 2002)
proporcionando não apenas a consolidação da Administração enquanto área de conhecimento, com características
próprias, como também tem levado a saudáveis reflexões sobre a qualidade da produção ci entífica no campo (LOPES;
BERNARDES, 2001).
Na perspectiva de Romanowski e Ens (2006), a elevação do quantitativo de publicações gera inquietações e
questionamentos como: quais são os temas mais estudados? Que abordagens têm sido utilizadas? Quais as
contribuições pertinentes destas publicações para a área? O que tem sido publicado sobre o tema? Nesse sentido,
conforme salientam Caldas, Tonelli e Lacombe (2002, p.1), a partir dos anos 90, a academia brasileira de administração
– apesar de uma escola nova, principalmente quando comparada a outras ciências – parece ter se voltado para si
mesma, “em uma análise crítica retrospectiva que busca indagar se, além do evidente crescimento quantitativo, a
produção na área cresceu também em qualidade, relevância e originalidade” (CALDAS; TONELLI; LACOMBE, 2002, p.1).
Os meta-estudos surgiram e se multiplicaram, “analisando as mais diversas dimensões da produção científica em cada
uma dessas áreas” (CALDAS; TONELLI; LACOMBE, 2002, p.1).
Não diferente de outras áreas do conhecimento, a Administração vem sofrendo transformações em ritmo muito
acelerado, portanto, em função de tal crescimento, é necessário monitorar periodicamente o alcance dos estudos
desenvolvidos em um período de tempo específico, pois, o crescimento quantitativo não necessariamente implica em
critério de avanço no campo de investigação. Deste modo, Ferreira (2002) e Cardoso et al (2005) destacam a
importância de se mapear, discutir e conhecer a produção acadêmica em determinada área. O primeiro autor
acrescenta que é preciso buscar
responder que aspectos e dimensões vêm sendo destacados e privilegiados em diferentes épocas e lugares, de que
formas e em que condições têm sido produzidas certas dissertações de mestrado, teses de doutorado, publicações
em periódicos e comunicações em anais de congressos e seminários (2002, p.258).
Apesar de reconhecida importância, diversos estudos indicam reduzido número de trabalhos produzidos no país cujo
objetivo seja o de mapear e analisar o conhecimento acumulado em determinada área (TEIXEIRA; MEGID NETO, 2006;
CALDAS; TINOCO, 2004). Assim, ao passo que a ciência vai sendo construída ao longo do tempo, privilegiando ora um
aspecto, uma metodologia, um referencial teórico, também a análise, em pesquisas de estado do conhecimento
produzidas ao longo do tempo deve, a partir do entendimento de Soares e Maciel (2000), ser paralelamente elaborada,
identificando e explicitando os caminhos da ciência para que seja revelado o processo de construção de conhecimento
sobre determinado tema, na tentativa de integrar os resultados e identificar duplicações, contradições e, especialmente,

407
lacunas, ou seja, aspectos ainda não explorados.
Marketing interno: para além de um simples significado
Considerando o aumento de competitividade nas últimas décadas e a busca pela prestação de serviços de alta qualidade
enquanto diferencial competitivo, a equipe de funcionários começou a receber maior importância por parte dos
gestores, uma vez que passou a existir o entendimento de que a motivação dos funcionários poderia impactar na
prestação do serviço e, consequentemente, na percepção de satisfação dos clientes (KURTZ; CLOW, 1996).
Papasolomou (2006) reforça a ideia dos autores anteriores quando salienta que as organizações que selecionam,
desenvolvem, gerenciam e motivam sua força de trabalho possuem uma extraordinária vantagem competitiva frente
aquelas que nada disso fazem.
Assim, em função da importância do marketing interno apontada por Kurtz e Clow (1996) e Papasolomou (2006), e da
discussão proposta por Farias (2012), é importante apresentar o conceito de marketing interno na tentativa de dirimir
quaisquer interpretações equivocadas.
Neste sentido, Farias (2012, p.107) chama a atenção de que “há aproximadamente 34 anos o marketing interno (MI) foi
proposto como uma solução para o problema da prestação, de maneira consistente, de serviços de alta qualidade por
Berry et al. (1976)”. Já para Grönroos (2006), o conceito de marketing interno foi originário na pesquisa de marketing
de serviços. Varey e Lewis (1999) vão mais além e alertam para o fato de que este conceito tem origem em discussões
originadas nos primeiros anos do século XX.
Parece que a essência do marketing interno não é um fenômeno da era pós-industrial, uma vez que há alguma evidência
de atitudes e métodos na literatura inicial de marketing e gestão, indicando que os programas para gerar o
compromisso entre os funcionários e os objetivos da empresa não são recentes. Assim, embora não sendo um conceito
novo, situação na qual pudessem ser geradas confusões de interpretação, uma vasta literatura tem sido examinada a
partir da qual uma série de preocupações relativas a limitações e falta de clareza foram apontadas relativas a noção
atual de marketing interno (VAREY; LEWIS, 1999). Portanto, ainda permanece na literatura um certo conflito com
relação ao entendimento do que seja marketing interno e quais ações devem ser realizadas para implementá-lo.
Embora muitas das definições de marketing interno visualizem este termo tanto como um conceito, quanto uma
filosofia ou uma prática de gestão, quer em relação à gestão de recursos humanos, marketing de serviços ou gestão da
mudança (LINGS; BROOKS, 1998, p. 327 apud FARIAS, 2012, p.110), grande parte das obras iniciais sobre marketing
interno focou a motivação e satisfação dos funcionários, pois, acreditava-se que, na medida em que uma organização
satisfizesse seus funcionários, seus clientes também ficariam satisfeitos, já que o que se compra em empresas
prestadoras de serviço é a mão-de-obra (FARIAS, 2012). Neste sentido, Papasolomou (2006) entende que o objetivo do
marketing interno é tornar motivados os empregados-clientes a fim de alcançar a excelência de serviço. Para Berry et al
(1976 apud FARIAS, 2012, p. 107), o que nos parece a melhor definição, o marketing interno está “preocupado em
disponibilizar produtos internos (tarefas) que satisfaçam as necessidades de um mercado interno vital (empregados)
desde que os objetivos da organização sejam atendidos”. Este conceito é complementado pelo de Greene et al (1994, p.
8 apud FARIAS, 2012) quando eles dizem que o marketing interno está visualizando os empregados como clientes
internos, as tarefas como produtos internos, e empenhando-se em projetar esses produtos para melhor atender as
necessidades de tais clientes.
Varey e Lewis (1999) ressaltam ainda a importância do trabalho de Rafiq e Ahmed (1993) expondo características do
pensamento e pressupostos habituais da discussão sobre marketing interno.
Deste modo, percebe-se o quanto o marketing interno ganha prestígio e contribui amplamente para o aumento dos
níveis de envolvimento e comprometimento dos colaboradores, nomeadamente das empresas de serviço (ÓRFÃO,
2010).
E o que dizer da produção científica em Administração no Brasil?
Não é possível dissociar a evolução da produção acadêmica em Administração do desenvolvimento dos cursos de pós -
graduação na área, de “onde se registra parte substancial da produção científica de docentes e discentes” (BERTERO;
CALDAS; WOOD JR, 1999, p.150).

408
As universidades públicas brasileiras e um reduzido número de privadas, que não são operadas como negócios, se
caracterizam por liderar a produção científica, como pode ser constatado pelas avaliações regularmente feitas pela
Capes dos programas de mestrado e doutorado. São também as IES responsáveis por boa parte da pesquisa que se
faz no país sobre administração (BERTERO, 2006, p.72).
Por isso, para se analisar a produção científica, é preciso ser considerado o contexto no qual os cursos de pós -graduação
se desenvolveram. É importante destacar que, o modelo adotado, para implantação e desenvolvimento dos programas
de pós-graduação no Brasil, estava relacionado, diretamente, à produção do conhecimento científico. Tal modelo, de
origem germânica, “chegou com a Reforma Universitária de 1968 e partiu da união indissolúvel entre ensino e
pesquisa”, colocam Bertero, Caldas e Woord Jr (1999, p.175).
Nos primórdios da década de 60, a escola de administração da Fundação Getúlio Vargas deu início as atividades de um
núcleo de pesquisa e de publicações, como o da Revista de Administração de Empresas (RAE), sendo, hoje, o mais
antigo periódico brasileiro em circulação destinado à administração no âmbito empresarial, destaca Bertero (2006).
Nesta época, em meados dos anos 60, a teoria administrativa “vivia uma fase de desenvolvimento controlado dentro de
um acordo tácito de métodos, metodologias, perspectivas de análise e base epistemológica” (PECI; ALCADIPANI, 2004,
p.10). Apesar de tais iniciativas e de já existir um controlado desenvolvimento das pesquisas em administração, a
importância e a intensificação da atividade de pesquisa só foram verificadas após a institucionalização dos curso de
pós-graduação stricto sensu no país (BERTERO, 2006).
Neste sentido, de acordo com as leis e normas que orientam os Cursos de Pós-Graduação, “a pesquisa científica é
colocada como objetivo principal por ser considerada o instrumento para desenvolver a capacidade de pensar e criar”
(MARTINS, 1996, p.3). Assim, ainda sobre as pós-graduações:
a área de administração encontra-se presente na pós-graduação stricto sensu desde os seus primeiros passos. Já em
fins dos anos sessenta e início da década seguinte programas sugiram no Rio de Janeiro, São Paulo, Minas Gerais, Rio
Grande do Sul e Paraíba. Os anos oitenta assistiram ao aparecimento de programas de mestrado e doutorado em
administração em vários outros Estados da União (BERTERO; CALDAS; WOOD JR, 1999, p.149).
O que se tem percebido, portanto, é que “apesar de novo como campo científico no Brasil, a pesquisa em administração
de empresas tem crescido quantitativamente nos últimos anos”, destacam Bertero, Caldas e Wood Jr. (1999, p.148). A
união entre pesquisa, ensino e pós-graduação stricto sensu, para Bertero (2006, p.99), “explica o aumento da produção
científica na última década”.
Nesse sentido, também é possível creditar tal transformação, segundo Kirshbaum, Porto e Ferreira (2004, p.3), devido
ao “papel desempenhado pela Capes, ao estabelecer o sistema de pontuação dos acadêmicos e exigir pontuação mínima
para docentes pesquisadores”, já que “o sistema de avaliação da Capes atribui importância decisiva à pesquisa que
resulte em publicações” (BERTERO, 2006, p.98). Assim sendo, é importante destacar também o papel que a Anpad
(Associação Nacional de Pós-Graduação e Pesquisa em Administração) vem desempenhando nos últimos anos,
acrescenta Bertero (2006). Dessa maneira, o debate, sobre condições e critérios que motivam temas e métodos da
pesquisa em Administração, tornou-se bastante amplo e complexo (MARTINS, 1996), inclusive em virtude da qualidade
que permeia tal pesquisa, já que, “nos últimos anos, o desenvolvimento e a consolidação da Administração como uma
área de conhecimento com características próprias têm levado a saudáveis reflexões sobre a quali dade da produção
científica no campo” (LOPES; BERNARDES, 2001, p.92).
Foi apenas com o trabalho precursor de Machado-da-Silva, Cunha e Amboni (1990) que a academia de Administração
parece ter despertado para a necessidade de uma ampla avaliação de sua produção.
A partir desse primeiro levantamento, várias áreas passaram a fazer balanços críticos desse tipo, como a de Marketing (Vieira, 1998, 1999, 2000; Perin et al., 2000; Botelho e Macera, 2000), a de Administração da Informação (Hoppen et al., 1998), Produção (Bignetti e Paiva, 1997) e a de Administração Pública (Keinert, 2000). O que chama a atenção em praticamente todos estes estudos é a convergência da conclusão: quase todos indicam problemas sérios na qualidade dos trabalhos (TONELLI et al, 2003, p.106)
Neste sentido, a qualidade e aplicabilidade da produção científica em administração tem sido tema de interesse e de
inquietações de muitos estudiosos da área, principalmente nos últimos anos (por exemplo: CARRIERI; LUZ, 1998;
BERTERO, CALDAS; WOOD JR., 1999; PERIN EL AL, 2000; LOPES; BERNADES, 2001; DAVEL; ALCADIPANI, 2002; entre
outros).
Embora o foco de análise, dos trabalhos realizados pelos autores supracitados, seja, por vezes, diferente, todos os
estudos apresentam uma semelhança na identificação de que a produção científica em Administração é “bastante
fragmentada, na qual distintos paradigmas são utilizados ao mesmo tempo, formando uma espécie de ‘grande colagem’
409
de idéias e abordagens”, destacam Lopes e Bernardes (2001, p.97). Bertero, Caldas e Wood Jr (1999, p.148)
acrescentam ainda que a produção nacional em Administração é “periférica, epistemologicamente falha,
metodologicamente deficiente, sem originalidade e pratica, em grande escala, mimetismo mal informado”. Nesse
sentido, corroboram Peci e Alcadipani (2004, p.11), pelo fato de que, análises críticas sobre a qualidade da produção
científica em diferentes áreas, como “Organizações, Marketing, Administração da Informação, Estratégia, Administração
Pública e Recursos Humanos, identificaram fragilidades do ponto de vista teórico, metodológico e também acerca da
relevância das contribuições do campo”. Assim, a administração parece ser “uma área reconhecidamente carente de
maior densidade científica” (BERTERO, 2006, p.101).
Em virtude da preocupação com a qualidade do que é produzido na área de Administração, reflexões na academia têm
sido geradas, segundo Antunes et al (2004), e, “além dos artigos, alguns painéis e mesas redondas vêm analisando
desde a qualidade até a continuidade dos trabalhos realizados e publicados em âmbito nacional dentro [...] da
Administração” (PERIN et al, 2000, p.1). A comunidade científica brasileira de administração parece ter se debruçado
sobre o conteúdo que tem sido produzido, refletindo, criticando e analisando a atividade que acabou por incorporar à
própria pesquisa. Dessa forma, é possível encontrar importantes trabalhos reflexivos e descritivos sobre a pesquisa em
administração no país desde a década 1980 e que prosseguem até o momento atual (BERTERO, 2006, p.104).
Design de pesquisa
Este trabalho caracteriza-se por ser um estudo sobre a produção brasileira na área de marketing interno. Apresenta-se
uma metodologia de caráter inventariante e descritivo, própria dos trabalhos conhecidos como estado do
conhecimento e que podem ser caracterizados como estudos bibliométricos (FERREIRA, 2002).
A bibliometria, nesse sentido, é uma ferramenta que possibilita o mapeamento e a geração de “diferentes indicadores
de tratamento e gestão da informação e do conhecimento, (...) necessários ao planejamento, avaliação e gestão da
ciência e da tecnologia, de uma determinada comunidade científica ou país” (GUEDES; BORSCHIVER, 2005, p.15).
Cardoso et al (2005) complementam que a análise bibliométrica constitui parte essencial no proc esso de compreensão
da ciência e, quando tal análise é acrescida de pesquisas qualitativas, os resultados adquirem maior alcance na
interpretação.
A seleção dos artigos para este estudo atendeu aos procedimentos de coleta e análise seguidos por Tonelli et al (2003),
que, por sua vez, considerou os mais citados meta-estudos nas diversas áreas do Enanpad, a exemplo de Vieira (1998) e
Perin et al (2000).
A seleção dos artigos para este trabalho atendeu aos critérios que se seguem:
As base de dados escolhidas para extrair o corpus deste estudo levou em consideração a
representatividade em termos de publicações na área de Administração para os eventos, bem como a
classificação pelo Sistema Qualis da Coordenação de Aperfeiçoamento de Pessoal de Nível Superior -
Capes (com conceito maior ou igual a B3) para os principais periódicos;
O corpus para este estudo é formado a partir da recuperação de todos os artigos na base de dados online:
de eventos organizados pela Associação Nacional dos Programas de Pós-Graduação em Administração
(Anpad), considerando o período de 1997 a 2012; da Revista de Administração (Rausp), considerando o
período de 1977 a 201216 (35anos); da Revista Eletrônica de Gestão Organizacional (Gestão.org),
considerando o período de 2003 a 2012; da Revista de Administração Contemporânea (RAC),
considerando o período de 1997 a 2012; da Revista Eletrônica de Administração (REAd), considerando
o período de 1995 a 2012; dos Cadernos EBAPE.BR, considerando o período de 2003 a 2012; da Revista
de Administração de Empresas (RAE), considerando o período de 1961 a 2012; da Brazilian
Administration Review (BAR – publicação da Anpad), considerando o período de 2004 a 2012 e da
16 Publicação suspensa de 1967 a 1976.

410
Brazilian Business Review (BBR), considerando o período de 2004 a 2012;
Foi utilizada a regra da exaustividade17 de Bardin (2011) para definir o corpus. Assim, não foi definido, a
priori, um corte temporal para validar os artigos recuperados, sendo considerados como válidos,
portanto, todos artigos que apareceram nos resultados da busca, totalizando, 12 papers completos e
selecionados;
O critério de busca adotou a busca a partir de categorias analíticas que devem estar presentes no título,
cujas palavras-chaves pesquisadas foram: marketing interno e endomarketing18;
A recuperação dos artigos foi realizada no período de 04 a 11 de dezembro de 2012.
Após demarcação do universo e a coleta dos artigos, foi possível constituir o corpus da pesquisa que cobriu toda a
existência da teoria do marketing interno. “O corpus é o conjunto dos documentos tidos em conta para serem
submetidos aos procedimentos analíticos” (BARDIN, 2011, p.126).
A análise de conteúdo de Bardin (2011, p.44) foi utilizada como técnica de análise de dados:
conjunto de técnicas de análise das comunicações que utiliza procedimentos sistemáticos e objetivos de descrição
do conteúdo das mensagens. A intenção da análise de conteúdo e a inferência de conhecimentos relativos às
condições de produção, inferência esta que recorre a indicadores (quantitativos ou não).
As categorias definidas para análise foram: termos (contidos nos títulos dos artigos e nas palavras-chave), autoria e
filiação dos autores (quantidade de autores, programas, grupos de pesquisa), referências (principais autores, principais
congressos, periódicos e autores fontes de citação), perfil metodológico (natureza do trabalho, locus do estudo).
Cada artigo foi analisado em termos de seu conteúdo com a finalidade de identificar informações a respeito dos aspetos
acima indicados. Os artigos estão identificados, quando necessário, ao longo das análises de acordo com a simbologia
adotada na tabela 1 abaixo.
Tabela 1 – Simbologia para identificação dos artigos
Identificação artigos
Brazilian Business Review (BBR) BBR_2012
Revista Eletrônica de Administração (REAd)
REAd_2002
REAd_2005a
REAd_2005b
EnANPAD - Encontro da Associação Nacional de Pós-Graduação e Pesquisa em Administração
EnANPAD_2001
EnANPAD_2005
EnANPAD_2007
EnANPAD_2008
EnANPAD_2011
EnADI - Encontro de Administração da Informação EnADI_2009
EnGPR – Encontro de Gestão de Pessoas e Relações de Trabalho EnGPR_2009
EMA – Encontro de Marketing EMA_2012
Análise de dados
Os artigos foram obtidos em meio digital através do site da Associação Nacional de Pós -Graduação e Pesquisa em
Administração (Anpad), da Revista de Administração (Rausp); da Revista Eletrônica de Gestão Organizacional
(Gestão.org); da Revista de Administração Contemporânea (RAC); da Revista Eletrônica de Administração (REAd); dos
Cadernos EBAPE.BR; da Revista de Administração de Empresas (RAE); da Brazilian Administration Review (BAR –
publicação da Anpad) e da Brazilian Business Review (BBR).
17 Totalizando 35 anos de publicação em eventos da área.
18 Inclusive suas variações: endo-marketing e endo marketing.

411
É importante enfatizar que, apesar de todos os periódicos pesquisados ressaltarem em suas linhas editoriais que os
escopos de publicação contemplam temas relativos à gestão das organizações e suas diversas áreas (incluindo-se
marketing e recursos humanos), não foram encontrados, de acordo com a tabela 2 a seguir, artigos que satisfizessem as
condições de pesquisa na maioria dos periódicos investigados: Revista de Administração (Rausp); da Revista Eletrônica
de Gestão Organizacional (Gestão.org), dos Cadernos EBAPE.BR, da Revista de Administração de Empresas (RAE) e da
Brazilian Administration Review (BAR). Na base de dados da Revista de Administração Contemporânea (RAC) foi
recuperada apenas uma entrada para a pesquisa, no entanto, o material recuperado foi classificado como notas
bibliográficas, não satisfazendo, portanto, os critérios de busca para este estudo. Assim, os dois únicos periódicos que
apresentaram resultados de busca satisfatórios foram a Revista Eletrônica de Administração (REAd), publicada pela
Escola de Administração da Universidade Federal do Rio Grande do Sul, avaliada com nível B2 (de acordo com os novos
níveis de classificação da Capes) e a Brazilian Business Review (BBR), publicada pela Fucape Business School, avaliada
com nível A2 no sistema Qualis/Capes.
Com relação aos artigos de congressos, foram analisados trabalhos de cinco edições do EnANPAD, uma do EnADI,
do EnGPR e EMA. Das oito edições dos congressos analisadas, apenas uma ocorreu na região centro-oeste e outra no
nordeste; a grande maioria (seis), foi no sul-sudeste (tabela 3 a seguir).
Tabela 2 – Artigos por periódico/ano
Periódico Qualis/Capes19 Ano Edição Quantidade de
artigos
Revista de Administração de Empresas (RAE) A2 -
Brazilian Administration Review (BAR) A2 -
Brazilian Business Review (BBR) A2 2012 out-dez 01
Revista de Administração Contemporânea (RAC) A2 - - -
Revista de Administração (Rausp) B1 - - -
Cadernos EBAPE.BR B1 - - -
Revista Eletrônica de Administração (REAd) B2 2002 jul-ago 01
2005 jan-fev 02
Revista Eletrônica de Gestão Organizacional (Gestão.org) B3 - - -
TOTAL 04
Tabela 3 – Artigos por evento Anpad/local/ano
Evento Anpad Ano Local Região Quantidade de
artigos
EnANPAD - Encontro da Associação Nacional de Pós-Graduação e Pesquisa em Administração
2001 Campinas/SP S 01
2005 Brasília/DF CO 01
2007 Rio de Janeiro/RJ SE 01
2008 Rio de Janeiro/RJ SE 01
2011 Rio de Janeiro/RJ SE 01
EnADI - Encontro de Administração da Informação 2009 Recife/PE NE 01
EnGPR – Encontro de Gestão de Pessoas e Relações de Trabalho
2009 Curitiba/PR S 01
EMA – Encontro de Marketing 2012 Curitiba/PR S 01
TOTAL 08
Outros aspectos chamam bastante atenção: as publicações sobre o tema são bastante recentes (começaram a partir de
2001), não são constantes (não foram encontrados estudos publicados em 2003, 2004, 2006 e 2010, por exemplo) nem,
19 À época da realização deste estudo e considerando a avaliação para a área de Administração.

412
tampouco, expressivas em termos de quantidade por evento ou edição do periódico (todas as edições/eventos têm
apenas um artigo publicado, com exceção da edição de jan-fev de 2005 da REAd, que apresentou dois artigos).
A análise da autoria dos artigos (tabela 4 a seguir) mostra que 58,3% apresenta entre um e dois autores, entretanto, é
também significativa a quantidade de artigos que apresentam três ou mais autores (41,7%). Dada as pressões do
sistema de avaliação da Capes, que atribui importância decisiva à pesquisa que resulte em publicações por publicação,
os pesquisadores que optam pela co-autoria aumentam, portanto, suas possibilidades de publicação.
Tabela 4 – Quantidade de autores por artigo
Artigos 1 autor 2 autores 3 autores Mais de 3 autores TOTAL
Quantidade 03 04 02 03 12
% 25% 33,3% 16,7% 25% 100%
A tabela 5 a seguir apresenta o perfil metodológico. Os artigos publicados são predominantemente de natureza teórico-
empírica e teórica, no entanto, algumas considerações nas proporções dessa natureza podem ser feitas em relação à
produção dos periódicos e dos eventos da Anpad. A primeira consideração é que a preferência dos congressos parece
ser por artigos de natureza teórico-empírica, uma vez que todos os artigos publicados nos eventos da Anpad podem ser
classificados dessa maneira. Outra consideração é que apenas dois artigos de natureza teórica foram publicados em
todo o corpus deste estudo. Tais publicações foram feitas em periódicos. O método mais utilizado foi o estudo de caso,
tanto com abordagens qualitativas (entrevistas e grupos focais) quanto quantitativas (surveys).
Tabela 5 – Perfil metodológico
Natureza Tipo de publicação Subtotal Total
Teórico Congresso -
02 Periódico 02
Teórico-empírica Congresso 08
10 Periódico 02
TOTAL 12
O locus predominantemente (tabela 6 abaixo) do estudo foram empresas de s erviços. Apenas quatro artigos
relacionaram seus estudos com a indústria.
Tabela 6 – Locus dos estudos
Locus do estudo Quantidade
Serviço 06
Indústria 04
TOTAL 10
As análises que se seguem dizem respeito às referências bibliográficas utilizadas nos artigos.
A primeira análise feita foi em relação às referências bibliográficas dos artigos recuperados para estudo. Foram
contabilizadas 429 referências completas que serviram de base para análises posteriores. De acordo com as
informações da tabela 7 abaixo, pode-se verificar que houve uma pequena variação na quantidade média de referências
dos artigos publicados nos congressos daqueles publicados nos periódicos (34,38 e 38,5 respectivamente).
Tabela 7 – Quantidade de referências por publicação e média de referências por artigo
Quantidade
de referências Média
por artigo Quantidade de
artigos
Congresso 275 34,38 08
Periódico 154 38,5 04
TOTAL 429 - 12

413
Na tabela 8 abaixo são apresentadas as doze principais obras referenciadas nos artigos. Vale a pena chamar atenção
para o fato de que, das 429 referências, as obras que mais foram referenciadas nos artigos foram a de Kotler e
Grönroos, com 07 observações cada uma. Este último autor aparece duas vezes na tabela abaixo com duas obras
diferentes. O que se pode perceber é que existe uma dispersão das obras utilizadas, não existindo, ainda um quadro de
referência em marketing interno na área, uma vez que Kotler não é propriamente um autor específico que versa sobre
marketing interno.
Tabela 8 – Principais obras referenciadas 20
Ranking Obra Quantidade Referências
1 KOTLER, P. Administração de marketing. 07
GRÖNROOS, C. Marketing: gerenciamento e serviços 07
2 CERQUEIRA, W. Endomarketing: Educação e Cultura para a Qualidade 06
3
BERRY, L.; PARASURAMAN, A. Serviços de Marketing: Competindo através da Qualidade
04
BRUM, A. M. Respirando Endomarketing
BRUM, A. M. Endomarketing
BANSAL, H.; MENDELSON, M.; SHARMA, B. Impact of Internal Marketing Activities on External Marketing Outcomes
GEORGE, W. Internal marketing and organizational behavior: a partnership in developing customer Conscious employees at Every Level
GRÖNROOS, Christian. Internal marketing: an integral part of marketing theory.
RAFIQ, M.; AHMED, P. K. Advances in the internal marketing concept: definition, synthesis and extension.
VAREY, R. Internal Marketing: A Review and some Interdisciplinary Research Challenges.
Foi feito um ranking referente aos autores mais referenciados, independentemente da obra utilizada nos artigos (tabela
9 abaixo). Em consonância com os trabalhos de Bertero (2006); Bertero e Keinert (1994); Vergara e Carvalho Jr (1995)
e Vergara e Pinto (2001) salientarem o uso exacerbado de teorias, autores e modelos estrangeiros, o autor mais citado é
Christian Grönroos, de origem Finlandesa. No entanto, contrariando tais autores, a segunda autora mais referenciada é
brasileira (Analisa de Medeiros Brum), e dos próximos dez autores mais referenciados, apenas dois não são da área de
marketing. Outra consideração importante é sobre o uso do termo endomarketing x marketing interno. Das seis obras
da autora brasileira referenciada, cinco possuem no título endomarketing, e apenas um marketing interno.
20 Após a referências às obras de Brum, as próximas obras foram referenciadas três ou menos vezes em grande quantidade. Por isso, deu-se preferência a indicação apenas das obras com até quatro indicações.

414
Tabela 9 – Principais autores referenciados
Ranking Autor Quantidade Referências
1 Christian Grönroos 14
2 Analisa de Medeiros Brum
13 Mohammed Rafiq e Pervaiz K. Ahmed
3 Philipe Kotler 09
4 Saul Faingaus Bekin
07 Leonard Berry
5 Wilson Cerqueira 06
6
Evert Gummesson
05 William R George
Richard J. Varey
A análise dos termos dos artigos selecionados foi realizada identificando-se as palavras-chave da busca (endomarketing
ou marketing interno) nos títulos dos artigos. Os resultados são demonstrados na tabela 10 a seguir.
Tabela 10 – Termos mais frequentes no título dos artigos
Termos Tipo de publicação Subtotal Total
Endomarketing Congresso 05
06 Periódico 01
Marketing Interno Congresso 03
06 Periódico 03
TOTAL 12
Não foi identificada a presença dos dois temas em um mesmo título, assim, o total da tabela 10 é exatamente igual ao
número total de artigos selecionados.
O que se percebe na análise dos artigos é que, de uma maneira geral, o uso do termo endomarketing aparece apenas
como sinônimo de marketing interno, como sendo uma alternativa à tradução de internal marketing. Dessa forma, os
autores ora usam um, ora usam o outro tão-somente como estratégia de redação do texto, sem questionar a existência
dessa variedade de termos para um mesmo conceito. Porém, recorrem aos autores estrangeiros (BERRY, 1981; BERRY;
PARASURAMAN, 1995; GRÖNROOS, 1995; RAFIQ; AHMED, 2000) e às suas obras sobre o tema para poder
contextualizar o propósito e o conceito de marketing interno.
Trechos extraídos dos artigos permitem compreender tal situação21:
“o endomarketing, ou marketing interno, de acordo com Gronroos (1995) e Brum (1998), deve ser
entendido como...” (EnANPAD_2011);
“o marketing interno, também chamado de endomarketing, é um conjunto de práticas introduzidas e
aprimoradas...” (REAd_2002);
“Dessas constatações, surgiu um novo campo de estudo: o marketing interno (ou endomarketing)”
(EnANPAD_2001);
“o endomarketing, também conhecido como marketing interno, constitui -se em projetos ou ações que
visam obter...” (EnADI_2009);
“o marketing interno ou endomarketing é uma forma de gestão que integra as funções da organização...”
(EnANPAD_2007);
“No Brasil, a literatura de marketing interno (também chamado de endomarketing) é ainda escassa...”
(EnANPAD_2005);
21 Vide seção de design de pesquisa, página 7, sobre a identificação dos artigos.
415
“o marketing interno, que também é conhecido pela terminologia de Endomarketing consiste em um
conceito do tipo ‘guarda-chuva’...” (REAd_2005a).
Salienta-se que esta discussão sobre o melhor termo a ser utilizado não se restringe apenas à língua portuguesa. Varey
e Lewis (1999) acrescentam que existe forte resistência entre alguns acadêmicos e profissionais quanto ao uso do
termo marketing interno, uma vez que este termo sugere que o mecanismo de gestão da mudança que está sendo
descrito é de propriedade exclusiva dos gestores de marketing. Os termos “marketing de relacionamento interno”,
“gestão interna de relacionamento” ou “processo de gestão social interna” são propostos como alternativa na literatura
estrangeira. Papasolomou (2006) revisitou a literatura e alerta para existência de uma variedade de formatos de
implementação do marketing interno, os quais confundem e criam ambiguidade, em vez de clareza e compreensão.
Dos artigos analisados:
apenas três deles não fazem o uso dos autores estrangeiros clássicos, concentrando a discussão teórica
sobre o tema apenas em Brum (1998, 2000, 2003), Bekin (1995, 2004, 2005) e Cerqueira (1994, 1999,
2005) (autores brasileiros que enfatizam o uso do termo endomarketing);
sete deles apresentam interpretação equivocada do conceito de marketing interno. Parte deste equívoco
deve-se ao fato de mesclar o que tem sido discutido nas literaturas estrangeiras e nas brasileiras,
prevalecendo a discussão da literatura nacional. Em todos esses sete artigos existe a troca frequente
entre os termos marketing interno e endomarketing, como se sinônimos fossem. Trechos extraídos dos
artigos permitem compreender tal situação:
- “o marketing interno pode ser definido como um conjunto de ações que tem como objetivo
tornar comum, entre funcionários de uma empresa, objetivos, metas e resultados”
(EnANPAD_2007);
- “o endomarketing, também conhecido como marketing interno, constitui -se em projetos ou
ações que visam obter ou até mesmo resgatar a conscientização dos usuários e salientar a
relevância de seu apoio e colaboração para que mudanças organizacionais possam ser
implantadas com sucesso” (EnADI_2009);
- “o marketing interno, também chamado de endomarketing, é um conjunto de práticas
introduzidas e aprimoradas na organização, e que tem por objetivo obter, ou elevar, o
comprometimento dos seus funcionários” (REAd_2002);
- Define-se “endomarketing como ações gerenciadas de marketing, eticamente dirigidas ao
público interno (funcionários) das organizações e empresas focadas no lucro, das organizações
não-lucrativas e governamentais e das do terceiro setor, observando condutas de
responsabilidade comunitária e ambiental” (EnANPAD_2008).
três deles chamam atenção para o fato de existir uma gama de conceitos sobre marketing interno
causando confusão já que não há um conceito unificado sobre o que se entende ser marketing interno.
Trechos extraídos dos artigos permitem compreender tal situação:
- “há uma grande confusão na literatura quanto a exatamente o que é o MI, o que se deve fazer,
como deve-se fazer, e quem deve fazer. Um dos principais problemas que contribuem para isso
é que não existe um conceito unificado do que se entende por MI” (BBR_2010);
- “esta gama de definições distintas de marketing interno acarreta a não-existência de uma
conceituação considerada preponderante sobre o assunto” (EnANPAD_2005);
- “o conceito de marketing interno não reúne unanimidade entre os estudiosos” (REAd_2002).
em quatro deles, apesar de discutirem os vários pontos de vista sobre o conceito, ele está claro e
referenciado de acordo com a literatura internacional, e em três, os autores afirmam que o conceito mais
completo é o de Rafiq e Ahmed (2000).
É importante destacar que o termo endomarketing é de propriedade e uso exclusivo da S. Bekin & Consultores
Associados Ltda, registro de marca (n° 815990995) concedido pelo INPI - Instituto Nacional de Propriedade Industrial,
autarquia vinculada ao Ministério da Indústria e Comércio, em 03 de janeiro de 1995 (INKOTTE, 2000).
Considerações finais
Este trabalho se propôs a analisar como a temática marketing interno vem sendo abordada nos pri ncipais periódicos de
Administração e nos eventos organizados pela Associação Nacional dos Programas de Pós -Graduação em

416
Administração (Anpad) com o objetivo de contribuir para o entendimento de como os acadêmicos estão estudando o
marketing interno no contexto brasileiro. Através da análise dos artigos foi possível identificar, por exemplo, termos
mais utilizados nos títulos dos trabalhos, os autores que mais publicam, as principais referências utilizadas e os autores
mais referenciados. A principal contribuição de um estudo como este é o de monitorar periodicamente o alcance dos
estudos desenvolvidos em um período de tempo específico, pois, o crescimento quantitativo não implica,
necessariamente, em critério de avanço no campo de investigação.
Este trabalho revela que a produção científica brasileira sobre marketing interno é bastante pontual e em alguns casos,
como periódicos de Administração, surpreendentemente inexistente, uma vez que dos oito periódicos analisados,
apenas em dois foram encontrados artigos que satisfizeram os critérios de pesquisa para este trabalho. Este aspecto
permite visualizar diversas inquietações dentre as quais a mais expressiva delas é: por qual motivo o marketing interno
não tem recebido – pelo menos no que tange aos periódicos e congressos nacionais de Administração – a atenção
merecida?
Este estudo revela que não existe uma predominância expressiva de referências cujas definições de marketing interno
são as de fato as mais adequadas. Desvelar o aparente equívoco no uso do conceito de endomarketing como sinônimo
de marketing interno destaca a necessidade de se evitar o uso do primeiro já que a literatura internacional é claro no
uso de um termo único – o marketing interno. Constatar que existe uma frequência baixa de referência dos autores
seminais sobre marketing interno serve como um alerta para os pesquisadores (atuais e futuros) brasileiros.
De uma maneira geral o que se pode perceber é que o termo endomarketing, quando utilizado, é tido como sinônimo de
marketing interno. A interpretação do conceito, no entanto, diverge da literatura estrangeira quando considerado
apenas os autores brasileiros. Sejam por questões de perda na tradução ou falta de acesso às obras dos autores
estrangeiros, o fato é que os artigos que consideraram apenas os autores brasileiros apresentaram um conceito e
aplicação distorcidos do marketing interno.
Diante do exposto, é importante explorar o conceito de marketing interno em termos da sua contribuição para a
academia e nesta ocasião, diante dos levantamentos e diagnósticos, é importante deixar registrado que se desenvolvam
mais artigos acerca do tema sem, no entanto, abrasileirar o entendimento de marketing interno, utilizando o
endomarketing como sinônimo, cuja essência não acompanha os construtos basilares do marketing interno e por sua
vez resulta em análises equivocadas.
É importante ressaltar que, em função das limitações desse estudo, quais sejam: considerar apenas oito periódicos em
Administração, os eventos organizados pela Anpad e o período de tempo analisado (embora tenha sido contemplado
todo o acervo digital disponível); os resultados aqui apresentados não podem ser generalizados para outros eventos ou
periódicos. Os resultados dizem respeito aos padrões dos periódicos e eventos analisados , entretanto, por serem
academicamente reconhecidos, este trabalho tem condições de contribuir para a compreensão da produção científica
sobre marketing interno em Administração.
References ANTUNES, Elaine Di Diego, et al. (2004). Trajetória das dissertações em Gestão de Pessoas de um curso de pós-
graduação do sul do país: caminhos de uma tradição de pesquisa e atalhos para a renovação . Encontro dos
Programas de Pós-Graduação em Administração , XXVIII Encontro dos Programas de Pós-Graduação em
Administração, Curitiba: Anpad.
BARDIN, L. (2011). Análise de Conteúdo. São Paulo: Edições 70.
BERTERO, C. O. (2006). Ensino e Pesquisa em Administração . São Paulo: Thomson Learning.
BERTERO, Carlos Osmar; CALDAS, Miguel Pinto; WOOD JR., Thomaz. (1999). Produção cientí fica em Administração de
Empresas: provocações, insinuações e contribuições para um debate local. RAC, v.3., n.1., Jan./Abr.
BERTERO, C. O.; KEINERT, T. M. M. (1994). A evolução da análise organizacional no Brasil (1961-93). Revista de
Administração de Empresas, v. 34, n. 3, p. 81-90, maio/ jun.
CALDAS, Miguel; TONELLI, Maria José; LACOMBE, Beatriz Maria Braga. (2002). Espelho, Espelho Meu: Meta-estudo da
Produção Científica em Recursos Humanos nos ENANPADs da Década de 90. Encontro dos Programas de Pós-
Graduação em Administração , XXVI Encontro dos Programas de Pós-Graduação em Administração, São Paulo:

417
Anpad
CALDAS, Miguel P.; TINOCO, Tatiana. (2004). Pesquisa em gestão de recursos humanos nos anos 1990: um estudo
bibliométrico. Revista de Administração de Empresas. vol.44, n.3, pp. 100-114.
CARDOSO, R. L.; MENDONÇA NETO, O. R.; RICCIO, E. L.; SAKATA, M. C. G. (2005). Pesquisa científica em contabilidade
entre 1990 e 2003. Revista de Administração de Empresas. São Paulo, v. 45, n. 2, p. 34-45, abr/jun.
CARRIERI, Alexandre P.; LUZ, Talita R. (1998). Paradigmas e metodologias: não existe pecado o lado debaixo do
equador. Encontro dos Programas de Pós-Graduação em Administração , XXII Encontro dos Programas de Pós-
Graduação em Administração, Foz do Iguaçu: Anpad
DAVEL, Eduardo; ALCADIPANI, Rafael. (2002). Estudos críticos em Administração: reflexões e constatações sobre
produção brasileira. Encontro de Estudos Organizacionais, Observatório da Realidade Organizacional: Recife:
ANPAD.
FARIAS, Salomão Alencar. (2010). Marketing Interno (MI): uma revisão da literatura e proposições de pesquisa para a
excelência nos serviços. Brazilian Business Review. Vitória, v. 7, n. 2, p.106-122, maio/ago.
FERREIRA, Norma Sandra de Almeida. (2002). As pesquisas denominadas “estado da arte”. Educação & Sociedade, ano
XXIII, no 79, Agosto.
GUEDES, Vânia; BORSCHIVER, Suzana. (2005). Bibliometria: uma ferramenta estatística para a gestão da informação e
do conhecimento, em sistemas de informação, de comunicação e de avaliação científic a e tecnológica.
Proceedings CINFORM - Encontro Nacional de Ciência da Informação, Salvador – Bahia.
GRÖNROOS, C. (2006). On defining marketing: Finding a new roadmap for marketing. Marketing Theory, v. 6(4), 395-
417.
INKOTTE, Alexandre Luz. (2000). Endomarketing: elementos para construção de um marco teórico. Universidade
Federal de Santa Catarina, Florianópolis.
KIRSHBAUM, Charles; PORTO, Elvio Corrêa; FERREIRA, Fernando Coelho Martins. (2004). Neo-Institucionalismo na
produção acadêmica em Administração. RAE-Eletrônica, v.3., n.1., art. 12, Mai./Jun.
KURTZ, David; CLOW, Kenneth e. (1996). Services Marketing. New York: John Wiley & Sons.
LOPES, Humberto Elias Garcia; BERNARDES, Patrícia. (2001). Ampliando a análise da produção científica em
administração: o indutivo versus o dedutivo. Economia & Gestão, v.1., n.2., Jul./Dez.
MACHADO-DA-SILVA, Clóvis L., CUNHA, Vera C., AMBONI, Nério. (1990). Organizações: o estado da arte da produção
acadêmica no Brasil. XIV Encontro dos Programas de Pós-Graduação em Administração , Florianópolis: Anpad.
MARTINS, Gilberto de Andrade. (1996). Epistemologia da pesquisa em Administração. XXXI Assembla Anual Conselho
Latino-Americano de Escolas de Administração , Santiago, Chile: CLADEA.
ÓRFÃO, Catarina. (2010). O efeito do Marketing Interno no envolvimento e comprometimento organizacional e a
influência destes na satisfação e desempenho individual – o caso do Banco Comercial Português S.A, Faculdade
de Economia da Universidade de Coimbra, Coimbra.
PAPASOLOMOU, Ioanna. (2006). Can internal marketing be implemented within bureaucratic organisations?
International Journal of Bank Marketing . v.24, n. 3, p.194-212.
PECI, Alketa; ALCADIPANI, Rafael. (2004). Demarcação científica: uma reflexão crítica. XXVIII Encontro dos Programas
de Pós-Graduação em Administração , Curitiba: Anpad.
PERIN, Marcelo Gattermann et al. (2000). A pesquisa survey em artigos de marketing nos ENANPADs da década de 90.
XXIV Encontro dos Programas de Pós-Graduação em Administração , Florianópolis: Anpad.
ROMANOWSKI, Joana Paulin; ENS, Romilda Teodora. (2006). As pesquisas denominadas do tipo “estado da arte” em
educação. Diálogo Educ., v.6., n.19., p.37-50, Set./Dez.
SOARES, M. B.; MACIEL, F. (2000). Alfabetização. Brasília: MEC/INEP/COMPED.
TEIXEIRA, Paulo Marcelo Marini; MEGID NETO, Jorge. (2006). Investigando a pesquisa educacional: um estudo
418
enfocando dissertações e teses sobre o ensino de Biologia no Brasil. Investigações em Ensino de Ciências, v.11.,
p. 261-282.
TONELLI, Maria José; CALDAS, Miguel P.; LACOMBE, Beatriz Maria Braga; TINOCO, Tatiana. (2003). Produção
acadêmica em Recursos Humanos no Brasil: 1991-2000. Revista de Administração de Empresas. São Paulo, v.
43, n. 1, jan/mar.
VAREY, Richard J.; LEWIS, Barbara R. (1999). A broadened conception of internal marketing. European Journal of
Marketing. v. 33, n. 9/10, p.926-944.
VERGARA, S. C.; CARVALHO JR., D. (1995). Nacionalidade dos autores referenciados na literatura brasileira sobre
organizações. Revista Brasileira de Administração Contemporânea , v. 1.
VERGARA, S. C.; PINTO, M. C. S. (2001). Referências teóricas em análise organizacional: um estudo das nacionalidades
dos autores referenciados na literatura brasileira. Revista de Administração Contemporânea , Curitiba, v. 5, n.
spe.
VIEIRA, Francisco G. D. (1998). Por quem os sinos dobram? Uma análise da publicação ci entífica na área de marketing
do Enanpad. XXII Encontro dos Programas de Pós-Graduação em Administração , Foz do Iguaçu: Anpad.

419
Consumer Behaviour, Consumption and
Symbolism: a theoretical development Consumer Behaviour, Symbolism, Experiential Aspects, Consumerism, Symbolic Value, Value in Use.
Danilo de Oliveira Sampaio, Federal University of Juiz de Fora, [email protected]
Marlusa Gosling, UFMG, [email protected]
Caissa Veloso e Sousa, Faculdade Novos Horizontes, [email protected]
André Francisco Alcântara Fagundes, Universidade Federal de Uberlândia, [email protected]
Gustavo Rodrigues Cunha, Faculdade Novos Horizontes, [email protected]
Abstract
Consumer behaviour is a multi and transdisciplinary concern with implications to individuals, organizations and
society, which has been investigated by researchers from several areas. Building up mainly in the marketing field since
1950’s, consumer behaviour has received contributions from many sciences, as anthropology, sociol ogy, economics,
philosophy, psychology, and, latterly, neuroscience. Departing from a theoretical approach, the current work aims to
present the study of consumer behaviour vis a vis its symbolic relation and integration between diverse areas of
knowledge. The conception of consumption has changed across time, based on both positive and negative aspects
explored by authors interested in tendencies as, for instance, the volatile consumption or with no purposes observed
often in the postmodern world (BAUMAN, 1997, 1999, 2001; FEATHERSTONE, 1995). Under this perspective, the
conception of power in terms of consumption relations, and the description of life styles, self -image and subject as
he/she would like to be viewed by society, lead the consumer to purchase more than a product or service, i.e., to
purchase a symbol, a representation of ideas and conceptions. In this sense, it is can be said that the individual, while
social being, belonging to a given reality, assumes different roles, inclusive that of consumer, in which the symbolic is
translated as power, and what he/she have and consume are attributes of inclusion in social groups.
1 Introduction and objective
In the last three decades aspects related to consumption of various goods and services, showed c hanges in
circumstances, which causes the analysis of its structure and motivational aspects in different contexts. In this sense,
there are some dual relationships that may be involved with the sense of consumption, such as the need or desire, to
quality of life, among others. However, it is worth noting that, despite the influence of circumstantial life "modern" or
postmodernism (Baudrillard, 2008; Bauman, 1997, 1999, 2001; Featherstone, 1995; Giddens, 2009; Simmel, 1998),
consumption cannot be divorced from the social and cultural relations as well as their implications in daily life.
Organizations, public or private, develop an important role in the constitution of the social dimension of consumption.
Organizations represent a complex role as influence of consumption. To Carrieri, Paula and Davel (2008), organizations
are the "products" of "social actors", i.e. the individuals that compose.
In this sense, individuals belonging to a particular organization identify with him, since they are in a space bounded by
organizational reality (GONZÁLEZ REY, 2003). This case, individuals as employees need to understand the internal and
external environment, so that they pose to identify with the policies of the Organization. A portion of this external
environment is constituted by consumers perceived to be beyond the rational perspective consumption. According to
Bourdieu (2003), the rational perspective of consumption is justified when it takes on different roles specifically for a
social group. According to the author, consumption represents a symbolic role, which can mean power and social
status.

420
Given its pervasiveness, the consumer behaviour is not restricted to one science, or a great field of science, specifically.
Foxall (1986) and Solomon (1998) highlight that the investigation of consumption behaviour is explored by
researchers from different sciences due its multidisciplinary and applicability in many individual and social contexts. In
fact, the theoretical development of consumption behaviour results from human and social sciences (e.g., Economics,
Anthropology, Sociology, Management, Philosophy and Psychology), medical sciences (mainly from recent studies in
the fields of Neuromarketing and Neuroeconomics) and exact sciences, which contributes with the development of
explicative model of consumption behaviour (ZALTMAN, 2003, MESQUITA, 2004; BRAIDOT, 2005; SOUSA 2007;
LINDSTROM, 2008; 2009; CARVALHO, 2009; SAMPAIO, 2012; DIAS, 2012; SOUSA, 2012).
In view of the necessity to confine such pervasive argument, it was chosen at the present work to focus on the symbolic
relations that permeate the process of consumption, from its idealization to its conception. Therefore, this theoretical
paper has as main objective to discuss the symbolism and its relationship with the consumer, based on existing
literature on consumer behaviour. Were approached themes as consumer behaviour and its relationship with
consumption, culture, style life and correlated aspects, under the perspective of symbolism.
Following this brief introduction, the rest of the document as organized as follows: theoretical review, conclusions,
limitations and final considerations. The findings are presented directly in the conclusions, due the theoretical nature of
the present work.
2 Literature Review
2.1 Consumption, Consumption Revolution and Symbolism
The individual, as consumer, accomplish changes with other individuals or organizations in order to satisfy their wishes
or necessities (LEVITT, 1960; HOWARD; SHETH, 1969; MCCARTHY, 1982; BAGOZZI et al., 2002). In accomplishing
these changes, the individual is faced with the social world, which would be analyzed from a symbolic perspective, since
ideologies present in the symbolic system make invisible its meaning, making it virtually imperceptible, although is
regarded and legitimated (RICOEUR, 1988; BOURDIEU, 2003).
In discussing about the investigation of consumption in the contemporary social sciences Barbosa and Campbell (2006)
state that consumption, under exhaustion perspective, does not regard just material resources, but also those physical
and emotional related to the consumption of the individual. Thus, the authors assume consumption as more negative
than positive, and, moreover, that it results in the contemporary societies from the work, whi ch constitutes the source
of creativity and identity, and that brings value to the individual.
From a etymological point of view, consumption derive from the Latin consumere, that means to use fully, to exhaust, to
destroy; and from the English term consummation, that means to sum, to add. In the Brazilian context, the mean of
consumption is near of the negative first perspective, while consummation, referring to sexual act, remained with the
positive sense of realization and climax (BARBOSA; CAMPBELL, 2006).
Historically, the consumption has contributed to substantial social changes and to the development of the social
sciences, mainly from the XVII century (McCRACKEN, 2003). Notwithstanding this relevance, McCracken (2003)
observes that the academy did not give enough attention to consumption development, since the theoretical focus
remained essentially on legal, economical and sectorial analysis. In this sense, it can be said that consumption history is
still recent, and, likely, pre-paradigmatic (KUHN, 1987).
McKendrick et al. (1982) points out the blooming of consumption revolution in the XVIII century, in England, when
consumption was viewed as necessary problem, and nobles purchase for luxury and poor people for survival. Mukerji
(1983) observes that the revolution began indeed in the England, however earlier, in the XV and XVI centuries. XVI.
Diversely, Williams (1982) states that the revolution began, in fact, in the XIX century, in France. Notwithstanding this
lack of agreement on where and when have begun consumption revolution, there is a clear common sense about its
influence on social changes, and the importance of its analysis in order to understand modern consumption.
Adopting a more delineated historical perspective on consumption revolution was chosen to follow what McCracken
(2003, p. 30) defines the “three moments of consumption history: (1) Boom of consumption in England, XVII century;
(2) Consumption in the XVIII century; and, (3) Consumption in the XIX century”.
In the consumption relationships of the XVII century in the England, according to McCracken (2003), the British

421
nobleness consumed in overkill, in the dinners, clothing, residences, motivated mainly by the Queen Elizabeth I, which
smiled just to those that demonstrated loyalty through the transference of resources. Beyond the expenses in
ceremonials with the royalty, the British nobleness had to show an excessive consumption in their travels to the court
with the objective to keep the status quo. Thus the intention of the nobleness was to consume, even if that would make
indebted.
Corroborating with this setting of excessive consumption, the consumerism is a relevant factor since the XV century,
being still more exacerbated nowadays. The influence of the means of mass communication and oriented medias has
contributed to the dissemination of messages to different audiences, from children and teenagers, to youths and
pensioners, which see themselves in real conditions to have goods before beyond their possibilities, as electronic s, cars,
and even a house by mean of governmental programs of funding (LIMEIRA, 2008; OLIVEIRA, 2008). The consumption
segmentation, however, it occurred with more emphasis with the incoming and strengthening of the capitalist
economic system in the centuries XVIII and XIX (POLANYI, 1957).
In the century XVII the consumerism was viewed predominantly in the dominant classes. The fundamental was
flaunting luxury, while the work remained to the lower classes.
"The goal of this new expenditure pattern was to the court, in the words of Braudel (1973, p. 307)," a kind of parade
of theatrical show ... and with lust, a means of governing. Confronted by extraordinary difficulties inside and outside
the kingdom, Elizabeth explored the hegemonic power of expressive things that was used by the British rulers ever
since. The objects, especially in the context of a highly ceremonial cutting, may lend itself to communicate the
legitimacy of the monarch to rule, aspirations for the government, qualities of power and majesty , and finally a
divine status as an individual is seen increasingly in terms mythical, religious and literary. The symbolism of the
supercharged cutting monarchical, hospitality and clothing became the opportunity for persuasion and education
policies" (McCRACKEN, 2003, p. 30-31).
(Translated by the authors of the original)
McCracken (2003) points out still a social competition between the nobles, which were before habituated to consume
familiar goods able to reinforce familiar image (buildings and furnishings), and found themselves forced to consumer
modern goods as symbol of status and power, becoming, thus, slaves of the consumption. In this sense, the
consumption altered, making the individual instead to the family. Campbell (1983) indicates the consumption turned to
a romantic definition of self. Thus, the individual is viewed as consumer, and not just as that member consuming what
the family wants to hold.
The transformation of consumption becomes evident in the eighteenth century, in which McKendrick et al. (1982)
highlight the birth of the consumer society, thus beginning the modern consumer culture. Consumption was seen as a
possible vertical rise of social and economic class (SIMMEL, 1904; VEBLEN, 1912). To these authors, the consumption
and the culture in the occident were intrinsically linked. McKendrick et al. (1982) observed in this context a
development of marketing, due to the awakening of the individualized consumption since the small nobleness, where
the mode was adjusted and interpreted for the bottom classes, with symbolical inspiration in the high nobleness.
The mode magazines, scotch hawkers and the London retail market stimulated the access to new products and
information to the provinces (McKENDRICK et al., 1982). In this sense, it is observed yet the link between consumer
behaviour and symbolism, in which the burghers from the provinces dressed as the nobles from the big cities, what
conferred to them status, glamour and power. The larger number of people in conditions to consume was also one of
the reasons to the larger consumption in the century XVIII, when arose the expression mass consumption. McCracken
(2003) highlights changings in the century XVIII in the symbolic properties of consumption goods, which assumed
meanings of social mobility. The consumption good becomes, thus, at this time, an object of mode, which in its turn
migrated to the category of design. The more an individual hold fashion consumption good, the more he would
appertain to higher social classes.
Society and consumption found themselves interlinked in the century XIX (McCRACKEN, 2003). The consumption boom
gives place to a dynamic relationship, where a social change implies in consumption changings and vice-versa. The
modern consumption occurs in different types of arenas, under diverse styles of consumption derived from life styles of
individuals. Williams (1982) presents this transformation of consumption in France, where the consumption has
migrated from nobleness to public places, when tailors that attends just nobles open their stores in public
environments, similar to chefs, which open their restaurants in the cities.
The media explored persuasive and informative stimulus, what provoked, according to Williams (1982), a whish of

422
participation and not just of a brief purchase of goods. The author focus especially to the department stores in France,
which invite the consumers to a new standard of interaction, that includes the introduction of credit through that the
consumer could buy the good in instalments, something before impossible, accomplishing a true dream of consumption.
To McCracken (2003) another important factor in the century XIX was that sold goods by department stores given
material expression. According to the author, a department store became a physical locus and an institutional home, in
line with Durkheim’s (2000) statement that the society brings the individuals to a place before unimaginable, including
in extremely situations, to the suicide. In the case of modern consumption, under the view of the present paper, the
place referred by Durkheim (2000) can be interpreted as department stores and shopping, truly apotheosis of the
consumption. In this sense to affirm I buy, therefore I am (socially), is something understandable from the point of view
according Durkheim (2000).
From the half of the century XX, the post-modernity followed the discourse of overtaking the modernity, due to
technological changes accrued with the globalization of markets and ideas, which led societies as a whole to rethink. In
this sense, to Bauman (1999, 2001) the reality becomes, so, ambiguous. The individual becomes autonomous and free
in a fragmented society and in the consequent fragmentation of consumption. It emerges a new retail, the virtual,
electronic retail. The anthropology of consumption to allows an enlargement of the concept of values connection or link
value. In studies of consumption behaviour, the quantitative positivist methodology cedes space to contribution from
sociological and anthropological studies, especially to ethnography (COVA, 1997).
2.1 Symbolism and the Relationships with Daily Life and the Culture of Consumption
The “symbol” nowadays can configure something legitimate with to a feeling, act or even a product. The several
campaigns of sportive products employ diverse symbols, as brands and athletes to divulge goods and services to
consumers.
The cult to the consumption can be exemplified in the feature film “Goodbye Lênin”, directed by Wolfgang Becker. At
one point in that East Germany was unified with the hand saw West is interesting to note the narrative: "the market
turned the corner paradise consumer, where the consumer is king." In the film, socialism cannot impose consumer
capitalism.
The consumption symbolizes power, and as such, is theme as in the post-structuralism (Bourdieu, 1974; Foucault,
2006) as in the modernism and post-modernism (COOPER; BURRELL, 1988). In the post-modernism the devices of
power become the consumption. At this point, consumer behaviour is complex. The goods are destined, for instance, to
smaller families, single mothers, or families with just one child. The marketing segmentation approaches the post-
modern consumption (or modern, or still, neo-modern) with redoubled attention, since that the individual is
fragmented and independent, and at same time, consumer of symbols which refer sophistication.
Augras (1967, p. 3) simplifies the conception of a symbol as something that represents other. To the authoress, the
relationship between the object and the symbol is abstract, unreal, but, serves to allow the adaptation of the men to the
reality. To the marketing, the reality of the day to day in terms of consumer behaviour is almost an unarguable idealism.
The attempt to understand the day to day of consumer can bring some advantages in comparison with others
marketing strategies. Thus, it is important to know more about the individuals’ reality, and in order to do that, is must
be regarded not just the individual, but the society where him is inserted.
According Berger and Luckmann (2002) the reality of everyday life is organized around my body here and now my
present. There are other phenomena that interact with reality, as the world and the work around the individual, which
share with others his daily life. Is necessary to study not just the individual as consumer, but also to how this lives in the
society. In this context, the cultural dimension is a key factor.
McCracken (2003) think that the culture constitutes the phenomena world in terms of two concepts: cultural categories
(the differences employed in a culture to divide the world of phenomena; and cultural principles (basic premises which
allow that all cultural phenomena are distinguishable and inter-related). McCracken (2003) complements arguing that
the cultural meaning is absorbed from the world culturally constituted and transferred to consumption good, and this
fact, being such good in fact an object transferred to a consumer. The author highlight that this transference of meaning
as far as the final consumer occurs by publicity means and by product’s project.
At this moment, the symbolism becomes fundamental to publicist comprehension about what can approximate a

423
product of consumer expectation. Thus, the symbolic role must be able to verify what is the best environment to
develop the advertisement (urban, rural, executive), what (s) the genre (s) which have to be regarded, age, social class,
and other aspects that configure the symbolic space concerning the consumer.
According to Bourdieu (1974, p. 142) the market of symbolic goods is that more or less unified second the social
standards and dominated by the rules of the dominant market under the perspective of legitimacy . In this case, the
legitimacy refers to follow a legitimate culture, such as that experienced by the consumer. The social space (1974) is as
a field of forces where the social agents are defined for their relative positions. The questions related to physical space
are views by the author as social representations of several social groups, being such representations constituted by
differences in social positions, in the habitus and choices of the agents.
In general, the social space involves the set of distinct and coexistent positions (BOURDIEU, 1974, p. 18). Differentiated
positions are function of economic and social capital, and each class of positions correspond to a class of habitus.
According the author, habitus would be the mediation between structure and practice. Each individual experiences his
experiences second his position in the social structures, constituting an unconscious mode of future orientation of the
subject actions. Through of the habitus, the past survives in the actual moment and tends to subsists in the individual
future actions, a process called by Bourdieu (1974) as interiorization of the external and exteriorization of the internal.
Bourdieu (1974, p. 190) comments on habitus socially constituted, as being that which the consumer feel himself
ideologically inserted due to characteristics of group of agents. So, there are specific behaviours of teenagers when
they are together in a shopping mall speaking about some argument of interest. In this habitus, it is possible to verify
gestures, expressions, languages and other factors that can serve as characteristics which could compose the symbolic
space of this kind of consumer. The habitus has the function to attach the practices, the individuals and their goods,
associating the position with a unique life style of a determined class. The brands of the social position which the
individual occupies, the symbols, beliefs and preferences being incorporated, become portion of the nature of the
consumer, that is, a habitus.
According Slater (2002), the culture of the modern consumption derives from the individualism and f rom market
relations. In this sense, Slater (2002, p. 18) observes that the consumption culture is related to the modernism or post-
modernism, since the consumption culture is not a late consequence of industrial modernization and cultural modernity,
but, in fact, part of the own construction of the modern world. In this sense, the consumer and the act to consume
appertain to a constructed reality, in which there are symbolic and economic changes, where goods produced by
organizations and institutions are acquired by individuals in their daily life.
In discussing about theories on culture and consumption, Featherstone (1995, p. 31) identifies three perspectives: (1)
conception of consumption culture as a premise of the expansion of the capitalist production of goods (Marcuse, 1964;
Lefebvre, 1971; Lukács, 1971; Horkheimer; Adorno, 1983); (2) social conception in which the individuals use goods in
order to create ties or to establish social distinctions (Leiss, 1978; Douglas e Isherwood, 1980; Hirshman, 1982;
Bourdieu, 1984); and (3) conception of the emotional pleasures of consumption, where the cultural consumerist ideal
produces physical excitation and esthetical pleasures (SIMMEL, 1978; BENJAMIN, 1982; BAILEY, 1986; URRY, 1988;
ZUKIN, 1988).
Featherstone (1995) presented an evolution of the culture of consumption showing the shift from the economic culture
to that of social relationships, as far as the relation of consumption culture by means of dreams, images and pleasures.
The symbolism is seen as part of consumer culture, passing by the processes of life style, marketing and design.
Based on the north-American consumption, cradle of the capitalist consumption, Limeira (2008) cites four processes
that contributed to the development of the society of consumption: (1) industrial production; (2) mass distribution; (3)
credit availability; and (4) overhead consumption of industrialized products. The authoress reinforces in commenting
that actually the majority of the population consumes above its basic needs, and that consumption practices are socially
accepted as source of satisfaction and pleasure. The identity of the modern individual is constructed with basis on the
life styles defined by consumption.
The consumption as a social process represents how the people must live and how the society is or should be
organized. The consumption is allied with the symbolic structure of the daily life, thus, it is not possible to deny the link
between society of consumption and modernity (SLATER, 2002). According to the author the symbolism earlier
propagated by mean of publicity and communication mass, begins to be treated with more sophistication, passing over
the use of the design, marketing, and arriving to the individual in department stores or even in his residence.

424
2.2 Consumer Behaviour, Symbolism and Post-Modernism
According Mowen and Minor (2003, p. 3) consumer behaviour can be defined as the study of purchaser unities and the
processes of change involved in acquisition, consumption, and goods’ availability, services , experiences and ideas. In
this conception it is can be noted yet the presence of a word that is also common to the meaning of symbolism in
relation to the consumption goods: change. This change goes beyond the economic sense of the word. The change is
also disclosed in terms of value, meaning and satisfaction.
According Wilkie (1994, p. 14), consumer behaviour is the set of mental, emotional and physical activities, in which the
people attend in selecting, buying, using, and disposing products and services in order to satisfy necessities and wishes.
In referring to emotional and mental activities, and to cite satisfaction and wishes, the author approaches the consumer
behaviour definition with that of symbolism, being that both of conceptions bring meanings of power to the individual.
The consumer behaviour area is supported by models and conceptions that permeate the objective and the subjective,
the quantitative and the qualitative, and it can be analysed through of mathematical model, with the o bjective to
respond specific questions, be through explicative models analysing the reasons involved in consumer’s decision
making process. The mainly explicative models are those of Engel, Blackwell e Miniard (2000), the model of Howard-
Sheth (1969) and that of Sheth, Mittal e Newman (2001).
The model proposed by Howard e Sheth (1969), presents five main relations: (1) stimuli (marketing, symbolical,
social); (2) perceptual schemas (attention and perceptual bias); (3) learning schemas (motives, attitudes , intention; (4)
purchase; and (5) satisfaction. The authors state the symbolical and social stimuli as primary cognitive activities of
consumer behaviour, which starting to the decision making process of purchase. In the marketing field, the symbolism
is viewed as an emotional element associated to the product, which brings an effective contribution to the brand.
Sheth, Mittal and Newman (2001) enlarge the consumer behaviour scope in observing that the organizations must
search for value creation to the consumer through the management of loyalty and notoriety to the brand. Here, it is
observed the sign as being the brand, which brings as change symbolical value what itself represents to the consumer.
In this context, the brand has the sense of intangible values to the consumer.
To Engel et al. (2000), the intangible values can be represented of social values or individuals that influence the
purchase and the consumption, according to the Berger e Luckmann’s (2002) conception of sharing individual's social.
The consumption is viewed by scholars in the area of consumer behaviour as something which can be harmful to the
individual, especially in cases of incentive in to consume products as cigarettes and alcoholic drinks, which are risky to
the health (HAWKINS et al., 2007). To the authors, the excessive consumption of superfluous goods and services can
damage the saving, which, in the case of old people, helps with the expenditures of health treatments and complements
retirement stipends. In this context, the consumption can be viewed as something maleficent to the society.
According to Hawkins et al. (2007) the nature of consumer behaviour involves the auto-image and life style, being these
influenced by internal and external variables, resulting in a decision making process which characterizes specific
situations. The symbolism is present be in external aspects as culture, status social and marketing strategies, be in
internal aspects, as attitudes and emotions.
The consumer behaviour, according to Hawkins et al. (2007), denotes a rational mental model of the individual
concerted with a psychological and social model, however, in this work it is regarded also a broader perspective among
individuals, society, organizations and consumption. In other way, to Sheth, Mittal e Newman (2001) e Howard e Sheth
(1969), the organizations as institutions appurtenant to society, observe the individual as that which wants not just his
needs, but also his feelings, expectancies and relationships with reference groups, that is, Family, friends and co-
workers. The way how the communication between organization and the individual as consumer, occurs by means of
symbolical and economical changes. The marketing appeal employed as a mean of contact between organization and
consumer occurs by the use of the language and brands, which express justly the expectancies and feelings of the
individual (Figure 1).

425
Figure 1 – Relationship among individual, society, organization and consumption
Source: Elaborated by the authors based on Sheth, Mittal and Newman (2001), Howard e and Sheth (1969) and Bourdieu (1974).
Rocha (1995) observes that in the field of anthropology, the cultural industry is a social fact, since that the message
produced by it is understood by society. The dream is transferred to the society by mean of the publicity which explores
the symbols and sign, as in the case of the exploitation of the brands through the means of communication. In the view
more specific of consumer behaviour, the social dimension is understood when the individuals are segmented in social
classes. The consumers associate the brand with specific social classes (ENGEL et al., 1995). In this sense, it can be
inferred that the habitus socially constructed, as referred by Bourdieu (1974), is something acknowledge in the
marketing view.
In the field of marketing the individuals search and purchase products, becoming consumers, since them are looking for
some meaning to that choice. Thus, a genuine Louis Vuitton bag is viewed as a sign which transfer the symbolical value
to a more capitalized class, and a replica of the same bag, is viewed by other social class less privileged as also symbolic
sign. In this example, what is important to highlight is the search for meaning, which in the case is the meaning of
“status and power”, that is, both classes hold a Louis Vuitton bag.
To Levy (1959) the consumer acquires in fact symbols but not just a product or service. According to the author, the
symbolic value is evaluated by the consumer for that what it represents. In the case of services, the consumer
perception is differentiated in comparison to tangible goods, because these are make tangibles by services rendered in
itself, as well as for that what the publicity of services informs the consumer.
The managers must regard the cultural symbols in order to better understand the consumer behaviour. To Mowen and
Minor (2003, p. 306) symbols are entities that represent ideas and concepts, which are able to communicate meanings
in a more rapid and effortless way. The authors highlight that products and services are consumed due its symbolic
values, as in the automotive industry, which communicates symbolic values to automobiles as synonym of security
(Volvo), design (Fiat), cost X benefit (Tata), status (Mercedes), strength (Volkswagen), velocity, status and privilege
(Ferrari), among others. In all of these examples the communication with the Market involves the symbolism, be in the
brand, slogan, personage, or publicity.
In the post-modernism, the analysis of consumer behaviour becomes fundamental in order to better understand how
occurs the individual independence of the consumer, which is characterized by unpredictability. However, the
consumer behaviour does not support of its own accord to understand this individual. Oliveira (2008) reinforces the
post-modern discourse of Cova (1997), stating that consumer choices are based in the capacity of the products and
services to give support to the social interactions which permeate the formation and maintenance of communities with
specific meanings. The post-modernity brought changes in the consumption, passing from the emphasis given to the
value of use to the value of connection, this last more and more plural and complex.
The individual postmodern quickly adapts to the environment, realizing a great amount of interactions over time. The
individual postmodern quickly adapts to the environment, realizing a great amount of interactions over time. However,
postmodernism is not well accepted by some theoretical marketing, such as Hunt (2002). The author sees
postmodernism as normative, not scientific, and not palpable. There is a consensus among scholars that
postmodernism is indeed something so spectacular, beyond the modern and revolutionary.
Individual
SOCIETY
ORGANIZATION
Use of the language
and brands
Relationships
Feelings
Expectancies
Local Social Group (Family, friends, work)
Consumption by means of symbolical and
economical changes.
HABITUS

426
Even with the criticism of postmodernism, some of his contributions are for the manager in organizations perceives the
consumer as a complex individual who has several interactions and that is changing in terms of choices. That is, the
individual consumes itself but can also be induced consumption. Even with research about consumer behaviour, there
is no single model or an opinion to prevail or answer how and why people consume. There are explanatory models,
specific and tested, however, cannot answer any questions about the use and symbolism that lead people to buy.
3 Considerations and Contributions
In this paper, we have analysed the study of consumer behaviour and its symbolic relation and integration between
diverse areas of knowledge, in specific, its relationship with consumption.
Are we what we consume? In this article was seen that the consumer has a reasonable influence of social relationships.
In this respect, the professional of consumer behaviour needs to work hard to further research the internal
relationships of social groups.
Many of consumers who belong to the disadvantaged social classes, working excessively to meet the desire to buy
products such as Nike, Pierre Cardin, Ferrari, Sony and others. These consumers can now have access to social groups
of more privileged classes. Organizations are studying these emerging consumers?
Despite this theoretical paper addressing a topic not very common in studies of consumer behaviour, after perusal of
the authors cited in this study, it is possible to see an approximation of the thoughts of sociology in order to better
understand the relationship between the individual, society and consumption.
The individual as a social actor takes on different roles in a particular reality. The symbolic value is translated as power.
The consumer is accepted by society because of who owns and uses. Buy and use a product that has a prestigious brand
in terms of status and luxury means to belong to a social space, thus having the opportunity to relationships with other
people who are in higher social classes.
In this paper becomes visible social belonging originated in the possibility and the act of consumption. Campbell (1983)
and Barbosa and Campbell (2006) corroborate the consumer society, to address us about modern consumerism.
Another finding of this study was to discussion revealed the importance of society towards individuals. The society in
its mystical paths zooms in and out individuals when it comes to the issue of consumption. It was found in this research
that consumerism is studied in different sciences, however, sociology stood out as the science that most closely matches
the theme of consumption, and therefore the research of consumer behaviour.
As a consumer, the individual carries out your wishes according to the symbolic power that is passed through the
marketing communication and semiotics, using signs. It was observed by the researchers used in this paper that
consumer behaviour, with the influence of the sociology, provides data and information that enable managers to make
decisions more arguments about product launches and consumer trends
Another contribution given by this article reveals that interest in the consumption of material goods has led to the
consumption of representations in contemporary society. The l ifestyle of characters found in television programs,
novels, movies and commercials alienate people and format a consumption-based "hyper-reality in the society of the
spectacle" as Baudrillard says (1968, 1981).
Added to this context the postmodern culture, which is represented by the signs, confirming the dematerialisation of
products. The products beyond the tangible represent attitudes and dreams.
The participation of individuals in social groups that share common symbolic universes as pointed out by B erger and
Luckmann (2002) takes us to a vision of postmodern consumption, in which the "tribes" while new forms of groups are
targeted segments of research marketing.
4 Suggestions for Future Research and Limitations
In terms of recommendations for future studies, it is suggested that this work encourages others theoretical and
empirical researches, enabling new research.
Develop studies with groups of same behaviours of consumptions would be interesting, because the results of the

427
observation about these groups will show important information to the marketing team. Develop a job using case
studies of companies that have prestigious and famous brands with consumer focus of these brands can bring
hypotheses and interesting statistics, which can point out similarities with this theoretical article.
Limitations of this study point to a specific number of researchers and scholar’s consumption. This essay is to awaken a
thematic principle, the theme "symbolism / consumption" is not exhausted. Because these paper an essay and not a
ready answer, the reader is invited to broaden the debates and discussions about consumer behaviour and
consumption before the symbolic value: are managers prepared to understand this relationship and to develop
effective marketing strategies to attend to consumers? Perhaps this is the best message or contribution to this test be
used by managers in their marketing strategies possible!
Acknowledgement
The authors would like to thank the Federal University of Juiz de Fora/Faculty of Administration and Accounting, the
Federal University of Uberlândia and the Novos Horizontes Faculty, in Brazil, which supported this research. We are
grateful to anonymous review for your suggestions and comments.
References
AUGRAS, M. (1967). A dimensão simbólica. Rio de Janeiro: FGV, 1967.
BAGOZZI, R. P.; GÜRHAN-CANLI, Z.; PRIESTER, J. R. (2002). The social psychology of consumer behaviour. Open
University Press: Buckingham, Philadelphia.
BARBOSA, L.; CAMPBELL, C. (2006). Cultura, consumo e identidade. Rio de Janeiro: FGV.
BAILEY, P. (1986). Music hall: the business of pleasure. Milton Keynes: Open University Press.
BAUDRILLARD, J. (1968). Le système des objets: la consummation des signes. Paris: Denoel-Gonthier.
___________________. (1981). For a critique of the political economy of the sign. St. Louis: Telos, 1981.
___________________. (2008). A sociedade de consumo. 2. ed., Lisboa, Portugal: Edições 70 LDA.
BAUMAN, Z. (1997). A sociological theory of postmodernity. European Journal of Marketing, vol. 31, n 3, 4.
_______________________. (1999). Modernidade e ambivalência. Rio de Janeiro: Zahar.
_______________________. (2001). Modernidade líquida. Rio de Janeiro: Zahar.
BENJAMIN, W. (1982). Das passagen-werk. Frankfurt: Suhrkamp.
BERGER, P. L.; LUCKMANN, T. (2002). A construção social da realidade: tratado de sociologia do conhecimento.
Petrópolis: Vozes.
BOURDIEU, P. (1974). A economia das trocas simbólicas. São Paulo: Perspectiva.
BOURDIEU, P. (1984). Distinction: a social critique of the judgment of taste. Londres: Routledge & Kegan Paul.
BRAIDOT, N. P. (2005). Neuromarketing: neuroeconomia y negocios. Madrid: puertoNorte-SUR.
CAMPBELL, C. (1983). Romanticism and the consumer ethic: intimations of a Weber style Thesis. Sociological Analysis,
v. 44, n. 4.
CARRIERI, A. P.; PAULA, A. P. P.; DAVEL, E. (2008). Identidade nas Organizações: Múltipla? Fluída? Autônoma? Revista
Organizações & Sociedade (O&S), v. 15 .
CARVALHO, J. E. (2009). Neuroeconomia: ensaio sobre a sociobiologia do comportamento. Lisboa:
Europress.
COOPER, R.; BURRELL, B. (1988). Modernism, post modernism and organizational analysis: an introduction.
Organization Studies, n. 9.

428
COVA, B. (1997). Community and consumption: towards a definition of the linking value of products or services .
European Journal of Marketing, v. 31, nº 3/4.
COVA, B.; COVA, V. (2002). Tribal Marketing: the tribalisation of society and its impact on the conduct of
marketing. European Journal of Marketing, v. 36, n 5/6.
DOUGLAS, M.; ISHERWOOD, B. (1980). The world of goods. Harmondsworth: Penguin.
DURKHEIM, E. (2000). O suicídio: estudo de sociologia. São Paulo: Martins Fontes.
ENGEL, J. F.; BLACKWELL, R. D.; MINIARD, P. W. (1995). Consumer behaviour. Fort Worth: The Dryden Press.
FEATHERSTONE, M. (1995). Cultura do consumo e pós-modernismo. São Paulo: Studio Nobel.
FOUCAULT, M. (2006). Microfísica do poder. 22. ed. Rio de Janeiro: Grall.
FOXALL, G. R. (1986). Consumer theory: some contributions of a behavioural analysis of choice. Management
Bibliographies and Reviews, v. 12.
GIDDENS, A. (2009). A constituição da sociedade. 3. ed. São Paulo: WMF Martins Fontes.
GONZÁLEZ REY, F. L. (2003). Sujeito e subjetividade: uma aproximação histórico-cultural. São Paulo: Pioneira Thomson
Learning.
HAWKINS, D. L.; MONTHERSBAUGH, D. L.; BEST, R. J. (2007). Comportamento do consumidor: construindo a estratégia
de marketing. Rio de Janeiro: Elsevier.
HIRSHMAN, A. O. (1982). Shifting involvements. Oxford: Basil Blackwell.
HORKHEIMER, M.; ADORNO, T. M. (1983). Dialética do esclarecimento. Rio de Janeiro: Zahar.
HOWARD, J.; SHETH, J. (1969). The theory of buyer behaviour. New York: John Wiley & Sons Ltd.
HUNT, S. D. (2002). Foundations of marketing theory: towards a general theory of marketing. Nova York: Sharpe.
KUHN, T. S. (1987). A estrutura das revoluções científicas. São Paulo: Perspectiva.
LEFEBVRE, H. (1971). Everyday life in the modern world. Londres: Allen Lane.
LEISS, W. (1978). The limits to satisfaction. Londres: Marion Boyars.
LEVITT, T. Marketing myopia. (1960). Harvard Business Review, v. 38, jul-aug.
LEVY, S. J. Symbols for sale. (1959). Harvard Business Review, v. 4, Jul.
LIMEIRA, T. M. V. (2008). Comportamento do consumidor brasileiro. São Paulo: Saraiva.
LINDSTROM, M. (2008). Buy.Ology: how everything we believe about why we buy is wrong. London:
Random House Business Books.
______________. (2009). A Lógica do Consumo: verdades e mentiras sobre por que compramos. Rio de
Janeiro: Nova Fronteira.
LUKÁCS, G. (1971). History and class consciousness. Londres: Merlin Press.
MARCUSE, H. (1964). One dimensional man. Londres: Routledge & Kegan Paul.
McCARTHY, E. J. (1982). Essentials of marketing. Irwin: Homewood, Illinois.
McCRACKEN, G. (2003). Cultura e simbolismo: novas abordagens ao caráter simbólico dos bens e das atividades de
consumo. Rio de Janeiro: Mauad Editora.
___________________. (2007). Cultura e consumo: uma explicação teórica da estrutura e do movimento do significado
cultural dos bens de consumo. RAE - Revista de Administração de Empresas, v. 47 , n.1 jan./mar.
McKENDRICK, N.; BREWER, J.; PLUMB, J. H. (1982). The birth of a consumer society: the commercialization of
eighteenth- century England. Bloomington: Indiana University Press.
MENECHETTI, F. K. (2009). O que é um Ensaio-Teórico? In: II EnEPQ, Encontro de Ensino e Pesquisa em Administração

429
e Contabilidade, 2, 2009, Curitiba. Anais... Curitiba: Anpad.
MESQUITA, J. M. C. (2004). Atributos Explicativos da Intenção de Recompra em Supermercados. Tese (Doutorado).
Universidade Federal de Minas Gerais. Centro de Pós-Graduação e Pesquisa em Administração.
MOWEN, J. C.; MINOR, M. S. (2003). Comportamento do consumidor. São Paulo: Prentice Hall.
MUKERJI, C. (1983). Form graven images: patterns of modern materialism. Nova Iorque: Columbia University Press.
OLIVEIRA, S. A. L. (2008). O homem e o shopping: um estudo de caso sobre o significado de ir ao shopping, Dissertação
(Mestrado) – Centro de Pós-Graduação e Pesquisas em Administração da Universidade Federal de Minas
Gerais, Belo Horizonte.
POLANYI, K. (1957). The great transformation: the political and economic origins of our time. Boston: Beacon Press.
RICOEUR, P. (1988). Interpretação e ideologias. Rio de Janeiro: F. Alves.
ROCHA, E. (1995). Sociedade do sonho: comunicação, cultura e consumo. Rio de Janeiro: Mauad Editora.
SAMPAIO, D. O. (2012). Intenção de compra e consumo de alimento orgânico no varejo: um estudo sobre as crenças,
atributos e grupos de referência. Tese (doutorado). Universidade Federal de Minas Gerais. Centro de Pós -
Graduação e Pesquisa em Administração.
SIMMEL, G. Fashion. (1904). International Quarterly, v. 10.
_____________ . (1978). The philosophy of Money. Londres: Routledge & Kegan Paul.
_____________. (1998). Conceito e tragédia da cultura. In: SOUZA, J OELZE, B. (org.) Simmel e a
modernidade. Brasília, Editora UNB.
SHETH, N. J.; MITTAL B.; NEWMAN, B. I. (2001). Comportamento do cliente: indo além do comportamento do
consumidor. São Paulo: Altas.
SLATER, D. (2002). Cultura do consumo & modernidade. São Paulo: Nobel.
SOLOMON, M. R. (1998). Consumer behaviour: buying, having and being. (4 th. ed.). New Jersey: Prentice Hall.
SOUSA, C. V. (2012). Neurociências e Marketing: explorando fronteiras diádicas e integrando metodologias para a
compreensão do comportamento do consumidor. Tese (doutorado). Universidade Federal de Minas Gerais.
Centro de Pós-Graduação e Pesquisa em Administração.
URRY, J. (1988). Cultural change and contemporary Holiday-making. In: Theory, culture & society, 5(1).
VEBLEN, T. (1912). The theory of the Leisure Class. Nova Iorque: McMillan.
WILKIE, W. L. (1994). Consumer behaviour. (3 th. ed.). New York: Wiley & Sons.
WILLIAMS, R. H. (1982). Dream worlds: mass consumption in late nineteenth century France. Berkeley: University of
California Press.
ZALTMAN, G. (2003). Afinal, o que os clientes querem? O que os consumidores não contam e os
concorrentes não sabem? 2. ed. Rio de Janeiro: Elsevier, 2003.
ZUKIN, S. (1988). Loft living. (2 th. ed.). London: Hutchinson Radius.

430
Social Support Expectations from Health Care
Systems- Antecedents and Emotions Emotion, Social Support, Social System, Healthcare System.
Aruna Mesquita e Noronha, S.S. Dempo College of Commerce & Economics , [email protected]
Nandakumar Mekoth, Department of Management Studies, Goa University, [email protected]
Abstract
Objectives: The paper addresses social support expectations of consumers during negative emotional experiences. It
attempts (a) to highlight the factors that lead to the expectation of social support from health care systems; (b)to study
the role of negative consumer emotions in the expectation of social support from health care systems. ‘Emotion’ is
posited as a key influencing factor behind the need for emotional, instrumental and informational support from ‘people’
involved in providing health care services.
Methodology: Literature review briefly points to the influence of negative emotions on customer satisfaction levels
which depend on meeting customer expectations. Depth interviews of customers of health care services have been
conducted to arrive at hypotheses for developing a conceptual model of customer expectations of social support from
health care systems.
Conclusion: Negative symptoms and negative emotions are found to be positively related to the expected social
support from health care systems, with negative emotions also partially mediating the positive relationship between
negative symptoms and expected social support from health care systems. Negative emotions are also found to
moderate the negative relationship between perceived social support from social systems and expected social support
from health care systems.
Implications: The relevance of the study of emotion change through social support during times of illness, and its
impact on consumer behavioural intentions is discussed.
Originality: This research attempts to integrate previous research in customer expectations and social support within
the purview of health care. Consumer emotions are explored as determinants of social support needs, during illness.
1. Background
Studies on consumer satisfaction have often been linked to the meeting of consumer expectation (Russ, 2006; Zeithaml,
Bitner, Gremler, & Pandit, 2011). Successful organisations constantly strive to achieve competitive advantage by
delivering according to consumer expectations (Russ, 2006). However, the study of emotions within the context of
customer expectations in health care services requires some attention, as consumer emotions influence their
perception of satisfaction with services. Negative emotions lead to low levels of customer satisfaction or high levels of
dissatisfaction (Zeithaml, Bitner, Gremler, & Pandit, 2011).
Individuals experience a surge of negative emotions during times of illness, prior to the consumption of health care
services. During such situations, it is presumed that consumers of health care systems expect social support from the
persons involved in providing such service so as to help them cope with their situation.
Emotion
Several scholars have attempted to understand and define the term ‘Emotion’. It has been described as something more
than a state of feeling, caused by stimulus events which affect every person differently (Izard, 1977; Parrott, 2001;

431
Plutchik, 2001). Emotions are states of feelings experienced at different points of time depending on the stimulus that
triggers those feelings. We often tend to describe emotions using terms and expressions that describe the degree or
extent to which we experience those feelings.
Emotions have also been grouped into different categories viz; basic or primary, secondary, tertiary, which include
anger, contempt, disgust, distress, fear, guilt, interest, joy, shame, surprise, acceptance, anticipation, sadness, and love
(Izard, 1977; Parrott, 2001; Plutchik, 2001).These emotions could be broadly categorised under Positive and Negative
emotions.
The importance of including emotional aspects in consumer research has assumed great significance. There is a diverse
set of emotions that are related to many different aspects of the decision-making process (Zeelenberg, Nelissen,
Breugelmans, & Pieters, 2008). The diversity of understandings of emotions has affected consumer research where
such understanding is still unclear (Sorensen, 2008).
Social Support
The onset of an illness or a health concern may trigger stressful conditions, usually resulting in negative emotions for
the individual. During such situations, the individual may expect to gain some strength or ability to cope through
support from within his or her social system. Social support has been defined as the resources provided by other
people that would have either positive or negative influences on health, which may lead a person to believe that he or
she is loved, valued and belongs to a network of communication and mutual obligation (Cohen & Syme, 1985; Cobb,
1976).
In the context of this study, Social Support refers to the resources provided by a person(s) to an individual, to help the
latter endure or cope with the negative emotions or stress caused due to the prevailing heath concern. This kind of
support may be expected from family members, relatives, friends, social groups, work groups, the doctor(s) and/or the
hospital, or even people who have experienced/are experiencing similar health issues.
The types and sources of social support may vary.
This study has considered three basic forms of social support viz; emotional, informational and instrumental, as
sources of coping strength to individuals experiencing negative emotions during illness, as described by House (1981).
Emotional support is provided by family and close friends and is the most commonly recognized form. It
includes empathy, concern, caring, love, and trust.
Informational support includes advice, suggestions, or directives that enable the person to respond to personal
or situational demands.
Instrumental support is a tangible form of social support, which covers help in the form of money, time, in-kind
assistance, and other explicit interventions on the person’s behalf.
The impact of social support in reducing the effects of stress and adjusting to life’s changes faced during situations of
health concerns has been proved in a number of studies on health care (Halushka, Jessee, & Nagy, 2002).
Support has therapeutic value in mental and physical health. It is an important moderator to the effects of psychosocial
stressors (Pearson, 1986).
During stressful health situations or negative emotional experiences triggered during illness, individuals are most likely
to seek social support first from personal sources and later from healthcare service providers. This social support
seeking behaviour arises out of the need to cope with the difficult situation. Social support may change the meaning of a
stressful situation, the emotional or behavioural response of a person towards it and, may also help ease the situation
(Holtzman, Newth, & Delongis, 2004).
Social System
A social system refers to a person or group of persons who function interdependently to accomplish common goals
over an extended period of time (Lesser & Pope, 2011).
The Rules theory in consumer behaviour posits that people are an integral part of multiple complex systems, wherein
each system socially constructs its own rules of meaning and action (Buttle, 1998). Thus, a social system is a complex

432
whole comprised of components that work together in an orderly way, over an extended period of time, toward the
achievement of a common goal.
Social systems may also be invariably called as social networks, social relationships and the like, which include the
units in society namely- nuclear family, extended family, friend-circle, work-groups, cultural systems, religious groups
and significant others. Each of the social systems have a considerable influence on its members, the impact of which
may also differ in various cultural contexts. The benefits of receiving social support from one’s social system are proved
to be more incase of persons with highly supportive social systems or those who are more socially embedded (Gottlieb,
1985).
Health care System
Equipped with necessary knowledge, expertise and facilities; health care service providers may also be termed as
health care systems that comprise of a group of professionally trained people who function interdependently to
accomplish the common goals of providing appropriate services for the purpose of treating illness, or maintaining good
health of their patients/customers.The role of the health care provider is relevant to social support research relating to
health, since it can nurture the existing social support system that a patient may have at the time of diagnosis and, it is
also able to provide an opportunity for the patient to discuss health issues (Ritchie, 2001). By increasing the sources of
social support to patients, health care systems will be able to improve positive patient outcomes (Corey, Haase, Azzouz,
& Monahan, 2008).
Consumer Expectations
Consumer expectations have been defined in services marketing in the context of expectations of service quality,
whereby expectations are regarded as beliefs about service delivery which are used as reference points for evaluation
(Zeithaml, Bitner, Gremler, & Pandit, 2011). Consumer expectations are also defined as consumer desires regarding
what service providers should offer (Parasuraman, Zeithaml, & Berry, 1988).
Consumer expectation formation in healthcare shows a strong social dimension through the social network.
Expectation from the health care system was also found to be influenced by the coping strategy employed (Russ, 2006).
2. Research Objectives
The paper is an attempt to study social support expectations of consumers during negative emotional experiences. The
specific factors which influence the expectations of social support from health care systems are identified and the
relationships are hypothesized.
The focal question is-
What are the factors that influence consumer social support expectations from the health care system?
The paper attempts;
a)To highlight the factors that lead to the expectation of social support from health care systems.
b)To study the role of negative consumer emotions in the expectation of social support from health care systems.
Social support expectation has been hinged on consumer ‘need’ as a state of felt deprivation. The need here arises out of
the desire to cope with the imposing health situation that arises. The paper posits ‘emotion’ as one of the key
influencing factors behind the need for emotional, instrumental and/or informational support from ‘people’ involved in
providing the health care service.
3. Methodology
Exploratory research was required to develop an understanding of consumer emotional experiences during an illness.
Depth interviews of consumers of healthcare services have been conducted to provide input for arriving at hypotheses,
for developing a conceptual model of customer expectations of social support from health care systems, through an
analysis of the narrations. Indepth interviews were found to be appropriate for eliciting individual experiences,
opinions and feelings regarding sensitive health issues as recommended by Mack, Woodsong, MacQueen, Guest, &

433
Namey (2005)
The exploratory research design for this study was chosen to include contexts where different sources of social support
and different types of consumer social support expectations might exist for different types of illness.
Sample and Method
A total of twenty four customers of health care services were interviewed in-depth, regarding their illness, the emotions
they felt through the entire experience, the kind of social support received from their social systems and health care
systems and, the extent to which their social support expectations were met.
The duration of each interview had been 1-2 hours, where the respondents were engaged in a conversation and asked
to recall feelings and experiences. The depth interviews were semi-structured, where broad areas of investigation were
formulated. Respondents were probed for elaboration in order to obtain meaningful responses and uncover hidden
issues. The direction of the interview was determined by the respondents’ replies, as recommended by Chawla &
Sondhi (2011). Broad questions were posed to guide the direction of the interview (e.g., “What can you tell me about
your ailment?” “How did you feel when you realised that you could be facing a health problem?” “Who helped you to
cope with the situation?” “What did you expect from the doctor/hospital?”).
Data Analysis
The stories obtained through the interviews were analysed and specific attention was paid to the themes underlined by
the research question. Samples of narratives have been selected in keeping with the research objectives being
investigated. The interpretation of narratives represents the researchers’ understanding of the phenomenon under
study. This procedure was consistent with Zhang & Wildemuth’s (2009) call for qualitative content analysis.
The proposed model of consumer expectations from the healthcare systems is based on four constructs namely;
Negative Symptoms, Negative Emotions, Social Support from Social Systems, Expected Social Support from Healthcare
Systems.
CONSTITUENTSOF CONSTRUCTS
Negative Symptoms Negative Emotions
Social Support Social Systems Healthcare Systems
•Pain•Discomfort•Abnormal growth•Prolonged bleeding•Fever•Boils•Prolonged hoarseness of voice•Ear discharge•Blurred vision
•Fear•Anxiety•Worry•Disgust•Frustration
•Emotional•Informational•Instrumental
•Spouse•Children/Grandchildren•Brothers/Sisters•Other blood relatives•Relatives by Marriage•Friends•Co-workers•Neighbours•Community
•Doctor•Nurse•Hospital attendants•Receptionist•Technician
Table 1: Constituents of Constructs
4. Development of Hypotheses
a) Negative symptoms and Social support expectations:
A relationship was found between negative symptoms experienced by respondents and the need to consult a doctor to
alleviate the pain or discomfort. The services of the healthcare system were sought with the expectation of not only
professional service but, also to help the patient reduce the stress caused due to the feeling that there was a health
concern. Some excerpts are given below:

434
The abnormal signs made me go to the hospital.It did not seem very serious in nature.There was no
fear in the early stages of my illness due to the ignorance of the type of illness.(Female, age- early 40’s
with a chronic illness)
There was some pain and swelling in my stomach so I visited the doctor. The doctor said that it was
hernia. He advised surgery but he also said that I could decide not to have the surgery and it was left
for me to decide. The doctor said that although I could face some discomfort, I could still go about my
daily activities. But I decided to go ahead with the surgery, just to finish it off. I was not afraid at all
because nobody dies with hernia. (Male, age- early 70’s)
I experienced a stomach ache, since it was unbearable; I decided to visit the doctor. (Female, age- early
20’s with a chronic illness)
The negative symptoms specified above relate to physical discomfort or pain. Respondents visited the doctor with the
urgent expectation that the doctor would be able to provide relief through appropriate treatment (instrumental
support) and provide necessary advice (informational and emotional support)
We can thus hypothesize that-
H1: The intensity of negative symptoms is positively related with the expectation of social support from the
healthcare system.
This implies that the increase in intensity of negative symptoms, would lead to increased expectation that the
healthcare system would provide emotional, instrumental and/or informational support to the consumer.
b) The Mediating effect of negative emotions:
Negative symptoms were not always the only reasons why respondents expected social support from healthcare
systems. In some cases, negative emotions such as fear, worry and anxiety caused due to the negative symptoms, also
influenced respondents to seek the services of the healthcare system. As is evident in the following excerpts:
------- Later on I discovered a different health problem; I experienced a severe pain in the stomach and
promptly went for a check-up at a specialized hospital since I feared a severe problem like gall
bladder stones or something as severe.
I was more worried than before, and even began inquiring about the issue with the scan technician.
More inquiries followed with the doctor and finally I relaxed after consultation with the doctor. (Male,
age- late 30’s with an acute illness)
I noticed a painless & abnormal swelling/growth on my hip. The fear that the growth could lead to
something dangerous prompted me to visit the doctor.
I feared that the growth could be cancerous since the growth did not hurt. It was a self decision to
visit the doctor. After consultation with the doctor, I felt some relief . (Male, age- late 30’s with a chronic
illness)
When I experienced the pain, I was crying, I had no strength and felt helpless. I had fear. Until I visited
the doctor, I did not feel relieved. After sonography, surprisingly I had no pain. (Male, age- late 20’s with
a chronic illness)
Specific types of social support expected in the above examples include- emotional and informational.
This leads us to hypothesize that-

435
H2: The relationship between intensity of negative symptoms and expectation of social support from the
healthcare system is partially mediated by the intensity of negative emotions.
This implies that while there is a positive relationship between intensity of negative symptoms and social support
expectations from the healthcare system, the increase in intensity of negative emotions due to negative symptoms
experienced, may sometimes increase the expectation of social support from the healthcare system.
c) Perceived Social Support from the Social System and Expected Social Support from the Healthcare System :
It was found that the type and intensity of social support received from the respondents’ social system, determined the
type and intensity of support expected from the healthcare system. This may be evident through the excerpts given
below:
My relatives advised me not to consume the prescribed medication, which led to an increase in fear. So
then I decided to take the medication in moderation as and when I felt I required it the most. I did not
take the medication as per prescription. (Female, age- early 40’s with a chronic illness)
I was not afraid at all because nobody dies with hernia. (Male, age- in 70’s)
The narratives above reveal that the respondents were provided with informational and emotional support from their
social systems. This provided them with the required confidence to take decisions and form opinions, thus seeking
limited or negligible social support from the healthcare system. The excerpts given below reveal that the converse is
also true:
I did not share my problem with other family members because I did not want to create fear or worry
in them……. I sometimes expected more of the doctor’s time which, I did not always receive but, it was
not his normal/usual behaviour. (Male, age- early 30’s with a chronic illness)
I was all alone, without my family but I did not have to worry as I was taken care of very well. (Male,
age- late 30’s with a chronic illness)
In the narratives above, respondents revealed that the social support (in this case, emotional support) received from
their social systems was perceived to be inadequate or lacking. During such situations, more support was expected
from the healthcare system.
Thus we hypothesize that;
H3: The perceived social support from the social system, is negatively related with the expected social support
from the healthcare system.
Simply stated, higher the social support received from the social system, lower is the social support expected from the
healthcare system. The negative relationship however may be specific to each type of social support viz; emotional,
informational and instrumental. This logic could be related to the fact that individuals expect the healthcare system to
effectively treat their illness (instrumental) support, since they would probably not receive such support from the
social system.
d) The Moderating effect of Negative Emotions:
The intensity of negative emotions experienced by consumers of healthcare services, was found to have a moderating
effect on the relationship between the perceived social support from social systems and expected social support from
healthcare systems. Excerpts in support of this statement are given below:
My husband was very practical and clamed me down. My mother also made me calm. However my
family support did not seem to alleviate the problem. I felt that I was going through the problem so no
one would be able to understand it…….My experience with the mammogram was a horrible
experience. The technician was stern and un-co-operative. I felt scared and worried. (Female, age- in
40’s)

436
I experienced a stomach ache, since it was unbearable; I decided to visit the doctor. I did not know the
problem & I did not know what to do….I felt irritated, there was too much of fear & anxiety. I cried
bitterly & made others (family and relatives) also cry. The condition was so bad that many of my
family members also accompanied me to the doctor. I felt depressed…The doctor irritated me with his
questions. Although he diagnosed the problem, he seemed unsure of the treatment. However, the
initial treatment was effective….I felt that the doctor wasted time, first in meeting me and then with
his questions. (Female, age-in 20’s with a chronic illness)
The emotional and informational support provided to the respondents in the above examples did not lead to lower
expectation of such support from the healthcare system since the negative emotions experienced were high in intensity.
We can therefore hypothesize that;
H4: The relationship between perceived social support from the social system and the expected social support
from the healthcare system is moderated by the intensity of negative emotions.
This implies that while social support from social systems reduces the extent of social support expected from the
healthcare system but, it may not do so or does it to a lesser extent if the intensity of consumer negative emotions are
high.
e) Negative emotions and social support expectations:
Expectations of social support from the health care system were found to be influenced by the negative emotions
experienced by respondents. Increase in the intensity of negative emotions gave rise to higher expectations from the
health care provider to calm down fears or help the patient to adjust to the difficult situation.
After consultation with the doctor, I felt some relief since the doctor said that it was just a harmless
growth called lypoma. When the lump kept on growing, fear arose again and then I went in for a
second opinion. The second opinion did not rule out cancer so the fear crept in again. (Male, age- late
30’s)
After my sister went through the ailment, I decided to get a check-up. (Female, age-in 40’s with a chronic
illness)
The above excerpts reveal that increase in fear cause by a negative symptom experienced by self or others lead a
person to consult a health care facility with the expectation of informational or emotional support. We can therefore
hypothesize that,
H5: The experience of negative emotions is positively related with the expectation of social support from the
healthcare system.
This implies that when individuals experience negative emotions in relation to an illness, they will be more likely to
consult a health care facility with the expectation of social support from the health care system in addition to the
professional treatment.
The broad model depicting the hypothesized relationships is shown below.

437
A CONCEPTUAL MODEL OF EXPECTED SOCIAL SUPPORT FROM HEALTHCARE SYSTEM
Social Support
from Social
System
Negative Symptoms
Negative Emotions
Expected Social Support from
Healthcare System
H1
H2
H3
H4
H5
Figure1. Conceptual Model of hypothesized relationships
5. Conclusion
There is a positive relationship between intensity of negative symptoms and the expectation of social support from the
health care system. This relationship is partially mediated by negative emotions.
Apart from the mediating relationship, a direct relation is also hypothesized between intensity of negative symptoms
and the expected social support from the health care system.
Expectation of social support from health care system is negatively related with perceived social support from soc ial
systems. The relationship between perceived social support from social system and expected social support from
health care system is moderated by intensity of negative emotions.
There is a positive relationship between negative emotions experienced and the expectation of social support from the
health care system.
6. Limitations
The study only takes into consideration facts obtained through a qualitative study. A quantitative study on a larger
sample has not been conducted to strengthen the hypotheses. Relationships between perception and expectations of
specific types of social support namely emotional, instrumental and informational have not been identified and are only
broadly covered. The study has also not explored the relationship between negative symptoms and perceived social
support from social systems although there is an evident positive relationship in existence.
7. Managerial implications
The study is of relevance to health care marketers as it probes consumer emotion change and coping through social
support.
By studying the extent and impact of social support received from social systems during times of illness, health care
service providers can tune in to the social support needs of their customers and focus on gaining a competitive edge.
When health care systems are able to build upon and reinforce social support to patients apart from providing
professional treatment to them, they are expected to receive patient cooperation for treatment procedures. Follow-up
treatment and procedure would also be easier to carry out. When social support expectations of consumers are

438
successfully met by health care systems, irrespective of whether the ailment is cured, consumers would tend to display
positive behavioural intentions towards the service provider.
References
BUTTLE, F. A. (1998). Rules Theory: Understanding the Social Construction of Consumer Behaviour. Journal of
Marketing Management, 14, 63-94.
CHAWLA, D., & SONDHI, N. (2011). Research Methodology: Concepts and cases. New Delhi: Vikas Publishing House pvt.
ltd.
COBB, S. (1976). Social Support as a Moderator of Life Stress. Psychosomatic Medicine, 38(5), 300-314.
COHEN, S., & SYME, S. L. (1985). Issues in the study and application of Social Support. In S. Cohen, & S. L. Syme (Eds.),
Social Support and Health (pp. 3-22). San Francisco: Academic Press.
COREY, A. L., HAASE, J. E., AZZOUZ, F., & MONAHAN, P. O. (2008). Social Support and Symptom distress in
adoloscents/young adults with cancer. Journal of Pediatric Oncology Nursing, 25(5), 275-284.
GOTTLIEB, B. H. (1985). Social Networks and Social support: An overview of research, practice and policy implications.
Health Education Quarterly, 12(1), 5-22.
HALUSHKA, H. B., JESSEE, P. O., & NAGY, M. C. (2002). Sources of Social Support: Adolescents with cancer. Oncology
Nursing Forum, 29, 1317-1324.
HOLTZMAN, S., NEWTH, S., & DELONGIS, A. (2004). The Role of Social Support in coping with daily pain among patients
with rheumatoid arthritis. Journal of Health Psychology, 9(5), 677-695.
HOUSE, J. S. (1981). Work Stress and Social Support. Reading, Mass: Addison-Wesley.
IZARD, C. E. (1977). Human Emotions. New York: Plenum.
LESSER, J. G., & POPE, D. S. (2011). Human Behavior and the Social Environment: Theory and Practice (2 ed.). Pearson.
MACK, N., WOODSONG, C., MACQUEEN, K. M., GUEST, G., & NAMEY, E. (2005). In-Depth Interviews. In Qualitative
Research Methods: A Data Collector's Field Guide (pp. 29-49). North Carolina: Family Health International.
PARASURAMAN, A., ZEITHAML, V. A., & BERRY, L. L. (1988). SERVQUAL: A Multiple-item scale for measuring Consumer
perceptions of Service quality. Journal of Retailing, 64(1), 12-40.
PARROT, W. G. (2001). Emotions in Social Psychology:essential readings. Philadelphia: Psychology Press.
PEARSON, J. E. (1986). The definition and measurement of social support. Journal of Counseling and Development, 64 ,
390-395.
PLUTCHIK, R. (2001). The nature of emotions. American Scientist, 89, 344-350.
RITCHIE, M. (2001). Psychosocial nursing care for adolescents with cancer. Issues in Comprehensive Pediatric Nursing,
24(3), 165-175.
RUSS, K. R. (2006, December). Consumer expectation formation in health care services: A psycho -social model. (PhD
Thesis). B.S., Louisiana State University.
SORENSEN, J. (2008). Measuring emotions in a consumer decision-making context-approaching or avoiding. Aalborg
University(online). Available at www.business.aau.dk/wp/08-20.pdf (accessed April 8, 2009)
ZEELENBERG, M., NELISSEN, R. M., BREUGELMANS, S. M., & PIETERS, R. (2008). On emotion specificity i n decision-
making: Why feeling is for doing. Judgement and Decision-making, 3(1), 18-27.
ZEITHAML, V. A., BITNER, M. J., GREMLER, D. D., & PANDIT, A. (2011). Services Marketing: Integrating customer focus
across the firm (5 ed.). India: Tata McGraw-Hill.
ZHANG, Y., & WILDEMUTH, B. M. (2009). Qualitative Analysis of Content. In B. Wildemuth, Applications of Social
Research Methods to Questions in Informational and Library Science (pp. 1-12). Westport, CT: Libraries
Unlimited.PDF.

439
Session 12

440
Revitalization of outside commercial areas as
strategy to attract consumers and get
competitiveness Visual merchandising – Mystery Shopping – Commerce area revitalization – Retail marketing – Costumer relationship.
Paulo Brum, Universidade Regional Integrada, [email protected]
Lurdes Froemming, Universidade Regional do Noroeste do Estado do Rio Grande do Sul, [email protected]
Abstract
The revitalization of the outside commercial areas is a world tendency that is being aggregated to several departments
of market development around the world. This paper expects to instigate the marketing practices generators of
competitiveness advantage. The current researches points tendencies to commercial environments more qualified,
attractive and safe, with focus on the consumer experience and the improvement on the relationship actions to the
client. The revitalization process presented on the study looks for minimize the weaknesses and expand the
competitive excellence on the companies of the market conglomerate in face to the traditional shopping centers. The
implementation of Mystery Shopping is predictable to be used on the internal and external aspects. The study shows
that the external mystery shopping go through the commercial space analyzing relevant points that affect the access to
the consumption. The internal phase has the objective to evaluate the quality of the services provided to the mix of
companies that compose the commercial area in what brings the satisfaction to the consumer and the real process of
relationship focused on the attendance. The revitalization projects proposes actions of implementation and
qualification of visual merchandising to promote improvement on the attractiveness on the stores and the right use of
merchandising techniques. The study present the actions focused on the qualification to the employees of the
companies, looking for the improvement on the implementation of the set of marketing practices to stimulate the
consumption and to increase the relationship with the customer.
1. INTRODUCTION
The revitalization of outside commercial areas is a tendency of the commerce that have been implanted since 1990 in
several countries of the world and have been increase by globalization. The competitiveness among the companies
became aggressive and the ability to change is the vital factor to the permanency of then in the sustainable activity.
Several market actions followed by qualification in management and commercial area urbanization are in the agenda of
projects in many cities of the world committed to this practices. These strategic points have been used as usual
background for analysis and multidisciplinary reflection inside institutions all over the world..
It's common interest of urban marketers that the market streets need to be revitalized and start to offer public welfare.
We need to fight for the organized market, shop tourism and promote a good coexistence among the different social
layers in order to reach this interest (FERRARI, 2007).
Observing these facts, this paper will discuss marketing practices which are present on revitalization projects of
commercial areas and its expected impact after the implementation of its actions in the territory.
Professor of Kellogg Graduate School of Management of Northwestern University, Kotler intensely discussed on the
corporative environment the idea that the marketing area need a major role on the project of the company strategy, in
other words, it should orientate the company. He agrees with Peter Drucker, known as one of the greatest philosophers
of management, when he affirms that a company has just two functions: innovation and marketing. "What makes the
company are the ideas and marketing offers. Production, shopping, PD, finances and other functions just support the

441
work of the company on the market", affirms on his consulting group website. "Marketing is the homework the
company makes to find out what people need and what the company shall do." explain. But there's a huge
misunderstanding between marketing and sales, for example, to Kotler, the sale is the tip of the iceberg of marketing.
"The sale starts when you have a product. Marketing starts before this one even exist." says (KOTLER, 2013).
Listening to the needs of a contemporaneous society, also known as consumer society, that has new shopping
procedures, based on the innovation, visual appealing, comfort, good attendance, pleasure practices, safety, physical
access and other factors that creating a modern consumer behavior, the suitability of outside commercial areas became
essential.
On the other hand, the traditional shopping centers are getting more and more market shares that once belonged to
retail of classic market city streets by offering modern places and marketing practices that comply and stimulate better
the new demands of this third millennium consumer.
Already consolidated on the country market, the increase of the numbers of shoppings centers are significant. Data
from ABRASCE points that in 2012 the prediction of increase on the sales keeps around 12%, whereas 31 shoppings
should be founded in the year, on which twelve was already opened to the public and 40 new malls shall open until the
end of 2013 (ABRASCE, 2012).
The chart below (Figure 1) presents the numbers of shopping growth in Brazil.
Figure 1 - Data from ABRASCE 2012.
Watching this phenomenon, several entities, governmental agencies and researchers stated projects with the objective
to support companies inserted on commercial areas, improving the survival and competitiveness conditions in face of
the new markets that keep rising in other city areas, specifically the modern shopping centers, the ones which are
attracting the traditional consumers.
The revitalization process of a commercial conglomerate counts on a important strategic planning that connect the
modern management and urban interventions that creates a mix of actions that leads to the increase of the market
atmosphere, reaching the increase of the local economy.
The project scope is showed in relevant marketing practices to be planed, implanted and executed by actors involved
on the transition with objective of solidification of the present companies.
The external space that is used by the conglomerate and its influence on the shop behavior, as even the several inner
places of the stores, serve as decisive factors on the process of increase of the outside stores which are being studied in
this paper.

442
2. Diagnose and Analysis of Marketing Practices
There are three brazilian revitalization programs consisting and implemented that started in the main brazilian cities:
1. Programa de Ruas Comerciais de São Paulo; 2. Programa Polos do Rio, on the city of Rio de Janeiro and 3. Programa
de Revitalização de Espaços Comerciais linked to SEBRAE (RODRIGUES, 2012).
Every program follows international patterns adapted to the brazilian reality, and this reality pretty much look alike in
the three programs. With a high coverage and numerous experiences collected, the SEBRAE Naci onal program the
following processes as methodology of project implementation: Performing research on the environment, diagnose the
commercial area, workshop of sensitization and presentation, creation of the action plan, execution, performs the
second diagnosis and workshop of result presentation after two years of project (SEBRAE, 2012).
In the main execution processes we can find marketing practices that support the objectives of strength the commercial
area by increasing the local attractiveness and the companies competitiveness. These steps consists to external and
internal analysis of the conglomerate universe made by specialized consulters to reflect at first moment the current
conditions of the area and the organizations that are inserted in it.
The use of this view expects to increase the results of the companies located on the observed market. Starting this
method, it's expected to build a cohesive group of entrepreneurs with a defined leadership, to generate market actions
together and improve the management on the participant companies of the project. Besides, the involved companies
shall benefit from the actions performed trough the better comprehension of the needs and tendencies of the market
and attending proactively on the development of new actions for the conglomerate (SEBRAE, 2012).
Some examples of the expected results on the companies acquired from the application of this method are the
following:
• Increase on the sales of the participant companies;
• Increase on the client numbers;
• Increase on the medium ticket on the consumers purchases;
• Increase on the client satisfaction.
In this context, the marketing research is the essence of the initial phase of the revitalization project on outside
commercial areas. The marketing research is what connects the consumer, the client and the public to the professional
marketing trough information - information used to identify and define opportunities and marketing problems, to track
the marketing performance and to improve the marketing comprehension as a process (MALHOTRA, 2004).
2.1. Mystery Shopping to external and internal analysis of commercial area
The research has the objective to evaluate the internal and external aspects of stores that composes a determinate
commercial area, as well as the infrastructure of this conglomerate for the purpose of diagnose its strengths, weakness,
opportunities and threats.
This internal and external analysis of the area is essential to elaborate a diagnose a market view so the actors who are
responsible for the revitalization process have the specific vision of the points to be improved.
The proposed method of the mystery shopping looks for the creation and achievement of benefits for ever individual
involved on the project, even if the involvement is in different levels of intensity. The marketing research contributes to
the identification of opportunities, improvement in the organization and generation of new ideas and business by
collection of data and analysis of results.
In innovative companies, the innovations is not concentrated in only one place, on the contrary, the innovation is in
several levels of the organization. It's not a question of which departments, but of who: specific people who can be
located anywhere, even out of the organization (TRIAS DE BES; KOTLER, 2011 ).
On the implementation of the mystery shopping, the researcher will simulate the behavior of a customer in his
shopping procedure, and trough a checklist of evaluation previously prepared, that contains the analyzed points of the
store, will generate an action plan that will direct the improvements that must be implemented.
Mystery Shopping presents the following steps (SEBRAE, 2010):

443
It's a technique of data collection called observation;
The observation is performed without announcement, in other words, the researchers will behave as real
customers;
The researchers use a planned checklist;
The evaluation is performed trough the researcher perception, the way he sees and feels the environment
that is being observed;
The researcher perception is turned in a scale that allows evaluation on how the company reaches the
need of its consumer.
The researchers are called mystery consumer and have the function to acquire data about the environment on the point
of sale of a company and about the interaction between employees. We can see how the view of the consumer is
essential to the companies on the context of the marketing society nowadays.
The predictions indicate some steps that the retailer must follow to survive or achiev e some participation in the market
of this new environment, such as: to plan a proposal for a well designed trademark; to explore new tools, techniques
and data to increase the knowledge about the consumers; optimize the main activities trough systemic bus iness
intelligence; to work the inner limitations of people, systems and technology (SOUZA; SERRENTINO, 2002).
The major difference of the use of mystery shopping compared to other techniques of marketing research is that the
researchers will not interview any person. The research will observe and behave as a ordinary consumer.
Based on (SEBRAE, 2010), let's understand how mystery shopping can contribute to the improvement of the company
results:
The researchers relate to the company administration if the "frontline" is treating its consumers
according to the company pattern, in other words, mystery shopping evaluate if the team communicate its
knowledge about the products and if it's efficient, useful and friendly with the consumer;
If the impressions collected by the mystery shopping were applied to a database, it's possible to create a
standard of performance on the consumer attendance. With this data the team can be motivated to
overcome at every evaluation;
Another opportunity generated by the Mystery Shopping is the individual evaluation of the employees.
From this evaluation it's possible to reward the employees that reach the expectations, developing a
motivation to the team;
The mystery shopping can identify the weaknesses and the strengths, contributing to improve the
environment of the point of sale of the company and to promote coaching on specific skills of the team.
The mystery shopping data allows the company to estimate the factors that affect the customers' choice. The variability
on the classification of customers, stores, occasions, items and aspects can be crossed each other to obtain a final
analysis (FINN; KAYANDÉ, 1999).
The use of Mystery Shopping can contribute to the organization action plans that increase the customer satisfactions,
what brings increase on the sales and a new level of competitiveness, as a consequence, obtaining profitability.
2.2. Merchandising as a decisive factor on the shopping experience
Several authors detach the important role of the excellence in satisfaction of clients in order to transform then in the
advocates of the company. They also indicate that the clients are in search for service experiences that complement its
life style, and that they are up to pay for that (VANN DER WIELE; HESSELINNK; IWAARDEN, 2005).
The store visual must approach the consumer to the store and not intimidate him. When this approach is performed,
the store must stimulate the purchase by pleasant experiences offered to the client, according to Basso (2008).
• Point of Sale - is the place where the consumer pass through its purchase experience, where the
merchandising actions happen and where the visual merchandising is applied, in other words, the
store.
• Purchase experience - as the consumer performs his purchases. The store will educate the consumer
inducing his look, respecting his rhythm, stimulating him to walk, relate and integrate with the sale.
• Merchandising actions: every activity developed with the main objective of detach and promote the

444
store products.
• Visual merchandising: it's the programmed visualization of the product on the point of view that what
is exposed on the point of sale is there to be sold and, in this case, the POS is the showcase. The place
where the product is being sold is the showcase! The exposition of the trademark of the
product/service will be essential to the sale.
Merchandising is essential to call the attention of the consumers to the success of the sales on the market, affirms
Blessa (2005), because according to information about merchandising and brazilian consumer habits, this tool is
responsible for definition of marks and for the arouse of the impulsive purchase from the consumer. The author also
talks about some POPA - Brazil data (Point-of-Purchase Advertising Institute) an international organization dedicated
to study and knowledge collect of market activities - indicates that 85% of satisfying purchases performed by brazilian
consumers are decided on the point-of-purchase, what comes to confirm the importance of the merchandising
activities, i.e., the promotion actions performed inside the store increase the stimulation of the impulse purchase by the
consumer (POPAI, 1998).
According to Blessa (2005), merchandising is defined as any technique, action or promotion material used on the point-
of-sale that serve to provide not just a better visibility of products, marks or services, but also provide information to
the consumer, with the propose to extract, motivate and induce the purchase decisions.
Analyze concepts and structural characteristics of the companies that are in the same area to be revitalized is extremely
important to the project preparation. In this context, the merchandising actions can help to this companies became
more competitive. The right exposition of the products, its presentation, pleasant environment and an atmosphere that
proportionate the client's welfare.
The interior of the store counts too much to its inner look, agreeing with (BASSO, 2008) we can consider the Inner Look
- the entrance (floor, wall, roof), the inner space, layout, signalization, product exposure, sale area (balcony, tables), the
inventory, the administration room, bathrooms, the pantry and the state of the inner equipments. These are some of the
essential points to achieve a good atmosphere inside the store providing the client's welfare and increasing the sales.
Deep in the analysis of the point-of-sale (POS), we consider important points to a ideal environment the room
temperature, its acoustic, use of the right scent and the ambient sound. Without forget the basic merchandising
characteristics as pricing, product visibility, variety and conservation (SEBRAE, 2010).
The external point of view, several aspects influence the store visual, including front appearance, signboard, entrance,
neighborhood, visibility during day or night, signboard clarity, external painting and other points that are analyzed by
the marketing research and became bases of the improvement actions proposed on the revitalization projects.
The showcase is a important component of the visual merchandising, it values the product based and its exposition,
because of its structure, right theme decoration, clarity and use of composition techniques. This way it represent
relevant aspects of beauty and functionality on urban locations.
On the urban walks, the direction view is also a important point to be estimated. People like to look to other people
more than everything, however, people also are always looking for urban traps as the curb, holes, beggars on the
sidewalk and other things that disrupt the walking. With the popularization of the traffic lights and the improvement of
the paving, the human eyes usually turn down. From the market point of view it's a good thing, because the eyes keep
from down to middle high, where the products are arranged in the showcases (UNDERHILL, 2004).
Showcases are essential market spots, in the same time they convince the public, show the products and present the
tendency. The showcase enhances the idea of the one-desire, the trend, built by marketing and advertisement, present
on the media, that says what shall be used on each consumer profile and that acts on the recognition of the trademark.
Both of then, the identification between subject and products and the relationship of the trademarks , project itself on
the showcase, since it's a part of this marketing, that has the objective to force then to expose the product and the logo
(DEMETRESCO, 2005).
The store must inform its concept, make clear the way it want to be recognized by the people, for its price policy,
variety of products, quantity of products that work with or for the quality of the products indentified by the costumers.
Just like the store, the commercial area also needs to be recognized by its beauty and showcase innovation, the one
which attract and keep the people around.
The customer need to be attracted to enter de store. For this the showcases need to be renewed at each chance,

445
delighting the customer and creating surprises, either by different products or by other kind of appeal.
In a recent paper published by (FEIJÓ; BOTELHO, 2012) we can prove the increase of revenue generated by
merchandising actions on POS: The second phase of the experiment affirms the effect of two merchandising factors on
the revenue. In the moment the stores of the control group started to be set based on the merchandising model, they
showed effective recover, presenting performances better than the stores from the experimental group and better than
the average revenue of the sector.
Merchandising actions performed by the conglomerate companies are ascertained by the marketing research on the
place. The generated report will be used as base to the actions that will be at the action plans for the revitalization
project that will be used to improve the general commercial area.
2.3. Relationship with the customer focused on competitiveness
On the market society the companies look for several ways to acquire competitive advantage on other companies. The
fight for gain on aggregated value is daily, tough and require strategies well elaborated and implemented to achieve this
objective.
In this context, the definition of value is pretty much wide, because its dimensions can be referred to different types of
actors, natures and finalities. While the value of use satisfy a need of a person or company, as this value has a specific
utility, the exchange value is defined by its situational concept (ITO; HAYASHI;GIMENEZ; FENSTERSEIFER, 2012).
It's easy to see that, in most of the companies, the Customer Value is certainly the most important component of the
company, although the customer value of a company can't be the total value of the company (for example, the physical
actives, the competency, the intellectual property also aggregates value), the current clients will certainly be the future
source of monetary profit. This way, find out how to conduct the values is very important to make the decisions in any
company, and the formula of how to do it can give it a good competitive advantage (RUST; ZEITHAML; LEMON, 2001).
Understanding the points that leads the client to make the decision to buy and what to do to assist him on this crucial
moment is the study of the relationship marketing. FROEMMING; DARONCO; ZAMBERLAN; SPAREMBERGER (2009)
says that lots of factors can change the final result, including internal motivation and external influence, as social
pressure and marketing activities. In some way, the individuals organize all of these factors and make the decisions that
are local and coherent for then.
In every of these processes can be found the search for the client satisfaction, where among some relevant factors, the
market conglomerate can be differentiated by the good attendance culture to its attendees. We can say that the formula
of satisfaction is trough the good attendance, that consists agility and quickness, generating satisfaction and attraction.
According to Guimarães (2007)
Differentiate "good attendance" and "good treatment" on the process of the search for the client
satisfaction;
Recognize the importance of identify the Moment of Truth, aspects that affect the level of the client
satisfaction;
List the qualities and characteristics that must compose the profile of the customer service staff;
On the perspective of a good attendance, the companies must treat very well the customer complaints, creating
strategic channels to listen to it and proceed with the right treat of each demand. According to GUIMARÃES (2007),
48% of the customers quit buying on the market companies because of the bad attendance they received, against 19,2%
for lack of attention; 18,5% for better products on other stores and 13.6% for find a cheaper product on the market.
This way, to a revitalization project of a commercial area achieve its objectives of sustainability and the increase on the
profit of the companies that compose it, can't misdirect the focus of its current clients through the tools of relationship
marketing.
Nowadays, the changes occur so fast and unpredictably that pattern and behaviors already established on the market
are no longer sustainable (MCKENNA, 1999). To keep a competitive pattern in a market conglomerate demand the
companies a continuous investment on the qualification of the employees to keep a good relationship with their clients,
always consentient with loyalty strategies defined by the marketing plan.

446
The revitalization method of commercial areas used by SEBRAE provides opportunity the companies presented on the
market conglomerate to achieve its levels of competitiveness trough group actions that prov ides opportunity to concur
with products that couldn't do by itself. Besides the group actions, the qualification recommended but the method
guarantee entrepreneurs prepared to achieve the high levels of maturity on the management of his companies. The
different levels of competitiveness considered on this approach are based on a triad: systemic, structural and
business(SEBRAE, 2012). The figure 2 presents this context.
Each level of competitiveness can be analyzed on each category:
Business competitiveness
Management - efficiency of process and operation;
Entrepreneurship - knowledge, skills and leader attitudes;
Business theory - strategy effectiveness.
Structural competitiveness
The more integrated and complete a production chain of an area, more competitive the companies will be;
The structural level brings the concept of cooperation during the competition;
Lots of problems, considered out of control on the companies, can be solved on the structural view, trough
cooperation.
Systemic competitiveness
Prediction of future events;
Strategic adaptation of the company to the future;
Act cooperatively with the sector or the industry to affect the general area;
Act correctively in critical processes of the business;
Qualify the planning.
Figure 2 - Source: MCB - Movimento Brasil Competitivo
Final Considerations
The revitalization projects of commercial areas are each moment being applied around the world searching for
innovation and competitiveness on the territory it occur. This paper tried to relate and emphasize the importance of
marketing practices that compose the scope of these projects directed the companies to change their strategies, that
once was efficient and effective, but when applied to the consumer of the future need some modific ation.
Peter Drucker says that the competitiveness makes the companies abandon quickly the past. Inside a market extremely

447
competitive, being prepared to act conscious and with responsibility is essential to achieve the success. In this context,
the small company needs to professionalize and to look for alternatives to follow the market and to gain a differential
on its competitors. Turbulent times demands a company to abandon systematically the past (DRUKER, 2002).
In this perspective, the right implementation of marketing strategies contribute to the success of the revitalization,
since the research applied on the conglomerate to the correct diagnose of the points to improve or adjust as well as the
analysis of visual merchandising of the areas geographically delimited to the generation of data to the phases of
strategy definition and its implementation.
In the context of the information gathering to strategic project manager, the use of the mystery shopping and its
implied observations supply precisely the worksheet with details of the real level of quality that the territory
represents on the perspective of the modern consumer and its expectations on any of the great variety of market
demands.
Merchandising showed its major role on the marketing practices that take a part on the projects, helping on relevant
points where its tools design companies more proper to the current needs of a consumer with numerous new
consumer characteristics.
All this marketing effort counts on the real comprehension of who is the consumer that attends the territory and who is
the possible consumer that will keep attending to it. This consumer is already used to the modern and comfortable
shopping centers, but is still attached to the tradition of outside market centers and their characteristics, so this
consumer waits for the moment when will be persuaded by the good attendance and the urbanism innovations.
Related to the marketing practices presents on this paper, the competitiveness is a factor connected to everything was
proposed. A group of companies that search together with strategic partners the revitalization of a geographically
limited commercial area will consequentially built the need of competitiveness gain in its work processes, otherwise
would be developing in disagreement with the action plans that would be being implemented.
We understand that this paper was limited to some marketing practices and the marketing universe is further
extensive, but the emphasis in merchandising sales-focused, developing a visual unity to the shared space stores;
consumer treatment and reception, unrevealed by this paper on the view of the analysis of mystery shopping; the
relationship that became the sustainable point of this paper will certainly strong parts to be composed the strategi c
plan of projects of the area, predicting improvement on the possibilities of success .
References
ABRASCE (2012). Associação Brasileira de Shopping Centers. Accessed in: 2013.02.22
<http://www.portaldoshopping.com.br/index.asp>.
BASSO, C.T.R. (2008). Gestão do Visual de Loja: a sua loja planejada para vender melhor . Guia do Educador. Sebrae:
Brasília.
BLESSA, R. (2005). Merchandising no ponto-de-venda. São Paulo: Atlas.
DEMETRESCO, S. (2005). Vitrina: estratégias e produção . Apostila oficina da Cultura, São Paulo.
DRUCKER, P. F. (2002). O Melhor de Peter Drucker. São Paulo: Nobel.
FEIJÓ, R. & BOTELHO, D. (2012) Efeitos dos Fatores de Merchandising nas Vendas do Varejo. RAE. Revista de
Administração de Empresas 52(6).
FERRARI, R. (2007). A valorização das ruas comerciais . Jornal Do Commercio, Rio de Janeiro, United States, Rio de
Janeiro, Jan, pp. n/a.
FINN, A. & KAYANDÉ, U. (1999). Unmasking a Phantom: a Psycometric Assessment of Mystery Shopping. Journal of
Retailing, 75, pp 195-217.
FROEMMING, L. M. S.; DARONCO E.; ZAMBERLAN L.; & SPAREMBERGER A. (2009). Comportamento do Consumidor e
Comprador. Ijuí, UNIJUI.
GUIMARÃES, S. (2007). Atendimento ao cliente : obtendo resultado por meio da satisfação do cliente - Guia do educador.

448
Brasília : SEBRAE.
ITO, N. C., HAYASHI J. P., GIMENEZ, F. A. P. & FENSTERSEIFER, J. E. (2012). Valor e vantagem competitiva: buscando
definições, relações e repercussões. Revista de Administração Contemporânea , 16(2), 290-307. Retrieved
March 10, 2013, from <http://www.scielo.br/scielo.php?script=sci_arttext&pid=S1415-
65552012000200008&lng=en&tlng=pt. 10.1590/S1415-65552012000200008>.
KOTLER, P. (2013) Marketing é (quase) tudo. Portal HSM. Accessed in: 2013.02.26:
<http://hsm.com.br/editorias/estrategia-e-marketing/marketing-e-quase-tudo>.
MALHOTRA, N. (2004). Pesquisa de Marketing: Uma orientação aplicada . Porto Alegre: Bookman.
MCKENNA, R. (1999). Marketing de Relacionamento . Rio de Janeiro: Editora Campus.
POPAI. Point-of-Purchase Advertising Institute (1998). 1º Estudo sobre o Comportamento do Consumidor no Ponto-de-
Venda. São Paulo: Vozes.
RODRIGUES, E. R. R. (2012). Shopping a céu aberto no Brasil: transformações, estratégias e perspectivas da rua comercial
na sociedade de consumo contemporânea. Tese de Doutorado, Faculdade de Arquitetura e Urbanismo,
Universidade de São Paulo, São Paulo. Accessed in: 2013-02-09, from
<http://www.teses.usp.br/teses/disponiveis/16/16139/tde-30112012-145901>.
RUST, R. T.; ZEITHAML, V. & LEMON, K. N. (2001). O valor do cliente: o modelo que está reformulando a estratégia
corporativa – customer equity. Porto Alegre: Bookman.
SEBRAE (2012). Diagnóstico de Espaço Comercial. Projeto Mais Varejo – Manual de aplicação. Sebrae: Porto Alegre.
SEBRAE (2010). Manual Descritivo Cliente Oculto . Sebrae: Porto Alegre.
SOUZA, M. G. & SERRENTINO, A (2002). Multivarejo: na próxima economia. São Paulo: Pearson Education.
TRIAS DE BES, F. & KOTLER, P (2011). A Bíblia da Inovação. São Paulo: Leya.
UNDERHILL, P. (2004). A magia dos shoppings: como os shoppings atraem e seduzem. Rio de Janeiro: Elsevier.
VANN DER WIELE, T.; HESSELINNK, M. & IWAARDEN, J. (2005). Mystery Shopping: a tool to develop insight into
customer service provision. Total Quality Management, 16(4), pp. 529-541.

449
The application of Market Basket Analysis to
A Fashion Retailer Consumer behavior; Market basket analysis; Fashion marketing; Fashion retailing; Product association.
Yi Wang, Manchester University, [email protected]
Hiu Ching Iris Cheung, Manchester University, [email protected]
Abstract
The purpose of this research is to uncover the associations between different categories of fashion products and
understand the buying behaviour of the store being studied using market basket analysis. Such analysis seeks business
value from a large set of transactional data to generate information to aid managerial decisions regarding store layouts,
promotional campaigns etc. in order to increase the likelihood of impulse buying, cross -selling and up-selling.
A set of transactional data was collected from a high-end high street fashion retailer and four association rules were
mined: Skirts ⟹ Shirts, Bags ⟹ Shoes, Belts ⟹Dresses and Bags ⟹ Dresses. An online survey was then carried out in
order to gather sufficient information to validate, explore and explain the association rules found.
1. Introduction
Advances in technology and e-commerce can together, generate a large amount of data from sources such as, websites,
electronic POS systems, loyalty programs and social media sites. In particular, transactional data can provide a useful
insight into consumer habits and behaviour when analysed proficiently. The main element of transactional data is the
set of items in each shopping basket purchased by each individual customer; other elements are: time of sale, location,
total spending, customer identifier etc. To gain business value and competi tive advantage from these data, market
basket analysis can be applied. “Market-basket analysis refers to methodologies studying the composition of a shopping
basket of products purchased during a single shopping event.”(Olson and Delen, 2008, p.55).
Through this analysis, interesting buying patterns and product associations can be identified. Findings can then be used
in managerial decision-making and strategic planning exercises in store such as, store design and promotion campaigns
that, in-turn, increases cross-selling, up-selling and impulse buying (Chen, et al., 2006). The application of market
basket analysis is not limited to in-store transactions, as it can be applied to online baskets, where results can be used
in personalised recommendation systems implemented by e-retailers such as amazon.com and asos.com (Sekozawa et
al., 2011). With the fashion industry being extremely competitive, fashion retailers need to better understand their
customers’ purchase behaviours, in order to optimise placement and targeting of their products, maximising their
business opportunities.
In the retailing industry, market basket analysis is widely applied to grocery stores to examine the composition of
shopping baskets (Giudici, 2002, Manchanda et al., 1999). The results often suggest that there are some interesting
associations between products often purchased together. A classic example is the unexpected association between
baby diapers and beer bought by men on Friday afternoons; as discovered by the supermarket, Wal-Mart (Martin,
2000). Wal-Mart then formulated strategic marketing plans accordingly by placing premium beer adjacent to baby
diapers. As a result, more premium beer was purchased due to convenience and impulse; meaning the up-selling and
cross-selling of premium beer was successful and sales of premium beer increased significantly . More associations
were found between cake mix and cake frosting, detergent and softener by Manchanda et al. (1999) and bacon and eggs
by Niraj et al. (2008).
Hand et al., (2001) indicated that many published papers concentrated on the market basket analysis algorithms rather
than their applications. Therefore, this paper is focused on examining the association between fashion items, i.e.

450
dresses and shoes. This paper will first review the relevant research context and literatures, then it will discussed
market basket analysis, after that a case study is introduced and the fpaper will end with conclusion and future works.
2. Literature review
The fashion industry is worth investing in as £48.008bn was spent on clothing and adornment in 2011, an increase of
31% over the last decade, according to the ‘British Lifestyles 2011 Consumer Expenditure Report’ (Mintel 2011a). This
shows that a significant amount of money is being invested in the fashion industry and customers are willing to spend
on fashion. This research is therefore, very worthwhile and may help to push the fashion retailing business to further
success by gaining a better understanding of customers’ buying behavior. Identifying the so-called, ‘driver products’, i.e.
items which drive traffic into the store, is very important to a retailer. It is extremely valuable with regards to inventory
(Gutierrez, 2006). Retailers must be able to judge the correct amount of stock to hold for popular items, as a lack of
stock can lower customer satisfaction and may reduce the likelihood of extra purchases or repeat visits. Additionally,
identification of driver products can be used to determine which items to put on promotion. Promoting driver products
may increase sales of associated products; however promoting so-called, ‘filler products’ will not bring additional sales
(Gutierrez, 2006).
Associations between products can be quantified using association rules, which indicate the likelihood of certain items
being purchased together (Brin et al., 1997). A good understanding of these associations can enable effective store
planning to create a convenient shopping experience, while encouraging customers into impulse purchases.
Additionally, product associations can assist in product bundling, promotional campaigns and sales forecasting.
Market-basket analysis is a marketing methodology used to analyse the composition of shopping baskets, where each
basket contains products purchased during a single shopping event (Giudici, 2003). The objective of market basket
analysis is to generate business values from large sets of raw transactional data, resulting sets of interesting and
previously uncovered knowledge. Manchanda et al. (1999) and Russell and Petersen (2000) applied market basket
analysis to grocery stores.
Exploratory approach presents previously undiscovered category relationships in a more aggregate manner, whereas
explanatory approach is more targeted, with known variables to be analysed (Mild and Reutterer, 2003). Explanatory
approach aims to study the effect of marketing mix and demographic variables, such as price, brand, in-store marketing
campaign, personal income and employment status on choice across multiple categories (Mild and Reutterer, 2003 and
Hoch et al., 1995).
The data mining techniques; association rules mining is used in the application of market basket analysis, to identify
consumer purchase patterns, such as items associations and items that are frequently purchased together (frequent
itemsets). These findings can aid in managerial decision-making and strategic planning exercises such as, store design
and promotion campaigns. 38% of retailers surveyed by Nishi (2005) found the application of market basket analysis
had a positive effect on their business.
Findings from the application of association rules are then validated and further investigated through questionnaires to
understand the motivations and reasoning behind associations of the bundles of goods in each market basket and why
items are or are not often purchased together.
3. Market basket analysis
“A market basket consists of a set of items (or categories) purchased by a customer during one single shopping
occasion.”(Mild and Reutterer, 2003, p.124) and market basket analysis is the study of the composition of such market
baskets (Giudici, 2003). According to Mild and Reutterer (2003), Boztuğ and Silberhorn, (2006) and Boztuğ & Reutterer
(2008), there are two types of approach when applying market basket analysis; exploratory and explanatory. The
exploratory approach aims to uncover and summarise the interrelationships within categories or between items often
purchased together (Boztuğ & Reutterer, 2008). Under exploratory approaches, Julander (1992) and Dickinson et al.
(1992) used pairwise association measures to identify relationships between item pairs while Agrawal and Srikant
(1994), Buechter and Wirth (1998) and Hildermand et al. (1998) discovered association rules between subsets of
categories purchased together using data mining technique.

451
3.1 Definition of association rules
Market basket analysis can be carried out in exploratory or explanatory approaches through different statistical models
and data mining techniques. Due to the lack of literature of market basket analysis in fashion retailing, an exploratory
approach will be taken in this study, where association rule mining wil l be applied as definitions of marketing
objectives and testing hypothesises are not required (Giudici, 2003). Association rule mining was first proposed by
Agrawal et al. (1993), which aimed to uncover relationships between items within a large set of transactional data.
Let be a set of items. Let D be a set of transactions, where each transaction T is a set of items such
that . is a set of some items in and a transaction T contains X, if . An association rule is an implication
statement expressed in the form of ‘ If X , then Y ’ (i.e. X ÞY), where , and (Agrawal et
al., 1993). If consumers purchase X , it is likely that they also purchase Y , where X is an antecedent and Y is a
consequent (Agrawal et al., 1993).
3.2 Common measures of association rule
Many association rules can be generated from market basket analysis and only the ‘interesting’ ones can give real
business value. It is difficult to determine and quantify the ‘interestingness’ or ‘goodness’ of an association rule using
one single metric (Bayardo and Agrawal, 1999). Agrawal et al. (1993) developed the measures of “Support” and
“Confidence” where “Support corresponds to statistical significance” and “Confidence is a measure of the rule’s strength”
(Agrawal et al., 1993, p.208). However, Brin et al. (1997) believed there is a downside in Confidence, as it does not take
into account the probability of the consequent occurring and therefore developed “Lift” as a measure of interestingness,
which was called “Interest” initially.
3.2.1 Support of an association rule
“Support of a rule is a relative frequency that indicates the proportion of transactions in which the rule is observed.”
(Giudici, 2003, p.123) It measures how likely it is that a bundle of items is purchased together and it is often given as a
percentage. The Support of { X ÞY} is the number of transactions including both and divided by the total
number of transactions.

452
c
Support can also be interpreted as the probability of occurrence, the probability of both X and occurring ( and
are being purchased together), statistically written as = P ( XÇY)
Example 3.2:
The higher the Support, the more frequent of and are purchased together within a set a transactional data.

453
c
3.2.2 Confidence of an association rule
“Confidence is the conditional probability of the consequent given antecedent.” (Giudici, 2003, p.123). It measures the
level dependence of consequent on the antecedent .
Confidence of { X ÞY} is the probability of both and occurs given has occurred, statistically written as:
Example 3.3:
83.33%
The higher the Confidence, the more likely it is to find in a market basket given is in the market basket.
4. Case study
The target customers of the store being studied being females of all ages, convenience sampling is applied in this study
and the sample size is 250. Online questionnaires are sent out to female members of a social media. The questionnaire
consists of 28 questions, with a mix of multiple-choice, ranking, rating and open-ended questions. The aim of the online
questionnaire is to collect information on consumers' shopping habits and behaviours for fashion items in a p hysical
shopping environment then consequently explore and verify the associations between fashion items in a single transaction
found from data mining. The online questionnaire is based on three themes; demographic, fashion involvement and
consumer purchasing habit/behaviour.
There are 18 categories available in the store and 100 transactions were collected by observation,. The transactional
data is expressed as a data matrix where each row represents a single transaction and each column is marked with
binary variables representing whether or not each specific item was bought (at least once) in that transaction. 1
represents the presence of an item in a transaction, 0 otherwise,. The transactional data is then input into a model
developed in PASW Modeler 13 to mine association rules with the application of Apriori algorithm, see Figure 1.

454
Figure 1. Model developed in PASW Modeler 13 to generate association rules
The association rules, which satisfy both the minimum support threshold of 7% the minimum threshold of confidence
of 50%, are listed in Table 1.
Table 1. List of association rules generated from the transactional data
Association Rule Occurrence Support Confidence
1. Skirts ⟹ Shirts 7 7.00% 77.78%
2. Bags ⟹ Shoes 7 7.00% 58.33%
3. Belts ⟹Dresses 9 9.00% 56.25%
4. Bags ⟹ Dresses 11 11.00% 52.38%
Rule 1: Skirts ⟹ Shirts
Skirts ⟹ Shirts represents the rule “If skirts, then shirts”. The support for the rule is 7%; this means that 7% of the
transactions considered have both shirts and skirts. The confidence of the rule is 77.78%; this suggests that given those
who buy skirts, 77.78% also buy shirts. Lift for the rule is 5.19, much greater than 1, this suggests that there is a
positive association between the occurrence of shirts and the occurrence of skirts.
Rule2: Bags ⟹ Shoes
Bags ⟹ Shoes represents the rule “If bags, then shoes”. The support for the rule is 7%; this means that 7% of the
transactions considered have both bags and shoes. The confidence of the rule is 58.33%; this suggests that given those
who buy bags, 58.33% also buy shoes. Lift for the rule is 1.37, slightly greater than 1, this indicates that bags and shoes
appear more often together than expected. This suggests that there is a positive association between the occurrence of
bags and the occurrence of shoes.
Rule3: Belts ⟹ Dresses
Belts ⟹ Dresses represents the rule “If belts, then dresses”. The support for the rule is 9%; this means that 9% of the
transactions considered have both belts and dresses. The confidence of the rule is 56.25%; this suggests that given
those who buy belts, 56.25% also buy dresses. Lift for the rule is 1.76, greater than 1, this indicates that belts and
dresses appear more often together than expected. This suggests that there is a positive association between the
occurrence of belts and the occurrence of dresses.

455
Rule 4: Bags ⟹Dresses
Bags ⟹ Dresses represents the rule “If bags, then dresses”. The support for the rule is 11%; this means that 11% of the
transactions considered have both bags and dresses. The confidence of the rule is 52.38%; this suggests that given
those who buy bags, 52.38% also buy dresses. Lift for the rule is 1.64, greater than 1, this indicates that bags and
dresses appear more often together than expected. This suggests that there is a positive association between the
occurrence of bags and the occurrence of dresses.
Figure 2. Web graph showing the positive associations between items
The associations between items and the strength of associations are represented by the blue lines and their density.
The heavier the line, the stronger are the association between items.
Conclusion and future work
This paper concerns the understanding of associations between each specified product category at a fashion retailer,
with the aim of gaining a richer understanding of customer purchase behaviour. This paper uncovers the associations
between different categories of fashion products and understands the buying behaviour of the store being studied
using market basket analysis. Such analysis seeks business value from a large set of transactional data to generate
information to aid managerial decisions regarding store layouts, promotional campaigns etc. in order to increase the
likelihood of impulse buying, cross-selling and up-selling.
An insight into customer behaviour was gained from evaluating questionnaire responses , demonstrating the
importance of the qualitative research approach in this piece of study. This insight may initiate effective adjustments to
be made or further investigation to be carried out on the association rules found, allowing targeted strategies to be
made from a managerial perspective.
Market basket analysis was undertaken in this research with an initial aim of identifying associations between fashion
items, for which association rule mining was used. However, association rules lack the ability to investigate and
understand causality of purchases and product associations. Future work can be carried out to search and identify the
causality between the associated fashion items found in this study.
Future work should study sequential transactions possibly using transactional data from a loyalty program, where each
customer has their own personal identifier. This way, patterns can be built up over a series of purchases or even over a
lifetime of purchases, allowing associations between products over two or more transactions to be identified. The same
study can also be applied to online retailers, where the sequential items being put in the shopping basket are recorded.

456
References
Agrawal, R., Imielinski, T. and Swami, A.(1993). Mining association rules between sets of items in large databases. In:
Buneman, P., Jajodia, S. (Eds.), Proceedings of the 1993 ACM SIGMOD International Conference on Management
of Data, Washington, DC, pp. 207–216.
Agrawal, R. and Srikant, R. (1994). Fast Algorithms for Mining Association Rules. In Proceedings of the 20th
International Conference on Very Large Databases , Santiago, Chile. Expanded version available as IBM
Research Report RJ9839, pp 487-499.
Boztuğ, Y. and Silberhorn, N. (2006). Modellierungsansätze in der Warenkorbanalyse im Überblick, Journal für
Betriebswirtschaft, Vol. 56, No. 2, pp.105-128.
Boztuğ, Y. and Reutterer, T. (2008). A Combined Approach for Segment-Specific Analysis of Market Basket Data.
European Journal of Operational Research , Vol. 187, pp. 294-312
Brin, S., Motwani, R. and Silverstein, C. (1997) Beyond market baskets Generalizing association rules to correlation.
Proceedings of the ACM SIGMOD International Conference on Management of Data, pp. 265–276.
Buechter, O. and Wirth, R. (1998). Discovery of association rules over ordinal data: A new and faster algorithm and its
application to basket analysis. Research and Development in Knowledge Discovery and Data Mining , pp. 36-47.
Chen, Y-L., Chen, J-M., Tung,C-W. (2006) A data mining approach for retail knowledge discovery with consideration of
the effect of shelf-space adjacency on sales, Decision Support Systems, Volume 42, Issue 3, Pages 1503-1520.
Dickinson, R., Harris, F. and Sircar, S. Merchandise compatibility: An exploratory study of its measurement and effect on
department store performance. International Review of Retail, Distribution and Consumer Research , 2 (4)
(1992), pp. 351–379
Hand, Mannila and Smyth. 2001. Principles of Data Mining. MIT Press.
Hausman, A. (2000) A multi-method investigation of consumer motivations in impulse buying behavior, Journal of
Consumer Marketing, Vol.17, No.15, pp403-19.
Hilderman, R., Hamilton, H. and B. Barber. Ranking the interestingness of summaries from data mining systems. In Proc.
of the 12th International Florida Artificial Intelligence Research Symposium (FLAIRS'99) , pp.100-106, Orlando,
FL, May 1999.
Hoch, S.J. and Kim, B.D., Montgomery, A.L. and Rossi, P.E. Determinants of Store-Level Price Elasticity. Journal of
Marketing Research, Vol. 32, No. 1 (Feb., 1995), pp. 17-29.
Julander, C. (1992). Basket Analysis: A New Way of Analysing Scanner Data. International Journal of Retail & Distribution
Management 20 (7), pp. 10-18.
Giudici, P. (2003) Applied Data Mining: Statistical Methods for Business and Industry , Wiley, Chichester.
Gutierrez. 2006. Demystifying Market Basket Analysis. Information Management Special Reports. [Online] Available at:
http://www.information-management.com/specialreports/20061031/1067598-1.html [Accessed on 13
October 2011].
Manchanda, P., Ansari, A. and Gupta, S. (1999) The ‘Shopping Basket:’ A Model for Multi -Category Purchase Incidence
Decisions. Marketing Science, Vol.18 (2), pp. 95–114.
Martin, R. (1987) Fashion and surrealism. New York: Rizzoli.
Mild, A., and Reutterer, T. (2003). An improved collaborative filtering approach for predicting cross -category purchase
based on binary market basket data. Journal of Retailing and Consumer Services, 10, pp. 123–133
Mintel (2009) Mintel Report: Mintel's Global Market Navigator reveals fashionable markets Sep 2009. Mintel Oxygen
Report. [Online] available at http://www.mintel.com/press-centre/press-releases/396/mintels-global-
market-navigator-reveals-fashionable-markets [accessed 08-12-2011]
Niraj, Padmanabhan and Seetharaman. 2008. A Cross-Category Model of Households’ Incidence and Quantity Decisions.
Marketing Science, Vol.27, No. 2, pp.225-235.

457
Olson and Delen. 2008. Advanced Data Mining Techniques. Springer.
Russell, G. J. and Petersen A. (2000). Analysis of Cross Category Dependence in Market Basket Selection. Journal of
Retailing, 76 (3), pp. 367-392.
Sekozawa, Mitsuhashi and Ozawa. 2011. One-to-One Recommendation System in Apparel Online Shopping. Electronics
and Communications in Japan. Volume 94, Issue1, pp.51–60.

458
Consumer behavior in Retail: online and
offline – what is the future? Consumer Buying Behavior; Commitment; Loyalty; Retail; Online; Offline.
Sílvia Faria, IPAM – The Marketing School, [email protected]
Jael Assunção, ESERP, [email protected]
Vítor Carvalho, IPAM – The Marketing School, [email protected]
Ana Silva, IPAM – The Marketing School, [email protected]
Pedro Ferreira, IPAM – The Marketing School, [email protected]
Eva Reinares, URJC, [email protected]
Having the cooperation of some IPAM’s students: Cunha, R.; Fernandes, R.; Rodrigues, M.; Santos, F.; Silva, N.
Abstract
Modern Distribution has suffered many changes in the last decades in terms of the stores layout, variety of offers
(products, services, brands) and price strategies; it is one of the sectors with the highest rate of employment,
significantly contributing to the national GDP, a mature market with a growing number of individuals increasingly
informed and very demanding, able to gather various information about products and services, aware of the need to
save money but eager for brands that surprises them.
Our purpose is to understand if it is possible, in the retail area, to consider having only online stores, since e-commerce
in Portugal has been changing over the past few years and the numbers registered in the virtual trade have been
growing and constituting a nice scenario or, alternatively, if it is important to offer both possibilities. In a more specific
way, we want to understand the importance of offering good buying experiences, both on off and online stores, to make
consumer feel satisfied and, therefore, committed to a certain point of sale – Player – and capable t develop loyalty.
This article focuses on the major groups of the Portuguese retail sector aiming to analyze these two scenarios and a
model is proposed, through the formulation of some Hypotheses, as a result of the bibliographic study done to the
related concepts we think are fundamental to make the consumer want to establish a temporal relationship with a
retail group; in a second part, to test the suggested model, we’ve decided to develop a questionnaire to a sample of 165
persons and to treat data using SPSS.
According to data it seems that offering the two possibilities is, in fact, the best option; the actual crisis situation created
a very rational consumer, totally aware of the need to save money because his/her income has been reduced due to
politic and economic measures adopted. As a consequence, the individuals want to be in control of the buying process,
having the possibility to easily access to a lot of information about products and services and, therefore, make the right
choice.
Good shopping experiences, both in on and offline stores, lead to Satisfaction that leads to Commitment and, therefore,
increases the possibility for the client to become Loyal (and recommend the on and offline store to their closest
friends).
1. Introduction
Consumer behavior has changed significantly in regard to the choice of what to buy, where, when and how; the

459
evolution and changes in consumer habits are closely related to the appearance of new technologies and the way the
consumer chooses to purchase. In the present, consumer goods are not only products made available in the
marketplace to attract attention, to be purchased, to be used and consumed in order to satisfy a need or desire
(KotlerandArmstrong, 2006), but its goal is to exceed expectations and to create emotions in the consumer (Kotler et
al, 2011).
Retailers should always bear in mind that their customer’s satisfaction and commitment are keywords to their own
success; these two concepts must be managed in a conscious way; the current crisis environment highly influences
consumer choices and sets very clear rules regarding their consumption habits and restrictions, therefore, Portuguese
companies must adapt to new realities and trends. One of the main trends is the use of online platforms as a preferred
channel to choose or purchase products and services.
In this study we analyze the growth of this phenomenon in the recent years and what implications it may have in the
future; some changes need to be made and the Portuguese players must be vigilant for signs that consumers convey
when they are assessing the available data on rates of internet penetration, use of websites, social networking and
registry queries online.
After a bibliography research on internet actual use and on the issues that must be carefully managed - Satisfaction,
Commitment and Loyalty – to keep consumers wanting to come back and repurchase, we’ve decided to develop a
questionnaire to ask directly the final consumer about his/her plans towards shopping in the future; regardless of the
optimism of some authors that really trust the continuous growth of the new technologies our intention is to get an
impartial perspective from final consumers and, therefore, breaking grounds to collect realistic data that can be used by
companies playing in this sector: diversity (meaning, offering clients both possibilities to find and buy products and
services) also means Satisfaction which, in turn, may lead consumer to become committed and, ideally, loyal to a certain
retail player.
2. Buying behaviour
Although we are living an economic crisis and there is no doubt that this environment is changing buying behaviors,
there are still opportunities for the modern distribution players because the consumers will continue to evolve and
modern distribution should evolve with them (Gibson, 2012). Understanding the current market in its various areas of
trade must go beyond studying the economic process to adopting marketing strategies that involves producing and
distributing consumer goods or services (Pinheiro and Castro, 2006). The consumer has played such a fundamental role
in the market since the 1950’s that science, such as Psychology, Sociology, Anthropology, Economy and Administration
have been studying him (Pinheiro and Castro, 2006); companies try to define the right planning strategies, using
market research and study’s results to create positive relationships with consumers, as they aim to satisfy their needs
and desires (Kotler et al, 2011).
Hawkins and Coney (2001) state that the consumer behavior is the study of people, groups of people and organizations
and the processes that are constructed for choosing, obtaining, using and assorting consumer goods and services,
promoting ideas and experiences that satisfy their needs and desires; it also studies the impact of these processes both
in public and in private consumption. Other authors are inclined to identify the study of consumer behavior as the set of
physical and mental activities played out by consumers as a result of their decisions, the manner in which they seek,
pick, buy and use products and services to satisfy a latent need (Ehrenber et al, 1990; Engel, 1884).
According to Morrison (2009), consumer behavior is based on the consumer’s decisions that result from the acquisition
and use of the products and services. Churchill and Peter (2000) defend that the decision making processes is
composed by many factors that influence the final buying decision; the social influencing factors (Culture, Sub-culture,
Social class, Reference groups and Family), the marketing influencing factors (Price, Product, Promotion and
Placement) and the situational influencing factors (Physical environment, Social environment, Weather, Nature of the
task and Individual´s physical condition). Motivation is another factor for many authors; Shank (2002) says that
motivation is an inner force that draws the consumer behavior towards the fulfillment of needs. To make a purchase
the consumer uses motivation to satisfy a need that was created from desire. According to Engel et al (1990)
motivation is where consumption starts, where it all begins, with the acknowledgement of a need. In fact, motivation is
a dynamic factor that is constantly changing because once a previous set of needs are fulfill ed, new ones arise.
What results consensual is the fact that the consumer buying process is understood as a learning, information-

460
processing and decision-making activity, divided in several consequent steps: problem identification, information
research, alternatives evaluation, purchasing decision and post-purchase behaviour (Bettman, 1979; Dibb et al, 2001;
Jobber, 2001; Boyd et al, 2002; Kotler, 1997; Brassington and Petit, 2003). For any company it is very important to
identify the elements on this decision process, to observe the changes occurring in the individuals over the time and to
prepare adequate answers, in the form of products or services (Rousseau, 2008; Faria et al, 2012).
When a consumer is buying a certain product class for the first time he lacks experience; he/she doesn’t have a set of
decision mediators to help him/her make the right choice. In order to gather all the needed information, he/she
actively searches for information in commercial and social environments (Faria et al, 2012). “Therefore, brands that are
capable of creating additional search components... providing sufficient information for consumers to predict
satisfaction without experiencing the merchandise...” will have an advantage in the consumer’s mind and, therefore, will
reduce the perceived risk associated to buying a product or service (Danaher et al, 2003, pp. 462).
A few years ago, some authors really believed that the sort of persons that used to buy online were different from those
who decided only to shop in a traditional store (Degeratu et al, 2000; Emmanouilides and Hammond, 2000; Danaher et
al, 2003); however, today, some studies seem to prove that there are no differences. In fact, the same person may
decide to buy on and/or offline, according to the situation itself and/or to the type of products and services to be
bought because, in fact, what really matters to actual clients is to be able to gather all the needed information, establish
wise comparisons and, therefore, feel that they are controlling the buying process itself – no longer depending on what
the stores or players decide to offer them (Kwon and Lennon, 2009; Christodoulides, 2011; Faria et al, 2012).
2.1. Choosing the Point of Sale
The physical point of sale continues to play a key and strategic role, being one of the main points of contact between the
brands and the consumers. Many individuals visit and circulate through the commercial spaces without really buying
anything; while some just want to enjoy the spaces, pass time, socialize, be intellectually stimulated, entertain or simply
repeat a previous experience, others choose to delay their purchases because they don’t find everything they need or
simply because they decide to postpone their purchases because they like the ability to see and touch items before
buying them (Joahansson, 2006; Milliward Brown, 2010).
According to a recent study developed in the Portuguese market by ACEPI – E-mail and Interactive Communication
Group – 78% of the Portuguese population buys online (Oliveira, 2012); the results also showed that 43% of the
respondents believed that the percentage will increase until the end of 2012. The Portuguese is online approx. 13, 20
hours per week and they lead the e-mail ranking of the European users (Oliveira, 2012).
Having these figures in mind, one may say that e-commerce is not suffering from crisis (Oliveira, 2012); in fact,
comparing the first three months of 2012 with the same months of 2011 we notice an increase in sales of 57%. This
research also showed us that 97% of the Portuguese consumers use the internet to search for goods and 78% end up by
buying online. Books, magazines, home products, art and decoration were the most purchased products; trips, clothes,
accessorizes, holidays and show tickets are the most sought (Oliveira, 2012).
It is important for our study to realize that the Portuguese consumer is adhering to new technologies and platforms
available to make purchases, due to a considerable number of factors: easy access to internet, Smartphone’s, Laptops,
Tablets with a lower price and also the brands’ capacities to communicate through the internet; in fact, 51% of the
respondents said that internet really helps them to make the wise decisions about the products and services to buy. At
the same time and understanding the need to save money, the consumers look at the internet as a possible way to avoid
picking situations (Oliveira, 2012). Some interesting elements (Oliveira, 2012):
34% of the Portuguese people visit new sites diary;
62% of the Portuguese watch TV by net;
86% of the Portuguese read news on net;
Radio online had an increase of 42% (2011 vs 2010).

461
2.2. Cross Channel Strategy
Nowadays most companies use to distribute products and services via different channels – a multi-channel strategy;
alongside physical stores there are also online stores and e-commerce portals (www.ebeltoftgroup.com). Cross channel
retailing is at a turning point but with a recognizable extent of progress since it started only five or six years ago. This
strategy aims to answer a growing use of internet and new technologies and leads consumers to switch between the
two channels during the buying process - the so called new phenomenon: Research Online, Purchase Offline -
ROPO(www.ebeltoftgroup.com). The ROPO behavior can be categorized in two directions:
The purchase process begins online, with research and with actual acquisition taking place offline (ROPO A);
The research and try in a physical store and the subsequent purchase in the Internet (ROPO B).
The recent consumer studies point out that at times over 50% of the target group scan, research and compare
information online before they finally purchase at the local store (www.ebeltoftgroup.com); this seems to encourage
retailers to embrace cross channel strategy, giving consumers the opportunity to research and know the products they
offer before purchasing them (Danaher et al, 2003; Kwon and Lennon, 2009; Christodoulides, 2011).
3. Satisfaction
Consumer satisfaction is both about regarding consuming a product – consumer goods and services or idea (post-
purchase stage)– as well as all that takes place prior to the purchase (Dubois, 2003; Ferreira et al, 2011); it is a
momentary feeling, one can feel satisfied with a product’s performance, a service or an attendance action (Lovelock,
2001).
According to Kotler (2000, p.58) “…satisfaction is the feeling of pleasure or disappointment resulting from comparing
the performance (or outcome) of a product perceived in relation to the buyer’s expectation”.
In this study’s scope it is important to consider satisfaction as an essential goal for companies, because it is the mean to
get and keep clients (Alves, 2003); recent authors have referred that satisfaction is/should be the ultimate reason to
justify all consumer behavior (Ferreira et al, 2011; Kotler et al, 2011). Moreover, the mere consumer satisfaction is not
enough to attract them: nowadays, it takes more than to merely satisfy, “… you need to delight them” (Mittal et al, 2008,
pp. 345).
When a company starts its activity, it normally has no client portfolio; their efforts should focus exclusively on
attracting new customers. In companies that have been in the market for some time, normally the number of conquered
clients is greater than those they want to attract; this means that the effort towards customer retention should be
greater than the effort to attract new customers (Kotler, 1997; Danaher et al, 2003). Unfortunately, companies dedicate
themselves largely on concquering new customers and give little attention to customer retention and/or to apply
efforts in order to establish a stronger relation with their actual/current customers: “…companies spend 70% of their
marketing budgets on acquiring new customers while 90% of revenues result from current customers” ( Kotler, 1997,
p.26). The basic principle should be the opposite because the market share is a retrospective indicator while customer
satisfaction is a prospective indicator; more, it is a clear indicator of a close relationship with clients, a thorough
understanding of their actions and needs, anticipating them and proactively presenting solutions instead of presenting
problems and doubts (Ferreira et al, 2011; Kotler et al, 2011; Faria et al, 2012). The idea that is consensually accepted
is that highly satisfied customers are less likely to switch suppliers , act as advocates and as the company’s prescribers,
increasing its importance in the market, causing more people and/or organizations to approach them and become new
clients (Kotler, 1997).
Satisfaction allows the client to gain confidence and start a loyal relationship. It is also an important premise that
clients should be loyal to a brand, making repeated purchases and establishing an affectionate relationship with it; this
relationship will allow managers to measure the customer’s affection and sensitivity towards the brand (Aaker, Kumar,
& Day, 2001). Nevertheless, successful companies and brands are the ones that achieve more than their customer’s
satisfaction (meet your client´s needs): they manage to surprise them, give them more than they expected to have
(Kotler and Armstrong, 2006; Silverstein and Butman, 2008; Mittal et al, 2008; Silva, 2009; Ferreira et al, 2011) and,
furthermore help them feel that they have gathered all the information needed to ensure a proper decision (Pires and
Santos, 1996; Azjen, 2001; Danaher et al, 2003; Foxall, 2003; Kotler and Armstrong, 2006; Mattei et al, 2006; Mittal et
al, 2008; Silverstein and Butman, 2008; Kwon and Lennon, 2009; Solomon, 2009; Christodoulides, 2011; Faria et al,

462
2012), in terms of products, services and points of sale (Sproles and Kendall, 1986; Sproles and Sproles, 1990; Faria,
2003; Faria et al, 2012). Therefore, to give the consumer the opportunity to decide what, where, when and how much to
buy is the only way to ensure a good shopping experience and, therefore, to achieve consumers’ satisfaction and make
them come back (Kwon and Lennon, 2009; Christodoulides, 2011; Faria et al, 2012).
4. Commitment
“Commitment corresponds to the psychological and emotional involvement established with a brand before the
consumer is able to determine that the repeat purchase behavior results from a sense of loyalty” (Vieira, 2011, pp. 15).
According to several authors, different motivations can be found behind the desire to remain and therefore, different
kinds of relationships are established with a brand: affective and calculated (Gundlach et al, 1995; Geyskens et al, 1996;
Samuelson and Sandvik, 1999). That is why Vieira and Baptista (2007) have stated, in a complementary way, the
existence of various types of commitment: calculated (calculative, as stated originally), defining it as the individua l’s
connection to a brand (or product, service, point of sale…company) based on the perceived costs associated with a
decision to drop (exit cost) and affective, defining it as a sense of pleasure and well-being one feels to stay in a
relationship with a brand - product, service, point of sale…organization (Faria et al, 2012).
The commitment does not appear immediately, it is built through a relationship that grows between both parties. The
authors’ general opinion is that consumer’s commitment is only related to the salesperson/service provide; a high level
of commitment is a powerful emotional barrier in changing consumer behavior in respect to the change of brand or
product (Hultén, 2007), i.e., the higher the commitment, the less likely consumers switch brands or products they
usually consume.
According to Hunter and Mukerji (2011), proper strategies to reach our target audience are essential to create a long-
term relationship with customers. Consumer compromise and loyalty can only be achieved through excellent
performance in service providing - when the consumer receives a positive in-shop experience, no matter if it occurs on
or offline (Kwon and Lennon, 2009; Solomon, 2009; Christodoulides, 2011; Faria et al, 2012).
5. Loyalty
The first step towards customer loyalty is customer satisfaction, many times mistaken for loyalty itself (Vilares, 2005);
satisfaction is materialized by a repeated purchasing behavior and loyalty is materialized prior to the buying decision
process: loyalty materializes in intention or willingness to repeat a purchase (previously…).
In increasingly competitive markets and in sectors such as modern distribution, that have been characterized by a
slowdown on growth, companies that emphasize their performance more on acquiring new customers than retaining
current customers enter into highly risky and costly strategies (Rosenberg and Czepiel, 1983; Danaher et al, 2003);
retention related to customer loyalty, as a dimension, has been measured and worked on for a long time (Assael, 1998;
Seth et al, 2001; Mowen, 2003). It is understood that the number of repeated purchases of the same brand (Tucker,
1964; Macconell, 1968; Lawrence, 1969) and the ratio in which it is purchased (Blattberg and Sem, 1976; Wind and
Frank, 1967) demonstrate the existence of loyalty. What the authors aim to demonstrate is that, in fact, repeated
purchases and/or consistent purchases of the same brand or in the same point of sale indicate loyalty towards them
(brands or point of sale); however, the same loyal customers, occasionally buy another brand or visit a different point
of sale (and in the scope of the present study, this could apply to the choice to purchase on a website or in a “real-life”
store) They do not act this way because they feel dissatisfied with their usual brands or point of sale but because they
might be attracted by other drivers such as sales promotions, appealing packs, good information, among others
(Lichtenstein et al, 1993, in Bearden y Netemeyer, 1999; Danaher et al, 2003; Christodoulides, 2011; Faria et al, 2012).
Hence, so that one can speak of customer loyalty, two conditions are necessary: attitude and commitment (Bloemer
and Ruyter, 1997; Chaudhuri and Holbrook, 2001; Fullerton, 2005; Mattei et al, 2006; Mittal et al, 2008); if competitor
companies/brands have lower prices or other attractive characteristics and the customer remains faithful it could be
considered that the companies’ products/brands are emotionally involved with the consumer, so, we are speaking of
loyalty (Faria, 2003; Ponzoa, 2007).
According to Reichheled (1996) there are two types of loyalty: customers who are loyal to the point of sale (the

463
customer knows in which point of sale their preferred products/brands can be found and there is low risk involved)
and the customer that is loyal to the brand (when the customer has already purchased and knows what to expect, the
risk is automatically reduced); being loyal to a brand is reflected in the customer’s action of buying a specific
product/brand. Seth and Sobel (2001) also refer two types of loyalty: loyalty behavior and loyalty attitudes: there is
loyalty behavior when the customer re-purchases, which indicates that the customer is satisfied with the product.
Loyalty attitude exists when the customer’s motivation to buy a company’s product is convenience, or force of habit; the
authors state that this type of loyalty builds unstable relationships, and if competitors offer better conditions this
customer will not be immune.
Seth and Sobel (2001) also say that behavior and attitude loyalty define a cycle composed of five stages that the
customer will go through whenever a purchase is made: the first stage is characterized as an initiating stage in which
the customer is made aware of the product and purchases it. Afterwards, the customer will go through two stages,
evaluating post-purchase and the new purchase decision. If the latter is confirmed then the fifth stage will be
implemented and the cycle completed, achieving a closed circuit, i.e., a repeated purchase and, thus, establishing a
loyalty connection.
A client’s loyalty is what all companies aspire, and retaining clients mean lessening costs (compared with that of
attracting new ones), especially in such a time of economic instability and increasingly competitive markets. One of the
most important factor and the one that has greater impact in customer loyalty is creating a good experience in the way
companies and their clients get in touch, not only at the time of purchase but over the moments of consumption and,
particularly, in the post-sale (Dionisio, 2009). In fact, our emotions are what keep us loyal in our relationships, making
them more durable and stable. The best result is obtained and the relationships strengthened when the
complementarity of both forms of loyalty are promoted and integrated (Dionisio, 2009).
It is important to point out that loyal customers are not necessarily satisfied but that satisfied customers tend to be
loyal (Fornell, 1992). The modern believes on customer satisfaction and loyalty has a seductive logic: simply satisfy
your customers and they will love you (Shaw, 1998).
To a considerable amount of authors, loyalty is an intention or predisposition ( Vilares, 2005, among others) and loyalty
is associated with customer retention (Griffin, 1998) or re-purchase; however, many authors consider them as
synonyms (Day, 1969; Jacoby and Chestnut, 1978; Solomon, 1996; Too et al, 2001; Faria, 2003; Fullerton, 2005; Gómez,
2009; Samaha, et al, 2011) so our the decision was to use the indistinct expressions fidelity and loyalty in the present
study.
What seems to be consensual, nowadays, is that loyal clients stay with a certain brand or point of sale and that a good
online store may contribute in a positive way to a great number of loyal ty clients (Danaher et al, 2003; Christodoulides,
2011).
6. Modern Distribution in an European perspective
Throughout the last 10 years a lot of economic and social changes happened in Europe causing a significant change in
the retail sector (Cliquet, 2000; Flavián et al, 2002; Fernandes, 2007; Rousseau, 2008) concerning the mix of products
available in the stores, commercial relation between Suppliers, Distributors and final Consumers. As far as consumers
are concerned, we are facing a tendency to an older population all over the European countries but with particular
impact in Portugal. Until 2008 we were watching a growth in the families’ buying power but, from 2009, the tendency is
the opposite, with most of the countries having to face a gradual loss of the purchasing power (despite the crisis
situation there are still some societies that reveal a strong propensity for purchase but in a more rational way, with
families equitably distributing their incomes for different types of products). In a general way one may say that, all over
Europe we are having an increase in the population educational level and in the number of women working actively; as
a consequence some changes in the consumption habits are being felt: (ex.: food – an increase in the number of pre-
cooked meals selled in the different stores and also the development of powerful household appliances. Last of all we
have to consider, also, the growing concern about environmental and health care issues that are also responsible for the
considerable number of changes and adaptations in the consumption patterns. If we think about suppliers it is
undeniable that they are feeling the need to adapt their products and services to the new market Tendencies and to the
new type of consumers, that became well informed and demanding persons.
Distributors also felt the need to adapt their business model, mainly the stores and their lay -out (ex.: increasing the

464
number of cash registers), changing opening and closing hours and trying to offer a greater diversity of products and
services (ex.: delivering products at home; online requests; means of transport); at the same time they introduced some
technological innovations, such as self-service cash registers, they decided to pay more attention to the shelves ,
categories’ management and to constantly look for prices (shopping’s).
Europe has a retail sector mainly concentrated in a few number of players (Flavian et al, 2002; Fernandes, 2007):
Carrefour (a French group); Metro (Germany); Tesco (British); Rewe (Germany ); Auchan (French); Intermarché
(French); Schwarz (Germany); Aldi (Germany); Edeka (Germany); Casino (French).
6.1. Modern Distribution in Portugal
The eighties in Portugal were a period with substantial changes happening in different areas, having a di rect effect in
the consumers’ behavior (Farhangmehr and Veiga, 1995): the country faced a stabilization of the political life and, by
entering the European union, a significant improvement in the population living conditions which lead to the opening
of new and different stores (Alturas, 2003). That explains what we have today: different types of stores, different ways
of selling products, different brands and different ways to communicate with the consumers (Alturas, 2003; Rousseau,
2008).
Stores are targeted according to their price strategies, services offered and variety of assortment (brands and
products); we have, mainly, Hyper and Supermarkets that are distinct because of their size, variety of products in
shelves and the diversity of sections and space allocated to them (Rousseau, 2008); Supermarkets are, usually, located
nearby the places of residence. In the between we use to have Discounts (in Portugal better to call them Soft-Discounts,
because the pure Discount concept was not accepted by the Portuguese population), small supermarkets with a smaller
variety of products, betting essentially in the Distributors’ Own Brands/Products, combined with the leading and sub -
leading brand (Rousseau, 2008) and choosing to the same prices all year round (avoiding promotions except for short
periods of time – INandOUT Actions). We are talking about Pingo Doce, Lidl and Minipreço, noticing that the last two
were pure Discounts that decided to reposition themselves as nearby supermarkets, including promotions (Li dl with
just-in-time actions; Minipreço with a loyalty card); only Pingo Doce, until the 1st May of 2012 still worked as a Discount
(better, Soft-Discount) but, nowadays, is also a nearby supermarket with competitive promotions (Faria et al, 2012).
According to AcNielsen recent studies, the Portuguese market has the following players:
Graphic 1 – NATIONAL PLAYERS’MARKET SHARE – The different Groups
Source: AcNielsen data, 2012
The leading brands are Continente (Sonae) and Pingo Doce (Jerónimo Martins) and this still happens in 2013 with
Continente being the brand that the Portuguese people trust the most.
7. Methodology
Recent studies have shown that nowadays, individuals have a strong wish to be able to look for products and services
online; it is a fact that in the present day it is not possible to dissociate technology from the retail sector (Desphande,
2002; Danaher et al, 2003; Morrissey, 2005; Kwon and Lennon, 2009; Christodoulides, 2011; Shahney and Kotler,

465
2011; Marques, 2012). The new electronic channels are thus changing the way companies interact with their
customers, and this facilitates or may facilitate various marketing strategies adopted by the companies (ex.: direct
marketing, relationship marketing and personalization) and contribute toward customer’s loyalty (Evans and Warster,
1997; Kara and Kaynak, 1997; Peters, 1998; Srirojanant and Thirkell, 1998; Danaher et al, 2003; Christodoulides, 2011;
Wen et al, 2011). Consumers growingly tend to be online users, seeking mechanisms of self-service and easier
alternatives for finding information, critical for various purchasing decisions and allow quick comparisons of the
various selling points of modern distribution (Punj and Starlin, 1983; Alba et al, 1997; Brynjolfsson and Smith, 2000;
Howard et al, 2001; Shira et al, 2001; Danaher et al, 2003; Holloway and Beaty, 2003; Hoffman et al, 2004; Johnson,
2004; Shih, 2004; Ferbes and Hoffman, 2005; Achille, 2008; Kim et al, 2009; Christodoulides, 2011; Wei et al, 2011;
Wen et al, 2011). On the other hand, this group of individuals does not tend to see shopping as a pleasurable activity
(Sproles and Kendall, 1986; Sproles and Sproles, 1990), so the online option seems to them the best solution.
H1: It is expected that with the increasing use of the internet and the continuous adoption for new technologies
a considerable number of individuals start enjoying purchasing online and, as a consequence, become
Satisfied, developing a sense of commitment and loyalty.
For some authors, however, the consumer, in regard to retail stores, primarily demands a sensory analysis of the
product in order to make the purchase decision; clients prefer to touch, feel the product to sense they are getting the
best possible quality (Sproles and Kendall, 1986; Sproles and Sproles, 1990); in a first phase, the consumer’s confidence
toward a brand depends almost exclusively on the contact between the consumer and the retail store, where human
interaction has increased importance as it poses as a vital factor of the consumer experience (Rojo, 1998; Daskalopolou
and Petro, 2005; Theodoras and Moschuris, 2005; Rousseasu, 2008; Simpson et al, 2008; Silva, 2009; Sum and Hui,
2009). The consumer is able to find the desired product/service, with minimum risk associated at the time of the
purchase decision because there is direct access to what is about to be bought, giving the consumer a sense of
satisfaction (Gemunden, 1985; Oliver and Swan, 1989; McCorkle, 1990; Dowling and Staelin, 1994; Pires and Santos,
1996; Azjen, 2001: Foxall, 2003; Holloway and Beatty, 2003; Forbes and Hoffman, 2005; Kotler and Armstrong, 2006;
Mattei et al, 2006; Mittal et al, 2008; Silverstein and Butman, 2008; Hahn and Kim, 2009; Kwon and Lennon, 2009; Kim
et al, 2009; Solomon, 2009; Wen et al, 2011) and the intention to remain (Sproles and Kendall, 1986; Sproles and
Sproles, 1990).
H2: Despite the increasing use of internet and the continuous adoption of new technologies it is expected that a
considerable number of individuals still prefer to go shopping in physical stores, wanting to have direct
interaction with the products and persons and, though, feeling satisfied, committed and loyal.
For some authors, the ideal for a considerable number of individuals seems to be the combination of both options
(Danaher et al, 2003; Christodoulides, 2011). The online retail serves mostly as a search engine for product information
and then boosting offline purchasing; through offline service consumers have access e.g. to touch, smell and adjust.
Players who use both online and offline service, can fully interact and create a better outcome for a company through
granting product information and to allow its physical representation in stores, facilitating the individual’s decision
making process; another point to consider is that certain product categories are more favorable to be purchased online
than in the offline retail, this is due to concerns regarding how returns and refunds are managed, i.e. security of e.g.
services such as computer programs and leisure activities (Punj and Staelin, 1983; Danaher et al, 2003; Kim et al, 2005;
MCCorkel, 1990; Elliot and Fowell, 2000; Jihyun and Park, 2005; Levi et al, 2005; Christodoulides, 2011). Thus:
H3: It is expected that a considerable number of individuals prefer market players that enable them to gather
information and decide on the completion of the purchase in online and offline stores.
As the result of the present study’s scope and it’s bibliographic revision, satisfaction is understood as the ultimate
reason for any consumer behavior, thus, a major concern for companies/brands (Ferreira et al, 2011; Kotler, 2011) is to
understand the need to satisfy and delight consumers so that it is their wish to establish a long term relationship and a
willingness to consider them at the moment to purchase a product or service, no matter in a on or offline perspective
(Reicheld, 1996; Seth and Sobel, 2001; Solomon, 2002; Danaher et al, 2003; Vilares, 2005; Vieira and Baptista, 2007;
Mittal et al, 2008; Christodoulides, 2011; Hunter and Mukerji, 2011; Samaha et al, 2011; Dionisio, 2009; Faria et al,
2012). The higher the commitment, the less likely consumers will switch brands, products or stores (Húlten, 2007;
Faria et al, 2012). The consumer’s compromise and loyalty can only be achieved through excellent performance and a
pleasant experience in the moment of buying, regardless of on or offline stores; satisfaction seems to increase

466
commitment that seems to lead to loyalty and only by this can a retail player ensure a considerable number of clients
and a competitive position in the market (Danaher et al, 2003; Christodoulides, 2011; Faria et al, 2012). Therefore:
H4: I t is expected that once feeling Satisfied with a buying experience, on/and or offline, consumers tend to
develop the intention to stay – Commitment.
And
H5: It is expected that once individuals develop the intention to stay - Commitment- they will develop a full
identification and, as a consequence, feel prone to re-purchase- Loyalty (to on and/or offline stores).
8. Investigation and Conceptual Model
The Conceptual Model in Scheme:
Scheme n. 1
9. Study’s’ Description
We’ve decided to do a quantitative research using a sample of 165 valid answers; Googledocs was the tool used to
develop and applying the questionnaire; sample was no probabilistic, by convenience - contact network of the
researchers – due to the financial and timing resources available. Table 1 describes our sample:
Table 1 - Samples’ main Characteristics
Gender M 92 55,8%
F 73 44,2%
Age Between 15 and 24 19 11,5%
Between 25 and 34 44 26,7%
Between 35 and 44 61 37,0%
Between 45 and 54 37 22,4%
Between 55 and 64 3 1,8%
More than 64 1 0,6%
Region Porto 60 36%
Vila Nova de Gaia 27 16%
Matosinhos 17 10%
Maia 9 5%
Lisboa 30 18%

467
Aveiro 4 2%
Viana do Castelo 4 2%
Vila do Conde 4 2%
Braga 6 4%
Others (2) 4 2%
Qualifications Secondary (12th ) 37 22%
Higher Education 97 59%
Postgraduate Education 31 19%
Trying to summarize one may say that the majority of respondents were male (55,8%), between 25 and 54 years of age,
mainly from Oporto (62%) and Lisbon (20%, since “others” were regions close to this town). Only individuals with
more than the secondary degree of education answered our questionnaire (what is acceptable considering the range of
ages and, also, the networking of the investigators).
92% of the respondents already used the internet to shop and the majority of them uses internet for more than 9 years
(66%). In a general way one may say that our respondents can be divided in two important groups, considering time
spend on net: 26% between 4 and 10 hours and 23% more than 22 hours; seems possible for us to say that time spend
using internet is high. The favorite place to access net is at home (64%), followed by the working place (32%).
As far as services and resources are concerned, access to the e-mail appears as the first option (46%), followed by
research for information and using social networks (both with 22%, each); for buying we had just 1% of answers.
Regarding shopping online, most of the respondents said that they carried out online purchases for less than 1 year
(24%) and between 3 to 6 years (24%); in the last six months 21% of the individuals made 2 purchases and 22% more
than 5 purchases online. Products having a higher demand are books (435), informatics (45%), clothes (33%), products
of personal hygiene (26%), household appliances (19%) and food (18%), which meets the previous studied on the
Portuguese population habits (Oliveira, 2012).
10. Variables and respective Scales, Measures and Psychometric Qualities
In order to reduce the number of variables that were used to measure each construct we’ve decided to do a PCA; as far
as the Cronbach Alpha is concerned (index α that determines how consistently contribute the items to the unweighted
sum of the instrument, on a scale ranging from 0 to 1 - internal consistency of the scale) - Curtain (1993) describes it as
a measure of reliability – we’ve choose to follow the measure proposed by Murphy and Davidsholder, 1988, but
proceeding according to Debellis (1991), who argues that for research in the area of social and behavioral sciences (e.g.,
consumer behavior), α of 0.60 is coming to be considered acceptable if the treatment makes use of a high level of
caution and care (in Faria et al, 2012).
Table 2 - α-Reliability Measure Under Debellis (1991)
Reliability α considered aceptable
Unacceptable Reliability <0.6 (except for studies in the area of social and behavioral sciences (Debellis, 1991)
Low Reliability 0.7
Moderate to High Reliability 0.8-0.9
High Relizability > 0.9
Source: adapted from Davidsholder, 1988 and Debellis, 1991, in Faria et al, 2012
Next we analyze each of the variables that constitute the Principal Component Analysis model (PCA):
SATISFACTION
We performed a Principal Component Analysis (PCA) with all the items and we’ve reached 2 factors afterwards named
F1 – SAT. ONLINE and F2 – SAT. OFFLINE; Cronbach’ Alpha with Acceptable to Moderate Reliability (0,651 to 0,852);

468
KMO of 0,821 and Bartlett’ test inferior to 0,05 therefore, correlation between the two variables and good adequacy;
total variance explained of 81,6%.
Table 3 - Exploratory Factor Analysis of Satisfaction Scale
F1 F2 Comunality
49,047 32,520
81,567
0,888 0,761
3 2
2,524 1,554
0,739
α Cronbach
Number of itens
Eigen Values after Rotation
α Cronbach total (6 itens)
F1 - Offline; F2 - Online
Q1 0,892 0,804
% Variance
% Variance Acumulated
Q2 0,911 0,845
Q3 0,901 0,813
I'm very satisfied with service of the online stores I've
choose.
My option for the physical (offline) store was well done.
I'm very satisfied with the service of the physical
(offline) stores I've choose.
Q6 Shopping in this stores really exceed my expectations. 0,867 0,752
Iten
Q4 0,928 0,865My option for the Online Store was well done.
Source: adapted from SPSS
It is remarkable to notice, whatever, the higher values reached in the 1st factor – online stores -, compared to the 2nd
factor – offline stores.
COMMITMENT
After the Principal Component Analysis (PCA) we’ve reached one factor named COM.; Cronbach’ Alpha with Low to
Moderate Reliability (0,788); KMO of 0,500 and Bartlett’ test of Sph. inferior to 0,05 which means good adequacy. Total
variance explained of 82,3%.
Table 4 -Exploratory Factor Analysis of Commitment Scale
F1 Comunality
82,537
82,537
0,788
2
1,651
0,788
α Cronbach
Number of itens
Eigenvalues after Rotation
α Cronbach total (2 itens)
To shop online is something I want to repeat and keep on
doing.
% Variance
% Variance Acumulated
Q2I believe that the online stores I choose continue to make a
strong effort to have me coming back.0,908 0,825
Iten
Q1 0,908 0,825
Source: adapted from SPSS
LOYALTY
Principal Component Analysis (PCA) indicated one factor, named LOYALTY; Cronbach’ Alpha with Low to Moderate
Reliability (0,786); KMO of 0,733 and Bartlett’s test of Sph. inferior to 0,05 which means good adequacy. Total variance
explained of 61,9%.

469
Table 5 - Exploratory Factor Analysis of Loyalty Scale
F1 Comunality
61,920
61,920
0,786
4
2,477
0,786α Cronbach total (4 itens)
Q1 I intend to keep buying in these stores in the years to come. 0,672 0,452
% Variance
% Variance Acumulated
α Cronbach
Number of Itens
Eigenvalues after Rotation
Q3 I recomend my friends to go shopping in the same stores I go. 0,827 0,684
Q4 I consider myself as loyal to the stores where I go shopping. 0,773 0,597
Iten
Q2I use to say good things about the store where I go shopping to
other persons.0,862 0,743
Source: adapted from SPSS
11. Research findings presentation, analysis and verification of the model
1st Hypothesis - Made the correlation between individuals who claim to shop online with the variables set out in the
hypothesis 1 - Satisfaction, Loyalty and Commitment - we can say that there is a positive correlation for all of them.
Thus, there are indeed a considerable number of individuals who, as a result of online shopping experiences feel
satisfied, eventually develop a commitment to this method of buying and become loyal to it and, therefore, develop
positive feelings towards the retail player that allows them to do it. Those results meet the previous studies mentioned
in this research project: Pires and Santos, 1996; Azjen, 2001; Danaher et al, 2003; Foxall, 2003; Kotler and Armstrong,
2006; Mattei et al, 2006; Mittal et al, 2008; Silverstein and Butman, 2008; Kwon and Lennon, 2009; Solomon, 2009;
Christodoulides, 2011; Faria et al, 2012; Oliveira, 2012.
2nd Hypothesis - Made the correlation between individuals who claim to shop offline with the variables set out in the
hypothesis 2 - Satisfaction, Loyalty and Commitment - we can say that there is a positive correlation for all of them.
Thus, there are indeed a considerable number of individuals who, as a result of offline shopping experiences feel
satisfied, eventually develop a commitment to this method of buying and become loyal to it. In fact this is something
that a lot of authors defend and the marketing itself advocates (Sproles and Kendall, 1986; Sproles and Sproles, 1990;
Faria, 2003; Kotler and Armstrong, 2006; Silverstein and Butman, 2008; Mittal et al, 2008; Silva, 2009; Ferreira et al,
2011; Kotler et al, 2011).
3rd Hypothesis – Only by descriptive statistic one may say that, in fact, people prefer those players that allow them to
decide where to buy and/or gather information about products and services, meaning, to have the possibility to look for
and decide where to buy in an off and online perspective:
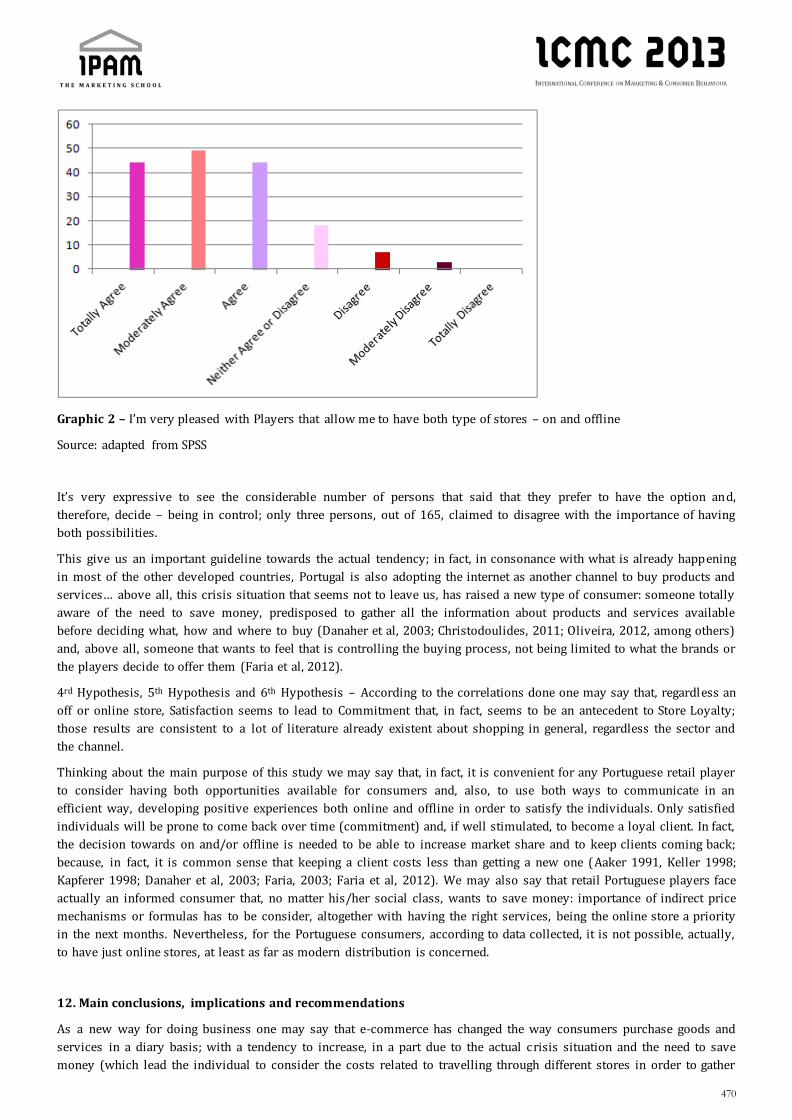
470
Graphic 2 – I’m very pleased with Players that allow me to have both type of stores – on and offline
Source: adapted from SPSS
It’s very expressive to see the considerable number of persons that said that they prefer to have the option and,
therefore, decide – being in control; only three persons, out of 165, claimed to disagree with the importance of having
both possibilities.
This give us an important guideline towards the actual tendency; in fact, in consonance with what is already happening
in most of the other developed countries, Portugal is also adopting the internet as another channel to buy products and
services… above all, this crisis situation that seems not to leave us, has raised a new type of consumer: someone totally
aware of the need to save money, predisposed to gather all the information about products and services available
before deciding what, how and where to buy (Danaher et al, 2003; Christodoulides, 2011; Oliveira, 2012, among others)
and, above all, someone that wants to feel that is controlling the buying process, not being limited to what the brands or
the players decide to offer them (Faria et al, 2012).
4rd Hypothesis, 5th Hypothesis and 6th Hypothesis – According to the correlations done one may say that, regardless an
off or online store, Satisfaction seems to lead to Commitment that, in fact, seems to be an antecedent to Store Loyalty;
those results are consistent to a lot of literature already existent about shopping in general, regardless the sector and
the channel.
Thinking about the main purpose of this study we may say that, in fact, it is convenient for any Portuguese retail player
to consider having both opportunities available for consumers and, also, to use both ways to communicate in an
efficient way, developing positive experiences both online and offline in order to satisfy the individuals. Only satisfied
individuals will be prone to come back over time (commitment) and, if well stimulated, to become a loyal client. In fact,
the decision towards on and/or offline is needed to be able to increase market share and to keep clients coming back;
because, in fact, it is common sense that keeping a client costs less than getting a new one (Aaker 1991, Keller 1998;
Kapferer 1998; Danaher et al, 2003; Faria, 2003; Faria et al, 2012). We may also say that retail Portuguese players face
actually an informed consumer that, no matter his/her social class, wants to save money: importance of indirect price
mechanisms or formulas has to be consider, altogether with having the right services, being the online store a priority
in the next months. Nevertheless, for the Portuguese consumers, according to data collected, it is not possible, actually,
to have just online stores, at least as far as modern distribution is concerned.
12. Main conclusions, implications and recommendations
As a new way for doing business one may say that e-commerce has changed the way consumers purchase goods and
services in a diary basis; with a tendency to increase, in a part due to the actual crisis situation and the need to save
money (which lead the individual to consider the costs related to travelling through different stores in order to gather

471
information and/or get the best prices and promotions), customers are getting used to shop in an online store instead
of going to a physical one (Danaher et al, 2003; Christodoulides, 2011; Wen et al, 2011; Oliveira, 2012).
If we compare the traditional stores – offline and/or face-to-face commerce model –, the online option presents some
advantages, such as products or services specially selected to be sell online (not available in offline stores), plenty of
detailed information and advices and, specially, no temporal or spatial limitations (Christodoulides, 2011; Wen et al,
2011; Oliveira, 2012). In fact it is undeniable that the shopping environment is changing and we are now starting to
face an increasingly mature channel, easy to manage, secure to use and with very interesting and appellative layouts,
which really satisfy the clients and make them wish to return (Christodoulides, 2011; Oliveira, 2012).
It seems very important, according to our study, that retail players consider the fact of having both off and online stores
if they really want to keep their clients and/or conquer potential ones. Online customer retention it is, in fact, a hot
issue in both IT and marketing areas (Danaher et al, 2003; Christodoulides, 2011; Wen et al, 2011). As far as the
Portuguese players are concerned it is in fact crucial to understand what must be done in order to increase the number
of purchasing actions online: what are the key factors that can not only satisfy the consumer but exceed his/her
expectations, leading to the intention to buy over time (commitment)? How to make the perfect marriage between
online and offline experiences, so that picking situations can be created and used in both realities? What type of
promotional actions to develop so that people shall use both channels and, in this way, achieve a win-win perspective
(Loyalty)? This cross-channel action may become one differentiation factor in a sector that has been fighting essentially
based on price and promotions.
Having in mind the need to put the consumer in control of the buying process (Faria et al, 2012), meaning we are now
facing a very rational individual that seeks for the best shopping experience – quality vs price –, gathers information
and compares prices and promotions, this “...underscores the importance of the customer interface, and requires that
retail business models articulate how the retailer will optimize its direct interactions with end customers to strengthen
relationships with them… where the goal was to sell goods and services to ultimate customers, to one focused on
enhancing the customer experience” (Sorescu et al, 2011, pp. 5). A customer that has, in fact, less money to spend and
that, in the Portuguese situation, is getting older and, consequently, needs adapted solutions (easy to find stores, next to
their homes or “in” their own computers, information wisely spread and promotions and stocks variety well
communicated) so that he/she realizes that less risk and effort are associated also when buying mass market products.
References
Aaker, D. A. 1991. Managing Brand Equity: Capitalizing on the Value of a Brand Name. Free Press, New York.
Alturas, B. (Dezembro de 2003). Venda directa: determinantes da aceitação do consumidor. Tese de Doutoramento em
Organização e Gestão de Empresas, esp. em Marketing, ISCTE.
Assael, Henry (1988). Consumer behavior and marketing action. Cincinnati: South-Western College Publishing.
Bettman, J.R. (1979). An Information Processing Theory of Consumer Choice. Addison-Wesley Advances in marketing
Series, Reading, U.S.A.
Blomer, J. and Ruyter, K. (1998). On the relationship between store image, store satisfaction and store loyalty. European
Journal of Marketing, V. 32, nº 5/6, pp. 499-513.
Chaudhuri, A. and Holbrook, M.B. (2001). The Chain of Effects from Brand Trust and Brand Affect to Brand
Performance: the Role of Brand Loyalty. Journal of Marketing, V. 65, nº 2, pp. 81-93.
Christodoulides, G. (2011). Shopping motives as antecedents of e-satisfaction and e-loyalty. Journal of Marketing
Management, Vol. 27, n.s 1-2, February, pp. 181-197.
Churchill, G.A. and Peter, P.J. (2005). Marketing: Criando valor para os clientes. Saraiva, São Paulo.
Cliquet, G. (2008). Large format retailers a French tradition despite reactions. Journal of retailing and Consumer
Services, nº 7, pp. 183-195.
Danaher, P.J.; Wilson, I.W. and Davis, R.A. (2003). A Comparison of Onl ine and Offline Consumer Brand Loyalty.
Marketing Science, Vol. 22, nº 4, Fall 2003, pp. 461-476.

472
Daskalopoulou, I. and Petrou, A. (2005). Service Quality and Store Performance: some evidence from Greece. Managing
Service Quality, 15, 1. ABI/INFORM Global, pp. 24-40.
Day, G.S. (1969). A two dimensional concept of brand loyalty. Journal of Advertiding, Vol. 9, pp. 29-35.
Degeratu, A., Arvind Rangaswamy, J. Wu. 2000. Consumer choice behavior in online and traditional supermarkets: The
effects of brand name, price, and other search attributes. Internat. J. Res.in Marketing 17(1) 55–78.
Dubois, B. (2003). Compreender o Consumidor. Lisboa, Publicações D.Quixote.
Dowling, G.R. and Uncles, M. (1997). Do Customer Loyalty Programs Really Work? Sloan Management Review, Nº 38, Vl.
4, pp. 71-82.
Ehrenberg, A.S.C., Goodhart, G.J. and Barwise, T.P. (1990). Double jeopardy revisited. Journal of Marketing, 54, pp. 82-
91.
Engel, J. F., Blackwell, R. and Miniard, P.W. (1994). Consumer Behavior, Ed. 8, Dryden Press, Setembro.
Emmanouilides, Chris J., Kathy A. Hammond. 2000. Internet usage: Predictors of active users and frequency of use. J.
Interactive Marketing 14(2) 17–32.
Faria, S. (2003). A Fidelização às Marcas Um Processo Continuo e que passa pelo Consumidor Jovem. Tese de Mestrado,
Universidade do Minho.
Faria, S., Costa, P., Lara, E. and Magalhães, C. (2012). Análisis de los principales determinantes en el proceso de
selección de un punto de venta de retail por el consumidor – el caso del mercado portugués. Tese de
Doutoramento, Universidade Rey Juan Carlos, Madrid
Farhangmehr, M., Marques, S. and Silva, J. (1995). Consumer and retailer perceptions in Hypermarkets and Traditional
Retail Stores in Portugal. Journal of Retailing and Consumer Services, Vl.7, pp. 197-206.
Flavian, C., Haberberg, A. and Polo, Y. (2002). Food retailing strategies in the european union, a comparative analysis in
the UK and Spain. Journal of retailing and Consumer Services, V. 9(3), pp. 125-138.
Fernandes, M.C.R.B.V. (2007). Desenvolvimento de um sistema de avaliação e melhoria do desempenho no sector do
retalho. Dissertação para a Faculdade de Engenharia da Universidade do Porto p/obtenção do grau de Doutor
em Engenharia Industrial e Gestão.
Ferreira, B., Marques, H., Caetano, J., Rasquilga, L. and Rodrigues, M. (2011). Fundamentos de Marketing. Edições Sílabo,
Lda, Lisboa.
Fornell, C. (1992). A national customer satisfaction barometer: the Swedish experience. Journal of Marketing, Vol. 56,
pp. 6-21.
Foxal, G.R. (2003). Radical behaviorist interpretation: Generating and evaluating an account on consumer behavior. The
Behaviorist Analyst, nº 21 (pp. 321-354).
Fullerton, G. (2005). Impact of Brand Commitment on Loyalty to Retail Service Brands. Canadian Journal of
Administrative Sciences, Junho, pp. 55-62;
Geyskens, I., Steenkamp, J.-B. and Kumar, N. (1998). Generalizations about Trust in Marketing Channel Relationships
using Meta-analysis. International Journal of Research in Marketing, V. 15, nº 3, pp. 223-248.
Jacoby, J.Yr. and Chestnut, R.W. (1978). Brand Loyalty: Measurement and Management. New York: J.Wiley e Sons.
Johnston, R. (2004). Towards a better understanding of service excellence. Managing Service Quality, Vol. 14, nº 2/3, pp.
129-133.
Kapferer, J-N. 1998. Strategic Brand Management: Creating and SustainingBrand Equity Long Term, 2nd ed. Kogan Page,
Dover, NH.
Keller, Kevin L. 1998. Strategic Brand Management: Building, Measuring,and Managing Brand Equity, 1/e . Prentice Hall
Business Publishing.

473
Kotler, P. (1997). Marketing Management: Analysis, Planning, Implementation and Control. 9th Edtion, Upper Sale River,
NJ., Prentice Haal Inc.
Kotler and Armstrong (2006). Principios de Marketing. 12ª Edição, Prentice Hall, São Paulo.
Kotler, P., Jaya, H.K. and Setiwan, I. (2011). Marketing 3.0 - Do Produto e do Consumidor Até ao Espírito Humano. Actual
Editora, Fevereiro de 2011, Lisboa.
Kwon, W.S., and Lennon, S.J. (2009). What induces online loyalty? Online versus offline brand images. Journal of
Business Research, 62, 557–564.
Levy et al (2005). Supply Chain Management and advanced planning – basics, overview and challenges. European
Journal of Operational Research, Vl. 163, Issue 3, pp. 575-588.
Lichtenstein, D.R., Ridgway, N.M. and Netemeyer, R.G. (1993). Price perceptions and consumer shopping behavior: a
field study. Journal of Marketing Research, 30, pp. 234-245.
Mattei, D., Machado, M. and Oliveira, P.A. (Dezembro de 2006). Comportamento do Consumidor: factores que
influenciam no processo de decisão de compra dos consumidores finais. Maringá Management: Revista de
Ciências Empresariais, V.3, nº2, pp. 177-186.
Mittal, B., Halbrook, M., Beaty, S., Raghubir, P. and Woodside, A. (2008). Consumer Behavior How Humans Think, Feel
and Act in the Marketplace. Open Mentis.
Mowen, J. and Minor, M. S. (2003). Comportamento do Consumidor. São Paulo. Prentice Hall.
Pires, A. and Santos, A.P. (1996). Satisfação dos clientes um objectivo estratégico de gestão. Texto Editora, 1ª Edição.
Ponzoa, C.J.M. (2007). Programas de fidelización de clientes: Un estúdio empírico sobre la efectividad de los canales de
comunicación directa e interactiva en la dinamización de ventas y relaciones. Tesis de Doctoral. Universidad
Computense de Madrid.
Reichheld, F. (1996). The Loyalty Effect: The Hidden Force behind Growth, Profits and Lasting Value. Harvard Business
School Press.
Rojo, F.J.G. (1998).Pesquisa: o comportamento do consumidor nos supermercados. Revista de Administração de
Empresas, São Paulo, V.38, nº 3, pp. 16-24.
Rosenberg, Larry and Czepiel, John (1983). A Marketing Approach for customer retention. Journal of Consumer
Marketing, Vl. 1, pp. 45-21.
Rousseau, J.A. (2008). Manual de Distribuição, Principia, 2ª edição.
Samaha, S.A., Palmatier, R.W. and Dant, R.P. (2011); Poisoning Relationships: Perceived Unfairness in Channels of
Distribution; Journal of Marketing, V. 75, nº 3, pp. 73-82.
Seth, J., Mittal, B. and Newman,B. (2001). Comportamento do consumidor: indo além do comportamento do cliente.
Edição Atlas.
Silva, L. (2009). A Sedução das compras. As melhores estratégias de Marketing no Ponto de Venda. Gestão Plus Edições,
1ª Edição.
Simpson, P.M., Siguaw, J.A. and Cadogan, J.W. (2008). Understanding the consumer propensity to observe. European
Journal of Marketing, Vol. 42, nº ½, pp. 196-221.
Solomon, M.R. (1996). Consumer Behavior. Buying having and being.New Jersey: Prentice Hall.
Solomon, M. (2002). O Comportamento do Consumidor: Comprando, Possuindo e Sendo. Bookman, 5ª Edição, São
Paulo.
Solomon, M. (2009). Os segredos da mente dos consumidores, saiba como eles decidem fazer compras.
CentroAtlantico.pt, 1ª Edição.
Sproles, G.B. and Kendall, E. (1986). A Methodology for Profiling Consumers’ Decision-Making Styles. Journal of
Consumer Affairs, nº 20, pp. 267-279.
474
Sproles, E.K. and Sproles, G.B. (1990). Consumer Decision-Making Styles as a Function of Individual Learning Styles.
Journal of Consumer Affairs, nº 24, pp. 134-147.
Sum, C.Y. and Hui, C.L. (2009). Salespersons’ service quality and customer loyalty in fashion chain stores, A study in
Hong Kong retail stores. Journal of Fashion Marketing and Management, Vol. 13, nº 1, pp. 98-108.
Theodoras, D., Laios, L. and Moschuris, S. (2005). Improving Customer Service performance within a food supplier-
retailers context. International Journal of Retail and Distribution Management, 33, 5, ABI/INFORM Globa, pp.
353-370.
Too, L.H.Y., Souchon, A.L. and Thirkell, P.C. (2001); Relationship Marketing and Customer Loyalty in a Retail Setting: A
Dydatic Exploration. Journal of Marketing Management, Vl. 7, nº 3 e 4, pp. 287-319.
Vieira, V.A. and Baptista, P.P. (2007). Uma proposta de um instrumento para mensurar comprometimento no varelo
electrónico, in Vieira, 2011.
Vieira, V.A. (2011). Escalas em Marketing Métricas de Resposta do Consumidor e de Desempenho Empresarial. Editora
Atlas S.A., São Paulo.
Wen, C.; Prybutok, V.R. and Xu, C. (2011). An Integrated Model for Customer Online Purchase Retention. Journal of
Computer Information Systems, Fall 2011, pp. 14-23.
http://www.ebeltoftgroup.com/global-cross-channel-retail-report---the-unconnected-store.html, accessed in February
2013

475
Session 13

476
The level of technology on Social Customer
Relationship Management CRM, Social Networking, SCRM, CRM Systems, SMM
José Duarte Santos, Instituto Superior Politécnico Gaya and Instituto Superior de Contabilidade e Administração do
Porto, [email protected]
Fernando Almeida, Instituto Superior Politécnico Gaya; [email protected]
José Augusto Monteiro, Instituto Superior Politécnico Gaya; [email protected]
Abstract
In the context of this article it is intended to identify and analyze a set of key technological elements that Social
Customer Relationship Management (SCRM) applications must possess in order to facilitate and deepen the interaction
with the client. The process of acquiring, retaining, and supporting customers is a very challenge task in these times of
economic slowdown and even recession. At the same time, the recent explosion in social media usage, combined with
the increase transformation of consumers in a more active role, has permanently changed the relationship between a
company and its customers. Therefore, we intend to analyze the technologic evolution of CRM software into Social CRM
platforms and look how these solutions address the new challenges for enterprises, in the context of Social Media, more
specifically on social networks. The aim is to verify the existence of features that the applications may have to facilitate
interaction with the client via social networks and/or integrate the software in a more customer-focused vision. As
conclusion we analyzed the main criteria that could help companies to choice the most adequate social CRM according
to their needs and we identified two approaches adopted by SCRM vendors based on an extended CRM functionality or
a completely dedicated SCRM platform. We also concluded that the success of a SCRM implementation is less about
technology, but more to do with the strategy that is employed by the company.
1. Introduction
In the contemporary world the consumer plays an increasingly active role and customer relationship management
(CRM), in times of economic downturn and especially in times of recession, it is becoming increasingly crucial to the
survival of organizations. There are different conceptions of the CRM concept, but there is a tendency of predominance
of the orientation of the company to a 360-degree perspective of the customer, looking to create added value for the
customer and at the same time aiming to increase customer value to the organization.
The development of the Internet, the emergence of new technologies has driven companies to use new types of
interaction to seek to maximize the relationship with the client. The emergence of Social Media supported on the web
2.0 brings new responsibilities to the companies, because the client has been transforming itself from a static version
for a more dynamic and there is a client-to-client relationship and not just company-client.
This article begins by presenting the main perspectives of the CRM concept. Then try to contextualize the social
networks and identify key players. The third point deals with the management of customer relationships via social
networks. In the three following sections deals with software technology, primarily in terms of the traditional version,
after integrating the social dimension and finally presenting aspects to be taken into consideration in the choice of
technological alternatives.
2. The Customer Relationship Management
The literature is inconsistent and highly fragmented on the CRM concept. Some authors (Shaw et al, 2001; Verhoef &
Donkers, 2001; Xu et al, 2002) underline the technological perspective of CRM, others (Croteau & Li, 2003; Kumar &
Reinartz, 2006; Parvatiyar & Sheth, 2001; Zikmund et al, 2002) focus on management-oriented business processes of
customer experiences. On the other hand there are different definitions of CRM, although some have conceptual

477
similarities. In a survey (Zablah et al, 2004) which encompassed academic papers, articles on portals about CRM and
CRM software companies, met distinct definitions of CRM, explicit or implicit way, allowing to obtain five dominant
perspectives in the conceptualization of CRM: process, strategy, philosophy, capacity and technological tool. CRM as
process includes activities to maintain and develop durable and profitable activities managing customer interactions. In
strategic perspective there is a focus on how to build the right relationship with each individual. CRM as business
philosophy is based on the concept of relationship marketing, delivering customer value by developing a customer-
centric culture. The capability approach in CRM stands out the need for companies to invest in resources that allow the
modification of its transaction to relational orientation. Finally the technological perspective emphasizes the
importance of this to the operationalization of the CRM, making it easy to build relationships with customers.
Santos e Castelo (2010) analyzed different models proposed by several authors – Chalmeta, 2006; Chen & Popovich,
2003; Curry & Kkolou, 2004; Galbreath & Rogers, 1999; Park & Kim, 2003; Parvatiyar & Sheth, 2001; Payne & Frow,
2005, 2006; Ryals & Payne; 2001; Sin et al, 2005; Urbanskiené et al, 2008; Winer, 2001; Zablah et al, 2004 - , for the
adoption of customer relationship management, and considered that CRM is a strategy, whose conceptualization is
based on a formulation according to a determined relationship model, influenced by the benefits that one can get and
having a philosophy with influences of relationship marketing. Its implementation is s upported in the definition of
organizational structure, human resources, processes, technology and best practices in the permanent application
which include management metrics.
So, the company needs to have human resources capabilities and an organizational structure to develop the business
processes required to support the CRM strategy. In the design of processes it is important to take account of the needs
of customer interaction and the channels used, as, for example, social media, sales force, call centers, web sites and
points of sale. In turn, the technology, which aims to facilitate company access to customer information and interaction
with it, cannot be alienated.
3. The Social Networking
The social relationships are not a recent phenomenon. Nevertheless, over the time, it has being assumed different
forms. The most recent form of human relationships is from social networks. People interact with other people without
having in same physical place. So far, nothing is new, except the fact of this situation it verifies in real time. The
potential of the new paradigm is the possibility to know how extent is the number of the people contacts and how they
are related. A very difficult task without a registration support, namely, in the context of the traditional human contact
forms (Jamali & Abolhassani, 2006).
In the context of organizations, CRM already support contact registration to track the customer and, in some cases,
allow identifying how customers relate each other. However, traditional CRM, it is been far from the potential of the
social networking. Today, organizations are becoming to perceive the advantages of having an online presence, in
particular, in the more popular networks. They start to become more visible to a broad set of contacts and, they have
the possibility to get information about its fans or the fans of its products more easily than when they have the efforts
to initiate the contacts and the task of fill all forms parameters of some potential costumer (Mangold & Faulds, 2009).
In social networks we may consider two categories of presence: (i) individuals and (ii) organizations. However, the
classifications of its relationships are more extent and have multiple forms. It depends the concept of each one views
the relationship. For example, the network of an individual could have: (i) family; (ii) friends; (iii) colleagues; (iv)
classmates; (v) acquaintances; (vi) friends of friends. In the same context, an organization could have: (i) employees;
(ii) vendors; (iii) customers; (iv) suppliers; (v) partners; (v) fans; (vi) friends of fans.
Looking to these classifications, it seems clear that groups are formed by individuals. However, depending of the
context, the groups could be created according segmentation needs.
Additionally, we may consider other categories or concepts, nevertheless it seems common sense to perceive that when
an organization makes a new contact, it have associated a multiplied factor related with the connections of these
contact. Differently from the traditional communication technologies (tv, radio, press, etc...), social networks not only
provide the ability for users to communicate with each other but also enable users to form ad hoc groups and
communities based on mutual interests where are used to promote discussion, sharing and enable creativity, among
other things. It potentiates two emerging powers: (i) the power of the masses (free translation) and (ii) the power of

478
organizations that are able to drive its influence over the masses (the customers).
Considering that social networks tend to grow in popularity and in number of users, organizations can no longer ignore
the fact. With this new paradigm, the way how organizations communicate with the target public cannot rely only on
traditional mediums technologies to communicate new products. The social networks, in theory, are “open” 24h a day,
7 days per week, 365 days by year. It constitutes an optimum medium to stay connect permanently with c ustomers. We
may infer that, if a an organization has a presence on social networks, it is available 24h a day.
The sensation that we have when we are online, is that the other people that share a profile with us are still present all
the time, even if they were disconnected. By generalization, in the case of an organization, to the individuals that are
part of the network of the organization, the perspective is: “They are there”. No matters if it is lunch time or they are
closed. This means that is latent the idea that presence online means available in real time.
The social networking has brought a major proximity to the potential customers and a very diverse and infinite set of
opportunities. However, like the abundance of the information that came with the propagation of Internet, it becomes
urgent to know how to deal with the abundance of contacts on social networks. Once more, like in the context of the
Internet, and later, in the context of social networks, the technology has an important role and social media also enables
customers to talk to enterprises (Mangold & Faulds, 2009).
4. The Social Customer Relationship Management
According Greenberg (2010, p. 34) “Social CRM is a philosophy and a business strategy, supported by a technology
platform, business rules, processes, and social characteristics, designed to engage the customer in a collaborative
conversation in order to provide mutually beneficial value in a trusted and transparent business environment”.
The SCRM not nullifies the efforts developed by CRM marketing, but provides a supplement, reinforcing the company's
customer focus and facilitating knowledge of behaviors, attitudes and feelings (Woodcock et al, 2011).
Social media, allow an interaction on an individual basis with each client and can be framed in the following categories:
blogs, social networks (e.g. Facebook, LinkedIn and Twitter), Youtube, photo sharing (such as Flickr), interactive
applications (such as, for example, applications for mobile devices like PDA and Smartphone), on local networks,
aggregating channels (for example, comparison sites), independent and sponsored sites, communities, review sites,
webinars, discussion groups/user forums, events online, company website and search engines (Woodcock et al, 2011).
Social media will facilitate contact with the client, the client with the company and between customers. The customer's
power has been increasing (Stone, 2009) and it is important for companies to monitor and intervene in conversations
that are held in social media, providing content and experiences to improve the customers ' trust (Woodcoc k et al,
2011).
Faase et al (2011) propose a SCRM model where the concept view has two parts: (i) customer management focused
with customer lifetime value, customer behavior and customer interaction; (ii) customer engagement supported in
user-generated content in architecture of participation and harnessing the power of the crowd. This model has a
system view that integrates the concept view with information and infrastructure. According to these authors the aim is
customer retention (CRM) and their involvement (SCRM).
5. The traditional Customer Relationship Management Software
The dimension technology has an important role in the adoption of a CRM strategy, and may find themselves three
strands in their use, that being enhanced to profitability contribution: information flow, capture of information and use
of information (Ismail et al, 2007).
The CRM Software allows you to collect information about the client at various points of contact, store it, analyze it and
be accessible in various channels of interaction with the client (Shaw, 2002). Thus, facilitates the access to customer
information, the implementation of activities, interaction and supports decision-making (Nguyen et al, 2007), allowing
you to manage the customer's knowledge (Ryals & Know, 2001). Provide information to support operational, analytical
and collaborative CRM processes (Alt & Puschmann, 2004), With the technology is easier to identify the most valuable
customers and focus on better marketing efforts allowing improvements in customer loyalty (Chen & Popovich, 2003)

479
and enable organizations to leverage the customer relationship (Frow & Payne, 2009).
5.1. Features of a CRM system
To support CRM processes, technology offers a set of features that aggregate CRM areas (operational, collaborative and
analytical) and the functional areas of the organization on which there is a focus of CRM (marketing, sales, service).
Marketing automation supports marketing activities, especially the management of marketing campaigns, comprising
(Cooner, 2009; Fredricks, 2009; Piepiorra; 2008; Torggler, 2008):
• Campaign planning: definition of objectives, targets, costs, communication channels, planned dates for
execution;
• The execution of the campaign: use of rules for selection of recipients and by the choice of communication
channels it is possible to customize the communication;
• Campaign control: allows you to monitor and control the evolution of the campaign and the results obtained.
The sales automation supports sales activities, seeking also to record the different phases of the sales cycle. There are
three major features (Cooner, 2009; Fredricks, 2009; Piepiorra; 2008; Torggler, 2008):
• Sales management: help to manage leads, follow up the sales cycle, as well the orders received;
• Sales force support: help to register and plan sales activities, as well manage contacts;
• Product configuration: facilitates the process of finding the best product/service to the customers ’ needs, or,
carry out combinations of products.
In service automation, after sales important, the main important features are (Cooner, 2009; Fredricks, 2009; Piepiorra;
2008; Torggler, 2008):
• Help desk: support for customers using the knowledge databases that include past and similar situations that
provide automatic identification of the problem and the ability to provide immediate aid;
• Claims management: allows you to keep on record any customer feedback, categorizing complaints and
manage the responses to those complaints;
• Requests to the service: includes the history of interactions with the client and enables the management of all
cases still pending.
There is still a set of features common to the three functional areas of Business Software (CRM, 2008; Lin, 2003):
• Contact management: allows access to the detailed information of the entity on which it will focus the
commercial force, marketing and service/support. Is of recognized importance, access to accurate and timely
information about the caller, before establishing contact;
• Calendar, agenda and management activities: management of commitments and actions to be taken with the
contacts make it necessary to the presentation of these features integrated and simple way for users;
• Management of opportunities: this functionality is one of the most common options in any CRM software and
allows you to register potential business and its evolution throughout the sales cycle;
• Sales forecasting: the sales forecast is based essentially in the sales funnel, i.e. graphic mode provides an
overview of the various ongoing business contemplating the probability of achieving the same.
Xu et al (2002) considering the functional areas of CRM, present a set of impacts, provided by CRM technology, as can
analyze in the following table.

480
Characteristics Impacts
Salesforce automation Greatly empowered sales professionals
Customer service and support Customer problems can be solves efficiently through proactive customer support
Field service Remote staff can efficiently get help from customer service personnel to meet customers’ individual expectations
Marketing automation Companies can lean clients like and dislikes to better understand customers’ needs. Consequently the companies can capture a market before their competitors
Table nº 1 – The characteristics of CRM system.
Source: Xu et al, 2002, p. 443.
5.2. CRM technological alternatives
To analyze CRM alternatives, we propose three dimensions: (i) how software becomes available to be used
organizations; (ii) how software becomes available in terms of code; (iii) and what are the alternatives in terms of
categories of infrastructures to host software.
Started by how software becomes available to be used organizations we have divided in two categories:
On demand: in this category it is not needed to install software or to have a complex network infrastructure.
Software is already available online, pre-configured, and ready to be used. In some cases, organizations do not
need to have the traditional office concept. Users could be connected with the application anytime and
anywhere. All of they need to have is an Internet connection and a valid access to the software. The access
usually implies a license per user or a license per group of users. Some services provide a limited period of
experimentation. Others provide a free access to the service with a limited number of functionalities.
Customizations are limited by the offer of the service. Nevertheless, some services provide an Application
Programing Interface (API) that allows creating customized applications to integrate local data with online
data. While the software configuration has a hi-level interface with users, the API needs technical programing
knowledge. Also, it is common to have associated technical support to users included on the service.
On premise: this is what we consider a traditional option. It implies to have hardware devices, an in site
infrastructure, or in alternative, to have a host or housing solution (above it will be explained these concepts)
to implement on premise software solutions. The software package is ins talled on desktop computers
(depending on the number of workstations needed) and the server version is installed on a dedicated server.
The objective is to make easy the share of information among users and the data more secure to organization
(Santos & Lopes, 2006). In this case, organizations need to plan what will be the more appropriated
infrastructures and devices (in accordance with software requirements) to implement the software. Due the
“physical” possession of the software, this category has implicit more options to obtain the software than the
on demand category. The organizations can obtain the software by different ways: (i) proprietary software, for
example, the Service Level Agreements (SLA); (ii) Free software, for example the community versi ons of a
certain software product; (iii) and open source, for example, a software developed and supported by a
community of users.
The second dimension is how software becomes available in terms of code. Some organizations consider important to
create “add-ins” to the software to adapt to the existent legacy applications or to improve the software functionalities.
To classify the options we consider three categories:
Proprietary: CRM software, that usually is available on media support, by download or throughout an online
service. The first and the second, after acquisition has no additional held fees. In terms of the interface, it can be
based on classical desktop applications or Web based. In the case of the he third option, the software usually is

481
available on the Internet (web based interface) and is not needed to install on desktops or in a local server. It
implies a fee by use which depends of a determined form of consumption (numbers of users or time). It can be
framed like Software as a Service (SaaS) and it releases the organizations of the management of the IT
resources allowing focusing on its core business (Santos & Lopes, 2006). Additionally, proprietary software, it
is characterized by a cost associated to the acquisition and by being closed in terms of the code. Which do not
leave the possibility of being modified by users.
Free version software: this category does not imply to pay fees by the acquisition or the use of the software.
However, this not means that the source code is available. Some variants of this software can be: discontinued
versions of proprietary software; new products of software that are in the market acceptance phase (less
common to found on CRM software products). In parallel with the paid versions, some brands, made available
free versions with less features, designated by “community version”. This allows small organizations to have
access to basic and functional CRM software. Like in the case of proprietary software, free version software are
available to download or online as SaaS. In some cases it is possible to find some advertising in this software,
which can be disabled on paid versions. By this reason we cannot say that the free version software has no
costs. As we mentioned before, SaaS releases the organizations of the management of the IT resources and
focusing on its core business (Santos & Lopes, 2006).
Open-source software: this category of software is freely distributed and the code can be accessed by users
(developers) to be adapted, modified, maintaining the core characteristics, without additional fees. By opposite
proprietary software, open source software has no direct cost of acquisition. However, freely distributed does
not mean that has no other costs. (Hawkins, 2004). The term open source, associated to the software, was
original created by OSI (Open Source Initiative) and also can be referred as a free software (term defined by
Free Software Foundation). The main differences among these two designations are mainly identified by of
how both are available to users. The first is centered on the technical aspects and the second is more centered
on the ethical perspective (Fuggetta, 2003). There are some costs associated to this category of software, like
installation, training users and maintenance (Economides & Katsamakas, 2006).
The third dimension that should be considered is the alternatives in terms of categories of infrastructures to host
software. In a simple way, two approaches can be taken before adopt a CRM software solution: (i) Top-down: start by
choosing the software that meet the needs of the organization and, in the last, choose the hardware infrastructures that
will meet the needs of the software. (ii) Bottom-up: Start by analyze the infrastructures options, decide what type of
software fits the needs of the organization in terms of the process and the implications on the hardware infrastructures.
Software as a Service: in this alternative, as we mentioned before, the hardware infrastructure is on the side of
the service. Organizations do not buy the software. The software is always hosted on the infrastructure of the
service provider. The costs (if have…) are only related with the software and the communications (Internet
service). Organizations only use the software and pay the utilization, per period of time and (or) per user. In
this concept, there is no need to invest on hardware, the costs are predictable and the software is always
updated.
Local/Desktop: based on the classic paradigm client/server this alternative is adopted by the organizations
who intend to maintain the applications locally and under by self-control. Theoretically it is based on the
traditional intranet concept and does not require an Internet connection to support software operation.
Nevertheless, today, most of the organizations are connected to the Internet.
Hosting: the hosting category is based on the concept of web hosting, traditionally used to host websites. The
service takes from the basic hosting where it only allow a simple website to the professional hosting where is

482
available a large amount of disk space and also the more actual web frameworks to the most diverse proposes.
Naturally, it implies a connection to the Internet. It should be notice that not all applications could be installed
on web hosting services. Some factors like the traffic, disk space, framework technologies, database
technologies, should be taken in consideration. It should be analyzed case by case.
Housing: this concept is based on a service that includes dedicated hardware, infra-structures and is remotely
accessible. Comparing with the local/desktop alternative, in the housing concept, the organization have its
main systems, hardware and (or) software hosted on the housing service. It only needs the basic devices and
an Internet connection to access to the service. The care of the hardware is on the side of the provider. Below,
on table nº 2 we illustrate our approach with a classification of ten different CRM software brands: CiviCRM;
GoldMine; Maximizer Sofware; Microsoft Dynamics CRM; Oracle Siebel; SalesForce; SAP CRM; Sugar CRM;
vTiger; Zoho CRM. Our criteria to choose these software options were drive by the need to demonstrate with
practical examples our analytical dimensions.
Proprietary Free version Open source
On demand
Maximizer Software
Microsoft Dynamics CRM
Oracle Siebel
SalesForce
VTiger
Zoho CRM
Zoho CRM
Not applied SaaS
On premise
Maximizer Software
Microsoft Dynamics CRM
Oracle Siebel
SalesForce
SAP
CiviCRM
VTiger
Sugar CRM
Local/Desktop
Sugar CRM CiviCRM
VTiger
SugarCRM
Hosting
Maximizer Software
Microsoft Dynamics CRM
Oracle Siebel
SalesForce
SAP
CiviCRM
VTiger
SugarCRM
Housing
Table nº 2 – Brands of CRM software and its positioning.
Source: author.
6. The Social Customer Relationship Management Software
Currently, a significant number of CRM vendors are moving their applications to the Social Customer Relationship
Management (SCRM) environment, by integrating their solutions with social media tools or by letting customers to
build and manage online communities. A social CRM solution is essentially any software product that gathers and
manages data from social platforms to help companies better manage their relationships with their customers (TEC,
2012).
The incumbent CRM vendors have responded to this request by adding new features that allow their products to
interact with Web 2.0 applications, providing new technological solutions or offering add-ons to their products. At the
same time, it has appeared on the market new technological companies that have identified this gap and market
opportunity. These companies typical does not offer common CRM functions like marketing automation and sales force,
but provide technology solutions specifically targeted to the interaction and communication between people through
social software. Some of these products have ended up by being acquired by major vendors in the market that already
have strong know-how in the CRM field or in Web 2.0 applications.
The most relevant advantage brought by the introduction of social media functionality to CRM is the continuous
monitoring and dialogue between companies and their potential and current customers. These benefits are not only

483
focused in the marketing campaigns, but can be extended to other activities, such as customer service, event planning
or product development. The value of this approach is based in fact that social data is continuously updated and
growing. However, according to Sexton (2012) there are some practical issues that a company should consider before
enter in the social CRM, namely invest in a polite interaction with their unsatisfactory customers, avoid a reactive
behavior but invest in a proactive approach and finally establish always a plan for the social CRM campaign.
Actually, the relationship between companies and companies are becoming interactive. The CRM solutions are
increasingly turning more flexible, which gives the opportunity to some CRM vendors to expand their core activities,
filling the gaps left unfilled by large CRM vendors. These small CRM firms are looking for the integration of their CRM
solutions with other solutions, developing newer platforms, establishing partnerships and creating applications
marketplaces. Their purpose is to offer new functionalities that are not typically found in a CRM system, but is being
increasingly viewed as complementary to a solid CRM strategy, such as content management, human resources and
project management.
The key component of SCRM applications is the smooth integration of outside information sources and the leverage of
Web 2.0 concepts of collaboration and community, including social networking applications. The major vendors are
mainly following an approach where social media management capabilities are offered in the form of modules that
integrate with their existing CRM platforms. Modules can range from simple (just a Twitter, LinkedIN or Facebook
integration) to complex (complete community management) depending on the business goals. The implementation is
done using web-based systems, APIs, programming platforms and languages such as .NET and Java, which allow a
seamless integration between different systems. Add-on solutions can be embedded into core CRM packages, and end
users can use different tools in the same browser and machine.
The main advantage of extended CRM functionality is that it affords customers more functionality than a traditional
CRM system. On the other hand, some vendors may not offer CRM modules that could be considered necessary by the
customers, forcing them to use two or more systems (e.g., one of marketing campaigns and another for sales
processing). Extended functionality can also be available in the form of development frameworks, which allow
companies to not only manage their CRM packages, but also create applications and add-ons that could be required for
specific business domains. Lastly, another benefit of extended CRM functionality is that it incentives the purchase of a
best-of-breed solution. Add-ons can be plugged into existing systems and typically requires minimal intervention.
The other alternative approach is to offer a SCRM platform focus almost exclusively on customer relationship
management through social networks. These SCRM products are developed with community engagement and online
communication in mind, and are less process-centric than the previous model. The majority of these platforms are
standalone, but it is also possible to find in the market solutions that are already integrated with major CRM platforms.
In both approaches, there are common components of SCRM which includes (BS, 2010):
Brand monitoring: track conversations regarding the brand or business. This can be made tracking user
conversations or opinions collected at customer service/support calls;
Social media platform: ability to access and contribute to social media platforms (e.g., Facebook, Twitter, etc.).
This component should also allow the creation and managing of customer communities from within the
platform;
SCRM analytics: inclusion of business intelligence tools supported in data mining algorithm s to allow
sentimental and behavioral analysis, and to monitor customer interactions within the business’s online
communities.
There are already in the market several companies that are starting to offer SCRM solutions. The most relevant players
are depicted in table nº 3.

484
Product Extended CRM Social
Plataforms
Business
Intelligence
Open
Collaboration
Bazaarvoice NO NO YES YES
Jive NO YES YES YES
Lithium Social Customer Suite NO YES YES YES
Nimble YES YES NO NO
Salesforce.com YES YES YES YES
SugarCRM YES YES YES NO
Telligent Enterprise Suite YES YES YES YES
Table nº 3 – Comparative analysis of major SCRM products. Source: author.
The extended CRM applies when the company already has a CRM standalone solution available in the market. The social
platforms brings support for external connection with popular social software as twitter, facebook or google plus. The
business intelligence add-on provides centralized views in dashboards and the ability to make change to reports, drill
down for more details, and share statistics and graphs with other people. At last, the open collaboration benefits from
the community or collective knowledge, and combines the efforts of individuals to create and maintain information that
can be used by companies and their customers. The business intelligence and open collaboration features can be found
in Extended CRM and Social Platforms models.
In the SCRM the integration of structured (quantitative data) and unstructured (qualitative data) is a huge challenge.
The data can be structured in four levels, like it is shown in figure nº 1.
Figure nº 1 – Categorization of data type.
Source: author.
The internal structured data is the category best understood by the enterprise. However it is usefulness is reduced
because a company needs to shift focus to external and unstructured data. On the other side, and looking only in the
structured layer, the external structured data is a logical extension of the current analytics done on internal structured
data in the enterprise. Looking for the unstructured perspective the internal unstructured data is a prime learning
ground for the company to understand how to get value from these data formats. The last quadrant intersects the
external with unstructured data and represents the largest area of opportunity for the enterprise to gather consumer
insights. According to Pritchard (2012), the business potential of this last segment is very high, considering that 80% of
the world’s data is unstructured and it is growing at 15 times the rate of structured data.
Finally, the appearance of cloud computing has allowed companies to buy and use more software functionality for
relatively low costs, compared with on-premise solutions. Solutions adopting a cloud computing approach are easier to
integrate with other products in the cloud because they use similar technology and platforms. This approach is
particularly adopted by vendors that follow an extended CRM approach because it can decreases significantly the
incompatibility issues between the core CRM functionalities and social modules. The use of cloud system also brings
opportunities for social media interactions, considering that the social media occurs almost exclusively on the Internet.

485
According to Liu et al (2009) to provide value-added trustee services, the cloud should be capable of identifying the
customer relationship communities and answering for users’ innovation strategy. At the same time, to maximize
flexible integration of computing resources, the cloud should integrate both human computing resources and electronic
computing resources. This implies that the cloud should be responsible for tracking customer informati on and
understanding the interaction way of its users.
7. The choice of software SCRM
The acquisition of technology implies a careful analysis and covering your entire development framework strategy so
as not to be seen in isolated technology (Messner, 2005). Technology is an enabler of organizational strategy
implementation, so it is important that is perfectly aligned (Ryals & Knox, 2001). It is suggested that even if the own
technology investment plan be included in the strategic plan of the organization and that the technology is framed and
adapted to the operational needs of the organization (Raman et al, 2006) which will allow the implementation of the
strategy. There are different technological solutions for different social CRM objectives, because each company has its
own way of doing business and managing the relationship with your customers and the social CRM software requires
an exhaustive configuration. Thus, the choice of social CRM technology occurs only after there has been a decision to
adopt the social CRM as a strategy (Buckley, 2013), the organization is able to perform change at his organizational
levels (Woodcock et al, 2011), and there is a culture of sharing information and knowledge between customers and
employees (Askool & Nakata, 2010).
Social CRM does not intent to replace completely the already installed CRM solution, but should be used in conjunction
with it. ThinkTank (2012) argues that companies should look to SCRM platforms as a tool to further enhance customer
relationships maintained through traditional CRM functionality, keeping always the customer as the main focus. On the
same direction, Magniant and Lévy-Bencheton (2011) defends that new improved strategy originated by the
introduction of a SCRM solution should combine the benefits of social media with those of the current CRM approach,
namely in terms of target, objectives and budget. Additionally, the company should take proactive steps to encourage IT
teams to familiarize themselves with social tools relevant to their area of work (Pydimarri, 2012).
The entry cost for social CRM is relatively low considering that many vendors already offer in the market a free or demo
solutions for smaller users. According to Verrill (2013) there are essentially two types of SCRM buyers: enterprise
buyers and best-of-breed buyers. The former are investing in company-wide CRM products with contact management,
marketing automation, and help desk management. For them, seamless integration is likely more important than
specific features. The latter, typically SME companies tend to be less focused on enterprise-wide applications and more
focused on maximum effectiveness at particular activities.
Independently of the adopted SCRM strategy, the company should also choose carefully from many SCRM o ptions
according to its needs. Therefore, Currah (2012) establishes that it should be evaluated the cost and features of chosen
vendors, including their ability to integrated media monitoring and community management platforms. Primault
(2012) makes a deeper analysis and adds some new choice attributes like flexibility, integration capabilities, scalability
and ease of use. Finally, it should be defined metrics to assess the performance of social CRM in terms of customer
satisfaction and operating costs. For that, the company should determine the most relevant key performance indicators
that will help to figure out the effectiveness of the social CRM (Magniant & Lévy-Bencheton, 2011).
8. Conclusions
The relationship with the client aims to provide greater value for the company and also for the customer. CRM assumes
a dynamization of the interactions with the client and a leverage of existing knowledge. With social networks the client
takes a more active role, but also there is an interaction between different actors which forces companies to act even
more targeted to the client. The SCRM is the CRM strategy based on web 2.0 creating engagement between the company
and the customer, the process of reviving the enterprise-customer interaction, but also being present in client-client
looking to listening what is being said about the company, the brand and the products.
CRM software industry still remains developing on premise versions, mainly because were organizations where data
cannot be host outside. However, new alternatives based on demand concept are emerging. Brands like Microsoft; SAP
or Siebel that mainly offer on premise solutions has “shifted” its CRM products to on demand versions. Our belief is that

486
the success of the Salesforce software has “attracted” other competitors. Another factor that influences this shift of
paradigm was the emerging of social networking concept. Now we assist to a reformulation of the traditional CRM
software to embrace social network concepts and, in parallel, industry start by offering a new concept of software
called Social CRM.
Social CRM can be used by companies to improve the customer experience by amplified the voice of consumers in the
marketplace. Social CRM platforms can help team across an enterprise to manage campaigns across different social
media platforms, and gain better insight into customers’ general online behavior. There are already appearing in the
market a significant number of tools and vendors that offer Social CRM solutions based on an extended CRM
functionality or a completely dedicated SCRM platform strategies. However, independently of the adopted approach,
the success of a social CRM implementation is less about the technology level, but more to do with the strategy that is
employed by the company. Before a company spends money, time and resources in building out a complex social CRM
platform, it must be established a social CRM plan that promotes a culture around customer service and success.
Additionally, companies should identify and map out the customer metrics that will help them to measure and manage
the success of the customer experience.
In this work we only analyzed at the seven largest technology players SCRM, which can constitute itself as an
opportunity to develop this study. On the other hand we suggests a future empirical study on implementation by
enterprises of existing functionality in the software of SCRM.
References
Alt, R., & Puschmann, T. (2004). Successful practices in customer relationship management [Online]. Proceedings of the
37th Hawaii International Conference on System Sciences, Hawaii, 2004. Available at
http://www.alexandria.unisg.ch/ EXPORT/DL/28210.pdf [6/2/2009].
Askool, S., & Nakata, K. (2010). Scoping study to identify factos influencing the acceptance of social CRM . IEEE
International Conference on Management of Innovation and Technology (ICMIT), 1055-1060.
Bose, R. (2002). Customer relationship management: key components for IT success. Industrial Management & Data
Systems, 102(2), 89-97.
BS (2010). Social CRM: What is & How It Will Benefit You [Online]. Available at thttp://www.business-
software.com/article/social-crm-what-i t-is-and-how-it-will-benefit-you/ [21/1/2013].
Buckley, C. (2013). Social CRM is about strategy, not technology [Electronic Versions]. Available at
http://info.axceler.com/Blog/bid/112792/Social-CRM-is-about-Strategy-Not-Technology [23/2/2013].
Bull, C. (2003). Strategic issues in customer relationship management (CRM) implementation. Business Process
Management Journal, 9(5), 592-602.
Business Software (2008). Top 10 Mobile CRM Vendors [Online]. Available at http://www.business-software.com/crm-
reports/mobile-crm.php [20/5/2009].
Chalmeta, R. (2006). Methodology for customer relationship management. The Journal of Systems & Software, 79(7),
1015-1024.
Chen, I. J., & Popovich, K. (2003). Understanding customer relationship management (CRM). Business Process
Management Journal, 9(5), 672-688.
Cooner, N. (2009). Zoho 4 everyone. Indianapolis: Pearson Education, Inc.
Croteau, A. M., & Li, P. (2003). Critical success factors of CRM technological initiatives. Canadian Journal of
Administrative Sciences, 20(1), 21–34.
Currah, A. (2012). Future of Customer Service: the rise of the social customer [Online]. Available at
http://www.newsroom.firstdirect.com/press/release/attachment/the_rise_customer_social_company.pdf
[23/2/2013].
Curry, A., & Kkolou, E. (2004). Evaluating CRM to contribute to TQM improvement–a cross-case comparison. The TQM

487
Magazine, 16(5), pp. 314-324.
Economides, N., & Katsamakas, E. (2006). Two-sided competition of proprietary vs. open source technology and the
implications for the software industry. Management Science, 52(7), 1057-1071.
Faase, R., Helms, R., & Spruit, M. (2011). Web 2.0 in the CRM domain: defining social CRM. International Journal
Electronic Customer Relationship Management, 5(1), 1-22.
Fredricks, K. S. (2009). Sugar CRM for dummies. Indianapolis: Wiley Publishing, Inc.
Frow, P., & Payne, A. (2009). Customer Relationship Management: A Strategic Perspective. Journal of Business Market
Management, 3(1), 7-27.
Fuggetta, A. (2003). Open source software – an evaluation. The Journal of Systems ans Software, 66, 77-90.
Galbreath, J., & Rogers, T. (1999). Customer relationship leadership: a leadership and motivation model for the twenty -
first century business. The TQM Magazine, 11(3), 161-171.
Greenberg, P. (2010). CRM at the Speed of Light: Social CRM Strategies, Tools, and Techniques (4th ed.). McGraw-Hill.
Hawkins, R. E. (2004). The economics of open source software for a competitive firm. Why give it away for free?
Netnomics, 6, 103-117.
Ismail, H. B., Talukder, D., & Panni, M. (2007). Technology dimension of CRM: the orientation level and its impact on the
business performance of SMEs in Malaysia. International Journal of Electronic Customer Relationship
Management, 1(1), 16-29.
Jamali, M., & Abolhassani, H. (2006). Different aspects of social network analysis. In Web Intelligence, 2006. WI 2006.
IEEE/WIC/ACM International Conference on (pp. 66-72). IEEE.
Karakostas, B., Kardaras, D., & Papathanassiou, E. (2005). The state of CRM adoption by the financial services in the UK:
an empirical investigation. Information & Management, 42(6), 853-863.
Kim, J., Suh, E., & Hwang, H. (2003). A model for evaluating the effectiveness of CRM using the balanced scorecard.
Journal of Interactive Marketing, 17(2), 5-19.
Kumar, V., & Reinartz, W. (2006). Customer Relationship Management: a Databased Approach . New York: John Wiley &
Sons Inc..
Lin, M. C. (2003). A Study of Main Features of CRM System and Evaluation Criteria [Online]. Available at
http://www.ecet.ipfw.edu/~linm/publications/asee2003_1135.pdf [1/6/2009].
Liu, J., Liu, F., Zhou, J., & He, C. (2009). Irregular Community Discovery for Social CRM in Cloud Computing. Lecture Notes
in Computer Science, Vol. 5931, 497-509.
Magniant, S., & Lévy-Bencheton, E. (2011). Social CRM: Towards enhanced Customer Relationship Management [Online].
Atos Consulting White Papers. Available at http://atos.net/NR/rdonlyres/6855E7FE-ABFA-46E3-B060-
B5020CCC9813/0 /atoswhitepapersocialcrm.pdf [19/2/2013],
Mangold, W. G., & Faulds, D. J. (2009). Social media: The new hybrid element of the promotion mix. Business horizons,
52(4), 357-365.
Nguyen, T. U. H., Sherif, J. S., & Newby, M. (2007). Strategies for successful CRM implementation. Information
Management & Computer Security, 15(2), 102-115.
Park, C., & Kim, Y. (2003). A framework of dynamic CRM: linking marketing with information strategy. Business Process
Management Journal, 9(5), 652-671.
Parvatiyar, A., & Sheth, J. (2001). Customer relationship management: emerging practice, process, and discipline.
Journal of Economic and Social Research, 3(2), 1-34.
Payne, A., & Frow, P. (2004). The role of multichannel integration in customer relationship management. Industrial
Marketing Management, 33(6), 527-538.
Payne, A., & Frow, P. (2005). A Strategic Framework for Customer Relationship Management. Journal of Marketing,

488
69(4), 167-176.
Payne, A., & Frow, P. (2006). Customer Relationship Management: from Strategy to Implementation. Journal of
Marketing Management, 22(1), 135-168.
Piepiorra, F. (2008). vtiger CRM v5.x: User and Administration Manual [Online]. Available at. http://mirrors.psu.ac.th
/pub/vtiger/LeadTrackerManual.pdf [23/1/2010].
Primault, C. (2012). How to choose CRM software – a buyer’s guide for small business [Online]. Available at
http://www.getapp.com/blog/how-to-choose-crm-software-a-buyer´s-guide-for-small-business/
[21/2/2013],
Pritchard, S. (2012). How to manage unstructured data for business benefit [Online]. Available at
http://www.computerweekly.com/ feature/How-to-manage-unstructured-data-for-business-benefit
[23/1/2013].
Pydimarri, S. (2012). Dear Mr. CTO – How to avoid Social CRM nightmares? [Online]. Available at
http://www.infosysblogs.com/ customer-relationship-management/2012/12/dear_mrcto_-_how_to.html
[19/2/2013].
Richards, K. A., & Jones, E. (2008). Customer relationship management: Finding value drivers. Industrial Marketing
Management, 37(2), 120-130.
Ryals, L., & Knox, S. (2001). Cross-functional issues in the implementation of relationship marketing through customer
relationship management. European Management Journal, 19(5), 534-542.
Ryals, L. & Payne, A. (2001). Customer relationship management in financial services: towards information-enabled
relationship marketing. Journal of Strategic Marketing, 9(1), 3-27.
Santos, J. D., & Castelo, J. P. (2010). As dimensões formulação, filosofia, melhores práticas, organização e recursos
humanos, processos e tecnologia na adopção de uma estratégia de CRM. Proceedings of XX Jornadas Luso-
Espanholas de Gestão Científica, Instituto Politécnico de Setúbal, Setúbal, 4 e 5 de Fevereiro de 2010.
Santos, J. D., & Lopes, F. C. (2006). CRM no modelo SaaS: uma lufada de ar fresco para as PME. Politécnica, 13, 35-40.
Sexton, K. (2012). Do’s and Don’ts of Social CRM [Online]. Available at
http://www.business2community.com/strategy/dos-and-donts-of-social-crm-0187365 [19/02/2013].
Shaw, R. (2002). Customer Relationship Management [Online]. Gartner, Inc. Available at
http://facweb.cs.depaul.edu/nsutcliffe/
450Readings/Customer%20Relationship%20Management%20(CRM)%20Overview.htm [22/4/2008].
Sin, L., Tse, A., & Yim, F. (2005). CRM: conceptualization and scale development. European Journal of Marketing,
39(11/12), 1264-1290.
Shaw, M., Subramaniam, C., Tan, G. W., & Welge, M. (2001). Knowledge management and data mining for marketing,
Decision Support Systems, 32, 127–137.
Stone, M. (2009). Staying customer-focused and trusted: Web 2.0 and Customer 2.0 in financial services. The Journal of
Database Marketing & Customer Strategy Management, 16(2), 101-131.
TEC (2012). Customer Relationship Management: A Buyer’s Guide . Montreal: Technology Evaluation Centers, Inc.
ThinkTank, J. (2012). What you need to know about social CRM [Online]. Available at
http://www.softwarethinktank.com/ articles/what-you-need-to-know-about-social-crm/ [19/2/2013].
Torggler, M. (2008). The Functionality and Usage of CRM Systems [Online]. Proceedings of the World Academy of
Science, Engineering and Technology, Viena de Austria, 2008. Available at
http://www.waset.org/pwaset/v31/v31-53.pdf [10/11/2008].
Urbanskiené, R., Žostautiené, D., & Chreptaviciené, V. (2008). The Model of Creation of Customer Relationship
Management (CRM) System, Engineering Economis, 3(58), 51-59.
Verhoef, P., & Donkers, B. (2001). Predicting Customer Potential Value an Application in the Insurance Industry.
489
Decision Support Systems, 32, 189–199.
Verrill, A. (2013). Social CRM Software [Online]. Available at http://www.softwareadvice.com/crm/social-crm-
comparison/ [22/2/2013].
Wilson, H., Daniel, E., & McDonald, M. (2002). Factors for Success in Customer Relationship Management (CRM)
Systems. Journal of Marketing Management, 18(1-2), 193-219.
Winer, R. S. (2001). A Framework for Customer Relationship Management, California Management Review, 43(4), 89-
105.
Woodcok, N., Green, A., & Starkey, M. (2011). Social CRM as a business strategy. Database Marketing & Customer
Strategy Management, 18(1), 50-64.
Xu, Y., Yen, D. C., Lin, B., & Chou, D. C. (2002). Adopting customer relationship management technology. Industrial
Management & Data Systems, 102(8), 442-452.
Zablah, A. R., Bellenger, D. N., & Johnston, W. J. (2004). An evaluation of divergent perspectives on customer relationship
management: Towards a common understanding of an emerging phenomenon. Industrial Marketing
Management, 33(6), 475-489.
Zikmund, W.G., McLeod, R., & Gilbert, F.W. (2002). Customer Relationship Management: Integrating Marketing Strategy
and Information Technology. New York: Wiley.

490
How Online Fashion Videos Affect Consumers’
Perception of Brands – Eye Tracking
Exploratory Study Online Videos, Fashion Brand, Interactivity, Perception, Eye Tracking, Memory
Ryan Payne, Ryerson University, [email protected]
Osmud Rahman, Ryerson University, [email protected]
Abstract
The objective of this research is to explore how online fashion videos affect consumers’ perception toward fashion
brands. This study builds upon research in cognitive processing, attitude formation and interactive online
technology. This study used optometric or gaze tracking to follow what participants focused upon when exposed
to fashion videos. All participants were female, half in fashion related programs and the other half in non-fashion,
non-design related programs. A semi-structured interview, visual stimuli (video), and pre-/post-questionnaire
were used. The study found that participants did not fully remember videos to which they have been exposed to or
content upon which they had focused. However, it is important to note that participants could recall a
considerable amount of information when their eye pupils dilated during viewing. Although participants’
perceptions toward video did not show significant changes after they found out the brand name, they tended to
use different words or vocabularies from the pre-questionnaire survey to describe the brand image. It is evident
that the relationship between pupil dilation and memory recall is positive. As this study deals with perceptions, a
further investigation to participant’s memories associated with visual attributes would be interesting, particularly
how associations were made and recalled by viewers overtime and after exposed to a brand’s messages over a
period of time.
Introduction
Investigation of how online videos influence and shape the perceptions of viewers is an emerging field of research.
Prior researchers (Rowley 2009) have investigated the impact of e-tailing websites from different perspectives
including website design, quality and online strategy. This early research of the Internet as a shopping medium was
primarily focused on text-based interfacing. Due to the advancement of online technology, the research focus has
shifted from text-based study to multimedia including audio, visual and video. This technological transformation from
text to multimedia has created a significant change in consumer and social behavior patterns (Rosen et al., 2011).
According to some studies (e.g., Haythornthwaite et al., 2008), multimedia plays a more important role than traditional
print media in shaping consumers’ perception towards a brand. In order to understand this rapidly changing
phenomenon and how fashion video affects viewers’perceptions, consumer theory grounded in psychology was
employed to examine the salient impact of online fashion videos from the experience and perspectives of consumers.
Literature Review
Brand Equity
The ability of a fashion house to utilize multimedia to create brand equity is essential, especially as online media
continues to transform and integrate into people’s everyday lives (Haythornthwaite et al., 2008). Many studies
(Biswas & Sherrell 1993; del Rio et al., 2001) reported that products with strong image categorization can
enhance consumers’ long-term memory and increase the likelihood of purchase when a need for that product

491
arises (Wilkie, 1994). In other words, product image may createa link between consumers’ purchasing intent and
perceived choices (Chen-Yu & Kincade, 2001). Therefore, the way in which products are designed, packaged,
presented and marketed are critical for the success or failure of a product. As Clement (2007) pointed out, “…
presently 70% of consumer purchase choices are made at the shelf, 85% are made without even picking up a
competitive item, and 90% are made after looking at just the front face of the packaging” (p.251); this implies that
the visual impression of a brand could play a significant role on product recall, categorization, differentiation and
positive/negative responses. In this study, we use fashion videos as a vehicle to examine the consumers’ cognitive
and affective responses to a fashion brand image, to understand the importance of the fashion video in the
contexts of branding, and most importantly, to provide insights and recommendation for online video strategy to
fashion practitioners and marketers.
Multimedia and Consumers’ Perceptions
It is evident that online multimedia can greatly influence viewers’ perceptions as well as memory recall (Sundar
2000; Chen et al. 2005). However, viewers from their interactions with multimedia can develop “true” or “false”
memories according to what they see and how they interpret the content. Wade and associates (2002) found that
image manipulation can change or distort viewers’ memories – for instance, the event depicted in a photograph
may not necessarily reflect what actually happened, however, it will be what participants recall as happening. In
addition, Paivo (1991) asserted “… verbal and nonverbal codes corresponding to the same object (e.g., pictures
and their names) can have additive effects on recall” (p. 267). Therefore, the more product information a
consumer obtains, the more likely a solidified perception will be developed (Olson & Mitchell 2000). Consumers’
perceptions and attitudes towards a product or website are critical because this may influence their purchasing
behavior and decisions (Everard & Galletta, 2003).
Multimedia is a powerful communication tool in fostering attitudes and responses through online activities
because of its dynamic ability to engage and arouse users into different levels of involvement, including cognition
and affect (Street Jr. & Manning, 1997). According to Brewer (1988), when people are exposed to content,
personal opinions and perceptions about the content will be formed, and judgments and actions may take place;
this theoretical model can be referred to as dual-process impression formation under the guidance of the general
stimulus response theory. Due to its ability to affect consumers’/viewers’ responses, memories, recall and
perceptions, research on the impact of multimedia is imperative. Over the last two decades, research on
multimedia has been spawned across a wide range of disciplines including consumers’/users’ virtual interactivity
and experience (Griffith & Chen, 2004; McMillan & Hwang, 2002; Shen, 2002; Coyle & Thorson, 2001), however,
the results are scattered and inconclusive. Thus, further research is needed to gain a deeper understanding.
Online Shopping and Communications
It is evident that the consumer culture has been evolving from a mass-produced/-consumed market to what Ha
and James (1998) predicted would be an “endless feast of niches and specialties.” Computer database software
can be used to track and predict consumers’ choices based on their past online activities and purchase records
(Kim et al., 2004); this allows websites such as Youtube and Vimeo to predict what videos will appeal to a specific
user (Kim et al., 2004). In today’s online culture, because of these predictive and targeted messages, individuals
are able to construct and immerse themselves within their own worlds. According to some previous studies of e-
retailing (Oh et. al., 2008; Tractinsky & Lowengart, 2007), fashion consumers have moved beyond the functional
aspects of online shopping to aesthetic experience, interactivity and entertainment. In other words, online
shoppers do not merely search for utilitarian values of a product but also seek for hedonistic experience and
entertainment (Liu & Forsythe, 2010).
Due to the accessibility and capacity of the Internet, people can conduct and enjoy various online activities prior
to the product or service consumption. Online shopping and information search is clearly a self-directed process
to a large extent – it has the potential to elicit a substantial “amount of invested mental effort” (AIME).

492
Fashion Video and Online Engagement
Online videos are becoming increasingly important for many fashion/designer houses; through vídeos, they create
or strengthen their brand image by building a story around their name. Such efforts are deemed to be true for any
company that relies on brand equity and perceived differentiation, rather than price alone to sell its products
over rival brands or comparable generic versions (e.g., Crocs shoes or Coca Cola) (Keller, 2003).
Prior literature of web experiences (Murray, 1997) suggested that people were entertained by online activities
(e.g., video games) when they engaged and interacted with the online content. Furthermore, the ability to create
motion is different from traditional advertising formats such as printed media and radio broadcast, which make
video a distinct form of communication (Griffith & Chen 2004; McMillian & Hwang 2002; Shen 2002). As Kuisma et
al. (2010) stated, “Earlier research has focused principally on printed ads, which are not capable of attracting
attention by auditory stimuli or motion” (p. 11).According to a statistical report of Average Daily Unique Viewers
(ADUV) released by Comscore (2010), the consumption of online fashion videos has increased by the millions
compared to minimal growth of other categories of sites (e.g., news). With this growth of societal attention
towards online fashion content, the study of how fashion videos may affect viewers’ perspectives and
consumption patterns is deemed to be current and important
Viewers’ Attention and Experience – Eye Movement and Fixation
According to a study conducted by Faraday (2000), large and bright objects are deemed to be more attractive to
the website viewers than the small-scaled dark-coloured objects. Other studies (e.g. Lohse, 1997) also indicated
that bigger objects have a higher potential of capturing a viewer’s attention and enhancing the brand’s recognition
and recall. The motion and position of an object also plays an important role in website design ( Djamasbi et al.
2010). Thus, image properties such as colour, orientation and motion of a video could play a significant role on
attention capture, visual response and memory recall (Brockmole & Henderson, 2005). According to Kuisma et al.
(2010), viewers’ attention can be measured by eye fixation metric, and memory can be measured by recognition
and recall tests. In order to understand the salient attributes of fashion video, and visual attention and memory
recall of viewers, eye-movement tracking experiments and semi-structured interviews were employed for the
present study.
Research Method
In order to understand what role the online fashion video may play on viewers’ perceptions towards various fashion
brands, a mixed methods (questionnaire, interview, audio recording, optometric monitoring and field notes) and
experimental stimuli were used.
Subjects were drawn from a convenience sample of students, aged 18 to 25 years old, living in Toronto, Canada.
In total, 30 female subjects were recruited for this study. Women of this age range were selected because they are
more fashion and brand conscious, and shop more frequently, than their male counterparts (Beaudoin &
Lachance, 2006; Chen-Yu & Seock, 2002). Half of our sample were students enrolled in a fashion design program,
another half were non-fashion students in order to avoid possible bias. The research methods of Cover (2006) and
Wandel (2008) were adopted as guidelines to design and develop our experimental procedures for the current
study.
Research Design
An optometric instrument provide a more accurate measuring method to measure of eye movement, gaze and
fixation (Ju & Johnson 2010) than reliance on participants’s repsonses in a lab setting. As a result, this instrument
helps researchers to gain an understanding of a participants’ focus of attention during their video viewing. One
participant was assessed at a time in this study. Experiment and interviews were conducted in a room without
windows or decorations in order to prevent any potential distractions; a laptop and eye-tracking device were set
up on a desk as shown in Figure 1. To avoid participants’ fatigue and confusion, they were asked to watch one
video at a time using the eye-tracking system, and this viewing episode was followed by an interview about their

493
perceptions and experience.
Figure 1: Eye tracking device in experimental setup
Selection of Stimulus
Participants were exposed to a video produced by Issey Miyake, available through the website of the magazine
Dazed and Confused. This film involved eight different scenes and three models. Each model looked slightly similar
in aesthetic; however, each had defining features such as hair colour, jaw line or eye shape. Our selection criteria
for the vídeo to be used included: (1) the video must be from an online website; (2) the video must reveal no
brand-name, logo or recognizable brand features (e.g., Burberry plaid, Issey Miyake pleat); (3) the vídeo must be
short to avoid fatigue of participants; and (4) music must be abstract (without lyric) to avoid any associative
meanings. (After the pilot test, researchers decided to mute the music in order to focus on the visual experience of
the viewers.)
Eye Tracking Device
To conduct this experiment, the programs utilized were Facelab 5 and GazeTracker on a standard 15.4” laptop
computer system (Seeing Machines, 2013). FaceLab 5 records in a vídeo-based progression and exports data to
external processing software – in this case, GazeTracker. GazeTracker was loaded with the video and subjects
were recorded at a frame rate of 60 frames per second. Participants were seated in front of a laptop computer;
approximately 45 to 76 cms from the screen’s surface. Participants were able to adjust their position based upon
their personal taste and comfort level. A nine-point calibration setup was utilized. All 30 participants’ facial
features could be recognized and the program calibrated to the participants’ comfortable seating position (see
Table 1).
Table 1: Eye-tracking device attributes and setup
In general, FaceLab 5 data is able to hold a typical static accuracy of head measurement within +/- 1mm of
translational error and +/- 1° of rotational error and a typical static accuracy of gaze direction measurement of
approximately 0.5-1° rotational error. Therefore, results for where a participant looks, fixes a gaze, or glances
Attribute Measurement
Distance 45-76 cm
Angle 43 – 47 ° degrees
Rate 60 Frames per second
Lens 25mm
Tracking Search Size 15.4 “

494
over are considered high in accuracy.
Procedure
This study consisted of three stages. In stage one, participants answered a questionnaire survey about their
personal information and behaviour such as age, gender, online experience, and fashion/brand awareness.
Participants were given a list of 30 fashion brand names (consisting of actual and fake names)and were asked to
circle the ones for which they believed they could identify the brand values/image. Then on a following page they
were asked to write a word or a short sentence to describe ten selected brands. If the participant did not recall the
brand, or its identity, they were asked to guess based upon the name. This elicitation interview was used to
understand how the participants recalled and/or perceiveed the brand names according to their impression, past
knowledge and experience.
In stage two, optometric, (pupil) measuring was used to measure where participants looked on the screen when
exposed to a fashion video. By using the optometric measuring instrument or cameras, we were able to indentify
and collect reliable data relating to viewers’ attention, gaze and fixation on tested stimuli (Vertagaal & Ding,
2002).
Upon completion of exposure to the fashion videos, a short semi-structured interview was conducted (about 30
minutes per interview) by a researcher to capture participants’ reponses, perceptions and opinions of the videos.
Questions included: “What did you remember from the videos?”, “What elements stood out to you?”, “What did
you like and dislike about the fashion video?”, “What would you have done differently with this video?”, and “How
did you perceive the brand?”
Content Analysis
We adopted the procedure of content analysis described by Stemler (2001) to classify and identify the significant
categories from the semi-structured interviews. A team of two reviewers (one fashion professor and one researcher)
independently reviewed and examined the transcripts to identify the key attributes and content categories, with each
reviewer devising his/her own classification scheme. Two reviewers then intensively discussed the commonalities and
differences of their classified schemes and reconciled the differences. Once the reviewers reached the mutual
agreement, codes will be assigned to each individual’s responses until all data had been analyzed.
Results with Discussion
Optometric data and participants’ responses to what events happened in the film were collected, further research
upon this data is in progress. It was found that 20 participants’ pupils dilated in size during the passages of
viewing that they later free recalled when asked what had happened during the vídeo. According to a study
conducted by Partala and Surakka (2003), a pupil is deemed to be dilated if its size increases more than 0.375mm..
Interestingly, the majority of our participants (n=26) omitted large passages of the first vídeo during the viewing
because their pupils did not dilate and they did not pay attention or fix their gaze on any specific area of the
screen. Figure 3 is a breakdown of the results of the analysis of gazes during the video viewing.
Measurement
Result (in average)
Total time tracking 42.787 seconds
Total video length 38.610 seconds
Total fixation time 34.530 seconds ( 80.702%)
Total non fixation time 8.257 seconds (19.298%)
Fixation count 4.394 times
Average fixation time .184 seconds
Average number of gaze points 58.119
Average base pupil size 36.5mm
Average dilation range 32mm - 47 mm
Table 2: Optometric or eye tracking results from experiements

495
Participants were found to have a comfortable pupil range of 36mm to 37mm, dilating when exposed to a new
video scene in one participant to 57mm, far above the mean average range of 32mm to 47mm (see Table 2). The
greatest change happened during the introduction of each new scene; especially during the beginning of the noted
confusing passage. Participants expressed that the passage was confusing when two images were shown
simultaneously. On the right side was an outward flourishing flower and on the left side was a model wearing a
dress with the camera panning from the bottom to the top (Figure 2). After the experiment, when participants
were asked “What would you have done differently with this video?” Many participants indicated that they would
change this double image passage because it was “confusing,” (“I didn’t know where to look,” “It was a lot going
on,” “I was waiting for the flowers to transform into something”). Although participants found this double-image
effect confusing, everyone remembered it immediately; likewise, this showed the greatest dilation in eye
movement, from a baseline of 36mm to 47mm. During their viewing, it is evident that the eye movements shifted
between both images– flowers and model (particular focus was given to the model’s eyes, and the eyes of the
statue upon her dress). This finding is similar to Faraday’s hierarchy of factors which influence viewers’ point of
entry to a website (Faraday, 2000), even though in this case the subject matter was based upon a fashion video
instead of a fashion website.
Figure 2: Video with split screen playing two film simultaneously Figure 3: Eye gazing paths
Although every participant remembered and said they would like to change the dual screens with different
actions, there was a lack of comments in regards to absence of audio presented with the video clips. It was not
statically significant in terms of the number of people who commented on the absence of audio. This does not
mean it is not a factor; rather, it was not a factor that participants noted or saliently highlighted in aiding in their
recall of the video.
Our findings indicated that only a few participants introduced new vocabulary into how they would describe the
video. Thus, it is reasonable to suggest that this fashion video has a limited ability to communicate in such a way
as to completely change the associated vocabulary and perceptions viewers associate with a specific brand.
According to the results of gaze capture, it is evident that many participants focused more on the beauty
aesthetics rather than on the apparel.
Perceived message of the video Frequency Viewer’s Perceptions & Interpretations
(Associative Meanings)
No idea 12
Orientalism 7 The style of the umbrella, cherry blossoms
Japanese Style 3 Cherry blossoms
Pink Hair 2
The most significant visual elements of tested video
Spinning umbrella 13 Distracting, Orientalism, Japanese style
Flowers/cherry blossoms 13 Orientalism, Japanese style
Hair 13 Distracting (e.g., shiny pink hair)
Makeup 7 Distracting (e.g., pink lipstick)
Eyes 5
Clothing 5 Simplicity
Model 8
Split Screen 3 Confusing and distracting

496
Perceived brand image (from a more holistic view)
High-end/luxury brand 4
Middle luxury brand 13 Example: “Not polished enough to be luxury.”
Mid-market brand 5
Congruency between video content & brand image (after
revealing the brand name to the participant)
It fits/makes sense 9
Japanese designer brand (Issey Miyake) and
Orientalism/Japanese style
It doesn’t fit/disconnect 4 Not innovative, a bit old school
What would you suggest to strengthen the brand image?
No idea 6
Create a story line 4
Avoid split screen 2
Less focus on the makeup 2
More action and motion 2
Table 3: Content analysis of impression and perception of fashion video
Many participants consistently perceived the brand as above mainstream but below the high-end luxury status
(see Table 3). None of the participants could recognize the brand name by watching the vídeo, only one person
was able to identify the brand (Issey Miyake) based upon a list of names provided by the interviewer. Although
vast majority of respondents could not identify or recognize the brand name, several respondents were familiar
with the style of Issey Miyake. As soon as they found out the brand name of the video, many of them were able to
make connections between the brand and the visual imageries such as oriental umbrella, cherry blossom and
strong makeup.
According to the results of our semi-structure interviews, umbrella, flowers/cherry blossoms and hair were the
most frequently cited visual images by our participants, followed by pink colour and makeup. The findings are
similar to Faraday (2000), the size and colour of an image grealty affect viewers’ perception not merely towards
the video content but also the brand image. Although the video was about fashion, clothing was relatively less
significant as compared to other visual attributes (as shown in Table 3). This could be the reason why many
participants were not able to make a connection between the video content and a fashion brand. Other than the
visual disconnection, several participants also indicated that the split screen and close-up of model’s face
(makeup, pink hair) were confusing and distracting. When the participants were asked “What would you suggest
to strengthen the brand image?”, four participants suggested that a brand image can be enhance by creating a
story line and narratives. Aesthetic visual images can draw people’s attention and arouse visual experience but
story telling can connect with the viewers emotionally in a deeper and intimated level.
The results of our monitoring of the gaze and fixation to determine what participants focused upon showed that
participants concentrated on the faces, specifically the eyes of the models in the video (as shown in Figures 4 and
5). The darker the colour, the longer a fixed gaze was held. This is consistent with several previous studies (Cyr et
al., 2009; Djamasbi et al., 2010; Tullis et al., 2009), which showed that viewers often pay more attention to a
person’s face and eyes than to other objects when looking at a picture or image. This finding also echoed with
other studies on trust and image perception that show that referential cues are often drawn through the eyes of
participants. Therefore, fashion marketers should pay attention not only to the selection of model but also to the
facial expressions, presentation, and mood and attitude of model in an ad or video.

497
Figure 4 & 5: Scenes from Experiment with heatma indicate viewer’s fixation and attention
Conclusion
In this digital age, communicative strategy becomes more and more important for a fashion company to create a strong
brand image. Image is one of the significant aspects of a brand because it resides in the consumers’ mind. It can be
described as the “consumer perception and interpretation of a cluster of associated attributes, benefits and values”
(Batey, 2008), and Keller’s (2003) describes that brand associations are nodes of information that are perceived and
stored in the brain of an individual. In other words, everything communicates with the consumers about the brand may
consider as associative meanings or a “touch point” for the communication of meanings. As many pri or researchers
(Rowley, 2004) point out that it is important to convey a consistent, coherent and relevant message to the consumers
regardless of its format – billboard advertisement, TV commercial or online video.
It is evident that viewer’s perceptions of a brand are greatly influenced by what they have seen or encountered through
different visual objects or images. In this study, many viewers were confused with the designer’s motives and
intentions (e.g., promoting Orientalism, Japanese style, cosmetic products, hair style or clothing products) – the
congruency between the video content and the brand image was weak. The vast majority of the particpants did not
perceive the video as high-end fashion brand, several of them even decribed the video as old school.
With this perspective, fashion marketers should pay more attention to emotional elements (story telling, narrative,
motion), avoid confusing designs (split screen), use relevant video content (images) to reflect the brand/designer’s
image (innovativeness, prestige, high-end).
Limitations and Future Research:
The current study has several limitations. The sample was limited to students from one university, and half of the
sample was recruited from a fashion based program.Therefore, the results may be skewed toward younger people,
which potentially limits the generalizability. Additionally, this experiment may not have found a change in
perceptions as participants already were familiar with the brand being in the fashion bachelorette program and
therefore the video was overcoming preconceptions of brands more than generating an initial perception. (In
future study including audio in one clip and not in another and testing to see if the ability to remember over a
period of time was influenced would be a beneficial study to aid in the discovery of how the dual-coding process
influenced participants.) Likewise, The ability to control (stop, start, fast forward, rewind, pause) and/or interact
with fashion video could be considered for future research to uncover what viewers want to see and explore.
References
Batey, M. (2008). Brand Meaning. New York: Routledge.
Beaudoin, P. & Lachance, M.J. (2006). Determinants of Adolescents’ Brand Sensitivity to Clothing, Family and Consumer
Sciences Research Journal, 36(4),. 312-331.

498
Biswas, A., & Sherrell, D. L. (2006). The Influence of Product Knowledge and Brand Name on Internal Price Standards
and Confidence. Psychology & Marketing, 10(1), 31-46.
Brewer, M. (1988). A Dual Process Model of Impression Formation. Advances in Social Cognition. Hillsdale, NJ, England:
Lawrence Erlbaum Associates, Inc Srull, Thomas K. (Ed); Vol. 1.pp. 1-36. Wyer, Robert S., Jr. (Ed), xii, 192.
Brockmole, J.R. & Henderson, J.M. (2005). Prioritization of New Objects in Real -world Scenes: Evidence from Eye
Movements, Journal of Experimental Psychology: Human perception and Performance , 31(5), 857-868.
Chen, Q., Griffith, D. A., & Shen, F. (2005). The Effects of Interactivity on Cross-Channel Communication Effectiveness.
Journal of Interactive Advertising, 5(2), 30-44.
Chen-Yu, H. J., & Kincade, D. H. (2001). Effects of Product Image at Three Stages of the Consumer Decision Proc ess for
Apparel Products: Alternative Evaluation, Purchase and Post-Purchase. Journal of Fashion Marketing and
Management, 5(1), 29-43.
Chen, Y.J.H. & Seock, Y.-K. (2002).Adolescents’ clothing purchase motivations, information sources, and store selection
criteria: A comparison of male/female and impulse/nonimpulse shoppers, Family and Consumer Sciences
Research Journal, 31(1), 50-77.
Clement, J. (2007). Visual Influence on In-store Buying Decisions: An Eye-Track Experiment on the Visual Influence of
Packaging Design. Journal of Marketing Management. 23(9), 917-928.
Coyle, J.R. &Thorson, E. (2001), The Effects of Progressive Levels of Interactivity and Vividness in Web Marketing
Sites,Journal of Advertising, 30 (3), 65-77.
Comscore, NP, www.comscore.com Accessed March 2012
Cover, R. (2006). Interactive Media, Narrative Control and Reconceiving Audience History.New Media & Society, 8(1).
139-158.
Cyr, D., Head, M. & Ivanov, A. (2009).Perceived Interactivity Leading to e-loyalty: Development of a Model for Cognitive-
Affective User Responses, International Journal of Human-Computer Studies, 67(10), 850-69.
del Rio, A.B., Vazquez, R.,& Iglesias, V. (2001), The effects of brand associations on consumer response, Journal of
Consumer Marketing, 18(5), 410-425.
Djamasbi, S., Siegel, M., & Tullis, T. (2010). Generation Y, Web design, and Eye Tracking. International Journal of Human-
Computer Studies, 68(5), 307-323.
Everard, A. & Galletta, D. F. (2003, January). Effect of Presentation Flaws on Users’ Perception of Quality of On-Line
Stores’ Web Sites: Is it Perception that Really Counts?. WORKSHOP PROGRAM. MA. 60.
Faraday, P. (2000). Visually Critiquing Web Pages. In Proceedings of the Sixth Conference on Human Factors & the Web .
Griffith, D. & Chen, Q. (2004). The influence of virtual direct experience on online ads message effectiveness, Journal of
Advertising, 33 (1), 55-69.
Ha, L. & James, E.L. (1998). Interactivity Reexamined: A Baseline Analysis of Early Business Web Sites, Journal of
Broadcasting & Electronic Media, 42 (4), 457-474.
Haythornthwaite, C. & Wellman, H. (2008). The Internet in Everyday Life: An Introduction, in The Internet in Everyday
Life (eds.) B. Wellman and C. Haythornthwaite, Blackwell Publishers Ltd, Oxford, UK.
Ju, H. W., & Johnson, K. K. (2010). Fashion Advertisements and Young Women: Determining Visual Attention Using Eye
Tracking. Clothing and Textiles Research Journal, 28(3), 159-173.
Keller, K.L. (2003). Strategic Brand Management: Building, Measuring, and Managing Brand Equity. 2nd ed. Upper Saddle River, NJ: Prentice Hall.
Kim, S., Williams, R., & Lee, Y. (2004). Attitude Towards Online Shopping and Retail Website Quality. Journal of
International Consumer Marketing, 16(1), 89-111.
Kuisma, J., Simola, J., Uusitalo, L. &Öörni, A. (2010). The Effects of Animation and Format on the Perception and Memory
of Online Advertising, Journal of Interactive Marketing, 24, 269-282.
499
Liu, C. & Forsythe, S. (2010). Post adoption online shopping continuances, International Journal of Retail and
Distribution Management. 38(2), 97-114.
Lohse, G.L. (1997). Consumer Eye Movement Patterns on Yellow Pages Advertising, Journal of Advertising, 26(1), 61-73.
McMillan, S. &Hwang, J.(2002). Measures of Perceived Interactivity: An Exploration of the Role of Direction of
Communication, User Control, and Time in Shaping Perceptions of Interactivity, Journal of Advertising, 31(3),
29-42.
Oh, J., Fiorito, S.S., Cho, H. & Hofacker, C.F. (2008) Effects of Design Factors on Store Image and Expectation of
Merchandise Quality in Web-based Stores, Journal of Retailing and Consumer Services, 15(4), 237-49.
Olson, J. C., & Mitchell, A. A. (2000). Are Product Attribute Beliefs The Only Mediator of Advertising Effects on Brand
Attitude? Advertising & Society Review, 1(1).
Paivio, A.(1986). Mental Representations: A Dual-coding Approach. NY: Oxford University Press.
Partala, T., & Surakka, V. (2003). Pupil Size Variation As An Indication of Affective Processing. International Journal of
Human-Computer Studies, 59(1), 185-198.
Rosen, D., Barnett, G. A., & Kim, J. H. (2011). Social Networks and Online Environments: When Science and Practice Co -
evolve. Social Network Analysis and Mining, 1(1), 27-42.
Rowley, J. (2009). Online Branding Strategies of UK Fashion Retailers. Internet Research, 19(3), 348-369.
Seeing Machines (2013) Face Lab 5 Specifications Retrieved February 23, 2013
http://www.seeingmachines.com/product/facelab/specifications/
Shen, F. (2002). Banner Advertisement Pricing, Measurement and Pretesting Practices: Perspectives from Interactive
Agencies. Journal of Advertising, 31(3), 59-67.
Stemler, S. (2001). An overview of content analysis, Practical Assessment, Research & Evaluation. 7(17). Retrieved
September 27, 2010, from http://pareonline.net/getvn.asp?v=7&n=17
Street Jr., R. & Manning, T. (1997). Health Promotion and Interactive Technology Theoretical Applications and Future
Directions, Ed. Richard L. Street Jr., William R. Gold and Timothy Manning. Mahwah, NJ: Lawrence Erlbaum
Associates Publishers. 121-139.
Tractinsky, N. & Lowengar, O. (2007). Website Aesthetic in E-retailing: A Conceptual Framework and Some Theoretical
Implications.Academy of Marketing Science Review. 11 (1) 1-18.
Tullis, T., Siegel, M. & Sun, E. (2009). Are People Drawn to Faces on Webpages?Proceedings of the 27th international
Conference Extended Abstracts on Human Factors in Computing Systems,
Vertegaal, R., & Ding, Y. (2002, November). Explaining Effects of Eye Gaze on Mediated Group Conversations: Amount or
Synchronization?. In Proceedings of the 2002 ACM conference on Computer supported cooperative work (41-
48).
Wade, K. A., Garry, M., Read, J. D., & Lindsay, D. S. (2002). A Picture is Worth a Thousand Lies: Using False Photograph to
Create False Childhood Memories. Psychonomic Bulletin & Review. 9, 597–603.
Wandel, T. L. (2008). Colleges and Universities Want to be your Friend: Communicating via Online Social Networking .
Planning for Higher Education. 37(1), 35-48.
Wilkie, W. L. (1994). Consumer Behaviour, 3rd Ed. New York, John Wiley & Sons.

500
The influence of eWOM generated by the
reference groups on Facebook, in Portugal. eWOM, Facebook, Consumer, Reference Groups, Social Networking
Ângelo Telmo Monteiro Gomes, ISCAP, [email protected]
Inês Veiga Pereira, ISCAP, [email protected]
Abstract
With the advent of social networking consumers start to produce content. The need to express their views and
experiences of buying and consumption has taken new dimensions. Facebook is currently the most successful social
network in the world, making it imperative to understand consumer behavior on this platform.
The fostering of eWOM allowed consumers access to many opinions registered by other consumers, and can even serve
as guides to market trends at the moment (Riegner, 2007). Our study, used a convenience sample of 719 individuals,
aimed to understand the influence of eWOM generated by reference groups on Facebook, in Portugal. It was concluded
that, although Facebook is not a major source for searching information on products, the larger the search information
and online contribution (information sharing) on Facebook, the greater the trust in eWOM obtained on the same social
network. Respondents who contribute most online are also those who seek for information online and more rely on
that information. It was also found that the opinions expressed by reference groups on Facebook are positively
correlated with confidence in eWOM and purchase decision. Finally, we concluded that the reference groups that have
more influence on trust in eWOM and seeking information on Facebook are: users on the brands pages, users in
discussion groups, friends and other users.
1. Introduction
According to Solomon (2002) the search for other people´s opinions to confirm opinions of impersonal sources and the
transmission of that recommendation from one people to another is called word-of-mouth (WOM). Still today a search
for WOW is one of the behaviors that strongly influences the buying process a certain product or service (Mittal et al,
2008).This study focus on eWOM, defined by Hennig-Thurau et al (2004) as a positive or negative statement made by
potential, current orpossible clients about a product or company and that will be seen and evaluated by a large number
of people and institutions through the internet.Consumers seek for information on the Internet about products and
brands.
Citizens are increasingly present in social networks, mainly Facebook, as well as brands, products, services and
businesses. Given these facts, we will try to understand if consumers seek for information about products and brands
on Facebook, and understand the importance of eWOM generated on Facebook. Solomon (2002) indicates that, despite
being influenced by several reference groups like family, friends or co-workers, their individual influences are not
equally powerful for all types of products and activities. Further, we will try to understand if different reference groups
influence differently the purchase decision.
The paper is divided in four parts. The first part includes a review of literature about the buying decision process,
reference groups, eWord-of-Mouth and social networks. In the next part we explore the hypothesis of the study and the
methodology adopted. The next part is followed by the results, and its discussion. Finally, we present the conclusions,
the implications for managers, the limitations of the study and clues for future research.

501
2. The buying decision process
The buyer decision process initiates when a certain individual feels that there is a discrepancy between his/hers
current state and the one he/she wants to have. The desire to diminish this difference will influence and give rise to the
buyer decision process (Mowen and Minor, 2003). This process has several levels for the individual. The buyer process
is activated when the personal and inherent characteristics are confronted with the proper marketing stimulus, on a
certain situation (Celsi and Olson, 1988).
The search for real and assertive information is an important step for that decision. This search for information can be
characterized in two types: internal and external search (Blackwell, et al. 2008). Blackwell s tates that the external
search is carried out next to friends and family and then the market. The individual may have a passive attitude,
resorting only to the available information or active when there is a more intentional search through market research,
WOM (Word-of-mouth), internet or even trough search next to the point of sale. Assael (1998) describes reference
groups as one of the bigger behaviour influences, because they are references for the opinion making process of a
certain product, attitude or behaviour. Reference groups encompass all the groups that influence directly or indirectly a
person attitude or behaviour (Kotler, 1998) and can be formed by individuals like celebrities, athletes or political
leaders (Blackwell, et al. 2008).
Reference groups
Solomon (2002) indicates that, despite being influenced by several reference groups like family, friends or co-workers,
their individual influences are not equally powerful for all types of products and activities. According to Blackwell et al.
(2008), opinion leaders express/send information and opinion in a word-of-mouth process which influences the other
person decision. These known personalities are complex to define because they have several interests that absorb
other several types of information regarding products, services and brands, despite this being superficial information.
According to Mittal et al. (2008) the diffusion of information by social media through the available channels, affects not
just the opinion leaders but also the remaining individuals, promoting unknown products and services. The same
author indicates a group of online opinion leaders called e-fluentials. Senecal and Nantel (2004) carried out a study
where they verified that the choices of consumers are influenced on their choices due to the visualization of online
recommendations. However they add that not all the recommendations have the same effect regarding the way they
affect the consumer. Those who are considered as the main reference groups are: family, professional associations,
community associations and friends. It can be any person that serves as a comparison point (or reference) for an
individual on the context of the evolution of their general or specific morals, attitudes or behaviours (Schiffman, 2000).
For our research, taking into account the individuals being studied as well as the e-fluentials, we will study the impact
of the information generated on a virtual environment of family, friends, other users, known personalities and
Facebook users of brand pages.
eWord-of-mouth (eWOM)
According to Solomon (2002) the search for other people´s opinions to confirm opinions of impersonal sources and the
transmission of that recommendation from one people to another is called word-of-mouth (WOM). Still today a search
for WOW is one of the behaviors that strongly influenciates the process of acquiring a certain product or service (Mittal
et al, 2008).
This study focus on eWOM, defined by Hennig-Thurau et al (2004) as a positive or negative statement made by
potential, current or possible clients about a product or company and that will be seen and evaluated by a large number
of people and institutions through the internet. Henning-Thurau (2004) defined eWOM (electronic Word-of-Mouth) as
any positive or negative statement available to a large number of people and institutions on the Internet, and that can
be done about a product or company by a potential, current or old consumer.
Yuen (2010) carried out a study on online forums and concluded that, if there are any similar traces between the user
and the forum members, a direct relationship with the intention on buying the products addressed on the forum, is
established. So it is crucial to understand the way eWOM affects the consumer in the new online environments as, for
example, social networks.
The development of virtual environments made the search for information and the spreading of eWOW much easier.
When a consumer uses the internet to make an opinion known and that opinion can be either negative or positive,
eWOW is being generated (Henning-Thruaut, 2004).
502
Xia and Nasr (2008) show that the level of identification developed when analyzing opinions posted online is connected
to the nature of the research itself (information research, casual visualization, etc.). When an individual is analyzing the
information and agrees with it, he/she considers that opinion to be useful and reliable, which has a bigger impact on
their buying intentions. Consumers that actively post their opinions, enjoy sharing their experiences as well as knowing
that their reviews can be appreciated. This represents a reward to those consumers (Xia and Nasr, 2008).
As a result of this participation on online content, consumers are not just receivers of information. They are
simultaneously creators of content trough texts, images, videos, music and the broadcast of information like websites or
brands (Kliatchko, 2008). This new consumer, the Prosumer, was characterized by Carrera (2009) as an individual that
generates information, is close to companies and develops a relationship of mutual proximity and development. This
consumer uses social networks on a regular basis.
3. Social Networks
A Social Network is a social structure made of entities (individuals or organizations) intertwined in several ways and
that share morals, financial flow, ideas, friendships, family bonds (Carrera, 2009). The Social Network Facebook
launched at February 4 2004, had as its main founder Mark Zuckerberg. According to Facebook.com, in 2011 more than
750 million people had an active account and each person was connected to an average of 130 people or “friends”.
Socialbalkers (2011) recent numbers from August 2011 indicate that, in Portugal, the presence of Facebook reaches
37,67% and the number of accounts is about to reach 4 million. Brands, companies and products Facebook pages have
won over more than half of the three millions Facebook users in the country.
In November 2011, Netsonda (2011) presented a new wave of studies about Facebook and brands in Portugal.
According to this study, Facebook was the website that grew the most in 2010 and 40% of the Portuguese population
has an account on this social network. NetSonda indicates that, in November 2011, 55% of the users preferred
companies, brands or products pages. Camila Ferreira (2010) analyzed the structure of business communication in a
way that would conquer the client credibility and encourage the WOM. She concluded that communication should be
carefully planned based on the needs and desires of the different publics in order for them to be positive WOM
“vehicles”. Since there are not still any studies in Portugal regarding eWOM data, it becomes necessary to gather
information about it.
The necessities of socially existing trough Facebook, the search for information and the exposure to shared information,
inevitably generates eWOM. The theme of our study will take into account all these premises.
4. Research
The main goal behind this study was to grasp a relationship between: the consumer, reference groups, Facebook e-
Word-of-mouth and also evaluate if the level of confidence on eWOM depends on the online contribution, studying the
importance of reference groups on the eWOM confidence level generated on Facebook by Portuguese users.
Hypothesis
A lot of brands websites use testimonies of individuals that have consumed their products and brands showing, for
example, discussion lists, in order to influence other consumers (Siegel, 1999). Neto (2009) concluded that consumers
are more exposed o eWOM through e-mail and that virtual consumers are not relevant for the search of information,
research or clarification regarding questions or doubts. This study, made in Brazil in 2009, indicates that consumers
use the Internet to ask questions about the products and that they frequently read opinions available online about a
product before buying it (Neto, 2009).
Xia and Nasr (2008) mention that consumers that actively post opinions enjoy sharing them and seeing that their
indications might be appreciated, which represents a reward to them. The individual analyses the information and
when he feels he agrees with it, he considers the information to be useful and reliable, which creates an impact on their
buying intentions (Xia and Nasr, 2008). According to Ainsworth (2005) consumers that value opinion websites about
products and services are more susceptible to be influenced by the available information.
Solomon (2002) mentions that each of the reference groups influences are not equally powerful for all kinds of

503
products and consumption activities. According to Senecal and Nantel (2004) consumers are influenced when choosing
their products by online recommendations, however, not all of them are equally powerful or have the same level of
influence. There are groups that due to bigger sociability, influence consumers with the information and opinions that
they broadcast. The opinion leaders are more confident and they influence other consumers.
Current researches do not address the eWOM influence on the buyer decision process generated on Facebook. Besides,
in Portugal, the description of Facebook users does not exist.
Taking into account the above mentioned, it is pertinent to study the following hypothesis:
H1- Facebook is used for searching information about products, services and brands.
H2- The larger the search for information through Facebook, the greater the confidence on eWOM achieved through
that same social network.
H3- Opinions stated on Facebook by reference groups have a positive influence on buying decision.
H4- Different reference groups have different levels of influence on Facebook users’ buying decision process.
H5- The larger the online contribution on Facebook, the greater the confidence level on eWOM .
H6- The larger the online contribution on Facebook, the greater the information search on the same social network.
H7- The larger the online contribution on Facebook, the greater the influence of reference groups
For the preparation of the questionnaire, there were two scientifically proven studies based on. A 2009 study by Braga
Neto with the theme "The Influence of Online Word of Mouth on Consumer Purchase Decision" and another by Parke
and Lessig (1977) to study the influence of reference groups.
These studies led to the creation of 13 and 9 items respectively, measured by a 5-point Likert scale. In that the value 1
corresponds to total disagreement ("totally disagree") and the value 5 to complete agreement ("totally agree ").
To characterize the sample were also included sociodemographic variables: age, gender, educati onal attainment,
marital status, occupation, monthly net income and country of residence. And also the variables that characterize the
use of Facebook: time surfing on Facebook, frequency of content sharing and content type. To search for answers to the
hypothesis above, 5 variables were used: Search for Information through Facebook (Braga Neto, 2009), Confidence on
eWOM and Buyer Decision Process(Braga Neto, 2009), Influence of Reference Groups(Park e Lessig, 1977), Influence
of Reference Groups II (Park e Lessig, 1977) and Online Contribution (Braga Neto, 2009). Each variable was studied
based on questions from the elaborated questionnaire.
5. Methodology
The questionnaire was shared online through Facebook (posted on private walls, groups, on Facebook chat and private
messages) and sent to several e-mail lists. It was asked for the individuals to share a link for the questionnaire with
their Facebook contacts as well as their e-mails. The sample results of a self-elected sample, not probabilistic (Malhotra,
2001 and Barañano, 2004) nor representative of the population (Manson and Bramble, 1989).
Sample
A sample by convenience was used and encompasses Portuguese citizens with ages over 18 years old, both genders and
Facebook users. The research turned to a non-probabilistic sample constituted by 755 individuals. The data analysis
was made with the help of a data analysis program S.P.S.S (Statistical Package for Social Sciences) version 18.0.
The questionnaire had a filter question: “Do you have an active Facebook account?”. Only the individuals that answered
“Yes” could proceed in filling in the questionnaire. The study used 719 answered questionnaires. The answerers were
collected during February 18 and 22 2012. The questionnaire was advertised through Facebook and sent to a large e-
mail list. On Facebook it was advertised on discussion groups, friend’s profiles as well as unknown people profiles.
The questionnaire was answered by individuals of all the ages groups and a large answer percentage was verified by

504
individuals between 18-25 years old (63,8%) and between 26-40 (31,6%). The age range with the smallest percentage
was >41 years old (4,6%). Regarding gender, 58,7% is female and the rest 41,3% is male. We verified that the average
time of browsing on a normal day of the present sample is 2,14 hours; 32,0% of the inquired generate content on
Facebook on a daily basis, 29,9% several times per week and 16,4% only one time per week.
Internal Consistency of Scales
With the intent to measure the internal consistency of the scale variables for Search for Information through Facebook,
Confidence on eWOM and Buyer Decision Process, Influence of Reference Groups, Influence of Reference Groups II and
Online Contribution, we proceed to a calculation of the reliability coefficient trough Alpha of Cronbach. And
respectively we obtained values of α =0,903, α=0,914, α=0,902, α=0,916 and α=0,932. Which translates on an great
internal variable consistency.
6. Results
One of the main goals of this study is the analyze the correlation between the different variables and, on this case, we
elaborated testes of correlation between the variables which can go from very low to very high (Table 1).
The Pearson Correlation allows obtaining statistically interesting results. It allows seeing the relation between the
variables, regarding quantitative variables, or the order of those variables for ordinal variables (Pestana e Gageiro,
2005). So, all the studied variables were related between themselves allowing all the desired answers. In this study we
detected the existence of moderated correlations, high and very high (Table 2).
Table 1. Significance of the Correlation Level
Calculation Result Significance level of
correlation
Up to 0,2
Very Low
Over 0,2 to 0,4
Low
More than 0,4 to 0,6
Moderate
More than 0,6 to 0,8
High
Over 0,8 Very High
Source: Cohen, J.(1988), Statistical power analysis for the behaviour sciences, 2nd Ed. Hillsdale, NJ, LEA.
In this study we detected the existence of correlations moderate, high and very high, while the same are indicated in the
following table:

505
Table 2. Correlations between the dimensions of the study
Influence of Reference Groups II
Confidence
on eWOM and
Buyer
Decision
Process
Search for
Information
through
Influence of
Reference
Groups I
Family Friends Other
users
Famous
People
Users in Brands
Profiles
Users in
discution
Groups
Online Contribution
Confidence
on eWOM
and Buyer
Decision
Process
1 - - - - - - - - -
Search for
Information
through
,761** 1 - - - - - - - -
Influence of
Reference
Groups I
,791** ,784** 1 - - - - - - -
Infl
ue
nc
e o
f R
efe
ren
ce
Gro
up
s I
I
Family ,579** ,568** ,613** 1
- - - - -
Friends ,671** ,659** ,690** ,829** 1 - - - - -
Other users ,655** ,607** ,652** ,554** ,639** 1 - - - -
Famous
People ,549** ,500** ,593** ,489** ,553** ,719** 1 - - -
Users in
Brands
Profiles
,685** ,682** ,730** ,549** ,672** ,688** ,655** 1 - -
Users in
discution
Groups
,695** ,666** ,712** ,604** ,668** ,719** ,631** ,787** 1 -
Online
Contribution ,654** ,656** ,699** ,463** ,539** ,536** ,472** ,564** ,578** 1
**Correlation for a lev el of p < 0,01 (2-tailed)

506
We verified that the bigger the confidence on eWOM, the bigger the search for information through Facebook (r=0,761;
p<0,01); the bigger the Influence of Reference Groups (r=0,791; p<0,01); and the bigger the online contribution (r=0,654;
p<0,01);
There is also a positive relation between the search for information on Facebook and the influence of reference groups
(r=0,784; p<0,01); as well as with the online contribution (r=0,656; p<0,01);
We also verified a positive and high correlation between the Influence of reference groups and a greater online
contribution (r=0,699; p<0,01).
7. Discussion
The results of this study regarding all the hypothesis will be presented next. The data for each hypothesis will be analyzed.
H1- Facebook is used for searching information about products, services and brands.
This hypothesis had the goal to understand if, for the Portuguese Facebook users, this social network is one of the means
of information research regarding products and brands.
The sentence “I use Facebook to get information about products and services before I buy them”, was measured using a
Likert scale from 1 (totally disagree) to 5 (totally agree). The average obtained for the entire sample was 2,3; which
indicates that individuals disagreed with this sentence. We believe that on of the reasons for this result is related with the
fact that Facebook is a recent tool, so consumers don’t look ate it as a source of information, yet. If we take into account
that the average answers to the sentence “I usually read opinions on Facebook about a product before I buy it” was 2,61;
we may conclude that consumers may not me aware they use that tool to search for information. This result is consistent
with Neto (2009). Although, as the next results show, we must take into account that despite individuals say they don’t
search information about products or brands on Facebook they see that information on the brand murals and on
comments other Facebook users make.
H2- The larger the search for information through Facebook, the greater the confidence on eWOM achieved through that
same social network.
H2 was tested correlating two variables: Information research through Facebook and eWOM trust and buying decision.
The first variable allows us to observe the sample behavior concerning Facebook use to search for information about
brands and products. The second variable allows us to understand if there might be a change in behavior after seeing or
reading information from other Facebook users. The correlation between variables is high (R=0,761; p<0,01). H2 was
confirmed, meaning the information read on Facebook affect buying decision. This conc lusion is interesting because it
helps us to understand the interpretation of H1. Facebook users do not search for information about products or brands
actively, but they read them and are influenced by them.
H3- Opinions stated on Facebook by reference groups have a positive influence on buying decision.
Information and opinions of more sociable groups have more influence on consumers (Churchill and Peter, 2000). The
relationship between the influence of reference groups, eWOM trust and buying decision through Facebook was tested.
The correlation between variables was 0,784 with a significance level of 0,01; so H3 was accepted. Involved and dedicated
members within a community may influence consumers. This result is consistent with Yuen’s (2010), who studi ed online
forums and concluded if there is similarity between the users and forum members, there is direct influence on buying
intention of products discussed in the forum. While Yuen (2010) focused on buying intention, our research focused on
buying decision, and did Neto (2009). Our research concluded that reference group’s opinion on Facebook, influence
buying decision. This difference is relevant because brands focus on buying decision and previous research point out the
existence of a gap between buying intention and buying decision (Lafferty, 1996; Proença e Pereira, 2008).

507
H4- Different reference groups have different levels of influence on Facebook users’ buying decision process.
Consumers’ choice of products is influenced by online opinions, but not all the opinions have the same level of influence
(Senecal and Nantel, 2004). So, to understand consumers’ behaviour of different reference groups, one of the questions
was separated for each of the reference groups included in our research. We analysed the correlation between eWOM trust
and buying decision, for each of the reference groups. Our research obtained the following correlations: family (r=0,579;
p<0,01); friends ((r=0,671; p <0,01); other users (r=0,655; p <0,01); famous people (r=0,549; p <0,01); users of brand
Facebook pages (r=0,658; p <0,01) and users o discussion groups (r=0,695; p <0,01). All of them show significance level
inferior to 0,01 indicating and high level of correlation. On Facebook we could confirm that different reference groups
show different levels of influence, consistent with Senecal and Nantel’s conclusions (sup.cit.). One interesting conclusion i s
that page users and discussion groups’ users show higher correlation then other groups (except friends). This indicates the
individuals from our sample are influence by opinions left on Facebook buy people they don’t know, which shows the
importance of e-fluencial (Mittal et al., 2008). Another interesting conclusion is the low influence of family opinion on
Facebook. This may be related with the average age of our sample (very young) to which the influence of friends is more
relevant, included on the identification group (Mittal et al, 2008).
Previous research indicates that opinion leaders have influence on consumers (Solomon, 2002, Mittal et al, 2008). Our
research confirms this conclusion, but other groups have an higher level of influence on our sample.
H5- The larger the online contribution on Facebook, the greater the confidence level on eWOM .
To study H5 we calculated the correlation between Online Contribution on Facebook and eWOM trust. Before we have
studied the relationship between information search and WOM trust. This analysis allows us to complement the previous
one. In this case we are focusing on consumers who use Facebook more actively, giving their own opinion about products
or brands. The correlation between these two variables show and high level of correlation (r=0,654) with a significance
level lower that 0,01. So H5 was accepted. Ainsworth (2005) stated that consumers who value opinion websites tend to be
more influence by the opinions written on them. This shows that the individuals from our sample that write their opinion
on Facebook, do it sincerely, because they trust on other users’ opinion.
H6- The larger the online contribution on Facebook, the greater the information search on the same social network.
Hypothesis 6 related Facebook online contribution and information search through Facebook. The correlation is 0,656 for
a significance level lower than 0,01, showing a high correlation level. This indicates that a consumer that uses Facebook
actively, either to write information or to search for information about brands, tends to use Facebook as a means to search
for information online, about products and/or brands.
H7- The larger the online contribution on Facebook, the greater the influence of reference groups
Our research showed that online participation through Facebook and the influence of reference groups is positive
(r=0,699; p<0,01). Though, it is possible to identify an interesting situation. Users that ‘liked’ brand pages and users of
group discussion are the ones who have a higher influence on consumers. Further, the larger the online participation the
greater the influence of the information read on Brand pages and discussed on group discussions. Despite that, consumers
are affected by information they read on Facebook’s Brand murals and group discussions, what is very interesting
concerning research on consumer behaviour and eWOM on Facebook. E-fluentials, individuals who have an active online
participation, compare information obtained both in opinion websites and corporate websites and participate in online
group discussions on Facebook, have a great influence on Facebook users.
8. Conclusion
Our research aimed to analyse the influence of eWOM generated by reference groups through Facebook on information
search on Facebook, reference groups influence, eWOM trust and buying decision and online contribution.
Concerning information search about products and/or brands on Facebook our sample showed that women use more
Facebook to search for information, than men.

508
The majority of individuals of our sample don’t consider Facebook as the first mean to search for information about
products/brands. Although, Facebook is one of the information external sources, on consumers buying decision process.
Our research allowed us to conclude that the larger the search for information through Facebook the greater is Facebook’s
eWOM trust. In fact, the information displayed on Facebook by reference groups influences consumers buying decision,
and there is a positive correlation between eWOM trust and buying decision and the influence of reference individuals.
Despite that, different reference groups have different levels of influence. Users of brand pages, users on discussion groups
and other users are the ones with a higher level of influence on consumers. Family and famous people are the groups that
show a small correlation level. These correlations occur both when we establish the correlation between influence of
different influence groups and online contribution or online information search.
Finally, consumers who use Facebook more actively (online contribution), show higher levels of trust on information seen
on that social network. We could also conclude that users who more actively participate on Facebook, meaning they write
more opinions about products/brands, are the ones who search for information more often an also trust on that
information. Further, the larger the online contribution the greater the influence of information read on Facebook brand
pages and discussion groups; online contribution showed high levels of correlation with brand page users and group
discussion users.
9. Implications for managers
As our research focused on eWOM on Facebook and reference groups, we can establish a list of suggestions useful to
include this social network in communication campaigns of organizations.
First of all, the users are more influenced by page users or group discussion users, then by family and famous people. This
can be interesting to companies, because the use of a famous person in a campaign may be expensive and may not have an
higher impact than an unknown person.
The information showed on a Brand mural influences consumers who read it. The company should have an active part on
the creation of positive eWOM. It is necessary to write about the products/ brands on the facebook page. The results show
that creating a discussion group may be an interesting tool, with daily discussion topics to promote the brand and its
products. This would increase costumer-brand relationship. As eWOM trust is greater as online contribution increases,
companies should motivate online contribution of their Facebook page users. T his participation will increase the
relationship with the brand and will increase trust on information read on this social network.
As Facebook is not yet seen as the main mean to search for information, it is very important that brands keep other
sources of information about their products/brands.
This research shows that there is information search about brands, products and services with other consumers, through
Facebook. The reinforces the idea that despite there is interest and information sharing, some consumers after doing ‘like’
to the page, don’t keep their interest. So, it is necessary that companies develop campaigns that motivate this relationship.
10. Limitations and Future research
Several clues came up to develop future research. This research allowed us to obtain more information about the influence
of reference groups. In the future, it may be important to understand the differences on consumer behaviour for different
products or services. According to Solomon (2002) reference groups influence is different for different products or
services. So, it is important to understand for which products Facebook influence is greater and how f -commerce
applications can be incorporated. Also analysing the return on investments possibility taking into acc ount costumer’s
predisposition to shop online on Facebook.
The number of Facebook users has been increasing, as their online contribution also. It would be interesting to make a
longitudinal study and analyse consumer’s behaviour using the variables in this study, in particular, concerning online
search for information and eWOM trust.
In this research we used a convenience sample. The use of a representative sample that characterizes Portuguese
Facebook user and that allows us to compare different users with different characteristics, may lead to different results
(e.g. geographical area).
509
Finally, as there are several social networks with specific targets, it may be interesting to analyse the behaviour of each o f
these social networks targets, as their eWOM trust.
References
AINSWOTH, A., Bailey. (2005). Consumer awareness and use of product review websites. Journal of interactive advertising,
v6, 88-91.
ASSAEL, H. (1998). Consumer behavior and marketing action. International Thomson Publishing
BANARÃNO, A. M. (2004). Métodos e técnicas de investigação em Gestão – Manual de apoio à realização de trabalhos de
investigação. Lisboa, Edições Sílabo.
BLACKWELL, R., Miniard, P.W., Engel, J.F. (2008). Comportamento do consumidor. São Paulo: Pioneira Thomson Learning.
CARRERA, F. (2009). Marketing digital na versão 2.0, o que não pode ignorar. Lisboa: Edições Sílabo, 167-183.
CELSI, R., Olson, J. (1988). The role of involvement in attention and comprehension processes. Journal of consumer
research, v.15, 210-224.
CHURCHILL J., Gilbert, A., Peter, J. (2000). Marketing: criando valor para o cliente. São Paulo: Saraiva.
FERREIRA, Camila (2010). Credibilidade e indicação como fontes de divulgação no segmento de serviços. Universidade
Federal do Rio Grande do Sul. Porto Alegre
HENNING-THURAU, t. et al. (2004). Electronic word-of-mouth via consumer-opinion platforms: what motivates consumers
to articulate themselves on the internet. Journal of interactive marketing, vol. 18, 38-52.
KLIATCHKO, J. (2008). Revisiting the IMC construct: a revised definition and four pillars. International journal of
advertising, vol.27, 133–160.
KOTLER, P. (1998). Administração de marketing: análise, planeamento, implementação e controlo. São Paulo: Atlas.
LAFFERTY, B.A. (1996). Cause-related marketing: does the cause make a difference in consumers' attitudes and purchase
intentions toward the product?' working paper, Department of Marketing, Florida State University, Tallahassee,
FL.
MALHOTRA, N. K. (2001). Pesquisa de marketing: uma orientação aplicada. 3ª edição. Porto Alegre, Bookman.
MANSON, E e Bramble, W. (1989). Understanding and Conducting Research . New York, McGraw-Hill Internacional Editions.
MITTAL, B. et. al. (2008). Consumer behavior: how humans think, feel and act in the market plac e. Open mentis.
MOWEN, J. C.; MINOR, M. S. (2003). Comportamento do Consumidor. Pearson Prentice Hall.
NETO, Braga, J. (2009). A Influência do Boca a Boca Online na Decisão de Compra do Consumidor. Universidade Católica do
Rio de Janeiro. Rio de Janeiro.
NETSONDA (2011), Netsonda apresenta nova vaga do estudo Face to Facebook, Available at:
www.netsonda.pt/not_noticias_detail.php?aID=1693
PARK, C. Whan; LESSIG, Parker (1977). Students and Housewives: Differences in Susceptibility of Reference Groupe Influence .
Journal of Consumer Research, 4, 102-110. University of Chicago Press. Scale
PESTANA, M. H. e Gageiro, J. N. (2005). Análise de dados para Ciências Sociais – A complementaridade do SPSS. 4ª edição.
Lisboa, Edições Sílabo.
PROENÇA, João F. e Pereira, Inês V. (2008) Exploring the consumption of charity linked products. International Review on
Public Marketing, vol. 5; 53-69.
RIEGNER, C. (2007). Word of mouth on the web: the impact of web 2.0 on consumer purchase decisions. Journal of
advertising research.
SCHIFFMAN, L., Kanuk, L. (2000). Comportamento do consumidor. ltc editora.

510
SENECAL, S., Nantel, J. (2004). The influence of online product recommendations on consumers’ online choices. Journal of
Retailing, vol. 80, 167.
SIEGEL, David (1999) . Futurize your enterprise: business strategy in the age of e-customer. New York: John Wiley.
SOCIALBAKERS (2011), Portugal Facebook Statistics, Available at: www.socialbakers.com/facebook-
statistics/portugal#chart-intervals
SOLOMON, M. (2002). O comportamento do consumidor: comprando, possuindo e sendo . Porto Alegre: Bookman.
XIA, L., Nasr, N. (2008). Word of mouse: the role of cognitive personalization in online consumer reviews. Journal of
interactive advertising research, vol.9, 3-13.
YUEN, S. (2010). Online word of mouth and consumer purchase intentions. Hong Kong: Baptist University.

511
Session 14
512
Atributos influenciadores da escolha por
veículos: aspectos experienciais e simbólicos Comportamento do consumidor; grupos focais; aspectos experienciais; valor simbólico; marca; tomada de decisão.
Caissa Veloso e Sousa, Faculdade Novos Horizontes, [email protected]
José Edson Lara, Faculdades Pedro Leopoldo, [email protected]
Érico de Castro e Costa, Centro de Pesquisa Rene Rachou/Fiocruz, [email protected]
Rodrigo Affonseca Bressan, Universidade Federal de São Paulo – UNIFESP, [email protected]
Álvaro Machado Dias, Universidade Federal de São Paulo – UNIFESP, [email protected]
Resumo
A segunda metade do século XX foi marcada por transformações econômicas e sociais que impactaram em diversos
aspectos do cotidiano organizacional e dos indivíduos. Ao se considerar as relações de consumo, especificamente, esse
passou a representar algo que transcende o valor de troca, se caracterizando em aspectos relacionados a seus signos.
Nesse prisma também se inclui a indústria automotiva e a representação dos automóveis para seus consumidores, ou
possuidores. Nesse contexto, o presente trabalho teve como objetivo principal descrever atributos influenciadores da
tomada de decisão na escolha de um veículo. Além de uma investigação sobre aspectos gerais entre marcas e modelos,
foram analisados de forma mais específica os veículos Fiat Bravo, Ford Focus e Hyundai I30. A pesquisa, de abordagem
qualitativa, foi conduzida a partir da realização de oito grupos focais. As entrevistas foram conduzidas na cidade de São
Paulo/Brasil. Entre as categorias de análises incluíram-se: razões para se escolher determinada marca/modelo de veículo,
incluindo-se design, atributos tangíveis e não tangíveis; itens que não podem faltar em um carro; e preço. Os resultados
permitem inferir que a marca pode representar tanto critério de escolha como de exclusão da cesta de escol ha, sendo as
experiências pessoais ou de familiares e conhecidos importantes para a decisão, o que indicou a importância dos grupos de
referência para a formulação de atitudes em relação a determinados veículos.
1 – Introdução
A segunda metade do século XX foi marcada por transformações econômicas e sociais que impactaram em
diversos aspectos do cotidiano organizacional e dos indivíduos. Ao se considerar as relações de consumo, especificamente,
esse passou a representar algo que transcende o valor de troca, se caracterizando em aspectos relacionados a seus signos.
Nesse sentido, é possível fazer uma distinção entre valor de uso e valor de troca dos bens, emergindo a significância de
valores como status, valor sentimental e valor simbólico (Baudrillard, 2008). Concernente a esses aspectos, o
desenvolvimento tecnológico fez com que a tecnologia passasse a ser facilmente copiável, fatos esses que conduziram as
organizações à necessidade de diferenciações de seus produtos que vão além de argumentos tangíveis.
Nesse prisma também se inclui a indústria automotiva e a representação dos automóveis para seus consumidores,
ou possuidores. Se considerados os automóveis a partir de seu significado para o consumo individual e o das famílias, o
que transcende sua utilidade como meio de transporte, destaca-se a importância do valor do marca e da imagem formada
pela marca em suas mentes ao longo do tempo, construída por meio de suas experiências de consumo, que são
responsáveis para a formação de sentimentos, positivos ou não, em relação a ela (Torres & Gonçalves, 2010).
A escolha por se trabalhar com o setor automotivo encontra justificativas que permeiam tanto a participação e a
importância do setor no Produto Interno Bruto (PIB) de diversos países e brasileiro, como, mais especificamente, seu
significado no cotidiano das pessoas, podendo representar além de um bem de transporte, um poder simbólico, tal como o
termo foi cunhado pelo sociólogo Pierre Bourdieu. Nesse sentido, para Bourdieu (2007) a distribuição dos bens m ateriais
513
e dos bens não materiais se dá de forma desigual, reproduzindo estereótipos e posições ocupadas em determinados
campos da sociedade.
A despeito da crise econômica deflagrada em 2007, com importantes reflexos no ano de 2008, permanecendo até
os dias atuais, o mercado automotivo vivenciou considerável crescimento nos últimos 10 anos, saindo de uma produção
anual de 58.994 unidades, em 2002, e atingindo um patamar de 80.093 unidades anuais em 2011. A Ásia foi o continente
com a maior participação na produção no ano de 2011, o equivalente a 50,4%, seguida pela Europa (26,4%), América
(22,2%) e Oceania (0,3%). Nesse cenário, percebe-se a estabilização ou decréscimo da produção no período em países
como Japão, Estados Unidos, Alemanha, Espanha, França, Reino Unido e Itália, e aumento na produção em países como
China, Coreia do Sul, Brasil, Índia e Argentina (ANFAVEA, 2012).
Para Fantini, Gonçalves & Souki (2011), para manter vantagem competitiva frente a concorrência, a indústria
automotiva mundial tem-se reestruturado, passando por movimentos de fusões e aquisições, intensificação e
diversificação de modelos em mercados mais segmentados, com estilos diferenciados, redução do ciclo de vida de seus
produtos, além da maior aproximação de seus produtos a aspectos emocionais relacionados ao consumo.
Nesse contexto, o presente estudo teve por objetivo principal descrever atributos influenciadores da tomada de
decisão na escolha de um veículo, considerando-se aspectos gerais entre marcas e modelos, além da comparação entre três
marcas/modelos distintos: Fiat Bravo, Ford Focus e Hyundai I30. De forma específica, pretendeu-se: a) identificar os
principais atributos percebidos como importantes pelos sujeitos de pesquisa na escolha de um veículo; b) analisar a
importância do preço na escolha de um veículo; c) identificar como os indivíduos percebem cada veículo em relação ao
perfil de comprador; d) identificar preferências em relação a cada um dos veículos apresentados.
As entrevistas foram realizadas na cidade de São Paulo/Brasil. A escolha do locus da pesquisa se justifica uma vez
que o Brasil, atualmente, é um importante competidor na produção de veículos automotivos, com reflexos no nível de
consumo per capta de veículos, exportações e importações. O investimento na indústria automotiva no país saiu de U$976
milhões em 2002, para U$4.971 milhões em 2011, o que representa, se considerado apenas o comércio de veículos com a
União Europeia (excluindo-se autopeças, máquinas agrícolas e rodoviárias), um volume comercializado de U$123,8
milhões em exportações e U$2.074,7 milhões em importações, apenas no ano de 2011. A cidade de São Paulo possui a
maior frota estimada de automóveis leves do país, o que corresponde a 35,88% dos carros (ANFAVEA, 2012).
2 Desenvolvimento teórico
2.1 O Comportamento do Consumidor como campo de pesquisa
O comportamento do consumidor constitui um tema multidisciplinar de pesquisa, que ganhou importância
principalmente após o término da Segunda Guerra Mundial, quando o consumidor passou a desempenhar papel mais ativo
em suas escolhas, dado a diversidade de bens disponíveis e o acesso aos meios de comunicação de massa (Engel, Blackwell
& Miniard, 2000; Mesquita, 2004; Sousa, 2012). Tais circunstâncias conduziram a teoria de Marketing à emersão, na
década de 1950, da escola do Comportamento do Consumidor. Os pesquisadores dessa escola buscavam responder aos
motivos pelos quais os mercados se comportavam de determinada maneira, com foco nos consumidores. Segundo Sheth,
Gardner & Garret (1988), uma diversidade de pesquisas foi produzida nesta escola, cuja ênfase está no consumo de bens,
mesmo que se mostre crescente as pesquisas em serviços e compras industriais. Isso se explica dada a maior facilidade de
pesquisas empíricas nesse tipo.
A partir da década de 1960, várias universidades se interessaram pelo estudo do comportamento do consumidor.
A partir de então, modelos foram desenvolvidos. Em geral, esta escola produz muitas pesquisas empíricas, porém seus
resultados são frequentemente conflitantes. Contudo, suas teorias são altamente generalizáveis, dado o emprego das
modelagens estatísticas (Sheth, Gardner & Garret, 1988).
O estudo do comportamento do consumidor contribuiu significativamente com o desenvolvimento da disciplina
de Marketing, inclusive, atraindo estudiosos de outras disciplinas, como as ciências matemáticas, antropologia, psicologia e
sociologia. Para Vilas Boas, Sette e Abreu (2004) essa interdisciplinaridade no estudo do comportamento do consumidor
possibilita o desenvolvimento de teorias e a compreensão do fenômeno estudado a partir de distintos aspectos: os grupos
focais e as entrevistas em profundidade, por exemplo, herdados das ciências sociais, permitem maior conectividade entre
o pesquisador e o fenômeno; os experimentos, originários principalmente da psicologia, permitem relatar teorias
cognitivas e de aprendizado; os métodos de laboratório, associados à psicologia fisiológica, e mais recentemente às

514
Neurociências (BANKS et al., 2012; DIAS, 2010a, 2010b, 2010c; McCLURE et al., 2005; VENKATRAMAN et al., 2012),
permitem captar reações a estímulos sensoriais e percepções da realidade percebida.
Cabe destacar que essa multiplicidade de possibilidades para se estudar um fenômeno no campo do
“Comportamento do Consumidor” possibilita que esse seja analisado sobre distintas vertentes, assim como proposto por
Sousa (2012). Portanto, não se trata de julgar o melhor método de maneira generalizada, mas sim de adequar a métrica ao
problema de pesquisa, proporcionando maior conhecimento do fato de estudo em questão.
Nesse sentido, e novamente argumentando acerca da riqueza de aspectos a se estudar quando o tema se relaciona
ao comportamento do consumidor, considerar que esse consumidor seja um ser racional, que busca tomar as melhores
decisões nas relações de troca implica em negligenciar aspectos importantes relacionados ao simbolismo presente em tais
dinâmicas. Para Pinto e Lara (2010a; 2010b), o ato de comprar não deve ser dissociado de sua representação como forma
de socialização, estando o consumo imbuído de sentimentos diversos, como prazer, emoção, alegria, raiva, frustação,
reconhecimento e tédio.
A abordagem multidisciplinar do comportamento do consumidor, procurando entender aspectos psicológicos do
consumo, especialmente com as contribuições apresentadas no modelo de Howard-Sheth, formou uma forte corrente,
sugerindo que as atitudes, a priori formuladas em relação a uma marca ou a um produto, são importantes preditoras do
comportamento de consumo (Sheth, Gardner & Garret, 1998). Em consonância com essa perspectiva, faz-se pertinente
estudar os aspectos experienciais envoltos nas relações de consumo, uma vez que esses podem influenciar na formação
dessa atitude (Pinto & Lara, 2010a).
2.2 Elementos experienciais e simbólicos do consumo
Para Baudrillard (2008) as relações de consumo não representam especificamente o valor de troca do bem ou
serviço prestado, caracterizando-se em algo além, como o valor dos signos. Ressalta-se, segundo Featherstone (1995), que
há uma distinção entre valor de uso e valor de troca dos bens, caracterizando aspectos como status, valor sentimental e
valor simbólico. Nesse prisma, os bens podem ser usados como forma de destacar o pertencimento a determinado grupo,
de exaltar diferenças sociais e ainda transmitir mensagens, ajudando a produção e manutenção de relações sociais, sendo
necessário o reconhecimento de suas funções que superam as medidas utilitaristas (Christino & Gonçalves, 2010;
Featherstone, 1995; Leão, 2005).
Pinto e Lara (2010a) reforçam os argumentos acerca da lógica feiticista do consumo ao afirmarem que existe uma
interlocução entre os aspectos experienciais e os aspectos culturais e simbólicos envolvidos no consumo. Para os autores,
tal fato tem proporcionado uma maior busca por parte dos pesquisadores no campo de estudos do consumo do
entendimento de dimensões como significados construídos e experiências vividas pelas pessoas.
A compreensão da importância dos aspectos experienciais e culturais do consumo é também abordada por
Featherstone (1995), ao argumentar sobre a cultura de consumo, que apesar de representar um fenômeno individual de
cada país, fazendo sentido apenas para aqueles que a compartilham, não exclui o compartilhamento entre nações, o que o
autor chama de “condição global”.
Nesse aspecto, Craig e Douglas (2012) afirmam que a exposição de membros de uma cultura a símbolos e
experiências de outras culturas possibilita a emersão de valores coletivos, especialmente compartilhados por meio dos
meios de comunicação de massa, internet e contato pessoal. Passuello e Souza (2006) corroboram com a proposição de
Craig e Douglas (2012) ao afirmarem que “os processos decisórios são influenciados por fatores culturais, políticos e
pessoais, nos quais componentes conscientes e inconscientes mesclam-se na tomada de decisão”.
Para Semprini (2010), a atribuição de importância relevante ao consumo é uma característica da pós -
Modernidade, na qual são valorizados aspectos como: o individualismo; o culto ao corpo; o imaterial, ou seja, o
desenvolvimento de formas imateriais de consumo, com valores mais abstratos, conceituais, virtuais e de interação com o
ambiente; a mobilidade, tanto física quanto geográfica, percebida a partir de frequência de viagens, deslocamentos,
trajetos percorridos, meios de transporte (carro, avião e trem), passeios e uso de celulares, entre outros; e o imaginário,
representando uma abertura a formas de consumo mais voltadas a fantasias, criatividade, expressão pessoal, procura de
sentido.

515
A partir das diferenças entre o consumo moderno e o consumo pós-moderno, apontadas por Semprini (2010),
destaca-se a importância da marca no universo do consumo na atualidade. “As novas formas de comunicação interativa
entre a marca e seus públicos (internet, novas mídias) instalam um simulacro de relação personalizada, no qual o
indivíduo não está mais em posição de recepção passiva, mas colabora ativamente com a construção da relação e de seu
significado” (Semprini, 2010, p. 68).
Nesse aspecto, os consumidores estariam mais dispostos a pagar mais caro por marcas que enfatizam as cinco
dimensões apresentadas, em comparação com marcas que não se enquadram nessas dimensões. Portanto, marcas que
contenham valores simbólicos, que se engendram em parâmetros da mobilidade (celulares, por exemplo) e que
representem status, conceitos de consumo e atendimento de desejos individuais tendem a competir em posições de
destaque na lógica do consumo pós-moderno.
Para Santi (2005), a atualidade contempla uma época de superabundância de ofertas, que, em instância íntima,
prometem a felicidade. O consumo representa mais do que a aquisição de um bem, mas o acesso a um mundo não
controlável, porém que se torna necessário para a satisfação do prazer imediato. Destaca-se que nesse mundo o consumo
representa um fator relacional, de forma que enfatiza as diferenças.
“Assim, por exemplo, o desejo de adquirir determinado automóvel é movido pelo valor atribuído a ele nos grupos
aos quais pertenço e, sobretudo, aos quais gostaria de pertencer. Se determinado modelo torna-se comum entre os ‘meus
iguais’, ele perde o valor, independente de seus atributos como produto” (Santi, 2005, p. 188).
3 Método
A presente pesquisa tem abordagem qualitativa, dado o caráter subjetivo proposto para análise. Para coleta dos
dados foi utilizada a técnica de grupos focais, que constitui um tipo de entrevista em profundidade realizada por meio de
reuniões com grupos predefinidos em relação tanto à proposta quanto ao tamanho e o arquétipo de condução (Oliveira &
Freitas, 2010).
Percebe-se, na atualidade, a aplicação da técnica de grupos focais em pesquisas de diversas áreas do
conhecimento, sendo os serviços de saúde um dos campos em que mais são utilizados. A origem desta técnica de pesquisa
se encontra na Sociologia, tendo emergido na década de 1940, inicialmente utilizada por Robert Merton. Paul Lazarsfeld a
utilizou, na mesma década, na área de Marketing, investigando as reações às propagandas e transmissões de rádio durante
a Segunda Guerra Mundial (Barbour, 2009; Oliveira & Freitas, 2010).
Foram realizados oito grupos focais, sendo que em sete encontros houve a participação de quatro indivíduos e
apenas em um grupo houve a participação de três indivíduos. Optou-se por incluir o grupo de três participantes na análise,
uma vez este apresentou contribuições ao contexto geral da pesquisa. O tamanho dos grupos, que permeia o limite mínimo
sugerido (Barbour, 2009; Oliveira & Freitas, 2010), foi preferido por permitir maior participação de todos os envolvidos,
possibilitando ampliar o poder explicativo de suas percepções. Conforme apontado por diversos autores (Barbour, 2009;
McDaniel & Gates, 2003; Morgan, 1993, 1997; Oliveira & Freitas, 2010) os trabalhos preferivelmente são realizados com
grupos entre oito e doze participantes, porém, conforme observado por McDaniel e Gates (2003) e Barbour (2009), grupos
menores (em torno de quatro participanetes) podem funcionar melhor com tópicos carregados em fatores emocionais, que
desenvolvem altos níveis de envolvimento dos participantes, enquanto que grupos maiores possuem uma dinâmica mais
fluida com tópicos neutros, gerando níveis menores de envolvimento.
Optou-se por não realizar grupos adicionais a partir do momento em que os pesquisadores perceberam que novos
encontros apresentavam informações saturadas, não contribuindo argumentos diferenciados em face dos já apresentados
(Barbour, 2009; Oliveira & Freitas, 2010).
Foram adotados os seguintes critérios de exclusão para participação nas reuniões: sujeitos com idade inferior a 18
anos, uma vez que não estão habilitados legalmente para conduzir veículos automotivos; empregados de qualquer uma das
organizações responsáveis pelas marcas de veículos pesquisados; e indivíduos que afirmassem possuir na ocasião da
pesquisa qualquer um dos três veículos analisados. A escolha da amostra se deu por conveniência o que segundo Hair Jr.,
Babin, Money e Samouel (2005, p. 247), “envolve a seleção de elementos de amostra que estejam mais disponíveis para
tomar parte no estudo e que podem oferecer as informações necessárias” e houve anuência para participação de todos os
envolvidos. Parte dos convites partiu dos pesquisadores envolvidos na coleta de dados e outra parte contou com o suporte

516
de uma empresa de telemarketing, que contatava os sujeitos, explicava o propósito da pesquisa, fazia o convite e o
agendamento, no caso de concordância, o que consistiu em aproximadamente 50% da amostra.
As reuniões foram conduzidas por um moderador e um assistente, que ficaram responsáveis por fazer as
anotações e registrar as impressões acerca da atividade. A duração média das reuniões foi de 60 minutos. Previamente foi
elaborado um roteiro que serviu de guia para condução das entrevistas, sendo que tanto o moderador quanto o assistente
tiveram a liberdade para extrapolar aspectos previamente acordados, vislumbrando maior entendimento do fenômeno. O
roteiro se encontra disponível no apêndice.
A técnica escolhida para a análise dos dados dos grupos focais foi a análise de conteúdo. Alguns pesquisadores, ao
trabalharem com a análise de conteúdo, preferem se restringir ao que está manifesto e consideram subjetivo o que
ultrapassa esse nível. Em outra perspectiva, há pesquisadores que defendem que a análise de conteúdo deve contemplar
uma avaliação subjetiva, a partir de avaliações que são feitas pelo operador. Nesse sentido, os grupos focais devem ser
capazes de produzir inferências (GOULART, 2006), perspectiva essa adotada pelos pesquisadores, uma vez que procurou-
se transcender aspectos quantitativos, a partir de inferências sobre as observações.
Os grupos focais aconteceram todos na cidade de São Paulo / Brasil. Adotou-se a identificação dos participantes
por iniciais do nome e último sobrenome, conforme acordado previamente, de forma a garantir o anonimato das
informações. Para sete grupos, optou-se por uma formatação mista em relação ao sexo, sendo que para o último encontro
todos os participantes foram do sexo masculino.
Na tabela 1, apresentam-se as configurações de cada grupo, com as respectivas identificações (iniciais do
nome/sobrenome), sexo e idade dos participantes.
Tabela 1 – Formatação dos grupos focais
GRUPO 1 QUANTIDADE DE PARTICIPANTES DISTRIBUIÇÃO QUANTO AO SEXO FAIXA ETÁRIA
4 Masculino - 3 Entre 20 a 29 anos Feminino - 1
GRUPO 2 QUANTIDADE DE PARTICIPANTES DISTRIBUIÇÃO QUANTO AO SEXO FAIXA ETÁRIA
4 Masculino – 3 Entre 21 a 23 anos Feminino - 1
GRUPO 3 QUANTIDADE DE PARTICIPANTES DISTRIBUIÇÃO QUANTO AO SEXO FAIXA ETÁRIA
4 Masculino – 2 Entre 18 a 25 anos Feminino - 2
GRUPO 4 QUANTIDADE DE PARTICIPANTES DISTRIBUIÇÃO QUANTO AO SEXO FAIXA ETÁRIA
4 Masculino – 2 Entre 23 a 63 anos Feminino - 2
GRUPO 5 QUANTIDADE DE PARTICIPANTES DISTRIBUIÇÃO QUANTO AO SEXO FAIXA ETÁRIA
3 Masculino – 1 Entre 54 a 59 anos Feminino - 2
GRUPO 6 QUANTIDADE DE PARTICIPANTES DISTRIBUIÇÃO QUANTO AO SEXO FAIXA ETÁRIA
4 Masculino – 3 Entre 22 a 58 anos Masculino - 1
GRUPO 7 QUANTIDADE DE PARTICIPANTES DISTRIBUIÇÃO QUANTO AO SEXO FAIXA ETÁRIA
4 Masculino – 2 Entre 25 a 51 anos Feminino - 2
GRUPO 8 QUANTIDADE DE PARTICIPANTES DISTRIBUIÇÃO QUANTO AO SEXO FAIXA ETÁRIA
4 Masculino - 4 Entre 53 a 57 anos
Fonte: Dados da pesquisa

517
Sobre a formatação dos grupos focais, faz-se importante comentar acerca de algumas escolhas e suas justificativas:
Quanto à distribuição por sexo – sete grupos foram constituídos a partir de voluntários dos sexos masculino e
feminino. Acredita-se que essa diversidade tenha contribuído para que os pesquisados compartilhassem
sentimentos sobre o perfil do comprador de cada modelo de carro. À medida que os grupos foram
acontecendo, percebeu-se que não havia constrangimento por nenhuma parte em expor as características
sobre o perfil projetado para cada um dos veículos, inclusive servindo este de motivação para que homens e
mulheres expressassem sentimentos diferenciados e discutissem a respeito. Ao se perceber que as
informações já estavam saturadas, realizou-se um grupo apenas com homens, confirmando que não houve
diferenças perceptíveis para a análise em questão.
Quanto à distribuição por idade – em relação à idade, três configurações foram utilizadas: a) grupos 1, 2, e 3
entre 18 e 30 anos; b) grupos 4, 6 e 7 mistos; e c) grupos 5 e 8 entre 50 a 60 anos.
Não houve segmentação quanto a renda, escolaridade e estado civil, apesar de estas terem sido levantadas no
questionário respondido pelos participantes. A decisão de não segmentar os grupos de acordo com essas
variáveis partiu do pressuposto de que a intenção era projetar um perfil para o comprador de cada veículo, e
não de se apurar se estes sujeitos comprariam cada um dos carros.
4 Apresentação e análise dos resultados
O primeiro aspecto abordado procurou identificar as principais “razões” avaliadas pelos participantes para a
compra de um veículo. Para motivar a discussão, o moderador, em todos os encontros, citou exemplos como: design
externo, design interno, bancos (conforto e design), itens de segurança (air bag, freios ABS...), itens de conforto (ar
condicionado, vidros e travas elétricas), cor do veículo e desempenho.
Apesar de a “marca” não ter sido exposta como exemplo pelos moderadores, este foi o item mais comentado por
participantes de todos os grupos. As marcas chinesas foram, de maneira geral, tidas como “não confiáveis” e as marcas
japonesas como “confiáveis”. No grupo 2, todos os participantes citaram as marcas chinesas como critério de exclusão.
“Para mim é a marca, a confiabilidade na marca. Por exemplo, não pegaria uma dessas marcas chinesas. Se você pegar um
Volkswagen dificilmente precisará se preocupar com a manutenção” (DIO FAG – GRUPO 1).
“A marca, o preço e os opcionais. Estabeleceria uma faixa de preço e procuraria os modelos em três ou quatro marcas
diferentes. O primeiro critério de exclusão é a marca. As marcas francesas eu não compraria, pois tenho diversos familiares
que tiveram problemas. Compraria carros de marcas americanas e japonesas. Outro problema é que os carros da Fiat são
muito roubados. O Uno é mais roubado que o Gol” (VIC HIR – GRUPO 2).
“O nome da marca é muito importante, principalmente para quem não entende de carros, se não teria que pesquisar muito
até achar o melhor modelo” (GAB AQUI – GRUPO 2).
“Com relação a marca, não pegaria carros chineses nem franceses. Confio nas marcas Toyota e Hyndai” (KEL YUH – Grupo
4)
“Quando se refere a confiabilidade das marcas, por enquanto os japoneses são imbatíveis, no caso a Honda e a Toyota. [...].
Quando pensamos em marca vemos que está relacionada a filosofia de seus fabricantes [...]” (TAD AKI – Grupo 4)
Ainda sobre as marcas, é interessante observar que as experiências, sejam pessoais ou de familiares e conhecidos,
são importantes para a decisão sobre qual marca comprar, o que corrobora com a discussão sobre a importância dos
grupos de referência para a formulação de atitudes em relação a determinado objeto (ENGLEL; BLACKWELL; MINIARD,
2000; FERREL; HARTLINE, 2009; MOWEN; MINOR, 2003; PETER; OLSON, 2009; SHET; MITTAL; NEWMAN, 2001;
SOLOMON, 2002).
“[...] eu não compraria um carro chinês. Para tomar a minha decisão de compra, estudaria o mercado, trocaria ideias com
amigos, veria fóruns e, por último, iria nas concessionárias quando já tivesse restringido o número de opções” (LUI GAB –
GRUPO 3).
“Na nossa casa, somos todos Fiat. Montei um Siena e era aquilo que eu queria [...]” (NAN JES – GRUPO 7).
518
“Meu marido só compra Fiat” (SIR ZAC – GRUPO 6).
“Confiabilidade na marca, Fiat por exemplo. Depois que eu usei um Fiat, nunca mais mudei” (ADI BRA – GRUPO 6).
“Usava Ford e hoje não troco o Hyundai por nada” (PAU GOU – GRUPO 6).
“Confio em carros de marca japonesa porque são os que minha família comprou até hoje” (CAR TOR – GRUPO 4).
Para alguns entrevistados (ressalta-se nesse caso com idade superior a 50 anos) o Fiat 147 foi lembrado como
veículo que apresentava problemas, o que impacta a decisão de compra atual. Verifica-se que essa percepção muda para
indivíduos que possuem veículos dessa montadora atualmente.
Não foi possível perceber preferência por carros com motores mais ou menos potentes, dependendo este critério
do uso a que se destinam. Para alguns entrevistados, o carro 1.6, 1.8 ou até 2.0 se mostrou como essencial. Para outros esse
aspecto não é prioritário ou, até mesmo, considerado inviável dado o consumo.
“Não precisa de um espaço interno grande. Prefiro carros mais econômicos, entre um 1.6 e um 2.0 pegaria um 1.6” (CAR
TOR – GRUPO 4).
“Carros 1.4 são uma tendência, pois aliam desempenho com baixo consumo” (LUI GAB – GRUPO 3).
A disponibilidade de peças também foi citada por alguns participantes como fator importante para a defi nição da
marca no momento da compra, o que permite inferir que as montadoras devem se preocupar com a disponibilidade dessas
no mercado. Nesse sentido, as marcas de produção nacional se beneficiariam, na a opinião dos consumidores,
especialmente àquelas estabelecidas a mais tempo no país. Algumas pessoas parecem ainda não ter assimilado que novas
marcas antes importadas são agora produzidas no Brasil, como pode ser observado no discurso do participante THI PED,
do Grupo 6.
“Já tive Ford, Volks e Fiat, e hoje fico com a Fiat. Não compro importado, para não precisar de peça” (THI PED – GRUPO 6).
Além da marca, outros fatores foram comentados, como a mecânica e o consumo. A mecânica se mostrou
importante para as pessoas acima de 50 anos e o consumo para o grupo até 30 anos.
Quando perguntados sobre itens que “não podem faltar em um carro”, a direção hidráulica e o ar-condicionado
foram os mais comentados. O espaço interno se mostrou relevante para as pessoas cujo principal uso do veículo está
relacionado à família. O ar condicionado e o trio elétrico foram citados como os principais itens de conforto. Não há
consenso sobre itens de segurança: freios são importantes, mas o ABS não se mostrou fundamental; algumas pessoas se
preocupam com o air bag, mas outras acham secundário; alguns acham que potência é importante para a segurança,
especialmente em estradas, contudo há controvérsias quando essa é comparada ao consumo.
A cor se mostrou como critério de exclusão para a compra de um carro, sendo as cores pretas e pratas preferidas.
Outras cores, apesar de serem apreciadas, mostraram-se como tendo o valor comercial reduzido na revenda, o que
desestimularia sua compra. Para VIC HIR (Grupo 2) gostar de uma cor não significa incluí -la em sua cesta de compras.
“Eu gosto de verde garrafa ou azul marinho, mas nunca compraria um carro dessa cor, porque seria muito difícil de
vender. Compraria preto ou prata” (VIC HIR – GRUPO 2) .
Essa proposição abre espaço para discussão acerca de futuras companhas das montadoras, nas quais é possível
que cores consideradas mais chamativas possam atrair a atenção das pessoas, apesar de não serem exatamente essas as
escolhidas no momento da compra.
No grupo 7 o moderador introduziu o questionamento sobre a consulta à internet antes de se dirigir à
concessionária. Para esse grupo, a internet se mostrou como uma boa fonte de consulta para pesquisa enquanto as pessoas
estão restringindo as marcas/modelos que entrarão em sua cesta de escolha. Contudo, após definidos os veículos de
preferência, o atendimento na concessionária se mostrou como o mais importante. Nesse aspecto, permite-se inferir que
as montadoras devem ter sites acessíveis, com informações claras e de fácil navegação, lembrando-se que as pessoas têm
conhecimentos, equipamento e acessos variáveis entre si para navegação. Ainda, concessionárias com atributos visuais
atrativos podem auxiliar na tomada de decisão de compra.
“Eu montei para visualizar (sobre a internet), mas fui até a concessionária para visualizar” (HEL MAL – GRUPO 7).
Foi perguntado se o preço pode definir uma situação de compra. Para a grande parte dos entrevistados, em todos
os grupos, apesar da importância do preço, este item não parece se mostrar como um atributo decisor. Aparentemente, as

519
pessoas montam suas cestas para escolha a partir de determinada faixa de preços, e com base na qual tomam suas
decisões. Nesse aspecto, pequenas diferenças entre veículos que competem nas mesmas categorias parecem não
representar o principal fator para a escolha.
Foram mostradas fotos dos três veículos eleitos para comparação na pesquisa. A partir de então se iniciou a sessão
de questionamentos específicos sobre cada marca de veículo. Sobre o perfil financeiro de quem tem cada carro, de maneira
geral, este não foi especificado. Os participantes afirmaram que atualmente é difícil saber, dada a disponibilidade de
financiamentos (ressalta-se que esse fator foi importante motivador do consumo para as classes de renda mais baixas no
Brasil, especialmente na última década). Às vezes, as pessoas têm um carro que parece caro, mas esse é financiado. O que
muda é o que a pessoa quer demonstrar, como status.
No grupo 7, foi perguntado o que acham de cada um dos carros. Todos os participantes concordaram que o Fiat
Bravo é imponente e agressivo. Também, concordaram que o Ford Focus “tem cara de pessoa madura e equilibrada, que
está bem”. Outros comentários sobre o Fiat Bravo e o Hyundai I30 se destacaram, como o da participante NAN JES, que
afirma:
“O Bravo é arrojado, jovem. É para quem gosta de movimento” (NAN JES – GRUPO 7)
O participante JOS BAT que fala sobre a personalidade do carro:
“Personalidade. A personalidade do Bravo chama a atenção” (JOS BAT – GRUPO 8).
O Hyundai I30 foi percebido pelo grupo como o carro que transmite mais status, conforme afirma JOS BAT:
“Não sei o preço, mas o comprador quer demonstrar status” (JOS BAT – GRUPO 8).
Quando dispostas fichas sobre a mesa com atributos que podem se relacionar a pessoas ou a características de veículos e
solicitado que os participantes as associassem a cada um dos veículos, o grupo 1 – diferente dos demais – fez declarações
interessantes sobre o que visualizam a partir de cada modelo de veículo, conforme apresentado no quadro 1. Aqui se faz
importante mencionar que esse grupo foi composto por voluntários de idade entre 18 a 29 anos. Para os outros grupos, ao
Fiat Bravo foi atribuída a característica de ser o carro mais jovem, seguido pelo Hyundai I30. O Ford Focus não foi
identificado como “carro mais jovem” por nenhum membro dos outros grupos.
Quadro 1 – Percepção em relação aos atributos dos veículos – Grupo 1
Participante Veículo Comentário
HEN AKI I30 “Carro moderno”.
HEN AKI I30 “Olhando para ele me dá a impressão de uma nave espacial”.
DIO FAG I30 “Não parece um carro que o pai vai dar para o filho que passar na faculdade”.
CAR HUN I30 “Legal para pegar carona”.
HEN AKI I30 “Impressão de caro”.
DIO FAG Focus “A linha dos vidros é a melhor. A parte de baixo é meio alta. Coisa de carro de boy. É um
carro que um pai daria para o filho, mas também é um carro que ele mesmo teria... tipo um
cara na crise da meia idade”.
Todos Focus “É um carro bem mais masculino que o I30”.
CAR HUN Focus “Se for de mulher, é de uma mulher com um salto bem alto”.
DIO FAG Focus “Se for de mulher, é de mulher agressiva”.
DIO FAG Focus “Não é carro executivo”.
DIO FAG Bravo “É um carro que me dá a impressão de velocidade, de ser leve e rápido. A frente é de
carrinho da Hot Wheels: roda grande e agressiva, corpo leve”.
RAF TAF Bravo “Para-choque mais magro que o Focus. Reforça a impressão de agilidade. Parece também
mais frágil que o Focus. É um carro que não serve para pessoas com mais de 30 anos. Dos

520
três carros, é o mais esportivo e o mais jovem”.
DIO FAG Bravo “É um carro de filho. Mesmo o pai na crise da meia idade não teria esse carro”.
DIO FAG Bravo “É um carro que seria bastante usado por mulheres, mulheres que gostam de correr”.
Fonte: Dados da pesquisa
Para os grupos 7 e 8, foi perguntada a idade de quem teria cada um dos veículos . Todos concordaram que o dono
de um Fiat Bravo tem até 30 e os donos do Ford Focus são pessoas mais maduras e casadas. Não houve consenso sobre o
perfil da pessoa que teria um Hyundai I30 em relação à idade, contudo não ultrapassando a 40 anos.
Os grupos 5, 7 e 8 identificaram o Fiat Bravo como o carro de perfil mais masculino, com 10 concordâncias. Sobre
o veículo de perfil mais feminino, o Hyundai I30 recebeu dos mesmos grupos sete votos, seguido do Fiat Bravo, com três
votos.
Diante das observações, faz-se possível inferir que o Fiat Bravo seja associado a pessoas mais jovens e do sexo
masculino, o que não exclui a possibilidade de interesse feminino. Ainda, este veículo foi considerado o mais agressivo, o
que indica um público específico, que gosta de velocidade e linhas “leves”. O Hyundai I30 foi considerado o veículo que
indica maior status ao proprietário, também destinando ao público jovem, porém um pouco mais maduro do que o Fiat
Bravo. Para o Ford Focus não houve consenso sobre o perfil de “carro masculino” ou “carro feminino”. Contudo, este esteve
mais associado a pessoas arrojadas, mais maduras e casadas.
5 Considerações Finais
A partir da pesquisa realizada faz-se interessante observar que as técnicas de pesquisa como grupos focais e,
possivelmente, entrevistas em profundidade podem fornecer insights exploratórios interessantes, contudo não
compreendem métricas ideais para se identificar atributos específicos de um produto.
Segundo achados decorrentes dos grupos focais, foi possível projetar um perfil dos proprietários dos três veículos
analisados. Contudo, apesar de por várias vezes os moderadores/entrevistadores questionarem o que seria um design
“bonito”, atributos específicos dificilmente foram abordados, indicando dificuldade em se desm embrar os veículos da
análise de suas partes em separado. Nesse sentido, faz-se possível inferir que esses possam evocar a memória dos
indivíduos, tanto se apresentados em parte como se constituindo um todo. Contudo, esses podem ao mesmo tempo evocar
lembranças relacionadas à marca e experiências passadas, o que pode representar tanto um ponto positivo quanto
negativo para o veículo.
No quadro 2 são apresentados os objetivos propostos para o trabalho e sua respectiva relação com os resultados
obtidos:
Quadro 2 – Relação entre objetivos e resultados
Objetivo geral Resultado relacionado
Descrever atributos influenciadores da
tomada de decisão na escolha de um veículo,
considerando-se as três marcas/modelos
pesquisados, a saber: Fiat Bravo, Ford Focus e
Hyundai I30.
A marca foi o principal atributo mencionado. Também foram
considerados a mecânica (para participantes acima de 50 anos) e o
consumo (para participantes até 30 anos).
Objetivos específicos Resultado relacionado
Identificar os principais atributos percebidos
como importantes pelos sujeitos de pesquisa
na escolha de um veículo.
Além dos atributos citados no atendimento do objetivo geral,
identificou-se que a cor pode exercer papel de exclusão. Ainda, a
direção hidráulica e o ar condicionado são os itens considerados de
maior importância pelos entrevistados. Não houve consenso em
relação a freios ABS e air bag.
Analisar a importância do preço na escolha de Segundo os participantes, a escolha normalmente é realizada por
521
um veículo uma faixa de preços. A partir dessa, é possível fazer a escolha entre
diversas opções de veículos. Apesar de constituir fator importante,
portanto, o preço não pode ser considerado decisor na escolha da
marca / modelo de veículo.
Identificar preferências em relação a cada um
dos veículos apresentados.
Todos os participantes concordaram que o Fiat Bravo é imponente e
agressivo. Também, concordaram que o Ford Focus “tem cara de
pessoa madura e equilibrada, que está bem” e também concordaram
sobre a imponência do Hyundai I30. Fonte: Dados da pesquisa
Como limitações da pesquisa, considera-se o escopo idealizado do estudo, que envolveu caráter qualitativo, sendo
interessante a utilização das informações ora coletadas para a elaboração de estudos generalizáveis, sejam esses por
regiões específicas, como países, ou ainda, comparativos entre esses.
References
ASSOCIAÇÃO NACIONAL DOS FABRICANTES DE VEÍCULOS AUTOMOTORES – ANFAVEA. (2012). Anuário da Indústria Automobilística
Brasileira. Disponível em: http://www.anfavea.com.br/anuario.html. Acesso em 01/02/13.
BANKS, S. J. et al. (2012). Bilateral Skin Conductance Response to Emotional Faces. Appl Psycophysiol Biofeedback, v. 37: 145 -152.
BARBOUR, R. (2009). Grupos Focais. Brazil, Porto Alegre: Bookman.
BAUDRILLARD, J (2008). A sociedade de consumo. 2ª ed., Lisboa, Portugal: Edições 70 LDA.
BOURDIEU, P. A (2007). Economia das Trocas Simbólicas. 6ª ed. Brazil, São Paulo: Perspectiva.
CRAIG, C. S. & DOUGLAS, S. P. (2012). Culture and consumer behavior: contextual and compositional components. In: WELLS, V. &
FOXALL, G. (edited). Handbook of Developments in Consumer Behaviour. cap. 3: 47 -83. UK, Glos: Edward Elgar Publishing
Limited.
DIAS, A. M. (a) Processo Não Declarativos em Tomadas de Decisão: modelos e experimentos. 245 p. Tese de doutorado apresentada ao
Instituto de Psicologia da Universidade de São Paulo – USP. São Paulo, 2010.
DIAS, A. M. (b) (2010). The foundations of neuroanthropology. Front. Evol. Neurosci. 2:5. doi: 10.3389/neuro.18.005.2010. Disponível
em: http://www.frontiersin.org/evolutionary_neuroscience/10.3389/neuro.18.005.2010/full. Acesso em 10/04/2013.
DIAS, A. M. (c). Razão e Desrazão nas Tomadas de Decisão. Psicologia UsP, São Paulo, abril/junho, 2010, 21(2), 391-416.
ENGEL, J. F., KOLLAT, D. & Blackwell, R. D. (1968). Consumer Behavior. New York: Holt, Rinehart and Winston.
ENGEL, J F., BLACKWELL, R. D. & MINIARD, P. W. (2000). Comportamento do Consumidor. 8ª edição. Rio de Janeiro: Livros Técnicos e
Científicos Editora S.A.
FANTINI, M. J., GONÇALVES FILHO & SOUKI, G. Q. (2011). Antecedentes do amor a marca e seus impactos nas intenções
comportamentais de consumidores: um estudo empírico no setor automotivo. Revista Gestão e Planejamento, Brazil,
Salvador. v. 12 (1): 74-94.
FEATHERSTONE, M. (1997). A autonomização da esfera cultural. In: FEATHERSTONE, M. O desmanche da cultura. Brazil, São Paulo:
Studio Nobel.
FERREL, O. C. & HARTLINE, M. D. (2009). Estratégia de Marketing. São Paulo: Cengage Learning, 2009.
GOLDSTEIN, M. & ALMEIDA, H. S. (jan/mar 2000). Crítica dos Modelos Integrativos do Comportamento do Consumidor . Revista de
Administração. Brazil, São Paulo. v. 35 (1): 14-22.
GOULART, I. B. Análise de Conteúdo. (2006) Cap. 5. In: Temas de Psicologia e Administração. Íris Barbosa Goulart (org.). Brazil, São
Paulo: Casa do Psicólogo.
HAIR Jr., J. F., BABIN, B., MONEY, A. H. & SAMOUEL, P. (2005). Fundamentos de métodos de pesquisa em administração. Brazil, Porto
Alegre: Bookman.
HOWARD, J. A. & SHETH, J. N. (1969). The theory of buyer behavior. New York: John Wiley e Sons.
522
LEÃO, A. L. M. S. Hedonismo como Valor do Cliente Pós-moderno: simplex clímax experiencial ou uma nova razão no consumo? XXX
Encontro da ANPAD – EnAPAD. Brazil, Salvador/BA.
McCLURE, S. M. et al. (2004). Neural Correlates of Behavioral Preference for Culturally Familiar Drinks. Neuron, v. 44: 379-387.
McDANIEL, C.D. & GATES, R. (2003). Pesquisa de marketing. São Paulo: Pioneira Thomson Learning.
MESQUITA, José M. C. Atributos Explicativos da Intenção de Recompra em Supermercados. 2004. 253 p. Tese de Doutorado. Faculdad e
de Ciências Econômicas da UFMG. Belo Horizonte, 2004.
MORGAN, D. L. (1997). Focus group as qualitative research. 2a ed. London: Sage Publications Ltd..
MORGAN D.L. & KRUEGER R.A. (1993). When to use focus groups and why. In; Morgan D.L. (Ed.) Successful Focus Groups: advancing the
state of art (pp. 3-19). Newbury Park, CA: Sage.
MOWEN, J. C. & MINOR, M. S. (2003). Comportamento do consumidor. Brazil, São Paulo: Pearson Prentice Hall.
NICÓSIA, F. M. (1970). La decision del consumidor: y sus implicaciones en marketing y publicidad. Espanha, Barcelona: Editorial Gustavo
Gili, S.A.
OLIVEIRA, M. & FREITAS, H. (2010). Focus group: instrumentalizando o seu planejamento. In: GODOI, C. K., BANDEIRA-DE-MELLO, R. &
SILVA, A. B. (edited.). Pesquisa Qualitativa em estudos organizacionais: paradigmas, estratégias e métodos. 2ª ed., cap. 11:
325-346. Brazil, São Paulo: Saraiva.
PASSUELLO, C. B. & SOUZA, Y. S. (2006). Confiança e Risco em Decisões Estratégicas: uma análise de elementos do sistema experiencial.
XXX Encontro da ANPAD – EnAPAD. Brazil, Salvador/BA.
PETER, P. J. & OLSON, J. C. (2009). Comportamento do consumidor e estratégia de marketing. 8ª ed. Brazil, São Paulo: McGraw-Hill.
PINTO, M. R. & LARA, J. E. (2007) A Pesquisa na Área do Comportamento do Consumidor; uma análise da produção acadêmica brasil eira
entre 1997 e 2006. XXXI Encontro da ANPAD – EnANPAD. Brazil, Rio de Janeiro.
PINTO, M. R. & LARA, J. E. (2010a) O Marketing de Relacionamento no Mercado Consumidor em uma Perspectiva Experiencial e
Simbólica: buscando novas proposições para pesquisas. In: IV Encontro de Marketing da ANPAD – EMA.
PINTO, M. R. & LARA, J. E. (2010b) As experiências de consumo na perspectiva da teoria da cultura de consumo. In: PIMENTA, Solange M.
et al. (edited) Sociedade e Consumo: Múltiplas Dimensões na contemporaneidade. cap. 13: 317 -336. Brazil, Curitiba: Juruá.
SANTI, P. L. R. (2005). Consumo e desejo na cultura do narcisismo. Comunicação, Mídia e Consumo. Brazil, São Paulo, v. 2 (5): 173 -204.
SEMPRINI, A. (2010). A marca pós-moderna: poder e fragilidade da marca na sociedade contemporânea. 2. ed. Brazil, São Paulo: Estação
das Letras e Cores.
SHETH, J. N.; GARDNER, D. M. & GARRETT, D. E. (1988). Marketing Theory: Evolution and Evaluation. Chichester: Jonh Wiley & Sons.
SHETH, J. N., MITTAL, B. & NEWMAN, B. I. (2001). Comportamento do Cliente Indo Além do Comportamento do Consumidor. Brazil, S ão
Paulo: Ed. Atlas.
SOLOMON, M. R. (2002). O comportamento do consumidor: comprando, possuindo e sendo. 5ª ed. Brazil, Porto Alegre: Bookman.
SOUSA, C. V. (2012). Neurociências e Marketing: explorando Fronteiras Diádicas e Integrando Metodologias para a Compreens ão do
Comportamento do Consumidor. Tese de Doutorado apresentada à Faculdade de Ciências Econômicas de Minas Gerais –
FACE/CEPEAD.
TORRES, D. F. & GONÇALVES, C. A. (2010). Modelo de Avaliação da relação entre a reputação e o valor da marca: um estudo no s etor
automotivo. Revista Ciências Administrativas, Fortaleza, v. 16, (2): 327-350.
VENKATRAMAN, V. et al. New scanner data for brand marketers: how neuroscience can help better understand differences in brand
preferences. Journal of Consumer Psychology, vol. 22, p. 143-153, 2012.
VILAS BOAS, L. H. B., SETTE, R. S. & ABREU, N. R. (2004) Teoria e Pesquisa em Marketing: a contribuição da antropologia para o estudo
do comportamento do consumidor. XXV Encontro da ANPAD – EnAPAD, Brasil, Curitiba/PR.
Nota: Os autores agradecem a FAPEMIG – Fundação de Amparo à Pesquisa do Estado de Minas Gerais e a Fiat Automóveis S.A. (Brasil),
pelo apoio financeiro para realização dessa pesquisa.
APÊNDICE – Roteiro Focus Group
1. Debate do tema – guia de perguntas

523
1.1. Na compra de um veículo, quais são as principais “razões” avaliadas. Introduzir a discussão sobre os seguintes aspectos:
Design externo/interno
Bancos (conforto e design)
Itens de segurança (air bag, freios ABS...) e itens de conforto (ar condicionado, vidros e travas el étricas)
Cor do veículo
Desempenho
1.2. Após iniciado o debate procurar identificar, a medida que as palavras/atributos forem surgindo, o que significa:
Conforto em um veículo
Melhor design
O que é necessário para um veículo ser considerado seguro
Melhor desempenho (relacionado as características mecânicas)
1.3. Importância do preço. Pergunta: “O preço pode definir o veículo a ser comprado?”
1.4. Apresentar foto dos três veículos analisados. Pedir que os participantes selecionem as fichas coloridas dispostas sobre a mesa, que constituem características relacionadas aos carros e a pessoas e as associem a cada um dos modelos de veículos analisado. Pedir que expliquem o motivo da escolha em relação a cada aspecto.
Carro jovem
Tem alma masculina
Preferível pelo público feminino
Tem imponência
Tem aspecto agressivo
O carro que mais se parece comigo
Apresentar novamente as imagens dos veículos, individualmente. Solicitar que montem um perfil para o proprietário de cada veículo. Sugestões, caso o grupo não se mobilize de abordar: estado civil, faixa etária, poder aquisitivo e sexo.
1.5. Caso tivesse R$70.000,00 em mãos, qual dos veículos apresentados escolheria para comprar? Por que?

524
The Other Customer’s Presence in the Shopping
Experience: A Conceptual Approach CCI-driven service, customer-to-other customer interaction, service encounter, role theory, service experience.
Carmen Marques, Universidade de Aveiro, [email protected]
Irina Saur-Amaral, Universidade de Aveiro, [email protected]
Joaquim Gouveia, Universidade de Aveiro, [email protected]
Abstract:
Purpose: This research work addresses the management challenges, from a service provider point of view, considering
the interaction between customers in a service encounter context. Values like “customer’s desire experience” and “linking
value” (e.g. the satisfied need of community) have changed economy from goods to experience, and are a challenge for
service process.
Design/Methodology/Approch: A conceptual framework is developing to identify the management of interaction
between customers challenges that service provider can attend focused on a service encounter context. Literature review
briefly presents customer interaction and role theory providing the knowledge management for customer interaction
analyses. The management of customer interaction analyses, at an operational level, is developed from two
complementary perspectives: customer-other customer interaction (e.g. an interaction unplanned by service provider)
and customer-to-customer interaction (CCI) (e.g. an interaction provoked by the service provider). We ground our study
on Role Theory (e.g. exploring the behavior and script perspective) to justify the knowledge gaps, in terms of service
design and service process. Finally, we present a conceptual model.
Originality/value: In previous researches, the relationship established in service encounter context has been studied,
especially from the perspectives of customer-employee interaction and customer-environmental interaction. The
customer-to-customer interaction has been understudied, considering the lack of control, in the each incident, by service
provider. Literature review focuses on customer role. This research explores an emergent issue (e.g. management of
interaction challenges between customers) from two different perspectives. First, integrating customer interaction as a
feature of service concept and, second, considering customer interaction as a core service experience. We used social
constructed (Role Theory) to analyse service at operational levels.
Paper type: Conceptual paper
1. Introduction
In service process, for long time, inseparability (e.g. the simultaneously of production and consumption of servi ce) was a
key service feature pointed out by academic scholars (Lovelock, 1983; Ottenbacher, Gnoth & Jones, 2006; Shostack, 1977;
Zeithaml, Parsuraman & Berry, 1985, Wemmerlöv, 1990) together with loyalty (Guenzi & Pelloni, 2004); they stood at the
core of success of long relationships with customers, from a service provider point of view.
Alam (2002:515) pointed out that "service tends to involve customers in their delivery, and the purchase of services tends
to involve a longer commitment and therefore a more intimate relationship with customers.” It means that the delivery of
the service is no longer enough to ensure customer’s loyalty. From today’s “experience economy” Pine and Gilmore (1998)
argue that new values are required.
Two complementary management perspectives are pointed, from a customer point of view. Pine and Gilmore (1998)
indicate that “customer desires experience”, and this need has been behind what has changed economy from goods to
525
experience. Aubert-Gamet and Cova (1999) argue that the postmodern interest in service settings has changed. It is less
for use-value (e.g. functional) and more “linking value” (e.g. the satisfied need of community).
Nevertheless, in some service where customer is physically present, customer interaction contri butes to the overall
service experience. Other customers’ presence and their behavior (e.g. their pleasantness, diversity, approachability, etc.)
contribute to the overall quality of customer’s service experience (Bitner, 1990; Lehtinen & Lehtinen, 1991). Solomon,
Surprenant, Czepiel & Gutman (1985) proposed dyadic interaction to determine customer satisfaction.
Role Theory is used to support this research because it is drawn on behavioral and script perspective (Solomon,
Surprenant, Czepiel & Gutman, 1985). Broderick (1998: 349) added to Role Theory, the service provider and customer
perspectives. From behavioral perspective and customer point of view, individual behavior determines the patterns of
social interaction and integration and the future possibilities (e.g. patronage). Still from behavioral perspective but from
service providers’ perspective, customer behavior determines the customer’s ability to play the service. From the latest
perspective, script can be seen as prerequisite for good service experience, planned by the service provider and played by
customer.
Yoo, Arnaold and Frankwick (2012) point out the lack of empirical research on customer-to-customer interaction.
Considering the service provider’s point of view, Baron, Patterson, Harris and Hodgson (2007) use the question initially
formulated by Pranter and Martin (1991) and Martin and Pranter (1992) “Can customer interaction be managed?”.
Broderick (1998:349) proposed two different questions: “1) how service provider expects customer behaves? 2) what
specific service provider behaves influence the customer’s ability to participate in the role script?”. Those questions
orientated the reflection for this research.
The purpose of this research is to understand the interaction between customers in service dynamic activities. The focus is
on service provider and on managerial challenges concerning customer interaction, more specifically on the steps
identification of customer’s interaction. This analysis is made from two complementary perspectives. The first, considered
customer interaction as a feature of service concept (e.g. assumption that service is provided in the presence of other
customer and their behavior can cause positive or negative impact on service evaluation). This kind of interacti on is called
customer-other customer interaction and is an unplanned interaction. The second perspective uses customer interaction
to enlarge overall experience (e.g. considering the customer’s desire of experience, and his ability to play the service, to
provide a good service experience and customer satisfaction). This kind of interaction is called customer-to-customer
interaction (CCI) and is provoked by the service provider.
In this paper we first identify the literature review on the central issues concerning customer interaction in service
encounter context and role theory, suggestion that instead of the type of customer interaction (e.g. unplanned or provoked
by the service provider) role theory is a proper way to answer. Then, we present examples of these two types of customer
interaction to better understand the complexity of the service management. Next we present a conceptual model and
present the critical steps of management challenges. We conclude by giving some suggestions for future research.
2. Literature Review
2.1. Customer Interaction
From literature review, the main reasons pointed out to the importance of customer interaction refer to the customer
interaction frequency (Grove & Fisk, 1997) considered the largest customer-to-provider interaction (Evans, 1963) and the
diversity of customer interaction contexts explain other aspects of the importance of customer interaction ( Baron,
Patterson, Harris & Hodgson, 2007; Coghlan, 2012; Grove & Fisk, 1997; McGrath & Otnes, 1995; Nicholls, 2009; Wu &
Liang, 2009). All the reasons pointed above take into consideration the service provider’s perspective, in terms of the
service process, the customer behavior and roles they play. From a customer’s perspective, the changes of value that they
put on service, and the appreciation of the service experience, justify the interest in researching this theme. Moore, Moore
and Capella (2005) pointed that there is little investigation on the influence of customer interaction on service evaluation.
The deep understanding of the service process management and customer management were stressed by Piercy and
Morgan (1995). From the literature review, the concept of customer interaction contributes for two different approaches.
The customer’s management, in the first approach, takes into consideration customer interaction as a feature of service
concept. The first refers that customer interaction occurs accidentally (from a customer perspective) and that is an

526
unplanned interaction (by the service provider). In this paper, this kind of interaction was called “customer-other
customer interaction”.
In the second approach, the customer’s management is done using customer interaction to enlarge overall experience .
The second approach refers customer interaction that occurs intentionally. Nicholls (2010) calls this relationship as
“customer-to-customer interaction” (CCI) and the main characteristic is the existence of controlled conditions (e.g. is
provoked by service provider to emerge the experience from customer interaction) and create value for and with
customer.
2.1.1. Customer-other customer interaction
In terms of management service process, customer-other customer interaction is a secondary outcome (Nicholls, 2005),
from a customer and service provider perspective, and should be considered in order to eliminate negative impact.
Baron, Patterson, Harris and Hodgson (2007) argue that research in customer interaction has been understudied due to
the fact that the service provider is faced with an “uncontrollable situation” (e.g. service provider doesn’t influence
customers’ interactions). Grove and Fisk (1997) give service encounter as an example of how customers share the
servicescape with each another. Bitner (1990) refers the presence of other customer in service provider, and the positive
or negative impact caused by their behavior can cause on service evaluation. Wu (2008) pointed out that other customers’
presence and their behavior cannot be predicted. These factors explain why customer interaction has been less studied
(Nicholls, 2009).
Customer interaction definition has received some contribution. Libai, Bolton, Marnix, Ruyter, Götz, Risselada and Stephen
(2010) focus on “contents” in terms of transfer of information. Baron, Harris and Davies (1996) focus on “activities”,
“product advice” or “product discussion”. Grove and Fisk (1997) focus on “interactions between strangers”, more
specifically on “behaviors of the customers”, and distinguishes between protocol (refers to physical and verbal behaviors)
and sociability (refers to friendliness and ambiance resulting from their presence).
Empirical researches apply role theory to define customer-other customer interaction. McGrath and Otnes (1995)
identified identify three major role plays by retail customer in their interactions with other customer. Parker and Ward
(2000) used McGrath and Otnes’ (1995) work and argued that customer-other customer interaction is a common and
important element of the shopping experience. Wu (2008) investigated the relationship between customer interactions,
role typology and customer reaction. Yoo, Arnaold and Frankwick’s (2012) deep understanding of customer-other
customer interactions and the way how interactions affect customer’s perceptions of their role in service delivery.
In terms of managing the service process, Harris and Baron (2004) cited on Baron, Patterson, Harris and Hodgson (2007)
proposed three characteristics of customer interaction: the stimuli, manifestations and consequences. Nicholls (2005)
argues that “it is essential that service managers understand their nature and origin, recognise cause and effect, assess
their frequency and significance, and develop a capacity to influence customer interaction to the benefice of the service
organization and its customers.”
2.1.2. Customer-to-customer interaction
The concept of customer-to-customer interaction (CCI) is based on value creation in which the dominant part of offering is
the interaction between customers (Nicholls, 2009). Pine and Gilmore (1998) point out that customer seeks experiences
and service provider has noticed this tendency. Nicholls (2010) argues that it is one of the ten new directions of CCI
research.
Nicholls (2009) referred that «third place» seems to be a promising avenue for future research” (e.g. the place where the
person goes to meet someone, as opposed of the second place (work) or first place (home)) to analyse customer-to-
customer interaction.
Some empirical research emphasizes the customer experience, such as: rafting trips (Arnould & Price, 1993), speed dating
encounters (Baron, Patterson, Harris & Hodgson, 2007), weight watchers international (Bitner, Faranda, Hubbert &
Zeithaml, 1997) , tourism attributes on the Great Barrier Reef, in Australia (Coghlan, 2012), amusement parks (Grove &
Fisk, 1997), group adventure holidays (Price, Arnould & Tierney, 1995).

527
The table below (Table 2) analyses two examples CCI-driven service based on Baron, Patterson, Harris and Hodgson
(2007) presenting a speed dating example (e.g. control CCI-driven service) and Nicholls (2009) presenting the an example
of Poznan café (e.g. organize CCI-driven service). In both examples, the authors considered the service core (e.g.
experience exchange with other customer through conversation) applying different service dynamics.
In terms of managing service process, Baron, Patterson, Harris and Hodgson (2007) enlarge the customer interaction
features, by adding three more elements to service provider concern: planning for customer interaction, roles and
performances during customer interaction and cooperation versus competition in customer interaction.
2.2. Role Theory and Management Challenges
Role Theory is used to support this research. Role theory can be seen from script perspective (e.g. customer knows how
and when he must interact regarding a dramaturgical perspective) and behavior perspective (e.g. focus is in the
appropriateness of the behavior adopted) (Broderick, 1999).
In terms of managing service process, script and behavior perspective aspects have implications in future interactions (e.g.
for customer satisfaction) as well as service provider (e.g. by managing the interaction features of service encounter).
Broderick (1999:118) argues that “positive management of role script and role behavioral can have an important influence
on service performance”.
2.2.1. Script perspective from Role theory
Using Abelson’s (1981:715) definition “the script is a simple form of schema and embodies knowledge of stereotyped
event sequences.” Storbacka, Strandvik and Grönroos (1994:30) argue that customer usually has a clear script guiding his
behavior.
Service provider attends to different needs. It means that the creation of value is in the exchange relationship established
between service provider and customer. Solomon, et al. (1985) defined “exchange” as the basic unit of analysis which
intended to measure the “social exchange” and Bagozzi (1975) defined “exchange” considering the “reward” and “cost”
associated to the exchange process. As rewards examples Bagozzi (1975:32) mentions “psychol ogical pleasure or social
gain”.
2.2.2. Behavior perspective from Role theory
Biddle (1997:11) defined role theory as “a science concerned with the study of behaviors that are characteristic of people
with contexts and with processes that produce, explain or are affected by these behaviors” (citied in Broderick
(1999:119))
Storbacka, Strandvik and Grönroos (1994:33) point out that different “customer generated different types of episodes”.
These reasons provide us the way to find, in previous research, the understanding of the relation between customer and
service experience in service process activities within the encounter context.
3. Customer Interaction and Service Encounter Management: A Conceptual Model
Image 1 shows the conceptual model of challenges in service process with customer interactions, resulting from literature
review. The main purpose of our model is identifying critical steps of management challenges, from the service provider’s
point of view. This model is formed by three major parts:
- Role Theory: corresponds to the way service provider explained the result of customer experience, in a service
encounter context.
- Management challenges: corresponds to the issues that service provider can attend, when he considers customer
interaction in service service process, adopting Nicholls’ (2005) information from chapter six.
- Outcome from customer perspective, corresponds to the customer assess to service process.

528
The management of customer interaction analyses, at an operational level, is developed in two complementary
perspectives. The first one considered customer interaction as a feature of service concept (e.g. assumption that
service is provided in presence of other customer and their behavior can cause positive or negative impact on servi ce
evaluation).
Image 2: Challenges in Service Process with Customer Interaction: Conceptual Model
The second perspective uses customer interaction to understand how to enlarge overall experience (e.g. considered the
customer desire of experience, and the use of the ability to play the service by customer, to provide a good service
experience and customer satisfaction). This kind of interaction is called customer-to-customer interaction (CCI) and is
provoked by the service provider.
3.1. Script Management Challengers
From literature review, we used inputs from three papers. First the Jüttner and Wehrli’s (1994) paper that analyzes the
relationship marketing within the exchange paradigm. Harris and Baron’s (2004) paper that proposed three
characteristics of customer interaction: the stimuli, manifestations and consequences. This information is used in both
types of customer interaction defined in this paper (e.g. customer-other customer and customer-to-customer interaction).
Nicholls’ (2005) paper provides a practice of relational perspective of service encounter and concerns customer-other
customer interaction. The main proposition refers to:
P1. Script perspective explains positively the challenges of service process managemen t of interaction between
customers
3.1.1. Understand customers interaction
Juttner and Wehrli’s (1994:57) work contributed to identify the key issues to analyze, from service provider’s point of
view, when looking into the reaction of customer interaction (e.g. customer role). Jüttner and Wehrli (1994) took into
consideration the concepts of “relational” and “interactive”, according to “objective”, “customer understanding”,
“marketers task and performance criteria” and “core aspects of the exchange”.

529
In the first approach, which refers to customer interactions as a feature of service concept , the objective of the
customer interaction is taken in consideration. Hence:
P1.1. Script perspective explains positively the service process management understanding how to stimulate
customer’s interaction
In the second approach, customer interaction to enlarge overall experience, the customer’s management is done by
definition of roles by the service provider.
Hence:
P1.2. Script perspective explains positively the service process management and customer appropriate role behavior
3.1.2. Recognize customers interaction cause / effects
In customer interactions as a feature of service concept , customer knowledge is used to manage the service process.
Hence:
P1.3. Script perspective explains positively how service provider can perspective customer’s role play
In the second approach, customer interaction to enlarge overall experience, the customer’s management is done by
confirming the customer’s role expectation, by service provider. Hence:
P1.4. Script perspective explains positively the understanding of how service provider can perspective customer
expectations
3.1.3. Assess customer interaction
In customer interactions as a feature of service concept perspective , the focus is on service design and service
dynamics process. Hence:
P1.5 Script perspective explains positively the impact of performance criteria on service process
Broderick (1998:350) pointed role performance and role expansion as a way for service provider to observe customer
experience (see Table 8). Johnston and Kong (2011) defined customer experience as “their personal interpretation of the
service process”.
In the second approach, customer interaction to enlarge overall experience, the customer’s management is done by
confirming the customer’s role expectation, by service provider. Hence:
P1.6. Script perspective explains positively the impact of service dynamics process on customer experience
3.1.4. Develop the capacity to influence customer interaction
In customer interactions as a feature of service concept , core aspect of exchange corresponds to customer service
assessment. Hence:
P1.7 Script perspective explains positively the capacity of influencing customer interaction
In the second approach, customer interaction to enlarge overall experience, the customer’s management is done by
confirming the customer’s role expectation, by service provider. Hence:
P1.8. Script perspective explains positively the assessment of customer experience
3.2. Behavior Management Challenges
This topic is not developed as well as script management challenges, because it is a customer’ feature. However, the
management of emotions, in service process concept, brings advantages to the enlargement of behavioral expectations .

530
P2. Behavioral perspective influences the challenges of service process management of interaction between
customers
The behavior ability and predispositions/willingness are referred as causes of service experience (Dobni, Zerbe & Ritchie,
1997; Uzkurt, 2010) however with different consequences to customer interaction. In customer-other customer
interaction, customer B interacted if he wanted or felt that he had the abilities to do it. In customer-to-customer
interaction context, given the fact that we are in a social exchange in which attitudes like courtesy or helpfulness are well
seen (Crosby, Evans & Cowles, 1990).
P2.1. Behavior ability and predispositions/willingness influence positively the challenges in service process
3.3. Outcomes from customer perspective
The propositions were seen in service provider’s point of view (in terms of service process management) although the
assessment of service was analysed from customer’s perspective. Using Parasuraman, Zeithaml and Berry’s (1985)
conceptual model of service quality, the main relationship focuses on service provider and customer and their relationship
on service delivery systems and the value creation is in the service outputs. The interactive and integrative features of
service encounters allow the identification of two outcome complementary perspectives (P.3) type of outputs and (P.4)
customer satisfaction.
P3. Service process management perspective influences the outcomes from customer perspective.
This research work presents a different perspective using service evaluation based on role typology . Literature review
points out as outcomes on customer perspective, perceived service quality, perceived service performance and customer
satisfaction. We also considered these outputs, however we introduced perceived role play performance (e.g. the way how
customer assesses the service through his own performance.
Hui and Bateson (1991:174) presented the customer experience concept “as the consumer’s emotional feelings during the
service encounter”. From customer’s perspective, outcome corresponds to the customer assess to service process.
P4. Customer perspectives outcomes influence positively customer overall service experience.
Many other authors refer to customer satisfaction as an output (Bateson, 1985; Cermak, File & Prince, 1994; Mills &
Morris, 1986; Solomon, Surprenant, Czepiel & Gutman, 1985). According to Liljander and Strandvik (1994), citided on
Storbacka, Strandvik and Grönroos (1994:24) customer satisfaction would correspond to an inside perspective (e.g.
customer’s experience of the service, in other words, what customer must give in order to receive an outside perspective
(e.g. customer’s knowledge of the service, through word-of-mouth or advertising). Wu and Liang (2009) point out the
importance of understanding customer satisfaction, to better manage the service design and service delivery.
4. Conclusion
4.1. Summary of research findings
This conceptual research reinforces the importance of customer interaction mentioned on the literature. Not only in
customer’s perspective, in service quality field, focus on the positive or negative impact on service evaluation (Bitner,
Booms & Tetreault, 1990; Grove & Fisk (1997) but also in service provider, in perspective management process.
The main goal, at an operational level, is to identify the key critical steps in service process management that enhance
customer experience. The service process management which incorporates customer interaction has challenges in
terms of customer script and customer behavior, in both types of interaction (unplanned and controlled).
We used social constructed, Role Theory, to analyse service process and identify challenges associated. Hence:
Customer perspective: This represents the most difficult challenges to service provider. From literature review the
presence and behavior of the “other customer” introduces positive or negative impacts. However, in this paper the
perspective addresses the integration of customers’ relations on the feature of service concept.
Service provider perspective: considering the present research focuses on customer interactions (e.g. customer-to-other
customer interaction) and integration (e.g. customer-to-customer interaction) in service process. The script concept

531
seems appropriate, in a way that customer feels connected to the service provider and knows and wants (behavioural
perspective) to interact with other customers.
Service process management: Broderick (1999:119) considered that “role script determine the way the service provider
defines their experiences” and the four topics considered (e.g. understand customer’s interaction, recognize cause and
effects of the interaction, assessment of customer interaction and development of the capacity to influence customer
interaction) were considered to help service provider to design and define service process.
Customer’s outcome: In service quality perspective, customer assesses the performance of service provider by
comparing the expectation and the service setting, and the service provider’s behavior. In this paper we focus on customer
role play performance to assess the service delivery and feeling of satisfaction with the service delivered.
The perspective adopted of customer interaction corresponds to the main originality of this research work. It means,
literature review pointed the other customer’s presence in service encounter physical environmental and the
consequences of the interactions between customers. We proposed to deepen the relation that customer establishes with
service provider (e.g. using the interaction of customer in service process management (e.g. considering customer
interactions as a feature of service concept (e.g. unplanned) or customer interaction to enlarge overall experience (e.g.
provoked)).
In terms of service process management, this perspective still remains one aspect of originality. The competitiveness of the
implementation of this service process is guaranteed by service design that allows customer experience and /or the sense
of community by customer. So, the “customer loyalty” is no longer just the intention to repeat the service (e.g. patronage)
but the ability, willingness and desire of experience. Other aspect, considered as competitiveness is the conscience of
customer’s role play of service as well as in the service assesses (e.g. the process initiate and ended with customer).
Customer satisfaction was seen as an output resulting from dyadic interaction, personal encounter or “degree of script
congruence” played by service provider (Solomon, Surprenant, Czepiel & Gutman, 1985). This paper proposed customer
satisfaction” as “the” output (e.g. there are several aspects assessed by customer and they all contribute to overall service
experience).
4.2. Managerial Implications
The main propose of this work is identify challenges (based on literature review) that helps service provider in the
managerial practice. The conceptual model pointed important clues in the service provider’s perspective (e.g. under the
box of management challenges) and the outcome considered on customer perspective.
This work also aims to bring implications at an operational level. Providing “experience” involves a great challenge for
service provider, while to the customer it represents a “memorable event”. “Great challenge” becaus e experience depends
on two dimensions of the customer: the customer participation (e.g. different levels of interaction between customers) and
customer connection (e.g. the relationship established between customer and service provider) and “memorable event”
occurs “in the mind of an individual who has been engaged on an emotional, physical, intellectual or even spiritual level”
(Pine & Gilmore, 1998:99). This means that two people can be at the same event and have a different experience therefore
have different evaluations of service quality.
4.3. Academic Implications
This work may have academic implications by results obtained taking into consideration the operational level. This
knowledge brings advantages to service provider through the identification of main sets of skills of customer role scripts
and customer behaviors in order ensure service experience, as well as the importance of customer compatibility in
management of service quality perception.

532
5. Limitations and Future research
5.1. Limitations
Although the customer interaction is considered as important to service delivery an empirical research still misses (Wu,
2008). This paper increases the gap between theoretical and empirical research because opens a different perspective to
service provider.
5.2. Future research
At the beginning of this paper, we mentioned the main feature of service provider, from service research field. We
assumed that the customer-to-customer interaction could also be considered as core element of service delivery and a
contribution between research fields should be useful to enlarge knowledge on this issue.
This paper focuses on operational level in future research also considering the strategic level, the service provider must
put “experience” at the core of service design.
We used role theory in the service process management field and we considered as innovation in service design because it
integrates and enhances customer participation, ability, motivation and needs. We call for future empirical research in
order to deepen this issue.
Further future research should consider organizational socialization of customers (Claycomb, Lengnick-Hall & Inks, 2001).
Uzkurt (2010) proposed the “adoption of customer participation as an element of organizational culture”.
References
Abelson, R.P., (1981). Psychological status of the script concept. American Psychologist, 36 (7), 715-729.
Alam, I. (2002). A customer-oriented new service development process. Journal of Services Marketing, 16 (6), 515-534.
Arnould, E. J., & Price, L., (1993). River magic: extraordinary experience and the extended service encounter. Journal of
Consumer Research, 20 (June), 24-45.
Aubert-Gamet, V., & Cova, B., (1999). Servicescapes: from modern non-places to postmodern common places. Journal of
Business Research, 44, 37-45.
Bagozzi, R. P., (1975). Marketing as an organized behavioral system of exchanges. Journal of Marketing, 38 (4), 32–43.
Baron, S., Harris, K., & Davies, B., (1996). Oral participation in retail service delivery: a comparison of the roles of contact
personnel and customers. European Journal of Marketing, 30 (9), 75-90.
Baron, S., Patterson, A., Harris, K., & Hodgson, J., (2007). Strangers in the night: speeddating, CCI and service businesses.
Service Business, 1, 211-232.
Bateson, J. (1985). Self-service consumer: an exploratory study. Journal of Retailing. 61 (3), 49-76.
Biddle, B. J., (1979). Role Theory: Expectations, Identities and behaviors. Academic Press. (citied in Broderick (1999:119))
Bitner, M. J., (1990). Evaluating Service Encounters: The effects of Physical Surroundings and Employee Responses. Journal
of Marketing, 54 (April), 69-82.
Bitner, M.J., Booms, B., & Tetreault, M., (1990). The Service Encounter: Diagnosing Favorable and Unfavorable Incidents.
Journal of Marketing, 54 (1), 71-84.
Bitner, M.J., Faranda, W., Hubbert, A., & Zeithaml, V., (1997). Customer contributions and roles in service delivery.
International Journal of Service Industry Management, 8 (3), 193-205.
Broderick, A. J., (1999). Role Theory and the Management of Service Encounters. Service Industries Journal, 19 (2 April),
117-131.
Broderick, A. J., (1998). Role theory, role management and service performance. Journal of Services Marketing, 12 (5),
348–361.

533
Cermak, D.S., File, K., & Prince, R., (1994). Customer participation in service specification and delivery. Journal of Applied
Business Research, 10 (2), 90-97.
Claycomb, C., Lengnick-Hall, C., & Inks, L., (2001). The customer as a productive resource: a pilot study and strategic
implications. Journal of Business Strategies, 18 (1), 47-68.
Coghlan, A. (2012). Facilitating reef tourism management through an innovative importance-performance analysis
method. Tourism Management, 33 (4), 767-775.
Crosby, L. A., Evans, K., & Cowles, D., (1990). Relationship Quality in Services Selling: An Interpersonal Influence
Perspective. Journal of Marketing, 54 (July), 68-81.
Dobni, D., Zerbe, W., & Ritchie, J., (1997). Enhancing service personnel effectiveness through the use of behavioral
repertoires. Journal of Services Marketing, 11 (6), 427-445.
Evans, F. B., (1963) Selling as a Dyadic Relationship – A New Approach. American Behavioral Science, 6 (May), 76-79.
Grove, S. J., & Fisk, R., (1997). The impact of other customers on service experiences: a critical incident examination of
“getting along”. Journal of Retailing, 73 (1), 63-85.
Guenzi, P., & Pelloni, O., (2004). The impact of interpersonal relationships on customer satisfaction and loyalty to the
service provider. International Journal of Service Industry Management, 15 (4), 365-384.
Harris, K., & Baron, S., (2004). Consumer-to-consumer conversations in service settings. Journal of Service Research, 6 (3),
287-303.
Hui, M. K., & Bateson, J., (1991). Perceived Control and the Effects of Crowding and Consumer Cho ice on the Service
Experience. Journal of Consumer Research, 18 (2), 174-184.
Johnston, R., & Kong, X., (2011). The customer experience: a road-map for improvement. Managing Service Quality, 21 (1),
5-24.
Juttner, U., & Wehrli, P., (1994). Relationship marketing from a value system perspective. International Journal of Service
Industry Management, 5 (5), 54-73.
Lehtinen, U., & Lehtinen, J., (1991). Two approaches to service quality. The Services Industry Journal, 11 (July), 287-303;
Libai, B., Bolton, R., Marnix, B., Ruyter, K., Götz, O., Risselada, H., & Stephen, A., (2010). Customer-to-Customer Interactions:
Broadening the Scope of Word of Mouth Research. Journal of Service Research, 13 (3), 267-282.
Liljander, V., & Strandvik, T. (1994). The Relation between Service Quality, Satisfaction and Intentions. Kunst, P. and
Lemmink, J. (Eds). in Quality Management in Services II. Van Gorcum. Assen / Maastricht, The Netherlands,
forthcoming.
Lovelock, C. H., (1983). Classifying services to gain strategic insight. Journal of Marketing, 47 (3), 9-20.
Martin, C. L., & Pranter, C., (1992). Compatibility management: customer-to-customer relationships in service
environments. Journal of Service Marketing, 3 (Summer), 5–15. (cited in Baron, S., Patterson, A., Harris, K. &
Hodgson, J. (2007)).
McGrath, M. A., & Otnes, C., (1995). Unacquainted influencers: when strangers interact in the retail setting. Journal of
Business Research, 32, 261-272.
Mills, P. K., & Morris, J., (1986). Clients as ‘partial’ employees of service organizations: role development in client
participation. Academy of Management Review, 11 (4), 726-735.
Moore, R., Moore, M. L., & Capella, M., (2005). The impact of customer-to-customer interaction in a high personal contact
service setting. Journal of Services Marketing, 19 (7), 482-491.
Nicholls, R. (2010). New directions for customer-to-customer interaction research. Journal of Services Marketing, 24 (1),
87-97.
Nicholls, R. (2009). Customer-to-Customer Interaction (CCI)-Driven Service: Exploring a new construct. Service
Management. 5, The Poznan University of Economics Publishing House. Poznan.
534
Nicholls, R. (2005). Interactions between Service Customers: Managing On-site Customer-to-Customer Interactions for
Service Advantage. The Poznan University of Economics Publishing House. Poznan. p: 273. (Unpublished book).
Ottenbacher, M., Gnoth, J., & Jones, P., (2006). Identifying determinants of success in development of new high-contact
services: Insights from the hospitality industry. International Journal of Service Industry Management, 17 (4),
344–363.
Parasuraman, A., Zeithaml, V. A., & Berry, L. L., (1985). A conceptual model of service quality and its implications for future
research. Journal of Marketing, 49 (Fall), 41–50.
Parker, C., & Ward, P., (2000). An analysis of role adoptions and scripts during customer-to-customer encounters.
European Journal of Marketing, 34 (3/4), 341-358.
Pine II, B.J., & Gilmore, J., (1998). Welcome to the experience economy. Harvard Business Review, July – August, 97-105.
Piercy, N. F., & Morgan, N., (1995). Customer Satisfaction Measurement and Management: a Processual Analysis. Journal of
Marketing Management, 11, 817-834.
Pranter, C. A., & Martin, C. L., (1991). Compatibility management: roles in service performances. Journal of Services
Marketing, 5 (2), 43-53. (cited in Baron, S., Patterson, A., Harris, K. & Hodgson, J. (2007))
Price, L.L., Arnould, E. & Tierney, P., (1995). Going to Extremes: Managing Service Encounters and Assessing Provider
Performance. Journal of Marketing, 59 (April), 83-97.
Shostack, G.L., (1977). Breaking free from product marketing. Journal of Marketing, 41, 73-80.
Solomon, M. R., Surprenant, C., Czepiel, J., & Gutman, E., (1985). A Role Theory Perspective on Dyadic Interactions: The
Service Encounter. Journal of Marketing, 49 (Winter), 99-111.
Storbacka, k., Strandvik, T., & Grönroos, C., (1994). Managing Customer Relationships for Profit: The Dynamics of
Relationship Quality. International Journal of Service Industry Management, 5 (5), 21 -38.
Uzkurt, C. (2010). Customer participation in the service process: a model and research propositions. International Journal
of Services and Operations Management, 6 (1), 17–37.
Wemmerlöv, U. (1990). A Taxonomy for Service Processes and its Implications for System Design. International Journal of
Service Industry Management, 1 (3), 20-40.
Wu, C. H., (2008). The influence of customer-to-customer interactions and role typology on customer reaction. The Service
Industries Journal, 28 (10) 1501-1513.
Wu, C. H., & Liang, R. D., (2009). Effect of experiential value on customer satisfaction with service encounters in luxury -
hotel restaurants. International Journal of Hospitality Management, 28, 586-593.
Yoo, J. J., Arnold, T. J., & Frankwick, G. L., (2012). Effects of positive customer-to-customer service interaction. Journal of
Business Research, 65 (9), 1313–1320.
Zeithaml, V.A., Parsuraman, A., & Berry, L. L., (1985). Problems and strategies in services marketing. Journal of Marketing,
49, 33-46.

535
Experience marketing and hospitality industry:
social media as a tool to enhance customer
experience Marketing experience; web 2.0; hospitality; social media
Medéia Veríssimo, University of Aveiro, [email protected]
Natália Menezes, Universidade Federal de Pernambuco, [email protected]
Abstract
The main goal of this article is to understand how hotels use social media as a tool to enhance customer experience. Also as
complementary goals the paper wants to: indicate which components of experience are more used by hotels in social
media; to know which social media online are the preferred ones; and also point out in practical terms how hotels are
focusing in social media to enhance customer experience. The methodology of this study was based in a qualitative
research with exploratory character. Data collect was made through interviews with hotel managers, the content of
interviews were based in Gentile et al (2007) model of customer experience. Interviews were done and recorded through
videoconference, namely with Skype program, were 30 hotel managers inquired, 15 in Brazil and 15 in Portugal. Data
analysis was made through content analysis, with Atlas TI software. The results show that lifestyle and relational
components are related to social media, and that Facebook and Twitter are more used by hotels. To enhance customer
experience, social media are mainly used to market research, to consolidate brand image, to improve connection with
customer, and also to create a community of fans. Two are the main limitations of the research: first of all the use of a
generic model of customer experience not applied to tourism industry, also for future research we suggest extend the
number of inquired.
1 Introduction
Recently, researchers and practioners noticed that price and quality are no longer the only points for
competitiveness(SHAW AND IVENS, 2005), and focusing in customer experience could be a differential (BIGHAM, 2008),
nevertheless this is a recent field of study in marketing and still not so explored in hospitality services.
In a marketing perspective the tourism experience is a experience of consumption because is based in tourist
consumption, but it is important to highlight that tourist consumption goes beyond material goods, when we consider
emotional aspects involved we can understand that tourist consume experiences during all the journey (MOSSBERG,
2007). Then is important to focus in affective and cognitive aspects even when tourist services had a clearly functional
value for customers, as hotels and transportation, because experiences can influence directly in the process of evaluation
of services and consequently in tourist experience.
Web 2.0 and social media brought more interactivity to internet and tied the relationship between customer and firms.
Also, this characteristic of social media could be used by hospitality industry as a tool to enhance marketing experience
and to connect to their customer, because this way it is possible to understand their needs and wishes, offering services
with a differential, creating value to brand and getting competitive advantage face to their competitors.
This close approach with customer through social media has to be seen as a differential in planning marketing experience
in hospitality industry. It is in this context that present research tries to understand how hotels use social media as a too l
to enhance customer experience. In order to accomplish this goal in this paper, first is shown a review in theory
background, followed by methodology, main results and limitations and implications for future researches.

536
2 Tourism and marketing experience
Nowadays, many societies are characterized by a sense of uniqueness where to pursuit common things is not a factor of
distinction anymore, people are seeking for “the extraordinary” and this new trend reflects in a demand for services with
an experiential value.
Economy is changing, technology revolution and the increase of competitiveness of markets has pushed companies to
search for differentiation, beyond that, economic values are progressively in a change- from commodities to goods, to
services and finally to experiences (PINE AND GILMORE, 1999).
We live now in the experience economy, where societies devotes a considerable part of their resources to pursuit the good
of life – in a constantly search for joy, pleasure and happiness. According to Holbrook & Hirschman (1982, p. 132)
experience economy is the fourth economy stage, and is characterized by the constantly seek for “fantasy, feelings and
fun.”
Panosso Neto and Gaeta (2011) also highlight that humanity reached a stage where simple things does not make sense
anymore most of people wants something touchable, different, out of common sense and day by day life. In tourism
experience is the core of services, because beyond of involve leisure, tourism has a great potential to connect with
customer through emotional appeal, and this goes beyond of functional and utilitarian attributes in services (OTTO AND
RITCHIE, 1996; MOSSBERG, 2007).
In concept experience is made inside the person and involves individual aspects as: humor, mental state and how the
person reacts to interactions with the event. For Mossberg (2007) and experience is a mix of many elements capable of to
connect with the customer emotionally, intellectually and spiritually.
However considering subjective and individual aspects in experience concept, there are some divergences between
academics and practioners. Some authors believe that companies can provide customers with experiences (PINE AND
GILMORE, 2000; SCHMITT, 1999), otherwise a more recent comprehension of this field of study consider that experiences
are co-created in a relational way by firms and customers. For Prahalad e Ramaswamy (2004) creation of value is not add
to goods or services, but they are in personalized experiences created through active participation where experiences are
co-created.
According to Panosso Neto and Gaeta (2011) to be an experience, travel should overcome banality and trivial aspects that
most times are conventional and stereotyped, so tourist experience should be based in personal aspects and should seek
for moments and places that increase one’s personal history.
Experience has been used as a vehicle to describe the meaning of many activities related to leisure and tourism. Pine and
Gilmore (1999) consider tourism as part of experience industry, because one thing that hospitality, attractions, retail,
events and transportation have in common is that they all exist to provide customer with experiences.
This way, considering hospitality services, mainly hotels, we can identify in core of these services an hedonic character,
because they consist in sell the experience to enjoy the destination. Additionally is also important to understand the
complexity of tourist services which are more difficult to be interpreted and analyzed by potential clients before purchase,
because in case of tourist services clients can only try the “product” at the same time they are being offered (FARIAS ET AL,
2011).
Despite of the theme is still not so explored academically, the relation between hospitality services and marketing
experience presuppose market advantages what highlight the importance of researches in this field of study. We can
mention four main reasons to use experience approach to hospitality services: connection with customer, differentiate
offering, competitive advantage and value creation (VERÍSSIMO E LOUREIRO, 2013).
First of all the possibility to connect to customer permit firms to be alert to wishes and needs of their customers, also
differentiate offering should provide an environment to increase experience, involving subjective and emotional aspects
of customer. Companies could still get an competitive advantage when include experience as an strategic factor,
associating experience with positioning an brand image. Finally creating value is also an important aspect where firms can
create high quality interactions with customers permitting the tourist to create unique experiences.
But even when the mentioned market advantages that were discussed, hospitality marketing is still turned to a traditional
vision and strategy of consumption, with little interacting with alternative market orientations. This type of perspective
turn tourist products in a commoditized service, mainly oriented to price, that is why experience marketing can help firms

537
to scape of the price trap. This way it is important to mention that for companies to be competitive in hospitali ty and
tourism industries is indispensable to be attentive to new market and customer’s perspective (WILLIAMS, 2006).
3 Tourism and Social Media
The study of human relations in the society is a recurring subject over time, for the humanity’s development based itself in
the relationship between individuals and groups. Therefore, today’s society is a reflection of the continuous evolution of
these relations (EGLER, 2007). An element that well represents this evolution of human relations is the social network , an
old concept that was molded in time by the technological advancements.
Granovetter (2000, p. 219) conceptualizes social network as “a set of actors (people and organizations) connected by
human relations or bonds of some specific kind. A bond or relationship between two actors has power and content. The
content may include information, advices or friendship, mutual interests or associations and typically some level of trust”.
With the coming of Internet, the roles played by the social networks were transferred to the virtual world and took an
even bigger proportion, allowing people to be permanently connected exchanging information, creating thus a massive
growth of content generation and content sharing.
The online social network or social media emerged in a more interactive and dynamic internet model, the Web 2.0 - Web’s
second generation, where content is made and shared by users, demonstrating interests, preferences and incentives about
information exchanging (TOMAS et al, 2012). The social media websites allow participants to publish information about
them and to get in touch with other people who share their same interests and opinions or who want to make commercial
contacts (SOLOMON, 2008, p. 421).
According to Paes et al (2012), what makes social media websites unique is the possibility users have to articulate and to
make visible their social networks and perceptions. Recuero (2009, p. 24) agrees with this idea declaring that these tools
provide the actor the possibility to interact and communicate with other actors, leaving a track in the computer network
that enables the acknowledgment of the patterns on their connections and the visualization of the social networks through
these tracks.
This set of information (tracks) generated and shared between these social media users is an important marketing
strategy tool to the companies. Today with the aid o this technological tool, an enterprise can monitor its clients, interact
with them directly, get feedback about its products and services and thus, get to know its users’ habits better (E.life, 2012).
To get this set of information they must use the social media to stimulate the dialog and the interaction, for this
development between the brand and the consumer may be essential to the development of l oyalty, the content production
and the increasing of knowledge about the brand (TUTEN, 2008).
In the tourism field, an advantage ensured by this tool is the chance the company has to interact and to strengthen the
relationship with tourists. An engaged positioning into social media helps the company to make a difference alongside
competitors, creating a bond of trust with the clients and understating the impacts of the tourist services intangibility.
Agreeing with this idea Machado and Almeida (2010) say that the social media are changing the way to communicate with
clients, because they opened a series of opportunities to relate with and to know the tourist by an instant connection with
consumers and by the information exchanging.
According to Brusha (2010 apud Cruz, 2012) there are some opportunities which must be considered in social media using
on the tourism field: the attraction of new clients; effective and straight communication with real and potential clients,
conveying confidence and credibility; viral effect of the content that is relevant to the tourists, which makes the brand to
be promoted spontaneously; management of online reputation - the monitoring and the constant control of the social
networks is an important tool to manage the brand’s image; interaction, for the use of online applications smoothes the
production of fun and original content - videos, images, contests, group discussion, etc.
Surpassing these usual utilities, Martínez (2011) defends the utility of social media as a tool to promote marketing
experience to the consumer. To the author the organizations must try to establish emotional links between the brand and
the tourist. These emotional connections may be developed through all the purchase process and may have as its main
goal to build a destination over people, such as the social media does. This way the attributes of the destination get quality,
innovation, competitive edge, cooperation and collaboration.
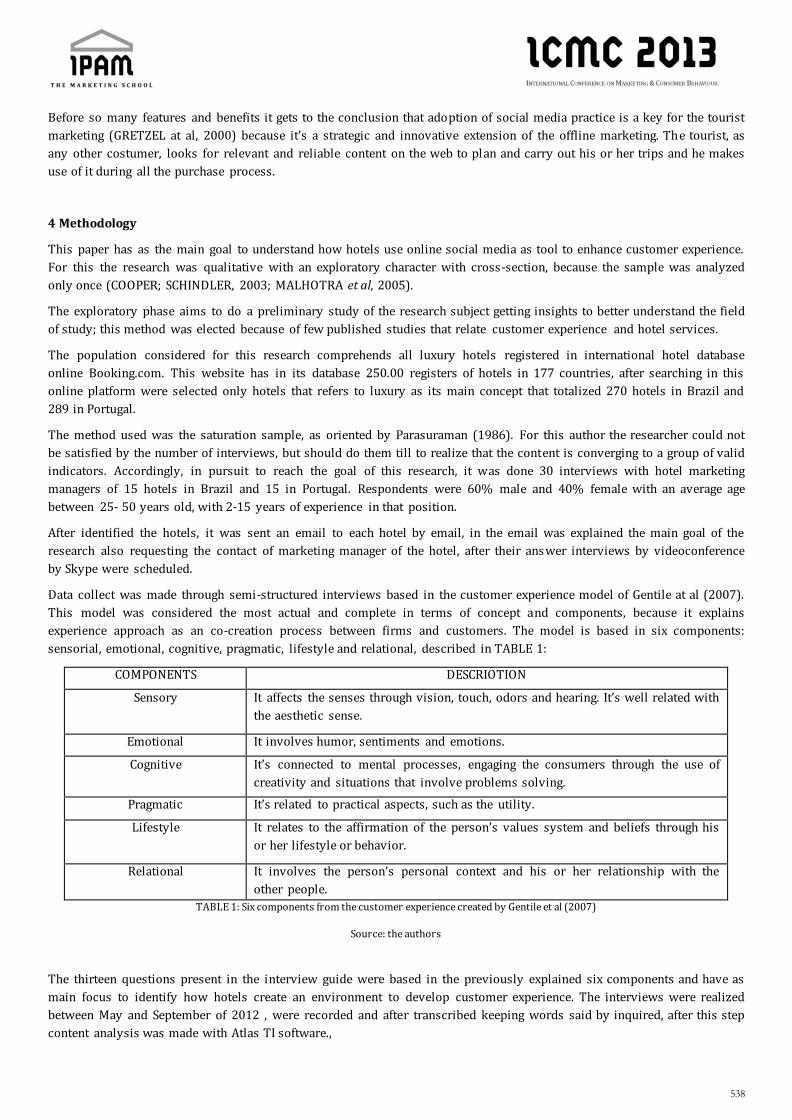
538
Before so many features and benefits it gets to the conclusion that adoption of social media practice is a key for the tourist
marketing (GRETZEL at al, 2000) because it’s a strategic and innovative extension of the offline marketing. The tourist, as
any other costumer, looks for relevant and reliable content on the web to plan and carry out his or her trips and he makes
use of it during all the purchase process.
4 Methodology
This paper has as the main goal to understand how hotels use online social media as tool to enhance customer experience.
For this the research was qualitative with an exploratory character with cross-section, because the sample was analyzed
only once (COOPER; SCHINDLER, 2003; MALHOTRA et al, 2005).
The exploratory phase aims to do a preliminary study of the research subject getting insights to better understand the field
of study; this method was elected because of few published studies that relate customer experience and hotel services.
The population considered for this research comprehends all luxury hotels registered in international hotel database
online Booking.com. This website has in its database 250.00 registers of hotels in 177 countries, after searching in this
online platform were selected only hotels that refers to luxury as its main concept that totalized 270 hotels in Brazil and
289 in Portugal.
The method used was the saturation sample, as oriented by Parasuraman (1986). For this author the researcher could not
be satisfied by the number of interviews, but should do them till to realize that the content is converging to a group of valid
indicators. Accordingly, in pursuit to reach the goal of this research, it was done 30 interviews with hotel marketing
managers of 15 hotels in Brazil and 15 in Portugal. Respondents were 60% male and 40% female with an average age
between 25- 50 years old, with 2-15 years of experience in that position.
After identified the hotels, it was sent an email to each hotel by email, in the email was explained the main goal of the
research also requesting the contact of marketing manager of the hotel, after their answer interviews by videoconference
by Skype were scheduled.
Data collect was made through semi-structured interviews based in the customer experience model of Gentile at al (2007).
This model was considered the most actual and complete in terms of concept and components, because it explains
experience approach as an co-creation process between firms and customers. The model is based in six components:
sensorial, emotional, cognitive, pragmatic, lifestyle and relational, described in TABLE 1:
COMPONENTS DESCRIOTION
Sensory It affects the senses through vision, touch, odors and hearing. It’s well related with
the aesthetic sense.
Emotional It involves humor, sentiments and emotions.
Cognitive It’s connected to mental processes, engaging the consumers through the use of
creativity and situations that involve problems solving.
Pragmatic It’s related to practical aspects, such as the utility.
Lifestyle It relates to the affirmation of the person’s values system and beliefs through his
or her lifestyle or behavior.
Relational It involves the person’s personal context and his or her relationship with the
other people.
TABLE 1: Six components from the customer experience created by Gentile et al (2007)
Source: the authors
The thirteen questions present in the interview guide were based in the previously explained six components and have as
main focus to identify how hotels create an environment to develop customer experience. The interviews were realized
between May and September of 2012 , were recorded and after transcribed keeping words said by inquired, after this step
content analysis was made with Atlas TI software.,

539
5 Main results
Results show that online social media are an important tool to create a good environment to enhance customer experience
in hotels services, also it was identified that both experience approach and social media are important to marketing
managers increase hotel services. In addition, social media were strictly related to two specific components of customer
experience: lifestyle and relational.
In lifestyle component it was the goal to understand how hotels try to associate services offering with customer lifestyle
and also how hotels try to align with their values and beliefs focusing in hotel’s target, for this social media are an
important tool to help in market research and to consolidate hotel’s brand image.
Relational component refers to hotel’s efforts to encourage connection between customers and other people through its
services. In this component, answers converge to the use of social media as a tool to connect with customer and the
possibility of use social media to create a community of fans.
Then, identifying what social media are most used by hotels with a great diversification, being present in many social
media, but the most cited were Facebook an twitter, and were also mentioned Flickr, Tripadvisor, Blogger, Website,
Linkedin and Youtube, as in GRAPHIC 1:
GRAPHIC 1: Main social media used by hotels
Source: the authors
By the analysis of mentioned components it was identified social media as a tool to enhance customer experience, mainly
by fours aspects: to help in market research, associate to brand image of the hotel, also social media were considered as
allies in relationship (connection) with customer, and finally social media are important to create a community of Fans to
hotels, as presented in FIGURE 1:

540
FIGURE 1: How the hotels use social media?
Source: the authors
Market research – Here there is the possibility to know better hotels’ customers, social media permit firms to know
demographic data of the users as age, gender, localization, as well as to know subjective information as needs and wishes
of clients through monitoring tools, as an example EdgeRank on Facebook.
Brand image – Brand image enable hotels to show customers its identity, this way social media are important tool to
consolidate hotel’s image to customers, creating a strong connection with them even before or after their stayed in hotel.
Customer relationship – Social media are consolidating as quick and efficient communication media, that is why they can
be excellent tools of interaction between hotel and customer, what can be also managed to enable a strong connection with
customer.
Community of fans – To consolidate relationship with customer not only in encounter moment, but also before and after
this, social media should be used as a tool to create a community of fans, enabling hotels to create strong ties with
customers.
6. Conclusions
Social media online is a phenomenon that came from web 2.0 and brought more interactivity to Internet enabling closing
relationships between customers and firms. In this context, companies should create practices that evolve social media to
develop memorable experiences for customers. Hospitality and tourism industry should be attempt to this trend, and
cannot consider being away from fundamental market orientation, because to develop innovative experiences is more and
more important to services, and those ones who goes beyond excel lence in services, engaging customers through
experiences, will be the ones whose will get the leadership in creating value of market.
Thus, social media should be used by hotel firms as a tool to enhance customer experience and consequently to connect
with customer, trying to understand their deep wishes and needs, also offering different services, creating value of brand
and getting competitive advantage compared to its competitors.
Results show that this presence in online social media in order to develop experiences is a constant awareness of hotel
managers, and that social media when thought strategically can generate many benefits to hotel. Also is important to

541
highlight that the presence of hotels in different social media is a possibility to reach many targets and can expand the field
of communication between hotel and the guest, however as shown in main results Facebook is the preferential social
media between the inquired in this research, what can be explained in terms of number of users.
Also it was identified as main benefits to use social media as experience tools, namely: the possibility to use social media as
market research tool, also to consolidate hotel’s brand image, to narrow relationship with customer, and finally to create a
community of fans, all of these points highlight the importance of a close relationship with customer in order to create an
environment to develop different and unique experiences.
As main limitations of this research we considered the use of a generic model of customer experience, because of not being
till the moment a specific model to analyze this field of study for hotels. Also, the sample of study was limited and for
future investigation we suggest a bigger sample with the possibility to inquiry also customers, this way it is possible to
comprehend experience facing both elements in co-creation, firms and customers. Finally should be considered to
complement this research with a quantitative perspective of the study, to better understand relations between social
media and customers in hotel services.
7 References
BIGHAM, L. (2008). New survey: experiential spend to grow in 2008”, 360° Newsletter 28th. January, [online]. Available at:
http://360.jackmorton.com/articles/article012808.php.
COOPER, D. R.; SCHINDLER, P. S. (2003) Métodos de pesquisa em administração (7.ed). Porto Alegre: Bookman.
CRUZ, V.; MOTA, K.; BARBOSA, V.; PERINOTTO, A (2012). Redes sociais como estratégia de marketing turístico: o facebook e
a Região Norte do Estado do Piauí-Brasil. Revista TURyDES, Turismo y Desarrollo Local, vol. 5, no. 13.
EGLER, T. C. (2007) Ciberpólis: redes no governo da cidade. Rio de Janeiro: 7 letras.
E.life. (2012) Estudo dos hábitos 2012. E.life [Online] Available at: <elife.com.br/estudospapers/estudo-habitos-2012/>.
[10 de dezembro de 2012].
FARIAS, S.; FILHO, M.; BARBOSA, L.; COSTA, C. (2011). Experiência extraordinária na internet: Uma análise da oferta de
Experiência em portais de turismo governamentais. REGE, São Paulo – SP, Brasil, 18 (3) p. 451-468.
GENTILE, C; SPILLER, N; NOCI,G. (2007) How to Sustain the Customer Experience:: An Overview of Experience Components
that Co-create Value With the Customer. European Management Journal, 25(5), 395-410.
GRANOVETTER, M. (1973) The Strengh of Weak Ties, in American Journal of Sociology. Vol 78, 1973, 1360-80.
GRETZEL, U; YUAN, Y; FESENHAIER, D. (2000). Preparing for the new economadvertising strategies and change in
destination marketing organization. Journal of Travel Research, v. 39, 149-156.
HOLBROOK, M.B; HIRSCHMAN, E.C. (1982). The experiential aspects of consumption: Consumer fantasy, feelings and fun .
Journal of Consumer Research, 9(2), 132–140.
MACHADO, L. P.; ALMEIDA, A. (2010) Turismo: inovação e tecnologia. Princípia Editora, Portugal, 2010. Available at
<http:// <web.spi.pt/turismo/Manuais/Manual_III.pdf>. [10 out 2012].
MALHOTRA, N. K; ROCHA, I. ; LOUDISIO, M. C. ; ALTHERMAN, E. ; BORGES, F. M. (2005) Introdução à pesquisa em
Marketing. São Paulo: Pearson Prentice Hall.
MARTINEZ, E. (2011). Turismo 2.0 y Medios sociales (Master’s Thesis). Universitat de Les Illes Balears, España.
MOSSBERG,, L. (2007). A Marketing Approach to the Tourist Experience. Scandinavian Journal of Hospitality and Tourism,
7(1), 59-74.
OTTO, J; RITCHIE, J.R. (1996) The Service experience in tourism. Tourism Management, 17(3), 165 174.
PAES, T. A. A.; MATIAS, E. M.; AGUIAR, D. F. (2012) Turismo e Comportamento do consumidor: retaliação a empresas no
ambiente virtual. Anais do Seminário da Associação Nacional Pesquisa e Pós-Graduação em Turismo.
PANOSSO, A N. GAETA, C. (2011) Turismo de experiência. Senac, São Paulo.

542
PARASURAMAN, A.(1986) Marketing Reasearch. Canada: Adisson-Wesley Publishing Company.
PINE II, B. J.; GILMORE, J. H.. (1999). The experience economy: Work is theatre and every business is a stage. Boston: HBS
Press.
PRAHALAD, C.K.; RAMASWAMY, V. (2004). Co-Creation Experiences: The Next Practice in Value Creation . Journal of
Interactive Marketing 18(3), 5–14.
RECUERO, R. (2009) Redes Sociais na Internet. Porto Alegre: Editora Sulina.
SCHMITT, B.H. (1999) . Experiential Marketing. The Free Press, New York.
SHAW, C.; IVENS, J. (2005). Building Great Customer Experiences. New York: MacMillan.
SOLOMON, M. R. (2008) O comportamento do consumidor: comprando, possuindo e sendo (7. ed.) Porto Alegre : Bookman.
TOMAS, R.; MESCHGRAHW, R; ALCANTARA, R. (2012) As redes sociais e o comportamento do consumidor de compra do
consumidor: o reinado do “boca-a-boca” está de volta? Revista Brasileira de Marketing. v. 11. n. 2.
TUTEN, T. (2008). Social media marketing in Web 2.0 world. Westport, CT: Praegir.
VERÍSSIMO, M.; LOUREIRO, S. (2013). Experience marketing and the luxury travel industry . Tourism and Management
Studies journal (special issues Encontros Científicos forthcoming).
WILLIAMS, A. (2006). Tourism and hospitality marketing: fantasy, feeling and fun. International Journal of Contemporary
Hospitality Management. 18 (6), 482 – 495.

543
Session 15

544
Drivers of innovation under turbulent times in
the hotel industry Innovativeness, learning orientation, customer solutions, turbulence, new services success, performance
Ana Santos, IPAM The Marketing School [email protected]
Cláudia Costa, Universidade Nova de Lisboa, Faculdade de Economia, [email protected]
Abstract
This study uses longitudinal data to investigate the relationship between past performance (time 0), customer oriented
solutions, innovativeness, and learning orientation (time 1) on the success of new services and their performance (time 2)
on the hotel industry. Using the last period as a reference the authors aim to shed light on the managerial adjustments to
customer solutions and learning orientation arising from market feedback (Lages et al. 2008). Further this adjustment is
tested on future performance.
Results show that performance is an antecedent and a consequence of customer activities. We found that managers will
invest in customer-oriented solutions and innovativeness when they face increases in performance, realizing the
importance of serving the current customer as well as fostering a culture that supports innovative solutions. Interstingly
learning orientation is not vulnerable to short term performance fluctuations. These solutions in turn are important
drivers of future performance (Baker and Sinkula 2007).
We have conducted group analises to test for high and low levels of managerial perception of environment turbulence. It
also revealed that market performance is contingent on the relationship between the organization and the environment:
there are different routes to new services’ success according to the level that managers perceive the environmental
turbulence. Stability favours client oriented solutions to achieve new service success, while innovativeness is the
managerial response under high turbulence. This increases the importance of learning as a tool to deal with turbulence.
Implications for researchers and practitioners are discussed.
1. Introduction
Our research model is based on three main drivers of competitive advantage: innovativeness, customer oriented solutions
and learning orientation, and we investigate their relationship to performance through the enhancement of new services
success. As we enter the twenty-first century, the marketing function continues to remain focused on serving customers
effectively. Increased competition is forcing companies to place unprecedented emphasis on innovation, whilst providing
customer-oriented solutions in order to achieve greater competitive advantage. Managerial evidence has been supported
by previous research which reveals that innovation is critical to the provision of superior customer value and sales success
(e.g. Gatignon and Xuereb, 1997; Hult and Ketchen, 2001). Nevertheless, research suggests that innovativeness as a
strategic orientation might not be equally suitable for all companies.
This study will contribute to the literature at three levels. First, we revisited the debate of the innovator's dilemma.
Although several empirical studies have looked at the relationship between customer orientation and innovativeness (Han
et al., 1998, Lukas and Ferrel, 2000, Matsuno et al, 2002), the debate on how much should be invested in a culture that
fosters the view of the customer versus another that departures from their view is still alive. An established body of
research argues that too much focus on the customer will render the “organization myopic” (Hamel and Prahalad, 1994;
Christensen, 1997; Zou et al., 2005) suggesting the need for firms to, at times, disregard the customers' voices and focus on
its own innovativeness skills. A second stream of research contends that firms should stay close to the customer, with the
customer at the heart of the organization (Deshpande at al, 1993, Gatignon and Xuereb, 1997). These studies argue that
firms that consistently identify and respond to customers' needs are in a better position to satisfy customers and perform

545
better against competitors. We will investigate whether promoting organizational climate as innovative or as customer-
oriented solutions will relate differently to performance. We investigate the role of learning orientation within this debate.
Learning as been seen as a culture that encourages firms to question not only the information they process but also
whether their particular approach to new services is suitable to the organization. The question is extended to the
marketplace, in particular about core beliefs about customers and better ways to deliver customer benefits (Barker and
Sinkula, 1999b). As such the learning orientation is likely to be the avenue to conciliate the innovators dilemma, as it
forces the organization to look at customer intelligence as well as challenging the existing value chain.
Secondly, we contribute to the literature by looking at the temporal sequence of performance of these customer activities
and learning. For example, several studies have investigated the temporal sequence of performance on innovation (see
Bowen et al, 2009 for a review) with conflicting results. Poor performance signals a mismatch between the environment
and the organization's strategy. The mismatch is likely to make managers search for remedial action generating
information that may motivate corrective adjustments and promote new incremental solutions (Cyert and March, 1963).
On the other hand, good performance signals managers that they are getting it right and are likely to create organizational
slack (Mone et. al., 1998, Chattopadhyay et al., 2001). Will managers use these resources towards new activities or will
they instead invest on their existing relationships? And what about learning orientation, is it a rescue for performance
decline?
Thirdly, we will assess performance through objective financial data. By using objective data we aim to avoid common
method bias and contribute to marketing accountability (as suggested by Marketing Science Institute 2008-2012
priorities). This is especially relevant in the service setting where products are more difficult to protect, customer
interaction is unavoidable, and firms need to continuously innovate to stay ahead of competitors. We will add to empirical
research by moving away from technological innovativeness where the main contributions have been centered (e.g.
Andrews and Smith, 1996; Im and Workman, 2004).
Finally, we evaluate the role of the external environment. Environments are increasingly turbulent (Day, 1994; Jaworski
and Kohli, 1993) and organizations need to learn quickly in order to adapt (Baker and Sinkula, 2007) and innovate
(Ferrier, 2001; Lant et al., 1992). Because firm's responsiveness to a turbulent market is likely to become more important
when an organization is faced with an evolving mix of customers and aggressive competi tors, we tested our model in high
and low levels of perception of turbulence, based on a final sample of 138 hotel managers.
2. Research hypotheses and conceptual model
Drivers of innovation
The concept of innovativeness depends on the standpoint the research takes (Sigwall, 2006 for a review). Some authors
define it as the uniqueness or novelty of the product (Im and Workman, 2004), or whether individuals are early adopters
of innovation (Kerin et al., 1992). It may be the adoption of an idea or behaviour that is new to the organization or an
organizational culture that encourages the introduction of new processes, products and ideas (Hurley and Hunt, 1998).
Hult et al. (2004) suggest that future research should delve more deeply into these constructs and their interrelationships
in a variety of settings among industrial firms. More recently, Bowen et al. (2009) observes a muddling of definitions of
innovativeness.
Hurley and Hult (1998) define innovation along two dimensions: innovativeness and the capacity to innovate. They
conceptualize innovativeness as ‘‘the notion of openness to new ideas as an aspect of a firm’s culture. Innovativeness of the
culture is a measure of the organization's orientation toward innovation. ’’(p. 44). This aspect of organizational culture is
reported to have a positive impact on innovative behaviours as it supports a work environment that promotes individual
innovative behaviours and creativity (Sharma 1981; Scott and Bruce 1994; Amabile et al.,1996; Matsuo, 2006). As such
this study focuses on innovativeness as an organizational climate that supports innovation.
Menon and Varadarajan (1992) suggest that an innovation oriented culture encourages information dissemination that
will require the collection and dissemination of customer intelligence to offer solutions with greater value for customers
(Siguaw et al., 2006).
Customer orientation is part of a broader concept of market orientation, first developed by Narver and Slater (1990). They
defined it as consisting of three behavioural components: customer orientation, competitor orientation, and inter
functional coordination. Market orientation, which has a broader meaning than that of customer orientation, refers to ‘‘the

546
organization culture that most effectively and efficiently creates the necessary behaviours for the creation of superior
value for buyers’’ (Narver and Slater, 1990, p.21). Of the three components of market orientation, we focus on customer
oriented solutions, because it is the most fundamental aspect of market oriented corporate culture (Lawton and
Parasuraman, 1980, Desphande et al., 1993), and it is based on a marketing concept that promotes putting the interests of
customers first (Han et al., 1998). Some definitions include ‘‘the set of beliefs that puts the customer's interest first’’
(Desphande et al., 1993, p.27) or ‘‘firm’s ability and will to identify, analyse, understand, and answer user needs’’
(Gatignon and Xuereb, 1997, p.78). In fact some studies regard customer orientation and market orientation as
synonymous (Desphande et al., 1993, Matsuno, 2006). Homburg and Pflesser (2000) unveiled a multi layer model of
market oriented culture that supported market oriented behaviors. Values and norms are supportive of market oriented
behaviors but the organizational culture need to add a further layer (artefacts) to produce the desirable market oriented
behavior that will contribute to increasing levels of performance (Narver and Slater 1990). As such this study uses the
cultural perspective of organizational norms and values that encourage behaviors that are consistent with market
orientation as described above.
Aligned with the market orientation concept is the learning orientation conceptualised as the degree to which the
organisation values knowledge, is open-minded and has a shared vision (Sinkula et al., 1997). More specifically, it may be
viewed as the degree to which firms are committed to systematically challenge the fundamental beliefs and practices that
maximize organizational performance (Argyris and Schön, 1978) including the innovation process itself (Day, 1994; Baker
and Sinkula, 1999b). In essence learning orientation is reflected by the presence of values that influence the propensity of
a firm to proactively pursue new knowledge and challenge the status quo (Slater and Narver, 1995; Sinkula et al., 1997).
Such firms are more likely to question whether core beliefs about customers, competitors and suppliers that provide the
basis for actions continue to be applicable. They scan the external environment for new technological paradigms that may
offer a better means to deliver core product category benefits (Baker and Sinkula, 1999b). Additionally the firms
encourage their employees to question how they operationalize their market-oriented behaviours (Day, 1994), the way
they interpret the informational output of these behaviours and the way they integrate this information with other
information (e.g., new technology). Therefore, learning orientation is a resource that influences the quality of custom er
solutions, thus is arguably as necessary as a market orientation itself (Baker and Sinkula, 1999a).
Past performance as an antecedent
Managers are often asked to take major decisions, even though the information available to them at the time is incomplete
and uncertain. Given that the decision environment is often highly uncertain and the financial stakes large, it is not
surprising that firms often revisit such decisions after they obtain new information to determine whether the firm should
continue with, modify, or terminate the initially chosen course of action (Biyalogorsky et al., 2006).
Innovativeness: Short term performance signals the fit of current strategy with the environment (Lages et al., 2008).
Managers will react to short term performance by developing an understanding of the connections between their actions
and the organizations outcomes. For example, gains signal management that they are in the path to success, boosting their
confidence about the future (Lant et al., 1992). This confidence is likely to increase the search for riskier projects as those
entailing higher levels of innovativeness. In a confident mood managers are more likely to frame activities as opportunities
rather than threats (Chattopadhyay et al., 2001; Simon and Houghton, 2003). In an optimistic climate managers will direct
their attention to positive past experiences course of action taken and as such start using their own heuristics to make
decisions as they are certain about the outcomes and likely to adopt a more entrepreneurial approach to the market
(Busenitz and Barney, 1997). Thus when managers frame innovations as opportunities they are more likely to develop a
willingness to adopt risky innovations.
A further argument supporting a positive effect between past performance and innovativeness comes from the role of
slack literature (Mone et al., 1998). Organizational slack helps to deal with ambiguity of outcomes arising from new
projects by providing a buffer to short term operations (Cyert and March, 1963). Availability of organizational slack
encourages adaptive responses to performance shortfalls considering innovative alternatives (such as new product
introductions, new market entries) as an option that would otherwise be deemed too risky under the context of decline
(Bourgeois, 1981; Nohria and Gulati, 1996). Finally a third common argument can be found in the threat rigidity theory
(Staw et al., 1981). It posits that when performing poorly, managers focus on initiatives of efficiency gains, cost cutting,
and increased accountability. Under threat managers are likely to reduce both the scope and nature of their innovation
activities as they are seen as riskier projects with uncertain future revenues. Therefore our first hypothesis is:
547
H1: There is a positive relationship between past performance and innovativeness.
Customer Oriented Solutions: Western companies are short term oriented. On the one hand, managers come under
considerable scrutiny and pressure when there is a crisis (Billing et al., 1980) and on the other, managers annual bonuses
can be tied to short term performance (Fredrickson, 1985, Doyle et al., 1992). As such, managers tend to react to past
performance for their own personal interest. In a scenario of growth, managers are likely to feel confident and to believe
that they have "gotten it right" (Miller and Chen, 1994). When past performance signals the right course of action,
customer oriented solutions such as changing prices, labels or packaging, positioning or a new advertising campaign are
likely to be reinforced with managers following the same course of action. This reasoning resonated with Cyert and
March’s (1963) argument that managers in organizations with good performance are less likely to search for new
activities because they are satisfied with their aspiration-level performance and find it unnecessary to engage in risky
projects, such as in new market segments. On the other hand Miller (1993) argues that as managers become more
confident about current strategies they are likely to reduce the need for experimentation.
Central to relationship marketing is that the goal of managers is to nurture lasting relationships by achieving more
business out of existing customers (Morgan and Hunt, 1994; Achrol, 1997, Palmatier, 2006) that will receive further
incentives from managers. In fact most researchers assume that investments in existing relationships will enhance
stronger customer relationships that will boost performance outcomes, such sales growth, share, and profits (Crosby et al.,
1990; Morgan and Hunt, 1994). Therefore we put forward the following hypothesis:
H2: There is a positive relationship between past performance and customer oriented solutions.
Learning orientation: Under an organizational learning perspective, managers are viewed as assessing past performance
in accordance with specified goals and then determining necessary actions to be taken. Hence, managers can be viewed as
reactive to past performance in the determination of current strategies. Empirical research in organi zational learning
demonstrates that past performance influences current managerial decisions (Lant et al., 1992). These findings are
consistent with a central assumption of the organizational learning literature, which argues that organizations and
individuals set goals and adjust their behaviour in response to favourable and unfavourable feedback (Cyert and March,
1963). For example, Greve (1998) reveals that if performance increases adaptive behaviour declines. This decline occurs
because organizations exhibit political resistance to change, and managers face uncertainty regarding the opportunities
that exist in the environment. In a similar manner, it can be theorized that a firm may be more likely to take a standardized
approach to its marketing strategy in an export venture when its past export performance has been particularly strong
(Lages and Montgomery, 2004). In contrast, when a firm is not performing well, managers do not have the privilege of
maintaining the status quo and will be more willing to take actions deviating from the firm’s current activities and to
search for new opportunities in more distant places. This tends to be more risky than sticking to what proved to be
successful in the past. This core intuition has been formalized in a number of related simulation models (Lant, 1992; Greve,
1998). Therefore we propose the following hypothesis:
H3: There is a negative relationship between past performance and learning orientation.
Learning orientation and innovativeness
Firms with strong learning orientations encourage employees to constantly question the organizational norms that guide
their MIP activities and organizational actions (Day 1991; Garvin 1993; Sinkula 1994; Sinkula et al. 1997). In this respect,
learning orientation affects the degree to which organizational members are encouraged, to "think outside the box" in line
with the proactive approach to the market. Marketing research has distinguished between a responsive and a proactive
approach (Kohli and Jaworski, 1990; Slater and Narver, 1995; Matsuno et al., 2002). A responsive firm tends to focus on
the expressed wants of customers and attempts to better target existing customer groups. In contrast, the proactive
approach is oriented towards the latent, unexpressed needs and unrevealed preferences of customers. Baker and Sinkula
(1999b) and Day (1991, 1994) revealed that learning orientation facilitates shifts in product paradigms questioning long-
held assumptions, fundamental beliefs and practices that eventually led to successful innovation. Proactive firms rely more
strongly on the exploration of new opportunities recognise that innovation may not always be maximised through a strict
interpretation of the feedback received from current customers, channels and competitors (Atuahene-Gima et al., 2005).
This view recognises that innovation sometimes requires the vision to predict what the market may become as such they

548
tend to be more innovative, launching more new-to-the-world products (Lukas and Ferrell, 2000) and targeting customers
in novel ways. These authors confirmed that the extent to which an organisation engages in a successful product
innovation is a function of learning orientation. Hence our hypothesis is stated as follows:
H4: Learning orientation will positively influence innovativeness
Innovativeness and customer oriented solutions
Innovativeness as an organization's trait, facilitates the implementation of innovations. Firms with greater capacity to
innovate will be more successful in responding to their customers by developing new capabilities to satisfy them timely
(Han et al., 1998). The possession of such orientation will allow firms to accumulate internal capabilities to provide
meaningful customers solutions that transform customer's desires and needs into solutions resulting in satisfied
customers (Gatignon and Xuereb, 1997; Hult and Ketchen, 2001).These firms trait towards innovative behaviours generate
inimitable, valuable, unique resources (Barney, 1991; Teece et al, 1997) that can be used to strengthen the relationship. As
customers perceive value in their relationship with the firm their willingness to develop relational bonds increases, as well
as their willingness to stay in the relationship (Palmatier et al, 2006). The firm will find itself in a superior market position
thus creating a competitive advantage (Amit and Schoemaker, 1993). Therefore we propose:
H5: There is a positive association between levels of innovativeness and customer oriented solutions.
New Service Success as a Consequence
Innovativeness: The resource-based view of the firm (e.g.,Barney, 1991) sees a firm as an idiosyncratic bundle of resources
and capabilities that are available for deployment by the firm’s business units but are difficult for rivals to imitate ( Amit
and Schoemaker, 1993). When innovativeness is deeply embedded in the firm's routines and practices, it can become an
organizational key capability. Key resources are typically intangible and developed over time making them costly or
difficult to trade, imitate or duplicate and becoming a source of competitive advantage (Barney, 1991; Day 1994; Teece et
al., 1997). Several studies have indicated that innovativeness has a positive impact on a firm’s performance. For example,
Hurley and Hult (1998) found that existing innovativeness of divisions in government agencies promoted the divisions’
capacity to innovate, as well as the ability of the organization to adopt or implement new ideas, processes, or products
successfully. Thus innovativeness enhances its performance because it encourages organization members to come up with
new innovative services and products in order to cope with technological and market changes. Empirical studies have also
looked at outcomes directly related to innovation, such as the number of innovations an organization is able to adopt or
implement successfully, law protected patents, technological knowledge or proprietary production processes (Ritter and
Gemunden, 2004), or indirectly such as the ability to negotiate change in the organization's environment (Teece et al.,
1997), the development of fast response to market changes (Kerin et al., 1992), the ability to deal with economic crisis
(Grewal and Tansuhaj, 2001) and more committed and loyal employees (Kirca et al., 2005). Thus we expect that
innovativeness has a direct impact on the success of launching new services.
H6: There is a positive relationship between innovativeness and new services success.
Customer Oriented Solutions: In general the marketing theory predicts that serving the needs of the customer better by
providing products that fit their needs creates an advantage for firms as their products are perceived as standing out from
competition (Day, 1991; Andrews and Smith 1996). Consistently identifying and responding to customer's current
needs and preferences and anticipating future needs and preferences, firms will be in a better position to satisfy customers
and perform better against competitors (Cadogan et al., 2002). Such ability will bring higher revenues to the organization
as it develops capabilities to create valuable and unique solutions (Day, 1994) placing the organization in a better position
than competitors (Hunt and Morgan, 1995). The underpinning logic is firmly grounded on the resource-based view of the
firm (e.g., Barney, 1991) where the firm is a bundle of assets and capabilities that can be combined to produce competitive
advantages. At the turning of the millennium researchers have also turned attention to the adoption of the customer
centric marketing in place of product and segment centric marketing (Sheth et al., 2000). The importance of fostering
successful relationships to achieve long-term benefits, is highlighted in relationship marketing studies (Morgan and Hunt,
1994).This stream of research is grounded on the assumption that stronger customer relationships has positive

549
performance outcomes (Crosby et al.,1990; Morgan and Hunt, 1994, Palmatier, 2006). Effective practice of relationship
marketing implies a strong customer focus which increases their willingness to develop relational bonds, a decreased
propensity to leave a relationship (Morgan and Hunt, 1994) and have a more long term orientation (Ganesan, 1994),
enhanced or flexibility (Lusch and Brown, 1996) that will generate higher sales (Siguaw et al., 1998) through enhanced
customer satisfaction, loyalty, image, positive word of mouth and reduced price sensitivity (Simpson et al. 2006).
Customer oriented solutions are a key dimension of this relationship aiming at getting more business out of existing
customers and fostering the acceptance of new products. Therefore our hypothesis is:
H7: Customer oriented solutions are positively related to new services success.
Learning orientation: Baker and Sinkula (1999a and 1999b) demonstrated that a firm's learning orientation is likely to
directly influence organizational performance by facilitating the type of learning that leads to innovations in products,
procedures, and systems. This implies that the learning processes may be critical in creating a sustainable competitive
advantage in the firm. In fact learning has been playing a prominent role in new theories on competitive advantages (Hunt
and Morgan, 1995) which result from resources and capacities created and controlled inside the organization such as
innovation, people’s learning skills and organizations’ entrepreneurial capabilities (Hunt and Morgan, 1995). This study
looks to innovativeness, customer oriented solutions and learning orientation as key performance drivers of new
developed services. New product success is a dimension of performance that involves the firm's ability to adapt to
changing conditions and opportunities in the environment (Walker and Ruekert, 1987). A strong learning orientation is
likely to be a route to new product development without relying on external sources of information. For example, firms
with high learning orientation may not always follow a market-oriented approach to new product development because
they are capable to lead these processes by learning from all available sources including internal ones that help
questioning long held beliefs. Therefore, we propose a positive link between learning orientation and new services success
as it improves the predisposition to accept innovative processes, practices, and decision making, which drive to the
development of new services with success (Matsuno et al., 2002). Hence we suggest the following hypothesis:
H8: There is a positive relationship between a learning orientation and new services success
Based on previous findings it is acceptable that the success of new innovative services is a consequence of greater
customer satisfaction with the introduction of new services, and that this may result in large gross profit margins to the
firm, and in a quicker return on the investment. Additionally, Baker and Sinkula (1999b) recognised that learning
orientation facilitates the type of higher-order learning that leads to shifts in product paradigms. This dynamic generative
learning will enable firms to be first to market with differentiated successful innovations, and to engage innovative
activities that increase productivity (Baker and Sinkula, 1999a, 1999b; Sinkula et al., 1997). Moreover, services innovation
may lead to a continuous and cumulative customer satisfaction, which Homburg et. al., (2004) found to have a strong
impact on profit margins and the willingness to pay. Similarly, we expect that the successful development of new services
may result in large gross profit margins to the hotel units and in a quicker return on the investment. We propose
H9: New services success will impact positively the financial performance
Thus our research model integrates nine research hypothesis (fig.1) in a longitudinal perspective from time 0 to time 2.
Fig.1 – Conceptual Model and Hypothesis

550
3. Methodology
Sample Procedure
Services have become the primary sector of the world’s economy. In 2009 services accounted for approximately 70% of
the total gross value added for the OECD countries (OECD, 2010). Several studies have reported that the impact of market
orientation on the service sector should be stronger compared to manufacturing firms, due to the greater dependence on
person-to-person interactions (e.g., Singh, 2000; McNaughton et al., 2002). In 2009 the international tourism accounted
worldwide to provided over 235 million jobs and forecast shows that by 2020, 1 in every 10.9 jobs will be related to the
travel and tourism industry. Portugal its currently ranked 28th in the world in terms of tourist visits, and is set to becom e
the world’s tenth largest market by 2020, with an expected annual growth of 4% (WTTC, 2010) heavily dependent on the
quality and added value that accommodation services provide to their customers.
In this context we focus the study on the hotel industry for its relevance and the research setting is the country of Portugal.
The unit of analysis is each hotel establishment and we mailed a postal questionnaire to each hotel manager.
Data Collection Procedure
All measures were translated from English to Portuguese, using the back-translation method to ensure conceptual
equivalence (c.f. Douglas and Craig, 1983). We measured all items using seven-point Likert scales. The final version was
mailed to 2.203 hotel establishments from the Portuguese “Official Guide for Tourist Accommodation-2003” database. The
data was collected in 2005, with 448 valid responses yielding an overall response rate of 21% (95% confidence level).
After matching the questionnaires with the available financial data, our sample was further reduced to 138 usable
questionnaires. The respondents are organized as follows: 66% CEOs, 4% administrators, 15% directors of the SBUs, and
17% a wide range of directors (e.g. marketing, operations, human resources and finance). We also asked respondents to
indicate their total years of experience in the industry and the SBU. The means were 18 and 7, respectively. These data
suggest that the key informants had a deep knowledge of the topic and were well qualified. Tests of non-response bias
were conducted comparing early and late respondents (Armstrong and Overton, 1977). No evidence of bias was found.
Measures
Innovativeness and customer oriented solutions were assessed on a scale adapted from Homburg and Pflesser (2000), in
their study of identifying a culture that supports market orientation. For innovativeness we ask respondents to rate how
their business unit emphasized innovation and creativity, cooperative work and valued entrepreneurial thinking (1 =
Strongly Disagree; 7 = Strongly Agree). To assess customer oriented solutions respondents were questioned how often the
following was heard of on their business unit “we now try to look at this problem from the customer’s point of view…”, “
What is the value added to the customer of doing that?” and “Can we offer the customers what they are expecting from
us?” (1= Very Infrequent; 7=Very Frequently). Learning orientation was measured by adapting Baker and Sinkula (1999a)
scale (1 = Strongly Disagree; 7 = Strongly Agree) if they agreed with questions such as “.. basic v alues of this hotel unit
include learning...”, “ the collective wisdom in this hotel unit is that once we quit learning, we endanger our future”. New
service success was adapted from Baker and Sinkula (1999a) by asking respondents to indicate, “how has your business
unit performed over the last three years, with respect to new service introduction rate, success and differentiation relative
to largest competitor”. Objective performance was measured using the value of sales per room. Past performance was
measured in 2003 and future performance in 2006. We further measured environmental perceptions of turbulence
adapted from Menon et al.,(1999). We asked respondents to describe the level of changes in the following areas over the
past three years (1= Very low; 7= Very high) in terms of market opportunities, production/process technology in the
industry and products/services innovation in your industry. Full item scales can be found in appendix A.
4. Data Analysis
Measurement Estimation
In order to assess the validity of the measures the items are subjected to CFA using LISREL 8.51 (Jöreskog and Sörbom,
1993). The chi-square for this model is significant (chi-square=410.32, p<.00). Since the chi-square statistic is sensitive to
sample size, we also assess additional fit indices: the Comparative Fit Index (CFI= .97) and the Tucker-Lewis Fit Index
(TLI= .96). The RMSEA of this measurement model is .06. All constructs present the desirable levels of composite

551
reliability (Bagozzi, 1980) and all passed the Fornell and Larcker’s (1981) test of discriminant validity. Convergent validity
was evidenced by the significant standardized loadings of each item on its intended construct (average loading size was
0.75). Objective performance was measured using sales per room (appendix A).
Structural paths
The assessment of the structural model was performed using Partial Least Squares (PLS) with Smart PLS 2.0 (Ringle et al.,
2005). The model was tested using the intensity of the path coefficients (β) and applying the non-parametric bootstrap
technique to assess the precision and stability of the estimations obtained. Consistent with Chin (1998) a bootstrap test
(500 subsamples) was used to generate the standard error and t-values of the parameters. Table 1 summarizes the PLS
structural analysis for the hypothesized relations.
Table 1 Model Path Coefficients and t values
Estimates t-values
H1 Past performance – Innovativeness 0.16 2.62
H2 Past performance – Customer oriented solutions 0.11 2.15
H3 Past performance – Learning Orientation 0.07 0.91
H4 Learning Orientation - Innovativeness 0.64 13.33
H5
H6
Innovativeness – Customer oriented solutions
Innovativeness – New Service Success
0.31
0.22
3.46
2.3
H7 Learning Orientation - New Service Success 0.21 2.59
H8 Customer solutions – New Service Success 0.21 2.34
H9 New Service Success – Future Performance 0.23 3.39
Significant at p < .05 ; ** Significant at p< .01; *** Significant at p < .001 two-tailed test.
H1 specifies that innovativeness is influenced by the level of past performance. Our results show a positive association
between past performance and innovativeness (.155, t= 2.69, p<.05) supporting H1. In H2 we stated that short time results
influenced the level of customer oriented solution within the firm. We found that positive performance levels will direct
managerial attention to further customer oriented solutions rendering support to H2 (0.11, t = 2.25, p<.05). H3 predicted a
negative relationship between past performance and learning orientation. This hypothesis was rejected as the relationship
was found to be non significant (0.07, t= 0,868, p<.05). H4 predicted a positive influence of learning orientation on the
organization's innovativeness. This was strongly supported in this study (13.478, t = 13.756, p<0.5).
In line with the predictions of H5 we found that organization innovativeness strengths the delivery of customer
oriented solutions as management attempts to fulfil l customers expectations of the organization offerings. H5 was
supported (0.36, t = 3.5, p<.05). H6 predicts that innovativeness will have a direct impact on new service success and we
found a significant positive coefficient (.220, t = 2.39, p < .05) supporting H6. H7 predicts that customer oriented solutions
will have a positive contribution to new service success. We found a significant coefficient (.205, t = 2.328, p < .05). H7 is
supported. H8 and H9 pertained to the outcomes of learning orientation to new service success and ultimately to
performance. Learning orientation is positively related to new service success (.210, t= 2,838, p<.05) and new service
success relates positively to future performance (.231, t=3.300, p<.05), supporting H8 and H9 respectively.
Multi-group Analysis:
Because H3 provided unexpected findings we decided to conduct further analyses to understand the positive influence of
past performance on learning orientation. We aimed to understand if the main effect derived from populations
characterized by different values. Consistent with prior research we examined whether the effects were contingent upon
the level of environmental turbulence that includes technology and market turbulence: technology turbulence is the rate of
change associated with new product technologies, and market turbulence is the rate of change associated with the
composition of customers, their preferences, and competitor strategies (Jaworski and Kohli, 1993). We focus on this
construct as turbulence is likely to force organizations' proactivity by requiring rapid responses, such as product
adaptations, to satisfy changing preferences of customers (Jaworski and Kohli, 1993). In such environment firms that want
to keep up with and stay ahead of competitors, need to be attentive listeners and learners. If on the one hand responding

552
to fast changing customer preferences is likely to be achieved through close contact with the market, on the other hand
fast changing technology is more likely to be met by innovative research driven products. Both approaches to turbulence
are likely to be reinforced by organizational learning because these firms are more likely to use extensive sources of
information, knowledge and experience to recognize and exploit opportunities. Hence, organizational learning is expected
to be more important in fast pace environments.
As such we have conducted group analysis to test for differences in results whether managers perceive that they operate
in turbulent or stable environments. The analysis was conducted by sorting the sample in ascending order of
environmental turbulence and then splitting it at the median to form two groups, one with relatively low environment
turbulence and the other with relatively high environment turbulence. Next, performance was regressed on the full model
allowing all regression coefficients to take on different values in the two subgroups.
Results showed that in high turbulent environments past performance is a determinant of both customer solutions (client
and innovativeness) and learning orientation influencing. Increasing important are the solutions for existing customers.
The route to new services success in such environments is very strongly influenced by the levels of innovativeness with
customer oriented solutions with only a marginal (.0018, p<0.05) and non significant influence.
By contrast in stable environments (low perceptions of turbulence) client oriented solutions are the driver of new services
success, down playing the role of learning and with innovativeness as a route to new service success. As expected, the
influence of short term past performance is much less felt on organizations, although the relationship with learning
assumes now the hypothesied direction. Please see table 2a and b.
Table 2a Multigroup Analysis – High Environmental turbulence n= 63
Estimates t-values
H1
Past performance – Innovativeness 0.22 2.79
H2
Past performance–Customer oriented soluti 0.36 2.31
H3
Past performance – Learning Orientation 0.18 2.36
H4 Learning Orientation - Innovativeness 0.68 10.06
H5 Innovativeness – Customer oriented solutions 0.01 0.03
H6
Innovativeness – New Service Success
0.44
2.88
H7
H8
Customer solutions – New Service Success
Learning Orientation – New Service Sucess
0.02
0.11
0.1
0.81
H9 New Service Success – Future Performance 0.2 1.77
Significant at p < .05 ; ** Significant at p< .01; *** Significant at p < .001 two-tailed test.
Table 2b Multigroup Analysis – Low Environmental turbulence n = 63
Estimates t-values
H1 Past performance – Innovativeness 0.08 0.51
H2 Past performance–Customer oriented soluti 0.04 0.78
H3 Past performance – Learning Orientation -0.1 0.56
H4 Learning orientation - Innovativeness 0.67 9.49
H5
H6
Innovativeness – Customer oriented solutions
Innovativeness – New Service Sucess
0.49
0.11
4.42
0.84
H7 Learning Orientation- New Service Success 0.14 1.07
H8 Customer solutions – New Service Success 0.39 3.44
H9 New Service Success – Future Performance 0.22 1.8
Significant at p < .05 ; ** Significant at p< .01; *** Significant at p < .001 two-tailed test.
5. Discussion
This study develops a model that simultaneously tests the ability of innovativeness, customer oriented solutions and
learning orientation to indirectly affect organizational performance through new service success. Findings show that both
variables are important routes to new service success but our key find is that the relative importance of these solutions are
553
dependent on the levels of managers perceptions of environmental turbulence. Moreover learning orientation is an
effective way to maximize new service success regardless of the dynamics of the environment.
Contrary to predicted, past performance does not significantly influence a learning orientation. Values of learning make
the firm able to extract lessons from both successes and failures to generate new insights (Baker and Sinkula, 1999a) and
as such we would expect past performance to influence learning orientation. This suggests that the values of learning are
culture traits deeply embedded not vulnerable to short term performance.
Short term performance has a significant impact on both customer solutions and learning in high turbulent environments.
To deal with turbulence firms need to deploy different internal capabilities (innovativeness and customer oriented
solutions) to maximize new service success. Our results clearly indicate that innovativeness is more conducive of new
services success than customer oriented solutions in turbulent perceptions of the environment while under stable
conditions drivers of new service success become the customer oriented solutions. This means that the organization needs
internal flexibility to deploy the different competencies required by the environment in which they operate. This flexibility
can be achieved through a learning orientation.
The impact of customer oriented activities on performance is in line with the relationship marketing and resource based
view, suggesting that customer solutions and learning are culture-based, firm-specific, complex capabilities that can lead
to sustainable relationships that will create durable competitive advantages (Day 1994; Hunt and Morgan, 1995).
Relationships are strengthen by the existence of a learning orientation as this ability gives the organization the flexibility
to direct resources to respond more efficiently to changes in market (either opportunities or technology). This is in
alignment with considerations by many scholars (Dickson, 1992;Baker and Sinkula 1999a) that organizational learning is
the key to firm success, the ability to learn faster than competitors and is a source of competitive advantage.
Theoretical implications
Our contribution is threefold for future research. First, our analysis suggests that short term performance is an antecedent
of both customer activities but the influence on customer solutions is more important (ß=0.155vs ß=0.113).
This indicates that the sense of security arising from increased performance (availability of slack) supports a culture of
ideas and creativeness but managers will primarily focus increasing resources on initiatives to support the mainstream
customer. The belief that managers will direct their search to fix a performance problem by searching familiar options first
(Chattopaddhyay et al, 2001) and using existing competencies to provide short-term success (Atuaheme Gima, 2005) is
not fully supported. The finding becomes important as both initiatives have a direct impact on performance. Declines in
performance are likely to reduce the levels of innovativeness and customer oriented solutions thus dec reasing the
investment on the internal abilities to launch new services successfully. This finding is aligned with the threat rigidity
theory where decline is synonymous of shrinking resources, increasing internal rigidities and control in order to achieve
the efficiency and cost reduction needed to put performance on the upward trend again.
Secondly we found a strong link between innovativeness and the ability to think solutions through the customers' lens.
The internal marketing literature (see Gounaris, 2006 for a review) argues that the main source of customer satisfaction is
the staff which in turn must have their needs met before they can properly serve the customers (Rafiq and Ahmed, 2000).
Values of creativity, cooperation and entrepreneurship are l ikely to be employees' motivators. Motivated, committed
employees will contribute to the organization's modus operandis engaging in broader array of innovative activities that can
be used to stay close to the customer that eventually will increase success of new services.
Findings also revealed a strong influence of learning orientation on the levels of innovativeness. A learning orientation
turns information into valuable internal knowledge from many sources: the market, direct experience, or the experiences
of others. Motivated employees are essential to grasp all these sources - an essential aspect of service innovation, as firms
cannot generate insights for new services without it (Sinkula et al., 1997). Learning orientation becomes the facilitator
between innovativeness and a customer oriented focus because it helps the organization to experiment with new ways to
deliver service benefits while discarding limiting beliefs and assumptions about the external environment (Baker and
Sinkula, 1999b) and as such increase its levels of innovativeness.
In all learning oriented firm can be a way to balance the “innovator's dilemma” (Christensen, 1997): short-sighted
customers do not necessarily know what they really want, so the firm will scan and innovate on thei r behalf, rescuing the
organization from the “tyranny of the served market” (Hamel and Prahalad, 1994). On the other hand the firm can “ get

554
closer to the customer” to increase share and fight off competitors (Day, 1994) with the assurance that continuous
questioning, openness of communications and shared vision will not render the “organization myopic” (Hamel and
Prahalad, 1994). Finally the environment plays a decisive role on the effect of the vicious/virtuous circle of performance.
According to many authors environment turbulence moderates the relationship between customer oriented solutions,
innovativeness and learning to performance. For example, Dickson (1992) emphasizes the importance of learning in
transferring information into knowledge, arguing that in dynamic and turbulent markets, the ability to learn more quickly
than competitors may be the only source of sustainable competitive advantage. Kirca et al. (2005) argue that technological
turbulence is likely to diminish the impact of customer oriented solutions on performance because when technology is
changing rapidly, research and development–driven innovation becomes more important to a firm’s performance than
does the customer-focused innovation as answers do not lie in the market (Grewal and Tansuhaj, 2001; Kohli and
Jaworski, 1990).
Our study shows that under high levels of environment perceptions of turbulence innovativeness is more important to
new service success than learning orientation or customer oriented solutions. It seems that when technology and
consumer preferences change quickly, firms need to introduce more creative products to stand out from competition than
just following mainstream customers. Existing customers are not sufficient to develop new service efficiently and a
favorable attitude toward innovation (i.e., new ideas, cooperation and entrepreneurial thinking) may be the key. This is
also a reflection of the nature of innovativeness and learning orientation as both have a strong internal focus (business
processes and self-renewal), whilst customer oriented solutions have a strong external focus. As such, innovativeness and
learning are more suitable to cope with challenges that do not demand a market focus. Stable, predicted environments
achieve maximization of new service success by staying close to mainstream customers rather than prioritizing internal
innovativeness or learning. Why is this?
Learning organizations have the internal competencies to stay tuned with the environment delivering, as a result, new
services more successfully. This is because learning direct influence on new services success but also by the ability to
influence levels of innovativeness which in turn facilitates both the delivery of solutions new to the world and to existing
customers. These organizations because read their reality quickly they can allocate internal competences to cope with the
challenges of the context. This echoes Baker and Sinkula (1999a and 1999b) arguments that on the one hand learning is
expected to impact more on environments where technologies changes render product obsolete more rapidly and on the
other hand they help overcoming the risk of managerial complacency and inertia in stable environments. In an
environment in which no new overt signals from competitors, customers, or channels demand change, improving
performance may depend totally on the motivation and ability of an organization to look proactively at the environment in
a new way and, in essence, to change it themselves to their advantage (Baker and Sinkula, 1999a and 1999b). We expected
turbulence to make managers more attentive to short term performance as the need to learn quicker than competitors
may be the major source of sustainable competitive advantage (Dickson, 1992), market responsiveness is more need in
evolving and changing customer preferences (Jaworski and Kohli 1993) and shorthen product life cycles demand a
constant adaptation on strategy (Lages et al., 2008). Our results confirm these arguments. Worthwhile to note is the
negative coefficient of learning (β=-0.1) in stable environments under conditions of performance decline. When the
sources of information are fully available in the market (due to the stability opportunities and technologies transparent to
all) asking the organization to engage more fully on learning and apply it to current market situations are seen as the
preferred way to fix a performance problem (Cyert and March, 1963).
Managerial Implications
Our results fit with the new paradigm that mass consumption is giving way to the one focused on individuals. Sharp
increases in higher education, standards of living, social complexity, and longevity gave rise to a new desire for individual
needs and wants. The leading edge of consumption is now moving from products and services to relationships enabled by
interactive technologies: Amazon.com, Apple, eBay, and YouTube. The customer value is coming from individual tailor
made services at reduced cost, expressing a convergence of technological capabilities and the values associated with needs
and desires of the customer. A good example is the internal frame of mind of Apple when it understood that iPod users
wanted to be connected to one another. By broadening the scope of its offerings, creating new partnerships and business
models Apple was able to go from a stand-alone iPod to the iPhone delivering building a strong market leader position.
This shows managers need to continuously provide solutions to mainstream customers while introducing new services
that question the existing market logic. The ability to interact with the customer should be directed not only to cultivate

555
brands but also to build strong customer relationships. In times where information sources are accessible to all (customer
forums, blogs, online purchasing and social networks) only the adequate climate can help the organization to translate
these increasing levels of information into relevant customer services. This source of advantage is particularly valuable in
services where technology may provide limited advantage as it eventually will be available to all that can afford it. Positive
customer oriented attitudes, however are considered much more difficult to introduce. Dedicated salesperson, social
entertaining sharing the customer experience are more likely to contribute to building customer–firm relationships then
frequency-driven loyalty programs or product that are of very high quality standards but do not relate to what customers
want (Palmatier et al., 2006). For instance, employees are likely to determine the level of adoption of self-service services,
by explaining and “selling” its advantages to customers. Organizations need employees, market and customer knowledge
to develop successful new products and services assuring for example, they are corrected implemented and executed by
customers building stronger customers ties. Customers should not be regarded as a route to the answer but as critical
market intelligence that can focus the new service team in searching for ingenious solutions. This view is learning oriented
because it encourages the teams to engage in, but not to blindly depend on the knowledge generated through market-
oriented behaviors (Baker and Sinkula, 1999a). Finally our results caution managers that we may be in the presence of a
vicious cycle of performance as investment in core internal values that facilitate innovation and solutions to customers are
being disregarded. Regardless, learning orientation is not affected by short term past performance suggesting that the
construct holds whether performance decreases or increases. The “rigidity” of the construct can be used to break the
vicious cycle of performance by the ability of the organization to question mental models and “theory in use” and in the
process finding novel solutions (e.g. more efficient organizational structures, more open channels of communication,
innovative training techniques) that eventually will generate in new services. Values of innovativeness and customer focus
seem more likely to be at odds with external pressures.
Limitations and future research
While direct effects of both customer solutions and learning orientation were all observed the specific nature of these
effects need to be more specifically explained. For example we can infer but not demonstrate from this research that
different types of learning (generative or adaptive) play a differentiate influence on innovativeness and customer oriented
solutions. Also, we can infer but not confirm that the innovativeness is more likely to produce explorative services and
customer oriented solutions more exploitative solutions. Exploration is defined as the “experimentation with new
alternatives having returns that are uncertain, distant and often negative”, while exploitation is the “refinement and
extension of existing competences, technologies and paradigms” (March, 1991, p.85). Research suggests that firms need to
develop both exploratory and exploitative capabilities to ensure long-term success (Atuahema-Gima, 2005). Although we
can infer support for these arguments we cannot fully demonstrate it.
Our results should be viewed in light of the constraints of the study. For example we speculate that when the environment
is stable managers will see learning orientation as a solution to fix a performance decline. The numbers in our sample
failed to support this finding and its implications on performance. Furthermore we can only take our group analysis as
indicative as some of the effects are not supported and this could be due to the sample size. Future studies could look at
validating these findings by enlarging the sample.
Although we used a longitudinal study the time span used may have not been enough to reflect the full effects from short
term perform on one hand and to understand its full effect on performance on the other. Future research is encouraged to
explore the impact of long term objective performance measures on the constructs at study: innovativeness is likely to
produce effects on a longer time span than customer oriented solutions (Lages et al., 2008) while learning should prove to
be an important orientation for sustained growth. Our measures of new service success are self-explicated as opposed to
objective measures used to evaluate performance. Future research should also investigate other objective measures such
as return on investment, gross profit or more market oriented measure such as market share, customer satisfactions or
providing customer benefits. In addition, we sampled only one industry in one context and it may be interesting to explore
these dynamics in other industries and contexts.
Other moderating effects should be tested. Critical to innovation and learning are some internal conditions such as the risk
profile of managers, the urgency to react to the short term performance due to shareholders pressures , annual bonus or
even the competition. For example: are competitors incursions in the market demanding more innovativeness or customer
oriented solutions? Do they have different bearings to new service success? What type of learning could help in
neutralizing competitor's moves? Future studies could evaluate the influence of such characteristics.
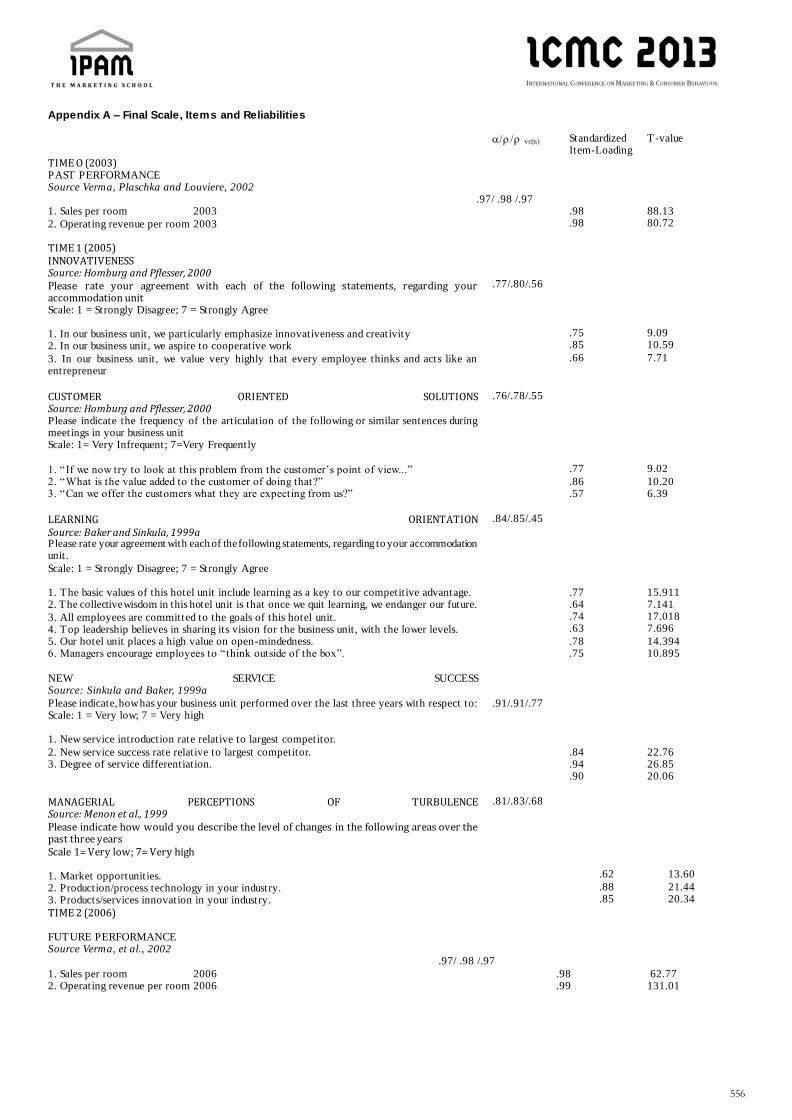
556
Appendix A – Final Scale, Items and Reliabilities
vc(n) Standardized Item-Loading
T-value
TIME O (2003) PAST PERFORMANCE Source Verma, Plaschka and Louviere, 2002 1. Sales per room 2003
2. Operating revenue per room 2003
.97/ .98 /.97
.98 .98
88.13 80.72
TIME 1 (2005) INNOVATIVENESS Source: Homburg and Pflesser, 2000 Please rate your agreement with each of the following statements, regarding your accommodation unit Scale: 1 = Strongly Disagree; 7 = Strongly Agree 1. In our business unit, we particularly emphasize innovativeness and creativity 2. In our business unit, we aspire to cooperative work
3. In our business unit, we value very highly that every employee thinks and acts like an entrepreneur
.77/.80/.56
.75 .85
.66
9.09 10.59
7.71
CUSTOMER ORIENTED SOLUTIONS Source: Homburg and Pflesser, 2000 Please indicate the frequency of the articulation of the following or similar sentences during meetings in your business unit Scale: 1= Very Infrequent; 7=Very Frequently
1. “If we now try to look at this problem from the customer’s point of view...” 2. “What is the value added to the customer of doing that?” 3. “Can we offer the customers what they are expecting from us?”
.76/.78/.55
.77
.86
.57
9.02
10.20 6.39
LEARNING ORIENTATION Source: Baker and Sinkula, 1999a Please rate your agreement with each of the following statements, regarding to your accommodation unit.
Scale: 1 = Strongly Disagree; 7 = Strongly Agree 1. The basic values of this hotel unit include learning as a key to our competitive advantage. 2. The collective wisdom in this hotel unit is that once we quit learning, we endanger our future.
3. All employees are committed to the goals of this hotel unit. 4. Top leadership believes in sharing its vision for the business unit, with the lower levels. 5. Our hotel unit places a high value on open-mindedness. 6. Managers encourage employees to “ think outside of the box”.
.84/.85/.45
.77
.64
.74
.63
.78
.75
15.911 7.141 17.018 7.696
14.394 10.895
NEW SERVICE SUCCESS
Source: Sinkula and Baker, 1999a
Please indicate, how has your business unit performed over the last three years with respect to: Scale: 1 = Very low; 7 = Very high 1. New service introduction rate relative to largest competitor.
2. New service success rate relative to largest competitor. 3. Degree of service differentiation.
.91/.91/.77
.84
.94
.90
22.76 26.85 20.06
MANAGERIAL PERCEPTIONS OF TURBULENCE Source: Menon et al., 1999 Please indicate how would you describe the level of changes in the following areas over the past three years Scale 1= Very low; 7= Very high
1. Market opportunities. 2. Production/process technology in your industry. 3. Products/services innovation in your industry.
.81/.83/.68
.62
.88 .85
13.60
21.44 20.34
TIME 2 (2006) FUTURE PERFORMANCE Source Verma, et al., 2002
1. Sales per room 2006 2. Operating revenue per room 2006
.97/ .98 /.97
.98 .99
62.77 131.01

557
References
Achrol. Ravi S. (1997), Changes in the Theory of Interorganizational Relations in Marketing: Toward a Network Paradigm.
Journal of the Academy of Marketing Science. 25(1), 56-71.
Amabile, T.M.; Conti, R.,Coon: H., Lazenby, J. & Herron, M. (1996). Assessing the Work Environment for Creativity. Academy
of Management Journal, 39 (5), 1154–84.
Amit, R. & Schoemaker, P.H. (1993). Strategic Assets and Organizational Rent,” Strategic Management Journal, 14
(January), 33–46.
Andrews, J. & Smith, D.C. (1996). In Search of the Marketing Imagination: Factors Affecting the Creativity of Marketing
Programs for Mature Products. Journal of Marketing Research, 33 (May), 174-187.
Argyris, C. e D.A. Schön, 1978. Organizational Learning: A Theory of Action Perspective (Reading, MA: Addison-Wesley).
Armstrong, J.S., & Overton, T.S. (1977). Estimating non response bias in mail surveys. Journal of Marketing Research,
16(Aug), 396-400.
Atuahene-Gima, K. (2005). Resolving the capability–rigidity paradox in new product innovation. Journal of Marketing,
69(October), 61–83.
Baker, W. E., & Sinkula, J. M. (1999a). The synergistic effect of market orientation and learning orientation on
organizational performance. Journal of the Academy of Marketing Science, 27 (4), 411-427.
Baker, W. E., & Sinkula, J. M. (1999b). Learning orientation, market orientation, and innovation: integrating and extending
models of organisational performance. Journal of Market Focused Management, 4, 295-308.
Baker, W. E., & Sinkula, J. M. (2007). Does Market Orientation Facilitate Balanced Innovation Programs? An Organizational
Learning. Journal of Product Innovation Management, 24, 316-334.
Bagozzi, R.P., 1980. Causal models in marketing (John Wiley, New York, USA).
Billings, R.S., Milburn, T.W., & Schaalman, M.L. (1980). A model of crisis perception: A theoretical and empirical analysis.
Administrative Science Quarterly, 25: 300–316.
Barney, J. B. (1991). Firm Resources and Sustained Competitive Advantage,” Journal of Management, 17 (1), 99–120.
Biyalogorsky, E.Boulding, W.& Staelin, R. (2006) Stuck in the Past:Why Managers Persist with New Product Failures
Journal of Marketing , 70 (April), 108–121.
Bourgeois, L.J. (1981). On the measurement of organizational slack. Academy Management Review;6, 29–39.
Bowen, F.; Rostami, M.; Steel, P. (2009). Timing is everything: A meta-analysis of the relationships between organizational
performance and innovation Journal of Business Research In press.
Busenitz, L.W. & Barney, J. B. (1997). Differences between entrepreneurs and managers in large organizations: Biases and
heuristics in strategic decision making Journal of Business Venturing, 12, 9-30.
Cadogan, J.W., Diamantopoulos, A. & Siguaw, J.A:, (2002). Export Market-Oriented Activities: Their Antecedents and
Performance Consequences. Journal of International Business Studies, 33 (3), 615-626.
Chattopadhyay, P., Glick, W.H., & Huber, G.P., (2001). Organizational actions in response to threats and opportunities.
Academy of Management Journal, 44: 937-955.
Chin, W.W. (1998). The partial least squares approach for structural equation modeling. In Marcoulides, George A. (Ed).
Modern Methods for Business Research. Lawrence Erlbaum: Mahwah, NJ, 295-336.
Christensen, C. (1997). The Innovator’s Dilemma. Boston: Harvard Business School Press.
Crosby, L. A., Evans, K.R. & Cowles, D. (1990). Relationship Quality in Services Selling: An Interpersonal Influence
Perspective, Journal of Marketing, 54 (July), 68–81.
Cyert, R.M., & March, J.G. (1963). A behavioral theory of the firm. Englewood Cliffs, NJ: Prentice Hall.
Day, G.S. (1991). Learning about markets, Jreport Number 91-117, Marketing Science Institute, Cambridge MA.

558
Day, G.S. (1994). The capabilities of market-driven organization, Journal of Marketing, 58 (October), 37-52.
Deshpande, R., Farley, J.U. & Webster, F.E. (1993). Corporate Culture, Customer O rientation and Innovativeness in Japanese
firms: a Quadrad analysis. Journal of Marketing, 57 (January), 23-27.
Dickson, P.R., 1992, Toward a general theory of competitive rationality, Journal of Marketing, 56(January), 69-83.
Douglas, S.P. & Craig, C.S. (1983). International Marketing Research (2nd Ed., Englewood Cliffs, NJ: Prentice Hall
International Editions).
Doyle, P., Saunders, J., & Wong V. (1992). Competition in global markets: A case study of American and Japanese
competition in the British market. Journal of International Business Studies, 23(3): 419–442.
Ferrier, W. J. (2001). Navigating the competitive landscape: The drivers and consequences of competitive aggressiveness.
Academy of Management Journal, 44(4): 858–877.
Fornell, C. & Larcker, D. (1981). Evaluating structural equation models with unobservable variables and measurement
error. Journal of Marketing Research, 18, 39-50.
Fredrickson, J X. (1985). Effects of Decision Motive an organizational performance level on Strategic Decision Process es
American Management Review,28 (4), 821-843.
Ganesan, S. (1994). Determinants of Long-Term Orientation in Buyer–Seller Relationships. Journal of Marketing, 58 (April),
1–19.
Gatignon,H., & Xuereb, J.M., (1997). Strategic Orientation of the Firm and new Product performance. Journal of Marketing
Research, 34 (1), 77-90
Gounaris, S.O (2006). Internal-market orientation and its measurement. Journal of Business Research, 59 (4), 432-448.
Greve, H. R. (1998). Performance, aspirations, and risky organizational change. Administrative Science Quarterly, 43(1):
58–86.
Grewal, R., Tansuhaj, P. (2001). Building Organizational Capabilities for Managing Economic Crisis: The role of market
Orientation and Strategic Flexibility Journal of Marketing 65 (April) , 45-62.
Hamel G & Prahalad, C.K. (1994).Competing for the future. Boston’ Harvard Business School Press.
Han JK, Kim N & Srivastava, RK. (1998) Market orientation and organizational performance: is innovation a missing link?
Journal of Marketing; 62 (October), 30 –45.
Hunt, S.D. & Morgan, R. M. (1995). The Comparative Advantage theory of Competition. Journal of Marketing, 59 (April) 1-
15.
Hult, G. T., & Ketchen, J. D. (2001). Does Market Orientation Matter? A test of the relationship between position advantages
and performance. Strategic Management Journal. 22 (9), 899-906.
Hult, G., Hurley, R & Knight, G., (2004). Innovativeness: its antecedents and impact on business performance. Industrial
Marketing Management, 33, 429–438.
Hurley, R.F. & Hult, G.T.M. (1998): Innovation, Market Orientation, and Organizational Learning: An Integration and
Empirical Examination. Journal of Marketing, 62 (July), 42 -54.
Homburg, C. & Pflesser, C. (2000). A multiple-layer model of market-oriented organizational culture: measurement issues
and performance outcomes, Journal of Marketing Research XXXVII (November), 449-62.
Homburg, C., H. Krohmer e J.P. Workman Jr., (2004), A strategy implementation perspective of market orientation, Journal
of Business Research 57(12), 1331-1340.
Im, S. & Workman Jr., J.P. (2004). Market Orientation, Creativity, and New Product Performance in High-Technology Firms.
Journal of Marketing, 68 (4), 114-132.
Jaworski, B.J. e A.K. Kohli, 1993, Market orientation: antecedents and consequences, Journal of Marketing 57(July), 53-70.
Jöreskog, K. G. & Sörbom (1993). LISREL 8: Structural equation modelling with the SIMPLIS command language. Scientific
Software International, Inc., Chicago, IL.
559
Kerin, A. K., Varadarajan, P.R., Peterson, R.A. (1992) First-Mover Advantage: a synthesis, conceptual Framework and
research Propositions. Journal of Marketing 56 (October) 33-52.
Kirca,A.H.,Jayachandran, S., Bearden, W. O. (2005)- Market Orientation: A Meta-Analytic Review and Assessment of Its
Antecedents and Impact on Performance Journal of Marketing 60 (April) 24-41.
Kohli, A.K. & Jaworski, B.J (1990). Market orientation: the construct, research propositions, and managerial implications,
Journal of Marketing 54(April), 1-18.
Lant, T. K., & Mezias, S. J. (1992). An organizational learning model of convergence and reorientation. Organization Science,
3(1): 47–71.
Lant, T.K., Milliken, F.J. & Batra, B. (1992). The role of managerial learning and interpretation in strategic persistence and
reorientation An empirical exploration. Strategic Management Journal, 13: 585-608.
Lages, L. F., & Montgomery, D. B. (2004). Export performance as an antecedent of export commitment and marketing
strategy adaptation: Evidence from small and medium sized exporters. European Journal of Marketing, 38(9/10):
1186–1214.
Lages, L.F., Jap, S.D.& Griffith, D. (2008). The Role of Past Performance in Export Ventures: A Short-Term Reactive
Approach. Journal of International Business Studies, 39 (2), 304–25.
Lawton L, Parasuraman A. (1980). The impact of the marketing concept on new product planning. Journal of
Marketing;44:19 – 25.
Levitt, B., & March, J.C (1988). Organizational learning. In B.Bacharach (Ed.), Annual review of psychology, Vol. 14: 319–
340. Palo Alto, CA: Annual Reviews.
Lukas ,BA & Ferrell, OC. (2000). The effect of market orientation on product innovation. Journal Academy Marketing
Science; 28 (2), 239–47.
Lusch. Robert F. and James R. Brown (1996). Interdependency Contracting, and Relational Behaviors in Markeling
Channels. Journal of Marketing. 60 (October). 19-38.
March, J. G. (1991). Exploration and Exploitation in Organizational Learning. Organization Science, 2(February),71–87.
Matsuo, M. (2006). Customer orientation, conflict and innovativeness in Japanese sales departments. Journal of Business
Research, 59 (2), 242-250
Matsnuo, M. (2006). Customer orientation, conflict, and innovativeness in Japanese sales departments. Journal Business
Research; 59, 242–50.
Matsuno, K., Mentzer, J.T. & Ozsomer, A. (2002). The Effects of Entrepreneurial Proclivity and Market Orientation on
Business performance. Journal of Marketing, 66 (July), 18-32.
McNaughton, R. B., Osborne, P., & Imrie, B. C. (2002). Market oriented value creation in service firms. European Journal of
Marketing, 36 (9/10), 990– 1002.
Miller, D. (1993). The architecture of simplicity. Academy of Management Review, 18(1): 116–138.
Miller,D., & Chen, M.J. (1994). Sources and Consequences of Competitive Inertia: A Study of the U.S. Airline Industry,
Administrative Science Quarterly, 39: 1-23.
Menon, A., Varadarajan PR (1992). A model of marketing knowledge within the firm. Journal of Marketing, 56 (October)
53-71.
Menon, A., Bhatadwaj, S., Adidam, P. & Edison, S. (1999). Antecedents and Consequences of Marketing strategy Making: A
Model and a Test, Journal of Marketing, 63, (April), 18-40.
Mone, M., McKinley, W., & Barker, V. (1998). Organizational decline and innovation: A contingency framework. Academy of
Management Review, 23 (1), 115-132.
Morgan, R. M. and Hunt, S. D. (1994). The Commitment–Trust Theory of Relationship Marketing, Journal of Marketing, 58
(July), 20–38.

560
Narver, J.C. & Slater, S.F. (1990). The effects of a market orientation on business profitability. Journal Of Marketing 54 20-
35.
Nohria, N. & Gulati, R. (1996). Is slack good or bad for innovation? Academy of Management Journal 39 (5), 1245-1264.
OECD 2010. OECD in figures. Statistics on the member countries. Available from: http://www.oecd.org.
Palmatier, R.W., Dant, R.P. & Evans, R. K. (2006). Factors Influencing the Effectiveness of Relationship Marketing: A Meta-
Analysis Journal of Marketing, 70 (July), 136–53.
Ringle, C. M., Wende, S. & Will, A. (2005). SmartPLS 2.0 (beta). Hamburg: www.smartpls.de.
Rafiq, M. & Ahmed, P.K. 2000. Advances in the internal marketing concept: definition synthesis and extensions Journal of
Services Marketing, 14 (6) ,449-462.
Ritter, T. & Gemunden, H.G. 2004. The impact of of a company´s business strategy on its technological competence,
network competence and innovation success. Journal of Business Research 57 548-56.
Scott, S.G. & Bruce ,R.A. 1994. Determinants of innovative behavior: a path model of individual innovation in the
workplace. Academy of Management Journal ;37(3) 580– 607.
Sharma, S., Durand, R. M., & Gur-Arie, O. 1981. Identification and analysis of moderator variables. Journal of Marketing
Research, 18(3): 291–300.
Sheth, J.N., Sisodoa, R.S. & Sharma (2000). Antecedents and consequences of customer-centric marketing. Journal of
Academy of Management Science, 28 (1) 55-66.
Siguaw, J.A., Simpson, P.M. & Baker, T.L. (1998). Effects of Supplier Market Orientation on Distributor Market Orientation
and the Channel Relationship: The Distributor Perspective. Journal of Marketing, 62 (July), 99–111.
Siguaw, J.A., Simpson, P.M. & Enz, C.A., (2006). Conceptualizing innovation orientation: a framework for study and
integration of innovation research Journal of Product Innovation Management 23 (6), 556–574.
Simon, M. & Houghton, S. (2003). The Relationship between Overconfidence and the introduction of Risky products:
Evidence from a Field Study Academy of Management Journal, 46 (2) 139-149
Simpson, P.M., Siguaw, J.A., Enz, C.A., (2006). Innovation orientation outcomes: The good and the bad. Journal of Business
Research 59, 1133-1141.
Singh, J. (2000). Performance productivity and quality of frontline employees in service organizations. Journal of
Marketing, 64(2), 15–34.
Sinkula, J.M., 1994, Market information processing and organizational learning, Journal of Marketing 58(January), 35-45.
Sinkula, J. M., Baker, W. E., & Noordewier (1997). A framework for market-based organisational learning: linking values,
knowledge, and behaviour. Journal of the Academy of Marketing Science, 25 (4), 305-318.
Slater, S.F. e J.C. Narver, 1995, Market orientation and the learning organization, Journal of Marketing 59(July), 63-74.
Staw, B.M., Sandelands, L.E., & Dutton, J.E. (1981). Threat-rigidity effects in organizational behavior: A multi-level analysis.
Administrative Science Quarterly, 26: 501–524.
Teece, D.J., Pisano, G., Shuen, A., (1997). Dynamic capabilities and strategic management. Strategic Management Journal 18
(7), 509–533.
Walker, O. e R. Ruekert, 1987, Marketing’s role in the implementation of business strategies: a critical review and
conceptual framework, Journal of Marketing 51(July), 15-33.
WTTC, 2010 Economic Impact Data and Forecasts- World – Key facts at a Glance. Available from:
http://www.wttc.org/eng/Tourism_Research/.

561
Individual and Social Marketing in Cultural
Routes Operation Cultural routes, cooperation, social marketing in tourism, stakeholder management
István Piskóti, University of Miskolc, [email protected]
Katalin Nagy, University of Miskolc, [email protected]
Abstract
According to modern trends, tourism offer becomes more and more diversified. The most important feature of
tourism products is complexity, and this, together with the experience-centric demands, sets the tourism enterprises
before new challenges, highlighting the necessity not only for product, but process and organisational innovations, too.
The aim of our research is to study how different forms and models of cooperation, and the consequent joint marketing
activities can effectively contribute to successful tourism innovations, product development and management, analysing
the examples of a specific field of tourism.
Cultural routes have a special, determining role among tourism products. We have analysed the possible problems
and means of solutions arising from complexity – occurring in the course of development and realization – and also the
criteria of marketability and competitiveness. Our starting hypothesis is that the more complex a tourism product is, the
more broader and well-planned co-operation, that is the so-called stakeholder-management is necessary between the
enterprises and community (non-profit) tourism organisations.
We have carried out our research within and after a Hungarian – Slovakian project aiming to develop joint tourism
packages along thematic routes. We have examined the co-operational abilities and intensity of the tourism actors in both
countries. Solutions mixing business and social marketing techniques equally appeared in the development and
management of cultural routes as complex tourism products, but, at the same time, they have not formed an efficient co -
operational system.
Our tested, competence-marketing based co-operational model, introduces the determining actors of heritage-
based cultural routes, emphasizing the importance of the existence of an adequate coordinating-managing marketing
organization. According to our results, the absence of such an organization hinders the successful operation of cultural
routes, which was confirmed by the comparison of an effectual Swiss example and a similar Hungarian tourism product
initiation.
“A cultural route is neither invented nor designed: it is discovered.”
(Martorell, 2003:1)
1. INTRODUCTION
Tourism is one of the leading and most dynamic fields in global economy, even in spite of the protraction of the
economical crisis. The number of international tourist arrivals grew by 4 % in 2012 (compared to 2011), and reached the
magic 1 billion for the first time. A slower, about 3-4 % growth is forecasted for 2013, in line with the UNWTO’s long-term
outlook to 2030, which counts with an average growth of 3,8 % per year between 2010 and 2020. Europe keeps its leading
position, with a 3 % growth, in spite of the economical pressure, and within the continent, the destinations of Central and
Eastern Europe could reach the highest result with 8 % growth (UNWTO 2013). According to modern trends, tourism of fer
becomes more and more diversified, sometimes with quite surprising combinations by mixing elements from culture,
history, industry or other economic fields. This is a natural consequence of the demand for innovations, being a
determining factor in competitiveness, and also of other reasons: seeking novelty; tourism is really experiment-centric;

562
and furthermore – partly also as a result of economical difficulties – the tendency of travels to be more in number but
shorter in duration, consumers are more price-value conscious and quality became an important factor in decisions.
The most important feature of tourism products is complexity – that is they have to include all service elements to
satisfy the more and more refined consumer needs (Lagrosen 2005). The nature of tourism products is widely researched
(Medlik & Middleton, 1973, Levitt 1981, Smith 1994, Middleton & Clarke, 2001, Gyöngyössy -Lissák 2003, Lengyel 2004,
Michalkó 2012), the characteristics of complexity and being experience-centric can be found in all models, emphasizing
the inseparability, i.e. the necessity of consumer involvement. These represent a main line in our research of cultural
routes.
There is a rich literature of heritage tourism, and the questions of heritage (Richards 2003, Nuryanti 1996, Hall-
McArtur 1998, Tunbridge and Ashworth 1996, Swarbrook 1994, Nurick 2000, Silberberg 1995, Fladmark 1994, Puczkó -
Rácz 2000). According to Nuryanti (1996) heritage is part of the cultural traditions of a society, and also part of a
community’s identity. It is such a past value which is considered to be worthy to preserve and pass over to the next
generation (Hall-McArthur 1998). Tunbridge and Ashworth (1996) say that there are five main aspects in the broader
sense of heritage: (1) any physical remains of the past, (2) individual and collective memories, intangible elements of the
past, (3) results of cultural and artistic creativity, (4) natural environment, and (5) the so-called heritage industry, i.e. the
different economic activities built on these.
According to Swarbrooke’s (1994) definition, heritage tourism is based on heritage, which is the central element of
the product on the one hand, and the main motivation for tourists on the other. We can say, in general, that it is a type of
tourism directed towards the acknowledgement of a destination’s cultural heritage. According to Fladmark (1994),
cultural heritage tourism means the identification, management and preservation of heritage, and, furthermore, helps to
understand tourism’s effects on local communities and regions, increases the economical and social benefits, and provides
financial resources for preservation, marketing and promotion.
The other direction to our questions is the field of tourism innovations. No doubt, innovation is the motor of
growth and competitiveness in the global world of tourism. We know from Schumpeter’s typology that all five types can be
found in tourism as well: (1) creation of new products or services, (2) new production processes, (3) new markets, (4)
new suppliers and (5) changed organisation or management systems. On the other hand, in practice, we can meet the lack
of innovation in many parts of the tourism industry, mainly because it is dominated by small and medium size enterprises,
or even private persons, who do not have their own research and development activities, like in bigger companies. Thus,
cooperation is the only way to increase the competitiveness of the tourism industry.
Regarding tourism, the most well-known typology has been given by Weiermair, stating that the main points of
tourism innovations are to give new target-tool combinations, new problem solutions – the possible forms are: (1) organic
innovations (based on existing competences, relations and networks), (2) niche innovations (new, concentrated forms of
existing competences), (3) organisational innovations (new co-operations without existing competences), and (4)
revolutionary innovations (new competences on existing relations) (Weiermair 2004):
As new product innovations can be easily and often adapted by others (though in cultural tourism, the uniqueness
of heritage elements is a barrier in this), process innovations, quality improvements (resulting in the increase of
uniqueness) and market-based innovations are becoming more and more essential. Innovations in tourism cannot be
narrowed for individual innovative performances, but they are results of some kind of cooperation, where we can find the
entrepreneurial level (stakeholders, employees, consumers, companies) and the community level (tourism offices,
marketing agencies, national local and regional municipalities, clusters and destination management agencies) as well. The
latter determine the economical, social, environmental, legal, organisational and other elements which influence the
development of tourism, and, at the same time, serve as its environment. Their management has the greatest influence on
the innovation process, which is very similar to the management of clusters. When regarding the experiment-centric
feature of tourism we can accept that innovation is rather the result of a procedure than the output of the creativity of
individuals.
Innovation in tourism is no longer a question of a giant leap forward – it is a series of small steps (evolution) that
lead to incremental growth – it was one of the main statements of the Conference of OECD in 2003, in Lugano.
We can approach innovations from several points of view: on market, destination or resource basis. In this study
we do not wish to analyse the wide literature and models of tourism innovations. It is the resource-based, or competence-

563
based approach which can be best applied to our case, i.e. cultural routes, where human, natural and cultural resources are
all have to be utilized (Figure 1):
Figure 1. Innovation approaches
Source: Innovation in Tourism (Koch, 2004, in Keller 2005)
2. OBJECTIVES
The aim of our research is to study how different forms and models of cooperation, and the consequent joint
marketing activities can effectively contribute to successful tourism innovations, product development and management,
analysing the examples of a specific field of tourism, i.e. cultural routes.
Cultural routes have a special, determining role among tourism products, especially those built on heritage
elements. According to the general concept, cultural routes are such thematic roads where the central theme is some kind
of cultural value, heritage element, and cultural attractions have dominant role (Dávid-Jancsik-Rátz 2007). On the
contrary, our opinion is that it is necessary to emphasize a stronger borderline between the two concepts – thematic roads
and cultural routes – and only the added value arising from heritage and culture can fulfil this expectation, and can serve
as the basis for further requirements of development.
Cultural routes can provide possibility for visitors to understand and appreciate the given cultural relations. This
intention has luckily met the tourists’ demands for diversified products. Several countries and international organisations
(e.g. UNWTO, UNESCO, ICOMOS, and EU) initiated such cooperations. “Route-based” tourism is a heritage and tourism
development method serving not only tourism but also social and economical improvements. At the same time, a third
concept also appears in literature, i.e. heritage trails, which have significant differences compared to cultural routes, as it is
summarized in Table 1 (Chairatudomkul 2008):
Cultural routes Heritage trails
Characteristics
Existing travelling routes
functioned for religious,
commercial or military
purposes through history.
Created for tourism purposes,
connecting nodal attractions,
in suitable distance and
supported by services. There
are no necessary links to
history.
Networks Cooperation in scientific
research.
Cooperation with tourism
organisations for promotion,
without real scientific basis.
Market based approach
Destination
based
approach
Resource
based approach
Creative forces of the market: looking at
tourism from demand side
Independent and routinized
entrepreneurship:
create added value to the customer
Endogenous growth potential: Importance of attractions; new
packages of services, processes and marketing organisations

564
Targets
Cultural, economical and
social aspects; fostering
interest and solidarity for
heritage of other people and
communities.
Economical benefits and
tourism effects; social,
community and cultural
benefits are secondary.
Authenticity
Collection of heritage items,
which were directly
connected through history,
for a continuous cultural
exchange.
There are no heritage items
resulting from cultural
exchanges over quite a long
period in history.
Importance
Important considering
relations and influences
between two or more cultural
communities (groups).
Common roots are
determining in understanding
of cultural heritage.
Experiences and enjoyment
are in focus – visitors can
increase the sense of local
proudness.
Table 1. Conceptual differences between cultural routes and heritage trails
Source: Adapted from Martorell (2003), Chairatudomkul 2008:28
It is important to make these differences clear, because we will see in the third chapter that during the
implementation of the project being presented, these meaningful differences have not been taken into consideration.
Unfortunately, it is still quite common in Hungary....
Heritage-based cultural routes, compared to the traditional product development, have to meet several other
social and community expectations as well. We have started from the four steps of successful cultural heritage tourism
development, namely (1) access the potential, (2) planning and organizing, (3) preparing for visitors, preservation and
management, and (4) marketing (www.culturalheritagetourism.org). We have analysed the possible problems and means
of solutions arising from complexity – occurring in the course of development and realization – and also the criteria of
marketability and competitiveness. The success factors of heritage tourism projects are the following: (1) access and
inclusion (access, inclusion, education, learning, ICT); (2) sustainability (regeneration, conservation, product renewal,
financial resources, multiple uses, return visits); (3) catalysis (cooperation, value for money, return on investment,
structured and multiple agendas); and (4) competitiveness (quality and standards, benchmarking, marketing,
management, visitor satisfaction) (Nurick 2000). All these elements have to be built into the proper phases of tourism
product development, too.
3. METHODOLOGY
Regarding the 7P s of individual tourism marketing and the 2Cs of community marketing, we consider cooperation
to be one of the most important endogenous attribute. Our starting hypothesis is that the more complex a tourism product
is, the more broader and well-planned co-operation, that is the so-called stakeholder-management is necessary between
the enterprises and community (non-profit) tourism organisations (Ruckh-Noll-Bornholdt 2006).
We have carried out our first research during and after a project aiming to develop joint tourism packages on
thematic routes, in the framework of the Hungary–Slovakia Cross-border Cooperation Program 2007-2013. We have used
mainly quantitative methods, structured questionnaire survey among tourism enterprises, organisations, and tourism and
marketing experts, plus interviews. We have examined the co-operational abilities and intensity of the tourism actors of
both countries, exploring significant differences regarding both objectives of co-operation and groups of those concerned.
We have found that 65 % of the Hungarian and 40 % of the Slovakian tourism enterprises have some kind of
existing partnerships. Concerning future cooperations, the first four most important organisations are, in case of
Hungarians, tourism information centres (91 %), regional tourism marketing organisations (70 %), accommodations (65
%) and restaurants (61 %). In case of Slovakians, tourism civil organisations (70 %), travel agencies (70 %), tourism
information centres (50 %) and regional tourism marketing organisations (50 %) reached the first positions (Figure 2).

565
We have asked the experts about the importance of the same elements. As the number of the participants of the
survey has been much less than in the previous case, we have ranked the elements. The most important ones, in a 5 point
scale, are the following: (1) attractions fitting into the route [it is quite evident], (2) other spare-time possibilities, (3) tour
operators, (4) destination management agencies, (5) tourism information centres, plus travel agencies, accommodations
and restaurants with the same importance (Figure 3).
The results have made it clear that there are essential shortcomings in the tourism entrepreneurs’ co-operational
and product development knowledge, especially in comparison with the experts of the theme. Our entrepreneurs are now
“learning” that – besides the individual, mainly material interests – community interests and organisational relations are
also important. They consider new product development as the main tool in renewal; they understand the importanc e of
marketing and rely more and more on organisations carrying out community marketing activities – but, at the same time,
sale does not seem to be such determinant (see the relatively low position of tour operators and travel agencies) . The co-
operations are not conscious, rather spontaneous, built on a given opportunity . This is the reflection of the fact that there
are no traditions of destination management agencies – in Hungary, their establishment has started only in the past 3-4
years, the process is quite difficult, pressed mainly by the municipalities, and the engagement of entrepreneurs is slow. In
Slovakia, this process is even slower, the system is dominated either by clearly non-profit or business organisations.
Figure 2. Cooperation partners according to importance, entrepreneurial survey, arranged by Hungarian answers
Source: compiled by the authors

566
Figure 3. Ranking of cooperation partners, expert survey
Source: compiled by the authors
It is reflected in the experts’ answers that product formation has to focus on complexity, both individual and social
marketing, individual and community interests are equally important in cooperation, they can contribute to
competitiveness by strengthening each other. However, the fact that cultural routes are much more than simply thematic
routes is not emphasized properly; scientific background and the participation of experts can substantiate successful
operation and long-term quality guarantees. In so far as we possess theoretical knowledge, its practical translation and
attitude formation of entrepreneurs in practice cannot be considered effectual .
Concerning cooperation targets, Hungarians considered the following element the most important: reaching new
guests (74 %), new promotion channels (60 %) and more successful low seasons (56 %). Slovakians ranked new
promotion channels (90 %), more successful low seasons (80 %), reaching new guests and obtaining professional
information (70 %) in the first three places (Figure 4). Similarly like in the previous case, we have ranked these factors by
the expert survey, and the first positions are occupied by the following elements: reaching new guests , enlargement of
existing markets, reaching new markets, better market positions, and more successful low seasons, reduction of the effects
of seasonality (Figure 5). Economical factors (like e.g. reduction of costs), or professional issues (like marketing and
cooperation) have significantly lower assessment.

567
Figure 4. Main targets of cooperation, entrepreneurial survey, arranged by the Hungarian answers
Source: compiled by the authors
Figure 5. Ranking of the targets of cooperation, expert survey
Source: compiled by the authors
The correspondence to the international trends of competitiveness and complexity is reflected again in the
experts’ answers, while the opinion of the experiential actors of tourism is dominated by individual, direct market efforts

568
and market interests. However, the Slovakian entrepreneurs’ demand for professional information, knowledge and know-
how is surprisingly outstanding, forecasting another path for development being different from the Hungarian one.
The results of our research have supported that, in spite of the striking differences in behaviour and attitudes –
arising from the different levels of tourism organisations and management in the two countries – organisational co-
operations get considerable emphasis in tourism product development and management. Solutions mixing business and
social marketing techniques equally appeared in the development and management of cultural routes as complex tourism
products, but, at the same time, they have not formed an efficient co-operational system. International theories and models
could have not been successfully adapted, the intentions have stayed on the level of elaborating new offers, and only
entrepreneurs have been addressed; the aspects of community interests, building on adequate background and complexity
have been under-valued and left out of consideration. As a consequence, the new products (offers) have not been
introduced to the market, the questions of organised sale were not solved, and there is still not a responsible organisation,
thus quality control and monitoring is still lacking. On the basis of our analyses and results we can find that significant co-
operational and co-ordination deficit hinders the successful establishment and operation of cultural routes. At the same
time, significant improvement can be reached by applying the planning and organizational solutions, combined tools of
social marketing – as through the complexity and value-principled feature of these products, regarding the societal task of
the management of heritage, the analogy is obvious. Our related researches have displayed that the solution is in the
integrated strategic approach, which is the co-operation of the different involved actors, entrepreneurs, municipalities,
professional and civil organisations. We have to solve the tasks of stakeholder management based on the establishment of
a peculiar value-community, and integrated marketing combining certain competences.
4. CASE STUDY
Here we present – with regard to the above results – a successful example, the system of the Cultural Routes of
Switzerland, and draw a parallel with a similar Hungarian cultural route initiation, where the tools and methods of social
marketing could be of great help.
In Switzerland, during the great infrastructure development programs of the 1970s it was discovered that the old
traditional, mainly pilgrimage, commercial and military roads may completely disappear. Thus, acknowledging the value
and its importance, the federal state asked an interdisciplinary expert team of the University of Bern to map these old
roads. The Inventory of Historical Traffic Routes in Switzerland (IVS) has been compiled between 19ö84-2003, after 20
years work of 30 persons, with 50 million CHF federal investments, containing detailed maps, desc riptions, historical and
scientific information. The inventory rests upon Article 5 of the Swiss Federal Law for the Protection of Nature and
Cultural Heritage. After the work has been completed, a national – regional – local classification has been set up. Originally,
IVS has been created as a planning tool. At the same time, even during the production of the IVS it became obvious that
historic routes with their attractive features, natural environment and cultural sights , have a great potential for both
tourism and regional development. This is how the project Cultural Routes of Switzerland has been started …
After finishing the inventory in 2003, the expert team stayed together and established the organisation named
ViaStoria, with the purpose of preserving the considerable amount of specialised knowledge and continuing to work on the
exploration, renovation and appropriate use of historic traffic routes. The Cultural Routes of Switzerland project has three
main goals:
offering a new holiday experience, carefree hiking along historic routes,
using the academic research results (IVS) as a basis for new tourist packages, and
linking regional and local tourism initiatives with providers of local agricultural production and helping to create
more added values in the regions.
The program is based on the network of 12 Via routes. Each of them represents a special part of the Swiss culture and
history. The inclusion of agriculture and handicrafts can further emphasize the historical traditions and commercial past of
the certain regions.
However, the project has not been finished at this point. The experts have chosen 300 more routes of local and
regional importance, and the tasks of tourism product and offer formation is still going on. Thus the cooperation between
national and cantonal level will enhance, and a complex national network will be established. It is really important to
emphasize that each route has its own responsible organisation, the coordinator and manager of the local/regional
initiatives, carrying out the operation of the tourism offer. It is also possible to book packages in case of all 12 national

569
routes. As the Cultural Routes of Switzerland program has been established, ViaStoria functions as an umbrella marketing
organisation, and became responsible for maintaining the national information platform, producing publications, ensuring
a uniformity of quality and marketing the products at a national level. Research, counselling and information are the three
most important domains of their activity, and they have elaborated a special program, a “tool-kit” with nature preservation
(cultural landscape), agriculture (regional products), tourism and education (didactics) sections.
Industrial heritage appears in the offer of cultural and heritage tourism and it is part of the cultural routes of the
European Council. The Iron Route of Central Europe has been established in 2007 with the following participating
countries: Austria, Czech Republic, Germany, Hungary, Italy, Poland, Slovakia and Slovenia. Centuries ago, Hungary has
been known as the “iron heart” of Europe, with deep roots of metallurgic and iron manufacturing traditions. Northern
Hungary was the flagship of great industries before the political transformation, mainly by mining and metallurgy . By
today, the two largest ironworks in Miskolc and Ózd ceased to produce, the factories have been closed several years ago,
the ownership structure is disintegrated, and the real utilization of these huge areas is unsolved. Almost 20 years ago,
some enthusiastic, committed specialists, mainly older representatives of the metalworker profession, have started a
“never-ended” work trying to reveal, preserve and present the industrial heritage. The Central European Industrial
Heritage Route Association has been established in 2008 with its seat in Miskolc. Their main targets are to reveal and
preserve the industrial heritage; to safeguard the traditions; to replace production (even just partly) and the proper
utilization of the huge brown field territories.
They had several success and failures in the last years. A few new industrial exhibitions could be established; the
existing museums could be kept; and with the help of some marketing activities (publications, programmes, scientific
forums and iron factory tours occasionally) they could call the attention to these values. On the other hand, naturally we
know that tourism alone cannot be the solution for such huge industrial areas, in spite of the several good examples of, for
instance, the Ruhr region or Austria, in spite of examining the best practices. Principally they have to be the scenes of
production, economical activities – with wisely planned and integrated tourism possibilities. Referring back to the project
we have presented in the previous chapter, one of the joint Hungarian-Slovakian product formations was along industrial
heritage, too, based mainly on the traditions of the common history. Then, what is the reason for the fact that this product
cannot be function as a cultural route in Hungary?
Figure 6. Comparison of the case studies
Source: compiled by the authors

570
The historical background similarly exists, like in Switzerland. But there are great deficiencies in almost all other
factors (Figure 6). There is not a complete inventory; only partially, an assessment of the existing objects and places has
been evaluated within the project, of those which could be utilized in tourism. There is not any conception or strategy for
the management and utilization of these industrial landscapes and areas. Although scientists and civil organisations are
aware of the problems, there is no responsible management organisation – even in the sub-field of tourism, not to mention
other economical and social problems. The dialogue with the local destination management agency (which is now under
formation) is loose and casual. There are no financial resources for either product development or marketing tasks . A wide
social dialogue has been started recently, going on at the same time of our present study, but the solutions still seem to be
far away. In fact, regarding industrial heritage, we have wasted the last two decades... A real, complex program would be
necessary together with the establishment of a realizing management organisation and cooperation system.
5. CONCLUSIONS
Our tested co-operational model, which is formed on the basis of competence-marketing, introduces the
determining actors of heritage-based cultural routes, their importance and roles, emphasizing the importance of the
existence of an adequate coordinating-managing marketing organization. According to our results, the absence of such an
organization hinders the successful operation of cultural routes, which was confirmed by the comparison of the examples
of the case study.
Figure 7. Cooperation model for cultural routes
Source: compiled by the authors
The integrating competence centre, which can be interpreted as a special cluster organisation, is responsible for
the conscious internal (building the captivation and cooperation of the actors) and the outside, tourism market centred,
community-based marketing activities. The basic condition of competitive establishment and operation of cultural routes
is the strengthening of the present weak cooperation abilities and skills, with the help of methods and tools of the social
marketing model.

571
ACKNOWLEDGEMENT:
This article and the conference participation are carried out as part of the TAMOP-4.2.2/B-10/1-2010-0008 project in the
framework of the New Hungarian Development Plan. The realization of this project is supported by the European Union, co -
financed by the European Social Fund.
References Advance Release, Volume 11, January 2013 (2013). UNWTO World Tourism Barometer. World Tourism Organisation UNWTO
[www.unwto.org]. Available at: http://dtxtq4w60xqpw.cloudfront.net/sites/all/files/
pdf/unwto_barom13_01_jan_excerpt_0.pdf [Access date 24.02.2013]
CHAIRATUDOMKUL, S. (2008): Cultural Routes as Heritage in Thailand: Case Studies of King Narai’s Royal Procession Route and Buddha’s
Footprint Pilgrimage Route (PhD Thesis). Silpakorn University, Bangkok, Thailand
DÁVID, L., JANCSIK, A., RÁTZ, T. (2007): Turisztikai erőforrások – a természeti és kulturális erőforrások turisztikai hasznosítása, Perfekt
Kiadó, Budapest
FLADMARK, J.M. (1994): Cultural tourism: papers presented at the Robert Gordon University Heritage Convention, Conference
proceedings book, Donhead Publishing, London
Four Steps for Successful Cultural Heritage Tourism. Cultural Heritage Tourism website [www.culturalheritage tourism.org]. Available at:
http://www.culturalheritagetourism.org/fourSteps.htm [Access date 19.09.2012]
GYÖNGYÖSY, Z. – LISSÁK, GY. (2003): Termékpolitika, terméktervezés, termékdesign, Miskolci Egyetemi Kiadó, Miskolc
HALL, C.M., McARTHUR, S. (1998): Integrated Heritage Management. Principles and Practice. The Stationery Office, London, UK
KELLER, P., BIEGER, T. (2005): Innovation in Tourism – Creating Customer Value, Editions AIEST, St. Gallen, Switzerland
LAGROSEN, S. (2005): Customer involvement in new product development. A relationship marketing p erspective. European Journal of
Innovation Management.Vol.8. Iss.4. pp. 424-436.
LENGYEL, M. (2004): A turizmus általános elmélete, Heller Farkas Főiskola, Budapest
LEWITT, T. (1981): Marketing Intangible Products and Product Intangibles. Harvard Business Review, May-June, pp. 37-44.
MARTORELL, A.C. (2003): Cultural Routes: Tangible and Intangible Dimensions of Cultural Heritage. ICOMOS [www.icomos.org]
Available at: http://www.international.icomos.org/victoriafalls2003/papers/A1-5%20-%20Martorell.pdf [Access date
24.02.2013] (In: 14th ICOMOS General Assembly and International Symposium: ‘Place, memory, meaning: preserving
intangible values in monuments and sites’, 27 – 31 Oct 2003, Victoria Falls, Zimbabwe)
MEDLIK, S., MIDDLETON, V.T.C. (1973): Product Formulation in Tourism. Tourism and Marketing, Vol.13. Berne, AIEST
MICHALKÓ, G. (2012): Turizmológia, Akadémiai Kiadó, Budapest
MIDDLETON, V.T.C., CLARKE, J. (2001): Marketing in Travel and Tourism , pp.124-125, 3rd Edition, Butterworth-Heinemann, Oxford
NURICK, J. (2000): Heritage and Tourism, Locum Destination Review, Issue 2. pp. 35-38.
NURYANTI, W. (1996): Heritage and Postmodern Tourism. Annals of Tourism Research, Volume 23.(2) pp. 249–260.
PISKÓTI, I. (2012): Régió és településmarketing, Akadémiai Kiadó, Budapest, p.400
PUCZKÓ, L., RÁCZ, T. (2000, 2011): Az attrakciótól az élményig, Geomédia Kiadó, Budapest; and Akadémiai Kiadó, Budapest
RICHARDS, G. (2003): What is Cultural Tourism? In van Maaren, A. (ed.) Erfgoed voor Toerisme. Nationaal Contact Monumenten.
RUCKH, M., NOLL, Ch., BORNHOLDT, M. (Hrsg.): Sozialmarketing als Stakeholder-Management. Bern–Stuttgart–Wien, 2006, Haupt
Verlag, 343.
SCHUMPETER, J.A. (1934): The Theory of Economic Development, NY, Oxford University Press
SILBERBERG, T. (1995): Cultural tourism and business opportunities for museums and heritage sites. Tourism Management, 16(5), pp.
361-365.
SMITH, S. L. J. (1994): The Tourism Product, Annals of Tourism Research, Vol.21. No.3. pp.582-595, Elsevier Science Ltd. USA
SWARBROOKE, J. (1994): The Future of the Past: Heritage Tourism into the 21st Century. In: Seaton, A.V. (ed): Tourism. The Stateof the
Art. John Wiley & Sons, Chichester, pp. 222-229.

572
TUNBRIDGE, J.E., ASHWORTH, G.J. (1996): Dissonant Heritage: The Management of the Past as a Resource in Conflict. John Wiley & Sons,
Chichester
WEIERMAIR, K. (2004): Product improvement or innovation: What is the key to success in tourism? OECD [www.oecd.org] Available at:
www.oecd.org/dataoecd/55/31 /34267947.pdf [Access date 23.01.2013]
WEIERMAIR, K. (2006): Prospects for Innovation in Tourism, Journal of Quality Assurance in Hospitality & Tourism , Vol.6. Issue 3-4, 59-72

573
How to Measure Brand Personality of a Nature-
Based Tourist Destination Tourism, destination, branding, personality, consumer behavior.
Per Ivar Seljeseth, Bodø Graduate School of Business, University of Nordland, [email protected]
Tor Korneliussen, Bodø Graduate School of Business, University of Nordland, [email protected]
Abstract
It is generally agreed upon that it would be useful to know the brand personality of tourist destinations. There is, however,
no validated measurement instrument for a tourist destinations brand personality. The objective of this study is therfor to
try to validate such an instrument.
Questionnaire data was collected from a sample of 234 tourists on holiday in a nature-based tourist destination. An
exploratory factor analysis shows that the measurement instrument works relatively well. The results indicate that the
brand personality of this tourist destination consists of four dimensions: ruggedness, sophistication, naturalness and
activeness. This study is the first validation of a measuring instrument for tourist destinations brand personality using a
sample consisting exclusively of tourists who are on holiday at the investigated destination. Implications and
opportunities for further research are suggested.
1. INTRODUCTION
A tourist destination's brand personality is important for differentiating the destinations (Murphy et al., 2007b) and is
essential for building a tourist destination as a brand (Ekinci and Hosany, 2006). A tourist destination's brand personality
(TDBP) is defined as the set of human characteristics associated with the destination. TDBP creates a unique identity for
the tourist destination (Ekinci and Hosany, 2006) and may help to improve the destination's image (Hosany et al., 2006;
Hosany et al., 2007). TDBP can affect the preference for and choice of a tourist destination (Murphy et al., 2007a), and may
increase the demand for the destination (Crockett and Wood, 2002). Tourists are more satisfied with a holiday visit when
the tourist's self-image is in accordance with the perceived TDBP (Murphy et al., 2007a), and TDBP can enhance a tourist's
loyalty to a destination.(Ekinci and Hosany, 2006).
TDBP is a good metaphor for understanding the tourist's perception of a tourist destination (Caprara et al., 2001; Crask
and Henry, 1990; Morgan et al. 2002). A brand’s personality can create symbolic effects for the consumer (Aaker, 1996),
and can thus make a holiday a status symbol and an expression of a lifestyle (Aaker, 1996; Clarke, 2000). Building TDBP is
very different from traditional marketing of tourist destinations, which mainly promotes specific attributes and activities
(Murphy et al., 2007a).
There is strong documentation of the positive marketing effects of TDBP. Still, research on TDBP is in an exploratory stage
(Ekinci and Hosany, 2006). There is, for example, no valid instrument for measuring TDBP. The aim of this research is
therefor to try to validate such an instrument. The present study builds on the research of Aaker (1997). There are three
empirical studies (i.e. Ekinci and Hosany, 2006; Murphy et al., 2007b; and Usakli and Baloglu, 2011) of the brand
personality of a tourist destination, and they all use variations of Aaker’s measurement instrument. Although generally
well-crafted, the results of these studies varied much as they show that the brand personality of a tourist destination may
have three (Ekinci and Hosany, 2006; Murphy et al., 2007b), four (Murphy et al., 2007b) and five dimensions (Usakli and
Baloglu, 2011). It is therefor not clear how many dimension a tourist destination’s brand personality consist of. This
inequality in dimensions shows that the measuring tool is unstable across measurements (Murphy et al. (2007b). There is
therefor a need for additional studies to refine and develop a more valid and reliable instrument for measuring a TDBP
(Murphy et al., 2007b). Further, there were possible weaknesses related to the selection of respondents of some studies, as
574
it is uncertainty about whether all respondents were tourists and if all respondents had adequate experience and
knowledge about the destination they were asked to evaluate.
The research question of the present study is: Is the measurement instrument used by this study suitable for measuring
the brand personality of a nature-based tourist destination? The contribution of this study is to replicate and extend the
research done by Ekinci and Hosany (2006), Murphy et al. (2007b), and Usakli and Baloglu (2011). We use the same
statistical technique for analyzing our data as used by Ekinci and Hosany (2006), Murphy et al. (2007b) and Usakli and
Baloglu, 2011. We make sure that the respondents of this study are tourists at the destination, and thus in a position to
evaluate the brand personality of the selected tourist destination.
The next section reviews the relevant literature. The methodology, analysis and results follow. The paper ends with a
conclusion, implications and suggestions for further research.
2. MEASUREMENT OF A TOURISM DESTINATION’S BRAND PERSONALITY
There are several studies of brand personality, but only three published studies of the brand personality of a tourist
destination (i.e. Ekinci and Hosany, 2006; Murphy et al., 2007b; and Usakli and Baloglu, 2011). These three studies build
on the research of Aaker (1997). We therefore start by reviewing this study.
Aaker’s (1997) study was done across industry sectors and was based on 309 adjectives from the so-called "Big Five"
personality traits of psychology. Aaker (1997) reduced these 309 adjectives to a more manageable 42 personality traits
that loaded five dimensions. A further principal component analysis reduced these 42 personality traits to 15 personality
traits that loaded on five dimensions (Aaker, 1997). These dimensions are:
Sincerity: down-to-earth, honest, wholesome, cheerful.
Excitement: daring, spirited, imaginative, up-to-date.
Competence: reliable, intelligent, successful.
Sophistication: upper class, charming.
Ruggedness: outdoorsy, tough.
The three empirical studies (i.e. Ekinci and Hosany, 2006; Murphy et al., 2007b; Usakli and Baloglu, 2011) of the brand
personality of a tourist destination uses variations of this measurement instrument developed by Aaker (1997).
The first attempt to validate Aaker’s (1997) industry-neutral brand personality scale on a tourist destination was made by
Ekinci and Hosany (2006). They asked a group of British respondents to associate Aaker’s (1997) 42 personality traits
with their most recently visited tourist destination. They found 27 personality traits to be well suited to describe the
visited tourist destinations. Ekinci and Hosany (2006) tested the validity of these 27 personality traits by asking two
samples of tourists how strongly these traits could be associated with their most recently visited tourist destination. They
identified 12 personality traits loading on three dimensions that described the data well. These dimensions are:
Sincerity: reliable, sincere, intelligent, successful, wholesome.
Excitement: exciting, daring, original, spirited.
Conviviality: friendly, family oriented, charming.
Murphy et al. (2007b) was the first published study that has measured TDBP by asking respondents to rate a specific
tourist destination rather than the most recently visited tourist destination. The sample was collected on a transport route
between the two tourist destinations that were measured--Whitsundays region and Cairns region in Queensland,
Australia. The sample consisted of Australian and foreign tourists who had visited one, both or neither of the destinations,
as well as residents in the region. So as not to wear out the respondents, Murphy et al. (2007b) used Aaker’s (1997) 15
personality traits, and added five personality traits with similar names that Aaker (1997) gave to the five dimensions.
The explorative factor analysis of the data from Whitsundays region resulted in a solution of four factors, whereas that of
the Cairns region resulted in three factors. Murphy et al. (2007b) therefore concluded that the measuring instrument was
unstable across tourist destinations.

575
The data from Whitsundays region identified the following four dimensions:
Upper class: sophisticated, successful, intelligent, charming, reliable, up-to-date, competent.
Honest: sincere, down-to-earth, wholesome, reliable, outdoorsy.
Exiting: cheerful, spirited, imaginative.
Tough: rugged, daring.
The data from Cairns region identified these three dimensions:
Sincere: honest, down-to-earth, wholesome, competent, reliable, intelligent.
Sophisticated: up-to-date, successful, upper class, imaginative, cheerful.
Outdoorsy: rugged, daring, exciting, tough, spirited, charming.
Usakli and Baloglu (2011) examined the TDBP of Las Vegas, Nevada, USA by using two steps to develop the research
variables. First step, 28 tourists were asked to write down the personality traits that first came to their mind thinking of
Las Vegas. Nine traits were mentioned by over 25% of the tourists. Next step, the same 28 tourists contributed to the
analysis of the content validity of the 42 personality traits from Aaker (1997). This analysis generated 23 personality
traits, and because three of them were similar to those nine found in the first step, they used 29 personality traits to
measure the TDBP of Las Vegas. An exploratory factor analysis of data collected from a convenience sample of 368
respondents resulted in 24 personality traits loading on five dimensions:
Vibrancy: energetic, alive, vibrant, showy, exciting, sexy, daring.
Sophistication: feminine, charming, upper class, good looking, glamorous.
Competence: leader, successful, confident, independent, intelligent.
Contemporary: unique, up-to-date, imaginative, young, trendy.
Sincerity: friendly, cheerful.
Although well-crafted, the studies by Ekinci and Hosany (2006) and Murphy et al. (2007b) suffer from weaknesses. The
study done by Ekinci and Hosany (2006) asked respondents to evaluate the brand personality of the most recent tourism
destination they had visited. Consequently the respondents would evaluate different tourism destinations, while the
purpose of the tool is to measure the TDBP of a specific tourist destination. In the study by Murphy et al. (2007b) there is
uncertainty related to the sample. First, the sample includes an unreported number of respondents who are local
inhabitants and not tourists. The problem with including local inhabitants in the sample may be that they may have
different needs, interests and impressions of a destination than those of tourists. In addition, there is uncertainty about
what kind of knowledge the respondents have about the tourist destinations. The respondents may have visited either the
Whitsundays region or the Cairns region, both regions, and neither of these two tourist destinations. The present study
consists exclusively of respondents who are actual tourists with experience at the destination they are asked to assess.
3. METHODOLOGY
This study poses the research question: Is the measurment instrument used by Murphy et al. (2007b) suitable for
measuring the brand personality of a nature-based tourist destination? A cross-sectional survey design was used to
investigate the research question. The use of a questionnaire for self-completion can generate precise answers to complex
questions, and personal inquiry can reduce the dropout problem.
The target population is summer tourists visiting Lofoten, a nature-based tourist destination in Nordland, in the northern
part of Norway. A sample of 234 respondents was personally contacted outdoors at resting places, restaurants, and in cars
and boats in Svolvær, the centre of Lofoten. First, they were asked if they were visiting Lofoten as tourists, and if so, they

576
were asked to fill in a questionnaire. By contacting tourists at their holiday destination, we ensured that the respondents
had actual experience as tourists in Lofoten. Using a homogeneous samples of Norwegian tourists allow us to control for
random sources of error (Calder et al., 1981). The data in the present study was collected in 2010, and was the first study
to use a sample exclusively consisting of tourists on holiday in the examined destination. As actual tourists at the
destination examined, they should be in a good position to evaluate the TDBP of the selected destination, Lofoten.
The sample used in Murphy et al. (2007b) contained an unknown number of local inhabitants and tourist without
experience and knowledge about the investigated tourist destination. Usakli and Baloglu (2011) collected their sample at
the “Fountain Show”, a popular place for visitors. But they do not clarify how they distinguish between tourists and other
visitors at the location.
The sample consists of 54.3% men and 45.3% women. The average age is 45.8 years. The average years of higher
education are slightly below two years (1.84). The average income is NOK 460.000 (about USD 81.000).
The measurement instrument uses the same 20 personality traits as that of Murphy et al. (2007b), because we want to
compare our factor structure with the results from previous studies. The personality traits are based on Aaker’s (1997)
original instrument for measuring brand personality ("Brand Personality Scale"). The measurement instrument includes
the 20 personality traits shown in table 1.
Table 1: Personality traits for the measurement of the brand persoanality of a tourist destination
Charming Exciting Reliable Succesful
Cheerful Honest Rugged Tough
Competent Imaginative Sincere Upper class
Daring Intelligent Sophisticated Up-to-date
Down-to-earth Outdoorsy Spirited Wholesome
All items are measured using a five-point Likert scale anchored by ”to a very small degree” (1), “to a small degree” (2),
“neither large or small degree” (3), “to a large degree” (4), ”to a very large degree” (5). The same type of scale was used by
Aaker (1997), Ekinci and Hosany (2006) and Murphy et al. (2007b).
The data was analyzed using exploratory factor analysis. Ekinci and Hosany (2006), Murphy et al. (2007b) and Usakli and
Baloglu (2011) were also using exploratory factor analysis to analyze their data. The results of these studies should
therefore be comparable. This analysis used a rule of thumb from Hair et al. (2010) which specifies that factor loads
greater than 0.50 are generally considered necessary for practical significance. There is no statistical guideline for
evaluating the variables communality, but .50 will in many cases be regarded as a minimum for keeping the variable in the
analysis (Hair et al., 2010).
4. RESULTS AND DISCUSSION
The Kaiser-Meyer-Olkin Measure gave the value of 0.828 indicating that the sample size is adequate for the number of
traits in the study and that explorative factor analysis should be an appropriate analysis technique (Hair et al., 2010).
Barlett's test is statistically significant with a value of 0.000. This indicates that there are sufficient correlations among the
variables to use exploratory factor analysis (Hair et al., 2010).
The exploratory factor analysis identified four factors with eigenvalues larger than 1.0, and the results are shown in table
2. The factors explain respectively 28.48, 11.08, 8.59 and 7.16% of the variance in the data. This amounted to 55.31% of
the total variance in the data. All four factors have Cronbach's alpha higher than the minimum requirement of 0.6
suggested for exploratory research (Hair et al., 2010).

577
Table 2: The factor structure of brand personality
Factor 1 Factor 2 Factor 3 Factor 4
RUGGEDNESS SOPHISTICATION NATURALNESS ACTIVENESS Communality
Rugged .822 .034 .110 .085 .697
Tough .781 .103 .155 .141 .665
Outdoorsy .756 .026 .220 .046 .623
Charming .574 .293 .170 .371 .581
Exciting .572 .162 .193 .250 .453
Intelligent .117 .686 .273 .059 .563
Sophisticated .199 .676 .184 .157 .555
Competent .030 .656 .289 .108 .526
Up-to-date .095 .623 .009 .116 .411
Upper class .126 .617 .283 .363 .608
Successful .343 .535 .298 .011 .492
Cheerful .257 .493 .339 .243 .483
Honest .112 .080 .746 .102 .586
Down-to-earth .301 .010 .653 .257 .583
Sincere .267 .024 .641 .152 .506
Wholesome .238 .176 .640 .069 .502
Reliable .062 .491 .558 .109 .569
Imaginative .075 .178 .382 .658 .617
Spirited .061 .061 .228 .645 .475
Daring .432 .216 .043 .578 .569
Eigenvalue 5.70 2.22 1.72 1.43
Explaines variance by factors (55.31 %) 28.48 11.08 8.59 7.16
Cronbach's alpha .799 .763 .772 .618
The first factor has five personality traits with loadings higher than .5. These are: rugged (0.822), tough (0.871),
outdoorsy (0.756), charming (0.574) and exciting (0.572). These personality traits have no high cross loading on other
factors. The personality trait “daring” cross-loads on the first factor with 0.432, and the fourth factor with 0.578.
“Ruggedness” is chosen as the name for this factor because this term seems to be adequate for the five personality traits
that load on the factor. Aaker (1997) has previously used “ruggedness” as a label of a similar factor, while Murphy et al.
(2007b) used the close synonym “tough” as a factor name for a comparable factor in their study of the Whitsundays region
and the label “outdoorsy” in their study of the Cairns region. The first factor’s eigenvalue is 5.70 and the explained variance
is 28.48%. Cronbach's alpha is 0.8. The personality traits that load on “ruggedness” identified in our survey have a great
similarity with the personality traits that load on “outdoorsy” identified by Murphy et al.’s (2007b) exam ination of the
Cairns region.
The second factor has seven personality traits with loadings of about .5 or higher. These are: intelligent (0.686),
sophisticated (0.676), competent (0.656), up-to-date (0.623), upper class (0.617), successful (0.535) and cheerful (0.493).
These personality traits have no large cross loadings on other factors, except cheerful which also load on the third factor
with a factor loading of 0.339. The personality trait “reliable” loads on the second factor with a factor loading of 0.491 and
loads on the third factor with 0.558. Since the personality trait “reliable” has loadings of about .5 and higher on two factors
we suggest removing this personality trait from the measurement instrument. “Sophistication” is chosen as the name of
the second factor because this term seems to be adequate for the personality traits that load on the factor. Aaker (1997)
and Murphy et al. (2007b) used respectively “sophistication” and “sophisticated” as names to their comparable factors.
The second factor has an eigenvalue of 2.22 and an explained variance of 11.08%. Cronbach's alpha is 0.8. Our factor,
“sophistication”, has a great similarity with the factor "upper class" from the study of the Whitsundays region (Murphy et
al., 2007b) as both factors contain the same six personality traits (intelligent, sophisticated, competent, up-to-date, upper
class and successful). The results of the exploratory factor analysis of our data and the data from the Whitsundays region
(Murphy et al., 2007b) suggest that the factor “sophistication” is well suited to describe the brand personality of a nature-
based tourist destination.
The third factor has five personality traits with loadings higher than .5. These are: honest (0.746), down-to-earth (0.653),
sincere (0.641), wholesome (0.640) and reliable (0.558). Four of these personality traits have very low cross -loading on
other factors, while the personality trait “reliable” loads relatively high on the second factor (sophistication) with a factor
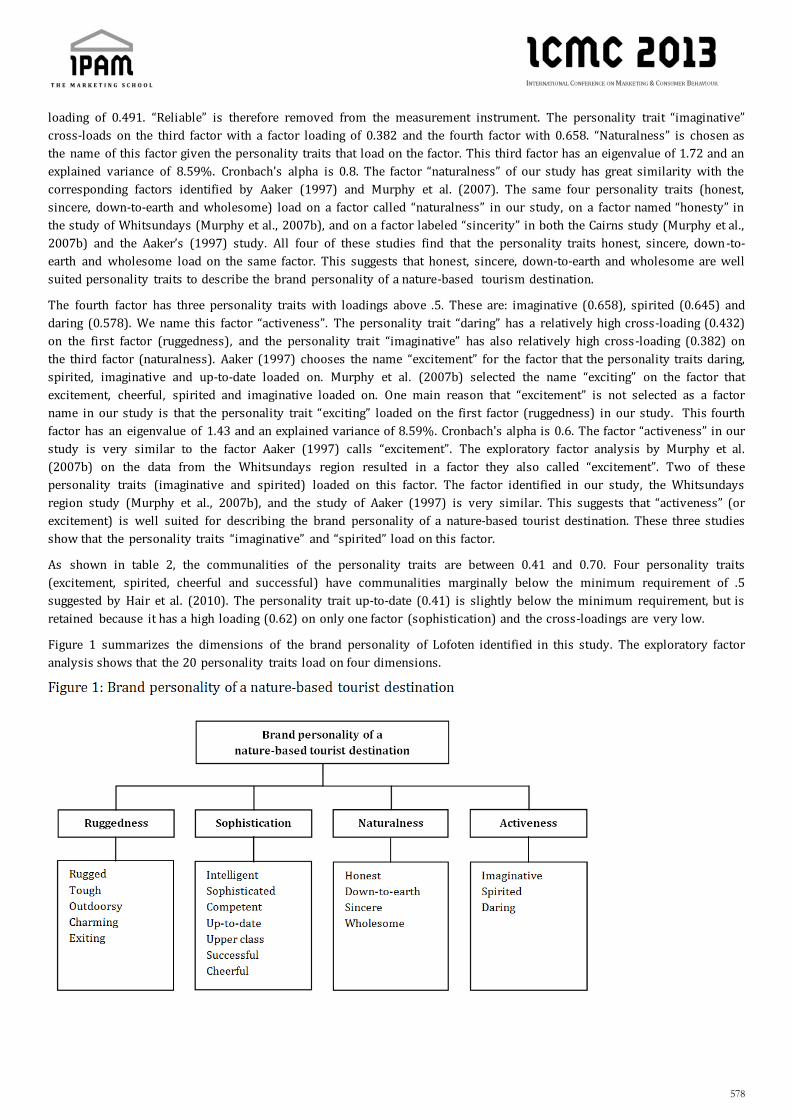
578
loading of 0.491. “Reliable” is therefore removed from the measurement instrument. The personality trait “imaginative”
cross-loads on the third factor with a factor loading of 0.382 and the fourth factor with 0.658. “Naturalness” is chosen as
the name of this factor given the personality traits that load on the factor. This third factor has an eigenvalue of 1.72 and an
explained variance of 8.59%. Cronbach's alpha is 0.8. The factor “naturalness” of our study has great similarity with the
corresponding factors identified by Aaker (1997) and Murphy et al. (2007). The same four personality traits (honest,
sincere, down-to-earth and wholesome) load on a factor called “naturalness” in our study, on a factor named “honesty” in
the study of Whitsundays (Murphy et al., 2007b), and on a factor labeled “sincerity” in both the Cairns study (Murphy et al.,
2007b) and the Aaker’s (1997) study. All four of these studies find that the personality traits honest, sincere, down-to-
earth and wholesome load on the same factor. This suggests that honest, sincere, down-to-earth and wholesome are well
suited personality traits to describe the brand personality of a nature-based tourism destination.
The fourth factor has three personality traits with loadings above .5. These are: imaginative (0.658), spirited (0.645) and
daring (0.578). We name this factor “activeness”. The personality trait “daring” has a relatively high cross-loading (0.432)
on the first factor (ruggedness), and the personality trait “imaginative” has also relatively high cross-loading (0.382) on
the third factor (naturalness). Aaker (1997) chooses the name “excitement” for the factor that the personality traits daring,
spirited, imaginative and up-to-date loaded on. Murphy et al. (2007b) selected the name “exciting” on the factor that
excitement, cheerful, spirited and imaginative loaded on. One main reason that “excitement” is not selected as a factor
name in our study is that the personality trait “exciting” loaded on the first factor (ruggedness) in our study. This fourth
factor has an eigenvalue of 1.43 and an explained variance of 8.59%. Cronbach's alpha is 0.6. The factor “activeness” in our
study is very similar to the factor Aaker (1997) calls “excitement”. The exploratory factor analysis by Murphy et al.
(2007b) on the data from the Whitsundays region resulted in a factor they also called “excitement”. Two of these
personality traits (imaginative and spirited) loaded on this factor. The factor identified in our study, the Whitsundays
region study (Murphy et al., 2007b), and the study of Aaker (1997) is very similar. This suggests that “activeness” (or
excitement) is well suited for describing the brand personality of a nature-based tourist destination. These three studies
show that the personality traits “imaginative” and “spirited” load on this factor.
As shown in table 2, the communalities of the personality traits are between 0.41 and 0.70. Four personality traits
(excitement, spirited, cheerful and successful) have communalities marginally below the minimum requirement of .5
suggested by Hair et al. (2010). The personality trait up-to-date (0.41) is slightly below the minimum requirement, but is
retained because it has a high loading (0.62) on only one factor (sophistication) and the cross-loadings are very low.
Figure 1 summarizes the dimensions of the brand personality of Lofoten identified in this study. The exploratory factor
analysis shows that the 20 personality traits load on four dimensions.

579
5. CONCLUSION AND IMPLICATIONS
This study investigates the brand personality of a nature-based tourist destination. We use a measurement instrument
consisting of 20 personality traits, according to previous research on tourist destinations brand personality. Collecting
empirical data in the tourist destination Lofoten and analyzing the data using exploratory factor analysis resulted in four
factors named: ruggedness, sophistication, naturalness and activeness.
The dimensions that emerged in the factor analysis of the data from our study are compared with the dimensions of Aaker
(1997) and Murphy et al. (2007b). We conclude that there is a great similarity between the results from our study and
Murphy et al.’s (2007b) finding from the Whitsundays region of Queensland, Australia. Although the names of the
dimensions are somewhat different (ruggedness vs. tough, sophistication vs. upper class, naturalness vs. honest, and
activeness vs. exciting), we conclude that the measuring instrument of TDBP has a reasonably good reliability and validity .
This suggests that the measurement instrument used by this study and by Murphy et al. (2007b) may work satisfactorily
for empirical measurement and description of TDBP of nature-based tourist destinations. Another important finding of
this study is that the personality traits within each factor have a conceptually more consistent meaning than those of
Murphy et al. (2007b) and Aaker (1997).
The findings in this study are highly relevant to marketers of tourist destinations. The results show that tourists associate
personality traits with tourist destinations, and that the measurement instrument is able to measure these associations.
This research has tried to validate the measurement instrument used by Murphy et al. (2007b). It seems that this
measurement instrument for TDBP works rather well, and that with some small adjustments it can be used for empirical
measurement of TDBP.
A distinctive and attractive brand personality has several documented marketing effects for tourist destinations.
Marketers of tourist destinations should therefore strive to create a clear and attractive brand personality. Increased
competition in the global tourism industry requires more sophisticated marketing and branding. The validated instrument
can be used to identify the personality traits that build the various dimensions of a TDBP. Attractive and desired
personality traits can be implemented in the promotion by communicating the desired brand personality through
marketing mix; product, services, marketing communication, price and distribution channels (Kotler, 2003). In
advertising, TDBP can be highlighted by presenting for example activities and typical guests that promotes the tourist
destination's brand personality.
This research shows that the brand personality of a nature-based tourism destination can be summed up by the four
dimensions of ruggedness, sophistication, naturalness and activeness. A next step would then be to do confirmatory factor
analysis of the scale of tourist destination brand personality using structural equation modeling. This may be followed up
by research that includes tourist destination brand personality in more theory-driven models.
This research used a homogeneous sample of Norwegian tourists. The measurement instrument of tourist destination
brand personality should also be tested on more heterogeneous samples of tourists from many nationalities. It will be
interesting to find out whether the cultural backgrounds of tourists influence how they perceive the brand personality of a
tourist destination. More research should be done to develop a measurement instrument for brand personality for other
types of tourism destinations, for winter tourism, and perhaps also a measurement instrument that can work for all types
of tourist destinations.
Future research on TDBP should also try to connect the research on TDBP more closely with other research topics in the
marketing and branding of tourist destinations, because every brand element is part of an overall brand and marketing
strategy.
References
AAKER, D. A. (1996). Measuring Brand Equity Across Products and Markets. California Management Review. Spring 1996.
38, 3, 102.
AAKER, J. L. (1997). Dimensions of Brand Personality. Journal of Marketing Research. 34. 347-56.
CALDER, B. J., PHILLIPS, L. W., TYBOUT, A.M. (1981). Designing Research for Application. Journal of Consumer Research.
8 (2). 197-207.

580
CAPRARA, G. V., BARBARANELLY, C. and GUIDO, G. (2001). Brand Personality: How to Make the Metaphor Fit? Journal of
Economic Psychology. 22, 377-95.
CLARKE, J. (2000). Tourism Brands: An Exploratory Study of Brands Box Model . Journal of Vacation Marketing. 6 (4). 329-
45.
CRASK, M. R. and HENRY, A. L. (1990). A positioning-Based Decision Model for Selecting Advertising Messages. Journal of
Advertising Research. 30 (4). 32-38.
CROCKETT, S. R., and WOOD, L. J. (2002). Brand Western Australia: Holidays of an Entirely Different Nature. Destination
Branding: Creating the Unique Destination Proposition (124-147). Oxford: Boston: Butterworld-Heinemann.
EKINCI, Y. and HOSANY, S. (2006). Destination Personality: An Application of Brand Personality to Tourism Destinations.
Journal of Travel Research. 45 (November). 127-139.
HAIR, J. F., BLACK, W. C., BABIN, B. J. and ANDERSON, R. E. (2010). Multivariate Data Analysis: A global perspective (7. ed.)
New Jersey: Pearson Prentice Hall.
HOSANI, S., EKINCI, Y. and UYSAL, M. (2006). Destination Image and Destination Personality: An Application of Branding
Theories to Tourism Places. Journal of Business Research. 59 (5). 638-642).
HOSANI, S., EKINCI, Y. and UYSAL, M. (2007). Destination Image and Destination Personality. International Journal of
Culture, Tourism and Hospitality Research. 1 (1). 62-81.
KOTLER, P. (2003). Marketing Management: International Edition. New Jersey: Pearson Education Inc.
MORGAN, N., PRITCHARD, A. and PIGGOTT, R. (2002). New Zealand, 100 % Pure: The Creation of a Powerful Niche
Destination Brand. Journal of Brand Management. 9 (4/5). 335-54.
MURPLY, L., BENCKENDORFF, P. and MOSCARDO, G. (2007a). Linking Travel Motivation, Tourist Self-Image and
Destination Brand Personality. Journal of Travel & Tourism Marketing. 22 (2). 45-59.
MURPHY, L., MOSCARDO, G. and BENCKENDORFF, P. (2007b). Using Brand Personality to Differentiate Regional Tourism
Destinations. Journal of Travel Research. 46 (1). 5-14.
USAKLI, A. and BALOGLU, S. (2011). Brand Personality of Tourist Destinations: An Application og Self-Congruity Theory.
Journal of Tourism Management. 32 (1). 114-127.

581
Service Quality Measurement in Thermal Spas’
Tourism Perceived Service Quality; Thermal Spas’ Tourism; SERVPERF; SERVTHERM
Rosa Maria Riveiro Conde, IPAM – The Marketing School, [email protected]
Abstract
The aim of this study is to analyze the different dimensions of service quality applied to the thermal spas’ tourism.
Defining and measuring quality service is important to this sector because it contributes to its success and influences
the customer satisfaction. In 2009, the demand for well-being had an important increase of 13.5% compared to 2008. In
the North of Portugal, the segments of classical spa tourism had a share of 80%, and well -being had almost 5000 users
(20% of the total).
Design/methodology/approach:
The research was developed with spa customers of the North of Portugal. An adaptation of the SERVPERF scale was
used to measure the service quality (Alén, 2003; Cronin & Taylor, 1992, 1994; Grande et al., 2002; Snoj, 1995; Ramsaran-
Fowdar, 2004; Snoj & Mumel, 2002). Although the original scale of SERVPERF contains 22 items, after the anal ysis of the
pre-test, one item (Assurance) was eliminated, because it was irrelevant. Each of the 21 items of the scale was rated on a
seven point Likert scale. SERVPERF (performance component of the Service Quality scale), has been shown to measure
five underlying dimensions: Tangibility, Reliability, Responsiveness, Assurance and Empathy (Parauraman et al., 1988).
The data were collected using a self-administered questionnaire. The sample size was 832 (46% male, 54% female,
the minimum age is 22 years and maximum is 86 years, and (M=62.82; SD=11.79). A descriptive statistical analysis was
used (average, standard deviation and frequencies). The dimensionality of the scale was explored and confirmed through a
main components’ analysis with a Varimax rotation technique and a confirmatory factor analysis. The dimensions’
reliability was measured using the Cronbach's alpha.
Findings:
The results indicate that the nature of perceived service quality measurement instruments in spa services has three
dimensions: employee’s professionalism, tangibility and empathy. Employee’s professionalism explains 46.2 % of the total
variance. Nevertheless, the three dimensions found explain 60.9% of the total variance.
Originality/Value:
This article is an example of applying the SERVPERF scale in the Thermal Spas’ sector.
Research Limitation Originality/value:
The sample is limited to thermal spas’ customers in the North of Portugal.
1. Introduction
Nowadays, the tourism sector is determinant in any country, not only due to the wealth and employment it creates, but
also because it is a booster of development in the world’s economies.
Tourism rises as important economic and social phenomena of the 20th century. In fact, since the 50’s, the tourism
expansion in the world has been exponential. The number of international touristic arrivals increased from 25 million in
1950 to 1,56 billion in 2020, according to data from the World Tourism Organization. Therefore, in the next few years,

582
tourism will become the main economic activity in the world, surpassing, as far as exports are concerned, the sectors
connected to the oil and car industries (World Tourism Organization). On a qualitative point of view, it will be necessary to
develop the concept of active holidays and of varied and complementary touristic products. There will be more
competitiveness among the different destinations. New destinations will appear, others will go into decline.
Today, tourism is a lot more diversified. Travels tend to be spread along the year. Holliday’s’ typologies are themselves
more varied, whether we are talking about the goal of the trip, its duration or even the lodging type. It’s becoming much
more frequent to have shorter holidays in the summer and other holiday periods during the year. This change generated
an increment in the segments of cultural, sports, adventure and well-being tourism (Fazenda, 2008).
Inside these new touristic products there is the spa tourism, which can be defined as the set of activities related to the
therapeutic use of mineral natural water.
In the last few years spa tourism has been associated not only with purely medical and healing components, but also with
other elements, such as prevention, entertainment and well-being, capable of attracting other types of clients. This way,
two different areas can be identified in spa tourism: the classical (therapy and rehabilitation) and well -being (prevention
and promotion of physical and psychic health). These two possibilities are market niches with divergent characteristics
and needs. In the first case, we are dealing with an emerging market which needs intervention regarding its consolidation.
These two segments have been allowing the reduction of seasonality in spa resorts, considering that the well -being
segment compensates the summer period concentration that demands the classical segment (Programa de Acção de
Enfoque Temático – “Turismo de Saúde e Bem-estar” para o Porto e Norte de Portugal - Agenda Regional do Turismo:28).
Spa tourism is a sub sector with great potentiality and increasing importance. It is, therefore, necessary a rehabilitation of
its universe, with the modernization of the facilities, a varied offer of services, without a focus on the cure concept, but also
covering leisure, prevention, beauty and well-being. Thus, the new image of spas, instead of emphasizing their traditional
image of centers for illness treatments, will have to be oriented for well -being, the search for body cult and leisure. The
non seasonal component of spa tourism (classical) allows an elevated occupation index during the entire year, reaching
total occupation during 10 months. The average permanence/stay on a spa resort is higher due to the duration of spa
treatments (10 to 15 days), much more than any other tourism type. Usually, spas are located in interior areas, thus being
propellers of local development (Alén & Rodriguez, 2004:3).
The present work aims at elaborating a scale to measure quality perceived by spas’ clients. The measurement instrument
was developed from the SERVPERF scale (Cronin & Taylor, 1992) and applied in the Spas of Porto and the North of
Portugal.
2. Perceived Quality Measurement in Thermal Spas’ Tourism
The quality of products and services has become a main issue since the eighties. Companies needed to differentiate
themselves from their competitors due to the increasing competition and the fast deregulation of the sector (Parasuraman,
Zeithaml and Berry, 1988:12). Service quality is considered a determinant factor as far as competitiveness is concerned,
thus becoming a differentiating element (Ghobadian et al., 1994:44).
In spite of being a vastly debated concept, service quality’s definition is not consensual at all. One of the mostly used
definitions comes from Parasuraman, Zeithaml and Berry (1988). To these authors, perceived quality is the extent of the
discrepancies or the existent differences between the clients’ expectations or wishes and their perceptions.
The interest for the study of quality in the area of tourism is directly connected with its impact in terms of competitiveness
of the products and touristic destinations, within the context of a scenario characterized by the globalization of the offer
and by a greater demand and knowledge of tourists regarding the options suggested to them (Silva et al.,2001).
The delivery of a quality touristic service is an element of strategic differentiation. This fact is due to the evolution of the
consumption habits and the increasing growth of competitiveness among touristic companies (Grande et al., 2002:81).
To Kandampully (2000), quality in tourism will be the main differentiation factor to the sector’s competitiveness. To
provide the definition of a quality strategy in tourism, it will be necessary, among other aspects, to have competent and
motivated human resources, to integrate sustainable environmental and tourism policies, to create a network of
stakeholders as well as a set of personalized services (Eraqui, 2006:475).
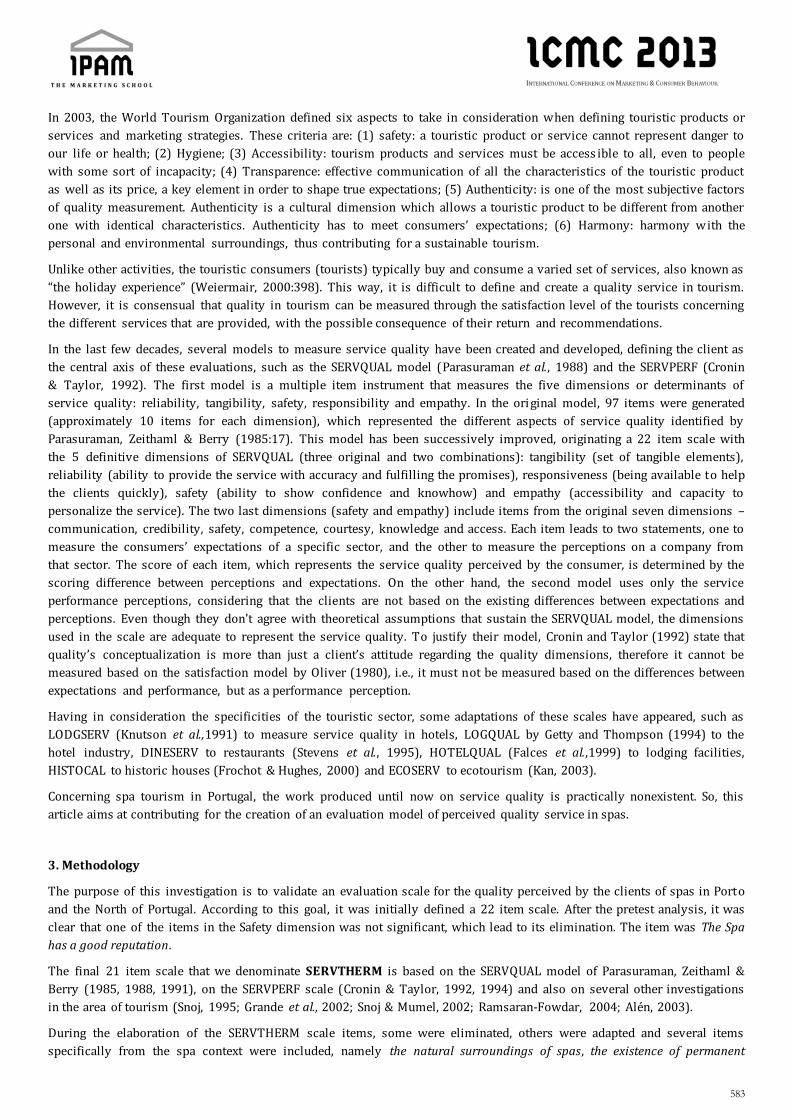
583
In 2003, the World Tourism Organization defined six aspects to take in consideration when defining touristic products or
services and marketing strategies. These criteria are: (1) safety: a touristic product or service cannot represent danger to
our life or health; (2) Hygiene; (3) Accessibility: tourism products and services must be access ible to all, even to people
with some sort of incapacity; (4) Transparence: effective communication of all the characteristics of the touristic product
as well as its price, a key element in order to shape true expectations; (5) Authenticity: is one of the most subjective factors
of quality measurement. Authenticity is a cultural dimension which allows a touristic product to be different from another
one with identical characteristics. Authenticity has to meet consumers’ expectations; (6) Harmony: harmony w ith the
personal and environmental surroundings, thus contributing for a sustainable tourism.
Unlike other activities, the touristic consumers (tourists) typically buy and consume a varied set of services, also known as
“the holiday experience” (Weiermair, 2000:398). This way, it is difficult to define and create a quality service in tourism.
However, it is consensual that quality in tourism can be measured through the satisfaction level of the tourists concerning
the different services that are provided, with the possible consequence of their return and recommendations.
In the last few decades, several models to measure service quality have been created and developed, defining the client as
the central axis of these evaluations, such as the SERVQUAL model (Parasuraman et al., 1988) and the SERVPERF (Cronin
& Taylor, 1992). The first model is a multiple item instrument that measures the five dimensions or determinants of
service quality: reliability, tangibility, safety, responsibility and empathy. In the original model, 97 items were generated
(approximately 10 items for each dimension), which represented the different aspects of service quality identified by
Parasuraman, Zeithaml & Berry (1985:17). This model has been successively improved, originating a 22 item scale with
the 5 definitive dimensions of SERVQUAL (three original and two combinations): tangibility (set of tangible elements),
reliability (ability to provide the service with accuracy and fulfilling the promises), responsiveness (being available to help
the clients quickly), safety (ability to show confidence and knowhow) and empathy (accessibility and capacity to
personalize the service). The two last dimensions (safety and empathy) include items from the original seven dimensions –
communication, credibility, safety, competence, courtesy, knowledge and access. Each item leads to two statements, one to
measure the consumers’ expectations of a specific sector, and the other to measure the perceptions on a company from
that sector. The score of each item, which represents the service quality perceived by the consumer, is determined by the
scoring difference between perceptions and expectations. On the other hand, the second model uses only the service
performance perceptions, considering that the clients are not based on the existing differences between expectations and
perceptions. Even though they don’t agree with theoretical assumptions that sustain the SERVQUAL model, the dimensions
used in the scale are adequate to represent the service quality. To justify their model, Cronin and Taylor (1992) state that
quality’s conceptualization is more than just a client’s attitude regarding the quality dimensions, therefore it cannot be
measured based on the satisfaction model by Oliver (1980), i.e., it must not be measured based on the differences between
expectations and performance, but as a performance perception.
Having in consideration the specificities of the touristic sector, some adaptations of these scales have appeared, such as
LODGSERV (Knutson et al.,1991) to measure service quality in hotels, LOGQUAL by Getty and Thompson (1994) to the
hotel industry, DINESERV to restaurants (Stevens et al., 1995), HOTELQUAL (Falces et al.,1999) to lodging facilities,
HISTOCAL to historic houses (Frochot & Hughes, 2000) and ECOSERV to ecotourism (Kan, 2003).
Concerning spa tourism in Portugal, the work produced until now on service quality is practically nonexistent. So, this
article aims at contributing for the creation of an evaluation model of perceived quality service in spas.
3. Methodology
The purpose of this investigation is to validate an evaluation scale for the quality perceived by the clients of spas in Porto
and the North of Portugal. According to this goal, it was initially defined a 22 item scale. After the pretest analysis, it was
clear that one of the items in the Safety dimension was not significant, which lead to its elimination. The item was The Spa
has a good reputation.
The final 21 item scale that we denominate SERVTHERM is based on the SERVQUAL model of Parasuraman, Zeithaml &
Berry (1985, 1988, 1991), on the SERVPERF scale (Cronin & Taylor, 1992, 1994) and also on several other investigations
in the area of tourism (Snoj, 1995; Grande et al., 2002; Snoj & Mumel, 2002; Ramsaran-Fowdar, 2004; Alén, 2003).
During the elaboration of the SERVTHERM scale items, some were eliminated, others were adapted and several items
specifically from the spa context were included, namely the natural surroundings of spas, the existence of permanent

584
medical assistance, the variety and quantity of treatments, the quality of medicinal waters and the adaptation of the schedules
to the several clients. All the questions were written in a positive manner, as it was suggested by Parasuraman, Zeithaml &
Berry (1994) & Carman (1990). The scale is presented in Figure 1.
Figure 1 | SERVTHERM Scale
Tangibility
1. The Spa’s equipment is modern 2. The decoration of the Spa ****** is simple and welcoming 3. The collaborators of the Spa ***** have a careful and professional look 4. The Spa ******* has a very beautiful natural surrounding 5. The Spa*** is well located
Reliability
6. The employees of the Spa ***** have a good knowledge when dealing with clients (they know the business)
7. When the clients have a problem, the Spa **** solves it 8. The services provided by the Spa ****** are trustful 9. The services of the Spa ***** are provided on schedule
Responsiveness
10. The clients of this Spa ***** are accurately informed about the services’ schedules 11. The employees of this Spa are always willing to help the clients 12. In the Spa **** there is permanent medical assistance 13. The Spa ****** has a great variety and quantity of treatments (medical and beauty)
Safety
14. The medicinal and mineral waters of this Spa ***** have great quality and are in perfect conditions
15. The behavior of the employees of this Spa **** conveys trust to their clients 16. The employees of this Spa are prepared to answer to their clients
Empathy
17. The behavior of the employees in this Spa is friendly and familiar 18. The clients of this Spa **** always receive personal attention 19. The schedules of this Spa ****** are flexible and adapted to the various clients 20. The employees of this Spa ***** have the capacity of recognizing the clients’ needs 21. The problems of the clients in this Spa **** are always solved.
The importance of each component was measured using a Likert Scale of 7, going from “1 – I totally disagree” to “7 – I
totally agree”.
The field work took place between August 11 and October 22, 2010. These dates were chosen because they included a
regular holiday period as well as the time of year spas have more clients. The questionnaires were conducted in six spas’
facilities: Termas de Chaves (n=250;30%), Termas das Taipas (n=69;8,3%); Termas de Caldelas (n=148;17,8%); Termas do
Gerês (n=200;24%); Termas de S. Jorge (n=149;17,9%) and Caldas de Carlão (n=16;1,9%).
In the gathering of information during the field work, the following aspects were considered: a) the information was
collected through a personal interview; b) the interviewed individuals had, at least, a two year experience at the Spa; c) to
667 interviewees it was used a team of interviewers properly trained for that effect and, for the remaining 165 individuals,
the interviews were made by employees of the spas. It took more or less 15 minutes to answer each questionnaire. The
credits of this study are in Table 1.

585
Table 1 | Studies’ Credits
Universe Clients of Spas in Porto and the North of Portugal
Geographical Context Spas in the North of Portugal
Sample Size 832 Inquiries
Sample Error 3,4%
Confidence Level 95%; Z=1,96; p=q=0,5
Information Gathering Method Personal Interview
Field Work Dates August 11 to October 22, 2010
4. Findings and Discussion
4.1. Sample
The main social demographic characteristics of the sample can be observed in table 2. This way, it is shown that the
majority of the interviewees are Portuguese (97,3%) and from the northern region (58,9%) from both sexes (women: 54%
and men: 46%). The customer type is between 62-77 years old ( =62,8 years old; =11,79), married or unmarried couples
(78,1%), with primary education (55,1%), retired (46,9%) and with an income below 600 euros (gross monthly income of
the household).
Table 2 | Sample Description
Variables % Variables %
Sex Marital Status
Male Female
46 Single Widow Divorced/Separated Married/Unmarried Couples
8,7 54 10,2
2,9 78,1
Studies’ level %
Primary Education
Secondary/Technical Education
Higher Education
55,1
25,4
19.2
Professional Status %
Exerts a profession
Unemployed
House keeper
Retired
34.2
2
16.9
46.9
Ages % Income %
From 22 to 45
Between 46 and 61
From 62 to 77
More than 77 years old
Ages / Average
Standard Deviation
7.3 39 43.6 10.2 62.82 11.79
Less than 600 euros
Between 600 and 1.200
From 1.200 to 1.800
More 1.800 euros
Doesn’t know/Doesn’t answer
39.6
22
11.8
15.6
11
Residence % Region of Origin %

586
Portugal
Abroad
97.3
2,3
North
Lisbon
Algarve
Center
Alentejo
58.9
10.4
1.2
23.5
6
4.2. Measurement Scale of Perceived Quality - SERVTHERM
As it was stated before, the SERVTHERM scale of perceived service quality was built from scales already validated in
previous works (Alén,2003; Cronin & Taylor, 1992;1994; Grande et al.,2002; Parasuraman et al.,1985; 1988;1991;
Snoj,1995; Ramsaran-Fowdar,2004; Snoj & Mumel, 2002.
First, we made an exploratory factorial analysis of the main components to determine de SERVTHERM scale’s dimensions.
We verified if the data obtained were adequate for the above mentioned analysis. Both Bartlet’s Sphericity Test (3740.17;
p<0,001) and the index of Kaiser-Meyer-Olkin (0,931) showed a good adequacy of the data to the main components’
analysis. To favour the interpretation of the factors a Varimax rotation was used, which is a standard procedure in similar
investigations in service quality evaluation (Cronin & Taylor, 1992; Falces et al.,1999).
In the first analysis the 21 attributes of the SERVTHERM scale were included, obtaining 4 factors with eigenvalues higher
than 1 and with a variance explained by those factors of 61.07%. After that, the items in which the communality value was
lower than 0,5 were eliminated: The Spa’s equipment is modern; When the clients have a problem, the Spa solves it; The
medicinal and mineral waters of this Spa have great quality and are i n perfect conditions; The collaborators of the Spa have a
careful and professional look; The Spa has a great variety and quantity of treatments; The services of the Spa are provided o n
schedule.
After eliminating these items, we obtained the final solution, which can be observed in table 3. The main components final
analysis shows the existence of 3 factors that explain 60.93% of the total variance, which can be considered acceptable,
thus indicating a good summary of the 15 items set in the original scale. The original SERVQUAL scales’ variance ranged
between 56% and 61.6%, and the SERVPREF’s scales between 29% and 57.5%. In the work of Babakus and Boller (1992),
the variance was 58.3% and in Carman (1990) it was between 61% and 75%; In Alén (2003), in a study applied to the Spa
sector in Spain, the variance was 55.98%.
Table 3 | Exploratory Factorial Analysis of SERVTHERM
Item F1 F2 F3 Com.
The employees of this Spa have a good knowledge when
dealing with clients (they know the business)
0.775 0.653
The employees of this Spa are always willing to help the
clients
0.772 0.658
The behaviour of the employees in this Spa is friendly and
familiar
0.765 0.659
The behavior of the employees of this Spa conveys trust to
their clients
0.709 0.630
The clients of this Spa always receive personal attention 0.684 0.556
The clients of this Spa are accurately informed about the
services’ schedules
0.662 0.485
The services provided by the Spa are trustful 0.638 0.634
The employees of this Spa are prepared to answer to your
clients
0.630 0.631
The decoration of the Spa is simple and welcoming 0.563 0.494
The Spa has a very beautiful natural surrounding 0.504 0.312
In the Spa there is permanent medical assistance 0.776 0.653
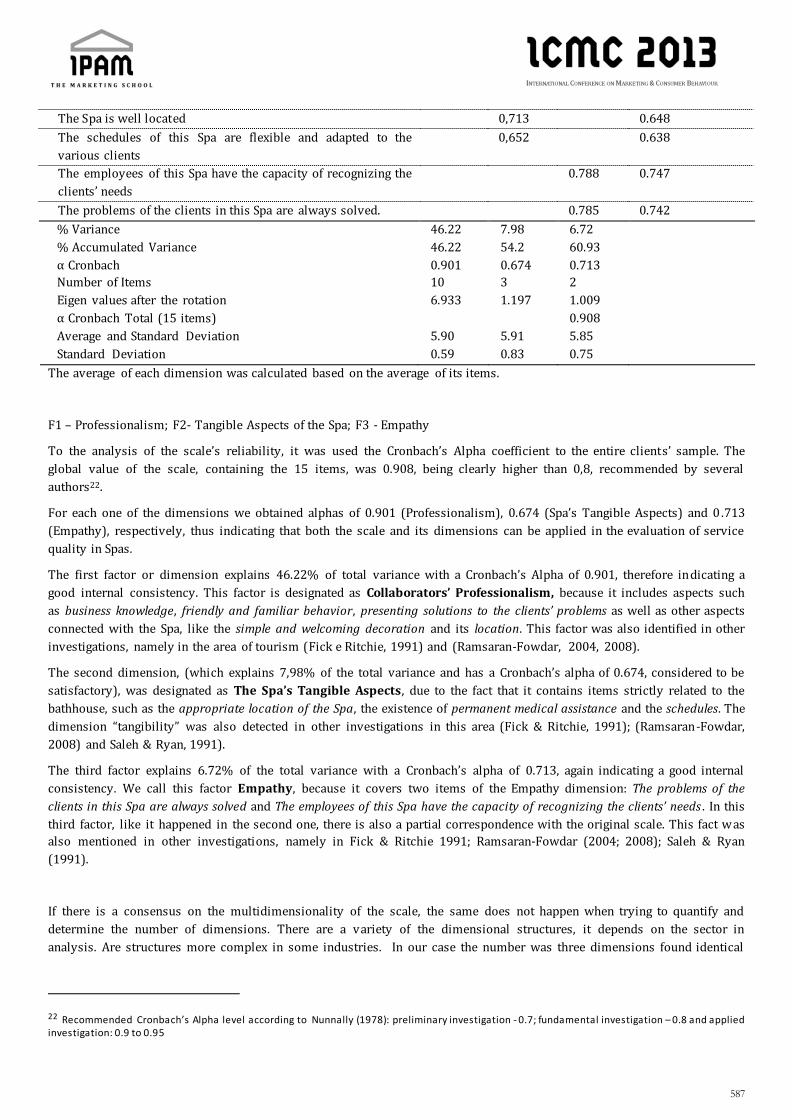
587
The Spa is well located 0,713 0.648
The schedules of this Spa are flexible and adapted to the
various clients
0,652 0.638
The employees of this Spa have the capacity of recognizing the
clients’ needs
0.788 0.747
The problems of the clients in this Spa are always solved. 0.785 0.742
% Variance
% Accumulated Variance
α Cronbach
Number of Items
Eigen values after the rotation
α Cronbach Total (15 items)
Average and Standard Deviation
Standard Deviation
46.22
46.22
0.901
10
6.933
5.90
0.59
7.98
54.2
0.674
3
1.197
5.91
0.83
6.72
60.93
0.713
2
1.009
0.908
5.85
0.75
The average of each dimension was calculated based on the average of its items.
F1 – Professionalism; F2- Tangible Aspects of the Spa; F3 - Empathy
To the analysis of the scale’s reliability, it was used the Cronbach’s Alpha coefficient to the entire clients’ sample. The
global value of the scale, containing the 15 items, was 0.908, being clearly higher than 0,8, recommended by several
authors22.
For each one of the dimensions we obtained alphas of 0.901 (Professionalism), 0.674 (Spa’s Tangible Aspects) and 0 .713
(Empathy), respectively, thus indicating that both the scale and its dimensions can be applied in the evaluation of service
quality in Spas.
The first factor or dimension explains 46.22% of total variance with a Cronbach’s Alpha of 0.901, therefore indicating a
good internal consistency. This factor is designated as Collaborators’ Professionalism, because it includes aspects such
as business knowledge, friendly and familiar behavior, presenting solutions to the clients’ problems as well as other aspects
connected with the Spa, like the simple and welcoming decoration and its location. This factor was also identified in other
investigations, namely in the area of tourism (Fick e Ritchie, 1991) and (Ramsaran-Fowdar, 2004, 2008).
The second dimension, (which explains 7,98% of the total variance and has a Cronbach’s alpha of 0.674, considered to be
satisfactory), was designated as The Spa’s Tangible Aspects, due to the fact that it contains items strictly related to the
bathhouse, such as the appropriate location of the Spa, the existence of permanent medical assistance and the schedules. The
dimension “tangibility” was also detected in other investigations in this area (Fick & Ritchie, 1991); (Ramsaran-Fowdar,
2008) and Saleh & Ryan, 1991).
The third factor explains 6.72% of the total variance with a Cronbach’s alpha of 0.713, again indicating a good internal
consistency. We call this factor Empathy, because it covers two items of the Empathy dimension: The problems of the
clients in this Spa are always solved and The employees of this Spa have the capacity of recognizing the clients’ needs . In this
third factor, like it happened in the second one, there is also a partial correspondence with the original scale. This fact was
also mentioned in other investigations, namely in Fick & Ritchie 1991; Ramsaran-Fowdar (2004; 2008); Saleh & Ryan
(1991).
If there is a consensus on the multidimensionality of the scale, the same does not happen when trying to quantify and
determine the number of dimensions. There are a variety of the dimensional structures, it depends on the sector in
analysis. Are structures more complex in some industries. In our case the number was three dimensions found identical
22 Recommended Cronbach’s Alpha level according to Nunnally (1978): preliminary investigation - 0.7; fundamental investigation – 0.8 and applied investigation: 0.9 to 0.95

588
number was identified in other studies, in particular by Falces et al. (1999), Getty and Thompson (1994) Parasunaman et
al. (1994).
In the analysis of the correlations Pearson between the three dimensions we noticed a positive, moderated and significant
correlation between the first dimension (collaborators’ professionalism) and the second dimension (the spa’s tangible
aspects) [r=0.577; n=346; p<0,001] and with the third dimension (Empathy) [r=0.597; n=346; p<0,001]. The lowest
correlation [r=0.445; n=346; p<0,001] is between the second and the third dimensions. The Cronbach’s alpha of the 15
items was 0.908, and this value is identical to the alpha coefficient of the original scale of Cronin & Taylor (1992) and
Parasuraman et al. (1988). Considering that the main components’ analysis previously made is an exploratory technique,
its validation will be assured through the confirmatory factorial analysis (CFA), having in account that we want to prove
that a specific construct is formed by a set of dimensions or latent factors.
To the confirmatory factorial analysis three factors were considered, which were obtained from the exploratory factorial
analysis. The confirmatory factorial analysis (Figure 2) allowed the verification of the items’ saturation in the factors,
considering them as first rate latent variables and the total scale as second rate latent variables.23 As several authors have
been suggesting, the latent variable or the service quality dimensions must be combined in order to create a single
measure to evaluate service quality, thus implying that service quality is itself a latent variable which enhances the other
service quality dimensions (Kilbourne et al., 2004). In this context, the evaluation of perceived service quality will be built
as a second rate factor generated from first rate factors – Professionalism, Tangibility and Empathy. Figure 1 contains the
final estimates of the second rate model. It can be pointed out that the global adjustment indexes of the GFI model (0,919),
AGFI (0,888), CFI (0,939) are higher or at least very close to the recommended figures. There is also the RMSEA value
(0,069), which is lower than 0,08. The 2 statistics has a low value 229,356; gl= 87) which is significant to a trust level of
95%.
This test analyses the discrepancy between the theoretical model and the reality observed. If a specific model presents a 2
statistically significant, the residues generated are significantly different from zero, thus implying that the data differ from
the theoretical model tested. However, this result is typically found in large samples. For that reason, some authors (Marsh
et al., 1985) suggest not to use this test or to perform the analysis together with other indexes (Kahn, 2006). Consequently,
the absolute index of 2/g.l. (229,356/87) was determined, which was considered acceptable.
23 The weights obtained in the CFA were pondered (proportionally according to their relative weight) to reach a total of 1. Ther efore, it was possible to assure that the composite measure obtained had a minimum and maximum limit identical to each item, w ith the same range.

589
Figure 2 | Confirmatory Factorial analysis
With the data previously presented, it can be stated that the adjustment of the second rate model is acceptable. The
estimated coefficients are all positive and significant to a confidence level of 95%. Therefore, these factors
(Professionalism, Tangibility and Empathy) truly represent the concept underlying the Perceived Service Quality
Evaluation.
5. Conclusions
This work allowed the creation of a measurement scale regarding perceived quality service in Portuguese Spas, which was
designated as SERVTHERM. This scale includes three dimensions: Professionalism; The Spa’s Tangible Aspects and
Empathy.
Our results identify a group of determinant factors connected with clients’ satisfaction in Portuguese Spas. This way, spas
must have well prepared employees, performing their tasks adequately and professionally, while showing some
knowledge about the area. Availability, courtesy, individual and familiar attentions towards the clients are also factors that
should be considered. The clients have to be informed about the timing and duration of their treatments, and these must
be trustful.
The clients of Spas aren’t simply looking for several types of treatments; they are aiming at the possibility of having direct
contact with nature, to enjoy a peaceful atmosphere of great natural beauty. The managers of Spas should also give special
attention to decoration, to the permanent availability of doctors, to define flexible schedules, adapted to all sorts of clients.
GFI=0,919 AGFI=0,888 CFI=0,939 RMSEA=0,069 2(87)=229,356
2/g.l.=2,64

590
Although placed in the original scale, there are some factors that weren’t relevant to the clients when they are determining
the quality of the several services. Therefore, when considering that the equipments and the quality of the waters are not
important factors, this can be explained, on one hand, due to the effort spas have been doing to improve their facilities and
equipments, and, on the other hand, to the quality and diversity of thermal waters, namely in the North of Portugal.
The commitment of spas aiming at solving their problems and fulfill the treatments’ deadlines has not been entirely
recognized, thus suggesting the inexistence of problems during the service delivery process, which can lead to some
depreciation concerning their work. With the development of well being thermal spas and the consolidation of classical
thermalism, a wide range of services has been delivered to the clients, which also contributed to pay less attention to the
great variety and quantity of treatments.
The SERVTHERM scale to measure service quality may be useful for the sector, for many different reasons; it is an
instrument that can be used to improve service quality, because it enhances the positive and negatives aspects mentioned
by clients. If we determine the specific dimensions of perceived quality in thermalism, then we will define some actions
that would be able to improve each one of those dimensions and, consequently, global quality. The scale may be used to
compare the quality in different spas, thus allowing the creation of a quality index for this sector.
Finally, it is necessary to consider some limitations. The first one is connected with the character of the research, which
was applied to the thermal spas’ sector and to a specific region: the North of Portugal. Consequently, the results obtained
cannot be generalized. A second issue is related to the time period of the field work, less than one year, which can lead to
differences in the results, if we consider other time periods. A third aspect has to do with the dimensions obtained. In fact,
this three dimensions’ model must be tested again, with a new clients’ sample, to analyze its validity. A fourth element
refers to the scale validation procedures, due to the use of exploratory and confirmatory factorial analysis to the same
sample, without performing cross validation, i.e., the scales validation in different samples. Finally, we can mention the
inexistence of relevant literature on quality evaluation in the thermalism’ sector services.
In spite of the limitations above mentioned, the SERVTHERM scale may well be used to evaluate service quality in thermal
spas in Porto and the North of Portugal, and it should be developed and validated in order to be used on a national scale.
Bibliography
Alén, G.,2003, Análisis de la calidad de servicios percibida en los estabelecimentos termales:conceptualización, medición y
relación con otras variables de marketing , Phd thesis, Universidad Vigo, Spain.
Alén, G.; Rodríguez,L.,2004, Evaluación de la calidad percibida por los clientes de establecimentos termales a través del
análisis de sus expectativas,Revista Galega de Economía, Vol.13(1/2) pp.1-18.
Babakus, E.;Boller,W.,1992, An Empirical Assessment of the SERVQUAL Scale, Journal of Business Research, Vol.24(3),
pp.253-268.
Carman, M.,1990,Consumer perceptions of service quality:an assessment of the SERVQUAL dimensions, Journal of
Retailing, Vol.66(1)pp.33-55.
Cronin, J.;Taylor, S., 1992, Measuring Service Quality: A Reexamination and Extension, Journal of Marketing, Vol. 56(3),
pp.55-131.
Cronin, J.; Taylor, S., 1994, SERVPERF Versus SERVQUAL: Reconciling Performance-Based and Perceptions-Minus-
Expectations Measurement of Service Quality, Journal of Marketing, Vol. 58(3), pp.125-131.
Eraqui, I.,2006,Tourism services quality (TourServQual) in Egypt - The viewpoints of external and internal customers,
Benchmarking: An International Journal, Vol. 13(4), pp.469-492.
Falces, D.; Sierra, D.; Becerra, G.; Briñol, T.,1999,HOTELQUAL: Una Escala para medir calidad percibida en servicios de
alojamiento, Estudios Turísticos, Vol. 139, pp.95-110.
Fazenda,N.,2008,O turismo da região do Norte de Portugal,Plano Regional de Ordenamento do Território do Norte-PROT-
Norte,pp.1-42.
Fick, R.; Ritchie, B.,1991,Measuring service quality in the travel and tourism industry, Journal of Travel Research,
Vol.30(2),pp.2-9.

591
Frochot, I.; Hughes, H,2000,HISTOQUAL: The development of a historic houses assessment scale, Tourism
Management,Vol.21,pp.157-167.
Getty,M.; Thompson,N.,1994,The relationship between quality, satisfaction, and recommending behavior in lodging
decisions, Journal of Hospitality & Leisure Marketing ,Vol.2(3),pp.3.22.
Ghobadian, A.;Séller,S.; Jones, M.,1994, Service Quality - Concepts and Models,The International Journal of Quality &
Reliability Management, Vol.11(9), pp.43-66.
Grande,F.; Valejo,M.; Moya,D.,2002,Análises de las expectativas de la oferta y la demanda relativas a la cualidade del
servicio en zonas turísticas de interior: implicaciones de gestión,
Estudios Turísticos, Vol.154,pp.79-112.
Kan,M.,2003,ECOSERV - Ecotourists Quality expectations,Annals of Tourism Research,Vol. 30(1), pp.109-124.
Kahn,H.,2006,Factor analysis in counseling psychology research, training, and practice: Principles, advances, and
applications, The Counseling Psychologist, Vol. 34, pp.684-718.
Kandampully,J.,2000,The impact of demand fluctuation on the quality of service: a tourism industry example, Managing
Service Quality, Vol.10(1),pp.10-18.
Kilbourne, W.; Duffy, Ann; Duffy, Michael; Giarchi, George,2004,The applicability of SERVQUAL in cross -national
measurements of heakth-care quality,The Journal of Service Marketing,Vol. 18(7), pp.524-533.
Knutson, B.;Stevens, P.; Wullaert, C.; Patton, M.; Yokoyama, F.,1991,LODGSERV:A service quality index for the lodging
industry,Hospitality Research Journal,Vol.14(2),pp.277-284.
Marsh,W.; Hocevar,D.,1985,Application of confirmatory factor analysis to the study of self -concept:First and Higher order
factor models and their invariance across groups, Psychological Bulletin, Vol.97(3),pp.562-582.
Nunnally, C.,1978, Psychometric theory, McGraw-Hill, New York.
Oliver, L.,1980,A cognitive model of the antecedents and consequences of satisfaction decisions,Journal of Marketing
Research,Vol.17,pp.460-469.
Parauraman,A.; Zeithaml, V.;Berry, L.,1985, A conceptual model of service quality and its implications for future
research,Journal of Marketing, Vol. 49(4), pp.41-50.
Parauraman, A.; Zeithaml, V.;Berry, L.,1988,SERVQUAL: A multiple-item scale for measuring consumer perceptions of
service quality,Journal of Retailing, Vol. 64(1),pp.12-40.
Parasuraman, A.; Berry, L.; Zeithaml, V.,1991,Perceived service quality as a customer-based performance measure: An
empirical examination of organizational barriers using an extended service quality model", Human Resource
Management, Vol.30(3),pp. 335-364.
Parasuraman, A.;Zeithaml, V.; Berry, L.,1994,A Reassessment of Expectations as a Comparison Standard in Measuring
Service Quality: Implications for Further Research, Journal of Marketing, Vol.58, pp.111-124.
Programa de Acção de Enfoque Temático – “Turismo de Saúde e Bem-estar” para o Porto e Norte de Portugal - Agenda
Regional do Turismo, Julho 2009:28.
Ramsaran-Fowdar,R.,2004,Identifying Health Care Quality Attributes, Journal of Health and Human Services
Administration,Vol.27(3/4),pp.428-443.
Ramsaran-Fowdar, R.,2008,The relative importance of service dimensions in a healthcare setting, International Journal of
Health Care, Vol.21(1), pp.104-124.
Saleh, F.; Ryan, C.,1991,Analysing service quality in the hospitality industry using the SERVQUAL model, The Service
Industries Journal, Vol. 11(3), pp.324-345.
Silva,J.;Mendes,J.;Guerreiro,M,,2001,Construção de indicadores de avaliação da qualidade no turismo,Universidade do
Algarve,Faro.
Snoj,B.,1995,The profiles of importance of service quality components in health spas, Dear Mark,Col.34(2),pp.95-104.

592
Snoj,B.; Mumel,D.,2002,The measurement of perceived in service quality-The case of health spas in Slovenia, Journal of
Vacation Marketing,Vol.8(4),pp.362-379.
Stevens, P.; Knutson, B.; Patton, M.,1995,DISNESERV: A tool for measuring service quality in restaurants, Cornel Hotel and
Restaurant Administration Quarterly, Vol. 36(2), pp.56-60.
UNWTO, [http://www.unwto.org/facts/eng./vision.htm],(site accessed 22 February 2009).
Weiermair, K.,2000,Tourists' perceptions towards and satisfaction with service quality in the cross -cultural service
encounter:implications for hospitality and tourism management,Managing Service Quality, Vol.10(6),pp.397-409.

593
Session 16

594
A importância relativa da emoção e da razão no
processo de tomada de decisão do consumidor Emoção; Razão; Comportamento do consumidor; Processo de decisão; Envolvimento; Es tímulos do meio; Tendência de
compra
Adelino Cardoso, IPAM – The Marketing School, [email protected]
Ferreira Cascão, IPAM – The Marketing School, [email protected]
Mónica Pérez, URJC, [email protected]
Abstract
The models of consumer decision-making have evolved from a perspective essentially grounded on the rational basis to
the integration of emotions in the decision process. The Homo Economicus, who makes objective choices and finds the
necessary information about each alternative, has been progressively replaced to the thinking man, who is able to process
cognitively the information gathered from the environment. Finally, this thinking man has been progressively replaced to
the feeling man, who integrates the emotions in the decision process.
Nevertheless, the emotions integration in the consumer decision-making process has not been a pacific accepted by all the
researchers. The followers of the traditional paradigm defend that the cognition precedes the emotion, being the latter
consequence of the former. The defenders of the emotion’s primacy claim that the first decision of the consumer is
emotional, justifying subsequently his decision rationally. Other researchers advocate the existence of two independent
decision processes: a rational and an emotional.
This research supports the complementarity between rationality and emotion in consumer decision process. It is further
demonstrated that the rational or emotional preponderance of the consumer purchase decision is related to the
interaction between the relative importance of emotion and rationality at the level of environmental stimuli
(products/services), the degree of involvement (emotional and rational intensity) of the products and services and, the
consumer buying trends (rational or emotional preponderance).
The presented studies have shown that the independent variables: relative importance of emotions (E) and reason (R) in
terms of products and services, measured by the ratio E/R and the degree of involvement of the same products and
services, measured by the ratio (E+R)/2, have a major effect on the rational or emotional preponderance and intensity on
the purchase decision. The independent variable: consumer buying trend, although contributing to the strengthening of the
rational or emotional component in the purchasing decision, is not sufficient to determine the rational or emotional
preponderance of buying decision, in both high and low involvement products.
INTRODUÇÃO
Perceber como reage o consumidor aos diferentes estímulos: produto, preço, ponto de venda, promoção e compreender
que outras forças quer intrínsecas ao comprador quer inerentes ao seu meio envolvente, interferem no seu processo de
tomada de decisão de compra, tem constituído uma questão central em Marketing. As respostas dos compradores aos
referidos estímulos representam a parte mais visível da solução para esta questão. Menos percetível é o que se passa na
“caixa negra” do consumidor, ou seja, que fatores interferem no seu comportamento de compra, aspetos fundamentais
para o compreender e influenciar.
Tem, assim, sido objeto de estudo e de controvérsia a importância atribuída pelos investigadores ao papel da razão e da
emoção no processo de decisão do consumidor.

595
O paradigma dominante (tradicional) considera que o consumidor utiliza uma elevada deliberação e análise nas suas
tomadas de decisão, que se processam pela capacidade cognitiva e habilidades para fazer escolhas de consumo (Simon,
1955). Esta perspetiva racional de consumo encontrou sustentação na teoria da ação racional (Fishbein e Ajzen, 1975) e
na teoria do comportamento planeado (Ajzen, 1988, 2006).
Neste quadro, o consumidor foi entendido, numa primeira perspetiva, como Homo economicus, sendo considerado
psicologicamente racional porque faz escolhas objetivas e desapaixonadas, não influenciadas por preconceitos ou outras
influências irracionais, e economicamente racional porque encontra as informações que existem sobre cada alternativa.
Num segundo momento, esta perspetiva centrada, essencialmente, nos resultados do processo de escolha e na decisão
lógica visando a maximização da utilidade, cedeu espaço à perspetiva do processamento da informação, ao homem
pensante. Esta mudança decorreu da convicção de que as escolhas são complexas pelo que o comportamento de decisão é
não só influenciado pelo esforço mental e resultado da escolha em termos de utilidade, mas também pelas alternativas de
escolha. Esta perspetiva de processamento racional da informação foi suportada pelas teorias BDT – behavior decision
theory (Payne, 1984) e prospect theory (Tversky e Kahneman, 1991).
A predominância da natureza racional do consumidor foi, entretanto, questionada por excluir muitos comportamentos que
não seguem o princípio de que os consumidores deliberam antes de decidir atuar. Estão neste caso os designados “hábitos”
que podem ocorrer automaticamente e independentemente das atitudes (Eagly e Chaiken, 1993; Verplanken e Aarts,
1999) e os comportamentos deduzidos da relação direta atitude-comportamento (Fazio,1986).
Por outro lado o interesse pelo papel das emoções fez emergir uma corrente da pesquisa alternativa à perspetiva
tradicional de tomada de decisão, vista como racional e desapaixonada. Esta nova corrente, associada à pesquisa de novos
tipos de compra, como a compra impulsiva, introduziu a perspetiva emocional no processo de tomada de decisão. O
consumidor começa, assim, a ser entendido não apenas como um homem pensante (thinking man), mas também como um
homem sensível (feeling man).
O papel das emoções começou, assim, a ser tímida mas consistentemente reconhecido a partir da década de oitenta do
século passado, procurando-se integrá-las no processo de tomada de decisão. A corrente tradicional defendia que os afetos
só ocorrem depois do processamento racional, ou seja, são dependentes da razão (Lazarus, 1984). Contrariamente Zajonc
(1980, 1984), postulava que a cognição não só não necessita sempre de preceder a emoção mas também que esta pode
constituir um sistema de processamento separado.
Refletindo esta perspetiva Elliott (1998), considera que uma parte significativa das decisões do consumidor não s ão
explicadas por um processo de decisão cognitivo e que as escolhas não são feitas só pela utilidade dos produtos, mas
também pelo seu significado simbólico. Propõe, por isso, um modelo alternativo de processamento da informação do
consumidor, baseado mais num processo emocional do que numa avaliação cognitiva: Modelo de escolha guiado pela
emoção (a model of emotion-driven choice).
Por sua vez, Damásio (1995,2000,2010), inserido na corrente das neurociências, mostra-se crítico relativamente à ideia
tradicional que defende que as decisões sensatas provêm de uma “cabeça fria” e que as emoções e a razão se misturam do
mesmo modo que a água e o azeite. Defende, assim, que as regiões cerebrais de “alto nível” e as de “baixo nível”, desde os
córtices pré-frontais ao hipotálamo e ao tronco cerebral cooperam umas com as outras.
Na mesma linha, Massey (2002), interpretando as pesquisas das neurociências, conclui que somos uma adição de mente
racional numa pré-existente base emocional. Temos, assim, um cérebro emocional e um cérebro racional que trabalham
em conjunto para coordenar os “imputs” dos sentidos e gerar sentimentos subjetivos e estados emocionais que
influenciam a subsequente cognição e comportamento.
Também Chaudhuri (2006), suportado na teoria do cérebro “triúnico” (triune brain) de Mclean (1973,1990), defende a
complementaridade da emoção e da razão no conhecimento do mundo em geral e ao nível do consumo em particular.
Noutra linha de investigação (Verplanken e Herabadi, 2001; Cardoso e Cascão, 2009), relevaram-se tendências enraizadas
na personalidade humana que permitem distinguir consumidores tendencialmente mais planeados (racionais) ou
tendencialmente mais impulsivos (emocionais).
Seguindo esta linha de investigação, o presente estudo propõe-se explorar a complementaridade da emoção e da razão no
processo de tomada de decisão do consumidor, aprofundando, a importância relativa de cada uma destas dimensões, ao
nível dos estímulos do meio (produtos/serviços) e das diferenças individuais (tendências de c ompra dos consumidores).

596
1. OBJETIVOS DA PESQUISA
A temática da importância da emoção e da razão no processo de tomada de decisão do consumidor não está estabilizada e
é ainda bastante influenciada por fenómenos de “moda”, sem adequada sustentação empírica.
A emoção tem sido, assim, apresentada, no processo de tomada de decisão do consumidor, como alternativa autónoma à
razão, de que é exemplo o modelo de escolha guiado pela emoção (Elliott, 1998), como primeira decisora em modelos de
dupla decisão, como no modelo de processamento de escolha de dupla decisão para produtos experienciais (Kwortnik, 2003)
ou como decisora determinante da escolha do consumidor, remetendo para a razão o papel secundário de justificação da
decisão já assumida pela emoção (Cherry, 2007).
As mais recentes pesquisas, vindas nomeadamente do campo das neurociências, preconizam que emoção e razão, embora
sejam dimensões diferenciadas e com localizações autónomas a nível cerebral, graças à rede de interconexões neurais,
trabalham em conjunto, assumindo, assim, um papel complementar no processo de decisão.
A análise da complementaridade destas dimensões no processo de tomada de decisão do consumidor levou Buck e
Chaudhuri (1994) e Buck et al. (2004) a introduzirem o conceito de “importância relativa” para diferenciar a
preponderância emocional ou racional dos estímulos do meio – produtos e serviços - na decisão do consumidor.
A presente pesquisa propõe-se, assim, aceitando a premissa de que emoção e razão se combinam e complementam no
processo de decisão de compra do consumidor, contribuir para a clarificação da importância relativa de cada uma destas
dimensões neste processo. Este estudo pode, assim, ser sintetizado no seguinte problema de pesquisa: Existe uma relação
entre a preponderância emocional ou racional da decisão de compra e a combinação da importância relativa da emoção e da
razão ao nível dos estímulos – produtos e serviços - e da tendência de compra do consumidor?
1.1 Objetivo Geral
Demonstrar que a preponderância racional ou emocional da decisão de compra do consumidor se relaciona com a
interação da importância relativa da Emoção e da Razão, ao nível dos estímulos do meio (produtos/serviços), do
grau de envolvimento (intensidade da emoção e da razão) dos produtos e serviços e da tendência de compra do
consumidor
1.2. Objetivos específicos
Medir a importância relativa da Emoção e da Razão ao nível dos produtos e serviços através do rácio E/R
(Emoção/Razão) e verificar a sua influência na predominância emocional ou racional da decisão de compra;
Medir o grau de envolvimento dos produtos e serviços através do rácio (E+R)/2 e verificar a sua influência na
predominância emocional ou racional da decisão de compra;
Medir a preponderância da Emoção ou da Razão ao nível da “Tendência de Compra do Consumidor” e verificar a sua
influência na predominância emocional ou racional da decisão de compra;
Verificar as variações da preponderância da Emoção ou da Razão ao nível da “Decisão de Compra” (variável
dependente), decorrentes das variações conjugadas da preponderância da Emoção ou da Razão ao nível da
tendência de compra dos consumidores e do Rácio E/R e do grau de envolvimento (E+R)/2) dos produtos/serviços
(variáveis independentes).
A Influência da Importância Relativa da Emoção e da Razão ao nível dos Produtos e Serviços
As dimensões racionais e emocionais dos produtos e serviços têm uma importância relativa diferenciada
consoante se trate de produtos e serviços de natureza mais utilitária, hedónica ou experiencial. Assim os produtos e
serviços mais utilitários deverão estar associados a decisões de compra mais racionais do que os de natureza hedónica e
experiencial que contribuirão para decisões mais emocionais.
Para medir a importância relativa da emoção e da razão ao nível dos estímulos do meio - produtos e serviços –
utilizaremos, inspirados em Chaudhuri (2006), o rácio “Emoção/Razão” (E/R), considerando emoção a vertente hedónica,

597
afetiva e espontânea na aquisição destes produtos enquanto a razão representará a sua face utilitária, qualitativa, refletida
e planificada.
Considerando que o peso emocional ou racional dos produtos e serviços influenciará a preponderância emocional
ou racional da decisão de compra, estabelece-se a primeira hipótese de pesquisa:
Hipótese 1: A importância relativa da emoção e da razão ao nível dos produtos e serviços influencia a
preponderância emocional ou racional da decisão de compra.
A Influência da Importância Relativa da Emoção e da Razão ao nível do Envolvimento dos Produtos e Serviços
Há produtos e serviços que se caracterizam por um alto grau de envolvimento, ou seja, são elevados em
importância emocional e racional, enquanto outros apresentam um mais baixo grau de envolvimento, sendo-lhes atribuída
menor relevância emocional e racional.
Com efeito, a relevância atribuída aos produtos e serviços não assenta apenas numa base cognitiva ou racional,
enfatizada por alguns autores (Celsi e Oslon, 1988; Hsu e Lee, 2003; Lamb et al., 2004; Babu e Manoj, 2009), mas também
numa base emocional, havendo autores como Park e Young (1986), a defenderem a existência de dois tipos de
envolvimento: “cognitivo” e “afetivo”.
Por sua vez Chaudhuri (2006), na sequência de estudos anteriores (Buck e Chaudhuri, 1994) considerou os
produtos com elevado e baixo envolvimento, consoante a média conjunta de afeto e razão - (A+R)/2 – é elevada ou baixa.
Nesta perspetiva produtos com mais elevado envolvimento serão elevados em emoção e razão e produtos com mais baixo
envolvimento serão baixos em emoção e razão.
Suportados em Chaudhuri (2006), assumimos na presente pesquisa, como padrão de referência para considerar o
“Alto” e “Baixo” grau de envolvimento dos produtos, a média conjunta da emoção e da razão – (E+R)/2 .
Considera-se, assim, que os produtos com “Alto” grau de envolvimento estarão associados a decisões de compra
de maior intensidade emocional e racional e, consequentemente a menor preponderância de uma destas dimensões. Por
sua vez os produtos com “Baixo” grau de envolvimento estarão associados a menor intensidade emocional e racional na
decisão de compra, reduzindo, também a preponderância duma destas dimensões. Formulam-se, assim, a partir desta
premissa as seguintes hipóteses de estudo:
Hipótese 2 – O alto grau de envolvimento dos produtos e serviços reduz a preponderância emocional
ou racional da decisão de compra.
Hipótese 3 – O baixo grau de envolvimento dos produtos e serviços reduz a preponderância
emocional ou racional da decisão de compra.
A Influência da tendência de compra do consumidor
A tendência de compra do consumidor que encontra o seu enraizamento na personalidade do consumidor
(Verplanken e Herabadi, 2001; Cardoso e Cascão, 2009), constitui uma diferença indivi dual bastante fiável na previsão de
comportamentos de compra mais impulsivos, determinados por ativações emocionais fortes e racionais baixas, ou mais
planeados, determinados por ativações racionais fortes e emocionais baixas.
A tendência de compra constituirá, assim, uma variável influente na decisão de compra do consumidor como se
propõe na hipótese seguinte:
Hipótese 4 – A preponderância emocional ou racional da tendência de compra do consumidor
influencia a preponderância emocional ou racional da decisão de compra.
A interação das variáveis
Considerando que as três variáveis referidas têm individualmente uma influência própria (influência relativa) no
comportamento do consumidor, a interação das três terá um impacto determinante na predominância emocional ou
racional da decisão de compra.

598
Considera-se, assim, que a tendência de compra do consumidor, associada a um “Alto” ou “Baixo” grau de
envolvimento dos produtos e serviços (elevados ou baixos em emoção e razão), terá algum significado na decisão de
compra. Com efeito, tratando-se de produtos e serviços em que o peso emocional e racional se equilibra, ganhará
relevância na decisão do consumidor a sua tendência para agir de forma mais emocional ou mais racional.
Formulam-se com base nesta premissa as seguintes hipóteses:
Hipótese 5 – A decisão de compra de produtos e serviços de alto envolvimento é tendencialmente
mais emocional nos consumidores com tendência de compra preponderantemente emocional do que nos
consumidores com tendência de compra preponderantemente racional.
Hipótese 6 – A decisão de compra de produtos e serviços de baixo envolvimento é tendencialmente
mais emocional nos consumidores com tendência de compra preponderantemente emocional do que n os
consumidores com tendência de compra preponderantemente racional.
Por outro lado, a preponderância emocional e a preponderância racional dos produtos e serviços (Rácio E/R),
associada a um “Baixo” grau de envolvimento, será o fator determinante da decisão, independentemente da tendência de
compra do consumidor. Com efeito, sendo baixa a relevância para o consumidor destes produtos e serviços, ganhará peso
na decisão a importância relativa da emoção e da razão ao nível dos produtos e serviços.
Tendo presentes os referidos pressupostos propomo-nos verificar as seguintes hipóteses:
Hipótese 7 – A preponderância da emoção é superior à da razão na decisão de compra de produtos e
serviços altos em rácio E/R e baixos em grau de envolvimento quer quando a prepon derância da tendência
de compra do consumidor é emocional quer quando é racional.
Hipótese 8 – A preponderância da razão é superior à da emoção na decisão de compra de produtos e
serviços baixos em rácio E/R e baixos em grau de envolvimento quer quando a preponderância da tendência
de compra do consumidor é emocional quer quando é racional.
2. METODOLOGIA
2.1. Identificação da população e definição da amostra
O presente estudo teve como população o conjunto dos estudantes da Licenciatura em Gestão de Marketing do
IPAM – Instituto Português de Administração de Marketing, inscritos no ano letivo 2010/2011 na Escola de Lisboa.
Para a constituição da amostra foram selecionados aleatoriamente, de entre um total potencial de 486 alunos
inscritos, todos os que se disponibilizaram para participar na resposta aos Questionários, num total de 283.
Foram considerados inválidos onze Questionários pelo que a amostra final corresponde à totalidade dos
Questionários corretamente preenchidos num total de 272, sendo constituída por 61% elementos do sexo masculino e
39% do sexo feminino com a seguinte distribuição etária: 43% (18-24 anos), 18% (25-30 anos), 14% (31-35 anos), 25% (>
35 anos).
2.2. Os instrumentos de pesquisa
Foi construído um Questionário de Investigação integrando as várias escalas relativas à verificação das variáveis
em análise, tendo-se, para o feito, realizado pré-testes junto de 17 estudantes do Ensino Superior da área de Letras, não se
tendo verificado nenhuma dificuldade de entendimento e de preenchimento das escalas relativas à caracterização
emocional e racional dos produtos e serviços e à tendência de compra. No que respeita à escala de caracterização da
decisão de compra, verificaram-se dificuldades em emitir respostas durante o tempo de exposição das imagens, que era de
cinco segundos. Houve, assim, necessidade de corrigir este tempo, passando, na versão final, para dez segundos.
Para a escolha dos 16 produtos e serviços que integram as escalas referidas, partiu-se de um conjunto de 40,
selecionados a partir de listagens de produtos e serviços que haviam sido caracterizados pela sua natureza mais hedónica
ou utilitária por outros investigadores (Kwortnik, Jr.,2003; Chaudhuri, 2006).
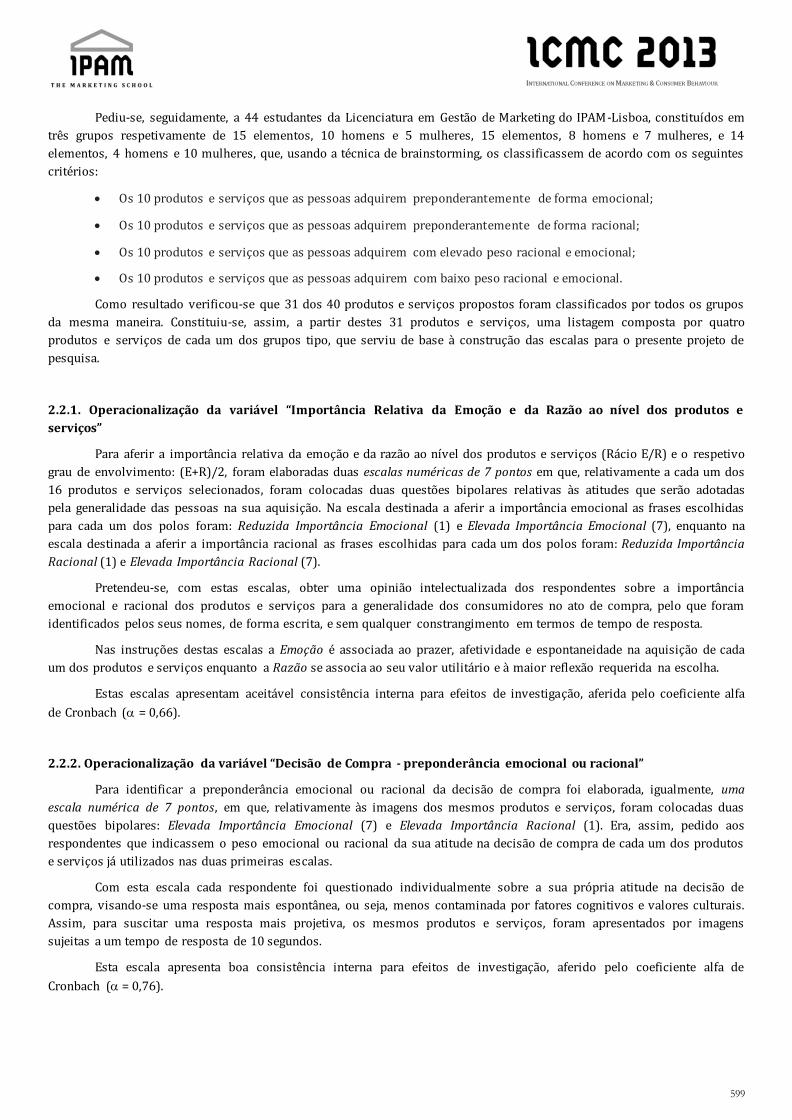
599
Pediu-se, seguidamente, a 44 estudantes da Licenciatura em Gestão de Marketing do IPAM-Lisboa, constituídos em
três grupos respetivamente de 15 elementos, 10 homens e 5 mulheres, 15 elementos, 8 homens e 7 mulheres, e 14
elementos, 4 homens e 10 mulheres, que, usando a técnica de brainstorming, os classificassem de acordo com os seguintes
critérios:
Os 10 produtos e serviços que as pessoas adquirem preponderantemente de forma emocional;
Os 10 produtos e serviços que as pessoas adquirem preponderantemente de forma racional;
Os 10 produtos e serviços que as pessoas adquirem com elevado peso racional e emocional;
Os 10 produtos e serviços que as pessoas adquirem com baixo peso racional e emocional.
Como resultado verificou-se que 31 dos 40 produtos e serviços propostos foram classificados por todos os grupos
da mesma maneira. Constituiu-se, assim, a partir destes 31 produtos e serviços, uma listagem composta por quatro
produtos e serviços de cada um dos grupos tipo, que serviu de base à construção das escalas para o presente projeto de
pesquisa.
2.2.1. Operacionalização da variável “Importância Relativa da Emoção e da Razão ao nível dos produtos e
serviços”
Para aferir a importância relativa da emoção e da razão ao nível dos produtos e serviços (Rácio E/R) e o respetivo
grau de envolvimento: (E+R)/2, foram elaboradas duas escalas numéricas de 7 pontos em que, relativamente a cada um dos
16 produtos e serviços selecionados, foram colocadas duas questões bipolares relativas às atitudes que serão adotadas
pela generalidade das pessoas na sua aquisição. Na escala destinada a aferir a importância emocional as frases escolhidas
para cada um dos polos foram: Reduzida Importância Emocional (1) e Elevada Importância Emocional (7), enquanto na
escala destinada a aferir a importância racional as frases escolhidas para cada um dos polos foram: Reduzida Importância
Racional (1) e Elevada Importância Racional (7).
Pretendeu-se, com estas escalas, obter uma opinião intelectualizada dos respondentes sobre a importância
emocional e racional dos produtos e serviços para a generalidade dos consumidores no ato de compra, pelo que foram
identificados pelos seus nomes, de forma escrita, e sem qualquer constrangimento em termos de tempo de resposta.
Nas instruções destas escalas a Emoção é associada ao prazer, afetividade e espontaneidade na aquisição de cada
um dos produtos e serviços enquanto a Razão se associa ao seu valor utilitário e à maior reflexão requerida na escolha.
Estas escalas apresentam aceitável consistência interna para efeitos de investigação, aferida pelo coeficiente alfa
de Cronbach ( = 0,66).
2.2.2. Operacionalização da variável “Decisão de Compra - preponderância emocional ou racional”
Para identificar a preponderância emocional ou racional da decisão de compra foi elaborada, igualmente, uma
escala numérica de 7 pontos, em que, relativamente às imagens dos mesmos produtos e serviços, foram colocadas duas
questões bipolares: Elevada Importância Emocional (7) e Elevada Importância Racional (1). Era, assim, pedido aos
respondentes que indicassem o peso emocional ou racional da sua atitude na decisão de compra de cada um dos produtos
e serviços já utilizados nas duas primeiras escalas.
Com esta escala cada respondente foi questionado individualmente sobre a sua própria atitude na decisão de
compra, visando-se uma resposta mais espontânea, ou seja, menos contaminada por fatores cognitivos e valores culturais.
Assim, para suscitar uma resposta mais projetiva, os mesmos produtos e serviços, foram apresentados por imagens
sujeitas a um tempo de resposta de 10 segundos.
Esta escala apresenta boa consistência interna para efeitos de investigação, aferido pelo coeficiente alfa de
Cronbach ( = 0,76).

600
2.2.3. Operacionalização da variável “tendência de compra”
Para operacionalizar a variável “Tendência de Compra” foi adotada a Escala de Tendência Geral de Compra por
Impulso de Verplanken e Herabadi (2001), já anteriormente adaptada à população portuguesa (Cardoso e Cascão, 2009).
Com efeito, para além de se ter revelado um instrumento válido para medir o enraizamento da tendência de compra na
personalidade, testada em contexto europeu (Verplanken e Herabadi, 2001; Cardoso e Cascão, 2009) e indonésio
(Herabadi, 2003), é composta por duas subescalas, uma cognitiva e outra afetiva, integrando, assim, as duas dimensões
subjacentes, no presente estudo, à identificação da tendência de compra do consumidor.
No total esta Escala é composta por 20 itens, oito cotados em sentido inverso, correspondendo dez à subescala
cognitiva (reflexão, utilidade, planeamento e deliberação) e os outros dez à subescala afetiva (sentimento de prazer,
afetividade, excitação, falta de controlo e arrependimento).
Os valores elevados obtidos nesta escala, correspondendo a ativações emocionais fortes e cognitivas fracas,
identificam uma tendência de compra preponderantemente emocional e os valores baixos, correspondendo a ativações
emocionais fracas e cognitivas fortes, identificam uma tendência de compra preponderantemente racional.
Na aplicação ao presente estudo foi adotada uma modalidade alternativa à escala de Likert, pela facilidade de
decisão que proporciona ao respondente. Trata-se de uma escala bietápica de seis pontos, cuja variação vai de
discordância (1 – Totalmente, 2 – Muito, 3 – Pouco) a concordância (4 – Pouco; 5 – Muito, 6 – Totalmente), induzindo num
primeiro momento um raciocínio dicotómico e em seguida de intensidade (Albaum, 1997).
Esta escala apresenta boa consistência interna para efeitos de investigação, aferido pelo coeficiente alfa de
Cronbach ( = 0,88).
2.3. Análise de dados
A análise estatística foi efetuada com o apoio do SPSS (Statistical Package for the Social Sciences) versão 18.0 para
Windows.
Para testar as hipóteses enunciadas usou-se como referência para aceitar ou rejeitar a hipótese nula um nível de
significância (α) ≤ 0,05.
Para testar a hipótese nº 1 usou-se o modelo de regressão linear simples. Os seus pressupostos foram analisados,
nomeadamente o pressuposto de independência dos resíduos (teste de Durbin-Watson), normalidade dos resíduos
(através do teste de Kolmogorov-Smirnov) e linearidade da relação entre a variável independente e a variável dependente,
e encontravam-se satisfeitos.
As hipóteses nº 2 e 3 foram analisadas com o coeficiente de correlação paramétrico de Pearson pois as variáveis
são de tipo quantitativo e as amostras têm dimensão superior a 30 pelo que se aceitou a normalidade de distribuição dos
valores de acordo com o teorema do limite central.
As hipóteses nº 4 a nº 8 foram analisadas com o teste t de Student para amostras independentes. Os pressupostos
deste teste foram analisados, designadamente o pressuposto de normalidade de distribuição dos valores e o pressuposto
de homogeneidade de variâncias. Este último foi analisado com o teste de Levene. Nos casos em que este pressuposto não
se encontrava satisfeito utilizou-se o teste t de Student com correção de Welch.
2.4. Resultados
No presente capítulo serão analisadas as variáveis que integram o presente estudo: Importância Relativa da
Emoção e da Razão ao nível dos produtos e serviços – preponderância emocional ou preponderância racional; Grau de
Envolvimento dos produtos e serviços – alto Envolvimento e baixo Envolvimento; Tendência de Compra dos
Consumidores – preponderância emocional ou preponderância racional; Decisão de Compra dos Consumidores -
preponderância emocional ou preponderância racional e a verificação das hipóteses formuladas.
O Gráfico seguinte permite visualizar a importância relativa da emoção e da razão ao nível dos produtos e
serviços, medida através do rácio E/R, considerando-se que os produtos e serviços com rácio superior a 1 são
preponderantemente emocionais e os produtos com rácio inferior a 1 preponderantemente racionais.

601
Gráfico 1 – Rácio E/R
O Gráfico 2 identifica o grau de envolvimento dos produtos, medido através do rácio (E+R)/2, considerando -se com “Alto”
envolvimento os produtos e serviços com rácio superior a 4,5 e com “Baixo” envolv imento e os produtos com rácio inferior
a 3,5. Esta opção decorre da necessidade de considerar com “Alto” envolvimento apenas os produtos/serviços com elevado
peso emocional e racional e com “Baixo” envolvimento apenas os produtos/serviços com baixo peso emocional e racional.
Os produtos/serviços cujo rácio se situa entre 3,5 e 4,5 não cumprem esta dupla condição.
Gráfico 2 – Grau de envolvimento
O Gráfico 3 explicita os resultados obtidos na Escala de caracterização da decisão de compra, considerando-se que a
decisão de compra foi preponderantemente emocional nos produtos com valores médios superiores a 5 e
preponderantemente racional nos produtos com valores médios inferiores a 3. Esta opção decorre da necessidade de
distinguir os Produtos/serviços cuja decisão de compra é claramente mais emocional ou mais racional. Nos
produtos/serviços cuja decisão de compra se situa entre 3 e 5 o peso das componentes emocionais e racionais equilibram -
se, ou seja, não predominam uma sobre a outra.
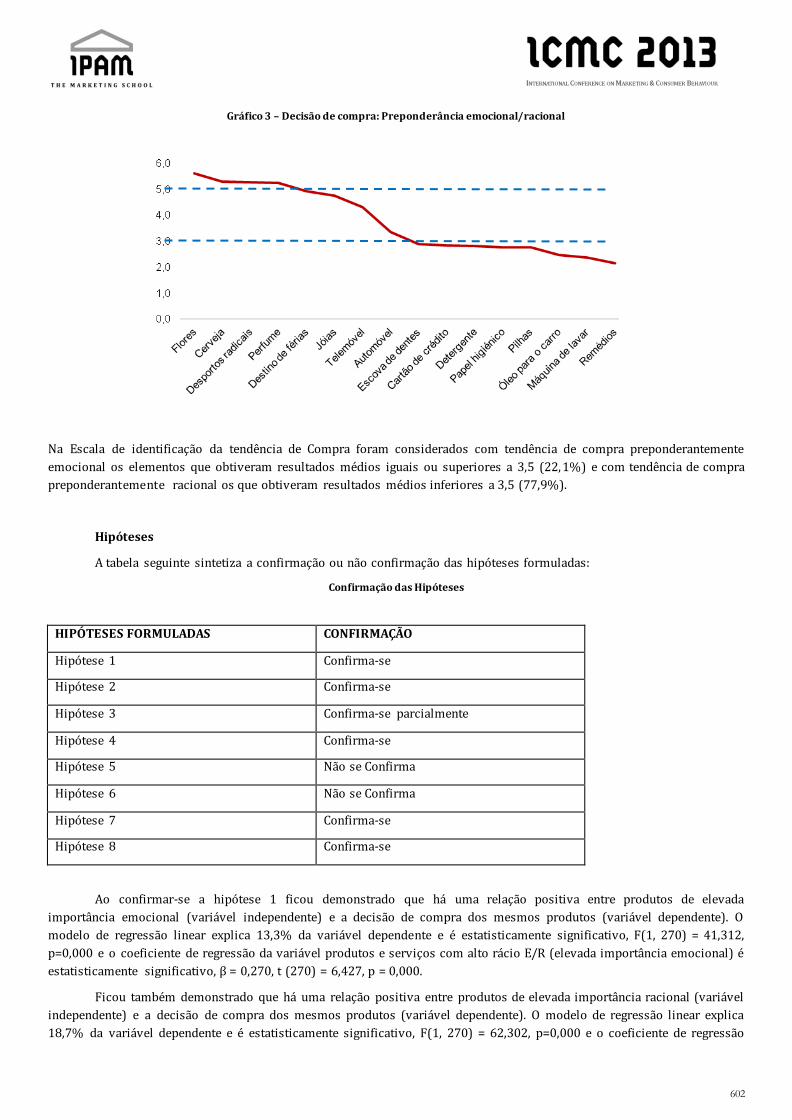
602
Gráfico 3 – Decisão de compra: Preponderância emocional/racional
Na Escala de identificação da tendência de Compra foram considerados com tendência de compra preponderantemente
emocional os elementos que obtiveram resultados médios iguais ou superiores a 3,5 (22, 1%) e com tendência de compra
preponderantemente racional os que obtiveram resultados médios inferiores a 3,5 (77,9%).
Hipóteses
A tabela seguinte sintetiza a confirmação ou não confirmação das hipóteses formuladas:
Confirmação das Hipóteses
HIPÓTESES FORMULADAS CONFIRMAÇÃO
Hipótese 1 Confirma-se
Hipótese 2 Confirma-se
Hipótese 3 Confirma-se parcialmente
Hipótese 4 Confirma-se
Hipótese 5 Não se Confirma
Hipótese 6 Não se Confirma
Hipótese 7 Confirma-se
Hipótese 8 Confirma-se
Ao confirmar-se a hipótese 1 ficou demonstrado que há uma relação positiva entre produtos de elevada
importância emocional (variável independente) e a decisão de compra dos mesmos produtos (variável dependente). O
modelo de regressão linear explica 13,3% da variável dependente e é estatisticamente significativo, F(1, 270) = 41,312,
p=0,000 e o coeficiente de regressão da variável produtos e serviços com alto rácio E/R (elevada importância emocional) é
estatisticamente significativo, β = 0,270, t (270) = 6,427, p = 0,000.
Ficou também demonstrado que há uma relação positiva entre produtos de elevada importância racional (variável
independente) e a decisão de compra dos mesmos produtos (variável dependente). O modelo de regressão linear explica
18,7% da variável dependente e é estatisticamente significativo, F(1, 270) = 62,302, p=0,000 e o coeficiente de regressão

603
da variável produtos e serviços com baixo rácio E/R (elevada importância racional) é estatisticamente significativo, β =
0,989, t (270) = 7,893, p = 0,000.
A correlação entre produtos e serviços de alto envolvimento e a preponderância emocional/racional da decisão de
compra dos mesmos produtos e serviços é negativa, muito fraca e não significativa, r=-0,106, confirmando-se, assim, a
hipótese 2.
A correlação entre produtos e serviços de baixo envolvimento e a preponderância emocional/racional da decisão
de compra dos mesmos produtos e serviços é negativa, fraca e significativa, r=-0,299, confirmando-se, assim, parcialmente
a hipótese 3.
Os consumidores com tendência de compra predominantemente emocional têm uma decisão de compra mais
emocional do que os consumidor com tendência de compra predominantemente racional (3,88 versus 3,68) sendo a
diferença estatisticamente significativa, t(270) = -2,598, p=0,010. Confirma-se, assim, a hipótese 4.
Na compra de produtos de alto envolvimento os consumidores com tendência de compra predominantemente
emocional têm uma decisão de compra tendencialmente mais emocional do que os consumidores com tendência de
compra predominantemente racional (4,99 versus 4,80) não sendo, no entanto, a diferença estatisticamente significativa,
t(79,831) = -1,403, p=0,165. Não se confirma, assim, a hipótese 5.
Na compra de produtos de baixo envolvimento os consumidores com tendência de compra predominantemente
emocional têm uma decisão de compra tendencialmente mais emocional do que os consumidores com tendência de
compra predominantemente racional (2,99 versus 2,88) cuja diferença não é estatisticamente significativa, t(80,916) =
0,560, p=0,577. Não se confirma, assim, a hipótese 6.
Na compra de produtos e serviços de alto rácio E/R e baixo envolvimento a decisão de compra é
predominantemente emocional independentemente da tendência de compra do consumidor (5,48 versus 5,22) já que a
diferença não é estatisticamente significativa, t(270) = -1,236, p=0,217. Confirma-se, assim, a hipótese 7.
Na compra de produtos e serviços de baixo rácio E/R e baixo envolvimento a decisão de compra é
predominantemente racional independentemente da tendência de compra do consumidor (2,89 versus 2,69), já que a
diferença não é estatisticamente significativa, t(270) = -1,134, p=0,258. Confirma-se, assim, a hipótese 8.
3. CONCLUSÕES
Sendo o objetivo final avaliar a influência conjunta das três variáveis independentes – importância relativa da
emoção e da razão ao nível dos produtos e serviços, grau de envolvimento dos produtos e serviços e tendência de compra
– sobre a variável dependente - decisão de compra - a primeira verificação a fazer era se cada uma das variáveis
independentes tinha individualmente influência na variável dependente.
Confirmou-se, assim, que a importância relativa da emoção e da razão ao nível dos produtos e serviços (estímulos)
influencia a decisão de compra, uma vez que a sua preponderância emocional ou racional, medida pelo rácio E/R, se
relaciona positivamente com a preponderância emocional ou racional da decisão de compra dos mesmos produtos e
serviços, o que está em linha nomeadamente com os estudos de Chaudhuri (2006).
No que respeita à influência do grau de envolvimento dos produtos e serviços sobre a decisão de compra, medido
pelo rácio (E+R)/2, considerou-se que quer o “Alto” quer o “Baixo” envolvimento teriam um efeito equilibrador da
preponderância emocional ou racional da decisão de compra, o que se confirmou. Com efeito, sendo, por definição, os
produtos e serviços de alto envolvimento elevados em emoção e razão e os de baixo envolvimento reduzidos nestas
mesmas dimensões, era esperado que se verificasse equilíbrio entre a emoção e a razão na decisão de compra deste tipo de
produtos e serviços.
Relativamente à tendência de compra do consumidor era esperado, e veio a confirmar-se, que a preponderância
emocional ou racional desta tendência tem relação com a preponderância emocional ou racional da decisão de compra.
Esta verificação é consonante com estudos anteriores, (Youn, 2000; Verplanken e Herabadi, 2001; Costa, 2002; Cardoso e
Cascão, 2009), que relacionaram as dimensões emocionais e racionais da personalidade com os comportamentos do
consumidor, nomeadamente ao nível da compra impulsiva e planeada.

604
Procurou-se, em seguida, através da combinação de variáveis independentes, verificar o peso de cada uma na
decisão de compra. Assim, na combinação da tendência de compra com o “Alto” e “Baixo” grau de envolvimento , verificou-
se que a decisão de compra era tendencialmente mais emocional nos sujeitos com tendência de compra
predominantemente emocional do que nos sujeitos com tendência de compra predominantemente racional. Porém, as
diferenças não são estatisticamente significativas. Pode, assim, deduzir-se que, embora a tendência de compra reforce o
peso emocional ou racional da decisão de compra, a sua influência não é suficiente para alterar a preponderânc ia
emocional ou racional da decisão de compra. Os produtos e serviços elevados em emoção e razão (Ex. automóveis) serão
adquiridos com forte peso emocional e racional enquanto os produtos e serviços baixos em emoção e razão (Ex. escova de
dentes) serão comprados com reduzida carga emocional e racional, sem que a tendência de compra do consumidor altere a
sua predominância emocional ou racional.
Verificou-se, por outro lado, que em produtos e serviços quer com preponderância emocional (alto E/R) quer
racional (baixo E/R) e cujo grau de envolvimento é baixo, a decisão de compra dos produtos e serviços de alto E/R é
preponderantemente emocional enquanto nos de baixo E/R é preponderantemente racional, independentemente da
tendência de compra do consumidor. Por exemplo o produto “cerveja” (alto E/R e baixo envolvimento) é adquirido por
qualquer consumidor de forma preponderantemente emocional, enquanto o produto “detergente” (baixo E/R e baixo
envolvimento) é comprado de forma preponderantemente racional. Deduz-se, assim, que a variável importância relativa
da emoção e da razão ao nível dos produtos e serviços tem um papel determinante na decisão de compra quando associada
a um baixo grau de envolvimento dos mesmos produtos e serviços.
Conclui-se, assim, que as variáveis independentes: importância relativa da emoção e da razão ao nível dos
produtos e serviços, aferida pelo rácio E/R e o grau de envolvimento dos mesmos produtos e serviços, aferido pelo rácio
(E+R)/2, têm um efeito preponderante sobre a preponderância e intensidade emocional ou racional da decisão de compra.
A tendência de compra do consumidor, embora contribua para o reforço da componente emocional ou racional da decisão
de compra, a sua influência não é suficiente para determinar a sua preponderância quer se trate de produtos de alto ou de
baixo envolvimento.
Em síntese, o presente estudo, ao concluir pelo papel relativo da emoção e da razão no processo de decisão do
consumidor, afasta-se não só do paradigma tradicional que enfatiza o primado da razão nas decisões de compra (Simon,
1955) mas também de processos de decisão alternativos guiados pela emoção (Elliott, 1998) e aproxima-se às teses dos
neurocientistas (Damásio, 1995, 2000, 2010; Chaudhuri, 2006) que preconizam a ação conjunta da emoção e da razão no
processo de decisão. Questiona, também, os modelos de dupla decisão (Kwortnik, 2003) e os que defendem a primazia da
emoção sobre a razão (Cherry, 2007). Permite, finalmente, clarificar o peso das variáveis que interferem na decisão de
compra, salientando-se a relevância dos estímulos (produtos/serviços) sobre a tendência de compra.
3.1. Limitações do estudo
Apesar do rigor científico colocado na execução do presente estudo, existiram algumas limitações metodológicas
que devem ser assinaladas e tidas em conta na compreensão dos resultados e implicações em futuras investigações sobre
este tema.
Tratando-se de uma amostra não-probabilística de conveniência, as conclusões da presente pesquisa não deverão
ser extrapoladas para além da população-alvo utilizada.
As escalas utilizadas para medir a caracterização emocional e racional dos produtos e serviços, embora tenham
obtido valores de consistência interna adequados à sua utilização como instrumento de pes quisa, foram considerados
fracos pelo que deverá ser tido em conta o seu aperfeiçoamento em futuras investigações.
Para minorar os efeitos culturais associados aos conceitos “emoção” e “razão” utilizaram -se na escala de
caracterização da decisão de compra, imagens projetadas dos produtos e serviços e tempo de resposta limitado, de modo a
que os respondentes pudessem expressar a sua decisão de forma mais espontânea ou menos culturalmente contaminada.
Porém, apesar do conceito “emoção” ser hoje valorizado, estando, portanto, menos contaminado por associações negativas
a que foram associadas as decisões emocionais no passado, nomeadamente falta de autocontrolo, persiste algum peso
histórico sobre este conceito que pode ainda permanecer subjacente às respostas dadas nas escalas utilizadas.

605
Finalmente, as variáveis utilizadas não constituem as únicas influências que interferem na decisão de compra,
havendo outros fatores como, por exemplo, a marca, a cultura ou a afiliação que poderiam ser integrados e que poderão
ser considerados em desenvolvimentos futuros.
3.2. Implicações de gestão do estudo
O presente estudo permite-nos concluir pela existência de quatro tipos fundamentais de produtos e serviços:
Produtos e serviços hedónicos – em que a importância relativa da emoção se sobrepõe à da razão, sendo,
fundamentalmente, propiciadores de prazer e afeto (Ex. flores, desportos radicais, etc.).
Produtos e serviços utilitários – em que a importância relativa da razão se sobrepõe à da emoção, sendo,
fundamentalmente, proporcionadores de benefícios (Ex. máquina de lavar, remédios, etc.).
Produtos e serviços de elevado valor hedónico e utilitário – em que a importância relativa da emoção e da
razão são elevadas, proporcionando, simultaneamente, benefícios e prazer (Ex. automóveis, telemóveis,
etc.).
Produtos e serviços com baixo valor hedónico e utilitário - em que a importância relativa da emoção e da
razão são baixos, propiciando benefícios e prazer pouco valorados (Ex. detergente, papel higiénico, etc.).
Se, como se deduz do presente estudo, a importância relativa da emoção e da razão ao nível dos produtos e
serviços é o principal determinante da preponderância emocional ou racional da decisão de compra, as estratégias de
comercialização e marketing para cada um destes tipos de produtos deverá ser necessariamente diferenciada.
Assim, sem deixar de ter em conta que todos os produtos e serviços têm uma componente emocional e racional e
que há consumidores mais despertos para abordagens racionais enquanto outros são mais sensíveis a exposições
emocionais, é possível delinear estratégias de promoção de cada tipo de produto em função do peso emocional e racional
que o caracteriza.
Deste modo, enquanto na promoção de produtos hedónicos a vertente emocional, indutora de prazer e afetos
deverá predominar, nos produtos utilitários deverá ser realçada a vertente racional, realçando características e benefícios.
Por sua vez, enquanto nos produtos de elevado valor hedónico e utilitário deverão ser realçadas conjuntamente as suas
características e benefícios e o prazer e afeto que proporcionam, aos produtos de baixo valor hedónico e utilitário, poderá
ser induzido algum valor racional, suportado, por exemplo, na diferenciação de preços, ou algum valor emocional,
suportado por exemplo, no desconforto da sua não utilização.
Esta diferenciação dos tipos de produtos e serviços é também importante na escolha dos média para a sua
publicitação. De acordo com Chaudhuri (2006) os média impressos (jornais, revistas, etc.) geram um nível de racionalidade
mais elevado que os média eletrónicos (televisão, rádio, etc.), enquanto estes proporcionam respostas mais emocionais.
Assim, para os produtos e serviços elevados em emoção e/ou razão a escolha dos média deverá ser feita em função da
perspetiva que se quer realçar: os média eletrónicos para induzir emoções e afetos os média impressos para evidenciar
características e benefícios. Já no que respeita aos produtos de baixo valor hedónico e utilitário os média eletrónicos serão
os mais indicados não só pelo efeito direto que têm na formação da atitude, através da repetição (Krugman, 1965), mas
também pelo prazer que pode ser induzido pelo próprio anúncio (Chaudhuri, 2006).
O presente estudo permitiu, também, verificar que a tendência de compra do consumidor tem uma influência
significativa na decisão de compra, embora não seja suficiente para determinar a preponderância emocional ou racional da
decisão de compra de cada produto ou serviço. Com efeito, os el ementos da amostra com tendência de compra
preponderantemente emocional revelaram preponderância emocional mais elevada na decisão de compra do que os
sujeitos com tendência de compra predominantemente racional.
Assim, embora todos os consumidores sejam sensíveis às valências emocionais e racionais dos produtos e todos
adquiram produtos influenciados quer pelas suas qualidades emocionais quer racionais, uns serão mais sensíveis para
valorizar o prazer por eles proporcionados e outros a sua utilidade.
Nas abordagens comerciais haverá consumidores que serão mais sensíveis aos argumentos emocionais enquanto
outros gostarão de ser esclarecidos com mais pormenor sobre as características, a utilidade e os custos e benefícios.
606
References
ALBAUM, G. (1997). The Likert scale revisited: an alternative version. Journal of the Market Research Society, Vol. 39 (2),
331-48.
AJZEN, I. (1988). Attitudes, personality and behaviour. Milton Reynes, UK: Open University Press.
AJZEN, I. (2006). TpB Diagram. http://www.people.umass.edu/aizen/tpb.diag.html#null-link Consultado em Novembro
2009.
BABU, G. e MANOJ, E. (2009). Cognitive Dissonance and Purchase Involvement in the Consumer Behaviour Context. The
IUP Journal of Marketing Management, Vol. VIII, Nos. 3 & 4, 7-24.
BUCK, R. e CHAUDHURI, A. (1994). Affect, Reason and involvement in persuation: The ARI model. In P. Weinberg (Ed.).
Konsumenterforschung , 107-117. Minich:Vahlen.
BUCK, R. ANDERSON, E. CHAUDHURI, A. e RAY, I. (2004). Emotion and reason in persuasion: Applying the ARI model and
the CASC scale. Journal of Business Research , Vol. 57(6), 647-656.
CARDOSO, A.. e CASCÃO, A. (2009). O Enraizamento da Tendência de Compra Impulsiva Versus Planeada na Personalidade
do Consumidor. Revista Portuguesa de Marketing, Vol. 24, 35-46.
CARDOSO, A. (2009). O comportamento do consumidor: Porque é que os consumidores compram? . Lisboa: Lidel, Edições
Técnicas Lda.
CELSI, R. e OLSON, J. (1988), “The Role of Involvement in Attention and Comprehension Processes,” Journal of Consumer
Research, Vol. 15, 210-224.
CHAUDHURI, A. (2006). Emotion and Reason in Consumer Behavior. Oxford: Elsevier.
CHERRY, P. (2007).The “neuroeconomics” of Sales. How buyers really decide. Agency sales, Vol. 36 (6), 26-28.
COSTA, F., (2002). Influências Ambientais e o Comportamento de Compra por Impulso: um Estudo em Lojas Físicas e Virtuai s
(Tese de Doutoramento). Universidade de S. Paulo.
DAMÁSIO, A. (1995). O Erro de Descartes ( 5ª edição). Lisboa: Publicações Europa-América.
DAMÁSIO, A. (2000). O Sentimento de Si. Lisboa: Publicações Europa-América.
DAMÁSIO, A. (2010). O Livro da Consciência. Lisboa: Círculo de Leitores.
EAGLY, A. e CHAIKEU, S. (1993). The Psychology of attitude. Orlando: Harcourt Brace.
ELLIOTT, R. (1998). A Model of emotion-driven choice. Journal of Marketing Management, Vol. 14, 95-108.
FAZIO, R. (1986). How do attitudes guide behaviour? In R. M. Sorrentino e E.T. Higgins. The handbook of motivation and
cognition: Foundations of social behaviour. New York: Guilford Press.
FISHBEIN, M. e AJZEN, I. (1975). Belief, attitude, intention and behaviour: an introduction to theory of research . Addison-
Wesley: Reading, MA.
HERABADI, G. (2003). Buying impulses: a study on impulsive consumption (PhD Thesis). Katholieke Universiteit Nijmegen.
HSU, T. e LEE, M. (2003). The refinement of measuring consumer involvement – an empirical study. Competitiveness
Review, Vol. 13 (1), 56-65.
KRUGMAN, H. (1965). The impact of television advertising: Learning without involvement. Public Opinion Quarterly, Vol.
29, 349-356.
KWORTNIK R. (2003). The role of positive emotions in consumer choice for experiential products . (PhD Thesis). Temple
University.
LAMB, W., HAIR, F. e MACDANIEL, C. (2004). Marketing. Cinccinati. Ohio, South-Western College Publishing.
LAZARUS, R. (1984). On the primacy of cognition. American Psychologist, Vol. 39, 124-129.
MACLEAN, P. (1973). A triune concept of the brain and behavior. Toronto: University of Toronto Press.

607
MACLEAN, P. (1990). The triune brain in evolution. New York: Plenum Press.
MASSEY, D. (2002). A brief history of human society: The origin and role of emotion in social life. American Sociological
Review, Vol. 67 (1), 1.
PARK, C. e YOUNG, S. (1986). Consumer Response to Television Commercials: The Impact of Involvement and Background
Music on Brand Attitude Formation. Journal of Marketing Research, Vol. 23, 17-24.
PAYNE, J. (1984). Contingent decision behavior. Psychological Bulletin, Vol. 92, 382-402.
SIMON, H. (1955). A behavioural model of rational choice. Quarterly Journal of Economics, Vol. 69, 99-118.
TVERSKY, A. e KAHNEMAN, D. (1991). Loss aversion in riskless choice: A Reference-Dependent Model. Quarterly Journal of
Economics, Vol.106, 1039-1061.
VERPLANKEN, B. e AARTS H. (1999). Habit, attitude and planned behaviour: is habit an empty construct or an interesting
case of automaticity? European Review of Social Psychology, Vol. 10, 101-134.
VERPLANKEN, B. e HERABADI, A. (2001). Individual differences in impulse buying tendency: feeling and no thinking.
European Journal of Personality, Vol. 15 (1), 71-83.
YOUN, S. (2000). The dimentional structure of consumer buying impulsivity: measurement and validation (PhD Thesis).
University of Minnessota.
ZAJONC, R. (1980). Feeling and thinking: Preferences need to influences. American Psychologist, Vol. 32(2), 151-175.
ZAJONC, R. (1984). On the primacy of affect. American Psychologist, Vol. 39, 117-123.
ZIKMUND, William G. (2006). Princípios da pesquisa de marketing . Thomson, S. Paulo.

608
Hedonic Consumption and Depressed Mood:
How Does Depression Influence Consumer
Behavior? Moods, Emotions, Depression, Hedonic Consumption, Consumer Behavior, Buying Decision
Muge Elden, Ege University Faculty of Communication, [email protected]
Ugur Bakir, Ege University Faculty of Communication, [email protected]
Ozen Okat Ozdem, Ege University Faculty of Communication, [email protected]
Abstract
The meaning of consumption in present-day consumer societies signifies having more than that which satisfies physical
needs. Possessing a product represents for a consumer in today’s world the sum total of the feelings, perceptions,
fantasies and emotions related to it. When consumers are buying, they are meeting a large number of their needs such as
entertainment, climbing the social ladder, gaining status, socialization, and feeling good and happy. From this point of
view, shopping is as much a psychological phenomenon as an economic one. It is closely related to an individual’s ways of
learning, reaction to stimuli, reasons for motivation, the formation of attitudes, and to perso nality and moods. A
depressive mood is something often met with today, and it also has effects on an individual’s personality as a consumer.
Depression influences different aspects of personal life, and one of these is consuming. The consumption habits of a
depressive consumer can exhibit differences from the consumption expectations of other consumers. The present study
examined the relationship between the tendency to hedonistic consumption and that of individuals in a depressive mood.
The primary data for this study was obtained from a questionnaire that was administered in Izmir in Turkey. Results of the
study show that individuals who have severe depression tend to purchase hedonic products less than others who have no
depression, mild depression or moderate depression. People with no depression to moderate depression have a strong
urge to purchase hedonic products for the sensation derived from the experience of using the products. However, when
the degree of depression is severe, the desire to consume hedonic products is reduced.
Introduction
However much the Greek philosopher Epicurus (341-270 BCE), one of the important names of the Hedonistic school of
thought, advised us not to possess more than was necessary and to be restrained, the word hedonism has taken on quite
another meaning in this modern consumer-focused world. For people today, the road to happiness runs through
consumption, and that means consuming far more than is required simply for bodily needs. The spiritual fulfillment that
was once sought in the temple or in religious observance is now provided by unrestrained shopping, buying things and
consuming. In other words, for people today, consumption and its associated activities have become an alternative to the
spiritual fulfillment that was generally looked for in the rituals of religion before the advent of modernism, or are at least
an important side-activity. In this way, the act of consuming, that is the behavior of buying something, can be seen as far
more than the purchase of a physical object but rather as a process involving the exchange of money for feelings, dreams
and status to make the individual feel good. For people today, consumption is seen as a way of facing the difficulties of the
outside world, countering the effect of negative feelings created by the stress of living, relieving depression at least a little
and attaining the gratification which we feel we need.

609
Conceptual Background
People, from the moment they appeared on Earth, were involved, like it or not, in activities which culminated in
consumption. From the most primitive person to the most modern, it is impossible to find anyone who has not in some
way or another been involved in consumption. People, just like other living things, are involved in the process of
consumption as long as they live. However, there is an important difference in human consumption from that of other
living things. While other animals only consume as much as they need to satisfy their physical requirements, humans also
reflect their psychological and social needs in their consumption activities.
Research in the field of consumer behavior has found that consumers perceive goods or services as a physical quality, but
that they can attach other meanings than the satisfaction of physical needs to the act of purchasing (Hirschman and
Holbrook 1982, Batra and Ahtola 1991, Babin et al. 1994, Mano and Oliver 1993, Shiv and Fedorikhin 1999, Botti and
McGill 2010). In particular, in work begun in the 1950s (Gardner and Levy 1955, Levy 1959), it began to be shown that
goods and services carried symbolic values for consumers, and the attention of the academic world was turned towards
the symbolic meanings of purchasing behavior. In the 1980s, Hirschman and Holbrook (1982) conceptualized the
symbolic side of consumer behavior as hedonic consumption. According to this approach, hedonic consumption
designates consumer behavior that relates to the multisensory, fantasy and emotive aspects of one's experience with
products. In this sense, while utilitarian consumption is about functions performed by products, hedonic consumption
refers to the purchase of a product for the sensation derived from the experience of using the products (Voss et al. 2003).
The basic motivations in the direction of hedonic consumption can be internal or external just as they can be social or
individual. Among the individual reasons for hedonic consumption can be counted physical activity, entertainment, the
desire to buy goods or services cheaper, emotional stimuli , and the desire for personal gratification. Social reasons for
hedonic consumption include gaining social experience, establishing communication, eliciting a response from leaders of
society, reference groups and dialogue (Antonides and Raaij 1998: 420). Generally, hedonic consumption can be seen as
consumption which is related to emotional qualities and is focused on emotional satisfaction (Spangenberg et al. 1997:
239), and in this way it has a mission as a means or strategy for an individual to avoid facing depression or other
unwanted moods.
In modern life, such adverse emotional experiences as difficult working conditions arising especially from socio -economic
circumstances, individualization and the social isolation following from it, changes in fam ily structure and operation,
unemployment, and unhealthy living conditions in the daily life of consumers result in a negative mental state. One of
these negative moods is depression.
The term depression is used in everyday language to describe a range of experiences from a slightly noticeable and
temporary mood decrease to a profoundly impaired and even life-threatening disorder (Hammen and Watkins 2001: 3). It
may cause physical changes in the body and affects a person’s moods , which are the way a person feels and how she or he
expresses those feelings (Roy 2005: 10). According to the World Health Organization (WHO), depression is a significant
contributor to the global burden of disease and affects people in all communities across the world. Today, depression is
estimated to affect 350 million people. The World Mental Health Survey conducted in 17 countries found that on average
about 1 in 20 people reported having an episode of depression in the previous year (Marcus et al. 2012).
These statistics reported by the WHO undoubtedly have great importance in many fields such as health, politics and
education. At the same time, they are important for researchers into the individual as a consumer and for profit or non-
profit organizations, because it is an unavoidable fact that in the emotional world of an individual depression caused by
significant changes in mood have an effect on consumer habits and purchasing behavior.
The relationship between the consumption process and mood is a phenomenon much discussed in daily life. Purchasing
behavior is a process mostly activated by emotions and controlling the individual, in contrast to the classical concept of the
‘rationally behaving man’. Therefore, mood formed under the influence of emotions can have a great ef fect on this process.
Moods, which can be conceptualized as emotional states that are precursors to further activities and behaviors directed
toward managing the mood (Kacen 1994) are generally classified into two categories: Negative and Positive Moods.
Different types of positive moods (e.g., cheeriness, peacefulness, and sexual warmth) and negative moods (e.g., anxiety,
guilt, and depression) can be readily identified (Gardner 1985). Positive moods generally relate to the wishes and desires
of an individual, while this is not the case with negative moods. According to mood regulation theory, negative moods
have a quality such that the individual needs to overcome (Maier et al. 2012). It is here that hedonic consumption emerges
as a frequently employed strategy.

610
A review of the literature reveals many studies on the relationship between the consumption process and consumer
behavior from many aspects such as purchase intention (e.g. Cai et al. 2009), brand recall (e.g. Lee and Sternthal 1999),
and advertising effectiveness (e.g. Martin 2003). Among these studies, those which have examined the effect of negative
moods on consumption tendencies have demonstrated that consumption behavior is seen as performing the function of a
kind of therapy for the consumer in such a mood, and that consumption is perceived by consumers as a strategy to cope
with negative mood (Kacen 1994, Luomala 2001, Lerner et al. 2004, Gang and Lerner 2010, Kemp and Kopp 2011, Maier et
al. 2012).
Of course, self-regulation of negative moods through consumption-related activities may vary across gender (Martin 2003),
culture (Maier et al. 2012), product type (Gardner and Scott 1990), etc. But when it happens, the consumer benefits from its
therapeutic power. According to Luomala (2001) there are three types of therapeutic power of mood regulation through
consuming. These are distraction, self-indulgence, and stimulated elaboration. Distractive therapeutic power works by
transferring the person’s thoughts from the issues related to negative mood to something else. Self-indulgence reduces
negative moods and reinstates a sufficiently aversive-free mental state that enables an individual to think and function in a
more normal manner. Lastly, mood-alleviative consumer behavior whose therapeutic power is based on stimulated
elaboration (e.g. skiing, bicycling and running, listening to music) inspires deep elaboration that is related to the
experience of negative mood.
A depressive mood is something often met with today, and it also has effects on an individual’s personality as a consumer.
Depression influences different aspects of personal life, and one of these is consuming. The consumption habits of a
depressive consumer can exhibit differences from the consumption expectations of other consumers. For example, a
depressed consumer may have an intense yearning to alleviate his/her depression (MacInnis and Chun 2007). Therefore,
hedonic shopping can be seen as a solution for regulating emotions and moods. Ergin (2010) reports that shopping has a
strong symbolic, emotional role especially for women. It helps them to deal with a number of factors including boredom,
stress, low self-esteem and even depression. So compulsive buying, meaning a behavioral disorder that causes an
individual to make continuous purchases regardless of financial, social, or psychological consequences, may appear among
depressed consumers. “Compulsive shopping occurs in 6% of the general population, which is a greater point prevalence
than has been observed with generalized anxiety disorder (GAD) or depression” (Hartston 2012:65).
However much consumers wish to overcome their depression by consuming, it does not seem as though different levels of
depression will have the same effect in terms of consumer behavior. Depression, sometimes, can block the shopping. In
particular, in conditions where depression whose effect is felt strongly in the life of an individual in a physical and
emotional sense and which becomes permanent, consumption can be reduced. “A severe depressive episode with
psychotic features indicates the presence of either delusions or hallucinations during the index episode. Typically, the
content of the delusions or hallucinations are congruent with the depressive themes and often include delusions of guilt,
deserved punishment, poverty, nihilism, or somatic illness (McIntyre& Nathanson 2010:7)”. Those delusions influence
individual’s life directly and may reduce shopping.
According to Hirschman and Stern (1998), clinical depression is manifested by consumption at a bare subsistence level.
Consumers experiencing severe depression may sleep for many hours a day, close the curtains to avoid sunlight, wear the
same clothes for days or weeks, fail to bathe or groom themselves, become unable to perform basic life tasks such as
buying food, keeping themselves clean, or getting dressed and leaving their homes. In this way, we must not ignore the
level of depression in a consumer when we examine the effect of depression on the consumption process.
The aim of this study was to establish the relationship between different levels of depression and the tendency to hedonic
consumption. Thus, the purchasing behavior of the not inconsiderable number of depressive individuals will be elucidated
by considering the much discussed interaction between depression and the consumer.
Method
Participants and Procedure
The primary data for this study was obtained from a questionnaire that was administered in Izmir in Turkey. Participants
were 325 college students from Ege University. Their ages varied between 18 and 26 years. The average age of male
participants was 20.80 (N = 191, S = 1.83) and females 20.24 (N = 134, S = 1.60).

611
Questionnaires were given to the participants before class in the classroom environment in a session that lasted about 15
minutes. When the researchers entered the classroom, they told the participants that they were going to carry out two
separate studies, one of them about finding out how university students felt, and the other about university students’
consumption habits. The purpose of not telling participants that the two questionnaires were part of the same research
was to prevent the aim of the research from influencing the participants’ answers.
Data obtained in the study was analyzed in IBM SPSS Statistics Version 20 with the use of various statistical tests
(descriptive statistics, variance analysis (ANOVA), and Scheffé test).
Measures
Two basic measures were made of the participants for the purposes of the research. These were to determine their
depression levels and their intention towards making a hedonic purchase. The Beck Depression Inventory (BDI), which is
one of the most frequently used self-rating scales of depression, was used to determine depression levels. This scale was
developed by Beck (1961), and was adapted to Turkish by Hisli (1988).
The BDI measures symptoms of depression according to 21 items. These are: sadness, pessimism, sense of failure,
dissatisfaction, guilt, expectation of punishment, self-dislike, self-accusations, suicidal ideations, crying, irritability, social
withdrawal, indecisiveness, body image change, work retardation, insomnia, fatigability, anorexia, weight loss, somatic
preoccupations and loss of libido. Each symptom or category is described by statements, rated on a four-point intensity
scale (0- 3), linked to the range of severity of symptoms (Chetty and Hoque 2012). The highest possible score is 63. The
interpretations of the scores are as follows (Beck, 1972): 0 - 10 no depression, 11 - 17 mild depression, 18-23 moderate
depression, and a score of 24 or more severe depression. Based on these cutoff scores, participants were divided into the
four groups in this research: (1) no depression, (2) mild depression, (3) moderate depression, and (4) severe depression.
The Cronbach alpha score of the scale in this study was .88.
Following measurement of the participants’ depression levels, a scenario was presented to them to measure their
intention to make a hedonic purchase. This was adapted from Rook and Fisher (1995) and Kemp and Kopp (2011) and
involved the use of an imaginary stimulus situation:
Imagine you are a college student with a part-time job. In three days, you will get your paycheck, but until then you only have
40 Turkish Liras (TL) left for necessities. You go to a supermarket to buy some needed groceries, and in the desserts section
you see your favorite desert displayed in the most appetizing way. This dessert will cost you 25 TL, and it would be really
great to share it with your best friends this evening.
Following this, participants indicated their purchase intentions for the dessert. A scale developed by Haley and Case
(1979: 20-32) and adapted to Turkish by Bakir (2012) was used to determine purchase intention. The scale, in the
beginning, was prepared as a Likert type, but later was adapted by a large number of researchers for five, seven and nine
point semantic differential scales (Bearden et al. 1984, MacKenzie et al. 1986, Zhang 1996: 15–32). The Cronbach’s alpha
score of the scale was above .70 in all studies. For example, in Zhang’s study (1996) the coefficient of internal consistency
was .90.
In the version of the scale used in this study, there were three lines of opposite statements (likely-unlikely, improbable-
probable, impossible-possible) with seven points on each line. The box nearest to the negative statement scored 1 and the
one furthest away (the box nearest to the positive statement) scored 7. The Cronbach alpha score of the scale in this study
was .97.
Findings
ANOVA was used to determine whether the depression levels of participants in the study had an effect on their intentions
to purchase a hedonic product, or in other words whether their intention to purchase a hedonic product varied according
to their depression level. Statistics relating to the intentions to buy a hedonic product and ANOVA results are set out
below according to different depression levels.

612
Table 1. Means and Standard Deviations for Purchase Intentions
N X S
No depression 190 4.19 2.28
Mild 68 4.20 2.34
Moderate 37 4.48 2.23
Severe 30 2.80 2.13
Total 325 4.09 2.30
Table 2. Analysis of Variance: Degree of Depression and Gender Effects on Purchase Intentions
Source Sum of Squares df Mean Square F Sig.
A 58.76 3 19.58 3,74 .01
B 1.90 1 1.90 .36 .54
A X B 10.58 3 3.52 .67 .56
Error 1658.37 317 5.23
A = Degree of Depression
B = Gender
Results from ANOVA indicate that depression had a major effect for on purchase intentions, F (3, 317) = 3.74, p < .01.
(Table 1). Post hoc analyses using the Scheffé post hoc criterion for significance indicated that the mean of purchase
intentions was significantly lower for severe depression than for the other three groups (no depression, mild depression,
and moderate depression). As is seen from Table 3, participants who were in the severe depression group had lower
purchase intentions for a hedonic product in comparison with the other groups
Results of ANOVA also indicate that the main effect of gender on purchase intentions was non-significant, F (1, 317) =.36, p
> .05. The interaction effect between degree of depression and gender on purchase intentions was also non-significant, F
(3, 317) = .67, p > .05.
Table 3. Scheffé Comparisons for Purchase Intentions
(I) Degree of Depression (J) Degree of Depression Mean Difference (I-J) Sig.
No depression
Mild -.00 1.00
Moderate -.29 .91
Severe 1.39* .02
Mild depression
No depression .00 1.00
Moderate -.28 .94
Severe 1.40 .05
Moderate depression
No depression .29 .91
Mild .28 .94
Severe 1.68* .03
Severe depression
No depression -1.39* .02
Mild -1.40 .05
Moderate -1.68* .03
*The mean difference is significant at the 0.05 level.
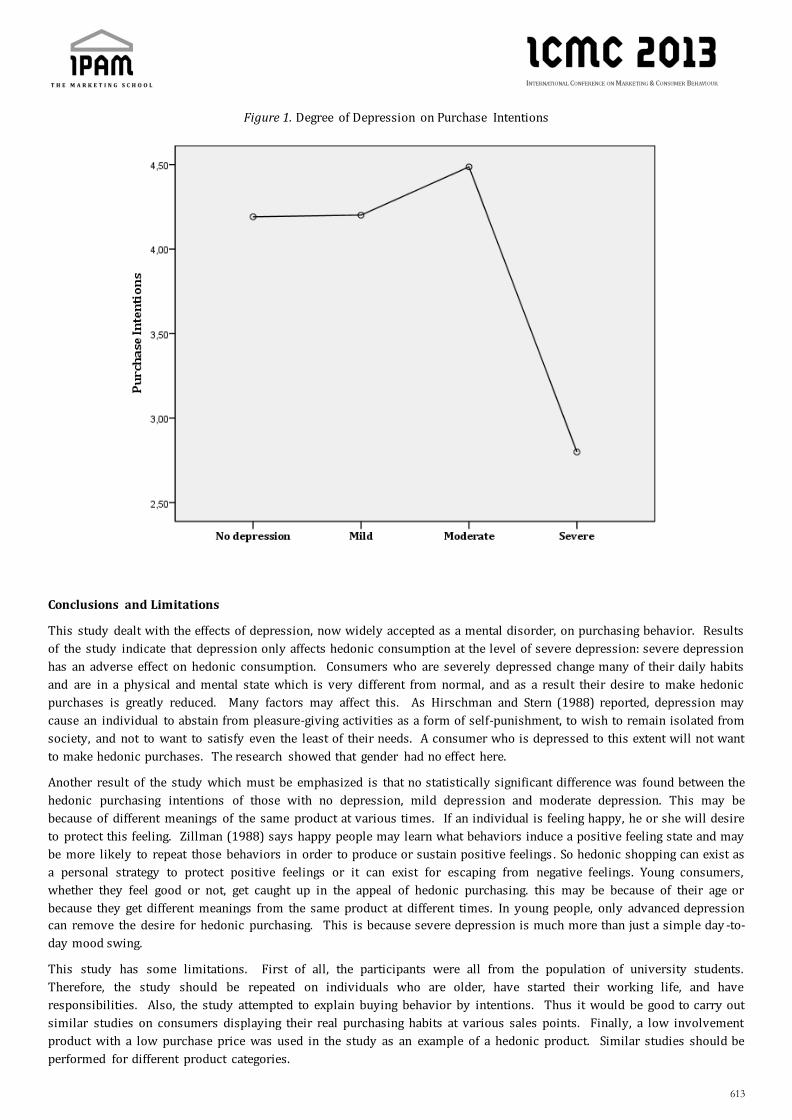
613
Figure 1. Degree of Depression on Purchase Intentions
Conclusions and Limitations
This study dealt with the effects of depression, now widely accepted as a mental disorder, on purchasing behavior. Results
of the study indicate that depression only affects hedonic consumption at the level of severe depression: severe depression
has an adverse effect on hedonic consumption. Consumers who are severely depressed change many of their daily habits
and are in a physical and mental state which is very different from normal, and as a result their desire to make hedonic
purchases is greatly reduced. Many factors may affect this. As Hirschman and Stern (1988) reported, depression may
cause an individual to abstain from pleasure-giving activities as a form of self-punishment, to wish to remain isolated from
society, and not to want to satisfy even the least of their needs. A consumer who is depressed to this extent will not want
to make hedonic purchases. The research showed that gender had no effect here.
Another result of the study which must be emphasized is that no statistically significant difference was found between the
hedonic purchasing intentions of those with no depression, mild depression and moderate depression. This may be
because of different meanings of the same product at various times. If an individual is feeling happy, he or she will desire
to protect this feeling. Zillman (1988) says happy people may learn what behaviors induce a positive feeling state and may
be more likely to repeat those behaviors in order to produce or sustain positive feelings . So hedonic shopping can exist as
a personal strategy to protect positive feelings or it can exist for escaping from negative feelings. Young consumers,
whether they feel good or not, get caught up in the appeal of hedonic purchasing. this may be because of their age or
because they get different meanings from the same product at different times. In young people, only advanced depression
can remove the desire for hedonic purchasing. This is because severe depression is much more than just a simple day -to-
day mood swing.
This study has some limitations. First of all, the participants were all from the population of university students.
Therefore, the study should be repeated on individuals who are older, have started their working life, and have
responsibilities. Also, the study attempted to explain buying behavior by intentions. Thus it would be good to carry out
similar studies on consumers displaying their real purchasing habits at various sales points. Finally, a low involvement
product with a low purchase price was used in the study as an example of a hedonic product. Similar studies should be
performed for different product categories.

614
References
ANTONIDES, G. & RAAIJ, W. F.(1998). Consumer Behaviour: A European Perspective. New York: John Wiley & Sons.
BABIN, B.J. & DARDEN, W. R. & GRIFFIN, M. (1994). Work and/or Fun: Measuring Hedonic and Utilitarian Shopping Value.
Journal of Consumer Research, Volume 20(4), p. 644-656.
BAKIR, U. (2012). Reklam Mesajlarının Etkililiginde Kaynagın Fiziksel Cekiciliginin Rolü . Ege Universitesi Sosyal Bilimler
Enstitüsü, Izmir.
BATRA, R. & AHTOLA, O. T. (1990). Measuring the Hedonic and Utilitarian Sources of Consumer Attitudes. Marketing
Letters, Volume 2 (2), pp. 159-170.
BEARDEN, W. O. & LICHTENSTEIN, D. R. & TEEL, J. E. (1984). Comparison Price, Coupon and Brand Effects on Consumer
Reactions to Retail Newspaper Advertisements. Journal of Retailing, Volume 60 (2), pp. 11-35.
BECK, A.T. & WARD, C.H. & MENDELSON, M. & MOCK, J. & ERBAUGH, J. (1961). An Inventory for Measuring Depression.
Archives of General Psychiatry, Volume 4, pp. 561-571.
BECK, A. T. (1972). Depression: Causes and Treatment. Philadelphia: University of Pennsylvania Press.
BOTTI, S. & MCGILL, A. L. (2011).The Locus of Choice: Personal Causality and Satisfaction with Hedonic and Utilitarian
Decisions. Journal of Consumer Research, Volume 37(6), pp. 1065-1078.
CAI, F. & TANG, F. & JIA, J. (2009). The Interaction Effect of Mood and Price Level on Purchase Intention. Advances in
Consumer Research, Volume 36, pp. 963-965.
CHETTY, D. & HOQUE, ME (2012). Effectiveness of a Volunteer-Led Crafts Group Intervention amongst Mild to Moderately
Depressed Indian Women in KwaZulu-Natal, South Africa. Gender & Behaviour, Volume 10 (2), pp. 4914-4925
ERGIN, E. A. (2010). Compulsive Buying Behavior Tendencies: The Case of Turkish Consumers. African Journal of Business
Management, Volume 4 (3), pp. 333-338.
GARDNER, B. & LEVY, S. J. (1955). The Product and the Brand, Harvard Business Review, Volume 33 (March-April), pp. 33-
39.
GARDNER, M. P., & SCOTT, J. (1990). Product type: A Neglected Moderator of the Effects of Mood. Advances in Consumer
Research, Volume 17(1), pp. 585–589.
GARDNER, M. P. (1985). Mood States and Consumer Behavior: A Critical Review. Journal of Consumer Research, Volume 12
(December), pp. 281-300.
GARG, N. & LERNER, J. S. (October, 2010), Sadness and Consumption: The Attenuating Role of Choice. Association for
Consumer Research Conference, FL: Jacksonville.
HAMMEN, C. & WATKINS, E. (2001). Depression. Clinical Psychology A Modular Course . Sussex: Psychology Press.
HARTSTON, H. (2012). The Case for Compulsive Shopping as an Addiction. Journal of Psychoactive Drugs, Volume 44(1), pp.
64-67.
HIRSCHMAN, E.C. & STERN, B.B. (1998). Consumer Behavior and the Wayward Mind: The Influence of Mania and
Depression on Consumption. Advances in Consumer Research, Volume 25, pp. 421-427.
HIRCHMAN, E. C. & HOLBROOK, M. B. (1982). Hedonic Consumption; Emergi ng Concepts, Methods and Propositions.
Journal of Marketing, Volume 46 (3), pp. 92-101.
HISLI, N. (1989). Beck Depresyon Envanterinin Universite Ogrencileri Icin Gecerliligi, Guvenirliligi, Psikoloji Dergisi,
Volume 7, pp. 3-13.
KACEN, J. J. (1994). Phenomenological Insights into Moods and Mood-related Consumer Behaviors. Advances in Consumer
Research, Volume 21, pp. 519-525.
KEMP, E. & KOPP, S. (2011). Emotion Regulation Consumption: When Feeling Better is the Aim. Journal of Consumer
Behaviour, Volume 10(1), pp. 1-7.

615
LEE, A. Y. & STERNTHAL, B. (1999). The Effects of Positive Mood on Memory. Journal of Consumer Research, Volume 26, pp.
115–127.
LERNER, J.S. & SMALL, D.A. & LOEWENSTEIN, G. (2004). Heart Strings and Purse Strings: Carry‐Over Effects of Emotions
on Economic Transactions. Psychological Science, Volume 15, pp. 337‐341.
LEVY, S. J. (1959). Symbols for Sale. Harvard Business Review, Volume 37 (July-August), pp. 117-119.
LUOMALA, H. T. (2001). Consumption as Therapy: a Phenomenological Inquiry into Mood-Alleviative Consumer Behaviors.
Asia Pacific Advances in Consumer Research, Volume 4, pp. 175-182.
LUOMALA, H. T. (1998). A Mood-alleviative Perspective on Self-gift Behaviors: Stimulating Consumer Behaviour Theory
Development. Journal of Marketing Management, Volume 14, pp. 109-132.
MACINNIS, D. J. & CHUN, H. E. (2007). Understanding Hope and its Implications for Consumer Behavior: I Hope, Therefore I
Consume. Foundations and Trends in Marketing , Volume 1(2), pp. 97-188.
MACKENZIE, S. B. & LUTZ, R. J., & BELCH, G. E. (1986). The Role of Attitude toward the Ad as a Mediator of Advertising
Effectiveness: A Test of Competing Explanations. Journal of Marketing Research, Volume 23, pp. 130-143.
MAIER, E. & WILKEN, R. & SCHNEIDER, H. (2012). In The Mood to Buy? Understanding the Interplay of Mood Regulation
and Congruence in an International Context. Marketing Letters, Volume 23, pp. 1005-1018.
MANO, H. & OLIVER, R.L. (1993). Assessing The Dimensionality and Structure of The Consum ption Experience: Evaluation,
Feeling and Satisfaction. Journal of Consumer Research, Volume 20(3), pp. 451-466.
MARCUS, M. & YASAMY, M. T. & OMMEREN, M. & CHISHOLM, D. & SAXENA, S. (2012). Depression: A Global Public Health
Concern. WHO Department of Mental Health and Substance Abuse, Available at:
http://www.who.int/mental_health/management/depression/who_paper_depression_wfmh_2012.pdf ,
(02.02.2013).
MARTIN, B. A. S. (2003). The Influence of Gender on Mood Effects in Advertising. Psychology & Marketing, Volume 20(3),
pp. 249-273.
MCINTYRE, R. & NATHANSON J. (2012). Severe Depression, New York: Oxford University Press.
ROOK D. & FISHER R. J. (1995). Normative Influences on Impulsive Buying Behavior. Journal of Consumer Research, Volume
22, pp. 305–313.
ROY, J. R. (2005). Depression. New York: Benchmark Books.
SHIV, B. & FEDORIKHIN, A. (1999). Heart and Mind in Conflict: The Interplay of Affect and Cognition in Consumer Decision
Making. Journal of Consumer Research, Volume 26 (December), pp. 278-292.
SPANGENBERG, E. R. & VOSS, K. E. & CROWLEY, A. E. (1997). Measuring the Hedonic and Utilitarian Dimensions of
Attitude: A Generally Applicable Scale. Advances in Consumer Research, Volume 24, pp. 235-241.
VOSS, K.E. & SPANGENBERG, E.R. & GROHMANN, B. (2003). Meas uring the Hedonic and Utilitarian Dimensions of
Consumer Attitude. Journal of Marketing Research, Volume 40 (3), pp. 310-320.
ZHANG, Y. (1996). Responses to Humorous Advertising: The Moderating Effect of Need for Cognition. Journal of
Advertising, Volume 25 (1), pp. 15–32.
ZILLMAN, D. (1988). Mood Management through Communication Choices. American Behavioral Scientist, Volume 31(3), pp.
327-340.
616
Main Drivers for Purchase Decision in the
Pharmaceutical Market for Mandatory
Prescription Drugs
Decision Making Process, Decision rules, Purchase choice, Brand choice, Brand Selection.
Hugo Barbosa, CLEGI - Lusiada University, [email protected]
Elizabeth Real de Oliveira, CLEGI - Lusiada University, [email protected]
Pedro Ferreira, CLEGI - Lusiada University, [email protected]
Abstract
This paper presents a theoretical approach to the study of the main drivers for purchase decision in the pharmaceutical
market of mandatory prescription drugs.
As this is a recent problem within the Portuguese context, arising with the latest changes in the legal framework for drug
prescription (which transfers part of the decision-making power to the consumer that previously was limited to accept
medical choice) it was understood that the starting point for the study should be the understanding of the purchase choice
drivers for common consumption situations.
For this purpose, the authors carried out a Systematic Literature Review based on ISI Current Contents database. The
search was based on a set of keywords based on authors’ previous experience and brainstorm. The search results were
submitted to relevance procedure and further analysis using RefViz.
The outcome of this research paper is to identify trends and subject clusters within the phenomenon of purchase behavior
and choice criteria in a market with very particular characteristics such as the mandatory prescription drugs.
Introduction
The first idea for this paper comes after the latest changes in regulations for prescribing of mandatory
prescription drugs and the new environment created by these changes in the pharmaceutical market in Portugal.
For a better understanding of the subject it is important to get to know the purchasing process for this kind of
products. This process rather than a purchase itself it´s a set of sequential steps: the physician writes the drug
prescription, secondly the pharmacist dispenses the same drug and finally the patient consumes (Merino-Castelló, 2003).
This sequence, prescription-dispensation-consumption, apparently linear, shows the physician has the only
decision maker, reserving for the remaining players a passive role in respect to the purchasing choice decision.
In this context the marketing efforts of the pharmaceutical industry have traditionally been directed to the
prescriber (Physician).
However, in recent years the creation of the “generic market” as well as the introduction of a number of legislative
changes has introduced a second level of decision to be exercised at the pharmacy level. In fact, pharmacists acquired the
opportunity to change (under certain circumstances) the branded product prescribed by a similar generic wi th lower
price. Nevertheless, physicians remained with the power to not allow this substitution preserving themselves as the most
important decision maker in most cases.

617
More recently, the new legal regimen introduced by “Lei n.º 11/2012”, the new law for electronic prescribing that
establishes mandatory prescription by INN (International Nonproprietary Name), gives the patient, at the time of
purchase, the opportunity to choose between the branded drug prescribed and 3 cheaper generic alternatives.
This new legal environment empowers the consumer / patient as the ultimate decider even against the preferred
choice of the doctor and / or the pharmacist.
This new context, opens a new interest in relation to the study of how the consumer / patient makes a choi ce
between two or more alternatives taking into account the opinion of their doctor, pharmacist but also other factors such as
price, brand loyalty, trust or other.
The emergence of the topic justifies almost no scientific studies on this issue and opens a new field that can be
exploited in order to accurately explain this, apparently, more complex purchase choice process.
From a practical point of view, taking into account the prohibition of making any kind of promotion of such
products to the final consumer, knowledge of specific processes in the context of choice in analysis will allow
pharmaceutical companies to adopt policies of product, price, distribution and institutional communication, enabling them
to acquire an advantageous position among its target customers.
As stated earlier, this paper is the first step toward the goal of answering the central research question. In fact, the
lack of previous work on the purchase behavior in the market of mandatory prescription drugs (Merino-Castelló, 2003),
justifies the need to understand what determinants of choice behavior are considered in the literature. In fact, Valečková
(2012) states that it is necessary to find the factors that influence the purchase of pharmaceutical products.
The aim of the research implied a review of the current knowledge on the topic under study. The research was
performed in the methodological underpinning of Systematic Literature Review since it ensures scientific rigor (Tranfield
et al., 2003; Mulrow, 1994) so that the results can effectively be useful to apply in pharmaceutical market.
Methods
According to Tranfield et al. (2003) undertaking a review of the literature to provide evidence for informing policy
and practice, is a key research objective for academic communities. In the same direction, Briner & Denyer (2012) states
that every knowledge should be based on a reasonably comprehensive and critical understanding of the previous state of
relevant knowledge, and thus, new empirical and theoretical research is supposed to build upon, existing research.
However, traditional reviews (narrative reviews) frequently show some lack thoroughness, and consequently
they often cannot make sense of what the collection of studies is saying. In fact, because researchers tend to use informal
and unstructured processes to decide upon the key areas to research and to review literatures, these reviews can be easily
biased (Tranfield et al., 2003; Saur-Amaral, 2011) and consequently leads to an incomplete process of identification of
scientific school of thought and to low efficiency in the research process (Kofinas & Saur-Amaral, 2008; Saur-Amaral,
2011).
In order to overcome this limitation Tranfield et al. (2003) proposes the view that applying the principles of a
systematic review methodology can help in counteracting bias by making explicit the values and assumptions
underpinning a review.
Mulrow (1994) argues that Systematic literature review is a fundamental scientific activity and its rationale is
grounded firmly in four premises: Firstly, large quantities of information must be reduced and systematized. Secondly,
decision makers need to integrate several critical parts of the information available. Thirdly, the systematic review is an
efficient scientific technique. Fourthly, the generalizability of scientific findings can be established in systematic reviews.
Both narrative and systematic reviews are retrospective observational studies and are, therefore, subject to
random and systematic error. Therefore, the quality of a review depends on the extent to which the methods of scientific
analysis have been used to minimize errors and biases (Cook, 1997). Like any other method, systematic reviews have
weaknesses and limitations but, as the review method is made explicit, such limitations are acknowledged and can be
critically evaluated (Briner & Denyer, 2012).
Several authors support that systematic literature reviews offer the advantage of showing that, whether scientific
findings are consistent and can be generalized across populations (Mulrow, 1994; Petticrew, 2006; Kitchenham, 2004), or

618
whether they vary significantly and it can help us to improve our understanding of inconsistencies among different pieces
of research evidence (Cook, 1997; Kitchenham, 2004).
On the other hand systematic reviews differ from narrative reviews because their reprodutible, scientific and
transparent procedure. This process allows the minimization of biases (Tranfield et al., 2003; Petticrew, 2006; Cook, 1997;
Kitchenham, 2004). In fact Tranfield et al. (2003) reported that a comprehensive, unbiased search is one of the
fundamental differences between a traditional narrative review and a systematic review.
That is why, in recent years, a large number of academic studies appeared focusing on this method - Systematic
Reviews Literature. (Briner & Denyer, 2012; Crossan & Apaydin, 2010; Kofinas & Saur-Amaral, 2008; Real de Oliveira et
al., 2012; Ferreira et al., 2012)
The authors followed the methodological approach proposed by Tanfield et al (2003) presented in Table 1.
Stage I - Planning the review
Phase 0 - Identification for the need for a review
Phase 1 - Preparation of a proposal for a review
Phase 2 - Development of a review protocol
Stage II - Conducting a review
Phase 3 - Identification of research
Phase 4 - Selection of studies
Phase 5 - Study quality assessment
Phase 6 - Data extraction and monitoring progress
Phase 7 - Data synthesis
Stage III - Reporting and dissemination
Phase 8 - The report and recommendations
Phase 9 - Getting evidence into practice
Tabel 1: Synthesis of approach suggested by Tranfield et al. (2003)
The authors apply these three steps, considering the experience of previous studies (Kofinas & Saur-Amaral, 2008;
Real de Oliveira et al., 2012; Ferreira et al., 2012).
As the first step, the authors build the review protocol, based on keywords directly related to the research
question. The search was performed rigorously according with the review protocol, recording all the steps, justifying all
the decisions as well as ensuring transparency and replicability of the study.
As the second step the records were extracted to Endnote X6, where the preliminary relevance analysis and
selection were performed and then exported relevant records to xml in order to be imported into RefViz.
RefViz software was used to better understand the sample and create the starting point for content analysis.
Description of Procedures for the Systematic Literature Review
Search was conducted on January 12th, 2013 using ISI Current Contents. A combination of three different, pre-
determined, research equations have been implemented (See Appendix 2):
Search 1 had as search equation “Decision Making Process” and “Purchase choice” IN Topic. The search
was done using the Social & Behavioural Sciences (SBS) database of ISI Current Contents, with a timespan

619
filter of publication date between 2005 and 2013 (date of search). The search was refined by: document
type = (Article or Review) and Subject Areas = (Business Economics). This search obtained 77 results.
Search 2 had as search equation “Decision Making Process” and “Brand choice” IN Topic. The search was
done using the Social & Behavioural Sciences (SBS) database of ISI Current Contents, with a timespan
filter of publication date between 2005 and 2013 (date of search). The search was refined by: document
type = (Article or Review) and Subject Areas = (Business Economics). This search obtained 50 results.
Search 3 had as search equation “Decision Making Process” and “choice criteria” IN Topic. The search was
done using the Social & Behavioural Sciences (SBS) database of ISI Current Contents, with a timespan
filter of publication date between 2005 and 2013 (date of search). The search was refined by: document
type = (Article or Review) and Subject Areas = (Business Economics). This search obtained 69 results.
After this procedure, the three searches were combined using Search History functionality in ISI Current Contents,
so as to ensure there were no duplicate records in the final sample. With this procedure the 196 articles found resulted in
a list of 178 articles which were the working sample exported to Endnote X6.
The authors performed a relevance analysis, reading all abstracts and putting aside those that were not related
with Drivers for Purchase Decision, according to our initial research goal. After this relevance analysis, our working
sample was reduced to 48 relevant articles (See appendix 1).
Results of Systematic Literature Review
Descriptive Statistics
Regarding the publication year the data are not entirely conclusive. Nevertheless, observing the graph in Figure 1 we can
see the large number (21) of papers published during the last two which means a higher level of interest on this field.
Another phenomenon that can be observed is the high number of articles in 2008, especially bearing in mind the coming
years. The authors tried to explain this by searching for eventually related events in this period but no explanation could
be found.
Figure 8: Paper distribution per publication year
When we look to the scientific journals (Figure 2), we can identify one that is the most representative in terms of
number of publications in the late years: “Marketing Letters”, concentrating about 12% of the selected papers in our
sample.
Then we can identify a group of three journals with three publications each and it´s interesting to note that all
three are related to the study of the consumer or marketing research.
In fact, if we consider only the journals which scope is psychology (mainly consumer psychology) or marketing we
see that 47% of the journals have published 61% of the selected articles. There are also publications in journals of
economics and other topics but without scale to be considered significant.
This means that we can identify two primary approaches: the marketing perspective and the consumer
psychology.

620
Figure 9: Papers published per scientific journal
The analysis reveals no reference authors, since only three have two papers (Exley, van der Merwe and Van
Osselaer) which is not relevant to consider them as a reference author in this subject (See Appendix 3).
Figure 10: Papers published per Author
Exploratory Galaxies: Results from Data-Mining in Refviz
As stated above RefViz software was used to better understand the sample and create the starting point for
content analysis. Acording to Agrawal (2009) RefViz defines groups using word count and semantic distance (applied to
abstracts, titles and keywords) while the researcher uses major topics and minor topics, together with stop words and
thesaurus in order to get to literature map allowing to identify and comprehend invisible colleges, trends and or gaps.
For the present paper, the application of this software, for the relevant sample characterized in the previous
section, resulted in the map we can see in Figure 4. The Literature map presented was obtained after three reiterations in
order to reach a robust output.
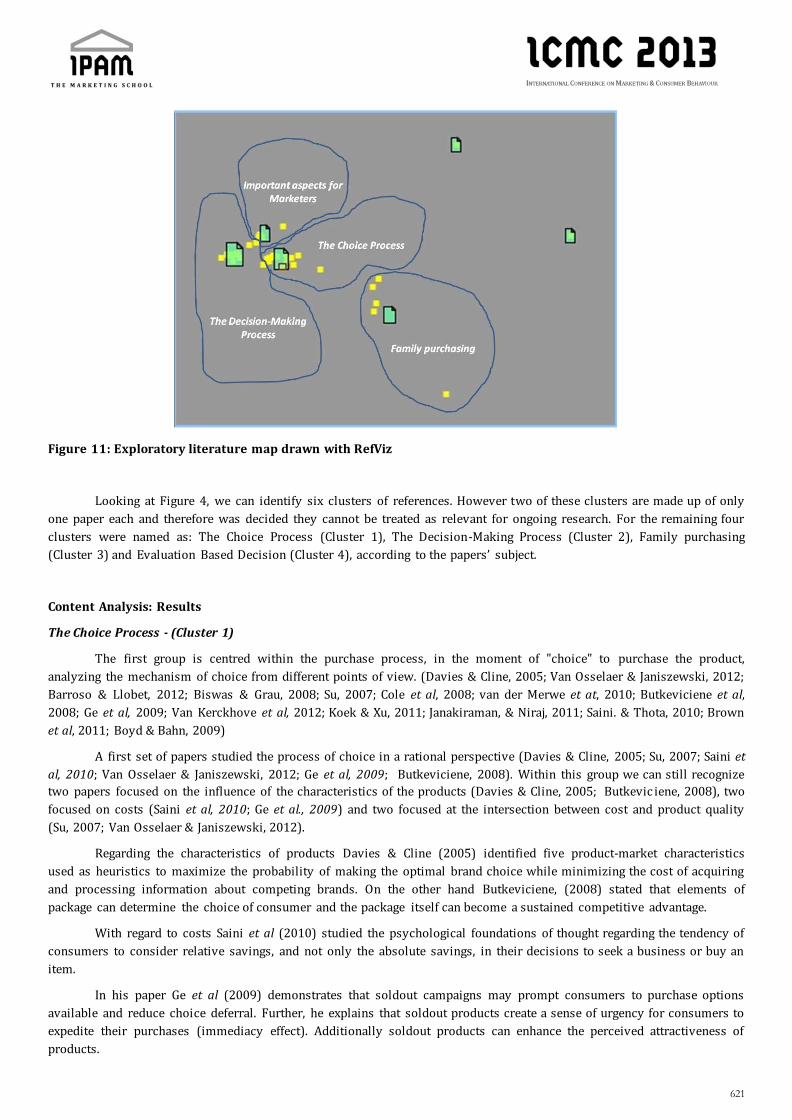
621
Figure 11: Exploratory literature map drawn with RefViz
Looking at Figure 4, we can identify six clusters of references. However two of these clusters are made up of only
one paper each and therefore was decided they cannot be treated as relevant for ongoing research. For the remaining four
clusters were named as: The Choice Process (Cluster 1), The Decision-Making Process (Cluster 2), Family purchasing
(Cluster 3) and Evaluation Based Decision (Cluster 4), according to the papers’ subject.
Content Analysis: Results
The Choice Process - (Cluster 1)
The first group is centred within the purchase process, in the moment of "choice" to purchase the product,
analyzing the mechanism of choice from different points of view. (Davies & Cline, 2005; Van Osselaer & Janiszewski, 2012;
Barroso & Llobet, 2012; Biswas & Grau, 2008; Su, 2007; Cole et al, 2008; van der Merwe et at, 2010; Butkeviciene et al,
2008; Ge et al, 2009; Van Kerckhove et al, 2012; Koek & Xu, 2011; Janakiraman, & Niraj, 2011; Saini. & Thota, 2010; Brown
et al, 2011; Boyd & Bahn, 2009)
A first set of papers studied the process of choice in a rational perspective (Davies & Cline, 2005; Su, 2007; Saini et
al, 2010; Van Osselaer & Janiszewski, 2012; Ge et al, 2009; Butkeviciene, 2008). Within this group we can still recognize
two papers focused on the influence of the characteristics of the products (Davies & Cline, 2005; Butkevic iene, 2008), two
focused on costs (Saini et al, 2010; Ge et al., 2009) and two focused at the intersection between cost and product quality
(Su, 2007; Van Osselaer & Janiszewski, 2012).
Regarding the characteristics of products Davies & Cline (2005) identified five product-market characteristics
used as heuristics to maximize the probability of making the optimal brand choice while minimizing the cost of acquiring
and processing information about competing brands. On the other hand Butkeviciene, (2008) stated that elements of
package can determine the choice of consumer and the package itself can become a sustained competitive advantage.
With regard to costs Saini et al (2010) studied the psychological foundations of thought regarding the tendency of
consumers to consider relative savings, and not only the absolute savings, in their decisions to seek a business or buy an
item.
In his paper Ge et al (2009) demonstrates that soldout campaigns may prompt consumers to purchase options
available and reduce choice deferral. Further, he explains that soldout products create a sense of urgency for consumers to
expedite their purchases (immediacy effect). Additionally soldout products can enhance the perceived attractiveness of
products.

622
When evaluating on a weighted cost / quality Su (2007) identified three choice strategies: the first strategy,
expected value, chooses the lowest expected cost (or highest utility) in terms of price, brand, and expected credibility. The
second, brand seeking, chooses the best-known retailer. The third, price aversion, chooses the lowest-price retailer to
minimize immediate costs. He found that price, objective product information, and perceptions of retailer credibility are
the three important attributes to consumers; that consumers consider objective product information and perceptions of
retailer credibility regardless of their brand-seeking or price-aversion strategy; an increase in objective product
information leads to a dramatic increase in expected-value choices and to a decrease in brand-seeking and price-aversion
choices.
The second set of papers in this same group propose social motivations for purchase choice (Brown et al, 2011; Koek. &
Xu, 2011; Janakiraman, & Niraj, 2011). Brown et al, (2011) suggests that brands are a risk-reduction heuristic and
consequently the influence of brands increases as a function of risk. The paper proposes that risk and brand sensitivity are
related in a U-shaped manner, where brand sensitivity is highest in relatively low or high risk situations.
Koek & Xu (2011) model consumer in two different hierarchical structures: a brand-primary model in which
consumers choose a brand first, then a product type in the chosen brand, and a type-primary model in which consumers
choose a product type first, then a brand within that product type. He found that with the brand-primary model, both the
optimal and the competitive assortments for each brand consist of the most popular product types from the brand. But
with the type-primary choice model, the optimal and the competitive assortments for each brand may not always consist
of the most popular product types of the brand. Instead, the overall assortment in the category consists of a set of most
popular product types.
Finally, Janakiraman & Niraj (2011) explain the importance of social contagion effects due to geographical
proximity on consumer choices of what to buy (i.e., brand choice), how to buy (i.e., the channel), and where to buy (i.e.,
retailers). The results indicate significant contagion effect on each of the three choices.
The third set of papers investigate the importance of information on choice process (Biswas & Grau, 2008;
Barroso & Llobet, 2012; van der Merwe et al, 2010; Boyd & Bahn, 2009).
This last group examines the importance of presence of information for customers to make a choice and defend
that consumers choose a higher number of product options in the presence of more information about the products and
their features (Biswas & Grau, 2008; van der Merwe et al, 2010), and the same applies with an increased assortment
(Boyd & Bahn, 2009).
In the same set another paper proposes an approach to assess the dynamic effect that advertising expenditures
have on consumers choices. The results sustained that awareness of each product affects the purchase choice and can be
significantly speed up by advertising (Barroso & Llobet, 2012).
The Decision-Making Process (Cluster 2)
The second cluster is centred in the decision-making process itself. (Aribarg et al, 2010; Babutsidze, 2012; Bin Jun
& Il Kim, 2011; Bond et al, 2008; Carlson et al,2008; Chakravarti et al, 2006; Colonna et al, 2011; Darke et al, 2006; Exley et
al, 2009; Gazley et al, 2011; Heiman & Lowengart, 2011; Izquierdo & Martinez, 2009; Jang et al, 2012; Koklic & Vida, 2011;
Sela & Berger, 2012; Shao et al, 2008; Shen & Wyer, 2010; Szrek & Bundorf, 2011; van Dijk et al, 2008; Van Osselaer et al,
2005; Yoon et al, 2012; Zhang, 2006).
In this cluster is also possible to identify some sub-groups according to the angle from which they address the
theme.
One of those sub-groups discusses the influence of some consumer personal characteristics in the decision-making
purchase process. (Bond et al, 2008; Koklic & Vida, 2011; Szrek & Bundorf, 2011).
Within this group Szrek & Bundorf (2011) studied the influence of age and find that more than the age of the
consumers, numeracy and cognitive reflection are positively associated with likelihood to purchase and that they are more
important determinants of than age. In fact according to their work, greater numeracy is associated with a lower
willingness to pay for choice.

623
The goal of Bond et al (2008) was to determine the dimensions over which consumers make purchasing decisions
and to identify key market segments. As a result he obtained the following market segments: Urban, Assurance Seekers,
Price Conscious Consumers, Quality and Safety Consumers, and Personal Value Buyers.
In the last paper of this sub-group Koklic & Vida (2011) tried to explain the consumer choice process in case of
strategic purchases. The results suggest that personal situation of the consumer, environmental factors, the role of
feelings, experience, subconscious factors, needs, and goals should to be taken into account in order to understand
strategic consumer decision making and their choice process.
Still under the study of decision-making process we can recognize a second sub-group that focuses on the role of
information in the same process. (Babutsidze, 2012; Chakravarti et al, 2006; Colonna et al, 2011; Heiman & Lowengart,
2011; Izquierdo & Martinez, 2009; Jang et al, 2012).
Under this point of view Jang et al (2012) found that consumers use product reviews more in the consideration set
stage and less in the choice stage suggesting that marketers should make product review information available from the
beginning of the search process.
However, Chakravarti et al (2006) sustained that information used to screen alternatives becomes less important
than information acquired later in the search process.
Though Izquierdo & Martinez (2009) showed that main sources of uncertainty in the phases prior to the purchase
choice are determined by the lack of trust. That signals emitted by firms to mitigate information asymmetries contribute to
build trust towards the company chosen, and trust leads buyers to choose the option with the lowest perceived risk.
The last sub-group in this cluster examines the decision-making process itself. (Carlson et al,2008; Darke et al,
2006; Sela & Berger, 2012; Shao et al, 2008; Shen & Wyer, 2010; Van Osselaer et al, 2005; Zhang, 2006).
In this context Shen et al (2008) and Shao et al (2008) studied the conditions in which spontaneous processes
leads the purchase choice.
In the other hand Darke et al (2006) as well as Sela & Berger (2012) explained that the "pleasure" and "assigned"
a central role in decision-making processes of purchase. Likewise, Sela et al (2008) showed that the increase of attribute
quantity shifts choice toward hedonic options, regardless of whether the attributes are hedonic, utilitarian, or mixed in
nature.
A last set of papers in this cluster introduces a goal-based view of consumer choice in which choice is influenced
by three classes of goals (consumption goals, criterion goals, and process goals). (Van Osselaer et al, 2005; Carlson et al,
2008)
Family Purchasing (Cluster 3)
The authors named Cluster nº 3 of “Family Purchasing” because papers of this group are related either with
purchases decided jointly by different members of a family or with purchasing home related products. (Hammond &
Chapman, 2008; van der Merwe & Campbell, 2008; Jang et al, 2007; Simonson, 2005; Decrop & Snelders, 2005)
In this context Jang et al (2007) and Decrop & Snelders (2005) analyzed group decision-making in a family context
and concluded that each member of a couple act in order to reduce conflicts by adding some of the other's alternatives to
built the final choice set, which tend to be acceptable to both.
Now the work of Hammond & Chapman (2008); van der Merwe & Campbell (2008) show that for purchases
related to home consumers seek, on the one hand, ensure maximization of value taking advantage of the variety of choice
whenever it exists (Hammond & Chapman, 2008). These results are consistent with the work of van der Merwe &
Campbell (2008) which find that consumers evaluated options based on their needs, values and personal style, whil e
making their final product choice based on product quality, appearance and price.

624
Evaluation Based Decision(Cluster 4)
The four papers on the last cluster (Gershoff & Burson, 2011; Valentini et al, 2011; Choudhury & Karahanna, 2008;
Carrillat et al, 2011) address different ways wich consumers evaluate alternatives during the choice process, either by
comparison with other consumers, by analysis of past experiences or by analyzing specific information available..
In the first paper Gershoff & Burson (2011) sustained that people tend to compare themselves to other consumers
when making purchasing decisions. Unfortunately, they tend to err in this task, because consumers tend to overestimate
the dispersion of results.
In this cluster we can find two papers that address channel choice process. (Valentini et al, 2011; Choudhury &
Karahanna, 2008). The first one (Valentini et al, 2011) shows that the increasing number of sales channels through which
customers can shop made imperative for managers to understand how customers make their choice about which channel
to use. The second (Choudhury & Karahanna, 2008) supports that the dimensions along which the consumer evaluates the
channel to be used include dimensions as confidence and convenience measured at two distinct phases of the purchase
process: gathering information and executing the operation.
The last paper of this cluster (Carrillat et al, 2011) explores the paradoxical phenomenon that “maximizers”
undervalue information resulting from their past experiences. In fact, the results sustained that a “maximize” starts over
the decision process for each decision that is undertaken even if a similar process has been undertaken in the past and
therefore past retail store performance becomes a weaker predictor of repurchase intention among maximize consumers.
The author also claims that as prices became higher even the average consumer (“satisficers”) tend to behave in a similar
way to “maximizers”.
Discussion and Final Considerations
As stated above the first idea for this paper comes after the latest changes in Portuguese law for mandatory
prescribed medicines and the new environment created by the same changes in the pharmaceutical market in Portugal.
This paper is, therefore, a first step toward the goal of answering the central research question.
In this sense, the authors tried to conclude from the paper useful insights to continue to search for answers in the
specific market of mandatory prescription drugs.
The efficacy of method chosen for this research (Systematic Literature Review) depends, largely, on the quality of
the search and this depends on prior experience in doing systematic literature reviews and also on planning.
In this context the recent work of two of the authors of this paper in other Systematic Literature Review papers,
allows some degree of comfort within the conclusions of this paper.
The first of our initial findings was the observation of the small amount of relevant papers resulted from our
query. In fact a total of 49 relevant papers in a time span of 8 years (which means an average of about 6 papers per year)
clearly showing little scientific production. However the number of publications on this subject seems to show a positive
trend during the last couple of years. This trend, if confirmed in the coming years, may represent some emergency of the
studied field.
Looking into the scientific journals the authors identified “Marketing Letters” as the most representative in terms
of number of publications in the late years. Nevertheless, this journal published not more than 6 papers representing
about 12% of the selected researches in our sample.
Concerning the authors it was not possible to identify any reference author, since none had a sufficient number of
publications to be considered a reference.
From the literature map obtained with Refviz the authors identified 4 clusters using the grounded theory
approach. These clusters were named taking into account a subjective analysis reflecting the issues and concerns of the
papers: Cluster 1 - The Choice Process, Cluster 2 - The Decision-Making Process, Cluster 3 - Family purchasing and Cluster
4 - Evaluation Based Decision.
Through the analysis of the RefViz resulting clusters it is possible to observe that, at the time of purchase, the
choice made by the consumer is influenced by a variety of factors that are summarized in the following lines.

625
First some papers shown that it’s possible to identify some aspects related to the purchased product that influence
choice: characteristics of the products, the price, the relation between price and product quality, the brand, the presence
and quality of information specially during the consideration set stage.
On the other hand it is also possible to identify some aspects related to the consumer itsel f such as personal
characteristics (age, numeracy and others), his personal situation (environmental factors, the role of feelings, experience,
subconscious factors, needs, and goals) as well as social contagion effects.
Additionally it was possible to identify an important role for advertising.
These findings will form, now, the basis for the study of the purchase situation and determinants of choice in the
market for mandatory prescription pharmaceutical products.
References
Agrawal, A. (2009). “EndNote 1-2-3 Easy!: Reference Management for the Professional”, 2nd Edition, Berlin, Springer
Aribarg, Anocha; Arora, Neeraj; Kang, Moon Young. (2010). "Predicting Joint Choice Using Individual Data." Marketing
Science, 29(1): 139-157.
Babutsidze, Zakaria. (2012) "How do Consumers Make Choices? A Survey of Evidence." Journal of Economic Surveys,
26(4): 752-762.
Barroso, Alicia; Llobet, Gerard. (2012). "Advertising and Consumer Awareness of New, Differentiated Products." Journal of
Marketing Research, 49(6): 773-792.
Bin Jun, Duk; Il Kim, Jung. (2011) "A choice-based multi-product diffusion model incorporating replacement demand."
Technological Forecasting and Social Change, 78(4): 674-689.
Biswas, Dipayan; Grau, Stacy Landreth (2008) "Consumer choices under product option framing: Loss aversion principles
or sensitivity to price differentials?" Psychology & Marketing, 25(5): 399-415.
Bond, Craig A.; Thilmany, Dawn; Bond, Jennifer Keeling. (2008). "Understanding consumer interest in product and
process-based attributes for fresh produce." Agribusiness, 24(2): 231-252.
Boyd, D. Eric; Bahn, Kenneth D. (2009) "When Do Large Product Assortments Benefit Consumers? An Information-
Processing Perspective." Journal of Retailing, 85(3): 288-297.
Briner, R. B., & Denyer, D. (2012). “Systematic review and evidence synthesis as a practice and scholarship tool.” In
Rousseau, D. (Ed.) Handbook of Evidence-Based Management: Companies, Classrooms and Research, Oxford:
Oxford University Press
Brown, Brian P.; Zablah, Alex R.; Bellenger, Danny N.; Johnston, Wesley J. (2011). "When do B2B brands influence the
decision making of organizational buyers? An examination of the relationship between purchase risk and brand
sensitivity." International Journal of Research in Marketing, 28(3): 194-204.
Butkeviciene, Vitalija; Stravinskiene, Jurgita; Rutelione, Ausra. (2008) "Impact of consumer package communication on
consumer decision making process." Inzinerine Ekonomika-Engineering economics, (1): 57-65.
Carlson, Kurt A.; Janiszewski, Chris; Keeney, Ralph L.; Krantz, David H.; Kunreuther, Howard C.; Luce, Mary Frances; Russo,
J. Edward; van Osselaer, Stijn M. J.; von Winterfeldt, Detlof. (2008) "A theoretical framework for goal -based
choice and for prescriptive analysis." Marketing Letters, 19(3-4): 241-254.
Carrillat, Francois A.; Ladik, Daniel M.; Legoux, Renaud. (2011). "When the decision ball keeps rolling: An investigation of
the Sisyphus effect among maximizing consumers." Marketing Letters, 22(3): 283-296.
Chakravarti, Amitav; Janiszewski, Chris; Ulkumen, Gulden. (2006). "The neglect of prescreening information." Journal of
Marketing Research, 43(4): 642-653.
Choudhury, Vivek; Karahanna, Elena. (2008). "The relative advantage of electronic channels: A multidimensional view."
Mis Quarterly, 32(1): 179-200.
Cole, Catherine; Laurent, Gilles; Drolet, Aimee; Ebert, Jane; Gutchess, Angela; Lambert-Pandraud, Raphaelle; Mullet,

626
Etienne; Norton, Michael I.; Peters, Ellen. (2008). "Decision making and brand choice by older consumers."
Marketing Letters, 19(3-4): 355-365.
Colonna, A.; Durham, C.; Meunier-Goddik, L. (2011). "Factors affecting consumer's preferences for and purchasing
decisions regarding pasteurized and raw milk specialty cheeses." Journal of Dairy Science, 94(10): 5217-5226.
Cook, Deborah J., Mulrow, Cynthia D. & Haynes, R. Brian. (1997). “Systematic Reviews: Synthesis of Best Evidence for
Clinical Decisions.” Annals of Internal Medicine 126:376 380.
Crossan, M. M., & Apaydin, M. (2010). “A Multi-Dimensional Framework of Organizational Innovation: A Systematic Review
of the Literature”. Journal of Management Studies, 47(6), 1154-1191
Darke, Peter R.; Chattopadhyay, Amitava; Ashworth, Laurence. (2006). "The importance and functional significance of
affective cues in consumer choice." Journal of Consumer Research, 33(3): 322-328.
Davies, A.; Cline, T. W. (2005). "A consumer behavior approach to modeling monopolistic competition." Journal of
Economic Psychology, 26(6): 797-826.
Exley, Catherine E.; Rousseau, Nikki S.; Steele, Jimmy; Finch, Tracy; Field, James; Donaldson, Cam; Thomason, J. Mark; May,
Carl R.; Ellis, Janice S. (2009) "Paying for treatments? Influences on negotiating clinical need and decision-
making for dental implant treatment." Bmc Health Services Research, 9.
Ferreira, P., Saur-Amaral, I., Conde, R., (2012) "Linking Past and Future Research in Tourism Management: A Systematic
Literature Review". TMS – Management Studies – International Conference, Universidade do Algarve, Faro
November 21-24
Gazley, Aaron; Clark, Gemma; Sinha, Ashish (2011) "Understanding preferences for motion pictures." Journal of
Business Research, 64(8): 854-861.
Ge, Xin; Messinger, Paul R.; Li, Jin (2009). "Influence of Soldout Products on Consumer Choice." Journal of Retailing, 85(3) :
274-287.
Gershoff, Andrew D.; Burson, Katherine A. (2011). "Knowing Where They Stand: The Role of Inferred Distributions of
Others in Misestimates of Relative Standing." Journal of Consumer Research, 38(3): 407-419.
Hammond, Gail K.; Chapman, Gwen E. (2008) "Decision-making in the dairy aisle: Maximizing taste, health, cost and family
considerations." Canadian Journal of Dietetic Practice and Research, 69(2): 66-70.
Heiman, Amir; Lowengart, Oded (2011). "The effects of information about health hazards in food on consumers' c hoice
process." Journal of Econometrics, 162(1): 140-147.
Izquierdo Yusta, Alicia; Martinez Ruiz, Maria Pilar. (2009) "Analysis of the Factors that Condition the purchase Chanel
Choice by Consumers: Empirical Evidences in the Hotelling Industry." Cuadernos De Economia Y Direccion De
La Empresa, (41): 93-122.
Janakiraman, Ramkumar; Niraj, Rakesh (2011) "The Impact of Geographic Proximity on What to Buy, How to Buy, and
Where to Buy: Evidence from High-Tech Durable Goods Market." Decision Sciences, 42(4): 889-919.
Jang, Hochan; Lee, Seokho; Lee, Sang-Woo; Hong, Sung-kwon . (2007). "Expanding the individual choice-sets model to
couples' honeymoon destination selection process." Tourism Management, 28(5): 1299-1314.
Jang, Sungha; Prasad, Ashutosh; Ratchford, Brian T. (2012). "How consumers use product reviews in the purchase decision
process." Marketing Letters, 23(3): 825-838.
Kitchenham, B. (2004). “Procedures for Performing Systematic Reviews.” Joint Technical Report: Software Engineering
Group Department of Computer Science Keele University & Empirical Software Engineering National ICT
Australia Ltd.
Koek, A. Guerhan; Xu, Yi. (2011) "Optimal and Competitive Assortments with Endogenous Pricing Under Hierarchical
Consumer Choice Models." Management Science, 57(9): 1546-1563.
Kofinas, A., & Saur-Amaral, I. (2008). “25 years of knowledge creation processes in pharmaceutical industry: contemporary
trends”. Comportamento Organizacional e Gestão, 14(2), 257-280.

627
Koklic, Mateja Kos; Vida, Irena. (2011) "Consumer strategic decision making and choice process: prefabricated house
purchase." International Journal of Consumer Studies, 35(6): 634-643.
Merino-Castelló (2003). “Demand for Pharmaceutical Drugs: a Choice Modelling Experiment”. Departament d’Economia i
Empresa, Universitat Pompeu Fabra
Mulrow, C. D. (1994). Rationale for systematic reviews. British Medical Journal, 309:597-9
Petticrew, M & Roberts, H. (2006). Systematic Reviews in the Social Sciences: A Practical Guide, Blackwell Publishing.
Real de Oliveira, E., Ferreira, P., Saur-Amaral, I. (2012) "Human Resources Management and Corporate Social
Responsibility: A Systematic Literature Review". 11th International Conference of the Asia Chapter & 2nd
International Conference of the MENA Chapter, Academy of HRD, Istanbul November 8-10, 2012
Saini, Ritesh; Thota, Sweta C. (2010) "The psychological underpinnings of relative thinking in price comparisons."
Journal of Consumer Psychology, 20(2): 185-192.
Saur-Amaral, I. (2011). “Towards a Methodology for Literature Reviews in Social Sciences. Investigação e Intervenção em
Recursos Humanos 2011 – gestão para a cidadania”. Escola Superior de Estudos Industriais e de Gestão do
Instituto Politécnico do Porto.
Sela, Aner; Berger, Jonah. (2012) "How Attribute Quantity Influences Option Choice." Journal of Marketing Research, 49(6):
942-953.
Shao, Wei; Lye, Ashley; Rundle-Thiele, Sharyn. (2008) "Decisions, decisions, decisions Multiple pathways to choice."
International Journal of Market Research, 50(6): 797-816.
Shen, Hao; Wyer, Robert S., Jr. (2010) "The effect of past behavior on variety seeking: Automatic and deliberative
influences." Journal of Consumer Psychology, 20(1): 33-42.
Simonson, I. (2005). "Determinants of customers' responses to customized offers: Conceptual framework and research
propositions." Journal of Marketing, 69(1): 32-45.
Su, Bo-chiuan. (2007). "Consumer e-tailer choice strategies at on-line shopping comparison sites." International Journal of
Electronic Commerce, 11(3): 135-159.
Szrek, Helena; Bundorf, M. Kate (2011) "Age and the Purchase of Prescription Drug Insurance by Older Adults." Psychology
and Aging, 26(2): 308-320.
Tranfield, D., Denyer, D., & Smart, P. (2003). “Towards a methodology for developing evidence-informed management
knowledge by means of systematic review”. British Journal of Management, 14(3), 207-222
Valentini, Sara; Montaguti, Elisa; Neslin, Scott A. (2011) "Decision Process Evolution in Customer Channel Choice." Journal
of Marketing, 75(6): 72-86.
Valečková, Jana (2012) “The Analysis of the Influence of Residence in the Purchase of Pharmaceutical Products”. Journal of
Competitiveness, Vol. 4, Issue 1, pp. 56-68.
Van der Merwe, Daleen; Campbell, Theresa. (2008) "Profiling consumers in home ware stores according to their decision-
making process: an exploratory study." International Journal of Consumer Studies, 32(4): 328-334.
Van der Merwe, Daleen; Kempen, Elizabeth L.; Breedt, Sophia; de Beer, Hanli. (2010) "Food choice: student consumers'
decision-making process regarding food products with limited label information." International Journal of
Consumer Studies, 34(1): 11-18.
Van Dijk, Machiel; Bijlsma, Michiel; Pomp, Marc. (2008). "The price of free advice." Applied Economics, 40(14): 1889-1903.
Van Kerckhove, Anneleen; Geuens, Maggie; Vermeir, Iris. (2012) "Intention superiority perspectives on preference-
decision consistency." Journal of Business Research, 65(5): 692-700.
Van Osselaer, Stijn M. J.; Janiszewski, Chris; (2012) "A Goal-Based Model of Product Evaluation and Choice." Journal of
Consumer Research, 39(2): 260-292.
Van Osselaer, S. M. J.; Ramanathan, S.; Campbell, M. C.; Cohen, J. B.; Dale, J. K.; Herr, P. M.; Janiszewski, C.; Kruglanski, A. W.;
Lee, A. Y.; Read, S. J.; Russo, J. E.; Tavassoli, N. T. (2005). "Choice based on goals." Marketing Letters, 16(3-

628
4): 335-346
Yoon, Carolyn; Gonzalez, Richard; Bechara, Antoine; Berns, Gregory S.; Dagher, Alain A.; Dube, Laurette; Huettel, Scott A.;
Kable, Joseph W.; Liberzon, Israel; Plassmann, Hilke; Smidts, Ale; Spence, Charles. (2012). "Decision
neuroscience and consumer decision making." Marketing Letters, 23(2): 473-485.
Zhang, Jie. (2006). "An integrated choice model incorporating alternative mechanisms for consumers' reactions to in-store
display and feature advertising." Marketing Science, 25(3): 278-290.
Appendix 1 – List of papers included in the relevant sample (ordered alphabetically)
Arens, Zachary G.; Rust, Roland T. (2012). "The duality of decisions and the case for impulsiveness metrics." Journal of the
Academy of Marketing Science 40(3); 468-479.
Aribarg, Anocha; Arora, Neeraj; Kang, Moon Young. (2010). "Predicting Joint Choice Using Individual Data." Marketing
Science, 29(1): 139-157.
Babutsidze, Zakaria. (2012) "How do Consumers Make Choices? A Survey of Evidence." Journal of Economic Surveys,
26(4): 752-762.
Barroso, Alicia; Llobet, Gerard. (2012). "Advertising and Consumer Awareness of New, Differentiated Products." Journal of
Marketing Research, 49(6): 773-792.
Bin Jun, Duk; Il Kim, Jung. (2011) "A choice-based multi-product diffusion model incorporating replacement demand."
Technological Forecasting and Social Change, 78(4): 674-689.
Biswas, Dipayan; Grau, Stacy Landreth (2008) "Consumer choices under product option framing: Loss aversion principles
or sensitivity to price differentials?" Psychology & Marketing, 25(5): 399-415.
Bond, Craig A.; Thilmany, Dawn; Bond, Jennifer Keeling. (2008). "Understanding consumer interest in product and
process-based attributes for fresh produce." Agribusiness, 24(2): 231-252.
Boyd, D. Eric; Bahn, Kenneth D. (2009) "When Do Large Product Assortments Benefit Consumers? An Information-
Processing Perspective." Journal of Retailing, 85(3): 288-297.
Brown, Brian P.; Zablah, Alex R.; Bellenger, Danny N.; Johnston, Wesley J. (2011). "When do B2B brands influence the
decision making of organizational buyers? An examination of the relationship between purchase risk and brand
sensitivity." International Journal of Research in Marketing, 28(3): 194-204.
Butkeviciene, Vitalija; Stravinskiene, Jurgita; Rutelione, Ausra. (2008) "Impact of consumer package communication on
consumer decision making process." Inzinerine Ekonomika-Engineering economics, (1): 57-65.
Carlson, Kurt A.; Janiszewski, Chris; Keeney, Ralph L.; Krantz, David H.; Kunreuther, Howard C.; Luce, Mary Frances; Russo,
J. Edward; van Osselaer, Stijn M. J.; von Winterfeldt, Detlof. (2008) "A theoretical framework for goal -based
choice and for prescriptive analysis." Marketing Letters, 19(3-4): 241-254.
Carrillat, Francois A.; Ladik, Daniel M.; Legoux, Renaud. (2011). "When the decision ball keeps rolling: An investigation of
the Sisyphus effect among maximizing consumers." Marketing Letters, 22(3): 283-296.
Chakravarti, Amitav; Janiszewski, Chris; Ulkumen, Gulden. (2006). "The neglect of prescreening information." Journal of
Marketing Research, 43(4): 642-653.
Choudhury, Vivek; Karahanna, Elena. (2008). "The relative advantage of electronic channels: A multidimensional view."
Mis Quarterly, 32(1): 179-200.
Cole, Catherine; Laurent, Gilles; Drolet, Aimee; Ebert, Jane; Gutchess, Angela; Lambert-Pandraud, Raphaelle; Mullet,
Etienne; Norton, Michael I.; Peters, Ellen. (2008). "Decision making and brand choice by older consumers."
Marketing Letters, 19(3-4): 355-365.
Colonna, A.; Durham, C.; Meunier-Goddik, L. (2011). "Factors affecting consumer's preferences for and purchasing
decisions regarding pasteurized and raw milk specialty cheeses." Journal of Dairy Science, 94(10): 5217-5226.

629
Darke, Peter R.; Chattopadhyay, Amitava; Ashworth, Laurence. (2006). "The importance and functional significance of
affective cues in consumer choice." Journal of Consumer Research, 33(3): 322-328.
Davies, A.; Cline, T. W. (2005). "A consumer behavior approach to modeling monopolistic competition." Journal of
Economic Psychology, 26(6): 797-826.
Decrop, A.; Snelders, D. (2005). "A grounded typology of vacation decision-making." Tourism Management, 26(2): 121-
132.
Exley, Catherine; Rousseau, Nikki; Donaldson, Cam; Steele, Jimmy G. (2012) “Beyond price: individual s' accounts of
deciding to pay for private healthcare treatment in the UK." Bmc Health Services Research, 12.
Exley, Catherine E.; Rousseau, Nikki S.; Steele, Jimmy; Finch, Tracy; Field, James; Donaldson, Cam; Thomason, J. Mark; May,
Carl R.; Ellis, Janice S. (2009) "Paying for treatments? Influences on negotiating clinical need and decision-
making for dental implant treatment." Bmc Health Services Research, 9.
Gazley, Aaron; Clark, Gemma; Sinha, Ashish (2011) "Understanding preferences for motion pictures." Journal of
Business Research, 64(8): 854-861.
Ge, Xin; Messinger, Paul R.; Li, Jin (2009). "Influence of Soldout Products on Consumer Choice." Journal of Retailing, 85(3) :
274-287.
Gershoff, Andrew D.; Burson, Katherine A. (2011). "Knowing Where They Stand: The Role of Inferred Distributions of
Others in Misestimates of Relative Standing." Journal of Consumer Research, 38(3): 407-419.
Hammond, Gail K.; Chapman, Gwen E. (2008) "Decision-making in the dairy aisle: Maximizing taste, health, cost and family
considerations." Canadian Journal of Dietetic Practice and Research, 69(2): 66-70.
Heiman, Amir; Lowengart, Oded (2011). "The effects of information about health hazards in food on consumers' choice
process." Journal of Econometrics, 162(1): 140-147.
Izquierdo Yusta, Alicia; Martinez Ruiz, Maria Pilar. (2009) "Analysis of the Factors that Condition the purchase Chanel
Choice by Consumers: Empirical Evidences in the Hotelling Industry." Cuadernos De Economia Y Direccion De
La Empresa, (41): 93-122.
Janakiraman, Ramkumar; Niraj, Rakesh (2011) "The Impact of Geographic Proximity on What to Buy, How to Buy, and
Where to Buy: Evidence from High-Tech Durable Goods Market." Decision Sciences, 42(4): 889-919.
Jang, Hochan; Lee, Seokho; Lee, Sang-Woo; Hong, Sung-kwon . (2007). "Expanding the individual choice-sets model to
couples' honeymoon destination selection process." Tourism Management, 28(5): 1299-1314.
Jang, Sungha; Prasad, Ashutosh; Ratchford, Brian T. (2012). "How consumers use product reviews in the purchase decision
process." Marketing Letters, 23(3): 825-838.
Koek, A. Guerhan; Xu, Yi. (2011) "Optimal and Competitive Assortments with Endogenous Pricing Under Hierarchical
Consumer Choice Models." Management Science, 57(9): 1546-1563.
Koklic, Mateja Kos; Vida, Irena. (2011) "Consumer strategic decision making and choice process: prefabricated house
purchase." International Journal of Consumer Studies, 35(6): 634-643.
Saini, Ritesh; Thota, Sweta C. (2010) "The psychological underpinnings of relative thinking in price comparisons."
Journal of Consumer Psychology, 20(2): 185-192.
Sela, Aner; Berger, Jonah. (2012) "How Attribute Quantity Influences Option Choice." Journal of Marketing Research, 49(6):
942-953.
Shao, Wei; Lye, Ashley; Rundle-Thiele, Sharyn. (2008) "Decisions, decisions, decisions Multiple pathways to choice."
International Journal of Market Research, 50(6): 797-816.
Shen, Hao; Wyer, Robert S., Jr. (2010) "The effect of past behavior on variety seeking: Automatic and deliberative
influences." Journal of Consumer Psychology, 20(1): 33-42.
Simonson, I. (2005). "Determinants of customers' responses to customized offers: Conceptual framework and research
propositions." Journal of Marketing, 69(1): 32-45.

630
Su, Bo-chiuan. (2007). "Consumer e-tailer choice strategies at on-line shopping comparison sites." International Journal of
Electronic Commerce, 11(3): 135-159.
Szrek, Helena; Bundorf, M. Kate (2011) "Age and the Purchase of Prescription Drug Insurance by Older Adults." Psychology
and Aging, 26(2): 308-320.
Valentini, Sara; Montaguti, Elisa; Neslin, Scott A. (2011) "Decision Process Evolution in Customer Channel Choice." Journal
of Marketing, 75(6): 72-86.
van der Merwe, Daleen; Campbell, Theresa. (2008) "Profiling consumers in home ware stores according to their decision-
making process: an exploratory study." International Journal of Consumer Studies, 32(4): 328-334.
van der Merwe, Daleen; Kempen, Elizabeth L.; Breedt, Sophia; de Beer, Hanli. (2010) "Food choice: student consumers'
decision-making process regarding food products with limited label information." International Journal of
Consumer Studies, 34(1): 11-18.
van Dijk, Machiel; Bijlsma, Michiel; Pomp, Marc. (2008). "The price of free advice." Applied Economics, 40(14): 1889-1903.
Van Kerckhove, Anneleen; Geuens, Maggie; Vermeir, Iris. (2012) "Intention superiority perspectives on preference-
decision consistency." Journal of Business Research, 65(5): 692-700.
Van Osselaer, Stijn M. J.; Janiszewski, Chris; (2012) "A Goal-Based Model of Product Evaluation and Choice." Journal of
Consumer Research, 39(2): 260-292.
Van Osselaer, S. M. J.; Ramanathan, S.; Campbell, M. C.; Cohen, J. B.; Dale, J. K.; Herr, P. M.; Janiszewski, C.; Kruglanski, A. W.;
Lee, A. Y.; Read, S. J.; Russo, J. E.; Tavassoli, N. T. (2005). "Choice based on goals." Marketing Letters, 16(3-
4): 335-346
Yoon, Carolyn; Gonzalez, Richard; Bechara, Antoine; Berns, Gregory S.; Dagher, Alain A.; Dube, Laurette; Huettel, Scott A.;
Kable, Joseph W.; Liberzon, Israel; Plassmann, Hilke; Smidts, Ale; Spence, Charles. (2012). "Decision
neuroscience and consumer decision making." Marketing Letters, 23(2): 473-485.
Zhang, Jie. (2006). "An integrated choice model incorporating alternative mechanisms for consumers' reactions to in-store
display and feature advertising." Marketing Science, 25(3): 278-290.
Appendix 2 – Search
Search was conducted on January 12th. A combination of three different, pre-determined, research
equations have been implemented.
Search equation Database Refined by Timespan Lemmatization Results
“Decision Making
Process” and
“Purchase choice” IN
Topic
Social &
Behavioural
Sciences (SBS)
database of ISI
Current Contents
Document type
= (Article or
Review) and
Subject Areas =
(Business
Economics).
Publication
date between
2005 and
2013 (date of
search)
ON
77
“Decision Making
Process” and “Brand
choice” IN Topic
50
“Decision Making
Process” and “choice
criteria” IN Topic
69

631
Appendix 3 – Relevant Authors in Each Literature Group

632
The influence of ethnocentricity in purchase
behavior and ethnocentric attitudes Ethnocentricity, purchase behavior, national identification, cosmopolitan, domestic purchase, foreign purchase
M. Elena Aramendia-Muneta, Universidad de Navarra, [email protected]
James Reardon, University of Northern Colorado, [email protected]
Abstract
Objective: This research examines the effect of Consumer Ethnocentricity (CE) under conditions of persistent financial
crisis.
Consumer Ethnocentricity (CE) has been examined in many contexts. The conceptual underpinnings of CE imply that
consumers, at least some, respond to foreign goods negatively based on the idea of preserving the domestic economy.
Thus, it would logically follow that when the economy is in recession or crisis this phenomenon might be exaggerated.
The continuing economic crisis has been significant both in terms of impact and duration. Thus, an examination of the
CE model in the context of high unemployment and reduced consumer expenditure appears ripe for analysis.
Methodology: The sample consisted of 560 Spanish college students. Spain is most affected areas of the global
economic crisis, and within this country, young students have been among the hardest hit. There are 4 hypothesis:
H1a: Ethnocentric attitudes of consumers have a positive effect on Domestic Purchase Behavior; H1b: Ethnocentric
attitudes of consumers have a negative effect on Foreign Purchase Behavior; H2: National Identification has a positive
effect on Ethnocentricity; H3: Cosmopolitanism has a negative effect on Ethnocentricity
Conclusion: Hypothesis H1a, H1b and H2 are supported and H3 is not supported.
Limitations: Ideally, this research needs a longitudinal methodology to examine the pre-post effects of an economic
crisis on consumer behaviour.
INTRODUCTION
Consumer Ethnocentrism (CE) models have been used to examine a host of country of origin issues over the last two
decades. However, all the models imply or presume that the resultant effects are static as to environment. Yet, both
reality and theory would suggest otherwise. Consumers adapt to both declines and increases in income. They also
adjust to psychological factors related to consumption. Most recently, the global economic crisis has had a significant
and persistent effect on consumers. However, there has been limited examination as to the effects of this rather
massive environmental factor on the psychology of consumers.
The EU has been perhaps the hardest hit by the global economic crisis. Within this context, some nations have been
tagged with the moniker PIGS (Portugal, Ireland, Greece and Spain), which were the hardest hit countries and still today
attempting to recover. Until 2008, Spain, Germany and the UK received more than half of all immigrants in the EU27,
more than 2 million (European Commission, 2008). However, given the current economic crisis in Spain, this evolution
could change and turn Spain into an emigrant country rather than an immigrant one. The Spanish youth are concerned
about the increasing rate of unemployment, which rose to 26% last December 2012 (INE, 2013). It is in this context
that consumers are adapting their consumption patterns. Given the global nature of the crisis, we use CE to examine
both domestic and foreign purchase propensity within the context of this persistent economic crisis.
Therefore, in this paper we intend to measure whether Spanish youth have a critical attitude towards purchasing
domestic or foreign products, we also research into what extent they have strong feelings of ethnocentrism or
cosmopolitanism.

633
LITERATURE REVIEW
With globalization, countries, no matter how far apart they may be, are present in the lives of people, especially, thanks
to mass media and internet. So people have their own view and image of a country through external influences
(D’Astous & Boujbel, 2006.). The concept of country of origin (COO) started and gained relevance in the early 1960s (Lu
& Heslop, 2008; Roth & Diamantopoulos, 2009), and since then more than 1000 works have been published about this
topic (Papadopoulos, 2004).
Other researchers explain the effects of COO as part of a psychological process, likening it to a halo model (Han, 1989).
This psychological process has an influence on consumers, especially, in the case of those with no direct personal
experience of having lived or visited a foreign country.
Consumers evaluate products based on the nation where they have been made and this is a concept researched in
depth (Douglas & Nijssen, 2004; Granzin & Olsen, 1998; Han, 1988; Shimp & Sharma, 1987). Culture, ethnic and nation
are concepts whose identity is inside the consumer and when markets change due to economic or political reason, this
identity tends to become extremist (Herche, 1994; Vida & Dmitrović, 2001).
Although, we live in the age of globalization, this does not necessarily lead to homogenizing consumer behavior (De
Mooj & Hosftede, 2002). However, in an economic crisis, consumers may have more of a tendency to protect the
domestic economy or likewise blame global trade for the ills .
This study aims to identify consumers’ preferences between domestic and foreign product in the Spanish market. We
also attempted to contrast a model of ethnocentric attitudes.
CONCEPTUAL DEVELOPMENT
Ethnocentric Attitudes
Shimp and Sharma (1987) described consumer ethnocentrism as the way that consumers view their products more
superior that foreign made products. With this attitude, the consumer enhances their feeling of patriotism and truly
believes that this behavior could aid to develop the domestic economy and foster employment. Then, Sharma, Shimp
and Shin in 1995 created a model to understand this phenomenon. They made suggestions on a number of factors with
the purpose of explaining how ethnocentrism adapts itself to consumerism (e.g. culture, patriotism, demography,
general economic conditions, characteristic of consumer,..). These variables were confirmed as key factors of influence
in consumer ethnocentrism (Balabanis et al., 2001; Herche, 1994; Kaynak & Cavusgil 1983; Reardon et al., 2005;
Shankarmaresh, 2006; Yelkur et al., 2006; Wang and Chen, 2004).
Not only does ethnocentricity have a deep impact in consumers, but also country of origin (COO), when consumers buy
a product (Balabanis & Diamantopoulos, 2004). COO favors this ethnocentric attitude and COO could even have a
negative effect on domestic/foreign purchase behavior (Balabanis & Diamantopoulos, 2004; Suh & Kwon, 2002).
However, there are some researchers who suggest that product quality is a notable aspect for less ethnocentric
consumers. Therefore, COO also affects the perception of a product in consumerism. It must also be highlighted that
COO has an influence on the quality perception of a product (Balabanis & Diamantopoul os, 2004; Bilkey & Ness, 1982;
Brodowsky, 1998; Herche, 1994) as well as on the image of the country. Consumers tend to evaluate products more or
less favorably, depending on that image or perception (Liu & Johnson, 2005).
H1a: Ethnocentric attitudes of consumers have a positive effect on Domestic Purchase Behavior
H1b: Ethnocentric attitudes of consumers have a negative effect on Foreign Purchase Behavior
Antecedents of Ethnocentric Attitudes
The concept as ethnocentricity concept is related to several socio-psychological factors like culture and nation and
unique historical identity (Costa & Bamossy, 1995; Cui & Adams, 2002; Keillor, Hult, Erffmeyer, & Babakus, 1996; Suh &
Kwon, 2002). However, there is no consensus among researchers about the real sources of consumer ethnocentricity.
Some of them like Javalgi et al. (2005), de Ruyter et al. (1998) and Sharma et al (1995) agreed that patriotism, cultural

634
openness, individualism and conservatism are the main sources of consumer ethnocentricity. While, others such as e.g.
Balabanis et al. (2001) reached an understanding as to the insignificant effect of internationalism on patriotism and
nationalism.
H2: National Identification has a positive effect on Ethnocentricity.
H3: Cosmopolitanism has a negative effect on Ethnocentricity.
METHODOLOGY
Sample
The sample consisted of 560 respondents from the region of Navarre (Spain). College students were chosen as subjects,
based on several factors: a) relative homogeneity of extraneous influences (Burgess & Steenkamp 2006, Coulter et al.
2005 and Strizhakova et al. 2008), b) relatively high exposure to global commerce (Gidley 2002; Kjeldgaard &
Askegaard 2006) and c) relatively high exposure to multiple languages/cultures.
Measures
Construct measures for this research were derived from existing literature (Granzin & Olsen, 1998; Keillor et al., 1996;
Parameswaran & Pisharodi, 1994; Yoon, Cannon & Yaprak, 1996). All measures used have been proven
psychometrically sound in cross-cultural contexts. CETSCALE, for example, has been previously used and validated in
various cross-cultural contexts (e.g. Lindquist, Vida, Plank & Fairhurst, 2001; and Good & Huddleston, 1995). For this
study, the six-item version of the original scale was utilized to measure ethnocentrism. Seven-point Likert-type scales
(1 = strongly disagree to 7 = strongly agree) were utilized for the individual scales to measure the five constructs.
In the process of translation and cross-cultural adaptation of the research stimuli and questionnaire (scale items), we
followed the guidelines for conducting international consumer research by Craig and Douglas (1999) and by Douglas
and Craig (2006).
Table 1
Measures
Construct/Items Reliability
(Alpha)
National Identification (NAtID)
(Adapted from Keillor et al., 1996 )
1. Being a(n) Spanish citizen means a lot to me 2. I am proud to be an Spanish citizen 3. When a foreign person praises Spain, it feels like a personal compliment 4. I feel strong ties with Spain
0.944
Cosmopolitanism (Cosmo)
(Adapted from Yoon et al, 1996)
1. I like immersing myself in different cultural environments 2. I like having contact with people from different cultures 3. I would enjoy travelling to foreign countries for an extended period of time 4. Getting information and news from around the world is important to me
0.836
Ethnocentricity (CET Scale)
(Adapted from Shimp and Sharma 1987)
1. Only those products that are unavailable in Spain should be imported 2. Spanish products, first, last and foremost 3. A real Spanish citizen should always buy Spain-made products 4. Spanish citizens should not buy foreign products, because this hurts Spain's businesses and causes
unemployment 5. It may cost me in the long-run, but I prefer to support Spanish products 6. Spanish consumers who purchase products made in other countries are responsible for putting
their fellow Spanish citizens out of work
0.876
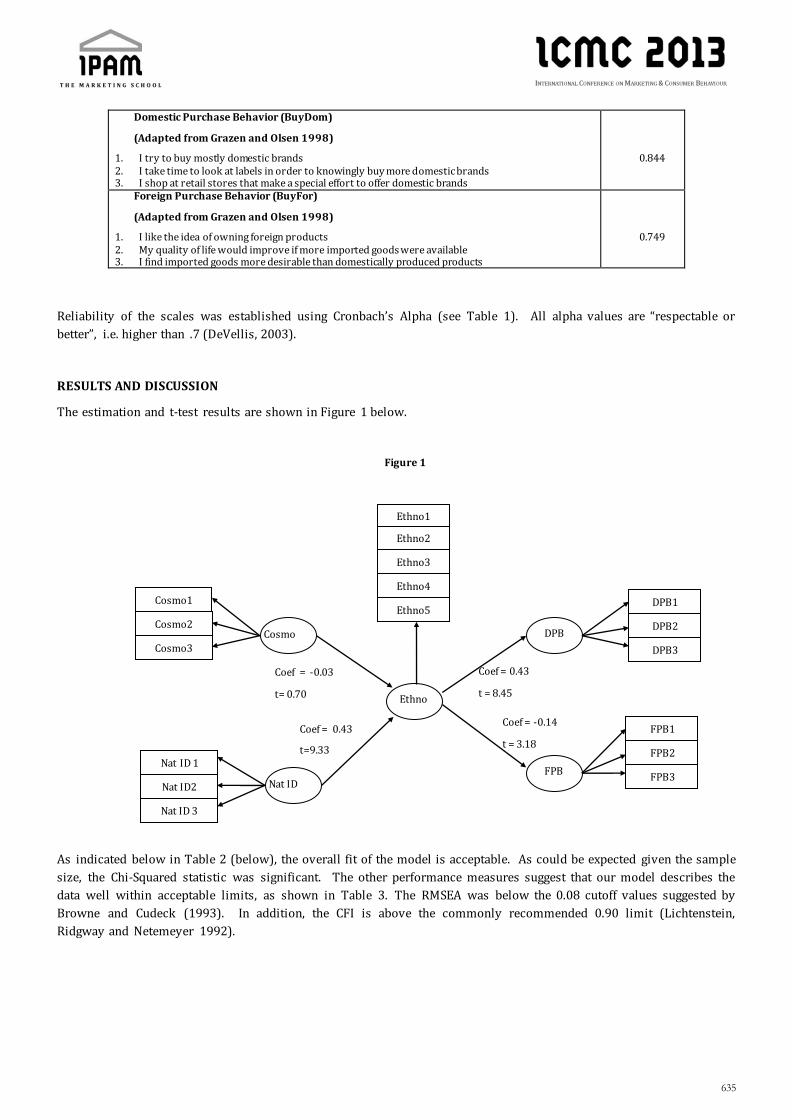
635
Domestic Purchase Behavior (BuyDom)
(Adapted from Grazen and Olsen 1998)
1. I try to buy mostly domestic brands 2. I take time to look at labels in order to knowingly buy more domestic brands 3. I shop at retail stores that make a special effort to offer domestic brands
0.844
Foreign Purchase Behavior (BuyFor)
(Adapted from Grazen and Olsen 1998)
1. I like the idea of owning foreign products 2. My quality of life would improve if more imported goods were available 3. I find imported goods more desirable than domestically produced products
0.749
Reliability of the scales was established using Cronbach’s Alpha (see Table 1). All alpha values are “respectable or
better”, i.e. higher than .7 (DeVellis, 2003).
RESULTS AND DISCUSSION
The estimation and t-test results are shown in Figure 1 below.
Figure 1
As indicated below in Table 2 (below), the overall fit of the model is acceptable. As could be expected given the sample
size, the Chi-Squared statistic was significant. The other performance measures suggest that our model describes the
data well within acceptable limits, as shown in Table 3. The RMSEA was below the 0.08 cutoff values suggested by
Browne and Cudeck (1993). In addition, the CFI is above the commonly recommended 0.90 limit (Lichtenstein,
Ridgway and Netemeyer 1992).
Cosmo1
Cosmo
Ethno
FPB FPB3
FPB2
FPB1
Coef = -0.03
t= 0.70
Cosmo2
Cosmo3
Nat ID 1
Nat ID2
Nat ID 3
Nat ID
Ethno1
Ethno2
Ethno3
Ethno4
Ethno5
Coef = 0.43
t=9.33
DPB
Coef = 0.43
t = 8.45
DPB3
DPB2
DPB1
Coef = -0.14
t = 3.18

636
Table 2
Model Fit
Chi-Squared 527.13 df=165
RMSEA 0.063
CFI/IFI 0.96
NFI 0.95
RFI 0.94
The hypotheses are tested by examining the individual structural paths of the model (Table 3).
Table 3
Hypotheses Results
Hypotheses Linkage Estimate t/p-value Result
H1a: CET→ BuyDom (+) 0.43 8.45* Supported
H1b: CET→ BuyFor (-) -0.14 3.18* Supported
H2: NatID → CET (+) 0.43 9.33* Supported
H3: Cosmo → CET (-) -0.03 0.70 Not Supported
*=p <0.05
Overall, all of the hypotheses except H3 are supported. It apparently seems that Spanish youth owns a sense of
ethnocentricity. Actually, ethnocentric attitudes and national identification have a positive effect on domestic purchase
behavior. While living in an international atmosphere, having contact with people from different cultures, as well as
travelling to foreign countries for a long period of time are factors that have neither a negative impact nor a positive
one on ethnocentricity.
The hypothesized negative effects of ethnocentric attitudes on their foreign purchase behavior was confirmed. The
influence of foreign brands and products has no effect on the purchase as domestic brands and products. Spanish youth
tends to buy domestic product, instead of foreign ones. The “made in Spain” label favors domestic purchase behavior
and increases local bonds and attachment.
LIMITATIONS AND FUTURE RESEARCH
The obvious limitations are the sample (students) and single country analysis – but that really was the purpose of this
research that is to concentrate on local conditions. Furthermore, the study does not take into account variables like the
current economic situation in Spain and the high rate of unemployment among the target group (youth). The selection
of this target group is consistent with an economic strategy known as Europe 2020, which emphasizes three elements
that are important for the future of Europe: youth, education and mobility (European Commission, 2010).
In the last four years, the Spanish national football team won two European champions and the World championship.
As football is the first sport in Spain, those victories may have had a great impact on national identity. In fact, the
national flag and the national football team t-shirt are quite common be seen in the Spanish territory. Therefore, it
would be worthy while researching the football effect on ethnocentricity and nationalism.
These results could be improved in the future by expanding the sample to other places in the Spanish territory, as well
as by researching other collectives of consumers not only youth.

637
REFERENCES
BALABANIS, G., DIAMANTOPOULOS, A., MUELLER, R. D., & MELEWAR, T.C. (2001). The Impact Of Nationalism,
Patriotism And Internationalism On Consumer Ethnocentric Tendencies. Journal of International Business
Studies, 32, 157-175.
BALABANIS, G., & DIAMANTOPOULOS, A. (2004). Domestic country bias, country -of-origin effects, and consumer
ethnocentrism: a multidimensional unfolding approach. Journal of Academy of Marketing Science, 32(1), 80-
95.
BILKEY, W.J., & NES, E. (1982). Country-of-Origin Effects on Product Evaluations. Journal of International Business
Studies, 13(1), 89-99.
BRODOWSKY, G.H. (1998). The Effects of Country of Design and Country of Assembly on Evaluative Beliefs About
Automobiles and Attitudes Toward Buying Them: A Comparison Between Low and High Ethnocentric
Consumers. Journal of International Consumer Marketing, 10(3), 85-113.
BROWNE, M., & CUDECK, R. (1993). Alternative Ways in Assessing Model Fit. In K.A. Bollen & J.S. Long (Eds.), Testing
Structural Equation Models (pp 136-162). Newbury Park: Sage Publications.
BURGESS, S., & STEENKAMP, J.-B. (2006). Marketing Renaissance: How Research in Emerging Markets Advances
Marketing Science and Practice. International Journal of Research in Marketing , 23(4), 337-356.
COSTA, J.A., & BAMOSSY, G.J. (1995). Marketing in a Multicultural World: Ethnicity, Nationalism and Cultural Identity .
Thousand Oaks, CA: Sage Publications.
COULTER, R.A., PRICE, L.L., FEICK, L., & MICU, C. (2005). The Evolution of Consumer Knowledge and Sources of
Information: Hungary in Transition. Journal of the Academy of Marketing Science, 33(4), 604-619.
CRAIGH, C. S., & DOUGLAS, S. P. (1999). International Marketing Research, New York, NY: John Wiley & Sons, LTD.
CUI, C.C., & ADAMS, E. I. (2002). National Identity and NATID: An Assessment in Yemen. International Marketing Review,
19(6), 637-662.
DASTOUS, A., & BOUJBEL, L. (2006). Positioning countries on personality dimensions: Scale development and
implications for country marketing. Journal Business Research, 60, 231-239.
DE MOOIJ, M., & HOFSTEDE, G. (2002). Convergence and divergence in consumer behavior: implicati ons for
international retailing. Journal of Retailing, 78(1), 61-69.
DE RUYTER, K., VAN BIRGELEN, M., & WETZELS, M. (1998). Consumer ethnocentrism in international services
marketing. International Business Review, 7, 185-202.
DEVELLIS, R.F. (2003). Scale Development: Theory and Applications (2nd ed.). Sage Publications, Thousand Oaks.
DOUGLAS, S,, & CRAIG, C.S. (2006). On Improving the Conceptual Foundations of International Marketing Research.
Journal of International Marketing, 14(1), 1-22.
EUROPEAN COMMISSION (2008). Eurostat EU Labour Force Survey. Brussels: EU.
EUROPEAN COMMISSION (2010). Europe 2020. A strategy for smart, sustainable and inclusive growth. Brussels: EU.
GIDLEY, J. (2002). Global Youth Culture: A Transdisciplinary Perspective. In J. Gidley & S. Inayatullah (Eds.). Youth
Futures: Comparative Research and Transformative Visions (pp. 3-18). Santa Barbara, CA: Praeger Publishers.
GOOD, L.K., & HUDDLESTON, P. (1995). Ethnocentrism of Polish and Russian Consumers: Are Feelings and Intentions
Related?. International Marketing Review, 12(5). 35-48.
GRANZIN, K.L., & OLSEN, J.E. (1998). Americans’ Choice of Domestic over Foreign Products: A Matter of Helping
Behavior?. Journal of Business Research, 43, 39-54.
HAN, C.M. (1989). Country Image: Halo or Summary Construct?. Journal of Marketing Research, 26, 222-229.
HERCHE, J. (1994). Ethnocentric Tendencies, Marketing Strategies and Import Purchase Behavior. International
Marketing Review, 11(3), 4-16.

638
INSTITUTO NACIONAL DE ESTADÍSTICA (INE) (2013). EPA. Tasa de Paro. 2012T4. Retrieved from http://www.ine.es/.
Accessed on 15 February 2013.
JAVALGI, R.G., PIOCHE KHARE, V., GROSS, A.C, & SCHERER, R.F. (2004). An application of the consumer ethnocentrism
model to French consumers. International Business Review, 14, 325-344.
KAYNAK, E., & CAVUSGIL, S.T. (1983). Consumer Attitudes Toward Products Of Foreign Origin: Do They Vary Across
Product Classes?. International Journal of Advertising, 2, 147-157.
KEILLOR, B.D., HULT, T.G., ERFFMEYER, R.C., & BARBAKUS, E. (1996). NATID: The Development and Application of a
National Identity Measure for Use in International Marketing. Journal of International Marketing, 4(2), 57-73.
KJELDGAARD, D., & ASKEGAARD, S. (2006). The Globalization of Youth Culture: The Global Youth Segment as Structures
of Common Differences. Journal of Consumer Research, 33(2), 231-247.
LICHTENSTEIN, D.R., RIDGWAY, N.M., & NETEMEYER, R.G. (1992). Price Perceptions and Consumer Shopping Behavior:
A Field Study. Journal of Marketing Research, 30 (2), 234-245.
LINQUIST, J.D., VIDA, I., PLANK R., & FAIRHURST A. (2001). The Modified CETSCALE: Validity Tests in the Czech
Republic, Hungary and Poland. International Business Review, 10(5), 505-516.
LIU, S.S., & JOHNSON, K.F. (2005). The automatic country-of-origin effects on brand judgments. Journal of Advertising,
34(1), 87-97.
LU, I.R.R., & HESLOP, L.A. (2008). Measuring country image: A research proposal. Paper presented at Annual Conference
of the Administrative Sciences Association of Canada (ASAC), 24-27 May, Halifax, Nova Scotia, available at:
http://ojs.acadiau.ca/index.php/ASAC/article/viewFile/744/647 (accessed 11 February 2013).
PAPADOPOULOS, N. (2004). Place Branding: Evolution, Meaning, and Implication. Place Branding, 1(1), 36-49.
PARAMESWARAN, R., & PISHARODI, R.M. (1994). Facets of country of origin image: An empirical assessment. Journal of
Advertising, 23(1), 43–56.
REARDON, J., MILLER, C., VIDA, I., & KIM, I. (2005). The effects of ethnocentrism and economic development on the
formation of brand and ad attitudes in transitional economies. EuropeanJournal of Marketing, 39(7/8), 737-
754.
ROTH, K.P., & DIAMANTOPOULOS, A. (2009). Advancing the country image construct. Journal of Business Research, 62,
726-740.
SHANKARMAHESH, M.N. (2006). Consumer ethnocentrism: An integrative review of its antecedents and consequences.
International Marketing Review, 23(2), 146-172.
SHARMA, S., SHIMP, T.A. & SHIN, J. (1995). Consumer Ethnocentrism: A Test of Antecedents and Moderators. Journal of
Academy of Marketing Science, 23(1), 26-37.
SHIMP, T.A., & SHARMA, S. (1987). Consumer Ethnocentrism: Construction and Validation of the CETSCALE. Journal of
Marketing Research, 24, 280-289.
STRIZHAKOVA, Y., COUNTER, R.A., & PRICE, L. (2008). The Meanings of Branded Products: A Cross -National Scale
Development and Meaning Assessment. International Journal of Research in Marketing , 25(2), 82-93.
SUH T., & KWON, I-W.G. (2002). Globalization and reluctant buyers. International Marketing Review, 19(6), 663-80.
YELKUR, R., CHAKRABARTY, S., & BANDYOPADHYAY, S. (2006). Ethnocentrism and buying intentions: Does economic
development matter?. Marketing Management Journal, 16(1), 26-37.
YOON, S-J., CANNON, H.M., & YAPRAK, A. (1996). Evaluating the CYMYC Cosmopolitanism Scale on Korean Consumers.
Advances in International Marketing, 7, 211-232.
VIDA, I., & DMITROVIĆ, T. (2001). An Empirical Analysis of Consumer Purchasing Behavior in Southeastern European
Markets. Economic and Business Review, 3(3/4), 191-207.
WANG C.L., & CHEN Z.X. (2004). Consumer ethnocentrism and willingness to buy domestic products in a developing
country setting: Testing moderating effects. Journal of Consumer Marketing, 21(6), 391-400.

639
Session 17

640
Receptivity to advertising in social networks:
an empirical replication with Portuguese
users Social networks, advertising, receptivity, replication, structural equation modeling.
André Almeida, ISAG - Instituto Superior de Administração e Gestão, andre.pacheco.almeida@ gmail.com
Susana Marques, ISAG - Instituto Superior de Administração e Gestão, [email protected]
Maria de Lurdes Sarmento, Universidade do Minho, [email protected]
David Taylor, Sacred Heart University, [email protected]
Abstract
In a context of growing popularity of social-networking sites (SNS), it is fundamental to understand the factors that
affect users´ receptivity to social networking advertising. This study replicates a major empirical study conducted with
American users (Taylor, Lewin and Strutton, 2011). The purpose is to provide and accumulate empirical support about
the facilitators of—and barriers to—consumer acceptance of Social Network Advertising (SNA), a research area still
dominated by anecdotal evidence.
The hypothesized model was drawn based on the effects of several constructs (perceived informativeness, perceived
entertainment, self-brand congruity, peer influence, quality of life, time structure, invasiveness, and privacy concerns)
on the attitude toward SNA. To test the model in the Portuguese context the authors adopted the same methodology of
the original study, namely a quantitative approach using SEM - Structural Equation Modeling. The empirical research
was based on 2201 online survey questionnaires gathered in May 2012 from Portuguese university students.
The main conclusions of the original study were corroborated in the Portuguese replication however the findings
reveal some interesting differences. The results allowed us to conclude that regarding dimensions such as the
advertisement content (perceived informativeness and entertainment) and socialization factors (self congruity and
peer influence) the results were similar, while regarding dimensions related to structure (quality of life and structure of
time) and with barriers (such as invasiveness) the results shown to be diverse. These differences in receptivity to SNA
between audiences in Portugal and North America, have major practical implications that should be considered by
advertisers when crafting their targeted appeals.
1. Introduction
Social media is a global phenomenon, with sites such as Facebook, LinkedIn, YouTube, Twitter and others enjoying
growth around the world. For both the operators of these sites and advertisers, it is crucial that users accept
advertising as a component of the social media environment. Yet, research consistently suggests that social media
users hold negative attitudes toward advertising. In one study, only 22 percent of those surveyed had a positive
attitude toward social media advertising, with 8 percent of them reporting that they had abandoned a social media site
because of excessive advertising (AdReaction, 2010). This perception of excessive advertising has been blamed for the
demise of MySpace as the premier social networking site (Vara, 2006). Advertising on virtual communities is
challenging since typically the users dislike when marketing messages intrude on their personal space (Pinho and
Soares, 2011).
And yet, social networking sites depend on this very advertising for revenue. Thus, understanding how to improve
consumers’ receptivity to advertising is of critical importance to the operators of social networking sites, as well as to

641
the advertisers who are increasingly depending on them as part of their promotion mix. The academic literature on
social media users’ receptivity to advertising is sparse at best. Kelly, Kerr and Drennal (2010) developed a study about
advertising avoidance on social networking sites leading to the development of a model that suggests that advertising
in the online social networking environment is more likely to be avoided if the user has expectations of a negative
experience, the advertising is not relevant to the user, the user is skeptical toward the advertising message, or the
consumer is skeptical toward the advertising medium. The study also revealed important reasons for advertising
avoidance in online social network sites, such as relevance and credibility. Another qualitative study concluded that the
users of online social networks do not dislike advertisements, but they simply do not notice them, because of the
competition of other content found in online social networks such as friends profiles and pictures (Hadija, Barnes and
Hair, 2012). A major empirical study of American users (Taylor, Lewin and Strutton, 2011) provided a comprehensive
model of determinants of attitudes toward social network advertising (SNA) based on structural, content and social
factors, along with barriers to receptivity.
This study replicates the model proposed and tested by Taylor, Lewin and Strutton (2011). There are three reasons we
chose to replicate this study. First, there is a low tendency in marketing to replicate other studies but, recently, several
leading journals are encouraging more replications, reminding academics and practitioners that these are crucial to
advance knowledge. This study responds to this call. Following the original study, the purpose is to further understand
and provide and accumulate more empirical support about consumer receptivity to SNA. Second, several recent studies
demonstrate that there are important cultural differences on how consumers are influenced by internet adverti sing
(Brettel and Spilker-Attig, 2009; Wang and Sun, 2009). For example, compared with Americans, Romanians held a more
favorable general attitude toward online advertising and tended to view it as more informative, credible, economically
beneficial, and less value corruption (Wang and Sun, 2009). Third, In Portugal, the research on this specific subject is
scarce and doesn’t focus specifically on social networks. One of the few empirical studies (Cardoso and Cardoso, 2012)
reveals that adolescents have rather neutral or even negative perceptions toward internet advertising. The results
suggest that Information, Entertainment, and Trustworthiness have a positive effect on the attitude toward Internet
advertising, and Irritation revealed a negative effect. Despite similarities between genders, female consumers
considered Internet Advertising more informative but also more irritating than male consumers.
In a context of growing popularity of social-networking sites (SNS), it is fundamental to understand the factors that
affect users´ receptivity to social networking advertising. The research objectives here were to identify the factors that
facilitate—or function to stimulate—positive consumer attitudes toward SNA; the factors that inhibit—or function to
impede—positive consumer attitudes toward SNA; the moderating effect of gender and the comparison between
Portuguese and American consumers attitudes towards SNA.
2. Literature Review
To understand the factors that influence attitude toward SNA, it is necessary to examine the factors that affect attitudes
toward advertising in general. Although the attitude toward a specific advertisement may be influenced by factors such
as credibility, ad perceptions, preexisting attitudes toward the sponsor, and the recipient’s mood (Lutz, 1985), attitudes
toward advertising in general are more complex. Over the years, a number of studies have examined generalized
attitudes toward advertising (e.g. Bauer and Greyser, 1968; Mittal, 1994; O’Donohoe, 1995). Most of these studies
examine overall attitudes toward advertising, as well as perceptions of trustworthiness, informativeness,
entertainment value, offensiveness and other related dimensions. One widely cited study suggests that attitudes toward
advertising in general are composed of two dimensions—instrument and institution (Sandage and Leckenby, 1980).
The “instrument” refers to the consumer’s evaluation of individual advertisers’ methods; “institution” refers to the
social and economic impact of advertising as a whole.
Over the years, consumers’ attitudes toward advertising have become increasingly negative. In 1959, a poll suggested
that most consumers had a positive opinion of advertising and preferred advertised products over unadvertised
products (Redbook, 1959). By the 1970s, however, attitudes toward advertising became increasingly negative (Zanot
1981, 1984), a trend that has held steady through modern times (Mittal, 1994).
A number of studies have examined attitudes toward Internet advertising, with mixed and contradictory findings.
Schlosser et al. (1999) found opinions of online ads to bemore or less evenly distributed between positive, negative and
neutral. Brackett and Carr (2001) reported that college students found online ads to be irritating, annoying and

642
insulting to their intelligence, but nonetheless predicted that online ads would become the most valuable source of
advertising. Schlosser and colleagues explain these contradictory findings by suggesting that attitudes toward Internet
advertising are determined by consumers’ perceptions of informativeness and usefulness for making purchase
decisions. Similarly, Handel, Cowley and Page (2007) suggest that attitudes toward Internet ads may encompass
hedonic motives, social role and image, and product information.
Research on consumer attitudes toward social network advertising (SNA) is more scarce, but available data suggests a
similar mixture of opinions. For example, in a recent study, 31% of Americans and 33% of Canadians found SNA
“useless” (Epsilon, 2011). In another, approximately one-third of social media users said that SNA was more annoying
than other types of online advertising, 15% report sharing a social media ad, while 26% report “liking” an ad on social
media (Nielsen, 2012).
In order to reconcile these conflicting attitudes, Taylor et al (2011) developed a model of consumer receptivity to SNA
based on uses and gratifications theory (Katz and Foulkes, 1962). According to this theory, consumers selectively
expose themselves to media based on their needs and gratification-seeking, i.e. they actively seek out media to satisfy
either utilitarian or hedonic needs. Utilitarian needs might include learning about a topic or keeping abreast of news,
while hedonic needs are related to entertainment or enjoyment. Lull (1980) broke down these motives further into
structural dimensions (using media to fill time) and relationship-based dimensions (using media to facilitate
interpersonal relationships or communications). Implicit in this model is an internal cost/benefit analysis on the part of
the consumer. If the perceived benefit of the advertising exceeds the perceived cost the attitude toward advertising will
be positive. Conversely, if the consumer perceives that the costs exceed the economic and social benefits of the
advertising, the attitude will be negative. Thus, the consumers’ attitude toward SNA can be explained by the utility they
perceive in SNA.
For their model of attitudes toward SNA, Taylor et al (2011) categorize uses and benefits as content-related, structural,
and/or social. Content-related benefits include information and entertainment; structural uses relate to filling and
structuring time; and social benefits are derived from the self-enhancing value of advertising and the peer-influenced
socialization factor. In the SNS environment, the costs of advertising (i.e., barriers to acceptance of SNA) are identified
as the perceived invasiveness of the advertisements and users’ loss of privacy concerns. The conceptual model of these
usage motivations influences acceptance of SNA, as does the perceived costs that serve as barriers to SNA acceptance
(Figure 1). While Taylor et al. developed the model using a sample from the United States, the present study tests this
model among Portuguese consumers.
3. Research Method
As in the original study (Taylor et al., 2011) we adopted an online questionnaire using the same structure and scales.
For example, to measure informativeness we used items from Ducoffe (1996) and Cheng et al. (2009); Lastivicka
(1983) work to measure entertainment and Huang et al. (2007) items to measure quality of life (etc.). The research
instrument was tested and evaluated among 30 potential respondents. In response to the feedback obtained we made
minor modifications such as the wording of specific items and the order of the questions.
The questionnaire was sent to all of the Portuguese public and private universities listed in the Portuguese Ministry of
Science database, asking for collaboration in the diffusion of the questionnaire near the students population. The
questionnaire was sent in February 2012, followed by two reminders. The final sample comprised 2201 cases. Data
were analysed using SEM – Structural Equation Modeling. SPSS and AMOS were used as statistical packages.
Sample profile. While in the sample of the original study, 51% of the respondents were female, in the Portuguese sample
the number of women was higher (66,6%). Regarding age, the average in both samples was similar (mean: 26 years/
PT; 24 years/USA). Portuguese respondents indicated they spent an average of 8,1 hours per week on SNS activities
while the American sample referred they spent an average of 7,5 hours. It is interesting to note that Portuguese
students indicated they have participated in SNS sites for about 5 years (62 months) on average, while the American
sample mentioned 2,2 years (27 months). These findings are curious and might be explained by the difficulties humans
experience in measuring time perceptions, or by the elapsed time between the two studies (Table 1).

643
Table 1 – Sample Demographics (PT vs USA)
Gender Portuguese sample American sample
Male 33,4% 49%
Female 66,6% 51%
Age (Mean) 25,9 years 23,5 years
SNS usage (Mean) 8,1 hours per week 7,5 hours per week
Participation in SNS (Mean) 62,4 months 27,1 months
4. Conceptual Model and Hypotheses
Taylor et al (2011) developed a model, based upon uses and gratifications theory, and tested it among North American
consumers. The model consists of four broad dimensions – content, quality of life and structure, socialization factors
and barriers. Content includes informativeness and entertainment, while quality of life and structure is comprised of
SNA’s perceived ability to enhance the quality of life and structure time. The socialization factors include self-brand
congruity and peer influence, and, finally, the barriers to receptivity include privacy concern and perceived
invasiveness of SNA. The results of the study found that the model was a good predictor of attitudes toward SNA,
although neither structural factor (quality of life nor structure of time) were significant.
Figure 1 – Conceptual Model
Source: Taylor et al. (2011), p. 262

644
The goal of the present study was to test the model among consumers in a different country and culture. Previous
studies (e.g. Brettel and Spilker-Attig, 2009; Wang and Sun, 2009) suggest that cultural and geographic differences
affect consumers’ attitudes toward online advertising. Thus, a replication of Taylor and colleagues’ study not only
provides additional support for its efficacy as a predictive model, but may also uncover important differences between
the attitudes of Portuguese consumers and those of North Americans.
Advertising content
Consumers’ attitudes toward advertising messages are shaped largely by the ads’ content, specifically their perceived
levels of informativeness and/or entertainment (Gao and Koufaris, 2006). An ad that is perceived as informative may
educate the consumer about a new product, feature or function, providing utility to the consumer. Similarly, an
entertaining ad can satisfy a consumer’s need for diversion or enjoyment.
H1: Perceived informativeness is positively related to attitude toward SNA.
H2: Perceived entertainment is positively related to attitude toward SNA.
Quality of Life and Structure
Since the advent of scheduled programming on radio, then television, consumers have used media to not only improve
their perceived quality of life, but also to provide structure (Katz and Foulkes, 1962). Through television, radio, cinema
or Internet content, consumers are able to enhance their lives by purposefully distracting themselves from their
everyday lives. Similarly, ads on social media may provide a needed respite from life’s challenge. In addition to the
quality of life, popular media have long been used to provide structure; many viewers plan their schedules around
favorite television programmes. Many consumers use social media in similar fashion, checking in at certain times of the
day.
H3: Perceived value of online social networks as a means to enhance quality of life is positively
related to attitude toward SNA.
H4: Perceived value of online social networks as a means to structure time is positively related to attitude toward SNA.
Socialization factors
The social aspects inherent in SNSs suggest that factors related to interactions with others will influence attitude
toward SNA. Self-brand congruity – the extent to which the focal brand of an ad is consistent with the recipient’s self-
image – has been shown to improve the consumer’s attitude toward the brand (Escalas and Bettman, 2005), suggesting
that it should also increase consumers’ positive attitudes toward the brand. In addition, SNSs are primarily used to
maintain and enrich interpersonal relationships, so peers play a role in shaping attitude toward SNA. The more SNA
enhance these interpersonal relationships, the more positive we would expect the attitude toward the SNA.
H5: Self-brand congruity is related positively to attitude toward SNA.
H6: Peer influence is related positively to attitude toward SNA
Barriers
Taylor et al. (2011) identify two major barriers to consumers’ acceptance of SNA – perceived invasiveness and privacy
concerns. Consumers perceive ads as being invasive when the ads interfere in their behaviors by intrusion or
distraction (Li, Edwards and Li, 2002). Similarly, consumers become apprehensive when they feel that their privacy is
being violated or information about them is being collected against their will. Both exert negative i nfluences on
consumers’ attitudes toward SNA.
H7: Perceived invasiveness of SNA is related negatively to attitudes toward SNA.
H8: User perceptions of privacy concern are related negatively to attitudes toward SNA

645
5. Model Testing
Structural equation modeling (SEM) using maximum likelihood estimation was employed to examine measurement
properties of the scales and to test the hypothesized relationships between constructs. SEM permits the simultaneous
estimation of multiple regression equations in a path model. For this study, AMOS software was used. In addition, to
test moderating relationships between the two samples, a multi-group analysis was conducted through AMOS. The
results of each step are described below.
Measurement model. To test the psychometric properties we conducted Confirmatory Factor Analysis (CFA). We
performed an overall measurement model including all the first order constructs: informativeness, entertainment, self
brand congruity, peer influence, invasiveness, privacy concerns, quality of life, structure time and attitude toward SNA.
Although the chi-square statistic is significant (ᵪ2=3026, df=314, P<.001) the overall goodness of fit indices of the
measurement model are above the benchmark value of 0.90 (GFI=0.91; CFI=0.94 and the RMR (=0.04) and RMSEA
(=0.06) and both bellow the cut-off value of 0.08 showing acceptable fit (Hair et al., 2009). Additionally, the fact that the
chi- square statistic suggested a poor fit was considered to be of limited value, because it is responsive to sample size
(n=2201) (Bagozzi et al., 1991).
Convergent validity was evidenced by the large and significant coefficients of each item on the respective construct
(ranging from 0.631 to 0.952). The composite reliability coefficients range from 0.82 to 0.95, all exceeding the
recommended guidelines of .60 (Bagozzi and Yi, 1988). The average variances extracted for the constructs are all
higher than 0.50 (Fornell and Larcker, 1981) ranging from 0.60 to 0.90. Evidence of construct discriminant validity is
observed in the fact that the shared variance among any two constructs (i.e. the square of their intercorrelation) is less
than the average variance extracted for the constructs (Fornell and Larcker, 1981). Table 2 provides the means,
standard deviations and a correlation matrix for the constructs.
Structural Model. A structural model involving hypothesized relationships for the main effects was conducted. The
structural model provided adequate fit for the data: ᵪ2=3026, df=314, P<.001, GFI=0.91, CFI=0.94, RMR=0.04,
RMSEA=0.06. Figure 2 shows the achieved results compared with the ones of the original USA study.
Table 2 – Summary statistics and correlations among constructs
Variables 1 2 3 4 5 6 7 8 9
1.Informativeness (0,915)
2.Entertainment 0,707 (0,892)
3.self-Brand congruity 0,292 0,304 (0,905)
4.Peer Influence 0,242 0,268 0,655 (0,880)
5.Invasiveness 0,502 0,540 0,305 0,421 (0,722)
6.Privacy concerns 0,309 0,328 0,717 0,601 0,361 (0,884)
7.Quality of life -0,287 -0,387 -0,069 0,005 -0,200 -0,104 (0,897)
8.Structure time -0,167 -0,213 -0,368 -0,367 -0,301 -0,460 0,136 (0,912)
9.Attitude toward SNA 0,597 0,692 0,354 0,281 0,474 0,401 -0,295 -0,273 (0,863)
Mean 2,78 2,35 2,96 2,13 1,83 2,90 3,28 3,99 2,93
Standard Deviation 1,04 0,95 1,09 0,92 0,81 0,86 1,04 0,91 0,96
All interconstruct correlation coefficients are significant at P <.001 Cronbach alpha coefficients are listed within parentheses on the diagonal
Advertising Content
Regarding H1 (Perceived informativeness is positively related to attitude toward SNA) and H2 (Perceived
entertainment is positively related to attitude toward SNA) the study confirmed both hypotheses which is evidenced by
the significant coefficient representing the effect of informativeness on the attitude towards SNA (0.145, t=5,768) and

646
by the significant coefficient representing the effect of perceived entertainment on the attitude towards SNA (0.437,
t=13,116). In the original USA study these two hypotheses, related to advertising content, were also confirmed.
Structure
With reference to H3 (Perceived value of online social networks as a means to enhance quality of life is positively
related to attitude towards SNA) and H4 (Perceived value of online social networks as a means to structure time is
positively related to attitude towards SNA), we could confirm H3 because the hypothesized effect on attitude towards
SNA was significant (0.074, t=2,598). The hypothesized effect of H4 was also significant, but proved to be of a different
sign (-0.100, t=-2,551), which means that the significant effect of the perceived value of online social networks as a
means to structure time is not positively related to attitude toward SNA, as hypothesized, but it turns to be significantly
negatively related to attitude towards SNA. Interestingly, neither of these hypotheses was confirmed in the original USA
study.
Figure 2 – Portuguese (PT) vs USA path estimates
Socialization factors
Considering H5 (Self brand congruity is related positively to attitude toward SNA) and H6 (Peer influence is related
positively to attitude toward SNA) the study corroborated both hypotheses because the effect of self brand congruity on

647
attitude towards SNA was significant (0.067, t=2,105) as well as the effect of peer influence on attitude toward SNA
(0.185, t=4,325). H5 and H6 were also confirmed in the original USA study.
Barriers
With respect to H7 (Perceived invasiveness of SNA is related negatively to attitude towards SNA) and H8 (User
perceptions of privacy concerns are related negatively to attitudes towards SNA) the study only confirmed H8, because
the negative effect of privacy concerns on attitude towards SNA was significant (-0.065, t=-2,742) while the effect of
perceived invasiveness on attitude towards SNA proved to be non significant (-0.004, t=-0.171), therefore rejecting H7.
It is interesting to note that both of these barrier related hypotheses were confirmed in the original USA study.
Moderation Analysis: Gender
To test the possible effects of gender as a moderator variable the total sample was separated into two gender
subsamples (male: n=735; female: n=1466). The model was re-estimated and both subsamples results were compared.
Table 3 illustrates the results from both Portuguese and USA studies as far as gender as a moderator variable is
concerned.
Regarding the effect of informativeness on attitude toward SNA, the results were significant in both Portuguese and
USA studies both for men and women, but while in the USA sample the effect of informativeness on attitude toward
SNA was higher in the case of women, in the Portuguese sample the effect was higher in the case of men.
Considering the effect of entertainment on attitude toward SNA, again the results were similar in both studies. The
effect of entertainment on attitude toward SNA was significant in both samples and without differences across both
men and women groups.
Another similar achievement in both samples was related to the effect of SNA activities as a means of structuring time
on attitude toward SNA. In this case, the effect was significant for men, but not for women in both samples. An
interesting achievement was the fact that, in both samples, men consumers that use SNS activities to structure time
have a significant negative attitude toward SNA, while the proposed model predicted a hypothesized positive effect.
Findings also indicate that the effect of SNS to enhance quality of life on attitude toward SNA was not significant for
women in both samples. Notwithstanding, this effect proved to be significant for men in both samples, but while in the
case of Portuguese males the effect was positive, in the case of American males the effect was negative.
Table 3 – Moderating Effects of Gender: SEM Path Estimates (PT vs USA)
Attitude toward SNA (dependent variable)
Portuguese sample USA sample
Men Women Men Women
H1 Informativeness 0.21 a) 0.14 a) 0.07 c) 0.14 b)
H2 Entertainment 0.43 a) 0.46 a) 0.45 b) 0.53 b)
H3 Quality of life 0.12 b) 0.06 ns -0.11 b) -0.07 ns
H4 Structure time -0.20 a) -0.03 ns -0.10 c) 0.06 ns
H5 Self-brand congruity 0.10 b) 0.03 ns 0.09 b) 0.10 b)
H6 Peer influence 0.09 ns 0.15 a) 0.52 b) 0.12 b)
H7 Invasiveness 0.02 ns -0.01 ns -0.06 b) -0.06 c)
H8 Privacy concerns -0.08 ns -0.05 ns -0.05 c) -0.04 ns
a) p<0.001; b) p<0.01; c) p<0.05; (ns) not significant
The fit indices for both gender models in both samples are above acceptable levels (Hu and Bentler, 1999)

648
Regarding socialization factors such as self brand congruity and peer influence the results were different in both
samples. While the effects of these socialization factors on the attitude toward SNA were significant both for men and
women in the USA sample, in the Portuguese sample the effect of self brand congruity on attitude toward SNA was
significant for men but not for women, and the opposite with the effect of peer influence on attitude toward SNA, which
was significant for women but not for men. Additionally, in the USA sample, the significant effect of peer influence on
attitude toward SNA was higher in men´s group.
Considering factors such as invasiveness and privacy concerns (barriers) different achievements were also found in
both samples. While in the Portuguese sample none of these effects on attitude toward SNA were significant, neither for
men and women, in the case of the USA sample, the effects of invasiveness on attitude toward SNA proved to be
significant, with similar effects, both for men and women, but the effect of privacy concerns on attitude toward SNA was
significant only in the case of men´s group.
Conclusion and Implications
The original study of social media users in the U.S. (Taylor et al., 2011) found that consumers were more positively
disposed toward advertising that was informative, entertaining, that helped them connect with others or featured
brands consistent with their self-images, while they were negatively inclined toward ads that were invasive or raised
concerns about privacy. From this replication with a sample of 2201 social media users in Portugal, interesting
differences emerged.
Like their U.S. peers across the Atlantic, the Portuguese consumers were more positively disposed toward ads that
entertain or inform them, that facilitated social interaction with peers and featured self-congruent brands. However,
the effect size of entertainment was significantly less in Portugal than the U.S., and although Portuguese consumers
were also deterred by ads that raised concerns about privacy, they apparently are not deterred by the invasiveness of
advertising, which was not a significant predictor of attitudes. Even more interesting, however, was the effect of quality
of life and time structuring on the Portuguese consumers’ attitudes. Quality of life (e.g. reducing stress or helping the
consumer relax) and structuring time (e.g. helping structure the day or contributing to a routine) were both
hypothesized in the original study to exert a positive influence on attitudes toward ads, but neither effect was
significant in the U.S. study. These effects were significant among Portuguese consumers, however, with different types
of influence. While quality of life had a positive effect on attitude, as hypothesized, the effect of structure time on
attitude proved to be negative.
This study lends useful and actionable insights into social media users in the international marketplace. Social media is
truly a global phenomenon, and advertisers can reach an audience spanning oceans, crossing borders and
encompassing multiple cultures. Understanding how advertising is received by various cultures and geographic regions
is of utmost importance to advertisers – and, for that matter, the social media sites themselves who depend on
advertising revenue. There appear to be significant differences between audiences in Europe and North America, which
advertisers should heed when crafting their targeted appeals. The results provide theoretical implications for
academics, as well as practical guidance for practitioners. Specifically, in the academic realm this study provides
additional support for the model proposed and tested by Taylor et al. (2011), while suggesting that the relative weights
of each effect may vary with culture or geography. For marketers, it suggests that European customers are less
concerned about the intrusiveness of ads, but also less persuaded by the entertainment value of the ad than their peers
“across the pond.” Portuguese consumers appear to view social media advertising more holistically, viewing them more
positively when they perceive them as contributing to their quality of life.
Also very interesting is to examine how women and men differ in both empirical contexts. In Portugal, there are major
differences between men and women concerning the effects of quality of life, structure time, self brand congruity and
peer influence on attitude toward SNA. In the US, like in Portugal, the effect of quality of life and structure time on
attitude toward SNA also differs with gender. However, in the US, the effect of privacy concerns on attitude toward SNA
is different between men and women, whereas in Portugal gender doesn’t influence that effect.
Another insight concerns the absolute convergence and absolute divergence between American and Portuguese men
and American and Portuguese women. The effect of invasiveness on attitude is different among Ameri can and
Portuguese men and women. On the other hand, the effect of informativeness, entertainment and structure time on
attitude toward SNA is the same among men and women in both countries. Regarding the effect of Structure time, in

649
particular, it is interesting to highlight that despite the differences among countries, when considering gender alone we
get a completely different perspective, with similar achievements among American and Portuguese men and American
and Portuguese women.
These findings on the effect of gender raise an interesting debate regarding the importance of other dimensions and
factors in receptivity to advertising in social networks, rather than culture and geography.
Limitations
As with the original study that was replicated, the results must be viewed with several caveats in mind. First, the model
has been tested using samples constrained to the southwestern United States and Portugal. The former sample was
skewed toward younger consumers, while the latter sample was disproportionately female. Either condition may limit
the generalizability of the results. Second, both studies relied on survey data and self-reported attitudes. While each
measure has been validated using rigorous and widely accepted methods, self-reported data has limitations.
Despite these limitations, the study of Portuguese consumers contributes to the body of knowledge by providing insight
into the determinants of attitudes toward social network advertising. With the rapidly expanding popularity of social
media – which, in turn, depends on advertising revenues – such insights are of great importance to marketers and are
actionable. In addition, the comparison of consumers in the U.S. and Portugal highlights important differences between
the two groups.
References
AdReaction (2010) “Brands + Consumers + Social Media: What Marketers Should Know About Who’s Getting Social
and Why.” http://www. dynamiclogic.com/na/research/industry_ p r e s e n t a t i o n s / d o c s / D y n a m
i c L o g i c _ AdReaction09_OMMASocial_26Jan2010.pdf [accessed April 12, 2013]
Bagozzi, R.; Yi, Y. (1988) “On the evaluation of structural equation models” Journal of the Academy of Marketing Science,
16, 1, 74-94
Bagozzi, R.; Yi, Y; Lynn, P. (1991) “Assessing Construct Validity in Organizational Research” Administrative Science
Quarterly 36 (September): 421-458
Bauer, R. A., & Greyser, S. A. (1968). Advertising in America: The Consumer View. Boston: Harvard University, Graduate
School of Business Administration, Division of Research.
Brettel, M.; Spilker-Attig, A. (2010) “Online advertising effectiveness: a cross-cultural comparison”, Journal of Research
in Interactive Marketing, 4, 3,176-196
Cardoso, P.R. & Cardoso, A. 2011, "Adolescents' Attitudes Toward Internet Advertising/atitudes Dos Adolescentes Face
a Publicidade Na Internet" Revista Portuguesa de Marketing,, 27, 20-31
Cheng, J.; Blankson, C.; Wang, T.; Chen, L. (2009) “Consumer attitudes and interactive digital advertising” International
Journal of Advertising, 28, 3, 501-525
Ducoffe, R. (1996) “Advertising value and Advertising the web” Journal of Advertising Research, 36, 5, 21-35
Epsilon Targeting (2011) “2011 Channel Preference Study”
Escalas, J.E. and Bettman, J.R. (2005) “Self-Construal, Reference Groups, and Brand Meaning,” Journal of Consumer
Research 32, 3, 378-389
Fornell, C.; Larcker, D. (1981) “Evaluating structural equation models with unobserved variables and measurement
error” Journal of Marketing Research, 18, 39-50
Gao, Y.; Koufaris, M. (2006) “Perceptual Antedents of User Attitude in Electronic Commerce”, ACM Signis, 37, 2-3, 43-50
Hair, J.; Black, W.; Babin, B.; Anderson, R. (2009) Multivariate Data Analysis, 7th Edition, Prentice Hall.
Handel, R.; Cowley, E.; Page, K. (2000), "Attitudes toward Advertising Implications for the World Wide Web."
Proceedings of the 2000 Conference of the Australian & New Zealand Marketing Academy, 463-67.

650
Hu, L.; Bentler. P. (1999) “Cutoff Criteria for Fit Indexes in Covariance Structure Analysis: Conventional Criteria versus
New Alternatives” Structural Equation Modeling 6, 1, 1–55
Hadija, Z.; Barnes, SB; Hair, N. (2012), “Avoidance of advertising in social networking sites: the teenage perspective”
Qualitative Market Research: An International Journal, 15, 1, 19-32
Huang, Z.; Wang, M.; Quan, M; Ahang, J.; Tao, R (2006) “Chinese internet addiction inventory: developing a measure of
problematic internet use for Chinese college students” Cyber Psychology and Behavior, 10, 6, 805-812
Kelly, L., Kerr, G., & Drennan, J. (2010) “Avoidance of Advertising in Social Networking Sites: The Teenage Perspective”
Journal of Interactive Advertising, 10, 2 , 16-27.
Lastovicka, J. (1983) “Convergent and discriminant validity of television commercial rating scales” Journal of
Advertising, 12, 2, 14-23
Li, H.; Edwards, S.M., Lee, J.H. (2002) “Meausring the Intrusiveness of Advertisements: Scale Development and
Validation” Journal of Advertising, 31, 2, 37-47
Mittal, B. (1994) “Public Assessment of TV Advertising: Faint Praise and Harsh Criticism” Journal of Advertising
Research, 34, 1, 35–53.
Nielsen (2012) “State of the Media: The Social Media Report”, http://www.nielsen.com/us/en/reports/2012/state-of-
the-media-the-social-media-report-2012.html [accessed April 13, 2013].
O’Donohoe, S. (1995) “Attitudes to Advertising: A Review of British and American Research”, International Journal of
Advertising, 14, 245–261.
Pinho, J. C.; Soares, A. M. 2011, "Examining the technology acceptance model in the adoption of social networks",
Journal of Research in Interactive Marketing, 5, 2, 116-129
Redbook (1959), “Study of Public Attitudes Toward Advertising”, Special Report.
Schlosser, A.; Shavitt, S.; Kanfer, A. (1999), “Survey of Internet Users’ Attitudes Toward Internet Advertising”, Journal of
Interactive Marketing, 13, 3, 34-54.
Taylor, D.; Lewin J.; Strutton D. (2011), “Friends, Fans, and Followers: Do Ads Work on Social Networks? How Gender
and Age Shape Receptivity” Journal of Advertising Research, 259-275
Vara, V. (2006) “Myspace, Bye Space: Some Users Renounce Social Sites as Too Big.” Wall Street Journal, October 26: B1.
Wang, Y.; Sun, S (2010), “Examining the role of beliefs and attitudes in online advertising. A comparison between the
USA and Romania” International Marketing Review, 27, 1, 87-107

651
A Study of Fashion Mobile Marketing from the
Users’ Perspective Mobile marketing, fashion retailing, consumer behaviour
Ivonne Serna, School of Fashion, Ryerson University, [email protected]
Osmud Rahman, School of Fashion, Ryerson University, [email protected]
Abstract
A cross-sectional study of mobile marketing for fashion was conducted in Toronto. 390 participants responded to an
online survey which included questions about mobile user behaviour and consumer’s perception. Non-probabilistic
convenience sampling was used. All response data was entered and coded into SPSS version 20.0 for its analysis.
Findings showed that retailers should find ways to overcome consumers’ concerns for privacy, to make their apps and
mobile websites convenient and easy to use, and even to educate shoppers in the use of apps, Wi -Fi enablement and
Quick-Response (QR) code scanning. It is advisable to create a consistent experience across channels, where clients can
go from website, to mobile website to a bricks-and-mortar store, and have a seamless and consistent experience. There
were distinct gender differences among respondents in regards to mobile device usage. Retailers may focus their e-mail
communications efforts primarily on women who are more receptive to this medium. It is not recommended that
apparel retailers engage clients through SMS text message subscriptions as a communication channel. Users clearly
responded that they usually do not opt-in for receiving such messages from retailers. This is a fast paced environment,
in order to enhance web development efforts, retailers should constantly monitor platform preferences among users.
They may also benefit by engaging customers through social media efforts. Mobile gaming was one of the most popular
activities among mobile device users. Depending on the product and target market, retailers may choose to engage with
customers in creative ways, perhaps integrated into the gaming experience.
Introduction
Mobile commerce (m-commerce) can be considered as an extension of electronic commerce (e-commerce) to wireless
media (Rajnish et al., 2006; Zhang et al., 2012). According to the Mobile Marketing Association (MMA, 2008), mobile
marketing (m-marketing) is defined as “the use of wireless media as an integrated content delivery and direct response
vehicle within a cross-media or standalone marketing communications program.”A smartphone is a phone that has an
operating system that allows applications to be added or removed, that can take or send data, and can access web
content (Krum, 2010).
Apple, once known as a computer company, is now the world's biggest music retailer and a leading phone maker.
Results for the last quarter of 2012 show Apple sold 14 million iPads and 26.9 million iPhones (“Apple Fourth Quarter
Results,” 2012). The mobile device industry has been transformed rapidly over the last ten years, where people across
the globe have increasingly adopted the use of smart phones, tablets and other related devices as a necessity for their
everyday lives. In early 2012 Google announced at the Mobile World Conference in Barcelona that the total number of
Android activations had surpassed 300 million worldwide. They also reported to have 850,000 daily Android
activations (Schmidt, 2012). Internet giants such as Google, Amazon, and Microsoft are looking at mobile as a way to
break out of the fixed Internet (Wisely, 2009). We are shifting into a mobile world, where the fixed telecom operators
have been busy trying to meet a convergence point in which fixed and mobile worlds become part of the same telecom
experience.

652
Objectives
Mobile fashion marketing is still in a stage of infancy (Yang, 2010; Zhang et al., 2012) and further res earch is needed to
explore how this relatively new technology can be used to enhance brand awareness, improve communication and
ultimately generate more revenues. The purpose of this research study is threefold: (a) to gain a deeper understanding
of how consumers perceive mobile marketing, (b) to explore and identify the potential of mobile marketing for specific
targeted end users and, (c) to explore and identify the differences and similarities among mobile users from
demographic perspectives encompassing age and gender.
Literature Review
Mobile Marketing as Part of a Multi-Channel Strategy
Before smartphones became pervasive, most direct marketing was tied to a specific location. A marketer’s ability to
communicate with people largely depended on people actually being at specific places. Now in a world where most
adults have cell-phones, we can more easily reach exactly who we are looking for, when we want to market them. This
is because mobile phone numbers are assigned to “specific people instead of specific locations” (Krum, 2010).
Mobile marketing efforts help to provide a seamless experience to the customer, going from the retailer’s Internet
website, to the mobile e-commerce (or m-commerce) website, to the bricks-and-mortar store (in-store experience).
Rangaswamy and Van Bruggen (2005) explained that many retailers now explicitly offer a combination of physical
stores, catalogues, call centres, and e-commerce sites. Offering more than one channel has become commonplace for
many retailers. Hahn and Kim (2009) advocate for using the multi-channel approach, they studied the consumers’
desire to use the Internet as a flexible tool for researching products and locating stores, as well as purchasing
merchandise, and they also researched the effect of offline brand trust and perceived Internet confidence on online
shopping intention within the multi-channel context. Weltevrenden and Boschma (2008) found that established high-
street retailers that have ventured online tend to enjoy increased footfall, improved customer relationships, and
enhanced promotional exposure. They also say that leading edge retailers that have developed the most sophisticated
websites, will most likely enjoy the greatest comparative advantage from their online ventures.
Location-Based Services and the In-Store Experience
Location-based services (LBS) are any service that takes into account the geographic location of an entity (Junglas and
Watson, 2008). The advantage of location-aware services is that they also take into account the coordinate’s
surrounding context. Context can be any source of useful information for the intended application; it can take the form
of the user’s identity, location/position, time, orientation of movement, navigation history (history of a user’s position),
purpose of use, social and cultural situation, physical surroundings, and system properties. Therefore more relevant
messaging and services can be sent to a user if the information received from them is adjusted to their context
(Mohammadi, 2011).
Bricks-and-mortar stores can set up location-based services (LBS), with Radio-Frequency Identification (RFID)
technologies that broadcast digital messages to enabled devices within a specific radius or proximity. These broadcasts
send marketing messages directly to the consumer (who has opted-in) when they are in the area. The most suitable
technologies for this purpose are : Bluetooth and Wi-Fi (Wireless Fidelity).They have the advantages of reaching the
client who is already there, thus adding excitement. They may also increase impulse buying, and, ideally, enhance brand
perception with the client. These broadcasts reach enabled mobile devices such as mobile phones, laptops, and tablets
within the covered radius. An important aspect is that the mobile devices must be enabled in order to receive these
messages. This can easily be communicated to clients with in-store posters encouraging them to enable their devices to
download promotional information. Sales associates can also act as promoters and offer clients gui dance on how to
enable their devices (Krum, 2010). Another way of reaching shoppers is through the use of applications (apps).
Retailers and shopping malls may develop their own ‘apps’ which can be programmed to send messages, and enable the
GPS tracking locator, which could entice a shopper in location A to visit nearby retailer B and receive an instant

653
discount or another appealing promotion. Permission for this information exchange is inherently granted when the
user agrees to the terms and conditions of use when downloading and installing the app.
Social Networking and Geo-Location
The geographic location of a mobile device user is increasingly a topic of interest to marketers. Facebook is the most
widely used social network; their membership base reached over one billion users in October 2012 (Smith, Seagall, &
Cowley, 2012). With social networks people are now able to share content in real -time and from any place (as long as
they have an Internet connection). Half of Facebook’s members use it from mobi le devices and 102 million of them
access it exclusively through their mobile devices (rather than from their PCs).
Foursquare was launched in March 2009 and it added a new layer to social networking, recording the time and
whereabouts of users through using the app on their mobile devices. Foursquare is a platform in which users can
digitally detect which businesses (restaurants, entertainment, shopping, etc.) and attractions are nearby. Facebook
launched its own version of this and calls it Places. This feature enables users to share their location with “Facebook
friends” in real time and view friends’ comments about past visited places. These are examples of Augmented Reality
(AR) in use. AR, according to Skeldon (2011) is the “overlaying of digital information onto the real world” (p.100). It
uses “superimposed over live images to enhance the real environment around us” (Skeldon, 2011, p. 99). For instance,
geo-location app users can use a map of their location and look for nearby merchants. They can find information such
as store hours, their phone, a description of the retailer, and they can see comments or suggestions that other users
have left digitally. Therefore users are able to “augment their reality” by having extra information about a specific
retailer. This should be of particular interest to merchants, because potential clients may base their opinions from such
postings, either in a positive or in a negative way. Other functionality of geo-social networking is the ability to “check-
in” to a place, which would mean to register with the app and record the place and time of their visit. Sometimes
businesses will offer incentives to lure customers into their stores and the client can “unlock” a reward, or get a special
promotion or discount on products and services. This information can be linked with other social media applications
(such as Pinterest and Instagram), allowing for a much larger audience. During the lifetime of a user, the frequencies of
how often the user visits particular businesses or types of businesses that offer particular products or services, can be
recorded. Furthermore, periodical patterns can also be easily detected in the sequence of visits (Gidofalvi and Larsen
2008).
Fayyad, Piatetsky-Shapiro, and Smyth (1996) describe Data Mining (DM) or knowledge discovery in databases, as “the
extraction of interesting, meaningful, implicit, previously unknown, valid and actionable information from a pool of
data sources”. This information can be used for executive decision making. We are witnessing the start of deeper and
more meaningful consumer relationships, that only mobile devices are making possible.
Nayak and Seow (2004) discussed the advantages of geo-location information through Data Mining. With that
information over time patterns may emerge and “knowing the locations that a person frequents will allow the
prediction of a user’s daily life” (p.117). Therefore we can target customized marketing campaigns while segmenting
groups. According to Varshney (2001), in terms of B2C, “providing all information to every user, ignoring the user’s
interest in the type of information given, can result in the user unsubscribing to the services offered by the business”
(p.1).
Mobile Gaming
Fashion retailers can explore mobile gaming as a mobile marketing strategy. Survey data from the United States Bureau
of Labor Statistics (2011) reveals that individuals aged 15 to 19 years old spend an average of 1.2 hours (72 minutes)
per day playing games on any given platform. According to Flurry Analytics (as cited in Farago, 2012), games are the
most profitable app category. Flurry Analytics estimates games take about 80% of the total apps market, and that users
spend 43% of within-mobile-apps-time playing games (Laughlin, 2012). In 2007 with the introduction of the iPhone,
Apple took the carrier out of the content-creation-equation. This allowed developers to create content (such as mobile
games), upload it to the AppStore and sell in a global scale (Chasey, 2010). Several gaming companies focused
exclusively on mobile devices rather than regular PC gaming or consoles (Feijoo, Gómez-Barroso, Aguado, & Ramos,
2012). Apple is also becoming a dominant player in the gaming industry, having sold over 500 million iOS devices that

654
have generated over 40 billion downloads (from over 800,000 apps), and a sizable amount of those apps are games. In
comparison, Microsoft has sold 75 million Xbox consoles worldwide (since their launch, 7 years ago), Nintendo has sold
100 million Wii consoles and 150 million Nintendo DS (including all versions) (Siegler, 2013). Clearly, Apple is going at
a faster pace.
Gaming companies, just like other content-generating apps, have developed different mobile business models; they
have the “freemium” model, that is, offering versions of the game (or app) free of charge, but charging a premium for
advanced functionalities, levels, features, or virtual goods (such as virtual weaponry, virtual pets, lives, levels, avatar
accessories, special outfits, money, etc). These models sometimes also rely on advertising (advergaming). Advertising
to online players may have tracking advantages from Internet-based advertising. According to the Office of the Privacy
Commissioner of Canada (2011), “behavioural advertising involves tracking consumers online over time, in order to
deliver advertisements that are targeted to their inferred interests”. Yang andWang (2008) studied the advertising
effectiveness of virtual product placement in online games and found that the right combination of product type and
placement form can prove to be an effective marketing strategy. According to Çeltek (2010) advergaming is the
“inclusion of brands in electronic games or the brand as the game” (p.267). Advergames can be a tool for marketers to
enhance brand loyalty, and also provides the possibility of collecting data from clients that may benefit CRM efforts.
Gaming can be used to drive brand awareness, educate shoppers about product features and support marketing efforts.
For example, gamers can be asked to enter promo codes from their previous purchases to unlock extra gaming features.
Successful gaming is usually addictive and entertaining. Zynga became extremely popular among Facebook users. In
2010 Facebook had more than 120 million users playing Zynga’s online games (M acMillan, 2010). The company was
able to capture a market of non-gamers for instance stay-at-home-moms who would otherwise never play in regular
consoles became casual gamers. The games were easy to play and had hints attached educating players along the way.
For Zynga, the viral effect was and still is of great relevance. For this purpose, Zynga games entice players to ask their
friends to join them, by giving them extra rewards or features once they add new gamers. In Farmville, the most
popular game from Zynga, players asked their friends to become “their neighbors”: in Candy Crush Saga, friends “give
lives” to friends who need them. This stratagem makes the game go viral. The goal is to engage many people in a short
time, making them as addicted as possible to the game.
Methodology
Adult males and females (18 years or older) who owned a smartphone and/or a tablet were recruited. A sample size of
390 respondents answered a self-administered online survey based in the Greater Toronto Area. According to Malhotra
(2007), a sample size between 300 and 500 is acceptable, and the sample size of this study was 390 which was
therefore deemed to be sufficient. This cross-sectional study used descriptive research, which, as Churchill (1995) and
McDaniel & Gates (1999) explained, attempts to describe characteristics of certain groups; estimates proportion of
people in a population who behave in a certain way; and makes specific predictions. Non-probabilistic convenience
sampling and judgement sampling were used. In total, the survey consisted of 49 questions and they were grouped into
three sections: mobile user behaviour; consumer perception and experience (including examination of apparel
attributes and fashion information source); and demographic profile. Likert scale, nominal and ordinal questions were
used throughout the survey. Questions included attributes such as perceptions towards online apparel purchase
decisions, the role of mobile social media for apparel purchase decisions , their perceptions about locatio n-based
services, permission-based email subscriptions, as well as their attitudes towards m-commerce. Prior to data collection,
10 pre-tests were administered to assess the applicability and efficacy of the measuring instrument. Based on the
results and observations of the pre-test, minor revisions were made to improve clarity and to add extra choices to the
close-ended questions.
All response data were entered and coded into Statistical Package for the Social Sciences (SPSS) version 20.0 statistical
software for its analysis.
Findings and Results
Demographics
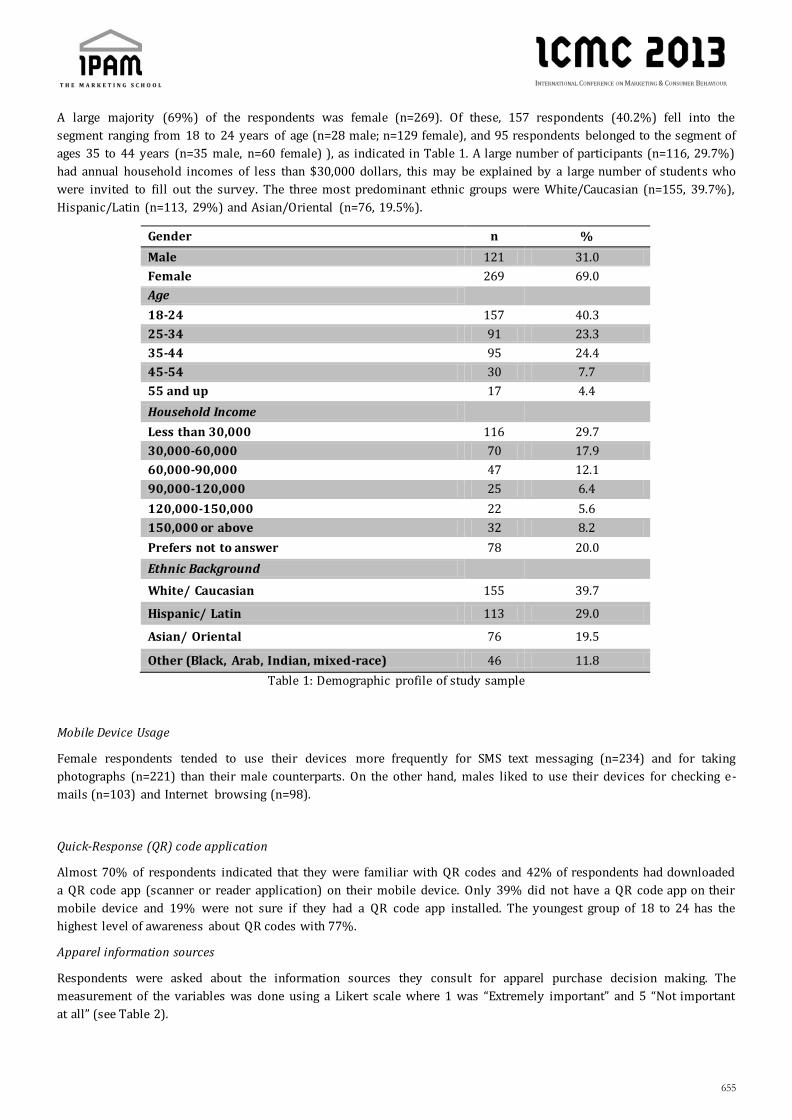
655
A large majority (69%) of the respondents was female (n=269). Of these, 157 respondents (40.2%) fell into the
segment ranging from 18 to 24 years of age (n=28 male; n=129 female), and 95 respondents belonged to the segment of
ages 35 to 44 years (n=35 male, n=60 female) ), as indicated in Table 1. A large number of participants (n=116, 29.7%)
had annual household incomes of less than $30,000 dollars, this may be explained by a large number of students who
were invited to fill out the survey. The three most predominant ethnic groups were White/Caucasian (n=155, 39.7%),
Hispanic/Latin (n=113, 29%) and Asian/Oriental (n=76, 19.5%).
Gender n %
Male 121 31.0
Female 269 69.0
Age
18-24 157 40.3
25-34 91 23.3
35-44 95 24.4
45-54 30 7.7
55 and up 17 4.4
Household Income
Less than 30,000 116 29.7
30,000-60,000 70 17.9
60,000-90,000 47 12.1
90,000-120,000 25 6.4
120,000-150,000 22 5.6
150,000 or above 32 8.2
Prefers not to answer 78 20.0
Ethnic Background
White/ Caucasian 155 39.7
Hispanic/ Latin 113 29.0
Asian/ Oriental 76 19.5
Other (Black, Arab, Indian, mixed-race) 46 11.8
Table 1: Demographic profile of study sample
Mobile Device Usage
Female respondents tended to use their devices more frequently for SMS text messaging (n=234) and for taking
photographs (n=221) than their male counterparts. On the other hand, males liked to use their devices for checking e-
mails (n=103) and Internet browsing (n=98).
Quick-Response (QR) code application
Almost 70% of respondents indicated that they were familiar with QR codes and 42% of respondents had downloaded
a QR code app (scanner or reader application) on their mobile device. Only 39% did not have a QR code app on their
mobile device and 19% were not sure if they had a QR code app installed. The youngest group of 18 to 24 has the
highest level of awareness about QR codes with 77%.
Apparel information sources
Respondents were asked about the information sources they consult for apparel purchase decision making. The
measurement of the variables was done using a Likert scale where 1 was “Extremely important” and 5 “Not important
at all” (see Table 2).

656
Information sources for apparel decision making N=390
Frequency Mean S.D.
Retail websites 387 2.21 1.256
Friends & family recommendations
388 2.31 1.124
Store display 387 2.51 1.177
Customer's reviews 384 2.89 1.327
Magazines 389 2.94 1.221
Retail mobile websites 385 3.27 1.379
Blogs 383 3.48 1.242
TV ads 384 3.7 1.17
Table 2: Significance of apparel information source
The eight variables were subjected to exploratory factor analysis. Principal components analysis (PCA) using SPSS
version 20 was performed. A previous assessment for the suitability of data for factor analysis was conducted.
Inspection of the correlation matrix revealed the presence of many coefficients of .4 and above. The Kaiser-Meyer-Olkin
value was .75, exceeding the recommended value of .6 (Kaiser 1974) and Bartlett’s Test of Sphericity (Bartlett 1954)
reached statistical significance (p=.000), indicating significant relationships between variables, therefore factor
analysis was appropriate to use. Principal components analysis revealed the presence of two components with
eigenvalues exceeding 1, explaining 37.2% and 15.7% of the variance respectively; a third component with an
eigenvalue of .976 was also considered, which helped to explain an additional 12.2% of the variance. The three-factor
solution explained a total of 65% of the variance. To assist in the interpretation of these three components, Oblimin
rotation with Kaiser’s Normalization was performed. Rotation converged in 7 iterations. Reliability of the scale was
tested with the eight items, with a reported Cronbach alpha coefficient of .76, which was acceptable because it was >.7
(DeVellis 2003; Christmann & Van Aelst 2006).
Major determinants of the factors derived by exploratory factor analysis
Pattern coefficients Structure coefficients
Communalities
Item Factor 1
Factor 2
Factor 3
Factor 1
Factor 2
Factor 3
Customer reviews 0.388 -0.204 0.677 0.553 0.007 0.758 0.726
Retail mobile website 0.757 0.031 -0.002 0.763 0.191 0.237 0.584
Blogs 0.609 0.015 0.209 0.676 0.184 0.399 0.498
Retail websites 0.807 0.040 -0.080 0.791 0.196 0.176 0.632
Friends & family recommendations
-0.087 0.146 0.864 0.210 0.292 0.866 0.773
Store display -0.134 0.849 0.077 0.070 0.835 0.198 0.714
Magazines 0.338 0.746 -0.163 0.446 0.787 0.083 0.725
TV ads 0.080 0.513 0.411 0.316 0.608 0.534 0.556
Table 3: Major determinants of the factors derived by exploratory factor analysis
Factor 1 in the pattern coefficients matrix clustered three variables (see Table 3) with factor loadings >.50 indicating a
strong relationship between the variables of apparel shopping information sources: retailers’ websites (both regular
and mobile), and blogs. The customer reviews variable also loaded strongly for factor 1 in the structure coefficients
matrix. Factor 2 clustered three variables: store display, magazines, and TV ads. In component 3 there were two
variables with strong loadings: customer reviews, and friends and family recommendations.

657
Mobile communications
In terms of permission-based e-mail subscriptions, female respondents (54%) were more willing to receive e-mail
communications from their favourite apparel retailers than were males (only 33%). Therefore retailers should focus
their e-mail communications efforts primarily on women.
Respondents also gave their opinion about the desired frequency of such e-mail communications from apparel
retailers: 32% of them thought once per month was adequate, 20% opted for two or three times per week, 19% once a
week, 13% twice a month, and 13% daily. Opinions are fragmented, therefore careful consideration should be placed
when sending e-mail communications. Retailers should find the right balance for their target customers; that is,
whereby they maintain proper communication with clients and at the same time, are not perceived as spam.
Respondents who did not usually sign-up to receive e-mails from their favourite apparel retailers thought that
receiving discounts and/or promotions would compel them to opt-in (62%), followed by frequent shopper programs
(22%).
In regards to receiving SMS text messages from their favourite apparel retailers, an overwhelming amount of
respondents (95%) answered that they do not opt-in to receive such messages. This is an interesting finding,
particularly because 71% of respondents use SMS text messages on their smartphones on a regular basis. Text
messaging actually occupied the second position in terms of mobile usage, right after ‘making phone calls’. It seems
users perceive SMS text messages to be of a more personal nature, therefore not sharing this communication channel
with apparel retailers.
Social networking and location-based services
In terms of social networks Facebook maintained a hegemonic position. This social network is “the second most visited
website on the web”, according to its CEO Mark Zuckerberg, he also declared “we are now a mobile company”. In this
study, 92% of female respondents were Facebook members, meanwhile 87% of their male counterparts had such
membership. The second most sought after social network was Twitter, with almost equal amounts of gender
participation. LinkedIn occupied the third place, however it is interesting to note that males seem to be more interested
in it with a 46% membership, than females with only 29% of affiliation. Perhaps this could be explained because
LinkedIn is mostly associated with professional relationships and for job-hunting, and stereotypes may play a role with
males being the “breadwinners”, thus using LinkedIn more than females. Respondents often belong to more than one
social network.
Users of social networks have the option to “check-in” to a physical place and share their location with friends. Once
“checked-in,” users are sometimes able to earn discounts and rewards points. They also have the option of reading
and/or leaving online comments about a place, which could be a retail store, a restaurant, or almost any place; users
can also add places not currently listed. Foursquare, Google +, and Facebook’s Places are examples of social networks
who allow social “check-ins.” Findings of this study revealed that there was a wide age gap in regards to social check-in.
More mature participants were the least interested and had the least awareness about “check-ins. The 18 to 24 age
group was the most experienced. Fashion retailers can upload descriptions about their stores, update, and maintain
them as part of a social networking marketing strategy. It would be beneficial to understand the age differences among
target consumers, and perhaps even to educate potential clients who would be interested in engaging through this
medium. According to a recent IBM (2012) report, “social sales” or customers referred from social networks (Facebook,
Twitter, LinkedIn, YouTube) generated 0.34% of all online sales during Black Friday 2012.
Mobile Play
In this study, 52% of respondents were players. Gaming was most frequent among the youngest group of 18-24 year
olds (54%) followed by the 35-44 age group (53%). The most cited game played was “Angry Birds”, however “fashion”
in games changes rather frequently. As of this writing, the “Candy Crush Saga” seems to be the new fashionable game
according to informal and anecdotal information gathered by these researchers.
Most respondents had not downloaded games from retailers (n=326). Downloading such games was more popular
among males than females (27% vs. only 10%). If retailers are considering the addition of a gaming component to an
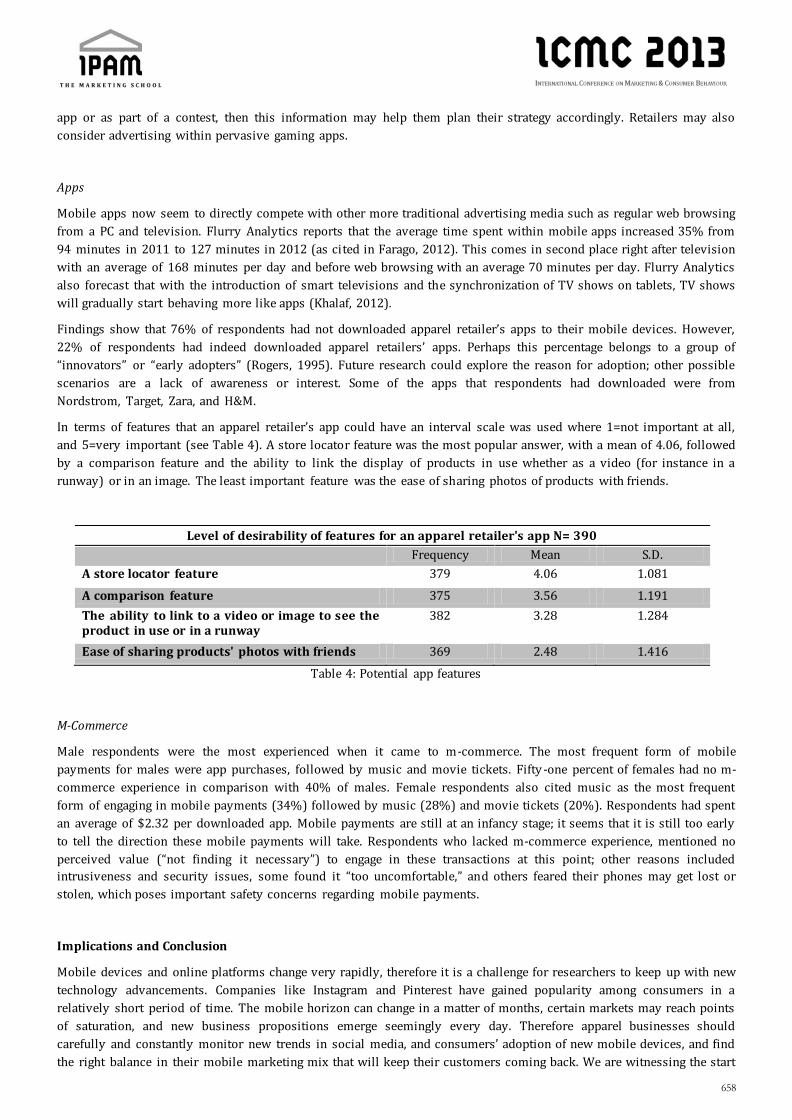
658
app or as part of a contest, then this information may help them plan their strategy accordingly. Retailers may also
consider advertising within pervasive gaming apps.
Apps
Mobile apps now seem to directly compete with other more traditional advertising media such as regular web browsing
from a PC and television. Flurry Analytics reports that the average time spent within mobile apps increased 35% from
94 minutes in 2011 to 127 minutes in 2012 (as cited in Farago, 2012). This comes in second place right after television
with an average of 168 minutes per day and before web browsing with an average 70 minutes per day. Flurry Analytics
also forecast that with the introduction of smart televisions and the synchronization of TV shows on tablets, TV shows
will gradually start behaving more like apps (Khalaf, 2012).
Findings show that 76% of respondents had not downloaded apparel retailer’s apps to their mobile devices. However,
22% of respondents had indeed downloaded apparel retailers’ apps. Perhaps this percentage belongs to a group of
“innovators” or “early adopters” (Rogers, 1995). Future research could explore the reason for adoption; other possible
scenarios are a lack of awareness or interest. Some of the apps that respondents had downloaded were from
Nordstrom, Target, Zara, and H&M.
In terms of features that an apparel retailer’s app could have an interval scale was used where 1=not important at all,
and 5=very important (see Table 4). A store locator feature was the most popular answer, with a mean of 4.06, followed
by a comparison feature and the ability to link the display of products in use whether as a video (for instance in a
runway) or in an image. The least important feature was the ease of sharing photos of products with friends.
Level of desirability of features for an apparel retailer's app N= 390
Frequency Mean S.D.
A store locator feature 379 4.06 1.081
A comparison feature 375 3.56 1.191
The ability to link to a video or image to see the product in use or in a runway
382 3.28 1.284
Ease of sharing products' photos with friends 369 2.48 1.416
Table 4: Potential app features
M-Commerce
Male respondents were the most experienced when it came to m-commerce. The most frequent form of mobile
payments for males were app purchases, followed by music and movie tickets. Fifty -one percent of females had no m-
commerce experience in comparison with 40% of males. Female respondents also cited music as the most frequent
form of engaging in mobile payments (34%) followed by music (28%) and movie tickets (20%). Respondents had spent
an average of $2.32 per downloaded app. Mobile payments are still at an infancy stage; it seems that it is still too early
to tell the direction these mobile payments will take. Respondents who lacked m-commerce experience, mentioned no
perceived value (“not finding it necessary”) to engage in these transactions at this point; other reasons included
intrusiveness and security issues, some found it “too uncomfortable,” and others feared their phones may get lost or
stolen, which poses important safety concerns regarding mobile payments.
Implications and Conclusion
Mobile devices and online platforms change very rapidly, therefore it is a challenge for researchers to keep up with new
technology advancements. Companies like Instagram and Pinterest have gained popularity among consumers in a
relatively short period of time. The mobile horizon can change in a matter of months, certain markets may reach points
of saturation, and new business propositions emerge seemingly every day. Therefore apparel businesses should
carefully and constantly monitor new trends in social media, and consumers’ adoption of new mobile devices, and find
the right balance in their mobile marketing mix that will keep their customers coming back. We are witnessing the start

659
of deeper and more meaningful consumer relationships, and mobile devices and their respective apps are making this
increasingly possible.
Retailers should find ways to overcome consumers’ concerns for privacy/security, to make their apps and mobile
websites convenient and easy to use, and even to educate shoppers in the use of apps, Wi -Fi enablement, QR code
scanning, and/or pinpoint the location of digital look-books.
It is advisable to create a consistent experience across channels, whereby clients can go from website, to mobile
website to a bricks-and-mortar store, and have a seamless and consistent experience.
There were distinct gender differences among respondents in regards to mobile device usage. Retailers may focus their
e-mail communications efforts primarily on women who are more receptive to such communications. Findings showed
that consumers may feel compelled to opt-in to receive e-mails when they are offered discounts. In terms of SMS text
message subscriptions from apparel retailers, it is not recommended that retailers engage clients through this
communication channel. Users clearly responded that they usually do not opt-in for receiving such messages from
retailers. It is possible that SMS text messaging is perceived to be of a more personal nature.
It would be beneficial if apparel retailers maintain websites that are optimized for mobile device viewing. This helps
shoppers access information wherever they are as long as they have an Internet connection available.
Wi-fi provides an interesting alternative to regular telecom carriers. Within bricks-and-mortar retail stores, or at
shopping malls, Wi-Fi enablement may give a competitive advantage for communicating and interacting with
customers. Shoppers may experience a more friendly and interactive shopping environment, and at the same time,
retailers can effectively overcome inherent communication problems. Wi-Fi is a tool that can help (a) overcome
communication issues with clients who are from out of town and do not have a local data plan; (b) retail locations that
are underground or otherwise have signal problems (due to location, a crowded environment, thick concrete walls,
metal furniture, etc.); and (c) users of iPod Touch or similar devices, who only rely on Wi-Fi for Internet access. Wi-Fi
can also act as an empowerment tool for employees; for example, tablets can be distributed among employees to help
illustrate points, product uses, or otherwise showcase information to clients.
Apparel retailers may use QR codes within their stores to enhance the customer shopping experience. A QR code can be
placed as a merchandise hangtag and customers can get further product information when they scan it. QR codes may
also be placed in close proximity to merchandise, and when scanned, they can link to an online video (which could be
setup in Youtube). This video may have promotional content, suggested product combinations (such as “this blouse
goes well with this skirt”) or instructions about product use (such “how to tie a scarf” and, “different ways a scarf can be
worn”). QR codes may also link users to an audio file, such files may contain directions or guidance for shoppers.
Apparel retailers may create a wide range of exciting experiences for customers through creative QR code use. A sign
placed in a storefront window inviting passerby shoppers to “scan this for a free item” or to get a discount, may prove
to be an efficient way to engage them.
Social Networking
To enhance web development efforts, retailers also need to constantly monitor platform preferences among users; (e.g.,
Apple’s iPhone now has a hegemonic presence, but this could change; after all, BlackBerry once had a prime position,
and then lost it). It would be beneficial for retailers to engage their customers through social media efforts (e.g.,
Facebook pages, corporate Twitter accounts, monitoring customers’ reviews, etc.) and to be aware of users’
preferences, because new players enter social networks, and sometimes they can have a great influence in a very short
period of time, (two recent examples being Instagram and Pinterest). This is a fast-paced environment. Mobile users
enjoy being in contact with friends, engaging with their favourite retail businesses through social networks, and being
informed about discounts or special promotions and events. With this perspective, it is advisable for fashion marketers
and retailers to connect and communicate with their consumers through social networking and mobile dev ices.
Apps and Mobile Gaming
Mobile gaming is one of the most popular activities among mobile device users. Depending on the product and target
market, retailers may choose to advertise within pervasive gaming apps (advergaming), or engage consumers/game

660
players in creative ways, perhaps integrated into the gaming experience; however, this needs careful planning and
testing.
Apparel retailers may benefit by developing their own branded app. It should be perceived as an added convenience for
the shopper, and features may include barcode scanning, inventory status, look-books, store locator (and hours)
information, product information and reviews, and social media features. The app may also have a GPS component for
tracking customers; if they opt-in or their device is enabled, this could alert them of promotions or special events when
they are nearby. At the same time, this information may also help to develop more meaningful CRM databases.
Limitations
This research used judgemental and convenience sampling which have inherent statistical limitations due to their non-
probabilistic nature. Therefore a future study that utilizes a probabilistic approach could strengthen results. Also,
qualitative research methods can be employed to gain a deeper understanding of consumers’ perceptions and
preferences about mobile marketing efforts from apparel retailers. A single study should not form the basis for
generalizations. Therefore, more replication is needed to strengthen the data validity and reliability. In addition to this
point, cross-cultural/longitudinal replication of this type of study could be beneficial.
Future Research
We are beginning to learn more about consumer behaviour and perceptions towards mobile devices and how they can
be useful tools for apparel retailers. However this is a broad topic, future research could focus on further exploring
areas such as the role of different social media platforms in mobile marketing; a deeper exploration into augmented-
reality and its uses; the effectiveness level of mobile advertising; further study about mobile payments in apparel; and
the enhancement of location-based services in order to improve the retail customer’s in-store experience.
References
Apple reports fourth quarter results. (2012, October 25). In Apple press info. Retrieved from
http://www.appl e.com/pr/library/2012/10/25Apple-Reports-Fourth-Quarter-Results.html
Bartlett, M.S. (1954). A note on the multiplying factor for various chi square approximations. Journal of the Royal
Statistical Society, 16 (Series B), 296-298.
Office of the Privacy Commissioner of Canada (2011, December 6) New online advertising guidance sets out restrictions
for tracking. Retrieved from http://search.proquest.com.ezproxy.lib.ryerson.ca/docview/908507429
Çeltek, E. (2010). Mobile advergames in tourism marketing. Journal of Vacation Marketing, 16(4), 267–281.
Chasey, J. (2010). The evolution of mobile gaming. ITNOW, 52(6), 14–15.
Churchill, G. (1995) Marketing research methodological foundations. Fort Worth, TX: Dryden Press
Christmann,A. & Van Aelst, S. (2006) Robust estimation of Cronbach’s alpha. Journal of Multivariate Analysis. 97 (7),
1660-1674.
DeVellis, R.F. (2003). Scale development: Theory and applications (2nd edn). Thousand Oaks, CA: Sage.
Farago, P. (2012, Oct 22) App engagement: The matrix reloaded [Web log post]. Retrieved from:
http://blog.flurry.com/bid/88867/iOS-and-Android-Adoption-Explodes -Internationally
Fayyad, U., Piatetsky-Shapiro, G., & Smyth, P. (1996). Knowledge discovery and data mining: Towards a unifying
framework. Proceedings of the second international conference on knowledge discovery and data mining .
Retrieved from http://citeseerx.ist.psu.edu/viewdoc/summary?doi=10.1.1.27.363
Feijoo, C. Gómez-Barroso, J.L., Aguado, J.M. & Ramos, S. (2012). Mobile gaming: industry challenges and policy
implications. Telecommunications Policy, 36, (3), 212 – 221.

661
Gidofalvi, G. & Larsen, H.R. (2008). Estimating the capacity of the location-based advertising channel. International
Journal of Mobile Communications, 6(3), 357-375.
Hahn, K.H., & Kim, J. (2009). The effect of offline brand trust and perceived Internet confidence on online shopping
intention in the integrated multi-channel context. International Journal of Retail & Distribution Management,
39(2), 126-141.
IBM (2012). IBM 2012 Holiday benchmark reports: Black Friday [Data file]. Retrieved from http://www-
01.ibm.com/software/marketing-solutions/benchmark-reports/black-friday-2012.html
Junglas, I. & Watson, R. (2008). Location based services: Evaluating user perceptions of location-tracking and location
awareness services. Communications of the ACM, 51(3), 65-69.
Kaiser, H. (1974). An index of factorial simplicity. Psychometrika, 39, 31-36.
Khalaf, S. (2012, December 5). Mobile apps: We interrupt this broadcast [Web log post]. Retrieved from
http://blog.flurry.com/bid/92105/Mobile-Apps-We-Interrupt-This-Broadcast
Krum, C. (2010). Mobile marketing: Finding your customers no matter where they are . Indianapolis, IN: Que.
Laughlin, D. (2012, December 13). The gamification of mobile games [Web log post]. Retrieved from
http://blog.flurry.com/bid/92377/The-Gamification-of-Mobile-Games
MacMillan, D.(2010). Zynga and Facebook. It’s complicated. Business Week . 4176, 47. Retrieved from
http://www.businessweek.com/stories/2010-04-21/zynga-and-facebook-dot-its-complicated
Malhotra, N. K. (2007). Marketing research an applied orientation. New York, NY: Prentice Hall.
McDaniel, C., & Gates, R. (1999) Contemporary marketing research. Cincinnati, OH: South-Western College Publishing.
Mobile Marketing Association (2008), Mobile marketing industry glossary, Mobile Marketing Association. Retrieved
from http://www.mmaglobal.com/glossary.pdf
Mohammadi, E. (2011). Indoor location based services (Master’s Thesis). University of Alberta, Calgary, Alberta.
Retrieved from http://tinyurl.com/c8o6nku
Nayak, R. & Seow, L. (2004) Knowledge discovery in mobile business data. In Si Shi (Ed.) Mobile commerce applications
(p.25) Hershey, PA: Idea Group.
Rajnish, T., Buse, S. & Herstatt, C. (2008). From electronic to mobile commerce: opportunities though technology
convergence for business services, Asia-Pacific Tech Monitor, Sept-Oct, 38-45. Retrieved from
http://www.mobile-prospects.com/publications/files/E2M-Commerce.pdf
Rangaswamy, A., & Van Bruggen, G.H. (2005). Opportunities and challenges in multi-channel marketing: an introduction
to the special issue. Journal of Interactive Marketing, 19(2), 5-11.
Rogers, E.M. (1995) Diffusion of innovations (4th ed.). New York, NY: The Free Press.
Schmidt, E. (2012). There will be an Android in every pocket. Mobile World Live Barcelona 2012. Retrieved from
http://www.mobileworldlive.com/videos/google-there-will-be-an-android-in-every -pocket/22677
Siegler, M. (2013, February 14). The fall TV lineup may include apple dominating gaming. [Web log post]. Retrieved
from http://techcrunch.com/2013/02/14/death -by-apps/
Skeldon, P. (2011). mCommerce: Boost your business with the power of mobile commerce. Surrey, U.K.: Crimson
Publishing.
Smith, A. Segall, L. & Cowley, S. (2012, October 4). Facebook reaches one billion users. CNN Money. Retrieved from
http://money.cnn.com/2012/10/04/technology/facebook-billion-users/index.html
United States Bureau of Labor Statistics (2011). American time use survey: 2011 results [Data file]. Retrieved from
http://www.bls.gov/news.release/pdf/atus.pdf
Varshney, U. (2001). Location management support for mobile commerce applications. In Proceedings of the First
International Workshop on Mobile Commerce (pp.1-6).

662
Weltevrenden, J.W., & Boschma, R.A. (2008). Internet strategies and the performance of Dutch retailers. Journal of
Retailing and Consumer Services, 15, 163-178.
Wisely, D. (2009) IP for 4G. West Sussex, U.K : Wiley.
Yang, H.L. & Wang, C.H. (2008). Product placement of computer games in cyberspace. Cyberpsychology & Behavior: The
impact of the Internet , multimedia and virtual reality on behavior and society. 11 (4), 399 - 404
Yang, K. (2010), Determinants of US consumer mobile shopping services adoption: implications for designing mobile
shopping services, Journal of Consumer Marketing, 27 ( 3), 262-270.
Zhang, L., Zhu, J. & Liu, Q. (2012), A meta-analysis of mobile commerce adoption and the moderating effect of culture,
Computer in Human Behavior, 28, 1902-1911.

663
Internet and consumer empowerment: the
role of decision aids and social media Consumer empowerment, decision aids, social media, choice, Internet, youth
Peter Atorough, Robert Gordon University Aberdeen, [email protected]
Adrienne Steffen, Hochschule für Internationales Management Heidelberg, [email protected]
Abstract
The main objectives of this paper are to critically analyse past and current narratives on the topic of consumer
empowerment, in the light of the emergence of the Internet as a domain for retail and consumption activity, and to
propose a framework for understanding consumer empowerment online.
A literature review approach was adopted, in which extant research in the areas of empowerment, consumer behaviour
and electronic retail characteristics was reviewed and critically analysed. This led to the specification of an
empowerment framework that reflects the role of unique Internet-enabled characteristics relating to decision making
and social media.
We argue that a decision making based model of empowerment in online shopping which reflects the role of social
media and decision aids can provide insights into how consumers (especially youth) are empowered by the Internet.
Understanding consumer empowerment in general and how it affects decision making, and therefore buying behaviour,
is an important objective of marketing and consumer behaviour research. Our contribution advances this objective
through theory building and proposition. However, this paper is currently limited to theoretical propositions and
assumptions, which must be empirically tested and validated in future research.
1. Introduction
It would appear that the tug-of-war that exists between consumers’ attempts to stay in control of their spending on the
one hand and marketers’ efforts to encourage them to spending on the other, is now fully replicated in the Internet
domain. While a number of studies show that one important objective for consumers’ adoption of Internet commerce is
the desire for control (Rodriguez-Ardura and Martinez-Lopez, 2008; Wolfinbarger and Gilly, 2001), there is also
evidence that marketers are constantly devising ingenious ways of counteracting this very control (Larose, 2001),
resulting in, example, high impulsivity (Dawson and Kim, 2010). From nexus to transformation marketing
(Parasuraman and Zinkhan, 2002), electronic marketing has evolved and taken unique forms, frequently focused on
circumventing any control mechanisms consumers may have habituated. For instance a recent British newspaper
report highlighted the now growing practice of using professional admen to pose as celebrity tweeters in extolling the
virtue of a particular brand or another. While the ethic of such practice in itself may be argued, its intended effects are
to create an illusion in consumers of endorsement by their favourite celebrities, thereby increasing prominence of
choice for the brand in question. A similar scenario is evolving in the dimension of so called consumer empowerment
over the web. As marketers begin to acknowledge that consumers desire better control, self-determination and
independence online, a number of tools and mechanisms have emerged, some – for example social media – independent
of retailers’ control, and some aimed at persuading the customer that she/he is in control, and therefore empowered,
when shopping online. Empowerment in this sense is described by Hunter and Garnefeld (2008) as a positive
subjective state which results from increasing control. These tools include safety and privacy seals, inter- and intra-
retailer information availability, and interactive decision making aids.
However there are two streams of thought that are in contention as to whether the consumer is actually empowered by
information and choice attributes when participating in Internet commerce (for example, Harrison et al, 2006) or

664
whether marketers are more successful in their ability to persuade and manipulate consumers toward behaviour
beneficial to them (marketers), but which is counter-intuitive to the aspirations of empowerment (for example, Dawson
and Kim, 2010; Henry, 2005); but overall findings remain inconclusive and non-unanimous. Regardless, online
marketers and retailers have been quick to realise that consumers seek some form of self-control and self-regulation
when shopping online, hence a number of utilities have been introduced to enable users take control of the shopping
process: cookie persistent shopping baskets, content choice management, competitor price comparisons, risk relievers
and other interactive decision aids (Haubl and Trifts, 2000). A common example of how these tools can be used to
persuade consumers toward the feeling of empowerment is the provision of privacy seals and policies as well as
trading terms and conditions on a website. Because retailers do not expect consumers to actually read them, when
these documents are read, it becomes evident that there is often very little useful and enforceable protection being
promised, and their content is often couched in confusion rather than providing transparency (Nehf, 2005).
When Harrison et al. (2006) argued that extensive choice and information quantity presented through specific cues can
potentially empower consumers in the online shopping arena, they had a strong case. After all, common sense tells us
that information, or its related concept, knowledge, bequests power. Therefore we can reasonably assume that when
we are informed, we are more in control and we can consider ourselves better empowered. Equally, the more choice we
are given in a situation, the more our alternatives and therefore the more we should be at liberty to make the best
possible choice for ourselves, assuming that we behave according to the rules of the rational choice model. However
this argument neglects some important limitations of human nature - those of our ability to cope with information,
process decisions, and effectively balance contending goals against time pressure. Indeed Harrison et al. (2006)
acknowledge that greater choice does not always lead to the perception of empowerment because empowerment also
entails costs. This argument is presented even more clearly in Henry (2005) who argues that first, access to more
information and choice over the Internet should not necessarily be equated with better decision making on the part of
the consumer, given the limit of effort and resources required to gather, evaluate and comprehend this information.
Secondly, Henry argues that information availability on the Internet has not fundamentally changed the way consumers
search for product options, or their decision making strategies, but instead it has increased the volume of available
options that consumers have to consider. He avers that for most purchase decisions, consumers are already overloaded
with information and that as decision complexity increases, we tend to actually use less of the available information,
preferring instead to rely on the most important bits. It appears that these arguments resonates with both practitioners
and academics, whose understanding of the bounded rationality paradigm of human behaviour has led them to
conclude that Internet information and choice is best useful when presented in manageable and relevant quantities.
Practitioners have been quick to develop and implement decision aid tools online, whil e there is now emerging
literature that evaluates and assesses the impact of these tools on consumers’ decision behaviour, decision quality,
satisfaction, and therefore perceived empowerment. However, if we agree with Henry (2005), as indeed we do, that
with the introduction of decision making aids, technology has simply taken us on a cycle, then we should be right to
accept his conclusion that the use of decision aids is counterintuitive to the empowering possibilities presented by raw
information and choice that consumers could access online. This is because as soon as information is compressed or
selectively presented in simpler forms, then the Internet source providing this information becomes a surrogate expert,
whose bias cannot be determined. But this is exactly what consumers thought they were avoiding by going online: for
independence, self determination, for decision control. True, when Internet agents (for example marketers and
retailers) distil and refine the available information and choice according to some criteria based on their understanding
of our preferences, they provide us with useful information and manageable choices, reducing the cognitive effort
required to sieve through the information ourselves and the combinations and permutations that we must process in
order to arrive at our preferred choice. But in utilising these aids, can we genuinely say that the choice we make and the
decision we arrive at are ours? Is Henry (2005) therefore right to conclude that increased choice and information on
the Internet and the use of decision aid tools creates an illusion, but not a reality, of consumer empowerment?
In this article, we represent perspectives from the literature which persuades us to argue that while the likes of Haubl
and Trifts (2000), Harrison et al. (2006) and Wang and Benbasat, (2009) may be overly optimistic about the ability of
information, choice and decision aids to truly improve decision quality and thereby empower consumers online, Henry
(2006) is, on the other hand, too dismissive of this possibility, without thoroughly considering what empowerment
means to the online consumer or how current Internet use by the youth generation may represent an episode in
consumer empowerment. Specifically, we contend that actions that might be interpreted as empowerment are in
themselves not so important. What matters more is the perception. That one is empowered, that one has ownership of

665
decisions, and that one can take pride in the choices they make and ultimately feel a higher sense of satisfaction. We
conclude this introduction with a number of questions.
First, as highlighted by Harrison et al. (2006) does the presence of decision aid utilities resulting from Internet
information and choice lead to perceived empowerment on the part of consumers? Second does perceived
empowerment online translate to consumers perceiving a sense of better control, improved decision quality, and
satisfaction with the consumption outcome? In order words, do consumers feel happy with decision aids? These
questions loom as important consumer behaviour issues, but represent areas of discord, which we must strive to
resolve as we continue to build our understanding of consumer engagement with this relatively new channel.
One objective for this paper is to discuss the issues raised above by analysing and evaluating the general literature on
empowerment and its potential relationship to the Internet in terms of the specific attributes of choice and information
availability. Secondly, the paper aims to consider the role that decision aids might play in delivering information and
choice in a manner that online consumers can cope with and find useful. Finally, the paper proposes a model of Internet
consumer empowerment and suggests potential approaches toward future research to validate these propositions.
2. Empowerment
Empowerment has been discussed with a varying degree of consensus on its meaning and definition (Starkey, 2003),
with differences potentially resulting from the diversity of its origins. As Harrison et al. (2006, p. 973) state:
“empowerment has its roots in a range of traditions, including among others, the civil rights, anti -racist and women’s
movements and consumerism. Thus empowerment holds varying meanings in a range of contexts with different
underpinning assumptions and ideologies.” In motivational psychology, empowerment is the concept which describes
the feeling that one’s action makes a difference to the situation; that one’s choices matter (Geller, in Thorgeston, 2005).
Thorgeston goes on to describe it as a feeling or perception that has implications for a person’s propensity to initiate
action toward a goal and to persist in goal striving. Hence empowerment is not only a question of capabilities but it also
embodies the perception of those capabilities, and the motivation to utilise them. Thus in the context of Internet
shopping, one can expect that perceived empowerment produces positive engagement and participation, as it creates
the perception within the consumer of self-determination, autonomy and competence (Ryan and Deci, 2000). This is
evident in previous research which shows that consumers’ adoption of the Internet for retail exploitation purposes is,
to some respect, motivated by their need for self efficiency and behavioural control (Wolfinbarger and Gilly, 2001).
Croft and Beresford (1995) discuss two contending views of empowerment, identifying these as the consumerist view
of empowerment and the liberation view of empowerment. Whereas the liberation view focus on and addresses iss ues
of a social justice, equity and structure, the consumerist model emphasis individual change and control. Both models of
empowerment can be seen at play in the evolving nature of the Internet as a retailing and shopping medium. A ready
example of the counteracting application of the liberation and consumerist models is the ongoing “do-not-track” debate
between the US Federal Trade Commission and Internet services providers (Acohido and Swartz, 2010). While the
Commission takes the view that intervention in this case is tantamount to a liberation empowerment of the consumer,
opponents of the law, including major Internet enablers, are of the opinion that this would impinge upon individual
empowerment by creating yet another choice burden for consumers. The “nayers” point to the assertion that
consumers are already overloaded with choice, information and decision tasks in the online domain. Depending on
whose point of view you look at, either argument would be right: the government argues that respect of the individual’s
right to privacy and consent to sniffing acts as an empowering tool in the Internet domain, whereas marketers and
other users of cookie tracking technology argue that asking consumers to opt in or out would result in poor decision
making and choices, because consumers would be overwhelmed by information and choice that is untailored to their
search and previous usage needs.
Both arguments are plausible: liberation and consumerist approaches to empowerment can be beneficial to the
consumer, but only if the approach adopted creates benefits rather than dis-benefits. Consumers do value privacy, and
this has been cited often as a major concern in Internet shopping (Nehf, 2005), and indeed the regulator might argue
that its approach is also consumerist, but simply of a democratic type which aims to empower consumers by giving
them a voice in services and consequently a chance to change their services; on the other hand, opponents would aver
that information overload has also been argued to constitute a major dis-benefit of online shopping, thus a technology

666
that aims to manage web content so that it is presented in appropriate and relevant quantity must be considered
positively, even if it also derives commercial benefits for marketers and retailers .
The above is only one example of how the dimensions of empowerment can affect online retailing and shopping.
However the scope of this paper is such that the implications of the approach argument cannot be fully evaluated;
instead, we focus on the consumerist market model (Taylor et al. 1992) which emphasises empowerment through
individual choice. It views the individual consumer as able to make effective and pragmatic choices from services and
products on offer – hence empowerment suggests both the giving of power and authority to someone as well as the
recognition within oneself that power has been given and one has the capacity to utilise that power (Harrison et al.
2006). The ideology of empowerment underpins Porter’s (2005) argument that bargaining power of the buyer forms
one of the five forces within an industry’s demand and supply relationships. In the five-forces model, information about
the existence of alternatives creates bargaining ability by increasing the options available to the consumer.
Consequently, it can be argued that greater access to choice, created through knowledge sharing and information
availability on the Internet, has potentially increased the bargaining power of, as well as empowered, consumers. But as
we know, the boundaries of our rationality are such that greater choice and increased information may also potentially
render us powerless. The concept of bounded rationality explains this succinctly; it states that in decision making,
rationality of the individual is limited by the information they have, the cognitive limitations of their mind, and the
finite amount of time they have to make the decision (see Kahneman, 2003). Therefore depending on the view point,
and contingent upon a number of conditions, Internet empowerment could be considered an illusion or a reality.
3. Empowerment and Choice
According to Thogerson (2005) consumers are considered to be empowered if offered choices for their everyday
necessities which are easy to identify, trust, and understand, and which fit into their current way of life without making
unreasonable demands on time, effort, decision making energy, volition and self regulation, as well as money. Therefore
choice must be balanced against the other scarce resources which are at a limited disposal of the consumer. Indeed
Mattila and Cranage (2005) aver that while increasing consumer choice can lead to consumers taking greater
ownership of the choices made, this also increases the burden of responsibility. This assertion is supported by Wathieu
et al. (2002) who argue that greater choice does not always lead to perception of empowerment, and that
empowerment may also entail costs for consumers. These could be in the form of regret, overload and the inability to
self control. But a counter argument persists that increasing consumer choice and control can increase the feeling of
responsibility and can lead to consumers taking greater ownership of the choices they make (Mattila and Cranage,
2005). It is true that for the reasons of human fallibility, the burden of decision making associated with choice may
increase exponentially as choice increases; Henry (2005) raises this possibility when he argues that the consumer’s
burden is actually compounded by the Internet through increased choice, information explosion and increased time
pressure, while Shankar et al. (2006) speak of a higher risk for possible choice paralysis when consumers are exposed
to more choice. Nevertheless, as Gabriel and Lang (2008) note, consumption is also work, which requires patient and
breathless searches, whether on the high street, at the shopping mall, or on the Internet. All the Internet does is to
increase the possibilities for the consumer as to what they choose to consume and with whom, thereby creating a
distinct type of knowledge. Whether consumers use the available choice or not, well, will be their choice. The
relationship between empowerment and choice leads us to the research question:
Q1: Does the availability of more choice on the Internet lead consumers to greater perception of empowerment?
4. Empowerment and Information
Harrison et al. (2006) state that for choice to empower, it must be accompanied by information; for example in the case
of the Internet shopping, choice should be accompanied by reliable information on availability, price, quality, contract
terms and conditions, as well as easy access to comparisons and user reviews. The Internet provides information in
large quantities and from various sources; in the context of retail, this can be from the retailer or previous/current
users of a product or service. Gabriel and Lang (2008) provide an example of how Amazon customers are offered a
wonderful opportunity to sample what they are about to purchase and also to read the stories of those who have
purchased it before, leading to consumer empowerment and the ability to make meaningful and potentially better
informed choices. But information must be provided in an appropriate manner, to appropriate quantities and from

667
trustable sources. Indeed, Pitt et al. (2002) are of the opinion that information incompleteness and information
asymmetry can result in helplessness and powerlessness because they do not provide the conditions upon which
consumers feel that they have the necessary tools to act, make better decisions and therefore feel empowered. The
paradox that information availability poses has been further highlighted. While consumers may be empowered because
they are fully informed (Goldsmith, 2005), Gabriel and Land (2008, p.328) state that we live in a society drowning in
information, “a society in which the ability to navigate in shortcuts, around the endless detour of mostly useless
information, accords individuals, organisations and networks considerable power.” Therefore, what becomes essential
is the ability to recognise and transform the right information into knowledge. Hence we ask:
Q2: Does the availability of more information on the Internet lead consumers to greater perception of empowerment?
5. Empowerment and Decision Aids
The discussion on choice and information above can be represented diagrammatically as Model A (figure 1). Closely
linked to managing the quantity and relevance of information are decision aids (Haubl and Trifts, 2000). Haubl and
Trifts identify two common decision aids as recommendation agents (RA) and comparison matrixes (CM). They argue
that these interactive tools, designed to assist consumers in the initial screening of available alternatives and to
facilitate in-depth comparisons among selected alternatives in an online shopping environment may have strong
favourable effects on the quality and the efficiency of purchase decisions, two outcomes closely linked to the concept of
empowerment as described earlier. This is because using decision agents reduces the amount of search for product
information, reduces the size of the consideration set, and reduces the processing effort required by the consumer.
Therefore decision aids should support the consumer empowerment approach to consumer behaviour because it
reduces constraints at the individual level (see Model B in figure 1).
Figure 1: Literature derived base models of Internet consumer empowerment
The initial value of decision aids to a consumer lies in the notion that humans are typically willing to settle for imperfect
accuracy of their decisions in return for a reduction in effort (Bettman et al. 1990). This notion points us to the fact that

668
decision aids do not lead to accurate decisions as much as they reduce the cognitive load required to make the decision.
In order words, if a consumer were willing, and capable, of processing all available information and considering all
choices by themselves, their decisions could more closely resemble their aspiration than decisions that might arise out
of a decision aid recommendation or comparison. Secondly, as mentioned earlier, online decision making aids are
provided by a party other than the consumer, either directly by the retailer or a third party whose allegiance is not
clear. Either of this party could deliberately and genuinely design decision aids that led consumers to specific choices
and decisions, rather than to the best choice possible. To illustrate, recall what information is returned to you when you
do a typical search on the Internet using, say, Google. Using a technology known as search engine optimisation, Google
returns numerous results to you, but the top search results are not necessarily the best or even the most relevant to
you; rather they are a result of which company or retailer is paying the smartest brains to manage its search engine
performance. The effect of this is that we are subjected to a phenomenon known as position and anchoring bias,
whereby the first items that are presented to us form a sort of referent point for any further comparisons. Similarl y,
your search results are increasingly being accompanied by search advertising, and although search engine providers
argue that it is the consumer’s choice whether or not to act on these ads, we know that their very presentation has the
potential of clouding our judgement and affecting which retailer we eventually patronise. We know this because
consumer psychology tells us that stimuli that are unusual, surprising, novel or otherwise perceptually striking and
distinctive can capture and direct attention involuntarily (Nehf, 2005). It would therefore appear that in their current
form, recommendation agents and other decision aids serve the purpose of the marketer more than aid consumers.
Should we therefore conclude firmly that neither the availability of more information and more choice on the Internet,
nor the use of decision aids to filter and present these in a way in which we can make sense of, leads to better decision
quality and ultimately empowerment of the consumer? Henry (2005) and Shankar et al. (2006) would like us to think
so. Their conclusion is that because the Internet challenges consumer decision making effort with choice and
information, and human nature is such that we prefer less complexity and minimal effort, it will only increase reliance
upon expert knowledge or create a choice paralysis. As Henry avers, relying upon decision aids online, he argues, is no
different from old-fashioned reliance upon the advice of knowledge custodians, and will neither lead to substantial
knowledge enhancement nor empower the consumer. We argue differently, and based on propositions in this paper,
aver that Internet technologies provide consumers with more than mere power illusions.
6. How the Internet can uniquely empower consumers
Instead we invite pessimists of the proposition that the Internet empowers consumers to first consider empowerment
in its wider conceptualisation, whereby not only is it viewed as an end state but preferably as a retrospective and
counter-dependent outcome of its consequences: that is, greater satisfaction and confidence in the choice and decision
quality which derives from the concept of an empowered consumer as a sovereign consumer (Denegri -Knott et al.
2006). Secondly, we suggest that there is a third way. Whereas information and choice availability by themselves on the
one hand and decision aid utilities on the other may not be enough to empower consumers online, as discussed above,
what about the combination of these elements? Let us discuss these issues in turn.
One assumption commonly held by those who talk about consumer empowerment is that it is an end state resulting
from the provision of an enabling environment within which consumers should act empowered (for example Shankar
et al. 2006; Henry, 2005). In this regard, if the Internet were truly empowering because it provided more information
and choice, then consumers should be seeing to be acting empowered by some objective criteria. The question to be
asked would therefore be: is the consumer displaying actions that can be construed as empowerment? However if we
deviate from this thinking and instead conceptualise empowerment not so much as what the consumer does but rather
as what they experience, then we should ask: does the consumer feel empowered? Wathieu et al. (2002) rightly point
out that consumer empowerment is a subjective experience, possibly influenced by a combination of certain elements
within the consumer’s environment., while Hunter and Garnefeld (2008) clarify the link between empowerment and
satisfaction . Even where consumers’ decision-making independence does not always lead to more satisfactory
outcomes, a more important consideration is how the experience of empowerment resulting from this self -
determination and sovereignty impacts the way consumers ultimately evaluate their choices (Wathieu et al. 2002). For
instance, the pride attached to the feeling that one made their own choice or had a significant degree of input in the
choices made may add persistent positive value beyond the enjoyment of the objective itself (Langer and Rodin, 1976).
Geiger and Prothero (2007, p. 376) provide useful insight in this direction by stating that empowerment can be seen

669
both as an end state or goal and as a process through which to reach such a goal. As an end state, it often refers to a
person’s ability to control her life and is associated with knowledge, self esteem and self confidence; as a process, it is a
route to achieving the end state of empowerment, which in marketing is equated to the power to exercise choic e, and
the understanding that one has the freedom and control to do so. As Geiger and Prothero (2007) surmise,
empowerment can be viewed as a process that requires negotiation and renegotiation over time, in an extended service
encounter during which consumer confidence, trust and abilities can change.
In line with the above discussion, we can parody Gabriel and Lang (2008) by stating that empowerment on the Internet
is not just a destination to travel toward, but a way of travelling. The full destination i ncludes satisfaction, confidence,
self-fulfilment and pride in one’s use or non-use of the choices and information that this medium affords us. In this
sense, Internet empowerment is not just an outcome, it is also a process. We generally hypothesise here that these
consequences of empowerment are more appropriate criteria, and if these consequences are realised, then the
consumer is rightly considered to be empowered. To be exact, we contend that the internal perception of
empowerment which leads to or derives from the belief that one made a better decision or selected the right alternative
because one had the freedom and volition to determine the outcome, is more important than any objective external
valuation of empowerment.
An appropriate approach toward measuring empowerment might therefore be to measure the reliance and confidence
that consumers place on Internet information and information sources as well as tools purported to increase their
empowerment in this medium. We can ask to what extent they believe decision aid tools and information work for
them; we can also attempt to ascertain to what extent they depend on these tools, and whether they believe that their
decision quality is improved as a result of their use. Haubl and Trifts (2000) and Wang and Benbasat (2009) have
looked at decision aids and their effects on consumer decision making in e-commerce, Michela et al (2011) have
compiled a generalised consumer empowerment index, and Harrison et al. (2006) were among the first to qualitatively
utilise cue items to determine criteria for consumer Internet empowerment. However, to our knowledge, there is as yet
no substantive instrument specifically developed to measure consumer empowerment on the Internet that may arise
from information availability, expanded choice and the use of decision aids, from the consumer’s viewpoint. We call for
research attention in this direction.
But even if we were to measure purely economic evidence rather than the subjective perceptual evidence that we
suggest, we only have to look at the performance of the Internet as a medium and how this has been driven by the
consumer. According to Pires et al. (2006), the growth of the phenomenon of consumer empowerment may be inferred
from Internet statistics, which, continue to show unprecedented growth in e-commerce. This growth has led to
intensified competition, increasing amenities and decreasing deterrents, all of which combine to increase consumer
power, raise consumers’ quality expectations thresholds and ultimately empower consumers.
That said, we may now direct our attention to decisions aids. After careful consideration of the counter arguments (for
example Wathieu et al. 2002; Henry, 2005; Haubl and Trifts, 2006; and Harrison et al. 2006), we are of the opinion that
although they may serve marketers purposes even as they purport to empower consumers, their use nevertheless
presents consumers with a wider array of choice and information in an intuitive, manageable and comprehendible
form. These decision aids cannot in themselves be empowering, and we agree, they may even be used in deceptive ways
(Henry, 2005); however, presenting consumers with no useful means of harnessing the wealth of information and
choice available online is arguably counterproductive, and is even less empowering given the arguments already
illuminated. One way that decision aids can be effective tools toward empowerment is proposed by Wathieu et al.
(2002) who state that consumers can experience a choice context as empowering when it possesses three el ements:
control of choice set composition, progress cues, and information about other consumers. First we draw attention to
their contention that perception of empowerment will be driven less by the size of the provided choice set than by the
consumer’s ability to specify and adjust the choice context. Therefore the empowering capacity of decision aids will lie
in their ability to enable consumers specify their choice constitution. Secondly, if decision aids provide consumers with
the ability to monitor the progress of the choice process, reverse their choice, and reference other consumers’
experiences, then they may not in themselves lead to consumer empowerment, but we suggest that they will have an
impact on the online decision making process, which will in turn empower consumers (that is, process empowerment).
We concur with Henry (2005) that like traditional expertise providers, decision aids may suffer from mistrust from
consumers. For this reason we hypothesise that decision aids can only be empowering if consumers are able to trust
their sources as well as the sources upon which their choices and information are derived. One means of achieving this

670
is to ensure that consumers can easily have recourse to the full information and choices upon which recom mendations
are derived. In order words, consumers must be aware that full disclosure is only a click away, and they are able to
cross-verify “expert” decision aid recommendations agents and comparison matrices.
7. Social Media as source of empowerment
The emergence of social media as a credible source for peer-based information and decision aiding can help to serve
this purpose. There is increasing evidence that in Internet based retail, consumers, especially the younger generation,
are more trusting of information sources that emanate from a social media platform, especially if this information is
provided freely by other users.
Social media refers to “Internet-based applications that promote social interaction between participants. Examples of
social media include (but are not limited to) discussion forums, blogs, wikis, podcasting, social network sites, video
sharing and microblogging” (Page, 2012, p. 5). Whereas mass media is a one-to many broadcast mechanism social
media “delivers content via a network of participants where the content can be published by anyone but is still
distributed across potentially large-scale audiences” (Page, 2012, p. 5).
Using social media is a good opportunity for teenagers to communicate with others. In addition to develo ping
communication; social media helps adolescents to develop their social and professional identities (Hartman and
McCambridge, 2011). Social media is an instrument for learning how networking and relationship-building works
(Decarie, 2010). These media and network savvy teenagers will be valuable for organisations in the future (Sacks and
Graves, 2012, p. 81). There is however also a danger attached to the use of social media for younger generations. The
CEO of Google, Eric Schmidt suggests that misbehaviour in social network can have a dramatic impact on the future of
adolescents which sometimes will require very extreme measures like name changes to overcome mistakes made in the
youth to get a job (Hanlon, 2010). The type of network, the network quality and the social distance to network partners
are crucial factors to consider.
In any network, the size and the social distance to another person play a crucial role in the person’s ability to receive
information from other network partners. Yet when networks become too large, they become time-intensive and the
quality of the ties suffers. In Sacks and Graves’ (2012, p. 81) study, adolescents realised that the more members there
are in their network, the less they know about each individual partner. In large networks, adolescents have little time to
engage in in-depth conversations. Consequently adolescents who have very large networks or networks with rather
superficial ties are not likely to use their networks adequately. Large networks are likely to provide adolescents with
some help concerning the information search e.g. for a desired product. Yet when more complex search task are
performed and an extensive evaluation of alternatives is required the student is less likely to benefit from large
networks with weak ties as most network partners will not spend a lot of time and effort to help the network partner to
evaluate different product alternatives. The weak ties here might be counterproductive.
Furthermore, social distance helps to explain how people act in networks. The closer the connection is, the more likely
people do a favour for others. Sacks and Graves (2012, p. 83) distinguish different types of connection to explain social
distance: a direct connection which is also called “first-order connection” is the strongest tie. “Second-order
connections” are network connection where a friend of a friend is asked. Lastly, “third-order-connection” or
connections of a friend of a friend still have a closer relationship than a stranger. By and large, the extensive
engagement with social media by the youth consumer represents an important episode in the empowerment debate
and is a potential game changer.
A complete base model of Internet empowerment should therefore reflect these possibilities, and look like Model C
(figure 2). In this model, a potential source of cross referencing for the consumer is the use of social media, including
word –of-mouth (WOM) and users’ reviews. This model depicts the relationship between information availability,
choice, decision aids, social media, the decision process online and Internet empowerment as a process and as an
outcome: while decision aids are the result of information and choice and can shape the online decision making process
which leads to empowerment, decision aids are mainly influential in the process empowerment phase, whereas the
feedback that results from the empowerment outcome is communicated via social media and this has the impact of
influencing future use of decision aids as well as the overall decision making process in a non-recursive relationship.
The idea of a feedback process in empowerment is not new, as it has already been suggested that empowerment takes
place in an iterative interplay between the actors involved in consumption processes (Wahlen and Huttunen 2011).

671
However for these propositions to be valid, we assume that the online market provides self-evident information and
choice which can be easily utilised by consumers (for example social media platforms that are truly independent), and
that this provision is not based on the notion of customerisation, that is, offering consumers more control in the
exchange but still decisively influencing their decision making and choice processes (Pires et al, 2006).
Figure 2: A base model for Internet consumer empowerment
8. Social Media as source of empowerment
There is already evidence pointing to the effects of the combination of market driven competition and regulatory
direction in leading stakeholders to adopt or seriously consider models that are ty pically based upon transparently
managed choice and full disclosure. The recent cookies debate is but one example of these developments. As we know,
cookies make life a lot easier for us by getting to “know” us and then help tailor information and choice i n
hypothetically useful forms for us. The trouble is that we do not fully understand or are always aware that this is going
on, the implication of which is that the requirement for creating possibilities of full disclosure is violated. Only an open
declaration and education of consumers as to their purpose will help enable consumers to accept cookies as useful and
empowering features of the Internet. A similar fate may be predicted for any decision aid that does not provide
consumers with the ability to verify and substantiate its recommendations. Market forces, regulatory mandate, or a
combination of both, will lead to the demise of such a utility in the long run. Finally, decision aids and agents which do
not truly serve the consumer will not play an enduring role in consumers’ engagement with online shopping because, as
West et al. (1999) recommend, agents should be designed with three goals in mind in order to be relevant. These goals
are: i) to improve decision quality; ii) to increase customer satisfaction; and iii) to develop trust by acting in the best
interest of the consumer.
Consumers will not always utilise the new opportunities the Internet presents for empowerment, not will they always
be successful when they do so. But consumers are always learning. It is this ability to learn and adapt that leads Kotler
et al. (2006) to declare that that new media will augment the power of consumers to define their choices, and Denegri -
Knott et al. (2006) to state that information technology will lead to a renegotiation of the relationship between
consumers and their suppliers. After all, as Gabriel and Lang (2008) state, consumers have proven that in spite of the
best efforts on the part of marketers to constrain, control and manipulate them, they can act in way s that are
unpredictable, inconsistent and contrary. And if we accept the active, rather than passive view of the consumer, that

672
consumers are active in adapting and manipulating producer-intended outcomes of consumption (Denegri-Knott et al.
2006) then increased information and choice on the Internet, and the use of decision aids to help manage these, will
most certainly be used by marketers as tools for greater persuasion, but nevertheless present enormous opportunities
for consumers to be more self-determining, to shape their own consumption behaviour, to take ownership of their
choice outcomes, and to derive pride and satisfaction accordingly. This, perhaps, is empowerment.
References
ACOHIDO, B. & SWARTZ, J. (2010). Do Not Track Could Revolutionize Online Ad Industry, USA TODAY, Dec. 13, 2010,
available at http://www. usatoday.com/tech/news/2010-12-13 1Adonottrack13_CV_N.htm. [Accessed 05-
01-2011]
BETTMAN, J. R., JOHNSON, E. J., & PAYNE, J.W. (1990). A componential analysis of cognitive effort in choice.
Organizational Behavior and Human Decision Processes, 45, 111–139.
CROFT S. & BERESFORD P. (1995). Whose empowerment? Equalizing the competing discourses in community care. In:
Jack R. (Ed), Empowerment in community care. London. Chapman & Holt: 59–76.
DAWSON, S., & KIM, M. (2010). Cues on apparel web sites that trigger impulse purchases. Journal of Fashion Marketing
and Management, 14(2), 230-246.
DENEGRI-KNOTT, J., ZWICK, D. & SCHROEDER, J.E. (2006). Mapping consumer power: an integrative framework for
marketing and consumer behavior. European Journal of Marketing, 40 (9/10), 950-971.
GABRIEL, Y., & LANG, T. (2008). New faces and new masks of today's consumer. Journal of Consumer Culture 8(3): 321-
340.
GEIGER, S. & PROTHERO, A. (2007). Rhetoric versus reality: exploring consumer empowerment in a maternity setting.
Consumption Markets and Culture, 10(4), 375-400.
GOLDSMITH, E.B. (2005). Consumer empowerment: public policy and insurance regulation. International Journal of
Consumer Studies, 29, 86-92.
GUDIGANTALA, N., SONG, J., & JONES, D. R. (2010). Transforming consumer decision making in e-commerce: a case for
compensatory decision aids. In I. Lee (Ed.), Transforming E-Business Practices and Applications: Emerging
Technologies and Concepts (pp. 72-88). Hershey, PA: Information Science Reference.
HANLON, M. (2010). 'Goggle's boss, hypocrisy and the death of privacy: it's a hit rich for Eric Schmidt to warn us about
the terrifying amount of personal data in cyberspace'. Mail Online, 19 August 2010. Available at:
http://www.dailymail.co.uk/sciencetech/article-i3O4334/Google-boss-warns-terrifying-personal-data-in-
cybcrspacc.html. (Accessed 31 August 2010).
HARRISON, T., WAITE, K. & HUNTER, G.L. (2006). ‘The Internet, information and empowerment’. European Journal of
Marketing, 40, (9-10), 972-993.
HARTMAN, J. & MCCAMBRIDGE, J. (2011). Optimizing millennials’ communication styles . Business Communication
Quarterly, 74, 22-44.
HÄUBL, G. & TRIFTS, V. (2000) Consumer decision making in online shopping environments : The effects of interactive
decision aids, Marketing Science, 19 (1), 4-21.
HENRY, P.C. (2005). Social class, market situation, and consumers’ metaphors of (dis)empowerment. Journal of
Consumer Research, 31 (4), 766-778.
HUNTER GL & GARNEFELD I. (2008). When does consumer empowerment lead to satisfied customers? Some mediating
and moderating effects of the empowerment-satisfaction link. Journal of Research for Consumers, 15, 1–14.
KAHNEMAN, D. (2003). Maps of bounded rationality: Psychology for behavioral economics.
American Economic Review, 93(5): 1449-1475.
KARANDE, K., MERCHANT, A. & SIVAKUMAR, K. (2011). Relationship among time orientation, consumer
innovativeness, and innovative behaviour: the moderating role of product characteristics. AMS Review, June
2011.

673
KOTLER, P., RACKHAM, N. & KRISHNASWAMY, S. (2006). Ending the war between sales and marketing. Harvard
Business Review, 84 (7/8), 68‐78.
LANGER, E.J. & RODIN, J. (1976). The effects of choice and enhanced personal responsibility for the aged: A field
experiment in an institutional setting. Journal of Personality and Social Psychology 134, 191-198.
MATTILA, A.S & CRANAGE, D. (2005). The impact of choice on fairness in the context of service recovery. Journal of
Service Marketing, 19 (5), 271–279.
NEHF, J.P. (2005). Shopping for privacy online: consumer decision making strategies and the emerging market for
information privacy. University of Illinios Journal of Law, Technology and Policy , 2005(1), 1. Available at SSRN:
http://ssrn.com/abstract=1002398 [Accessed on 15-10-2012]
PAGE, R. (2012). Stories and social media- identities and interaction. New York: Routledge.
PARASURAMAN, A. & ZINKHAN, G.M. (2002). Marketing to and serving customers through the
internet: An overview and research agenda. Journal of the Academy of Marketing Science 30 (3), 286-295.
PITT, L.F., BERTHON, P.R., WATSON, R.T. & ZINKHAN, G.M. (2002). The Internet and the birth of real consumer power.
Business Horizons, (July/August), 7-14.
PORTER .M.E (1980). Competitive Strategy: Techniques for analyzing industries and competitors , New York: Free press.
RODRÍGUEZ-ARDURA, I. & MARTÍNEZ-LÓPEZ, F.J. (2008). Playing cat and mouse: consumer empowerment and
marketing interaction on the net. International Journal of Business Environment, 2 (2), 201-214.
RYAN, R.M. & DECI, E.L. (2000). Self-determination theory and the facilitation of intrinsic motivation, social
development, and well-being. American Psychologist, 55(1), 68-78.
SACKS, M. A. & GRAVES, N. (2012). How many “friends” do you need? Teaching students how to network using social
media. Business Communication Quarterly, 75 (1), 80-88.
SHANKAR, A., CHERRIER, H. & CANNOFORD, R. (2006). Consumer empowerment: a Foucauldian interpretation.
European Journal of Marketing, 40 (9/10), 1013-1030.
SIEGALL, M. & GARDNER, S. (2000). Contextual factors of psychological empowerment. Personnel Review, 29 (6), 703 –
722.
STARKEY, F. (2003). The ‘Empowerment Debate:’ consumerist, professional and liberational perspectives in health and
social care. Social Policy and Society 2 (4), 273-284.
TAYLOR, S.E., KEMENY, M.E., ASPINWALL, L.G., SCHNEIDER, S.G., RODRIGUEZ, R. & HERBERT, M. (1992). Optimism,
coping, psychological distress, and high-risk sexual behavior among men at risk for acquired
immunodeficiency syndrome (AIDS). Journal of Personality and Social Psychology 63 (3), 460–473.
WAHLEN, S. & HUTTUNEN, K. (2012). Consumer policy and consumer empowerment: comparing the historic
development in Finland and Germany. International Journal of Consumer Studies, 36 (1), 2-9.
WANG, W. & BENBASAT, I. (2009). Interactive decision aids for consumer decision making in ecommerce: The influence
of perceived strategy restrictiveness. MIS Quarterly, 31 (2), 293-320.
WATHIEU, L., BRENNER, L., CARMON, Z., CHATTOPAHYAY, A., WETENBROCH, K., DROLET, A., GOURVILLE, J.,
MUTHUKRISHNAN, A. V., NOVEMSKY, N., RATNER, R.K. & WU, G. (2002). Consumer control and
empowerment: a primer. Marketing Letters, 13 (3), 297-305.
WEST, P. M., ARIELY, D., BELLMAN, S., BRADLOW, E., HUBER, J., JOHNSON,E., et al. (1999). Agents to the rescue?
Marketing Letters, 10(3), 285–300.

674
Session 18

675
Standardization vs. Localization of
Pharmaceutical Ads: evidence from
Germany/Austria and the United States Pharmaceutical Advertising, Standardization, Localization, Gender Portrayal, Endorser, Ad Appeal
Isabell Koinig, Alpen-Adria University of Klagenfurt, [email protected]
Sandra Diehl, Alpen-Adria University of Klagenfurt, [email protected]
Abstract
This cross-cultural research presents an investigation into how promotional messages for over-the-counter (OTC)
medications are designed with regard to gender portrayal and ad appeal in the United States and Germany/Austria in
order to determine a potential for standardization. A content analysis was performed on a total of 385 print ads,
covering a nine months period. As to gender, results indicate that advertisers continue to rely on traditional stereotypes
by primarily depicting women in all countries. This trend is even more distinct in Ger/Aut when compared to the U.S.
Female presenters’ portrayals in OTC advertising are shaped by contemporary beauty standards and social norms: they
are presented as young or middle-aged, attractive and healthy, with this trend being even more pronounced in the U.S.
Concerning the advert’s setting and protagonists’ relationships with other people, traditional stereotypes are no longer
confirmed, but results show that modern emancipated women have not found their way into pharmaceutical
advertising yet. With regard to ad appeal, results indicate that informative appeals dominate OTC drug advertising,
aiding consumers in making qualified decisions when purchasing medications. Whereas informative appeals dominate
in both the U.S. and Ger/Aut, it is noteworthy that in the U.S. emotional approaches are more often used than in
Ger/Aut, especially with regard to general ad appeal, the headline and the body text. Even though standardization is not
practiced to a large degree yet, a clear potential for standardized ad execution cannot be denied on grounds of these
findings, as e.g. informative appeals, single, young or middle aged, slim and healthy Caucasian women in neutral
settings dominate in the countries scrutinized. Limitations of the study are addressed and implications for further
research are provided.
PURPOSE OF THE STUDY
„Pharmaceutical advertising can be defined as messages created by marketers of pharmaceutical products that attempt
to inform, persuade and even entertain members of the target audience with the goal of influencing recipient’s attitudes
– and ultimately behavior – in a favorable manner“ (Diehl et al., 2008: 100). It concerns both prescription and non-
prescription drugs, whereby the latter can be categorized as self-medication preparations, which are directly promoted
to physicians and consumers alike. They are also the only kind of medication allowed to be promoted according to
European law, whereas in the United States all kinds of drugs can be publically advertised (Buckley, 2004: 4f.).
Medical promotions encourage competition amongst pharmaceutical companies and lead to a reduction of drug prices
in the long run (Wind, 1994: 323). In addition, pharmaceutical advertising can be considered as a useful tool of
providing the public with information, thereby fostering self-medication practices. Nonetheless, it often only presents
pharmaceuticals’ positive effects while neglecting possible side effects and is, thus, accused of white-washing potential
risks. Moreover, inequalities in advertising spending might result in large brands being predominantly purchased
(Diehl et al. 2007) – a trend that actually contradicts the purpose of self-medication.
While the area of pharmaceutical advertising is claimed to be widely researched, the highly competitive non-
prescription drug market has only received very little attention up until now, with only a total of 24 studies having

676
focused on this important market segment over the last half century (DeLorme et al., 2010: 208f.). This leads to the
assumption that some findings might be outdated as well as incomplete. Consequently, the present study, expanding
the example of Main et al. (2004: 130) who have only surveyed the U.S. American medication market, intends to add to
this field of research by conducting an extensive cross-cultural content analysis with reference to both ads’ visual and
textual data (headline, body text and slogan).
In a globalized and converging world, advertising executives are often confronted with the difficult question of whether
to apply standardized or localized advertising messages. On the one hand, localized advertising executions are
especially recommended by Shoham (1999), who argues that due to micro-differences consumers attributes are not
converging but rather diverging (Shoham, 1999). For instance, local languages as well as social customs are
components that prevent the realization of standardized promotional messages (Howard and Ryans, 1989; Harvey,
1993), but foster adapted/localized approaches, that are regarded as beneficial to companies, since adaptations can be
turned into competitive and differential advantages (Hite and Fraser, 1990; Onkvisit and Shaw, 1990). On the other
hand, a standardized (or global) advertising strategy presupposes consumer homogeneity (Levitt, 1983; Okazaki et al.,
2006: 17) instead of heterogeneity (Hofstede et al., 1999) and assists companies in creating a consistent image across
cultures, thus preventing recipients from getting contradictory impressions when exposed to various localized ads
(Backhaus and van Doorn, 2007: 37). It has already received a considerable amount of attention from scholars
(Agrawal, 1995) and is put into practice as part of a global marketing strategy (GMS; Zou and Cavusgil, 2002) that
focuses on cultural communalities of markets and amongst consumers (Onkvisit and Shaw, 1990; Link, 1988).
Researchers have tried to determine which local environments and/or product categories particularly favor
standardized advertising approaches (Doherty and Ennew, 1995), but have not been able to come up with a coherent
answer. Rather, some studies have demonstrated that most globally operating companies still predominantly pursue
localized advertising campaigns that require them to adapt their promotional content to local conditions (Kanso, 1992).
One possible reason for businesses’ reluctance to apply standardized promotional messages might lie in the fact that
advertising is less qualified for uniformization than other communication forms, as it heavily depends on cultural
conditions that influence its marketing process (Boddewyn et al., 1986; Hite and Fraser, 1990). Yet, if communalities
outweigh differences, a potential for standardization should be given.
Societies’ communication strategies are culture specific and thus, people’s media usage patterns need to be taken into
consideration (de Mooji, 2001: 11f.). The countries examined (United States, Germany and Austria) all classify as low-
context cultures, where messages are communicated explicitly, that is in a clearly comprehensible manner and without
any hidden implications (Wells et al., 2006: 522). Furthermore, individualistic societies are described as being verbally
oriented, whereas collective cultures are visually focused instead (De Mooji, 2001: 12). In the context of this content
analysis, several cultural dimensions taken from the GLOBE study (House et al., 2004) are of particular importance:
Gender Egalitarianism (Practices: Ger: 3.21/Aut: 3.18/U.S.: 3.36 vs. Values: Ger: 5.02/Aut: 4.83/U.S.: 5.03; Emrich et al.,
2004, 365f.), Uncertainty Avoidance (Practices: Ger: 5.27/Aut: 5.10/U.S.: 4.15 vs. Values: Ger: 3.70/Aut: 3.65/U.S.: 3.99;
Sully de Luque and Javidan, 2004), Performance Orientation (Practices: Ger: 4.29/Aut: 4.47/U.S.: 4.45 vs. Values: Ger:
6.26/Aut: 6.12/U.S.: 6.14; Javidan, 2004), Future Orientation (Practices: Ger: 4.23/Aut: 4.47/U.S.: 4.13 vs. Values: Ger:
5.21/Aut: 5.15/U.S.: 5.34; Ashkanay et al., 2004) and Humane Orientation (Practices: Ger: 3.38/Aut: 3.77/U.S.: 4.18 vs.
Values: Ger: 5.60/Aut: 5.68/U.S.: 5.51; Kabasakal and Badur, 2004). As the figures suggest no substantial differences
between the country clusters in terms of cultural dimensions’ manifestations, similar results are anticipated for the
content analysis.
The motivations behind this extensive content analysis are manifold: first, it is meant to determine the application of
existing gender stereotypes in OTC drug advertising. This means it will look at the amount of women featured in OTC
drug ads as well as their gendered portrayal in terms of physical appearance and surrounding. Second, it intends to
compare whether advertising practices in the U.S. and Germany/Austria use predominantly informative or emotional
advertising appeals to reach their prospective customers. Third, this cross-cultural survey intends to examine whether
there are differences between Germany/Austria and the United States, thereby also adding to the body of intercultural
advertising research. The countries examined have one important aspect in common: they all classify as low-context or
individualistic cultures (de Mooji, 2001: 17; Hall, 1976), where messages are communicated explicitly, that is in a
clearly comprehensible manner and without any hidden implications (Wells et al., 2006: 522), thereby offering a
potential for standardized application. Due to similarities in the countries communication behavior and cultural
dimensions, which allocate them mostly in the same cultural bands according to the GLOBE study (House et al., 2004),
this content analysis is expected to bring about similarities in results for both pharmaceutical print ad markets. In order

677
to test this main assumption, ads will scrutinized along a variety of ad elements, such as endorsers (gender, physical
appearance), ad surrounding as well as ad appeal in different textual components. Due to similarities in the countries’
cultural profiles, no significant differences are anticipated and, therefore, a large potential for standardization should
be detected.
THEORETICAL BACKGROUND AND HYPOTHESES
Endorsers in advertising
In the process of marketing their products, advertisers often set out to construct idealized images, which then find
expression in terms of the portrayal of adverts’ endorsers. The latter is best described as “an animate being or animated
object that is used to promote a product, service, or idea” (Phillips, 1996) and rejoices increasing prominence as ads’
centerpieces (Phillips and Gyoerick, 1999: 713). Thereby advertisers can choose one of the following three types:
prominent endorsers (testimonials), fictional characters or typical person testimonials. In the area of OTC drug
advertising, the last category is of the greatest relevance, which can also be explained by the fact that “consumers tend
to model the behavior of advertising characters who most resemble them as well as prefer brands advertised with
characters that are similar to them” (Main et al., 2004: 128; Whittler and Spira, 2002: 293-295).
Female endorsers in OTC drug advertising
“Since OTC medicines are purchased directly by the consumer and administered at home, often to relieve symptoms of
illness or injury, marketers of these products see women as their primary target consumers” (Craig, 1992: 304). By
predominantly depicting female characters, OTC drug adverts pictorially construct women as their implied readers and,
thus, their target audience (Piller, 2001: 171). This trend seems to not have changed over time, for a German survey
conducted in 2008 still produced strong support for this phenomenon, finding that almost two third of consumers
buying cough/cold remedies are female (Verbraucheranalyse, 2008: 3). A recent USA Today report argues along similar
lines: drug buyers were predominantly female (60 %), mostly middle aged (57 %) and almost exclusively Caucasian (80
%; Kennedy, 2012: 5A). This assumption is also backed up by previous research (Craig, 1992; Main et al. 2004) which
revealed that OTC medication advertisements were very more likely than any other product category to depict female
characters (Main, 2004: 134). As a consequence, the following hypothesis can be derived:
H1: OTC drug advertisements feature more female models than male models in both countries.
Due to restrictions in space, this paper will solely focus on female protagonists in OTC drug advertising, examining
whether traditional female stereotypes still prevail with regard to physical appearance and surrounding in all
countries.
Physical appearance (age, ethnicity, physique, health status)
Age: Some studies (e.g. Raman et al., 2006) found that age and aging are negatively connoted and regarded as less
desirable in advertising, where they are often depicted in humorous ways (Zhang et al., 2006: 12). Nonetheless, lately
age-flattering images have taken on greater significance (Flueren et al., 2002). Brownfield et al . (2004) revealed that
middle aged and older people, who are generally female, constituted the primary target audience for OTC medications,
since they are considered to play a major role in families’ health care decisions (2004: 495; Francis et al., 2005). Taking
this assumption as a starting point, the following can be assumed:
H2a: In Germany/Austria and the United States, more young and middle aged women are featured in OTC drug
promotions when compared to older women.
Ethnicity: Generally, media plays an essential role in reinforcing racial differences by favoring models of particular
races over other ethnical groups (Johnson, 2008: 6f.), with several studies highlighting a strong trend towards
Caucasian models (Main et al., 2004; Craig, 1992; Johnson, 2008; Rallapalli et al., 1994). Hence, a racial bias can be said
to be characteristic of contemporary advertising, which often goes hand in hand with unfavorable and stereotypical
portrayals of ethnic minorities (Plous and Neptune, 1997: 629f.). As certain (racial) groups receive more attention than
others, attitude towards ethnical sub-groups might be negatively affected, leading to the following conclusion:

678
H2b: In Germany/Austria and the United States, OTC drug ads depict more female Caucasian models t han
models of other ethnical groups.
Physique and Health Status: An evaluation of ads’ spokespersons takes place as part of a social categorization process
(Tajfel, 1981), whereby the model is judged along the dimension of attractiveness amongst others. Studies have shown
that opinions presented as well as products promoted by attractive people are met with more approval than when
introduced by unattractive models (Reingen and Kernan, 1994; Chaiken, 1986). Women in particular are still
constructed in ways that emphasize contemporary beauty ideals, meaning athletic and slim. Moreover, due to its
positive portrayals in terms of health, advertising for non-prescription drugs has been accused of “cultivat[ing] a ‘magic
of medicine’ belief in OTC drugs – the rapid, easy, and risk-free way of relieving health problems” (DeLorme et al., 2010:
218; Harwood and Roy, 1999: 275). Thus, the following hypotheses can be derived:
H2c: Women are predominantly portrayed as being attractive in both Germany/Austria and the Un ited States.
H2d: Women are predominantly portrayed as being healthy in both Germany/Austria and the United States.
Surrounding (relationship, setting)
Relationship (Number of People): Studies have demonstrated that female models are also characterized by a higher
degree of dependence – i.e. they are hardly portrayed by themselves but in company – when contrasted with men
(Furnham and Bitar, 1993; Gentry and Harrison, 2010; Furnham and Spencer-Bowdage, 2002; Ifezue, 2010). Thereby, a
“transgenerational approach” (Swayne and Greco, 1987: 51; Wolin, 2003) is commonly applied. With respect to
people’s relationship, OTC drug ads are more likely to portray a parent than any other kind of promotion material
(Craig, 1992: 308). Thereby, in more than 80 % all commercials “mothers” charge of drug administration were featured
with their children (Craig, 1992: 309), allowing for the following hypothesis:
H2e: In Germany/Austria and the U.S., women are more frequently presented in company than alone.
Setting: Due to the fact of women being predominantly portrayed as families’ health experts (Craig, 1992) it was further
assumed that they would be featured in the private sphere of the home to the largest extent. This is the case as past
studies have determined that domestic settings outnumber any other kind of location when portraying women
(Furnham and Saar, 2005; Skoric and Furnham, 2002; Verhellen et al., 2011; Ifezue, 2010), leading to the following
hypothesis:
H2f: More women are featured in domestic settings as against other settings in Germany/Austria as well as the
United States.
General ad appeal and textual ad components
According to Pieters et al. (1999) visual attention is best captured by advertisements’ visual components, which are not
only processed faster and with less effort but also transmit their messages more implicitly than written texts, whose
comprehension is far more effortful and time-consuming (Pieters and Wedel, 2004: 39; Okazaki et al., 2010a). When
looking at different ad elements, Rosbergen et al. (1997) found that the visual and/or headline are the biggest attention
catchers, followed by the product illustration (packshot) and the actual product text (i.e. the body text; 1997: 313).
Headlines constitute essential elements in advertising since they are, due to their concision, usually read thoroughly
and segue directly into the body copy. Serving as an extension to the headline, the body text’s major purpose is to
transport the advertiser’s intended message by providing the reader with information and explanations on product
features and specifications alike (Wells et al., 2003). Slogans, best understood as short phrases accompanying brands
and/or products, are meant to condense or summarize their philosophies and identities for the public in a
comprehensible manner (Piller, 1997). Together with the ads’ headlines, they constitute advertisements' central voices
and are applied to reinforce a companies’ expertise and competence (Piller, 2001: 162). Textual elements, due to their
written form, are often attributed a high degree of credibility and formality (Piller, 2001: 160) – characteristics, which
are especially important for pharmaceutical advertising.

679
Informative or direct/hard-sell vs. emotional/soft-sell appeals
Pharmaceutical companies can use either informative/hard, emotional/soft or mixed arguments in their
advertisements (Main et al., 2004: 119ff.). Informative appeals are rather explicit and direct in their nature, basing their
arguments on tangible information and proof (Okazaki et al., 2010a: 20f.). They focus on product-related aspects, such
as their functionalities as well as utilities (Okazaki et al., 2010b: 8), which can be evaluated independently and in all
objectivity (Leonidou and Leonidou, 2009: 522; Edell and Staelin, 1983). Direct/hard-sell appeals extend this concept
by adding a competitive dimension. Thereby, the advertised product is directly compared against its strongest
opponent, usually in terms of effectiveness, performance or price (Okazaki et al., 2010a: 20f.; Okazaki et al., 2010b: 6).
This definition is extended by Mueller (1987), who adds other important aspects, such as direct appeals’ sales
intentions and “leader” or “#1” statements (1987: 53). Taking product category into consideration, informative/hard-
sell appeals perform best when promoting utilitarian, industrial or technologically advanced products that require
excessive thought processes (Johar and Sirgy, 1991).
Emotional approaches are characterized by a clear visual dominance and convey rather general associations and/or
emotional messages with regard to a promoted brand (Okazaki et al., 2010a: 20f.). These image-centered and subtle
marketing approaches can be also classified as soft-sell appeals (Okazaki et al., 2010a: 20f.; Okazaki et al., 2010b: 5f.)
that come in two forms: positive and negative emotional approaches (Main et al., 2004: 124). Positive emotional
appeals can either contain humor, nostalgia, fantasy or even sex. Humor is a very effective means of attracting and
maintaining consumers’ attention, while nostalgia is useful by linking advertisements to personal experiences, creating
favorable images of the past. Fantastic and sexual appeals are normally linked to achievement but receive very little
attention in the area of medical advertising (Main et al., 2004: 125f.). Negative emotional appeals, by contrast, normally
center on adverse emotions, such as fear, guilt, shame or anger. Thereby, the promoted product or service is presented
as a solution or cure to a current medical condition (Main et al., 2004: 126f.). These concepts, nonetheless, seldom occur
in their pure form in reality but blur at times, taking mixed forms. Thereby, mixed appeals are characterized by both
product information and facts coupled with emotional recounts or personal statements (Kroeber-Riel and Esch, 2011:
101f.).
Choice of ad appeal mainly depends on two factors, namely product category and target audience. If close attention is
solely directed towards products as well as their distinctive features and benefits, hard-sell appeals are applied more
often (Leonidou and Leonidou, 2009: 541). High-involvement products present the ideal environment for the
application of hard-sell appeals (Okazaki et al., 2010a: 22) and are predominantly featured in low-context cultures
(Hall, 1976), such as the United States and Germany/Austria, where rational content is perceived more favorable than
any emotional message (Hofstede, 1980). The use of soft-sell and emotional approaches is, however, particularly
recommended for specialty convenience products demanding little thought as the information provided by ads is
usually intangible and subjective (Johar and Sirgy, 1991; Leonidou and Leonidou, 2009: 543). Affecting people’s
wellbeing and health, pharmaceuticals are best categorized as rather high-involvement products. This means that they
present a sensitive topic, are bought on an irregular basis and often require extensive review processes before they are
acquired. In terms of advertising, extensive and detailed information is demanded in order to aid consumers in their
evaluations (Diehl et al., 2007: 40). Studies on OTC drug advertising content in the U.S. have revealed that promotional
messages are highly likely to contain rational/informative appeals in either the adverts’ general appeal and/or its
textual components (Main et al., 2004: 132), resulting in the following hypotheses:
H3a: Advertisements for non-prescription drugs apply informative appeals more often than emotional appeals
in the ad’s general appeal in both the U.S. and Ger/Aut.
H3b: Advertisements for non-prescription drugs apply informative appeals more often than emotional appeals
in the ad’s headline in both the U.S. and Ger/Aut.
H3c: Advertisements for non-prescription drugs apply informative appeals more often than emotional appeals
in the ad’s body text in both the U.S. and Ger/Aut.
H3d: Advertisements for non-prescription drugs apply informative appeals more often than emotional appeals
in the ad’s slogan in both the U.S. and Ger/Aut.

680
METHODOLOGY
The study's complete corpus was comprised of 385 print ads obtained from either special or general interest
magazines, of which 183 ads (47.5 %) were taken from German and Austrian magazines and the remaining 202 ads
(52.5 %) were collected from U.S. American magazines. Promotions were compiled over a nine month period to achieve
a good coverage of the pharmaceutical print ad markets examined. Ads were only selected for analysis if they fit into
the category of non-prescription drug advertisements, meaning they needed to contain references to over-the-counter
availability and minor disease treatment purposes (Craig, 1992: 306), with any repeat ads being omitted on purpose.
Coding of ads occurred along a pre-developed scheme of analysis that addressed 48 variables relating to both product
endorsers and textual elements. Each of the 385 adverts was analyzed by two independent coders, who achieved an
inter-coder reliability of .88 according to Cohen’s Kappa (Cohen, 1968) and (dis)solved any possible disagreements in
the course of a post-coding discussion.
DISCUSSION OF RESULTS
Endorsers’ gender in OTC drug advertising
It is notable that even though the responsibility for family’s health care decisions is traditionally ascribed to women,
they are scarcely exclusively targeted by OTC drug advertising (Total: 12.6 %; Ger/Aut: 8.0 % / U.S.: 16.4 %). Instead,
advertisers reach out for a broader audience by raising awareness amongst the general public (Total: 18.1 %; Ger/Aut:
23.4 % / U.S.: 13.7 %) or more specifically adults (Total: 62.1 %; Ger/Aut: 64.4 % / U.S.: 60.2 %). A central argument for
this trend is the fact that most diseases (thematized) are not gender-specific but gender-neutral. Yet, a clear trend
towards female models in OTC drug advertising can be observed, since in 77.6 % (Ger/Aut: 82.5 % / U.S.: 72.8 %) of all
cases the characters displayed are women as opposed to men, who are depicted in roughly 40 % of all adverts
(Ger/Aut: 31.5 % / U.S.: 46.3 %). This imbalance of male models versus female models can be said to lead to the
affirmation of hypothesis H1 for both clusters (chi2= 37.112, p= .000) as well as Germany/Austria (chi2= 32.693, p=
.000) and the United States (chi2= 8.691, p= .003) alone. Differences between Ger/Aut and the U.S. are significant
(chi2= 4.799, p= .028), with more male presenters being depicted in the U.S. as compared to Ger/Aut.
Physical appearance (age, ethnicity, physique, health status)
Age: Results from previous research can be backed up by the present study, which demonstrated quite plai nly that
young (Total: 28.4 %; Ger/Aut: 28.7 % / U.S.: 34.3 %) and middle aged females (Total: 60.0 %; Ger/Aut: 54.0 % / U.S.:
59.6 %) are featured more often as ads’ protagonists (Total young and middle-aged women together: 88.4 %; Ger/Aut:
82.7 % / U.S.: 93.9 %) as opposed to older women (Total: 11.6 %; Ger/Aut: 17.3 % / U.S.: 6.1 %). Hence, hypothesis H2a
can be verified for the complete corpus (chi2= 125.226, p= .000) and is also typical of Germany/Austria (chi2= 44.462,
p= .000) and the United States (chi2= 81.667, p= .000). The above assumption does not manifest any significant
differences between the countries inquired (chi2= 1.895, p= .169).
Ethnicity: OTC drug adverts do not set themselves apart from other product promotions and even contribute to foster
racial suppression by featuring female Caucasian models in 94.4 % of all cases for the complete ad corpus.
Germany/Austria, where 100.0 % of all pictured models are white, score higher than the United States, where 92.1 % of
all models in non-prescription drug adverts are Caucasian women. Racial minorities are only featured to a small extent
in the United States (7.9 %), prevailing that ‘whiteness’ can be still considered to be the norm in OTC preparation
advertising. Hypothesis H2b can, therefore, be confirmed for the complete data set (chi2= 174.241, p= .000). Also in the
United States a significant imbalance between Caucasian and non-Caucasian women is observed (chi2= 71.535, p=
.000). A highly significant difference between North America and Germany/Austria is noteworthy, where models are
exclusively white (chi2= 9.217, p= 0.002).
Physique and Health Status: For the present study, physical appearance was measured following the example of
Verhellen et al. (2011) by both physique (BMI I) and muscularity (BMI II). The individual variables were later on
clustered into the umbrella category attractiveness . In terms of models' physique, the majority of protagonists is coded
as attractive (Total: 90.2 %; Ger/Aut: 88.1 % / U.S.: 92.5 %), whereby only a limited proportion is considered
unattractive (Total: 9.8 %; Ger/Aut: 11.9 % / U.S.: 7.5 %). As a consequence, hypothesis H2c is backed up for the

681
complete data set (chi2= 145.604, p= .000) as well as for Germany/Austria (chi2= 68.644, p= .000) and the U.S. ( chi2=
77.393, p= .000), whereby results do not significantly differ between the countries (chi2= 1.225, p= .268).
The assumption of positive portrayals dominating OTC drug promotions is further supported by the present study since
a clear tendency towards women’s healthy depictions is notable: 80.9 % (Ger/Aut: 73.7 % / U.S.: 88.8 %) of all ads'
female protagonists are shown in a healthy condition. Consequently, also hypothesis H2d is acknowledged for the total
corpus (chi2= 85.871, p= .000) and the individual countries (Germ/Aut: chi2= 26.576, p= .000 / U.S.: chi2= 64.383, p=
.000). Significant differences between the three countries, however, exist in terms of models’ health status (chi2= 8.229,
p= .004), with female models being depicted even more often in a healthy shape in the U.S. than in Ger/Aut.
Surrounding (relationship, setting)
Relationship (Number of People): The current study, nonetheless, does not produce any evidence for women’s
dependence in terms of relationship. Almost 90 % of all adverts examined feature a single (female) person (Total: 88.9
%; Ger/Aut: 85.6 % / U.S.: 92.5 %). Hence, the present analysis does not support previous research, as the majority of
women is portrayed by themselves, perhaps alluding to their newly gained independence and sovereignty. Their
missing embedment in peer groups consequently leads to the rejection of hypothesis H2e for both country clusters
(chi2= 136.111, p= .000), Germany/Austria (chi2= 59.797, p= .000) and the United States (chi2= 77.393, p= .000).
Moreover, as to women’s relationships in OTC drug advertising no significant differences between Ger/Aut and the U.S.
can be detected (chi2= 2.729, p= .099).
Setting: After studying an extensive number of OTC drug advertisements, the dominance of domestic settings has to be
rejected (Total: 16.2 %; Ger/Aut: 15.9 % / U.S.: 16.5 %). Instead, plain, uni-color backgrounds without any kind of
scenery are featured in most instances (Total: 44.8 %; Ger/Aut: 47.6 % / U.S.: 41.7 %), thereby reducing settings to a
minimum (for similar results see Harwood and Roy, 1999: 274). Also natural settings, as favored by Rallapalli et al.
(1994), presented a moderately sized part (Total: 35.3 %; Ger/Aut: 36.5 % / U.S.: 33.9 %). Regardless of previous
findings, a prominent female stereotype does not pertain anymore: women are not principally depicted in domestic
settings any longer and, hence, hypotheses H2f ends up being rejected for all countries examined (Cluster: chi2=
96.040, p= .000; Germ/Aut: chi2= 51.559, p= .000; U.S.: chi2= 44.495, p= .000). Cross-culturally speaking, significant
differences between Germany/Austria and the U.S. cannot be detected (chi2= .026, p= .873).
General ad appeal and textual ad components
General Ad Appeal: The present study found 51.7 % of all OTC drug ads to use plain informative appeals (Ger/Aut: 55.7
% / U.S.: 48.0 %), which clearly outnumber plain emotional appeals (Total: 5.7 %; Ger/Aut: 2.7 % / U.S.: 8.4 %). Mixed
appeals occur in 42.6 % of all cases (Ger/Aut: 41.6 % / U.S.: 43.0 %). Most adverts also apply product illustrations
(Total: 96.1 %; Germ/Aut: 95.1 % / U.S.: 97.0 %), which are not only essential in familiarizing the public with the
product and its package, but are also characteristic of rational ad appeals. Hence, hypothesis H3a can be confirmed for
the complete ad corpus (chi2= 141.760, p= .000) as well as for Germany/Austria (chi2= 87.935, p= .000) and the United
States (chi2= 56.140, p= .000). The countries themselves are marked by significant differences regarding general ad
appeal (chi2= 6.456, p= .011), since U.S. marketers employ more emotional appeals.
Headline: As far as the headline’s setup is concerned, a clear preference for informative (Total: 50.6 %; Ger/Aut: 49.3 %
/ U.S.: 51.4 %) and mixed elements (Total: 37.5 %; Ger/Aut: 40.7 % / U.S.: 35.7 %) over emotional/soft components
(Total: 11.9 %; Ger/Aut: 10.0 % / U.S.: 12.9 %) can be noted. The attention getting devices in the headline can take
various forms, such as questions, questions and answers, general statements, facts, appellations as well as personal
statements. The use of rational textual devices indicates that clear informative appeals can be said to dominate over
emotional approaches in all countries (chi2= 129.754, p= .000). Also in the United States and Germany /Austria alone,
informative appeals constitute the majority (U.S.: chi2= 37.926, p= .000 / Ger/Aut: chi2= 97.200, p= .000). As a
consequence, hypothesis H3b can be confirmed, further revealing highly significant differences between the countries
examined (chi2= 12.466, p= .000): in the U.S., plain informative as well as emotional appeals are featured more
frequently when contrasted with Germany/Austria.
Body Text: In primarily focusing on central and objective aspects concerning the products promoted (e.g. quality,
dosage), informative approaches continue to dominate adverts' body texts. Out of the total 385 ads, 84.2 % (Ger/Aut:
682
94.0 % / U.S.: 74.8 %) pursue a clearly direct stance by focusing on exclusively factual product information, followed by
15.0% (Ger/Aut: 6.0 % / U.S.: 23.3 %) of mixed appeals. Due to the fact that OTC medications constitute somehow high-
risk/high-involvement products, pure emotional matters take a backseat in advertising, accounting only for 1.0 %
(Ger/Aut: 0.0 % / U.S.: 2.0 %). As a consequence, also hypothesis H3c can be acknowledged for the complete corpus
(chi2= 312.195, p= .000) and the United States (chi2= 319.413, p= .000). Germany/Austria present a special case as no
emotional approaches in adverts’ body texts were coded, al lowing for significant differences between the markets
investigated (chi2= 4.520, p= .034), with the U.S. employing more emotional elements in the ads’ body texts.
Slogan: Underrating both the importance and effect of this particular textual element, not even half of all
advertisements utilize a slogan (Total: 43.3 %; Ger/Aut: 42.6 % / U.S.: 44.1 %). If slogans are applied, they are
composed in a similar manner to the remaining textual elements and, accordingly, informative approaches continue to
prevail1 (Total: 48.5 %; Ger/Aut: 53.8 % / U.S.: 43.8 %). Mixed appeals are only slightly inferior (Total: 43.7 %;
Ger/Aut: 39.7 % / U.S.: 47.2 %), while emotional approaches rank far behind (Total: 7.8 %; Ger/Aut: 6.4 % / U.S.: 9.0
%). Also this textual element predominantly offers factual content in order to satisfy patients’ need for information,
leading to the confirmation of hypothesis H3d (chi2= 51.194, p= .000). The hypothesis also applies to the
German/Austrian (chi2= 29.128, p= .000) and the U.S. American market (chi2= 22.261, p= .000), whereby no significant
differences between Germany/Austria and North America are found (chi2= .434, p= .510).
CONCLUSION
This paper’s intention consisted of pointing out to which extent pharmaceutical advertisements from two different
cultures (Europe and North America) are suited for a standardized (global) execution. In order to determine a potential
for standardization, the most important ad elements were analyzed in detail, namely product endorsers and ad appeal.
In terms of gender portrayals, results indicate that OTC drug advertisers continue to partly rely on traditional
stereotypes by primarily depicting women in all countries. This trend is even more distinct in the U.S. when compared
to Germany/Austria, where male presenters are significantly more often included in advertisements than in
Germany/Austria. The portrayals of female presenters in OTC drug ads are often shaped by contemporary beauty
standards and social norms. Predominantly, they are presented as young or middle-aged, attractive and healthy,
whereby this trend is even more pronounced in the U.S. than in Germany/Austria. In this context, it is interesting to
note that both healthy and attractive people dominate the present advertising discourse, even though O TC drug adverts
are actually meant to promote remedies for diseases. Yet, in reality not the problem or the disease is depicted, but an
idealized state, whereby the product is presented as a solution or means to prevent a particular medical condition. With
regard to ads’ surroundings, traditional stereotypes no longer prevail in the countries examined: female presenters are
neither necessarily featured in domestic settings nor in company. In spite of private sphere settings not dominating any
longer, business women in professional atmospheres or women mastering both their children and jobs have not found
their way into advertising yet. Rather, neutral settings dominate the present-day advertising discourse, whereby this
tendency is characteristic of all countries investigated. As to their social environment, women are no longer shown
amongst other family members but primarily by themselves in Germany/Austria and the United States.
With regard to ad appeal, the present study confirmed a dominance of information to still prevail in the United States
and Germany/Austria, which is used to approach consumers in a cognitive way. Its use is also recommended by experts
(Main et al., 2004), since OTC preparations somehow qualify as rather high-involvement/high-risk products. Even
though a high degree of standardization was assumed on grounds of the markets’ commonalities, little evidence was
found: Only 2.9 % of all ads were completely standardized in the US and Germany/Austria, however, a clear potential
for standardized ad execution cannot be denied as the study results indicate.
Even though some expert claim the pharmaceutical industry to disqualify for standardization for a variety of reasons
(such as heterogeneous consumer groups, varying demands for preparations and dosages, and differences in drug
administration as well as prescription habits; Doherty and Ennew, 1995; Corstjens, 1992), the present study proved
otherwise. In all countries, single young or middle aged, slim and healthy Caucasian women in neutral settings are
primarily featured as endorsers in OTC pharmaceutical advertising. Moreover, informative appeals continue to
dominate and are applied to the different textual elements addressed herein in order to draw a coherent picture. In
spite of some minor differences between the country clusters (more male endorsers as well as more emotional appeals
utilized in the United States), similarities outweigh possible differences and thus it is recommended for ad executives to
seize this opportunity. The question if standardized advertising messages would be recommendable for the

683
pharmaceutical industry can be, hence, answered with a clear yes. In case companies opted for implementing
standardized messages, they would have to be, in accordance with present study results, of informative nature to
appeal to both U.S. American and German/Austrian target audiences. The outcomes are suggestive of more similarities
than anticipated beforehand and, as a result, marketers should grasp the opportunity to approach consumers i n equal
ways around the globe – at least in countries characterized by a high degree of communalities according to recent and
significant studies (e.g., House et al., 2004).
Some limitations to the present research project exist: first, only two country cl usters belonging to the same
categorization (low-context, individualistic cultures) have been examined; second, consumers’ evaluations of and
responses towards OTC drug ads must not be left out of sight and should be addressed in future research in order to
determine a potential overlapping between the present results and customers’ judgments. An interesting research
question would be to analyze whether consumers’ involvement is overestimated or if they even might respond more
favorably to mixed or emotional ad appeals. A follow-up study should not only focus on print advertising, but also
include the medium Internet, which must not be underestimated, for its advancement brought some far-reaching
changes: available medications as well as possible treatment options have become more transparent and are turned
into a “lifestyle” (Harms et al., 2008: 147ff.), with consumers actively engaging in their health care decisions. Thus, the
Internet plays a vital role in fostering self-medication together with self-responsible consumers.
References
Amos, Clinton/Holmes, Gary/Strutton, David. (2008). Exploring the relationship between celebrity endorser effects and
advertising effectiveness: A quantitative synthesis of effect size. International Journal of Advertising. 27(2).
209-234.
Backhaus, Klaus and van Doorn, Jenny. (2007). Consumer perceptions of Advertising Standardization: A Cross -Country
Study of Different Categories. International Management Review. 3(4). 37-49.
Brownfield, Erica D./Bernhardt, Jay M./Phan, Jennifer L./Williams, Mark V./Parker, Ruth M. (2004). Direct-to-Consumer
Drug Advertisements on Network Television: An Exploration of Quantity, Frequency, and Placement. Journal
of Health Communication. 9(6). 491-497.
Buckley, Joan. (2004). Pharmaceutical Marketing – Time for Change. Electronic Journal of Business Ethics and
Organizational Studies. 9(2). 4-11.
Chaiken, S. (1986). Physical Appearance and Social Influence. In: Herman, C.P./Zanna, M.P./Higgins E.T. (eds.). Physical
Appearance, stigma and social behavior. The Ontario Symposium. 3. 280-308.
Challot, Margaret F. and Lee, Wei-Na. (1994).A Content Analysis of Animation and Animated Spokes-Characters in
Television Commercials. Journal of Advertising. 23. 1-12.
Cohen, J. (1968). Weighted kappa: Nominal scale agreement provision for scaled disagreement or partial credit.
Psychological Bulletin. 70(4). 213-220.
Corstjens, M. (1992). Marketing Strategy in the Pharmaceutical Industry. London: Chapman & Hall.
Craig, Stephen R. (1992). Women as Home Caregivers: Gender Portrayal in OTC Drug Commercials. Journal of Drug
Education. 22(4). 303-312.
De Mooij, Marieke. (2001). The Impact of Culture on Advertising. In: Kloss, Ingomar. (ed.). Advertising worldwide.
Berlin: Springer. 1-24.
DeLorme, Denise E./Huh, Jisu/Reid, Leonard N./An, Soontae. (2010). The state of public research on over-the-counter
drug advertising. International Journal of Pharmaceutical and Healthcare Marketing. 4(3). 208-231.
Diehl, Sandra/Mueller, Barbara/Terlutter, Ralf. (2007). Skepticism towards pharmaceutical advertising in the U.S. and
Germany. Advances in International Marketing. 18. 31-60.
Diehl, Sandra/Mueller, Barbara/Terlutter, Ralf. (2008). Consumer responses towards non-prescription and
prescription drug advertising in the US and Germany: They don’t really like it, but they do believe it.
International Journal of Advertising. 27(1). 99-131.

684
Doherty, Gerard and Ennew, Christine T. (1995). The Marketing of pharmaceuticals: standardization or customization?
Journal of Marketing Practice. 1(3).
Edell, Julie A. andStaelin, Richard. (1983). The information processing of pictures in print advertisements. Journal of
Consumer Research. 10(1). 45-61.
Emrich, Cynthia G./Denmark, Florence L./Den Hartog, Deanne N. (2004). Cross -Cultural Differences in Gender
Egalitarianism. In: House Robert J./Hanges, Paul J./Javidan, Mansour (eds.), Culture, Leadership, and
Organizations: The GLOBE Study of 62 Societies. Thousand Oaks, CA: Sage, 343-394.
Esteban, Diego. (2008). Strengthening corporate social responsibility in the pharmaceutical industry. Journal of Medical
Marketing. 8(1). 77-79.
Feick, Lawrence and Higie, Robin A. (1992). The Effects of Preference Heterogeneity and Source Characteristics on Ad
Processing and Judgments about Endorsers. Journal of Advertising. 21(2). 16-21.
Flueren, Hans J./Klein, Marion/Radetzki-Rodermann, Heidrun. (2002). Das Altersbild der Deutschen Daily Soaps:
Ergebnisse einer quantitativ-qualitativen Untersuchung. Medien praktisch. 1. 23-27.
Francis, S.A./Barnett, N./Denham, M. (2005). Switching of prescription drugs to over-the-counter status. Drugs and
Aging. 22(5). 361-370.
Furnham, Adrian and Bitar, Nadine (1993). The Stereotyped Portrayal of Men and Women in British Television
Advertisements. Sex Roles. 29. 297-310.
Furnham, Adrian and Saar, Alexandra. (2005). Gender-role Stereotyping in Adult and Children's Television
Advertisements: A Two-Study Comparison between Great Britain and Poland. Communications. 30. 73-90.
Furnham, Adrian and Spencer-Bowdage, Sarah. (2002). Sex Roles Stereotyping in Television Advertisements: A Content
Analysis from South Africa and Great Britain. Communications. 27. 457-483.
Gentry, James and Harrison, Robert. (2010). Is Advertising a Barrier to Male Movement toward Gender Change?
Marketing Theory. 10(1). 74-96.
Hall, E.T. (1976). Beyond Culture. New York: Doubleday/Anchor.
Harms, Fred/Gänshirt, Dorothee/Rumler, Robin. (2008, ed.). Pharmamarketing. Gesundheitsökonomische Aspekte
einer innovativen Industrie am Beispiel von Deutschland, Österreich und der Schweiz. Stuttgart: Lucius &
Lucius.
Harwood, Jake and Roy, Abhik. (1999). The Portrayal of Older Adults in Indian and U.S. Magazine Advertisements. The
Howard Journal of Communications. 10. 269-280.
Hofstede, FreneklTer/Steenkamp, Jan-Benedict E.M./Wedel, Michel. (1999). International Market Segmentation Based
on Consumer Product Relations. Journal of Marketing Research. 36(1). 1-17.
Hofstede, Gert. (1980). Culture’s consequences: International differences in work-related values. Beverly Hills, CA: Sage
Publications.
House Robert J./Hanges, Paul J./Javidan, Mansour (2004; eds.), Culture, Leadership, and Organizations: The GLOBE
Study of 62 Societies. Thousand Oaks, CA: Sage.
Ifezue, Alexander N. (2010). What makes an effective Advertising for a man or a woman? Journal of Communication.
1(1). 13-18.
IMS Health Austria (2010). The Rising Tide of OTC in Europe: Trends, Challenges and new Potential in a rapidly
evolving market. URL:
http://www.imshealth.com/imshealth/Global/Content/Consumer%20Health/Documents/The_Rising_Tide_
Of_OTC_Europe.pdf (retrieved 19.11.2011)
Johar, J.S. and Sirgy, M.J. (1991). Value expressive versus utilitarian advertising appeals: When and why to use each
appeal. Journal of Advertising. 20(3). 23-33.
Johnson, Fern L. (2008). Imaging in Advertising: Verbal and visual codes of commerce. New York: Routledge.

685
Kelly, Kathleen J./Slater, Michael D./Karan, David/Hunn Liza. (2000). The Use of Human Models and Cartoon Characters
in Magazine Advertisements for Cigarettes, Beer, and Nonalcoholic Beverages. Journal of Public Policy and
Marketing. 19(2). 189-200.
Kennedy, Kelly. (2012). Just 1 % of patients drive American health care spending. In: USA Today. 13-15 January 2012.
5A.
Kermani, Faiz (2005). Why corporate social responsibility is healthy for pharma. URL:
http://www.pharmiweb.com/features/feature.asp?ROW_ID=630 (accessed 26.02.2012)
Kotler, P. and Lee, N. (2005). Corporate Social Responsibility – Doing the Most Good for Your Company and your Cause.
Hoboken, NJ: John Wiley & Sons.
Kroeber-Riel, Werner and Esch, Franz-Rudolf. (2011, 7th ed.). Strategie und Technik der Werbung. Stuttgart:
Kohlhammer.
Leonidou, Leonidas C. and Leonidou, Constatinos N. (2009). Rational Versus Emotional Appeals in Newspaper
Advertising: Copy, Art and Layout Differences. Journal of Promotion Management. 15. 522-546.
Levitt, T. (1983). The globalization of markets. Harvard Business Review. 61(3). 69-81.
Main, Kelley J./Argo, Jennifer J./Huhmann, Bruce A. (2004). Pharmaceutical Advertising in the USA: information or
influence? International Journal of Advertising. 23. 119-112.
Martin, Brett A.S./Wentzel, Daniel/Romczak, Torsten.(2008). Effects of susceptibility to normative influence and type of
testimonial on attitudes toward print advertising. Journal of Advertising. 37(1). 29-43.
McGuire, W.J. (1985). Attitudes and Attitude Change. In: Lindzey, G. and Aronson, E. (ed.). The Handbook of Social
Psychology. Band 2. 233-346.
Mueller, Barbara. (1987). Reflections of Culture: An Analysis of Japanese and American Advertising Appeals. Journal of
Advertising Research. 27(3). 51-59.
Nussbaum, Alexander K. (2009). Ethical corporate social responsibility (CSR) and the pharmaceutical industry: A happy
couple? Journal of Medical Marketing. 9(1). 67-76.
Okazaki, Shintaro/Mueller, Barbara/Taylor, Charles R. (2010a). Global Consumer Culture Positioning: Testing
Perceptions of Soft-Sell and Hard-Sell Advertising Appeals Between U.S. and Japanese Consumers. Journal of
International Marketing. 18(2). 20-34.
Okazaki, Shintaro/Mueller, Barbara/Taylor, Charles R. (2010b). Measuring Soft-Sell versus Hard-Sell Advertising
Appeals. Journal of Advertising. 39(2). 5-20.
Okazaki, Shintaro/Taylor, Charles R./Zou, Shaoming. (2006). Advertising Standardization’s Positive Impact on the
Bottom Line. A Model of When and How Standardization Improves Financial and Strategic Performance.
Journal of Advertising. 35(3). 17-33.
Onkvisit, Sak and Shaw, John J. (1990). Global Advertising: revolution or myopia. Journal of International Consumer
Marketing. 2(3). 97-112.
Phillips, Barbara J. (1996). Defining Characters and Their Role in American Popular Culture. Journal of Popular Culture.
29. 143-158.
Phillips, Barbara J. and Gyoerick, Barbara. (1999). The cow, the Cook, and the Q uaker: Fifty Years of Spokes-Character
Advertising. Journalism and Mass Communication Quarterly. 76(4). 713-728.
PhRMA (2010). Pharmaceutical Industry Profile. URL:
http://www.phrma.org/sites/default/files/159/profile_2010_final.pdf (accessed 21.03.2012)
Pieters, Rik and Wedel, Michel. (2004). Attention Capture and Transfer in Advertising: Brand, Pictoral, and Text-Size
Effects. Journal of Marketing. 68. 36-50.
Pieters, Rik/Edward Rosbergen/Wedel, Michel. (1999). Visual Attention to Repeated Print Advertis ing: A Test of
Scanpath Theory. Journal of Marketing Research. 36(4). 424-438.

686
Piller, Ingrid. (1997). Englische Werbeslogans. In: Anglica. 115. 193-222.
Piller, Ingrid. (2001). Identity Constructions in Multilingual Advertising. Language and Society. 30. 153-186.
Plous, Scott and Neptune, Dominique. (1997). Racial and Gender Biases in Magazine Advertising: A Content-Analytic
Study. Psychology of Women Quarterly. 21. 627-644.
Priester, Joseph R. and Petty, Richard E. (1995). Source Attribution and Persuasion: Perceived Honesty as a determinant
of Message Scrutiny. Personality and Social Psychology Bulletin. 21. 637-654.
Priester, Joseph R. and Petty, Richard E. (2003). The Influence of Spokesperson Trustworthiness on Message
Elaboration, Attitude Strength, and Advertising Effectiveness. Journal of Consumer Psychology. 13(4). 408-
421.
Rallapalli, K.C./Smith, M.C./Stone, G.W. (1994). The social portrayal of people in OTC drug advertising: a content
analysis of magazine advertisements. Journal of Pharmaceutical Marketing and Management. 8(2). 111-126.
Raman, Priya/Harwood, Jake/ Weis, Deborah/Anderson, Judith L./Miller, Grace. (2006). Portrayals of Age Groups in
U.S. And Indian Magazine Advertisements: A Cross-Cultural Comparison.
Reingen, P.H. and J.B. Kernan, (1994). Social perception and interpersonal influence: some consequences of the
physicalattractiveness stereotype in a personal selling setting. Journal of Consumer Psychology. 2(11), 25-38.
Rosbergen, Edward/Pieters, Rik/Wedel, Michel. (1997). Visual Attention to Advertising: A Segment-Level Analysis.
Journal of Consumer Research. 24. 305-314.
Skonieczna, Agnieszka. (2011). OTC market in Central and Eastern Europe expected to grow by 9% per annum between
2011 and 2013. Source Report. PRM Publications.
Skoric, Marko and Furnham, Adrian. (2002). Gender Role Stereotyping in Television Advertisements: A Comparative
Study of British and Serbian Television. S. Shohov Advances in Psychology Research. 10. 123-142.
Stawarska, Agnieszka. (2010). The OTC market in Central and Eastern Europe will be worth more than €12bn in 2012.
Source Report. PRM Publications.
Swayne, L. E. and Greco, A. J. (1987). The Portrayal of Older Americans in Television Commercials. Journal of
Advertising. 16(1). 47-54.
Tajfel, Henry. (1981). Human groupsandsocialcategories. Cambridge, NY: CUP.
Verbraucheranalyse (2008). Kleine Viren, Großer Markt. URL: www.verbraucheranalyse.de/downloads/3/VA-
aktuell_Nr_4_OTC.pdf (accessed 19.11.2011)
Verhellen, Yann/Dens, Nathalie/De Pelsmacker, Patrick. (2011). A Content Analysis of Gender Role Depiction in Belgian
Television Advertising. 1-12.
Wells, Willism/Burnett, John/Moriarty, Sandra E. (2006). Advertising: Principles and practice. Upper Saddle River, NJ:
Prentice Hall.
Whittler, Tommy E. and Spira, Joan Scattone. (2002). Model’s Race: A Peripheral Cue in Advertising Messages? Journal
of Consumer Psychology. 12(4). 291-301.
Wind, Yoram Jerry. (1994). Pharmaceutical Advertising – A Business School Perspective. In: Arch Fam Med. Vol. 3/No.
4. 321-323.
Wolin, Lori D. (2003). Gender Issues in Advertising – An Oversight Synthesis of Research: 1970 – 2002. Journal of
Advertising Research. 43(1). 111-129.
Würtz, Elizabeth (2005). A cross-cultural analysis of websites from high-context cultures and low-context cultures.
Journal of Computer-Mediated Communication. 11(1).
Zhang, Yan Bing/Harwood, Jake/Williams, Angie/Ylaenne-McEven, Virpi/Waldleigh, Paul Mark/Thim, Caja. (2006). The
Portrayal of Older Adults in Advertising: A Cross-National Review. Journal of Language and Social Psychology.
25. 264-282.

687
Appendix
Target Audience
TOTAL GERMANY/AUSTRIA UNITED STATES
GENERAL PUBLIC 75 18.1 % 44 23.4 % 31 13.7 %
ADULTS 257 62.1 % 121 64.4 % 136 60.2 %
CHILDREN 11 2.7 % 4 2.1 % 7 3.1 %
WOMEN 52 12.6 % 15 8.0 % 37 16.4 %
MEN 19 4.5 % 4 2.1 % 15 6.6 %
GENDER
TOTAL GERMANY/AUSTRIA UNITED STATES
MALE 57 19.7 % 21 14.7 % 36 24.5 %
FEMALE 169 58.3 % 94 65.7 % 75 51.0 %
BOTH 56 19.3 % 24 16.8 % 32 21.8 %
UNCLEAR/NONE 8 2.7 % 4 2.8 % 4 2.7 %
Gender
TOTAL GERMANY/AUSTRIA UNITED STATES
MALE 113 33.4 % 45 27.6 % 68 38.9 %
FEMALE 225 66.6 % 118 72.4 % 107 61.1 %
Age
TOTAL GERMANY/AUSTRIA UNITED STATES
YOUNG 64 28.4 % 25 28.7 % 34 34.4 %
MIDDLE AGED 135 60.0 % 47 54.0 % 59 59.6 %
OLDER 26 11.6 % 15 17.3 % 6 6.1 %
Caucasian
TOTAL GERMANY/AUSTRIA UNITED STATES
YES 205 94.9 % 112 100.0 % 93 92.1 %
NO 11 5.1 % 0 0.0 % 8 7.9 %
Attractiveness
TOTAL GERMANY/AUSTRIA UNITED STATES
YES 203 90.2 % 104 88.1 % 99 92.5 %
NO 22 9.8 % 14 11.9 % 8 7.5 %
Health Status
TOTAL GERMANY/AUSTRIA UNITED STATES
HEALTHY 182 80.9 % 87 73.7 % 95 88.8 %
UNHEALTHY 43 19.1 % 31 26.3 % 12 11.2 %
Relationship
TOTAL GERMANY/AUSTRIA UNITED STATES
YES 25 11.1 % 17 14.4 % 8 7.5 %
NO 200 88.9 % 101 85.6 % 99 92.5 %
Setting
TOTAL GERMANY/AUSTRIA UNITED STATES
PROFESSIONAL 9 3.7 % 0 0.0 % 9 7.8 %
OUTDOORS 85 35.3 % 46 36.5 % 39 33.9 %
NONE 108 44.8 % 60 47.6 % 48 41.7 %
DOMESTIC 39 16.2 % 20 15.9 % 19 16.5 %
AD APPEAL
General Appeal
TOTAL GERMANY/AUSTRIA UNITED STATES
INFORMATIVE 199 51.7 % 102 55.7 % 97 48.0 %
EMOTIONAL 22 5.7 % 5 2.7 % 17 8.4 %
MIXED 164 42.6 % 76 41.6 % 88 43. %
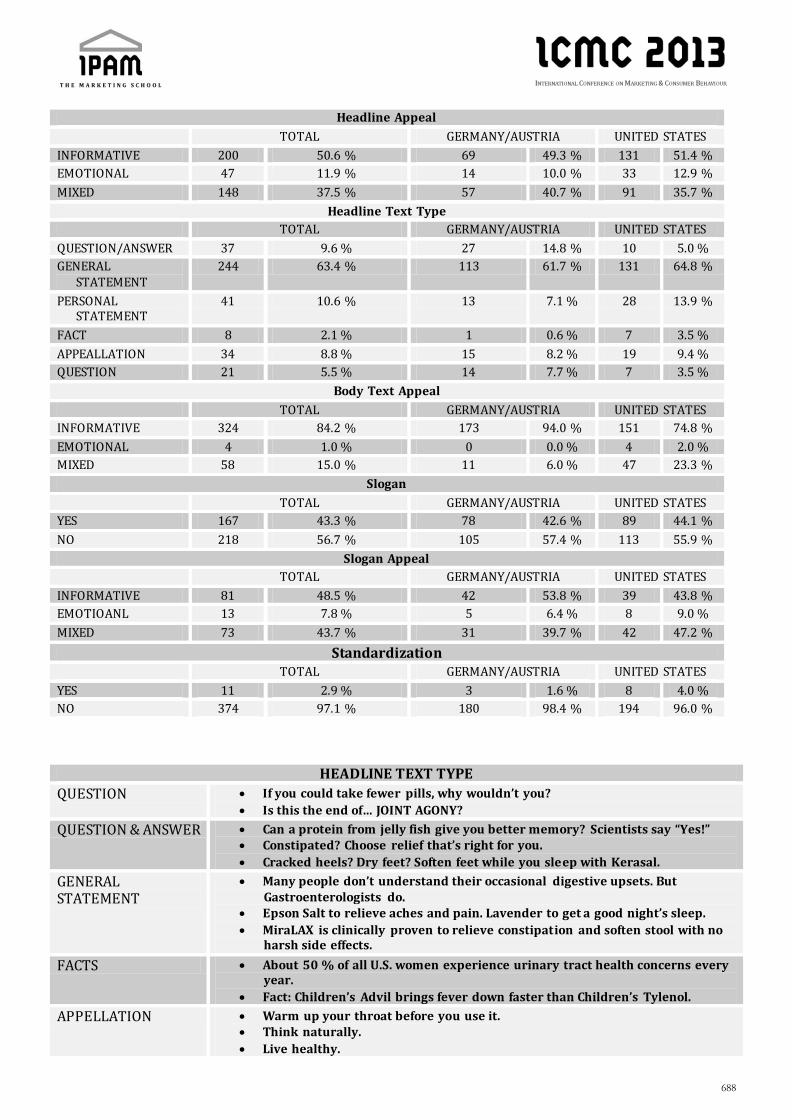
688
Headline Appeal
TOTAL GERMANY/AUSTRIA UNITED STATES
INFORMATIVE 200 50.6 % 69 49.3 % 131 51.4 %
EMOTIONAL 47 11.9 % 14 10.0 % 33 12.9 %
MIXED 148 37.5 % 57 40.7 % 91 35.7 %
Headline Text Type
TOTAL GERMANY/AUSTRIA UNITED STATES
QUESTION/ANSWER 37 9.6 % 27 14.8 % 10 5.0 %
GENERAL STATEMENT
244 63.4 % 113 61.7 % 131 64.8 %
PERSONAL STATEMENT
41 10.6 % 13 7.1 % 28 13.9 %
FACT 8 2.1 % 1 0.6 % 7 3.5 %
APPEALLATION 34 8.8 % 15 8.2 % 19 9.4 %
QUESTION 21 5.5 % 14 7.7 % 7 3.5 %
Body Text Appeal
TOTAL GERMANY/AUSTRIA UNITED STATES
INFORMATIVE 324 84.2 % 173 94.0 % 151 74.8 %
EMOTIONAL 4 1.0 % 0 0.0 % 4 2.0 %
MIXED 58 15.0 % 11 6.0 % 47 23.3 %
Slogan
TOTAL GERMANY/AUSTRIA UNITED STATES
YES 167 43.3 % 78 42.6 % 89 44.1 %
NO 218 56.7 % 105 57.4 % 113 55.9 %
Slogan Appeal
TOTAL GERMANY/AUSTRIA UNITED STATES
INFORMATIVE 81 48.5 % 42 53.8 % 39 43.8 %
EMOTIOANL 13 7.8 % 5 6.4 % 8 9.0 %
MIXED 73 43.7 % 31 39.7 % 42 47.2 %
Standardization TOTAL GERMANY/AUSTRIA UNITED STATES
YES 11 2.9 % 3 1.6 % 8 4.0 %
NO 374 97.1 % 180 98.4 % 194 96.0 %
HEADLINE TEXT TYPE
QUESTION If you could take fewer pills, why wouldn’t you?
Is this the end of… JOINT AGONY?
QUESTION & ANSWER Can a protein from jelly fish give you better memory? Scientists say “Yes!” Constipated? Choose relief that’s right for you.
Cracked heels? Dry feet? Soften feet while you sleep with Kerasal.
GENERAL STATEMENT
Many people don’t understand their occasional digestive upsets. But Gastroenterologists do.
Epson Salt to relieve aches and pain. Lavender to get a good night’s sleep.
MiraLAX is clinically proven to relieve constipation and soften stool with no harsh side effects.
FACTS About 50 % of all U.S. women experience urinary tract health concerns every year.
Fact: Children’s Advil brings fever down faster than Children’s Tylenol.
APPELLATION Warm up your throat before you use it. Think naturally.
Live healthy.

689
PERSONAL STATEMENTS
I beat that funk!
„Mom… You’re back!“
SLOGAN TEXT TYPE
INFORMATIVE Great Digestion through science. The Better Vitamin C.
MIXED Enjoy your vitamins. Trust your gut to Culturelle. Relief you can trust.
Delsym: Silence is Relief.
EMOTIONAL Feel the good.
How healthy works.
HYPOTHESES COUNTRY
CLUSTER GERMANY/AUSTRIA UNITED STATES COUNTRY
DIFFERENCE
chi2 p chi2 p chi2 p chi2 p
H1 37.112 .000 32.693 .000 8.691 .003 4.799 .028
H2a 125.226 .000 44.462 .000 81.667 .000 1.895 .169
H2b 174.241 .000 --- --- 71.535 .000 9.217 .002
H2c 145.604 .000 68.644 .000 77.393 .000 1.225 .268
H2d 85.871 .000 26.576 .000 64.383 .000 8.229 .004
H2e 136.111 .000 59.797 .000 77.393 .000 2.729 .099
H2f 96.040 .000 51.559 .000 44.495 .000 .026 .873
H3a 141.760 .000 87.935 .000 56.140 .000 6.456 .011
H3b 129.754 .000 97.200 .000 37.926 .000 12.466 .000
H3c 312.195 .000 --- --- 139.413 .000 4.520 .034
H3d 51.194 .000 29.128 .000 22.261 .000 .434 .510
SCHEME OF ANALYSIS
GENDER:
TARGET GROUP: general public adults children
women men
GENDER: male female both
AGE: children (0-15) young adults (15-35)
middle aged (35- 60) older (60+)
ETHNICITY: Caucasian African Asian
Hispanic Other
PHYSIQUE:
BMI I: underweight normal overweight
BMI II: not muscular slightly muscular strongly muscular
HEALTH STATUS: healthy unhealthy
RELATIONSHIP: partnership friendship family
work
SURROUNDING: professional domestic outdoors/nature

690
none
AD APPEAL:
GENERAL AD APPEAL: informative emotional mixed
HEADLINE APPEAL: informative emotional mixed
HEADLINE TEXT TYPE: question question/answer general statement
fact appellation personal statement
BODY TEXT APPEAL: informative emotional mixed
SLOGAN: yes no
SLOGAN APPEAL: informative emotional mixed
STANDARDIZATION: yes no

691
Limits to transparency in Corporate
Communication: A Reflection on need to
embrace sacred in secular space of B-Schools Corporate Communication, Pragmatic Transparency, Principled Theologians, Authenticity, Self regulation
Sandip Anand, XIMB, [email protected]
Ibha Kumar, XIMB, [email protected]
Upendra Maurya, National Institute for Micro, Small, and Medium Enterprises, [email protected]
Abstract
We study limits to transparency in corporate communication (LTC), as need for conflict minimization; constraints, and
pragmatic transparency. We develop a LTC scale and test with 175 MBA students in India. LTC needs to be seen from
organizational politics’ perspective. We argue that there is a need for active recognition of plurality, and conflict
minimization in corporate communication. This needs to be discussed actively in B-School curriculum and political,
normative, and ethical aspects need to be incorporated in the theoretical development related to corporate
communication. This can be done only when we embrace sacred in our secular space.
1. Introduction
Transparency in corporate communication is a critical issue for naked organizations (Tapscott and Ticoll, 2002.)
Organizations are increasingly being questioned by their employees, consumers, civil society organizations, and
regulatory bodies. Corporate communication of organizations is supposed to capture the essence of corporate
philosophy. The essence is likely to be captured through vision, mission, and goal (VMG). VMG seems to cover different
aspects of its orientation i.e. strategic orientation, market orientation, customer orientation, HR orientation etc. The
transparency debate tries to unravel the gap between inner self of organizations, primarily view of shareholders, and
message to other stakeholders, society at large. Exploring the debate is a quest for authenticity i.e. shared genuineness
amongst community of stakeholders.
Munz and O’Guinn (2001) argue that there are three core components or markers of a community, in our case
community of stakeholders. The components are consciousness of kind (Gusfield, 1978), shared rituals and traditions,
and sense of moral responsibility. Shared consciousness is a way of thinking that is more than shared attitudes or
perceived similarity, but it is shared knowing of belonging (Weber, [1922] 1978). Rituals and traditions perpetuate the
community’s shared history, culture, and consciousness and create social solidarity (Durkheim, [1915] 1965). The
sense of moral responsibility is a felt sense of duty or obligation to the community as a whole and responsible for
collective actions in times of threat to the community (Anderson, 1993 as quoted in Muniz and Oguinn, 2001). Without
the sense of moral responsibility, authenticity may not be achievable.
Lack of transparency has resulted into degeneration of trust for several stakeholders. This necessitates repair
of trust (Kim et al., 2009). In a culture of distrust, a corporate communication is often seen with skepticism. Fine
packaging of corporate corporation which seems to lack credibility, is very often questioned. In the given context, we
propose that corporate communication is likely to be embedded in pragmatic transparency. Pragmatic transparency
defines the limits transparency. Naked corporations (Tapscott and Ticoll, 2002) pose a challenge to aesthetics of
communication. Aesthetics of communication is likely to be found if transparency is inherent rather than enforced. A
naked corporate communication enforced by regulatory agencies or pressurized by civil society organizations
(Tapscott and Ticoll, 2002) is often not a communication with free-will. In this context, pragmatic refers on one hand to

692
acknowledgement of the value of transparency in corporate communication, on the other it accepts that corporate
communications are very often situational, context specific, and biased towards immediate opportunity available to
them.
Further, stakeholders are not homogenous groups. They vary in terms of their choices and are often segmented
by corporations for various purposes. Conflicts exist s as trade-offs of different stakeholders may vary in terms of their
positions. This trade-off is well captured by Tetlock (2002) identifying 3 alternative social functionalist starting points
for inquiry: people as pragmatic politicians trying to cope with accountability demands from key constituencies in their
lives, principled theologians trying to protect sacred values from secular encroachments, and prudent prosecutors
trying to enforce social norms (Tetlock, 2002). Interest of big shareholder are often seen in conflict with small
shareholders, high net worth customers’ pose different demands v is-à-vis small stakeholders. However, this issue of
conflict is often resolved with the mind-set of pragmatic politicians (Tetlock, 2002).
In this study we find the extent to which conflict minimization is regarded as integral part of corporate
communication. Conflict minimization is defined as reduction of conflicts in the minds of stakeholders through various
tools of communication. Corporate communication is often seen as emerging from the top management (Balmer, 2012).
With the given conflicts, ignorance of stakeholders’ happiness is not an unexpected outcome. Due to this
ignorance and denial of stakeholders’ happiness, suffering has become a commonly prevalent phenomenon (Frost et al.
2006). This constraints the corporate communication, and shifts corporations away from its objectives viz. VMG. Very
often alignment of this communication with VMG is not possible. This leads us to propose that corporate
communication is full of constraints.
In the light of the above discussion, we study limits to transparency in corporate communication (LTC), by
conceptualizing limits in terms of challenges with respect to stakeholder’s conflicts, presenting a need for conflict
minimization; with constraints, and the best captured in pragmatic transparency. LTC captures the classical debate
between transparency and privacy, which is referred to as transparency paradox (Bernstein, 2012). Exploration of
limits to transparency in corporate communication needs to be seen from the organizational politics perspective and
requires a theoretical development.
1.2. An appreciation of deep ecology
Right to information is very critical for all stakeholders, and is integral part of corporate governance. Information
asymmetry is a commonly known problem, and corporate communication is just a manifestation of that. If many
organizations share information, however, in a limited way; then it is appreciation that organizations are interrelated
and their many problems are common as they share the common ecology. This kind of understanding has been referred
to as appreciation of deep ecology by Spinoza (Jonge, 2004). Corporate communication is an ecological issue, and deep
ecology is related to deep questioning to ecological issue (Jonge, 2004). The higher the realization related to the
interconnectedness of organization, the more natural this approach becomes. Appreciation of deep ecology has led to
trust-based marketing perspective (Morgan and Hunt, 1994) as marketers seem to have globally contributed towards
creation of distrust.
1.2. Embracing sacred in our secular space
It seems that management theories which we teach in MBA schools are, at present destroying good management
practices (Ghoshal, 2005). To address this Walsh (2011) argues to embrace sacred in our secular place. These
arguments are very basic and present in the critique of philosophy of science (Visvanathan, 1997) which are basis of
modern MBA education and Business schools. Our theories are not value-neutral. Management theories have seen a
paradigm shift from era of rationality (neo-liberal economics) to bounded rationality (triggered Herbert Simon’s work
and later on crystallized by Williamson’s work on Transaction cost economics) to an era of intuition, wherein emergent
organizational capacity for compassion (Madden et al. 2012) is being emphasized. The terms like compassion, care, etc.
provide new direction to corporate communication and necessitate a fundamental change in the approach of corporate
communication which accepts that there are limits to transparency as organizations have limitations in sharing the
information. This necessitates respect for plurality in corporate communication (Visvanathan, 2009). Plurality here
implies that corporate communication is not centralized and shared information to different stakeholders is

693
conditional. This is increased recognition that corporate communication represents a politics of knowledge played by
different stakeholders.
As like any other human phenomena, corporate communication too is political in nature referring to action of
pragmatic politician. Regulatory agencies act as prudent prosecutors, however, remain limited to the domain of
legalization. Regulation, and pressure from civil society led to the development of naked organizations. However, there
is a need to activate theologians who try to protect sacred values from secular encroachments (Tetlock, 2002). Only
activation of theologian mindset can repair the trust in corporate communication as it brings in the legitimization, and
helps organizations in moving towards self regulation (Shiva,1997) which is regarded as the ultimate unifying goal of
governance.
A change in the approach of corporate communication is needed; a change that acknowledges and accepts that there
are limits to transparency, and also respects plurality in organizations. This change can be brought about by shifting the
role of the pragmatic politician to the role of prudent prosecutor which will be more socialistic in nature and spirit. The
job does not end here. The role of the prudent prosecutor must be coupled with the role of the principled theologian
which will be more individualistic and value-based. Should this happen the shift from legalization to legitimization may
follow.
Sacred values are likely to be defined by the history of organizations, culture, and social context in which they are
embedded. Further, there is an element of those sacred values which are regarded as universal in nature which need to
be protected. Protection to minimize human sufferings in the life of stakeholders seems to be a universal value (Frost et
al. 2006). This study has been conducted to understand the extent to which students’ of B -schools relate conflict
minimization with corporate communication. This may call for a theoretical development in the literature of c orporate
communication covering political aspects which has be taught at Business schools to enhance the alignment of theory
with business practices (Ghoshal, 2005; Walsh, 2011). Keeping this in mind, we have carried out this study with
students in an Indian Business school.
2. Research Objective
In the context of the above, this study has been done to find out the factors of limits to transparency. Following specific
hypotheses were tested:
H1: There are three key factors explaining limits to transparency.
H2: All three factors viz. Conflict minimization, Constraints, and Pragmatic Transparency are equally important.
3. Methods and Material
This study is a survey based research. A structured questionnaire was developed for this study. The survey was
conducted amongst 175 MBA students in India. Majority of MBA students had prior corporate work experience. MBA
students were selected for this study, as we wanted to explore the extent to which youth in India perceive the limits to
transparency. In most of these cases, these MBA students are hired by corporations. Therefore, it is critical to capture
youth’s perspective in India. Sample has been selected through convenience sampling. The sample represents mix of
first year, and second year young students.
Results and discussion
Results indicate that there is evidence in favour of
H1: There are three key factors explaining limits to transparency.
However, following hypothesis is refuted.
H2: All three factors viz. Conflict minimization, Constraints, and Pragmatic Transparency are equally important.
In the following sub-sections, we have discussed the results of this study in detail.

694
3.1. Emergence of Three Factors
Internal consistency of the scale was checked, by computing coefficient alphas for the overal l LTC and its three factors.
Table 1 contains the various psychometric properties of the scales. The construct LTC and its factors, achieve coefficient
alpha values are between .5-.6 (Eisinga et al., 2012; George & Mallery, 2003) which may be acceptable. Column fifth in
Table 1 entitled ‘Alpha, If Item Deleted’ indicates that only one item, if deleted, would not improve the coefficient for
any of the subscales. As evident from the table 1 that further deletion of item isn’t improving alpha value and inter-item
correlations are adequate within individual factor items. The first factor viz. conflict minimization achieves a coefficient
alpha value of .588. and a value greater than .3 for inter-item correlations. The second factor, pragmatic transparency
achieves a coefficient alpha value of .497 and a value greater than .3 for inter-item correlations. And the third factor,
constraints achieves alpha value of .534 and a value greater than .3 for inter-item correlations. These values are very
within acceptable range to describe these factors. However, according to Robinson, Shaver, and Wrightsman (1991) a
coefficient alpha value greater than .8 and an average inter-item correlation greater than .3 is an exemplary construct.
In view of the above discussions and guidelines, we consider the psychometric properties of the three factors of limit to
transparency just adequate. Table 1 describes the Reliability and other psychometric properties of limit to
transparency factors.
Table 1 : Reliability and other psychometric properties of limit to transparency
Factor items Mean Std. Deviation Corrected Item-Total Correlation
Cronbach's Alpha if Item Deleted
v6 5.97 1.203 0.351 0.539
v7 4.16 1.885 0.423 0.504
v8 4.9 1.429 0.353 0.535
v9 6.24 0.958 0.453 0.5
v16 3.47 1.803 .325 .480
v19 2.83 1.443 .407 .342
v22 3.59 1.482 .316 .475
v43 3.25 1.447 .399 .353
v44 3.67 1.537 .335 .460
v46 2.61 1.396 .315 .486
Table 2: Factor structure of the limit to transparency in communication (Maximum likelihood method and pro-max rotation)
Conflict minimization Alpha= .588
v6 A company is likely to be more profitable in the long run if it can resolve the conflict that exists in the minds of people.
.499
v7 A company is likely to be more profitable in long run if it can resolve the conflicts in the family of its clients/customers
.548
v8 A company is likely to be more profitable in long run if it can lessen social tensions. .485
v9 A company is likely to be more profitable in long run if it can resolve the conflicts in the minds of its employees.
.703
Pragmatic Transparency Alpha= .538
v13 Corporate communication needs to be more situational than being driven by company’s character (values, integrity, etc).
.497
v19 Any corporate communication needs to be aimed at exploiting the immediate opportunity rather than being worried about future.
.676
A company is likely to be more successful and profitable if all information related to the company is available in public domain.
.531
Constraints Alpha= .534
v43 The VMG (vision, mission and goals) set by the companies are often eyewash. .642

695
v44 It is often impossible for the companies to align their communication to stakeholders with its (vision, mission and goals).
.502
v46 Happiness of company’s stakeholders (employees, customers, etc.) is less important than profit for company.
.467
3.2. Validity of Measures
To collect evidence of construct validity, we analyzed the pattern of correlations between the limit to transparency
construct and its three components. Consistent with theory, we had hypothesized that limit to transparency was a one-
dimensional construct with three correlated components. The ML factor analysis with pro-max rotation yielded the
three factors solution, which supports our hypothesis. See Table 3 for correlations between the factors. We had
expected each of the components to have significant loadings on the limit to transparency construct. The results in
Table 3 show that all three components have low to moderate loadings, between .474 and .639, on the limit to
transparency construct, which indicates the existence of a higher-order construct (Clark and Watson, 1995). The three
components share significant correlations with each other.
Table 3: Factor correlations
Limit to
Transparency
Conflict minimization Pragmatic
transparency
Constraints
Limit to Transparency 1
Conflict minimization 0.474 1
Pragmatic transparency 0.639 -0.044 1
Constraints 0.559 -0.105 0.05 1
**. Correlation is significant at the 0.01 level (2-tailed).
4. Managerial Implications and Conclusion
By highlighting LTC, this study argues that there is need for active recognition of plurality goal of conflict minimization
in corporate communication. This needs to be discussed actively in B-School curriculum and political, normative, and
ethical aspects need to be incorporated in the theoretical development related to corporate communication. This can be
done only when we embrace sacred in our secular space.
References
Anderson, B (1983). Imagined Community.London: Verso.
Bernstein, E. (2012). The Transparency Paradox: A Role for Privacy in Organizational Learning and Control.
Administrative Science Quarterly, 57(2), 181-216.
Balmer, J.M.T. (2012).Corporate Brand Management Imperatives: Custodianship, Credibility, and Calibration. California
Management Review, 54 (3),6- 33.
Eisinga, R., Te Grotenhuis, M., Pelzer, B. (2012). The reliability of a two-item scale: Pearson,
Clark, L. A., & Watson, D. (1995), "Constructing Validity: Basic Issues in Objective Scale Development," Psychological
Assessment, 7 (3), 309-319.
Frost, P., Dutton, J.E., Maitilis, S., & Lilius, J. M., Kanov, J.M., & Worline, M.C. (2006). Seeing organizations differently :
Three lenses on Compassion. In C. Hardy, S. Clegg, T. Lawrence, & W. Nord (Eds), Handbook of organization
studies (2nd ed.): 843-866. London: Sage.
George, D., & Mallery, P. (2003). SPSS for Windows step by step: A simple guide and reference. 11.0 update (4th ed.).
Boston: Allyn & Bacon.
Durkheim, E. ([1915] 1965). The Elementary forms of the Religious Life. New York: Free Press.

696
Ghoshal, S. (2005). Bad Management Theories are Destroying Good Management Practices. Academy of Management
Learning and Education, 4(1), 75-91.
Gusfield, J. R. (1978). Community: A Critical Response. New York: Harper & Row.
Jonge, E.D. (2004). Spinoza and Deep Ecology: Challenging Traditional Approaches to Environmentalism.
Kim, P.H., Dirks, K.T., and Cooper, C.D. (2009). The Repair of Trust: A Dynamic Bilateral Perspective and Multilevel
Conceptualization, Academy of Management Review, 34(3), 401-422.
Madden, L.T., Duchon, D., Madden, T.M., & Plowman, D.A. (2012). Emergent Organizational Capacity for Compassion,
Academy of Management Review, 37 (4), 689-704.
Morgan, R. M., & Hunt, S. D. 1994. The commitment-trust theory of relationship marketing. Journal of Marketing, 58(4):
20-38.
Muniz, Jr., A.M., & O’Guinn, T.C. (2001). Brand Communication. Journal of Consumer Research,
Shiva, V. (1997). Biopiracy: The Plunder of Nature and Knowledge, Cambridge: South End Press.
Tapscott, D., & Ticoll, D. (2002). The Naked Corporation. How the Age of Transparency will
Revolutionize Business. Free Press : New York
Tetlock, P.E. (2002). Social functionalist framework for judgment and choice : Intuitive Politicians, theo logicians and
prosecutors. Psychological Review, 109(3), 451.
Visvanathan, S. (2009). The search for cognitive justice. Seminar, 597, 45-49. .
Visvanathan, S. (1997). A Carnival for Science: Essays on science, technology and devel opment. London: Oxford
University Press.
Walsh, J.P. (2011). Embracing the sacred in our secular scholarly world. Academy of Management Review, 36(2), 215-
234.
Weber, M. ([1922]1978).Economy and Society. Berkeley: University of California Press.

697
Location Based Sales Promotion Strategies Location Based Services (LBS), Location Based Marketing (LBM), Sales Promotion, Retailing, Mobile Marketing,
Permission Marketing
Caner Dilmener, Business Administration Programme, [email protected]
Onur Yazıcıbaşıoğlu, Business Administration Programme, [email protected]
Abstract
Mobile devices have become an important tool in consumer’s live. Consumers start searching every product or service
detail through their mobile devices. It’s important for retailers to promote their products or services and reach
customers on the point of sales via mobile devices. Businesses become closer to the customer and it has become
appropriate to present proposals to the customers with these new technologies.
Location based marketing is still in its infancy and a new concept in literature. Location based sales promotion (LBSP)
can be defined as a process of reaching right customers, at right location, at right time with customized or mass sales
promotion offer by location based tools and technologies. As a result, new concepts and practices should be considered.
Our aim is to create a literature base on location-based sales promotion, define location based sales promotion, discuss
how to manage a location-base sales promotion campaigns regarding push and pull demand strategies with examples
for businesses. This is an exploratory research. This article highlights important issues on location-based sales
promotion and concludes an agenda for future studies.
1. Introduction
In the era of consumer centric marketing and as Kartajaya, Kotler and Setiawan (2010) named it “Marketing 3.0”,
consumers are hit daily by many marketing messages. Point of sale consumer engagement is crucial to affect
consumer’s purchase behavior.
2011 has been declared as the “Year of the Mobile” and as consumers spend more time with their smartphones, they
are more accessible. By knowing the position of a consumer relative to bricks and mortar retail locations, marketers
can trigger relevant alerts and reminders, and provide relevant value-added information, discounts or deals when the
consumer needs it at the right place and at the right time(PwC Report, 2011). This situation has continued to accelerate
after 2012.
According to Sultan et. al. (2009), brand managers view mobile devices as an attractive platform from which to
interact with consumers through various forms of marketing communications, including location based promotions.
Through increased used of location-aware technologies and the development of branded mobile networks, global
wireless and mobile marketing platforms and applications have begun to create fundamental changes in the ways
brands and consumers interact.
The developments in mobile technologies and the increased use of smart phones had led marketers to do targeted
marketing activities easier through mobile devices.
According to a 2009 Gartner report, location targeting will be one of the primary types of marketing predicted to
explode in upcoming years, and by 2013, mobile advertising expenditure will surpass $13 billion. Fueling this growth
are improvements in GPS technology and rapid adoption of smartphones, including iPhone and Blackberry (Davis ,
2009). There is an importance of mobile devices for mobile marketing applications.
The mobile device has three important characteristics: ultra portability, location sensitivity and untetheredness (not
restricted with a tether) (Shankar and Balasubramanian, 2009). If a person uses mobile devices, he/she becomes
better equipped and informed as a consumer; consumers start searching every product or service detail through their

698
mobile devices therefore it’s important for retailers to promote their products or services via mobile devices.
According to Harvey and Needham (2011) the dramatic growth in the social networking, proliferation of smart phones
and drive to create commercial opportunities based on location have led to several new services. According to Winter
(2009), marketers are more interested in “behavioral targeting” that is focusing on developing personalized messages
based on what people are doing on the web or the paths that people take when surfing the web or where they are by
their personal GPS ”system”, the cellphone. More than 80 % of brick and mortar retailers will have wireless networks
available in their stores by 2017 (Motorola Solutions, 2012). Customer’s lives are "internetized" and mobilized in a way
that businesses should use it in order to maximize their profit. Customers also came into position ready to search ,
select and/or purchase.
Location based services had made retailers to target a specific group of customers within a specified location. Location
based sales promotion (LBSP) can be defined as a process of reaching the right customers, at the right location, at the
right time with customized or mass sales promotion offer by location based tools and technologies. Retailers can
increase their sales, attract new customers and collect permission driven database. Location based services (LBS) tools
enable small firms to manage sales promotion campaigns inexpensively. Location based services (LBS) is subject to
change conventional sales promotions. Our study limited only for location-based consumer sales promotion via mobile
devices. Location-based services have great potential for growth; while estimates vary, most research indicates that
revenues are expected to triple in the next five years. In June 2011, Foursquare (the location-based social networking
company) reported that it had exceeded ten million users who have “checked-in”, posting their location to friends over
750 million times (Wireless Communications Bureau, 2012).
Location based marketing is still in its initial stage and it is projected that in the future, as use of smart mobile devices
and tablets increase, retailer’s investment in location based marketing technologies will enhance consumer shopping
experience. Therefore in this article we would like to explain some basic concepts of this issue and then we focused on
strategies that can be used and give some examples of some implications.
2.1. Sales Promotion
Sales promotion is the direct inducement or incentive to the sales force, the distributor, or the consumer, with the
primary objective of creating an immediate sale (Shultz and Robinson, 1982). Sales promotion consists of short term
incentives to encourage purchase or sales of a product or service (Kotler,2006). There are several articles on sales
promotion: Blattberg and Neslin(1990), Kotler (2006),Gedenk and Neslin (2002), Kwok (2005), Low and Mohr (2000)
studied on types of sales promotion tools; Florence et. al. (2011), Buil et al. (2013) studied relationships between sales
promotion and brand equity; Haans and Gijsbrechts compared effectiveness of sales promotion between smaller and
larger supermarkets; Gamliel and Herstein (2011) studied the effects of price promotion on consumer’s purchase
intentions; Jayasingh and Eze(2009), Muk (2012), Im and Ha (2012), Banerjee and Yancey(2010), Sanches et. al. (2012)
studied mobile coupons.
What seems to be consensual is the fact that promotions thought to surprise de the consumers are an important
element of competitive advantage in retail markets with retailers using different promotion techniques to attract
consumers. Some of the most commonly used tools are price promotions, “loss leader” promotions (deep discount
deals), feature advertising (store flyers), and in-store displays (Ailawadi et al., 2009).
2.2. Location Based Services
According to Roebuck (2011) location based services (LBS) is an information or entertainment service, accessible with
mobile devices through the mobile network and using the ability to profit from the geographical position of the mobile
device. Location-based services are information technology services for providing information that has been created,
compiled, selected, or filtered taking into consideration the current locations of the users or those of other persons or
mobile objects (Küpper, 2005).
Location based services enable marketers to provide location relevant information to their customers via mobile
devices; they’ve emerged in the mid-1970 in the US by indentifying the location of callers who dial the 9-1-1 emergency
phone number (Nichols, 2009).

699
Location services are mainly used in three areas: military and government industries, emergency services, and the
commercial sector (Schiller and Voisard,2004). There are several recent articles on location based services (Dey et.
al.,2010;Phillips et. al.,2010;Zipf et.al.,2012;Zibuschka,2011,Li et. al.,2012). Research by Kühn (2004) illustrated that
new class of services, based on location and context awareness such as a dynamic navigation support is feasible using
GPRS data communication.
Table 1. Categories and examples of LBS applications.
Push Services Pull Services
Person-oriented
Communication Ex. 1: You get an alert from a friend zone application that
a friend has just entered your area.
Ex. 2: A message is pushed to you asking whether you
allow a friend to locate you.
Ex. 1: You request from a friend finder application
who is
Information Ex. 3: You get an alert that a terror alarm has been issued
by the city you are in.
Ex. 2: You look for the nearest cinema in your area
and navigation instructions to get there.
Entertainment Ex. 4: You have opted to participate in a location-based
''shoot 'em up'' game and are being attacked.
Ex. 3: You play a location-based game and look for
another opt-in in your area to attack.
M-Commerce and
Advertising
Ex. 5: A discount voucher is being sent to you from a
restaurant in the area you are in.
Ex. 4: You look for cool events happening in the
area you are in.
Device-oriented
Tracking Ex. 6: An alert is sent to you from an asset-tracking
application that one of your shipments has just deviated
from its foreseen route.
Ex. 7: You get an alert that your child has left the
playground.
Ex. 5: You request information on where your
truck fleet currently is located in the country.
Source: SCHILLER, JOCHEN., VOISARD, AGNES. (2004). Location-based Services. Morgan Kaufmann Publishers.
Location-based services (LBS), allow people to report their current location in real time to a given platform. It is
accessible with mobile devices through the mobile network and can be used in a variety of applications. Although
location- based services have been around since 2000, they were mainly used in commerce with a subscription-based
business model; with the releases of a new generation of smart phones, developers were able to introduce location-
based services to use of the mainstream consumer (IBM Corporation 2012).
Location based services are defined as context-aware services that use the location of the user to adapt the service
accordingly (Kaasinen, 2003 in Pannevis, 2007). From the marketer’s point of view, location based services are the
technologies developed to direct to a product or service while individuals moving or in a particular position
(Yamamoto, 2012).
2.3. Location-based Marketing
Location-based Marketing is a new concept in literature. LBM can be defined as targeting mobile users within a
specified geophone area or a location via mobile marketing tools. Location-based marketing (LBM) targets the user
directly and most of the time, the consumer receives a message on their mobile device containing a call to action (such
as enter a competition, visit a website or order a product) and an incentive, such as a coupon (Gartner IT Glossary,
2012). According to PWC Report (2012), location-based marketing (LBM) bridges the gap between all forms of
marketing media, inclusive of social media and the internet. LBM covers the utilization and /or integration of all media
to engage and market to people in specific places with specific offerings. LBM uses location-based services to reach and
engage with customers based upon where they are located (PwC, 2012).
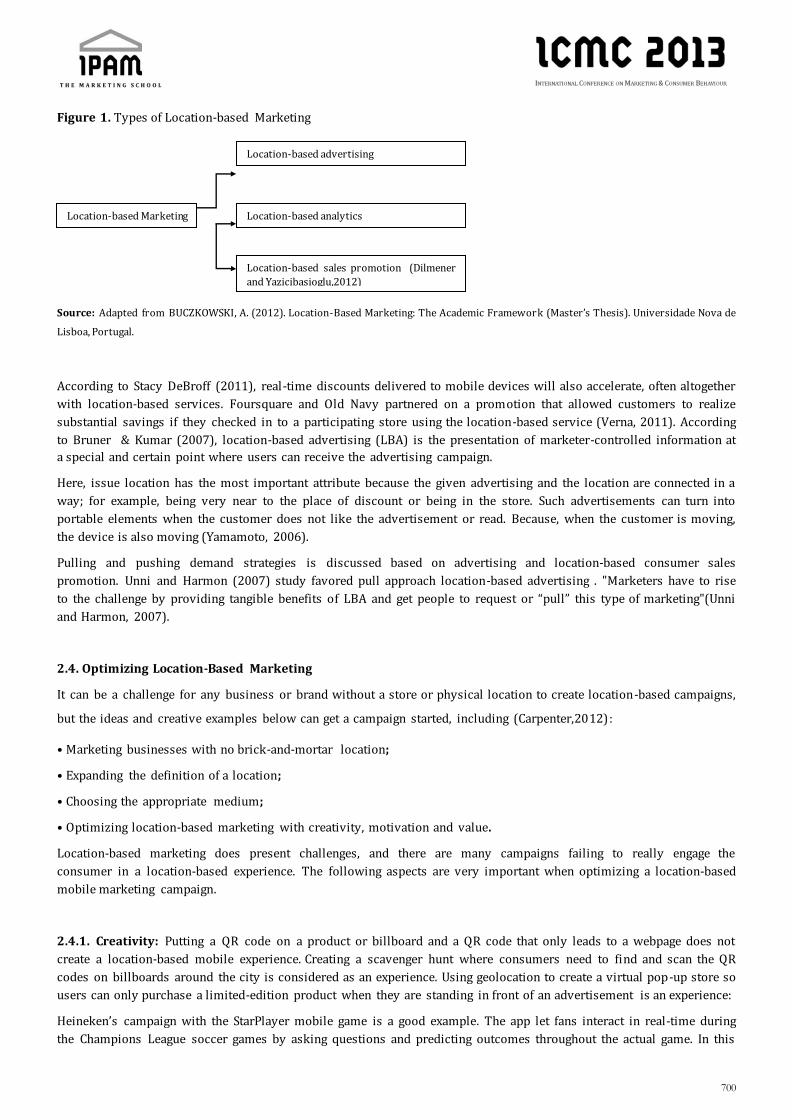
700
Figure 1. Types of Location-based Marketing
Source: Adapted from BUCZKOWSKI, A. (2012). Location-Based Marketing: The Academic Framework (Master’s Thesis). Universidade Nova de
Lisboa, Portugal.
According to Stacy DeBroff (2011), real-time discounts delivered to mobile devices will also accelerate, often altogether
with location-based services. Foursquare and Old Navy partnered on a promotion that allowed customers to realize
substantial savings if they checked in to a participating store using the location-based service (Verna, 2011). According
to Bruner & Kumar (2007), location-based advertising (LBA) is the presentation of marketer-controlled information at
a special and certain point where users can receive the advertising campaign.
Here, issue location has the most important attribute because the given advertising and the location are connected in a
way; for example, being very near to the place of discount or being in the store. Such advertisements can turn into
portable elements when the customer does not like the advertisement or read. Because, when the customer is moving,
the device is also moving (Yamamoto, 2006).
Pulling and pushing demand strategies is discussed based on advertising and location-based consumer sales
promotion. Unni and Harmon (2007) study favored pull approach location-based advertising . "Marketers have to rise
to the challenge by providing tangible benefits of LBA and get people to request or “pull” this type of marketing"(Unni
and Harmon, 2007).
2.4. Optimizing Location-Based Marketing
It can be a challenge for any business or brand without a store or physical location to create location-based campaigns,
but the ideas and creative examples below can get a campaign started, including (Carpenter,2012):
• Marketing businesses with no brick-and-mortar location;
• Expanding the definition of a location;
• Choosing the appropriate medium;
• Optimizing location-based marketing with creativity, motivation and value.
Location-based marketing does present challenges, and there are many campaigns failing to really engage the
consumer in a location-based experience. The following aspects are very important when optimizing a location-based
mobile marketing campaign.
2.4.1. Creativity: Putting a QR code on a product or billboard and a QR code that only leads to a webpage does not
create a location-based mobile experience. Creating a scavenger hunt where consumers need to find and scan the QR
codes on billboards around the city is considered as an experience. Using geolocation to create a virtual pop-up store so
users can only purchase a limited-edition product when they are standing in front of an advertisement is an experience:
Heineken’s campaign with the StarPlayer mobile game is a good example. The app let fans interact in real-time during
the Champions League soccer games by asking questions and predicting outcomes throughout the actual game. In this
Location-based Marketing Location-based analytics
Location-based sales promotion (Dilmener
and Yazicibasioglu,2012)
Location-based advertising

701
scenario, the games had a location, but not every viewer could be there. Instead, Heineken made the location wherever
the consumer was watching the game. Using mobile, they brought a location-based experience to every consumer.
2.4.2 Motivation: One of the hardest things on location-based marketing is getting people to take action—to pull their
mobile device out of their pocket and engage with a campaign. This can be even harder when a company doesn’t have
the resources to offer 20 percent off for just walking through their doors and checking-in to their store. The most
successful campaigns motivated their consumers by being easy, timely and solving an immediate need.
The Red Cross operates blood drives at all kinds of locations, many of them mobile and temporary. Working with
Foursquare, the Red Cross introduced the “Blood Donor Badge” which can be unlocked from any blood drive, at any
location. The user simply needs to check in at their location, and then give a shout-out using the words “Red Cross”
“blood” and “donate.”
2.4.3. Value: Foursquare badges and mayor hoods are successful because they’re exclusive; a person can’t get a badge
just by visiting a website, and only one person can be mayor at a time. If a campaign is going to ask the consumer to
take an action, they need to be motivated with something valuable. For example, if a campaign where five billboards
around the city each have a different text code, consumers can be rewarded with an SMS coupon tailored for something
in the immediate vicinity of each billboard. If consumers can pull the same coupons off of marketer’s website, they’re no
longer receiving something unique and valuable from marketer’s location-based mobile campaign.
2.4.4. SoLoMo - Social-Local-Mobile Marketing: we have only discussed the tip of the iceberg for location-based
mobile marketing for non-brick-and-mortar businesses. Even without a permanent location, there are lots of ways to
create an alternative location – at an event, becoming associated with another place, using ad space as a location and by
using consumer as the location. At the very least, it’s essential that marketer’s website is mobile friendly and monitor
the amount of mobile traffic marketer’s business is getting.
Marketers can connect with consumers wherever they are. Mobile devices are key to connecting a campaign to a
consumer’s physical location. That’s why we have buzzwords like SoLoMo or LoSoMo – successful marketing now
makes things Social, Local, and Mobile. While location-based mobile marketing isn’t ubiquitous for mobile users, it’s a
growing trend marketers can – and should – be using. Location-based mobile marketing connects the consumer to a
campaign because it’s real-time, personal and engaging; it’s marketer’s brand wherever they are (Carpenter, 2012).
Later on, marketers don’t have to be a brick-and-mortar business to operate a great location-based mobile campaign.
Location-based campaigns allow marketers to make more than just a static ad. This is the opportunity to create a truly
engaging experience.
2.5. Location-based Consumer Sales Promotion Pull Strategies
In a pull strategy, customers wants to have the product. The intention comes from the customers. As the privacy and
opt-in marketing issues becoming important, pull stragies are important for retailers in order to promote their sales
promotion. A retailer can manage a promotion campaign through a social networking mobile application such as
Foursquare, Facebook Places and Gowalla (which was closed in 2012). Location based consumer sales promotion
campaign can give monetary incentives such as discounts, vouchers, price pack deals, buy 1 get one free or non
monetary incentives such as gift products.
In social networking sites, promotion has been offered to the customers on a conditional base. In order to make a
consumer sales promotion via social networking sites, retailers should acquire the control of it’s virtual location page
on social networking site. The retailer should decide on the type of promotion. Any kind of consumer promotion can be
done by a retailer providing consumer check-in at their retail store. The period of the promotion, the number of the
promotion rewards and the place of the promotion is under the control of the retailer. According to Kaplan (2012),
location based promotions done via Foursquare do not necessarily need to be associated with tangible benefits.
The advantage of doing sales promotion via social networking sites means to get two objectives at one go: the retailer
can gain new customers and, at the same time, promotes its brand/store, which creates brand awareness. Pull based
consumer sales promotion can be done by mobile applications such as Vouchercloud in UK and PlaceCast in USA.

702
Consumers can choose to receive text messages in a variety of ways—at the store, online, via text-message, mobile
websites or on Facebook and geofences are virtual areas set around physical locations; when an opted-in consumer is
inside a geo-fenced area (a virtual fence that has been specified on a real world map), he/she receives a message from
a business, including a discount, notice of a sale, directions to a store or other content
(http://techcrunch.com/2011/08/22/placecast-brings-location-based-shopping-alerts-to-smartphone-apps). There
are more examples for this kind of implementations. In May 2012, US retailer Target launched a campaign with mobile
couponing app Shopkick that enabled shoppers to collect and exchange points for rewards; customers could earn 60
points just for walking into a store, with even more on offer for certain promotional days throughout the year: points
were also on offer in return for scanning certain products (http://econsultancy.com/tr/blog/11303-eight-great-
location-based-mobile-campaigns-from-2012).
Starpet also started a promotion campaign through Facebook in November 2012. Starpet provided different discount
rates at different Starpet branches, allowing the Foursquare users to check in at Starpet and show their tablet or mobile
device screen to the salesperson: Foursquare users could benefit from discounted fuel prices
(http://otomobil.milliyet.com.tr/starpet-ten-foursquare-kullanicilarina-akaryakit-indirimi/otokampanya/haberdetay/
07.11.2012/1623383/default.htm). Considering the fact that Turkey has one of the highest petrol prices in the world,
sales promotions in the gas sector is highly attractive to the consumers.
2.6. Location-based Consumer Sales Promotion Push Strategies
In a push strategy, the retailer push their products. The intention comes from the retailer who collaborates with GSM
operators. GSM operator has been paid to share itss customer database and afterwards the retailer decided which
persons to target. The selected targeted customers received information about the sales promotion, when the targeted
customer came nearby the retailer’s location (retailer’s geofence).
The geofence can be decided by the retailers. The advantage of this strategy is that retailers can offer customized sales
promotions to the customers. Mobile application technologies offer the potential for location based price promotions,
in which customers receive coupons and promotions directly on their cell phones when they are near a store that sells
items they may be interested in purchasing (Grewal et al., 2011).
There are several mobile advertising tools: Short Message Service (SMS), Multimedia Messaging Service (MMS),
Interactive Voice Response (IVR), Wap Push and others. Short Message Service (SMS) is one of the most used type of
mobile advertising. A text message about sales promotion can be send to customers.
In the last quarter of 2011, Vodafone and Caffé Nero Turkey have managed to attract the attention of customers with an
interesting campaign; Vodafone users, passing nearby a Caffe Nero had received a free coffee offer via SMS, allowing
them to give a free coffee gift to their friends. Within 3 days, over 500 coffee cups have been consumed by the campaign
users. The aim of the campaign was to receive instant feedback from the customers and it was achieved
(http://sosyalmedyabulteni.com/vodafone-ve-caffe-nerodan-basarili-bir-pazarlama-ornegi). Multimedia Message
Service (MMS) enables sending pictures, videos and other type of multimedia to mobile devices. Interactive Voice
Response (IVR) is a technology that allows retailers to call customers with an automated sales promotion message.
WAP Push enables retailers to add a link to a promotion offer. Location-based mobile coupons are getting popular.
According to Prosper Mobile Insights research, 67% of mobile users agree that location-based coupons on a mobile
device are "convenient and useful", while 42% say that they have already used a mobile coupon of some kind
(http://www.trendwatching.com/trends/dealerchic).
2.7. Opt-in / Opt-out, Permission Based Marketing
According to Smith (2004), opt-in means that a prospect or customer has not granted permission to be interrupted with
mailings, e-mails and telemarketing (telephone calls) unless he has made the effort and decided to ticking an opt-in
box; this is a proactive agreement to receive electronic communications and opt-out assumes that a customer has given
permission to receive marketing communications unless he has actively made the effort and “opted out” by ticking an
“opt-out” box.

703
In addition to get sure that consumers receive proper notice of privacy practices, companies also face the challenge of
making sure that consumers are afforded with the opportunity to exercise meaningful choice with respect to the
collection and use of their personal information. The concept of “choice” in privacy policies refers to providing the
consumer with the opportunity to tell a company what it can and cannot do with his/her personal information. Choice
can take the form of “opt-out,” where the default option permits the company to use personal information in a
particular way unless the consumer objects, or “opt-in,” where the company cannot use personal information without
the advance consent of the consumer.
In the LBS business environment, companies encounter unique challenges to ensuring that consumers have the
opportunity to make meaningful choices. One issue these companies face is whether consumer choice should be opt-out
or opt-in for location information, although there appears to be a developing consensus in the LBS industry that opt-in
is appropriate for such sensitive information. A Zogby International Survey commissioned by Common Sense Media
and conducted in August 2010 found that “the vast majority of respondents say that search engines and online social
networking sites should not be able to share their physical location with other companies before they have given
specific authorization.” Another particular challenge facing companies is minimizing interference with the user
experience while concurrently offering meaningful choice to consumers. As noticed at the FCC Forum, there is a
“tension between granularity and simplicity” between the desire to ensure that consumers are provided the
opportunity to make meaningful choices in real time regarding the use of their location-based information and the
desire to ensure a seamless user experience. Companies and third party intermediaries are developing creative choice
mechanisms having this in mind, including utilizing uniform language that would allow consumers to make their
privacy preferences known by categories or characteristics.
Individually, companies have taken a variety of approaches to consumer choice. Apple acknowledges the importance of
“providing its customers with the ability to control the location-based services capabilities of their devices” (Letter
from Bruce Sewell, Apple General Counsel and Senior Vice President, Legal and Government Affairs, to The Honorable
Edward J. Markey, U.S. House of Representatives (July 12, 2010)).As Microsoft has stated (Letter from Andy Lees,
President, Microsoft Mobile Communications Business, to The Honorable Fred Upton, U.S. House of Representatives
(May 9, 2011))Microsoft does not collect information to determine the approximate location of a device unless a user
has expressly allowed an application to collect it. Users that have allowed an application to access location data always
have the option to access the location at an application level or they can disable location collection altogether for all
applications by disabling the location service feature on their phone. Google states that “opt-in consent and clear notice
are required for collection and use of location information on Android” (Google Inc. ex parte, WT Docket No. 11-84 (July
8, 2011)
2.8. Security / Fraud and Limitations on Location Based Services (LBS) – Location Based Marketing (LBM)
The promise of LBS, however, comes with challenges and concerns. Because mobile devices have the ability—and often
the technical requirement—to regularly transmit their location to a network, they also enable the creation of a precise
record of a user’s locations over time. This can result in the creation of a very accurate and highly personal user profile,
which raises questions of how, when and by whom this information can and should be used.
In light of these developments, the staff of the Federal Communications Commission (the “FCC” or “Commission”) has
prepared this report on LBS. As discussed in greater detail below, drawing upon its experience in protecting consumer
privacy, Commission staff believes:
LBS have tremendous potential to provide value and foster innovation to benefit the economy and consumers;
LBS industry players face challenges as they attempt to provide consumers with appropriate notice and choice
with respect to the use of the data generated by LBS and the devices and networks that host them;
Industry is taking steps to answer these challenges but the degree of responsiveness varies among companies
and industry segments; and
New issues continue to emerge that need to be addressed, timely and responsively.
Consequently, in collaboration with federal partners and industry representatives, Commission staff will continue to
monitor industry compliance with applicable statutory requirements and evolving industry best practices to ensure

704
LBS evolves to meet its fullest potential while protecting the legitimate interests of consumers in safeguarding their
personally identifiable information.
Location-based services are transforming the ways people across the country conduct business, organize their lives,
and have fun. They can save time, money, and even lives. However, because of the technologies that enable them, LBS
have the inherent ability to create accurate snapshots of their users’ activities that can contain very personal
information. As both the potential and the challenges of LBS have become more understood, the US Federal
Communications Commission, along with other federal agencies and Congress, has begun to assess ways to best ensure
the LBS users enjoy all their benefits and that their confidential information is secure. Industry has also played an
important role. The Commission has a long tradition of ensuring that the privacy of consumers is protected (The
Consumer Privacy Protection Act of 2011, H.R. 1528, 112th Cong. (2011)). Consumers have opinions and want to be
heard, yet sometimes, they would prefer to be anonymous in sharing these opinions or their whereabouts. With
location verification it's possible to ensure a person’s privacy and still consider their insight credible and worthy and
many international software companies are still working on such software regulations (Rush, 2012).
3.Conclusion
Mobile marketing is a new area, and SMEs (Small and Medium Enterprises) should be careful before spending too much
money in such a new area; businesses need to be cautious and keep some crucial issues in mind before running a
mobile marketing campaign. Location based marketing is an integrated and collaborative marketing process. Mobile
analytics, location-based advertising and location-based sales promotion should be managed in an integrated way.
Businesses can conduct a successful location-based sales promotion campaign through a good collaboration with
service providers and GSM operators.
Location based marketing is one of the fastest developing and versatile direct marketing strategy. This versatility also
makes location based marketing sales promotion a strategy way of acting with a lot of advantages and innovations.
Location based services has shown that its impact on sales promotion with correctly narrowed down target groups is
also working very efficiently as far as costs are concerned. Location Based Marketing is also considered not only as a
short time marketing strategy but it’s one of the strongest long term player on the Integrated Marketing
Communication area. The brilliant future of LBM has also some question marks related to it and one of the biggest one
is the customer’s privacy and security; companies/brands and international commissions are working hardly to offer
different choices.
The key to achieve success on location based marketing (LBM) is knowing the customers, observing what they are
doing and then matching marketing strategies to the customer behavior. There is a huge opportunity for businesses to
get ahead of the game as mobile marketing is still in its childhood.
This paper has thrown up many questions in need of further research. Further research might explore whether location
based sales promotion cause brand switching. It would be interesting to study the effects of gender, age and sector
factors. Further research should try to determine which location-based advertising tool is the most effective. Another
research question might be: are location based sales promotion effective on convenience products?
4.Acknowledgements
Prof. Dr. Gonca Telli YAMAMOTO encouraged us to research location based marketing. The authors wis hes to express
their gratitudes to Prof. Dr. Gonca Telli YAMAMOTO for guiding and reviewing their article.
References
AILAWADI, K., DONTHU, N. & GAURI, D. (2009). Communication and Promotion Decisions in Retailing: A Review and
Directions for Future, Journal of Retailing (85), 42-45.
BANERJEE, S. & YANCEY, S. (2010). Enhancing mobile coupon redemption in fast food campaigns. Journal of Research
in Interactive Marketing, 4(2), 97-100.
BLATTBERG, R. & NESLIN, S. (1990). Sales Promotion: Concepts, Methods and Strategies. Prentice Hall.

705
BRUNER, G. C., & KUMAR, A. (2007). Attitude toward location-based advertising. Journal of Interactive Advertising,
7(2), 3-15.
BUCZKOWSKI, A. (2012). Location-Based Marketing: The Academic Framework (Master’s Thesis). Universidade Nova
de Lisboa, Portugal.
BUIL, I., CHERNATONY, L. & MARTINEZ, E. (2013). Examining the Role of Advertising and Sales Promotions in Brand
Equity Creation, Journal of Business Research (66), 115-122.
BUTCHER, D. (2011). Location-based marketing can increase average order value, frequency, loyalty [Online],Available
at: http://www.mobilemarketer.com/cms/news/advertising/9540.html[05.12.2012 [15.12.2012].
CARPENTER, C. (2012). SoLoMo: Location-Based Mobile Marketing For Non-Brick-and-Mortar Businesses [Online].
Available at: http://www.carousel30.com/about/news/coverage/solomo-location-based-mobile-marketing-
non-brick-and-mortar-businesses [15.02.2013].
DAVIS, A. (2009). Location-based Marketing Platform, 1020 Placecast Secures $5 Million in Series B Funding[Online],
Available at: http://www.prweb.com/releases/2009/11/prweb3222984.htm [15.12.2012].
DELOITTE. (2012). Retail Sector Update [Online], Available at: http://www.deloitte.com/assets/Dcom-
Turkey/Local%20Assets/Documents/turkey_tr_cb_retailsectorupdate_040612.pdf [10.12.2012].
DEY, A., HIGHTOWER, J., & DAVIES, N. (2010). Location-based services. Pervasive Computing, IEEE, 9(1), 11-12.
FLORENCE, P.V.,GUIZANI, H. & MERUNKA, D. (2011). The Impact of Brand Personality and Sales Promotions on Brand
Equity, Journal of Business Research (64), 24-28.
GAMIEL, E. & HERSTEIN, R. (2011). To save or to lose: does framing price promotion affect consumers’ purchase
intentions? Journal of Consumer Marketing, 28, (2), 152 – 158.
Gartner IT Glossary. Location-Based Marketing (LBM). Available at: http://www.gartner.com/it-glossary/location-
based-marketing-lbm [15.02.2013].
GREWAL, D., AILAWADI, K., GAURI, D., HALL, K., KOPALLE, P. & ROBERTSON, J. (2011). Innovations in Retail Pricing and
Promotions. Journal of Retailing (1,2011), 43-52.
HARVEY, T. & NEEDHAM, G. (2011). NFC Mobile Phones-Opportunities for Location Based Marketing[Online], Available
at: http://fenbrook.com/wp-content/upLoads/2011/04/Location-Based-Marketing-White-Paper-1-2.pdf
[15.12.2012].
HERRAN, G., SIGUE, S.P. & ZACCOUR, G. (2010), The Dilemma of Pull and Push Price Promotions, Journal of Retailing
(86), No. 1, 51-68.
IM, H. & HA. Y. (2012) Who are the users of mobile coupons? A profile of USA consumers. Journal of Research in
Interactive Marketing, 6(3), 215-232.
JAVASINGH, S. & EZE, C. (2009). An Empirical analysis of consumer behavioral intention toward mobile coupons in
Malaysia. International Journal of Business and Information, 4(2), 221-242.
KAPLAN, A. (2012). If you love something, let it go mobile: Mobile Marketing and mobile social media 4x4. Business
Horizons (55), 129-139.
KARTAJAYA, H., KOTLER, P. & SETIAWAN, I. (2006). From Products to Customers to the Human Spirit: Marketing 3.0 (1
Edition). WILEY.
KOTLER, P. (2006). Principles of Marketing(Eleventh Edition).Pearson Prentice Hall.
KÜHN, P. (2004). Location-Based Services in Mobile Communication Infrastructures. International Journal of
Electronics and Communications (58), 159-164.
KÜPPER, A. (2005). Location-based services: Fundamentals and Applications (New Edition). Wiley, John & Sons.
KWOK, S. & UNCLES, M (2005). Sales Promotion effectiveness: the impact of consumer differences at an ethnic –group
level. Journal of Product & Brand Management, 14(3), 170-186.
706
LI, K. & DU, K. (2012). Building a targeted mobile advertising system for location-based services. Decision Support
Systems.
LOW, G. S. & MOHR, J. J. (2000). Advertising vs. sales promotion: a brand management perspective. Journal of Product &
Brand Management, 9(6), 389-414.
MOTOROLA SOLUTIONS. (2012). How Brick-And-Mortar Retailers Can Win The Omnichannel Battle[Online], Available
at: http://www.thelbma.com/files/324-Motorola-OmniChannel%20Study.pdf [15.02.2013].
MUK, A. (2012). Perceptions of mobile coupons: A cross-national study. Journal of Direct, Data and Digital Marketing
Practice, 13(4), 311-324.
NICHOLS, S. (2009). Will Mobile Computing’s Future Be Location, Location, Location?. Computer, Volume (42), 14 -17.
PANNEVIS, M. (2007). I’m bored! Where is Everybody? Location Based Systems for Mobile Phones (Master’s Thesis).
University of Amsterdam, Holland.
PHILLIPS, A., SCHROTH, F., PALMER, M., ZIELINSKI, G., SMITH, P. & CUNNIGHAM, M. (2010). U.S. Patent No. 7,848,765.
Washington, DC: U.S. Patent and Trademark Office.
PWC. (2012). Marketing Goes Local [Online], Available at: http://www.researchfindr.com/marketing-goes-local
[10.12.2012].
ROEBUCK, K. (2011). Location-Based Services (Lbs): High-Impact Strategies - What You Need to Know: Definitions,
Adoptions, Impact, Benefits, Maturity, Vendors. Emereo Pty Limited.
RUSH, D. (2012). Yes, It's True: Location and Consumer Privacy Can Co-Exist[Online]. Available at:
http://www.huffingtonpost.com/david-rush/location-based-technologies_b_2433944.html [15.02.2013].
SANCHES, J., VELASCO, J., RUIZ, L & GOMEZ A. (2012). AN NFC-Based Solution for Discount and Loyalty Mobile Coupons.
In Near Field Communication (NFC), 2012 4th International Workshop on (pp.45-50). IEEE.
SCHILLER, J. & VOISARD, A. (2004). Location-based Services. Morgan Kaufmann Publishers.
SCHLUTZ, E. & ROBINSON, W. (1982), Sales Promotion Management, Crain Books.
SHANKAR, V. (2009). Mobile Marketing: A Synthesis and Prognosis. Journal of Interactive Marketing(23), 118-129.
SHULTZ, D. & ROBINSON, W. (1982). Sales Promotion Management.NTC Business Books.
SMITH, P. R. & TAYLOR, J. (2004) Marketing Communications: An Integrated Approach, Kogan Page Publishers.
SMITH, P.R. & TAYLOR, J. (2004). Marketing Communications: An Integrated Approach (4 th edition). London.
SULTAN, F., ROHM A. J., GAO, T. & PAGANI, M. (2012). Brand in the hand: A cross-market investigation of consumer
acceptance of mobile marketing. Business Horizons(55), 485-493.
SULTAN, F., ROHM, A. & GAO, T. (2009). Factors Influencing Consumer Acceptance of Mobile Marketing A Two -Country
Study of Youth Markets. Journal of Interactive Marketing (23), 308-320.
UNNI, F. & HARMON, R. (2007). Perceived Effectiveness of Push Vs. Pull Mobile Location-Based Advertising. Journal of
Interactive Advertising (Vol 7,No:2), 28-40.
VERNA, P. (2011). Top Digital Trends for 2012. Checking In Checking Out(12). eMarketer.
VU, T. & RYU, K. (2009). A method for predicting future location of mobile user for location-based services system.
Computer & Industrial Engineering (57), 91-105.
WINTER, R. (2009). New Communications Approaches in Marketing: Issues and Research Directions. Journal of
Interactive Marketing(23), 108-117.
WIRELESS COMMUNICATION BUREAU (2012). Location-based Services An Overview of Opportunuties and Other
Considerations. Washington DC: Federal Communications Comission.
YAMAMOTO, G.T. (2010), Mobilized Marketing and the Consumer: Technological Developments and Challenges,
Business Science Reference.

707
YAMAMOTO, G.T. (2012), Mail Correspondance, 30.12.2012.
ZIBUSCHKA, J., RANNENBERG, K. & KÖLSCH, T. (2011). Location-based services. Digital privacy, 679-695.
ZIPF, A. & JÖST, M. M. (2012). Location-Based Services. Springer Handbook of Geographic Information, 417-421.
http://techcrunch.com/2011/08/22/placecast-brings-location-based-shopping-alerts-to-smartphone-apps
[15.02.2013].
http://econsultancy.com/tr/blog/11303-eight-great-location-based-mobile-campaigns-from-2012 [15.02.2013].
http://otomobil.milliyet.com.tr/starpet-ten-foursquare-kullanicilarina-akaryakit-
indirimi/otokampanya/haberdetay/07.11.2012/1623383/default.htm [15.02.2013].
http://sosyalmedyabulteni.com/vodafone-ve-caffe-nerodan-basarili-bir-pazarl ama-ornegi [15.02.2013].
http://www.trendwatching.com/trends/dealerchic [15.02.2013].
FCC 2012 (Federal Communications Commision)Public Notice, 26 FCC Rcd 6757 (2011).
Manufacturing, and Trade and the Subcomm. on Communications and Technology of the H. Committee on Energy and
Commerce, 112th Cong. (July 14, 2011).
http://energycommerce.house.gov/hearings/hearingdetail.aspx?NewsID=8769
Protecting Mobile Privacy: Your Smartphones, Tablets, Cell Phones and Your Privacy: Hearing Before the
Subcomm. on Privacy, Technology and the Law of the S. Comm. on the Judiciary, 112th Cong. (May 10, 2011), available
at:http://www.judiciary.senate.gov/hearings/hearing.cfm?id=e655f9e2809e5476862f735da16bd1e7
[10.02.2013]
ECPA Reform and the Revolution in Location Based Technologies and Services: Hearing Before the Subcomm. on the
Constitution , Civil Rights, and Civil Liberties of the H. Comm. on the Judiciary , 111th Cong. (June 24, 2010).
The Collection and Use of Location Information for Commercial Purposes (June 24 2010) Available at :
http://judiciary.house.gov/hearings/printers/111th/111-109_57082.PDF [10.02.2013].
“Protecting Consumer Privacy in an Era of Rapid Change: Recommendations for Business and Policy Makers,” FTC
Privacy Report at 60 (Mar. 2012), available at http://ftc.gov/os/2012/03/120326privacyreport.pdf
[10.02.2013].
McKinsey Global Inst., Big data: The next frontier for innovation, competition, and productivity 85 (2011), available at
http://www.mckinsey.com/mgi/publications/big_data/pdfs/MGI_big_data_full_report.pdf [15.02.2013].
“Privacy Policy Guidance Memorandum,” Dept. of Homeland Security, Memorandum No. 2008-01 at 3 (Dec. 29, 2008),
available at http://www.dhs.gov/xlibrary/assets/privacy/privacy_policyguide_2008-01.pdf. [15.02.2013].
“Commercial Data Privacy in a Networked World: A Framework for Protecting Privacy and Promoting Innovation in
the Global Economy,” Dept. of Commerce Internet Policy Task Force at 14 (Feb. 2012) available at
http://www.whitehouse.gov/sites/default/files/privacy-final.pdf.
(“Privacy Blueprint”). Ginger Myles, Adrian Friday and Nigel Davies, “Preserving Privacy in Environments with
Location-Based Applications,” Pervasive Computing, IEEE Computing Society at 56 (January -March 2003).
“Paper, Plastic… or Mobile? An FTC Workshop on Mobile Payments” (Apr. 26, 2012), available at
http://www.ftc.gov/bcp/workshops/mobilepayments/.
Mobile Location Based Services Marketing Whitepaper, Mobile Marketing Association, at 17 (Oct. 2011), available at
http://www.mmaglobal.com/MobileLBSWhitepaper.pdf (“MMA White Paper”).
Guidelines for Ethical Business Practices, Direct Marketing Association, at 42 (May 2011), available at
http://www.dmaresponsibility.org/Guidelines/ (“DMA Guidelines”).

708
Letter from Andy Lees, President, Microsoft Mobile Communications Business, to The Honorable Fred Upton, U.S.
House of Representatives (May 9, 2011).
Comments of Verizon Wireless, WT Docket No. 11-84, at 2 (July 8, 2011).See Foursquare Labs, Inc. Privacy Policy (Jan.
12, 2011), available at https://foursquare.com/legal/privacy.
Apple Inc. Privacy Policy (Oct. 21, 2011), available at http://www.apple.com/privacy/.
Loopt, Inc. Privacy Notice (Oct. 15, 2009), available at https://app.loopt.com/loopt/privacyNotice.aspx.
Comments of AT&T Inc., WT Docket No. 11-84, at 5 (July 8, 2011).
Privacy Blueprint at 14 (promoting greater consistency among privacy notices to make companies’ privacy practices “a
more salient point of competition among different products and
services” ). ( July 8, 2011).
Remarks of Brendon Lynch, Chief Privacy Officer, Microsoft Corp., at FCC Forum (identifying privacy as “core to creating
trust with our customer and core to our business success”).(July 8, 2011).
Remarks of Peter Swire, C. William O’Neill Professor of Law, Moritz College of Law of the Ohio State University, at FCC
Forum (“there is a broad sense that opt in is the way to go”)(July 8, 2011).
DMA Guidelines at 41 (“Marketers should obtain prior express consent from existing and prospective customers before
sending mobile marketing to a wireless device.”).
Memorandum from Zogby International to Common Sense Media (Aug. 24, 2010), available at
http://www.privacylives.com/wp-content/uploads/2010/10/Final.
2012 MMA White Paper at 4. Letter from Bruce Sewell, Apple General Counsel and Senior Vice President, Legal and
Government Affairs, to The Honorable Edward J. Markey, U.S. House of Representatives (July 12, 2010).
Letter from Andy Lees, President, Microsoft Mobile Communications Business, to The Honorable Fred Upton, Available
at U.S. House of Representatives (May 9, 2011).
SimpleZesty Agency Releases (October 12, 2011) Available at: http://www.simplyzesty.com/mobile/augmented-
reality-app-turns-the-world-into-virtual-art-gallery/.

709
Sex and the city and brands. An exploratory
study of the effects of product placement in
young Portuguese viewers Brands; Product placement; Audience; Consumption; Fashion; Motivation.
Sofia Lameira, ISCSP – UTL, [email protected]
Paula Cordeiro, ISCSP – UTL, [email protected]
Abstract
This article approaches fashion in television, using Sex and the City as an example of a fashion trendsetter. Accounting
for a multidisciplinary theory, we follow an empirical research on effects of television and uses and gratifications as the
source of information about relations between audience, series characters and brands in television series. Therefore,
we recover Morin (1962) and Bourdieu (1984) perspectives about mass culture and cultural industry, as well as market
structures and cultural production with media, to frame our approach and main objective of product placement in
television series, and the way it affects viewers attitudes towards the brand and buying behaviours.
Television relates also with fashion through innovative advertising strategies such as product placement in television
series.
We focus on brands, rather than products, since we consider that far from early days of product placement, branded
content, even if lacking theoretical consolidation and compelling examples in television series, can be conceived as an
evolution of product placement. Brands need to relate with consumers, which help building brand’s identity,
personality, heritage and value. Characters in television series use brands to help construct their identity, but true
sophistication is not yet, occurring in advertising, integrating brands identity and personality in media content to
establish an emotional connection with consumers, as Lehu (2009) introduced.
The article relates television studies with marketing theory, rooted in the theoretical framework of the identity -based
brand management approach, taking into account the brand perception by television audiences of Sex and the City.
1. Product placement and television series
Television is going through a rapid process of change. Audience transformations, regarding structures of visual
communication, consumption habits and access to television content has been influencing entertainment strategies and
relations of production with private funding systems of audiovisual industry.
In Portugal, television industry has currently four free to air channels: the public service broadcaster RTP (Rádio e
Televisão de Portugal / Radio and Television of Portugal), broadcasting since 1957 (RTP1) and 1968 (RTP2). In the
nineties, the privatization of the sector brought new players transforming the market structure from monopoly to a
competition market, led by entertainment programming strategies: SIC (Sociedade Independente de Comunicação /
Independent Society of Comunication) established in 1992 and TVI (Televisão Independente / Independent Television)
in 1993.
Entertainment is, for long, the touchstone of Portuguese television with plays and soap operas being one of most
popular genres for decades. In the seventies, the popular Brazilian telenovela debuted in Portuguese television,
introducing a different understaning of the genre, also diverse consumption routines and in mid eighties,fostering the
national production of telenovelas, with RTP leading the way, SIC and TVI following this trend, in late nineties.

710
Although several Anglo-Saxon entertainment productions have achieved high levels of popularity in Portugal - take for
instance the example of Mr. Ed (Walter R. Brooks, 1961); The Saint (Leslie Charteris, 1962); Bonanza (David Dortort
and Fred Hamilton, 1959); Star-trek (Gene Roddenberry, 1966); Dallas (David Jacobs 1978); All in the Family (Norman
Lear, 1971); Alf (Paul Fusco and Tom Patchett, 1986); MacGiver (Lee David Zlotoff, 1985) or Sopranos (David Chase,
1999) - Portuguese-spoken productions (mostly made in Brazil, and particularly telenovelas) were prime-time
entertainment content, with English and North-American productions air-played in late afternoon or late night
schedules and weekend afternoons. Furthermore, these are part of a collective memory, contributing as well to the
audience fragmentation phenomena.
Television series became increasingly important as the country itself evolved culturally and socially, in a cosmopolitan
sense24 and Sex and the City is an example of it. In late nineties, cable TV introduced a new paradigm in Portuguese
television consumption. By offering packages including television and internet access (which by the way, could not be
contracted separately), telecom companies destabilized the market and introduced novelty: a diverse set of thematic
channels, providing entertainment, information and news. How Cintra Torres recently stated (2011: 20), paid television
channels and their audiences, show the dispersion of audience attention and a more oriented, selective choice.
Convergence culture (Jenkins, 2006; Deuze, 2007), in terms of convergence of production and consumption, also
contributed to change the paradigm of television viewing.
Synergies of media, computing and telecommunications created a media ecology that changed the linear model of
communication and entailed new forms of engagement between producers and consumers of television content. In
addition, original production, distribution and presentation of such content, corresponds to the breakthrough of
renewed business models, even if built upon advertising investment, which is too, implementing new forms and
formats.
Over the years, cable networks and content offer have evolved in Portugal, regarding penetration rate (accompanying
internet access rate all over the country) and audiences25. Most expressive ratings among cable channels happen to be
of television series and movies channels, like AXN, MOV, Sony TV (now AXN WHITE), FOX, FOX Life, FOX Crime, FOX
Next, FX and Hollywood, plus, although with lesser audience ratings, subscription channels like TV Cine1, TV Cine2, TV
Cine3 that are also available in Portugal26.
All of these channels connect, the most, with younger audiences, characterized to be on the forefront of media
transformations. If cable television contributed to segmentation around television channels, plus, if television industry
depends upon patterns of consumption to define targeted advertising (or targeted content), the popularity of these
thematic channels corresponds to an individualized media experience: not only regarding fragmentation around
different media; but with the ability to build each one’s own media digest. In short television industry is progressively
more attentive to patterns of media consumption: television viewers concentrates around different activities and
contexts simultaneously, since television content became one more content, competing for people’s attention among all
available media content.
2. Television, consumption and cultural industries. Lifestyle matters. So do brands.
Currently, television channels have an identity, framed by shows around specific lifestyles and contributing to frame
consumption patterns in contemporary society. If we consider that television programming is a symbolic tool that
forms and reflects prevailing cultural values (Tiwsakul, Hackley and Szmigin, 2005) then, our social experience is built
in reference to a shared system of meanings, supported, influenced and promoted by cultural industries.
Encompassing an economic approach to organize and understand the nature and value of creative and cultural work
(Garnham, 1990; Miège, 1986/1996/2000; Flichy, 1980/1991; Pratt, 2000; Jones , 2003; Picard, 2005), we
24 The wider opening of the country to foreign countries and influences from 1974 ahead, as well as joining the EEC (European Ec onomic Community, later European Union, EU) in 1986, technological development and trends of cultural globalization helped to foster a new media environment in which, audiences portray a very important role.
25 Marketest. (2000), 'Internet aumenta dez vezes em 16 anos', http://www.marktest.com/wap/a/n/id~1a70.aspx . Acceded 25 November 2012.
26 Santos, R. (2011), ‘Canais por cabo batem recorde’, http://industrias-culturais.blogspot.pt/2011/05/televisao-por-cabo-e-audiencias.html. Acceded 26 November 2012.

711
conceptualized it in an industrial structure of production, chasing maximum profitability and, therefore, submitting
strategies of production to the market and audience expectations.
The impact of cultural industries in everyday life has been analyzed from a perspective that understands cultural
consumption and the majority of industries, characterized by their intangibility and symbolic or ideological nature,
producing social meanings (Baudrillard, 1974; Bourdieu, 1984). Cultural consumption of industrial activities has been
generalized to produce a system of commonly shared representations to which Sex and the City (Darren Star, 1998-
2004) also contribute. But these also contribute to raise influence on group identity and cultural practices, with large
scale distribution, comprising a plurality of individuals, in different parts of the world (Venkatesh and Meamber, 2006).
In series like Sex and the City (Darren Star, 1998-2004) symbolic meanings are intrinsically related to lifestyles and the
way these are promoted through cultural products. Series have a strong relation with advertising, understood as
responsible for make a product recognized, wanted and ultimately, sold. In this sense, appeals to psychological, social
and economic aspirations, rather than people’s reality, appealing to what they want to be, to seem to be or to possess.
Douglas and Isherwood (1979) characterized the consumption of any kind as a cultural practice, stating it as a form of
social relationship. The desire for social integration is often manifested by the adherence of individuals to cultural
practices of the majority, and social groups to which they wish to belong. In this sense, consumption is, consciously or
unconsciously, distinctive and representative of social groups and subgroups, reason why consumption can be seen as a
process in itself, full of meaning. Bell and Hollows (2006) defend that traditional social structures which form the basis
for identity have been replaced for lifestyle practices. Which, unquestioningly, are delivered through media, especially
television series, such as Sex and the City (Darren Star, 1998-2004).
3. Audience: from social sciences to a marketer perspective
By collecting viewers from a wide variety of sociocultural experiences and numerous subcultures, television producers
intend to homogenize this wide variety so that one television program will ultimately appeal to a mass, though, diverse
audience. And so will brands advertised, placed or sponsoring the show. Bell and Hollows (2006) explain that media
audiences are composed of fractions, characterized by socio-economic variables that represent audience groups to
whom media producers address to. Hence, brands can use television to communicate with their customers at certain
times of day, week, and with specific audience segments, through thematic channels, genre and content. Tiwsakul,
Hackley and Szmigin (2005) focused on changes in media landscape along with industry deregulation and media
technologies with global reach, to conclude about audiences’ fragmentation and their sceptical growth towards
conventional advertising. Following this approach, Cordeiro (2012) analysed content and advertising formats in radio,
scrutinizing branded entertainment as a form of sophisticated product placement.
Research proves that placements in televisions series increase sales (Russel and Stern, 2006); therefore, by attending to
changes in media, audience and business, television industry is trying to fit advertisers needs, regarding audience
fragmentation and sophistication, saturation and repulse with current advertising formats, lower return of investment
and digital platforms that have shaped new trends in advertising (Cordeiro, 2012).
Changes in media consumption, particularly patterns of television viewing, have been introducing a shift in advertising
investment in media (Saladino, 2008; Wilbur, Goeree and Ridder, 2008). Moreover, audience activity during
commercial breaks and the way audiences are avoiding commercial breaks is also under scrutiny as well as saturation
and repulse with advertising being addressed through innovative advertising formats (Ang 1991; Zwaga, 1992;
Saladino, 2008; Wilbur, Goeree and Ridder, 2008). In this sense, as Russell, Stern and Stern (2006) sustain, product
placement has become ubiquitous and part of the marketing mix of most worldwide companies (Russell, Stern and
Stern, 2006). Tiwsakul, Hackley and Szmigin (2005) summarise several perspectives to conclude that product
placement is a promotion placed in a non-promotional entertainment context, with non-explicit intent, whereas the
meaning of the brand in this context may not be the same as in advertising (Tiwsakul, Hackley and Szmigin, 2005),
bringing strong benefits for the brand, instead of the consumer, who may even not be aware of it.
Product Placement research focus on several issues, namely attitudes, perceptions and behaviours. Research includes
behaviour, studying the effects on audience attitudes and perceptions (Morton and Friedman, 2002; Lai -man and Wai-
yee, 2008) as well relationships viewers have with the program characters, as Russell, Norman, and Heckler (2004)
found.

712
Respecting attitudes, product placement has affect consumers’ memory (Gupta and Lord, 1998) with different effects
and producing different reactions on television viewers. If some research reveals acceptance of product placement in
general (Gupta & Gould, 1997; Russell, 2002), others define audiences evaluating negatively product placement on
mini-series/drama television programs (d’Astous e Séguin, 1999). Furthermore, Russell, Stern and Stern (2006) show
some character-product associations, examining the influence of product placements in television serial comedies on
consumer attitudes toward the products. By studying how characters’ relations to placed products and how consumers’
relations with the characters affect their attitudes toward the products, Russell, Stern and Stern (2006) found that
consumers align their attitudes with the inside-program characters' to products.
As subliminal persuasion, product placement integrates logos, brand sounds or images, products and objects in the
scrip, making it plausible. It became so common that sometimes these even help to build and give trustworthiness to
the plot or the characters. It is, for instance, the example of Carrie Bradshaw and Manolo Blahnik shoes. This character
became the most famous wearer of this brand, because it has accompanied her during the plot. Has Hudson and Hudson
(2006), we do consider that branded products are no longer just 'placed'; they are woven into entertainment content
making a stronger emotional connection with the consumer.
Karrh (1998) had already referred to brand placement, including brands as part of media content and its affect
audiences, through bonding with characters and aspiring of attitudes and characteristics between them. However,
Marshall (2005) questioned this connection concerning effectiveness of this placement in branding, brand imagery and
brand preferences. Follow up occurs in Stern and Stern (2006) investigating attitudes toward products within
television series.
If previous definitions of categories of product placement made sense, today one must observe that product placement
is moving from the introduction of the product implicitly in a television show without formal expression of it, or by
playing an active role in the scene, to new forms of introducing the brand to viewers. Placement is simultaneously
placing brands in series adding references to the brand in dialogues or including the brand in the storyline, which
represents brands telling stories (or, at least, being part of it), enhancing the brand identity.
Brands need to relate with consumers, which help building brand’s identity, personality, heritage and value. Characters
in television series use brands to help construct their identity, but true sophistication is not yet, occurring in
advertising, integrating brands identity and personality in media content to establish an emotional connection with
consumers, as Lehu (2009) introduced.
Evidence of relevance to brand conversation is within consumer habits and media characteristics, which are essentially
based on inherently conversational and spontaneous feelings. Vargo e Lusch (2004) state that in the last decades new
perspectives emerged, to revise previous views. In this sense, marketing strategies focus on intangible features, co-
creating value and establishing relationships. Even if emotional branding achieved noteworthiness with Gobé (2001), it
is a perspective rooted in early nineties to challenge traditional brand management and strategies based on functional
features of products (Thompson and Rindfleisch, 2006). Emotional branding is all about stories that engage consumers.
These are structured according to their lifestyles and understood as part of their lifestyles, dreams and objectives.
Today, brands interfere in media content: in entertainment industry, brands and content get together with all sorts of
content formats. The idea, from marketeers, is simple: people see something on television that generates a specific
desire - because the main character is wearing a lovely outfit or just talks about something still unknown to the regular
consumer. That will prompt consumption. At least, will create the “to have” desire.
4. Why television and fashion in Sex and the City?
We address an integrated position that crosses critical theories, questioning media content, and particularly product
placement in television series and its contribution to hegemony, ideology and alienation. In some frameworks,
television entertainment is understood as a way to deliver content and values, worldviews and mindscapes. Our
proposition recognizes that through television series audience can improve their mindset by getting in touch with
different contexts, mindscapes and values. Nevertheless, our research questions indicate that mediation has an impact
on viewers favouring commercial interests as a way of matching producers and consumers.
In this sense, which values are transmitted through fashion-related series like Sex and the City (Darren Star, 1998-
2004)? What kind of social habits, daily routines, themes, values and preconceptions are expressed in it? Does this

713
thrive in the same society in which is being produced? It is a common assumpti on that television entertainment
expresses reality as we know it. Hence, what kind of social representations and social reality Sex and the City (Darren
Star, 1998-2004) portray? Is this recognized by viewers? Do they mirror themselves?
Television series are discussed as a global content delivered by television and Internet with concerns about the impact
of ideas, fashion and trends that these kinds of series profess through product placement. And also the influence of
placement in consumption habits and behaviours of viewers. This context can be analyzed through a combination of
theories under audience research, cultural industries, gender studies, applying uses and gratifications theory, reception
models and, even, cultural and economic empowerment by media. We chose to use the empirical reception approach,
adjusted to our objectives of analyzing Sex and the City (Darren Star, 1998-2004) implications and effects on young
audiences, following analysis of the consumption and reception of TV serials.
The empirical thesis of communication studies settled the beginning of communication research with an idea around
the relationship of mediated communication with society, characterized essentially by an approach to understand
media functions in society (Parsons, 1937). The massive representation of audience members, typical from the first
decades of communication studies, gave way to an individualized public vision, and research around audience´s media
experience concerning its uses and interpretation of media messages of cultural studies.
The definition of social reality occurs from the process of negotiation, underlying message receptions, which result
from a combination of practices of communication and cultural contexts (Hall, 1973). Even if Herzog (1941) had
already associated the relation between audiences and media, uses and gratifications was impelled by Katz, Gurevich e
Haas (1973), to build a theory focusing on the receiver, habits and satisfaction of needs of social communication. It
states the individual reception as an active process, oriented to problem solving and achieve gratification.
Blumler e Katz (1974) suggested that media audiences have an active role when they make choices and how they use
media, to fulfil their needs. The audience was characterized by a group of active members able to build their own media
digest creating their own experience. Further, Blumer e Katz (1974) suggested that media users were able to fulfil an
active role, by choosing the media and the way they use it, seeking those which better pleased their needs.
Uses and Gratifications is founded on the assumption that user would identify available alternatives to satisfy his own
needs and would recognize that there isn’t a single way to use media, rather several ways to do so. It is an optimistic
vision of the process of communication in society, although it does not concern the way it might, unconsciously,
influence users’ conceptions.
We are focusing on viewers’ active interpretation of the series content within their everyday context, to find the effects
that product placement might produce, through the way television series can unconsciously influence attitudes, beliefs
and consumption behaviours of viewers.
Among reasons to choose Sex and the City (Darren Star, 1998-2004) it is a weekly program with prime-time exposure
and consistent cast of characters; most of all, the importance of costume design and fashion, as well as ongoing plots
and themes, representing changes in popular culture, along with audience appeal, which resul ts in its impressive
popularity27. In addition, the recent publication of a study concluding about psychological profile of most popular
television series led us to think about television series preferences among television viewers in Portugal 28.
The plot for Sex and the City (Darren Star, 1998-200429) started the lifestyle of a willing-to-make-it-happen young
women and her friends in urban New York. The series was created by Darren Star in 1998 for HBO, an American
premium cable TV network owned by Time Warner. It was broadcasted until 2004. The series six seasons unfolded the
evolution of the life story of four female characters until the series ended. And if, at the end, their lifestyle was not qui te
the same has the lifestyle of our sample might be, it represents in an aspirational way, expectations that most of our
sample have for their own life story.
27 TV Dependente. (2012). ‘Audiências: e as séries mais vistas do ano são…’,http://tvdependente.net/2012/05/audiencias-e-as-series-mais-vistas-do-ano-sao/. Acceded 25 November 2012.
28 Sábado. (2012), ‘O que série de que gosta diz sobre si’, http://www.sabado.pt//Multimedia/FOTOS/-span--b-Sociedade-b---span--(1)/a.aspx?id=531072. Acceded 25 November 2012
29 Known for writing, among others, Beverly Hills 90210 (1990-2000) or Melrose Place (1992-1999).

714
5. Objectives
We structured this research around two specific objectives: to find if Sex and the City (Darren Star, 1998-2004) would
be fashion trendsetters; to account for the effects of product placement in buying habits and consumption behaviours of
those with low incomes of even no income at all. Our universe is composes by communication students, because it is
our assumption that they are supposed to be more attentive to the phenomenon we are analyzing: product placement
in TV.
6. Methodology
This exploratory study uses a mixed methodology combining an online survey with a focus group. Inspired by empirical
research on Dallas (Katz and Liebes, 1986, 1990), we decided to include a focus groups discussion during and after
viewing selected episodes of Sex and the City (Darren Star, 1998-2004) focusing, in our case, on the themes which
structure the program (fashion and style, consumption, cosmopolitanism, romance) to evaluate how they contribute to
the series popularity and confirm previous findings (Katz and Liebes, 1986, 1990; Morley, 1980, 1981; Ang, 1985; Silj,
1988), that show a relation between lifestyle and social backgrounds and interpretations of the series episodes. We also
focus on the leading character of the series with the brands, following Russel (1998), about how audiences relate to
them in terms of familiarity and identification.
Influenced by the recent publication of a study concluding about psychological profile of most popular television series
in Portugal, we decided to pool popular television series in Portugal. A link to the news was published in CC@ISCSP30
and the post generated a strong conversation around conclusions of the report. Then, we pooled television series,
allowing anyone to add options. The idea was solely to refute the published news about it, because this highlighted the
fact “if you love 'Game of Thrones' may be a potential psychopath and 'Grey's Anatomy' fan is likel y to walk all day in
pajamas”31.
The poll gathered 1073 votes. We found this a very interesting opportunity to further develop an analysis based on
television series. From this first poll, we selected the fashion related series which gathered more votes and started a
new poll to elect, among these students favourite fashion related series. We gathered 136 votes with Sex and the City
(Darren Star, 1998-2004) being the most voted fashion-related series.
Since our universe is composed of media and communication students, it is our assumption that they are supposed to
be more attentive to the phenomenon we are analyzing: product placement in TV series and the way it affects viewers
attitudes towards the brand and buying behaviours, reason why we decided to focus on this universe.
We addressed their series consumption habits, motivations to follow the series, the relation between viewer with Sex
and the City (Darren Star, 1998-2004) favourite character, brand recall, brand perception and influence on buying
decisions and consumption habits.
We developed a qualitative research through an on-line enquiry that was almost made of open–ended answers
followed by a focus group, using communication and media college students from ISCSP who elected Sex and the City
(Darren Star, 1998-2004) as their fashion-related favourite television series. We used an intentional sampling method,
asking students who participated in the fashion-related series polling to answer the questionnaire and to take part in a
focus group. The sampling method brings limitations on the potential of representing the universe. Hence, that was not
our goal in this study. We prefer an in-depth reading that makes it possible to talk not about “viewers” but to focus our
sample individuals as “consumers”.
We had 46 answers in 3 days of online access; all were considered valid answers, submitted to statistical and content
analysis. Once the questionnaire was completed the system does not allow for a second access thus avoiding
duplicating participants.
30 CC@ISCSP is a Facebook closed group composed by 400 undergraduate students from communication and media BA from the School of Politic and Social Sciences, composed of 412 students. This group was created in 2009 and includes all students from this BA from 2009 to today.
31 Sábado. (2012), ‘O que série de que gosta diz sobre si’, http://www.sabado.pt//Multimedia/FOTOS/-span--b-Sociedade-b---span--(1)/a.aspx?id=531072. Acceded 26 November 2012
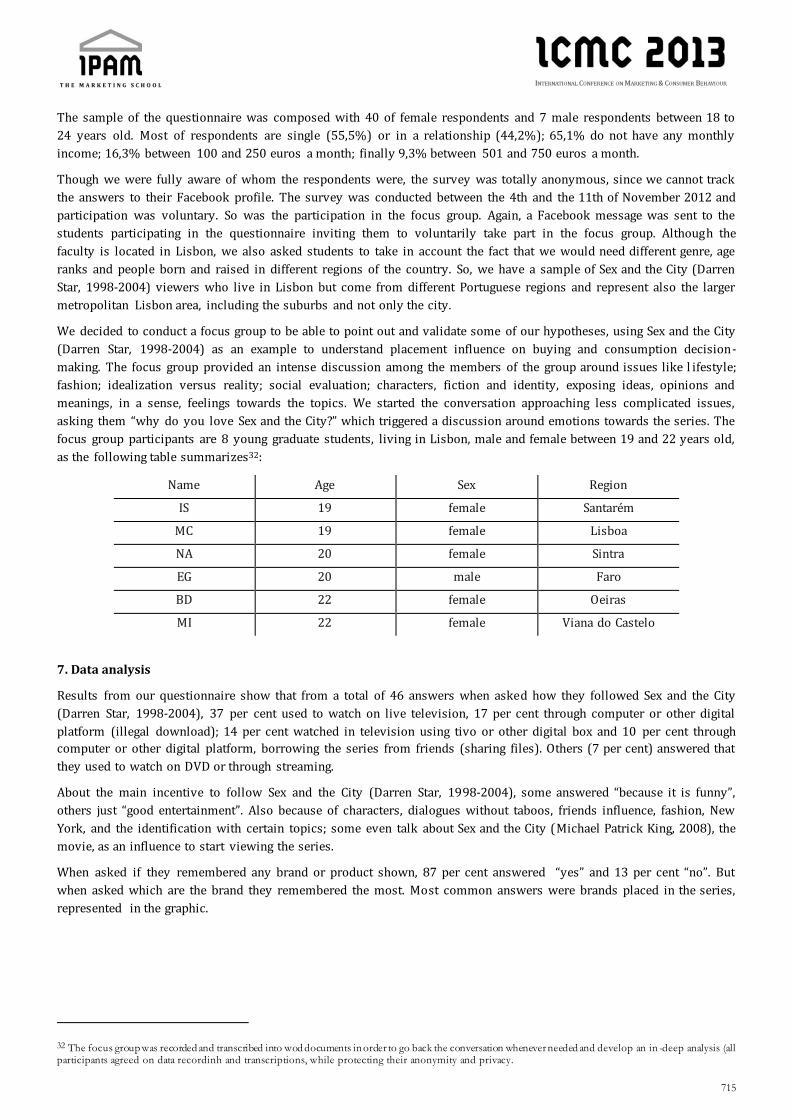
715
The sample of the questionnaire was composed with 40 of female respondents and 7 male respondents between 18 to
24 years old. Most of respondents are single (55,5%) or in a relationship (44,2%); 65,1% do not have any monthly
income; 16,3% between 100 and 250 euros a month; finally 9,3% between 501 and 750 euros a month.
Though we were fully aware of whom the respondents were, the survey was totally anonymous, since we cannot track
the answers to their Facebook profile. The survey was conducted between the 4th and the 11th of November 2012 and
participation was voluntary. So was the participation in the focus group. Again, a Facebook message was sent to the
students participating in the questionnaire inviting them to voluntarily take part in the focus group. Although the
faculty is located in Lisbon, we also asked students to take in account the fact that we would need different genre, age
ranks and people born and raised in different regions of the country. So, we have a sample of Sex and the City (Darren
Star, 1998-2004) viewers who live in Lisbon but come from different Portuguese regions and represent also the larger
metropolitan Lisbon area, including the suburbs and not only the city.
We decided to conduct a focus group to be able to point out and validate some of our hypotheses, using Sex and the City
(Darren Star, 1998-2004) as an example to understand placement influence on buying and consumption decision-
making. The focus group provided an intense discussion among the members of the group around issues like l ifestyle;
fashion; idealization versus reality; social evaluation; characters, fiction and identity, exposing ideas, opinions and
meanings, in a sense, feelings towards the topics. We started the conversation approaching less complicated issues,
asking them “why do you love Sex and the City?” which triggered a discussion around emotions towards the series. The
focus group participants are 8 young graduate students, living in Lisbon, male and female between 19 and 22 years old,
as the following table summarizes32:
Name Age Sex Region
IS 19 female Santarém
MC 19 female Lisboa
NA 20 female Sintra
EG 20 male Faro
BD 22 female Oeiras
MI 22 female Viana do Castelo
7. Data analysis
Results from our questionnaire show that from a total of 46 answers when asked how they followed Sex and the City
(Darren Star, 1998-2004), 37 per cent used to watch on live television, 17 per cent through computer or other digital
platform (illegal download); 14 per cent watched in television using tivo or other digital box and 10 per cent through
computer or other digital platform, borrowing the series from friends (sharing files). Others (7 per cent) answered that
they used to watch on DVD or through streaming.
About the main incentive to follow Sex and the City (Darren Star, 1998-2004), some answered “because it is funny”,
others just “good entertainment”. Also because of characters, dialogues without taboos, friends influence, fashion, New
York, and the identification with certain topics; some even talk about Sex and the City (Michael Patrick King, 2008), the
movie, as an influence to start viewing the series.
When asked if they remembered any brand or product shown, 87 per cent answered “yes” and 13 per cent “no”. But
when asked which are the brand they remembered the most. Most common answers were brands placed in the series,
represented in the graphic.
32 The focus group was recorded and transcribed into wod documents in order to go back the conversation whenever needed and develop an in -deep analysis (all participants agreed on data recordinh and transcriptions, while protecting their anonymity and privacy.
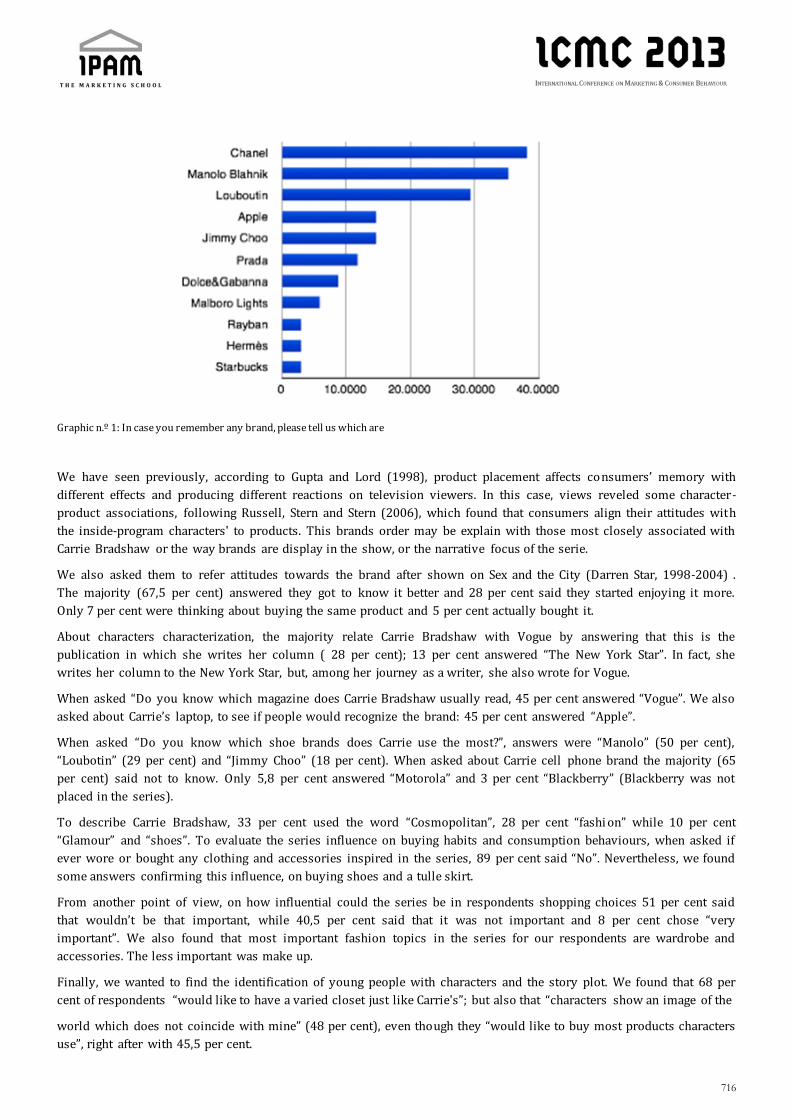
716
Graphic n.º 1: In case you remember any brand, please tell us which are
We have seen previously, according to Gupta and Lord (1998), product placement affects consumers’ memory with
different effects and producing different reactions on television viewers. In this case, views reveled some character-
product associations, following Russell, Stern and Stern (2006), which found that consumers align their attitudes with
the inside-program characters' to products. This brands order may be explain with those most closely associated with
Carrie Bradshaw or the way brands are display in the show, or the narrative focus of the serie.
We also asked them to refer attitudes towards the brand after shown on Sex and the City (Darren Star, 1998-2004) .
The majority (67,5 per cent) answered they got to know it better and 28 per cent said they started enjoying it more.
Only 7 per cent were thinking about buying the same product and 5 per cent actually bought it.
About characters characterization, the majority relate Carrie Bradshaw with Vogue by answering that this is the
publication in which she writes her column ( 28 per cent); 13 per cent answered “The New York Star”. In fact, she
writes her column to the New York Star, but, among her journey as a writer, she also wrote for Vogue.
When asked “Do you know which magazine does Carrie Bradshaw usually read, 45 per cent answered “Vogue”. We also
asked about Carrie’s laptop, to see if people would recognize the brand: 45 per cent answered “Apple”.
When asked “Do you know which shoe brands does Carrie use the most?”, answers were “Manolo” (50 per cent),
“Loubotin” (29 per cent) and “Jimmy Choo” (18 per cent). When asked about Carrie cell phone brand the majority (65
per cent) said not to know. Only 5,8 per cent answered “Motorola” and 3 per cent “Blackberry” (Blackberry was not
placed in the series).
To describe Carrie Bradshaw, 33 per cent used the word “Cosmopolitan”, 28 per cent “fashi on” while 10 per cent
“Glamour” and “shoes”. To evaluate the series influence on buying habits and consumption behaviours, when asked if
ever wore or bought any clothing and accessories inspired in the series, 89 per cent said “No”. Nevertheless, we found
some answers confirming this influence, on buying shoes and a tulle skirt.
From another point of view, on how influential could the series be in respondents shopping choices 51 per cent said
that wouldn’t be that important, while 40,5 per cent said that it was not important and 8 per cent chose “very
important”. We also found that most important fashion topics in the series for our respondents are wardrobe and
accessories. The less important was make up.
Finally, we wanted to find the identification of young people with characters and the story plot. We found that 68 per
cent of respondents “would like to have a varied closet just like Carrie's”; but also that “characters show an image of the
world which does not coincide with mine” (48 per cent), even though they “would like to buy most products characters
use”, right after with 45,5 per cent.

717
The focus group discussion leads to interesting conclusions that confirm some of the questionnaire results. The focus
group discussion occurred after the exhibition of one episode 1 of season 2, episode 11 of season 4 of Sex and the City
(Darren Star, 1998-2004).33
As for social habits, daily routines, themes, values and preconceptions, our focus group participants recognize that Sex
and the City (Darren Star, 1998-2004) approaches reality and conveys social evaluation, prompting issues like abortion,
infertility or homosexuality:
“Although it has censor themes, is open to delicate topics, like when Carrie stops smoking, for instance, or
abortion” (EG)
“If Charlotte critiques Samantha’s attitudes both sides are exposed, and so both are criticized. It is similar to a
meditation of social values”. (IS)
“When Charlotte calls the doctor, to talk about her fertility problem (and not her husband).” (EG)
“Is this serial topics are debated in a liberal way, they are open-minded”. (MI)
“HBO series are really good, they are honest and open to speech”. (EG)
As for the characters, besides identification, the participants in the focus group have a clear understanding of the
characters and their role in the narrative:
“They are all independent women”. (AN)
“Samatha´s birkin bag – the acquisition of the handbag makes her feel important. Is who she is”. (BD)
“When I finished watching all season I though ‘When I grow up I want to be like them…and now I give
importance to a good pair of shoes’”. (MC)
“I watch it because of the plot and not brands”. (AN)
“Carrie is characterized by her free spirit and fearless” (MI)
Regarding brands, these resemble to be part of the plot, helping us (viewers) to understand the characters:
“Brands appear in a non ostensive way, they are subtle they are shown in a natural way, and are not forced (...)
Characters use brands because it makes sense”. (BD)
“There is a clear evolution. Carry had a “trash” style and it has evolved to sophistication (...) characters houses
and decoration also reflects their features”. (MI)
“Some brands became part and symbols of Sex and the City, for instance, Dolce & Gabanna”. (MC)
“The closet reflects who she is. It is where everything happens” (EG, about Carrie Bradshaw).
They all recognize the insufficiency of reality in the plot, especially for their lifestyle and brands in use. Although they
are aware of the clothing design combinations, of very cheap clothes with luxury fashion brands, they all know that this
is a television series:
“It just how she is. She lives in the threshold with her credit cards”. (MI, about Carrie Bradshaw)
“Sex and the city was a marc on television history. I believe this kind of story and plot will reappear. It is
strong”. (MI)
“There is a clear character evolution from season 1 till 6. On the movie, they are only clichés of themselves”.
(EG)
In fact, today one must observe that product placement is moving from the introduction of the product implicitly in a
television show without formal expression of it, or by playing an active role in the scene, to new forms of introducing
the brand to viewers.
33 Choices of episodes and seasons resulted from the series analysis of product placement from an random sample of episodes.

718
The discussion led us conclude that placement is simultaneously placing brands in series adding references to the
brand in dialogues or including the brand in the storyline. In this case these even help to build and give trustworthiness
to the plot or the characters. It is a common argument that characters in television series use brands to help construct
their identity and so brands need to relate with consumers, which help building brand’s identity,
8. Conclusion: placement, branding and TV series
Fashion. The trendy approach in New York. The plot and characters seem to be the main motivations for people to
follow Sex and the City (Darren Star, 1998-2004). Fashion related brands are the brands with most remembrance,
being shoe brands the most recalled brands within our respondents. Fashion and cosmopolitism are people’s greatest
references regarding Sex and the City (Darren Star, 1998-2004) .
Even if the characters convey an idea of an unreal world the series does not have much influence in buying decisions of
clothing and fashion accessories. We argue that in long term Sex and the City (Darren Star, 1998-2004) might have
influence on people’s references, as for brands, and most of all, fashion brands. Is it our assumption that product
placement in series such as Sex and the City (Darren Star, 1998-2004) as to be analysed from an aspirational marketing
perspective, triggering emotions for future shopping; to keep the brand in reference; to position the brand as luxury or
premium; and to establish an emotional relation with it. Also to have people identified with the brand from the likeness
with characters and the plot of the series.
These ideas, combined with the fact that although most of our sample representatives have no income, most
respondents would like to buy most of the objects that the characters use, or, at least, to have a wardrobe as varied as
Carrie Bradshaw.
This assumption led us to think about the objectives of placing in Sex and the City (Darren Star, 1998-2004). Brands are
placed in the series episodes, but rarely in an ostensible way. Brands, as well as placement of brands and products,
come along the characters life stage and supposed lifestyle. Since the plot of Sex and the City (Darren Star, 1998-2004)
concerns the evolution the characters life, brands also evolve with the story, as for sophistication, representing
professional triumphs and personal success of each of the characters, according to their life goals. Therefore, these
audience members can also be thought to be aspirational audience. Brands placed in Sex and the City (Darren Star,
1998-2004) are premium brands and luxury brands that organize a dream reality and enhance in audience a context of
what they would like to be, rather than what they actually are.
Sex and the City (Darren Star, 1998-2004) is the example of creating the dream and generating positive emotional
reactions from the audience in the context of fashion-related television series. This aspirational marketing offers
audience a continuity of fashion and trends ideals to which they should aspire. It is a sort of real -life models through
fiction. We are talking about aspirational fantasies, advice and even if brands don’t get to be bought, they create an
exquisite aura and establish them in the market as exclusive, prompting status and ensuring future buys. As said before,
marketing strategies currently seek customer loyalty through stories about the brand, rather than exposing the product
features. People got a better knowledge of the brand and fell in love with the brand, even if not buying any of the brands
they recognized.
According to our results, by combining the questionnaire with the focus group we can say that Sex and the City (Darren
Star, 1998-2004) is realistic and it is common knowledge that themes and values expressed in Sex and the City (Darren
Star, 1998-2004) are keen to influence people. They establish strong relations with characters, defending them and
their lifestyle for the inherent identification that has been built upon the plot, and everything surrounding each
character.
Placement is recognized, but not important. In Sex and the City (Darren Star, 1998-2004), brands are part of the
narrative, part of the characters and complete the idea to be exposed. Brands, in Sex and the City (Darren Star, 1998-
2004) help to build the narrative and are part of it, representing specific features of each character’s life, the city life
and their lifestyles. Furthermore it also helps to build brands identity and establishing emotional connections with
consumers.
It is our conclusion that these have become so common that build and give trustworthi ness to television series fostering
branded content conceived as an evolution of product placement.

719
References
ANG, I. (1991), Desperately seeking the audience, London: Routledge.
ANG, I. (1995), The Nature of the audience, In Downing, J., Mohammadi A. e Sreberny.
BOURDIEU, P. (1984), Distinction: a social critique of the judgement of taste , London: Routledge.
BAUDRILLARD, J. (1974), La société de consommation: ses mythes, ses structures, Paris: Gallimard.
BELL, D. and HALLOWS, J. (2006), Making sense of ordinary lifestyles, Open University Press, England.
BLUMER, J. and KATZ, E. (1974). The uses of mass communications: Current perspectives on gratifications research,
Beverly Hills: CA: Sage.
CINTRA TORRES, E. (2011), Television in Portuguese Daily Life, in Barker, A. (2006), Television, Aesthetics and Reality,
Cambridge Scholars Press.
CORDEIRO, P. (2012), A rádio como meio social: tendências de consumo e modelos de negócio . Comunicação e Sociedade.
Centro de Estudos de Comunicação e Sociedade. V. 20 - 2011: 115-129.
D’ASTOUS, A. and SÉGUIN, N. (1999) Consumer reactions to product placement strategies in television sponsorship ,
European Journal of Marketing, Vol. 33 Iss: 9/10, pp.896 – 910.
DEUZE, M. (2007), Convergence culture in the creative industries, International Journal of Cultural Studies, 10(2), pp.
243–263.
DOUGLAS, M. and ISHERWOOD, B. (1979). The World of Goods: Towards an Anthropology of Consumption, New York:
Basic Books.
DUNCOMBE, S. (1997). Notes From underground: Zines And the politics of alternative culture , London: Verso.
FLICHY, P. (1991 [1980]), Les industries de l'imaginaire: pour une analyse économique des médias , Grenoble: Pug.
GARNHAM, N. (1990), Capitalism and Communication: Global Culture and the Economics of Information , London: Sage.
GOBÉ, M. (2001), Emotional Branding: The New Paradigm for Connecting Brands to People , New York: Allworth Press.
GUPTA, P. and GOULD, S. (1997). Consumers’ perceptions of the ethics and acceptability of product placements in movies:
product category and individual differences , Journal of Current Issues and Research in Advertising, 19(1), pp.
37–50.
________ and LORD, K. (1998), Product Placement in Movies: The Effect of Prominence and Mode on Audience Recall ,
Journal of Current Issues & Research in Advertising, Vol. 20, Iss. 1.
HALL, S. (1973). Encoding and Decoding in the Television Discourse , Stenciled Occasional Paper, Center for
Contemporary Cultural Studies, University of Birmingham.
HERZOG, H. (1941), On borrowed experience. Studies in Philosophy and Social Science , 11, 65-95.
HUDSON, S. and HUDSON, D. (2006), Branded Entertainment: A New Advertising Technique or Product Plac ement in
Disguise?, Journal of Marketing Management, Vol. 22, Iss. 5-6, 2006.
JENKINS, H. (2006), Convergence Culture: Where Old and New Media Collid , New York University Press.
JONES, M. (2003), Industry as a Workplace, in BECK, A. (ed.) (2003). Cultural Work: Understanding the Cultural
Industries, London: Routledge.
KARRH, J. (1998), Brand Placement: A Review’, Journal of Current Issues & Research in Advertising , Vol. 20, Iss. 2.
KATZ, E., GUREVITCH, M. and HAAS, H. (1973), On the Use of Mass Media for Important Things, American Sociological
Review. 38: 164-18.
KATZ, E. and LIEBES, T. (1990 [1980]), The export of meaning: Cross‐cultural readings of Dallas, NewYork: Oxford
University Press.
LAI-MAN, S. and WAI-YEE, S. (2008), Predicting the effectiveness of product placement: a study on the execution strategy
and impacts on hierarch of effects, Oxford Business & Economics Conference Program.

720
LEHU, J. (2009), Branded Entertainment: Product Placement & Brand Strategy in the Entertainment Business , Kogan
Page.
LIVINGSTONE, S. (1991), Audience reception: the role of the viewer in retelling romantic drama, [online]. London: LSE
Research Online.
MIÈGE, B. et all (1986), L'industrialisation de l'audiovisuel. Des programmes pour les nouveaux médias, Paris: Aubier.
________(1996), La société conquise par la communication , 1. logiques sociales. Grenoble : PUG.
_______ (2000), Les Industries Du Contenu Face À L’ordre Informationnel, Grenoble: Pug.
MORIN, Edgar. (1962), L'Esprit du temps I. Névrose, Paris: Grasset.
MORLEY, D. (1981 [1980]), The Nationwide Audience. London: BFI.
MORTON, C. and FRIEDMAN, M. (2002), “I Saw it in the Movies”: Exploring the Link between Product Placement Beliefs
and Reported Usage Behavior, Journal of Current Issues & Research in Advertising, Volume 24, Issue 2, pp 33-
40.
PARSONS, T. (1949 [1937]), The Structure of Social Action: Vol. II, New York: MacGraw.
PRATT, A. (2000), The Cultural Economy, International Journal of Cultural Studies, Vol. 7 (1).
PICARD, R. (2005), Unique characteristics and business dynamics of media products , Journal of Media Business Studies. 2
(2): 61-69.
RUSSEL, C. (1998), Toward a Framework of Product Placement: Theoretical Propositions , in Advances in Consumer
Research, Volume 25, pp 357-363.
RUSSEL, C. and STERN, B. (2006), Consumers, Characters and Products: A Balance Model of Sitcom Product Placement
Effects, Journal of Advertising Issue: Volume 35, Number 1 / Spring 2006 Pages: 7 – 21.
SALADINO, M. (2008), The proliferation of product placement as a means of advertising communication, Journal of
International Business Ethics Vol.1 No.1 2008, pp: 100-106.
SILJ, A. (1988), East of Dallas: The European challenge to American television , London: BritishFilm Institute.
THOMPSON, C., RINDFLEISCH, A. and ARSEL, Z. (2006), Emotional Branding and the Strategic Value of the Doppelganger
Brand Image, Journal of Marketing, Vol.70 (1): 50–64.
TIWSAKUL, R., HACKLEY, C. and SZMIGIN, I. (2005), Explicit, Integrated Product Placement in British Television
Programmes, International Journal of Advertising, 24(1), pp. 95–111.
WARNER, H. (2012), Tracing patterns: Critical approaches to on-screen fashion, Film, Fashion & Consumption Volume 1
Number 1: pp. 121–132.
VARGO, S. and LUSCH (2004), Evolving to a New Dominant Logic for Marketing, Journal of Marketing, Vol. 68, pp 1-17.
VENKATESH, A. and MEAMBER, L. A. (2006), Arts and aesthetics: Marketing and cultural production, Marketing Theory,
Vol. 6, No.1, pp.11-39. Sage Publications.
WILBUR, K., GOEREE, M., RIDDER, G. Effects of Advertising and Product Placement on Television Audiences, November 9,
2008 http://ssrn.com/abstract=1151507.
ZWAGA, W. (1992), Delivering Television Audiences to the Advertisers? Impressions from the Living Room , Marketing
Bulletin, 3, 9 -17, Article 2, Page 1 of 8 http://marketing-bulletin.massey.ac.nz

721
Session 19

722
Marketing Strategy and the Flowers Trade
with Portugal Flowers, international trade, convergence, volatility, Marketing, BRICS.
Vítor João Pereira Domingues Martinho, Research Centre of the Polytechnic Institute of Viseu, [email protected]
Acknowledgments: The Portuguese Foundation for Science and Technology (FCT) through the project PEst-
OE/CED/UI4016/2011, and the Center for Studies in Education, Technologies and Health (CI&DETS).
Abstract
There are few papers about the international trade of flowers, so it is believed that this paper, with this topic, could be
an important contribution to the international scientific community. It is intended to analyze if the tendencies of the
flowers international trade and their respective policies, namely the marketing strategies, are adapted to the actual
world context. For that it was used data about the import and export of flowers, in different forms, between Portugal
and the world. To better understand the data analyzed it is made several estimations based in the absolute convergence
theory and a data volatility explore. This helps us to conclude about the stability of the data and, as consequence, about
the coherency of the policies. As main conclusions, there is a tendency to the countries trade the flowers between their
neighbors and on the other hand it is needed a more coherent policy for the international trade of this agricultural
product. More specifically, the most important relationship of Portugal with the world in the international trade of
flowers is with the Europe. So, as said before, there is a tendency to trade flowers with the neighbors countries, to
economize costs of transport, as defended, for example, by the new economic geography. We must define a new policy
for the flowers international trade, where the marketing strategies play a fundamental role, namely to find and create
loyal customers from the emergent economies, like the BRICS countries, helping the exports, and redefine the national
consummation.
1. Introduction
The climate is an important resource for agrarian activity, namely for the flowers activities, because the territory of
some countries, as the Mediterranean areas, has sun in the majority of the months, during the year.
Nevertheless, these productions are not totally explored in some countries landscape, because a lot of reasons.
The most important reason, in the European Union countries, is because the common agricultural policy. This European
policy is more oriented to the agricultural sector of the north countries and less oriented to the south and
Mediterranean. In this way the Mediterranean farmers are induced to produce the agricultural goods typical of the
European north countries and not their products, like the flowers and others outputs from the horticulture and fruit
activities. The farmers are induced, because they receive more financial supports if they choose some productions in
detriment of others. As, the agricultural activities have a lot of risks and uncertainties, the farmers opt for activities with
at least one guarantee that is the public support, in form of subsidies.
It is needed some adjustments in the international, European and national policies for the flowers productions and
commercialization and, of course, for the international trade of these activities. Because, it is needed to demonstrate to
the farmers that despite the flowers activities can have few national and European supports, this sector well organized
could be a profitable sector, with benefits to the rural populations and the countries. It is needed, also, a new
international marketing strategy for the trade of the Portuguese flowers.
The landscape of some countries origin small farms, but there are some works that demonstrate that is needed small
area for be profitable the flowers production.

723
So, in this work, it is tried to analyze the data about the international trade of flowers with Portugal. This, because the
international trade is the first step to become profitable the production of a sector with tradable products, like said the
Keynesian theorist. From here it is analyzed, with the convergence theory (Islam, 1995 and Solow, 1956), some test of
stationary and panel data methods, the evolution of the statistical information and conclude about the coherency of the
policies and strategies in the sector.
This analyze is an approach to conclude about the development of the international flowers sector (Vega, 2008;
Wijnands et al., 2006; Shah, 2007: and Nyangito, 2004), the perspective for the future and about some necessities of
adjustments in the policies and in the marketing strategies to become more profitable this sector with great possibility
of grow in some countries. The data used are from 2006 to 2010 and were obtained from the INE (Statistics Portugal),
gently given by the AICEP (Trade & Investment Agency).
There are another works available about the flower sector that analyzes, this question, in different perspective. For
example, Reinten et al. (2011) analyzed the cut flowers activity in the southern African and it potential for the
international trade. The influence of the United Kingdom retailers in the international trade of flowers was analyzed by
(Hughes, 2000). The relationship between the international trade of flowers and some plant pest dissemination was
studied by (Areal et al., 2008). The labor conditions in the cut flowers activities were considered by Riisgaard (2008).
The African flowers growers potential in the European markets were researched by Cunden and Van Heck (2004). In
another way, Vringer and Blok (2000) analyzed the environment implications of the decorative cut flowers.
2. Data analysis
In the table 1 it is presented the countries with more than ninety per cent of import and export, together, of flowers, in
different forms, with Portugal. Some data are presented in percentage to try catch the country and year effect.
The majority of import comes from the Europe, namely from Netherlands, Spain, France, Italy and Belgium.
Portugal export flowers, also, namely, to the Europe. Netherlands, Spain, France, United Kingdom, Italy and Germany
are the most important destinations of the Portuguese flowers.
From South Africa Portugal import particularly other live plants (including roots), cuttings, slips, mushroom spawn,
flowers, buds cut for branches and ornamental purposes, fresh, dried, etc. Do not import any flowers from Angola and
Cape Verde. From Brazil import in particular flowers, buds cut for branches and ornamental purposes, fresh, dried, etc.
The United States of America send to Portugal namely other live plants (including roots), cuttings, slips and mushroom
spawn. The Swiss few importance has in the Portuguese flowers importations. The majority of imports from China are
other live plants (including roots), cuttings, slips and mushroom spawn. From Israel are bulbs, tubers, roots, vegetation
or flowers, roots, other live plants (including roots), cuttings, slips and mushroom spawn. From Thailand the majority
are flowers, buds cut for branches and ornamental purposes, fresh, dried, etc. From India Portugal import namely
flowers, buds cut for branches, ornamental purposes, fresh, dried, etc, foliage, branches and other parts of plants,
without flowers and buttons.
From the European countries Portugal import in particular other live plants (including roots), cuttings, slips and
mushroom spawn. The differences in the import of flowers from different countries are normal, because their
availability depend from their natural and climate conditions.
Portugal exports namely other live plants (including roots), cuttings, slips and mushroom spawn. However the
Portuguese export has little importance to South Africa, Brazil, United States of America, China, Israel, India, Thailand
and Denmark.
The most important country for the Portuguese imports of flowers is clearly the Netherlands and after Spain.
It can be said the same to the Portuguese exports. The principal destination of the Portuguese flowers is the
Netherlands and after Spain. However Spain is the first destination of Portuguese foliage, branches and other parts of
plants, without flowers and buttons.

724
Table 1. Flowers, in different forms, import and export values
Flowers, in different forms, import values (euros)
Year South Africa Angola Cape Verde Brazil USA Swiss China Israel Thailand India Germany Belgium Denmark Spain France Netherlands Italy UK
2006 2.157 NA NA 1.274 372 NA 1.647 7.986 138.327 NA 184.655 323.358 2.081 1.719.302 76.858 7.314.035 22.233 109
2007 NA NA NA NA NA NA NA 18.029 14.793 NA 218.944 420.957 13.790 1.414.294 24.020 8.108.684 83.434 NA
2008 NA NA NA NA NA NA NA 18.437 5.881 NA 172.713 263.807 5.610 979.793 121.148 7.380.338 208.148 5.262
2009 2.044 NA NA NA NA NA NA 18.118 15.538 3.095 45.533 20.095 5.599 311.182 44.927 18.140.983 1.762 NA
2010 799 NA NA NA NA NA NA 7.329 26.048 NA 158.095 44.527 NA 568.419 32.663 8.265.723 212 NA
2006 31.472 NA NA 8.702 210.723 NA 33.211 46.549 2.643 NA 812.604 1.935.345 155.717 19.648.803 1.275.583 23.872.143 4.873.415 235.806
2007 17.763 NA NA 15.291 6.626 340 123.611 23.472 6.706 NA 958.877 1.200.847 86.945 20.719.930 1.557.055 24.984.372 4.956.950 296.460
2008 33.954 NA NA 2.232 38.996 NA 84.095 24.151 4.504 631 879.314 1.577.302 121.919 33.488.342 2.320.759 28.173.080 4.876.879 163.012
2009 45.153 NA NA 2.401 98.204 NA 43.796 25.149 NA 386 925.327 853.432 52.771 20.032.454 3.174.921 21.341.104 3.691.985 4.073
2010 40.043 NA NA NA 6.831 NA 42.926 11.871 7.831 35.339 947.652 725.835 16.206 14.275.770 3.008.624 25.605.736 5.801.943 181.842
2006 403.975 NA NA 621.467 NA NA 4.768 747 NA 3.420 18.119 742.311 NA 3.184.189 19.959 18.564.755 23.234 307.593
2007 411.523 NA NA 600.341 841 NA 11.067 2.263 9.908 4.552 58.322 703.287 NA 4.340.428 233.570 17.597.788 571.456 47.485
2008 351.874 NA NA 394.230 NA NA 377 3.461 9.243 13.745 63.523 296.022 NA 4.511.597 183.583 17.554.637 341.210 7.330
2009 94.730 NA NA 269.030 NA NA 10.439 NA 54.422 11.952 53.344 NA NA 5.881.775 471.971 11.289.615 18.563 NA
2010 32.594 NA NA 120.340 NA NA 7.348 7.350 56.163 23.714 83.297 NA NA 3.699.776 1.096.432 14.337.539 38.959 1.309
2006 115.553 NA NA 4.229 4.290 2.100 10.791 1.362 NA 72.208 44.484 111.946 9.682 694.007 233.900 2.701.125 39.742 104.062
2007 100.953 NA NA 13.542 5.583 NA 38.982 NA NA 66.024 64.743 24.685 NA 885.546 38.878 2.786.677 49.211 17.746
2008 86.019 NA NA 33.422 2.562 NA 56.646 3.864 165 25.814 11.323 98.458 26 2.183.000 5.744 2.990.013 8.428 22.888
2009 23.300 NA NA 66.852 482 NA 11.543 NA 168 NA 35.927 231.130 NA 1.109.228 4.997 2.125.187 22.937 NA
2010 21.388 NA NA 50.288 556 NA 6.239 NA 550 73.237 92.800 85.399 NA 1.460.915 4.768 2.134.191 61.688 140
Bulbs, tubers, roots,
vegetation or flowers,
etc., roots
Other live plants
(including roots),
cuttings and slips,
mushroom spawn
Flowers and buds of p /
branches / ornamental
purposes, fresh, dried,
etc.
Foliage, branches and
other parts of plants, s
/ flowers / buttons, etc.
Flowers, in different forms, export values (euros)
Year South Africa Angola Cape Verde Brazil USA Swiss China Israel Thailand India Germany Belgium Denmark Spain France Netherlands Italy UK
2006 NA NA NA NA NA NA NA NA NA NA NA NA NA 12.708 NA 1.079.522 NA NA
2007 NA NA NA NA NA NA NA NA NA 585 NA NA NA 67.904 14.871 1.375.967 NA NA
2008 NA NA NA NA NA NA NA NA NA 620 NA 39 NA 63.563 NA 930.373 NA NA
2009 NA 222 NA NA NA NA NA NA NA NA NA NA NA 3.230.676 NA 780.195 NA NA
2010 NA 804 NA NA NA NA NA NA NA NA 1.250 NA NA NA 10.280 1.090.755 NA NA
2006 2.009 24.638 3.586 6.014 152.809 201.578 11.466 NA NA NA 2.520.958 524.812 95 5.228.290 5.094.387 7.853.049 339.464 2.523.495
2007 14.629 20.104 5.367 3.085 188.855 78.588 18.110 1.216 NA NA 2.404.217 566.594 NA 8.195.069 5.416.216 9.087.990 509.067 2.694.163
2008 90 68.185 5.808 5.031 69.720 73.130 NA 1.265 NA NA 1.168.196 556.362 13.743 6.155.503 5.717.727 9.803.493 787.499 2.527.302
2009 NA 71.048 3.838 NA 77.862 44.287 NA NA NA NA 1.131.320 1.030.193 91.816 4.954.271 6.197.957 9.432.277 1.400.801 2.219.833
2010 NA 57.885 3.484 NA 161.294 29.904 NA NA NA NA 456.796 716.690 102.716 5.046.533 6.361.183 11.731.354 2.948.997 3.061.114
2006 NA 17.738 7.169 NA NA 1.572 NA NA NA NA 314.610 163.381 NA 162.320 175.185 4.724.390 130.188 5.819
2007 NA 22.538 3.228 NA NA 1.370 NA NA NA NA 243.326 21.188 NA 289.375 210.492 4.751.432 13.529 NA
2008 NA 10.987 1.260 NA NA 877 NA NA NA NA 253.031 277.834 NA 318.687 6.004 5.256.735 NA 27.029
2009 NA 11.726 3.822 NA 1.368 840 NA NA NA NA 63.184 331.742 NA 618.525 35.044 7.508.691 NA 153.114
2010 NA 50.352 11.272 NA NA 1.152 NA NA NA NA NA 123.427 NA 330.097 3.537 3.213.584 NA 94.047
2006 NA 1.360 602 NA NA NA NA NA NA NA 504.076 202.770 NA 12.496.917 603.765 2.196.748 2.099.778 98.945
2007 NA 2.631 NA NA NA 20 NA NA NA NA 539.568 228.525 NA 15.937.919 58.797 1.981.932 4.505.754 102.114
2008 NA 4.785 NA NA NA NA NA NA NA NA 576.795 262.566 NA 8.864.672 38.611 2.467.610 1.549.003 208.783
2009 NA 4.344 31 NA NA NA NA NA NA NA 387.664 289.549 NA 9.353.731 44.199 1.806.112 2.468.492 156.980
2010 NA 5.439 1.696 NA NA NA NA NA NA NA 636.750 296.178 NA 16.586.061 30.447 1.294.269 5.235.820 131.597
Foliage, branches and
other parts of plants, s
/ flowers / buttons, etc.
Bulbs, tubers, roots,
vegetation or flowers,
etc., roots
Other live plants
(including roots),
cuttings and slips,
mushroom spawn
Flowers and buds of p /
branches / ornamental
purposes, fresh, dried,
etc.
Flowers, in different forms, import percentage relatively to the total of each country
Year South Africa Angola Cape Verde Brazil USA Swiss China Israel Thailand India Germany Belgium Denmark Spain France Netherlands Italy UK
2006 NA NA NA NA NA NA NA 41,20 47,10 NA 16,83 17,91 13,69 5,17 1,30 15,16 1,47 NA
2007 NA NA NA NA NA NA NA 36,94 29,71 NA 15,33 11,80 4,40 2,38 4,60 13,16 3,83 2,65
2008 1,24 NA NA NA NA NA NA 41,87 22,16 20,05 4,30 1,82 9,59 1,14 1,22 34,29 0,05 NA
2009 0,84 NA NA NA NA NA NA 27,60 28,75 NA 12,33 5,20 NA 2,84 0,79 16,42 0,00 NA
2010 NA NA NA NA NA NA NA 4,95 NA NA 9,50 24,19 NA 3,79 2,07 18,35 0,01 NA
2006 3,35 NA NA 2,43 50,77 100,00 71,18 53,63 21,35 NA 73,71 51,10 86,31 75,73 84,01 46,72 87,56 81,96
2007 7,20 NA NA 0,52 93,84 NA 59,59 48,39 22,76 1,57 78,03 70,55 95,58 81,36 88,20 50,22 89,74 82,13
2008 27,33 NA NA 0,71 99,51 NA 66,58 58,13 NA 2,50 87,28 77,26 90,41 73,29 85,88 40,34 98,84 100,00
2009 42,23 NA NA NA 92,47 NA 75,96 44,71 8,64 26,71 73,93 84,82 100,00 71,36 72,63 50,86 98,29 99,21
2010 85,74 NA NA 12,32 99,47 NA 27,16 95,05 3,73 47,86 80,52 55,27 97,77 69,26 84,48 44,94 92,16 95,54
2006 77,61 NA NA 95,42 6,44 NA 6,37 5,17 31,55 6,45 4,48 29,93 NA 15,86 12,60 32,91 10,09 13,13
2007 74,57 NA NA 91,71 NA NA 0,27 6,93 46,70 34,20 5,64 13,24 NA 10,96 6,98 31,29 6,28 3,69
2008 57,33 NA NA 79,53 NA NA 15,87 NA 77,60 77,44 5,03 NA NA 21,52 12,77 21,34 0,50 NA
2009 34,37 NA NA 70,53 NA NA 13,00 27,68 62,00 17,93 6,50 NA NA 18,49 26,47 28,48 0,66 0,71
2010 8,06 NA NA 86,52 NA NA 0,12 NA 96,23 NA 2,86 19,31 NA 17,43 13,28 30,10 2,02 2,02
2006 19,04 NA NA 2,15 42,78 NA 22,45 NA NA 93,55 4,98 1,05 NA 3,24 2,10 5,21 0,87 4,91
2007 18,23 NA NA 7,77 6,16 NA 40,14 7,74 0,83 64,23 1,00 4,40 0,02 5,30 0,22 5,33 0,16 11,53
2008 14,10 NA NA 19,76 0,49 NA 17,55 NA 0,24 NA 3,39 20,92 NA 4,06 0,14 4,02 0,61 NA
2009 22,56 NA NA 29,47 7,53 NA 11,04 NA 0,61 55,36 7,24 9,98 NA 7,30 0,12 4,24 1,05 0,08
2010 6,20 NA NA 1,16 0,53 NA 72,73 NA 0,03 52,14 7,12 1,23 2,23 9,52 0,17 6,61 5,81 2,44
Bulbs, tubers, roots,
vegetation or flowers,
etc., roots
Other live plants
(including roots),
cuttings and slips,
mushroom spawn
Flowers and buds of p /
branches / ornamental
purposes, fresh, dried,
etc.
Foliage, branches and
other parts of plants, s
/ flowers / buttons, etc.

725
(continuation)
Flowers, in different forms, export percentage relatively to the total of each country
Year South Africa Angola Cape Verde Brazil USA Swiss China Israel Thailand India Germany Belgium Denmark Spain France Netherlands Italy UK
2006 NA NA NA NA NA NA NA NA NA 100,00 NA NA NA 0,28 0,26 8,00 NA NA
2007 NA NA NA NA NA NA NA NA NA 100,00 NA 0,00 NA 0,41 NA 5,04 NA NA
2008 NA 0,25 NA NA NA NA NA NA NA NA NA NA NA 17,79 NA 4,00 NA NA
2009 NA 0,70 NA NA NA NA NA NA NA NA 0,11 NA NA NA 0,16 6,29 NA NA
2010 NA 1,02 NA NA NA NA NA NA NA NA 0,03 NA NA 0,00 NA 3,80 NA NA
2006 100,00 44,41 62,44 100,00 100,00 98,26 100,00 100,00 NA NA 75,44 69,41 NA 33,46 95,02 52,85 10,12 96,35
2007 100,00 81,21 82,17 100,00 100,00 98,81 NA 100,00 NA NA 58,47 50,73 100,00 39,96 99,23 53,11 33,70 91,47
2008 NA 81,35 49,90 NA 98,27 98,14 NA NA NA NA 71,50 62,38 100,00 27,29 98,74 48,30 36,20 87,74
2009 NA 50,56 21,18 NA 100,00 96,29 NA NA NA NA 41,72 63,07 100,00 22,98 99,31 67,69 36,03 93,13
2010 NA 59,94 44,58 NA 100,00 98,91 NA NA NA 100,00 35,66 62,07 100,00 22,42 99,51 74,20 24,13 98,17
2006 NA 49,78 37,56 NA NA 1,71 NA NA NA NA 7,63 2,60 NA 1,18 3,69 27,63 0,27 NA
2007 NA 13,09 17,83 NA NA 1,19 NA NA NA NA 12,66 25,33 NA 2,07 0,10 28,48 NA 0,98
2008 NA 13,43 49,69 NA 1,73 1,86 NA NA NA NA 3,99 20,09 NA 3,41 0,56 38,45 NA 6,05
2009 NA 43,98 68,51 NA NA 3,71 NA NA NA NA NA 10,86 NA 1,50 0,06 18,54 NA 2,86
2010 NA 24,26 54,08 NA NA 1,09 NA NA NA NA NA 19,22 NA 5,15 NA 13,06 NA 0,48
2006 NA 5,81 NA NA NA 0,03 NA NA NA NA 16,93 27,99 NA 65,08 1,03 11,52 89,61 3,65
2007 NA 5,70 NA NA NA NA NA NA NA NA 28,87 23,94 NA 57,55 0,67 13,37 66,30 7,56
2008 NA 4,97 0,40 NA NA NA NA NA NA NA 24,50 17,53 NA 51,52 0,70 9,25 63,80 6,20
2009 NA 4,75 10,31 NA NA NA NA NA NA NA 58,16 26,07 NA 75,52 0,48 7,47 63,97 4,00
2010 NA 14,77 1,34 NA NA NA NA NA NA NA 64,32 18,71 NA 72,43 0,49 8,94 75,87 1,35
Other live plants
(including roots),
cuttings and slips,
mushroom spawn
Flowers and buds of p /
branches / ornamental
purposes, fresh, dried,
etc.
Foliage, branches and
other parts of plants, s
/ flowers / buttons, etc.
Bulbs, tubers, roots,
vegetation or flowers,
etc., roots
Flowers, in different forms, import percentage relatively to the total of each year
Year South Africa Angola Cape Verde Brazil USA Swiss China Israel Thailand India Germany Belgium Denmark Spain France Netherlands Italy UK
2006 0,02 NA NA 0,01 0,00 NA 0,02 0,08 1,41 NA 1,88 3,30 0,02 17,52 0,78 74,55 0,23 0,00
2007 NA NA NA NA NA NA NA 0,17 0,14 NA 2,12 4,08 0,13 13,70 0,23 78,55 0,81 NA
2008 NA NA NA NA NA NA NA 0,20 0,06 NA 1,89 2,88 0,06 10,69 1,32 80,55 2,27 0,06
2009 0,01 NA NA NA NA NA NA 0,10 0,08 0,02 0,24 0,11 0,03 1,67 0,24 97,48 0,01 NA
2010 0,01 NA NA NA NA NA NA 0,08 0,29 NA 1,74 0,49 NA 6,24 0,36 90,79 0,00 NA
2006 0,06 NA NA 0,02 0,39 NA 0,06 0,09 0,00 NA 1,52 3,62 0,29 36,75 2,39 44,65 9,11 0,44
2007 0,03 NA NA 0,03 0,01 0,00 0,22 0,04 0,01 NA 1,71 2,14 0,16 37,01 2,78 44,63 8,85 0,53
2008 0,05 NA NA 0,00 0,05 NA 0,12 0,03 0,01 0,00 1,21 2,17 0,17 46,04 3,19 38,73 6,70 0,22
2009 0,09 NA NA 0,00 0,19 NA 0,09 0,05 NA 0,00 1,82 1,68 0,10 39,44 6,25 42,01 7,27 0,01
2010 0,08 NA NA NA 0,01 NA 0,08 0,02 0,02 0,07 1,85 1,41 0,03 27,82 5,86 49,91 11,31 0,35
2006 1,63 NA NA 2,52 NA NA 0,02 0,00 NA 0,01 0,07 3,00 NA 12,89 0,08 75,14 0,09 1,24
2007 1,60 NA NA 2,33 0,00 NA 0,04 0,01 0,04 0,02 0,23 2,73 NA 16,87 0,91 68,40 2,22 0,18
2008 1,40 NA NA 1,57 NA NA 0,00 0,01 0,04 0,05 0,25 1,18 NA 17,94 0,73 69,79 1,36 0,03
2009 0,50 NA NA 1,41 NA NA 0,05 NA 0,28 0,06 0,28 NA NA 30,74 2,47 59,01 0,10 NA
2010 0,16 NA NA 0,59 NA NA 0,04 0,04 0,28 0,12 0,41 NA NA 18,27 5,42 70,82 0,19 0,01
2006 2,75 NA NA 0,10 0,10 0,05 0,26 0,03 NA 1,72 1,06 2,66 0,23 16,51 5,56 64,25 0,95 2,48
2007 2,40 NA NA 0,32 0,13 NA 0,93 NA NA 1,57 1,54 0,59 NA 21,04 0,92 66,21 1,17 0,42
2008 1,53 NA NA 0,60 0,05 NA 1,01 0,07 0,00 0,46 0,20 1,75 0,00 38,90 0,10 53,28 0,15 0,41
2009 0,63 NA NA 1,82 0,01 NA 0,31 NA 0,00 NA 0,98 6,30 NA 30,22 0,14 57,89 0,62 NA
2010 0,53 NA NA 1,24 0,01 NA 0,15 NA 0,01 1,81 2,30 2,11 NA 36,13 0,12 52,78 1,53 0,00
Foliage, branches and
other parts of plants, s
/ flowers / buttons, etc.
Bulbs, tubers, roots,
vegetation or flowers,
etc., roots
Other live plants
(including roots),
cuttings and slips,
mushroom spawn
Flowers and buds of p /
branches / ornamental
purposes, fresh, dried,
etc.
Flowers, in different forms, export percentage relatively to the total of each year
Year South Africa Angola Cape Verde Brazil USA Swiss China Israel Thailand India Germany Belgium Denmark Spain France Netherlands Italy UK
2006 NA NA NA NA NA NA NA NA NA NA NA NA NA 1,16 NA 98,51 NA NA
2007 NA NA NA NA NA NA NA NA NA 0,04 NA NA NA 4,57 1,00 92,65 NA NA
2008 NA NA NA NA NA NA NA NA NA 0,06 NA 0,00 NA 6,39 NA 93,54 NA NA
2009 NA 0,01 NA NA NA NA NA NA NA NA NA NA NA 80,54 NA 19,45 NA NA
2010 NA 0,07 NA NA NA NA NA NA NA NA 0,11 NA NA NA 0,93 98,26 NA NA
2006 0,01 0,10 0,01 0,02 0,61 0,81 0,05 NA NA NA 10,11 2,10 0,00 20,96 20,42 31,48 1,36 10,12
2007 0,05 0,07 0,02 0,01 0,64 0,26 0,06 0,00 NA NA 8,09 1,91 NA 27,58 18,23 30,59 1,71 9,07
2008 0,00 0,25 0,02 0,02 0,25 0,27 NA 0,00 NA NA 4,26 2,03 0,05 22,46 20,87 35,78 2,87 9,22
2009 NA 0,27 0,01 NA 0,29 0,17 NA NA NA NA 4,22 3,84 0,34 18,49 23,13 35,20 5,23 8,28
2010 NA 0,19 0,01 NA 0,52 0,10 NA NA NA NA 1,48 2,33 0,33 16,40 20,67 38,12 9,58 9,95
2006 NA 0,31 0,12 NA NA 0,03 NA NA NA NA 5,47 2,84 NA 2,82 3,05 82,13 2,26 0,10
2007 NA 0,40 0,06 NA NA 0,02 NA NA NA NA 4,34 0,38 NA 5,16 3,75 84,68 0,24 NA
2008 NA 0,18 0,02 NA NA 0,01 NA NA NA NA 4,11 4,51 NA 5,18 0,10 85,37 NA 0,44
2009 NA 0,13 0,04 NA 0,02 0,01 NA NA NA NA 0,72 3,79 NA 7,07 0,40 85,81 NA 1,75
2010 NA 1,30 0,29 NA NA 0,03 NA NA NA NA NA 3,20 NA 8,55 0,09 83,23 NA 2,44
2006 NA 0,01 0,00 NA NA NA NA NA NA NA 2,77 1,11 NA 68,62 3,32 12,06 11,53 0,54
2007 NA 0,01 NA NA NA 0,00 NA NA NA NA 2,31 0,98 NA 68,22 0,25 8,48 19,29 0,44
2008 NA 0,03 NA NA NA NA NA NA NA NA 4,12 1,88 NA 63,36 0,28 17,64 11,07 1,49
2009 NA 0,03 0,00 NA NA NA NA NA NA NA 2,67 1,99 NA 64,30 0,30 12,42 16,97 1,08
2010 NA 0,02 0,01 NA NA NA NA NA NA NA 2,62 1,22 NA 68,34 0,13 5,33 21,57 0,54
Bulbs, tubers, roots,
vegetation or flowers,
etc., roots
Other live plants
(including roots),
cuttings and slips,
mushroom spawn
Flowers and buds of p /
branches / ornamental
purposes, fresh, dried,
etc.
Foliage, branches and
other parts of plants, s
/ flowers / buttons, etc.
3. Estimations results for the neoclassical model with panel data
The estimations results presented in the following tables, were obtained with the informatics program stata12, and are
obtained with different method of estimation in panel data. Are presented all values for the different methods and the
statistics tests. The statistics tests allow us to find the correct method and the correct estimation values.
The model used is the traditional model of the neoclassical theory (absolute convergence) of Solow (1956) with the
development to panel data of Islam (1995).
In the tables 2, 3 and 4 presented below, it is observed the importance of the fixed effects, analyzing the statistics tests
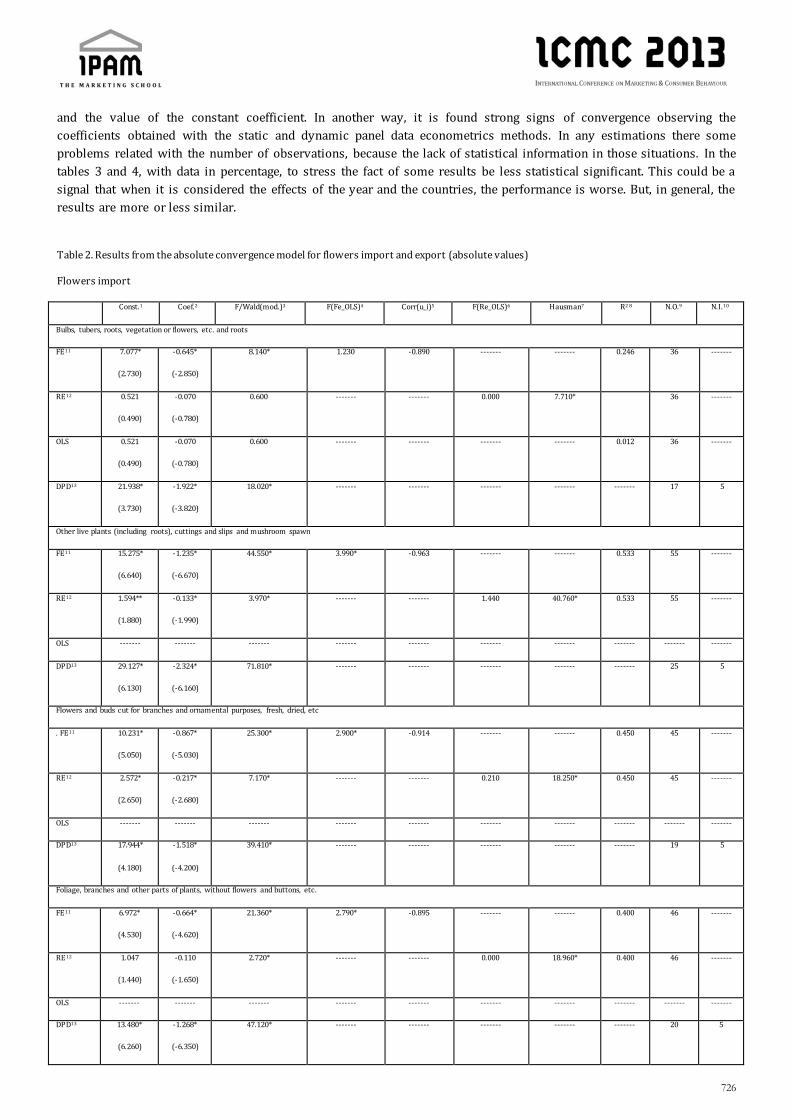
726
and the value of the constant coefficient. In another way, it is found strong signs of convergence observing the
coefficients obtained with the static and dynamic panel data econometrics methods. In any estimations there some
problems related with the number of observations, because the lack of statistical information in those situations. In the
tables 3 and 4, with data in percentage, to stress the fact of some results be less statistical significant. This could be a
signal that when it is considered the effects of the year and the countries, the performance is worse. But, in general, the
results are more or less similar.
Table 2. Results from the absolute convergence model for flowers import and export (absolute values)
Flowers import
Const.1 Coef.2 F/Wald(mod.)3 F(Fe_OLS)4 Corr(u_i)5 F(Re_OLS)6 Hausman7 R2 8 N.O.9 N.I.10
Bulbs, tubers, roots, vegetation or flowers, etc. and roots
FE11 7.077*
(2.730)
-0.645*
(-2.850)
8.140* 1.230 -0.890 ------- ------- 0.246 36 -------
RE12 0.521
(0.490)
-0.070
(-0.780)
0.600 ------- ------- 0.000 7.710* 36 -------
OLS 0.521
(0.490)
-0.070
(-0.780)
0.600 ------- ------- ------- ------- 0.012 36 -------
DPD13 21.938*
(3.730)
-1.922*
(-3.820)
18.020* ------- ------- ------- ------- ------- 17 5
Other live plants (including roots), cuttings and slips and mushroom spawn
FE11 15.275*
(6.640)
-1.235*
(-6.670)
44.550* 3.990* -0.963 ------- ------- 0.533 55 -------
RE12 1.594**
(1.880)
-0.133*
(-1.990)
3.970* ------- ------- 1.440 40.760* 0.533 55 -------
OLS ------- ------- ------- ------- ------- ------- ------- ------- ------- -------
DPD13 29.127*
(6.130)
-2.324*
(-6.160)
71.810* ------- ------- ------- ------- ------- 25 5
Flowers and buds cut for branches and ornamental purposes, fresh, dried, etc
. FE11 10.231*
(5.050)
-0.867*
(-5.030)
25.300* 2.900* -0.914 ------- ------- 0.450 45 -------
RE12 2.572*
(2.650)
-0.217*
(-2.680)
7.170* ------- ------- 0.210 18.250* 0.450 45 -------
OLS ------- ------- ------- ------- ------- ------- ------- ------- ------- -------
DPD13 17.944*
(4.180)
-1.518*
(-4.200)
39.410* ------- ------- ------- ------- ------- 19 5
Foliage, branches and other parts of plants, without flowers and buttons, etc.
FE11 6.972*
(4.530)
-0.664*
(-4.620)
21.360* 2.790* -0.895 ------- ------- 0.400 46 -------
RE12 1.047
(1.440)
-0.110
(-1.650)
2.720* ------- ------- 0.000 18.960* 0.400 46 -------
OLS ------- ------- ------- ------- ------- ------- ------- ------- ------- -------
DPD13 13.480*
(6.260)
-1.268*
(-6.350)
47.120* ------- ------- ------- ------- ------- 20 5

727
Flowers export
Const.1 Coef.2 F/Wald(mod.)3 F(Fe_OLS)4 Corr(u_i)5 F(Re_OLS)6 Hausman7 R2 8 N.O.9 N.I.10
Bulbs, tubers, roots, vegetation or flowers, etc. and roots
FE11 0.929
(0.080)
-0.015
(-0.010)
0.000 0.880 0.361 ------- ------- 0.073 9 -------
RE12 1.995
(1.160)
-0.112
(-0.740)
0.550 ------- ------- 0.000 0.010 0.073 9 -------
OLS 1.995
(1.160)
-0.112
(-0.740)
0.550 ------- ------- ------- ------- 0.073 9 -------
DPD13 ------- ------- ------- ------- ------- ------- ------- ------- ------- -------
Other live plants (including roots), cuttings and slips and mushroom spawn
FE11 14.922*
(5.010)
-1.192*
(-5.020)
25.190* 2.920* -0.978 ------- ------- 0.419 52 -------
RE12 0.257
(0.360)
-0.021
(-0.370)
0.140 ------- ------- 1.410 25.770* 0.419 52 -------
OLS ------- ------- ------- ------- ------- ------- ------- ------- ------- -------
DPD13 8.711*
(3.200)
-0.683*
(-3.220)
22.470* ------- ------- ------- ------- ------- 22 5
Flowers and buds cut for branches and ornamental purposes, fresh, dried, etc.
FE11 11.467*
(4.580)
-1.058*
(-4.650)
21.660* 3.320* -0.938 ------- ------- 0.485 34 -------
RE12 2.379
(1.770)
-0.233
(-1.970)
3.890* ------- ------- 0.820 18.020* 0.485 34 -------
OLS ------- ------- ------- ------- ------- ------- ------- ------- ------- -------
DPD13 15.450*
(4.630)
-1.427*
(-4.660)
41.910* ------- ------- ------- ------- ------- 15 5
Foliage, branches and other parts of plants, without flowers and buttons, etc.
FE11 11.092*
(7.540)
-0.878*
(-7.460)
55.720* 20.970* -0.943 ------- ------- 0.708 33 -------
RE12 6.002*
(5.590)
-0.473*
(-5.560)
30.920* ------- ------- 4.040* 24.360* 0.708 33 -------
OLS ------- ------- ------- ------- ------- ------- ------- ------- ------- -------
DPD13 18.512*
(6.000)
-1.450*
(-5.990)
38.690* ------- ------- ------- ------- ------- 16 5
Note: 1, Constant; 2, Coefficient; 3, Test F for fixed effects model and test Wald for random effects and dynamic panel data models; 4, Test F for fixed
effects or OLS (Ho is OLS); 5, Correlation between errors and regressors in fixed effects; 6, Test F for random effects or OLS (Ho is OLS); 7, Hausman
test (Ho is GLS); 8, R square; 9, Number of observations; 10, Number of instruments;, 11, Fixed effects model; 12, Random effects model; 13, Dynamic
panel data model; *, Statically significant at 5%.

728
Table 3. Results from the absolute convergence model for flowers import and export (percentage values relatively to the total of each country)
Flowers import
Const.1 Coef.2 F/Wald(mod.)3 F(Fe_OLS)4 Corr(u_i)5 F(Re_OLS)6 Hausman7 R2 8 N.O.9 N.I.10
Bulbs, tubers, roots, vegetation or flowers, etc. and roots
FE11 0.632
(1.720)
-0.533*
(-2.870)
8.230* 1.380 -0.791 ------- ------- 0.286 34 -------
RE12 -0.142
(-0.510)
-0.065
(-0.600)
0.360 ------- ------- 0.000 9.580* 0.286 34 -------
OLS -0.142
(-0.510)
-0.065
(-0.600)
0.360 ------- ------- ------- ------- 0.020 34 -------
DPD13 1.569*
(4.360)
-1.150*
(-6.340)
50.420* ------- ------- ------- ------- ------- 15 5
Other live plants (including roots), cuttings and slips and mushroom spawn
FE11 1.337*
(2.940)
-0.326*
(-2.750)
7.540* 3.450* -0.535 ------- ------- 0.162 55 -------
RE12 0.630*
(2.130)
-0.149*
(-2.010)
4.030* ------- ------- 1.760 3.610 0.162 55 -------
OLS 0.578*
(2.500)
-0.127*
(-2.180)
4.740* ------- ------- ------- ------- 0.065 55 -------
DPD13 2.282*
(4.110)
-0.525*
(-3.680)
48.600* ------- ------- ------- ------- ------- 25 5
Flowers and buds cut for branches and ornamental purposes, fresh, dried, etc.
FE11 2.940*
(5.410)
-1.138*
(-5.950)
35.350* 2.890* -0.805 ------- ------- 0.549 43 -------
RE12 0.603
(1.460)
-0.281*
(-2.100)
4.390* ------- ------- 0.000 39.280* 0.549 43 -------
OLS ------- ------- ------- ------- ------- ------- ------- ------- ------- -------
DPD13 5.961*
(9.880)
-2.185*
(-10.250)
118.920* ------- ------- ------- ------- ------- 19 5
Foliage, branches and other parts of plants, without flowers and buttons, etc.
FE11 1.241*
(4.660)
-0.992*
(-5.990)
35.880* 3.690* -0.772 ------- ------- 0.521 47 -------
RE12 0.576
(1.800)
-0.470*
(-3.620)
13.120* ------- ------- 0.090 25.690* 0.521 47 -------
OLS ------- ------- ------- ------- ------- ------- ------- ------- ------- -------
DPD13 2.165*
(4.510)
-1.839*
(-5.010)
27.710* ------- ------- ------- ------- ------- 21 5
Flowers export
Const.1 Coef.2 F/Wald(mod.)3 F(Fe_OLS)4 Corr(u_i)5 F(Re_OLS)6 Hausman7 R2 8 N.O.9 N.I.10
Bulbs, tubers, roots, vegetation or flowers, etc. and roots
FE11 0.339 -0.003 0.000 1.530 0.273 ------- ------- 0.049 10 -------

729
(0.400) (-0.000)
RE12 0.356
(0.580)
-0.070
(-0.260)
0.070 ------- ------- 0.000 0.000 0.049 10 -------
OLS 0.417
(0.890)
-0.145
(-0.640)
0.410 ------- ------- ------- ------- 0.071 10 -------
DPD13 ------- ------- ------- ------- ------- ------- ------- ------- ------- -------
Other live plants (including roots), cuttings and slips and mushroom spawn
FE11 3.752*
(6.660)
-0.901*
(-6.680)
44.580* 2.810* -0.851 ------- ------- 0.567 50 -------
RE12 0.993*
(2.940)
-0.239*
(-2.960)
8.780* ------- ------- 0.000 37.420* 0.567 50 -------
OLS ------- ------- ------- ------- ------- ------- ------- ------- ------- -------
DPD13 6.280*
(5.800)
-1.523*
(-5.860)
40.180* ------- ------- ------- ------- ------- 23 5
Flowers and buds cut for branches and ornamental purposes, fresh, dried, etc.
FE11 2.491*
(7.180)
-1.359*
(-7.990)
63.820* 9.610* -0.873 ------- ------- 0.744 32 -------
RE12 0.533
(1.280)
-0.357*
(-2.180)
4.750* ------- ------- 0.060 482.300* 0.744 32 -------
OLS ------- ------- ------- ------- ------- ------- ------- ------- ------- -------
DPD13 4.391*
(3.460)
-2.296*
(-3.540)
24.580* ------- ------- ------- ------- ------- 14 5
Foliage, branches and other parts of plants, without flowers and buttons, etc.
FE11 3.309*
(7.910)
-1.360*
(-7.980)
63.750* 8.470* -0.947 ------- ------- 0.727 34 -------
RE12 0.447
(1.540)
-0.171
(-1.700)
2.880 ------- ------- 1.050 75.260* 0.727 34 -------
OLS ------- ------- ------- ------- ------- ------- ------- ------- ------- -------
DPD13 2.299
(1.420)
-0.964
(-1.460)
4.210 ------- ------- ------- ------- ------- 16 5
Table 4. Results from the absolute convergence model for flowers import and export (percentage values relatively to the total of each year)
Flowers import
Const.1 Coef.2 F/Wald(mod.)3 F(Fe_OLS)4 Corr(u_i)5 F(Re_OLS)6 Hausman7 R2 8 N.O.9 N.I.10
Bulbs, tubers, roots, vegetation or flowers, etc. and roots
FE11 -0.446
(-1.840)
-0.751*
(-3.480)
12.120* 1.420 -0.879 ------- ------- 0.327 36 -------
RE12 -0.298
(-1.190)
-0.123
(-1.220)
1.490 ------- ------- 0.000 10.850* 0.327 36 -------
OLS -0.298
(-1.190)
-0.123
(-1.220)
1.490 ------- ------- ------- ------- 0.014 36 -------
DPD13 8.233 -0.735 6.560* ------- ------- ------- ------- ------- 10 5

730
(1.500) (-1.600)
Other live plants (including roots), cuttings and slips and mushroom spawn
FE11 -1.087*
(-5.460)
-1.207*
(-6.610)
43.710* 4.050* -0.962 ------- ------- 0.529 55 -------
RE12 -0.177
(-0.790)
-0.147*
(-2.120)
4.510* ------- ------- 1.160 39.350* 0.529 55 -------
OLS ------- ------- ------- ------- ------- ------- ------- ------- ------- -------
DPD13 -1.682*
(-6.340)
-2.243*
(-6.530)
76.030* ------- ------- ------- ------- ------- 25 5
Flowers and buds cut for branches and ornamental purposes, fresh, dried, etc.
FE11 -0.443*
(-2.450)
-0.854*
(-5.040)
25.410* 2.970* -0.910 ------- ------- 0.451 45 -------
RE12 -0.074
(-0.310)
-0.221*
(-2.700)
7.290* ------- ------- 0.160 18.190* 0.451 45 -------
OLS ------- ------- ------- ------- ------- ------- ------- ------- ------- -------
DPD13 -0.718*
(-2.890)
-1.462*
(-4.020)
40.340* ------- ------- ------- ------- ------- 19 5
Foliage, branches and other parts of plants, without flowers and buttons, etc.
FE11 -0.117
(-0.990)
-0.683*
(-4.730)
22.370* 2.930* -0.890 ------- ------- 0.411 46 -------
RE12 -0.130
(-0.750)
-0.139
(-1.950)
3.810* ------- ------- 0.000 18.740* 0.411 46 -------
OLS ------- ------- ------- ------- ------- ------- ------- ------- ------- -------
DPD13 -0.104
(-0.950)
-1.315*
(-6.600)
52.290* ------- ------- ------- ------- ------- 20 5
Flowers export
Const.1 Coef.2 F/Wald(mod.)3 F(Fe_OLS)4 Corr(u_i)5 F(Re_OLS)6 Hausman7 R2 8 N.O.9 N.I.10
Bulbs, tubers, roots, vegetation or flowers, etc. and roots
FE11 1.590
(1.650)
-0.601
(-0.900)
0.810 0.760 -0.897 ------- ------- 0.455 9 -------
RE12 1.084
(2.490*)
-0.215
(-1.770)
3.130 ------- ------- 0.440 0.350 0.455 9 -------
OLS 1.090
(2.570*)
-0.217
(-1.820)
3.320 ------- ------- ------- ------- 0.225 9 -------
DPD13 ------- ------- ------- ------- ------- ------- ------- ------- ------- -------
Other live plants (including roots), cuttings and slips and mushroom spawn
FE11 -0.044
(-0.430)
-1.167*
(-4.910)
24.120* 2.850* -0.978 ------- ------- 0.408 52 -------
RE12 -0.061
(-0.400)
-0.020
(-0.370)
0.140 ------- ------- 1.330 24.640* 0.408 52 -------
OLS ------- ------- ------- ------- ------- ------- ------- ------- ------- -------
DPD13 0.127 -0.705* 22.030* ------- ------- ------- ------- ------- 22 5

731
(0.088) (-3.210)
Flowers and buds cut for branches and ornamental purposes, fresh, dried, etc.
FE11 -0.150
(-0.870)
-0.981*
(-4.110)
16.900* 2.870* -0.932 ------- ------- 0.424 34 -------
RE12 -0.120
(-0.380)
-0.228
(-1.920)
3.670 ------- ------- 0.620 13.220* 0.424 34 -------
OLS ------- ------- ------- ------- ------- ------- ------- ------- ------- -------
DPD13 -0.281
(-1.610)
-1.462*
(-4.580)
32.900* ------- ------- ------- ------- ------- 15 5
Foliage, branches and other parts of plants, without flowers and buttons, etc.
FE11 0.461*
(4.880)
-0.953*
(-6.790)
46.160* 12.790* -0.955 ------- ------- 0.667 33 -------
RE12 0.205
(0.580)
-0.404*
(-4.630)
21.480* ------- ------- 1.860 24.630* 0.667 33 -------
OLS ------- ------- ------- ------- ------- ------- ------- ------- ------- -------
DPD13 1.121*
(6.130)
-1.556*
(-6.500)
48.480* ------- ------- ------- ------- ------- 16 5
Table 5, presents the same data, but more aggregated. Give us another perspective of the data. Again the results are
more or less similar. The influence of the country and year is not significative.
Table 5. Results from the absolute convergence model for all flowers
Absolute values
Const.1 Coef.2 F/Wald(mod.)3 F(Fe_OLS)4 Corr(u_i)5 F(Re_OLS)6 Hausman7 R2 8 N.O.9 N.I.10
Import
FE11 9.590*
(9.000)
-0.833*
(-9.110)
82.930* 2.390* -0.927 ------- ------- 0.390 182 -------
RE12 1.138*
(2.830)
-0.106*
(-3.140)
9.880* ------- ------- 2.220 73.110* 0.390 182 -------
OLS ------- ------- ------- ------- ------- ------- ------- ------- ------- -------
DPD13 19.238*
(9.590)
-1.653*
(-9.700)
147.870* ------- ------- ------- ------- ------- 81 5
Export
FE11 12.048*
(7.820)
-1.001*
(-7.800)
60.890* 3.580* -0.956 ------- ------- 0.409 128 -------
RE12 2.238*
(3.720)
-0.185*
(-3.720)
13.830* ------- ------- 0.130 47.580* 0.409 128 -------
OLS ------- ------- ------- ------- ------- ------- ------- ------- ------- -------
DPD13 14.249*
(6.390)
-1.160*
(-6.390)
91.770* ------- ------- ------- ------- ------- 56 5
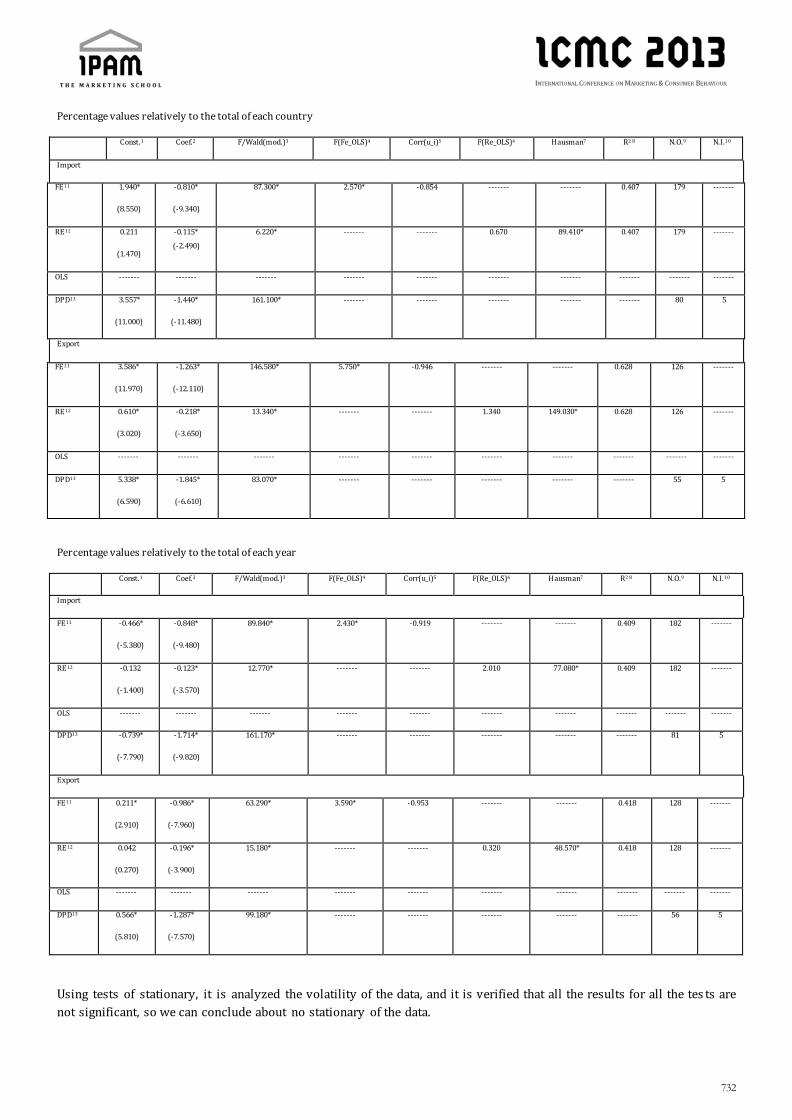
732
Percentage values relatively to the total of each country
Const.1 Coef.2 F/Wald(mod.)3 F(Fe_OLS)4 Corr(u_i)5 F(Re_OLS)6 Hausman7 R2 8 N.O.9 N.I.10
Import
FE11 1.940*
(8.550)
-0.810*
(-9.340)
87.300* 2.570* -0.854 ------- ------- 0.407 179 -------
RE12 0.211
(1.470)
-0.115*
(-2.490)
6.220* ------- ------- 0.670 89.410* 0.407 179 -------
OLS ------- ------- ------- ------- ------- ------- ------- ------- ------- -------
DPD13 3.557*
(11.000)
-1.440*
(-11.480)
161.100* ------- ------- ------- ------- ------- 80 5
Export
FE11 3.586*
(11.970)
-1.263*
(-12.110)
146.580* 5.750* -0.946 ------- ------- 0.628 126 -------
RE12 0.610*
(3.020)
-0.218*
(-3.650)
13.340* ------- ------- 1.340 149.030* 0.628 126 -------
OLS ------- ------- ------- ------- ------- ------- ------- ------- ------- -------
DPD13 5.338*
(6.590)
-1.845*
(-6.610)
83.070* ------- ------- ------- ------- ------- 55 5
Percentage values relatively to the total of each year
Const.1 Coef.2 F/Wald(mod.)3 F(Fe_OLS)4 Corr(u_i)5 F(Re_OLS)6 Hausman7 R2 8 N.O.9 N.I.10
Import
FE11 -0.466*
(-5.380)
-0.848*
(-9.480)
89.840* 2.430* -0.919 ------- ------- 0.409 182 -------
RE12 -0.132
(-1.400)
-0.123*
(-3.570)
12.770* ------- ------- 2.010 77.080* 0.409 182 -------
OLS ------- ------- ------- ------- ------- ------- ------- ------- ------- -------
DPD13 -0.739*
(-7.790)
-1.714*
(-9.820)
161.170* ------- ------- ------- ------- ------- 81 5
Export
FE11 0.211*
(2.910)
-0.986*
(-7.960)
63.290* 3.590* -0.953 ------- ------- 0.418 128 -------
RE12 0.042
(0.270)
-0.196*
(-3.900)
15.180* ------- ------- 0.320 48.570* 0.418 128 -------
OLS ------- ------- ------- ------- ------- ------- ------- ------- ------- -------
DPD13 0.566*
(5.810)
-1.287*
(-7.570)
99.180* ------- ------- ------- ------- ------- 56 5
Using tests of stationary, it is analyzed the volatility of the data, and it is verified that all the results for all the tes ts are
not significant, so we can conclude about no stationary of the data.

733
4. Conclusions
The most important relationship of Portugal with the world in the international trade of flowers is with the Europe,
namely with Netherlands and Spain. So, there is a tendency to trade flowers with the neighbors, to economize costs of
transport. But is important that Portugal redefine the international policies (Marketing, support programs, etc) to
explore new markets, as those considered emergent. Portugal import and export in particular other live plants
(including roots), cuttings, slips and mushroom spawn.
There are strong signs of convergence in this international trade of flowers. In the majority of the results the values
have statistical significance. So, we have convergence in the import and export of flowers.
In terms of stationary of the results we find a preoccupant volatility of the values for the different forms of flowers
imports and exports. These results can compromise the conclusions presented before. This means that we do not have
a coherent Policy and Marketing strategy for the international trade of flowers. This is reinforced when it is analyzed
the effects of the countries and the time in the flowers trade performance and is contacted that these factors are
negligible. This seems that Portugal do not have a differentiated strategy and did not change in the recent years.
When we speak about tradable products like the flowers, is important to have a good global strategy for the
international trade, because, as said the Keynesian theory, the external demand (exports) are the engine of the national
product.
Anyway, this is a contribution to the international trade flowers sector and the related policies understanding, using
Portugal as the central country.
References
Areal F.J.; Touza J.; MacLeod A.; Dehnen-Schmutz K.; Perrings C.; Palmieri M.G.; and Spence N.J. (2008). Integrating
drivers influencing the detection of plant pests carried in the international cut flower trade. Journal of
Environmental Management, 89, 300–307.
Cunden, M. and Van Heck, E. (2004). Bargaining Power and Information Technology in African–European Business
Relationships: Case of the Dutch Flower Auctions. European Management Journal, 22, 573–587.
Hughes A. (2000). Retailers, knowledges and changing commodity networks: the case of the cut fower trade. Geoforum,
31, 175-190
Islam, N. (1995). Growth Empirics : A Panel Data Approach. Quarterly Journal of Economics, 110, 1127-1170.
Nyangito, H.O. (2004). Performance of African Agricultural Exports and External Market Access Conditions under
International Trade Reforms. N.º 9518, 2004 Inaugural Symposium, December 6-8, Nairobi, Kenya from African
Association of Agricultural Economists (AAAE).
Reinten, E.Y.; Coetzee, J.H.; and van Wyk, B.-E. (2011). The potential of South African indigenous plants for the
international cut flower trade. South African Journal of Botany, 77, 934–946.
Riisgaard, L. (2008). Global Value Chains, Labor Organization and Private Social Standards: Lessons from East African
Cut Flower Industries. World Development, 37, 326–340.
Shah, D. (2007). Infrastructure Development for Agro-Processing Cooperatives in Maharashtra: An Ex-Post Evaluation.
MPRA Paper from University Library of Munich, Germany .
Vega, H.L. (2008). Transportation Costs of Fresh Flowers: A Comparison across Major Exporting Countries. N.º 48798,
IDB Publications from Inter-American Development Bank.
Solow, R. (1956). A Contribution to the Theory of Economic Growth. Quarterly Journal of Economics.
Vringer, K. and Blok, K. (2000). The energy requirement of cut flowers and consumer options to reduce it. Resources,
Conservation and Recycling, 28, 3–28.
Wijnands, J.H.M.; van der Lans, K.; and Hobbs, J.E. (2006). International Flower Networks: Transparency and Risks in
Marketing Channel Choice. N.º 7759, 99th Seminar, February 8-10, Bonn, Germany from European Association
of Agricultural Economists.

734
The marketing plan in the wine producing
companies in Portugal Marketing; marketing plan; wine sector; Portugal.
Rita Carvalho, ESAI – Escola Superior de Atividades Imobiliárias, [email protected]
Abstract
The creation of a marketing plan is something that has been studied and brings benefits to companies.
The goal of this article transcribes the results of research, conducted on Portuguese wine companies, about the
development and implementation of a marketing plan.
We researched literature regarding context, benefits and barriers of the marketing plan and questioned the biggest 50
wine producing companies - responsible for 61, 6% of total wine production - in mainland Portugal (2009/2010).
65% of respondents did not have a marketing plan: they simply set some goals and tried to react to what happens in the
market. The main reasons presented for not having a marketing plan are the lack of available human resources and the
lack of a suitable model/template to be applied to the company.
The results indicated that the marketing plan is made annually and, the responsible for their implementation are
mainly, marketing directors with the approval of top management. The advantages of the marketing plan outlined by
the companies are: marketing plan helps to think about what the firm will do in the future, helps to organize the work
and to assess and monitorizes the company's performance. In this study are also listed the main elements that comprise
marketing plan and the most important ones for companies - as well as the type of packaging used, the criteria for
setting prices, distribution and the most used actions of communication.
The method of collect data was done through the creation of a questionnaire online. The study universe is the
Portuguese wine companies. The sampling method is not probabilistic. Sample ´s method selection is intentional.
I – INTRODUCTION AND DEFINITION OF THE OBJECTIVE
The goal of this article transcribes the results of research, conducted on Portuguese wine companies, about the
development and implementation of their marketing plan.
Companies have been growing their attention, by conducting planning that sustains their survival and prosperity. Even
in the past when the importance of a marketing plan was referred - Stasch and Lanktree (1980, p.79) had the opinion
that the development of the annual marketing plan is, perhaps, the most important activity for a marketing manager or
product manager. Mason, Mayer and Koh (1985, p.161) reported that professionals and academics have been devoting
increasing attention to strategic issues during the last decade. On the other hand, Farhangmehr (1997); Farhangmehr
(2000) and Zinkhan and Pereira (1994) consider that there are benefits to firms when conducting marketing planning.
Leeflang and Mortanges (1997) report that most organizations devote two to three months, to the preparation of the
marketing plan and the period that usually covers the strategic marketing plan usually has a time horizon of three to
five years, while the operational plan covers one year.
It has been observed that aspects such as the company potential and expected growth may increase motivation to
formalize their marketing plan. However, some smaller companies may be able to successfully conduct business
without the need for a formal planning process (Chae and Hill, 2000).

735
In parallel, the wine industry was the target´s interest, as well as the curiosity to see how the main Portuguese wine
producing companies implement, or not, the marketing plan. Which points of the plan they give greater importance,
which forms of dissemination are used, among other.
According to Ferreira (2011) and Palomar (2011) the key aspects for the future of the wine industry in Portugal are the
"internationalization", by "innovation" and "the knowledge of the consumer." The OIV, Organisation Internationale de la
Vigne et du Vin (2011) refers to Portugal as the tenth-largest wine export, the world’s and European´s second largest
consumer world of wine per capita, followed by France. It is also the twelfth largest producer and the fifth in the EU
(OIV, 2011).
This sector has been developing various marketing initiatives, including the creation of an umbrella brand: Wines of
Portugal - a world of difference, to increase awareness, internationalization, increasing the volume and value of exports
in markets with high purchasing power. In addition, programs have been developed to support and promoting wines,
intending to strengthen the institutional image of this product as a strategic sector, as well as preserving the heritage
and history of the industry (IVV, 2011).
II.1 – Contextualization, benefits and barriers of the marketing plan
The marketing plan is a written document, usually performed by a marketer or the top management of an organization,
done in the context of strategic marketing and marketing operations. It is the result of a planning process that includes
an analysis of the situation (diagnosis), the definition of objectives for the product / brand and the strategies to achieve
these goals. It also includes an action plan, properly organized, scheduled, budgeted and monitored. The timeframe that
covers depends on each organization, but it is common to be set for a year (and frequently updated). As regards
Defilippo (2008), there are products and brands that can be successful without a marketing plan. But with a plan, you
can set up what you want to build and this helps in achieving sustainable business.
To Defilippo (2008), create a successful marketing plan we need to know the target market, focus efforts to achieve a
good marketing strategy, organize tasks, a schedule and monitorize the development of the plan monthly. The
marketing plan is as well art as science, and adjustments will be needed to make it suitable to business.
For Schroeder and Rodrigues (2008), marketing planning is a set of ideas and decisions in order to prepare the
company for future market situations, to prevent threats and reach opportunities that may arise.
According to Jarratt and Fayed (2001) and Leder and Gerri (2006), the responsible for making marketing decisions
should be the senior partner, senior consultant, general manager, marketing director, regional director or the director
of business development. Farhangmehr (2000) and Leder and Gerri (2006) show us a strong association between top
management and marketing activities. Meanwhile, Ames (2000), adds that top executives should actively participate in
the development of marketing plans, however, sometimes rather encourage the open ideas exchange; they s tifle others,
avoiding those exchanges.
These authors refer the importance for simplicity and objectivity of the marketing plan, in addition to the need for a
synthetic composition - i.e. orderly, constant and ongoing - should be a practical document that responds efficiently to
the way in how the company reaches its target audience. This view is also shared by Sirsi (2006) and Bogan and Doss
(2010) were the last add that the marketing plan should also be sustainable; it must have conditions to be implemented,
at a defined time and without harming its term. Sirsi (2006) complements this idea, advising not to perform very
extensive marketing plans, because sometimes they are not read or implemented.
According Farhangmehr (2000), about two-thirds of Portuguese companies studied, produce marketing plans.
In the opinion of several authors, as it is showed in the table below, we can see the benefits of achieve the planning and
its formalization.

736
Table 1. Advantages of marketing planning
AUTHORS ADVANTAGES Taghian (2010) Helps to improve the market share and overall performance of the organization.
Global implementation - can be applied in all situations of global marketing.
Taghian (2010), Knychalska and Shaw (2002)
(quoting the authors: Steiner, 1997; Stevens, Loudon,
Wrenn, and Warren, 1997; O'Hara, 1995) and
Mortanges Leeflang (1997).
Helps to improve the general company performance.
Toledo, Prado, and Petraglia (2007) Helps to guide the company to achieve its objectives for its products.
Claycomb et al (2000) Increases ability to obtain relevant information, conclusions, make decisions and achieve
expected results.
Increases preparation in dealing with change.
Better use of resources to promote sales.
Knychalska and Shaw (2002) (quoting the authors:
Steiner, 1997; Stevens, Loudon, Wrenn and Warren,
1997; O'Hara, 1995), Claycomb et al (2000), and
Mortanges Leeflang (1997)
Enables the evaluation and control of marketing actions.
Knychalska e Shaw (2002) (citing authors: Steiner,
1997; Stevens, Loudon, Wrenn e Warren, 1997;
O’Hara, 1995)
Forces the organization to establish goals and objectives.
Evaluates the company position, its weaknesses, strengths and competitive advantages.
Helps the company to rapidly adjust to a business environment in continuous changing, take
advantage of the opportunities created by these changes, and recognize the threats arising
from different factors.
Provides an overview of the company, acknowledges the relationship between the parties
rather than dealing with each area separately.
Claycomb et al (2000), Leeflang and Mortanges
(1997)
Leads to the identification of tasks and task assignment.
There is better coordination among individuals whose actions are related, due to the
organization and functions definition.
Ames (2000) Helps managers to rely on facts and not on opinions or hunches.
Helps to adopt "aggressive" maneuvers instead of defensive ones.
Minimizes the impact of surprise when developing contingency plans.
Leeflang and Mortanges (1997) They are ways to establish and communicate goals, strategies, and activities chosen by the
company.
Results of a careful consideration and coordination of activities.
Saves time and money because the working efficiency of the company is improved.
Source: Author's
Despite the advantages outlined above there are barriers faced by companies, in the planning process and the
implementation of the marketing plan. Slotegraaf and Dickson (2004) report that, although they find benefits in their
execution, there is some rigidity associated with the planning capacity. They state that companies are less likely to
improvise after the approval of their marketing plans. But when companies engage improvisations from an approved
marketing plan, they have advantages because they can benefit their performance.
Ames (2000) states that the marketing plan gives a very important contribution to any company. However, in his
research he found disappointing results in some industrial companies when they applied the marketing plan. The
reason for the failure is the fact that the marketing planning doesn´t adapt to real world problems. The actions cannot
be applied without modification, for different businesses or customers. If an organization has several different types of
customers and placement channels, may have to take different actions for each. The author advises that all attention
should be focused on achieve goals and concrete actions, through an analysis of a well-considered and continuous
exchange of information, between the technical and business elements of the top of the organization.

737
Some authors also identified several barriers in the implementation of marketing planning, as can be seen in the
following table.
Table 2. Barriers in the implementation of marketing planning
SOURCES Barriers of the marketing planning
Dibb, Simkin and Wilson (2008) Are related to organizational infrastructure, with the process of planning and implementing the marketing plans.
Jain (2002), Simkin (2002), Pearson and Proctor(1994), McDonald (1992), Giles (1991)
The strategy is isolated from the analyses or tactics formulations of the programs.
Jain (2002), Simkin (2002), Dibb (1997), Greenley (1982) Limited understanding of the forces of the external environment.
Simkin (2002),Greenley (1982) Inadequate marketing intelligence available within the organization.
Simkin (2002), Piercy e Morgan (1994), McDonald (1992) The planning staff loses motivation and energy due to the resources and pressures.
Jain (2002), Simkin (2002), Dibb (1997), Piercy and Morgan (1994), Greenley (1982)
Insufficient details in marketing programs or implementation plans.
Simkin (2002), McDonald (1992) Inability to break with existing operation forms.
Simkin (2002), Pearson and Proctor (1994) Inability to have a business overview.
Dibb (1997), Simkin (1996), Pearson and Proctor (1994) Marketing intelligence between the various functions and management levels isn´t sufficiently shared.
Dibb (1997), Simkin (1996), Pearson and Proctor (1994),Piercy and Morgan (1994), McDonald (1992), Giles (1991), Greenley (1982)
Poor internal communication: within marketing, across functions, across business units and management levels.
Simkin (1996), Piercy and Morgan(1994), McDonald (1992) Inability of top management marketing planning activity.
Simkin (1996), Piercy and Morgan(1994), McDonald (1992) Lack of confidence and belief of those responsible for marketing planning
Source: Dibb, Simkin and Wilson (2008, p.540)
2 - METHODOLOGY
In the theoretical and practical point of view, the theme of the marketing plan can arouse interest, and its applicability
is an asset for businesses, even in a context of great transition and change we are experiencing.
To know the shape and components of a marketing plan that wine businesses use, a questionnaire was conducted with
a sample of 50 major wine producing companies, in mainland Portugal, that represent 51.6% of total production in the
year 2009 / 2010, according to data from the IVV.
The questionnaire was sent by internet between 17/05/2011 and 06/09/2011. A total of 28 questionnaires were
received and two were disposed by failure in fulfillment, allowing obtaining a useful response rate of 52%.
The sampling method is not probabilistic. Sample´s method selection is intentional.
The questionnaire consists of an open question, and the remaining, closed questions.
Through the Cronbach Alpha the internal consistency of the scale in relation to the degree of importance assigned to
the various components of the marketing plan was analyzed.
To verify the independence relationship between two variables, the correlation and chi -square between them was
checked.
3 - ANALYSIS AND PRESENTATION OF RESULTS
3.1 - Sample characterization
Regarding the obtained results, from the questionnaires, it can be seen that only 35% of companies surveyed held a
marketing plan, and 65% did not do it.

738
Of the companies that don´t make the marketing plan, 40% report that one of the reasons for non-completion is related
to the fact that goals, or actions, are only set in accordance with what is happening in the market. Another reason to not
execute the marketing plan is that companies do not have available staff to do so (17%) and the absence of a template /
script Marketing Plan (17%). No companies express that it isn´t necessary the development of a marketing plan.
The marketing plan, mentioned by 89% of companies, is annual and plans with more than a year aren´t usual.
At the level of those responsible to execute the marketing plan was found that, typically, this task is the responsibility of
the director of marketing (38%) and sales and marketing director of the company (38%). The CEO or m anagement
(13%) and commercial director (13%) also participate but in a less expressive way. Please note that no company
interviewee uses an outside company to perform the marketing plan.
The advantages that companies focus in making a marketing plan is that it helps to reflect on what is going to be done in
the future (19%). Another factor is that helps to organize work (17%) and to monitorize the performance of the
company (17%).
When inquired if companies really applied the marketing plan, it was realized that only one did it totally. The remaining
89% said that the plan is done in most points.
3.2 – Marketing plan
To execute the marketing plan, there are factors (components) to be examined. As show in the follow figure it can be
seen the importance that companies assign to each of these factors.
Almost all companies consider the factors presented as important and very important. However, there are some which
are considered very important, as is the case of price and brand awareness. They are followed by communication,
placement and definition of the overall company objectives . The only factors marked as unimportant are community
analysis, social factors and suppliers analysis.

739
Figure 1. Respondents profile according to the degree of importance assigned to the components of the marketing plan
Source: Author's
It appears that most of the components are considered important (49.5%) and very important (40.2%). The options
fairly important (8.9%) and minor (1.4%) had low expression and no options were classified as nothing important. In
this regard, 89.7% of the sample believes at least - important - all factors as a whole.
Regarding the degree of importance assigned to the various components of the marketing plan, the scale's internal
consistency was analyzed by Cronbach´s Alpha. The study of symmetry was conducted, which revealed that the variable
"political-legal factors" did not fulfill the requirements (negative asymmetry) even with the variable transformation.
Given this conclusion it was decided to remove the political and legal factors from this analysis.
Regarding the study in question, the average found in each of the 23 items range between 3.5 and 4.75, with a standard
deviation between 0.463 and 1.069. These results are considered satisfactory initial and there is no positive or negative
grip substantially in the single items, as well as equal averages or very close to extreme values (1 to 5). The total
correlation coefficients range between -0.184 and 0.830. From this information - ensuring the basis for the calculation
of internal consistency - it is possible to calculate the Cronbach´s Alpha. Based on these results, the Cronbach´s Alpha
presents for these 23 items, a value of 0.858. Based on this information it can be concluded that the scale has a good
internal consistency.
The following table shows a number of other factors that companies take into account when developing the marketing
plan. All companies mentioned take into account the budget and goals for next year. It is followed by the objectives of
internationalization and timing of actions. The definition of the contingency plan and the product portfolios were the
options that had fewer choices, with only 3%.

740
Table 3: Other factors taken into account in the preparation of the marketing plan
Factors taken into account to execute the marketing plan
Percentage of respondents who choose this criterion
SWOT analysis 44,4%
Next year objectives 100%
Internationalization objectives 88,9%
Next year strategies 66,7%
Product policy definition 66,7%
Product portfolios 22,2%
Price policy definition 66,7%
Placement policy definition 55,6%
Communication policy definition 55,6%
Schedule of actions 88,9%
Responsibility actions definition 44,4%
Budget 100%
Contingency plan 22,2%
Source: Author's
3.3 - Marketing mix information
The range of issues covered in this group is related to some variables of marketing: product, service, brand, price,
placement and communication.
Regarding the type of wine produced is verified that the interviewed companies produce all three types: PDO -
Protected Designation of Origin (PDO) (40%), GI - Geographic Identification (30%), and Wine, with 30%.
For commercialization, the type of wine packaging mostly used is glass bottles (48%), followed by bag in box (37%),
finally the carboy with 11%.
The final package (labels, color, bottle ...) is defined usually by the marketing / commercial companies manager (36%),
followed by the administration (18%). The CEO, the company owner, the certified technici an, 11%. Finally, only 7% of
companies assign to the enologist the pack definition.
Decision makers about the type of final packaging vary according to the companies. It is usually a technician along with
the top professional company. This technician is mostly responsible for marketing / commercial enterprise areas. There
are also companies that rely on advertising agencies or packaging.
In 64% of the companies interviewed, the provided services are detailed information about the products (33%),
clarification of issues (31%) and a clarification on how to use (28%).
To set the price for the product, several criteria were presented: price from competitors; price from costs; price the
customer is willing to pay; price from the overall business strategy; price from the legislation.
For the answers, there are two companies that place the price taking into account from all criteria. There is a
respondent that places the price only after costs. However, all others use more than one criterion for setting the price.
The segmentation was a criterion added by an interviewee, as part of its policy of setting prices. The overall company
strategy and prices from costs were the criteria for setting choicest prices (28%), followed by the price the customer is
willing to pay (19%) and competitor’s price (17%). The legislation is the least selected criterion.
The range of marketing communication actions is very diverse but the most used are the following: catalogs /
brochures (10%), sales promotion (10%) and events or experiences, such as wine tastings, fairs (10%). It should be
noted that this percentage is set by the total shares of marketing communication actions that were mentioned in the
question.

741
Following these three actions there are: advertising in magazines, with 9%, sponsorships (7%), the company's website
(7%), advertising in newspapers (5%), outdoor advertising (5%), public relations, including relations with the media
(5%), social networks (5%) and radio advertising (5%).
Patronage, advertising on TV, direct marketing, were the least chosen forms of communication (3%).
For most companies interviewed, the placement is done through the sale to the wholesaler (19%), followed by sales to
retailers (17%), consumer (17%) and supermarkets (17%). The direct sales and horeca channel showed lower
expression, with 13%.
To choose the brand, the business criterion is area or place of production, with 41% (ex: Vidigueira Wine) followed by
the name of the company (27%).
Regarding brand strategy, 84% of companies surveyed, said they choose different brands for several lines, or choose
multi-brands criterion.
A - Variables crossing
In this analysis there are some variable crosses, important for this study. We determinate whether there is any
relationship between sales volume and realization of the marketing plan, or between the realization of the marketing
plan and the number of workers.
A.1 - Sales volume versus execution of the marketing plan
Businesses with smaller volume invoicing (1 to 5M€), mostly do not execute the marketing plan.
In companies with sales between 5 to 10M € prevails, without significative expression, those that do not execute the
marketing plan.
Finally, companies with higher volume invoicing (> 10 M €), the majority held a marketing plan although the difference
is not very pronounced.
To verify the independence relationship between these two variables was determined chi -square and correlation
between them, in order to test the following hypotheses:
H0: sales volume and the development of a marketing plan are independent
H1: sales volume and the development of a marketing plan are not independent
The chi-square test showed a value of 2.545 and a significance level of 0.280. As the p value is greater than 0.05 can´t
reject the H0. So it is concluded that the volume of sales and marketing plan are two independent variables.
A.2 - Implementation of marketing plan versus numbers of workers
It appears that firms with fewer workers do not execute the marketing plan. As the number of workers increases also
increases the development of marketing plans.
In order to test the following hypotheses:
H0: number of employees and the development of a marketing plan are independent
H1: number of employees and the development of a marketing plan are not independent
The degree of correlation between the two variables under study was determinate and the chi-square was performed
between them. The chi-square test shows a value of 8.513 and significance level of 0.037. As the p value is less than 0.05
H0 is rejected. So it is concluded that there is a dependence of these two variables - the number of workers and the
development of a marketing plan - are two variables that are correlated to a significance level of 5%.
With regard to how the respondents make the marketing plan, this response was not very thorough by the
respondents. It was also mentioned that the plan was done based on previous years, in updating estimated values
sales, cost structure, market price and the current market situation. One respondent added that the marketing plan was
done by continuous monitoring of the product, in the field, through its customers and in accordance with the policy of
the company sales. Another interviewee said that strategic objectives are held on the organization in terms of portfolio,
markets, and export channels. To support these objectives approaches are defined and actions undertaken to achieve
them. He added that there are regular informal meetings between enologists and marketing area / commercial being
made a permanent monitoring of business performance.

742
4 - CONCLUSION
Companies that do not execute a marketing plan report some goals and act in accordance with what is happening in the
market. The choicest reasons for not performing it is the fact that there is no staff available, and because there isn´t a
template / script, previously done, to help implementing it in the company.
Almost all companies execute the marketing plan for one year (89%), as showed in the literature review. Those
responsible for perform it are the marketing director, and sales and marketing director of the company. The general
director or administration also participate but in a more reduced way. The results reinforce the view of Leder and Gerri
(2006) and Farhangmehr (2000), confirming a strong association between top management and marketing activities.
Implementing the marketing plan provides benefits, consider these interviewed companies. They report that helps to
reflect on what they will do in the future, as well as in the work organization, as referred Toledo, Prado, and Petraglia
(2007), Claycomb et al (2000), and Mortanges Leeflang (1997), in literature review.
The marketing plan is implemented in most points, and not in the overall, as answer by 89% of the respondents. This
reflects that companies adjust , through the time, to what the market brings.
Table 4. Marketing plan model
1 - EXECUTIVE SUMMARY
2 - SITUATION ANALYSIS
External analysis - Economic factors (country), social and cultural, political and legal, environmental, technological, sector analysis,
competitor analysis, consumer analysis, suppliers analysis, placement analysis, community analysis
Internal analysis - Overall objectives of the company, marketing objectives in previous years, financial resources, human resources,
production resources, management capacity, current segmentation, positioning, brand awareness, product policy, pricing policy , place
policy, communication policy
SWOT analysis
3 - OBJECTIVES AND MARKETING STRATEGIES
marketing objectives
Targeting, branding, Placement
4- OPERATIONAL MARKETING PLAN
Marketing mix
Product
Price
Placement
Communication
5 - IMPLEMENTATION PLAN AND ACTION PROGRAMME
Action programmes
Actions Schedule
Organization of the actions programmes
6 - FINANCIAL INFORMATION
Budget
Forecast financial returns expected
7 - MONITORING AND EVALUATION
Methods of evaluation and control
8 - CONTINGENCY PLAN
Source: Author´s
Regarding the importance that each component, of the marketing plan, has for the respondents, it was found that the
components were considered important and very important. However, the most important elements were the price,
brand awareness, following year’s goals and budget setting.
The types of wine produced by companies are PDO, PGI and wine (previously called table wine), with a slight emphasis
on the PDO. The most used packaging is the bottle, followed by Bag in Box. The packaging is mostly defined by the
responsible for marketing / commercial, followed by the top professional company.

743
Despite these companies are industrial, associated services were provide, through the transmission of detailed
information about the products (33%), clarification of issues (31%) and forms of consumption (28%).
Regarding the price policy, the criteria for setting the price most frequently mentioned were: from the overall company
strategy and price from cost. Then came, what the customer is willing to pay and the price from the competition.
Regarding marketing communications vehicles, the most used are the catalogs / brochures, promotions and sales
events or experiences that include fairs and wine tastings.
The placement policy is performed mainly through the sale to wholesale, then retail sales to the final consumer and
large surfaces.
For the brand assignment, the chosen criterion is the region or place of production. Next is the name of the company
and finally, some respondents pointed to marketing studies to define the name.
Regarding brand strategy most companies choose different brands for multiple lines, i.e. a multi brand.
Through informal interviews, that were done during these surveys and information obtained in the questionnaire, it can
be seen that companies who execute the marketing plan do not conduct a very thorough work, despite reflecting on
almost all of its components. They are alert to the market, customers and competition, define goals and strategies,
action programs, make their financial projections and will decide some changes throughout the year. This way of work,
follows the opinion presented by Defilippo (2008) about some aspects that the successful marketing plan must report.
In the study it was found that there is a dependency relationship between the number of workers and the realization of
marketing plan for a significance level of 5%.
The research undertaken, has some limitations in the chosen sample, because beyond the limitations of time and cost,
the actual sample was smaller than initially expected, making it impossible to carry out another type of data processing
and other statistical analyzes.
References
AMES, Charles, (2000), “Marketing planning for industrial products”, Harvard Business Review, p100-111.
BOGAN, Stephanie e DOSS, Natalie, (2010), “The Marketing Plan You'll Nee - To grow in this new, more treacherous
business environment, every planner needs a plan”, Financial Planning.
CHAE, M., e HILL, J., (2000), “Determinants and benefits of global strategic marketing planning formality”, International
Marketing Review, Vol.17(6), p538-562.
CLAYCOMB, C.; GERMAIN, R. e DROGE, C., (2000), “The Effects of Formal Strategic Marketing Planning on the Industrial
Firm's Configuration, Structure, Exchange Patterns, and Performance.” Industrial Marketing Management,
Vol.29, (3), p219-234.
DEFILIPPO, (2008), “Making a Marketing Plan Easy and Simple”, National Underwriter.
DIBB, (1997), "How Marketing Planning Builds Internal Networks”, Long Range Planning.
DIBB, SIMKIN e WILSON, (2008), “Diagnosing and treating operational and implementation barriers in synopti c
marketing planning”, Industrial Marketing Management, Vol.37, (5), p539-553.
FARHANGMEHR, Minoo, (1997), “Do Planeamento Estratégico ao Pensamento Estratégico: Uma Revisão de Diferentes
Abordagens”, Universidade do Minho, Centro de Estudos em Economia e Gestão: Série de Documentos de
Trabalho.
FARHANGMEHR, Minoo, (2000), “Marketing Planeado e Marketing Praticado”, Revista Portuguesa de Marketing.
FERREIRA, Francisco, (2011), “Desafios para o futuro do sector Vitivinícola - O presente e futuro dos vinhos
portugueses”, Lisboa, Seminário - Desafios para o Futuro do Setor Vitivinícola.
JARRATT, Denise e FAYED, Ramzi, (2001), “The impact of market and organizational challenges on marketing strategy
decision-making: a qualitative investigation of the business-to-business sector”, Journal of Business Research,
Vol.51 (1), p61-72.

744
KNYCHALSKA, Izabela e SHAW, Margaret, (2002), “A Perspective on Marketing Planning and Its Essentiality for the
Entrepreneurial Restaurateur”, Journal of Foodservice Business Research, Vol.5 (1), p101-117.
LEDER e GERRI, (2006), “Making your plan work – A simple written strategy can make prospecting easier. I will boil
your needs down and set a course of action”, Wall Street, p89.
LEEFLANG e MORTANGES, (1997),“An Empirical Investigation of Marketing Planning”, Journal of Euromarketing, Vol.6,
(1), p77-101.
MASON, J.; MAYER, M. e KOH, A., (1985), “Functional Marketing Plan Development in Department Store Retailing”,
Journal of the Academy of Marketing Science, Vol. 13, n.3, p161-182.
PALOMAR, Oscar, (2011), “O presente e futuro dos vinhos portugueses - Chaves para afrontar o futuro de forma
concorrencial”, Lisboa, Seminário - Desafios para o Futuro do Setor Vitivinícola.
SCHROEDER, Jerusa Betina e RODRIGUES, Diana, (2008), “Plano de marketing para a empresa indústria e comércio de
móveis e estofados Alvorada Ltda”, Revista Interdisciplinar Científica Aplicada, Blumenau, Vol.2, n.2, p01-20.
SIRSI, Ajay, (2006), “Job one, get a good plan”, Marketing Magazine ,Vol. 111 (16), p28-28.
SLOTEGRAAF, R. e DICKSON, P., (2004), “The Paradox of a Marketing Planning Capability”, Journal of the Academy of
Marketing Science, Vol.32, n. 4, p371-385.
STASCH, Stanley F. e LANKTREE, (1980), “Patricia Can Your Marketing Planning Procedures be Impro ved?”, The
Journal of Marketing, Vol. 44, n.3, p79-90.
TAGHIAN, Mehdi, (2010), “Marketing planning: Operationalising the market orientation strategy”, Journal of Marketing
Management, Vol.26 (9), p825- 841.
TOLEDO, PRADO, e PETRAGLIA, (2007), “O plano de marketing: Um estudo discursivo”, Comportamento
Organizacional e Gestão, Vol.13, n.2, p285-300.
ZINKHAN, G. M.; PEREIRA, A., (1994), “An overview of marketing strategy and planning”, International Journal of
Research in Marketing, vol.11(3), p185-218.
Web pages
OIV - Organisation International de la Vigne et du Vin, (2011), “9th General Assembly of the OIV Porto 2011 - World
Statistics”,http://www.oiv.int/oiv/info/frstatistiquessecteurvitivinicole#secteur, (20 de maio de 2012).

745
Influencia de las Orientaciones de la Empresa
en el Desempeño del Vendedor de Productos
Financieros Customer Orientation, Competitive Orientation, Seller’s Customer Orientation, Salesperson Performance .
Verónica Rosendo Ríos, Colegio Universitario de Estudios Financieros, [email protected]
Miguel Martín Dávila, IPAM – The Marketing School, [email protected]
Abstract
This paper aims to propose the key elements of the Customer Orientation in Financial Services. Furthermore, as a
component closely related to the above, it also raises the key aspects of the sale of financial services and the
performance and effectiveness of salespeople.
From a previous investigation with a variety of researchers from industry, the paper raises the possibility of a
relationship between Market Orientation and Customer Orientation and Employee Performance of financial
institutions.
To verify this relationship, a structural equation model relating the most important constructs in the study is posed.
The data to determine the specification and estimation of the model are based on the collection of information through
a survey of employees and industry executives. To carry out the survey, a questionnaire validated in previous
researches has been adapted to the Spanish environment.
The data were obtained from a sample of managers and directors of financial institutions. The survey was carried out
on the basis of a questionnaire already used in similar investigations in other sectors.
The structural equation model was estimated using EQS modelling software.
The results show that the role of the sales force is decisive in vendors´ obtaining good results themselves.
1.- Orientaciones Estratégicas de la Organización
La Orientación al Mercado se describe como constituida por los elementos organizacionales - cultura y
comportamientos - que permiten implementar una orientación al cliente (Kohli y Jaworski, 1990; Narver y Slater,
1990).
Es posible, por tanto, identificar dos corrientes diferentes sobre la caracterización de la "Orientación al Mercado": una
perspectiva comportamental y una perspectiva cultural.
La perspectiva comportamental (Kohli y Jaworski, 1990) considera que la Orientación al Mercado se refleja en la
realización de una serie de actividades, casi en secuencia temporal: obtención de información, difusión de información
por la organización, y respuesta organizacional a esta información (Macedo y Pinho, 2006).
Por su parte, la perspectiva cultural (Narver y Slater, 1990) postula que la organización debe ser capaz de generar
normas y valores que fomenten comportamientos coherentes con la Filosofía de la Gestión de Marketing.
La capacidad de respuesta a las necesidades y deseos del mercado depende, por supuesto, de su grado de conocimiento
de los clientes, pero también del grado de conocimiento que la organización tiene de sus competidores (Narver y Slater,
1990).

746
De acuerdo con este razonamiento, la Orientación al Mercado se basa en tres pilares: la orientación a los clientes, la
orientación a los competidores y la coordinación interfuncional (Hammond, Webster, y Harmon, 2006).
Narver y Slater (1990) conciben el concepto de la Orientación al Mercado de forma diferente, viéndola como una
cultura organizacional con tres características:
- Orientación a los clientes – Profundo conocimiento del cliente y compromiso en la búsqueda de la creación de valor
para él. Para ello, es necesario recopilar información y comprender la cadena de valor del cliente (Day y Wensley,
1988). También supone la búsqueda continua y proactiva de la satisfacción de las necesidades y deseos de los clientes.
- Orientación a los competidores – Profundo entendimiento y conocimiento actualizado de los competidores actuales y
potenciales. Las empresas orientadas a los competidores comparar su Desempeño con los de sus competidores (Day y
Wensley, 1988), identificando sus puntos fuertes y débiles.
- Coordinación interfuncional – Las organizaciones con una fuerte coordinación interfuncional más capaces de crear,
conservar y transferir conocimiento (Argote, McEvily, y Reagan, 2003).
El modelo original de Jaworski y Kohli (1993) hacía referencia como antecedentes de la Dirección General, a la
Dinámica Organizacional y al tipo de Sistema Organizacional. Un estudio de 2005 (Kirca, Jayachandran y Bearden,)
analiza más de doscientos artículos publicados después de este primer trabajo, y concluye que esta estructuración sigue
siendo todavía generalmente aceptada.
En la siguiente figura se muestra la visión de antecedentes y consecuentes de la Orientación al Mercado de una
Organización, de acuerdo al enfoque de Jaworski y Kohlí:
Figura 1.- Antecedentes y Efectos de la Orientación al Mercado
(Jaworski y Kohlí, 1996)
El primer conjunto de antecedentes se fundamenta en la percepción de que, en ausencia de signos claros de la Dirección
General sobre la necesidad de ser eficientes en la satisfacción de las necesidades de los clientes, las organizaciones no
se orientan hacia el mercado (Webster Jr., 1988, p. 37).
La evidencia empírica indica que la Orientación al Mercado proporciona un mejor Des empeño Organizacional (Kohli y
Jaworski, 1993; Narver y Slater, 1990) y esto se desprende de una mejora en la satisfacción de los clientes (Jaworski y
Kohli, 1993, Narver y Slater, 1990).
La evaluación del Desempeño Organizacional presenta, sin embargo, dos limitaciones: los datos se basan, normalmente,
en mediciones de desempeño basadas en criterios personales, aunque hubo una correlación positiva entre las
mediciones objetivas y subjetivas (Pearce, Robbins, Jr y Robinson, 1987); y las mediciones son por lo general globales, y
reflejan varias métricas (o dimensiones del Desempeño) no habiendo ninguna razón teórica para s u combinación en
una métrica agregada (Kaplan y Norton, 1992)
Como resumen podríamos decir que las dos aproximaciones a la Orientación al Mercado (Kohli y Jaworski, 1990;
Narver y Slater, 1990.), incorporan dos dimensiones básicas principales:
(1) Orientación al cliente, que es un enfoque en las necesidades y deseos de los clientes.
(2) Orientación competitiva, que hace hincapié en un enfoque en las amenazas competitivas.

747
Este planteamiento se formaliza en la siguiente figura:
Figura 2.- Componentes de la Orientación al Mercado de la Organización
La idea de la Orientación al Cliente como eje unificador de la organización ha propiciado una considerable investigación
(por ejemplo, Kirca, Jayachandran y Bearden, W., 2005).
La mayor parte de los estudios empíricos que abordan la temática de la Orientación Estratégica han intentado
establecer una relación entre Orientación al cliente y el Desempeño Organizacional en diversas condiciones medio
ambientales y organizacionales.
Una de las convicciones más fuertes del área de Marketing es la de la superioridad de la Orientación al Cliente sobre las
Orientaciones Estratégicas alternativas en lo que se refiere a su contribución al Desempeño Organizacional.
La literatura académica que examina la Orientación al Mercado ha encontrado de manera consistente que las
organizaciones Orientadas al Mercado alcanzar mayores niveles de rendimiento en las ventas, pero este enfoque hace
caso omiso de la posibilidad de que el efecto observado sea el resultado de las variables intervinientes en un nivel
inferior de análisis, como por ejemplo, del trabajo de los propios vendedores imbuidos de una propia Orientación al
Cliente.
Es concebible que los efectos de la Orientación al Mercado a nivel de la empresa influyen indirectamente a través de los
vendedores que son embajadores de la organización frente a sus clientes, y que aplican la filosofía de la empresa en
contacto con los clientes.
La investigaciones centradas en los vendedores y su Orientación al Cliente, muestran que los vendedores que tienen
una Orientación hacia el Cliente mayor tienden a alcanzar mayores niveles de rendimiento de las ventas (Harris,
Mowen y Brown, 2005).
En los años setenta, la importancia de la Orientación al Mercado de la organización se vio disminuida ante la rápida
evolución tecnológica que redujo las ventajas obtenidas por la capacidad de respuesta a las necesidades de cada cliente
individual (Tauber, 1974).
El vínculo entre la Orientación al Mercado de la organización y el desempeño se analizó empíricamente ya en 1990
(Narver y Slater, 1990). Y por lo que se refiere al vínculo entre la Orientación al Cliente del vendedor y el desempeño
fue observado por Saxe y Weitz ya en 1982, y fue objeto de un examen empírico de Sujan, Weitz y Kumar (1994).
Por otra parte, otros estudios han investigado los efectos directos de la Orientación al Cliente de los vendedores
individuales.
Los vendedores podrían ser los únicos representantes de la organización de ventas que un cliente ve, por lo que el
enfoque individual del vendedor en la satisfacción de las necesidades del cliente es un tema crucial de investigación
(Crosby, Evans y Cowles, 1990).
Swenson y Herche (1994) en un estudio sobre vendedores industriales, hallaron que los comportamientos de venta
Orientados al Cliente están positivamente relacionados con el desempeño del vendedor. Por otra parte, en un estudio
de los agentes inmobiliarios, los agentes con mejores resultados parecían estar más Orientados al Cliente que los
agentes con resultados peores, para niveles de experiencia parecidos (Dunlap, Dotson y Chambers, 1988).

748
Resultados similares se encontraron en investigaciones diferentes llevadas a cabo por Babin y Boles (1998) y Boles,
Babin, Brashear y Brooks, (2001). La evidencia de una relación positiva entre la Orientación al Cliente de un vendedor
y el desempeño también fue presentada en un estudio por Saxe y Weitz (1982).
La Orientación al Cliente de los vendedores es fundamental en la teoría moderna de la venta. El enfoque principal de los
esfuerzos de marketing y ventas en el entorno empresarial actual se centra en determinar con precisión y satisfacer las
necesidades del cliente con el fin de crear valor en las relaciones a largo plazo, y esta es la esencia de la Orientación al
Cliente.
Esta orientación a largo plazo de los vendedores hacia sus clientes, es decir la Orientación al Cliente, es "la puesta en
práctica del Concepto de Marketing a nivel del vendedor individual y el cliente" (Saxe y Weitz, 1982, p. 343).
Este concepto se basa en el principio de que los vendedores deben entender las necesidades y deseos de un cliente a fin
de generar un valor percibido por el cliente en las interacciones de ventas.
Un alto nivel de Orientación al Cliente refleja un alto nivel de preocupación por las necesidades a largo plazo del cliente,
mientras que un bajo nivel de Orientación al Cliente refleja una preocupación interesada del vendedor orientada al
logro de objetivos de ventas a corto plazo.
La preocupación del vendedor por el cliente es una inversión emocional, que se ha demostrado que actúa como un
fuerte
motivador que se asocia con mayores niveles de desempeño (Brown, Cron y Slocum, 1997).
Saxe y Weitz (1982), así como Williams y Wiener (1990), afirman que la Orientación al Cliente es un comportamiento
aprendido que puede estar influido por factores ambientales, es decir, una adaptación que evoluciona con el tiempo.
Los vendedores individuales pueden adoptar una Orientación al Cliente como resultado de prácticas organizacionales
de gestión y de marketing (Williams y Wiener, 1990).
La cultura de la organización ayuda a dar forma a las actitudes y comportamientos de los empleados (Rozell, Pettijohn y
Parker, 2003). También es posible que las empresas Orientadas al Mercado recluten a vendedores que estén más
orientados al Cliente.
2.- Modelo con efecto mediador de la Orientación al Cliente del vendedor y Desempeño de Ventas
En Marketing es usual tener en cuenta la Satisfacción de los clientes y la Lealtad como importantes indicadores del
Desempeño (Kohli y Jaworski, 1990). El concepto de Satisfacción de los clientes se refiere a la comparación del
desempeño del producto / servicio en relación a las expectativas del cliente; la Lealtad se refiere a una preferencia
duradera, traducida en la repetición de la adquisición (Oliver, 1999).
La literatura no presenta estudios que relacionen la Orientación Competitiva de la Organización con los elementos
utilizados por Kohli y Jaworski (1990) para describir el Desempeño. Existen evidencias empíricas de que las empresas
con elevada Orientación Competitiva creen que la superioridad tecnológica es la clave del éxito (Atuahene-Gima y Ko,
2001); mientras que la satisfacción de los clientes existentes tendría un papel secundario, ya que existiría una ruptura
con la realidad circunstancial de los mercados.
El estudio de la Orientación al Cliente y el espíritu de la Orientación a la Competencia han seguido caminos separados.
Existe un amplio consenso de que una Orientación al Cliente tiene una influencia robusta y positiva en el Desempeño de
la organización (por ejemplo, Cano, Carrilat y Jaramillo, 2004). En una corriente diferente en la literatura sobre Gestión
Estratégica, la Orientación a la Competencia ha sido reconocida como importante para el éxito de la empresa (por
ejemplo, Wiklund y Shepherd, 2005).
Para Becherer y Maurer (1999), tanto la Orientación al Cliente como la Orientación Competitiva coexisten en una
organización y ambas tienen efectos positivos sobre el Desempeño de la empresa. El entorno externo de la organización
altera el grado de influencia de cada Orientación y su efecto sobre el Desempeño.
Parnell y Wright (1993) sostienen que la adopción de una combinación de Orientaciones Estratégicas permite
mantener una ventaja competitiva, residiendo el éxito del proceso en los tipos de Orientación a combinar y en el énfasis
puesto en cada tipo (Parnell, 2000). Parnell y Hershey (2005) consideran incluso que las empresas rara vez utilizan una

749
única Orientación Estratégica. La elección de las Orientaciones Estratégicas seguidas cambia con el tiempo, como
respuesta a los cambios ambientales (Webb y Pettigrew, 1999).
En resumen en nuestra investigación consideraremos los resultados de una combinación de Orientaciones Estratégicas
de la organización, en vez de cada una de ellas por separado, incluyendo simultáneamente el efecto mediador de la
"Orientación al Cliente del Vendedor".
Pero Siguaw, Brown y Widing (1994) sugieren un mecanismo alternativo que considera los efectos sobre los
empleados como mediador en el Desempeño Financiero. Estos autores sugieren que una Orientación al Mercado afecta
a la orientación al cliente de sus vendedores, el “stress" que sienten en su trabajo, la satisfacción que obtienen de su
trabajo y la motivación organizacional. Y que esto conducirá a respuestas más rápidas y más coordinada frente a los
cambios en los mercados, reforzando la Orientación al Mercado.
Nuestro modelo incorpora por ello la Orientación al Cliente del Vendedor como un elemento mediador cuando el
Desempeño Organizacional se concreta en el Desempeño Financiero basado en el Desempeño de Ventas.
Como se muestra en esta figura, nuestro objetivo es determinar los efectos indirectos de las dos Orientaciones de la
Organización en el Desempeño del Vendedor a través de su influencia directa en la Orientación al Cliente del Vendedor
y del efecto directo de esta Orientación al Cliente del Vendedor en el Desempeño de Ventas. El modelo se completa con
los efectos directos de las dos Orientaciones de la Organización en el Desempeño del Vendedor.
Figura 3.- Planteamiento del Modelo de la investigación
3.- Hipótesis y diseño de la investigación
Los aspectos considerados en los apartados anteriores nos conducen a la propuesta de las cinco siguientes hipótesis:
H1. El impacto de la Orientación al Cliente de la Organización en el Desempeño del Vendedor es positivo y significativo.
H2. El impacto de la Orientación a la Competencia de la Organización en el Desempeño del Vendedor es positivo y
significativo.
H3. El impacto de la Orientación al Cliente de la Organización en la Orientación al Cliente del Vendedor es positivo y
significativo.
H4. El impacto de la Orientación a la Competencia de la Organización en la Orientación al Cliente del Vendedor es
positivo y significativo.
H5. El impacto de la Orientación al Cliente de del Vendedor en el Desempeño del Vendedor es positivo y significativo.
Orientación al Cliente
de la Organización
Orientación a la Competencia
de la Organización
Orientación al Cliente
del Vendedor
Desempeño
del Vendedor

750
En cuanto al diseño de la investigación ésta se ha llevado a cabo en el mercado financiero español y los datos han sido
recogidos en el primer trimestre de 2010. (Embid, P., 2011).
Puesto que la investigación se centra en el desempeño de los vendedores en las entidades financieras el universo a
estudiar está formado, en principio, por el conjunto de dichos empleados del total de entidades financieras, en dos
categorías: Gestor y Directivo.
En cuanto al conjunto de entidades financieras incluidas en el universo a estudiar se han considerado las dos categorías
principales en el momento de la investigación (2010), Bancos y Cajas de Ahorros, con una representación de un Banco
representativo y cinco Cajas de diferentes tamaños.
Por lo que se refiere al tamaño muestral (146 elementos útiles) este es ligeramente inferior a los tamaños medios de
otras investigaciones (alrededor de 250 elementos) examinadas en la literatura académica sobre el tema (tales como
Cross, Brashear, Rigdon y Bellenger, 2007 o Thomas, Soutar y Ryan,. 2001) pero creemos que es suficientemente
representativa por la variedad de instituciones financieras, nacionales y regionales, representadas.
En nuestra investigación comenzamos por validar las escalas de medida utilizadas para la medición de los cuatro
“constructos” sobre los que se basa el estudio: La Orientación al Cliente de la Organización, la Orientación a a l
Competencia de la Organización, la Orientación al Cliente del Vendedor y el Desempeño del Vendedor. Esta fiabilidad se
lleva a cabo mediante el cálculo de los coeficientes Alfa de Cronbach.
Los cuatro "constructos" de la investigación se han medido util izando escalas multi-ítem adaptadas de la literatura
(Anexo I).
Todas las escalas utilizadas son de tipo Likert de nueve puntos etiquetados en base al “constructo” medido. Para los
dos “constructos” relacionados con las Orientaciones de la Organización: Orientación al Cliente de la Organización y
Orientación a la Competencia de la Organización, los puntos de la escala de Likert se etiquetarían de la siguiente
manera:1 = "Nunca", 3 = "A veces", 5 = "Alrededor del 50%", 7 = "Muchas veces" y. 9 = "Siempre"
La escala de Orientación al Mercado Organizacional desarrollada por Narver y Slater (1990) la hemos dividido en dos
sub-escalas: Orientación al Cliente de la Organización, con 6 ítems correspondientes a las seis primeras preguntas, y la
Organización a la Competencia de la Organización, con 4 ítems, correspondientes a las cuatro últimas.
En la medición de la Orientación al Cliente de la Organización se reflejan elementos correspondientes a la satisfacción
de las necesidades del cliente, la creación de valor, el desarrollo de compromiso y servicio al cliente.
Por otro lado, la Orientación Competitiva de la Organización se refleja en elementos como la "compartición de la
información" acerca de las características del mercado experimentadas por la organización, incluyendo el conocimiento
sobre las acciones de la competencia y las posibles ventajas competitivas.
Para la medición de la Orientación al Cliente del Vendedor hemos utilizado una modificación de una escala desarrollada
por Saxe y Weitz (1982). Esta modificación nos permite adaptar la escala a la muestra de informantes elegida.
Nuestra escala se compone de 10 ítems evaluados en escalas de tipo Likert de 9 puntos y las siguientes etiquetas,
iguales a las utilizadas en los dos “constructos” anteriores.
Mediante los ítems de la escala de Saxe y Weitz, los informantes son cuestionados para describir su relación con los
clientes, con especial atención a su ayuda a los clientes y a sus acciones dirigidas a satisfacer las necesidades de los
clientes.
Finalmente, para medir el Desempeño se ha elegido una valoración, por parte de los propios vendedores, de sus
resultados en términos tanto cualitativos como cuantitativos.
Los ítems del cuestionario elegido son similares a los usados en una escala desarrollada por Brown y Peterson (1994).
Los ítems se refieren al cuestionamiento del vendedor para una valoración de si mismo en términos de "muy mal" a
"muy bien", en escalas de tipo Likert con etiquetas similares a las de los “constructos” anteriores.
Como justificación a esta elección de ítems auto-evaluativos podemos señalar que Behrman y Perreault (1987) han
encontrado en sus investigaciones que las medidas de auto-evaluación de los vendedores producen resultados
consistentes con las valoraciones de los gestores de los equipos de venta y con las medidas cuantitativas de desempeño
de ventas de la propia empresa.

751
Una lista de todas las escalas usadas en esta investigación se presenta en el Anexo I.
4.- Resultados e implicaciones de la investigación
En cuanto a la fiabilidad de las escalas de medida a continuación se presentan los resultados correspondientes a las
alfas de Cronbach para cada uno de los cuatro “constructos” investigados:
OCO = Orientación al Cliente de la Organización
OKO = Orientación a la Competencia de la Organización
OCO = Orientación al Cliente de la Organización
OCV = Orientación al Cliente del Vendedor
DV = Desempeño del Vendedor
Constructo de Cronbach
OCO 0,932
OKO 0,877
OCV 0,848
DV 0,871
Tabla 1.- Alfas de Cronbach para las cuatro escalas de medida
Como se puede observar en todos los casos el valor de la alfa de Cronbach está muy por encima del valor mínimo
recomendado (0,7), por lo que podemos confirmar la fiabilidad de las cuatro escalas elegidas para cada uno de los
cuatro “constructos”.
Por otra parte, los resultados del modelo de ecuaciones estructurales (Tabla 2) mediante el software EQS, muestran los
siguientes valores de los índices de ajuste:
Índices de ajuste Modelo
χ2 814,553*
df 399
GFI 0,773
NFI 0,717
CFI 0.830
RMSEA 0,085
Coef. de Fiabilidad 0,954
Tabla 2 . – Índices de ajuste y fiabilidad para las estimaciones de los parámetros del Modelo de Ecuaciones
Estructurales
Como puede observarse los valores de los indicadores de bondad de ajuste: GFI, NFI y CFI presentan magnitudes
próximas a 0,8 o superiores por lo que podemos afirmar que, de acuerdo con lo generalemente aceptado, el ajuste del
modelo de ecuaciones estructurales es aceptable.
Por otra parte, en la siguiente tabla se resumen los estimadores de los coeficientes de la intensidad de las relaciones
entre los “constructos”:

752
coeficiente β Significación
OCO OCV 0,249 3,631*
OKO OCV 0,140 2,289*
OCO DV 0,221 2,914*
OKO DV 0,035 0,546
OCV DV 0,504 3,928*
Tabla 3 . – Estimaciones de los coeficientes β de las relaciones planteadas en el Modelo de Ecuaciones Estructurales
Gráficamente, el modelo junto con la estimación de los parámetros β de las ecuaciones estructurales se muestra a
continuación:
Figura 4.- Estimaciones EQS de la intensidad de las relaciones entre “constructos” para el Modelo (*= significativa al
95%)
La significación de los dos coeficientes para la influencia de OCO en OCV (0,249*) y para la influencia de OKO en OCV
(0,140*), confirman cada una de las hipótesis planteadas H3 y H4. Se confirman también, por otra parte, las hipótesis
H1, de la influencia directa de OCO en DV (0,221*) y H5, sobre la influencia directa de OCV en DV (0,504*). No se
confirma, sin embargo, la hipótesis H2.
La no confirmación de la hipótesis H2, al ser el valor del coeficiente estimado (0,035) no significativo, se interpretaría
en el sentido de que la OCV es mediadora entre la OKO y DV, lo que confirma a su vez la importancia del papel de los
vendedores, al menos en la influencia de la OKO en la DV.
En cuanto a la influencia de la OCO en la DV el modelo no permite confirmar que la OCV medie totalmente en dicha
influencia, como en el caso de la OKO, aunque también presenta la existencia de una mediación significativa. Futuras
investigaciones podrían aclarar de una manera más precisa la importancia de dicha mediación.
6.- Implicaciones del trabajo de investigación
Hay una serie de conclusiones que pueden extraerse de los resultados de este estudio.
La combinación de las perspectivas teóricas que analizan la Orientación al Cliente a los niveles de medida
organizaciónal e individual, permite una visión más completa de los efectos de la Orientación al Mercado. Los estudios
de la Orientación al Mercado que han pasado por alto la posible influencia de los vendedores, han omitido un indicador
clave.
Orientación al Cliente
de la Organización
Orientación a la Competencia
de la Organización
Orientación al Cliente
del Vendedor
Desempeño
del Vendedor
0,221*
0,035
0,249*
0,140*
0,504*

753
Aunque las organizaciones hagan un esfuerzo considerable en comunicar a sus clientes la creación de valor, su
determinación de compromiso, comprendiendo y satisfaciendo las necesidades del cliente, estos objetivos no se
conseguirían sin la inclusión de un factor clave en la expansión de sus posibilidades, el personal de ventas.
Los vendedores apoyan, canalizan y refuerzan el enfoque en el cliente de las organizaciones. Es el vendedor quien en
última instancia tiene éxito o no al mostrar comportamientos orientados al cliente y las empresas podrían obtener
beneficios si dirigieran sus esfuerzos hacia el interior de la organización, mejorando el entrenamiento, soporte de su
personal para desarrollar un clima que sustente la orientación de marketing.
La Orientación al Cliente, por definición, es un enfoque a largo plazo y es importante que este enfoque sea comunicado a
los clientes por una fuente estable de larga duración, tal como una fuerza de ventas permanente. Al contrario de lo que
sucede en muchas organizaciones de la fuerza de ventas, en las que los vendedores cambian de un cliente a otro con
bastante frecuencia, y sólo la propia empresa se mantiene estable y constante.
References
Argote, L., McEvily, B., y Reagans, R. (2003). “Managing knowledge in organizations: An integrative framework and
review of emerging themes”. Management Science, 49(4), 571-582.
Atuahene-Gima, K., y Ko, A. (2001). “An empirical investigation of the effect of market orientation and entrepreneurship
orientation alignment on product innovation”. Organization Science, 12(1), 54-74.
Babin, B.J. y Boles, J.S. (1998), “Employee behavior in a service environment: a model and test of potential differences
between men and women”, Journal of Marketing, Vol. 62, pp. 77-91.
Becherer, R., y Maurer, J. (1999). “The proactive personality disposition and entrepreneurial behavior among small
company presidents”. Journal of Small Business Management, 37(1), 28-36.
Behrman, D.N. y Perreault, W.D. Jr (1987), “A role stress model of the performance and satisfaction of industrial
salespersons”, Journal of Marketing, Vol. 48 No. 3, pp. 9-21.
Boles, J.S., Babin, B.J., Brashear, T.G. y Brooks, C.M. (2001), “An examination of the relationships between retail work
environments, salesperson selling orientation customer orientation and job performance”, Journal of
Marketing Theory and Practice, Vol. 9, p. 113.
Brown, S., Cron, W. y Slocum, J. (1997), “Effects of goal-directed emotions on salesperson volitions, behavior, and
performance: a longitudinal study”, Journal of Marketing, Vol. 61, pp. 39-50.
Brown, S.P. y Peterson, R.A. (1994), “The effect of effort on sales performance and job satisfaction”, Journal of
Marketing, Vol. 58, pp. 70-80.
Cano, C., Carrilat, F., y Jaramillo, F. (2004), “ A meta-analysis of the relationship between market orientation and
business performance: evidence from five continents”. International Journal of Research in Marketing , 21(2),
179-200.
Crosby, L.A., Evans, K.R. y Cowles, D. (1990), “Relationship quality in services selling: an interpersonal perspective”,
Journal of Marketing, Vol. 54, pp. 68-81.
Cross, M. E., Brashear, T.G., Rigdon E.E. y Bellenger, T.J. (2007), “Customer Orientation and salesperson performance”,
European Journal of Marketing, Vol. 41 Iss: 7/8, pp.821 – 835
Day, G., y Wensley, R. (1988). Assessing Advantage: A Framework for Diagnosing Competitive Superiority. Journal of
Marketing, 52(2), 1-20.
Dunlap, B.J., Dotson, M.J. y Chambers, T.M. (1988), “Perceptions of real-estate brokers and buyers: a sales-oriented,
customer-oriented approach”, Journal of Business Research, Vol. 17, pp. 175-87.
Embid, P. (2011) "La Orientación al Cliente y el Rendimiento de los vendedores de Servicios Financieros", Tesis
Doctoral, Universidad Complutense de Madrid.

754
Hammond, K., Webster, R., y Harmon, H. (2006). “Market orientation, top management emphasis, and performance
within university schools of business: Implications for universities”. Journal of Marketing Theory and Practice,
14(1), 69-85.
Harris, J.G., Mowen, J.C. y Brown, T.J. (2005), “Re-examining salesperson goal orientations: personality influencers,
customer orientation, and work satisfaction”, Journal of the Academy of Marketing Science, Vol. 33, pp. 19-35.
Jaworski, B., y Kohli, A. (1993). “Market Orientation: Antecedents and Consequences”. Journal of Marketing, 57(3), 53-
70.
Jaworski, B., y Kohli, A. (1996). “Market Orientation: Review Refinement, and Roadmap”. Journal of Market Focused
Management, 1, 119-135.
Kaplan, R., y Norton, D. (1992). The Balanced Scorecard - Measures that Drive Performance. Harvard Business Review,
(January-February), 71-79.
Kirca, A., Jayachandran, S., y Bearden, W. (2005). Market Orientation: A Meta-analytic Review and Assessment of Its
Antecedents and Impact on Performance. Journal of Marketing, 69(2), 24-41.
Kohli, A. y Jaworski, B. (1990), “Market orientation: the construct, research propositions, and managerial implications”,
Journal of Marketing, Vol. 54, pp. 1-18.
Kohli, A., Jaworski, B., y Kumar, A. (1993). “MARKOR: A Measure of Market Orientation". Journal of Marketing Research,
30(4), 467-477.
Macedo, I., y Pinho, J. (2006). “The relationship between resource dependence and market orientation: The specific case
of non-profit organizations”. European Journal of Marketing, 40(5/6), 533-553.
Narver, J., y Slater, S. (1990). “The Effect of a Market Orientation on Business Profitability”. Journal of Marketing, 54(4),
20-35.
Oliver, R. (1999). Whence consumer loyalty. Journal of Marketing, 63(Special Issue), 33-44.
Parnell, J. (2000). Reframing the combination strategy debate: Defining forms of combination. Journal of Applied
Management Studies, 9(1), 33-54.
Parnell, J., y Hershey, L. (2005). The strategy-performance relationship revisited: The blessing and curse of the
combination strategy. International Journal of Commerce & Management, 15(17-33).
Parnell, J., y Wright, P. (1993). Generic strategy and performance: An empirical test of the Miles and Snow typology.
British Journal of Management, 4(1), 29-36.
Pearce JAI; Robbins DK y Robinson RB Jr. (1987). The impact of grand strategy and planning formality on financial
performance. Strategic Management Journal, 8,125-134.
Rozell, E., Pettijohn, C. y Parker, R. (2003), “Customer-oriented selling: exploring the roles of emotional intelligence and
organizational commitment”, Psychology and Marketing, Vol. 21, pp. 405-24.
Saxe, R. y Weitz, B. (1982), “The SOCO scale: a measure of the customer orientation of salespeople”, Journal of Marketing
Research, Vol. 19, pp. 343-51.
Siguaw, J., Brown, G., y Widing, R. (1994). “The Influence of Market Orientation of the Firm on Sales Force Behavior and
Attitudes”. Journal of Marketing Research, 31(February), 106-116.
Sujan, H., Weitz, B. y Kumar, N. (1994), “Learning orientation, working smart, and effective selling”, Journal of
Marketing, Vol. 58, pp. 39-52.
Swenson, M. y Herche, J. (1994), “Social values and salesperson performance: and empirical examination”, Journal of
Academy of Marketing Science, Vol. 22, pp. 283-9.
Tauber, E. (1974), “How marketing discourages major innovation”, Business Horizons, Vol. 17, pp. 22-6.
Thomas, R., Soutar G. y Ryan, M. (2001), “The Selling Orientation-Customer Orientation (S.O.C.O.) Scale: A Proposed
Short Form”, The Journal of Personal Selling & Sales Management, Winter, pp. 63-69.

755
Webb, D., y Pettigrew, A. (1999). The temporal development of strategy: Patterns in the U.K. insurance industry.
Organization Science, 10(5), 601-621.
Webster Jr, F. (1988). “The rediscovery of the marketing concept”. Business Horizons, 31(3), 29-40.
Wiklund, J., y Shepherd, D. (2005). Entrepreneurial orientation and small business performance: a configurational
approach. Journal of Business Venturing, 20(1), 71-91.
Williams, M. y Wiener, J. (1990), “Does the selling orientation-customer orientation (SOCO) scale measure behavior or
disposition?”, in Bearden, W., Despande´, T.J., Madden, P.R. and Varadarajan, A. (Eds), Enhancing Knowledge
Development in Marketing, American Marketing Association, Chicago, IL.

756
Develoing A Model of Superior Marketing
Strategy to Sustained Competitiveness and
Business Success Holistic perspective, modeling marketing strategy, new retailing strategy, value creation, competitve advantage,
business success.
Somdee Hongphisanvivat, Thammasat University, [email protected]
Abstract
The high dynamics call for more consumer centricity but need other logics to sustained advantages and success.
Modeling superior marketing strategies to identify and prioritize the appropriate implementation of the different logics
is thus essential.
This paper addresses the under-studied area and pioneering provides insights how the holistic/integrated views
generate superior value-driven strategies in the retail setting using in-depth interviews with senior managers, a real
case study, observation and informal conversation. The findings reveal four implications: 1) True retail success
requires consumer centricity through market-based learning to formulate a proper retailing strategy to superior
customer value; 2) Sustainable retail success needs employed the distinctive-resource and social centricity to greater
satisfy shoppers and enhance community well-being; 3) Applying the mental model along value creation process, a
four-stage model of new retailing strategy is suggested. The first two strategies: unique transaction and excellent
relationship are necessary foundation to create superior core value and relative value to achieve retail success. The
latter two: proactive innovation and sustainability are sufficient drivers to build innovative and sustainable value
crucial for a more sustainable retail performance; and 4) Effective implementation of the model requires dynamic
strategic capabilities to develop different retailing strategies better satisfying stakeholders and securing outcomes.
Future research should conduct more case studies and develop valid measures to test the model across industries for
wider applications.
1. Introduction
Highly fragmented markets and global competition imply customer focus/centricity is increasingly important but
needed to be aligned with other logics to increase sufficient strategic capabilities in pursing the new challenging
advantages (Heinonen, et al. 2010; Tollin and Jones 2009; Vargo and Lusch 2004). However, there is a lack of study
describing how to use the different logics appropriately for developing a superior marketing strategy to sustained
competitiveness and business success.
Marketing strategy formulated through the three pillars, i.e. customers, company, and competitors is implemented to
create, communicate and deliver value to a target market. When integrated with other functional areas, such as human
resources and supply chain, it will become a competitive strategy leading to improve firm’s effectiveness and efficiency
essential for creating customer value to better performance (Porter 1996; El-Ansary 2006). Nevertheless, there is a
fundamental shift of effective marketing from market-driven to value-driven strategy as the next source of sustained
advantages and continued success (Best 2009; Woodruff 1997). Not only consumer or market-centric but strategic
resource in particular, human capital and ecological imperatives encourage firms to take a holistic view of value
creation to satisfy various stakeholders for sustained superior performance (Akroush 2012; Berthon 2010; Wilkinson
2011; Win 2005).

757
Specifically, future retail change toward sustainability needs taken two different focuses into consideration: market-
driven (following consumers’ needs) and market-driving (following the firms’ desires). Both are suitably implemented
in different retailing situations (Medina and Rufin 2009; Rintamaki, et al. 2007). Meanwhile, relationship marketing is
more critical to service businesses which require different marketing strategies to added firm value (Gronroos 1994;
O’Malley and Patterson 1998). However, recent evidence reveals traditional/transactional marketing remains
necessary to be a complementary paradigm (e.g. Zineldin and Phillipson 2007). This supports there is no one
approach/principle able to fit for all and generates the best results over time. Achieving sustainable superiority and
success in the long-run requires multiple or multilevel perspectives applicable, flexible and adaptable to different needs
and objectives (Bonoma 1984; Othman and Sheehan 2011; Conant et al. 1990).
Further, building customer experience is the most important strategic decision to gain advantages (Rintamaki, et al.
2007; Sorescu et al.) suggesting the need of modeling superior marketing strategy to identify and prioritize which one
is more relevant than the other to properly create and implement superior value in experience toward sustainability
(Chimhanzi 2004; Ngo and O’Cass 2010). A mental model should be applied as it illustrates a more practical approach
from different views as well as categorizes appropriate actions based on managerial sensemaking and process suited to
the environment (Tollin and Jones 2009; Wind 2005). Therefore, effective marketing strategy for superior value
creation able to sustained long-term advantages requires a holistic view of integrated appropriate logics and key
knowledge/capabilities into organization practices driving to a better performance.
This paper thus attempts to explore three critical areas under-studied in the retail setting: 1) Which concepts/theories
relevant to holistic value-driven perspective; 2) How the holistic perspective guides to develop value-driven retailing
strategy; and 3) How to implement this new retailing approach to sustained retail success. Background and conceptual
framework of holistic value-driven orientation to new retailing strategy is presented. Then the empirical results by in-
depth interviews, a real case study, observation research and informal interviews are discussed followed by managerial
implications and future research recommendations.
2. Theoretical Background and Key Scenarios of Value-Driven Retailing Strategy
2.1 Definition of Retailing Value Creation Logic
Value creation logic in marketing focuses on customer value referred to getting more benefits than costs of desired
products or services (Woodruff 1997). High dynamics requires the boarder concept of value creation based on
consumer centricity to the holistic perspective using multiple logics to create appropriate value driving to superiority
and sustainability (Potocan and Mulej 2003).
In a similar vein, more diverse demand and global competitive pressures call for the new wheel of retailing with the
emphasis of more innovative and integrative marketing strategies to sustained superior outcomes (Jones et al. 2008;
Sorescu, et al. 2011). This drives to the need of building superior customer experience through holistic value creation
beyond the service process of value in use or consume (see Heinonen et al. 2010).
Accordingly, this study proposes the new retailing strategy based on holistic value-driven orientation and defines it as a
superior strategic alternative of offering total shared value in experiences (valuable things either goods, servi ces, ideas,
knowledge, information, physical or store experiences) to satisfy customers and other relevant stakeholders driving to
sustained competitiveness and business success. This new perspective employs retailing-mix strategies most
compatible with the dynamic improvement of organization capabilities and taken social well -being into consideration
since retailing is a people business and facing revolution in nature. Not only customers but other stakeholders, in
particular employees, suppliers/partners and community need positive contact with qualified interactive response to
get strong cooperation and help create superior value which evidentially leads to better performance in the long-run
(Barsky et al. 1999; Berthon 2010; Sorescu et al. 2011).
2.2 Alternative Strategy of Retailing Value Creation Logic
According to Levy and Weitz (2007), the basic retailing-mix strategy is composed of 6 components: store location,
merchandise assortments, pricing policy, communication mix, store design and dis play, and customer service. In the
high turbulent economy, it is critical to integrate these components properly to generate the best basic retailing-mix

758
strategy (named as unique transaction strategy) for superior value creation of shoppers’ experiences driving to
sustained advantage and retail success (Berman and Evans 2013). Recently, several scholars have addressed different
views of relevant retailing strategies. For instance, Sorescu et al. (2011) contend retailers today have to make a
suitable decision on three interconnected core elements: retailing format, activities and governance to organize logic of
business model innovation for value creation and appropriation to gain long-run advantage and success. Matzler et al.
(2013) suggest to use business model innovation for value creation (satisfying consumers’ needs) and value capture
(generating company’s profits) to achieve sustainability successfully.
This study, on the other hand, purposes the holistic views of building four retailing strategies along value creation
process essential for practical implementation to a more sustainable retail success in future. They are unique
transaction strategy, excellent relationship strategy, proactive innovation strategy and sustainability strategy. These
strategies are developed based on different focus of relevant concepts/theories for better managerial implications.
2.3 Theoretical Background of Retailing Value Creation Logic
Pursuing new perspective of retailing strategy requires interdisciplinary concepts (Alexander 2010). Intensive
reviewed literature suggests to employ the new holistic views of critical management driving from the three integrated
principles: market orientation, strategic resource orientation and ecological orientation. The first two orientations are
complementary and necessary basis for developing a better competitive strategy while the last one ergs to formulate
strategy sufficiently driving for sustainable development.
2.2.1 Market orientation toward value-driven retailing strategy
Market orientation emphasizing consumer-centric and competitive-centric perspective has been identified as a major
prerequisite for ability to create superior customer value which in turn becomes a major source of competitive
advantage and business success (Best 2009; Fritz 1996; Phahalad and Ramaswamy 2004). Several studies indicate
market orientation has positive relationship with profitability and sustainable advantages when capabilities are taken
into account (e.g. Subramanian and Stranddholm 2009). Especially, superior knowledge is critical to make a proper
strategic decision on developing competitiveness (Tzokas and Saren 2004).
True retail success requires ability not only to get insight knowledge/information for deeply understanding consumers’
needs and preference to create differentiate value better than competitors (Slater and Narver 1996; Voola and O’Cass
2010) but to identify unique position of offering superior experience to customers (Rintamaki et al. 2007; Sorescu
2011). For instance, a focus on high quality product (Pike and Melewar 2006); building the niche retail brands (Mintel
2006); and managing shopping spaces into dynamic places (Myers, Gore and Liu 2008).
Further, ability to well manage market knowledge/information of consumer and competitor trends, in particular the
unexpected environment changes are crucial for effective value-driven retailing strategy to sustained advantages and
superior performance (Homburg et al. 2004; Sorescu et al. 2011). For instance, shifting world population structure and
demographic characteristics, especially one-person family unit suggests the need shifted the focus of effective retailing
strategy from building traditional core value by selling variety of product assortments to enhance customer
experiences through holistic knowledge management of creating superior core value to gain long-lasting advantages
(Grewal et al. 2009). This indicates a clear need to shift orientation towards a more market-driven approach to
enhance market competitiveness for being sustainable in the long-run. Therefore, the following proposition is stated:
Further, learning about best practices and identify what are key success factors in retailing over time provide a basis
for sustainable advantage and superior performance of service businesses (Smith 2000). Knowledge/capabilities about
effectively managing process of marketing relationships are critical to achieve a suitable retail operation strategy for
superior customer value creation, proposition and performance (Rintamaki et al. 2007; Yu and Ramanathan 2012).
For instance, creating utilitarian value is a primary approach for many retailers to attract customers to visit their store
in the first place but the more abstract dimensions of hedonic value to differentiate shopping experiences might keep
them coming back again (Carbone 2004).

759
Sustained long-term advantages and success require proactive innovative knowledge to ensure dynamic capabilities in
generating a sound marketing strategy over time. As Voola and O’Cass (2010) contend, firms have to develop unique
insight market knowledge/capabilities (responsive market-orientation) and unique foresight (proactive market-
orientation) to understand customers’ latent needs and catching up the new product/market opportunities. In
addition, proactive innovative knowledge able to create more value-added products/services to customers in terms of
intangible assets will consequently provide the increased profit for the company (Matzler et al. 2013).
2.2.2 Strategic resource orientation toward value-driven retailing strategy
Resource-base orientation focusing on distinctive resources difficult to imitate and non-substitutable is key driver of
sustained advantages and organizational success (Barney 1991). Core knowledge/capabilities derived from intangible
resources tend to offer a more durable strategy, super value creation and firm performance than the market
orientation. Specifically, the capabilities and experiences of management and employees are the most important
strategic resources driving to critical wealth creation in practice and long-term profit (Pfeffer, 1995; Sharkie, 2003).
However, utilized strategic resources will generate above-market profitability when they are consistent with adopting
the most appropriate market strategy (Andersen 2007; Pehrsson 2000). These suggest distinctive resource-centricity
should be applied coincidentally with a consumer centricity in order to develop superior marketing strategies to
sufficiently sustained advantages and business success. Consequently, building stakeholder value to satisfy employees,
suppliers or involving partners is essential for out-performing operation in retailing business.
Attraction, selection and well training of high quality employees including proper incentive schemes and reward
system are critical to improve employees’ competency and motivation to better provide services to serve different
shopping needs (Guenzi et al. 2009), significantly satisfy customers (Akroush 2012), enhance financial performance
and sustained advantages (Mavondo, et al. 2005).
Building long-term customers relationships, marketers must develop effective internal relationships (Nguen and
Mutum 2012; Piercy 2009). Recent evidence suggests retailers have to put much more attention on building
relationship-specific capability with customers and suppliers, while keep good relationship with government in general
because the former critically generates better operation strategy to gain advantages and sustained retail success (Yu
and Ramanathan 2012).
Being successful in today’s interconnected world depends on the ability of networking. Networks provide firms to
access to knowledge resources, technologies and markets. Interpersonal networks are critical to management as the
key mechanism of ensuring quality and achieving superior performance (Fonson 1999). It also gives rise to innovation
(Dhanraj and Parkhe 2006). Since working, learning and innovation complement each other in modern organizations.
When their internal networking is developed through knowledge creation and transferred processes for value creation,
this yields great benefits and becomes the most critical source of lasting competitive advantages (Seufert et el. 1999).
Similarly, networking with good business partners or alliances is necessary to increase external capabilities when
resources needed to improve performance is not available for purchase from the market (Othman and Sheehan 2011).
Ability of network to interact, learn and transfer knowledge/capabilities to value creation process shapes value
proposition driving to gain advantages and increases innovation potential to create new value or benefits to one or
more parties able to sustained advantages and business success (Mele et al. 2010).
However, service innovation is a complex, often incremental, sequenced steps and process in nature which requires
more human resources and collaboration than product innovation (Alam 2002). The service offerings are designed
with value co-created with customers in a social context (Edvardsson et al. 2013). Firms have to combine the
resources/capabilities from outside with inside to quickly create new knowledge to generate better competitive
strategy driving to new value creation/proposition for attracting new markets and gaining advantage to sustained
superior performance in the long-run (Simon et al. 2008).
2.2.3 Ecological orientation toward value-driven retailing strategy
The emerged ecological imperatives suggest marketers to take responsibility towards society and ecological
sustainability to serve and save the planet for a better quality of life primarily through value creation (Kotler et al.

760
2002; Smith and Sharicz 2011). The study of Jones et al. (2008) reports environmental conscious consumers prefer
retailers to make choices and decisions for them when taking personnel commitment to sustainable development. This
implies retailing business should take an active role in developing lower cost and higher value of sustainable products
or services to help change consumer perceptions toward well-being. Such achievement requires to use the effective
marketing communications to promote a more sustainable consumption patterns (Durieu 2003; Jackson 2006). Since
a more holistic understanding of the customer’s life, practices and experiences is essential for the emerged customer
value in the new service management (Heinonen et al. 2010).
Therefore, ecological-centric perspective should be taken into account with other centric approaches to better
formulate and implement retailing strategy to gain a more promising superiority. It is also crucial for creating social
value suited to each context of society’s demand to sustainable long-run business success and secure lasting human
welfare.
3. Value Creation Process of Value-Driven Retailing Strategy
This study focuses on using holistic perspective through a sense-making process of how to create superior customer
value to sustained advantages and better performance. Following the three integrated principles with the mental
model (see Heinonen et al. 2010; Tollin and Jones 2009) to provide consumer experiences in the different challenges,
four scenarios of value-driven retailing strategies (a four-stage model) is suggested. They are unique transactional
strategy, excellent relationship strategy, proactive innovation strategy and sustainability strategy. Each of them should
be pursued step by step but coincidental and continuous implementation is crucial for delivering a more sustainable
retail success in future.
3.1 Unique Transactional Strategy
This is the first strategy to offer superior core value in experience by adopting appropriately different key
drivers/components of basic retailing-mix strategy suited to various retailing situations. According to Lawson (2005),
to sustained advantage and success, retailing strategy needs to encompass all elements of marketing/retail -mix. In
particular, the successful retailers of the next century selling the consumer packaged products have to adopt core
strategies composed of at least 4 distinctive components (Berman and Evans 2013; Lawson 2005):
Building an individual store product focusing on consumers perceiving it as a brand in its own right;
Providing a higher value than any competitor, but at a lower cost;
Offering unique products and services at a continued basis matching the changing needs; and
Supplying a unique customer service through more convenience and added value.
The unique transactional strategy is a necessary condition of retail success. It offers superior shopping experience to
customers through a unique portfolio of retailing mix better motivating more customers to make continued
transactions satisfied them. This is accomplished through constantly analyzing the markets to catch the direct
consumer trends and preferences in regard to build marketing knowledge/capabilities and close
interaction/collaboration with inside and outside stakeholders, in particular competent staffs/employees, key
suppliers and community leaders to achieve excellent retailing operation. Therefore, the better transactional strategy
is applied, the greater the customer value in experience and the more sustainable advantages and business success.
3.2 Excellent Relationship Strategy
This second alternative places an emphasis on offering relational value in experience to create more loyal shoppers as
a cornerstone of retail success since strong loyalty builds intangible assets unable to imitate easily which in turn lead to
greater profits and sustainable advantages (Reichheld and Sasser 1990; Lee et al. 2005),
Building strong relationship is critical for retailing as representing one typical form of service business which needs
adopted more proactive value-based marketing strategy (Codron et al. 2005). Firms can add value through building
brand awareness and experience to customers by using effective communication, personal interaction and relationship

761
which motivate consumers to look for holistic benefits beyond those associated with features, functions and pricing
(Berry 2000; Ngo and O’Cass 2010). Consequently, building quality relationship enables firms to develop superior
customer value and other stakeholder value resulting in sustainable long-term advantages. It also provides real
picture of the retail business position to help implement retail marketing strategy (Peppers and Rogers 1995). This
scenario is increasingly imperative as relationship quality is a better predictor of behavior intention than service
quality because it evidentially leads to higher share of consumer wallet and free word-of-mouth advertising (e.g., Sok
and Aron 2011).
3.3 Proactive Innovation Strategy
The third scenario is essential due to the rapid changes in consumer lifestyle, highly global competition, market
saturation and new retailing technologies (Matzler et al. 2013; Sorescu et al. 2011). This alternative focuses on offering
innovative value in experience. Successful retailers have to take proactive role in managing the retailing-mix and
concept meeting the consumers’ needs in a truly creative approach (Voola and O’Case 2010).
Sound retailing innovation needed not only to improve services, location and store layout but the whole value creation
process in the retail operation (Alexander 2010; D’Andrea et al. 2006; Sorescu et al. 2011). Therefore, building
innovative value successfully requires retailers to proactively develop superior marketing knowledge and capabilities
in at least four critical areas: 1) having proactive foresight 2) adding more customer knowledge; 3) better
managing collaborative relationships for external value-creating resources; and 4) closer integration of the demand and
supply chain to maximize innovative value driving to profitable growth and sustainable retailing success .
3.4 Sustainability Strategy
Post-modern retailing will face more dynamic and complex environments with more demanding from various key
players, particularly in the area of sustainable development (Jones et al. 2011). This addresses the need of the fourth
scenario concentrating on offering sustainable value in experience as it is the most critical driver to sustainable
retailing success in the long-run (i.e. Seyfang 2006).
Successful in creating sustainable value requires retailers to build broader marketing knowledge and capabilities in the
emphasis of building effective social innovation to increase shopping experiences driving to a better quality of life and
social well-being (Alexander 2010; Lejeune 2011; Jones et al. 2008). Consequently, three critical areas need to be
pursued: 1) deeper understanding active consumer commitment to sustainable development; 2) closer interaction
with pro-social shoppers ; and 3) greater communication and impressive collaboration to encourage stronger
commitment from important stakeholders and other networks in sustainable development. These will speed the
applicability of retailing social innovation to create sustainable value aligning with ethical business operation for last-
long social well-being and a more sustainable retail in future.
In conclusions, the 4 stage-model needs life cycle implications with a well integration matching to the company’s
mission, knowledge and resources. Transactional marketing strategy and relationship strategy tends to be
complementary and are necessary foundation to retail success. Meanwhile, proactive innovation strategy and
sustainability strategy are sufficient foundation to sustainable retail success. Therefore, successful retailers in future
should carefully consider when and how to appropriately apply each of the four scenarios due to their different
proposes and implications. It is better to apply them coincidently at a continual basis in order to be more powerful to
secure last-long retailing success in the highly dynamic and fragmented changes.
4. Conceptual Framework
The above review of previous studies, theoretical background and suggested key scenarios of retailing strategy lead to a
proposed framework as shown in Figure 1. This framework explores the relationship among holistic perspective, new
retailing strategy, and superior value creation toward sustainability outcomes.
Applying holistic perspective successfully will result in effectively formulating and implementing retailing strategies to
create different types of superior value in experience (i.e. core value, relation value, innovative value and sustainable
value) to satisfy various stakeholders, especially consumers. These lead to sustainability outcomes composed of
sustainable advantages (i.e. unique differentiation in retailing services and/or cost leadership in retailing operation)
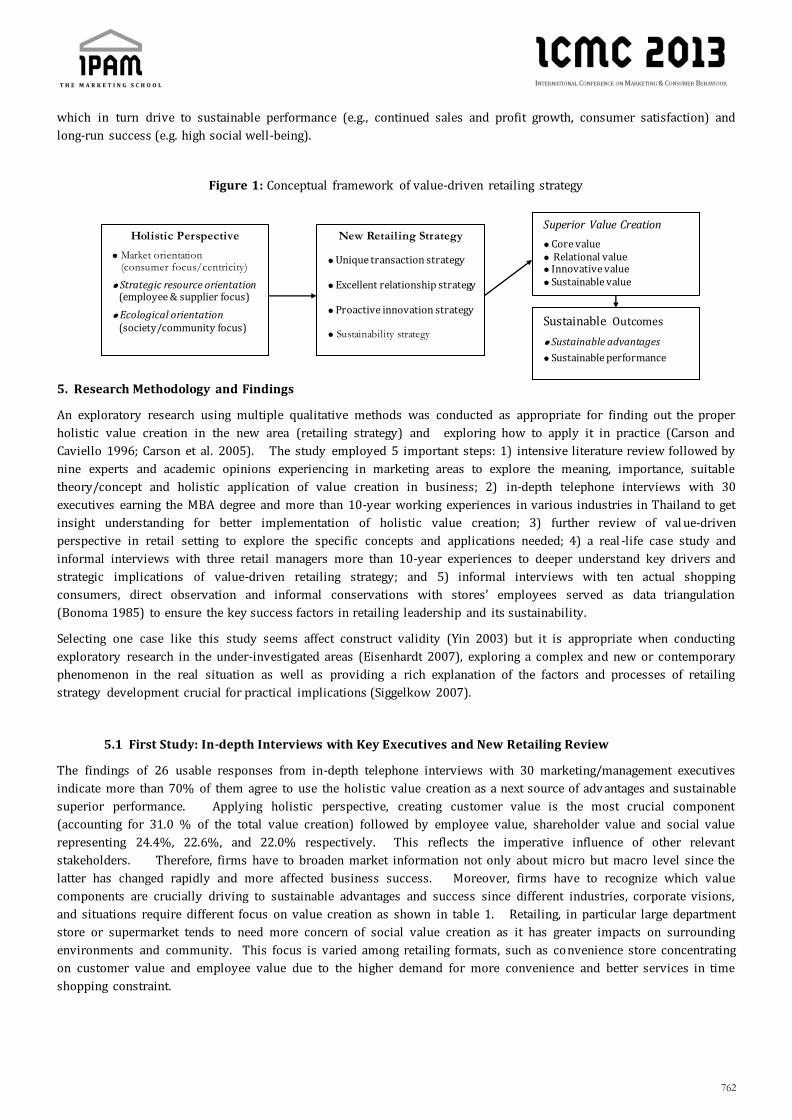
762
which in turn drive to sustainable performance (e.g., continued sales and profit growth, consumer satisfaction) and
long-run success (e.g. high social well-being).
Figure 1: Conceptual framework of value-driven retailing strategy
5. Research Methodology and Findings
An exploratory research using multiple qualitative methods was conducted as appropriate for finding out the proper
holistic value creation in the new area (retailing strategy) and exploring how to apply it in practice (Carson and
Caviello 1996; Carson et al. 2005). The study employed 5 important steps: 1) intensive literature review followed by
nine experts and academic opinions experiencing in marketing areas to explore the meaning, importance, suitable
theory/concept and holistic application of value creation in business; 2) in-depth telephone interviews with 30
executives earning the MBA degree and more than 10-year working experiences in various industries in Thailand to get
insight understanding for better implementation of holistic value creation; 3) further review of val ue-driven
perspective in retail setting to explore the specific concepts and applications needed; 4) a real -life case study and
informal interviews with three retail managers more than 10-year experiences to deeper understand key drivers and
strategic implications of value-driven retailing strategy; and 5) informal interviews with ten actual shopping
consumers, direct observation and informal conservations with stores’ employees served as data triangulation
(Bonoma 1985) to ensure the key success factors in retailing leadership and its sustainability.
Selecting one case like this study seems affect construct validity (Yin 2003) but it is appropriate when conducting
exploratory research in the under-investigated areas (Eisenhardt 2007), exploring a complex and new or contemporary
phenomenon in the real situation as well as providing a rich explanation of the factors and processes of retailing
strategy development crucial for practical implications (Siggelkow 2007).
5.1 First Study: In-depth Interviews with Key Executives and New Retailing Review
The findings of 26 usable responses from in-depth telephone interviews with 30 marketing/management executives
indicate more than 70% of them agree to use the holistic value creation as a next source of adv antages and sustainable
superior performance. Applying holistic perspective, creating customer value is the most crucial component
(accounting for 31.0 % of the total value creation) followed by employee value, shareholder value and social value
representing 24.4%, 22.6%, and 22.0% respectively. This reflects the imperative influence of other relevant
stakeholders. Therefore, firms have to broaden market information not only about micro but macro level since the
latter has changed rapidly and more affected business success. Moreover, firms have to recognize which value
components are crucially driving to sustainable advantages and success since different industries, corporate visions,
and situations require different focus on value creation as shown in table 1. Retailing, in particular large department
store or supermarket tends to need more concern of social value creation as it has greater impacts on surrounding
environments and community. This focus is varied among retailing formats, such as convenience store concentrating
on customer value and employee value due to the higher demand for more convenience and better services in time
shopping constraint.
Holistic Perspective
Market orientation (consumer focus/centricity)
Strategic resource orientation (employee & supplier focus)
Ecological orientation (society/community focus)
New Retailing Strategy
Unique transaction strategy Excellent relationship strategy Proactive innovation strategy Sustainability strategy
Sustainable Outcomes
Sustainable advantages
Sustainable performance
Superior Value Creation
Core value Relational value Innovative value Sustainable value

763
Table 1: Weighted value components classified by types of business
Types of Average weighted value components (%)
Business Customer Value Employee Value Shareholder Value Social Value
1. Retailing Business 20.0 20.0 30.0 30.0
2. Cosmetic Business 40.0 25.0 20.0 15.0
3. Cigarette Business 20.0 25.0 15.0 40.0
Further findings reveals, most respondents suggest to utilize multiple concepts. For instance, total quality
management, relationship marketing, experience marketing and sufficiency economy should be employed
coincidentally with the proposed principles. Since successful implementation of holistic value creation, in particular
retailing requires the continued quality improvement of the whole business operation to catch up the new growth
opportunity in several fragmented markets with different desires of life experience. As such, rel evant information is
essential. All respondents agree to gather it from multiple qualitative rather quantitative methods. It is suggested to
use the integrative approach between knowledge-based and behavioral based research to get more reliable data
through a time-cost saving mode. Real and up-to-date case study is also needed to provide insightful for better
implementing holistic orientation.
However, it is more critical to obtain valid information and effectively analyze it for deeper understandi ng the new
market trends as soon as possible to correspondingly develop sound retailing strategy and proper action to satisfy the
changing needs and gain advantages. Moreover, successful implementation of holistic perspective requires fairness,
honesty, and high commitment from top executives to avoid conflict of interests as well as enhance harmonization
among various stakeholders.
Finally, most respondents advise to use both qualitative and quantitative measures. They all agree to employ
satisfaction, happiness, and attitudes toward the company as the key-based assessing the customer value, employee
value, and social value. Meanwhile, sales/revenue and profit growth, return on equity (ROE) and dividend payment
should be the major-based measurement of shareholder value. Obviously, retailing tends to focus on using the two key
measures: customer and employee satisfaction and happiness as they appear to have the most crucial impact on
business success in the fast moving service industry, in particular convenience store retailing.
In conclusion, this first study provides a major contribution to develop the proposed conceptual framework of a
holistic perspective essential for unique value creation to sustainable advantages and superior performance. However,
more qualitative studies need investigated to have enough evidence whether different industries employ similar or
different holistic views and what should be the major concern for better applying it to achieve business success in the
long-run.
Further review literature of retailing indicates holistic perspective is applicable for retailing business but pursuing
different focus on the key drivers. The study has proposed the 4-stage model of retailing strategies along the value
creation process, the most under-explored area. This significantly sheds insight the new wheel of retailing maneuver
to be a more powerful driver of sustainable development. Nevertheless, there is no clear support whether the
proposed framework addressing this new retailing strategic approach will lead to sustained advantages and superior
performance. Therefore, further qualitative study using a real case of a success retailing public company applying the
holistic perspective is illustrated with the additional three informal interviews with key retailing managers, and ten
actual shopping consumers including direct observation and informal conversations at the 5 selected 7-Eleven stores
located at the well-known education institution in the Bangkok metropolis, Thammasat University These will give
more insights on what are the real key drivers and how to successfully apply holistic value-driven retailing strategy to
achieve superiority and sustainability in the highly intensified global competition.
5.2 Second Study: Case Method, Observation and Informal Interviews
5.2.1 Case method
A real case study of CP All, the most successful public company in Thailand retail trade industry is demonstrated due to
many reasons: 1) it is in the high dynamics and competitive environments; 2) it has various key players involvement; 3)
it has adopted the holistic orientation using value-driven retailing strategies; 4) there are more details including
financial figures of large retail companies listed at the stock Exchange of Thailand (SET) which allow to make a

764
thorough and deeper analysis to provide a more precise findings and suggestions; 5) retailing in Thailand performs the
highest share of average daily trading among the top 50 listed companies of 5 ASEAN countries, and also generates the
highest return on equity ratio (ROE) among them, accounting for 29.4% above average of 11.0% (SET 2012); and 6) the
global retail growth will be emerged in Asia due to the middle-class shoppers shifting to Asia-Pacific accounting for
54% of the world population 3,249 millions in 2020 and 66% of 4,884 millions in 2030 (OECD 2010). Consequently,
studying retailing in Thailand will be worth applying to other Asian countries and western nations to grasp this
increasing global retail opportunity.
CP All has bought the license for the 7-Eleven trademark from the Southland Corporation, USA in 1988 to operate
convenience store in Thailand. It’s major goal is to be the leadership with the top priority of delivering convenience
and happiness to consumers as well as bringing the maximum benefits to the involving stakeholders. The company has
operated 6,822 stores in 2012, the largest nationwide network and the third rank in the world of 7-Eleven stores. CP
All’s core services focuses on food and beverages accounting for 72.8 per cent of its business and serves 7.6 million
shoppers daily in 2011 increasing by 7.0 per cent from 2010. The company has adopted the holistic perspective to
build sound retailing strategies for superior value creation. This drives to sustained advantages and superior
performance as shown in table 2 reflecting its effective strategies consistent with the corporate vision and well suited
to the changing trends of retailing trade pattern in Thailand. Therefore, exploring how it has executed to achieve
superiority and sustainability would be fruitful. Following the proposed conceptual framework in Figure 1, the
detailed analysis is demonstrated as follows:
1) Effective implementation of holistic perspective
The company employs multiple orientations with an emphasis of customer and employee focus. Regarding the
company’s philosophy (Through our happy employees, we desire to see similes from customers), vision (We serve
convenience to all communities) and mission (To create customer engagement with quality product and service
assortment by “Harmony” management and to enhance good relations with society and community) indicates CP All
catches up the heart of competitive success in the retailing business.
First of all, the company employs the market orientation with the emphasis of customer-centric perspective as a key
driver of its sustainable success. It continually monitors consumers across segments by store locations and situations
through annual and quarterly consumer survey. At the same time, it pursues the best retail operation at the global
standard by learning new knowledge, benchmarking and key information affecting core abilities and activities from its
US licensor, business partners, industry experts, ad hoc market research and smart lecture/training series. The focus
is to get insight views for better developing and implementing retailing strategies to satisfy the ever-changing demand
of customers. Its’ well market information drives for effective value-based management suited to the dynamics which
in turn enhances profitability and sustained competitive success.
Second, the company concentrates on strategic resource orientation, in particular building dedicated employees as a
dynamic force to better serve customers and communities by making them feel happy, loyal and proud to work at
7-Eleven through a strong organizational culture encouraging creativity and innovation, share learning, team working,
competency enhancement using the human management process approach: PDCA (Plan-Do-Check-Act) with good
incentives/compensations. It also emphasizes on building human capabilities and satisfaction to create superior
customer value and sustained advantages of retailing business. On the similar vein, the company has worked closely
with suppliers, producers, merchandisers and franchise stores to have insight business information and learning
experience about retail operation including their expectation of transparency to better working together in the long-
run. Its effective interaction with employees, subsidiaries, partners and alliances become intangible assets to enhance
superior value creation and profit generation to sustainable long-run success.
Third, the company has greater concerns of social responsibilities by implementing various projects in primary regard
to education, religion and the environment. The main focus is on developing capable and good people to Thai society
by promoting several unique programs for youths and communities. In parallel, the company has put more effort to
operate the business with integrity and transparency to achieve a better listed company evaluated by the Thai Institute
of Directors Association. The underlying these active social responsibilities is to create superior social value as an
intangible asset. This not only builds a solid differentiation in terms of high brand recognition but enhances core

765
sustainability since retailing is a people business. Organizations better on intangible asset performance will achieve
higher levels of productivity and long-term profitability to enduring competitive advantages.
2) Aggressive and constructive retailing strategies
CP All concentrates on using differentiation retailing strategies rather than cost leadership to create superior value
creation. The differentiation focus is based on convenience, quality, relationship, innovation and sustainability with the
emphasis on business process critical to business success in the long-run. It thus employs the three strategies
holistically: unique transaction strategy, excellent relationship strategy and proactive innovation strategy, while the
last strategy: sustainability strategy has involved with the others at some extents in order to blend all of them for
building superior retailing-mix strategies ahead its competitors and better satisfy all stakeholders in the timely manner.
The company has formulated and implemented the relating strategies driving to superior value creation and sustained
business growth and success as the following:
First, set up a clear policy of each strategy and action toward the best practice, fairness to the involved stakeholders,
differentiate from competitors and better satisfy customer and other stakeholders fi t to the changing demand and
environment.
Second, develop superior transaction retailing strategies through the high quality standard of products and services
with attractive display and effective merchandising, fair or multiple pricing worth to value for money, most efficient
distribution network with faster delivery and greater services over the country, and using the most effective
promotion strategy which are mainly price and stamp promotion to increase sales continually and attract more amount
of customers.
Third, build strong relationship with the global partner (e.g. the US licensor) and all the local partners, alliances and
business network using a “Connect-and-Develop” model by gaining advance technology, new knowledge, and
global/brand image critical to superior management of the new retail trade pattern in Thailand. This makes the
company enjoy creating superior market values and performance. These advantages have been applied to the
company’s alliances and local partnerships resulting in stronger cooperation and connectivity. Success in bridging
global and local competencies enables the company to continually build key strategic processes “hard to imitate” and
retain core capabilities to rapidly provide superior value to customers and other stakeholders.
The company uses dual orientation between customer centricity and employee centricity as a guideline to build good
relationship based on intensive consumer and employee surveys and analyze them in terms of cause-effect
relationship, satisfaction, financial performance, sustainable business growth and success to improve services , create
new service edges, and handle unpleasant/complaint activities immediately.
Fourth, work closely with producers, suppliers, and merchandisers using the deep information from annual market
research, industry insights and expert opinions to ensure the uniqueness of better quality, reliability, quickness based
on the First Best Only approach (Firstly launched in 7-Eleven stores, Best selection, Only available at 7-Eleven stores),
and shift the lower to higher profit margin items including providing new technology to assists in faster and better
display, product arrangement and following-up the correct delivery.
Fifth, pursue innovation strategy ahead competitors in 3 critical areas since successful value creation process needs
well integration of distinctive, effective and efficient ways to gain sufficient advantages and more sustainable outcomes.
1) Innovation in retailing-mix strategy focusing on consumer-centric management by building fast and in-depth
market intelligence to deeply understand changes of consumers and competitors to improve the value creation process
in new retailing-mix development to stimulate repurchase of the existing customers, attract new accounts, better
satisfy the consumers’ needs and expectation in a timely manner driving to sustained advantages and success.
2) Innovation in retailing operation focusing on partnership-centric management by engaging actively in research and
development in parallel to working more closely with suppliers and manufacturers to jointly improve all innovative
process leading to lower operation expenses, grater differentiations, higher quality and more value added. This will
better meet the current and future needs of consumers as well as help find out new alternatives to increase opportunity
for new markets, products and services. In addition, investing in related business to create business network to
sustainable growth, and enhancing co-innovation development through continually sharing knowledge and experiences

766
in managing advanced retail business with worldwide network, franchisees and interested executives for generating
new ideas of retailing management in conjunction with forming new business alliances.
3) Innovation in retailing human resources focusing on employee-centric management by motivating employees
through incentive projects and promoting higher education to learn and transfer knowledge, experience and best
practice systematically to the whole organization. This will improve the working process and innovation in the
company, find out the alternatives to better serve customers. Moreover, to encourage them to suggest new alternatives
of strengthening store performance and networking, and to enhance their competence in building retail innovative
process essential for superior value creation and sustainable long-run success.
Finally, conduct social satisfaction survey to help prioritize the required social activities, and develop worthwhile
projects with “dedicated employee volunteers” focusing on improving the community’s intellect and quality of life
through supporting education and training. In addition, more emphasis is placed on giving back to society by building
good new generation youth and capable people for Thai society through informal education, religion and culture. This
will create more intangible assets of sustainable last long advantages and success.
3) Sustainable outcomes
Successful implementation of holistic value-driven retailing strategy leads CP All to enable to maintain its leadership in
retailing trade industry in Thailand with a continued high growth rate of revenue and profit exhibiting in the Table 2.
The company’s average growth of sales (18.7%), net profit (32.2%) and ROE (38.5%) are above the industry average
exhibiting 16.2%, 17.5% and 30.7% respectively. Further, several well -known SET research analysts all agree CP All
will continue being the leader in the market with the expected highest ROE accounting for 42%-47% higher than the
average in 2013-2014. In addition, it has received many awards, such as Taxpayer Recognition Award, and has been
recognized as one of the 50 best biggest listed company in the Asia Pacific Region in 2011 due to pursue the effective
retail management focusing on satisfying customers’ needs and catering to corporate social responsibility. These
evidences support applying holistic orientation appropriately enables firm to create superior val ue to satisfy customers
and other relevant stakeholders which in turn lead to sustainable advantages and success.
Table 2: Financial performance of CP All and retail sector in Thailand
Financial CV ALLa Average Growth CP All Industry b
Performance 2009 2010 2011 2012F 2013F Performance 2010-2012F 2010-2012F
1. Sales (Bm) 112,377
134,954
155,360
187,874
215,432
1. Sales (%) 18.7 16.2
2. Gross profit (Bm)
28,247 30,079 34,032 43,365 49,447 2. Gross profit (%)
16.7 21.2
3. Net profit (Bm)
4,992 6,663 8,008 11,443 13,812 3. Net profit (%) 32.2 17.5
4. EPS (B) 1.11 1.48 1.78 1.27 1.54 4. EPS (%) 9.4 26.1
5. Gross margin
(%)
26.4 24.9 24.8 25.9 26.0 5. Gross margin
(%)
25.2 18.1
6. ROE (%) 26.4 37.1 36.9 41.6 42.9 6. ROE (%) 38.5 30.7
Source: a. Company and AIRA Estimates, February 13, 2013.
b. Research ASP (Asia Plus Securities), March 5, 2012.
5.2.2 Direct observation
To gain more insight of how CP All is successful in convenience store operation, direct observation was co nducted at
the 5 selected 7-Eleven stores scattered in different locations at Thammasat University during Dec. 2012-Mar. 2013 to
explore store merchandising, pricing, promotion and services followed by informal conversations with the store
managers, assistant store managers and several employees in terms of their work satisfaction, knowledge, and
responsiveness. These observation initiatives indicate three from five stores can manage store well while the other two
have some weaknesses in lower quality of customer services. However, they are able to solve the unpleasant problem
very fast within a few hour or one day. This initial results support CP All gains advantages and superior performance
because of its excellent transaction strategy and human competency.

767
5.2.3 Informal interviews
Two informal interviews served as a tool of data triangulation to initially explore validity and reliability of qualitative
findings (Bonoma 1985) were conducted during Feb. 2013. The first informal interviews with three retail managers
experiencing in retail businesses more than 10 years. They are Regional Manager of 7-Eleven, Retail Manager of retail
food shop, and Retail Manager of retail food operation. Informal interviews with them focusing on the key driv ers of
retailing success in general outlets and in 7-Eleven stores. The results indicate some common relevant factors driving
to retailing success: For instance, effective supply chain management, good customer service, offering unique products,
good human resource, building good customer relationship, developing relevant innovation, and managing business
with fairness, ethics and transparency.
The second informal interviews with ten actual shopping consumers at the 5 selected 7-Eleven stores in Thammasat
University. All respondents were undergrad students from different majors and gave the interviews while shopping at
the store. Two main questions were asked: what extra services did you need from the 7-Elven store? and what was the
major reason to go shopping at the other stores. The results reveal most respondents feel satisfied the operation of 7-
Eleven store because of its good retailing-mix strategy. But they go shopping at the other places in order to get
different or new experiences. For instance, finding out some cheaper or more healthy foods, or buying clothes at the
large department stores.
These two informal interviews support the key drivers needed for leadership or high successful retail performers no
matter what size of business is operated. The most crucial drivers are well supply chain management, distinctive
human resources, excellent services and good relationship management.
6. Conclusions and Recommendations
6.1 Holistic perspective and the 4-stage model of value-driven retailing strategy
This study is the first among the others to significantly shed insights how to apply holistic value creation process in
retailing strategy as a promising approach to sustained competitiveness and business success in the high dynamic
economy. Using multiple qualitative methods, the study provides greater contributions into three critical areas:
1) It broadens the three integrated management concepts essential for holistic value creation in the retail setting:
market orientation (consumer focus/centricity), strategic resource orientation (employee and supplier focus) and
ecological orientation (social focus).
2) It elaborates new approach of retailing strategy through the 4-stage model based on the value creation process
which is very fruitful to broaden the new wheel of retailing and its implications.
3) It illustrates detailed analysis how to apply holistic retailing strategy in practice. The findings suggest firms to
identify the key knowledge/capabilities essential for each value-driven component or strategy in order to prioritize and
suitably utilize each of the four retailing strategies to create superior value to better satisfy stakeholders in a timely
manner and finally leads to sustained superiority and sustainability.
6.2 Managerial implications and future research
Empirical findings indicate that holistic value creation is worth applying in retailing business but focusing on different
key drivers and stage of application. The major forces driving to its successful implementation do not depend on the
size or investment but on high commitment, efforts and coordination among stakeholders and alliances essential for
developing sound strategic capabilities in the business process. Such process i s critical to deliver superior value
continually to the customers consistent with their real needs and better than competitors.
Applying the four scenarios of value-driven retailing strategy successfully, firms need to pursue at least four strategic
capabilities to achieve superiority and sustainable success: 1) set-up clear vision and develop feasible marketing plan
with stakeholders using co-creation approach through close collaboration among them in order to get new ideas
continuously and avoid conflict of interests; 2) develop core competencies able to provide superior value creation hard
to be imitated for satisfying customers and other relevant stakeholders; 3) develop harmonized, learning and
innovative organization to ensure the continuity of advantages and superior outcomes; 4) develop crucial database

768
about market, resource, business operation and other key information from worldwide and best practice including
better quality controlling system able to make sound anticipation of market trends, develop effective business process
focusing on value creation and value capture, fast feedback and improvement as well as quick response to the
environmental changes; and 5) take advantages from customers and suppliers by using both demand and supply
management approach based on value creation process to effectively implement life cycle value creation and mental
model essential for practical sustainable development in future retailing success.
To increase more construct validity (Yin 2003), future research should extend the scope of this study to other four
aspects: 1) conduct more case studies to explore different focus on key drivers leading to sustainable advantages and
superior performance; 2) formulate a proper model of retailing strategy to test whi ch scenario creates superior
stakeholder value and has the most impact on sustained retail success; 3) illustrate more examples of retailing firms
successful in applying different strategies driving to sustainable success in the different situations; and 4) develop
sound theoretical foundation and measurement of holistic value creation to widen its applications and contributions.
References
Andersen, J. (2007). A Holistic Approach to Acquisition of Strategic Resources. Journal of European Industrial Training,
31 (8), 660-677.
Alam, I. (2002). An Exploratory Investigation of User Involvement in New Service Development. Journal of the Academy
of Marketing Science, 30, 250-261.
Akroush, M. N. (2012). An Empirical Model of Marketing Strategy and Shareholder Value: A Value-Based Marketing
Perspective. Competitiveness Review: An International Business Journal, 22 (1), 48-49.
Alexander, A. (2010). Past, Present and Future Directions in the Study of the History of Retailing. Journal of Historical
Research in Marketing, 2 (3), 356-362.
Barney, J.B. (1991). Firm Resources and Sustained Competitive Advantage. Journal of Management, 17, 99-120.
Barsky, N.P., Hussein, M.E. and Joblonsky, S.F. (1999). Shareholder and Stakeholder Value in Corporate Downsizing: The
Case of United Technologies Corporation. Accounting, Auditing & Accountability Journal, 12 (5), 583-604.
Berman, B. and Evans, J. R. (2013). Retail Management: A Strategic Approach (12th ed.). Canada: Prentice Hall.
Berry, L.L. (2000). Cultivating Service Brand Equity. Journal of the Academy of Marketing Science, 28 (1), 128-137.
Berthon, B. (2010). Responding to the Crisis: Redefining Corporate Value. Corporate Governance, 10 (4), 354-359.
Best, R. J. (2009). Market-Based Management: Strategies for Growing Customer Value and Profitability (5th ed.). Upper
Saddle River, New Jersey: Pearson Education Inc.
Bonoma, T.V. (1984). Making Your Marketing Strategy Work. Harvard Business Review, March/April, 68-76.
Bonoma, T.V. (1985). Case research in Marketing: Opportunities Problems, and a Process. Journal of Marketing
Research, 22 (2), 199-208.
Carbon, L.P. (2004). Clued In: How to Keep Customers Coming Back Again and Again. Upper Saddle River, NJ:
Prentice-Hall,
Carson, D., Gilmore, A., Perry, C. and Gronhaug, K. (2005). Qualitative Marketing Research. London: Sage Publications.
Carson, D. and Coviello, N. (1996). Qualitative Research Issues at the Marketing/Entrepreneurship Interface.
Marketing Intelligence & Planning, 14 (6), 51-58.
Chimhanzi, J. (2004). The Impact of Marketing – HR Interactions on Marketing Strategy Implementation. European
Journal of Marketing, 38 (1), 73-98.
Conant, j.S., Mokwa, M.P. and Varadarajan, P.R. (1990). Strategic Types, Distinctive Marketing Competencies and
Organizational Performance: A Multiple Measures-Based Study. Strategic Management Journal, 11 (5), 365-
383.

769
Codron, Jean-Marie, Grunert, K., Girud-Heraud, E. (2005). New Directions in Global Food Markets (AIB-974). chapter 3
Retail Sector Responses to Changing Consumer Preferences: The European Experience. United States:
Economic Research Service/USDA, Agriculture Information Bulletin No. 974, Department of Agriculture.
Available at: www.ers.USDA.gov. [Accessed 1 January 2013].
D’Andrea, G., Costa, L., Fernandes, F. and Fossen F. (2006). Successful Retail Innovation in Emerging Markets: Latin
American Companies Translate Smart Ideas into Profitable Businesses . Booz Allen Hmilton, Booz & Company.
Available at: www.booz.com [Accessed 1 January 2013].
Dhanraj, C. and Parkhe, A.(2006). Orchestrating Innovation Networks. Academy of Management Review, 31 (3), 659-669.
Durieu, X. (2003). How Europe’s Retail Sector Helps to Promote Sustainable Production . Industry and Environment, 26
(1), 7-9.
Edvardsson, B. and Tronvoll, B. (2013). A New Conceptualization of Service Innovation Grounded in S-D Logic and
Service Systems. International Journal of Quality and Service Sciences , 5 (1), 19-31.
El-Ansary, A. I. (2006). Marketing Strategy: Taxonomy and Frameworks. European Business Review, 18 (4), 256-293.
Eisenhardt, K. and Graebner, M. (2007). Theory Building from Cases: Opportunities and Challenges. Academy of
Management Journal, 50 (1), 25-32.
Fritz, W. (1996). Market Orientation and Corporate Access: Findings from Germany. European Journal of Marketing, 30
(8), 59-75.
Fonson, K.M.C. (1999). New Ways of Organizing the Realization of Customer Value–A New challenge for the Twenty–
First Century. The TQM Magazine, 11 (6), 445-449.
Grewal, D. Levy, M. and Kumar, V. (2009). Customer Experience Management in Retai ling: An Organizing Framework.
Journal of Retailing. 85 (1), 1-14.
Gronroos, C. (1994). From Marketing Mix to Relationship Marketing: Towards a Paradigm Shift in Marketing.
Management Decision, 32 (2), 4-20.
Guenzi, P., Johnson, M.D., and Castaldo, S. (2009). A Comprehensive Model of Customer Trust in Two Retail Stores.
Journal of Service Management, 20 (3), 290-316.
Heinonen, K., Strandvik, T. and Mickelsson, Karl-Jacob (2010). A Customer-Dominant Logic of Service. Journal of Service
Management, 21 (4), 531-548.
Homburg, C., Krohmer, H. and Workman, J.P. (2004). A Strategy Implementation Perspective of Market Orientation.
Journal of Business Research, 58 (1), 18-27.
Jackson, T. (2006). Readings in sustainable consumption. in Jackson, T. (Ed.), The Earthscan Reader in Sustainable
Consumptin, London: Earthscan.
Jones, P, Comfort, D. and Hiller, D. (2008). UK Retailing Through the Looking Glass. International Journal of Retail &
Distribution Management, 36 (7), 564-570.
Jones, P., Hillier, D. and Comfort, D. (2011). Shopping for Tomorrow: Promoting Sustainable Consumption within Food
Stores. British Food Journal, 113 (7), 935-948.
Kotler, P, N. Roberto and N. Lee (2002). Social Marketing: Improving the Quality of Life (2nd ed.). Thousand Oaks, CA:
Sage.
Levy, M. and Weitz, B. (2007). Retailing Managemen. New York: McGraw-Hill Education.
Lawson, R.H. (2005). Retail Operations Strategies: Empirical Evidence of Role, Competitive Contribution and Life Cycle.
International Journal of Operations & Production Management, 25 (7), 642-680.
Lee, Y., Park, K., Park, D., Lee, K. and Kwon, Y. (2005). The Relative Impact of Service Quality on Service Value,
Customer Satisfaction and Customer Loyalty in Korean Family Restaurant Context. International Journal of
Hospitality and Tourism Administration, 6, 27-50.

770
Mavondo, F.T., Chimmhanzi, J., and Stewart, J. (2005). Learning Orientation and Market Orientation: Relationshi p with
Innovation, Human Resource Practices and Performance. European Journal of Marketing, 39 (11/12), 1236-
1263.
Matzler, K., Bailom, F., Friedrich von den E. S. and Kohler, T. (2013). Business Model Innovation: Coffee Triumphs for
Nespresso. Journal of Business Strategy, 34 (2), 30-37.
Medina, C. and Rufin, R. (2009). The Mediating Effect of Innovation in the Relationship Between Retailers’ Strategic
Orientations and Performance. International Journal of Retail & Distribution Management, 37 (7), 629-655.
Mele, C., Spena, T.R., and Colurcio, M. (2010). Co-Creating Vale Innovation Through Resource Integration. International
Journal of Quality and Service Sciences, 2 (1), 60-78.
Mintel (2006). Clothing Retailing in Europe. London: Mintel.
Myers, H., Gore, J. and Liu, K. (2008). European Shopping Centre Developments: An Industry Perspective. Journal of
Place Management and Development, 1 (1), 109-114.
Ngo, L.V. and A. O’Cass (2010). Value Creation Architecture and Engineering: A Business Model Encompassing the Firm-
Customer Dyad. European Business Review, 22 (5), 496-514.
Nguyen, B. and Mutum, D.S. (2012). A Review of Customer Relationship Management: Successes, Advances, Pitfalls and
Futures. Business Process Management Journal, 18 (3), 400-419.
OECD (2010). Projecting GDP and Trends in the Global Middle Class . Organization for Economic Co-operation and
Development (OECD). Available at: www.oecd.org/dev/44457738.pdf [Accessed 5 January 2013].
O’Malley, L. and Patterson, M. (1998). Vanishing Point: The Mix Management Paradigm Reviewed. Journal of Marketing
Management, 42 (2), 292-312.
Othman, R. and Sheehan, N.T. (2011). Value Creation Logics and Resource Management: A Review. Journal of Strategy
and Management, 4 (1), 5-24.
Pehrsson, A. (2000). Strategy Competence: A Key Profitability Driver. Strategic Change, 9 (2), 89-102.
Peppers, P. and Rogers, M. (1995). A New Marketing Paradigm: Share of Customer, Not Marketing Share. Managing
Service Quality, 5 (3), 48-51.
Pfeffer, J. (1995). People, Capability and Competitive Success. Management Development Review, 8 (5), 6-11.
Piercy, N.F. (2009). Strategic Relationships Between Boundary-Spanning Functions: Aligning Customer Relationship
Management with Supplier Relationship Management. Industrial Marketing Management, 38 (8), 857-864.
Pike, W. and Melewar, T.C. (2006). The Demise of Independent Wine Production in France: A Marketing Challenge?,
International Journal of Wine Marketing , 18 (3), 183-203.
Porter, M.E. (1996). What is Strategy?. Harvard Business Review, November-December, 61-78.
Potocan, V. and Mulej, M. (2003). On Requisitely Holistic Understanding of Sustainable Development from Business
Viewpoints. Systemic Practice and Action Research, 16 (6), 421-436.
Prahalad, C.K. and Ramaswamy, V. (2004). Co-Creating Unique Value with Customer. Strategy & Leadership, (3), 4-9.
Reichheld, F.F. and Sasser, W. (1990). Zero Defections, Quality Comes to Services. Harvard Business Review, 68 (5), 105-
111.
Rintamaki, T., Kuusela, H., and Mitronen, L (2007). Identify Competitive Customer Value Proposition in Retailing.
Managing Service Quality, 17 (6), 621-634.
SET (2012). Asian Exchanges. Stock Exchange of Thailand (SET). Available at:
www.set.or.th/en/Asean__exchanges/asean_exchange.html [Accessed 5 January 2013].
Seufert, A., Krogh, G.V. and Bach, A. (1999). Towards Knowledge Networking. Journal of Knowledge Management, 3 (3),
180-190.

771
Seyfang, G. (2006). Ecological Citizenship and Sustainable Consumption: Examining Local Organic Networks. Rural
Studies, 22 (4), 383-95.
Sharkie, R. (2003). Knowledge Creation and its place in the Development of Sustainable Competitive Advantage. Journal
of Knowledge Management, 7 (1), 20-31.
Siggelkow, N. (2007). Persuasion with Case Studies. Academy of Management Journal, 50 (1), 20-4.
Sirmon, D.G., Gove, S. and Hitt, M.A. (2008). Resource Management in Dyadic Competitive Rivalry: The Effects of
Resource Bundling and Deployment. Academy of Management Journal, 51, 919-935.
Slater, S.F. and Narver, J.C. (1996). Competitive Strategy in the Market-Focused Business. Journal of Marketing Focused
Management, 1 (2), 159-174.
Smith, A.M. (2000). Using Consumer Benchmarking Criteria to Improve Service Sector Competitiveness. Benchmarking:
An International Journal, 7 (5), 373-388.
Smith, Peter A.C. and Sharicz, C. (2011). The Shift Needed for Sustainability. The Learning Organization, 18 (1), 73-86.
Sok, P. and O’Cass, A. (2011). Understanding Service Firms Brand Value Creation: A Multilevel Perspective Including the
Overarching Role of Service Brand Marketing Capability. Journal of Service Marketing, 25 (7), 528-539.
Sorescu, A., Ruud, T. Frambach, J. S., Arvind R. and Cheryl B. (2011). Innovations in Retail Business Models. Journal of
Retailing, 7, S3-S16.
Subramanian, R., Kumar, K. and Strandholm, K. (2009). The Role of Organizational Competencies in the Market-
Orientation-Performance Relationship: An Empirical Analysis. International Journal of Commerce and
Management, 19 (1), 7-26.
Tollin, K. and Jones, R. (2009). Marketing Logics for Competitive Advantage?. European Journal of Marketing, 43 (3/4),
523-550.
Tzokas, N. and Saren, M. (2004). Competitive Advantage, Knowledge and Relationship Marketing: Where, What and
How?. Journal of Business & Industrial Marketing , 19 (2), 124-135.
Vargo, S.L. and Lusch, R.F. (2004). Evolving to A New Dominant Logic for Marketing. Journal of Marketing, 68 (1), 1-17.
Voola, R. and O’Cass, R. (2010). Implementing Competitive Strategies: The Role of Responsive and Proactive Market
Orientations. European Journal of Marketing, 44 (1/2), 245-266.
Wilkinson, I. F. (2011). Tipping Point: the Teaching of the Wharton Marketing Theory Seminar 50 Years Ago. Journal of
Historical Research in Marketing, 3 (1), 29-32.
Win, Y. (2005). Marketing as An Engine of Business Growth: A Cross-Functional Perspective. Journal of Business
Research, 58, 863-873.
Woodruff, R.B. (1997). Customer Value: The Next Source for Competitive Advantage. Journal of the Academy Marketing
Science, 25 (2), 139-153.
Yin, R.K. (2003). Case Study Research: Design and Methods (3rd ed.). Thousand Oaks, CA: Sage Publications.
Yu, W. and Ramanathan, R. (2012). Managing Strategic Business Relationships in Retail Operations: Evidence from
China. Asia Pacific Journal of Marketing and Logistics , 24 (3), 372-393.
Zineldin, M. and Philipson, S. (2007). Kotler and Borden Are Not Dead: Myth of Relationship Marketing and Truth of the
4ps. Journal of Consumer Marketing, 24 (3), 2-22.

772
Session 20

773
Costumer’s views on food safety in food
services: a Brazilian study Food service, food safety, consumer behavior, qualitative research, collective subject’s discourse .
J.H. Behrens, Faculty of Food Engineering, University of Campinas, [email protected]
G.M.Vedovato, Institute of Health and Society, Federal University of Sao Paulo, [email protected]
D.H.M. Bastos, Faculty of Public Health, University of São Paulo, [email protected]
A.M. Cervato-Mancuso, Faculty of Public Health, University of São Paulo
Abstract
Costumer's attitudes to foodservices have been extensively studied using quantitative research frameworks. However,
qualitative studies can yield very useful information regarding consumer’s food choices. T his research aimed to evoke
and analyze the perceptions of “Safe Food” through the perspective of customers in two different food services settings
in São Paulo, Brazil: an institutional restaurant housed in a communications company and low-price restaurant
maintained by the government to serve meals for the lower income public Food Security policy. Interviews (N=66)
were conducted using a guide with open questions focused on the individual’s food safety views, knowledge of food-
borne diseases and self-involvement in the food safety chain. The Collective Subject’s Discourse (CSD) technique, based
on the theory of social representations, was used to analyze the content of the individual speeches and to build a
collective discourse representing the “voice of the consumer”. The CSD technique revealed similarities and differences
among the interviewees’ speeches reflecting different socio-economic backgrounds. In general the interviewees
showed concerns about hygiene and good practices and recognized some food hazards, especially those of chemical and
biological natures. On the other hand most people reported a passive role and seemed to transfer to the restaurant the
entire responsibility for the safety of the meals served therein. Interestingly, only the customers of the low-price
restaurant showed concern with the guarantee of access to a substantial and nutritious meal, even though they feel not
to have choice but to trust in the restaurant in face of the economic constraint.
1. Introduction
Consumers' attitude in food services has been extensively explored in the literature using different theoretical
frameworks, especially in the identification of food hygiene and handle practices among consumers (Brewer & Prestat,
2002). An understanding of consumers’ views toward the safety of foods and related issues is essential to developing
adequate and effective risk management and communication strategies regarding this topic both in the domestic scene
and in foodservice settings (Raspor & Jevsnik, 2008).
Experts in food hazards and the general public often differ in their perceptions of food-related health risks. While
experts judge food-related hazards on the basis of the scientific process of risk assessment (quantitative methods used
to identify the likelihood of a negative effect), lay people base their judgment on criteria that are influenced by factors
other than science, such as beliefs, culture, mass media communication, familiarity with the issue and personal
experiences (Brewer & Prestat, 2002; Hansen et al, 2003; Bruhn, 2005; Ellis & Tucker, 2009). In this sense, consumer
research is a need not only to produce knowledge about the complexity of people’s food choices, but also to design
effective risk management strategies. So, a way to understand how consumers behave and the underlying beliefs,
perceptions, needs, preferences and behaviors related to food choices is through qualitative research methods (Ellis &
Tucker, 2009; Lawless & Heymann, 2010).
Qualitative techniques are not aimed to substitute quantitative research such as surveys, but can complement
consumer studies both in the early phases – when the researcher is theorizing about a subject – as well as to check

774
findings of quantitative research (Lawless & Heymann, 2010). Fife-Schaw and Rowe (1996) developed an attitude scale
to assess perceptions of food-related hazards from the data of nine focus groups. Using an initial qualitative research
design, De Jonge et al. (2004) defined a framework to investigate important factors affecting the consumer confidence
in the safety of food and how it is built and sustained.
The increasing use of qualitative methods, namely focus groups and in-depth interviews, ensues the need for
theoretical frameworks to analyze the verbal content of the interviews. To identify consumers' views, Moscovici -‘s
social representations theory can be adopted as an interesting theoretical framework in social research (Moscovici,
2003). The social representations are “re-workings” of knowledge and information generated in various social spaces
where such knowledge is produced and disseminated by the media, internet, academy, diffusers cultural, religious
institutions, workplaces and primarily the nuclear family (Moscovici, 2003; Lefèvre & Lefèvre, 2012).
eenage pregnancy, medical services, self-medication, sport, drugs are examples of topics in social research conducted in
Brazil in the last years and that used techniques based on the theory of social representation to analyze the empirical
data (Lefèvre, 2006; Lefèvre & Lefèvre, 2012). Other topics including public perception of science and consumer
behavior are promising areas to the use qualitative techniques associated to the social representations framework.
In short, this study consisted in a qualitative research aiming at revealing the underlying food services customers’
opinions, beliefs, feelings and social representations regarding food safety, food-borne diseases and behaviors. Personal
interviews, a technique which allows for a more effective researcher-interviewee interaction and provides the
opportunity to explore in-depth themes not anticipated by the researcher, were conducted with 66 customers of two
food services in São Paulo, Brazil, the biggest city in the country, reflecting urban consumption patterns within Brazil.
2. Methodology
The market of food services is expressively growing in Brazil as a result of the economic improvements of the last years.
To date, Brazilians make about two out of the three main daily meals outside home, which represents an important –
and quick – change in the local food habits (Federação das Indústrias do Estado de São Paulo, 2010). Not only should
the food services be ready to attend the demand, but also the consumer food decisions and views on important issues
such as food safety must be fully understand in order to improve the services. The qualitative research approach is
suitable for this purpose because it allows the research to investigate consumer habits and attitudes and in relatively
open perspective before establishing hypothesis to be tested in quantitative studies (Lawless and Heymann, 2010).
This study used a qualitative approach to gain understanding on food service customers’ choices and views on food
safety issues. Afterwards, the technique named Collective Subject Discourse (CSD), based on the social representations
theory (Moscovici, 2003) and proposed by Lefèvre (2006) was used to to identify, organize and quantify the main ideas
embedded in the discourse of a social group, a way of giving voice to costumers.
CSD assumes that in any society the ideas, opinions, beliefs or social representations are shared by groups of
individuals, so that the individual discourses have similar content and meaning, i.e., that there is a collective discourse
on a topic. Such discourse is formulated from central ideas that act guiding social practices. So, when the central ideas
are identified, the collective discourse can be written (Lefèvre & Lefèvre, 2012).
2.1. Interviews
Costumers (N=66) of two different food services participated in the research. In R1, an institutional restaurant that
serves meals to the employees of a company in the communications sector, 30 costumers were interviewed, while in
R2, a popular restaurant directed to the low-income public supported by a government program on Food Security in
the State of Sao Paulo (São Paulo, 2012), 36 individuals participated in the study.
Respondents were randomly sampled according to a statistical sampling plan based on the size of the restaurant’s daily
public so that the samples could be representative of each settings.
Before starting answering the poll, they participants were encouraged to voice their opinions and thoughts freely. They
were also that told about the objectives of the research and that the interviews would be audio-taped. Afterward they
signed a term consenting with the use of the records. In Brazil, this procedure is compulsory in research involving
humans approved by a research ethics committee.

775
Interviews were conducted by the researcher Vedovato using a semi-structure questionnaire with three open questions
focused on food safety in food services. A guide with open questions was used to facilitate and foster broad
participation of the consumers. Three questions comprised the guide: 1) What does it mean safe food to you?; 2) What
do you know about food-borne diseases?; 3) Assuming all the concern over food quality and safety from field from
table, (i.e. primary production, processing, transport, storage, distribution, preparation for consumption), what is your
involvement in the food safety chain as a customer of the restaurant?
Questions 1) and 2) aimed at the cognitive dimension of food safety, while question 3) focused the behavioral
dimension about the topic.
2.2. Content Analysis
Content analysis was performed on the transcripts of each interview following the guidelines to the CSD technique
(Lefèvre & Lefèvre, 2012) which were:
1) Identification of the Key Expressions (KE): selection of excerpts from speeches that bracket the essence
thereof, i.e., a debugging all that is irrelevant, not essential and secondary information.
2) Identification of Central ideas (CI) or categories: name or linguistic expressions that briefly and accurately
describe the meaning of key expressions and that make up the individual’s discourse.
3) Identification of Anchors (A): manifestation of a linguistic theory, belief, value, feling, etc. It is a general
statement that qualifies a specific context, expressing a latent idea.
The KE were grouped according to the analytical similarity with a certain CI. The strongest CI was those most often
detected in the individual speeches. On the other hand, if a CI appeared in different groups, it demonstrated
breadth or the degree of diffusion in the researched field (Lefèvre & Lefèvre, 2012). Strength and breadth of a CI give a
quali-quantitative character to the CSD.
The CI were finally grouped to build a synthesized speech, the CSD itself, written in the first person singular to answer
each research questions, as if a customer were voicing a collective answer.
The Qualiquantisoft® software (IPDSC, 2013) helped in all stages of the analysis, from the selection of KE to the final
CSD (Instituto de Pesquisa do Discurso do Sujeito Coletivo, 2013).
3. Results
Most of the interviewees from R1 (the institutional restaurant), i.e. 73.3%, stated to have a college or university degree,
pertaining to the most affluent socioeconomic classes in Brazil (A and B1). On the other hand, only 14% of the
customers in R2 (the social restaurant) reported to have a higher educational degree and, indeed, most of them
pertained to the lower income classes (B2 to D), according to the Brazilian Socioeconomic classification criterion
(Associação Brasileira das Empresas de Pesquisa, 2013). The difference in socioeconomic background not only reflects
the nature of both services, but also helps understanding the views on food safety, perceptions of food risks and
reported behaviors. Table 1 summarizes the socioeconomic profile of the interviewees.

776
Table 1: Socioeconomic profile of the interviewees.
Food Service N Education* Socioeconomic class** (%)
Ground to high school (%) College or university (%)
R1 30 26.7 73.3 A:23.3 B:53.3 C:23.3
R2 36 86.1 13.9 B: 33.3 C: 52.8 D: 13.9
* Education backgrounds differ significantly (p<0.05) according to the chi-square test. ** Socioeconomic status differ significantly (p<0.05) according to the chi-square test.
Tables 2, 3 and 4 present the central ideas (CI), strength of each CI (relative frequency of occurrence in the
individual discourses) and summaries of the discourses related to each CI.
3.1. The consumers' concept of safe food
Regarding the question “what does it mean safe food to you? (Table 2), eleven CI were identified in the individual
discourses of both groups. Hygiene, food safety, biological hazards, freshness and control were the strongest, frequent,
ideas in the discourse of group R1, while risky foods, sensory quality and food security appeared to be stronger ideas
among customers in group R2. It is noteworthy that risky foods – especially meats – and food security, or the access to a
sufficient, safe and nutritious food that fulfils the individual’s dietary needs, were issues of concern only among the
customers of lower income, and this is certainly due to the sensation of social vulnerability that these people must
experience. Such rationale seems to be perfectly voiced in the following excerpt:
“It's the food we have every day as a meal. Here we can have a cheap meal, for just one real [about U$0.50]. That's all I can
afford. It’s bad to feel hungry”.
The category "Hygiene", with higher occurrence among customers of R1, emphasizes hygiene and sanitary parameters
assessed through aesthetic and sensory attributes, as Henson et al. (2006) and Worsfold (2006) had observed in other
consumer studies.
Again, the highest proportion of responses in the categories "Safety" and “Biological hazards” were found among
consumers with higher education and purchasing power (R1), which gave the idea that the absence of microorganisms
is an essential attribute of safe foods, at least for these individuals. On the other hand, customers in R2 (the low-price
restaurant) pointed out "Chemical Hazards" more frequently, showing particular concern with agricultural practices:
“Nowadays, 99% of food is produced with pesticides”
Greater concern about chemical and microbiological contaminants and their risk to health have been reported in
consumer research (Miles and Frewer, 2001; Prestat and Brewer, 2002; Behrens et al, 2010). This can be justified by
broad dissemination of outbreaks and food scandals in the media, with negative impact on consumer perception
(Morris, 1999; Prestat and Brewer, 2002; Bruhn, 2005).
In the category "Control”, R1 customers appeared to me more aware of quality standards and surveillance by food and
health authorities. The reasons for such awareness must be twofold: access to information on food science and
nutrition, and, secondly, the relevance of health issue to these customers since the importance of safety increases when
the food basic needs are fulfilled in more affluent consumers segments (Wilcock et al., 2004).


778
Table 2. Central ideas (IC), strength (relative frequency in the speeches) and collective discourse (CSD) regarding consumer’s perceptions of food safety in food services in the city
of Sao Paulo, Brazil.
Central Ideas
(IC)
Strength
(%) “What does it mean safe food to you?”
R1 R2
1. Hygiene 58 41 “It is a clean food, properly prepared to ensure safety and hygiene. To me, hygiene is a basic quality dimension to
consider food safe.[…] The restaurant itself should be a clean place, this is a priority”
2. Safety 59 40 “A safe food do not cause harm to people and do not offer any risk to health”
3. Biological hazards 66 35 “Free from bacteria”
4. Chemical hazards 42 58 “Free from pesticides. Nowadays, most foods, 99% of food is produced with pesticide”.
5. Freshness 62 48 “A food that is not expired”
6. Control 67 32
“The food must be within the quality standards established by of health surveillance and other relevant food
authorities. A food that arrives at our table, the consumer table, inspected, checked”. “This restaurant has a
nutricionist in charge”
7. Risky foods 0 100 “[Free from] genetically modified foods”.”There is a particular concern with meats”.
8. Healthiness 45 55 “Colorful foods; fruits, vegetables, legumes. Less fat and salt. Free from cholesterol that can be cause heart disease.
[Promotion of ] wellness.” Anchor: “Nothing better than a healthy and safe food”.
10. Sensory quality 61 98 “Tasty and appealing. I look to the food and see that it’s good for consumption. Sometimes the appearance is enough
to know if it is safe or not”.
11. Food Security 0 100 “It's the food we have every day as a meal. Here we can have a cheap meal, for just one real [Brazilian currency].
That's all I can afford”. Anchor: “It’s bad to feel hungry”

779
Table 3. Central ideas (IC), strength (relative frequency in the speeches) and collective discourse (CSD) regarding consumer’s perceptions of food-borne diseases in food services of
the city of Sao Paulo, Brazil.
Central Ideas
(IC)
Strength
(%)
R1 R2
“What do you know about food-borne diseases?”
1. Microbiological contaminants
53 53
“I know that you can get sick from contaminated foods . […] contagious diseases transmitted by microorganisms. Depending
on the food, it may contain fungus, bacteria, viruses, etc. But I don’t know specific names. I have basic knowledge about this
issue.”
2. Sources 58 40
“There's this typical issue of pork. I forgot the name of the disease, but I know that it can be transmitted by undercooked
meat. It's bad for head, brain”” There is a disease caused by milk. “Salmonella in eggs”. “I know that they exist [food-borne]
diseases, but don’t know their names”. “There is a disease of vegetables, pig disease, disease of milk, fish disease. That disease
of the egg, Salmonella”.” I heard a lot about botulism in palm heart”, “Hot dogs sold in that food carts”
3. Symptoms 22 78 “It can causes stomach pain, headache, stomachache, vomiting, diarrhea, dysentery. Infection that can come to death. I've met
people who almost died of something like that”
4. Control 41 55 “Beginning in the farm [raw] food must be conserved properly. That's why the employee has to wear cap, glove, mask”.
“Foods that are not well cooked can transmit diseases.”
5. Lack of personal experience
66 32 I’ve never had such experience [a food-borne illness].

780
Table 4. Central ideas (IC), strength (relative frequency in the speeches) and collective discourse (CSD) regarding consumer’s behaviors in food services of the city of Sao Paulo,
Brazil.
Central Ideas
(IC)
Strength
(%)
R1 R2
“What is your involvement in the food safety chain as a customer of the restaurant?”
1. Assertiveness 58 41 “As a consumer, my role is to pay attention to the food served [in the restaurant], if it looks healthy, and I must complain [if
something looks wrong]. Whenever I see something that is not right, I try to talk to the nutritionist in charge”.
2. Visit the kitchen 38 61 “It’s good idea to visit the kitchen and check out the cleanliness, how food is handled and prepared. I should check how food is
handled, if it is kept cooled and if the restaurant is neat and clean The kitchen must be open to visits”
3. Good practices 50 50 “You must wash your hands, sanitize them, so that you do not contaminate the food. I should not get too close to the garbage
cans. I avoid to touch plates and silverware [...]and try to keep the place clean. [ I prevent] hair to fall in the food”
4. Not involved at all 57 43 “I do not have any involvement with safety. I come [here] and make my meal and that’s all. I'm just a customer”
5. Waste 67 34 “I think that [food safety] has to do with waste as well. People should be aware to serve themselves that amount [of food] they
really want, avoiding leftovers”

781
Moreover, the social representations in the cognitive domain of safe food incorporated other attributes that do not fit the
technical-scientific definition, i.e., subjective attributes related to the sensory perception such as "Freshness" and “Sensory
quality”. For R1 customers freshness was related to the expiration date (“A food that is not expired”), while customers in R2
secure seem to rely on sensory characteristics, especially appearance and flavor: (“Tasty and appealing. I look to the food
and see that it’s good for consumption. Sometimes the appearance is enough to know if it is safe or not”). Consumers with
lower educational levels seem act more empirically, while consumers with more formal education justify their behaviors
with cognitive arguments (Behrens et al, 2009; Behrens et al., 2010).
Healthiness" was considered inherent in the scope of safe food for both groups, especially with respect to “colorful” fruits
and vegetables. On the other hand, foods rich in fat, salt and cholesterol are considered unhealthy. Some foods, especially
categories such as meats and fatty foods, are directly related to health risks and are seen as major problems in both in
individual and social levels (Miles and Frewer,2001).
3.2. The consumers’ knowledge about food-borne diseases
The question “what do you know about food-borne diseases?” (Table 3) revealed five CI. About "Sources", customers in R1
pointed out risky foods more frequently than those in R2. Pork, eggs, fish, vegetables and milk were the main cited sources
in association with microorganisms (particularly bacteria). Even though the interviewees demonstrated concern relative
to chemical hazards, when they were asked about food safety, they did not mention them as food risks. Perhaps, as a result
of the larger media coverage of food poisoning by microorganisms (e.g., BSE, aftosa fever, salmonellosis, botulism, etc.),
food-borne diseases are socially represented by the association of certain foods with biological contamination.
Street foods were also related to higher levels of perceived risk. Such concern was reposted by Rheinlander et al. (2008)
previously. In spite of being an important economic activity in the urban centers all around the world, street food seems to
produce ambivalent feelings and, therefore, seen in low regard. The following excerpt ill ustrates it:
“I stay all day without eating, but I won’t have a snack. Do you ever heard about "mata -boy" [literally, ‘kill the boy’]? "Mata-
boy" is hot dog. The vendors have a bucket with water [to boil the sausages] and they use it all the day long. And you come and
eat that stuff…”
The category "Symptoms" was considerably more representative for consumers of popular restaurant (R2), and associated
with gastrointestinal outcomes of food poisoning such as ache (stomach, head, belly, etc), vomiting, diarrhea, and
dysentery. Some authors had already reported higher levels of perceived risk and worry among consumers with lower
educational level (Nayga, 1996; Knightet al., 2005).
Past experience with food-borne diseases results in higher levels of concern and risk perception (Hansen et al., 2003; De
Jonge et al, 2004). In the category "Lack of Experience," a higher frequency of occurrence was observed among individuals
in R2. Interviewees in R1 were more emphatic in stating that they had never fallen ill due to food poisoning. According to
Miles and Scaife (2003), due to the optimistic bias people, comparing their personal status with the status of stigmatized
social groups, tend to underestimate their likelihood of experiencing a negative event. The optimistic bias is a personal
psychological defense against the anxiety caused by the risk to health and physical integrity, a way to protect the ego with
false certainties about their safety. This can be exemplified in the excerpt:
“That’s that: Don’t eat crap! Would you eat a Greek barbecue in downtown Sao Paulo?
Greek barbecue (or giro) is a popular and cheap snack found in bars and food carts in downtown São Paulo, where
cleanliness, as for the hot dog carts, is doubtful. Thus, such food services tend to be stigmatized and considered risky at the
public viewpoint. “Control” emerged as a way to prevent food poisoning, especially among customers of R2. In this sense,
cooking and proper storage are means to ensure the safety of foods.
3.3. The consumers' involvement in food safety

782
Table 4 presents the CIs identified in the discourses to ““what is your involvement in the food safety chain as a customer of
the restaurant?”.
“Assertiveness”, a strong idea among customers of R1, emerged as a behavior towards the obs ervation that something
about the service goes wrong. In this sense, the customer communicates the fact to a manager or whoever is in charge, and
expects him to solve the problem.
“Visiting the kitchen” emerged as behavior especially reported by the interv iewees of R2. This must be due to the presence
of a board saying “Visit our kitchen”, common in some restaurants and a right warranted by law in Brazil.
“Good Practices” in food services such as washing hands, taking care with plates and silverware, keepi ng away from
garbage cans, preventing hair to fall in the food, etc., were voiced by consumers of both restaurants and they clearly relate
to personal care much more than an active role in food safety assurance.
Raspor & Jevsnik (2008) argue that consumers conceive the food chain for them, not considering themselves as part of it.
So, in this sense, the category “not involved at all” is well illustrated by the excerpts:
“I do not have any involvement with safety. I come [here] and make my meal and that’s all. I'm just a customer”
As a matter of fact, if the restaurant is viewed as a commercial activity where costumers pay for a service, the
establishment itself is responsible for quality and safety of the foods prepared and served there. The role of the customers
in the food chain is to judge – through the available resources they have and this includes their senses – the quality of the
service. Indeed, this is especially true when the individual is aware of their rights as a consumer and, besides, has the
power of choice. On the other hand, for customers of R2, due to their economic constraint a social vulnerability context,
choices are much more limited and food security is more of an issue:
“It's the food we have every day as a meal. Here we can have a cheap meal, for just one real [Brazilian currency]. That's all I
can afford”. “It’s bad to feel hungry”.
Although not directly related to food safety, “waste” emerged in the speeches, especially in the R1 group. When they say
“People should be aware to serve themselves that amount [of food] they really want, avoiding leftovers”, it seems to be due to
communication campaigns addressed to reduce leftovers and their impact in the production costs. Such campaigns usually
appeal to a rational consumption, which has much more to do with food security instead of safety.
Conclusions
In this research it was possible to identify ideas that support the views of restaurant customers about food safety, food-
borne and personal behaviors in foodservice. In general, customers were able to recognize risks associated with the
consumption of poisoned foods, such as biological or chemical contaminants, as well as the importance of good practices in
production of meals in restaurants. However, customers do not feel part of the food chain, transferring the responsibility
for ensuring the whole responsibility for safety to producers and retailers. Moreover, the more affluent and educated the
individuals, the less aware they seemed to be of the risk of becoming ill due to food poisoning and, on the other hand, for
the costumers in a context of social vulnerability, ensuring a meal that meets their nutritional needs seemed to be more of
an issue.
Thus, CSD can be recommended for consumer research in order to identify factors involved in food habits, attitudes to
non-conventional technologies, decision-making processes, and other related food choice issues. Finally, CSD analysis
allowed the elaboration of a collective discourse representing the voice of the consumer about the research topics.
783
Safe food:
“Safe foods are cooked properly and with hygiene. You need to know not only the origin of the product, but the way it is stor ed,
transported, prepared. Food should be thoroughly washed to be free of bacteria, well-cut, cooked, packed, stored, refrigerated.
Must be within the quality standards established by the government, the health surveillance and the food authorities. A safe
food is not expired; it is fresh and tasty too. A look at the product can show its quality and if it is goo d for consumption. For me
[safe foods] are healthy, colorful and nutritious as fruits and vegetables. I also include in this list foods that are not ve ry high
in fat; less fried food, with less salt, and cholesterol that can be harmful to heart."
Food-borne diseases:
"I know that you can get various diseases caused by fungi, bacteria, viruses, worms in foods. You can get ill eating vegetabl es -
if they have much pesticides. Pork, fish and eggs can cause diseases as well."Salmonella" and botulism from palm hearts. Food
can be also contaminated by insects, by animal carp, particularly the issue of rat urine, leptospirosis.
That story of the milk contaminated with caustic soda, when people got sick. I never had any [food-borne] disease. I always eat
out and nothing happened to me. Thank God, I never had anything!
That’s that! Don’t eat crap! Would you eat a Greek barbecue in downtown Sao Paulo? Have you ever heard about the “mata -
boy”, hot dog? The vendors have a bucket and they use the same water [to boil the sausages] all day long. And so you come and
eat the stuff, not noticing the crap!"
Behaviors related to safety in food services:
"We have the role of checking if the place is ok As a consumer, my role is to pay attention to the foods served here, if they look
healthy, if they are damaged or not, and if I see something wrong, I complain about it. I have to check how the food is
prepared, maintained, etc. Whenever I see something that is not right, I try to talk to the nutritionist responsible for the
restaurant. I eat here because I know they have a nutritionist and this ensures quality. It's confidence. Simply look and feel the
environment, everything is perfect and trust people who are cooking. "
Complementing the CSD above, the central ideas found in the speeches of R2 costumers, the restaurant directed at low-
income public:
"It’s good idea to visit the kitchen, checking the cleanliness, the handling, and how foods are prepared. The kitchen should be
open to us, because our health is at stake. So, people [handlers] would be more careful. It's the food we have every day as a
meal. Here we can have a cheap meal, for just one real . That's all I can afford. It’s bad to feel hungry!”
Acknowledgments
To Aline Nascimento Sardinha, for assistance during the interviews in the restaurants, and to the Instituto Assistencial
Ajinomoto, for awarding of a scholarship for collaboration in this work.
References
ABEP – Associação Brasileira de Empresas de Pesquisa. Critério de Classificação Econômica Brasil (2013). Criteério de
Classificação Econômica Brasil. Available at:
http://www.abep.org/default.aspx?usaritem=arquivos&iditem=23.[February,25th,2013].
Behrens, J.H.; Barcellos, M.N., Frewer, L.J.; Nunes T.P.; Landgraf M. (2009) Brazilian consumer views on food irradiation.
Innovative Food Science and Emerging Technologies, 10, 383-389.
Behrens, J.H.; Barcellos, M.N., Frewer, L.J.; Nunes T.P.; Franco B.D.G.M.; Destro, M.T.; Landgraf M. (2010) Consumer
purchase habits and views on food safety: a Brazilian study. Food Control, 21(7),963-69.
Brewer M.S.; Prestat, C.J. (2002) Consumer attitudes toward food safety issues. Journal of Food Safety, 22, 67-83.

784
Bruhn C.M. Explaining the concept of health risk versus hazards to consumers. Food Control, 16, 487-90.
De Jonge, J.; Frewer, L.; Van Trijp, H. 2004. Monitoring consumer confidence in food safety: an exploratory study. British
Food Journal. 106(10/11), 837-49.
Ellis, J.D.; Tucker M. (2009) Factors influencing consumer perception of food hazards. CAB Reviews. 4(6),1-8.
Federação das Indústrias do Estado de São Paulo (2010). Brasil Food Trends 2020. Available at:
www.brasilfoodtrends2020.com.br. [April 15th 203].
Fife-Schaw, C., & Rowe, G. (1996). Public perceptions of everyday food hazards: A psychometric study. Risk Analysis, 16(4),
487–500.
Flick, U. (2004). Uma introdução à pesquisa qualitativa . (2nd ed.). Porto Alegre: Bookman, 312p.
Fonseca M.C.P.; Salay,E. (2007). Beef, chicken and pork consumption and consumer safety and nutritional concerns in the
city of Campinas, Brazil. Food Control,19(11),1051-58.
Hansen, J,; Holm, L.; Frewer, L.; Robinson, P.; Sandoe, P. (2003) Beyond the knowledge deficit: recent research into lay and
expert attitudes to food risks. Appettite. 41(11), 111-21.
Henson, S.; Majowicz, S.; Masakure, O.; Sockett, P.; Jones, A.; Hart, R. (2006). Consumer assessment of the safety of
restaurants: the role of inspection notices and other information cues . Journal of Food Safety. 26, 275-301.
Instituto de Pesquisas do Discurso do Sujeito Coletivo. (2013). QualiQuantiSoft. Available at:
http://www.ipdsc.com.br/scp/qualiquantisoft.php [14th January 2013].
Knight, A.; Warland, R. (2005) Determinants of food safety risks: a multi-disciplinary approach. Rural Sociology, 70, 253–
75.
Lawless, H.T.; Heymann, H. (2010) Sensory Evaluation of Food – Principals and Practices. Gaithersburg: Aspen Publishers.
848p.
Lefèvre, F. (2006). O Discurso do Sujeito Coletivo: Um novo enfoque em pesquisa qualitativa . Rio de Janeiro: EDUCS, 256p.
Lefèvre, F.; Lefèvre, A.M.C. (2012). Depoimentos e Discursos – uma proposta de análise em pesquisa social. Brasília: Liber
Livro. 96p.
Miles, S.; Frewer, L.J. (2001). Investigating specific concerns about different food hazards. Food Quality and Preference,12,
47–61.
Miles, S.; Scaife V. (2003) Optimistic bias. Nutrition Research Reviews, 16,13-19.
Morris, K. (1999). A danger at my table? The Lancet. 354(30), 1565.
Moscovici, S. (2003). Representações Sociais – investigações em psicologia social. Petrópolis- RJ: Vozes. 404p.
Nayga, R.M. (1996) Sociodemographic influences in consumer concern for food safety: the case of irradiation, antibiotics,
hormones, and pesticides. Review of Agricultural Economics, 18, 467–75.
Raspor, P.; Jevsnik, M. (2008) Good nutritional practice: from producer to consumer. Critical Reviews in Food Science and
Nutrition, 48, 276–292.
Rheinländer, T., Olsen, M.; Bakang, J.A.; Takyi, H.; Konradsen, F.; Samuelsen, H. (2008). Keeping Up Appearances:
Perceptions of Street Food Safety in Urban Kumasi, Ghana. Journal of Urban Health: Bulletin of the New York
Academy of Medicine, 85(6), 952-64.
Wilcock, A.; Pun, M.; Khanona, J.; Aung, M. (2004). Consumer attitudes, knowledge and behaviour: A review of food safety
issues. Trends in Food Science and Technology, 15, 56–66.
Worsfold, D. (2006) Eating out: consumer perceptions of food safety. International Journal of Environmental Health
Research, 16, 219–29.
785
The Effect of Service Context in Consumer
Relationship Proneness and Behavior Relationship Marketing, Service, Context, Consumer Behavior, Consumer Relationship Proneness
Fábia Esteves, Faculty of Economics - University of Porto, [email protected]
Teresa Fernandes, Faculty of Economics - University of Porto, [email protected]
Abstract
Objective: The paper discusses the effect of context on service relationships. Considering the customers’ point of view, we
argue that customers may hold different proneness to establish a relationship with the provider depending on the specific
service context. Different relationship proneness will, in turn, influence the more or less favorable behavior of the
consumer in the relationship. As such, this paper aims to increase understanding of consumer relationship proneness and
its role in different service settings.
Methodology: Data were collected in two contexts, high and low contact services (health services and wholesales,
respectively). Through a convenience sample of 516 consumers, we conducted a survey to examine differences in
consumer proneness and behaviors in both contexts.
Conclusion: Results revealed that consumer relationship proneness and behaviors vary significantly among the contexts
studied. In the high contact service (healthcare services), customers exhibit higher relationship proneness and show more
favorable behaviors towards the relationship, when compared with the low contact service (wholesales). It was also found
that the majority of consumer behaviors are, in both contexts, correlated with relationship proneness.
Implications: This research aims to fill an existing gap in the RM literature by taking consumer relationship proneness
into consideration. Additionally, the effect of service types has not yet been fully explored, particularly in the customer
relationship field. In managerial terms, the results of this study provide guidance to managers to differentiate customer
relationship strategies according to the specific service context that they operate in.
1. Introduction
During the 1980s, relationships became one of the main issues in marketing, with several authors emphasizing the
importance of relationships in business. A new term, “Relationship Marketing” (RM), has entered the marketing literature.
Berry (1983) first introduced the term relationship marketing, defining it as attracting, maintaining, and enhancing
customer relationships.
Today, RM is embraced by both practitioners and academics in a wide range of markets and contexts (O’Malley and Tynan
2000). But RM practices may not be effective in every situation (Pressey and Mathews, 2000; Hennig-Thurau et al., 2009)
since differences between contexts may affect the existing buyer-seller relationships patterns and relationship proneness.
Grönroos (1995) stated that the marketing strategies available may be seen as a continuum between a relationship-
oriented strategy and a transaction-oriented strategy, and that one orientation makes more sense than another depending
on the situation. However, the role of context in relationships has not yet been fully explored, particularly in the customer
relationship field.
We thus offer a new direction by investigating differences in customer relationships based on different contexts. Namely,
the empirical research was conducted in service contexts given its inherently relational nature (Grönroos, 2000) and since
much of the current understanding of RM is due to advances in these settings (Lindgreen and Pels, 2002). Additionally,
though it has been recognized that the nature of customer relationships is influenced by the nature of services, very little

786
empirical research exists that takes into account the effect of service contexts on customer relationships (Galetza et al,
2006; Veloutsou et al, 2002; Paolo and Laurent, 2010).
Considering the customers’ point of view, we argue that customers may hold different proneness to establish a
relationship with the provider depending on the specific service context. With low contact, reduced and commoditized
services, consumers may not attach much value to relationships. Conversely, in contexts characterized by high contact and
service components and customization, customers may be more relationship prone. Different relationship proneness will,
in turn, influence the more or less favorable behavior of the consumer in the relationship. As such, this paper aims to
increase understanding of consumer relationship proneness and its role in different service settings.
The paper begins with a brief literature review. We then test our hypothesis through data collected in two contexts, high
and low contact services. A self-administered, cross-sectional survey was conducted to examine differences in consumer
relationship proneness and behaviors (e.g. word-of-mouth and repurchase intention) in both contexts. A convenience
sample of 516 consumers was used to perform significance and correlation tests. We end up concluding that consumer
relationship proneness and behaviors vary significantly among the contexts studied and that the majority of consumer
behaviors are, in both contexts, correlated with relationship proneness.
2. Relationship Marketing and Consumer Relationship Proneness
Since the early 1980s, a new phrase has entered the marketing literature: “Relationship Marketing” (RM). This philosophy
is said to have replaced the old short term marketing practices, defined as stressing sales and promotions instead of
relationship enhancement, and conveniently labeled “transactional marketing” by RM proponents (Fernandes and
Proença, 2008). According to Sheth and Parvatiyar (1995), marketers started realizing the limitations of their transaction-
oriented strategies under pressure of eroding repeat purchases and intensified competitive pressures in increasingly
saturated markets.
Though in marketing there is a long lasting tradition that has always valorized relationships - Grönroos (2004) states the
phenomenon itself is as old as the history of trade and commerce - the roots of RM can be found over three decades ago
(Möller and Halinen 2000). In a conference paper on service marketing, Berry (1983) first introduced the term
relationship marketing, defining it as attracting, maintaining, and enhancing customer relationships. Two years after,
Jackson (1985) used it in a business-to-business context. During the 70s, the channels literature introduces the discussion
about efficient channel relationships (Dwyer, Schurr and Oh 1987). Later, Morgan and Hunt (1994) suggested that
relationship marketing refers to all marketing activities directed towards establishing, developi ng and maintaining
successful relational exchanges and Gummesson (2002) described relationship marketing as marketing based on
interaction within networks of relationships.
Today, RM is embraced by both practitioners and academics in a wide range of markets and contexts (O’Malley and Tynan
2000). But is the concept of RM ubiquitous and can it be applied to any context? (Zolkiewski, 2004) Some scholars argue
that RM is context-specific (Egan, 2003). In this discussion, it is important to underline that relationships both drive and
are driven by the context where they take place (Fournier, Dobscha and Mick 1998), that marketing is context driven
(Egan, 2003) and that it is important to recognize the context in which exchanges take place (Möller and Halinen 2000).
Thus, RM practices may not be effective in every situation (O’Malley and Tynan 2000; Thompson et al 2000; Zolkiewski,
2004; Egan and Harker, 2006; Fernandes and Proença, 2008, Grayson and Ambler, 1999; Pressey and Mathews, 2000;
Shrivastava and Kale 2003; Hennig-Thurau et al., 2009) since differences between contexts may affect the existing buyer-
seller relationships patterns. Each product-market may exhibit different levels of relationship-friendliness or proneness
(Bahia et al., 2005), since enhancing relationships is generally easier in high involvement contexts as opposed to low
involvement ones (deWulf et al., 2001; Pressey and Mathews, 2000). Also product categories characterized by high service
components and customization (Gronroos, 2000) may help the formation of relationships. The context may not only alter
the status quo, but also the actor’s disposition and behavior (Pels, 1999).
From the seller’s perspective, relational benefits are widely discussed in the literature. By adopting relational marketing
strategies, the company gets benefits such as increased customer retention and duration of the relationship, increasing
profitability and therefore greater stability and security (Gummesson, 1997). Moreover, customer loyalty also becomes
profitable because retaining customers is less expensive than to conquer new ones (Berry, 1995). The literature often

787
discusses activities the firm should engage in to develop relationships with customers (e.g., CRM strategies, loyalty
programs), following the assumption that a relationship can be formed with any customer, in any situation (Blois, 1997).
However, firms are often surrounded by incorrect beliefs about what matters to customers and their reaction to relational
strategies. Not all customers wish to engage in close relationships, nor are they willing participants in RM strategies or
equally receptive (Bendapudi and Berry, 1997). Customers can be transactional in some situations and relational in others
(Benamour and Prim, 2000; Pels, 1999; Bloemer et al., 2003; Grönroos, 2004). Customers may perceive some advantages
in maintaining a relationship, such as confidence (reduced anxiety and comfort), social (personal recognition and
familiarity) and special treatment (customization) benefits (Gwinner et al., 1998; Hennig-Thurau et al., 2002). But when
the drawbacks of engaging in a relationship (e.g. loss of privacy and freedom of choice, upkeep, commitment) are
perceived as too high by the consumer, relationship formation might be avoided (Noble and Philips, 2004). For instance,
deWulf et al. (2001) claim that while in high-involvement situations, customers desire more personal treatment, in low-
involvement situations the treatment of customers as individuals would not probably pay off (Han et al, 2008) and,
however well-intentioned, could even be regarded by the customer as undesirable (Christy et al, 1996). Also situations
when consumers play a passive role and interactive communication is lacking do not facilitate a relational environment
(Pressey and Mathews, 2000). The clients’ receptivity to engage in relationships is believed to affect the success o f
relational strategies (Sheth and Parvatiyar, 1995; Bahia et al., 2005). When the RM concept is applied too broadly or where
it is misapplied, valuable company resources may be wasted (Barnes, 2003). Yet, little work has been done to explore why
consumers may be interested in, or more prone to, form a relationship with their company (Noble and Philips, 2004).
3. Consumer Relationship Proneness and Behavioral Intentions
Some customers are more likely to create and commit to relationships with a company, in a long-term basis. These
consumers exhibit high consumer relationship proneness (Bendapudi and Berry, 1997; Parish and Holloway, 2010;
Bouguerra and Mzougha, 2011).
In this study, we define consumer relationship proneness as a consumer's tendency to engage in relationships with
providers of a particular product category. According to Barnes (1997), in some situations a relationship can’t be formed
because customers do not want one or because the circumstances surrounding the firm’s interaction with its customers
are not conductive. Consumer relationship proneness can vary according to a variety of factors . Besides consumer
individual treats (e.g. personal characteristics, individual preferences, demographic variables, consumer lifestyle), the
literature mainly discusses the importance of contextual factors.
Customers with higher relationship proneness tend to exhibit behaviors more favorable to the development of the
relationship (Odekerken-Schröder, deWulf and Schumacher, 2001). Repeat purchasing is more likely in relationship prone
customers (Zeithaml, Berry and Parasuraman, 1996). These customers also tend to recommend more and to generate
positive word of mouth (Zeithaml, Berry and Parasuraman, 1996). In terms of price sensitivity, relationship prone
customers tend to be less sensitive to the price, since the connection that the company establishes with its clients turns
them less sensitive to price changes in the company or in the competition (Grönroos, 1994). Regarding complaints,
relationship prone customers tend to express their complaints to the provider instead of third parties (Berry and
Parasuraman, 1991). The important role played by customers in the production of services, and the importance of keeping
customers loyal makes the handling of complaints a critical moment in the development and maintenance of relationships
(Berry and Parasuraman, 1991).
4. Problem definition and research methodology
Research problem
According to our literature review, the aim of this study is to investigate differences in customer relationships based on
contextual factors. We argue that customers may hold different proneness to establish a relationship given the context
considered and that these differences, in turn, affect the more or less favorable behavior of the consumer in the
relationship.
The empirical research was conducted in service contexts given its inherently relational nature (Grönroos, 2000) and since
much of the current understanding of RM is due to advances in these settings (Lindgreen and Pels, 2002). Two distinct

788
service contexts were considered, defined according to the level of customer contact with the service provider (Lovelock
and Wright, 2004). The first is the healthcare context, where the consumer has a high degree of contact with the service
provider, the service is personalized and is centered on people. The second context is retailing/wholesales, where the
degree of contact with the customer is lower (Lovelock and Wright, 2004). Since this is a mass service, the main emphasis
is the standardization of processes (Silpakit and Fisk, 1985). The degree of contact affects several aspects of service
operations. When a service has a lower degree of contact with the client, the use of physical resources tends to be a
priority, thus encouraging the standardization of processes. On the other hand, services with a high degree of contact with
the customer tend to minimize the importance of highly structured actions to stimulate new business and are based
mostly on the personal relations between the client and the provider (Lovelock and Wright, 2004).
Taking into account the contexts chosen, it becomes relevant to try to understand how consumer behavioral intentions
and their relationship proneness differ according to the context analyzed. It is thus significant (i) firstly, to assess the
differences in consumers relationship proneness between the contexts presented in order to understand if this proneness
changes from context to context; and (ii) secondly, to make the same analysis for consumer behavioral intentions.
The second part of the study analyzes the correlation, in both contexts, between consumer relationship proneness and the
different dimensions of behavioral intentions previously mentioned (namely repeat purchase, word of mouth, price
sensitivity and complaints) in order to verify whether this correlation is statistically significant.
Research hypotheses
As discussed in the literature review, contextual factors can affect the nature of relationships and the behavior of the
parties involved. From the point of view of the consumer, with reduced services, commoditized products, increased
availability and reduced switching costs, consumers may not attach much value to relationships (Pressey and Mathews,
2000). Conversely, highly complex and salient purchases may be situations for which customers may desire to be
relational due to complexity and perceived costs associated with incorrect decision making (Burnham et al., 2003; Venetis
and Ghauri, 2004). Also, highly emotional and personalized purchases may also be an indicator of the willingness to be
involved in relationships (Sheaves and Barnes, 1996; Yu and Dean, 2001; Coulter and Ligas, 2004).
Several studies have analyzed the behavior of consumers and relational orientation from context to context, in services as
diverse as hairdressing, health, retail or banking (Han et al, 2008; Bloemer and Odekerken-Schrӧder (2007); Bloemer et al.
(2003); Odekerken-Schrӧder et al. (2001); Pressey and Mathews, 2000; Gwinner et. al, 1998; Grönroos, 1995). However,
to date the majority of these studies are based on one service industry and cross-validation across different service
industries is lacking (Paolo and Laurent, 2010). In this study, the first hypotheses are based on the comparison between
consumer behavioral intentions in the healthcare context (high-touch and high involvement service) and in the
retailing/wholesales context (low contact and involvement service), as well as the distinction of consumer relationship
proneness between both contexts:
H1: There are significant differences between behavioral intentions in the healthcare context when compared
with the retailing/wholesales context
H2: There are significant differences between consumer relationship proneness in the healthcare context when
compared with the retailing/wholesales context
The existence of a correlation between consumers’ relational orientation and their future behavioral intentions was
explored by Bloemer et al. (2003) in a context of high contact services, and Odekerken-Schrӧder et al. (2001) in an
industrial context. While Odekerken-Schrӧder et al. (2001) introduced the relational propensity of the consumer as a
variable capable of influencing behavioral intentions of consumers, Bloemer et al. (2003) proved the existence o f a
relationship between relational propensity of consumers and their behavioral intentions, albeit limited. Based on
literature review, our third hypothesis intends to verify the existence of a correlation between consumer behavioral
intentions and their relationship proneness in both contexts:
H3: Consumer relationship proneness is correlated with behavioral intentions in both contexts

789
Data Collection and Analysis
Data was collected through a self-administered, on-line, cross-sectional survey. A convenience sample of 516 consumers
was used to perform significance and correlation tests. The questionnaire was divided into three parts: the first part aims
to characterize the sample; the second part evaluates consumer relationship proneness and behaviors in the healthcare
service; and finally the third part evaluates consumer relationship proneness and behaviors in the retailing/wholesales
context. All constructs were measured based on multi-item scales established in previous research (Zeithaml et al., 1996;
Bloeme et al., 2003; Odekerken-Schrӧder et al., 2003) and assessed in a 7-point Likert scale.
Data analysis begins with the characterization of the sample, followed by a comparative analysis of relationship proneness
(H1) and behavioral intentions (H2) in both contexts. Later, an exploratory factor and a correlation analysis are performed
in order to determine if behavioral intentions and consumer relationship proneness are related in both contexts (H3).
5. Research findings
Descriptive analysis
The majority (59.3 percent) of them were female. Regarding the age of the respondents, 30.8 percent were aged between
18 and 24 years, 49.2 percent were aged between 25 to 34, 13 percent between 35 and 44, between 5 percent 45 and 54
and 1.9 per center between 55 and 64 years age. In terms of education, 3.7 percent of respondents had a PhD, 36.8 percent
had a master's degree, 40.9 percent had a bachelor degree or, 18.4 percent had secondary education and 0,2 percent had
primary education.
In terms of income, 19.2 percent of respondents had an annual income of less than € 6,790, 63.2 percent had an annual
income between € 6,791 and € 35,000, and 6 percent had an annual income of more than 35,001 €.
Hypothesis testing
To verify H1 and H2, respectively, we have performed the t-Student independence test in order to analyze differences
between behavioral intentions (Table 1) and consumer relationship proneness (Table 2) in both contexts, item by item.
For all items and dimensions, the average value assigned to the healthcare context is different to the average value
assigned to the retailing context and the differences observed are statistically significant (p-value = 0.000 <0.05). The only
exception is the second item of the “Repeat Purchase” dimension.

790
Behavioral Intentions
Items description Average
Healthcare Context
Average Retailing Context
t-student
Word of Mouth (WOM)
WOM1 Say positive things 5,11 4,64
WOM2 Recommend XYZ to someone who seeks your advice 5,08 4,74
WOM3 Encourage friends and relatives to do business with XYZ 4,71 4,25
Repeat Purchase
(RP)
RP1 Consider XYZ your first choice to buy services 5,33 4,92
RP2 Do more business with XYZ in the next few years 4,14 4,17 x
RP3 Do less business with XYZ in the next few years 2,92 3,16
Price Sensitivity
(PS)
PS1 Take some of your business to a competitor that offers
better prices 3,33 5,63
PS2 Continue to do business with XYZ if its prices increase
somewhat 4,64 3,09
PS3 Pay a higher price than competitors charge for the
benefits you currently receive from XYZ 4,14 2,74
Complaints (C)
C1 Switch to a competitor if you experience a problem with
XYZ’s service 4,97 5,21
C2 Complain to other customers if you experience a problem
with XYZ’s service 4,89 5,38
C3
Complain to external agencies, such as consumer
organizations, if you experience a problem with XYZ’s
service
3,55 4,33
C4 Complain to XYZ’s employees if you experience a problem
with XYZ’s service 4,42 5,16
(X) - The difference is (not) statistically significant for a significance level of 5%
Sources: Zeithaml, V.A., Berry, L.L. and Parasuraman, A. (1996); Bloemer, J., Odekerken-Schrӧder, G. and Kestens, L. (2003)
Table 1: H1 Testing Results: t-Student test performed to behavioral intentions in both contexts
Items description
Average Healthcare
Context
Average Retailing Context
t-student
Consumer Relationship
Proneness (CRP)
CRP1 Generally, I am someone who likes to be a regular customer of a service provider
5,19 4,69
CRP2 Generally, I am someone who wants to be a steady customer of the same service provider
5,33 4,52
CRP3 Generally, I am someone who is willing to ’go the extra mile’ to purchase at the same service provider
4,98 3,56
(X) - The difference is (not) statistically significant for a significance level of 5%
Source: Odekerken-Schrӧder, G., De Wulf, K. and Schumacher, P. (2003)
Table 2: H2 Testing Results: t-Student test performed to consumer relationship proneness in both contexts
To verify H3, we first performed an exploratory factorial analysis. This analysis aims to simplify the relationships between
groups of items, resulting in the definition of a new set of factors which explain the parametric correlations (Pearson type)
between the variables (Hill and Hill, 2005). Four new factors were extracted, referring to each one of the four behavioral
intentions considered. The same was done for consumer relationship proneness, with one factor extracted (Table 3),
reaching accepted values (KMO, AVE, Cronbach’s Alpha) for all constructs.

791
Behavioral Intentions Context Number of Components KMO Variance Extracted
Cronbach’s Alpha
Word of Mouth Healthcare 3 0,71 82,67% 0,892
Retailing 3 0,75 84,02% 0,903
Repeat Purchase Healthcare 3 0,67 64,13% 0,718
Retailing 3 0,6 61,23% 0,68
Price Sensitivity Healthcare 3 0,64 65,58% 0,727
Retailing 3 0,66 68,17% 0,765
Complaints Healthcare 4 0,62 53,35% 0,706
Retailing 4 0,7 56,96% 0,74
Consumer Relationship Proneness
Context Number of Components KMO Variance Extracted
Cronbach’s Alpha
Healthcare 3 0,73 79,02% 0,866
Retailing 3 0,68 81,74% 0,886
Table 3: Exploratory factorial analysis results for behavioral intentions and consumer relationship proneness
In order to verify the existence of a positive relationship between consumer relationship proneness and their behavioral
intentions in both contexts (H3), a correlation analysis was performed. The results are presented in the following table
(Table 4):
Table 4: Correlation analysis results: consumer relationship proneness and behavioral intentions
In both contexts, the correlations between consumer relationship proneness and word of mouth, repeat purchase and
price sensitivity are significant (p-value < 0.01). Repeat purchase and word of mouth have correlation coefficients larger
than 0.5, which means that there is a strong correlation in both contexts. Price sensitivity presents a moderate correlation
with consumer relationship proneness. In the case of complaints, both contexts show low, non-significant correlation
coefficients (below 0.25).
6. Discussion of results
Our study shows there are statistically significant differences in consumer behavioral intentions (Repeat purchase; Word
of Mouth; Price Sensitivity; Complaints) between the contexts analyzed (H1), with the exception of one item on the
“Repeat Purchase” dimension. Healthcare customers tend to exhibit behaviors more favorable to the development of the
relationship than retailing customers for all behavior intentions where the differences were significant, since context
conditions are more conducive. It was also possible to verify that there are significant differences in consumer relationship
proneness between the contexts analyzed (H2), in favor of the healthcare context, where customers have direct contact
with the service provider and the degree of customization is higher. Finally, it was also concluded that consumer
behavioral intentions are correlated with relationship proneness in both contexts, except for complaints. This situation
may be related to internal complaints. According to Zeithaml et al. (1996), authors of the scale in which the analysis was
792
based, clients that demonstrate a more favorable disposition towards the company may be more likely to make complaints
internally to give a second chance to the company.
However, this study is not without its limitations. First, the limitations of data collection warrant caution in generalizing
these results beyond the population sampled. Replication of this study with random sampling procedures would clearly
add weight to the reported results. Second, further research using a longitudinal design could better address relationship
dynamics. This study could also be improved with access to database information on customer actual behavior history
since measurements were based on self-reports. Additionally, a number of factors, such as consumer personal
characteristics, individual preferences, demographic variables or lifestyle, not investigated here may prove to be
significant to future studies. Future researchers may also consider replicating this study across other service contexts or
even consumer goods to examine how our conclusions can apply in other purchase contexts.
7. Conclusion
While the service sector is growing and becoming more competitive, service providers have to start focusing more on
increasing their competitive advantage by strategically managing their customer relationships. However, a review of the
RM literature still reveals a focus on the seller’s perspective. Also, few authors have explored why consumers may be more
or less interested to form a relationship with their company. Additionally, the effect of service types has not yet been fully
explored, particularly in the customer relationship field.
We thus offer a new direction by investigating differences in customer relationships based on different service types (e.g.
high and low contact services). The results of this study provide guidance to managers to differentiate customer
relationship strategies according to the specific service context that they operate in. Namely, results revealed that
consumer relationship proneness and behaviors vary significantly among the contexts studied. In the high contact service
(healthcare services), customers exhibit higher relationship proneness and show more favorable behaviors towards the
relationship, when compared with the low contact service (wholesales). It was also found that the majority of consumer
behaviors are, in both contexts, correlated with relationship proneness.
On a managerial level, we identify contextual conditions conducive to relationship formation for firms to fine-tune their
relational efforts. Instead of wasting resources with non-prone consumers, firms should realistically recognize the
possibility of building a relationship or not by analyzing those circumstances and situations into which the customer
enters and remains because perceives obvious benefits.
References
BAHIA, K., PERRIEN, J. and; TOMIUK, M. (2005), “Some antecedents and consequences of the client’s relational predisposition: an
application to the retail banking industry”, presented at the Servsig Conference, American Marketing Association, Singapore.
BARNES, J. (1997), “Closeness, Strength, and Satisfaction: Examining the Nature of Relationships between Providers of Financi al
Services and their Retail Customers”, Psychology and Marketing, Vol. 14 No.8, pp. 765-790.
BARNES, J. (2003), “Establishing Meaningful Customer Relationships: Why Some Companies and Brands Mean More to Their
Customers”, Managing Service Quality, Vol. 13 No 3, pp. 178-186.
BENAMOUR, Y. and PRIM, I. (2000), “Orientation relationnelle versus transactionnelle du client: développement d’une échelle dans le
secteur bancaire franccais. Une étude exploratoire” , Cahier nº 279, Centre de Recherche DMSP.
BENDAPUDI, N. and BERRY, L. (1997), “Customers’ motivations for maintaining relationships with service providers,” Journal of
Retailing, Vol. 73 No. 1, pp. 15–37.
BERRY, L. (1983) "Relationship Marketing" in Emerging Perspetives on Services Marketing. Eds. Leonard L. Berry, G. Lynn Shostack, and
Gregory Upah. pp. 25-28, Chicago, IL: American Marketing Association,
BERRY, L. (1995), “Relationship marketing of services—growing interest, emerging perspectives” Journal of the Academy of Marketing
Science, Vol. 23 No. 4, pp. 236–245.
BLOEMER, J., ODEKERKEN-SCHRӧDER, G. and KESTENS, L. (2003), “The impact of need for social affiliation and consumer re lationship
proneness on behavioral intentions: an empirical study in a hairdresser’s context,” Journal of Retailing and Consumer Services ,
Vol. 10 No. 4, pp. 231–240.

793
BLOEMER, J. and ODEKERKEN-SCHRӧDER, G. (2007). “The Psychological Antecedents of Enduring Customer Relationships: An
Empirical Study in a Bank Setting”, Journal of Relationship Marketing, Vol. 6, No 1, pp. 21-43
BLOIS, K. (1997), “When is a Relationship “A Relationship”?” in Walter, A., Gemunden, H.G. and Ritter, T. (Ed.), Relationships and
Networks in International Markets, Elsevier Science, Pergamon, pp. 53-64.
BOUGUERRA, A. and MZOUGHA, M. (2011), “Relationship Marketing: The Forgotten Consumer,” International Journal of Business and
Social Science, Vol. 2 No. 6, pp. 210 – 223.
BURNHAM, T., FRELS, J. and MAHAJAN, V. (2003), “Consumer Switching Costs: a Typology, Antecedents and Consequences”, Journal of the
Academy of Marketing Science, Vol. 31 No. 2, pp. 109-121.
CHRISTY, R., OLIVER, G. and PENN, J. (1996), “Relationship Marketing in Consumer Markets”, Journal of Marketing Management, Vol. 12
No 1-3, pp. 175-187.
VELOUTSOU,C, SAREN, M. and TZOKAS, N.(2002), "Relationship marketing: What if … ?", European Journal of Marketing, Vol. 36 No.4,
pp.433 – 449.
COULTER, R. and LIGAS, M. (2004), “A Typology of Customer-Service Provider Relationships: the Role of Relational Factors in Classifying
Customers”, Journal of Services Marketing, Vol. 18 No 6, pp. 482-493.
DE WULF, K., ODEKERKEN-SCHRÖDER G. and IACOBUCCI, D. (2001), “Investments in Consumer Relationships: A Cross-Country and
Cross-Industry Exploration”, Journal of Marketing, Vol. 65 (October 2001), pp. 33-50.
DWYER, F., SHURR, P., and OH, S. (1987), “Developing Buyer Seller Relations”, Journal of Marketing, Vol. 51No. 2, pp. 11-28.
EGAN, J. (2003), “Back to the Future: Divergence in Relationship Marketing Research”, Marketing Theory, Vol. 3 No 1, pp. 145-157.
EGAN, J. and HARKER, M. (2006), “The Past, Present and Future of Relationship Marketing”, Journal of Marketing Management, Vol. 22
No.1, pp. 215-242.
FERNANDES, T. and PROENÇA, J. (2008), “The blind spot of relationships in consumer markets: the consumer proneness to engage in
relationships,” Journal of Marketing Management, Vol. 24 No. 1-2, pp. 153–168.
FOURNIER, S., DOBSCHA, S. and MICK, D. (1998), “Preventing the Premature Death of Relationship Marketing”, Harvard Business Review,
Vol. 76, pp. 42-51.
GALETZKA, M., VERHOEVEN, J. and PRUYN, A. (2006),” Service validity and service reliability of search, experience and credence
services: a scenario study”, International Journal of Service Industry Management, Vol. 17 No.3, pp. 271-283.
GRAYSON K. and AMBLER, T. (1999), “The dark side of long-term relationships in marketing services”, Journal of Marketing Research,
Vol. 36 No.1, pp. 132-142.
GRӧNROOS, C. (1994), “From marketing mix to relationship marketing: towards a paradigm shift in marketing” , Management Decision,
Vol. 32 No. 2, pp. 4-20
GRӧNROOS, C. (1995), “Relationship marketing: the strategy continuum,” Journal of the Academy of Marketing Science, Vol. 23 No. 4, pp.
252–254.
GRÖNROOS, C. (2000), Service Management and Marketing: a Customer Relationship Management Approach, John Wiley & Sons, London
GRӧNROOS, C. (2004), “The relationship marketing process: communication, interaction, dia logue, value,” Journal of Business &
Industrial Marketing, Vol. 19 No. 2, pp. 99–113.
GWINNER, K., GREMLER, D. and BITNER, M. (1998), “Relational benefits in services industries: the customer’s perspe ctive,” Journal of
the Academy of Marketing Science, Vol. 26 No. 2, pp. 101–114.
GUMMESSON, E. (1997), “Relationship marketing as a paradigm shift: some conclusions from the 30R approach” Management Decision,
Vol. 35 No. 4, pp. 267–272.
HAN, X., KWORTNIK, R. and WANG, E. (2008), “Service Loyalty: An Integrative Model and Examination across Service Contexts”, Journal
of Service Research, Vol. 11, No. 1, pp.22-42
HENNIG-THURAU, T., GWINNER, K. and GREMLER, D. (2002), "Understanding Relationship Marketing Outcomes: An Integration of
Relational Benefits and Relationship Quality," Journal of Service Research, Vol.4 (February), pp. 230-247.
HENNIG-THURAU, T., PAUL, M., GREMLER, D., GWINNER, K. and WEITZ, C. (2009), “Toward a Theory of Repeat Purchase Drivers for
Consumer Services”, Journal of the Academy of Marketing Science, Vol. 37 No.2, pp. 215-237.
HILL, M. (2005), Investigação por Questionário, Lisboa, Edições Sílabo
JACKSON, B. (1985), “Build Customer Relationships That Last,” Harvard Business Review, Vol. 63, pp. 120–128.

794
LINDGREEN, A. and PELS, J. (2002), 'Buyer-seller exchange situations: four empirical cases', Journal of Relationship Marketing, Vol. 1, No.
3/4, pp. 60-93. 86.
LOVELOCK, C. and GUMMESON, E. (2004), “Whither Services Marketing? In Search of a New Paradigm and Fresh Perspectives”, Journal
of Services Research, Vol. 7, No. 1, pp. 20-41
MÖLLER, K. and AINO H. (2000), “Relationship Marketing Theory: Its Roots and Directions”, Journal of Marketing Management, Vol. 16
No. 1, pp. 29-54.
MORGAN, R. and HUNT, S. (1994), "The Commitment-Trust Theory of Relationship Marketing", Journal of Marketing, Vol. 58, pp.20-38.
NOBLE, S. and PHILLIPS, J. (2004), “Relationship Hidrance: Why Would Consumers not Want a Relationship with a Retailer?”, Journal of
Retailing, Vol. 80, pp. 289-303.
O’LOUGHLIN, D. and SZMIGIN, I. (2006), “Emerging Perspectives on Customer Relationships, Interactions and Loyalty in Irish Retail
Financial Services”, Journal of Consumer Behaviour, Vol. 5 No.2, pp. 117-129.
O’MALLEY, L. and TYNAN, C. (2000), “Relationship Marketing in Consumer Markets: Rhetoric or Reality? “, European Journal of
Marketing, Vol. 3 No. 7, pp. 797-815.
ODEKERKEN-SCHRÖDER, G. and BLOEMER, J. (2004), “Constraints and Dedication as Drivers for Relationship Commitment: An
Empirical Study in a Health-Care Context”, Journal of Relationship Marketing, Vol. 3 No. 1, pp. 35-52.
GUENZI, P. and GEORGES, L. (2010) "Interpersonal trust in commercial relationships: Antecedents and consequences of customer trust
in the salesperson", European Journal of Marketing, Vol. 44 No 1/2, pp.114 – 138.
PARISH, J. and HOLLOWAY, B. (2010), “Consumer relationship proneness: a reexamination and extension across service exchanges,”
Journal of Services Marketing, Vol. 24 No. 1, pp. 61–73.
PELS, J. (1999), “Exchange Relationships in Consumer Markets?”. European Journal of Marketing, Vol. 33 No.1-2, 19-37.
PRESSEY, A. and MATHEWS, B. (2000), “Barriers to Relationship Marketing in Consumer Retailing”, Journal of Services Marketing, Vol. 14
No. 3, pp. 272-286.
SILPAKIT, P. and FISK, R. (1985) “"Participatizing" the service encounter: a theoretical framework”, Oklahoma State University .
SHRIVASTAVA, S. and KALE, S. (2003), “Philosophizing on the Elusiveness of Relationship Marketing Theory in Consumer Markets: a
case for Reassessing Ontological and Epistemological Assumptions”, Australasian Marketing Journal, Vol. 11 No. 3, pp. 61-72.
VENETIS, K. and GHAURI, P. (2004), “Service Quality and Customer Retention: Building Long Term Relationships”, European Journal of
Marketing, Vol. 38 No. 11-12, pp. 1577-1598
YU, Y. and DEAN, A. (2001), “The Contribution of Emotional Satisfaction to Consumer Loyalty”, International Journal of Service Industry
Management, Vol. 12 No. 3, pp. 234-250.
ZEITHAML, V., BERRY, L. and PARASURAMAN, A. (1996), “The behavioral consequences of service quality,” The Journal of Marketing, Vol.
60 (April), pp. 31-46.
ZOLKIEWSKI, J. (2004), “Relationships Are Not Ubiquitous in Marketing”, European Journal of Marketing, Vol. 38 No.1-2), pp. 24-29.

795
The Role of Operations Management and
Marketing in the Planning of Vending Machines Vending Machines; Operations Management; Marketing; Triangulation.
Telma Santos, Universidades Lusiada, [email protected]
Ângela Silva, Universidades Lusiada, [email protected]
Raquel Reis, Universidades Lusiada, [email protected]
Abstract
Vending machines have emerged from the ‘self-service’ concept, being located in a particular place, making available to
potential customers food, hot and cold drinks, among other products. These machines are prepared for processing a
transaction, through customer’s payment, without personal attendance and with the condition of satisfying an order of the
client.
Nowadays, due to people’s lifestyle, these machines are located in several strategic places, namely hospitals, schools,
companies, with the most varied and diverse products. Lack of time is common in everyday life, people not wanting to wait
in queues. Thus, vending machines are each time more appealing for several customers’ segments. The market of vending
machines has been increasing at an accelerated rate, becoming a tendency in marketing.
Moreover, these machines have more and more an attractive and modern design. Therefore, operations management and
marketing are complementary concepts regarding vending machines, being part of its management process, and always
having in mind customers’ needs.
This research aims to explore the vending machines concept in all its phases. In Operations Management, regarding the
planning and supply chain management of products, markets, targets, quality and employees’ training. In addition,
regarding the vending machine itself, it is important to note that operations include the maintenance management, the
information system used and the response to new technologies.
Marketing, on the other side, is responsible for identifying customers’ needs and expectations, planning all the strategies /
promotions in the acquisition and sale of products. The installation of a vending machine, if well planned, can be part of a
well defined marketing strategy, aiming to reinforce the brand power and its impact in achieving the target and
consequent sales development.
Having in mind both the research aim and the different customer’s profiles of vending machines, this study employs
triangulation, mixing qualitative and quantitative methods. Initially, four focus groups will be conducted, two in a
university and two in a secondary school, both in the North of Portugal. In a later stage, a quantitative study, via
questionnaire, will be conducted within the same institutions.
The selection of these groups was made in order to understand the preferences and use of vending machines in different
contexts and ages. Moreover, both groups, from secondary schools and universities, are key customers of vending
machines.
Summarizing, this working paper attempts to assess the requirements and different perspectives on the selected products,
quality, diversity, cost, machine design, handling, potential problems, customer needs and satisfaction and other aspects
that may emerge in the focus groups.

796
Introduction:
A relationship business in growing development involves the vending machines, vending services and consumers. A
relationship, firstly, because operations management ensures that customer requests are met in a timely manner and with
quality levels of service / product set. The appropriate planning management of the control of materials, costs and
manpower influence the success of the business.
Furthermore, marketing in this type of business becomes a powerful tool to achieve customer satisfaction. In fact, some
elements of strategic marketing (price, image, positioning, segmentation, distribution channels and promotion) are
interconnected and influence customers’ behavior. The product selection, brands, suppliers, prices, selected locations and
the communication types foster the desire to create a service that is able to meet a client need. According to SHETH and
PARVATIYAR (1995b, p. 398), due to technological advancement, the producers / distributors directly interact with their
consumers. Due to the development of production processes as well as the inclusion of quality programs, the relationship
between producers / distributors and consumers becomes more oriented towards markets.
Both roles, operations management and marketing, can be discussed from the user’s perspective. In this case, the position
advocated, criticism, client involvement (target selected), cannot only convey the degree of satisfaction felt by having a
primary need (get a food and / or drink), but also the type of product (s), type of brand (s), organization, involvement of
technicians and complaining treatment regarding the design and implementation of new technologies in every type of
vending machine.
This study can highlight and clarify technical and psychological characteristics of customers’ behavior. The chosen sample,
two groups of teens from a secondary education, two groups of two different courses of a university as well as the
deployment location of vending machines (school and university) will be appropriate in obtaining the necessary
information.
In this working paper, first it is presented a literature review on this topic. Then, the methodology will be examined. It is
also presented the case study of LEE (2003) that explored students, staff and professors of an education University of the
United States. The study deepened consumer experiences with vending machines, opinions and attitudes, satisfaction and
behavior according to complaints. It will be an important reference to this research. However, this research aims to
examine the Portuguese experience. The two age groups selected, although close, are embedded in different environments
and fall within the key target of operating vending machines.
Literature Review:
In the nineteenth century, the first vending machine to be successfully commercialized by Thomas Adams was used for the
sale of their chewing gum in underground stations of New York. Only in 1902 the first company of vending machines
emerged, Horn & Hardart Baking Company in Philadelphia. In turn, the Committee Definitions of the American Marketing
Association define vending machines as "retail sales of products or services by operating machines that are used by end
consumers" (STEIN, 1964).
Market developed via automatic vending machines has grown quickly since it is convenient, faster and cheaper (KIM, YOO,
2012). According to history, the coffee vending machines emerged in the 50s since profits decreased and managers needed
to reduce costs. They concluded that could save money by using coffee automatic machines (STEIN 1964). The vending
machine also had an important role in the new economy of America, being a generator of employment (WEEK, 1999; Apud
LEE, 2003). Yet there is some vulnerability in this kind of business. When the economy is in recession, sales of this
business also decreased (LEE, 2003). For example, the consumption of products from vending machines decreased by 5%
in 2001 due to the economic downturn (NATIONAL AUTOMATIC MERCHANDISING ASSOCIATION, 2002; Apud LEE, 2003).
Nowadays, vending services include a large amount of products such as coffee, drinks, snacks, books, toys and other
products located in stations, schools, universities, companies and hospitals (KIM, YOO 2012). However, STEIN (1964)
pointed out a limitation, clearly stating that is not possible to serve a “full meal” in a vending machine.
Regarding the evolution of the vending machine itself, in the '30s, there was the coin changers’ development. Also in the
'30s, small refrigerator were placed inside the vending machine, which allowed the sale of chilled drinks and ice cream at
competitive prices compared to sales in stores. In turn, in the 50s, the automatic coffee machines expanded to several
small businesses. Its clean look and beautiful design would be appropriate in cafeterias or classrooms. In the '60s, two

797
manufacturers have introduced machines with the hypothesis of automatic note changers (STEIN, 1964). In 1961, a
million and a half of the U.S. population bought at least one product in the vending machines every day (STEWART, 1961;
Apud STEIN, 1964).
Vending machines were developed further, which led to a focus on installation, training and / or existence of effective
instruction, maintenance and repair, being essential to achieve customer needs and satisfaction in different markets. In
turn, the development of new machinery found a wide range of design requirements in project stage (GOFFIN, 2000).
Services firms acquired vending machine to self-service businesses (GOFFIN, 2000; KIM, YOO, 2012). However, these
machines are a complex mix of mechanical and electronic technologies, security and display. Due to the wear and tear of a
number of components, maintenance and repair are required. In these terminals, communication channels (links, machine
to machine) may exist via modem to a central computer showing performance data, sales activities and stock levels in the
chain of vending machines. With the updating of these channels of communication in services, companies of vending
machines had good management practices reflected in a maintenance management and in an efficient and effective supply
planning in record time (GOFFIN, 2000).
If there is a problem, the customer may contact the vending company and a compensation will be given. In order to achieve
a better services quality, vending machine services companies normally have a department that is responsible for
repairing any identified damage. All repairs are carried out in the place where the machine is located. Technicians make
regular visits to carry out periodic inspections and preventive maintenance during times that do not have to make repairs
(KIM, YOO, 2012).
According to the authors, KIM and YOO (2012), vending machines can be distinguished by two types of failure
mechanisms. The group mechanism I, which includes transaction currency, delivery mechanism (s) of product ( s), and the
mechanism which includes the electronic part. According to statistics, most faults relate to this group. The group of
mechanisms II are related with the engine cooler in the case of ice creams or beverages refrigerator vending machines.
This mechanism includes the compressor, control of ice and refrigerant charge. For this group the repair mechanisms are
necessarily more expensive because of technical resources as well as heavier equipment needed. According to different
breakdowns of the two groups of mechanisms I and II, it is important to distinguish two types of technicians for the
manpower planning and repair process to be effective. After contact with the technicians, they move to repair the
mechanisms of group I. If the detected failure is part of the mechanisms of group II, they contact colleagues to conduct the
visit and repair. However, the group I did not leave without first carrying out inspections of the mechanisms of this group.
The optimal preventive maintenance interval was determined to minimize the total average cost for the maintenance
compound, additional expects and capacity loss (HSU, TAPIERO, 1987; Apud KIM, YOO, 2012). It is true that if they opt for
preventive maintenance, the probability of failure decreases and vending machines in the near future may witness a
reduction of costs and an increased level of customer satisfaction (KIM, YOO, 2012).
From a design perspective, the following question could be asked: what is the influence of the design in the vending
machines? The design influences both the necessity of handling and the way of distribution (GARVIN, 1988; Apud GOFFIN,
2000). The decisions obtained in the phase of design / development machine, affect equipment reliability and
consequently the requirements for maintenance of that machine (LELE, 1986; Apud GOFFIN, 2000). Some companies
develop products / machines with a good assistance level. They reach this level because they get an excellent grasp and
understanding of customer needs and to support the equipment evaluation.This will be carried out during the project
development stage (GOFFIN, 2000).
GOFFIN (2000), a Senior Operations Manager, argues that machine assistance is the key role of marketing either in
technology practiced either in development of engineering machinery. Technical assistance was a significant change in
many industries over the last ten years. GOFFIN (2000) considers not only the types of maintenance and repair but also
includes other elements like support via phone or online and contact customers.

798
Source: Adapted from STEIN, 1964
A research study focuses on a mathematical model of integration and planning of the technical department of the vending
machines. Closely, related to preventive maintenance and failures. Planning determines levels of technical work (full-time
and temporary), preventive maintenance and repairs to minimize the total cost (KIM, YOO, 2012). However, surprisingly,
in practice, many companies maintain these services to a minimum number of human resources (technical) dedicated to
fault repair and preventive maintenance. This strategy can even keep labour costs lower, but in terms of total costs, in the
long run these are not minimal (KIM, YOO, 2012).
The market success of vending machines depends on the customers’ knowledge of their needs before offering products in
the machines. It can even exist a disagreement according to the quality of the products but they should be part of the list o f
consumer preferences (STEIN, 1964). The stronger the exposure of products and / or vending machines, the larger image
and recognition it will be. This is an open path to marketing communications. This strategy is valid in the United States
because of reputable brands of products to dispose of this type of vending service (LEE, 2003). As people are adapted to
use different types of vending machines, these will expand and represent increasingly different types of services.
Interestingly, STEIN (1964, p.51) stresses that: "to be successful the desire should override the machine and not vice
versa!"
In the current services economy, the use of information technologies increases significantly (WEBSTER, 1992; SHETH,
1994; SHETH, PARVATIYAR, 1995a; GRONROOS, 2000; GUMMESON, 2002; Apud HUNT, ARNETT, 2006), and therefore i t
is each time more important to understand customers’ opinions and feedback (SHETH, PARVATIYAR, 1995b).
Previous Studies on Vending Machines
There are many studies about the effects of consumption of beverages (soft drinks) - juices - on the physical health of
adolescents, being obesity one of the consequences. (MALIK, SCHULZE, HU, 2006; POWELL, CHRIQUI, CHALOUPKA, 2009;
FLETCHER, FRISVOLT, TEFFT, 2010a; Apud FLETCHER, FRISVOLT, TEFFT, 2010b; LEVY, FRIEND, WANG, 2011; Apud
PRICE, 2012). However, few studies investigated possible links between excessive consumption of these beverages and its
consequences on customer behavior (PRICE, 2012).
LIEN et al. (2006) investigated the link between the consumption of juices and the students’ behavior. The authors used a
"Strengths and Difficulties Questionnaire" to measure behavioral problems of young Norwegians. They found that the
adolescents consume more than three juices a day. In this study, it is clear that there is a need to research further possibl e
causes for binding events. Another study by PRICE (2012, p.93, pgs. 97-98) was the observation of changes in accounting
policies such as prohibiting the sale of juices in vending machines in some schools, and compare them with other schools
ASSISTANCE
Training
Contact Costumer
Upgrades
Understanding Instructions
Support online
Customer assistance organization
SERVIÇES
Installation
Maintenance
Repaire
Accessoires substitution
Warrant
Field services

799
allowing the existence of these products in vending machines. The author observed the behavior of teenagers.
Interestingly, and according to the results of this study, in schools where there are these kind of drinks in vending
machines, students arrive late to class less often (between breaks) than in schools where there are not. The impact is also
positive since students had better results in subjects related to mathematics. Anyhow, in this study, there are two
limitations to know. First, it is assumed that the only difference between schools is whether or not they have vending
machines. It is also assumed that the treatment and control of experiments in schools translate into behaviors in the same
academic curriculum time. (LIEN et al., 2006; Apud PRICE, 2012).
Another study that was carried out was based on the behavior in terms of consumer purchasing attitudes and opinions
about the vending machines. The satisfaction, non-satisfaction and complaints were also investigated. As a result,
consumers considered the machines useful, beneficia, important, very positive in terms of selected locations, cleanliness
and freshness of the products. However, regarding the services provided through a vending machine, consumers have
rated them as regular and reported that the delivery system and complaint handling is inappropriate. Moreover,
consumers approached product prices negatively and mentioned functional problems of the machines, like constant loss of
money (LEE, 2003). Importantly, the incorrect treatment of a complaint may induce actions of frustration or even anger, so
vandalism could be one of the consequences (HUEFNER, HUNT, 2000; Apud LEE 2003).
According to LEE (2003, p. 178), given the rapid growth and the presence of vending machines in consumers' lives, it is
surprising the lack of studies on marketing and behavior, opinions, satisfaction and complaints from vending services. He
states that for companies engaged in this business, vending machines emphasize the normal channels of distribution and
easily reach more and more new customers. Other authors reinforce the strong presence of this type of service recognition
(PHILLIPS, 1992; Apud LEE, 2003). Moreover, from the standpoint of the consumer, the vending machines are convenient
and offer benefits such as savings in time (QUELCH, TAKACHI, 1981; Apud LEE, 2003). It is only needed to press a button
and the product appears "I’ll see, want and it is ours”. The fact that these machines can readily provide services 24 hours a
day is considered a strong advantage (KOTLER, 2003; Apud LEE, 2003).
Despite many benefits of vending machines, there are also black holes in this type of services that negatively affect
consumers and the vending machines industries themselves in the long run (LEE, 2003). Many consumers prefer to shop
in stores with personalized service than the use of such machines (TRACHTENBERG, 1994; Apud LEE, 2003). Other
consumers are not comfortable with the language of the vending machine (LEANER, 2002; Apud LEE, 2003).
When consumers do not feel satisfied with the purchase did not know what to do. Another downside is that in the early
hours, the consumer does not feel confident in buying in isolated locations (LEE, 2003).
Many marketing managers commented on their books matters related to the vending machines on the type of machinery
and advanced technologies (LAMB, HAIR, MCDANIEL, 2002; PETER, DONNELLY, 2003, KOTLER 2003; Apud LEE, 2003).
However, there are no studies of marketing and consumer behavior as well as their experiences with vending machines. It
is important for managers of vending machines to understand the consumer’s behavior. This may be a significant
opportunity to guide marketing strategies. If vending services firms and their managers do not understand their potential
problems, in the medium and long term, success of this type of business will have a negative impact (LEE, 2003).
The marketing success depends on the optimal solution for customers. GRONROOS (2004, p.103) says that “customers’
perceptions of relationships are holistic and cumulative”. He also emphasises the importance of trust in order to develop a
relationship. GRONROOS (2004) stresses that if the product has no interest or value, the relationship will not be created.
Reasons such as late deliveries, no customer service, complaints not handled properly, constant lack of information can
destroy that relationship.
Finally, an innovative marketing strategy from NAMA (National Automatic Merchandising Association) was conducted in
order to get direct feedback from consumers about which products to add, and which new and different places customers
would like to have vending machines. This was part of the campaign to commemorate America's Love of Vending
(Vend.Love.Win) in August 2011. There were prizes to motivate consumer participation. Interestingly, NAMA has carried
out research to understand consumers' opinions about the development strategies of the vending industry sector
Technological innovation, for example the embedded touch-screen and the option of payment in coins of low value are
benefits pointed out by consumers (Vending Industry Launches Vend.Love.Win, 2011).

800
Methodology:
Some authors refer to the methodology of triangulation of methods, mixing qualitative and quantitative approaches
(GREENE & CARACELLI, 1997; BARBOUR, 1998; Apud THURMOND, 2001). This connection allows benefiting from the
advantages of both approaches (LINCOLN & GUGA, 2000; Apud THURMOND, 2001). Thus, researchers can use both
methods in the same study: quantitative through questionnaires and qualitative through focus groups and/or interviews
(MITCHELL, 1986; KIMCHI et al, 1991; BOYD, 2000; Apud THURMOND, 2001). In other words, the methodology of
triangulation can expose, through qualitative methods, what is unknown in the questionnaire (THURMOND, 2001).
In line with the objective of this research work and having in mind different user profiles, the study follows the
methodology of triangulation, associating qualitative and quantitative methods. Initially, four focus groups will be selected,
two belonging to a University and two belonging to a secondary school, both institutions of northern Portugal (each focus
group has about 12 students and will be applied in their school context). Later the same groups will be involved in a
quantitative study by a questionnaire. It is believed that mixing different age groups will bring a strong contribution to the
literature on vending machines.
In summary, this study attempts to assess the requirements and different perspectives on the selected products, quality,
diversity, cost, machine design, confrontation with new technologies, handling thereof, possible faults found, contact the
technical needs and other aspects that may emerge in the focus groups.
Afterwards, the questionnaires, in the quantitative phase, will be sent to students. The sample will include at least one
class of each year in secondary school while at the university preference will be given to Marketing, Management and
Information Systems courses. It will be used a5 point Likert scale. The aim will be to perceive students’ behaviour in
several aspects such as the frequency of use, selection of products / brands and vending machines, reasons for use,
satisfaction service vending, most frequent type of complaint, the attitudes and forms of complaint resolution obtai ned,
some relevant attributes from a user's perspective to the vending machine.
Thus, this paper initially follows the LEE’s (2003, p. 181) study, to contribute in terms of knowledge to the understanding
of consumer behavior towards the vending services, including satisfaction and attitudes towards complaints. However,
this study adds the part of the consumer involvement in this type of service / machine (vending service / vending
machine).
Conclusions
This working paper discussed some of the literature on the development of the vending machines, the main problems
emerging by the functioning of this kind of machines and the results and conclusions of previous studies. Also it is
presented the methodology that will be used in the next stage of data collection, which is already being prepared. It is
expected that this research will positively contribute to the literature in this important topic regarding the complementary
concepts, operations management and marketing, having in mind customer’s needs and consequent satisfaction towards
vending machines.
Acknowledgments
The work reported in this paper was co-financed by FCT - Fundação para a Ciência e a Tecnologia, Portugal (PEst-
OE/EME/UI4005/2011) and carried out within the research centre Centro Lusíada de Investigação e Desenvolvimento em
Engenharia e Gestão Industrial (CLEGI).
References
BARBOUR, R.S. - Mixing qualitative methods: Quality assurance or qualitative quagmire? Qualitative Health Research 8:3 (1998) 352 -
361.
BOYD, C.O. - Combining qualitative and quantitative approaches. Nursing research: A qualitative Perspective. 2ª ed. Boston: Jones &
Bartlett, 2000. 454-475.
FLETCHER, J.; FRISVOLD, D.; TEFFT, N. - Taxing Soft Drinks and Restricting Access to Vending Machines to Curb Child Obesity. Health
Affairs. 29:5 (2010a) 1059–1066.

801
The Effects of Soft Drink Taxation on Soft Drink Consumption and Weight for Children and Adolescents. Journal of Public Econo mics.
94:11/12 (2010b) 967–974.
GARVIN, D.A. - Managing Quality. New York: The Free Press, 1988.
GOFFIN, Keith – Design for supportability: An Essential Component of New Product Development. Research -Technology Management.
43:2 (1 March 2000) 40-51.
GREENE, J.C., & CARACELLI, V.J. - Advances in mixed-method evaluation: The challenges and benefits of integrating diverse paradigms.
San Francisco: Jossey-Bass, 1997.
GRONROOS, C. – Service Management and Marketing: A customer relationship management approach. Wiley & Sons, Inc. New York.
2000.
____. – The relationship marketing process: communication, interaction, dialogue, value. Journal of Business & Industrial Marketing. 19:2
(2004) 99-113.
GUMMESSON, E. - Total Relationship Marketing: Marketing Management, Relationship Strategy, and CRM Approaches for the Network
Economy. Butterworth-Heinemann: Woburn. 2002.
HSU, L.F.; TAPIERO, C.S. - Maintenance of an unreliable M/G/1 queue like job shop. Queuing Systems. 2 (1987) 333 –350.
HUEFNER, Jonathan C.; HUNT, Keith. - Consumer Retaliation as a Response to Dissatisfaction. Journal of Consumer Satisfaction,
Dissatisfaction And Complaining Behavior, 13 (2000) 61-82.
HUNT, S.D.; ARNETT, D.B. – The explanatory foundations of relationship marketing theory. Journal of Business & Industrial Marketing.
21:2 (2006) 72-87.
KOTLER, P. - Marketing Management. 11ª ed. Prentice Hall:Upper Saddle River, 2003.
KIM, S.; YOO, S. – The combined manpower planning and preventive maintenance strategies by aggregate planning for the service
division of vending machines. Journal of the Operational Research Society. ISSN 0160 -5682. 63:8 (2012) 1034-1050.
KIMCHI, J., POLIVKA, B., & STEVENSON, J.S. - Triangulation: Operational definitions. Nursing Research. 40:6 (1991) 364 -366.
LAMB, Charles W.; HAIR, Joseph F.; MCDANIEL, Carl - Marketing. 6ª ed. South-Western Publishing, 2002.
LEANER, Neal – Vending Machines that Match the Minimart. Christian Science Monitor. (4 November 2002).
LEE, Dong Hwan – Consumers’ Experiences, Opinions, Attitudes, Satisfaction, Dissatisfaction, and Complaining Behavior with Vending
Machines. Journal of Consumer, Satisfaction, Dissatisfaction and Complaining Behavior. 16 (2003) 178 -197.
LELE, M.M. - How Service Needs Influence Product Strategy. Sloan Management Review, 28:1 (1986) 63 -70.
LEVY, D.T.; FRIEND, K.B.; WANG, Y.C. - A Review of the Literature on Policies Directed at the Youth Consumption of Sugar Sweetened
Beverages. Advances in Nutrition 2:2 (2011) 1825–2005.
LIEN, L.; LIEN, N.; HEYERDAHL, S.; THORESEN, M.; BJERTNESS, E. - Consumption of Soft Drinks and Hyperactivity, Mental Distress, and
Conduct Problems Among Adolescents in Oslo, Norway. American Journal of Public Health. 96:1 (2006) 1815 –1820.
LINCOLN, Y.S., & GUBA, E.G. Paradigmatic controversies, contradictions, and emerging confluences. Handbook of qualitative res earch, 2ª
ed. Thousand Oaks, CA: Sage, 2000. 163-188.
MALIK, V.S.; SCHULZE, M.B.; HU, F.B. - Intake of Sugar-Sweetened Beverages and Weight Gain: A Systematic Review. American Journal of
Clinical Nutrition. 84:2 (2006) 274–288.
MITCHELL, E.S. Multiple triangulation: A methodology for nursing science. Advances in Nursing Science. 8:3 (1986) 18-26.
NATIONAL AUTOMATIC MERCHANDISING ASSOCIATION. Automatic Merchandiser 2002 State of the Vending Industry Report, 2002
PETER, J. Paul; DONELLY, James H. – Marketing Management. 7ª ed. Nova Yorque:McGraw-Hill, 2003.
PHILLIPS, Kent – Critical Vending. Beverage World. 3 (February 1992) 99.
POWELL, L.; CHRIQUI, J.; CHALOUPKA, F.J. – Associations Between State-Level Soda Taxes and Adolescent Body Mass Index. Journal of
Adolescent Health. 45:3 (2009) 57-63.
PRICE, Joshua – De-Fizzing Schools: The Effect on Student Behaviour of Having Vending Machines in Schools. Agricultural and Resource
Economics Review. 41:1 (April 2012) 92-99.
QUELCH, John A.; TAKEUCHI, Hirotaka – Nonstore Marketing: Fast Track or Slow? Harvard Business Review. (July-August 1981) 75-84.

802
SHETH, J.N. - The domain of relationship marketing. 2nd Research Conference on Relationship Marketing. Center of Relationship
Marketing: Atlanta. (June 1994) 9-11.
SHETH, J.N.; PARVATIYAR, A. – Relationship marketing in consumer markets: Antecedents and consequences. Journal of the Academy of
Marketing Science. 23 (1995a) 255-271.
____. – The evolution of relationship marketing. International Business Review. 4:4 (1995b) 397 -418.
STEIN, Charles S. – The Phenomenon of Automatic Merchandising. Journal of Retailing. ISSN 0022-4359. 40:1 (Sprint 1964) 15-19, 50-
51.
STEWART, David W. - Vending: Threat or a Promise. Food Service. (November 1961) 43-44.
THURMOND, Veronica A. – The Point of Triangulation. Journal of Nursing Scholarship. 33:3 (2001) 253-258.
TRACHTENBERG, Jeffery A. – Interactive Kiosks May Be High-Tech, But They Underwhelm U.S. Consumers. Wall Street Journal. (14
March 1994).
Vending Industry Launches Vend.Love.Win. Facebook Contest, Calling on Gen Y C onsumers to Share Their Vending Favorites.
US:Newswire. (8 February 2011).
WEBSTER, F.E. – The changing role of marketing in the corporation. Journal of Marketing. 56:4. (1992) 1 -17.
WEEK, Leisure - Reports Shows Growth in Vending Machines. (23 April 1999) 13.

803
Session 21

804
The Effect of Servicescape on Customer
Perceived Quality, Satisfaction and Desire to
Return to a Sports Service: the Estádio do
Dragão (Dragon Stadium) Case Servicescape, Services, Sport Services, Service Quality, Customer Satisfaction, Customer Retention.
Sara Neves, Faculty of Economics - University of Porto, [email protected]
Teresa Fernandes, Faculty of Economics - University of Porto, [email protected]
Abstract
Purpose: The literature suggests that the desire to return to a service provider is a function of customer satisfaction with
the servicescape (Bateson and Hui, 1992). The present investigation is based on the work of Wakefield and Blodgett
(1996), and proposes to measure the weight of the servicescape variables of the Dragon Stadium in perceived quality by
the spectators of Futebol Clube Porto. It also aims to assess its influence on satisfaction, and the desire of returning to the
stadium in the future in order to attend soccer games.
Methodology: 368 questionnaires were collected in a match from the Portuguese Soccer League (season 2011/12). Data
analysis was initiated with a descriptive analysis of the different variables. After a Factor Analysis, by the method of
Principal Component Analysis, we were able to confirm all the five servicescape factors originally envisaged, in particular,
Layout Accessibility, Facility Aesthetics, Seating Comfort, Cleanliness and Electronic Equi pment. Hypotheses were tested
through Linear Regression Analysis.
Findings: The three hypotheses were confirmed empirically. The Multiple Linear Regression Analysis showed that the five
dimensions of servicescape influence the customer perceived quality. The Comfort and Layout Accessibility are the two
factors that best explain the variance in the model, followed by Cleaning and Electronic Equipment, and finally Facility
Aesthetics. A Simple Linear Regression Analysis demonstrated a relationship between Customer Perceived Quality, and the
dependent variable, Customer Satisfaction. Finally, using Pearson Correlation, it was possible to confirm the third
hypothesis: the spectators' satisfaction influence their desire to return to Dragon Stadium.
1. Introduction
Sport organizations are facing intense competition, not only from other sports but also from a wide range of other leisure
services (Shilbury and Westerbeek, 1996). Thus, it is true to say that sports organizations should strive for customers’
preference (Greenwell, 2001). It is also true that sports organizations realized that the game can also be played outside the
‘four lines’, meaning their attention is now focused on the implementation of strategies that increase the attendance of
spectators in their sports venues. This seems an easy problem to solve, however to increase spectator presence in the
games and hold their attention is a hard task. Especially, and as Kennett et al. (2001) pointed out, because the sporting
events have several dimensions beyond the managers’ control, in particular, the players’ performance, the presence of
certain star players, the outcome of the game, the quality of the teams, and even the quality of the game itself (Kelly and
Turley, 2001),
Since sport managers have little or no control over core service, they can have an influence on the supplementary
elements. This way, since the place of consumption has a strong impact on customer perceptions regarding the service

805
experience (Bitner, 1992), sport managers are able to work with some environmental dimensions in order to manage the
service encounter the way they desire.
Since games are largely dependent on the physical environment it is crucial to manage audience perceptions about the
quality of the service, trying to understand the extent to which these same perceptions affect the spectator’s satisfaction
and behaviour, including their repatronage intention.
2. Literature Review
Service intangibility and Service Cues
Berry (1980) defines services as actions, efforts or performances, distinguishing them from goods, as they are articles,
materials, objects or things. At first, services are considered intangible, since they can not be viewed, touched or even
tasted (Kandampully, 2002). The intangility is considered to be the main distinguishing characteristic between services
and goods (MacKay and Crompton, 1988).
In short, given service intangibility, customer trust is often supported on visible and tangible cues (Zeithaml et al., 1985) .
This tangible evidence may eventually affect the evaluation that a customer does of the service encounter, given that the
physical environment offers a "visual metaphor of the total supply of an organization," by the proposal "of the potential
usage and quality of service" (Bitner, 1992).
The fact that the services do not possess a physical form does not restrict the ability of the customers to understand the
service by itself, since they are able to apprehend certain tangible evidence and to associate them with the service in
question. Véronique Aubert-Gamet (1997) compares the tangible evidence to "cues" for the “invisible” service, and those
cues will form the customers’ expectations (Bebko, 2000).
Servicescape
Throughout time, several researchers have used various terms to indicate ‘environment’. It is commonly accepted that the
term "environment" was first used in 1973 by Philip Kotler in his article "Atmospheric as a Marketing Tool" in which the
author defines it as the conscious design of the space in order to create certain emotions on the customer and thereby lead
to an increased likelihood of purchase. However, servicescape, is the term more commonly known, and was defined as "the
environment in which the service is assembled and where the seller and the customer interact, in combinati on with the
tangible products that facilitate the performance or communication of the service" (Bitner, 1992). The word was
introduced in literature by Mary Jo Bitner in 1992 and was the result of the union of two English words - service - and -
landscape, used to describe the artificial setting of the surrounding facilities’ services.
The servicescape influences the customers' perceptions, it provides clues throughout the meeting, it creates memories in
the mind of the customer (Bitner, 1990; Reimer and Kuehn, 2005); and it may serve to create expectations about the price
and quality of the service (Bebko et al., 2006). The servicescape can also entertain or distract the customer, thereby
influencing their sense of time (Baker and Cameron, 1996; Berry et al., 2006) and have an effect on the evaluation of
intangible aspects such as trust and empathy (Reimer and Kuehn, 2005).
Besides the impact on customer perceptions, the servicescape is also capable of persuading spectator behaviour. Therefore
it creates emotions and changes the state of mind through the sensory qualities of the environment (Baker and Cameron,
1996; Le Bel, 2005; Berry et al., 2006); influencing personal interactions among customers and between them and the
employees (Le Bel 2005), and affecting future intentions of repatronage (Carbone and Haeckel, 1994; Berry et al., 2006).
Quality, Satisfaction and Repatronage Intention
Chelladurai and Chang (2000) define quality as the ability to delight customers and to satisfy their needs. However, it i s
known that the supply of services involves human perceptions and expectations, making thereby the definition and
measurement of their quality into a complex and difficult task (Brady and Cronin, 2001). The most common definition of
quality relates it to the perception that the customer has of the excellence of the service (Parasuraman et al., 1988) and its
relative performance superiority (Grönroos, 1982). This definition is based on a comparison between the quality of service
perceived prior to consumption and the perception of performance after service delivery (Parasuraman et al., 1985;
Grönroos, 1982).

806
Oliver (1997) argues that satisfaction is a customer response. It is the evaluation of a feature of the product or service, o r
the product or service itself, which provided (and continues to provide) a level of enjoyment related to the exercise of their
functions (Oliver, 1997). This way, satisfaction is the mediator in the relationship between perceived service quality and
the company performance (Fornell, 1992). Customer satisfaction is a post-purchase phenomenon that portrays how much
the customer likes or dislikes the service (Churchill and Surprenant, 1982), thus being an attitude that results from a
comparison between expectations and the perceived performance of the service (Oliver, 1980).
Meanwhile, expectations are the needs or desires of the customers, based on what they feel should receive, which
naturally, varies from customer to customer. The perceptions are beliefs and opinions of the custom er of the service
received. The judgment of customer satisfaction or dissatisfaction depends on how customers perceive the result obtained
when compared with what they expected to receive (Millan and Esteban, 2004). Burns et al. (2003) describe the
Disconfirmation as the event when perceived performance is lower than expectations. Confirmation, in turn, is when the
perceived performance is greater than expectations. It is more likely that the customer will be satisfied when there is
Confirmation (Rust et al., 1995), and a satisfied customer with multiple service encounters will in the long term develop a
positive perception of the overall quality of the company (Parasuraman et al. 1988).
3. Research Framework and Methodology
The present investigation is based on the work of Wakefield and Blodgett (1996), and proposes to measure the weight of
the servicescape variables of the Dragon Stadium in perceived quality of the viewers of Futebol Clube Porto. It also aims to
assess its influence on satisfaction, and the desire of returning to the stadium in the future in order to attend soccer games.
According to literature review, we propose the following research framework and hypothesis (Fig. 1):
Figure 1: Hypothesized model.
Layout Accessibility refers to the way in which furnishings and equipment, service areas, and hallways are organized
(Bitner, 1992). An effective layout will provide an easy entry and exit, and will make ancillary service areas such as
concessions, restrooms, and souvenir stands easier to get into (Wakefield e Blodgett, 1996). The Facility Aesthetics refer to
the design of the interior and its decoration, elements that contribute to the attractiveness of the servicescape. Customers
tend to evaluate the attractiveness of the place when they approach it, even outside of it. Once inside, customers of leisure
services spend hours examining (consciously and unconsciously) the interior of the facility (Wakefield and Blodgett,
1994).
SERVICESCAPE DIMENSIONS

807
The third factor, Seating Comfort, is associated with the degree of physical comfort. This factor, as a servicescape
dimension, represents a nonverbal communication between the customer and the servicescape (Lam et al., 2011) and is
particularly relevant to those customers who remain seated for a long number of hours (Wakefield and Blodgett, 1996).
On the other hand, Electronic Equipment can be used to improve the customer experience. High quality scoreboards
projecting instant replays scores, information about players, etc., are able to make the waiting times more pleasant and
add emotion for the spectator. Finally, the Cleaning factor is also of particular importance, mostly in situations where the
customer remain in the facility for several hours, as they tend to implicitly associate cleanliness with the quality of the
service (Wakefield and Blodgett, 1996). Barber and Scarcelli (2010) conclude that customers tend to select, stay and
return to a service depending on the perceived degree of cleanliness.
The Perceived Quality was measured with three items that portray the perceptions of the customers (terrible – great), the
expectations (much worse than I expected – much better than I expected), and the standards (not at all what it should be –
just what it should be) as suggested by Fornell (1992), and as Wakefield and Blodgett (1996) did. We thus propose that:
Hypothesis 1 (H1): The Servicescape Dimensions [Layout Accessibility, Facility Aesthetics, Seating Comfort, Electronic
Equipment and Facility Cleanliness] will have a positive effect on the Perceived Quality of the Servicescape.
The satisfaction is the mediator of the relationship between perceived quality service and the company performance
(Fornell, 1992). Several studies demonstrate the influence of the physical environment on the perception of service quality
and on customer satisfaction (Bitner, 1990; Le Blanc, 1992, Young et al., 1994; Wakefield and Blodgett, 1996; Hightower et
al., 2002; Swan et al., 2003; Park et al., 2005; Le Bel, 2005; Van Pham and Simpson, 2006). It's therefore important to know
how the sequence servicescape → quality → satisfaction works. Thus we propose that:
Hypothesis 2 (H2): Perceived Quality of the Servicescape will have a positive effect on spectator Satisfaction.
Finally, one can say that all customers visit a service company with a purpose or a goal, which can be strengthened or
harmed by the servicescape (Bitner, 1992). As a result, perceptions of physical environments can affect and constrain
satisfaction, although in a roundabout way, the intention or not to return (Le Bel 2005, Berry et al., 2006), and so we
expect that:
Hypothesis 3 (H3): Satisfaction will have a positive effect on spectator Repatronage Intention.
Data was collected through a self-administered, on-line, cross-sectional survey. Each question was created on the existing
literature in the field of sports management and marketing services. With the exception of the initial questions regarding
the characteristics of the spectators and the frequency of their visits, all the other variables were applied based on the
research of Wakefield and Blodgett (1996) and Wakefield et al. (1996). The focus of the investigation covers only the
environment that can be controlled, this way, all physical evidence that is outside, including the parking lot and access to
the stadium, were not included. The spectator's satisfaction was also measured in accordance with Wakefield and Blodgett
(1996), with one item from Cronin and Taylor (1994) and another from Bitner (1992). Finally, to assess the Repatronage
Intention to the stadium, individuals were asked about their willingness to attend matches in the future, the same way it
was done in Cronin and Taylor (1994), Wakefield and Sloan (1995), Wakefield and Blodgett (1996), Wakefield et al.
(1996) and, Hill and Green (2000) studies.
4. Data Analysis
The surveys were distributed in person at Dragon Stadium, by a team of 12 collaborators, two hours before the match
"kick-off" between Futebol Clube do Porto (FCP) and Sporting Clube de Portugal (SCP), Portuguese Soccer League
(2011/12). After validation, 368 questionnaires collected resulted in 349 responses (about 95%).
Sample
From the 349 validated questionnaires, 18 belonged to fans of the visiting team. So to study the relationships between the
variables it was decided to work only with the remaining 331 questionnaires.
In our sample, the majority of individuals (74.3%) were male, and only 25.7% are female. The proportion obtained in our
study is similar to that of Dhurup and Mofoka (2011), 73% male and 27% female.
With regard to ages we observed that the average is approximately 38 years, and that nearly 60% of the sample was aged
up to 39 years. We can observe from Table 1 that the different percentages are very close to each other, showing somehow
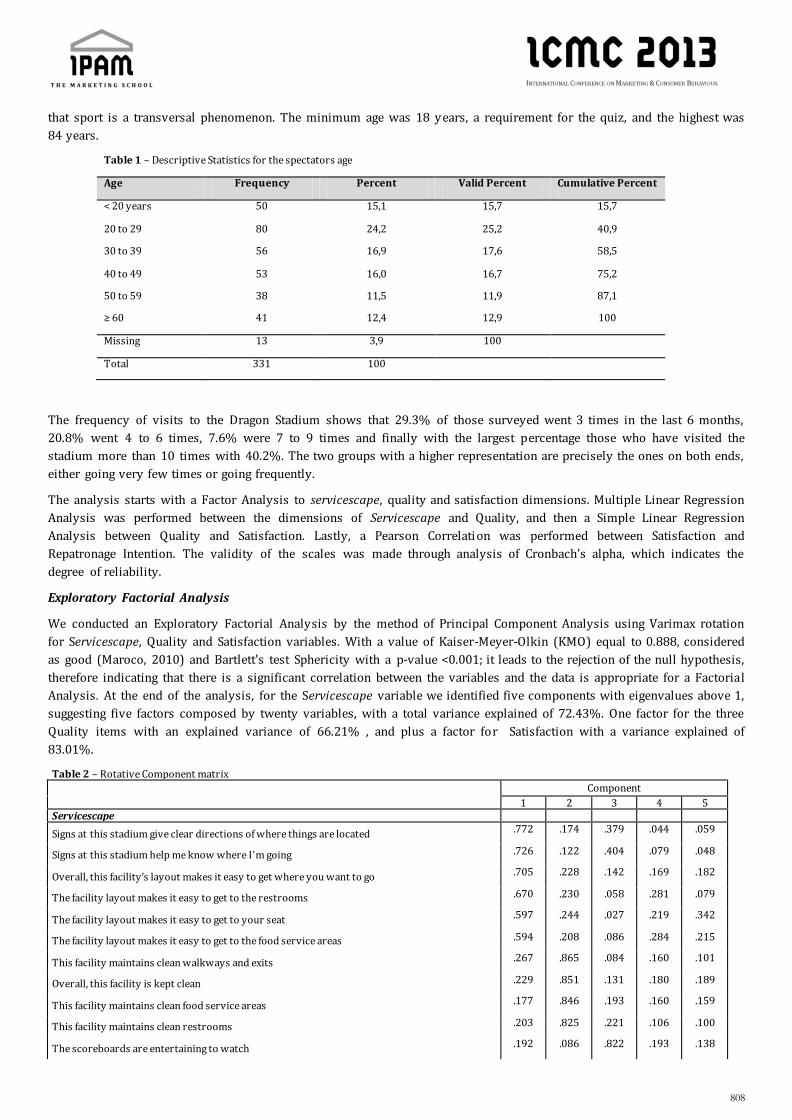
808
that sport is a transversal phenomenon. The minimum age was 18 years, a requirement for the quiz, and the highest was
84 years.
Table 1 – Descriptive Statistics for the spectators age
Age Frequency Percent Valid Percent Cumulative Percent
< 20 years 50 15,1 15,7 15,7
20 to 29 80 24,2 25,2 40,9
30 to 39 56 16,9 17,6 58,5
40 to 49 53 16,0 16,7 75,2
50 to 59 38 11,5 11,9 87,1
≥ 60 41 12,4 12,9 100
Missing 13 3,9 100
Total 331 100
The frequency of visits to the Dragon Stadium shows that 29.3% of those surveyed went 3 times in the last 6 months,
20.8% went 4 to 6 times, 7.6% were 7 to 9 times and finally with the largest percentage those who have visited the
stadium more than 10 times with 40.2%. The two groups with a higher representation are precisely the ones on both ends,
either going very few times or going frequently.
The analysis starts with a Factor Analysis to servicescape, quality and satisfaction dimensions. Multiple Linear Regression
Analysis was performed between the dimensions of Servicescape and Quality, and then a Simple Linear Regression
Analysis between Quality and Satisfaction. Lastly, a Pearson Correlation was performed between Satisfaction and
Repatronage Intention. The validity of the scales was made through analysis of Cronbach's alpha, which indicates the
degree of reliability.
Exploratory Factorial Analysis
We conducted an Exploratory Factorial Analysis by the method of Principal Component Analysis using Varimax rotation
for Servicescape, Quality and Satisfaction variables. With a value of Kaiser-Meyer-Olkin (KMO) equal to 0.888, considered
as good (Maroco, 2010) and Bartlett's test Sphericity with a p-value <0.001; it leads to the rejection of the null hypothesis,
therefore indicating that there is a significant correlation between the variables and the data is appropriate for a Factorial
Analysis. At the end of the analysis, for the Servicescape variable we identified five components with eigenvalues above 1,
suggesting five factors composed by twenty variables, with a total variance explained of 72.43%. One factor for the three
Quality items with an explained variance of 66.21% , and plus a factor for Satisfaction with a variance explained of
83.01%.
Table 2 – Rotative Component matrix
Component
1 2 3 4 5 Servicescape
Signs at this stadium give clear directions of where things are located .772 .174 .379 .044 .059
Signs at this stadium help me know where I'm going .726 .122 .404 .079 .048
Overall, this facility’s layout makes it easy to get where you want to go .705 .228 .142 .169 .182
The facility layout makes it easy to get to the restrooms .670 .230 .058 .281 .079
The facility layout makes it easy to get to your seat .597 .244 .027 .219 .342
The facility layout makes it easy to get to the food service areas .594 .208 .086 .284 .215
This facility maintains clean walkways and exits .267 .865 .084 .160 .101
Overall, this facility is kept clean .229 .851 .131 .180 .189
This facility maintains clean food service areas .177 .846 .193 .160 .159
This facility maintains clean restrooms .203 .825 .221 .106 .100
The scoreboards are entertaining to watch .192 .086 .822 .193 .138

809
The scoreboards add excitement to the place .139 .137 .811 .216 .023
The scoreboards provide interesting statistics .191 .123 .809 .115 .109
This facility has high quality scoreboards .159 .266 .643 .133 .208
The seat arrangements provide plenty of space .239 .182 .234 .803 .098
There is plenty of knee room in the seats .192 .122 .185 .785 .078
This facility provides comfortable seats .195 .193 .181 .749 .132
This is an attractive facility .144 .217 .160 .131 .888
This facility’s architecture gives it an attractive character .135 .189 .080 .080 .884
This facility is painted in attractive colours .408 .015 .248 .108 .559
Quality
The overall quality of this facility is: much worse than I expected – much better than I expected .851
The overall quality of this facility is: not at all what it should be – just what it should be .837
The overall quality of this facility is: terrible – great .750
Satisfaction
The overall feeling I get from this facility: puts me in a bad mood – puts me in a good mood .911
The overall feeling I get from this facility: is dissatisfaction – is satisfaction .911
Extraction Method: Principal Component Analysis. Rotation Method: Varimax with Kaiser Normalization.
Analyses of Hypotheses and Results
Hypothesis 1 aims to determine to what extent the quality perceived by the spectators (dependent variable) is explained
by the variables that belong to the Servicescape, in particular Layout Accessibility, Facility Aesthetics, Seating Comfort,
Electronic Equipment and Facility Cleanliness (independent variables). Thereby we proceed to Multiple Linear Regression
Analysis, a statistical technique used to analyse the relationship between a single dependent variable and several
independent variables (Hair et al., 1998).
The coefficient of determination R² (R² = 0.365) tends to be influenced by the sample size and it is considered an
optimistic measure of the quality (Pestana and Gageiro, 2005). Thereby, alternatively it is possible to use the R² Adjusted
(adjusted R² = 0.355). 35.5% of the variability of the Perceived Quality of Servicescape is explained by the variables of
Servicescape. The analysis of the simple correlation coefficient (R=0.604) suggests that there is a high positive correlation
(R> 0.6) between the variables (Table 3).

810
Hypothesis 2 was also supported (Table 4). By analysing the simple correlation coefficient (R = 0.482) we verified that
there is a good positive correlation (R> 0.4) between the variables. The adjusted coefficient of determination (adjusted R ²
= 0.230) suggests that 23.0% of the variability of the dependent variable Satisfaction is explained by the independent
variable Quality.
Similar to hypothesis 1 and 2, hypothesis 3 was also supported. Repatronage Intention consists of a single variable,
therefore impossible to make a Principal Component Analysis as in the case of the other dimensions. Thus, the hypothesis
that satisfaction positively influences the return of the spectator is tested by a Pearson Correlation between the factor
Satisfaction and the variable "In the future, their presence in the games in this stadium will... Not Frequent / Very
Frequent)". The satisfaction of the spectators has an influence, although small (R = 0,201) in the pre-disposition to return
to the stadium to watch a football match, so we can say that an increase in spectator satisfaction has a positive effect on its
return to the stadium.
Table 3 – Regression Analyses between the Servicescape Variables and Quality
R R Square Adjusted R
Square Durbin-Watson
0,604 0,365 0,355 2,133 ANOVA
Sum of Squares df Mean Square F Sig.
Regression 109,454 5 21,891 34,743 0,000
Residual 190,282 302 0,63
Total 299,736 307
Coefficients
B Std. Error Beta T Sig.
(Constant) 0,014 0,045 0,303 0,762
Accessibility 0,321 0,045 0,325 7,088 0,000
Aesthetics 0,168 0,045 0,170 3,716 0,000
Comfort 0,363 0,045 0,367 8,008 0,000
Electronic Equip. 0,206 0,045 0,208 4,541 0,000
Cleanliness 0,226 0,045 0,229 4,992 0,000
a. Predictors: (Constant), ACCESS, AESTHE, COMFO, EQUIP ,CLEAN b. Dependent: QUALID
Table 4 – Regression analysis between Quality and Satisfation
R R Square
Adjusted R
Square Durbin-Watson
0,482 0,232 0,230 1,889
ANOVA Sum of Squares Df Mean Square F Sig.
Regression 76,454 1 76,454 99,022 0,000
Residual 252,474 327 0,772
Total 328,929 328
Coefficients
B Std. Error Beta T Sig.
(Constant) 0,001 0,048 0,017 0,987
Quality 0,483 0,049 0,482 9,951 0,000
a. Predictors: (Constant), QUALID
b. Dependent: SATISF

811
5. Discussion of Results
Our aim with the present research is to examine a model that verifies which are the dimensions of the servicescape that can
influence certain key service variables. The results show that the servicescape has an influence on Perceived Quality and
Satisfaction of the Dragon Stadium spectator. Internal satisfaction has an impact on the spectators’ behaviour, and in their
loyalty, which translates into Repatronage Intention.
Factorial Analysis resulted in five servicescape factors as in the work of Wakefield and Blodgett (1996). Seating Comfort is
the dimension that has a greater load variation in the quality perceived by the spectator, going once more towards the
study of Wakefield and Blodgett (1996) who believe that this dimension is relevant for those services where the customer
has to be sitting for long periods of time. In addition, Melnick (1993) reached a similar conclusion, arguing that the
physical comfort is an important factor in the quality of the stadium and facilitates the enjoyment of the match.
Layout Accessibility was empirically proved as a determinant factor, as demonstrated in other studies (Wakefield and
Blodgett, 1996; Lucas, 2003). Indeed, a confined space, with narrow entrances and exits, or even with tight corridors will
give a feeling of being cramped or crowded. As Hui and Bateson (1991) stated, an area perceived as overcrowded affects
the emotions and behaviours of customers and therefore tends to be perceived as l ower quality. In many cases it is
important to find on the service facilities multiple customers on the service facilities (examples of such services are:
restaurant, hotel, cinema, theatre, holiday camp, etc.), and if that does not happen it can be interpreted as being a poorer
service. However, the presence of other customers must be moderate for each service. Perceptions of a full stadium adds
excitement, but shall not be such that it makes the spectator feel crowded and make the trip to auxiliary servic es difficult
(for example, restaurants), thereby reducing their consumption. Therefore, we can say that overcrowded environments
reduce the excitement and customer satisfactions within the servicescape. A spectator that feels uncomfortable due to
presence of other spectators may leave the stadium before the end of the game and feel doubt and hesitation in attending
other matches in the future (Wakefield and Sloan, 1995).
In terms of Facilities Cleanliness, its importance has been highlighted in several studies that relate perceived servicescape
cleanliness with future customer behaviour, and it happens in this study. In accordance with the outcome of Wakefield and
Blodgett (1996) we can state that Cleanliness is an important aspect of the quality of service and customer satisfaction,
and is particularly important in those services where the customer spends longer periods of time as is the case of a football
match.
Electronic Equipments can be used not only as a technological way to broadcast information (hours, play time, result, etc.)
but also as a way of entertainment during the service experience (instant replays, sports news, trivia and statistics of
players on the field, among others) (Wakefield and Blodgett, 1996). In this research, despite the fact that Electronic
Equipment has been in fourth place we are able to state that, for the spectators of Futebol Clube do Porto, this is a factor of
substantial importance. Lastly, the Aesthetic factor has also been proven as influential on the perception of quali ty.
In this paper, the adjustment of servicescape to sporting events was carried out essentially building on the work of
Wakefield and Blodgett (1996). The authors conducted an empirical study into three different services: in soccer, baseball
and casino. We consider it interesting to note that their sample was only about football, the same sport as this research,
which could prove the capacity of influence of the five servicescape dimensions, since the other two failed on Electronic
Equipment (sample Baseball) or the Seat Comfort (Sample Casino).
The satisfaction has an impact on the future behaviour of the spectators, particularly in their willingness to return to the
stadium. Thus, after the confirmation of the two previous hypotheses, it is possible to recognize the importance of
servicescape to keep viewers interested so that they return to the stadium. Wakefield and Blodgett (1996) argued that to
maximize customer satisfaction it is necessary that the managers of leisure facilities, including sporting events, regularly
assess the quality of their servicescapes.
Discussion and implications
On the Analysis of Multiple Linear Regression we realized that the servicescape influences the spectators’ perceived quality
of the Dragon Stadium. In particular, we emphasize the dimension Seating Comfort, which occupies the first place in the
explanation of the variance in the model, followed by the dimension Layout Accessibility, Facilities Cleanliness, Electronic
Equipment, and finally the Aesthetic Dimension.

812
We must point out that today's customers have at their disposal an extremely wide range of leisure services, a fact that
became progressively more challenging for service providers. In this way, and to turn the customer into a loyal one,
managers should create a value-added service in order to achieve customer preference.
We were also able to prove that the perceived quality influences satisfaction, and this, in turn, influences the desire of the
spectators to return. Managers who focus only on the delivery of the service and not on making the service encounter
environment enjoyable, may be losing further sales and not maximizing their profits.
As a final reflection, on this research, it was possible to verify the importance of physical evidence management. It is
essential to guide managers of leisure services in order to choose the elements of the servicescape to change or to improve.
Consequently, we consider it critical to develop improved and increased studies, taking into account that there is still a
very small number of investigations focused on this approach.
Managerial contributions
In this investigation, we analyzed two distinct data about the five servicescape variables, namely, the average ratings
allocated and the contribution of each variable in the change of the perceived quality. Curiously, the variable with the
lowest rating is the one with a higher variance value, while the variable that spectators ranked in first place is the last on
explaining the variation of the model. Effectively, Aesthetics was the factor with the highest average (mean = 6.52) and
ranked in last in the contribution to the explanation of the variance of the perceived quality (Beta = 0.170). Moreover, the
comfort factor, which was classified with an average of 5.42 (on the 5th and last place), is the one that presents the highest
beta value’s (Beta = 0.367).
The remaining factors obtained the same results for both. Thus, the Navigation is in the second place of the two
classification variables (mean = 6.30) and the contribution of the variants in the model (Beta = 0.325). The same goes for
Cleaning, which is in third place (mean = 6.06, Beta = 0.229), as well as the Electronics, fourth (mean = 5.72, Beta = 0.208) .
These results suggest that an eventual investment to improve the comfort scale factor will represent an increase in the
perceived quality, to a greater extent when compared to a possible improvement on the remaining four dimensions in the
study. The study also shows that FC Porto can be satisfied with the good work that has been developed, as the high scores
given by the spectators to all the dimensions of the servicescape show, as well as the average occupancy rate in the stadium
(over 74%), and the growth of the gate receipts of approximately 9% during 2008-2011 (Futebol Clube do Porto, 2011 and
Futebol Clube do Porto, 2012).
We conclude that the Dragon Stadium embodies what we consider to be an example of good management and
implementation of the servicescape variables, which leads to a progressive increase in satisfaction of its spectators, and
consequent increase on visits and gate receipts.
6. Conclusion
This study adds to the growing body of literature on servicescape by exploring the concept applied to the area of sports
entertainment, where studies are still limited. Furthermore, the vast majority analyzes only a single dimension or even a
single item, like music or decoration. By considering the full spectrum of the servicescape applied to a football stadium, this
research aims to fill this gap. Additionally, there are few studies in Portugal concerning the servicescape of sports
entertainment, and even less when considering its effect on service quality, satisfaction, and desire to return. Since
increasing the gate revenues is essential and this requires an understanding of spectators’ behavior, our purpose is to
provide guidance to sports managers to increase competitive advantage through servicescape. Our study proposes a
“starting point” that future research should extend and further refine. The following gives a list of future directions:
- We consider it would be interesting if future studies repeat the survey in more matches, since our research was
performed in a single match;
- We note that it would also be interesting to evaluate the service-core based on the same variables in order to compare
the influence of both. Some studies have already addressed such differences, namely Madrigal (1995) reached the
conclusion that some attributes of the game have contributed to the enjoyment of the spectator. Tomlinson et al. (1995) in
their study have concluded that both dimensions are important for the spectators, and that the servicescape was regarded
as the most important in contrast with the service core.

813
- Other research opportunity exists in the analysis of the fanaticism and loyalty to the soccer club. Although the
servicescape dimensions influence the spectators, it is likely that some loyal supporters will return to the stadium more for
its loyalty to the club than because the perceived quality of the servicescape (Lee et al., 2003).
- Also, the effect on sales profit may be further studied. Positive perceptions upon the physical environment influence
customers’ desire to stay, to return, and to spend money (Mehrabian and Russell, 1974). Hui and Bateson (1991) show in
their research that pleasant environments lead to a greater desire to stay in that specific space, drawing attention to the
the fact that sales profits that result from a longer stay in the facilities can be higher than the amount spend on the tick et
(Wakefield et al. 1996).
- Finally, Uhrich and Benkenstein (2011) research found that positive perceptions of other customers, the density, their
appearance and their behavior can influence the response of customers to the environment. The effect of people, either
employees or other customers, can change the perception of quality. Nevertheless, this dimension was left out for the
future and might produce a new research in the future.
References
AUBERT-GAMET, V. (1997), “Twisting Servicescapes: Diversion of the Physical Environment in a Re-Appropriation
Process”, International Journal of Service Industry Management, Vol. 8, Nº 1, pp. 26-41.
BAKER, J. and CAMERON, M. (1996), “The Effects of the Service Environment on Affect and Consumer Perception of
Waiting Time: An Integrative Review and Research Propositions”, Journal of the Academy of Marketing Science,
Vol. 24, Nº 4, pp. 338-349.
BARBER, N. and SCARCELLI, J. (2010), “Enhancing the Assessment of Tangible Service Quality Through the Creation of a
Cleanliness Measurement Scale”, Managing Service Quality, Vol. 20, Nº 1, pp. 70-88.
BATESON, J. and M. HUI (1992), “Ecological Validity of Photographic Slides and Videotapes in Simulating the Service
Setting”, Journal of Consumer Research, Vol.19, pp. 271-281.
BEBKO, C. (2000), “Service Intangibility and its Impact on Consumer Expectations of Service Quality”, Journal of Services
Marketing, Vol. 14, Nº 1, pp. 9-26.
BEBKO, C., SCIULLI, L., and GARG, R. (2006), “Consumers' Level of Expectation for Services and the Role of Implicit Service
Promises”, Services Marketing Quarterly, Vol. 28, Nº 2, pp. 1-23.
BERRY, L. (1980), “Services Marketing is Different”, Business, Vol. 30, Nº 3, pp. 24-36.
BERRY, L., SHANKAR, V., PARISH, J., CADWALLADER, S., and DOTZEL, T. (2006), “Creating New Markets Through Service
Innovation”, MIT Sloan Management Review, Vol. 47, Nº 2, pp. 56-63.
BITNER, M. (1990), “Evaluating Service Encounters: The Effects of Physical Surroundings and Employee Responses”, The
Journal of Marketing, Vol. 54, pp. 69-82.
BITNER, M. (1992), “Servicescapes: The Impact of Physical Surroundings on Customers and Employees” The Journal of
Marketing, Vol. 56, Nº 2, pp. 57-71.
BRADY, M. and J. CRONIN (2001), “Some New Thoughts on Conceptualizing Perceived Service Quality : A Hierarchical
Approach”, Journal of Marketing, Vol. 65, Nº 3, pp. 34-49.
BURNS, R., A. GRAEFE and J. ABSHER (2003), “Alternate Measurement Approaches to Recreational Customer Satisfaction:
Satisfaction-only Versus Gaps Scores”, Leisure Sciences, Vol. 25, Nº 4, pp. 363-380.
CARBONE L. and HAECKEL S. (1994), “Engineering Customer Experiences”, Marketing Management, Vol. 3, Nº 3, pp. 8-19.
CHELLADURAI, P. and K. CHANG (2000), “Targets and Standards of Quality in Sport Services”, Sport Management Review,
Vol. 3, pp. 1-22.
CHURCHILL G. and C. SURPRENANT (1982), “An Investigation into the Determinants of Customer Satisfaction”, Journal of
Marketing Research, Vol. 19, Nº 4, pp. 491-504.

814
CRONIN J. and TAYLOR S. (1994), “SERVPERF versus SERVQUAL: Reconciling Performance-Based and Perceptions-Minus-
Expectations Measurement of Service Quality”, The Journal of Marketing, Vol. 54, Nº1, pp. 125-131.
FORNELL, C. (1992), “A National Customer Satisfaction Barometer: The Swedish Experience”, The Journal of Marketing,
Vol. 56, Nº 1, pp. 6-21.
FUTEBOL CLUBE DO PORTO – FUTEBOL SAD (2011). Relatório e Contas Consolidado, 1º Semestre de 2010/2011. Available
at:
http://www.fcporto.pt/IncFCP/PDF/Investor_Relations/RelatoriosContas/RelatorioContas1S10CONSOLIDADO.
pdf. [Accessed: 07/05/2012]
FUTEBOL CLUBE DO PORTO – FUTEBOL SAD (2012). Relatório e Contas Consolidado, 1º Semestre de 2011/2012. Available
at:
http://www.fcporto.pt/IncFCP/PDF/Investor_Relations/RelatoriosContas/ir_RelatorioContas1S11Consolidado_
290212.pdf). [Accessed: 07/05/2012]
GREENWELL C. (2001) The Influence of Spectator Sports Facilities on Customer Satisfaction and Profitability . Dissertation
Presented in Partial Fulfillment of the Requirements for the Degree Doctor of Philosophy in the Graduate School
of The Ohio State University.
GRÖNROOS, C. (1982), Strategic Management and Marketing in the Service Sector, Helsingfors: Research Reports, Swedish
School of Economics and Business Administration.
HAIR, J., ANDERSON, R., TATHAM, R. and BLACK W. (1998), Multivariate Data Analysis, (5ª edição), New Jersey: Prentice
Hall.
HIGHTOWER, R., BRADY, M. and BAKER, T. (2002), “Investigating the Role of the Physical Environment in Hedonic Service
Consumption: An Exploratory Study of Sporting Events”, Journal of Business Research, Vol. 55, Nº 9, pp. 697-707.
HILL, B. and GREEN, B. (2000), “Repeat Attendance as a Function of Involvement, Loyalty, and the Sportscape across Three
Football Contexts”, Sport Management Review, Vol. 3, Nº 2, pp. 145-162.
HUI, M. and BATESON, J. (1991) “Perceived Control and the Effects of Crowding and Consumer Choice on the Service
Experience”, Journal of Consumer Research, Vol. 18, pp. 174-184.
KANDAMPULLY, J. (2002), Services Management: The New Paradigm in Hospitality . Frenchs Forest, New South Wales,
Pearson Education Australia.
KELLY, S. and TURLEY, L. (2001), “Consumer Perceptions of Service Quality Attributes at Sporting Events”, Journal of
Business Research, Vol. 54, Nº 2, pp. 161-166.
KENNETT, P., SNEATH, J. and HENSON, S. (2001), “Fan Satisfaction and Segmentation: A Case Study of Minor League
Hockey Spectators”, Journal of Targeting, Measurement and Analysis for Marketing , Vol. 10, Nº 2, pp. 132-142.
KOTLER, P. (1973), “Atmospherics as a Marketing Tool”, Journal of Retailing, Vol. 49, Nº 4, pp. 48-64.
LAM L., CHAN, K., FONG, G. and LO, F. (2011), “Does the Look Matter? The Impact of Casino Servicescape on Gaming
Customer Satisfaction, Intention to Revisit, and Desire to Stay”, International Journal of Hospitality Management,
Vol. 30, pp. 558–567.
LE BEL, J. (2005), “Beyond the Friendly Skies: An Integrative Framework for Managing the Air Travel Experience”,
Managing Service Quality, Vol. 15, Nº 5, pp. 437-451.
LE BLANC, G. (1992), “Factors Affecting Customer Evaluation of Service Quality in Travel Agencies: An Investigation of
Customer Perceptions”, Journal of Travel Research, Vol. 30, Nº 4, pp. 10-16.
LEE, S., RYDER, C. and HEE-JOON, S. (2003) “An Investigation of Environmental Motivation Factors Among Minor League
Baseball (MiLB) Fans”, The Sport Journal, Vol. 6, Nº 3.
LUCAS, A. (2003), “The Determinants and Effects of Slot Servicescape Satisfaction in a Las Vegas Hotel Casino”, UNLV
Gaming Research & Review Journal, Vol. 7, Nº 1, pp. 1-19.
MADRIGAL, R. (1995), “Cognitive and Affective Determinants of Fan Satisfaction with Sporting Event Attendance”, Journal
of Leisure Research, Vol. 27, Nº 3, pp. 205-227.

815
MARI, M. and S. POGGESI (2011), “Servicescape Cues and Customer Behavior: A Systematic Literature Review and
Research Agenda”, The Service Industries Journal, iFirst Article, pp. 1–29.
MARÔCO, J. (2011), Análise Estatística com o SPSS Statistics, (5ª edição), ReportNumber.
MEHRABIAN, A. and RUSSELL, J. (1974), An Approach to Environmental Psychology. Cambridge, Mass.: MIT Press.
MELNICK, M. (1993), “Searching for Sociability in the Stands: A Theory of Sports Spectating”, Journal of Sport Management,
Vol. 7, Nº 1, pp. 44-60.
MILLÁN, À. and Á. ESTEBAN (2004), “Development of a Multiple-item Scale for Measuring Customer Satisfaction in Travel
Agencies Services”, Tourism Management, Vol. 25, pp. 533- 546.
OLIVER, R. (1980), “A Cognitive Model of the Antecedents and Consequences of Satisfaction Decisions”, Journal of
Marketing Research, Vol. 17, pp. 460-469.
OLIVER, R. (1997), Satisfaction: A Behavioral Perspective on the Consumer, New York: McGraw-Hill.
PARASURAMAN, A., V. ZEITHAML and L. BERRY (1985), "A Conceptual Model of Service Quality and Its Implications for
Future Research," Journal of Marketing, Vol. 49, pp. 41-50.
PARASURAMAN, A., V. ZEITHAML and L. BERRY (1988), “SERVQUAL: A Multiple-item Scale for Measuring Customer
Perceptions of Service Quality and its Implications for Future Research”, Journal of Retailing, Vol. 64, pp. 12-40.
PARK, J., ROBERTSON, R. and WU C.(2005), “Investigating the Effects of Airline Service Quality on Airline Image and
Passengers' Future Behavioral Intentions: Findings from Australian International Air Passengers”, The Journal of
Tourism Studies, Vol. 16, Nº 1, pp. 2-11.
PESTANA, M. and GAGEIRO, J. (2005), Análise de Dados para Ciências Sociais – A Complementaridade do SPSS, (4ª edição),
Edições Sílabo, Lisboa.
RAPOPORT, A. (1982), The Meaning of the Built Environment, Sage Publications, Beverly Hills, CA.
REIMER, A. and KUEHN, R. (2005), “The Impact of Servicescape on Quality Perception”, European Journal of Marketing, Vol.
39, Nº 7 e 8, pp. 785-808.
RUST, R., A. ZAHORIK and T. KEININGHAM (1995), “Return On Quality (ROQ): Making Service Quality Financially
Accountable”, Journal of Marketing, Vol. 59, pp. 58-70.
SHILBURY, D. and WESTERBECK, H. (1996), “Measuring Service Quality: A Study of Victorian based NBL Teams'', 2 nd
Annual Sport Management Association of Australia and New Zealand Conference, Southern Cross University,
Lismore, pp. 149-66.
SWAN, J., RICHARDSON, L. and HUTTON, J. (2003), “Do Appealing Hospital Rooms Increase Patient Evaluations of
Physicians, Nurses, and Hospital Services?”, Health Care Management Review, Vol. 28, Nº 3, pp. 254-264.
TOMLINSON, M., BUTTLE, F. and MOORES, B. (1995), “The Fan as a Customer: Customer Service in Sports Marketing”,
Sport Marketing Quarterly, Vol. 3, Nº 1, pp. 19-33.
UHRICH, S. and BENKENSSTEIN, M. (2011), “Physical and Social Atmospheric Effects in Hedonic Service Consumption:
Customers’ Roles at Sporting Events”, The Service Industries Journal, iFirst Article, pp. 1-17.
VAN PHAM, K. and SIMPSON, M. (2006), “The Impact of Frequency of Use on Service Quality Expectations: An Empirical
Study of Trans-Atlantic Airline Passengers”, Journal of American Academy of Business, Vol. 10, Nº 1, pp. 1-6.
WAKEFIELD, K. and BLODGETT, J. (1994), “The Importance of Servicescapes in Leisure Service Settings”, Journal of Service
Marketing, Vol. 8, Nº 3, pp. 66–76.
WAKEFIELD, K. and BLODGETT, J. (1996), “The Effect of the Servicescape on Customers' Behavioral Intentions in Leisure
Service Settings”, The Journal of Services Marketing, Vol. 10, Nº 6, pp. 45-61.
WAKEFIELD, K. and SLOAN, H. (1995), “The Effects of Team Loyalty and Selected Stadium Factors on Spectator
Attendance”, Journal of Sport Management, Vol. 9, Nº 2, pp. 153-172.

816
WAKEFIELD, K., BLODGETT, J. and SLOAN, H. (1996), “Measurement and Management of the Sportscape”, Journal of Sport
Management, Vol. 10, Nº 1, pp. 15-31.
YOUNG, C., CUNNINGHAM, L. and LEE, M. (1994), “Assessing Service Quality as an Effective Management Tool: The Case of
the Airline Industry”, Journal of Marketing, Vol. 2, Nº 2, pp. 76-96.
ZEITHAML, V., A. PARASURAMAN and L. BERRY (1985), “Problems and Strategies in Services Marketing”, Journal of
Marketing, Vol. 49, Nº 2, pp. 33–46.

817
A Influência do Patrocínio no Comportamento
dos Adeptos: O caso do Futebol Profissional
Português Marketing Desportivo, Patrocínio, Comportamento do Consumidor, Perceção, Recomendação, Intenção de Compra.
Pedro Mendes, IPAM – The marketing School, [email protected]
Resumo
Esta investigação pretende avaliar o impacto do patrocínio no comportamento dos adeptos, tendo como referência o
futebol profissional em Portugal.
Definidos os objetivos, efetuamos um estudo que envolveu adeptos de dois clubes participantes da Liga Portuguesa de
Futebol Profissional com características similares em termos de dimensão, localização geográfica e médias de assistências.
O referido estudo baseou-se na aplicação de um questionário a 278 adeptos da Associação Académica de Coimbra e do
Sport Clube Beira-Mar no decorrer da época desportiva 2010/2011.
Consideramos a influência das variáveis independentes - Clube, Envolvimento com o Clube, Frequência de Assistência aos
Jogos, Envolvimento Específico (Sócio ou Não Sócio) em termos do impacto nas variáveis dependentes consideradas:
Perceção, Intenção de Compra e Recomendação.
Os resultados obtidos confirmam uma correlação entre o Envolvimento com o Clube e as três variáveis dependentes, o
mesmo não se verificando com as restantes variáveis independentes.
1. Introdução
O atual cenário de competitividade veio introduzir uma importância acrescida na forma como as Organizações comunicam.
A necessidade de assumir um posicionamento diferenciado e eficaz veio fazer com que se tenha desenvolvido uma enorme
diversidade de formas de comunicação.
No sentido de comunicar com o consumidor, é essencial desenvolver esforços ao nível da comunicação. A publicidade,
enquanto forma tradicional, tem sido amplamente utilizada, tendo-se assumido como meio prioritário, sendo este cenário
ideal, caso a sua massificação não tivesse levado a uma diminuição da sua eficácia, facto que levou ao surgimento de novas
alternativas.
Neste contexto, a funcionalidade que o patrocínio apresenta no sentido de adequar as mensagens de uma Organização a
determinados segmentos de mercado fez com que este tenha passado a ter uma aceitação generalizada.
Por sua vez o desporto tem-se assumido como veículo de excelência na atividade de patrocínio, sobrepondo-se a outras
áreas, como a música, a moda, a cultura e o cinema. Em Portugal, o futebol é a modalidade que proporciona maiores níveis
de visibilidade, sendo abrangente, mas simultaneamente dispendioso para os patrocinadores.
Novos desafios se colocam actualmente às Organizações Desportivas. No âmbito da sua forma, temos Sociedades
Desportivas privadas cuja perspectiva é o lucro, e por outro lado, temos Clubes Amadores presos a um modelo de gestão
ultrapassado e com dificuldades claras de sobrevivência. É precisamente neste contexto que a atividade de patrocínio tem
consolidado a sua posição.
A utilização do desporto enquanto ferramenta de comunicação assume hoje um protagonismo de tal ordem que obriga a
conhecer e compreender as suas potencialidades. De acordo com estes pressupostos torna-se imperativo perceber a forma

818
como o Patrocínio Desportivo influencia o comportamento dos adeptos. No nosso caso estudaremos a especificidade do
Futebol Profissional em Portugal, focada nos adeptos da Associação Académica de Coimbra e do Sport Clube Beira-Mar.
2. Justificação do Estudo
A atividade de patrocínio tem tido uma conotação diversificada com contornos pouco definidos em Portugal, cujas
fronteiras se apresentam muitas vezes dúbias, contudo o patrocínio é considerado um elemento de referência no
desenvolvimento desportivo na atualidade. Sem ele, um número significativo de Organizações Desportivas já teriam
seguido o caminho da extinção.
No sentido de confirmar o potencial desta ferramenta, podemos recorrer aos indicadores referenciados por (Carrillat et
all., 2005): “As despesas com patrocínios aumentaram em todo o mundo desde $2 biliões em 1984 até $28 biliões em 2004” , e
ainda aos referidos por (Seguin et all., 2005): “Na Europa tem sido relatado que em 2004 foram investidos $7,4 biliões em
programas de patrocínio”, e por (Howard, 2005) que nos diz o seguinte: “globalmente, as empresas aumentaram os seus
investimentos em patrocínio desportivo entre 2003 e 2005 numa percentagem de 2 9%.”.
Recorrendo a dados mais recentes, podemos destacar o estudo elaborado pela empresa Reuters sobre a atividade de
patrocínio nas 5 principais ligas europeias de futebol, precisamente, na Alemanha, Inglaterra, Espanha, Itália e França,
disponível em (www.futebolfinance.com), e que nos revela o seguinte: “O valor total das receitas de patrocínio nas
camisolas das 5 maiores ligas Europeias (Inglaterra, Espanha, Itália, Alemanha e França) caiu 2,6% para os 365 m ilhões de
Euros na temporada de 2009/10. Em termos de média de receitas provenientes de patrocínios nas camisolas, os clubes da
Bundesliga continuam a liderar, sendo que em média cada clube arrecada cerca de 6,3 milhões de Euros por ano neste género
de patrocínio, o que significa um aumento de 5% em relação à temporada anterior. Estes valores significam também que a
Bundesliga bate mais uma vez a Premier League Inglesa, uma vez que os clubes ingleses registam uma média de 4,8 milhões
de Euros em patrocínios nas camisolas, uma queda de 10% em relação à temporada de 2008/09.”
(http://www.futebolfinance.com/media-de-receitas-dos-patrocinios-nas -camisolas-0910 ás 25/01/2012 ás 15h52).
A partir dos dados disponíveis, podemos de seguida verificar a potencialidade dos patrocínios enquanto indutores do
desenvolvimento da atividade desportiva ao longo dos últimos tempos. Segundo (Sá, 2004): “Desde o maior evento
desportivo mundial, os Jogos Olímpicos, até à mais pequena prova de carácter amador, qualquer agente desportivo se habitou
a equacionar os patrocinadores como alguém que o pode ajudar na realização das suas provas” .
Num plano inverso, também os patrocinadores perceberam que a associação ao desporto poderia ser altamente vantajosa
no âmbito das suas atividades de marketing, contudo continua a persistir um aspeto de difícil compreensão: qual a
verdadeira eficácia do patrocínio desportivo?
À medida que vai ganhando preponderância, nunca o patrocínio desportivo conseguiu provar de forma inequívoca a sua
verdadeira eficácia e influência junto dos consumidores, ou seja, nem patrocinadores nem patrocinados conseguiram até a
momento desenvolver formas ou ferramentas de avaliação consensuais, quer do ponto de vista da prática, quer do ponto
de vista académico.
A comunidade científica, os agentes desportivos e o mundo empresarial carecem de provas capazes de confirmar a
efetividade das ações de patrocínio, tal como refere (Papadimitriou, 2008): “surpreendentemente, a pesquisa é escassa ao
nível do patrocínio, bem como em relação à sua importância enquanto recurso estratégico e instrumento de gestão da
marca.”. Por sua vez (Dees et all, 2008) advogam a necessidade de se incrementar o número e variedade de estudos no
âmbito do patrocínio, facto que sustenta esta investigação: “Devido ao facto do patrocínio se ter tornado uma forma
amplamente utilizada de comunicação de marketing, é necessário, no sentido de melhorar continuamente, estudar este
fenómeno, num esforço para determinar o seu impacto sobre os consumidores, bem como as suas perceções so bre os
patrocinadores e os seus produtos e serviços.” .
Tendo em conta as anteriores considerações podemos dizer que esta investigação se justifica pelas seguintes razões
fundamentais: 1- importância da atividade de patrocínios no desporto, 2- escassez de ferramentas fidedignas para avaliar
a eficácia do patrocínio desportivo, 3- escassez de estudos académicos sobre o tema.
819
3. Objetivos do estudo
A génese deste estudo está diretamente relacionada com a forma como o patrocínio desportivo influencia os espectadores.
Quando um Patrocinador se associa a um Clube Desportivo, torna-se fundamental perceber de que forma são influenciados
os adeptos desse clube, nomeadamente ao nível da perceção, recomendação e intenção de compra em relação às marcas
desse patrocinador.
Assim sendo, podemos dizer que o objetivo principal desta investigação passa por compreender a influência do Patrocínio
Desportivo no Comportamento dos Adeptos, sendo que teremos ainda os seguintes objetivos complementares: 1- Perceber
a forma como as intenções dos patrocinadores são percebidas pelos adeptos; 2- Contribuir para a clarificação da eficácia
das ações de patrocínio; 3- Esclarecer o verdadeiro impacto do patrocínio desportivo nos Adeptos; Dotar as Empresas e as
Organizações Desportivas de uma base teórica para avaliar a eficácia das Ações de Patrocínio.
4. Organização do estudo
Do ponto de vista da organização deste estudo, partimos inicialmente de uma abordagem conceptual de modo a perceber
as principais contribuições teóricas desenvolvidas até aos dias de hoje no âmbito da temática de estudo. Numa fase
posterior auscultamos os adeptos no sentido de perceber de que forma são estes influenciados pelas ações de patrocínio.
Em termos da revisão da literatura, apresentamos uma abordagem ao patrocínio desportivo enquanto ferramenta de
comunicação. Neste âmbito, incidimos a nossa análise no conceito, objetivos, modelos e ferramentas de avaliação da
eficácia das ações de Patrocínio.
Tendo como objetivo refletir sobre a influência do patrocínio desportivo no comportamento dos adeptos, decidimos
escutar precisamente a opinião os referidos adeptos (através de um questionário), tendo optado neste caso por estudar
dois concorrentes da mesma região e da mesma competição, precisamente a Associação Académica de Coimbra e o Sport
Clube Beira-Mar.
5. Apresentação do Problema
O problema central deste estudo consiste na identificação da forma como os adeptos são influenciados pelas ações de
patrocínio desportivo.
Pretendemos avaliar o grau e a forma de influência do patrocínio desportivo nos adeptos, bem como concluir se o clube, o
comportamento e o perfil do espectador influenciam a forma como percecionam a mensagem. Neste contexto, a perceção,
a recomendação e a intenção de compra assumem-se como variáveis dependentes e o clube, a frequência de
assistência aos jogos e o tipo de relação com o clube surgem como variáveis independentes deste estudo. O tipo de
relação com o clube será medido através de dois indicadores: envolvimento efetivo e o facto de o adepto ser ou não sócio
do clube.
6. Condicionantes
A principal condicionante em Portugal, passa pela ausência de informação sistematizada e devidamente fundamentada do
ponto de vista científico sobre a atividade de Patrocínio, facto que nos levou a optar pelo Futebol Profissional por ser a
modalidade com mais dados disponíveis.
Outra dificuldade a considerar tem a ver com as restrições que os Clubes portugueses colocam no acesso a informações
sobre as suas políticas e as suas práticas. Esta postura torna-se ainda mais notória quando confrontados com a
necessidade de aplicar um questionário no âmbito de um jogo.
Finalmente, não podemos esquecer que este estudo será desenvolvido num Estádio, no âmbito de um jogo, em diferentes
locais, e perante uma amostra heterogénea, o que implica obrigatoriamente uma operacionalização baseada em
componentes logísticas de alguma complexidade.

820
7. Revisão Bibliográfica
7.1. Conceito de patrocínio
Ao iniciarmos a abordagem ao tema específico dos patrocínios, torna-se fulcral partir do pressuposto de que a atividade de
patrocínio tem tido recentemente uma importância acrescida, tanto ao nível das políticas de marketing dos Patrocinadores
como das Organizações Desportivas.
(Davidsson e Savolainen, 2004) fazem precisamente referência a esta ideia: “Os patrocínios, particularmente os desportivos,
têm obtido uma crescente importância nos últimos anos, revelando -se, atualmente, como uma importante estratégia no
desenho do marketing-mix das organizações. Hoje em dia, o desporto, bem como outros eventos, não sobreviveriam sem o
investimento dos patrocinadores.”.
No mesmo seguimento, o relatório (IOC, 2008) revela uma importante reflexão referente aos Jogos Olímpicos: “Sem o apoio
da comunidade empresarial, sem a sua tecnologia, conhecimento, pessoas, serviços, produtos, telecomunicações, sua fonte de
financiamento - os Jogos Olímpicos não podem nem poderiam acontecer. Sem este apoio, os atletas não podem competir nem
alcançar o seu melhor.”.
Por sua vez (Madrigal, 2001) diz que, “A política de patrocínio de eventos desportivos representa um dos investimentos de
comunicação de marketing que mais rapidamente tem crescido, sendo atualmente uma estratégia importante no desenho do
marketing-mix das Organizações. Estas esperam que o “goodwi l” que os consumidores percecionam relativamente a um
evento, a uma causa ou a uma equipa desportiva se possa refletir positivamente no capital das suas marcas.” .
Ainda sobre as vantagens competitivas associadas ao patrocínio, destacamos as referências de (Yang et all, 2008) no
âmbito dos Jogos Olímpicos de Beijing realizados em 2008: “O patrocínio desportivo na China ajudou, não apenas a
construir o valor das marcas, mas também a desenvolver relacionamentos, redes e alianças. O relacionamento é precisament e
o elemento mais importante no âmbito dos negócios, no caso específico da China.” .
Demonstrada que está a importância do patrocínio nos dias de hoje e a sua função central na atual gestão das Organizações
Desportivas, podemos destacar a importância desta ferramenta de comunicação enquanto meio para atingir um cenário de
lucro financeiro.
Recorrendo a (Schwarz e Hunter, 2008): “podemos destacar a importância do patrocínio no sentido de tornar lucrativos,
torneios e campeonatos, através da sua potencialidade de exposição nos media e da exploração de publicidade relacionada ao
evento.”.
Segundo (Madrigal, 2001): “Os patrocinadores são uma excelente fonte de receitas, e as relações de patrocínio de longo prazo
podem fornecer um fluxo constante de receitas para os programas desportivos. Essas relações são também altamente
benéficas para as organizações patrocinadoras, porque as Instituições Desportivas e Organizadores de Eventos podem
“oferecer” um público vasto e fiel, a quem as empresas podem comercializar as suas respetivas marcas.”.
Do ponto de vista do patrocinador, a ação de patrocínio deve ser vista também como ferramenta de comunicação com
elevado valor agregado, tal como sugere (Fahy et all, 2004): “o uso do patrocínio pode servir como uma fonte de vantagem
competitiva sustentável através do uso de combinações únicas de recursos inimitáveis” .
Tendo em conta a importância do patrocínio, bem como o seu papel central nesta investigação, apresentamos de seguida a
definição sustentada do conceito bem como das suas ramificações.
Acerca do conceito de patrocínio (Cornwell et all, 2005; Madrigal, 2001), definem-no com sendo: Um valor pago por uma
Instituição (patrocinador), em dinheiro ou em espécie, em troca do acesso ao potencial comercial explorável associado a
uma determinada Organização (patrocinado).
Em função da reflexão anterior, poderemos pressupor que estamos perante uma relação de transferência de propriedade
de exploração de uma componente comercial de comunicação mediante um fluxo financeiro relacionado com serviços ou
géneros.
Sobre o conceito de propriedade associado aos patrocínios, (Farrelly et all, 2008) dizem-nos o seguinte: “Comummente
utilizado na literatura, o termo "propriedade” refere-se a qualquer organização (por exemplo, o COI, a NFL, o New York
Yankees ou Manchester United), com as quais um patrocinador adota um alinhamento formal como parte integrante da sua
estratégia corporativa de marketing.”.
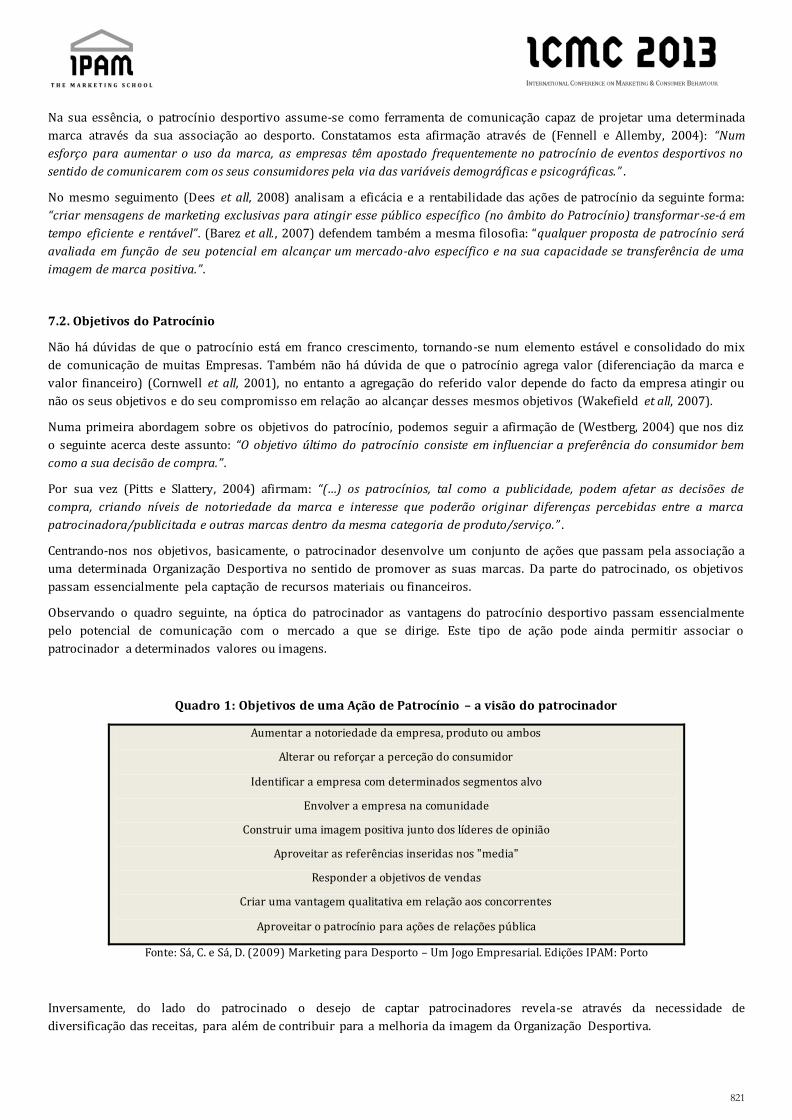
821
Na sua essência, o patrocínio desportivo assume-se como ferramenta de comunicação capaz de projetar uma determinada
marca através da sua associação ao desporto. Constatamos esta afirmação através de (Fennell e Allemby, 2004): “Num
esforço para aumentar o uso da marca, as empresas têm apostado frequentemente no patrocínio de eventos desportivos no
sentido de comunicarem com os seus consumidores pela via das variáveis demográficas e psicográficas.” .
No mesmo seguimento (Dees et all, 2008) analisam a eficácia e a rentabilidade das ações de patrocínio da seguinte forma:
“criar mensagens de marketing exclusivas para atingir esse público específico (no âmbito do Patrocínio) transformar-se-á em
tempo eficiente e rentável”. (Barez et all., 2007) defendem também a mesma filosofia: “qualquer proposta de patrocínio será
avaliada em função de seu potencial em alcançar um mercado-alvo específico e na sua capacidade se transferência de uma
imagem de marca positiva.”.
7.2. Objetivos do Patrocínio
Não há dúvidas de que o patrocínio está em franco crescimento, tornando-se num elemento estável e consolidado do mix
de comunicação de muitas Empresas. Também não há dúvida de que o patrocínio agrega valor (diferenciação da marca e
valor financeiro) (Cornwell et all, 2001), no entanto a agregação do referido valor depende do facto da empresa atingir ou
não os seus objetivos e do seu compromisso em relação ao alcançar desses mesmos objetivos (Wakefield et all, 2007).
Numa primeira abordagem sobre os objetivos do patrocínio, podemos seguir a afirmação de (Westberg, 2004) que nos diz
o seguinte acerca deste assunto: “O objetivo último do patrocínio consiste em influenciar a preferência do consumidor bem
como a sua decisão de compra.”.
Por sua vez (Pitts e Slattery, 2004) afirmam: “(…) os patrocínios, tal como a publicidade, podem afetar as decisões de
compra, criando níveis de notoriedade da marca e interesse que poderão originar diferenças percebidas entre a marca
patrocinadora/publicitada e outras marcas dentro da mesma categoria de produto/serviço.” .
Centrando-nos nos objetivos, basicamente, o patrocinador desenvolve um conjunto de ações que passam pela associação a
uma determinada Organização Desportiva no sentido de promover as suas marcas. Da parte do patrocinado, os objetivos
passam essencialmente pela captação de recursos materiais ou financeiros.
Observando o quadro seguinte, na óptica do patrocinador as vantagens do patrocínio desportivo passam essencialmente
pelo potencial de comunicação com o mercado a que se dirige. Este tipo de ação pode ainda permitir associar o
patrocinador a determinados valores ou imagens.
Quadro 1: Objetivos de uma Ação de Patrocínio – a visão do patrocinador
Aumentar a notoriedade da empresa, produto ou ambos
Alterar ou reforçar a perceção do consumidor
Identificar a empresa com determinados segmentos alvo
Envolver a empresa na comunidade
Construir uma imagem positiva junto dos líderes de opinião
Aproveitar as referências inseridas nos "media"
Responder a objetivos de vendas
Criar uma vantagem qualitativa em relação aos concorrentes
Aproveitar o patrocínio para ações de relações pública
Fonte: Sá, C. e Sá, D. (2009) Marketing para Desporto – Um Jogo Empresarial. Edições IPAM: Porto
Inversamente, do lado do patrocinado o desejo de captar patrocinadores revela-se através da necessidade de
diversificação das receitas, para além de contribuir para a melhoria da imagem da Organização Desportiva.

822
Quadro 2: Objetivos de uma ação de patrocínio – a visão do patrocinado
Aumentar e diversificar as receitas
Tornar a instituição mais atrativa para todos os públicos
Potenciar ações promocionais
Melhorar o espetáculo oferecido ao público
Proporcionar maior margem de manobra nos investimentos
Fonte: Sá, C. e Sá, D. (2009) Marketing para Desporto – Um Jogo Empresarial. Edições IPAM: Porto
Na mesma linha podemos verificar o que nos diz (Madrigal, 2001): “O patrocínio é atrativo para as empresas, dado que pode
ser usado para ligar os consumidores às marcas patrocinadoras, utilizando o evento desportivo como envolvente ou elemento
de associação, e influencia os consumidores, formando imagens de marca positivas, ou induzindo -os a comprar produtos
dessas empresas. Idealmente, as empresas patrocinadoras gostariam que os fãs de um determinado evento transferissem
sentimentos positivos para a propriedade das suas marcas ou produtos específicos.”.
Ainda no âmbito dos objetivos do patrocínio, (Westberg, 2004) defende que a principal razão para patrocinar passa pelo
aumento da preferência do consumidor bem como pela sua decisão de comprar e recomprar os produtos/serviç os da
empresa patrocinadora.
Para (Papadimitriou et all, 2008): “A literatura sobre marketing desportivo proporciona uma discussão sobre o valor do
patrocínio no desporto, baseada na geração de benefícios, tais como: sensibilização para o consumo, aumento das vendas e
da quota de mercado, bem como, oportunidades para desenvolver situações de relações públicas com empregados e
clientes (ou seja, a hospitalidade).”.
Numa outra abordagem (Barez et all, 2007) através da realização de um estudo baseado na análise de vinte e sete casos
concluíram que as ações que se traduziram em sucesso atingiram os seguintes objetivos: reconhecimento da marca;
promoção da imagem de marca e estimulação da experimentação do produto.
Podemos ainda desenvolver, no âmbito da aplicação a este trabalho a componente teoria de alguns objetivos do patrocínio
(na óptica do patrocinador) diretamente relacionadas com as variáveis desta investigação.
Intenção de Compra
Segundo (Meenaghan, 2001): “A primeira motivação para investir num patrocínio é a obtenção de uma resposta por parte do
consumidor”, sendo que no caso deste, a resposta desejada passa pela intenção de compra rumo à compra efetiva. Deste
modo, um dos objetivos críticos do patrocínio é precisamente a capacidade de influenciar a intenção de compra.
A intenção de compra e a lealdade à marca são fatores importantes para alcançar mudanças positivas nas vendas,
constituindo uma evidência da eficácia do patrocínio (Pitts et all, 2004).
Na perspectiva de (Spears e Singh, 2004): “a intenção de compra proporciona uma sensação de força motivacional de um
indivíduo para executar um comportamento de compra específico. A definição do termo é que, as intenções de compra
constituem um plano consciente de um indivíduo no sentido de fazer um esforço para comprar uma determinada marca.” .
(Flaircloth et all, 2001), reforçam a ideia de que as ações de patrocínio têm uma influência direta nas intenções de compra:
“Após as atitudes para com os patrocinadores estarem formadas, estas podem ter um forte impacto no comportamento do
consumidor. Estudos diversos mostram que a atitude em relação ao patrocinador influencia as intenções de compra do
consumidor.”.
(Koo et all, 2006) num estudo centrado no Bowl Universitário, concluíram também no mesmo sentido: “determinou-se que
os participantes com maiores níveis de respostas afetivas para patrocínio de empresas do College Bowl Chapionship Series
(BCS) mostraram significativas intenções de compra em comparação com participantes com menor nível de respostas
afetivas.”.

823
Imagem de Marca
Acerca da importância da Imagem de Marca nos dias de hoje, (Wong e Merrilees, 2005), salientam o seguinte: “Na busca de
vantagens competitivas no mercado, a marca deve estar no coração da estratégia corporativa. Em outras palavras, os
gestores devem ser capazes de combinar aspetos corporativos, elementos de marketing e planos de promoção numa
estratégia de utilização da marca. Esta estratégia irá oferecer á empresa uma vantagem sustentável sobre os seus
concorrentes.”.
Segundo (Keller, 2003), definimos Imagem de Marca da seguinte forma: “perceções sobre uma marca refletidas na memória
do consumidor. Associações à marca são nódulos informativos ligados ao nódulo da marca em memória e contêm o
significado da marca para os consumidores.” .
Por sua vez (Grohs et all, 2004) fazem uma adaptação do conceito anterior, chegando ao seguinte á seguinte conclusão:
“perceções sobre um evento refletidas pelas associações ao evento residentes na memória do consumidor. Associações ao
evento são nódulos informativos ligados ao nódulo da marca em memória e contêm o significado do evento para os
consumidores.”.
Torna-se também fundamental perceber de que forma as ações de patrocínio, poderão arrastar consigo importantes
funções ao nível da modificação da imagem de marca. A este nível (Amis, 2003) diz-nos o seguinte: “como as empresas se
esforçam para construir marcas fortes com elevado valor no mercado, o patrocínio do desporto pode servir como ferramenta
de apoio aos objetivos de gestão da marca.” .
Ao analisarmos o papel da imagem nos patrocínios, devemos ter presente o conceito de Transferência de Imagem, sendo
que para tal, teremos de perceber em concreto o conceito que apresentamos. Segundo (Grohs et all, 2004): “A
Transferência de Imagem nos patrocínios desportivos é definida como a transferência de associações, atribuídas à atividade
patrocinada, para a marca patrocinadora, ou seja, existe o objetivo de evocar sentimentos e atitudes positivas relativamente
ao patrocinador, ligando esse patrocinador a um evento altamente valorizado pelos indivíduos, para dessa forma, conseguir
que a imagem percecionada acerca do evento passe para os patrocinadores.” .
Recomendação
A recomendação, enquanto objetivo associado à atividade de patrocínio surge associada com a obtenção de comentários
positivos em relação às marcas da empresa patrocinadora por parte do espectador. O desenvolvimento desta temática
relaciona-se muitas vezes com a designação Word-of-mouth, sendo patente a sua presença em diversos estudos realizados
no âmbito do patrocínio.
De acordo com (Swanson, et all, 2003): “A comunicação Word-of-mouth foi procurada e utilizada para se tornar numa
poderosa influência ao nível do processo de compra por parte do consumidor.” .
A afirmação anterior coloca-nos precisamente no campo do estudo da comunicação word-of-mouth enquanto objetivo
associado com a atividade de patrocínio, ou seja, enquanto meta que as marcas pretendem alcançar através da sua ligação
ao desporto.
Sobre esta temática, (Laczniak et all, 2001) consideram através dos seus estudos, a Comunicação Word-of-mouth como
uma poderosa ferramenta de marketing para qualquer organização empresarial.
Por sua vez (Swanson et all, 2003) referem-se da seguinte forma às qualidades inerentes a este tipo de comunicação: “A
comunicação Word-of-mouth pode ter uma influência mais poderosa no comportamento do consumidor do que a imprensa
escrita, pois os consumidores encontram-na mais acessível, confiável e menos tendenciosa.” .
Envolvimento
Segundo (Meenaghan, 2001): “Relativamente a um evento ou a uma equipa, poderemos encontrar adeptos altamente
envolvidos, bem como poderemos encontrar aqueles ligeiramente comprometidos .”.
No fundo, através desta variável pretendemos demonstrar que os adeptos de uma equipa ou de uma determinada
modalidade (alto grau de envolvimento) serão mais facilmente “afetados” pelas ações de patrocínio inerentes a essa
equipa ou a essa modalidade.

824
(Brown et all, 2003) dizem-nos o seguinte a este propósito: “Da mesma forma que o envolvimento com o produto/serviço
conduzirá a níveis mais desenvolvidos e mais fortes de perceção dos atributos da marca e de compromisso com a marca, existe
considerável evidência de que o envolvimento com o desporto desenvolverá e ampliará o efeito do patrocínio.” .
De acordo com o que nos diz (Pitts et all, 2004): “Os espectadores altamente envolvidos (e, logo, mais conhecedores da
atividade patrocinada), tais como os possuidores de bilhete de época, reconhecem mais frequentemente, os patrocinadores,
comparativamente aos espectadores pouco envolvidos.” .
(Meenaghan, 2001) considera que, Consumidores altamente envolvidos são extremamente sensíveis ao comportamento
de empresas patrocinadoras no que diz respeito á sua atividade preferida, reagindo positivamente ou negativamente de
acordo com este comportamento.
No mesmo sentido, podemos explorar os trabalhos desenvolvidos por (Kwon e Armstrong, 2002) e (Madrigal, 2000) que
nos revelam que, os fãs mais ligados ou envolvidos com sua equipa geralmente têm dificuldade em distanciarem -se de seu
grupo ou evento favorito. Devido ao seu desejo de alcançar uma forte ligação com a equipa, fãs altamente envolvidos,
compram frequentemente mais artigos de merchandising da sua equipa. Este tipo de fãs tende também a assistir a mais
jogos da sua equipa (Laverie e Arnett, 2000) e (Trail et all, 2003).
(Kwon e Armstrong, 2002) desenvolveram ainda um estudo que veio revelar dados ainda mais específi cos: “fãs altamente
envolvidos não só compram mais artigos de merchandising da sua equipa, como também o fazem de forma impulsiva.
Neste estudo, as previsões apontavam para que, o prazer da compra, a disponibilidade de tempo, a disponibilidade de
dinheiro, e identificação com a equipa teriam um impacto importante nos comportamentos de compra impulsiva.
Verificou-se no entanto que, a identificação (envolvimento) com a equipa foi o único fator que produziu significativos
comportamentos de compra por impulso.
Para (Quester e Thompson, 2001): “O envolvimento dos fãs constitui-se como um elemento integrante na avaliação da
eficácia do patrocínio, pois os vários níveis de compromisso emocional que os fãs têm com o evento patrocinado afetarão a
perceção em relação aos patrocinadores desse mesmo evento. Dependendo de como os consumidores estão envolvidos com os
seus desportos favoritos ou outros eventos (tais como as artes), eles podem estabelecer uma série de relações com os
patrocinadores.”.
7.3. Eficácia e avaliação das Ações de Patrocínio
7.3.1. Análise conceptual
Sendo o patrocínio definido enquanto ferramenta de comunicação com contornos de ligação emocional entre patrocinador
e patrocinado, (Vale et all, 2008) atribuem precisamente a esta relação emocional, o maior ou menor grau de eficácia de
uma ação de patrocínio.
(Dees et all, 2008), no seguimento da investigação que realizaram no âmbito de competições interescolares dizem o
seguinte: “A avaliação das atividades de patrocínio ligadas aos eventos desportivos interescolares de elite tornou-se
fundamental para determinar a eficácia do patrocínio e para maximizar as relações entre os departamentos de atletismo e os
seus parceiros corporativos.”.
Intangibilidade e dificuldades de mensuração, são dois termos que definem um pouco a árdua tarefa dos quadros
empresariais que operam na área dos patrocínios. Os instrumentos de medição estão ainda numa fase primária em termos
de abordagem académica, e a sua aplicação tem sido até ao momento caracterizada pelo aspeto rudimentar.
Sobre a mesma temática podemos obter a seguinte reflexão de (Wakefield et all, 2007): “Embora os eventos e as
organizações desportivas possam realizar periodicamente estudos orientados ou auditorias externas sobre os patrocínios, os
resultados são influenciados pela perceção prévia acerca da marca e pelo ruído proveniente do meio ambiente, bem como com
os gastos com publicidade e promoção que não estão diretamente relacionados com o programa de patrocínio. Uma forma de
controlo para outros esforços de comunicação e para o ruído ambiente passará precisamente por testar as mensagens de
patrocínio dentro de um ambiente de laboratório.” .
(Papadimitriou et all, 2008) no âmbito da sua investigação sobre os patrocínios levados a cabo no decorrer das Olimpíadas
de Atenas em 2004 confirmam a nossa suposição de que a avaliação destas mesmas ações de patrocínio é precisamente
um tema ainda numa fase pouco consolidada.
825
De acordo com (Papadimitriou et all, 2008): “dos indicadores usados para determinar o papel dos acordos de patrocínio
em termos da estratégia e da gestão da marca por parte das empresas, a presente medida (avaliação) é provavelmente
aquela que gera respostas mais vagas e generalistas.”
Da amostra considerada na referida investigação, de uma amostra de dez patrocinadores, apenas sete referem ter
desenvolvido mecanismos para medir a eficácia do patrocínio, tendo estes incidido muito superficialmente em planos para
medir o impacto sobre o volume de vendas, métodos para medir índices de recordação da marca, recolha informações
sobre a imagem percebida junto dos consumidores e estudos de análise de custo-benefício após os jogos (Papadimitriou et
all, 2008).
Segundo (Boluda et all, 2008): “Supor-se-ia lógico que, se os objetivos que se atribuem ao patrocí nio fossem distintos, também
deveriam ser diferentes as ferramentas utilizadas para medir a sua eficácia.” . Apesar do referido anteriormente, de acordo
com (Grohs et all, 2004): “Mais de 70% dos patrocínios são avaliados exclusivamente em função da audiênc ia alcançada.”.
Perante este cenário torna-se fundamental perceber por que razão não se utilizam outras ferramentas de medida sobre a
eficácia das ações de patrocínio.
Sobre este aspeto, (Boluda et all, 2008) diz-nos: “Poderíamos argumentar que é difícil realizar outro tipo de ações no sentido
de medir a eficácia do patrocínio. Esta afirmação poderia ser correta para certas medições relacionadas com a imagem de
marca, mas não tanto para o reconhecimento da marca. A razão parece estar mais ao nível dos maus resultados que os
estudos sobre a notoriedade das marcas patrocinadoras revelam nos últimos anos.” .
Sobre a eficácia do patrocínio associada á exposição das mensagens, De Pelsmacker et all in (Davidsson e Savolainen,
2004) referem: “A eficácia do patrocínio baseia-se no efeito de exposição, ou seja, a exposição a um patrocinador aumenta a
familiaridade, a longo prazo, com a marca desse patrocinador, bem como gera uma preferência por essa marca.” .
7.3.2. Modelos de análise
“Uma boa gestão do patrocínio serve de argumento chave para a sua renovação mas, para que isto realmente se concretize
falta ainda um passo essencial para garantir uma relação de continuidade com o seu patrocinador, fazendo uso dos registos e
medições anteriores no sentido de as comunicar ao seu parceiro de negócio” (Cardoso, 2004).
Definir objetivos, apresentar propostas, negociar contrapartidas e implementar ações são tarefas comuns a patrocinadores
e patrocinados. Onde todos os agentes envolvidos começam a ter dificuldades é na fase pós-evento, ou seja, a gestão de um
patrocínio não acaba no dia do evento, mas sim após a avaliação que as duas partes fazem da relação que desenvolveram
em conjunto.
(Cardoso, 2004) entende que os patrocínios devem ser sempre mensuráveis, pois trata-se da única forma de evidenciar as
vantagens do investimento. Este autor descreve um conjunto de dados que permitem ajudar a tangibilizar as vantagens do
investimento: dados demográficos, índices de memorização e reconhecimento da marca, impacto na comunicação social,
suportes de merchandising distribuídos, registo das vendas efetuadas no decorrer da ação, novos contactos realizados,
número de contactos efetuados e ações conjuntas com outros patrocinadores.
Neste âmbito podemos analisar o trabalho desenvolvido por (Speed e Thomson, 2000) que nos referem o seguinte: “A
relação entre a exposição e a memorização tem sido tratada com profundidade com outras ferramentas de comunicação,
gerando teorias que são transferíveis para a área dos patrocínios.” .
Dentro dos modelos estudados no âmbito desta tese, gostaríamos de referenciar o modelo de (Meenaghan, 2001) que nos
descreve o efeito específico que o patrocínio produz no espectador. Este autor identifica, a atitude para com o
patrocinador, o goodwill e o envolvimento com os fãs, como sendo as três variáveis centrais que condicionam as intenções
de compra do consumidor dentro de um contexto de eficácia de uma ação de patrocínio.
Do ponto de vista da atitude perante o patrocinador, esta pode ser vista como a avaliação global que o consumidor faz de
uma organização que patrocina um evento (Keller, 2003).
Referente ao modelo de análise dos efeitos do patrocínio de (Meenaghan, 2001), as atitudes positivas perante os
patrocinadores antecedem as intenções de compra, bem como os comportamentos de compra efetiva. Sobre o goodwill, o
autor define-o, como sendo, “atitude positiva dos consumidores em transmitir uma boa imagem de um patrocinador que
apoia e facilita a organização de um evento ou de um clube, sendo esta a causa pela qual os mesmos se apaixonam.”.

826
Sobre o envolvimento com os fãs, (Madrigal, 2001) e (Meenagham, 2001) referem-se a esta variável como sendo, uma
componente da teoria de identificação social, sendo operacionalizada como a extensão em que os consumidores se
identificam, e são motivados por meio da sua ligação e filiação com atividades de lazer.
(Papadimitriou et all, 2008) desenvolveram um modelo de análise relacionado com a avaliação dos patrocínios dos Jogos
Olímpicos de Atenas 2004. Este modelo, baseado na aplicação de uma entrevista semiestruturada aplicada aos Diretores
de Marketing das empresas patrocinadoras, incidiu sobre as seguintes questões: 1) as razões pelas quais as empresas
decidiram patrocinar os Jogos Olímpicos; 2) a forma como o patrocínio olí mpico foi integrado na estratégia global da
empresa, estratégia de marketing e esforços de gestão de marca; 3) o montante dos recursos que foram mobilizados para o
patrocínio; 4) as iniciativas desenvolvidas para alavancar o patrocínio; 5) planos das empresas no sentido de procederem
à avaliação do patrocínio olímpico.
Por último, torna-se fundamental, por se enquadrar nos objetivos e nos pressupostos metodológicos da nossa
investigação, referir os trabalhos desenvolvidos por (Sá, 2004), (Tsiotsou e Alexandris, 2007) e por (Alexandris; Tsaousi e
James, 2007) os quais se basearam na aplicação de questionários com vista a avaliarem a influência do patrocínio no
espectador, centrando-se na correlação das seguintes variáveis: perceção, recomendação, intenção de compra e
envolvimento
8. Definição do Problema e Hipóteses de Estudo
8.1. Definição do problema
A nossa problemática de estudo passa por avaliar o grau e a forma de influência do patrocínio desportivo nos adeptos, bem
como concluir se o clube, o comportamento e o perfil do espectador influenciam a forma como percecionam a mensagem.
Neste contexto, a perceção, a recomendação e a intenção de compra assumir-se-ão como variáveis dependentes e o
clube, a frequência de assistência aos jogos e o tipo de relação com o clube surgem como variáveis independentes
deste estudo. O tipo de relação com o clube será medido através de dois indicadores: envolvimento efetivo e o facto de o
adepto ser ou não sócio do clube.
8.2. Hipóteses
Tendo como ponto de partida, os estudos prévios realizados no âmbito desta investigação, consideramos as seguintes
hipóteses, em função da problemática central que pretendemos estudar:
H1: A perceção sobre o patrocinador é influenciada pelo clube ao qual o adepto está ligado sentimentalmen te
H2: A perceção sobre o patrocinador é influenciada pela frequência com que o adepto assiste aos jogos do clube.
H3: A perceção sobre o patrocinador é influenciada pelo facto do adepto ser sócio do clube.
H4: A perceção sobre o patrocinador está correlacionada com o envolvimento com o clube
H5: A recomendação sobre o patrocinador é influenciada pelo clube ao qual o adepto está ligado
sentimentalmente
H6: A recomendação sobre o patrocinador é influenciada pela frequência com que o adepto assiste aos jog os do
clube.
H7: A recomendação sobre o patrocinador é influenciada pelo facto do adepto ser sócio do clube.
H8: A recomendação sobre o patrocinador está correlacionada com o envolvimento com o clube
H9: A intenção de compra sobre os produtos do patrocinador é influenciada pelo clube ao qual o adepto está
ligado sentimentalmente.
H10: A intenção de compra sobre os produtos do patrocinador é influenciada pela frequência com que o adepto
assiste aos jogos do clube.

827
H11: A intenção de compra sobre os produtos do patrocinador é influenciada pelo facto do adepto ser sócio do
clube.
H12: A intenção de compra sobre os produtos do patrocinador está correlacionada com o envolvimento com o
clube
9. Metodologia
9.1. Questionário
9.1.1. Caracterização da Amostra
De acordo com o que definimos anteriormente, este estudo concentra-se num público-alvo devidamente definido, e que
logo a partida condicionou a nossa amostragem. Esta opção metodológica é reforçada pelos trabalhos desenvolvidos por
(Tsiotsou e Alexandris, 2007); (Alexandris; Tsaousi e James, 2007) e (Sá, 2004), sendo que os dois primeiros trabalhos
foram desenvolvidos no âmbito do Basquetebol Profissional e o último no âmbito do Futebol Profissional.
Neste sentido tomamos logo á partida uma importante decisão que passou por centrar a aplicação do nosso instrumento
de recolha de dados (questionário) a uma amostra exclusiva de espectadores, eliminando à partida outros grupos.
Partindo igualmente dos autores referidos optamos por seguir a sugestão de incluir apenas adeptos com idade igual ou
superior a 15 anos. Esta decisão baseou-se na legislação em vigor e na metodologia apresentada pelos referidos trabalhos.
Tomando em consideração a nossa opção em estudar o futebol profissional, ficaríamos resumidos a jogos da Seleção
Nacional e da Liga Profissional, todavia, e dado que uma das nossas variáveis independentes é precisamente o Clube,
avançamos obrigatoriamente com uma análise centrada na Liga Profissional, designada nesta época desportiva
2010/2011 por Liga Zon Sagres.
A Liga Zon Sagres corresponde à I Divisão Portuguesa, sendo por natureza uma Liga Profissional. Esta competição é
composta por 16 clubes, segundo uma lógica de regularidade competitiva em que jogam todos contra todos num total de
30 jornadas e 240 jogos.
Perante este cenário teríamos de fazer então uma opção em termos dos clubes (mínimo dois) e dos jogos em função dos
quais iríamos aplicar o nosso questionário. Por uma questão de inovação e equidade nos termos de comparação, e depois
de contactar alguns clubes para avaliação de disponibilidade, decidimos aplicar o nosso questionário a dois clubes rivais e
concorrentes de um mesmo mercado, neste caso o Sport Clube Beira-Mar e a Associação Académica de Coimbra.
Por razões de organização do estudo e dos timings definidos para esta investigação optamos por aplicar o nosso
instrumento de recolha de dados nos seguintes jogos e nas respetivas datas:
a) Associação Académica de Coimbra vs. Sport Clube Beira-Mar: 06-02-2011
b) Sport Clube Beira-Mar vs. Portimonense Sporting Clube: 27-02-2011
Na aplicação do questionário tornou-se fundamental tomar uma outra decisão ao nível de quem entrevistar, tendo-se
optado por inquirir apenas adeptos do clube visitado. A opção de aplicar o referido questionário nos jogos em casa deve-se
também á maior afluência de adeptos dos referidos clubes, bem como á sua maior disponibilidade para participarem nesta
investigação.
Acerca do número total de espectadores presentes no estádio, e com base nos números oficiais divulgados pela Liga
Portuguesa de Futebol Profissional (LPFP) in www.lpfp.pt (04-04-2011 às 16h37), podemos referir o seguinte para os dois
jogos estudados:
Académica vs. Beira-Mar: 3.286 espectadores
Beira-Mar vs. Portimonense: 2.165 espectadores
Do ponto de vista prático e operacional, fazemos também referência ao número total de questionários válidos obtidos em
ambos os jogos realizados. No total obtivemos 278 questionários:

828
Académica vs. Beira-Mar: 142 questionários
Beira-Mar vs. Portimonense: 136 questionários
Por último tomamos a decisão de centrar a nossa análise ao nível do Patrocinador principal de cada clube estudado,
seguindo mais uma vez as metodologias propostas por (Tsiotsou e Alexandris, 2007); (Alexandris; Tsaousi e James, 2007)
e (Sá, 2004).
9.1.2. Construção do Questionário
A metodologia seguida para a construção do instrumento de medida, baseou-se num estudo preliminar referente a testes
de instrumentos já existentes. Segundo (Hill; Hill, 2008), são duas as situações em que é fundamental testar um
questionário já existente: “Quando se pretende aplicar o questionário a uma amostra retirada de um Universo, diferente
daquele para o qual foi desenvolvido o questionário” , e ainda “quando se pretende traduzir um questionário e testar a
tradução.”.
Deste modo, definimos o nosso instrumento em função de estudos realizados por (Tsiotsou e Alexandris, 2007);
(Alexandris; Tsaousi e James, 2007) e (Sá, 2004), passando posteriormente para uma fase de teste de questionário de
forma a tentar minimizar eventuais erros de elaboração. Posto isto, avançamos para a construção de um questionário
composto por 3 secções, com base nos trabalhos desenvolvidos pelos referidos autores: os dois primeiros referentes ao
Basquetebol Profissional [Grécia] e o terceiro referente ao Futebol Profissional [Portugal].
O referido questionário inicia-se com uma parte introdutória composta por duas questões de filtragem em função da
amostra que definimos: Se o indivíduo é adepto dos Clubes que estamos a estudar? Se tem menos de 15 anos? Estes são os
dois requisitos para se avançar com a entrevista.
A secção 1 centrou-se na obtenção de dados sobre o envolvimento do adepto com o seu clube e com o futebol em geral.
Neste mesma secção, adaptada do trabalho desenvolvido por (Tsiotsou e Alexandris, 2007) pretendemos compreender
então os referidos tópicos, tendo sido adotada uma escala de Likert para efeitos de medição (1 a 7, em que 1 discorda e 7
concorda).
Desenvolvemos igualmente uma secção 2 – com base no questionário desenvolvido por (Tsiotsou e Alexandris, 2007)
enquanto elemento específico para avaliar a recordação, perceção e intenções de compra e recomendação relativamente
aos patrocinadores dos clubes estudados.
As questões sobre a recomendação foram adaptadas do trabalho desenvolvido por (Alexandris; Tsaousi e James, 2007).
Esta secção inicia-se com duas questões relativas à recordação espontânea. A primeira questão é mesmo: qual o
patrocinador principal do Clube? A segunda pergunta tem a ver com identificação desse patrocinador. As restantes dizem
respeito ao patrocinador principal.
Inicialmente os entrevistados vão classificar a empresa e os produtos do patrocinador principal, para de seguida avaliarem
oito afirmações referentes às motivações, perceções e atitudes face ao referido patrocinador. Tal como na secção 1,
optamos por recorrer à escala de Likert, em que os parâmetros vão de 1 a 7 (1 a 7, em que 1 discorda e 7 concorda).
Por último, incluímos a secção 3 - baseada no questionário desenvolvido por (Sá, 2004), no sentido de caracterizar os
espectadores em termos demográficos (sexo e idade) e comportamentais (frequência de assistências; sócio ou não sócio
do clube; possuidores ou não de bilhete temporada).
9.1.3. Pré-teste
A aplicação do questionário foi efetuada apenas após a realização de um pré-teste para avaliar a clareza das perguntas, a
consistência do instrumento e o tempo médio de resposta. O referido pré-teste foi realizado no dia 21 de Janeiro de 2011
durante uma aula no IPAM – Instituto Português de Administração de Marketing a 32 estudantes da Licenciatura do Curso
de Gestão de Marketing.
Terminada a aplicação do questionário, reunimos com os participantes no sentido de recolher informações acerca das
reações e opiniões relativas às entrevistas. Este procedimento revelou, com base na referida amostra que o questionário
estava devidamente estruturado e elaborado, permitindo demonstrar com clareza as opiniões dos entrevistados. Na fase
829
final do pré-teste procedemos ainda à avaliação dos tempos resposta e preenchimento do questionário, tendo-se
verificado que o tempo médio de resposta foi de 6 minutos.
9.1.4. Aplicação
Após a definição de toda a componente teórica, apresentamos o nosso projeto a seis clubes da Liga Zon Sagres. A
apresentação foi feita na primeira semana de Janeiro de 2011, tendo-se obtido respostas quase imediatas por parte de dois
clubes (S.C. Beira-Mar e Associação Académica de Coimbra) que se enquadravam dentro da amostra pretendida.
Partindo deste pressuposto, avançamos com uma apresentação mais pormenorizada, realçando o conceito, a ideologia e os
métodos a utilizar no âmbito a recolha de dados que pretendemos efetuar no decorrer de um jogo. Realçamos também as
nossas necessidades de colaboração por parte dos clubes e as vantagens que este estudo lhes poderia proporcionar.
Sintetizando, foi fundamental da parte do clube, obter uma autorização formal, a credenciação da equipa de investigação e
a disponibilização de condições especiais para a realização do estudo no terreno, nomeadamente, junto das forças de
segurança e do controlo interno de acesso ao estádio.
O processo desenrolou-se em função da aceitação formal por parte dos clubes, e da nomeação de um interlocutor direto
que facilitou a operacionalização de todo o processo. Após esta fase, todas as decisões foram tomadas, tendo em conta a
tipologia dos estádios e o perfil dos adeptos.
Num outro âmbito procedemos ao processo de recrutamento e formação da equipa de investigação (entrevistadores). A
base de recrutamento incidiu no universo dos alunos do Instituto Português de Administração de Marketing de Aveiro,
tendo-se constituído uma equipa de 14 elementos que levaram a cabo todos os procedimentos operacionais de recolha de
dados (questionário).
No dia 6 de Fevereiro de 2011 aplicamos o questionário no jogo em casa da Associação Académica de Coimbra, tendo
assistido ao jogo, um total de 3.286 espectadores, tendo-se obtido 142 questionários. No dia 27 de Fevereiro recolhermos
os dados no jogo em casa do Sport Clube Beira-Mar, sendo presenciado por 2.165 espectadores, e obtivemos 136
questionários. No total foram obtidos 278 questionários.
A recolha de dados iniciou-se pelas 14h00 e terminou pelas 15h55, precisamente 5 minutos antes do inicio do jogo. Esta
decisão foi tomada em conjunto com os clubes, dado que à partida coincidiria com o período em que os adeptos teriam
mais disponibilidade para responder ao questionário.
A aplicação do questionário foi feita exclusivamente na zona envolvente do estádio, precisamente junto às portas de
entrada. O estudo foi realizado totalmente fora do recinto de jogo, tendo como referência a necessidade de não afetar a
recordação espontânea dos adeptos sobre o patrocinador.
10. Análise de Resultados
10.1. Técnicas de análise
Como ponto de partida de análise dos resultados, realizamos uma análise descritiva para caracterização da amostra.
Posteriormente, para reduzir o número de variáveis em estudo sem perda significativa de informação, procedeu-se a uma
Análise Fatorial de Componentes Principais.
As variáveis (Perceção, Recomendação, Intenção de Compra, Envolvimento com o Clube e Envolvimento com o Futebol)
foram obtidas a partir da média aritmética das variáveis iniciais (itens 1 ao 9 e 12 ao 19). Para avaliar se a análise fatori al,
tal como se verificou apropriado, utilizamos a análise estatística de Kaiser-Meyer-Olkin (KMO) e o teste de esfericidade de
Bartlett.
Na fase seguinte, para verificar as hipóteses em estudo (H1 a H12), recorremos à Análise de Variância Univariada
(ANOVA). Os pressupostos para este teste são a normalidade das observações dentro de cada grupo e a igualdade entre si
das variâncias de cada grupo (homocedasticidade).
Nesta investigação não houve necessidade da verificação destes pressupostos, pois o número de elementos em cada grupo
é elevado (torna a não normalidade não restritiva) e o número de observações em cada grupo é semelhante, o que faz com
que o teste seja robusto para eventuais violações de homocedasticidade (Pestana e Gageiro, 2005).

830
O nível de significância utilizado nesta investigação foi de α = 0,05. Os resultados são considerados significativos para p<α
= 0,05.
Finalmente, para verificar as hipóteses formuladas em H4; H8 e H12 para esta investigação, recorreu-se ao cálculo do
coeficiente de correlação de Spearman. Este coeficiente mede a intensidade da relação entre variáveis ordinais, variando
entre -1 e 1, e quanto mais próximo se está desses extremos maior é a associação linear entre as variáveis (Pestana e
Gageiro, 2005).
10.2. Análise fatorial e propriedades psicométricas
No sentido de se proceder á avaliação da validade relacionada com a análise fatorial exploratória utilizou-se o critério
KMO e o teste de esfericidade de Bartlett.
Nos instrumentos de medida que medem a perceção, a intenção de compra e a recomendação, os valores de adequação
para o índice KMO foram, respetivamente, 0,668 (razoável, Kaiser), 0,752 (média, Kaiser) e 0,500 (má, Kaiser). Isto indica
que a análise fatorial de componentes principais pode ser feita em termos de viabilidade. O teste de esfericidade de
Bartlett apresentou valores adequados para cada um dos instrumentos de medida (p = 0,000<0,001) pelo que se pode
concluir que as variáveis são correlacionáveis.
Tabela 2: Análise Fatorial: Perceção, Recomendação e Intenção de Compra
Item Cargas fatoriais α de Cronbach % Variância Total
Explicada
Perceção
12. Eu tenho uma atitude positiva em relação ao patrocinador principal
e aos seus produtos, devido ao patrocínio do meu clube 0,869
0,780 69,63% 13. O patrocínio do meu clube melhora a minha perceção sobre o patrocinador principal e os seus produtos
0,871
14. Devido a este patrocínio em particular, eu gosto mais dos produtos do patrocinador principal
0,758
Intenção de Compra
15. Considerarei a compra de produtos do patrocinador principal no futuro
0,943
0,950 90,78% 16. Vou tentar comprar produtos do patrocinador principal no futuro 0,969 17. Vou comprar seguramente produtos do patrocinador principal no futuro
0,950
Recomendação
18. Eu farei comentários positivos em relação aos produtos do patrocinador principal
0,924 0,918 92,43%
19. É provável que eu passe a fazer comentários positivos em relação ao patrocinador principal devido a este patrocínio
0,924
Para todas as escalas foi obtido apenas um fator que contribui para o máximo da variância.
Perceção
O resultado obtido para o Alfa de Cronbach revela uma fiabilidade razoável para esta escala (Pestana e Gageiro, 2005). As
cargas fatoriais para cada um dos itens variam entre 0,758 e 0,871, mantendo-se os três itens para esta escala. O fator
resultante explica 69,63% da variância total.

831
Intenção de Compra
A análise da fiabilidade apresenta um nível muito bom para utilização nesta amostra (Pestana e Gageiro, 2005). As cargas
fatoriais para cada item variam entre 0,943 e 0,969, mantendo-se os três itens desta escala. A análise fatorial conduziu a
um fator que explica 90,78% da variância total.
Recomendação
À semelhança do que aconteceu para a Intenção de Compra, a fiabilidade apresentou um nível mui to bom. Os dois itens
que constituem esta escala apresentaram cargas fatoriais no valor de 0,924, mantendo-se ambos. O fator resultante desta
análise explica 92,43% da variância total.
No instrumento de medida que mede o envolvimento, o valor do índice KMO foi 0,869 (boa, Kaiser). Isto indica que a
análise fatorial pode ser feita. O teste de esfericidade de Bartlett apresenta um valor adequado (p = 0,000<0,001),
concluindo-se que as variáveis são correlacionáveis.
Tabela 3: Análise Fatorial: Envolvimento com o Clube e com o Futebol
Item Cargas fatoriais α de Cronbach % Variância
Explicada
Fator 1: Envolvimento com o clube
1. Eu sinto-me como membro do meu clube 0,834
0,797 31,92% 2. O meu clube assume-se como uma parte importante da minha vida 0,755
3. Eu quero que os outros saibam que eu sou fã do meu clube 0,692 4. Creio que trabalho para o bem do meu clube 0,717
Fator 2: Envolvimento com o futebol
5. Assistir a jogos de futebol é importante para mim 0,604
0,815 29,28%
6. Assistir a jogos de futebol é uma das atividades que mais prazer me dá
0,647
7. O Futebol é uma parte importante da minha vida 0,764 8. A maioria dos meus amigos está de certa forma relacionada com o futebol
0,673
9. Para mim não há nenhum desporto como o Futebol 0,776 Variância Total Explicada: 61,2%
Alfa de Cronbach: 0,863
Para a escala que mede o envolvimento foi obtida uma solução fatorial de dimensão 2, com uma variância total explicada
de 61,2% e um coeficiente Alfa de Cronbach de 0,863 que revela uma boa fiabilidade da escala.
Fator 1: Envolvimento com o clube
Este fator (itens 1, 2, 3 e 4) revelou uma fiabilidade razoável (Pestana e Gageiro, 2005) e explica 31,92% da variância total .
Os itens que constituem este fator apresentam cargas fatoriais a oscilar entre 0,692 e 0,834.
Fator 2: Envolvimento com o futebol
Este fator agrupa os itens 5, 6, 7, 8 e 9, com cargas fatoriais a oscilar entre 0,604 e 0,776, explica 29,28% da variância to tal
e revelou uma fiabilidade boa para a sua utilização nesta amostra (Pestana e Gageiro, 2005).

832
10.3. Teste de Hipóteses
10.3.1. Teste de Hipóteses (H1, H5 e H9) - Diferenças em função do clube: Perceção, Recomendação e Intenção de
Compra
Tabela 4: Teste de Hipóteses – Clube/Perceção
N Média Desvio-Padrão
Académica 142 5,17 2,009
Beira-Mar 136 4,95 1,547
Total 278 5,06 1,797
A análise das médias mostra que os adeptos da Académica apresentam um nível de Perceção superior ao dos adeptos do
Beira-Mar. Contudo, e não obstante, esta diferença não se mostrou estatisticamente significativa (F(1,276)=0,999,
p=0,318>0,05).
Tabela 5: Teste de Hipóteses – Clube/Recomendação
N Média Desvio-Padrão
Académica 142 5,43 1,997
Beira-Mar 136 5,53 1,329
Total 278 5,48 1,701
A análise das médias mostra que os adeptos do Académica apresentam um nível na Recomendação inferior ao dos adeptos
do Beira-Mar. Esta diferença não se mostrou contudo estatisticamente significativa (F(1,276)=0,222, p=0,638>0,05).
Tabela 6: Teste de Hipóteses – Clube/Intenção de Compra
N Média Desvio-Padrão
Académica 142 4,94 2,094
Beira-Mar 136 4,95 1,477
Total 278 4,94 1,815
A análise das médias mostra que os adeptos do Académica apresentam um nível de Intenção de Compra muito idêntico ao
dos adeptos do Beira-Mar. A análise da variância (ANOVA) acaba por confirmar que não existem diferenças significativas
(F(1,276)=0,006, p=0,939>0,05).
10.3.2. Teste de Hipóteses (H2, H6 e H10) - Diferenças em função da frequência de assistência aos jogos do clube:
Perceção, Recomendação e Intenção de Compra
Tabela 7: Teste de Hipóteses - Assistências/Perceção
N Média Desvio-Padrão
Menos de 5 44 5,05 2,508
Entre 5 e 10 67 4,70 1,706
Entre 11 e 20 81 5,23 1,396
Mais de 20 86 5,19 1,763
Total 278 5,06 1,797

833
A análise das médias mostra que a maior diferença no nível de Perceção ocorre entre os segmentos “Entre 5 e 10” e “Entre
11 e 20” (maior para este último). Esta diferença não se afigura contudo estatisticamente significativa (F(3,274)=1,294,
p=0,277>0,05).
Tabela 8: Teste de Hipóteses – Assistências/Recomendação
N Média Desvio-Padrão
Menos de 5 44 5,43 1,972
Entre 5 e 10 67 5,07 1,732
Entre 11 e 20 81 5,66 1,468
Mais de 20 86 5,66 1,703
Total 278 5,48 1,701
A análise das médias mostra que a maior diferença ao nível da Recomendação ocorre entre os adeptos que assistem entre
5 e 10 jogos por época e os que assistem a mais de 11 (maior para estes últimos). Esta diferença não é todavia
estatisticamente significativa (F(3,274)=1,963, p=0,120>0,05).
Tabela 9: Teste de Hipóteses – Assistências/Intenção de Compra
N Média Desvio-Padrão
Menos de 5 44 5,08 1,974
Entre 5 e 10 67 4,61 1,789
Entre 11 e 20 81 5,08 1,657
Mais de 20 86 5,01 1,891
Total 278 4,94 1,815
A análise das médias mostra que a maior diferença no nível de Intenção de Compra ocorre entre os adeptos que assistem
entre 5 e 10 jogos por época e os que assistem menos de 5 e entre 11 e 20 jogos. Esta diferença não é contudo
estatisticamente significativa (F(3,274)=1,044, p=0,373>0,05).
10.3.3. Teste de Hipóteses (H3, H7 e H11) - Diferenças em função do facto do adepto ser sócio do clube: Perceção,
Recomendação e Intenção de Compra
Tabela 10: Teste de Hipóteses – [Sócio/Não Sócio]/Perceção
N Média Desvio-Padrão
Sim 153 5,19 1,638
Não 125 4,91 1,971
Total 278 5,06 1,797
A análise das médias mostra que os adeptos sócios apresentam um nível de Perceção superior aos não sócios. Esta
diferença não é contudo estatisticamente significativa (F(1,276)=1,618, p=0,204>0,05).
Tabela 11: Teste de Hipóteses – [Sócio/Não Sócio]/Recomendação
N Média Desvio-Padrão
Sim 153 5,63 1,675
Não 125 5,30 1,720
Total 278 5,48 1,701

834
A análise das médias mostra que os adeptos que são sócios apresentam um nível de Recomendação superior aos não
sócios. Esta diferença não é todavia estatisticamente significativa (F(1,276)=2,681, p=0,103>0,05).
Tabela 12: Teste de Hipóteses – [Sócio/Não Sócio]/Intenção de Compra
N Média Desvio-Padrão
Sim 153 4,98 1,833
Não 125 4,91 1,800
Total 278 4,94 1,815
A análise das médias mostra que os adeptos que são sócios apresentam um nível de Intenção de Compra superior aos que
não o são (muito ligeiramente). Esta diferença não é contudo estatisticamente significativa (F (1,276)=0,100, p=0,752>0,05).
10.3.4. Teste de Hipóteses (H4, H8 e H12) - Correlações com envolvimento com o clube: Perceção, Recomendação
e Intenção de Compra
Tabela 13: Teste de Hipóteses - Coeficientes de correlação Ró de Spearman [Envolvimento/Perceção, Intenção de
Compra e Recomendação]
Envolvimento com o clube
Perceção ,258*
Intenção de compra ,169*
Recomendação ,201*
* Correlação é significativa para um nível de significância de 0,01 (bilateral)
O Envolvimento com o Clube mantém uma relação positiva e significativa com as variáveis Perceção, Intenção de Compra e
Recomendação, mostrando os coeficientes mais altos na sua relação com a Perceção e com a Recomendação.
De acordo com os dados obtidos a correlação verifica-se, o que significa que, estatisticamente as hipóteses H4, H8 e H12 se
comprovam, ou seja, o envolvimento com o Clube correlaciona-se diretamente com as variáveis dependentes deste estudo,
influenciando-as positivamente.
11. Conclusões e Recomendações
11.1. Conclusões
Referente às conclusões deste trabalho, convém referir que os resultados obtidos estão diretamente relacionados com a
amostra considerada, sendo esta representativa de uma realidade marcante em Portugal (clubes de pequena dimensão,
concorrentes na mesma região e competição).
Em termos de apontamentos conclusivos, em primeiro lugar fazemos referência ao facto de uma elevada percentagem dos
inquiridos (36,7%) demonstrar total desconhecimento relativo ao Patrocinador principal do seu Clube. Os inquiridos
demonstram também dificuldades em identificar o nome desse mesmo patrocinador principal: EFAPEL: Académica e
DIATOSTA: Beira-Mar.
Ao nível da variável envolvimento, a maioria dos inquiridos demonstrou um elevado grau de envolvimento com o seu
clube e com o futebol em geral. A correlação do envolvimento com o clube com as nossas variáveis dependentes verificou-
se positiva, comprovando-se que a perceção, a intenção de compra e a recomendação estão diretamente relacionadas com
um maior ou menor grau de envolvimento com o clube (hipóteses H4, H8 e H12).

835
Relativamente á influência da variável Clube ao nível da perceção, intenção de compra e recomendação, verificou-se que os
adeptos da Associação Académica de Coimbra apresentaram índices de resposta superiores aos do Sport Clube Beira-Mar.
Todavia, os dados não foram considerados estatisticamente significativos, concluindo-se que a variável clube não tem
influência sobre a perceção, a intenção de compra e a recomendação (hipóteses H1, H5 e H9).
Analisando de seguida a influência da frequência de assistência aos jogos ao nível das nossas variáveis dependentes,
verificamos que, apesar de se verificarem algumas diferenças em termos dos intervalos de análise previamente definidos,
do ponto de vista estatístico esta influência não demonstra ser significativa. Deste modo verificamos que não se verificam
as hipóteses relativas a esta variável. Este tópico corresponde às hipóteses (H2, H6 e H10).
Por último, os testes relacionados com a variável de envolvimento específico (sócio ou não sócio do clube) revelaram que,
apesar dos sócios terem um maior índice de respostas positivas em comparação com os não sócios, os valores obtidos não
são estatisticamente significativos, não se verificando consequentemente as hipóteses relativas a esta variável (hipóteses
H3, H7 e H11).
Como conclusão central deste estudo, podemos dizer que as variáveis independentes: Clube, Frequência de Assistência e
Envolvimento Específico (Sócio ou Não Sócio do Clube) não têm uma influência estatisticamente significativa ao nível da
Perceção, Intenção de Compra e Recomendação. Por outro lado, conclui -se que existe uma correlação direta entre o
Envolvimento com o Clube e as variáveis dependentes: Perceção, Intenção de Compra e Recomendação.
11.2. Limites da Investigação
O primeiro limite objetivo deste estudo relaciona-se como o facto deste se realizar em Portugal, país onde a atividade
profissional na área dos patrocínios tem ainda pouco tempo de existência.
Focando os limites específicos desta investigação, convém referir que esta se desenvolveu no âmbito restrito de dois
clubes, centrada num único patrocinador (patrocinador principal do clube) e em dois momentos específicos: jogo
Académica X Beira-Mar e jogo Beira-Mar X Portimonense.
Por últimos deve ser dada também relevância ao facto das conclusões serem um reflexo da especificidade da metodologia
utilizada, nomeadamente em termos da amostra e do questionário.
11.3. Contribuição para as Estratégias de Gestão de Marketing dos Clubes
A primeira grande contribuição que esta investigação terá para os Clubes de Futebol profissional em Portugal está
diretamente relacionada com o potencial da informação recolhida que no seu todo se constitui como um conjunto de
importantes indicadores de gestão.
O facto dos inquiridos apresentarem dificuldades na identificação do patrocinador principal do seu clube, deve servir de
reflexão e reformulação das estratégias de marketing no sentido de uma maior aproximação entre patrocinador e adeptos.
Outra contribuição passará pela necessidade de uma nova abordagem na construção das ofertas de patrocínio, uma vez
que facilmente se identifica que o elemento de maior influência é o envolvimento com o clube, em comparação com o
envolvimento específico (sócio ou não sócio) e com a frequência de assistência aos jogos.
Esta investigação veio revelar que urge alterar a forma como os Clubes definem o seu grau de envolvimento com os
adeptos. De acordo com as conclusões deste estudo, o número de sócios deixa de fazer sentido enquanto argumento
comercial no âmbito dos patrocínios.
Por último, dado que o principal elemento de influência na forma como o patrocínio chega ao espectador é precisamente o
envolvimento com o clube, julgamos fundamental que os clubes apostam em novas estratégias de aproximação e de
envolvimento efetivo com os seus adeptos.
11.4. Futuras Linhas de Investigação
Ao nível das futuras linhas de investigação, em primeiro lugar consideramos pertinente alargar o âmbito desta
investigação a outras realidades desportivas, nomeadamente: Clubes, Competições, Modalidades ou Eventos Específicos.

836
Centrando-se este estudo apenas em dois Clubes, consideramos também relevante a generalização da aplicação da nossa
metodologia a todos os Clubes que participem na mesma competição, recolhendo importantes informações comparativas
em função de cada realidade específica.
Por último, recomenda-se que se possam desenvolver novas investigações que utilizem mais do que um patrocinador e
não apenas o patrocinador principal do Clube, tentando perceber se será, ou não vantajoso (rentável) investir na obtenção
de um estatuto principal ou secundário.
Referências
Alexandris, K.; Tsaousi, E. & James, J. (2007) – “Predicting Sponsorship Outcomes from Attitudinal Constructs: The Case
of a Professional Basketball Event”. Sports Marketing Quarterly. Vol. 16 Nº 3, pp. 130-139
Amis, J. (2003) – “Good things come to those who wait: the strategic management of image and reputation of Guiness” .
European Sport Management Quartely. Vol. 3 Nº 3, pp. 189-214
Barez, A.; Manion, M.; Schoepfer, K. & Cherian, J. (2007) – “Global Cases of Effective Sponsorship: An exploration of a new
communications models”. Innovative Marketing, Vol. 3 Nº 3, pp. 69-77
Boluda, I.; López, N.; Santos, C. & Manzano, J. (2008) – “El efecto de la Congruencia Marca-acontecimento sobre el
recuerdo de marca: el caso del Patrocínio de Louis Vitton a la America’s Cup” . Revista Portuguesa de
Marketing, Vol. 2, Nº 23, pp. 7-18
Brown, M. R., Pope, N. & Voges, K. (2003), “An Examination of the Effect of Sponsorship Stimuli on Consumer Perceptions
of Concrete and Abstract Brand Attributes” . ANZMAC Conference, Adelaide
Cardoso, J. (2004) – “Como Gerir Patrocínios com Sucesso: para promotores e projectos de eventos” . Edições Sílabo:
Lisboa
Carrilat, F.; Lafferty, B. & Harris, E. (2005) - “Investigating sponsorship effectiveness: do less familiar brands have an
advantage over more familiar brands in single and multiple sponsorship agreements” . Brand Management, Vol.
13 Nº 1, pp. 50-64
Cornwell, B. T. & Coote, L. V. (2005) - “Corporate Sponsorship of a Cause: The Role of Identification in Purchase Intent.”
Journal of Business Research, 58 (3), pp. 268 – 276
Cornwell, T.; Roy, D. & Steinard, A. (2001) – “Exploring Managers: perceptions of the Impact of Sponsorship on Brand
Equity”. Journal of Advertising. Vol. 30 Nº 2, pp. 41-51
Davidsson, V. & Savolainen, V. (2004) – “Event Sponsorship – A Corporate Tool for Brand Position” . School of Economics
and Comercial Law. Gutemburb. Gutemburg University
Dees, W.; Bennett, G. & Villegas, J. (2008) – “Measuring the Effectiveness of Sponsorship of an Elite Intercollegiate
Football Program”. Sports Marketing Quarterly. Vol. 17 Nº 2, pp. 78-89
Fahy, J.; Farrelly, F. & Quester, P. (2004) – “Competitive advantage through sponsorship: a conceptual model and
research propositions”. European Journal of Marketing. Vol. 38 Nº 8, pp. 1013-30
Farrelly, F.; Quester, P. & Clulow, V. (2008) – “Exploring Market Orientation and Satisfaction of Partners in the
Sponsorship Relationship”. Australasian Marketing Journal. Vol. 16 Nº 2, pp. 51-66
Fennell, G. & Allenby, G. (2004) – “An integrated approach: Market definition, market segmentation, and brand
positioning create a powerful combination.” . Marketing Research, Vol. 16 Nº 4, pp. 28-34
Flaircloth, J.; Capella, L. & Alford, B. (2001) – “The effect of attitude toward the sponsor and brand image on brand
equity”. Journal of MarketingTheory and Practice. Vol. 9, pp. 61-75
Futebol Finance (2011). futebolfinance.com. <http://www.futebolfinance.com/media-de-receitas-dos-patrocinios-
nas-camisolas-0910 (acesso em 25 de Janeiro de 2011)
Grohs, R.; Wagner, U. & Vsetecka, S. (2004) – “Acessing the Effectiveness of Sport Sponsorship – An Empirical
Examination”. Schamalenback Business Review, Nº 56, pp. 119-138

837
Hill, A. & Hill, M. (2008) – “Investigação por Questionário”. Lisboa: Edições Silabo
Howard, T. (2005) – “Investors can capitalize when companies score sports sponsorships” . USA Toda, 14 October, pp. 5B
International Olympic Committee (2008) – “Revenue Generation 2001-2004”. Organisation Facts and Figures,
disponível em IOC (2008) < www.olympic.org/uk/organisation/facts/revenue/index_uk.asp (acesso em 28
de Setembro de 2010)
Keller, K. (2003) – “Brand Synthesis: The multidimensionality of brand knowledge” . Journal of Consumer Research. Vol.
29, pp. 595-600
Keller, K. (2003) – “Brand Synthesis: The multidimensionality of brand knowledge” . Journal of Consumer Research. Vol.
29, pp. 595-600
Koo, G.; Quarterman, J. & Flynn L. (2006) - “The effect of perceived sports event and sponsor image fit on consumers
cognition affect, and behavioral intentions” . Sports Marketing Quarterly, Vol. 15 Nº 2, pp. 80-90
Kwon, H. & Armstrong, K. (2002) – “Factors influencing buying of sports team licensed merchandising” . Sport Marketing
Quarterly. Vol. 11, pp. 151-163
Laczniak, R. N., DeCarlo, T. E. & Ramaswami, S. (2001), “Consumers’ Responses to Negative Word-of-Mouth
Communication: An Attribution Theory Perspective”. Journal of Consumer Psychology, Vol. 11 (1), 57-73.
Laverie, D. & Arnett, D. (2000) – “Factors affecting fan attendance: The influence of identify salience and satisfaction” .
Journal of Leisure Research. Vol. 32, pp. 225-246
Liga Portuguesa de Futebol Profissional (2011). Lpfp.pt. < www.lpfp.pt (acesso em 4 de Abril de 2011)
Madrigal, R. (2000) – “The influence of social alliances with sports teams on intentions to purchase corporate sponsors’
products”. Journal of Advertising. Vol. 29, pp. 13-24
Madrigal, R. (2001) – “Social Identify Effects in a Belief-Attitude-Intentions Hierarchy: Implications for Corporate
Sponsorship”. Psychology e Marketing, Vol. 18 Nº 2, pp. 145-165
Meenaghan, T. (2001) – “Understanding Sponsorship Effects” . Psychology & Marketing. Vol. 18 Nº 2, pp. 95-122
Papadimitriou, D.; Apostolopoulou, A. & Dounis, T. (2008) – “Event Sponsorship as a Value Creating Strategy for
Brands”. Journal of Product e Brand Management. Vol. 17 Nº 4, pp. 212-222
Pestana, M. & Gageiro, J. (2005) – “Análise de Dados para Ciências Sociais: A Complementaridade do SPSS” . Lisboa:
Edições Silabo
Pitts, B. & Slatetery, J. (2004) – “An Examination of the Effects if Time on Sponsorship Awareness Levels” . Sport
Marketing Quartely. Vol. 13 Nº 1, pp. 43-54
Pitts, B. & Slatetery, J. (2004) – “An Examination of the Effects if Time on Sponsorship Awareness Levels”. Sport
Marketing Quartely. Vol. 13 Nº 1, pp. 43-54
Quester, P. & Thompson, B. (2001) – “Advertising and promotion leverage on arts sponsorship effectiveness” . Journal of
Advertising Research. Vol. 41, pp. 33-47
Sá, C. & Sá, D. (2009) – “Marketing para Desporto: Um Jogo Empresarial” . Edições IPAM, 3ª Edição: Porto
Sá, D. (2004) – “O Patrocínio no Futebol Profissional Português: Objetivos dos Patrocinadores e Influência no
Comportamento do Espectador.”. Dissertação de Mestrado na Faculdade de Ciências do Desporto e Educação
Física da Universidade do Porto: Porto
Schwarz, E. & Hunter, J. (2008) – “Advanced theory and practice in sports marketing” . Elsevier, San Diego, CA
Seguin, B.; Teed, K. & O’Reilly, N. (2005) – “National sport organizations an sponsorship: an identification of best
practices”. International Journal of Sport Management and Marketing, Vol. 1, pp. 69-90
Spears, N. & Singh, S. (2004) – “Measuring attitude toward the brand and purchase intentions” . Journal of Current Issues
and Research in Advertising. Vol. 26, pp. 53-66
Speed, R. & Thompson, P. (2000) – “Determinants of Sports Sponsorship Response” . Journal of the Academy of Marketing

838
Science. Vol. 28 Nº 2, pp. 226-238
Swanson, S. R., Gwinner, K., Larson, B. & Janda, S. (2003), “Motivations of College Student Game Attendance and Word-of-
Mouth Behavior: The Impact of Gender Differences” . Sport Marketing Quarterly, 12 (3), 151-162
Trail, G.; Fink, J. & Anderson, D. (2003) – “Sport Spectator Consumption Behavior” . Sport Marketing Quarterly. Vol. 12,
pp. 8-17
Tsiotsou, R. & Alexandris, K. (2007) – “Delineating the outcomes of sponsorship: Sponsor image, word of mouth, and
purchase intentions”. International Journal of Retail & Distribution Management. Vol. 37 Nº 4, pp. 358-369
Vale, J.; Vale, V.; Serra, E. & Vieira, J. (2007) – “O Impacto do Patrocínio no Capital das Marcas – Um Estudo aplicado ao
F.C. Porto”. Revista Portuguesa de Marketing, Vol. 2 Nº 22, pp. 7-21
Wakefield, K.; Becker-Olsen, K. & Cornwell, T. (2007) – “I Spy a Sponsor: The Effects of Sponsorship Level, Prominence;
Relatedness, and Cueing on Recall Accuracy” . Journal of Advertising. Vol. 36 Nº 4, pp. 61-74
Westberg, K. (2004) – “The Impact of Cause-Related Marketing on Consumer Attitude to the Brand and Purchase
Intention: A comparison with Sponsorship and Sales Promotion” . Marketing School, Griffith Universitycts
Wong, H.Y. & Merrilees, B (2005) - “A brand orientation typology for SMEs: a case research approach” . Journal of
Product & Brand Management, Vol. 14 Nº 3, pp. 155-62
Yang, S.X., Sparks, R. & Li, M. (2008) - ‘‘Sport sponsorship as a strategic investment in China: perceived risks and benefits
by corporate sponsors prior to the Beijing 2008 Olympics’’ . International Journal of Sports Marketing and
Sponsorship, Vol. 10 Nº 1, pp. 63-78

839
The dillemas of startups in the creative
industries - tension between artistic and
market goals Creative industries, market orientation, product orientation, start-ups, dilemmas, Poland.
Marcin Awdziej, Kozminski University, [email protected]
Jolanta Tkaczyk, Kozminski University, [email protected]
Abstract
The creative industries include companies that create, produce and sell creative products and services, such as arts and
cultural goods. Although their importance for European economies is widely acknowledged, their contribution to GNP, as
well as the stage of development varies across the EU countries. In Poland their contribution to GNP is relatively low,
comprising merely 1%. The Polish creative industries are in the very early stage of their development. Although business
orientation of creative entrepreneurs was already researched, the evidence is not conclusive and little is known about
orientation of creative entrepreneurs at the start-up stage. A creative person may face the dilemma, whether to produce
personally and artistically satisfying work, or something that will be attractive to customers and, hence, generate profits.
Some research studies suggest that satisfying market demand may contradict the perception of creative integrity. In
marketing terms, this can be translated into the dilemma of being “product” versus “market” oriented.
The objective of the paper is to identify business orientation of creative start-ups. The study was conducted on a sample of
entrepreneurs, who planned to start their business in August 2012, in the metropolitan area of Warsaw. A quantitative
study was conducted among 110 participants of the EU funded program “Entrepreneurship in the Creative Industries”
(Human capital operational program, priority 6 “Open labor market”, action 6.2. “support and promotion of
entrepreneurship and self-employment”) and in the initial first stage of the program, among 81 project participants, who
received financial support to launch their businesses.
1. Objective
The creative industries include companies that create, produce and sell creative products and services, such as arts and
cultural goods. Although their importance for European economies is widely acknowledged, their contribution to GNP, as
well as the stage of development varies across the EU countries. In Poland their contribution to GNP is relatively low,
comprising merely 1%. The Polish creative industries are in the very early stage of their development and cluster in the
metropolitan area of Warsaw, where they comprise 5,5% of all businesses. Although business orientation of creative
entrepreneurs was already researched, the evidence is not conclusive and little is known about orientation of creative
entrepreneurs at the start-up stage. A creative person may face the dilemma, whether to produce personally and
artistically satisfying work, or something that will be attractive to customers and, hence, generate profits.
The objective of the paper is to identify business orientation of creative start-ups. The study was conducted on a sample of
entrepreneurs, who planned to start their business in August 2012, in the metropolitan area of Warsaw. A quantitative
study was conducted among 110 participants of the EU funded program “Entrepreneurship in the Creative Industries” and
81 participants who received financial support. The main objective of the project was stimulating development of new,
dynamic enterprises in the creative industries in the metropolitan area of Warsaw. The target group of the project were
individuals planning to start up businesses. The preference was towards unemployed (including long- term),
professionally non- active, females, disabled and 45+ aged candidates. Since the funding was provided within Human
capital operational program, action 6.2. “support and promotion of entrepreneurship and self -employment”, classical

840
support mechanism, employed for this action, was implemented. Based on 2100 applications, received on recruitment
stage, 160 participants were selected for the second stage of the project (training). Un-repayable funding of 40.000 PLN
was granted to 81 participants. The study conducted is a part of wider research program planned for the years 2012-
2013.
The paper consists of four sections. In the first, the literature on creative industries and business orientations is reviewed.
In the second, methodology of the study is presented. The third presents results and conclusions. The limitations to study,
as well as further investigation areas are identified in the fourth part.
2. Literature review and hypothesis
The term creative industries was first used in Great Britain to describe industries that generate significant economic and
social value from creative and knowledge- based inputs(Parkman, Holloway, & Sebastiao, 2012). The creative industries
include companies from arts and crafts markets, design, architecture, fashion, media and advertising services, software
development, the performing arts, publishing, music, movies and TV(DCMS, 1998). In the US a more narrow perspective is
adopted, focusing on art- centric businesses, and excluding software developers and research for the Arts. Various
international organizations propose own definitions of creative industries, sometimes referred as to “copyright
industries”(UNCTAD, 2008; WIPO, 2003). In the literature, considering the type of creative product or service, a distinction
between cultural industries, more related to “art” or “high art”, and more applicable industries (lik e crafts) is
drawn(Hesmondhalgh & Pratt, 2005). Similarly, some authors postulate the need to distinguish between sectors open to
mass production and distribution and sectors focused on crafts and creation of “prototypes” like visual and performing
arts (Parkman et al., 2012). Despite operational differences, these numerous definitions agree that creative industries
embrace sectors of economy that supply products or services associated with cul tural, artistic or entertainment value
(Caves, 2000). What all creative industries have in common, is the fact that “human creativity is the ultimate resource”
and the main input, allowing generation of economic and social value (Caves, 2000).
Regardless the definitions adopted, the importance of creative industries as contributor for GNP, and invigorating force of
economies and cities, is widely acknowledged. According to the European Commission, creative industries account for 2%
of the EU’s GDP (excluding Romania and Bulgaria), and grow 12% annually. In Poland these figures are- respectively- 1%
and 6%. The biggest cluster of creative businesses in Poland is found in Warsaw metropolitan area, where they account for
5,5% of all enterprises registered (Sektory kreatywne w Warszawie. Potencjał i warunki rozwoju , 2010). High-growth
creative industries not only contribute directly to the GDP, but also might generate spillover effects (Parkman et al., 2012),
such as employment opportunities for artists, broadening market for creative products and services, educating consumers,
and stimulating innovativeness. As many countries find it difficult to compete in terms of manufacturing and low costs
with competitors like China or India, various governments implement initiatives to switch their economies to models
based on creativity, Great Britain being probably the most exalted example. Some authors suggest that creative industries
may generate resources difficult to imitate (Parkman et al., 2012). Last, but not least, creative industries characterize with
high marginal productivity of capital invested.
However, the underlying objective of various governmental assistance programs, aiming at support and development of
the creative industries, is their sustainability and success in business, rather than artistic, terms. This, we believe, may be
source of tensions, especially between fulfillment in the creative field and business objectives.
As Chaston points, the creative industries are an example where lifestyle of an entrepreneur is more important than
business objectives (Chaston & Sadler‐Smith, 2012). To one extent this may be influenced by the predominance of self-
employment among creative entrepreneurs, and artists in particular, but, more important, the prevailing “arts for art’s
sake” philosophy (Chaston & Sadler‐Smith, 2012). One may speculate, whether factors such as contemporary art’s
philosophy and artistic education have also influenced the phenomenon mentioned. A creative person may face the
dilemma, whether to produce personally and artistically satisfying work, or something that will be attractive to customers
and, hence, generate profits. Some studies suggest that satisfying market demand may contradict the perception of
creative integrity (Fillis, 2002; TOWNROE & MALLALIEU, 1993). Caust and Nielsen object to the adoption of businesslike
approach and philosophy in the fields of arts, as this means making inevitable artistic sacrifices at the expense of artistic
value of work (Caust, 2003; Nielsen, 2003). According to Caust, businesslike approach will lead to production of safe,
consumer pleasing products, which may not necessarily be what the audience wants or needs (Caust, 2003). This,
however, may be limited to well educated, critical elite, but not necessarily to mass audiences. We agree that adopting

841
businesslike approach and philosophy may not necessarily suit all types of creative activities, like “high arts”, and be more
suitable for “crafts”, defined by Becker to be responsible for production of utilitarian objects (Becker, 1978). However, the
line between “high arts” and utilitarian “crafts”, which, in other words, is the difference between objects of pure aesthetic
contemplation and of functional value is rather difficult to be drawn. This is best illustrated by products of industrial
design, like Bauhaus. Their design focused on functionality, but over the years they became collectible items, prized and
esteemed similarly to more conventional objects of “high arts”, like paintings or sculptures. The opposition of arts and
crafts is, we believe, based on romantic conception of art as an autonomous phenomenon (Boorsma, 2006). The autonomy
of art is a modernist concept, in which art is seen as a self- contained phenomenon, defined on the basis of intrinsic
properties (Novitz, 2001). This stance is nowadays criticized, and arts are seen as cultural and social phenomenon, and
considered the result of social interaction (Boorsma, 2006). Moreover, none would disagree that the reception of creative
products and value placed on them is both subjective, and reflects also specific set of cultural norms.
In marketing terms, this can be translated into the dilemma of being “product” versus “market” oriented. Product
orientation seems to be more suitable in the context of the creative industries, as it better accommodates the elements of
creativity and artistic integrity, that allow developments of new products (Izquierdo & Samaniego, 2007). Some authors
argue that the marketing concept itself does not match behavior of artists, as they create to express their subjective
concepts and ideals (Becker, 1978; Holbrook, 1981). Aesthetic creativity to express oneself, rather than customer needs, is
driving force behind creative production (FILLIS, 2010). Therefore, the marketing concept may not be suitable for artistic
production, as it does not match values and philosophies typically held by artists (FILLIS, 2010). Kotler and Scheff
suggested that customer – centered approach should be applied to the way product is communicated, priced, packaged
and delivered, rather the artwork itself (Kotler & Scheff, 1997). Also Botti suggests that marketing is involved in the
process once the artwork has been completed, so it seldom accompanies the initial stage of artistic product’s development
(Botti, 2000). Considering the nature of creative production itself, one may expect that creative entrepreneurs, and high
arts representatives in particular, should display rather product- centered approach, with emphasis put on creative part of
the process rather than responding to the needs of market. Although such argumentation seems logic, some authors
suggest that even the works of high art are not conceived solely by the artist’s creativity (Meyer & Even, 1998). Heinrichs
argues that the work’s reception is regarded as the last step of its coming into being (Heinrichs, 1993). As each act of
reception is at the same time an interpretation and a realization, the separation of manufacturer and consumer is not
applicable to works of art (Eco, 1989). Meyer and Even proved that marketing could be observed through art history, and
in many cases the primary objective of artists were profits, as complete negligence of their financial interests is not
realistic (Meyer & Even, 1998).
The empirical evidence suggests rather diverse orientations of the creative entrepreneurs. The literature addressing
business orientations of creative entrepreneurs, and exploring the conflict between artistic and business orientation is stil l
rather limited. The tension between artistic and market orientation received so far little attention, and was researched in
rather narrow contexts, focusing on specific types of creative products or services.
Numerous studies in various markets have identified the key sources of a firm’s success, such as innovativeness, key
competencies and market orientation. Market orientation focuses on customers and competitors. Market success depends
on understanding and satisfying customer needs better than competitors. It is obligatory condition for development of
marketing, understood both as philosophy of business and way of conducting business.
There are 5 components of market orientation; two characterizing external, and three- internal perspective (Narver &
Slater, 1990):
competitor orientation (necessary analysis of competitors’ objectives, resources and competencies),
customer orientation (understanding customer needs and creating products and services perceived by
them as valuable),
cross- functional coordination (development of coordination of activities of business functions to create
solutions that satisfy customer needs),
organizational culture ( embracing by all employees customer- centric approach),
long term perspective.

842
Based on the analysis of the existing literature, the following hypotheses were formulated:
H1a: creative entrepreneurs at the start-up stage are product- oriented,
H1b: creative entrepreneurs at the start-up stage are market- oriented,
H2: creative entrepreneurs having business partners have different perception of business than entrepreneurs
without business partners.
3. Methodology
A quantitative study was conducted to identify business orientation of creative entrepreneurs starting their business in
August 2012, in the metropolitan area of Warsaw. The data was gathered with a self- administered in-hall survey. The
sample included creative entrepreneurs at the stage of establishing their businesses, participating in the support program
“Entrepreneurship in the Creative industries”. The project aimed to stimulate development of new creative businesses,
and comprised three phases: recruitment, training and consulting, and investment. The uniformed questionnaire was used
to survey 110 participants of the program before the beginning of training and consulting stage. 103 questionnaires were
returned and validated. The final sample included: 59 females, 44 males representing 14 different sectors of creative
industry. An average age of respondents was 34 years (median= 32). The sample was divided into four groups. One
included entrepreneurs who had business partners, three other were randomly sampled. In the second stage, after
completion of training, 81 projects were selected for funding. This group consisted of 48 females and 33 males. Their
average age was 38 years (median= 35), average number of years of professional experience was 10 (median= 9). 17
individuals had business experience prior project participation. The structure of the sample in the first (training) and in
the third stage is presented in table 1.
Table 1. Sample structure (according to sector)
Sector Number of companies qualified for training
Number of companies qualified for funding
Film and video 16 12
Visual arts and graphic design 18 9
Publishing 8 8
Crafts 11 8
Electronic media 6 6
Architecture 8 8
Photography 7 6
Fashion design 9 8
Music 5 5
Antiques and art market 4 3
Video/ computer games 2 1
Theatre 2 2
Industrial design 7 5
Total 103 81
The article presents the initial results of the first and the second stages of the project consisting of the following
phases:
1. Research of the perception of business orientation before launching business and training,
2. Research of the perception of business orientation after training and launching business,
3. Investigation of the results of business activities after one year of business operations (number of
customers, sales, market share, financial results and evaluation by customers).

843
Business orientation of respondents before undertaking business activities and training was researched using modified
MARKOR scale (Kohli & Jaworski, 1990), Market Orientation scale (Narver & Slater, 1990) and Organizational Culture
scale (Deshpandé, Farley, & Jr, 1993). MARKOR scale and Market Orientation scale were modified to reflect situation of an
entrepreneur before undertaking any actual business activities, and to emphasize the external perspective (customer and
competitor orientation). Statements related to product orientation were added, too. The internal perspective of business
orientation was researched with Organizational Culture Scale. It aimed to investigate functional coordination and culture
planned for the future business. Survey into internal perspective was extended with additional questions relating to time
orientation of an entrepreneur.
The questionnaire consisted of 3 parts. The first included statements with 5- dimensional Likert scale. The second part
investigated perception of organizational culture planned. The third part included questions regarding characteristics of a
respondent.
Scales’ reliabilities were tested with alpha- Cronbach, (which, in all cases, was above 0.65, proving their reliability).
The second part of the research was linked to the project’s evaluation process. The participants were surveyed with a
questionnaire consisting of 5 parts. The survey measured individual, financial, technical, technological, human and
relational resources of their businesses. The questionnaire included both open- and closed- ended questions.
4. Findings and conclusions
To verify H1a hypothesis, responses to 3 statements measuring product orientation were analyzed (Table 2).
Table 2. Product orientation
Statement Mean Standard deviation
1. When doing business, an artist can sometimes ignore changes in consumer behavior 2,86408 1,00531
2. When developing new products, one should consider changes in technology first, then expectations of customers
2,23301 0,81894
3. An artist- entrepreneur should produce and sell products following his/ her own knowledge and opinion, not those of customers
1,80583
0,87513
The first statement proved to be controversial: 39% respondents disagreed with it, 30% had no opinion, and 31% agreed.
The authors believe that this statement best reflected conflict between artistic and business orientation. 65% of
respondents disagreed with the second statement, regarding the dominant role of technology in new product
development, 30% had no opinion, and 5% agreed. In respect to the third statement, 85% of respondents disagreed, 8%
had no opinion, and 3% agreed. The responses were not differentiated according to gender, age, nor the type of business
planned. The results do not support hypothesis H1a.
Responses to the questions relating to competitor, customer and time orientation, as well organizational culture planned,
were used to verify hypothesis H1b. The mean scores for the set of statements measuring competitor orientation ranged
between 4.50 and 4.60, which allows to conclude that, at least declaratively, respondents were aware of the importance of
gathering competitive information, and taking competitive actions into consideration when conducting business. The
mean scores for the set of statements measuring customer orientation ranged between 4.33 and 4.50. This allows to
conclude that creative entrepreneurs understood the crucial role of customers already at the start-up stage of their
business. The respondents declared that they wanted to know / research the needs of their customers and to
accommodate them. The long-term perspective was measured with the set of statements regarding the necessity to
achieve business results in a short time. The mean scores for these statements ranged between 2.01 and 3. 23. These
results allow to conclude that the respondents planned their ventures for long time, and were ready to wait for results
longer than one year.
Summated rating scale was used to measure cross- functional coordination and organizational culture. The respondents
were asked to divide 100 points between descriptions proposed by Desphande, Farley and Webster, related to four issues:
a) kind of an organization,
b) leadership,
c) factors holding an organization together, and

844
d) what is important.
The responses were classified into 4 types of organizational cultures: market, clan, adhocracy, and hierarchy. Each type of
organizational culture could score from 0 to 100 points. Market oriented culture and adhocracy received highest average
scores, 107, and 105 points, respectively. Clan - type of culture received 92 points on average, while hierarchy- oriented
culture - 81 points. It can be concluded that the respondents declared development of an organizational culture strongly
rooted in market. Relatively high score of adhocracy-type of culture may be explained with specific nature of the creative
industries, typified with high dynamics and innovativeness. Besides, innovative projects were preferred in the
implemented support program.
The results achieved allow to state that market orientation was dominant among the creative entrepreneurs participating
in the support program (at least in the declarative sphere). Therefore, hypothesis H1b was supported.
An analysis of variance was conducted for each of the four groups of respondents, to verify hypothesis H2. The group of
respondents that had a business partner, was labeled “1”. The initial analysis of variance did not indicate significant
dispersion of results between groups. Canonical discriminant analysis of Wilks’ lambda distribution, measured with ratio
of variance matrix determinant/ inner- group covariance to variance matrix determinant/ positive definite covariance
indicated no dispersion.
Tab.3 Squared Mahalanobis distances
Groups 1 (with business partner)
2 3 4
1 (with business partner))
0,000000 2,851378 2,337187 1,683006
2 2,851378 0,000000 3,515402 5,109480
3 2,337187 3,515402 0,000000 3,516969
4 1,683006 5,109480 3,516969 0,000000
Rather insignificant values of Mahalanobis distances between group 1 and groups 2, 3, and 4 suggest (Table 3), that there
are no significant differences in perception of business orientation between creative entrepreneurs having business
partners and those, who started business on their own. Therefore, hypothesis H2 is not supported.
Additionally, the participants of the project were asked, for control purposes, to distribute 100 points between two
situations, which were related (descriptively) to sales and market orientations.
Sales orientation related statement was:
“Company A focuses mainly on sales. The sales targets are clearly defined and pursues according to the plan. Customer
satisfaction is important, yet not as much as selling products/ services produced”.
Market orientation statement was:
“Company B focuses mainly on gathering market information through marketing research. The company tries to research
customer preferences to design products/ services tailored to their expectations. Sales are important, but not as much as
designing product/ services that ‘will sell themselves’”.
The results were rather surprising. It was assumed that, at least declaratively, the respondents, planning their business
would be directed by market orientation. Only 3 of them agreed 100% with the answer explicitly indicating market
orientation (100 point for statement B). Market orientation was dominant (82 respondents assigned importance
exceeding 50%). However, 11 indicated sales orientation, and 7 were not able to come to decision, assigning each
statement 50 points. These results suggest that the real dilemma in the creative industries is not the choice between
market or product orientation as such, but selecting any coherent business orientation at all.
The analysis of the selected parts of the questionnaire, which evaluated business concept and environment perception,
indicated 10 cases of significant redefinitions of business concept (e.g. from art gallery to café with exhibition space). 35
participants decided to expand business through offer modification, addition of alternative distribution channels and
targeting additional market segments.

845
Individuals participating in the study declared significant influence of training on their perception of market, both
customers and competitors. This influence was declared strong and very strong by the graduates of art schools. Weaker
influence on perception of customers and business concept was declared by these individuals who had business
experience prior participation in the project.
5. Limitations and further research
The paper presented the initial results of a research project in progress. Moreover, the data was gathered partly before
training and consulting phase and during the investment stage. The next stage of the research project will be completed
during the final, investment phase, and the data obtained will be compared with the above presented results. It is probable
that the already achieved results reflected the awareness of the respondents that they participated in some sort of a
competition. Therefore, they might answered as they thought it was expected from them, in order to have better chances
to qualify for the program. A comparison of the above discussed results with the data to be gathered in a year from the
completion of the program will probably provide interesting, and more reliable results. It will be interesting not only to
investigate whether creative entrepreneurs follow market or chose to pursue their artistic goals, but also what is more
suitable for creative industries.
Besides the question, of what is the business orientation of creative entrepreneurs, and whether the creative industries
need market orientation to survive and thrive at all, another issues need empirical studies. Assuming that the compromise
between artistic and business objectives is possible, there is a question whether business orientation of a creative person
may change under the influence of business practice or business- related education received (for example in governmental
support program). Does business orientation of a creative entrepreneur differ between start-up stage and after some
business experience was accumulated? This means whether product –centric approach, embracing the creative nature of
production process may evolve over time into market-oriented.
References
Becker, H. (1978). Arts and crafts. American Journal of Sociology. Retrieved from
http://www.jstor.org/stable/10.2307/2777719
Boorsma, M. (2006). A strategic logic for arts marketing. International Journal of Cultural Policy. Retrieved from
http://www.tandfonline.com/doi/abs/10.1080/10286630600613333
Botti, S. (2000). What role for marketing in the arts? An analysis of arts consumption and artistic value. International
Journal of Arts Management. Retrieved from http://www.jstor.org/stable/10.2307/41064697
Caust, J. (2003). Putting the “art” back into arts policy making: How arts policy has been “captured” by the economists and
the marketers. The International Journal of Cultural Policy. Retrieved from
http://www.tandfonline.com/doi/abs/10.1080/1028663032000089723
Caves, R. (2000). Creative industries: Contracts between art and commerce . Retrieved from
http://books.google.com/books?hl=en&lr=&id=imftuhj8uvcc&oi=fnd&pg=pr7&dq=caves,+r.,+(2000),+creative+
industries+:+contracts+between+art+and+commerce.+cambridge,+mass.+london:+harvard+university+press&
ots=1duhr7rrh1&sig=ocdnty9s9s0y-mazpc01pz2gxfq
Chaston, I., & Sadler‐Smith, E. (2012). Entrepreneurial cognition, entrepreneurial orientation and firm capability in the
creative industries. British Journal of Management. Retrieved from
http://onlinelibrary.wiley.com/doi/10.1111/j.1467 -8551.2011.00752.x/full
Dcms. (1998). The Creative Industries Mapping Document. London.
Deshpandé, R., Farley, J., & JR, F. W. (1993). Corporate culture, customer orientation, and innovativeness in Japanese firms:
a quadrad analysis. The Journal of Marketing. Retrieved from http://www.jstor.org/stabl e/10.2307/1252055
Eco, U. (1989). The open work. Retrieved from
http://www.google.com/books?hl=pl&lr=&id=7jrom0m8tuwc&oi=fnd&pg=pr7&dq=++eco,+u.+(1989).+the+op
en+work.+harvard+&ots=s0zd0ued9n&sig=cmdnldpqm7zdrgi1jqbmvte1tmw

846
Fillis, I. (2002). Barriers to internationalisation: An investigation of the craft microenterprise. European Journal of
Marketing, 36(7/8), 912–927.
Fillis, I. (2010). The tension between artistic and market orientation in visual art. In D. O’REILLY & F. KERRIGAN (Eds.),
Marketing the Arts: A Fresh Approach (pp. 31–39). Abingdon: Taylor & Francis.
Heinrichs, W. (1993). Einführung in das Kulturmanagement. Retrieved from
http://scholar.google.pl/scholar?q=heinrichs%2c+w.+%281993%29+winf%c3%bchrung+in+das+kulturmanag
ement&btng=&hl=pl&as_sdt=0#0
Hesmondhalgh, D., & Pratt, A. C. (2005). Cultural industries and cultural policy. International Journal of Cultural Policy,
11(1), 1–13. doi:10.1080/10286630500067598
Holbrook, M. (1981). Introduction: The esthetic imperative in consumer research. Symbolic consumer behavior. Retrieved
from
http://scholar.google.pl/scholar?q=holbrook,+m.b.+(1981).+introduction:+the+esthetic+imperative+in+consum
er+research&btng=&hl=pl&as_sdt=0#0
Izquierdo, C., & Samaniego, M. (2007). How alternative marketing strategies impact the performance of Spanish museums.
… of Management Development. Retrieved from
http://www.emeraldinsight.com/journals.htm?articleid=1628124&show=abstract
Kohli, A., & Jaworski, B. (1990). Market orientation: the construct, research propositions, and managerial implications. The
Journal of Marketing. Retrieved from http://www.jstor.org/stable/10.2307/1251866
Kotler, P., & Scheff, J. (1997). Standing room only: strategies for marketing the performing arts, 34. retrieved from
http://www.google.com/books?hl=pl&lr=&id=9q_9nwurnmoc&oi=fnd&pg=pr9&dq=kotler,+p.,+scheff,+j.+(199
7).+standing+room+only:+strategies+for+marketing+the+performing+arts,+harvard+business+&ots=ey8f7bika
r&sig=npshqqamcozin3_83aznuju6tfm
Meyer, J., & Even, R. (1998). Marketing and the fine arts–inventory of a controversial relationship. Journal of Cultural
Economics. Retrieved from http://www.springerlink.com/index/K861L657747V5043.pdf
Narver, J., & Slater, S. (1990). The effect of a market orientation on business profitabili ty. The Journal of Marketing.
Retrieved from http://www.jstor.org/stable/10.2307/1251757
Nielsen, H. (2003). Cultural policy and evaluation of quality. International Journal of Cultural Policy. Retrieved from
http://www.tandfonline.com/doi/abs/10.1080/1028 663032000161678
Novitz, D. (2001). Postmodernism. Barthes and Derrida. Teoksessa The Routledge Companion to Aesthetics , 155–165.
Retrieved from
http://scholar.google.pl/scholar?q=novitz,+d.+(2001).+postmodernism:+barthes+and+derrida.+the+routlege+c
ompanion+to+aesthetics+&btng=&hl=pl&as_sdt=0#0
Parkman, I. D., Holloway, S. S., & Sebastiao, H. (2012). Creative industries: aligning entrepreneurial orientation and
innovation capacity. Journal of Research in Marketing and Entrepreneurship , 14(1), 95–114.
Sektory kreatywne w Warszawie. Potencjał i warunki rozwoju. (2010). Retrieved from
http://www.creativemetropoles.eu/uploads/files/creative_metropoles_raport_warszawski_sektor_kreatywny.p
df
Townroe, P., & Mallalieu, K. (1993). Founding a new business in the countryside. In J. Curran & D. Storey (Eds.), Small Firms
in Urban and Rural Locations. London: Rutledge.
Unctad. (2008). Creative Economy Report. New York.
Wipo. (2003). Guide on surveying the economic contribution of the copyright- based industries. Geneva.

847