
rbs.com Annual Report and Accounts 2010
445
rbs.com Annual Report and Accounts 2010
-
Upload
khangminh22 -
Category
Documents
-
view
0 -
download
0
Transcript of rbs.com Annual Report and Accounts 2010
rbs.com
Annual Report and Accounts 2010
What’s inside
01 Essential reading
02 Chairman’s statement
04 Group Chief Executive’s review
06 Q&As on progress
07 Our key targets
08 Our business and our strategy
10 Our approach to business
12 Progress on our Strategic Plan
14 Our Core businesses
16 The economic environment
17 Our approach to risk management
20 Divisional review
22 UK Retail
24 UK Corporate
26 Wealth
28 Global Transaction Services
30 Ulster Bank
32 US Retail & Commercial
34 Global Banking & Markets
36 RBS Insurance
38 Business Services and Central Functions
40 Non-Core Division
41 Asset Protection Scheme (APS)
42 Sustainability
44 Sustainability in practice
45 Our five key themes
45 Our community programmes
47 Highlights of how we focus action across our businesses
48 Report and accounts
49 Business review
225 Governance
266 Financial statements
386 Additional information
423 Shareholder information
M Why go online?www.rbs.com/AnnualReport
If you haven’t already tried it, visit our easy-to-useonline Annual Report. Many shareholders are nowbenefiting from more accessible information andhelping the environment too.
1RBS Group 2010
Essential reading
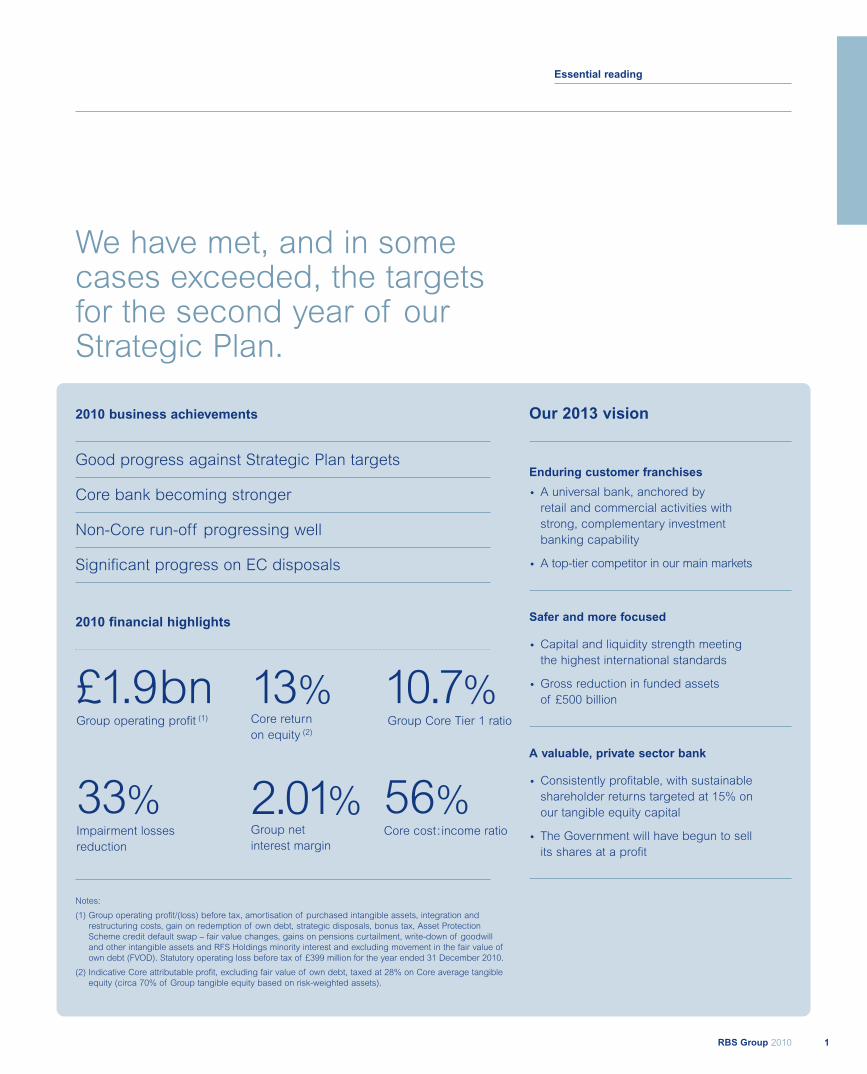
We have met, and in somecases exceeded, the targetsfor the second year of ourStrategic Plan.
2010 business achievements
Good progress against Strategic Plan targets
Core bank becoming stronger
Non-Core run-off progressing well
Significant progress on EC disposals
2010 financial highlights
Our 2013 vision
Enduring customer franchises
• A universal bank, anchored byretail and commercial activities withstrong, complementary investmentbanking capability
• A top-tier competitor in our main markets
Safer and more focused
• Capital and liquidity strength meetingthe highest international standards
• Gross reduction in funded assetsof £500 billion
A valuable, private sector bank
• Consistently profitable, with sustainableshareholder returns targeted at 15% onour tangible equity capital
• The Government will have begun to sellits shares at a profit
£1.9bnGroup operating profit (1)
33%Impairment lossesreduction
13%Core returnon equity (2)
2.01%Group netinterest margin
10.7%Group Core Tier 1 ratio
56%Core cost:income ratio
Notes:
(1) Group operating profit/(loss) before tax, amortisation of purchased intangible assets, integration andrestructuring costs, gain on redemption of own debt, strategic disposals, bonus tax, Asset ProtectionScheme credit default swap – fair value changes, gains on pensions curtailment, write-down of goodwilland other intangible assets and RFS Holdings minority interest and excluding movement in the fair value ofown debt (FVOD). Statutory operating loss before tax of £399 million for the year ended 31 December 2010.
(2) Indicative Core attributable profit, excluding fair value of own debt, taxed at 28% on Core average tangibleequity (circa 70% of Group tangible equity based on risk-weighted assets).

2
Chairman’s statement
Philip Hampton, Chairman
d Watch or listen toPhilip Hampton at www.rbs.com/AnnualReport
M For biographiessee pages 226-229
Business achievementsThere are two dimensions to the internal rebuilding process at RBS:reducing our exposure to certain assets and risks, and strengtheningour core businesses. On asset and risk reduction, we are ahead ofschedule. Our programme of business disposals has attracted the mostattention, with 20 agreements signed or completed in 2010. But ourasset restructuring deals and run-off programme are also contributingto making RBS a stronger and safer bank, with a greatly improvedcapital position and lower funding needs.
This progress means we can increasingly focus on the core businessesthat will drive our future. It has been pleasing to see the early results ofour efforts to strengthen them. For example, we have increased ourshare of the mortgage and savings markets in the UK, with accountnumbers rising by 44,000 and 579,000, respectively. We are investingheavily in our core businesses, with a strong emphasis on servingcustomers better and improving our efficiency.
Economic backdrop – getting betterThe global economy rebounded strongly in 2010, but the strength ofthe recovery was unevenly spread across countries, and over time.Among our core markets, the UK and the US both returned to fairlymodest growth. Conditions in Ireland remained very challenging.
This general improvement must be viewed against a backdrop offinancial market turbulence at various points in the year, especially inEurope. So while our expectation is that the return of economic growthin 2010 will be sustained in 2011, and that interest rates will graduallystart to rise during the year, we are vigilant about the downside risksand the possibility of spill-over effects from political uncertainties insome countries and regions.
Public policy – lending and remunerationIn the public policy debate, two issues attracted controversy for UKbanks in 2010: lending to companies, especially small and mediumenterprises; and remuneration. In February 2011, the leading UK banksreached an agreement with the UK Government with the intention ofreducing public controversy and improving constructive relationships.
The agreement involves a series of commitments by the larger banks,including on lending, remuneration and capital support, which are apositive reaction to issues of concern in our communities. We welcomethe UK Government’s recognition of the contribution of financialservices to the economy, and its commitment to support the creationof a level international playing field to promote effective competition.
On lending, it is important that banks give customers confidence thatrequests for funds for viable businesses will be met. RBS has beenactive in support of our customers over the last two years of significantdownturn. For example, we are on track to meet our current targets forUK lending availability, agreed in March 2010. In the UK, we lent £52billion to businesses over the first eleven months of the March 2010 –February 2011 period, well ahead of our full year target of £50 billion.Over the same eleven month period we lent over £15 billion to mortgagecustomers, resulting in net balance growth of more than £8 billion, inexcess of our full year mortgage net lending target of £8 billion.
RBS Group 2010
Rebuilding and Recovery
There was a step-change in our overall financialperformance last year. The return to operatingprofit(1) reflects both the internal rebuildingprocess at RBS and the external recovery inmarket and economic conditions. We are stilla good way from where we want to be in termsof our performance but 2010 representsanother big stride towards that goal.
(1) As defined on page 1.
3RBS Group 2010
Essential reading
Chairman’s statement
Our lending goals to businesses will now continue in 2011, withadditional capacity available to support further growth if demand ishigher than expected. This time, we will be joined by the other largeUK banks. We hope this initiative will help give confidence to stimulateeconomic growth. In addition, the banks have agreed to support a newmajor equity fund targeted at small businesses, and provide capital tothe UK Government’s “big society” bank.
Our support for business extends beyond lending. This is particularlytrue in tough economic times when it is even more important topreserve economic activity and jobs. A 500-strong team of our mostexperienced relationship managers provides intensive support to newand fast-growing companies, who may be experiencing a recessionand its aftermath for the first time. We have also grown our team ofrestructuring specialists who help struggling businesses back to health.We helped around 950 UK businesses to restructure successfully in2010. We work with companies of all shapes and sizes across thecountry – from a small road haulage business to higher-profileexamples, such as Liverpool Football Club, and large multinationals.
On remuneration, we have been a leading advocate of international,industry-wide reform in the banking sector over the last two years, havingfocused early on the need for deferrals, clawback and strong alignmentof rewards to shareholders’ interests by using equity instead of cash.
Following an extensive consultation with both our institutionalshareholders and UK Financial Investments, the Board has decidedour approach on the key aspects of 2010 remuneration, includingperformance-related awards, and has balanced the need to attractand retain talented people to serve customers effectively with otherkey drivers, including regulatory compliance and the control of costs.It will again include a £2,000 cap on immediate cash bonuses.
On tax, the Government will introduce a levy on banks’ balance sheetsfrom 1 January 2011. This policy was announced by the Chancellor ofthe Exchequer in the June Budget, with the details finalised as part ofthe February 2011 agreement outlined above. If the levy had beenapplied to the balance sheet at 31 December 2010, the cost of thelevy to RBS would be in the region of £350 to £400 million in 2011.
We made a gross contribution of £3.9 billion to the UK Government in2010. The bulk of this was taxes, including £1.5 billion paid on behalfof employees, directly or indirectly. We also paid around £1.5 billionfees, including £700 million for the Asset Protection Scheme.
Governance – building on the changes we made last yearWe made comprehensive changes to the Board and the ExecutiveManagement team in 2009, so last year was one of relative stability.I remain confident that the Board has the right blend of skills andexperience to succeed. Our management team, under the experiencedleadership of Stephen Hester, is doing an excellent job in movingRBS forward.
Penny Hughes joined the Board on 1 January, as a Non-executiveDirector, and took over as Chair of our Remuneration Committee from1 June 2010. Brendan Nelson was appointed as a Non-executiveDirector with effect from 1 April, and took over as Chair of the GroupAudit Committee following the 2010 AGM.
Archie Hunter left the Board at the 2010 AGM after six years andI would like to thank him for his work as a director and Chair of theAudit Committee. The commitment he provided during a time of majorchanges on the Board was very professional and valuable.
Finally, Colin Buchan will stand down from the Board in the summer,after nine years. Again, his commitment as a director and, last year,as chairman of the Remuneration Committee, has been greatlyappreciated by the Board.
Sustainable Banking – serving local communitiesFinancial services provide important benefits to society when they aredelivered responsibly and efficiently. Having learned the lessons fromthe past, the challenge for RBS is to deliver these services in a waythat our communities value and that our people can be proud of. I amconfident that the changes we are making at RBS in the way we dobusiness, as well as the business we do, will help to achieve this. Muchof this work is overseen by the Group’s Sustainability Committee, whichis chaired by our Senior Independent Director, Sir Sandy Crombie, andreports to our Board.
For example, NatWest and RBS introduced Customer Charters in 2010.These are based on the issues that customers have told us are importantto them, such as making banking easy (we will extend our openinghours in our busiest branches). Similarly, Ulster Bank in Ireland andCitizens in the US launched their own commitments, which are alreadydelivering tangible benefits to our customers.
We are also committed to investing in and developing our communityprogrammes. Our long-running MoneySense programme continues toprovide education on basic financial matters to thousands ofschoolchildren in the UK, and is actively supported by employeevolunteers. The Citizens ‘Gear for Grades’ programme in the USprovides school supplies for children whose families are unable toafford them. Since the programme’s inception in 2003, Citizens hasserved over 150,000 school children in the US. Our community activitiesalso include business start-up support and microfinance programmes.Our annual Sustainability Report contains extensive information on ouractivities in this key area for us in the UK, USA, India and many othercountries where we operate.
Value for our shareholdersIt is vital that we make a proper financial return on the large amountsof new capital that RBS has raised in recent years, mainly from theUK Government. To make that return, we know that we have to run thebusinesses efficiently and support our customers effectively. An intrinsicpart of our effectiveness comes from being a healthy and safe bank, withsufficient capital and liquidity to meet the demands of customers, marketsand regulation. Many banks in the UK and elsewhere, including RBS,operated for a number of years with levels of capital and liquidity which,certainly in hindsight, left them weak and vulnerable. Our job is to makesure RBS remains strong and safe, but also to reward shareholdersappropriately through improving financial results. I hope you will agreethat the progress we have made is evident in our 2010 Results. Muchremains to be done, but we are another important step closer to realisingthe potential in the businesses that make up the RBS Group.
Philip HamptonChairman

4
Group Chief Executive’s review
Stephen Hester, Group Chief Executive
d Watch or listen toStephen Hester at www.rbs.com/AnnualReport
M For biographiessee pages 226-229
Two years on from the global financial crisis,our recovery is ahead of schedule. In 2010 wemade big strides in risk reduction and an earlyreturn to operating profits. We have much workstill to do and there are significant obstaclesstill to overcome. We aim for continuedprogress this year.
Our goalsOur overriding focus is on achieving three things:
• to serve customers well;
• to restore the Bank to undoubted standalone strength; and
• to rebuild sustainable value for all shareholders, and in so doing toenable the UK Government to sell its holding profitably over time.
StrategyRBS’s strategy, announced in 2009, remains our best route to achievingthese goals. It is serving us well in meeting the twin challenges ofcontinuing change in our external environment and the need for radicalinternal restructuring at RBS.
The new RBS is built upon customer franchises with substantialcompetitive strengths in their respective markets, our “Core”businesses. Each is being reshaped to provide improved and enduringperformance. The Core businesses all generate strong value in theirown right, and a still stronger, balanced and more valuable mix together.The business shape and new management disciplines we areestablishing can drive RBS to success as a leading bank in its marketsfor many years to come.
The weaknesses uncovered by the financial crisis – of leverage, riskconcentration and business stretch – are being fixed. The successfuland continuing run-down and sale of assets which weakened us, orbusinesses where we have no competitive advantage, illustrates this.These assets were placed in our Non-Core Division and give a focus toour risk reduction objectives. We are changing a balance sheet whichcould not withstand the crisis and, importantly, the culture that created it.
2010 Results against goals2010 was a year of good progress and the Group is on or ahead of itspublished goals for this stage of our Plan. There have been and still arechallenges to face into, whether economic, regulatory or political. Ourresilience to such events is increasing steadily.
Customers: We are completely clear – success in serving customersis the key to our business future. Overdue investment in service,technology and a changing cultural approach is starting to roll outacross RBS. Most of our Core franchises showed gains on a variety ofcustomer measures during the year though we are conscious that muchremains to be done. It will take time for our actions to have full effect,in particular where business restructuring has been most marked.
In each of our retail businesses we have re-energised and investedin our customer offering around the organising thought of ‘helpfulbanking’. The proposition in each market is tailored to suit localcustomers: NatWest has ‘Helpful Banking’; RBS has ‘Here for You’;Citizens has ‘Good Banking is Good Citizenship’, and; Ulster Bankhas ‘Help For What Matters’. This is supporting improved customerattraction and retention and has resonated positively with staff,customers, and the broader communities we serve.
Risk: Excellent progress has been made on the journey towards bringingRBS’s risk profile in line with the highest standards of our industry.Our funding and liquidity profile is much improved and no longer anoutlier for our industry. Non-Core assets are down a further £63 billion,the loan-to-deposit ratio is 117%, down from 154% at peak and ourCore businesses now take in over £1 of deposits for every £1 of loans
RBS Group 2010
5RBS Group 2010
Essential reading
Group Chief Executive’s review
made – the “gold standard” we are targeting. Improvements in riskare also evident through reductions in single name and sectoralcredit concentrations.
RBS has strong capital ratios – with a Core Tier 1 ratio of 10.7%.The additional protection of the Asset Protection Scheme, as expected,is unlikely to be called upon and we target scheme exit by the endof 2012, subject to continued progress on risk reduction and toregulatory approvals.
Shareholder value: This vital part of our goals is on track but inevitablywill take the most time to deliver fully. The potential is there and theperformance of the Bank will increasingly speak for itself. 2010 resultswere a large improvement on 2009 and our budgets for the year. AtGroup level RBS posted £1.9 billion of operating profits, excluding fairvalue of own debt (from a £6.1 billion loss in 2009). It was only after thepost tax effect of APS (£1.1 billion) that we reported a net attributableloss of £1.1 billion. We are taking significant steps toward repaying thesupport we have received.
The RBS Core business posted operating profits of £7.4 billion andreturn on equity of 13%, above its cost of capital. Importantly thequality of results also improved. While still significantly impacted byhigh credit costs, low interest rates and other economic challenges,our Retail and Commercial businesses increased operating profits by66% to £3.8 billion with a 10% ROE. Our Irish bank and our Insurancebusiness remained in loss as a result of prior risk exposures which weare working down. Our investment banking arm, despite tough markets,posted £3.4 billion operating profits and a 17% ROE – a competitiveresult when compared with peers, though down from the record prioryear. Adding the related parts of our GTS business gives still strongerreturns for our wholesale client activity as a whole.
2010 results were achieved with strong attention to efficiency – beatingour cost targets and allowing vital investment right across the Group toenhance future growth and business quality.
In Non-Core progress was also pleasing, though losses will continuein this division during the remaining Plan period as assets are soldand run down. Non-Core assets reduced by £63 billion to £138 billionduring 2010, beating our targets. Losses narrowed sharply thoughthey are still significant.
PeopleOur people are doing a great job in producing the turnaround wehave targeted despite great stresses and challenges. I thank all ofmy colleagues at RBS for this.
Our ability to attract, retain and motivate the best people is still notwhat we want it to be. Our business challenges and the externalenvironment lead to management compromises that add risk to theachievement of our business goals. We are working hard to moveforward and balance staff motivation with external acceptance thatpast mistakes have been addressed.
RegulationWe support the revolution in regulatory standards that, when complete,and coupled with the dramatic industry changes taking place, will make fora safer financial services industry for everyone. But a safer economy alsoneeds global macro-economic imbalances to be successfully addressed.
The Basel-led process seems likely to get to the right place on banksafety and there is good progress in the design of bank resolution andrecapitalisation (“bail-in”) mechanisms, which should remove the needfor future state capital support. The impact of these measures materiallyimpacts bank costs and return prospects. These in turn impact cost andavailability of customer service, including credit provision. There is animportant balance to be struck by policy-makers.
2011 will be noteworthy in the UK for the conclusion of the IndependentCommission on Banking (ICB). The ICB has the opportunity to reflect onall of the change under way and to determine if additional measureswould be beneficial. There are traps to avoid in areas where UK reform,which is not followed elsewhere, might bring more cost than benefit,hamper banks and the economy and give the illusion of more safetywithout its reality. The Commission’s work is continuing thoughtfully andwe are co-operating fully to give insights wherever helpful.
OutlookRBS is on track to meet its ambitious goals. These goals set out thepath for our recovery period but also establish the foundations for the“new” RBS to enjoy strong and enduring prospects well into the future.For 2011, we target continued progress toward published targets. Wecontinue to prioritise risk reduction, strengthening of customer serviceand building the quality and quantity of Core profits.
We are alert to the risks facing our businesses. In 2010, our resultswere accomplished despite eurozone market volatility, additional Irishimpairments and higher than expected insurance provisioning. 2011will doubtless have its own challenges as the global economic recoveryseeks a firmer footing. Our plans might also face further substantialimpacts from national and international regulatory changes.
And, as visible exemplars of the financial crisis, RBS remains vulnerableto “public mood”. The journey from “problem” to “opportunity” is importantand our progress will aid customer trust, staff stability and investorconfidence. In that context we hope that the opportunity to sell part ofthe UK Government’s shareholding becomes increasingly visible andappealing – a “win win” for the taxpayer and for RBS. That moment willbe an emblem of our progress and, in some respects, of progress inthe wider UK economy.
RBS in 2011Our goals for 2011 are clear. External events can still blow us off courseand caution is needed until these clarify. But for our part, the strategy isdelivering. We are focussing on serving our customers well and better.We are stripping away excess risk inherited from the past. We arebuilding enduring strength and value in the new RBS and supportingthe economies we serve.
In conclusion, I would like to thank all of our staff, our shareholders andother stakeholders for their continued support as we build the new RBS.
Stephen HesterGroup Chief Executive
RBS Group 20106
Q&As on progress
When we speak to our investors, somequestions are asked more often than others.Below we provide a selection of thosefrequently asked questions – and answers.
x Where are you in the impairment cycle?The level of Group impairments fell by 33 per cent in 2010, reflectingimprovements in the economic environment. Impairments fell in all corebusinesses, except Ulster Bank, where asset default levels and lossrates remained high in both the retail and corporate portfolios, reflectingdifficult economic conditions in Ireland.
We currently expect impairments in Ulster Bank to stabilise in 2011,and to continue falling in our other businesses, assuming the globaleconomic recovery is sustained.
x When will the UK Government sell its shareholding?The UK Government set up UK Financial Investments Ltd (UKFI) tomanage its investments in financial institutions, including RBS. UKFIhas been given a clear mandate by the Government, to protect andcreate value for the taxpayer as shareholder. As such, decisionsaround the timing of any sale are outside the remit of the RBS Group.We are acutely aware of our responsibility as part of this process.By successfully implementing our Strategic Plan, we will serve ourcustomers well and achieve the business success needed to attractnew investors.
x Can you explain the treatment of the APS and fair valueof own debt?Our financial performance is affected by two items that do not reflectthe day-to-day business of the Group – the Asset Protection Schemeand the fair value of own debt. Both can exhibit counter-cyclicalbehaviour, in that improving market conditions result in a charge, andvice versa.
The APS is a credit derivative and so must be accounted for at fairvalue; fluctuations in this value are reflected in the results. If marketcircumstances are getting better and credit spreads for the assets inthe covered portfolio narrow, the value of the protection decreases anda loss is recognised. If spreads widen, the protection is more valuable,giving rise to a gain.
For accounting purposes, the Group values some of its issued debt(e.g. bond issues) at the current market price. Changes in this value arerecorded in profit or loss. Part of this change results from marketmovements in the price of the Group’s credit: when the Group’s creditspreads tighten a loss is recorded, when they widen a gain is recorded.
x What has been happening to margins, and why?We need to rebuild net interest margins (NIMs) if we are to produceadequate profits to service the capital our shareholders have invested inRBS. Encouragingly, we made further progress in 2010: the Group NIM
rose by 25 basis points to 2.01 per cent. This improvement was drivenby the Retail & Commercial business, where asset margins recoveredacross a number of markets, primarily due to the run-off of olderbusiness written at unsustainably lower margins.
Progress on liability margins has been more difficult. This reflects strongcompetition for customer deposits, as the banking sector tries to narrowits funding gap, and the low interest rate environment.
x What recommendations have you made to the IndependentCommission on Banking (ICB)?The Commission inquiry is a major event for our industry in the UK, andwe have sought to engage thoughtfully. Our response was published onthe ICB website.
In our view, the debate about banking size and structure can oftengenerate more heat than light. The banks that failed during thecrisis didn’t fail because they were too big, or because they had aninvestment bank. They failed because they had some form ofconcentration risk: in funding, in lending to property, in geographyor in proprietary trading.
We should aim for a financial system where the probability of futurecrises is substantially reduced and there is an effective resolutionregime for those institutions that do still fail. If this can be achieved thenthe size and shape of banks can be driven by the choices of customersand shareholders, within the context of strong and effective regulation.
x How much progress have you made towards thecost reduction target you set?Our cost reduction programme continues to deliver material savings.Annualised savings are now just ahead of the £2.5 billion target for2011 and are forecast to exceed £3 billion by 2013. This reflects bettercost control in our day-to-day operations, as well as a number ofbusiness disposals.
These cost savings will help to finance the £6 billion of essentialinvestments we have committed to make as part of our five-yearrecovery plan. These will strengthen our core businesses. Examplesinclude the provision of an integrated Wealth IT platform and enhancedelectronic trading facilities for GBM.
x How much exposure do you have to the sovereign debt crisis?Our exposure to sovereign bonds in the two countries most deeplyembroiled in the crisis – Greece and Ireland – is relatively low (£895million and £104 million, respectively at 31 December 2010). But weclearly have significant exposure to the Republic of Ireland economythrough our Ulster Bank subsidiary (total lending was £43.2 billionat 31 December 2010). To help manage this exposure, we placedc.£15 billion of assets in our Non-Core Division, the vast majority ofwhich relates to commercial property. We are managing this down overtime and, where assets are currently non-performing, they are beingheavily provisioned.
7RBS Group 2010
Essential reading
Q&As on progress
Our key targets
Why?
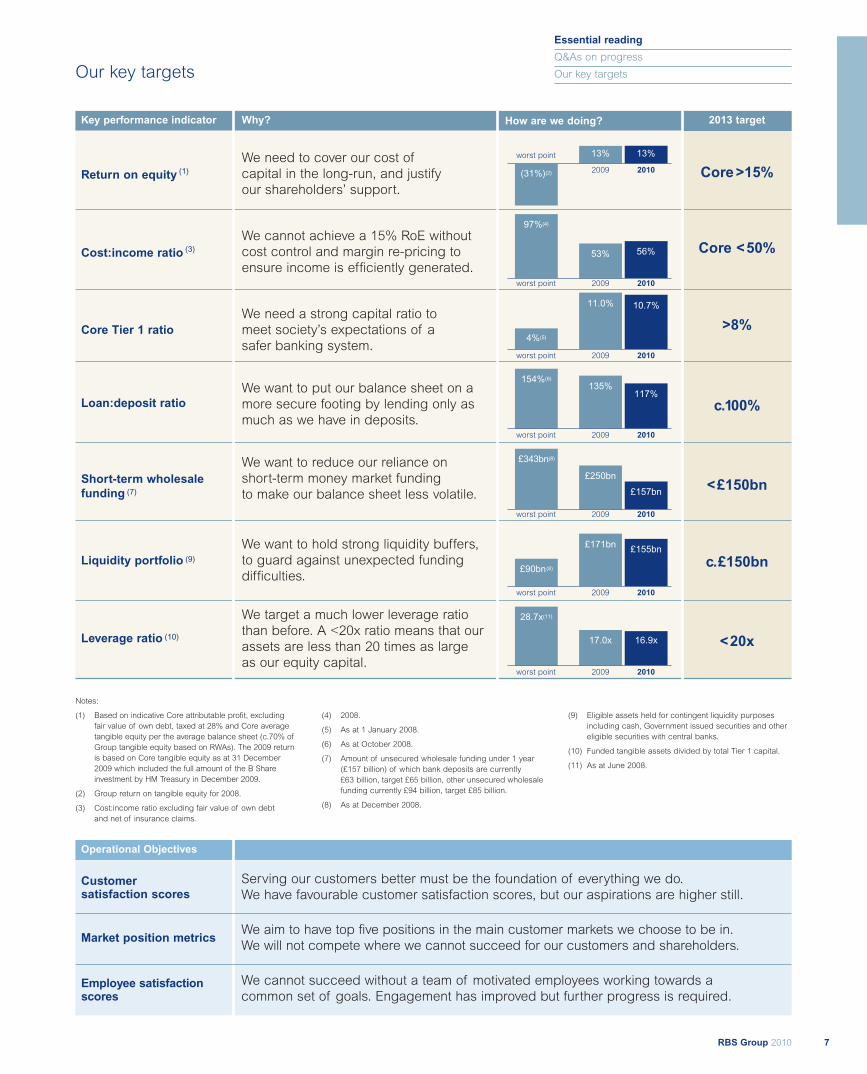
We need to cover our cost ofcapital in the long-run, and justifyour shareholders’ support.
We cannot achieve a 15% RoE withoutcost control and margin re-pricing toensure income is efficiently generated.
We need a strong capital ratio tomeet society’s expectations of asafer banking system.
We want to put our balance sheet on amore secure footing by lending only asmuch as we have in deposits.
We want to reduce our reliance onshort-term money market fundingto make our balance sheet less volatile.
We want to hold strong liquidity buffers,to guard against unexpected fundingdifficulties.
We target a much lower leverage ratiothan before. A <20x ratio means that ourassets are less than 20 times as largeas our equity capital.
2013 target
Core>15%
Core <50%
>8%
c.100%
<£150bn
c.£150bn
<20x
Key performance indicator
Return on equity (1)
Cost:income ratio (3)
Core Tier 1 ratio
Loan:deposit ratio
Short-term wholesalefunding (7)
Liquidity portfolio (9)
Leverage ratio (10)
Our key targets
How are we doing?
10.7%11.0%
4%(5)
worst point 2009 2010
117%135%
154%(6)
worst point 2009 2010
£157bn
£250bn
£343bn(8)
worst point 2009 2010
£155bn£171bn
£90bn(8)
worst point 2009 2010
16.9x17.0x
28.7x(11)
worst point 2009 2010
13%13%
(31%)(2)
worst point
2009 2010
56%53%
97%(4)
worst point 2009 2010
Operational Objectives
Customersatisfaction scores
Market position metrics
Employee satisfactionscores
Serving our customers better must be the foundation of everything we do.We have favourable customer satisfaction scores, but our aspirations are higher still.
We aim to have top five positions in the main customer markets we choose to be in.We will not compete where we cannot succeed for our customers and shareholders.
We cannot succeed without a team of motivated employees working towards acommon set of goals. Engagement has improved but further progress is required.
Notes:
(1) Based on indicative Core attributable profit, excludingfair value of own debt, taxed at 28% and Core averagetangible equity per the average balance sheet (c.70% ofGroup tangible equity based on RWAs). The 2009 returnis based on Core tangible equity as at 31 December2009 which included the full amount of the B Shareinvestment by HM Treasury in December 2009.
(2) Group return on tangible equity for 2008.
(3) Cost:income ratio excluding fair value of own debtand net of insurance claims.
(4) 2008.
(5) As at 1 January 2008.
(6) As at October 2008.
(7) Amount of unsecured wholesale funding under 1 year(£157 billion) of which bank deposits are currently£63 billion, target £65 billion, other unsecured wholesalefunding currently £94 billion, target £85 billion.
(8) As at December 2008.
(9) Eligible assets held for contingent liquidity purposesincluding cash, Government issued securities and othereligible securities with central banks.
(10) Funded tangible assets divided by total Tier 1 capital.
(11) As at June 2008.

RBS Group 20108
Our business and our strategy Our approach to business
Progress on our strategic plan
Our core businesses
The economic environment

9RBS Group 2010
Our business and our strategy
Our over-riding focus is onachieving three things:
to serve customers well;
to restore the Bank toundoubted standalonestrength; and
to rebuild sustainablevalue for all shareholders.
In the second year of ourfive-year plan, we madeprogress on all three counts.
Our approach to risk management

Our approach to business
We have three over-riding goals:
• to serve customers well
• to restore the Bank to undoubted standalone strength
• to rebuild sustainable value for all shareholders
There are important inter-dependencies between these goals.We cannot serve customers well if the Bank is not safer andmore resilient. We cannot achieve standalone strength withoutrebuilding shareholder value. And we cannot rebuild shareholdervalue if we do not serve customers well. So while each of thesegoals is important on its own, we will succeed only if weconsistently achieve them together.
Customers
Serving our customers well is the cornerstoneof the Group’s strategy. It is embedded in ourOperational Objectives, our CustomerCharters and in our ‘How we do business’framework, which we describe below. It isencouraging that most of our core franchisesshowed gains on a variety of customermeasures during the year. But we are notcomplacent. Our customers’ needs andpreferences change over time, so goodservice today does not guarantee goodservice tomorrow. And financial services is acompetitive, dynamic industry. So it isimportant that we work hard to streamline andenhance our customer service proposition.
CustomersWe understandour customers
We know who weare dealing with
We treat our customers fairly
We treat all customerinformation asconfidential
ReputationWe conduct ourselves in a
way that protects our reputationWe work within all relevant
laws and regulations
We are a responsible and engagedmember of the community
We conduct our businessin a sustainable manner
We deliver essential customerservices and critical business
processes at all times
PeopleWe value our people
We recruit, develop andreward people based on their
ability to do the job
We manage our peopleresponsibly and fairly
RBS Group 201010
Our business and our strategy
Our approach to business
RiskWe understand
and manage the riskswe are taking
We identify and managethe level of risk we are
prepared to take
SecurityWe operate in a
secure environment
We protect access to ourpremises, systems and data
We operate our processes,systems and controlsto minimise loss from
fraud or error
FinancesWe manage ourfinances carefully
We use the Group’s capitaland resources efficiently
We account for and reportour transactions properly
11RBS Group 2010
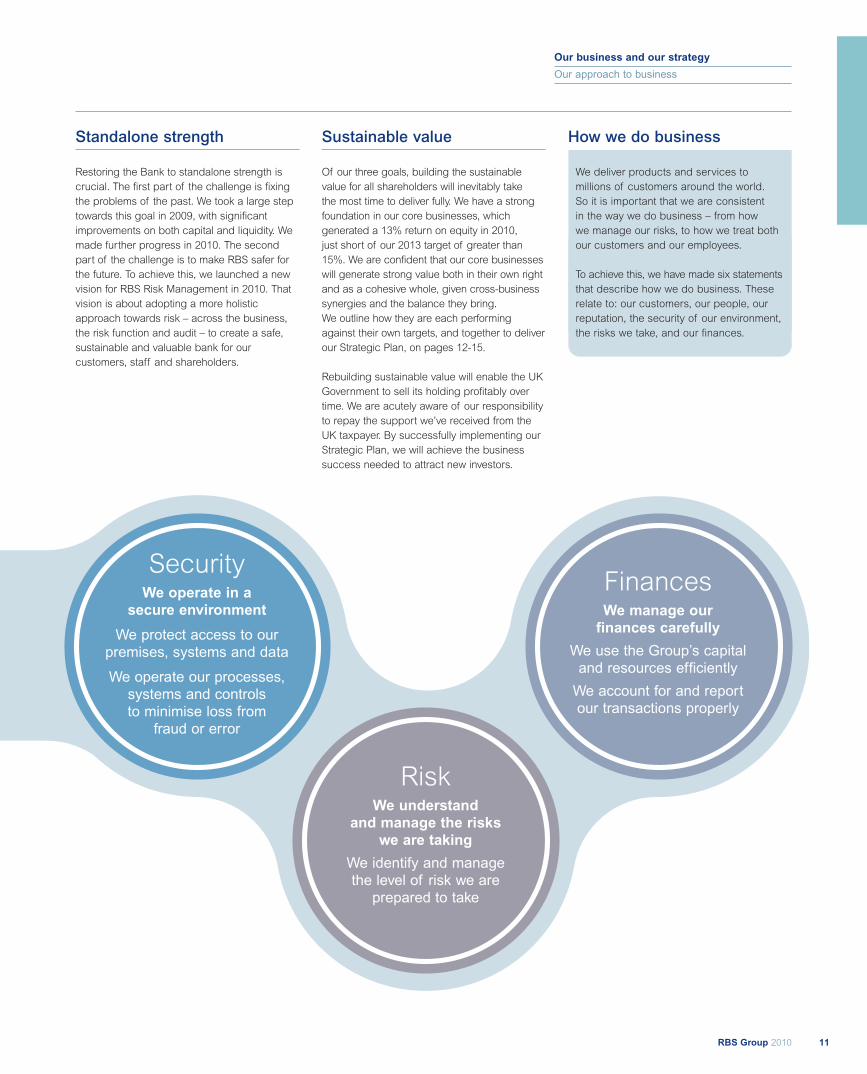
Standalone strength
Restoring the Bank to standalone strength iscrucial. The first part of the challenge is fixingthe problems of the past. We took a large steptowards this goal in 2009, with significantimprovements on both capital and liquidity. Wemade further progress in 2010. The secondpart of the challenge is to make RBS safer forthe future. To achieve this, we launched a newvision for RBS Risk Management in 2010. Thatvision is about adopting a more holisticapproach towards risk – across the business,the risk function and audit – to create a safe,sustainable and valuable bank for ourcustomers, staff and shareholders.
Sustainable value
Of our three goals, building the sustainablevalue for all shareholders will inevitably takethe most time to deliver fully. We have a strongfoundation in our core businesses, whichgenerated a 13% return on equity in 2010,just short of our 2013 target of greater than15%. We are confident that our core businesseswill generate strong value both in their own rightand as a cohesive whole, given cross-businesssynergies and the balance they bring.We outline how they are each performingagainst their own targets, and together to deliverour Strategic Plan, on pages 12-15.
Rebuilding sustainable value will enable the UKGovernment to sell its holding profitably overtime. We are acutely aware of our responsibilityto repay the support we’ve received from theUK taxpayer. By successfully implementing ourStrategic Plan, we will achieve the businesssuccess needed to attract new investors.
How we do business
We deliver products and services tomillions of customers around the world.So it is important that we are consistentin the way we do business – from howwe manage our risks, to how we treat bothour customers and our employees.
To achieve this, we have made six statementsthat describe how we do business. Theserelate to: our customers, our people, ourreputation, the security of our environment,the risks we take, and our finances.
RBS Group 201012
Progress on our Strategic Plan
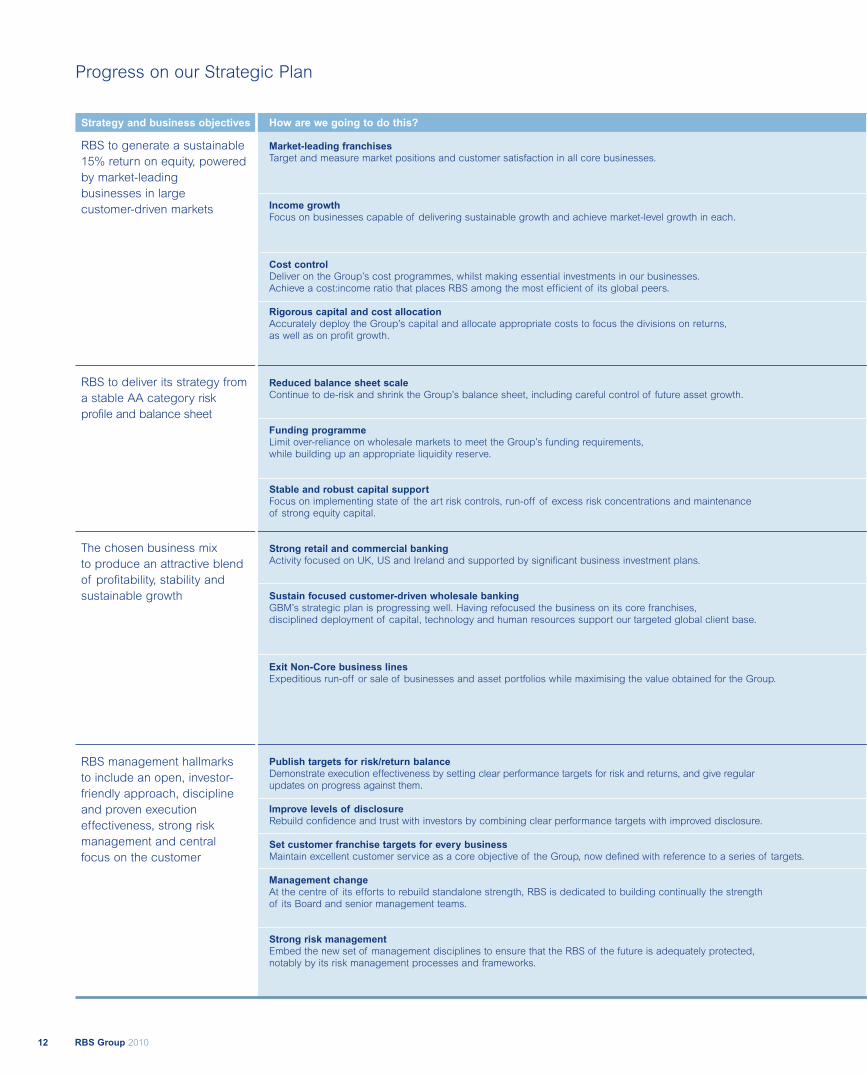
Strategy and business objectives
RBS to generate a sustainable15% return on equity, poweredby market-leadingbusinesses in largecustomer-driven markets
RBS to deliver its strategy froma stable AA category riskprofile and balance sheet
The chosen business mixto produce an attractive blendof profitability, stability andsustainable growth
RBS management hallmarksto include an open, investor-friendly approach, disciplineand proven executioneffectiveness, strong riskmanagement and centralfocus on the customer
How are we going to do this?
Market-leading franchisesTarget and measure market positions and customer satisfaction in all core businesses.
Income growthFocus on businesses capable of delivering sustainable growth and achieve market-level growth in each.
Cost controlDeliver on the Group’s cost programmes, whilst making essential investments in our businesses.Achieve a cost:income ratio that places RBS among the most efficient of its global peers.
Rigorous capital and cost allocationAccurately deploy the Group’s capital and allocate appropriate costs to focus the divisions on returns,as well as on profit growth.
Reduced balance sheet scaleContinue to de-risk and shrink the Group’s balance sheet, including careful control of future asset growth.
Funding programmeLimit over-reliance on wholesale markets to meet the Group’s funding requirements,while building up an appropriate liquidity reserve.
Stable and robust capital supportFocus on implementing state of the art risk controls, run-off of excess risk concentrations and maintenanceof strong equity capital.
Strong retail and commercial bankingActivity focused on UK, US and Ireland and supported by significant business investment plans.
Sustain focused customer-driven wholesale bankingGBM’s strategic plan is progressing well. Having refocused the business on its core franchises,disciplined deployment of capital, technology and human resources support our targeted global client base.
Exit Non-Core business linesExpeditious run-off or sale of businesses and asset portfolios while maximising the value obtained for the Group.
Publish targets for risk/return balanceDemonstrate execution effectiveness by setting clear performance targets for risk and returns, and give regularupdates on progress against them.
Improve levels of disclosureRebuild confidence and trust with investors by combining clear performance targets with improved disclosure.
Set customer franchise targets for every businessMaintain excellent customer service as a core objective of the Group, now defined with reference to a series of targets.
Management changeAt the centre of its efforts to rebuild standalone strength, RBS is dedicated to building continually the strengthof its Board and senior management teams.
Strong risk managementEmbed the new set of management disciplines to ensure that the RBS of the future is adequately protected,notably by its risk management processes and frameworks.
13RBS Group 2010
Our business and our strategy
Progress on our Strategic Plan
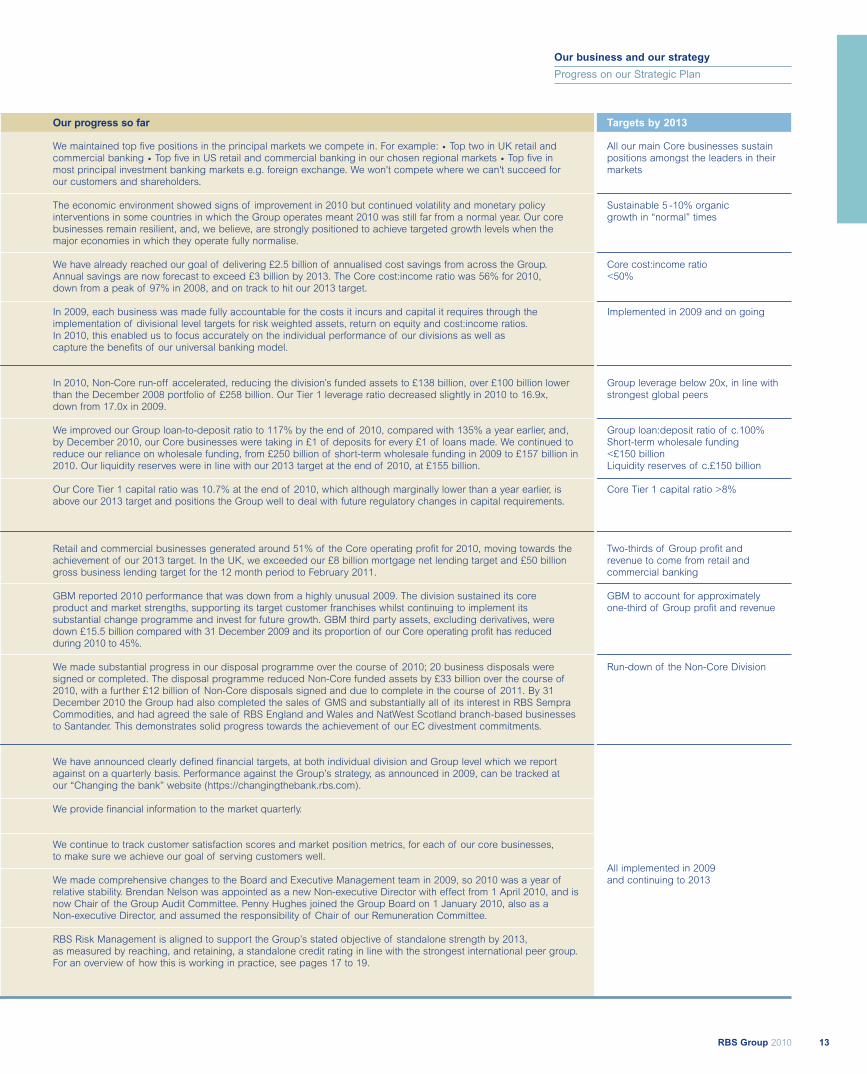
Targets by 2013
All our main Core businesses sustainpositions amongst the leaders in theirmarkets
Sustainable 5 -10% organicgrowth in “normal” times
Core cost:income ratio<50%
Implemented in 2009 and on going
Group leverage below 20x, in line withstrongest global peers
Group loan:deposit ratio of c.100%Short-term wholesale funding<£150 billionLiquidity reserves of c.£150 billion
Core Tier 1 capital ratio >8%
Two-thirds of Group profit andrevenue to come from retail andcommercial banking
GBM to account for approximatelyone-third of Group profit and revenue
Run-down of the Non-Core Division
All implemented in 2009and continuing to 2013
Our progress so far
We maintained top five positions in the principal markets we compete in. For example: • Top two in UK retail andcommercial banking • Top five in US retail and commercial banking in our chosen regional markets • Top five inmost principal investment banking markets e.g. foreign exchange. We won't compete where we can't succeed forour customers and shareholders.
The economic environment showed signs of improvement in 2010 but continued volatility and monetary policyinterventions in some countries in which the Group operates meant 2010 was still far from a normal year. Our corebusinesses remain resilient, and, we believe, are strongly positioned to achieve targeted growth levels when themajor economies in which they operate fully normalise.
We have already reached our goal of delivering £2.5 billion of annualised cost savings from across the Group.Annual savings are now forecast to exceed £3 billion by 2013. The Core cost:income ratio was 56% for 2010,down from a peak of 97% in 2008, and on track to hit our 2013 target.
In 2009, each business was made fully accountable for the costs it incurs and capital it requires through theimplementation of divisional level targets for risk weighted assets, return on equity and cost:income ratios.In 2010, this enabled us to focus accurately on the individual performance of our divisions as well ascapture the benefits of our universal banking model.
In 2010, Non-Core run-off accelerated, reducing the division’s funded assets to £138 billion, over £100 billion lowerthan the December 2008 portfolio of £258 billion. Our Tier 1 leverage ratio decreased slightly in 2010 to 16.9x,down from 17.0x in 2009.
We improved our Group loan-to-deposit ratio to 117% by the end of 2010, compared with 135% a year earlier, and,by December 2010, our Core businesses were taking in £1 of deposits for every £1 of loans made. We continued toreduce our reliance on wholesale funding, from £250 billion of short-term wholesale funding in 2009 to £157 billion in2010. Our liquidity reserves were in line with our 2013 target at the end of 2010, at £155 billion.
Our Core Tier 1 capital ratio was 10.7% at the end of 2010, which although marginally lower than a year earlier, isabove our 2013 target and positions the Group well to deal with future regulatory changes in capital requirements.
Retail and commercial businesses generated around 51% of the Core operating profit for 2010, moving towards theachievement of our 2013 target. In the UK, we exceeded our £8 billion mortgage net lending target and £50 billiongross business lending target for the 12 month period to February 2011.
GBM reported 2010 performance that was down from a highly unusual 2009. The division sustained its coreproduct and market strengths, supporting its target customer franchises whilst continuing to implement itssubstantial change programme and invest for future growth. GBM third party assets, excluding derivatives, weredown £15.5 billion compared with 31 December 2009 and its proportion of our Core operating profit has reducedduring 2010 to 45%.
We made substantial progress in our disposal programme over the course of 2010; 20 business disposals weresigned or completed. The disposal programme reduced Non-Core funded assets by £33 billion over the course of2010, with a further £12 billion of Non-Core disposals signed and due to complete in the course of 2011. By 31December 2010 the Group had also completed the sales of GMS and substantially all of its interest in RBS SempraCommodities, and had agreed the sale of RBS England and Wales and NatWest Scotland branch-based businessesto Santander. This demonstrates solid progress towards the achievement of our EC divestment commitments.
We have announced clearly defined financial targets, at both individual division and Group level which we reportagainst on a quarterly basis. Performance against the Group’s strategy, as announced in 2009, can be tracked atour “Changing the bank” website (https://changingthebank.rbs.com).
We provide financial information to the market quarterly.
We continue to track customer satisfaction scores and market position metrics, for each of our core businesses,to make sure we achieve our goal of serving customers well.
We made comprehensive changes to the Board and Executive Management team in 2009, so 2010 was a year ofrelative stability. Brendan Nelson was appointed as a new Non-executive Director with effect from 1 April 2010, and isnow Chair of the Group Audit Committee. Penny Hughes joined the Group Board on 1 January 2010, also as aNon-executive Director, and assumed the responsibility of Chair of our Remuneration Committee.
RBS Risk Management is aligned to support the Group’s stated objective of standalone strength by 2013,as measured by reaching, and retaining, a standalone credit rating in line with the strongest international peer group.For an overview of how this is working in practice, see pages 17 to 19.
RBS Group 201014
Our Core businesses
Bus
ines
sSe
rvic
es
Busines
s Services provides a diverse range of services
tothe
custo
mer-facing operations of the Group.
UK RetailGlobal TransactionServices
GlobalBanking
& Markets
US Retail &Commercial
UK Corporate RBS Insurance
Wealth
Ulster Bank
Non-Core
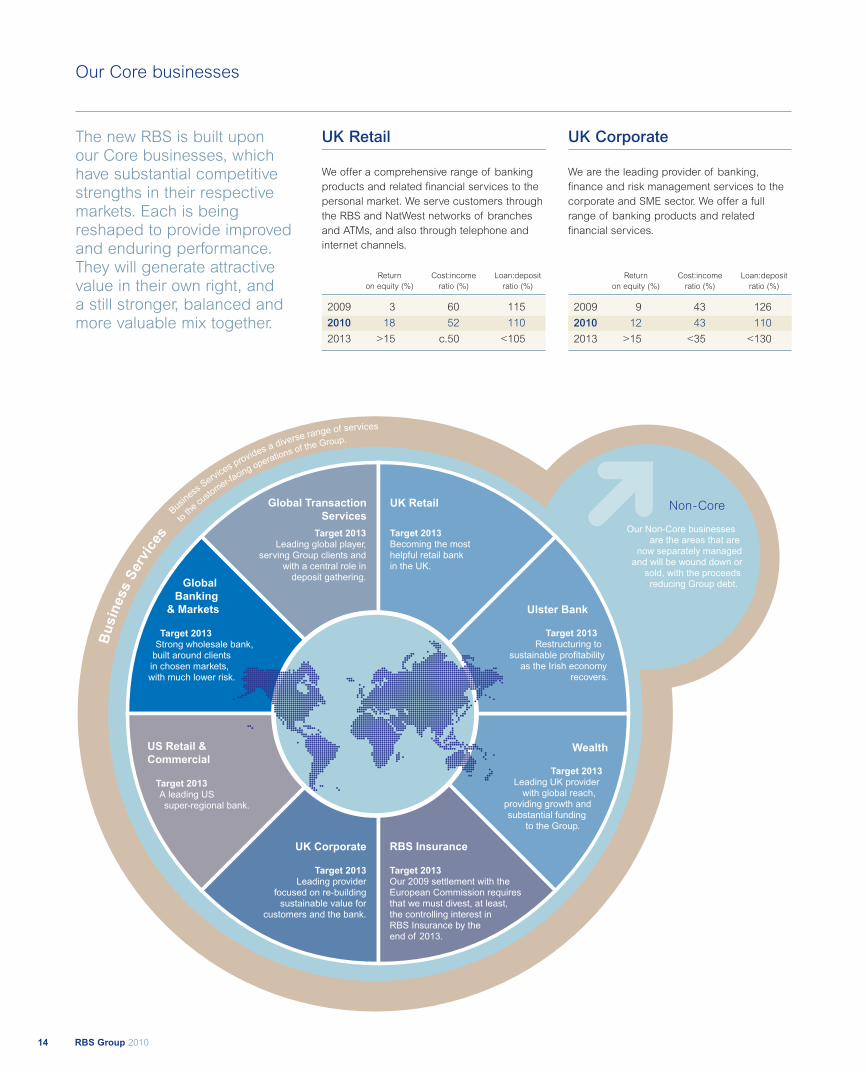
Target 2013Becoming the mosthelpful retail bankin the UK.
Target 2013Strong wholesale bank,
built around clientsin chosen markets,with much lower risk.
Target 2013A leading USsuper-regional bank.
Target 2013Our 2009 settlement with theEuropean Commission requiresthat we must divest, at least,the controlling interest inRBS Insurance by theend of 2013.
Target 2013Leading provider
focused on re-buildingsustainable value for
customers and the bank.
Target 2013Leading global player,
serving Group clients andwith a central role in
deposit gathering.
Target 2013Restructuring to
sustainable profitabilityas the Irish economy
recovers.
Target 2013Leading UK provider
with global reach,providing growth andsubstantial funding
to the Group.
Our Non-Core businessesare the areas that are
now separately managedand will be wound down or
sold, with the proceedsreducing Group debt.
The new RBS is built uponour Core businesses, whichhave substantial competitivestrengths in their respectivemarkets. Each is beingreshaped to provide improvedand enduring performance.They will generate attractivevalue in their own right, anda still stronger, balanced andmore valuable mix together.
UK Retail
We offer a comprehensive range of bankingproducts and related financial services to thepersonal market. We serve customers throughthe RBS and NatWest networks of branchesand ATMs, and also through telephone andinternet channels.
Return Cost:income Loan:depositon equity (%) ratio (%) ratio (%)
2009 3 60 115
2010 18 52 110
2013 >15 c.50 <105
UK Corporate
We are the leading provider of banking,finance and risk management services to thecorporate and SME sector. We offer a fullrange of banking products and relatedfinancial services.
Return Cost:income Loan:depositon equity (%) ratio (%) ratio (%)
2009 9 43 126
2010 12 43 110
2013 >15 <35 <130
15RBS Group 2010
Our business and our strategy
Our Core businesses
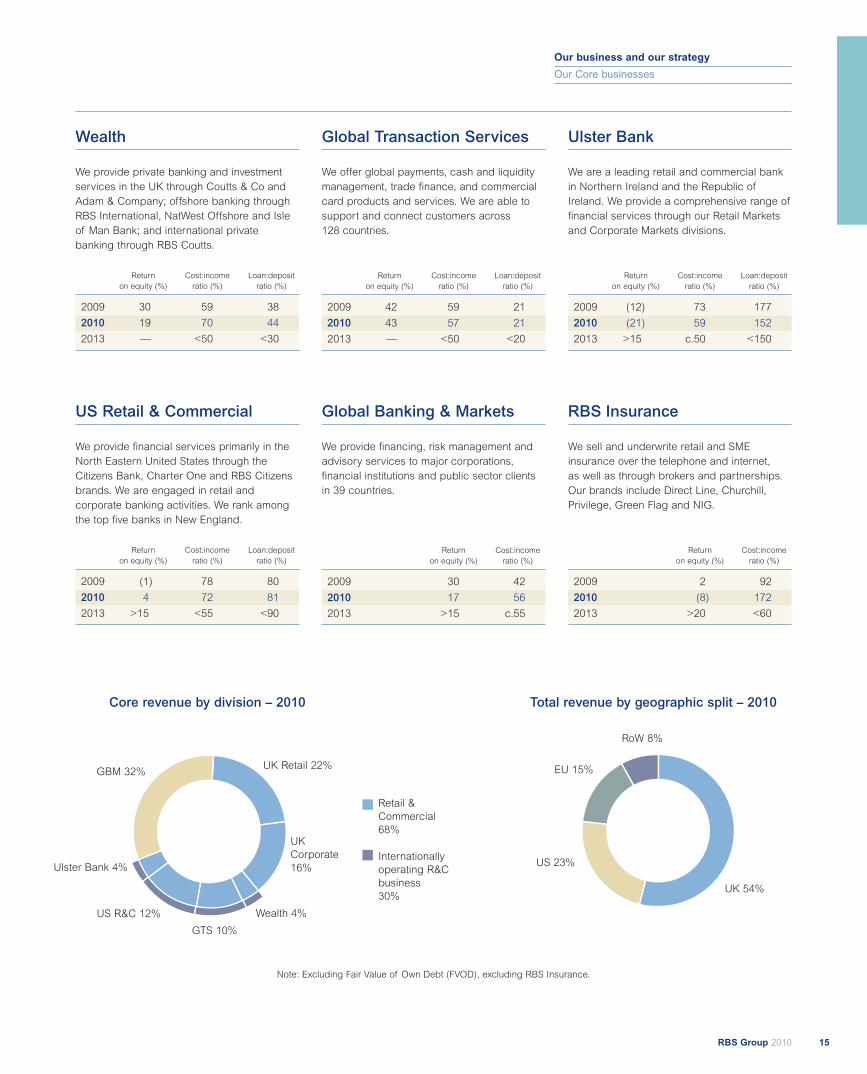
Wealth
We provide private banking and investmentservices in the UK through Coutts & Co andAdam & Company; offshore banking throughRBS International, NatWest Offshore and Isleof Man Bank; and international privatebanking through RBS Coutts.
Return Cost:income Loan:depositon equity (%) ratio (%) ratio (%)
2009 30 59 38
2010 19 70 44
2013 — <50 <30
Global Transaction Services
We offer global payments, cash and liquiditymanagement, trade finance, and commercialcard products and services. We are able tosupport and connect customers across128 countries.
Return Cost:income Loan:depositon equity (%) ratio (%) ratio (%)
2009 42 59 21
2010 43 57 21
2013 — <50 <20
Ulster Bank
We are a leading retail and commercial bankin Northern Ireland and the Republic ofIreland. We provide a comprehensive range offinancial services through our Retail Marketsand Corporate Markets divisions.
Return Cost:income Loan:depositon equity (%) ratio (%) ratio (%)
2009 (12) 73 177
2010 (21) 59 152
2013 >15 c.50 <150
Core revenue by division – 2010 Total revenue by geographic split – 2010
GBM 32%UK Retail 22%
Ulster Bank 4%
Wealth 4%US R&C 12%
UKCorporate16%
EU 15%
RoW 8%
UK 54%
US 23%
US Retail & Commercial
We provide financial services primarily in theNorth Eastern United States through theCitizens Bank, Charter One and RBS Citizensbrands. We are engaged in retail andcorporate banking activities. We rank amongthe top five banks in New England.
Return Cost:income Loan:depositon equity (%) ratio (%) ratio (%)
2009 (1) 78 80
2010 4 72 81
2013 >15 <55 <90
Global Banking & Markets
We provide financing, risk management andadvisory services to major corporations,financial institutions and public sector clientsin 39 countries.
Return Cost:incomeon equity (%) ratio (%)
2009 30 42
2010 17 56
2013 >15 c.55
RBS Insurance
We sell and underwrite retail and SMEinsurance over the telephone and internet,as well as through brokers and partnerships.Our brands include Direct Line, Churchill,Privilege, Green Flag and NIG.
Return Cost:incomeon equity (%) ratio (%)
2009 2 92
2010 (8) 172
2013 >20 <60
GTS 10%
Retail &Commercial68%
Internationallyoperating R&Cbusiness30%
Note: Excluding Fair Value of Own Debt (FVOD), excluding RBS Insurance.

RBS Group 201016
The economic environment
M Keep up with our latest economic researchand analysis at www.rbs.com/economics
Current position• UK and US economies in recovery• Outlook for gradual improvement• Indebtedness still a headwind• Emerging economics stilloutperforming
Possible risks• Interest rates stay near zero bound,or rise too rapidly
• Economic growth falters• Sovereign credit risks not controlled• Wholesale funding conditions deteriorate
GDP growth (%, real terms)
-4.9
-2.6
1.32.8
-10
-8
-6
-4
-2
0
2
4
UK
2009
Source: Datastream
2010
UKUS
US
Sterling exchange rates
1.00
1.15
1.30
1.45
1.60
1.75
Jan 2010 Dec 2010
$ to £1 € to £1
Our marketsIn the UK, which is our largest market,economic conditions improved in 2010. Totaleconomic activity, as measured by grossdomestic product (GDP), grew by 1.3 percent in 2010. This followed a contraction of4.9 per cent in 2009. However, a fall inactivity in the final quarter of 2010 served asa timely reminder that, while conditions aregenerally improving, the recovery is fragile.
The recovery has helped many of ourcustomers. Company trading profits grew forthe first time since 2008. The unemploymentrate levelled off at around 8 per cent, whichis much higher than at the start of therecession, but still relatively low comparedwith the peak in other recessions. Thesefactors supported commercial propertyprices, which were 6 per cent higher inDecember 2010 than they were a year earlier,according to International Property Databank.Most of those gains came in the first half ofthe year. The residential market was lessrobust: house prices fell in the second half ofthe year, dragging the year-on-year growthrate to -1 per cent in December 2010,according to the Nationwide index.
The US economy registered the fastestgrowth among our main markets. GDP grewby 2.8 per cent, following a contraction of 2.6per cent in 2009. Despite this, theunemployment rate remained stubbornlyhigh, which prompted a further loosening ofmonetary and fiscal policy. In Ireland, GDPcontracted by an estimated 0.5 per cent in2010, following a 7.6 per cent reduction in2009, though there were tentative signs ofstrengthening towards the end of the year.
The general improvement in economicconditions must be viewed against abackdrop of financial market turbulence at
various points in the year, most notablythe sovereign debt crisis that affected theEurozone periphery. This led to a markedfall in risk appetite in Q2 and, again, in Q4.Equity prices fell in the banking sector andthere was a ‘flight to quality’, which pusheddown long-term interest rates on governmentdebt in some countries. This included the UK,where the 10-year gilt rate fell from more than4 per cent at the start of 2010, to less than3 per cent in October. UK gilt yieldssubsequently rose in the final months of2010, in anticipation of interest rate risesin 2011.
The increase in risk aversion also causedsome sharp currency movements. At onepoint the pound was 11 per cent downagainst the dollar, but sterling rallied in thesecond half of 2010, to end the year justslightly lower than where it started ($1.57from $1.61). Sterling rose by 10 per centagainst the euro in the first half of the year,before giving up most of these gains, toend the year at €1.17 (from €1.13).
The economic outlookWe expect the global recovery to bemaintained, but to remain uneven. The paceof growth in the major developed economies– including the UK and the US – is likelyto remain sluggish by historic standards,and volatile. This reflects high levels ofindebtedness and the expectation thatinterest rates will gradually rise. Emergingmarkets, especially Asia, will continue tooutperform as they are less encumbered bybalance sheet strains. Moreover, growth incountries like China and India will continueto be underpinned by the process of‘catch-up’ with industrial nations.
N.B. All data are from Thomson Datastreamunless otherwise indicated.

17RBS Group 2010
A new vision for RBS Risk ManagementAt RBS, Risk Management plays an integral role in delivering theStrategic Plan by embedding appropriate frameworks. With theneed for financial strength and resilience at the heart of this, RBSRisk Management is aligned to support the Group’s stated objectiveof standalone strength by 2013, as measured by reaching and thenretaining credit standing in line with the strongest international peergroup. The Group Board agreed in 2009 four risk objectives whichare aligned to the Plan. These are to:
• maintain capital adequacy;• maintain market confidence;• deliver stable earnings growth; and• ensure stable and efficient access to funding and liquidity.
Strategy and policyThese strategic risk objectives are the bridge between the Group-levelbusiness strategy and the frameworks, measures and metrics we useto set appetite and manage risk in our business divisions. Our RiskAppetite Framework is aligned with business objectives, with underlyingand cascading frameworks and limits.
Appropriate and effectively implemented policy standards are a pre-requisite to achieving a standalone credit rating in line with the strongestin our international peer group, and unless we maintain an upper quartilecontrol framework we will not succeed in this objective. In 2010, webegan work on a revised Group Policy Framework (GPF) and this willcontinue to be rolled out as a key component of Risk Appetite during2011. It has two very specific but correlated objectives which will apply atthe individual policy level as well as the aggregate policy standard level:
• to ensure that Risk Appetite is set in accordance with strongstandalone credit ratings on a consistent basis; and
• to ensure an upper quartile control environment is maintained againstrelevant external benchmarks.
An enhanced approach to embedding policies will form an integralpart of our communication and training with both our frontline staffand across RBS Risk Management. Our revised GPF is structured torequire policy standard owners and policy sponsors to re-assess theirpolicies on a regular basis and where shortfalls against industrypractice are identified these are documented and addressed withinan agreed timeframe.
Operating modelThe risk and liquidity balance sheet management strategies are ownedand set by the Group’s Board of directors, and implemented byexecutive management led by the Group Chief Executive. A number ofcommittees supports the execution of the business plan and strategy.Interaction between them helps to promote cross-risk linkages. Theroles and responsibilities fulfilled by the key risk committees have beenreviewed and more clearly defined during the course of 2010 andfurther enhancements are planned in 2011.
Equally important as improved governance is strengthening thecapabilities of our people and rebuilding trust with our externalstakeholders to convince them that the culture which allowed the oldRBS to fail has changed and changed for good. Our people agenda istackling this through our performance management process and theway we incentivise our people as well as our risk skills and capabilitiesprogramme. These are as important for our customer facing staff asthey are for our risk and control functions.
Risk appetiteRisk appetite is an expression of the maximum level of risk that we areprepared to accept to deliver our business objectives. Risk and balancesheet management across the Group is based on the Risk Appetiteapproved by the Board, who ultimately will agree this for each divisionand regularly reviews the Group’s performance in relation to risk. Riskappetite is defined in both quantitative and qualitative terms, whichserve as a way of setting appetite and managing risk performance aswe implement an agreed strategy.
• Quantitative: encompassing capital, funding and liquidity, credit,country, market, operational, regulatory and business risksunderpinned by stress testing.
• Qualitative: ensuring that the Group applies the correct principles,policies and procedures, manages reputational risk with soundcontrols and a strong risk culture.
Risk architectureA key deliverable on our journey to a standalone credit rating in line withour strongest international peer group by 2013 is the design and buildingof a risk architecture that will support this, and we are doing this as apartnership between the Risk, Finance and Treasury functions. When fullyimplemented this will provide RBS with consistent reference data anddefinitions across our three functions and significantly improve the qualityof management information and analytical capability we have to manageour major risks.
Our approach to risk management
Our business and our strategy
The economic environment
Our approach to risk management
OperatingModel
RiskArchitecture
StrategyandPolicy
RiskAppetite andFramework
Deliver 5 year planwith strong risk and
balance sheet management
Strategy and Policy
• Alignment – risk and businessstrategy
• Group policy framework• Capital/risk adjusted performance
Risk Architecture
• Risk, finance andtreasury architecture
• Risk data quality• Analytics and modelling• Risk information andreporting
Operating Model
• Governance• Organisation, people and culture• One risk community• Regulatory and operationalrisk coverage
Risk Appetite and Framework
• Credit risk approval and control• Market risk limits and controls• Risk concentrations• Asset and product class• Country risk• Treasury risk management• Scenario testing
RBS Group 201018
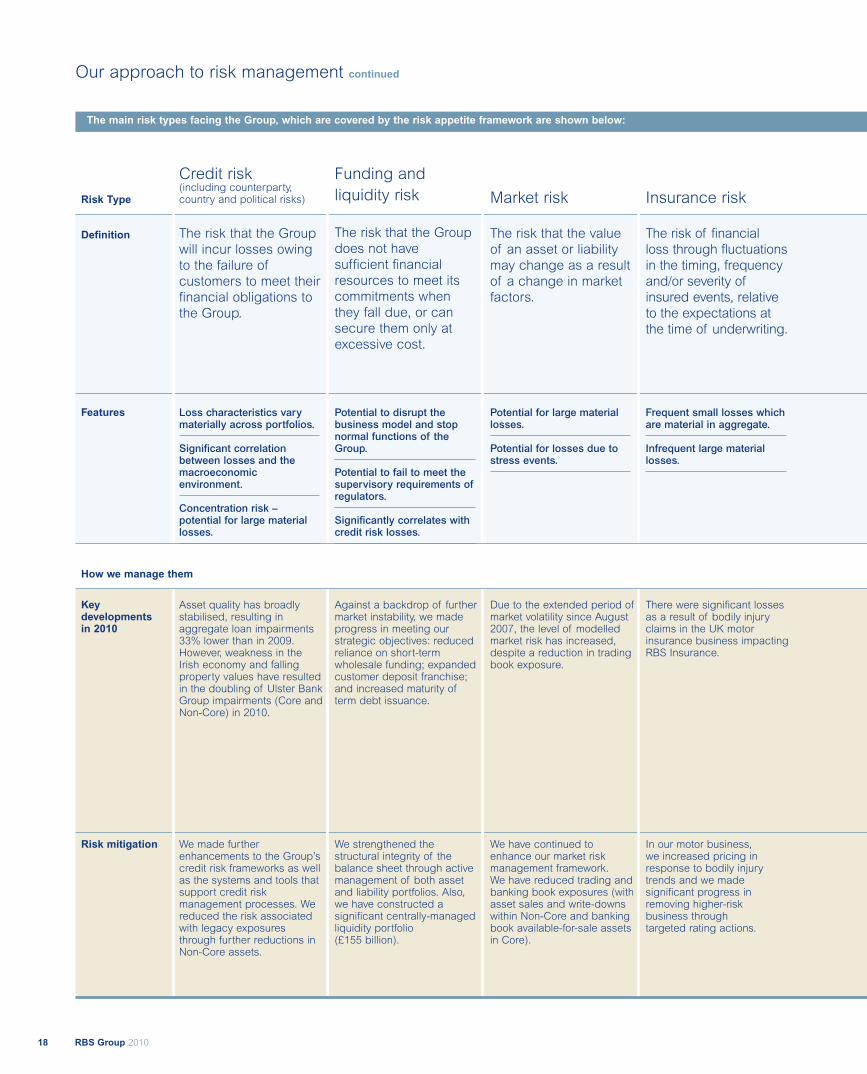
Our approach to risk management continued
Credit risk(including counterparty,country and political risks)
The risk that the Groupwill incur losses owingto the failure ofcustomers to meet theirfinancial obligations tothe Group.
Funding andliquidity risk
The risk that the Groupdoes not havesufficient financialresources to meet itscommitments whenthey fall due, or cansecure them only atexcessive cost.
Market risk
The risk that the valueof an asset or liabilitymay change as a resultof a change in marketfactors.
Insurance risk
The risk of financialloss through fluctuationsin the timing, frequencyand/or severity ofinsured events, relativeto the expectations atthe time of underwriting.
Risk Type
Definition
Features Loss characteristics varymaterially across portfolios.
Significant correlationbetween losses and themacroeconomicenvironment.
Concentration risk –potential for large materiallosses.
Potential to disrupt thebusiness model and stopnormal functions of theGroup.
Potential to fail to meet thesupervisory requirements ofregulators.
Significantly correlates withcredit risk losses.
Potential for large materiallosses.
Potential for losses due tostress events.
Frequent small losses whichare material in aggregate.
Infrequent large materiallosses.
Asset quality has broadlystabilised, resulting inaggregate loan impairments33% lower than in 2009.However, weakness in theIrish economy and fallingproperty values have resultedin the doubling of Ulster BankGroup impairments (Core andNon-Core) in 2010.
We made furtherenhancements to the Group’scredit risk frameworks as wellas the systems and tools thatsupport credit riskmanagement processes. Wereduced the risk associatedwith legacy exposuresthrough further reductions inNon-Core assets.
Against a backdrop of furthermarket instability, we madeprogress in meeting ourstrategic objectives: reducedreliance on short-termwholesale funding; expandedcustomer deposit franchise;and increased maturity ofterm debt issuance.
We strengthened thestructural integrity of thebalance sheet through activemanagement of both assetand liability portfolios. Also,we have constructed asignificant centrally-managedliquidity portfolio(£155 billion).
Due to the extended period ofmarket volatility since August2007, the level of modelledmarket risk has increased,despite a reduction in tradingbook exposure.
We have continued toenhance our market riskmanagement framework.We have reduced trading andbanking book exposures (withasset sales and write-downswithin Non-Core and bankingbook available-for-sale assetsin Core).
There were significant lossesas a result of bodily injuryclaims in the UK motorinsurance business impactingRBS Insurance.
In our motor business,we increased pricing inresponse to bodily injurytrends and we madesignificant progress inremoving higher-riskbusiness throughtargeted rating actions.
How we manage them
Keydevelopmentsin 2010
Risk mitigation
The main risk types facing the Group, which are covered by the risk appetite framework are shown below:
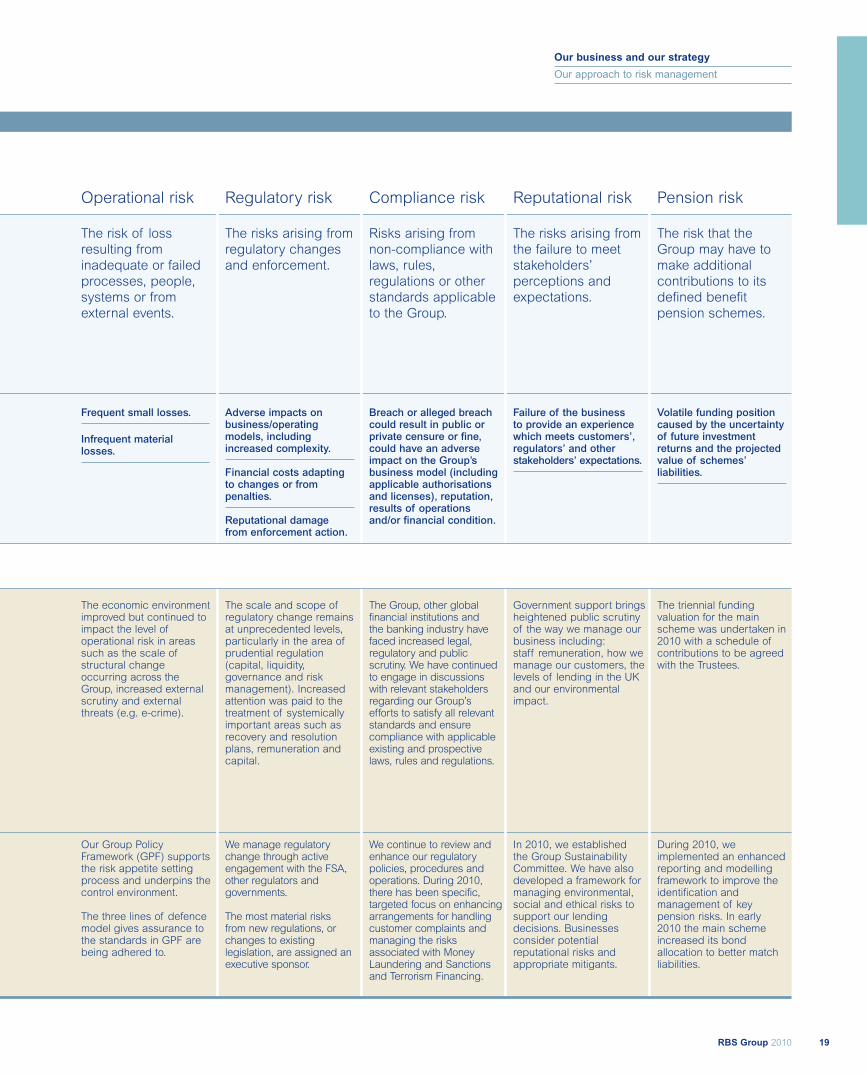
The economic environmentimproved but continued toimpact the level ofoperational risk in areassuch as the scale ofstructural changeoccurring across theGroup, increased externalscrutiny and externalthreats (e.g. e-crime).
Our Group PolicyFramework (GPF) supportsthe risk appetite settingprocess and underpins thecontrol environment.
The three lines of defencemodel gives assurance tothe standards in GPF arebeing adhered to.
The scale and scope ofregulatory change remainsat unprecedented levels,particularly in the area ofprudential regulation(capital, liquidity,governance and riskmanagement). Increasedattention was paid to thetreatment of systemicallyimportant areas such asrecovery and resolutionplans, remuneration andcapital.
We manage regulatorychange through activeengagement with the FSA,other regulators andgovernments.
The most material risksfrom new regulations, orchanges to existinglegislation, are assigned anexecutive sponsor.
The Group, other globalfinancial institutions andthe banking industry havefaced increased legal,regulatory and publicscrutiny. We have continuedto engage in discussionswith relevant stakeholdersregarding our Group’sefforts to satisfy all relevantstandards and ensurecompliance with applicableexisting and prospectivelaws, rules and regulations.
We continue to review andenhance our regulatorypolicies, procedures andoperations. During 2010,there has been specific,targeted focus on enhancingarrangements for handlingcustomer complaints andmanaging the risksassociated with MoneyLaundering and Sanctionsand Terrorism Financing.
Government support bringsheightened public scrutinyof the way we manage ourbusiness including:staff remuneration, how wemanage our customers, thelevels of lending in the UKand our environmentalimpact.
In 2010, we establishedthe Group SustainabilityCommittee. We have alsodeveloped a framework formanaging environmental,social and ethical risks tosupport our lendingdecisions. Businessesconsider potentialreputational risks andappropriate mitigants.
The triennial fundingvaluation for the mainscheme was undertaken in2010 with a schedule ofcontributions to be agreedwith the Trustees.
During 2010, weimplemented an enhancedreporting and modellingframework to improve theidentification andmanagement of keypension risks. In early2010 the main schemeincreased its bondallocation to better matchliabilities.
19RBS Group 2010
Our business and our strategy
Our approach to risk management
Operational risk
The risk of lossresulting frominadequate or failedprocesses, people,systems or fromexternal events.
Regulatory risk
The risks arising fromregulatory changesand enforcement.
Compliance risk
Risks arising fromnon-compliance withlaws, rules,regulations or otherstandards applicableto the Group.
Reputational risk
The risks arising fromthe failure to meetstakeholders’perceptions andexpectations.
Pension risk
The risk that theGroup may have tomake additionalcontributions to itsdefined benefitpension schemes.
Frequent small losses.
Infrequent materiallosses.
Adverse impacts onbusiness/operatingmodels, includingincreased complexity.
Financial costs adaptingto changes or frompenalties.
Reputational damagefrom enforcement action.
Breach or alleged breachcould result in public orprivate censure or fine,could have an adverseimpact on the Group’sbusiness model (includingapplicable authorisationsand licenses), reputation,results of operationsand/or financial condition.
Failure of the businessto provide an experiencewhich meets customers’,regulators’ and otherstakeholders’ expectations.
Volatile funding positioncaused by the uncertaintyof future investmentreturns and the projectedvalue of schemes’liabilities.

RBS Group 201020
Divisional review UK Retail
UK Corporate
Wealth
Global Transaction Services
Ulster Bank
US Retail & Commercial
Global Banking & Markets
RBS Insurance
21RBS Group 2010
Business Servicesand Central Functions
Non-Core Division
Asset Protection Scheme (APS)
Divisional review
The balance of the Corebusiness is an asset to ourcustomers, shareholdersand risk profile – even beforecross-business synergiesare taken into account.
The changes we are makingto strengthen the Corebusiness further can driveRBS to success as a leadingbank in its markets for manyyears to come.
RBS Group 201022
UK Retail
Brian HartzerChief Executive, UK Retail,Wealth and Ulster Bank
M For biographiessee pages 226-229
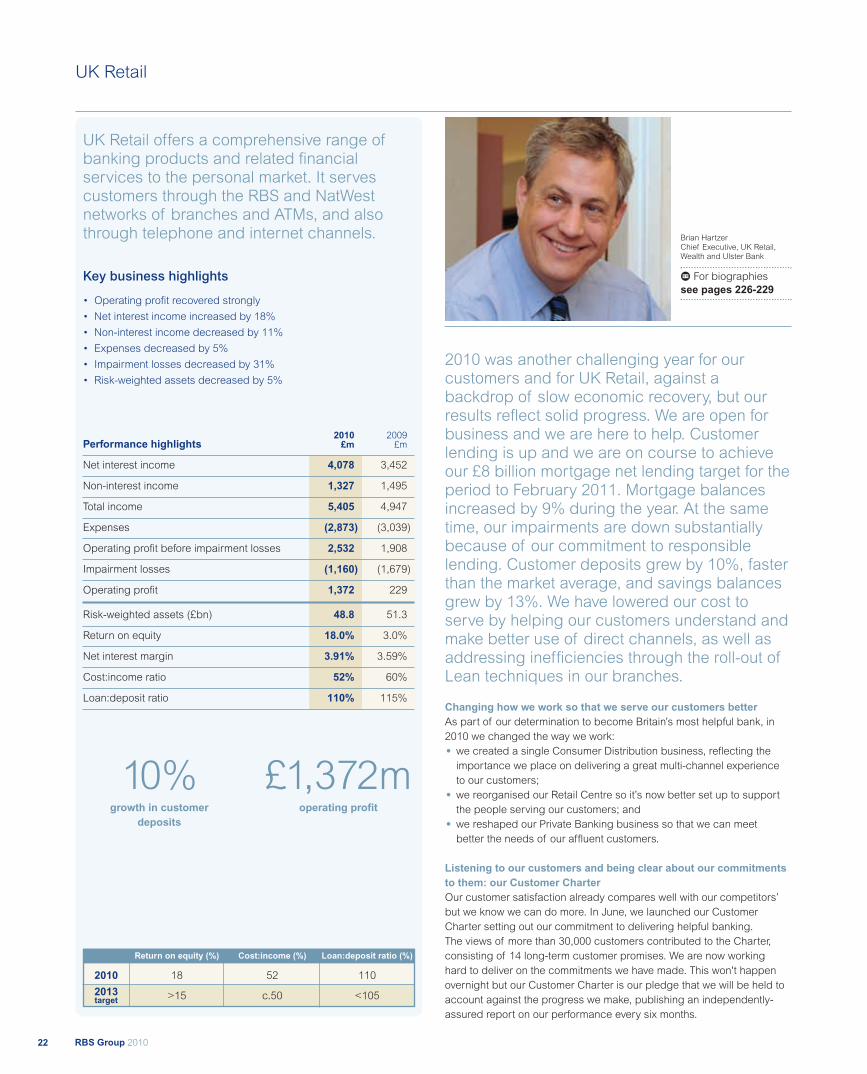
2010 was another challenging year for ourcustomers and for UK Retail, against abackdrop of slow economic recovery, but ourresults reflect solid progress. We are open forbusiness and we are here to help. Customerlending is up and we are on course to achieveour £8 billion mortgage net lending target for theperiod to February 2011. Mortgage balancesincreased by 9% during the year. At the sametime, our impairments are down substantiallybecause of our commitment to responsiblelending. Customer deposits grew by 10%, fasterthan the market average, and savings balancesgrew by 13%. We have lowered our cost toserve by helping our customers understand andmake better use of direct channels, as well asaddressing inefficiencies through the roll-out ofLean techniques in our branches.
Changing how we work so that we serve our customers betterAs part of our determination to become Britain’s most helpful bank, in2010 we changed the way we work:
• we created a single Consumer Distribution business, reflecting theimportance we place on delivering a great multi-channel experienceto our customers;
• we reorganised our Retail Centre so it’s now better set up to supportthe people serving our customers; and
• we reshaped our Private Banking business so that we can meetbetter the needs of our affluent customers.
Listening to our customers and being clear about our commitmentsto them: our Customer CharterOur customer satisfaction already compares well with our competitors’but we know we can do more. In June, we launched our CustomerCharter setting out our commitment to delivering helpful banking.The views of more than 30,000 customers contributed to the Charter,consisting of 14 long-term customer promises. We are now workinghard to deliver on the commitments we have made. This won't happenovernight but our Customer Charter is our pledge that we will be held toaccount against the progress we make, publishing an independently-assured report on our performance every six months.
UK Retail offers a comprehensive range ofbanking products and related financialservices to the personal market. It servescustomers through the RBS and NatWestnetworks of branches and ATMs, and alsothrough telephone and internet channels.
Key business highlights
• Operating profit recovered strongly
• Net interest income increased by 18%
• Non-interest income decreased by 11%
• Expenses decreased by 5%
• Impairment losses decreased by 31%
• Risk-weighted assets decreased by 5%
2010 2009Performance highlights £m £m
Net interest income 4,078 3,452
Non-interest income 1,327 1,495
Total income 5,405 4,947
Expenses (2,873) (3,039)
Operating profit before impairment losses 2,532 1,908
Impairment losses (1,160) (1,679)
Operating profit 1,372 229
Risk-weighted assets (£bn) 48.8 51.3
Return on equity 18.0% 3.0%
Net interest margin 3.91% 3.59%
Cost:income ratio 52% 60%
Loan:deposit ratio 110% 115%
Return on equity (%) Cost:income (%) Loan:deposit ratio (%)
2010 18 52 110
2013 >15 c.50 <105target
10%growth in customer
deposits
£1,372moperating profit

23RBS Group 2010
Divisional review
UK Retail
Listening is what a helpful bank does and we now have a programme inplace to ensure our staff, including our Executives, hear first hand aboutthe needs and frustrations of our customers. Through our CustomerCharter we will show clearly what we’re doing as a result of what ourcustomers tell us. In 2010, we opened early morning and late eveningin our 200 busiest branches. In addition, we open 846 branches on aSaturday because customers told us that would make life easier. Theyalso told us to keep things simple so this year we have rewritten all ourbanking hall literature and improved our customer review process,making it easier for customers to choose the right product for them. Wehave also simplified our overdraft charging structure for customers whogo overdrawn without agreement and introduced ‘Act Now' pre-emptivetext and e-mail alerts.
While these are early days for the Charter, initial progress has beenencouraging. We asked Deloitte LLP to track our progress in the first sixmonths. They told us that we achieved 80% of the goals during that time.
Highlights of their findings include:
• answering 91.4% of calls in under 60 seconds in our UK telephonebanking call centres against a target of 90%;
• meeting a commitment to maintain local banking services where weare ‘last bank in town’, keeping 146 ‘last bank’ branches open acrossthe country, against a target of 100; and
• sending replacement cards within 24 hours to 97% of customerswhose debit cards were lost or stolen, against a target of nextworking day delivery.
Our goals are stretching and we still have work to do as we missed fiveof our 20 goals, including:
• against a goal of nine out of 10 customers being very satisfied withservice, eight out of 10 were very satisfied; and
• against a target of simplifying and rewriting all our branch literaturein line with customer feedback, we managed to make available thenew literature from end of February 2011.
We will strive to do better, but these first results are a good start anddemonstrate our commitment to be a better bank for our customers.
Resolving customer complaints fairly, consistently and promptlyThe treatment of complaints was a big focus for the industry in 2010.We worked hard to get better at this. We have trained over 10,000
designated complaint handlers so that we can resolve customercomplaints more fairly and consistently and address the root causes ofcomplaints. Through our Customer Charter we are also going one stepfurther by committing to be completely transparent about the top fivecustomer complaints.
Playing an active role in the communities we serveWe know that playing an active role in supporting the communities wherewe live and work is an important part of rebuilding our reputation. Welaunched our Community Fund, providing £1.8 million worth of financialsupport to local charities and community projects nominated by ourcustomers. In addition, all of our employees now have the option of aday’s leave to get involved in local volunteering. Our commitment tofinancial education remains as important as ever. We delivered 30,653lessons in schools right across the country through our independentlyaccredited MoneySense programme.
Committing to maintaining local banking servicesMany of our customers, particularly in Scotland, live in rural areas.Through our Customer Charter, we have made a firm commitment tomaintain local banking services in the communities we serve, pledgingto stay open if we are the last bank in town and continuing to run ourmobile bank service. We have also extended access to our accountsthrough Post Office counters.
Addressing the legacy of the pastIn August 2010, we reached an early agreement on the sale of 318branches to Santander UK Plc. The sale was required as part of theState Aid agreement reached with the European Commission. It providesgreater clarity for our staff and customers and represents anothersignificant step forward in our restructuring for the future. We expect theprocess to be completed by the end of March 2012. RBS Group remainscommitted to the UK retail banking market and, even after the sale wewill continue to operate the second largest retail branch network in the UK.
Striving to become Britain’s Most Helpful and Sustainable BankWe expect 2011 to be another challenging year but we know that we willsucceed as a business by helping our customers through good timesand bad. Our commitment to becoming Britain’s most Helpful andSustainable Bank is a long-term one and we are confident we arecreating a new kind of retail bank.
We have trained over 10,000 designatedcomplaints handlers to ensure we areresolving customer complaints fairly,consistently and promptly.
We launched our Community Fund,providing £1.6 million of financialsupport to local charities andcommunity projects nominated by ourcustomers.
RBS Group 201024
UK Corporate
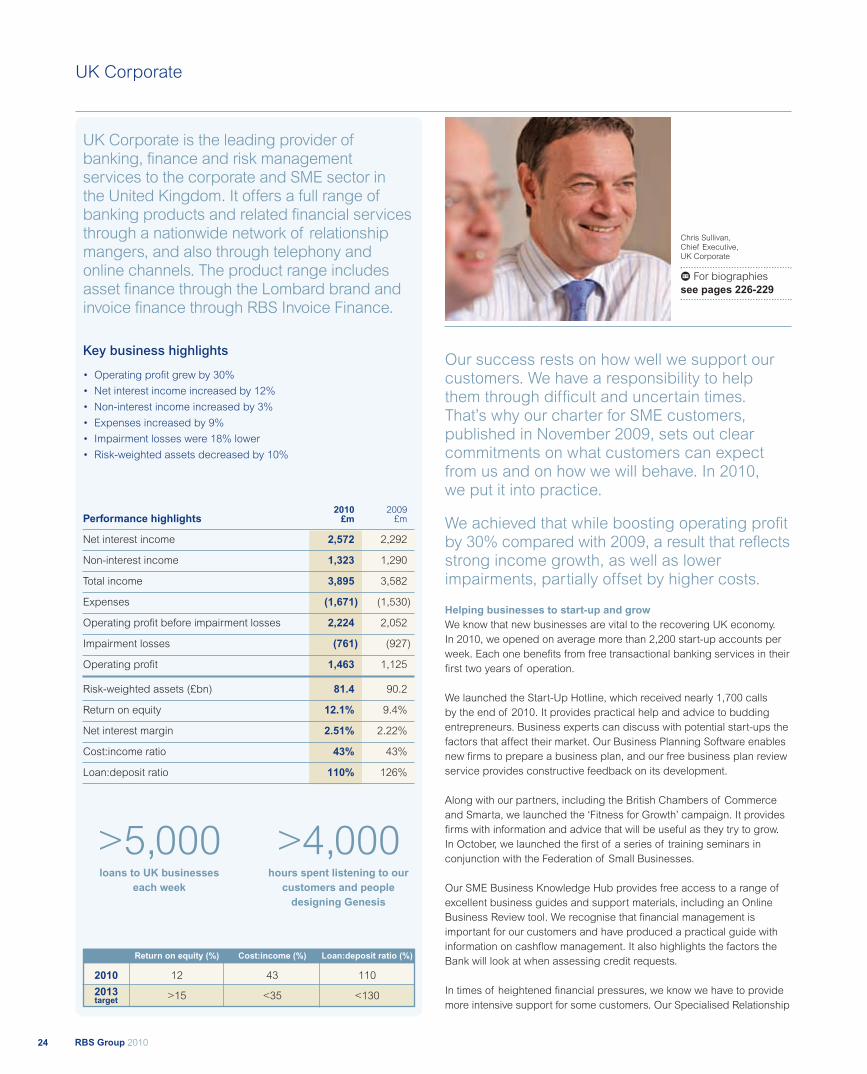
Our success rests on how well we support ourcustomers. We have a responsibility to helpthem through difficult and uncertain times.That’s why our charter for SME customers,published in November 2009, sets out clearcommitments on what customers can expectfrom us and on how we will behave. In 2010,we put it into practice.
We achieved that while boosting operating profitby 30% compared with 2009, a result that reflectsstrong income growth, as well as lowerimpairments, partially offset by higher costs.
Helping businesses to start-up and growWe know that new businesses are vital to the recovering UK economy.In 2010, we opened on average more than 2,200 start-up accounts perweek. Each one benefits from free transactional banking services in theirfirst two years of operation.
We launched the Start-Up Hotline, which received nearly 1,700 callsby the end of 2010. It provides practical help and advice to buddingentrepreneurs. Business experts can discuss with potential start-ups thefactors that affect their market. Our Business Planning Software enablesnew firms to prepare a business plan, and our free business plan reviewservice provides constructive feedback on its development.
Along with our partners, including the British Chambers of Commerceand Smarta, we launched the ‘Fitness for Growth’ campaign. It providesfirms with information and advice that will be useful as they try to grow.In October, we launched the first of a series of training seminars inconjunction with the Federation of Small Businesses.
Our SME Business Knowledge Hub provides free access to a range ofexcellent business guides and support materials, including an OnlineBusiness Review tool. We recognise that financial management isimportant for our customers and have produced a practical guide withinformation on cashflow management. It also highlights the factors theBank will look at when assessing credit requests.
In times of heightened financial pressures, we know we have to providemore intensive support for some customers. Our Specialised Relationship
Chris Sullivan,Chief Executive,UK Corporate
M For biographiessee pages 226-229
UK Corporate is the leading provider ofbanking, finance and risk managementservices to the corporate and SME sector inthe United Kingdom. It offers a full range ofbanking products and related financial servicesthrough a nationwide network of relationshipmangers, and also through telephony andonline channels. The product range includesasset finance through the Lombard brand andinvoice finance through RBS Invoice Finance.
Key business highlights
• Operating profit grew by 30%
• Net interest income increased by 12%
• Non-interest income increased by 3%
• Expenses increased by 9%
• Impairment losses were 18% lower
• Risk-weighted assets decreased by 10%
2010 2009Performance highlights £m £m
Net interest income 2,572 2,292
Non-interest income 1,323 1,290
Total income 3,895 3,582
Expenses (1,671) (1,530)
Operating profit before impairment losses 2,224 2,052
Impairment losses (761) (927)
Operating profit 1,463 1,125
Risk-weighted assets (£bn) 81.4 90.2
Return on equity 12.1% 9.4%
Net interest margin 2.51% 2.22%
Cost:income ratio 43% 43%
Loan:deposit ratio 110% 126%
Return on equity (%) Cost:income (%) Loan:deposit ratio (%)
2010 12 43 110
2013 >15 <35 <130target
>5,000loans to UK businesses
each week
>4,000hours spent listening to ourcustomers and peopledesigning Genesis

25RBS Group 2010
Divisional review
UK Corporate
Management team of over 500 experienced employees continued toprovide locally based, hands-on support where needed. In 2010, over5,600 customers were successfully managed back to financial health.
Giving customers access to financeGetting access to finance is a key concern for many of our customers.We continue to be open for business. In 2010, we provided on averageover 5,000 loans to UK businesses each week. Our approval rate remainshigh: we continue to accept over 85% of the credit applications we receive.
For the period from March 2010 to February 2011, RBS Group had agreedto make £50 billion of gross new lending facilities available to customersthrough its Business & Commercial, Corporate and Institutional Bankingand GBM businesses. We launched a number of initiatives to ensure firmsand their advisers know we are making lending available.
In January, we announced our Manufacturing Fund, pledging to make £1billion of new loans available on competitive and flexible terms to UKmanufacturing businesses.
The Manufacturing Fund won the ‘Innovation in Product Design – BusinessBanking’ category at the Financial World Financial Innovation Awards.We also created £2.15 billion of specific lending programmes to supportinfrastructure and public sector developments, including social housing,local authorities and renewable energies.
We supported the creation of the Enterprise Finance Guarantee (EFG)in 2008, which aims to improve the availability of working capital to SMEfirms. Initially available until March 2010, it was extended to March 2011.By December 2010, we led the field in taking applications for the EFG,accounting for over 40% of all loans drawn under the scheme.
In 2008, we agreed a £250 million funding agreement with the EuropeanInvestment Bank, whereby funds were provided to eligible customers atpreferential borrowing rates. The success of the scheme led to a second£300 million tranche being agreed in July 2010.
We remain a leader in helping UK corporate clients to raise funds fromthe stock market, as well as a range of debt products. In 2010, we ledon the arrangements for two of the top three UK corporate equity deals.
Being fair and transparent in how we treat our customersIn our SME charter, we extended our committed overdraft and pricepromises to cover 2010. This ensured that a customer’s overdraft facilityremained in place for the duration of their agreement, unless they
breached conditions or there was a significant deterioration in their riskprofile. Our price promise ensures that we will not increase overdraftmargins at renewal times, unless there is a significant change in the firm’srisk profile. By October 2010, over nine out of 10 small businesses hadbenefited from overdraft renewals at the same or a lower rate.
Meeting our customer needsOur customers like the steps we have taken and the support we provide.RBS Group is in the top three banks in the UK for business customersatisfaction. The percentage of our corporate customers describingthemselves as ‘very satisfied’ has remained consistently high. In March,Lombard won Best Leasing and Asset Finance Provider at the BusinessMoneyfacts Awards for the second consecutive year. Our Invoice Financebusiness works closely with customers providing products to meet theirchanging needs. For example, in October, RBS Invoice Finance finalisedits first asset backed lending deal for the retail sector, with a flexible £9million facility to DM London Limited trading under the brand ‘Time 2’.
However, we continue to look for ways to improve how we deliver services.A major contribution to that is our transformation programme, which wecall Genesis. When we put it together, we spent over 4,000 hours listeningto our customers and people in developing the programme’s design. Webelieve that Genesis will make our customers’ banking experience simpler,more responsive and better suited to their needs.
Contributing towards the new RBSThe progress we made in 2010 contributes to the wider objectives ofmaking RBS a stronger and safer Bank. We increased our customerdeposits by 14%, helping to reduce the gap between loans and depositsby 16%. We continued to enhance our risk control systems, includingimplementing specific new guidance for Real Estate Finance.
We also took steps to deal with the legacy of the past. In line with theEU’s divestment requirements, in August 2010 we announced a saleagreement with Santander UK plc for 318 branches. This includes theSME accounts attached to these branches, as well as our Direct SMEbusiness and certain mid-sized corporate customers. Our plans forseparating and segregating this business are well advanced and weexpect the process to be completed by the end of March 2012. We willtry to keep any disruption for customers and staff to a minimum.
2010 was a year of delivering the commitments we have made to supportour customers. We are taking the necessary steps to restore the reputationof the Bank, brick by brick, and putting our customers at the heart ofeverything we do.
We are currently opening more than2,200 start-up accounts per week.
To date, we have led the field in takingapplications for the Enterprise FinanceGuarantee, accounting for over 40%of all loans drawn under the scheme.
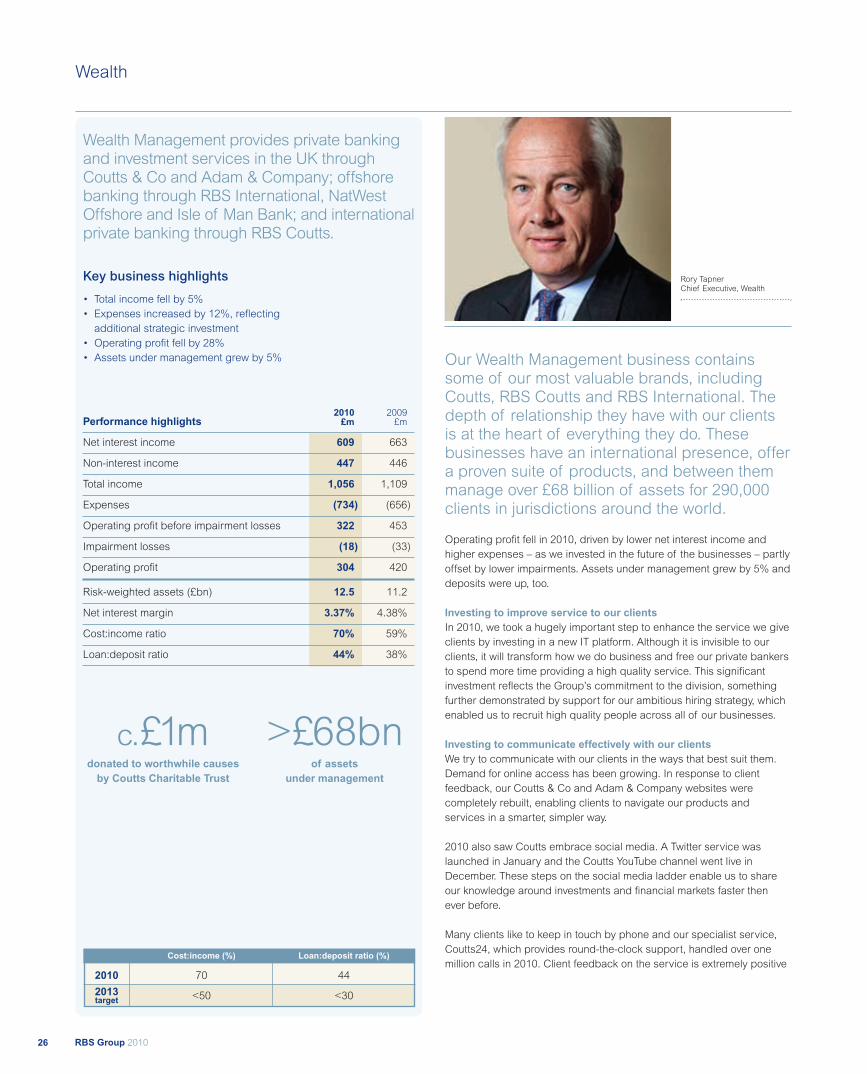
RBS Group 201026
Wealth
Our Wealth Management business containssome of our most valuable brands, includingCoutts, RBS Coutts and RBS International. Thedepth of relationship they have with our clientsis at the heart of everything they do. Thesebusinesses have an international presence, offera proven suite of products, and between themmanage over £68 billion of assets for 290,000clients in jurisdictions around the world.
Operating profit fell in 2010, driven by lower net interest income andhigher expenses – as we invested in the future of the businesses – partlyoffset by lower impairments. Assets under management grew by 5% anddeposits were up, too.
Investing to improve service to our clientsIn 2010, we took a hugely important step to enhance the service we giveclients by investing in a new IT platform. Although it is invisible to ourclients, it will transform how we do business and free our private bankersto spend more time providing a high quality service. This significantinvestment reflects the Group’s commitment to the division, somethingfurther demonstrated by support for our ambitious hiring strategy, whichenabled us to recruit high quality people across all of our businesses.
Investing to communicate effectively with our clientsWe try to communicate with our clients in the ways that best suit them.Demand for online access has been growing. In response to clientfeedback, our Coutts & Co and Adam & Company websites werecompletely rebuilt, enabling clients to navigate our products andservices in a smarter, simpler way.
2010 also saw Coutts embrace social media. A Twitter service waslaunched in January and the Coutts YouTube channel went live inDecember. These steps on the social media ladder enable us to shareour knowledge around investments and financial markets faster thenever before.
Many clients like to keep in touch by phone and our specialist service,Coutts24, which provides round-the-clock support, handled over onemillion calls in 2010. Client feedback on the service is extremely positive
Wealth Management provides private bankingand investment services in the UK throughCoutts & Co and Adam & Company; offshorebanking through RBS International, NatWestOffshore and Isle of Man Bank; and internationalprivate banking through RBS Coutts.
Key business highlights
• Total income fell by 5%• Expenses increased by 12%, reflectingadditional strategic investment
• Operating profit fell by 28%• Assets under management grew by 5%
2010 2009Performance highlights £m £m
Net interest income 609 663
Non-interest income 447 446
Total income 1,056 1,109
Expenses (734) (656)
Operating profit before impairment losses 322 453
Impairment losses (18) (33)
Operating profit 304 420
Risk-weighted assets (£bn) 12.5 11.2
Net interest margin 3.37% 4.38%
Cost:income ratio 70% 59%
Loan:deposit ratio 44% 38%
Cost:income (%) Loan:deposit ratio (%)
2010 70 44
2013 <50 <30target
c.£1mdonated to worthwhile causesby Coutts Charitable Trust
>£68bnof assets
under management
Rory TapnerChief Executive, Wealth

27RBS Group 2010
Divisional review
Wealth
and the Coutts24 team pride themselves in ‘going the extra mile’ whenresponding to enquiries. This was evident during the volcanic ash cloudrestrictions. Stranded clients experienced a range of financial and travelissues but received support from Coutts24 with payments, short-termcredit sanctioning, booking new journeys and reserving hotels.
Supporting entrepreneursIn 2010, we hosted our 5th annual Coutts Prize for Family Businesses,with MI Dickson and Shepherd Neame winning the top awards in theirturnover category.
Our launch of the Coutts Social Enterprise Advisory service demonstratedour commitment to entrepreneurs. It aims to match clients with socialentrepreneurs looking for funding and/or mentoring. The Entrepreneurs’magazine and Coutts Entrepreneur’s video were launched – the formerreached 1,500 clients, the latter showcased the breadth of industriesacross which our entrepreneurs work. In RBS Coutts, our businesseson the Isle of Man and Jersey continued to focus on entrepreneurs,sponsoring awards and events to raise our profile. And our sponsorshipof London Fashion Week was part of a programme designed to buildour profile with entrepreneurs from the creative industries, which playsuch a vital role in their contribution to our economy.
Focusing on women clientsWe ran more than 60 events solely for women, which were attendedby around 1,900 clients and prospects. The continuing success of theCoutts Woman website has led to plans for a global roll-out in 2011. TheRBS Coutts FT “Women in Asia” awards helped us to build on the launchof the RBS Coutts Woman initiative and lay the foundations for a globalapproach to targeting this valuable segment. The year also saw thecreation of the Coutts Women Network (CWN), a series of tailoredevents. Using mentoring and professional development programmes,it aims to create an inclusive and supportive environment for women.
Being recognised for the quality of our serviceRBS International launched its three customer promises in 2010, acampaign which saw the business achieve world class levels of NetPromoter Scores. It was also shortlisted in five categories at the NationalCustomer Service awards, with a Jersey employee winning ‘FrontlineProfessional of the Year’. In addition, two RBS International products,Autopilot and Navigator, won the Innovation Award in the 2010Investment Life and Pensions Moneyfacts awards.
Supporting good causesIn 2010, the Coutts Charitable Trust donated around £1 million toworthwhile causes and Wealth Management staff in the UK have raisedaround £300,000 for charities like the NSPCC, Maggie’s Cancer Centresand the Prince’s Trust. The Coutts Senior Client Partners chose ChildLineas their nominated charity in 2010, raising over £215,000, which wouldfund a ChildLine supervisor for three years.
The team at RBS International led an active sustainabilityprogramme in their business and raised more than £160,000 forMacmillan Cancer Support.
The MoneySense for Schools programme is an online, interactivefinancial education programme to help 11–18 year olds prepare tomanage their finances in the future. Specially trained RBS Internationalemployees helped to deliver over 100 lessons in schools and collegesduring the year.
Our tradition of supporting the performing arts goes back over 150 yearsand continued in 2010. This included Coutts’ principal sponsorship ofthe Almeida Theatre in London (for the eighth successive year) andAdam & Company’s sponsorship of the Scottish Ballet’s Autumn Season,Geometry and Grace, for which it received a Commendation in the Arts& Business Scotland Awards. These sponsorships are an importantelement of our client centric service. It’s an approach that has helped usto acquire new clients across Wealth Management. In Coutts for example,there were 4,833 new clients in 2010. And of these, over 1,000 werereferred to us from other divisions within RBS, demonstrating the breadthof relationships we have across the Group.
Looking aheadIn 2011, we have a strategy for growth and a desire to develop further awell-balanced business across all of our jurisdictions. The second phaseof our IT project will also see us roll out the platform in Coutts. It promisesto be a busy and exciting year.
Our sponsorship of London Fashion Weekis part of a programme designed to buildour profile with young entrepreneurs.
Our investment in new systems is designedto improve the service we give our clients.
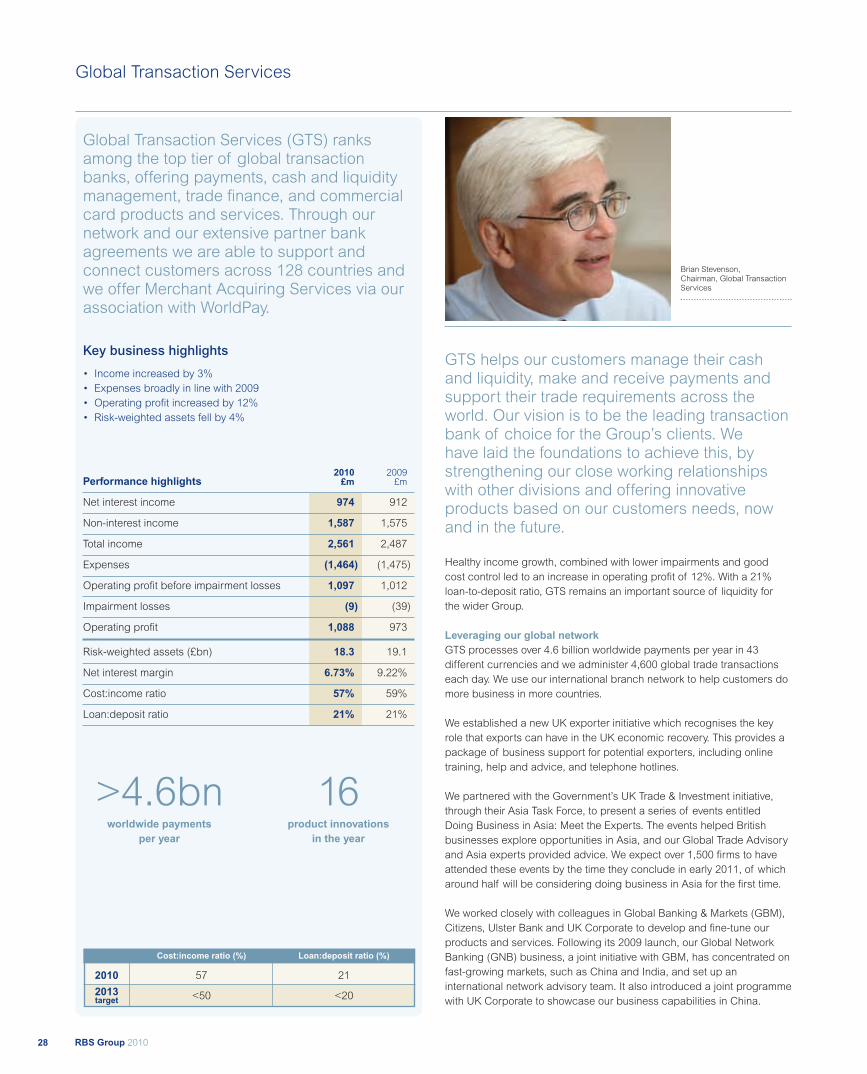
RBS Group 201028
Global Transaction Services
GTS helps our customers manage their cashand liquidity, make and receive payments andsupport their trade requirements across theworld. Our vision is to be the leading transactionbank of choice for the Group’s clients. Wehave laid the foundations to achieve this, bystrengthening our close working relationshipswith other divisions and offering innovativeproducts based on our customers needs, nowand in the future.
Healthy income growth, combined with lower impairments and goodcost control led to an increase in operating profit of 12%. With a 21%loan-to-deposit ratio, GTS remains an important source of liquidity forthe wider Group.
Leveraging our global networkGTS processes over 4.6 billion worldwide payments per year in 43different currencies and we administer 4,600 global trade transactionseach day. We use our international branch network to help customers domore business in more countries.
We established a new UK exporter initiative which recognises the keyrole that exports can have in the UK economic recovery. This provides apackage of business support for potential exporters, including onlinetraining, help and advice, and telephone hotlines.
We partnered with the Government’s UK Trade & Investment initiative,through their Asia Task Force, to present a series of events entitledDoing Business in Asia: Meet the Experts. The events helped Britishbusinesses explore opportunities in Asia, and our Global Trade Advisoryand Asia experts provided advice. We expect over 1,500 firms to haveattended these events by the time they conclude in early 2011, of whicharound half will be considering doing business in Asia for the first time.
We worked closely with colleagues in Global Banking & Markets (GBM),Citizens, Ulster Bank and UK Corporate to develop and fine-tune ourproducts and services. Following its 2009 launch, our Global NetworkBanking (GNB) business, a joint initiative with GBM, has concentrated onfast-growing markets, such as China and India, and set up aninternational network advisory team. It also introduced a joint programmewith UK Corporate to showcase our business capabilities in China.
Brian Stevenson,Chairman, Global TransactionServices
Global Transaction Services (GTS) ranksamong the top tier of global transactionbanks, offering payments, cash and liquiditymanagement, trade finance, and commercialcard products and services. Through ournetwork and our extensive partner bankagreements we are able to support andconnect customers across 128 countries andwe offer Merchant Acquiring Services via ourassociation with WorldPay.
Key business highlights
• Income increased by 3%• Expenses broadly in line with 2009• Operating profit increased by 12%• Risk-weighted assets fell by 4%
2010 2009Performance highlights £m £m
Net interest income 974 912
Non-interest income 1,587 1,575
Total income 2,561 2,487
Expenses (1,464) (1,475)
Operating profit before impairment losses 1,097 1,012
Impairment losses (9) (39)
Operating profit 1,088 973
Risk-weighted assets (£bn) 18.3 19.1
Net interest margin 6.73% 9.22%
Cost:income ratio 57% 59%
Loan:deposit ratio 21% 21%
Cost:income ratio (%) Loan:deposit ratio (%)
2010 57 21
2013 <50 <20target
>4.6bnworldwide payments
per year
16product innovations
in the year

29RBS Group 2010
Divisional review
Global Transaction Services
Innovating to enhance customer serviceIn 2010, we embarked on a significant investment programme, designedto drive innovation and deliver new technologies to our customers. Ournew products and services provide customers with greater flexibility andtransparency, and in many cases help to improve risk management andlower costs.
We were one of the first global banks to facilitate cross-border tradesettlement in Chinese Renminbi (RMB) and to offer RMB accounts,currency exchange and trade finance services. For financial institutions,we unveiled the new Euro Trade Deduct product that maximises thebenefits available from our cash and trade services.
The launch of the RBS SWIFT Service Bureau throughout our GlobalPayments network enables us to offer comprehensive, global solutions tolarge corporate customers. Users can become quickly established on theuniversal banking platform and with less capital investment than before.
Other innovations included:
• PayAway-IP Direct, a remote access web-based payment service forRBS and NatWest customers.
• GTS Salesline, which since its launch in May 2010 has helped morethan 1,000 customers to arrange and complete transactions.
• accessMOBILE, introduced by Citizens as an easy-to-use smartphoneapplication enabling clients to manage commercial bankingtransactions on a convenient and portable basis.
• Our Netherlands investment product, the Yield Call Demand Account,rewards longer-term deposits while also ensuring funds are accessibleif needed. It has also been successfully rolled out in Singapore.
• MaxTrad Digisuite provides a secure online service for firms withglobal supply chains and reduces the need for expensivedocumentation and courier services.
Being recognised for the quality of our serviceOur awards in 2010 reflect the quality and international coverage of ourbusinesses. Global Finance magazine awarded us:
• Best Bank for Liquidity Management (Western Europe)• Best Continuous Linked Settlement Bank (Western Europe andNorth America)
• Best Trade Finance Bank (Netherlands)• Best Supply Chain Finance Provider
Positioning for the futureWe continued to build upon the foundation of the Group’s 2009 StrategicPlan. Our risk management programmes have been enhanced, with thefirst phase of a new model for credit risk and portfolio management. Thisprovides a more streamlined credit approval process for customers andstrengthens accountability across business divisions.
Our people agenda seeks to align employees with customer needs andour business strategy. In 2010, we identified a set of values for GTS basedupon empowered leaders, customer focus, the drive to succeed,connectivity, and risk awareness. Our employees are encouraged toengage fully through discussion forums, focus groups and roadshows.Fostering teamwork throughout our business creates an inclusive workplaceand we are active in creating a trusted adviser role with our clients.
In April, we completed the legal separation and integration of the formerABN AMRO NV businesses. The parts acquired by RBS now operateunder a unified brand which gives us greater opportunities for ourbusiness and our clients. Our new banking platform in the Netherlandssuccessfully migrated more than 40,000 corporate accounts to RBS.
In line with the settlement agreed with the EC in 2009, we announced andcompleted the divestment of our Global Merchant Services (‘WorldPay’)business to Advent International and Bain Capital. Under the terms ofthe sale, RBS will retain a 19.99% stake in the business, and will refer ourcustomers to WorldPay for merchant acquiring products and services.
Going onto the front footThe launch of our new customer proposition highlights the strengths ofour business, enhances our market profile and helps to differentiate usfrom the competition. The combined strengths of our business includeour global reach, product expertise, customer service, technologyplatforms and most importantly our people. These are underpinned byour continuing commitment to customers and our ability to generate newideas and products.
In 2011, we will continue to build on the momentum of 2010 and toposition GTS as a stable and powerful transaction bank for our customersand our shareholders. GTS will move forward under new leadership, withScott Barton taking over as CEO in January 2011. Brian Stevenson willwork with Scott in his new capacity as Chairman, GTS.
We partnered with the Government’s UKTrade & Investment initiative, through theirAsia Task Force, to present a series ofevents entitled Doing Business in Asia:Meet the Experts.
We administer 4,600 global tradetransactions each day.
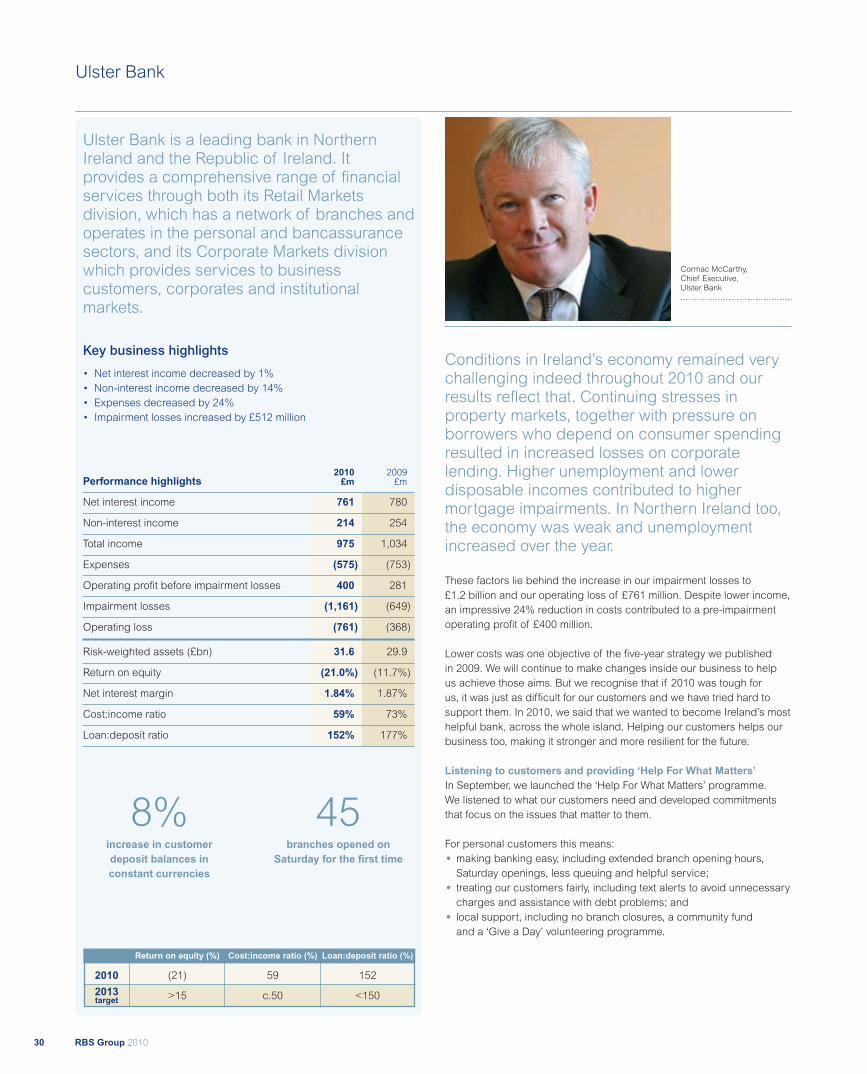
RBS Group 201030
Ulster Bank
Conditions in Ireland’s economy remained verychallenging indeed throughout 2010 and ourresults reflect that. Continuing stresses inproperty markets, together with pressure onborrowers who depend on consumer spendingresulted in increased losses on corporatelending. Higher unemployment and lowerdisposable incomes contributed to highermortgage impairments. In Northern Ireland too,the economy was weak and unemploymentincreased over the year.
These factors lie behind the increase in our impairment losses to£1.2 billion and our operating loss of £761 million. Despite lower income,an impressive 24% reduction in costs contributed to a pre-impairmentoperating profit of £400 million.
Lower costs was one objective of the five-year strategy we publishedin 2009. We will continue to make changes inside our business to helpus achieve those aims. But we recognise that if 2010 was tough forus, it was just as difficult for our customers and we have tried hard tosupport them. In 2010, we said that we wanted to become Ireland’s mosthelpful bank, across the whole island. Helping our customers helps ourbusiness too, making it stronger and more resilient for the future.
Listening to customers and providing ‘Help For What Matters’In September, we launched the ‘Help For What Matters’ programme.We listened to what our customers need and developed commitmentsthat focus on the issues that matter to them.
For personal customers this means:
• making banking easy, including extended branch opening hours,Saturday openings, less queuing and helpful service;
• treating our customers fairly, including text alerts to avoid unnecessarycharges and assistance with debt problems; and
• local support, including no branch closures, a community fundand a ‘Give a Day’ volunteering programme.
Cormac McCarthy,Chief Executive,Ulster Bank
Ulster Bank is a leading bank in NorthernIreland and the Republic of Ireland. Itprovides a comprehensive range of financialservices through both its Retail Marketsdivision, which has a network of branches andoperates in the personal and bancassurancesectors, and its Corporate Markets divisionwhich provides services to businesscustomers, corporates and institutionalmarkets.
Key business highlights
• Net interest income decreased by 1%• Non-interest income decreased by 14%• Expenses decreased by 24%• Impairment losses increased by £512 million
2010 2009Performance highlights £m £m
Net interest income 761 780
Non-interest income 214 254
Total income 975 1,034
Expenses (575) (753)
Operating profit before impairment losses 400 281
Impairment losses (1,161) (649)
Operating loss (761) (368)
Risk-weighted assets (£bn) 31.6 29.9
Return on equity (21.0%) (11.7%)
Net interest margin 1.84% 1.87%
Cost:income ratio 59% 73%
Loan:deposit ratio 152% 177%
Return on equity (%) Cost:income ratio (%) Loan:deposit ratio (%)
2010 (21) 59 152
2013 >15 c.50 <150target
8%increase in customerdeposit balances inconstant currencies
45branches opened on
Saturday for the first time

31RBS Group 2010
Divisional review
Ulster Bank
For SME business customers this means:
• access to credit and working capital. We will continue to make creditavailable to viable businesses and maintain overdrafts for their fullterm, unless there is a breach of terms. An appeals process isavailable for unsuccessful applications;
• clarity about what customers can expect concerning the costs,terms and conditions of credit and the factors that influence theprice of a loan; and
• understanding and support for businesses, including two-yearfree transactional banking for start-ups and an on-line businesssupport programme.
We are still at an early stage in the programme, but we are alreadydelivering on these commitments. For example, in 2010 we opened 45branches on Saturdays for the first time. We now have more branchesopen on Saturdays across Ireland than any other bank. By opening onSaturdays and extending our weekly opening hours, we are giving ourcustomers an extra 30,000 hours each year to visit our branches.
Focusing on customers and serviceWe are working with our personal and business customers every dayto support them in dealing with any financial difficulties they may beexperiencing. Initiatives such as Flex and Breathing Space in retailbanking demonstrate to our customers that we are committed to themover the long-term. Our smallbusinesscan online community in businessbanking is well received and continues to grow. It now attracts over15,000 small and medium enterprise visitors each month, allowing themto access knowledge and share insights, ideas and experiences withlike-minded peers to assist the survival and growth of their businesses.
In 2010, we increased the numbers of new retail customers to UlsterBank and made strong progress in growing our deposit franchise. Wealso extended our Private Banking business into the Republic of Ireland,with new relationship managers based in Dublin and Cork.
We became the first bank in the Republic of Ireland to launch an iPhonemobile banking application. In October, we extended our mobile phonebanking services to a wider range of mobile phones, enabling ourcustomers to manage their money on the move and helping them reduceavoidable current account charges.
In business banking, over the course of 2010 we achieved an averageCustomer Satisfaction Index of 89% for all our business bankingtouchpoints. We continued to forge strong links with key small businesssupport and lobbying bodies island-wide through our businessengagement programme.
In September, we launched a new campaign to support early-stagebusinesses, including access to a Start Up Knowledge Centre and StartUp Live events in 14 different locations.
Investing in our peopleOur employees are central to our ambition of becoming Ireland’s mosthelpful bank. Through the Ulster Bank People Plan, we are taking stepsto ensure our people feel engaged, motivated and that we give themopportunities to develop to their full potential. In January, we launchedthe Ulster Bank Academy, with over 3,500 of our people attendinglearning and development courses throughout the year.
Getting fit for the futureThe ‘Lean’ programme is part of our strategy to transform the way wedo business so that we can serve customers better. It will also help usto become more efficient. Behind every interaction with a customer is aprocess and it is important to get this process right from start to finish.If we do that, it will help us to be Ireland’s most helpful bank.
We’re using the experience of our people in making these changes,for example in designing new procedures for call-handling, feeding backon call quality and coaching the telephony agents. As a result, we’vereduced the Average Handling Time of a call by 23% since January2010. This means we are able to speak to more customers each day.It has also provided stronger links between our businesses, with ourtelephony agents able to hand over more customer leads to the RetailDirect Sales Centre.
Significant economic and business challenges remain. However, over thelast two years we have proven our ability to adapt to change and supportour customers. This, combined with the continued strong support ofRBS, leaves us very well positioned for the future.
We became the first bank in the Republicof Ireland to launch an iPhone mobilebanking application.
Our online business resource initiativewww.smallbusinesscan.com attracts over15,000 SME visitors each month.

RBS Group 201032
US Retail & Commercial
In 2009, we set out our five-year plan to createa stronger, more resilient business. 2010 sawus take significant steps along this path, withinvestments in products, customer service,infrastructure and people.
We have seen a return to operating profitability and a substantial increase innew accounts opened. We are better placed to respond to external factors,such as regulatory changes and a subdued and uncertain US economicrecovery. Though we are still at the early stages of our plan, momentumis building towards our aim of being a leading super-regional bank.
Strengthening customer relationshipsIn May, Citizens Bank and Charter One launched the “Good Banking isGood Citizenship” brand platform. The initiative underscores our long-standing heritage and helps to restore trust in the banking industry,and has received a positive response from new and existing customers.It brings to life our central and long-standing belief that a bank shouldcontribute to the growth and vibrancy of its communities, operatingthrough all of the channels in which the bank interacts with its customersand the community.
US Retail & Commercial added more than 52,500 new customer accountsand 12,500 small business accounts in the year to 30 September 2010.Commercial Banking has expanded its reach into niche markets withsignificant growth opportunities, including Commercial EnterpriseBanking, Health-Care Banking, Capital Markets/Debt Syndication andFranchise Finance.
Our Home Lending Solutions first mortgage business is ranked nationallyamong the top 20 retail originators by Inside Mortgage Finance, havingmoved up the rankings in the past two years. In addition, we see well-managed home-equity lending as a strategic product, attracting newcustomers and serving as an anchor for stronger customer relationships.Nearly 90% of home-equity customers also have deposit relationshipswith us.
Good customer service is at the heart of our ability to attract and retaincustomers. Citizens’ Contact Centers have made significant improvementsin the customer experience, reducing the average time to answer acustomer call by 50% over the last two years.
In September, we launched a new Mobile Banking application for theiPhone. It allows retail customers to check account balances, transferfunds, find ATM and branch locations, and make payments. We also
Ellen AlemanyChief Executive,Citizens and Head ofAmericas
M For biographiessee pages 226-229
US Retail & Commercial provides financialservices primarily through the Citizens Bank,Charter One and RBS Citizens brands. It isengaged in retail and corporate bankingactivities through its 1,500 branch network in12 states in the northeastern quadrant of theUnited States and through non-branch officesin other states. It ranks among the top fivebanks in New England (based on depositmarket share).
Key business highlights
• Net interest income increased by 8%
• Non-interest income increased by 8%
• Expenses decreased by 1%
• Impairment losses decreased by 26%
• Operating profit increased by £419 million
2010 2009Performance highlights £m £m
Net interest income 1,917 1,775
Non-interest income 1,029 949
Total income 2,946 2,724
Expenses (2,123) (2,135)
Operating profit before impairment losses 823 589
Impairment losses (517) (702)
Operating profit/(loss) 306 (113)
Risk-weighted assets (£bn) 57.0 59.7
Return on equity 3.6% (1.3%)
Net interest margin 2.85% 2.37%
Cost:income ratio 72% 78%
Loan:deposit ratio 81% 80%
Return on equity (%) Cost:income ratio (%) Loan:deposit ratio (%)
2010 4 72 81
2013 >15 <55 <90target
50%reduction in average timeto answer a customer callover the last two years
81%loan to deposit ratio

33RBS Group 2010
Divisional review
US Retail & Commercial
launched the Student Money Bundle, a new packaged account offeringa range of services and incentives for students. GoalTrack Savings is aprogramme that allows customers to set their own savings goals andearn a bonus for achieving them. Since it was introduced in December2009 it has seen over 26,000 new enrolments, with more than $42 millionin committed savings goals.
Re-investing in the core franchiseWe are committed to upgrading our infrastructure, with a 41% increasein capital investment in 2010 compared with the previous year. Keyinitiatives include new commercial loan and mortgage systems, a newteller system with image capture at our branches, and online bankingenhancements, as well as the iPhone mobile banking.
Restructuring for the futureIn line with the settlement agreed with the EC in 2009, we announcedand completed the divestment of our Global Merchant Services (GMS)business, including RBS WorldPay in Atlanta. Under the terms of the saleto Advent International and Bain Capital, RBS will retain a 19.9% stake inthe business, and can refer its customers to them for global merchantproducts and services. In May 2010, we also completed the exit of ourjoint arrangement with Kroger Personal Finance.
Strengthening risk managementEnhancing our risk-management capabilities is a critical business objectivewithin our Strategic Plan. We have created two new Risk Managementgroups and made several appointments to our risk leadership team,including a Chief Risk Officer for Citizens Financial Group. We’re beingswift and strategic as we respond to the changing environment we face.
Leveraging commercial capabilitiesThrough Global Transaction Services (GTS), we introducedaccessMOBILE, an easy-to-use smart phone application that enablesclients to manage commercial banking transactions on a convenient andportable basis. We were the first bank in our footprint area to offer sucha service. We also worked closely with GTS on a fall sales campaign,strengthening our partnership for the benefit of serving our customers.
Commercial Banking has partnered with Business Services to implementAFS, our new loan origination and servicing platform. This will enhanceour relationship managers’ ability to respond quickly to their customers’needs. We also invested in over 150 days of training programmes aimedat enhancing sales management skills across different products andareas. More than 700 staff from Commercial Banking, GTS and ForeignExchange desks participated in the training.
The Commercial teams are capitalizing on market disruption, as three infive mid-sized companies ($10 million to $500 million in annual sales) areactively seeking a new provider or would consider it if presented with acompelling offer. We are also leveraging strong client loyalty, with 86% ofthe $5 million to $25 million client segment and 75% of the $25 million to$500 million client segment saying they would continue using Citizens forfuture banking needs.
Our new Commercial Enterprise Banking division addresses the needsof companies with $5 million to $25 million in annual revenues. CEB’s$10 million in technology and people investments included Citizens’ firstshared, uniform credit delivery and portfolio management businessmodel, as well as a larger sales force to improve market coverage andbetter serve existing clients.
Community responseOften we experience events outside our control. A profound example isthe historic flooding that occurred in New England in late March andearly April. Citizens responded with special financing and grants for localbusinesses, non-profit agencies and individual customers.We supported our colleagues who suffered damages of their ownthrough the company’s Emergency Assistance Fund. This event wasmore than a disaster recovery exercise – it was leadership at its finest.
RecognitionWe received a range of awards that recognised our industry leadershipand commitment to staff, customers and the communities where we dobusiness:
• Citizens was named second in the US in delivering the best experiencefor small-business customers by the ath Power 2010 Small BusinessBanking Study™, moving up from No.10 in 2009.
• In New Hampshire, Citizens Bank was named the Business of theDecade in the financial services category by Business NH Magazine.
• In Connecticut, we received a Green Business Award from BusinessNew Haven for our Green$ense programme. The RBS AmericasHeadquarters building in Stamford also received a Climate ChangeLeadership Award from Connecticut’s Governor.
• Citizens Financial Group was recognised by Conceive magazine, forthe third consecutive year, as the top company nationwide for offeringfamily-building benefits to its staff, including fertility treatment andadoption assistance. For the fourth consecutive year, we were alsorecognised by the Dave Thomas Foundation as the Best Adoption-Friendly workplace in financial services.
New client acquisition in the CommercialEnterprise Banking segment tripled fromthe prior year.
Citizens was named second in the USin delivering the best experience for smallbusiness customers, moving up fromNo.10 in 2009.
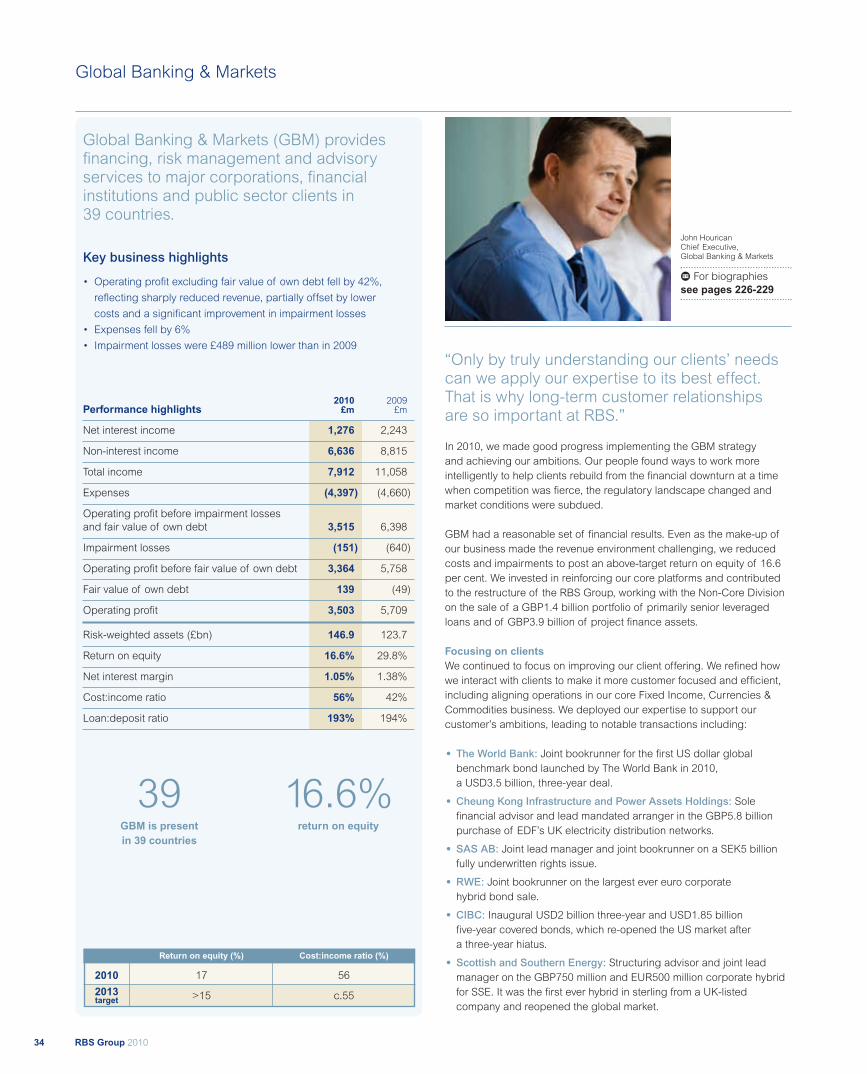
RBS Group 201034
Global Banking & Markets
“Only by truly understanding our clients’ needscan we apply our expertise to its best effect.That is why long-term customer relationshipsare so important at RBS.”
In 2010, we made good progress implementing the GBM strategyand achieving our ambitions. Our people found ways to work moreintelligently to help clients rebuild from the financial downturn at a timewhen competition was fierce, the regulatory landscape changed andmarket conditions were subdued.
GBM had a reasonable set of financial results. Even as the make-up ofour business made the revenue environment challenging, we reducedcosts and impairments to post an above-target return on equity of 16.6per cent. We invested in reinforcing our core platforms and contributedto the restructure of the RBS Group, working with the Non-Core Divisionon the sale of a GBP1.4 billion portfolio of primarily senior leveragedloans and of GBP3.9 billion of project finance assets.
Focusing on clientsWe continued to focus on improving our client offering. We refined howwe interact with clients to make it more customer focused and efficient,including aligning operations in our core Fixed Income, Currencies &Commodities business. We deployed our expertise to support ourcustomer’s ambitions, leading to notable transactions including:
• The World Bank: Joint bookrunner for the first US dollar globalbenchmark bond launched by The World Bank in 2010,a USD3.5 billion, three-year deal.
• Cheung Kong Infrastructure and Power Assets Holdings: Solefinancial advisor and lead mandated arranger in the GBP5.8 billionpurchase of EDF’s UK electricity distribution networks.
• SAS AB: Joint lead manager and joint bookrunner on a SEK5 billionfully underwritten rights issue.
• RWE: Joint bookrunner on the largest ever euro corporatehybrid bond sale.
• CIBC: Inaugural USD2 billion three-year and USD1.85 billionfive-year covered bonds, which re-opened the US market aftera three-year hiatus.
• Scottish and Southern Energy: Structuring advisor and joint leadmanager on the GBP750 million and EUR500 million corporate hybridfor SSE. It was the first ever hybrid in sterling from a UK-listedcompany and reopened the global market.
John HouricanChief Executive,Global Banking & Markets
M For biographiessee pages 226-229
Return on equity (%) Cost:income ratio (%)
2010 17 56
2013 >15 c.55target
39GBM is presentin 39 countries
16.6%return on equity
Global Banking & Markets (GBM) providesfinancing, risk management and advisoryservices to major corporations, financialinstitutions and public sector clients in39 countries.
Key business highlights
• Operating profit excluding fair value of own debt fell by 42%,
reflecting sharply reduced revenue, partially offset by lower
costs and a significant improvement in impairment losses
• Expenses fell by 6%
• Impairment losses were £489 million lower than in 2009
2010 2009Performance highlights £m £m
Net interest income 1,276 2,243
Non-interest income 6,636 8,815
Total income 7,912 11,058
Expenses (4,397) (4,660)
Operating profit before impairment lossesand fair value of own debt 3,515 6,398
Impairment losses (151) (640)
Operating profit before fair value of own debt 3,364 5,758
Fair value of own debt 139 (49)
Operating profit 3,503 5,709
Risk-weighted assets (£bn) 146.9 123.7
Return on equity 16.6% 29.8%
Net interest margin 1.05% 1.38%
Cost:income ratio 56% 42%
Loan:deposit ratio 193% 194%

35RBS Group 2010
Divisional review
Global Banking & Markets
Our clients valued the work we did for them in 2010 and rewarded usaccordingly. They voted us in the global top five for foreign exchange(2010 Euromoney FX Survey) and one of the top five dealers forderivatives (2010 Risk Interdealer Poll). Our debt capital marketsbusiness was voted Euromoney Best Debt House in the UK and theNetherlands. The Banker magazine gave us the Deal of the Year awardfor equities and sovereign bonds in Europe, financial institutions in theMiddle East and loans in Asia.
GBM engaged with regulators to help our clients, and our own people,fully understand the various changes proposed to banking supervision.We invited expert regulatory speakers to client meetings in cities inEurope, Asia Pacific and the US, giving our customers the rareopportunity to ask technical questions on how changes will affect theirbusinesses. We also acted as bookrunner on the first Solvency II-compliant issue in the market.
Making global connectionsWe maximised our 39-country network to help customers manage risksbetween regions and access funding around the world, cementing ourposition in the world’s biggest economies and increasing our presencein high-growth markets.
In Europe, we delivered some of the largest transactions of the year.These included Switzerland-based Glencore’s USD2.5 billion repurchaseof the Prodeco coal mine in Colombia and the EUR3.6 billion sale ofGerman drugs producer Ratiopharm. Improvements in the equitiesbusiness led to Greenwich Associates ranking us number one in OverallService Quality for retail structured products in Europe.
In the US, GBM cemented our place as a leader in the bond market.We were ranked the Number Two Manager by Asset-Backed Alert afterthe US ABS team closed 73 deals worth USD58 billion and we executedcovered bonds that re-opened the US market after a three-year gap.In September alone, GBM was active bookrunner on about USD11 billionof investment grade debt offerings.
In India, we completed one out of every three foreign-currency bondissues in 2010, including the country’s biggest corporate and financialinstitutions bond sales. In November, we became the first UK bank givenpreliminary permission to form a joint venture securities company inChina, which will allow us to underwrite equity and bond sales in thedomestic market.
Investing in risk managementWe continued to improve how we manage risk, introducing systemsand processes that optimised capital and made us more efficient. Weimproved the way in which we manage our exposure to derivatives andintroduced an Operational Data Cache, which consolidated all sourcesof data into a single real-time database. A global investment programme,launched in 2009, is nearly complete and on target to deliver its objectiveof establishing front-to-back systems that improve client transactionsand support business growth. We envisage further investment.
Investing in our people and communitiesOur achievements in 2010 were made possible by our people. Wefocused on attracting the best talent – welcoming more than 200 newgraduates globally. We nurtured almost 300 new joiners through ourrevamped induction programme and hired experienced leaders. Wecombined these efforts with activities that embedded our GBM Valuesof accountability, connectivity, thoughtful decisions and successamong employees.
We helped GBM reach out in our local communities and make adifference to young people from disadvantaged backgrounds. TheGBM in the Community programme, launched in September, providedan avenue through which employees volunteered their time and donatedmoney. Together we gave GBP1.7 million to communities in which weoperate and donated more than 16,000 hours of employee time.
Our clients voted us in the global top fivefor foreign exchange and one of the topfive dealers for derivatives.
Our debt and capital markets businesswas voted Euromoney Best Debt Housein the UK and the Netherlands.
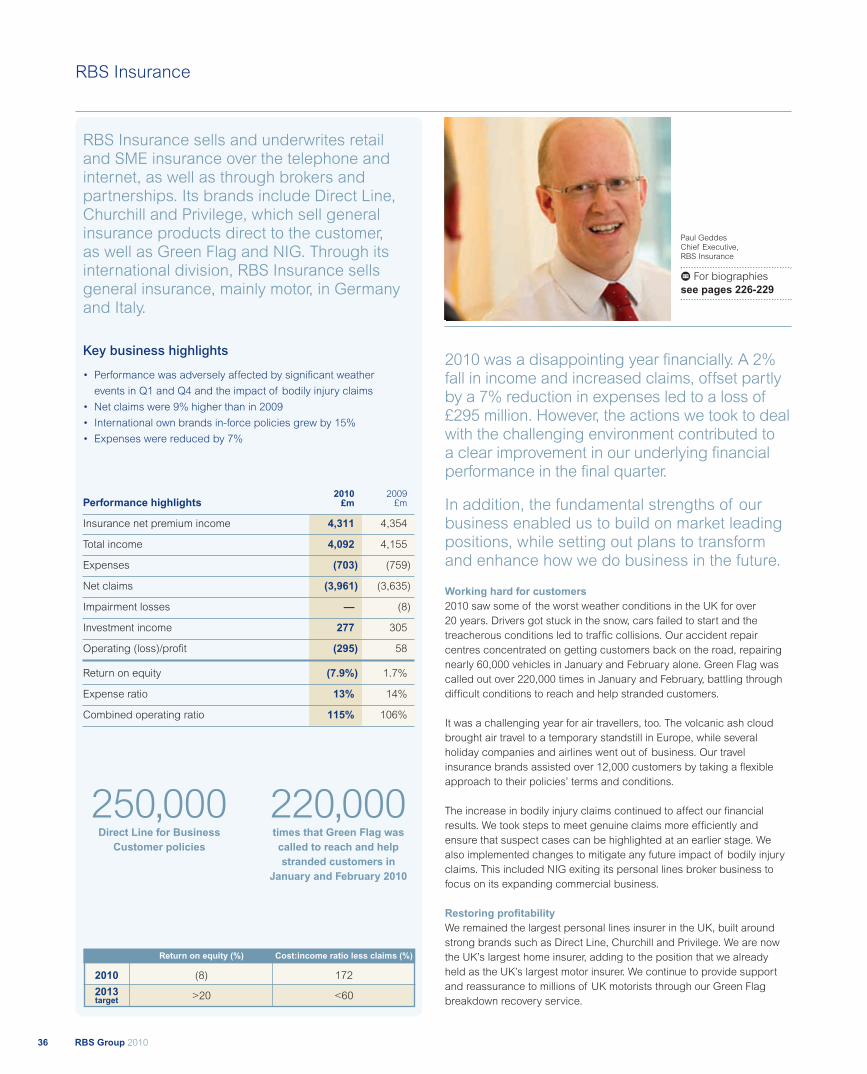
RBS Group 201036
RBS Insurance
2010 was a disappointing year financially. A 2%fall in income and increased claims, offset partlyby a 7% reduction in expenses led to a loss of£295 million. However, the actions we took to dealwith the challenging environment contributed toa clear improvement in our underlying financialperformance in the final quarter.
In addition, the fundamental strengths of ourbusiness enabled us to build on market leadingpositions, while setting out plans to transformand enhance how we do business in the future.
Working hard for customers2010 saw some of the worst weather conditions in the UK for over20 years. Drivers got stuck in the snow, cars failed to start and thetreacherous conditions led to traffic collisions. Our accident repaircentres concentrated on getting customers back on the road, repairingnearly 60,000 vehicles in January and February alone. Green Flag wascalled out over 220,000 times in January and February, battling throughdifficult conditions to reach and help stranded customers.
It was a challenging year for air travellers, too. The volcanic ash cloudbrought air travel to a temporary standstill in Europe, while severalholiday companies and airlines went out of business. Our travelinsurance brands assisted over 12,000 customers by taking a flexibleapproach to their policies’ terms and conditions.
The increase in bodily injury claims continued to affect our financialresults. We took steps to meet genuine claims more efficiently andensure that suspect cases can be highlighted at an earlier stage. Wealso implemented changes to mitigate any future impact of bodily injuryclaims. This included NIG exiting its personal lines broker business tofocus on its expanding commercial business.
Restoring profitabilityWe remained the largest personal lines insurer in the UK, built aroundstrong brands such as Direct Line, Churchill and Privilege. We are nowthe UK’s largest home insurer, adding to the position that we alreadyheld as the UK’s largest motor insurer. We continue to provide supportand reassurance to millions of UK motorists through our Green Flagbreakdown recovery service.
Paul GeddesChief Executive,RBS Insurance
M For biographiessee pages 226-229
RBS Insurance sells and underwrites retailand SME insurance over the telephone andinternet, as well as through brokers andpartnerships. Its brands include Direct Line,Churchill and Privilege, which sell generalinsurance products direct to the customer,as well as Green Flag and NIG. Through itsinternational division, RBS Insurance sellsgeneral insurance, mainly motor, in Germanyand Italy.
Key business highlights
• Performance was adversely affected by significant weather
events in Q1 and Q4 and the impact of bodily injury claims
• Net claims were 9% higher than in 2009
• International own brands in-force policies grew by 15%
• Expenses were reduced by 7%
2010 2009Performance highlights £m £m
Insurance net premium income 4,311 4,354
Total income 4,092 4,155
Expenses (703) (759)
Net claims (3,961) (3,635)
Impairment losses — (8)
Investment income 277 305
Operating (loss)/profit (295) 58
Return on equity (7.9%) 1.7%
Expense ratio 13% 14%
Combined operating ratio 115% 106%
Return on equity (%) Cost:income ratio less claims (%)
2010 (8) 172
2013 >20 <60target
250,000Direct Line for BusinessCustomer policies
220,000times that Green Flag wascalled to reach and helpstranded customers in
January and February 2010

37RBS Group 2010
Divisional review
RBS Insurance
Gross written premiums in our international business grew 25% in Euroterms compared to 2009, with the Italian business reporting 35% growth.Combined, the Italian and German businesses surpassed the landmark1 million insured vehicles at 1.1 million. Direct Line for Business alsoaccomplished a new landmark, growing rapidly from its launch in 2007to reach over 250,000 customer policies. It offers insurance productsdirect to small business customers, providing them with a straightforwardway to insure their firm.
We implemented pricing changes that reflect the increased risk andfrequency of bodily injury claims. To reduce this risk further, a new‘rating engine’ was implemented in the own brands motor business.It dramatically increases the flexibility in pricing risk, reducing the timerequired to deliver new risk and pricing strategies. It will continue to berolled out among other products.
A pro-active programme of investment in people, processes andtechnology ensured that we were ready for the introduction in Aprilof the Ministry of Justice’s new insurance claims handling procedure.The reforms enable genuine personal injury claimants to receive faircompensation more quickly and provides greater control over costsfor insurers.
In October, we sponsored an event at the Houses of Parliament todiscuss the challenging environment the UK’s ‘compensation culture’has created for the insurance industry. We continue to work alongsidethe Association of British Insurers in support of Lord Justice Jackson’srecommendations for reforming personal injury compensation claims.
Putting customers firstOur customer satisfaction ratings remain strong. We scored 85.8% forSales and Service and received the same result for Claims. In October,our commitment to the highest standards of service and behaviour wasaffirmed as we signed the Aldermanbury Declaration. It sets out theprofessional standards we will meet in areas including: Commitment toExcellence; Training and Development; and standards for broking,underwriting, claims and management procedures.
We are committed to protecting customers from the scourge ofuninsured drivers. In November, Direct Line hosted a seminar with theindustry, politicians and police to promote wider discussion about theimpact of uninsured drivers and potential measures to stop it.
Direct Line celebrated its 25th birthday in 2010. Its spirit of innovationcontinued as it launched its free “On the Road” application for theiPhone. This provides a route planner and live traffic updates to help planjourneys. Should an accident happen, it also features an easy-to-use toolto record and store key information and to send the details straightthrough to the Direct Line claims team.
NIG extended its free Risk Aware risk management service to newcustomer areas. It provides a tailored assessment of risk managementprocedures and assists with the implementation of any recommendedimprovements. NIG also rolled out a new mapping tool, covering thewhole of the UK, which provides underwriters with specific geographicaldata on issues such as the risks of flood.
Our dedication to customers, innovative products and hard workingemployees was recognised through a variety of awards in 2010. Wereceived three ‘Your Money’ awards, with Direct Line winning for the BestOnline Travel Insurance, Churchill for Best Pet Insurance and Green Flagfor Best Breakdown Cover. For the second consecutive year, Green Flagreceived the Institute of Transport Management’s award for UK RoadsideAssistance Company of the Year. RBS Insurance’s investment in thelearning and development of its people was honoured with a prestigiousNational Training Award. Our vocational training programme supportsemployees in their jobs and provides the opportunity to gainqualifications and strengthen key skills.
Refocusing for the futureWe announced plans to restructure our UK office network to create newCentres of Excellence. This will help to make better use of our properties,lower costs and promote best practice across our functions. Fewer siteswill enhance our ability to serve customers by allowing new technologyand telephony systems to be introduced at a faster pace in the future.
The settlement agreed with the European Commission in 2009 meansthat RBS must divest, at least, the controlling interest in RBS Insuranceby the end of 2013. We continue to explore the available options formeeting this commitment in the most effective way for customers, staffand investors. 2010 has been an important year for RBS Insurance inrefocusing the business for an independent future and we will continueto be managed in a way that meets customer and shareholder needs.
Our travel insurance brands assisted over12,000 customers during the Icelandicvolcanic ash cloud episode.
We are now the UK’s largest home insurer,adding to the position that we already heldas the UK’s largest motor insurer.
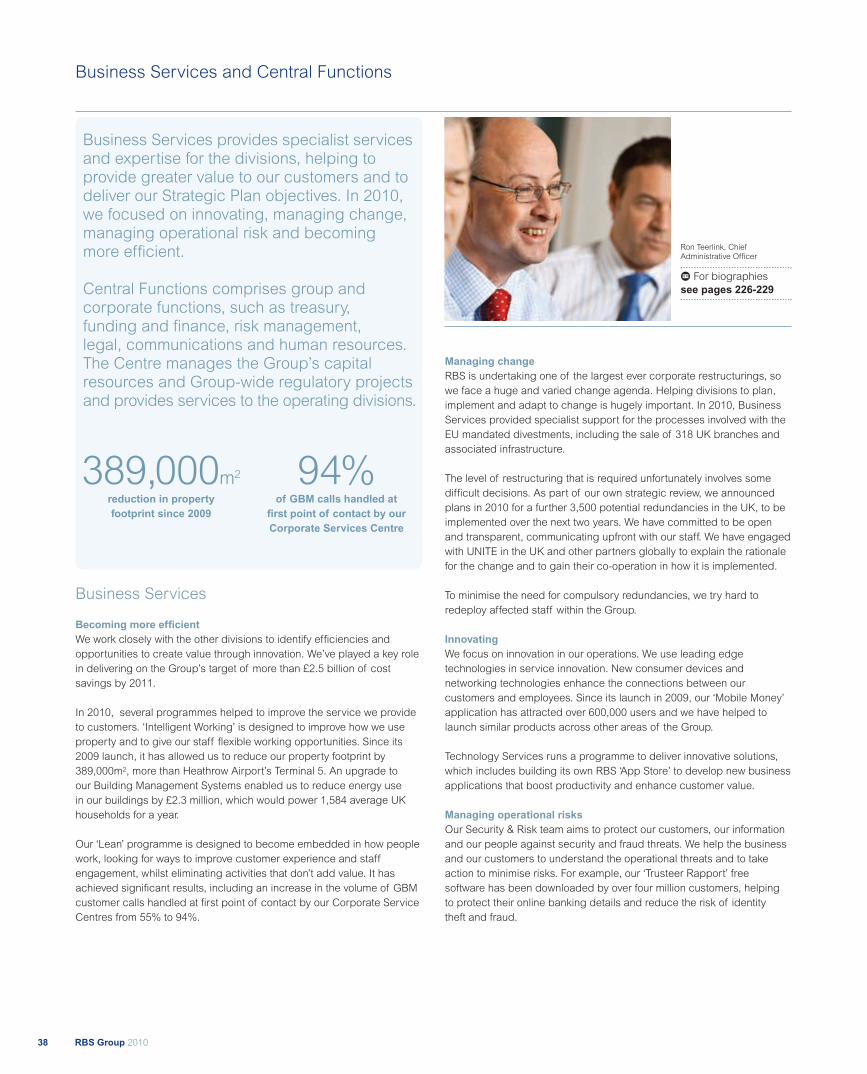
RBS Group 201038
Business Services and Central Functions
Ron Teerlink, ChiefAdministrative Officer
M For biographiessee pages 226-229
Business Services provides specialist servicesand expertise for the divisions, helping toprovide greater value to our customers and todeliver our Strategic Plan objectives. In 2010,we focused on innovating, managing change,managing operational risk and becomingmore efficient.
Central Functions comprises group andcorporate functions, such as treasury,funding and finance, risk management,legal, communications and human resources.The Centre manages the Group’s capitalresources and Group-wide regulatory projectsand provides services to the operating divisions.
Business Services
Becoming more efficientWe work closely with the other divisions to identify efficiencies andopportunities to create value through innovation. We’ve played a key rolein delivering on the Group’s target of more than £2.5 billion of costsavings by 2011.
In 2010, several programmes helped to improve the service we provideto customers. ‘Intelligent Working’ is designed to improve how we useproperty and to give our staff flexible working opportunities. Since its2009 launch, it has allowed us to reduce our property footprint by389,000m2, more than Heathrow Airport’s Terminal 5. An upgrade toour Building Management Systems enabled us to reduce energy usein our buildings by £2.3 million, which would power 1,584 average UKhouseholds for a year.
Our ‘Lean’ programme is designed to become embedded in how peoplework, looking for ways to improve customer experience and staffengagement, whilst eliminating activities that don’t add value. It hasachieved significant results, including an increase in the volume of GBMcustomer calls handled at first point of contact by our Corporate ServiceCentres from 55% to 94%.
Managing changeRBS is undertaking one of the largest ever corporate restructurings, sowe face a huge and varied change agenda. Helping divisions to plan,implement and adapt to change is hugely important. In 2010, BusinessServices provided specialist support for the processes involved with theEU mandated divestments, including the sale of 318 UK branches andassociated infrastructure.
The level of restructuring that is required unfortunately involves somedifficult decisions. As part of our own strategic review, we announcedplans in 2010 for a further 3,500 potential redundancies in the UK, to beimplemented over the next two years. We have committed to be openand transparent, communicating upfront with our staff. We have engagedwith UNITE in the UK and other partners globally to explain the rationalefor the change and to gain their co-operation in how it is implemented.
To minimise the need for compulsory redundancies, we try hard toredeploy affected staff within the Group.
InnovatingWe focus on innovation in our operations. We use leading edgetechnologies in service innovation. New consumer devices andnetworking technologies enhance the connections between ourcustomers and employees. Since its launch in 2009, our ‘Mobile Money’application has attracted over 600,000 users and we have helped tolaunch similar products across other areas of the Group.
Technology Services runs a programme to deliver innovative solutions,which includes building its own RBS ‘App Store’ to develop new businessapplications that boost productivity and enhance customer value.
Managing operational risksOur Security & Risk team aims to protect our customers, our informationand our people against security and fraud threats. We help the businessand our customers to understand the operational threats and to takeaction to minimise risks. For example, our ‘Trusteer Rapport’ freesoftware has been downloaded by over four million customers, helpingto protect their online banking details and reduce the risk of identitytheft and fraud.
389,000m2
reduction in propertyfootprint since 2009
94%of GBM calls handled atfirst point of contact by ourCorporate Services Centre

39RBS Group 2010
Divisional review
Business Services and Central Functions
Bruce Van Saun, GroupFinance Director
M For biographiessee pages 226-229
We provide business continuity support, enabling the Group to continueto deliver key products and services in the event of disruption.
Investing for the futureBusiness Services offers a range of scale benefits, includingpurchasing, and specialist knowledge for the Group. Our focus is onimproving on these services, whilst managing risk. Together, the actionswe took in 2010, and will continue to implement in future years, aredesigned to make the Group more efficient and enable it to provide abetter service to our customers.
Central Functions
RBS Risk ManagementRBS Risk Management is responsible for developing and embeddingrisk policy, measurement and frameworks to ensure that risk is identified,managed and controlled across the Group. The management of risk is afundamental activity performed throughout all the Group's Businesses.It underpins the Group's performance and future success. It is criticallyimportant that the adequacy and effectiveness of our risk managementprocesses are of the highest standard and subject to continuous reviewand enhancement.
FinanceFinance is responsible for the external reporting of the Group’sperformance and financial position, including regulatory and centralbank reporting. As part of our mission to rebuild investor confidence andtrust, we have greatly improved the quality and transparency of RBS’sexternal reporting, and we provide financial information to the marketquarterly. Finance has a critical role in partnering with our divisions tomonitor performance against the Group Strategic Plan, and is helpingthe business achieve our strategic aims using enhanced forecastingtools and thoughtful analytics.
The Treasury function has focused on driving improvements to theGroup’s liquidity, funding and capital position. In 2010, Finance hasplayed a central role in the initiative to dispose of EU-mandateddivestments as well as assessing the implications of changes in theregulatory environment.
Finance’s key objectives include a transformation programme to improvethe efficiency of the function over the next three years. The programmeenvisages the creation of a world class finance function through anumber of initiatives including substantial investment in finance and risksystems infrastructure.
Human ResourcesA new leadership capability framework has been launched to ensureour leaders are assessed and developed against behaviours thatsupport the delivery of our strategic plans and our emerging culture.The behaviours are assessed in a 360-degree feedback tool which isan integral part of how we review our Executives’ performance. Thebehaviours we focus on include: Strategic Progress, Business Delivery& Financial Performance, Customers' Expectations, Risk, Efficiencyand Control, People Management, and Personal Skills. The outputs of360-degree feedback help to prepare personal development plansand inform leadership development priorities.
Group Strategy and Group Corporate FinanceOur Group Strategy and Corporate Finance team supports the ChiefExecutive, Chief Financial Officer and the Executive Committee in thedevelopment of the Group’s strategy. Its objective is to ensure that theGroup has the right portfolio of businesses, active in the right markets,supported by the appropriate allocation of capital and other resources.The team plays a key role in the Group’s disposal activity.
Group Legal, Secretariat and Regulatory Affairs & ComplianceOur Group Legal, Secretariat and Regulatory Affairs & Compliancefunctions play a vital role in setting a framework within which the Groupcan deliver long term sustainable returns. The team works in partnershipwith the businesses it supports. It adopts a commercial approach butretains its independence and professional judgement in order to drive aculture of compliance and good governance designed to protect theGroup's franchise.
RBS CommunicationsRBS Communications manages our relationships with externalstakeholders and makes sure we keep our employees informed aboutdevelopments in the business. RBS wants to be open to stakeholdersand during the year RBS Communications helped elected officials,commentators and others gain a better understanding of our businessand our plans.
Elaine Arden, Group HumanResources Director

RBS Group 201040
Non-Core Division
Helping to deliver the Strategic PlanThe Non-Core Division is a central pillar of the Group’s Strategic Plan,helping to make RBS stronger and safer. We help to lower the Group’srisk exposure, strengthen its funding position and allow management tofocus on the Core Bank. As we approach the mid-point of our five-yearjourney, we have achieved significant progress and are on-track to meetour targets.
But we don’t take further progress for granted. Our Definition toDelivery programme ensured we moved from defining and structuringthe division in 2009 to delivering huge strides in reducing assets andmanaging risk in 2010. Moving into the next stage, we are exploringoptions for exiting from our assets. The division’s leadership team
has been strengthened. We are in a good position to continue themomentum of progress into 2011.
Exiting from Non-Core assetsIn 2010, we passed the £100 billion milestone in our journey, reducingthird party assets (“TPAs”) to £138 billion at year-end, down from the initialDecember 2008 portfolio of £258 billion. We also reduced our portfolioof derivatives from an initial £85 billion to £16 billion. Despite sometimeschallenging market conditions, careful preparation and asset managementenabled us to take, and sometimes accelerate, exit opportunities.
While our disposal programme has attracted the most attention, the run-off programme and asset restructuring deals have also been important.
• International Businesses & Portfolios made huge progress in thedisposal of non-core country or whole businesses. Sale agreementswere reached for our Non-Core businesses in Latin America, India,Kazakhstan, Pakistan and the United Arab Emirates, as well as for partof our Asset Management business and for our Invoice Financebusinesses in Germany and France. We completed the transfer ofassets in six Asian countries to ANZ Group.
• Portfolio & Banking agreed deals to dispose of non-core portfolioassets. Examples included the sale of a portfolio of US and Europeanprivate equity fund interests, the sale of Leveraged Finance assetsthrough a Collateralised Loan Obligation and the sale of propertyassets, such as the Cumberland and five other hotels.
• Non-Core Markets achieved significant progress in reducing assetsthrough sales and the unwinding of facilities and risk exposures.Markets TPAs fell from £24.4 billion at the start of the year to £13.6billion at the end of 2010.
• Across all areas, our run-off programme has helped to deliversignificant reductions through holding assets to maturity, exploringways to achieve earlier repayment and identifying options for assetsto be refinanced elsewhere.
• In line with the settlement agreed with the EC in 2009, we completed thesale of substantially all of RBS’s interest in RBS Sempra Commodities.
Though the Non-Core Division was established to separately manageand exit from the portfolio of non-core assets, we work closely with otherparts of RBS Group in achieving these aims. For example, colleagues inGBM have provided invaluable assistance in structuring and deliveringseveral deals.
The Non-Core Division separately managesassets that the Group intends to exit fromby 2013. The division contains a range ofbusinesses and asset portfolios, primarilyoriginating from GBM, linked to proprietarytrading, higher risk profile asset portfolios(including excess risk concentrations) andother illiquid portfolios. It also includes anumber of portfolios and businesses that theGroup has concluded are no longer part ofits core strategy.
2010 2009Performance highlights £m £m
Net interest income 1,959 1,534
Non-interest income 1,074 (3,835)
Total income 3,033 (2,301)
Expenses (2,325) (2,447)
Operating profit/(loss) before other operatingcharges and impairment losses 708 (4,748)
Insurance net claims (737) (588)
Impairment losses (5,476) (9,221)
Operating loss (5,505) (14,557)
Risk-weighted assets (£bn) 153.7 171.3
Net interest margin 1.16% 0.69%
Cost:income ratio 77% (106%)
Nathan BostockHead of Restructuring & Risk
M For biographiessee pages 226-229
62%fall in operating losses
4wholesale countryexits in the year

41RBS Group 2010
Divisional review
Non-Core Division
Asset Protection Scheme (APS)
Maximising shareholder valueWe achieved a significant reduction in the division’s operating loss from£14.6 billion in 2009 to £5.5 billion, largely due to improvements in incomefrom trading activities and lower impairments.
The active management of our market risk exposures helped to achievea significant improvement in income from trading activities, turning a £5.2billion loss in 2009 into a £31 million loss in 2010. Our exposure to monolineinsurers has been managed down, while hedging and credit protectionhelped to reduce day-to-day swings even when market volatility was high.
Impairments continued to fall, reflecting the reduction in assets andimprovements in the underlying quality of the remaining portfolio.Impairments totalled £5.5 billion in 2010, down from £9.2 billion in 2009.
Taking risk ‘off the table’We also concentrated on strengthening risk management, throughreducing risk exposures and responding to risks that emerge. In the
markets area, risk management has reduced the daily incomevolatility of traded assets, helping to protect the Bank against suddenmarket changes.
However, there was upward pressure on Risk Weighted Assets from pro-cyclical increases in risk weights and from regulatory changes. Offsettingthis has been the progress achieved in asset disposals, run-offs andstrengthened risk management. As a result, RWAs have reduced from£171 billion at the start of the year to £154 billion at year-end.
Looking aheadThe Non-Core Division is central to the strategy that will return RBS tostand-alone strength. The encouraging progress made so far providesa solid foundation for meeting the challenges ahead.
We are ahead of our plan and gathering momentum for the further workahead. We are confident that we have the team in place to continue todeliver one of the largest corporate restructurings ever undertaken.
We passed the £100 billion milestonein our journey, reducing third party assetsto £138 billion at year-end.
We continue to target an exit from theAPS within the last two years of theStrategic Plan (2012-13), subject toregulatory approval.
The APS is a key part of the UK government’smeasures to restore stability and confidencein the banking sector. It provides RBS withcredit protection in the unlikely, though stillpossible, event of a severe downturn in theeconomy. RBS Group’s participation in theAPS is managed centrally within theRestructuring & Risk area.
Following the agreement of the terms of the Scheme in December 2009,we have enhanced and widened our training programme for staff andhave restructured our operating procedures to accommodate the
Scheme’s requirements. We continue to work closely with the AssetProtection Agency (APA) with regard to the day-to-day stewardship ofassets covered by the Scheme.
It is our opinion that the APS continues to provide valuable support duringour restructuring, providing additional confidence to the market againstthe backdrop of economic uncertainty. But we continue to target an exitfrom the APS within the last two years of the Strategic Plan (2012-13),subject to regulatory approval.
The amount of assets covered by the scheme has fallen from an initial£282 billion to £195 billion at the end of 2010. We estimate, on the basisof expected future recoveries, the expected loss on triggered assets at31 December 2010 to be approximately £25 billion, equivalent to 42% ofthe £60 billion first loss threshold under the APS. RBS does not currentlyexpect that losses on covered assets will exceed the first loss provisionover the lifetime of its participation in the Scheme.
Asset Protection Scheme (APS)
Rory CullinanHead of Non-Core Division

RBS Group 201042
Sustainability

43RBS Group 2010
Building asustainable RBS‘Sustainability is fundamental to how RBSis changing the way we operate. It is acore part of our thinking and we havemade improvements in this area over thelast year. However, we are mindful thatthere is still a long way to go.’
Philip Hampton, Chairman
At RBS, sustainability means two things. First, weconsider the environmental, social and ethicalconsequences of our activities and then we manageour business appropriately. Secondly, we look tocapitalise on the opportunities for our businesses thatsustainable technologies present.
Our sustainability activities focus on five themes thatwe chose because our stakeholders have told us thatthey are the topics that matter most to them.The themes are:
• Fair banking
• Supporting enterprise
• Employee engagement
• Safety and security
• Citizenship and environmental sustainability
In addition, we have a number of targeted communityprogrammes that enable us to enhance our contributionto society. We aim to invest Group resources tomaximise our impact, creating real and sustainablebenefits in the communities in which we operate.
Sustainability

RBS Group 201044
Sustainability
Sustainability in practice
Stakeholder feedback
We work actively with stakeholders to find outwhat they think about us and how we dobusiness. The table below outlines some of theways we consulted stakeholders in 2010.
Taking sustainability seriously
One of the ways we show the world that we take sustainability
seriously is by embedding it in the way we run the business, from
the highest levels to the responsibilities of individual employees.
Our Senior Independent Director, Sir Sandy Crombie chairs the
Group Sustainability Committee (GSC). Other members of the GSC
include the Chief Executive Officers of a number of our divisions.
The GSC reviews the Group’s overall sustainability strategy, values
and policies.
The Group Sustainability Forum is a network of senior managers
from each division that makes sure we put into practice the priorities
the GSC sets. The executive-led Environment Working Group
monitors environmental developments, commercial opportunities,
operational impacts, and communications and engagement.
The Retail Sustainability Taskforce focuses on the sustainability
issues that most affect our Retail division. The Microfinance
Advisory Board comprises senior members from a range of
stakeholder groups and provides external oversight and support for
microfinance and supporting enterprise programmes across the
Group’s international business.
“To ensure that we are operating as a sustainable business in
every sense of the word, we will have to develop and work to a
set of principles which guide our management on social and
ethical issues.”
Sir Sandy Crombie, Senior Independent Director
Stakeholder group
Customers
Employees
Investors
Industry Forums
Consumer Groups
Non-GovernmentalOrganisations(NGOs)
Types of consultation
We started to change how we gather ourcustomers’ opinions. We launched a new PublicOpinion Survey and we spoke to over 21,000people through surveys. This work, along with theregular feedback we receive from our customers isa key component in how we shape our business.
Our Employee Opinion Survey gathered theviews of over 119,000 employees, a responserate of 81%.
Last year the Group engaged with over 1,200institutional investors. Socially responsibleinvestment continues to grow in importance andlast year we took part in regular meetings withanalysts on this issue, including meetings withour Chairman and senior executives focusedexclusively upon sustainable investment.
The Group is involved in a number of industryforums including both the Equator Principles (EPs)and UN Global Compact (UNGC) which have aspecific focus on sustainability issues. Last yearwe took the lead in one of the EPs working groupsand became Chair of the UK Network of the UNGC.
In 2010, we substantially increased our dialoguewith consumers groups. We met a wide variety ofgroups to discuss a range of issues from debtadvice to our Group Customer Charter.
We regularly consult with NGOs, which in 2010included direct engagement with both ourChairman and the Group Sustainability Committee.
Group Board
GroupSustainabilityCommittee
GroupSustainability
Team
EnvironmentWorking Group
GroupSustainability
Forum
RetailSustainabilityTaskforce
MicrofinanceAdvisory Board

45RBS Group 2010
Sustainability
Our five key themes
Fair bankingWe are committed to treating our customers to the highest of standards,and being transparent about the products and services they can expectfrom us. This theme covers: responsible lending practices, customerservice (including dealing with customer complaints), access to financialservices, and financial education.
Supporting enterpriseOne of our main responsibilities is to provide tailored support to a broadrange of businesses. There are a number of ways that we demonstrateour commitment to enterprises: from lending to small and mediumenterprises (SMEs), to funding microfinance institutions in India, tomaking finance available to social enterprises and facilitating youthenterprise through working with partners
Employee engagementOur employees are the core of our organisation and it is very importantthat we treat them fairly and responsibly. It has been a difficult year forsome of them as we continue to restructure the Group. So it’s vital that aswe build the new RBS we support our people throughout these changesby involving and listening to them as much as possible.
Safety and securityProtecting the security of our customers’ money and data is afundamental responsibility of the Group. We have continued to investheavily in the prevention of financial crime. This theme also includes howwe safeguard the safety, health and wellbeing of our employees.
Citizenship and environmental sustainabilityAs a global organisation we have to manage our broader economic,social and environmental impacts. This includes wider citizenship issuessuch as business and human rights and bribery and corruption as wellas environmental concerns. We fully support the transition to the moresustainable use of natural resources.
How others have judged usEvery year independent, external bodies judge our performance andcompare us with our peers.
We received the AA1000 (2008) reporting and assurance accreditation forour 2008 and 2009 annual Sustainability Reports. We were also short-listedfor the ICSA/Hermes award for best sustainability and stakeholderdisclosure for the Sustainability Report 2009.
We have participated in the Carbon Disclosure Project since its inceptionand in 2010 received the joint highest score for financial servicesglobally, scoring 93 and an ‘A’ rating for performance, a significantimprovement since 2009. We were also included in the Dow JonesSustainability Index for the third year running, scoring 75%, and in theFTSE4Good index.
Newsweek magazine placed us 27th in their recent ‘Green Rankings’where three environmental research organisations ranked the world’s100 biggest listed companies across a number of environmental issues.
Our community programmes
We recognise our responsibility to play an active role in the communitieswe serve. This begins with providing the services our customers want,and operating in a sustainable way. We then go further through ourcommunity programmes, which allow us to make more of a differencein areas that we can have an impact. Our efforts centre on ourMoneySense, Supporting Enterprise, and Employee and CommunityEngagement programmes.
MoneySenseThe aim of our MoneySense programme is to increase financialeducation, capability and inclusion, which is part of our widercommitment to Fair Banking.
We continued to invest in our Group MoneySense programmes in 2010.We improved and expanded our MoneySense for Schools programmesby developing new online resources, holding teacher training days andcompleting the 3rd annual MoneySense Panel Research. This researchrevealed the attitudes towards money of over 10,000 12-19 year olds.The 2nd annual RBS Personal Finance Education Awards for Schoolsrecognised the 2010 achievements of primary and secondary schools.
Ulster Bank extends MoneySense
Building on its commitment to widenaccess to financial education, UlsterBank launched its own MoneySense forSingle Parents Guide in 2010. This wasproduced with OPEN in the Republic ofIreland and Gingerbread in NorthernIreland. This is the first in a set offinancial ‘life guides’ designed to givemore practical support based onpeople’s specific circumstances.
RBS Group 201046
Sustainability continued
We introduced a new magazine called Pocket Money for families, reachingan audience of over 600,000 people in the UK. New Business Start-UpGuides were launched on NatWest.com, and our MoneySense bookletsfor adults were revised and written in plain English as part of the UKCustomer Charter commitment to make banking easier.
Over the last three years our funding to Macmillan cancer support helpedthem to expand their benefits helpline by 50%. In 2010, three new face toface Macmillan advice services were launched. Together this helped9,500 people unlock over £20 million of funds to help with the impact oftheir cancer diagnosis. At the end of 2010, the RBS Group agreed to fundMacmillan for a further three years to increase delivery of face-to-facemoney guidance for people living with cancer across the UK.
The Group continued to assist our key partners. We remain to be one ofthe largest corporate sponsors of the Money Advice Trust and in 2010provided funding for key projects or areas of research to Mind, RNIB,Gingerbread, Transact, Toynbee Hall, and Citizen’s Advice. We willcontinue to work with the charities in 2011 to fund projects which willimprove access to information, increase the number of quality financialeducation and training resources available, and meet the specific needsfor the members of each charity organisation.
Our Ulster Bank MoneySense for Schools programme was launched in2007 and is already the largest financial education programme forsecondary schools in Northern Ireland and Ireland, with 380 volunteersfrom Ulster Bank. The Youthbank programme run by Ulster Bank alsohelps to develop a range of skills in young people by distributing grantsfor youth-led projects in their communities.
The Community Reinvestment Act in the US encourages banks to lend tolow and moderate income communities. In 2010, Citizens and Charter Oneprovided more than 275 financial literacy programmes, educating over13,000 people. Citizens has also partnered with the Federal DepositInsurance Corporation to provide Money Smart Training, helping peopleoutside the financial mainstream enhance their money skills and createpositive banking relationships. Citizens’ ‘Gear for Grades’ programmeprovides school supplies for children whose families cannot afford them.Since its inception in 2003, ‘Gear for Grades’ has served over 150,000school children.
Supporting enterpriseOur Supporting enterprise programme works with partners to supportpotential business start-ups and helps to build the capability ofalternative means of finance and support for would-be entrepreneurswho would not normally qualify for direct support from banks.
We have a long standing relationship with The Prince’s Trust. We arethe largest corporate sponsor of The Prince’s Trust EnterpriseProgramme, which helped nearly 5,000 young people in 2010. Weare proud sponsors of their new practical guide to starting up yourown business. This book condenses the years of expertise The Prince’sTrust has gained when helping young people in business and includesreal life stories of success and advice from business leaders. This isjust one of the ways we have supported them through our corporatepartnership. We also provide support for The Prince’s Scottish YouthBusiness Trust.
smallbusinesscan provides guidance and support to help smallbusinesses in the UK and Ireland and is supported by Ulster Bank.
This programme provides simple and practical tools to help smallbusinesses gain insights and build a network of trusted contacts,enabling start ups to progress and promote growth.
In 2010, we launched a partnership with the British Academy of Film andTelevision Arts (BAFTA) and its Youth Mentoring Programme, deliveredin conjunction with Media Trust. In this programme, BAFTA members,award-winners and leading practitioners volunteer as mentors todisadvantaged young people on media projects, enhancing theirknowledge, skills and personal development to give them newopportunities in life.
We also sponsor Youth Business International projects in Russia,Hong Kong and France that provide opportunities for would-be youngentrepreneurs in those countries.
Our microfinance programme in India goes further than simply lendingto Microfinance Institutions (MFIs). We have also invested in 'technicalassistance' to create and sustain robust, creditworthy MFIs inunderserved regions. This programme has supported 37 MFIs,facilitating access to finance for over 200,000 households. Also in India,our Livelihood projects improve communities' income generating abilitiesthrough a range of interventions including training, investment andmarket linkages. We currently have 17 Livelihood projects across 14states, reaching over 63,000 households.
2010 also saw the launch of the RBS SE100 Index, a unique report thatprovides information on the growth and impact of the top 100 socialenterprises in the UK. This will play a vital role in promoting the successand diversity of this sector.
Employee and community engagementOur Employee and community engagement programme supports thegreat work that our employees already do in their communities andencourages further involvement to strengthen our support for thecommunities we live in.
As part of our UK Customer Charter we launched the Community Fundin 2010, a way of putting real benefit back into the communities, at thechoice of our customers. To date £1.8 million has been given to charitieschosen by our customers and employees from their local branch and7,547 days off have been given to branch staff to help support thecauses important to them.
Our volunteering programme provides a range of team activities thatour employees can take part in during work time. We run the activitiesthrough nine charities so that our employees can deliver the skills,services or fundraising that they need. This year 4,100 employeesengaged in 225 activities.
Our Global Banking and Markets division launched a new, bespokevolunteering programme across all of its businesses, targeting fourareas where it hopes to have a lasting impact on the lives of childrenand young people: education, health, social welfare and enterprise andemployability. In 2010, over 1,000 employees volunteered their time insupport of this programme.
In 2010, the Citizens Charitable Foundation invested more than $14million in charitable grants to more than 1,000 non-profit organisationsacross 12 states.

47RBS Group 2010
Sustainability
The Prince’s Trust
We sponsored the launch of The Prince’sTrust’s first start-up guide book – Make ItHappen. Years of expertise and knowledgehave been distilled into this highly practicalbook, designed to get young entrepreneursstarted. Our sponsorship will ensure thatThe Trust will be able to give a free copy toevery young person they start up in businessfor the next three years, around 6,000copies in total.
Highlights of how we focus action across our businesses
Productsand services
Corporatepartnerships
Employeecontribution
Operations andsupply chain
Fair banking
The Group Customer Charter setout 14 clear commitments to ourUK retail customers in 2010.Within these, we set ourselves 25specific and stretching goals andwe achieved 20 of these outrightin the first 6 months.
The Citizens CollegeSaveraccount rewards customers whosave money for a child with a$1,000 bonus plus the accruedinterest when the child turns 18.The enrolment age was extendedfrom 6 to 12 years in 2010.
We work with a range ofCommunity Development FinanceInstitutions and Credit Unions aspart of the Trusted Partnerprogramme.
We worked with the NationalHousing Federation to launch anew affordable credit providerpilot, My Home Finance (MHF) in2010. MHF provides loans to thefinancially excluded.
In 2010, 774 employees helpedto deliver our MoneySenseprogramme throughout the UKby devoting their time to givelessons in schools.
We use a number of third-partyorganisations to assist with creditchecking, helping to ensure thatwe lend responsibly.
Supporting enterprise
RBS supports the BusinessFinance Taskforce and itsmeasures to increase investment,provide more business mentorsand introduce new lendingprinciples for SMEs.
Our Technical Assistanceprogramme in India facilitatedwork with 37 MFIs across 13states in India, increasing thereach of microfinance to morethan 100,000 additional poorfamilies.
In order to be able to supporta wide selection of differentbusiness clients, we work withpartners to bridge the gap infunding for organisations such associal enterprises and charities.
We support youth enterprisethrough sponsoring the Prince’sTrust Enterprise Programme, thePrince’s Scottish Youth BusinessTrust and Youth BusinessInternational in Hong Kong,France and Russia.
In 2010, 380 employeesvolunteered for The Prince’s Trust,raising a total of over £250,000.
Through our supply chain wespend nearly £8.5 billion eachyear on goods and services,of which £6.2 billion is spent inthe UK.
Employee engagement
We provide a suite of competitiveemployment policies, training anddevelopment opportunities and abespoke benefits package andprovide support when it is neededthrough our Employee Assistanceprogramme.
We measure engagement throughour employee opinion survey andtake action in response toemployee feedback.
We have nine charity partners:BTCV, Prince's Trust, Oxfam,Barnardo’s, Fairbridge, MarieCurie, Macmillan, Help theHospices and Cancer Research inthe UK.
We work with partners thatsupport our Diversity & Inclusionprogramme including Stonewall,Employers Forums on Belief; Age;and Disability, Opportunity Now,Working Families and Race forOpportunity in the UK and AsiaNetwork (DIAN).
Our Group Employee Volunteeringprogramme engaged 39,500employees in 2010 who weregiven over 24,000 days off tomake a contribution to the causessupported by our nine charitypartners.
We aim to extend our employeeengagement activities as far aspossible to temporary employeesand contractors working in ourorganisation.
Safety and security
Our free online data protectionsoftware, Rapport, currentlyprotects 4.6 million onlinecustomers from fraud.
Customers have access toservices such as SMS text alertsto inform them of any activity ontheir accounts, or when there hasbeen fraudulent activity.
The Security and Risk team workclosely with authorities to shareinformation and help preventfinancial crime. This includes afocused intelligence sharingpartnership with GreaterManchester Police, UK.
During 2010 we developed aglobal occupation healthprogramme in partnership withInternational SOS to review theoccupational health serviceprovision across our internationalbusiness.
A number of employees getinvolved in Safety, Health andWellbeing programmes.
Every year we review oursuppliers to ensure that theappropriate controls are in placeto ensure customer information isprotected.
Citizenship and environmentalsustainability
Since 2006, we have providedmore finance to wind powerprojects than any other type ofenergy project.
Our Business MentorEnvironmental scheme continuesto provide expert environmentaladvice to customers who need it,24/7.
BTCV is an environmental charityand one of our nine charitypartners that providesvolunteering opportunities foremployees to get involved in.
We are actively involved in themanagement of the UnitedNations Global Compact andEquator Principles initiatives.
We are sponsoring Climate weekin the UK, a national awarenessraising campaign.
We have over 600 environmentalchampions in the Group helpingto engage colleagues and makea difference to our carbonfootprint at a local level.
Our ethical code for supplierssets out our commitments toworking with openness andintegrity, which we also expectfrom out suppliers.
The Group Community Cashback scheme allows employees to claimcash for the charities they support by volunteering or fundraising in theirown time. In 2010, 4,300 awards totalling £1.2 million were given to over2,500 charities. We continue to match donations our employees make tocharity via their salary, and this year we supported over 3,000 charitiesdirectly in this way.
We also launched a new recognition scheme in 2010 for our employees –Community Stars. We give £65,500 per year to support the fantastic workemployees do for the causes they are passionate about and to recognise
that they are great ambassadors for the Group. Citizens’ Colleaguesin Action also recognises community involvement and provides theopportunity for colleagues to take a three month sabbatical to serveas a volunteer on a longer-term project.
Overall, more than 39,500 employees gave their skills, time and moneyto make a difference in the communities that we operate in. The Groupsupported those efforts financially and by giving employees almost170,000 hours off work to volunteer.
RBS Group 201048
Report and accounts
50 Presentation of information
52 Forward-looking statements
53 Description of business
54 Competition
55 Risk factors
56 Key financials
57 Summary consolidated income statement
62 Analysis of results
77 Divisional performance
106 Consolidated balance sheet
111 Cash flow
112 Capital resources
113 Reconciliations of pro forma to statutoryincome statements and balance sheets
119 Risk and balance sheet management
119 – Introduction
126 Balance sheet management
126 – Capital
134 – Funding and liquidity risk
143 – Interest rate risk
144 – Structural foreign currency exposures
145 – Equity risk
146 Risk management
146 – Credit risk
193 – Market risk
199 – Insurance risk
199 – Operational risk
202 – Regulatory risk
203 – Reputation risk
203 – Pension risk
204 – Other risk exposures
221 Asset Protection Scheme
49RBS Group 2010
Business review
In the Report and Accounts, and unless specified otherwise, the term ‘company’ or ‘RBSG’ means The Royal Bank of Scotland Group plc, ‘RBS’, ‘RBS Group’ or the ‘Group’ means the company and its subsidiaries, ‘the Royal Bank’ means The Royal Bank of Scotland plc and ‘NatWest’ means National Westminster Bank Plc. The company publishes its financial statements in pounds sterling (‘£’ or ‘sterling’). The abbreviations ‘£m’ and ‘£bn’ represent millions and thousands of millions of pounds sterling, respectively, and references to ‘pence’ represent pence in the United Kingdom (‘UK’). Reference to ‘dollars’ or ‘$’ are to United States of America (‘US’) dollars. The abbreviations ‘$m’ and ‘$bn’ represent millions and thousands of millions of dollars, respectively, and references to ‘cents’ represent cents in the US. The abbreviation ‘€’ represents the ‘euro’, the European single currency, and the abbreviations ‘€m’ and ‘€bn’ represent millions and thousands of millions of euros, respectively. Certain information in this report is presented separately for domestic and foreign activities. Domestic activities primarily consist of the UK domestic transactions of the Group. Foreign activities comprise the Group's transactions conducted through those offices in the UK specifically organised to service international banking transactions and transactions conducted through offices outside the UK. The geographic analysis in the Business Review, including the average balance sheet and interest rates, changes in net interest income and average interest rates, yields, spreads and margins in this report have been compiled on the basis of location of office - UK and overseas. Management believes that this presentation provides more useful information on the Group's yields, spreads and margins of the Group's activities than would be provided by presentation on the basis of the domestic and foreign activities analysis used elsewhere in this report as it more closely reflects the basis on which the Group is managed. ‘UK’ in this context includes domestic transactions and transactions conducted through the offices in the UK which service international banking transactions. The results, assets and liabilities of individual business units are classified as trading or non-trading based on their predominant activity. Although this method may result in some non-trading activity being classified as trading, and vice versa, the Group believes that any resulting misclassification is not material.
International Financial Reporting Standards As required by the Companies Act 2006 and Article 4 of the European Union IAS Regulation, the consolidated financial statements of the Group are prepared in accordance with International Financial Reporting Standards issued by the International Accounting Standards Board (IASB) and interpretations issued by the International Financial Reporting Interpretations Committee of the IASB (together ‘IFRS’) as adopted by the European Union. They also comply with IFRS as issued by the IASB. RBS Holdings N.V. (formerly ABN AMRO Holding N.V.) In 2007, RFS Holdings B.V., which was jointly owned by RBSG, the Dutch State (successor to Fortis) and Santander (the “Consortium Members”) completed the acquisition of ABN AMRO Holding N.V.. RFS Holdings B.V. has now substantially completed the separation of the business units of ABN AMRO Holding N.V.. As part of this reorganisation, on 6 February 2010, the businesses of ABN AMRO Holding N.V. acquired by the Dutch State were legally demerged from those acquired by the Group and were transferred into a newly established company, ABN AMRO Bank N.V. (save for certain assets and liabilities acquired by the Dutch State that were not part of the legal separation and which will be transferred to the Dutch State as soon as possible). Legal separation of ABN AMRO Bank N.V. occurred on 1 April 2010, with the shares in that entity being transferred by ABN AMRO Holding N.V (renamed RBS Holdings N.V. at legal separation) to a holding company called ABN AMRO Group N.V., which is owned by the Dutch State. Following legal separation, RBS Holdings N.V. has one direct subsidiary, The Royal Bank of Scotland N.V. (RBS N.V.), a fully operational bank within the Group. RBS N.V. is independently rated and regulated by the Dutch Central Bank. Certain assets within RBS N.V. continue to be shared by the Consortium Members.
RBS Group 201050
Presentation of information

Pro forma results The pro forma financial information shows the underlying performance of the Group including the results of the ABN AMRO businesses retained by the Group. This information is prepared using the Group’s accounting policies and is being provided to give a better understanding of the results of RBS operations excluding the results attributable to the other Consortium Members. In future periods, there will be no significant differences between pro forma and statutory results other than presentation aspects discussed below. Consistent with the manner in which the Group is managed, Group operating profit on a pro forma basis excludes:
amortisation of purchased intangible assets;
integration and restructuring costs;
gain on redemption of own debt;
strategic disposals;
bonus tax;
Asset Protection Scheme credit default swap - fair value changes;
gains on pensions curtailment;
write-down of goodwill and other intangible assets; and
other Consortium Members’ interest in shared assets.
Statutory results The statutory results of the Group include the results and financial position of RFS Holdings, the entity that acquired ABN AMRO (see page 50). The interests of the State of the Netherlands and Santander are included in non-controlling interests. Reconciliations between pro forma and statutory results are detailed on pages 113 to 118. Comparative information Following legal separation of ABN AMRO Bank NV, the results of ABN AMRO attributable to the Consortium Members are classified as discontinued operations, with consequent changes to the presentation of comparative financial information. Glossary A glossary of terms is detailed on pages 434 to 439.
51RBS Group 2010
Business review
Certain sections in this document contain ‘forward-looking statements’ as that term is defined in the United States Private Securities Litigation Reform Act of 1995, such as statements that include the words ‘expect’, ‘estimate’, ‘project’, ‘anticipate’, ‘believes’, ‘should’, ‘intend’, ‘plan’, ‘could’, ‘probability’, ‘risk’, ‘Value-at-Risk (VaR)’, ‘target’, ‘goal’, ‘objective’, ‘will’, ‘endeavour’, ‘outlook’, ‘optimistic’, ‘prospects’ and similar expressions or variations on such expressions. In particular, this document includes forward-looking statements relating, but not limited to: the Group’s restructuring plans, capitalisation, portfolios, net interest margin, capital ratios, liquidity, risk-weighted assets, return on equity (ROE), cost:income ratios, leverage and loan:deposit ratios, funding and risk profile; the Group’s future financial performance; the level and extent of future impairments and write-downs; the protection provided by the Asset Protection Scheme (APS); and the Group’s potential exposures to various types of market risks, such as interest rate risk, foreign exchange rate risk and commodity and equity price risk. These statements are based on current plans, estimates and projections, and are subject to inherent risks, uncertainties and other factors which could cause actual results to differ materially from the future results expressed or implied by such forward-looking statements. For example, certain of the market risk disclosures are dependent on choices about key model characteristics and assumptions and are subject to various limitations. By their nature, certain of the market risk disclosures are only estimates and, as a result, actual future gains and losses could differ materially from those that have been estimated. Other factors that could cause actual results to differ materially from those estimated by the forward-looking statements contained in this document include, but are not limited to: the full nationalisation of the Group or other resolution procedures under the Banking Act 2009; the global economy and instability in the global financial markets, and their impact on the financial industry in general and on the Group in particular; the financial stability of other financial institutions, and the Group’s counterparties and borrowers; the ability to complete restructurings on a timely basis, or at all, including the disposal of certain Non-Core assets and assets and businesses required as part of the EC State Aid restructuring plan; organisational restructuring; the ability to access sufficient funding to meet liquidity needs; the extent of future write-downs and impairment charges caused by depressed asset valuations; the inability to hedge certain risks economically; costs or exposures borne by the Group arising out of the origination or sale of mortgages or mortgage-backed securities in the United States; the value and effectiveness of any
credit protection purchased by the Group; unanticipated turbulence in interest rates, yield curves, foreign currency exchange rates, credit spreads, bond prices, commodity prices, equity prices and basis, volatility and correlation risks; changes in the credit ratings of the Group; ineffective management of capital or changes to capital adequacy or liquidity requirements; changes to the valuation of financial instruments recorded at fair value; competition and consolidation in the banking sector; HM Treasury exercising influence over the operations of the Group; the ability of the Group to attract or retain senior management or other key employees; regulatory or legal changes (including those requiring any restructuring of the Group’s operations) in the United Kingdom, the United States and other countries in which the Group operates or a change in United Kingdom Government policy; changes to regulatory requirements relating to capital and liquidity; changes to the monetary and interest rate policies of the Bank of England, the Board of Governors of the Federal Reserve System and other G7 central banks; impairments of goodwill; pension fund shortfalls; litigation and regulatory investigations; general operational risks; insurance claims; reputational risk; general geopolitical and economic conditions in the UK and in other countries in which the Group has significant business activities or investments, including the United States; the ability to achieve revenue benefits and cost savings from the integration of certain of RBS Holdings N.V.’s (formerly ABN AMRO Holding N.V.) businesses and assets; changes in UK and foreign laws, regulations, accounting standards and taxes, including changes in regulatory capital regulations and liquidity requirements; the participation of the Group in the APS and the effect of the APS on the Group’s financial and capital position; the ability to access the contingent capital arrangements with HM Treasury; the conversion of the B shares in accordance with their terms; limitations on, or additional requirements imposed on, the Group’s activities as a result of HM Treasury’s investment in the Group; and the success of the Group in managing the risks involved in the foregoing. The forward-looking statements contained in this document speak only as of the date of this announcement, and the Group does not undertake to update any forward-looking statement to reflect events or circumstances after the date hereof or to reflect the occurrence of unanticipated events. The information, statements and opinions contained in this document do not constitute a public offer under any applicable legislation or an offer to sell or solicitation of any offer to buy any securities or financial instruments or any advice or recommendation with respect to such securities or other financial instruments.
RBS Group 201052
Forward-looking statements
Description of business Introduction The Royal Bank of Scotland Group plc is the holding company of a large global banking and financial services group. Headquartered in Edinburgh, the Group operates in the United Kingdom, the United States and internationally through its two principal subsidiaries, the Royal Bank and NatWest. Both the Royal Bank and NatWest are major UK clearing banks whose origins go back over 275 years. In the United States, the Group's subsidiary Citizens is a large commercial banking organisation. Globally, the Group has a diversified customer base and provides a wide range of products and services to personal, commercial and large corporate and institutional customers in over 50 countries. Following placing and open offers in December 2008 and in April 2009, HM Treasury owned approximately 70.3% of the enlarged ordinary share capital of the company. In December 2009, the company issued a further £25.5 billion of new capital to HM Treasury. This new capital took the form of B shares, which do not generally carry voting rights at general meetings of ordinary shareholders but are convertible into ordinary shares and qualify as core tier one capital. Following the issuance of the B shares, HM Treasury's holding of ordinary shares of the company remained at 70.3% although its economic interest rose to 84.4%. During the year, the company converted non-cumulative convertible preference shares into ordinary shares in the company. As a result, HM Treasury’s holding in the company’s ordinary shares reduced to 67.8% and its economic interest reduced to 82.8%. The Group had total assets of £1,453.6 billion and owners' equity of £75.1 billion at 31 December 2010. The Group's capital ratios, were a Total capital ratio of 14.0 per cent, a Core Tier 1 capital ratio of 10.7 per cent and a Tier 1 capital ratio of 12.9 per cent, at 31 December 2010. Organisational structure and business overview The Group’s activities are organised on a divisional basis as follows: UK Retail offers a comprehensive range of banking products and related financial services to the personal market. It serves customers through the RBS and NatWest networks of branches and ATMs in the United Kingdom, and also through telephone and internet channels. UK Retail launched the Retail Customer Charter in June 2010 and progress against the commitments made will be formally reported in March 2011. UK Corporate is a leading provider of banking, finance, and risk management services to the corporate and SME sector in the United Kingdom. It offers a full range of banking products and related financial services through a nationwide network of relationship managers, and also through telephone and internet channels. The product range includes asset finance through the Lombard brand.
Wealth provides private banking and investment services in the UK through Coutts & Co and Adam & Company, offshore banking through RBS International, NatWest Offshore and Isle of Man Bank, and international private banking through RBS Coutts. Global Transaction Services (GTS) ranks among the top five global transaction services providers, offering global payments, cash and liquidity management, and trade finance and commercial card products and services. It includes the Group's corporate money transmission activities in the United Kingdom and the United States. Ulster Bank is the leading retail and business bank in Northern Ireland and the third largest banking group on the island of Ireland. It provides a comprehensive range of financial services. The Retail Markets division which has a network of 236 branches, operates in the personal and financial planning sectors. The Corporate Markets division provides services to SME business customers, corporates and institutional markets. US Retail & Commercial provides financial services primarily through the Citizens and Charter One brands. US Retail & Commercial is engaged in retail and corporate banking activities through its branch network in 12 states in the United States and through non-branch offices in other states. The divisions discussed above are collectively referred to as Retail & Commercial. Global Banking & Markets (GBM) is a leading banking partner to major corporations and financial institutions around the world, providing an extensive range of debt and equity financing, risk management and investment services to its customers. The division is organised along six principal business lines: money markets; rates flow trading; currencies and commodities; equities; credit and mortgage markets and portfolio management & origination. RBS Insurance provides a wide range of general insurance products to consumers through a number of well known brands including; Direct Line, Churchill and Privilege. It also provides insurance services for third party brands through its UKI Partnerships division. In the commercial sector, its NIG and Direct Line for Business operations provide insurance products for businesses via brokers or direct respectively. Through its international division, RBS Insurance sells general insurance, mainly motor, in Germany and Italy. In addition to insurance services, RBS Insurance continues to provide support and reassurance to millions of UK motorists through its Green Flag breakdown recovery service and Tracker stolen vehicle recovery and telematics business.
53RBS Group 2010
Business reviewBusiness review
Central Functions comprises Group and corporate functions, such as treasury, funding and finance, risk management, legal, communications and human resources. The Centre manages the Group's capital resources and Group-wide regulatory projects and provides services to the operating divisions. Non-Core Division manages separately assets that the Group intends to run off or dispose of. The division contains a range of businesses and asset portfolios primarily from the GBM division, linked to proprietary trading, higher risk profile asset portfolios including excess risk concentrations, and other illiquid portfolios. It also includes a number of other portfolios and businesses including regional markets businesses that the Group has concluded are no longer strategic. Business Services supports the customer-facing businesses and provides operational technology, customer support in telephony, account management, lending and money transmission, global purchasing, property and other services. Business Services drives efficiencies and supports income growth across multiple brands and channels by using a single, scalable platform and common processes wherever possible. It also leverages the Group's purchasing power and is the Group's centre of excellence for managing large-scale and complex change. For reporting purposes, Business Services costs are allocated to the divisions above. It is not deemed a reportable segment. Business divestments To comply with EC State Aid requirements the Group has agreed a series of restructuring measures to be implemented over a four year period from December 2009. This will supplement the measures in the strategic plan previously announced by the Group. These include divesting RBS Insurance, 80.01% of Global Merchant Services and substantially all of RBS Sempra Commodities JV business, as well as divesting the RBS branch-based business in England and Wales and the NatWest branches in Scotland, along with the Direct SME customers across the UK. Competition The Group faces strong competition in all the markets it serves. Banks’ balance sheets have strengthened whilst loan demand has been subdued as many customers have sought to de-lever and the UK economy has proved slow to recover. Competition for retail deposits remains intense as institutions continue to target strong and diverse funding platforms for their balance sheets. Competition for corporate and institutional customers in the UK is from UK banks and from large foreign financial institutions who are also active and offer combined investment and commercial banking capabilities. In asset finance, the Group competes with banks and specialised asset finance providers, both captive and non-captive. In European and Asian corporate and institutional banking markets the Group competes with the large domestic banks active in these markets and with the major international banks.
In the small business banking market, the Group competes with other UK clearing banks, specialist finance providers and building societies. In the personal banking segment, the Group competes with UK clearing banks and building societies, major retailers and life assurance companies. In the mortgage market, the Group competes with UK clearing banks and building societies. The ambitions of non-traditional players in the UK market remain strong with retailers and new entrants forming aggressive expansion plans. The Group's life assurance businesses compete with Independent Financial Advisers and life assurance companies. In the UK credit card market large retailers and specialist card issuers, including major US operators are active in addition to the UK banks. In addition to physical distribution channels, providers compete through direct marketing activity and the internet. In Wealth Management, The Royal Bank of Scotland International competes with other UK and international banks to offer offshore banking services. Coutts and Adam & Company compete as private banks with UK clearing and private banks, and with international private banks. Competition in wealth management remains strong as banks maintain their focus on competing for affluent and high net worth customers. RBS Insurance competes in personal lines insurance and, to a more limited extent, in commercial insurance. There is strong competition from a range of insurance companies which now operate telephone and internet direct sales businesses. Competition in the UK motor market remains intense, and price comparison internet sites now play a major role in the marketplace. These sites are now extending their scope to home insurance and other lines. RBS Insurance also competes with local insurance companies in the direct motor insurance markets in Italy and Germany. In Ireland, Ulster Bank competes in retail and commercial banking with the major Irish banks and building societies, and with other UK and international banks and building societies active in the market. The challenging conditions in the Irish economy persist and many of the domestic Irish banks have required State support and are engaged in significant restructuring actions. In the United States, Citizens competes in the New England, Mid-Atlantic and Mid-West retail and mid-corporate banking markets with local and regional banks and other financial institutions. The Group also competes in the US in large corporate lending and specialised finance markets, and in fixed-income trading and sales. Competition is principally with the large US commercial and investment banks and international banks active in the US. The economic recovery in the US is proving weaker than expected and loan demand is weak in Citizens’ markets which in turn has dampened the level of competitive pressure in the deposit markets as funding pressures have eased.
RBS Group 201054
Business review continued
Risk factors Set out below is a summary of certain risks which could adversely affect the Group. These should not be regarded as a complete and comprehensive statement of all potential risks and uncertainties. A fuller description of these and other risk factors is included on pages 405 to 422.
RBSG or any of its UK bank subsidiaries may face the risk of full nationalisation or other resolution procedures and various actions could be taken by or on behalf of the UK Government, including actions in relation to any securities issued, new or existing contractual arrangements and transfers of part or all of RBSG’s businesses.
The Group’s ability to implement its strategic plan depends on the success of its efforts to refocus on its core strengths and its balance sheet reduction programme. As part of the Group’s strategic plan and implementation of the State Aid restructuring plan agreed with the EC and HM Treasury, the Group is undertaking an extensive restructuring which may adversely affect the Group’s business, results of operations and financial condition and give rise to increased operational risk and may impair the Group’s ability to raise new Tier 1 capital due to restrictions on its ability to make discretionary dividend or coupon payments on certain securities.
The Group’s businesses, earnings and financial condition have been and will continue to be affected by geopolitical conditions, the global economy, the instability in the global financial markets and increased competition. These have resulted in significant changes in market conditions including interest rates, foreign exchange rates, credit spreads, and other market factors and consequent changes in asset valuations.
The Group requires access to sources of liquidity, which have been constrained in recent years, and a failure to access liquidity due to market conditions or otherwise could adversely affect the Group’s financial condition. In addition, the Group’s borrowing costs and its access to the debt capital markets and other sources of liquidity depend significantly on its and the UK Government’s credit ratings.
The actual or perceived failure or worsening credit of the Group’s counterparties (including monolines or other credit insurers) or borrowers and depressed asset valuations resulting from poor market conditions have adversely affected and could continue to adversely affect the Group.
The value of certain financial instruments recorded at fair value is determined using financial models incorporating assumptions, judgements and estimates that may change over time or may ultimately not turn out to be accurate.
The Group’s insurance businesses are subject to inherent risks involving claims on insured events.
The Group’s business performance, financial condition and capital and liquidity ratios could be adversely affected if its capital is not managed effectively or as a result of changes to capital adequacy and liquidity requirements, including those arising out of Basel III implementation (globally or by UK authorities), or if the Group is unable to issue Contingent B Shares to HM Treasury under certain circumstances.
The Group could fail to attract or retain senior management, which may include members of the Board, or other key employees, and it may suffer if it does not maintain good employee relations.
Any significant developments in regulatory or tax legislation could have an effect on how the Group conducts its business and on its results of operations and financial condition, and the recoverability of certain deferred tax assets recognised by the Group is subject to uncertainty.
The Group is subject to substantial regulation and oversight, and any significant regulatory or legal developments could have an adverse effect on how the Group conducts its business and on its results of operations and financial condition. In addition, the Group is and may be subject to litigation and regulatory investigations that may impact its business, results of operations and financial condition.
Operational and reputational risks are inherent in the Group’s operations.
The Group may be required to make contributions to its pension schemes and government compensation schemes, either of which may have an adverse impact on the Group’s results of operations, cash flow and financial condition.
As a result of the UK Government’s majority shareholding in the Group they can, and in the future may decide, to exercise a significant degree of influence over the Group including suspending dividends and certain coupon payments, modifying or cancelling contracts or limiting the Group’s operations. The offer or sale by the UK Government of all or a portion of its shareholding in the company could affect the market price of the equity shares and other securities and acquisitions of ordinary shares by the UK Government (including through conversions of other securities or further purchases of shares) may result in the delisting of the Group from the Official List.
The Group’s participation in the APS is costly and complex and may not produce the benefits expected and the occurrence of associated risks may have a material adverse impact on the Group’s business, capital or tax position, financial condition and results of operations. Any changes to the regulatory treatment of the APS may negatively impact the Group’s capital position and any withdrawal from, or termination of, the APS will be costly.
55RBS Group 2010
Business review
Key financials Pro forma Statutory for the year ended 31 December
2010 £m
2009 £m
2008 £m
2010 £m
2009 £m
2008 £m
Total income (1) 32,662 29,567 19,367 31,868 33,026 20,730 Operating profit/(loss) before impairment losses and fair value of own debt (2) 11,169 7,809 (738) 8,857 11,252 (18,252)Loss before tax (3) (239) (1,928) (8,296) (399) (2,647) (25,691)Loss attributable to ordinary and B shareholders (1,125) (3,607) (24,306) (1,125) (3,607) (24,306)Cost:income ratio (4) 60% 69% 105% 57% 53% 169% Basic loss per ordinary and B share from continuing operations (pence) (0.5p) (6.3p) (146.2p) (0.5p) (6.3p) (146.2p)Adjusted earnings/(loss) per ordinary and B share (pence) (5) 0.6p (13.2p) (43.1p) — — —
Pro forma Statutory at 31 December
2010 £m
2009 £m
2008 £m
2010 £m
2009 £m
2008 £m
Total assets 1,452,634 1,522,481 2,218,693 1,453,576 1,696,486 2,401,652 Funded balance sheet (6) 1,025,557 1,084,282 1,227,198 1,026,499 1,255,032 1,409,093 Loans and advances to customers 555,260 595,694 731,265 555,260 728,393 874,722 Deposits 609,370 636,252 781,070 609,483 756,346 897,556 Owners' equity 75,132 77,736 58,879 75,132 77,736 58,879 Risk asset ratio - Core Tier 1 10.7% 11.0% 5.9% 10.7% 11.0% 6.6% - Tier 1 12.9% 14.4% 9.9% 12.9% 14.1% 10.0% - Total 14.0% 16.3% 14.2% 14.0% 16.1% 14.1%
Notes: (1) Pro forma total income excludes changes in fair value of own debt, gain on redemption of own debt, strategic disposals and Asset Protection Scheme credit default swap - fair value changes. In the
statutory consolidated income statement, these items are included in total income. (2) Pro forma operating profit/(loss) excludes amortisation of purchased intangible assets, integration and restructuring costs, gain on redemption of own debt, strategic disposals, bonus tax, gains on
pensions curtailment, Asset Protection Scheme credit default swap - fair value changes and write-down of goodwill and other intangible assets. On a statutory basis, fair value of own debt is included in total income.
(3) Pro forma loss before tax excludes write-down of goodwill and other intangible assets. (4) Pro forma cost:income ratio represents operating expenses excluding amortisation of purchased intangibles, write-down of goodwill and other intangible assets, bonus tax and gains on pensions
curtailment expressed as a percentage of total income excluding fair value of own debt, gain on redemption of own debt, strategic disposals, Asset Protection Scheme credit default swap - fair value changes and after netting insurance claims.
(5) Adjusted loss per ordinary and B share is based on earnings from continuing operations adjusted for fair value of own debt, purchased intangibles amortisation, integration and restructuring costs, gain on redemption of own debt, strategic disposals, gains on pensions curtailment, bonus tax, write-down of goodwill and other intangible assets and Asset Protection Scheme credit default swap - fair value changes.
(6) Funded balance sheet represents total assets less derivatives.
Overview of results The results of RFS Holdings B.V., the entity that acquired ABN AMRO, are fully consolidated in the Group’s financial statements. The interests of the State of the Netherlands and Santander in RFS Holdings are included in non-controlling interests. Legal separation of ABN AMRO Bank N.V. took place on 1 April 2010. As a result, RBS presents the interests of its Consortium Members in ABN AMRO as discontinued operations and has re-presented prior periods accordingly.
Pro forma results have been prepared to include only those business units of RBS N.V. that will be retained by RBS and to reclassify certain non-operating items. The basis of preparation of the pro forma results is detailed on page 51.
RBS Group 201056
Business review continued

Summary consolidated income statement for the year ended 31 December 2010 In the pro forma income statement set out below, fair value of own debt, amortisation of purchased intangible assets, integration and restructuring costs, gain on redemption of own debt, strategic disposals, bonus tax,
gains on pensions curtailment, Asset Protection Scheme credit default swap - fair value changes and write-down of goodwill and other intangible assets are shown separately. In the statutory consolidated income statement set out below and on page 268, these items are included in non-interest income and operating expenses, as appropriate.
Pro forma Statutory
2010 2009 2008 2010 2009 2008 £m £m £m £m £m £m
Net interest income 14,200 13,567 15,764 14,209 13,388 15,482 Fees and commissions receivable 8,194 8,738 8,845 8,193 8,738 8,855 Fees and commissions payable (2,211) (2,790) (2,411) (2,211) (2,790) (2,444)Other non-interest income 7,351 4,786 (8,540) 6,549 8,424 (6,872)Insurance net premium income 5,128 5,266 5,709 5,128 5,266 5,709 Non-interest income 18,462 16,000 3,603 17,659 19,638 5,248 Total income 32,662 29,567 19,367 31,868 33,026 20,730 Operating expenses (16,710) (17,401) (16,188) (18,228) (17,417) (35,065)Profit/(loss) before other operating charges 15,952 12,166 3,179 13,640 15,609 (14,335)Insurance net claims (4,783) (4,357) (3,917) (4,783) (4,357) (3,917)Operating profit/(loss) before impairment losses 11,169 7,809 (738) 8,857 11,252 (18,252)Impairment losses (9,256) (13,899) (7,432) (9,256) (13,899) (7,439)Operating profit/(loss) before fair value of own debt (1) 1,913 (6,090) (8,170) (399) (2,647) (25,691)Fair value of own debt 174 (142) 1,232 — — —Operating profit/(loss) (1) 2,087 (6,232) (6,938) (399) (2,647) (25,691)Amortisation of purchased intangible assets (369) (272) (443) — — —Integration and restructuring costs (1,032) (1,286) (1,357) — — —Gain on redemption of own debt 553 3,790 — — — —Strategic disposals 171 132 442 — — —Bonus tax (99) (208) — — — —Gains on pensions curtailment — 2,148 — — — —Asset Protection Scheme credit default swap - fair value changes (1,550) — — — — —Loss before tax (239) (1,928) (8,296) (399) (2,647) (25,691)Tax (charge)/credit (663) 339 1,280 (634) 429 2,167 Loss from continuing operations (902) (1,589) (7,016) (1,033) (2,218) (23,524)Loss from discontinued operations, net of tax (28) (72) (86) (633) (105) (11,018)Loss for the year (930) (1,661) (7,102) (1,666) (2,323) (34,542)Non-controlling interests (61) (648) (412) 665 (349) 10,832 Other owners’ dividends (124) (935) (596) (124) (935) (596)Loss attributable to ordinary and B shareholders before write-down of goodwill and other intangible assets (1,115) (3,244) (8,110) (1,125) (3,607) (24,306)Write-down of goodwill and other intangible assets, net of tax (10) (363) (16,196) — — —Loss attributable to ordinary and B shareholders (1,125) (3,607) (24,306) (1,125) (3,607) (24,306)
Basic loss per ordinary and B share from continuing operations (0.5p) (6.3p) (146.2p) (0.5p) (6.3p) (146.2p)Amortisation of purchased intangible assets 0.2p 0.4p 2.1p Integration and restructuring costs 0.8p 1.6p 5.9p Gain on redemption of own debt (1.0p) (6.8p) — Strategic disposals (0.1p) (0.2p) (2.7p) Bonus tax 0.1p 0.4p — Gains on pensions curtailment — (3.0p) — Asset Protection Scheme credit default swap - fair value changes 1.1p — —Write-down of goodwill and other intangible assets — 0.7p 97.8p Adjusted earnings/(loss) per ordinary and B share from continuing operations 0.6p (13.2p) (43.1p)
Note: (1) Pro forma operating profit/(loss) excludes amortisation of purchased intangible assets, integration and restructuring costs, gain on redemption of own debt, strategic disposals, bonus tax, gains on
pensions curtailment, Asset Protection Scheme credit default swap - fair value changes and write-down of goodwill and other intangible assets.
57RBS Group 2010
Business review
2010 compared with 2009 - pro forma Operating profit/(loss) Group operating profit, excluding fair value of own debt, amortisation of purchased intangible assets, integration and restructuring costs, gain on redemption of own debt, strategic disposals, bonus tax, gains on pensions curtailment, fair value changes in the Asset Protection Scheme credit default swap and write-down of goodwill and other intangible assets, was £1,913 million, compared with a loss of £6,090 million in 2009. The improvement in performance is primarily driven by stronger Core Retail & Commercial operating profits offsetting more normal results from Global Banking & Markets, coupled with lower impairments in the Non-Core division. After fair value of own debt, amortisation of purchased intangible assets, integration and restructuring costs, gain on redemption of own debt, strategic disposals, bonus tax, gains on pensions curtailment and write-down of goodwill and other intangible assets, the Group recorded a loss before tax of £249 million, compared with a loss before tax of £2,291 million in 2009. After tax, non-controlling interests and preference share and other dividends, the loss attributable to ordinary and B shareholders was £1,125 million, compared with an attributable loss of £3,607 million in 2009. Total income Total income, excluding fair value of own debt, gain on redemption of own debt, strategic disposals and fair value changes in the Asset Protection Scheme credit default swap, increased by 10% to £32,662 million, primarily reflecting growth in net interest income coupled with lower Non-Core trading losses as underlying asset prices recovered and credit spreads tightened. Whilst income was down in Global Banking & Markets to more normal levels compared with the favourable market conditions seen in 2009, this was offset by good growth in Core Retail & Commercial and the improvement in Non-Core. Net interest income Net interest income increased by 5% to £14,200 million reflecting improvements in net interest margin which more than offset lower interest-earning assets and interest-bearing liabilities. Group net interest margin increased from 1.76% to 2.01% largely reflecting expanding asset margins in UK Retail and UK Corporate divisions as well as in US Retail & Commercial. The run-off of low-yielding Non-Core assets also contributed to this increase. The Group net interest margin was also affected by increased funding costs. Non-interest income Non-interest income increased to £18,462 million from £16,000 million in 2009, largely reflecting the sharp improvement in Non-Core from reduced trading losses. This was partially offset by lower trading revenues in Global Banking & Markets, which had seen unusually buoyant market conditions in 2009 as rapidly falling interest rates generated significant revenue opportunities.
Operating expenses Total operating expenses, excluding amortisation of purchased intangible assets, integration and restructuring costs, bonus tax, gains on pensions curtailment and write-down of goodwill and other intangible assets, fell by 4% to £16,710 million, largely reflecting the recognition of benefits from the Group-wide efficiency programme. The programme continues to deliver material savings which have been funding investments to strengthen our Core franchises. Premises and equipment costs fell by 8% in the year largely driven by efficiency cost savings, significant one-off property impairments recognised in 2009 and country exits following Non-Core disposals. The Group cost:income ratio improved by 9 percentage points in 2010 to 60%. Impairment losses Impairment losses fell to £9,256 million from £13,899 million in 2009, with Core impairments falling by £898 million and Non-Core by £3,745 million. The decrease reflects an overall improvement in the economic environment. Impairments fell in all businesses, except Ulster Bank, which has faced an economic environment that remains challenging. Impairments represented 1.7% of gross loans and advances, excluding reverse repos, in 2010 compared with 2.3% in 2009. Risk elements in lending and potential problem loans at 31 December 2010 represented 7.4% of loans and advances, excluding reverse repos, compared with 6.2% a year earlier. Provision coverage was 46%, compared with 43% at 31 December 2009. Non-operating items Integration and restructuring costs decreased from £1,286 million to £1,032 million, primarily as ABN AMRO integration activity neared completion, partly offset by restructuring activity following the conclusion of the strategic review. In 2010 the Group recorded a gain of £553 million, compared with £3,790 million in 2009, on a liability management exercise to redeem a number of Tier 1 and upper Tier 2 securities. In addition, the overall gain on strategic disposals, £171 million, primarily relates to gains on the sale of Global Merchant Services partially offset by provisions for losses on the sales of other businesses undertaken as part of the Group’s strategic plan. The Asset Protection Scheme is accounted for as a credit derivative, and movements in the fair value of the contract are taken as non-operating items. The charge of £1,550 million in 2010 reflects improving credit spreads on the portfolio of covered assets, as well as a decrease in covered assets. Tax The Group recorded a tax charge of £663 million in 2010, compared with a tax credit of £339 million in 2009. Earnings Basic loss per ordinary and B share from continuing operations improved from a loss of 6.3p to a loss of 0.5p. Adjusted loss per ordinary and B share improved from a loss of 13.2p to earnings of 0.6p per share.
RBS Group 201058
Business review continued
2010 compared with 2009 - statutory Operating loss Operating loss before tax for the year was £399 million compared with a loss of £2,647 million in 2009. Total income Total income decreased 4% to £31,868 million in 2010. Net interest income Net interest income increased by 6% to £14,209 million. Non-interest income Non-interest income decreased to £17,659 million from £19,638 million in 2009. This included movements in the fair value of the Asset Protection Scheme - credit default swap resulting in a £1,550 million charge and gain on redemption of own debt of £553 million (2009 - £3,790 million). Excluding these items, non-interest income was up 18% primarily reflecting an increase in income from trading activities. Operating expenses Operating expenses increased to £18,228 million (2009 - £17,417 million) of which integration and restructuring costs were £1,032 million compared with £1,286 million in 2009. Write down of goodwill and other intangible assets was £10 million compared with £363 million in 2009.
Net insurance claims Bancassurance and general insurance claims, after reinsurance, increased by 10% to £4,783 million. Impairment losses Impairment losses were £9,256 million, compared with £13,899 million in 2009. Risk elements in lending and potential problem loans represented 7.4% of gross loans and advances to customers excluding reverse repos at 31 December 2010 (2009 - 5.5%). Provision coverage of risk elements in lending and potential problem loans was 46% (2009 - 45%). Tax The tax charge for 2010 was £634 million compared with a tax credit of £429 million in 2009. Earnings Basic earnings per ordinary share, including discontinued operations, was a loss of 0.5p per share compared with a loss of 6.4p for 2009.
59RBS Group 2010
Business review
2009 compared with 2008 - pro forma Operating loss Group operating loss, excluding fair value of own debt, amortisation of purchased intangible assets, write-down of goodwill and other intangible assets, integration and restructuring costs, gain on redemption of own debt, strategic disposals, gains on pensions curtailment and bonus tax was £6,090 million, compared with a loss of £8,170 million in 2008. The reduction in the loss is primarily a result of a substantial increase in non-interest income partially offset by a significant increase in impairment losses and lower net interest income.
After fair value of own debt, amortisation of purchased intangible assets, write-down of goodwill and other intangible assets, integration and restructuring costs, gain on redemption of own debt, strategic disposals, gains on pensions curtailment and bonus tax, the Group recorded a loss before tax of £2,291 million, compared with a loss before tax of £25,207 million in 2008.
After tax, non-controlling interests and preference share and other dividends, the loss attributable to ordinary and B shareholders was £3,607 million, compared with an attributable loss of £24,306 million in 2008. Total income Total income, excluding the gain on redemption of own debt and strategic disposals, increased by 53% to £29,567 million, primarily reflecting a significant reduction in credit and other market losses. Increased market volatility and strong customer demand in a positive trading environment also contributed to this improvement. While income was down marginally in UK Corporate and held steady in Retail & Commercial and RBS Insurance, a significant improvement occurred in Global Banking & Markets, reflecting the reduced credit and other market losses and a more buoyant trading market during the year compared with 2008. Net interest income Net interest income fell by 14% to £13,567 million, with average loans and advances to customers down 4% and average customer deposits down 7%. Group net interest margin fell from 2.08% to 1.76% largely reflecting the pressure on liability margins, given rates on many deposit products already at floors in the low interest rate environment, and strong competition, particularly for longer-term deposits and the build up of the Group's liquidity portfolio. Non-interest income Non-interest income increased to £16,000 million from £3,603 million in 2008, largely reflecting the sharp improvement in income from trading activities, as improved asset valuations led to lower credit market losses and GBM benefited from the restructuring of its business to focus on core customer franchises. However, fees and commissions fell as a result of the withdrawal of the single premium payment protection insurance product and the restructuring of UK current account overdraft fees. Operating expenses Total operating expenses, excluding amortisation of purchased intangible assets, write-down of goodwill and other intangible assets, integration and restructuring costs, gains on pensions curtailment and bonus tax, increased by 7% to £17,401 million, largely resulting from increased staff costs. Staff costs were up 14% with most of the movement relating to
adverse movements in foreign exchange rates and some salary inflation. Changes in incentive compensation, primarily in Global Banking & Markets, represented most of the remaining change. The Group cost:income ratio improved to 69%, compared with 105% in 2008. Impairment losses Impairment losses increased to £13,899 million from £7,432 million in 2008, with Core bank impairments rising by £2,182 million and Non-Core by £4,285 million. Signs that impairments might be plateauing appear to have been borne out in the latter part of the year, and there are indications that the pace of downwards credit rating migration for corporates is slowing. Nonetheless, the financial circumstances of many consumers and businesses remain fragile, and rising refinancing costs, whether as a result of monetary tightening or of increased regulatory capital requirements, could expose some customers to further difficulty.
Impairments represented 2.3% of gross loans and advances, excluding reverse repos, in 2009 compared with 0.9% in 2008.
Risk elements in lending and potential problem loans at 31 December 2009 represented 6.2% of loans and advances, excluding reverse repos, compared with 2.7% a year earlier. Provision coverage was 43%, compared with 50% at 31 December 2008 as a consequence of the growth in risk elements in lending being concentrated in secured, property-related loans. These loans require relatively lower provisions in view of their collateralised nature. Non-operating items Integration and restructuring costs decreased, primarily as ABN AMRO integration activity neared completion, partly offset by restructuring activity following the conclusion of the strategic review.
In 2009 the Group recorded a gain of £3,790 million on a liability management exercise to redeem a number of Tier 1 and upper Tier 2 securities. In addition, the overall gain on strategic disposals, £132 million, primarily relates to gains on the sale of Bank of China and Linea Directa partially offset by losses arising from the sale of the Retail and Commercial Asian businesses and Latin America asset portfolio.
Pension curtailment gains of £2,148 million were recognised during the fourth quarter of 2009 arising from changes to prospective pension benefits in the defined benefit scheme and certain other subsidiary schemes. A charge related to the UK Government's bonus tax proposals of £208 million was reflected in 2009 with a further £160 million deferred until 2010 and 2011. Tax The Group recorded a tax credit of £339 million in 2009, compared with a tax credit of £1,280 million in 2008. Earnings Basic loss per ordinary and B share from continuing operations improved from 146.2p to a loss of 6.3p. Adjusted loss per ordinary and B share improved from 43.1p to a loss of 13.2p per share. The number of ordinary shares in issue increased to 56,366 million at 31 December 2009, compared with 39,456 million in issue at 31 December 2008, reflecting the placing and open offer in April 2009. The Group also issued 51 billion B shares to Her Majesty's Treasury in December 2009.
RBS Group 201060
Business review continued
2009 compared with 2008 - statutory Operating loss Operating loss before tax for the year was £2,647 million compared with a loss of £25,691 million in 2008. Total income Total income increased 59% to £33,026 million in 2009. Net interest income Net interest income decreased by 14% to £13,388 million. Non-interest income Non-interest income increased to £19,638 million from £5,248 million in 2008. This included a gain on redemption of own debt of £3,790 million. Excluding the gain on redemption of own debt, non-interest income increased by £10,600 million primarily due to the increase in income from trading activities. Operating expenses Operating expenses decreased from £35,065 million in 2008 to £17,417 million of which integration and restructuring costs were £1,286 million compared with £1,357 million in 2008. Write-down of goodwill and other intangible assets was £363 million compared with £16,911 million in 2008.
Net insurance claims Bancassurance and general insurance claims, after reinsurance, increased by 11% to £4,357 million. Impairment losses Impairment losses were £13,899 million, compared with £7,439 million in 2008. Risk elements in lending and potential problem loans represented 5.5% of gross loans and advances to customers excluding reverse repos at 31 December 2009 (2008 - 2.5%). Provision coverage of risk elements in lending and potential problem loans was 45% (2008 - 51%). Tax The Group recorded a tax credit of £429 million in 2009, compared with a tax credit of £2,167 million in 2008. Earnings Basic earnings per ordinary and B share, including discontinued operations, improved from a loss of 146.7p to a loss of 6.4p.
61RBS Group 2010
Business review
Analysis of results Net interest income
Pro forma Statutory 2010 2009 2008 2010 2009 2008
£m £m £m £m £m £m
Interest receivable (1,2,6) 22,693 26,390 42,197 22,703 26,377 42,606 Interest payable (1,2,7) (8,855) (13,107) (26,877) (8,856) (13,273) (27,568)Net interest income 13,838 13,283 15,320 13,847 13,104 15,038
% % % % % %
Gross yield on interest-earning assets of the banking business (3) 3.29 3.50 5.72 3.29 3.51 5.63 Cost of interest-bearing liabilities of the banking business (1.48) (1.95) (3.88) (1.48) (1.96) (3.84)Interest spread of the banking business (4) 1.81 1.55 1.84 1.81 1.55 1.79 Benefit from interest-free funds 0.20 0.21 0.24 0.19 0.19 0.20 Net interest margin of the banking business (5) 2.01 1.76 2.08 2.00 1.74 1.99
Yields, spreads and margins of the banking business % % % % % %
Gross yield (3) - Group 3.29 3.50 5.72 3.29 3.51 5.63
- UK 3.40 3.33 5.77 3.40 3.33 5.72 - Overseas 3.14 3.71 5.66 3.13 3.71 5.55 Interest spread (4) - Group 1.81 1.55 1.84 1.81 1.55 1.79
- UK 2.04 1.48 1.88 2.04 1.48 1.94 - Overseas 1.50 1.66 1.79 1.49 1.62 1.64 Net interest margin (5) - Group 2.01 1.76 2.08 2.00 1.74 1.99
- UK 2.19 1.74 2.28 2.19 1.73 2.34 - Overseas 1.76 1.80 1.86 1.75 1.75 1.64 The Royal Bank of Scotland plc base rate (average) 0.50 0.64 4.67 0.50 0.64 4.67 London inter-bank three month offered rates (average)
- Sterling 0.70 1.21 5.51 0.70 1.21 5.51 - Eurodollar 0.34 0.69 2.92 0.34 0.69 2.92 - Euro 0.75 1.21 4.63 0.75 1.21 4.63
Notes: (1) Interest-earning assets and interest-bearing liabilities exclude the Retail bancassurance long-term assets and liabilities attributable to policyholders, in view of their distinct nature. As a result, net
interest receivable has been increased by £6 million (2009 - £20 million; 2008 - £84 million). (2) Interest receivable has been increased by £11 million (2009 - £46 million; 2008 - £332 million) and interest payable has been decreased by £30 million (2009 - £350 million increase; 2008 - £860
million increase) to record interest on financial assets and liabilities designated as at fair value through profit or loss. Related interest-earning assets and interest-bearing liabilities have also been adjusted.
(3) Gross yield is the interest rate earned on average interest-earning assets of the banking business. (4) Interest spread is the difference between the gross yield and the interest rate paid on average interest-bearing liabilities of the banking business. (5) Net interest margin is net interest income of the banking business as a percentage of average interest-earning assets of the banking business. (6) Interest receivable has been decreased by £90 million in respect of a non-recurring receivable (2009 - nil; 2008 - nil). (7) Interest payable has been increased by £319 million in respect of non-recurring adjustments (2009 - nil; 2008 - nil).
RBS Group 201062
Business review continued
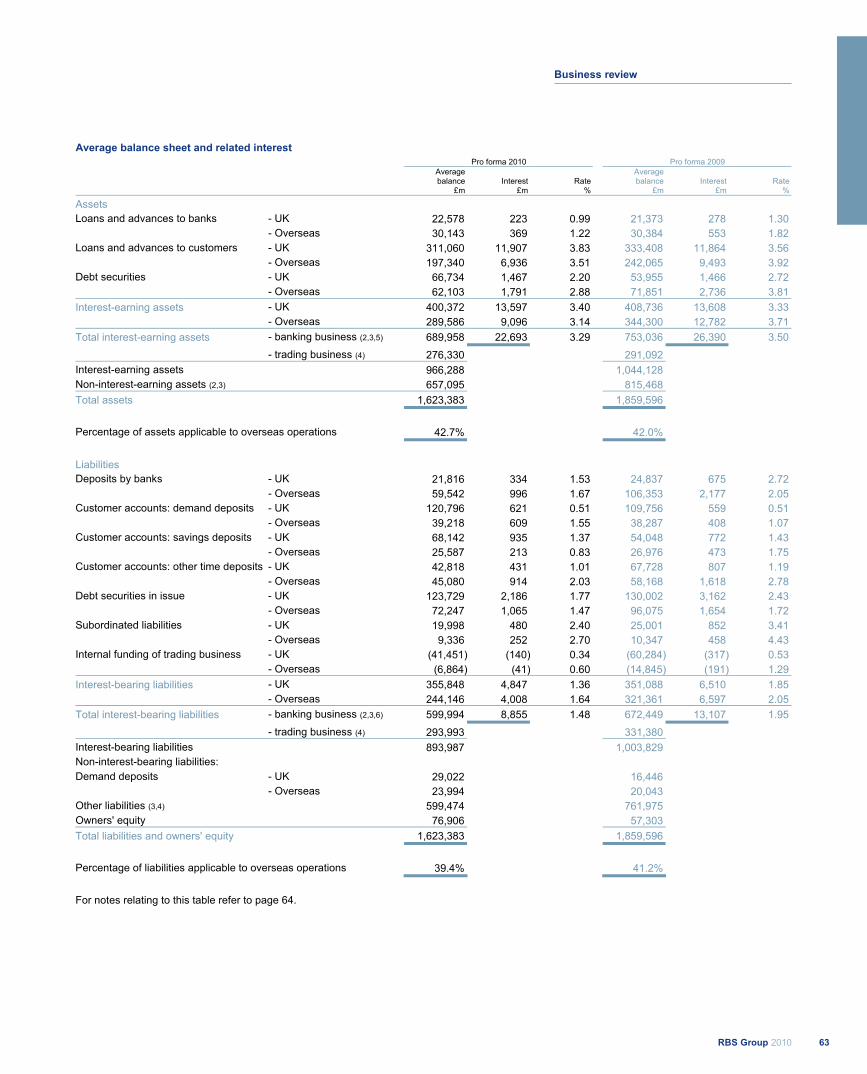
Average balance sheet and related interest Pro forma 2010 Pro forma 2009
Average balance Interest Rate
Average balance Interest Rate
£m £m % £m £m %
Assets Loans and advances to banks - UK 22,578 223 0.99 21,373 278 1.30 - Overseas 30,143 369 1.22 30,384 553 1.82 Loans and advances to customers - UK 311,060 11,907 3.83 333,408 11,864 3.56 - Overseas 197,340 6,936 3.51 242,065 9,493 3.92 Debt securities - UK 66,734 1,467 2.20 53,955 1,466 2.72 - Overseas 62,103 1,791 2.88 71,851 2,736 3.81 Interest-earning assets - UK 400,372 13,597 3.40 408,736 13,608 3.33
- Overseas 289,586 9,096 3.14 344,300 12,782 3.71 Total interest-earning assets - banking business (2,3,5) 689,958 22,693 3.29 753,036 26,390 3.50
- trading business (4) 276,330 291,092 Interest-earning assets 966,288 1,044,128 Non-interest-earning assets (2,3) 657,095 815,468 Total assets 1,623,383 1,859,596
Percentage of assets applicable to overseas operations 42.7% 42.0% Liabilities Deposits by banks - UK 21,816 334 1.53 24,837 675 2.72 - Overseas 59,542 996 1.67 106,353 2,177 2.05 Customer accounts: demand deposits - UK 120,796 621 0.51 109,756 559 0.51 - Overseas 39,218 609 1.55 38,287 408 1.07 Customer accounts: savings deposits - UK 68,142 935 1.37 54,048 772 1.43 - Overseas 25,587 213 0.83 26,976 473 1.75 Customer accounts: other time deposits - UK 42,818 431 1.01 67,728 807 1.19 - Overseas 45,080 914 2.03 58,168 1,618 2.78 Debt securities in issue - UK 123,729 2,186 1.77 130,002 3,162 2.43 - Overseas 72,247 1,065 1.47 96,075 1,654 1.72 Subordinated liabilities - UK 19,998 480 2.40 25,001 852 3.41 - Overseas 9,336 252 2.70 10,347 458 4.43 Internal funding of trading business - UK (41,451) (140) 0.34 (60,284) (317) 0.53 - Overseas (6,864) (41) 0.60 (14,845) (191) 1.29 Interest-bearing liabilities - UK 355,848 4,847 1.36 351,088 6,510 1.85
- Overseas 244,146 4,008 1.64 321,361 6,597 2.05 Total interest-bearing liabilities - banking business (2,3,6) 599,994 8,855 1.48 672,449 13,107 1.95
- trading business (4) 293,993 331,380 Interest-bearing liabilities 893,987 1,003,829 Non-interest-bearing liabilities: Demand deposits - UK 29,022 16,446 - Overseas 23,994 20,043 Other liabilities (3,4) 599,474 761,975 Owners' equity 76,906 57,303 Total liabilities and owners' equity 1,623,383 1,859,596
Percentage of liabilities applicable to overseas operations 39.4% 41.2%
For notes relating to this table refer to page 64.
63RBS Group 2010
Business review

Average balance sheet and related interest continued Pro forma 2008
Average balance Interest Rate
£m £m %
Assets Loans and advances to banks - UK 19,049 978 5.13 - Overseas 28,474 1,311 4.60 Loans and advances to customers - UK 321,177 19,085 5.94 - Overseas 275,000 16,030 5.83 Debt securities - UK 36,395 1,679 4.61 - Overseas 57,998 3,114 5.37 Interest-earning assets - UK 376,621 21,742 5.77
- Overseas 361,472 20,455 5.66 Total interest-earning assets - banking business (2,3,5) 738,093 42,197 5.72
- trading business (4) 425,454 Interest-earning assets 1,163,547 Non-interest-earning assets (2,3) 660,628 Total assets 1,824,175
Percentage of assets applicable to overseas operations 42.5%
Liabilities Deposits by banks - UK 45,123 1,507 3.34 - Overseas 109,705 4,630 4.22 Customer accounts: demand deposits - UK 99,840 2,794 2.80 - Overseas 36,108 672 1.86 Customer accounts: savings deposits - UK 42,870 1,691 3.94 - Overseas 23,753 570 2.40 Customer accounts: other time deposits - UK 95,181 3,964 4.16 - Overseas 88,570 3,426 3.87 Debt securities in issue - UK 114,234 5,281 4.62 - Overseas 106,207 4,734 4.46 Subordinated liabilities - UK 26,799 1,369 5.11 - Overseas 8,068 413 5.12 Internal funding of trading business - UK (85,664) (3,445) 4.02 - Overseas (18,090) (729) 4.03 Interest-bearing liabilities - UK 338,383 13,161 3.89
- Overseas 354,321 13,716 3.87 Total interest-bearing liabilities - banking business (2,3,6) 692,704 26,877 3.88
- trading business (4) 466,610 Interest-bearing liabilities 1,159,314 Non-interest-bearing liabilities: Demand deposits - UK 19,262 - Overseas 14,759 Other liabilities (3,4) 572,296 Owners' equity 58,544 Total liabilities and owners' equity 1,824,175
Percentage of liabilities applicable to overseas operations 43.1%
Notes: (1) The analysis into UK and Overseas has been compiled on the basis of location of office. (2) Interest-earning assets and interest-bearing liabilities exclude the Retail bancassurance long-term assets and liabilities attributable to policyholders, in view of their distinct nature. As a result, net
interest receivable has been increased by £6 million (2009 - £20 million; 2008 - £84 million). (3) Interest receivable has been increased by £11 million (2009 - £46 million; 2008 - £332 million) and interest payable has been decreased by £30 million (2009 - £350 million increase; 2008 - £860
million increase) to record interest on financial assets and liabilities designated as at fair value through profit or loss. Related interest-earning assets and interest-bearing liabilities have also been adjusted.
(4) Interest receivable and interest payable on trading assets and liabilities are included in income from trading activities. (5) Interest receivable has been decreased by £90 million in respect of a non-recurring receivable (2009 - nil; 2008 - nil). (6) Interest payable has been increased by £319 million in respect of non-recurring adjustments (2009 - nil; 2008 - nil).
RBS Group 201064
Business review continued
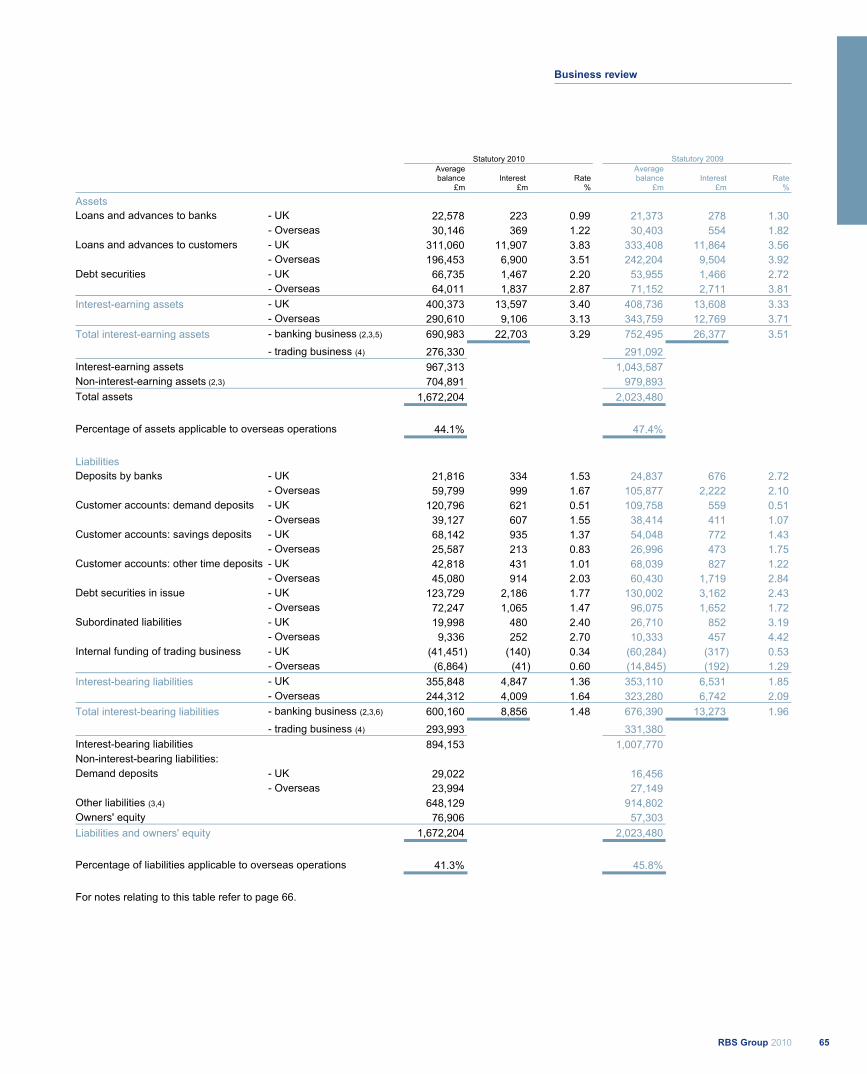
Statutory 2010 Statutory 2009
Average balance Interest Rate
Average balance Interest Rate
£m £m % £m £m %
Assets Loans and advances to banks - UK 22,578 223 0.99 21,373 278 1.30 - Overseas 30,146 369 1.22 30,403 554 1.82 Loans and advances to customers - UK 311,060 11,907 3.83 333,408 11,864 3.56 - Overseas 196,453 6,900 3.51 242,204 9,504 3.92 Debt securities - UK 66,735 1,467 2.20 53,955 1,466 2.72 - Overseas 64,011 1,837 2.87 71,152 2,711 3.81 Interest-earning assets - UK 400,373 13,597 3.40 408,736 13,608 3.33
- Overseas 290,610 9,106 3.13 343,759 12,769 3.71 Total interest-earning assets - banking business (2,3,5) 690,983 22,703 3.29 752,495 26,377 3.51
- trading business (4) 276,330 291,092 Interest-earning assets 967,313 1,043,587 Non-interest-earning assets (2,3) 704,891 979,893 Total assets 1,672,204 2,023,480
Percentage of assets applicable to overseas operations 44.1% 47.4% Liabilities Deposits by banks - UK 21,816 334 1.53 24,837 676 2.72 - Overseas 59,799 999 1.67 105,877 2,222 2.10 Customer accounts: demand deposits - UK 120,796 621 0.51 109,758 559 0.51 - Overseas 39,127 607 1.55 38,414 411 1.07 Customer accounts: savings deposits - UK 68,142 935 1.37 54,048 772 1.43 - Overseas 25,587 213 0.83 26,996 473 1.75 Customer accounts: other time deposits - UK 42,818 431 1.01 68,039 827 1.22 - Overseas 45,080 914 2.03 60,430 1,719 2.84 Debt securities in issue - UK 123,729 2,186 1.77 130,002 3,162 2.43 - Overseas 72,247 1,065 1.47 96,075 1,652 1.72 Subordinated liabilities - UK 19,998 480 2.40 26,710 852 3.19 - Overseas 9,336 252 2.70 10,333 457 4.42 Internal funding of trading business - UK (41,451) (140) 0.34 (60,284) (317) 0.53 - Overseas (6,864) (41) 0.60 (14,845) (192) 1.29 Interest-bearing liabilities - UK 355,848 4,847 1.36 353,110 6,531 1.85
- Overseas 244,312 4,009 1.64 323,280 6,742 2.09 Total interest-bearing liabilities - banking business (2,3,6) 600,160 8,856 1.48 676,390 13,273 1.96
- trading business (4) 293,993 331,380 Interest-bearing liabilities 894,153 1,007,770 Non-interest-bearing liabilities: Demand deposits - UK 29,022 16,456 - Overseas 23,994 27,149 Other liabilities (3,4) 648,129 914,802 Owners' equity 76,906 57,303 Liabilities and owners' equity 1,672,204 2,023,480
Percentage of liabilities applicable to overseas operations 41.3% 45.8%
For notes relating to this table refer to page 66.
65RBS Group 2010
Business review
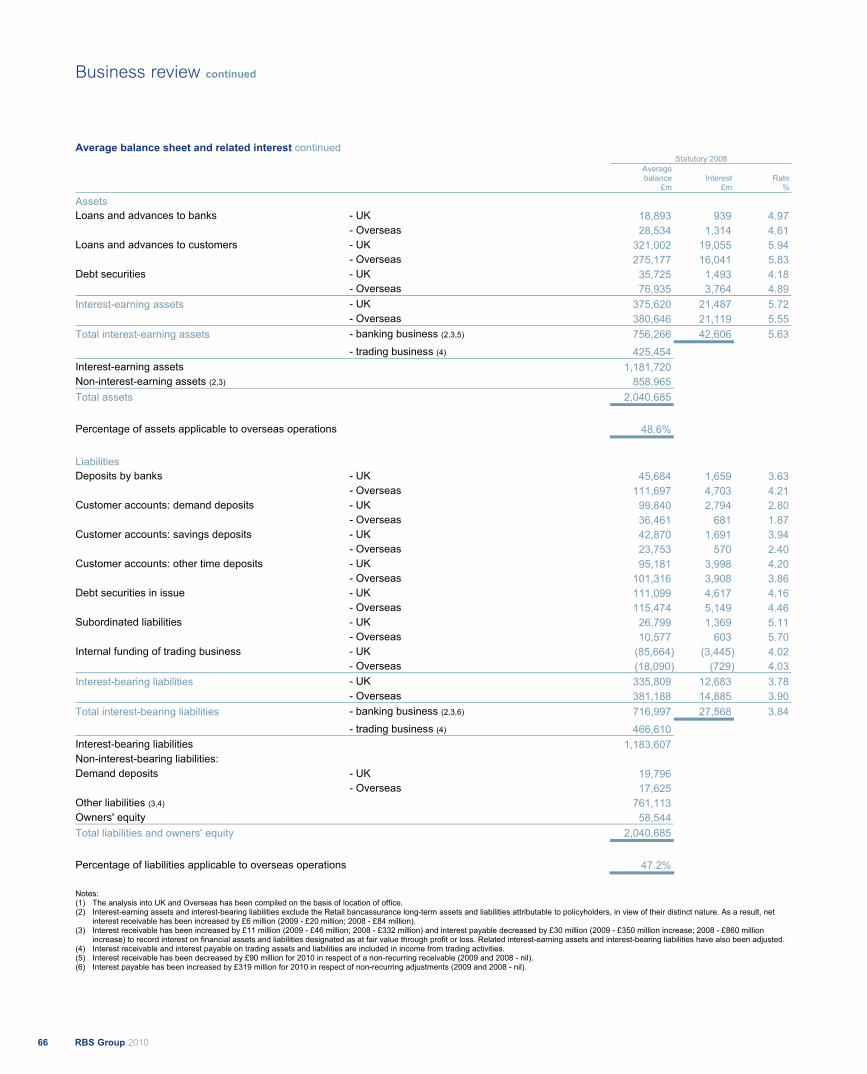
Average balance sheet and related interest continued Statutory 2008
Average balance Interest Rate
£m £m %
Assets Loans and advances to banks - UK 18,893 939 4.97 - Overseas 28,534 1,314 4.61 Loans and advances to customers - UK 321,002 19,055 5.94 - Overseas 275,177 16,041 5.83 Debt securities - UK 35,725 1,493 4.18 - Overseas 76,935 3,764 4.89 Interest-earning assets - UK 375,620 21,487 5.72
- Overseas 380,646 21,119 5.55 Total interest-earning assets - banking business (2,3,5) 756,266 42,606 5.63
- trading business (4) 425,454 Interest-earning assets 1,181,720 Non-interest-earning assets (2,3) 858,965 Total assets 2,040,685
Percentage of assets applicable to overseas operations 48.6%
Liabilities Deposits by banks - UK 45,684 1,659 3.63 - Overseas 111,697 4,703 4.21 Customer accounts: demand deposits - UK 99,840 2,794 2.80 - Overseas 36,461 681 1.87 Customer accounts: savings deposits - UK 42,870 1,691 3.94 - Overseas 23,753 570 2.40 Customer accounts: other time deposits - UK 95,181 3,998 4.20 - Overseas 101,316 3,908 3.86 Debt securities in issue - UK 111,099 4,617 4.16 - Overseas 115,474 5,149 4.46 Subordinated liabilities - UK 26,799 1,369 5.11 - Overseas 10,577 603 5.70 Internal funding of trading business - UK (85,664) (3,445) 4.02 - Overseas (18,090) (729) 4.03 Interest-bearing liabilities - UK 335,809 12,683 3.78
- Overseas 381,188 14,885 3.90 Total interest-bearing liabilities - banking business (2,3,6) 716,997 27,568 3.84
- trading business (4) 466,610 Interest-bearing liabilities 1,183,607 Non-interest-bearing liabilities: Demand deposits - UK 19,796 - Overseas 17,625 Other liabilities (3,4) 761,113 Owners' equity 58,544 Total liabilities and owners' equity 2,040,685
Percentage of liabilities applicable to overseas operations 47.2%
Notes: (1) The analysis into UK and Overseas has been compiled on the basis of location of office. (2) Interest-earning assets and interest-bearing liabilities exclude the Retail bancassurance long-term assets and liabilities attributable to policyholders, in view of their distinct nature. As a result, net
interest receivable has been increased by £6 million (2009 - £20 million; 2008 - £84 million). (3) Interest receivable has been increased by £11 million (2009 - £46 million; 2008 - £332 million) and interest payable decreased by £30 million (2009 - £350 million increase; 2008 - £860 million
increase) to record interest on financial assets and liabilities designated as at fair value through profit or loss. Related interest-earning assets and interest-bearing liabilities have also been adjusted. (4) Interest receivable and interest payable on trading assets and liabilities are included in income from trading activities. (5) Interest receivable has been decreased by £90 million for 2010 in respect of a non-recurring receivable (2009 and 2008 - nil). (6) Interest payable has been increased by £319 million for 2010 in respect of non-recurring adjustments (2009 and 2008 - nil).
RBS Group 201066
Business review continued
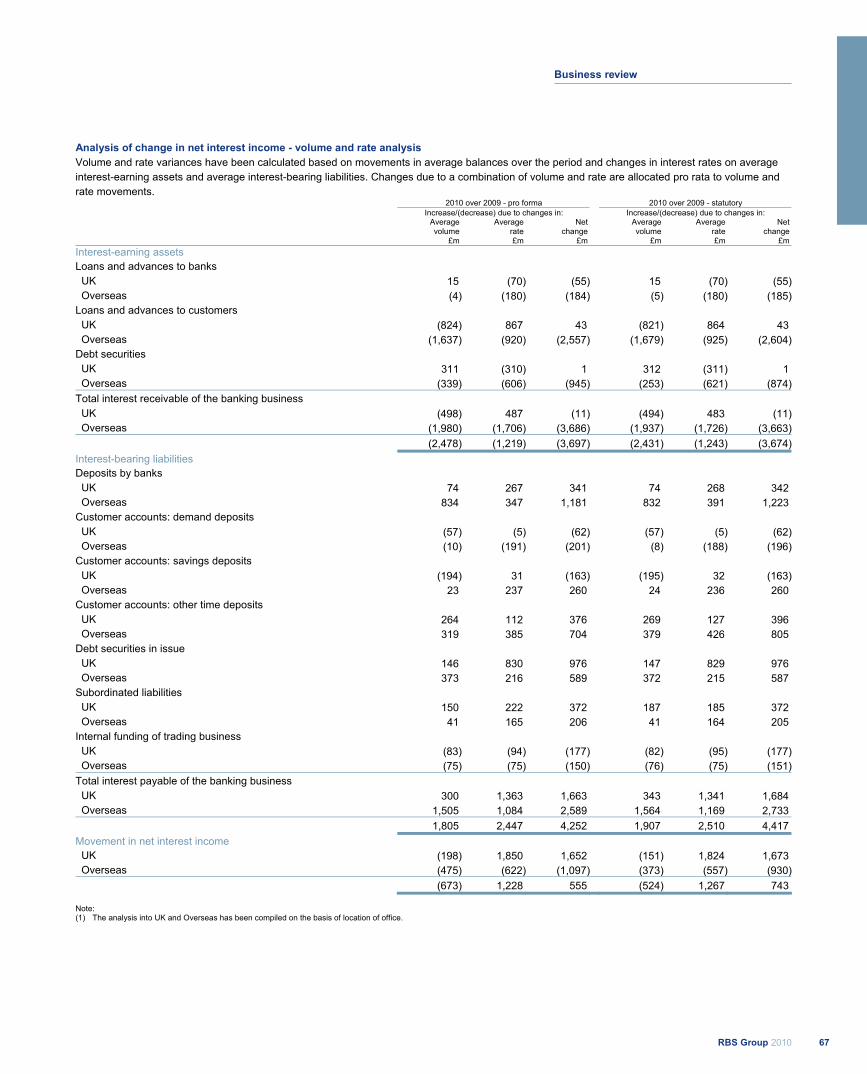
Analysis of change in net interest income - volume and rate analysis Volume and rate variances have been calculated based on movements in average balances over the period and changes in interest rates on average interest-earning assets and average interest-bearing liabilities. Changes due to a combination of volume and rate are allocated pro rata to volume and rate movements. 2010 over 2009 - pro forma 2010 over 2009 - statutory Increase/(decrease) due to changes in: Increase/(decrease) due to changes in:
Average volume
Average rate
Net change
Average volume
Average rate
Net change
£m £m £m £m £m £m Interest-earning assets Loans and advances to banks
UK 15 (70) (55) 15 (70) (55) Overseas (4) (180) (184) (5) (180) (185)Loans and advances to customers
UK (824) 867 43 (821) 864 43 Overseas (1,637) (920) (2,557) (1,679) (925) (2,604)Debt securities
UK 311 (310) 1 312 (311) 1 Overseas (339) (606) (945) (253) (621) (874)Total interest receivable of the banking business
UK (498) 487 (11) (494) 483 (11) Overseas (1,980) (1,706) (3,686) (1,937) (1,726) (3,663) (2,478) (1,219) (3,697) (2,431) (1,243) (3,674)Interest-bearing liabilities Deposits by banks
UK 74 267 341 74 268 342 Overseas 834 347 1,181 832 391 1,223 Customer accounts: demand deposits
UK (57) (5) (62) (57) (5) (62) Overseas (10) (191) (201) (8) (188) (196)Customer accounts: savings deposits
UK (194) 31 (163) (195) 32 (163) Overseas 23 237 260 24 236 260 Customer accounts: other time deposits
UK 264 112 376 269 127 396 Overseas 319 385 704 379 426 805 Debt securities in issue
UK 146 830 976 147 829 976 Overseas 373 216 589 372 215 587 Subordinated liabilities
UK 150 222 372 187 185 372 Overseas 41 165 206 41 164 205 Internal funding of trading business
UK (83) (94) (177) (82) (95) (177) Overseas (75) (75) (150) (76) (75) (151)Total interest payable of the banking business
UK 300 1,363 1,663 343 1,341 1,684 Overseas 1,505 1,084 2,589 1,564 1,169 2,733 1,805 2,447 4,252 1,907 2,510 4,417 Movement in net interest income
UK (198) 1,850 1,652 (151) 1,824 1,673 Overseas (475) (622) (1,097) (373) (557) (930) (673) 1,228 555 (524) 1,267 743
Note: (1) The analysis into UK and Overseas has been compiled on the basis of location of office.
67RBS Group 2010
Business review
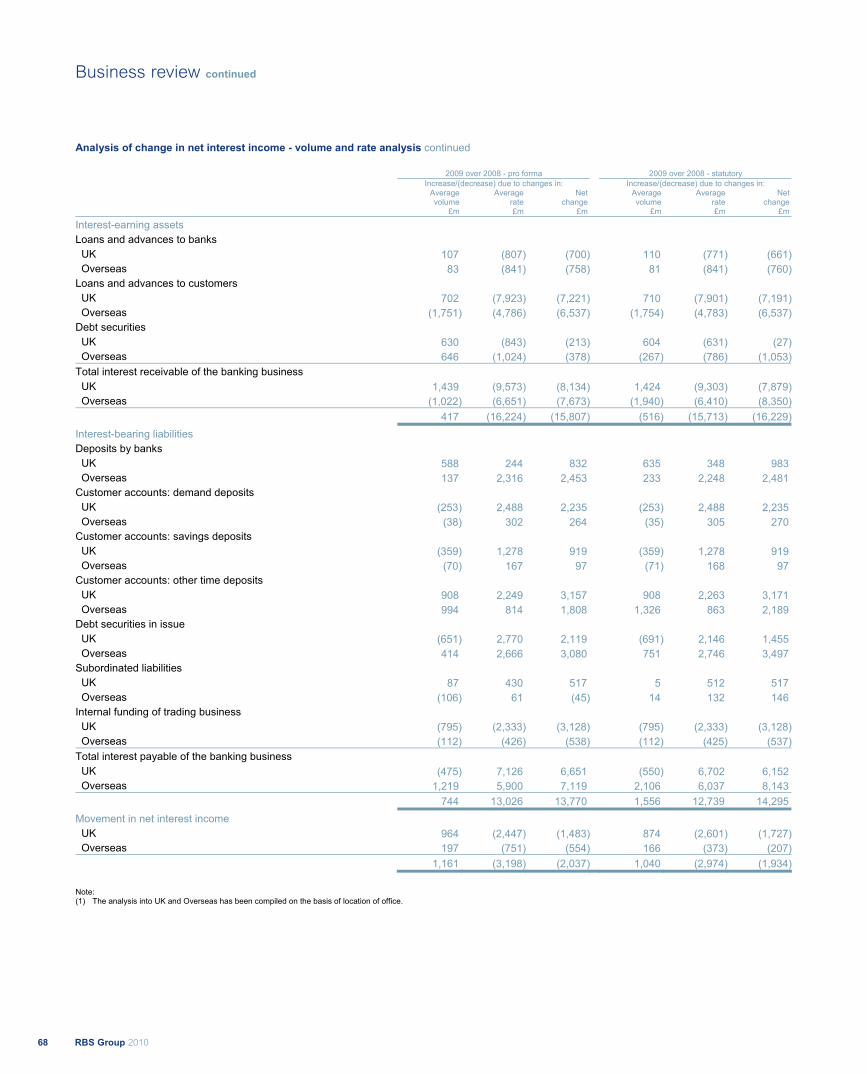
Analysis of change in net interest income - volume and rate analysis continued
2009 over 2008 - pro forma 2009 over 2008 - statutory Increase/(decrease) due to changes in: Increase/(decrease) due to changes in:
Average volume
Average rate
Net change
Average volume
Average rate
Net change
£m £m £m £m £m £m
Interest-earning assets Loans and advances to banks
UK 107 (807) (700) 110 (771) (661) Overseas 83 (841) (758) 81 (841) (760)Loans and advances to customers
UK 702 (7,923) (7,221) 710 (7,901) (7,191) Overseas (1,751) (4,786) (6,537) (1,754) (4,783) (6,537)Debt securities
UK 630 (843) (213) 604 (631) (27) Overseas 646 (1,024) (378) (267) (786) (1,053)Total interest receivable of the banking business
UK 1,439 (9,573) (8,134) 1,424 (9,303) (7,879) Overseas (1,022) (6,651) (7,673) (1,940) (6,410) (8,350) 417 (16,224) (15,807) (516) (15,713) (16,229)Interest-bearing liabilities Deposits by banks
UK 588 244 832 635 348 983 Overseas 137 2,316 2,453 233 2,248 2,481 Customer accounts: demand deposits
UK (253) 2,488 2,235 (253) 2,488 2,235 Overseas (38) 302 264 (35) 305 270 Customer accounts: savings deposits
UK (359) 1,278 919 (359) 1,278 919 Overseas (70) 167 97 (71) 168 97 Customer accounts: other time deposits
UK 908 2,249 3,157 908 2,263 3,171 Overseas 994 814 1,808 1,326 863 2,189 Debt securities in issue
UK (651) 2,770 2,119 (691) 2,146 1,455 Overseas 414 2,666 3,080 751 2,746 3,497 Subordinated liabilities
UK 87 430 517 5 512 517 Overseas (106) 61 (45) 14 132 146 Internal funding of trading business
UK (795) (2,333) (3,128) (795) (2,333) (3,128) Overseas (112) (426) (538) (112) (425) (537)Total interest payable of the banking business
UK (475) 7,126 6,651 (550) 6,702 6,152 Overseas 1,219 5,900 7,119 2,106 6,037 8,143 744 13,026 13,770 1,556 12,739 14,295 Movement in net interest income
UK 964 (2,447) (1,483) 874 (2,601) (1,727) Overseas 197 (751) (554) 166 (373) (207) 1,161 (3,198) (2,037) 1,040 (2,974) (1,934)
Note: (1) The analysis into UK and Overseas has been compiled on the basis of location of office.
RBS Group 201068
Business review continued
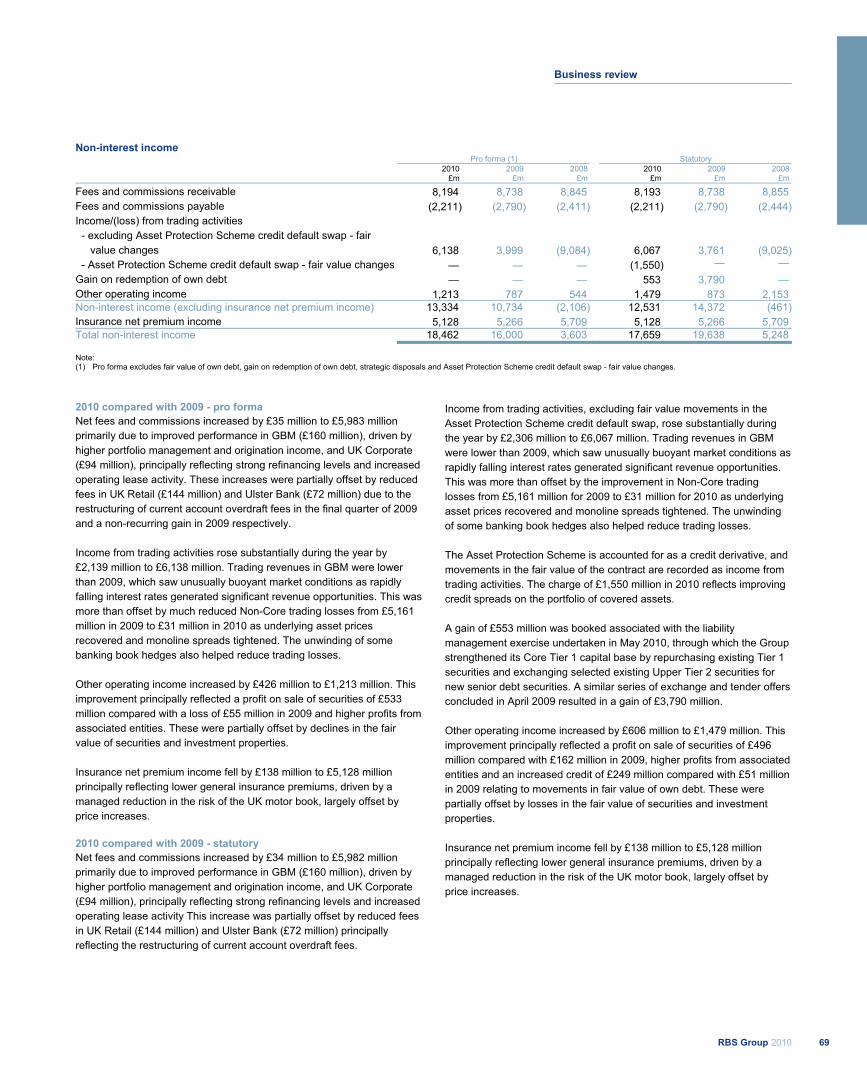
Non-interest income Pro forma (1) Statutory 2010 2009 2008 2010 2009 2008
£m £m £m £m £m £m
Fees and commissions receivable 8,194 8,738 8,845 8,193 8,738 8,855 Fees and commissions payable (2,211) (2,790) (2,411) (2,211) (2,790) (2,444)Income/(loss) from trading activities
- excluding Asset Protection Scheme credit default swap - fair value changes 6,138 3,999 (9,084) 6,067 3,761 (9,025) - Asset Protection Scheme credit default swap - fair value changes — — — (1,550) — —Gain on redemption of own debt — — — 553 3,790 — Other operating income 1,213 787 544 1,479 873 2,153 Non-interest income (excluding insurance net premium income) 13,334 10,734 (2,106) 12,531 14,372 (461)Insurance net premium income 5,128 5,266 5,709 5,128 5,266 5,709 Total non-interest income 18,462 16,000 3,603 17,659 19,638 5,248
Note: (1) Pro forma excludes fair value of own debt, gain on redemption of own debt, strategic disposals and Asset Protection Scheme credit default swap - fair value changes.
2010 compared with 2009 - pro forma Net fees and commissions increased by £35 million to £5,983 million primarily due to improved performance in GBM (£160 million), driven by higher portfolio management and origination income, and UK Corporate (£94 million), principally reflecting strong refinancing levels and increased operating lease activity. These increases were partially offset by reduced fees in UK Retail (£144 million) and Ulster Bank (£72 million) due to the restructuring of current account overdraft fees in the final quarter of 2009 and a non-recurring gain in 2009 respectively. Income from trading activities rose substantially during the year by £2,139 million to £6,138 million. Trading revenues in GBM were lower than 2009, which saw unusually buoyant market conditions as rapidly falling interest rates generated significant revenue opportunities. This was more than offset by much reduced Non-Core trading losses from £5,161 million in 2009 to £31 million in 2010 as underlying asset prices recovered and monoline spreads tightened. The unwinding of some banking book hedges also helped reduce trading losses. Other operating income increased by £426 million to £1,213 million. This improvement principally reflected a profit on sale of securities of £533 million compared with a loss of £55 million in 2009 and higher profits from associated entities. These were partially offset by declines in the fair value of securities and investment properties. Insurance net premium income fell by £138 million to £5,128 million principally reflecting lower general insurance premiums, driven by a managed reduction in the risk of the UK motor book, largely offset by price increases. 2010 compared with 2009 - statutory Net fees and commissions increased by £34 million to £5,982 million primarily due to improved performance in GBM (£160 million), driven by higher portfolio management and origination income, and UK Corporate (£94 million), principally reflecting strong refinancing levels and increased operating lease activity This increase was partially offset by reduced fees in UK Retail (£144 million) and Ulster Bank (£72 million) principally reflecting the restructuring of current account overdraft fees.
Income from trading activities, excluding fair value movements in the Asset Protection Scheme credit default swap, rose substantially during the year by £2,306 million to £6,067 million. Trading revenues in GBM were lower than 2009, which saw unusually buoyant market conditions as rapidly falling interest rates generated significant revenue opportunities. This was more than offset by the improvement in Non-Core trading losses from £5,161 million for 2009 to £31 million for 2010 as underlying asset prices recovered and monoline spreads tightened. The unwinding of some banking book hedges also helped reduce trading losses. The Asset Protection Scheme is accounted for as a credit derivative, and movements in the fair value of the contract are recorded as income from trading activities. The charge of £1,550 million in 2010 reflects improving credit spreads on the portfolio of covered assets. A gain of £553 million was booked associated with the liability management exercise undertaken in May 2010, through which the Group strengthened its Core Tier 1 capital base by repurchasing existing Tier 1 securities and exchanging selected existing Upper Tier 2 securities for new senior debt securities. A similar series of exchange and tender offers concluded in April 2009 resulted in a gain of £3,790 million. Other operating income increased by £606 million to £1,479 million. This improvement principally reflected a profit on sale of securities of £496 million compared with £162 million in 2009, higher profits from associated entities and an increased credit of £249 million compared with £51 million in 2009 relating to movements in fair value of own debt. These were partially offset by losses in the fair value of securities and investment properties. Insurance net premium income fell by £138 million to £5,128 million principally reflecting lower general insurance premiums, driven by a managed reduction in the risk of the UK motor book, largely offset by price increases.
69RBS Group 2010
Business review
Non-interest income continued 2009 compared with 2008 - pro forma Net fees and commissions fell by £486 million primarily due to the withdrawal of the single premium payment protection insurance product and the restructuring of current account overdraft fees within UK Retail during the year, as well as to reduced fees received in Non-Core. This was partially offset by improved performance in GBM (£112 million) and US Retail & Commercial (£50 million). Income from trading activities rose substantially during the year by £13,083 million, principally due to lower credit market losses reflecting improved underlying asset prices compared with 2008. Increased market volatility and strong customer demand in a positive trading environment also contributed to this improvement. Other operating income increased by £243 million. This improvement reflected a small gain in the fair value of securities and other assets and liabilities compared with a loss of £1.4 billion in 2008 partially offset by lower profits on sales of securities and properties and reduced dividend income. Insurance net premium income fell by £443 million reflecting lower bancassurance fees, £288 million, and lower general insurance premiums, £155 million.
2009 compared with 2008 - statutory Net fees and commissions fell by £463 million primarily due to the withdrawal of the single premium payment protection insurance product and the restructuring of current account overdraft fees within UK Retail during the year, as well as to reduced fees received in Non-Core. This was partially offset by improved performance in GBM (£112 million) and US Retail & Commercial (£50 million). Income from trading activities rose substantially during the year by £12,786 million, principally due to lower credit market losses reflecting improved underlying asset prices compared with 2009. Increased market volatility and strong customer demand in a positive trading environment also contributed to this improvement. In the second quarter of 2009 the Group recorded a gain of £3,790 million on a liability management exercise to redeem a number of Tier 1 and upper Tier 2 securities. Other operating income decreased by £1,280 million. This reflected changes in the fair value of own debt of £926 million together with lower profits on sales of securities and properties and reduced dividend income. Included in 2008 is a gain of £600 million on the sale of Angel Trains. Insurance net premium income fell by £443 million reflecting lower bancassurance fees, and lower general insurance premiums.
RBS Group 201070
Business review continued
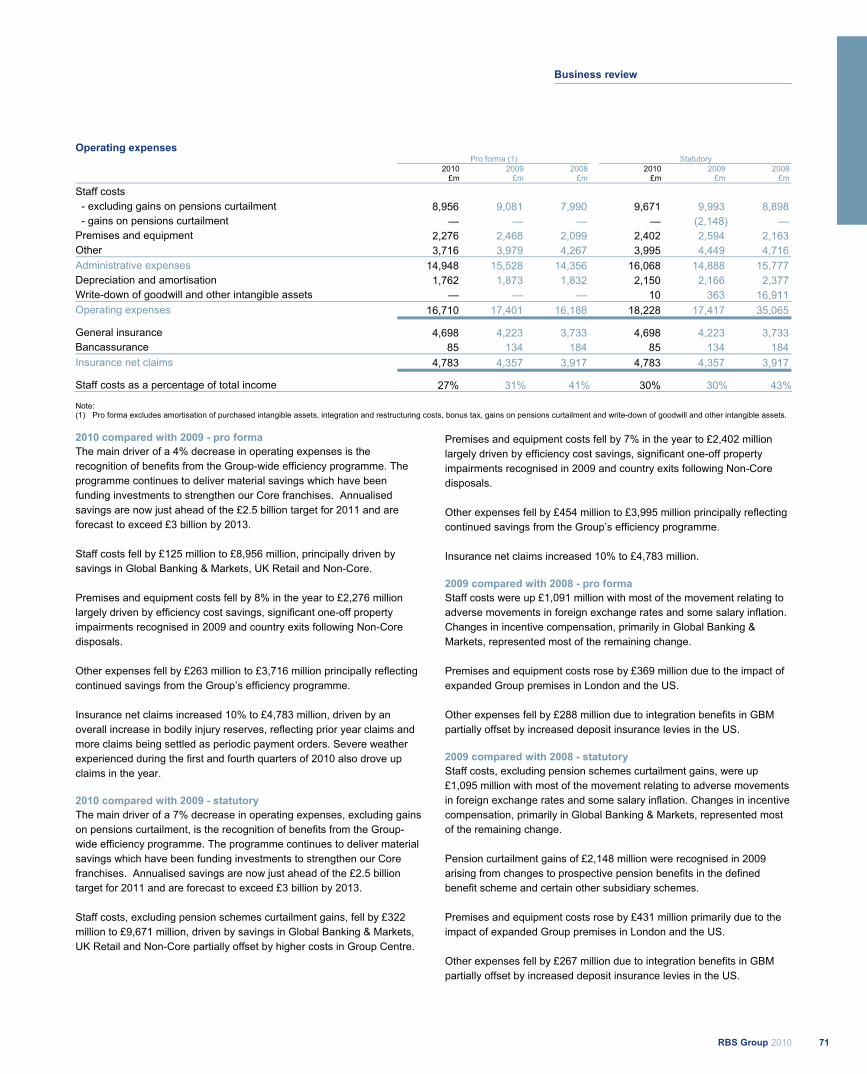
Operating expenses Pro forma (1) Statutory 2010 2009 2008 2010 2009 2008
£m £m £m £m £m £m
Staff costs - excluding gains on pensions curtailment 8,956 9,081 7,990 9,671 9,993 8,898
- gains on pensions curtailment — — — — (2,148) — Premises and equipment 2,276 2,468 2,099 2,402 2,594 2,163 Other 3,716 3,979 4,267 3,995 4,449 4,716 Administrative expenses 14,948 15,528 14,356 16,068 14,888 15,777 Depreciation and amortisation 1,762 1,873 1,832 2,150 2,166 2,377 Write-down of goodwill and other intangible assets — — — 10 363 16,911 Operating expenses 16,710 17,401 16,188 18,228 17,417 35,065
General insurance 4,698 4,223 3,733 4,698 4,223 3,733 Bancassurance 85 134 184 85 134 184 Insurance net claims 4,783 4,357 3,917 4,783 4,357 3,917
Staff costs as a percentage of total income 27% 31% 41% 30% 30% 43%
Note: (1) Pro forma excludes amortisation of purchased intangible assets, integration and restructuring costs, bonus tax, gains on pensions curtailment and write-down of goodwill and other intangible assets. 2010 compared with 2009 - pro forma The main driver of a 4% decrease in operating expenses is the recognition of benefits from the Group-wide efficiency programme. The programme continues to deliver material savings which have been funding investments to strengthen our Core franchises. Annualised savings are now just ahead of the £2.5 billion target for 2011 and are forecast to exceed £3 billion by 2013.
Staff costs fell by £125 million to £8,956 million, principally driven by savings in Global Banking & Markets, UK Retail and Non-Core.
Premises and equipment costs fell by 8% in the year to £2,276 million largely driven by efficiency cost savings, significant one-off property impairments recognised in 2009 and country exits following Non-Core disposals.
Other expenses fell by £263 million to £3,716 million principally reflecting continued savings from the Group’s efficiency programme.
Insurance net claims increased 10% to £4,783 million, driven by an overall increase in bodily injury reserves, reflecting prior year claims and more claims being settled as periodic payment orders. Severe weather experienced during the first and fourth quarters of 2010 also drove up claims in the year. 2010 compared with 2009 - statutory The main driver of a 7% decrease in operating expenses, excluding gains on pensions curtailment, is the recognition of benefits from the Group-wide efficiency programme. The programme continues to deliver material savings which have been funding investments to strengthen our Core franchises. Annualised savings are now just ahead of the £2.5 billion target for 2011 and are forecast to exceed £3 billion by 2013.
Staff costs, excluding pension schemes curtailment gains, fell by £322 million to £9,671 million, driven by savings in Global Banking & Markets, UK Retail and Non-Core partially offset by higher costs in Group Centre.
Premises and equipment costs fell by 7% in the year to £2,402 million largely driven by efficiency cost savings, significant one-off property impairments recognised in 2009 and country exits following Non-Core disposals.
Other expenses fell by £454 million to £3,995 million principally reflecting continued savings from the Group’s efficiency programme.
Insurance net claims increased 10% to £4,783 million. 2009 compared with 2008 - pro forma Staff costs were up £1,091 million with most of the movement relating to adverse movements in foreign exchange rates and some salary inflation. Changes in incentive compensation, primarily in Global Banking & Markets, represented most of the remaining change.
Premises and equipment costs rose by £369 million due to the impact of expanded Group premises in London and the US.
Other expenses fell by £288 million due to integration benefits in GBM partially offset by increased deposit insurance levies in the US. 2009 compared with 2008 - statutory Staff costs, excluding pension schemes curtailment gains, were up £1,095 million with most of the movement relating to adverse movements in foreign exchange rates and some salary inflation. Changes in incentive compensation, primarily in Global Banking & Markets, represented most of the remaining change.
Pension curtailment gains of £2,148 million were recognised in 2009 arising from changes to prospective pension benefits in the defined benefit scheme and certain other subsidiary schemes.
Premises and equipment costs rose by £431 million primarily due to the impact of expanded Group premises in London and the US. Other expenses fell by £267 million due to integration benefits in GBM partially offset by increased deposit insurance levies in the US.
71RBS Group 2010
Business review

Integration costs 2010 2009 2008 £m £m £m
Staff costs 210 365 503 Premises and equipment 3 78 25 Other administrative expenses 143 398 486 Depreciation and amortisation 20 18 36 376 859 1,050
2010 compared with 2009 Integration costs were £376 million compared with £859 million in 2009. The fall in integration costs primarily relates to RBS N.V. (formerly ABN AMRO), as they migrate onto RBS systems.
2009 compared with 2008 Integration costs in 2009 were £859 million compared with £1,050 million in 2008. Integration costs decreased primarily due to lower RBS N.V. (formerly ABN AMRO) integration activity during the year.
Accruals in relation to integration costs are set out below.
At
31 December Charge
to income Utilised during
At 31 December
2009 statement the year 2010 £m £m £m £m
Staff costs - redundancy — 55 (55) — Staff costs - other — 155 (155) — Premises and equipment 40 3 (19) 24 Other 1 163 (164) — 41 376 (393) 24
Restructuring costs 2010 2009 2008 £m £m £m
Staff costs 353 328 251 Premises and equipment 117 48 15 Other administrative expenses 104 51 41 574 427 307
2010 compared with 2009 Restructuring costs were £574 million compared with £427 million in 2009. The increase is a result of the number of restructuring projects being undertaken.
2009 compared with 2008 Restructuring costs were £427 million compared with £307 million in 2008. The number of restructuring projects increased during the year, as a result of ongoing strategic review being undertaken by the Group.
Accruals in relation to restructuring costs are set out below. At Charge Utilised At 31 December to income during 31 December 2009 statement the year 2010 £m £m £m £m
Staff costs - redundancy 255 255 (309) 201 Staff costs - other 4 98 (85) 17 Premises and equipment 37 117 (37) 117 Other 35 104 (93) 46 331 574 (524) 381
RBS Group 201072
Business review continued
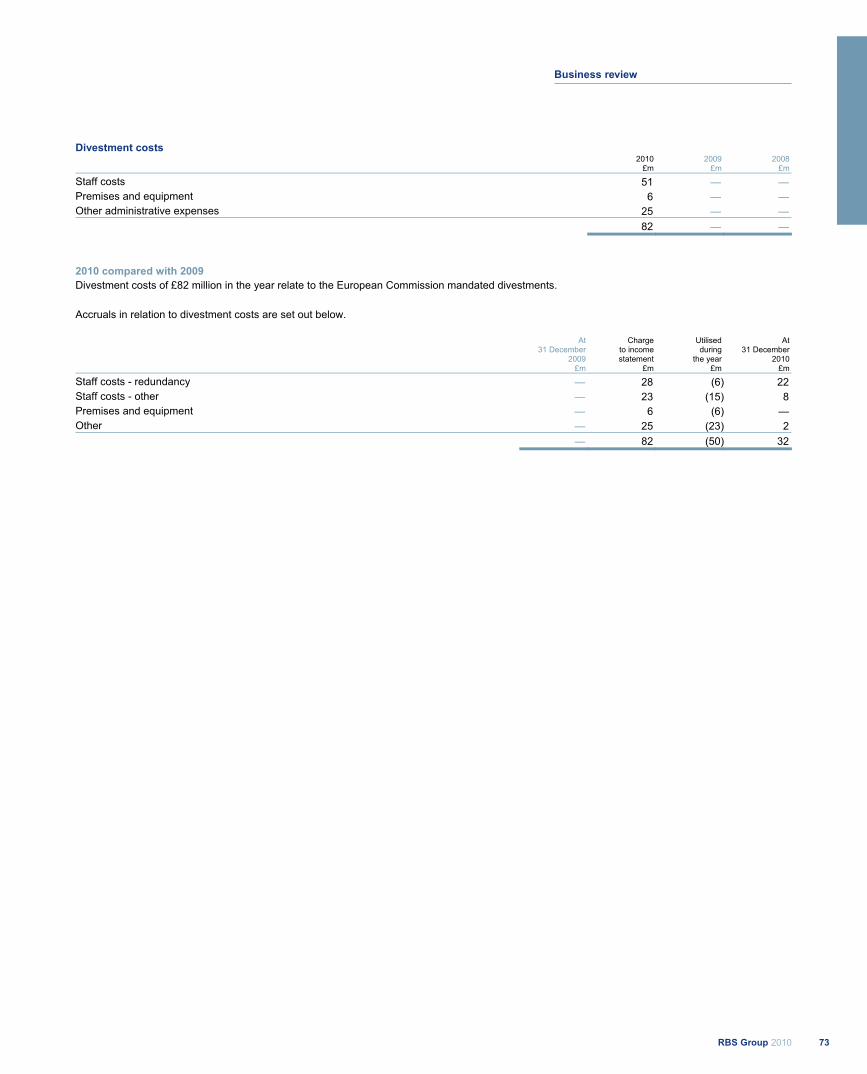
Divestment costs 2010 2009 2008 £m £m £m
Staff costs 51 — —Premises and equipment 6 — —Other administrative expenses 25 — —
82 — —
2010 compared with 2009 Divestment costs of £82 million in the year relate to the European Commission mandated divestments. Accruals in relation to divestment costs are set out below.
At Charge Utilised At 31 December to income during 31 December 2009 statement the year 2010 £m £m £m £m
Staff costs - redundancy — 28 (6) 22 Staff costs - other — 23 (15) 8 Premises and equipment — 6 (6) — Other — 25 (23) 2 — 82 (50) 32
73RBS Group 2010
Business review

Impairment losses Pro forma Statutory 2010 2009 2008 2010 2009 2008
£m £m £m £m £m £m
New impairment losses 9,667 14,224 7,693 9,667 14,224 7,700 Less: recoveries of amounts previously written-off (411) (325) (261) (411) (325) (261)Charge to income statement 9,256 13,899 7,432 9,256 13,899 7,439
Comprising: Loans and advances 9,144 13,090 6,478 9,144 13,090 6,478 Securities 112 809 954 112 809 961 Charge to income statement 9,256 13,899 7,432 9,256 13,899 7,439
2010 compared with 2009 - pro forma and statutory Impairment losses were £9,256 million, compared with £13,899 million in 2009. The 33% decrease reflects an overall improvement in the economic environments in which the Group operates. Impairments fell in all Core businesses, except Ulster Bank Group, which faced an economic environment that remains challenging, with rising default levels across both personal and corporate portfolios. Impairments for Ulster Bank Group (Core and Non-Core) increased to £3,843 million compared with £1,927 million in 2009. A significant proportion of the reduction in Core impairments relates to lower specific and latent provisions in UK Corporate, US Retail & Commercial and GBM. Non-Core impairments fell by 41% in 2010 reflecting the gradual improvement in the economic environment through 2010 and lower specific provisions, alongside a non-repeat of the large single name losses seen in 2009.
2009 compared with 2008 - pro forma Impairment losses were £13,899 million compared with £7,432 million. Impairment losses in the Core divisions increased by £2,182 million, while Non-Core losses increased by £4,285 million. In the Core business, the biggest increases were in UK Retail, UK Corporate and Ulster Bank, reflecting the difficult economic environment. Non-Core losses also increased substantially, particularly across the corporate and property sectors. 2009 compared with 2008 - statutory Impairment losses were £13,899 million compared with £7,439 million. Impairment losses in the Core divisions increased by £2,182 million, Non-Core losses increased by £4,285 million off-set by a decrease in RFS Holdings minority interest of £7 million. In the Core business, the biggest increases were in UK Retail, UK Corporate and Ulster Bank, reflecting the difficult economic environment. Non-Core losses also increased substantially, particularly across the corporate and property sectors.
RBS Group 201074
Business review continued
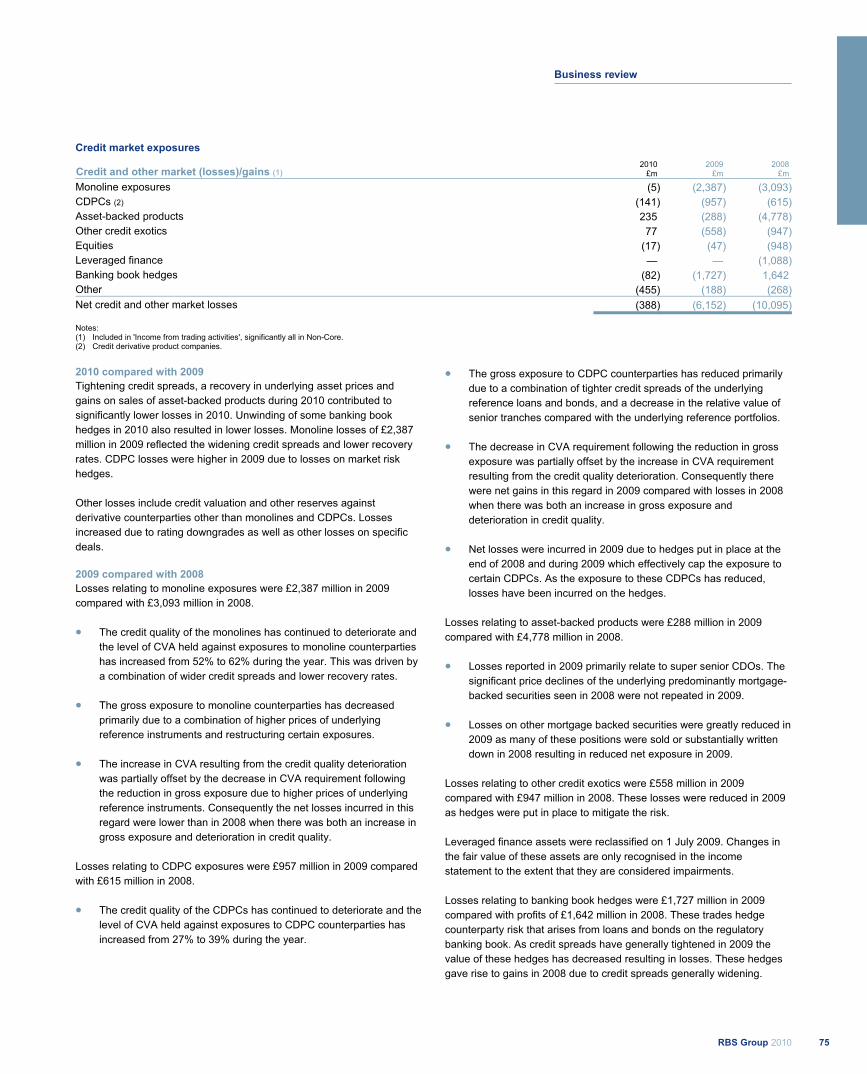
Credit market exposures
Credit and other market (losses)/gains (1) 2010
£m2009
£m2008
£m
Monoline exposures (5) (2,387) (3,093)CDPCs (2) (141) (957) (615)Asset-backed products 235 (288) (4,778)Other credit exotics 77 (558) (947)Equities (17) (47) (948)Leveraged finance — — (1,088)Banking book hedges (82) (1,727) 1,642 Other (455) (188) (268)Net credit and other market losses (388) (6,152) (10,095)
Notes: (1) Included in 'Income from trading activities', significantly all in Non-Core. (2) Credit derivative product companies.
2010 compared with 2009 Tightening credit spreads, a recovery in underlying asset prices and gains on sales of asset-backed products during 2010 contributed to significantly lower losses in 2010. Unwinding of some banking book hedges in 2010 also resulted in lower losses. Monoline losses of £2,387 million in 2009 reflected the widening credit spreads and lower recovery rates. CDPC losses were higher in 2009 due to losses on market risk hedges. Other losses include credit valuation and other reserves against derivative counterparties other than monolines and CDPCs. Losses increased due to rating downgrades as well as other losses on specific deals. 2009 compared with 2008 Losses relating to monoline exposures were £2,387 million in 2009 compared with £3,093 million in 2008.
The credit quality of the monolines has continued to deteriorate and the level of CVA held against exposures to monoline counterparties has increased from 52% to 62% during the year. This was driven by a combination of wider credit spreads and lower recovery rates.
The gross exposure to monoline counterparties has decreased primarily due to a combination of higher prices of underlying reference instruments and restructuring certain exposures.
The increase in CVA resulting from the credit quality deterioration was partially offset by the decrease in CVA requirement following the reduction in gross exposure due to higher prices of underlying reference instruments. Consequently the net losses incurred in this regard were lower than in 2008 when there was both an increase in gross exposure and deterioration in credit quality.
Losses relating to CDPC exposures were £957 million in 2009 compared with £615 million in 2008.
The credit quality of the CDPCs has continued to deteriorate and the level of CVA held against exposures to CDPC counterparties has increased from 27% to 39% during the year.
The gross exposure to CDPC counterparties has reduced primarily due to a combination of tighter credit spreads of the underlying reference loans and bonds, and a decrease in the relative value of senior tranches compared with the underlying reference portfolios.
The decrease in CVA requirement following the reduction in gross exposure was partially offset by the increase in CVA requirement resulting from the credit quality deterioration. Consequently there were net gains in this regard in 2009 compared with losses in 2008 when there was both an increase in gross exposure and deterioration in credit quality.
Net losses were incurred in 2009 due to hedges put in place at the end of 2008 and during 2009 which effectively cap the exposure to certain CDPCs. As the exposure to these CDPCs has reduced, losses have been incurred on the hedges.
Losses relating to asset-backed products were £288 million in 2009 compared with £4,778 million in 2008.
Losses reported in 2009 primarily relate to super senior CDOs. The significant price declines of the underlying predominantly mortgage-backed securities seen in 2008 were not repeated in 2009.
Losses on other mortgage backed securities were greatly reduced in 2009 as many of these positions were sold or substantially written down in 2008 resulting in reduced net exposure in 2009.
Losses relating to other credit exotics were £558 million in 2009 compared with £947 million in 2008. These losses were reduced in 2009 as hedges were put in place to mitigate the risk. Leveraged finance assets were reclassified on 1 July 2009. Changes in the fair value of these assets are only recognised in the income statement to the extent that they are considered impairments. Losses relating to banking book hedges were £1,727 million in 2009 compared with profits of £1,642 million in 2008. These trades hedge counterparty risk that arises from loans and bonds on the regulatory banking book. As credit spreads have generally tightened in 2009 the value of these hedges has decreased resulting in losses. These hedges gave rise to gains in 2008 due to credit spreads generally widening.
75RBS Group 2010
Business review
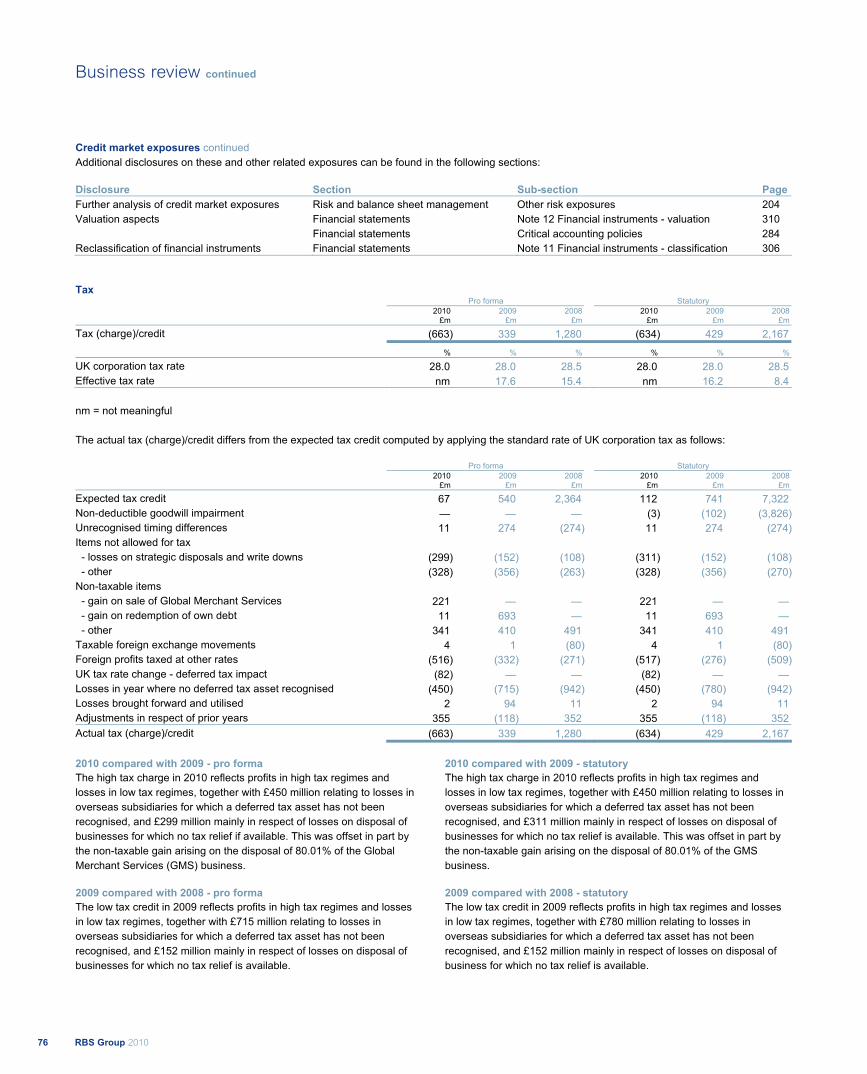
Credit market exposures continued Additional disclosures on these and other related exposures can be found in the following sections: Disclosure Section Sub-section PageFurther analysis of credit market exposures Risk and balance sheet management Other risk exposures 204 Valuation aspects Financial statements Note 12 Financial instruments - valuation 310 Financial statements Critical accounting policies 284 Reclassification of financial instruments Financial statements Note 11 Financial instruments - classification 306
Tax Pro forma Statutory 2010 2009 2008 2010 2009 2008
£m £m £m £m £m £m
Tax (charge)/credit (663) 339 1,280 (634) 429 2,167
% % % % % %
UK corporation tax rate 28.0 28.0 28.5 28.0 28.0 28.5 Effective tax rate nm 17.6 15.4 nm 16.2 8.4
nm = not meaningful The actual tax (charge)/credit differs from the expected tax credit computed by applying the standard rate of UK corporation tax as follows:
Pro forma Statutory 2010 2009 2008 2010 2009 2008
£m £m £m £m £m £m
Expected tax credit 67 540 2,364 112 741 7,322 Non-deductible goodwill impairment — — — (3) (102) (3,826)Unrecognised timing differences 11 274 (274) 11 274 (274)Items not allowed for tax
- losses on strategic disposals and write downs (299) (152) (108) (311) (152) (108) - other (328) (356) (263) (328) (356) (270)Non-taxable items
- gain on sale of Global Merchant Services 221 — — 221 — —- gain on redemption of own debt 11 693 — 11 693 —
- other 341 410 491 341 410 491 Taxable foreign exchange movements 4 1 (80) 4 1 (80)Foreign profits taxed at other rates (516) (332) (271) (517) (276) (509)UK tax rate change - deferred tax impact (82) — — (82) — —Losses in year where no deferred tax asset recognised (450) (715) (942) (450) (780) (942)Losses brought forward and utilised 2 94 11 2 94 11 Adjustments in respect of prior years 355 (118) 352 355 (118) 352 Actual tax (charge)/credit (663) 339 1,280 (634) 429 2,167
2010 compared with 2009 - pro forma The high tax charge in 2010 reflects profits in high tax regimes and losses in low tax regimes, together with £450 million relating to losses in overseas subsidiaries for which a deferred tax asset has not been recognised, and £299 million mainly in respect of losses on disposal of businesses for which no tax relief if available. This was offset in part by the non-taxable gain arising on the disposal of 80.01% of the Global Merchant Services (GMS) business. 2009 compared with 2008 - pro forma The low tax credit in 2009 reflects profits in high tax regimes and losses in low tax regimes, together with £715 million relating to losses in overseas subsidiaries for which a deferred tax asset has not been recognised, and £152 million mainly in respect of losses on disposal of businesses for which no tax relief is available.
2010 compared with 2009 - statutory The high tax charge in 2010 reflects profits in high tax regimes and losses in low tax regimes, together with £450 million relating to losses in overseas subsidiaries for which a deferred tax asset has not been recognised, and £311 million mainly in respect of losses on disposal of businesses for which no tax relief is available. This was offset in part by the non-taxable gain arising on the disposal of 80.01% of the GMS business. 2009 compared with 2008 - statutory The low tax credit in 2009 reflects profits in high tax regimes and losses in low tax regimes, together with £780 million relating to losses in overseas subsidiaries for which a deferred tax asset has not been recognised, and £152 million mainly in respect of losses on disposal of business for which no tax relief is available.
RBS Group 201076
Business review continued
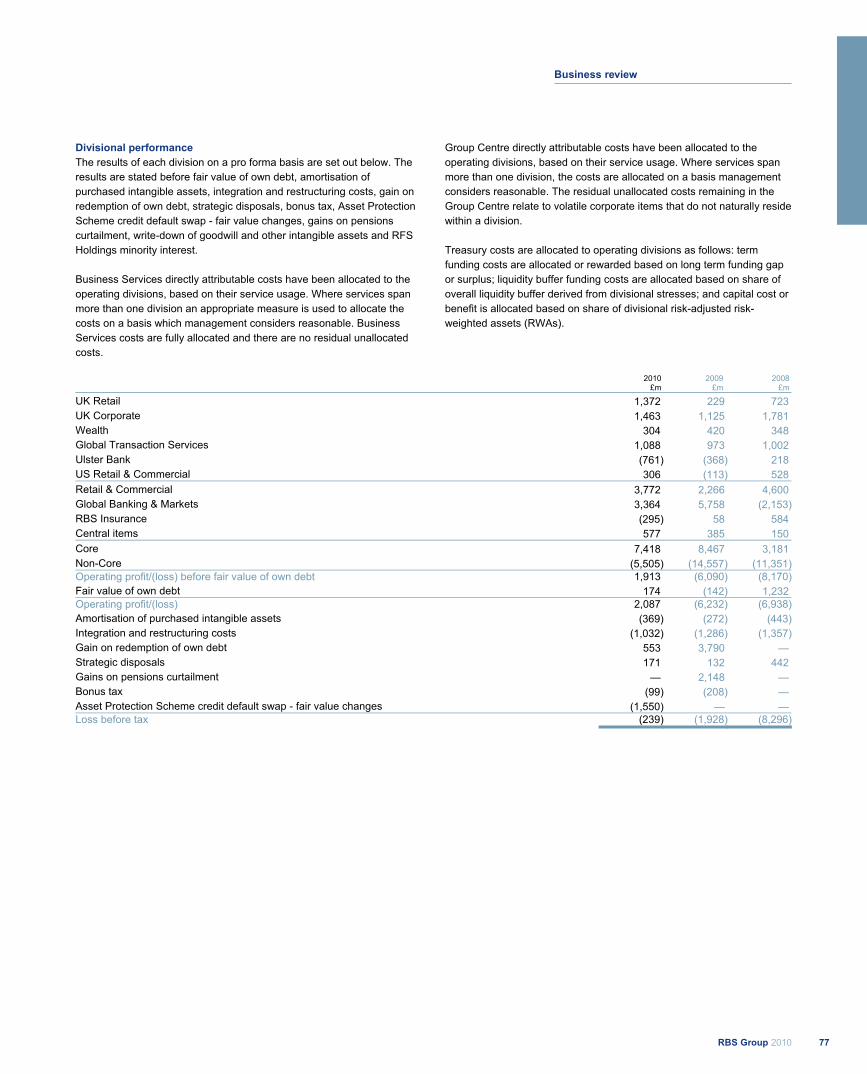
Divisional performance The results of each division on a pro forma basis are set out below. The results are stated before fair value of own debt, amortisation of purchased intangible assets, integration and restructuring costs, gain on redemption of own debt, strategic disposals, bonus tax, Asset Protection Scheme credit default swap - fair value changes, gains on pensions curtailment, write-down of goodwill and other intangible assets and RFS Holdings minority interest. Business Services directly attributable costs have been allocated to the operating divisions, based on their service usage. Where services span more than one division an appropriate measure is used to allocate the costs on a basis which management considers reasonable. Business Services costs are fully allocated and there are no residual unallocated costs.
Group Centre directly attributable costs have been allocated to the operating divisions, based on their service usage. Where services span more than one division, the costs are allocated on a basis management considers reasonable. The residual unallocated costs remaining in the Group Centre relate to volatile corporate items that do not naturally reside within a division. Treasury costs are allocated to operating divisions as follows: term funding costs are allocated or rewarded based on long term funding gap or surplus; liquidity buffer funding costs are allocated based on share of overall liquidity buffer derived from divisional stresses; and capital cost or benefit is allocated based on share of divisional risk-adjusted risk-weighted assets (RWAs).
2010 2009 2008
£m £m £m
UK Retail 1,372 229 723 UK Corporate 1,463 1,125 1,781 Wealth 304 420 348 Global Transaction Services 1,088 973 1,002 Ulster Bank (761) (368) 218 US Retail & Commercial 306 (113) 528 Retail & Commercial 3,772 2,266 4,600 Global Banking & Markets 3,364 5,758 (2,153)RBS Insurance (295) 58 584 Central items 577 385 150 Core 7,418 8,467 3,181 Non-Core (5,505) (14,557) (11,351)Operating profit/(loss) before fair value of own debt 1,913 (6,090) (8,170)Fair value of own debt 174 (142) 1,232 Operating profit/(loss) 2,087 (6,232) (6,938)Amortisation of purchased intangible assets (369) (272) (443)Integration and restructuring costs (1,032) (1,286) (1,357)Gain on redemption of own debt 553 3,790 — Strategic disposals 171 132 442 Gains on pensions curtailment — 2,148 — Bonus tax (99) (208) — Asset Protection Scheme credit default swap - fair value changes (1,550) — —Loss before tax (239) (1,928) (8,296)
77RBS Group 2010
Business review
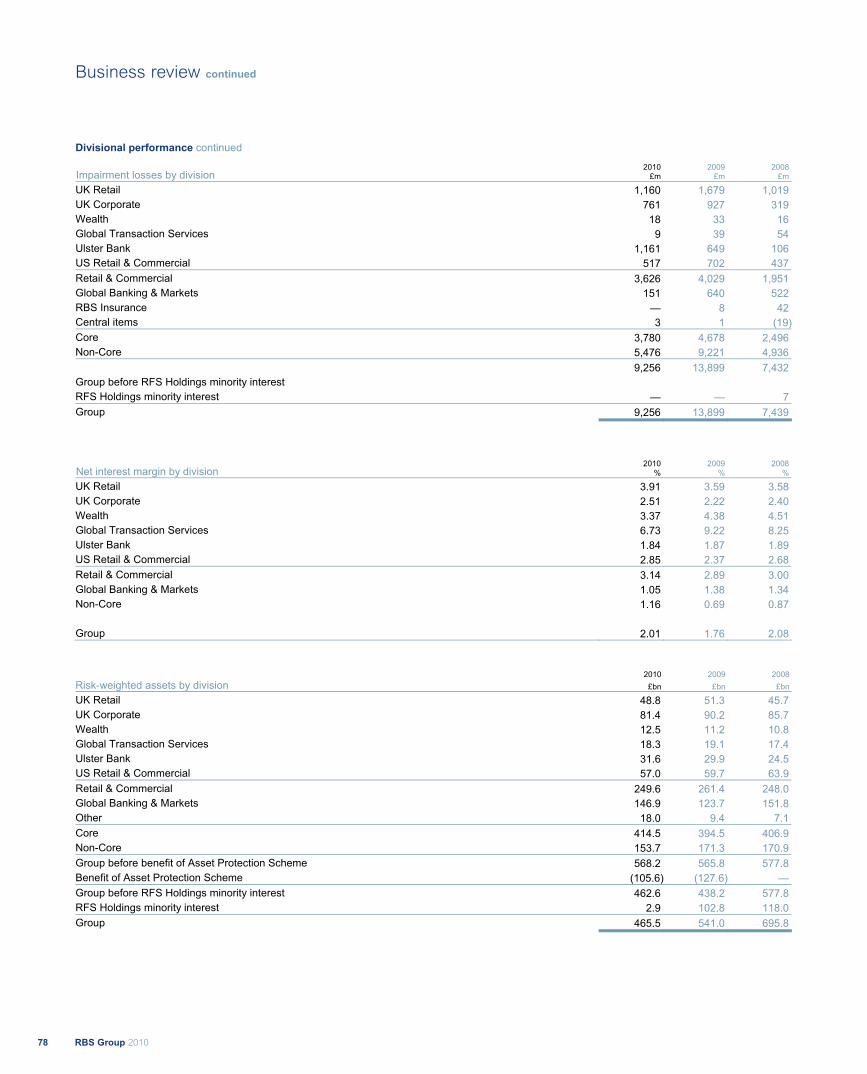
Divisional performance continued Impairment losses by division
2010 £m
2009 £m
2008 £m
UK Retail 1,160 1,679 1,019 UK Corporate 761 927 319 Wealth 18 33 16 Global Transaction Services 9 39 54 Ulster Bank 1,161 649 106 US Retail & Commercial 517 702 437 Retail & Commercial 3,626 4,029 1,951 Global Banking & Markets 151 640 522 RBS Insurance — 8 42 Central items 3 1 (19)Core 3,780 4,678 2,496 Non-Core 5,476 9,221 4,936 9,256 13,899 7,432 Group before RFS Holdings minority interest RFS Holdings minority interest — — 7Group 9,256 13,899 7,439
Net interest margin by division 2010
%2009
%2008
%
UK Retail 3.91 3.59 3.58 UK Corporate 2.51 2.22 2.40 Wealth 3.37 4.38 4.51 Global Transaction Services 6.73 9.22 8.25 Ulster Bank 1.84 1.87 1.89 US Retail & Commercial 2.85 2.37 2.68 Retail & Commercial 3.14 2.89 3.00 Global Banking & Markets 1.05 1.38 1.34 Non-Core 1.16 0.69 0.87 Group 2.01 1.76 2.08
2010 2009 2008 Risk-weighted assets by division £bn £bn £bn
UK Retail 48.8 51.3 45.7 UK Corporate 81.4 90.2 85.7 Wealth 12.5 11.2 10.8 Global Transaction Services 18.3 19.1 17.4 Ulster Bank 31.6 29.9 24.5 US Retail & Commercial 57.0 59.7 63.9 Retail & Commercial 249.6 261.4 248.0 Global Banking & Markets 146.9 123.7 151.8 Other 18.0 9.4 7.1 Core 414.5 394.5 406.9 Non-Core 153.7 171.3 170.9 Group before benefit of Asset Protection Scheme 568.2 565.8 577.8 Benefit of Asset Protection Scheme (105.6) (127.6) — Group before RFS Holdings minority interest 462.6 438.2 577.8 RFS Holdings minority interest 2.9 102.8 118.0 Group 465.5 541.0 695.8
RBS Group 201078
Business review continued
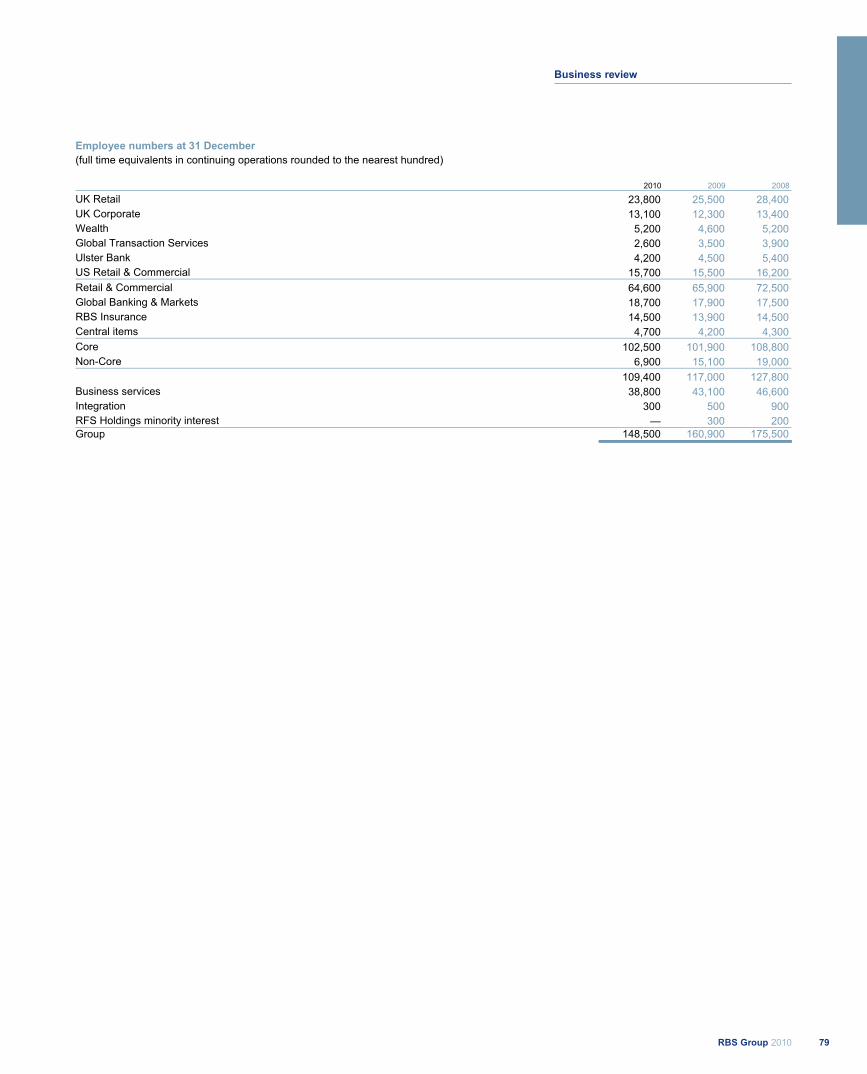
Employee numbers at 31 December (full time equivalents in continuing operations rounded to the nearest hundred)
2010 2009 2008
UK Retail 23,800 25,500 28,400 UK Corporate 13,100 12,300 13,400 Wealth 5,200 4,600 5,200 Global Transaction Services 2,600 3,500 3,900 Ulster Bank 4,200 4,500 5,400 US Retail & Commercial 15,700 15,500 16,200 Retail & Commercial 64,600 65,900 72,500 Global Banking & Markets 18,700 17,900 17,500 RBS Insurance 14,500 13,900 14,500 Central items 4,700 4,200 4,300 Core 102,500 101,900 108,800 Non-Core 6,900 15,100 19,000 109,400 117,000 127,800 Business services 38,800 43,100 46,600 Integration 300 500 900 RFS Holdings minority interest — 300 200 Group 148,500 160,900 175,500
79RBS Group 2010
Business review
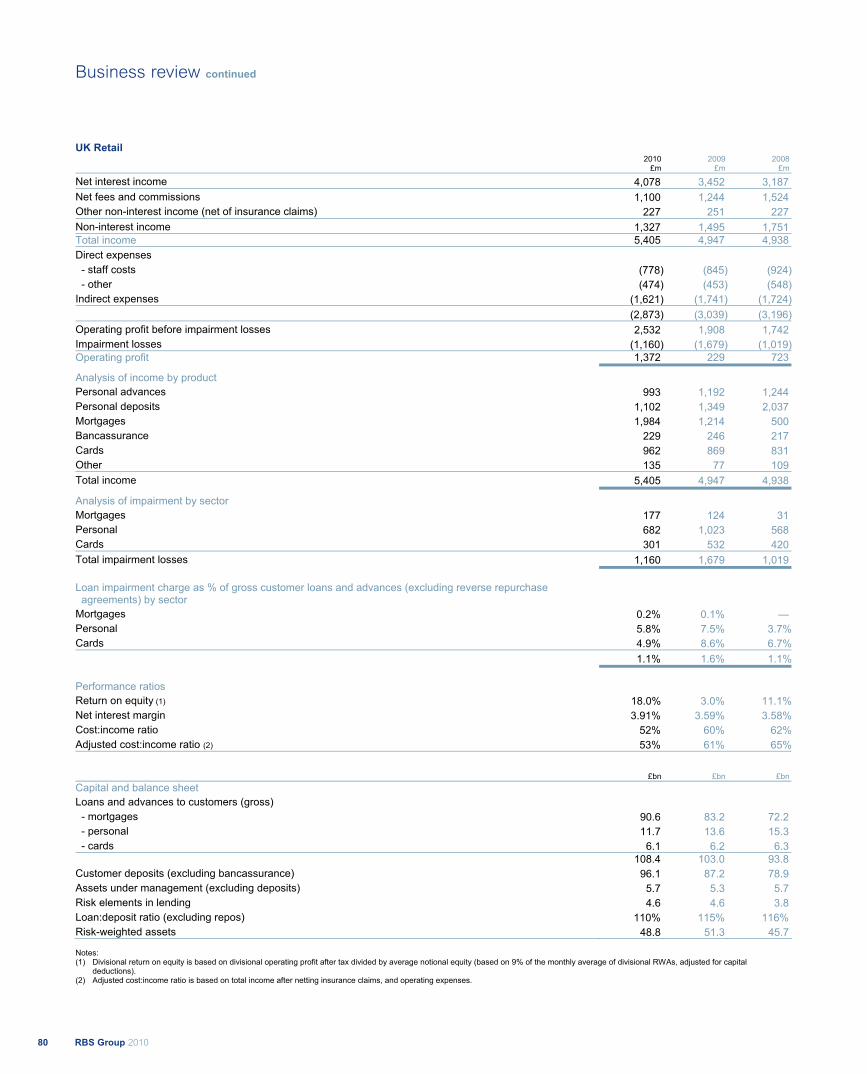
UK Retail 2010 2009 2008 £m £m £m
Net interest income 4,078 3,452 3,187 Net fees and commissions 1,100 1,244 1,524 Other non-interest income (net of insurance claims) 227 251 227 Non-interest income 1,327 1,495 1,751 Total income 5,405 4,947 4,938 Direct expenses
- staff costs (778) (845) (924) - other (474) (453) (548)Indirect expenses (1,621) (1,741) (1,724) (2,873) (3,039) (3,196)Operating profit before impairment losses 2,532 1,908 1,742 Impairment losses (1,160) (1,679) (1,019)Operating profit 1,372 229 723
Analysis of income by product Personal advances 993 1,192 1,244 Personal deposits 1,102 1,349 2,037 Mortgages 1,984 1,214 500 Bancassurance 229 246 217 Cards 962 869 831 Other 135 77 109 Total income 5,405 4,947 4,938
Analysis of impairment by sector Mortgages 177 124 31 Personal 682 1,023 568 Cards 301 532 420 Total impairment losses 1,160 1,679 1,019
Loan impairment charge as % of gross customer loans and advances (excluding reverse repurchase agreements) by sector Mortgages 0.2% 0.1% — Personal 5.8% 7.5% 3.7%Cards 4.9% 8.6% 6.7% 1.1% 1.6% 1.1%
Performance ratios Return on equity (1) 18.0% 3.0% 11.1%Net interest margin 3.91% 3.59% 3.58%Cost:income ratio 52% 60% 62%Adjusted cost:income ratio (2) 53% 61% 65%
£bn £bn £bn Capital and balance sheet Loans and advances to customers (gross) - mortgages 90.6 83.2 72.2 - personal 11.7 13.6 15.3 - cards 6.1 6.2 6.3 108.4 103.0 93.8 Customer deposits (excluding bancassurance) 96.1 87.2 78.9 Assets under management (excluding deposits) 5.7 5.3 5.7 Risk elements in lending 4.6 4.6 3.8 Loan:deposit ratio (excluding repos) 110% 115% 116% Risk-weighted assets 48.8 51.3 45.7
Notes: (1) Divisional return on equity is based on divisional operating profit after tax divided by average notional equity (based on 9% of the monthly average of divisional RWAs, adjusted for capital
deductions). (2) Adjusted cost:income ratio is based on total income after netting insurance claims, and operating expenses.
RBS Group 201080
Business review continued
The development of the RBS and NatWest Customer Charters aims to deliver those elements that customers have said are most important to them, and has been well received by both customers and staff. The division is reaping continuing benefits from investment in process improvements and automation, resulting in gains in both service quality and cost efficiency. Serving our customers better is a key priority for RBS. While our customer satisfaction compares well with our competitors we know we can do more. In June 2010 we launched a Customer Charter setting out 14 commitments to delivering helpful banking. The Customer Charter reflects the views and expectations of more than 30,000 customers. We are working hard to deliver on the commitments we have made. This won't happen overnight but the Customer Charter is our pledge that we will be regularly held to account against the progress we make. As part of this we will publish an independently-assured report on our performance every six months. 2010 compared with 2009 Operating profit recovered strongly from the low levels recorded in 2008 and 2009 to £1,372 million. Profit before impairments was up £624 million or 33% and impairments fell by £519 million as the economic environment continued to recover. The division has continued to focus in 2010 on growing secured lending while at the same time building customer deposits, thereby reducing the Group’s reliance on wholesale funding. Loans and advances to customers grew 5%, with a change in mix from unsecured to secured as the Group actively sought to improve its risk profile. Mortgage balances grew by 9% while unsecured lending contracted by 10%.
Mortgage growth was due to good retention of existing customers and new business, the majority of which comes from the existing customer base. Gross mortgage lending market share remained broadly in line with 2009 at 12%, with the Group on track to meet its Government target on net mortgage lending.
Customer deposits grew 10% on 2009, reflecting the strength of the UK Retail customer franchise, which outperformed the market in an increasingly competitive environment. Savings balances grew by £8 billion or 13% with 1.8 million accounts opened, outperforming the market total deposit growth of 3%. Personal current account balances increased by 3% on 2009.
Net interest income increased significantly by 18% to £4,078 million, driven by strong balance sheet growth and repricing. Net interest margin improved by 32 basis points to 3.91%, with widening asset margins partially offset by contracting liability margins in the face of a competitive deposit market. Non-interest income declined 11% to £1,327 million, principally reflecting the restructuring of current account overdraft fees in the final quarter of 2009. Expenses decreased by 5%, with the cost:income ratio (net of insurance claims) improving from 61% to 53%.
Direct staff costs declined by 8%, largely driven by a clear management focus on process re-engineering enabling a 7% reduction in headcount.
RBS continues to progress towards a more convenient, lower cost operating model, with over 4.8 million active users of online banking and a record share of new sales achieved through direct channels. More than 7.8 million accounts have switched to paperless statements and 276 branches now utilise automated cash deposit machines.
Impairment losses decreased 31% to £1,160 million primarily reflecting the recovery in the economic environment.
The mortgage impairment charge was £177 million (2009 - £124 million) on a total book of £91 billion. Mortgage arrears rates marginally increased in 2010 but remain below the industry average, as reported by the Council of Mortgage Lenders. Repossessions showed only a small increase on 2009, as the Group continues to support customers facing financial difficulties.
The unsecured lending impairment charge was £983 million (2009 - £1,555 million) on a total book of £18 billion.
Risk-weighted assets decreased by 5% to £48.8 billion, with lower unsecured lending, improving portfolio credit metrics and small procyclicality benefits more than offsetting growth in mortgages.
81RBS Group 2010
Business review
UK Retail continued 2009 compared with 2008 Operating profit of £229 million was £494 million lower than in 2008. Profit before impairments was up £166 million or 10%, but impairments rose by £660 million as the economic environment deteriorated, albeit with signs of conditions stabilising in the second half of the year. The division has focused in 2009 on growing secured lending to meet its Government targets while at the same time building customer deposits, thereby reducing the Group's reliance on wholesale funding. Loans and advances to customers grew 10%, with a change in mix from unsecured to secured as the Group sought actively to reduce its risk profile, with 15% growth in mortgage lending and an 8% reduction in unsecured lending.
Mortgage growth was due to good retention of existing customers and new business sourced predominantly from the existing customer base. Gross mortgage lending market share increased to 12% from 7% in 2008, with the Group on track to exceed its Government targets on net lending by £3 billion.
Customer deposits grew 11% on 2008 reflecting the strength of the UK Retail customer franchise, which outperformed the market in an increasingly competitive environment. Savings balances grew by £6 billion or 11% and account acquisition saw a 20% increase, with 2.2 million accounts opened. Personal current account balances increased by 12% on 2008 with a 3% growth in accounts to 12.8 million.
Net interest income increased significantly by 8% to £3,452 million, driven by strong balance sheet growth. Net interest margin was flat at 3.59%, with decreasing liability margins in the face of stiff competition for deposits offsetting wider asset margins. The growth in mortgages and the reduction in higher margin unsecured balances also had a negative impact on the blended net interest margin. Non-interest income declined 15% to £1,495 million, principally reflecting the withdrawal of the single premium payment protection insurance product and the restructuring of current account overdraft fees in the final quarter of 2009, with the annualised impact of the overdraft fee restructuring further affecting income in 2010. The weak economic environment presented little opportunity in 2009 to grow credit card, private banking and bancassurance fees.
Expenses decreased by 5%, with the cost:income ratio improving from 62% to 60%.
Direct staff costs declined by 9%, as the division benefited from strong cost control, a focus on process re-engineering and a 10% reduction in headcount.
RBS continues to progress towards a more convenient, lower cost operating model, with over 4 million active users of online banking and a record share of new sales achieved through direct channels. More than 5.5 million accounts have switched to paperless statements and 254 branches now utilise automated cash deposit machines.
Impairment losses increased 65% to £1,679 million reflecting the deterioration in the economic environment, and its impact on customer finances.
The mortgage impairment charge was £124 million (2008 - £31 million) on a total book of £83.2 billion. Mortgage arrears rates stabilised in the second half of 2009 and remain well below the industry average, as reported by the Council of Mortgage Lenders. Repossessions show only a small increase on 2008, as the Group continues to support customers facing financial difficulties.
The unsecured lending impairment charge was £1,555 million (2008 - £988 million) on a book of £19.8 billion. Industry benchmarks for cards arrears showed a slightly improving trend in the final quarter of 2009, which is consistent with the Group's experience. RBS continues to perform better than the market on arrears.
Risk-weighted assets increased by 12% to £51.3 billion due to higher lending and the upward pressure from procyclicality, more than offsetting the adoption of a through-the-cycle loss given default approach for mortgages.
RBS Group 201082
Business review continued
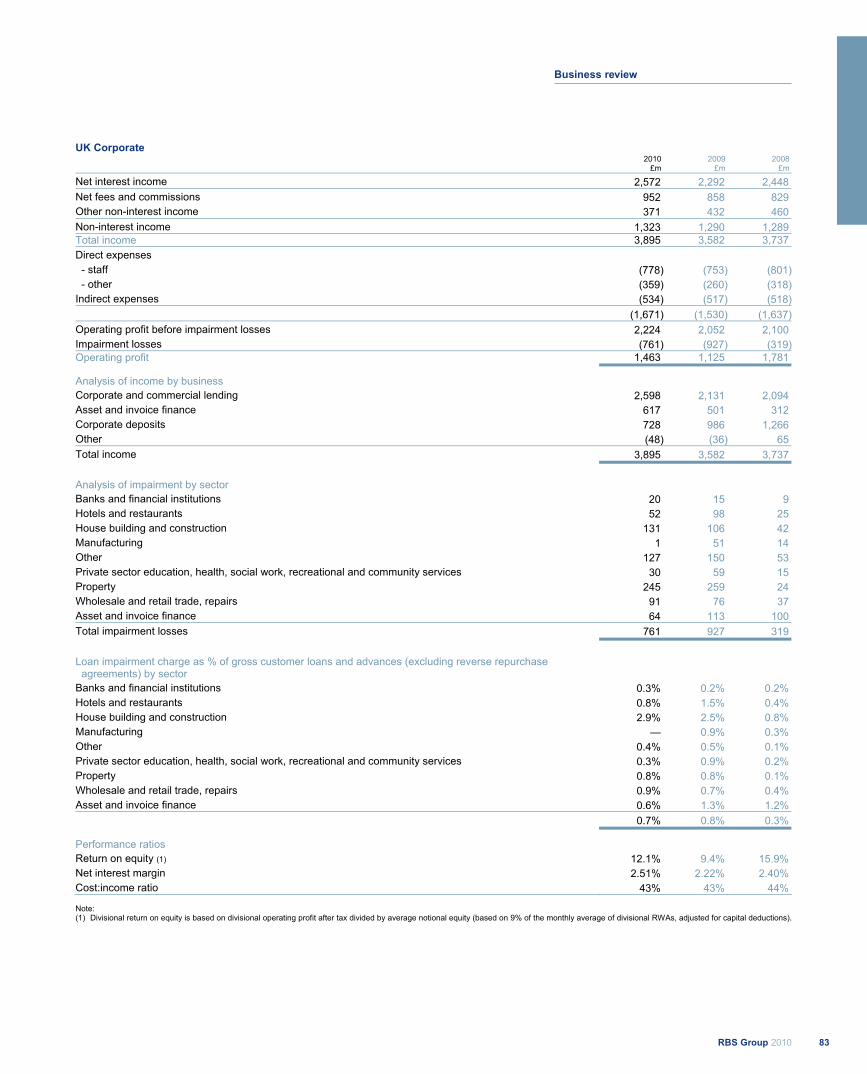
UK Corporate 2010 2009 2008 £m £m £m
Net interest income 2,572 2,292 2,448 Net fees and commissions 952 858 829 Other non-interest income 371 432 460 Non-interest income 1,323 1,290 1,289 Total income 3,895 3,582 3,737 Direct expenses
- staff (778) (753) (801) - other (359) (260) (318)Indirect expenses (534) (517) (518) (1,671) (1,530) (1,637)Operating profit before impairment losses 2,224 2,052 2,100 Impairment losses (761) (927) (319)Operating profit 1,463 1,125 1,781
Analysis of income by business Corporate and commercial lending 2,598 2,131 2,094 Asset and invoice finance 617 501 312 Corporate deposits 728 986 1,266 Other (48) (36) 65 Total income 3,895 3,582 3,737
Analysis of impairment by sector Banks and financial institutions 20 15 9 Hotels and restaurants 52 98 25 House building and construction 131 106 42 Manufacturing 1 51 14 Other 127 150 53 Private sector education, health, social work, recreational and community services 30 59 15 Property 245 259 24 Wholesale and retail trade, repairs 91 76 37 Asset and invoice finance 64 113 100 Total impairment losses 761 927 319
Loan impairment charge as % of gross customer loans and advances (excluding reverse repurchase agreements) by sector Banks and financial institutions 0.3% 0.2% 0.2% Hotels and restaurants 0.8% 1.5% 0.4% House building and construction 2.9% 2.5% 0.8% Manufacturing — 0.9% 0.3% Other 0.4% 0.5% 0.1% Private sector education, health, social work, recreational and community services 0.3% 0.9% 0.2% Property 0.8% 0.8% 0.1% Wholesale and retail trade, repairs 0.9% 0.7% 0.4% Asset and invoice finance 0.6% 1.3% 1.2% 0.7% 0.8% 0.3%
Performance ratios Return on equity (1) 12.1% 9.4% 15.9% Net interest margin 2.51% 2.22% 2.40% Cost:income ratio 43% 43% 44%
Note: (1) Divisional return on equity is based on divisional operating profit after tax divided by average notional equity (based on 9% of the monthly average of divisional RWAs, adjusted for capital deductions).
83RBS Group 2010
Business review
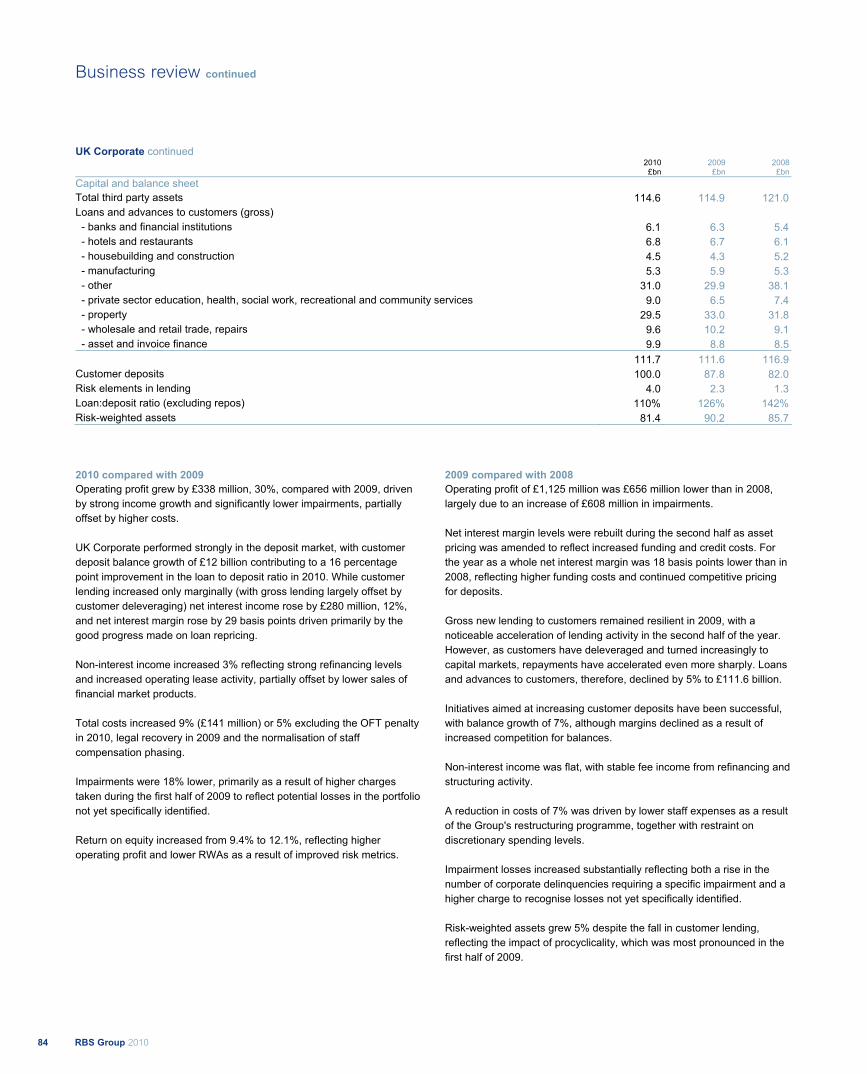
UK Corporate continued 2010 2009 2008 £bn £bn £bn
Capital and balance sheet Total third party assets 114.6 114.9 121.0 Loans and advances to customers (gross) - banks and financial institutions 6.1 6.3 5.4 - hotels and restaurants 6.8 6.7 6.1 - housebuilding and construction 4.5 4.3 5.2 - manufacturing 5.3 5.9 5.3 - other 31.0 29.9 38.1 - private sector education, health, social work, recreational and community services 9.0 6.5 7.4 - property 29.5 33.0 31.8 - wholesale and retail trade, repairs 9.6 10.2 9.1 - asset and invoice finance 9.9 8.8 8.5 111.7 111.6 116.9 Customer deposits 100.0 87.8 82.0 Risk elements in lending 4.0 2.3 1.3 Loan:deposit ratio (excluding repos) 110% 126% 142% Risk-weighted assets 81.4 90.2 85.7
2010 compared with 2009 Operating profit grew by £338 million, 30%, compared with 2009, driven by strong income growth and significantly lower impairments, partially offset by higher costs. UK Corporate performed strongly in the deposit market, with customer deposit balance growth of £12 billion contributing to a 16 percentage point improvement in the loan to deposit ratio in 2010. While customer lending increased only marginally (with gross lending largely offset by customer deleveraging) net interest income rose by £280 million, 12%, and net interest margin rose by 29 basis points driven primarily by the good progress made on loan repricing. Non-interest income increased 3% reflecting strong refinancing levels and increased operating lease activity, partially offset by lower sales of financial market products. Total costs increased 9% (£141 million) or 5% excluding the OFT penalty in 2010, legal recovery in 2009 and the normalisation of staff compensation phasing. Impairments were 18% lower, primarily as a result of higher charges taken during the first half of 2009 to reflect potential losses in the portfolio not yet specifically identified. Return on equity increased from 9.4% to 12.1%, reflecting higher operating profit and lower RWAs as a result of improved risk metrics.
2009 compared with 2008 Operating profit of £1,125 million was £656 million lower than in 2008, largely due to an increase of £608 million in impairments. Net interest margin levels were rebuilt during the second half as asset pricing was amended to reflect increased funding and credit costs. For the year as a whole net interest margin was 18 basis points lower than in 2008, reflecting higher funding costs and continued competitive pricing for deposits. Gross new lending to customers remained resilient in 2009, with a noticeable acceleration of lending activity in the second half of the year. However, as customers have deleveraged and turned increasingly to capital markets, repayments have accelerated even more sharply. Loans and advances to customers, therefore, declined by 5% to £111.6 billion. Initiatives aimed at increasing customer deposits have been successful, with balance growth of 7%, although margins declined as a result of increased competition for balances. Non-interest income was flat, with stable fee income from refinancing and structuring activity. A reduction in costs of 7% was driven by lower staff expenses as a result of the Group's restructuring programme, together with restraint on discretionary spending levels. Impairment losses increased substantially reflecting both a rise in the number of corporate delinquencies requiring a specific impairment and a higher charge to recognise losses not yet specifically identified. Risk-weighted assets grew 5% despite the fall in customer lending, reflecting the impact of procyclicality, which was most pronounced in the first half of 2009.
RBS Group 201084
Business review continued
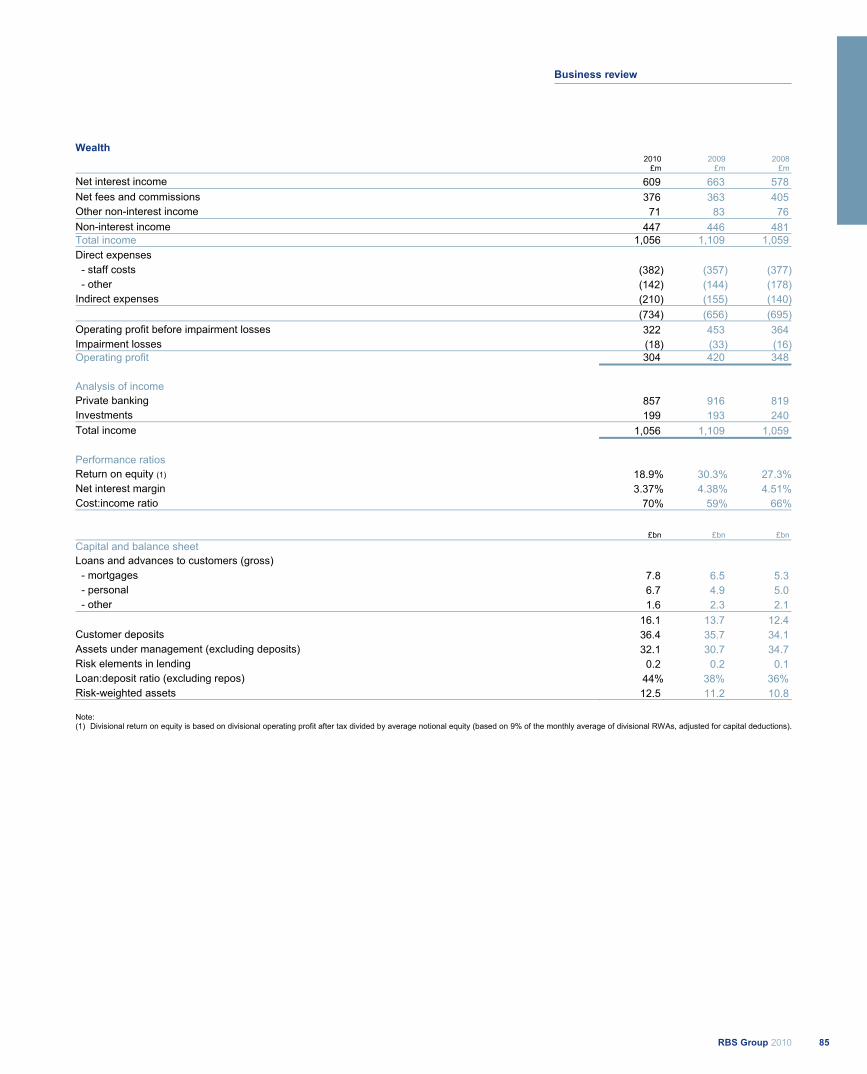
Wealth 2010 2009 2008 £m £m £m
Net interest income 609 663 578 Net fees and commissions 376 363 405 Other non-interest income 71 83 76 Non-interest income 447 446 481 Total income 1,056 1,109 1,059 Direct expenses
- staff costs (382) (357) (377) - other (142) (144) (178)Indirect expenses (210) (155) (140) (734) (656) (695)Operating profit before impairment losses 322 453 364 Impairment losses (18) (33) (16)Operating profit 304 420 348
Analysis of income Private banking 857 916 819 Investments 199 193 240 Total income 1,056 1,109 1,059
Performance ratios Return on equity (1) 18.9% 30.3% 27.3%Net interest margin 3.37% 4.38% 4.51%Cost:income ratio 70% 59% 66%
£bn £bn £bn Capital and balance sheet Loans and advances to customers (gross) - mortgages 7.8 6.5 5.3 - personal 6.7 4.9 5.0 - other 1.6 2.3 2.1 16.1 13.7 12.4 Customer deposits 36.4 35.7 34.1 Assets under management (excluding deposits) 32.1 30.7 34.7 Risk elements in lending 0.2 0.2 0.1 Loan:deposit ratio (excluding repos) 44% 38% 36% Risk-weighted assets 12.5 11.2 10.8
Note: (1) Divisional return on equity is based on divisional operating profit after tax divided by average notional equity (based on 9% of the monthly average of divisional RWAs, adjusted for capital deductions).
85RBS Group 2010
Business review

Wealth continued 2010 compared with 2009 2010 operating profit fell by 28% driven by lower net interest income and higher expenses, partly offset by a 45% decline in impairments in the year. Income declined by 5% primarily due to lower net interest income. Strong lending and investment income was offset by the impact of a competitive deposit market. Expenses grew by 12% to £734 million. Direct expenses were up 5%, £23 million reflecting additional strategic investment. Indirect expenses increased by £55 million reflecting a change in allocation of Business Services costs. Assets under management grew by 5% largely through improving market conditions. On a constant currency basis, assets fell 2% with valuation gains being offset by client losses in the international businesses, resulting from the private banker attrition previously experienced. 2009 compared with 2008 Wealth produced strong growth in operating profit, up 21% to £420 million, reflecting the increased value of the division's healthy deposit base in an increasingly competitive market for funding. Deposit balances increased by 5% from 2008, though the deposit market remains highly competitive.
Total income was up 5% (1% in constant currency terms), with strong growth in net interest income, up 12% in constant currency terms reflecting the increased internal pricing applied to Wealth's deposit base. This was offset by a marked decrease in investment income year on year as assets under management decreased by 8% at constant exchange rates during 2009, with investors turning to more liquid assets and away from longer term investments. Loans and advances increased by 10% over 2008, primarily in the UK. Lending margins improved, particularly for mortgages, and credit metrics for new business remain satisfactory. Expenses were down 6% (10% lower on a constant currency basis), reflecting a rigorous focus on cost management, with staff costs decreasing by 5% as a result of planned headcount reduction. The cost:income ratio improved from 66% to 59%. Impairments increased by £17 million over 2008 reflecting some isolated difficulties in the UK and offshore mortgage books (representing mortgages for second properties for expatriates). Provisions as a percentage of lending to customers increased slightly to 0.25%.
RBS Group 201086
Business review continued
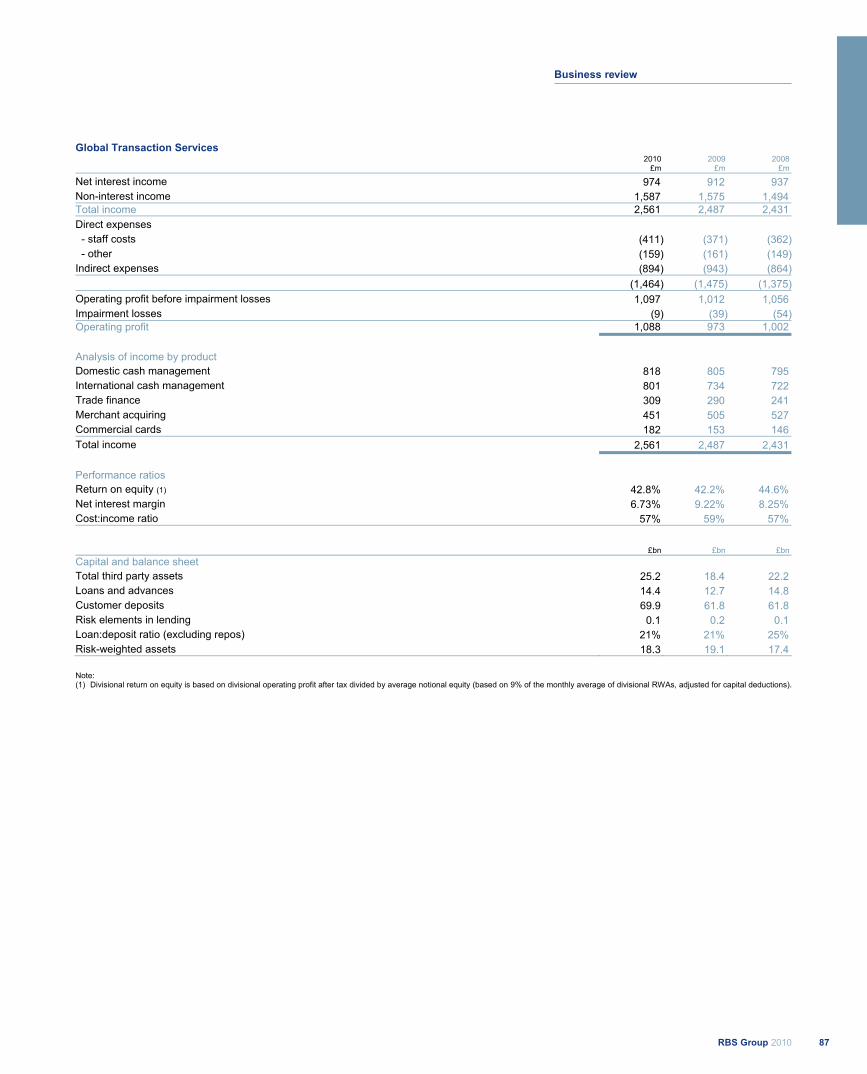
Global Transaction Services 2010 2009 2008 £m £m £m
Net interest income 974 912 937 Non-interest income 1,587 1,575 1,494 Total income 2,561 2,487 2,431 Direct expenses
- staff costs (411) (371) (362) - other (159) (161) (149)Indirect expenses (894) (943) (864) (1,464) (1,475) (1,375)Operating profit before impairment losses 1,097 1,012 1,056 Impairment losses (9) (39) (54)Operating profit 1,088 973 1,002
Analysis of income by product Domestic cash management 818 805 795 International cash management 801 734 722 Trade finance 309 290 241 Merchant acquiring 451 505 527 Commercial cards 182 153 146 Total income 2,561 2,487 2,431
Performance ratios Return on equity (1) 42.8% 42.2% 44.6% Net interest margin 6.73% 9.22% 8.25% Cost:income ratio 57% 59% 57%
£bn £bn £bn Capital and balance sheet Total third party assets 25.2 18.4 22.2 Loans and advances 14.4 12.7 14.8 Customer deposits 69.9 61.8 61.8 Risk elements in lending 0.1 0.2 0.1 Loan:deposit ratio (excluding repos) 21% 21% 25% Risk-weighted assets 18.3 19.1 17.4
Note: (1) Divisional return on equity is based on divisional operating profit after tax divided by average notional equity (based on 9% of the monthly average of divisional RWAs, adjusted for capital deductions).
87RBS Group 2010
Business review

Global Transaction Services continued 2010 compared with 2009 Operating profit increased 12%, or 10% on a constant foreign exchange basis, driven by a robust income performance (which has more than compensated for the loss of Global Merchant Services (GMS) income), good cost control and lower impairments. Adjusting for the disposal operating profit increased 21%. For the eleven months before disposal, GTS booked income of £451 million and total expenses of £244 million for GMS, generating an operating profit of £207 million. Income was up 3%, or 6% excluding GMS, reflecting higher deposit volumes in the International Cash Management business, growth in the Trade Finance business and improved Commercial Card transaction volumes. Expenses were broadly in line with 2009, at £1,464 million, as increased investment in front office and support infrastructure was mitigated by tight management of business costs. Third party assets increased by £6.8 billion, or £7.6 billion excluding GMS, as Yen clearing activities were brought in-house and loans and advances increased.
2009 compared with 2008 Operating profit declined by 3%, or 6% at constant foreign exchange rates, largely reflecting pressure on deposit income. The attrition of deposit balances experienced in the first half was reversed in the second, but margins remain compressed due to both a very competitive deposit market as well as the low rate environment. Customer deposit balances at £61.8 billion were flat on the previous year, with growth in the UK and international business offset by weaker US domestic balances. At constant exchange rates balances were up 3%. Loans and advances were down 14% (11% in constant currency terms) due to reduced overdraft utilisation and lower trade volumes. At constant exchange rates, international payment fees increased by 11%, while trade finance income increased by 8%, with improved penetration in the Asia-Pacific region. Merchant acquiring income, however, declined by 9% at constant exchange rates, as consumers continued to switch to lower margin debit card transactions in preference to using credit cards. Expenses were up 7% in headline terms but flat in constant currency terms, as cost savings and efficiencies helped to mitigate the impact of investment in infrastructure. Staff expenses were 2% lower in constant currency terms, with headcount down 5%. The cost:income ratio was 59%, a deterioration of 2.7 percentage points or 1.9 percentage points in constant currency terms. Impairment losses were £39 million, down £15 million versus 2008. Overall defaults remain modest at 0.3% of loans and advances.
RBS Group 201088
Business review continued

Ulster Bank 2010 2009 2008 £m £m £m
Net interest income 761 780 773 Net fees and commissions 156 228 238 Other non-interest income 58 26 28 Non-interest income 214 254 266 Total income 975 1,034 1,039 Direct expenses
- staff (237) (325) (330) - other (74) (86) (100)Indirect expenses (264) (342) (285) (575) (753) (715)Operating profit before impairment losses 400 281 324 Impairment losses (1,161) (649) (106)Operating (loss)/profit (761) (368) 218
Analysis of income by business Corporate 521 580 618 Retail 465 412 396 Other (11) 42 25 Total income 975 1,034 1,039
Analysis of impairment by sector Mortgages 294 74 17 Corporate - property 375 306 37 - other corporate 444 203 7 Other lending 48 66 45 Total impairment losses 1,161 649 106
Loan impairment charge as % of gross customer loans and advances (excluding reverse repurchase agreements) by sector Mortgages 1.4% 0.5% 0.1% Corporate - property 6.9% 3.0% 0.3% - other corporate 4.9% 1.8% 0.1% Other lending 3.7% 2.7% 2.1% 3.1% 1.6% 0.2% Performance ratios Return on equity (1) (21.0%) (11.7%) 8.9% Net interest margin 1.84% 1.87% 1.89% Cost:income ratio 59% 73% 69%
Note: (1) Divisional return on equity is based on divisional operating (loss)/profit after tax divided by average notional equity (based on 9% of the monthly average of divisional RWAs, adjusted for capital
deductions).
89RBS Group 2010
Business review
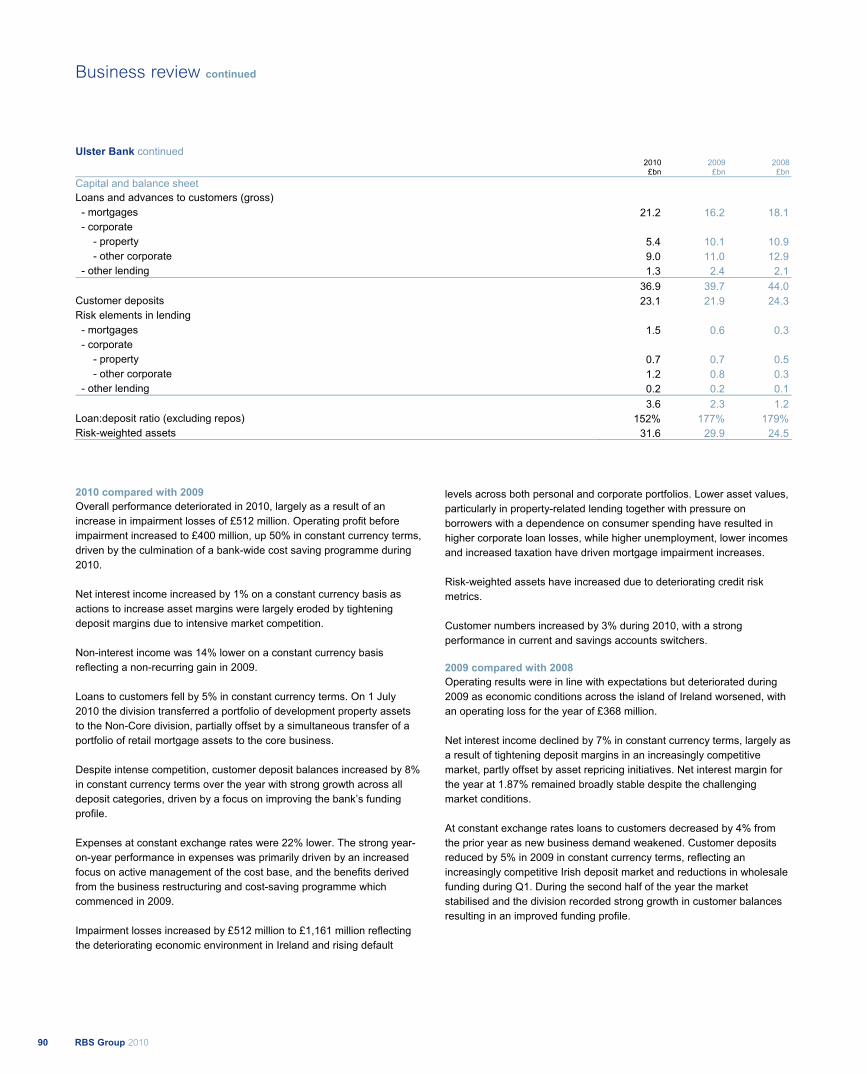
Ulster Bank continued 2010 2009 2008 £bn £bn £bn Capital and balance sheet Loans and advances to customers (gross) - mortgages 21.2 16.2 18.1 - corporate - property 5.4 10.1 10.9 - other corporate 9.0 11.0 12.9 - other lending 1.3 2.4 2.1 36.9 39.7 44.0 Customer deposits 23.1 21.9 24.3 Risk elements in lending - mortgages 1.5 0.6 0.3 - corporate - property 0.7 0.7 0.5 - other corporate 1.2 0.8 0.3 - other lending 0.2 0.2 0.1 3.6 2.3 1.2 Loan:deposit ratio (excluding repos) 152% 177% 179% Risk-weighted assets 31.6 29.9 24.5
2010 compared with 2009 Overall performance deteriorated in 2010, largely as a result of an increase in impairment losses of £512 million. Operating profit before impairment increased to £400 million, up 50% in constant currency terms, driven by the culmination of a bank-wide cost saving programme during 2010. Net interest income increased by 1% on a constant currency basis as actions to increase asset margins were largely eroded by tightening deposit margins due to intensive market competition. Non-interest income was 14% lower on a constant currency basis reflecting a non-recurring gain in 2009. Loans to customers fell by 5% in constant currency terms. On 1 July 2010 the division transferred a portfolio of development property assets to the Non-Core division, partially offset by a simultaneous transfer of a portfolio of retail mortgage assets to the core business. Despite intense competition, customer deposit balances increased by 8% in constant currency terms over the year with strong growth across all deposit categories, driven by a focus on improving the bank’s funding profile. Expenses at constant exchange rates were 22% lower. The strong year-on-year performance in expenses was primarily driven by an increased focus on active management of the cost base, and the benefits derived from the business restructuring and cost-saving programme which commenced in 2009. Impairment losses increased by £512 million to £1,161 million reflecting the deteriorating economic environment in Ireland and rising default
levels across both personal and corporate portfolios. Lower asset values, particularly in property-related lending together with pressure on borrowers with a dependence on consumer spending have resulted in higher corporate loan losses, while higher unemployment, lower incomes and increased taxation have driven mortgage impairment increases. Risk-weighted assets have increased due to deteriorating credit risk metrics. Customer numbers increased by 3% during 2010, with a strong performance in current and savings accounts switchers. 2009 compared with 2008 Operating results were in line with expectations but deteriorated during 2009 as economic conditions across the island of Ireland worsened, with an operating loss for the year of £368 million. Net interest income declined by 7% in constant currency terms, largely as a result of tightening deposit margins in an increasingly competitive market, partly offset by asset repricing initiatives. Net interest margin for the year at 1.87% remained broadly stable despite the challenging market conditions. At constant exchange rates loans to customers decreased by 4% from the prior year as new business demand weakened. Customer deposits reduced by 5% in 2009 in constant currency terms, reflecting an increasingly competitive Irish deposit market and reductions in wholesale funding during Q1. During the second half of the year the market stabilised and the division recorded strong growth in customer balances resulting in an improved funding profile.
RBS Group 201090
Business review continued

Non-interest income declined by 12% in constant currency terms due to lower fee income driven by reduced activity levels across all business lines. Total costs for the year were flat on a constant currency basis. Direct expenses were down 12% in constant currency terms during 2009, driven by the bank's restructuring programme, which incorporates the merger of the First Active and Ulster Bank businesses. The rollout of the programme has resulted in a downward trend in direct expenses throughout 2009. The reduction in direct expenses has been offset by a 17% increase in indirect expenses primarily reflecting provisions relating to the bank's own property recognised in the fourth quarter. Impairment losses increased to £649 million from £106 million driven by the continued deterioration in the Irish economic environment and resultant impact on loan performance across the retail and wholesale portfolios.
Necessary fiscal budgetary action allied to the well-entrenched downturn in property markets in Ireland has fed through to higher loan losses. Mortgage impairments have been driven by rising unemployment and lower incomes. Loans to the property sector experienced a substantial rise in defaults as the Irish property market declined, reflecting the difficult economic backdrop and the uncertainty surrounding the possible effect of the Irish Government's National Asset Management Agency on asset values. Sectors driven by consumer spending have been affected by the double digit decline in 2009 with rising default rates evident. Customer account numbers increased by 3% during 2009, with growth fuelled by strong current account activity and new-to-bank savings customers.
91RBS Group 2010
Business review
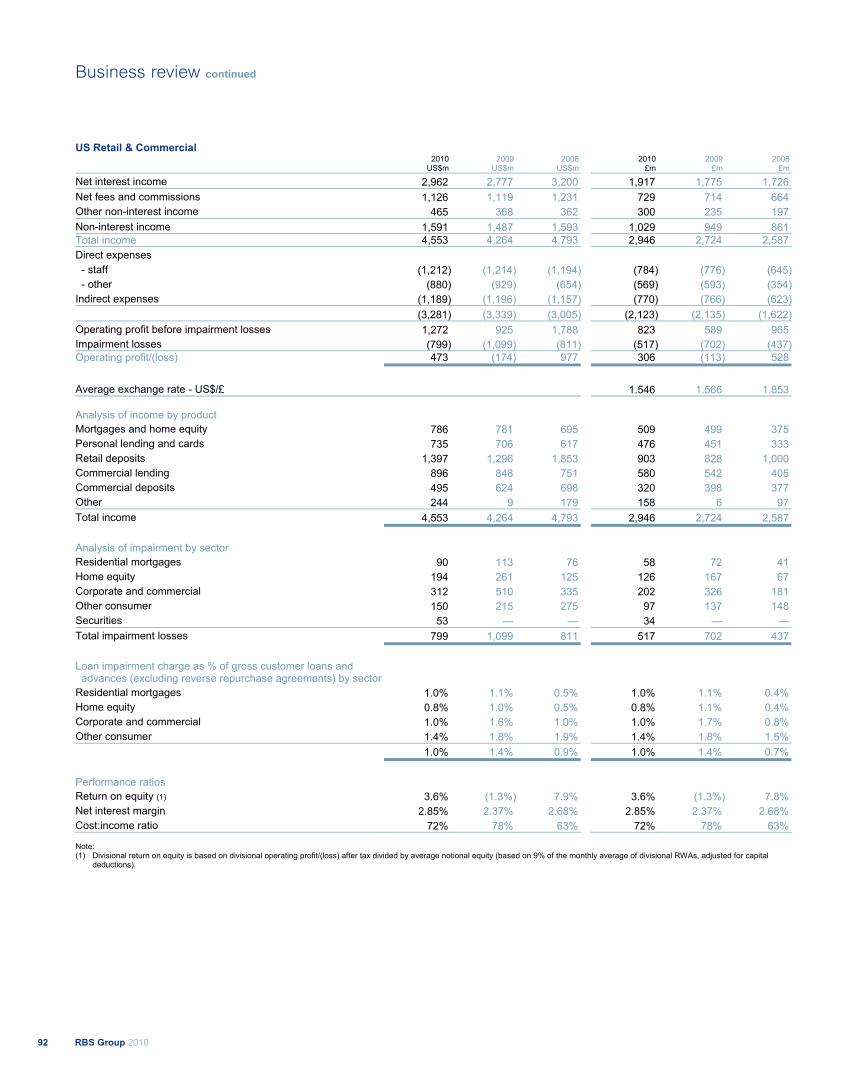
US Retail & Commercial 2010 2009 2008 2010 2009 2008 US$m US$m US$m £m £m £m
Net interest income 2,962 2,777 3,200 1,917 1,775 1,726 Net fees and commissions 1,126 1,119 1,231 729 714 664 Other non-interest income 465 368 362 300 235 197 Non-interest income 1,591 1,487 1,593 1,029 949 861 Total income 4,553 4,264 4,793 2,946 2,724 2,587 Direct expenses
- staff (1,212) (1,214) (1,194) (784) (776) (645) - other (880) (929) (654) (569) (593) (354)Indirect expenses (1,189) (1,196) (1,157) (770) (766) (623) (3,281) (3,339) (3,005) (2,123) (2,135) (1,622)Operating profit before impairment losses 1,272 925 1,788 823 589 965 Impairment losses (799) (1,099) (811) (517) (702) (437)Operating profit/(loss) 473 (174) 977 306 (113) 528
Average exchange rate - US$/£ 1.546 1.566 1.853 Analysis of income by product Mortgages and home equity 786 781 695 509 499 375 Personal lending and cards 735 706 617 476 451 333 Retail deposits 1,397 1,296 1,853 903 828 1,000 Commercial lending 896 848 751 580 542 405 Commercial deposits 495 624 698 320 398 377 Other 244 9 179 158 6 97 Total income 4,553 4,264 4,793 2,946 2,724 2,587
Analysis of impairment by sector Residential mortgages 90 113 76 58 72 41 Home equity 194 261 125 126 167 67 Corporate and commercial 312 510 335 202 326 181 Other consumer 150 215 275 97 137 148 Securities 53 — — 34 — — Total impairment losses 799 1,099 811 517 702 437
Loan impairment charge as % of gross customer loans and advances (excluding reverse repurchase agreements) by sectorResidential mortgages 1.0% 1.1% 0.5% 1.0% 1.1% 0.4% Home equity 0.8% 1.0% 0.5% 0.8% 1.1% 0.4% Corporate and commercial 1.0% 1.6% 1.0% 1.0% 1.7% 0.8% Other consumer 1.4% 1.8% 1.9% 1.4% 1.8% 1.5% 1.0% 1.4% 0.9% 1.0% 1.4% 0.7%
Performance ratios Return on equity (1) 3.6% (1.3%) 7.9% 3.6% (1.3%) 7.8% Net interest margin 2.85% 2.37% 2.68% 2.85% 2.37% 2.68% Cost:income ratio 72% 78% 63% 72% 78% 63%
Note: (1) Divisional return on equity is based on divisional operating profit/(loss) after tax divided by average notional equity (based on 9% of the monthly average of divisional RWAs, adjusted for capital
deductions).
RBS Group 201092
Business review continued
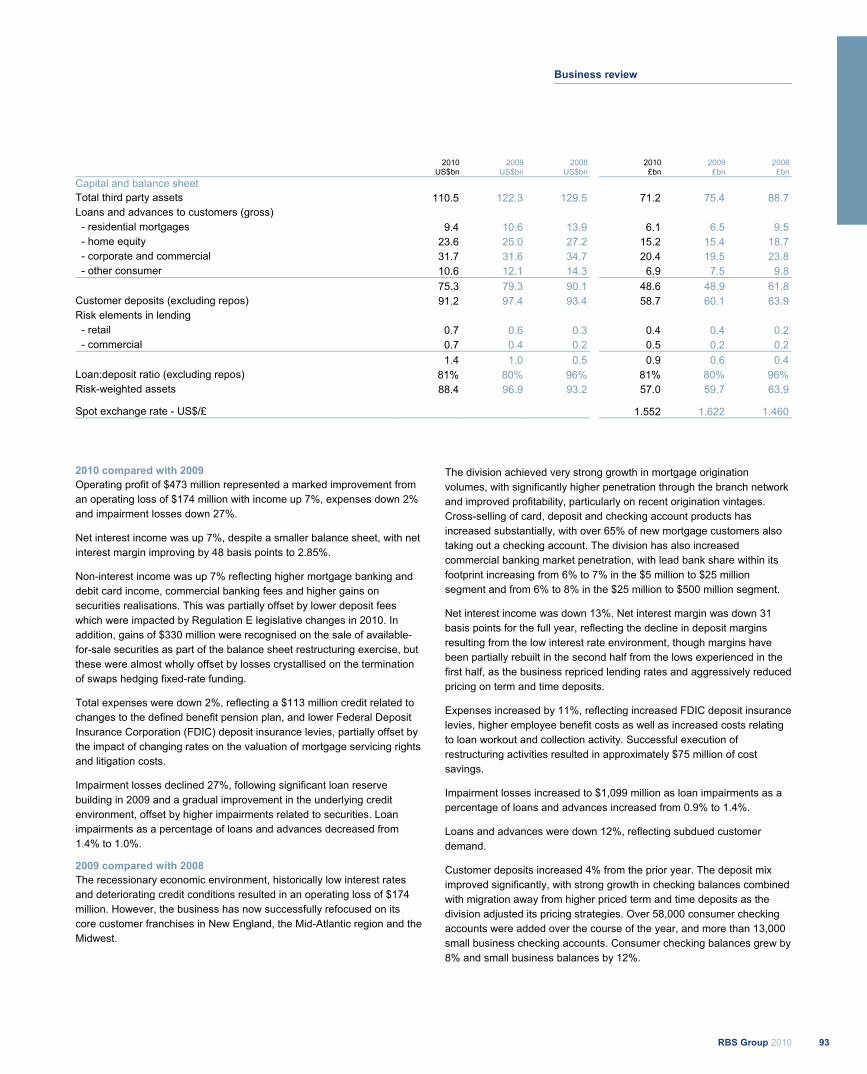
2010 2009 2008 2010 2009 2008 US$bn US$bn US$bn £bn £bn £bn
Capital and balance sheet Total third party assets 110.5 122.3 129.5 71.2 75.4 88.7 Loans and advances to customers (gross)
- residential mortgages 9.4 10.6 13.9 6.1 6.5 9.5 - home equity 23.6 25.0 27.2 15.2 15.4 18.7 - corporate and commercial 31.7 31.6 34.7 20.4 19.5 23.8 - other consumer 10.6 12.1 14.3 6.9 7.5 9.8 75.3 79.3 90.1 48.6 48.9 61.8 Customer deposits (excluding repos) 91.2 97.4 93.4 58.7 60.1 63.9 Risk elements in lending
- retail 0.7 0.6 0.3 0.4 0.4 0.2 - commercial 0.7 0.4 0.2 0.5 0.2 0.2 1.4 1.0 0.5 0.9 0.6 0.4 Loan:deposit ratio (excluding repos) 81% 80% 96% 81% 80% 96% Risk-weighted assets 88.4 96.9 93.2 57.0 59.7 63.9
Spot exchange rate - US$/£ 1.552 1.622 1.460
2010 compared with 2009 Operating profit of $473 million represented a marked improvement from an operating loss of $174 million with income up 7%, expenses down 2% and impairment losses down 27%.
Net interest income was up 7%, despite a smaller balance sheet, with net interest margin improving by 48 basis points to 2.85%.
Non-interest income was up 7% reflecting higher mortgage banking and debit card income, commercial banking fees and higher gains on securities realisations. This was partially offset by lower deposit fees which were impacted by Regulation E legislative changes in 2010. In addition, gains of $330 million were recognised on the sale of available-for-sale securities as part of the balance sheet restructuring exercise, but these were almost wholly offset by losses crystallised on the termination of swaps hedging fixed-rate funding.
Total expenses were down 2%, reflecting a $113 million credit related to changes to the defined benefit pension plan, and lower Federal Deposit Insurance Corporation (FDIC) deposit insurance levies, partially offset by the impact of changing rates on the valuation of mortgage servicing rights and litigation costs.
Impairment losses declined 27%, following significant loan reserve building in 2009 and a gradual improvement in the underlying credit environment, offset by higher impairments related to securities. Loan impairments as a percentage of loans and advances decreased from 1.4% to 1.0%.
2009 compared with 2008 The recessionary economic environment, historically low interest rates and deteriorating credit conditions resulted in an operating loss of $174 million. However, the business has now successfully refocused on its core customer franchises in New England, the Mid-Atlantic region and the Midwest.
The division achieved very strong growth in mortgage origination volumes, with significantly higher penetration through the branch network and improved profitability, particularly on recent origination vintages. Cross-selling of card, deposit and checking account products has increased substantially, with over 65% of new mortgage customers also taking out a checking account. The division has also increased commercial banking market penetration, with lead bank share within its footprint increasing from 6% to 7% in the $5 million to $25 million segment and from 6% to 8% in the $25 million to $500 million segment.
Net interest income was down 13%. Net interest margin was down 31 basis points for the full year, reflecting the decline in deposit margins resulting from the low interest rate environment, though margins have been partially rebuilt in the second half from the lows experienced in the first half, as the business repriced lending rates and aggressively reduced pricing on term and time deposits.
Expenses increased by 11%, reflecting increased FDIC deposit insurance levies, higher employee benefit costs as well as increased costs relating to loan workout and collection activity. Successful execution of restructuring activities resulted in approximately $75 million of cost savings.
Impairment losses increased to $1,099 million as loan impairments as a percentage of loans and advances increased from 0.9% to 1.4%.
Loans and advances were down 12%, reflecting subdued customer demand.
Customer deposits increased 4% from the prior year. The deposit mix improved significantly, with strong growth in checking balances combined with migration away from higher priced term and time deposits as the division adjusted its pricing strategies. Over 58,000 consumer checking accounts were added over the course of the year, and more than 13,000 small business checking accounts. Consumer checking balances grew by 8% and small business balances by 12%.
93RBS Group 2010
Business review

Global Banking & Markets 2010 2009 2008 £m £m £m
Net interest income from banking activities 1,276 2,243 2,440 Net fees and commissions receivable 1,495 1,335 1,223 Income from trading activities 4,982 7,812 (1,100)Other operating income (net of related funding costs) 159 (332) (206)Non-interest income 6,636 8,815 (83)Total income 7,912 11,058 2,357 Direct expenses
- staff (2,693) (2,904) (2,034) - other (842) (777) (1,017)Indirect expenses (862) (979) (937) (4,397) (4,660) (3,988)Operating profit/(loss) before impairment losses and fair value of own debt 3,515 6,398 (1,631)Impairment losses (151) (640) (522)Operating profit/(loss) before fair value of own debt 3,364 5,758 (2,153)Fair value of own debt 139 (49) 357 Operating profit/(loss) 3,503 5,709 (1,796)
Analysis of income by product Rates - money markets 65 1,714 1,641 Rates - flow 1,985 3,142 1,386 Currencies & commodities 870 1,277 1,539 Credit and mortgage markets 2,215 2,255 (3,435)Portfolio management and origination 1,844 1,196 858 Equities 933 1,474 368 Total income 7,912 11,058 2,357
Analysis of impairment by sector Manufacturing and infrastructure (51) 91 39 Property and construction 74 49 12 Banks and financial institutions 177 348 186 Other (49) 152 285 Total impairment losses 151 640 522 Loan impairment charge as % of gross customer loans and advances (excluding reverse repurchase agreements) 0.2% 0.6% 0.3%
Performance ratios Return on equity (1) 16.6% 29.8% (9.1%)Net interest margin 1.05% 1.38% 1.34% Cost:income ratio 56% 42% 169% Compensation ratio (2) 34% 26% 86%
Notes: (1) Divisional return on equity is based on divisional operating profit/(loss) after tax divided by average notional equity (based on 10% of the monthly average of divisional RWAs, adjusted for capital
deductions). (2) Compensation ratio is based on staff costs as a percentage of total income, excluding the fair value of own debt.
RBS Group 201094
Business review continued
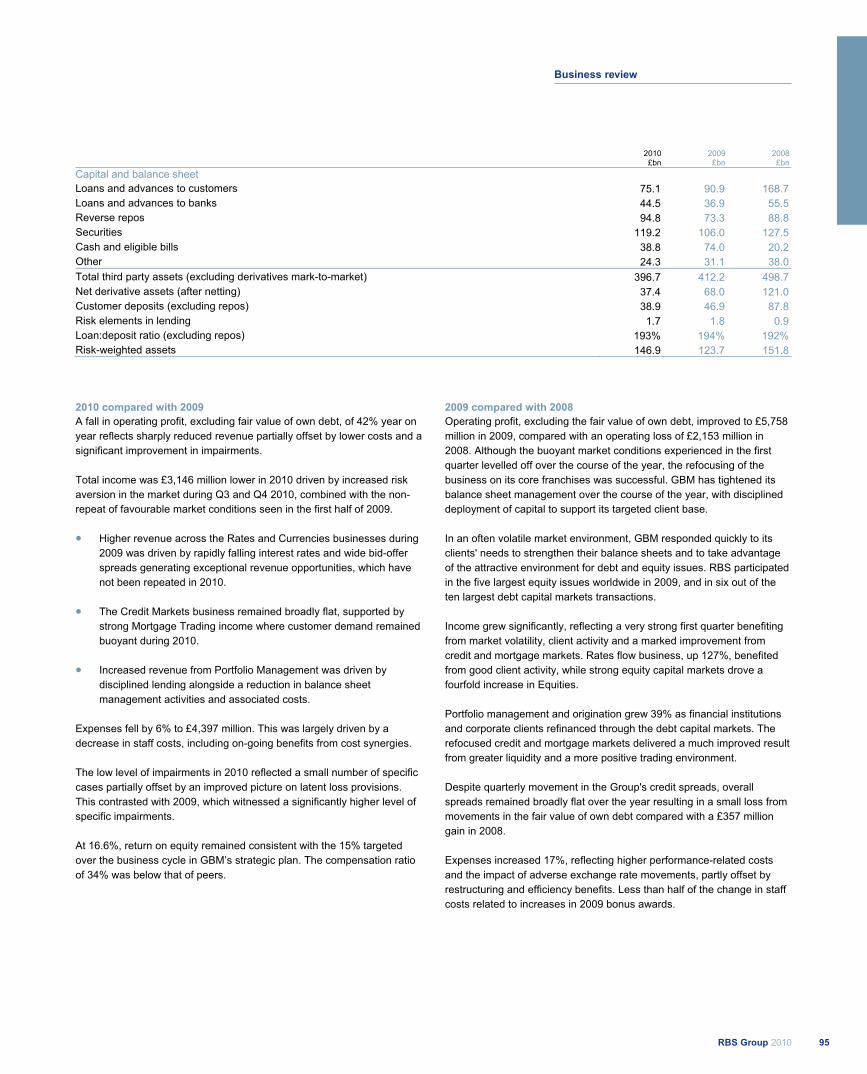
2010 2009 2008 £bn £bn £bn Capital and balance sheet Loans and advances to customers 75.1 90.9 168.7 Loans and advances to banks 44.5 36.9 55.5 Reverse repos 94.8 73.3 88.8 Securities 119.2 106.0 127.5 Cash and eligible bills 38.8 74.0 20.2 Other 24.3 31.1 38.0 Total third party assets (excluding derivatives mark-to-market) 396.7 412.2 498.7 Net derivative assets (after netting) 37.4 68.0 121.0 Customer deposits (excluding repos) 38.9 46.9 87.8 Risk elements in lending 1.7 1.8 0.9 Loan:deposit ratio (excluding repos) 193% 194% 192% Risk-weighted assets 146.9 123.7 151.8
2010 compared with 2009 A fall in operating profit, excluding fair value of own debt, of 42% year on year reflects sharply reduced revenue partially offset by lower costs and a significant improvement in impairments. Total income was £3,146 million lower in 2010 driven by increased risk aversion in the market during Q3 and Q4 2010, combined with the non-repeat of favourable market conditions seen in the first half of 2009.
Higher revenue across the Rates and Currencies businesses during 2009 was driven by rapidly falling interest rates and wide bid-offer spreads generating exceptional revenue opportunities, which have not been repeated in 2010.
The Credit Markets business remained broadly flat, supported by strong Mortgage Trading income where customer demand remained buoyant during 2010.
Increased revenue from Portfolio Management was driven by disciplined lending alongside a reduction in balance sheet management activities and associated costs.
Expenses fell by 6% to £4,397 million. This was largely driven by a decrease in staff costs, including on-going benefits from cost synergies. The low level of impairments in 2010 reflected a small number of specific cases partially offset by an improved picture on latent loss provisions. This contrasted with 2009, which witnessed a significantly higher level of specific impairments. At 16.6%, return on equity remained consistent with the 15% targeted over the business cycle in GBM’s strategic plan. The compensation ratio of 34% was below that of peers.
2009 compared with 2008 Operating profit, excluding the fair value of own debt, improved to £5,758 million in 2009, compared with an operating loss of £2,153 million in 2008. Although the buoyant market conditions experienced in the first quarter levelled off over the course of the year, the refocusing of the business on its core franchises was successful. GBM has tightened its balance sheet management over the course of the year, with disciplined deployment of capital to support its targeted client base. In an often volatile market environment, GBM responded quickly to its clients' needs to strengthen their balance sheets and to take advantage of the attractive environment for debt and equity issues. RBS participated in the five largest equity issues worldwide in 2009, and in six out of the ten largest debt capital markets transactions. Income grew significantly, reflecting a very strong first quarter benefiting from market volatility, client activity and a marked improvement from credit and mortgage markets. Rates flow business, up 127%, benefited from good client activity, while strong equity capital markets drove a fourfold increase in Equities. Portfolio management and origination grew 39% as financial institutions and corporate clients refinanced through the debt capital markets. The refocused credit and mortgage markets delivered a much improved result from greater liquidity and a more positive trading environment. Despite quarterly movement in the Group's credit spreads, overall spreads remained broadly flat over the year resulting in a small loss from movements in the fair value of own debt compared with a £357 million gain in 2008. Expenses increased 17%, reflecting higher performance-related costs and the impact of adverse exchange rate movements, partly offset by restructuring and efficiency benefits. Less than half of the change in staff costs related to increases in 2009 bonus awards.
95RBS Group 2010
Business review

Global Banking & Markets continued 2009 compared with 2008 continued Staff costs represented 26% of income. The Group introduced new deferral policies in 2009, which have led to changes in accrual patterns. Adjusting for both 2008 and 2009 deferrals, GBM's compensation ratio in 2009 would have been 28%. Higher impairments principally reflected a large individual failure recognised in the third quarter. Impairments represented 0.6% of loans and advances to customers compared with 0.3% in the prior year, reflecting the marked reduction in loans and advances.
Total third party assets, excluding derivatives, were down 17%, or 13% at constant exchange rates, compared with 31 December 2008, driven by a 43% reduction in loans and advances as customers took advantage of favourable capital market conditions to raise alternative forms of finance to bank debt. This reduction was partially offset by an increase in liquid assets. Risk-weighted assets decreased 19%, or 15% at constant exchange rates, reflecting the fall in third party assets and the Group's continued focus on reducing its risk profile and balance sheet usage.
RBS Group 201096
Business review continued
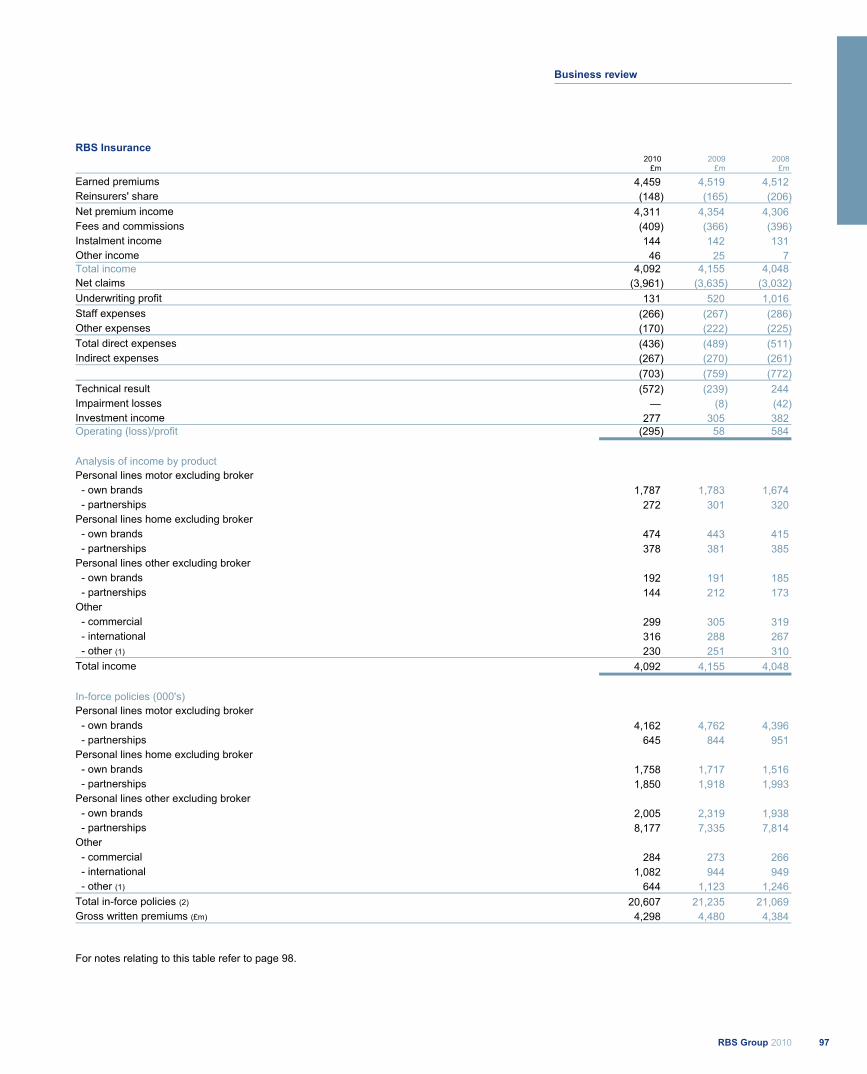
RBS Insurance 2010 2009 2008 £m £m £m
Earned premiums 4,459 4,519 4,512 Reinsurers' share (148) (165) (206)Net premium income 4,311 4,354 4,306 Fees and commissions (409) (366) (396)Instalment income 144 142 131 Other income 46 25 7 Total income 4,092 4,155 4,048 Net claims (3,961) (3,635) (3,032)Underwriting profit 131 520 1,016 Staff expenses (266) (267) (286)Other expenses (170) (222) (225)Total direct expenses (436) (489) (511)Indirect expenses (267) (270) (261) (703) (759) (772)Technical result (572) (239) 244 Impairment losses — (8) (42)Investment income 277 305 382 Operating (loss)/profit (295) 58 584
Analysis of income by product Personal lines motor excluding broker - own brands 1,787 1,783 1,674 - partnerships 272 301 320 Personal lines home excluding broker - own brands 474 443 415 - partnerships 378 381 385 Personal lines other excluding broker - own brands 192 191 185 - partnerships 144 212 173 Other - commercial 299 305 319 - international 316 288 267 - other (1) 230 251 310 Total income 4,092 4,155 4,048
In-force policies (000's) Personal lines motor excluding broker - own brands 4,162 4,762 4,396 - partnerships 645 844 951 Personal lines home excluding broker - own brands 1,758 1,717 1,516 - partnerships 1,850 1,918 1,993 Personal lines other excluding broker - own brands 2,005 2,319 1,938 - partnerships 8,177 7,335 7,814 Other - commercial 284 273 266 - international 1,082 944 949 - other (1) 644 1,123 1,246 Total in-force policies (2) 20,607 21,235 21,069 Gross written premiums (£m) 4,298 4,480 4,384
For notes relating to this table refer to page 98.
97RBS Group 2010
Business review
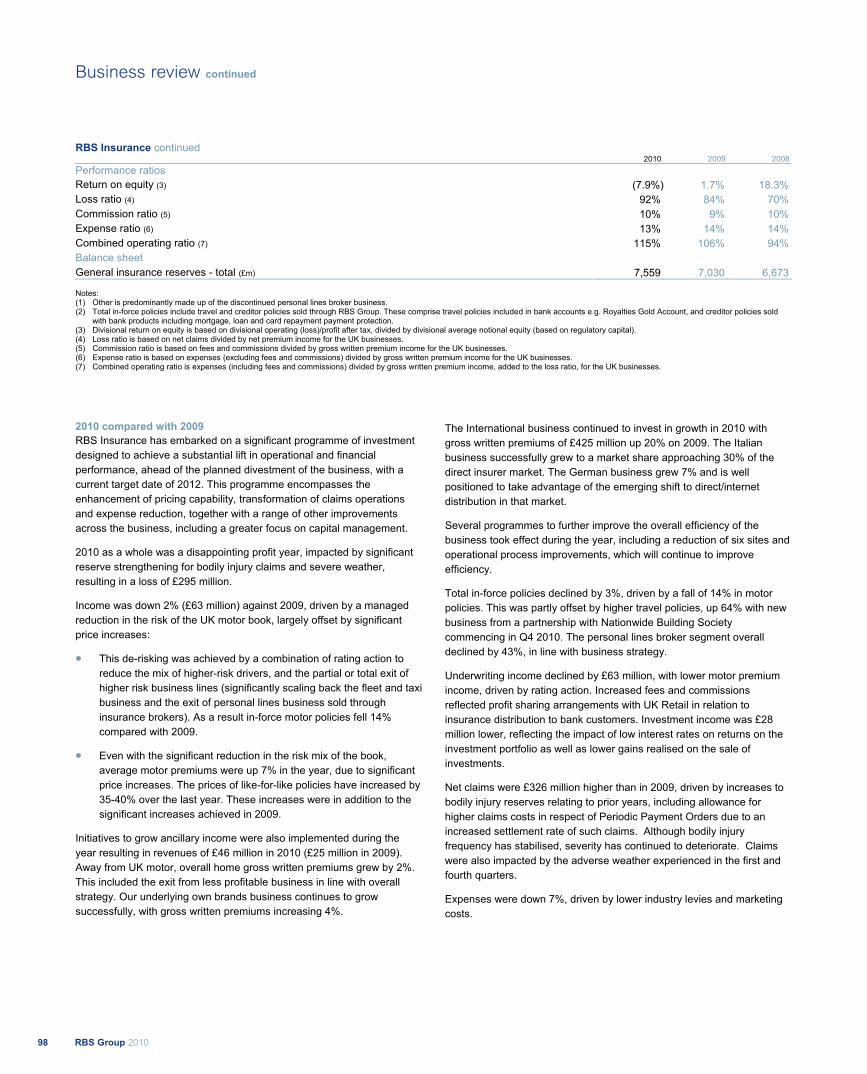
RBS Insurance continued 2010 2009 2008 Performance ratios Return on equity (3) (7.9%) 1.7% 18.3% Loss ratio (4) 92% 84% 70% Commission ratio (5) 10% 9% 10% Expense ratio (6) 13% 14% 14% Combined operating ratio (7) 115% 106% 94% Balance sheet General insurance reserves - total (£m) 7,559 7,030 6,673
Notes: (1) Other is predominantly made up of the discontinued personal lines broker business. (2) Total in-force policies include travel and creditor policies sold through RBS Group. These comprise travel policies included in bank accounts e.g. Royalties Gold Account, and creditor policies sold
with bank products including mortgage, loan and card repayment payment protection. (3) Divisional return on equity is based on divisional operating (loss)/profit after tax, divided by divisional average notional equity (based on regulatory capital). (4) Loss ratio is based on net claims divided by net premium income for the UK businesses. (5) Commission ratio is based on fees and commissions divided by gross written premium income for the UK businesses. (6) Expense ratio is based on expenses (excluding fees and commissions) divided by gross written premium income for the UK businesses. (7) Combined operating ratio is expenses (including fees and commissions) divided by gross written premium income, added to the loss ratio, for the UK businesses.
2010 compared with 2009 RBS Insurance has embarked on a significant programme of investment designed to achieve a substantial lift in operational and financial performance, ahead of the planned divestment of the business, with a current target date of 2012. This programme encompasses the enhancement of pricing capability, transformation of claims operations and expense reduction, together with a range of other improvements across the business, including a greater focus on capital management.
2010 as a whole was a disappointing profit year, impacted by significant reserve strengthening for bodily injury claims and severe weather, resulting in a loss of £295 million.
Income was down 2% (£63 million) against 2009, driven by a managed reduction in the risk of the UK motor book, largely offset by significant price increases:
This de-risking was achieved by a combination of rating action to reduce the mix of higher-risk drivers, and the partial or total exit of higher risk business lines (significantly scaling back the fleet and taxi business and the exit of personal lines business sold through insurance brokers). As a result in-force motor policies fell 14% compared with 2009.
Even with the significant reduction in the risk mix of the book, average motor premiums were up 7% in the year, due to significant price increases. The prices of like-for-like policies have increased by 35-40% over the last year. These increases were in addition to the significant increases achieved in 2009.
Initiatives to grow ancillary income were also implemented during the year resulting in revenues of £46 million in 2010 (£25 million in 2009). Away from UK motor, overall home gross written premiums grew by 2%. This included the exit from less profitable business in line with overall strategy. Our underlying own brands business continues to grow successfully, with gross written premiums increasing 4%.
The International business continued to invest in growth in 2010 with gross written premiums of £425 million up 20% on 2009. The Italian business successfully grew to a market share approaching 30% of the direct insurer market. The German business grew 7% and is well positioned to take advantage of the emerging shift to direct/internet distribution in that market.
Several programmes to further improve the overall efficiency of the business took effect during the year, including a reduction of six sites and operational process improvements, which will continue to improve efficiency.
Total in-force policies declined by 3%, driven by a fall of 14% in motor policies. This was partly offset by higher travel policies, up 64% with new business from a partnership with Nationwide Building Society commencing in Q4 2010. The personal lines broker segment overall declined by 43%, in line with business strategy.
Underwriting income declined by £63 million, with lower motor premium income, driven by rating action. Increased fees and commissions reflected profit sharing arrangements with UK Retail in relation to insurance distribution to bank customers. Investment income was £28 million lower, reflecting the impact of low interest rates on returns on the investment portfolio as well as lower gains realised on the sale of investments.
Net claims were £326 million higher than in 2009, driven by increases to bodily injury reserves relating to prior years, including allowance for higher claims costs in respect of Periodic Payment Orders due to an increased settlement rate of such claims. Although bodily injury frequency has stabilised, severity has continued to deteriorate. Claims were also impacted by the adverse weather experienced in the first and fourth quarters.
Expenses were down 7%, driven by lower industry levies and marketing costs.
RBS Group 201098
Business review continued

2009 compared with 2008 Operating profit was severely affected by the rising costs of bodily injury claims, declining to £58 million. Significant price increases were implemented in the latter part of the year to mitigate the industry trend of rising claims costs. Income grew by 3%, with premium income stable but lower reinsurance costs. Investment income was 20% lower, reflecting the impact of low interest rates and returns on the investment portfolio partially offset by gains realised on the sale of equity investments. In-force policies grew by 1%, driven by the success of own brands, up 12%. Churchill and Privilege have benefited from deployment on selected price comparison websites, with motor policy numbers up 19% and 3% respectively, and home policies up 32% and 109% respectively, compared with prior year. Direct Line motor and home policies grew by 4% and 2% respectively. The partnerships and broker segment declined by 10% in line with business strategy.
Expenses fell by 2% in 2009, with wage inflation, higher industry levies and professional fees offset by cost efficiencies, reduction in headcount and lower marketing expenditure. Net claims were 20% higher than in 2008 driven by a £448 million increase in bodily injury claims as well as by adverse weather experienced in the fourth quarter. Significant price increases were implemented in the latter part of the year to mitigate the industry trend of rising claims costs, and additional significant initiatives have also been undertaken to adapt pricing models and enhance claims management. The UK combined operating ratio, including business services costs, was 106% compared with 94% in the previous year, with the impact of the increase in reserves for bodily injury claims and the bad weather experience only partially mitigated by commission and expense ratio improvement.
99RBS Group 2010
Business review

Central items 2010 2009 2008 £m £m £m
Central items not allocated before fair value of own debt 577 385 150 Fair value of own debt 35 (93) 875 Central items not allocated 612 292 1,025
Note: (1) Costs/charges are denoted by brackets.
Funding and operating costs have been allocated to operating divisions, based on direct service usage, requirement for market funding and other appropriate drivers where services span more than one division. Residual unallocated items relate to volatile corporate items that do not naturally reside within a division. 2010 compared with 2009 Central items not allocated before fair value of own debt, including available-for-sale (AFS) gains of £237 million and one-off VAT recovery in 2010 of £170 million, amounted to a net credit of £577 million, an increase of £192 million on 2009.
The Group’s credit spreads have fluctuated over the course of the year, but ended the year slightly wider, resulting in an overall annual decrease in the carrying value of own debt. 2009 compared with 2008 Items not allocated during the year amounted to a net credit of £292 million. The Group's credit spreads have fluctuated over the course of the year, but ended the year slightly tighter, resulting in an increase in the carrying value of own debt. This was offset by a net credit on unallocated Group Treasury items, including the impact of economic hedges that do not qualify for IFRS hedge accounting. 2008 results included some significant disposal gains.
RBS Group 2010100
Business review continued

Non-Core 2010 2009 2008 £m £m £m
Net interest income 1,959 1,534 2,156 Net fees and commissions 471 510 912 Loss from trading activities (31) (5,161) (7,739)Insurance net premium income 702 784 986 Other operating income
- rental income 752 690 682 - other (1) (820) (658) (29)Non-interest income 1,074 (3,835) (5,188)Total income 3,033 (2,301) (3,032)Direct expenses
- staff (731) (851) (988) - operating lease depreciation (452) (402) (475) - other (642) (642) (681)Indirect expenses (500) (552) (539) (2,325) (2,447) (2,683)Operating profit/(loss) before other operating charges and impairment losses 708 (4,748) (5,715)Insurance net claims (737) (588) (700)Impairment losses (5,476) (9,221) (4,936)Operating loss (5,505) (14,557) (11,351)
Analysis of income by business Banking & portfolios 550 (1,338) 2,324 International businesses & portfolios 1,922 2,262 2,980 Markets 561 (3,225) (8,336)Total income 3,033 (2,301) (3,032)
Performance ratios Net interest margin 1.16% 0.69% 0.87% Cost:income ratio 77% (106%) (88%)Adjusted cost:income ratio 101% (85%) (72%)
£bn £bn £bn
Capital and balance sheet (2,3)
Total third party assets (excluding derivatives) 137.9 201.0 257.9 Total third party assets (including derivatives) 153.9 220.9 342.9 Loans and advances to customers (gross) 108.4 149.5 191.4 Customer deposits 6.7 12.6 27.4 Risk elements in lending 23.4 22.9 11.1 Risk-weighted assets 153.7 171.3 170.9
Notes: (1) Includes losses on disposals of £504 million for the year ended 31 December 2010. (2) Includes disposal groups. (3) Includes RBS Sempra Commodities JV: 2010 third party assets (TPAs) £6.7 billion; RWAs £4.3 billion (2009 TPAs £14.2 billion; RWAs £10.2 billion).
101RBS Group 2010
Business review
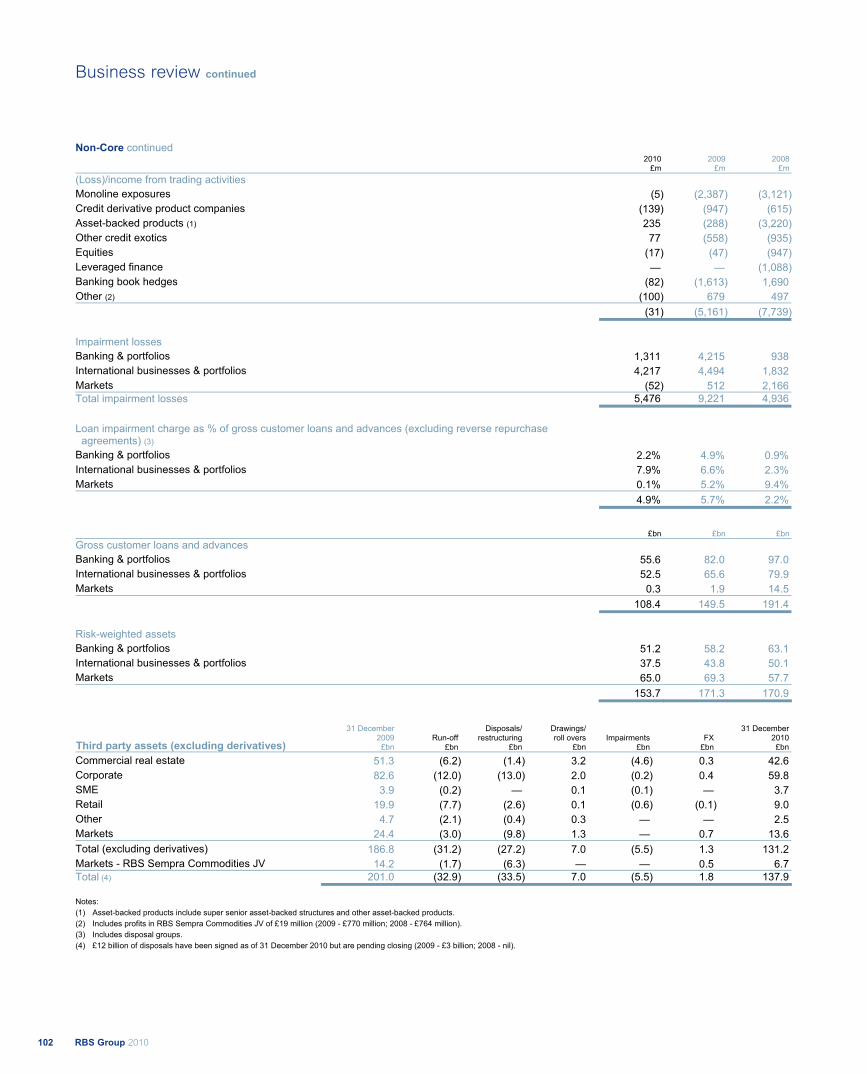
Non-Core continued 2010 2009 2008 £m £m £m (Loss)/income from trading activities Monoline exposures (5) (2,387) (3,121)Credit derivative product companies (139) (947) (615)Asset-backed products (1) 235 (288) (3,220)Other credit exotics 77 (558) (935)Equities (17) (47) (947)Leveraged finance — — (1,088)Banking book hedges (82) (1,613) 1,690 Other (2) (100) 679 497 (31) (5,161) (7,739)
Impairment losses Banking & portfolios 1,311 4,215 938 International businesses & portfolios 4,217 4,494 1,832 Markets (52) 512 2,166 Total impairment losses 5,476 9,221 4,936
Loan impairment charge as % of gross customer loans and advances (excluding reverse repurchase agreements) (3) Banking & portfolios 2.2% 4.9% 0.9% International businesses & portfolios 7.9% 6.6% 2.3% Markets 0.1% 5.2% 9.4% 4.9% 5.7% 2.2%
£bn £bn £bn Gross customer loans and advances Banking & portfolios 55.6 82.0 97.0 International businesses & portfolios 52.5 65.6 79.9 Markets 0.3 1.9 14.5 108.4 149.5 191.4
Risk-weighted assets Banking & portfolios 51.2 58.2 63.1 International businesses & portfolios 37.5 43.8 50.1 Markets 65.0 69.3 57.7 153.7 171.3 170.9
Third party assets (excluding derivatives) 31 December
2009 £bn
Run-off £bn
Disposals/ restructuring
£bn
Drawings/ roll overs
£bn Impairments
£bn FX
£bn
31 December 2010 £bn
Commercial real estate 51.3 (6.2) (1.4) 3.2 (4.6) 0.3 42.6 Corporate 82.6 (12.0) (13.0) 2.0 (0.2) 0.4 59.8 SME 3.9 (0.2) — 0.1 (0.1) — 3.7 Retail 19.9 (7.7) (2.6) 0.1 (0.6) (0.1) 9.0 Other 4.7 (2.1) (0.4) 0.3 — — 2.5 Markets 24.4 (3.0) (9.8) 1.3 — 0.7 13.6 Total (excluding derivatives) 186.8 (31.2) (27.2) 7.0 (5.5) 1.3 131.2 Markets - RBS Sempra Commodities JV 14.2 (1.7) (6.3) — — 0.5 6.7 Total (4) 201.0 (32.9) (33.5) 7.0 (5.5) 1.8 137.9
Notes: (1) Asset-backed products include super senior asset-backed structures and other asset-backed products. (2) Includes profits in RBS Sempra Commodities JV of £19 million (2009 - £770 million; 2008 - £764 million). (3) Includes disposal groups. (4) £12 billion of disposals have been signed as of 31 December 2010 but are pending closing (2009 - £3 billion; 2008 - nil).
RBS Group 2010102
Business review continued
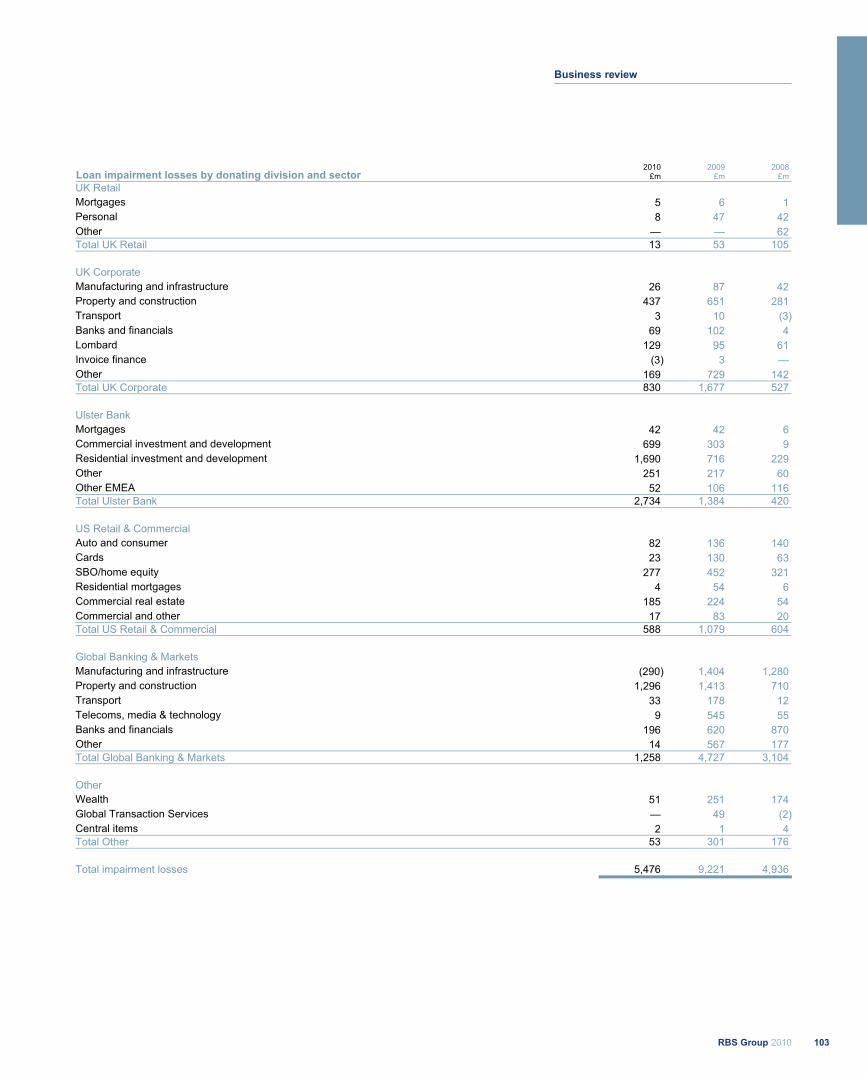
Loan impairment losses by donating division and sector 2010
£m2009
£m2008
£mUK Retail Mortgages 5 6 1Personal 8 47 42 Other — — 62 Total UK Retail 13 53 105
UK Corporate Manufacturing and infrastructure 26 87 42 Property and construction 437 651 281 Transport 3 10 (3)Banks and financials 69 102 4 Lombard 129 95 61 Invoice finance (3) 3 —Other 169 729 142 Total UK Corporate 830 1,677 527
Ulster Bank Mortgages 42 42 6 Commercial investment and development 699 303 9 Residential investment and development 1,690 716 229 Other 251 217 60 Other EMEA 52 106 116 Total Ulster Bank 2,734 1,384 420
US Retail & Commercial Auto and consumer 82 136 140 Cards 23 130 63 SBO/home equity 277 452 321 Residential mortgages 4 54 6 Commercial real estate 185 224 54 Commercial and other 17 83 20 Total US Retail & Commercial 588 1,079 604
Global Banking & Markets Manufacturing and infrastructure (290) 1,404 1,280 Property and construction 1,296 1,413 710 Transport 33 178 12 Telecoms, media & technology 9 545 55 Banks and financials 196 620 870 Other 14 567 177 Total Global Banking & Markets 1,258 4,727 3,104
Other Wealth 51 251 174 Global Transaction Services — 49 (2)Central items 2 1 4Total Other 53 301 176
Total impairment losses 5,476 9,221 4,936
103RBS Group 2010
Business review
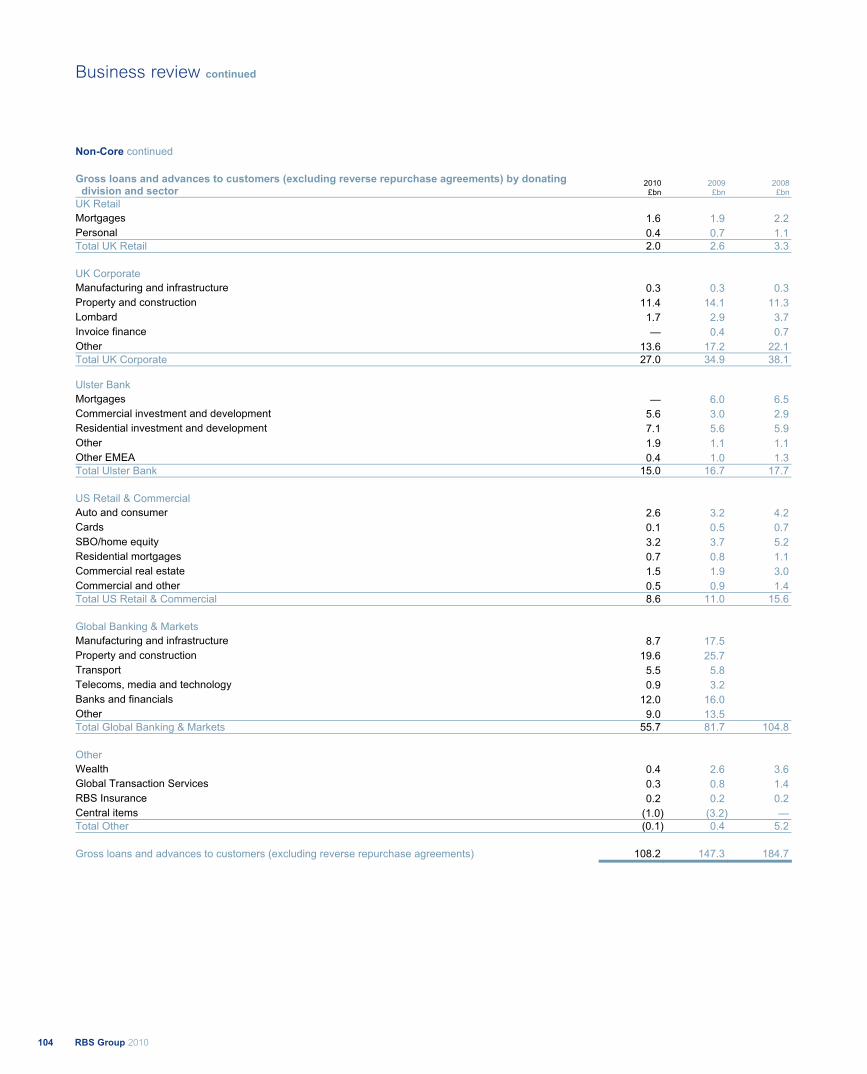
Non-Core continued Gross loans and advances to customers (excluding reverse repurchase agreements) by donating division and sector
2010 £bn
2009 £bn
2008 £bn
UK Retail Mortgages 1.6 1.9 2.2 Personal 0.4 0.7 1.1 Total UK Retail 2.0 2.6 3.3
UK Corporate Manufacturing and infrastructure 0.3 0.3 0.3 Property and construction 11.4 14.1 11.3 Lombard 1.7 2.9 3.7 Invoice finance — 0.4 0.7 Other 13.6 17.2 22.1 Total UK Corporate 27.0 34.9 38.1
Ulster Bank Mortgages — 6.0 6.5 Commercial investment and development 5.6 3.0 2.9 Residential investment and development 7.1 5.6 5.9 Other 1.9 1.1 1.1 Other EMEA 0.4 1.0 1.3 Total Ulster Bank 15.0 16.7 17.7
US Retail & Commercial Auto and consumer 2.6 3.2 4.2 Cards 0.1 0.5 0.7 SBO/home equity 3.2 3.7 5.2 Residential mortgages 0.7 0.8 1.1 Commercial real estate 1.5 1.9 3.0 Commercial and other 0.5 0.9 1.4 Total US Retail & Commercial 8.6 11.0 15.6
Global Banking & Markets Manufacturing and infrastructure 8.7 17.5 Property and construction 19.6 25.7 Transport 5.5 5.8 Telecoms, media and technology 0.9 3.2 Banks and financials 12.0 16.0 Other 9.0 13.5 Total Global Banking & Markets 55.7 81.7 104.8
Other Wealth 0.4 2.6 3.6 Global Transaction Services 0.3 0.8 1.4 RBS Insurance 0.2 0.2 0.2 Central items (1.0) (3.2) — Total Other (0.1) 0.4 5.2
Gross loans and advances to customers (excluding reverse repurchase agreements) 108.2 147.3 184.7
RBS Group 2010104
Business review continued
2010 compared with 2009 By the end of 2010 third party assets (excluding derivatives) had decreased to £138 billion, £5 billion lower than the end of year target, as a result of a successful disposal strategy, managed portfolio run-off and impairments. 2010 operating losses in Non-Core were 62% lower than those recorded in 2009. The improvement in performance was driven by significantly lower trading losses, reduced expenses and a marked decline in impairments. Losses from trading activities declined from £5,161 million for 2009 to £31 million for 2010 as underlying asset prices recovered, offset by continuing weakness in credit spreads. The division has recorded profits on the disposal of many asset-backed securities positions. In addition, a significantly smaller loss of £161 million was recorded on banking book hedges as spreads tightened, compared with £1,728 million in 2009. Staff expenses fell by 14% over the year, largely driven by the impact of business divestments, including a number of country exits and the disposal of substantially all of the Group’s interest in the RBS Sempra Commodities JV. Impairments were £3,745 million lower than 2009. The decline reflects the overall improvement in the economic environment, although still high loss rates reflect the difficult conditions experienced in specific sectors, including both UK and Irish commercial property sectors. Wholesale country exits completed during 2010 were Chile, Colombia, Pakistan and Taiwan. Risk-weighted assets decreased by £18 billion (10%), reflecting active management to reduce trading book risk and disposals, partially offset by the impact of regulatory changes (£30 billion) and more conservative weightings applied to large corporate exposures.
2009 compared with 2008 Losses from trading activities have declined significantly as underlying asset prices rallied. Mark-to-market values for exposures such as monolines, super senior high grade collateralised debt obligations, and many negative basis trade asset classes have risen over the course of 2009. However, the £1.6 billion gain recorded on banking book hedging in 2008 unwound over the course of the year to a loss of £1.6 billion in 2009, as spreads continued to tighten throughout the year, ending almost in line with origination levels. Impairment losses increased to £9.2 billion, reflecting continued weakness in the economic environment, particularly across the corporate and property sectors. There were signs of a slowdown in the rate of provisioning towards the end of the year. Staff costs decreased by 14% over the year, or by 20% at constant exchange rates, due to headcount reductions and business divestments, notably Linea Directa and Tesco Personal Finance. Lower depreciation charges followed the 2008 sale of the Angel Trains business. Third party assets, excluding derivatives, decreased by £56.9 billion in the year as the division has run down exposures and pursued opportunities to dispose of loan portfolios. Sales of equity stakes, including Bank of China, were concluded while further disposals announced in 2009, including Asian retail and commercial operations, are moving towards completion in 2010. Risk-weighted assets increased by 0.2% in 2009, and at constant exchange rates increased by 3%. The reduction of 15% since 30 September 2009, reflects active management to reduce trading book exposures, largely offset by the impact of procyclicality, monoline downgrades and adverse market risk.
105RBS Group 2010
Business review
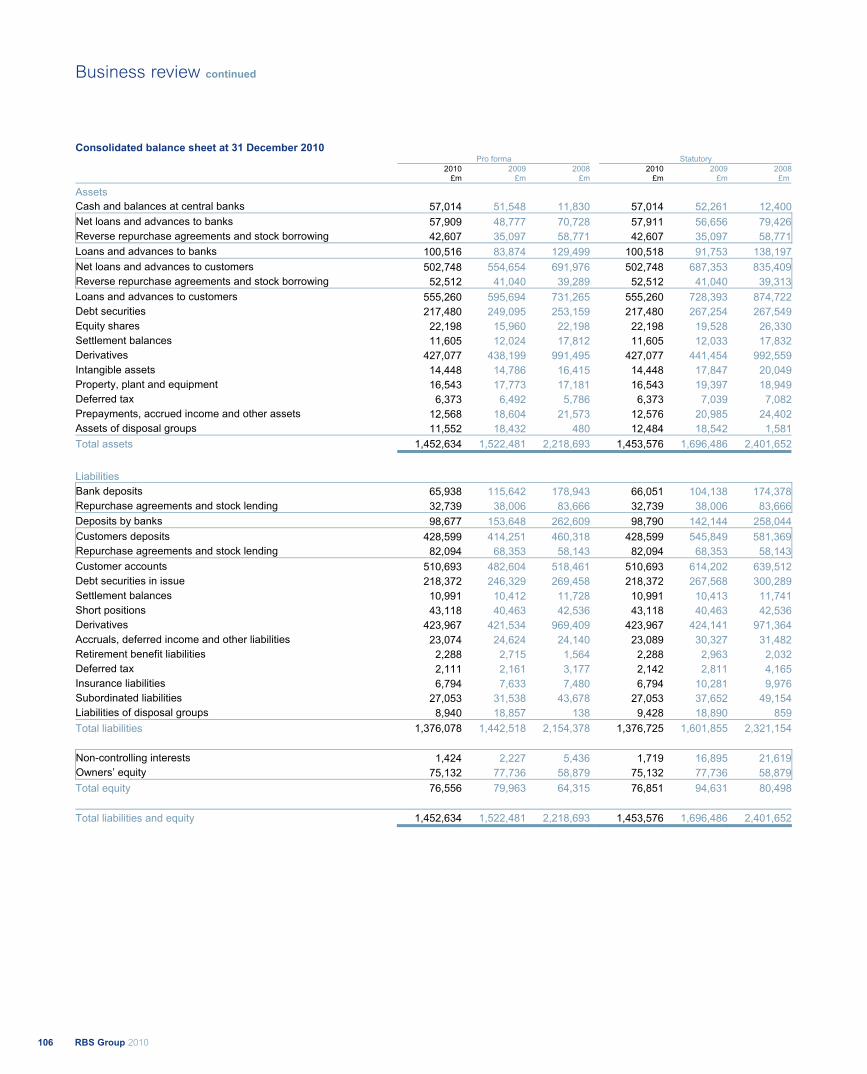
Consolidated balance sheet at 31 December 2010 Pro forma Statutory 2010 2009 2008 2010 2009 2008
£m £m £m £m £m £m
Assets Cash and balances at central banks 57,014 51,548 11,830 57,014 52,261 12,400Net loans and advances to banks 57,909 48,777 70,728 57,911 56,656 79,426Reverse repurchase agreements and stock borrowing 42,607 35,097 58,771 42,607 35,097 58,771Loans and advances to banks 100,516 83,874 129,499 100,518 91,753 138,197Net loans and advances to customers 502,748 554,654 691,976 502,748 687,353 835,409Reverse repurchase agreements and stock borrowing 52,512 41,040 39,289 52,512 41,040 39,313Loans and advances to customers 555,260 595,694 731,265 555,260 728,393 874,722Debt securities 217,480 249,095 253,159 217,480 267,254 267,549Equity shares 22,198 15,960 22,198 22,198 19,528 26,330Settlement balances 11,605 12,024 17,812 11,605 12,033 17,832Derivatives 427,077 438,199 991,495 427,077 441,454 992,559Intangible assets 14,448 14,786 16,415 14,448 17,847 20,049Property, plant and equipment 16,543 17,773 17,181 16,543 19,397 18,949Deferred tax 6,373 6,492 5,786 6,373 7,039 7,082Prepayments, accrued income and other assets 12,568 18,604 21,573 12,576 20,985 24,402Assets of disposal groups 11,552 18,432 480 12,484 18,542 1,581Total assets 1,452,634 1,522,481 2,218,693 1,453,576 1,696,486 2,401,652
Liabilities Bank deposits 65,938 115,642 178,943 66,051 104,138 174,378Repurchase agreements and stock lending 32,739 38,006 83,666 32,739 38,006 83,666Deposits by banks 98,677 153,648 262,609 98,790 142,144 258,044Customers deposits 428,599 414,251 460,318 428,599 545,849 581,369Repurchase agreements and stock lending 82,094 68,353 58,143 82,094 68,353 58,143Customer accounts 510,693 482,604 518,461 510,693 614,202 639,512Debt securities in issue 218,372 246,329 269,458 218,372 267,568 300,289Settlement balances 10,991 10,412 11,728 10,991 10,413 11,741Short positions 43,118 40,463 42,536 43,118 40,463 42,536Derivatives 423,967 421,534 969,409 423,967 424,141 971,364Accruals, deferred income and other liabilities 23,074 24,624 24,140 23,089 30,327 31,482Retirement benefit liabilities 2,288 2,715 1,564 2,288 2,963 2,032Deferred tax 2,111 2,161 3,177 2,142 2,811 4,165Insurance liabilities 6,794 7,633 7,480 6,794 10,281 9,976Subordinated liabilities 27,053 31,538 43,678 27,053 37,652 49,154Liabilities of disposal groups 8,940 18,857 138 9,428 18,890 859Total liabilities 1,376,078 1,442,518 2,154,378 1,376,725 1,601,855 2,321,154
Non-controlling interests 1,424 2,227 5,436 1,719 16,895 21,619Owners’ equity 75,132 77,736 58,879 75,132 77,736 58,879Total equity 76,556 79,963 64,315 76,851 94,631 80,498
Total liabilities and equity 1,452,634 1,522,481 2,218,693 1,453,576 1,696,486 2,401,652
RBS Group 2010106
Business review continued
Commentary on consolidated balance sheet - pro forma 2010 compared with 2009 Total assets of £1,452.6 billion at 31 December 2010 were down £69.8 billion, 5%, compared with 31 December 2009. This principally reflects the continuing planned disposal of Non-Core assets, together with a reduction in the level of debt securities and mark-to-market value of derivatives in Global Banking & Markets. Cash and balances at central banks were up £5.5 billion, 11%, to £57.0 billion due to an improvement in the Group's structural liquidity position during 2010. Loans and advances to banks increased by £16.6 billion, 20%, to £100.5 billion. Reverse repurchase agreements and stock borrowing (‘reverse repos’) were up £7.5 billion, 21%, to £42.6 billion and bank placings rose £9.1 billion, 19%, to £57.9 billion, primarily as a result of the investment of surplus liquidity in short-term assets. Loans and advances to customers were down £40.4 billion, 7%, at £555.3 billion. Within this, reverse repurchase agreements were up £11.5 billion, 28%, to £52.5 billion. Customer lending decreased by £51.9 billion to £502.7 billion or £48.9 billion before impairment provisions. This reflected planned reductions in Non-Core of £39.7 billion along with declines in Global Banking & Markets £16.7 billion, US Retail & Commercial, £2.6 billion and Ulster Bank, £2.0 billion. These were partially offset by growth in UK Retail, £5.4 billion, Wealth, £2.4 billion and Global Transaction Services, £1.7 billion, together with the effect of exchange rate and other movements, £2.6 billion. Debt securities were down £31.6 billion, 13%, to £217.5 billion driven mainly by reductions in Global Banking & Markets. The value of derivative assets were down £11.1 billion, 3%, to £427.1 billion, primarily reflecting a decrease in interest contracts, movements in five to ten year interest yields, and the combined effect of currency movements, with Sterling weakening against the dollar but strengthening against the Euro. The reduction in assets and liabilities of disposal groups resulted from completion of disposals of certain of the Group’s Asian and Latin American businesses, and substantially all of the RBS Sempra Commodities JV business.
Deposits by banks declined £55.0 billion, 36%, to £98.7 billion, with reduced inter-bank deposits, down £49.7 billion, 43%, to £65.9 billion and lower repurchase agreements and stock lending (‘repos’), down £5.3 billion, 14%, to £32.7 billion. Customer accounts rose £28.1 billion, 6%, to £510.7 billion. Within this, repos increased £13.7 billion, 20%, to £82.1 billion. Excluding repos, customer deposits were up £14.3 billion, 3%, to £428.6 billion, reflecting growth in UK Corporate, £12.2 billion, Global Transaction Services £7.8 billion, UK Retail, £7.0 billion, Ulster Bank, £1.7 billion and Wealth, £0.8 billion, together with exchange rate and other movements of £3.0 billion. This was partially offset by decreases in Global Banking & Markets, £8.3 billion, US Retail & Commercial, £4.0 billion and Non-Core, £5.9 billion. Debt securities in issue were down £28.0 billion, 11% to £218.4 billion. Reductions in the level of certificates of deposit and commercial paper in Global Banking & Markets were partially offset by a programme of new term issuances totalling £38.4 billion. Subordinated liabilities decreased by £4.5 billion, 14% to £27.1 billion. This reflected the redemption of £2.6 billion undated loan capital, debt preference shares and trust preferred securities under the liability management exercise completed in May, together with the conversion of £0.8 billion US dollar and Sterling preference shares and the redemption of £1.6 billion of other dated and undated loan capital, which were partially offset by the effect of exchange rate movements and other adjustments of £0.5 billion. The Group’s non-controlling interests decreased by £0.8 billion, 36%, to £1.4 billion, primarily reflecting the disposal of the majority of the RBS Sempra Commodities JV business, £0.6 billion, and the life assurance business, £0.2 billion. Owner’s equity decreased by £2.6 billion, 3%, to £75.1 billion. This was driven by the partial redemption of preference shares and paid-in equity, £3.1 billion less related gains of £0.6 billion, the attributable loss for the period, £1.1 billion, together with an increase in own shares held of £0.7 billion and higher losses in available-for-sale reserves, £0.3 billion. Offsetting these reductions were the issue of £0.8 billion ordinary shares on conversion of US dollar and Sterling denominated non-cumulative preference shares classified as debt and exchange rate and other movements, £1.2 billion.
107RBS Group 2010
Business review
Commentary on consolidated balance sheet - statutory 2010 compared with 2009 Total assets of £1,453.6 billion at 31 December 2010 were down £242.9 billion, 14%, compared with 31 December 2009. This principally reflects the disposal of the RFS minority interest, the continuing planned disposal of Non-Core assets, together with a reduction in the level of debt securities and the mark-to-market value of derivatives. Cash and balances at central banks were up £4.8 billion, 9%, to £57.0 billion principally due to an improvement in the Group's structural liquidity position during 2010. Loans and advances to banks increased by £8.8 billion, 10%, to £100.5 billion. Adjusting for the disposal of the RFS minority interest, the increase was £16.6 billion, 20%. Reverse repurchase agreements and stock borrowing (‘reverse repos’) were up £7.5 billion, 21% to £42.6 billion and bank placings rose £9.1 billion, 19%, to £57.9 billion, primarily as a result of the investment of surplus liquidity in short-term assets. Loans and advances to customers decreased £173.1 billion, 24%, to £555.3 billion. Excluding the disposal of the RFS minority interest, lending to customers was down £40.4 billion, 7%. Within this, reverse repurchase agreements were up £11.5 billion, 28%, to £52.5 billion. Customer lending decreased by £51.9 billion to £502.7 billion or £48.9 billion before impairment provisions. This reflected planned reductions in Non-Core of £39.7 billion along with declines in Global Banking & Markets, £16.7 billion, US Retail & Commercial, £2.6 billion and Ulster Bank, £2.0 billion. These were partially offset by growth in UK Retail, £5.4 billion, Wealth, £2.4 billion and Global Transaction Services, £1.7 billion, together with the effect of exchange rate and other movements, £2.6 billion. Debt securities were down £49.8 billion, 19%, to £217.5 billion, or £31.6 billion, 13%, adjusting for the disposal of the RFS minority interest, driven mainly by reductions in Global Banking & Markets. The value of derivative assets were down £14.4 billion, 3%, to £427.1 billion, primarily reflecting a decrease in interest contracts, movements in five to ten year interest yields, and the combined effect of currency movements, with Sterling weakening against the dollar but strengthening against the Euro. The reduction in assets and liabilities of disposal groups resulted from the completion of disposals of certain of the Group’s Asian and Latin American businesses, and substantially all of the RBS Sempra Commodities JV business.
Deposits by banks declined £43.4 billion, 31%, to £98.8 billion or £55.0 billion, 36% following the disposal of the RFS minority interest, with reduced inter-bank deposits, down £49.7 billion, 43%, to £65.9 billion and lower repurchase agreements and stock lending (‘repos’), down £5.3 billion, 14%, to £32.7 billion. Customer accounts decreased £103.5 billion, 17%, to £510.7 billion but were up £28.1 billion, 6%, excluding the disposal of the RFS minority interest. Within this, repos increased £13.7 billion, 20%, to £82.1 billion. Excluding repos, customer deposits were up £14.3 billion, 3%, to £428.6 billion, reflecting growth in UK Corporate, £12.2 billion, Global Transaction Services, £7.8 billion, UK Retail, £7.0 billion, Ulster Bank, £1.7 billion and Wealth, £0.8 billion, together with exchange rate and other movements of £3.0 billion. This was partially offset by decreases in Global Banking & Markets, £8.3 billion, US Retail & Commercial, £4.0 billion and Non-Core, £5.9 billion. Debt securities in issue were down £49.2 billion, 18%, to £218.4 billion. Excluding the RFS minority interest disposal, they declined £28.0 billion, 11%, to £218.4 billion. Reductions in the level of certificates of deposit and commercial paper in Global Banking & Markets were partially offset by a programme of new term issuances totalling £38.4 billion. Subordinated liabilities decreased by £10.6 billion, 28% to £27.1 billion or £4.5 billion, 14% excluding the disposal of the RFS minority interest. This reflected the redemption of £2.6 billion undated loan capital, debt preference shares and trust preferred securities under the liability management exercise completed in May, together with the conversion of £0.8 billion US dollar and Sterling preference shares and the redemption of £1.6 billion of other dated and undated loan capital, which were partially offset by the effect of exchange rate movements and other adjustments of £0.5 billion. The Group’s non-controlling interests decreased by £15.2 billion, primarily reflecting the disposal of the RFS minority interest, £14.4 billion, the majority of the RBS Sempra Commodities JV business, £0.6 billion, and the life assurance business, £0.2 billion. Owner’s equity decreased by £2.6 billion, 3%, to £75.1 billion. This was driven by the partial redemption of preference shares and paid-in equity, £3.1 billion less related gains of £0.6 billion, the attributable loss for the period, £1.1 billion, together with an increase in own shares held of £0.7 billion and higher losses in available-for-sale reserves, £0.3 billion. Offsetting these reductions were the issue of £0.8 billion ordinary shares on conversion of US dollar and Sterling non-cumulative preference shares classified as debt and exchange rate and other movements, £1.2 billion.
RBS Group 2010108
Business review continued
Commentary on consolidated balance sheet - pro forma 2009 compared with 2008 Total assets of £1,522.5 billion at 31 December 2009 were down £696.2 billion, 31%, compared with 31 December 2008, principally reflecting substantial repayments of customer loans and advances, as corporate customer demand fell and corporates looked to deleverage their balance sheets. Lending to banks also fell in line with significantly reduced wholesale funding activity. There were also significant falls in the value of derivative assets, with a corresponding reduction in derivative liabilities. Cash and balances at central banks were up £39.7 billion to £51.5 billion due to the placing of short-term cash surpluses, including the proceeds from the issue of B shares in December, with central banks. Loans and advances to banks decreased by £45.6 billion, 35%, to £83.9 billion with reverse repurchase agreements and stock borrowing ('reverse repos') down by £23.7 billion, 40% to £35.1 billion and lower bank placings, down £22.0 billion, 31%, to £48.8 billion, largely as a result of reduced wholesale funding activity in Global Banking & Markets. Loans and advances to customers were down £135.6 billion, 19%, at £595.7 billion. Within this, reverse repos increased by 4%, £1.8 billion to £41.0 billion. Excluding reverse repos, lending decreased by £137.3 billion to £554.7 billion or by £131.6 billion, 19%, before impairment provisions. This reflected reductions in Global Banking & Markets of £71.4 billion, and planned reductions in Non-Core of £30.1 billion, including a £3.2 billion transfer to disposal groups in respect of RBS Sempra Commodities JV and the Asian and Latin American businesses. There were also reductions in US Retail & Commercial, £7.4 billion; UK Corporate, £5.4 billion; Ulster Bank, £1.8 billion; and the effect of exchange rate movements, £22.8 billion, following the strengthening of sterling during the year, partially offset by growth in UK Retail of £9.2 billion, and in Wealth of £1.4 billion. Debt securities decreased by £4.1 billion, 2%, to £249.1 billion and equity shares decreased by £6.2 billion, 28%, to £16.0 billion, principally due to the sale of the Bank of China investment and lower holdings in Global Banking & Markets and Non-Core, largely offset by growth in Group Treasury, in part reflecting an £18.0 billion increase in the gilt liquidity portfolio. Settlement balances were down £5.8 billion, 32%, at £12.0 billion as a result of lower customer activity. Movements in the value of derivative assets, down £553.3 billion, 56%, to £438.2 billion, and liabilities, down £547.9 billion, 57%, to £421.5 billion, reflect the easing of market volatility, the strengthening of sterling and significant tightening in credit spreads in the continuing low interest rate environment. Increases in assets and liabilities of disposal groups reflect the inclusion of the RBS Sempra Commodities JV business and the planned sale of a number of the Group's retail and commercial activities in Asia and Latin America.
Deposits by banks declined by £109.0 billion, 41%, to £153.6 billion, due to a decrease in repurchase agreements and stock lending (‘repos’), down £45.7 billion, 55%, to £38.0 billion and reduced inter- bank deposits, down £63.3 billion, 35%, to £115.6 billion, principally in Global Banking & Markets reflecting reduced reliance on wholesale funding. Customer accounts were down £35.9 billion, 7%, to £482.6 billion. Within this, repos increased £10.2 billion, 18%, to £68.4 billion. Excluding repos, deposits were down £46.1 billion, 10%, to £414.3 billion, primarily due to reductions in Global Banking & Markets, down £43.6 billion; Non-Core, £13.0 billion, including the transfer of £8.9 billion to disposal groups; and Ulster Bank, £1.2 billion; together with exchange rate movements, £11.3 billion, offset in part by growth across all other divisions, up £23.0 billion. Debt securities in issue were down £23.1 billion, 9% to £246.3 billion, mainly as a result of movements in exchange rates together with reductions in Global Banking & Markets and Non-Core. Retirement benefit liabilities increased by £1.2 billion, 74%, to £2.7 billion, with net actuarial losses of £3.8 billion, arising from lower discount rates and higher assumed inflation, partially offset by curtailment gains of £2.1 billion due to changes in prospective pension benefits. Subordinated liabilities were down £12.1 billion, 28% to £31.5 billion, reflecting the redemption of £5.0 billion undated loan capital, £1.5 billion trust preferred securities and £2.7 billion dated loan capital, together with the effect of exchange rate movements and other adjustments, £2.9 billion. Equity non-controlling interests decreased by £3.2 billion, 59%, to £2.2 billion. Equity withdrawals of £3.1 billion, due to the disposal of the investment in the Bank of China attributable to minority shareholders and the redemption, in part, of certain trust preferred securities, the recycling of related available-for-sale reserves to income, £0.4 billion, and dividends paid of £0.3 billion, were partially offset by attributable profits of £0.6 billion. Owners' equity increased by £18.9 billion, 32% to £77.7 billion. The issue of B shares to HM Treasury in December 2009 raised £25.1 billion, net of expenses, and was offset in part by the creation of a £1.2 billion reserve in respect of contingent capital B shares. The placing and open offer in April 2009 raised £5.3 billion to fund the redemption of the £5.0 billion preference shares issued to HM Treasury in December 2008. Actuarial losses, net of tax, of £2.7 billion, the attributable loss for the period, £2.7 billion, exchange rate movements of £1.9 billion, the payment of other owners' dividends of £0.9 billion including £0.3 billion to HM Treasury on the redemption of preference shares, and partial redemption of paid-in equity, £0.3 billion, were partly offset by increases in available-for-sale reserves, £1.8 billion, cash flow hedging reserves, £0.6 billion, and the equity owners gain on withdrawal of non-controlling interests, net of tax, of £0.5 billion arising from the redemption of trust preferred securities.
109RBS Group 2010
Business review

Commentary on consolidated balance sheet - statutory 2009 compared with 2008 Total assets of £1,696.5 billion at 31 December 2009 were down £705.2 billion, 29%, compared with 31 December 2008, principally reflecting substantial repayments of customer loans and advances as corporate customer demand fell and corporates looked to deleverage their balance sheets. Lending to banks also fell in line with significantly reduced wholesale funding activity. There were also significant falls in the value of derivative assets, with a corresponding fall in derivative liabilities. Cash and balances at central banks were up £39.9 billion to £52.3 billion due to the placing of short-term cash surpluses, including the proceeds from the issue of B shares in December, with central banks. Loans and advances to banks decreased by £46.4 billion, 34%, to £91.8 billion with reverse repurchase agreements and stock borrowing (‘reverse repos’) down by £23.7 billion, 40% to £35.1 billion and lower bank placings, down £22.7 billion, 29%, to £56.7 billion largely as a result of reduced wholesale funding activity in Global Banking & Markets. Loans and advances to customers were down £146.3 billion, 17%, at £728.4 billion. Within this, reverse repos increased by 4%, £1.7 billion to £41.0 billion. Excluding reverse repos, lending decreased by £148.0 billion, 18%, to £687.4 billion or by £141.8 billion, 17%, before impairment provisions. This reflected reductions in Global Banking & Markets of £71.4 billion, and planned reductions in Non-Core of £30.1 billion, including a £3.2 billion transfer to disposal groups in respect of RBS Sempra Commodities JV and the Asian and Latin American businesses. Reductions were also experienced in US Retail & Commercial, £7.4 billion; UK Corporate, £5.4 billion; Ulster Bank, £1.8 billion; and the effect of exchange rate movements, £33.1 billion, following the strengthening of sterling during the year, partially offset by growth in UK Retail of £9.2 billion, and in Wealth of £1.4 billion. Debt securities were flat at £267.3 billion and equity shares decreased by £6.8 billion, 26%, to £19.5 billion, principally due to the sale of the Bank of China investment and lower holdings in Global Banking & Markets and Non-Core, largely offset by growth in Group Treasury, in part reflecting an £18.0 billion increase in the gilt liquidity portfolio, and in the RFS Holdings minority interest. Settlement balances were down £5.8 billion, 33%, at £12.0 billion as a result of lower customer activity. Movements in the value of derivative assets, down £551.1 billion, 56%, to £441.5 billion, and liabilities, down £547.2 billion, 56%, to £424.1 billion, reflect the easing of market volatility, the strengthening of sterling and significant tightening in credit spreads in the continuing low interest rate environment. Increases in assets and liabilities of disposal groups reflect the inclusion of the RBS Sempra Commodities JV business and the planned sale of a number of the Group's retail and commercial activities in Asia and Latin America.
Deposits by banks declined by £115.9 billion, 45%, to £142.1 billion due to a decrease in repurchase agreements and stock lending (‘repos’), down £45.7 billion, 55%, to £38.0 billion and reduced inter-bank deposits, down £70.2 billion, 40% to £104.1 billion principally in Global Banking & Markets, reflecting reduced reliance on wholesale funding, and in the RFS Holdings minority interest. Customer accounts were down £25.3 billion, 4%, to £614.2 billion. Within this, repos increased £10.2 billion, 18%, to £68.4 billion. Excluding repos, deposits were down £35.5 billion, 6%, to £545.8 billion, primarily due to; reductions in Global Banking & Markets, down £43.6 billion; Non-Core, £13.0 billion; including the transfer of £8.9 billion to disposal groups; and Ulster Bank, £1.2 billion; together with exchange rate movements, £21.3 billion, offset in part by growth across all other divisions, up £23.0 billion, and in the RFS Holdings minority interest, up £20.6 billion. Debt securities in issue were down £32.7 billion, 11% to £267.6 billion mainly as a result of movements in exchange rates, together with reductions in Global Banking & Markets, Non-Core and the RFS Holdings minority interest. Retirement benefit liabilities increased by £0.9 billion, 46%, to £3.0 billion, with net actuarial losses of £3.7 billion, arising from lower discount rates and higher assumed inflation, partially offset by curtailment gains of £2.1 billion due to changes in prospective pension benefits. Subordinated liabilities were down £11.5 billion, 23% to £37.7 billion, reflecting the redemption of £5.0 billion undated loan capital, £1.5 billion trust preferred securities and £2.7 billion dated loan capital, together with the effect of exchange rate movements and other adjustments, £2.9 billion, partly offset by the issue of £2.3 billion undated loan capital within the RFS Holdings minority interest. Equity non-controlling interests decreased by £4.7 billion, 22%, to £16.9 billion. Equity withdrawals of £3.1 billion, due to the disposal of the investment in the Bank of China attributable to minority shareholders and the redemption, in part, of certain trust preferred securities, exchange rate movements of £1.4 billion, the recycling of related available-for-sale reserves to income, £0.5 billion, and dividends paid of £0.3 billion, were partially offset by attributable profits of £0.3 billion. Owners' equity increased by £18.9 billion, 32% to £77.7 billion. The issue of B shares to HM Treasury in December 2009 raised £25.1 billion, net of expenses, and was offset in part by the creation of a £1.2 billion reserve in respect of contingent capital B shares. The placing and open offer in April 2009 raised £5.3 billion to fund the redemption of the £5.0 billion preference shares issued to HM Treasury in December 2008. Actuarial losses, net of tax, of £2.7 billion; the attributable loss for the period, £2.7 billion; exchange rate movements of £1.9 billion; the payment of other owners dividends of £0.9 billion including £0.3 billion to HM Treasury on the redemption of preference shares, and partial redemption of paid-in equity £0.3 billion were partly offset by increases in available-for-sale reserves, £1.8 billion; cash flow hedging reserves, £0.6 billion; and the equity owners gain on withdrawal of non-controlling interests, net of tax, of £0.5 billion arising from the redemption of trust preferred securities.
RBS Group 2010110
Business review continued
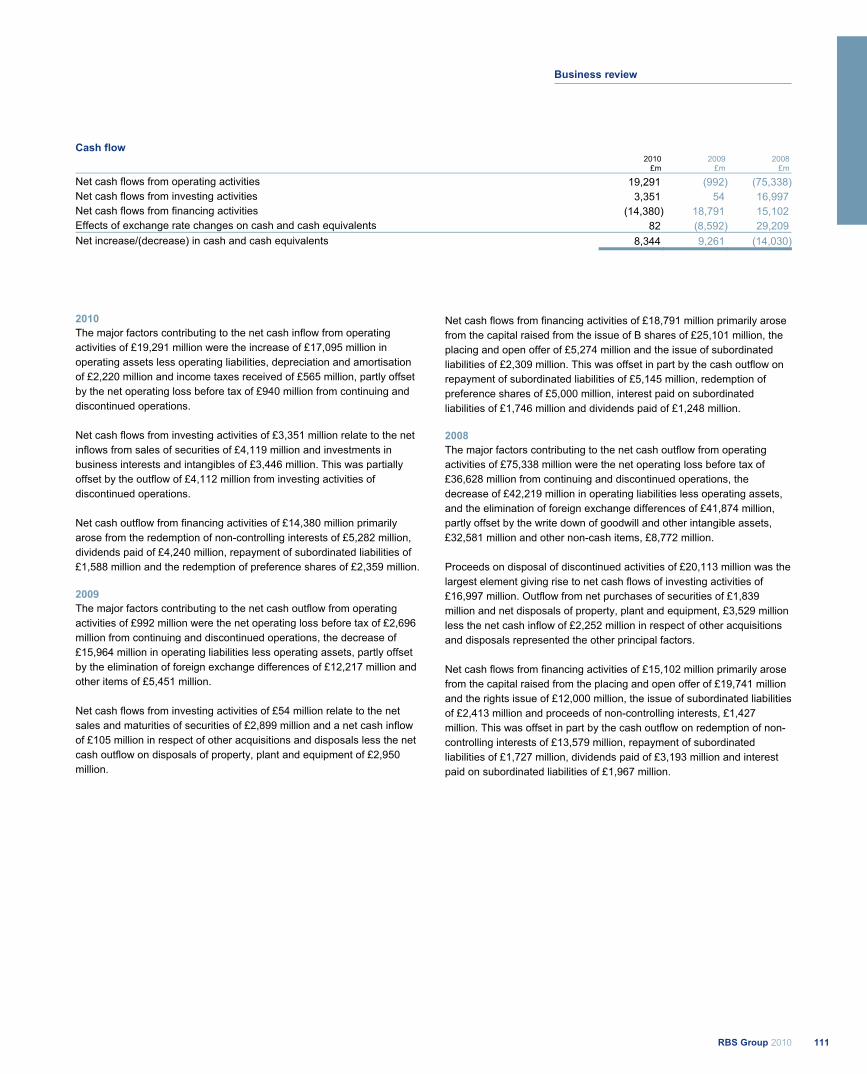
Cash flow 2010 2009 2008 £m £m £m
Net cash flows from operating activities 19,291 (992) (75,338)Net cash flows from investing activities 3,351 54 16,997 Net cash flows from financing activities (14,380) 18,791 15,102 Effects of exchange rate changes on cash and cash equivalents 82 (8,592) 29,209 Net increase/(decrease) in cash and cash equivalents 8,344 9,261 (14,030)
2010The major factors contributing to the net cash inflow from operating activities of £19,291 million were the increase of £17,095 million in operating assets less operating liabilities, depreciation and amortisation of £2,220 million and income taxes received of £565 million, partly offset by the net operating loss before tax of £940 million from continuing and discontinued operations. Net cash flows from investing activities of £3,351 million relate to the net inflows from sales of securities of £4,119 million and investments in business interests and intangibles of £3,446 million. This was partially offset by the outflow of £4,112 million from investing activities of discontinued operations. Net cash outflow from financing activities of £14,380 million primarily arose from the redemption of non-controlling interests of £5,282 million, dividends paid of £4,240 million, repayment of subordinated liabilities of £1,588 million and the redemption of preference shares of £2,359 million. 2009The major factors contributing to the net cash outflow from operating activities of £992 million were the net operating loss before tax of £2,696 million from continuing and discontinued operations, the decrease of £15,964 million in operating liabilities less operating assets, partly offset by the elimination of foreign exchange differences of £12,217 million and other items of £5,451 million. Net cash flows from investing activities of £54 million relate to the net sales and maturities of securities of £2,899 million and a net cash inflow of £105 million in respect of other acquisitions and disposals less the net cash outflow on disposals of property, plant and equipment of £2,950 million.
Net cash flows from financing activities of £18,791 million primarily arose from the capital raised from the issue of B shares of £25,101 million, the placing and open offer of £5,274 million and the issue of subordinated liabilities of £2,309 million. This was offset in part by the cash outflow on repayment of subordinated liabilities of £5,145 million, redemption of preference shares of £5,000 million, interest paid on subordinated liabilities of £1,746 million and dividends paid of £1,248 million. 2008The major factors contributing to the net cash outflow from operating activities of £75,338 million were the net operating loss before tax of £36,628 million from continuing and discontinued operations, the decrease of £42,219 million in operating liabilities less operating assets, and the elimination of foreign exchange differences of £41,874 million, partly offset by the write down of goodwill and other intangible assets, £32,581 million and other non-cash items, £8,772 million. Proceeds on disposal of discontinued activities of £20,113 million was the largest element giving rise to net cash flows of investing activities of £16,997 million. Outflow from net purchases of securities of £1,839 million and net disposals of property, plant and equipment, £3,529 million less the net cash inflow of £2,252 million in respect of other acquisitions and disposals represented the other principal factors. Net cash flows from financing activities of £15,102 million primarily arose from the capital raised from the placing and open offer of £19,741 million and the rights issue of £12,000 million, the issue of subordinated liabilities of £2,413 million and proceeds of non-controlling interests, £1,427 million. This was offset in part by the cash outflow on redemption of non-controlling interests of £13,579 million, repayment of subordinated liabilities of £1,727 million, dividends paid of £3,193 million and interest paid on subordinated liabilities of £1,967 million.
111RBS Group 2010
Business review
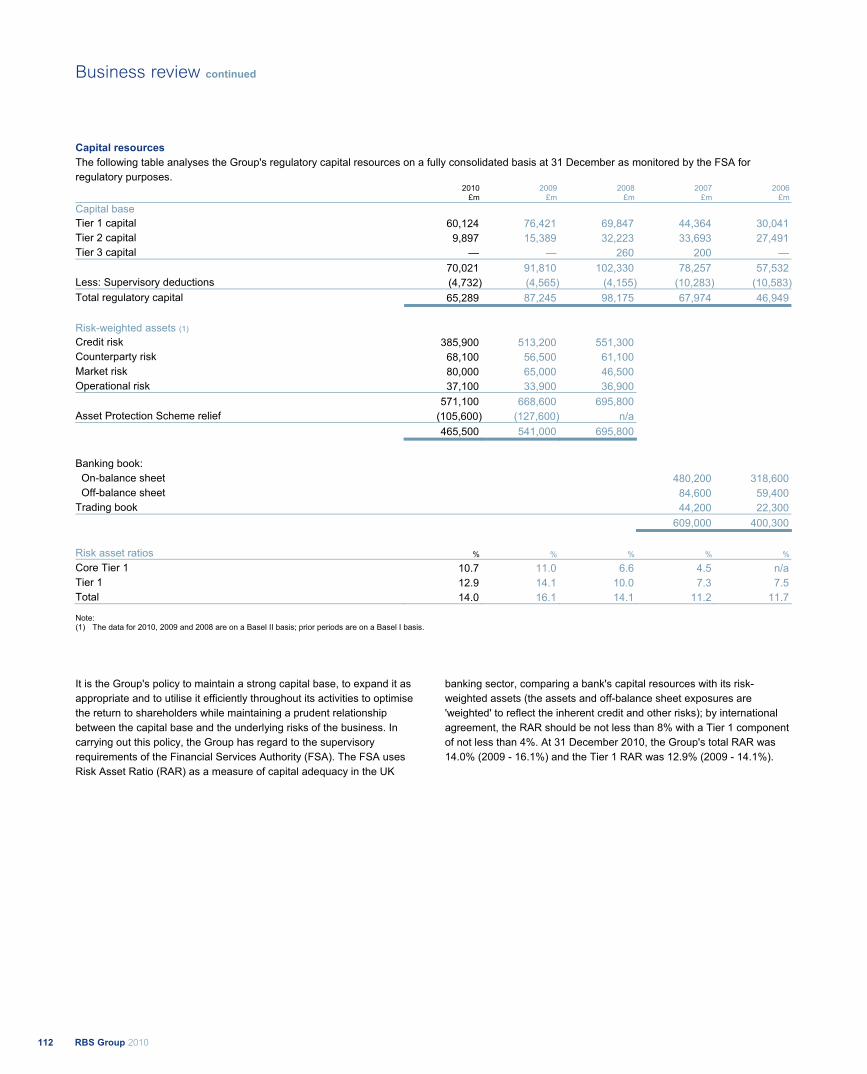
Capital resources The following table analyses the Group's regulatory capital resources on a fully consolidated basis at 31 December as monitored by the FSA for regulatory purposes. 2010 2009 2008 2007 2006 £m £m £m £m £m Capital base Tier 1 capital 60,124 76,421 69,847 44,364 30,041 Tier 2 capital 9,897 15,389 32,223 33,693 27,491 Tier 3 capital — — 260 200 — 70,021 91,810 102,330 78,257 57,532 Less: Supervisory deductions (4,732) (4,565) (4,155) (10,283) (10,583)Total regulatory capital 65,289 87,245 98,175 67,974 46,949
Risk-weighted assets (1) Credit risk 385,900 513,200 551,300 Counterparty risk 68,100 56,500 61,100 Market risk 80,000 65,000 46,500 Operational risk 37,100 33,900 36,900 571,100 668,600 695,800 Asset Protection Scheme relief (105,600) (127,600) n/a 465,500 541,000 695,800
Banking book: On-balance sheet 480,200 318,600 Off-balance sheet 84,600 59,400 Trading book 44,200 22,300 609,000 400,300
Risk asset ratios % % % % %
Core Tier 1 10.7 11.0 6.6 4.5 n/a Tier 1 12.9 14.1 10.0 7.3 7.5 Total 14.0 16.1 14.1 11.2 11.7
Note: (1) The data for 2010, 2009 and 2008 are on a Basel II basis; prior periods are on a Basel I basis.
It is the Group's policy to maintain a strong capital base, to expand it as appropriate and to utilise it efficiently throughout its activities to optimise the return to shareholders while maintaining a prudent relationship between the capital base and the underlying risks of the business. In carrying out this policy, the Group has regard to the supervisory requirements of the Financial Services Authority (FSA). The FSA uses Risk Asset Ratio (RAR) as a measure of capital adequacy in the UK
banking sector, comparing a bank's capital resources with its risk-weighted assets (the assets and off-balance sheet exposures are 'weighted' to reflect the inherent credit and other risks); by international agreement, the RAR should be not less than 8% with a Tier 1 component of not less than 4%. At 31 December 2010, the Group's total RAR was 14.0% (2009 - 16.1%) and the Tier 1 RAR was 12.9% (2009 - 14.1%).
RBS Group 2010112
Business review continued
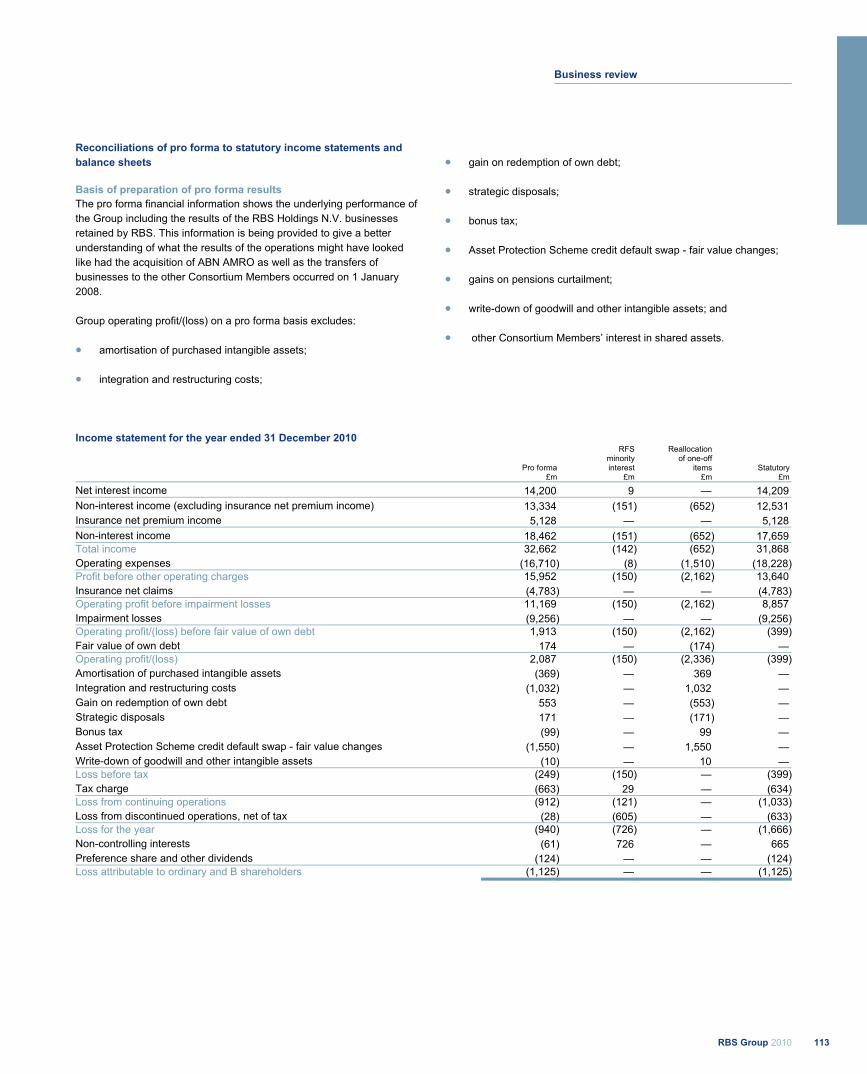
Reconciliations of pro forma to statutory income statements and balance sheets Basis of preparation of pro forma results The pro forma financial information shows the underlying performance of the Group including the results of the RBS Holdings N.V. businesses retained by RBS. This information is being provided to give a better understanding of what the results of the operations might have looked like had the acquisition of ABN AMRO as well as the transfers of businesses to the other Consortium Members occurred on 1 January 2008. Group operating profit/(loss) on a pro forma basis excludes:
amortisation of purchased intangible assets;
integration and restructuring costs;
gain on redemption of own debt;
strategic disposals;
bonus tax;
Asset Protection Scheme credit default swap - fair value changes;
gains on pensions curtailment;
write-down of goodwill and other intangible assets; and
other Consortium Members’ interest in shared assets.
Income statement for the year ended 31 December 2010 RFS Reallocation minority of one-off Pro forma interest items Statutory £m £m £m £m
Net interest income 14,200 9 — 14,209 Non-interest income (excluding insurance net premium income) 13,334 (151) (652) 12,531 Insurance net premium income 5,128 — — 5,128 Non-interest income 18,462 (151) (652) 17,659 Total income 32,662 (142) (652) 31,868 Operating expenses (16,710) (8) (1,510) (18,228)Profit before other operating charges 15,952 (150) (2,162) 13,640 Insurance net claims (4,783) — — (4,783)Operating profit before impairment losses 11,169 (150) (2,162) 8,857 Impairment losses (9,256) — — (9,256)Operating profit/(loss) before fair value of own debt 1,913 (150) (2,162) (399)Fair value of own debt 174 — (174) — Operating profit/(loss) 2,087 (150) (2,336) (399)Amortisation of purchased intangible assets (369) — 369 — Integration and restructuring costs (1,032) — 1,032 — Gain on redemption of own debt 553 — (553) — Strategic disposals 171 — (171) — Bonus tax (99) — 99 — Asset Protection Scheme credit default swap - fair value changes (1,550) — 1,550 — Write-down of goodwill and other intangible assets (10) — 10 — Loss before tax (249) (150) — (399)Tax charge (663) 29 — (634)Loss from continuing operations (912) (121) — (1,033)Loss from discontinued operations, net of tax (28) (605) — (633)Loss for the year (940) (726) — (1,666)Non-controlling interests (61) 726 — 665 Preference share and other dividends (124) — — (124)Loss attributable to ordinary and B shareholders (1,125) — — (1,125)
113RBS Group 2010
Business review

Income statement for the year ended 31 December 2009 RFS Reallocation minority of one-off Pro forma interest items Statutory £m £m £m £m
Net interest income 13,567 (179) — 13,388 Non-interest income (excluding insurance net premium income) 10,734 (142) 3,780 14,372 Insurance net premium income 5,266 — — 5,266 Non-interest income 16,000 (142) 3,780 19,638 Total income 29,567 (321) 3,780 33,026 Operating expenses (17,401) (35) 19 (17,417)Profit before other operating charges 12,166 (356) 3,799 15,609 Insurance net claims (4,357) — — (4,357)Operating profit before impairment losses 7,809 (356) 3,799 11,252 Impairment losses (13,899) — — (13,899)Operating loss before fair value of own debt (6,090) (356) 3,799 (2,647)Fair value of own debt (142) — 142 — Operating loss (6,232) (356) 3,941 (2,647)Amortisation of purchased intangible assets (272) — 272 — Integration and restructuring costs (1,286) — 1,286 — Gain on redemption of own debt 3,790 — (3,790) — Strategic disposals 132 — (132) — Bonus tax (208) — 208 — Gains on pensions curtailment 2,148 — (2,148) — Write-down of goodwill and other intangible assets (363) — 363 — Loss before tax (2,291) (356) — (2,647)Tax credit 339 90 — 429 Loss from continuing operations (1,952) (266) — (2,218)Loss from discontinued operations, net of tax (72) (33) — (105)Loss for the year (2,024) (299) — (2,323)Non-controlling interests (648) 299 — (349)Preference share and other dividends (935) — — (935)Loss attributable to ordinary and B shareholders (3,607) — — (3,607)
RBS Group 2010114
Business review continued
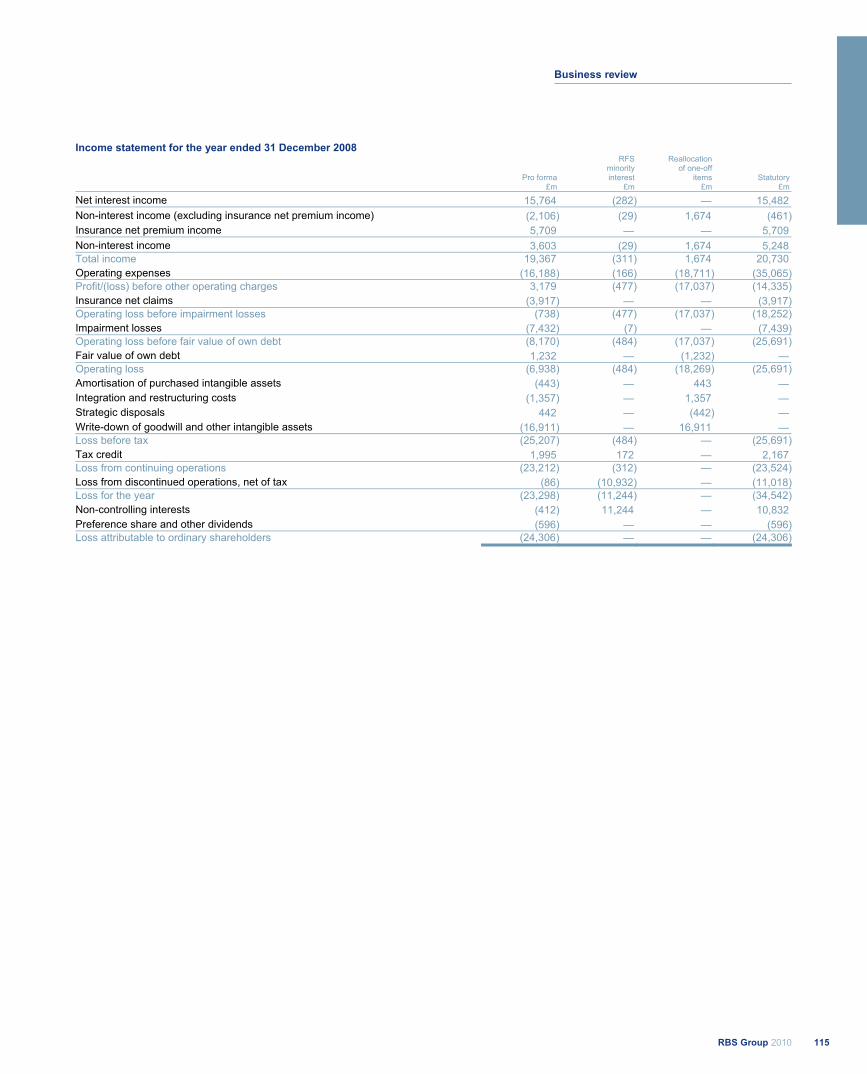
Income statement for the year ended 31 December 2008 RFS Reallocation minority of one-off Pro forma interest items Statutory £m £m £m £m
Net interest income 15,764 (282) — 15,482 Non-interest income (excluding insurance net premium income) (2,106) (29) 1,674 (461)Insurance net premium income 5,709 — — 5,709 Non-interest income 3,603 (29) 1,674 5,248 Total income 19,367 (311) 1,674 20,730 Operating expenses (16,188) (166) (18,711) (35,065)Profit/(loss) before other operating charges 3,179 (477) (17,037) (14,335)Insurance net claims (3,917) — — (3,917)Operating loss before impairment losses (738) (477) (17,037) (18,252)Impairment losses (7,432) (7) — (7,439)Operating loss before fair value of own debt (8,170) (484) (17,037) (25,691)Fair value of own debt 1,232 — (1,232) — Operating loss (6,938) (484) (18,269) (25,691)Amortisation of purchased intangible assets (443) — 443 — Integration and restructuring costs (1,357) — 1,357 — Strategic disposals 442 — (442) — Write-down of goodwill and other intangible assets (16,911) — 16,911 — Loss before tax (25,207) (484) — (25,691)Tax credit 1,995 172 — 2,167 Loss from continuing operations (23,212) (312) — (23,524)Loss from discontinued operations, net of tax (86) (10,932) — (11,018)Loss for the year (23,298) (11,244) — (34,542)Non-controlling interests (412) 11,244 — 10,832 Preference share and other dividends (596) — — (596)Loss attributable to ordinary shareholders (24,306) — — (24,306)
115RBS Group 2010
Business review
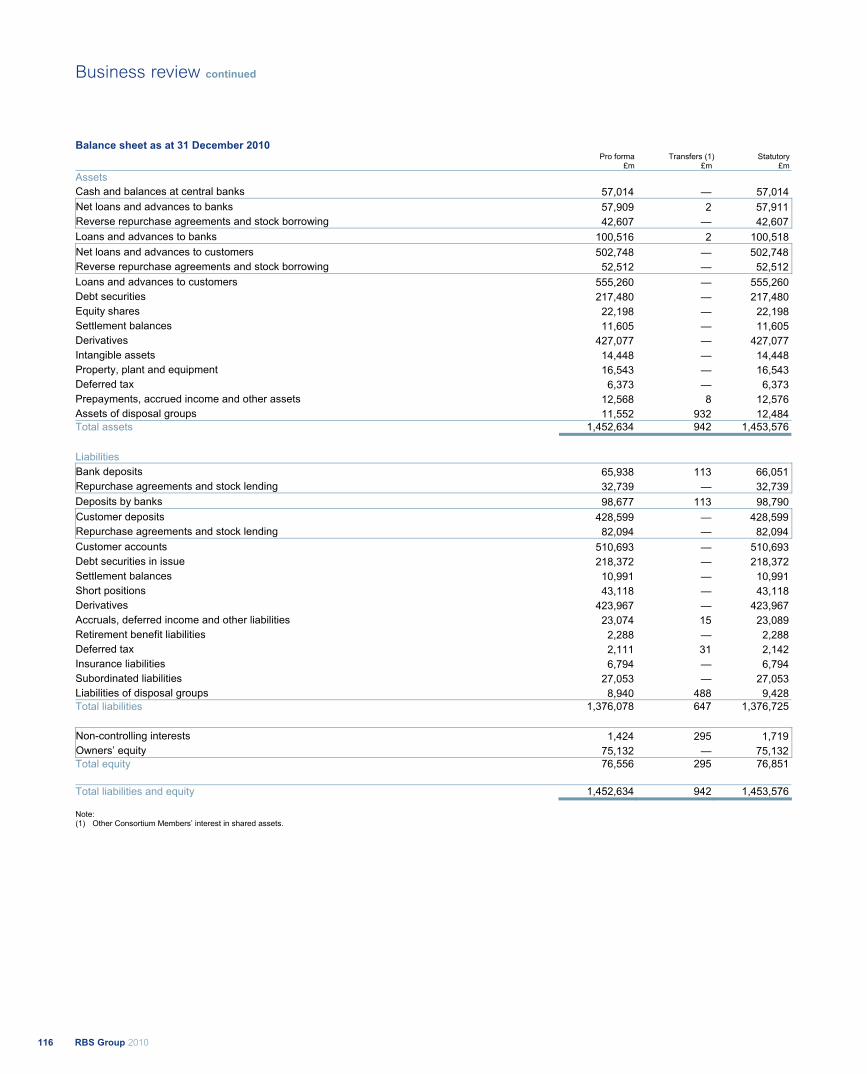
Balance sheet as at 31 December 2010 Pro forma Transfers (1) Statutory £m £m £m Assets Cash and balances at central banks 57,014 — 57,014 Net loans and advances to banks 57,909 2 57,911 Reverse repurchase agreements and stock borrowing 42,607 — 42,607 Loans and advances to banks 100,516 2 100,518 Net loans and advances to customers 502,748 — 502,748 Reverse repurchase agreements and stock borrowing 52,512 — 52,512 Loans and advances to customers 555,260 — 555,260 Debt securities 217,480 — 217,480 Equity shares 22,198 — 22,198 Settlement balances 11,605 — 11,605 Derivatives 427,077 — 427,077 Intangible assets 14,448 — 14,448 Property, plant and equipment 16,543 — 16,543 Deferred tax 6,373 — 6,373 Prepayments, accrued income and other assets 12,568 8 12,576 Assets of disposal groups 11,552 932 12,484 Total assets 1,452,634 942 1,453,576
Liabilities Bank deposits 65,938 113 66,051 Repurchase agreements and stock lending 32,739 — 32,739 Deposits by banks 98,677 113 98,790 Customer deposits 428,599 — 428,599 Repurchase agreements and stock lending 82,094 — 82,094 Customer accounts 510,693 — 510,693 Debt securities in issue 218,372 — 218,372 Settlement balances 10,991 — 10,991 Short positions 43,118 — 43,118 Derivatives 423,967 — 423,967 Accruals, deferred income and other liabilities 23,074 15 23,089 Retirement benefit liabilities 2,288 — 2,288 Deferred tax 2,111 31 2,142 Insurance liabilities 6,794 — 6,794 Subordinated liabilities 27,053 — 27,053 Liabilities of disposal groups 8,940 488 9,428 Total liabilities 1,376,078 647 1,376,725
Non-controlling interests 1,424 295 1,719 Owners’ equity 75,132 — 75,132 Total equity 76,556 295 76,851
Total liabilities and equity 1,452,634 942 1,453,576
Note: (1) Other Consortium Members’ interest in shared assets.
RBS Group 2010116
Business review continued
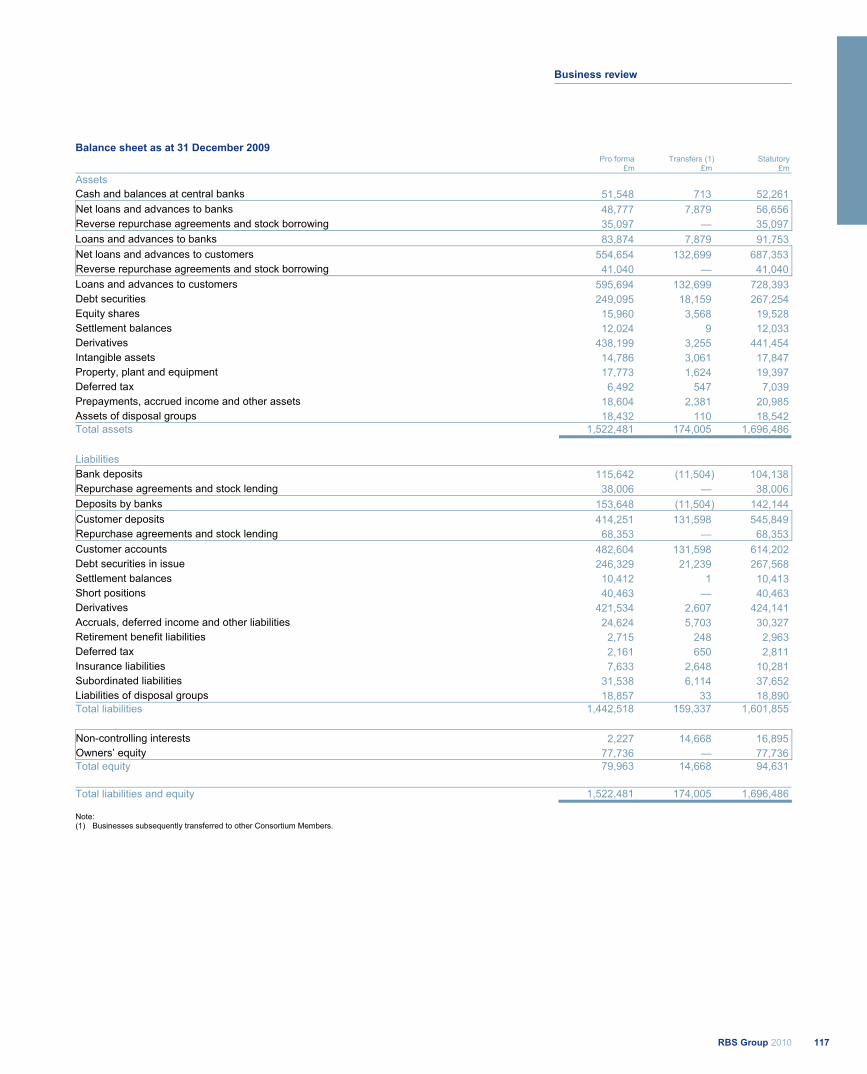
Balance sheet as at 31 December 2009 Pro forma Transfers (1) Statutory £m £m £m Assets Cash and balances at central banks 51,548 713 52,261 Net loans and advances to banks 48,777 7,879 56,656 Reverse repurchase agreements and stock borrowing 35,097 — 35,097 Loans and advances to banks 83,874 7,879 91,753 Net loans and advances to customers 554,654 132,699 687,353 Reverse repurchase agreements and stock borrowing 41,040 — 41,040 Loans and advances to customers 595,694 132,699 728,393 Debt securities 249,095 18,159 267,254 Equity shares 15,960 3,568 19,528 Settlement balances 12,024 9 12,033 Derivatives 438,199 3,255 441,454 Intangible assets 14,786 3,061 17,847 Property, plant and equipment 17,773 1,624 19,397 Deferred tax 6,492 547 7,039 Prepayments, accrued income and other assets 18,604 2,381 20,985 Assets of disposal groups 18,432 110 18,542 Total assets 1,522,481 174,005 1,696,486
Liabilities Bank deposits 115,642 (11,504) 104,138 Repurchase agreements and stock lending 38,006 — 38,006 Deposits by banks 153,648 (11,504) 142,144 Customer deposits 414,251 131,598 545,849 Repurchase agreements and stock lending 68,353 — 68,353 Customer accounts 482,604 131,598 614,202 Debt securities in issue 246,329 21,239 267,568 Settlement balances 10,412 1 10,413 Short positions 40,463 — 40,463 Derivatives 421,534 2,607 424,141 Accruals, deferred income and other liabilities 24,624 5,703 30,327 Retirement benefit liabilities 2,715 248 2,963 Deferred tax 2,161 650 2,811 Insurance liabilities 7,633 2,648 10,281 Subordinated liabilities 31,538 6,114 37,652 Liabilities of disposal groups 18,857 33 18,890 Total liabilities 1,442,518 159,337 1,601,855
Non-controlling interests 2,227 14,668 16,895 Owners’ equity 77,736 — 77,736 Total equity 79,963 14,668 94,631
Total liabilities and equity 1,522,481 174,005 1,696,486
Note: (1) Businesses subsequently transferred to other Consortium Members.
117RBS Group 2010
Business review
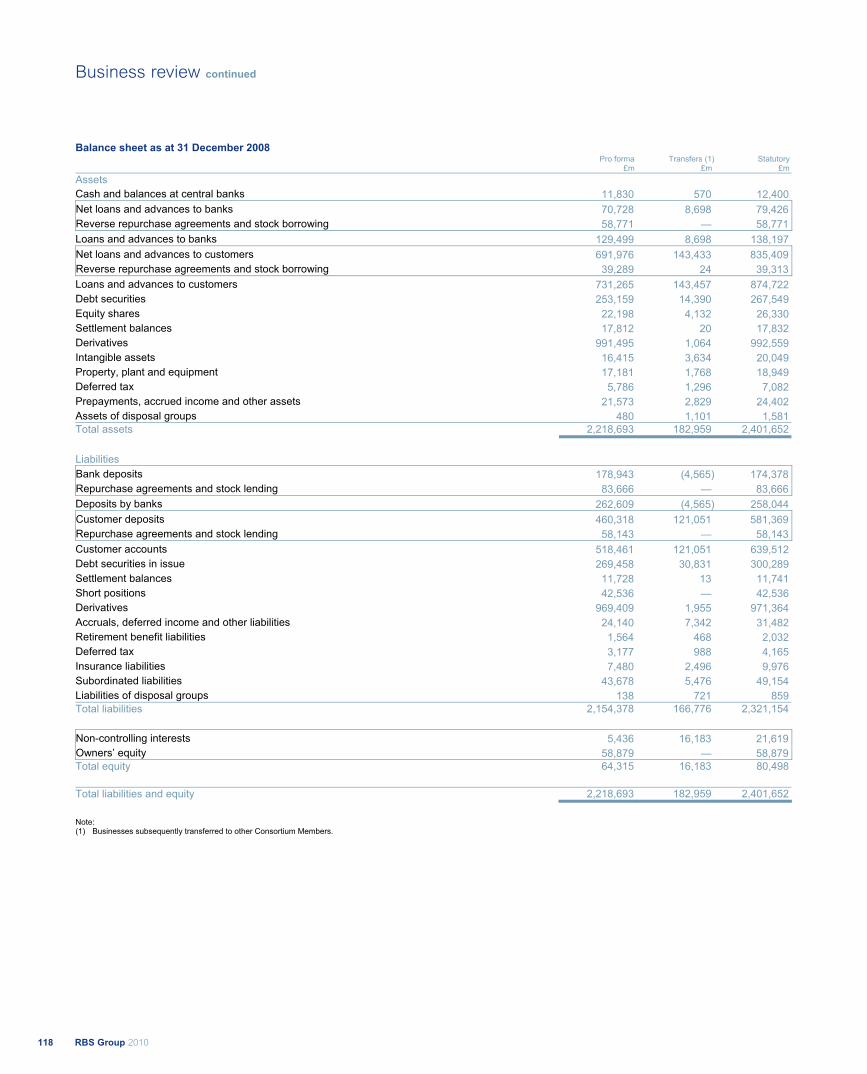
Balance sheet as at 31 December 2008 Pro forma Transfers (1) Statutory £m £m £m Assets Cash and balances at central banks 11,830 570 12,400 Net loans and advances to banks 70,728 8,698 79,426 Reverse repurchase agreements and stock borrowing 58,771 — 58,771 Loans and advances to banks 129,499 8,698 138,197 Net loans and advances to customers 691,976 143,433 835,409 Reverse repurchase agreements and stock borrowing 39,289 24 39,313 Loans and advances to customers 731,265 143,457 874,722 Debt securities 253,159 14,390 267,549 Equity shares 22,198 4,132 26,330 Settlement balances 17,812 20 17,832 Derivatives 991,495 1,064 992,559 Intangible assets 16,415 3,634 20,049 Property, plant and equipment 17,181 1,768 18,949 Deferred tax 5,786 1,296 7,082 Prepayments, accrued income and other assets 21,573 2,829 24,402 Assets of disposal groups 480 1,101 1,581 Total assets 2,218,693 182,959 2,401,652
Liabilities Bank deposits 178,943 (4,565) 174,378 Repurchase agreements and stock lending 83,666 — 83,666 Deposits by banks 262,609 (4,565) 258,044 Customer deposits 460,318 121,051 581,369 Repurchase agreements and stock lending 58,143 — 58,143 Customer accounts 518,461 121,051 639,512 Debt securities in issue 269,458 30,831 300,289 Settlement balances 11,728 13 11,741 Short positions 42,536 — 42,536 Derivatives 969,409 1,955 971,364 Accruals, deferred income and other liabilities 24,140 7,342 31,482 Retirement benefit liabilities 1,564 468 2,032 Deferred tax 3,177 988 4,165 Insurance liabilities 7,480 2,496 9,976 Subordinated liabilities 43,678 5,476 49,154 Liabilities of disposal groups 138 721 859 Total liabilities 2,154,378 166,776 2,321,154
Non-controlling interests 5,436 16,183 21,619 Owners’ equity 58,879 — 58,879 Total equity 64,315 16,183 80,498
Total liabilities and equity 2,218,693 182,959 2,401,652
Note: (1) Businesses subsequently transferred to other Consortium Members.
RBS Group 2010118
Business review continued
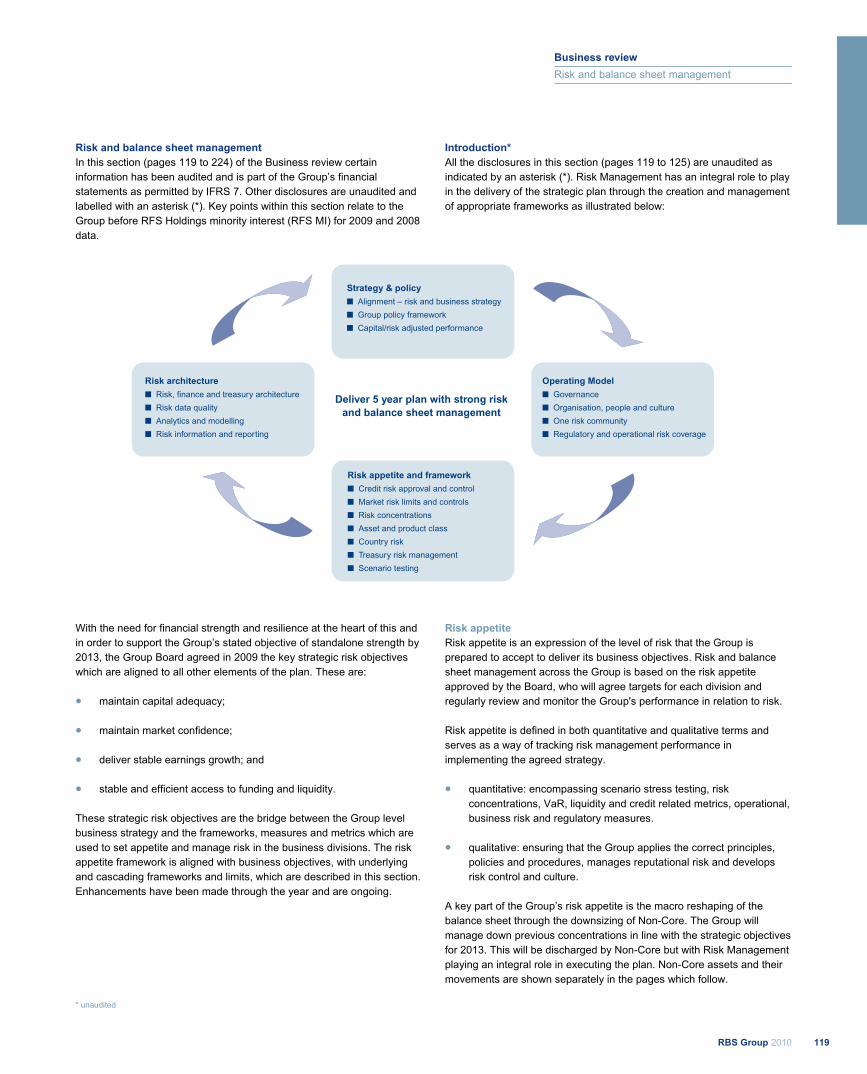
Risk and balance sheet management In this section (pages 119 to 224) of the Business review certain information has been audited and is part of the Group’s financial statements as permitted by IFRS 7. Other disclosures are unaudited and labelled with an asterisk (*). Key points within this section relate to the Group before RFS Holdings minority interest (RFS MI) for 2009 and 2008 data.
Introduction* All the disclosures in this section (pages 119 to 125) are unaudited as indicated by an asterisk (*). Risk Management has an integral role to play in the delivery of the strategic plan through the creation and management of appropriate frameworks as illustrated below:
With the need for financial strength and resilience at the heart of this and in order to support the Group’s stated objective of standalone strength by 2013, the Group Board agreed in 2009 the key strategic risk objectives which are aligned to all other elements of the plan. These are:
maintain capital adequacy;
maintain market confidence;
deliver stable earnings growth; and
stable and efficient access to funding and liquidity. These strategic risk objectives are the bridge between the Group level business strategy and the frameworks, measures and metrics which are used to set appetite and manage risk in the business divisions. The risk appetite framework is aligned with business objectives, with underlying and cascading frameworks and limits, which are described in this section. Enhancements have been made through the year and are ongoing.
Risk appetite Risk appetite is an expression of the level of risk that the Group is prepared to accept to deliver its business objectives. Risk and balance sheet management across the Group is based on the risk appetite approved by the Board, who will agree targets for each division and regularly review and monitor the Group's performance in relation to risk. Risk appetite is defined in both quantitative and qualitative terms and serves as a way of tracking risk management performance in implementing the agreed strategy.
quantitative: encompassing scenario stress testing, risk concentrations, VaR, liquidity and credit related metrics, operational, business risk and regulatory measures.
qualitative: ensuring that the Group applies the correct principles, policies and procedures, manages reputational risk and develops risk control and culture.
A key part of the Group’s risk appetite is the macro reshaping of the balance sheet through the downsizing of Non-Core. The Group will manage down previous concentrations in line with the strategic objectives for 2013. This will be discharged by Non-Core but with Risk Management playing an integral role in executing the plan. Non-Core assets and their movements are shown separately in the pages which follow.
* unaudited
S
119RBS Group 2010
Business review
Risk and balance sheet management
Strategy & policy
■ Alignment – risk and business strategy
■ Group policy framework
■ Capital/risk adjusted performance
Risk architecture
■ Risk, finance and treasury architecture
■ Risk data quality
■ Analytics and modelling
■ Risk information and reporting
Operating Model
■ Governance
■ Organisation, people and culture
■ One risk community
■ Regulatory and operational risk coverage
Risk appetite and framework
■ Credit risk approval and control
■ Market risk limits and controls
■ Risk concentrations
■ Asset and product class
■ Country risk
■ Treasury risk management
■ Scenario testing
Deliver 5 year plan with strong riskand balance sheet management
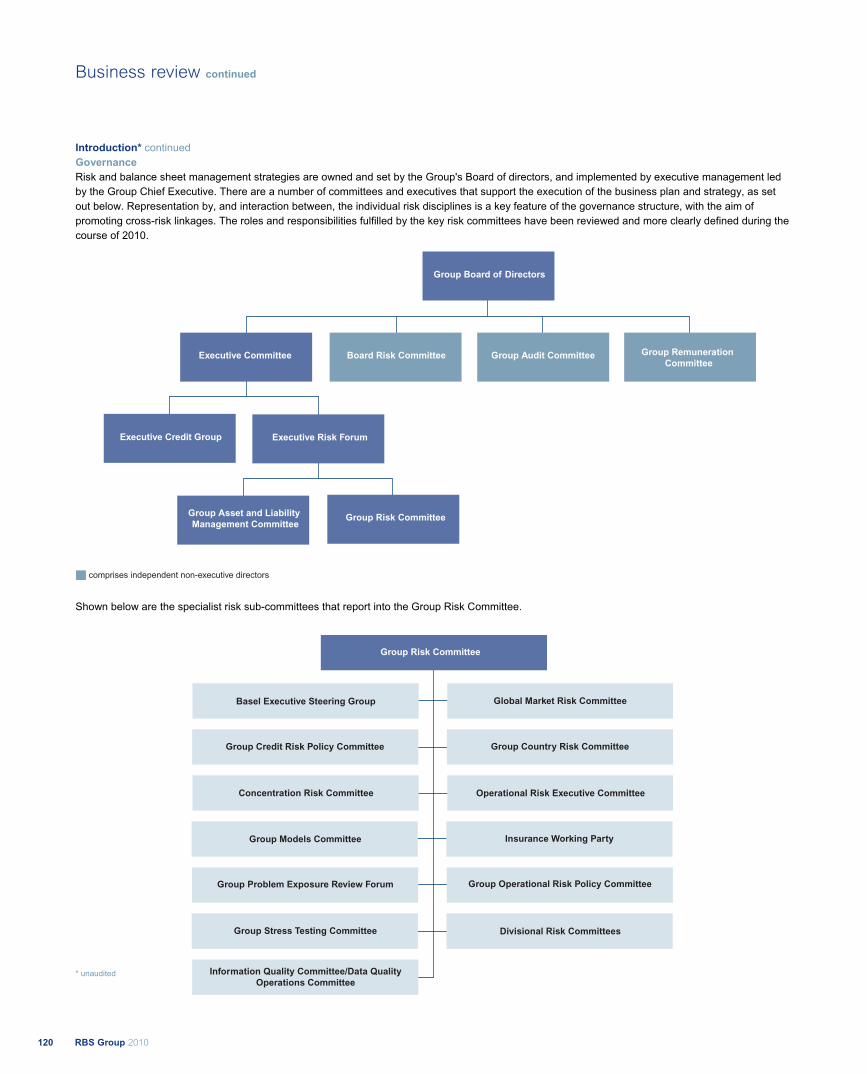
Introduction* continued Governance Risk and balance sheet management strategies are owned and set by the Group's Board of directors, and implemented by executive management led by the Group Chief Executive. There are a number of committees and executives that support the execution of the business plan and strategy, as set out below. Representation by, and interaction between, the individual risk disciplines is a key feature of the governance structure, with the aim of promoting cross-risk linkages. The roles and responsibilities fulfilled by the key risk committees have been reviewed and more clearly defined during the course of 2010.
RBS Group 2010120
Business review continued
Group Risk Committee
Basel Executive Steering Group
Group Credit Risk Policy Committee
Concentration Risk Committee
Group Models Committee
Group Problem Exposure Review Forum
Group Stress Testing Committee
Information Quality Committee/Data QualityOperations Committee
Global Market Risk Committee
Group Country Risk Committee
Operational Risk Executive Committee
Insurance Working Party
Group Operational Risk Policy Committee
Divisional Risk Committees
Shown below are the specialist risk sub-committees that report into the Group Risk Committee.
* unaudited
R
Group Board of Directors
Group Asset and LiabilityManagement Committee
Group Risk Committee
Executive Risk ForumExecutive Credit Group
Board Risk Committee Group Audit Committee Group RemunerationCommittee
Executive Committee
comprises independent non-executive directors

The role and remit of these committees is set out below. These committees are supported at a divisional level by a risk governance structure embedded in the businesses. During 2010, Risk Management
has been enhanced by the appointment of a Deputy Chief Risk Officer to whom the Divisional CROs and the functional risk heads now report.
Committee Focus Membership Group Board The Group Board is the main decision making forum at Group level.
It ensures that the Group manages risk effectively through approving and monitoring the Group’s risk appetite, considering Group stress scenarios and agreed mitigants and identifying longer term strategic threats to the Group’s business operations.
The Board of directors
Executive Committee (ExCo)
This committee is responsible for managing Group-wide issues and those operational issues material to the broader Group.
Group Chief Executive Group Finance Director Chief Administrative Officer Chief Executive Officers: US Retail & Commercial and Head of Americas; RBS Insurance; Global Banking & Markets; UK Corporate; and UK Retail, Wealth and Ulster Head of Restructuring and Risk
Board Risk Committee (BRC)
The Board Risk Committee provides oversight and advice to the Group Board in relation to current and potential future risk exposures of the Group and risk strategy, including determination of risk appetite and tolerance. It reviews the performance of the Group relative to risk appetite and provides oversight of the effectiveness of key Group policies, referred to as the Group Policy Framework.
At least three independent non-executive directors, one of whom is the chairman of the Group Audit Committee
Group Audit Committee (GAC)
The Group Audit Committee is responsible for assisting the Group Board in carrying out its responsibilities relating to accounting policies, internal control and financial reporting functions. It assists on such other matters as may be referred to it by the Group Board and acts as the Audit Committee of the Group Board. The Group Audit Committee also identifies any matters within its remit which it considers that action or improvement is needed and makes recommendations as to the steps to be taken.
At least three independent non-executive directors, at least one of whom is a financial expert as defined in the SEC Rules under the US Exchange Act
Group Remuneration Committee
The Remuneration Committee is responsible for the overview of the Group’s remuneration policy and remuneration governance framework, ensuring that remuneration arrangements are consistent with and promote effective risk management. The committee also makes recommendations to the Board on the remuneration arrangements for executive directors.
At least three independent non-executive directors
Executive Credit Group (ECG)
The ECG decides on requests for the extension of existing or new credit limits on behalf of the Board of directors where the proposed aggregate facility limits are in excess of the credit approval authorities granted to individuals in divisions or in RBS Risk Management, or where an appeal against the decline decision of the Group Chief Credit Officer (or delegates) or Group Chief Risk Officer is referred for final decision.
Group A members Head of Restructuring and Risk Deputy Chief Risk Officer Group Chief Credit Officer/Chief Credit Officer RBS N.V. Head of Global Restructuring Group Chief Risk Officer, Non-Core division/APS (alternate) Group B members Group Chief Executive Chief Executive Officers: UK Retail, Wealth and Ulster; US Retail & Commercial and Head of Americas; Global Banking & Markets; RBS Insurance; UK Corporate President, Global Banking & Markets Group Finance Director
121RBS Group 2010
Business review
Risk and balance sheet management
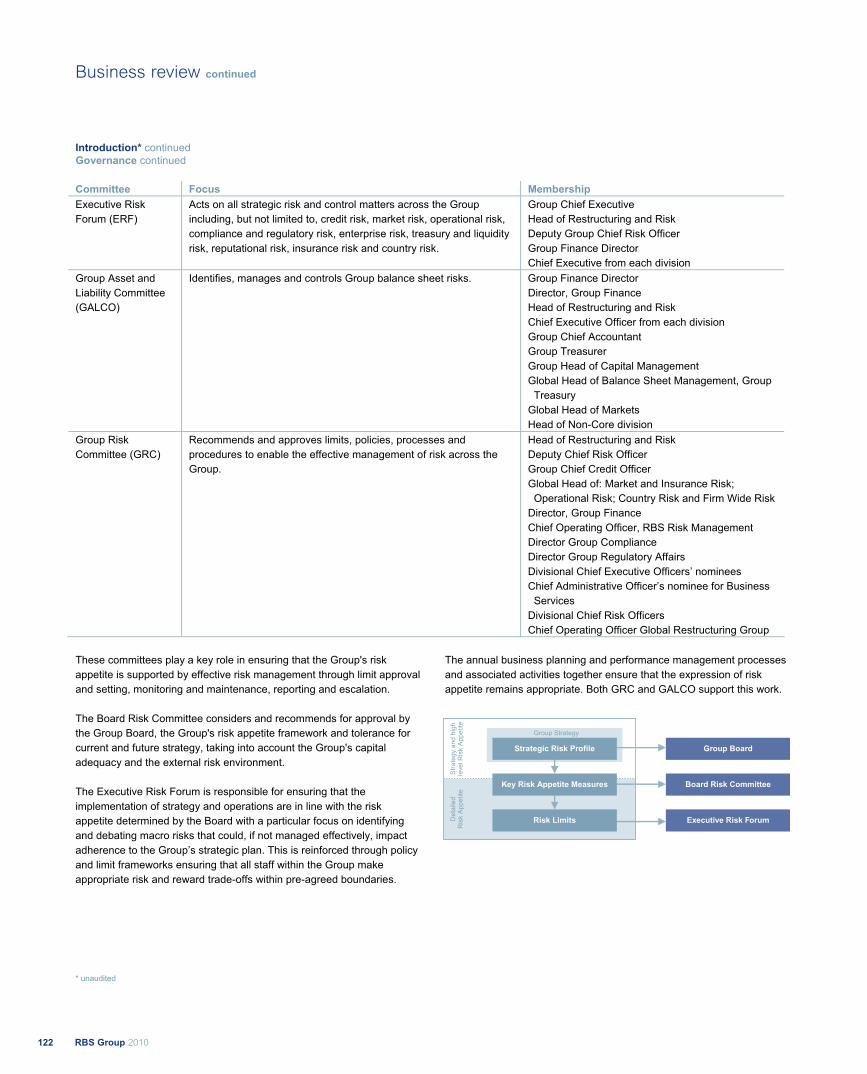
Introduction* continued Governance continued Committee Focus Membership Executive Risk Forum (ERF)
Acts on all strategic risk and control matters across the Group including, but not limited to, credit risk, market risk, operational risk, compliance and regulatory risk, enterprise risk, treasury and liquidity risk, reputational risk, insurance risk and country risk.
Group Chief Executive Head of Restructuring and Risk Deputy Group Chief Risk Officer Group Finance Director Chief Executive from each division
Group Asset and Liability Committee (GALCO)
Identifies, manages and controls Group balance sheet risks. Group Finance Director Director, Group Finance Head of Restructuring and Risk Chief Executive Officer from each division Group Chief Accountant Group Treasurer Group Head of Capital Management Global Head of Balance Sheet Management, Group Treasury Global Head of Markets Head of Non-Core division
Group Risk Committee (GRC)
Recommends and approves limits, policies, processes and procedures to enable the effective management of risk across the Group.
Head of Restructuring and Risk Deputy Chief Risk Officer Group Chief Credit Officer Global Head of: Market and Insurance Risk; Operational Risk; Country Risk and Firm Wide Risk Director, Group Finance Chief Operating Officer, RBS Risk Management Director Group Compliance Director Group Regulatory Affairs Divisional Chief Executive Officers’ nominees Chief Administrative Officer’s nominee for Business Services Divisional Chief Risk Officers Chief Operating Officer Global Restructuring Group
These committees play a key role in ensuring that the Group's risk appetite is supported by effective risk management through limit approval and setting, monitoring and maintenance, reporting and escalation. The Board Risk Committee considers and recommends for approval by the Group Board, the Group's risk appetite framework and tolerance for current and future strategy, taking into account the Group's capital adequacy and the external risk environment. The Executive Risk Forum is responsible for ensuring that the implementation of strategy and operations are in line with the risk appetite determined by the Board with a particular focus on identifying and debating macro risks that could, if not managed effectively, impact adherence to the Group’s strategic plan. This is reinforced through policy and limit frameworks ensuring that all staff within the Group make appropriate risk and reward trade-offs within pre-agreed boundaries.
The annual business planning and performance management processes and associated activities together ensure that the expression of risk appetite remains appropriate. Both GRC and GALCO support this work.
* unaudited
RRBS Group 2010122
Business review continued
Executive Risk Forum
Board Risk Committee
Group Board
Group Strategy
Str
ate
gyan
dhi
ghle
velR
isk
App
etite
Det
aile
dR
isk
App
etite
Risk Limits
Key Risk Appetite Measures
Strategic Risk Profile
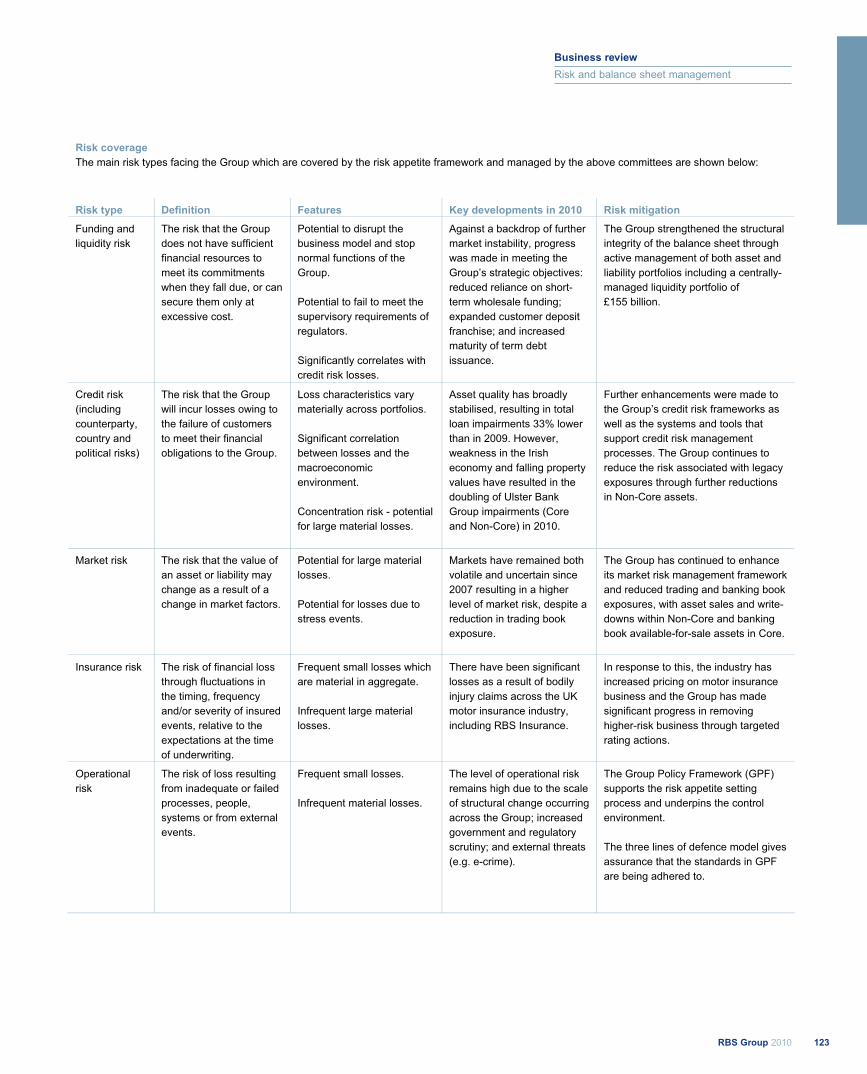
Risk coverage The main risk types facing the Group which are covered by the risk appetite framework and managed by the above committees are shown below:
Risk type Definition Features Key developments in 2010 Risk mitigation
Funding and liquidity risk
The risk that the Group does not have sufficient financial resources to meet its commitments when they fall due, or can secure them only at excessive cost.
Potential to disrupt the business model and stop normal functions of the Group. Potential to fail to meet the supervisory requirements of regulators. Significantly correlates with credit risk losses.
Against a backdrop of further market instability, progress was made in meeting the Group’s strategic objectives: reduced reliance on short-term wholesale funding; expanded customer deposit franchise; and increased maturity of term debt issuance.
The Group strengthened the structural integrity of the balance sheet through active management of both asset and liability portfolios including a centrally-managed liquidity portfolio of £155 billion.
Credit risk (including counterparty, country and political risks)
The risk that the Group will incur losses owing to the failure of customers to meet their financial obligations to the Group.
Loss characteristics vary materially across portfolios. Significant correlation between losses and the macroeconomic environment. Concentration risk - potential for large material losses.
Asset quality has broadly stabilised, resulting in total loan impairments 33% lower than in 2009. However, weakness in the Irish economy and falling property values have resulted in the doubling of Ulster Bank Group impairments (Core and Non-Core) in 2010.
Further enhancements were made to the Group’s credit risk frameworks as well as the systems and tools that support credit risk management processes. The Group continues to reduce the risk associated with legacy exposures through further reductions in Non-Core assets.
Market risk The risk that the value of an asset or liability may change as a result of a change in market factors.
Potential for large material losses. Potential for losses due to stress events.
Markets have remained both volatile and uncertain since 2007 resulting in a higher level of market risk, despite a reduction in trading book exposure.
The Group has continued to enhance its market risk management framework and reduced trading and banking book exposures, with asset sales and write-downs within Non-Core and banking book available-for-sale assets in Core.
Insurance risk The risk of financial loss through fluctuations in the timing, frequency and/or severity of insured events, relative to the expectations at the time of underwriting.
Frequent small losses which are material in aggregate. Infrequent large material losses.
There have been significant losses as a result of bodily injury claims across the UK motor insurance industry, including RBS Insurance.
In response to this, the industry has increased pricing on motor insurance business and the Group has made significant progress in removing higher-risk business through targeted rating actions.
Operational risk
The risk of loss resulting from inadequate or failed processes, people, systems or from external events.
Frequent small losses. Infrequent material losses.
The level of operational risk remains high due to the scale of structural change occurring across the Group; increased government and regulatory scrutiny; and external threats (e.g. e-crime).
The Group Policy Framework (GPF) supports the risk appetite setting process and underpins the control environment. The three lines of defence model gives assurance that the standards in GPF are being adhered to.
123RBS Group 2010
Business review
Risk and balance sheet management
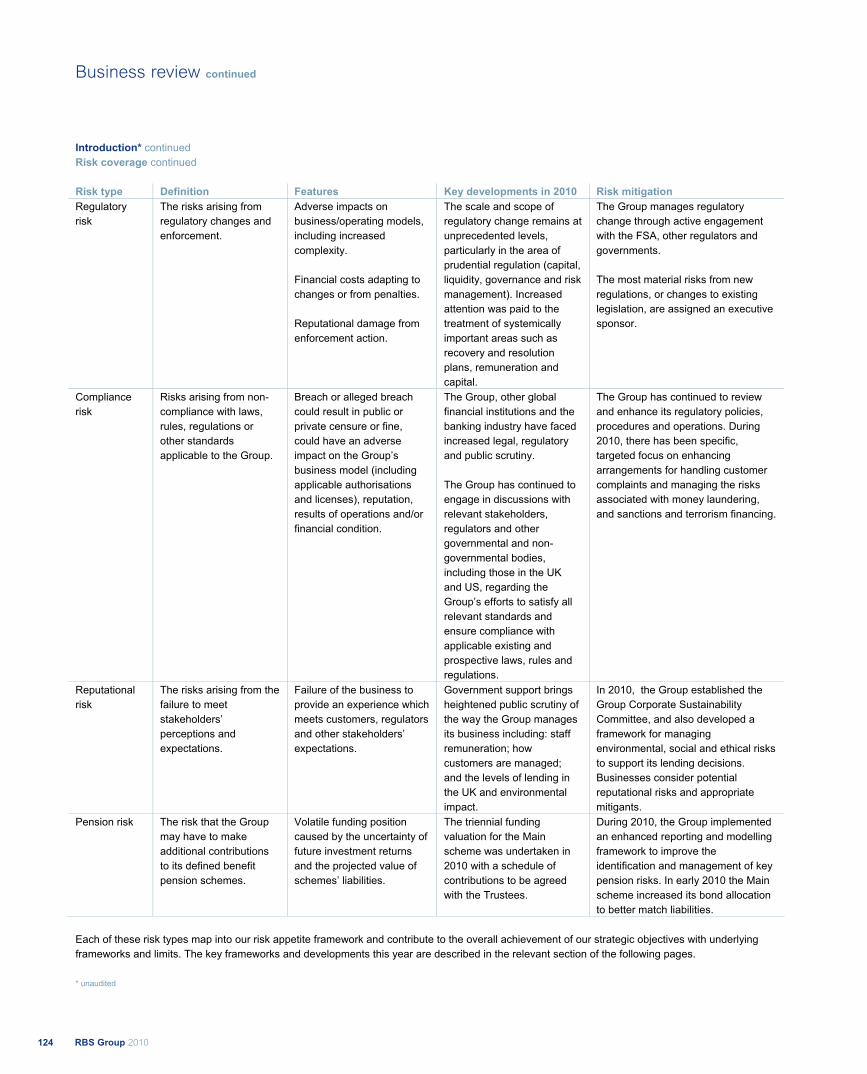
Introduction* continued Risk coverage continued Risk type Definition Features Key developments in 2010 Risk mitigation Regulatory risk
The risks arising from regulatory changes and enforcement.
Adverse impacts on business/operating models, including increased complexity. Financial costs adapting to changes or from penalties. Reputational damage from enforcement action.
The scale and scope of regulatory change remains at unprecedented levels, particularly in the area of prudential regulation (capital, liquidity, governance and risk management). Increased attention was paid to the treatment of systemically important areas such as recovery and resolution plans, remuneration and capital.
The Group manages regulatory change through active engagement with the FSA, other regulators and governments. The most material risks from new regulations, or changes to existing legislation, are assigned an executive sponsor.
Compliance risk
Risks arising from non-compliance with laws, rules, regulations or other standards applicable to the Group.
Breach or alleged breach could result in public or private censure or fine, could have an adverse impact on the Group’s business model (including applicable authorisations and licenses), reputation, results of operations and/or financial condition.
The Group, other global financial institutions and the banking industry have faced increased legal, regulatory and public scrutiny. The Group has continued to engage in discussions with relevant stakeholders, regulators and other governmental and non-governmental bodies, including those in the UK and US, regarding the Group’s efforts to satisfy all relevant standards and ensure compliance with applicable existing and prospective laws, rules and regulations.
The Group has continued to review and enhance its regulatory policies, procedures and operations. During 2010, there has been specific, targeted focus on enhancing arrangements for handling customer complaints and managing the risks associated with money laundering, and sanctions and terrorism financing.
Reputational risk
The risks arising from the failure to meet stakeholders’ perceptions and expectations.
Failure of the business to provide an experience which meets customers, regulators and other stakeholders’ expectations.
Government support brings heightened public scrutiny of the way the Group manages its business including: staff remuneration; how customers are managed; and the levels of lending in the UK and environmental impact.
In 2010, the Group established the Group Corporate Sustainability Committee, and also developed a framework for managing environmental, social and ethical risks to support its lending decisions. Businesses consider potential reputational risks and appropriate mitigants.
Pension risk The risk that the Group may have to make additional contributions to its defined benefit pension schemes.
Volatile funding position caused by the uncertainty of future investment returns and the projected value of schemes’ liabilities.
The triennial funding valuation for the Main scheme was undertaken in 2010 with a schedule of contributions to be agreed with the Trustees.
During 2010, the Group implemented an enhanced reporting and modelling framework to improve the identification and management of key pension risks. In early 2010 the Main scheme increased its bond allocation to better match liabilities.
Each of these risk types map into our risk appetite framework and contribute to the overall achievement of our strategic objectives with underlying frameworks and limits. The key frameworks and developments this year are described in the relevant section of the following pages.
* unaudited
RRBS Group 2010124
Business review continued
Stress testing Stress testing commonly describes the evaluation of a bank’s financial position under severe but plausible stress scenarios. The term stress testing is used to refer not only to the application of individual stress tests but also to the wider economic environment within which these tests are developed, evaluated and used within the decision making process. Since the financial crisis of 2008/2009 there has been an increased focus, both amongst regulators and senior management, on stress testing as a means of identifying vulnerabilities within a financial institution and within the financial system as a whole. Many regulatory documents and initiatives have emerged which require strong involvement of senior management in the design and evaluation of scenarios, an emphasis on plausible events and a shift from the assessment of instant shocks to multi-period analysis of capital adequacy over a prolonged period of stress. The Group’s stress testing framework is designed to embed stress testing as a key risk management technique into mainstream risk reporting, capital planning and business processes at both the Group and divisional level. The Executive Risk Forum is the main body overseeing the stress testing approach, processes and results. The forum is primarily responsible for reviewing and challenging the results of any Group-wide stress tests and ensuring, where necessary, appropriate management actions are initiated. Industry wide scenarios RBS has taken part in a number of industry wide stress tests such as an EU-wide stress testing exercise, the results of which were published in July 2010. It is important to note that the tests are theoretical in nature and none of the data published represent a forecast or prediction by RBS of what would actually happen in any of the modelled scenarios. Furthermore, the results are FSA calculations impacting revenues, impairments and balance sheet items and assume an unchanged balance sheet from the end of 2009. The test confirms RBS remains well capitalised with a strong Tier 1 capital ratio under both the benchmark and adverse scenarios.
In addition to the EU stress test, during the second half of 2010 RBS has undertaken the FSA anchor scenario test. During 2011, RBS is planning to take part in forthcoming International Monetary Fund, European Banking Federation and FSA stress testing exercises. Other stress testing In addition to industry wide stress tests, Group standards for stress testing allow for a combination of various stress testing methods in order to provide a comprehensive view of the Group’s risk profile. Depending on the complexity and materiality of the portfolio, techniques may range from sensitivity analyses performed on an individual product or an individual portfolio to the evaluation of complex stress scenarios performed at Group-wide level. Stress testing techniques applied within the Group are:
sensitivity analysis;
scenario analysis; and
reverse stress testing. The stress testing programme implemented aims to provide a comprehensive view of the Group’s risk profile. Stress tests are performed at the following levels of aggregation:
firm-wide level;
division level;
portfolio level; and
transactional or sub-portfolio level. More details on stress and scenario testing are set out in various sub sections in the following pages.
125RBS Group 2010
Business review
Risk and balance sheet management
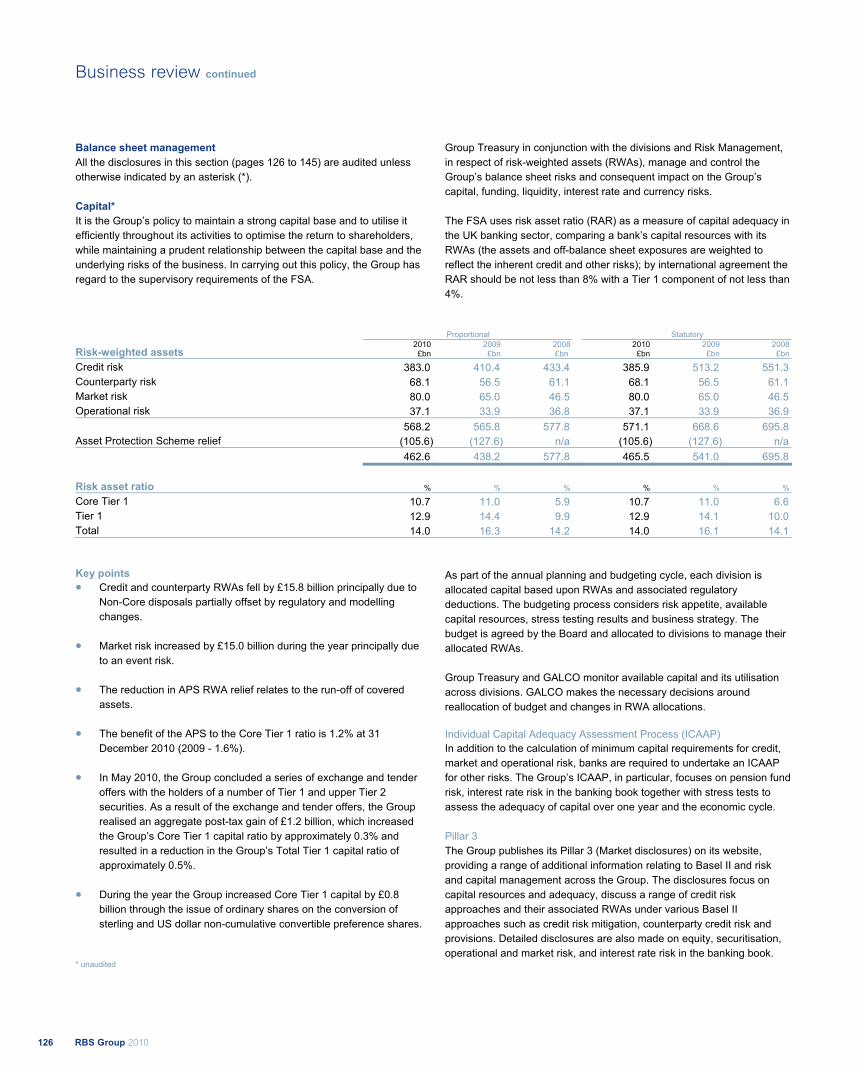
Balance sheet management All the disclosures in this section (pages 126 to 145) are audited unless otherwise indicated by an asterisk (*). Capital* It is the Group’s policy to maintain a strong capital base and to utilise it efficiently throughout its activities to optimise the return to shareholders, while maintaining a prudent relationship between the capital base and the underlying risks of the business. In carrying out this policy, the Group has regard to the supervisory requirements of the FSA.
Group Treasury in conjunction with the divisions and Risk Management, in respect of risk-weighted assets (RWAs), manage and control the Group’s balance sheet risks and consequent impact on the Group’s capital, funding, liquidity, interest rate and currency risks. The FSA uses risk asset ratio (RAR) as a measure of capital adequacy in the UK banking sector, comparing a bank’s capital resources with its RWAs (the assets and off-balance sheet exposures are weighted to reflect the inherent credit and other risks); by international agreement the RAR should be not less than 8% with a Tier 1 component of not less than 4%.
Proportional Statutory
Risk-weighted assets 2010 £bn
2009 £bn
2008 £bn
2010 £bn
2009 £bn
2008 £bn
Credit risk 383.0 410.4 433.4 385.9 513.2 551.3 Counterparty risk 68.1 56.5 61.1 68.1 56.5 61.1 Market risk 80.0 65.0 46.5 80.0 65.0 46.5 Operational risk 37.1 33.9 36.8 37.1 33.9 36.9 568.2 565.8 577.8 571.1 668.6 695.8 Asset Protection Scheme relief (105.6) (127.6) n/a (105.6) (127.6) n/a 462.6 438.2 577.8 465.5 541.0 695.8
Risk asset ratio % % % % % %
Core Tier 1 10.7 11.0 5.9 10.7 11.0 6.6 Tier 1 12.9 14.4 9.9 12.9 14.1 10.0 Total 14.0 16.3 14.2 14.0 16.1 14.1
Key points Credit and counterparty RWAs fell by £15.8 billion principally due to Non-Core disposals partially offset by regulatory and modelling changes.
Market risk increased by £15.0 billion during the year principally due to an event risk.
The reduction in APS RWA relief relates to the run-off of covered assets.
The benefit of the APS to the Core Tier 1 ratio is 1.2% at 31 December 2010 (2009 - 1.6%).
In May 2010, the Group concluded a series of exchange and tender offers with the holders of a number of Tier 1 and upper Tier 2 securities. As a result of the exchange and tender offers, the Group realised an aggregate post-tax gain of £1.2 billion, which increased the Group’s Core Tier 1 capital ratio by approximately 0.3% and resulted in a reduction in the Group’s Total Tier 1 capital ratio of approximately 0.5%.
During the year the Group increased Core Tier 1 capital by £0.8 billion through the issue of ordinary shares on the conversion of sterling and US dollar non-cumulative convertible preference shares.
As part of the annual planning and budgeting cycle, each division is allocated capital based upon RWAs and associated regulatory deductions. The budgeting process considers risk appetite, available capital resources, stress testing results and business strategy. The budget is agreed by the Board and allocated to divisions to manage their allocated RWAs. Group Treasury and GALCO monitor available capital and its utilisation across divisions. GALCO makes the necessary decisions around reallocation of budget and changes in RWA allocations. Individual Capital Adequacy Assessment Process (ICAAP) In addition to the calculation of minimum capital requirements for credit, market and operational risk, banks are required to undertake an ICAAP for other risks. The Group’s ICAAP, in particular, focuses on pension fund risk, interest rate risk in the banking book together with stress tests to assess the adequacy of capital over one year and the economic cycle. Pillar 3 The Group publishes its Pillar 3 (Market disclosures) on its website, providing a range of additional information relating to Basel II and risk and capital management across the Group. The disclosures focus on capital resources and adequacy, discuss a range of credit risk approaches and their associated RWAs under various Basel II approaches such as credit risk mitigation, counterparty credit risk and provisions. Detailed disclosures are also made on equity, securitisation, operational and market risk, and interest rate risk in the banking book.
* unaudited
RBS Group 2010126
Business review continued
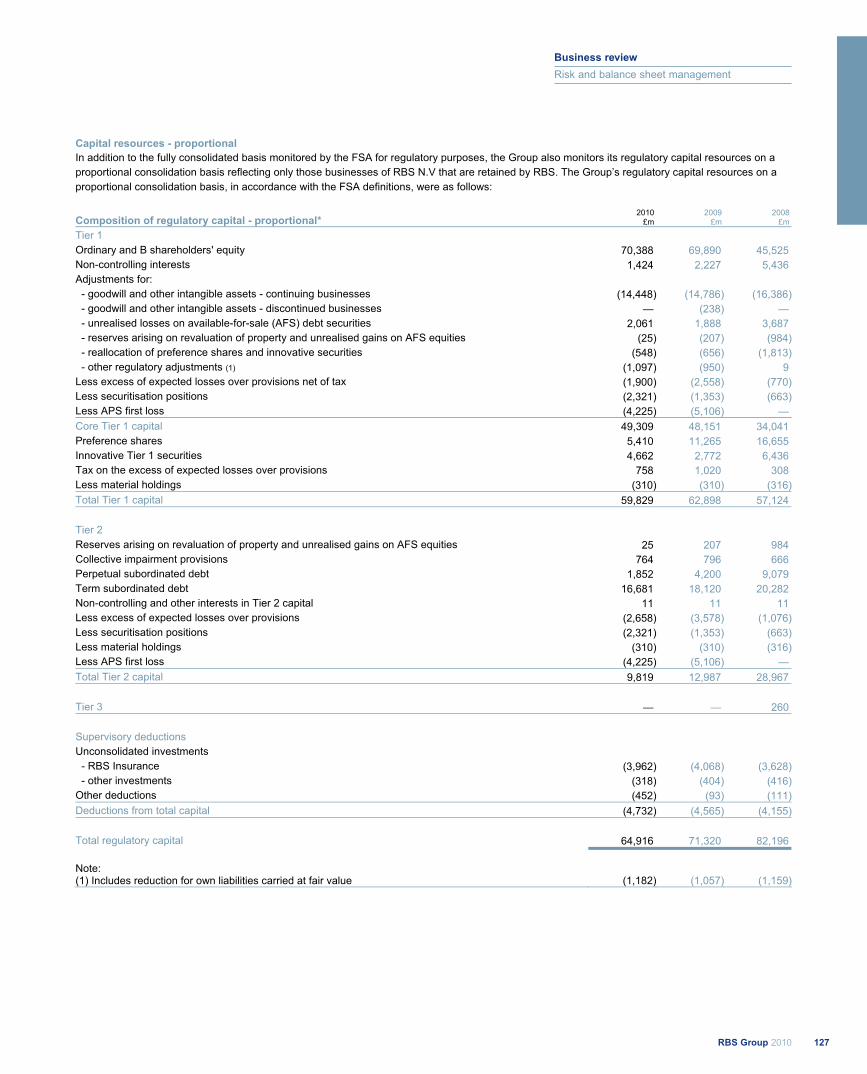
Capital resources - proportional In addition to the fully consolidated basis monitored by the FSA for regulatory purposes, the Group also monitors its regulatory capital resources on a proportional consolidation basis reflecting only those businesses of RBS N.V that are retained by RBS. The Group’s regulatory capital resources on a proportional consolidation basis, in accordance with the FSA definitions, were as follows:
Composition of regulatory capital - proportional* 2010
£m 2009
£m 2008
£m
Tier 1 Ordinary and B shareholders' equity 70,388 69,890 45,525 Non-controlling interests 1,424 2,227 5,436 Adjustments for:
- goodwill and other intangible assets - continuing businesses (14,448) (14,786) (16,386) - goodwill and other intangible assets - discontinued businesses — (238) — - unrealised losses on available-for-sale (AFS) debt securities 2,061 1,888 3,687 - reserves arising on revaluation of property and unrealised gains on AFS equities (25) (207) (984) - reallocation of preference shares and innovative securities (548) (656) (1,813) - other regulatory adjustments (1) (1,097) (950) 9 Less excess of expected losses over provisions net of tax (1,900) (2,558) (770)Less securitisation positions (2,321) (1,353) (663)Less APS first loss (4,225) (5,106) — Core Tier 1 capital 49,309 48,151 34,041 Preference shares 5,410 11,265 16,655 Innovative Tier 1 securities 4,662 2,772 6,436 Tax on the excess of expected losses over provisions 758 1,020 308 Less material holdings (310) (310) (316)Total Tier 1 capital 59,829 62,898 57,124
Tier 2 Reserves arising on revaluation of property and unrealised gains on AFS equities 25 207 984 Collective impairment provisions 764 796 666 Perpetual subordinated debt 1,852 4,200 9,079 Term subordinated debt 16,681 18,120 20,282 Non-controlling and other interests in Tier 2 capital 11 11 11 Less excess of expected losses over provisions (2,658) (3,578) (1,076)Less securitisation positions (2,321) (1,353) (663)Less material holdings (310) (310) (316)Less APS first loss (4,225) (5,106) — Total Tier 2 capital 9,819 12,987 28,967
Tier 3 — — 260 Supervisory deductions Unconsolidated investments
- RBS Insurance (3,962) (4,068) (3,628) - other investments (318) (404) (416)Other deductions (452) (93) (111)Deductions from total capital (4,732) (4,565) (4,155)
Total regulatory capital 64,916 71,320 82,196 Note: (1) Includes reduction for own liabilities carried at fair value (1,182) (1,057) (1,159)
127RBS Group 2010
Business review
Risk and balance sheet management

Balance sheet management: Capital* continued Capital resources - statutory The Group's regulatory capital resources on a full consolidation basis, in accordance with the FSA definitions, were as follows:
Composition of regulatory capital - statutory 2010
£m2009
£m2008
£m
Tier 1 Ordinary and B shareholders' equity 70,388 69,890 45,525 Non-controlling interests 1,719 16,895 21,619 Adjustments for:
- goodwill and other intangible assets - continuing businesses (14,448) (17,847) (20,049) - goodwill and other intangible assets - discontinued businesses — (238) — - unrealised losses on available-for-sale (AFS) debt securities 2,061 1,888 3,687 - reserves arising on revaluation of property and unrealised gains on AFS equities (25) (207) (984) - reallocation of preference shares and innovative securities (548) (656) (1,813) - other regulatory adjustments (1) (1,097) (1,184) (362)Less excess of expected losses over provisions net of tax (1,900) (2,558) (770)Less securitisation positions (2,321) (1,353) (663)Less APS first loss (4,225) (5,106) — Core Tier 1 capital 49,604 59,524 46,190 Preference shares 5,410 11,265 16,655 Innovative Tier 1 securities 4,662 5,213 7,383 Tax on the excess of expected losses over provisions 758 1,020 308 Less material holdings (310) (601) (689)Total Tier 1 capital 60,124 76,421 69,847
Tier 2 Reserves arising on revaluation of property and unrealised gains on AFS equities 25 207 984 Collective impairment provisions 778 796 666 Perpetual subordinated debt 1,852 4,950 9,829 Term subordinated debt 16,745 20,063 23,162 Non-controlling and other interests in Tier 2 capital 11 11 11 Less excess of expected losses over provisions (2,658) (3,578) (1,078)Less securitisation positions (2,321) (1,353) (662)Less material holdings (310) (601) (689)Less APS first loss (4,225) (5,106) — Total Tier 2 capital 9,897 15,389 32,223
Tier 3 — — 260 Supervisory deductions Unconsolidated investments - RBS Insurance (3,962) (4,068) (3,628) - other investments (318) (404) (416)Other deductions (452) (93) (111)Deductions from total capital (4,732) (4,565) (4,155)
Total regulatory capital 65,289 87,245 98,175
Note: (1) Includes reduction for own liabilities carried at fair value (1,182) (1,057) (1,159)
* unaudited
RBS Group 2010128
Business review continued
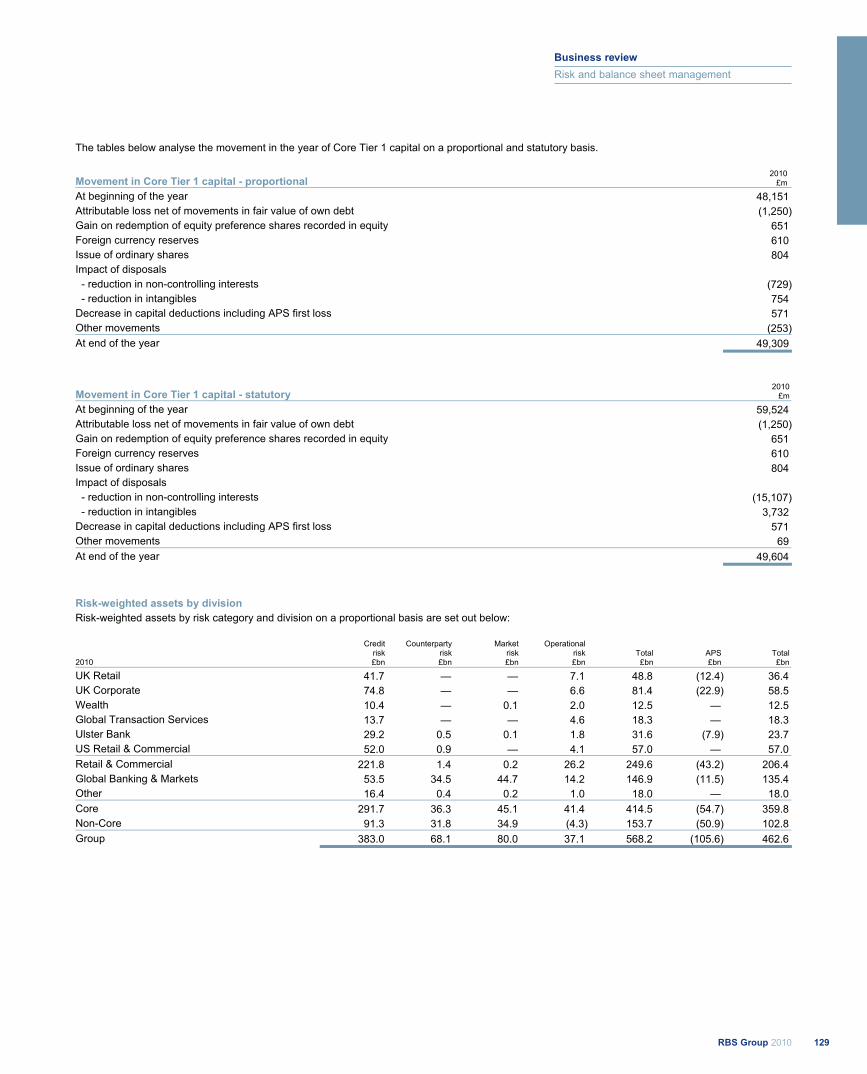
The tables below analyse the movement in the year of Core Tier 1 capital on a proportional and statutory basis.
Movement in Core Tier 1 capital - proportional 2010
£m
At beginning of the year 48,151 Attributable loss net of movements in fair value of own debt (1,250)Gain on redemption of equity preference shares recorded in equity 651 Foreign currency reserves 610 Issue of ordinary shares 804 Impact of disposals - reduction in non-controlling interests (729) - reduction in intangibles 754 Decrease in capital deductions including APS first loss 571 Other movements (253)At end of the year 49,309
Movement in Core Tier 1 capital - statutory 2010
£m
At beginning of the year 59,524 Attributable loss net of movements in fair value of own debt (1,250)Gain on redemption of equity preference shares recorded in equity 651 Foreign currency reserves 610 Issue of ordinary shares 804 Impact of disposals - reduction in non-controlling interests (15,107) - reduction in intangibles 3,732 Decrease in capital deductions including APS first loss 571 Other movements 69 At end of the year 49,604
Risk-weighted assets by division Risk-weighted assets by risk category and division on a proportional basis are set out below:
Creditrisk
Counterparty risk
Market risk
Operationalrisk Total APS Total
2010 £bn £bn £bn £bn £bn £bn £bn
UK Retail 41.7 — — 7.1 48.8 (12.4) 36.4 UK Corporate 74.8 — — 6.6 81.4 (22.9) 58.5 Wealth 10.4 — 0.1 2.0 12.5 — 12.5 Global Transaction Services 13.7 — — 4.6 18.3 — 18.3 Ulster Bank 29.2 0.5 0.1 1.8 31.6 (7.9) 23.7 US Retail & Commercial 52.0 0.9 — 4.1 57.0 — 57.0 Retail & Commercial 221.8 1.4 0.2 26.2 249.6 (43.2) 206.4 Global Banking & Markets 53.5 34.5 44.7 14.2 146.9 (11.5) 135.4 Other 16.4 0.4 0.2 1.0 18.0 — 18.0 Core 291.7 36.3 45.1 41.4 414.5 (54.7) 359.8 Non-Core 91.3 31.8 34.9 (4.3) 153.7 (50.9) 102.8 Group 383.0 68.1 80.0 37.1 568.2 (105.6) 462.6
129RBS Group 2010
Business review
Risk and balance sheet management

Balance sheet management: Capital* continued Asset Protection Scheme The Group acceded to the Asset Protection Scheme (‘APS’ or ‘the Scheme’) in December 2009. Following the accession to the APS, HM Treasury provides loss protection against potential losses arising in a pool of assets. HM Treasury also subscribed to £25.5 billion of capital in the form of B shares and a Dividend Access Share, with a further £8 billion of capital in the form of B shares potentially available as contingent capital. The Group pays annual fees in respect of the protection and contingent capital. The Group has the option, subject to HM Treasury consent, to pay the annual premium, contingent capital and the exit fee payable in connection with any termination of the Group’s participation in the APS in whole or in part, by waiving the entitlements of members of the Group to certain UK tax reliefs. Following accession to the APS, arrangements were put in place within the Group that extended effective APS protection to all other regulated entities holding assets covered by the APS. Regulatory capital impact of the APS Methodology The regulatory capital requirements for assets covered by the Scheme are calculated using the securitisation framework under the FSA prudential rules. The calculation is as follows (known as ‘the uncapped amount’):
First loss - the residual first loss, after impairments and write-downs, to date, is deducted from available capital split equally between Core Tier 1 and Tier 2 capital;
HM Treasury share of covered losses - after the first loss has been deducted, 90% of assets covered by HM Treasury are risk-weighted at 0%; and
RBS share of covered losses - the remaining 10% share of loss is borne by RBS and is risk-weighted in the normal way.
Should the uncapped amount be higher than the capital requirements for the underlying assets calculated as normal, ignoring the Scheme, the capital requirements for the Scheme are capped at the level of the requirements for the underlying assets (‘capped amount’). Where capped, the Group apportions the capped amount up to the level of the first loss as calculated above; any unused capped amount after the first loss capital deduction will be taken as RWAs for the Group’s share of covered losses. Adjustments to the regulatory capital calculation can be made for either currency or maturity mismatches. These occur where there is a difference between the currency or maturity of the protection and that of the underlying asset. These mismatches will have an impact upon the timing of the removal of the cap and level of regulatory capital benefit on the uncapped amount, but this effect is not material. Impact The Group calculates its capital requirements in accordance with the capped basis. Accordingly, the APS has no impact on the Pillar 1 regulatory capital requirement in respect of the assets covered by the APS. It does, however, improve the Core Tier 1 total capital ratio, of the Group as a whole. The protection afforded by the APS assists the Group in satisfying the forward looking stress testing framework applied by the FSA. Future regulatory capital effects As impairments or write-downs on the pool of assets are recognised, they reduce Core Tier 1 capital in the normal way. This will reduce the first loss deduction for the Scheme, potentially leading to a position where the capital requirement on the uncapped basis would no longer, for the assets covered by the APS, exceed the Non-APS requirement and as a result, the Group would expect to start reporting the regulatory capital treatment on the uncapped basis. For further information on the APS see page 221.
* unaudited
RBS Group 2010130
Business review continued
Regulatory developments Basel III and CRD IV The Basel Committee released the final text on the new Basel III Capital and Liquidity Frameworks in December 2010, the contents of which were broadly as expected. Whilst most of the new rules are ‘final’ there are lengthy observation periods for the more novel elements (the liquidity coverage ratio, the net stable funding ratio and the leverage ratio) designed to identify any unintended consequences prior to full implementation and it is possible that some of the detail may be amended. The capital requirements for credit valuation adjustments (CVAs) with respect to counterparty risk are subject to a final impact assessment which is being carried out in the first quarter of 2011. The Committee’s guidance on the countercyclical capital buffers allows for significant judgement which will need to be clarified by national regulators. The potential impacts for RBSG are set out below.
national implementation of increased capital requirements will begin on 1 January 2013;
there will be a phased five year implementation of new deductions and regulatory adjustments to Core Tier 1 capital commencing 1 January 2014;
the de-recognition of non-qualifying non common Tier 1 and Tier 2 capital instruments will be phased in over 10 years from 1 January 2013; and
requirements for changes to minimum capital ratios, including conservation and countercyclical buffers, as well as additional requirements for Systemically Important Financial Institutions, will be phased in from 2013 to 2019.
The focus will now be on the EU’s implementation of the Basel framework. The Commission’s legislative proposal - the Capital Requirements Directive (CRD) IV - is expected to appear in summer 2011. Contingent capital and loss absorbency The Basel Committee issued its final rules on the requirements to ensure all classes of capital instruments fully absorb losses at the point of non-viability, before tax payers are exposed to loss. These are designed to combat the experience during the crisis where holders of Tier 2 capital instruments did not suffer any losses when banks were bailed out by the public sector. Debate continues, meanwhile, over possible requirements for bailing-in senior debt holders, as a further means of protecting the taxpayer. Implementation by the Group RBS is advanced in its planning to implement these new measures and is appropriately well-capitalised with tangible equity of £56 billion, Core Tier 1 capital of £49 billion and a Core Tier 1 ratio of 10.7% at 31 December 2010.
Set out below are indicative impacts and timings of the major Basel 2.5 and Basel III proposals on the Group’s Core Tier 1 ratio. The estimates are still subject to change; a high degree of uncertainty still remains around implementation details as the guidelines are not fully finalised and must still be converted into rules by the FSA. A substantial part of the mitigating impacts mentioned in the following paragraphs relate to run-off in the normal course of business and de-leveraging of legacy positions and securitisations, including Non-Core. The Group is also devoting considerable resource to enhancing its models to improve management of market and counterparty exposures. A key mitigating action related to counterparty risk involves enhancement to internal models, which is a significant undertaking. There could be various hedging strategies and business decisions taken as part of mitigation which may have an adverse, but manageable, impact on revenues. CRD3 (Basel 2.5): Published rules for market risk and re-securitisations. Proposed implementation date 31 December 2011 The estimated impact on pro-forma at the end of 2011 on RWAs post mitigation is an increase of £25 billion to £30 billion, split equally between GBM and Non-Core. Basel III Counterparty risk: Proposed implementation date 1 January 2013The impact on RWAs on implementation in 2013 is currently estimated at £45 to £50 billion post mitigation and deleveraging, although there may still be movement in the final framework around this risk. Basel III Securitisations: Proposed implementation date 1 January 2013 Under the proposals, current deductions under Basel II (50% Core Tier 1, 50% Tier 2) for securitisation positions are switched to RWAs weighted at 1,250%. Post the run-off of securitisation positions and mitigating actions, the impact on implementation in 2013, on RWAs is estimated to be an increase of £30 billion to £35 billion with a corresponding reduction in deductions from Core Tier 1 and Tier 2 capital of £1.2 billion to £1.5 billion each. The impact net RWA equivalent of this change assuming a 10% Core Tier 1 ratio would be an increase in net RWA equivalents of £18 billion to £20 billion. Summary impacts The extent of the individual areas of impact, as set out above, may continue to change over time. As previously indicated, however, the overall impact on RWAs of CRD III and CRD IV after mitigation and deleveraging is estimated to be £100 billion to £115 billion, before allowing for the offsetting reduction in deductions. The impact referenced above would lower the Core Tier 1 ratio by approximately 1.3%, assuming RWAs of £600 billion and a Core Tier 1 ratio of 10%.
131RBS Group 2010
Business review
Risk and balance sheet management
Business review continued
132 RBS Group 2010
Balance sheet management: Capital* continued Regulatory developments continued Basel III capital deductions and regulatory adjustments In addition to the changes outlined above, Basel III will also result in revisions to regulatory adjustments and capital deductions. These will be phased in over a five year period from 1 January 2014. The initial deduction is expected to be 20%, rising 20 percentage points each year until full deduction by 1 January 2018. However, this is subject to final implementation rules determined by the FSA. The proportion not deducted in the transition years will continue to be subject to existing national treatments. The major categories of deductions include:
expected loss net of provisions;
deferred tax assets not relating to timing differences;
unrealised losses on available-for-sale securities; and
significant investments in non-consolidated financial institutions. The net impact of these adjustments is expected to be manageable as most of these drivers reduce or are eliminated by 2014. Other regulatory developments Treatment of Systemically Important Financial Institutions (SIFIs) Policy development around contingent capital and loss absorbency forms part of a wider policy initiative on addressing systemic institutions. A Financial Stability Board outline framework and plan of action was endorsed by G20 leaders at the November 2010 Seoul Summit. This now forms the main focus of global policy making following the finalisation of the Basel III framework. Policy initiatives in this area may include proposals for greater loss absorbency for systemic firms, the development of enhanced supervision and resolution frameworks, as well as recovery and resolution plans. The EU Commission Consultation Crisis management proposals The EU Commission issued a consultation paper on crisis management measures in January 2011. It covers prevention tools (such as recovery planning requirements, supervisory powers and new ideas on intra-group financial support mechanisms), as well as resolution tools (including partial transfer powers and possible approaches to debt write-down. The consultation will inform draft implementing legislation expected this summer, and is intended to help shape the global framework for SIFIs.
Markets in Financial Instruments Directive Review The EU Commission published a consultation on revising the Directive on Markets in Financial Instruments (MiFID2). The main proposals in the consultation are the extension of the transparency rules to include bonds and over the counter derivatives, measures to reinforce regulation of commodity derivatives and high frequency trading, strengthening investor protection and detailing the role of the new European Securities and Markets Authority. Financial activities tax In a recent speech, the EU Tax Commissioner talked about the introduction of a potential Financial Activities Tax at a European level. There will be an impact assessment in 2011 to review the cumulative impact on financial institutions of new regulation, bank levy and taxes, as part of the Commission's on-going examination of possible tax measures. Dodd-Frank In the United States the Dodd-Frank Wall Street Reform and Consumer Reform Act (Dodd-Frank) contains very significant reforms the full effect of which can only be assessed when the implementation rules are finalised. There have also been numerous derivative proposals from the Commodity Futures Exchange Commission (CFTC) and the Securities and Exchange Commission (SEC) plus joint agency proposals to implement minimum capital standards (Collins Amendment) and market risk capital guidelines. Project Merlin On 9 February 2011, the UK Government and the major British banks including the Group, announced the creation of an accord, known as Project Merlin, aimed at demonstrating the clear and shared intent to work together to help the UK economy recover and grow. The banks:
will work to foster credit demand, particularly among small and medium-sized businesses, and will make available additional lending capacity if demand should materialise above their current expectations;
expect to contribute more in UK tax as their performance strengthens and their profits grow and will jointly contribute an additional £1 billion to the Business Growth Fund;
confirm that the aggregate 2010 bonus pool including deferrals for their UK-based staff will be lower than that of 2009 and will reflect the engagement each bank has had with the Financial Services Authority, the UK Government and its shareholders, as well as their duty to manage pay policy to protect and enhance the long-term interests of shareholders; and
will extend disclosure of remuneration details of their most senior executives beyond international norms.
The Government has in the light of the banks’ statements affirmed its commitment to maintaining a strong, resilient, stable and globally competitive UK financial services sector, and to implementing and applying European and international regulation to create a level playing field in both policy and practice.
* unaudited
Structure of prudential regulation in the UK Following the consultation by HM Treasury on ‘A new approach to financial regulation’ in 2010, the government subsequently published further detailed proposals to give the Bank of England responsibility for prudential regulation, and to create a new Consumer Protection and Markets Authority to protect the interests of bank customers. Increase in the level of customer protection under Financial Services Compensation Scheme The European Commission has introduced a uniform compensation level of €100,000 across Member States from 1 January 2011. The sterling equivalent was confirmed by HM Treasury as £85,000. Independent Commission on Banking The Independent Commission on Banking has published responses from banks, academics and other interested parties to its initial consultation. In its summary of the evidence received the Commission noted that there was considerable interest, both positive and negative, in the question of splitting retail and investment banks. The Commission plans to publish its interim report in April. FSA Code on remuneration In July 2009 the European Commission adopted a proposal to further amend the Capital Requirements Directive (CRD) which included proposals on remuneration policies. This was subsequently voted for and approved (CRD III). CRD III required the Commission of European Banking Supervisors (CEBS) to issue guidelines on sound remuneration policies which comply with its principles and these were issued on 10 December 2010 (the “Guidelines”). The FSA amended its Remuneration Code to take into account the Guidelines and published its policy statement on remuneration on 17 December 2010. The Group is required to be compliant with the FSA Remuneration Code with effect from 1 January 2011:
as a “Tier 1” organisation, the Code applies to all employees on a global basis;
there are specific remuneration and governance requirements in relation to “Code Staff”; and
following an ongoing review of our remuneration arrangements and discussions with the FSA, 2011 RBS remuneration arrangements are fully compliant with the FSA Remuneration Code.
Bank levy In his 22 June 2010 budget statement, the Chancellor announced that the UK Government will introduce an annual bank levy. The Finance Bill 2011 contains details of how the levy will be calculated and collected. The levy will be collected through the existing quarterly corporation tax
collection mechanism starting with payment dates on or after the date the Finance Bill 2011 receives Royal Assent. Further information is included on page 368. Stress and scenario testing Stress testing forms part of the Group’s risk and capital framework and is an integral component of Basel II. As a key risk management tool, stress testing highlights to senior management potential adverse unexpected outcomes related to a mixture of risks and provides an indication of how much capital might be required to absorb losses, should adverse scenarios occur. Stress testing is used at both a divisional and Group level to assess risk concentrations, estimate the impact of stressed earnings, impairments and write-downs on capital. It determines the overall capital adequacy under a variety of adverse scenarios. The principal business benefits of the stress testing framework include: understanding the impact of recessionary scenarios; assessing material risk concentrations; and forecasting the impact of market stress and scenarios on the Group’s balance sheet liquidity. A series of stress events are monitored on a regular basis to assess the potential impact of an extreme yet plausible event on the Group. There are four core elements of scenario stress testing:
macroeconomic stress testing considers the impact on both earnings and capital for a range of scenarios. They entail multi-year systemic shocks to assess the Group’s ability to meet its capital requirements and liabilities as they fall due in a downturn in the business cycle and/or macroeconomic environment;
enterprise-wide stress testing considers scenarios that are not macroeconomic in nature but are sufficiently broad to impact across multiple risks or divisions and are likely to affect earnings, capital and funding;
cross-divisional stress testing includes scenarios which have impacts across divisions relating to sensitivity to a common risk factor(s). This would include, for example, sector based stress testing across corporate portfolios and sensitivity analysis to stress in market factors. These stress tests are discussed with senior divisional management and are reported to senior committees across the Group; and
divisional and risk specific stress testing is undertaken to support risk identification and management. Examples include the daily product based stress testing using a hybrid of hypothetical and historical scenarios within market risk.
Portfolio analysis, using historic performance and forward looking indicators of change, uses stress testing to facilitate the measurement of potential exposure to events and seeks to quantify the impact of an adverse change in factors which drive the performance and profitability of a portfolio.
133RBS Group 2010
Business review
Risk and balance sheet management
Balance sheet management: Funding and liquidity risk All disclosures in this section (pages 134 to 145) are audited unless indicated otherwise with an asterisk (*).
Introduction The Group’s balance sheet composition is a function of the broad array of product offerings and diverse markets served by its Core divisions. The structural integrity of the balance sheet is augmented as needed through active management of both asset and liability portfolios. The objective of these activities is to optimise liquidity transformation in normal business environments while ensuring adequate coverage of all cash requirements under extreme stress conditions.
Diversification of the Group’s funding base is central to the liquidity management strategy. The Group’s businesses have developed large customer franchises, the largest being in the UK, US and Ireland but extend into Europe, Asia and Latin America. Customer deposits provide large pools of stable funding to support the majority of the Group’s lending. It is a strategic objective to improve the Group’s loan to deposit ratio to 100%, or better, by 2013.
The Group also accesses professional markets funding by way of public and private debt issuances on an unsecured and secured basis. These debt issuance programmes are spread across multiple currencies, and maturities to appeal to a broad range of investor types, and preferences around the world. This market based funding supplements the Group’s structural liquidity needs and in some cases achieves certain capital objectives. Stress testing Simulated liquidity stress testing is periodically performed for each business and applied to the major operating subsidiary balance sheets. A variety of firm-specific and market related scenarios are used at the consolidated level and in individual countries. These scenarios include assumptions about significant changes in key funding sources, credit ratings, contingent uses of funding, and political and economic conditions in certain countries. Stress tests are regularly updated based on changing market conditions. Contingency planning The Group has a Contingency Funding Plan (CFP) which is maintained and updated as the balance sheet evolves. The CFP is linked to stress test results and forms the foundation for liquidity risk limits. Limits in the business-as-usual environment are bounded by capacity to satisfy the Group’s liquidity needs in the stress environments. The CFP provides a detailed description of the availability, size and timing of all sources of contingent liquidity available to the Group in a stress event. These are ranked in order of economic impact and effectiveness to meet the anticipated stress requirement. The CFP includes documented procedures and sign-offs for actions that may require businesses to provide access to customer assets for collateralized borrowing, securitisation or sale. Roles and responsibilities for the effective implementation of the CFP are also documented.
Liquidity reserves The Group maintains liquidity reserves sufficient to satisfy cash requirements in the event of a severe disruption in its access to either wholesale or retail funding sources. The reserves consist of high quality unencumbered government securities and cash held on deposit at central banks. Government securities vary by type and jurisdiction based on local regulatory considerations. The currency mix of the reserves reflects the underlying balance sheet composition. Regulatory oversight The Group operates in multiple jurisdictions and is subject to a number of regulatory regimes.
The Group's lead regulator is the Financial Services Authority (FSA). The FSA implemented a new liquidity regime on 1 June 2010. The new rules provide a standardised approach applied to all UK banks. At RBS, the rules focus on the RBS UK Defined Liquidity Group (a subset comprising the Group’s five main UK banks, The Royal Bank of Scotland plc, National Westminster Bank Plc, Ulster Bank Limited, Coutts & Company and Adam & Company) and cover adequacy of liquidity resources, controls, stress testing and the Individual Liquidity Adequacy Assessment (ILAA) process. The ILAA informs the Board and FSA of the assessment and quantification of the Group’s liquidity risks and their mitigation, and how much current and future liquidity is required. The ILAA was approved by the Board in November 2010. The FSA is expected to issue ‘Individual Liquidity Guidance’ to the Group in 2011.
In the US, the Group’s operations are required to meet liquidity requirements set out by the US Federal Reserve Bank, Office of the Comptroller of the Currency, Federal Deposit Insurance Corporation and Financial Industry Regulatory Authority. In the Netherlands, the Group is subject to the De Nederlandsche Bank liquidity oversight regime. Regulatory developments* There have been a number of significant developments in the regulation of liquidity risk.
In December 2010, the BCBS issued the ‘International framework for liquidity risk measurement, standards and monitoring’ which confirmed the introduction of two liquidity ratios, the liquidity coverage ratio (LCR) and the net stable funding ratio (NSFR). The introduction of both of these will be subject to an observation period, which includes review clauses to address and identify any unintended consequences.
After an observation period beginning in 2011, the LCR, including any revisions, will be introduced on 1 January 2015. The NSFR, including any revisions, will move to a minimum standard by 1 January 2018.
* unaudited
RBS Group 2010134
Business review continued
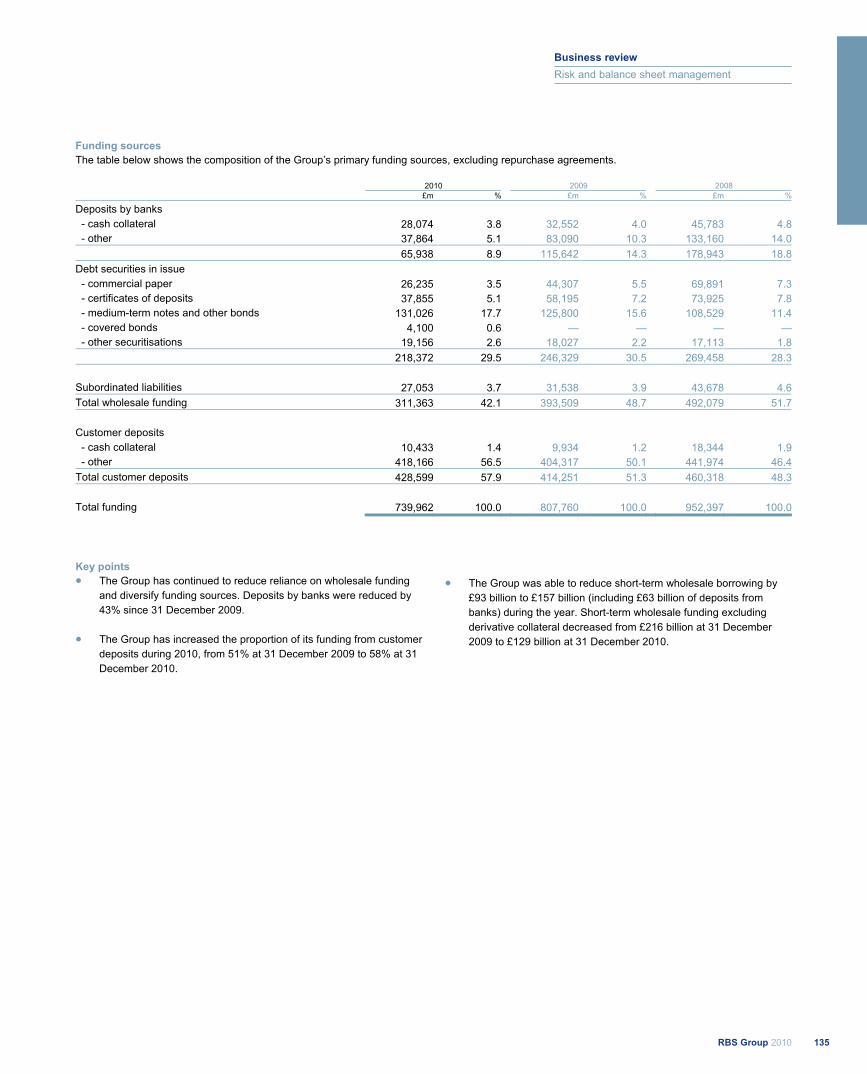
Funding sources The table below shows the composition of the Group’s primary funding sources, excluding repurchase agreements.
2010 2009 2008 £m % £m % £m %
Deposits by banks - cash collateral 28,074 3.8 32,552 4.0 45,783 4.8
- other 37,864 5.1 83,090 10.3 133,160 14.0 65,938 8.9 115,642 14.3 178,943 18.8Debt securities in issue
- commercial paper 26,235 3.5 44,307 5.5 69,891 7.3 - certificates of deposits 37,855 5.1 58,195 7.2 73,925 7.8 - medium-term notes and other bonds 131,026 17.7 125,800 15.6 108,529 11.4 - covered bonds 4,100 0.6 — — — — - other securitisations 19,156 2.6 18,027 2.2 17,113 1.8 218,372 29.5 246,329 30.5 269,458 28.3
Subordinated liabilities 27,053 3.7 31,538 3.9 43,678 4.6Total wholesale funding 311,363 42.1 393,509 48.7 492,079 51.7
Customer deposits - cash collateral 10,433 1.4 9,934 1.2 18,344 1.9 - other 418,166 56.5 404,317 50.1 441,974 46.4Total customer deposits 428,599 57.9 414,251 51.3 460,318 48.3
Total funding 739,962 100.0 807,760 100.0 952,397 100.0
Key points The Group has continued to reduce reliance on wholesale funding and diversify funding sources. Deposits by banks were reduced by 43% since 31 December 2009.
The Group has increased the proportion of its funding from customer deposits during 2010, from 51% at 31 December 2009 to 58% at 31 December 2010.
The Group was able to reduce short-term wholesale borrowing by £93 billion to £157 billion (including £63 billion of deposits from banks) during the year. Short-term wholesale funding excluding derivative collateral decreased from £216 billion at 31 December 2009 to £129 billion at 31 December 2010.
135RBS Group 2010
Business review
Risk and balance sheet management
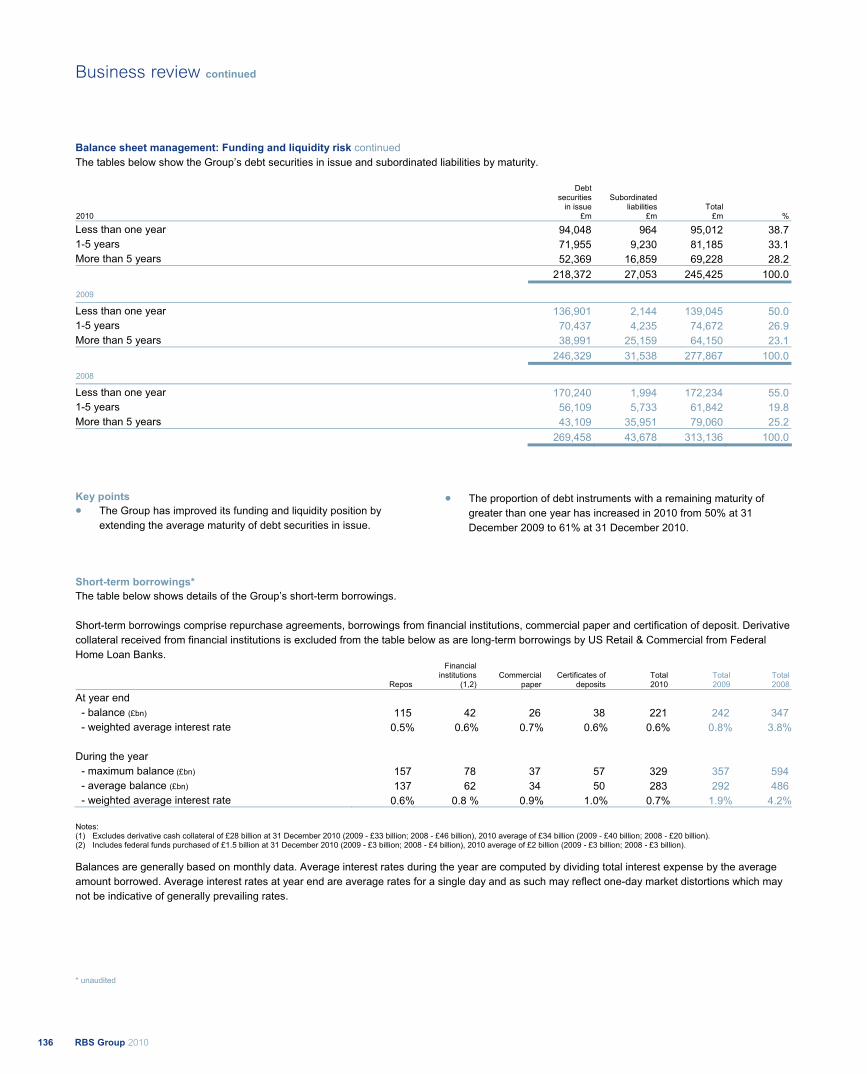
Balance sheet management: Funding and liquidity risk continued The tables below show the Group’s debt securities in issue and subordinated liabilities by maturity.
Debt securities
in issue Subordinated
liabilities Total 2010 £m £m £m %
Less than one year 94,048 964 95,012 38.7 1-5 years 71,955 9,230 81,185 33.1 More than 5 years 52,369 16,859 69,228 28.2 218,372 27,053 245,425 100.0
2009
Less than one year 136,901 2,144 139,045 50.0 1-5 years 70,437 4,235 74,672 26.9 More than 5 years 38,991 25,159 64,150 23.1 246,329 31,538 277,867 100.0
2008
Less than one year 170,240 1,994 172,234 55.0 1-5 years 56,109 5,733 61,842 19.8 More than 5 years 43,109 35,951 79,060 25.2 269,458 43,678 313,136 100.0
Key points The Group has improved its funding and liquidity position by extending the average maturity of debt securities in issue.
The proportion of debt instruments with a remaining maturity of greater than one year has increased in 2010 from 50% at 31 December 2009 to 61% at 31 December 2010.
Short-term borrowings* The table below shows details of the Group’s short-term borrowings. Short-term borrowings comprise repurchase agreements, borrowings from financial institutions, commercial paper and certification of deposit. Derivative collateral received from financial institutions is excluded from the table below as are long-term borrowings by US Retail & Commercial from Federal Home Loan Banks.
Repos
Financial institutions
(1,2) Commercial
paper Certificates of
deposits Total 2010
Total 2009
Total 2008
At year end - balance (£bn) 115 42 26 38 221 242 347
- weighted average interest rate 0.5% 0.6% 0.7% 0.6% 0.6% 0.8% 3.8% During the year - maximum balance (£bn) 157 78 37 57 329 357 594 - average balance (£bn) 137 62 34 50 283 292 486 - weighted average interest rate 0.6% 0.8 % 0.9% 1.0% 0.7% 1.9% 4.2%
Notes: (1) Excludes derivative cash collateral of £28 billion at 31 December 2010 (2009 - £33 billion; 2008 - £46 billion), 2010 average of £34 billion (2009 - £40 billion; 2008 - £20 billion). (2) Includes federal funds purchased of £1.5 billion at 31 December 2010 (2009 - £3 billion; 2008 - £4 billion), 2010 average of £2 billion (2009 - £3 billion; 2008 - £3 billion).
Balances are generally based on monthly data. Average interest rates during the year are computed by dividing total interest expense by the average amount borrowed. Average interest rates at year end are average rates for a single day and as such may reflect one-day market distortions which may not be indicative of generally prevailing rates.
* unaudited
RBS Group 2010136
Business review continued
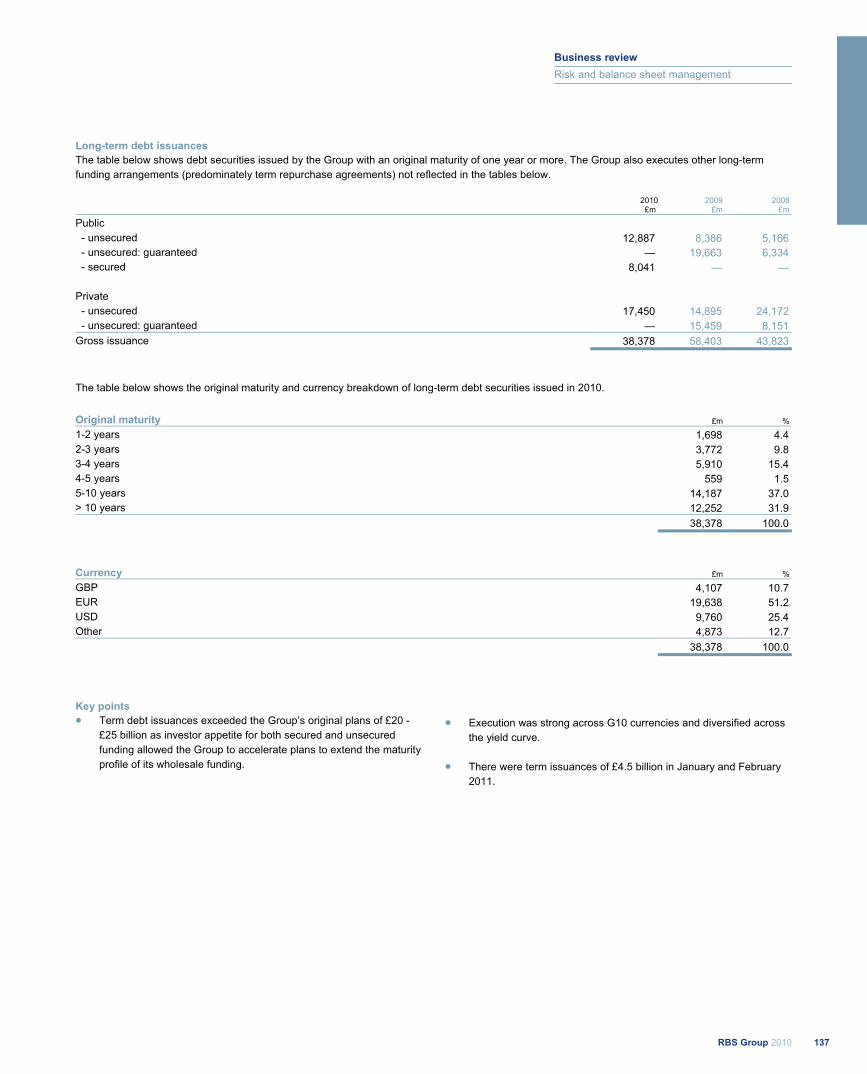
Long-term debt issuances The table below shows debt securities issued by the Group with an original maturity of one year or more. The Group also executes other long-term funding arrangements (predominately term repurchase agreements) not reflected in the tables below.
2010 2009 2008 £m £m £m
Public - unsecured 12,887 8,386 5,166
- unsecured: guaranteed — 19,663 6,334 - secured 8,041 — —
Private - unsecured 17,450 14,895 24,172 - unsecured: guaranteed — 15,459 8,151 Gross issuance 38,378 58,403 43,823
The table below shows the original maturity and currency breakdown of long-term debt securities issued in 2010. Original maturity £m %
1-2 years 1,698 4.4 2-3 years 3,772 9.8 3-4 years 5,910 15.4 4-5 years 559 1.5 5-10 years 14,187 37.0 > 10 years 12,252 31.9 38,378 100.0
Currency £m %
GBP 4,107 10.7 EUR 19,638 51.2 USD 9,760 25.4 Other 4,873 12.7 38,378 100.0
Key points Term debt issuances exceeded the Group’s original plans of £20 - £25 billion as investor appetite for both secured and unsecured funding allowed the Group to accelerate plans to extend the maturity profile of its wholesale funding.
Execution was strong across G10 currencies and diversified across the yield curve.
There were term issuances of £4.5 billion in January and February 2011.
137RBS Group 2010
Business review
Risk and balance sheet management
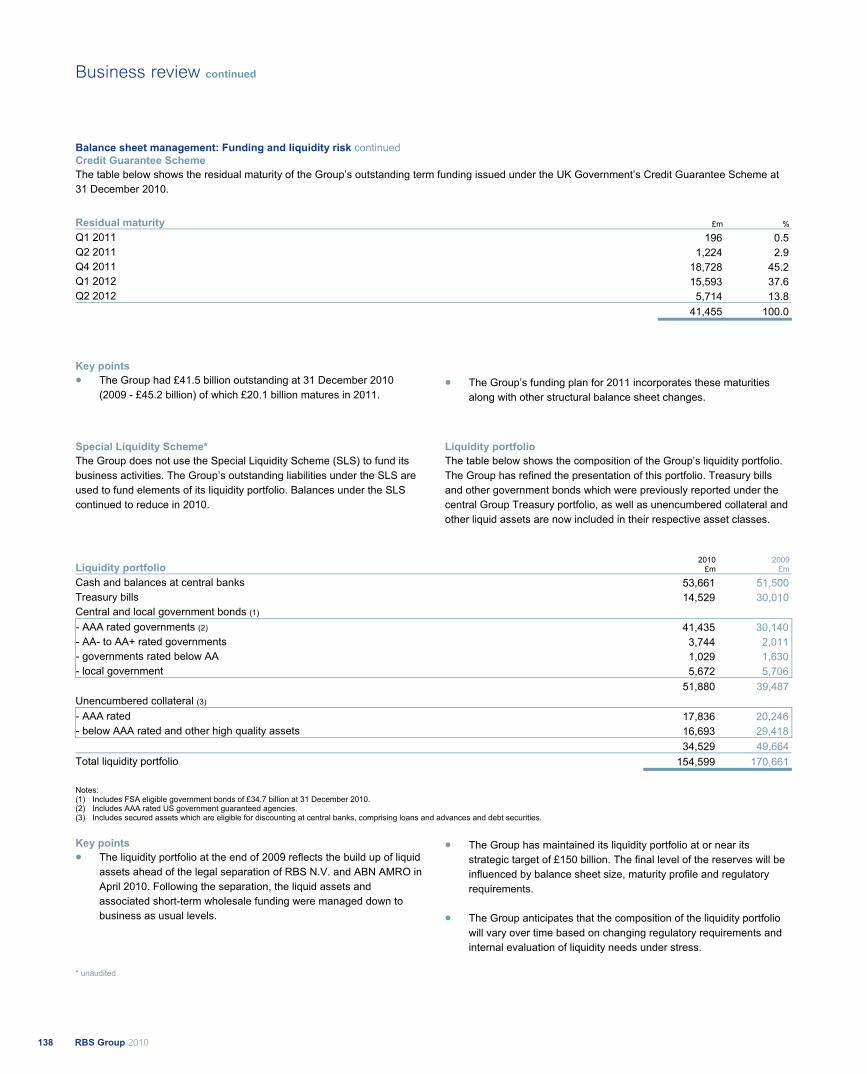
Balance sheet management: Funding and liquidity risk continued Credit Guarantee Scheme The table below shows the residual maturity of the Group’s outstanding term funding issued under the UK Government’s Credit Guarantee Scheme at 31 December 2010.
Residual maturity £m %
Q1 2011 196 0.5 Q2 2011 1,224 2.9 Q4 2011 18,728 45.2 Q1 2012 15,593 37.6 Q2 2012 5,714 13.8 41,455 100.0
Key points The Group had £41.5 billion outstanding at 31 December 2010 (2009 - £45.2 billion) of which £20.1 billion matures in 2011.
The Group’s funding plan for 2011 incorporates these maturities along with other structural balance sheet changes.
Special Liquidity Scheme* The Group does not use the Special Liquidity Scheme (SLS) to fund its business activities. The Group’s outstanding liabilities under the SLS are used to fund elements of its liquidity portfolio. Balances under the SLS continued to reduce in 2010.
Liquidity portfolio The table below shows the composition of the Group’s liquidity portfolio. The Group has refined the presentation of this portfolio. Treasury bills and other government bonds which were previously reported under the central Group Treasury portfolio, as well as unencumbered collateral and other liquid assets are now included in their respective asset classes.
Liquidity portfolio 2010
£m 2009
£m
Cash and balances at central banks 53,661 51,500 Treasury bills 14,529 30,010 Central and local government bonds (1) - AAA rated governments (2) 41,435 30,140 - AA- to AA+ rated governments 3,744 2,011 - governments rated below AA 1,029 1,630 - local government 5,672 5,706
51,880 39,487 Unencumbered collateral (3) - AAA rated 17,836 20,246 - below AAA rated and other high quality assets 16,693 29,418
34,529 49,664 Total liquidity portfolio 154,599 170,661
Notes: (1) Includes FSA eligible government bonds of £34.7 billion at 31 December 2010. (2) Includes AAA rated US government guaranteed agencies. (3) Includes secured assets which are eligible for discounting at central banks, comprising loans and advances and debt securities.
Key points
The liquidity portfolio at the end of 2009 reflects the build up of liquid assets ahead of the legal separation of RBS N.V. and ABN AMRO in April 2010. Following the separation, the liquid assets and associated short-term wholesale funding were managed down to business as usual levels.
The Group has maintained its liquidity portfolio at or near its strategic target of £150 billion. The final level of the reserves will be influenced by balance sheet size, maturity profile and regulatory requirements.
The Group anticipates that the composition of the liquidity portfolio will vary over time based on changing regulatory requirements and internal evaluation of liquidity needs under stress.
* unaudited
RBS Group 2010138
Business review continued

Funding and liquidity metrics The Group continues to improve and augment funding and liquidity risk management practices in light of market experience and emerging regulatory and industry standards. The Group monitors a range of funding and liquidity indicators for the consolidated Group as well as its principal subsidiaries. These metrics encompass short and long-term liquidity requirements under stress and normal operating conditions. Two important structural ratios are described below. Net stable funding ratio*
The table below shows the Group’s net stable funding ratio (NSFR) estimated by applying the Basel III guidance issued in December 2010. This measure seeks to show the proportion of structural term assets which are funded by stable funding including customer deposits, long-term wholesale funding, and equity.
2010 2009 2008 ASF(1) ASF(1) ASF(1) Weighting
£bn £bn £bn £bn £bn £bn %
Equity 76 76 80 80 64 64 100 Wholesale funding > 1 year 154 154 144 144 149 149 100 Wholesale funding < 1 year 157 — 250 — 343 — — Derivatives 424 — 422 — 969 — — Repurchase agreements 115 — 106 — 142 — — Deposits - Retail and SME - more stable 172 155 166 149 184 166 90 - Retail and SME - less stable 51 41 50 40 55 44 80 - Other 206 103 199 99 221 110 50 Other (2) 98 — 105 — 92 — — Total liabilities and equity 1,453 529 1,522 512 2,219 533
Cash 57 — 52 — 12 — — Inter-bank lending 58 — 49 — 71 — — Debt securities: - < 1year 43 — 69 — 69 — — - central and local governments AAA to AA- > 1 year 89 4 84 4 68 3 5 - other eligible bonds > 1 year 75 15 87 17 101 20 20 - other bonds > 1 year 10 10 9 9 15 15 100 Derivatives 427 — 438 — 991 — — Reverse repurchase agreements 95 — 76 — 98 — — Customer loans and advances - < 1 year 125 63 153 77 190 95 50 - residential mortgages > 1 year 145 94 137 89 170 111 65 - retail loans < 1year 22 19 24 20 30 25 85 - other > 1year 211 211 241 241 298 298 100 Other (3) 96 96 103 103 106 107 100 Total assets 1,453 512 1,522 560 2,219 674
Undrawn commitments 267 13 289 14 347 17 5 Total assets and undrawn commitments 1,720 525 1,811 574 2,566 691
Net stable funding ratio 101% 89% 77%
Notes: (1) Available stable funding. (2) Deferred tax, insurance liabilities and other liabilities. (3) Prepayments, accrued income, deferred tax and other assets. (4) Prior periods have been revised to reflect the Basel III guidance.
Key points* The Group’s estimated NSFR improved to 101% at 31 December 2010 from 89% at 31 December 2009, primarily due to a decrease in wholesale funding with maturity of less than one year and a reduction in customer loans.
The Group’s NSFR calculation will continue to be refined over time in line with regulatory developments.
139RBS Group 2010
Business review
Risk and balance sheet management
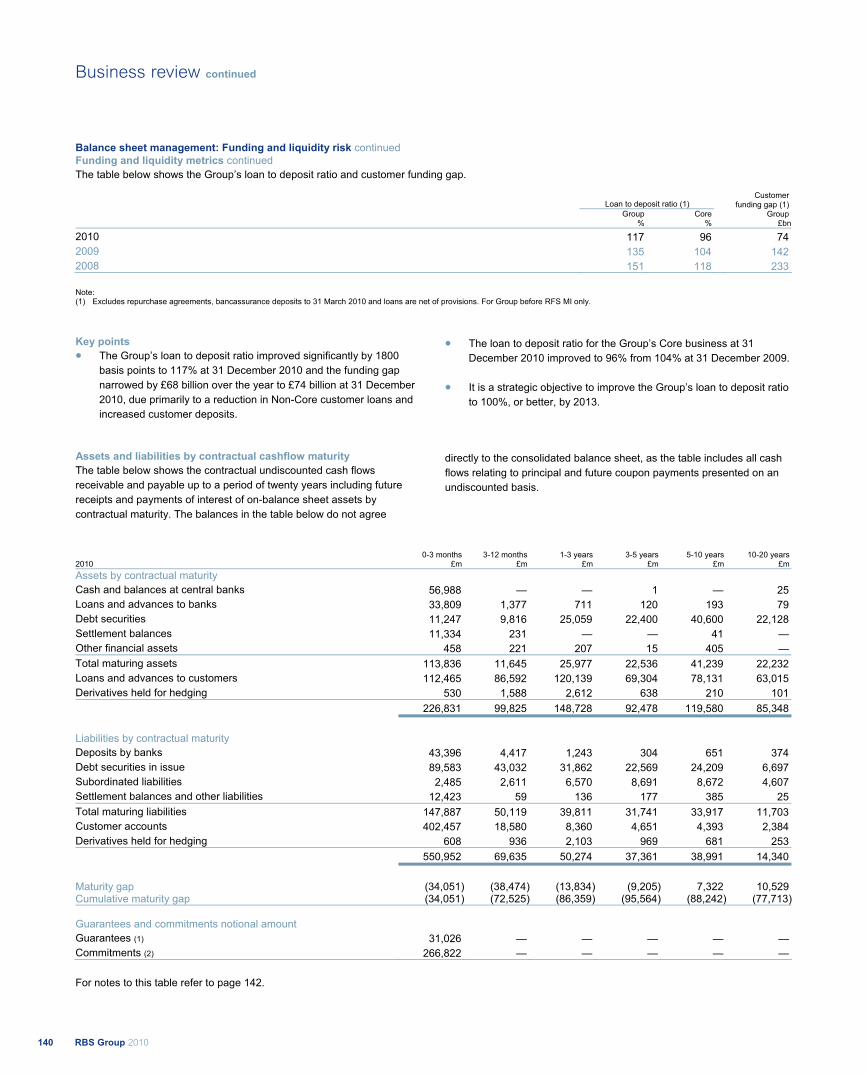
Balance sheet management: Funding and liquidity risk continued Funding and liquidity metrics continued The table below shows the Group’s loan to deposit ratio and customer funding gap.
Loan to deposit ratio (1)
Group
%Core
%
Customer funding gap (1)
Group £bn
2010 117 96 74 2009 135 104 142 2008 151 118 233
Note: (1) Excludes repurchase agreements, bancassurance deposits to 31 March 2010 and loans are net of provisions. For Group before RFS MI only.
Key points The Group’s loan to deposit ratio improved significantly by 1800 basis points to 117% at 31 December 2010 and the funding gap narrowed by £68 billion over the year to £74 billion at 31 December 2010, due primarily to a reduction in Non-Core customer loans and increased customer deposits.
The loan to deposit ratio for the Group’s Core business at 31 December 2010 improved to 96% from 104% at 31 December 2009.
It is a strategic objective to improve the Group’s loan to deposit ratio to 100%, or better, by 2013.
Assets and liabilities by contractual cashflow maturity The table below shows the contractual undiscounted cash flows receivable and payable up to a period of twenty years including future receipts and payments of interest of on-balance sheet assets by contractual maturity. The balances in the table below do not agree
directly to the consolidated balance sheet, as the table includes all cash flows relating to principal and future coupon payments presented on an undiscounted basis.
0-3 months 3-12 months 1-3 years 3-5 years 5-10 years 10-20 years
2010 £m £m £m £m £m £m Assets by contractual maturity Cash and balances at central banks 56,988 — — 1 — 25 Loans and advances to banks 33,809 1,377 711 120 193 79 Debt securities 11,247 9,816 25,059 22,400 40,600 22,128 Settlement balances 11,334 231 — — 41 — Other financial assets 458 221 207 15 405 — Total maturing assets 113,836 11,645 25,977 22,536 41,239 22,232 Loans and advances to customers 112,465 86,592 120,139 69,304 78,131 63,015 Derivatives held for hedging 530 1,588 2,612 638 210 101 226,831 99,825 148,728 92,478 119,580 85,348
Liabilities by contractual maturity Deposits by banks 43,396 4,417 1,243 304 651 374 Debt securities in issue 89,583 43,032 31,862 22,569 24,209 6,697 Subordinated liabilities 2,485 2,611 6,570 8,691 8,672 4,607 Settlement balances and other liabilities 12,423 59 136 177 385 25 Total maturing liabilities 147,887 50,119 39,811 31,741 33,917 11,703 Customer accounts 402,457 18,580 8,360 4,651 4,393 2,384 Derivatives held for hedging 608 936 2,103 969 681 253 550,952 69,635 50,274 37,361 38,991 14,340
Maturity gap (34,051) (38,474) (13,834) (9,205) 7,322 10,529 Cumulative maturity gap (34,051) (72,525) (86,359) (95,564) (88,242) (77,713) Guarantees and commitments notional amount Guarantees (1) 31,026 — — — — — Commitments (2) 266,822 — — — — —
For notes to this table refer to page 142.
RBS Group 2010140
Business review continued
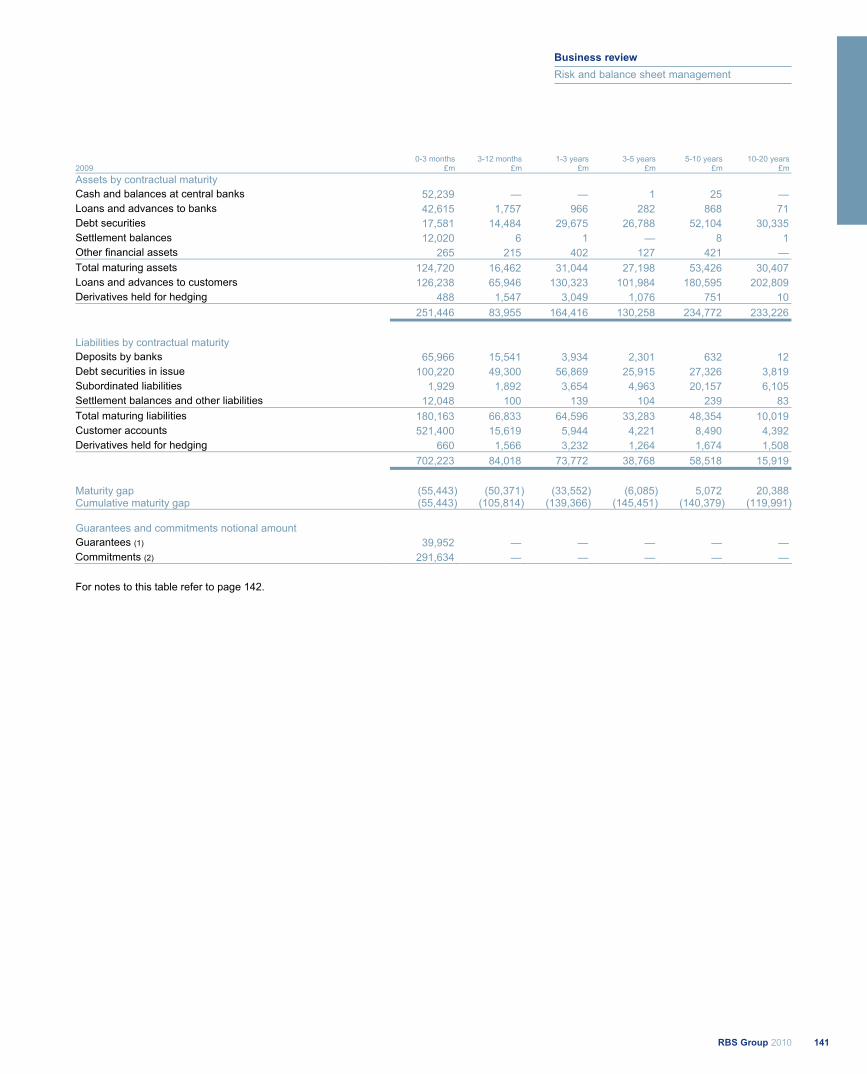
0-3 months 3-12 months 1-3 years 3-5 years 5-10 years 10-20 years 2009 £m £m £m £m £m £m Assets by contractual maturity Cash and balances at central banks 52,239 — — 1 25 — Loans and advances to banks 42,615 1,757 966 282 868 71 Debt securities 17,581 14,484 29,675 26,788 52,104 30,335 Settlement balances 12,020 6 1 — 8 1 Other financial assets 265 215 402 127 421 — Total maturing assets 124,720 16,462 31,044 27,198 53,426 30,407 Loans and advances to customers 126,238 65,946 130,323 101,984 180,595 202,809 Derivatives held for hedging 488 1,547 3,049 1,076 751 10 251,446 83,955 164,416 130,258 234,772 233,226
Liabilities by contractual maturity Deposits by banks 65,966 15,541 3,934 2,301 632 12 Debt securities in issue 100,220 49,300 56,869 25,915 27,326 3,819 Subordinated liabilities 1,929 1,892 3,654 4,963 20,157 6,105 Settlement balances and other liabilities 12,048 100 139 104 239 83 Total maturing liabilities 180,163 66,833 64,596 33,283 48,354 10,019 Customer accounts 521,400 15,619 5,944 4,221 8,490 4,392 Derivatives held for hedging 660 1,566 3,232 1,264 1,674 1,508 702,223 84,018 73,772 38,768 58,518 15,919
Maturity gap (55,443) (50,371) (33,552) (6,085) 5,072 20,388 Cumulative maturity gap (55,443) (105,814) (139,366) (145,451) (140,379) (119,991) Guarantees and commitments notional amount Guarantees (1) 39,952 — — — — — Commitments (2) 291,634 — — — — —
For notes to this table refer to page 142.
141RBS Group 2010
Business review
Risk and balance sheet management
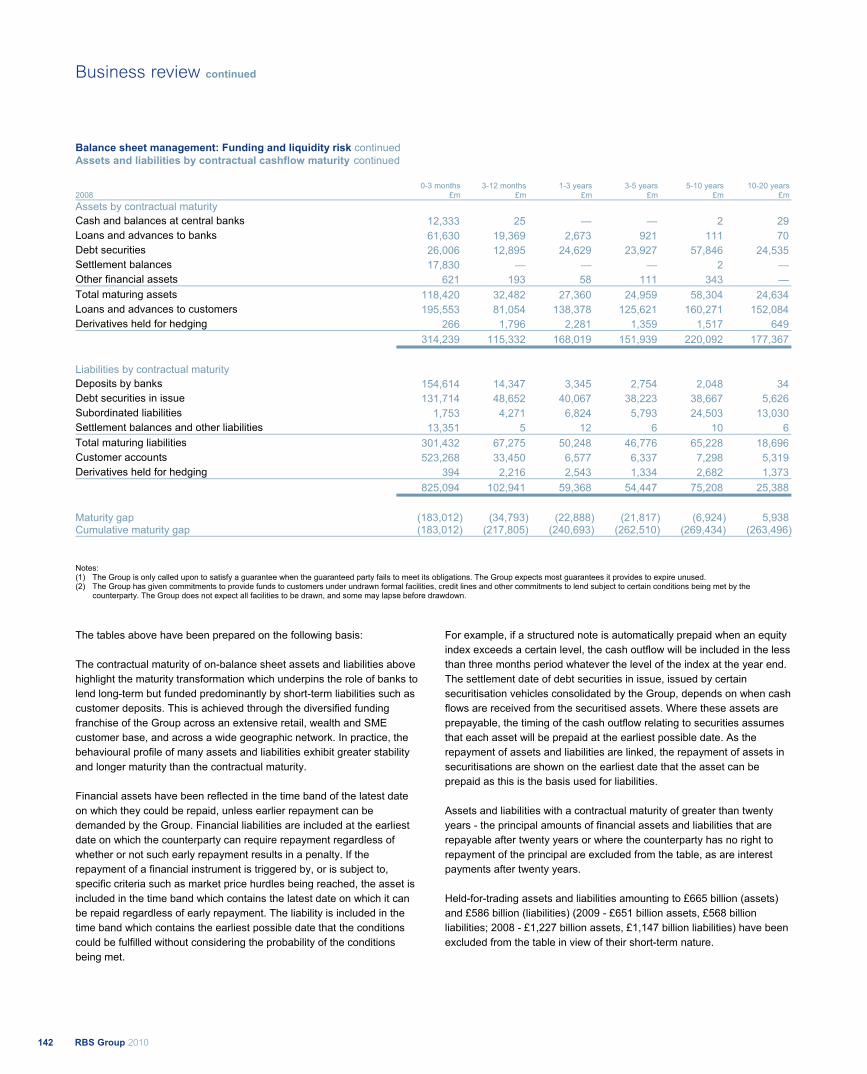
Balance sheet management: Funding and liquidity risk continued Assets and liabilities by contractual cashflow maturity continued
0-3 months 3-12 months 1-3 years 3-5 years 5-10 years 10-20 years 2008 £m £m £m £m £m £m Assets by contractual maturity Cash and balances at central banks 12,333 25 — — 2 29 Loans and advances to banks 61,630 19,369 2,673 921 111 70 Debt securities 26,006 12,895 24,629 23,927 57,846 24,535 Settlement balances 17,830 — — — 2 — Other financial assets 621 193 58 111 343 — Total maturing assets 118,420 32,482 27,360 24,959 58,304 24,634 Loans and advances to customers 195,553 81,054 138,378 125,621 160,271 152,084 Derivatives held for hedging 266 1,796 2,281 1,359 1,517 649 314,239 115,332 168,019 151,939 220,092 177,367
Liabilities by contractual maturity Deposits by banks 154,614 14,347 3,345 2,754 2,048 34 Debt securities in issue 131,714 48,652 40,067 38,223 38,667 5,626 Subordinated liabilities 1,753 4,271 6,824 5,793 24,503 13,030 Settlement balances and other liabilities 13,351 5 12 6 10 6 Total maturing liabilities 301,432 67,275 50,248 46,776 65,228 18,696 Customer accounts 523,268 33,450 6,577 6,337 7,298 5,319 Derivatives held for hedging 394 2,216 2,543 1,334 2,682 1,373 825,094 102,941 59,368 54,447 75,208 25,388
Maturity gap (183,012) (34,793) (22,888) (21,817) (6,924) 5,938 Cumulative maturity gap (183,012) (217,805) (240,693) (262,510) (269,434) (263,496)
Notes: (1) The Group is only called upon to satisfy a guarantee when the guaranteed party fails to meet its obligations. The Group expects most guarantees it provides to expire unused. (2) The Group has given commitments to provide funds to customers under undrawn formal facilities, credit lines and other commitments to lend subject to certain conditions being met by the
counterparty. The Group does not expect all facilities to be drawn, and some may lapse before drawdown.
The tables above have been prepared on the following basis: The contractual maturity of on-balance sheet assets and liabilities above highlight the maturity transformation which underpins the role of banks to lend long-term but funded predominantly by short-term liabilities such as customer deposits. This is achieved through the diversified funding franchise of the Group across an extensive retail, wealth and SME customer base, and across a wide geographic network. In practice, the behavioural profile of many assets and liabilities exhibit greater stability and longer maturity than the contractual maturity. Financial assets have been reflected in the time band of the latest date on which they could be repaid, unless earlier repayment can be demanded by the Group. Financial liabilities are included at the earliest date on which the counterparty can require repayment regardless of whether or not such early repayment results in a penalty. If the repayment of a financial instrument is triggered by, or is subject to, specific criteria such as market price hurdles being reached, the asset is included in the time band which contains the latest date on which it can be repaid regardless of early repayment. The liability is included in the time band which contains the earliest possible date that the conditions could be fulfilled without considering the probability of the conditions being met.
For example, if a structured note is automatically prepaid when an equity index exceeds a certain level, the cash outflow will be included in the less than three months period whatever the level of the index at the year end. The settlement date of debt securities in issue, issued by certain securitisation vehicles consolidated by the Group, depends on when cash flows are received from the securitised assets. Where these assets are prepayable, the timing of the cash outflow relating to securities assumes that each asset will be prepaid at the earliest possible date. As the repayment of assets and liabilities are linked, the repayment of assets in securitisations are shown on the earliest date that the asset can be prepaid as this is the basis used for liabilities. Assets and liabilities with a contractual maturity of greater than twenty years - the principal amounts of financial assets and liabilities that are repayable after twenty years or where the counterparty has no right to repayment of the principal are excluded from the table, as are interest payments after twenty years. Held-for-trading assets and liabilities amounting to £665 billion (assets) and £586 billion (liabilities) (2009 - £651 billion assets, £568 billion liabilities; 2008 - £1,227 billion assets, £1,147 billion liabilities) have been excluded from the table in view of their short-term nature.
RBS Group 2010142
Business review continued
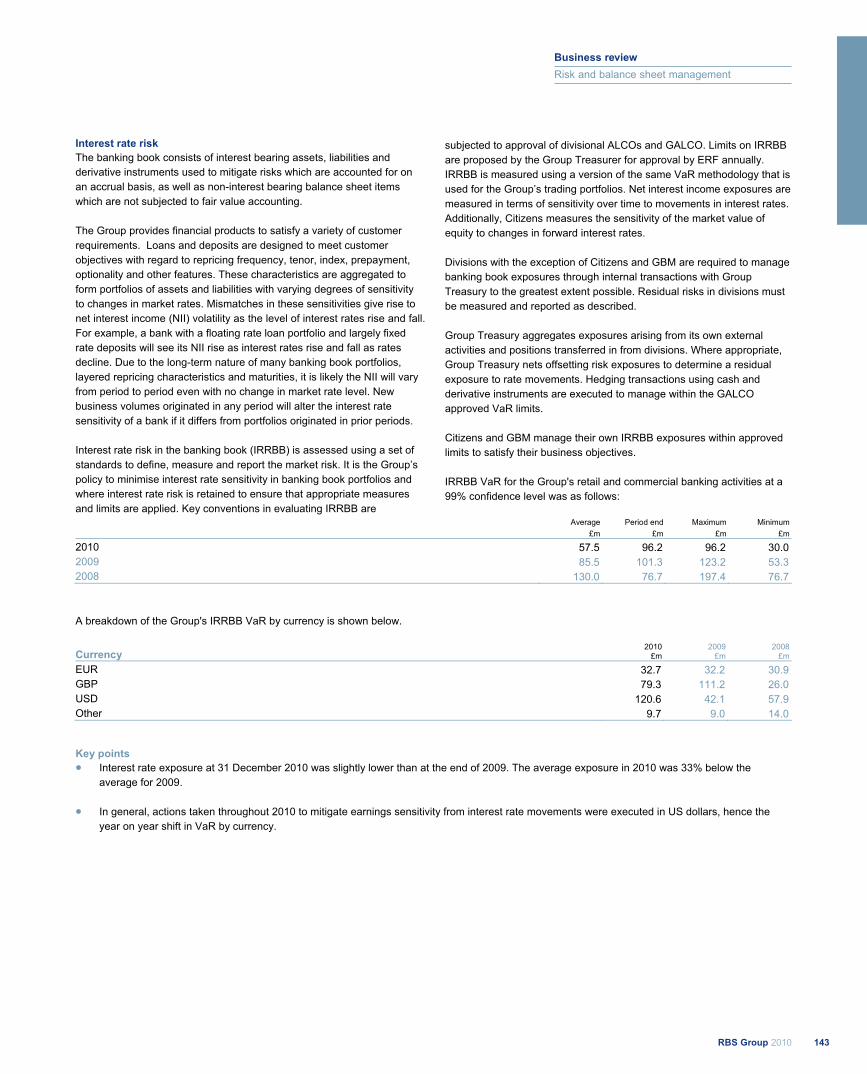
Interest rate risk The banking book consists of interest bearing assets, liabilities and derivative instruments used to mitigate risks which are accounted for on an accrual basis, as well as non-interest bearing balance sheet items which are not subjected to fair value accounting. The Group provides financial products to satisfy a variety of customer requirements. Loans and deposits are designed to meet customer objectives with regard to repricing frequency, tenor, index, prepayment, optionality and other features. These characteristics are aggregated to form portfolios of assets and liabilities with varying degrees of sensitivity to changes in market rates. Mismatches in these sensitivities give rise to net interest income (NII) volatility as the level of interest rates rise and fall. For example, a bank with a floating rate loan portfolio and largely fixed rate deposits will see its NII rise as interest rates rise and fall as rates decline. Due to the long-term nature of many banking book portfolios, layered repricing characteristics and maturities, it is likely the NII will vary from period to period even with no change in market rate level. New business volumes originated in any period will alter the interest rate sensitivity of a bank if it differs from portfolios originated in prior periods. Interest rate risk in the banking book (IRRBB) is assessed using a set of standards to define, measure and report the market risk. It is the Group’s policy to minimise interest rate sensitivity in banking book portfolios and where interest rate risk is retained to ensure that appropriate measures and limits are applied. Key conventions in evaluating IRRBB are
subjected to approval of divisional ALCOs and GALCO. Limits on IRRBB are proposed by the Group Treasurer for approval by ERF annually. IRRBB is measured using a version of the same VaR methodology that is used for the Group’s trading portfolios. Net interest income exposures are measured in terms of sensitivity over time to movements in interest rates. Additionally, Citizens measures the sensitivity of the market value of equity to changes in forward interest rates. Divisions with the exception of Citizens and GBM are required to manage banking book exposures through internal transactions with Group Treasury to the greatest extent possible. Residual risks in divisions must be measured and reported as described. Group Treasury aggregates exposures arising from its own external activities and positions transferred in from divisions. Where appropriate, Group Treasury nets offsetting risk exposures to determine a residual exposure to rate movements. Hedging transactions using cash and derivative instruments are executed to manage within the GALCO approved VaR limits. Citizens and GBM manage their own IRRBB exposures within approved limits to satisfy their business objectives. IRRBB VaR for the Group's retail and commercial banking activities at a 99% confidence level was as follows:
Average Period end Maximum Minimum £m £m £m £m
2010 57.5 96.2 96.2 30.0 2009 85.5 101.3 123.2 53.3 2008 130.0 76.7 197.4 76.7
A breakdown of the Group's IRRBB VaR by currency is shown below.
Currency 2010
£m 2009
£m 2008
£m
EUR 32.7 32.2 30.9 GBP 79.3 111.2 26.0 USD 120.6 42.1 57.9 Other 9.7 9.0 14.0
Key points Interest rate exposure at 31 December 2010 was slightly lower than at the end of 2009. The average exposure in 2010 was 33% below the average for 2009.
In general, actions taken throughout 2010 to mitigate earnings sensitivity from interest rate movements were executed in US dollars, hence the year on year shift in VaR by currency.
143RBS Group 2010
Business review
Risk and balance sheet management
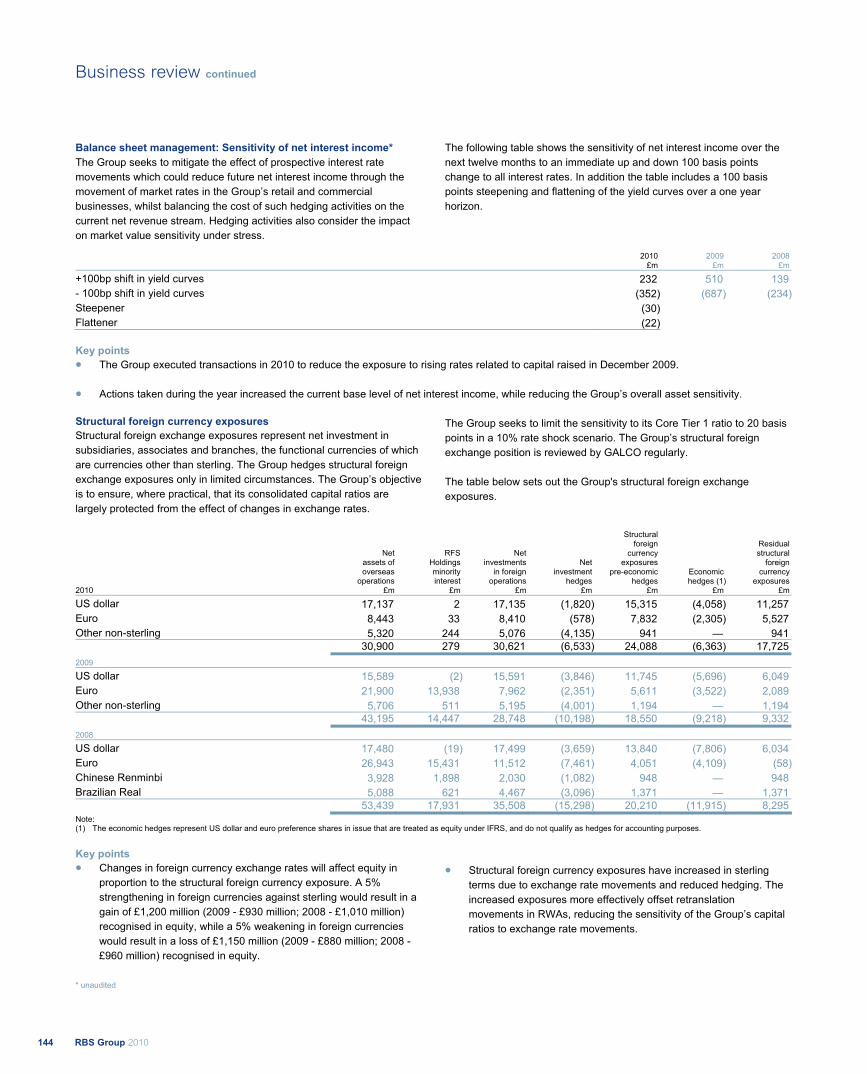
Balance sheet management: Sensitivity of net interest income* The Group seeks to mitigate the effect of prospective interest rate movements which could reduce future net interest income through the movement of market rates in the Group’s retail and commercial businesses, whilst balancing the cost of such hedging activities on the current net revenue stream. Hedging activities also consider the impact on market value sensitivity under stress.
The following table shows the sensitivity of net interest income over the next twelve months to an immediate up and down 100 basis points change to all interest rates. In addition the table includes a 100 basis points steepening and flattening of the yield curves over a one year horizon.
2010 2009 2008
£m £m £m
+100bp shift in yield curves 232 510 139 - 100bp shift in yield curves (352) (687) (234)Steepener (30)Flattener (22)
Key points The Group executed transactions in 2010 to reduce the exposure to rising rates related to capital raised in December 2009.
Actions taken during the year increased the current base level of net interest income, while reducing the Group’s overall asset sensitivity.
Structural foreign currency exposures Structural foreign exchange exposures represent net investment in subsidiaries, associates and branches, the functional currencies of which are currencies other than sterling. The Group hedges structural foreign exchange exposures only in limited circumstances. The Group’s objective is to ensure, where practical, that its consolidated capital ratios are largely protected from the effect of changes in exchange rates.
The Group seeks to limit the sensitivity to its Core Tier 1 ratio to 20 basis points in a 10% rate shock scenario. The Group’s structural foreign exchange position is reviewed by GALCO regularly. The table below sets out the Group's structural foreign exchange exposures.
Net assets of overseas
operations
RFS Holdings minority interest
Net investments
in foreign operations
Net investment
hedges
Structural foreign
currency exposures
pre-economic hedges
Economic hedges (1)
Residual structural
foreign currency
exposures 2010 £m £m £m £m £m £m £m
US dollar 17,137 2 17,135 (1,820) 15,315 (4,058) 11,257 Euro 8,443 33 8,410 (578) 7,832 (2,305) 5,527 Other non-sterling 5,320 244 5,076 (4,135) 941 — 941
30,900 279 30,621 (6,533) 24,088 (6,363) 17,725 2009
US dollar 15,589 (2) 15,591 (3,846) 11,745 (5,696) 6,049 Euro 21,900 13,938 7,962 (2,351) 5,611 (3,522) 2,089 Other non-sterling 5,706 511 5,195 (4,001) 1,194 — 1,194
43,195 14,447 28,748 (10,198) 18,550 (9,218) 9,332 2008
US dollar 17,480 (19) 17,499 (3,659) 13,840 (7,806) 6,034 Euro 26,943 15,431 11,512 (7,461) 4,051 (4,109) (58)Chinese Renminbi 3,928 1,898 2,030 (1,082) 948 — 948 Brazilian Real 5,088 621 4,467 (3,096) 1,371 — 1,371
53,439 17,931 35,508 (15,298) 20,210 (11,915) 8,295 Note: (1) The economic hedges represent US dollar and euro preference shares in issue that are treated as equity under IFRS, and do not qualify as hedges for accounting purposes.
Key points
Changes in foreign currency exchange rates will affect equity in proportion to the structural foreign currency exposure. A 5% strengthening in foreign currencies against sterling would result in a gain of £1,200 million (2009 - £930 million; 2008 - £1,010 million) recognised in equity, while a 5% weakening in foreign currencies would result in a loss of £1,150 million (2009 - £880 million; 2008 - £960 million) recognised in equity.
Structural foreign currency exposures have increased in sterling terms due to exchange rate movements and reduced hedging. The increased exposures more effectively offset retranslation movements in RWAs, reducing the sensitivity of the Group’s capital ratios to exchange rate movements.
* unaudited
RBS Group 2010144
Business review continued
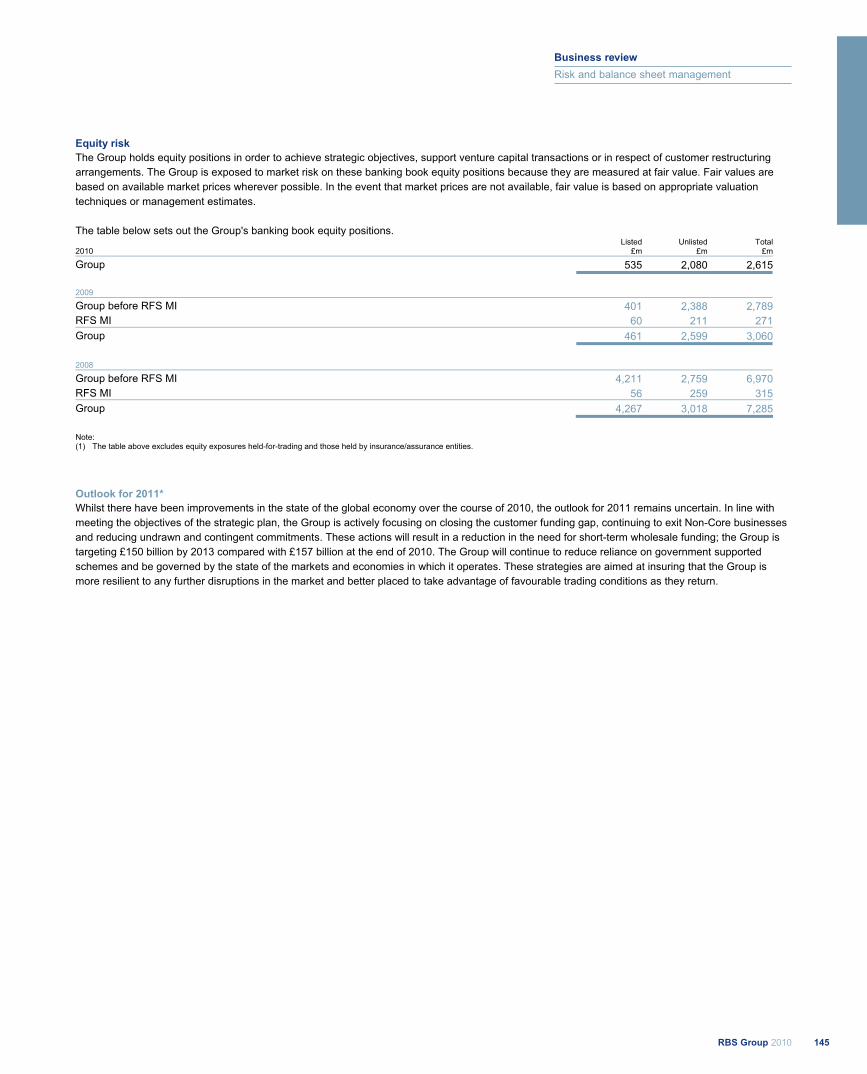
Equity risk The Group holds equity positions in order to achieve strategic objectives, support venture capital transactions or in respect of customer restructuring arrangements. The Group is exposed to market risk on these banking book equity positions because they are measured at fair value. Fair values are based on available market prices wherever possible. In the event that market prices are not available, fair value is based on appropriate valuation techniques or management estimates. The table below sets out the Group's banking book equity positions.
Listed Unlisted Total2010 £m £m £m
Group 535 2,080 2,615
2009
Group before RFS MI 401 2,388 2,789RFS MI 60 211 271Group 461 2,599 3,060
2008
Group before RFS MI 4,211 2,759 6,970RFS MI 56 259 315Group 4,267 3,018 7,285
Note: (1) The table above excludes equity exposures held-for-trading and those held by insurance/assurance entities.
Outlook for 2011* Whilst there have been improvements in the state of the global economy over the course of 2010, the outlook for 2011 remains uncertain. In line with meeting the objectives of the strategic plan, the Group is actively focusing on closing the customer funding gap, continuing to exit Non-Core businesses and reducing undrawn and contingent commitments. These actions will result in a reduction in the need for short-term wholesale funding; the Group is targeting £150 billion by 2013 compared with £157 billion at the end of 2010. The Group will continue to reduce reliance on government supported schemes and be governed by the state of the markets and economies in which it operates. These strategies are aimed at insuring that the Group is more resilient to any further disruptions in the market and better placed to take advantage of favourable trading conditions as they return.
145RBS Group 2010
Business review
Risk and balance sheet management
Risk management: Credit risk All the disclosures in this section (pages 146 to 165) are audited unless otherwise indicated by an asterisk (*). Credit risk is the risk of financial loss owing to the failure of customers or counterparties to meet payment obligations. The quantum and nature of credit risk assumed across the Group's different businesses varies considerably, while the overall credit risk outcome usually exhibits a high degree of correlation to the macroeconomic environment. Credit risk organisation The existence of a strong credit risk management organisation is vital to support the ongoing profitability of the Group. The potential for loss through economic cycles is mitigated through the embedding of a robust credit risk culture within the business units and through a focus on the importance of sustainable lending practices. The role of the credit risk management organisation is to own the credit approval, concentration and risk appetite frameworks and to act as the ultimate authority for the approval of credit. This, together with strong independent oversight and challenge, enables the business to maintain a sound lending environment within risk appetite. Responsibility for development of Group-wide policies, credit risk frameworks, Group-wide portfolio management and assessment of provision adequacy sits within the functional Group Credit Risk organisation (GCR) under the management of the Group Chief Credit Officer. Execution of these policies and frameworks is the responsibility of the risk management organisations located within the Group’s business divisions. These divisional credit risk functions work together with GCR to ensure that the Board’s expressed risk appetite is met within a clearly defined and managed control environment. Each credit risk function within the division is managed by a Chief Credit Officer who reports jointly to a divisional Chief Risk Officer and to the Group Chief Credit Officer. Divisional activities within credit risk include credit approval, transaction and portfolio analysis, early problem recognition and ongoing credit risk stewardship. GCR is additionally responsible for verifying compliance by the divisions with all Group credit policies. It is assisted in this by a credit quality assurance function owned by the Group Chief Credit Officer and housed within the divisions. Credit risk appetite Credit risk appetite is managed and controlled through a series of frameworks designed to limit concentration by sector, counterparty, country or asset class. These are supported by a suite of Group-wide and divisional policies setting out the risk parameters within which business units may operate. Information on the Group’s credit portfolios is reported to the Board via the divisional and Group level risk committees detailed in the Governance section on page 120.
Product/asset class Retail: a formal risk appetite framework establishes Group-level statements and thresholds that are cascaded through all retail franchises in the Group and to granular business lines. These include measures that relate to both aggregate portfolios and to origination asset quality that are monitored frequently to ensure consistency with Group standards and appetite. This appetite setting and monitoring then informs the processes and parameters employed in origination activities that require a large volume of small scale credit decisions, typically involving an application for a new product or a change in facilities on an existing product. The majority of these decisions are based upon automated strategies utilising credit and behaviour scoring techniques. Scores and strategies are typically segmented by product, brand and other significant drivers of credit risk. These data driven strategies utilise a wide range of credit information relating to a customer including, where appropriate, information across customers’ holdings. A small number of credit decisions are subject to additional manual underwriting by authorised approvers in specialist units. These include higher value, more complex, small business and personal unsecured transactions and some residential mortgage applications.
Wholesale: formal policies, specialised tools and expertise, tailored monitoring and reporting and in certain cases specific limits and thresholds are deployed to address certain lines of business across the Group where the nature of credit risk incurred could represent a concentration or a specific/heightened risk in some other form. Such portfolios are subject to formal governance, including periodic review, at either Group or divisional level, depending on materiality.
Sector Across wholesale portfolios, exposures are assigned to, and reviewed in the context of, a defined set of industry sectors. Through this sector framework, appetite and portfolio strategies are agreed and set at aggregate and more granular levels where exposures have the potential to represent excessive concentration or where trends in both external factors and internal portfolio performance give cause for concern. Formal periodic reviews are undertaken at Group or divisional level depending on materiality; these may include an assessment of the Group’s franchise in a particular sector, an analysis of the outlook (including downside outcomes), identification of key vulnerabilities and stress/scenario tests. Specific reporting on trends in sector risk and on status versus agreed appetite and portfolio strategies is provided to senior management and to the Board. Single name Within wholesale portfolios, much of the activity undertaken by the credit risk function is organised around the assessment, approval and management of the credit risk associated with a borrower or group of related borrowers. A formal single name concentration framework addresses the risk of outsized exposure to a borrower or borrower group. The framework includes specific and elevated approval requirements; additional reporting and monitoring; and the requirement to develop plans to address and reduce excess exposures over an appropriate timeframe.
RBS Group 2010146
Business review continued

Credit approval authority is discharged by way of a framework of individual delegated authorities that requires at least two individuals to approve each credit decision, one from the business and one from the credit risk management function. Both parties must hold sufficient delegated authority under the Group-wide authority grid. Whilst both parties are accountable for the quality of each decision taken, the credit risk management approver holds ultimate sanctioning authority. The level of authority granted to individuals is dependent on their experience and expertise with only a small number of senior executives holding the highest authority provided under the framework. Daily monitoring of individual counterparty limits is undertaken.
At a minimum, credit relationships are reviewed and re-approved annually. The renewal process addresses: borrower performance, including reconfirmation or adjustment of risk parameter estimates; the adequacy of security; and compliance with terms and conditions. For certain counterparties, early warning indicators are also in place to detect deteriorating trends of concern in limit utilisation or account performance. Single name concentrations Reducing the risk arising from concentrations to single names remains a key focus of management attention. Notwithstanding continued market illiquidity and the impact of negative credit migration caused by the current economic environment, significant progress was made in 2010 and credit exposures in excess of single name concentration limits fell by over 40% during the year. Country Country risk arises from sovereign events (default or restructuring); economic events (contagion of sovereign default to other parts of the economy, cyclical economic shock); political events (convertibility restrictions and expropriation or nationalisation); and natural disaster or conflict. Such events have the potential to impact elements of the Group’s credit portfolio that are directly or indirectly linked to the affected country and can also give rise to market, liquidity, operational and franchise risk related losses.
The framework for the Group’s appetite for country risk is set by the Executive Risk Forum (ERF) in the form of limits by country risk grade, with sub-limits on medium-term exposure. Authority is delegated to the Group Country Risk Committee to manage exposures within the framework, with escalation where needed to ERF. Specific limits are set for individual countries based on a risk assessment taking into account the Group’s franchise and business mix in that country. Additional limitations (for example, on foreign-currency exposure and product types with higher potential for loss in case of country events) may be established to address specific vulnerabilities in the context of a country's outlook and/or the Group's business strategy in a particular country. A country watch list framework is in place to proactively monitor emerging issues and facilitate the development of mitigation strategies.
Global Restructuring Group The Global Restructuring Group (GRG) manages problem and potential problem exposures in the Group's wholesale credit portfolios. Its primary function is to actively manage the exposures to minimise loss for the Group and, where feasible, to return the exposure to the Group’s mainstream loan book.
Originating business units consult with GRG prior to transfer to GRG when a potentially negative event or trend emerges which might affect a customer’s ability to service its debt or increase the Group’s risk exposure to that customer. Such circumstances include deteriorating trading performance, likely breach of covenant, challenging macroeconomic conditions, a missed payment or the expectation of a missed payment to the Group or another creditor.
On transfer of the relationship, GRG devises a bespoke strategy that optimises recoveries from the debt. This strategy may also involve GRG reviewing the business operations and performance of the customer. A number of alternative approaches will typically be considered including:
Covenant relief: the temporary waiver or recalibration of covenants may be granted to mitigate a potential or actual covenant breach. Such relief is usually granted in exchange for fees, increased margin, additional security, or a reduction in maturity profile of the original loan. Amendment of restrictive covenants: restrictions in loan documents may be amended or waived as part of an overall remedial strategy to allow: additional indebtedness; the granting of collateral; the sale of a business; the granting of junior lien on the collateral; or other fundamental change in capital or operating structure of the enterprise.
Variation in margin: contractual margin may be amended to bolster the customer’s day-to-day liquidity, with the aim of helping to sustain the customer’s business as a going concern. This would normally be accompanied by the Group receiving an exit payment, payment in kind or deferred fee.
Payment holidays and loan rescheduling: payment holidays or changes to the contracted amortisation profile including extensions in contracted maturity or roll-overs may be granted to improve customer liquidity. Such concessions often depend on the expectation that liquidity will recover when market conditions improve or from capital raising initiatives that access alternative sources of liquidity. Recently, these types of concessions have become more common in commercial real estate transactions in situations when a shortage of market liquidity rules out immediate refinancing and short-term forced collateral sales unattractive.
Forgiveness of all or part of the outstanding debt: debt may be forgiven or exchanged for equity where a fundamental shift in the customer’s business or economic environment means that other forms of restructuring strategies are unlikely to succeed in isolation and the customer is incapable of servicing current debt obligations. Debt forgiveness is often an element in leveraged finance transactions which are typically structured on the basis of projected cash flows from operational activities rather than underlying tangible asset values. Maintaining the business as a going concern with a sustainable level of debt is the preferred option rather than realising the underlying assets, provided that the underlying business model and strategy are considered viable.
147RBS Group 2010
Business review
Risk and balance sheet management
Risk management: Credit risk continued Global Restructuring Group continued Depending on the case in question, GRG may employ a combination of these options in order to achieve the best outcome. It may also consider alternative approaches, either alone or together with the options listed above. The following are generally considered as options of last resort:
Enforcement of security or otherwise taking control of assets: where the Group holds underlying collateral or other security interest and is entitled to enforce its rights, it may take ownership or control of the assets. The Group’s preferred strategy is to consider other possible options prior to exercising these rights.
Insolvency: where there is no suitable restructuring option or the business is no longer regarded as sustainable, insolvency will be considered. Insolvency may be the only option that ensures that the assets of the business are properly and efficiently distributed to relevant creditors.
As discussed above, GRG will consider a range of possible restructuring strategies. At the time of execution, the ultimate outcome of the strategy adopted is unknown and highly dependent on the cooperation of the borrower and the continued existence of a viable business. The customer’s financial position, its anticipated future prospects and the likely effect of the restructuring including any concessions are considered by the GRG relationship manager to establish whether an impairment provision is required, subject to divisional and Group governance. During 2010, GRG completed corporate loan restructurings totalling £6.2 billion (exposures of more than £5 million) of which £2.7 billion were classified as impaired. Of these restructurings £2.4 billion related to commercial real estate and £2.1 billion to manufacturing. The incidence of the main types of arrangements is analysed below:
% of loans (by value)
Term extensions 54Debt forgiveness 25Debt for equity 23Interest rate concessions and payment moratoriums 36
The total above exceeds 100% as an individual case can involve more than one type of arrangement. Transfer of restructured loans to the performing book follows assessment by relationship managers in GRG. All cases are individually assessed; when no further losses are expected the loan is returned to performing status. Restructured loans that carry an impairment provision remain classified as impaired. Of the £3.5 billion of corporate loans that were transferred to the performing book with a concession during 2010, loans amounting to £1.8 billion had a negotiated margin increase as compensation for concessions granted.
Retail collections and recoveries There are collections and recoveries functions in each of the consumer businesses. Their role is to provide support and assistance to customers who are currently experiencing difficulties in meeting their financial obligations. Where possible, the aim of the collections and recoveries teams is to return the customer to a satisfactory position, by working with them to restructure their finances. If this is not possible, the team has the objective of reducing the loss to the Group. Forbearance* The Group’s retail forbearance activities involve granting various contract revisions not normally available, such as reduced repayments, payment moratoriums and the roll up of arrears, principally to retail customers with secured lending that are experiencing temporary financial difficulties. Loans are identified for forbearance primarily as a result of contact from the customer or payment arrears and it is only granted following an assessment of the customer’s ability to pay. For those loans that are classified as impaired, the Group’s objective is to minimise the loss on these accounts; for currently performing loans the aim is to enable the customer to continue to service the loan. Forbearance lending for which an impairment loss provision has been recognised remains classified as non-performing. Where the customer met the loan terms prior to modification and where there is an expectation that the customer will meet the revised terms, these loans are classified as performing loans. Retail loan forbearance arrangements during 2010 totalled £3.3 billion (residential mortgages £3.1 billion), of which £1.0 billion were classified as impaired. The incidence of the main types of retail forbearance is analysed below. % of loans
(by value)
Reduced repayments 59Payment moratoriums 20Roll up of arrears 19Interest reductions 6Term extensions 3
The total exceeds 100% as an individual case can involve more than one type of arrangement. Of the forbearance arrangements agreed in the performing book during 2010, less than 15% were impaired as at 31 December 2010.
* unaudited
RBS Group 2010148
Business review continued
Credit risk mitigation* The Group employs a number of structures and techniques to mitigate credit risk. Netting of debtor and creditor balances will be undertaken in accordance with relevant regulatory and internal policies; exposure on over-the-counter derivative and secured financing transactions is further mitigated by the exchange of financial collateral and documented on market standard terms. Further mitigation may be undertaken in a range of transactions, from retail mortgage lending to large wholesale financing, by structuring a security interest in a physical or financial asset; credit derivatives, including credit default swaps, credit linked debt instruments, and securitisation structures; and guarantees and similar instruments (for example, credit insurance) from related and third parties are used in the management of credit portfolios, typically to mitigate credit concentrations in relation to an individual obligor, a borrower group or a collection of related borrowers. The use and approach to credit risk mitigation varies by product type, customer and business strategy. Minimum standards applied across the Group cover: general requirements, including acceptable credit risk mitigation types and any conditions or restrictions applicable to those mitigants; the means by which legal certainty is to be established, including required documentation and all necessary steps required to establish legal rights; acceptable methodologies for the initial and any subsequent valuations of collateral and the frequency with which they are to be revalued (for example, daily in the trading book); actions to be taken in the event the current value of mitigation falls below required levels; management of the risk of correlation between changes in the credit risk of the customer and the value of credit risk mitigation; management of concentration risks, for example, setting thresholds and controls on the acceptability of credit risk mitigants and on lines of business that are characterised by a specific collateral type or structure; and collateral management to ensure that credit risk mitigation remains legally effective and enforceable. Credit risk measurement Credit risk models are used throughout the Group to support the quantitative risk assessment element of the credit approval process, ongoing credit risk management, monitoring and reporting and portfolio analytics. Credit risk models used by the Group may be divided into three categories, as follows.
Probability of default/customer credit grade (PD) These models assess the probability that a customer will fail to make full and timely repayment of their obligations. The probability of a customer failing to do so is measured over a one year period through the economic cycle, although certain retail scorecards use longer periods for business management purposes. Wholesale businesses: as part of the credit assessment process, each counterparty is assigned an internal credit grade derived from a default probability. There are a number of different credit grading models in use across the Group, each of which considers risk characteristics particular to that type of customer. The credit grading models score a combination of quantitative inputs (for example, recent financial performance) and qualitative inputs, (for example, management performance or sector outlook). Retail businesses: each customer account is separately scored using models based on the most material drivers of default. In general, scorecards are statistically derived using customer data. Customers are assigned a score, which in turn is mapped to a probability of default. The probabilities of default are used to group customers into risk pools. Pools are then assigned a weighted average probability of default using regulatory default definitions. Exposure at default Facility usage models estimate the expected level of utilisation of a credit facility at the time of a borrower’s default. For revolving and variable draw down type products which are not fully drawn, the exposure at default (EAD) will typically be higher than the current utilisation. The methodologies used in EAD modelling provide an estimate of potential exposure and recognise that customers may make more use of their existing credit facilities as they approach default. Counterparty credit risk exposure measurement models are used for derivative and other traded instruments where the amount of credit risk exposure may be dependent upon one or more underlying market variables such as interest or foreign exchange rates. These models drive internal credit risk activities such as limit and excess management. Loss given default These models estimate the economic loss that may be experienced (the amount that cannot be recovered) by the Group on a credit facility in the event of default. The Group’s loss given default (LGD) models take into account both borrower and facility characteristics for unsecured or partially unsecured facilities, as well as the quality of any risk mitigation that may be in place for secured facilities, plus the cost of collections and a time discount factor for the delay in cash recovery.
149RBS Group 2010
Business review
Risk and balance sheet management
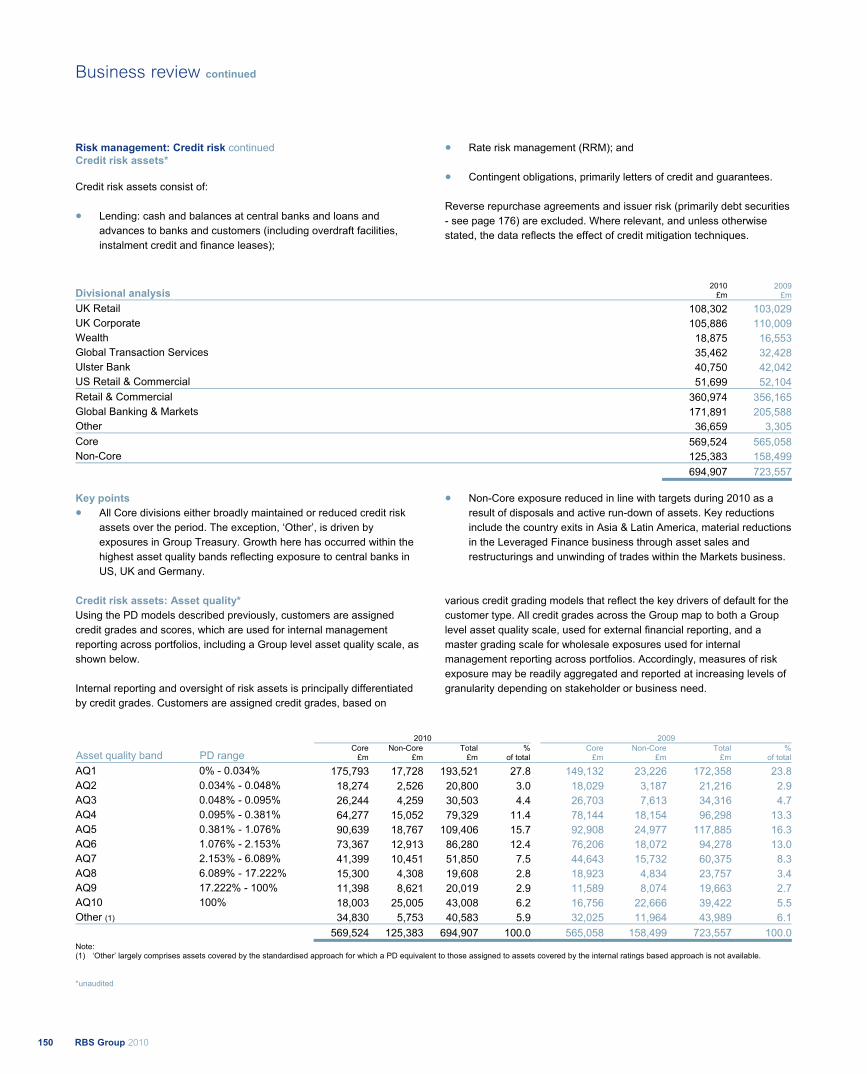
Risk management: Credit risk continued Credit risk assets* Credit risk assets consist of:
Lending: cash and balances at central banks and loans and advances to banks and customers (including overdraft facilities, instalment credit and finance leases);
Rate risk management (RRM); and
Contingent obligations, primarily letters of credit and guarantees. Reverse repurchase agreements and issuer risk (primarily debt securities - see page 176) are excluded. Where relevant, and unless otherwise stated, the data reflects the effect of credit mitigation techniques.
Divisional analysis 2010
£m2009
£m
UK Retail 108,302 103,029UK Corporate 105,886 110,009Wealth 18,875 16,553Global Transaction Services 35,462 32,428Ulster Bank 40,750 42,042 US Retail & Commercial 51,699 52,104Retail & Commercial 360,974 356,165Global Banking & Markets 171,891 205,588Other 36,659 3,305Core 569,524 565,058Non-Core 125,383 158,499 694,907 723,557
Key points All Core divisions either broadly maintained or reduced credit risk assets over the period. The exception, ‘Other’, is driven by exposures in Group Treasury. Growth here has occurred within the highest asset quality bands reflecting exposure to central banks in US, UK and Germany.
Non-Core exposure reduced in line with targets during 2010 as a result of disposals and active run-down of assets. Key reductions include the country exits in Asia & Latin America, material reductions in the Leveraged Finance business through asset sales and restructurings and unwinding of trades within the Markets business.
Credit risk assets: Asset quality* Using the PD models described previously, customers are assigned credit grades and scores, which are used for internal management reporting across portfolios, including a Group level asset quality scale, as shown below. Internal reporting and oversight of risk assets is principally differentiated by credit grades. Customers are assigned credit grades, based on
various credit grading models that reflect the key drivers of default for the customer type. All credit grades across the Group map to both a Group level asset quality scale, used for external financial reporting, and a master grading scale for wholesale exposures used for internal management reporting across portfolios. Accordingly, measures of risk exposure may be readily aggregated and reported at increasing levels of granularity depending on stakeholder or business need.
2010 2009
Asset quality band PD range Core
£mNon-Core
£mTotal
£m%
of totalCore
£m Non-Core
£m Total
£m%
of total
AQ1 0% - 0.034% 175,793 17,728 193,521 27.8 149,132 23,226 172,358 23.8AQ2 0.034% - 0.048% 18,274 2,526 20,800 3.0 18,029 3,187 21,216 2.9AQ3 0.048% - 0.095% 26,244 4,259 30,503 4.4 26,703 7,613 34,316 4.7AQ4 0.095% - 0.381% 64,277 15,052 79,329 11.4 78,144 18,154 96,298 13.3AQ5 0.381% - 1.076% 90,639 18,767 109,406 15.7 92,908 24,977 117,885 16.3AQ6 1.076% - 2.153% 73,367 12,913 86,280 12.4 76,206 18,072 94,278 13.0AQ7 2.153% - 6.089% 41,399 10,451 51,850 7.5 44,643 15,732 60,375 8.3AQ8 6.089% - 17.222% 15,300 4,308 19,608 2.8 18,923 4,834 23,757 3.4AQ9 17.222% - 100% 11,398 8,621 20,019 2.9 11,589 8,074 19,663 2.7AQ10 100% 18,003 25,005 43,008 6.2 16,756 22,666 39,422 5.5Other (1) 34,830 5,753 40,583 5.9 32,025 11,964 43,989 6.1 569,524 125,383 694,907 100.0 565,058 158,499 723,557 100.0Note: (1) ‘Other’ largely comprises assets covered by the standardised approach for which a PD equivalent to those assigned to assets covered by the internal ratings based approach is not available.
*unaudited
RBS Group 2010150
Business review continued
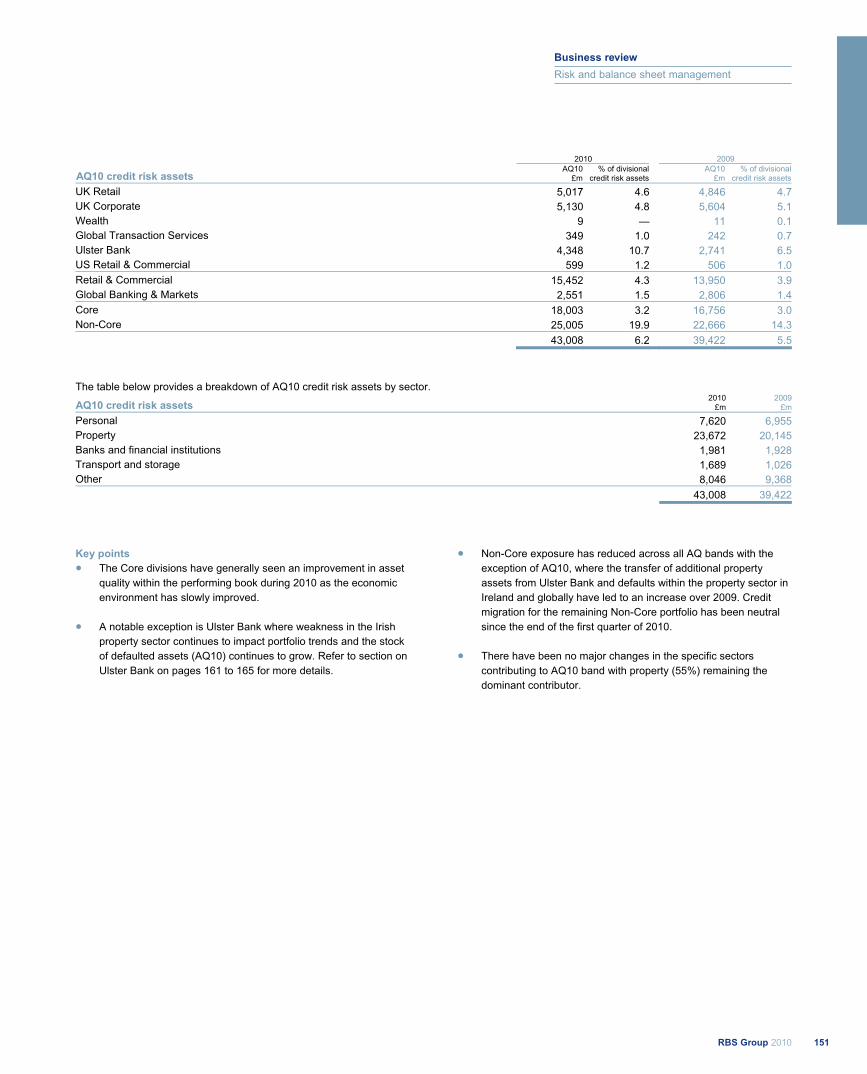
2010 2009
AQ10 credit risk assets AQ10
£m% of divisional
credit risk assets AQ10
£m% of divisional
credit risk assets
UK Retail 5,017 4.6 4,846 4.7 UK Corporate 5,130 4.8 5,604 5.1 Wealth 9 — 11 0.1 Global Transaction Services 349 1.0 242 0.7 Ulster Bank 4,348 10.7 2,741 6.5 US Retail & Commercial 599 1.2 506 1.0 Retail & Commercial 15,452 4.3 13,950 3.9 Global Banking & Markets 2,551 1.5 2,806 1.4 Core 18,003 3.2 16,756 3.0 Non-Core 25,005 19.9 22,666 14.3 43,008 6.2 39,422 5.5
The table below provides a breakdown of AQ10 credit risk assets by sector.
AQ10 credit risk assets 2010
£m2009
£m
Personal 7,620 6,955 Property 23,672 20,145 Banks and financial institutions 1,981 1,928Transport and storage 1,689 1,026Other 8,046 9,368 43,008 39,422
Key points The Core divisions have generally seen an improvement in asset quality within the performing book during 2010 as the economic environment has slowly improved.
A notable exception is Ulster Bank where weakness in the Irish property sector continues to impact portfolio trends and the stock of defaulted assets (AQ10) continues to grow. Refer to section on Ulster Bank on pages 161 to 165 for more details.
Non-Core exposure has reduced across all AQ bands with the exception of AQ10, where the transfer of additional property assets from Ulster Bank and defaults within the property sector in Ireland and globally have led to an increase over 2009. Credit migration for the remaining Non-Core portfolio has been neutral since the end of the first quarter of 2010.
There have been no major changes in the specific sectors contributing to AQ10 band with property (55%) remaining the dominant contributor.
151RBS Group 2010
Business review
Risk and balance sheet management

Business review continued
152 RBS Group 2010
Risk management: Credit risk continued Credit risk assets* continued Country risk Under the Group's country risk framework, country exposures are actively managed both for countries that represent a larger concentration and for those which, under the country watch list process, have been identified as exhibiting signs of actual or potential stress.
The country risk tables below show credit risk assets exceeding £1 billion by borrowers domiciled in countries with an external rating of A+ and below from Standard & Poor’s, Moody’s or Fitch and selected eurozone countries. The numbers are stated gross of mitigating action which may have been taken to reduce or eliminate exposure to country risk events.
Lending
Central and local
governmentCentral
bank
Otherfinancial
institutions Corporate Personal Total Core Non-Core
RRM and contingent obligations
2010 £m £m £m £m £m £m £m £m £m
Republic of Ireland 61 2,119 900 19,881 20,228 43,189 32,431 10,758 3,496Italy 45 78 1,086 2,483 27 3,719 1,817 1,902 2,312India 262 — 1,614 2,590 273 4,739 4,085 654 1,249China 17 298 1,240 753 64 2,372 2,136 236 1,572Turkey 282 68 485 1,365 12 2,212 1,520 692 547South Korea — 276 1,039 555 2 1,872 1,822 50 643Russia — 110 251 1,181 58 1,600 1,475 125 216Mexico — 8 149 999 1 1,157 854 303 148Brazil — — 825 315 5 1,145 1,025 120 120Romania 36 178 42 426 446 1,128 7 1,121 142Poland — 168 13 655 6 842 736 106 381Portugal 86 — 63 611 6 766 450 316 537 Additional selected eurozone countries Spain 19 5 258 6,962 407 7,651 3,130 4,521 2,447Greece 14 36 49 188 16 303 173 130 214 2009 Republic of Ireland 78 1,830 1,693 21,518 22,348 47,467 32,479 14,988 4,820Italy 10 119 751 4,465 27 5,372 1,877 3,495 2,146India — 109 499 2,752 63 3,423 3,240 183 1,691China 50 296 780 947 42 2,115 1,845 270 425Turkey 255 335 207 1,870 10 2,677 1,918 759 274South Korea — 6 903 656 1 1,566 1,467 99 1,458Russia — 58 84 1,578 27 1,747 1,275 472 511Mexico 2 45 161 1,262 1 1,471 594 877 112Brazil — — 623 420 3 1,046 833 213 282Romania 49 392 46 637 507 1,631 37 1,594 169Poland — 22 40 1,038 6 1,106 996 110 625Portugal — — 51 861 5 917 582 335 461 Additional selected eurozone countries Spain 30 17 373 7,658 438 8,516 2,957 5,559 2,325Greece 21 37 52 290 16 416 245 171 194
*unaudited
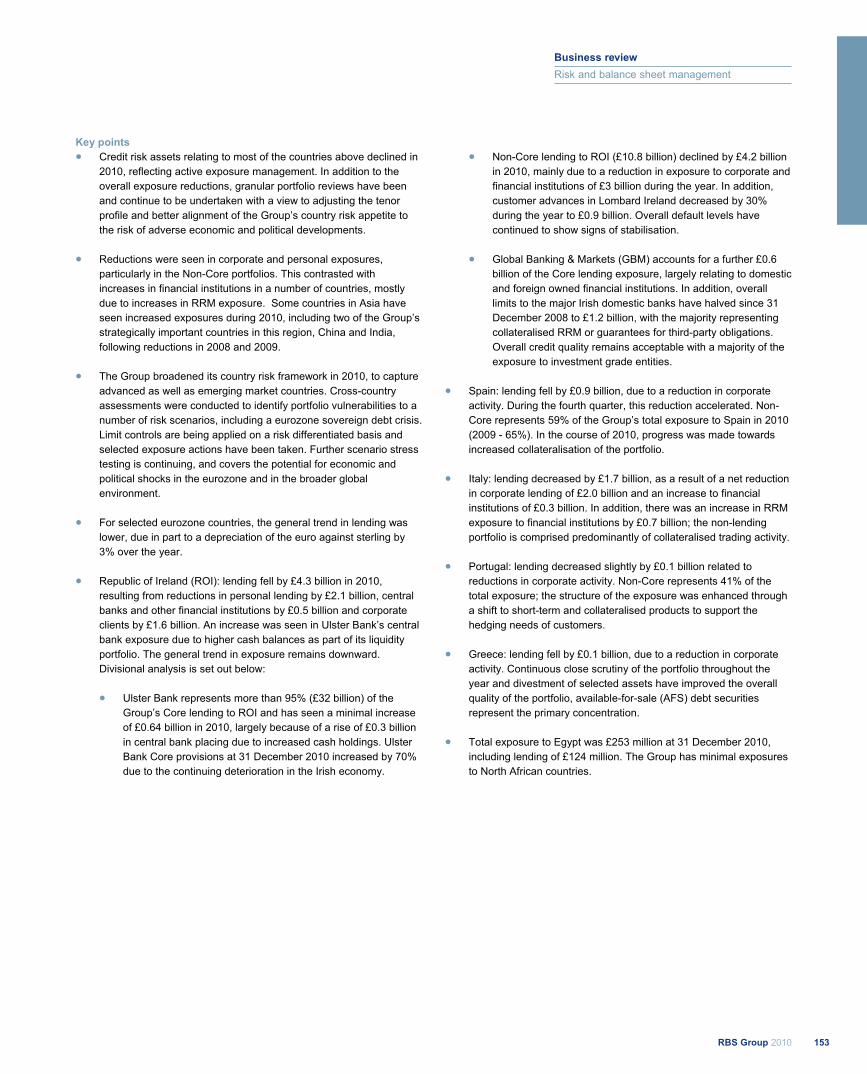
Key points Credit risk assets relating to most of the countries above declined in 2010, reflecting active exposure management. In addition to the overall exposure reductions, granular portfolio reviews have been and continue to be undertaken with a view to adjusting the tenor profile and better alignment of the Group’s country risk appetite to the risk of adverse economic and political developments.
Reductions were seen in corporate and personal exposures, particularly in the Non-Core portfolios. This contrasted with increases in financial institutions in a number of countries, mostly due to increases in RRM exposure. Some countries in Asia have seen increased exposures during 2010, including two of the Group’s strategically important countries in this region, China and India, following reductions in 2008 and 2009.
The Group broadened its country risk framework in 2010, to capture advanced as well as emerging market countries. Cross-country assessments were conducted to identify portfolio vulnerabilities to a number of risk scenarios, including a eurozone sovereign debt crisis. Limit controls are being applied on a risk differentiated basis and selected exposure actions have been taken. Further scenario stress testing is continuing, and covers the potential for economic and political shocks in the eurozone and in the broader global environment.
For selected eurozone countries, the general trend in lending was lower, due in part to a depreciation of the euro against sterling by 3% over the year.
Republic of Ireland (ROI): lending fell by £4.3 billion in 2010, resulting from reductions in personal lending by £2.1 billion, central banks and other financial institutions by £0.5 billion and corporate clients by £1.6 billion. An increase was seen in Ulster Bank’s central bank exposure due to higher cash balances as part of its liquidity portfolio. The general trend in exposure remains downward. Divisional analysis is set out below:
Ulster Bank represents more than 95% (£32 billion) of the Group’s Core lending to ROI and has seen a minimal increase of £0.64 billion in 2010, largely because of a rise of £0.3 billion in central bank placing due to increased cash holdings. Ulster Bank Core provisions at 31 December 2010 increased by 70% due to the continuing deterioration in the Irish economy.
Non-Core lending to ROI (£10.8 billion) declined by £4.2 billion in 2010, mainly due to a reduction in exposure to corporate and financial institutions of £3 billion during the year. In addition, customer advances in Lombard Ireland decreased by 30% during the year to £0.9 billion. Overall default levels have continued to show signs of stabilisation.
Global Banking & Markets (GBM) accounts for a further £0.6 billion of the Core lending exposure, largely relating to domestic and foreign owned financial institutions. In addition, overall limits to the major Irish domestic banks have halved since 31 December 2008 to £1.2 billion, with the majority representing collateralised RRM or guarantees for third-party obligations. Overall credit quality remains acceptable with a majority of the exposure to investment grade entities.
Spain: lending fell by £0.9 billion, due to a reduction in corporate activity. During the fourth quarter, this reduction accelerated. Non-Core represents 59% of the Group’s total exposure to Spain in 2010 (2009 - 65%). In the course of 2010, progress was made towards increased collateralisation of the portfolio.
Italy: lending decreased by £1.7 billion, as a result of a net reduction in corporate lending of £2.0 billion and an increase to financial institutions of £0.3 billion. In addition, there was an increase in RRM exposure to financial institutions by £0.7 billion; the non-lending portfolio is comprised predominantly of collateralised trading activity.
Portugal: lending decreased slightly by £0.1 billion related to reductions in corporate activity. Non-Core represents 41% of the total exposure; the structure of the exposure was enhanced through a shift to short-term and collateralised products to support the hedging needs of customers.
Greece: lending fell by £0.1 billion, due to a reduction in corporate activity. Continuous close scrutiny of the portfolio throughout the year and divestment of selected assets have improved the overall quality of the portfolio, available-for-sale (AFS) debt securities represent the primary concentration.
Total exposure to Egypt was £253 million at 31 December 2010, including lending of £124 million. The Group has minimal exposures to North African countries.
153RBS Group 2010
Business review
Risk and balance sheet management
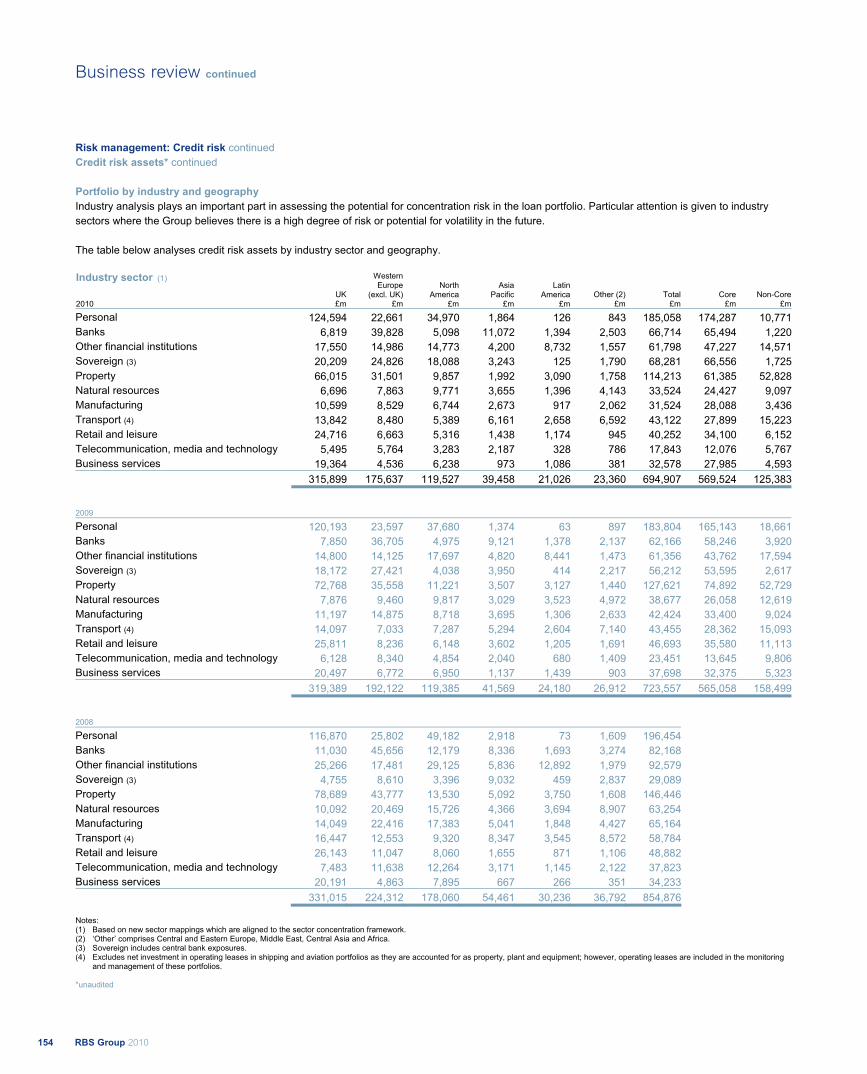
Risk management: Credit risk continued Credit risk assets* continued Portfolio by industry and geography Industry analysis plays an important part in assessing the potential for concentration risk in the loan portfolio. Particular attention is given to industry sectors where the Group believes there is a high degree of risk or potential for volatility in the future. The table below analyses credit risk assets by industry sector and geography. Industry sector (1) 2010
UK £m
Western Europe
(excl. UK)£m
NorthAmerica
£m
AsiaPacific
£m
LatinAmerica
£mOther (2)
£mTotal
£mCore
£mNon-Core
£m
Personal 124,594 22,661 34,970 1,864 126 843 185,058 174,287 10,771Banks 6,819 39,828 5,098 11,072 1,394 2,503 66,714 65,494 1,220Other financial institutions 17,550 14,986 14,773 4,200 8,732 1,557 61,798 47,227 14,571Sovereign (3) 20,209 24,826 18,088 3,243 125 1,790 68,281 66,556 1,725Property 66,015 31,501 9,857 1,992 3,090 1,758 114,213 61,385 52,828Natural resources 6,696 7,863 9,771 3,655 1,396 4,143 33,524 24,427 9,097Manufacturing 10,599 8,529 6,744 2,673 917 2,062 31,524 28,088 3,436Transport (4) 13,842 8,480 5,389 6,161 2,658 6,592 43,122 27,899 15,223Retail and leisure 24,716 6,663 5,316 1,438 1,174 945 40,252 34,100 6,152Telecommunication, media and technology 5,495 5,764 3,283 2,187 328 786 17,843 12,076 5,767Business services 19,364 4,536 6,238 973 1,086 381 32,578 27,985 4,593 315,899 175,637 119,527 39,458 21,026 23,360 694,907 569,524 125,383
2009 Personal 120,193 23,597 37,680 1,374 63 897 183,804 165,143 18,661 Banks 7,850 36,705 4,975 9,121 1,378 2,137 62,166 58,246 3,920Other financial institutions 14,800 14,125 17,697 4,820 8,441 1,473 61,356 43,762 17,594 Sovereign (3) 18,172 27,421 4,038 3,950 414 2,217 56,212 53,595 2,617 Property 72,768 35,558 11,221 3,507 3,127 1,440 127,621 74,892 52,729 Natural resources 7,876 9,460 9,817 3,029 3,523 4,972 38,677 26,058 12,619Manufacturing 11,197 14,875 8,718 3,695 1,306 2,633 42,424 33,400 9,024 Transport (4) 14,097 7,033 7,287 5,294 2,604 7,140 43,455 28,362 15,093 Retail and leisure 25,811 8,236 6,148 3,602 1,205 1,691 46,693 35,580 11,113Telecommunication, media and technology 6,128 8,340 4,854 2,040 680 1,409 23,451 13,645 9,806 Business services 20,497 6,772 6,950 1,137 1,439 903 37,698 32,375 5,323 319,389 192,122 119,385 41,569 24,180 26,912 723,557 565,058 158,499
2008 Personal 116,870 25,802 49,182 2,918 73 1,609 196,454Banks 11,030 45,656 12,179 8,336 1,693 3,274 82,168Other financial institutions 25,266 17,481 29,125 5,836 12,892 1,979 92,579Sovereign (3) 4,755 8,610 3,396 9,032 459 2,837 29,089Property 78,689 43,777 13,530 5,092 3,750 1,608 146,446Natural resources 10,092 20,469 15,726 4,366 3,694 8,907 63,254Manufacturing 14,049 22,416 17,383 5,041 1,848 4,427 65,164Transport (4) 16,447 12,553 9,320 8,347 3,545 8,572 58,784Retail and leisure 26,143 11,047 8,060 1,655 871 1,106 48,882Telecommunication, media and technology 7,483 11,638 12,264 3,171 1,145 2,122 37,823Business services 20,191 4,863 7,895 667 266 351 34,233 331,015 224,312 178,060 54,461 30,236 36,792 854,876
Notes: (1) Based on new sector mappings which are aligned to the sector concentration framework. (2) ‘Other’ comprises Central and Eastern Europe, Middle East, Central Asia and Africa. (3) Sovereign includes central bank exposures. (4) Excludes net investment in operating leases in shipping and aviation portfolios as they are accounted for as property, plant and equipment; however, operating leases are included in the monitoring
and management of these portfolios. *unaudited
RBS Group 2010154
Business review continued
Key points Exposure reductions occurred across most industry sectors and geographic regions.
Modest growth in North America is attributable to the weakening of sterling against the US dollar during the period and higher short-term exposures to central banks.
At 9.6% of total exposure, the banks sector is one of the largest in the Group, although it is geographically diversified with activities conducted in the Group's key markets across the world. Exposure is predominantly to major global banks (23% of sector exposure), defined as those with diversified domestic and international activities. The product range is diverse and includes loans and advances, treasury and capital markets products. Overall there has been a gradual downward trend in exposures to banks, but exposures have fluctuated markedly due to lines being drawn and repaid over short periods and mark to market movements associated with trading activity. Overall asset quality has stabilised in line with improving economic conditions, although the sovereign crisis affecting several eurozone countries has placed downward pressure on the asset quality of banks in these countries (11% of sector exposure).
Exposures to the non bank financial sector are dominated by traded products and spread across a wide range of financial institutions including insurance companies, securitisations, financial intermediaries, finance companies, unleveraged and leveraged funds (including hedge funds). The majority of these are domiciled in the UK, Western Europe and US with no other material geographic or sector concentrations and business is developed selectively. Asset quality has stabilised as the economic environment has improved. Exposures to defaulted entities totalled £1.8 billion, 3% of total exposure to this sector.
Sovereigns comprise activities with central governments, central banks and sub sovereigns such as local authorities in the Group's key markets in the UK, Western Europe and USA. The Group’s exposure to sovereigns fluctuates according to the Group's liquidity requirements and cash positions which determine the level of cash placed with sovereign entities. The asset quality of the portfolios has been impacted by the sovereign crisis in several eurozone countries and the resultant multiple downgrading of these countries.
The Group’s exposure to the property sector totals £114 billion, a reduction of 11% in the period, of which 76% is commercial real estate (further detail on pages 156 and 157). The remainder comprises lending to property-related sectors including housing associations, estate agents and management companies. The majority of property (with the exception of Non-Core) is within the UK Corporate division (33%) and Ulster Bank (6%).
Exposure to the manufacturing sector is concentrated in the industrial (40%), agriculture (24%) and food & consumer (21%) sub-sectors. The overall reduction in exposure of £10.9 billion is partly due to the run-off and restructuring of assets in Western Europe and in the Non-Core portfolio. Portfolio asset quality has held up well during the year but fluctuating commodity prices continue to pose a key risk to the more cyclical sub-sectors. Manufacturing exposure in default totals £1.5 billion (2009 - £3.7 billion).
The transport sector accounts for 6% of exposure and primarily comprises loans and advances to borrowers in the shipping, automotive and aviation segments in the Core bank. Aviation Capital and a portfolio of shipping loans are held within Non-Core. Core bank exposure resides primarily in Corporate Banking and Global Banking & Markets and the portfolio is well diversified geographically. In aggregate, the exposure within and asset quality of the Core portfolio remained stable over the year. Global economic conditions and related trends in trade flows and discretionary consumer spending continue to inform the Group’s cautious stance. Transport exposure in default totals of £1.7 billion (2009 - £1 billion).
Whilst there have been no material impairment charges for shipping to date, the exposure that is subject to a heightened level of monitoring currently stands at approximately £2.8 billion out of a total portfolio of £13 billion, which reflects the continued difficult market conditions that have been experienced during 2010. Recent quarterly vessel valuations undertaken by external shipbrokers show that the majority of our exposures remain fully secured. Conditions will remain challenging for the foreseeable future.
155RBS Group 2010
Business review
Risk and balance sheet management
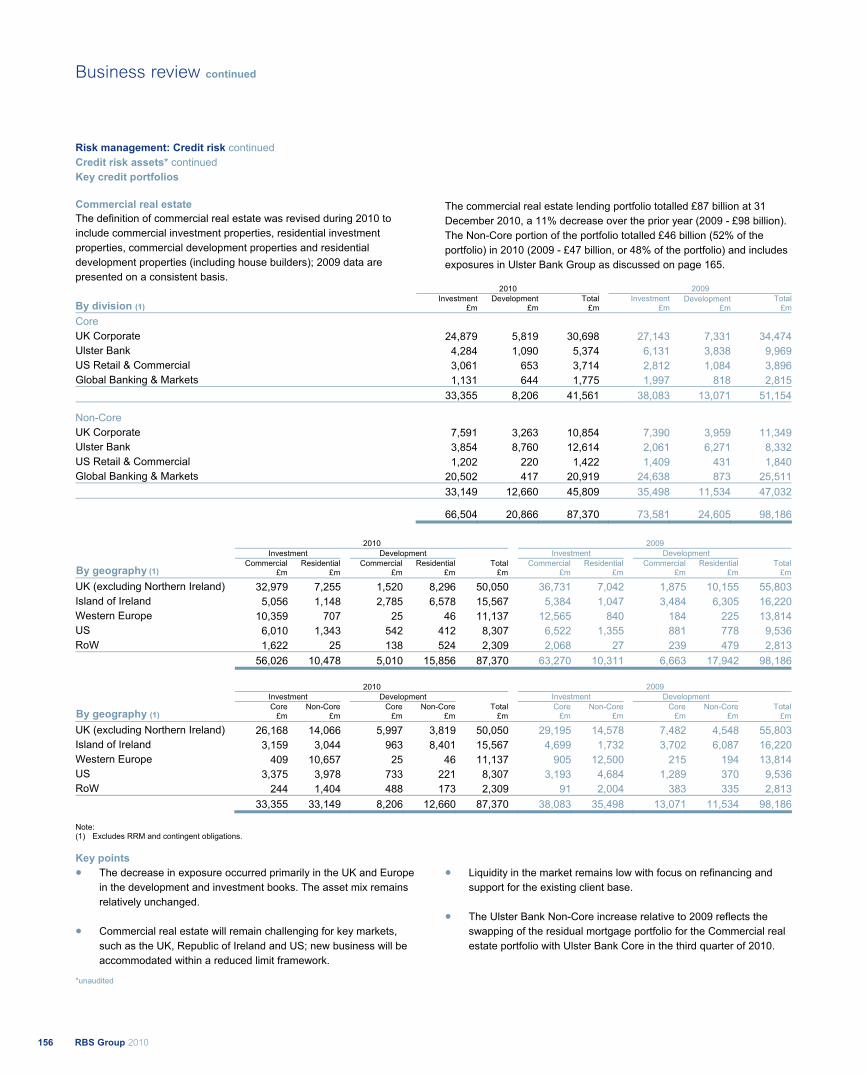
Risk management: Credit risk continued Credit risk assets* continued Key credit portfolios Commercial real estate
The definition of commercial real estate was revised during 2010 to include commercial investment properties, residential investment properties, commercial development properties and residential development properties (including house builders); 2009 data are presented on a consistent basis.
The commercial real estate lending portfolio totalled £87 billion at 31 December 2010, a 11% decrease over the prior year (2009 - £98 billion). The Non-Core portion of the portfolio totalled £46 billion (52% of the portfolio) in 2010 (2009 - £47 billion, or 48% of the portfolio) and includes exposures in Ulster Bank Group as discussed on page 165.
2010 2009
By division (1) Investment
£mDevelopment
£mTotal
£m Investment
£mDevelopment
£mTotal
£m
Core UK Corporate 24,879 5,819 30,698 27,143 7,331 34,474Ulster Bank 4,284 1,090 5,374 6,131 3,838 9,969US Retail & Commercial 3,061 653 3,714 2,812 1,084 3,896Global Banking & Markets 1,131 644 1,775 1,997 818 2,815 33,355 8,206 41,561 38,083 13,071 51,154
Non-Core UK Corporate 7,591 3,263 10,854 7,390 3,959 11,349Ulster Bank 3,854 8,760 12,614 2,061 6,271 8,332US Retail & Commercial 1,202 220 1,422 1,409 431 1,840Global Banking & Markets 20,502 417 20,919 24,638 873 25,511 33,149 12,660 45,809 35,498 11,534 47,032
66,504 20,866 87,370 73,581 24,605 98,186
2010 2009 Investment Development Investment Development
By geography (1) Commercial
£m Residential
£m Commercial
£mResidential
£mTotal
£mCommercial
£mResidential
£m Commercial
£mResidential
£mTotal
£m
UK (excluding Northern Ireland) 32,979 7,255 1,520 8,296 50,050 36,731 7,042 1,875 10,155 55,803Island of Ireland 5,056 1,148 2,785 6,578 15,567 5,384 1,047 3,484 6,305 16,220Western Europe 10,359 707 25 46 11,137 12,565 840 184 225 13,814US 6,010 1,343 542 412 8,307 6,522 1,355 881 778 9,536RoW 1,622 25 138 524 2,309 2,068 27 239 479 2,813 56,026 10,478 5,010 15,856 87,370 63,270 10,311 6,663 17,942 98,186
2010 2009 Investment Development Investment Development
By geography (1) Core
£m Non-Core
£m Core
£mNon-Core
£mTotal
£mCore
£mNon-Core
£m Core
£mNon-Core
£mTotal
£m
UK (excluding Northern Ireland) 26,168 14,066 5,997 3,819 50,050 29,195 14,578 7,482 4,548 55,803Island of Ireland 3,159 3,044 963 8,401 15,567 4,699 1,732 3,702 6,087 16,220Western Europe 409 10,657 25 46 11,137 905 12,500 215 194 13,814US 3,375 3,978 733 221 8,307 3,193 4,684 1,289 370 9,536RoW 244 1,404 488 173 2,309 91 2,004 383 335 2,813 33,355 33,149 8,206 12,660 87,370 38,083 35,498 13,071 11,534 98,186
Note: (1) Excludes RRM and contingent obligations.
Key points The decrease in exposure occurred primarily in the UK and Europe in the development and investment books. The asset mix remains relatively unchanged.
Commercial real estate will remain challenging for key markets, such as the UK, Republic of Ireland and US; new business will be accommodated within a reduced limit framework.
Liquidity in the market remains low with focus on refinancing and support for the existing client base.
The Ulster Bank Non-Core increase relative to 2009 reflects the swapping of the residual mortgage portfolio for the Commercial real estate portfolio with Ulster Bank Core in the third quarter of 2010.
*unaudited
RBS Group 2010156
Business review continued
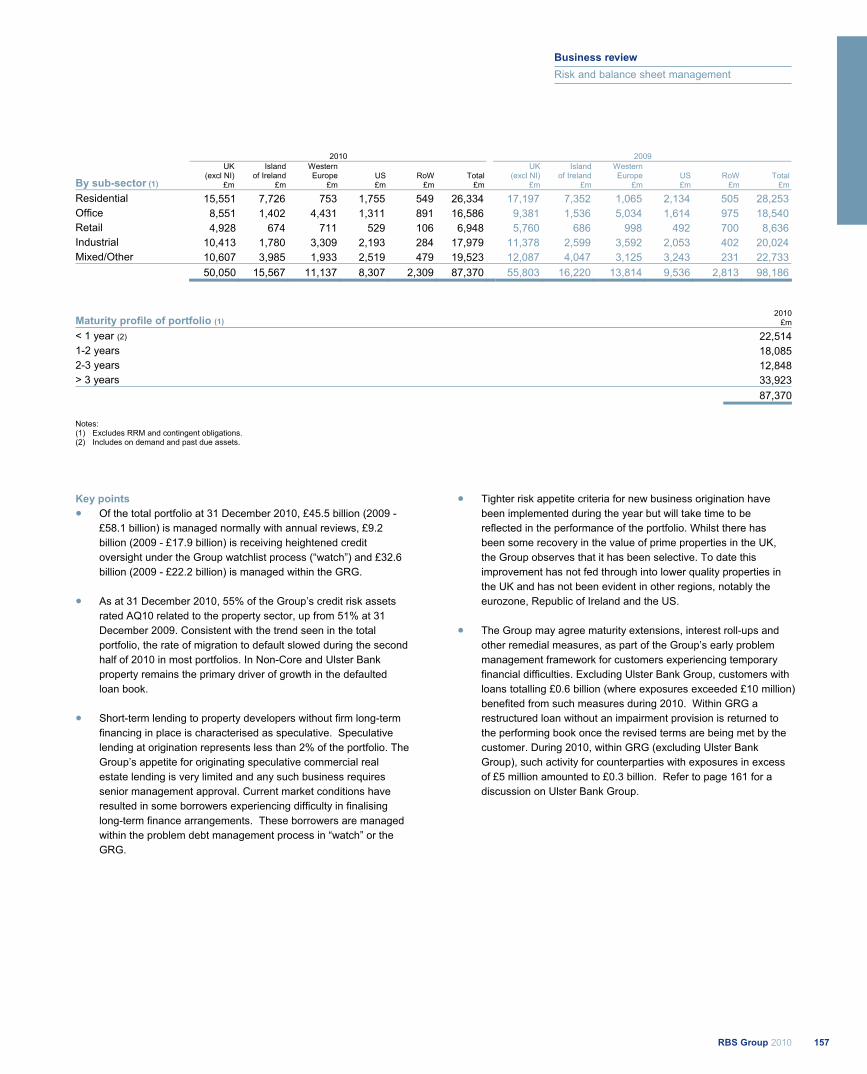
2010 2009
By sub-sector (1) UK
(excl NI) £m
Island of Ireland
£m
Western Europe
£m US £m
RoW £m
Total £m
UK (excl NI)
£m
Islandof Ireland
£m
Western Europe
£m US £m
RoW £m
Total £m
Residential 15,551 7,726 753 1,755 549 26,334 17,197 7,352 1,065 2,134 505 28,253 Office 8,551 1,402 4,431 1,311 891 16,586 9,381 1,536 5,034 1,614 975 18,540 Retail 4,928 674 711 529 106 6,948 5,760 686 998 492 700 8,636 Industrial 10,413 1,780 3,309 2,193 284 17,979 11,378 2,599 3,592 2,053 402 20,024 Mixed/Other 10,607 3,985 1,933 2,519 479 19,523 12,087 4,047 3,125 3,243 231 22,733 50,050 15,567 11,137 8,307 2,309 87,370 55,803 16,220 13,814 9,536 2,813 98,186
Maturity profile of portfolio (1) 2010
£m
< 1 year (2) 22,5141-2 years 18,0852-3 years 12,848> 3 years 33,923 87,370
Notes: (1) Excludes RRM and contingent obligations. (2) Includes on demand and past due assets.
Key points Of the total portfolio at 31 December 2010, £45.5 billion (2009 - £58.1 billion) is managed normally with annual reviews, £9.2 billion (2009 - £17.9 billion) is receiving heightened credit oversight under the Group watchlist process (“watch”) and £32.6 billion (2009 - £22.2 billion) is managed within the GRG.
As at 31 December 2010, 55% of the Group’s credit risk assets rated AQ10 related to the property sector, up from 51% at 31 December 2009. Consistent with the trend seen in the total portfolio, the rate of migration to default slowed during the second half of 2010 in most portfolios. In Non-Core and Ulster Bank property remains the primary driver of growth in the defaulted loan book.
Short-term lending to property developers without firm long-term financing in place is characterised as speculative. Speculative lending at origination represents less than 2% of the portfolio. The Group’s appetite for originating speculative commercial real estate lending is very limited and any such business requires senior management approval. Current market conditions have resulted in some borrowers experiencing difficulty in finalising long-term finance arrangements. These borrowers are managed within the problem debt management process in “watch” or the GRG.
Tighter risk appetite criteria for new business origination have been implemented during the year but will take time to be reflected in the performance of the portfolio. Whilst there has been some recovery in the value of prime properties in the UK, the Group observes that it has been selective. To date this improvement has not fed through into lower quality properties in the UK and has not been evident in other regions, notably the eurozone, Republic of Ireland and the US.
The Group may agree maturity extensions, interest roll-ups and other remedial measures, as part of the Group’s early problem management framework for customers experiencing temporary financial difficulties. Excluding Ulster Bank Group, customers with loans totalling £0.6 billion (where exposures exceeded £10 million) benefited from such measures during 2010. Within GRG a restructured loan without an impairment provision is returned to the performing book once the revised terms are being met by the customer. During 2010, within GRG (excluding Ulster Bank Group), such activity for counterparties with exposures in excess of £5 million amounted to £0.3 billion. Refer to page 161 for a discussion on Ulster Bank Group.
157RBS Group 2010
Business review
Risk and balance sheet management
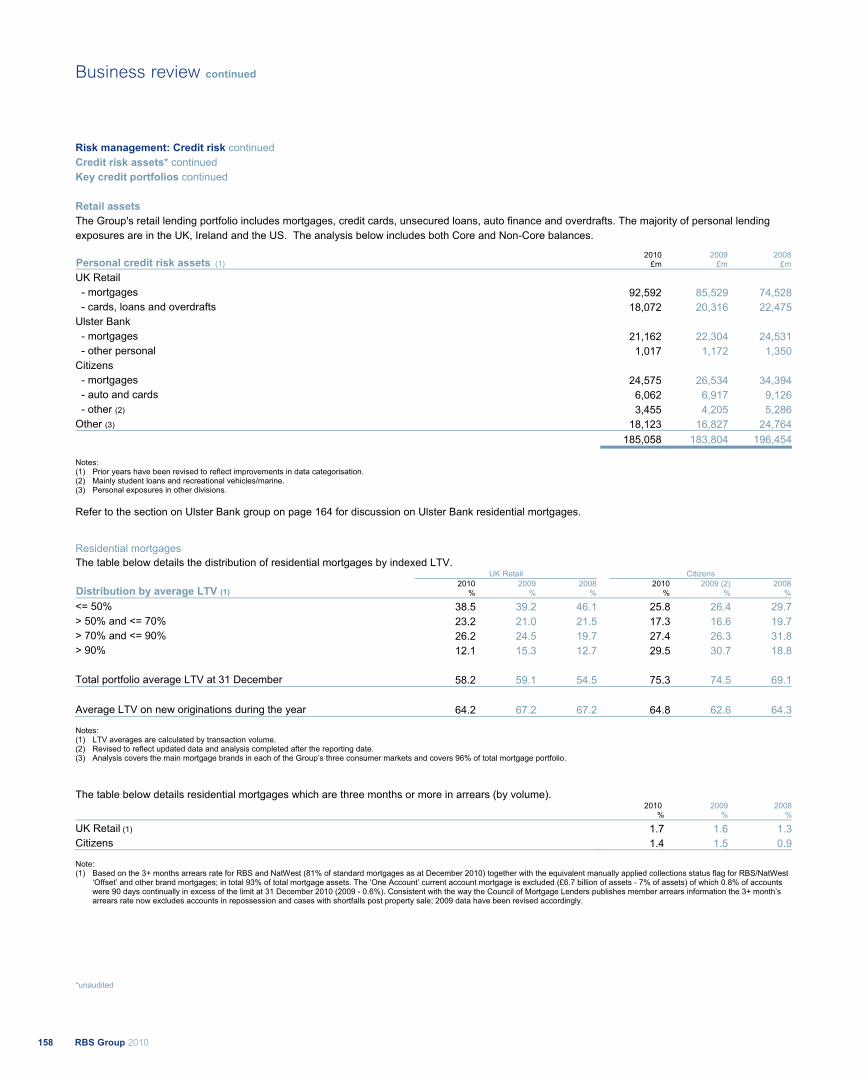
Risk management: Credit risk continued Credit risk assets* continued Key credit portfolios continued Retail assets The Group's retail lending portfolio includes mortgages, credit cards, unsecured loans, auto finance and overdrafts. The majority of personal lending exposures are in the UK, Ireland and the US. The analysis below includes both Core and Non-Core balances. Personal credit risk assets (1) 2010
£m2009 £m
2008£m
UK Retail - mortgages 92,592 85,529 74,528
- cards, loans and overdrafts 18,072 20,316 22,475Ulster Bank
- mortgages 21,162 22,304 24,531 - other personal 1,017 1,172 1,350Citizens
- mortgages 24,575 26,534 34,394 - auto and cards 6,062 6,917 9,126 - other (2) 3,455 4,205 5,286Other (3) 18,123 16,827 24,764 185,058 183,804 196,454
Notes: (1) Prior years have been revised to reflect improvements in data categorisation. (2) Mainly student loans and recreational vehicles/marine. (3) Personal exposures in other divisions.
Refer to the section on Ulster Bank group on page 164 for discussion on Ulster Bank residential mortgages.
Residential mortgages The table below details the distribution of residential mortgages by indexed LTV.
UK Retail Citizens
Distribution by average LTV (1) 2010
%2009
%2008
%2010
%2009 (2)
%2008
%
<= 50% 38.5 39.2 46.1 25.8 26.4 29.7> 50% and <= 70% 23.2 21.0 21.5 17.3 16.6 19.7> 70% and <= 90% 26.2 24.5 19.7 27.4 26.3 31.8> 90% 12.1 15.3 12.7 29.5 30.7 18.8 Total portfolio average LTV at 31 December 58.2 59.1 54.5 75.3 74.5 69.1 Average LTV on new originations during the year 64.2 67.2 67.2 64.8 62.6 64.3
Notes: (1) LTV averages are calculated by transaction volume. (2) Revised to reflect updated data and analysis completed after the reporting date. (3) Analysis covers the main mortgage brands in each of the Group’s three consumer markets and covers 96% of total mortgage portfolio.
The table below details residential mortgages which are three months or more in arrears (by volume). 2010 2009 2008 % % %
UK Retail (1) 1.7 1.6 1.3Citizens 1.4 1.5 0.9
Note: (1) Based on the 3+ months arrears rate for RBS and NatWest (81% of standard mortgages as at December 2010) together with the equivalent manually applied collections status flag for RBS/NatWest
‘Offset’ and other brand mortgages; in total 93% of total mortgage assets. The ‘One Account’ current account mortgage is excluded (£6.7 billion of assets - 7% of assets) of which 0.8% of accounts were 90 days continually in excess of the limit at 31 December 2010 (2009 - 0.6%). Consistent with the way the Council of Mortgage Lenders publishes member arrears information the 3+ month’s arrears rate now excludes accounts in repossession and cases with shortfalls post property sale; 2009 data have been revised accordingly.
*unaudited
RBS Group 2010158
Business review continued

Retail credit assets: UK residential mortgages Key points
The UK mortgage portfolio totalled £92.6 billion at 31 December 2010, an increase of 8% from 31 December 2009, due to continued strong sales growth and lower redemption rates in historical terms. Of the total portfolio, 98% is designated as Core business with the primary brands being the Royal Bank of Scotland, NatWest, the One Account and First Active (Non-Core is made up of Direct Line Mortgages). The assets comprise prime mortgage lending and include 6.8% (£6.2 billion) of exposure to residential buy-to-let at 31 December 2010. There is a small legacy self certification book (0.3% of total assets); which was withdrawn from sale in 2004.
Gross new mortgage lending in 2010 was strong at £15.9 billion. The average LTV for new business during 2010 was 64.2% compared with 67.2% in 2009. The maximum LTV available to new customers remains at 90%. Based on the Halifax House Price index as at September 2010, the book averaged indexed LTV has reduced to 58.2% at 31 December 2010 from 59.1% at 31 December 2009 influenced by favourable house price movements with the proportion of balances in negative equity at 31 December 2010 standing at 6.9% down from 10.9% at 31 December 2009.
The arrears rate (more than 3 payments in arrears, excluding repossessions and shortfalls post property sale) increased slightly to 1.7% at 31 December 2010 from 1.6% at 31 December 2009. After a period of deterioration the arrears rate has stabilised and has remained broadly stable since late 2009. The arrears rate on the buy-to-let portfolio was 1.3 % at 31 December 2010 (2009 - 1.4%).
The mortgage impairment charge was £183 million for the year ended 31 December 2010 compared to £129 million for 2009, with a proportion of the 2010 charge (approximately £70 million) being the result of adjustments reflecting reduced expectations of recovery on prior period defaulted debt and refinement of provision methodology. Underlying default trends improved throughout 2010 when compared with 2009. Provisions as a percentage of loans and receivables have increased to 0.37% at 31 December 2010 compared with 0.25% at 31 December 2009. Default and arrears rates remain sensitive to economic developments and are currently supported by the low interest rate environment and strong book growth with recent business yet to mature.
A number of initiatives aimed at supporting customers experiencing temporary financial difficulties remain in place. Forbearance activities include offering reduced or deferred payment terms on a temporary basis for a period of up to 12 months during which arrears continue to accrue on the account. Forbearance activities in the performing book amounted to £0.6 billion during 2010. It is Group policy not to initiate repossession proceedings for at least six months after arrears are evident. The number of properties repossessed in 2010 was 1,392 compared to 1,251 in 2009.
Citizens real estate Key points
Citizens total residential real estate portfolio totalled $38.2 billion at 31 December 2010 (2009 - $42.5 billion). The real estate portfolio comprises $9.7 billion (Core: $8.6 billion; Non-Core: $1.1 billion) of first lien residential mortgages and $28.5 billion (Core: $23.7 billion; Non-Core: $4.8 billion) of home equity loans and lines (first and second lien). Home Equity Core consists of 46% first lien position while Non-Core consists of 97% second lien position. The Core business comprises 84% of the portfolio and Non-Core comprising 16%, with the serviced by others (SBO) portfolio being the largest component at 75% of the Non-Core portfolio.
Citizens continue to focus primarily on the ‘footprint states’ of New England, Mid-Atlantic and Mid-West targeting low risk products and maintaining conservative risk policies. Loan acceptance criteria were tightened during 2009 to address deteriorating economic and market conditions. As at 31 December 2010, the portfolio consisted of $31.5 billion (82% of the total portfolio) in these footprint states.
The SBO portfolio is part of Non-Core and consists of purchased pools of home equity loans and lines (96% second lien) with current LTV (105%) and geographic profiles (73% outside of Citizens footprint) leading to an annualised charge-off rate of 10.6% in 2010. The SBO book has been closed to new purchases since the third quarter of 2007 and is in run-off, with exposure down from $5.5 billion at 31 December 2009 to $4.5 billion at 31 December 2010. The arrears rate of the SBO portfolio decreased from 3.1% at 31 December 2009 to 2.7% at 31 December 2010 due to more effective account servicing and collections, following a service conversion in 2009.
The current weighted average LTV of the real estate portfolio increased slightly from 74.5% at 31 December 2009 to 75.3% at 31 December 2010, driven by a down turn in home prices. The current weighted average LTV of the real estate portfolio excluding SBO is 70.0%.
The arrears rate decreased slightly from 1.5% at 31 December 2009 to 1.4% at 31 December 2010. Delinquency rates have stabilised in recent months for both residential mortgages and home equity loans and lines. Citizens’ participates in the US Government Home Affordable Modification Program (HAMP) alongside other bank sponsored initiatives. Under HAMP, any borrower requesting a modification must be first reviewed to see if they meet the criteria of this programme. If the borrower does not qualify for HAMP, then they are reviewed for internal modification programmes. The HAMP programme is available only for first lien loans to owner-occupied. All second lien home equity lines and loans are modified using internal programmes.
The cumulative effect of these arrangements has helped the Group’s customers. Modified loan balances were $566 million at 31 December 2010 (2009 - $235 million).
159RBS Group 2010
Business review
Risk and balance sheet management
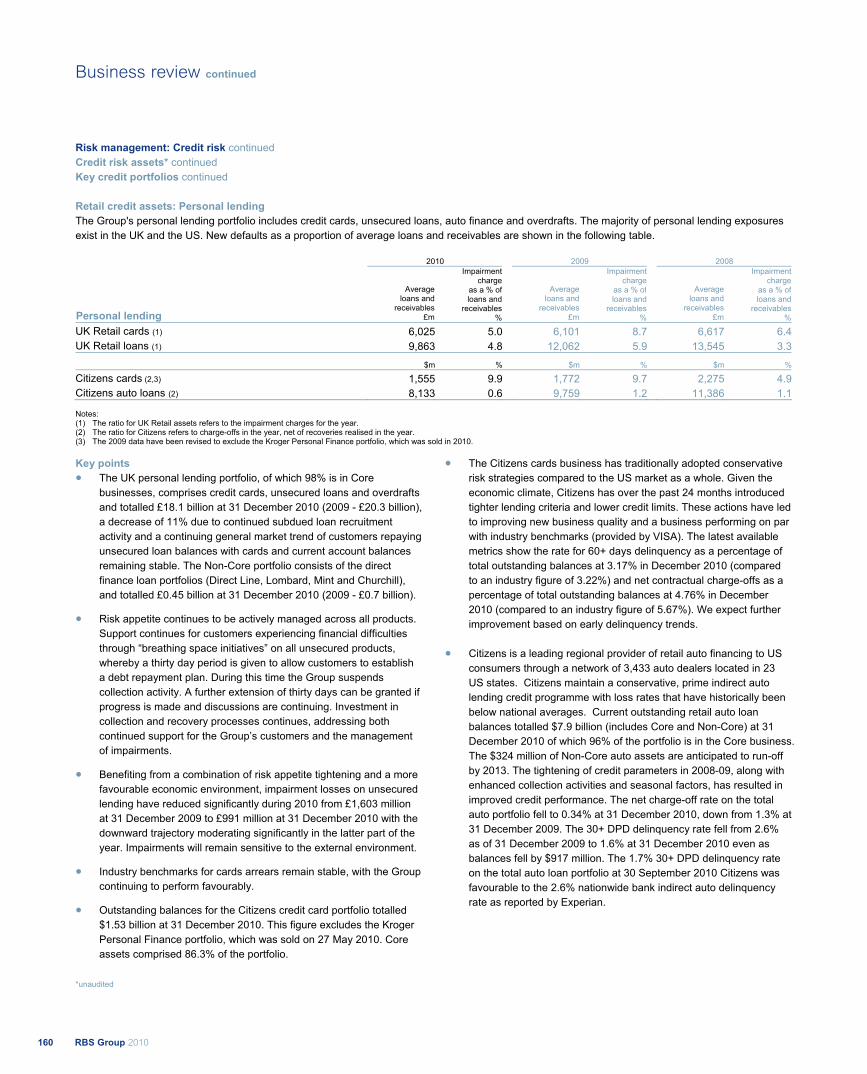
Risk management: Credit risk continued Credit risk assets* continued Key credit portfolios continued Retail credit assets: Personal lending The Group's personal lending portfolio includes credit cards, unsecured loans, auto finance and overdrafts. The majority of personal lending exposures exist in the UK and the US. New defaults as a proportion of average loans and receivables are shown in the following table.
2010 2009 2008
Personal lending
Average loans and
receivables£m
Impairmentcharge
as a % ofloans and
receivables%
Averageloans and
receivables£m
Impairment charge
as a % ofloans and
receivables%
Average loans and
receivables£m
Impairment charge
as a % ofloans and
receivables%
UK Retail cards (1) 6,025 5.0 6,101 8.7 6,617 6.4UK Retail loans (1) 9,863 4.8 12,062 5.9 13,545 3.3
$m % $m % $m %
Citizens cards (2,3) 1,555 9.9 1,772 9.7 2,275 4.9Citizens auto loans (2) 8,133 0.6 9,759 1.2 11,386 1.1
Notes: (1) The ratio for UK Retail assets refers to the impairment charges for the year. (2) The ratio for Citizens refers to charge-offs in the year, net of recoveries realised in the year. (3) The 2009 data have been revised to exclude the Kroger Personal Finance portfolio, which was sold in 2010.
Key points The UK personal lending portfolio, of which 98% is in Core businesses, comprises credit cards, unsecured loans and overdrafts and totalled £18.1 billion at 31 December 2010 (2009 - £20.3 billion), a decrease of 11% due to continued subdued loan recruitment activity and a continuing general market trend of customers repaying unsecured loan balances with cards and current account balances remaining stable. The Non-Core portfolio consists of the direct finance loan portfolios (Direct Line, Lombard, Mint and Churchill), and totalled £0.45 billion at 31 December 2010 (2009 - £0.7 billion).
Risk appetite continues to be actively managed across all products. Support continues for customers experiencing financial difficulties through “breathing space initiatives” on all unsecured products, whereby a thirty day period is given to allow customers to establish a debt repayment plan. During this time the Group suspends collection activity. A further extension of thirty days can be granted if progress is made and discussions are continuing. Investment in collection and recovery processes continues, addressing both continued support for the Group’s customers and the management of impairments.
Benefiting from a combination of risk appetite tightening and a more favourable economic environment, impairment losses on unsecured lending have reduced significantly during 2010 from £1,603 million at 31 December 2009 to £991 million at 31 December 2010 with the downward trajectory moderating significantly in the latter part of the year. Impairments will remain sensitive to the external environment.
Industry benchmarks for cards arrears remain stable, with the Group continuing to perform favourably.
Outstanding balances for the Citizens credit card portfolio totalled $1.53 billion at 31 December 2010. This figure excludes the Kroger Personal Finance portfolio, which was sold on 27 May 2010. Core assets comprised 86.3% of the portfolio.
The Citizens cards business has traditionally adopted conservative risk strategies compared to the US market as a whole. Given the economic climate, Citizens has over the past 24 months introduced tighter lending criteria and lower credit limits. These actions have led to improving new business quality and a business performing on par with industry benchmarks (provided by VISA). The latest available metrics show the rate for 60+ days delinquency as a percentage of total outstanding balances at 3.17% in December 2010 (compared to an industry figure of 3.22%) and net contractual charge-offs as a percentage of total outstanding balances at 4.76% in December 2010 (compared to an industry figure of 5.67%). We expect further improvement based on early delinquency trends.
Citizens is a leading regional provider of retail auto financing to US consumers through a network of 3,433 auto dealers located in 23 US states. Citizens maintain a conservative, prime indirect auto lending credit programme with loss rates that have historically been below national averages. Current outstanding retail auto loan balances totalled $7.9 billion (includes Core and Non-Core) at 31 December 2010 of which 96% of the portfolio is in the Core business. The $324 million of Non-Core auto assets are anticipated to run-off by 2013. The tightening of credit parameters in 2008-09, along with enhanced collection activities and seasonal factors, has resulted in improved credit performance. The net charge-off rate on the total auto portfolio fell to 0.34% at 31 December 2010, down from 1.3% at 31 December 2009. The 30+ DPD delinquency rate fell from 2.6% as of 31 December 2009 to 1.6% at 31 December 2010 even as balances fell by $917 million. The 1.7% 30+ DPD delinquency rate on the total auto loan portfolio at 30 September 2010 Citizens was favourable to the 2.6% nationwide bank indirect auto delinquency rate as reported by Experian.
*unaudited
RBS Group 2010160
Business review continued
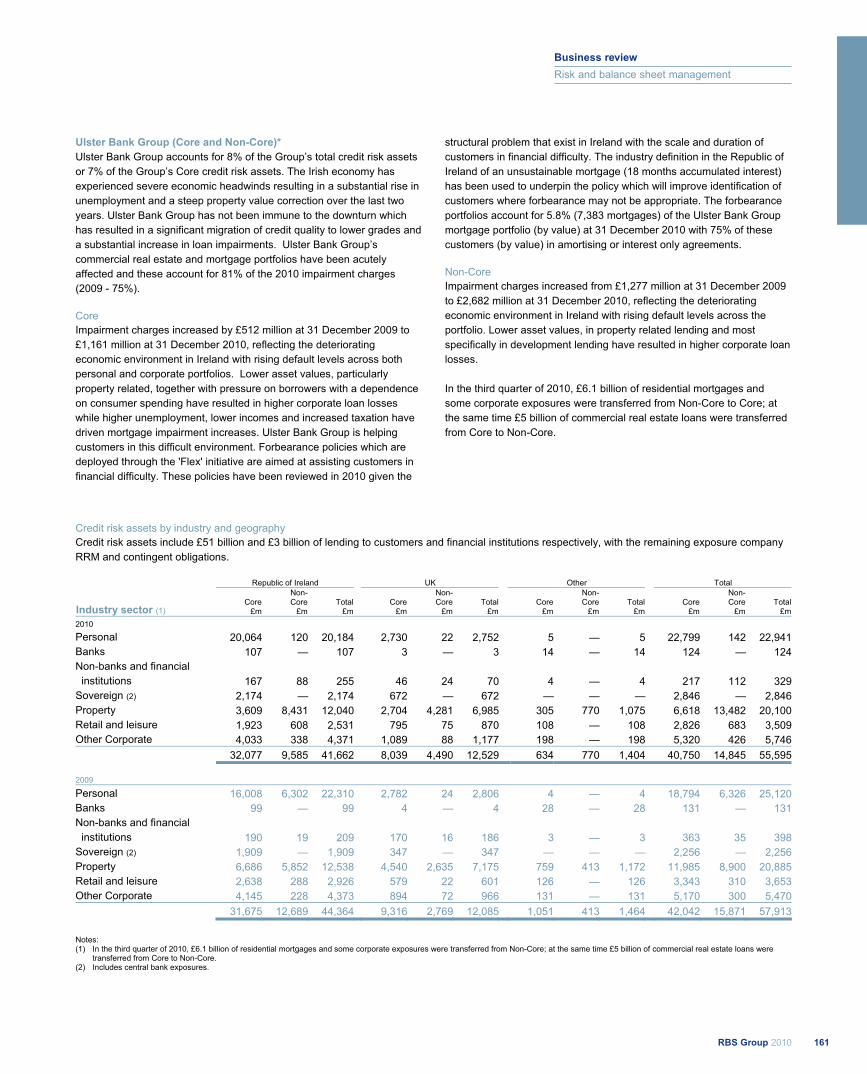
Ulster Bank Group (Core and Non-Core)* Ulster Bank Group accounts for 8% of the Group’s total credit risk assets or 7% of the Group’s Core credit risk assets. The Irish economy has experienced severe economic headwinds resulting in a substantial rise in unemployment and a steep property value correction over the last two years. Ulster Bank Group has not been immune to the downturn which has resulted in a significant migration of credit quality to lower grades and a substantial increase in loan impairments. Ulster Bank Group’s commercial real estate and mortgage portfolios have been acutely affected and these account for 81% of the 2010 impairment charges (2009 - 75%). Core Impairment charges increased by £512 million at 31 December 2009 to £1,161 million at 31 December 2010, reflecting the deteriorating economic environment in Ireland with rising default levels across both personal and corporate portfolios. Lower asset values, particularly property related, together with pressure on borrowers with a dependence on consumer spending have resulted in higher corporate loan losses while higher unemployment, lower incomes and increased taxation have driven mortgage impairment increases. Ulster Bank Group is helping customers in this difficult environment. Forbearance policies which are deployed through the 'Flex' initiative are aimed at assisting customers in financial difficulty. These policies have been reviewed in 2010 given the
structural problem that exist in Ireland with the scale and duration of customers in financial difficulty. The industry definition in the Republic of Ireland of an unsustainable mortgage (18 months accumulated interest) has been used to underpin the policy which will improve identification of customers where forbearance may not be appropriate. The forbearance portfolios account for 5.8% (7,383 mortgages) of the Ulster Bank Group mortgage portfolio (by value) at 31 December 2010 with 75% of these customers (by value) in amortising or interest only agreements. Non-Core Impairment charges increased from £1,277 million at 31 December 2009 to £2,682 million at 31 December 2010, reflecting the deteriorating economic environment in Ireland with rising default levels across the portfolio. Lower asset values, in property related lending and most specifically in development lending have resulted in higher corporate loan losses. In the third quarter of 2010, £6.1 billion of residential mortgages and some corporate exposures were transferred from Non-Core to Core; at the same time £5 billion of commercial real estate loans were transferred from Core to Non-Core.
Credit risk assets by industry and geography Credit risk assets include £51 billion and £3 billion of lending to customers and financial institutions respectively, with the remaining exposure company RRM and contingent obligations.
Republic of Ireland UK Other Total
CoreNon-Core Total Core
Non-Core Total Core
Non-Core Total Core
Non-Core Total
Industry sector (1) £m £m £m £m £m £m £m £m £m £m £m £m2010
Personal 20,064 120 20,184 2,730 22 2,752 5 — 5 22,799 142 22,941Banks 107 — 107 3 — 3 14 — 14 124 — 124Non-banks and financial institutions 167 88 255 46 24 70 4 — 4 217 112 329Sovereign (2) 2,174 — 2,174 672 — 672 — — — 2,846 — 2,846Property 3,609 8,431 12,040 2,704 4,281 6,985 305 770 1,075 6,618 13,482 20,100Retail and leisure 1,923 608 2,531 795 75 870 108 — 108 2,826 683 3,509Other Corporate 4,033 338 4,371 1,089 88 1,177 198 — 198 5,320 426 5,746 32,077 9,585 41,662 8,039 4,490 12,529 634 770 1,404 40,750 14,845 55,595
2009
Personal 16,008 6,302 22,310 2,782 24 2,806 4 — 4 18,794 6,326 25,120Banks 99 — 99 4 — 4 28 — 28 131 — 131Non-banks and financial institutions 190 19 209 170 16 186 3 — 3 363 35 398Sovereign (2) 1,909 — 1,909 347 — 347 — — — 2,256 — 2,256Property 6,686 5,852 12,538 4,540 2,635 7,175 759 413 1,172 11,985 8,900 20,885Retail and leisure 2,638 288 2,926 579 22 601 126 — 126 3,343 310 3,653Other Corporate 4,145 228 4,373 894 72 966 131 — 131 5,170 300 5,470 31,675 12,689 44,364 9,316 2,769 12,085 1,051 413 1,464 42,042 15,871 57,913
Notes: (1) In the third quarter of 2010, £6.1 billion of residential mortgages and some corporate exposures were transferred from Non-Core; at the same time £5 billion of commercial real estate loans were
transferred from Core to Non-Core. (2) Includes central bank exposures.
161RBS Group 2010
Business review
Risk and balance sheet management
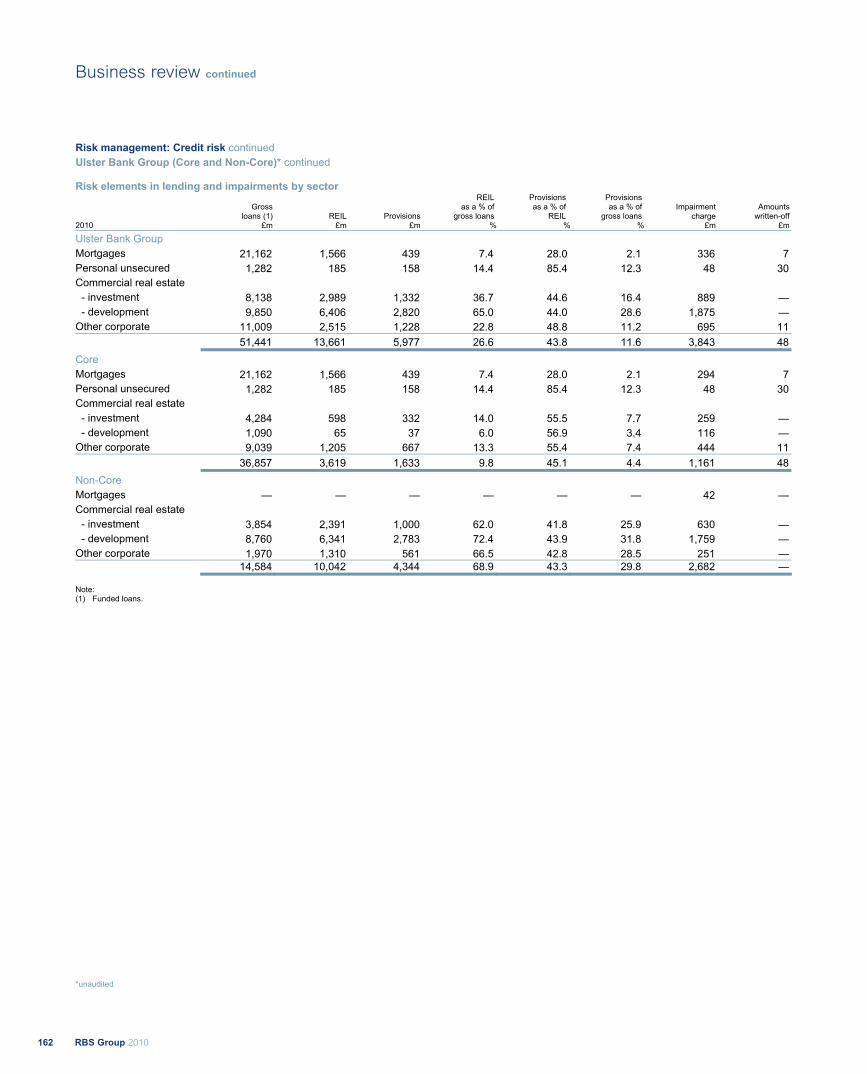
Risk management: Credit risk continued Ulster Bank Group (Core and Non-Core)* continued
Risk elements in lending and impairments by sector
Gross loans (1) REIL Provisions
REIL as a % of
gross loans
Provisions as a % of
REIL
Provisions as a % of
gross loans Impairment
charge Amounts
written-off 2010 £m £m £m % % % £m £m
Ulster Bank Group Mortgages 21,162 1,566 439 7.4 28.0 2.1 336 7 Personal unsecured 1,282 185 158 14.4 85.4 12.3 48 30 Commercial real estate - investment 8,138 2,989 1,332 36.7 44.6 16.4 889 — - development 9,850 6,406 2,820 65.0 44.0 28.6 1,875 — Other corporate 11,009 2,515 1,228 22.8 48.8 11.2 695 11 51,441 13,661 5,977 26.6 43.8 11.6 3,843 48 Core Mortgages 21,162 1,566 439 7.4 28.0 2.1 294 7 Personal unsecured 1,282 185 158 14.4 85.4 12.3 48 30 Commercial real estate - investment 4,284 598 332 14.0 55.5 7.7 259 — - development 1,090 65 37 6.0 56.9 3.4 116 — Other corporate 9,039 1,205 667 13.3 55.4 7.4 444 11 36,857 3,619 1,633 9.8 45.1 4.4 1,161 48 Non-Core Mortgages — — — — — — 42 — Commercial real estate - investment 3,854 2,391 1,000 62.0 41.8 25.9 630 — - development 8,760 6,341 2,783 72.4 43.9 31.8 1,759 — Other corporate 1,970 1,310 561 66.5 42.8 28.5 251 —
14,584 10,042 4,344 68.9 43.3 29.8 2,682 —
Note: (1) Funded loans.
*unaudited
RBS Group 2010162
Business review continued
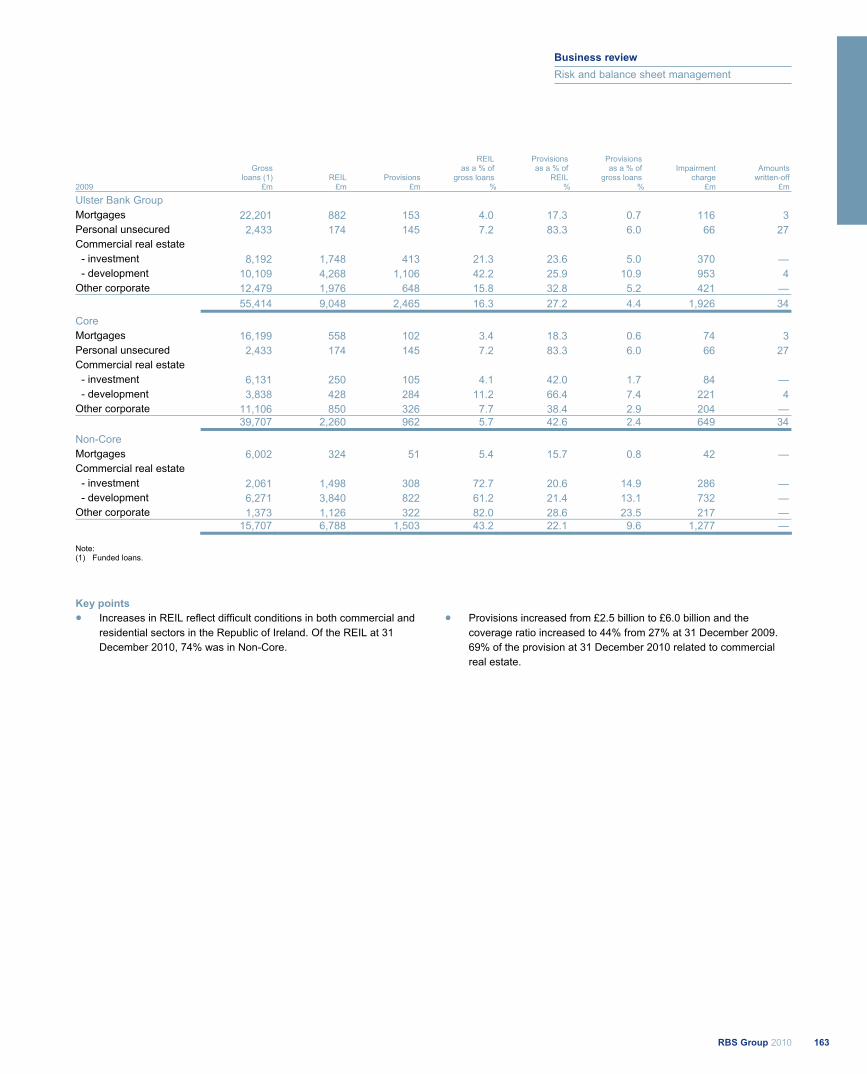
Gross loans (1) REIL Provisions
REIL as a % of
gross loans
Provisions as a % of
REIL
Provisions as a % of
gross loans Impairment
charge Amounts
written-off 2009 £m £m £m % % % £m £m
Ulster Bank Group Mortgages 22,201 882 153 4.0 17.3 0.7 116 3 Personal unsecured 2,433 174 145 7.2 83.3 6.0 66 27 Commercial real estate - investment 8,192 1,748 413 21.3 23.6 5.0 370 — - development 10,109 4,268 1,106 42.2 25.9 10.9 953 4 Other corporate 12,479 1,976 648 15.8 32.8 5.2 421 — 55,414 9,048 2,465 16.3 27.2 4.4 1,926 34 Core Mortgages 16,199 558 102 3.4 18.3 0.6 74 3 Personal unsecured 2,433 174 145 7.2 83.3 6.0 66 27 Commercial real estate - investment 6,131 250 105 4.1 42.0 1.7 84 — - development 3,838 428 284 11.2 66.4 7.4 221 4 Other corporate 11,106 850 326 7.7 38.4 2.9 204 —
39,707 2,260 962 5.7 42.6 2.4 649 34 Non-Core Mortgages 6,002 324 51 5.4 15.7 0.8 42 — Commercial real estate - investment 2,061 1,498 308 72.7 20.6 14.9 286 — - development 6,271 3,840 822 61.2 21.4 13.1 732 — Other corporate 1,373 1,126 322 82.0 28.6 23.5 217 —
15,707 6,788 1,503 43.2 22.1 9.6 1,277 —
Note: (1) Funded loans.
Key points Increases in REIL reflect difficult conditions in both commercial and residential sectors in the Republic of Ireland. Of the REIL at 31 December 2010, 74% was in Non-Core.
Provisions increased from £2.5 billion to £6.0 billion and the coverage ratio increased to 44% from 27% at 31 December 2009. 69% of the provision at 31 December 2010 related to commercial real estate.
163RBS Group 2010
Business review
Risk and balance sheet management
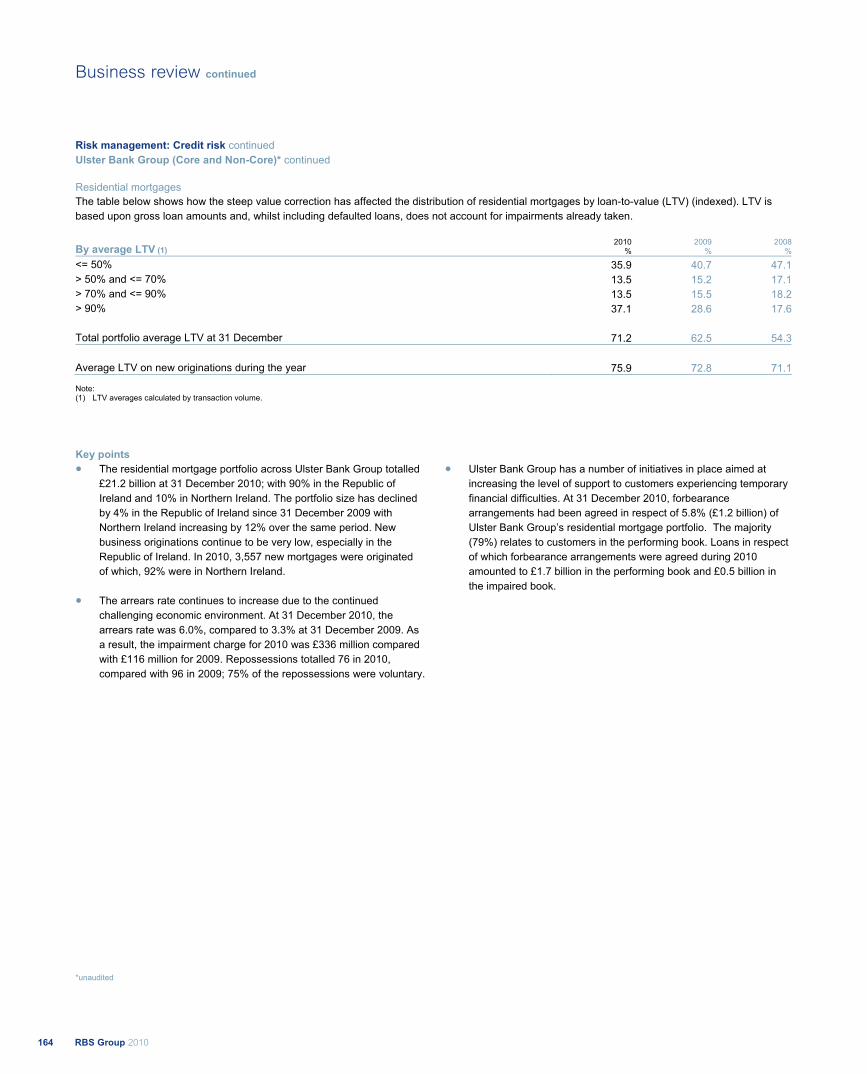
Risk management: Credit risk continued Ulster Bank Group (Core and Non-Core)* continued Residential mortgages The table below shows how the steep value correction has affected the distribution of residential mortgages by loan-to-value (LTV) (indexed). LTV is based upon gross loan amounts and, whilst including defaulted loans, does not account for impairments already taken.
By average LTV (1) 2010
%2009
%2008
%
<= 50% 35.9 40.7 47.1> 50% and <= 70% 13.5 15.2 17.1> 70% and <= 90% 13.5 15.5 18.2> 90% 37.1 28.6 17.6 Total portfolio average LTV at 31 December 71.2 62.5 54.3 Average LTV on new originations during the year 75.9 72.8 71.1
Note: (1) LTV averages calculated by transaction volume.
Key points The residential mortgage portfolio across Ulster Bank Group totalled £21.2 billion at 31 December 2010; with 90% in the Republic of Ireland and 10% in Northern Ireland. The portfolio size has declined by 4% in the Republic of Ireland since 31 December 2009 with Northern Ireland increasing by 12% over the same period. New business originations continue to be very low, especially in the Republic of Ireland. In 2010, 3,557 new mortgages were originated of which, 92% were in Northern Ireland.
The arrears rate continues to increase due to the continued challenging economic environment. At 31 December 2010, the arrears rate was 6.0%, compared to 3.3% at 31 December 2009. As a result, the impairment charge for 2010 was £336 million compared with £116 million for 2009. Repossessions totalled 76 in 2010, compared with 96 in 2009; 75% of the repossessions were voluntary.
Ulster Bank Group has a number of initiatives in place aimed at increasing the level of support to customers experiencing temporary financial difficulties. At 31 December 2010, forbearance arrangements had been agreed in respect of 5.8% (£1.2 billion) of Ulster Bank Group’s residential mortgage portfolio. The majority (79%) relates to customers in the performing book. Loans in respect of which forbearance arrangements were agreed during 2010 amounted to £1.7 billion in the performing book and £0.5 billion in the impaired book.
*unaudited
RBS Group 2010164
Business review continued
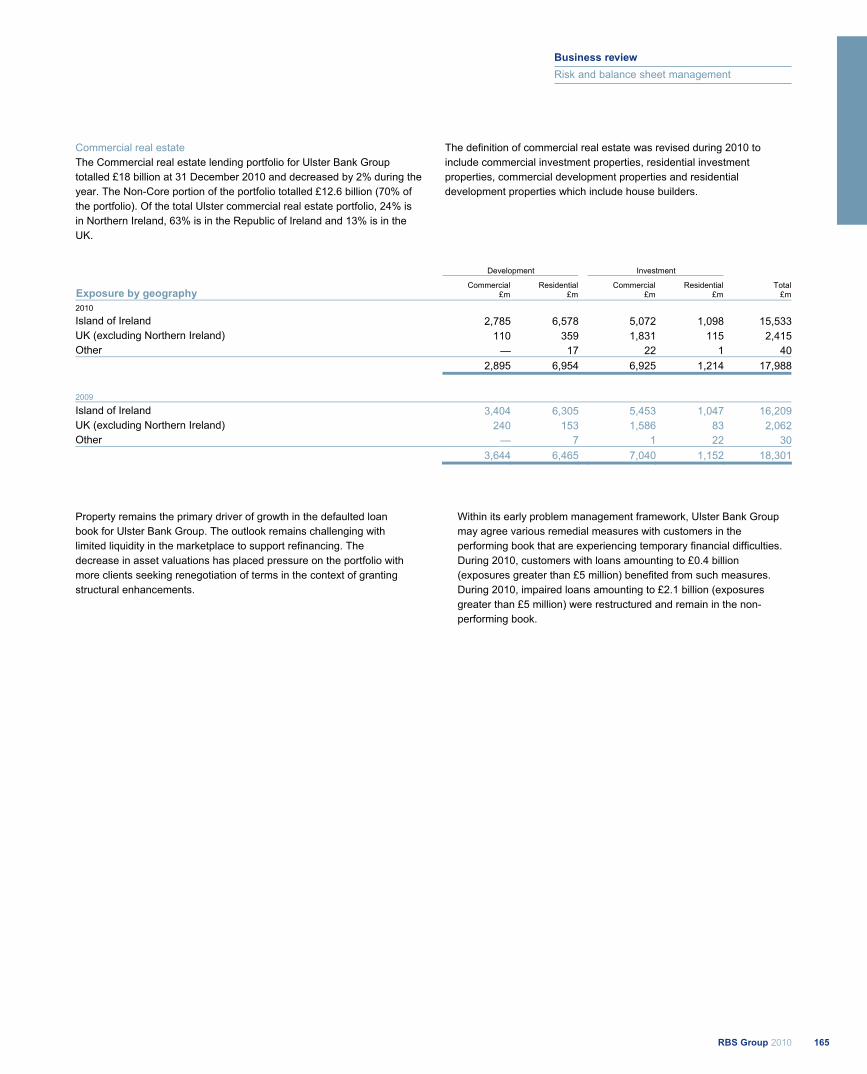
Commercial real estate The Commercial real estate lending portfolio for Ulster Bank Group totalled £18 billion at 31 December 2010 and decreased by 2% during the year. The Non-Core portion of the portfolio totalled £12.6 billion (70% of the portfolio). Of the total Ulster commercial real estate portfolio, 24% is in Northern Ireland, 63% is in the Republic of Ireland and 13% is in the UK.
The definition of commercial real estate was revised during 2010 to include commercial investment properties, residential investment properties, commercial development properties and residential development properties which include house builders.
Development Investment
Exposure by geography Commercial
£mResidential
£mCommercial
£mResidential
£mTotal
£m
2010
Island of Ireland 2,785 6,578 5,072 1,098 15,533UK (excluding Northern Ireland) 110 359 1,831 115 2,415Other — 17 22 1 40 2,895 6,954 6,925 1,214 17,988
2009
Island of Ireland 3,404 6,305 5,453 1,047 16,209UK (excluding Northern Ireland) 240 153 1,586 83 2,062Other — 7 1 22 30 3,644 6,465 7,040 1,152 18,301
Property remains the primary driver of growth in the defaulted loan book for Ulster Bank Group. The outlook remains challenging with limited liquidity in the marketplace to support refinancing. The decrease in asset valuations has placed pressure on the portfolio with more clients seeking renegotiation of terms in the context of granting structural enhancements.
Within its early problem management framework, Ulster Bank Group may agree various remedial measures with customers in the performing book that are experiencing temporary financial difficulties. During 2010, customers with loans amounting to £0.4 billion (exposures greater than £5 million) benefited from such measures. During 2010, impaired loans amounting to £2.1 billion (exposures greater than £5 million) were restructured and remain in the non-performing book.
165RBS Group 2010
Business review
Risk and balance sheet management
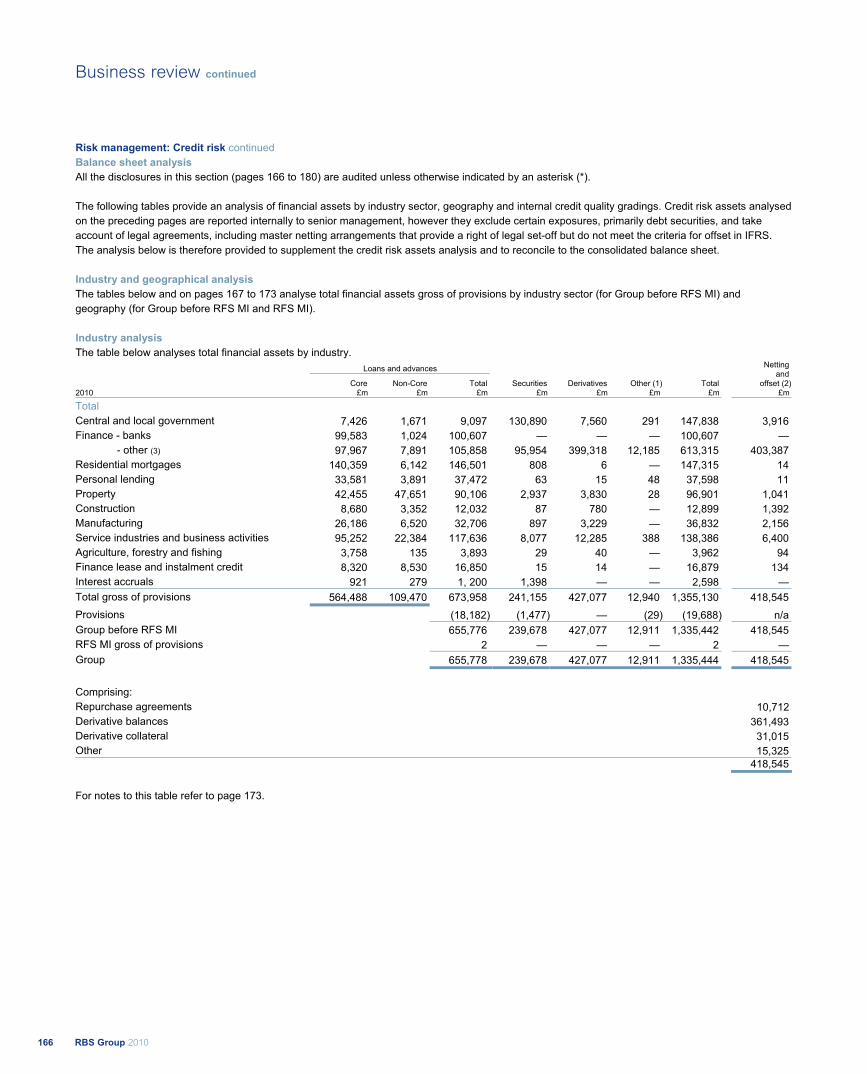
Risk management: Credit risk continued Balance sheet analysis All the disclosures in this section (pages 166 to 180) are audited unless otherwise indicated by an asterisk (*). The following tables provide an analysis of financial assets by industry sector, geography and internal credit quality gradings. Credit risk assets analysed on the preceding pages are reported internally to senior management, however they exclude certain exposures, primarily debt securities, and take account of legal agreements, including master netting arrangements that provide a right of legal set-off but do not meet the criteria for offset in IFRS. The analysis below is therefore provided to supplement the credit risk assets analysis and to reconcile to the consolidated balance sheet. Industry and geographical analysis The tables below and on pages 167 to 173 analyse total financial assets gross of provisions by industry sector (for Group before RFS MI) and geography (for Group before RFS MI and RFS MI). Industry analysis The table below analyses total financial assets by industry.
Loans and advances
Core Non-Core Total Securities Derivatives Other (1) Total
Netting and
offset (2)2010 £m £m £m £m £m £m £m £m
Total Central and local government 7,426 1,671 9,097 130,890 7,560 291 147,838 3,916 Finance - banks 99,583 1,024 100,607 — — — 100,607 — - other (3) 97,967 7,891 105,858 95,954 399,318 12,185 613,315 403,387 Residential mortgages 140,359 6,142 146,501 808 6 — 147,315 14 Personal lending 33,581 3,891 37,472 63 15 48 37,598 11 Property 42,455 47,651 90,106 2,937 3,830 28 96,901 1,041 Construction 8,680 3,352 12,032 87 780 — 12,899 1,392 Manufacturing 26,186 6,520 32,706 897 3,229 — 36,832 2,156 Service industries and business activities 95,252 22,384 117,636 8,077 12,285 388 138,386 6,400 Agriculture, forestry and fishing 3,758 135 3,893 29 40 — 3,962 94 Finance lease and instalment credit 8,320 8,530 16,850 15 14 — 16,879 134 Interest accruals 921 279 1, 200 1,398 — — 2,598 — Total gross of provisions 564,488 109,470 673,958 241,155 427,077 12,940 1,355,130 418,545 Provisions (18,182) (1,477) — (29) (19,688) n/a Group before RFS MI 655,776 239,678 427,077 12,911 1,335,442 418,545 RFS MI gross of provisions 2 — — — 2 —Group 655,778 239,678 427,077 12,911 1,335,444 418,545
Comprising: Repurchase agreements 10,712 Derivative balances 361,493 Derivative collateral 31,015 Other 15,325 418,545
For notes to this table refer to page 173.
RBS Group 2010166
Business review continued
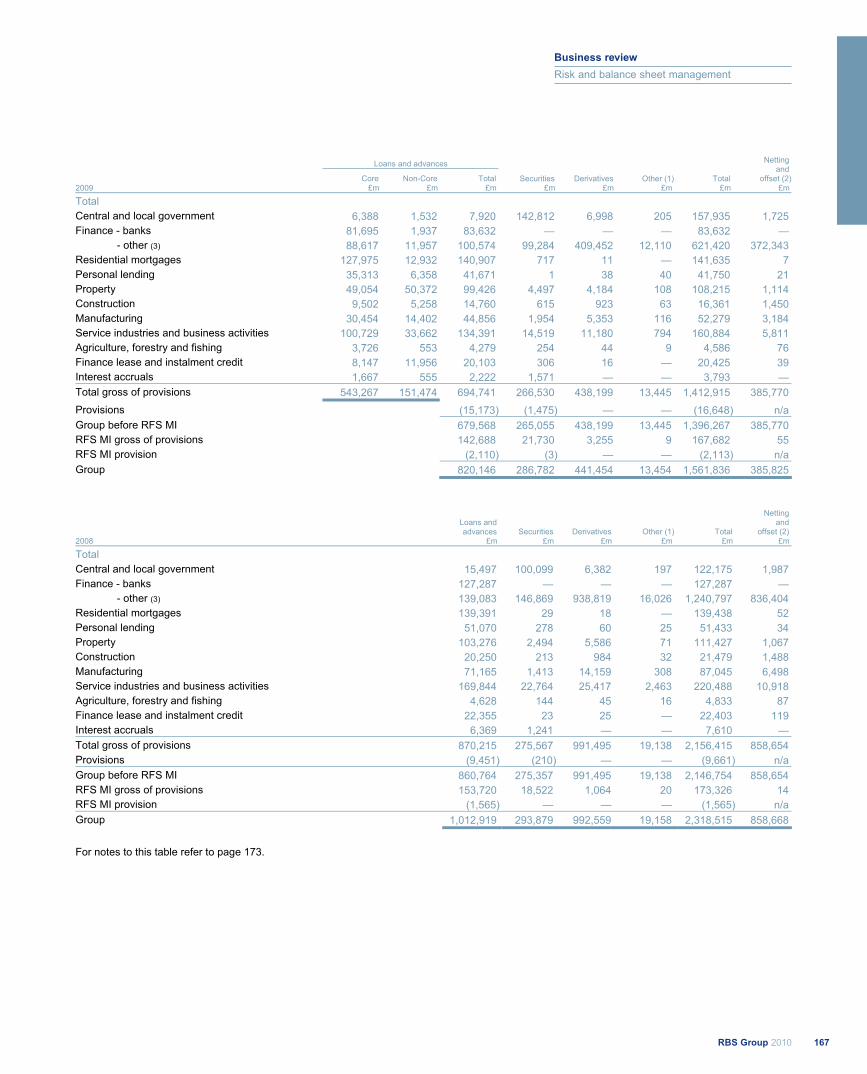
Loans and advances
Core Non-Core Total Securities Derivatives Other (1) Total
Netting and
offset (2)2009 £m £m £m £m £m £m £m £m
Total Central and local government 6,388 1,532 7,920 142,812 6,998 205 157,935 1,725 Finance - banks 81,695 1,937 83,632 — — — 83,632 — - other (3) 88,617 11,957 100,574 99,284 409,452 12,110 621,420 372,343 Residential mortgages 127,975 12,932 140,907 717 11 — 141,635 7 Personal lending 35,313 6,358 41,671 1 38 40 41,750 21 Property 49,054 50,372 99,426 4,497 4,184 108 108,215 1,114 Construction 9,502 5,258 14,760 615 923 63 16,361 1,450 Manufacturing 30,454 14,402 44,856 1,954 5,353 116 52,279 3,184 Service industries and business activities 100,729 33,662 134,391 14,519 11,180 794 160,884 5,811 Agriculture, forestry and fishing 3,726 553 4,279 254 44 9 4,586 76 Finance lease and instalment credit 8,147 11,956 20,103 306 16 — 20,425 39 Interest accruals 1,667 555 2,222 1,571 — — 3,793 — Total gross of provisions 543,267 151,474 694,741 266,530 438,199 13,445 1,412,915 385,770 Provisions (15,173) (1,475) — — (16,648) n/a Group before RFS MI 679,568 265,055 438,199 13,445 1,396,267 385,770 RFS MI gross of provisions 142,688 21,730 3,255 9 167,682 55 RFS MI provision (2,110) (3) — — (2,113) n/a Group 820,146 286,782 441,454 13,454 1,561,836 385,825
Loans and advances Securities Derivatives Other (1) Total
Netting and
offset (2) 2008 £m £m £m £m £m £m
Total Central and local government 15,497 100,099 6,382 197 122,175 1,987 Finance - banks 127,287 — — — 127,287 — - other (3) 139,083 146,869 938,819 16,026 1,240,797 836,404 Residential mortgages 139,391 29 18 — 139,438 52 Personal lending 51,070 278 60 25 51,433 34 Property 103,276 2,494 5,586 71 111,427 1,067 Construction 20,250 213 984 32 21,479 1,488 Manufacturing 71,165 1,413 14,159 308 87,045 6,498 Service industries and business activities 169,844 22,764 25,417 2,463 220,488 10,918 Agriculture, forestry and fishing 4,628 144 45 16 4,833 87 Finance lease and instalment credit 22,355 23 25 — 22,403 119 Interest accruals 6,369 1,241 — — 7,610 — Total gross of provisions 870,215 275,567 991,495 19,138 2,156,415 858,654 Provisions (9,451) (210) — — (9,661) n/a Group before RFS MI 860,764 275,357 991,495 19,138 2,146,754 858,654 RFS MI gross of provisions 153,720 18,522 1,064 20 173,326 14 RFS MI provision (1,565) — — — (1,565) n/a Group 1,012,919 293,879 992,559 19,158 2,318,515 858,668
For notes to this table refer to page 173.
167RBS Group 2010
Business review
Risk and balance sheet management
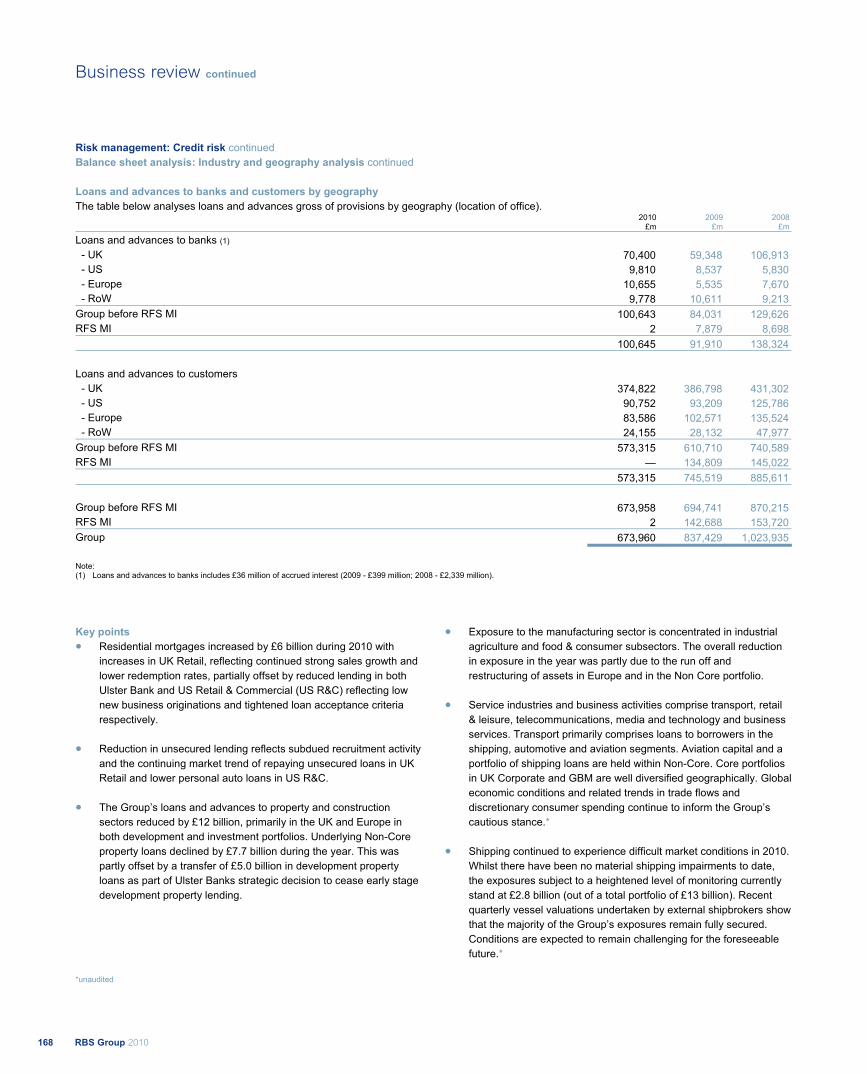
Risk management: Credit risk continued Balance sheet analysis: Industry and geography analysis continued
Loans and advances to banks and customers by geography The table below analyses loans and advances gross of provisions by geography (location of office). 2010 2009 2008 £m £m £m
Loans and advances to banks (1) - UK 70,400 59,348 106,913
- US 9,810 8,537 5,830 - Europe 10,655 5,535 7,670 - RoW 9,778 10,611 9,213 Group before RFS MI 100,643 84,031 129,626 RFS MI 2 7,879 8,698 100,645 91,910 138,324
Loans and advances to customers - UK 374,822 386,798 431,302 - US 90,752 93,209 125,786 - Europe 83,586 102,571 135,524 - RoW 24,155 28,132 47,977 Group before RFS MI 573,315 610,710 740,589 RFS MI — 134,809 145,022 573,315 745,519 885,611
Group before RFS MI 673,958 694,741 870,215 RFS MI 2 142,688 153,720 Group 673,960 837,429 1,023,935
Note: (1) Loans and advances to banks includes £36 million of accrued interest (2009 - £399 million; 2008 - £2,339 million).
Key points Residential mortgages increased by £6 billion during 2010 with increases in UK Retail, reflecting continued strong sales growth and lower redemption rates, partially offset by reduced lending in both Ulster Bank and US Retail & Commercial (US R&C) reflecting low new business originations and tightened loan acceptance criteria respectively.
Reduction in unsecured lending reflects subdued recruitment activity and the continuing market trend of repaying unsecured loans in UK Retail and lower personal auto loans in US R&C.
The Group’s loans and advances to property and construction sectors reduced by £12 billion, primarily in the UK and Europe in both development and investment portfolios. Underlying Non-Core property loans declined by £7.7 billion during the year. This was partly offset by a transfer of £5.0 billion in development property loans as part of Ulster Banks strategic decision to cease early stage development property lending.
Exposure to the manufacturing sector is concentrated in industrial agriculture and food & consumer subsectors. The overall reduction in exposure in the year was partly due to the run off and restructuring of assets in Europe and in the Non Core portfolio.
Service industries and business activities comprise transport, retail & leisure, telecommunications, media and technology and business services. Transport primarily comprises loans to borrowers in the shipping, automotive and aviation segments. Aviation capital and a portfolio of shipping loans are held within Non-Core. Core portfolios in UK Corporate and GBM are well diversified geographically. Global economic conditions and related trends in trade flows and discretionary consumer spending continue to inform the Group’s cautious stance.*
Shipping continued to experience difficult market conditions in 2010. Whilst there have been no material shipping impairments to date, the exposures subject to a heightened level of monitoring currently stand at £2.8 billion (out of a total portfolio of £13 billion). Recent quarterly vessel valuations undertaken by external shipbrokers show that the majority of the Group’s exposures remain fully secured. Conditions are expected to remain challenging for the foreseeable future.*
*unaudited
RBS Group 2010168
Business review continued
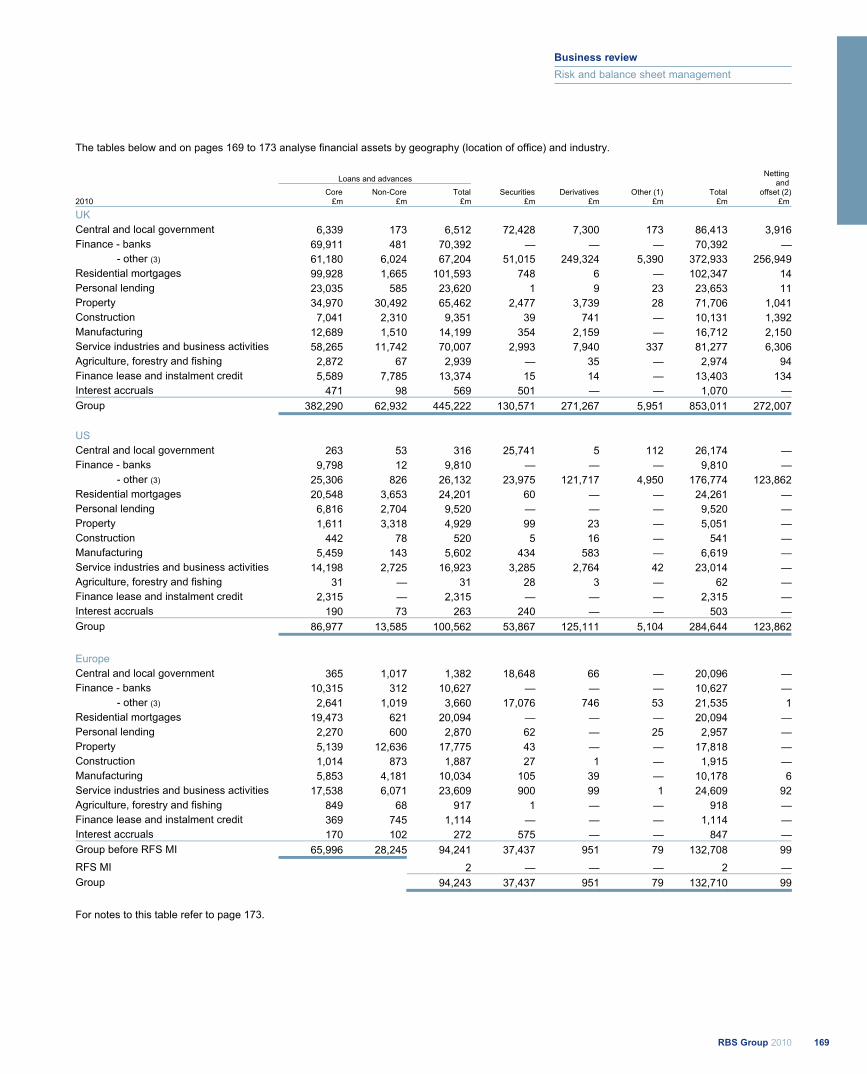
The tables below and on pages 169 to 173 analyse financial assets by geography (location of office) and industry.
Loans and advances Core Non-Core Total Securities Derivatives Other (1) Total
Netting and
offset (2)2010 £m £m £m £m £m £m £m £m
UK Central and local government 6,339 173 6,512 72,428 7,300 173 86,413 3,916Finance - banks 69,911 481 70,392 — — — 70,392 — - other (3) 61,180 6,024 67,204 51,015 249,324 5,390 372,933 256,949Residential mortgages 99,928 1,665 101,593 748 6 — 102,347 14Personal lending 23,035 585 23,620 1 9 23 23,653 11Property 34,970 30,492 65,462 2,477 3,739 28 71,706 1,041Construction 7,041 2,310 9,351 39 741 — 10,131 1,392Manufacturing 12,689 1,510 14,199 354 2,159 — 16,712 2,150Service industries and business activities 58,265 11,742 70,007 2,993 7,940 337 81,277 6,306Agriculture, forestry and fishing 2,872 67 2,939 — 35 — 2,974 94Finance lease and instalment credit 5,589 7,785 13,374 15 14 — 13,403 134Interest accruals 471 98 569 501 — — 1,070 —Group 382,290 62,932 445,222 130,571 271,267 5,951 853,011 272,007
US Central and local government 263 53 316 25,741 5 112 26,174 —Finance - banks 9,798 12 9,810 — — — 9,810 — - other (3) 25,306 826 26,132 23,975 121,717 4,950 176,774 123,862Residential mortgages 20,548 3,653 24,201 60 — — 24,261 —Personal lending 6,816 2,704 9,520 — — — 9,520 —Property 1,611 3,318 4,929 99 23 — 5,051 —Construction 442 78 520 5 16 — 541 —Manufacturing 5,459 143 5,602 434 583 — 6,619 —Service industries and business activities 14,198 2,725 16,923 3,285 2,764 42 23,014 —Agriculture, forestry and fishing 31 — 31 28 3 — 62 —Finance lease and instalment credit 2,315 — 2,315 — — — 2,315 —Interest accruals 190 73 263 240 — — 503 —Group 86,977 13,585 100,562 53,867 125,111 5,104 284,644 123,862
EuropeCentral and local government 365 1,017 1,382 18,648 66 — 20,096 —Finance - banks 10,315 312 10,627 — — — 10,627 — - other (3) 2,641 1,019 3,660 17,076 746 53 21,535 1Residential mortgages 19,473 621 20,094 — — — 20,094 —Personal lending 2,270 600 2,870 62 — 25 2,957 —Property 5,139 12,636 17,775 43 — — 17,818 —Construction 1,014 873 1,887 27 1 — 1,915 —Manufacturing 5,853 4,181 10,034 105 39 — 10,178 6Service industries and business activities 17,538 6,071 23,609 900 99 1 24,609 92Agriculture, forestry and fishing 849 68 917 1 — — 918 —Finance lease and instalment credit 369 745 1,114 — — — 1,114 —Interest accruals 170 102 272 575 — — 847 —Group before RFS MI 65,996 28,245 94,241 37,437 951 79 132,708 99RFS MI 2 — — — 2 —Group 94,243 37,437 951 79 132,710 99
For notes to this table refer to page 173.
169RBS Group 2010
Business review
Risk and balance sheet management
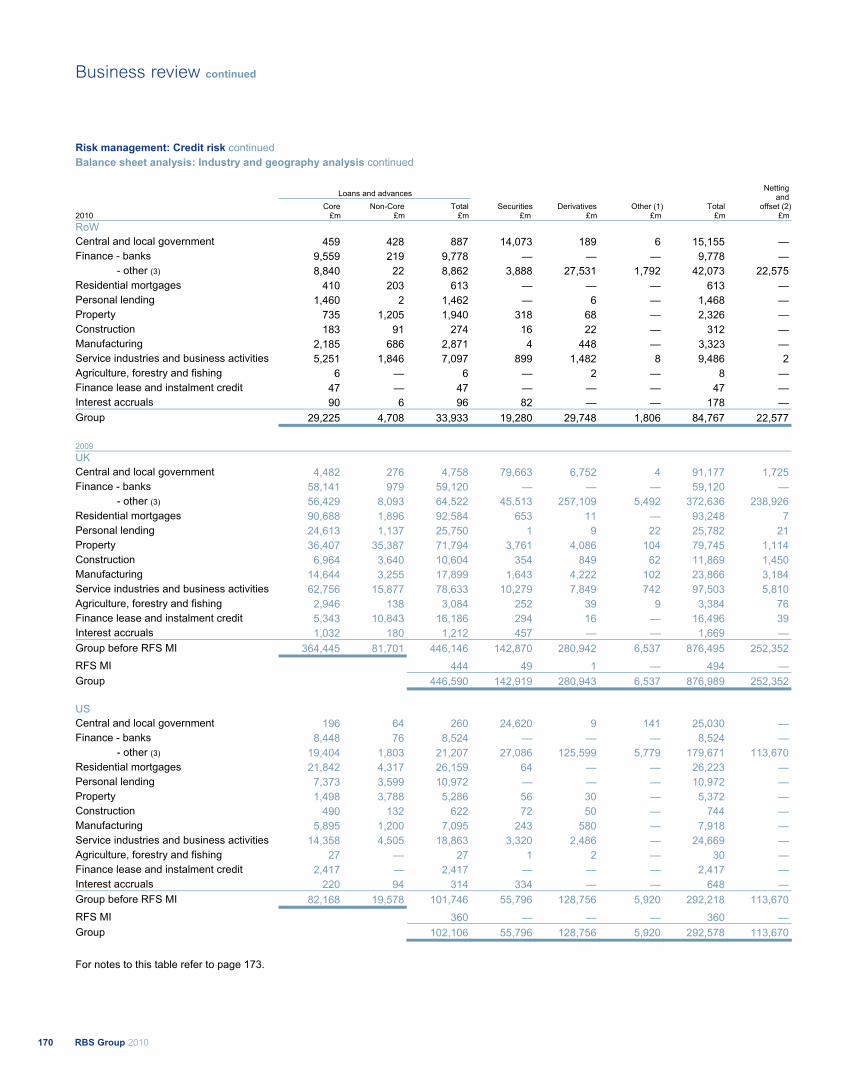
Risk management: Credit risk continued Balance sheet analysis: Industry and geography analysis continued
Loans and advances Core Non-Core Total Securities Derivatives Other (1) Total
Netting and
offset (2)2010 £m £m £m £m £m £m £m £m RoW Central and local government 459 428 887 14,073 189 6 15,155 — Finance - banks 9,559 219 9,778 — — — 9,778 — - other (3) 8,840 22 8,862 3,888 27,531 1,792 42,073 22,575 Residential mortgages 410 203 613 — — — 613 — Personal lending 1,460 2 1,462 — 6 — 1,468 — Property 735 1,205 1,940 318 68 — 2,326 — Construction 183 91 274 16 22 — 312 — Manufacturing 2,185 686 2,871 4 448 — 3,323 —Service industries and business activities 5,251 1,846 7,097 899 1,482 8 9,486 2 Agriculture, forestry and fishing 6 — 6 — 2 — 8 —Finance lease and instalment credit 47 — 47 — — — 47 — Interest accruals 90 6 96 82 — — 178 — Group 29,225 4,708 33,933 19,280 29,748 1,806 84,767 22,577
2009 UK Central and local government 4,482 276 4,758 79,663 6,752 4 91,177 1,725 Finance - banks 58,141 979 59,120 — — — 59,120 — - other (3) 56,429 8,093 64,522 45,513 257,109 5,492 372,636 238,926 Residential mortgages 90,688 1,896 92,584 653 11 — 93,248 7 Personal lending 24,613 1,137 25,750 1 9 22 25,782 21 Property 36,407 35,387 71,794 3,761 4,086 104 79,745 1,114 Construction 6,964 3,640 10,604 354 849 62 11,869 1,450 Manufacturing 14,644 3,255 17,899 1,643 4,222 102 23,866 3,184 Service industries and business activities 62,756 15,877 78,633 10,279 7,849 742 97,503 5,810 Agriculture, forestry and fishing 2,946 138 3,084 252 39 9 3,384 76 Finance lease and instalment credit 5,343 10,843 16,186 294 16 — 16,496 39 Interest accruals 1,032 180 1,212 457 — — 1,669 — Group before RFS MI 364,445 81,701 446,146 142,870 280,942 6,537 876,495 252,352 RFS MI 444 49 1 — 494 — Group 446,590 142,919 280,943 6,537 876,989 252,352
US Central and local government 196 64 260 24,620 9 141 25,030 — Finance - banks 8,448 76 8,524 — — — 8,524 — - other (3) 19,404 1,803 21,207 27,086 125,599 5,779 179,671 113,670 Residential mortgages 21,842 4,317 26,159 64 — — 26,223 — Personal lending 7,373 3,599 10,972 — — — 10,972 — Property 1,498 3,788 5,286 56 30 — 5,372 — Construction 490 132 622 72 50 — 744 — Manufacturing 5,895 1,200 7,095 243 580 — 7,918 — Service industries and business activities 14,358 4,505 18,863 3,320 2,486 — 24,669 — Agriculture, forestry and fishing 27 — 27 1 2 — 30 — Finance lease and instalment credit 2,417 — 2,417 — — — 2,417 — Interest accruals 220 94 314 334 — — 648 — Group before RFS MI 82,168 19,578 101,746 55,796 128,756 5,920 292,218 113,670 RFS MI 360 — — — 360 — Group 102,106 55,796 128,756 5,920 292,578 113,670
For notes to this table refer to page 173.
RBS Group 2010170
Business review continued
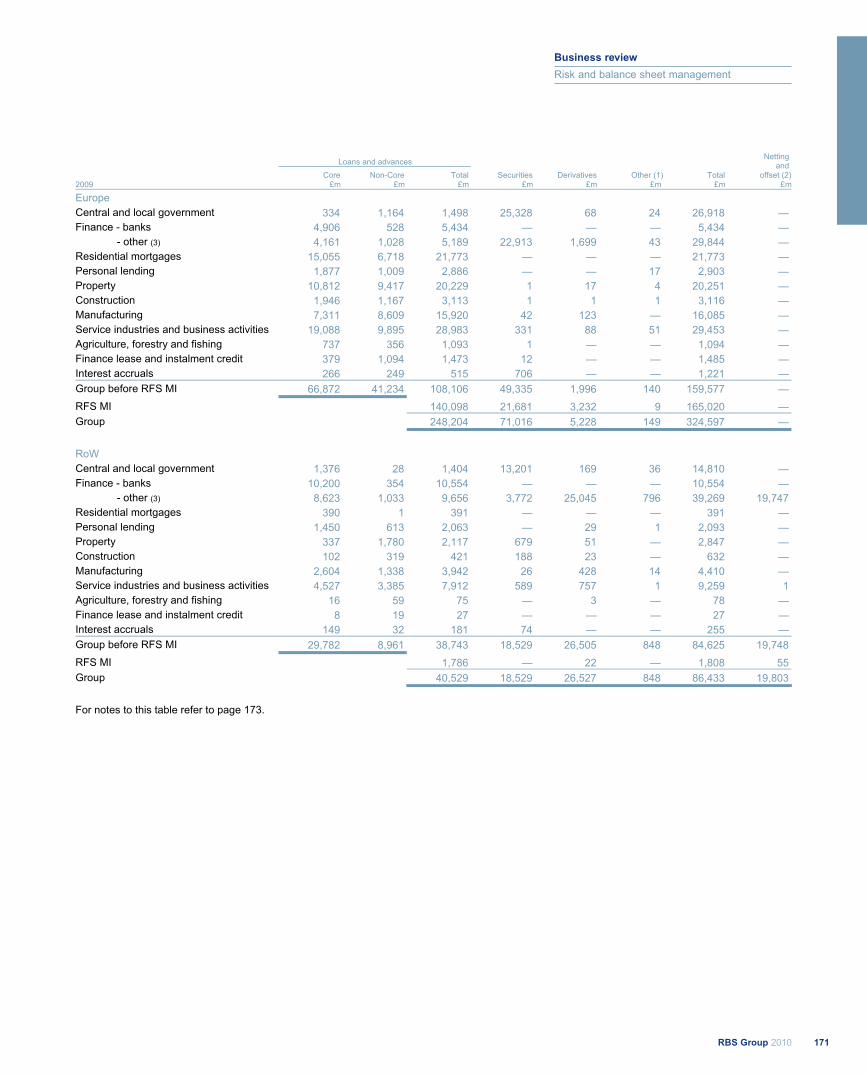
Loans and advances Core Non-Core Total Securities Derivatives Other (1) Total
Netting and
offset (2)2009 £m £m £m £m £m £m £m £m
Europe Central and local government 334 1,164 1,498 25,328 68 24 26,918 — Finance - banks 4,906 528 5,434 — — — 5,434 — - other (3) 4,161 1,028 5,189 22,913 1,699 43 29,844 — Residential mortgages 15,055 6,718 21,773 — — — 21,773 — Personal lending 1,877 1,009 2,886 — — 17 2,903 — Property 10,812 9,417 20,229 1 17 4 20,251 — Construction 1,946 1,167 3,113 1 1 1 3,116 — Manufacturing 7,311 8,609 15,920 42 123 — 16,085 — Service industries and business activities 19,088 9,895 28,983 331 88 51 29,453 — Agriculture, forestry and fishing 737 356 1,093 1 — — 1,094 — Finance lease and instalment credit 379 1,094 1,473 12 — — 1,485 — Interest accruals 266 249 515 706 — — 1,221 — Group before RFS MI 66,872 41,234 108,106 49,335 1,996 140 159,577 — RFS MI 140,098 21,681 3,232 9 165,020 — Group 248,204 71,016 5,228 149 324,597 —
RoW Central and local government 1,376 28 1,404 13,201 169 36 14,810 — Finance - banks 10,200 354 10,554 — — — 10,554 — - other (3) 8,623 1,033 9,656 3,772 25,045 796 39,269 19,747 Residential mortgages 390 1 391 — — — 391 — Personal lending 1,450 613 2,063 — 29 1 2,093 — Property 337 1,780 2,117 679 51 — 2,847 — Construction 102 319 421 188 23 — 632 — Manufacturing 2,604 1,338 3,942 26 428 14 4,410 — Service industries and business activities 4,527 3,385 7,912 589 757 1 9,259 1 Agriculture, forestry and fishing 16 59 75 — 3 — 78 — Finance lease and instalment credit 8 19 27 — — — 27 — Interest accruals 149 32 181 74 — — 255 — Group before RFS MI 29,782 8,961 38,743 18,529 26,505 848 84,625 19,748 RFS MI 1,786 — 22 — 1,808 55 Group 40,529 18,529 26,527 848 86,433 19,803
For notes to this table refer to page 173.
171RBS Group 2010
Business review
Risk and balance sheet management

Business review continued
172 RBS Group 2010
Risk management: Credit risk continued Balance sheet analysis: Industry and geography analysis continued
2008
Loans and advances
£mSecurities
£m Derivatives
£m Other (1)
£m Total
£m
Netting and
offset (2)£m
UK Central and local government 6,106 36,466 5,798 14 48,384 1,987 Finance - banks 105,100 — — — 105,100 — - other (3) 92,030 84,601 532,857 6,257 715,745 480,762 Residential mortgages 80,967 — 14 — 80,981 52 Personal lending 27,469 250 36 25 27,780 5 Property 74,010 2,008 5,094 71 81,183 1,026 Construction 13,426 144 754 26 14,350 1,485 Manufacturing 25,999 1,080 11,208 180 38,467 6,279 Service industries and business activities 88,334 10,154 13,278 1,471 113,237 7,624 Agriculture, forestry and fishing 3,118 93 34 15 3,260 87 Finance lease and instalment credit 17,363 3 25 — 17,391 119 Interest accruals 4,293 774 — — 5,067 — Group before RFS MI 538,215 135,573 569,098 8,059 1,250,945 499,426RFS MI 702 95 — — 797 — Group 538,917 135,668 569,098 8,059 1,251,742 499,426
US Central and local government 482 24,996 45 33 25,556 — Finance - banks 5,814 — — — 5,814 — - other (3) 24,618 37,344 355,502 5,754 423,218 323,910 Residential mortgages 34,235 — — — 34,235 — Personal lending 14,368 — — — 14,368 — Property 6,579 5 97 — 6,681 — Construction 885 63 122 6 1,076 — Manufacturing 13,127 102 1,809 128 15,166 217 Service industries and business activities 27,914 1,498 8,535 907 38,854 2,346 Agriculture, forestry and fishing 30 — 3 1 34 — Finance lease and instalment credit 3,066 — — — 3,066 — Interest accruals 498 466 — — 964 — Group before RFS MI 131,616 64,474 366,113 6,829 569,032 326,473 RFS MI 491 2 — — 493 — Group 132,107 64,476 366,113 6,829 569,525 326,473
For notes to this table refer to page 173.
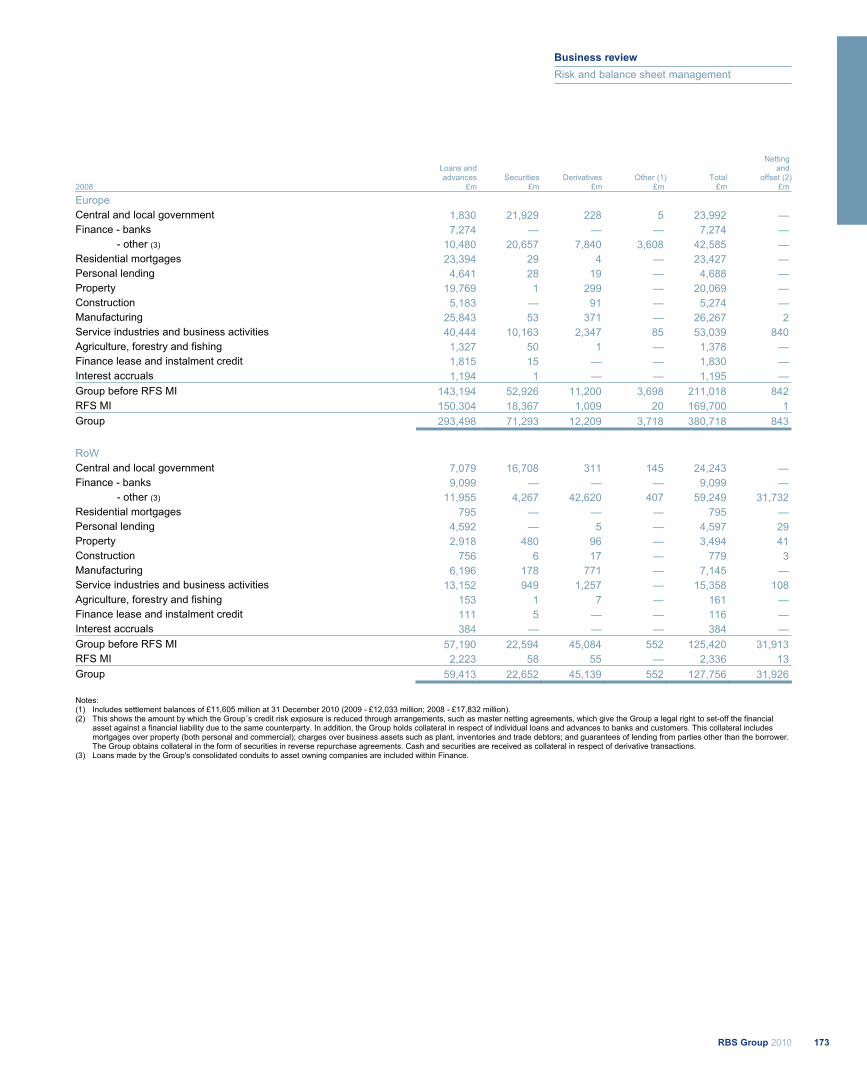
2008
Loans and advances
£mSecurities
£m Derivatives
£m Other (1)
£m Total
£m
Netting and
offset (2)£m
Europe Central and local government 1,830 21,929 228 5 23,992 — Finance - banks 7,274 — — — 7,274 — - other (3) 10,480 20,657 7,840 3,608 42,585 — Residential mortgages 23,394 29 4 — 23,427 — Personal lending 4,641 28 19 — 4,688 — Property 19,769 1 299 — 20,069 — Construction 5,183 — 91 — 5,274 — Manufacturing 25,843 53 371 — 26,267 2 Service industries and business activities 40,444 10,163 2,347 85 53,039 840 Agriculture, forestry and fishing 1,327 50 1 — 1,378 — Finance lease and instalment credit 1,815 15 — — 1,830 — Interest accruals 1,194 1 — — 1,195 — Group before RFS MI 143,194 52,926 11,200 3,698 211,018 842 RFS MI 150,304 18,367 1,009 20 169,700 1 Group 293,498 71,293 12,209 3,718 380,718 843
RoW Central and local government 7,079 16,708 311 145 24,243 — Finance - banks 9,099 — — — 9,099 — - other (3) 11,955 4,267 42,620 407 59,249 31,732 Residential mortgages 795 — — — 795 — Personal lending 4,592 — 5 — 4,597 29 Property 2,918 480 96 — 3,494 41 Construction 756 6 17 — 779 3 Manufacturing 6,196 178 771 — 7,145 — Service industries and business activities 13,152 949 1,257 — 15,358 108 Agriculture, forestry and fishing 153 1 7 — 161 — Finance lease and instalment credit 111 5 — — 116 — Interest accruals 384 — — — 384 — Group before RFS MI 57,190 22,594 45,084 552 125,420 31,913 RFS MI 2,223 58 55 — 2,336 13 Group 59,413 22,652 45,139 552 127,756 31,926
Notes: (1) Includes settlement balances of £11,605 million at 31 December 2010 (2009 - £12,033 million; 2008 - £17,832 million). (2) This shows the amount by which the Group´s credit risk exposure is reduced through arrangements, such as master netting agreements, which give the Group a legal right to set-off the financial
asset against a financial liability due to the same counterparty. In addition, the Group holds collateral in respect of individual loans and advances to banks and customers. This collateral includes mortgages over property (both personal and commercial); charges over business assets such as plant, inventories and trade debtors; and guarantees of lending from parties other than the borrower. The Group obtains collateral in the form of securities in reverse repurchase agreements. Cash and securities are received as collateral in respect of derivative transactions.
(3) Loans made by the Group's consolidated conduits to asset owning companies are included within Finance.
173RBS Group 2010
Business review
Risk and balance sheet management
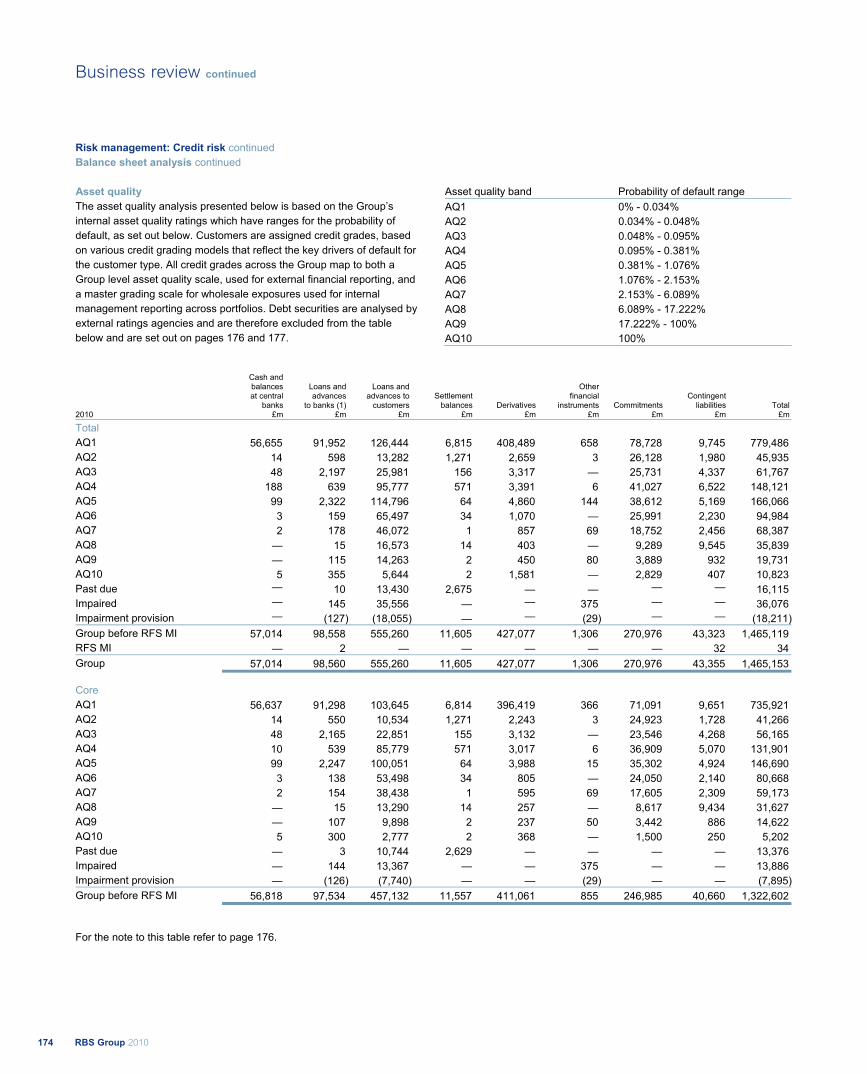
Risk management: Credit risk continued Balance sheet analysis continued
Asset quality The asset quality analysis presented below is based on the Group’s internal asset quality ratings which have ranges for the probability of default, as set out below. Customers are assigned credit grades, based on various credit grading models that reflect the key drivers of default for the customer type. All credit grades across the Group map to both a Group level asset quality scale, used for external financial reporting, and a master grading scale for wholesale exposures used for internal management reporting across portfolios. Debt securities are analysed by external ratings agencies and are therefore excluded from the table below and are set out on pages 176 and 177.
Asset quality band Probability of default range AQ1 0% - 0.034% AQ2 0.034% - 0.048% AQ3 0.048% - 0.095% AQ4 0.095% - 0.381% AQ5 0.381% - 1.076% AQ6 1.076% - 2.153% AQ7 2.153% - 6.089% AQ8 6.089% - 17.222% AQ9 17.222% - 100% AQ10 100%
Cash and balances at central
banks
Loans and advances
to banks (1)
Loans andadvances to customers
Settlement balances Derivatives
Other financial
instruments Commitments Contingent
liabilities Total 2010 £m £m £m £m £m £m £m £m £m
Total AQ1 56,655 91,952 126,444 6,815 408,489 658 78,728 9,745 779,486 AQ2 14 598 13,282 1,271 2,659 3 26,128 1,980 45,935 AQ3 48 2,197 25,981 156 3,317 — 25,731 4,337 61,767 AQ4 188 639 95,777 571 3,391 6 41,027 6,522 148,121 AQ5 99 2,322 114,796 64 4,860 144 38,612 5,169 166,066 AQ6 3 159 65,497 34 1,070 — 25,991 2,230 94,984 AQ7 2 178 46,072 1 857 69 18,752 2,456 68,387 AQ8 — 15 16,573 14 403 — 9,289 9,545 35,839 AQ9 — 115 14,263 2 450 80 3,889 932 19,731 AQ10 5 355 5,644 2 1,581 — 2,829 407 10,823 Past due — 10 13,430 2,675 — — — — 16,115 Impaired — 145 35,556 — — 375 — — 36,076 Impairment provision — (127) (18,055) — — (29) — — (18,211)Group before RFS MI 57,014 98,558 555,260 11,605 427,077 1,306 270,976 43,323 1,465,119 RFS MI — 2 — — — — — 32 34 Group 57,014 98,560 555,260 11,605 427,077 1,306 270,976 43,355 1,465,153
Core AQ1 56,637 91,298 103,645 6,814 396,419 366 71,091 9,651 735,921 AQ2 14 550 10,534 1,271 2,243 3 24,923 1,728 41,266 AQ3 48 2,165 22,851 155 3,132 — 23,546 4,268 56,165 AQ4 10 539 85,779 571 3,017 6 36,909 5,070 131,901 AQ5 99 2,247 100,051 64 3,988 15 35,302 4,924 146,690 AQ6 3 138 53,498 34 805 — 24,050 2,140 80,668 AQ7 2 154 38,438 1 595 69 17,605 2,309 59,173 AQ8 — 15 13,290 14 257 — 8,617 9,434 31,627 AQ9 — 107 9,898 2 237 50 3,442 886 14,622 AQ10 5 300 2,777 2 368 — 1,500 250 5,202 Past due — 3 10,744 2,629 — — — — 13,376 Impaired — 144 13,367 — — 375 — — 13,886 Impairment provision — (126) (7,740) — — (29) — — (7,895)Group before RFS MI 56,818 97,534 457,132 11,557 411,061 855 246,985 40,660 1,322,602
For the note to this table refer to page 176.
RBS Group 2010174
Business review continued
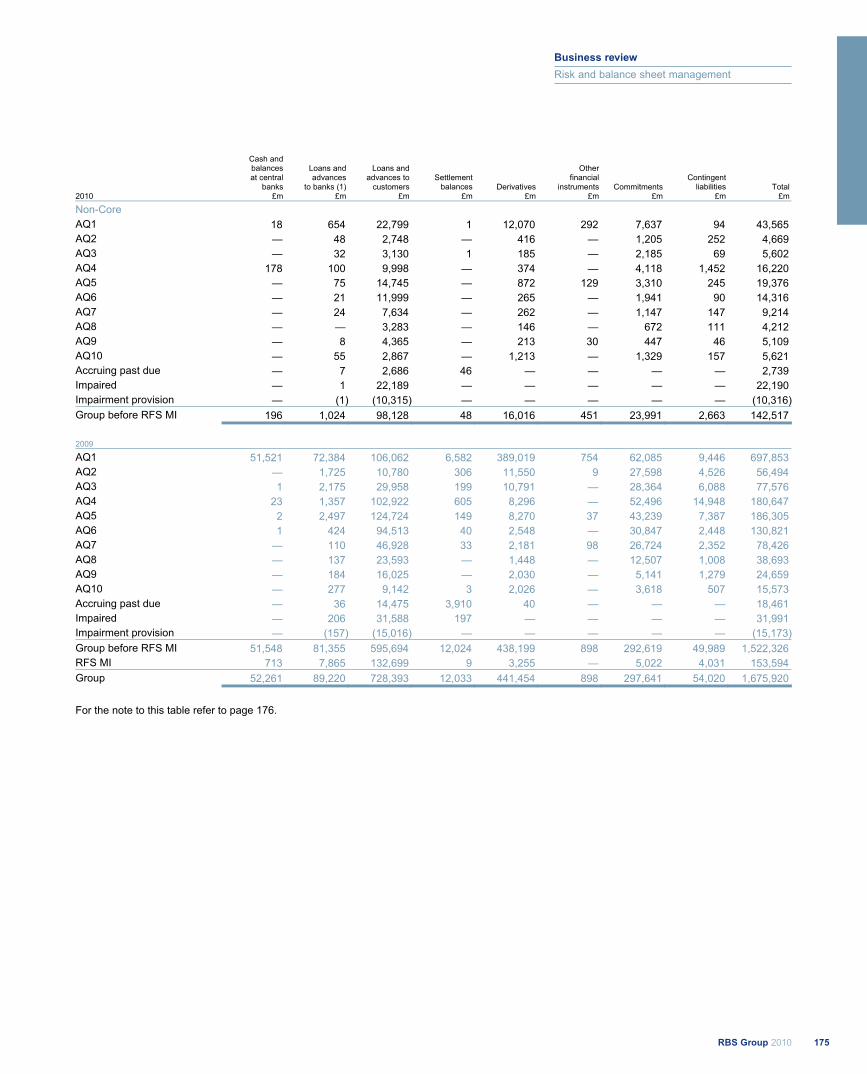
Cash and balances at central
banks
Loans and advances
to banks (1)
Loans andadvances to customers
Settlement balances Derivatives
Other financial
instruments Commitments Contingent
liabilities Total 2010 £m £m £m £m £m £m £m £m £m
Non-Core AQ1 18 654 22,799 1 12,070 292 7,637 94 43,565 AQ2 — 48 2,748 — 416 — 1,205 252 4,669 AQ3 — 32 3,130 1 185 — 2,185 69 5,602 AQ4 178 100 9,998 — 374 — 4,118 1,452 16,220 AQ5 — 75 14,745 — 872 129 3,310 245 19,376 AQ6 — 21 11,999 — 265 — 1,941 90 14,316 AQ7 — 24 7,634 — 262 — 1,147 147 9,214 AQ8 — — 3,283 — 146 — 672 111 4,212 AQ9 — 8 4,365 — 213 30 447 46 5,109 AQ10 — 55 2,867 — 1,213 — 1,329 157 5,621 Accruing past due — 7 2,686 46 — — — — 2,739 Impaired — 1 22,189 — — — — — 22,190 Impairment provision — (1) (10,315) — — — — — (10,316)Group before RFS MI 196 1,024 98,128 48 16,016 451 23,991 2,663 142,517
2009
AQ1 51,521 72,384 106,062 6,582 389,019 754 62,085 9,446 697,853 AQ2 — 1,725 10,780 306 11,550 9 27,598 4,526 56,494 AQ3 1 2,175 29,958 199 10,791 — 28,364 6,088 77,576 AQ4 23 1,357 102,922 605 8,296 — 52,496 14,948 180,647 AQ5 2 2,497 124,724 149 8,270 37 43,239 7,387 186,305 AQ6 1 424 94,513 40 2,548 — 30,847 2,448 130,821 AQ7 — 110 46,928 33 2,181 98 26,724 2,352 78,426 AQ8 — 137 23,593 — 1,448 — 12,507 1,008 38,693 AQ9 — 184 16,025 — 2,030 — 5,141 1,279 24,659 AQ10 — 277 9,142 3 2,026 — 3,618 507 15,573 Accruing past due — 36 14,475 3,910 40 — — — 18,461 Impaired — 206 31,588 197 — — — — 31,991 Impairment provision — (157) (15,016) — — — — — (15,173)Group before RFS MI 51,548 81,355 595,694 12,024 438,199 898 292,619 49,989 1,522,326 RFS MI 713 7,865 132,699 9 3,255 — 5,022 4,031 153,594 Group 52,261 89,220 728,393 12,033 441,454 898 297,641 54,020 1,675,920
For the note to this table refer to page 176.
175RBS Group 2010
Business review
Risk and balance sheet management
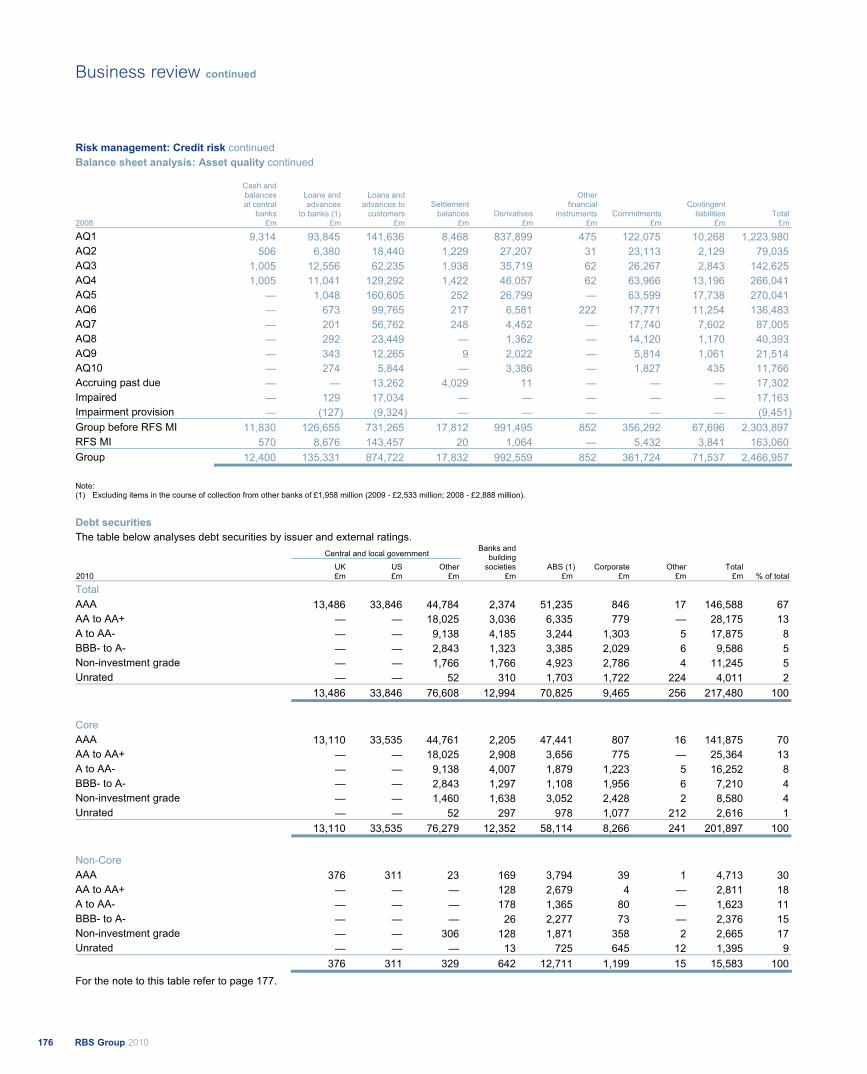
Risk management: Credit risk continued Balance sheet analysis: Asset quality continued
Cash and balances at central
banks
Loans and advances
to banks (1)
Loans and advances to customers
Settlement balances Derivatives
Other financial
instruments Commitments Contingent
liabilities Total 2008 £m £m £m £m £m £m £m £m £m
AQ1 9,314 93,845 141,636 8,468 837,899 475 122,075 10,268 1,223,980 AQ2 506 6,380 18,440 1,229 27,207 31 23,113 2,129 79,035 AQ3 1,005 12,556 62,235 1,938 35,719 62 26,267 2,843 142,625 AQ4 1,005 11,041 129,292 1,422 46,057 62 63,966 13,196 266,041 AQ5 — 1,048 160,605 252 26,799 — 63,599 17,738 270,041 AQ6 — 673 99,765 217 6,581 222 17,771 11,254 136,483 AQ7 — 201 56,762 248 4,452 — 17,740 7,602 87,005 AQ8 — 292 23,449 — 1,362 — 14,120 1,170 40,393 AQ9 — 343 12,265 9 2,022 — 5,814 1,061 21,514 AQ10 — 274 5,844 — 3,386 — 1,827 435 11,766 Accruing past due — — 13,262 4,029 11 — — — 17,302 Impaired — 129 17,034 — — — — — 17,163 Impairment provision — (127) (9,324) — — — — — (9,451)Group before RFS MI 11,830 126,655 731,265 17,812 991,495 852 356,292 67,696 2,303,897 RFS MI 570 8,676 143,457 20 1,064 — 5,432 3,841 163,060 Group 12,400 135,331 874,722 17,832 992,559 852 361,724 71,537 2,466,957
Note: (1) Excluding items in the course of collection from other banks of £1,958 million (2009 - £2,533 million; 2008 - £2,888 million).
Debt securities The table below analyses debt securities by issuer and external ratings. Central and local government
2010 UK £m
US £m
Other £m
Banks and building
societies £m
ABS (1)£m
Corporate £m
Other £m
Total £m % of total
Total AAA 13,486 33,846 44,784 2,374 51,235 846 17 146,588 67 AA to AA+ — — 18,025 3,036 6,335 779 — 28,175 13 A to AA- — — 9,138 4,185 3,244 1,303 5 17,875 8 BBB- to A- — — 2,843 1,323 3,385 2,029 6 9,586 5 Non-investment grade — — 1,766 1,766 4,923 2,786 4 11,245 5 Unrated — — 52 310 1,703 1,722 224 4,011 2 13,486 33,846 76,608 12,994 70,825 9,465 256 217,480 100
Core AAA 13,110 33,535 44,761 2,205 47,441 807 16 141,875 70 AA to AA+ — — 18,025 2,908 3,656 775 — 25,364 13 A to AA- — — 9,138 4,007 1,879 1,223 5 16,252 8 BBB- to A- — — 2,843 1,297 1,108 1,956 6 7,210 4 Non-investment grade — — 1,460 1,638 3,052 2,428 2 8,580 4 Unrated — — 52 297 978 1,077 212 2,616 1 13,110 33,535 76,279 12,352 58,114 8,266 241 201,897 100
Non-Core AAA 376 311 23 169 3,794 39 1 4,713 30 AA to AA+ — — — 128 2,679 4 — 2,811 18 A to AA- — — — 178 1,365 80 — 1,623 11 BBB- to A- — — — 26 2,277 73 — 2,376 15 Non-investment grade — — 306 128 1,871 358 2 2,665 17 Unrated — — — 13 725 645 12 1,395 9 376 311 329 642 12,711 1,199 15 15,583 100 For the note to this table refer to page 177.
RBS Group 2010176
Business review continued

Central and local government
2009 UK £m
US £m
Other £m
Banks and building
societies £m
ABS (1)£m
Corporate £m
Other £m
Total £m % of total (2)
AAA 26,601 23,219 44,396 4,012 65,067 2,263 — 165,558 66 AA to AA+ — — 22,003 4,930 8,942 1,429 — 37,304 15 A to AA- — — 13,159 3,770 3,886 1,860 — 22,675 9 BBB- to A- — — 3,847 823 4,243 2,187 — 11,100 5 Non-investment grade — — 353 169 3,515 2,042 — 6,079 2 Unrated — — 504 289 1,949 2,601 1,036 6,379 3 Group before RFS MI 26,601 23,219 84,262 13,993 87,602 12,382 1,036 249,095 100 RFS MI 721 183 11,871 3,803 580 906 95 18,159 Group 27,322 23,402 96,133 17,796 88,182 13,288 1,131 267,254
2008 AAA 18,787 16,514 43,197 8,126 93,853 3,953 — 184,430 73 BBB- to AA+ — — 15,862 13,013 11,437 10,172 — 50,484 20 Non-investment grade — — 242 127 3,678 2,259 — 6,306 2 Unrated — — 409 1,445 2,175 4,517 3,393 11,939 5 Group before RFS MI 18,787 16,514 59,710 22,711 111,143 20,901 3,393 253,159 100 RFS MI — 7 10,761 1,652 — 885 1,085 14,390 Group 18,787 16,521 70,471 24,363 111,143 21,786 4,478 267,549 Notes: (1) Asset-backed securities. (2) Percentage calculated on Group before RFS MI.
Key points The proportion of AAA rated securities was broadly unchanged during the year whilst the proportion of non-investment grade and unrated securities increased from 5% to 7%.
Holdings of debt securities issued by non-investment grade governments comprised: Greece £1.0 billion; Romania £0.3 billion; Turkey £0.2 billion; and Indonesia £0.2 billion.
Increase in non-investment grade securities reflects purchases by GBM’s mortgage trading business. Non-investment grade securities also increased as a result of credit downgrades and rating withdrawals of certain ABS structures in Non-Core during the year.
177RBS Group 2010
Business review
Risk and balance sheet management
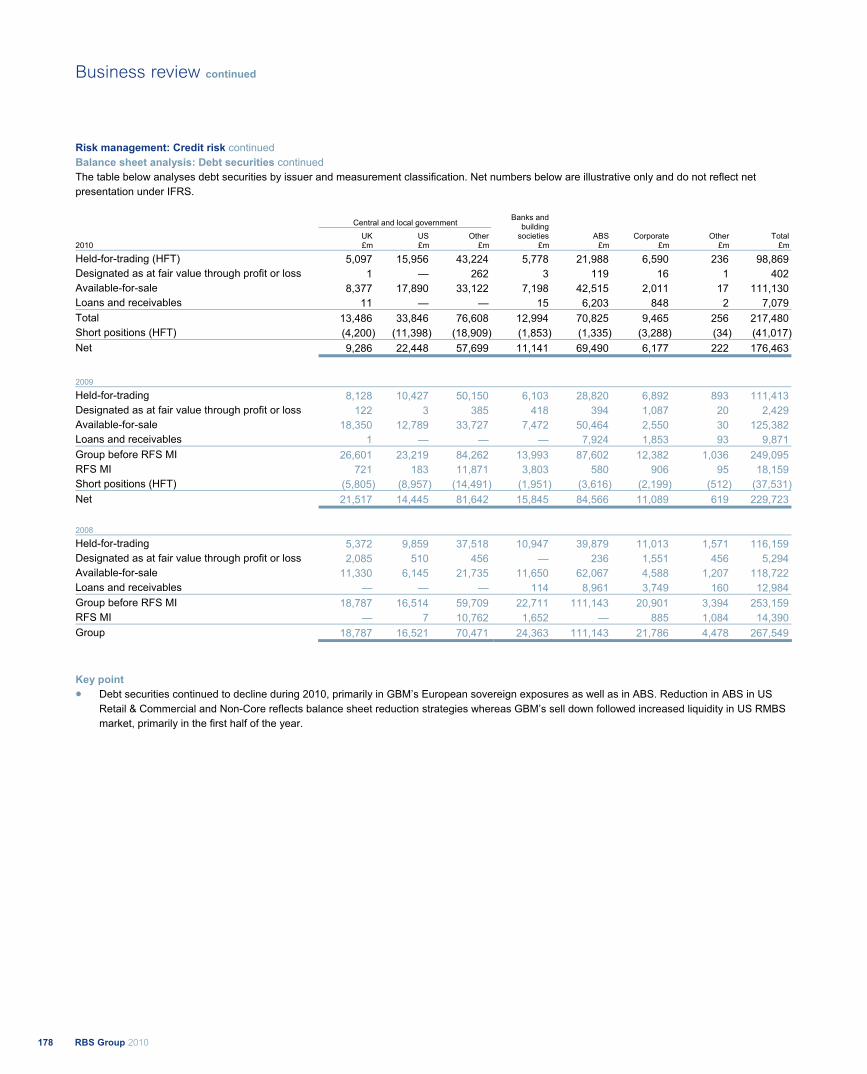
Risk management: Credit risk continued Balance sheet analysis: Debt securities continuedThe table below analyses debt securities by issuer and measurement classification. Net numbers below are illustrative only and do not reflect net presentation under IFRS.
Central and local government
UK US Other
Banks and building
societies ABS Corporate Other Total 2010 £m £m £m £m £m £m £m £m
Held-for-trading (HFT) 5,097 15,956 43,224 5,778 21,988 6,590 236 98,869 Designated as at fair value through profit or loss 1 — 262 3 119 16 1 402 Available-for-sale 8,377 17,890 33,122 7,198 42,515 2,011 17 111,130 Loans and receivables 11 — — 15 6,203 848 2 7,079 Total 13,486 33,846 76,608 12,994 70,825 9,465 256 217,480 Short positions (HFT) (4,200) (11,398) (18,909) (1,853) (1,335) (3,288) (34) (41,017)Net 9,286 22,448 57,699 11,141 69,490 6,177 222 176,463
2009 Held-for-trading 8,128 10,427 50,150 6,103 28,820 6,892 893 111,413 Designated as at fair value through profit or loss 122 3 385 418 394 1,087 20 2,429 Available-for-sale 18,350 12,789 33,727 7,472 50,464 2,550 30 125,382 Loans and receivables 1 — — — 7,924 1,853 93 9,871 Group before RFS MI 26,601 23,219 84,262 13,993 87,602 12,382 1,036 249,095 RFS MI 721 183 11,871 3,803 580 906 95 18,159 Short positions (HFT) (5,805) (8,957) (14,491) (1,951) (3,616) (2,199) (512) (37,531)Net 21,517 14,445 81,642 15,845 84,566 11,089 619 229,723
2008 Held-for-trading 5,372 9,859 37,518 10,947 39,879 11,013 1,571 116,159 Designated as at fair value through profit or loss 2,085 510 456 — 236 1,551 456 5,294 Available-for-sale 11,330 6,145 21,735 11,650 62,067 4,588 1,207 118,722 Loans and receivables — — — 114 8,961 3,749 160 12,984 Group before RFS MI 18,787 16,514 59,709 22,711 111,143 20,901 3,394 253,159 RFS MI — 7 10,762 1,652 — 885 1,084 14,390 Group 18,787 16,521 70,471 24,363 111,143 21,786 4,478 267,549
Key point Debt securities continued to decline during 2010, primarily in GBM’s European sovereign exposures as well as in ABS. Reduction in ABS in US Retail & Commercial and Non-Core reflects balance sheet reduction strategies whereas GBM’s sell down followed increased liquidity in US RMBS market, primarily in the first half of the year.
RBS Group 2010178
Business review continued
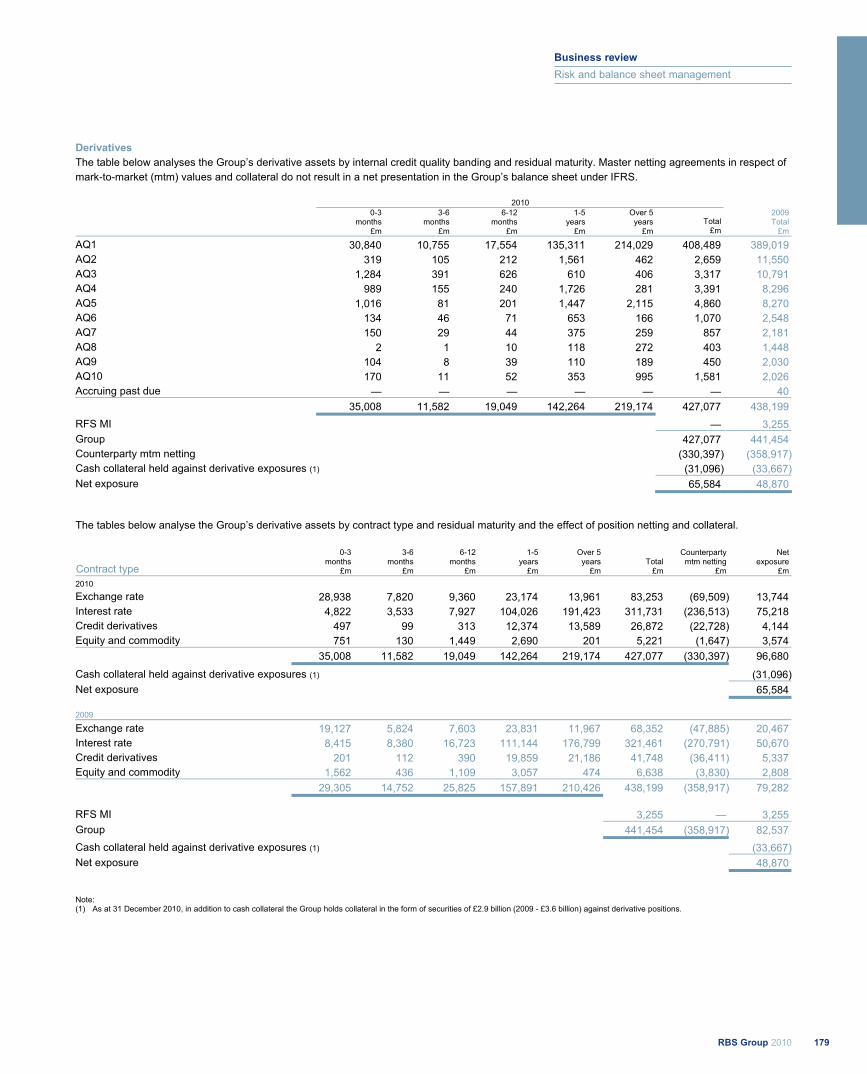
Derivatives The table below analyses the Group’s derivative assets by internal credit quality banding and residual maturity. Master netting agreements in respect of mark-to-market (mtm) values and collateral do not result in a net presentation in the Group’s balance sheet under IFRS.
2010
0-3
months £m
3-6 months
£m
6-12 months
£m
1-5 years
£m
Over 5 years
£mTotal
£m
2009 Total
£m
AQ1 30,840 10,755 17,554 135,311 214,029 408,489 389,019 AQ2 319 105 212 1,561 462 2,659 11,550 AQ3 1,284 391 626 610 406 3,317 10,791 AQ4 989 155 240 1,726 281 3,391 8,296 AQ5 1,016 81 201 1,447 2,115 4,860 8,270 AQ6 134 46 71 653 166 1,070 2,548 AQ7 150 29 44 375 259 857 2,181 AQ8 2 1 10 118 272 403 1,448 AQ9 104 8 39 110 189 450 2,030 AQ10 170 11 52 353 995 1,581 2,026 Accruing past due — — — — — — 40 35,008 11,582 19,049 142,264 219,174 427,077 438,199 RFS MI — 3,255 Group 427,077 441,454 Counterparty mtm netting (330,397) (358,917)Cash collateral held against derivative exposures (1) (31,096) (33,667)Net exposure 65,584 48,870
The tables below analyse the Group’s derivative assets by contract type and residual maturity and the effect of position netting and collateral.
Contract type 0-3
months £m
3-6 months
£m
6-12 months
£m
1-5 years
£m
Over 5 years
£m Total
£m
Counterparty mtm netting
£m
Net exposure
£m 2010 Exchange rate 28,938 7,820 9,360 23,174 13,961 83,253 (69,509) 13,744 Interest rate 4,822 3,533 7,927 104,026 191,423 311,731 (236,513) 75,218 Credit derivatives 497 99 313 12,374 13,589 26,872 (22,728) 4,144 Equity and commodity 751 130 1,449 2,690 201 5,221 (1,647) 3,574 35,008 11,582 19,049 142,264 219,174 427,077 (330,397) 96,680
Cash collateral held against derivative exposures (1) (31,096)Net exposure 65,584
2009 Exchange rate 19,127 5,824 7,603 23,831 11,967 68,352 (47,885) 20,467 Interest rate 8,415 8,380 16,723 111,144 176,799 321,461 (270,791) 50,670 Credit derivatives 201 112 390 19,859 21,186 41,748 (36,411) 5,337 Equity and commodity 1,562 436 1,109 3,057 474 6,638 (3,830) 2,808 29,305 14,752 25,825 157,891 210,426 438,199 (358,917) 79,282
RFS MI 3,255 — 3,255 Group 441,454 (358,917) 82,537 Cash collateral held against derivative exposures (1) (33,667)Net exposure 48,870
Note: (1) As at 31 December 2010, in addition to cash collateral the Group holds collateral in the form of securities of £2.9 billion (2009 - £3.6 billion) against derivative positions.
179RBS Group 2010
Business review
Risk and balance sheet management

Risk management: Credit risk continued Balance sheet analysis: Derivatives continued
Contract type 0-3
months £m
3-6 months
£m
6-12 months
£m
1-5 years
£m
Over 5 years
£m
Gross assets
£m
Counterparty mtm netting
£m
Net exposure
£m 2008 Exchange rate 65,428 21,106 25,150 43,860 17,339 172,883 (113,451) 59,432 Interest rate 14,195 17,364 23,603 193,254 405,926 654,342 (597,482) 56,860 Credit derivatives 932 384 2,511 83,599 54,940 142,366 (112,119) 30,247 Equity and commodity 4,807 2,864 5,579 8,069 585 21,904 (10,645) 11,259 85,362 41,718 56,843 328,782 478,790 991,495 (833,697) 157,798
RFS MI 1,064 — 1,064 Group 992,559 (833,697) 158,862
Key points Whilst gross exchange rate contracts increased due to the trading fluctuations and favourable movements in forward rates and volume, the mix in counterparty netting arrangements reduced the net exposure.
In a year of significant quarterly interest rate volatility, the overall annual interest rate trend was downwards, with all major rate indices moving down by at least 30 basis points in the medium to long end, with USD and GBP dropping approximately 70 basis points in the 5 year yield curve. The increase in gross asset values caused by the
drop in interest rates was offset by the greater use of London Clearing House (LCH) as a counterparty, up from 56% at the end of 2009 to 60% by end of 2010. Reduction in non-LCH related netting increased the net exposure, excluding the effect of collateral arrangements. *
The reduction in credit derivatives primarily reflected the APS credit derivative reducing from £1.4 billion at the start of the year to £550 million at end of 2010. The effect of credit spread widening in GBM and Non-Core were offset by portfolio reductions, as part of de-risking, and currency movements.
Cross border exposures Cross border exposures are loans and advances including finance leases and instalment credit receivables and other monetary assets, such as debt securities and net derivatives, including non-local currency claims of overseas offices on local residents. The Group monitors the geographical breakdown of these exposures based on the country of domicile of the borrower or guarantor of ultimate risk. Cross border exposures exclude exposures to local residents in local currencies.
The table below sets out the Group’s cross border exposures greater than 0.5% of the Group’s total assets. None of these countries have experienced repayment difficulties that have required restructuring of outstanding debt.
2010 Government Banks Other Total
2009 Total
2008 Total
£m £m £m £m £m £m
United States 21,201 14,382 36,813 72,396 74,409 91,544 France 17,293 16,007 6,756 40,056 37,489 58,251 Germany 22,962 6,276 10,467 39,705 41,727 40,812 Japan 7,983 6,962 7,542 22,487 18,939 14,933 Spain 1,401 4,248 11,589 17,238 27,118 36,441 Netherlands 2,900 3,055 10,824 16,779 20,262 34,283 Italy 6,409 1,083 2,188 9,680 14,412 16,582 Cayman Islands 2 94 7,330 7,426 10,786 18,126 Republic of Ireland 199 3,789 3,101 7,089 14,902 18,662 Belgium 1,461 752 2,806 5,019 9,340 16,313
*unaudited
RBS Group 2010180
Business review continued
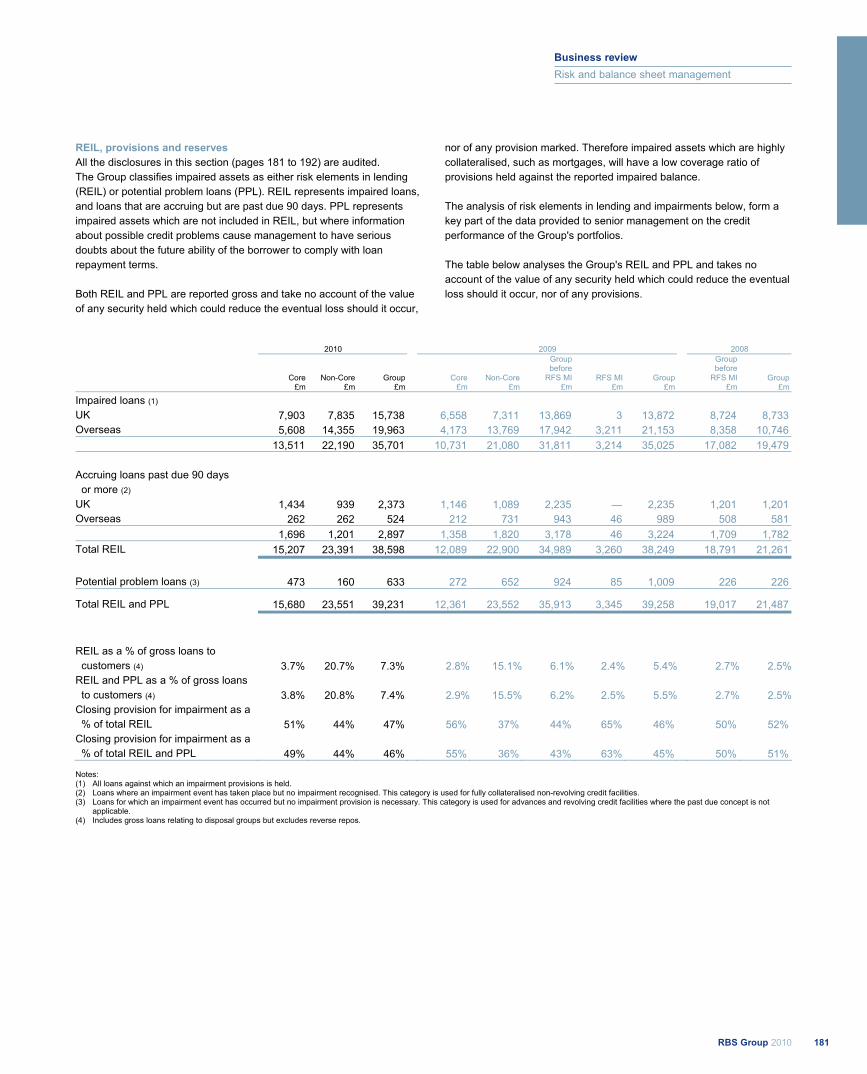
REIL, provisions and reserves All the disclosures in this section (pages 181 to 192) are audited. The Group classifies impaired assets as either risk elements in lending (REIL) or potential problem loans (PPL). REIL represents impaired loans, and loans that are accruing but are past due 90 days. PPL represents impaired assets which are not included in REIL, but where information about possible credit problems cause management to have serious doubts about the future ability of the borrower to comply with loan repayment terms. Both REIL and PPL are reported gross and take no account of the value of any security held which could reduce the eventual loss should it occur,
nor of any provision marked. Therefore impaired assets which are highly collateralised, such as mortgages, will have a low coverage ratio of provisions held against the reported impaired balance. The analysis of risk elements in lending and impairments below, form a key part of the data provided to senior management on the credit performance of the Group's portfolios. The table below analyses the Group's REIL and PPL and takes no account of the value of any security held which could reduce the eventual loss should it occur, nor of any provisions.
2010 2009 2008
Core Non-Core Group Core Non-Core
Group before
RFS MI RFS MI Group
Group before
RFS MI Group £m £m £m £m £m £m £m £m £m £m
Impaired loans (1) UK 7,903 7,835 15,738 6,558 7,311 13,869 3 13,872 8,724 8,733 Overseas 5,608 14,355 19,963 4,173 13,769 17,942 3,211 21,153 8,358 10,746 13,511 22,190 35,701 10,731 21,080 31,811 3,214 35,025 17,082 19,479
Accruing loans past due 90 days or more (2) UK 1,434 939 2,373 1,146 1,089 2,235 — 2,235 1,201 1,201 Overseas 262 262 524 212 731 943 46 989 508 581 1,696 1,201 2,897 1,358 1,820 3,178 46 3,224 1,709 1,782 Total REIL 15,207 23,391 38,598 12,089 22,900 34,989 3,260 38,249 18,791 21,261
Potential problem loans (3) 473 160 633 272 652 924 85 1,009 226 226
Total REIL and PPL 15,680 23,551 39,231 12,361 23,552 35,913 3,345 39,258 19,017 21,487
REIL as a % of gross loans to customers (4) 3.7% 20.7% 7.3% 2.8% 15.1% 6.1% 2.4% 5.4% 2.7% 2.5%REIL and PPL as a % of gross loans to customers (4) 3.8% 20.8% 7.4% 2.9% 15.5% 6.2% 2.5% 5.5% 2.7% 2.5%Closing provision for impairment as a % of total REIL 51% 44% 47% 56% 37% 44% 65% 46% 50% 52% Closing provision for impairment as a % of total REIL and PPL 49% 44% 46% 55% 36% 43% 63% 45% 50% 51%
Notes: (1) All loans against which an impairment provisions is held. (2) Loans where an impairment event has taken place but no impairment recognised. This category is used for fully collateralised non-revolving credit facilities. (3) Loans for which an impairment event has occurred but no impairment provision is necessary. This category is used for advances and revolving credit facilities where the past due concept is not
applicable. (4) Includes gross loans relating to disposal groups but excludes reverse repos.
181RBS Group 2010
Business review
Risk and balance sheet management
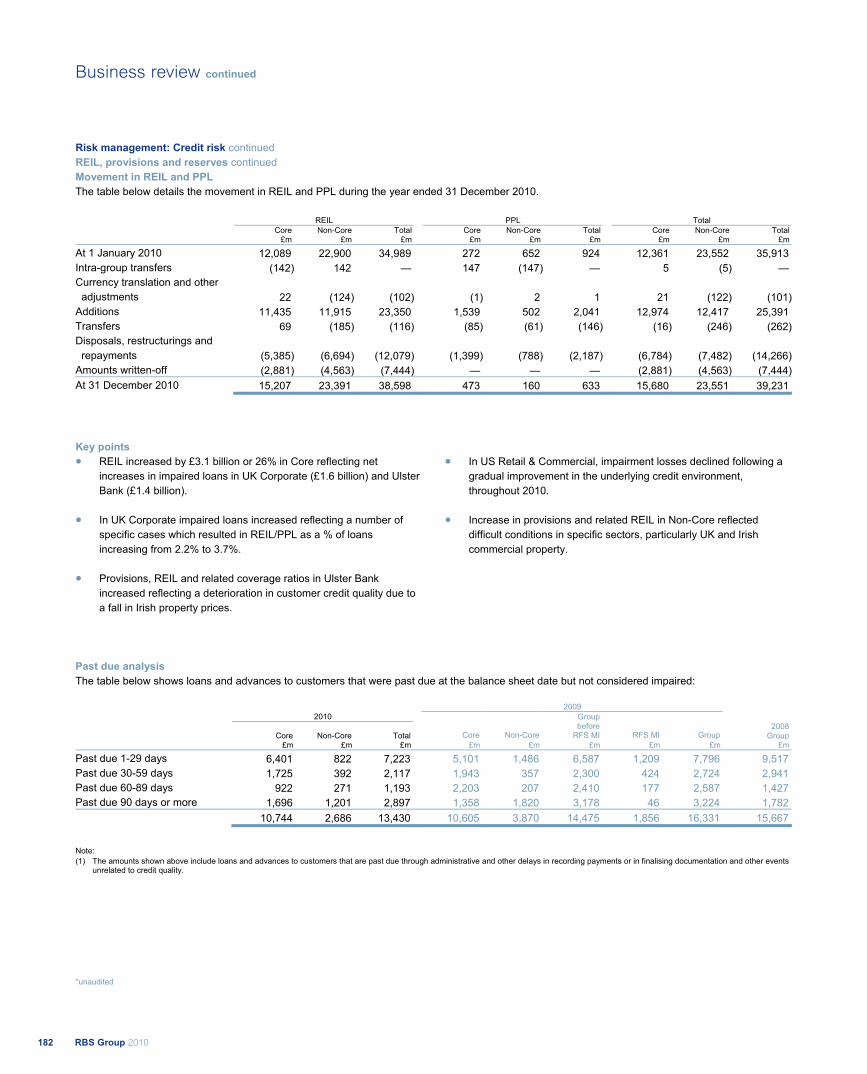
Risk management: Credit risk continued REIL, provisions and reserves continued Movement in REIL and PPL The table below details the movement in REIL and PPL during the year ended 31 December 2010.
REIL PPL Total Core Non-Core Total Core Non-Core Total Core Non-Core Total
£m £m £m £m £m £m £m £m £m
At 1 January 2010 12,089 22,900 34,989 272 652 924 12,361 23,552 35,913 Intra-group transfers (142) 142 — 147 (147) — 5 (5) — Currency translation and other adjustments 22 (124) (102) (1) 2 1 21 (122) (101)Additions 11,435 11,915 23,350 1,539 502 2,041 12,974 12,417 25,391 Transfers 69 (185) (116) (85) (61) (146) (16) (246) (262)Disposals, restructurings and repayments (5,385) (6,694) (12,079) (1,399) (788) (2,187) (6,784) (7,482) (14,266)Amounts written-off (2,881) (4,563) (7,444) — — — (2,881) (4,563) (7,444)At 31 December 2010 15,207 23,391 38,598 473 160 633 15,680 23,551 39,231
Key points REIL increased by £3.1 billion or 26% in Core reflecting net increases in impaired loans in UK Corporate (£1.6 billion) and Ulster Bank (£1.4 billion).
In UK Corporate impaired loans increased reflecting a number of specific cases which resulted in REIL/PPL as a % of loans increasing from 2.2% to 3.7%.
Provisions, REIL and related coverage ratios in Ulster Bank increased reflecting a deterioration in customer credit quality due to a fall in Irish property prices.
In US Retail & Commercial, impairment losses declined following a gradual improvement in the underlying credit environment, throughout 2010.
Increase in provisions and related REIL in Non-Core reflected difficult conditions in specific sectors, particularly UK and Irish commercial property.
Past due analysis The table below shows loans and advances to customers that were past due at the balance sheet date but not considered impaired:
2009 2010
Core Non-Core Total Core Non-Core
Group before
RFS MI RFS MI Group 2008
Group £m £m £m £m £m £m £m £m £m
Past due 1-29 days 6,401 822 7,223 5,101 1,486 6,587 1,209 7,796 9,517 Past due 30-59 days 1,725 392 2,117 1,943 357 2,300 424 2,724 2,941 Past due 60-89 days 922 271 1,193 2,203 207 2,410 177 2,587 1,427 Past due 90 days or more 1,696 1,201 2,897 1,358 1,820 3,178 46 3,224 1,782 10,744 2,686 13,430 10,605 3,870 14,475 1,856 16,331 15,667
Note: (1) The amounts shown above include loans and advances to customers that are past due through administrative and other delays in recording payments or in finalising documentation and other events
unrelated to credit quality.
*unaudited
RBS Group 2010182
Business review continued
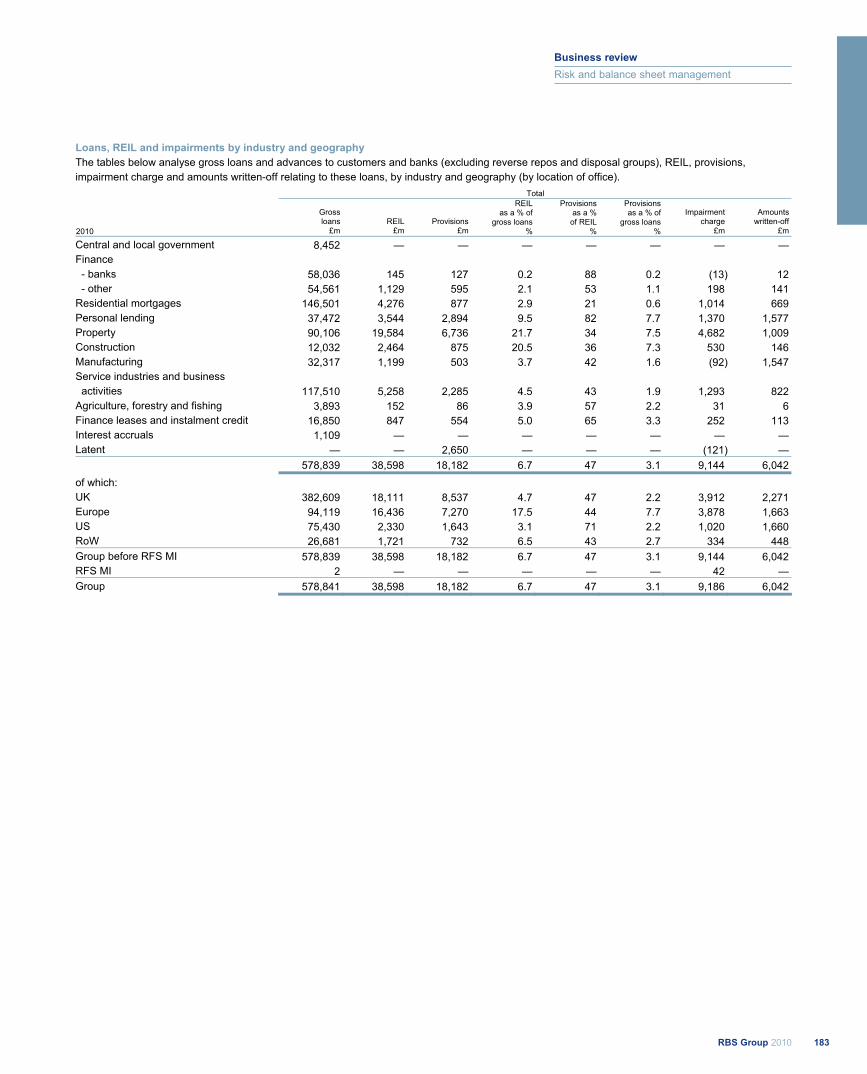
Loans, REIL and impairments by industry and geography The tables below analyse gross loans and advances to customers and banks (excluding reverse repos and disposal groups), REIL, provisions, impairment charge and amounts written-off relating to these loans, by industry and geography (by location of office). Total
2010
Gross loans
£mREIL
£m Provisions
£m
REIL as a % of
gross loans %
Provisions as a % of REIL
%
Provisions as a % of
gross loans %
Impairment charge
£m
Amounts written-off
£m
Central and local government 8,452 — — — — — — — Finance
- banks 58,036 145 127 0.2 88 0.2 (13) 12 - other 54,561 1,129 595 2.1 53 1.1 198 141 Residential mortgages 146,501 4,276 877 2.9 21 0.6 1,014 669 Personal lending 37,472 3,544 2,894 9.5 82 7.7 1,370 1,577 Property 90,106 19,584 6,736 21.7 34 7.5 4,682 1,009 Construction 12,032 2,464 875 20.5 36 7.3 530 146 Manufacturing 32,317 1,199 503 3.7 42 1.6 (92) 1,547 Service industries and business activities 117,510 5,258 2,285 4.5 43 1.9 1,293 822 Agriculture, forestry and fishing 3,893 152 86 3.9 57 2.2 31 6 Finance leases and instalment credit 16,850 847 554 5.0 65 3.3 252 113 Interest accruals 1,109 — — — — — — — Latent — — 2,650 — — — (121) — 578,839 38,598 18,182 6.7 47 3.1 9,144 6,042 of which: UK 382,609 18,111 8,537 4.7 47 2.2 3,912 2,271 Europe 94,119 16,436 7,270 17.5 44 7.7 3,878 1,663 US 75,430 2,330 1,643 3.1 71 2.2 1,020 1,660 RoW 26,681 1,721 732 6.5 43 2.7 334 448 Group before RFS MI 578,839 38,598 18,182 6.7 47 3.1 9,144 6,042 RFS MI 2 — — — — — 42 —Group 578,841 38,598 18,182 6.7 47 3.1 9,186 6,042
183RBS Group 2010
Business review
Risk and balance sheet management

Risk management: Credit risk continued REIL, provisions and reserves continued Total
2009
Gross loans
£m REIL
£mProvisions
£m
REIL as a % of
gross loans %
Provisions as a % of REIL
%
Provisions as a % of
gross loans %
Impairment charge
£m
Amounts written-off
£m
Central and local government 7,660 — — — — — — — Finance
- banks 48,934 206 157 0.4 76 0.3 34 — - other 60,386 1,539 419 2.5 27 0.7 886 692 Residential mortgages 140,907 3,284 551 2.3 17 0.4 909 642 Personal lending 41,671 3,940 2,926 9.5 74 7.0 2,517 2,002 Property 99,426 14,318 3,422 14.4 24 3.4 3,296 650 Construction 14,760 2,232 519 15.1 23 3.5 479 287 Manufacturing 44,674 3,131 2,088 7.0 67 4.7 1,520 784 Service industries and business activities 134,076 5,308 1,860 4.0 35 1.4 1,964 1,281 Agriculture, forestry and fishing 4,279 137 73 3.2 53 1.7 30 5 Finance leases and instalment credit 20,103 894 418 4.4 47 2.1 271 135 Interest accruals 1,728 — — — — — — — Latent — — 2,740 — — — 1,184 — 618,604 34,989 15,173 5.7 43 2.5 13,090 6,478 of which: UK 394,297 16,104 6,922 4.1 43 1.8 5,593 2,924 Europe 107,803 13,390 5,449 12.4 41 5.1 3,270 427 US 84,072 4,115 2,020 4.9 49 2.4 3,273 2,656 RoW 32,432 1,380 782 4.3 57 2.4 954 471 Group before RFS MI 618,604 34,989 15,173 5.7 43 2.5 13,090 6,478 RFS MI 142,688 3,260 2,110 2.3 65 1.5 1,044 461 Group 761,292 38,249 17,283 5.0 45 2.3 14,134 6,939
RBS Group 2010184
Business review continued

Core
2010
Gross loans
£m REIL
£m Provisions
£m
REIL as a % of
gross loans %
Provisions as a % of REIL
%
Provisions as a % of
gross loans %
Impairment charge
£m
Amounts written-off
£m
Central and local government 6,781 — — — — — — — Finance
- banks 57,033 144 126 0.3 88 0.2 (5) 1 - other 46,910 567 402 1.2 71 0.9 191 53 Residential mortgages 140,359 3,999 693 2.8 17 0.5 578 243 Personal lending 33,581 3,131 2,545 9.3 81 7.6 1,157 1,271 Property 42,455 3,287 818 7.7 25 1.9 739 98 Construction 8,680 610 222 7.0 36 2.6 189 38 Manufacturing 25,797 555 266 2.2 48 1.0 119 124 Service industries and business activities 95,127 2,576 948 2.7 37 1.0 687 349 Agriculture, forestry and fishing 3,758 94 57 2.5 61 1.5 24 5 Finance leases and instalment credit 8,321 244 140 2.9 57 1.7 63 42 Interest accruals 831 — — — — — — — Latent — — 1,649 — — — (5) — 469,633 15,207 7,866 3.2 52 1.7 3,737 2,224 of which: UK 319,679 9,337 4,797 2.9 51 1.5 2,234 1,519 Europe 65,874 3,905 2,027 5.9 52 3.1 936 111 US 62,085 1,027 824 1.7 80 1.3 425 556 RoW 21,995 938 218 4.3 23 1.0 142 38 Group before RFS MI 469,633 15,207 7,866 3.2 52 1.7 3,737 2,224
2009
Central and local government 6,128 — — — — — — — Finance
- banks 47,574 168 135 0.4 80 0.3 12 — - other 50,673 1,038 259 2.0 25 0.5 256 113 Residential mortgages 127,975 2,670 341 2.1 13 0.3 305 146 Personal lending 35,313 3,344 2,560 9.5 77 7.2 1,816 1,398 Property 49,054 1,766 468 3.6 27 1.0 417 37 Construction 9,502 457 131 4.8 29 1.4 58 30 Manufacturing 30,272 491 191 1.6 39 0.6 136 93 Service industries and business activities 100,438 1,762 669 1.8 38 0.7 500 365 Agriculture, forestry and fishing 3,726 90 46 2.4 51 1.2 24 4 Finance leases and instalment credit 8,147 303 116 3.7 38 1.4 52 100 Interest accruals 1,179 — — — — — — — Latent — — 2,005 — — — 991 — 469,981 12,089 6,921 2.6 57 1.5 4,567 2,286 of which: UK 315,254 7,704 4,209 2.4 55 1.3 2,884 1,645 Europe 66,707 2,607 1,709 3.9 66 2.6 750 46 US 64,526 1,497 876 2.3 59 1.4 813 576 RoW 23,494 281 127 1.2 45 0.5 120 19 Group before RFS MI 469,981 12,089 6,921 2.6 57 1.5 4,567 2,286
185RBS Group 2010
Business review
Risk and balance sheet management
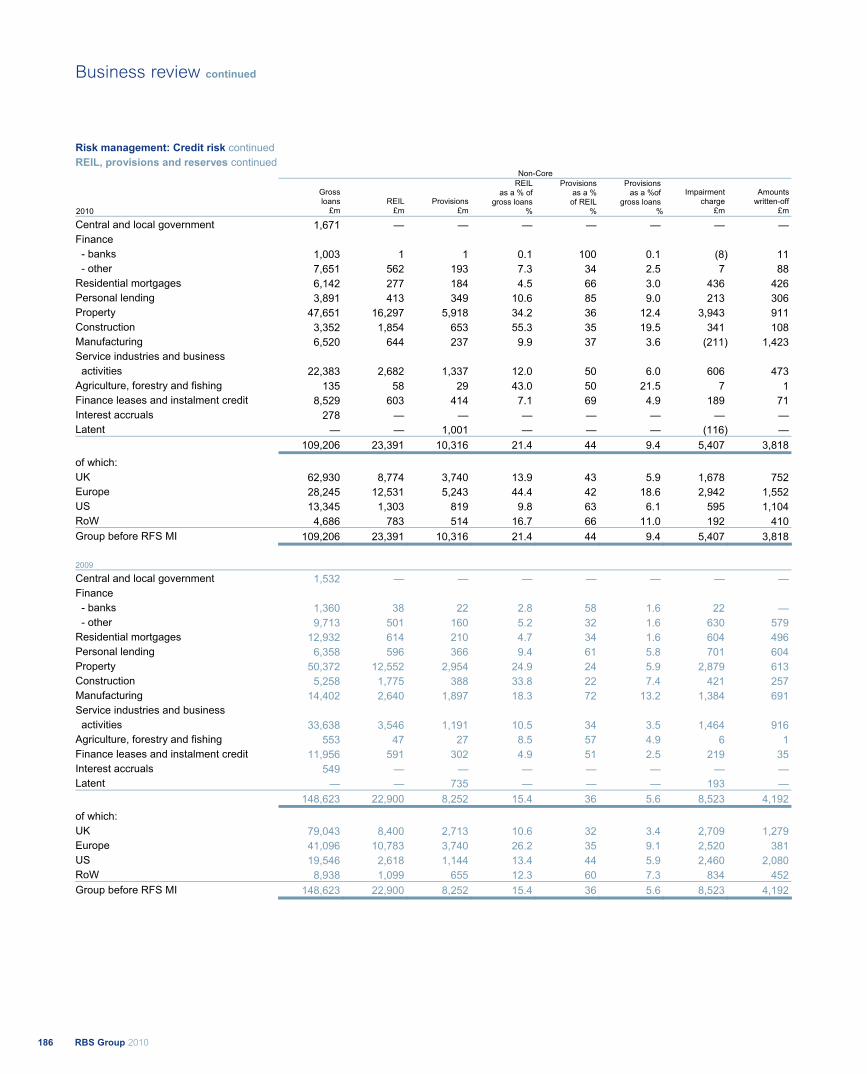
Risk management: Credit risk continued REIL, provisions and reserves continued
Non-Core
2010
Gross loans
£m REIL
£m Provisions
£m
REIL as a % of
gross loans %
Provisions as a % of REIL
%
Provisions as a %of
gross loans %
Impairment charge
£m
Amounts written-off
£m
Central and local government 1,671 — — — — — — — Finance
- banks 1,003 1 1 0.1 100 0.1 (8) 11 - other 7,651 562 193 7.3 34 2.5 7 88 Residential mortgages 6,142 277 184 4.5 66 3.0 436 426 Personal lending 3,891 413 349 10.6 85 9.0 213 306 Property 47,651 16,297 5,918 34.2 36 12.4 3,943 911 Construction 3,352 1,854 653 55.3 35 19.5 341 108 Manufacturing 6,520 644 237 9.9 37 3.6 (211) 1,423 Service industries and business activities 22,383 2,682 1,337 12.0 50 6.0 606 473 Agriculture, forestry and fishing 135 58 29 43.0 50 21.5 7 1 Finance leases and instalment credit 8,529 603 414 7.1 69 4.9 189 71 Interest accruals 278 — — — — — — — Latent — — 1,001 — — — (116) — 109,206 23,391 10,316 21.4 44 9.4 5,407 3,818 of which: UK 62,930 8,774 3,740 13.9 43 5.9 1,678 752 Europe 28,245 12,531 5,243 44.4 42 18.6 2,942 1,552 US 13,345 1,303 819 9.8 63 6.1 595 1,104 RoW 4,686 783 514 16.7 66 11.0 192 410 Group before RFS MI 109,206 23,391 10,316 21.4 44 9.4 5,407 3,818
2009
Central and local government 1,532 — — — — — — — Finance
- banks 1,360 38 22 2.8 58 1.6 22 — - other 9,713 501 160 5.2 32 1.6 630 579 Residential mortgages 12,932 614 210 4.7 34 1.6 604 496 Personal lending 6,358 596 366 9.4 61 5.8 701 604 Property 50,372 12,552 2,954 24.9 24 5.9 2,879 613 Construction 5,258 1,775 388 33.8 22 7.4 421 257 Manufacturing 14,402 2,640 1,897 18.3 72 13.2 1,384 691 Service industries and business activities 33,638 3,546 1,191 10.5 34 3.5 1,464 916 Agriculture, forestry and fishing 553 47 27 8.5 57 4.9 6 1 Finance leases and instalment credit 11,956 591 302 4.9 51 2.5 219 35 Interest accruals 549 — — — — — — — Latent — — 735 — — — 193 — 148,623 22,900 8,252 15.4 36 5.6 8,523 4,192 of which: UK 79,043 8,400 2,713 10.6 32 3.4 2,709 1,279 Europe 41,096 10,783 3,740 26.2 35 9.1 2,520 381 US 19,546 2,618 1,144 13.4 44 5.9 2,460 2,080 RoW 8,938 1,099 655 12.3 60 7.3 834 452 Group before RFS MI 148,623 22,900 8,252 15.4 36 5.6 8,523 4,192
RBS Group 2010186
Business review continued
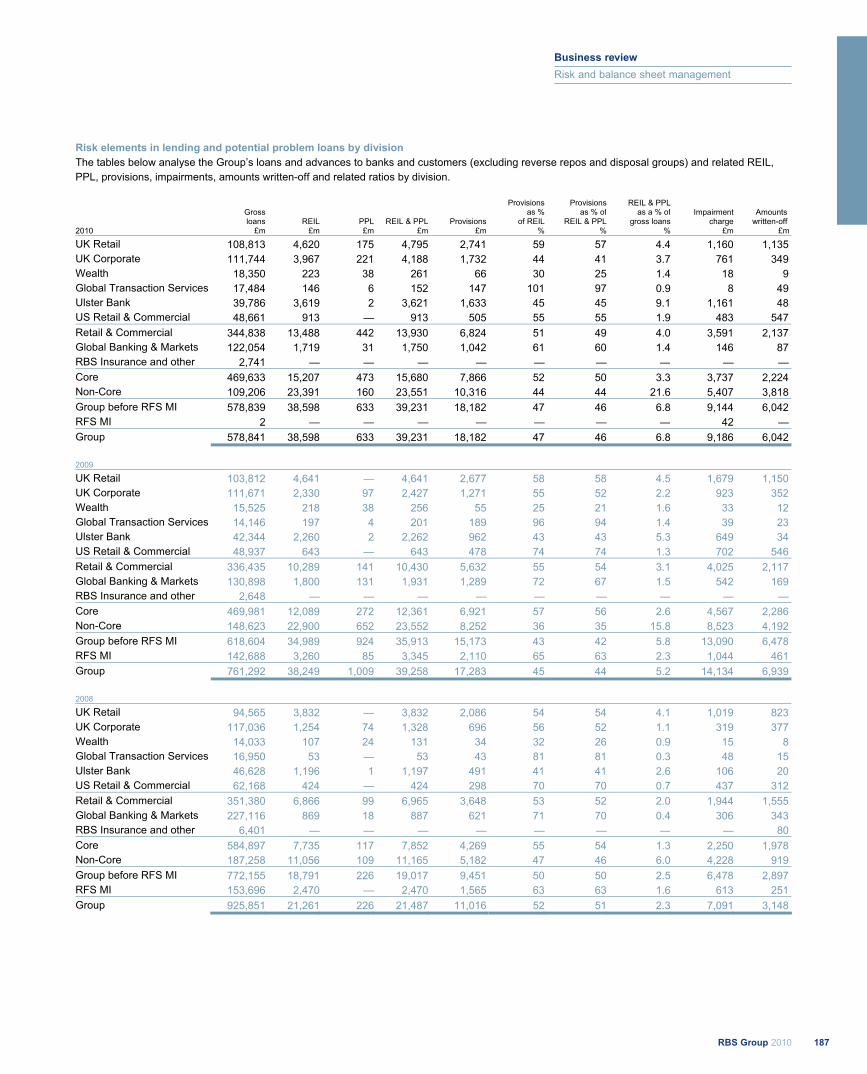
Risk elements in lending and potential problem loans by division The tables below analyse the Group’s loans and advances to banks and customers (excluding reverse repos and disposal groups) and related REIL, PPL, provisions, impairments, amounts written-off and related ratios by division.
Gross loans REIL PPL REIL & PPL Provisions
Provisionsas %
of REIL
Provisionsas % of
REIL & PPL
REIL & PPLas a % of
gross loansImpairment
charge Amounts
written-off 2010 £m £m £m £m £m % % % £m £m
UK Retail 108,813 4,620 175 4,795 2,741 59 57 4.4 1,160 1,135 UK Corporate 111,744 3,967 221 4,188 1,732 44 41 3.7 761 349 Wealth 18,350 223 38 261 66 30 25 1.4 18 9 Global Transaction Services 17,484 146 6 152 147 101 97 0.9 8 49 Ulster Bank 39,786 3,619 2 3,621 1,633 45 45 9.1 1,161 48 US Retail & Commercial 48,661 913 — 913 505 55 55 1.9 483 547 Retail & Commercial 344,838 13,488 442 13,930 6,824 51 49 4.0 3,591 2,137 Global Banking & Markets 122,054 1,719 31 1,750 1,042 61 60 1.4 146 87 RBS Insurance and other 2,741 — — — — — — — — — Core 469,633 15,207 473 15,680 7,866 52 50 3.3 3,737 2,224 Non-Core 109,206 23,391 160 23,551 10,316 44 44 21.6 5,407 3,818 Group before RFS MI 578,839 38,598 633 39,231 18,182 47 46 6.8 9,144 6,042 RFS MI 2 — — — — — — — 42 — Group 578,841 38,598 633 39,231 18,182 47 46 6.8 9,186 6,042
2009 UK Retail 103,812 4,641 — 4,641 2,677 58 58 4.5 1,679 1,150 UK Corporate 111,671 2,330 97 2,427 1,271 55 52 2.2 923 352 Wealth 15,525 218 38 256 55 25 21 1.6 33 12 Global Transaction Services 14,146 197 4 201 189 96 94 1.4 39 23 Ulster Bank 42,344 2,260 2 2,262 962 43 43 5.3 649 34 US Retail & Commercial 48,937 643 — 643 478 74 74 1.3 702 546 Retail & Commercial 336,435 10,289 141 10,430 5,632 55 54 3.1 4,025 2,117 Global Banking & Markets 130,898 1,800 131 1,931 1,289 72 67 1.5 542 169 RBS Insurance and other 2,648 — — — — — — — — — Core 469,981 12,089 272 12,361 6,921 57 56 2.6 4,567 2,286 Non-Core 148,623 22,900 652 23,552 8,252 36 35 15.8 8,523 4,192 Group before RFS MI 618,604 34,989 924 35,913 15,173 43 42 5.8 13,090 6,478 RFS MI 142,688 3,260 85 3,345 2,110 65 63 2.3 1,044 461 Group 761,292 38,249 1,009 39,258 17,283 45 44 5.2 14,134 6,939
2008 UK Retail 94,565 3,832 — 3,832 2,086 54 54 4.1 1,019 823 UK Corporate 117,036 1,254 74 1,328 696 56 52 1.1 319 377 Wealth 14,033 107 24 131 34 32 26 0.9 15 8 Global Transaction Services 16,950 53 — 53 43 81 81 0.3 48 15 Ulster Bank 46,628 1,196 1 1,197 491 41 41 2.6 106 20 US Retail & Commercial 62,168 424 — 424 298 70 70 0.7 437 312 Retail & Commercial 351,380 6,866 99 6,965 3,648 53 52 2.0 1,944 1,555 Global Banking & Markets 227,116 869 18 887 621 71 70 0.4 306 343 RBS Insurance and other 6,401 — — — — — — — — 80 Core 584,897 7,735 117 7,852 4,269 55 54 1.3 2,250 1,978 Non-Core 187,258 11,056 109 11,165 5,182 47 46 6.0 4,228 919 Group before RFS MI 772,155 18,791 226 19,017 9,451 50 50 2.5 6,478 2,897 RFS MI 153,696 2,470 — 2,470 1,565 63 63 1.6 613 251 Group 925,851 21,261 226 21,487 11,016 52 51 2.3 7,091 3,148
187RBS Group 2010
Business review
Risk and balance sheet management
Risk management: Credit risk continued REIL, provisions and reserves continued
Impairment loss provision methodology Provisions for impairment losses are assessed under three categories:
Individually assessed provisions: provisions required for individually significant impaired assets which are assessed on a case by case basis, taking into account the financial condition of the counterparty and any guarantee and other collateral held after being stressed for downside risk. This incorporates an estimate of the discounted value of any recoveries and realisation of security or collateral. The asset continues to be assessed on an individual basis until it is repaid in full, transferred to the performing portfolio or written-off;
Collectively assessed provisions: provisions on impaired credits below an agreed threshold which are assessed on a portfolio basis, to reflect the homogeneous nature of the assets, such as credit cards or personal loans. The provision is determined from a quantitative review of the relevant portfolio, taking account of the level of arrears, security and average loss experience over the recovery period. It incorporates loss experience adjustments, where appropriate, in the light of current economic and credit conditions. These include review of current cash collections profile performance against historic trends, updates to metric inputs - including model recalibrations and monitoring of operational processes used in managing exposure - including the time taken to process non-performing exposures; and
Latent loss provisions: provisions held against impairments in the performing portfolio that have been incurred as a result of events occurring before the balance sheet date but which have not been identified at the balance sheet date. The Group has developed methodologies to estimate latent loss provisions that reflect:
– historical loss experience adjusted where appropriate, in the light of current economic and credit conditions; and
– the period (‘emergence period’) between an impairment event occurring and a loan being identified and reported as impaired.
Recoverable cash flows or proceeds are estimated using two parameters: loss given default (LGD) - this is the estimated loss amount, expressed as a percentage, that will be incurred if the borrower defaults; and the probability that the borrower will default (PD).
Emergence periods are estimated at a portfolio level and reflect the portfolio product characteristics such as a coupon period and repayment terms, and the duration of the administrative process required to report and identify an impaired loan as such. Emergence periods vary across different portfolios from 2 to 225 days. They are based on actual experience within the particular portfolio and are reviewed regularly.
The Group's retail business segment their performing loan books into homogenous portfolios such as mortgages, credit cards or unsecured loans, to reflect their different credit characteristics. Latent provisions are computed by applying portfolio-level LGDs,
PDs and emergence periods. The wholesale calculation is based on similar principles but there is no segmentation into portfolios: PDs and LGDs are calculated on an individual basis.
Once a loss event has occurred, a loan is assessed for an impairment provision. In the case of loans that are restructured due to the financial condition of the borrower, the loss event and consequent loan impairment provision assessment (based on management’s best estimate of the incurred loss) almost invariably take place prior to the restructuring. The quantum of the loan impairment provision may change once the terms of the restructuring are known resulting in an additional provision charge or a release of provision in the period in which the restructuring takes place.
Provisions and AFS reserves The Group's consumer portfolios, which consist of high volume, small value credits, have highly efficient largely automated processes for identifying problem credits and very short timescales, typically three months, before resolution or adoption of various recovery methods. Corporate portfolios consist of higher value, lower volume credits, which tend to be structured to meet individual customer requirements.
Provisions are assessed on a case by case basis by experienced specialists with input from professional valuers and accountants. The Group operates a transparent provisions governance framework, setting thresholds to trigger enhanced oversight and challenge.
Analyses of provisions are set out on page 189.
Available-for-sale financial assets are initially recognised at fair value plus directly related transaction costs and are subsequently measured at fair value with changes in fair value reported in owners’ equity until disposal, at which stage the cumulative gain or loss is recognised in profit or loss. When there is objective evidence that an available-for-sale financial asset is impaired, any decline in its fair value below original cost is removed from equity and recognised in profit or loss.
Impairment losses are recognised when there is objective evidence of impairment. The Group reviews its portfolios of available-for-sale financial assets for such evidence which includes: default or delinquency in interest or principal payments; significant financial difficulty of the issuer or obligor; and it becoming probable that the issuer will enter bankruptcy or other financial reorganisation. However, the disappearance of an active market because an entity’s financial instruments are no longer publicly traded is not evidence of impairment. Furthermore, a downgrade of an entity’s credit rating is not, of itself, evidence of impairment, although it may be evidence of impairment when considered with other available information. A decline in the fair value of a financial asset below its cost or amortised cost is not necessarily evidence of impairment. Determining whether objective evidence of impairment exists requires the exercise of management judgment. The unrecognised losses on the Group’s available-for-sale debt securities are concentrated in its portfolios of mortgage-backed securities. The losses reflect the widening of credit spreads as a result of the reduced market liquidity in these securities and the current uncertain macroeconomic outlook in the US and Europe. The underlying securities remain unimpaired. Analyses of AFS debt securities and related AFS reserves are set out on pages 191 and 192.
RBS Group 2010188
Business review continued
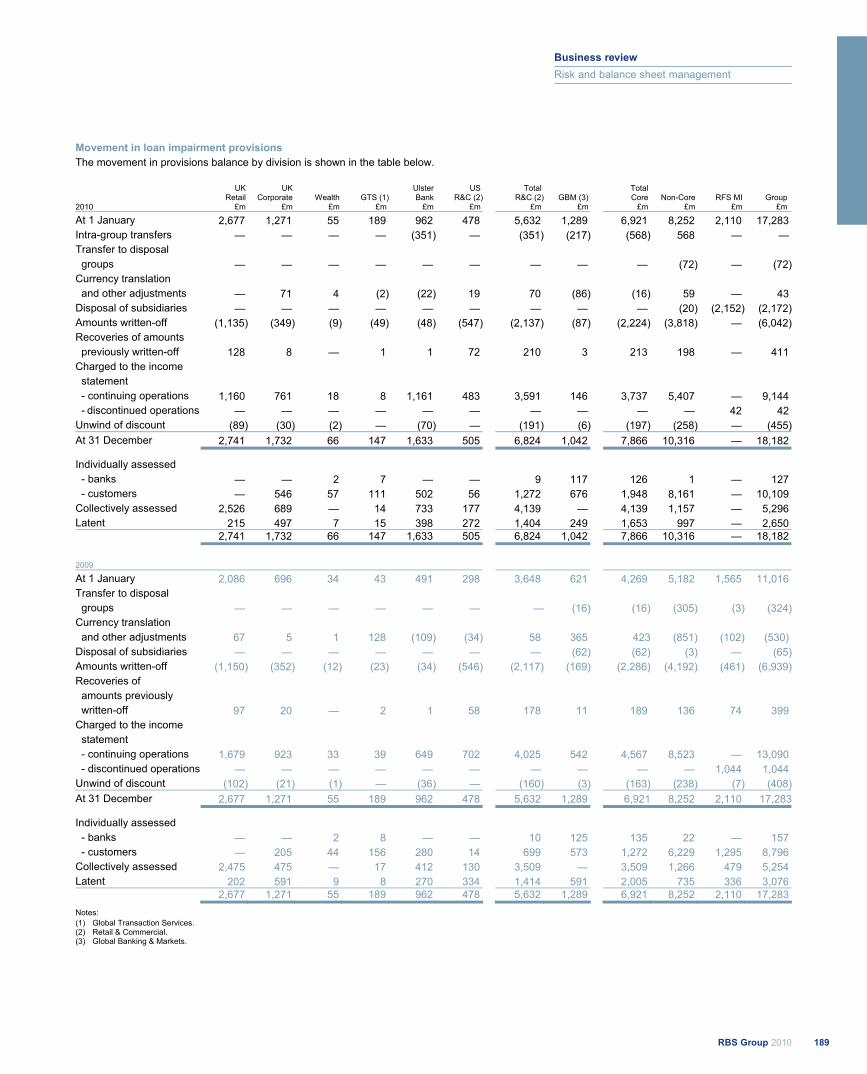
Movement in loan impairment provisions The movement in provisions balance by division is shown in the table below.
UKRetail
UKCorporate Wealth GTS (1)
Ulster Bank
USR&C (2)
TotalR&C (2) GBM (3)
Total Core Non-Core RFS MI Group
2010 £m £m £m £m £m £m £m £m £m £m £m £m
At 1 January 2,677 1,271 55 189 962 478 5,632 1,289 6,921 8,252 2,110 17,283 Intra-group transfers — — — — (351) — (351) (217) (568) 568 — — Transfer to disposal groups — — — — — — — — — (72) — (72)Currency translation and other adjustments — 71 4 (2) (22) 19 70 (86) (16) 59 — 43 Disposal of subsidiaries — — — — — — — — — (20) (2,152) (2,172)Amounts written-off (1,135) (349) (9) (49) (48) (547) (2,137) (87) (2,224) (3,818) — (6,042)Recoveries of amounts previously written-off 128 8 — 1 1 72 210 3 213 198 — 411 Charged to the income statement
- continuing operations 1,160 761 18 8 1,161 483 3,591 146 3,737 5,407 — 9,144 - discontinued operations — — — — — — — — — — 42 42 Unwind of discount (89) (30) (2) — (70) — (191) (6) (197) (258) — (455)At 31 December 2,741 1,732 66 147 1,633 505 6,824 1,042 7,866 10,316 — 18,182
Individually assessed - banks — — 2 7 — — 9 117 126 1 — 127
- customers — 546 57 111 502 56 1,272 676 1,948 8,161 — 10,109 Collectively assessed 2,526 689 — 14 733 177 4,139 — 4,139 1,157 — 5,296 Latent 215 497 7 15 398 272 1,404 249 1,653 997 — 2,650
2,741 1,732 66 147 1,633 505 6,824 1,042 7,866 10,316 — 18,182
2009 At 1 January 2,086 696 34 43 491 298 3,648 621 4,269 5,182 1,565 11,016 Transfer to disposal groups — — — — — — — (16) (16) (305) (3) (324)Currency translation and other adjustments 67 5 1 128 (109) (34) 58 365 423 (851) (102) (530) Disposal of subsidiaries — — — — — — — (62) (62) (3) — (65)Amounts written-off (1,150) (352) (12) (23) (34) (546) (2,117) (169) (2,286) (4,192) (461) (6,939)Recoveries of amounts previously written-off 97 20 — 2 1 58 178 11 189 136 74 399 Charged to the income statement - continuing operations 1,679 923 33 39 649 702 4,025 542 4,567 8,523 — 13,090
- discontinued operations — — — — — — — — — — 1,044 1,044 Unwind of discount (102) (21) (1) — (36) — (160) (3) (163) (238) (7) (408)At 31 December 2,677 1,271 55 189 962 478 5,632 1,289 6,921 8,252 2,110 17,283
Individually assessed - banks — — 2 8 — — 10 125 135 22 — 157
- customers — 205 44 156 280 14 699 573 1,272 6,229 1,295 8,796 Collectively assessed 2,475 475 — 17 412 130 3,509 — 3,509 1,266 479 5,254 Latent 202 591 9 8 270 334 1,414 591 2,005 735 336 3,076
2,677 1,271 55 189 962 478 5,632 1,289 6,921 8,252 2,110 17,283 Notes: (1) Global Transaction Services. (2) Retail & Commercial. (3) Global Banking & Markets.
189RBS Group 2010
Business review
Risk and balance sheet management
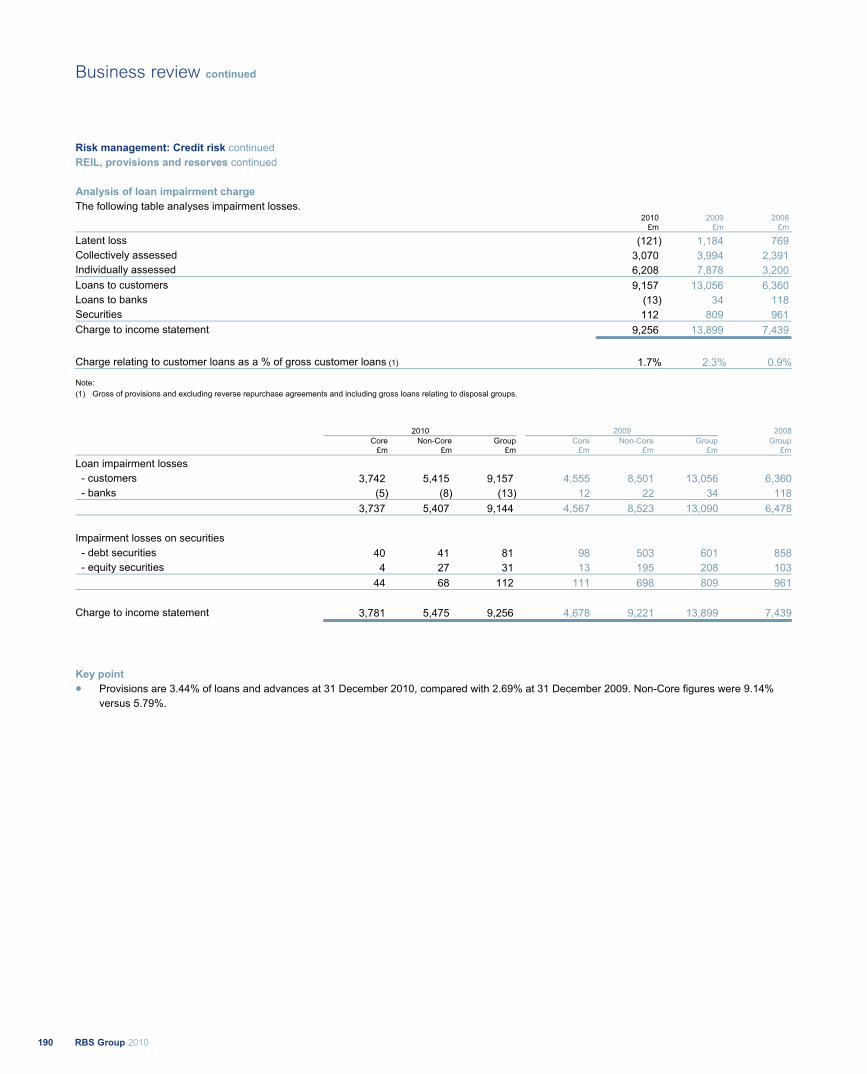
Risk management: Credit risk continued REIL, provisions and reserves continued Analysis of loan impairment charge The following table analyses impairment losses. 2010
£m 2009
£m 2008
£m
Latent loss (121) 1,184 769 Collectively assessed 3,070 3,994 2,391 Individually assessed 6,208 7,878 3,200 Loans to customers 9,157 13,056 6,360 Loans to banks (13) 34 118 Securities 112 809 961 Charge to income statement 9,256 13,899 7,439
Charge relating to customer loans as a % of gross customer loans (1) 1.7% 2.3% 0.9%
Note: (1) Gross of provisions and excluding reverse repurchase agreements and including gross loans relating to disposal groups.
2010 2009 2008Core
£mNon-Core
£mGroup
£mCore
£mNon-Core
£m Group
£mGroup
£m
Loan impairment losses - customers 3,742 5,415 9,157 4,555 8,501 13,056 6,360
- banks (5) (8) (13) 12 22 34 118 3,737 5,407 9,144 4,567 8,523 13,090 6,478
Impairment losses on securities - debt securities 40 41 81 98 503 601 858
- equity securities 4 27 31 13 195 208 103 44 68 112 111 698 809 961
Charge to income statement 3,781 5,475 9,256 4,678 9,221 13,899 7,439
Key point Provisions are 3.44% of loans and advances at 31 December 2010, compared with 2.69% at 31 December 2009. Non-Core figures were 9.14% versus 5.79%.
RBS Group 2010190
Business review continued
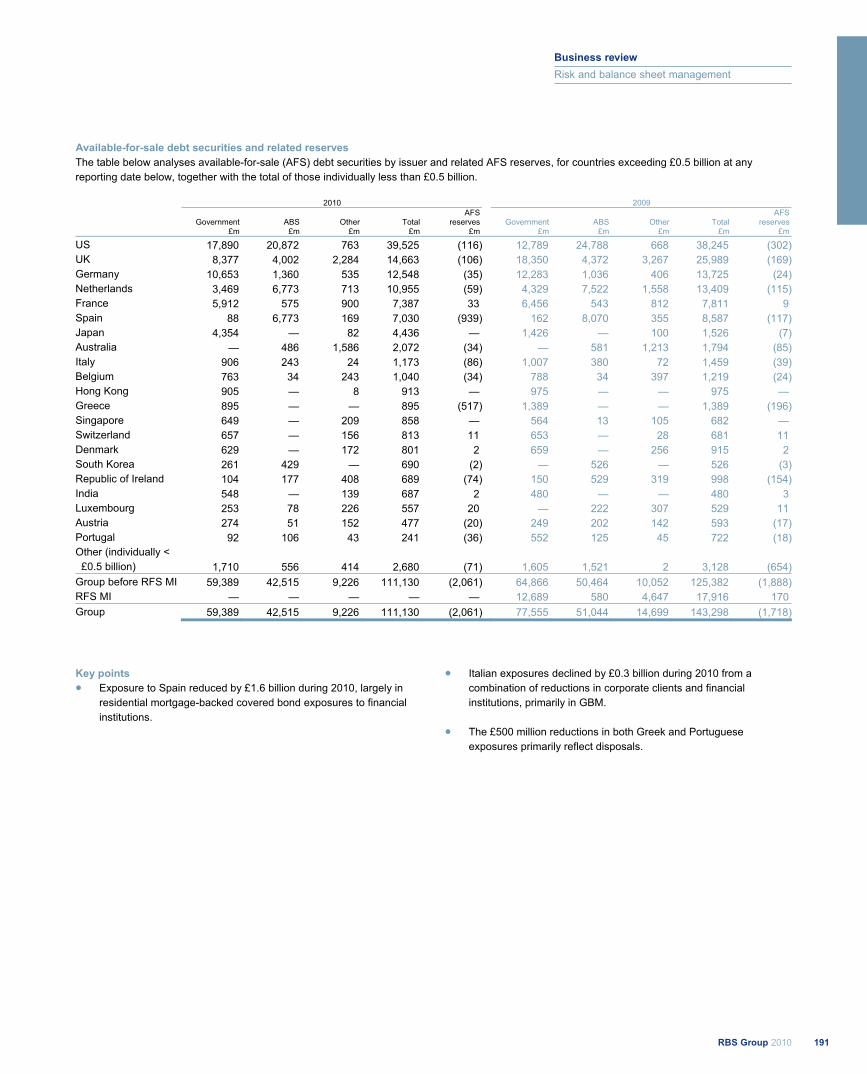
Available-for-sale debt securities and related reserves The table below analyses available-for-sale (AFS) debt securities by issuer and related AFS reserves, for countries exceeding £0.5 billion at any reporting date below, together with the total of those individually less than £0.5 billion.
2010 2009
Government ABS Other Total AFS
reserves Government ABS Other Total AFS
reserves £m £m £m £m £m £m £m £m £m £m
US 17,890 20,872 763 39,525 (116) 12,789 24,788 668 38,245 (302)UK 8,377 4,002 2,284 14,663 (106) 18,350 4,372 3,267 25,989 (169)Germany 10,653 1,360 535 12,548 (35) 12,283 1,036 406 13,725 (24)Netherlands 3,469 6,773 713 10,955 (59) 4,329 7,522 1,558 13,409 (115)France 5,912 575 900 7,387 33 6,456 543 812 7,811 9 Spain 88 6,773 169 7,030 (939) 162 8,070 355 8,587 (117)Japan 4,354 — 82 4,436 — 1,426 — 100 1,526 (7)Australia — 486 1,586 2,072 (34) — 581 1,213 1,794 (85)Italy 906 243 24 1,173 (86) 1,007 380 72 1,459 (39)Belgium 763 34 243 1,040 (34) 788 34 397 1,219 (24)Hong Kong 905 — 8 913 — 975 — — 975 — Greece 895 — — 895 (517) 1,389 — — 1,389 (196)Singapore 649 — 209 858 — 564 13 105 682 — Switzerland 657 — 156 813 11 653 — 28 681 11 Denmark 629 — 172 801 2 659 — 256 915 2 South Korea 261 429 — 690 (2) — 526 — 526 (3)Republic of Ireland 104 177 408 689 (74) 150 529 319 998 (154)India 548 — 139 687 2 480 — — 480 3 Luxembourg 253 78 226 557 20 — 222 307 529 11 Austria 274 51 152 477 (20) 249 202 142 593 (17)Portugal 92 106 43 241 (36) 552 125 45 722 (18)Other (individually < £0.5 billion) 1,710 556 414 2,680 (71) 1,605 1,521 2 3,128 (654)Group before RFS MI 59,389 42,515 9,226 111,130 (2,061) 64,866 50,464 10,052 125,382 (1,888)RFS MI — — — — — 12,689 580 4,647 17,916 170 Group 59,389 42,515 9,226 111,130 (2,061) 77,555 51,044 14,699 143,298 (1,718)
Key points Exposure to Spain reduced by £1.6 billion during 2010, largely in residential mortgage-backed covered bond exposures to financial institutions.
Italian exposures declined by £0.3 billion during 2010 from a combination of reductions in corporate clients and financial institutions, primarily in GBM.
The £500 million reductions in both Greek and Portuguese exposures primarily reflect disposals.
191RBS Group 2010
Business review
Risk and balance sheet management
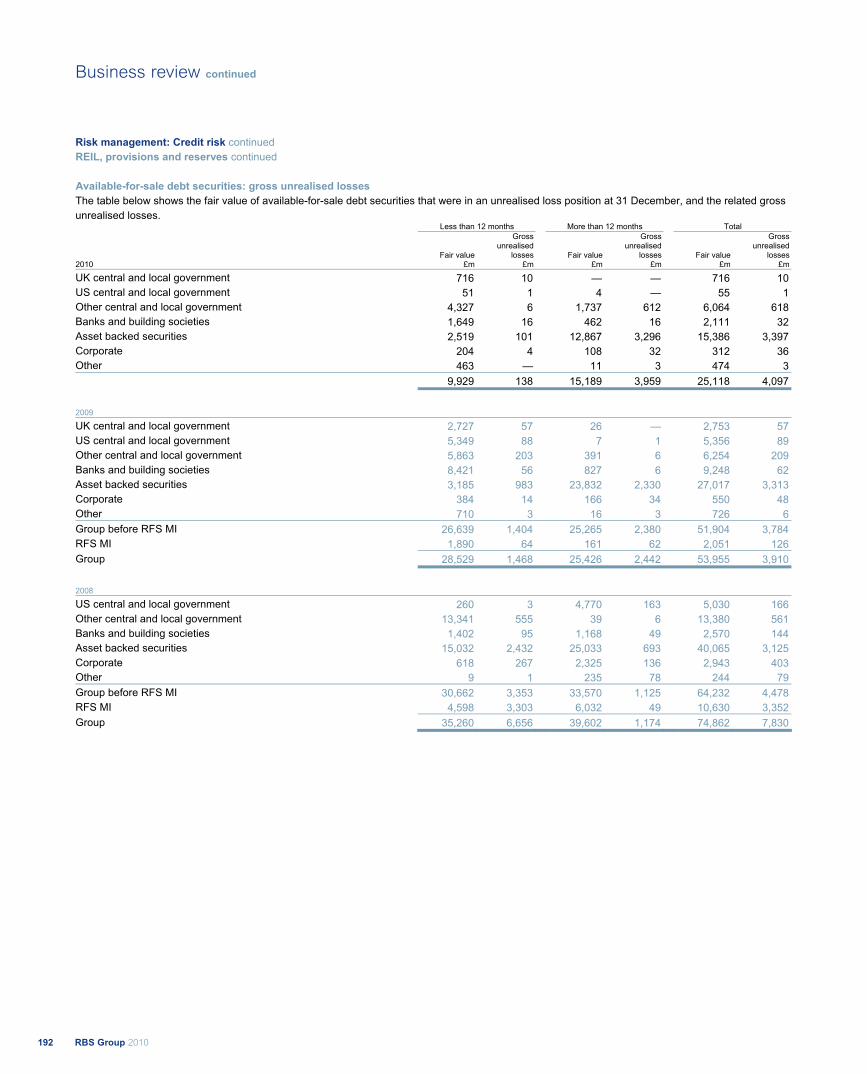
Risk management: Credit risk continued REIL, provisions and reserves continued Available-for-sale debt securities: gross unrealised losses The table below shows the fair value of available-for-sale debt securities that were in an unrealised loss position at 31 December, and the related gross unrealised losses. Less than 12 months More than 12 months Total Gross Gross Gross
unrealised unrealised unrealised Fair value losses Fair value losses Fair value losses 2010 £m £m £m £m £m £m
UK central and local government 716 10 — — 716 10 US central and local government 51 1 4 — 55 1 Other central and local government 4,327 6 1,737 612 6,064 618 Banks and building societies 1,649 16 462 16 2,111 32 Asset backed securities 2,519 101 12,867 3,296 15,386 3,397 Corporate 204 4 108 32 312 36 Other 463 — 11 3 474 3 9,929 138 15,189 3,959 25,118 4,097
2009
UK central and local government 2,727 57 26 — 2,753 57 US central and local government 5,349 88 7 1 5,356 89 Other central and local government 5,863 203 391 6 6,254 209 Banks and building societies 8,421 56 827 6 9,248 62 Asset backed securities 3,185 983 23,832 2,330 27,017 3,313 Corporate 384 14 166 34 550 48 Other 710 3 16 3 726 6 Group before RFS MI 26,639 1,404 25,265 2,380 51,904 3,784 RFS MI 1,890 64 161 62 2,051 126 Group 28,529 1,468 25,426 2,442 53,955 3,910
2008
US central and local government 260 3 4,770 163 5,030 166 Other central and local government 13,341 555 39 6 13,380 561 Banks and building societies 1,402 95 1,168 49 2,570 144 Asset backed securities 15,032 2,432 25,033 693 40,065 3,125 Corporate 618 267 2,325 136 2,943 403 Other 9 1 235 78 244 79 Group before RFS MI 30,662 3,353 33,570 1,125 64,232 4,478 RFS MI 4,598 3,303 6,032 49 10,630 3,352 Group 35,260 6,656 39,602 1,174 74,862 7,830
RBS Group 2010192
Business review continued

Market risk All the disclosures in this section (pages 193 to 198) are audited unless indicated otherwise with an asterisk (*). Market risk arises from changes in interest rates, foreign currency, credit spread, equity prices and risk related factors such as market volatilities. The Group manages market risk centrally within its trading and non-trading portfolios through a comprehensive market risk management framework. This framework includes limits based on, but not limited to, value-at-risk (VaR), stress testing, positions and sensitivity analyses. The majority of market risk exposure is in GBM and Non-Core. The Group is also exposed to market risk through interest rate risk on its non-trading activities. There are additional non-trading market risks in the Retail and Commercial businesses of the Group, principally interest rate risk and foreign exchange risk. These aspects are discussed in more detail in Balance sheet management - Interest rate risk on page 143 and structural foreign currency exposures on page 144. Organisation and structure The Executive Risk Forum approves market risk appetite for trading and non-trading activities. The Global Head of Market & Insurance Risk is responsible for the Group Market Risk Control Framework and under delegated authority from the Executive Risk Forum, sets a limit framework within the context of the approved market risk appetite, which is cascaded down through legal entity, division, business and desk level market risk limits. A daily report summarises the Group’s market risk exposures against agreed limits. This daily report is sent to the Head of Restructuring & Risk, Global Head of Market & Insurance Risk, business Chief Risk Officers and appropriate business Risk Managers. The head of each business, assisted by the business risk management team, is accountable for all market risks associated with its activities. Oversight and support is provided to the business by the Global Head of Market & Insurance Risk, assisted by the Group and business Market Risk teams. The Global Market Risk Committee reviews and makes recommendations concerning the market risk profile across the Group, including risk appetite, limits and utilisation. The Committee meets monthly and is chaired by the Global Head of Market Risk & Insurance Risk. Attendees include respective business Risk Managers and Group Market Risk. Risk measurement and control At the Group level, the risk appetite is expressed in the form of a combination of VaR, sensitivity and stress testing limits. VaR is a technique that produces estimates of the potential change in the market value of a portfolio over a specified time horizon at given confidence levels. For internal risk management purposes, the Group’s VaR assumes a time horizon of one trading day and a confidence level of 99%. The Group's VaR model is based on a historical simulation model, utilising data from the previous two years.
The VaR model has been approved by the FSA to calculate regulatory capital for the trading book. The approval covers general market risk in interest rate, foreign exchange, equity and limited commodity products and specific risk in interest rate and equity products. As the VaR model is an important market risk measurement and control tool and is used for determining a significant component of the market risk capital, it is regularly assessed. The main approach employed is the technique known as back-testing which counts the number of days when a loss (as defined by the FSA), exceeds the corresponding daily VaR estimate, measured at a 99% confidence interval. The FSA categorises a VaR model as green, amber or red. A green model is consistent with a good working model and is achieved for models that have four or less back-testing exceptions in a 12 month period. For the Group’s trading book, a green model status was maintained throughout 2010. The Group’s VaR should be interpreted in light of the limitations of the methodology used, as follows:
Historical Simulation VaR may not provide the best estimate of future market movements. It can only provide a prediction of the future based on events that occurred in the 500 trading day time series. Therefore, events that are more severe than those in the historical data series cannot be predicted.
The use of a 99% confidence level does not reflect the extent of potential losses beyond that percentile.
The use of a one-day time horizon will not fully capture the profit and loss implications of positions that cannot be liquidated or hedged within one day.
The Group computes the VaR of trading portfolios at the close of business. Positions may change substantially during the course of the trading day and intra-day profit and losses will be incurred.
These limitations mean that the Group cannot guarantee that losses will not exceed the VaR. A risk not in VaR framework has been developed to quantify those market risks not adequately captured by the market standard VaR methodology. Where risks are not included in the model, various non-VaR controls (for example, position monitoring, sensitivity limits, triggers or stress limits) are in place. The Group undertakes daily stress testing to identify the potential losses in excess of VaR. Stress testing is used to calculate a range of trading book exposures which result from extreme market events. Stress testing measures the impact of exceptional changes in market rates and prices on the fair value of the Group’s trading portfolios. The Group calculates historical stress tests and hypothetical stress tests. Historical stress tests calculate the loss that would be generated if the market movements that occurred during historical market events were repeated. Hypothetical stress tests calculate the loss that would be generated if a specific set of adverse market movements were to occur.
193RBS Group 2010
Business review
Risk and balance sheet management
Risk management: Market risk continued Risk measurement and control continued The Global Market Risk Stress Testing Committee reviews and discusses all matters relating to Market Risk Stress Testing. Stress test exposures are discussed with senior management and relevant information is reported to the Group Risk Committee, Executive Risk Forum and the Board. Breaches in the Group’s market risk stress testing limits are monitored and reported. In addition to VaR and stress testing, the Group calculates a wide range of sensitivity and position risk measures, for example interest rate ladders or option revaluation matrices. These measures provide valuable additional controls, often at individual desk or strategy level. Model validation governance Pricing models are developed and owned by the front office. Where pricing models are used as the basis of books and records valuations, they are all subject to independent review and sign-off. Models are assessed by the Group Model Product Review Committee (GMPRC) as having either immaterial or material model risk (valuation uncertainty arising from choice of modelling assumptions), the assessment being made on the basis of expert judgement. Those models assessed as having material model risk are prioritised for independent quantitative review. Independent quantitative review aims to quantify model risk (i.e. the impact of missing risk factors in the front office model or the possibility that we may be mismarking these products relative to other market participants who may be using an alternative model) by comparing model outputs against alternative independently developed models. The results of the independent quantitative review are used by Market Risk to inform risk limits and by Finance to inform reserves. Governance over this process is provided by GMPRC, a forum which brings together Front Office Quantitative Analysts, Market Risk, Finance and Quantitative Research Centre (QuaRC), Group Risk’s independent quantitative model review function. Risk (market risk, incremental default risk, counterparty credit risk) models are developed both within business units and by Group functions. Risk models are also subject to independent review and sign-off. Meetings are held with the FSA every quarter to discuss the traded market risk, including changes in models, management, back testing results, risks not included in the VaR framework and other model performance statistics. As part of the ongoing review and analysis of the suitability of the VaR model, a methodology enhancement to the ABS VaR was approved and incorporated into the regulatory model in 2010. The credit crisis in 2007 - 2009 caused large price changes for some structured bonds and the spread based approach to calculating VaR for these instruments started to give inaccurate risk levels, particularly for bonds trading at a significant discount to par. The methodology enhancement harmonised the VaR approach in the US and Europe by replacing the absolute spread-based approach with a more reliable and granular relative price-based mapping scheme. The enhancement better reflects the risk in the context of position changes, downgrades and vintage as well as improving differentiation between prime, Alt-A and sub-prime exposures.
The VaR disclosure is broken down into trading and non-trading portfolios. Trading VaR relates to the main trading activities of the Group and non-trading reflects the risk associated with reclassified assets, money market business and the management of internal funds flow within the Group’s businesses. Traded portfolios The primary focus of the Group’s trading activities is to provide an extensive range of debt and equity financing, risk management and investment services to its customers, including major corporations and financial institutions around the world. The Group undertakes these activities organised along six principal business lines: money markets; rates flow trading; currencies and commodities; equities; credit markets; and portfolio management & origination. Financial instruments held in the Group’s trading portfolios include, but are not limited to: debt securities, loans, deposits, equities, securities sale and repurchase agreements and derivative financial instruments (futures, forwards, swaps and options). The Group participates in exchange traded and over-the-counter (OTC) derivatives markets. The Group buys and sells financial instruments that are traded or cleared on an exchange, including interest rate swaps, futures and options. Holders of exchange traded instruments provide margin daily with cash or other security at the exchange, to which the holders look for ultimate settlement. The Group also buys and sells financial instruments that are traded OTC, rather than on a recognised exchange. These instruments range from commoditised transactions in derivative markets, to trades where the specific terms are tailored to the requirements of the Group’s customers. In many cases, industry standard documentation is used, most commonly in the form of a master agreement, with individual transaction confirmations. Assets and liabilities in the trading book are measured at their fair value. Fair value is the amount at which the instrument could be exchanged in a current transaction between willing parties. The fair values are determined following IAS 39 guidance which requires banks to use quoted market prices or valuation techniques (models) that make the maximum use of observable inputs. When marking to market using a model, the valuation methodologies are reviewed and approved by the market risk function. Group Risk provides an independent evaluation of the model for transactions deemed by the Group Model Product Review Committee (GMPRC) to be large, complex and/or innovative. Any profits or losses on the revaluation of positions are recognised in the daily profit and loss.
RBS Group 2010194
Business review continued
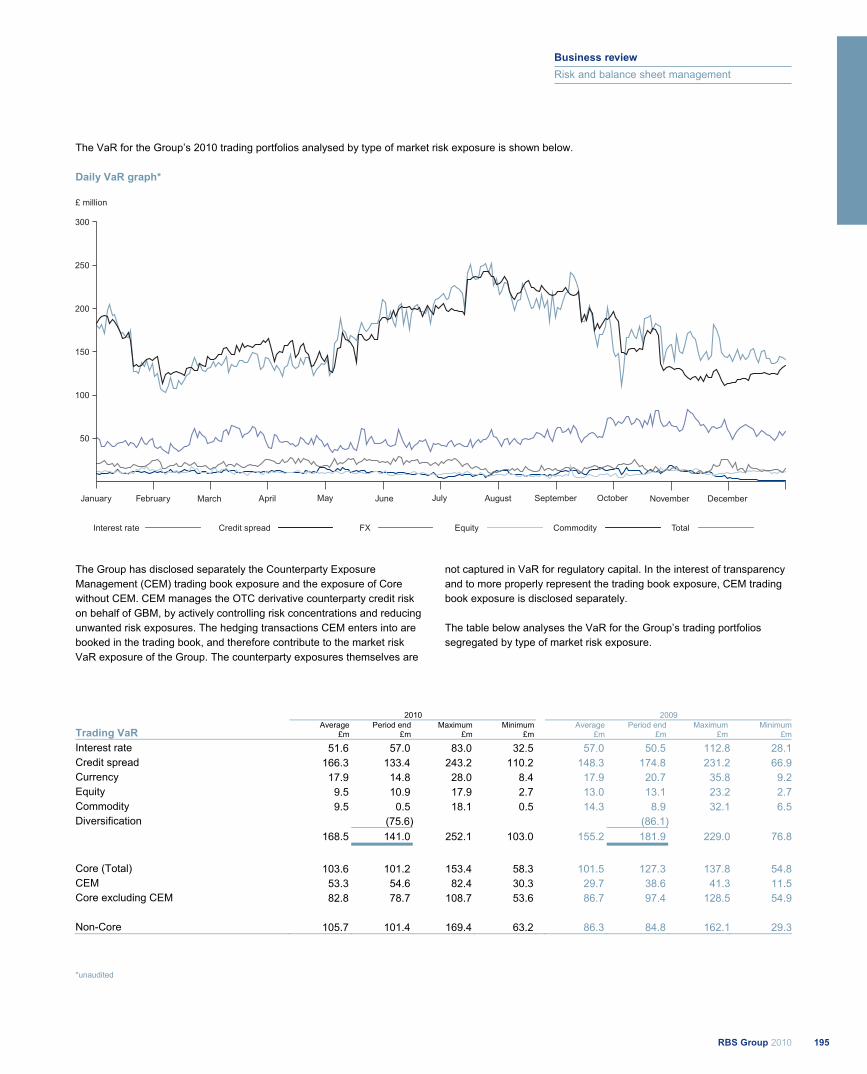
The VaR for the Group’s 2010 trading portfolios analysed by type of market risk exposure is shown below. Daily VaR graph*
195RBS Group 2010
Business review
Risk and balance sheet management
50
100
150
200
250
300
January February March April May June July August September October November December
£ million
Interest rate Credit spread FX Equity Commodity Total
The Group has disclosed separately the Counterparty Exposure Management (CEM) trading book exposure and the exposure of Core without CEM. CEM manages the OTC derivative counterparty credit risk on behalf of GBM, by actively controlling risk concentrations and reducing unwanted risk exposures. The hedging transactions CEM enters into are booked in the trading book, and therefore contribute to the market risk VaR exposure of the Group. The counterparty exposures themselves are
not captured in VaR for regulatory capital. In the interest of transparency and to more properly represent the trading book exposure, CEM trading book exposure is disclosed separately. The table below analyses the VaR for the Group’s trading portfolios segregated by type of market risk exposure.
2010 2009
Trading VaR Average
£m Period end
£mMaximum
£m Minimum
£m Average
£m Period end
£m Maximum
£m Minimum
£m
Interest rate 51.6 57.0 83.0 32.5 57.0 50.5 112.8 28.1Credit spread 166.3 133.4 243.2 110.2 148.3 174.8 231.2 66.9Currency 17.9 14.8 28.0 8.4 17.9 20.7 35.8 9.2Equity 9.5 10.9 17.9 2.7 13.0 13.1 23.2 2.7Commodity 9.5 0.5 18.1 0.5 14.3 8.9 32.1 6.5Diversification (75.6) (86.1) 168.5 141.0 252.1 103.0 155.2 181.9 229.0 76.8
Core (Total) 103.6 101.2 153.4 58.3 101.5 127.3 137.8 54.8CEM 53.3 54.6 82.4 30.3 29.7 38.6 41.3 11.5Core excluding CEM 82.8 78.7 108.7 53.6 86.7 97.4 128.5 54.9 Non-Core 105.7 101.4 169.4 63.2 86.3 84.8 162.1 29.3
*unaudited
R
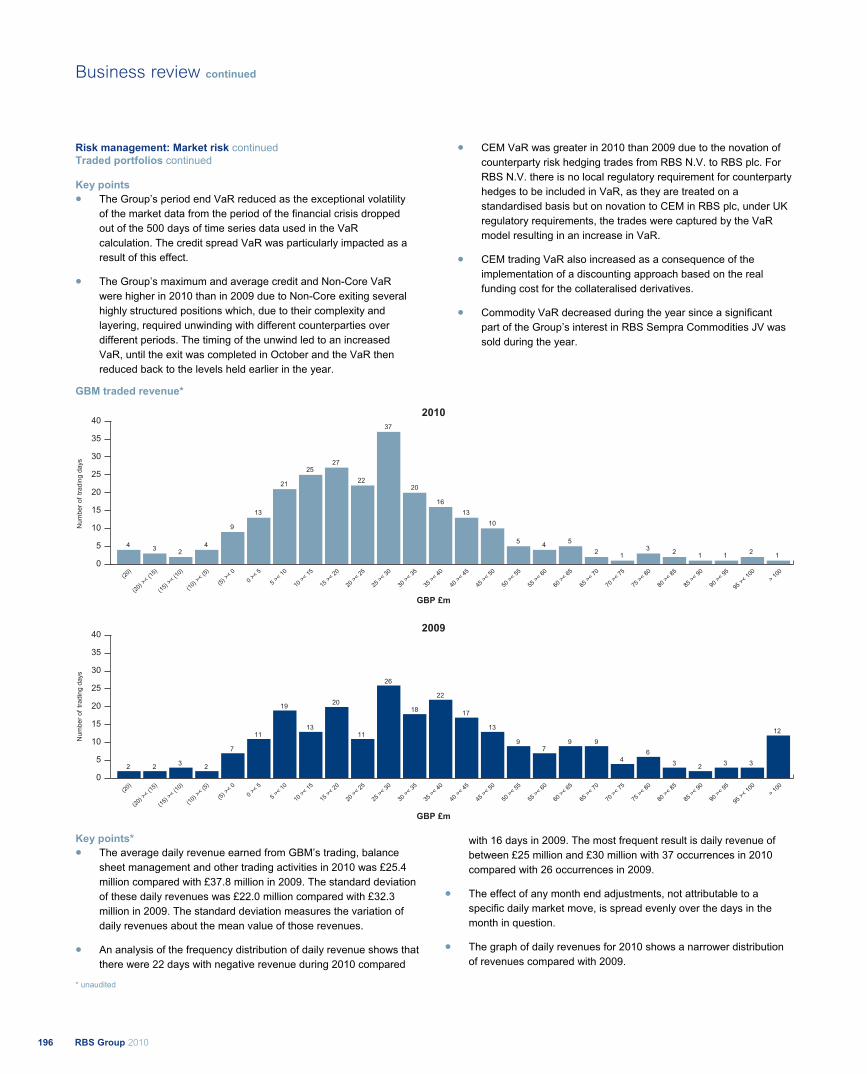
Risk management: Market risk continued Traded portfolios continued
Key points The Group’s period end VaR reduced as the exceptional volatility of the market data from the period of the financial crisis dropped out of the 500 days of time series data used in the VaR calculation. The credit spread VaR was particularly impacted as a result of this effect.
The Group’s maximum and average credit and Non-Core VaR were higher in 2010 than in 2009 due to Non-Core exiting several highly structured positions which, due to their complexity and layering, required unwinding with different counterparties over different periods. The timing of the unwind led to an increased VaR, until the exit was completed in October and the VaR then reduced back to the levels held earlier in the year.
CEM VaR was greater in 2010 than 2009 due to the novation of counterparty risk hedging trades from RBS N.V. to RBS plc. For RBS N.V. there is no local regulatory requirement for counterparty hedges to be included in VaR, as they are treated on a standardised basis but on novation to CEM in RBS plc, under UK regulatory requirements, the trades were captured by the VaR model resulting in an increase in VaR.
CEM trading VaR also increased as a consequence of the implementation of a discounting approach based on the real funding cost for the collateralised derivatives.
Commodity VaR decreased during the year since a significant part of the Group’s interest in RBS Sempra Commodities JV was sold during the year.
GBM traded revenue*
RBS Group 2010196
Business review continued
2
Num
ber
oftr
adin
gda
ys
2 3 2
7
11
19
11
26
18
22
17
13
97
9 9
46
3 2 3
12
3
20
13
(20)
><(1
5)
(15)
><(1
0)
(10)
><(5
)
(5) ><
0
0><
5
5><
10
10><
15
15><
20
20><
25
25><
30
30><
35
35><
40
40><
45
45><
50
50><
55
55><
60
60><
65
65><
70
70><
75
75><
80
80><
85
85><
90
90><
95
95><
100
>10
0(2
0)0
5
10
15
20
25
30
35
40
2010
GBP £m
2009
GBP £m
Key points* The average daily revenue earned from GBM’s trading, balance sheet management and other trading activities in 2010 was £25.4 million compared with £37.8 million in 2009. The standard deviation of these daily revenues was £22.0 million compared with £32.3 million in 2009. The standard deviation measures the variation of daily revenues about the mean value of those revenues.
An analysis of the frequency distribution of daily revenue shows that there were 22 days with negative revenue during 2010 compared
with 16 days in 2009. The most frequent result is daily revenue of between £25 million and £30 million with 37 occurrences in 2010 compared with 26 occurrences in 2009.
The effect of any month end adjustments, not attributable to a specific daily market move, is spread evenly over the days in the month in question.
The graph of daily revenues for 2010 shows a narrower distribution of revenues compared with 2009.
* unaudited
R
0
(20)
><(1
5)
(15)
><(1
0)
(10)
><(5
)
(5) ><
0
0><
5
5><
10
10><
15
15><
20
20><
25
25><
30
30><
35
35><
40
40><
45
45><
50
50><
55
55><
60
60><
65
65><
70
70><
75
75><
80
80><
85
85><
90
90><
95
95><
100
>10
0(2
0)
5
10
4 3 24
9
13
21 22
37
20
16
13
10
5 4 5
2 13 2 1 1 12
2725
Num
ber
oftr
adin
gda
ys
15
20
25
30
35
40
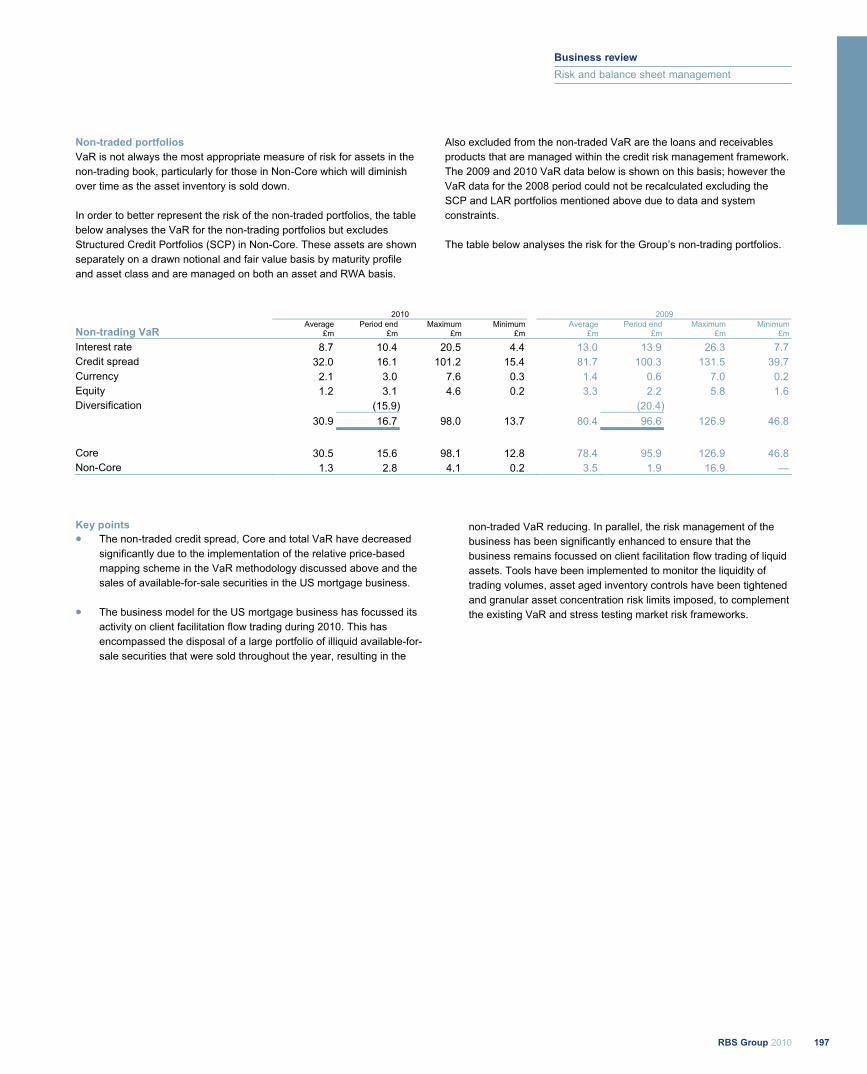
Non-traded portfolios VaR is not always the most appropriate measure of risk for assets in the non-trading book, particularly for those in Non-Core which will diminish over time as the asset inventory is sold down. In order to better represent the risk of the non-traded portfolios, the table below analyses the VaR for the non-trading portfolios but excludes Structured Credit Portfolios (SCP) in Non-Core. These assets are shown separately on a drawn notional and fair value basis by maturity profile and asset class and are managed on both an asset and RWA basis.
Also excluded from the non-traded VaR are the loans and receivables products that are managed within the credit risk management framework. The 2009 and 2010 VaR data below is shown on this basis; however the VaR data for the 2008 period could not be recalculated excluding the SCP and LAR portfolios mentioned above due to data and system constraints. The table below analyses the risk for the Group’s non-trading portfolios.
2010 2009
Non-trading VaR Average
£mPeriod end
£mMaximum
£mMinimum
£mAverage
£mPeriod end
£mMaximum
£mMinimum
£m
Interest rate 8.7 10.4 20.5 4.4 13.0 13.9 26.3 7.7 Credit spread 32.0 16.1 101.2 15.4 81.7 100.3 131.5 39.7 Currency 2.1 3.0 7.6 0.3 1.4 0.6 7.0 0.2 Equity 1.2 3.1 4.6 0.2 3.3 2.2 5.8 1.6 Diversification (15.9) (20.4) 30.9 16.7 98.0 13.7 80.4 96.6 126.9 46.8
Core 30.5 15.6 98.1 12.8 78.4 95.9 126.9 46.8 Non-Core 1.3 2.8 4.1 0.2 3.5 1.9 16.9 —
Key points The non-traded credit spread, Core and total VaR have decreased significantly due to the implementation of the relative price-based mapping scheme in the VaR methodology discussed above and the sales of available-for-sale securities in the US mortgage business.
The business model for the US mortgage business has focussed its activity on client facilitation flow trading during 2010. This has encompassed the disposal of a large portfolio of illiquid available-for-sale securities that were sold throughout the year, resulting in the
non-traded VaR reducing. In parallel, the risk management of the business has been significantly enhanced to ensure that the business remains focussed on client facilitation flow trading of liquid assets. Tools have been implemented to monitor the liquidity of trading volumes, asset aged inventory controls have been tightened and granular asset concentration risk limits imposed, to complement the existing VaR and stress testing market risk frameworks.
197RBS Group 2010
Business review
Risk and balance sheet management
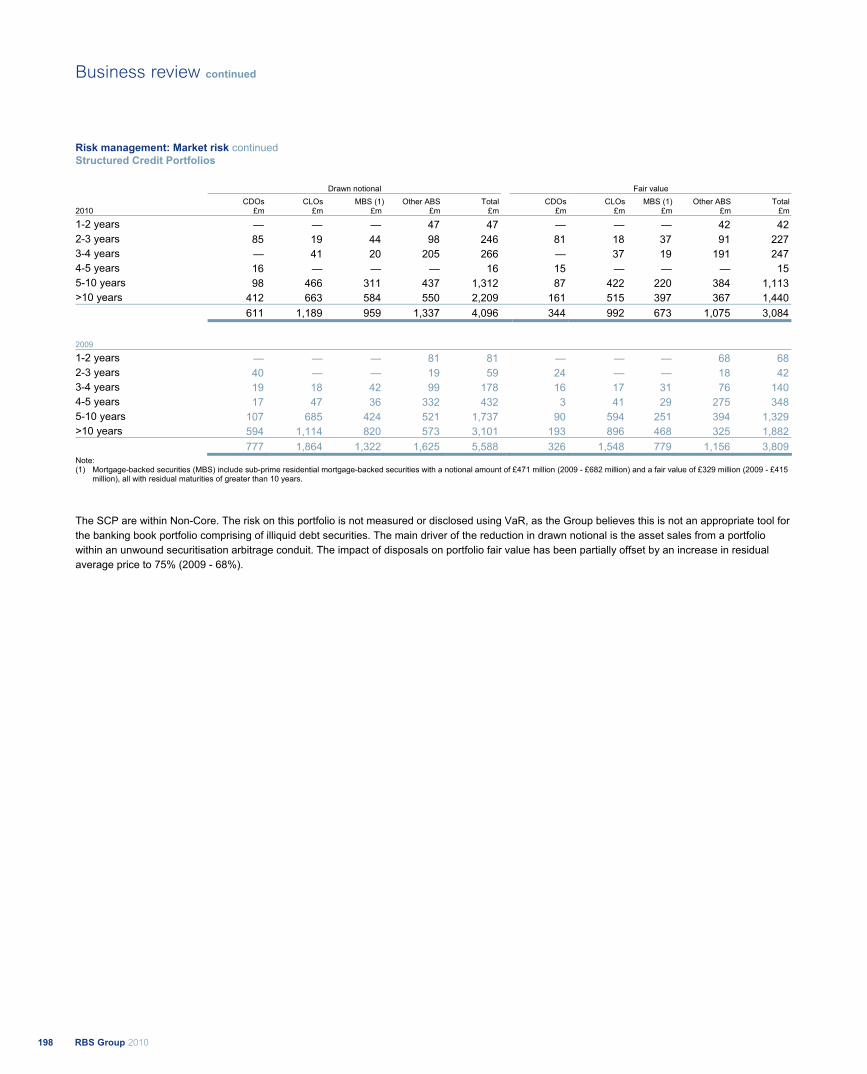
Risk management: Market risk continued Structured Credit Portfolios
Drawn notional Fair value CDOs CLOs MBS (1) Other ABS Total CDOs CLOs MBS (1) Other ABS Total 2010 £m £m £m £m £m £m £m £m £m £m
1-2 years — — — 47 47 — — — 42 42 2-3 years 85 19 44 98 246 81 18 37 91 227 3-4 years — 41 20 205 266 — 37 19 191 247 4-5 years 16 — — — 16 15 — — — 15 5-10 years 98 466 311 437 1,312 87 422 220 384 1,113 >10 years 412 663 584 550 2,209 161 515 397 367 1,440 611 1,189 959 1,337 4,096 344 992 673 1,075 3,084
2009
1-2 years — — — 81 81 — — — 68 68 2-3 years 40 — — 19 59 24 — — 18 42 3-4 years 19 18 42 99 178 16 17 31 76 140 4-5 years 17 47 36 332 432 3 41 29 275 348 5-10 years 107 685 424 521 1,737 90 594 251 394 1,329 >10 years 594 1,114 820 573 3,101 193 896 468 325 1,882 777 1,864 1,322 1,625 5,588 326 1,548 779 1,156 3,809 Note: (1) Mortgage-backed securities (MBS) include sub-prime residential mortgage-backed securities with a notional amount of £471 million (2009 - £682 million) and a fair value of £329 million (2009 - £415
million), all with residual maturities of greater than 10 years.
The SCP are within Non-Core. The risk on this portfolio is not measured or disclosed using VaR, as the Group believes this is not an appropriate tool for the banking book portfolio comprising of illiquid debt securities. The main driver of the reduction in drawn notional is the asset sales from a portfolio within an unwound securitisation arbitrage conduit. The impact of disposals on portfolio fair value has been partially offset by an increase in residual average price to 75% (2009 - 68%).
RRBS Group 2010198
Business review continued
All the disclosures in this section (pages 199 to 203) are unaudited and are marked with an asterisk (*). Insurance risk*
Insurance risk arises through fluctuations in the timing, frequency and/or severity of insured events, relative to the expectations at the time of underwriting. Insurance risk is managed in four distinct ways:
underwriting and pricing risk management is managed through the use of underwriting guidelines which detail the class, nature and type of business that may be accepted, pricing policies by product line and brand, and centralised control of wordings and any subsequent changes;
claims risk management is handled using a range of automated controls and manual processes;
reserving risk management is applied to ensure that sufficient funds have been retained to handle and pay claims as the amounts fall due, both in relation to those claims which have already occurred or will occur in future periods of insurance. Reserving risk is managed through the detailed analysis of historical and industry claims data and robust control procedures around reserving models; and
reinsurance risk management is used to protect against adverse claims experience on business which exceeds internal risk appetite. The Group uses various types of reinsurance to transfer risk that is outside the Group's risk appetite, including individual risk excess of loss reinsurance, catastrophe excess of loss reinsurance and quota share reinsurance.
Overall, insurance risk is predictable over time, given the large volumes of data. However, uncertainty does exist, especially around predictions such as the variations in weather for example. Risk is minimised through the application of documented insurance risk policies, coupled with risk governance frameworks and the purchase of reinsurance. The Group underwrites retail and SME insurance with a focus on high volume, relatively straightforward products. The key insurance risks are as follows:
motor insurance contracts (private and commercial): claims experience varies due to a range of factors, including age, gender and driving experience together with the type of vehicle and location;
property insurance contracts (residential and commercial): the major causes of claims for property insurance are weather (flood, storm), theft, fire, subsidence and various types of accidental damage; and
other commercial insurance contracts: risk arises from business interruption and loss arising from the negligence of the insured (liability insurance).
Most general insurance contracts are written on an annual basis, which means that the Group's liability extends for a twelve month period, after which the Group is entitled to decline to renew the policy or can impose renewal terms by amending the premium, terms and conditions. An analysis of gross and net insurance claims can be found in the notes on the financial statements (see page 347). Operational risk*
Operational risk is the risk of loss resulting from inadequate or failed internal processes, people and systems, or from external events. Operational risk is an integral and unavoidable part of the Group’s business as it is inherent in the processes it operates in to provide services to customers and generate profit for shareholders. An objective of operational risk management is not to remove operational risk altogether, but to manage the risk to an acceptable level, taking into account the cost of minimising the risk as against the resultant reduction in exposure. Strategies to manage operational risk include avoidance, transfer, acceptance and mitigation by controls. Group Policy Framework (GPF) The GPF supports a consistent approach to how we do business and helps everyone understand their individual and collective responsibilities. It is a core component of the Group’s Risk Appetite Framework; it supports the risk appetite setting process, and also underpins the control environment. Work to design, implement and embed an enhanced GPF has continued throughout 2010 and will extend into 2011. The Group’s plans for ongoing development of GPF will support increased consistency in risk appetite setting across all risk types faced by the Group, including alignment to the Group’s strategic business and risk objectives. The Group will use relevant external reference points such as peers and rating agencies to challenge and verify the content of the Policy Standards making up GPF. Appropriate and effectively implemented Policy Standards are a fundamental component of GPF and support attainment and maintenance of an ‘upper quartile’ control framework as compared against the Group’s relevant peer set. The GPF requires consideration and agreement through Group governance of the level of risk appetite we have and how this is justifiable in the context of our strategic objectives. There will be ongoing reassessment of risks, risk appetite and controls within the GPF and where appropriate, potential issues will be identified and addressed to ensure the Group moves in line with the set objectives and remains constantly aligned with the ‘upper quartile’ objective and market practice at all times.
* unaudited
R199RBS Group 2010
Business review
Risk and balance sheet management
Risk management: Operational risk* continued Through the three lines of defence model the Group obtains assurance that the standards in the GPF are being adhered to. GPF defines requirements for testing and gathering evidence which demonstrates that each division and function is appropriately controlled.
GPF is owned and managed by the Group’s operational risk function and relies upon the operational risk framework for effective implementation and ongoing maintenance.
Three lines of defence model To ensure appropriate responsibility is allocated for the management, reporting and escalation of operational risk, the Group operates a three lines of defence model which outlines principles for the roles, responsibilities and accountabilities for operational risk management.
1st line of defence The business
2nd line of defence Operational risk
3rd line of defence Group Internal Audit
Accountable for the ownership and day-to-day management and control of operational risk. Responsible for implementing processes in compliance with Group policies. Responsible for testing key controls and monitoring compliance with Group policies.
Responsible for the implementation and maintenance of the operational risk framework, tools and methodologies. Responsible for oversight and challenge on the adequacy of the risk and control processes operating in the business.
Responsible for providing independent assurance on the design, adequacy and effectiveness of the Group’s system of internal controls.
The Group’s Operational Risk Policy Standards (ORPS) are incorporated in the GPF. They provide the direction for delivering effective operational risk management and are designed to enable the consistent identification, assessment, management, monitoring and reporting of operational risk across the Group. The three lines of defence model and the ORPS apply throughout the Group and are implemented taking into account the nature and scale of the underlying business. The following key operational risk management techniques are included in the ORPS;
Risk and control assessments: business units identify and assess operational risks to ensure that they are effectively managed, prioritised, documented and aligned to risk appetite;
Scenario analysis: scenarios for operational risk are used to assess the possible impact of extreme but plausible operational risk loss events. Scenario assessments provide a forward looking basis for managing exposures that are beyond the Group’s risk appetite;
Loss data management: each business unit’s internal loss data management process captures all operational risk loss events above certain minimum thresholds. The data is used to enhance the adequacy and effectiveness of controls, identify opportunities to prevent or reduce the impact of recurrence, identify emerging themes, enable formal loss event reporting and inform risk and control assessments and scenario analysis. Escalation of individual events to senior management is determined by the seriousness of the event. Operational loss events are categorised under the following headings:
- clients, products and business practices; - technology and infrastructure failures; - employment practices and workplace safety; - internal fraud; - external fraud; - execution, delivery and process management; - malicious damage; and - disaster and public safety.
New product approval process: this process ensures that all new products or significant variations to existing products are subject to a comprehensive risk assessment. Products are evaluated and approved by specialist areas and are subject to executive approval prior to launch; and
Self certification process: this requires management to monitor and report regularly on the internal control framework for which they are responsible, confirming its adequacy and effectiveness. This includes certifying compliance with the requirements of Group policies.
Each business unit must manage its operational risk exposure within an acceptable level, testing the adequacy and effectiveness of controls and other risk mitigants (for example, insurance) regularly and documenting the results. Where unacceptable control weaknesses are identified, action plans must be produced and tracked to completion. The Group purchases insurance to provide the business with financial protection against specific losses and to comply with statutory or contractual requirements. Insurance is used as a risk mitigation tool in controlling the Group’s exposures providing protection against financial loss once a risk has crystallised.
* unaudited
RRBS Group 2010200
Business review continued
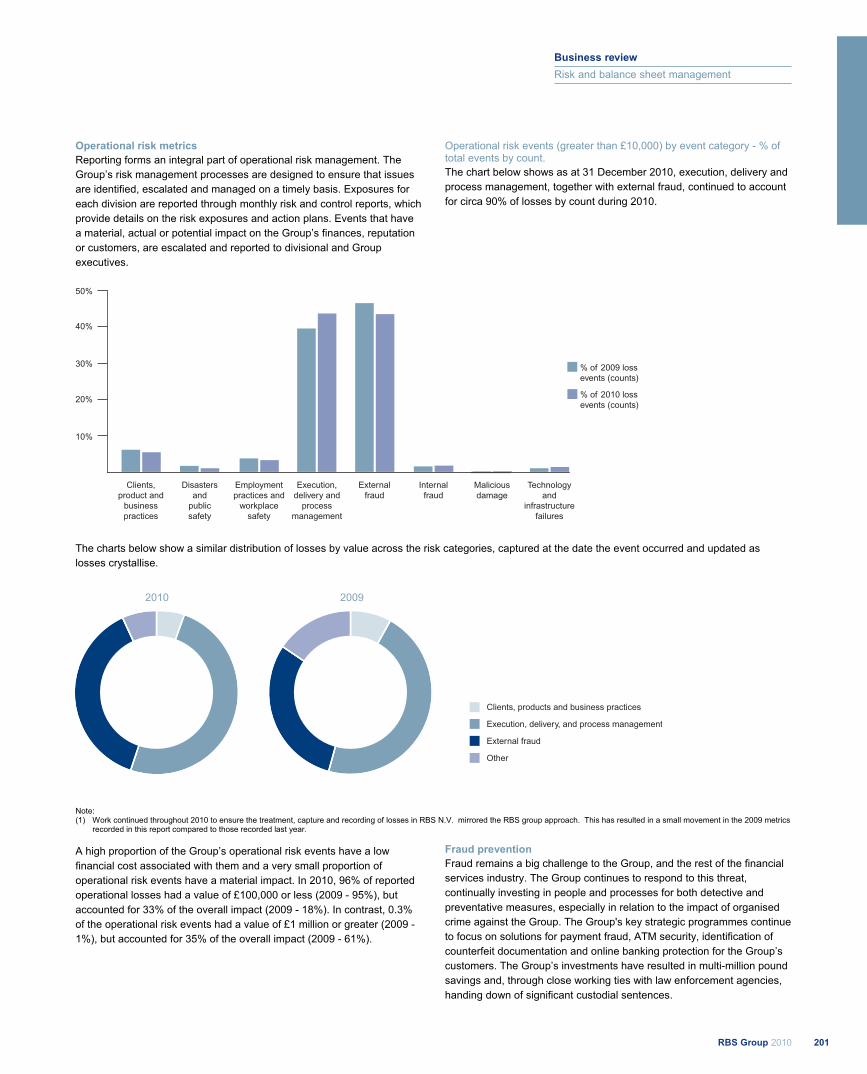
Operational risk metrics Reporting forms an integral part of operational risk management. The Group’s risk management processes are designed to ensure that issues are identified, escalated and managed on a timely basis. Exposures for each division are reported through monthly risk and control reports, which provide details on the risk exposures and action plans. Events that have a material, actual or potential impact on the Group’s finances, reputation or customers, are escalated and reported to divisional and Group executives.
Operational risk events (greater than £10,000) by event category - % of total events by count. The chart below shows as at 31 December 2010, execution, delivery and process management, together with external fraud, continued to account for circa 90% of losses by count during 2010.
201RBS Group 2010
Business review
Risk and balance sheet management
10%
20%
30%
40%
50%
Clients,product and
businesspractices
% of 2009 lossevents (counts)
% of 2010 lossevents (counts)
Disastersand
publicsafety
Employmentpractices and
workplacesafety
Execution,delivery and
processmanagement
Externalfraud
Internalfraud
Maliciousdamage
Technologyand
infrastructurefailures
Clients, products and business practices
Execution, delivery, and process management
External fraud
Other
2010 2009
The charts below show a similar distribution of losses by value across the risk categories, captured at the date the event occurred and updated as losses crystallise.
Note: (1) Work continued throughout 2010 to ensure the treatment, capture and recording of losses in RBS N.V. mirrored the RBS group approach. This has resulted in a small movement in the 2009 metrics
recorded in this report compared to those recorded last year.
A high proportion of the Group’s operational risk events have a low financial cost associated with them and a very small proportion of operational risk events have a material impact. In 2010, 96% of reported operational losses had a value of £100,000 or less (2009 - 95%), but accounted for 33% of the overall impact (2009 - 18%). In contrast, 0.3% of the operational risk events had a value of £1 million or greater (2009 - 1%), but accounted for 35% of the overall impact (2009 - 61%).
Fraud prevention Fraud remains a big challenge to the Group, and the rest of the financial services industry. The Group continues to respond to this threat, continually investing in people and processes for both detective and preventative measures, especially in relation to the impact of organised crime against the Group. The Group's key strategic programmes continue to focus on solutions for payment fraud, ATM security, identification of counterfeit documentation and online banking protection for the Group’s customers. The Group’s investments have resulted in multi-million pound savings and, through close working ties with law enforcement agencies, handing down of significant custodial sentences.
R
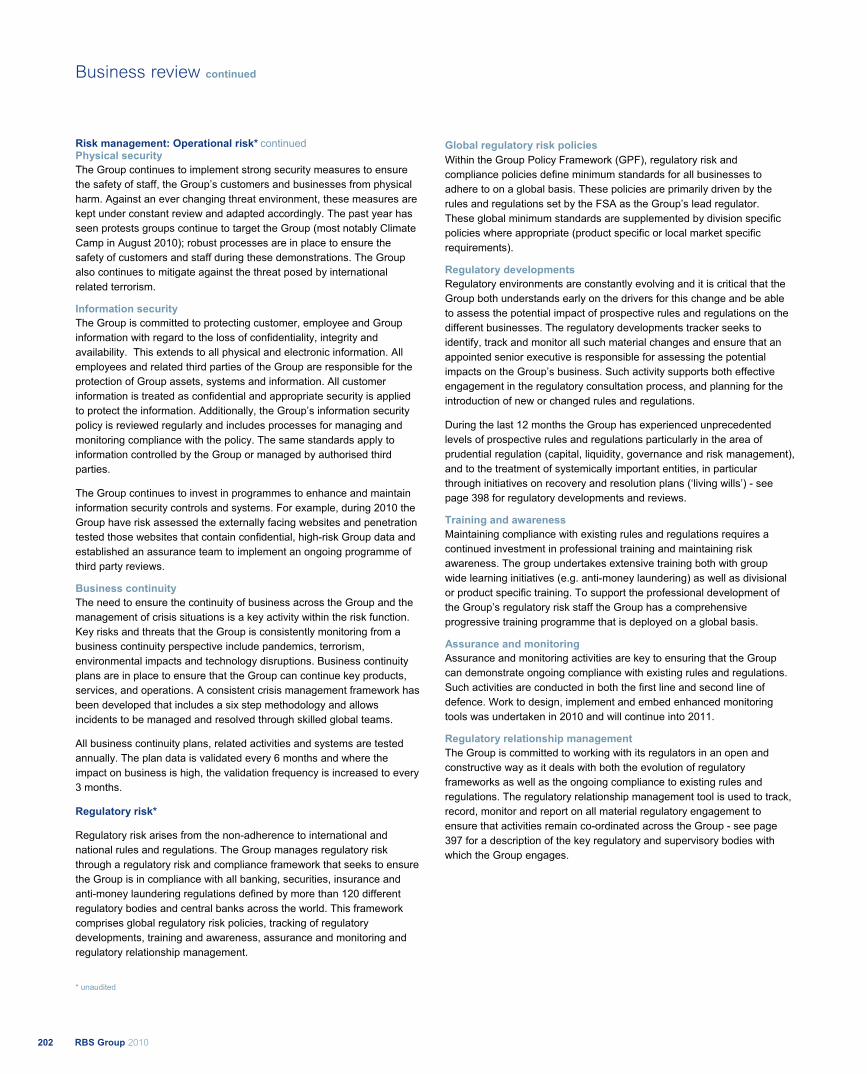
Risk management: Operational risk* continued Physical security The Group continues to implement strong security measures to ensure the safety of staff, the Group’s customers and businesses from physical harm. Against an ever changing threat environment, these measures are kept under constant review and adapted accordingly. The past year has seen protests groups continue to target the Group (most notably Climate Camp in August 2010); robust processes are in place to ensure the safety of customers and staff during these demonstrations. The Group also continues to mitigate against the threat posed by international related terrorism. Information security The Group is committed to protecting customer, employee and Group information with regard to the loss of confidentiality, integrity and availability. This extends to all physical and electronic information. All employees and related third parties of the Group are responsible for the protection of Group assets, systems and information. All customer information is treated as confidential and appropriate security is applied to protect the information. Additionally, the Group’s information security policy is reviewed regularly and includes processes for managing and monitoring compliance with the policy. The same standards apply to information controlled by the Group or managed by authorised third parties.
The Group continues to invest in programmes to enhance and maintain information security controls and systems. For example, during 2010 the Group have risk assessed the externally facing websites and penetration tested those websites that contain confidential, high-risk Group data and established an assurance team to implement an ongoing programme of third party reviews. Business continuity The need to ensure the continuity of business across the Group and the management of crisis situations is a key activity within the risk function. Key risks and threats that the Group is consistently monitoring from a business continuity perspective include pandemics, terrorism, environmental impacts and technology disruptions. Business continuity plans are in place to ensure that the Group can continue key products, services, and operations. A consistent crisis management framework has been developed that includes a six step methodology and allows incidents to be managed and resolved through skilled global teams.
All business continuity plans, related activities and systems are tested annually. The plan data is validated every 6 months and where the impact on business is high, the validation frequency is increased to every 3 months.
Regulatory risk* Regulatory risk arises from the non-adherence to international and national rules and regulations. The Group manages regulatory risk through a regulatory risk and compliance framework that seeks to ensure the Group is in compliance with all banking, securities, insurance and anti-money laundering regulations defined by more than 120 different regulatory bodies and central banks across the world. This framework comprises global regulatory risk policies, tracking of regulatory developments, training and awareness, assurance and monitoring and regulatory relationship management.
Global regulatory risk policies Within the Group Policy Framework (GPF), regulatory risk and compliance policies define minimum standards for all businesses to adhere to on a global basis. These policies are primarily driven by the rules and regulations set by the FSA as the Group’s lead regulator. These global minimum standards are supplemented by division specific policies where appropriate (product specific or local market specific requirements). Regulatory developments Regulatory environments are constantly evolving and it is critical that the Group both understands early on the drivers for this change and be able to assess the potential impact of prospective rules and regulations on the different businesses. The regulatory developments tracker seeks to identify, track and monitor all such material changes and ensure that an appointed senior executive is responsible for assessing the potential impacts on the Group’s business. Such activity supports both effective engagement in the regulatory consultation process, and planning for the introduction of new or changed rules and regulations.
During the last 12 months the Group has experienced unprecedented levels of prospective rules and regulations particularly in the area of prudential regulation (capital, liquidity, governance and risk management), and to the treatment of systemically important entities, in particular through initiatives on recovery and resolution plans (‘living wills’) - see page 398 for regulatory developments and reviews. Training and awareness Maintaining compliance with existing rules and regulations requires a continued investment in professional training and maintaining risk awareness. The group undertakes extensive training both with group wide learning initiatives (e.g. anti-money laundering) as well as divisional or product specific training. To support the professional development of the Group’s regulatory risk staff the Group has a comprehensive progressive training programme that is deployed on a global basis. Assurance and monitoring Assurance and monitoring activities are key to ensuring that the Group can demonstrate ongoing compliance with existing rules and regulations. Such activities are conducted in both the first line and second line of defence. Work to design, implement and embed enhanced monitoring tools was undertaken in 2010 and will continue into 2011. Regulatory relationship management The Group is committed to working with its regulators in an open and constructive way as it deals with both the evolution of regulatory frameworks as well as the ongoing compliance to existing rules and regulations. The regulatory relationship management tool is used to track, record, monitor and report on all material regulatory engagement to ensure that activities remain co-ordinated across the Group - see page 397 for a description of the key regulatory and supervisory bodies with which the Group engages.
* unaudited
RRBS Group 2010202
Business review continued
Reputation risk*
Reputation risk is defined as the potential loss in reputation that could lead to negative publicity, loss of revenue, costly litigation, a decline in the customer base or the exit of key Group employees.
Reputation risk can arise from actions taken by the Group or a failure to take action, such as failing to assess the environmental, social or ethical impacts of clients or projects that the Group has provided products or services to.
The Group seeks to safeguard its reputation by considering the impact on the value of its franchise from how it conducts business, its choice of customers and the way stakeholders view the Group. Managing the Group’s reputation is the joint responsibility of all employees, and reputational considerations should, as part of standard practice, be integrated into the Group’s day-to-day decision making structures.
Currently the Group manages reputational risk through a number of functions, such as divisions, Group Communications, Group Sustainability and an Environmental, Social and Ethical (ESE) risk management function. The latter function is responsible for assessing ESE risks associated with business engagements and business divisions.
The Board has ultimate responsibility for managing any impact on the reputation of the Group arising from its operations. The Group Sustainability Committee (established at the beginning of 2010) sets the overall strategy and approach for the management of Group sustainability, however all parts of the Group take responsibility for reputation management.
The risk is viewed as material given the central nature of the Group’s market reputation in the strategic risk objectives.
Pension risk*
The Group is exposed to risk from its defined benefit pension schemes to the extent that the assets of the schemes do not fully match the timing and amount of the schemes’ liabilities. Pension scheme liabilities vary with changes to long-term interest rates, inflation, pensionable salaries and the longevity of scheme members as well as changes in legislation. The Group is exposed to the risk that the market value of the schemes’ assets, together with future returns and any additional future contributions could be considered insufficient to meet the liabilities as they fall due. In such circumstances, the Group could be obliged, or may choose, to make additional contributions to the schemes.
The RBS Group Pension Fund (“Main scheme”) is the largest of the schemes and the main source of pension risk. The Main scheme operates under a trust deed under which the corporate trustee, RBS Pension Trustees Limited, is a wholly owned subsidiary of The Royal Bank of Scotland plc and the trustee board comprises six directors selected by the Group and four directors nominated by members.
The trustee is solely responsible for the investment of the schemes assets which are held separately from the assets of the Group. The Group and the trustee must agree on the investment principles and the funding plan.
In October 2006, the Main scheme was closed to new employees. In November 2009, the Group confirmed that it was making changes to the Main scheme and a number of other defined benefit schemes including the introduction of a limit of 2% per annum (or Consumer Price Indices (CPI) inflation, if lower) to the amount of any salary increase that will count for pensionable purposes.
Risk appetite and investment policy are agreed by the trustee with quantitative and qualitative input from the scheme actuaries and investment advisers. The trustee also consults with the Group to obtain its view on the appropriate level of risk within the pension fund.
The Group maintains an independent review of risk within its pension funds. The Group Risk Committee now monitors pension obligation risk on an ongoing basis with a monthly report illustrating the funding positions and key sensitivities of the Group’s pension schemes. Additionally, as part of the Internal Capital Adequacy Assessment Process (ICAAP) process, the change in asset and liability values is modelled over a twelve-month time horizon under a stressed scenario.
The funding valuation of the Main scheme at 31 March 2010 is currently in progress. Further details are given in Note 4 on the accounts.
The Main scheme, which represents 84% of plan assets at 31 December 2010, is invested in a diversified portfolio of quoted and private equity, government and corporate fixed interest and index-linked bonds, and other assets including property and hedge funds. The trustee has taken measures to partially mitigate inflation and interest rate risks both by investment in suitable physical assets and by entering into inflation and interest rate swaps. The Main scheme has an additional exposure to rewarded risk by investing in equity futures.
The table below shows the impact on the Main schemes assets and liabilities (measured according to IAS 19 ‘Employee Benefits’) of changes in interest rates and equity values at the year end, taking account of the current asset allocation and hedging arrangements.
Change in value
of assets £m
Change in value of liabilities
£m
Decrease/ (increase) in net
pension obligations
£m
As at 31 December 2010 Fall in nominal swap yields of 0.25% at all durations with no change in credit spreads 422 193 229 Fall in real swap yields of 0.25% at all durations with no change in credit spreads 355 799 (444)Fall in credit spreads of 0.25% at all durations with no change in nominal or real swap yields 98 1,005 (907)Fall in equity values of 10% (1,083) — (1,083)
203RBS Group 2010
Business review
Risk and balance sheet management
Risk management: Other risk exposures All the disclosures in this section (pages 204 to 220) are audited unless otherwise indicated with an asterisk (*). Explanatory note These disclosures provide information on certain elements of the Group's credit market activities, the majority of which are in Non-Core and, to a lesser extent, Global Banking & Markets, US Retail & Commercial and Group Treasury. For credit valuation adjustments (CVA), leveraged finance and conduits disclosures, the information presented has been analysed between the Group's Core and Non-Core businesses. Definitions of acronyms used in this section can be found in the Glossary on pages 434 to 439. Asset-backed securities The Group structures, originates, distributes and trades debt in the form of loan, bond and derivative instruments in all major currencies and debt capital markets in North America, Western Europe, Asia and major emerging markets. The carrying value of the Group's debt securities is detailed below.
2009 2008
2010 Group
Groupbefore
RFS MI Group
Group before
RFS MI Group £bn £bn £bn £bn £bn
Securities issued by central and local governments 124.0 134.1 146.9 95.1 105.8Asset-backed securities 70.8 87.6 88.1 111.1 111.1Securities issued by corporates and other entities 9.7 13.4 14.4 24.3 26.2Securities issued by banks and building societies 13.0 14.0 17.8 22.7 24.4 217.5 249.1 267.2 253.2 267.5
The Group’s credit market activities gave rise to risk concentrations in asset-backed securities (ABS). The Group has exposures to ABS which are predominantly debt securities, but can also be held in derivative form. ABS have an interest in an underlying pool of referenced assets. The risks and rewards of the referenced pool are passed onto investors by the issue of securities with varying seniority, by a special purpose entity. Debt securities include residential mortgage-backed securities (RMBS), commercial mortgage-backed securities (CMBS), collateralised debt obligations (CDOs), collateralised loan obligations (CLOs) and other ABS. In many cases the risk associated with these assets is hedged by way of credit derivative protection, purchased over the specific asset or relevant ABS indices. The counterparty to some of these hedge transactions are monoline insurers.
The following tables summarise the gross and net exposures and carrying values of these securities by geography of the underlying assets at 31 December 2010, 2009 and 2008. Gross exposures represent the principal amounts relating to ABS. G10 government RMBS comprises securities that are: (a) guaranteed or effectively guaranteed by the US government, by way of its support for US federal agencies and government sponsored enterprises or (b) guaranteed by the Dutch government. Net exposures represent the carrying value after taking account of the hedge protection purchased from monoline insurers and other counterparties, but exclude the effect of counterparty credit valuation adjustments. The hedge provides credit protection of both principal and interest cash flows in the event of default by the counterparty. The value of this protection is based on the underlying instrument being protected. The tables at 31 December 2009 exclude RMBS covered bonds in RFS MI, comprising gross exposure - £558 million, carrying value - £579 million, and net exposure - £579 million.
RBS Group 2010204
Business review continued

Asset-backed securities by product, geography and measurement classification FVTPL (1)
US UK Other
Europe RoW (2) Total HFT (3) DFV (4) AFS (5) LAR (6) 2010 £m £m £m £m £m £m £m £m £m
Gross exposure RMBS: G10 government 24,207 16 6,422 — 30,645 13,840 — 16,805 — RMBS: covered bond 138 208 8,525 — 8,871 — — 8,871 — RMBS: prime 1,784 3,385 1,118 192 6,479 1,605 1 4,749 124 RMBS: non-conforming 1,249 2,107 92 — 3,448 708 — 1,313 1,427 RMBS: sub-prime 792 365 139 221 1,517 819 — 496 202 CMBS 3,086 1,451 912 45 5,494 2,646 120 1,409 1,319 CDOs 12,156 128 453 — 12,737 7,951 — 4,687 99 CLOs 6,038 134 879 9 7,060 1,062 — 5,572 426 Other ABS 3,104 1,144 2,871 1,705 8,824 1,533 — 4,523 2,768 52,554 8,938 21,411 2,172 85,075 30,164 121 48,425 6,365
Carrying value RMBS: G10 government 24,390 16 5,958 — 30,364 13,765 — 16,599 — RMBS: covered bond 142 208 7,522 — 7,872 — — 7,872 — RMBS: prime 1,624 3,000 931 192 5,747 1,384 1 4,249 113 RMBS: non-conforming 1,084 1,959 92 — 3,135 605 — 1,102 1,428 RMBS: sub-prime 638 255 120 205 1,218 681 — 344 193 CMBS 2,936 1,338 638 38 4,950 2,262 118 1,281 1,289 CDOs 3,135 69 254 — 3,458 1,341 — 2,021 96 CLOs 5,334 102 635 3 6,074 691 — 4,958 425 Other ABS 2,780 945 2,615 1,667 8,007 1,259 — 4,089 2,659 42,063 7,892 18,765 2,105 70,825 21,988 119 42,515 6,203
Net exposure RMBS: G10 government 24,390 16 5,958 — 30,364 13,765 — 16,599 — RMBS: covered bond 142 208 7,522 — 7,872 — — 7,872 — RMBS: prime 1,523 2,948 596 192 5,259 897 1 4,248 113 RMBS: non-conforming 1,081 1,959 92 — 3,132 602 — 1,102 1,428 RMBS: sub-prime 289 253 112 176 830 305 — 332 193 CMBS 1,823 1,336 458 38 3,655 1,188 10 1,230 1,227 CDOs 1,085 39 245 — 1,369 743 — 530 96 CLOs 1,387 102 629 1 2,119 673 — 1,021 425 Other ABS 2,293 748 2,609 1,659 7,309 690 — 4,081 2,538 34,013 7,609 18,221 2,066 61,909 18,863 11 37,015 6,020
For notes to this table refer to page 207.
205RBS Group 2010
Business review
Risk and balance sheet management
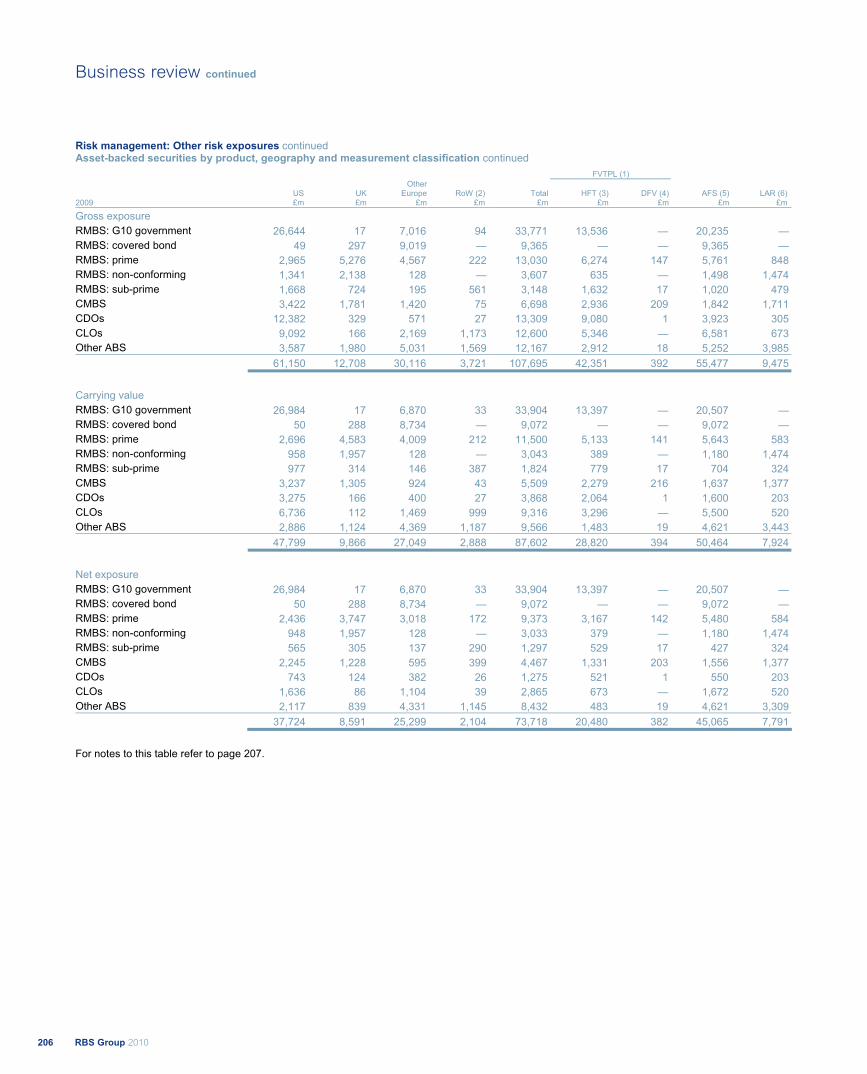
Risk management: Other risk exposures continued Asset-backed securities by product, geography and measurement classification continued
FVTPL (1)
US UK Other
Europe RoW (2) Total HFT (3) DFV (4) AFS (5) LAR (6) 2009 £m £m £m £m £m £m £m £m £m
Gross exposure RMBS: G10 government 26,644 17 7,016 94 33,771 13,536 — 20,235 — RMBS: covered bond 49 297 9,019 — 9,365 — — 9,365 — RMBS: prime 2,965 5,276 4,567 222 13,030 6,274 147 5,761 848 RMBS: non-conforming 1,341 2,138 128 — 3,607 635 — 1,498 1,474 RMBS: sub-prime 1,668 724 195 561 3,148 1,632 17 1,020 479 CMBS 3,422 1,781 1,420 75 6,698 2,936 209 1,842 1,711 CDOs 12,382 329 571 27 13,309 9,080 1 3,923 305 CLOs 9,092 166 2,169 1,173 12,600 5,346 — 6,581 673 Other ABS 3,587 1,980 5,031 1,569 12,167 2,912 18 5,252 3,985 61,150 12,708 30,116 3,721 107,695 42,351 392 55,477 9,475
Carrying value RMBS: G10 government 26,984 17 6,870 33 33,904 13,397 — 20,507 — RMBS: covered bond 50 288 8,734 — 9,072 — — 9,072 — RMBS: prime 2,696 4,583 4,009 212 11,500 5,133 141 5,643 583 RMBS: non-conforming 958 1,957 128 — 3,043 389 — 1,180 1,474 RMBS: sub-prime 977 314 146 387 1,824 779 17 704 324 CMBS 3,237 1,305 924 43 5,509 2,279 216 1,637 1,377 CDOs 3,275 166 400 27 3,868 2,064 1 1,600 203 CLOs 6,736 112 1,469 999 9,316 3,296 — 5,500 520 Other ABS 2,886 1,124 4,369 1,187 9,566 1,483 19 4,621 3,443 47,799 9,866 27,049 2,888 87,602 28,820 394 50,464 7,924
Net exposure RMBS: G10 government 26,984 17 6,870 33 33,904 13,397 — 20,507 — RMBS: covered bond 50 288 8,734 — 9,072 — — 9,072 — RMBS: prime 2,436 3,747 3,018 172 9,373 3,167 142 5,480 584 RMBS: non-conforming 948 1,957 128 — 3,033 379 — 1,180 1,474 RMBS: sub-prime 565 305 137 290 1,297 529 17 427 324 CMBS 2,245 1,228 595 399 4,467 1,331 203 1,556 1,377 CDOs 743 124 382 26 1,275 521 1 550 203 CLOs 1,636 86 1,104 39 2,865 673 — 1,672 520 Other ABS 2,117 839 4,331 1,145 8,432 483 19 4,621 3,309 37,724 8,591 25,299 2,104 73,718 20,480 382 45,065 7,791
For notes to this table refer to page 207.
RBS Group 2010206
Business review continued
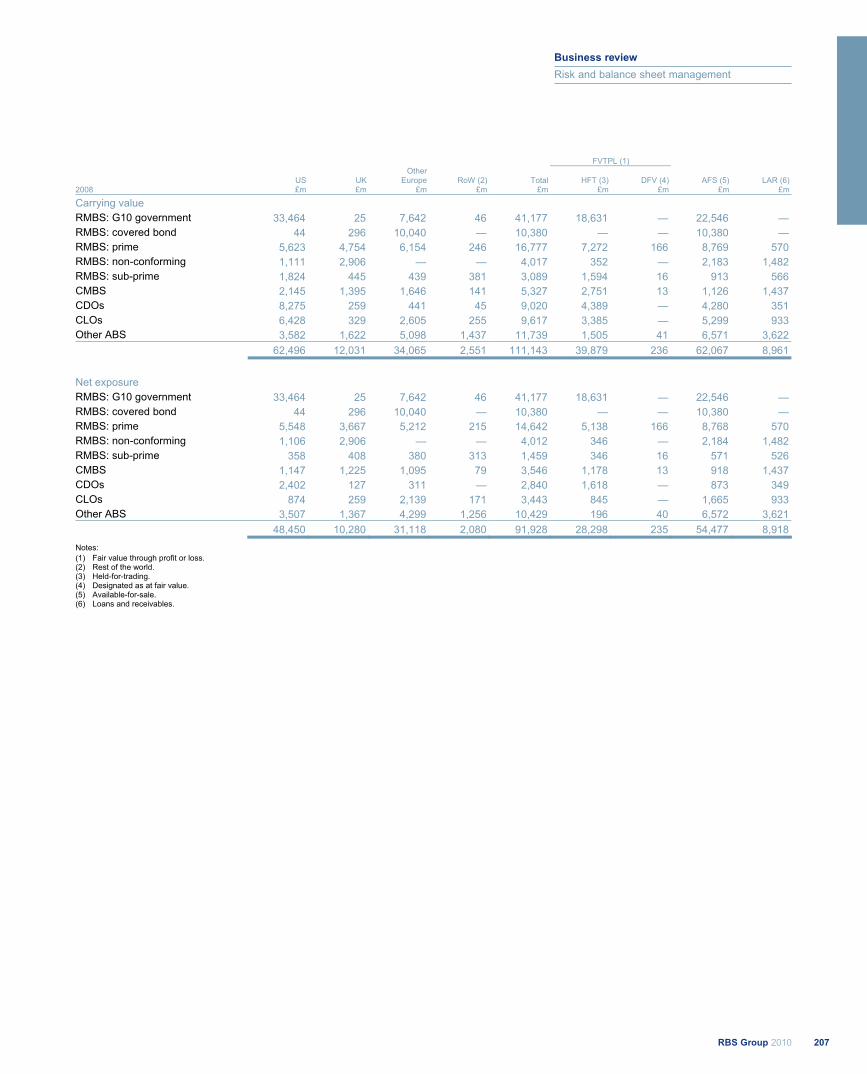
FVTPL (1)
US UK Other
Europe RoW (2) Total HFT (3) DFV (4) AFS (5) LAR (6) 2008 £m £m £m £m £m £m £m £m £m
Carrying value RMBS: G10 government 33,464 25 7,642 46 41,177 18,631 — 22,546 — RMBS: covered bond 44 296 10,040 — 10,380 — — 10,380 — RMBS: prime 5,623 4,754 6,154 246 16,777 7,272 166 8,769 570 RMBS: non-conforming 1,111 2,906 — — 4,017 352 — 2,183 1,482 RMBS: sub-prime 1,824 445 439 381 3,089 1,594 16 913 566 CMBS 2,145 1,395 1,646 141 5,327 2,751 13 1,126 1,437 CDOs 8,275 259 441 45 9,020 4,389 — 4,280 351 CLOs 6,428 329 2,605 255 9,617 3,385 — 5,299 933 Other ABS 3,582 1,622 5,098 1,437 11,739 1,505 41 6,571 3,622 62,496 12,031 34,065 2,551 111,143 39,879 236 62,067 8,961
Net exposure RMBS: G10 government 33,464 25 7,642 46 41,177 18,631 — 22,546 — RMBS: covered bond 44 296 10,040 — 10,380 — — 10,380 — RMBS: prime 5,548 3,667 5,212 215 14,642 5,138 166 8,768 570 RMBS: non-conforming 1,106 2,906 — — 4,012 346 — 2,184 1,482 RMBS: sub-prime 358 408 380 313 1,459 346 16 571 526 CMBS 1,147 1,225 1,095 79 3,546 1,178 13 918 1,437 CDOs 2,402 127 311 — 2,840 1,618 — 873 349 CLOs 874 259 2,139 171 3,443 845 — 1,665 933 Other ABS 3,507 1,367 4,299 1,256 10,429 196 40 6,572 3,621 48,450 10,280 31,118 2,080 91,928 28,298 235 54,477 8,918 Notes: (1) Fair value through profit or loss. (2) Rest of the world. (3) Held-for-trading. (4) Designated as at fair value. (5) Available-for-sale. (6) Loans and receivables.
207RBS Group 2010
Business review
Risk and balance sheet management
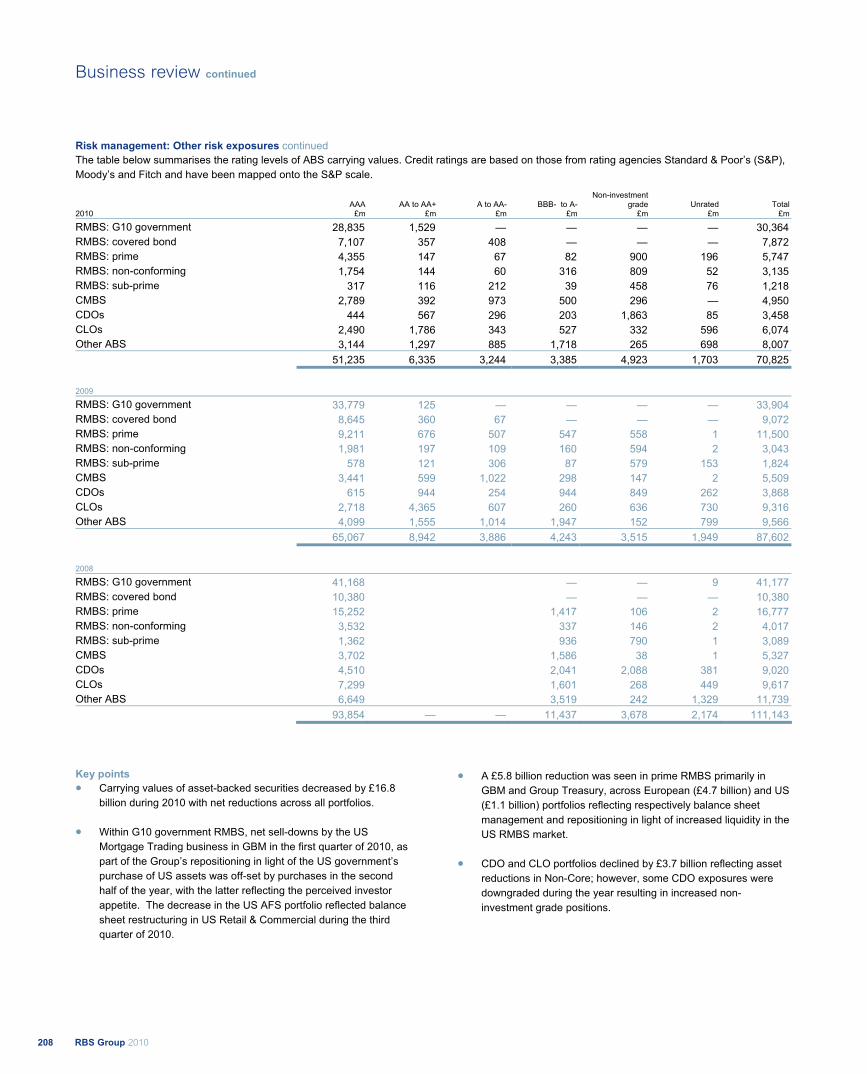
Risk management: Other risk exposures continued The table below summarises the rating levels of ABS carrying values. Credit ratings are based on those from rating agencies Standard & Poor’s (S&P), Moody’s and Fitch and have been mapped onto the S&P scale.
AAA AA to AA+ A to AA- BBB- to A- Non-investment
grade Unrated Total 2010 £m £m £m £m £m £m £m
RMBS: G10 government 28,835 1,529 — — — — 30,364 RMBS: covered bond 7,107 357 408 — — — 7,872 RMBS: prime 4,355 147 67 82 900 196 5,747 RMBS: non-conforming 1,754 144 60 316 809 52 3,135 RMBS: sub-prime 317 116 212 39 458 76 1,218 CMBS 2,789 392 973 500 296 — 4,950 CDOs 444 567 296 203 1,863 85 3,458 CLOs 2,490 1,786 343 527 332 596 6,074 Other ABS 3,144 1,297 885 1,718 265 698 8,007 51,235 6,335 3,244 3,385 4,923 1,703 70,825
2009 RMBS: G10 government 33,779 125 — — — — 33,904 RMBS: covered bond 8,645 360 67 — — — 9,072 RMBS: prime 9,211 676 507 547 558 1 11,500 RMBS: non-conforming 1,981 197 109 160 594 2 3,043 RMBS: sub-prime 578 121 306 87 579 153 1,824 CMBS 3,441 599 1,022 298 147 2 5,509 CDOs 615 944 254 944 849 262 3,868 CLOs 2,718 4,365 607 260 636 730 9,316 Other ABS 4,099 1,555 1,014 1,947 152 799 9,566 65,067 8,942 3,886 4,243 3,515 1,949 87,602
2008
RMBS: G10 government 41,168 — — 9 41,177 RMBS: covered bond 10,380 — — — 10,380 RMBS: prime 15,252 1,417 106 2 16,777 RMBS: non-conforming 3,532 337 146 2 4,017 RMBS: sub-prime 1,362 936 790 1 3,089 CMBS 3,702 1,586 38 1 5,327 CDOs 4,510 2,041 2,088 381 9,020 CLOs 7,299 1,601 268 449 9,617 Other ABS 6,649 3,519 242 1,329 11,739 93,854 — — 11,437 3,678 2,174 111,143
Key points Carrying values of asset-backed securities decreased by £16.8 billion during 2010 with net reductions across all portfolios.
Within G10 government RMBS, net sell-downs by the US Mortgage Trading business in GBM in the first quarter of 2010, as part of the Group’s repositioning in light of the US government’s purchase of US assets was off-set by purchases in the second half of the year, with the latter reflecting the perceived investor appetite. The decrease in the US AFS portfolio reflected balance sheet restructuring in US Retail & Commercial during the third quarter of 2010.
A £5.8 billion reduction was seen in prime RMBS primarily in GBM and Group Treasury, across European (£4.7 billion) and US (£1.1 billion) portfolios reflecting respectively balance sheet management and repositioning in light of increased liquidity in the US RMBS market.
CDO and CLO portfolios declined by £3.7 billion reflecting asset reductions in Non-Core; however, some CDO exposures were downgraded during the year resulting in increased non-investment grade positions.
RBS Group 2010208
Business review continued
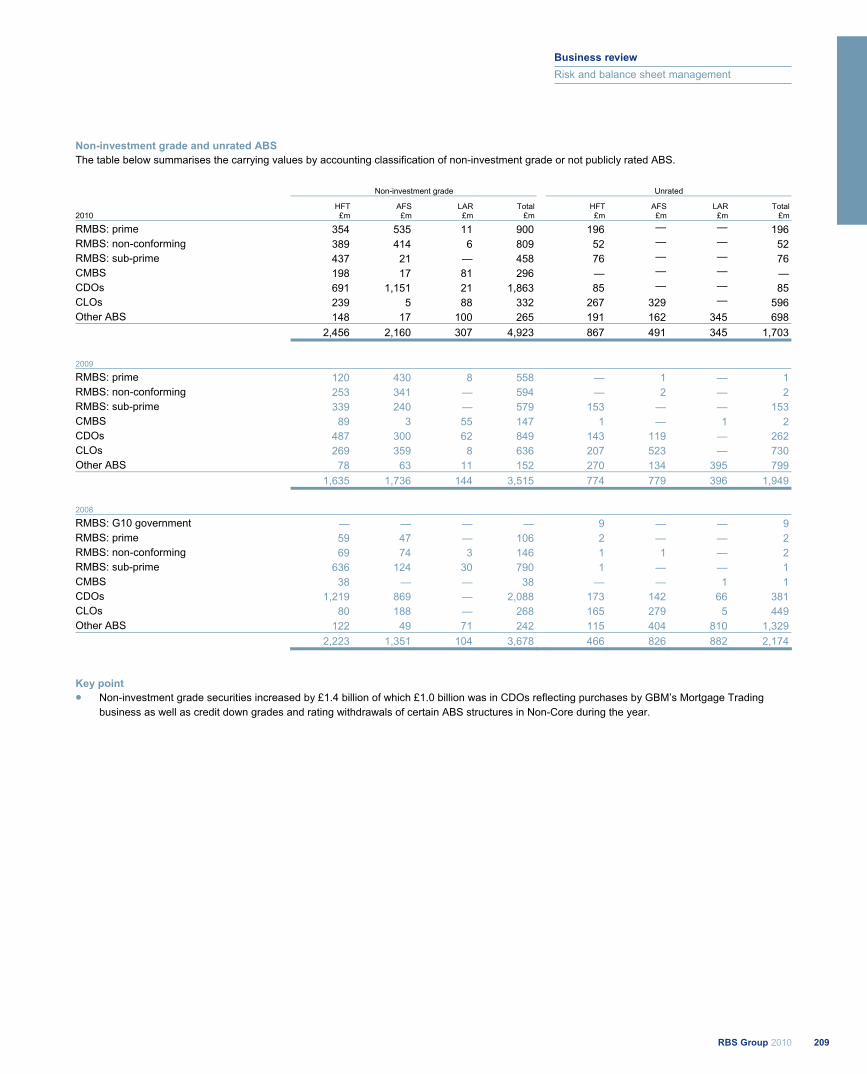
Non-investment grade and unrated ABS The table below summarises the carrying values by accounting classification of non-investment grade or not publicly rated ABS.
Non-investment grade Unrated
HFT AFS LAR Total HFT AFS LAR Total 2010 £m £m £m £m £m £m £m £m
RMBS: prime 354 535 11 900 196 — — 196 RMBS: non-conforming 389 414 6 809 52 — — 52 RMBS: sub-prime 437 21 — 458 76 — — 76 CMBS 198 17 81 296 — — — —CDOs 691 1,151 21 1,863 85 — — 85 CLOs 239 5 88 332 267 329 — 596 Other ABS 148 17 100 265 191 162 345 698 2,456 2,160 307 4,923 867 491 345 1,703
2009 RMBS: prime 120 430 8 558 — 1 — 1 RMBS: non-conforming 253 341 — 594 — 2 — 2 RMBS: sub-prime 339 240 — 579 153 — — 153 CMBS 89 3 55 147 1 — 1 2 CDOs 487 300 62 849 143 119 — 262 CLOs 269 359 8 636 207 523 — 730 Other ABS 78 63 11 152 270 134 395 799 1,635 1,736 144 3,515 774 779 396 1,949
2008
RMBS: G10 government — — — — 9 — — 9 RMBS: prime 59 47 — 106 2 — — 2 RMBS: non-conforming 69 74 3 146 1 1 — 2 RMBS: sub-prime 636 124 30 790 1 — — 1 CMBS 38 — — 38 — — 1 1 CDOs 1,219 869 — 2,088 173 142 66 381 CLOs 80 188 — 268 165 279 5 449 Other ABS 122 49 71 242 115 404 810 1,329 2,223 1,351 104 3,678 466 826 882 2,174
Key point Non-investment grade securities increased by £1.4 billion of which £1.0 billion was in CDOs reflecting purchases by GBM’s Mortgage Trading business as well as credit down grades and rating withdrawals of certain ABS structures in Non-Core during the year.
209RBS Group 2010
Business review
Risk and balance sheet management
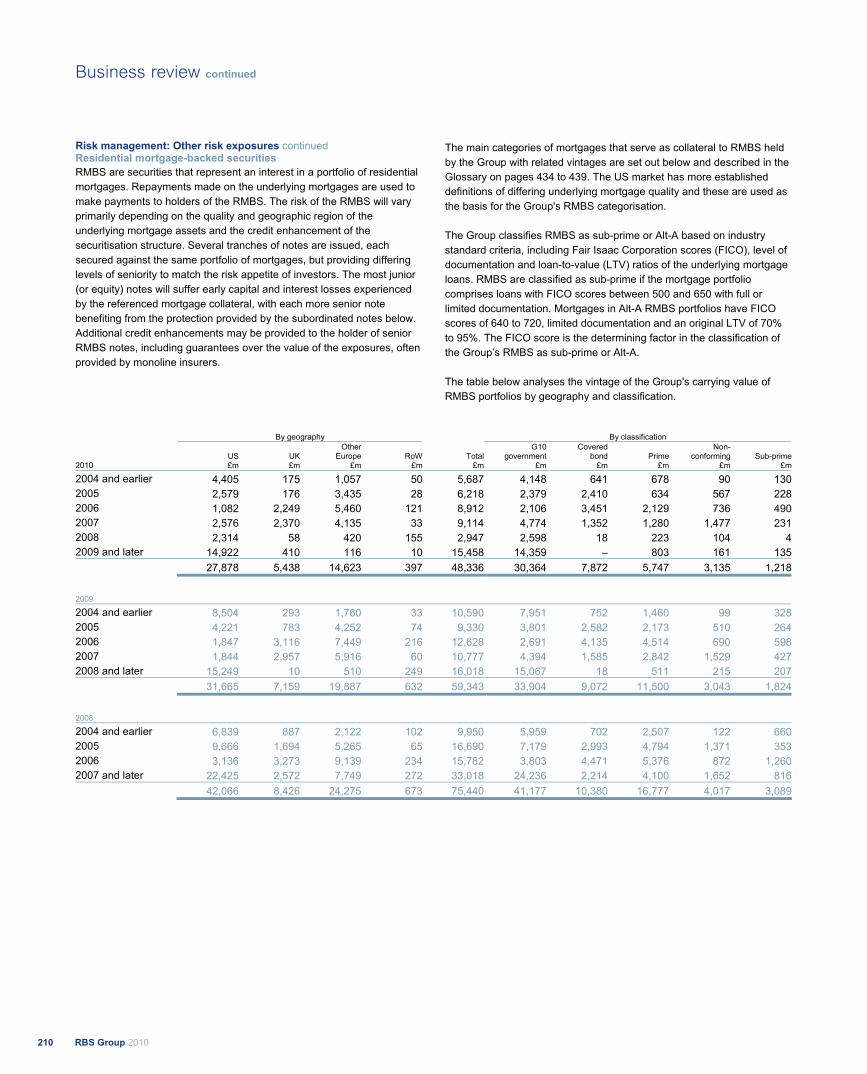
Risk management: Other risk exposures continued Residential mortgage-backed securities RMBS are securities that represent an interest in a portfolio of residential mortgages. Repayments made on the underlying mortgages are used to make payments to holders of the RMBS. The risk of the RMBS will vary primarily depending on the quality and geographic region of the underlying mortgage assets and the credit enhancement of the securitisation structure. Several tranches of notes are issued, each secured against the same portfolio of mortgages, but providing differing levels of seniority to match the risk appetite of investors. The most junior (or equity) notes will suffer early capital and interest losses experienced by the referenced mortgage collateral, with each more senior note benefiting from the protection provided by the subordinated notes below. Additional credit enhancements may be provided to the holder of senior RMBS notes, including guarantees over the value of the exposures, often provided by monoline insurers.
The main categories of mortgages that serve as collateral to RMBS held by the Group with related vintages are set out below and described in the Glossary on pages 434 to 439. The US market has more established definitions of differing underlying mortgage quality and these are used as the basis for the Group's RMBS categorisation. The Group classifies RMBS as sub-prime or Alt-A based on industry standard criteria, including Fair Isaac Corporation scores (FICO), level of documentation and loan-to-value (LTV) ratios of the underlying mortgage loans. RMBS are classified as sub-prime if the mortgage portfolio comprises loans with FICO scores between 500 and 650 with full or limited documentation. Mortgages in Alt-A RMBS portfolios have FICO scores of 640 to 720, limited documentation and an original LTV of 70% to 95%. The FICO score is the determining factor in the classification of the Group’s RMBS as sub-prime or Alt-A. The table below analyses the vintage of the Group's carrying value of RMBS portfolios by geography and classification.
By geography By classification
US UKOther
Europe RoW TotalG10
governmentCovered
bond PrimeNon-
conforming Sub-prime2010 £m £m £m £m £m £m £m £m £m £m
2004 and earlier 4,405 175 1,057 50 5,687 4,148 641 678 90 1302005 2,579 176 3,435 28 6,218 2,379 2,410 634 567 2282006 1,082 2,249 5,460 121 8,912 2,106 3,451 2,129 736 4902007 2,576 2,370 4,135 33 9,114 4,774 1,352 1,280 1,477 2312008 2,314 58 420 155 2,947 2,598 18 223 104 42009 and later 14,922 410 116 10 15,458 14,359 – 803 161 135 27,878 5,438 14,623 397 48,336 30,364 7,872 5,747 3,135 1,218
2009 2004 and earlier 8,504 293 1,760 33 10,590 7,951 752 1,460 99 3282005 4,221 783 4,252 74 9,330 3,801 2,582 2,173 510 2642006 1,847 3,116 7,449 216 12,628 2,691 4,135 4,514 690 5982007 1,844 2,957 5,916 60 10,777 4,394 1,585 2,842 1,529 4272008 and later 15,249 10 510 249 16,018 15,067 18 511 215 207 31,665 7,159 19,887 632 59,343 33,904 9,072 11,500 3,043 1,824
2008 2004 and earlier 6,839 887 2,122 102 9,950 5,959 702 2,507 122 6602005 9,666 1,694 5,265 65 16,690 7,179 2,993 4,794 1,371 3532006 3,136 3,273 9,139 234 15,782 3,803 4,471 5,376 872 1,2602007 and later 22,425 2,572 7,749 272 33,018 24,236 2,214 4,100 1,652 816 42,066 8,426 24,275 673 75,440 41,177 10,380 16,777 4,017 3,089
RBS Group 2010210
Business review continued
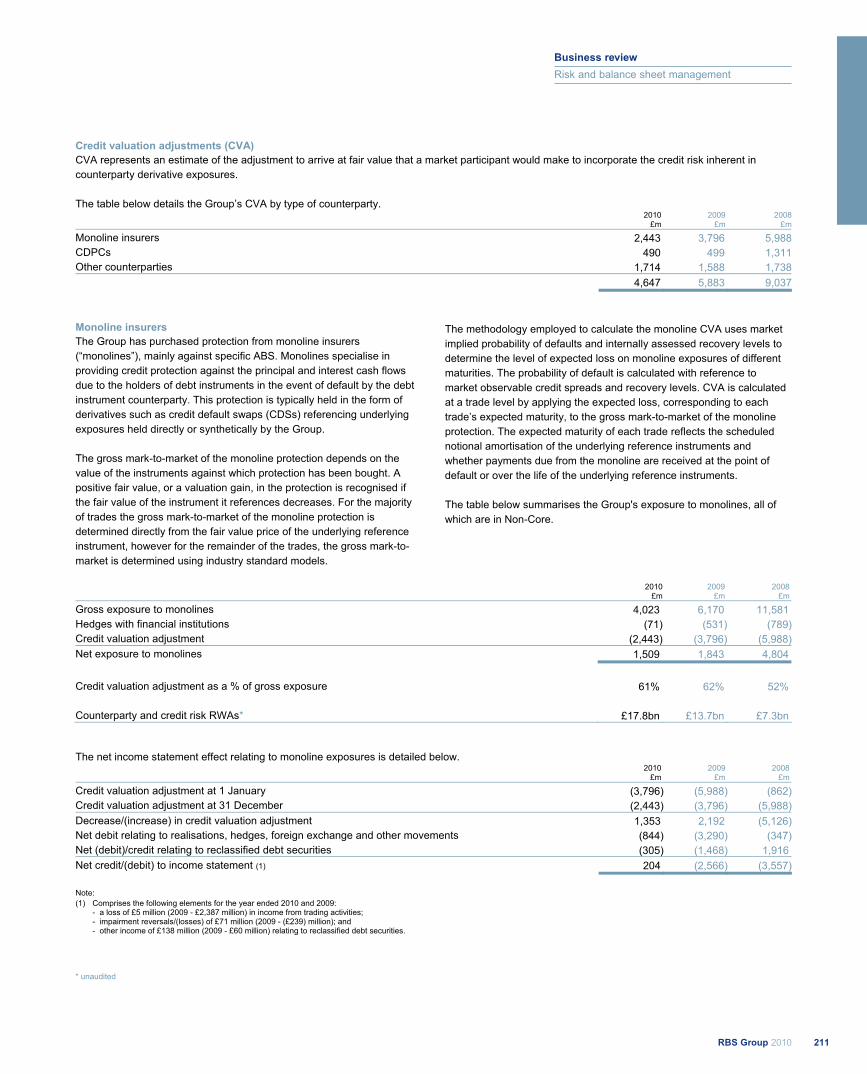
Credit valuation adjustments (CVA) CVA represents an estimate of the adjustment to arrive at fair value that a market participant would make to incorporate the credit risk inherent in counterparty derivative exposures. The table below details the Group’s CVA by type of counterparty.
2010
£m 2009
£m 2008
£m
Monoline insurers 2,443 3,796 5,988CDPCs 490 499 1,311Other counterparties 1,714 1,588 1,738 4,647 5,883 9,037
Monoline insurers The Group has purchased protection from monoline insurers (“monolines”), mainly against specific ABS. Monolines specialise in providing credit protection against the principal and interest cash flows due to the holders of debt instruments in the event of default by the debt instrument counterparty. This protection is typically held in the form of derivatives such as credit default swaps (CDSs) referencing underlying exposures held directly or synthetically by the Group. The gross mark-to-market of the monoline protection depends on the value of the instruments against which protection has been bought. A positive fair value, or a valuation gain, in the protection is recognised if the fair value of the instrument it references decreases. For the majority of trades the gross mark-to-market of the monoline protection is determined directly from the fair value price of the underlying reference instrument, however for the remainder of the trades, the gross mark-to-market is determined using industry standard models.
The methodology employed to calculate the monoline CVA uses market implied probability of defaults and internally assessed recovery levels to determine the level of expected loss on monoline exposures of different maturities. The probability of default is calculated with reference to market observable credit spreads and recovery levels. CVA is calculated at a trade level by applying the expected loss, corresponding to each trade’s expected maturity, to the gross mark-to-market of the monoline protection. The expected maturity of each trade reflects the scheduled notional amortisation of the underlying reference instruments and whether payments due from the monoline are received at the point of default or over the life of the underlying reference instruments. The table below summarises the Group's exposure to monolines, all of which are in Non-Core.
2010
£m 2009
£m 2008
£m
Gross exposure to monolines 4,023 6,170 11,581 Hedges with financial institutions (71) (531) (789)Credit valuation adjustment (2,443) (3,796) (5,988)Net exposure to monolines 1,509 1,843 4,804
Credit valuation adjustment as a % of gross exposure 61% 62% 52% Counterparty and credit risk RWAs* £17.8bn £13.7bn £7.3bn
The net income statement effect relating to monoline exposures is detailed below. 2010 2009 2008
£m £m £m
Credit valuation adjustment at 1 January (3,796) (5,988) (862)Credit valuation adjustment at 31 December (2,443) (3,796) (5,988)Decrease/(increase) in credit valuation adjustment 1,353 2,192 (5,126)Net debit relating to realisations, hedges, foreign exchange and other movements (844) (3,290) (347)Net (debit)/credit relating to reclassified debt securities (305) (1,468) 1,916 Net credit/(debit) to income statement (1) 204 (2,566) (3,557)
Note: (1) Comprises the following elements for the year ended 2010 and 2009: - a loss of £5 million (2009 - £2,387 million) in income from trading activities;
- impairment reversals/(losses) of £71 million (2009 - (£239) million); and - other income of £138 million (2009 - £60 million) relating to reclassified debt securities.
* unaudited
211RBS Group 2010
Business review
Risk and balance sheet management
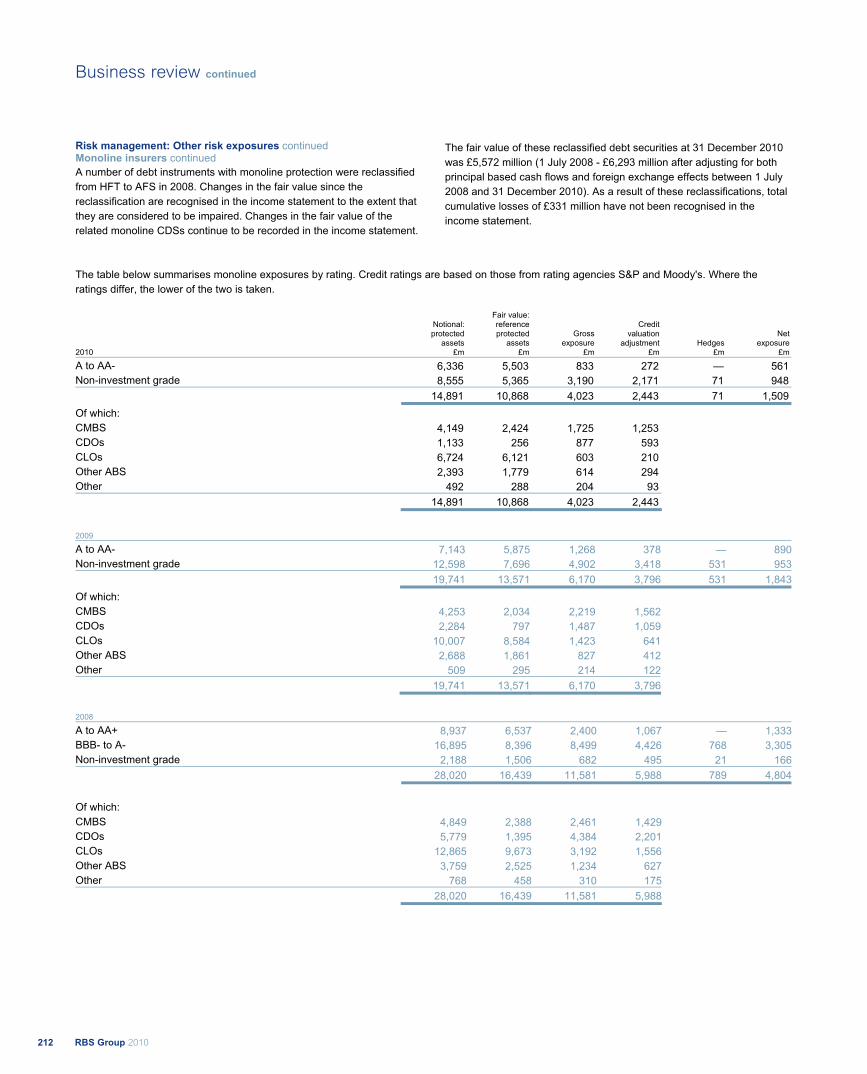
Risk management: Other risk exposures continued Monoline insurers continued A number of debt instruments with monoline protection were reclassified from HFT to AFS in 2008. Changes in the fair value since the reclassification are recognised in the income statement to the extent that they are considered to be impaired. Changes in the fair value of the related monoline CDSs continue to be recorded in the income statement.
The fair value of these reclassified debt securities at 31 December 2010 was £5,572 million (1 July 2008 - £6,293 million after adjusting for both principal based cash flows and foreign exchange effects between 1 July 2008 and 31 December 2010). As a result of these reclassifications, total cumulative losses of £331 million have not been recognised in the income statement.
The table below summarises monoline exposures by rating. Credit ratings are based on those from rating agencies S&P and Moody's. Where the ratings differ, the lower of the two is taken.
2010
Notional: protected
assets £m
Fair value: reference protected
assets £m
Gross exposure
£m
Credit valuation
adjustment £m
Hedges £m
Net exposure
£m
A to AA- 6,336 5,503 833 272 — 561 Non-investment grade 8,555 5,365 3,190 2,171 71 948 14,891 10,868 4,023 2,443 71 1,509 Of which: CMBS 4,149 2,424 1,725 1,253 CDOs 1,133 256 877 593 CLOs 6,724 6,121 603 210 Other ABS 2,393 1,779 614 294 Other 492 288 204 93 14,891 10,868 4,023 2,443
2009 A to AA- 7,143 5,875 1,268 378 — 890Non-investment grade 12,598 7,696 4,902 3,418 531 953 19,741 13,571 6,170 3,796 531 1,843Of which: CMBS 4,253 2,034 2,219 1,562 CDOs 2,284 797 1,487 1,059 CLOs 10,007 8,584 1,423 641 Other ABS 2,688 1,861 827 412 Other 509 295 214 122 19,741 13,571 6,170 3,796
2008
A to AA+ 8,937 6,537 2,400 1,067 — 1,333BBB- to A- 16,895 8,396 8,499 4,426 768 3,305Non-investment grade 2,188 1,506 682 495 21 166 28,020 16,439 11,581 5,988 789 4,804
Of which: CMBS 4,849 2,388 2,461 1,429 CDOs 5,779 1,395 4,384 2,201 CLOs 12,865 9,673 3,192 1,556 Other ABS 3,759 2,525 1,234 627 Other 768 458 310 175 28,020 16,439 11,581 5,988
RBS Group 2010212
Business review continued
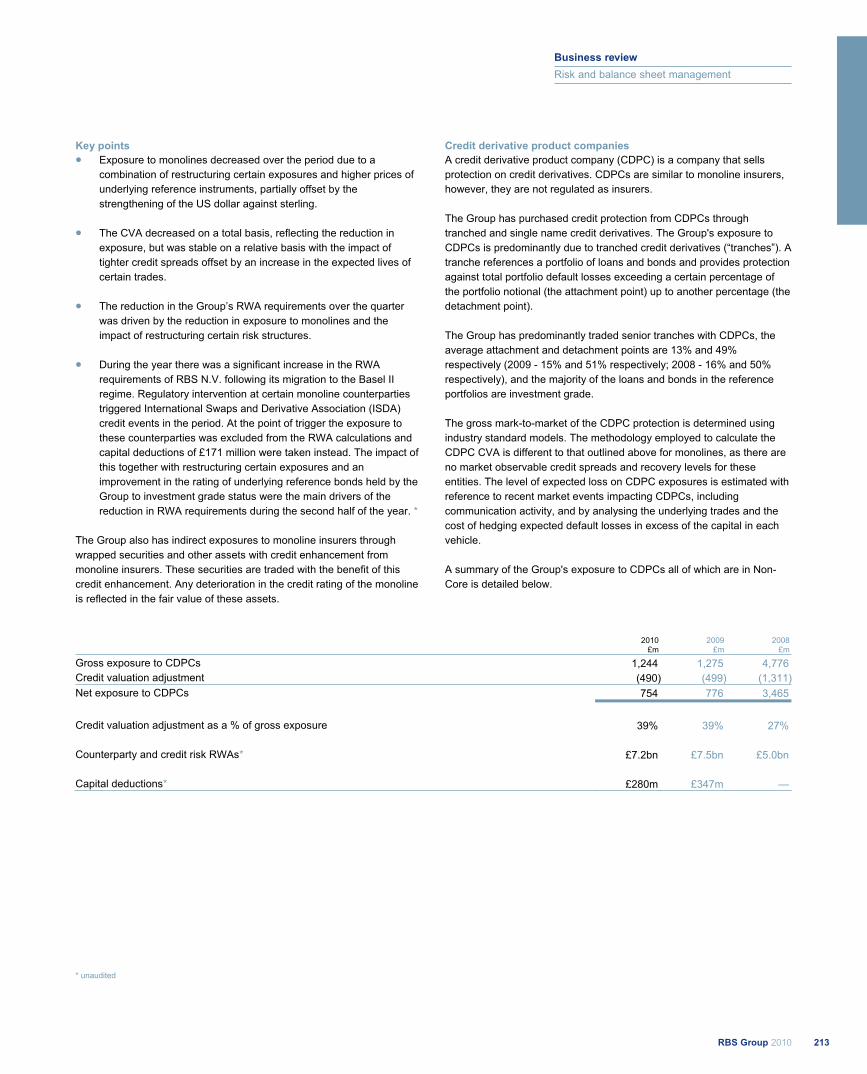
Key points Exposure to monolines decreased over the period due to a combination of restructuring certain exposures and higher prices of underlying reference instruments, partially offset by the strengthening of the US dollar against sterling.
The CVA decreased on a total basis, reflecting the reduction in exposure, but was stable on a relative basis with the impact of tighter credit spreads offset by an increase in the expected lives of certain trades.
The reduction in the Group’s RWA requirements over the quarter was driven by the reduction in exposure to monolines and the impact of restructuring certain risk structures.
During the year there was a significant increase in the RWA requirements of RBS N.V. following its migration to the Basel II regime. Regulatory intervention at certain monoline counterparties triggered International Swaps and Derivative Association (ISDA) credit events in the period. At the point of trigger the exposure to these counterparties was excluded from the RWA calculations and capital deductions of £171 million were taken instead. The impact of this together with restructuring certain exposures and an improvement in the rating of underlying reference bonds held by the Group to investment grade status were the main drivers of the reduction in RWA requirements during the second half of the year. *
The Group also has indirect exposures to monoline insurers through wrapped securities and other assets with credit enhancement from monoline insurers. These securities are traded with the benefit of this credit enhancement. Any deterioration in the credit rating of the monoline is reflected in the fair value of these assets.
Credit derivative product companies A credit derivative product company (CDPC) is a company that sells protection on credit derivatives. CDPCs are similar to monoline insurers, however, they are not regulated as insurers. The Group has purchased credit protection from CDPCs through tranched and single name credit derivatives. The Group's exposure to CDPCs is predominantly due to tranched credit derivatives (“tranches”). A tranche references a portfolio of loans and bonds and provides protection against total portfolio default losses exceeding a certain percentage of the portfolio notional (the attachment point) up to another percentage (the detachment point). The Group has predominantly traded senior tranches with CDPCs, the average attachment and detachment points are 13% and 49% respectively (2009 - 15% and 51% respectively; 2008 - 16% and 50% respectively), and the majority of the loans and bonds in the reference portfolios are investment grade. The gross mark-to-market of the CDPC protection is determined using industry standard models. The methodology employed to calculate the CDPC CVA is different to that outlined above for monolines, as there are no market observable credit spreads and recovery levels for these entities. The level of expected loss on CDPC exposures is estimated with reference to recent market events impacting CDPCs, including communication activity, and by analysing the underlying trades and the cost of hedging expected default losses in excess of the capital in each vehicle. A summary of the Group's exposure to CDPCs all of which are in Non-Core is detailed below.
2010 £m
2009 £m
2008 £m
Gross exposure to CDPCs 1,244 1,275 4,776 Credit valuation adjustment (490) (499) (1,311)Net exposure to CDPCs 754 776 3,465
Credit valuation adjustment as a % of gross exposure 39% 39% 27% Counterparty and credit risk RWAs* £7.2bn £7.5bn £5.0bn Capital deductions* £280m £347m —
* unaudited
213RBS Group 2010
Business review
Risk and balance sheet management
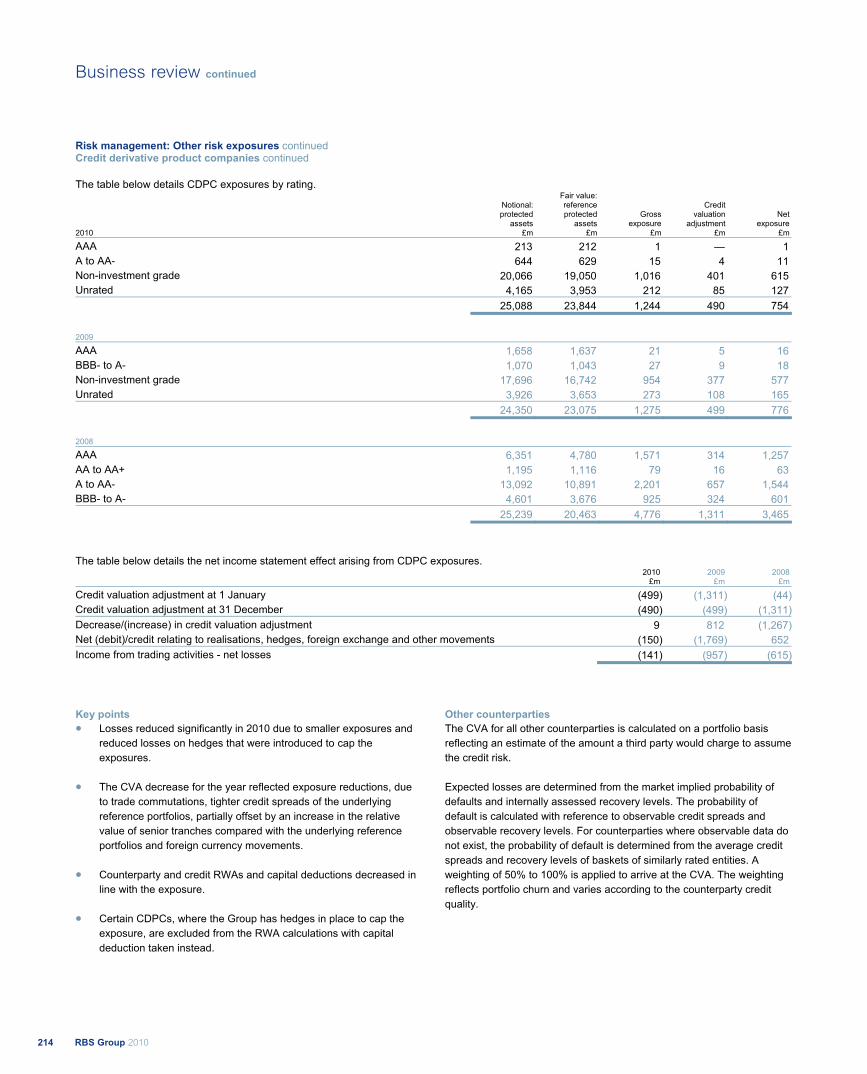
Risk management: Other risk exposures continued Credit derivative product companies continued
The table below details CDPC exposures by rating.
2010
Notional: protected
assets £m
Fair value: reference protected
assets £m
Gross exposure
£m
Credit valuation
adjustment £m
Net exposure
£m
AAA 213 212 1 — 1 A to AA- 644 629 15 4 11 Non-investment grade 20,066 19,050 1,016 401 615 Unrated 4,165 3,953 212 85 127 25,088 23,844 1,244 490 754
2009 AAA 1,658 1,637 21 5 16 BBB- to A- 1,070 1,043 27 9 18 Non-investment grade 17,696 16,742 954 377 577 Unrated 3,926 3,653 273 108 165 24,350 23,075 1,275 499 776
2008 AAA 6,351 4,780 1,571 314 1,257 AA to AA+ 1,195 1,116 79 16 63 A to AA- 13,092 10,891 2,201 657 1,544 BBB- to A- 4,601 3,676 925 324 601 25,239 20,463 4,776 1,311 3,465
The table below details the net income statement effect arising from CDPC exposures. 2010 2009 2008
£m £m £m
Credit valuation adjustment at 1 January (499) (1,311) (44)Credit valuation adjustment at 31 December (490) (499) (1,311)Decrease/(increase) in credit valuation adjustment 9 812 (1,267)Net (debit)/credit relating to realisations, hedges, foreign exchange and other movements (150) (1,769) 652 Income from trading activities - net losses (141) (957) (615)
Key points Losses reduced significantly in 2010 due to smaller exposures and reduced losses on hedges that were introduced to cap the exposures.
The CVA decrease for the year reflected exposure reductions, due to trade commutations, tighter credit spreads of the underlying reference portfolios, partially offset by an increase in the relative value of senior tranches compared with the underlying reference portfolios and foreign currency movements.
Counterparty and credit RWAs and capital deductions decreased in line with the exposure.
Certain CDPCs, where the Group has hedges in place to cap the exposure, are excluded from the RWA calculations with capital deduction taken instead.
Other counterparties The CVA for all other counterparties is calculated on a portfolio basis reflecting an estimate of the amount a third party would charge to assume the credit risk. Expected losses are determined from the market implied probability of defaults and internally assessed recovery levels. The probability of default is calculated with reference to observable credit spreads and observable recovery levels. For counterparties where observable data do not exist, the probability of default is determined from the average credit spreads and recovery levels of baskets of similarly rated entities. A weighting of 50% to 100% is applied to arrive at the CVA. The weighting reflects portfolio churn and varies according to the counterparty credit quality.
RBS Group 2010214
Business review continued
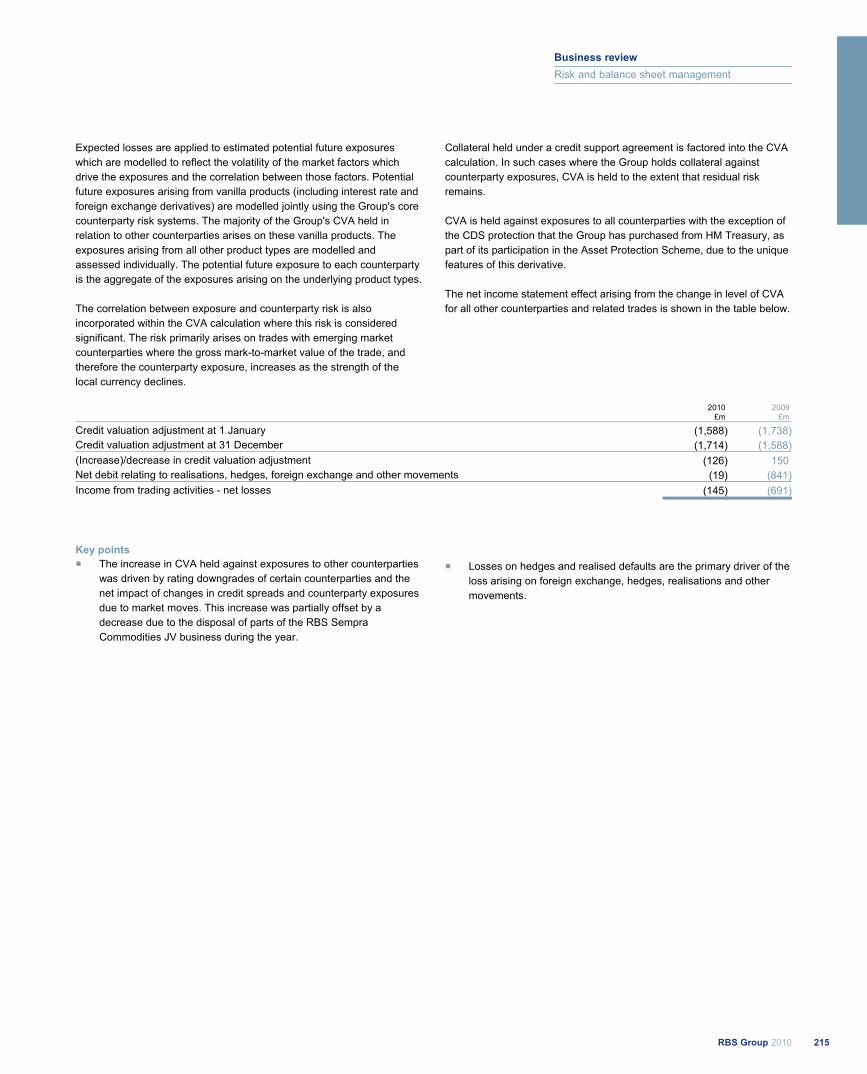
Expected losses are applied to estimated potential future exposures which are modelled to reflect the volatility of the market factors which drive the exposures and the correlation between those factors. Potential future exposures arising from vanilla products (including interest rate and foreign exchange derivatives) are modelled jointly using the Group's core counterparty risk systems. The majority of the Group's CVA held in relation to other counterparties arises on these vanilla products. The exposures arising from all other product types are modelled and assessed individually. The potential future exposure to each counterparty is the aggregate of the exposures arising on the underlying product types. The correlation between exposure and counterparty risk is also incorporated within the CVA calculation where this risk is considered significant. The risk primarily arises on trades with emerging market counterparties where the gross mark-to-market value of the trade, and therefore the counterparty exposure, increases as the strength of the local currency declines.
Collateral held under a credit support agreement is factored into the CVA calculation. In such cases where the Group holds collateral against counterparty exposures, CVA is held to the extent that residual risk remains. CVA is held against exposures to all counterparties with the exception of the CDS protection that the Group has purchased from HM Treasury, as part of its participation in the Asset Protection Scheme, due to the unique features of this derivative. The net income statement effect arising from the change in level of CVA for all other counterparties and related trades is shown in the table below.
2010 2009
£m £m
Credit valuation adjustment at 1 January (1,588) (1,738)Credit valuation adjustment at 31 December (1,714) (1,588)(Increase)/decrease in credit valuation adjustment (126) 150 Net debit relating to realisations, hedges, foreign exchange and other movements (19) (841)Income from trading activities - net losses (145) (691)
Key points The increase in CVA held against exposures to other counterparties was driven by rating downgrades of certain counterparties and the net impact of changes in credit spreads and counterparty exposures due to market moves. This increase was partially offset by a decrease due to the disposal of parts of the RBS Sempra Commodities JV business during the year.
Losses on hedges and realised defaults are the primary driver of the loss arising on foreign exchange, hedges, realisations and other movements.
215RBS Group 2010
Business review
Risk and balance sheet management
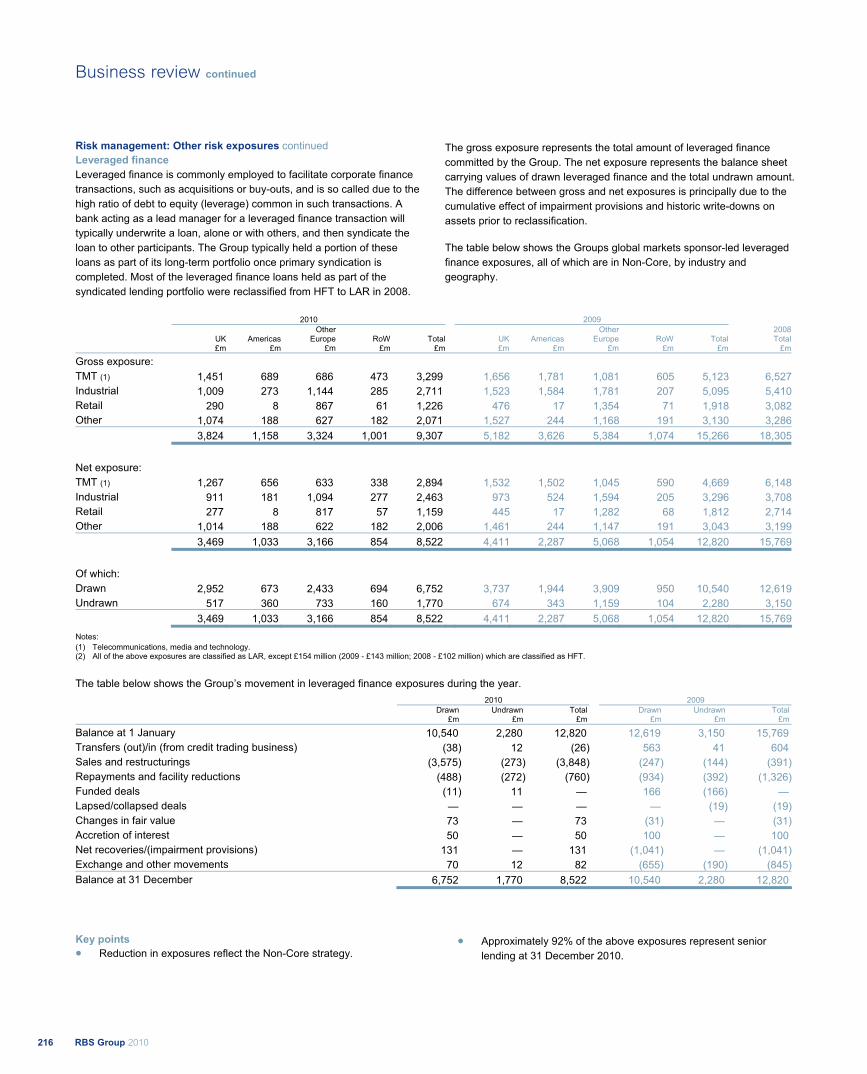
Risk management: Other risk exposures continued Leveraged finance Leveraged finance is commonly employed to facilitate corporate finance transactions, such as acquisitions or buy-outs, and is so called due to the high ratio of debt to equity (leverage) common in such transactions. A bank acting as a lead manager for a leveraged finance transaction will typically underwrite a loan, alone or with others, and then syndicate the loan to other participants. The Group typically held a portion of these loans as part of its long-term portfolio once primary syndication is completed. Most of the leveraged finance loans held as part of the syndicated lending portfolio were reclassified from HFT to LAR in 2008.
The gross exposure represents the total amount of leveraged finance committed by the Group. The net exposure represents the balance sheet carrying values of drawn leveraged finance and the total undrawn amount. The difference between gross and net exposures is principally due to the cumulative effect of impairment provisions and historic write-downs on assets prior to reclassification. The table below shows the Groups global markets sponsor-led leveraged finance exposures, all of which are in Non-Core, by industry and geography.
2010 2009
UK £m
Americas£m
OtherEurope
£mRoW
£mTotal
£mUK£m
Americas£m
Other Europe
£m RoW
£mTotal
£m
2008Total
£m
Gross exposure: TMT (1) 1,451 689 686 473 3,299 1,656 1,781 1,081 605 5,123 6,527Industrial 1,009 273 1,144 285 2,711 1,523 1,584 1,781 207 5,095 5,410Retail 290 8 867 61 1,226 476 17 1,354 71 1,918 3,082Other 1,074 188 627 182 2,071 1,527 244 1,168 191 3,130 3,286 3,824 1,158 3,324 1,001 9,307 5,182 3,626 5,384 1,074 15,266 18,305
Net exposure: TMT (1) 1,267 656 633 338 2,894 1,532 1,502 1,045 590 4,669 6,148Industrial 911 181 1,094 277 2,463 973 524 1,594 205 3,296 3,708Retail 277 8 817 57 1,159 445 17 1,282 68 1,812 2,714Other 1,014 188 622 182 2,006 1,461 244 1,147 191 3,043 3,199 3,469 1,033 3,166 854 8,522 4,411 2,287 5,068 1,054 12,820 15,769
Of which: Drawn 2,952 673 2,433 694 6,752 3,737 1,944 3,909 950 10,540 12,619Undrawn 517 360 733 160 1,770 674 343 1,159 104 2,280 3,150 3,469 1,033 3,166 854 8,522 4,411 2,287 5,068 1,054 12,820 15,769Notes: (1) Telecommunications, media and technology. (2) All of the above exposures are classified as LAR, except £154 million (2009 - £143 million; 2008 - £102 million) which are classified as HFT.
The table below shows the Group’s movement in leveraged finance exposures during the year. 2010 2009
Drawn
£m Undrawn
£m Total
£m Drawn
£m Undrawn
£m Total
£m
Balance at 1 January 10,540 2,280 12,820 12,619 3,150 15,769 Transfers (out)/in (from credit trading business) (38) 12 (26) 563 41 604 Sales and restructurings (3,575) (273) (3,848) (247) (144) (391)Repayments and facility reductions (488) (272) (760) (934) (392) (1,326)Funded deals (11) 11 — 166 (166) — Lapsed/collapsed deals — — — — (19) (19)Changes in fair value 73 — 73 (31) — (31)Accretion of interest 50 — 50 100 — 100 Net recoveries/(impairment provisions) 131 — 131 (1,041) — (1,041)Exchange and other movements 70 12 82 (655) (190) (845)Balance at 31 December 6,752 1,770 8,522 10,540 2,280 12,820
Key points Reduction in exposures reflect the Non-Core strategy.
Approximately 92% of the above exposures represent senior lending at 31 December 2010.
RBS Group 2010216
Business review continued
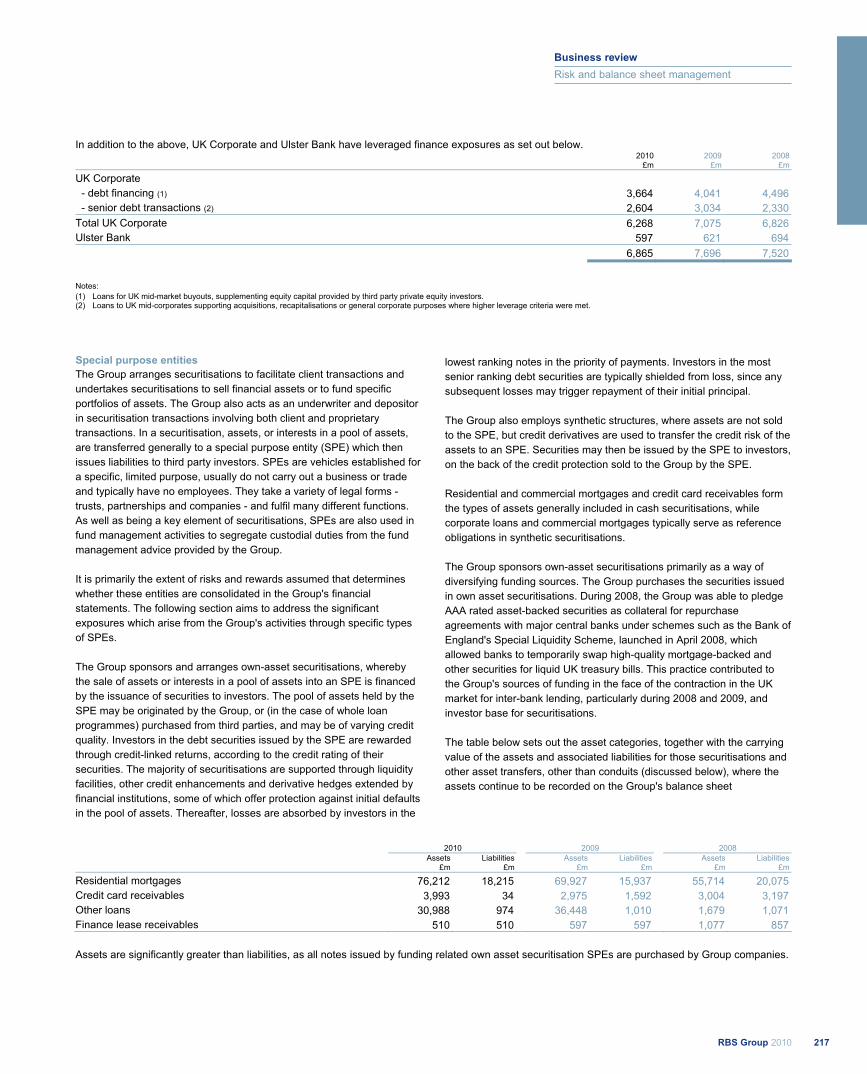
In addition to the above, UK Corporate and Ulster Bank have leveraged finance exposures as set out below. 2010 2009 2008 £m £m £m
UK Corporate - debt financing (1) 3,664 4,041 4,496
- senior debt transactions (2) 2,604 3,034 2,330 Total UK Corporate 6,268 7,075 6,826 Ulster Bank 597 621 694 6,865 7,696 7,520
Notes: (1) Loans for UK mid-market buyouts, supplementing equity capital provided by third party private equity investors. (2) Loans to UK mid-corporates supporting acquisitions, recapitalisations or general corporate purposes where higher leverage criteria were met.
Special purpose entities The Group arranges securitisations to facilitate client transactions and undertakes securitisations to sell financial assets or to fund specific portfolios of assets. The Group also acts as an underwriter and depositor in securitisation transactions involving both client and proprietary transactions. In a securitisation, assets, or interests in a pool of assets, are transferred generally to a special purpose entity (SPE) which then issues liabilities to third party investors. SPEs are vehicles established for a specific, limited purpose, usually do not carry out a business or trade and typically have no employees. They take a variety of legal forms - trusts, partnerships and companies - and fulfil many different functions. As well as being a key element of securitisations, SPEs are also used in fund management activities to segregate custodial duties from the fund management advice provided by the Group. It is primarily the extent of risks and rewards assumed that determines whether these entities are consolidated in the Group's financial statements. The following section aims to address the significant exposures which arise from the Group's activities through specific types of SPEs. The Group sponsors and arranges own-asset securitisations, whereby the sale of assets or interests in a pool of assets into an SPE is financed by the issuance of securities to investors. The pool of assets held by the SPE may be originated by the Group, or (in the case of whole loan programmes) purchased from third parties, and may be of varying credit quality. Investors in the debt securities issued by the SPE are rewarded through credit-linked returns, according to the credit rating of their securities. The majority of securitisations are supported through liquidity facilities, other credit enhancements and derivative hedges extended by financial institutions, some of which offer protection against initial defaults in the pool of assets. Thereafter, losses are absorbed by investors in the
lowest ranking notes in the priority of payments. Investors in the most senior ranking debt securities are typically shielded from loss, since any subsequent losses may trigger repayment of their initial principal. The Group also employs synthetic structures, where assets are not sold to the SPE, but credit derivatives are used to transfer the credit risk of the assets to an SPE. Securities may then be issued by the SPE to investors, on the back of the credit protection sold to the Group by the SPE. Residential and commercial mortgages and credit card receivables form the types of assets generally included in cash securitisations, while corporate loans and commercial mortgages typically serve as reference obligations in synthetic securitisations. The Group sponsors own-asset securitisations primarily as a way of diversifying funding sources. The Group purchases the securities issued in own asset securitisations. During 2008, the Group was able to pledge AAA rated asset-backed securities as collateral for repurchase agreements with major central banks under schemes such as the Bank of England's Special Liquidity Scheme, launched in April 2008, which allowed banks to temporarily swap high-quality mortgage-backed and other securities for liquid UK treasury bills. This practice contributed to the Group's sources of funding in the face of the contraction in the UK market for inter-bank lending, particularly during 2008 and 2009, and investor base for securitisations. The table below sets out the asset categories, together with the carrying value of the assets and associated liabilities for those securitisations and other asset transfers, other than conduits (discussed below), where the assets continue to be recorded on the Group's balance sheet
2010 2009 2008 Assets Liabilities Assets Liabilities Assets Liabilities
£m £m £m £m £m £m
Residential mortgages 76,212 18,215 69,927 15,937 55,714 20,075 Credit card receivables 3,993 34 2,975 1,592 3,004 3,197 Other loans 30,988 974 36,448 1,010 1,679 1,071 Finance lease receivables 510 510 597 597 1,077 857
Assets are significantly greater than liabilities, as all notes issued by funding related own asset securitisation SPEs are purchased by Group companies.
217RBS Group 2010
Business review
Risk and balance sheet management
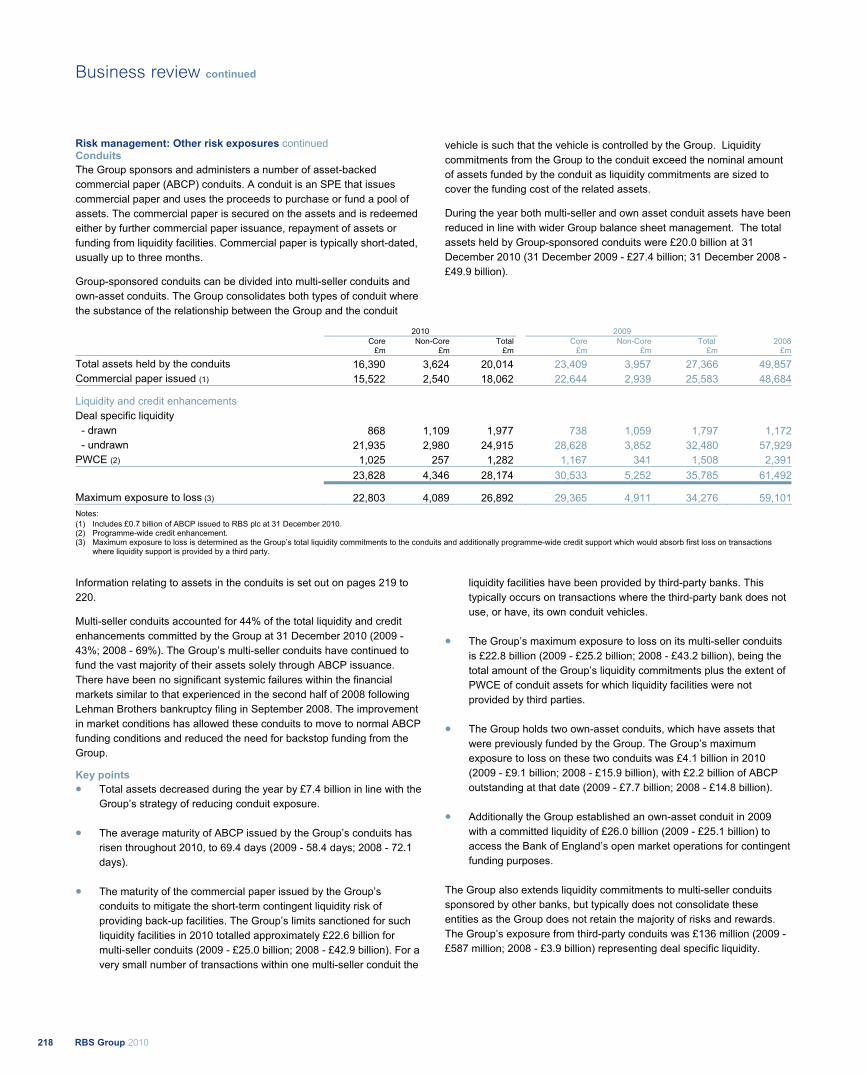
Risk management: Other risk exposures continued Conduits The Group sponsors and administers a number of asset-backed commercial paper (ABCP) conduits. A conduit is an SPE that issues commercial paper and uses the proceeds to purchase or fund a pool of assets. The commercial paper is secured on the assets and is redeemed either by further commercial paper issuance, repayment of assets or funding from liquidity facilities. Commercial paper is typically short-dated, usually up to three months.
Group-sponsored conduits can be divided into multi-seller conduits and own-asset conduits. The Group consolidates both types of conduit where the substance of the relationship between the Group and the conduit
vehicle is such that the vehicle is controlled by the Group. Liquidity commitments from the Group to the conduit exceed the nominal amount of assets funded by the conduit as liquidity commitments are sized to cover the funding cost of the related assets.
During the year both multi-seller and own asset conduit assets have been reduced in line with wider Group balance sheet management. The total assets held by Group-sponsored conduits were £20.0 billion at 31 December 2010 (31 December 2009 - £27.4 billion; 31 December 2008 - £49.9 billion).
2010 2009
Core
£m Non-Core
£m Total
£m Core
£m Non-Core
£m Total
£m2008
£m
Total assets held by the conduits 16,390 3,624 20,014 23,409 3,957 27,366 49,857Commercial paper issued (1) 15,522 2,540 18,062 22,644 2,939 25,583 48,684
Liquidity and credit enhancements Deal specific liquidity
- drawn 868 1,109 1,977 738 1,059 1,797 1,172 - undrawn 21,935 2,980 24,915 28,628 3,852 32,480 57,929PWCE (2) 1,025 257 1,282 1,167 341 1,508 2,391 23,828 4,346 28,174 30,533 5,252 35,785 61,492
Maximum exposure to loss (3) 22,803 4,089 26,892 29,365 4,911 34,276 59,101Notes: (1) Includes £0.7 billion of ABCP issued to RBS plc at 31 December 2010. (2) Programme-wide credit enhancement. (3) Maximum exposure to loss is determined as the Group’s total liquidity commitments to the conduits and additionally programme-wide credit support which would absorb first loss on transactions
where liquidity support is provided by a third party.
Information relating to assets in the conduits is set out on pages 219 to 220.
Multi-seller conduits accounted for 44% of the total liquidity and credit enhancements committed by the Group at 31 December 2010 (2009 - 43%; 2008 - 69%). The Group’s multi-seller conduits have continued to fund the vast majority of their assets solely through ABCP issuance. There have been no significant systemic failures within the financial markets similar to that experienced in the second half of 2008 following Lehman Brothers bankruptcy filing in September 2008. The improvement in market conditions has allowed these conduits to move to normal ABCP funding conditions and reduced the need for backstop funding from the Group.
Key points
Total assets decreased during the year by £7.4 billion in line with the Group’s strategy of reducing conduit exposure.
The average maturity of ABCP issued by the Group’s conduits has risen throughout 2010, to 69.4 days (2009 - 58.4 days; 2008 - 72.1 days).
The maturity of the commercial paper issued by the Group’s conduits to mitigate the short-term contingent liquidity risk of providing back-up facilities. The Group’s limits sanctioned for such liquidity facilities in 2010 totalled approximately £22.6 billion for multi-seller conduits (2009 - £25.0 billion; 2008 - £42.9 billion). For a very small number of transactions within one multi-seller conduit the
liquidity facilities have been provided by third-party banks. This typically occurs on transactions where the third-party bank does not use, or have, its own conduit vehicles.
The Group’s maximum exposure to loss on its multi-seller conduits is £22.8 billion (2009 - £25.2 billion; 2008 - £43.2 billion), being the total amount of the Group’s liquidity commitments plus the extent of PWCE of conduit assets for which liquidity facilities were not provided by third parties.
The Group holds two own-asset conduits, which have assets that were previously funded by the Group. The Group’s maximum exposure to loss on these two conduits was £4.1 billion in 2010 (2009 - £9.1 billion; 2008 - £15.9 billion), with £2.2 billion of ABCP outstanding at that date (2009 - £7.7 billion; 2008 - £14.8 billion).
Additionally the Group established an own-asset conduit in 2009 with a committed liquidity of £26.0 billion (2009 - £25.1 billion) to access the Bank of England’s open market operations for contingent funding purposes.
The Group also extends liquidity commitments to multi-seller conduits sponsored by other banks, but typically does not consolidate these entities as the Group does not retain the majority of risks and rewards. The Group’s exposure from third-party conduits was £136 million (2009 - £587 million; 2008 - £3.9 billion) representing deal specific liquidity.
RBS Group 2010218
Business review continued
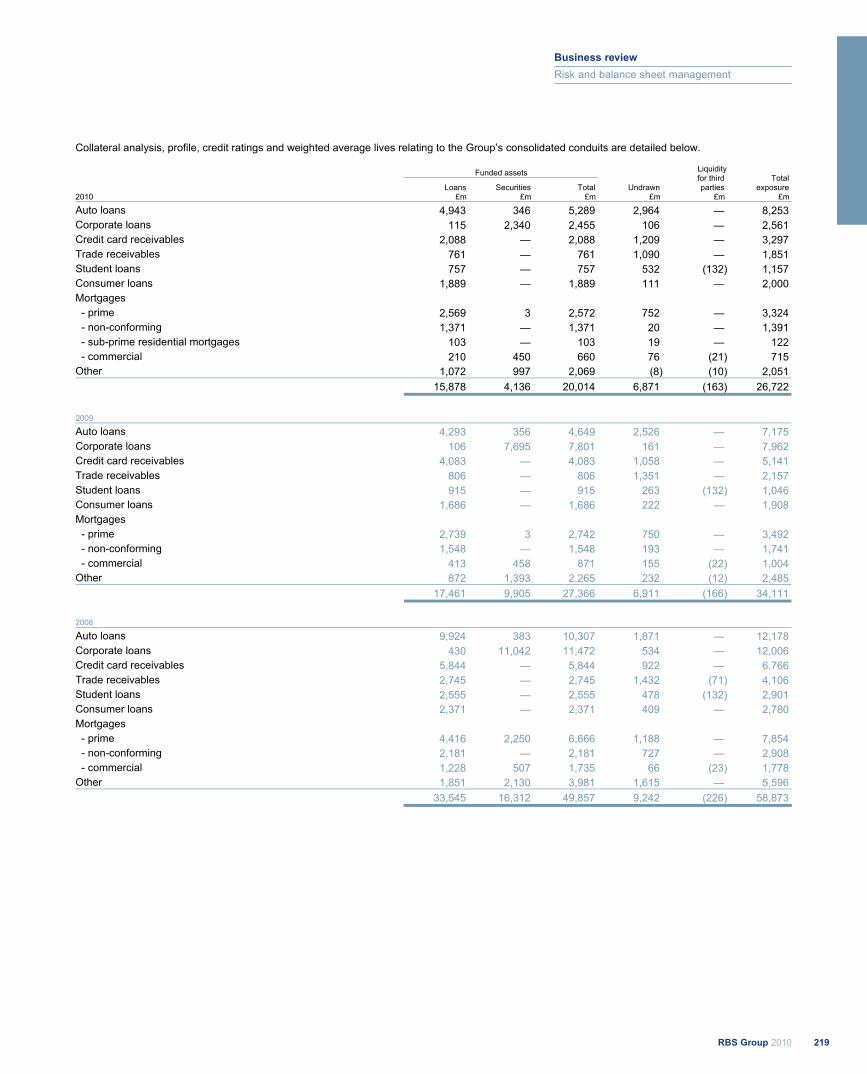
Collateral analysis, profile, credit ratings and weighted average lives relating to the Group’s consolidated conduits are detailed below.
Funded assets
Loans Securities Total Undrawn
Liquidityfor third parties
Total exposure
2010 £m £m £m £m £m £m
Auto loans 4,943 346 5,289 2,964 — 8,253 Corporate loans 115 2,340 2,455 106 — 2,561 Credit card receivables 2,088 — 2,088 1,209 — 3,297 Trade receivables 761 — 761 1,090 — 1,851 Student loans 757 — 757 532 (132) 1,157 Consumer loans 1,889 — 1,889 111 — 2,000 Mortgages - prime 2,569 3 2,572 752 — 3,324 - non-conforming 1,371 — 1,371 20 — 1,391 - sub-prime residential mortgages 103 — 103 19 — 122 - commercial 210 450 660 76 (21) 715 Other 1,072 997 2,069 (8) (10) 2,051 15,878 4,136 20,014 6,871 (163) 26,722
2009
Auto loans 4,293 356 4,649 2,526 — 7,175 Corporate loans 106 7,695 7,801 161 — 7,962 Credit card receivables 4,083 — 4,083 1,058 — 5,141 Trade receivables 806 — 806 1,351 — 2,157 Student loans 915 — 915 263 (132) 1,046 Consumer loans 1,686 — 1,686 222 — 1,908 Mortgages
- prime 2,739 3 2,742 750 — 3,492 - non-conforming 1,548 — 1,548 193 — 1,741 - commercial 413 458 871 155 (22) 1,004 Other 872 1,393 2,265 232 (12) 2,485 17,461 9,905 27,366 6,911 (166) 34,111
2008 Auto loans 9,924 383 10,307 1,871 — 12,178 Corporate loans 430 11,042 11,472 534 — 12,006 Credit card receivables 5,844 — 5,844 922 — 6,766 Trade receivables 2,745 — 2,745 1,432 (71) 4,106 Student loans 2,555 — 2,555 478 (132) 2,901 Consumer loans 2,371 — 2,371 409 — 2,780 Mortgages
- prime 4,416 2,250 6,666 1,188 — 7,854 - non-conforming 2,181 — 2,181 727 — 2,908 - commercial 1,228 507 1,735 66 (23) 1,778 Other 1,851 2,130 3,981 1,615 — 5,596 33,545 16,312 49,857 9,242 (226) 58,873
219RBS Group 2010
Business review
Risk and balance sheet management
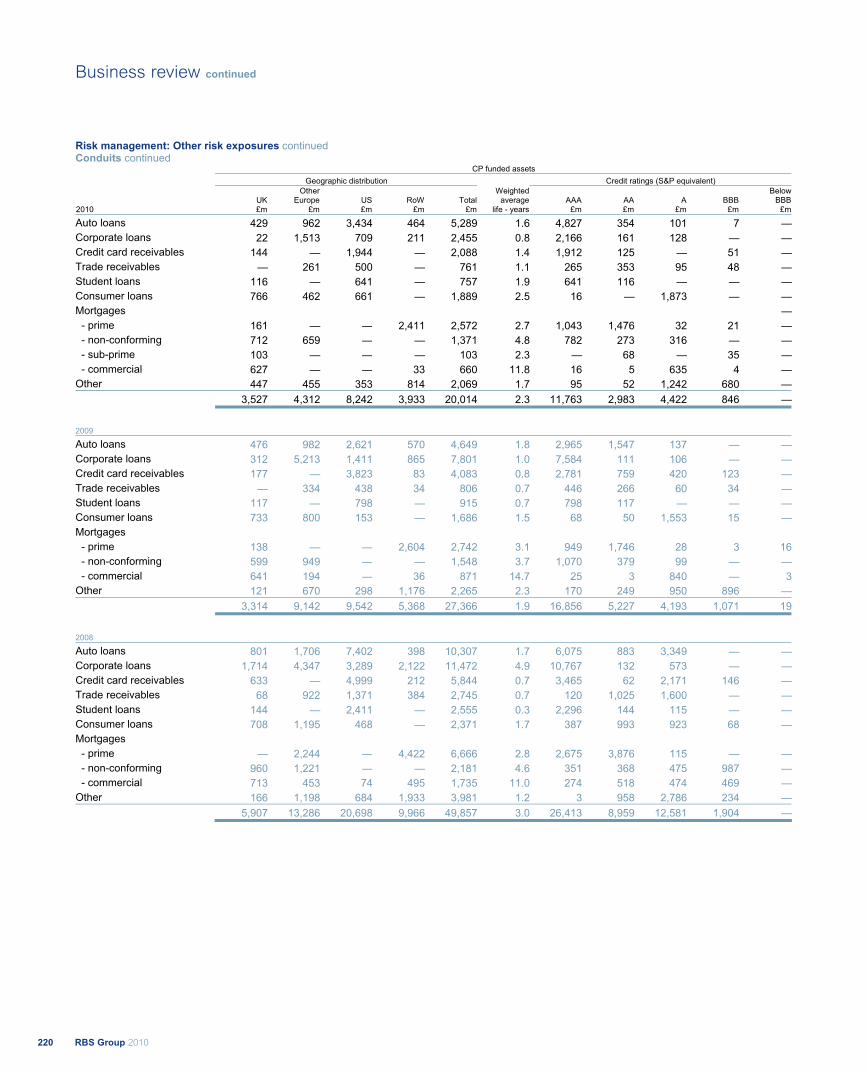
Risk management: Other risk exposures continued Conduits continued
CP funded assets Geographic distribution Credit ratings (S&P equivalent)
UK Other
Europe US RoW Total AAA AA A BBBBelow
BBB2010 £m £m £m £m £m
Weightedaverage
life - years £m £m £m £m £m
Auto loans 429 962 3,434 464 5,289 1.6 4,827 354 101 7 —Corporate loans 22 1,513 709 211 2,455 0.8 2,166 161 128 — —Credit card receivables 144 — 1,944 — 2,088 1.4 1,912 125 — 51 —Trade receivables — 261 500 — 761 1.1 265 353 95 48 —Student loans 116 — 641 — 757 1.9 641 116 — — —Consumer loans 766 462 661 — 1,889 2.5 16 — 1,873 — —Mortgages —
- prime 161 — — 2,411 2,572 2.7 1,043 1,476 32 21 — - non-conforming 712 659 — — 1,371 4.8 782 273 316 — — - sub-prime 103 — — — 103 2.3 — 68 — 35 — - commercial 627 — — 33 660 11.8 16 5 635 4 —Other 447 455 353 814 2,069 1.7 95 52 1,242 680 — 3,527 4,312 8,242 3,933 20,014 2.3 11,763 2,983 4,422 846 —
2009 Auto loans 476 982 2,621 570 4,649 1.8 2,965 1,547 137 — —Corporate loans 312 5,213 1,411 865 7,801 1.0 7,584 111 106 — —Credit card receivables 177 — 3,823 83 4,083 0.8 2,781 759 420 123 —Trade receivables — 334 438 34 806 0.7 446 266 60 34 —Student loans 117 — 798 — 915 0.7 798 117 — — —Consumer loans 733 800 153 — 1,686 1.5 68 50 1,553 15 —Mortgages
- prime 138 — — 2,604 2,742 3.1 949 1,746 28 3 16 - non-conforming 599 949 — — 1,548 3.7 1,070 379 99 — — - commercial 641 194 — 36 871 14.7 25 3 840 — 3Other 121 670 298 1,176 2,265 2.3 170 249 950 896 — 3,314 9,142 9,542 5,368 27,366 1.9 16,856 5,227 4,193 1,071 19
2008 Auto loans 801 1,706 7,402 398 10,307 1.7 6,075 883 3,349 — —Corporate loans 1,714 4,347 3,289 2,122 11,472 4.9 10,767 132 573 — —Credit card receivables 633 — 4,999 212 5,844 0.7 3,465 62 2,171 146 —Trade receivables 68 922 1,371 384 2,745 0.7 120 1,025 1,600 — —Student loans 144 — 2,411 — 2,555 0.3 2,296 144 115 — —Consumer loans 708 1,195 468 — 2,371 1.7 387 993 923 68 —Mortgages
- prime — 2,244 — 4,422 6,666 2.8 2,675 3,876 115 — — - non-conforming 960 1,221 — — 2,181 4.6 351 368 475 987 — - commercial 713 453 74 495 1,735 11.0 274 518 474 469 —Other 166 1,198 684 1,933 3,981 1.2 3 958 2,786 234 — 5,907 13,286 20,698 9,966 49,857 3.0 26,413 8,959 12,581 1,904 —
RBS Group 2010220
Business review continued
Asset Protection Scheme* All the disclosures in this section (pages 221 to 224) are unaudited and are marked with an asterisk (*). References to 'Group' in this section relate to 'Group before RFS MI'. Key aspects of the Scheme On 22 December 2009, the Group acceded to the Asset Protection Scheme (APS or ‘the Scheme’) with HM Treasury (HMT) acting on behalf of the UK Government. Under the Scheme, the Group purchased credit protection over a portfolio of specified assets and exposures ("covered assets") from HMT. The portfolio of covered assets had a par value of approximately £282 billion at 31 December 2008 and the protection is subject to a first loss of £60 billion and covers 90% of subsequent losses net of recoveries. Once through the first loss, when a covered asset has experienced a trigger event losses and recoveries in respect of that asset are included in the balance receivable under APS. Receipts from HMT will, over time, amount to 90% of cumulative losses (net of cumulative recoveries) on the portfolio of covered assets less the first loss amount. The Group has the right to terminate the Scheme at any time provided that the Financial Services Authority has confirmed in writing to HMT that it has no objection. On termination, the Group is liable to pay HMT a termination fee. The termination fee comprises the difference between £2.5 billion (or, if higher, a sum related to the economic benefit of regulatory capital relief obtained from APS) and the aggregate fees paid. In addition, the Group would have to repay any amounts received from HMT under the terms of APS. In consideration for the protection provided by the APS, the Group paid an initial premium of £1.4 billion on 31 December 2009. A further premium of £700 million was paid on 31 December 2010. Quarterly premiums of £125 million are payable from 31 December 2011 and subsequently until the earlier of 31 December 2099 and the termination of the agreement.
Losses are recognised when a covered asset has experienced a trigger event which comprises of failure to pay subject to grace periods, bankruptcy and restructuring. APS assets are spread across the Group’s main divisions. High volume commercial and retail exposures were selected on a portfolio basis where assets were high risk and in arrears at 31 December 2008. Large corporate and GBM exposures were selected at the counterparty/asset level based on individual risk reviews and defaulted assets in the workout/restructuring unit. HMT has the right to appoint step-in managers to carry out any oversight, management or additional functions on behalf of HMT to ensure that the covered assets are managed and administered in compliance with the agreed terms and conditions. This right is exercisable if certain step-in triggers occur. These include:
losses on covered assets in total exceed 125% of the first loss amount or losses on an individual covered asset class exceed specified thresholds;
a breach of specified obligations in the APS rules or the accession agreement;
the Group has failed or is failing to comply with any of the conditions in the APS rules in relation to asset management, monitoring and reporting, and governance and oversight, and such failure is persistent and material or it is evidence of a systematic problem; and
material or systematic data deficiencies in the information provided to HMT in accordance with the terms of the APS.
HMT may at any time elect to cease to exercise its step-in rights in whole or part when it is satisfied that the step-in triggers have been remedied.
* unaudited
R221RBS Group 2010
Business review
Risk and balance sheet management

Risk management: Asset Protection Scheme* continued Covered assets: roll forward to 31 December 2010 The table below details the movement in covered assets in the year. £bn
Covered assets at 1 January 2009 282.0 Disposals (3.0)Non-contractual early repayments (8.9)Maturities and amortisation (26.1)Rollovers and covered amount cap adjustments (1.7)Effect of foreign currency movements and other adjustments (11.8)Covered assets at 31 December 2009 230.5 Disposals (9.7)Maturities, amortisation and early repayments (28.7)Reclassified assets (2) 3.1 Withdrawals (2.9)Effect of foreign currency movements and other adjustments 2.4 Covered assets at 31 December 2010 194.7
Notes: (1) The Asset Protection Agency (APA) and the Group have now reached agreement on substantially all eligibility issues. (2) In Q2 2010, the APA and the Group reached agreement over the classification of some structured credit assets which resulted in adjustments to the covered amount, without affecting the underlying
risk protection.
Key points
The reduction in covered assets was due to run-off of the portfolio, disposals, early repayments and maturing loans.
As part of the Group’s risk reduction strategy significant disposals were made from the Structured Credit Portfolio (2010 - £3.0 billion). The Group took advantage of market conditions and executed sales from its derivative, loan and leveraged finance portfolios (2010 - £6.7 billion).
Credit impairments and write downs The table below analyses the cumulative credit impairment losses and adjustments to par value (including AFS reserves) relating to the covered assets.
2010 2009 2008 £m £m £m
Loans and advances 18,033 14,240 7,705Debt securities 11,747 7,816 7,942Derivatives 2,043 6,834 6,575 31,823 28,890 22,222
By division: UK Retail 2,964 2,431 1,492UK Corporate 1,382 1,007 285Ulster Bank 804 486 234Retail & Commercial 5,150 3,924 2,011Global Banking & Markets 1,496 1,628 1,640Core 6,646 5,552 3,651Non-Core 25,177 23,338 18,571 31,823 28,890 22,222
Key points The increase in Non-Core impairments of £1.8 billion accounted for the majority of the increase in credit impairments and write downs in 2010.
The APA and the Group reached agreement for the purposes of the Scheme, on the classification of some structured credit assets which has resulted in adjustments to credit impairments and write downs mainly between debt securities and derivatives.
The reduction in GBM is largely a result of transfers to Non-Core in the second half of the year.
* unaudited
RRBS Group 2010222
Business review continued
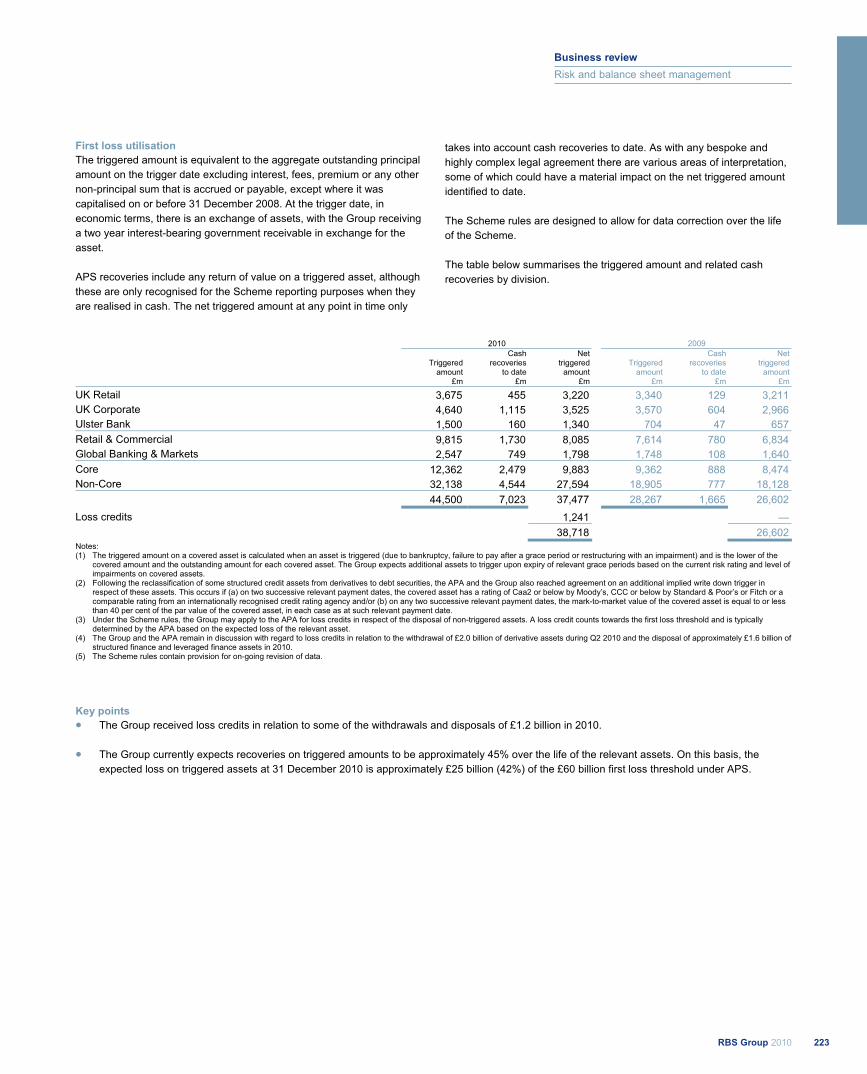
First loss utilisation The triggered amount is equivalent to the aggregate outstanding principal amount on the trigger date excluding interest, fees, premium or any other non-principal sum that is accrued or payable, except where it was capitalised on or before 31 December 2008. At the trigger date, in economic terms, there is an exchange of assets, with the Group receiving a two year interest-bearing government receivable in exchange for the asset. APS recoveries include any return of value on a triggered asset, although these are only recognised for the Scheme reporting purposes when they are realised in cash. The net triggered amount at any point in time only
takes into account cash recoveries to date. As with any bespoke and highly complex legal agreement there are various areas of interpretation, some of which could have a material impact on the net triggered amount identified to date. The Scheme rules are designed to allow for data correction over the life of the Scheme. The table below summarises the triggered amount and related cash recoveries by division.
2010 2009
Triggered
amount
Cash recoveries
to date
Net triggered
amount Triggered
amount
Cash recoveries
to date
Net triggered
amount £m £m £m £m £m £m
UK Retail 3,675 455 3,220 3,340 129 3,211 UK Corporate 4,640 1,115 3,525 3,570 604 2,966 Ulster Bank 1,500 160 1,340 704 47 657 Retail & Commercial 9,815 1,730 8,085 7,614 780 6,834 Global Banking & Markets 2,547 749 1,798 1,748 108 1,640 Core 12,362 2,479 9,883 9,362 888 8,474 Non-Core 32,138 4,544 27,594 18,905 777 18,128 44,500 7,023 37,477 28,267 1,665 26,602 Loss credits 1,241 —
38,718 26,602 Notes: (1) The triggered amount on a covered asset is calculated when an asset is triggered (due to bankruptcy, failure to pay after a grace period or restructuring with an impairment) and is the lower of the
covered amount and the outstanding amount for each covered asset. The Group expects additional assets to trigger upon expiry of relevant grace periods based on the current risk rating and level of impairments on covered assets.
(2) Following the reclassification of some structured credit assets from derivatives to debt securities, the APA and the Group also reached agreement on an additional implied write down trigger in respect of these assets. This occurs if (a) on two successive relevant payment dates, the covered asset has a rating of Caa2 or below by Moody’s, CCC or below by Standard & Poor’s or Fitch or a comparable rating from an internationally recognised credit rating agency and/or (b) on any two successive relevant payment dates, the mark-to-market value of the covered asset is equal to or less than 40 per cent of the par value of the covered asset, in each case as at such relevant payment date.
(3) Under the Scheme rules, the Group may apply to the APA for loss credits in respect of the disposal of non-triggered assets. A loss credit counts towards the first loss threshold and is typically determined by the APA based on the expected loss of the relevant asset.
(4) The Group and the APA remain in discussion with regard to loss credits in relation to the withdrawal of £2.0 billion of derivative assets during Q2 2010 and the disposal of approximately £1.6 billion of structured finance and leveraged finance assets in 2010.
(5) The Scheme rules contain provision for on-going revision of data.
Key points The Group received loss credits in relation to some of the withdrawals and disposals of £1.2 billion in 2010.
The Group currently expects recoveries on triggered amounts to be approximately 45% over the life of the relevant assets. On this basis, the expected loss on triggered assets at 31 December 2010 is approximately £25 billion (42%) of the £60 billion first loss threshold under APS.
223RBS Group 2010
Business review
Risk and balance sheet management
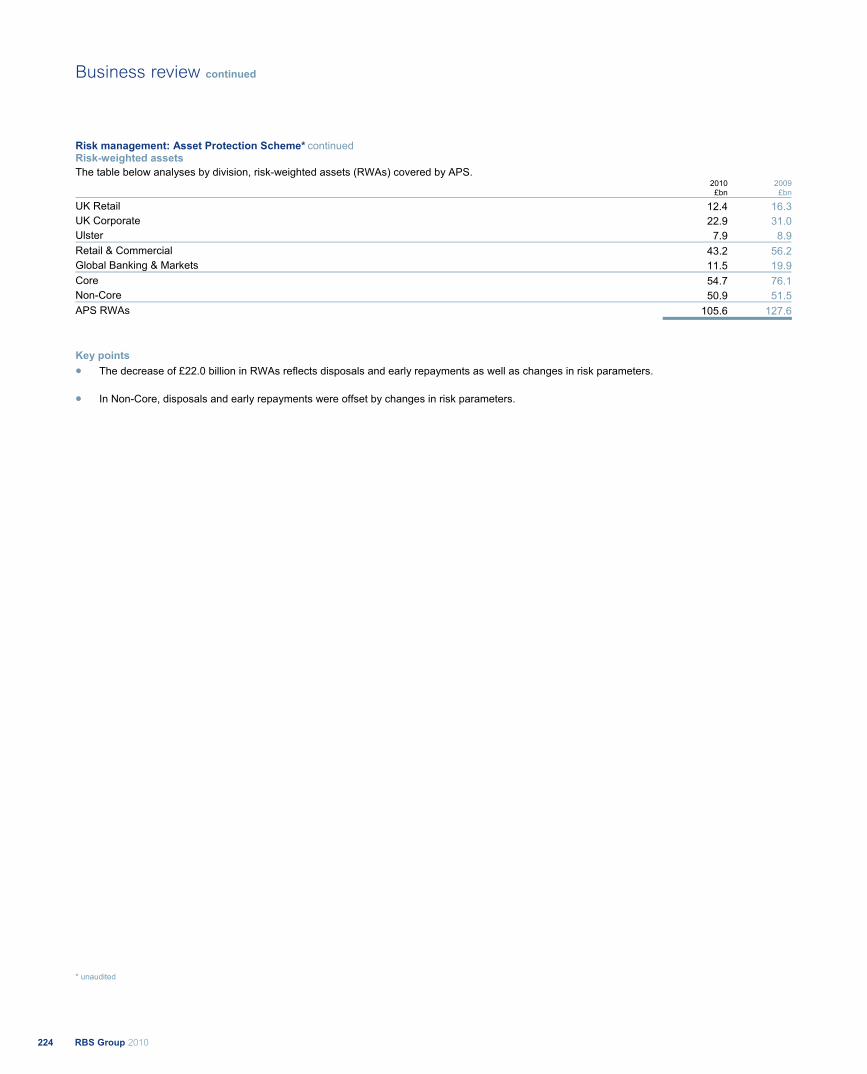
Risk management: Asset Protection Scheme* continued Risk-weighted assets The table below analyses by division, risk-weighted assets (RWAs) covered by APS. 2010 2009 £bn £bn
UK Retail 12.4 16.3UK Corporate 22.9 31.0Ulster 7.9 8.9Retail & Commercial 43.2 56.2Global Banking & Markets 11.5 19.9Core 54.7 76.1Non-Core 50.9 51.5APS RWAs 105.6 127.6
Key points The decrease of £22.0 billion in RWAs reflects disposals and early repayments as well as changes in risk parameters.
In Non-Core, disposals and early repayments were offset by changes in risk parameters.
* unaudited
RBS Group 2010224
Business review continued

225RBS Group 2010
226 Board of directors and secretary
228 Executive Committee
230 Report of the directors
235 Corporate governance
246 Letter from the Chair of the Remuneration Committee
248 Directors’ remuneration report
264 Directors’ interests in shares
265 Statement of directors’ responsibilities
Governance

RBS Group 2010226
Board of directors and secretary
Chairman
Philip Hampton (age 57)N (Chairman)Appointed to the Board on 19 January 2009 and to the position of Chairman on 3February 2009. Philip Hampton was previously chairman of J Sainsbury plc andgroup finance director of Lloyds TSB Group plc, BT Group plc, BG Group plc,British Gas and British Steel plc, an executive director of Lazards and a non-executive director of RMC Group plc. He is also former chairman of UK FinancialInvestments Limited which manages the UK Government's shareholding in banks.He is currently a non-executive director of Anglo American plc.
Executive directors
Stephen Hester (age 50)Group Chief ExecutiveAppointed to the Board on 1 October 2008 and to the position of Group ChiefExecutive on 21 November 2008, Stephen Hester was chief executive of TheBritish Land Company PLC. He was previously chief operating officer of AbbeyNational plc and prior to that he held positions with Credit Suisse First Bostonincluding Chief Financial Officer, Head of Fixed Income and co-Head of EuropeanInvestment Banking. From February 2008 to October 2008 he served as a non-executive deputy chairman of Northern Rock plc. He is also a trustee of TheFoundation and Friends of the Royal Botanical Gardens, Kew.
Bruce Van Saun (age 53)Group Finance DirectorAppointed to the Board on 1 October 2009, Bruce Van Saun has more than 25years financial services experience. From 1997 to 2008 he held a number of seniorpositions with Bank of New York and later Bank of New York Mellon, most recentlyas vice chairman and chief financial officer and before that he was responsible forthe Asset Management and Market Related businesses. Prior to that, he heldsenior positions with Deutsche Bank, Wasserstein Perella Group and KidderPeabody & Co. He has served on several corporate boards as a non-executivedirector and has been active in numerous community organisations.
Group Secretary
Aileen Taylor (age 38)Aileen Taylor assumed the role of Group Secretary in May 2010 and providessecretariat and corporate governance advice and support to the Group Board andits senior Committees. Aileen was appointed Deputy Group Secretary and Head ofGroup Secretariat in 2007, and prior to that held various legal, secretariat and riskroles at divisional and business level. Aileen is a Fellow of the Chartered Instituteof Bankers in Scotland and a Fellow of the Industry and Parliament Trust.
Key to pictures1. Philip Hampton, Chairman2. Stephen Hester,
Group Chief Executive3. Bruce Van Saun,
Group Finance Director4. Colin Buchan5. Sandy Crombie6. Penny Hughes7. Joe MacHale8. John McFarlane9. Brendan Nelson10. Arthur ‘Art’ Ryan11. Philip Scott12. Aileen Taylor
AbbreviationsA Member of the Audit CommitteeN Member of the Nominations CommitteeR Member of the Remuneration CommitteeRi Member of the Board Risk Committee* Independent non-executive director
1 2 3 7 8 9
4 5 6 10 11 12

227RBS Group 2010
Governance
Non-executive directors
Colin Buchan* (age 56) A, N, RiAppointed to the Board in June 2002, Colin Buchan was educated in South Africaand spent the early part of his career in South Africa and the Far East. He hasconsiderable international investment banking experience, as well as experience invery large risk management in the equities business. He was formerly a member ofthe group management board of UBS AG and head of equities of UBS Warburg,and was the former chairman of UBS Securities Canada Inc. He is chairman ofStandard Life Investments Limited and a director of Standard Life plc and BlackRock World Mining Trust Plc. Colin is a fellow of the Chartered Institute of Bankersof Scotland.
Sandy Crombie* (age 62) Senior Independent Director, N, R, RiAppointed to the Board in June 2009, Sandy Crombie was previously Group ChiefExecutive of Standard Life Plc. He was also previously a director of the Associationof British Insurers and a member of the Chancellor of the Exchequer’s High LevelGroup. In 2007, he was the Prince of Wales’ Ambassador for Corporate SocialResponsibility in Scotland. He currently serves as Chairman of the EdinburghUNESCO City of Literature Trust and Creative Scotland, as Vice Chairman of theBoard of Governors of the Royal Scottish Academy of Music and Drama, andPresident of The Cockburn Association.
Penny Hughes* (age 51) N, R (Chair)Penny Hughes joined the Board on 1 January 2010 and is currently a non-executivedirector of Home Retail Group plc, Cable & Wireless Worldwide plc and WmMorrison Supermarkets plc. She is a former non-executive director of Gap Inc,Vodafone PLC and Reuters PLC. Penny chairs the Remuneration Committee ofHome Retail Group. Penny was a director and chairman of the RemunerationCommittee of Skandinaviska Enskilda Banken AB until she stepped down on 20October 2009. Penny spent the majority of her executive career at Coca-Colawhere she held a number of leadership positions. In 1992, she was appointed asPresident, Coca-Cola Great Britain and Ireland. She is also a Trustee of the BritishMuseum and President of the Advertising Association.
Joe MacHale* (age 59) N, RiAppointed to the Board in September 2004, Joe MacHale is currently a non-executivedirector and chairman of the remuneration committee of Brit Insurance Holdings plc,and a trustee and treasurer of MacMillan Cancer Support. He held a number ofsenior executive positions with J P Morgan between 1979 and 2001 and was latterlychief executive of J P Morgan Europe, Middle East and Africa Region. He is a fellowof the Institute of Chartered Accountants and the Chairman of Prytania Group.
John McFarlane* (age 63) N, RAppointed to the Board on 1 October 2008, John McFarlane is former chiefexecutive officer of Australia and New Zealand Banking Group Limited. Previouslyhe was a group executive director of Standard Chartered and was head ofCiticorp/Citibank in the UK and Ireland. He is currently a non-executive directorof Westfield Holdings Limited and a director of Old Oak Holdings Limited. He is aformer president of the International Monetary Conference and a former chairmanof the Australian Bankers Association. He has previously served as a director ofthe London Stock Exchange and a member of the Auditing Practices Board.
Brendan Nelson* (age 61) A (Chairman), N, RiAppointed to the Board on 1 April 2010, Brendan Nelson is the former globalchairman, Financial Services for KPMG. Previously, he held a range of seniorleadership roles within KPMG including as a member of the KPMG UK board from1999 until 2006 and as vice chairman from 2006. He has been a board memberof the Financial Services Skills Council since 2008 and was chairman of the AuditCommittee of the Institute of Chartered Accountants of Scotland from 2005 until2008. He joined the Board of BP plc in November 2010.
Arthur ‘Art’ Ryan* (age 68) NAppointed to the Board on 1 October 2008, Art Ryan is the former chairman, chiefexecutive officer and president of Prudential Financial Inc. Previously he heldsenior positions with Chase Manhattan Bank NA. He is currently a non-executivedirector of Regeneron Pharmaceuticals Inc. and an active member of numerouscommunity boards. He was a founding member of the Financial Services Forum.
Philip Scott* (age 56) A, N, Ri (Chairman)Appointed to the Board on 1 November 2009, Philip Scott has wide-rangingexperience of financial services and risk management, including previousresponsibility for Aviva's continental European and international life and long-termsavings businesses. He held a number of senior executive positions during hiscareer at Aviva, including his role as Group Finance Director until January 2010.-Philip is also an experienced non-executive director and is currently on the boardof Diageo plc. He is a Fellow of the Institute of Actuaries and The Association ofCertified Public Accountants.

Executive Committee
228 RBS Group 2010
Key to pictures1 Stephen Hester, Group Chief Executive2 Bruce Van Saun, Group Finance Director3 Ellen Alemany, Chief Executive, Citizens and Head of Americas4 Nathan Bostock, Head of Restructuring & Risk5 Paul Geddes, Chief Executive, RBS Insurance6 Brian Hartzer, Chief Executive, UK Retail, Wealth and Ulster Bank7 John Hourican, Chief Executive, Global Banking & Markets8 Chris Sullivan, Chief Executive, UK Corporate9 Ron Teerlink, Chief Administrative Officer
1 2 3
4 5 6
7 8 9
The Executive Committee provides executive input to theGroup Board, and monitors and reports to the Group Boardon all operational and day to day activities in relation to theGroup’s businesses.
It is responsible for managing Group wide issues and thoseoperational issues material to the broader Group.
229RBS Group 2010
Governance
Executive Committee
Stephen Hester, Group Chief Executive
Bruce Van Saun, Group Finance Director
M For biographies see page 226
Ellen Alemany (age 55)Chief Executive, Citizens and Head of AmericasEllen Alemany joined the RBS Group in June 2007 as Chief Executive Officer ofCitizens Financial Group, Inc. and Head of RBS Americas. She became Chairmanof Citizens Financial Group, Inc. in March 2009. Prior to this appointment, Ellenwas the CEO for Global Transaction Services at Citigroup, one of Citi’s 12 publicityreported product lines. Ellen joined Citibank in 1987 and has held various positionsincluding EVP for Commercial Business Group, Chairman and CEO for CitibankInternational plc and Citibank’s European Bank.
Nathan Bostock (age 50)Head of Restructuring & RiskNathan Bostock joined the RBS Group in June 2009 as Head of Restructuring andRisk with responsibility for the Non-Core Division & APS, the Global RestructuringGroup and the control functions of Group Legal & Secretariat and Risk Management.Before joining RBS, Nathan spent eight years with Abbey National plc in severalroles and was latterly the CFO and main Board Director responsible for Products &Marketing, HR, Insurance and Cards. Before joining Abbey in 2001, Nathan spentten years with RBS in a number of roles, including Chief Operating Officer ofTreasury and Capital Markets and Group Risk Director. A Chartered Accountant,Nathan worked with Coopers & Lybrand, before starting his career in banking. Hespent seven years in Chase Manhattan Bank in a variety of areas and functions.He also holds a BSc (Hons) in Mathematics.
Paul Geddes (age 41)Chief Executive, RBS InsurancePaul Geddes graduated from Oxford in 1990, where he read Politics, Philosophyand Economics. His career started at Procter & Gamble, in the UK and Europe.He entered retailing in 1997, holding senior roles in Kingfisher and GUS Groupsbefore joining the RBS Group in 2004 as Managing Director, Products andMarketing, Retail Banking. He was appointed CEO, Retail Banking in December2006 and CEO, UK Retail in February 2009, before taking overall responsibility forsome of the UK’s best-known insurance brands, including Direct Line, Churchill,Privilege and Green Flag as CEO, RBS Insurance in August 2009. Paul is a Fellowof the Chartered Institute of Bankers in Scotland.
Brian Hartzer (age 44)Chief Executive, UK Retail, Wealth and Ulster BankBrian Hartzer has been the Chief Executive Officer for Retail, Wealth and UlsterBank since August 2009. He joined RBS from ANZ in Australia, where he wasChief Executive Officer Australia, as well as Global Segment Lead for Retailand Wealth. Brian joined ANZ in 1999 as Managing Director, Consumer Finance,and later ran ANZ’s Personal Banking division. Prior to joining ANZ, Brian spentten years as a financial services consultant in New York, San Francisco, andMelbourne. Brian is a graduate of Princeton University and holds joint US andAustralian citizenship.
John Hourican (age 40)Chief Executive, Global Banking & MarketsJohn Hourican was appointed Chief Executive of Global Banking & Markets inOctober 2008. Prior to this John held a variety of positions across the RBS Group,including CFO of ABN AMRO Group, Head of Leveraged Finance and ChiefOperating Officer of Global Banking & Markets. John was educated at the NationalUniversity of Ireland and received his Postgraduate Diploma from Dublin CityUniversity before starting his career at Price Waterhouse, where he worked inDublin, London and Hong Kong. He is a fellow of the Institute of CharteredAccountants in Ireland.
Chris Sullivan (age 53)Chief Executive, UK CorporateChris Sullivan was appointed Chief Executive of the UK Corporate BankingDivision and the GTS Division in August 2009. His previous role was ChiefExecutive of RBS Insurance, the second largest general insurance provider in theUK. Prior to this, Chris was Chief Executive of Retail and Deputy Chief Executiveof Retail Markets. Chris is Vice Chairman of the Association of British Insurers,Chairman of the General Insurance Council and a member of the CBI President’sCommittee. He spent five years as Chief Executive of Lombard Asset Finance andunder his leadership it attained a leading position in the UK and Europe. ChrisSullivan earned his Fellowship of Chartered Institute of Bankers Scotland for hisservices to Scottish Banking.
Ron Teerlink (age 50)Chief Administrative OfficerIn April 2008, Ron Teerlink joined the RBS Group as Chief Executive of BusinessServices, becoming the Group Chief Administrative Officer in February 2009. At thesame time he was re-appointed to the Managing Board of ABN AMRO to overseethe integration programme. Ron started his career with ABN Bank in 1986 as anIT/Systems analyst and held various functional positions before becoming ChiefOperating Officer of the Wholesale Clients Business in 2002. He was appointedChief Executive Officer of Group Shared Services in 2004 and joined ABN AMRO’sManaging Board in January 2006, where he was responsible for Services andMarket Infrastructure. Ron holds a Masters degree in Economics from Amsterdam’sVrije Universiteit.
Management Committee
The Management Committee, comprising our major business andfunctional leaders, meets three to four times annually as a vehicle forstrategy and business performance review.
It comprises members of the Executive Committee plus:
Elaine Arden, Group Human Resources DirectorScott Barton, Chief Executive, Global Transaction ServicesChris Campbell, Group General CounselMark Catton, Chief Executive, UK Corporate & Institutional BankingRory Cullinan, Head of Non-Core DivisionJohn Cummins, Group TreasurerJennifer Hill, Group Director – Strategy & Corporate FinanceSuneel Kamlani, President of Global Banking & MarketsMarco Mazzucchelli, Global Head of Banking & Deputy CEO, GBMCormac McCarthy, Chief Executive, Ulster BankJohn McCormick, Chief Executive, GBM Asia PacificAndrew McLaughlin, Head of Communications andGroup Chief EconomistPeter Nielsen, Global Head of MarketsDavid Stephen, Deputy Group Chief Risk OfficerBrian Stevenson, Chairman, Global Transaction ServicesRory Tapner, Chief Executive, Wealth Management

The directors present their report together with the audited accounts for the year ended 31 December 2010. Group structure The company is a holding company owning the entire issued ordinary share capital of The Royal Bank of Scotland plc, the principal direct operating subsidiary undertaking of the company. The Group comprises the company and all its subsidiary and associated undertakings, including the Royal Bank and NatWest. Details of the principal subsidiary undertakings of the company are shown in Note 18 on the accounts. Following placing and open offers in December 2008 and in April 2009, HM Treasury owned approximately 70.3% of the enlarged ordinary share capital of the company. In December 2009, the company issued a further £25.5 billion of new capital to HM Treasury. This new capital took the form of B shares, which do not generally carry voting rights at general meetings of ordinary shareholders but are convertible into ordinary shares and qualify as Core Tier 1 capital. During the year, the company converted certain non-cumulative convertible preference shares into ordinary shares in the company. As a result, HM Treasury’s holding in the company’s ordinary shares reduced to 67.8%. Results and dividends The loss attributable to the ordinary and B shareholders of the company for the year ended 31 December 2010 amounted to £1,125 million compared with a loss of £3,607 million for the year ended 31 December 2009, as set out in the consolidated income statement on page 268. The company did not pay a dividend on ordinary shares in 2009 or 2010. The Group has undertaken that, unless otherwise agreed with the European Commission, neither the company nor any of its direct or indirect subsidiaries (other than companies in the RBS Holdings N.V. group, which are subject to different restrictions, see below) will pay external investors any dividends or coupons on existing hybrid capital instruments (including preference shares, B shares and upper and lower tier 2 instruments) for a period of two years from 30 April 2010 (the “Deferral Period”), or exercise any call rights in relation to these capital instruments between 24 November 2009 and the end of the Deferral Period, unless there is a legal obligation to do so. Hybrid capital instruments issued after 24 November 2009 will generally not be subject to the restriction on dividend or coupon payments or call options. The Group has agreed that RBS Holdings N.V. will not pay investors any coupons on, or exercise any call rights in relation to, specified hybrid capital instruments for an effective period of two years from 1 April 2011, unless in any such case there is a legal obligation to do so. RBS Holdings N.V. and its group companies are also subject to restrictions on the exercise of call rights in relation to their other hybrid capital instruments. Business review Activities The Group is engaged principally in providing a wide range of banking, insurance and other financial services. Further details of the
organisational structure and business overview of the Group, including the products and services provided by each of its divisions and the competitive markets in which they operate, are contained in the Business review on pages 53 and 54. Risk factors The Group’s future performance and results could be materially different from expected results depending on the outcome of certain potential risks and uncertainties. Certain risk factors the Group faces are summarised on page 55. Fuller details of these and other risk factors are set out on pages 405 to 422. The reported results of the Group are also sensitive to the accounting policies, assumptions and estimates that underlie the preparation of its financial statements. Details of the Group’s critical accounting policies and key sources of accounting judgments are included in Accounting policies on pages 275 to 285. The Group’s approach to risk management, including its financial risk management objectives and policies and information on the Group’s exposure to price, credit, liquidity and cash flow risk, is discussed in the Risk and balance sheet management section of the Business review on pages 119 to 224. Financial performance A review of the Group's performance during the year ended 31 December 2010, including details of each division, and the Group's financial position as at that date is contained in the Business review on pages 56 to 112. ABN AMRO In 2007, RFS Holdings B.V., which was jointly owned by the Group, the Dutch State (successor to Fortis) and Santander (the “Consortium Members”) completed the acquisition of ABN AMRO Holding N.V.. RFS Holdings B.V. has now substantially completed the separation of the business units of ABN AMRO Holding N.V.. As part of this reorganisation, on 6 February 2010, the businesses of ABN AMRO Holding N.V. acquired by the Dutch State were legally demerged from those acquired by the Group and were transferred into a newly established company, ABN AMRO Bank N.V. (save for certain assets and liabilities acquired by the Dutch State that were not part of the legal separation and which will be transferred to the Dutch State as soon as possible). Legal separation of ABN AMRO Bank N.V. occurred on 1 April 2010, with the shares in that entity being transferred by ABN AMRO Holding N.V (renamed RBS Holdings N.V. at legal separation) to a holding company called ABN AMRO Group N.V., which is owned by the Dutch State. Following legal separation, RBS Holdings N.V. has one direct subsidiary, The Royal Bank of Scotland N.V. (“RBS N.V.”), a fully operational bank within the Group. RBS N.V. is independently rated and regulated by the Dutch Central Bank. Certain assets within RBS N.V. continue to be shared by the Consortium Members. The shareholdings of RFS Holdings B.V. were amended on 31 December 2010, resulting in approximately 98% of its issued share capital now being held by the Group.
RRBS Group 2010230
Report of the directors
Business divestments Significant progress has been made on the Group’s European Commission-mandated disposal programme, with three of the four disposals largely agreed. In August 2010, agreement was reached on the sale of the Group’s RBS branches in England and Wales and NatWest branches in Scotland to Santander UK plc. The sale remains subject to regulatory and other approvals. The sale of 80.01% of the Global Merchant Services (“GMS”) business to a consortium of Advent International and Bain Capital completed in November 2010. The Group holds a 19.99% minority stake in the new GMS business, to be known as WorldPay. The sale of RBS Sempra Commodities’ Metals, Oil and European Energy business lines to J.P.Morgan completed in July 2010. The sale of Sempra Energy Solutions to Noble Americas Gas & Power Corp completed in November 2010, while the sale of Sempra North American Power and Gas to J.P.Morgan completed in December 2010. Employees As at 31 December 2010, the Group employed over 148,500 employees (full-time equivalent basis) throughout the world. Details of employee related costs are included in Note 3 on the accounts. Employee learning and development The Group maintains a strong commitment to creating and providing learning opportunities for all its employees through a variety of personal development, training programmes, learning networks and targeted leadership programmes. Employees are also encouraged to do voluntary work with community partners. Employee communication Employee engagement is encouraged through a range of communication channels, at both divisional and Group level. These channels provide access to news and information in a number of ways, including the intranet, magazines, video, team meetings led by line managers, briefings held by senior managers and regular dialogue with employees and employee representatives. The Group Chief Executive and other senior Group executives regularly communicate with, and encourage feedback from, employees across a range of channels. Employee consultation Each year, all employees are invited to complete the global employee opinion survey. The survey is confidential and independently managed by Towers Watson. The survey provides a channel for employees to express their views and opinions about the Group on a range of key issues. The 2010 survey took place in September 2010 and the final response rate was 81%. This represents over 119,000 employees participating in the survey, from more than 50 countries.
The Group recognises employee representative organisations such as trade unions and work councils in a number of businesses and countries. The Group has two European employee fora that provide elected representatives with an opportunity to understand better its European operations. Engagement with its employees and such bodies remains important to the Group. Diversity and inclusion The Group recognises that the diversity of its workforce is a significant and necessary asset to the business. During 2010, the Group executive renewed its commitment to ensuring a working environment that is inclusive to all and one that will enable all employees to develop to their full potential. The Group has a range of policies and processes that extend through the employee life-cycle including recruitment, flexible working and support for ill-health and disability-related absence. Diversity performance is monitored and reviewed at Group and divisional executive level. This commitment extends beyond the Group including support of external charitable networks and fora and as part of the community engagement and supplier relationships. Internally, the Group supports initiatives such as the Women in Business network. Safety, health and wellbeing Ensuring the safety, health and wellbeing of employees and customers is core to the Group’s business, and a fundamental social responsibility for the Group. During 2010, the Group continued to focus on compliance, governance and managing risk across all jurisdictions. Enhanced services and supporting communication were implemented to support the health and wellbeing of employees, particularly given the impact of the economic environment. Pre-employment screening The Group has a comprehensive pre-employment screening process to guard against possible infiltration and employee-related fraud for all direct and non-direct staff engaged on Group business. Code of conduct The code of conduct applies to all employees globally and to all those engaged by the Group, but who are not employees, such as contractors and those engaged through external agencies. The code of conduct exists to promote honest and ethical conduct, including the handling of actual or apparent conflicts of interest between personal and professional relationships. The Group recognises that personal conduct, business integrity and the Group’s security are crucial, and the code of conduct serves to inform employees of the Group’s expectations of their behaviour and practices.
231RBS Group 2010
Governance
Sustainability Sustainability is central to the way the Group is managed. Sustainability is not just about the many responsibilities and obligations that the Group has in a legal sense, but about specific issues that need to be addressed to ensure that the Group is a healthy and respected business operating on a sustainable basis. There is a clear governance structure for Group Sustainability that oversees and aligns the Group's approach to the range of social, ethical and environmental issues which confront the business on a daily basis. For more information on the governance structure, see page 44. The Group continues to do significant work and address challenges across five key themes: Fair banking, Supporting enterprise, Employee engagement, Safety and security, and Citizenship and environmental sustainability. For more information on the Group Sustainability programme, see pages 43 to 47. Going concern The Group’s business activities and financial position, the factors likely to affect its future development and performance and its objectives and policies in managing the financial risks to which it is exposed and its capital are discussed in the Business review. The risk factors which could adversely affect the Group’s future results are set out on pages 405 to 422. The Group’s regulatory capital resources and significant developments since 2009 and anticipated future developments are detailed in the Capital section on pages 126 to 133. The Funding and liquidity risk section, pages 134 to 142, describes the Group’s funding and liquidity profile, including changes in key metrics, the build up of liquidity reserves and the outlook for 2011. Having reviewed the Group’s forecasts, projections and other relevant evidence, the directors have a reasonable expectation that the Group and the company will continue in operational existence for the foreseeable future. Accordingly, the financial statements of the Group and of the company have been prepared on a going concern basis. BBA disclosure code In September 2010, the British Bankers’ Association published its Code for Financial Reporting Disclosure. The code sets out five disclosure principles together with supporting guidance. The principles are that the Group and other major UK banks will provide high quality, meaningful and decision-useful disclosures; review and enhance their financial instrument disclosures for key areas of interest to market participants; assess the applicability and relevance of good practice recommendations to their disclosures acknowledging the importance of such guidance; seek to enhance the comparability of financial statement disclosures across the UK banking sector; and clearly differentiate in their annual reports between information that is audited and information that is unaudited. The Group’s 2010 financial statements have been prepared in compliance with the code’s principles.
Corporate governance The company is committed to high standards of corporate governance. Details are given on pages 235 to 245. The corporate governance statement forms part of this Report of the directors. Share capital Details of the ordinary share capital and preference share capital at 31 December 2010 and movements during the year, are shown in Note 29 on the accounts. Additional information Where not provided elsewhere in the Report of the directors, the following additional information is required to be disclosed by Part 6 of Schedule 7 to the Large and Medium-sized Companies and Groups (Accounts and Reports) Regulations 2008. The rights and obligations attaching to the company’s ordinary shares and preference shares are set out in the company’s Articles of Association, copies of which can be obtained from Companies House in the UK or at www.rbs.com. On a show of hands at a general meeting of the company every holder of ordinary shares and cumulative preference shares present in person or by proxy and entitled to vote shall have one vote. On a poll, every holder of ordinary shares present in person or by proxy and entitled to vote shall have one vote for every share held. On a poll, holders of cumulative preference shares present in person or by proxy and entitled to vote shall have four votes for every share held. The voting rights of holders of non-cumulative preference shares are set out in Note 29 on the accounts. The notices of Annual General Meetings and General Meetings specify the deadlines for exercising voting rights and appointing a proxy or proxies to vote in relation to resolutions to be passed at the meeting. The cumulative preference shares represent less than 0.01% and the non-cumulative preference shares represent less than 0.73% of the total voting rights of the company respectively, the remainder being represented by the ordinary shares. There are no restrictions on the transfer of ordinary shares in the company other than certain restrictions which may from time to time be imposed by laws and regulations (for example, insider trading laws). Pursuant to the Listing Rules of the Financial Services Authority (FSA), certain employees of the company require the approval of the company to deal in the company’s shares. The rules governing the appointment of directors are set out in the company’s Articles of Association and on page 236. The company’s Articles of Association may only be amended by a special resolution at a general meeting of shareholders.
RBS Group 2010232
Report of the directors continued
A number of the company’s share plans include restrictions on transfers of shares while shares are subject to the plans or the terms under which the shares were awarded. The rights and obligations of holders of non-cumulative preference shares are set out in Note 29 on the accounts. Except in relation to the Dividend Access Share, the company is not aware of any agreements between shareholders that may result in restrictions on the transfer of securities and/or voting rights. There are no persons holding securities carrying special rights with regard to control of the company. Under the rules of certain employee share plans, eligible employees are entitled to acquire shares in the company, and shares are held in trust for participants by The Royal Bank and Ulster Bank Dublin Trust Company as Trustees. Voting rights are exercised by the Trustees on receipt of participants’ instructions. If a participant does not submit an instruction to the Trustee no vote is registered. The Royal Bank of Scotland plc 1992 Employee Share Trust, The Royal Bank of Scotland Group plc 2001 Employee Share Trust and The Royal Bank of Scotland Group plc 2007 US Employee Share Trust hold shares on behalf of the Group’s employee share plans. The voting rights are exercisable by the Trustees, however, in accordance with investor protection guidelines, the Trustees abstain from voting. The Trustees would take independent advice before accepting any offer in respect of their shareholdings for the company in a takeover bid situation. Awards granted under the company’s employee share plans may be met through a combination of newly issued shares and shares acquired in the market by the company’s employee benefit trusts. A change of control of the company following a takeover bid may cause a number of agreements to which the company is party to take effect, alter or terminate. All of the company’s employee share plans contain provisions relating to a change of control. Outstanding awards and options may vest and become exercisable on change of control, subject where appropriate to the satisfaction of any performance conditions at that time and pro-rating of awards. In the context of the company as a whole, these agreements are not considered to be significant. Directors The names and brief biographical details of the directors are shown on pages 226 and 227. Colin Buchan, Sandy Crombie, Philip Hampton, Stephen Hester, Penny Hughes, Joe MacHale, John McFarlane, Art Ryan, Philip Scott and Bruce Van Saun all served throughout the year and to the date of signing of the financial statements.
Gordon Pell retired as an executive director on 31 March 2010. Brendan Nelson was appointed as a non-executive director on 1 April 2010. Archie Hunter retired as a non-executive director on 28 April 2010. All directors of the company will stand for re-election by shareholders at the 2011 Annual General Meeting and annually thereafter. Colin Buchan will stand down as a non-executive director on 5 August 2011 following the announcement of the Group’s interim results, having served just over nine years on the Board. Group General Counsel and Group Secretary Miller McLean retired as Group General Counsel and Group Secretary on 30 April 2010. He was succeeded by Chris Campbell as Group General Counsel and Aileen Taylor as Group Secretary. Directors’ interests The interests of the directors in the shares of the company at 31 December 2010 are shown on page 264. None of the directors held an interest in the loan capital of the company or in the shares or loan capital of any of the subsidiary undertakings of the company, during the period from 1 January 2010 to 23 February 2011. Directors’ indemnities In terms of section 236 of the Companies Act 2006 (the “Companies Act”), Qualifying Third Party Indemnity Provisions have been issued by the company to directors, members of the Group’s Executive and Management Committees and FSA Approved Persons. In terms of section 236 of the Companies Act, Qualifying Pension Scheme Indemnity Provisions have been issued to all trustees of the Group’s pension schemes. Post balance sheet events There have been no significant events between the year end and the date of approval of these accounts which would require a change to or disclosure in the accounts. Shareholdings The table below shows shareholders that have notified the Group that they hold more than 3% of the total voting rights of the company at 31 December 2010. Solicitor For The Affairs of Her Majesty’s Treasury as Nominee for Her Majesty’s Treasury Number of shares % held
Ordinary shares 39,644,835,194 67.8B shares (non-voting) 51,000,000,000 100.0
233RBS Group 2010
Governance
Charitable contributions In 2010, the Group’s overall community contribution was £56.1 million (2009 - £63.9 million). The total amount given for charitable purposes by the company and its subsidiary undertakings during the year ended 31 December 2010 was £29.6 million (2009 - £34.7 million). To ensure it makes its community investments as effective as possible, the Group’s policy is to focus its resources on a small number of substantial strategic programmes. These are issues most relevant to a financial institution and relate broadly to financial education, supporting enterprise and microfinance and the charitable endeavours of employees. Political donations At the Annual General Meeting in 2010, shareholders gave authority under Part 14 of the Companies Act, for a period of one year, for the company (and its subsidiaries) to make political donations and incur political expenditure up to a maximum aggregate sum of £500,000. This authorisation was taken as a precaution only, as the company has a longstanding policy of not making political donations or incurring political expenditure within the ordinary meaning of those words. Shareholders will be asked to renew this authorisation at the Annual General Meeting in 2011. During 2010, the Group made no political donations in the UK or EU. In keeping with the Group’s employment policies, Coutts & Company allowed a member of staff paid leave during the year to stand for election at the UK General Election. This might constitute political expenditure for the purposes of the Companies Act, as the definition in the Companies Act is capable of having a very wide meaning. The amount of expenditure in relation to the paid leave was £2,128. RBS Services Australia Limited, a company acquired by the Group through its acquisition of ABN AMRO, made donations of AUS$126,552 (£75,397) during 2010 to Australian political parties and Australian party-affiliated fundraising vehicles. These payments were fully compliant with ABN AMRO policy and Australian electoral law. No further donations will be made and it is not proposed that the Group’s longstanding policy of not making contributions to any political party be changed.
Policy and practice on payment of creditors The Group is committed to maintaining a sound commercial relationship with its suppliers. Consequently, it is the Group’s policy to negotiate and agree terms and conditions with its suppliers, which include the giving of an undertaking to pay suppliers within 30 days of receipt of a correctly prepared invoice submitted in accordance with the terms of the contract or such other payment period as may be agreed. At 31 December 2010, the Group’s trade creditors represented 29 days (2009 - 30 days) of amounts invoiced by suppliers. Directors’ disclosure to auditors Each of the directors at the date of approval of this report confirms that: (a) so far as the director is aware, there is no relevant audit information of which the company’s auditors are unaware; and (b) the director has taken all the steps that he/she ought to have taken as a director to make himself/herself aware of any relevant audit information and to establish that the company’s auditors are aware of that information. This confirmation is given and should be interpreted in accordance with the provisions of section 418 of the Companies Act. Auditors The auditors, Deloitte LLP, have indicated their willingness to continue in office. A resolution to re-appoint Deloitte LLP as the company’s auditors will be proposed at the forthcoming Annual General Meeting. By order of the Board
Aileen Taylor Secretary 23 February 2011 The Royal Bank of Scotland Group plc is registered in Scotland No. 45551
RBS Group 2010234
Report of the directors continued
The company is committed to high standards of corporate governance, business integrity and professionalism in all its activities. Throughout the year ended 31 December 2010, the company has complied with all of the provisions of the Combined Code issued by the Financial Reporting Council in June 2008 (the "Code") except in relation to the provision that the Remuneration Committee should have delegated responsibility for setting remuneration for the Chairman and executive directors. The company considers that this is a matter which should rightly be reserved for the Board. No director is involved in decisions regarding his or her own remuneration. Although not applicable to the current accounting period, the company has also complied with the main provisions of the UK Corporate Governance Code issued by the Financial Reporting Council in May 2010 (the “new Code”) except as noted above. The company has also taken steps to implement the recommendations arising from the review of governance in banks and financial institutions undertaken by Sir David Walker (the “Walker Review”), details of which are described in this section. A copy of the new Code can be found at http://www.frc.org.uk/corporate. The company has also complied in all material respects with the Financial Reporting Council Guidance on Audit Committees issued in December 2010. Under the US Sarbanes-Oxley Act of 2002 (the "Act"), specific standards of corporate governance and business and financial disclosures apply to companies with securities registered in the US. The company complies with all applicable sections of the Act. The New York Stock Exchange As a foreign issuer with American Depositary Shares representing ordinary shares, preference shares and debt securities listed on the New York Stock Exchange (the “NYSE”), the company must disclose any significant ways in which its corporate governance practices differ from those followed by US companies under the NYSE corporate governance listing standards. In addition, the company must comply fully with the provisions of the listing standards that relate to the composition, responsibilities and operation of audit committees. These provisions incorporate the relevant rules concerning audit committees of the US Securities Exchange Act of 1934 (“Exchange Act”). The company has reviewed its corporate governance arrangements and is satisfied that these are consistent with the NYSE’s corporate governance listing practices, with the exception that the Chairman of the Board is also the Chairman of the Nominations Committee, which is permitted under the Code (since the Chairman was considered independent on appointment). The company’s Audit, Board Risk, Remuneration and Nominations Committees are otherwise composed solely of non-executive directors deemed by the Board to be independent. The NYSE corporate governance listing standards also require that a compensation committee has direct responsibility to review and approve the Group Chief Executive’s remuneration.
As stated above, in the case of the company, the Board, rather than the Remuneration Committee, reserves the authority to make the final determination of the remuneration of the Group Chief Executive. The Audit Committee complies with the provisions of the NYSE corporate governance listing standards that relate to the composition, responsibilities and operation of audit committees. In May 2010, the company submitted its required annual written affirmation to the NYSE confirming its full compliance with those and other applicable provisions. More detailed information about the Audit Committee and its work during 2010 is set out in the Audit Committee report on pages 240 to 243. Board of directors The Board is the main decision-making forum for the company. It has overall responsibility for management of the business and affairs of the Group, the establishment of Group strategy and the allocation and raising of capital, and is accountable to shareholders for financial and operational performance. The Board considers strategic issues and ensures the Group manages risk effectively through approving and monitoring the Group’s risk appetite, considering Group stress scenarios and agreed mitigants and identifying longer term strategic threats to the Group’s business operations. The Board has a formal schedule of matters detailing key aspects of the company’s affairs reserved to it for its decision. This schedule is reviewed bi-annually. The roles of Chairman and Group Chief Executive are distinct and separate, with a clear division of responsibilities. The Chairman leads the Board and ensures the effective engagement and contribution of all executive and non-executive directors. The Group Chief Executive has responsibility for all Group businesses and acts in accordance with the authority delegated by the Board. Responsibility for the development of policy and strategy and operational management is delegated to the Group Chief Executive and the Group Finance Director. All directors participate in discussing strategy, performance and the financial and risk management of the company. Meetings of the Board are structured to allow sufficient time for consideration of all items and the Chairman encourages constructive challenge and debate. For 2010, eleven Board meetings were scheduled. Individual attendance at these meetings is set out on page 238. The directors were supplied with comprehensive papers in advance of each Board meeting. The Group Chief Executive provides a written report on business activities at each Board meeting. Members of executive management attend and make regular presentations at meetings of the Board. The Chairman and the non-executive directors meet at least once per year without executive directors present. The Board is aware of the other commitments of its directors and has established procedures for ensuring that the Board’s powers for authorising directors’ conflicts of interest are being operated effectively. With effect from 1 October 2008, the Companies Act introduced a statutory duty on directors to avoid conflicts of interest unless authorised. Since that date, the Board has considered, and where appropriate authorised, any actual or potential conflicts of interests that directors may have.
235RBS Group 2010
GovernanceCorporate governance

Board balance and independence The Board currently comprises the Chairman, two executive directors and eight independent non-executive directors, one of whom is the Senior Independent Director. The Board functions effectively and efficiently and is considered to be of an appropriate size. The directors provide the Group with the knowledge, mix of skills and experience required. The Board Committees comprise directors with a variety of relevant skills and experience so that no undue reliance is placed on any individual. The non-executive directors combine broad business and commercial experience with independent and objective judgement. The balance between non-executive and executive directors enables the Board to provide clear and effective leadership and maintain the highest standards of integrity across the Group’s business activities. The Board considers that the Chairman was independent on appointment and all non-executive directors are independent for the purposes of the Code. The standard terms and conditions of the appointment of non-executive directors are available on the Group’s website (www.rbs.com) and copies are available on request. Re-election of directors In accordance with the provisions of the new Code, all directors of the company will stand for re-election by shareholders at the company’s 2011 Annual General Meeting and annually thereafter. Colin Buchan will stand down as a non-executive director on 5 August 2011 following the announcement of the Group’s interim results, having served just over nine years on the Board. The names and biographical details of directors are shown on pages 226 and 227. Further information in relation to the company’s Annual General Meeting can be found in the Chairman’s letter to shareholders. Information, induction and professional development All directors receive accurate, timely and clear information on all relevant matters, and have access to the advice and services of the Group Secretary who is responsible to the Board for ensuring that Board procedures are followed and that applicable rules and regulations are complied with. In addition, all directors are able, if necessary, to obtain independent professional advice at the company’s expense. In line with recommendations of the Walker Review and the new Code, the company has reviewed the induction programme for new directors. Each new director receives a formal induction on joining the Board, including visits to the Group’s major businesses and meetings with directors and senior management and key stakeholders. The induction is tailored to the director’s specific requirements. The company has undertaken a comprehensive review of the ongoing professional development programme for directors. Directors are advised of appropriate training and professional development opportunities and undertake the training and professional development they consider necessary in assisting them to carry out their duties as a director.
Performance evaluation Following the external Board evaluation carried out in 2009, a number of initiatives were implemented aimed at improving the overall performance and effectiveness of the Board, including greater advance planning in relation to Board agendas to allow more in-depth discussion of businesses and enhancement of Board engagement in risk management and setting risk appetite. A formal and rigorous internal evaluation of the performance of the Board and Nominations Committee during 2010 was carried out by the Group Secretary. A detailed framework of questions was used to structure individual meetings held by the Group Secretary with each director and regular meeting attendees. The Group Secretary then discussed the outcomes and recommendations with the Chairman. Amongst the areas reviewed were the role and organisation of the Board and Board Committees, Board and Committee composition, Board processes, the structure and frequency of meetings, Board performance and reporting, strategy and risk management and external relationships, including those with shareholders and regulators. The Board has considered and discussed reports on the outcomes of the evaluation and is satisfied with the way in which the evaluation was conducted. The evaluation concluded that the Board is strong and operating effectively, headed by an excellent Chairman, who facilitates good, constructive debate. Generally, the Board is viewed as currently being of the appropriate size and has a good dynamic, although Board composition should be kept under continual review to ensure that the correct balance of skills and experience is maintained, particularly on Board Committees. On the structure of Board meeting agendas it was suggested that greater time could be allocated for discussions on key issues to allow in-depth focus on items which are material to the Group and to encourage an emphasis on debate and discussion rather than formal presentation. Separate in-depth evaluations were carried out for each of the Audit Committee, Board Risk Committee and Remuneration Committee by the Group Secretary, where appropriate in conjunction with the Committee Chair. Further information on the evaluations carried out in relation to the Audit Committee, Board Risk Committee and Remuneration Committee is set out on pages 243, 245 and 249 respectively. Additionally, directors were asked to provide feedback on their fellow directors. This feedback was shared with each director by the Chairman, who met with each director individually to discuss their own performance and ongoing professional development. Separately, the Senior Independent Director canvassed the views of the executive directors and met with the non-executive directors as a group, without the Chairman present, to consider the Chairman’s performance. Feedback was sought on governance and stewardship of the Group, relationships with key external and internal stakeholders, execution of the Group’s Strategic Plan and delivery of value and return to shareholders. The Senior Independent Director also canvassed views from United Kingdom Financial Investments Limited (UKFI) and the FSA. The results of this were then shared with the Chairman who agreed to consider the points raised and provide separate responses in due course.
RBS Group 2010236
Corporate governance continued
Board Committees In order to provide effective oversight and leadership, the Board has established a number of Board Committees with particular responsibilities. The Committee chairmanship and membership are reviewed on a regular basis. The names and biographies of all Board Committee members are set out on pages 226 and 227. The terms of reference of the undernoted committees are available on the Group’s website (www.rbs.com) and copies are available on request. Audit Committee The Audit Committee is comprised of at least three independent non-executive directors. The Audit Committee held seven scheduled meetings in 2010. The Audit Committee is responsible for assisting the Board in discharging its responsibilities in relation to the disclosure of the financial affairs of the Group. The Audit Committee reviews the accounting policies, financial reporting and regulatory compliance practices of the Group, the Group’s system and standards of internal controls, monitors the Group’s processes for internal audit and external audit and reviews the practices of the Divisional Risk and Audit Committees. The Audit Committee report is set out on pages 240 to 243. Board Risk Committee The Board Risk Committee is comprised of at least three independent non-executive directors. The Board Risk Committee held six scheduled meetings and three additional meetings in 2010. The Board Risk Committee is responsible for providing oversight and advice to the Board in relation to current and potential future risk exposures of the Group and future risk strategy, including determination of risk appetite and tolerance. The Board Risk Committee report is set out on pages 244 and 245. Remuneration Committee The Remuneration Committee is comprised of at least three independent non-executive directors. The Remuneration Committee held nine scheduled meetings and six additional meetings in 2010. The Remuneration Committee is responsible for the overview of the Groups remuneration policy and remuneration governance framework, ensuring that remuneration arrangements are consistent with and promote effective risk management. The committee also makes recommendations to the Board on the remuneration arrangements for executive directors. The Remuneration Report, including a letter from the Chair of the Remuneration Committee, is set out on pages 246 to 263.
Nominations Committee All non-executive directors are members of the Nominations Committee which is chaired by the Chairman of the Group. The Group Chief Executive is invited to attend meetings. The Nominations Committee holds at least two scheduled meetings per year, and also meets on an ad hoc basis as required. The Nominations Committee is responsible for:
assisting the Board in the formal selection and appointment of directors having regard to the overall balance of skills, knowledge, experience and diversity on the Board;
reviewing the structure, size and composition of the Board and making recommendations to the Board on any appropriate changes;
reviewing membership and Chairmanship of Group Board Committees; and
considering succession planning for the Chairman, Group Chief Executive and non-executive directors, taking into account the skills and expertise which will be needed on the Board in the future. No director is involved in decisions regarding his or her own succession.
The Nominations Committee engages with external consultants, considers potential candidates and recommends appointments of new directors to the Board. Group Sustainability Committee The Group Sustainability Committee (GSC) was established in 2009 and is chaired by the Senior Independent Director. The GSC is responsible for reviewing the Group’s overall sustainability strategy, values and policies and aligning the Group’s approach to social, environmental and ethical issues. All key business areas are represented on the GSC and it is attended by the Group Chairman. For more information on the governance framework which supports the GSC see page 44. Further details of the Group’s sustainability policies are available on www.rbs.com/sustainability and in the Annual Sustainability Report.
237RBS Group 2010
Governance
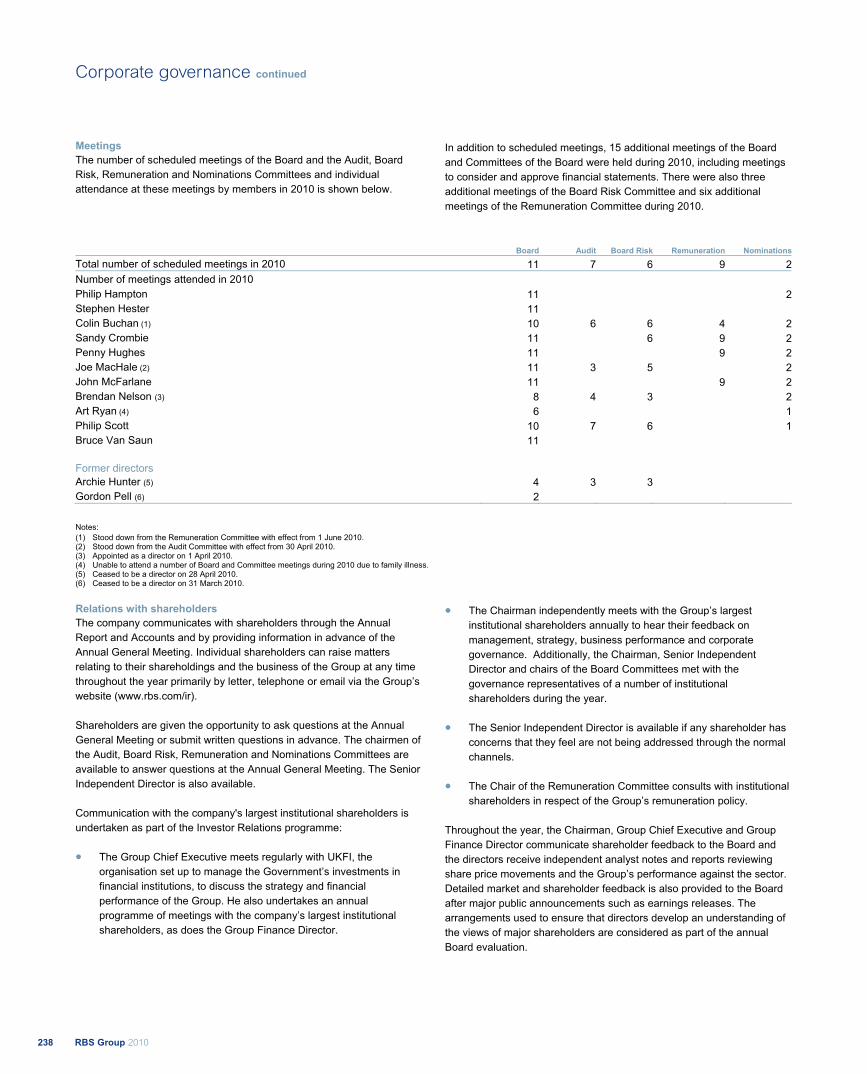
Meetings The number of scheduled meetings of the Board and the Audit, Board Risk, Remuneration and Nominations Committees and individual attendance at these meetings by members in 2010 is shown below.
In addition to scheduled meetings, 15 additional meetings of the Board and Committees of the Board were held during 2010, including meetings to consider and approve financial statements. There were also three additional meetings of the Board Risk Committee and six additional meetings of the Remuneration Committee during 2010.
Board Audit Board Risk Remuneration Nominations
Total number of scheduled meetings in 2010 11 7 6 9 2Number of meetings attended in 2010 Philip Hampton 11 2Stephen Hester 11Colin Buchan (1) 10 6 6 4 2Sandy Crombie 11 6 9 2Penny Hughes 11 9 2Joe MacHale (2) 11 3 5 2John McFarlane 11 9 2Brendan Nelson (3) 8 4 3 2Art Ryan (4) 6 1Philip Scott 10 7 6 1Bruce Van Saun 11
Former directors Archie Hunter (5) 4 3 3Gordon Pell (6) 2
Notes: (1) Stood down from the Remuneration Committee with effect from 1 June 2010. (2) Stood down from the Audit Committee with effect from 30 April 2010. (3) Appointed as a director on 1 April 2010. (4) Unable to attend a number of Board and Committee meetings during 2010 due to family illness. (5) Ceased to be a director on 28 April 2010. (6) Ceased to be a director on 31 March 2010.
Relations with shareholders The company communicates with shareholders through the Annual Report and Accounts and by providing information in advance of the Annual General Meeting. Individual shareholders can raise matters relating to their shareholdings and the business of the Group at any time throughout the year primarily by letter, telephone or email via the Group’s website (www.rbs.com/ir). Shareholders are given the opportunity to ask questions at the Annual General Meeting or submit written questions in advance. The chairmen of the Audit, Board Risk, Remuneration and Nominations Committees are available to answer questions at the Annual General Meeting. The Senior Independent Director is also available. Communication with the company's largest institutional shareholders is undertaken as part of the Investor Relations programme:
The Group Chief Executive meets regularly with UKFI, the organisation set up to manage the Government’s investments in financial institutions, to discuss the strategy and financial performance of the Group. He also undertakes an annual programme of meetings with the company’s largest institutional shareholders, as does the Group Finance Director.
The Chairman independently meets with the Group’s largest institutional shareholders annually to hear their feedback on management, strategy, business performance and corporate governance. Additionally, the Chairman, Senior Independent Director and chairs of the Board Committees met with the governance representatives of a number of institutional shareholders during the year.
The Senior Independent Director is available if any shareholder has concerns that they feel are not being addressed through the normal channels.
The Chair of the Remuneration Committee consults with institutional shareholders in respect of the Group’s remuneration policy.
Throughout the year, the Chairman, Group Chief Executive and Group Finance Director communicate shareholder feedback to the Board and the directors receive independent analyst notes and reports reviewing share price movements and the Group’s performance against the sector. Detailed market and shareholder feedback is also provided to the Board after major public announcements such as earnings releases. The arrangements used to ensure that directors develop an understanding of the views of major shareholders are considered as part of the annual Board evaluation.
RRBS Group 2010238
Corporate governance continued
Internal control The Board of directors is responsible for the Group’s system of internal control that is designed to facilitate effective and efficient operations and to ensure the quality of internal and external reporting and compliance with applicable laws and regulations. In devising internal controls, the Group has regard to the nature and extent of the risk, the likelihood of it crystallising and the cost of controls. A system of internal control is designed to manage, but not eliminate, the risk of failure to achieve business objectives and can only provide reasonable, and not absolute, assurance against the risk of material misstatement, fraud or losses. The Board has established a process for the identification, evaluation and management of the significant risks faced by the Group, which operated throughout the year ended 31 December 2010 and to 23 February 2011, the date the directors approved the Report and Accounts. This is confirmed by a process which requires senior members of the executive and management to certify that they have assessed the adequacy and effectiveness of their internal control framework and the compliance of their business with Group policies and associated standards (in accordance with the Group Policy Framework), and they meet the requirements of Sarbanes-Oxley Section 404 and the UK Corporate Governance Code Section C2. The policies that govern these processes, and reports on internal controls arising from them, are regularly reviewed by the Board and meet the requirements of the guidance ‘Internal Control: Revised Guidance for Directors on the Combined Code’ issued by the Financial Reporting Council in October 2005. Enhancements have been made to the Risk Management framework throughout 2010 and further improvements will be made in 2011. The effectiveness of the Group’s internal control system is reviewed regularly by the Board, the Audit Committee and the Board Risk Committee. Executive management committees or boards of directors in each of the Group’s businesses receive regular reports on significant risks facing their business and how they are being controlled. In addition, the Board receives monthly risk management reports. Details of the Group’s approach to risk management are given in the Risk and balance sheet management section, on pages 119 to 125 of the Business review. The Audit Committee has received confirmation that management has taken, or is taking, the necessary action to remedy any failings or weaknesses identified through the operation of the Group framework of controls. The Group’s independent auditors present to the Audit Committee reports that include details of any significant internal control matters which they have identified. The system of internal controls of the authorised institutions and other regulated entities in the Group is also subject to regulatory oversight in the UK and overseas. Additional details of the Group’s regulatory oversight are given in the Supervision and Regulatory developments and reviews sections on pages 397 to 399.
Internal control over financial reporting The Group is required to comply with Section 404 of the US Sarbanes-Oxley Act of 2002 and assess the effectiveness of internal control over financial reporting as of 31 December 2010. The Group assessed the effectiveness of its internal control over financial reporting as of 31 December 2010 based on the criteria set forth by the Committee of Sponsoring Organizations of the Treadway Commission in ‘Internal Control - Integrated Framework’. Based on its assessment, management has concluded that, as of 31 December 2010, the Group's internal control over financial reporting is effective. The Group's auditors have audited the effectiveness of the Group's internal control over financial reporting and have given an unqualified opinion. Management's report on the Group's internal control over financial reporting will be filed with the Securities and Exchange Commission at the same time as the Annual Report on Form 20-F. Disclosure controls and procedures As required by US regulations, the effectiveness of the company's disclosure controls and procedures (as defined in the rules under the Exchange Act) have been evaluated. The evaluation concluded that the company's disclosure controls and procedures were adequate and effective and designed to ensure that material information relating to the company and its consolidated subsidiaries would be made known to them by others within those entities. Changes in internal control There was no change in the company's internal control over financial reporting that occurred during the period covered by this report that has materially affected, or is reasonably likely to materially affect, the company's internal control over financial reporting.
239RBS Group 2010
Governance

Audit Committee Report by Brendan Nelson, Chairman Membership I assumed the role of Chairman of the Audit Committee on 28 April 2010, following the retirement of Archie Hunter. The current members of the Committee are Colin Buchan, Philip Scott and myself. Joe MacHale stood down from the Audit Committee with effect from 30 April 2010 and is now a member of the Board Risk Committee and Asset Protection Scheme (APS) Senior Oversight Committee. All members of the Audit Committee are independent non-executive directors. Colin Buchan and Philip Scott served throughout 2010, and I became a member of the Committee with effect from 1 April 2010. Attendance of each member at meetings of the Audit Committee in 2010 is shown on page 238. The members of the Audit Committee are also members of the Board Risk Committee. This common membership ensures effective governance across all Finance and Risk issues, and that agendas are aligned and overlap is avoided. The Audit and Board Risk Committees also have strong links with the Remuneration Committee, with particular regard to ensuring that relevant Finance and Risk matters are factored into the determination of appropriate levels of compensation. The Board is satisfied that all Audit Committee members have recent and relevant financial experience, and that each member of the Audit Committee is an ‘Audit Committee Financial Expert’ and is independent, each as defined in the SEC rules under the Exchange Act and related guidance. I am a Chartered Accountant, a member of the Institute of Chartered Accountants of Scotland and a former Vice Chairman of KPMG in the UK; Philip Scott is a fellow of the Institute of Actuaries and a former Group Finance Director of Aviva plc; and Colin Buchan is a Fellow of the Chartered Institute of Bankers of Scotland and was a member of the group management board at UBS AG. The members of the Audit Committee are selected with a view to the expertise and experience of the Audit Committee as a whole, and the Audit Committee reports to the Board as a single entity. Responsibilities The Audit Committee’s primary responsibilities are to:
assist the Group, The Royal Bank of Scotland plc and National Westminster Bank Plc Boards in discharging their responsibilities and in making all relevant disclosures in relation to the financial affairs of the Group;
review accounting and financial reporting and regulatory compliance;
review the Group's systems of internal control; and
monitor the Group's processes for internal audit and external audit.
The terms of reference of the Audit Committee are available at www.rbs.com and these are considered annually by the Audit Committee and approved by the Board. The Audit Committee is satisfied that it has complied with the relevant provisions of the Code and the new Code. Audit Committee Chairman As Chairman of the Audit Committee, I play a leading role in the setting of the annual agenda planner for the Committee and with the agenda for each Committee meeting. Prior to every Committee meeting, I hold meetings with each of the Head of Group Internal Audit, the external auditors, the Group Finance Director and the Group Chief Accountant. These meetings are instrumental in ensuring that I am briefed on all relevant issues and that these are brought to the attention of the Audit Committee. Meetings and visits A total of seven meetings of the Audit Committee were held in 2010, including meetings held immediately prior to the submission of the interim and annual financial statements to the Boards and the quarterly Interim Management Statements. Audit Committee meetings are attended by relevant executive directors, the internal and external auditors and Finance and Risk management executives. Other executives, subject matter experts and external advisers are also invited to attend the Audit Committee, as required, to present and advise on reports commissioned by the Committee. At least twice per annum the Audit Committee meets privately with the external auditors. The Audit Committee’s annual programme of visits to the Group's business divisions and control functions continued in 2010, and these are now also attended by the Board Risk Committee. The object of the programme is to allow the Audit Committee and the Board Risk Committee to gain a better understanding of the Group and an invitation to attend is extended to all non-executive directors. The programme of future visits is considered annually. The Audit Committee and the Board Risk Committee undertook six visits in 2010. These were to the Global Banking & Markets business; the Non-Core Division, Global Restructuring Group and the Asset Protection Scheme; Major Change Projects ongoing in the Group; the US Asset-backed Securities business; Risk Management and the Global Banking & Markets, Global Transaction Services and Private Banking businesses in Asia.
RBS Group 2010240
Corporate governance continued
Work in 2010 During 2010, the work of the Audit Committee focused on a number of key areas, including:
accounting, financial reporting and regulatory compliance;
impairments and fair values;
standards of internal control, including the work of the internal and external auditors;
provisioning and credit exposures;
general insurance reserves; and
the work and role of Divisional Risk and Audit Committees in so far as they relate to the work of the Committee.
The Audit Committee received regular updates on accounting issues and developments from both the Group Chief Accountant and from the external auditors, who presented for approval to the Committee their audit plan, their audit fee proposal and engagement letter, as well as confirmation of their independence and a comprehensive report of all non-audit fees. In addition the external auditors provided the Audit Committee with reports summarising their main observations and conclusions arising from their year end audit, their half year review and their work in connection with the first and third quarters, inter alia, inclusive of their comments on the issues set out below; and their recommendations for enhancements to the Group’s reporting and controls. The Audit Committee focused on a number of salient judgments and reporting issues in the preparation of the 2010 accounts, including:
valuation methodologies and assumptions for financial instruments carried at fair value including the Group's credit market exposures and the disclosures provided;
actuarial assumptions for the Group Pension Fund;
impairment losses in the Group's portfolio of loans and advances and available-for-sale securities;
impairment of goodwill and other purchased intangible assets;
the Group’s tax position, including the treatment of deferred tax assets; and
compliance with the requirements of the Sarbanes-Oxley Act 2002.
In its consideration of each of these issues, the aims of the Audit Committee have been to:
understand and challenge the valuation and other accounting judgments made by management;
review the conclusions of the external auditors and, where applicable, other experts and to understand how they came to their conclusions; and
satisfy itself that the disclosures in the financial statements about these estimates and valuations are transparent and appropriate.
The Audit Committee was regularly advised of whistleblowing events which occurred within the Group; of complaints raised with members of the Group’s executive team; of significant internal investigations undertaken within the Group; and of internal regulatory reviews and investigations. Group Internal Audit’s role is to continuously assess how operating risks are being managed and controlled throughout the Group and report regularly to the Group Executive and Audit Committee on the results of these assessments; and to influence the continuous development of the risk management and control process through sharing best practice. The Audit Committee oversees the work of Group Internal Audit, and receives a quarterly report from the Head of Group Internal Audit. This report rates the quality of the control environment of all the Group’s divisions and of management’s level of awareness on these matters. Group Internal Audit report to the Committee on areas where improvements are required to the control environment. The Audit Committee actively monitors these reports and ensures relevant matters raised are dealt with in a timely and appropriate manner. These reports offer the Audit Committee oversight of Group Internal Audit’s work, and allow the Audit Committee to monitor the level of internal control within the Group. The Audit Committee oversees the Group’s compliance with the rules of the APS, and reviews regular progress reports from RBS Risk Management. Relevant management also presented on a number of specific reporting, compliance and internal control matters. As far as it can determine, the Audit Committee received all the information and material it required to allow it to meet its obligations in respect of the 2010 financial statements.
241RBS Group 2010
Governance
External auditors Deloitte LLP has been the company’s auditors since March 2000. The Audit Committee undertakes an annual evaluation to assess the independence and objectivity of the external auditors and the effectiveness of the audit process, taking into consideration relevant professional and regulatory requirements. The annual evaluation is carried out following completion of the annual accounts and audit. In assessing the effectiveness of the Group’s external auditors the Audit Committee has regard to:
the experience and expertise of the senior members of the engagement team;
the proposed scope of the audit work planned and executed;
the quality of the dialogue between the external auditors, the Committee and senior management;
the clarity, quality and robustness of written reports presented to the Committee setting out the external auditor’s findings arising from the audit;
the quality of the observations provided to the company by the external auditor on the Group’s systems of internal control; and
the views of management on the performance of the external auditors.
The outcomes of the evaluation were considered by the Audit Committee and Board. In addition to the annual evaluation performed by the Audit Committee, the external auditors conduct their own annual review of audit quality. Twelve service criteria for the audit have been defined by the external auditors to measure their performance against the quality commitments set out in their annual audit plan, under the headings of “quality of audit approach and conduct”, “independence and objectivity”, “quality of the team” and “value added”. A questionnaire is completed by each Divisional CFO and each Divisional Risk and Audit Committee chairman after the completion of the annual audit and by relevant members of Group management and the Audit Committee. A follow up interview is held with each of them by senior partners independent of their immediate service teams. The results of this exercise will be presented to the Audit Committee, with actions defined and agreed to address any areas where performance has fallen below expected standards. The external auditors are required to rotate the lead audit partner responsible for the audit every five years and, in 2010, a new audit partner was appointed to lead the audit for the year ending 31 December 2010. There are no contractual obligations restricting the company's choice of external auditor. The Audit Committee is responsible for making recommendations to the Board in relation to the appointment, re-appointment and removal of the
external auditors. In order to make a recommendation to the Board, the Audit Committee consider and discuss the performance of the external auditor in the previous year, taking account of the outcomes of the annual evaluation carried out. The Board submits the Audit Committee's recommendations to shareholders for their approval at the Annual General Meeting. The Board has endorsed the Audit Committee's recommendation that shareholders be requested to approve the reappointment of Deloitte LLP as external auditors at the Annual General Meeting in April 2011. The Audit Committee approves the terms of engagement of the external auditors. The Audit Committee also fixes the remuneration of the external auditors as authorised by shareholders at the Annual General Meeting. Audit and non-audit services The Audit Committee has adopted a policy on the engagement of the external auditors to supply audit and non-audit services, which takes into account relevant legislation regarding the provision of such services by an external audit firm. In particular, the Group may not engage the external auditors to provide any of the non-audit services described below:
bookkeeping or other services related to the accounting records or financial statements;
financial information systems design and implementation;
appraisal or valuation services, fairness opinions or contribution-in-kind reports;
actuarial services;
internal audit outsourcing services;
management functions or human resources;
broker or dealer, investment adviser, or investment banking services;
legal services and expert services unrelated to the audit; or
other services determined to be impermissible by the US Public Company Accounting Oversight Board.
The Audit Committee reviews the policy annually and prospectively approves the provision of audit services and certain non-audit services by the external auditors. Annual audit services include all services detailed in the annual engagement letter including the annual audit and interim reviews (including US reporting requirements) and periodic profit verifications. Annual audit services also include statutory or non-statutory audits required by any Group companies that are not incorporated in the UK. Terms of engagement for these audits are agreed separately with management, and are consistent with those set out in the audit engagement letter insofar as local regulations permit.
RBS Group 2010242
Corporate governance continued
Prospectively approved non-audit services include the following classes of service:
capital raising, including consents, comfort letters and relevant reviews of registration statements;
provision of accounting opinions relating to the financial statements of the Group;
provision of reports that, according to law or regulation, must be rendered by the external auditors;
tax compliance services;
permissible services relating to companies that will remain outside the Group;
restructuring services relating to the Group's customers; and
reports providing assurance to third parties over certain of the Group's internal controls prepared under US Statement of Auditing Standards 70 or similar auditing standards in other jurisdictions.
For all other permitted non-audit services, Audit Committee approval must be sought, on a case by case basis, before the provision of the service commences. In August 2010, the Audit Committee approved changes to the existing non-audit services policy. The new streamlined process allows for the Chairman of the Audit Committee (or, in his absence, a designated delegate) to approve any non-audit services request with a value under £100,000. Any request with a value above this amount must be approved by the full Audit Committee. To ensure good governance all requests, regardless of financial limits, have to be approved by the Group Chief Accountant and Group Sourcing and Vendor Management. At each Audit Committee meeting, any non-audit services requests which have been approved since the previous meeting are considered for ratification. In addition, the Audit Committee reviews and monitors the independence and objectivity of the external auditors when it approves non-audit work to be carried out by them, taking into consideration relevant legislation, ethical guidance and the level of non-audit services relative to audit services. The approval process is rigorously applied to prevent the auditors from functioning in the role of management, auditing their own work, or serving in an advocacy role. Information on the audit and non-audit services carried out by the external auditors is detailed in Note 5 to the Group’s accounts. Performance evaluation An external review of the effectiveness of the Audit Committee takes place every three to five years, with internal reviews by the Board continuing in the intervening years. An internal review of the effectiveness of the Audit Committee during 2010 was conducted. The evaluation used detailed questionnaires and individual meetings were held with each member. Amongst the areas reviewed were the role of the Committee, composition, meetings and processes, performance and reporting, policy and procedures, divisional committees, induction and continuing professional development and communication.
The evaluation concluded that the Audit Committee operated effectively throughout 2010. The Committee was seen as effective in meeting its objectives, with members willing to spend the time necessary to do a good job. It was agreed that the new Chairman was a strong addition to the Committee, in particular given his strong financial background. The evaluation concluded that, whilst the Committee was of the appropriate size to discharge its responsibilities and the members had the appropriate skills and experience, Committee composition should be kept under review to ensure that the correct balance of skills and experience is maintained. The training and specific sessions on individual businesses and divisions were highly rated. The Committee has considered and discussed the report on the outcomes of the evaluation and is satisfied with the way in which the evaluation has been conducted, the conclusions and the recommendations for action. The outcomes of the evaluation have been reported to the Board and the actions are being progressed. An external review of the effectiveness of Group Internal Audit takes place every three to five years, in line with best practice, with internal reviews continuing in the intervening years. In 2010, an external review was conducted by Ernst & Young. In May 2010, the Audit Committee was presented with the final report by Ernst & Young. The report found that Group Internal Audit was compliant with all relevant professional standards. In January 2011 the Audit Committee undertook an internal evaluation of Group Internal Audit. The Committee sought views from members and attendees of the Committee, the external auditor, Divisional Chief Executive Officers and Finance Directors, Divisional Risk and Audit Committee and subsidiary audit committee Chairmen. The evaluation concluded that Group Internal Audit had operated effectively throughout 2010. Divisional Risk and Audit Committees Since 2005, Divisional Audit Committees have been responsible for reviewing each division's business. Following the creation of the Board Risk Committee in January 2010, the Group’s Divisional Audit Committees became Divisional Risk and Audit Committees and their terms of reference were revised to ensure full alignment with the Audit Committee and Board Risk Committee. With input from the Audit Committee, Board Risk Committee, Group Finance and Group Risk, a new framework was approved by the Audit Committee and Board Risk Committee in December 2010 and implemented in January 2011.
Brendan Nelson Chairman of the Audit Committee 23 February 2011
243RBS Group 2010
Governance
Board Risk Committee Report by Philip Scott, Chairman Membership I have been Chairman of the Board Risk Committee since its formation in January 2010, and I am a member of the Committee along with Colin Buchan, Sandy Crombie, Brendan Nelson and Joe MacHale. We all served throughout 2010 with the exception of Brendan Nelson who became a member of the Committee with effect from 1 April 2010. All members of the Board Risk Committee are independent non-executive directors. Attendance of each member at meetings of the Board Risk Committee in 2010 is shown on page 238. Archie Hunter was a member of the Board Risk Committee until 28 April 2010 when he stood down as a non-executive director at the end of his existing term. Colin Buchan, Brendan Nelson and I are also members of the Audit Committee. This common membership ensures effective governance across all Finance and Risk issues, and that agendas are aligned and overlap is avoided. The Board Risk Committee and Audit Committee also have strong links with the Remuneration Committee, with particular regard to ensuring that relevant Finance and Risk matters are factored in to the determination of appropriate levels of compensation. The Board Risk Committee is responsible for:
providing oversight and advice to the Group, The Royal Bank of Scotland plc and National Westminster Bank Plc Boards (the “Boards”) in relation to current and potential future risk exposures of the Group and risk strategy, including determination of risk appetite and tolerance;
reviewing the performance of the Group relative to risk appetite;
assisting on such other matters as may be referred to it by the Boards;
oversight of the effectiveness of key Group policies, referred to as the Group Policy Framework;
promoting a risk awareness culture within the Group; and
reporting to the Group Board, identifying any matters within its remit in respect of which it considers that action or improvement is needed and making recommendations as to the steps to be taken.
The terms of reference of the Board Risk Committee are available at www.rbs.com and these are considered annually by the Board Risk Committee and approved by the Board. Qualitative and quantitative information regarding the risks arising from the Group's financial instruments required under International Financial Reporting Standard 7 are incorporated within the financial statements and Business review.
Meetings and visits A total of nine meetings of the Board Risk Committee were held during 2010. Meetings are held as soon as practicable prior to Audit Committee meetings to ensure that the work of the two Committees is coordinated and consistent. A meeting is held immediately prior to submission of the interim and annual financial statements to the Board and the quarterly Interim Management Statements. This core programme is supplemented by additional meetings as required. Board Risk Committee meetings are attended by relevant executive directors, risk management, finance executives and the internal auditors. External advice may be sought by the Board Risk Committee where considered appropriate. The Board Risk Committee took part in an annual programme of visits to the Group's business divisions and control functions in 2010, along with the Audit Committee. The object of the programme is to allow the Board Risk Committee and the Audit Committee to gain a better understanding of the Group and an invitation to attend is extended to all non-executive directors. The programme of future visits is considered annually. The Board Risk Committee and the Audit Committee undertook six visits in 2010. These were to the Global Banking & Markets business; the Non-Core Division, Global Restructuring Group and the Asset Protection Scheme; Major Change Projects ongoing in the Group; the US Asset-backed Securities business; Risk Management and the Global Banking & Markets, Global Transaction Services and Private Banking businesses in Asia. Work in 2010 During 2010, the work of the Board Risk Committee focused on a wide range of matters, including the following key areas:
risk strategy and policy;
risk profile;
risk appetite, framework and limits;
risk management operating model; and
remuneration.
RBS Group 2010244
Corporate governance continued

At each meeting of the Board Risk Committee, the Group Chief Risk Officer provided the Committee with a presentation on the key risk issues faced by the Group. An update was also given on the key issues discussed at the Group’s Executive Risk Forum. In 2010 the Board Risk Committee considered a range of matters including:
the Group’s economic capital model;
the structured credit portfolio;
the output of stress testing and scenario planning;
the operational plan for the Group’s risk management function including organisation, resource and budget;
treating customers fairly and customer complaints; and
remuneration strategy and policy, including recommendations to the Remuneration Committee.
The Board Risk Committee played a key oversight role in the review, design and implementation of risk management and measurement strategies and risk management policy across the Group. The Board Risk Committee considered the Group's risk profile relative to current and future Group strategy. The Committee reported to the Board following each meeting on its consideration of the risk profile of the Group and any longer term macro or perceived strategic threats to the Group and made recommendations as appropriate. The Group Policy Framework provides a basis for ongoing self-assessment of appropriate risk appetite. The Board Risk Committee received regular reports on the development of the Group Policy Framework during 2010. The Group risk appetite framework was developed significantly during 2010 and continues to be enhanced. Risk appetite was regularly reviewed by the Board Risk Committee, which makes recommendations to the Board on risk appetite and tolerance as part of this ongoing process. This includes the Risk Management Operating Model, including the frameworks for credit, operational, regulatory, market, insurance and business continuity risk. The Committee also considered the Group's exposure to country, single name and sector concentration risk and ensured rigorous stress and scenario testing of the Group's business was undertaken. The output of this testing was reviewed by the Board Risk Committee throughout 2010 with a view to ensuring appropriate actions were taken where necessary. It made recommendations to the Group Board regarding related authorities, limits and mandates. In February 2010, the Committee was presented with and approved the RBS Risk Management operational plan, considering the adequacy and effectiveness of resource and the scope and nature of the work undertaken by the function.
The Committee considered the adequacy and effectiveness of the technology infrastructure supporting the finance and risk management framework. The Committee reviewed the risk input to divisional bonus pools and provided advice to the Remuneration Committee on risk weightings to be applied to performance objectives which are incorporated within the incentive structure for the Group's senior executives. The Committee also reviewed clawback proposals made by Group Human Resources and made recommendations to the Remuneration Committee in this respect. As required under the Walker Review, the Committee will meet as required to review the due diligence of any proposed strategic transaction (involving a merger, acquisition or disposal) prior to the Group Board approval of the transaction. Performance evaluation An internal review of the effectiveness of the Board Risk Committee during 2010 was conducted. The evaluation used detailed questionnaires and individual meetings were held with each member. Amongst the areas reviewed were the Role of the Committee, Composition, Meetings and Processes, Performance and Reporting, Policy and Procedures, Divisional Committees, Induction and Continuing Professional Development and Communication. The evaluation concluded that the Board Risk Committee operated effectively throughout 2010. The Committee was seen as effective in meeting its objectives, although it was acknowledged that this was a relatively new Committee having only been formed in January 2010. The evaluation concluded that the commitment of its members was outstanding, with members willing to spend the time necessary to discharge the Committee's responsibilities. As a new Committee, the structure, content and length of Committee meetings was considered to be appropriate. It was acknowledged that the Committee makes the best use of skills, experience and competencies of its members and a high level of technical expertise was required of members. The Committee considered and discussed the report on the outcomes of the evaluation and is satisfied with the way in which the evaluation was conducted, the conclusions and the recommendations for action. The outcomes of the evaluation have been reported to the Board and the actions are being progressed. Divisional Risk and Audit Committees Since 2005, Divisional Audit Committees have been responsible for reviewing each division's business. Following the creation of the Board Risk Committee in January 2010, the Group’s Divisional Audit Committees became Divisional Risk and Audit Committees and their terms of reference were revised to ensure full alignment with the Audit Committee and Board Risk Committee. With input from the Audit Committee, Board Risk Committee, Group Finance and Group Risk, a new framework was approved by the Audit Committee and Board Risk Committee in December 2010 and implemented in January 2011. Philip Scott Chairman of the Board Risk Committee 23 February 2011
R245RBS Group 2010
Governance
Dear Shareholder, I am pleased to be presenting the Group’s Remuneration Report for 2010. During the year, the Remuneration Committee has built on the progress made during 2009 when significant changes were made to the structure of rewards to staff following a thorough review of remuneration policy. We have continued to embed these practices throughout the organisation to ensure that they are aligned with good corporate governance and robust risk management. Our focus is to ensure that our remuneration policy continues to support delivery of the Group’s Strategic Plan. We are working hard to complete a hugely challenging and complex turnaround and are on track to deliver across a range of measures. The Group plays an important economic role, both as an employer and a lender. If we are going to achieve our strategic objectives and deliver a return to our shareholders including the UK taxpayer, we need talented and motivated management and employees. This requires us to pay them fairly within the context of the markets in which they operate. In setting pay policy, we take account of our duties to shareholders and our strategic objectives and seek to ensure that shareholder interests are not damaged as a result of staff retention, recruitment or motivation issues. Our commitment is to reward success not failure, and we are also very conscious of the need to demonstrate restraint. Across the Group we operate a range of incentive structures which are designed to reinforce messages about what employees are being asked to achieve, and deliver pay for performance. Our key objective in determining bonus awards is not to pay more than is warranted given business performance. In this context performance includes financial and non financial measures, risk performance and any other relevant factors. Our aggregate bonus awards for 2010 are lower than prior year as a result of lower profits and bonuses in the investment banking division and our recognition of the need for moderation. There is clear focus on differentiation, so that individually and by business, the best performers and the best performance will continue to be rewarded. There is strong central governance and oversight of both bonus pools and individual awards, and each year a significant proportion of staff will receive zero bonus. The key elements of our remuneration policy are: Pay for performance Performance related pay is designed to reflect success or failure against the range of targets which we set for our people, taking into account the context in which results were achieved. By way of example, the pay arrangements for executive directors are aligned to the performance of the Group and performance related pay is paid entirely in shares over several years. Executive directors have “no reward for failure” provisions in their service contracts. Further information on the company’s business performance and progress towards achievement of its strategic objectives can be found on pages 12 to 13.
Performance management We operate a structured process to ensure that all employees have clear objectives that are linked to long-term plans designed to drive business objectives including financial performance, risk, people and customer measures. Assessment of individuals’ performance is subject to a rigorous review of achievements against their objectives. Risk adjustment Focus on risk is achieved through clear risk input into incentive plan design and target setting, as well as a thorough risk review of performance, bonus pools and clawback. The Remuneration Committee has been supported in this by the Board Risk Committee and the RBS Risk Management function. Deferral The Remuneration Committee is acutely aware of the external focus on the role of incentive payments in the financial sector. The reality is that these remain a key part of the structure of pay across the industry. However, we have radically reformed our incentive plans. For our more senior employees annual awards are deferred over three years and a portion of the awards are paid in shares which increases alignment with the interests of shareholders. There will be a £2,000 cap on cash bonuses paid in March 2011, as was the case last year. Clawback We have had clawback provisions in place since 2009, which means that, in certain circumstances, the Group can reduce deferred annual incentives and long-term incentive awards up to the point they are released. Clawback allows us to respond appropriately if the performance factors on which reward decisions were based turn out not to reflect the corresponding performance in the longer term. Shareholder consultation In early 2011, we consulted extensively with institutional shareholders and other stakeholders on our remuneration approach. The consultation process involved one to one meetings and a roundtable session hosted by the Association of British Insurers and National Association of Pension Funds. Our presentation covered our wider remuneration policy as well as executive directors’ remuneration and we have been pleased with both the level of engagement with investors and the positive feedback we have received. Topics discussed with investors included pay positioning, scale and design of incentive structures, risk alignment of remuneration, deferral, clawback and remuneration disclosures. We have listened to the feedback from investors and have made a number of enhancements to disclosures in the Remuneration Report as a result. Investors recognised the difficult challenge faced by the Remuneration Committee in positioning pay competitively to support business goals, while being mindful of the wider economic environment and the need to show restraint. The Remuneration Committee and the Board have considered carefully their responsibilities and have applied judgement to achieve a balance whereby remuneration policy supports business goals without causing unacceptably high people risks.
RBS Group 2010246
Letter from the Chair of the Remuneration Committee
The retention and motivation of our executive directors is crucial over the next three years and whilst most aspects of our remuneration policy remain unchanged, we are making some changes to enhance the overall effectiveness of executive director remuneration. These include replacing the annual incentive plan with a long-term Share Bank and changes to the performance measures for the Long Term Incentive Plan (LTIP). We have introduced a scorecard of measures relating to risk and strategic goals to sit alongside the existing measures of total shareholder return and economic profit. These measures ensure that rewards for executive directors are aligned with achieving a sustainable long-term platform for the future success of the Group across a range of areas including risk, profitability, franchise strength and people. Details of these changes are set out in the Remuneration Report. While the primary focus of the remuneration policy clearly has to be to support the business to deliver the Strategic Plan, some shareholders asked for reassurance that the Remuneration Committee had in place sufficient tools to be able to adjust remuneration appropriately should another financial crisis occur. I am pleased to confirm that a huge amount of progress has been made in this respect. The starting point is making sure we set the right objectives in the first place. Risk is a key factor when setting annual and long term objectives and an independent review of risk objectives is undertaken by the RBS Risk Management function and the Board Risk Committee. At the end of each performance period, performance outcomes and bonus pool proposals are subject to rigorous review by the control functions, independent of the businesses/divisions. Our LTIP also has a risk underpin whereby awards will not vest unless the Remuneration Committee is satisfied on risk performance. Both annual and long term awards are subject to clawback and, accordingly, the Remuneration Committee has discretion to reduce the number of shares under award or determine that no shares will vest. Changes to approach In addition to the changes made to executive directors’ remuneration arrangements, the Remuneration Committee reached decisions on the following key areas during 2010:
establishing a governance framework for incentive plans and bonus funding across the Group, involving the Finance, Risk and Human Resources functions at all key decision points;
a structure of deferment for incentives for up to three years, with the ability to clawback if appropriate; and
the introduction of a new Long Term Incentive Plan following consultation with a number of institutional shareholders.
The new LTIP received the approval of over 99% of shareholders at the Annual General Meeting in 2010, and at the same meeting the Remuneration Report received overwhelming shareholder support.
External developments A number of external developments have impacted remuneration and remuneration policy in 2010, including the publication of the FSA’s revised Remuneration Code (the “FSA Code”). In light of the FSA Code, a review was undertaken of the remuneration policy and governance arrangements. I am pleased to report that the Group has been fully compliant with all aspects of the FSA Code from 1 January 2011. The Remuneration Committee supports the UK Government’s position that an international approach is required in relation to regulation on remuneration and disclosure. To rebuild the value of the company, an international level playing field that allows the Group and other UK banks to compete fairly with international competitors is essential. On 9 February 2011, the UK Government issued a statement in connection with Project Merlin, which represents commitments by the UK’s four largest banks, including the RBS Group, on matters including lending, shareholder engagement and pay disclosures. The banks have agreed that aggregate UK bonus pools will be lower than last year reflecting consideration of the public mood and engagement with key stakeholders. Furthermore, as a result of the Project Merlin agreement, we are disclosing in this year’s Remuneration Report the pay of our two executive directors and the pay of the five highest paid senior executive officers. The Remuneration Committee has also reviewed the remuneration of the ten highest paid staff in each of the Group’s divisions. Throughout 2010 we continued to work through a period of unprecedented restructuring. The Group has delivered remuneration arrangements that are FSA compliant, take proper account of the public mood and call for restraint and support the overarching objective of maximising shareholder returns and delivering a profit for the taxpayer. Importantly, these arrangements are consistent with the Project Merlin agreement. On behalf of the Remuneration Committee I would like to place on record our sincere appreciation for our people who have continued to focus on service to our customers, managing risk and driving the performance of our core and non-core businesses. Our people are working hard to help return the Group to financial strength and the Remuneration Committee is committed to creating an environment in which they can meet their ambitions.
Penny Hughes Chair of the Remuneration Committee 23 February 2011
R247RBS Group 2010
Governance
Membership of the Remuneration Committee The current members of the Remuneration Committee are Penny Hughes (Chair since 1 June 2010), Sandy Crombie, and John McFarlane. The members of the Remuneration Committee are all independent non-executive directors. Colin Buchan stepped down as Chairman and member of the Remuneration Committee on 1 June 2010. Attendance of each member at meetings of the Remuneration Committee in 2010 is shown on page 238. Responsibilities The Remuneration Committee is responsible for setting the Group’s policy on remuneration and overseeing its implementation, considering executive remuneration and making recommendations to the Group Board in respect of the remuneration arrangements of the executive directors of the Group. No director is included in decisions regarding his or her own remuneration. The Remuneration Committee is also responsible for setting the remuneration arrangements for members of the Group’s Executive Committee and Management Committee, as well as all higher-earning employees and any employees falling within the definition of “Code Staff” under the FSA Code. Details of the FSA Code can be found at www.fsa.gov.uk. The Remuneration Committee undertakes a regular review of the adequacy and effectiveness of the remuneration policy to ensure it is fully aligned with the Group's long-term objectives. The Committee receives a number of reports to assist it in its oversight of remuneration policy, such as on risk and financial performance across the Group. In determining directors’ remuneration, the Remuneration Committee has taken into account pay and employment conditions of employees of the company. It does this using an analysis of annual market data against an assessment of the competitiveness of current base salary ranges or benchmarks and actual salaries in payment. Salary increases for executive directors are also considered in the context of salary increases for the wider employee population. The Remuneration Committee considers remuneration in the context of the wider Group agenda such as talent development and the external market environment. The Remuneration Committee recognises that remuneration is only one aspect of the value proposition which the Group presents to our employees, and that engagement, flexibility and career development are important factors. It has received in-depth presentations from Human Resources functions in the USA and Asia so as to have a better understanding of the unique issues in these areas. Penny Hughes has also attended a number of external meetings and workshops with organisations such as Women in Business and the Young Bankers’ Association to gain a broader understanding of the people agenda. The Remuneration Committee also receives regular updates on regulatory developments and general remuneration issues, as well as market and benchmarking data from its remuneration advisors to support its decisions.
In December 2010, the Asset Protection Scheme Performance and Reward Committee (APSPRC) was formed. It is responsible for reviewing, reporting and, in certain cases, making recommendations to the Remuneration Committee in respect of (i) collective overall and individual performance of individuals who manage business units or assets which are assigned to or participate in the Asset Protection Scheme (APS), and members of the Group executive against the APS performance targets; (“APS In-Scope employees”) (ii) the individual proportion of the incentive and bonus components of the remuneration of those employees to be evaluated against APS performance targets for each calendar year and (iii) whether clawback should be applied to any deferred compensation elements of the remuneration of those employees prior to their vesting. The Remuneration Committee considers recommendations and reviews reports from the APSPRC and is responsible for determining the remuneration of APS In-Scope employees. Remuneration advisors On 14 September 2010, the Remuneration Committee appointed PricewaterhouseCoopers LLP (“PwC”) as its remuneration advisors, replacing Towers Watson. PwC were appointed after a formal selection process of panel interviews following the submission of detailed written proposals by a number of remuneration advisors. One aspect taken into account as part of the selection process was that the remuneration advisors be signatories to the voluntary code of conduct in relation to executive remuneration consulting in the UK. Both PwC and Towers Watson are signatories to the code of conduct and the relationship between the Remuneration Committee and both companies takes account of this. During the year, as well as advice received from Towers Watson and PwC, the Committee took account of the views of the Group Chairman, Philip Hampton; Group Chief Executive, Stephen Hester; Group Human Resources Directors, Neil Roden (until October 2010) and Elaine Arden (from October 2010); the Group General Counsel and Group Secretary, Miller McLean (until April 2010); and the Group Secretary, Aileen Taylor (from May 2010). Advice was received from Nathan Bostock, Head of Restructuring and Risk, on risk-adjustment of measures for bonus pool funding and a risk review of individual performance evaluations for the Management Committee. The Chairman of the Board Risk Committee, Philip Scott, also attended a Remuneration Committee meeting to advise the Committee on matters relating to risk adjustment. PwC also provides professional services in the ordinary course of business including assurance, advisory, tax and legal to subsidiaries of the Group. Towers Watson also provides actuarial advice to subsidiaries of the Group and investment consulting and actuarial advice to the trustees of some of the Group's pension funds. The advisors to the Remuneration Committee are appointed independently by the Committee, which reviews its selection of advisers annually. The Committee is notified of any work that is being undertaken by its advisors and is satisfied that there are processes in place to ensure that the advice it receives is independent.
RBS Group 2010248
Directors’ remuneration report
Performance evaluation An internal review of the effectiveness of the Remuneration Committee during 2010 was conducted. The evaluation used detailed questionnaires and individual meetings were held with each member. Amongst the areas reviewed were the role of the Committee, composition, meetings and processes, continuing professional development and communication. Generally, the Committee was considered to be effective and meeting its objectives, with members willing to spend the time necessary to discharge their responsibilities. Whilst the Committee was viewed as being of the right size and headed by a strong Chair, composition will be kept under review to maintain the correct balance of skills and experience. Improvement in the quality of Committee papers was acknowledged, although work is being undertaken to deliver further improvements. The importance of a strong link between the Committee and the Board Risk Committee was recognised and, whilst it was acknowledged that this relationship was working well, it was agreed that further improvements should be actively considered. The Committee has considered and discussed the report on the outcomes of the evaluation and is satisfied with the way in which the evaluation has been conducted, the conclusions and the recommendations for actions. The outcomes of the evaluation have been reported to the Board and the actions are being progressed. Group-wide remuneration policy The Remuneration Committee has reviewed the Group's remuneration policy which is anticipated will apply in 2011 and in subsequent years. The remuneration policy supports the Group's business strategy and is designed to:
attract, retain, motivate and reward high calibre employees to deliver superior long-term business performance; and
ensure that the Group's metrics, reward structures and governance processes as a whole provide coverage of the key risks in an appropriate way.
The key principles underpinning the remuneration policy are set out below: Pay-for-performance Reward is linked to business and individual performance and appropriate account is taken of risk factors associated with that business, including where appropriate risks associated with the sustainability agenda. Market facing Reward structures are designed to offer value for money in the markets where the Group operates. Both annual compensation and total compensation are set around market median competitiveness although our pay-for-performance policy allows for higher pay for the highest performers. Allow for customisation The composition of reward generally allows for customisation through individual choice, in order to maximise value delivered to employees.
Governance There is a robust governance framework in place to ensure that reward design and delivery complies with appropriate policy, standards, and meets relevant regulatory requirements. The Remuneration Committee undertakes an annual review of the adequacy and effectiveness of the remuneration policy to ensure it is fully aligned with the Group’s long-term objectives. There is also a key role for the RBS Risk Management function in the management and oversight of reward structures and decision-making. The Remuneration Committee will consider any issues raised by the Board Risk Committee prior to approving the policy. The individual elements of employees' remuneration packages are as follows: Base salary Base salaries should be appropriate in the specific market for the business in which an individual works and also reflect the talents, skills and competencies that the individual brings to the Group. There should be a sufficient level of fixed pay so that inappropriate risk-taking is not encouraged. Annual incentives Annual incentives are designed to reward good financial and non-financial performance that supports the business strategy, taking into account the Group’s risk appetite and personal contribution in the context that it was delivered. The approach to determining an appropriate annual incentive pool is based around four technical workstreams led by the central control functions (Finance, Human Resources and RBS Risk Management). The workstreams provide context around how much a market-competitive/on target pool would be on financial performance, on risk performance, on capital adequacy and on the impact of incentive awards on the balance sheet. Performance is central to the determination of annual incentive pools. Performance assessment is based on a balanced scorecard of measures including financial performance, risk, people and customer measures. Overall expenditure on annual incentives is reviewed by the Remuneration Committee at the end of each year taking into account the performance of the business on the basis described above. This is further scrutinised on a divisional and functional basis based on a range of different efficiency and risk adjusted profit measures including changes in Economic Profit for shareholders. Allocation of any variable reward from the pool depends on divisional, functional and individual performance against the performance measures set at the beginning of the year. Individual performance assessment is supported by a structured performance management framework. Targets should be specific, measurable, set at the beginning of the year and communicated to the employees. The Group only uses guaranteed bonuses in limited circumstances in accordance with the FSA Code.
R249RBS Group 2010
Governance
Deferred awards The purpose of deferred awards is to support a performance culture where employees recognise the importance of sustainable Group, business and individual performance. Under the Group-wide deferral arrangements a significant proportion of annual incentive awards for our more senior employees will be deferred over a three year period. Deferred awards are subject to clawback. A new deferral plan was approved by shareholders on 15 December 2009. Under this plan, annual incentives are deferred into awards vesting over a three year period. A significant portion of deferral is in a form which meets regulatory requirements. Long-Term Incentive Plans To encourage the creation of value over the long term and to align the rewards of the participants with the returns to shareholders, the Group provides employees in senior roles (executive level and selected senior management) the opportunity to receive annual awards of long-term incentives. A new Long-Term Incentive Plan was approved by shareholders on 28 April 2010, under which awards are structured as performance-vesting shares. For the most senior roles, vesting will be based partly on divisional or functional performance and partly on performance across the Group. Awards will not vest unless the Remuneration Committee is satisfied that risk management during the performance period has been effective at a Group and division/functional level. The Remuneration Committee's determination will be informed by input from the Group Chief Risk Officer and the Board Risk Committee. Specifically, prior to vesting, the Remuneration Committee will have regard to risk and compliance across the Group and divisions and make an assessment of future risks as appropriate. All awards are subject to clawback. Pension arrangements The Group aims to provide competitive retirement benefits. Since October 2006, UK employees have been eligible for a cash allowance in lieu of pension provision and have had the facility to choose to have part of their remuneration in the form of contributions to The Royal Bank of Scotland Group Retirement Savings Plan. A little over one half of UK employees continue to participate in defined benefit pension arrangements. Executive remuneration policy Components of executive directors’ remuneration Salary Base salaries of executive directors are reviewed annually. It has been agreed that the Group Chief Executive will receive no increase in base salary in 2011. The annual salary for the Group Finance Director will be increased from £725,000 to £750,000 with effect from 1 April 2011.
Benefits Executive directors are eligible to receive various employee benefits or a cash equivalent from a flexible benefits account, on a similar basis to other employees. Details of pension arrangements of directors are shown on page 262. Gordon Pell retired from the Group and the Board on 31 March 2010, shortly after his normal pension age of 60. Details of his pension are shown in this report. Following Gordon Pell's retirement, no current director is a member of the Group's defined benefit pension plans. For all executive directors joining on or after 1 October 2006, pension provision is in the form of a pension allowance which may be used to participate in The Royal Bank of Scotland Group Retirement Savings Plan which is open to all employees, or to invest in alternative pension arrangements, or to take all or some of the allowance in cash. In addition, as employees, executive directors are eligible to participate in Sharesave and Buy As You Earn plans. These plans are not subject to performance conditions since they are operated on an all-employee basis. Executive directors also receive death-in-service cover. In addition to salary and benefits, executive directors receive variable remuneration in the form of annual and long-term incentives. Annual incentives Following consultation with UKFI and other institutional shareholders, a Share Bank arrangement has been put in place for the executive directors’ annual incentive awards for 2010 and 2011. The Share Bank arrangement replaces the previous annual incentive arrangement and means that the executive directors will receive no cash bonus. 2010The 2010 targets covered progress against the Strategic Plan, financial performance, risk efficiency and control measures as well as stakeholder and people management. Executive directors have a normal maximum incentive opportunity of 200% of salary (with an exceptional maximum of 250% of salary). The Remuneration Committee has reviewed the annual incentive awards for the executive directors for 2010 performance, taking into account performance against targets set at the beginning of 2010. Performance was assessed across a broad range of quantitative and qualitative measures and was supported by a robust performance management framework including a formal half year review. During 2010, performance has been strong and all the Group's main performance indicators are ahead of the Strategic Plan both in terms of timing and outcomes. More information on the Group’s performance can be found on pages 12 and 13. There are, however, a small number of areas where the Group is not performing well ahead of the targets which have been set. Accordingly, the Remuneration Committee has recommended, and the Board (excluding executive directors) has agreed, that the Group Chief Executive and Group Finance Director should receive annual incentive awards of 170% and 186% of salary respectively.
RBS Group 2010250
Directors’ remuneration report continued
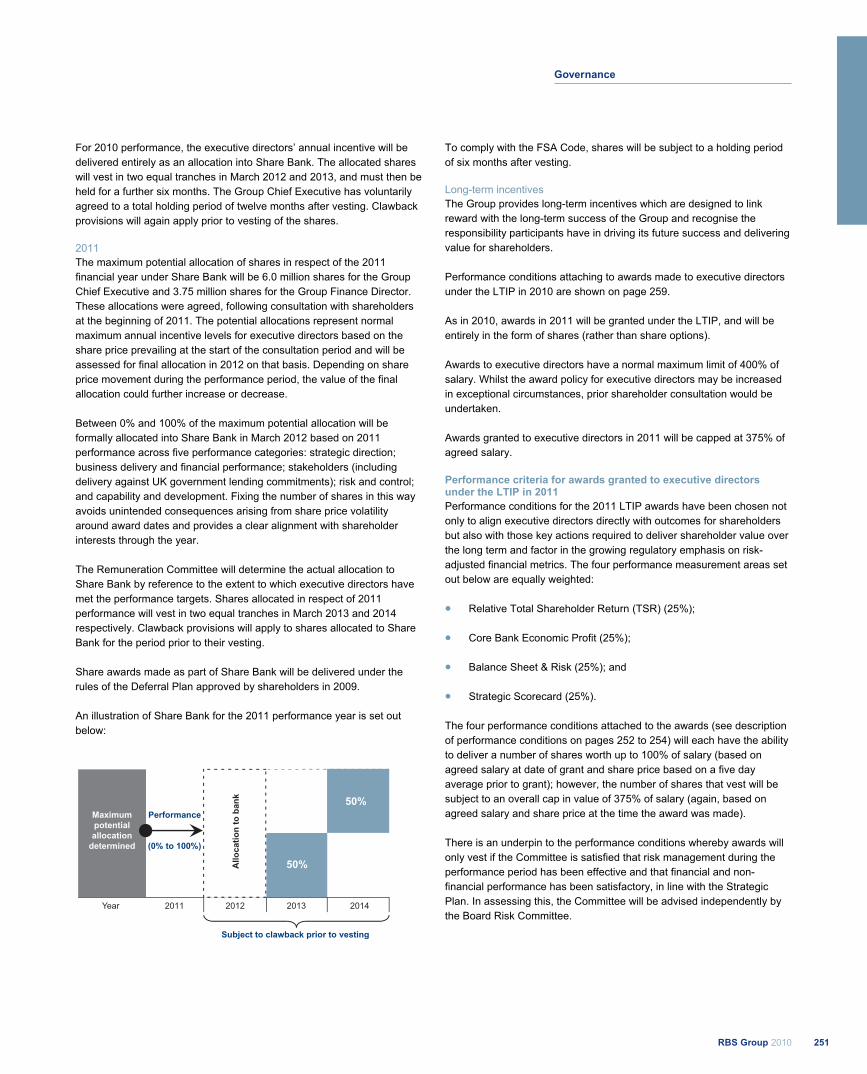
For 2010 performance, the executive directors’ annual incentive will be delivered entirely as an allocation into Share Bank. The allocated shares will vest in two equal tranches in March 2012 and 2013, and must then be held for a further six months. The Group Chief Executive has voluntarily agreed to a total holding period of twelve months after vesting. Clawback provisions will again apply prior to vesting of the shares. 2011The maximum potential allocation of shares in respect of the 2011 financial year under Share Bank will be 6.0 million shares for the Group Chief Executive and 3.75 million shares for the Group Finance Director. These allocations were agreed, following consultation with shareholders at the beginning of 2011. The potential allocations represent normal maximum annual incentive levels for executive directors based on the share price prevailing at the start of the consultation period and will be assessed for final allocation in 2012 on that basis. Depending on share price movement during the performance period, the value of the final allocation could further increase or decrease. Between 0% and 100% of the maximum potential allocation will be formally allocated into Share Bank in March 2012 based on 2011 performance across five performance categories: strategic direction; business delivery and financial performance; stakeholders (including delivery against UK government lending commitments); risk and control; and capability and development. Fixing the number of shares in this way avoids unintended consequences arising from share price volatility around award dates and provides a clear alignment with shareholder interests through the year. The Remuneration Committee will determine the actual allocation to Share Bank by reference to the extent to which executive directors have met the performance targets. Shares allocated in respect of 2011 performance will vest in two equal tranches in March 2013 and 2014 respectively. Clawback provisions will apply to shares allocated to Share Bank for the period prior to their vesting. Share awards made as part of Share Bank will be delivered under the rules of the Deferral Plan approved by shareholders in 2009. An illustration of Share Bank for the 2011 performance year is set out below:
To comply with the FSA Code, shares will be subject to a holding period of six months after vesting. Long-term incentives The Group provides long-term incentives which are designed to link reward with the long-term success of the Group and recognise the responsibility participants have in driving its future success and delivering value for shareholders. Performance conditions attaching to awards made to executive directors under the LTIP in 2010 are shown on page 259. As in 2010, awards in 2011 will be granted under the LTIP, and will be entirely in the form of shares (rather than share options). Awards to executive directors have a normal maximum limit of 400% of salary. Whilst the award policy for executive directors may be increased in exceptional circumstances, prior shareholder consultation would be undertaken. Awards granted to executive directors in 2011 will be capped at 375% of agreed salary. Performance criteria for awards granted to executive directors under the LTIP in 2011 Performance conditions for the 2011 LTIP awards have been chosen not only to align executive directors directly with outcomes for shareholders but also with those key actions required to deliver shareholder value over the long term and factor in the growing regulatory emphasis on risk-adjusted financial metrics. The four performance measurement areas set out below are equally weighted:
Relative Total Shareholder Return (TSR) (25%);
Core Bank Economic Profit (25%);
Balance Sheet & Risk (25%); and
Strategic Scorecard (25%). The four performance conditions attached to the awards (see description of performance conditions on pages 252 to 254) will each have the ability to deliver a number of shares worth up to 100% of salary (based on agreed salary at date of grant and share price based on a five day average prior to grant); however, the number of shares that vest will be subject to an overall cap in value of 375% of salary (again, based on agreed salary and share price at the time the award was made).
50%
There is an underpin to the performance conditions whereby awards will only vest if the Committee is satisfied that risk management during the performance period has been effective and that financial and non-financial performance has been satisfactory, in line with the Strategic Plan. In assessing this, the Committee will be advised independently by the Board Risk Committee.
Maximum potential allocation
determined
2011 2012 2013 2014
Performance
Subject to clawback prior to vesting
50% (0% to 100%)
Year
R251RBS Group 2010
Governance
Maximumpotentialallocation
determined
2011 2012 2013 2014
Performance
Subject to clawback prior to vesting
50%
(0% to 100%)
Year
50%
Allo
cati
on
tob
ank

Relative TSR (applying to 25% of overall 2011 LTIP award in total) Relative TSR has been retained in the LTIP to provide a direct connection between the reward provided to executive directors and the relative performance delivered to our shareholders. The relative TSR performance condition is identical to that applying for 2010 LTIP awards. The relative TSR measure compares the Group’s performance over a three year performance period against a basket of banks from the UK and overseas, weighted towards those companies most similar to the Group. The companies in the comparator group for 2011 awards are as follows: Comparator companies Weighting
1 Barclays 200%2 Lloyds Banking Group 3 Santander 150%4 HSBC 5 Standard Chartered 6 Citigroup 100%7 Deutsche Bank 8 JP Morgan Chase 9 Bank of America 50%10 BBVA 11 BNP Paribas 12 Credit Agricole 13 Credit Suisse Group 14 National Australia Bank Limited 15 Royal Bank of Canada 16 Societe Generale 17 The Toronto-Dominion Bank Group 18 UBS 19 Unicredito 20 Wells Fargo & Company
To receive any of the LTIP awards subject to this performance measure the Group’s performance must be at least as good as the median of the comparator companies, with vesting as follows:
20% of the award will vest if the Group’s TSR is at the median of the companies in the comparator group.
100% of the award will vest if the Group’s TSR is at the upper quartile of the companies in the comparator group.
A pro-rata proportion of the award will vest in between these points. Core bank Economic Profit (applying to 25% of overall 2011 LTIP award in total) At the end of the performance period for these awards, the value of the Group will be determined by the Core bank’s ability to generate enduring returns for shareholders. For this reason for the 2011 LTIP awards the Economic Profit measure is focused on the Core bank. The focus on Core bank Economic Profit ensures that performance reflects enduring earnings for the bank, while the Balance Sheet & Risk targets capture performance of Non-Core. Economic Profit, being a risk-adjusted financial measure, is consistent with the FSA Code, and also provides a balance between measuring growth and the cost of capital employed in delivering that growth.
RBS Group 2010252
Directors’ remuneration report continued
Core bank Economic Profit is defined as return attributable to shareholders less equity multiplied by the cost of equity:
return attributable to shareholders is Core Operating Profit reported in the financial statements, excluding fair value of own debt and APS, taxed at a standard tax rate of 28%.
equity is defined as tangible equity allocated to the Core businesses, with adjustments to strip out distorting impacts arising from fair value of own debt, available-for-sale reserves, cashflow hedging reserve, and APS.
current cost of equity is 12%, which is subject to review at least annually.
Targets have been set so that maximum vesting under the awards is only achieved for performance ahead of the Group’s refreshed Strategic Plan. 25% of this portion of the award will vest at threshold performance. Threshold vesting requires average return on tangible equity over the performance period at a reasonable margin above the cost of capital. Due to the commercially sensitive nature of these targets details of the actual targets, and performance against these, will be disclosed retrospectively once the award vests. Balance Sheet & Risk and Strategic Scorecard (applying to 50% of overall 2011 LTIP award in total) For the 2011 awards, 25% of the overall award will vest based on achievement of Balance Sheet & Risk targets and 25% of the overall award will vest on achievement of Strategic Scorecard targets, over a three year period. These measures have been chosen to complement the Core bank Economic Profit and Relative TSR measures in aligning the LTIP with the advancement of the strategic position and capability of the organisation and the building of a sustainable business. The 2011 measures will have a particular focus on risk reduction, the resolution of the Non-Core business and the building of a sustainable and responsible franchise for the Group. To ensure that the Group is positioned to deliver sustainable value for shareholders beyond the initial turnaround timeframe, the balanced Strategic Scorecard rewards management for delivering a robust basis for future growth in terms of the strength of our franchise, efficiency, reputation, and the strength and engagement of our employees. For the first of these awards, the Remuneration Committee will assess and judge performance against the measures set out below.
Performance measures Non-Core assets Cumulative Non-Core loss Group Core Tier 1 Capital Wholesale funding Liquidity reserves Leverage ratio Loan to deposit ratio Risk Appetite Framework Funded assets
Balance Sheet & Risk measures and targets
Attributes driving credit rating UK Retail and Commercial franchise US Retail and Commercial franchise Investment Banking franchise Measures from Group’s customer dashboard Cost:income ratio in Core bank European Commission divestments Sustainability Relative Economic Profit Growth Progress in people issues Embed strategic thinking, balanced business evolution
Strategic Scorecard measures and targets
Majority of Group’s divisions to have met the ‘5 tests’ at heart of the Strategic Plan
Where possible, quantitative strategic measures will be used. However, it is also important to the Group to focus on qualitative measures which consider issues such as reputation, customer excellence, organisational capability and sustainability given these will support the long term goals of the business.
Targets for each measure will be set at the start of the performance period. Where applicable these will be aligned with the bank’s published Strategic Plan targets. At the end of the period each measure will be assessed against the target, and vesting will be based on the proportion of targets fully met (see below), qualified by Remuneration Committee discretion taking other relevant factors into account. Consideration will also be given to volume of lending over the performance period, subject to commercial viability.
To avoid unintended consequences, the scorecard will not be set in a formulaic manner, but will provide a framework for structured Remuneration Committee discretion, which will be supported by disclosure at the end of the performance period justifying the vesting decision arrived at. In addition, commentary will be provided on an annual basis in relation to progress against targets (where not commercially sensitive).
Vesting point Indicative performance
Does not meet 0% Over half of objectives not met Partially meets 25% Half of objectives met Significantly meets 62.5% Two-thirds of objectives met Fully meets 100% Objectives met or exceeded in all
material respects Qualified by Remuneration Committee discretion taking into account changes in circumstances over the performance period, the relative importance of the measures, the margin by which individual targets have been missed or exceeded, and any other relevant factors.
253RBS Group 2010
Governance
Risk underpin and clawback The Remuneration Committee will also review financial and operational performance against the Strategic Plan and risk performance prior to agreeing vesting of awards. If the Remuneration Committee considers that the vesting outcome calibrated in line with the performance conditions outlined above does not reflect the Group's underlying financial results or if the Committee considers that the financial results have been achieved with excessive risk, then the terms of the awards allow for an underpin to be used to reduce vesting of an award, or to allow the award to lapse in its entirety. All awards are subject to clawback. 2011 compensation framework The chart below summarises the 2011 compensation framework (illustration for the Group Chief Executive):
In order to comply with the FSA Code, shares will be subject to a holding period of six months after vesting.
Subject to clawback prior to vesting
Share Bank
(6 million shares)
LTIP (up to
400% of salary)
50%
50%
100%
1 year performance
0% to 100%
2012 2013 2014
Salary
3 year performance
0% to 100%
20152011
RRBS Group 2010254
Directors’ remuneration report continued
ShareBank
(6 millionshares)
Salary
2011 2012 2013
2013
2014 2015
1 yearperformance
Subject to clawback prior to vesting
50% (0% to 100%)
3 yearperformance
(0% to 100%)
50%
Allo
cati
on
tob
ank
LT
IPA
lloca
tio
n
LTIP(up to
400% ofsalary)
100%
Cas
hS
har
esS
har
es
Shareholding guidelines The Group operates shareholding guidelines for executive directors. The target shareholding level is 200% of gross annual salary for the Group Chief Executive and 100% of gross annual salary for executive directors. Executive directors have a period of five years in which to build up their shareholdings to meet the guideline levels. UK-based executive directors' remuneration balance Executive director pay mix Group Chief Executive - Stephen Hester
Group Finance Director - Bruce Van Saun
Non-executive directors The level of remuneration for non-executive directors reflects their responsibility and time commitment and the level of fees paid to non-executive directors of comparable major UK companies. Non-executive directors do not participate in any incentive or performance plan. Non-executive director fees are reviewed regularly. Fees paid to non-executive directors for the year ended 31 December 2010 are set out on page 258. Total shareholder return performance The performance graph below illustrates the performance of the company over the past five years in terms of total shareholder return compared with that of the companies comprising the FTSE 100 Index. This Index has been selected because it represents a cross-section of leading UK companies. The total shareholder return for FTSE banks for the same period has been added for comparison. The total shareholder return for the company and the indices have been rebased to 100 for 2005. The second graph below illustrates the same performance of the company during 2010. Salary
Benefits
Pension allowance
On-Target Bonus (deferredinto shares)
Long-term incentive award(expected value)
Total shareholder return
0
20
40
60
80
100
120
140
2005 2006 2007 2008 2009 2010
Royal Bank of Scotland FTSE 100 FTSE Banks Source : Thomson Reuters Datastream
Salary
Benefits
P
Total shareholder return - one year
255RBS Group 2010
Governance
Salary
Benefits
Pension allowance
On-Target Bonus(deferred into shares)
Long term incentive award(expected value)
Salary
Benefits
Pension allowance
On-Target Bonus(deferred into shares)
Long term incentive award(expected value)
The charts above show the composition of remuneration opportunity for on-target annual performance, and with the long term incentive awards shown at the expected value. Short term incentive payments earned in relation to 2011 performance will be deferred and will vest, subject to satisfactory performance. The actual value of the long term incentive awards will depend on performance over the period 2011 to 2013 and the share price at the time the awards vest.
N
FTSE 100FTSE BanksRBS
Jan Feb Mar Apr May Jun Jul Aug Sep Oct Nov Dec
50
100
150
200
250
0
FTSE 100FTSE BanksRBS
2005 2006 2007 2008 2009 2010
20
40
60
80
100
120
140
0
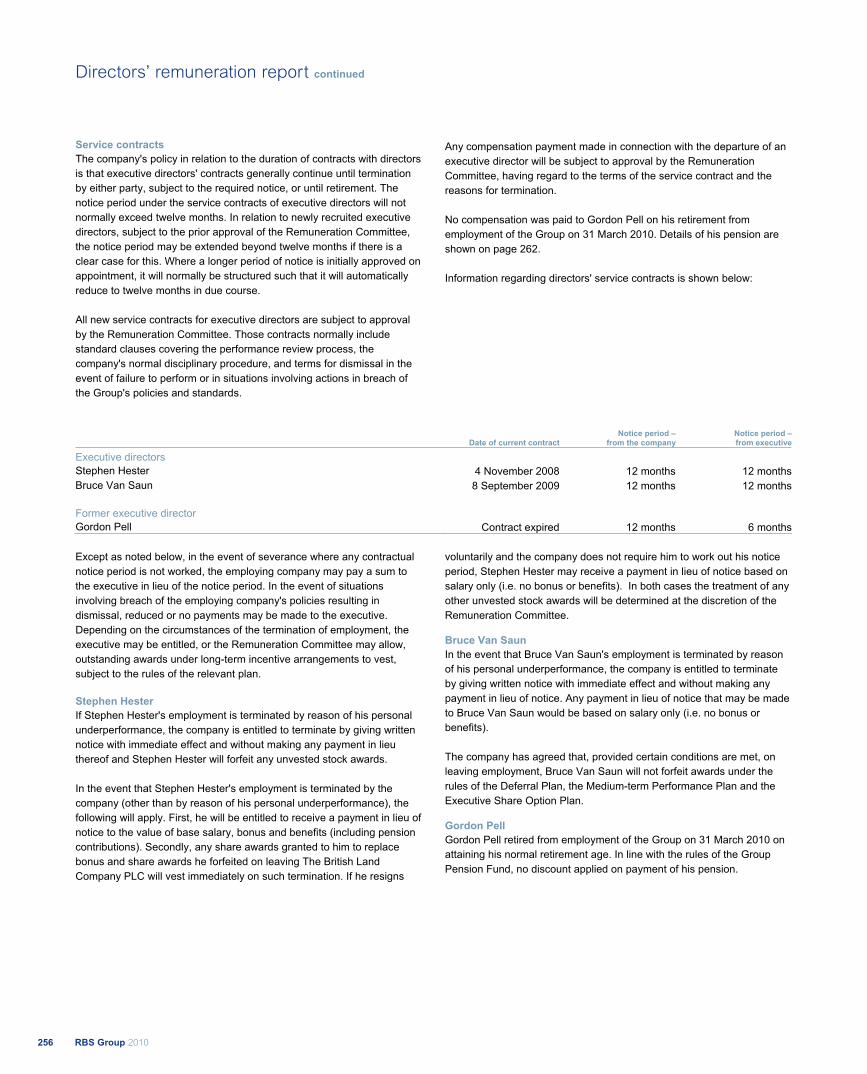
Service contracts The company's policy in relation to the duration of contracts with directors is that executive directors' contracts generally continue until termination by either party, subject to the required notice, or until retirement. The notice period under the service contracts of executive directors will not normally exceed twelve months. In relation to newly recruited executive directors, subject to the prior approval of the Remuneration Committee, the notice period may be extended beyond twelve months if there is a clear case for this. Where a longer period of notice is initially approved on appointment, it will normally be structured such that it will automatically reduce to twelve months in due course. All new service contracts for executive directors are subject to approval by the Remuneration Committee. Those contracts normally include standard clauses covering the performance review process, the company's normal disciplinary procedure, and terms for dismissal in the event of failure to perform or in situations involving actions in breach of the Group's policies and standards.
Any compensation payment made in connection with the departure of an executive director will be subject to approval by the Remuneration Committee, having regard to the terms of the service contract and the reasons for termination. No compensation was paid to Gordon Pell on his retirement from employment of the Group on 31 March 2010. Details of his pension are shown on page 262. Information regarding directors' service contracts is shown below:
Date of current contractNotice period –
from the companyNotice period –from executive
Executive directors Stephen Hester 4 November 2008 12 months 12 monthsBruce Van Saun 8 September 2009 12 months 12 months Former executive director Gordon Pell Contract expired 12 months 6 months
Except as noted below, in the event of severance where any contractual notice period is not worked, the employing company may pay a sum to the executive in lieu of the notice period. In the event of situations involving breach of the employing company's policies resulting in dismissal, reduced or no payments may be made to the executive. Depending on the circumstances of the termination of employment, the executive may be entitled, or the Remuneration Committee may allow, outstanding awards under long-term incentive arrangements to vest, subject to the rules of the relevant plan. Stephen Hester If Stephen Hester's employment is terminated by reason of his personal underperformance, the company is entitled to terminate by giving written notice with immediate effect and without making any payment in lieu thereof and Stephen Hester will forfeit any unvested stock awards. In the event that Stephen Hester's employment is terminated by the company (other than by reason of his personal underperformance), the following will apply. First, he will be entitled to receive a payment in lieu of notice to the value of base salary, bonus and benefits (including pension contributions). Secondly, any share awards granted to him to replace bonus and share awards he forfeited on leaving The British Land Company PLC will vest immediately on such termination. If he resigns
voluntarily and the company does not require him to work out his notice period, Stephen Hester may receive a payment in lieu of notice based on salary only (i.e. no bonus or benefits). In both cases the treatment of any other unvested stock awards will be determined at the discretion of the Remuneration Committee. Bruce Van Saun In the event that Bruce Van Saun's employment is terminated by reason of his personal underperformance, the company is entitled to terminate by giving written notice with immediate effect and without making any payment in lieu of notice. Any payment in lieu of notice that may be made to Bruce Van Saun would be based on salary only (i.e. no bonus or benefits). The company has agreed that, provided certain conditions are met, on leaving employment, Bruce Van Saun will not forfeit awards under the rules of the Deferral Plan, the Medium-term Performance Plan and the Executive Share Option Plan. Gordon Pell Gordon Pell retired from employment of the Group on 31 March 2010 on attaining his normal retirement age. In line with the rules of the Group Pension Fund, no discount applied on payment of his pension.
RBS Group 2010256
Directors’ remuneration report continued

Chairman and non-executive directors Under the Articles of Association of the company, directors must stand for re-election by shareholders at least once every three years. However, in accordance with the provisions of the UK Corporate Governance Code, all directors of the company will stand for re-election by shareholders at the company’s 2011 Annual General Meeting and annually thereafter. The original dates of appointment as directors of the company for the Chairman and non-executive directors’ and the dates for next re-election are as follows:
Date first appointedDate for election or
next re-election
Philip Hampton 19 January 2009 2011Colin Buchan (1) 1 June 2002 2011Sandy Crombie 1 June 2009 2011Penny Hughes 1 January 2010 2011Joe MacHale 1 September 2004 2011John McFarlane 1 October 2008 2011Brendan Nelson 1 April 2010 2011Art Ryan 1 October 2008 2011Philip Scott 1 November 2009 2011
Note: (1) Colin Buchan will stand down as a non-executive director of the Group on 5 August 2011 following the announcement of the Group’s interim results, having served just over nine years on the Board.
The non-executive directors do not have service contracts or notice periods although they have letters of engagement reflecting their responsibilities and commitments. These letters make clear to non-executive directors the time commitment they are expected to give to their Board duties. Brendan Nelson, Philip Scott and Penny Hughes' letters of engagement specifically state that their time commitment should be in line with the Walker Review in respect of their general Board duties and additional time as necessary in respect of Committee duties, including in particular any Committees which they chair.
No compensation would be paid to any non-executive director in the event of termination of appointment. Philip Hampton is entitled to receive a cash payment in lieu of notice if his appointment is terminated as a result of the Group's majority shareholder seeking to effect the termination of his appointment. The applicable notice period is twelve months. In the event that the company terminates Philip Hampton's appointment without good reason, or his re-election is not approved by shareholders in General Meeting resulting in the termination of his appointment, he will be entitled to receive a cash payment in lieu of notice of twelve months' fees.
257RBS Group 2010
Governance
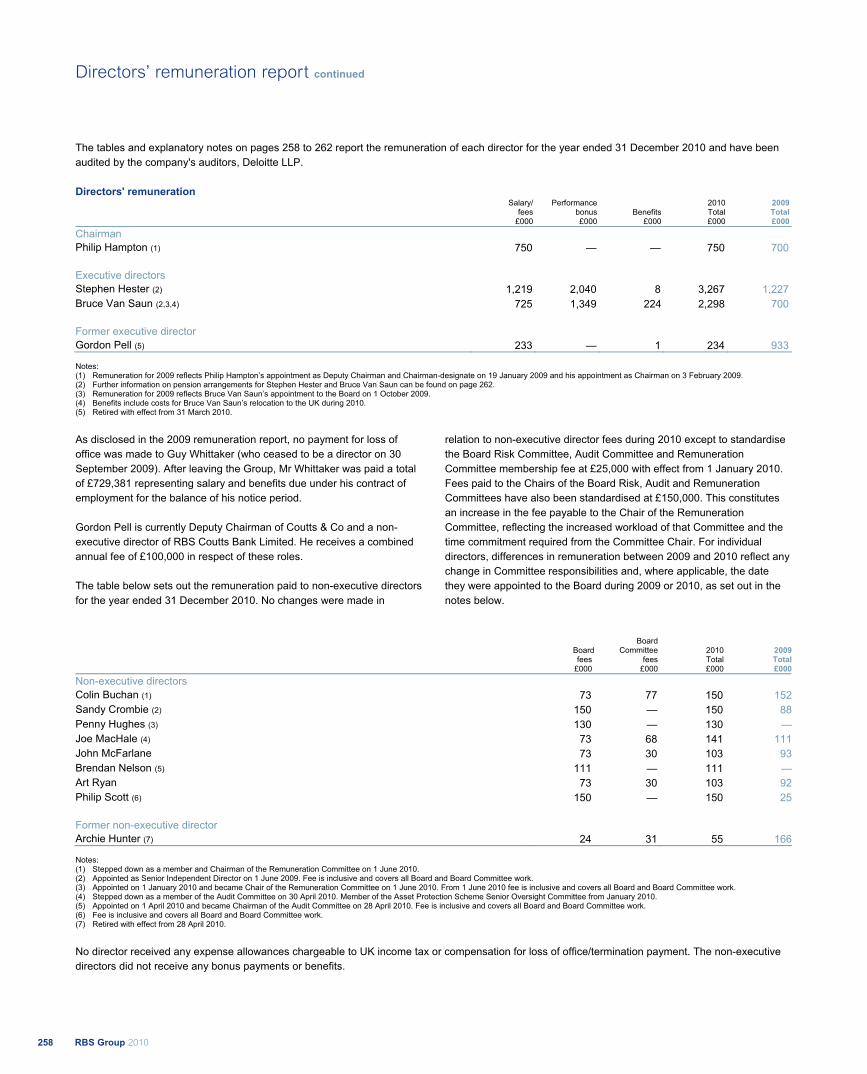
The tables and explanatory notes on pages 258 to 262 report the remuneration of each director for the year ended 31 December 2010 and have been audited by the company's auditors, Deloitte LLP. Directors' remuneration
Salary/
fees £000
Performance bonus £000
Benefits £000
2010 Total £000
2009 Total £000
Chairman Philip Hampton (1) 750 — — 750 700 Executive directors Stephen Hester (2) 1,219 2,040 8 3,267 1,227 Bruce Van Saun (2,3,4) 725 1,349 224 2,298 700 Former executive director Gordon Pell (5) 233 — 1 234 933
Notes: (1) Remuneration for 2009 reflects Philip Hampton’s appointment as Deputy Chairman and Chairman-designate on 19 January 2009 and his appointment as Chairman on 3 February 2009. (2) Further information on pension arrangements for Stephen Hester and Bruce Van Saun can be found on page 262. (3) Remuneration for 2009 reflects Bruce Van Saun’s appointment to the Board on 1 October 2009. (4) Benefits include costs for Bruce Van Saun’s relocation to the UK during 2010. (5) Retired with effect from 31 March 2010.
As disclosed in the 2009 remuneration report, no payment for loss of office was made to Guy Whittaker (who ceased to be a director on 30 September 2009). After leaving the Group, Mr Whittaker was paid a total of £729,381 representing salary and benefits due under his contract of employment for the balance of his notice period. Gordon Pell is currently Deputy Chairman of Coutts & Co and a non-executive director of RBS Coutts Bank Limited. He receives a combined annual fee of £100,000 in respect of these roles. The table below sets out the remuneration paid to non-executive directors for the year ended 31 December 2010. No changes were made in
relation to non-executive director fees during 2010 except to standardise the Board Risk Committee, Audit Committee and Remuneration Committee membership fee at £25,000 with effect from 1 January 2010. Fees paid to the Chairs of the Board Risk, Audit and Remuneration Committees have also been standardised at £150,000. This constitutes an increase in the fee payable to the Chair of the Remuneration Committee, reflecting the increased workload of that Committee and the time commitment required from the Committee Chair. For individual directors, differences in remuneration between 2009 and 2010 reflect any change in Committee responsibilities and, where applicable, the date they were appointed to the Board during 2009 or 2010, as set out in the notes below.
Board fees
Board Committee
fees 2010 Total
2009Total
£000 £000 £000 £000Non-executive directors Colin Buchan (1) 73 77 150 152Sandy Crombie (2) 150 — 150 88Penny Hughes (3) 130 — 130 —Joe MacHale (4) 73 68 141 111John McFarlane 73 30 103 93Brendan Nelson (5) 111 — 111 —Art Ryan 73 30 103 92Philip Scott (6) 150 — 150 25 Former non-executive director Archie Hunter (7) 24 31 55 166
Notes: (1) Stepped down as a member and Chairman of the Remuneration Committee on 1 June 2010. (2) Appointed as Senior Independent Director on 1 June 2009. Fee is inclusive and covers all Board and Board Committee work. (3) Appointed on 1 January 2010 and became Chair of the Remuneration Committee on 1 June 2010. From 1 June 2010 fee is inclusive and covers all Board and Board Committee work. (4) Stepped down as a member of the Audit Committee on 30 April 2010. Member of the Asset Protection Scheme Senior Oversight Committee from January 2010. (5) Appointed on 1 April 2010 and became Chairman of the Audit Committee on 28 April 2010. Fee is inclusive and covers all Board and Board Committee work. (6) Fee is inclusive and covers all Board and Board Committee work. (7) Retired with effect from 28 April 2010.
No director received any expense allowances chargeable to UK income tax or compensation for loss of office/termination payment. The non-executive directors did not receive any bonus payments or benefits.
RRBS Group 2010258
Directors’ remuneration report continued
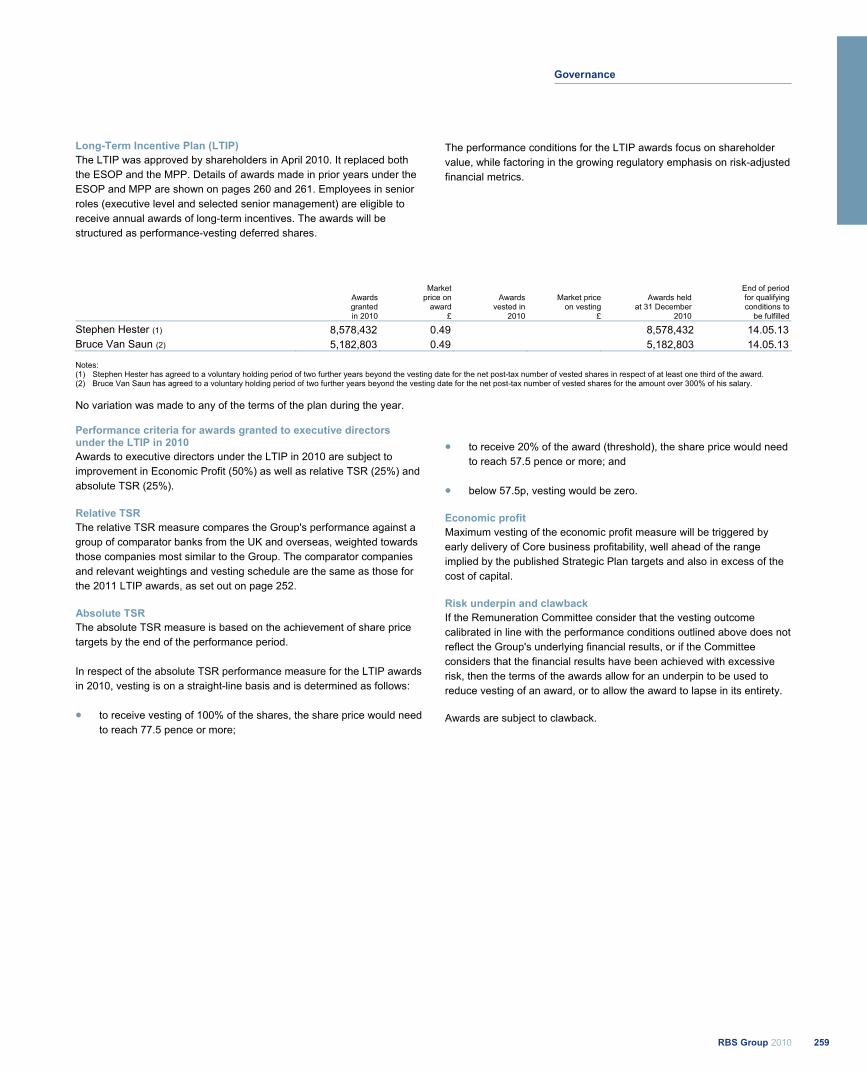
Long-Term Incentive Plan (LTIP) The LTIP was approved by shareholders in April 2010. It replaced both the ESOP and the MPP. Details of awards made in prior years under the ESOP and MPP are shown on pages 260 and 261. Employees in senior roles (executive level and selected senior management) are eligible to receive annual awards of long-term incentives. The awards will be structured as performance-vesting deferred shares.
The performance conditions for the LTIP awards focus on shareholder value, while factoring in the growing regulatory emphasis on risk-adjusted financial metrics.
Awards granted in 2010
Market price on
award £
Awardsvested in
2010
Market price on vesting
£
Awards held at 31 December
2010
End of period for qualifying conditions to
be fulfilled
Stephen Hester (1) 8,578,432 0.49 8,578,432 14.05.13 Bruce Van Saun (2) 5,182,803 0.49 5,182,803 14.05.13
Notes: (1) Stephen Hester has agreed to a voluntary holding period of two further years beyond the vesting date for the net post-tax number of vested shares in respect of at least one third of the award. (2) Bruce Van Saun has agreed to a voluntary holding period of two further years beyond the vesting date for the net post-tax number of vested shares for the amount over 300% of his salary.
No variation was made to any of the terms of the plan during the year. Performance criteria for awards granted to executive directors under the LTIP in 2010 Awards to executive directors under the LTIP in 2010 are subject to improvement in Economic Profit (50%) as well as relative TSR (25%) and absolute TSR (25%). Relative TSR The relative TSR measure compares the Group's performance against a group of comparator banks from the UK and overseas, weighted towards those companies most similar to the Group. The comparator companies and relevant weightings and vesting schedule are the same as those for the 2011 LTIP awards, as set out on page 252. Absolute TSR The absolute TSR measure is based on the achievement of share price targets by the end of the performance period. In respect of the absolute TSR performance measure for the LTIP awards in 2010, vesting is on a straight-line basis and is determined as follows:
to receive vesting of 100% of the shares, the share price would need to reach 77.5 pence or more;
to receive 20% of the award (threshold), the share price would need to reach 57.5 pence or more; and
below 57.5p, vesting would be zero.
Economic profit Maximum vesting of the economic profit measure will be triggered by early delivery of Core business profitability, well ahead of the range implied by the published Strategic Plan targets and also in excess of the cost of capital. Risk underpin and clawback If the Remuneration Committee consider that the vesting outcome calibrated in line with the performance conditions outlined above does not reflect the Group's underlying financial results, or if the Committee considers that the financial results have been achieved with excessive risk, then the terms of the awards allow for an underpin to be used to reduce vesting of an award, or to allow the award to lapse in its entirety. Awards are subject to clawback.
259RBS Group 2010
Governance
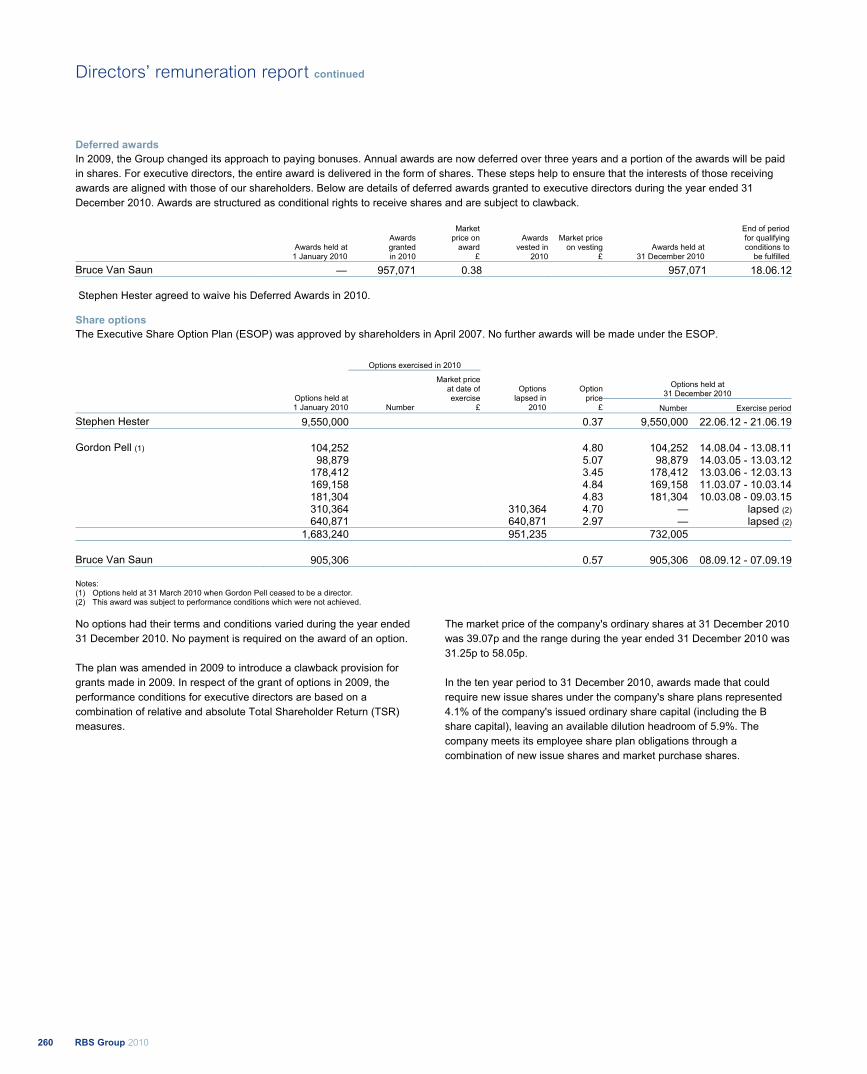
Deferred awards In 2009, the Group changed its approach to paying bonuses. Annual awards are now deferred over three years and a portion of the awards will be paid in shares. For executive directors, the entire award is delivered in the form of shares. These steps help to ensure that the interests of those receiving awards are aligned with those of our shareholders. Below are details of deferred awards granted to executive directors during the year ended 31 December 2010. Awards are structured as conditional rights to receive shares and are subject to clawback.
Awards held at 1 January 2010
Awardsgrantedin 2010
Market price on
award £
Awards vested in
2010
Market price on vesting
£Awards held at
31 December 2010
End of period for qualifying conditions to
be fulfilled
Bruce Van Saun — 957,071 0.38 957,071 18.06.12
Stephen Hester agreed to waive his Deferred Awards in 2010. Share options The Executive Share Option Plan (ESOP) was approved by shareholders in April 2007. No further awards will be made under the ESOP.
Options exercised in 2010
Options held at 31 December 2010
Options held at1 January 2010 Number
Market priceat date ofexercise
£
Optionslapsed in
2010
Option price
£ Number Exercise period
Stephen Hester 9,550,000 0.37 9,550,000 22.06.12 - 21.06.19
Gordon Pell (1) 104,252 4.80 104,252 14.08.04 - 13.08.11 98,879 5.07 98,879 14.03.05 - 13.03.12 178,412 3.45 178,412 13.03.06 - 12.03.13 169,158 4.84 169,158 11.03.07 - 10.03.14 181,304 4.83 181,304 10.03.08 - 09.03.15 310,364 310,364 4.70 — lapsed (2) 640,871 640,871 2.97 — lapsed (2) 1,683,240 951,235 732,005
Bruce Van Saun 905,306 0.57 905,306 08.09.12 - 07.09.19
Notes: (1) Options held at 31 March 2010 when Gordon Pell ceased to be a director. (2) This award was subject to performance conditions which were not achieved.
No options had their terms and conditions varied during the year ended 31 December 2010. No payment is required on the award of an option. The plan was amended in 2009 to introduce a clawback provision for grants made in 2009. In respect of the grant of options in 2009, the performance conditions for executive directors are based on a combination of relative and absolute Total Shareholder Return (TSR) measures.
The market price of the company's ordinary shares at 31 December 2010 was 39.07p and the range during the year ended 31 December 2010 was 31.25p to 58.05p. In the ten year period to 31 December 2010, awards made that could require new issue shares under the company's share plans represented 4.1% of the company's issued ordinary share capital (including the B share capital), leaving an available dilution headroom of 5.9%. The company meets its employee share plan obligations through a combination of new issue shares and market purchase shares.
RRBS Group 2010260
Directors’ remuneration report continued

Medium-Term Performance Plan (MPP) The MPP was approved by shareholders in April 2001. No further awards will be made under the MPP.
Scheme interests (share equivalents)at 1 January 2010
Market price on
award £
Awards vested in
2010
Awards exercised
in 2010
Scheme interests (share equivalents)
at 31 December 2010
End of period for qualifying conditions to
be fulfilled
Stephen Hester (1) 4,800,000 0.37 4,800,000 22.06.12 Gordon Pell (2) 305,177 2.97 — lapsed Bruce Van Saun (3) 1,810,611 0.57 1,810,611 22.06.12
Notes: (1) Stephen Hester has voluntarily agreed to retain any shares that he receives for a further two years past the vesting date. (2) Awards held at 31 March 2010 when Gordon Pell ceased to be a director. This award was subject to performance conditions which were not achieved. (3) End of qualifying period 22 June 2012, however award unavailable for exercise until 8 September 2012, three years from date of award.
No variation was made to any of the terms of the plan during the year. Restricted Share Award
Awards held at
1 January 2010
Awardsgranted in
2010
Marketprice on
award£
Awardsvested in
2010
Marketprice onvesting
£
Value ofawardsvested
£Awards held at
31 December 2010
End of period for qualifying conditions to
be fulfilled
Stephen Hester 5,506,987(1) 0.48 469,064 0.4491 210,657695,167 0.4368 303,649
879,458 0.3814 335,425 3,463,298 21.11.08 - 29.05.11 1,221,374(2) 0.48 610,687 0.4050 247,328 610,687 21.11.09 - 21.11.11 6,728,361 2,654,376 1,097,059 4,073,985Philip Hampton (3) 5,172,413 0.29 5,172,413 27.02.12
Notes: (1) Awards to replace bonus and share awards Stephen Hester forfeited on leaving The British Land Company PLC, which reflect the vesting dates of the original awards. Initially Stephen Hester was
awarded 10,407,081 restricted shares on joining the Group. (2) These awards vest as to 1/3 on each of the first, second and third anniversary of award, subject to their terms. (3) The Remuneration Committee can amend the award made to Philip Hampton as it considers appropriate. However, shareholder approval will be required to amend certain provisions to his
advantage. These provisions relate to the basis for determining his entitlement to, and the terms of shares or other benefits and for the adjustment thereof (if any) if there is a capitalisation issue, rights issue or open offer, sub-division or consolidation of shares or reduction of capital or any other variation of capital and the amendment power itself. The Remuneration Committee may, without shareholder approval, make minor amendments to facilitate the administration of the award, to comply with or take account of any proposed or existing legislation or to obtain or maintain favourable tax, exchange control or regulatory treatment for Philip Hampton or his employer. The benefit of the award is not pensionable. In assessing the performance to determine the vesting of this award, the Remuneration Committee will consider a number of factors which demonstrate whether Philip Hampton has led the successful and sustainable rebuilding of the Group. The Committee will also require to be satisfied that the vesting level is commensurate with the underlying financial performance of the Group.
261RBS Group 2010
Governance
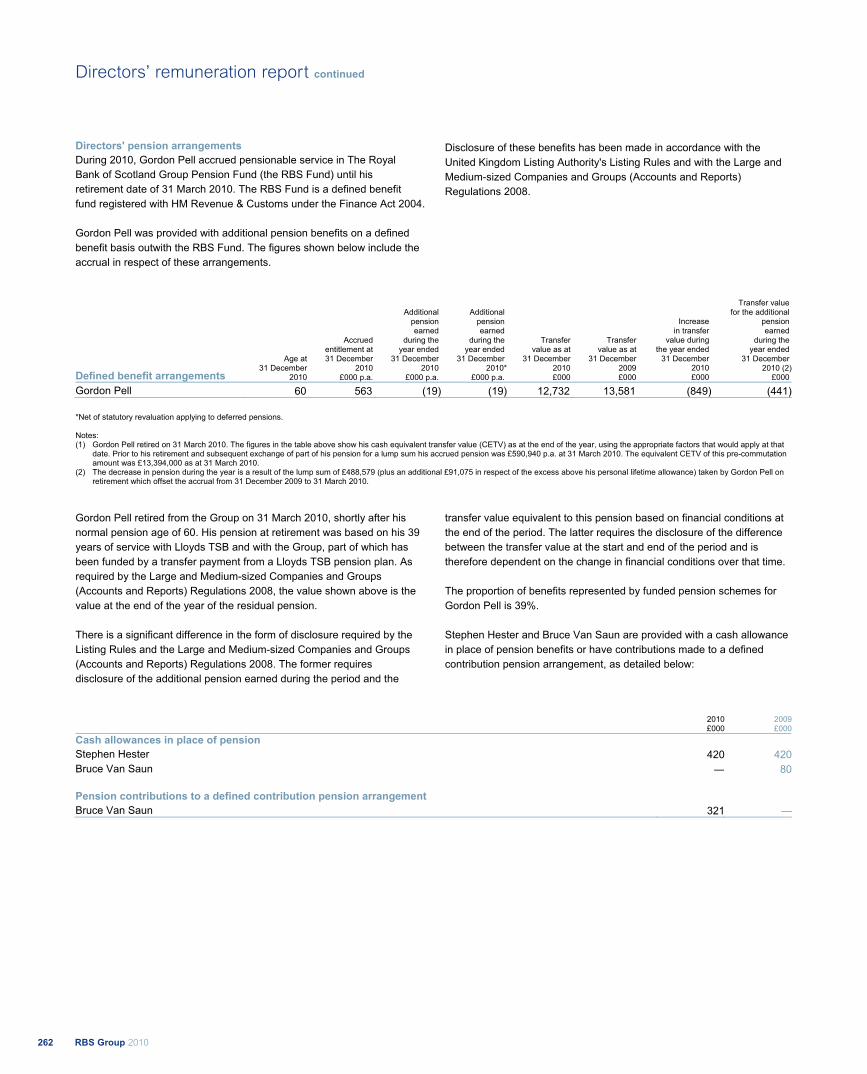
Directors' pension arrangements During 2010, Gordon Pell accrued pensionable service in The Royal Bank of Scotland Group Pension Fund (the RBS Fund) until his retirement date of 31 March 2010. The RBS Fund is a defined benefit fund registered with HM Revenue & Customs under the Finance Act 2004. Gordon Pell was provided with additional pension benefits on a defined benefit basis outwith the RBS Fund. The figures shown below include the accrual in respect of these arrangements.
Disclosure of these benefits has been made in accordance with the United Kingdom Listing Authority's Listing Rules and with the Large and Medium-sized Companies and Groups (Accounts and Reports) Regulations 2008.
Defined benefit arrangements Age at
31 December 2010
Accrued entitlement at 31 December
2010 £000 p.a.
Additional pension earned
during the year ended
31 December 2010
£000 p.a.
Additional pension earned
during the year ended
31 December 2010*
£000 p.a.
Transfer value as at
31 December 2010 £000
Transfer value as at
31 December 2009 £000
Increasein transfer
value duringthe year ended
31 December2010£000
Transfer value for the additional
pension earned
during the year ended
31 December 2010 (2)
£000
Gordon Pell 60 563 (19) (19) 12,732 13,581 (849) (441)
*Net of statutory revaluation applying to deferred pensions. Notes: (1) Gordon Pell retired on 31 March 2010. The figures in the table above show his cash equivalent transfer value (CETV) as at the end of the year, using the appropriate factors that would apply at that
date. Prior to his retirement and subsequent exchange of part of his pension for a lump sum his accrued pension was £590,940 p.a. at 31 March 2010. The equivalent CETV of this pre-commutation amount was £13,394,000 as at 31 March 2010.
(2) The decrease in pension during the year is a result of the lump sum of £488,579 (plus an additional £91,075 in respect of the excess above his personal lifetime allowance) taken by Gordon Pell on retirement which offset the accrual from 31 December 2009 to 31 March 2010.
Gordon Pell retired from the Group on 31 March 2010, shortly after his normal pension age of 60. His pension at retirement was based on his 39 years of service with Lloyds TSB and with the Group, part of which has been funded by a transfer payment from a Lloyds TSB pension plan. As required by the Large and Medium-sized Companies and Groups (Accounts and Reports) Regulations 2008, the value shown above is the value at the end of the year of the residual pension. There is a significant difference in the form of disclosure required by the Listing Rules and the Large and Medium-sized Companies and Groups (Accounts and Reports) Regulations 2008. The former requires disclosure of the additional pension earned during the period and the
transfer value equivalent to this pension based on financial conditions at the end of the period. The latter requires the disclosure of the difference between the transfer value at the start and end of the period and is therefore dependent on the change in financial conditions over that time. The proportion of benefits represented by funded pension schemes for Gordon Pell is 39%. Stephen Hester and Bruce Van Saun are provided with a cash allowance in place of pension benefits or have contributions made to a defined contribution pension arrangement, as detailed below:
2010 2009£000 £000
Cash allowances in place of pension Stephen Hester 420 420Bruce Van Saun — 80 Pension contributions to a defined contribution pension arrangement Bruce Van Saun 321 —
RBS Group 2010262
Directors’ remuneration report continued
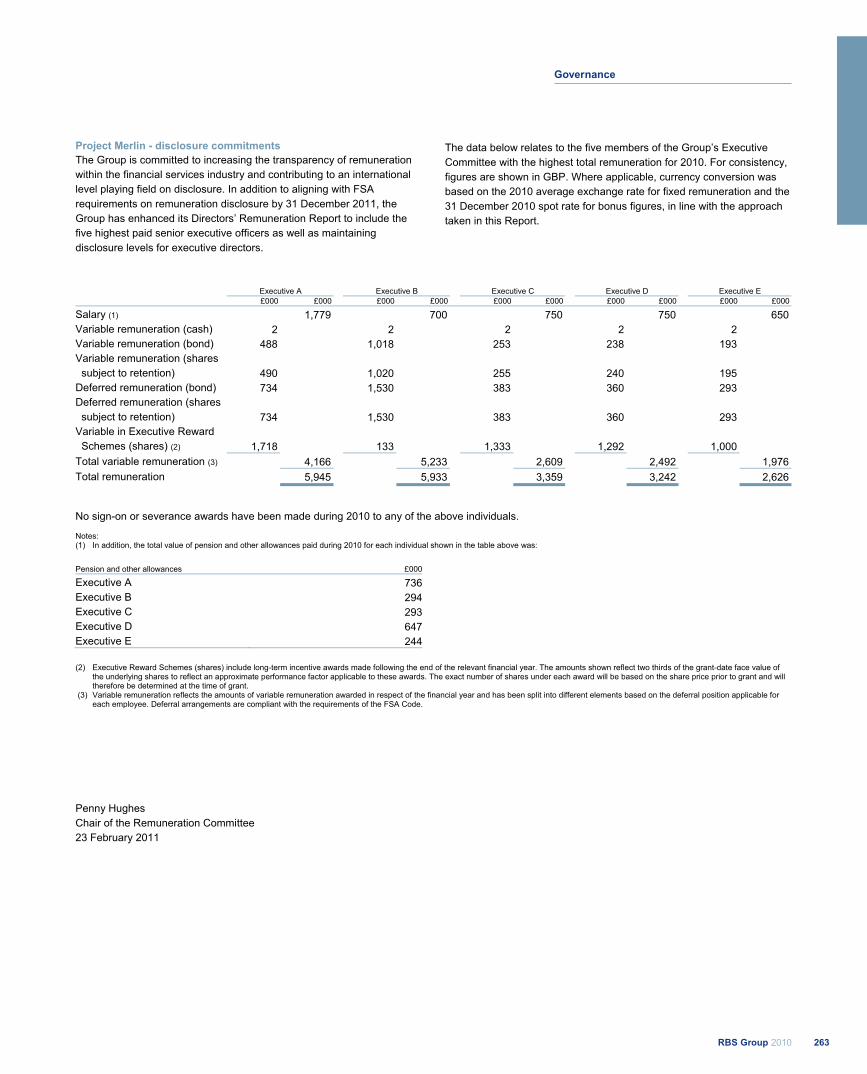
Project Merlin - disclosure commitments The Group is committed to increasing the transparency of remuneration within the financial services industry and contributing to an international level playing field on disclosure. In addition to aligning with FSA requirements on remuneration disclosure by 31 December 2011, the Group has enhanced its Directors’ Remuneration Report to include the five highest paid senior executive officers as well as maintaining disclosure levels for executive directors.
The data below relates to the five members of the Group’s Executive Committee with the highest total remuneration for 2010. For consistency, figures are shown in GBP. Where applicable, currency conversion was based on the 2010 average exchange rate for fixed remuneration and the 31 December 2010 spot rate for bonus figures, in line with the approach taken in this Report.
Executive A Executive B Executive C Executive D Executive E £000 £000 £000 £000 £000 £000 £000 £000 £000 £000
Salary (1) 1,779 700 750 750 650 Variable remuneration (cash) 2 2 2 2 2Variable remuneration (bond) 488 1,018 253 238 193 Variable remuneration (shares subject to retention) 490 1,020 255 240 195 Deferred remuneration (bond) 734 1,530 383 360 293 Deferred remuneration (shares subject to retention) 734 1,530 383 360 293 Variable in Executive Reward Schemes (shares) (2) 1,718 133 1,333 1,292 1,000 Total variable remuneration (3) 4,166 5,233 2,609 2,492 1,976 Total remuneration 5,945 5,933 3,359 3,242 2,626
No sign-on or severance awards have been made during 2010 to any of the above individuals. Notes: (1) In addition, the total value of pension and other allowances paid during 2010 for each individual shown in the table above was:
Pension and other allowances £000
Executive A 736Executive B 294Executive C 293Executive D 647Executive E 244
(2) Executive Reward Schemes (shares) include long-term incentive awards made following the end of the relevant financial year. The amounts shown reflect two thirds of the grant-date face value of the underlying shares to reflect an approximate performance factor applicable to these awards. The exact number of shares under each award will be based on the share price prior to grant and will therefore be determined at the time of grant.
(3) Variable remuneration reflects the amounts of variable remuneration awarded in respect of the financial year and has been split into different elements based on the deferral position applicable for each employee. Deferral arrangements are compliant with the requirements of the FSA Code.
Penny Hughes Chair of the Remuneration Committee 23 February 2011
R263RBS Group 2010
Governance
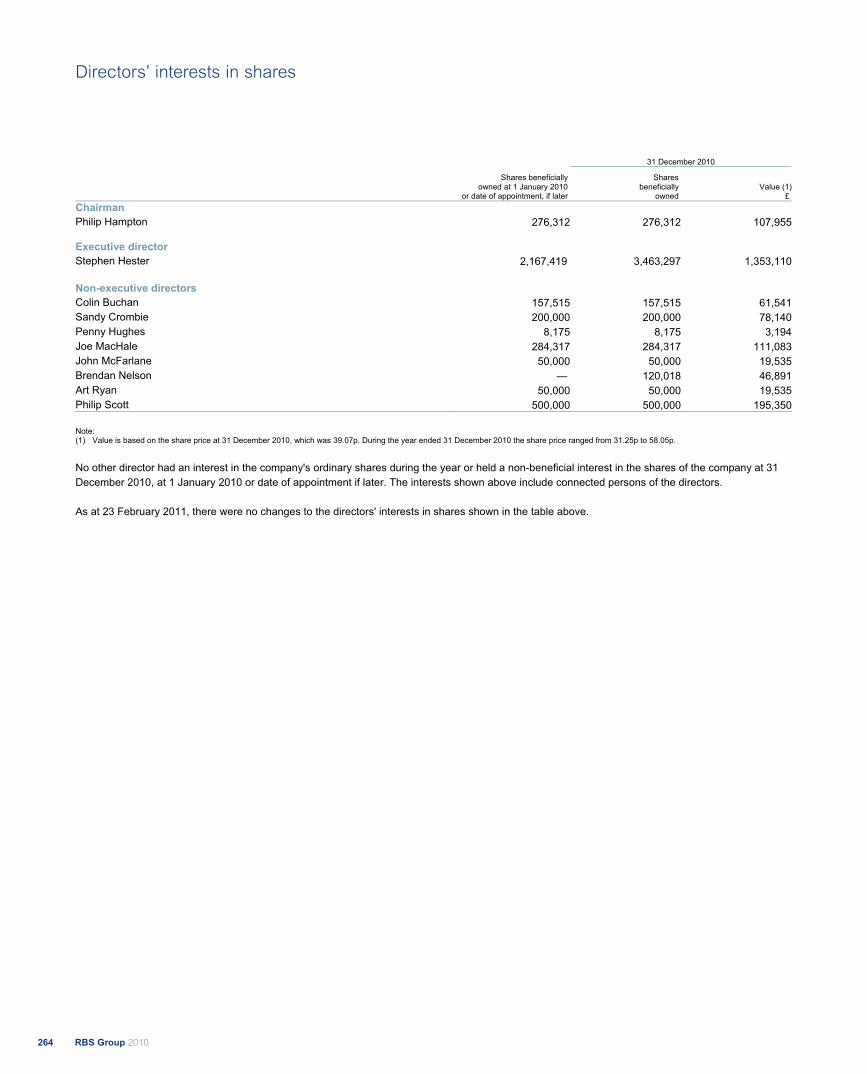
31 December 2010
Shares beneficially
owned at 1 January 2010 or date of appointment, if later
Shares beneficially
owned Value (1)
£Chairman Philip Hampton 276,312 276,312 107,955 Executive director Stephen Hester 2,167,419 3,463,297 1,353,110 Non-executive directors Colin Buchan 157,515 157,515 61,541Sandy Crombie 200,000 200,000 78,140Penny Hughes 8,175 8,175 3,194Joe MacHale 284,317 284,317 111,083John McFarlane 50,000 50,000 19,535Brendan Nelson — 120,018 46,891Art Ryan 50,000 50,000 19,535Philip Scott 500,000 500,000 195,350
Note: (1) Value is based on the share price at 31 December 2010, which was 39.07p. During the year ended 31 December 2010 the share price ranged from 31.25p to 58.05p.
No other director had an interest in the company's ordinary shares during the year or held a non-beneficial interest in the shares of the company at 31 December 2010, at 1 January 2010 or date of appointment if later. The interests shown above include connected persons of the directors. As at 23 February 2011, there were no changes to the directors' interests in shares shown in the table above.
RBS Group 2010264
Directors’ interests in shares
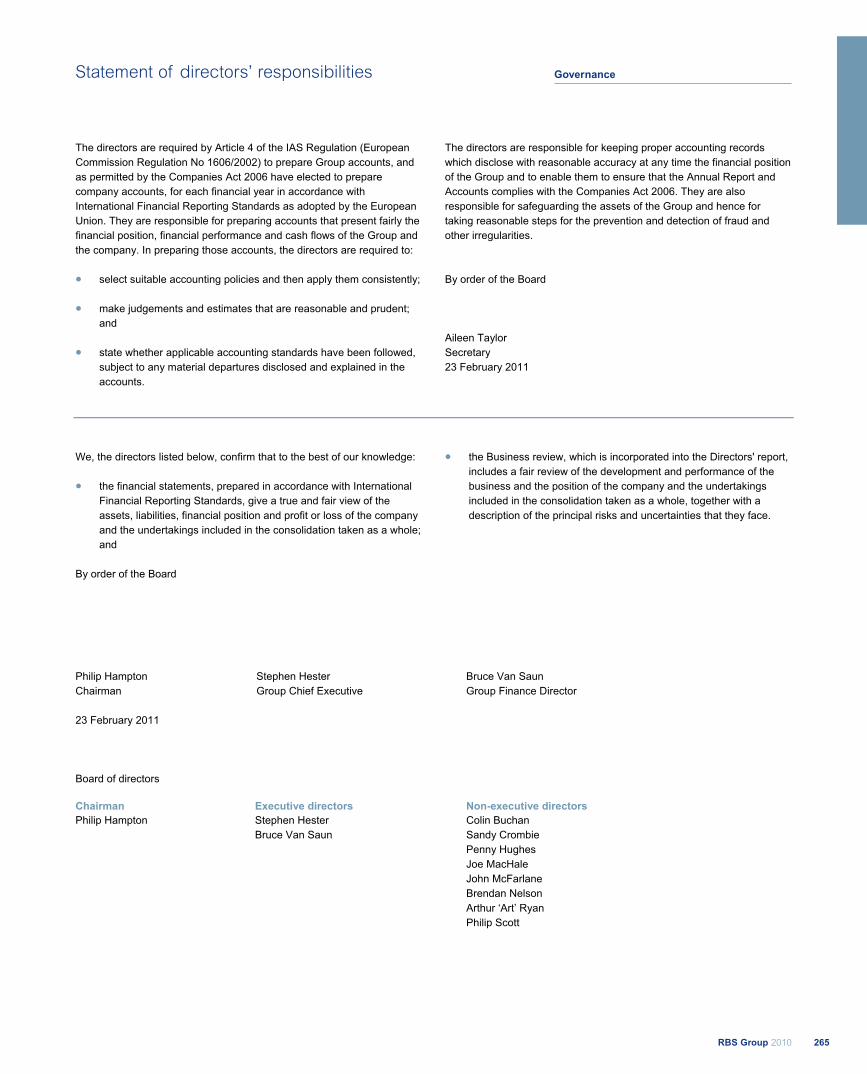
The directors are required by Article 4 of the IAS Regulation (European Commission Regulation No 1606/2002) to prepare Group accounts, and as permitted by the Companies Act 2006 have elected to prepare company accounts, for each financial year in accordance with International Financial Reporting Standards as adopted by the European Union. They are responsible for preparing accounts that present fairly the financial position, financial performance and cash flows of the Group and the company. In preparing those accounts, the directors are required to:
select suitable accounting policies and then apply them consistently;
make judgements and estimates that are reasonable and prudent; and
state whether applicable accounting standards have been followed, subject to any material departures disclosed and explained in the accounts.
The directors are responsible for keeping proper accounting records which disclose with reasonable accuracy at any time the financial position of the Group and to enable them to ensure that the Annual Report and Accounts complies with the Companies Act 2006. They are also responsible for safeguarding the assets of the Group and hence for taking reasonable steps for the prevention and detection of fraud and other irregularities.
By order of the Board
Aileen Taylor Secretary 23 February 2011
We, the directors listed below, confirm that to the best of our knowledge:
the financial statements, prepared in accordance with International Financial Reporting Standards, give a true and fair view of the assets, liabilities, financial position and profit or loss of the company and the undertakings included in the consolidation taken as a whole; and
the Business review, which is incorporated into the Directors' report, includes a fair review of the development and performance of the business and the position of the company and the undertakings included in the consolidation taken as a whole, together with a description of the principal risks and uncertainties that they face.
By order of the Board
Philip Hampton Stephen Hester Bruce Van Saun Chairman Group Chief Executive Group Finance Director 23 February 2011
Board of directors Chairman Executive directors Non-executive directors Philip Hampton Stephen Hester
Bruce Van Saun Colin Buchan Sandy Crombie Penny Hughes Joe MacHale John McFarlane Brendan Nelson Arthur ‘Art’ Ryan Philip Scott
265RBS Group 2010
GovernanceStatement of directors’ responsibilities
RBS Group 2010266
267 Independent auditors’ report
268 Consolidated income statement
269 Consolidated statement of comprehensive income
270 Balance sheets
271 Statements of changes in equity
274 Cash flow statements
275 Accounting policies
287 Notes on the accounts
1 Net interest income 287
2 Non-interest income
(excluding insurance premium income) 288
3 Operating expenses 289
4 Pension costs 292
5 Auditors’ remuneration 296
6 Tax 297
7 Profit attributable to preference shareholders
and paid-in equity holders 297
8 Ordinary dividends 298
9 Profit dealt with in the accounts of the company 298
10 Earnings per ordinary and B share 299
11 Financial instruments – classification 300
12 Financial instruments – valuation 310
13 Financial instruments – maturity analysis 325
14 Financial assets – impairments 328
15 Derivatives 329
16 Debt securities 332
17 Equity shares 333
18 Investments in Group undertakings 334
19 Intangible assets 335
20 Property, plant and equipment 338
21 Prepayments, accrued income and other assets 340
22 Discontinued operations and assets and
liabilities of disposal groups 340
23 Short positions 342
24 Accruals, deferred income and other liabilities 342
25 Deferred tax 342
26 Insurance business 344
27 Subordinated liabilities 349
28 Non-controlling interests 357
29 Share capital 358
30 Reserves 361
31 Leases 362
32 Collateral and securitisations 364
33 Capital resources 365
34 Memorandum items 366
35 Net cash inflow/(outflow) from operating activities 374
36 Analysis of the net investment in business
interests and intangible assets 375
37 Interest received and paid 375
38 Analysis of changes in financing during the year 376
39 Analysis of cash and cash equivalents 376
40 Segmental analysis 377
41 Directors’ and key management remuneration 383
42 Transactions with directors and key management 383
43 Related parties 383
44 Post balance sheet events 385
Financial statements
We have audited the financial statements of The Royal Bank of Scotland Group plc (the "company") and its subsidiaries (together the "Group") for the year ended 31 December 2010 which comprise the accounting policies, the balance sheets as at 31 December 2010, the consolidated income statement, the consolidated statement of comprehensive income, the statements of changes in equity and the cash flow statements for the year ended 31 December 2010, the related Notes 1 to 44 and the information identified as 'audited' in the Risk and balance sheet management section of the Business review. The financial reporting framework that has been applied in their preparation is applicable law and International Financial Reporting Standards (IFRS) as adopted by the European Union and, as regards the company financial statements, as applied in accordance with the provisions of the Companies Act 2006. This report is made solely to the company’s members, as a body, in accordance with Chapter 3 of Part 16 of the Companies Act 2006. Our audit work has been undertaken so that we might state to the company's members those matters we are required to state to them in an auditor’s report and for no other purpose. To the fullest extent permitted by law, we do not accept or assume responsibility to anyone other than the company and the company's members as a body, for our audit work, for this report, or for the opinions we have formed. Respective responsibilities of directors and auditor As explained more fully in the Statement of directors' responsibilities, the directors are responsible for the preparation of the financial statements and for being satisfied that they give a true and fair view. Our responsibility is to audit and express an opinion on the financial statements in accordance with applicable law and International Standards on Auditing (UK and Ireland). Those standards require us to comply with the Auditing Practices Board's Ethical Standards for Auditors. Scope of the audit of the financial statements An audit involves obtaining evidence about the amounts and disclosures in the financial statements sufficient to give reasonable assurance that the financial statements are free from material misstatement, whether caused by fraud or error. This includes an assessment of: the reasonableness of significant accounting estimates made by the directors in the preparation of the financial statements; whether the accounting policies are appropriate to the circumstances of the company and the Group and have been consistently applied and adequately disclosed; and the overall presentation of the financial statements. Opinion In our opinion:
the financial statements give a true and fair view of the state of the Group's and of the company’s affairs as at 31 December 2010 and of the Group’s loss for the year then ended;
the Group financial statements have been properly prepared in accordance with IFRS as adopted by the European Union;
the company financial statements have been properly prepared in accordance with IFRS as adopted by the European Union and as applied in accordance with the provisions of the Companies Act 2006; and
the financial statements have been prepared in accordance with the requirements of the Companies Act 2006 and, as regards the Group financial statements, Article 4 of the IAS Regulation.
Separate opinion in relation to IFRS as issued by the IASB As explained in the accounting policies, the Group has prepared financial statements that comply with IFRS as adopted by the European Union, and with IFRS as issued by the International Accounting Standards Board (IASB). In our opinion the Group financial statements comply with IFRS as issued by the IASB. Opinion on other matters prescribed by the Companies Act 2006 In our opinion:
the part of the Directors' remuneration report described as having been audited has been properly prepared in accordance with the Companies Act 2006; and
the information given in the Report of the directors for the financial year for which the financial statements are prepared is consistent with the financial statements.
Matters on which we are required to report by exception We have nothing to report in respect of the following: Under the Companies Act 2006 we are required to report to you if, in our opinion:
adequate accounting records have not been kept by the company, or returns adequate for our audit have not been received from branches not visited by us; or
the company financial statements and the part of the Directors' remuneration report described as having been audited are not in agreement with the accounting records and returns; or
certain disclosures of directors' remuneration specified by law are not made; or
we have not received all the information and explanations we require for our audit.
Under the Listing Rules we are required to review:
the directors' statement contained within the Report of the directors in relation to going concern;
the part of the corporate governance statement relating to the company's compliance with the nine provisions of the June 2008 Combined Code specified for our review; and
certain elements of the Directors’ remuneration report.
Kari Hale (Senior Statutory Auditor) for and on behalf of Deloitte LLP Chartered Accountants and Statutory Auditor London, United Kingdom 23 February 2011
267RBS Group 2010
Financial statementsIndependent auditor’s reportto the members of The Royal Bank of Scotland Group plc
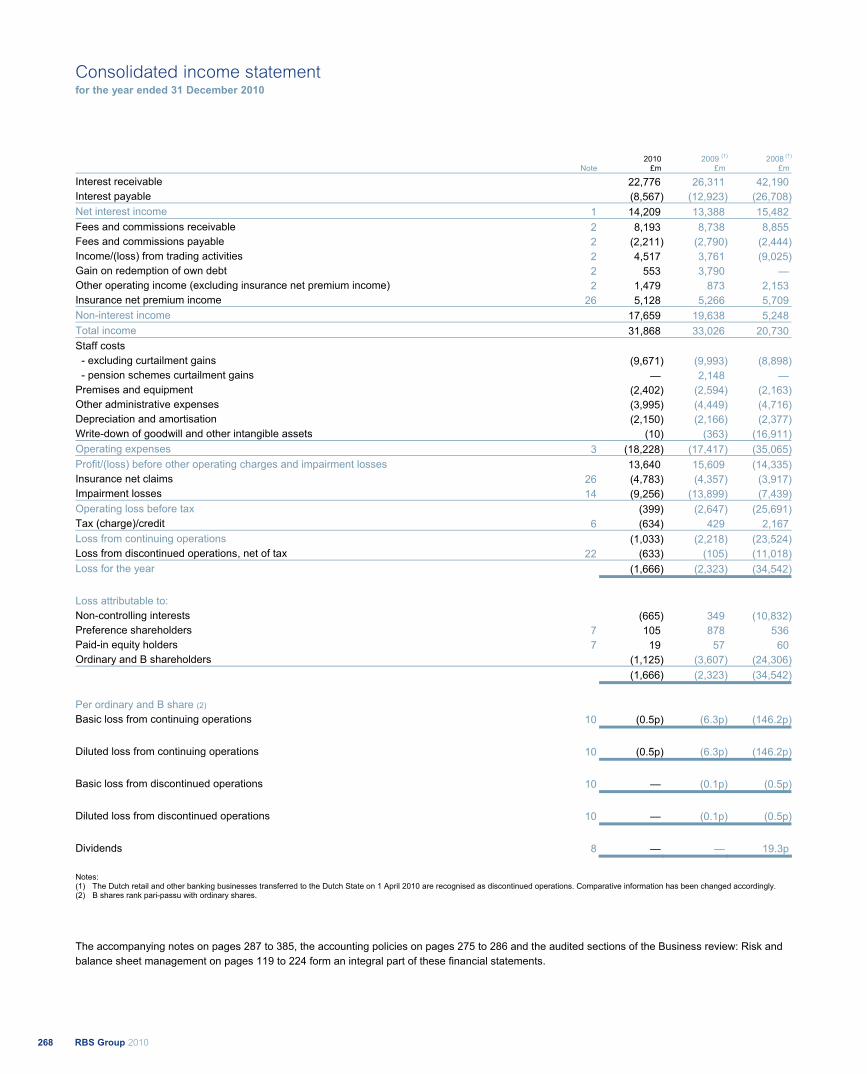
Note 2010
£m2009 (1)
£m2008 (1)
£m
Interest receivable 22,776 26,311 42,190 Interest payable (8,567) (12,923) (26,708)Net interest income 1 14,209 13,388 15,482 Fees and commissions receivable 2 8,193 8,738 8,855 Fees and commissions payable 2 (2,211) (2,790) (2,444)Income/(loss) from trading activities 2 4,517 3,761 (9,025)Gain on redemption of own debt 2 553 3,790 — Other operating income (excluding insurance net premium income) 2 1,479 873 2,153 Insurance net premium income 26 5,128 5,266 5,709 Non-interest income 17,659 19,638 5,248 Total income 31,868 33,026 20,730 Staff costs
- excluding curtailment gains (9,671) (9,993) (8,898) - pension schemes curtailment gains — 2,148 — Premises and equipment (2,402) (2,594) (2,163)Other administrative expenses (3,995) (4,449) (4,716)Depreciation and amortisation (2,150) (2,166) (2,377)Write-down of goodwill and other intangible assets (10) (363) (16,911)Operating expenses 3 (18,228) (17,417) (35,065)Profit/(loss) before other operating charges and impairment losses 13,640 15,609 (14,335)Insurance net claims 26 (4,783) (4,357) (3,917)Impairment losses 14 (9,256) (13,899) (7,439)Operating loss before tax (399) (2,647) (25,691)Tax (charge)/credit 6 (634) 429 2,167 Loss from continuing operations (1,033) (2,218) (23,524)Loss from discontinued operations, net of tax 22 (633) (105) (11,018)Loss for the year (1,666) (2,323) (34,542)
Loss attributable to: Non-controlling interests (665) 349 (10,832)Preference shareholders 7 105 878 536 Paid-in equity holders 7 19 57 60 Ordinary and B shareholders (1,125) (3,607) (24,306) (1,666) (2,323) (34,542)
Per ordinary and B share (2) Basic loss from continuing operations 10 (0.5p) (6.3p) (146.2p) Diluted loss from continuing operations 10 (0.5p) (6.3p) (146.2p) Basic loss from discontinued operations 10 — (0.1p) (0.5p) Diluted loss from discontinued operations 10 — (0.1p) (0.5p) Dividends 8 — — 19.3p
Notes: (1) The Dutch retail and other banking businesses transferred to the Dutch State on 1 April 2010 are recognised as discontinued operations. Comparative information has been changed accordingly. (2) B shares rank pari-passu with ordinary shares.
The accompanying notes on pages 287 to 385, the accounting policies on pages 275 to 286 and the audited sections of the Business review: Risk and balance sheet management on pages 119 to 224 form an integral part of these financial statements.
RBS Group 2010268
Consolidated income statementfor the year ended 31 December 2010
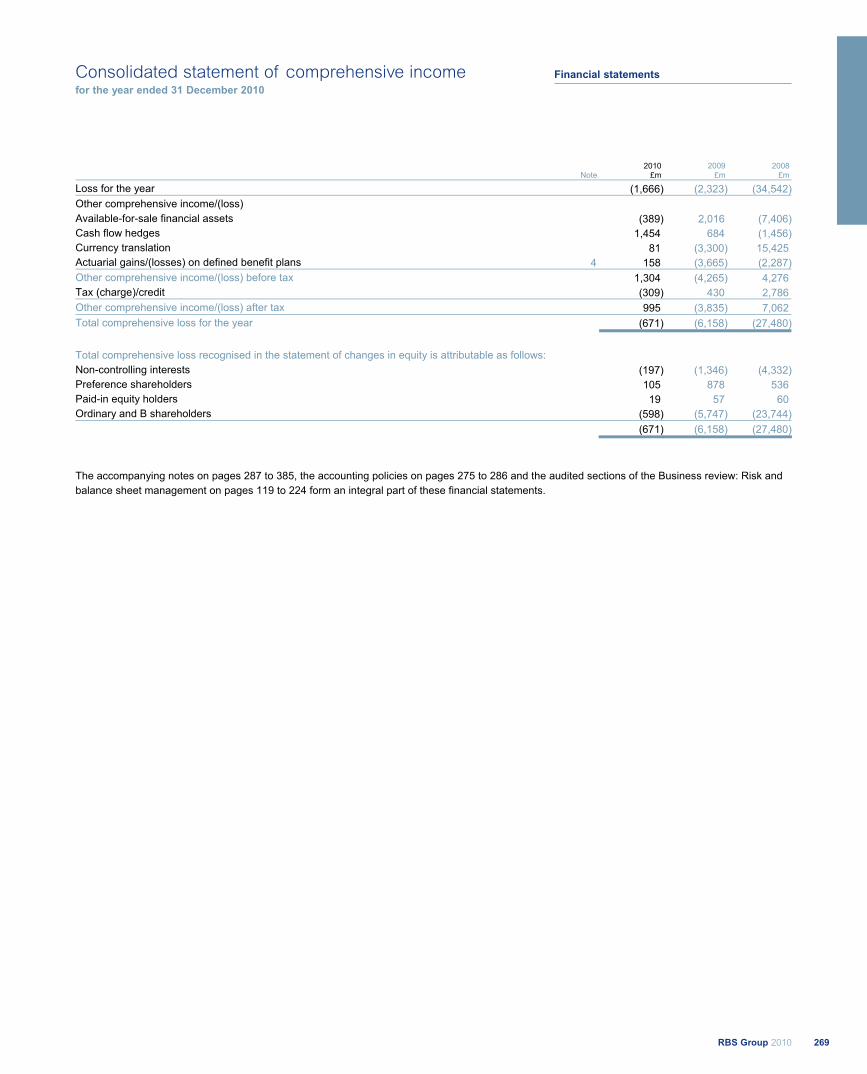
Note 2010
£m2009
£m2008
£m
Loss for the year (1,666) (2,323) (34,542)Other comprehensive income/(loss) Available-for-sale financial assets (389) 2,016 (7,406)Cash flow hedges 1,454 684 (1,456) Currency translation 81 (3,300) 15,425 Actuarial gains/(losses) on defined benefit plans 4 158 (3,665) (2,287) Other comprehensive income/(loss) before tax 1,304 (4,265) 4,276 Tax (charge)/credit (309) 430 2,786 Other comprehensive income/(loss) after tax 995 (3,835) 7,062 Total comprehensive loss for the year (671) (6,158) (27,480)
Total comprehensive loss recognised in the statement of changes in equity is attributable as follows: Non-controlling interests (197) (1,346) (4,332) Preference shareholders 105 878 536 Paid-in equity holders 19 57 60 Ordinary and B shareholders (598) (5,747) (23,744) (671) (6,158) (27,480)
The accompanying notes on pages 287 to 385, the accounting policies on pages 275 to 286 and the audited sections of the Business review: Risk and balance sheet management on pages 119 to 224 form an integral part of these financial statements.
269RBS Group 2010
Financial statementsConsolidated statement of comprehensive incomefor the year ended 31 December 2010
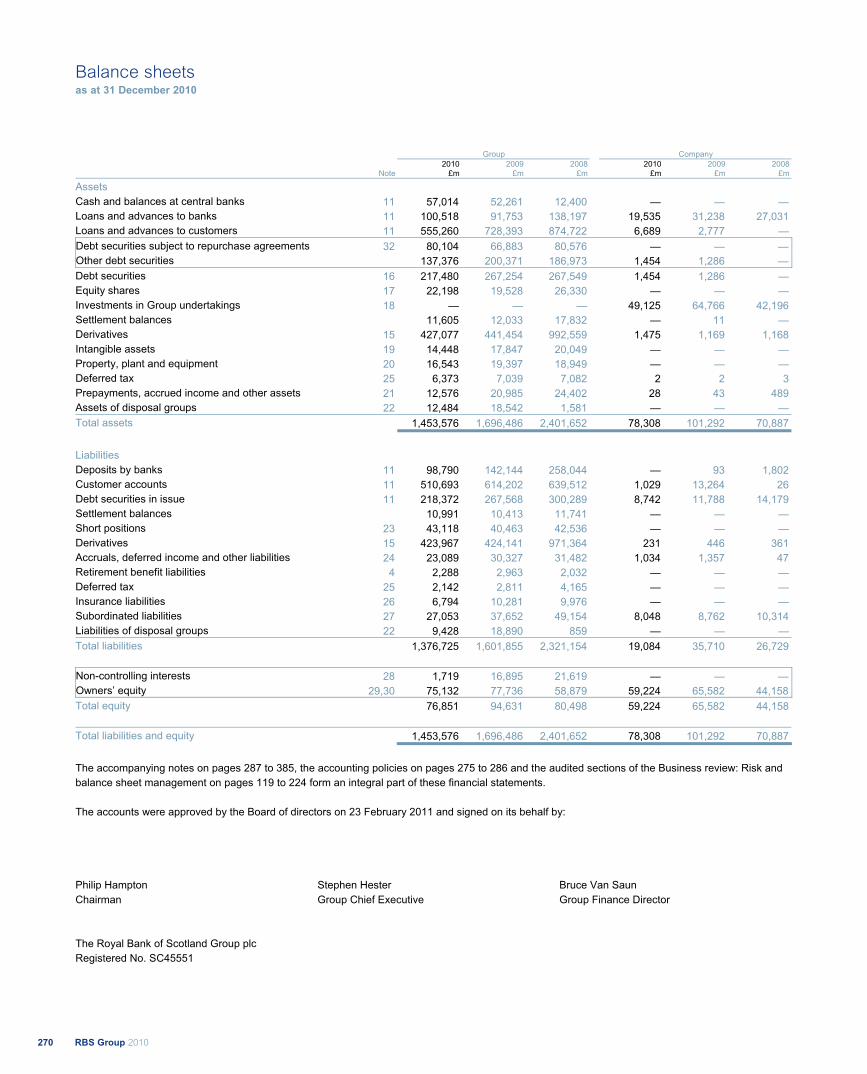
Group Company
Note2010
£m2009
£m2008
£m2010
£m2009
£m2008
£m
Assets Cash and balances at central banks 11 57,014 52,261 12,400 — — —Loans and advances to banks 11 100,518 91,753 138,197 19,535 31,238 27,031 Loans and advances to customers 11 555,260 728,393 874,722 6,689 2,777 — Debt securities subject to repurchase agreements 32 80,104 66,883 80,576 — — —Other debt securities 137,376 200,371 186,973 1,454 1,286 — Debt securities 16 217,480 267,254 267,549 1,454 1,286 — Equity shares 17 22,198 19,528 26,330 — — —Investments in Group undertakings 18 — — — 49,125 64,766 42,196 Settlement balances 11,605 12,033 17,832 — 11 — Derivatives 15 427,077 441,454 992,559 1,475 1,169 1,168 Intangible assets 19 14,448 17,847 20,049 — — —Property, plant and equipment 20 16,543 19,397 18,949 — — —Deferred tax 25 6,373 7,039 7,082 2 2 3Prepayments, accrued income and other assets 21 12,576 20,985 24,402 28 43 489 Assets of disposal groups 22 12,484 18,542 1,581 — — —Total assets 1,453,576 1,696,486 2,401,652 78,308 101,292 70,887
Liabilities Deposits by banks 11 98,790 142,144 258,044 — 93 1,802 Customer accounts 11 510,693 614,202 639,512 1,029 13,264 26 Debt securities in issue 11 218,372 267,568 300,289 8,742 11,788 14,179 Settlement balances 10,991 10,413 11,741 — — —Short positions 23 43,118 40,463 42,536 — — —Derivatives 15 423,967 424,141 971,364 231 446 361 Accruals, deferred income and other liabilities 24 23,089 30,327 31,482 1,034 1,357 47 Retirement benefit liabilities 4 2,288 2,963 2,032 — — —Deferred tax 25 2,142 2,811 4,165 — — —Insurance liabilities 26 6,794 10,281 9,976 — — —Subordinated liabilities 27 27,053 37,652 49,154 8,048 8,762 10,314 Liabilities of disposal groups 22 9,428 18,890 859 — — —Total liabilities 1,376,725 1,601,855 2,321,154 19,084 35,710 26,729
Non-controlling interests 28 1,719 16,895 21,619 — — —Owners’ equity 29,30 75,132 77,736 58,879 59,224 65,582 44,158 Total equity 76,851 94,631 80,498 59,224 65,582 44,158
Total liabilities and equity 1,453,576 1,696,486 2,401,652 78,308 101,292 70,887
The accompanying notes on pages 287 to 385, the accounting policies on pages 275 to 286 and the audited sections of the Business review: Risk and balance sheet management on pages 119 to 224 form an integral part of these financial statements. The accounts were approved by the Board of directors on 23 February 2011 and signed on its behalf by:
Philip Hampton Chairman
Stephen Hester Group Chief Executive
Bruce Van Saun Group Finance Director
The Royal Bank of Scotland Group plc Registered No. SC45551
RBS Group 2010270
Balance sheetsas at 31 December 2010
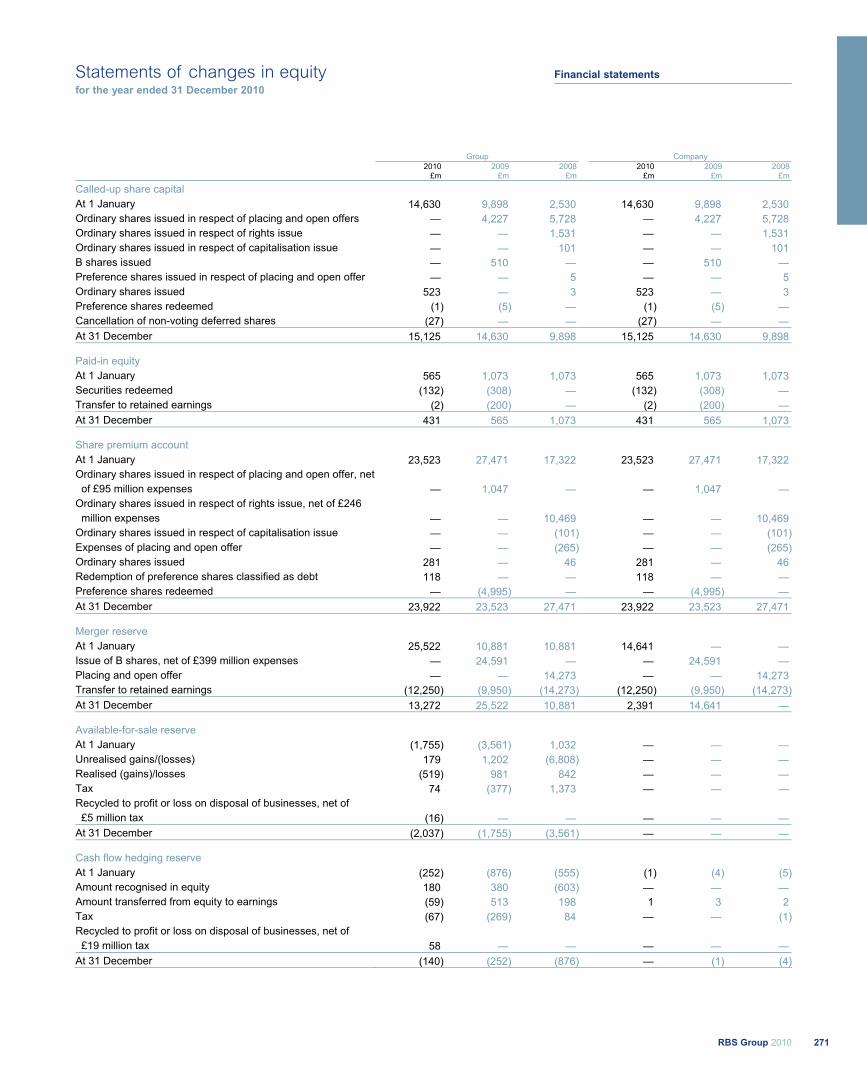
Group Company 2010 2009 2008 2010 2009 2008
£m £m £m £m £m £m
Called-up share capital At 1 January 14,630 9,898 2,530 14,630 9,898 2,530 Ordinary shares issued in respect of placing and open offers — 4,227 5,728 — 4,227 5,728 Ordinary shares issued in respect of rights issue — — 1,531 — — 1,531 Ordinary shares issued in respect of capitalisation issue — — 101 — — 101 B shares issued — 510 — — 510 — Preference shares issued in respect of placing and open offer — — 5 — — 5 Ordinary shares issued 523 — 3 523 — 3 Preference shares redeemed (1) (5) — (1) (5) — Cancellation of non-voting deferred shares (27) — — (27) — — At 31 December 15,125 14,630 9,898 15,125 14,630 9,898
Paid-in equity At 1 January 565 1,073 1,073 565 1,073 1,073 Securities redeemed (132) (308) — (132) (308) — Transfer to retained earnings (2) (200) — (2) (200) — At 31 December 431 565 1,073 431 565 1,073
Share premium account At 1 January 23,523 27,471 17,322 23,523 27,471 17,322 Ordinary shares issued in respect of placing and open offer, net of £95 million expenses — 1,047 — — 1,047 — Ordinary shares issued in respect of rights issue, net of £246 million expenses — — 10,469 — — 10,469 Ordinary shares issued in respect of capitalisation issue — — (101) — — (101)Expenses of placing and open offer — — (265) — — (265)Ordinary shares issued 281 — 46 281 — 46 Redemption of preference shares classified as debt 118 — — 118 — — Preference shares redeemed — (4,995) — — (4,995) — At 31 December 23,922 23,523 27,471 23,922 23,523 27,471
Merger reserve At 1 January 25,522 10,881 10,881 14,641 — — Issue of B shares, net of £399 million expenses — 24,591 — — 24,591 — Placing and open offer — — 14,273 — — 14,273 Transfer to retained earnings (12,250) (9,950) (14,273) (12,250) (9,950) (14,273)At 31 December 13,272 25,522 10,881 2,391 14,641 —
Available-for-sale reserve At 1 January (1,755) (3,561) 1,032 — — — Unrealised gains/(losses) 179 1,202 (6,808) — — — Realised (gains)/losses (519) 981 842 — — — Tax 74 (377) 1,373 — — — Recycled to profit or loss on disposal of businesses, net of £5 million tax (16) — — — — — At 31 December (2,037) (1,755) (3,561) — — —
Cash flow hedging reserve At 1 January (252) (876) (555) (1) (4) (5)Amount recognised in equity 180 380 (603) — — — Amount transferred from equity to earnings (59) 513 198 1 3 2 Tax (67) (269) 84 — — (1)Recycled to profit or loss on disposal of businesses, net of £19 million tax 58 — — — — — At 31 December (140) (252) (876) — (1) (4)
271RBS Group 2010
Financial statementsStatements of changes in equityfor the year ended 31 December 2010

Group Company 2010 2009 2008 2010 2009 2008
£m £m £m £m £m £m
Foreign exchange reserve At 1 January 4,528 6,385 (426) — — — Retranslation of net assets 997 (2,322) 11,970 — — — Foreign currency (losses)/gains on hedges of net assets (458) 456 (5,801) — — — Tax 63 9 642 — — — Recycled to profit or loss on disposal of businesses 8 — — — — — At 31 December 5,138 4,528 6,385 — — —
Capital redemption reserve At 1 January 170 170 170 170 170 170 Preference shares redeemed 1 — — 1 — — Cancellation of non-voting deferred shares 27 — — 27 — — At 31 December 198 170 170 198 170 170
Contingent capital reserve At 1 January (1,208) — — (1,208) — — Contingent capital agreement - consideration payable — (1,208) — — (1,208) — At 31 December (1,208) (1,208) — (1,208) (1,208) —
Retained earnings At 1 January 12,134 7,542 21,072 13,262 5,550 3,787 Loss attributable to ordinary and B shareholders and other equity owners - continuing operations (973) (2,600) (23,624) (4,554) (1,503) (9,602)
- discontinued operations (28) (72) (86) — — — Ordinary dividends paid — — (2,312) — — (2,312)Equity preference dividends paid (105) (878) (536) (105) (878) (536)Paid-in equity dividends paid, net of tax (19) (57) (60) (19) (57) (60)Transfer from paid-in equity
- gross 2 200 — 2 200 — - tax (1) — — (1) — — Equity owners gain on withdrawal of non-controlling interests - gross 40 629 — — — —
- tax (11) (176) — — — — Redemption of equity preference shares (2,968) — — (2,968) — — Gain on redemption of equity preference shares 609 — — 616 — — Redemption of preference shares classified as debt (118) — — (118) — — Transfer from merger reserve 12,250 9,950 14,273 12,250 9,950 14,273 Actuarial gains/(losses) recognised in retirement benefit schemes - gross 158 (3,756) (1,807) — — —
- tax (71) 1,043 472 — — — Purchase of non-controlling interests (38) — — — — — Net cost of shares bought and used to satisfy share-based payments (13) (16) (19) — — — Share-based payments - gross 385 325 177 — — —
- tax 6 — (8) — — — At 31 December 21,239 12,134 7,542 18,365 13,262 5,550
Own shares held At 1 January (121) (104) (61) — — — Shares purchased (700) (33) (64) — — — Shares issued under employee share schemes 13 16 21 — — — At 31 December (808) (121) (104) — — —
Equity owners at 31 December 75,132 77,736 58,879 59,224 65,582 44,158
RBS Group 2010272
Statements of changes in equityfor the year ended 31 December 2010 continued
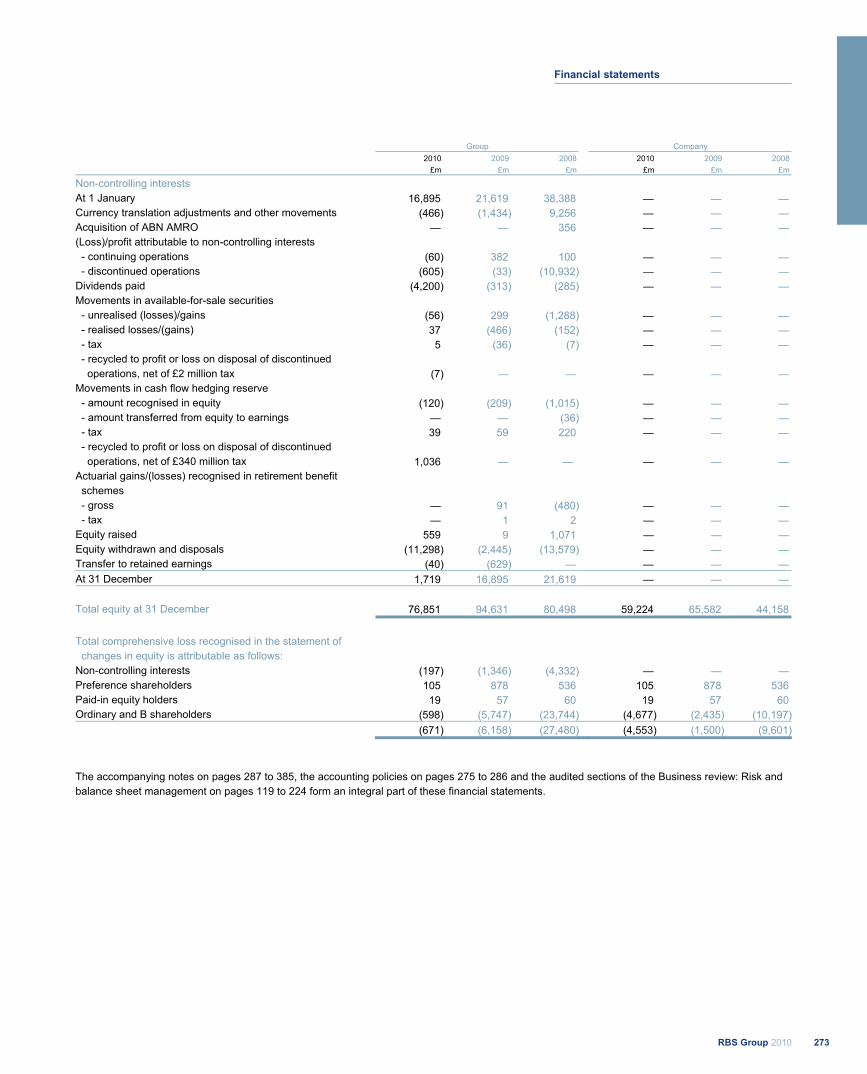
Group Company 2010 2009 2008 2010 2009 2008
£m £m £m £m £m £m
Non-controlling interests At 1 January 16,895 21,619 38,388 — — — Currency translation adjustments and other movements (466) (1,434) 9,256 — — — Acquisition of ABN AMRO — — 356 — — — (Loss)/profit attributable to non-controlling interests
- continuing operations (60) 382 100 — — — - discontinued operations (605) (33) (10,932) — — — Dividends paid (4,200) (313) (285) — — — Movements in available-for-sale securities
- unrealised (losses)/gains (56) 299 (1,288) — — — - realised losses/(gains) 37 (466) (152) — — — - tax 5 (36) (7) — — — - recycled to profit or loss on disposal of discontinued operations, net of £2 million tax (7) — — — — — Movements in cash flow hedging reserve
- amount recognised in equity (120) (209) (1,015) — — — - amount transferred from equity to earnings — — (36) — — — - tax 39 59 220 — — — - recycled to profit or loss on disposal of discontinued operations, net of £340 million tax 1,036 — — — — — Actuarial gains/(losses) recognised in retirement benefit schemes
- gross — 91 (480) — — — - tax — 1 2 — — — Equity raised 559 9 1,071 — — — Equity withdrawn and disposals (11,298) (2,445) (13,579) — — — Transfer to retained earnings (40) (629) — — — — At 31 December 1,719 16,895 21,619 — — —
Total equity at 31 December 76,851 94,631 80,498 59,224 65,582 44,158 Total comprehensive loss recognised in the statement of changes in equity is attributable as follows: Non-controlling interests (197) (1,346) (4,332) — — — Preference shareholders 105 878 536 105 878 536 Paid-in equity holders 19 57 60 19 57 60 Ordinary and B shareholders (598) (5,747) (23,744) (4,677) (2,435) (10,197) (671) (6,158) (27,480) (4,553) (1,500) (9,601)
The accompanying notes on pages 287 to 385, the accounting policies on pages 275 to 286 and the audited sections of the Business review: Risk and balance sheet management on pages 119 to 224 form an integral part of these financial statements.
273RBS Group 2010
Financial statements
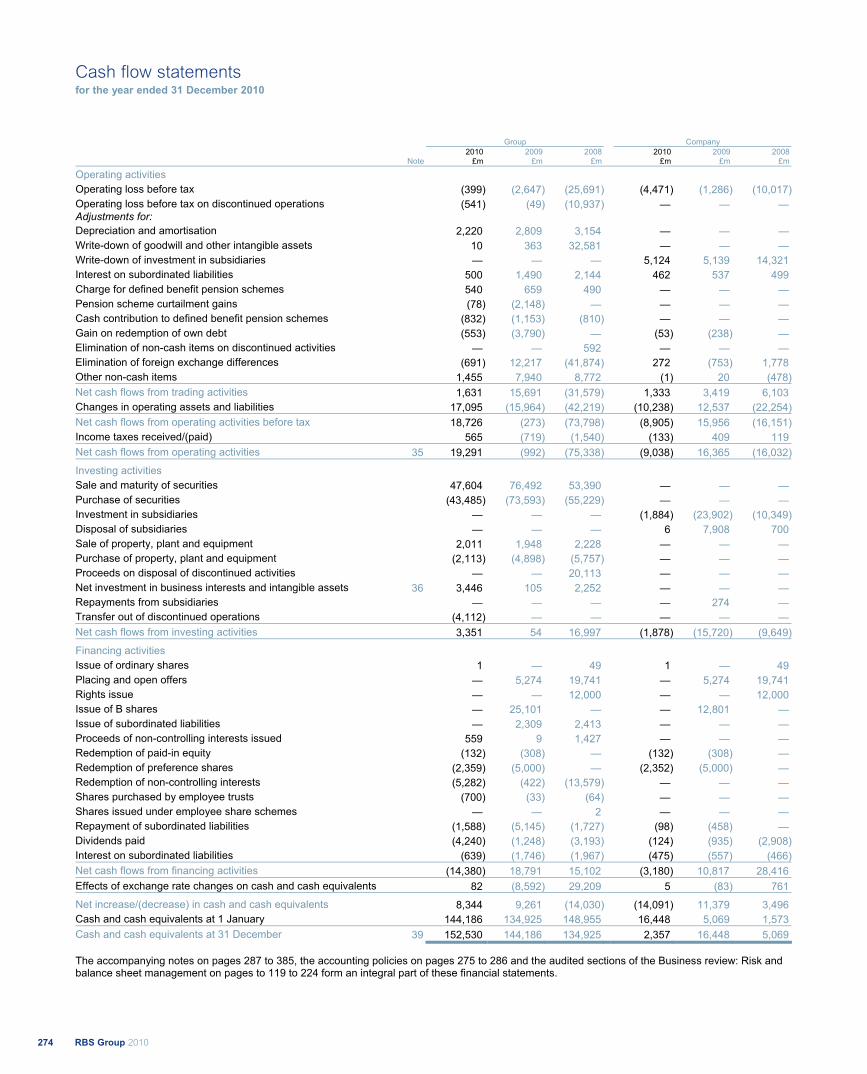
Group Company
Note 2010
£m2009
£m2008
£m2010
£m2009
£m2008
£m
Operating activities Operating loss before tax (399) (2,647) (25,691) (4,471) (1,286) (10,017)Operating loss before tax on discontinued operations (541) (49) (10,937) — — — Adjustments for:
Depreciation and amortisation 2,220 2,809 3,154 — — — Write-down of goodwill and other intangible assets 10 363 32,581 — — — Write-down of investment in subsidiaries — — — 5,124 5,139 14,321 Interest on subordinated liabilities 500 1,490 2,144 462 537 499 Charge for defined benefit pension schemes 540 659 490 — — — Pension scheme curtailment gains (78) (2,148) — — — — Cash contribution to defined benefit pension schemes (832) (1,153) (810) — — — Gain on redemption of own debt (553) (3,790) — (53) (238) — Elimination of non-cash items on discontinued activities — — 592 — — — Elimination of foreign exchange differences (691) 12,217 (41,874) 272 (753) 1,778 Other non-cash items 1,455 7,940 8,772 (1) 20 (478)Net cash flows from trading activities 1,631 15,691 (31,579) 1,333 3,419 6,103 Changes in operating assets and liabilities 17,095 (15,964) (42,219) (10,238) 12,537 (22,254)Net cash flows from operating activities before tax 18,726 (273) (73,798) (8,905) 15,956 (16,151)Income taxes received/(paid) 565 (719) (1,540) (133) 409 119 Net cash flows from operating activities 35 19,291 (992) (75,338) (9,038) 16,365 (16,032)
Investing activities
Sale and maturity of securities 47,604 76,492 53,390 — — — Purchase of securities (43,485) (73,593) (55,229) — — — Investment in subsidiaries — — — (1,884) (23,902) (10,349)Disposal of subsidiaries — — — 6 7,908 700 Sale of property, plant and equipment 2,011 1,948 2,228 — — — Purchase of property, plant and equipment (2,113) (4,898) (5,757) — — — Proceeds on disposal of discontinued activities — — 20,113 — — — Net investment in business interests and intangible assets 36 3,446 105 2,252 — — — Repayments from subsidiaries — — — — 274 — Transfer out of discontinued operations (4,112) — — — — — Net cash flows from investing activities 3,351 54 16,997 (1,878) (15,720) (9,649)
Financing activities Issue of ordinary shares 1 — 49 1 — 49 Placing and open offers — 5,274 19,741 — 5,274 19,741 Rights issue — — 12,000 — — 12,000 Issue of B shares — 25,101 — — 12,801 — Issue of subordinated liabilities — 2,309 2,413 — — — Proceeds of non-controlling interests issued 559 9 1,427 — — — Redemption of paid-in equity (132) (308) — (132) (308) — Redemption of preference shares (2,359) (5,000) — (2,352) (5,000) — Redemption of non-controlling interests (5,282) (422) (13,579) — — — Shares purchased by employee trusts (700) (33) (64) — — — Shares issued under employee share schemes — — 2 — — — Repayment of subordinated liabilities (1,588) (5,145) (1,727) (98) (458) — Dividends paid (4,240) (1,248) (3,193) (124) (935) (2,908)Interest on subordinated liabilities (639) (1,746) (1,967) (475) (557) (466)Net cash flows from financing activities (14,380) 18,791 15,102 (3,180) 10,817 28,416 Effects of exchange rate changes on cash and cash equivalents 82 (8,592) 29,209 5 (83) 761
Net increase/(decrease) in cash and cash equivalents 8,344 9,261 (14,030) (14,091) 11,379 3,496 Cash and cash equivalents at 1 January 144,186 134,925 148,955 16,448 5,069 1,573 Cash and cash equivalents at 31 December 39 152,530 144,186 134,925 2,357 16,448 5,069
The accompanying notes on pages 287 to 385, the accounting policies on pages 275 to 286 and the audited sections of the Business review: Risk and balance sheet management on pages to 119 to 224 form an integral part of these financial statements.
RBS Group 2010274
Cash flow statementsfor the year ended 31 December 2010
1. Presentation of accounts The accounts are prepared on a going concern basis (see page 232 of the Report of the directors) and in accordance with International Financial Reporting Standards issued by the International Accounting Standards Board (IASB) and interpretations issued by the International Financial Reporting Interpretations Committee (IFRIC) of the IASB as adopted by the European Union (EU) (together IFRS). The EU has not adopted the complete text of IAS 39 ‘Financial Instruments: Recognition and Measurement’; it has relaxed some of the standard's hedging requirements. The Group has not taken advantage of this relaxation and has adopted IAS 39 as issued by the IASB: the Group's financial statements are prepared in accordance with IFRS as issued by the IASB. The Group has adopted the revised IFRS 3 ‘Business Combinations’ and related revisions to IAS 27 ‘Consolidated and Separate Financial Statements’ issued in January 2008 and also IFRIC 17 ‘Distributions of Non-cash Assets to Owners’ and the IASB’s consequential amendments to IFRS 5 ‘Non-Current Assets Held for Sale and Discontinued Operations’ issued in December 2008. They apply to transactions on or after 1 January 2010 and have not resulted in the restatement of previously published financial information. There have been no material acquisitions in the year. In accordance with IFRS 5, before and after the amendment, the Dutch retail and other banking businesses that were transferred to the Dutch State on 1 April 2010 have been recognised as discontinued operations with consequent changes to the presentation of comparative financial information. There are a number of other changes to IFRS that were effective from 1 January 2010. They have had no material effect on the Group’s financial statements: in April 2009, ‘Improvements to IFRS’ - making non-urgent but necessary amendments to standards, primarily to remove inconsistencies and to clarify wording; and amendments to IAS 39 ‘Financial Instruments: Recognition and Measurement’ - limited changes to IAS 39 issued in July 2008 clarified that (a) a one-sided risk can be designated as a hedged risk i.e. an option can be used to hedge a risk above or below a specified threshold and (b) inflation can be a hedged risk but only if the cash flows include a specified inflation portion. The company is incorporated in the UK and registered in Scotland. The accounts are prepared on the historical cost basis except that the following assets and liabilities are stated at their fair value: derivative financial instruments, held-for-trading financial assets and financial liabilities, financial assets and financial liabilities that are designated as at fair value through profit or loss, available-for-sale financial assets and investment property. Recognised financial assets and financial liabilities in fair value hedges are adjusted for changes in fair value in respect of the risk that is hedged. The company accounts are presented in accordance with the Companies Act 2006.
2. Basis of consolidation The consolidated financial statements incorporate the financial statements of the company and entities (including certain special purpose entities) that are controlled by the Group. Control exists where the Group has the power to govern the financial and operating policies of the entity; generally conferred by holding a majority of voting rights. On acquisition of a subsidiary, its identifiable assets, liabilities and contingent liabilities are included in the consolidated accounts at their fair value. Any excess of the cost (the fair value of assets given, liabilities incurred or assumed and equity instruments issued by the Group plus any directly attributable costs) of an acquisition over the fair value of the net assets acquired is recognised as goodwill. The interest of minority shareholders is stated at their share of the fair value of the subsidiary's net assets. The results of subsidiaries acquired are included in the consolidated income statement from the date control passes up until the Group ceases to control them through a sale or significant change in circumstances. Changes in interest that do not result in a loss of control are recognised in equity. All intra-group balances, transactions, income and expenses are eliminated on consolidation. The consolidated accounts are prepared using uniform accounting policies. 3. Revenue recognition Interest income on financial assets that are classified as loans and receivables, available-for-sale or held-to-maturity and interest expense on financial liabilities other than those at fair value through profit or loss are determined using the effective interest method. The effective interest method is a method of calculating the amortised cost of a financial asset or financial liability (or group of financial assets or liabilities) and of allocating the interest income or interest expense over the expected life of the asset or liability. The effective interest rate is the rate that exactly discounts estimated future cash flows to the instrument's initial carrying amount. Calculation of the effective interest rate takes into account fees payable or receivable that are an integral part of the instrument's yield, premiums or discounts on acquisition or issue, early redemption fees and transaction costs. All contractual terms of a financial instrument are considered when estimating future cash flows. Financial assets and financial liabilities held-for-trading or designated as at fair value through profit or loss are recorded at fair value. Changes in fair value are recognised in profit or loss together with dividends and interest receivable and payable. Commitment and utilisation fees are determined as a percentage of the outstanding facility. If it is unlikely that a specific lending arrangement will be entered into, such fees are taken to profit or loss over the life of the facility otherwise they are deferred and included in the effective interest rate on the advance. Fees in respect of services are recognised as the right to consideration accrues through the provision of the service to the customer. The arrangements are generally contractual and the cost of providing the service is incurred as the service is rendered. The price is usually fixed and always determinable. The application of this policy to significant fee types is outlined below.
275RBS Group 2010
Financial statementsAccounting policies
Payment services - this comprises income received for payment services including cheques cashed, direct debits, Clearing House Automated Payments (the UK electronic settlement system) and BACS payments (the automated clearing house that processes direct debits and direct credits). These are generally charged on a per transaction basis. The income is earned when the payment or transaction occurs. Charges for payment services are usually debited to the customer's account monthly or quarterly in arrears. Income is accrued at period end for services provided but not yet charged.
Card related services - fees from credit card business include:
Commission received from retailers for processing credit and debit card transactions: income is accrued to the income statement as the service is performed;
Interchange received: as issuer, the Group receives a fee (interchange) each time a cardholder purchases goods and services. The Group also receives interchange fees from other card issuers for providing cash advances through its branch and automated teller machine networks. These fees are accrued once the transaction has taken place; and
An annual fee payable by a credit card holder is deferred and taken to profit or loss over the period of the service i.e. 12 months.
Insurance brokerage - this is made up of fees and commissions received from the agency sale of insurance. Commission on the sale of an insurance contract is earned at the inception of the policy, as the insurance has been arranged and placed. However, provision is made where commission is refundable in the event of policy cancellation in line with estimated cancellations. Investment management fees - fees charged for managing investments are recognised as revenue as the services are provided. Incremental costs that are directly attributable to securing an investment management contract are deferred and charged as expense as the related revenue is recognised. Insurance premiums - see Accounting policy 12.
4. Assets held for sale and discontinued operations A non-current asset (or disposal group) is classified as held for sale if the Group will recover the carrying amount principally through a sale transaction rather than through continuing use. A non-current asset (or disposal group) classified as held for sale is measured at the lower of its carrying amount and fair value less costs to sell. If the asset (or disposal group) is acquired as part of a business combination it is initially measured at fair value less costs to sell. Assets and liabilities of disposal groups classified as held for sale and non-current assets classified as held for sale are shown separately on the face of the balance sheet. The results of discontinued operations are shown as a single amount on the face of the income statement comprising the post-tax profit or loss of discontinued operations and the post-tax gain or loss recognised either on measurement to fair value less costs to sell or on the disposal of the discontinued operation. A discontinued operation is a cash-generating unit or a group of cash-generating units that either has been disposed of, or is classified as held for sale, and (a) represents a separate major line of business or geographical area of operations, (b) is part of a single co-ordinated plan to dispose of a separate major line of business or geographical area of operations or (c) is a subsidiary acquired exclusively with a view to resale. 5. Pensions and other post-retirement benefits The Group provides post-retirement benefits in the form of pensions and healthcare plans to eligible employees. For defined benefit schemes, scheme liabilities are measured on an actuarial basis using the projected unit credit method and discounted at a rate that reflects the current rate of return on a high quality corporate bond of equivalent term and currency to the scheme liabilities. Scheme assets are measured at their fair value. Any surplus or deficit of scheme assets over liabilities is recognised in the balance sheet as an asset (surplus) or liability (deficit). The current service cost, curtailments and any past service costs together with the expected return on scheme assets less the unwinding of the discount on the scheme liabilities is charged to operating expenses. Actuarial gains and losses are recognised in full in the period in which they occur outside profit or loss and presented in the consolidated statement of comprehensive income. Contributions to defined contribution pension schemes are recognised in the income statement when payable.
RBS Group 2010276
Accounting policies continued
6. Intangible assets and goodwill Intangible assets that are acquired by the Group are stated at cost less accumulated amortisation and impairment losses. Amortisation is charged to profit or loss over the assets' estimated economic lives using methods that best reflect the pattern of economic benefits and is included in depreciation and amortisation. The estimated useful economic lives are as follows: Core deposit intangibles 6 to 10 years Other acquired intangibles 5 to 10 years Computer software 3 to 5 years Expenditure on internally generated goodwill and brands is written-off as incurred. Direct costs relating to the development of internal-use computer software are capitalised once technical feasibility and economic viability have been established. These costs include payroll, the costs of materials and services, and directly attributable overheads. Capitalisation of costs ceases when the software is capable of operating as intended. During and after development, accumulated costs are reviewed for impairment against the projected benefits that the software is expected to generate. Costs incurred prior to the establishment of technical feasibility and economic viability are expensed as incurred as are all training costs and general overheads. The costs of licences to use computer software that are expected to generate economic benefits beyond one year are also capitalised. Acquired goodwill, being the excess of the cost of an acquisition over the Group's interest in the net fair value of the identifiable assets, liabilities and contingent liabilities of the subsidiary, associate or joint venture acquired, is initially recognised at cost and subsequently at cost less any accumulated impairment losses. Goodwill arising on the acquisition of subsidiaries and joint ventures is included in the balance sheet category ‘Intangible assets’ and that on associates within their carrying amounts. The gain or loss on the disposal of a subsidiary, associate or joint venture includes the carrying value of any related goodwill. 7. Property, plant and equipment Items of property, plant and equipment (except investment property - see Accounting policy 9) are stated at cost less accumulated depreciation and impairment losses. Where an item of property, plant and equipment comprises major components having different useful lives, they are accounted for separately. Depreciation is charged to profit or loss on a straight-line basis so as to write-off the depreciable amount of property, plant and equipment (including assets owned and let on operating leases) over their estimated useful lives.
The depreciable amount is the cost of an asset less its residual value. Land is not depreciated. Estimated useful lives are as follows: Freehold and long leasehold buildings 50 years Short leaseholds unexpired period of the lease Property adaptation costs 10 to 15 years Computer equipment up to 5 years Other equipment 4 to 15 years 8. Impairment of intangible assets and property, plant and equipment At each reporting date, the Group assesses whether there is any indication that its intangible assets, or property, plant and equipment are impaired. If any such indication exists, the Group estimates the recoverable amount of the asset and the impairment loss if any. Goodwill is tested for impairment annually or more frequently if events or changes in circumstances indicate that it might be impaired. If an asset does not generate cash flows that are independent from those of other assets or groups of assets, the recoverable amount is determined for the cash-generating unit to which the asset belongs. The recoverable amount of an asset is the higher of its fair value less cost to sell and its value in use. Value in use is the present value of future cash flows from the asset or cash-generating unit discounted at a rate that reflects market interest rates adjusted for risks specific to the asset or cash-generating unit that have not been reflected in the estimation of future cash flows. If the recoverable amount of an intangible or tangible asset is less than its carrying value, an impairment loss is recognised immediately in profit or loss and the carrying value of the asset reduced by the amount of the loss. A reversal of an impairment loss on intangible assets (excluding goodwill) or property, plant and equipment is recognised as it arises provided the increased carrying value does not exceed that which it would have been had no impairment loss been recognised. Impairment losses on goodwill are not reversed. 9. Investment property Investment property comprises freehold and leasehold properties that are held to earn rentals or for capital appreciation or both. It is not depreciated but is stated at fair value based on valuations by independent registered valuers. Fair value is based on current prices for similar properties in the same location and condition. Any gain or loss arising from a change in fair value is recognised in profit or loss. Rental income from investment property is recognised on a straight-line basis over the term of the lease. Lease incentives granted are recognised as an integral part of the total rental income.
277RBS Group 2010
Financial statements
10. Foreign currencies The Group's consolidated financial statements are presented in sterling which is the functional currency of the company. Transactions in foreign currencies are translated into sterling at the foreign exchange rate ruling at the date of the transaction. Monetary assets and liabilities denominated in foreign currencies are translated into sterling at the rates of exchange ruling at the balance sheet date. Foreign exchange differences arising on translation are reported in income from trading activities except for differences arising on cash flow hedges and hedges of net investments in foreign operations. Non-monetary items denominated in foreign currencies that are stated at fair value are translated into sterling at foreign exchange rates ruling at the dates the values were determined. Translation differences arising on non-monetary items measured at fair value are recognised in profit or loss except for differences arising on available-for-sale non-monetary financial assets, for example equity shares, which are included in the available-for-sale reserve in equity unless the asset is the hedged item in a fair value hedge. The assets and liabilities of foreign operations, including goodwill and fair value adjustments arising on acquisition, are translated into sterling at foreign exchange rates ruling at the balance sheet date. The revenues and expenses of foreign operations are translated into sterling at average exchange rates unless these do not approximate to the foreign exchange rates ruling at the dates of the transactions. Foreign exchange differences arising on the translation of a foreign operation are recognised directly in equity and included in profit or loss on its disposal. 11. Leases Contracts to lease assets are classified as finance leases if they transfer substantially all the risks and rewards of ownership of the asset to the customer. Other contracts to lease assets are classified as operating leases. Finance lease receivables are stated in the balance sheet at the amount of the net investment in the lease being the minimum lease payments and any unguaranteed residual value discounted at the interest rate implicit in the lease. Finance lease income is allocated to accounting periods so as to give a constant periodic rate of return before tax on the net investment. Unguaranteed residual values are subject to regular review to identify potential impairment. If there has been a reduction in the estimated unguaranteed residual value, the income allocation is revised and any reduction in respect of amounts accrued is recognised immediately. Rental income from operating leases is credited to the income statement on a receivable basis over the term of the lease. Operating lease assets are included within Property, plant and equipment and depreciated over their useful lives (see Accounting policy 7). 12. Insurance General insurance General insurance comprises short-duration contracts. Due to the nature of the products sold - predominantly property, and motor - the insurance
protection is provided on an even basis throughout the term of the policy. Consequently, written premiums are recognised on a straight-line basis over the period of the policy. Insurance premiums exclude insurance premium tax. Unearned premiums represent the proportion of the net premiums that relate to periods of insurance after the balance sheet date and are calculated over the period of exposure under the policy, on a daily basis, 24th's basis or allowing for the estimated incidence of exposure under policies which are longer than twelve months. Provision is made where necessary for the estimated amount of claims over and above unearned premiums including that in respect of future written business on discontinued lines under the run-off of delegated underwriting authority arrangements. The provision is designed to meet future claims and related expenses and is calculated across related classes of business on the basis of a separate carry forward of deferred acquisition expenses after making allowance for investment income. Acquisition expenses relating to new and renewed business for all classes are expensed over the period during which the premiums are earned. The principal acquisition costs so deferred are commissions payable, and costs associated with the telesales and underwriting staff. Claims and the related reinsurance are recognised in the accounting period in which the loss occurs. Provision is made for the cost of settling outstanding claims at the balance sheet date, including claims estimated to have been incurred but not yet reported at that date, and claims handling expenses. Provisions are only discounted where claims, principally motor, either have been or are expected to be settled by periodical payments. Related reinsurance receivables are recognised on the same basis and at the same time. Life assurance The Group's long-term assurance contracts include whole-life term assurance, endowment assurance, flexible whole-life, pension and annuity contracts that are expected to remain in force for an extended period of time. Long-term assurance contracts under which the Group does not accept significant insurance risk are classified as financial instruments. The Group recognises the value of in-force long-term assurance contracts as an asset. Cash flows associated with in-force contracts and related assets, including reinsurance cash flows, are projected, using appropriate assumptions as to future mortality, persistency and levels of expenses and excluding the value of future investment margins, to estimate future surpluses attributable to the Group. These surpluses, discounted at a risk-adjusted rate, are recognised as a separate asset. Changes in the value of this asset are included in profit or loss. Premiums on long-term insurance contracts are recognised as income when receivable. Claims on long-term insurance contracts reflect the cost of all claims arising during the year, including claims handling costs. Claims are recognised when the Group becomes aware of the claim. Reinsurance The Group has reinsurance treaties that transfer significant insurance risk. Liabilities for reinsured contracts are calculated gross of reinsurance and a separate reinsurance asset recorded.
RBS Group 2010278
Accounting policies continued

13. Provisions The Group recognises a provision for a present obligation resulting from a past event when it is more likely than not that it will be required to transfer economic benefits to settle the obligation and the amount of the obligation can be estimated reliably. Provision is made for restructuring costs, including the costs of redundancy, when the Group has a constructive obligation to restructure. An obligation exists when the Group has a detailed formal plan for the restructuring and has raised a valid expectation in those affected by starting to implement the plan or announcing its main features. If the Group has a contract that is onerous, it recognises the present obligation under the contract as a provision. An onerous contract is one where the unavoidable costs of meeting the obligations under it exceed the expected economic benefits. When the Group vacates a leasehold property, a provision is recognised for the costs under the lease less any expected economic benefits (such as rental income). Contingent liabilities are possible obligations arising from past events whose existence will be confirmed only by uncertain future events or present obligations arising from past events that are not recognised because either an outflow of economic benefits is not probable or the amount of the obligation cannot be reliably measured. Contingent liabilities are not recognised but information about them is disclosed unless the possibility of any outflow of economic benefits in settlement is remote. 14. Tax Provision is made for tax at current enacted rates on taxable profits, arising in income or in equity, taking into account relief for overseas tax where appropriate. Deferred tax is accounted for in full for all temporary differences between the carrying amount of an asset or liability for accounting purposes and its carrying amount for tax purposes, except in relation to overseas earnings where remittance is controlled by the Group, and goodwill. Deferred tax assets are only recognised to the extent that it is probable that they will be recovered. 15. Financial assets On initial recognition, financial assets are classified into held-to-maturity investments; available-for-sale financial assets; held-for-trading; designated as at fair value through profit or loss; or loans and receivables.
Held-to-maturity investments - a financial asset may be classified as a held-to-maturity investment only if it has fixed or determinable payments, a fixed maturity and the Group has the positive intention and ability to hold to maturity. Held-to-maturity investments are initially recognised at fair value plus directly related transaction costs. They are subsequently measured at amortised cost using the effective interest method (see Accounting policy 3) less any impairment losses. Held-for-trading - a financial asset is classified as held-for-trading if it is acquired principally for sale in the near term, or forms part of a portfolio of financial instruments that are managed together and for which there is evidence of short-term profit taking, or it is a derivative (not in a qualifying hedge relationship). Held-for-trading financial assets are recognised at fair value with transaction costs being recognised in profit or loss. Subsequently they are measured at fair value. Gains and losses on held-for-trading financial assets are recognised in profit or loss as they arise. Designated as at fair value through profit or loss - financial assets may be designated as at fair value through profit or loss only if such designation (a) eliminates or significantly reduces a measurement or recognition inconsistency; or (b) applies to a group of financial assets, financial liabilities or both, that the Group manages and evaluates on a fair value basis; or (c) relates to an instrument that contains an embedded derivative which is not evidently closely related to the host contract. Financial assets that the Group designates on initial recognition as being at fair value through profit or loss are recognised at fair value, with transaction costs being recognised in profit or loss, and are subsequently measured at fair value. Gains and losses on financial assets that are designated as at fair value through profit or loss are recognised in profit or loss as they arise. In 2009 and 2008, financial assets designated as at fair value through profit or loss included policyholders' assets underpinning insurance and investment contracts issued by the Group's life assurance businesses. Fair value designation significantly reduces the measurement inconsistency that would arise if these assets were classified as available-for-sale. Loans and receivables - non-derivative financial assets with fixed or determinable repayments that are not quoted in an active market are classified as loans and receivables, except those that are classified as available-for-sale or as held-for-trading, or designated as at fair value through profit or loss. Loans and receivables are initially recognised at fair value plus directly related transaction costs. They are subsequently measured at amortised cost using the effective interest method (see Accounting policy 3) less any impairment losses.
279RBS Group 2010
Financial statements
Available-for-sale - financial assets that are not classified as held-to-maturity; held-for-trading; designated as at fair value through profit or loss; or loans and receivables, are classified as available-for-sale. Financial assets can be designated as available-for-sale on initial recognition. Available-for-sale financial assets are initially recognised at fair value plus directly related transaction costs. They are subsequently measured at fair value. Unquoted equity investments whose fair value cannot be measured reliably are carried at cost and classified as available-for-sale financial assets. Impairment losses and exchange differences resulting from retranslating the amortised cost of foreign currency monetary available-for-sale financial assets are recognised in profit or loss together with interest calculated using the effective interest method (see Accounting policy 3). Other changes in the fair value of available-for-sale financial assets and any related tax are reported in a separate component of shareholders' equity until disposal, when the cumulative gain or loss is recognised in profit or loss. Reclassifications - held-for-trading and available-for-sale financial assets that meet the definition of loans and receivables (non-derivative financial assets with fixed or determinable payments that are not quoted in an active market) may be reclassified to loans and receivables if the Group has the intention and ability to hold the financial asset for the foreseeable future or until maturity. The Group typically regards the foreseeable future as twelve months from the date of reclassification. Additionally, held-for-trading financial assets that do not meet the definition of loans and receivables may, in rare circumstances, be transferred to available-for-sale financial assets or to held-to-maturity investments. Reclassifications are made at fair value. This fair value becomes the asset's new cost or amortised cost as appropriate. Gains and losses recognised up to the date of reclassification are not reversed. Regular way purchases of financial assets classified as loans and receivables are recognised on settlement date; issues of equity or financial liabilities measured at amortised cost are recognised on settlement date; all other regular way transactions in financial instruments are recognised on trade date. Fair value for a net open position in a financial asset that is quoted in an active market is the current bid price times the number of units of the instrument held. Fair values for financial assets not quoted in an active market are determined using appropriate valuation techniques including discounting future cash flows, option pricing models and other methods that are consistent with accepted economic methodologies for pricing financial assets. 16. Impairment of financial assets The Group assesses at each balance sheet date whether there is any objective evidence that a financial asset or group of financial assets classified as held-to-maturity, available-for-sale or loans and receivables is impaired. A financial asset or portfolio of financial assets is impaired and an impairment loss incurred if there is objective evidence that an event or events since initial recognition of the asset have adversely affected the amount or timing of future cash flows from the asset.
Financial assets carried at amortised cost - if there is objective evidence that an impairment loss on a financial asset or group of financial assets classified as loans and receivables or as held-to-maturity investments has been incurred, the Group measures the amount of the loss as the difference between the carrying amount of the asset or group of assets and the present value of estimated future cash flows from the asset or group of assets discounted at the effective interest rate of the instrument at initial recognition. For collateralised loans and receivables, estimated future cash flows include cash flows that may result from foreclosure less the costs of obtaining and selling the collateral, whether or not foreclosure is probable. Where, in the course of the orderly realisation of a loan, it is exchanged for equity shares or properties, the exchange is accounted for as the sale of the loan and the acquisition of equity securities or investment properties. Where the Group’s interest in equity shares following the exchange is such that the Group controlling an entity, that entity is consolidated. Impairment losses are assessed individually for financial assets that are individually significant and individually or collectively for assets that are not individually significant. In making collective assessment of impairment, financial assets are grouped into portfolios on the basis of similar risk characteristics. Future cash flows from these portfolios are estimated on the basis of the contractual cash flows and historical loss experience for assets with similar credit risk characteristics. Historical loss experience is adjusted, on the basis of observable data, to reflect current conditions not affecting the period of historical experience. Impairment losses are recognised in profit or loss and the carrying amount of the financial asset or group of financial assets reduced by establishing an allowance for impairment losses. If, in a subsequent period, the amount of the impairment loss reduces and the reduction can be ascribed to an event after the impairment was recognised, the previously recognised loss is reversed by adjusting the allowance. Once an impairment loss has been recognised on a financial asset or group of financial assets, interest income is recognised on the carrying amount using the rate of interest at which estimated future cash flows were discounted in measuring impairment. Impaired loans and receivables are written off, i.e. the impairment provision is applied in writing down the loan's carrying value partially or in full, when the Group concludes that there is no longer any realistic prospect of recovery of part or all of the loan. For portfolios that are collectively assessed for impairment, the timing of write off principally reflects historic recovery experience for each portfolio. For loans that are individually assessed for impairment, the timing of write off is determined on a case-by-case basis. Such loans are reviewed regularly and write offs will be prompted by bankruptcy, insolvency, restructuring and similar events. Most debt is written off within five years of the recognition of the initial impairment. It is not the Group’s usual practice to write-off all or part of the asset at the time an impairment loss is recognised; it may however, take place in rare circumstances. Amounts recovered after a loan has been written off are credited to the loan impairment charge for the period in which they are received.
RBS Group 2010280
Accounting policies continued

Financial assets carried at fair value - when a decline in the fair value of a financial asset classified as available-for-sale has been recognised directly in equity and there is objective evidence that the asset is impaired, the cumulative loss is removed from equity and recognised in profit or loss. The loss is measured as the difference between the amortised cost of the financial asset and its current fair value. Impairment losses on available-for-sale equity instruments are not reversed through profit or loss, but those on available-for-sale debt instruments are reversed, if there is an increase in fair value that is objectively related to a subsequent event. 17. Financial liabilities On initial recognition financial liabilities are classified into held-for-trading; designated as at fair value through profit or loss; or amortised cost. Held-for-trading - a financial liability is classified as held-for-trading if it is incurred principally for repurchase in the near term, or forms part of a portfolio of financial instruments that are managed together and for which there is evidence of short-term profit taking, or it is a derivative (not in a qualifying hedge relationship). Held-for-trading financial liabilities are recognised at fair value with transaction costs being recognised in profit or loss. Subsequently they are measured at fair value. Gains and losses are recognised in profit or loss as they arise. Designated as at fair value through profit or loss - financial liabilities may be designated as at fair value through profit or loss only if such designation (a) eliminates or significantly reduces a measurement or recognition inconsistency; or (b) applies to a group of financial assets, financial liabilities or both that the Group manages and evaluates on a fair value basis; or (c) relates to an instrument that contains an embedded derivative which is not evidently closely related to the host contract. Financial liabilities that the Group designates on initial recognition as being at fair value through profit or loss are recognised at fair value, with transaction costs being recognised in profit or loss, and are subsequently measured at fair value. Gains and losses on financial liabilities that are designated as at fair value through profit or loss are recognised in profit or loss as they arise. Financial liabilities designated as at fair value through profit or loss include structured liabilities issued by the Group: designation significantly reduces the measurement inconsistency between these liabilities and the related derivatives carried at fair value; and in 2009 and 2008 investment contracts issued by the Group's life assurance businesses: fair value designation significantly reduces the measurement inconsistency that would arise if these liabilities were measured at amortised cost. Amortised cost - all other financial liabilities are measured at amortised cost using the effective interest method (see Accounting policy 3). Fair value for a net open position in a financial liability that is quoted in an active market is the current offer price times the number of units of the instrument held or issued. Fair values for financial liabilities not quoted in an active market are determined using appropriate valuation techniques including discounting future cash flows, option pricing models and other methods that are consistent with accepted economic methodologies for pricing financial liabilities.
18. Financial guarantee contracts Under a financial guarantee contract, the Group, in return for a fee, undertakes to meet a customer’s obligations under the terms of a debt instrument if the customer fails to do so. A financial guarantee is recognised as a liability; initially at fair value and, if not designated as at fair value through profit or loss, subsequently at the higher of its initial value less cumulative amortisation and any provision under the contract measured in accordance with Accounting policy 13. Amortisation is calculated so as to recognise fees receivable in profit or loss over the period of the guarantee. 19. Loan commitments Provision is made for loan commitments, other than those classified as held-for-trading, if it is probable that the facility will be drawn and the resulting loan will be recognised at a value less than the cash advanced. Syndicated loan commitments in excess of the level of lending under the commitment approved for retention by the Group are classified as held-for-trading and measured at fair value. 20. Derecognition A financial asset is derecognised when it has been transferred and the transfer qualifies for derecognition. A transfer requires that the Group either (a) transfers the contractual rights to receive the asset's cash flows; or (b) retains the right to the asset's cash flows but assumes a contractual obligation to pay those cash flows to a third party. After a transfer, the Group assesses the extent to which it has retained the risks and rewards of ownership of the transferred asset. If substantially all the risks and rewards have been retained, the asset remains on the balance sheet. If substantially all the risks and rewards have been transferred, the asset is derecognised. If substantially all the risks and rewards have been neither retained nor transferred, the Group assesses whether or not it has retained control of the asset. If it has not retained control, the asset is derecognised. Where the Group has retained control of the asset, it continues to recognise the asset to the extent of its continuing involvement. A financial liability is removed from the balance sheet when the obligation is discharged, or cancelled, or expires. On the redemption or settlement of debt securities (including subordinated liabilities) issued by the Group, the Group derecognises the debt instrument and records a gain or loss being the difference between the debt's carrying amount and the cost of redemption or settlement. The same treatment applies where the debt is exchanged for a new debt issue that has terms substantially different from those of the existing debt. The assessment of whether the terms of the new debt instrument are substantially different takes into account qualitative and quantitative characteristics including a comparison of the discounted present value of the cash flows under the new terms with the discounted present value of the remaining cash flows of the original debt issue.
281RBS Group 2010
Financial statements
21. Sale and repurchase transactions Securities subject to a sale and repurchase agreement under which substantially all the risks and rewards of ownership are retained by the Group continue to be shown on the balance sheet and the sale proceeds recorded as a financial liability. Securities acquired in a reverse sale and repurchase transaction under which the Group is not exposed to substantially all the risks and rewards of ownership are not recognised on the balance sheet and the consideration paid is recorded as a financial asset. Securities borrowing and lending transactions are usually secured by cash or securities advanced by the borrower. Borrowed securities are not recognised on the balance sheet or lent securities derecognised. Cash collateral given or received is treated as a loan or deposit; collateral in the form of securities is not recognised. However, where securities borrowed are transferred to third parties, a liability for the obligation to return the securities to the stock lending counterparty is recorded. 22. Netting Financial assets and financial liabilities are offset and the net amount presented in the balance sheet when, and only when, the Group currently has a legally enforceable right to set off the recognised amounts; and it intends either to settle on a net basis, or to realise the asset and settle the liability simultaneously. The Group is party to a number of arrangements, including master netting agreements, that give it the right to offset financial assets and financial liabilities but where it does not intend to settle the amounts net or simultaneously and therefore the assets and liabilities concerned are presented gross. 23. Capital instruments The Group classifies a financial instrument that it issues as a financial asset, financial liability or an equity instrument in accordance with the substance of the contractual arrangement. An instrument is classified as a liability if it is a contractual obligation to deliver cash or another financial asset, or to exchange financial assets or financial liabilities on potentially unfavourable terms. An instrument is classified as equity if it evidences a residual interest in the assets of the Group after the deduction of liabilities. The components of a compound financial instrument issued by the Group are classified and accounted for separately as financial assets, financial liabilities or equity as appropriate. 24. Derivatives and hedging Derivative financial instruments are initially recognised, and subsequently measured, at fair value. Derivative fair values are determined from quoted prices in active markets where available. Where there is no active market for an instrument, fair value is derived from prices for the derivative's components using appropriate pricing or valuation models. A derivative embedded in a contract is accounted for as a stand-alone derivative if its economic characteristics are not closely related to the economic characteristics of the host contract; unless the entire contract is measured at fair value with changes in fair value recognised in profit or loss.
Gains and losses arising from changes in the fair value of a derivative are recognised as they arise in profit or loss unless the derivative is the hedging instrument in a qualifying hedge. The Group enters into three types of hedge relationship: hedges of changes in the fair value of a recognised asset or liability or firm commitment (fair value hedges); hedges of the variability in cash flows from a recognised asset or liability or a highly probable forecast transaction (cash flow hedges); and hedges of the net investment in a foreign operation. Hedge relationships are formally documented at inception. The documentation identifies the hedged item and the hedging instrument and details the risk that is being hedged and the way in which effectiveness will be assessed at inception and during the period of the hedge. If the hedge is not highly effective in offsetting changes in fair values or cash flows attributable to the hedged risk, consistent with the documented risk management strategy, hedge accounting is discontinued. Fair value hedge - in a fair value hedge, the gain or loss on the hedging instrument is recognised in profit or loss. The gain or loss on the hedged item attributable to the hedged risk is recognised in profit or loss and adjusts the carrying amount of the hedged item. Hedge accounting is discontinued if the hedge no longer meets the criteria for hedge accounting; or if the hedging instrument expires or is sold, terminated or exercised; or if hedge designation is revoked. If the hedged item is one for which the effective interest rate method is used, any cumulative adjustment is amortised to profit or loss over the life of the hedged item using a recalculated effective interest rate. Cash flow hedge - in a cash flow hedge, the effective portion of the gain or loss on the hedging instrument is recognised directly in equity and the ineffective portion in profit or loss. When the forecast transaction results in the recognition of a financial asset or financial liability, the cumulative gain or loss is reclassified from equity in the same periods in which the asset or liability affects profit or loss. Otherwise the cumulative gain or loss is removed from equity and recognised in profit or loss at the same time as the hedged transaction. Hedge accounting is discontinued if the hedge no longer meets the criteria for hedge accounting; if the hedging instrument expires or is sold, terminated or exercised; if the forecast transaction is no longer expected to occur; or if hedge designation is revoked. On the discontinuance of hedge accounting (except where a forecast transaction is no longer expected to occur), the cumulative unrealised gain or loss in equity is recognised in profit or loss when the hedged cash flow occurs or, if the forecast transaction results in the recognition of a financial asset or financial liability, in the same periods during which the asset or liability affects profit or loss. Where a forecast transaction is no longer expected to occur, the cumulative unrealised gain or loss in equity is recognised in profit or loss immediately. Hedge of net investment in a foreign operation - in the hedge of a net investment in a foreign operation, the portion of foreign exchange differences arising on the hedging instrument determined to be an effective hedge is recognised directly in equity. Any ineffective portion is recognised in profit or loss. Non-derivative financial liabilities as well as derivatives may be the hedging instrument in a net investment hedge.
RBS Group 2010282
Accounting policies continued
25. Share-based payments The Group awards shares and options over shares in The Royal Bank of Scotland Group plc to its employees. The expense for these transactions is measured based on the fair value on the date the awards are granted. The fair value of an option is estimated using valuation techniques which take into account its exercise price, its term, the risk-free interest rate and the expected volatility of the market price of The Royal Bank of Scotland Group plc's shares. Vesting conditions are not taken into account when measuring fair value, but are reflected by adjusting the proportion of awards that actually vest. The fair value is expensed on a straight-line basis over the vesting period. Following an amendment to IFRS 2 for accounting periods starting after 1 January 2009, the cancellation of an award with non-vesting conditions triggers immediate recognition of an expense in respect of any unrecognised element of the fair value of the award. 26. Cash and cash equivalents Cash and cash equivalents comprises cash and demand deposits with banks together with short-term highly liquid investments that are readily convertible to known amounts of cash and subject to insignificant risk of change in value. 27. Shares in Group entities The company's investments in its subsidiaries are stated at cost less any impairment. Critical accounting policies and key sources of estimation uncertainty The reported results of the Group are sensitive to the accounting policies, assumptions and estimates that underlie the preparation of its financial statements. UK company law and IFRS require the directors, in preparing the Group's financial statements, to select suitable accounting policies, apply them consistently and make judgements and estimates that are reasonable and prudent. In the absence of an applicable standard or interpretation, IAS 8 ‘Accounting Policies, Changes in Accounting Estimates and Errors’, requires management to develop and apply an accounting policy that results in relevant and reliable information in the light of the requirements and guidance in IFRS dealing with similar and related issues and the IASB's ‘Framework for the Preparation and Presentation of Financial Statements’. The judgements and assumptions involved in the Group's accounting policies that are considered by the Board to be the most important to the portrayal of its financial condition are discussed below. The use of estimates, assumptions or models that differ from those adopted by the Group would affect its reported results. Loan impairment provisions The Group's loan impairment provisions are established to recognise incurred impairment losses in its portfolio of loans classified as loans and receivables and carried at amortised cost. A loan is impaired when there is objective evidence that events since the loan was granted have affected expected cash flows from the loan. Such objective evidence, indicative that a borrower’s financial condition has deteriorated, can include for loans that are individually assessed: the non-payment of interest or principal; debt restructuring; probable bankruptcy or liquidation; significant reduction in the value of any security; breach of limits or covenants; and deteriorating trading performance and, for collectively assessed portfolios: the borrowers’ payment status and observable data about relevant macroeconomic measures.
The impairment loss is the difference between the carrying value of the loan and the present value of estimated future cash flows at the loan's original effective interest rate. At 31 December 2010, gross loans and advances to customers totalled £573,315 million (2009 - £745,519 million; 2008 - £885,611 million) and customer loan impairment provisions amounted to £18,055 million (2009 - £17,126 million; 2008 - £10,889 million). There are two components to the Group's loan impairment provisions: individual and collective. Individual component - all impaired loans that exceed specific thresholds are individually assessed for impairment. Individually assessed loans principally comprise the Group's portfolio of commercial loans to medium and large businesses. Impairment losses are recognised as the difference between the carrying value of the loan and the discounted value of management's best estimate of future cash repayments and proceeds from any security held. These estimates take into account the customer's debt capacity and financial flexibility; the level and quality of its earnings; the amount and sources of cash flows; the industry in which the counterparty operates; and the realisable value of any security held. Estimating the quantum and timing of future recoveries involves significant judgement. The size of receipts will depend on the future performance of the borrower and the value of security, both of which will be affected by future economic conditions; additionally, collateral may not be readily marketable. The actual amount of future cash flows and the date they are received may differ from these estimates and consequently actual losses incurred may differ from those recognised in these financial statements. Collective component - this is made up of two elements: loan impairment provisions for impaired loans that are below individual assessment thresholds (collectively assessed provisions) and for loan losses that have been incurred but have not been separately identified at the balance sheet date (latent loss provisions). Collectively assessed provisions are established on a portfolio basis using a present value methodology taking into account the level of arrears, security, past loss experience, credit scores and defaults based on portfolio trends. The most significant factors in establishing these provisions are the expected loss rates and the related average life. These portfolios include credit card receivables and other personal advances including mortgages. The future credit quality of these portfolios is subject to uncertainties that could cause actual credit losses to differ materially from reported loan impairment provisions. These uncertainties include the economic environment, notably interest rates and their effect on customer spending, the unemployment level, payment behaviour and bankruptcy trends. Latent loss provisions are held against estimated impairment losses in the performing portfolio that have yet to be identified as at the balance sheet date. To assess the latent loss within its portfolios, the Group has developed methodologies to estimate the time that an asset can remain impaired within a performing portfolio before it is identified and reported as such.
283RBS Group 2010
Financial statements
Pensions The Group operates a number of defined benefit pension schemes as described in Note 4 on the accounts. The assets of the schemes are measured at their fair value at the balance sheet date. Scheme liabilities are measured using the projected unit method, which takes account of projected earnings increases, using actuarial assumptions that give the best estimate of the future cash flows that will arise under the scheme liabilities. These cash flows are discounted at the interest rate applicable to high-quality corporate bonds of the same currency and term as the liabilities. Any recognisable surplus or deficit of scheme assets over liabilities is recognised in the balance sheet as an asset (surplus) or liability (deficit). In determining the value of scheme liabilities, financial and demographic assumptions are made including price inflation, pension increases, earnings growth and the longevity of scheme members. A range of assumptions could be adopted in valuing the schemes' liabilities. Different assumptions could significantly alter the amount of the surplus or deficit recognised in the balance sheet and the pension cost charged to the income statement. The assumptions adopted for the Group's pension schemes are set out in Note 4 on the accounts, together with sensitivities of the balance sheet and income statement to changes in those assumptions. A pension asset of £105 million and a liability of £2,288 million were recognised in the balance sheet at 31 December 2010 (2009 - asset - £58 million, liability - £2,963 million; 2008 - asset - £36 million, liability - £2,032 million). Fair value - financial instruments Financial instruments classified as held-for-trading or designated as at fair value through profit or loss and financial assets classified as available-for-sale are recognised in the financial statements at fair value. All derivatives are measured at fair value. Gains or losses arising from changes in the fair value of financial instruments classified as held-for-trading or designated as at fair value through profit or loss are included in the income statement. Unrealised gains and losses on available-for-sale financial assets are recognised directly in equity unless an impairment loss is recognised. Financial instruments measured at fair value include: Loans and advances (held-for-trading and designated as at fair value though profit or loss) - principally comprise reverse repurchase agreements (reverse repos) and cash collateral. Debt securities (held-for-trading, designated as at fair value though profit or loss and available-for-sale) - debt securities include those issued by governments, municipal bodies, mortgage agencies and financial institutions as well as corporate bonds, debentures and residual interests in securitisations.
Equity securities (held-for-trading, designated as at fair value though profit or loss and available-for-sale) - comprise equity shares of companies or corporations both listed and unlisted. Deposits by banks and customer accounts (held-for-trading and designated as at fair value though profit or loss) - deposits measured at fair value principally include repurchase agreements (repos), cash collateral and investment contracts issued by the Group's life assurance businesses. Debt securities in issue (held-for-trading and designated as at fair value though profit or loss) - principally comprise medium term notes. Short positions (held-for-trading) - arise in dealing and market making activities where debt securities and equity shares are sold which the Group does not currently possess. Derivatives - these include swaps (currency swaps, interest rate swaps, credit default swaps, total return swaps and equity and equity index swaps), forward foreign exchange contracts, forward rate agreements, futures (currency, interest rate and equity) and options (exchange-traded options on currencies, interest rates and equities and equity indices and OTC currency and equity options, interest rate caps and floors and swaptions). Fair value is the amount for which an asset could be exchanged, or a liability settled, between knowledgeable, willing parties in an arm’s length transaction. Fair values are determined from quoted prices in active markets for identical financial assets or financial liabilities where these are available. Fair value for a net open position in a financial instrument in an active market is the number of units of the instrument held times the current bid price (for financial assets) or offer price (for financial liabilities). In determining the fair value of derivative financial instruments gross long and short positions measured at current mid market prices are adjusted by bid-offer reserves calculated on a portfolio basis. Credit valuation adjustments are made when valuing derivative financial assets to incorporate counterparty credit risk. Adjustments are also made when valuing financial liabilities to reflect the Group’s own credit standing. Where the market for a financial instrument is not active, fair value is established using a valuation technique. These valuation techniques involve a degree of estimation, the extent of which depends on the instrument’s complexity and the availability of market-based data. More details about the Group’s valuation methodologies and the sensitivity to reasonably possible alternative assumptions of the fair value of financial instruments valued using techniques where at least one significant input is unobservable are given in Note 12 on pages 310 to 324.
RBS Group 2010284
Accounting policies continued
General insurance claims The Group makes provision for the full cost of settling outstanding claims arising from its general insurance business at the balance sheet date, including claims estimated to have been incurred but not yet reported at that date and claims handling expenses. General insurance claims provisions amounted to £6,726 million at 31 December 2010 (2009 - £5,802 million; 2008 - £5,478 million). Provisions are determined by management based on experience of claims settled and on statistical models which require certain assumptions to be made regarding the incidence, timing and amount of claims and any specific factors such as adverse weather conditions. In order to calculate the total provision required, the historical development of claims is analysed using statistical methodology to extrapolate, within acceptable probability parameters, the value of outstanding claims at the balance sheet date. Also included in the estimation of outstanding claims are other assumptions such as the inflationary factor used for bodily injury claims which is based on historical trends and, therefore, allows for some increase due to changes in common law and statute; and the incidence of periodical payment orders and the rate at which payments under them are discounted. Costs for both direct and indirect claims handling expenses are also included. Outward reinsurance recoveries are accounted for in the same accounting period as the direct claims to which they relate. The outstanding claims provision is based on information available to management and the eventual outcome may vary
from the original assessment. Actual claims experience may differ from the historical pattern on which the estimate is based and the cost of settling individual claims may exceed that assumed. Deferred tax The Group makes provision for deferred tax on short-term and other temporary differences where tax recognition occurs at a different time from accounting recognition. Deferred tax assets of £6,373 million were recognised as at 31 December 2010 (2009 - £7,039 million; 2008 - £7,082 million). The Group has recognised deferred tax assets in respect of losses, principally in the UK, and short-term timing differences. Deferred tax assets are recognised in respect of unused tax losses to the extent that it is probable that there will be future taxable profits against which the losses can be utilised. Business projections prepared for impairment reviews (see Note 19) indicate that sufficient future taxable income will be available against which to offset these recognised deferred tax assets within eight years (2009 - eight years). The Group's cumulative losses are principally attributable to the recent unparalleled market conditions. Deferred tax assets of £2,008 million (2009 - £2,163 million; 2008 - £1,748 million) have not been recognised in respect of tax losses carried forward in jurisdictions where doubt exists over the availability of future taxable profits.
285RBS Group 2010
Financial statements
Accounting developments International Financial Reporting Standards The IASB issued ‘Improvements to IFRS’ in May 2010 implementing minor changes to IFRS, making non-urgent but necessary amendments to standards, primarily to remove inconsistency and to clarify wording. The revisions are effective for annual periods beginning on or after 1 July 2010 and are not expected to have a material effect on the Group or the company. The IASB issued IFRS 9 ‘Financial Instruments’ in November 2009 simplifying the classification and measurement requirements in IAS 39 ‘Financial Instruments: Recognition and Measurement’ in respect of financial assets. The standard reduces the measurement categories for financial assets to two: fair value and amortised cost. A financial asset is classified on the basis of the entity's business model for managing the financial asset and the contractual cash flow characteristics of the financial asset. Only assets with contractual terms that give rise to cash flows on specified dates that are solely payments of principal and interest on the principal amount outstanding and which are held within a business model whose objective is to hold assets in order to collect contractual cash flows are classified as amortised cost. All other financial assets are measured at fair value. Changes in the value of financial assets measured at fair value are generally taken to profit or loss. In October 2010, IFRS 9 was updated to include the classification and measurement of liabilities. It is not markedly different from IAS 39 except for liabilities measured at fair value where the movement is due to changes in credit rating of the preparer it is recognised not in profit or loss but in other comprehensive income. The standard is effective for annual periods beginning on or after 1 January 2013; early application is permitted.
This standard makes major changes to the framework for the classification and measurement of financial assets and will have a significant effect on the Group's financial statements. The changes relating to the classification and measurement of liabilities carried at fair value will have a less significant effect on the Group. The Group is assessing these impacts which are likely to depend on the outcome of the other phases of IASB's IAS 39 replacement project. The IASB issued ‘Disclosures - Transfers of Financial Assets (Amendments to IFRS 7 Financial Instruments: Disclosures)’ in October 2010 to extend the standard’s disclosure requirements about derecognition to align with US GAAP. The revisions are effective for annual periods beginning on or after 1 July 2011 and will not affect the financial position or reported performance of the Group or the company. The IASB issued an amendment to IAS 12 ‘Income Taxes’ in December 2010 to clarify that recognition of deferred tax should have regard to the expected manner of recovery or settlement of the asset or liability. The amendment and consequential withdrawal of SIC 21 ‘Deferred Tax: Recovery of Underlying Assets’, effective for annual periods beginning on or after 1 January 2012, is not expected to have a material effect on the Group or the company. The International Financial Reporting Interpretations Committee issued IFRIC 19 ‘Extinguishing Financial Liabilities with Equity Instruments’ in December 2009. The interpretation clarifies that the profit or loss on extinguishing liabilities by issuing equity instruments should be measured by reference to fair value, preferably of the equity instruments. The interpretation, effective for the Group for annual periods beginning on or after 1 January 2011, is not expected to have a material effect on the Group or the company.
RBS Group 2010286
Accounting policies continued
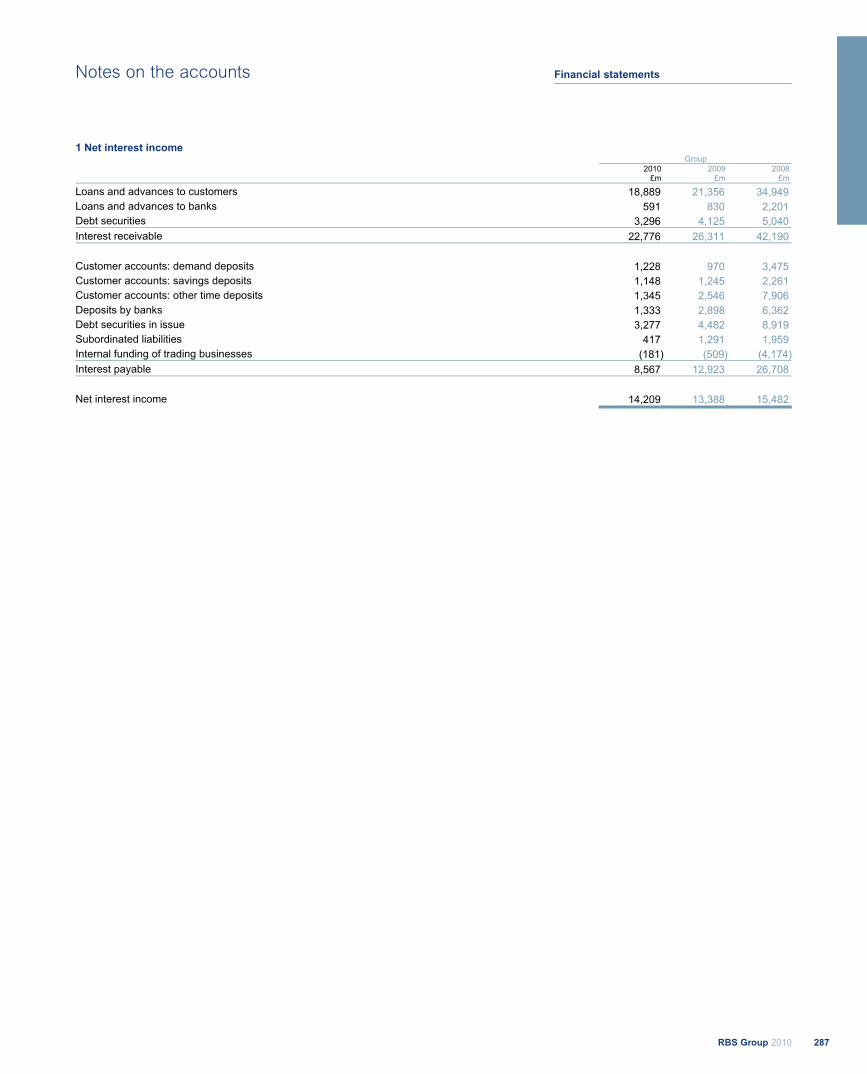
1 Net interest income Group 2010 2009 2008
£m £m £m
Loans and advances to customers 18,889 21,356 34,949 Loans and advances to banks 591 830 2,201 Debt securities 3,296 4,125 5,040 Interest receivable 22,776 26,311 42,190
Customer accounts: demand deposits 1,228 970 3,475 Customer accounts: savings deposits 1,148 1,245 2,261 Customer accounts: other time deposits 1,345 2,546 7,906 Deposits by banks 1,333 2,898 6,362 Debt securities in issue 3,277 4,482 8,919 Subordinated liabilities 417 1,291 1,959 Internal funding of trading businesses (181) (509) (4,174)Interest payable 8,567 12,923 26,708
Net interest income 14,209 13,388 15,482
287RBS Group 2010
Financial statementsNotes on the accounts
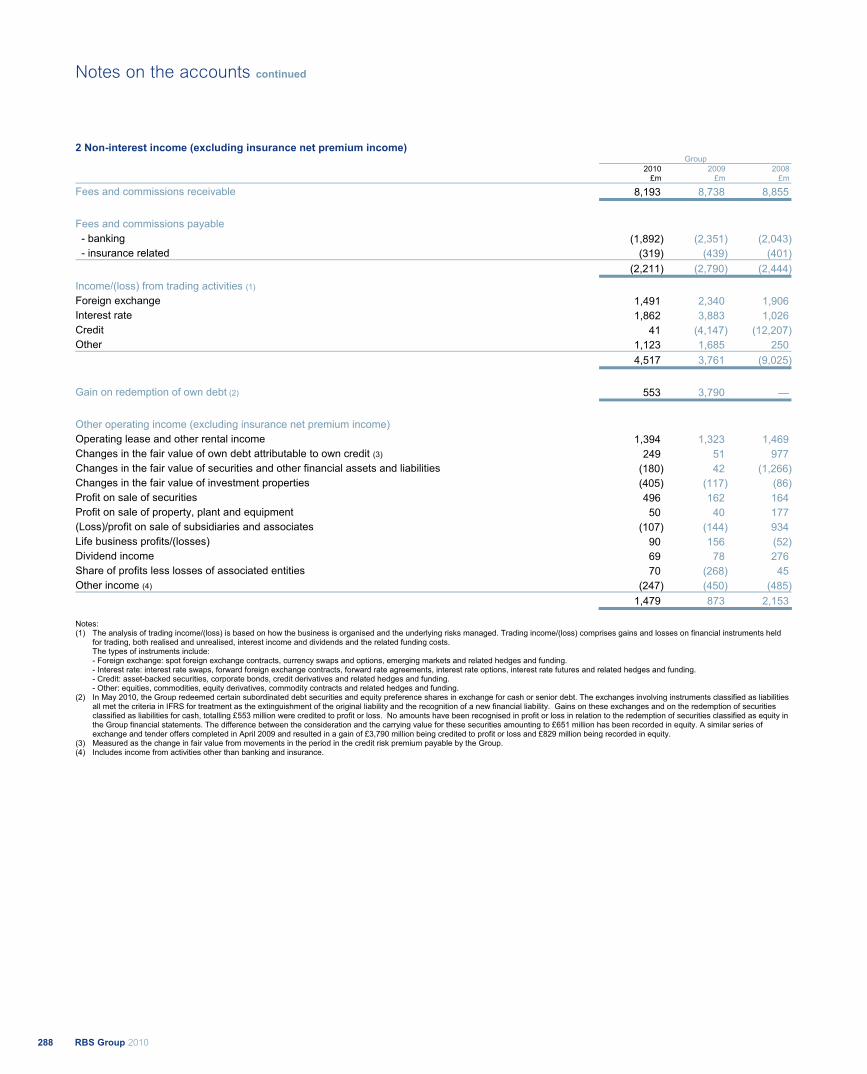
2 Non-interest income (excluding insurance net premium income) Group 2010 2009 2008
£m £m £m
Fees and commissions receivable 8,193 8,738 8,855
Fees and commissions payable - banking (1,892) (2,351) (2,043)
- insurance related (319) (439) (401) (2,211) (2,790) (2,444)Income/(loss) from trading activities (1) Foreign exchange 1,491 2,340 1,906 Interest rate 1,862 3,883 1,026 Credit 41 (4,147) (12,207)Other 1,123 1,685 250 4,517 3,761 (9,025)
Gain on redemption of own debt (2) 553 3,790 — Other operating income (excluding insurance net premium income) Operating lease and other rental income 1,394 1,323 1,469 Changes in the fair value of own debt attributable to own credit (3) 249 51 977 Changes in the fair value of securities and other financial assets and liabilities (180) 42 (1,266)Changes in the fair value of investment properties (405) (117) (86)Profit on sale of securities 496 162 164 Profit on sale of property, plant and equipment 50 40 177 (Loss)/profit on sale of subsidiaries and associates (107) (144) 934 Life business profits/(losses) 90 156 (52)Dividend income 69 78 276 Share of profits less losses of associated entities 70 (268) 45 Other income (4) (247) (450) (485) 1,479 873 2,153
Notes: (1) The analysis of trading income/(loss) is based on how the business is organised and the underlying risks managed. Trading income/(loss) comprises gains and losses on financial instruments held
for trading, both realised and unrealised, interest income and dividends and the related funding costs. The types of instruments include: - Foreign exchange: spot foreign exchange contracts, currency swaps and options, emerging markets and related hedges and funding. - Interest rate: interest rate swaps, forward foreign exchange contracts, forward rate agreements, interest rate options, interest rate futures and related hedges and funding. - Credit: asset-backed securities, corporate bonds, credit derivatives and related hedges and funding. - Other: equities, commodities, equity derivatives, commodity contracts and related hedges and funding.
(2) In May 2010, the Group redeemed certain subordinated debt securities and equity preference shares in exchange for cash or senior debt. The exchanges involving instruments classified as liabilities all met the criteria in IFRS for treatment as the extinguishment of the original liability and the recognition of a new financial liability. Gains on these exchanges and on the redemption of securities classified as liabilities for cash, totalling £553 million were credited to profit or loss. No amounts have been recognised in profit or loss in relation to the redemption of securities classified as equity in the Group financial statements. The difference between the consideration and the carrying value for these securities amounting to £651 million has been recorded in equity. A similar series of exchange and tender offers completed in April 2009 and resulted in a gain of £3,790 million being credited to profit or loss and £829 million being recorded in equity.
(3) Measured as the change in fair value from movements in the period in the credit risk premium payable by the Group. (4) Includes income from activities other than banking and insurance.
RBS Group 2010288
Notes on the accounts continued
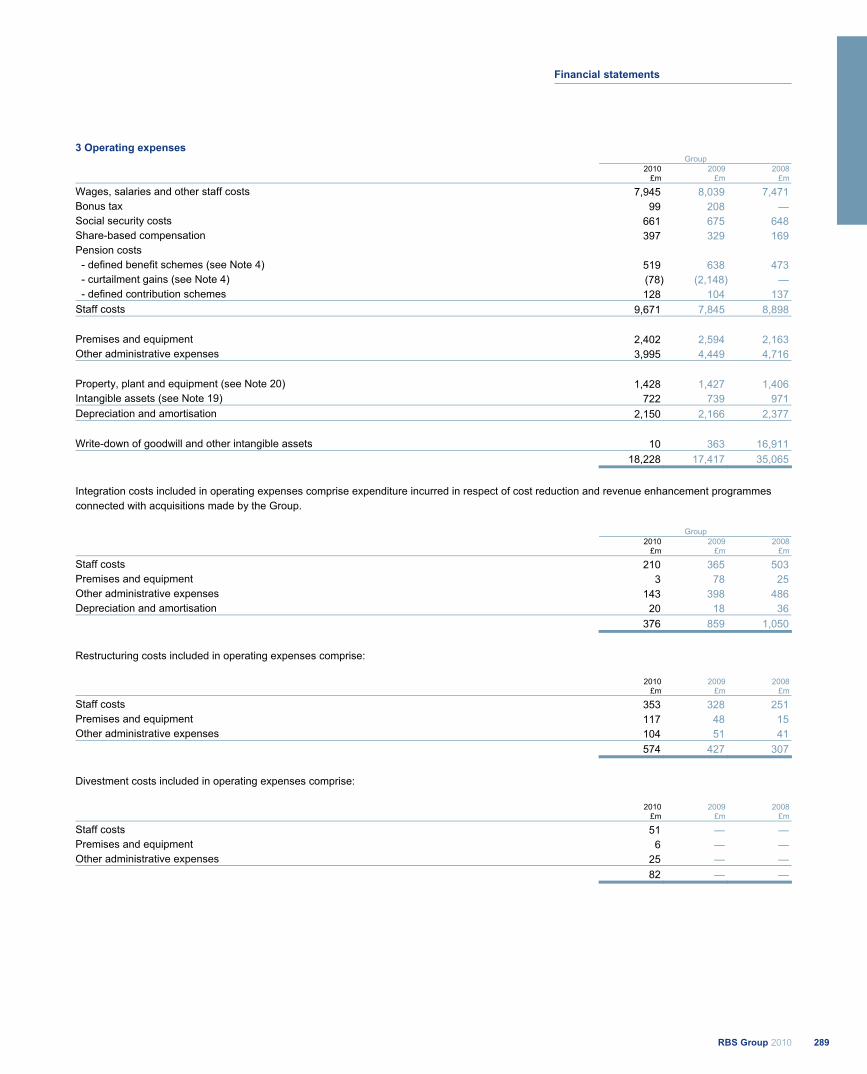
3 Operating expenses Group 2010 2009 2008
£m £m £m
Wages, salaries and other staff costs 7,945 8,039 7,471 Bonus tax 99 208 —Social security costs 661 675 648 Share-based compensation 397 329 169 Pension costs
- defined benefit schemes (see Note 4) 519 638 473 - curtailment gains (see Note 4) (78) (2,148) — - defined contribution schemes 128 104 137 Staff costs 9,671 7,845 8,898
Premises and equipment 2,402 2,594 2,163 Other administrative expenses 3,995 4,449 4,716 Property, plant and equipment (see Note 20) 1,428 1,427 1,406 Intangible assets (see Note 19) 722 739 971 Depreciation and amortisation 2,150 2,166 2,377
Write-down of goodwill and other intangible assets 10 363 16,911 18,228 17,417 35,065
Integration costs included in operating expenses comprise expenditure incurred in respect of cost reduction and revenue enhancement programmes connected with acquisitions made by the Group.
Group 2010 2009 2008
£m £m £m
Staff costs 210 365 503 Premises and equipment 3 78 25 Other administrative expenses 143 398 486 Depreciation and amortisation 20 18 36 376 859 1,050
Restructuring costs included in operating expenses comprise:
2010 2009 2008 £m £m £m
Staff costs 353 328 251 Premises and equipment 117 48 15 Other administrative expenses 104 51 41 574 427 307
Divestment costs included in operating expenses comprise:
2010 2009 2008 £m £m £m
Staff costs 51 — —Premises and equipment 6 — —Other administrative expenses 25 — —
82 — —
289RBS Group 2010
Financial statements
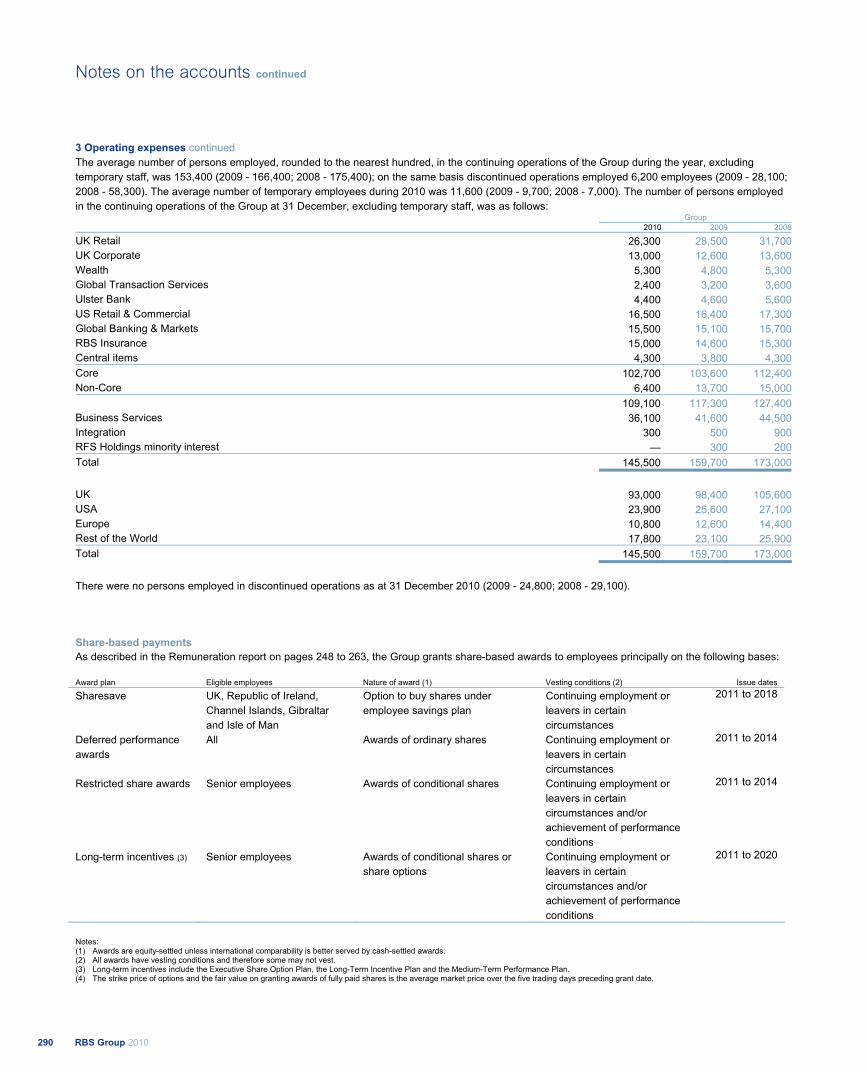
3 Operating expenses continued The average number of persons employed, rounded to the nearest hundred, in the continuing operations of the Group during the year, excluding temporary staff, was 153,400 (2009 - 166,400; 2008 - 175,400); on the same basis discontinued operations employed 6,200 employees (2009 - 28,100; 2008 - 58,300). The average number of temporary employees during 2010 was 11,600 (2009 - 9,700; 2008 - 7,000). The number of persons employed in the continuing operations of the Group at 31 December, excluding temporary staff, was as follows: Group 2010 2009 2008
UK Retail 26,300 28,500 31,700UK Corporate 13,000 12,600 13,600Wealth 5,300 4,800 5,300Global Transaction Services 2,400 3,200 3,600Ulster Bank 4,400 4,600 5,600US Retail & Commercial 16,500 16,400 17,300Global Banking & Markets 15,500 15,100 15,700RBS Insurance 15,000 14,600 15,300Central items 4,300 3,800 4,300Core 102,700 103,600 112,400Non-Core 6,400 13,700 15,000 109,100 117,300 127,400Business Services 36,100 41,600 44,500Integration 300 500 900RFS Holdings minority interest — 300 200Total 145,500 159,700 173,000
UK 93,000 98,400 105,600USA 23,900 25,600 27,100Europe 10,800 12,600 14,400Rest of the World 17,800 23,100 25,900Total 145,500 159,700 173,000
There were no persons employed in discontinued operations as at 31 December 2010 (2009 - 24,800; 2008 - 29,100).
Share-based payments As described in the Remuneration report on pages 248 to 263, the Group grants share-based awards to employees principally on the following bases: Award plan Eligible employees Nature of award (1) Vesting conditions (2) Issue dates
Sharesave UK, Republic of Ireland, Channel Islands, Gibraltar and Isle of Man
Option to buy shares under employee savings plan
Continuing employment or leavers in certain circumstances
2011 to 2018
Deferred performance awards
All Awards of ordinary shares Continuing employment or leavers in certain circumstances
2011 to 2014
Restricted share awards Senior employees Awards of conditional shares Continuing employment or leavers in certain circumstances and/or achievement of performance conditions
2011 to 2014
Long-term incentives (3) Senior employees Awards of conditional shares or share options
Continuing employment or leavers in certain circumstances and/or achievement of performance conditions
2011 to 2020
Notes: (1) Awards are equity-settled unless international comparability is better served by cash-settled awards. (2) All awards have vesting conditions and therefore some may not vest. (3) Long-term incentives include the Executive Share Option Plan, the Long-Term Incentive Plan and the Medium-Term Performance Plan. (4) The strike price of options and the fair value on granting awards of fully paid shares is the average market price over the five trading days preceding grant date.
RBS Group 2010290
Notes on the accounts continued
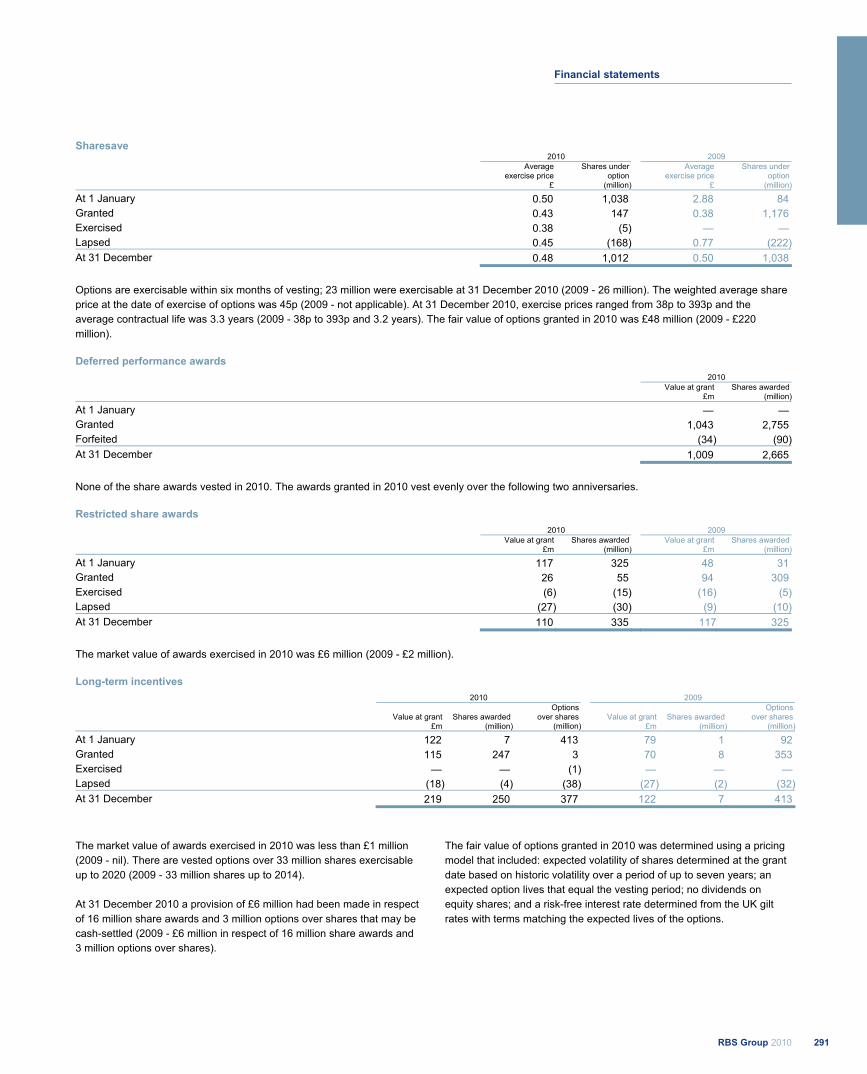
Sharesave 2010 2009
Average
exercise price £
Shares under option
(million)
Average exercise price
£
Shares under option
(million)
At 1 January 0.50 1,038 2.88 84 Granted 0.43 147 0.38 1,176 Exercised 0.38 (5) — —Lapsed 0.45 (168) 0.77 (222)At 31 December 0.48 1,012 0.50 1,038
Options are exercisable within six months of vesting; 23 million were exercisable at 31 December 2010 (2009 - 26 million). The weighted average share price at the date of exercise of options was 45p (2009 - not applicable). At 31 December 2010, exercise prices ranged from 38p to 393p and the average contractual life was 3.3 years (2009 - 38p to 393p and 3.2 years). The fair value of options granted in 2010 was £48 million (2009 - £220 million). Deferred performance awards 2010
Value at grant
£m Shares awarded
(million)
At 1 January — —Granted 1,043 2,755 Forfeited (34) (90)At 31 December 1,009 2,665
None of the share awards vested in 2010. The awards granted in 2010 vest evenly over the following two anniversaries. Restricted share awards 2010 2009
Value at grant
£mShares awarded
(million) Value at grant
£mShares awarded
(million)
At 1 January 117 325 48 31 Granted 26 55 94 309 Exercised (6) (15) (16) (5)Lapsed (27) (30) (9) (10)At 31 December 110 335 117 325
The market value of awards exercised in 2010 was £6 million (2009 - £2 million). Long-term incentives 2010 2009
Value at grant
£m Shares awarded
(million)
Options over shares
(million) Value at grant
£m Shares awarded
(million)
Options over shares
(million)
At 1 January 122 7 413 79 1 92 Granted 115 247 3 70 8 353 Exercised — — (1) — — —Lapsed (18) (4) (38) (27) (2) (32)At 31 December 219 250 377 122 7 413
The market value of awards exercised in 2010 was less than £1 million (2009 - nil). There are vested options over 33 million shares exercisable up to 2020 (2009 - 33 million shares up to 2014). At 31 December 2010 a provision of £6 million had been made in respect of 16 million share awards and 3 million options over shares that may be cash-settled (2009 - £6 million in respect of 16 million share awards and 3 million options over shares).
The fair value of options granted in 2010 was determined using a pricing model that included: expected volatility of shares determined at the grant date based on historic volatility over a period of up to seven years; an expected option lives that equal the vesting period; no dividends on equity shares; and a risk-free interest rate determined from the UK gilt rates with terms matching the expected lives of the options.
291RBS Group 2010
Financial statements
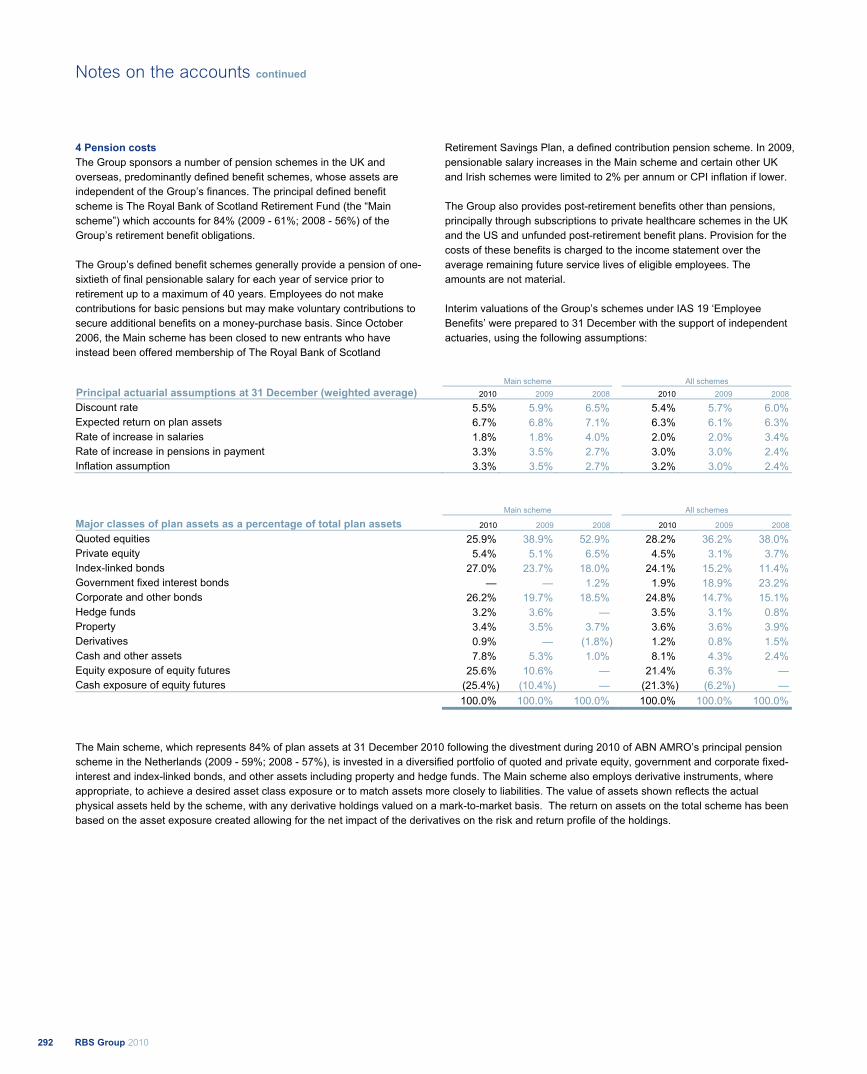
4 Pension costs The Group sponsors a number of pension schemes in the UK and overseas, predominantly defined benefit schemes, whose assets are independent of the Group’s finances. The principal defined benefit scheme is The Royal Bank of Scotland Retirement Fund (the “Main scheme”) which accounts for 84% (2009 - 61%; 2008 - 56%) of the Group’s retirement benefit obligations. The Group’s defined benefit schemes generally provide a pension of one-sixtieth of final pensionable salary for each year of service prior to retirement up to a maximum of 40 years. Employees do not make contributions for basic pensions but may make voluntary contributions to secure additional benefits on a money-purchase basis. Since October 2006, the Main scheme has been closed to new entrants who have instead been offered membership of The Royal Bank of Scotland
Retirement Savings Plan, a defined contribution pension scheme. In 2009, pensionable salary increases in the Main scheme and certain other UK and Irish schemes were limited to 2% per annum or CPI inflation if lower. The Group also provides post-retirement benefits other than pensions, principally through subscriptions to private healthcare schemes in the UK and the US and unfunded post-retirement benefit plans. Provision for the costs of these benefits is charged to the income statement over the average remaining future service lives of eligible employees. The amounts are not material. Interim valuations of the Group’s schemes under IAS 19 ‘Employee Benefits’ were prepared to 31 December with the support of independent actuaries, using the following assumptions:
Main scheme All schemes Principal actuarial assumptions at 31 December (weighted average) 2010 2009 2008 2010 2009 2008
Discount rate 5.5% 5.9% 6.5% 5.4% 5.7% 6.0% Expected return on plan assets 6.7% 6.8% 7.1% 6.3% 6.1% 6.3% Rate of increase in salaries 1.8% 1.8% 4.0% 2.0% 2.0% 3.4% Rate of increase in pensions in payment 3.3% 3.5% 2.7% 3.0% 3.0% 2.4% Inflation assumption 3.3% 3.5% 2.7% 3.2% 3.0% 2.4%
Main scheme All schemes
Major classes of plan assets as a percentage of total plan assets 2010 2009 2008 2010 2009 2008
Quoted equities 25.9% 38.9% 52.9% 28.2% 36.2% 38.0% Private equity 5.4% 5.1% 6.5% 4.5% 3.1% 3.7% Index-linked bonds 27.0% 23.7% 18.0% 24.1% 15.2% 11.4% Government fixed interest bonds — — 1.2% 1.9% 18.9% 23.2% Corporate and other bonds 26.2% 19.7% 18.5% 24.8% 14.7% 15.1% Hedge funds 3.2% 3.6% — 3.5% 3.1% 0.8% Property 3.4% 3.5% 3.7% 3.6% 3.6% 3.9% Derivatives 0.9% — (1.8%) 1.2% 0.8% 1.5% Cash and other assets 7.8% 5.3% 1.0% 8.1% 4.3% 2.4% Equity exposure of equity futures 25.6% 10.6% — 21.4% 6.3% — Cash exposure of equity futures (25.4%) (10.4%) — (21.3%) (6.2%) — 100.0% 100.0% 100.0% 100.0% 100.0% 100.0%
The Main scheme, which represents 84% of plan assets at 31 December 2010 following the divestment during 2010 of ABN AMRO’s principal pension scheme in the Netherlands (2009 - 59%; 2008 - 57%), is invested in a diversified portfolio of quoted and private equity, government and corporate fixed-interest and index-linked bonds, and other assets including property and hedge funds. The Main scheme also employs derivative instruments, where appropriate, to achieve a desired asset class exposure or to match assets more closely to liabilities. The value of assets shown reflects the actual physical assets held by the scheme, with any derivative holdings valued on a mark-to-market basis. The return on assets on the total scheme has been based on the asset exposure created allowing for the net impact of the derivatives on the risk and return profile of the holdings.
RBS Group 2010292
Notes on the accounts continued
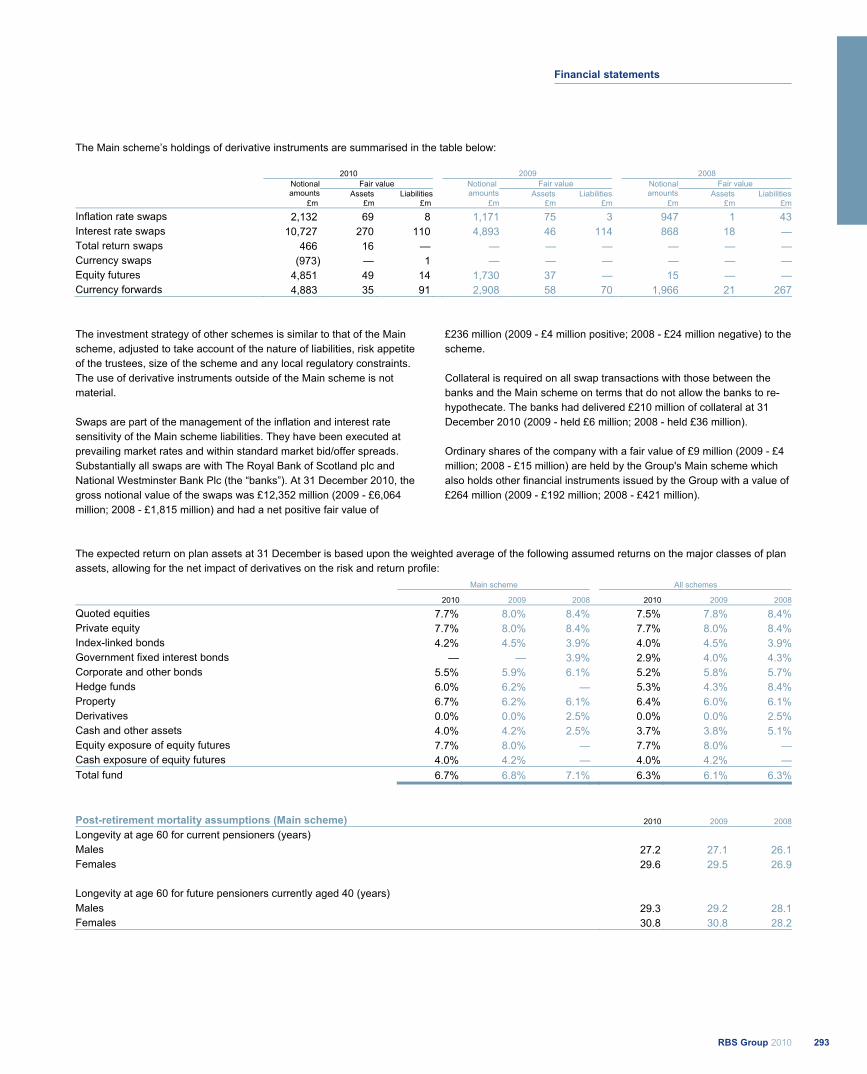
The Main scheme’s holdings of derivative instruments are summarised in the table below:
2010 2009 2008 Fair value Fair value Fair value Notional
amounts Assets LiabilitiesNotional amounts Assets Liabilities
Notionalamounts Assets Liabilities
£m £m £m £m £m £m £m £m £m
Inflation rate swaps 2,132 69 8 1,171 75 3 947 1 43Interest rate swaps 10,727 270 110 4,893 46 114 868 18 —Total return swaps 466 16 — — — — — — —Currency swaps (973) — 1 — — — — — —Equity futures 4,851 49 14 1,730 37 — 15 — —Currency forwards 4,883 35 91 2,908 58 70 1,966 21 267
The investment strategy of other schemes is similar to that of the Main scheme, adjusted to take account of the nature of liabilities, risk appetite of the trustees, size of the scheme and any local regulatory constraints. The use of derivative instruments outside of the Main scheme is not material. Swaps are part of the management of the inflation and interest rate sensitivity of the Main scheme liabilities. They have been executed at prevailing market rates and within standard market bid/offer spreads. Substantially all swaps are with The Royal Bank of Scotland plc and National Westminster Bank Plc (the “banks”). At 31 December 2010, the gross notional value of the swaps was £12,352 million (2009 - £6,064 million; 2008 - £1,815 million) and had a net positive fair value of
£236 million (2009 - £4 million positive; 2008 - £24 million negative) to the scheme. Collateral is required on all swap transactions with those between the banks and the Main scheme on terms that do not allow the banks to re-hypothecate. The banks had delivered £210 million of collateral at 31 December 2010 (2009 - held £6 million; 2008 - held £36 million). Ordinary shares of the company with a fair value of £9 million (2009 - £4 million; 2008 - £15 million) are held by the Group's Main scheme which also holds other financial instruments issued by the Group with a value of £264 million (2009 - £192 million; 2008 - £421 million).
The expected return on plan assets at 31 December is based upon the weighted average of the following assumed returns on the major classes of plan assets, allowing for the net impact of derivatives on the risk and return profile: Main scheme All schemes
2010 2009 2008 2010 2009 2008
Quoted equities 7.7% 8.0% 8.4% 7.5% 7.8% 8.4%Private equity 7.7% 8.0% 8.4% 7.7% 8.0% 8.4%Index-linked bonds 4.2% 4.5% 3.9% 4.0% 4.5% 3.9%Government fixed interest bonds — — 3.9% 2.9% 4.0% 4.3%Corporate and other bonds 5.5% 5.9% 6.1% 5.2% 5.8% 5.7%Hedge funds 6.0% 6.2% — 5.3% 4.3% 8.4%Property 6.7% 6.2% 6.1% 6.4% 6.0% 6.1%Derivatives 0.0% 0.0% 2.5% 0.0% 0.0% 2.5%Cash and other assets 4.0% 4.2% 2.5% 3.7% 3.8% 5.1%Equity exposure of equity futures 7.7% 8.0% — 7.7% 8.0% —Cash exposure of equity futures 4.0% 4.2% — 4.0% 4.2% —Total fund 6.7% 6.8% 7.1% 6.3% 6.1% 6.3%
Post-retirement mortality assumptions (Main scheme) 2010 2009 2008
Longevity at age 60 for current pensioners (years) Males 27.2 27.1 26.1Females 29.6 29.5 26.9 Longevity at age 60 for future pensioners currently aged 40 (years) Males 29.3 29.2 28.1Females 30.8 30.8 28.2
293RBS Group 2010
Financial statements

4 Pension costs continued Main scheme All schemes
Changes in value of net pension deficit/(surplus)
Fair value of plan assets
£m
Present value of defined benefit
obligations £m
Net pension
deficit/ (surplus)
£m
Fair value of plan assets
£m
Present value of defined benefit
obligations £m
Net pension
deficit/ (surplus)
£m
At 1 January 2009 14,804 15,594 790 25,756 27,752 1,996 Currency translation and other adjustments — — — (699) (813) (114)Income statement
Expected return 1,029 (1,029) 1,553 (1,553)Interest cost 999 999 1,614 1,614 Current service cost 300 300 583 583 Past service cost 15 15 15 15 Gains on curtailments (1,947) (1,947) (2,148) (2,148)
1,029 (633) (1,662) 1,553 64 (1,489)Statement of comprehensive income
- Actuarial gains and losses 993 4,473 3,480 1,344 5,009 3,665 Contributions by employer 536 — (536) 1,153 — (1,153)Contributions by plan participants and other scheme members 2 2 — 15 15 — Benefits paid (741) (741) — (1,175) (1,175) — Expenses included in service cost (20) (20) — (22) (22) — At 1 January 2010 16,603 18,675 2,072 27,925 30,830 2,905 Currency translation and other adjustments — — — (206) (206) — Income statement
Expected return 1,114 (1,114) 1,428 (1,428)Interest cost 1,091 1,091 1,402 1,402 Current service cost 345 345 499 499 Past service cost 76 76 67 67 Gains on curtailments — — (78) (78)
1,114 1,512 398 1,428 1,890 462 Statement of comprehensive income
- Actuarial gains and losses 1,718 1,674 (44) 1,797 1,639 (158)Disposal of subsidiaries — — — (7,993) (8,187) (194)Contributions by employer 444 — (444) 832 — (832)Contributions by plan participants and other scheme members — — — 10 10 — Benefits paid (716) (716) — (922) (922) — Expenses included in service cost (53) (53) — (55) (55) — At 31 December 2010 19,110 21,092 1,982 22,816 24,999 2,183
Net pension deficit/(surplus) comprises 2010
£m 2009
£m 2008
£m
Net assets of schemes in surplus (included in Prepayments, accrued income and other assets, Note 21) (105) (58) (36)Net liabilities of schemes in deficit 2,288 2,963 2,032 2,183 2,905 1,996
RBS Group 2010294
Notes on the accounts continued

The pension charge/(credit) to the income statement comprises:
2010
£m 2009
£m 2008
£m
Continuing operations 441 (1,510) 473 Discontinued operations 21 21 17 462 (1,489) 490
Curtailment gains of £78 million have been recognised in 2010 arising from changes to pension benefits in a subsidiary’s scheme. Curtailment gains of £2,148 million were recognised in 2009 arising from changes to pension benefits in the Main scheme and certain other subsidiaries’ schemes due to the capping of future salary increases that will count for pension purposes to the lower of 2% or the rate of CPI inflation in any year. The curtailment gains in 2009 were separately disclosed on the face of the income statement due to their size. Following the legal separation of ABN AMRO Bank N.V. on 1 April 2010, ABN AMRO’s principal pension scheme in the Netherlands was transferred to the State of the Netherlands. At 31 December 2009, this scheme had fair value of plan assets of £8,118 million (2008 - £8,181 million) and present value of defined benefit obligations of £8,298 million (2008 - £8,589 million). The principal actuarial assumptions at 31 December 2009 were: discount rate 5.25% (2008 - 5.4%); expected return on plan assets (weighted average) 5.25% (2008 - 5.25%); rate of increase in salaries 2.5% (2008 - 2.5%); rate of increase in pensions in payment 2.0% (2008 - 2.0%); and inflation assumption 2.0% (2008 - 2.0%).
The Group expects to contribute £500 million to its defined benefit pension schemes in 2011 (Main scheme - £333 million). Of the net liabilities of schemes in deficit, £161 million (2009 - £198 million; 2008 - £201 million) relates to unfunded schemes. The most recent funding valuation of the Main UK scheme was 31 March 2007. A funding valuation of the Main UK scheme at 31 March 2010 is currently in progress. The scheme trustees and the Group are in discussion on this valuation and the level of contributions to be paid by the Group and expect to reach agreement by 30 June 2011. The Group expects that in addition to estimated contributions of £300 - £350 million for future accrual of benefits, it will make additional contributions, as yet unquantified, in 2011 and subsequent years to improve the funding position of the scheme. Cumulative net actuarial losses of £4,224 million (2009 - £4,382 million losses; 2008 - £717 million gains) have been recognised in the statement of comprehensive income, of which £3,252 million losses (2009 - £3,296 million losses; 2008 - £184 million gains) relate to the Main scheme.
Main scheme All schemes
History of defined benefit schemes 2010
£m 2009
£m 2008
£m2007
£m 2006
£m2010
£m 2009
£m 2008
£m 2007
£m2006
£m
Fair value of plan assets 19,110 16,603 14,804 18,575 17,374 22,816 27,925 25,756 27,662 18,959 Present value of defined benefit obligations 21,092 18,675 15,594 18,099 19,004 24,999 30,830 27,752 27,547 20,951 Net deficit/(surplus) 1,982 2,072 790 (476) 1,630 2,183 2,905 1,996 (115) 1,992
Experience (losses)/gains on plan liabilities (858) 135 (55) (256) (4) (882) 328 (65) (210) (19)Experience gains/(losses) on plan assets 1,718 993 (4,784) 163 552 1,797 1,344 (6,051) 19 587 Actual return/(loss) on pension schemes assets 2,832 2,022 (3,513) 1,345 1,574 3,225 2,897 (4,186) 1,413 1,660 Actual return/(loss) on pension schemes assets - % 17.2% 13.8% (19.0%) 7.8% 9.9% 15.6% 11.4% (14.5%) 6.9% 9.6%
295RBS Group 2010
Financial statements
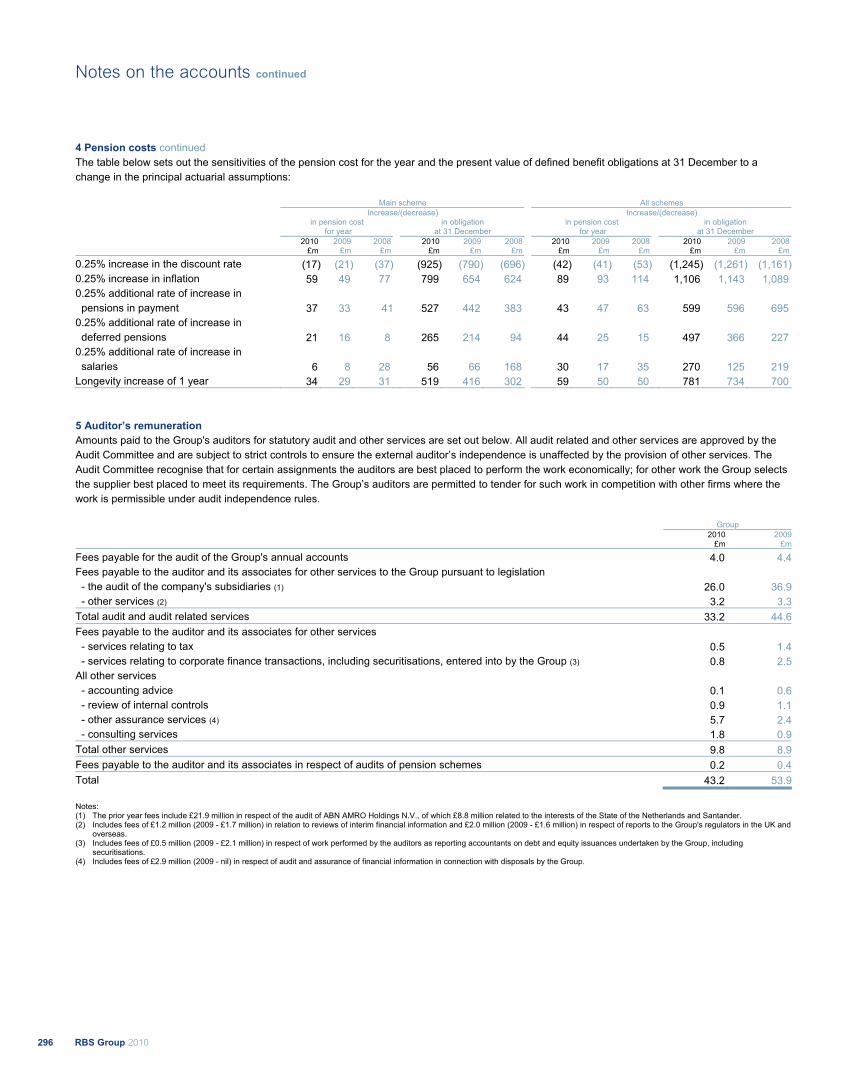
4 Pension costs continued The table below sets out the sensitivities of the pension cost for the year and the present value of defined benefit obligations at 31 December to a change in the principal actuarial assumptions:
Main scheme All schemes Increase/(decrease) Increase/(decrease)
in pension cost for year
in obligation at 31 December
in pension cost for year
in obligation at 31 December
2010 2009 2008 2010 2009 2008 2010 2009 2008 2010 2009 2008 £m £m £m £m £m £m £m £m £m £m £m £m
0.25% increase in the discount rate (17) (21) (37) (925) (790) (696) (42) (41) (53) (1,245) (1,261) (1,161)0.25% increase in inflation 59 49 77 799 654 624 89 93 114 1,106 1,143 1,089 0.25% additional rate of increase in pensions in payment 37 33 41 527 442 383 43 47 63 599 596 695 0.25% additional rate of increase in deferred pensions 21 16 8 265 214 94 44 25 15 497 366 227 0.25% additional rate of increase in salaries 6 8 28 56 66 168 30 17 35 270 125 219 Longevity increase of 1 year 34 29 31 519 416 302 59 50 50 781 734 700
5 Auditor’s remuneration Amounts paid to the Group's auditors for statutory audit and other services are set out below. All audit related and other services are approved by the Audit Committee and are subject to strict controls to ensure the external auditor’s independence is unaffected by the provision of other services. The Audit Committee recognise that for certain assignments the auditors are best placed to perform the work economically; for other work the Group selects the supplier best placed to meet its requirements. The Group’s auditors are permitted to tender for such work in competition with other firms where the work is permissible under audit independence rules.
Group 2010 2009
£m £m
Fees payable for the audit of the Group's annual accounts 4.0 4.4Fees payable to the auditor and its associates for other services to the Group pursuant to legislation - the audit of the company's subsidiaries (1) 26.0 36.9 - other services (2) 3.2 3.3Total audit and audit related services 33.2 44.6Fees payable to the auditor and its associates for other services
- services relating to tax 0.5 1.4 - services relating to corporate finance transactions, including securitisations, entered into by the Group (3) 0.8 2.5All other services - accounting advice 0.1 0.6 - review of internal controls 0.9 1.1 - other assurance services (4) 5.7 2.4 - consulting services 1.8 0.9Total other services 9.8 8.9Fees payable to the auditor and its associates in respect of audits of pension schemes 0.2 0.4Total 43.2 53.9
Notes: (1) The prior year fees include £21.9 million in respect of the audit of ABN AMRO Holdings N.V., of which £8.8 million related to the interests of the State of the Netherlands and Santander. (2) Includes fees of £1.2 million (2009 - £1.7 million) in relation to reviews of interim financial information and £2.0 million (2009 - £1.6 million) in respect of reports to the Group's regulators in the UK and
overseas. (3) Includes fees of £0.5 million (2009 - £2.1 million) in respect of work performed by the auditors as reporting accountants on debt and equity issuances undertaken by the Group, including
securitisations. (4) Includes fees of £2.9 million (2009 - nil) in respect of audit and assurance of financial information in connection with disposals by the Group.
RBS Group 2010296
Notes on the accounts continued

6 Tax Group 2010 2009 2008
£m £m £m
Current tax Charge for the year (251) (494) (1,386)Over provision in respect of prior periods 41 191 254 Relief for overseas tax — — 34 (210) (303) (1,098)Deferred tax (Charge)/credit for the year (738) 1,041 3,167 Over/(under) provision in respect of prior periods 314 (309) 98 Tax (charge)/credit for the year (634) 429 2,167
The actual tax (charge)/credit differs from the expected tax credit computed by applying the standard rate of UK corporation tax of 28% (2009 - 28%; 2008 - 28.5%) as follows: 2010 2009 2008 £m £m £m
Expected tax credit 112 741 7,322 Non-deductible goodwill impairment (3) (102) (3,826)Unrecognised timing differences 11 274 (274)Items not allowed for tax - losses on strategic disposals and write-downs (311) (152) (108) - other (328) (356) (270)Non-taxable items
- gain on sale of Global Merchant Services 221 — —- gain on redemption of own debt 11 693 —- other 341 410 491
Taxable foreign exchange movements 4 1 (80)Foreign profits taxed at other rates (517) (276) (509)UK tax rate change - deferred tax impact (82) — —Losses in year where no deferred tax asset recognised (450) (780) (942)Losses brought forward and utilised 2 94 11 Adjustments in respect of prior years (1) 355 (118) 352 Actual tax (charge)/credit (634) 429 2,167
Notes: (1) Prior year tax adjustments include releases of tax provisions in respect of structured transactions and investment disposals, and adjustments to reflect submitted tax computations in the UK and
overseas. (2) In the Budget on 22 June 2010, the UK Government proposed, amongst other things, to reduce Corporation Tax rates in four annual decrements of 1% with effect from 1 April 2011. The first
decrement was enacted in the Finance (No 2) Act 2010 and as a consequence the closing deferred tax assets and liabilities have been recognised at an effective rate of 27%. The impact of this change on the tax charge for the year is set out in the table above.
7 Profit attributable to preference shareholders and paid-in equity holders Group 2010
£m 2009
£m 2008
£m
Preference shareholders Non-cumulative preference shares of US$0.01 105 342 293 Non-cumulative preference shares of €0.01 — 201 183 Non-cumulative preference shares of £1
- issued to UK Financial Investments Limited (1) — 274 —- other — 61 60
Paid-in equity holders Interest on securities classified as equity, net of tax 19 57 60 Total 124 935 596
Note: (1) Includes £50 million redemption premium on repayment of preference shares.
297RBS Group 2010
Financial statements
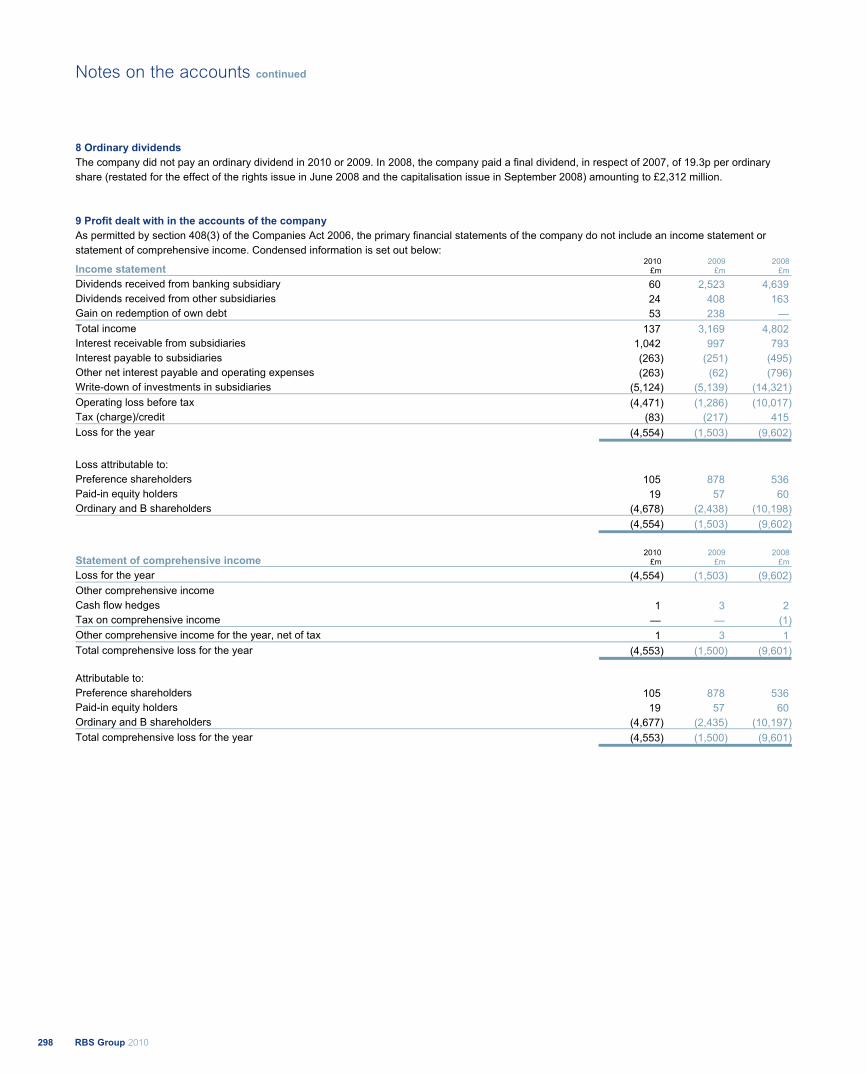
8 Ordinary dividends The company did not pay an ordinary dividend in 2010 or 2009. In 2008, the company paid a final dividend, in respect of 2007, of 19.3p per ordinary share (restated for the effect of the rights issue in June 2008 and the capitalisation issue in September 2008) amounting to £2,312 million.
9 Profit dealt with in the accounts of the company As permitted by section 408(3) of the Companies Act 2006, the primary financial statements of the company do not include an income statement or statement of comprehensive income. Condensed information is set out below:
Income statement 2010
£m2009
£m2008
£m
Dividends received from banking subsidiary 60 2,523 4,639 Dividends received from other subsidiaries 24 408 163 Gain on redemption of own debt 53 238 —Total income 137 3,169 4,802 Interest receivable from subsidiaries 1,042 997 793 Interest payable to subsidiaries (263) (251) (495)Other net interest payable and operating expenses (263) (62) (796)Write-down of investments in subsidiaries (5,124) (5,139) (14,321)Operating loss before tax (4,471) (1,286) (10,017)Tax (charge)/credit (83) (217) 415 Loss for the year (4,554) (1,503) (9,602)
Loss attributable to: Preference shareholders 105 878 536 Paid-in equity holders 19 57 60 Ordinary and B shareholders (4,678) (2,438) (10,198) (4,554) (1,503) (9,602)
Statement of comprehensive income 2010
£m 2009
£m 2008
£m
Loss for the year (4,554) (1,503) (9,602)Other comprehensive income Cash flow hedges 1 3 2Tax on comprehensive income — — (1)Other comprehensive income for the year, net of tax 1 3 1Total comprehensive loss for the year (4,553) (1,500) (9,601)
Attributable to: Preference shareholders 105 878 536 Paid-in equity holders 19 57 60 Ordinary and B shareholders (4,677) (2,435) (10,197)Total comprehensive loss for the year (4,553) (1,500) (9,601)
RBS Group 2010298
Notes on the accounts continued

10 Earnings per ordinary and B share Earnings per ordinary and B share have been calculated based on the following:
Group
2010
£m 2009
£m 2008
£m
Earnings Loss attributable to ordinary and B shareholders (1,125) (3,607) (24,306)Loss from discontinued operations attributable to ordinary and B shareholders 28 72 86 Gain on redemption of preference shares and paid-in equity 610 200 — Loss from continuing operations attributable to ordinary and B shareholders (487) (3,335) (24,220)
Weighted average number of shares (millions) Ordinary shares in issue during the year 56,245 51,494 16,563 B shares in issue during the year 51,000 1,397 — Weighted average number of ordinary and B shares in issue during the year (1) 107,245 52,891 16,563
Note: (1) Following reconsideration of the terms of the B share subscription agreement with HM Treasury, it is no longer treated as dilutive. The comparative amount for the year ended 31 December 2009 has
been restated.
The number of shares in issue in 2008 was adjusted retrospectively for the bonus element of the rights issue completed in June 2008 and the capitalisation issue in September 2008. None of the convertible securities had a dilutive effect in 2010, 2009 or 2008.
299RBS Group 2010
Financial statements
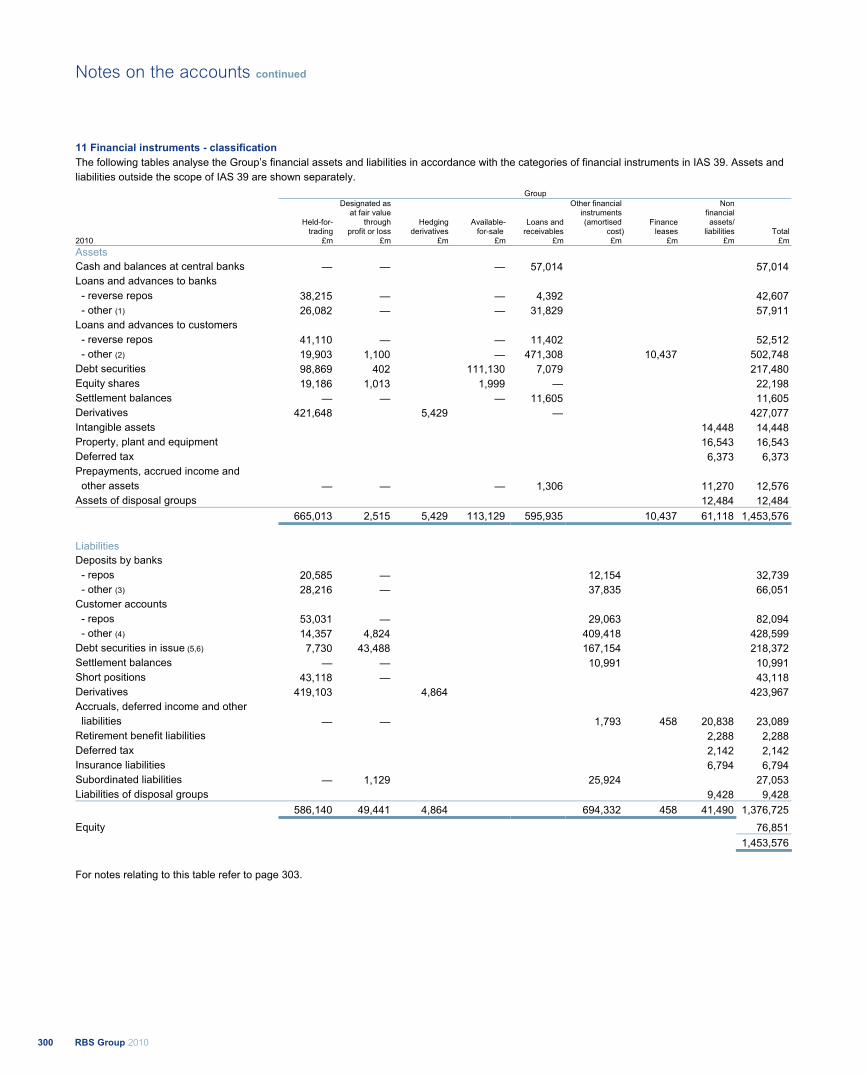
11 Financial instruments - classification The following tables analyse the Group’s financial assets and liabilities in accordance with the categories of financial instruments in IAS 39. Assets and liabilities outside the scope of IAS 39 are shown separately. Group
Held-for-
trading
Designated as at fair value
through profit or loss
Hedging derivatives
Available- for-sale
Loans and receivables
Other financial instruments (amortised
cost)Finance leases
Non financial assets/
liabilities Total 2010 £m £m £m £m £m £m £m £m £m Assets Cash and balances at central banks — — — 57,014 57,014 Loans and advances to banks
- reverse repos 38,215 — — 4,392 42,607 - other (1) 26,082 — — 31,829 57,911 Loans and advances to customers - reverse repos 41,110 — — 11,402 52,512 - other (2) 19,903 1,100 — 471,308 10,437 502,748 Debt securities 98,869 402 111,130 7,079 217,480 Equity shares 19,186 1,013 1,999 — 22,198 Settlement balances — — — 11,605 11,605 Derivatives 421,648 5,429 — 427,077 Intangible assets 14,448 14,448 Property, plant and equipment 16,543 16,543 Deferred tax 6,373 6,373 Prepayments, accrued income and other assets — — — 1,306 11,270 12,576 Assets of disposal groups 12,484 12,484 665,013 2,515 5,429 113,129 595,935 10,437 61,118 1,453,576
Liabilities Deposits by banks - repos 20,585 — 12,154 32,739 - other (3) 28,216 — 37,835 66,051 Customer accounts - repos 53,031 — 29,063 82,094 - other (4) 14,357 4,824 409,418 428,599 Debt securities in issue (5,6) 7,730 43,488 167,154 218,372 Settlement balances — — 10,991 10,991 Short positions 43,118 — 43,118 Derivatives 419,103 4,864 423,967 Accruals, deferred income and other liabilities — — 1,793 458 20,838 23,089 Retirement benefit liabilities 2,288 2,288 Deferred tax 2,142 2,142 Insurance liabilities 6,794 6,794 Subordinated liabilities — 1,129 25,924 27,053 Liabilities of disposal groups 9,428 9,428 586,140 49,441 4,864 694,332 458 41,490 1,376,725 Equity 76,851
1,453,576
For notes relating to this table refer to page 303.
RBS Group 2010300
Notes on the accounts continued
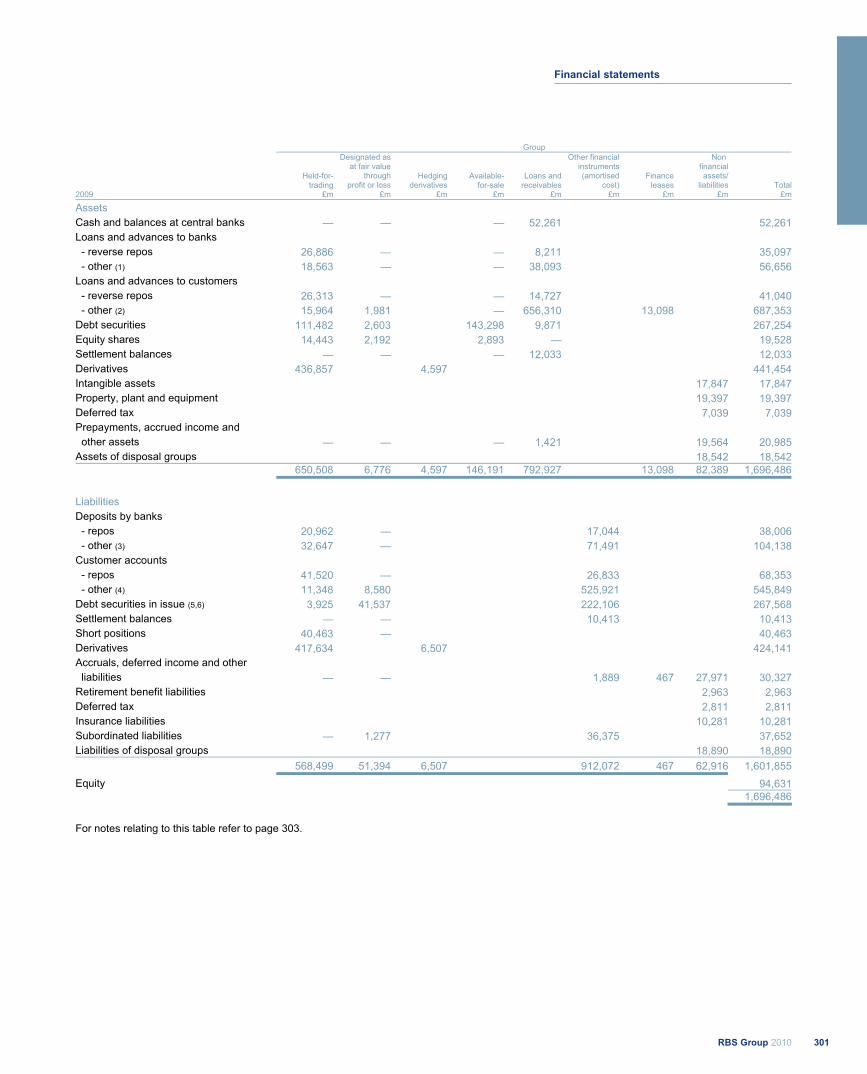
Group
Held-for-trading
Designated asat fair value
throughprofit or loss
Hedging derivatives
Available-for-sale
Loans and receivables
Other financial instruments (amortised
cost)Finance leases
Non financial assets/
liabilities Total2009 £m £m £m £m £m £m £m £m £m
Assets Cash and balances at central banks — — — 52,261 52,261Loans and advances to banks - reverse repos 26,886 — — 8,211 35,097 - other (1) 18,563 — — 38,093 56,656Loans and advances to customers - reverse repos 26,313 — — 14,727 41,040 - other (2) 15,964 1,981 — 656,310 13,098 687,353Debt securities 111,482 2,603 143,298 9,871 267,254Equity shares 14,443 2,192 2,893 — 19,528Settlement balances — — — 12,033 12,033Derivatives 436,857 4,597 441,454Intangible assets 17,847 17,847Property, plant and equipment 19,397 19,397Deferred tax 7,039 7,039Prepayments, accrued income and other assets — — — 1,421 19,564 20,985Assets of disposal groups 18,542 18,542 650,508 6,776 4,597 146,191 792,927 13,098 82,389 1,696,486
Liabilities Deposits by banks - repos 20,962 — 17,044 38,006 - other (3) 32,647 — 71,491 104,138Customer accounts - repos 41,520 — 26,833 68,353 - other (4) 11,348 8,580 525,921 545,849Debt securities in issue (5,6) 3,925 41,537 222,106 267,568Settlement balances — — 10,413 10,413Short positions 40,463 — 40,463Derivatives 417,634 6,507 424,141Accruals, deferred income and other liabilities — — 1,889 467 27,971 30,327Retirement benefit liabilities 2,963 2,963Deferred tax 2,811 2,811Insurance liabilities 10,281 10,281Subordinated liabilities — 1,277 36,375 37,652Liabilities of disposal groups 18,890 18,890 568,499 51,394 6,507 912,072 467 62,916 1,601,855Equity 94,631
1,696,486
For notes relating to this table refer to page 303.
301RBS Group 2010
Financial statements
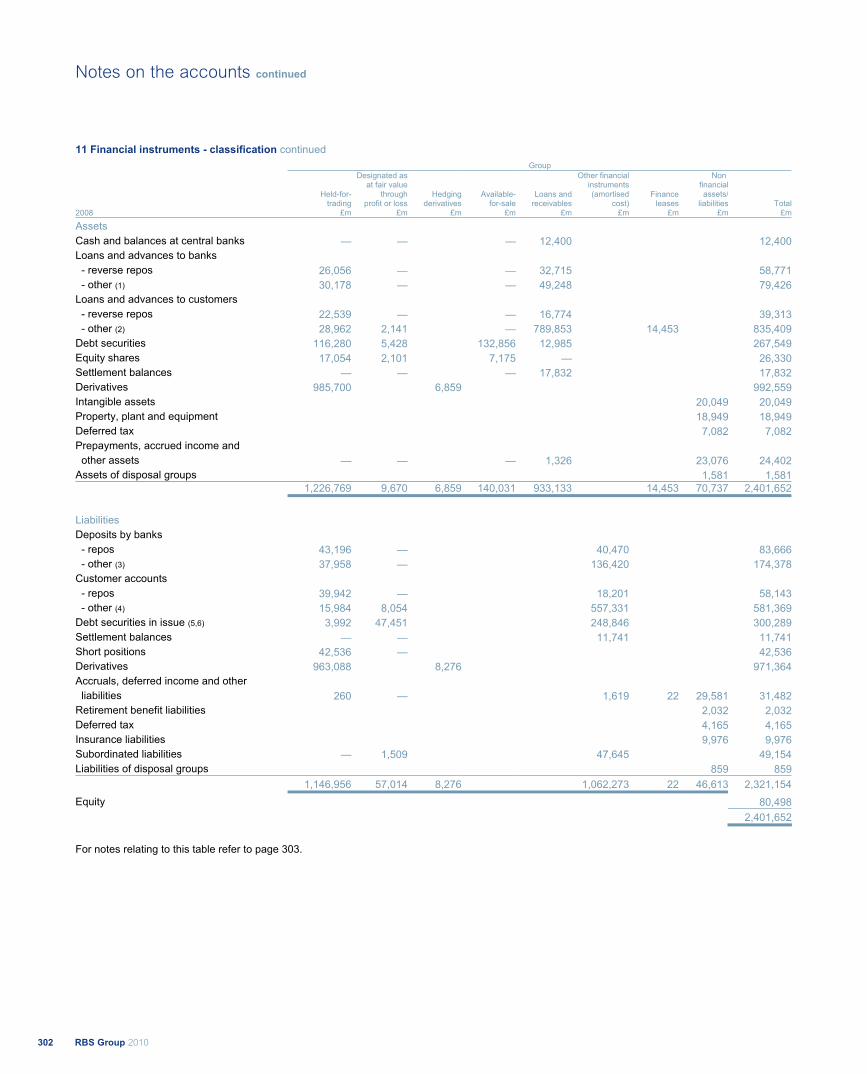
11 Financial instruments - classification continued Group
Held-for-trading
Designated asat fair value
throughprofit or loss
Hedging derivatives
Available-for-sale
Loans and receivables
Other financial instruments (amortised
cost)Finance
leases
Nonfinancialassets/
liabilities Total2008 £m £m £m £m £m £m £m £m £m
Assets Cash and balances at central banks — — — 12,400 12,400Loans and advances to banks - reverse repos 26,056 — — 32,715 58,771 - other (1) 30,178 — — 49,248 79,426Loans and advances to customers - reverse repos 22,539 — — 16,774 39,313 - other (2) 28,962 2,141 — 789,853 14,453 835,409Debt securities 116,280 5,428 132,856 12,985 267,549Equity shares 17,054 2,101 7,175 — 26,330Settlement balances — — — 17,832 17,832Derivatives 985,700 6,859 992,559Intangible assets 20,049 20,049Property, plant and equipment 18,949 18,949Deferred tax 7,082 7,082Prepayments, accrued income and other assets — — — 1,326 23,076 24,402Assets of disposal groups 1,581 1,581 1,226,769 9,670 6,859 140,031 933,133 14,453 70,737 2,401,652
Liabilities Deposits by banks - repos 43,196 — 40,470 83,666 - other (3) 37,958 — 136,420 174,378Customer accounts - repos 39,942 — 18,201 58,143 - other (4) 15,984 8,054 557,331 581,369Debt securities in issue (5,6) 3,992 47,451 248,846 300,289Settlement balances — — 11,741 11,741Short positions 42,536 — 42,536Derivatives 963,088 8,276 971,364Accruals, deferred income and other liabilities 260 — 1,619 22 29,581 31,482Retirement benefit liabilities 2,032 2,032Deferred tax 4,165 4,165Insurance liabilities 9,976 9,976Subordinated liabilities — 1,509 47,645 49,154Liabilities of disposal groups 859 859 1,146,956 57,014 8,276 1,062,273 22 46,613 2,321,154Equity 80,498
2,401,652
For notes relating to this table refer to page 303.
RBS Group 2010302
Notes on the accounts continued
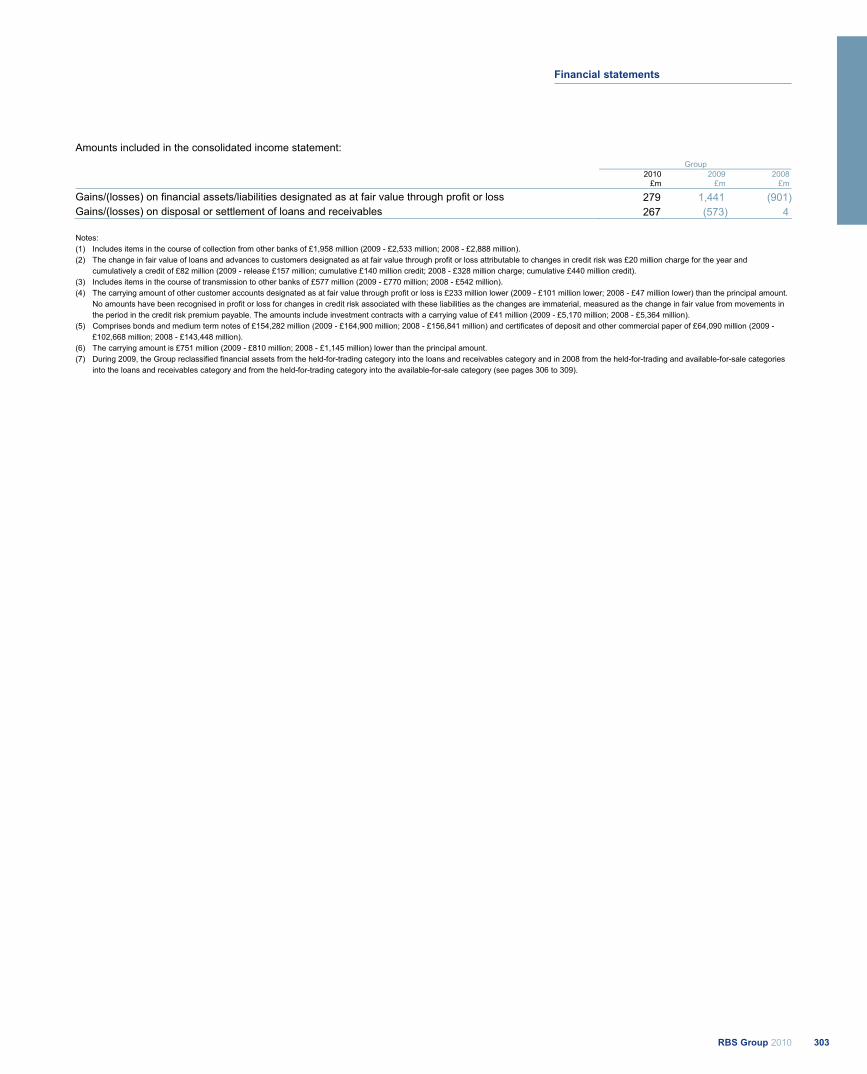
Amounts included in the consolidated income statement: Group
2010
£m 2009
£m 2008
£m
Gains/(losses) on financial assets/liabilities designated as at fair value through profit or loss 279 1,441 (901)Gains/(losses) on disposal or settlement of loans and receivables 267 (573) 4
Notes: (1) Includes items in the course of collection from other banks of £1,958 million (2009 - £2,533 million; 2008 - £2,888 million). (2) The change in fair value of loans and advances to customers designated as at fair value through profit or loss attributable to changes in credit risk was £20 million charge for the year and
cumulatively a credit of £82 million (2009 - release £157 million; cumulative £140 million credit; 2008 - £328 million charge; cumulative £440 million credit). (3) Includes items in the course of transmission to other banks of £577 million (2009 - £770 million; 2008 - £542 million). (4) The carrying amount of other customer accounts designated as at fair value through profit or loss is £233 million lower (2009 - £101 million lower; 2008 - £47 million lower) than the principal amount.
No amounts have been recognised in profit or loss for changes in credit risk associated with these liabilities as the changes are immaterial, measured as the change in fair value from movements in the period in the credit risk premium payable. The amounts include investment contracts with a carrying value of £41 million (2009 - £5,170 million; 2008 - £5,364 million).
(5) Comprises bonds and medium term notes of £154,282 million (2009 - £164,900 million; 2008 - £156,841 million) and certificates of deposit and other commercial paper of £64,090 million (2009 - £102,668 million; 2008 - £143,448 million).
(6) The carrying amount is £751 million (2009 - £810 million; 2008 - £1,145 million) lower than the principal amount. (7) During 2009, the Group reclassified financial assets from the held-for-trading category into the loans and receivables category and in 2008 from the held-for-trading and available-for-sale categories
into the loans and receivables category and from the held-for-trading category into the available-for-sale category (see pages 306 to 309).
303RBS Group 2010
Financial statements

11 Financial instruments - classification continued The following tables analyse the company's financial assets and financial liabilities in accordance with the categories of financial instruments in IAS 39. Assets and liabilities outside the scope of IAS 39 are shown separately.
Company
Held-for- trading
Hedging derivatives
Loans and receivables
Other financial
instruments (amortised cost)
Non financial assets/
liabilities Total 2010 £m £m £m £m £m £m Assets Loans and advances to banks (1) — 19,535 19,535 Loans and advances to customers (2) — 6,689 6,689 Debt securities (2) — 1,454 1,454 Investments in Group undertakings 49,125 49,125 Derivatives (2) 1,223 252 1,475 Deferred tax 2 2 Prepayments, accrued income and other assets — — 28 28 1,223 252 27,678 — 49,155 78,308
Liabilities Customer accounts (4) — 1,029 1,029 Debt securities in issue — 8,742 8,742 Derivatives (4) 231 — 231 Accruals, deferred income and other liabilities — — 1,034 1,034 Subordinated liabilities — 8,048 8,048 231 — 17,819 1,034 19,084 Equity 59,224
78,308
2009 Assets Loans and advances to banks (1) — 31,238 31,238 Loans and advances to customers (2) — 2,777 2,777 Debt securities (2) — 1,286 1,286 Investments in Group undertakings 64,766 64,766 Settlement balances 11 11 Derivatives (2) 930 239 1,169 Deferred tax 2 2Prepayments, accrued income and other assets — — 43 43 930 239 35,301 64,822 101,292
Liabilities Deposits by banks (3) — 93 93 Customer accounts (4) — 13,264 13,264 Debt securities in issue — 11,788 11,788 Derivatives (4) 432 14 446 Accruals, deferred income and other liabilities — — 1,357 1,357 Subordinated liabilities — 8,762 8,762 432 14 33,907 1,357 35,710 Equity 65,582
101,292
For notes relating to this table refer to page 305.
RBS Group 2010304
Notes on the accounts continued
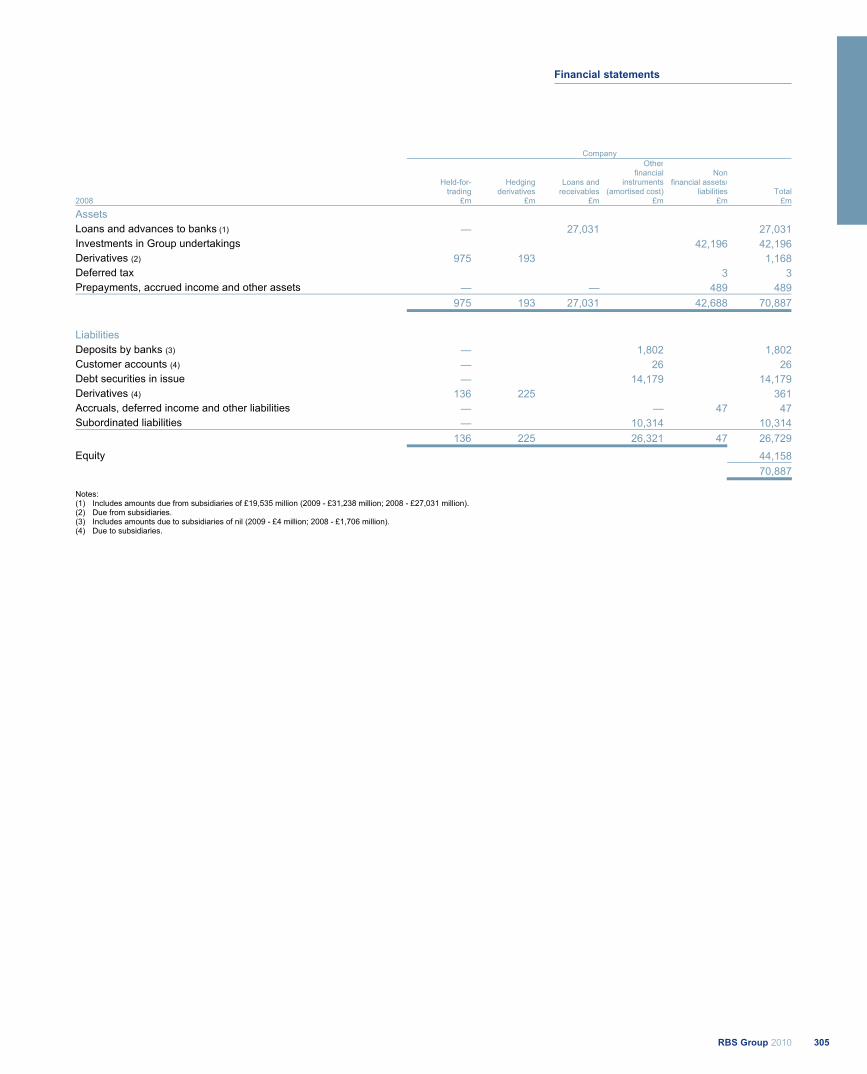
Company
Held-for-
tradingHedging
derivativesLoans and
receivables
Otherfinancial
instruments (amortised cost)
Non financial assets/
liabilities Total2008 £m £m £m £m £m £m
Assets Loans and advances to banks (1) — 27,031 27,031Investments in Group undertakings 42,196 42,196Derivatives (2) 975 193 1,168Deferred tax 3 3Prepayments, accrued income and other assets — — 489 489 975 193 27,031 42,688 70,887
Liabilities Deposits by banks (3) — 1,802 1,802Customer accounts (4) — 26 26Debt securities in issue — 14,179 14,179Derivatives (4) 136 225 361Accruals, deferred income and other liabilities — — 47 47Subordinated liabilities — 10,314 10,314 136 225 26,321 47 26,729Equity 44,158
70,887
Notes: (1) Includes amounts due from subsidiaries of £19,535 million (2009 - £31,238 million; 2008 - £27,031 million). (2) Due from subsidiaries. (3) Includes amounts due to subsidiaries of nil (2009 - £4 million; 2008 - £1,706 million). (4) Due to subsidiaries.
305RBS Group 2010
Financial statements
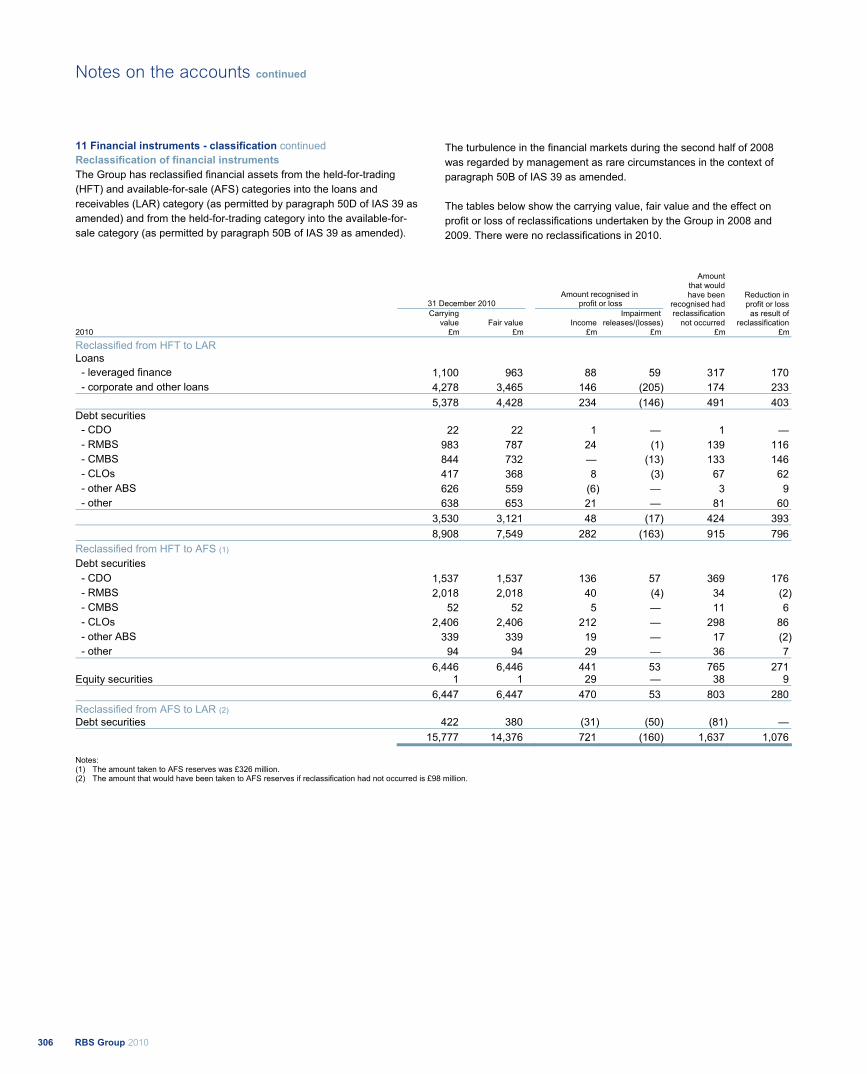
11 Financial instruments - classification continued Reclassification of financial instruments The Group has reclassified financial assets from the held-for-trading (HFT) and available-for-sale (AFS) categories into the loans and receivables (LAR) category (as permitted by paragraph 50D of IAS 39 as amended) and from the held-for-trading category into the available-for-sale category (as permitted by paragraph 50B of IAS 39 as amended).
The turbulence in the financial markets during the second half of 2008 was regarded by management as rare circumstances in the context of paragraph 50B of IAS 39 as amended. The tables below show the carrying value, fair value and the effect on profit or loss of reclassifications undertaken by the Group in 2008 and 2009. There were no reclassifications in 2010.
31 December 2010 Amount recognised in
profit or loss
Carrying
value Fair value Income Impairment
releases/(losses)
Amount that would have been
recognised had reclassification
not occurred
Reduction in profit or loss
as result of reclassification
2010 £m £m £m £m £m £m
Reclassified from HFT to LAR Loans
- leveraged finance 1,100 963 88 59 317 170 - corporate and other loans 4,278 3,465 146 (205) 174 233 5,378 4,428 234 (146) 491 403 Debt securities
- CDO 22 22 1 — 1 — - RMBS 983 787 24 (1) 139 116 - CMBS 844 732 — (13) 133 146 - CLOs 417 368 8 (3) 67 62 - other ABS 626 559 (6) — 3 9 - other 638 653 21 — 81 60 3,530 3,121 48 (17) 424 393
8,908 7,549 282 (163) 915 796 Reclassified from HFT to AFS (1) Debt securities
- CDO 1,537 1,537 136 57 369 176 - RMBS 2,018 2,018 40 (4) 34 (2) - CMBS 52 52 5 — 11 6 - CLOs 2,406 2,406 212 — 298 86 - other ABS 339 339 19 — 17 (2) - other 94 94 29 — 36 7 6,446 6,446 441 53 765 271 Equity securities 1 1 29 — 38 9 6,447 6,447 470 53 803 280 Reclassified from AFS to LAR (2) Debt securities 422 380 (31) (50) (81) — 15,777 14,376 721 (160) 1,637 1,076
Notes: (1) The amount taken to AFS reserves was £326 million. (2) The amount that would have been taken to AFS reserves if reclassification had not occurred is £98 million.
RBS Group 2010306
Notes on the accounts continued
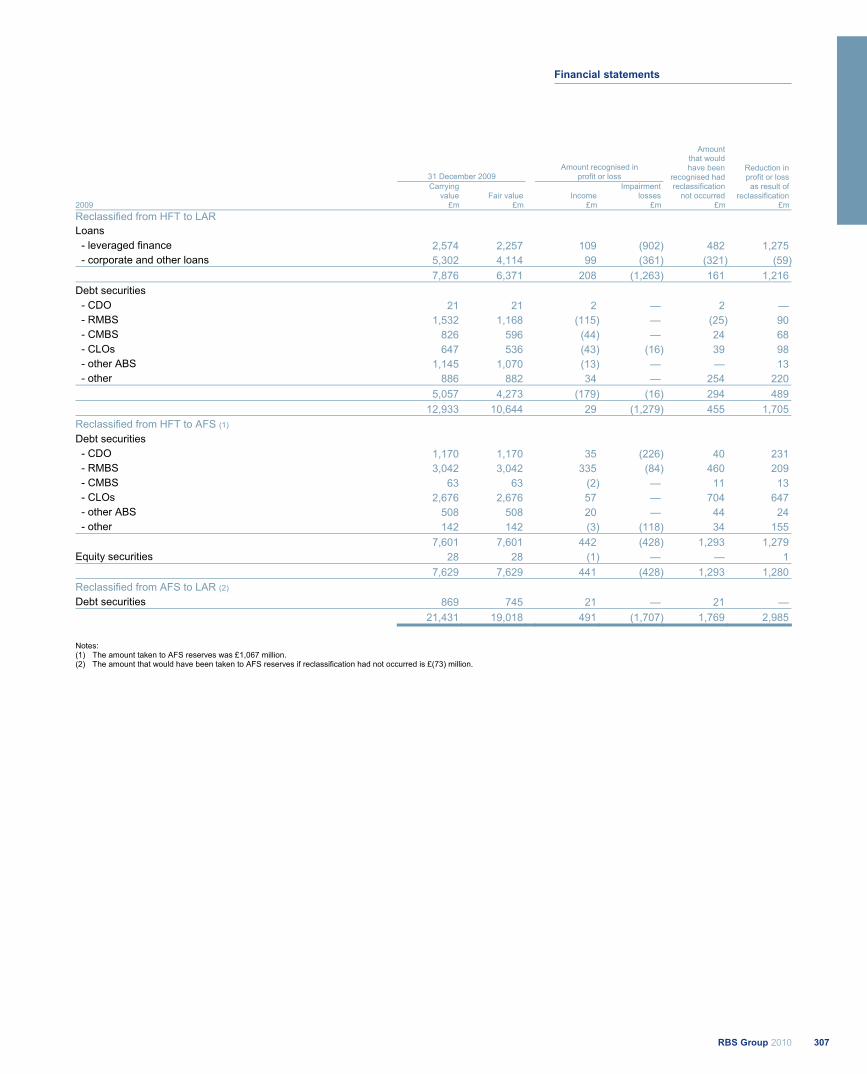
31 December 2009 Amount recognised in
profit or loss
Carrying
value Fair value Income Impairment
losses
Amount that would have been
recognised had reclassification
not occurred
Reduction in profit or loss
as result of reclassification
2009 £m £m £m £m £m £m Reclassified from HFT to LAR Loans
- leveraged finance 2,574 2,257 109 (902) 482 1,275 - corporate and other loans 5,302 4,114 99 (361) (321) (59) 7,876 6,371 208 (1,263) 161 1,216 Debt securities
- CDO 21 21 2 — 2 —- RMBS 1,532 1,168 (115) — (25) 90
- CMBS 826 596 (44) — 24 68 - CLOs 647 536 (43) (16) 39 98 - other ABS 1,145 1,070 (13) — — 13 - other 886 882 34 — 254 220 5,057 4,273 (179) (16) 294 489
12,933 10,644 29 (1,279) 455 1,705 Reclassified from HFT to AFS (1) Debt securities
- CDO 1,170 1,170 35 (226) 40 231 - RMBS 3,042 3,042 335 (84) 460 209 - CMBS 63 63 (2) — 11 13 - CLOs 2,676 2,676 57 — 704 647 - other ABS 508 508 20 — 44 24 - other 142 142 (3) (118) 34 155 7,601 7,601 442 (428) 1,293 1,279 Equity securities 28 28 (1) — — 1
7,629 7,629 441 (428) 1,293 1,280 Reclassified from AFS to LAR (2) Debt securities 869 745 21 — 21 — 21,431 19,018 491 (1,707) 1,769 2,985
Notes: (1) The amount taken to AFS reserves was £1,067 million. (2) The amount that would have been taken to AFS reserves if reclassification had not occurred is £(73) million.
307RBS Group 2010
Financial statements

11 Financial instruments - classification continued The following table provides information for reclassifications made in 2009.
2009 2008
2009 - on reclassification 31 December 2009 After reclassification
Carrying
value
Effective Interest
rate Expected
cash flows Carrying
value Fair
value
Gains/ (losses)
up to the date of
reclassification IncomeImpairment
losses
Amount that would have been
recognised had reclassification
not occurred
Reduction in profit or loss as result of
reclassification
Gains/(losses) recognised in
the income statement
in prior period
£m % £m £m £m £m £m £m £m £m £m
Reclassified from HFT to LAR Loans - leveraged finance 510 13.37 1,075 — — — (70) (71) (141) — (76) - corporate and other loans 1,230 2.85 1,565 887 924 (103) 26 (180) (115) 39 14 1,740 2,640 887 924 (103) (44) (251) (256) 39 (62)
Debt securities - RMBS 86 3.30 94 78 74 (2) 2 — (3) (5) (3)
- CMBS 64 2.17 67 41 36 (3) (6) — (10) (4) (14) - other ABS 39 2.51 41 7 7 1 1 — — (1) (10) - other 66 13.19 147 64 71 (29) 3 — 11 8 (12) 255 349 190 188 (33) — — (2) (2) (39)
1,995 2,989 1,077 1,112 (136) (44) (251) (258) 37 (101)
RBS Group 2010308
Notes on the accounts continued
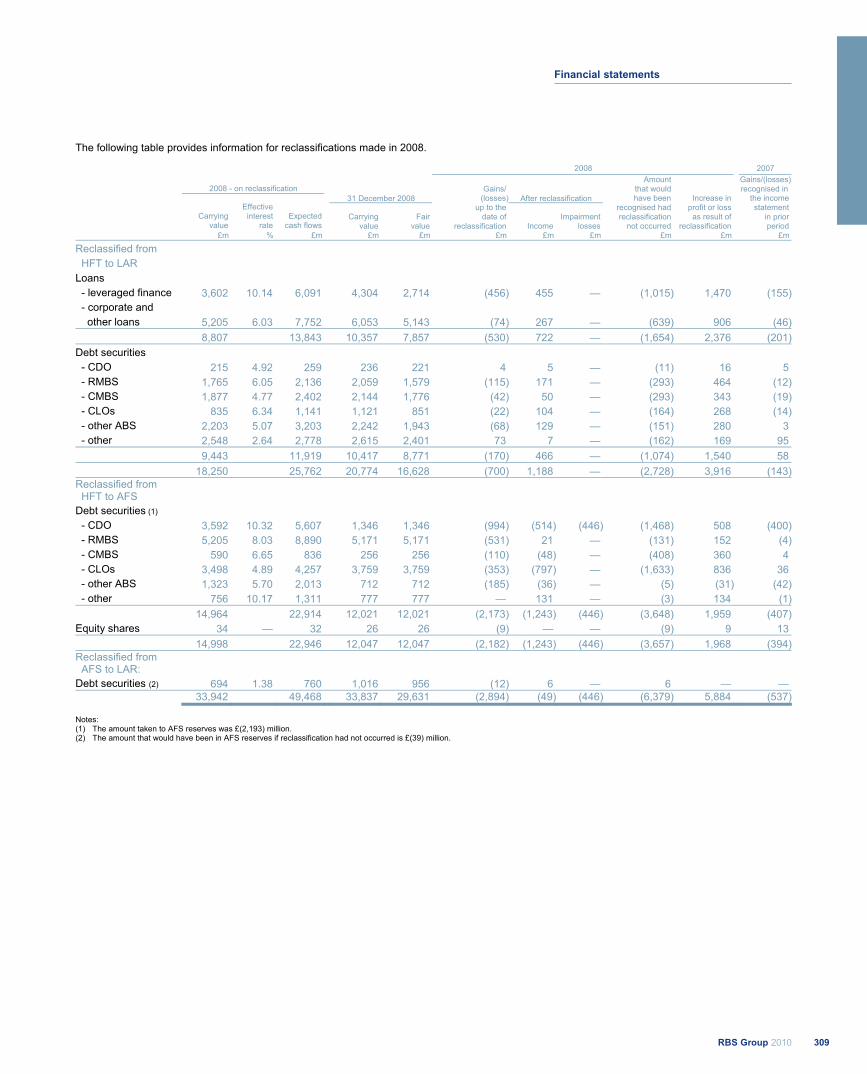
The following table provides information for reclassifications made in 2008.
2008 2007
2008 - on reclassification 31 December 2008 After reclassification
Carrying value
Effective interest
rate Expected
cash flows Carrying
value Fair
value
Gains/ (losses)
up to the date of
reclassification Income Impairment
losses
Amount that would have been
recognised had reclassification
not occurred
Increase in profit or loss
as result of reclassification
Gains/(losses) recognised in
the income statement
in prior period
£m % £m £m £m £m £m £m £m £m £m
Reclassified from HFT to LAR Loans
- leveraged finance 3,602 10.14 6,091 4,304 2,714 (456) 455 — (1,015) 1,470 (155) - corporate and other loans 5,205 6.03 7,752 6,053 5,143 (74) 267 — (639) 906 (46) 8,807 13,843 10,357 7,857 (530) 722 — (1,654) 2,376 (201)Debt securities
- CDO 215 4.92 259 236 221 4 5 — (11) 16 5 - RMBS 1,765 6.05 2,136 2,059 1,579 (115) 171 — (293) 464 (12) - CMBS 1,877 4.77 2,402 2,144 1,776 (42) 50 — (293) 343 (19) - CLOs 835 6.34 1,141 1,121 851 (22) 104 — (164) 268 (14) - other ABS 2,203 5.07 3,203 2,242 1,943 (68) 129 — (151) 280 3 - other 2,548 2.64 2,778 2,615 2,401 73 7 — (162) 169 95 9,443 11,919 10,417 8,771 (170) 466 — (1,074) 1,540 58
18,250 25,762 20,774 16,628 (700) 1,188 — (2,728) 3,916 (143)Reclassified from HFT to AFS Debt securities (1)
- CDO 3,592 10.32 5,607 1,346 1,346 (994) (514) (446) (1,468) 508 (400) - RMBS 5,205 8.03 8,890 5,171 5,171 (531) 21 — (131) 152 (4) - CMBS 590 6.65 836 256 256 (110) (48) — (408) 360 4 - CLOs 3,498 4.89 4,257 3,759 3,759 (353) (797) — (1,633) 836 36 - other ABS 1,323 5.70 2,013 712 712 (185) (36) — (5) (31) (42) - other 756 10.17 1,311 777 777 — 131 — (3) 134 (1) 14,964 22,914 12,021 12,021 (2,173) (1,243) (446) (3,648) 1,959 (407)Equity shares 34 — 32 26 26 (9) — — (9) 9 13 14,998 22,946 12,047 12,047 (2,182) (1,243) (446) (3,657) 1,968 (394)Reclassified from AFS to LAR: Debt securities (2) 694 1.38 760 1,016 956 (12) 6 — 6 — — 33,942 49,468 33,837 29,631 (2,894) (49) (446) (6,379) 5,884 (537)
Notes: (1) The amount taken to AFS reserves was £(2,193) million. (2) The amount that would have been in AFS reserves if reclassification had not occurred is £(39) million.
309RBS Group 2010
Financial statements
12 Financial instruments - valuation Valuation of financial instruments carried at fair value Control environment The Group's control environment for the determination of the fair value of financial instruments includes formalised protocols for the review and validation of fair values independent of the businesses entering into the transactions. There are specific controls to ensure consistent pricing policies and procedures, incorporating disciplined price verification. The Group ensures that appropriate attention is given to bespoke transactions, structured products, illiquid products and other instruments which are difficult to price. A key element of the control environment is the independent price verification (IPV) process. Valuations are first performed by the business which entered into the transaction. Such valuations may be directly from available prices, or may be derived using a model and variable model inputs. These valuations are reviewed, and if necessary amended, by a team independent of those trading the financial instruments, in the light of available pricing evidence. All IPV variances are classified as either ‘hard’ or ‘soft’. A variance is hard where the independent information represents tradable or liquid prices, and soft where it does not. Adjustments are required for all hard variances and for aggressive soft variances, but with conservative variances not requiring adjustment. Monthly meetings are held between the business and the support functions to discuss the results of the IPV and reserves process in detail. IPV is performed at a frequency to match the availability of independent data. For liquid instruments IPV is performed daily. The minimum frequency of review in the Group is monthly for exposures in the regulatory trading book, and six monthly for exposures in the regulatory banking book. The IPV control includes formalised reporting and escalation of any valuation differences in breach of established thresholds. The Global Pricing Unit (GPU) determines IPV policy, monitors adherence to that policy, and performs additional independent reviews on highly subjective valuation issues for GBM and Non-Core. Valuation models are subject to a review process which requires different levels of model documentation, testing and review, depending on the complexity of the model and the size of the Group's exposure. A key element of the control environment over model use is a modelled product review committee, made up of valuations experts from several functions within the Group. This committee sets the policy for model documentation, testing and review, and prioritises models with significant exposure for review by the Group's Quantitative Research Centre (QuaRC). Potential valuation uncertainty is a key input in determining model review priorities at these meetings. The QuaRC team within Group Risk, which is independent of the trading businesses, assesses the appropriateness of the application of the model to the product, the mathematical robustness of the model, and (where appropriate), considers alternative modelling approaches.
Senior management valuation control committees meet formally on a monthly basis to discuss independent pricing, reserving and valuation issues relating to both GBM and Non-Core exposures. All material methodology changes require review and ratification by these committees. The committees include valuation specialists representing several independent review functions which comprise market risk, QuaRC and finance. The Group Executive Valuation Committee discusses the issues escalated by the Modelled Product Review Committee, GBM and Non-Core senior management Valuations Control Committee and other relevant issues, including the APS credit derivative valuation. The committee covers key material and subjective valuation issues within the trading business. The committee will provide ratification to the appropriateness of areas with high levels of residual valuation uncertainty. Committee membership includes the Group Finance Director, the Group Chief Accountant, Global Head of Market and Insurance Risk, GBM Chief Financial Officer and Non-Core Chief Financial Officer, and representation from front office trading and finance. Valuation issues, adjustments and reserves are reported to the GBM, Non-Core and Group Audit Committees. Key judgmental issues are described in reports submitted to these Audit Committees. New products The Group has formal review procedures to ensure that new products, asset classes and risk types are appropriately reviewed to ensure, amongst other things, that valuation is appropriate. Group Operational Risk owns the Group New Product Approval Process, the scope of which includes new business, markets, models, risks and structures. During 2010, the Group made a significant and ongoing investment into enhancing its already robust control environment. This included a new global IPV and reserving tool, which partly automates the process of carrying out IPV and consolidation of reserves into a single central portal. Valuation hierarchy There is a process to review and control the classification of financial instruments into the three level hierarchy established by IFRS 7. Some instruments may not easily fall into a level of the fair value hierarchy per IFRS 7 (see pages 314 to 315) and judgment may be required as to which level the instrument is classified. Initial classification of a financial instrument is carried out by the Business Unit Control (BUC) team following the principles in IFRS. BUC base their judgment on information gathered during the IPV process for instruments which include the sourcing of independent prices and model inputs. The quality and completeness of the information gathered in the IPV process gives an indication as to the liquidity and valuation uncertainty of an instrument. These initial classifications are challenged by GPU and are subject to further review by local CFO, divisional CFO and the Group Chief Accountant. Particular attention is paid during the review processes upon instruments crossing from one level to another, new instrument classes or products, instruments that are generating significant profit and loss and instruments where valuation uncertainty is high.
RBS Group 2010310
Notes on the accounts continued
Valuation techniques The Group derives fair value of its instruments differently depending on whether the instrument is a non-modelled or modelled product. Non-modelled products Non-modelled products are valued directly from a price input and are typically valued on a position by position basis and include cash, equities and most debt securities. Modelled products Modelled products are those that are valued using a pricing model, ranging in complexity from comparatively vanilla products such as interest rate swaps and options (e.g. interest rate caps and floors) through to more complex derivatives. The valuation of modelled products requires an appropriate model and inputs into this model. Sometimes models are also used to derive inputs (e.g. to construct volatility surfaces). The Group uses a number of modelling methodologies. Inputs to valuation models Values between and beyond available data points are obtained by interpolation and extrapolation. When utilising valuation techniques, the fair value can be significantly affected by the choice of valuation model and by underlying assumptions concerning factors such as the amounts and timing of cash flows, discount rates and credit risk. The principal inputs to these valuation techniques are as follows:
Bond prices - quoted prices are generally available for government bonds, certain corporate securities and some mortgage-related products.
Credit spreads - where available, these are derived from prices of credit default swaps or other credit based instruments, such as debt securities. For others, credit spreads are obtained from pricing services.
Interest rates - these are principally benchmark interest rates such as the London Interbank Offered Rate (LIBOR) and quoted interest rates in the swap, bond and futures markets.
Foreign currency exchange rates - there are observable markets both for spot and forward contracts and futures in the world's major currencies.
Equity and equity index prices - quoted prices are generally readily available for equity shares listed on the world's major stock exchanges and for major indices on such shares.
Commodity prices - many commodities are actively traded in spot and forward contracts and futures on exchanges in London, New York and other commercial centres.
Price volatilities and correlations - volatility is a measure of the tendency of a price to change with time. Correlation measures the degree to which two or more prices or other variables are observed to move together. If they move in the same direction there is positive correlation; if they move in opposite directions there is negative
correlation. Volatility is a key input in valuing options and the valuation of certain products such as derivatives with more than one underlying variable that are correlation-dependent. Volatility and correlation values are obtained from broker quotations, pricing services or derived from option prices.
Prepayment rates - the fair value of a financial instrument that can be prepaid by the issuer or borrower differs from that of an instrument that cannot be prepaid. In valuing prepayable instruments that are not quoted in active markets, the Group considers the value of the prepayment option.
Counterparty credit spreads - adjustments are made to market prices (or parameters) when the creditworthiness of the counterparty differs from that of the assumed counterparty in the market price (or parameters).
Recovery rates/loss given default - these are used as an input to valuation models and reserves for asset-backed-securities and other credit products as an indicator of severity of losses on default. Recovery rates are primarily sourced from market data providers or inferred from observable credit spreads.
The Group may use consensus prices for the source of independent pricing for some assets. The consensus service encompasses the equity, interest rate, currency, commodity, credit, property, fund and bond markets, providing comprehensive matrices of vanilla prices and a wide selection of exotic products. GBM and Non-Core contribute to consensus pricing services where there is a significant interest either from a positional point of view or to test models for future business use. Data sourced from consensus pricing services is used for a combination of control processes including direct price testing, evidence of observability and model testing. In practice this means that the Group submits prices for all material positions for which a service is available. In order to determine a reliable fair value, where appropriate, management applies valuation adjustments to the pricing information gathered from the above sources. These adjustments reflect the Group's assessment of factors that market participants would consider in setting a price. Furthermore, on an ongoing basis, the Group assesses the appropriateness of any model used. To the extent that the price provided by internal models does not represent the fair value of the instrument, for instance in highly stressed market conditions, the Group makes adjustments to the model valuation to calibrate to other available pricing sources. Where unobservable inputs are used, the Group may determine a range of possible valuations derived from differing stress scenarios to determine the sensitivity associated with the valuation. When establishing the fair value of a financial instrument using a valuation technique, the Group considers certain adjustments to the modelled price which market participants would make when pricing that instrument. Such adjustments include the credit quality of the counterparty and adjustments to compensate for any known model limitations.
311RBS Group 2010
Financial statements
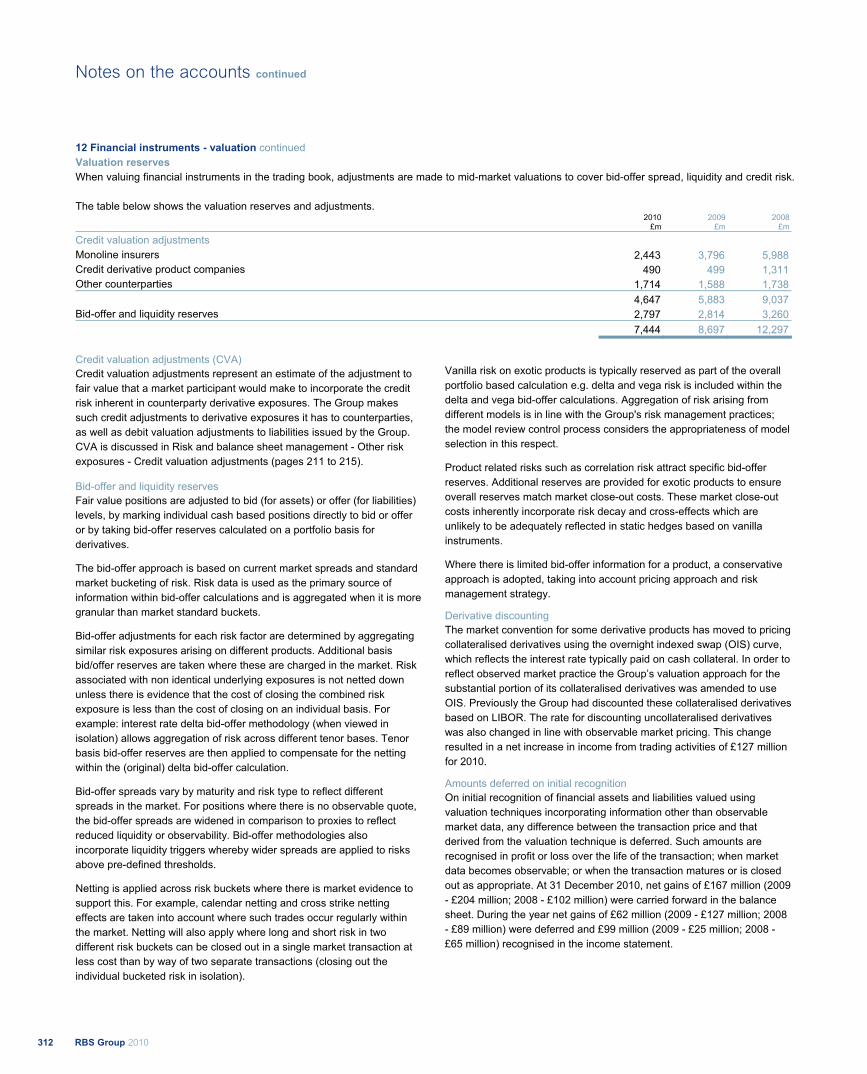
12 Financial instruments - valuation continued Valuation reserves When valuing financial instruments in the trading book, adjustments are made to mid-market valuations to cover bid-offer spread, liquidity and credit risk. The table below shows the valuation reserves and adjustments.
2010
£m2009
£m2008
£m
Credit valuation adjustments Monoline insurers 2,443 3,796 5,988 Credit derivative product companies 490 499 1,311 Other counterparties 1,714 1,588 1,738 4,647 5,883 9,037 Bid-offer and liquidity reserves 2,797 2,814 3,260 7,444 8,697 12,297
Credit valuation adjustments (CVA) Credit valuation adjustments represent an estimate of the adjustment to fair value that a market participant would make to incorporate the credit risk inherent in counterparty derivative exposures. The Group makes such credit adjustments to derivative exposures it has to counterparties, as well as debit valuation adjustments to liabilities issued by the Group. CVA is discussed in Risk and balance sheet management - Other risk exposures - Credit valuation adjustments (pages 211 to 215). Bid-offer and liquidity reserves Fair value positions are adjusted to bid (for assets) or offer (for liabilities) levels, by marking individual cash based positions directly to bid or offer or by taking bid-offer reserves calculated on a portfolio basis for derivatives.
The bid-offer approach is based on current market spreads and standard market bucketing of risk. Risk data is used as the primary source of information within bid-offer calculations and is aggregated when it is more granular than market standard buckets.
Bid-offer adjustments for each risk factor are determined by aggregating similar risk exposures arising on different products. Additional basis bid/offer reserves are taken where these are charged in the market. Risk associated with non identical underlying exposures is not netted down unless there is evidence that the cost of closing the combined risk exposure is less than the cost of closing on an individual basis. For example: interest rate delta bid-offer methodology (when viewed in isolation) allows aggregation of risk across different tenor bases. Tenor basis bid-offer reserves are then applied to compensate for the netting within the (original) delta bid-offer calculation.
Bid-offer spreads vary by maturity and risk type to reflect different spreads in the market. For positions where there is no observable quote, the bid-offer spreads are widened in comparison to proxies to reflect reduced liquidity or observability. Bid-offer methodologies also incorporate liquidity triggers whereby wider spreads are applied to risks above pre-defined thresholds.
Netting is applied across risk buckets where there is market evidence to support this. For example, calendar netting and cross strike netting effects are taken into account where such trades occur regularly within the market. Netting will also apply where long and short risk in two different risk buckets can be closed out in a single market transaction at less cost than by way of two separate transactions (closing out the individual bucketed risk in isolation).
Vanilla risk on exotic products is typically reserved as part of the overall portfolio based calculation e.g. delta and vega risk is included within the delta and vega bid-offer calculations. Aggregation of risk arising from different models is in line with the Group's risk management practices; the model review control process considers the appropriateness of model selection in this respect.
Product related risks such as correlation risk attract specific bid-offer reserves. Additional reserves are provided for exotic products to ensure overall reserves match market close-out costs. These market close-out costs inherently incorporate risk decay and cross-effects which are unlikely to be adequately reflected in static hedges based on vanilla instruments.
Where there is limited bid-offer information for a product, a conservative approach is adopted, taking into account pricing approach and risk management strategy. Derivative discounting The market convention for some derivative products has moved to pricing collateralised derivatives using the overnight indexed swap (OIS) curve, which reflects the interest rate typically paid on cash collateral. In order to reflect observed market practice the Group’s valuation approach for the substantial portion of its collateralised derivatives was amended to use OIS. Previously the Group had discounted these collateralised derivatives based on LIBOR. The rate for discounting uncollateralised derivatives was also changed in line with observable market pricing. This change resulted in a net increase in income from trading activities of £127 million for 2010. Amounts deferred on initial recognition On initial recognition of financial assets and liabilities valued using valuation techniques incorporating information other than observable market data, any difference between the transaction price and that derived from the valuation technique is deferred. Such amounts are recognised in profit or loss over the life of the transaction; when market data becomes observable; or when the transaction matures or is closed out as appropriate. At 31 December 2010, net gains of £167 million (2009 - £204 million; 2008 - £102 million) were carried forward in the balance sheet. During the year net gains of £62 million (2009 - £127 million; 2008 - £89 million) were deferred and £99 million (2009 - £25 million; 2008 - £65 million) recognised in the income statement.
RBS Group 2010312
Notes on the accounts continued

Own credit The Group takes into account the effect of its own credit standing when valuing financial liabilities recorded at fair value in accordance with IFRS. The categories of financial liabilities on which own credit spread adjustments are made are issued debt held at fair value, including issued structured notes and derivatives. An own credit adjustment is applied to positions where it is believed that counterparties would consider the Group's creditworthiness when pricing trades. For issued debt and structured notes, this adjustment is based on independent quotes from market participants for the debt issuance spreads above average inter-bank rates, (at a range of tenors) which the market would demand when purchasing new senior or sub-debt issuances from the Group. Where necessary, these quotes are interpolated using a curve shape derived from credit default swap prices.
The fair value of the Group's derivative financial liabilities has also been adjusted to reflect the Group's own credit risk. The adjustment takes into account collateral posted by the Group and the effects of master netting agreements. The own credit adjustment for fair value does not alter cash flows, is not used for performance management and is disregarded for regulatory capital reporting processes and will reverse over time as the liabilities mature. The reserve movement between periods will not equate to the reported profit or loss for own credit. The balance sheet reserves are stated by conversion of underlying currency balances at spot rates for each period whereas the income statement includes intra-period foreign exchange sell-offs. The effect of change in credit spreads could be reversed in future periods, provided the liability is not repaid at a premium or a discount.
The table below shows own credit adjustments on own liabilities. Cumulative own credit adjustment
Debt securities in issue (1)
£m
Subordinated liabilities
£m Total
£m Derivatives
£m Total
£m
2010 2,091 325 2,416 534 2,950 2009 1,857 474 2,331 467 2,798 2008 1,346 1,027 2,373 450 2,823
Carrying values of underlying liabilities £bn £bn £bn
2010 51.2 1.1 52.3 2009 45.5 1.3 46.8 2008 51.4 1.5 52.9
Note: (1) Consists of wholesale and retail note issuances.
313RBS Group 2010
Financial statements
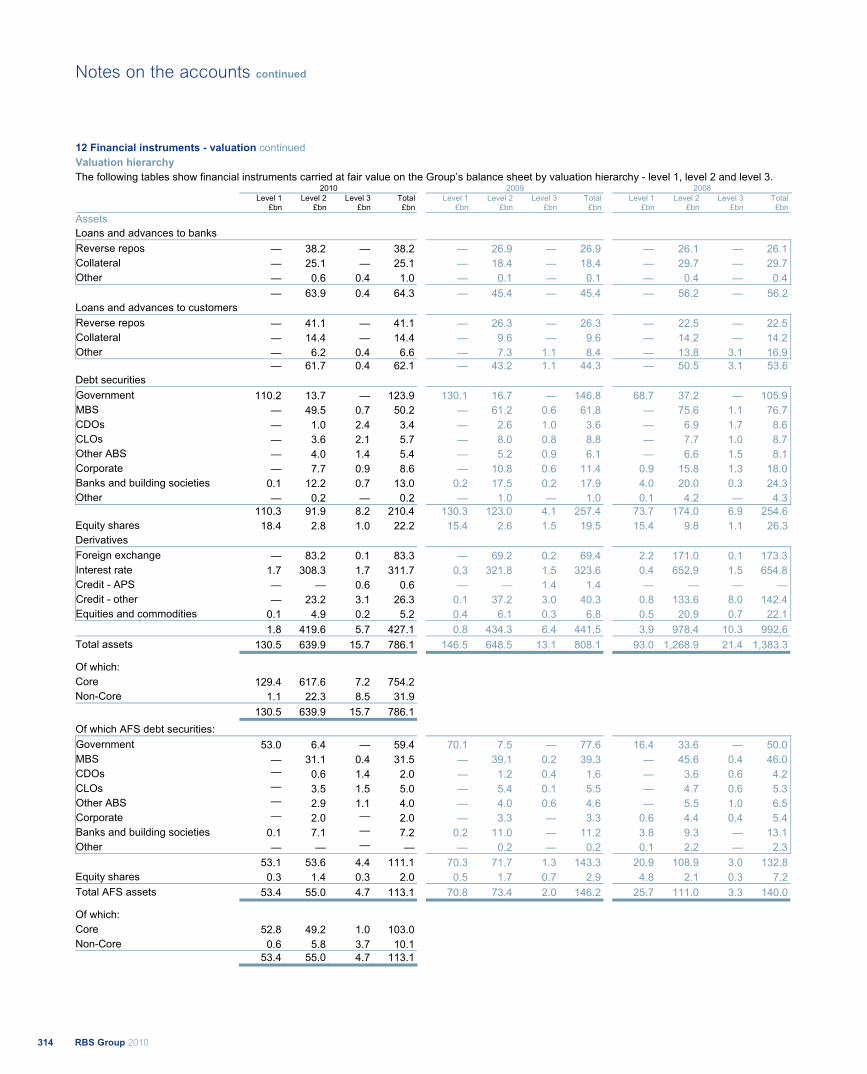
12 Financial instruments - valuation continued Valuation hierarchy The following tables show financial instruments carried at fair value on the Group’s balance sheet by valuation hierarchy - level 1, level 2 and level 3. 2010 2009 2008 Level 1 Level 2 Level 3 Total Level 1 Level 2 Level 3 Total Level 1 Level 2 Level 3 Total
£bn £bn £bn £bn £bn £bn £bn £bn £bn £bn £bn £bnAssets Loans and advances to banks Reverse repos — 38.2 — 38.2 — 26.9 — 26.9 — 26.1 — 26.1 Collateral — 25.1 — 25.1 — 18.4 — 18.4 — 29.7 — 29.7 Other — 0.6 0.4 1.0 — 0.1 — 0.1 — 0.4 — 0.4
— 63.9 0.4 64.3 — 45.4 — 45.4 — 56.2 — 56.2Loans and advances to customers Reverse repos — 41.1 — 41.1 — 26.3 — 26.3 — 22.5 — 22.5 Collateral — 14.4 — 14.4 — 9.6 — 9.6 — 14.2 — 14.2 Other — 6.2 0.4 6.6 — 7.3 1.1 8.4 — 13.8 3.1 16.9
— 61.7 0.4 62.1 — 43.2 1.1 44.3 — 50.5 3.1 53.6Debt securities Government 110.2 13.7 — 123.9 130.1 16.7 — 146.8 68.7 37.2 — 105.9 MBS — 49.5 0.7 50.2 — 61.2 0.6 61.8 — 75.6 1.1 76.7 CDOs — 1.0 2.4 3.4 — 2.6 1.0 3.6 — 6.9 1.7 8.6 CLOs — 3.6 2.1 5.7 — 8.0 0.8 8.8 — 7.7 1.0 8.7 Other ABS — 4.0 1.4 5.4 — 5.2 0.9 6.1 — 6.6 1.5 8.1 Corporate — 7.7 0.9 8.6 — 10.8 0.6 11.4 0.9 15.8 1.3 18.0 Banks and building societies 0.1 12.2 0.7 13.0 0.2 17.5 0.2 17.9 4.0 20.0 0.3 24.3 Other — 0.2 — 0.2 — 1.0 — 1.0 0.1 4.2 — 4.3
110.3 91.9 8.2 210.4 130.3 123.0 4.1 257.4 73.7 174.0 6.9 254.6Equity shares 18.4 2.8 1.0 22.2 15.4 2.6 1.5 19.5 15.4 9.8 1.1 26.3Derivatives Foreign exchange — 83.2 0.1 83.3 — 69.2 0.2 69.4 2.2 171.0 0.1 173.3 Interest rate 1.7 308.3 1.7 311.7 0.3 321.8 1.5 323.6 0.4 652.9 1.5 654.8 Credit - APS — — 0.6 0.6 — — 1.4 1.4 — — — — Credit - other — 23.2 3.1 26.3 0.1 37.2 3.0 40.3 0.8 133.6 8.0 142.4 Equities and commodities 0.1 4.9 0.2 5.2 0.4 6.1 0.3 6.8 0.5 20.9 0.7 22.1
1.8 419.6 5.7 427.1 0.8 434.3 6.4 441.5 3.9 978.4 10.3 992.6Total assets 130.5 639.9 15.7 786.1 146.5 648.5 13.1 808.1 93.0 1,268.9 21.4 1,383.3
Of which: Core 129.4 617.6 7.2 754.2 Non-Core 1.1 22.3 8.5 31.9
130.5 639.9 15.7 786.1 Of which AFS debt securities: Government 53.0 6.4 — 59.4 70.1 7.5 — 77.6 16.4 33.6 — 50.0 MBS — 31.1 0.4 31.5 — 39.1 0.2 39.3 — 45.6 0.4 46.0 CDOs — 0.6 1.4 2.0 — 1.2 0.4 1.6 — 3.6 0.6 4.2 CLOs — 3.5 1.5 5.0 — 5.4 0.1 5.5 — 4.7 0.6 5.3 Other ABS — 2.9 1.1 4.0 — 4.0 0.6 4.6 — 5.5 1.0 6.5 Corporate — 2.0 — 2.0 — 3.3 — 3.3 0.6 4.4 0.4 5.4 Banks and building societies 0.1 7.1 — 7.2 0.2 11.0 — 11.2 3.8 9.3 — 13.1 Other — — — — — 0.2 — 0.2 0.1 2.2 — 2.3
53.1 53.6 4.4 111.1 70.3 71.7 1.3 143.3 20.9 108.9 3.0 132.8Equity shares 0.3 1.4 0.3 2.0 0.5 1.7 0.7 2.9 4.8 2.1 0.3 7.2Total AFS assets 53.4 55.0 4.7 113.1 70.8 73.4 2.0 146.2 25.7 111.0 3.3 140.0
Of which: Core 52.8 49.2 1.0 103.0 Non-Core 0.6 5.8 3.7 10.1
53.4 55.0 4.7 113.1
RBS Group 2010314
Notes on the accounts continued
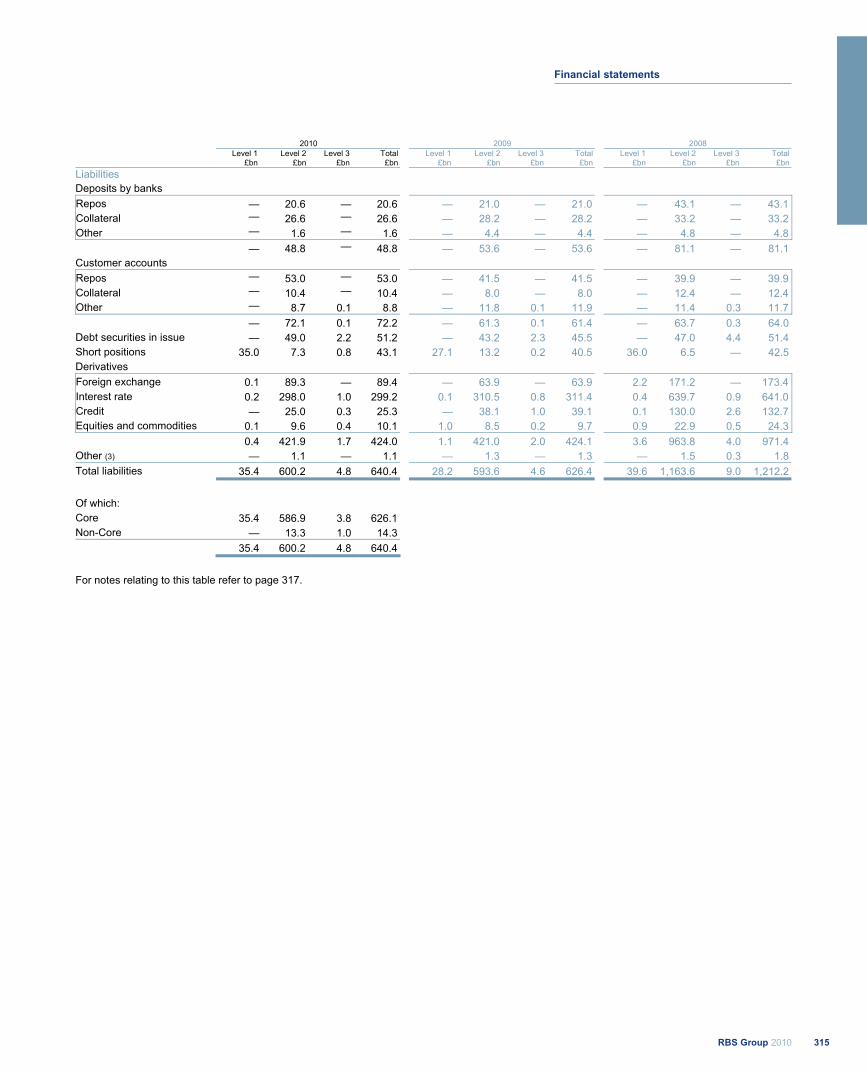
2010 2009 2008 Level 1 Level 2 Level 3 Total Level 1 Level 2 Level 3 Total Level 1 Level 2 Level 3 Total
£bn £bn £bn £bn £bn £bn £bn £bn £bn £bn £bn £bn Liabilities Deposits by banks Repos — 20.6 — 20.6 — 21.0 — 21.0 — 43.1 — 43.1 Collateral — 26.6 — 26.6 — 28.2 — 28.2 — 33.2 — 33.2 Other — 1.6 — 1.6 — 4.4 — 4.4 — 4.8 — 4.8
— 48.8 — 48.8 — 53.6 — 53.6 — 81.1 — 81.1 Customer accounts Repos — 53.0 — 53.0 — 41.5 — 41.5 — 39.9 — 39.9 Collateral — 10.4 — 10.4 — 8.0 — 8.0 — 12.4 — 12.4 Other — 8.7 0.1 8.8 — 11.8 0.1 11.9 — 11.4 0.3 11.7
— 72.1 0.1 72.2 — 61.3 0.1 61.4 — 63.7 0.3 64.0 Debt securities in issue — 49.0 2.2 51.2 — 43.2 2.3 45.5 — 47.0 4.4 51.4 Short positions 35.0 7.3 0.8 43.1 27.1 13.2 0.2 40.5 36.0 6.5 — 42.5 Derivatives Foreign exchange 0.1 89.3 — 89.4 — 63.9 — 63.9 2.2 171.2 — 173.4 Interest rate 0.2 298.0 1.0 299.2 0.1 310.5 0.8 311.4 0.4 639.7 0.9 641.0 Credit — 25.0 0.3 25.3 — 38.1 1.0 39.1 0.1 130.0 2.6 132.7 Equities and commodities 0.1 9.6 0.4 10.1 1.0 8.5 0.2 9.7 0.9 22.9 0.5 24.3
0.4 421.9 1.7 424.0 1.1 421.0 2.0 424.1 3.6 963.8 4.0 971.4 Other (3) — 1.1 — 1.1 — 1.3 — 1.3 — 1.5 0.3 1.8 Total liabilities 35.4 600.2 4.8 640.4 28.2 593.6 4.6 626.4 39.6 1,163.6 9.0 1,212.2
Of which: Core 35.4 586.9 3.8 626.1 Non-Core — 13.3 1.0 14.3 35.4 600.2 4.8 640.4
For notes relating to this table refer to page 317.
315RBS Group 2010
Financial statements
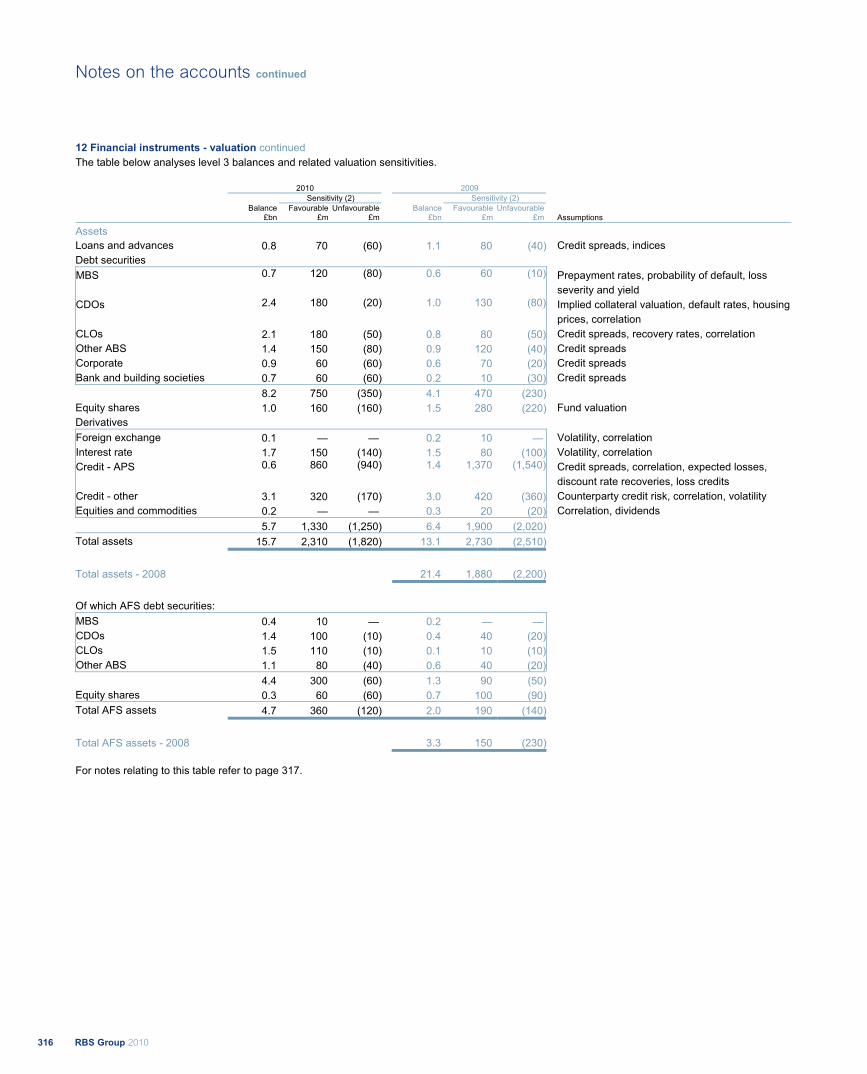
12 Financial instruments - valuation continued The table below analyses level 3 balances and related valuation sensitivities.
2010 2009 Sensitivity (2) Sensitivity (2)
Balance Favourable Unfavourable Balance Favourable Unfavourable £bn £m £m £bn £m £m Assumptions
Assets Loans and advances 0.8 70 (60) 1.1 80 (40) Credit spreads, indices Debt securities MBS 0.7 120 (80) 0.6 60 (10) Prepayment rates, probability of default, loss
severity and yield CDOs 2.4 180 (20) 1.0 130 (80) Implied collateral valuation, default rates, housing
prices, correlation CLOs 2.1 180 (50) 0.8 80 (50) Credit spreads, recovery rates, correlation Other ABS 1.4 150 (80) 0.9 120 (40) Credit spreads Corporate 0.9 60 (60) 0.6 70 (20) Credit spreads Bank and building societies 0.7 60 (60) 0.2 10 (30) Credit spreads
8.2 750 (350) 4.1 470 (230) Equity shares 1.0 160 (160) 1.5 280 (220) Fund valuation Derivatives Foreign exchange 0.1 — — 0.2 10 — Volatility, correlation Interest rate 1.7 150 (140) 1.5 80 (100) Volatility, correlation Credit - APS 0.6 860 (940) 1.4 1,370 (1,540) Credit spreads, correlation, expected losses,
discount rate recoveries, loss credits Credit - other 3.1 320 (170) 3.0 420 (360) Counterparty credit risk, correlation, volatility Equities and commodities 0.2 — — 0.3 20 (20) Correlation, dividends
5.7 1,330 (1,250) 6.4 1,900 (2,020) Total assets 15.7 2,310 (1,820) 13.1 2,730 (2,510)
Total assets - 2008 21.4 1,880 (2,200)
Of which AFS debt securities: MBS 0.4 10 — 0.2 — — CDOs 1.4 100 (10) 0.4 40 (20) CLOs 1.5 110 (10) 0.1 10 (10) Other ABS 1.1 80 (40) 0.6 40 (20)
4.4 300 (60) 1.3 90 (50) Equity shares 0.3 60 (60) 0.7 100 (90) Total AFS assets 4.7 360 (120) 2.0 190 (140)
Total AFS assets - 2008 3.3 150 (230)
For notes relating to this table refer to page 317.
RBS Group 2010316
Notes on the accounts continued

2010 2009 Sensitivity (2) Sensitivity (2)
Balance Favourable Unfavourable Balance Favourable Unfavourable £bn £m £m £bn £m £m Assumptions
Liabilities Customer accounts - other 0.1 60 (60) 0.1 — (10) Credit spreads, correlation Debt securities in issue 2.2 90 (110) 2.3 50 (10) Volatility, correlation Short positions 0.8 20 (50) 0.2 10 (20) Credit spreads, correlation Derivatives Foreign exchange — — (10) — — — Interest rate 1.0 70 (90) 0.8 40 (60) Volatility, correlation Credit - other 0.3 40 (40) 1.0 80 (100) Counterparty credit risk, correlation, volatility Equity and commodities 0.4 10 — 0.2 20 (70) Correlation, dividends
1.7 120 (140) 2.0 140 (230) 4.8 290 (360) 4.6 200 (270)
Total liabilities - 2008 9.0 550 (490)
Notes: (1) Level 1: valued using unadjusted quoted prices in active markets, for identical financial instruments. Examples include G10 government securities, listed equity shares, certain exchange-traded
derivatives and certain US agency securities.
Level 2: valued using techniques based significantly on observable market data. Instruments in this category are valued using: (a) quoted prices for similar instruments or identical instruments in markets which are not considered to be active; or (b) valuation techniques where all the inputs that have a significant effect on the valuations are directly or indirectly based on observable market data.
The type of instruments that trade in markets that are not considered to be active, but are based on quoted market prices, banker dealer quotations, or alternative pricing sources with reasonable levels of price transparency and those instruments valued using techniques include most government agency securities, investment-grade corporate bonds, certain mortgage products, most bank and bridge loans, repos and reverse repos, less liquid listed equities, state and municipal obligations, most physical commodities, investment contracts issued by the Group's life assurance (2009 and 2008) and certain money market securities and loan commitments and most OTC derivatives. Level 3: instruments in this category have been valued using a valuation technique where at least one input which could have a significant effect on the instrument’s valuation, is not based on observable market data. Where inputs can be observed from market data without undue cost and effort, the observed input is used. Otherwise, the Group determines a reasonable level for the input. Financial instruments primarily include cash instruments which trade infrequently, certain syndicated and commercial mortgage loans, unlisted equity shares, certain residual interests in securitisations, super senior tranches of high grade and mezzanine CDOs, other mortgage-based products and less liquid debt securities, certain structured debt securities in issue, and OTC derivatives where valuation depends upon unobservable inputs such as certain credit and exotic derivatives. No gain or loss is recognised on the initial recognition of a financial instrument valued using a technique incorporating significant unobservable data.
(2) Sensitivity represents the favourable and unfavourable effect on the income statement or the statement of comprehensive income due to reasonably possible changes to valuations using reasonably possible alternative inputs to the Group's valuation techniques or models. Totals for sensitivities are not indicative of the total potential effect on the income statement or the statement of comprehensive income.
(3) Comprise subordinated liabilities.
The level 3 sensitivities above are calculated at a trade or low level portfolio basis. They are not calculated on an overall portfolio basis and therefore do not reflect the likely overall potential uncertainty on the whole portfolio. The figures are aggregated and do not reflect the correlated nature of some of the sensitivities. In particular, for some of the portfolios the sensitivities may be negatively correlated where a downwards movement in one asset would produce an upwards movement in another, but due to the additive presentation of the above figures this correlation cannot be observed. For example, with assets in the APS scheme, the downwards sensitivity on the underlying asset would be materially offset by the consequent upward movement of the APS derivative, so whilst the net sensitivity of the two positions may be lower, it would be shown with the gross upside and downside sensitivity of the two assets inflating the overall sensitivity figures in the above table. The actual potential downside sensitivity of the total portfolio may be less than the non-correlated sum of the additive figures as shown in the above table.
Key points Level 3 assets of £15.7 billion represented 2.0% (2009 - £13.1 billion and 1.6%) of total assets carried at fair value, an increase of £2.6 billion, reflecting the movement of some lower quality AFS CDOs and CLOs in Non-Core in Q1 2010, where price discovery indicated uncertainty in observability. In addition, the use of more conservative internal recovery rates for the calculation of CVA for certain monolines resulted in these credit derivatives moving to level 3. This was partially offset by disposals in Q3 2010 and tighter credit spreads. The fair value of APS credit derivative decreased from £1,400 million to £550 million primarily due to the reduction in overall assets covered by the scheme.
Level 3 liabilities increased to £4.8 billion, mainly reflecting the impact of wider credit spreads on short positions.
The favourable and unfavourable effects of reasonably possible alternative assumptions on financial instruments carried at fair value were £2,310 million and (£1,820) million respectively of which £860 million and (£940) million related to the APS credit derivative. The reduction in the APS sensitivity corresponds with a decrease in the overall value of the protection that the scheme provides.
317RBS Group 2010
Financial statements
12 Financial instruments - valuation continued Judgmental issues The diverse range of products traded by the Group results in a wide range of instruments that are classified into the three level hierarchy. Whilst the majority of these instruments naturally fall into a particular level, for some products an element of judgment is required. The majority of the Group’s financial instruments carried at fair value are classified as level 2: inputs are observable either directly (i.e. as a price) or indirectly (i.e. derived from prices). Active and inactive markets A key input in the decision making process for the allocation of assets to a particular level is liquidity. In general, the degree of valuation uncertainty depends on the degree of liquidity of an input. For example, a derivative can be placed into level 2 or level 3 dependent upon its liquidity. Where markets are liquid or very liquid, little judgment is required. However, when the information regarding the liquidity in a particular market is not clear, a judgment may need to be made. This can be made more difficult as assessing the liquidity of a market may not always be straightforward. For an equity traded on an exchange, daily volumes of trading can be seen, but for an-over-the counter (OTC) derivative assessing the liquidity of the market with no central exchange can be more difficult. A key related issue is where a market moves from liquid to illiquid or vice versa. Where this change is considered to be temporary, the classification is not changed. For example, if there is little market trading in a product on a reporting date but at the previous reporting date and during the intervening period the market has been considered to be liquid, the instrument will continue to be classified in the same level in the hierarchy. This is to provide consistency so that transfers between levels are driven by genuine changes in market liquidity and do not reflect short term or seasonal effects. Interaction with the IPV process The determination of an instrument’s level cannot be made at a global product level as a single product type can be in more than one level. For example, a single name corporate credit default swap could be in level 2 or level 3 depending on whether the reference counterparty is liquid or illiquid. As part of the Group’s IPV process, data is gathered at a trade level from market trading activity, trading systems, pricing services, consensus pricing providers, brokers and research material amongst other sources. The breadth and detail of this data allows a good assessment to be made of liquidity and pricing uncertainty, which assists with the process of allocation to an appropriate level. Where suitable independent pricing information is not readily available the instrument will be considered to be level 3.
Modelled products For modelled products the market convention is to quote these trades through the model inputs or parameters as opposed to a cash price equivalent. A mark-to-market is derived from the use of the independent market inputs calculated using the Group’s model. The decision to classify a modelled asset as level 2 or 3 will be dependent upon the product/model combination, the currency, the maturity, the observability of input parameters and other factors. All these need to be assessed to classify the asset. An assessment is made of each input into a model. There may be multiple inputs into a model and each is assessed in turn for observability and quality. If an input fails the observability or quality tests then the instrument is considered to be in level 3 unless the input can be shown to have an insignificant effect on the overall valuation of the product. The majority of derivative instruments are classified as level 2 as they are vanilla products valued using observable inputs. The valuation uncertainty on these is considered to be low and both input and output testing may be available. Examples of these products would be vanilla interest rate swaps, foreign exchange swaps and liquid single name credit derivatives. Non-modelled products Non-modelled products are generally quoted on a price basis and can therefore be considered for each of the 3 levels. This is determined by the liquidity and valuation uncertainty of the instruments which is in turn measured from the availability of independent data used by the IPV process. The availability and quality of independent pricing information is considered during the classification process. An assessment is made regarding the quality of the independent information. For example where consensus prices are used for non-modelled products, a key assessment of the quality of a price is the depth of the number of prices used to provide the consensus price. If the depth of contributors falls below a set hurdle rate, the instrument is considered to be level 3. This hurdle rate is consistent with the rate used in the IPV process to determine whether or not the data is of sufficient quality to adjust the instrument’s valuations. However where an instrument is generally considered to be illiquid, but regular quotes from market participants exist, these instruments may be classified as level 2 depending on frequency of quotes, other available pricing and whether the quotes are used as part of the IPV process or not.
RBS Group 2010318
Notes on the accounts continued

For some instruments with a wide number of available price sources, there may be differing quality of available information and there may be a wide range of prices from different sources. In these situations an assessment is made as to which source is the highest quality and this will be used to determine the classification of the asset. For example, a tradable quote would be considered a better source than a consensus price. Instruments that cross levels Some instruments will predominantly be in one level or the other, but others may cross between levels. For example, a cross currency swap may be between very liquid currency pairs where pricing is readily observed in the market and will therefore be classified as level 2. The cross currency swap may also be between two illiquid currency pairs in which case the swap would be placed into level 3. Defining the difference between liquid and illiquid may be based upon the number of consensus providers the consensus price is made up from and whether the consensus price can be supplemented by other sources. Certain portfolios in level 2 contain instruments whose fair values incorporate the judgements discussed above. These include a portfolio of ABS in Non-Core of £5.7 billion that had more than average level of valuation uncertainty with a range of £5.6 billion to £5.9 billion using alternative valuation assumptions. Level 3 portfolios and sensitivity methodologies For each of the portfolio categories shown in the tables above, there follows a description of the types of products that comprise the portfolio and the valuation techniques that are applied in determining fair value, including a description of valuation techniques used for levels 2 and 3 and inputs to those models and techniques. Where reasonably possible alternative assumptions of unobservable inputs used in models would change the fair value of the portfolio significantly, the alternative inputs are indicated. Where there have been significant changes to valuation techniques during the year a discussion of the reasons for this are also included. Loans and advances to customers Loans in level 3 primarily comprise commercial mortgages. Commercial mortgages These senior and mezzanine commercial mortgages are loans secured on commercial land and buildings that were originated or acquired by the Group for securitisation. Senior commercial mortgages carry a variable interest rate and mezzanine or more junior commercial mortgages may carry a fixed or variable interest rate. Factors affecting the value of these loans may include, but are not limited to, loan type, underlying property type and geographic location, loan interest rate, loan to value ratios, debt service coverage ratios, prepayment rates, cumulative loan loss information, yields, investor demand, market volatility since the last securitisation, and credit enhancement. Where observable market prices for a particular loan are not available, the fair value will typically be determined with reference to observable market transactions in other loans or credit related products including debt securities and credit derivatives. Assumptions are made about the relationship between the loan and the available benchmark data.
Debt securities RMBS RMBS where the underlying assets are US agency-backed mortgages and there is regular trading are generally classified as level 2 in the fair value hierarchy. RMBS are also classified as level 2 when regular trading is not prevalent in the market, but similar executed trades or third-party data including indices, broker quotes and pricing services can be used to substantiate the fair value. RMBS are classified as level 3 when trading activity is not available and a model with significant unobservable data is utilised. In determining whether an instrument is similar to that being valued, the Group considers a range of factors, principally: the lending standards of the brokers and underwriters that originated the mortgages, the lead manager of the security, the issue date of the respective securities, the underlying asset composition (including origination date, loan to value ratios, historic loss information and geographic location of the mortgages), the credit rating of the instrument, and any credit protection that the instrument may benefit from, such as insurance wraps or subordinated tranches. Where there are instances of market observable data for several similar RMBS tranches, the Group considers the extent of similar characteristics shared with the instrument being valued, together with the frequency, tenor and nature of the trades that have been observed. This method is most frequently used for US and UK RMBS. RMBS of Dutch and Spanish originated mortgages guaranteed by those governments are valued using the credit spreads of the respective government debt and certain assumptions made by the Group, or based on observable prices from Bloomberg or consensus pricing services. The Group primarily uses an industry standard model to project the expected future cash flows to be received from the underlying mortgages and to forecast how these cash flows will be distributed to the various holders of the RMBS. This model utilises data provided by the servicer of the underlying mortgage portfolio, layering on assumptions for mortgage prepayments, probability of default, expected losses, and yield. The Group uses data from third-party sources to calibrate its assumptions, including pricing information from third-party pricing services, independent research, broker quotes, and other independent sources. An assessment is made of third-party data source to determine its applicability and reliability. The Group adjusts the model price with a liquidity premium to reflect the price that the instrument could be traded in the market and may also make adjustments for model deficiencies. The fair value of securities within each class of asset changes on a broadly consistent basis in response to changes in given market factors. However, the extent of the change, and therefore the range of reasonably possible alternative assumptions, may be either more or less pronounced, depending on the particular terms and circumstances of the individual security. The Group believes that probability of default was the least transparent input into Alt-A and prime RMBS modelled valuations (and most sensitive to variations).
319RBS Group 2010
Financial statements
12 Financial instruments - valuation continued Commercial mortgage backed securities CMBS are valued using an industry standard model and the inputs, where possible, are corroborated using observable market data. Collateralised debt obligations CDOs purchased from third-parties are valued using independent, third-party quotes or independent lead manager indicative prices. For super senior CDOs which have been originated by the Group no specific third-party information is available. The valuation of these super senior CDOs therefore takes into consideration outputs from a proprietary model, market data and appropriate valuation adjustments. A collateral net asset value methodology using dealer buy side marks is used to determine an upper bound for super senior CDO valuations. An ABS index implied collateral valuation is also used to provide a market calibrated valuation data point. Both the ABS index implied valuation and the collateral net asset value methodology apply an assumed immediate liquidation approach. Collateralised loan obligations To determine the fair value of CLOs purchased from third parties, the Group uses third-party broker or lead manager quotes as the primary pricing source. These quotes are benchmarked to consensus pricing sources where they are available. For CLOs originated and still held by the Group, the fair value is determined using a correlation model based on a Monte Carlo simulation framework. The main model inputs are credit spreads and recovery rates of the underlying assets and their correlation. A credit curve is assigned to each underlying asset based on prices from third-party dealer quotes and cash flow profiles, sourced from an industry standard model. Losses are calculated taking into account the attachment and detachment point of the exposure. Where the correlation inputs to this model are not observable, CLOs are classified as level 3. Other asset-backed and corporate debt securities Where observable market prices for a particular debt security are not available, the fair value will typically be determined with reference to observable market transactions in other related products, such as similar debt securities or credit derivatives. Assumptions are made about the relationship between the individual debt security and the available benchmark data. Where significant management judgment has been applied in identifying the most relevant related product, or in determining the relationship between the related product and the instrument itself, the instrument is classified as level 3. Equity shares Private equity investments include unit holdings and limited partnership interests primarily in corporate private equity funds, debt funds and fund of hedge funds. Externally managed funds are valued using recent prices where available. Where not available, the fair value of investments in externally managed funds is generally determined using statements or other information provided by the fund managers. The Group considers that valuations may rely significantly on the judgments and estimates made by the fund managers, particularly in assessing private equity components. Given the decline in liquidity in world markets, and the level of subjectivity, these are included in level 3.
Derivatives Derivatives are priced using quoted prices for the same or similar instruments where these are available. However, the majority of derivatives are valued using pricing models. Inputs for these models are usually observed directly in the market, or derived from observed prices. However, it is not always possible to observe or corroborate all model inputs. Unobservable inputs used are based on estimates taking into account a range of available information including historic analysis, historic traded levels, market practice, comparison to other relevant benchmark observable data and consensus pricing data. Credit derivatives - APS The Group purchased credit protection over a portfolio of specified assets and exposures (covered assets) from HMT. The Group has a right to terminate the APS at any time provided that the Financial Services Authority has confirmed in writing to HMT that it has no objection to the proposed termination. On termination the Group must pay HMT the higher of the regulatory capital relief received and £2.5 billion less premiums paid plus the aggregate of amounts received from the UK Government under the APS. In consideration for the protection provided by the APS, the Group paid an initial premium of £1.4 billion on 31 December 2009. A further premium of £700 million was paid on 31 December 2010. Quarterly premiums of £125 million will be payable from 31 December 2011 and subsequently until the earlier of 2099 and the termination of the agreement. The APS is a single contract providing credit protection in respect of the covered assets. Under IFRS, credit protection is treated either as a financial guarantee contract or as a derivative financial instrument depending on the terms of the agreement and the nature of the protected assets and exposures. The Group has concluded, principally because the covered portfolio includes significant exposure in the form of derivatives, that the APS does not meet the criteria to be treated as a financial guarantee contract. The contract has therefore been accounted for as a derivative financial instrument. It was recognised initially and measured subsequently at fair value with changes in fair value recognised in profit or loss within income from trading activities. There is no change in the recognition and measurement of the covered assets as a result of the APS. Where protection is provided on a particular seniority of exposure, as is the case with the APS, which requires initial losses to be taken by the Group, it is termed ‘tranched’ protection. The model being used to value the APS - a Gaussian Copula model with stochastic recoveries - is used by the Group to value tranches traded by the exotic credit desk and is a model that is currently used within the wider market. The option to exit the APS is not usually present in such tranched trades and consequently, there is no standard market practice for reflecting this part of the trade within the standard model framework. The approach that has been adopted assumes that the Group will not exit the trade before the minimum level of fees has been paid and at this point it will be clear whether it should exit the trade or not. The APS derivative is valued as the payment of the minimum level of fees in return for protection receipts which are in excess of both the first loss and the total future premiums.
RBS Group 2010320
Notes on the accounts continued
The model primarily uses the following inputs in relation to each individual asset: notional, maturity, probability of default and expected recovery rate given default. Other key inputs include: the correlation between the underlying assets; the range of possible recovery rates on the underlying assets (“alpha”); the size of the first loss; and the level of expected losses on covered assets that have been sold, that can be treated as losses for the purpose of the APS (“loss credits”). During 2010, refinements were made to the treatment of derivative trades in the valuation model. This followed a change in the nature of protection provided in relation to certain structured credit trades involving mainly asset backed securities and associated bought protection credit derivatives: the risk of losses arising on the derivative trades due to counterparty risk was replaced by the risk of incurring losses on the underlying asset backed securities that are not recovered through the derivative trades. The valuation refinements were made to accurately reflect the impact of this change and ensure a consistent treatment across all derivative trades. The APS protects a wide range of asset types, and hence, the correlation between the underlying assets cannot be observed from market data. In the absence of this, the Group determines a reasonable level for this input. The expected recovery rate given default is based on internally assessed levels. The probability of default is calculated with reference to data observable in the market. Where possible, data is obtained for each asset within the APS, but for most of the assets, such observable data does not exist. In these cases, this important input is determined from information available for similar entities by geography and rating. The approach for doing this was refined during the year in order to accurately reflect both changes in market conditions and the profile of the portfolio of covered assets. As the inputs into the valuation model are not all observable the APS derivative is a level 3 asset. The fair value of the credit protection at 31 December 2010 was £0.55 billion (2009 - £1.40 billion). The Group has used the following reasonably possible alternative assumptions in relation to those inputs that could have a significant effect on the valuation of the APS: Correlation: +/- 10% The correlation uncertainty relates to both the nature of the underlying portfolio and the seniority of protection. The +/-10% correlation range looks reasonable in light of market observable correlations of similar levels of protection seniority, for portfolios of investment grade and high yield assets.
Range of possible recovery rates on underlying assets (alpha): +/- 10% The level of alpha used in the valuation of the APS is in line with that used to value tranches traded by the exotic credit desk and assumes that the underlying assets have a wide range of potential recovery rates. As the APS protects a wider range of asset classes than is generally referenced by exotic credit trades, there is uncertainty in relation to this approach. A comparison of actual recoveries to expected recoveries supports the approach adopted and, in light of this, only changes of +/-10% in the assumed width of this range are considered reasonable. Credit spreads: +/- 10% The credit spread uncertainty relates to determining the probability of default for assets where there is no such observable data in the market. An analysis of the impact on credit spreads of small changes in the ratings assumptions in key geographic regions indicated that overall credit spread movements in the +/- 10% range look reasonable. Discount curve: +/- 1% Due to the long-dated contractual maturity of the APS, and the requirement to pay fixed levels of premiums each year, the valuation is sensitive to long-term interest rates. Valuation uncertainty arises due to the illiquidity of such interest rates. An interest rate range of +/- 1% is considered reasonable. Loss credits: +/- 10% The level of expected losses on covered assets that have been sold that can be treated as losses for the purpose of the APS are assessed by the Asset Protection Agency. For disposals made by the Group where this assessment has not been completed, the Group makes an estimate of the likely assessment for the purpose of valuing of the APS. A range of +/- 10% in the level of assessment is considered reasonable. Using the above reasonably possible alternative assumptions, the fair value of the APS derivative could be higher by approximately £860 million or lower by approximately £940 million as detailed in the table below.
Sensitivity Favourable
£mUnfavourable
£m
Correlation +/- 10% 300 300Recover alpha +/- 10% 250 300Spreads +/-10% 125 100Discount curve +/- 1% 175 230Loss credit +/- 10% 10 10
Total 860 940
Individual sensitivities above have been aggregated and do not reflect the correlated effect of some of the assumptions as related sensitivities.
321RBS Group 2010
Financial statements
12 Financial instruments - valuation continued Credit derivatives - other The Group's other credit derivatives include vanilla and bespoke portfolio tranches, gap risk products and certain other unique trades. Valuation of single name credit derivatives is carried out using industry standard models. Where single name derivatives have been traded and there is a lack of independent data or the quality of the data is weak, these instruments are classified into level 3. These assets will be priced using the Group’s standard credit derivative model using a proxy curve based upon a suitable alternative single name curve, a cash based product or a sector based curve. Where the sector based curve is used, the proxy will be chosen taking maturity, rating, seniority, geography and internal credit review on recoveries into account. Sensitivities for these instruments will be based upon the selection of reasonable alternative assumptions which may include adjustments to the credit curve and recovery rate assumptions. The bespoke portfolio tranches are synthetic tranches referenced to a bespoke portfolio of corporate names on which the Group purchases credit protection. Bespoke portfolio tranches are valued using Gaussian Copula, a standard method which uses observable market inputs (credit spreads, index tranche prices and recovery rates) to generate an output price for the tranche by way of a mapping methodology. In essence this method takes the expected loss of the tranche expressed as a fraction of the expected loss of the whole underlying portfolio and calculates which detachment point on the liquid index, and hence which correlation level, coincides with this expected loss fraction. Where the inputs to this valuation technique are observable in the market, bespoke tranches are considered to be level 2 assets. Where inputs are not observable, bespoke tranches are considered to be level 3 assets. However, all transactions executed with a CDPC counterparty are considered level 3 as the counterparty credit risk assessment is a significant component of these valuations. Gap risk products are leveraged trades, with the counterparty's potential loss capped at the amount of the initial principal invested. Gap risk is the probability that the market will move discontinuously too quickly to exit a portfolio and return the principal to the counterparty without incurring losses, should an unwind event be triggered. This optionality is embedded within these portfolio structures and is very rarely traded outright in the market. Gap risk is not observable in the markets and, as such, these structures are deemed to be level 3 instruments. Other unique trades are valued using a specialised model for each instrument and the same market data inputs as all other trades where applicable. By their nature, the valuation is also driven by a variety of other model inputs, many of which are unobservable in the market. Where these instruments have embedded optionality they are valued using a variation of the Black-Scholes option pricing formula, and where they have correlation exposure they are valued using a variant of the Gaussian Copula model. The volatility or unique correlation inputs required to value these products are generally unobservable and the instruments are therefore deemed to be level 3 instruments.
Equity derivatives Equity derivative products are split into equity exotic derivatives and equity hybrids. Equity exotic derivatives have payouts based on the performance of one or more stocks, equity funds or indices. Most payouts are based on the performance of a single asset and are valued using observable market option data. Unobservable equity derivative trades are typically complex basket options on stocks. Such basket option payouts depend on the performance of more than one equity asset and require correlations for their valuation. Valuation is then performed using industry standard valuation models, with unobservable correlation inputs calculated by reference to correlations observed between similar underlyings. Equity hybrids have payouts based on the performance of a basket of underlyings where underlyings are from different asset classes. Correlations between these different underlyings are typically unobservable with no market information on closely related assets available. Where no market for the correlation input exists, these inputs are based on historical time series. Interest rate and commodity derivatives Interest rate and commodity options provide a payout (or series of payouts) linked to the performance of one or more underlying, including interest rates, foreign exchange rates and commodities. Exotic options do not trade in active markets except in a small number of cases. Consequently, the Group uses models to determine fair value using valuation techniques typical for the industry. These techniques can be divided, firstly, into modelling approaches and, secondly, into methods of assessing appropriate levels for model inputs. The Group uses a variety of proprietary models for valuing exotic trades. Exotic valuation inputs include correlation between interest rates, foreign exchange rates and commodity prices. Correlations for more liquid rate pairs are valued using independently sourced consensus pricing levels. Where a consensus pricing benchmark is unavailable, these instruments are classified as level 3. The carrying value of debt securities in issue is represented partly by underlying cash and partly through a derivative component. The classification of the amount in level 3 is driven by the derivative component and not by the cash element. Other financial instruments In addition to the portfolios discussed above, there are other financial instruments which are held at fair value determined from data which are not market observable, or incorporating material adjustments to market observed data. These include subordinated liabilities and write downs relating to undrawn syndicated loan facilities.
RBS Group 2010322
Notes on the accounts continued
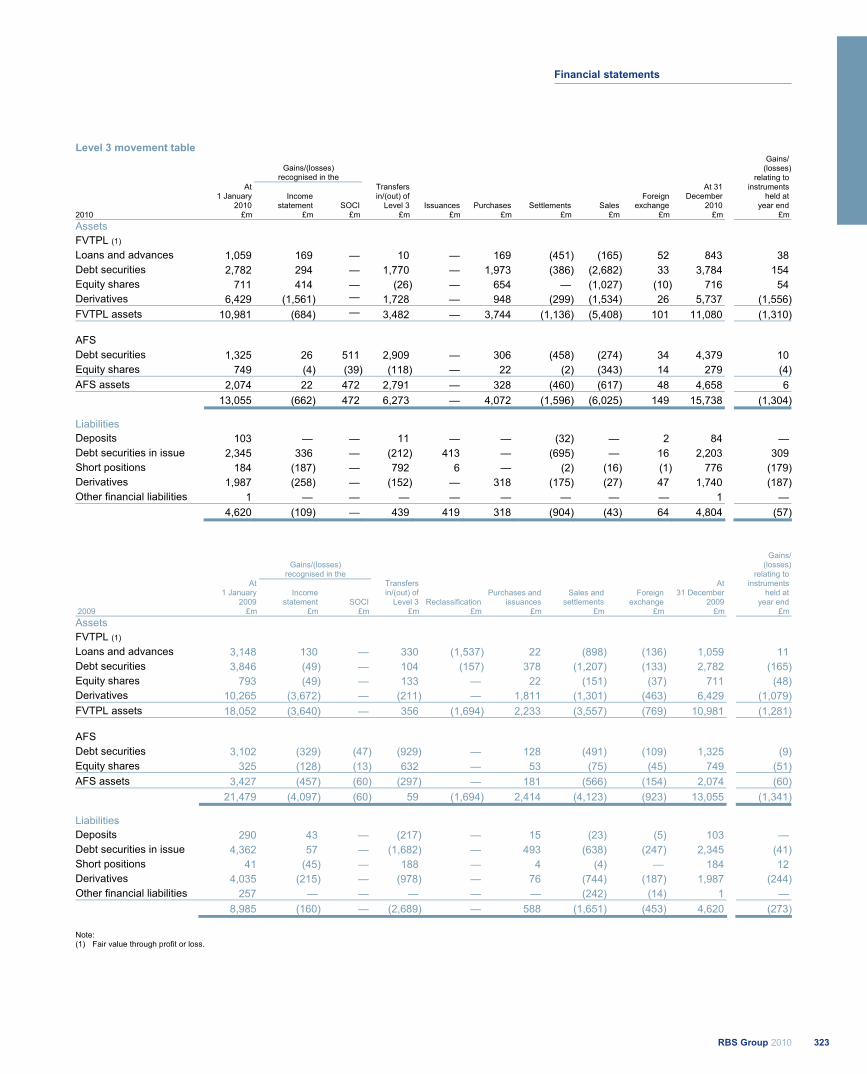
Level 3 movement table
Gains/(losses) recognised in the
At1 January
2010 Income
statement SOCI
Transfers in/(out) of
Level 3 Issuances Purchases Settlements Sales Foreign
exchange
At 31 December
2010
Gains/ (losses)
relating to instruments
held at year end
2010 £m £m £m £m £m £m £m £m £m £m £m Assets FVTPL (1) Loans and advances 1,059 169 — 10 — 169 (451) (165) 52 843 38 Debt securities 2,782 294 — 1,770 — 1,973 (386) (2,682) 33 3,784 154 Equity shares 711 414 — (26) — 654 — (1,027) (10) 716 54 Derivatives 6,429 (1,561) — 1,728 — 948 (299) (1,534) 26 5,737 (1,556)FVTPL assets 10,981 (684) — 3,482 — 3,744 (1,136) (5,408) 101 11,080 (1,310)
AFS Debt securities 1,325 26 511 2,909 — 306 (458) (274) 34 4,379 10 Equity shares 749 (4) (39) (118) — 22 (2) (343) 14 279 (4)AFS assets 2,074 22 472 2,791 — 328 (460) (617) 48 4,658 6
13,055 (662) 472 6,273 — 4,072 (1,596) (6,025) 149 15,738 (1,304)
Liabilities Deposits 103 — — 11 — — (32) — 2 84 — Debt securities in issue 2,345 336 — (212) 413 — (695) — 16 2,203 309 Short positions 184 (187) — 792 6 — (2) (16) (1) 776 (179)Derivatives 1,987 (258) — (152) — 318 (175) (27) 47 1,740 (187)Other financial liabilities 1 — — — — — — — — 1 — 4,620 (109) — 439 419 318 (904) (43) 64 4,804 (57)
Gains/(losses) recognised in the
At 1 January
2009 Income
statement SOCI
Transfers in/(out) of
Level 3 Reclassification Purchases and
issuances Sales and
settlements Foreign
exchange
At 31 December
2009
Gains/(losses)
relating to instruments
held at year end
2009 £m £m £m £m £m £m £m £m £m £m Assets FVTPL (1) Loans and advances 3,148 130 — 330 (1,537) 22 (898) (136) 1,059 11 Debt securities 3,846 (49) — 104 (157) 378 (1,207) (133) 2,782 (165)Equity shares 793 (49) — 133 — 22 (151) (37) 711 (48)Derivatives 10,265 (3,672) — (211) — 1,811 (1,301) (463) 6,429 (1,079)FVTPL assets 18,052 (3,640) — 356 (1,694) 2,233 (3,557) (769) 10,981 (1,281)
AFS Debt securities 3,102 (329) (47) (929) — 128 (491) (109) 1,325 (9)Equity shares 325 (128) (13) 632 — 53 (75) (45) 749 (51)AFS assets 3,427 (457) (60) (297) — 181 (566) (154) 2,074 (60)
21,479 (4,097) (60) 59 (1,694) 2,414 (4,123) (923) 13,055 (1,341)
Liabilities Deposits 290 43 — (217) — 15 (23) (5) 103 — Debt securities in issue 4,362 57 — (1,682) — 493 (638) (247) 2,345 (41)Short positions 41 (45) — 188 — 4 (4) — 184 12 Derivatives 4,035 (215) — (978) — 76 (744) (187) 1,987 (244)Other financial liabilities 257 — — — — — (242) (14) 1 — 8,985 (160) — (2,689) — 588 (1,651) (453) 4,620 (273)
Note: (1) Fair value through profit or loss.
323RBS Group 2010
Financial statements
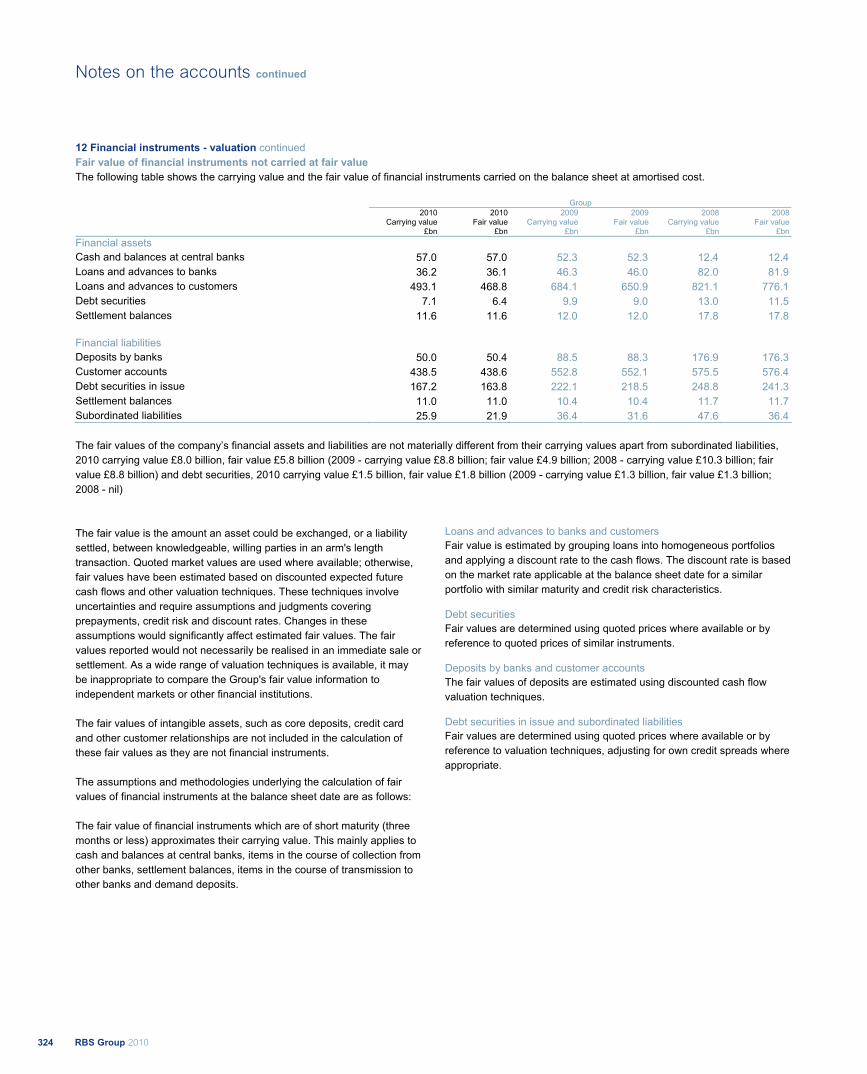
12 Financial instruments - valuation continued Fair value of financial instruments not carried at fair value The following table shows the carrying value and the fair value of financial instruments carried on the balance sheet at amortised cost.
Group
2010
Carrying value 2010
Fair value 2009
Carrying value 2009
Fair value 2008
Carrying value 2008
Fair value £bn £bn £bn £bn £bn £bn
Financial assets Cash and balances at central banks 57.0 57.0 52.3 52.3 12.4 12.4 Loans and advances to banks 36.2 36.1 46.3 46.0 82.0 81.9 Loans and advances to customers 493.1 468.8 684.1 650.9 821.1 776.1 Debt securities 7.1 6.4 9.9 9.0 13.0 11.5 Settlement balances 11.6 11.6 12.0 12.0 17.8 17.8 Financial liabilities Deposits by banks 50.0 50.4 88.5 88.3 176.9 176.3 Customer accounts 438.5 438.6 552.8 552.1 575.5 576.4 Debt securities in issue 167.2 163.8 222.1 218.5 248.8 241.3 Settlement balances 11.0 11.0 10.4 10.4 11.7 11.7 Subordinated liabilities 25.9 21.9 36.4 31.6 47.6 36.4
The fair values of the company’s financial assets and liabilities are not materially different from their carrying values apart from subordinated liabilities, 2010 carrying value £8.0 billion, fair value £5.8 billion (2009 - carrying value £8.8 billion; fair value £4.9 billion; 2008 - carrying value £10.3 billion; fair value £8.8 billion) and debt securities, 2010 carrying value £1.5 billion, fair value £1.8 billion (2009 - carrying value £1.3 billion, fair value £1.3 billion; 2008 - nil)
The fair value is the amount an asset could be exchanged, or a liability settled, between knowledgeable, willing parties in an arm's length transaction. Quoted market values are used where available; otherwise, fair values have been estimated based on discounted expected future cash flows and other valuation techniques. These techniques involve uncertainties and require assumptions and judgments covering prepayments, credit risk and discount rates. Changes in these assumptions would significantly affect estimated fair values. The fair values reported would not necessarily be realised in an immediate sale or settlement. As a wide range of valuation techniques is available, it may be inappropriate to compare the Group's fair value information to independent markets or other financial institutions. The fair values of intangible assets, such as core deposits, credit card and other customer relationships are not included in the calculation of these fair values as they are not financial instruments. The assumptions and methodologies underlying the calculation of fair values of financial instruments at the balance sheet date are as follows: The fair value of financial instruments which are of short maturity (three months or less) approximates their carrying value. This mainly applies to cash and balances at central banks, items in the course of collection from other banks, settlement balances, items in the course of transmission to other banks and demand deposits.
Loans and advances to banks and customers Fair value is estimated by grouping loans into homogeneous portfolios and applying a discount rate to the cash flows. The discount rate is based on the market rate applicable at the balance sheet date for a similar portfolio with similar maturity and credit risk characteristics. Debt securities Fair values are determined using quoted prices where available or by reference to quoted prices of similar instruments. Deposits by banks and customer accounts The fair values of deposits are estimated using discounted cash flow valuation techniques. Debt securities in issue and subordinated liabilities Fair values are determined using quoted prices where available or by reference to valuation techniques, adjusting for own credit spreads where appropriate.
RBS Group 2010324
Notes on the accounts continued

13 Financial instruments - maturity analysis Remaining maturity The following table shows the residual maturity of financial instruments, based on contractual date of maturity.
Group 2010 2009 2008
Less than 12 months
More than 12 months Total
Less than12 months
More than12 months Total
Less than12 months
More than12 months Total
£m £m £m £m £m £m £m £m £m
Assets Cash and balances at central banks 56,997 17 57,014 52,229 32 52,261 12,364 36 12,400Loans and advances to banks 98,789 1,729 100,518 89,622 2,131 91,753 133,565 4,632 138,197Loans and advances to customers 199,626 355,634 555,260 227,745 500,648 728,393 338,751 535,971 874,722Debt securities 42,678 174,802 217,480 69,197 198,057 267,254 69,912 197,637 267,549Equity shares — 22,198 22,198 — 19,528 19,528 — 26,330 26,330Settlement balances 11,605 — 11,605 12,022 11 12,033 17,795 37 17,832Derivatives 65,639 361,438 427,077 70,537 370,917 441,454 184,278 808,281 992,559 Liabilities Deposits by banks 95,241 3,549 98,790 135,641 6,503 142,144 248,896 9,148 258,044Customer accounts 492,609 18,084 510,693 586,628 27,574 614,202 611,047 28,465 639,512Debt securities in issue 94,048 124,324 218,372 140,826 126,742 267,568 174,507 125,782 300,289Settlement balances and short positions 16,981 37,128 54,109 17,952 32,924 50,876 24,448 29,829 54,277Derivatives 71,306 352,661 423,967 71,625 352,516 424,141 175,908 795,456 971,364Subordinated liabilities 964 26,089 27,053 2,144 35,508 37,652 3,394 45,760 49,154
Company 2010 2009 2008
Less than 12 months
More than 12 months Total
Less than 12 months
More than 12 months Total
Less than 12 months
More than 12 months Total
£m £m £m £m £m £m £m £m £m Assets Loans and advances to banks 4,651 14,884 19,535 16,447 14,791 31,238 16,096 10,935 27,031 Loans and advances to customers 3,855 2,834 6,689 — 2,777 2,777 — — — Debt securities — 1,454 1,454 52 1,234 1,286 — — — Settlement balances — — — 11 — 11 — — — Derivatives 2 1,473 1,475 80 1,089 1,169 221 947 1,168 Liabilities Deposits by banks — — — 93 — 93 1,802 — 1,802 Customer accounts 1,029 — 1,029 13,264 — 13,264 26 — 26 Debt securities in issue 1,460 7,282 8,742 4,965 6,823 11,788 7,253 6,926 14,179 Derivatives 25 206 231 53 393 446 227 134 361 Subordinated liabilities 307 7,741 8,048 130 8,632 8,762 424 9,890 10,314
325RBS Group 2010
Financial statements
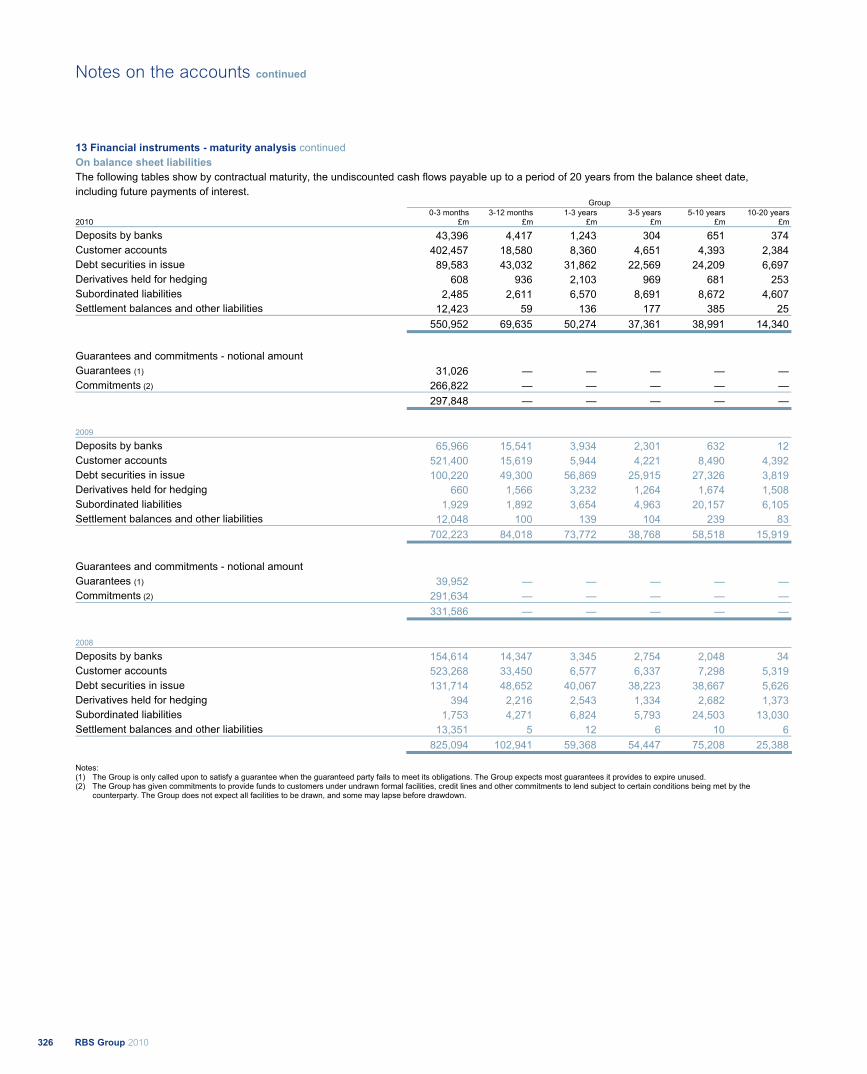
13 Financial instruments - maturity analysis continued On balance sheet liabilities The following tables show by contractual maturity, the undiscounted cash flows payable up to a period of 20 years from the balance sheet date, including future payments of interest. Group 0-3 months 3-12 months 1-3 years 3-5 years 5-10 years 10-20 years 2010 £m £m £m £m £m £m
Deposits by banks 43,396 4,417 1,243 304 651 374 Customer accounts 402,457 18,580 8,360 4,651 4,393 2,384 Debt securities in issue 89,583 43,032 31,862 22,569 24,209 6,697 Derivatives held for hedging 608 936 2,103 969 681 253 Subordinated liabilities 2,485 2,611 6,570 8,691 8,672 4,607 Settlement balances and other liabilities 12,423 59 136 177 385 25 550,952 69,635 50,274 37,361 38,991 14,340
Guarantees and commitments - notional amount Guarantees (1) 31,026 — — — — — Commitments (2) 266,822 — — — — — 297,848 — — — — —
2009 Deposits by banks 65,966 15,541 3,934 2,301 632 12 Customer accounts 521,400 15,619 5,944 4,221 8,490 4,392 Debt securities in issue 100,220 49,300 56,869 25,915 27,326 3,819 Derivatives held for hedging 660 1,566 3,232 1,264 1,674 1,508 Subordinated liabilities 1,929 1,892 3,654 4,963 20,157 6,105 Settlement balances and other liabilities 12,048 100 139 104 239 83 702,223 84,018 73,772 38,768 58,518 15,919
Guarantees and commitments - notional amount Guarantees (1) 39,952 — — — — — Commitments (2) 291,634 — — — — — 331,586 — — — — —
2008 Deposits by banks 154,614 14,347 3,345 2,754 2,048 34 Customer accounts 523,268 33,450 6,577 6,337 7,298 5,319 Debt securities in issue 131,714 48,652 40,067 38,223 38,667 5,626 Derivatives held for hedging 394 2,216 2,543 1,334 2,682 1,373 Subordinated liabilities 1,753 4,271 6,824 5,793 24,503 13,030 Settlement balances and other liabilities 13,351 5 12 6 10 6 825,094 102,941 59,368 54,447 75,208 25,388
Notes: (1) The Group is only called upon to satisfy a guarantee when the guaranteed party fails to meet its obligations. The Group expects most guarantees it provides to expire unused. (2) The Group has given commitments to provide funds to customers under undrawn formal facilities, credit lines and other commitments to lend subject to certain conditions being met by the
counterparty. The Group does not expect all facilities to be drawn, and some may lapse before drawdown.
RBS Group 2010326
Notes on the accounts continued
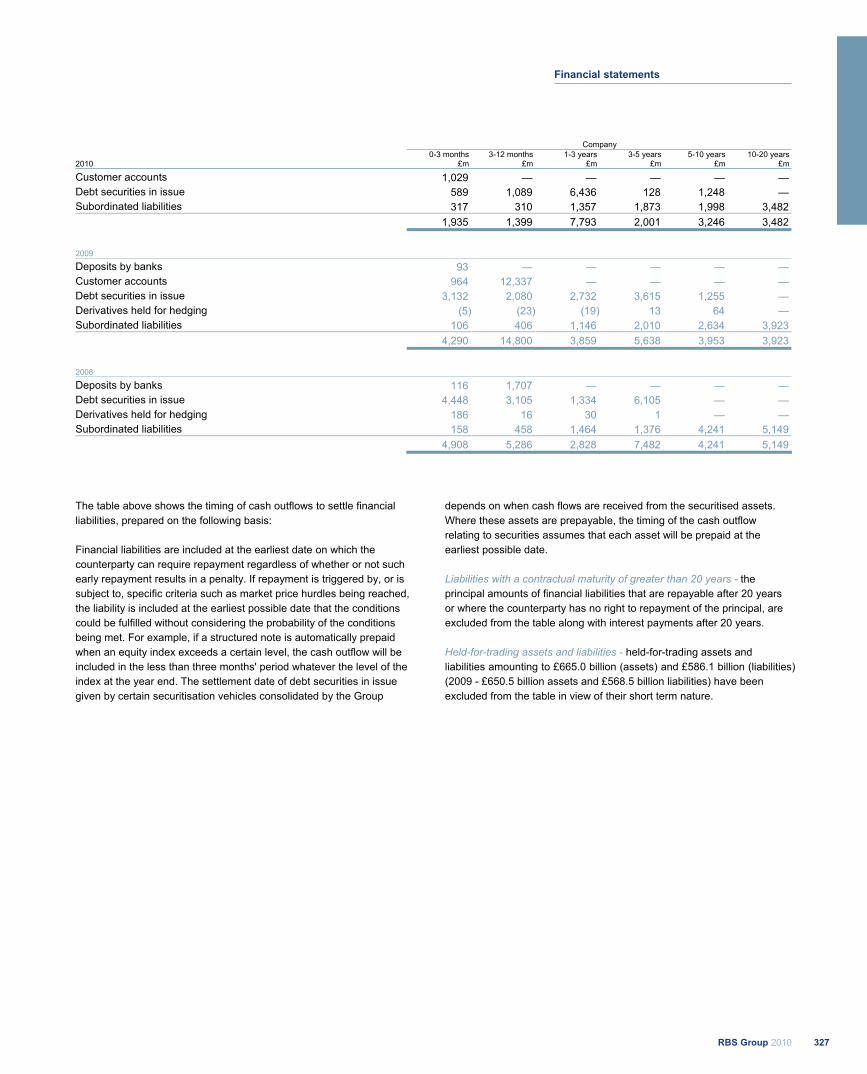
Company 0-3 months 3-12 months 1-3 years 3-5 years 5-10 years 10-20 years 2010 £m £m £m £m £m £m
Customer accounts 1,029 — — — — — Debt securities in issue 589 1,089 6,436 128 1,248 — Subordinated liabilities 317 310 1,357 1,873 1,998 3,482 1,935 1,399 7,793 2,001 3,246 3,482
2009 Deposits by banks 93 — — — — —Customer accounts 964 12,337 — — — — Debt securities in issue 3,132 2,080 2,732 3,615 1,255 — Derivatives held for hedging (5) (23) (19) 13 64 — Subordinated liabilities 106 406 1,146 2,010 2,634 3,923 4,290 14,800 3,859 5,638 3,953 3,923
2008 Deposits by banks 116 1,707 — — — — Debt securities in issue 4,448 3,105 1,334 6,105 — — Derivatives held for hedging 186 16 30 1 — — Subordinated liabilities 158 458 1,464 1,376 4,241 5,149 4,908 5,286 2,828 7,482 4,241 5,149
The table above shows the timing of cash outflows to settle financial liabilities, prepared on the following basis: Financial liabilities are included at the earliest date on which the counterparty can require repayment regardless of whether or not such early repayment results in a penalty. If repayment is triggered by, or is subject to, specific criteria such as market price hurdles being reached, the liability is included at the earliest possible date that the conditions could be fulfilled without considering the probability of the conditions being met. For example, if a structured note is automatically prepaid when an equity index exceeds a certain level, the cash outflow will be included in the less than three months' period whatever the level of the index at the year end. The settlement date of debt securities in issue given by certain securitisation vehicles consolidated by the Group
depends on when cash flows are received from the securitised assets. Where these assets are prepayable, the timing of the cash outflow relating to securities assumes that each asset will be prepaid at the earliest possible date. Liabilities with a contractual maturity of greater than 20 years - the principal amounts of financial liabilities that are repayable after 20 years or where the counterparty has no right to repayment of the principal, are excluded from the table along with interest payments after 20 years. Held-for-trading assets and liabilities - held-for-trading assets and liabilities amounting to £665.0 billion (assets) and £586.1 billion (liabilities) (2009 - £650.5 billion assets and £568.5 billion liabilities) have been excluded from the table in view of their short term nature.
327RBS Group 2010
Financial statements

14 Financial assets - impairments The following table shows the movement in the provision for impairment losses on loans and advances.
Group
Individually
assessed Collectively
assessed Latent Total 2010 2009 2008
£m £m £m £m £m £m
At 1 January 8,953 5,254 3,076 17,283 11,016 6,452 Transfer to disposal groups (72) — — (72) (324) (767)Currency translation and other adjustments (15) 27 31 43 (530) 1,441 Disposal of subsidiaries (1,344) (526) (302) (2,172) (65) (178)Amounts written-off (3,323) (2,719) — (6,042) (6,939) (3,148)Recoveries of amounts previously written-off 90 321 — 411 399 319 Charged/(credited) to the income statement – continuing operations 6,195 3,070 (121) 9,144 13,090 6,478 Charged/(credited) to the income statement – discontinued operations 35 41 (34) 42 1,044 613 Unwind of discount (283) (172) — (455) (408) (194)At 31 December (1) 10,236 5,296 2,650 18,182 17,283 11,016
Notes: (1) Includes £127 million relating to loans and advances to banks (2009 - £157 million; 2008 - £127 million). (2) There is no provision for impairment losses in the company.
Group
Impairment losses charged to the income statement 2010
£m 2009
£m 2008
£m
Loans and advances to customers 9,157 13,056 6,360 Loans and advances to banks (13) 34 118 9,144 13,090 6,478 Debt securities 81 601 858 Equity shares 31 208 103 112 809 961
9,256 13,899 7,439
The following tables show an analysis of impaired financial assets. Group
2010 2009 2008 Carrying Carrying Carrying
Cost Provision value Cost Provision value Cost Provision value £m £m £m £m £m £m £m £m £mLoans and receivables Loans and advances to banks (1) 145 127 18 206 157 49 129 127 2Loans and advances to customers (2) 35,556 15,405 20,151 34,801 14,050 20,751 19,350 8,945 10,405 35,701 15,532 20,169 35,007 14,207 20,800 19,479 9,072 10,407
Notes: (1) Impairment provisions individually assessed. (2) Impairment provisions individually assessed on balances of £25,492 million (2009 - £24,540 million; 2008 - £11,313 million).
Group Carrying Carrying Carrying
Value Value Value 2010 2009 2008 £m £m £mAvailable-for-sale securities Debt securities 580 758 618Equity shares 43 180 87
Loans and receivables Debt securities 230 — — 853 938 705
RBS Group 2010328
Notes on the accounts continued
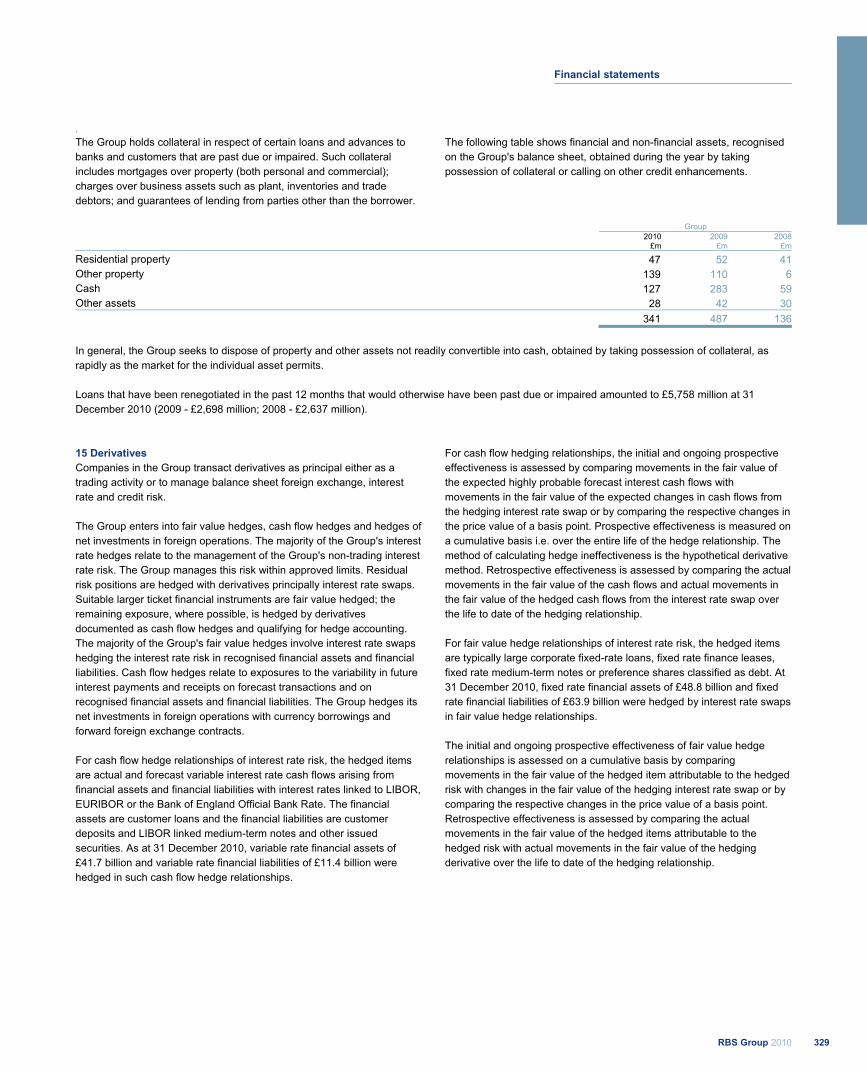
.
The Group holds collateral in respect of certain loans and advances to banks and customers that are past due or impaired. Such collateral includes mortgages over property (both personal and commercial); charges over business assets such as plant, inventories and trade debtors; and guarantees of lending from parties other than the borrower.
The following table shows financial and non-financial assets, recognised on the Group's balance sheet, obtained during the year by taking possession of collateral or calling on other credit enhancements.
Group
2010 2009 2008£m £m £m
Residential property 47 52 41Other property 139 110 6Cash 127 283 59Other assets 28 42 30 341 487 136
In general, the Group seeks to dispose of property and other assets not readily convertible into cash, obtained by taking possession of collateral, as rapidly as the market for the individual asset permits. Loans that have been renegotiated in the past 12 months that would otherwise have been past due or impaired amounted to £5,758 million at 31 December 2010 (2009 - £2,698 million; 2008 - £2,637 million).
15 Derivatives Companies in the Group transact derivatives as principal either as a trading activity or to manage balance sheet foreign exchange, interest rate and credit risk. The Group enters into fair value hedges, cash flow hedges and hedges of net investments in foreign operations. The majority of the Group's interest rate hedges relate to the management of the Group's non-trading interest rate risk. The Group manages this risk within approved limits. Residual risk positions are hedged with derivatives principally interest rate swaps. Suitable larger ticket financial instruments are fair value hedged; the remaining exposure, where possible, is hedged by derivatives documented as cash flow hedges and qualifying for hedge accounting. The majority of the Group's fair value hedges involve interest rate swaps hedging the interest rate risk in recognised financial assets and financial liabilities. Cash flow hedges relate to exposures to the variability in future interest payments and receipts on forecast transactions and on recognised financial assets and financial liabilities. The Group hedges its net investments in foreign operations with currency borrowings and forward foreign exchange contracts. For cash flow hedge relationships of interest rate risk, the hedged items are actual and forecast variable interest rate cash flows arising from financial assets and financial liabilities with interest rates linked to LIBOR, EURIBOR or the Bank of England Official Bank Rate. The financial assets are customer loans and the financial liabilities are customer deposits and LIBOR linked medium-term notes and other issued securities. As at 31 December 2010, variable rate financial assets of £41.7 billion and variable rate financial liabilities of £11.4 billion were hedged in such cash flow hedge relationships.
For cash flow hedging relationships, the initial and ongoing prospective effectiveness is assessed by comparing movements in the fair value of the expected highly probable forecast interest cash flows with movements in the fair value of the expected changes in cash flows from the hedging interest rate swap or by comparing the respective changes in the price value of a basis point. Prospective effectiveness is measured on a cumulative basis i.e. over the entire life of the hedge relationship. The method of calculating hedge ineffectiveness is the hypothetical derivative method. Retrospective effectiveness is assessed by comparing the actual movements in the fair value of the cash flows and actual movements in the fair value of the hedged cash flows from the interest rate swap over the life to date of the hedging relationship. For fair value hedge relationships of interest rate risk, the hedged items are typically large corporate fixed-rate loans, fixed rate finance leases, fixed rate medium-term notes or preference shares classified as debt. At 31 December 2010, fixed rate financial assets of £48.8 billion and fixed rate financial liabilities of £63.9 billion were hedged by interest rate swaps in fair value hedge relationships. The initial and ongoing prospective effectiveness of fair value hedge relationships is assessed on a cumulative basis by comparing movements in the fair value of the hedged item attributable to the hedged risk with changes in the fair value of the hedging interest rate swap or by comparing the respective changes in the price value of a basis point. Retrospective effectiveness is assessed by comparing the actual movements in the fair value of the hedged items attributable to the hedged risk with actual movements in the fair value of the hedging derivative over the life to date of the hedging relationship.
329RBS Group 2010
Financial statements
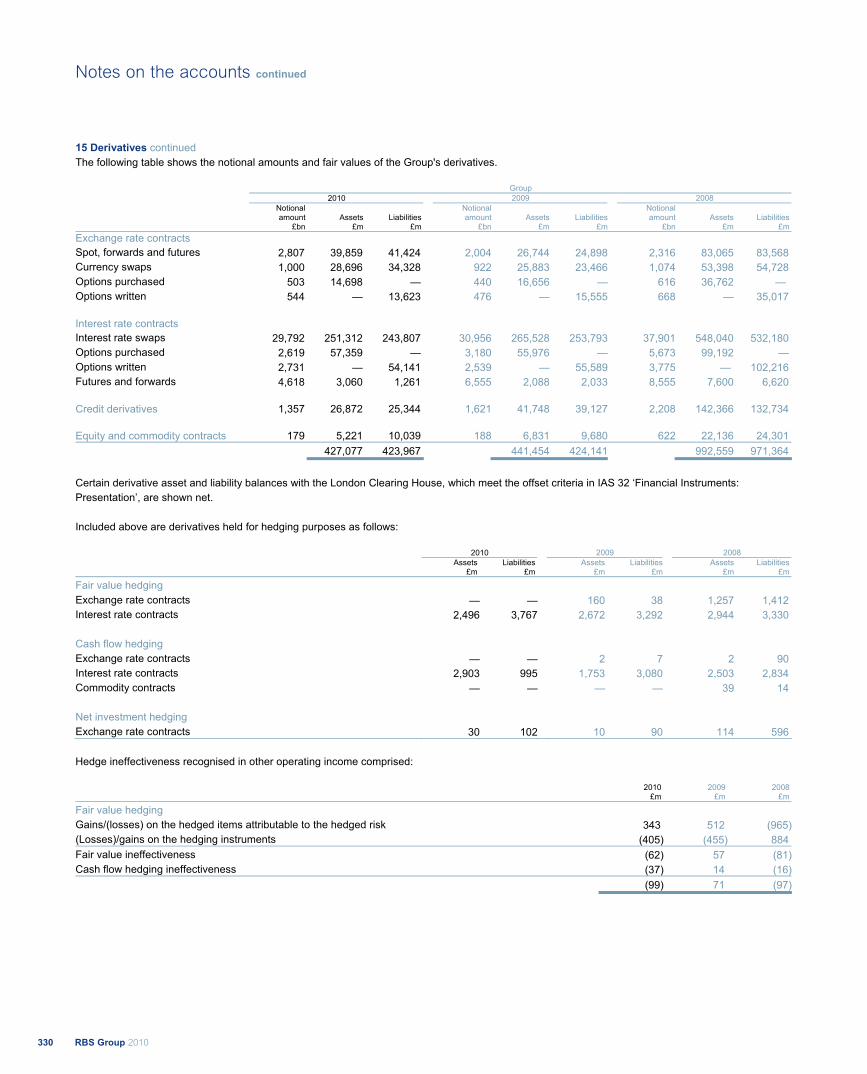
15 Derivatives continued The following table shows the notional amounts and fair values of the Group's derivatives.
Group 2010 2009 2008
Notional Notional Notional amount Assets Liabilities amount Assets Liabilities amount Assets Liabilities
£bn £m £m £bn £m £m £bn £m £m Exchange rate contracts Spot, forwards and futures 2,807 39,859 41,424 2,004 26,744 24,898 2,316 83,065 83,568 Currency swaps 1,000 28,696 34,328 922 25,883 23,466 1,074 53,398 54,728 Options purchased 503 14,698 — 440 16,656 — 616 36,762 — Options written 544 — 13,623 476 — 15,555 668 — 35,017 Interest rate contracts Interest rate swaps 29,792 251,312 243,807 30,956 265,528 253,793 37,901 548,040 532,180 Options purchased 2,619 57,359 — 3,180 55,976 — 5,673 99,192 — Options written 2,731 — 54,141 2,539 — 55,589 3,775 — 102,216 Futures and forwards 4,618 3,060 1,261 6,555 2,088 2,033 8,555 7,600 6,620 Credit derivatives 1,357 26,872 25,344 1,621 41,748 39,127 2,208 142,366 132,734 Equity and commodity contracts 179 5,221 10,039 188 6,831 9,680 622 22,136 24,301 427,077 423,967 441,454 424,141 992,559 971,364
Certain derivative asset and liability balances with the London Clearing House, which meet the offset criteria in IAS 32 ‘Financial Instruments: Presentation’, are shown net. Included above are derivatives held for hedging purposes as follows:
2010 2009 2008 Assets Liabilities Assets Liabilities Assets Liabilities
£m £m £m £m £m £m
Fair value hedging Exchange rate contracts — — 160 38 1,257 1,412 Interest rate contracts 2,496 3,767 2,672 3,292 2,944 3,330 Cash flow hedging Exchange rate contracts — — 2 7 2 90 Interest rate contracts 2,903 995 1,753 3,080 2,503 2,834 Commodity contracts — — — — 39 14 Net investment hedging Exchange rate contracts 30 102 10 90 114 596
Hedge ineffectiveness recognised in other operating income comprised:
2010 2009 2008 £m £m £m
Fair value hedging Gains/(losses) on the hedged items attributable to the hedged risk 343 512 (965)(Losses)/gains on the hedging instruments (405) (455) 884 Fair value ineffectiveness (62) 57 (81)Cash flow hedging ineffectiveness (37) 14 (16) (99) 71 (97)
RBS Group 2010330
Notes on the accounts continued
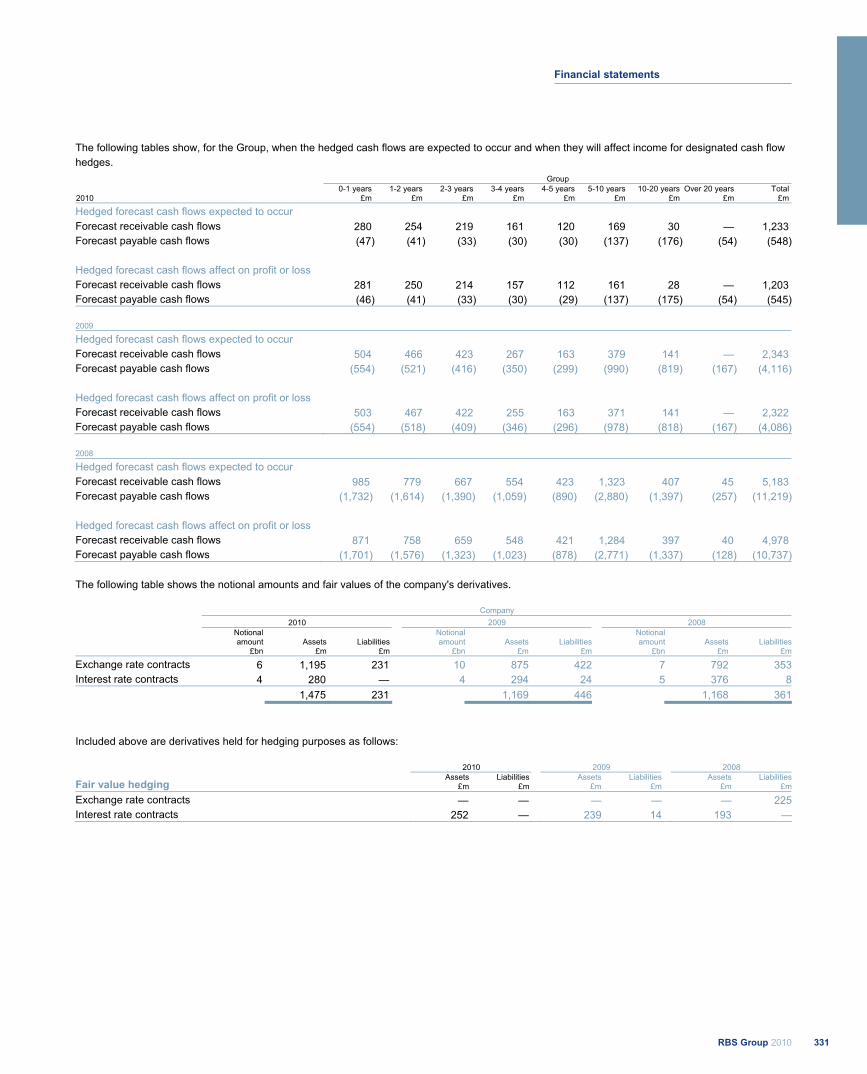
The following tables show, for the Group, when the hedged cash flows are expected to occur and when they will affect income for designated cash flow hedges. Group
2010
0-1 years £m
1-2 years £m
2-3 years £m
3-4 years £m
4-5 years £m
5-10 years £m
10-20 years £m
Over 20 years £m
Total £m
Hedged forecast cash flows expected to occur Forecast receivable cash flows 280 254 219 161 120 169 30 — 1,233 Forecast payable cash flows (47) (41) (33) (30) (30) (137) (176) (54) (548) Hedged forecast cash flows affect on profit or loss Forecast receivable cash flows 281 250 214 157 112 161 28 — 1,203 Forecast payable cash flows (46) (41) (33) (30) (29) (137) (175) (54) (545) 2009
Hedged forecast cash flows expected to occur Forecast receivable cash flows 504 466 423 267 163 379 141 — 2,343 Forecast payable cash flows (554) (521) (416) (350) (299) (990) (819) (167) (4,116) Hedged forecast cash flows affect on profit or loss Forecast receivable cash flows 503 467 422 255 163 371 141 — 2,322 Forecast payable cash flows (554) (518) (409) (346) (296) (978) (818) (167) (4,086)
2008
Hedged forecast cash flows expected to occur Forecast receivable cash flows 985 779 667 554 423 1,323 407 45 5,183 Forecast payable cash flows (1,732) (1,614) (1,390) (1,059) (890) (2,880) (1,397) (257) (11,219) Hedged forecast cash flows affect on profit or loss Forecast receivable cash flows 871 758 659 548 421 1,284 397 40 4,978 Forecast payable cash flows (1,701) (1,576) (1,323) (1,023) (878) (2,771) (1,337) (128) (10,737)
The following table shows the notional amounts and fair values of the company's derivatives.
Company 2010 2009 2008
Notional Notional Notionalamount Assets Liabilities amount Assets Liabilities amount Assets Liabilities
£bn £m £m £bn £m £m £bn £m £m
Exchange rate contracts 6 1,195 231 10 875 422 7 792 353Interest rate contracts 4 280 — 4 294 24 5 376 8 1,475 231 1,169 446 1,168 361
Included above are derivatives held for hedging purposes as follows:
2010 2009 2008
Fair value hedging Assets
£m Liabilities
£m Assets
£mLiabilities
£mAssets
£mLiabilities
£m
Exchange rate contracts — — — — — 225Interest rate contracts 252 — 239 14 193 —
331RBS Group 2010
Financial statements
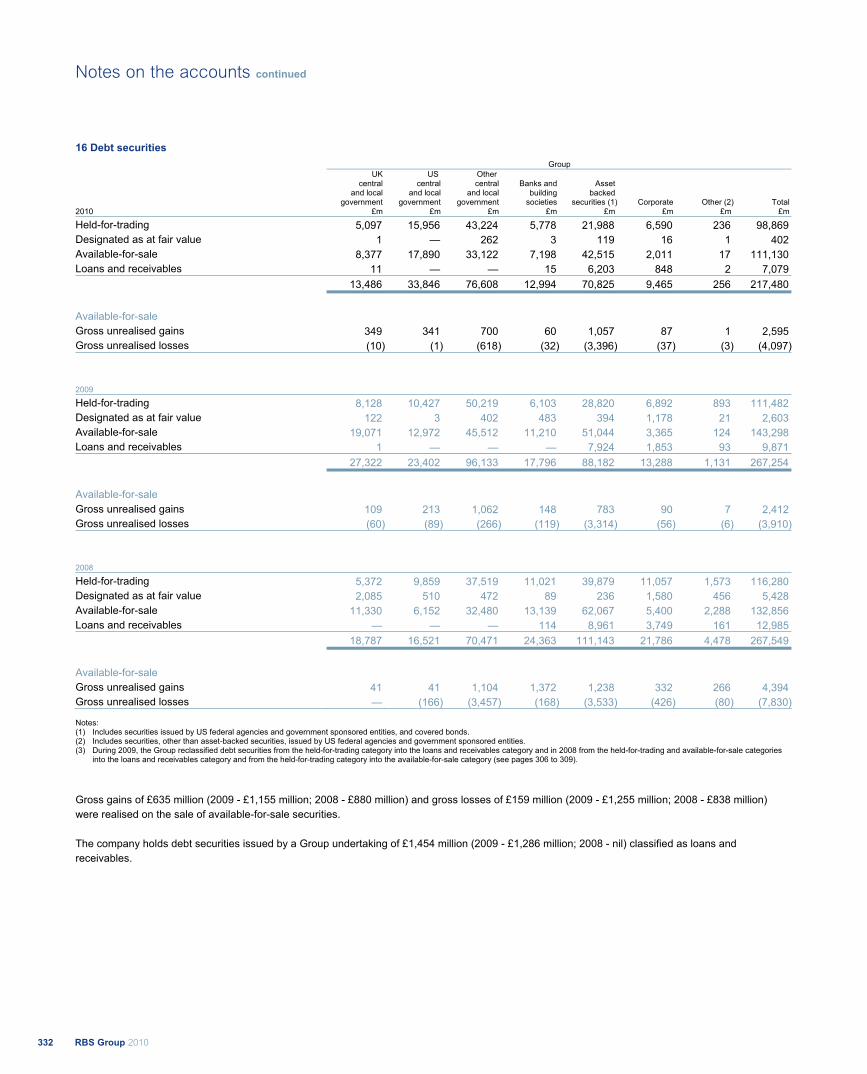
16 Debt securities Group
UKcentral
and local government
UScentral
and local government
Other central
and local government
Banks and building
societies
Asset backed
securities (1) Corporate Other (2) Total 2010 £m £m £m £m £m £m £m £m
Held-for-trading 5,097 15,956 43,224 5,778 21,988 6,590 236 98,869 Designated as at fair value 1 — 262 3 119 16 1 402 Available-for-sale 8,377 17,890 33,122 7,198 42,515 2,011 17 111,130 Loans and receivables 11 — — 15 6,203 848 2 7,079 13,486 33,846 76,608 12,994 70,825 9,465 256 217,480
Available-for-sale Gross unrealised gains 349 341 700 60 1,057 87 1 2,595 Gross unrealised losses (10) (1) (618) (32) (3,396) (37) (3) (4,097)
2009 Held-for-trading 8,128 10,427 50,219 6,103 28,820 6,892 893 111,482 Designated as at fair value 122 3 402 483 394 1,178 21 2,603 Available-for-sale 19,071 12,972 45,512 11,210 51,044 3,365 124 143,298 Loans and receivables 1 — — — 7,924 1,853 93 9,871 27,322 23,402 96,133 17,796 88,182 13,288 1,131 267,254
Available-for-sale Gross unrealised gains 109 213 1,062 148 783 90 7 2,412 Gross unrealised losses (60) (89) (266) (119) (3,314) (56) (6) (3,910)
2008 Held-for-trading 5,372 9,859 37,519 11,021 39,879 11,057 1,573 116,280 Designated as at fair value 2,085 510 472 89 236 1,580 456 5,428 Available-for-sale 11,330 6,152 32,480 13,139 62,067 5,400 2,288 132,856 Loans and receivables — — — 114 8,961 3,749 161 12,985 18,787 16,521 70,471 24,363 111,143 21,786 4,478 267,549
Available-for-sale Gross unrealised gains 41 41 1,104 1,372 1,238 332 266 4,394 Gross unrealised losses — (166) (3,457) (168) (3,533) (426) (80) (7,830)
Notes: (1) Includes securities issued by US federal agencies and government sponsored entities, and covered bonds. (2) Includes securities, other than asset-backed securities, issued by US federal agencies and government sponsored entities. (3) During 2009, the Group reclassified debt securities from the held-for-trading category into the loans and receivables category and in 2008 from the held-for-trading and available-for-sale categories
into the loans and receivables category and from the held-for-trading category into the available-for-sale category (see pages 306 to 309).
Gross gains of £635 million (2009 - £1,155 million; 2008 - £880 million) and gross losses of £159 million (2009 - £1,255 million; 2008 - £838 million) were realised on the sale of available-for-sale securities. The company holds debt securities issued by a Group undertaking of £1,454 million (2009 - £1,286 million; 2008 - nil) classified as loans and receivables.
RBS Group 2010332
Notes on the accounts continued
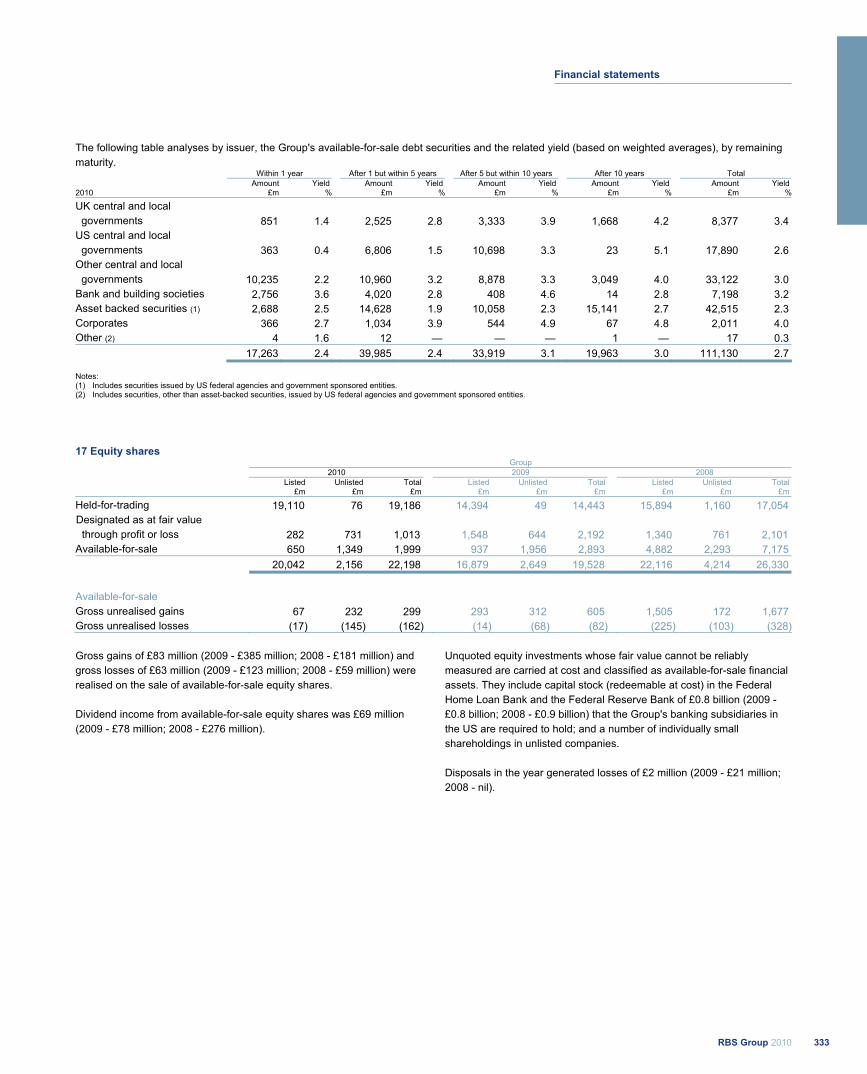
The following table analyses by issuer, the Group's available-for-sale debt securities and the related yield (based on weighted averages), by remaining maturity.
Within 1 year After 1 but within 5 years After 5 but within 10 years After 10 years Total Amount Yield Amount Yield Amount Yield Amount Yield Amount Yield 2010 £m % £m % £m % £m % £m %
UK central and local governments 851 1.4 2,525 2.8 3,333 3.9 1,668 4.2 8,377 3.4 US central and local governments 363 0.4 6,806 1.5 10,698 3.3 23 5.1 17,890 2.6 Other central and local governments 10,235 2.2 10,960 3.2 8,878 3.3 3,049 4.0 33,122 3.0 Bank and building societies 2,756 3.6 4,020 2.8 408 4.6 14 2.8 7,198 3.2 Asset backed securities (1) 2,688 2.5 14,628 1.9 10,058 2.3 15,141 2.7 42,515 2.3 Corporates 366 2.7 1,034 3.9 544 4.9 67 4.8 2,011 4.0 Other (2) 4 1.6 12 — — — 1 — 17 0.3 17,263 2.4 39,985 2.4 33,919 3.1 19,963 3.0 111,130 2.7
Notes: (1) Includes securities issued by US federal agencies and government sponsored entities. (2) Includes securities, other than asset-backed securities, issued by US federal agencies and government sponsored entities.
17 Equity shares Group 2010 2009 2008
Listed Unlisted Total Listed Unlisted Total Listed Unlisted Total £m £m £m £m £m £m £m £m £m
Held-for-trading 19,110 76 19,186 14,394 49 14,443 15,894 1,160 17,054 Designated as at fair value through profit or loss 282 731 1,013
1,548
644
2,192
1,340
761
2,101
Available-for-sale 650 1,349 1,999 937 1,956 2,893 4,882 2,293 7,175 20,042 2,156 22,198 16,879 2,649 19,528 22,116 4,214 26,330
Available-for-sale Gross unrealised gains 67 232 299 293 312 605 1,505 172 1,677 Gross unrealised losses (17) (145) (162) (14) (68) (82) (225) (103) (328)
Gross gains of £83 million (2009 - £385 million; 2008 - £181 million) and gross losses of £63 million (2009 - £123 million; 2008 - £59 million) were realised on the sale of available-for-sale equity shares. Dividend income from available-for-sale equity shares was £69 million (2009 - £78 million; 2008 - £276 million).
Unquoted equity investments whose fair value cannot be reliably measured are carried at cost and classified as available-for-sale financial assets. They include capital stock (redeemable at cost) in the Federal Home Loan Bank and the Federal Reserve Bank of £0.8 billion (2009 - £0.8 billion; 2008 - £0.9 billion) that the Group's banking subsidiaries in the US are required to hold; and a number of individually small shareholdings in unlisted companies. Disposals in the year generated losses of £2 million (2009 - £21 million; 2008 - nil).
333RBS Group 2010
Financial statements
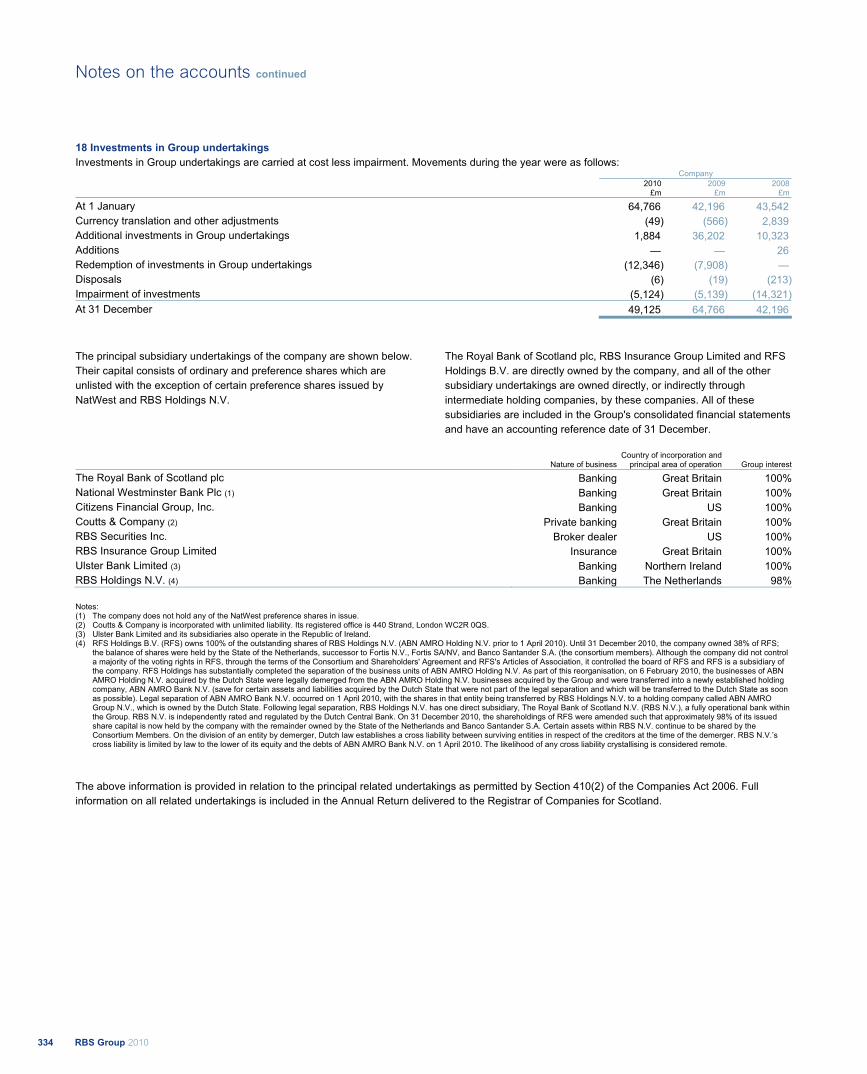
RBS Group 2010334
Notes on the accounts continued
18 Investments in Group undertakings Investments in Group undertakings are carried at cost less impairment. Movements during the year were as follows: Company 2010 2009 2008
£m £m £m
At 1 January 64,766 42,196 43,542 Currency translation and other adjustments (49) (566) 2,839 Additional investments in Group undertakings 1,884 36,202 10,323 Additions — — 26 Redemption of investments in Group undertakings (12,346) (7,908) — Disposals (6) (19) (213)Impairment of investments (5,124) (5,139) (14,321)At 31 December 49,125 64,766 42,196
The principal subsidiary undertakings of the company are shown below. Their capital consists of ordinary and preference shares which are unlisted with the exception of certain preference shares issued by NatWest and RBS Holdings N.V.
The Royal Bank of Scotland plc, RBS Insurance Group Limited and RFS Holdings B.V. are directly owned by the company, and all of the other subsidiary undertakings are owned directly, or indirectly through intermediate holding companies, by these companies. All of these subsidiaries are included in the Group's consolidated financial statements and have an accounting reference date of 31 December.
Nature of businessCountry of incorporation and
principal area of operation Group interest
The Royal Bank of Scotland plc Banking Great Britain 100%National Westminster Bank Plc (1) Banking Great Britain 100%Citizens Financial Group, Inc. Banking US 100%Coutts & Company (2) Private banking Great Britain 100%RBS Securities Inc. Broker dealer US 100%RBS Insurance Group Limited Insurance Great Britain 100%Ulster Bank Limited (3) Banking Northern Ireland 100%RBS Holdings N.V. (4) Banking The Netherlands 98%
Notes: (1) The company does not hold any of the NatWest preference shares in issue. (2) Coutts & Company is incorporated with unlimited liability. Its registered office is 440 Strand, London WC2R 0QS. (3) Ulster Bank Limited and its subsidiaries also operate in the Republic of Ireland. (4) RFS Holdings B.V. (RFS) owns 100% of the outstanding shares of RBS Holdings N.V. (ABN AMRO Holding N.V. prior to 1 April 2010). Until 31 December 2010, the company owned 38% of RFS;
the balance of shares were held by the State of the Netherlands, successor to Fortis N.V., Fortis SA/NV, and Banco Santander S.A. (the consortium members). Although the company did not control a majority of the voting rights in RFS, through the terms of the Consortium and Shareholders' Agreement and RFS's Articles of Association, it controlled the board of RFS and RFS is a subsidiary of the company. RFS Holdings has substantially completed the separation of the business units of ABN AMRO Holding N.V. As part of this reorganisation, on 6 February 2010, the businesses of ABN AMRO Holding N.V. acquired by the Dutch State were legally demerged from the ABN AMRO Holding N.V. businesses acquired by the Group and were transferred into a newly established holding company, ABN AMRO Bank N.V. (save for certain assets and liabilities acquired by the Dutch State that were not part of the legal separation and which will be transferred to the Dutch State as soon as possible). Legal separation of ABN AMRO Bank N.V. occurred on 1 April 2010, with the shares in that entity being transferred by RBS Holdings N.V. to a holding company called ABN AMRO Group N.V., which is owned by the Dutch State. Following legal separation, RBS Holdings N.V. has one direct subsidiary, The Royal Bank of Scotland N.V. (RBS N.V.), a fully operational bank within the Group. RBS N.V. is independently rated and regulated by the Dutch Central Bank. On 31 December 2010, the shareholdings of RFS were amended such that approximately 98% of its issued share capital is now held by the company with the remainder owned by the State of the Netherlands and Banco Santander S.A. Certain assets within RBS N.V. continue to be shared by the Consortium Members. On the division of an entity by demerger, Dutch law establishes a cross liability between surviving entities in respect of the creditors at the time of the demerger. RBS N.V.’s cross liability is limited by law to the lower of its equity and the debts of ABN AMRO Bank N.V. on 1 April 2010. The likelihood of any cross liability crystallising is considered remote.
The above information is provided in relation to the principal related undertakings as permitted by Section 410(2) of the Companies Act 2006. Full information on all related undertakings is included in the Annual Return delivered to the Registrar of Companies for Scotland.
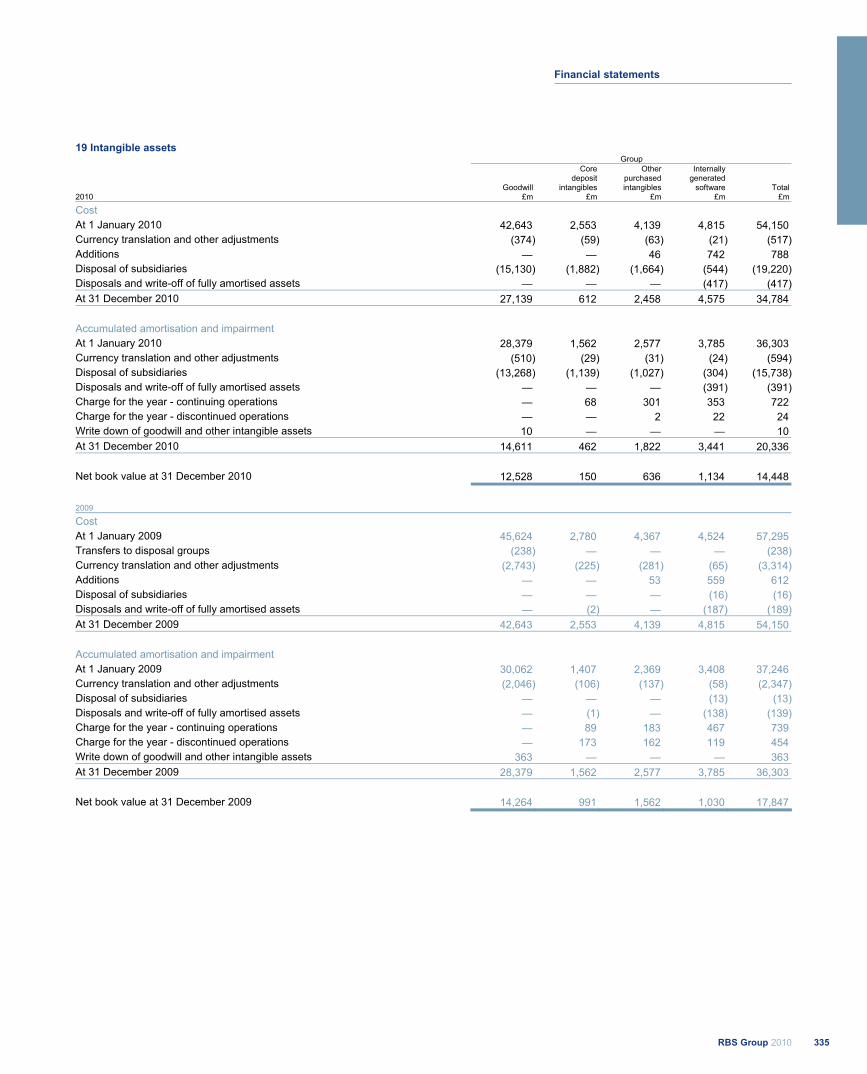
19 Intangible assets Group
Goodwill
Core deposit
intangibles
Other purchased intangibles
Internally generated
software Total 2010 £m £m £m £m £m
Cost At 1 January 2010 42,643 2,553 4,139 4,815 54,150 Currency translation and other adjustments (374) (59) (63) (21) (517)Additions — — 46 742 788 Disposal of subsidiaries (15,130) (1,882) (1,664) (544) (19,220)Disposals and write-off of fully amortised assets — — — (417) (417)At 31 December 2010 27,139 612 2,458 4,575 34,784
Accumulated amortisation and impairment At 1 January 2010 28,379 1,562 2,577 3,785 36,303 Currency translation and other adjustments (510) (29) (31) (24) (594)Disposal of subsidiaries (13,268) (1,139) (1,027) (304) (15,738)Disposals and write-off of fully amortised assets — — — (391) (391)Charge for the year - continuing operations — 68 301 353 722 Charge for the year - discontinued operations — — 2 22 24 Write down of goodwill and other intangible assets 10 — — — 10 At 31 December 2010 14,611 462 1,822 3,441 20,336
Net book value at 31 December 2010 12,528 150 636 1,134 14,448 2009 Cost At 1 January 2009 45,624 2,780 4,367 4,524 57,295 Transfers to disposal groups (238) — — — (238)Currency translation and other adjustments (2,743) (225) (281) (65) (3,314)Additions — — 53 559 612 Disposal of subsidiaries — — — (16) (16)Disposals and write-off of fully amortised assets — (2) — (187) (189)At 31 December 2009 42,643 2,553 4,139 4,815 54,150
Accumulated amortisation and impairment At 1 January 2009 30,062 1,407 2,369 3,408 37,246 Currency translation and other adjustments (2,046) (106) (137) (58) (2,347)Disposal of subsidiaries — — — (13) (13)Disposals and write-off of fully amortised assets — (1) — (138) (139)Charge for the year - continuing operations — 89 183 467 739 Charge for the year - discontinued operations — 173 162 119 454 Write down of goodwill and other intangible assets 363 — — — 363 At 31 December 2009 28,379 1,562 2,577 3,785 36,303
Net book value at 31 December 2009 14,264 991 1,562 1,030 17,847
335RBS Group 2010
Financial statements
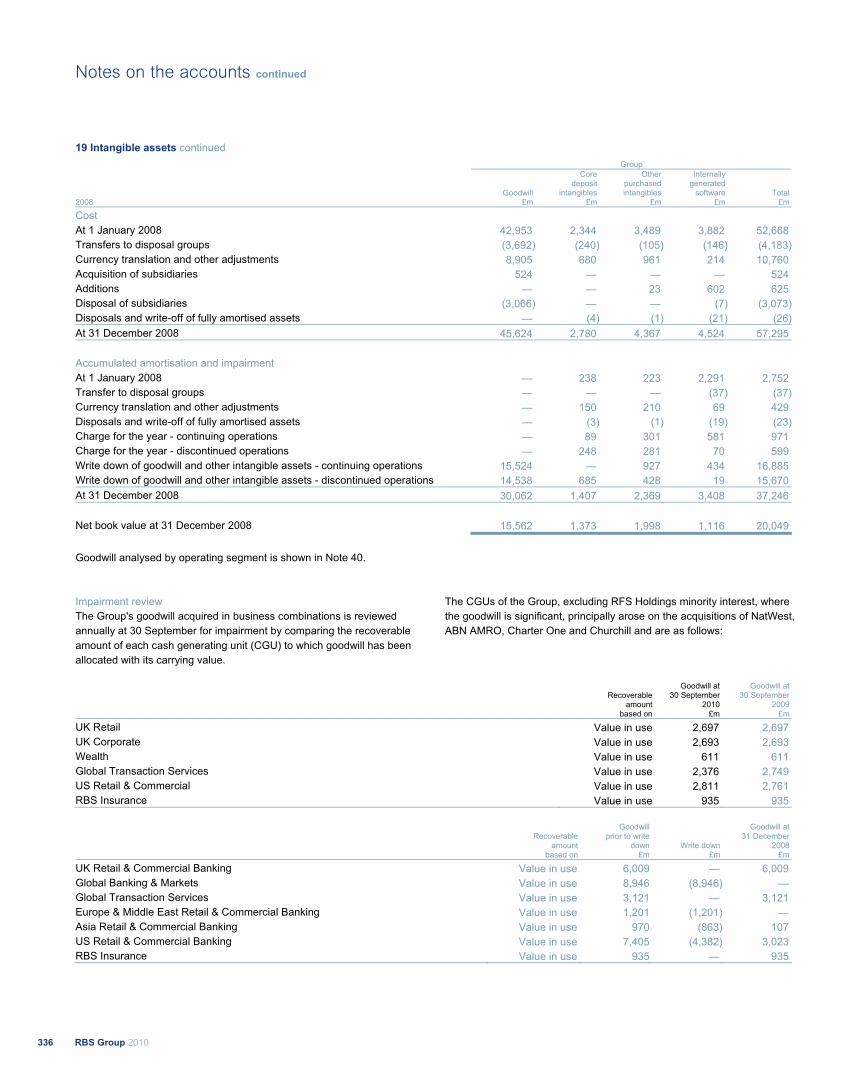
19 Intangible assets continued Group
Goodwill
Core deposit
intangibles
Other purchased intangibles
Internally generated
software Total 2008 £m £m £m £m £m
Cost At 1 January 2008 42,953 2,344 3,489 3,882 52,668 Transfers to disposal groups (3,692) (240) (105) (146) (4,183)Currency translation and other adjustments 8,905 680 961 214 10,760 Acquisition of subsidiaries 524 — — — 524 Additions — — 23 602 625 Disposal of subsidiaries (3,066) — — (7) (3,073)Disposals and write-off of fully amortised assets — (4) (1) (21) (26)At 31 December 2008 45,624 2,780 4,367 4,524 57,295
Accumulated amortisation and impairment At 1 January 2008 — 238 223 2,291 2,752 Transfer to disposal groups — — — (37) (37)Currency translation and other adjustments — 150 210 69 429 Disposals and write-off of fully amortised assets — (3) (1) (19) (23)Charge for the year - continuing operations — 89 301 581 971 Charge for the year - discontinued operations — 248 281 70 599 Write down of goodwill and other intangible assets - continuing operations 15,524 — 927 434 16,885 Write down of goodwill and other intangible assets - discontinued operations 14,538 685 428 19 15,670 At 31 December 2008 30,062 1,407 2,369 3,408 37,246
Net book value at 31 December 2008 15,562 1,373 1,998 1,116 20,049
Goodwill analysed by operating segment is shown in Note 40.
Impairment review The Group's goodwill acquired in business combinations is reviewed annually at 30 September for impairment by comparing the recoverable amount of each cash generating unit (CGU) to which goodwill has been allocated with its carrying value.
The CGUs of the Group, excluding RFS Holdings minority interest, where the goodwill is significant, principally arose on the acquisitions of NatWest, ABN AMRO, Charter One and Churchill and are as follows:
Recoverable amount
based on
Goodwill at 30 September
2010 £m
Goodwill at 30 September
2009 £m
UK Retail Value in use 2,697 2,697 UK Corporate Value in use 2,693 2,693 Wealth Value in use 611 611 Global Transaction Services Value in use 2,376 2,749 US Retail & Commercial Value in use 2,811 2,761 RBS Insurance Value in use 935 935
Recoverable amount
based on
Goodwill prior to write
down£m
Write down£m
Goodwill at 31 December
2008 £m
UK Retail & Commercial Banking Value in use 6,009 — 6,009 Global Banking & Markets Value in use 8,946 (8,946) — Global Transaction Services Value in use 3,121 — 3,121 Europe & Middle East Retail & Commercial Banking Value in use 1,201 (1,201) — Asia Retail & Commercial Banking Value in use 970 (863) 107 US Retail & Commercial Banking Value in use 7,405 (4,382) 3,023 RBS Insurance Value in use 935 — 935
RBS Group 2010336
Notes on the accounts continued
Impairment testing involves the comparison of the carrying value of a CGU or group of CGUs with its recoverable amount. The recoverable amount is the higher of the unit's fair value and its value in use. Value in use is the present value of expected future cash flows from the CGU or group of CGUs. Fair value is the amount obtainable for the sale of the CGU in an arm's length transaction between knowledgeable, willing parties. Impairment testing inherently involves a number of judgmental areas: the preparation of cash flow forecasts for periods that are beyond the normal requirements of management reporting; the assessment of the discount rate appropriate to the business; estimation of the fair value of CGUs; and the valuation of the separable assets of each business whose goodwill is being reviewed. Sensitivity to the variables more significant to each assessment are presented below. The recoverable amounts for all CGUs at 30 September 2010 were based on the value in use test, using management's latest five-year forecasts. The long-term growth rates have been based on respective country GDP rates adjusted for inflation. The risk discount rates are based on observable market long-term government bond yields and average industry betas adjusted for an appropriate risk premium based on independent analysis. The recoverable amount of UK Retail, based on a 3% (2009 - 4%) terminal growth rate and 15.7% (2009 - 14.6%) pre tax discount rate, exceeded the carrying amount by £6.9 billion (2009 - £0.7 billion). A 1% change in the discount rate or the terminal growth rate would change the recoverable amount by approximately £1.5 billion (2009 - £0.9 billion) and £0.9 billion (2009 - £0.5 billion) respectively. In addition, a 5% change in the forecast pre tax earnings would change the recoverable amount by approximately £0.9 billion (2009 - £0.4 billion). The recoverable amount of UK Corporate, based on 3% (2009 - 4%) terminal growth rate and a 15.6% (2009 - 15.1%) pre tax discount rate, exceeded its carrying value by £5.3 billion (2009 - £6.1 billion). A 1% change in the discount rate or the terminal growth rate would change the recoverable amount by approximately £1.6 billion (2009 - £1.4 billion) and
£0.9 billion (2009 - £0.9 billion) respectively. In addition, a 5% change in the forecast pre tax earnings would change the recoverable amount by approximately £1.0 billion (2009 - £0.8 billion). The recoverable amount of Wealth, based on a 3% (2009 - 4%) terminal growth rate and a 12.0% (2009 - 15.3%) pre tax discount rate, exceeded its carrying value by more than 100% and was insensitive to a reasonably possible change in key assumptions. The recoverable amount of Global Transaction Services, based on a 3% (2009 - 3%) terminal growth rate and a 12.8% (2009 - 16.7%) pre tax discount rate, exceeded its carrying value by more than 100% (2009 - 100%) and was insensitive to a reasonably possible change in key assumptions. The recoverable amount of US Retail & Commercial, based on a 5% (2009 - 5%) terminal growth rate and a 14.9% (2009 - 14.8%) pre tax discount rate, exceeded its carrying value by £1.6 billion (2009 - £2.1 billion). A 1% change in the discount rate or the terminal growth rate would change the recoverable amount by approximately £1.6 billion (2009 - £1.0 billion) and £0.8 billion (2009 - £0.8 billion) respectively. In addition, a 5% change in the forecast pre tax earnings would change the recoverable amount by approximately £0.7 billion (2009 - £0.7 billion). The recoverable amount of RBS Insurance, based on a 3% (2009 - 3%) terminal growth rate and a 13.1% (2009 - 13.9%) pre tax discount rate, exceeded the carrying amount by over £2.4 billion (2009 - £3.0 billion) and was insensitive to a reasonably possible change in key assumptions. In 2008, the recoverable amounts for all CGUs were based on value in use tests. Goodwill write downs were recorded in Global Banking & Markets, US Retail & Commercial, Europe & Middle East Retail & Commercial Banking and Asia Retail & Commercial Banking divisions. In addition, an impairment charge of £14.5 billion was recorded in respect of goodwill attributable to the State of Netherlands minority interest arising on the acquisition of ABN AMRO.
337RBS Group 2010
Financial statements
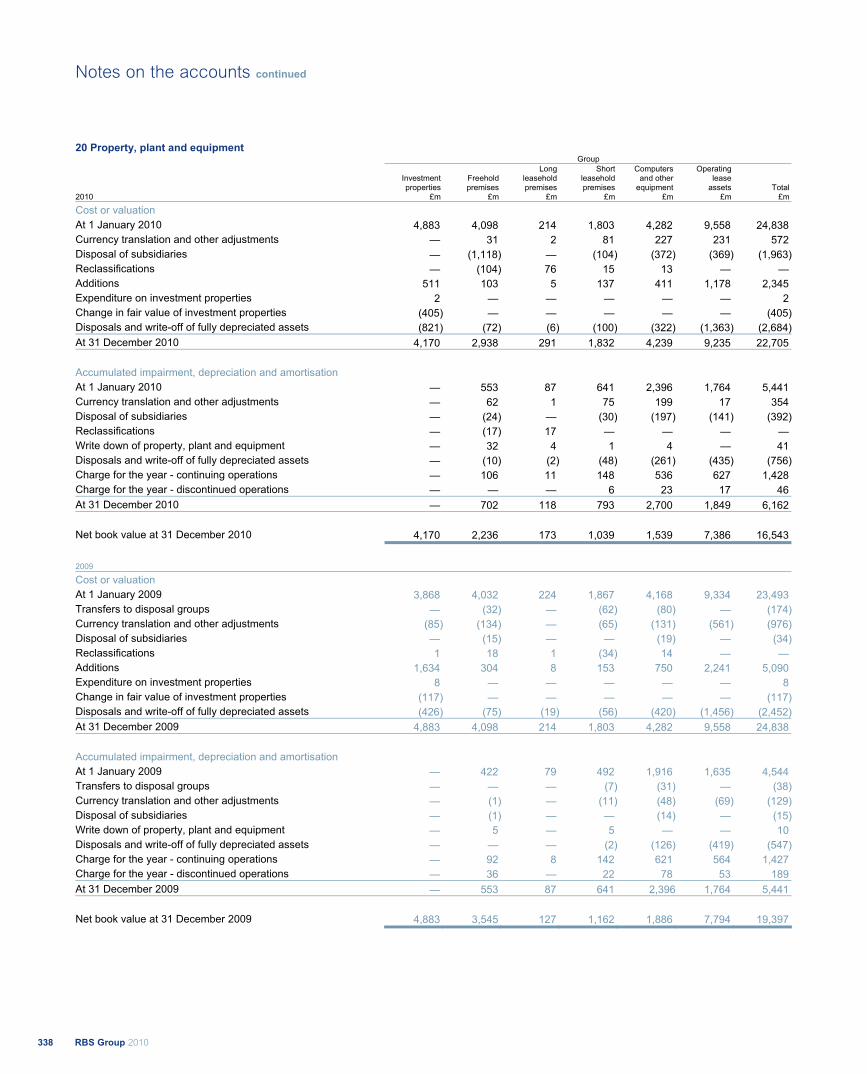
20 Property, plant and equipment Group
Investment properties
Freehold premises
Long leasehold premises
Short leasehold premises
Computers and other
equipment
Operating lease
assets Total 2010 £m £m £m £m £m £m £m
Cost or valuation At 1 January 2010 4,883 4,098 214 1,803 4,282 9,558 24,838 Currency translation and other adjustments — 31 2 81 227 231 572 Disposal of subsidiaries — (1,118) — (104) (372) (369) (1,963)Reclassifications — (104) 76 15 13 — — Additions 511 103 5 137 411 1,178 2,345 Expenditure on investment properties 2 — — — — — 2Change in fair value of investment properties (405) — — — — — (405)Disposals and write-off of fully depreciated assets (821) (72) (6) (100) (322) (1,363) (2,684)At 31 December 2010 4,170 2,938 291 1,832 4,239 9,235 22,705
Accumulated impairment, depreciation and amortisation At 1 January 2010 — 553 87 641 2,396 1,764 5,441 Currency translation and other adjustments — 62 1 75 199 17 354 Disposal of subsidiaries — (24) — (30) (197) (141) (392)Reclassifications — (17) 17 — — — — Write down of property, plant and equipment — 32 4 1 4 — 41 Disposals and write-off of fully depreciated assets — (10) (2) (48) (261) (435) (756)Charge for the year - continuing operations — 106 11 148 536 627 1,428 Charge for the year - discontinued operations — — — 6 23 17 46 At 31 December 2010 — 702 118 793 2,700 1,849 6,162
Net book value at 31 December 2010 4,170 2,236 173 1,039 1,539 7,386 16,543 2009 Cost or valuation At 1 January 2009 3,868 4,032 224 1,867 4,168 9,334 23,493 Transfers to disposal groups — (32) — (62) (80) — (174)Currency translation and other adjustments (85) (134) — (65) (131) (561) (976)Disposal of subsidiaries — (15) — — (19) — (34)Reclassifications 1 18 1 (34) 14 — — Additions 1,634 304 8 153 750 2,241 5,090 Expenditure on investment properties 8 — — — — — 8Change in fair value of investment properties (117) — — — — — (117)Disposals and write-off of fully depreciated assets (426) (75) (19) (56) (420) (1,456) (2,452)At 31 December 2009 4,883 4,098 214 1,803 4,282 9,558 24,838
Accumulated impairment, depreciation and amortisation At 1 January 2009 — 422 79 492 1,916 1,635 4,544 Transfers to disposal groups — — — (7) (31) — (38)Currency translation and other adjustments — (1) — (11) (48) (69) (129)Disposal of subsidiaries — (1) — — (14) — (15)Write down of property, plant and equipment — 5 — 5 — — 10 Disposals and write-off of fully depreciated assets — — — (2) (126) (419) (547)Charge for the year - continuing operations — 92 8 142 621 564 1,427 Charge for the year - discontinued operations — 36 — 22 78 53 189 At 31 December 2009 — 553 87 641 2,396 1,764 5,441
Net book value at 31 December 2009 4,883 3,545 127 1,162 1,886 7,794 19,397
RBS Group 2010338
Notes on the accounts continued
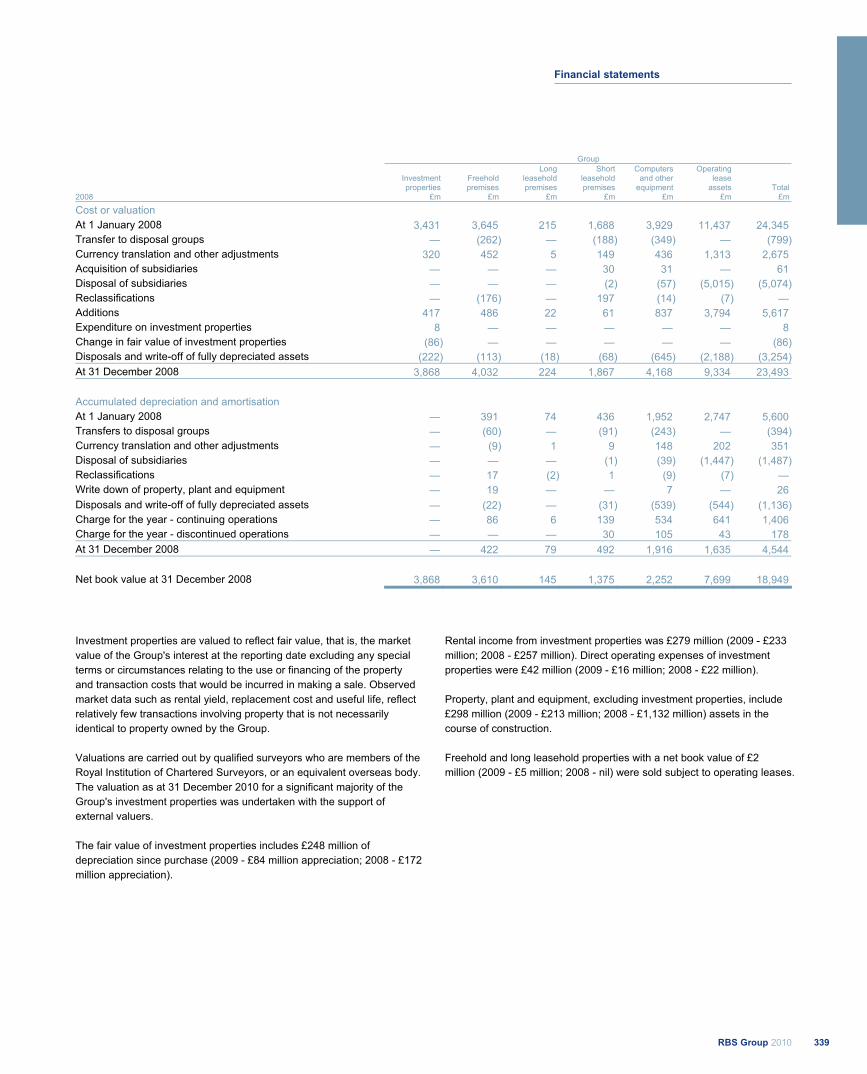
Group
Investment properties
Freehold premises
Long leasehold premises
Short leasehold premises
Computers and other
equipment
Operating lease assets Total
2008 £m £m £m £m £m £m £m
Cost or valuation At 1 January 2008 3,431 3,645 215 1,688 3,929 11,437 24,345 Transfer to disposal groups — (262) — (188) (349) — (799)Currency translation and other adjustments 320 452 5 149 436 1,313 2,675 Acquisition of subsidiaries — — — 30 31 — 61 Disposal of subsidiaries — — — (2) (57) (5,015) (5,074)Reclassifications — (176) — 197 (14) (7) — Additions 417 486 22 61 837 3,794 5,617 Expenditure on investment properties 8 — — — — — 8Change in fair value of investment properties (86) — — — — — (86)Disposals and write-off of fully depreciated assets (222) (113) (18) (68) (645) (2,188) (3,254)At 31 December 2008 3,868 4,032 224 1,867 4,168 9,334 23,493
Accumulated depreciation and amortisation At 1 January 2008 — 391 74 436 1,952 2,747 5,600 Transfers to disposal groups — (60) — (91) (243) — (394)Currency translation and other adjustments — (9) 1 9 148 202 351 Disposal of subsidiaries — — — (1) (39) (1,447) (1,487)Reclassifications — 17 (2) 1 (9) (7) — Write down of property, plant and equipment — 19 — — 7 — 26 Disposals and write-off of fully depreciated assets — (22) — (31) (539) (544) (1,136)Charge for the year - continuing operations — 86 6 139 534 641 1,406 Charge for the year - discontinued operations — — — 30 105 43 178 At 31 December 2008 — 422 79 492 1,916 1,635 4,544
Net book value at 31 December 2008 3,868 3,610 145 1,375 2,252 7,699 18,949
Investment properties are valued to reflect fair value, that is, the market value of the Group's interest at the reporting date excluding any special terms or circumstances relating to the use or financing of the property and transaction costs that would be incurred in making a sale. Observed market data such as rental yield, replacement cost and useful life, reflect relatively few transactions involving property that is not necessarily identical to property owned by the Group. Valuations are carried out by qualified surveyors who are members of the Royal Institution of Chartered Surveyors, or an equivalent overseas body. The valuation as at 31 December 2010 for a significant majority of the Group's investment properties was undertaken with the support of external valuers. The fair value of investment properties includes £248 million of depreciation since purchase (2009 - £84 million appreciation; 2008 - £172 million appreciation).
Rental income from investment properties was £279 million (2009 - £233 million; 2008 - £257 million). Direct operating expenses of investment properties were £42 million (2009 - £16 million; 2008 - £22 million). Property, plant and equipment, excluding investment properties, include £298 million (2009 - £213 million; 2008 - £1,132 million) assets in the course of construction. Freehold and long leasehold properties with a net book value of £2 million (2009 - £5 million; 2008 - nil) were sold subject to operating leases.
339RBS Group 2010
Financial statements
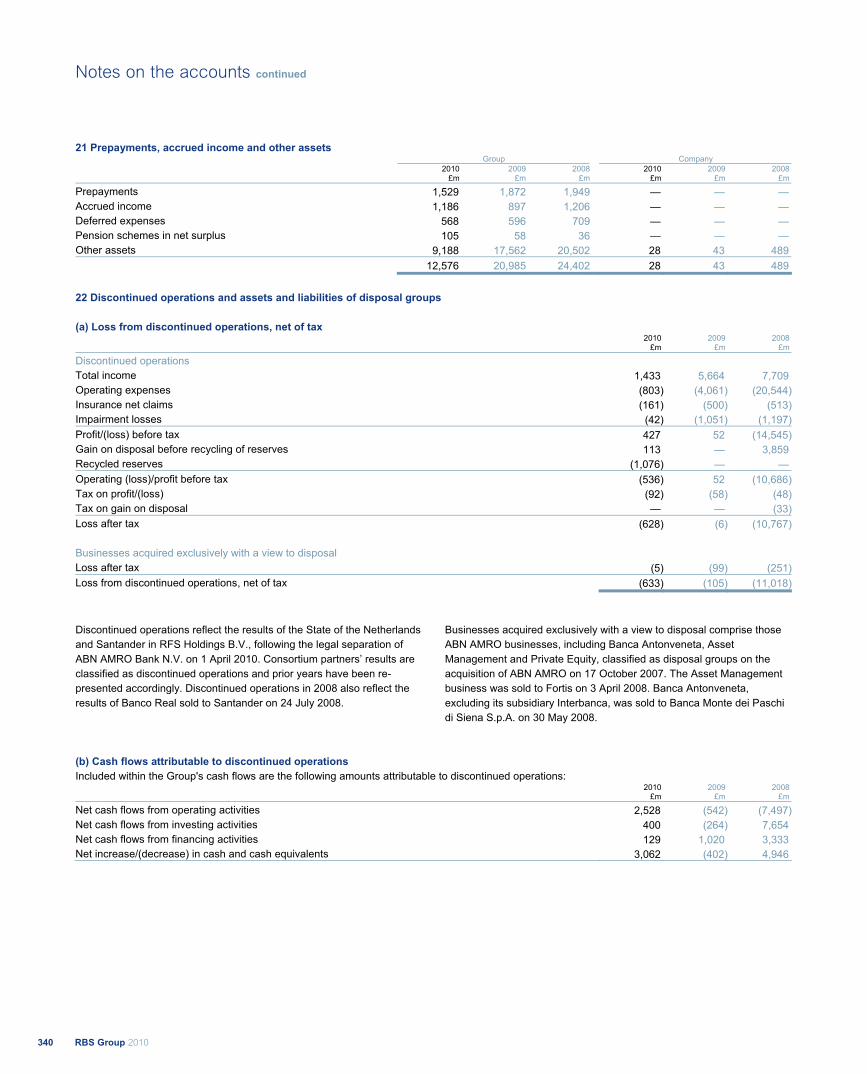
21 Prepayments, accrued income and other assets Group Company 2010 2009 2008 2010 2009 2008
£m £m £m £m £m £m
Prepayments 1,529 1,872 1,949 — — —Accrued income 1,186 897 1,206 — — —Deferred expenses 568 596 709 — — —Pension schemes in net surplus 105 58 36 — — —Other assets 9,188 17,562 20,502 28 43 489 12,576 20,985 24,402 28 43 489
22 Discontinued operations and assets and liabilities of disposal groups (a) Loss from discontinued operations, net of tax 2010 2009 2008 £m £m £m
Discontinued operations Total income 1,433 5,664 7,709 Operating expenses (803) (4,061) (20,544)Insurance net claims (161) (500) (513)Impairment losses (42) (1,051) (1,197)Profit/(loss) before tax 427 52 (14,545)Gain on disposal before recycling of reserves 113 — 3,859 Recycled reserves (1,076) — —Operating (loss)/profit before tax (536) 52 (10,686)Tax on profit/(loss) (92) (58) (48)Tax on gain on disposal — — (33)Loss after tax (628) (6) (10,767)
Businesses acquired exclusively with a view to disposal Loss after tax (5) (99) (251)Loss from discontinued operations, net of tax (633) (105) (11,018)
Discontinued operations reflect the results of the State of the Netherlands and Santander in RFS Holdings B.V., following the legal separation of ABN AMRO Bank N.V. on 1 April 2010. Consortium partners’ results are classified as discontinued operations and prior years have been re-presented accordingly. Discontinued operations in 2008 also reflect the results of Banco Real sold to Santander on 24 July 2008.
Businesses acquired exclusively with a view to disposal comprise those ABN AMRO businesses, including Banca Antonveneta, Asset Management and Private Equity, classified as disposal groups on the acquisition of ABN AMRO on 17 October 2007. The Asset Management business was sold to Fortis on 3 April 2008. Banca Antonveneta, excluding its subsidiary Interbanca, was sold to Banca Monte dei Paschi di Siena S.p.A. on 30 May 2008.
(b) Cash flows attributable to discontinued operations Included within the Group's cash flows are the following amounts attributable to discontinued operations: 2010 2009 2008 £m £m £m
Net cash flows from operating activities 2,528 (542) (7,497)Net cash flows from investing activities 400 (264) 7,654 Net cash flows from financing activities 129 1,020 3,333 Net increase/(decrease) in cash and cash equivalents 3,062 (402) 4,946
RBS Group 2010340
Notes on the accounts continued
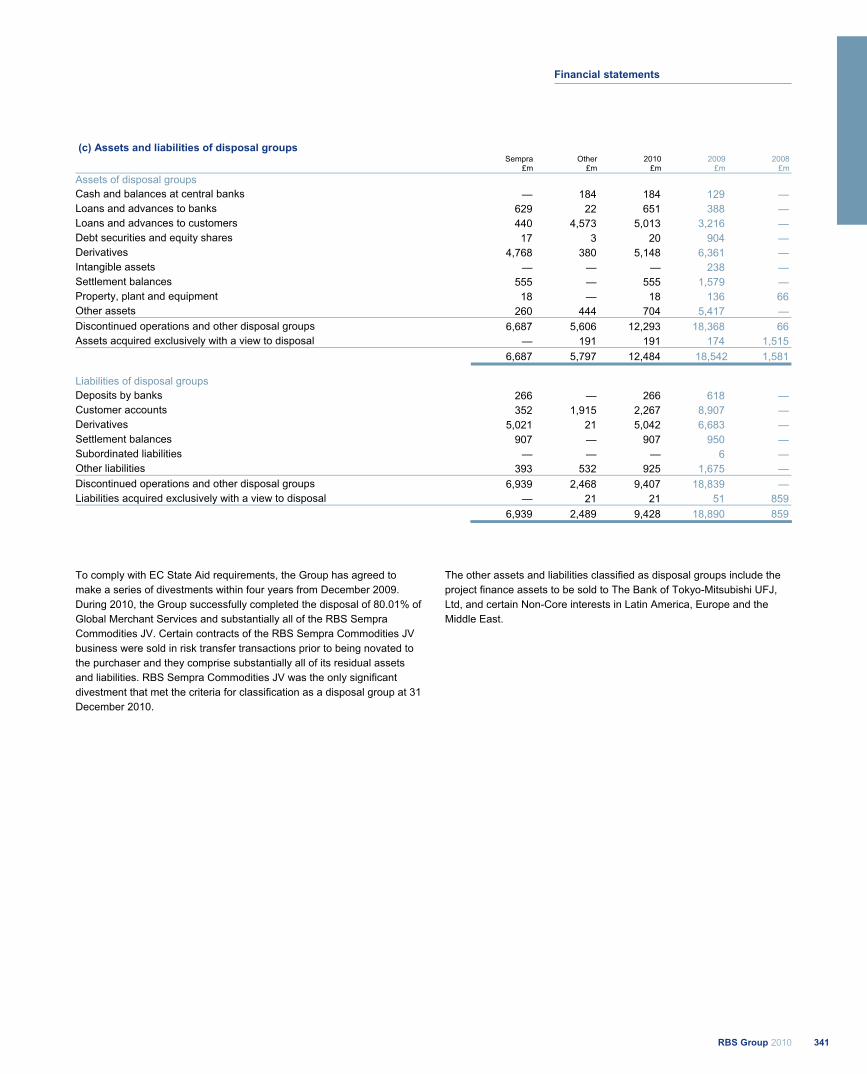
(c) Assets and liabilities of disposal groups Sempra Other 2010 2009 2008 £m £m £m £m £m Assets of disposal groups Cash and balances at central banks — 184 184 129 —Loans and advances to banks 629 22 651 388 —Loans and advances to customers 440 4,573 5,013 3,216 — Debt securities and equity shares 17 3 20 904 —Derivatives 4,768 380 5,148 6,361 — Intangible assets — — — 238 —Settlement balances 555 — 555 1,579 — Property, plant and equipment 18 — 18 136 66 Other assets 260 444 704 5,417 — Discontinued operations and other disposal groups 6,687 5,606 12,293 18,368 66 Assets acquired exclusively with a view to disposal — 191 191 174 1,515 6,687 5,797 12,484 18,542 1,581
Liabilities of disposal groups Deposits by banks 266 — 266 618 —Customer accounts 352 1,915 2,267 8,907 — Derivatives 5,021 21 5,042 6,683 — Settlement balances 907 — 907 950 —Subordinated liabilities — — — 6 —Other liabilities 393 532 925 1,675 — Discontinued operations and other disposal groups 6,939 2,468 9,407 18,839 — Liabilities acquired exclusively with a view to disposal — 21 21 51 859 6,939 2,489 9,428 18,890 859
To comply with EC State Aid requirements, the Group has agreed to make a series of divestments within four years from December 2009. During 2010, the Group successfully completed the disposal of 80.01% of Global Merchant Services and substantially all of the RBS Sempra Commodities JV. Certain contracts of the RBS Sempra Commodities JV business were sold in risk transfer transactions prior to being novated to the purchaser and they comprise substantially all of its residual assets and liabilities. RBS Sempra Commodities JV was the only significant divestment that met the criteria for classification as a disposal group at 31 December 2010.
The other assets and liabilities classified as disposal groups include the project finance assets to be sold to The Bank of Tokyo-Mitsubishi UFJ, Ltd, and certain Non-Core interests in Latin America, Europe and the Middle East.
341RBS Group 2010
Financial statements
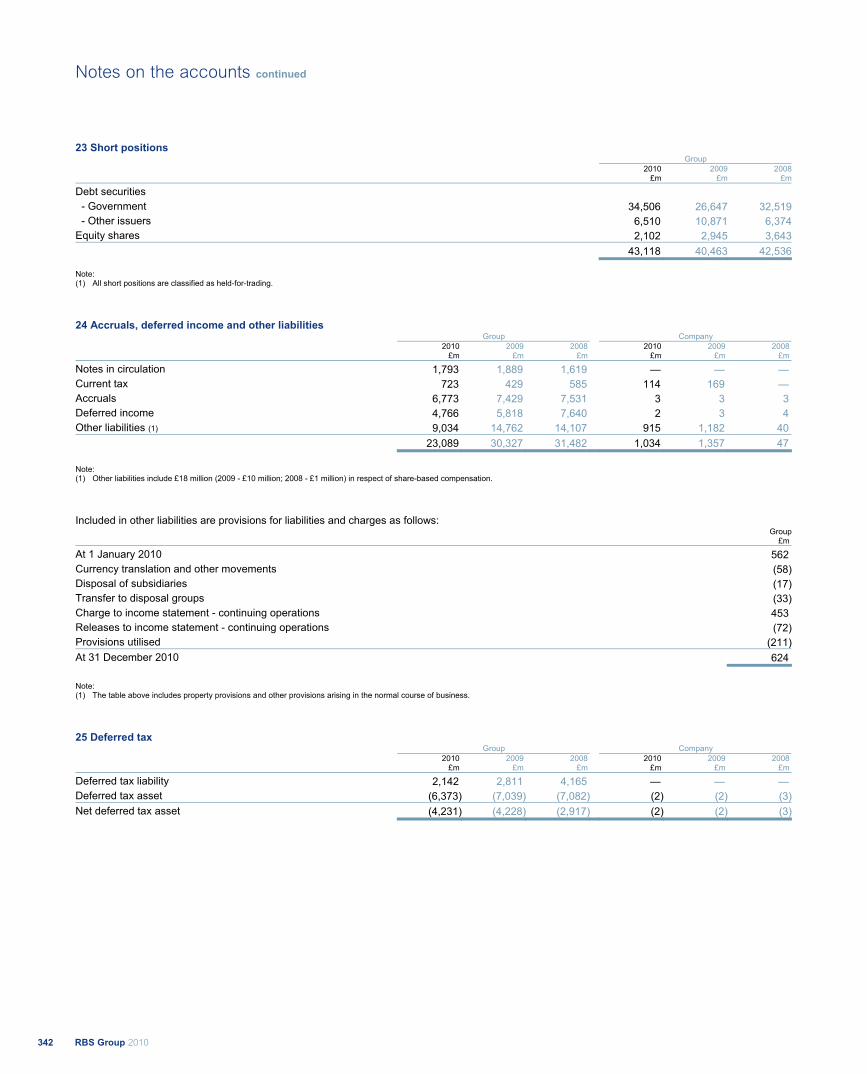
23 Short positions Group 2010 2009 2008
£m £m £m
Debt securities - Government 34,506 26,647 32,519
- Other issuers 6,510 10,871 6,374Equity shares 2,102 2,945 3,643 43,118 40,463 42,536
Note: (1) All short positions are classified as held-for-trading.
24 Accruals, deferred income and other liabilities Group Company 2010 2009 2008 2010 2009 2008
£m £m £m £m £m £m
Notes in circulation 1,793 1,889 1,619 — — —Current tax 723 429 585 114 169 —Accruals 6,773 7,429 7,531 3 3 3Deferred income 4,766 5,818 7,640 2 3 4Other liabilities (1) 9,034 14,762 14,107 915 1,182 40 23,089 30,327 31,482 1,034 1,357 47
Note: (1) Other liabilities include £18 million (2009 - £10 million; 2008 - £1 million) in respect of share-based compensation.
Included in other liabilities are provisions for liabilities and charges as follows:
Group£m
At 1 January 2010 562 Currency translation and other movements (58)Disposal of subsidiaries (17)Transfer to disposal groups (33)Charge to income statement - continuing operations 453 Releases to income statement - continuing operations (72)Provisions utilised (211)At 31 December 2010 624
Note: (1) The table above includes property provisions and other provisions arising in the normal course of business.
25 Deferred tax Group Company 2010 2009 2008 2010 2009 2008
£m £m £m £m £m £m
Deferred tax liability 2,142 2,811 4,165 — — —Deferred tax asset (6,373) (7,039) (7,082) (2) (2) (3)Net deferred tax asset (4,231) (4,228) (2,917) (2) (2) (3)
RBS Group 2010342
Notes on the accounts continued
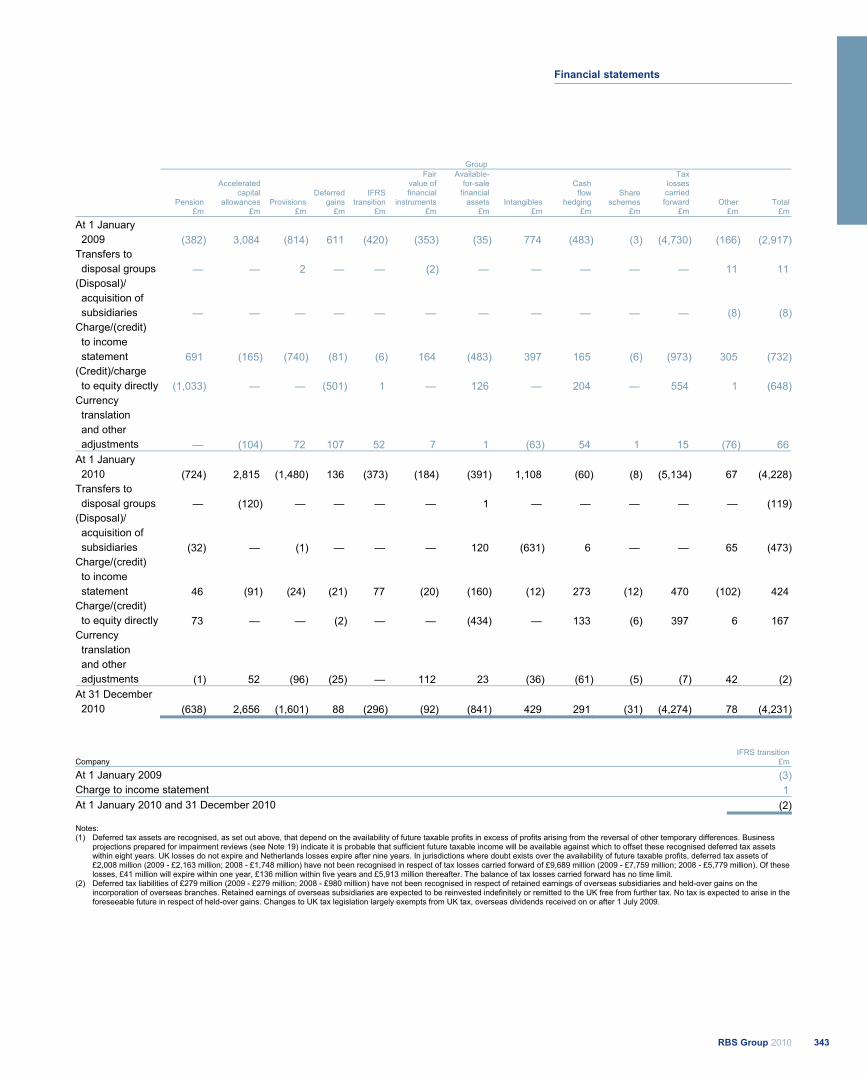
Group
Pension
Accelerated capital
allowances Provisions Deferred
gains IFRS
transition
Fairvalue offinancial
instruments
Available- for-sale
financial assets Intangibles
Cash flow
hedging Share
schemes
Tax losses carried forward Other Total
£m £m £m £m £m £m £m £m £m £m £m £m £m
At 1 January 2009 (382) 3,084 (814) 611 (420) (353) (35) 774 (483) (3) (4,730) (166) (2,917)Transfers to disposal groups — — 2 — — (2) — — — — — 11 11 (Disposal)/ acquisition of subsidiaries — — — — — — — — — — — (8) (8)Charge/(credit) to income statement 691 (165) (740) (81) (6) 164 (483) 397 165 (6) (973) 305 (732)(Credit)/charge to equity directly (1,033) — — (501) 1 — 126 — 204 — 554 1 (648)Currency translation and other adjustments — (104) 72 107 52 7 1 (63) 54 1 15 (76) 66 At 1 January 2010 (724) 2,815 (1,480) 136 (373) (184) (391) 1,108 (60) (8) (5,134) 67 (4,228)Transfers to disposal groups — (120) — — — — 1 — — — — — (119)(Disposal)/ acquisition of subsidiaries (32) — (1) — — — 120 (631) 6 — — 65 (473)Charge/(credit) to income statement 46 (91) (24) (21) 77 (20) (160) (12) 273 (12) 470 (102) 424 Charge/(credit) to equity directly 73 — — (2) — — (434) — 133 (6) 397 6 167 Currency translation and other adjustments (1) 52 (96) (25) — 112 23 (36) (61) (5) (7) 42 (2)At 31 December 2010 (638) 2,656 (1,601) 88 (296) (92) (841) 429 291 (31) (4,274) 78 (4,231)
IFRS transition Company £m
At 1 January 2009 (3)Charge to income statement 1At 1 January 2010 and 31 December 2010 (2)
Notes: (1) Deferred tax assets are recognised, as set out above, that depend on the availability of future taxable profits in excess of profits arising from the reversal of other temporary differences. Business
projections prepared for impairment reviews (see Note 19) indicate it is probable that sufficient future taxable income will be available against which to offset these recognised deferred tax assets within eight years. UK losses do not expire and Netherlands losses expire after nine years. In jurisdictions where doubt exists over the availability of future taxable profits, deferred tax assets of £2,008 million (2009 - £2,163 million; 2008 - £1,748 million) have not been recognised in respect of tax losses carried forward of £9,689 million (2009 - £7,759 million; 2008 - £5,779 million). Of these losses, £41 million will expire within one year, £136 million within five years and £5,913 million thereafter. The balance of tax losses carried forward has no time limit.
(2) Deferred tax liabilities of £279 million (2009 - £279 million; 2008 - £980 million) have not been recognised in respect of retained earnings of overseas subsidiaries and held-over gains on the incorporation of overseas branches. Retained earnings of overseas subsidiaries are expected to be reinvested indefinitely or remitted to the UK free from further tax. No tax is expected to arise in the foreseeable future in respect of held-over gains. Changes to UK tax legislation largely exempts from UK tax, overseas dividends received on or after 1 July 2009.
343RBS Group 2010
Financial statements
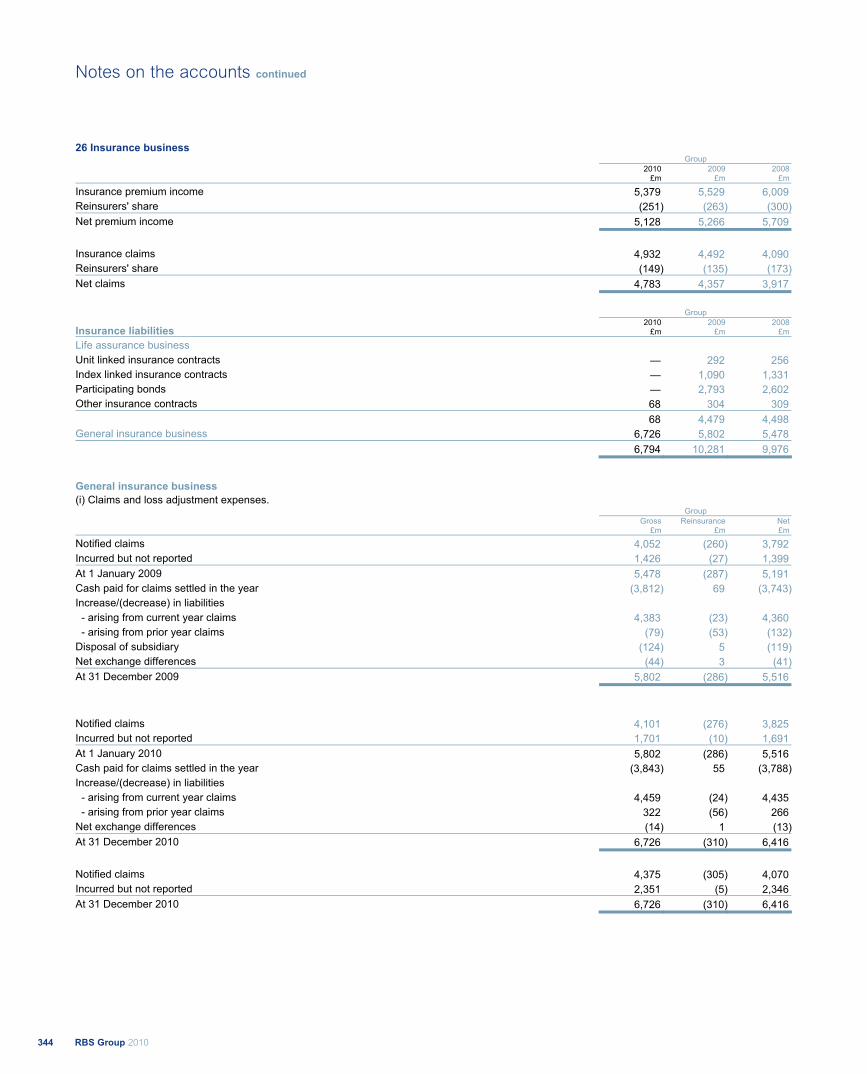
26 Insurance business Group 2010 2009 2008
£m £m £m
Insurance premium income 5,379 5,529 6,009 Reinsurers' share (251) (263) (300)Net premium income 5,128 5,266 5,709
Insurance claims 4,932 4,492 4,090 Reinsurers' share (149) (135) (173)Net claims 4,783 4,357 3,917
Group 2010 2009 2008 Insurance liabilities £m £m £m
Life assurance business Unit linked insurance contracts — 292 256 Index linked insurance contracts — 1,090 1,331 Participating bonds — 2,793 2,602 Other insurance contracts 68 304 309 68 4,479 4,498 General insurance business 6,726 5,802 5,478 6,794 10,281 9,976
General insurance business (i) Claims and loss adjustment expenses. Group Gross Reinsurance Net
£m £m £m
Notified claims 4,052 (260) 3,792 Incurred but not reported 1,426 (27) 1,399 At 1 January 2009 5,478 (287) 5,191 Cash paid for claims settled in the year (3,812) 69 (3,743)Increase/(decrease) in liabilities
- arising from current year claims 4,383 (23) 4,360 - arising from prior year claims (79) (53) (132)Disposal of subsidiary (124) 5 (119)Net exchange differences (44) 3 (41)At 31 December 2009 5,802 (286) 5,516
Notified claims 4,101 (276) 3,825 Incurred but not reported 1,701 (10) 1,691 At 1 January 2010 5,802 (286) 5,516 Cash paid for claims settled in the year (3,843) 55 (3,788)Increase/(decrease) in liabilities - arising from current year claims 4,459 (24) 4,435 - arising from prior year claims 322 (56) 266 Net exchange differences (14) 1 (13)At 31 December 2010 6,726 (310) 6,416
Notified claims 4,375 (305) 4,070 Incurred but not reported 2,351 (5) 2,346 At 31 December 2010 6,726 (310) 6,416
RBS Group 2010344
Notes on the accounts continued
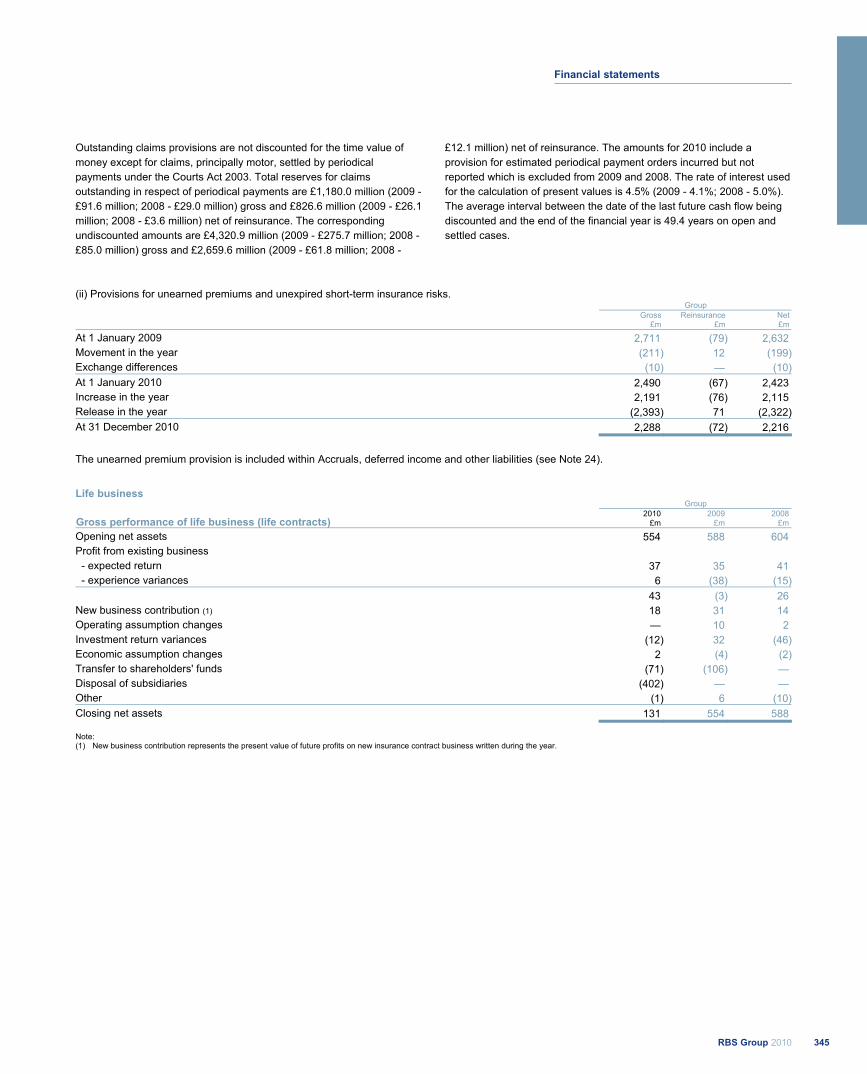
Outstanding claims provisions are not discounted for the time value of money except for claims, principally motor, settled by periodical payments under the Courts Act 2003. Total reserves for claims outstanding in respect of periodical payments are £1,180.0 million (2009 - £91.6 million; 2008 - £29.0 million) gross and £826.6 million (2009 - £26.1 million; 2008 - £3.6 million) net of reinsurance. The corresponding undiscounted amounts are £4,320.9 million (2009 - £275.7 million; 2008 - £85.0 million) gross and £2,659.6 million (2009 - £61.8 million; 2008 -
£12.1 million) net of reinsurance. The amounts for 2010 include a provision for estimated periodical payment orders incurred but not reported which is excluded from 2009 and 2008. The rate of interest used for the calculation of present values is 4.5% (2009 - 4.1%; 2008 - 5.0%). The average interval between the date of the last future cash flow being discounted and the end of the financial year is 49.4 years on open and settled cases.
(ii) Provisions for unearned premiums and unexpired short-term insurance risks. Group Gross Reinsurance Net
£m £m £m
At 1 January 2009 2,711 (79) 2,632 Movement in the year (211) 12 (199)Exchange differences (10) — (10)At 1 January 2010 2,490 (67) 2,423 Increase in the year 2,191 (76) 2,115 Release in the year (2,393) 71 (2,322)At 31 December 2010 2,288 (72) 2,216
The unearned premium provision is included within Accruals, deferred income and other liabilities (see Note 24).
Life business Group Gross performance of life business (life contracts)
2010 £m
2009 £m
2008 £m
Opening net assets 554 588 604 Profit from existing business
- expected return 37 35 41 - experience variances 6 (38) (15) 43 (3) 26 New business contribution (1) 18 31 14 Operating assumption changes — 10 2 Investment return variances (12) 32 (46)Economic assumption changes 2 (4) (2)Transfer to shareholders' funds (71) (106) — Disposal of subsidiaries (402) — —Other (1) 6 (10)Closing net assets 131 554 588
Note: (1) New business contribution represents the present value of future profits on new insurance contract business written during the year.
345RBS Group 2010
Financial statements
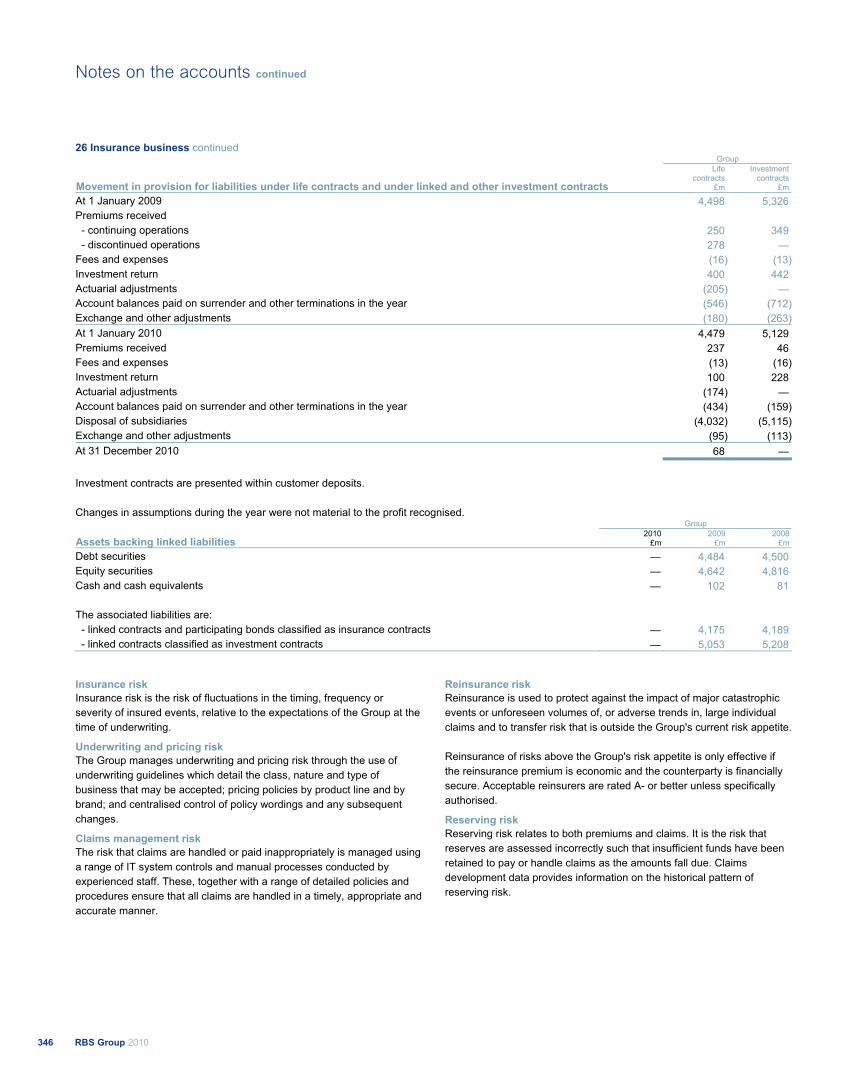
26 Insurance business continued Group
Movement in provision for liabilities under life contracts and under linked and other investment contracts
Life contracts
£m
Investment contracts
£m
At 1 January 2009 4,498 5,326 Premiums received - continuing operations 250 349 - discontinued operations 278 —Fees and expenses (16) (13)Investment return 400 442 Actuarial adjustments (205) — Account balances paid on surrender and other terminations in the year (546) (712)Exchange and other adjustments (180) (263)At 1 January 2010 4,479 5,129 Premiums received 237 46 Fees and expenses (13) (16)Investment return 100 228 Actuarial adjustments (174) — Account balances paid on surrender and other terminations in the year (434) (159)Disposal of subsidiaries (4,032) (5,115)Exchange and other adjustments (95) (113)At 31 December 2010 68 —
Investment contracts are presented within customer deposits. Changes in assumptions during the year were not material to the profit recognised.
Group 2010 2009 2008
Assets backing linked liabilities £m £m £m
Debt securities — 4,484 4,500 Equity securities — 4,642 4,816 Cash and cash equivalents — 102 81 The associated liabilities are:
- linked contracts and participating bonds classified as insurance contracts — 4,175 4,189 - linked contracts classified as investment contracts — 5,053 5,208
Insurance risk Insurance risk is the risk of fluctuations in the timing, frequency or severity of insured events, relative to the expectations of the Group at the time of underwriting. Underwriting and pricing risk The Group manages underwriting and pricing risk through the use of underwriting guidelines which detail the class, nature and type of business that may be accepted; pricing policies by product line and by brand; and centralised control of policy wordings and any subsequent changes. Claims management risk The risk that claims are handled or paid inappropriately is managed using a range of IT system controls and manual processes conducted by experienced staff. These, together with a range of detailed policies and procedures ensure that all claims are handled in a timely, appropriate and accurate manner.
Reinsurance risk Reinsurance is used to protect against the impact of major catastrophic events or unforeseen volumes of, or adverse trends in, large individual claims and to transfer risk that is outside the Group's current risk appetite. Reinsurance of risks above the Group's risk appetite is only effective if the reinsurance premium is economic and the counterparty is financially secure. Acceptable reinsurers are rated A- or better unless specifically authorised. Reserving risk Reserving risk relates to both premiums and claims. It is the risk that reserves are assessed incorrectly such that insufficient funds have been retained to pay or handle claims as the amounts fall due. Claims development data provides information on the historical pattern of reserving risk.
RBS Group 2010346
Notes on the accounts continued
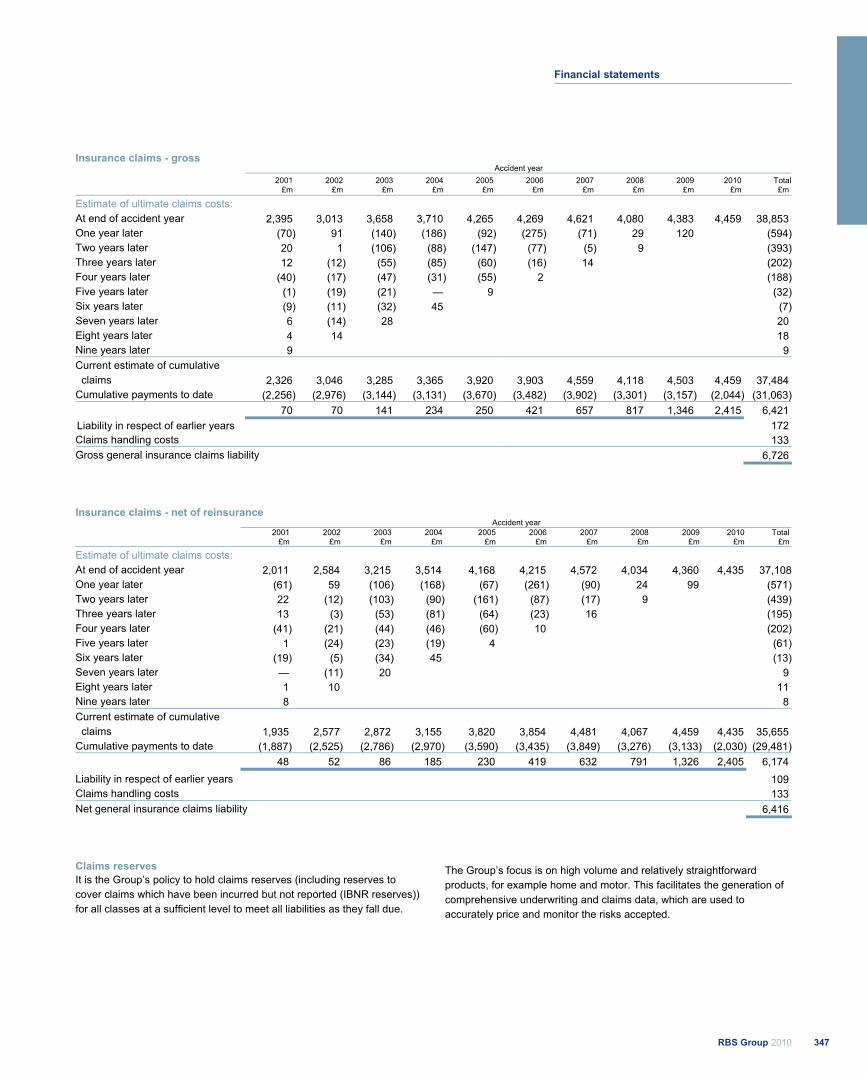
Insurance claims - gross Accident year
2001 £m
2002 £m
2003 £m
2004 £m
2005 £m
2006 £m
2007 £m
2008 £m
2009 £m
2010 £m
Total£m
Estimate of ultimate claims costs: At end of accident year 2,395 3,013 3,658 3,710 4,265 4,269 4,621 4,080 4,383 4,459 38,853 One year later (70) 91 (140) (186) (92) (275) (71) 29 120 (594)Two years later 20 1 (106) (88) (147) (77) (5) 9 (393)Three years later 12 (12) (55) (85) (60) (16) 14 (202)Four years later (40) (17) (47) (31) (55) 2 (188)Five years later (1) (19) (21) — 9 (32)Six years later (9) (11) (32) 45 (7)Seven years later 6 (14) 28 20 Eight years later 4 14 18 Nine years later 9 9Current estimate of cumulative claims 2,326 3,046 3,285 3,365 3,920 3,903 4,559 4,118 4,503 4,459 37,484 Cumulative payments to date (2,256) (2,976) (3,144) (3,131) (3,670) (3,482) (3,902) (3,301) (3,157) (2,044) (31,063) 70 70 141 234 250 421 657 817 1,346 2,415 6,421 Liability in respect of earlier years 172 Claims handling costs 133 Gross general insurance claims liability 6,726
Insurance claims - net of reinsurance Accident year 2001 2002 2003 2004 2005 2006 2007 2008 2009 2010 Total
£m £m £m £m £m £m £m £m £m £m £m
Estimate of ultimate claims costs: At end of accident year 2,011 2,584 3,215 3,514 4,168 4,215 4,572 4,034 4,360 4,435 37,108One year later (61) 59 (106) (168) (67) (261) (90) 24 99 (571)Two years later 22 (12) (103) (90) (161) (87) (17) 9 (439)Three years later 13 (3) (53) (81) (64) (23) 16 (195)Four years later (41) (21) (44) (46) (60) 10 (202)Five years later 1 (24) (23) (19) 4 (61)Six years later (19) (5) (34) 45 (13)Seven years later — (11) 20 9 Eight years later 1 10 11 Nine years later 8 8Current estimate of cumulative claims 1,935 2,577 2,872 3,155 3,820 3,854 4,481 4,067 4,459 4,435 35,655 Cumulative payments to date (1,887) (2,525) (2,786) (2,970) (3,590) (3,435) (3,849) (3,276) (3,133) (2,030) (29,481) 48 52 86 185 230 419 632 791 1,326 2,405 6,174 Liability in respect of earlier years 109 Claims handling costs 133 Net general insurance claims liability 6,416
Claims reserves It is the Group’s policy to hold claims reserves (including reserves to cover claims which have been incurred but not reported (IBNR reserves)) for all classes at a sufficient level to meet all liabilities as they fall due.
The Group’s focus is on high volume and relatively straightforward products, for example home and motor. This facilitates the generation of comprehensive underwriting and claims data, which are used to accurately price and monitor the risks accepted.
347RBS Group 2010
Financial statements

26 Insurance business continued Loss ratios The following table shows loss ratios for each major class of business, gross and net of reinsurance.
2010 2009 2008
Earned
premiums Claims
incurred Loss ratio
Earned premiums
Loss ratio
Earned premiums
Loss ratio
£m £m % £m % £m %
Residential property Gross 1,168 643 55 1,129 53 1,103 48Net 1,107 643 58 1,065 56 1,034 51
Personal motor Gross 2,829 3,530 125 2,984 103 3,173 84 Net 2,760 3,458 125 2,901 103 3,075 83Commercial property Gross 187 106 57 182 41 194 41 Net 169 106 63 166 45 174 46Commercial motor Gross 120 128 107 136 100 143 91 Net 119 124 104 135 98 141 91Other Gross 837 374 45 848 51 994 42 Net 834 369 44 845 51 828 51Total Gross 5,141 4,781 93 5,279 82 5,607 68
Net 4,989 4,700 94 5,112 83 5,252 71
Frequency and severity of specific risks and sources of uncertainty Most general insurance contracts are written on an annual basis, which means that the Group’s liability extends for a 12 month period, after which the Group is entitled to decline or renew or can impose renewal terms by amending the premium, terms and conditions, or both. The frequency and severity of claims and the sources of uncertainty for the key classes that the Group is exposed to are as follows: Motor insurance contracts (personal and commercial) Claims experience is quite variable, due to a wide range of factors, but the principal ones are age, sex and driving experience of the driver, type and nature of vehicle, use of vehicle and area. There are many sources of uncertainty that will affect the Group’s experience under motor insurance, including operational risk, reserving risk, premium rates not matching claims inflation rates, weather, the social, economic and legislative environment and reinsurance failure risk. Property insurance contracts (residential and commercial) The major causes of claims for property insurance are theft, flood, escape of water, fire, storm, subsidence and various types of accidental damage. The major source of uncertainty in the Group’s property contracts is the volatility of weather. Over a longer period, the strength of the economy is also a factor.
Other commercial insurance contracts Other commercial claims come mainly from business interruption and loss arising from the negligence of the insured (liability insurance). Business interruption losses come from the loss of income, revenue and/or profit as a result of property damage claims. Liability insurance includes employers’ liability and public/products’ liability. Liability insurance is written on an occurrence basis, and is subject to claims that are identified over a substantial period of time, but where the loss event occurred during the life of the policy. Fluctuations in the social and economic climate are a source of uncertainty in the Group’s business interruption and general liability accounts. Other sources of uncertainty are changes in the law, or its interpretation, and reserving risk. Other uncertainties are significant events (for example terrorist attacks) and any emerging new heads of damage or types of claim that are not envisaged when the policy is written. The following table shows the expected maturity of undiscounted insurance liabilities up to 20 years, excluding those linked directly to the financial assets backing these contracts (2010 - nil; 2009 - £4,175 million; 2008 - £4,189 million).
Group
0-3 months 3-12 months 1-3 years 3-5 years 5-10 years 10-20 years £m £m £m £m £m £m
2010 724 1,503 1,821 898 734 442 2009 561 1,685 1,898 949 665 73 2008 623 1,645 1,899 903 487 53
RBS Group 2010348
Notes on the accounts continued

27 Subordinated liabilities Group Company 2010 2009 2008 2010 2009 2008
£m £m £m £m £m £m
Dated loan capital 20,658 24,597 30,162 6,685 6,526 7,421Undated loan capital 2,552 8,164 11,697 563 574 1,071Preference shares 1,112 2,000 2,194 800 1,662 1,822Trust preferred securities 2,731 2,891 5,101 — — — 27,053 37,652 49,154 8,048 8,762 10,314
In May 2010, the Group redeemed certain subordinated debt securities and equity preference shares in exchange for cash or senior debt. The exchanges involving instruments classified as liabilities all met the criteria in IFRS for treatment as the extinguishment of the original liability and the recognition of a new financial liability. Gains on these exchanges and on the redemption of securities classified as liabilities for cash, totalling £553 million were credited to profit or loss. No amounts have been recognised in profit or loss in relation to the redemption of securities classified as equity in the Group financial statements. The difference between the consideration and the carrying value for these securities amounting to £651 million has been recorded in equity. A similar series of exchange and tender offers completed in April 2009 and resulted in a gain of £3,790 million and £829 million being recorded in equity. The Group has undertaken that, unless otherwise agreed with the European Commission, neither the company nor any of its direct or indirect subsidiaries (excluding companies in the RBS Holdings N.V. Group, which are subject to different restrictions, see below) will pay
external investors any dividends or coupons on existing hybrid capital instruments (including preference shares, B shares and upper and lower tier 2 instruments) from 30 April 2010 for a period of two years thereafter (“the Deferral Period”), or exercise any call rights in relation to these capital instruments between 24 November 2009 and the end of the Deferral Period, unless there is a legal obligation to do so. Hybrid capital instruments issued after 24 November 2009 will generally not be subject to the restriction on dividend or coupon payments or call options. The Group has agreed that RBS Holdings N.V. will not pay investors any coupons on, or exercise any call rights in relation to, specified hybrid capital instruments for an effective period of two years from 1 April 2011, unless in any such case there is a legal obligation to do so. RBS Holdings N.V. and its group companies are also subject to restrictions on the exercise of call rights in relation to their other hybrid capital instruments. Certain preference shares issued by the company are classified as liabilities; these securities remain subject to the capital maintenance rules of the Companies Act 2006.
349RBS Group 2010
Financial statements
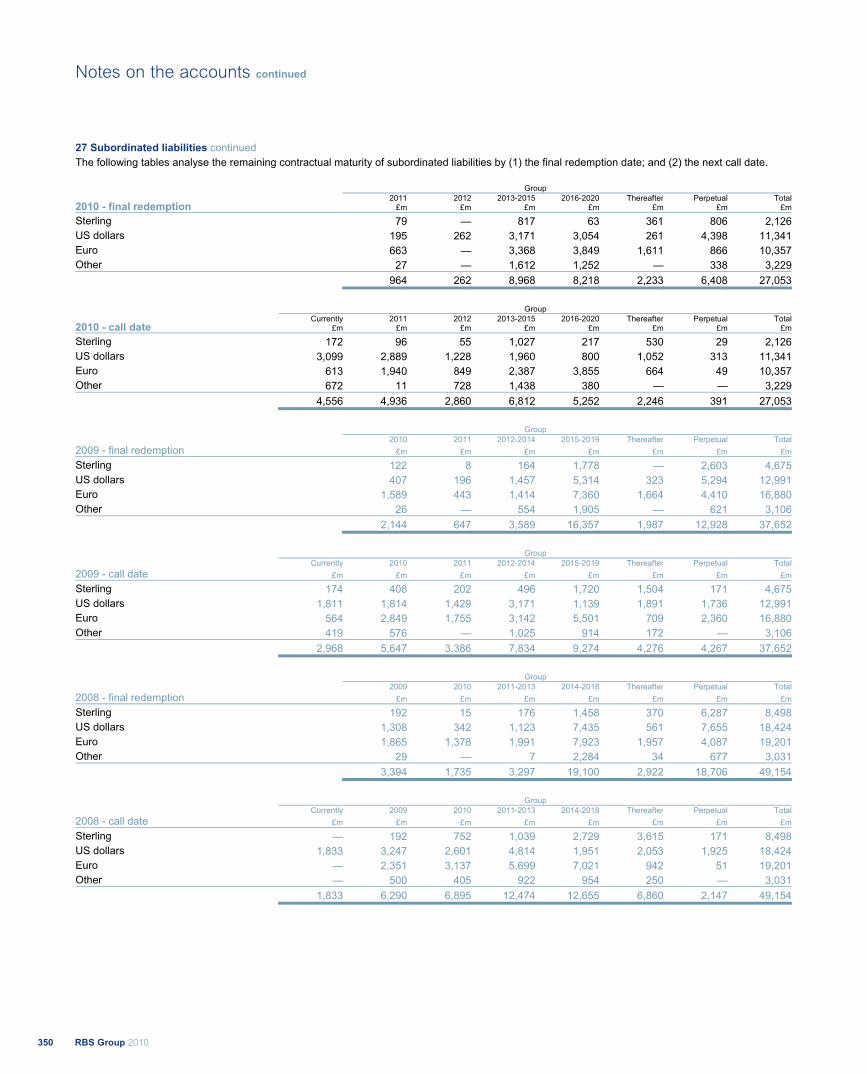
27 Subordinated liabilities continued The following tables analyse the remaining contractual maturity of subordinated liabilities by (1) the final redemption date; and (2) the next call date.
Group 2011 2012 2013-2015 2016-2020 Thereafter Perpetual Total2010 - final redemption £m £m £m £m £m £m £m
Sterling 79 — 817 63 361 806 2,126US dollars 195 262 3,171 3,054 261 4,398 11,341Euro 663 — 3,368 3,849 1,611 866 10,357Other 27 — 1,612 1,252 — 338 3,229 964 262 8,968 8,218 2,233 6,408 27,053
Group Currently 2011 2012 2013-2015 2016-2020 Thereafter Perpetual Total2010 - call date £m £m £m £m £m £m £m £m
Sterling 172 96 55 1,027 217 530 29 2,126US dollars 3,099 2,889 1,228 1,960 800 1,052 313 11,341Euro 613 1,940 849 2,387 3,855 664 49 10,357Other 672 11 728 1,438 380 — — 3,229 4,556 4,936 2,860 6,812 5,252 2,246 391 27,053
Group 2010 2011 2012-2014 2015-2019 Thereafter Perpetual Total2009 - final redemption £m £m £m £m £m £m £m
Sterling 122 8 164 1,778 — 2,603 4,675US dollars 407 196 1,457 5,314 323 5,294 12,991Euro 1,589 443 1,414 7,360 1,664 4,410 16,880Other 26 — 554 1,905 — 621 3,106 2,144 647 3,589 16,357 1,987 12,928 37,652
Group Currently 2010 2011 2012-2014 2015-2019 Thereafter Perpetual Total2009 - call date £m £m £m £m £m £m £m £m
Sterling 174 408 202 496 1,720 1,504 171 4,675US dollars 1,811 1,814 1,429 3,171 1,139 1,891 1,736 12,991Euro 564 2,849 1,755 3,142 5,501 709 2,360 16,880Other 419 576 — 1,025 914 172 — 3,106 2,968 5,647 3,386 7,834 9,274 4,276 4,267 37,652
Group 2009 2010 2011-2013 2014-2018 Thereafter Perpetual Total2008 - final redemption £m £m £m £m £m £m £m
Sterling 192 15 176 1,458 370 6,287 8,498US dollars 1,308 342 1,123 7,435 561 7,655 18,424Euro 1,865 1,378 1,991 7,923 1,957 4,087 19,201Other 29 — 7 2,284 34 677 3,031 3,394 1,735 3,297 19,100 2,922 18,706 49,154
Group Currently 2009 2010 2011-2013 2014-2018 Thereafter Perpetual Total2008 - call date £m £m £m £m £m £m £m £m
Sterling — 192 752 1,039 2,729 3,615 171 8,498US dollars 1,833 3,247 2,601 4,814 1,951 2,053 1,925 18,424Euro — 2,351 3,137 5,699 7,021 942 51 19,201Other — 500 405 922 954 250 — 3,031 1,833 6,290 6,895 12,474 12,655 6,860 2,147 49,154
RBS Group 2010350
Notes on the accounts continued
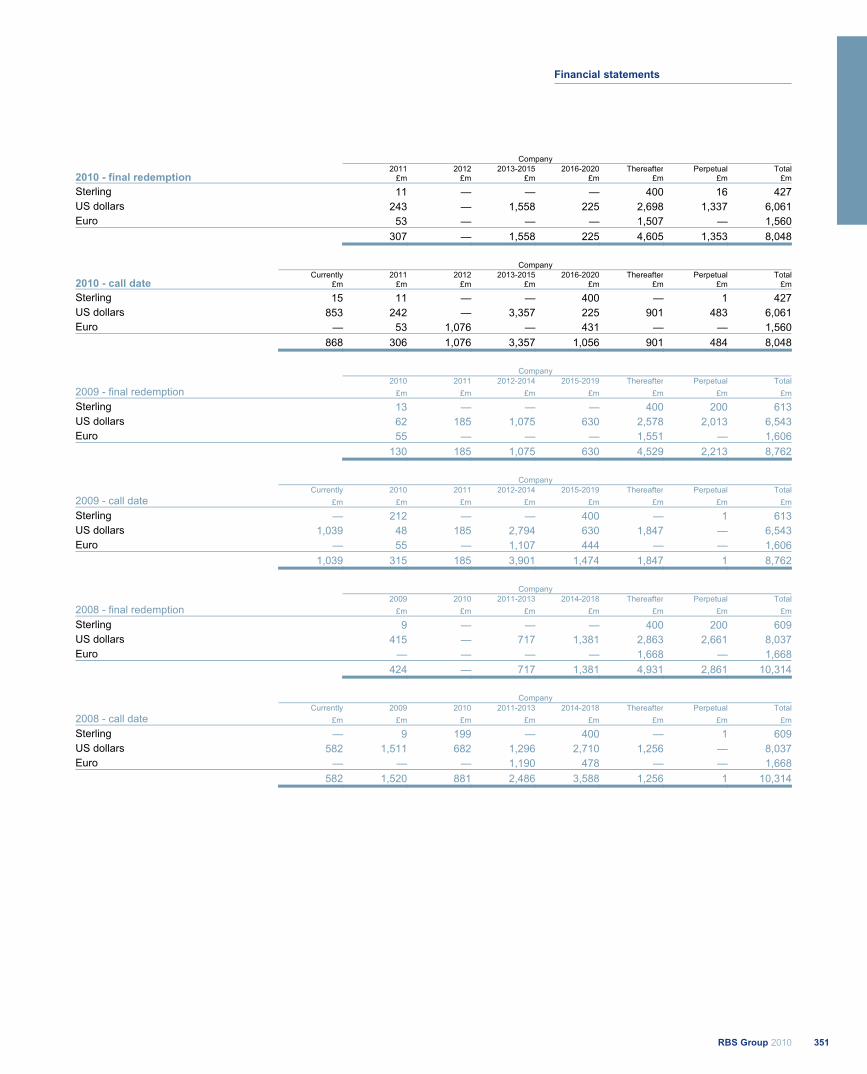
Company 2011 2012 2013-2015 2016-2020 Thereafter Perpetual Total2010 - final redemption £m £m £m £m £m £m £m
Sterling 11 — — — 400 16 427US dollars 243 — 1,558 225 2,698 1,337 6,061Euro 53 — — — 1,507 — 1,560 307 — 1,558 225 4,605 1,353 8,048
Company Currently 2011 2012 2013-2015 2016-2020 Thereafter Perpetual Total2010 - call date £m £m £m £m £m £m £m £m
Sterling 15 11 — — 400 — 1 427US dollars 853 242 — 3,357 225 901 483 6,061Euro — 53 1,076 — 431 — — 1,560 868 306 1,076 3,357 1,056 901 484 8,048
Company 2010 2011 2012-2014 2015-2019 Thereafter Perpetual Total2009 - final redemption £m £m £m £m £m £m £m
Sterling 13 — — — 400 200 613US dollars 62 185 1,075 630 2,578 2,013 6,543Euro 55 — — — 1,551 — 1,606 130 185 1,075 630 4,529 2,213 8,762
Company Currently 2010 2011 2012-2014 2015-2019 Thereafter Perpetual Total2009 - call date £m £m £m £m £m £m £m £m
Sterling — 212 — — 400 — 1 613US dollars 1,039 48 185 2,794 630 1,847 — 6,543Euro — 55 — 1,107 444 — — 1,606 1,039 315 185 3,901 1,474 1,847 1 8,762
Company 2009 2010 2011-2013 2014-2018 Thereafter Perpetual Total2008 - final redemption £m £m £m £m £m £m £m
Sterling 9 — — — 400 200 609US dollars 415 — 717 1,381 2,863 2,661 8,037Euro — — — — 1,668 — 1,668 424 — 717 1,381 4,931 2,861 10,314
Company Currently 2009 2010 2011-2013 2014-2018 Thereafter Perpetual Total2008 - call date £m £m £m £m £m £m £m £m
Sterling — 9 199 — 400 — 1 609US dollars 582 1,511 682 1,296 2,710 1,256 — 8,037Euro — — — 1,190 478 — — 1,668 582 1,520 881 2,486 3,588 1,256 1 10,314
351RBS Group 2010
Financial statements

27 Subordinated liabilities continued Dated loan capital 2010 2009 2008 £m £m £m
The company US$400 million 6.4% subordinated notes 2009 — — 278US$300 million 6.375% subordinated notes 2011 (redeemed February 2011) (1) 199 201 231US$750 million 5% subordinated notes 2013 (1) 532 503 579US$750 million 5% subordinated notes 2014 (1) 559 521 616US$250 million 5% subordinated notes 2014 (1) 162 153 169US$675 million 5.05% subordinated notes 2015 (1) 492 468 550US$350 million 4.7% subordinated notes 2018 (1) 252 231 286 2,196* 2,077* 2,709*The Royal Bank of Scotland plc €300 million 4.875% subordinated notes 2009 — — 298€1,000 million 6% subordinated notes 2013 989 1,014 1,083US$50 million floating rate subordinated notes 2013 38 36 36€500 million 6% subordinated notes 2013 439 452 487£150 million 10.5% subordinated bonds 2013 (2) 177 177 180US$1,250 million floating rate subordinated notes 2014 — — 862AUD590 million 6% subordinated notes 2014 (callable January 2011) 391 330 281AUD410 million floating rate subordinated notes 2014 (callable January 2011) 272 229 195CAD700 million 4.25% subordinated notes 2015 452 419 409£250 million 9.625% subordinated bonds 2015 303 301 311US$750 million floating rate subordinated notes 2015 (callable September 2011) 483 462 513€750 million floating rate subordinated notes 2015 725 741 783CHF400 million 2.375% subordinated notes 2015 287 244 257CHF100 million 2.375% subordinated notes 2015 83 69 72CHF200 million 2.375% subordinated notes 2015 136 117 125US$500 million floating rate subordinated notes 2016 (callable October 2011) 322 308 346US$1,500 million floating rate subordinated notes 2016 (callable April 2011) 967 926 1,038€500 million 4.5% subordinated notes 2016 (callable January 2011) 450 476 511CHF200 million 2.75% subordinated notes 2017 (callable December 2012) 138 120 129€100 million floating rate subordinated notes 2017 86 89 97€500 million floating rate subordinated notes 2017 (callable June 2012) 432 445 482€750 million 4.35% subordinated notes 2017 (callable January 2017) 721 728 770AUD450 million 6.5% subordinated notes 2017 (callable February 2012) 302 255 217AUD450 million floating rate subordinated notes 2017 (callable February 2012) 295 250 214US$1,500 million floating rate subordinated callable step-up notes 2017 (callable August 2012) 966 925 1,029€2,000 million 6.93% subordinated notes 2018 1,999 2,017 2,136US$125.6 million floating rate subordinated notes 2020 81 78 87€1,000 million 4.625% subordinated notes 2021 (callable September 2016) 949 962 1,019€300 million CMS linked floating rate subordinated notes 2022 280 292 303€144.4 million floating rate subordinated notes 2022 153 143 152
National Westminster Bank Plc US$1,000 million 7.375% subordinated notes 2009 — — 697€600 million 6% subordinated notes 2010 (redeemed January 2010) — 564 623€500 million 5.125% subordinated notes 2011 442 455 488£300 million 7.875% subordinated notes 2015 370 365 379£300 million 6.5% subordinated notes 2021 367 351 376
Charter One Financial, Inc. US$400 million 6.375% subordinated notes 2012 265 255 287
RBS Holdings USA Inc. US$170 million subordinated loan capital floating rate notes 2009 — — 116US$100 million 5.575% senior subordinated revolving credit 2009 — — 69US$500 million subordinated loan capital floating rate notes 2010 (redeemed December 2010) — 311 342
RBS Group 2010352
Notes on the accounts continued
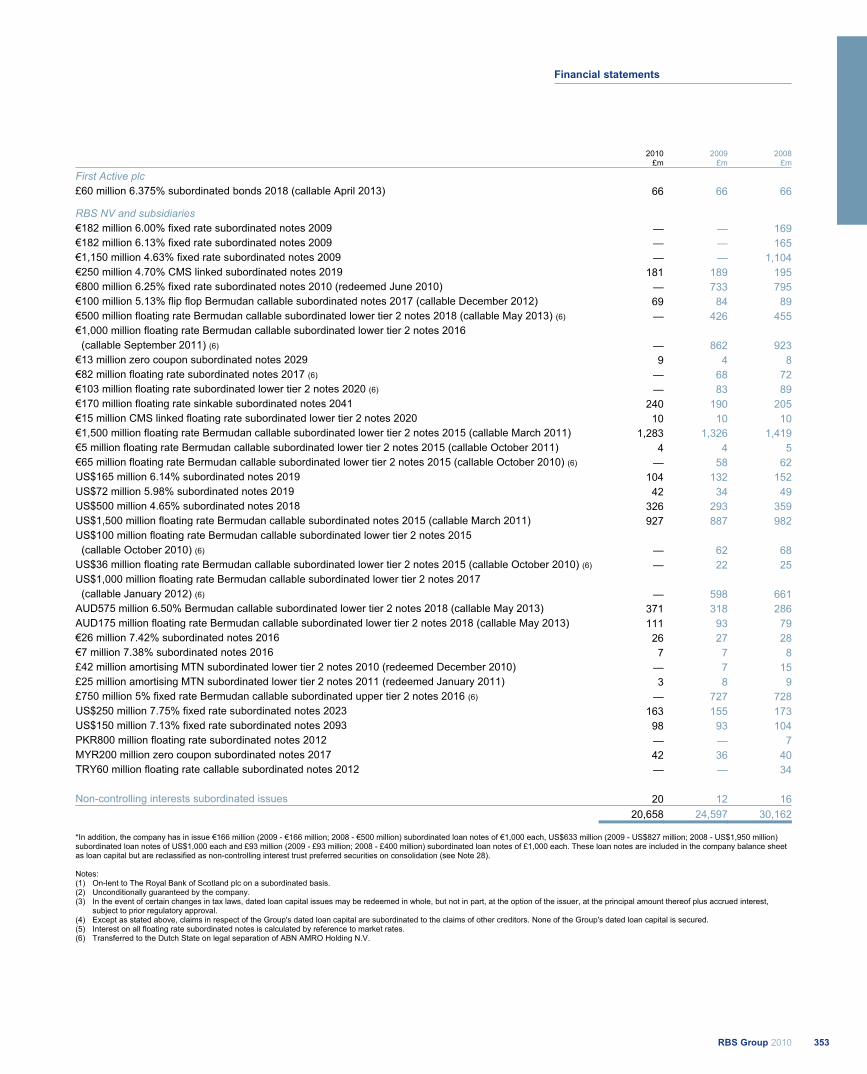
2010 2009 2008 £m £m £m
First Active plc £60 million 6.375% subordinated bonds 2018 (callable April 2013) 66 66 66
RBS NV and subsidiaries €182 million 6.00% fixed rate subordinated notes 2009 — — 169€182 million 6.13% fixed rate subordinated notes 2009 — — 165€1,150 million 4.63% fixed rate subordinated notes 2009 — — 1,104€250 million 4.70% CMS linked subordinated notes 2019 181 189 195€800 million 6.25% fixed rate subordinated notes 2010 (redeemed June 2010) — 733 795€100 million 5.13% flip flop Bermudan callable subordinated notes 2017 (callable December 2012) 69 84 89€500 million floating rate Bermudan callable subordinated lower tier 2 notes 2018 (callable May 2013) (6) — 426 455€1,000 million floating rate Bermudan callable subordinated lower tier 2 notes 2016 (callable September 2011) (6) — 862 923€13 million zero coupon subordinated notes 2029 9 4 8€82 million floating rate subordinated notes 2017 (6) — 68 72€103 million floating rate subordinated lower tier 2 notes 2020 (6) — 83 89€170 million floating rate sinkable subordinated notes 2041 240 190 205€15 million CMS linked floating rate subordinated lower tier 2 notes 2020 10 10 10€1,500 million floating rate Bermudan callable subordinated lower tier 2 notes 2015 (callable March 2011) 1,283 1,326 1,419€5 million floating rate Bermudan callable subordinated lower tier 2 notes 2015 (callable October 2011) 4 4 5€65 million floating rate Bermudan callable subordinated lower tier 2 notes 2015 (callable October 2010) (6) — 58 62US$165 million 6.14% subordinated notes 2019 104 132 152US$72 million 5.98% subordinated notes 2019 42 34 49US$500 million 4.65% subordinated notes 2018 326 293 359US$1,500 million floating rate Bermudan callable subordinated notes 2015 (callable March 2011) 927 887 982US$100 million floating rate Bermudan callable subordinated lower tier 2 notes 2015 (callable October 2010) (6) — 62 68US$36 million floating rate Bermudan callable subordinated lower tier 2 notes 2015 (callable October 2010) (6) — 22 25US$1,000 million floating rate Bermudan callable subordinated lower tier 2 notes 2017 (callable January 2012) (6) — 598 661AUD575 million 6.50% Bermudan callable subordinated lower tier 2 notes 2018 (callable May 2013) 371 318 286AUD175 million floating rate Bermudan callable subordinated lower tier 2 notes 2018 (callable May 2013) 111 93 79€26 million 7.42% subordinated notes 2016 26 27 28€7 million 7.38% subordinated notes 2016 7 7 8£42 million amortising MTN subordinated lower tier 2 notes 2010 (redeemed December 2010) — 7 15£25 million amortising MTN subordinated lower tier 2 notes 2011 (redeemed January 2011) 3 8 9£750 million 5% fixed rate Bermudan callable subordinated upper tier 2 notes 2016 (6) — 727 728US$250 million 7.75% fixed rate subordinated notes 2023 163 155 173US$150 million 7.13% fixed rate subordinated notes 2093 98 93 104PKR800 million floating rate subordinated notes 2012 — — 7MYR200 million zero coupon subordinated notes 2017 42 36 40TRY60 million floating rate callable subordinated notes 2012 — — 34 Non-controlling interests subordinated issues 20 12 16 20,658 24,597 30,162
*In addition, the company has in issue €166 million (2009 - €166 million; 2008 - €500 million) subordinated loan notes of €1,000 each, US$633 million (2009 - US$827 million; 2008 - US$1,950 million) subordinated loan notes of US$1,000 each and £93 million (2009 - £93 million; 2008 - £400 million) subordinated loan notes of £1,000 each. These loan notes are included in the company balance sheet as loan capital but are reclassified as non-controlling interest trust preferred securities on consolidation (see Note 28). Notes: (1) On-lent to The Royal Bank of Scotland plc on a subordinated basis. (2) Unconditionally guaranteed by the company. (3) In the event of certain changes in tax laws, dated loan capital issues may be redeemed in whole, but not in part, at the option of the issuer, at the principal amount thereof plus accrued interest,
subject to prior regulatory approval. (4) Except as stated above, claims in respect of the Group's dated loan capital are subordinated to the claims of other creditors. None of the Group's dated loan capital is secured. (5) Interest on all floating rate subordinated notes is calculated by reference to market rates. (6) Transferred to the Dutch State on legal separation of ABN AMRO Holding N.V.
353RBS Group 2010
Financial statements
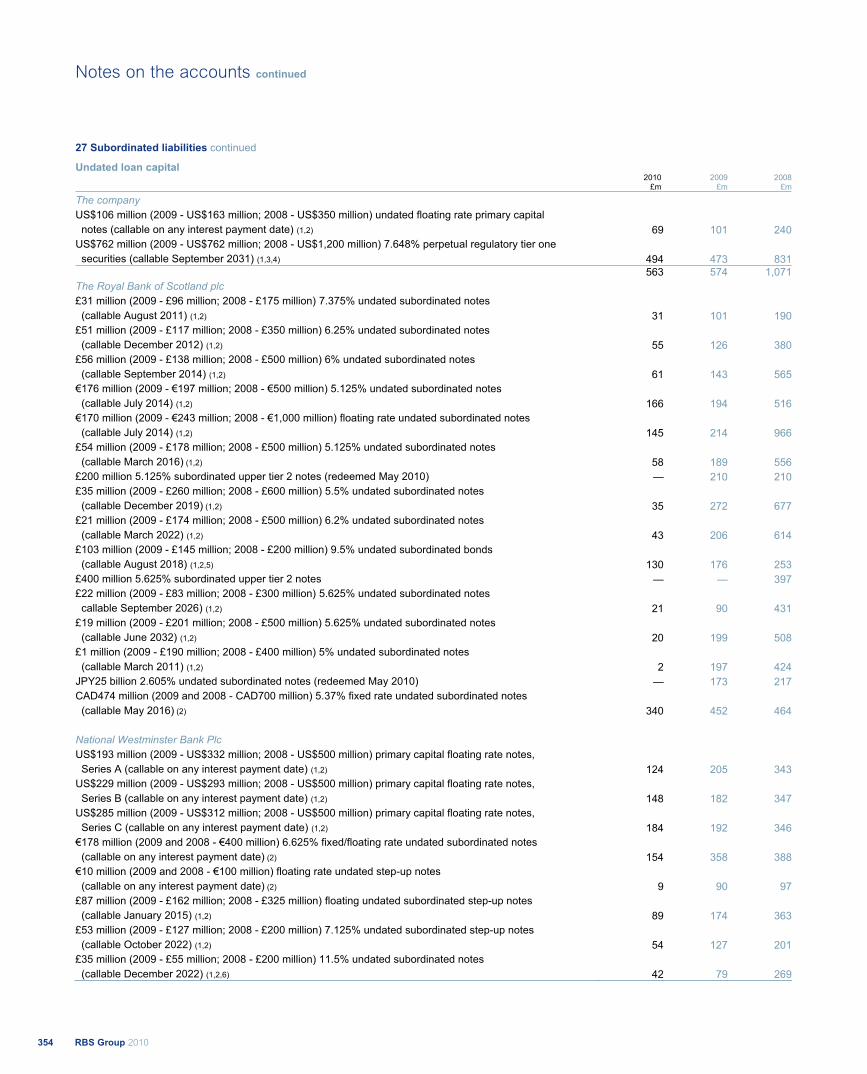
27 Subordinated liabilities continued Undated loan capital 2010 2009 2008 £m £m £m
The company US$106 million (2009 - US$163 million; 2008 - US$350 million) undated floating rate primary capital notes (callable on any interest payment date) (1,2) 69 101 240US$762 million (2009 - US$762 million; 2008 - US$1,200 million) 7.648% perpetual regulatory tier one securities (callable September 2031) (1,3,4) 494 473 831
563 574 1,071The Royal Bank of Scotland plc £31 million (2009 - £96 million; 2008 - £175 million) 7.375% undated subordinated notes (callable August 2011) (1,2) 31 101 190£51 million (2009 - £117 million; 2008 - £350 million) 6.25% undated subordinated notes (callable December 2012) (1,2) 55 126 380£56 million (2009 - £138 million; 2008 - £500 million) 6% undated subordinated notes (callable September 2014) (1,2) 61 143 565€176 million (2009 - €197 million; 2008 - €500 million) 5.125% undated subordinated notes (callable July 2014) (1,2) 166 194 516€170 million (2009 - €243 million; 2008 - €1,000 million) floating rate undated subordinated notes (callable July 2014) (1,2) 145 214 966£54 million (2009 - £178 million; 2008 - £500 million) 5.125% undated subordinated notes (callable March 2016) (1,2) 58 189 556£200 million 5.125% subordinated upper tier 2 notes (redeemed May 2010) — 210 210£35 million (2009 - £260 million; 2008 - £600 million) 5.5% undated subordinated notes (callable December 2019) (1,2) 35 272 677£21 million (2009 - £174 million; 2008 - £500 million) 6.2% undated subordinated notes (callable March 2022) (1,2) 43 206 614£103 million (2009 - £145 million; 2008 - £200 million) 9.5% undated subordinated bonds (callable August 2018) (1,2,5) 130 176 253£400 million 5.625% subordinated upper tier 2 notes — — 397£22 million (2009 - £83 million; 2008 - £300 million) 5.625% undated subordinated notes callable September 2026) (1,2) 21 90 431£19 million (2009 - £201 million; 2008 - £500 million) 5.625% undated subordinated notes (callable June 2032) (1,2) 20 199 508£1 million (2009 - £190 million; 2008 - £400 million) 5% undated subordinated notes (callable March 2011) (1,2) 2 197 424JPY25 billion 2.605% undated subordinated notes (redeemed May 2010) — 173 217CAD474 million (2009 and 2008 - CAD700 million) 5.37% fixed rate undated subordinated notes (callable May 2016) (2) 340 452 464 National Westminster Bank Plc US$193 million (2009 - US$332 million; 2008 - US$500 million) primary capital floating rate notes, Series A (callable on any interest payment date) (1,2) 124 205 343US$229 million (2009 - US$293 million; 2008 - US$500 million) primary capital floating rate notes, Series B (callable on any interest payment date) (1,2) 148 182 347US$285 million (2009 - US$312 million; 2008 - US$500 million) primary capital floating rate notes, Series C (callable on any interest payment date) (1,2) 184 192 346€178 million (2009 and 2008 - €400 million) 6.625% fixed/floating rate undated subordinated notes (callable on any interest payment date) (2) 154 358 388€10 million (2009 and 2008 - €100 million) floating rate undated step-up notes (callable on any interest payment date) (2) 9 90 97£87 million (2009 - £162 million; 2008 - £325 million) floating undated subordinated step-up notes (callable January 2015) (1,2) 89 174 363£53 million (2009 - £127 million; 2008 - £200 million) 7.125% undated subordinated step-up notes (callable October 2022) (1,2) 54 127 201£35 million (2009 - £55 million; 2008 - £200 million) 11.5% undated subordinated notes (callable December 2022) (1,2,6) 42 79 269
RBS Group 2010354
Notes on the accounts continued
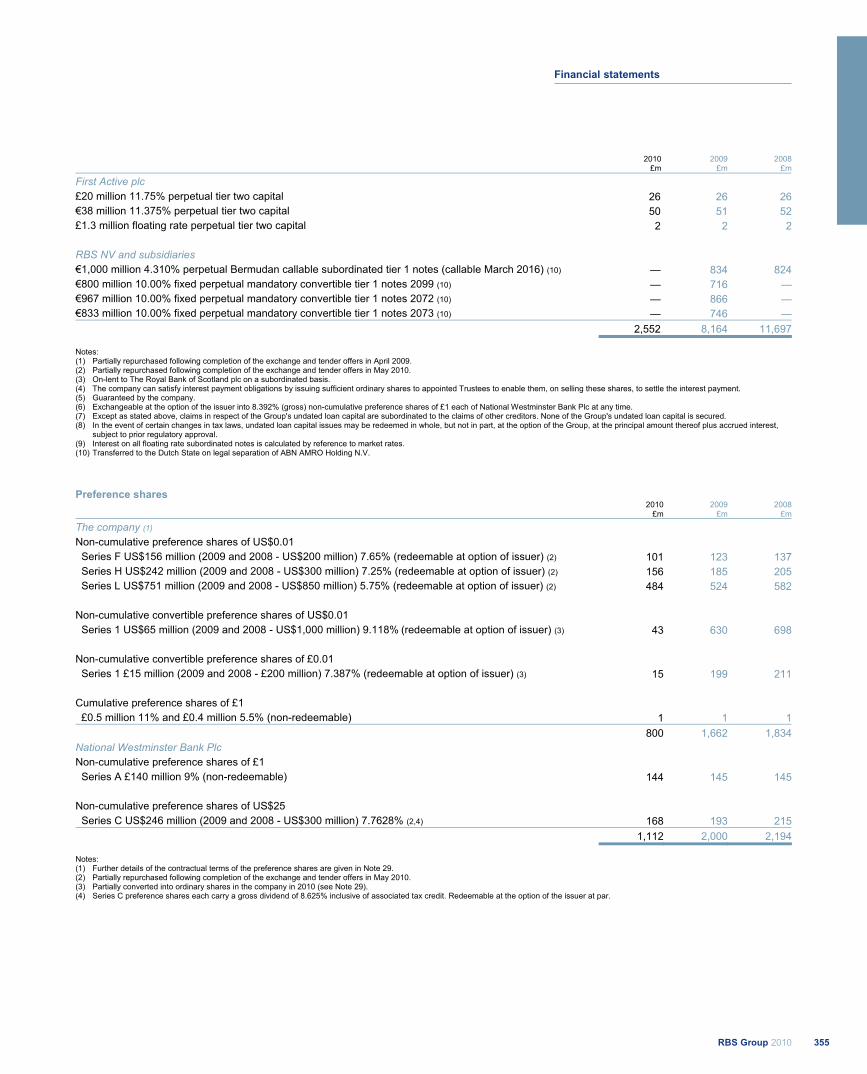
2010 2009 2008 £m £m £m
First Active plc £20 million 11.75% perpetual tier two capital 26 26 26€38 million 11.375% perpetual tier two capital 50 51 52£1.3 million floating rate perpetual tier two capital 2 2 2 RBS NV and subsidiaries €1,000 million 4.310% perpetual Bermudan callable subordinated tier 1 notes (callable March 2016) (10) — 834 824€800 million 10.00% fixed perpetual mandatory convertible tier 1 notes 2099 (10) — 716 —€967 million 10.00% fixed perpetual mandatory convertible tier 1 notes 2072 (10) — 866 —€833 million 10.00% fixed perpetual mandatory convertible tier 1 notes 2073 (10) — 746 — 2,552 8,164 11,697
Notes: (1) Partially repurchased following completion of the exchange and tender offers in April 2009. (2) Partially repurchased following completion of the exchange and tender offers in May 2010. (3) On-lent to The Royal Bank of Scotland plc on a subordinated basis. (4) The company can satisfy interest payment obligations by issuing sufficient ordinary shares to appointed Trustees to enable them, on selling these shares, to settle the interest payment. (5) Guaranteed by the company. (6) Exchangeable at the option of the issuer into 8.392% (gross) non-cumulative preference shares of £1 each of National Westminster Bank Plc at any time. (7) Except as stated above, claims in respect of the Group's undated loan capital are subordinated to the claims of other creditors. None of the Group's undated loan capital is secured. (8) In the event of certain changes in tax laws, undated loan capital issues may be redeemed in whole, but not in part, at the option of the Group, at the principal amount thereof plus accrued interest,
subject to prior regulatory approval. (9) Interest on all floating rate subordinated notes is calculated by reference to market rates. (10) Transferred to the Dutch State on legal separation of ABN AMRO Holding N.V.
Preference shares 2010 2009 2008
£m £m £m
The company (1) Non-cumulative preference shares of US$0.01
Series F US$156 million (2009 and 2008 - US$200 million) 7.65% (redeemable at option of issuer) (2) 101 123 137 Series H US$242 million (2009 and 2008 - US$300 million) 7.25% (redeemable at option of issuer) (2) 156 185 205 Series L US$751 million (2009 and 2008 - US$850 million) 5.75% (redeemable at option of issuer) (2) 484 524 582 Non-cumulative convertible preference shares of US$0.01
Series 1 US$65 million (2009 and 2008 - US$1,000 million) 9.118% (redeemable at option of issuer) (3) 43 630 698 Non-cumulative convertible preference shares of £0.01 Series 1 £15 million (2009 and 2008 - £200 million) 7.387% (redeemable at option of issuer) (3) 15 199 211
Cumulative preference shares of £1
£0.5 million 11% and £0.4 million 5.5% (non-redeemable) 1 1 1 800 1,662 1,834National Westminster Bank Plc Non-cumulative preference shares of £1
Series A £140 million 9% (non-redeemable) 144 145 145 Non-cumulative preference shares of US$25
Series C US$246 million (2009 and 2008 - US$300 million) 7.7628% (2,4) 168 193 215 1,112 2,000 2,194
Notes: (1) Further details of the contractual terms of the preference shares are given in Note 29. (2) Partially repurchased following completion of the exchange and tender offers in May 2010. (3) Partially converted into ordinary shares in the company in 2010 (see Note 29). (4) Series C preference shares each carry a gross dividend of 8.625% inclusive of associated tax credit. Redeemable at the option of the issuer at par.
355RBS Group 2010
Financial statements
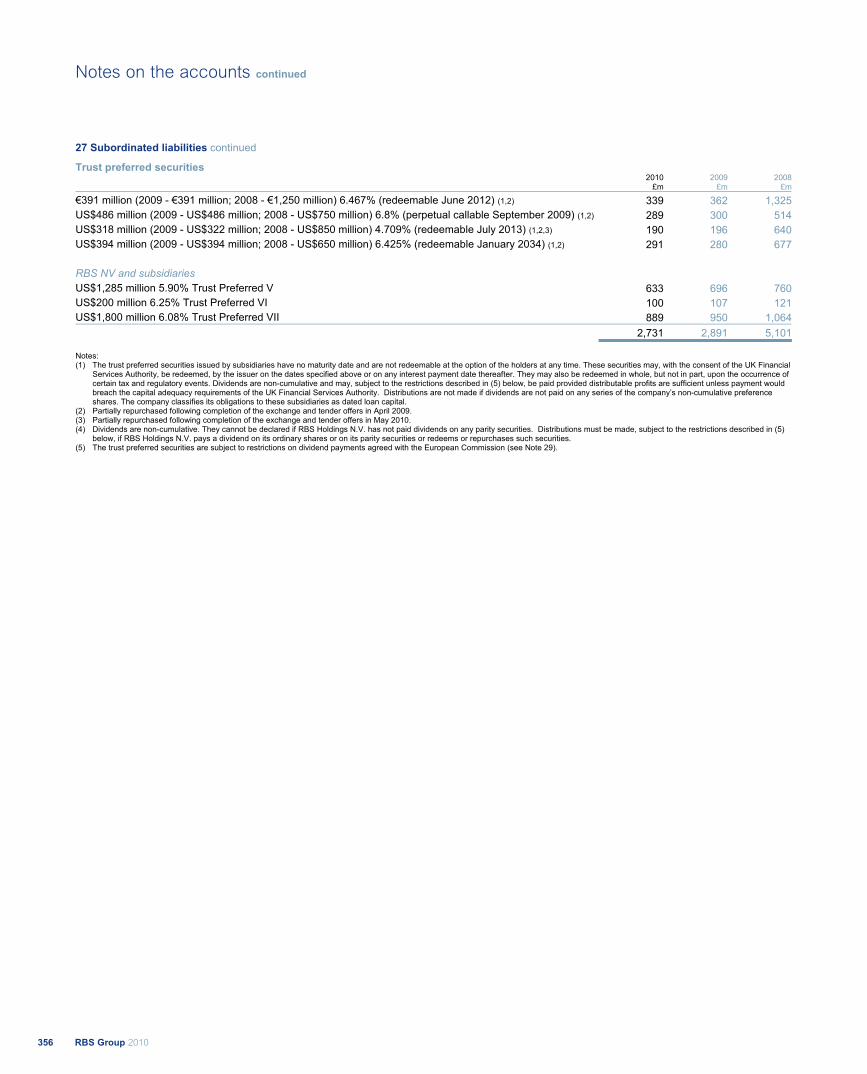
27 Subordinated liabilities continued Trust preferred securities 2010 2009 2008 £m £m £m
€391 million (2009 - €391 million; 2008 - €1,250 million) 6.467% (redeemable June 2012) (1,2) 339 362 1,325US$486 million (2009 - US$486 million; 2008 - US$750 million) 6.8% (perpetual callable September 2009) (1,2) 289 300 514US$318 million (2009 - US$322 million; 2008 - US$850 million) 4.709% (redeemable July 2013) (1,2,3) 190 196 640US$394 million (2009 - US$394 million; 2008 - US$650 million) 6.425% (redeemable January 2034) (1,2) 291 280 677 RBS NV and subsidiaries US$1,285 million 5.90% Trust Preferred V 633 696 760US$200 million 6.25% Trust Preferred VI 100 107 121US$1,800 million 6.08% Trust Preferred VII 889 950 1,064 2,731 2,891 5,101
Notes: (1) The trust preferred securities issued by subsidiaries have no maturity date and are not redeemable at the option of the holders at any time. These securities may, with the consent of the UK Financial
Services Authority, be redeemed, by the issuer on the dates specified above or on any interest payment date thereafter. They may also be redeemed in whole, but not in part, upon the occurrence of certain tax and regulatory events. Dividends are non-cumulative and may, subject to the restrictions described in (5) below, be paid provided distributable profits are sufficient unless payment would breach the capital adequacy requirements of the UK Financial Services Authority. Distributions are not made if dividends are not paid on any series of the company’s non-cumulative preference shares. The company classifies its obligations to these subsidiaries as dated loan capital.
(2) Partially repurchased following completion of the exchange and tender offers in April 2009. (3) Partially repurchased following completion of the exchange and tender offers in May 2010. (4) Dividends are non-cumulative. They cannot be declared if RBS Holdings N.V. has not paid dividends on any parity securities. Distributions must be made, subject to the restrictions described in (5)
below, if RBS Holdings N.V. pays a dividend on its ordinary shares or on its parity securities or redeems or repurchases such securities. (5) The trust preferred securities are subject to restrictions on dividend payments agreed with the European Commission (see Note 29).
RBS Group 2010356
Notes on the accounts continued
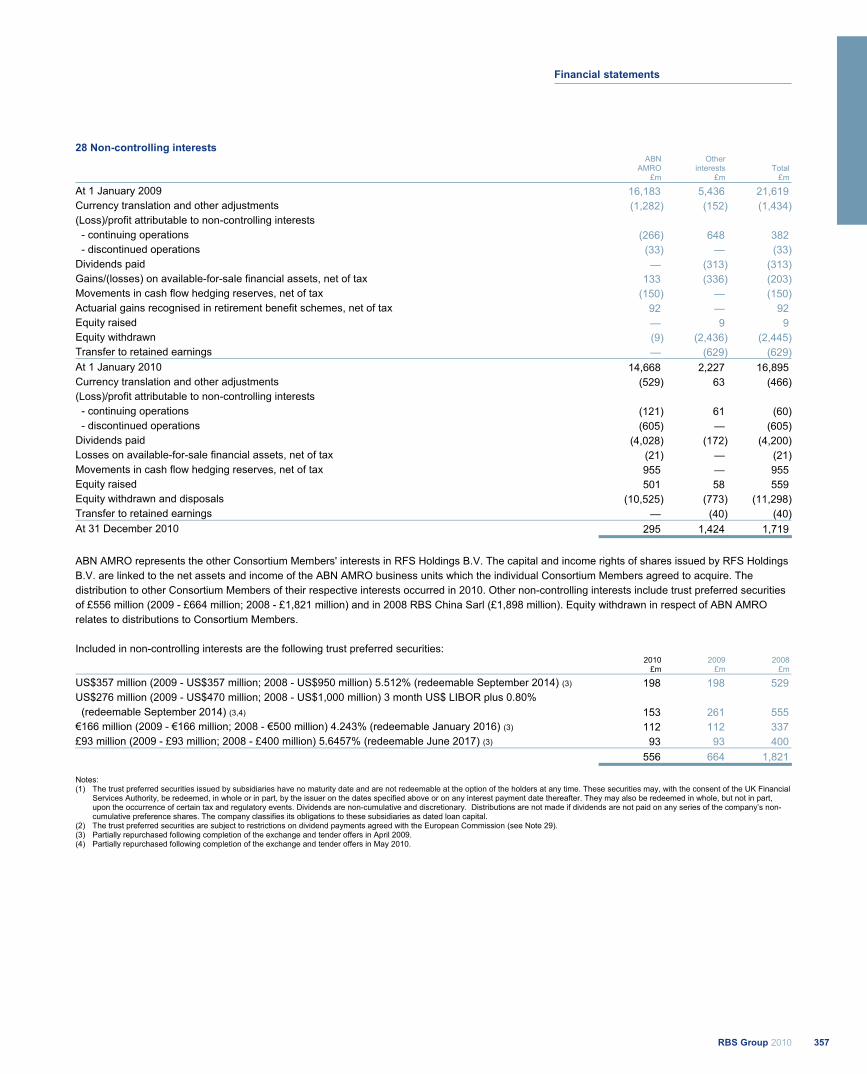
28 Non-controlling interests
ABN
AMRO Other
interests Total £m £m £m
At 1 January 2009 16,183 5,436 21,619 Currency translation and other adjustments (1,282) (152) (1,434)(Loss)/profit attributable to non-controlling interests - continuing operations (266) 648 382 - discontinued operations (33) — (33)Dividends paid — (313) (313)Gains/(losses) on available-for-sale financial assets, net of tax 133 (336) (203)Movements in cash flow hedging reserves, net of tax (150) — (150)Actuarial gains recognised in retirement benefit schemes, net of tax 92 — 92 Equity raised — 9 9Equity withdrawn (9) (2,436) (2,445)Transfer to retained earnings — (629) (629)At 1 January 2010 14,668 2,227 16,895 Currency translation and other adjustments (529) 63 (466)(Loss)/profit attributable to non-controlling interests - continuing operations (121) 61 (60) - discontinued operations (605) — (605)Dividends paid (4,028) (172) (4,200)Losses on available-for-sale financial assets, net of tax (21) — (21)Movements in cash flow hedging reserves, net of tax 955 — 955 Equity raised 501 58 559 Equity withdrawn and disposals (10,525) (773) (11,298)Transfer to retained earnings — (40) (40)At 31 December 2010 295 1,424 1,719
ABN AMRO represents the other Consortium Members' interests in RFS Holdings B.V. The capital and income rights of shares issued by RFS Holdings B.V. are linked to the net assets and income of the ABN AMRO business units which the individual Consortium Members agreed to acquire. The distribution to other Consortium Members of their respective interests occurred in 2010. Other non-controlling interests include trust preferred securities of £556 million (2009 - £664 million; 2008 - £1,821 million) and in 2008 RBS China Sarl (£1,898 million). Equity withdrawn in respect of ABN AMRO relates to distributions to Consortium Members. Included in non-controlling interests are the following trust preferred securities:
2010 2009 2008 £m £m £m
US$357 million (2009 - US$357 million; 2008 - US$950 million) 5.512% (redeemable September 2014) (3) 198 198 529 US$276 million (2009 - US$470 million; 2008 - US$1,000 million) 3 month US$ LIBOR plus 0.80% (redeemable September 2014) (3,4) 153 261 555 €166 million (2009 - €166 million; 2008 - €500 million) 4.243% (redeemable January 2016) (3) 112 112 337 £93 million (2009 - £93 million; 2008 - £400 million) 5.6457% (redeemable June 2017) (3) 93 93 400 556 664 1,821
Notes: (1) The trust preferred securities issued by subsidiaries have no maturity date and are not redeemable at the option of the holders at any time. These securities may, with the consent of the UK Financial
Services Authority, be redeemed, in whole or in part, by the issuer on the dates specified above or on any interest payment date thereafter. They may also be redeemed in whole, but not in part, upon the occurrence of certain tax and regulatory events. Dividends are non-cumulative and discretionary. Distributions are not made if dividends are not paid on any series of the company’s non-cumulative preference shares. The company classifies its obligations to these subsidiaries as dated loan capital.
(2) The trust preferred securities are subject to restrictions on dividend payments agreed with the European Commission (see Note 29). (3) Partially repurchased following completion of the exchange and tender offers in April 2009. (4) Partially repurchased following completion of the exchange and tender offers in May 2010.
357RBS Group 2010
Financial statements
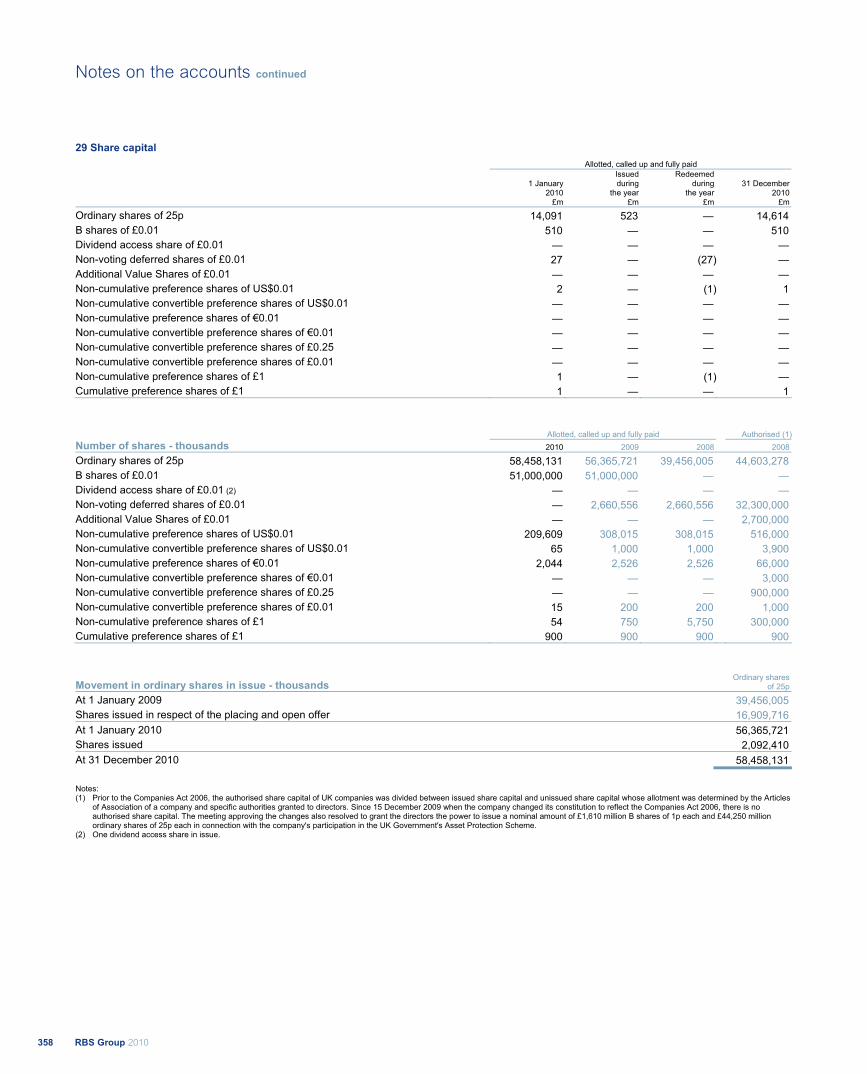
29 Share capital Allotted, called up and fully paid
1 January
2010
Issued during
the year
Redeemed during
the year 31 December
2010 £m £m £m £m
Ordinary shares of 25p 14,091 523 — 14,614 B shares of £0.01 510 — — 510 Dividend access share of £0.01 — — — —Non-voting deferred shares of £0.01 27 — (27) — Additional Value Shares of £0.01 — — — —Non-cumulative preference shares of US$0.01 2 — (1) 1 Non-cumulative convertible preference shares of US$0.01 — — — —Non-cumulative preference shares of €0.01 — — — —Non-cumulative convertible preference shares of €0.01 — — — —Non-cumulative convertible preference shares of £0.25 — — — —Non-cumulative convertible preference shares of £0.01 — — — —Non-cumulative preference shares of £1 1 — (1) — Cumulative preference shares of £1 1 — — 1
Allotted, called up and fully paid Authorised (1)Number of shares - thousands 2010 2009 2008 2008
Ordinary shares of 25p 58,458,131 56,365,721 39,456,005 44,603,278 B shares of £0.01 51,000,000 51,000,000 — — Dividend access share of £0.01 (2) — — — —Non-voting deferred shares of £0.01 — 2,660,556 2,660,556 32,300,000 Additional Value Shares of £0.01 — — — 2,700,000 Non-cumulative preference shares of US$0.01 209,609 308,015 308,015 516,000 Non-cumulative convertible preference shares of US$0.01 65 1,000 1,000 3,900 Non-cumulative preference shares of €0.01 2,044 2,526 2,526 66,000 Non-cumulative convertible preference shares of €0.01 — — — 3,000 Non-cumulative convertible preference shares of £0.25 — — — 900,000 Non-cumulative convertible preference shares of £0.01 15 200 200 1,000 Non-cumulative preference shares of £1 54 750 5,750 300,000 Cumulative preference shares of £1 900 900 900 900
Movement in ordinary shares in issue - thousands Ordinary shares
of 25p
At 1 January 2009 39,456,005 Shares issued in respect of the placing and open offer 16,909,716 At 1 January 2010 56,365,721 Shares issued 2,092,410 At 31 December 2010 58,458,131
Notes: (1) Prior to the Companies Act 2006, the authorised share capital of UK companies was divided between issued share capital and unissued share capital whose allotment was determined by the Articles
of Association of a company and specific authorities granted to directors. Since 15 December 2009 when the company changed its constitution to reflect the Companies Act 2006, there is no authorised share capital. The meeting approving the changes also resolved to grant the directors the power to issue a nominal amount of £1,610 million B shares of 1p each and £44,250 million ordinary shares of 25p each in connection with the company's participation in the UK Government's Asset Protection Scheme.
(2) One dividend access share in issue.
RBS Group 2010358
Notes on the accounts continued
Ordinary shares During the year, the ordinary share capital was increased by 3.7 million ordinary shares allotted as a result of the exercise of options under the company's executive and sharesave plans. Employee share trusts purchased 1.6 billion ordinary shares at a cost of £672 million and awarded 17.9 million ordinary shares on receipt of £0.5 million on the exercise of awards under employee share plans. The employee share trusts incurred costs of £3.7 million in purchasing the company's ordinary shares. In March 2010, the company converted 935,228 non-cumulative convertible preference shares of US$0.01 into ordinary shares resulting in approximately 1.6 billion ordinary shares being issued. In December 2010, the company converted 185,134 non-cumulative convertible preference shares of £0.01 into ordinary shares resulting in approximately 487 million ordinary shares being issued. B shares and dividend access share In December 2009, the company entered into an acquisition and contingent capital agreement with HM Treasury. HM Treasury agreed to acquire at 50p per share 51 billion B shares with a nominal value of 1p each and a dividend access share with a nominal value of 1p; these shares were issued to HM Treasury on 22 December 2009. Net proceeds were £25.1 billion. HM Treasury also agreed to subscribe for up to 16 billion further B shares with a nominal value of 1p each at 50p per share subject to certain conditions including the Group's Core Tier 1 capital ratio falling below 5%. The fair value of the consideration payable by the company on entering into this agreement amounted to £1,458 million; of this £1,208 million was debited to the contingent capital reserve. The B shares do not generally carry voting rights at general meetings of ordinary shareholders. Each B share is entitled to the same cash dividend as an ordinary share (subject to anti-dilution adjustments). The B shares may be converted into ordinary shares at a fixed ratio of issue price (50p) divided by the conversion price (50p subject to anti-dilution adjustments) at the option of the holder at any time after issue.
HM Treasury has agreed not to convert its B shares into ordinary shares to the extent that its holding of ordinary shares following the conversion would represent more than 75% of the company's issued ordinary share capital. The dividend access share entitles the holder to dividends equal to the greater of 7% of the aggregate issue price of B shares issued to HM Treasury and 250% of the ordinary dividend rate multiplied by the number of B shares issued, less any dividends paid on the B shares and on ordinary shares issued on conversion. Dividends on the dividend access share are discretionary unless a dividend has been paid on the ordinary shares, in which case dividends became mandatory. The dividend access share does not generally carry voting rights at general meetings of ordinary shareholders and is not convertible into ordinary shares. The contingent capital commitment agreement can be terminated in whole or in part by the company, with the FSA's consent, at any time. It expires at the end of five years or, if earlier, on its termination in full. Non-voting deferred shares In November 2010, the company cancelled all of its outstanding Non-voting deferred shares of £0.01 each, all of which were held by a nominee company wholly owned by the Group. Preference shares Under IFRS certain of the Group's preference shares are classified as debt and are included in subordinated liabilities on the balance sheet. Other securities Certain of the Group's subordinated securities in the legal form of debt are classified as equity under IFRS. These securities entitle the holders to interest which may be deferred at the sole discretion of the company. Repayment of the securities is at the sole discretion of the company on giving between 30 and 60 days notice.
359RBS Group 2010
Financial statements
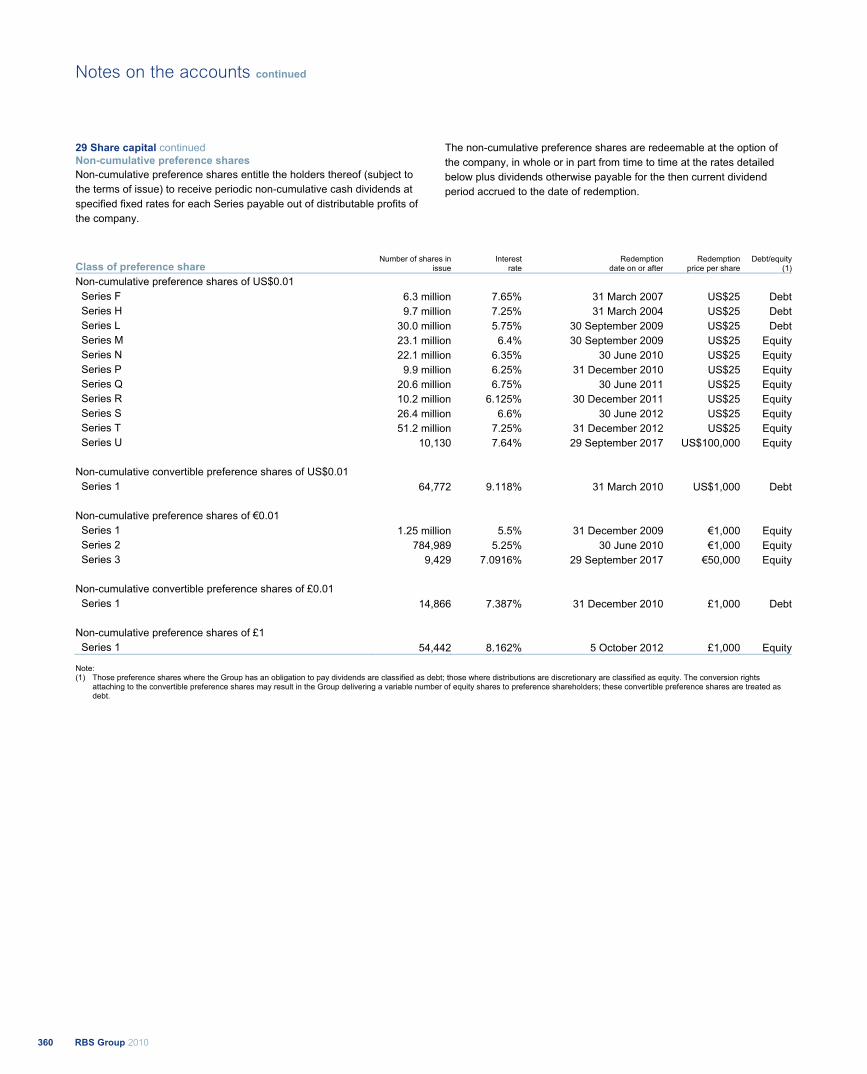
29 Share capital continued Non-cumulative preference shares Non-cumulative preference shares entitle the holders thereof (subject to the terms of issue) to receive periodic non-cumulative cash dividends at specified fixed rates for each Series payable out of distributable profits of the company.
The non-cumulative preference shares are redeemable at the option of the company, in whole or in part from time to time at the rates detailed below plus dividends otherwise payable for the then current dividend period accrued to the date of redemption.
Class of preference share Number of shares in
issueInterest
rateRedemption
date on or afterRedemption
price per shareDebt/equity
(1)
Non-cumulative preference shares of US$0.01 Series F 6.3 million 7.65% 31 March 2007 US$25 Debt
Series H 9.7 million 7.25% 31 March 2004 US$25 Debt Series L 30.0 million 5.75% 30 September 2009 US$25 Debt Series M 23.1 million 6.4% 30 September 2009 US$25 Equity Series N 22.1 million 6.35% 30 June 2010 US$25 Equity Series P 9.9 million 6.25% 31 December 2010 US$25 Equity Series Q 20.6 million 6.75% 30 June 2011 US$25 Equity Series R 10.2 million 6.125% 30 December 2011 US$25 Equity Series S 26.4 million 6.6% 30 June 2012 US$25 Equity Series T 51.2 million 7.25% 31 December 2012 US$25 Equity Series U 10,130 7.64% 29 September 2017 US$100,000 Equity Non-cumulative convertible preference shares of US$0.01 Series 1 64,772 9.118% 31 March 2010 US$1,000 Debt Non-cumulative preference shares of €0.01
Series 1 1.25 million 5.5% 31 December 2009 €1,000 Equity Series 2 784,989 5.25% 30 June 2010 €1,000 Equity Series 3 9,429 7.0916% 29 September 2017 €50,000 Equity Non-cumulative convertible preference shares of £0.01
Series 1 14,866 7.387% 31 December 2010 £1,000 Debt Non-cumulative preference shares of £1
Series 1 54,442 8.162% 5 October 2012 £1,000 Equity
Note: (1) Those preference shares where the Group has an obligation to pay dividends are classified as debt; those where distributions are discretionary are classified as equity. The conversion rights
attaching to the convertible preference shares may result in the Group delivering a variable number of equity shares to preference shareholders; these convertible preference shares are treated as debt.
RBS Group 2010360
Notes on the accounts continued
In the event that the non-cumulative convertible preference shares are not redeemed on or before the redemption date, the holder may convert them into ordinary shares in the company at the prevailing market price. Under existing arrangements, no redemption or purchase of any non-cumulative preference shares may be made by the company without the prior consent of the UK Financial Services Authority. On a winding-up or liquidation of the company, the holders of the non-cumulative preference shares will be entitled to receive, out of any surplus assets available for distribution to the company's shareholders (after payment of arrears of dividends on the cumulative preference shares up to the date of repayment) pari passu with the cumulative preference shares and all other shares of the company ranking pari passu with the non-cumulative preference shares as regards participation in the surplus assets of the company, a liquidation distribution per share equal to the applicable redemption price detailed in the table above, together with an amount equal to dividends for the then current dividend period accrued to the date of payment, before any distribution or payment may be made to holders of the ordinary shares as regards participation in the surplus assets of the company. Except as described above, the holders of the non-cumulative preference shares have no right to participate in the surplus assets of the company. Holders of the non-cumulative preference shares are not entitled to receive notice of or attend general meetings of the company except if any resolution is proposed for adoption by the shareholders of the company to vary or abrogate any of the rights attaching to the non-cumulative preference shares or proposing the winding-up or liquidation of the company. In any such case, they are entitled to receive notice of and to attend the general meeting of shareholders at which such resolution is to be proposed and are entitled to speak and vote on such resolution (but not on any other resolution). In addition, in the event that, prior to any general meeting of shareholders, the company has failed to pay in full the three most recent quarterly dividend payments due on the non-cumulative dollar preference shares (other than Series U), the two most recent semi-annual dividend payments due on the non-cumulative convertible dollar preference shares and the most recent dividend payments due on the non-cumulative euro preference shares, the non-cumulative sterling preference shares, the Series U non-cumulative dollar preference shares and the non-cumulative convertible sterling preference shares, the holders shall be entitled to receive notice of, attend, speak and vote at such meeting on all matters together with the holders of the ordinary shares. In these circumstances only, the rights of the holders of the non-cumulative preference shares so to vote shall continue until the company shall have resumed the payment in full of the dividends in arrears. The Group has undertaken that, unless otherwise agreed with the European Commission, neither the company nor any of its direct or indirect subsidiaries (excluding companies in the RBS Holdings N.V. Group, which are subject to different restrictions) will pay external investors any dividends or coupons on existing hybrid capital instruments (including preference shares, B shares and upper and lower tier 2
instruments) from 30 April 2010 for a period of two years thereafter ("the Deferral Period"), or exercise any call rights in relation to these capital instruments between 24 November 2009 and the end of the Deferral Period, unless there is a legal obligation to do so. Hybrid capital instruments issued after 24 November 2009 will generally not be subject to the restriction on dividend or coupon payments or call options. 30 Reserves On 1 January 2008, the merger reserve comprised the premium on shares issued to acquire NatWest less goodwill amortisation charged under previous GAAP. No share premium was recorded in the company financial statements through the operation of the merger relief provisions of the Companies Act 1985. UK law prescribes that only the reserves of the company are taken into account for the purpose of making distributions and in determining the permissible applications of the share premium account. The Group optimises capital efficiency by maintaining reserves in subsidiaries, including regulated entities. Certain preference shares and subordinated debt are also included within regulatory capital. The remittance of reserves to the company or the redemption of shares or subordinated capital by regulated entities may be subject to maintaining the capital resources required by the relevant regulator. Paid-in equity represents notes issued under the company's euro medium term note programme with an initial par value of US$1,600 million and CAD600 million that are classified as equity under IFRS. The notes attract coupons of 6.99% and 6.666% respectively until October 2017 when they change to 2.67% above the London interbank offered rate for 3-month US dollar deposits and 2.76% above the Canadian dollar offered rate respectively. Paid-in equity of US$1,036 million was repurchased in April 2009 and CAD279 million was repurchased in May 2010 as part of the liability management exercises. Under the arrangements for the placing and open offer in December 2008, the company issued shares in exchange for shares in Encuentro Limited. No share premium was recorded in the company financial statements through the operation of the merger relief provisions of the Companies Act 2006. The subsequent redemption of these shares gave rise to distributable profits of £14,273 million which were transferred from merger reserve to retained earnings. Under the arrangements for accession to APS in December 2009, the company issued B shares in exchange for shares in Aonach Mor Limited. No share premium was recorded in the company financial statements through the operation of the merger relief provisions of the Companies Act 2006. The subsequent redemption of some of these shares gave rise to distributable profits of £12,250 million (2009 - £9,950 million) which were transferred from merger reserve to retained earnings. At 31 December 2010, 1,717,095,004 (2009 - 138,695,912) ordinary shares of 25p each of the company were held by Employee Share Trusts in respect of share awards and options granted to employees.
361RBS Group 2010
Financial statements
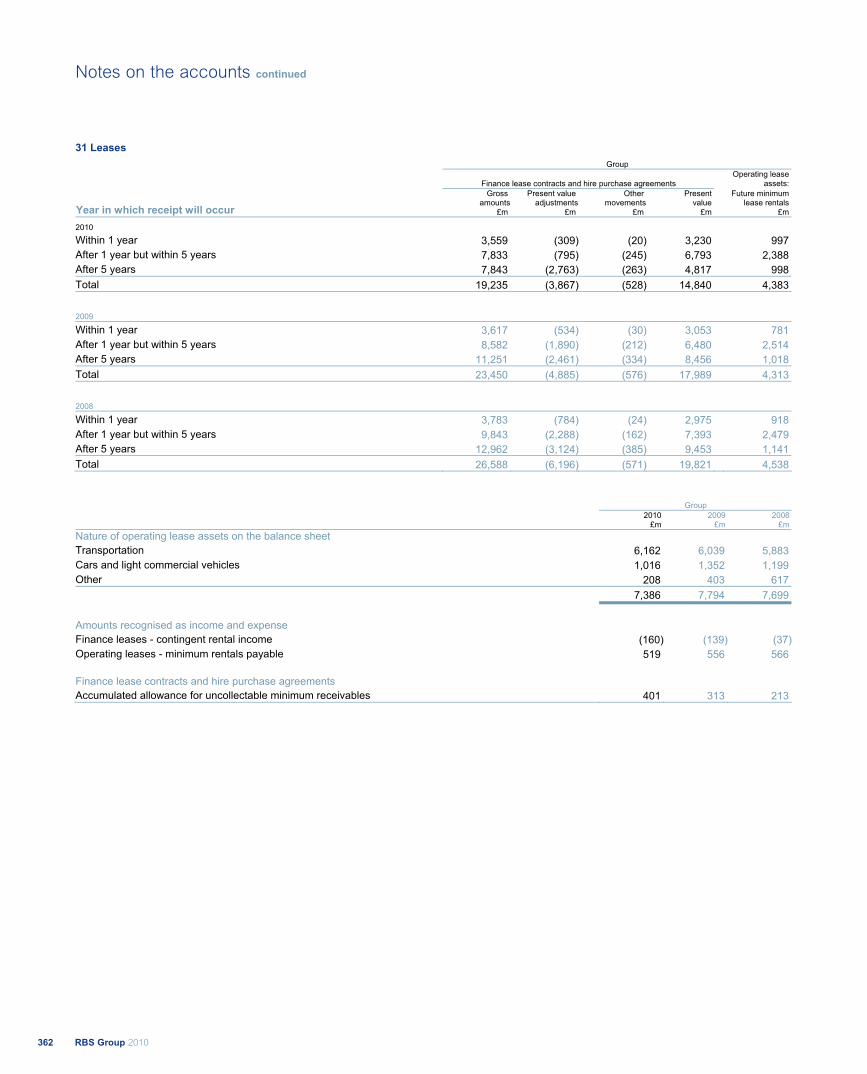
31 Leases Group
Finance lease contracts and hire purchase agreements Operating lease
assets:
Year in which receipt will occur Gross
amounts£m
Present value adjustments
£m
Other movements
£m
Present value
£m
Future minimum lease rentals
£m
2010 Within 1 year 3,559 (309) (20) 3,230 997 After 1 year but within 5 years 7,833 (795) (245) 6,793 2,388 After 5 years 7,843 (2,763) (263) 4,817 998 Total 19,235 (3,867) (528) 14,840 4,383
2009 Within 1 year 3,617 (534) (30) 3,053 781 After 1 year but within 5 years 8,582 (1,890) (212) 6,480 2,514 After 5 years 11,251 (2,461) (334) 8,456 1,018 Total 23,450 (4,885) (576) 17,989 4,313
2008 Within 1 year 3,783 (784) (24) 2,975 918 After 1 year but within 5 years 9,843 (2,288) (162) 7,393 2,479 After 5 years 12,962 (3,124) (385) 9,453 1,141 Total 26,588 (6,196) (571) 19,821 4,538
Group 2010 2009 2008
£m £m £m Nature of operating lease assets on the balance sheet Transportation 6,162 6,039 5,883 Cars and light commercial vehicles 1,016 1,352 1,199 Other 208 403 617 7,386 7,794 7,699
Amounts recognised as income and expense Finance leases - contingent rental income (160) (139) (37)Operating leases - minimum rentals payable 519 556 566 Finance lease contracts and hire purchase agreements Accumulated allowance for uncollectable minimum receivables 401 313 213
RBS Group 2010362
Notes on the accounts continued
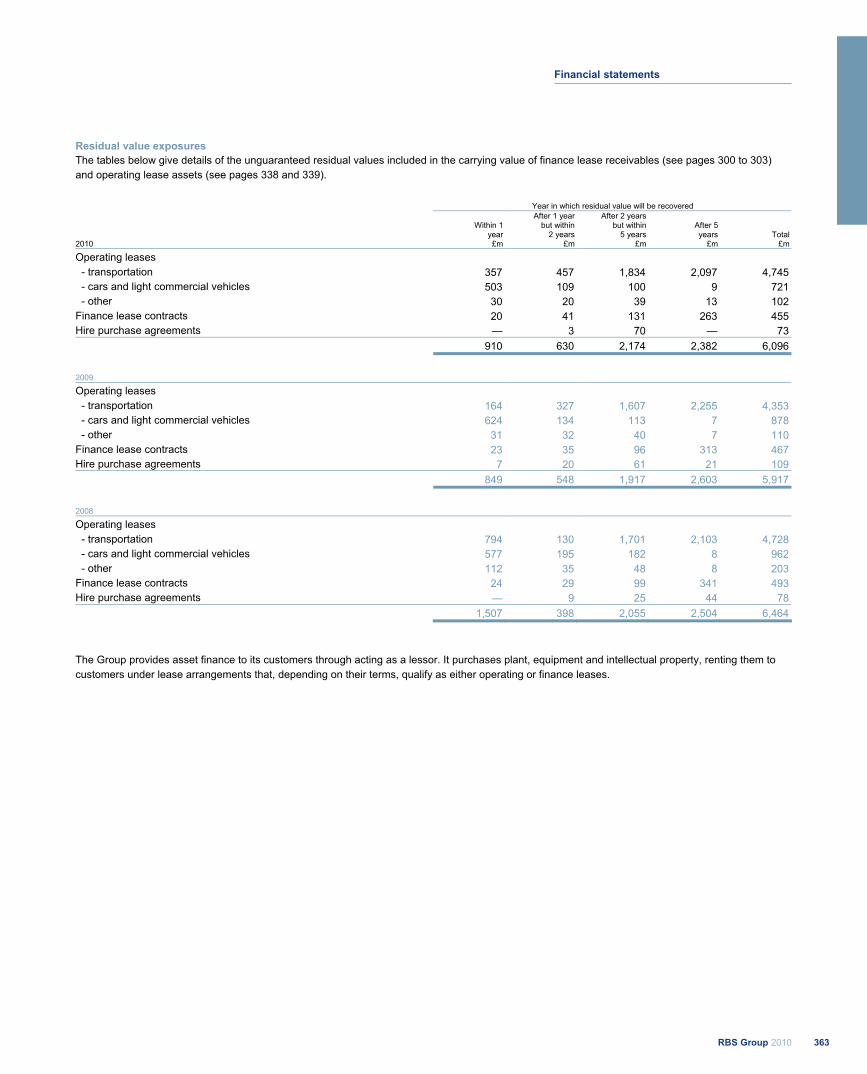
Residual value exposures The tables below give details of the unguaranteed residual values included in the carrying value of finance lease receivables (see pages 300 to 303) and operating lease assets (see pages 338 and 339).
Year in which residual value will be recovered
Within 1
year
After 1 year but within
2 years
After 2 years but within
5 years After 5 years Total
2010 £m £m £m £m £m
Operating leases - transportation 357 457 1,834 2,097 4,745
- cars and light commercial vehicles 503 109 100 9 721 - other 30 20 39 13 102 Finance lease contracts 20 41 131 263 455 Hire purchase agreements — 3 70 — 73 910 630 2,174 2,382 6,096
2009 Operating leases
- transportation 164 327 1,607 2,255 4,353 - cars and light commercial vehicles 624 134 113 7 878 - other 31 32 40 7 110 Finance lease contracts 23 35 96 313 467 Hire purchase agreements 7 20 61 21 109 849 548 1,917 2,603 5,917
2008 Operating leases
- transportation 794 130 1,701 2,103 4,728 - cars and light commercial vehicles 577 195 182 8 962 - other 112 35 48 8 203 Finance lease contracts 24 29 99 341 493 Hire purchase agreements — 9 25 44 78 1,507 398 2,055 2,504 6,464
The Group provides asset finance to its customers through acting as a lessor. It purchases plant, equipment and intellectual property, renting them to customers under lease arrangements that, depending on their terms, qualify as either operating or finance leases.
363RBS Group 2010
Financial statements
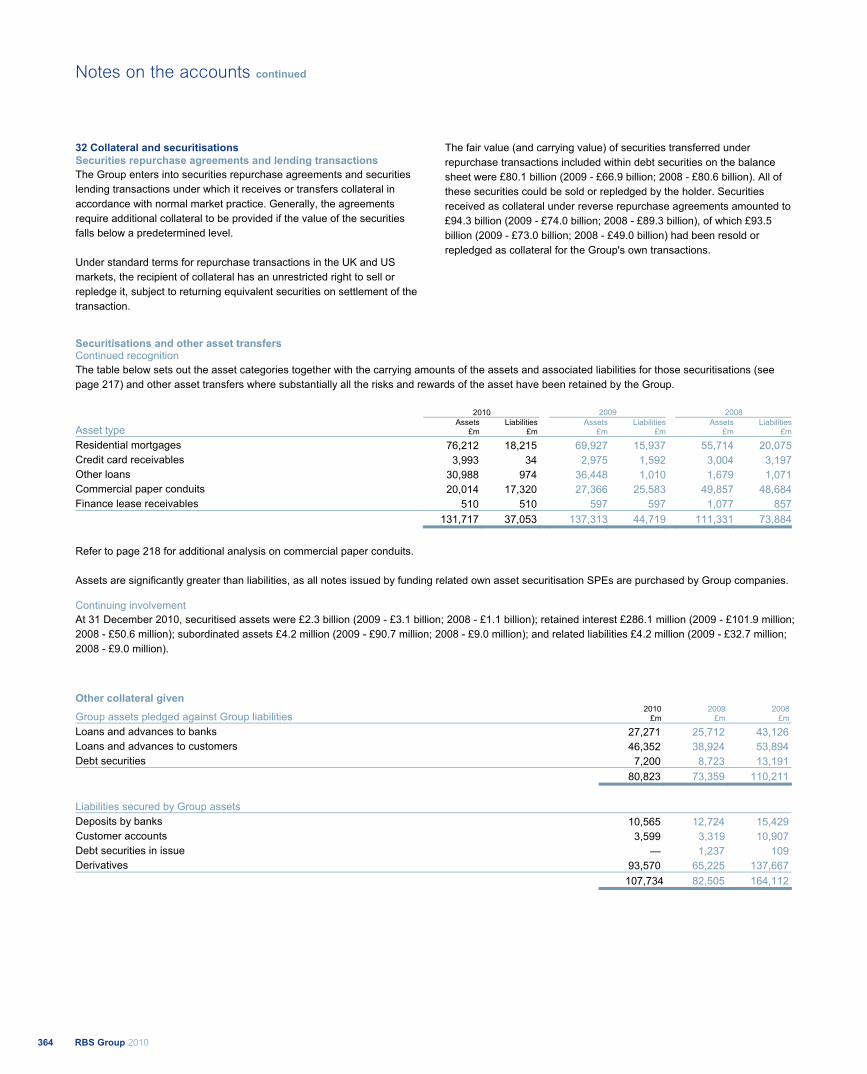
32 Collateral and securitisations Securities repurchase agreements and lending transactions The Group enters into securities repurchase agreements and securities lending transactions under which it receives or transfers collateral in accordance with normal market practice. Generally, the agreements require additional collateral to be provided if the value of the securities falls below a predetermined level. Under standard terms for repurchase transactions in the UK and US markets, the recipient of collateral has an unrestricted right to sell or repledge it, subject to returning equivalent securities on settlement of the transaction.
The fair value (and carrying value) of securities transferred under repurchase transactions included within debt securities on the balance sheet were £80.1 billion (2009 - £66.9 billion; 2008 - £80.6 billion). All of these securities could be sold or repledged by the holder. Securities received as collateral under reverse repurchase agreements amounted to £94.3 billion (2009 - £74.0 billion; 2008 - £89.3 billion), of which £93.5 billion (2009 - £73.0 billion; 2008 - £49.0 billion) had been resold or repledged as collateral for the Group's own transactions.
Securitisations and other asset transfers Continued recognition The table below sets out the asset categories together with the carrying amounts of the assets and associated liabilities for those securitisations (see page 217) and other asset transfers where substantially all the risks and rewards of the asset have been retained by the Group.
2010 2009 2008
Asset type Assets
£mLiabilities
£mAssets
£mLiabilities
£mAssets
£mLiabilities
£m
Residential mortgages 76,212 18,215 69,927 15,937 55,714 20,075Credit card receivables 3,993 34 2,975 1,592 3,004 3,197Other loans 30,988 974 36,448 1,010 1,679 1,071Commercial paper conduits 20,014 17,320 27,366 25,583 49,857 48,684Finance lease receivables 510 510 597 597 1,077 857 131,717 37,053 137,313 44,719 111,331 73,884
Refer to page 218 for additional analysis on commercial paper conduits. Assets are significantly greater than liabilities, as all notes issued by funding related own asset securitisation SPEs are purchased by Group companies. Continuing involvement At 31 December 2010, securitised assets were £2.3 billion (2009 - £3.1 billion; 2008 - £1.1 billion); retained interest £286.1 million (2009 - £101.9 million; 2008 - £50.6 million); subordinated assets £4.2 million (2009 - £90.7 million; 2008 - £9.0 million); and related liabilities £4.2 million (2009 - £32.7 million; 2008 - £9.0 million).
Other collateral given
Group assets pledged against Group liabilities 2010
£m 2009
£m 2008
£m
Loans and advances to banks 27,271 25,712 43,126 Loans and advances to customers 46,352 38,924 53,894 Debt securities 7,200 8,723 13,191 80,823 73,359 110,211
Liabilities secured by Group assets Deposits by banks 10,565 12,724 15,429 Customer accounts 3,599 3,319 10,907 Debt securities in issue — 1,237 109 Derivatives 93,570 65,225 137,667 107,734 82,505 164,112
RBS Group 2010364
Notes on the accounts continued
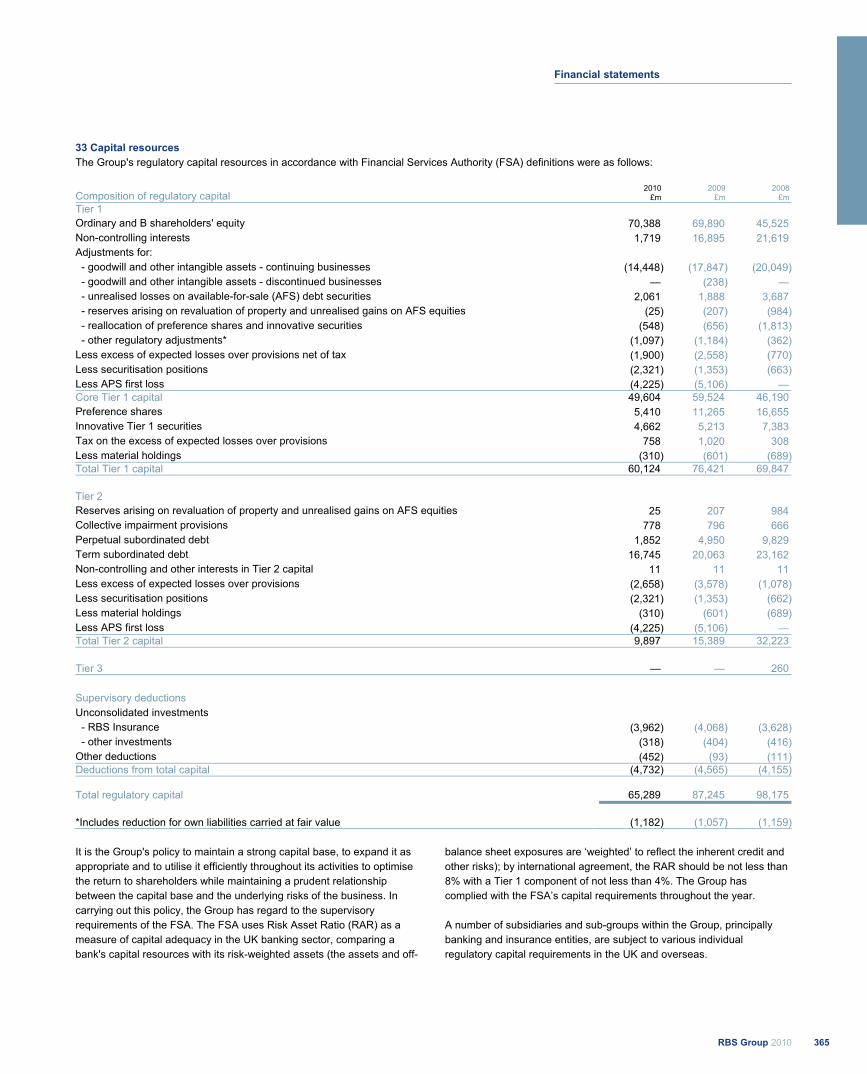
33 Capital resources The Group's regulatory capital resources in accordance with Financial Services Authority (FSA) definitions were as follows:
Composition of regulatory capital 2010
£m 2009
£m 2008
£m Tier 1 Ordinary and B shareholders' equity 70,388 69,890 45,525 Non-controlling interests 1,719 16,895 21,619 Adjustments for:
- goodwill and other intangible assets - continuing businesses (14,448) (17,847) (20,049) - goodwill and other intangible assets - discontinued businesses — (238) — - unrealised losses on available-for-sale (AFS) debt securities 2,061 1,888 3,687
- reserves arising on revaluation of property and unrealised gains on AFS equities (25) (207) (984) - reallocation of preference shares and innovative securities (548) (656) (1,813) - other regulatory adjustments* (1,097) (1,184) (362)Less excess of expected losses over provisions net of tax (1,900) (2,558) (770)Less securitisation positions (2,321) (1,353) (663)Less APS first loss (4,225) (5,106) — Core Tier 1 capital 49,604 59,524 46,190 Preference shares 5,410 11,265 16,655 Innovative Tier 1 securities 4,662 5,213 7,383 Tax on the excess of expected losses over provisions 758 1,020 308Less material holdings (310) (601) (689)Total Tier 1 capital 60,124 76,421 69,847
Tier 2 Reserves arising on revaluation of property and unrealised gains on AFS equities 25 207 984Collective impairment provisions 778 796 666Perpetual subordinated debt 1,852 4,950 9,829 Term subordinated debt 16,745 20,063 23,162 Non-controlling and other interests in Tier 2 capital 11 11 11 Less excess of expected losses over provisions (2,658) (3,578) (1,078)Less securitisation positions (2,321) (1,353) (662)Less material holdings (310) (601) (689)Less APS first loss (4,225) (5,106) — Total Tier 2 capital 9,897 15,389 32,223
Tier 3 — — 260
Supervisory deductions Unconsolidated investments - RBS Insurance (3,962) (4,068) (3,628) - other investments (318) (404) (416)Other deductions (452) (93) (111)Deductions from total capital (4,732) (4,565) (4,155)
Total regulatory capital 65,289 87,245 98,175
*Includes reduction for own liabilities carried at fair value (1,182) (1,057) (1,159)
It is the Group's policy to maintain a strong capital base, to expand it as appropriate and to utilise it efficiently throughout its activities to optimise the return to shareholders while maintaining a prudent relationship between the capital base and the underlying risks of the business. In carrying out this policy, the Group has regard to the supervisory requirements of the FSA. The FSA uses Risk Asset Ratio (RAR) as a measure of capital adequacy in the UK banking sector, comparing a bank's capital resources with its risk-weighted assets (the assets and off-
balance sheet exposures are ‘weighted’ to reflect the inherent credit and other risks); by international agreement, the RAR should be not less than 8% with a Tier 1 component of not less than 4%. The Group has complied with the FSA’s capital requirements throughout the year. A number of subsidiaries and sub-groups within the Group, principally banking and insurance entities, are subject to various individual regulatory capital requirements in the UK and overseas.
365RBS Group 2010
Financial statements

34 Memorandum items Contingent liabilities and commitments The amounts shown in the table below are intended only to provide an indication of the volume of business outstanding at 31 December. Although the Group is exposed to credit risk in the event of non-performance of the obligations undertaken by customers, the amounts shown do not, and are not intended to, provide any indication of the Group's expectation of future losses.
Group
Less than
1 year
More than 1 year but less than
3 years
More than 3 years but
less than 5 years
Over 5 years 2010 2009 2008
£m £m £m £m £m £m £m
Contingent liabilities Guarantees and assets pledged as collateral security 20,044 5,220 2,178 3,659 31,101 40,008 49,262Other contingent liabilities 6,058 2,877 1,235 2,084 12,254 14,012 22,275 26,102 8,097 3,413 5,743 43,355 54,020 71,537
Commitments Undrawn formal standby facilities, credit lines and other commitments to lend
- less than one year 117,581 — — — 117,581 127,423 166,572 - one year and over 22,258 80,267 26,931 19,785 149,241 164,211 185,826Other commitments 1,623 161 2,366 4 4,154 6,007 9,326 141,462 80,428 29,297 19,789 270,976 297,641 361,724
Banking commitments and contingent obligations, which have been entered into on behalf of customers and for which there are corresponding obligations from customers, are not included in assets and liabilities. The Group's maximum exposure to credit loss, in the event of non-performance by the other party and where all counterclaims, collateral or security proves valueless, is represented by the contractual nominal amount of these instruments included in the table above. These commitments and contingent obligations are subject to the Group's normal credit approval processes. Contingent liabilities Guarantees - the Group gives guarantees on behalf of customers. A financial guarantee represents an irrevocable undertaking that the Group will meet a customer's obligations to third parties if the customer fails to do so. The maximum amount that the Group could be required to pay under a guarantee is its principal amount as disclosed in the table above. The Group expects most guarantees it provides to expire unused. Other contingent liabilities - these include standby letters of credit, supporting customer debt issues and contingent liabilities relating to customer trading activities such as those arising from performance and customs bonds, warranties and indemnities.
Commitments Commitments to lend - under a loan commitment the Group agrees to make funds available to a customer in the future. Loan commitments, which are usually for a specified term may be unconditionally cancellable or may persist, provided all conditions in the loan facility are satisfied or waived. Commitments to lend include commercial standby facilities and credit lines, liquidity facilities to commercial paper conduits and unutilised overdraft facilities. Other commitments - these include documentary credits, which are commercial letters of credit providing for payment by the Group to a named beneficiary against presentation of specified documents, forward asset purchases, forward deposits placed and undrawn note issuance and revolving underwriting facilities, and other short-term trade related transactions.
RBS Group 2010366
Notes on the accounts continued
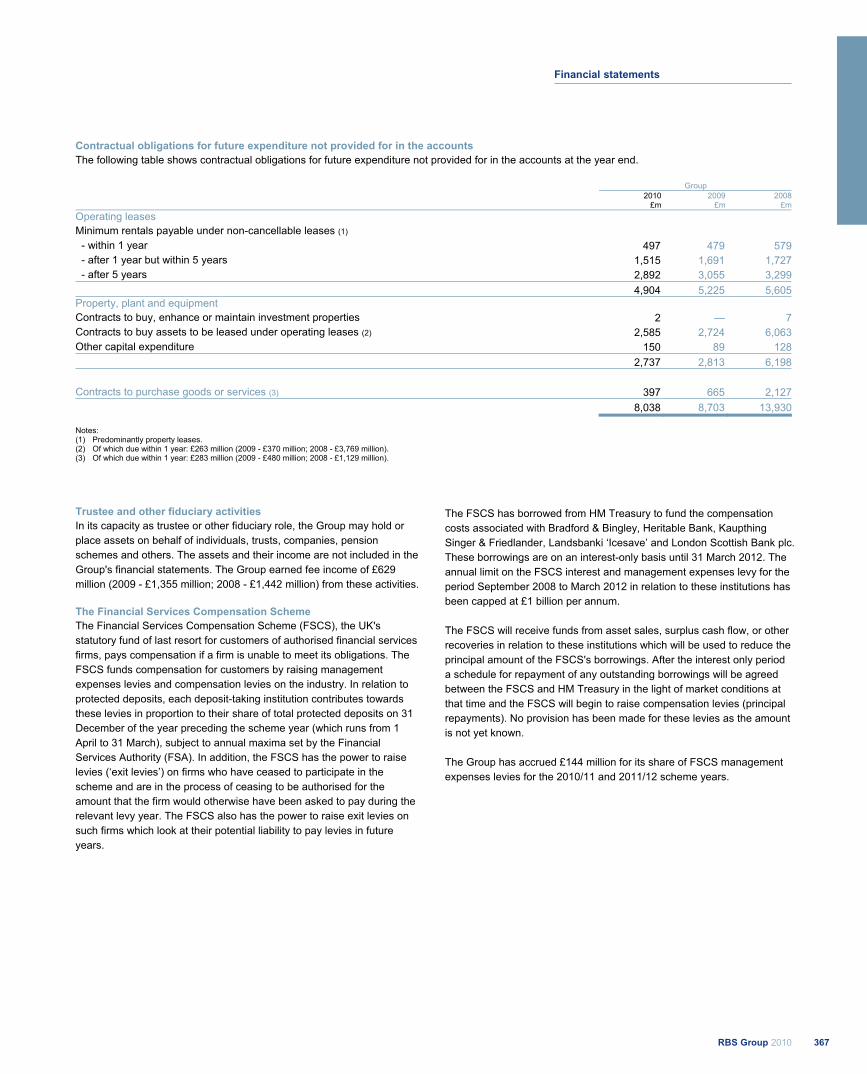
Contractual obligations for future expenditure not provided for in the accounts The following table shows contractual obligations for future expenditure not provided for in the accounts at the year end.
Group
2010
£m2009
£m2008
£mOperating leases Minimum rentals payable under non-cancellable leases (1)
- within 1 year 497 479 579 - after 1 year but within 5 years 1,515 1,691 1,727 - after 5 years 2,892 3,055 3,299 4,904 5,225 5,605Property, plant and equipment Contracts to buy, enhance or maintain investment properties 2 — 7Contracts to buy assets to be leased under operating leases (2) 2,585 2,724 6,063Other capital expenditure 150 89 128 2,737 2,813 6,198
Contracts to purchase goods or services (3) 397 665 2,127 8,038 8,703 13,930
Notes: (1) Predominantly property leases. (2) Of which due within 1 year: £263 million (2009 - £370 million; 2008 - £3,769 million). (3) Of which due within 1 year: £283 million (2009 - £480 million; 2008 - £1,129 million).
Trustee and other fiduciary activities In its capacity as trustee or other fiduciary role, the Group may hold or place assets on behalf of individuals, trusts, companies, pension schemes and others. The assets and their income are not included in the Group's financial statements. The Group earned fee income of £629 million (2009 - £1,355 million; 2008 - £1,442 million) from these activities. The Financial Services Compensation Scheme The Financial Services Compensation Scheme (FSCS), the UK's statutory fund of last resort for customers of authorised financial services firms, pays compensation if a firm is unable to meet its obligations. The FSCS funds compensation for customers by raising management expenses levies and compensation levies on the industry. In relation to protected deposits, each deposit-taking institution contributes towards these levies in proportion to their share of total protected deposits on 31 December of the year preceding the scheme year (which runs from 1 April to 31 March), subject to annual maxima set by the Financial Services Authority (FSA). In addition, the FSCS has the power to raise levies (‘exit levies’) on firms who have ceased to participate in the scheme and are in the process of ceasing to be authorised for the amount that the firm would otherwise have been asked to pay during the relevant levy year. The FSCS also has the power to raise exit levies on such firms which look at their potential liability to pay levies in future years.
The FSCS has borrowed from HM Treasury to fund the compensation costs associated with Bradford & Bingley, Heritable Bank, Kaupthing Singer & Friedlander, Landsbanki ‘Icesave’ and London Scottish Bank plc. These borrowings are on an interest-only basis until 31 March 2012. The annual limit on the FSCS interest and management expenses levy for the period September 2008 to March 2012 in relation to these institutions has been capped at £1 billion per annum. The FSCS will receive funds from asset sales, surplus cash flow, or other recoveries in relation to these institutions which will be used to reduce the principal amount of the FSCS's borrowings. After the interest only period a schedule for repayment of any outstanding borrowings will be agreed between the FSCS and HM Treasury in the light of market conditions at that time and the FSCS will begin to raise compensation levies (principal repayments). No provision has been made for these levies as the amount is not yet known. The Group has accrued £144 million for its share of FSCS management expenses levies for the 2010/11 and 2011/12 scheme years.
367RBS Group 2010
Financial statements
34 Memorandum items continued Bank levy In his 22 June 2010 budget statement, the Chancellor announced that the UK Government will introduce an annual bank levy. The Finance Bill 2011 contains details of how the levy will be calculated and collected. The levy will be collected through the existing quarterly Corporation Tax collection mechanism starting with payment dates on or after the date the Finance Bill 2011 receives Royal Assent. The levy will be based upon the total chargeable equity and liabilities as reported in the balance sheet at the end of a chargeable period. In determining the chargeable equity and liabilities the following amounts are excluded: Tier 1 capital; certain “protected deposits” (for example those protected under the Financial Services Compensation Scheme); liabilities that arise from certain insurance business within banking groups; liabilities in respect of currency notes in circulation; Financial Services Compensation Scheme liabilities; liabilities representing segregated client money; and deferred tax liabilities, current tax liabilities, liabilities in respect of the levy, revaluation of property liabilities, liabilities representing the revaluation of business premises and defined benefit retirement liabilities. It will also be permitted in specified circumstances to reduce certain liabilities by: netting against them certain assets; offsetting assets on the relevant balance sheets that would qualify as high quality liquid assets (in accordance with the FSA definition); and repo liabilities secured against sovereign and supranational debt. The levy will be set at a rate of 0.075 per cent from 2011. Three different rates apply during 2011, these average to 0.075 per cent. Certain liabilities will be subject to only a half rate, namely: any deposits not otherwise excluded (except for those from financial institutions and financial traders); and liabilities with a maturity greater than one year at the balance sheet date. The levy will not be charged on the first £20 billion of chargeable liabilities. If the levy had been applied to the balance sheet at 31 December 2010, the cost of the levy to RBS Group would be in the region of £350 million to £400 million in 2011. Litigation As a participant in the financial services industry, RBS Group operates in a legal and regulatory environment that exposes it to potentially significant litigation risks. As a result, the company and other members of RBS Group are involved in various disputes and legal proceedings in the United Kingdom, the United States and other jurisdictions, including litigation. Such cases are subject to many uncertainties, and their outcome is often difficult to predict, particularly in the earlier stages of a case.
Other than as set out in this section “Litigation”, so far as RBS Group is aware, no member of RBS Group is or has been engaged in or has pending or threatened any governmental, legal or arbitration proceedings which may have or have had in the recent past (covering the 12 months immediately preceding the date of this document) a significant effect on RBS Group’s financial position or profitability.
Unarranged overdraft charges In the US, Citizens Financial Group, in common with other US banks, has been named as a defendant in a class action asserting that Citizens charges excessive overdraft fees. The plaintiffs claim that overdraft fees resulting from point of sale and automated teller machine (ATM) transactions violate the duty of good faith implied in Citizens’ customer account agreement and constitute an unfair trade practice. RBS Group considers that it has substantial and credible legal and factual defences to these claims and will defend them vigorously. RBS Group is unable reliably to estimate the liability, if any, that might arise or its effect on RBS Group’s consolidated net assets, operating results or cash flows in any particular period. Shareholder litigation RBS Group and a number of its subsidiaries and certain individual officers and directors have been named as defendants in a class action filed in the United States District Court for the Southern District of New York. The consolidated amended complaint alleges certain false and misleading statements and omissions in public filings and other communications during the period 1 March 2007 to 19 January 2009, and variously asserts claims under Sections 11, 12 and 15 of the US Securities Act of 1933, Sections 10 and 20 of the US Securities Exchange Act of 1934 (“Exchange Act”) and Rule 10b-5 thereunder.
The putative class is composed of (1) all persons who purchased or otherwise acquired RBS Group ordinary securities and US American depositary receipts (ADRs) between 1 March 2007 and 19 January 2009; and/or (2) all persons who purchased or otherwise acquired RBS Group Series Q, R, S, T and/or U non-cumulative dollar preference shares issued pursuant or traceable to the 8 April 2005 US Securities and Exchange Commission (SEC) registration statement and were damaged thereby. Plaintiffs seek unquantified damages on behalf of the putative class.
On 11 January 2011, the District Court dismissed all claims except those based on the purchase of RBS Group Series Q, R, S, T, and/or U non-cumulative dollar preference shares. The Court has not yet considered potential grounds for dismissal of the remaining claims, and directed RBS Group to re-file its motion to dismiss those claims within 45 days of its ruling. On 28 January 2011, a new complaint was filed asserting claims under Sections 10 and 20 of the Exchange Act on behalf of a putative class of purchasers of ADRs. RBS Group has also received notification of similar prospective claims in the United Kingdom and elsewhere but no court proceedings have been commenced in relation to these claims.
RBS Group considers that it has substantial and credible legal and factual defences to the remaining and prospective claims and will defend them vigorously. RBS Group is unable to reliably estimate the liability, if any, that might arise or its effect on RBS Group’s consolidated net assets, operating results or cash flows in any particular period.
RBS Group 2010368
Notes on the accounts continued
Other securitisation and securities related litigation in the United States RBS Group companies have been named as defendants in a number of purported class actions and other lawsuits in the United States that relate to the securitisation and securities underwriting businesses. In general, the cases involve the issuance of mortgage backed securities, collateralised debt obligations, or public debt or equity where the plaintiffs have brought actions against the issuers and underwriters of such securities (including RBS Group companies) claiming that certain disclosures made in connection with the relevant offerings of such securities were false or misleading with respect to alleged “sub-prime” mortgage exposure. RBS Group considers that it has substantial and credible legal and factual defences to these claims and will continue to defend them vigorously. RBS Group cannot at this stage reliably estimate the liability, if any, that may arise as a result of or in connection with these lawsuits, individually or in the aggregate, or their effect on RBS Group’s consolidated net assets, operating results or cash flows in any particular period.
World Online International N.V. In November 2009, the Supreme Court in the Netherlands gave a declaratory judgment against World Online International N.V., Goldman Sachs International and ABN AMRO Bank N.V. (now known as The Royal Bank of Scotland N.V.) (“RBS NV”) in relation to claims arising out of the World Online initial public offering of 2000. It held that these defendants had committed certain wrongful acts in connection with the initial public offering. The judgment does not establish liability or the amount of any loss. The defendant banks have agreed to pay settlement sums to certain investors. RBS Group does not believe that such settlements or any final liability or loss will have a significant effect on RBS Group’s financial position or profitability. Madoff In December 2010, Irving Picard, as trustee for the bankruptcy estates of Bernard L. Madoff and Bernard L. Madoff Investment Securities LLC filed a claim against RBS NV for $270 million. This is a clawback action similar to claims filed against six other institutions in December. RBS NV (or its subsidiaries) invested in Madoff funds through feeder funds. The Trustee alleges that RBS NV received $71 million in redemptions from the feeder funds and $200 million from its swap counterparties while RBS NV “knew or should have known of Madoff’s possible fraud.” The Trustee alleges that those transfers were preferences or fraudulent conveyances under the US bankruptcy code and New York law and he asserts the purported right to claw them back for the benefit of Madoff’s estate. RBS Group considers that it has substantial and credible legal and factual defences to the claim and intends to defend it vigorously. Summary of other disputes, legal proceedings and litigation Members of RBS Group are engaged in other litigation in the United Kingdom and a number of overseas jurisdictions, including the United States, involving claims by and against them arising in the ordinary course of business. RBS Group has reviewed these other actual, threatened and known potential claims and proceedings and, after consulting with its legal advisers, does not expect that the outcome of any of these other claims and proceedings will have significant effect on RBS Group’s financial position or profitability in any particular period.
Investigations RBS Group’s businesses and financial condition can be affected by the fiscal or other policies and other actions of various governmental and regulatory authorities in the United Kingdom, the European Union, the United States and elsewhere. RBS Group has engaged, and will continue to engage, in discussions with relevant regulators, including in the United Kingdom and the United States, on an ongoing and regular basis regarding operational, systems and control evaluations and issues, including those related to compliance with applicable anti-bribery, anti-money laundering and applicable sanctions regimes. It is possible that any matters discussed or identified may result in investigatory or other action being taken by the regulators, increased costs being incurred by RBS Group, remediation of systems and controls, public or private censure, restriction of RBS Group’s business activities or fines. Any of these events or circumstances could have a significant effect on RBS Group, its business, authorisations and licences, reputation, results of operations or the price of securities issued by it. Political and regulatory scrutiny of the operation of retail banking and consumer credit industries in the United Kingdom and elsewhere continues. The nature and impact of future changes in policies and regulatory action are not predictable and are beyond RBS Group’s control but could have a significant effect on RBS Group’s businesses and earnings. Retail banking In the European Union, regulatory actions included an inquiry into retail banking initiated on 13 June 2005 in all of the then 25 member states by the European Commission’s Directorate General for Competition. The inquiry examined retail banking in Europe generally. On 31 January 2007, the European Commission (EC) announced that barriers to competition in certain areas of retail banking, payment cards and payment systems in the European Union had been identified. The EC indicated that it will consider using its powers to address these barriers and will encourage national competition authorities to enforce European and national competition laws where appropriate. In addition, in late 2010, the EC launched an initiative pressing for increased transparency of bank fees.
Multilateral interchange fees In 2007, the EC issued a decision that while interchange is not illegal per se, MasterCard’s current multilateral interchange fee (MIF) arrangement for cross border payment card transactions with MasterCard and Maestro branded consumer credit and debit cards in the European Union are in breach of competition law. MasterCard was required by the decision to withdraw the relevant cross-border MIF (i.e. set these fees to zero) by 21 June 2008.
369RBS Group 2010
Financial statements

34 Memorandum items continued MasterCard appealed against the decision to the European Court of First Instance on 1 March 2008, and RBS Group has intervened in the appeal proceedings. In addition, in summer 2008, MasterCard announced various changes to its scheme arrangements. The EC was concerned that these changes might be used as a means of circumventing the requirements of the infringement decision. In April 2009, MasterCard agreed an interim settlement on the level of cross-border MIFs with the EC pending the outcome of the appeal process and, as a result, the EC has advised it will no longer investigate the non-compliance issue (although MasterCard is continuing with its appeal). Visa’s cross-border MIFs were exempted in 2002 by the EC for a period of five years up to 31 December 2007 subject to certain conditions. On 26 March 2008, the EC opened a formal inquiry into Visa’s current MIF arrangements for cross border payment card transactions with Visa branded debit and consumer credit cards in the European Union and on 6 April 2009 the EC announced that it had issued Visa with a formal Statement of Objections. At the same time Visa announced changes to its interchange levels and introduced some changes to enhance transparency. There is no deadline for the closure of the inquiry. However, on 26 April 2010 Visa announced it had reached an agreement with the EC as regards immediate cross border debit card MIF rates only and in December 2010 the commitments were finalised for a four year period commencing December 2010 under Article 9 of Regulation 1/2003. The EC is continuing its investigations into Visa’s cross border MIF arrangements for deferred debit and credit transactions. In the UK, the OFT has carried out investigations into Visa and MasterCard domestic credit card interchange rates. The decision by the OFT in the MasterCard interchange case was set aside by the Competition Appeal Tribunal (the CAT) in June 2006. The OFT’s investigations in the Visa interchange case and a second MasterCard interchange case are ongoing. On 9 February 2007, the OFT announced that it was expanding its investigation into domestic interchange rates to include debit cards. In January 2010 the OFT advised that it did not anticipate issuing a Statement of Objections prior to the European General Court’s judgment, although it has reserved the right to do so if it considers it appropriate.
The outcome of these investigations is not known, but they may have a significant effect on the consumer credit industry in general and, therefore, on RBS Group’s business in this sector.
Payment Protection Insurance Having conducted a market study relating to Payment Protection Insurance (PPI), on 7 February 2007 the OFT referred the PPI market to the Competition Commission (CC) for an in-depth inquiry. The CC published its final report on 29 January 2009 and announced its intention to order a range of remedies, including a prohibition on actively selling PPI at point of sale of the credit product (and for 7 days thereafter), a ban on single premium policies and other measures to increase transparency (in order to improve customers’ ability to search and improve price competition). Barclays Bank PLC subsequently appealed certain CC findings to the CAT. On 16 October 2009, the CAT handed down a judgment quashing the ban on selling PPI at the point of sale of credit products and remitted the matter back to the CC for review. On 14 May 2010, the CC published its Provisional Decision following its review of
remedies in the PPI market indicating that the CC still intends to impose a prohibition on selling PPI at point of sale of the credit product. On 14 October 2010, the CC published its final decision on remedies following the remittal which confirmed the point of sale prohibition. The CC intends to make the final order in the first quarter of 2011, with the key measures coming into force in October 2011 and April 2012. The Financial Services Authority (FSA) has been conducting a broad industry thematic review of PPI sales practices and in September 2008, the FSA announced that it intended to escalate its level of regulatory intervention. Substantial numbers of customer complaints alleging the mis-selling of PPI policies have been made to banks and to the Financial Ombudsman Service (FOS) and many of these are being upheld by the FOS against the banks.
Following unsuccessful negotiations with the industry, the FSA issued consultation papers on PPI complaint handling and redress in September 2009 and again in March 2010. The FSA published its final policy statement on 10 August 2010 and instructed firms to implement the measures contained in it by 1 December 2010. The new rules impose significant changes with respect to the handling of mis-selling PPI complaints. On 8 October 2010, the British Bankers’ Association filed an application for judicial review of the FSA’s policy statement and of related guidance issued by the FOS. The court hearing took place from 25 to 28 January 2011 and judgment is awaited. RBS Group is unable to reliably estimate the liability, if any, that might arise from this litigation or its effect on RBS Group’s consolidated net assets, operating results or cash flows in any particular period. Separately, discussions continue between the FSA and RBS Group in respect of concerns expressed by the FSA over certain categories of historical PPI sales. Gender equality in insurance contracts A ruling is expected in March 2011 from the European Court of Justice (ECJ) in a case relating to gender equality in the pricing of and the provision of benefits under insurance contracts and whether a person’s gender can be used as one of the factors in calculating insurance premiums. At this stage, it is not possible to estimate the effect, if any, which the ECJ’s ruling may have on the Group. Personal current accounts On 16 July 2008, the OFT published the results of its market study into Personal Current Accounts (PCA) in the United Kingdom. The OFT found evidence of competition and several positive features in the personal current account market but believed that the market as a whole was not working well for consumers and that the ability of the market to function well had become distorted.
On 7 October 2009, the OFT published a follow-up report summarising the initiatives agreed between the OFT and personal current account providers to address the OFT’s concerns about transparency and switching, following its market study. Personal current account providers will take a number of steps to improve transparency, including providing customers with an annual summary of the cost of their account and making charges prominent on monthly statements. To improve the switching process, a number of steps are being introduced following work with BACS, the payment processor, including measures to reduce the impact on consumers of any problems with transferring direct debits.
RBS Group 2010370
Notes on the accounts continued
On 22 December 2009, the OFT published a further report in which it stated that it continued to have significant concerns about the operation of the personal current account market in the United Kingdom, in particular in relation to unarranged overdrafts, and that it believed that fundamental changes are required for the market to work in the best interests of bank customers. The OFT stated that it would discuss these issues intensively with banks, consumer groups and other organisations, with the aim of reporting on progress by the end of March 2010. On 16 March 2010, the OFT announced that it had secured agreement from the banks on four industry-wide initiatives, namely minimum standards on the operation of opt-outs from unarranged overdrafts, new working groups on information sharing with customers, best practice for PCA customers in financial difficulties and incurring charges, and PCA providers to publish their policies on dealing with PCA customers in financial difficulties. The OFT also announced its plan to conduct six-monthly ongoing reviews, to fully review the market again in 2012 and to undertake a brief analysis on barriers to entry. The first six-monthly ongoing review was completed in September 2010. The OFT noted progress in the areas of switching, transparency and unarranged overdrafts for the period March to September 2010, as well as highlighting further changes the OFT expects to see in the market. The next progress report is expected to be published by the OFT in March 2011. On 26 May 2010, the OFT announced its review of barriers to entry. The review concerns retail banking for individuals and small and medium size enterprises (up to £25 million turnover) and will look at products which require a banking licence to sell mortgages, loan products and, where appropriate, other products such as insurance or credit cards where cross-selling may facilitate entry or expansion. The OFT published its report in November 2010. It advised that it expected its review to be relevant to the Independent Commission on Banking, the FSA, HM Treasury and the Department for Business, Innovation and Skills and to the devolved governments in the United Kingdom. The OFT has not indicated whether it will undertake any further work. The report maintained that barriers to entry remain, in particular regarding switching, branch networks and brands. At this stage, it is not possible to estimate the effect of the OFT’s report and recommendations regarding barriers to entry upon RBS Group. Equity underwriting On 10 June 2010, the OFT announced its intention to conduct a market study into equity underwriting and related services and sought views on scope by 9 July 2010. The OFT study was formally launched on 6 August 2010. The OFT undertook to examine the underwriting services for the different types of share issue used by FTSE 350 firms to raise capital in the UK including rights issues, placings and follow-on offers but excluding initial public offerings. The OFT has been looking at the way that the market works and the following three key issues: (i) how underwriting services are purchased; (ii) how underwriting services are provided; and (iii) how the regulatory environment affects the provision of underwriting services. The OFT published its report on 27 January 2011 identifying certain concerns around the level of equity underwriting fees. The OFT has identified a number of options which would enable companies and
institutional shareholders to address these concerns and allow them to drive greater competition in the market. It is currently consulting on its provisional decision not to refer the market to the CC. RBS Group is engaged in the OFT market study and it is not possible to estimate with any certainty what effect this study and any related developments may have on RBS Group, its business or results of operations. Independent Commission on Banking On 16 June 2010, HM Treasury published the terms of reference for the Government’s Independent Commission on Banking (ICB). The ICB is considering the structure of the United Kingdom banking sector and is looking at structural and non-structural measures to reform the banking system and to promote competition. It is mandated to formulate policy recommendations with a view to: (i) reducing systemic risk in the banking sector, exploring the risk posed by banks of different size, scale and function; (ii) mitigating moral hazard in the banking system; (iii) reducing the likelihood and impact of a bank’s failure; and (iv) promoting competition in retail and investment banking with a view to ensuring that the needs of banks’ customers are served efficiently and considering the extent to which large banks can gain competitive advantage from being perceived as “too big to fail”. The ICB reports to the Cabinet Committee on Banking Reform and is required to produce a final report by the end of September 2011. RBS Group has responded to the call for evidence by the ICB. In addition it has attended a private hearing, as well as public hearings in Edinburgh and Cardiff in December 2010. An issues paper by the ICB is expected in spring 2011. At this stage it is not possible to estimate the effect of the ICB’s report and recommendations upon RBS Group, if any. US dollar clearing activities In May 2010, following a criminal investigation by the United States Department of Justice (DoJ) into its dollar clearing activities, Office of Foreign Assets Control compliance procedures and other Bank Secrecy Act compliance matters, RBS NV formally entered into a Deferred Prosecution Agreement (DPA) with the DoJ resolving the investigation. The investigation was in relation to activities before the Consortium Members acquired ABN AMRO Holding N.V. (now known as RBS Holdings N.V.). The agreement was signed by RBS NV and is binding on that entity and its subsidiaries. Pursuant to the DPA, RBS NV paid a penalty of US$500 million and agreed that it will comply with the terms of the DPA and continue to co-operate fully with any further investigations. Payment of the penalty was made from a provision established in April 2007 when an agreement in principle to settle was first announced. Upon satisfaction of the conditions of the DPA for the period of 12 months from May 2010, the matter will be fully resolved. Failure to comply with the terms of the DPA during the 12 month period could result in the DoJ recommencing its investigations, the outcome of which would be uncertain and could result in public censure and fines or have an adverse effect on RBS Holdings N.V.’s operations, any of which could have a material adverse effect on its business, reputation, results of operation and financial condition.
371RBS Group 2010
Financial statements
34 Memorandum items continued Securitisation and collateralised debt obligation business In September and October 2010, the SEC requested voluntary production of information concerning residential mortgage backed securities underwritten by subsidiaries of RBS Group during the period from September 2006 to July 2007 inclusive. In November 2010, the SEC commenced formal proceedings and requested testimony from RBS employees. The investigation is in its preliminary stages and it is difficult to predict any potential exposure that may result. In June 2009, in connection with an investigation into the role of investment banks in the origination and securitisation of sub prime loans in Massachusetts, the Massachusetts Attorney General issued subpoenas to various banks, including an RBS Group subsidiary, seeking information related to residential mortgage lending practices and sales and securitisation of residential mortgage loans. This investigation is ongoing and RBS Group is co-operating. Previously, in 2008, the New York State Attorney General issued subpoenas to a wide array of participants in the securitisation and securities industry, focusing on the information underwriters obtained as part of the due diligence process from the independent due diligence firms. RBS Group completed its production of documents requested by the New York State Attorney General in 2009, principally producing documents related to loans that were pooled into one securitisation transaction. More recently, in September 2010, RBS Group subsidiaries received a request from the Nevada State Attorney General requesting information related to securitisations of mortgages issued by three specific originators. The investigation by the Nevada Attorney General is in the early stages and therefore it is difficult to predict the potential exposure from any such investigation. RBS Group and its subsidiaries are co-operating with these various investigations and requests. US mortgages RBS's Global Banking & Markets N.A. (GBM N.A.), has been a purchaser of non-agency US residential mortgages in the secondary market, and an issuer and underwriter of non-agency residential mortgage backed securities (RMBS). GBM N.A. did not originate or service any US residential mortgages and it was not a significant seller of mortgage loans to government sponsored enterprises (GSEs) (e.g. the Federal National Mortgage Association and the Federal Home Loan Mortgage Association). In issuing RMBS, GBM N.A. generally assigned certain representations and warranties regarding the characteristics of the underlying loans made by the originator of the residential mortgages; however, in some circumstances, GBM N.A. made such representations and warranties itself. Where GBM N.A. has given those or other representations and warranties (whether relating to underlying loans or otherwise), GBM N.A. may be contractually required to repurchase such loans or indemnify certain parties against losses for certain breaches of such
representations and warranties. In certain instances where it is required to repurchase loans or related securities, GBM N.A. may be able to assert claims against third parties who provided representations or warranties to GBM N.A. when selling loans to it; although the ability to make recoveries against such parties and outcome of such claims would be uncertain. During the two-year period ended 31 December 2010, GBM N.A. has received approximately US$38 million in repurchase demands in respect of loans made and related securities sold where obligations in respect of contractual representations or warranties were undertaken by GBM N.A. However, repurchase demands presented to GBM N.A. are subject to challenge and, to date, GBM N.A. has rebutted a significant percentage of these claims. GBM N.A. has been named as a defendant in a number of suits relating to its role as issuer and underwriter of RMBS (see section above ‘other securitisation and securities related litigation in the United States’). Those lawsuits are in their early stages and we are not able to predict the outcome of such proceedings or their effect on the Group. Citizens Financial Group (CFG) has not been an issuer or underwriter of non-agency RMBS. However, CFG is an originator and servicer of residential mortgages, and it routinely sells such mortgage loans in the secondary market and to GSEs. In the context of such sales, CFG makes certain representations and warranties regarding the characteristics of the underlying loans and, as a result, may be contractually required to repurchase such loans or indemnify certain parties against losses for certain breaches of the representations and warranties concerning the underlying loans. During the two-year period ended 31 December 2010, CFG has received approximately US$26 million in repurchase demands in respect of loans originated. However, repurchase demands presented to CFG are subject to challenge and, to date, CFG has rebutted a significant percentage of these claims. Although there has been disruption in the ability of certain financial institutions operating in the United States to complete foreclosure proceedings in respect of US mortgage loans in a timely manner (or at all) over the last year (including as a result of interventions by certain states and local governments), to date, CFG has not been materially impacted by such disruptions and the Group has not ceased making foreclosures. The Group cannot estimate what the future level of repurchase demands or ultimate exposure of GBM N.A. or CFG may be, and cannot give any assurance that the historical experience will continue in the future. Furthermore, the Group is unable estimate the extent to which the matters described above will impact it and future developments may have an adverse impact on the Group’s business, financial condition, results of operations, cash flow and the value of its securities.
RBS Group 2010372
Notes on the accounts continued
Other investigations In April 2009, the FSA notified RBS Group that it was commencing a supervisory review of the acquisition of ABN AMRO in 2007 and the 2008 capital raisings and an investigation into conduct, systems and controls within the Global Banking & Markets division of RBS Group. RBS Group and its subsidiaries co-operated fully with this review and investigation. On 2 December 2010, the FSA confirmed that it had completed its investigation and had concluded that no enforcement action, either against RBS Group or against individuals, was warranted. RBS Group is engaging constructively with the FSA with regard to the publication of a report by the FSA relating to the supervisory review, subject to any necessary commercial constraints. In July 2010, the FSA notified RBS Group that it was commencing an investigation into the sale by Coutts & Co of ALICO (American Life Insurance Company) Premier Access Bond Enhanced Variable Rate Fund to customers between 2001 and 2008 as well as its subsequent review of those sales. On 11 January 2011, the FSA amended the date range on which their investigation is focused and the investigation start date is now December 2003. RBS Group and its subsidiaries are co-operating fully with this investigation.
In the United States, RBS Group and certain subsidiaries have received requests for information from various governmental agencies, self-regulatory organisations, and state governmental agencies including in
connection with sub-prime mortgages and securitisations, collateralised debt obligations and synthetic products related to sub-prime mortgages. In particular, during March 2008, RBS Group was advised by the SEC that it had commenced a non-public, formal investigation relating to RBS Group’s United States sub-prime securities exposures and United States residential mortgage exposures. RBS Group and its subsidiaries are co-operating with these various requests for information and investigations. The Federal Reserve and state banking supervisors have been reviewing RBS Group’s US operations and RBS Group and its subsidiaries have been required to make improvements with respect to various matters, including enterprise-wide governance, Bank Secrecy Act and anti-money laundering compliance, risk management and asset quality. RBS Group is in the process of implementing measures for matters identified to date. RBS Group may become subject to formal and informal supervisory actions and may be required by its US banking supervisors to take further actions and implement additional remedial measures with respect to these and additional matters. Any limitations or conditions placed on RBS Group’s activities in the United States, as well as the terms of any supervisory action applicable to RBS Group and its subsidiaries, could have a material adverse effect on RBS Group’s business, results of operations and financial condition.
373RBS Group 2010
Financial statements
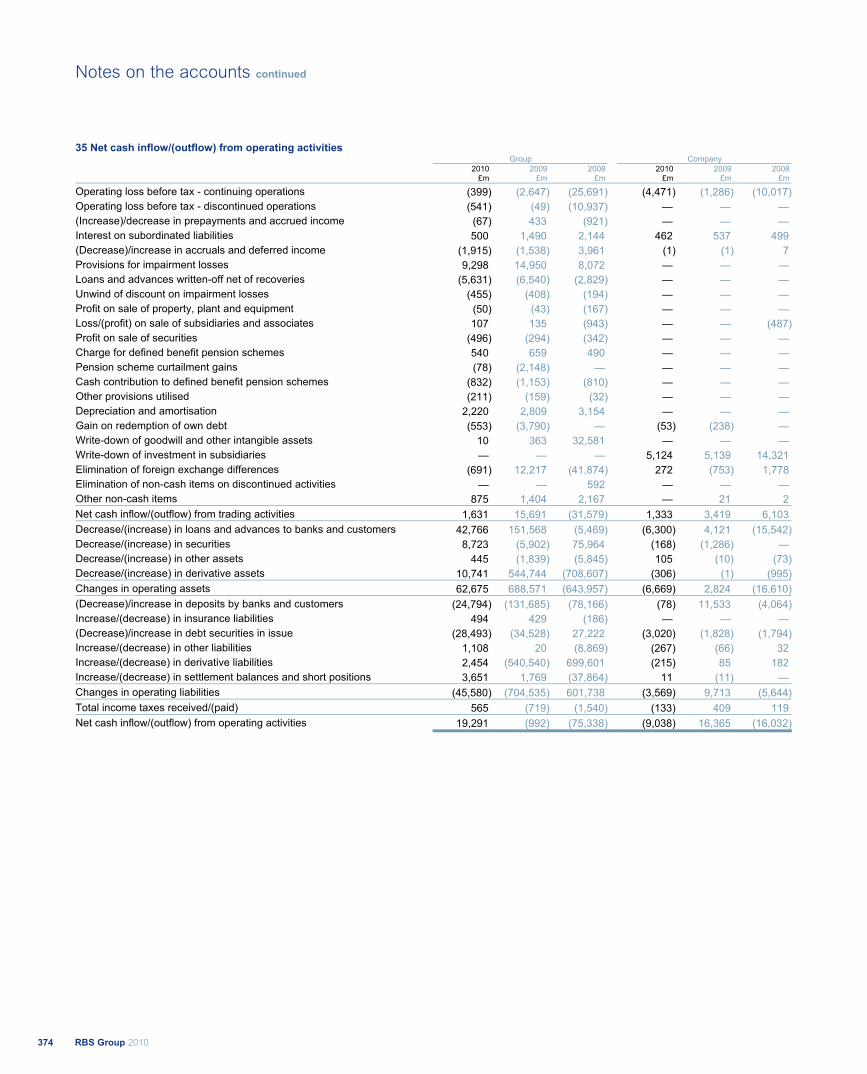
35 Net cash inflow/(outflow) from operating activities Group Company 2010 2009 2008 2010 2009 2008
£m £m £m £m £m £m
Operating loss before tax - continuing operations (399) (2,647) (25,691) (4,471) (1,286) (10,017)Operating loss before tax - discontinued operations (541) (49) (10,937) — — —(Increase)/decrease in prepayments and accrued income (67) 433 (921) — — —Interest on subordinated liabilities 500 1,490 2,144 462 537 499 (Decrease)/increase in accruals and deferred income (1,915) (1,538) 3,961 (1) (1) 7 Provisions for impairment losses 9,298 14,950 8,072 — — —Loans and advances written-off net of recoveries (5,631) (6,540) (2,829) — — —Unwind of discount on impairment losses (455) (408) (194) — — —Profit on sale of property, plant and equipment (50) (43) (167) — — —Loss/(profit) on sale of subsidiaries and associates 107 135 (943) — — (487)Profit on sale of securities (496) (294) (342) — — —Charge for defined benefit pension schemes 540 659 490 — — —Pension scheme curtailment gains (78) (2,148) — — — —Cash contribution to defined benefit pension schemes (832) (1,153) (810) — — —Other provisions utilised (211) (159) (32) — — —Depreciation and amortisation 2,220 2,809 3,154 — — —Gain on redemption of own debt (553) (3,790) — (53) (238) — Write-down of goodwill and other intangible assets 10 363 32,581 — — —Write-down of investment in subsidiaries — — — 5,124 5,139 14,321 Elimination of foreign exchange differences (691) 12,217 (41,874) 272 (753) 1,778 Elimination of non-cash items on discontinued activities — — 592 — — —Other non-cash items 875 1,404 2,167 — 21 2 Net cash inflow/(outflow) from trading activities 1,631 15,691 (31,579) 1,333 3,419 6,103 Decrease/(increase) in loans and advances to banks and customers 42,766 151,568 (5,469) (6,300) 4,121 (15,542)Decrease/(increase) in securities 8,723 (5,902) 75,964 (168) (1,286) — Decrease/(increase) in other assets 445 (1,839) (5,845) 105 (10) (73)Decrease/(increase) in derivative assets 10,741 544,744 (708,607) (306) (1) (995)Changes in operating assets 62,675 688,571 (643,957) (6,669) 2,824 (16,610)(Decrease)/increase in deposits by banks and customers (24,794) (131,685) (78,166) (78) 11,533 (4,064)Increase/(decrease) in insurance liabilities 494 429 (186) — — —(Decrease)/increase in debt securities in issue (28,493) (34,528) 27,222 (3,020) (1,828) (1,794)Increase/(decrease) in other liabilities 1,108 20 (8,869) (267) (66) 32 Increase/(decrease) in derivative liabilities 2,454 (540,540) 699,601 (215) 85 182 Increase/(decrease) in settlement balances and short positions 3,651 1,769 (37,864) 11 (11) — Changes in operating liabilities (45,580) (704,535) 601,738 (3,569) 9,713 (5,644)Total income taxes received/(paid) 565 (719) (1,540) (133) 409 119 Net cash inflow/(outflow) from operating activities 19,291 (992) (75,338) (9,038) 16,365 (16,032)
RBS Group 2010374
Notes on the accounts continued
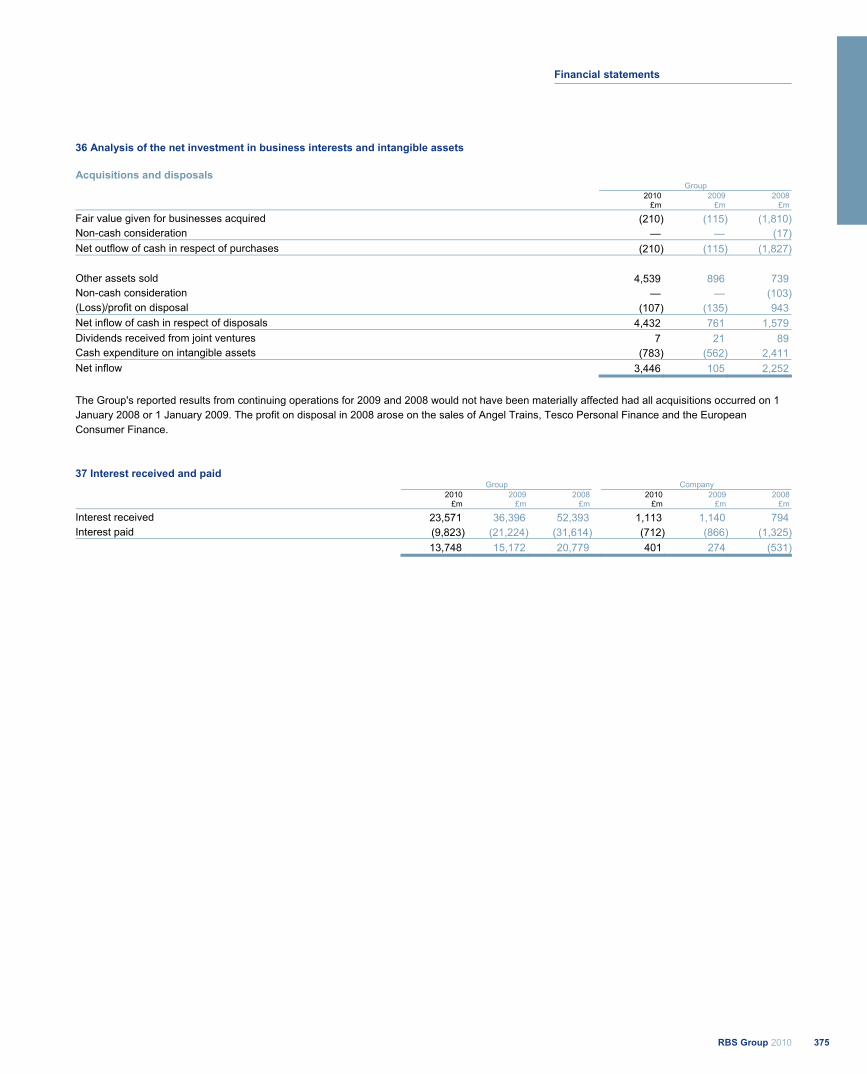
36 Analysis of the net investment in business interests and intangible assets Acquisitions and disposals Group
2010
£m2009
£m2008
£m
Fair value given for businesses acquired (210) (115) (1,810)Non-cash consideration — — (17)Net outflow of cash in respect of purchases (210) (115) (1,827)
Other assets sold 4,539 896 739 Non-cash consideration — — (103)(Loss)/profit on disposal (107) (135) 943 Net inflow of cash in respect of disposals 4,432 761 1,579 Dividends received from joint ventures 7 21 89 Cash expenditure on intangible assets (783) (562) 2,411 Net inflow 3,446 105 2,252
The Group's reported results from continuing operations for 2009 and 2008 would not have been materially affected had all acquisitions occurred on 1 January 2008 or 1 January 2009. The profit on disposal in 2008 arose on the sales of Angel Trains, Tesco Personal Finance and the European Consumer Finance.
37 Interest received and paid Group Company
2010
£m2009
£m2008
£m2010
£m2009
£m2008
£m
Interest received 23,571 36,396 52,393 1,113 1,140 794 Interest paid (9,823) (21,224) (31,614) (712) (866) (1,325) 13,748 15,172 20,779 401 274 (531)
375RBS Group 2010
Financial statements
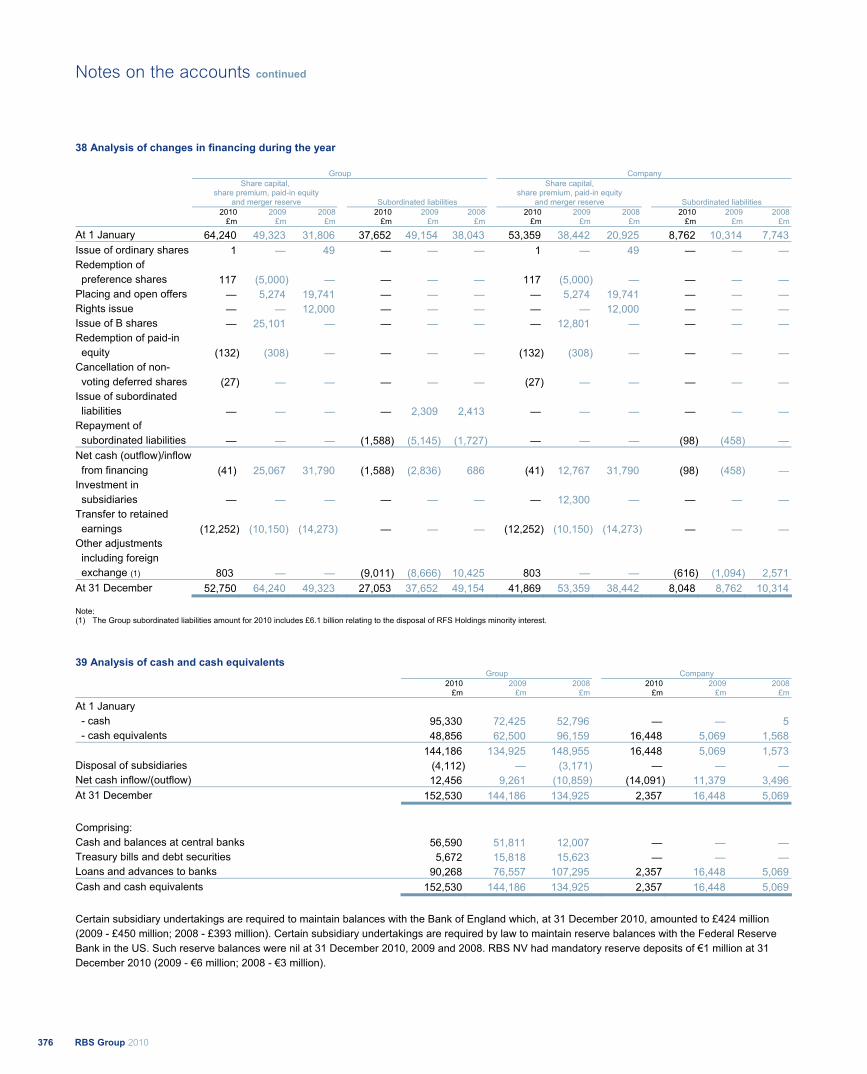
38 Analysis of changes in financing during the year
Group Company
Share capital, share premium, paid-in equity
and merger reserve Subordinated liabilities
Share capital, share premium, paid-in equity
and merger reserve Subordinated liabilities 2010
£m 2009
£m 2008
£m 2010
£m 2009
£m2008
£m 2010
£m 2009
£m 2008
£m 2010
£m 2009
£m 2008
£m
At 1 January 64,240 49,323 31,806 37,652 49,154 38,043 53,359 38,442 20,925 8,762 10,314 7,743 Issue of ordinary shares 1 — 49 — — — 1 — 49 — — —Redemption of preference shares 117 (5,000) — — — — 117 (5,000) — — — —Placing and open offers — 5,274 19,741 — — — — 5,274 19,741 — — —Rights issue — — 12,000 — — — — — 12,000 — — —Issue of B shares — 25,101 — — — — — 12,801 — — — —Redemption of paid-in equity (132) (308) — — — — (132) (308) — — — —Cancellation of non- voting deferred shares (27) — — — — — (27) — — — — —Issue of subordinated liabilities — — — — 2,309 2,413 — — — — — —Repayment of subordinated liabilities — — — (1,588) (5,145) (1,727) — — — (98) (458) — Net cash (outflow)/inflow from financing (41) 25,067 31,790 (1,588) (2,836) 686 (41) 12,767 31,790 (98) (458) — Investment in subsidiaries — — — — — — — 12,300 — — — —Transfer to retained earnings (12,252) (10,150) (14,273) — — — (12,252) (10,150) (14,273) — — —Other adjustments including foreign exchange (1) 803 — — (9,011) (8,666) 10,425 803 — — (616) (1,094) 2,571 At 31 December 52,750 64,240 49,323 27,053 37,652 49,154 41,869 53,359 38,442 8,048 8,762 10,314
Note: (1) The Group subordinated liabilities amount for 2010 includes £6.1 billion relating to the disposal of RFS Holdings minority interest.
39 Analysis of cash and cash equivalents Group Company
2010
£m2009
£m 2008
£m 2010
£m 2009
£m 2008
£m
At 1 January - cash 95,330 72,425 52,796 — — 5- cash equivalents 48,856 62,500 96,159 16,448 5,069 1,568
144,186 134,925 148,955 16,448 5,069 1,573 Disposal of subsidiaries (4,112) — (3,171) — — —Net cash inflow/(outflow) 12,456 9,261 (10,859) (14,091) 11,379 3,496 At 31 December 152,530 144,186 134,925 2,357 16,448 5,069
Comprising: Cash and balances at central banks 56,590 51,811 12,007 — — —Treasury bills and debt securities 5,672 15,818 15,623 — — —Loans and advances to banks 90,268 76,557 107,295 2,357 16,448 5,069 Cash and cash equivalents 152,530 144,186 134,925 2,357 16,448 5,069
Certain subsidiary undertakings are required to maintain balances with the Bank of England which, at 31 December 2010, amounted to £424 million (2009 - £450 million; 2008 - £393 million). Certain subsidiary undertakings are required by law to maintain reserve balances with the Federal Reserve Bank in the US. Such reserve balances were nil at 31 December 2010, 2009 and 2008. RBS NV had mandatory reserve deposits of €1 million at 31 December 2010 (2009 - €6 million; 2008 - €3 million).
RBS Group 2010376
Notes on the accounts continued
40 Segmental analysis (a) Divisions The directors manage the Group primarily by class of business and present the segmental analysis on that basis. This includes the review of net interest income for each class of business - interest receivable and payable for all reportable segments is therefore presented net. Segments charge market prices for services rendered to other parts of the Group; funding charges between segments are determined by Group Treasury, having regard to commercial demands. The segment measure is operating profit/(loss) before tax, which differs from that reported previously in that it excludes fair value of own debt. Comparative data have been restated accordingly. The Group's reportable segments are on a divisional basis as follows: UK Retail offers a comprehensive range of banking products and related financial services to the personal market. It serves customers through the RBS and NatWest networks of branches and ATMs in the United Kingdom, and also through telephone and internet channels. UK Corporate is a leading provider of banking, finance, and risk management services to the corporate and SME sector in the United Kingdom. It offers a full range of banking products and related financial services through a nationwide network of relationship managers, and also through telephone and internet channels. The product range includes asset finance through the Lombard brand. Wealth provides private banking and investment services in the UK through Coutts & Co and Adam & Company; offshore banking through RBS International, NatWest Offshore and Isle of Man Bank; and international private banking through RBS Coutts. Global Transaction Services (GTS) ranks among the top five global transaction services providers, offering global payments, cash and liquidity management, and trade finance and commercial card products and services. It includes the Group's corporate money transmission activities in the United Kingdom and the United States. Ulster Bank is the leading retail and business bank in Northern Ireland and the third largest banking group on the island of Ireland. It provides a comprehensive range of financial services. The Retail Markets division which has a network of 236 branches, operates in the personal and financial planning sectors. The Corporate Markets division provides services to SME business customers, corporates and institutional markets.
US Retail & Commercial provides financial services primarily through the Citizens and Charter One brands. US Retail & Commercial is engaged in retail and corporate banking activities through its branch network in 12 states in the United States and through non-branch offices in other states. Global Banking & Markets (GBM) is a leading banking partner to major corporations and financial institutions around the world, providing an extensive range of debt and equity financing, risk management and investment services to its customers. The division is organised along six principal business lines: money markets; rates flow trading; currencies and commodities; equities; credit and mortgage markets and portfolio management and origination. RBS Insurance provides a wide range of general insurance products to consumers through a number of well known brands including; Direct Line, Churchill and Privilege. It also provides insurance services for third party brands through its UKI Partnerships division. In the commercial sector, its NIG and Direct Line for Business operations provide insurance products for businesses via brokers or direct respectively. Through its international division, RBS Insurance sells general insurance, mainly motor, in Germany and Italy. In addition to insurance services, RBS Insurance continues to provide support and reassurance to millions of UK motorists through its Green Flag breakdown recovery service and Tracker stolen vehicle recovery and telematics business. Central items comprises Group and corporate functions, such as treasury, funding and finance, risk management, legal, communications and human resources. The Centre manages the Group's capital resources and Group-wide regulatory projects and provides services to the operating divisions.
Non-Core Division manages separately assets that the Group intends to run off or dispose of. The division contains a range of businesses and asset portfolios primarily from the GBM division, linked to proprietary trading, higher risk profile asset portfolios including excess risk concentrations, and other illiquid portfolios. It also includes a number of other portfolios and businesses, including regional markets businesses, that the Group has concluded are no longer strategic.
377RBS Group 2010
Financial statements
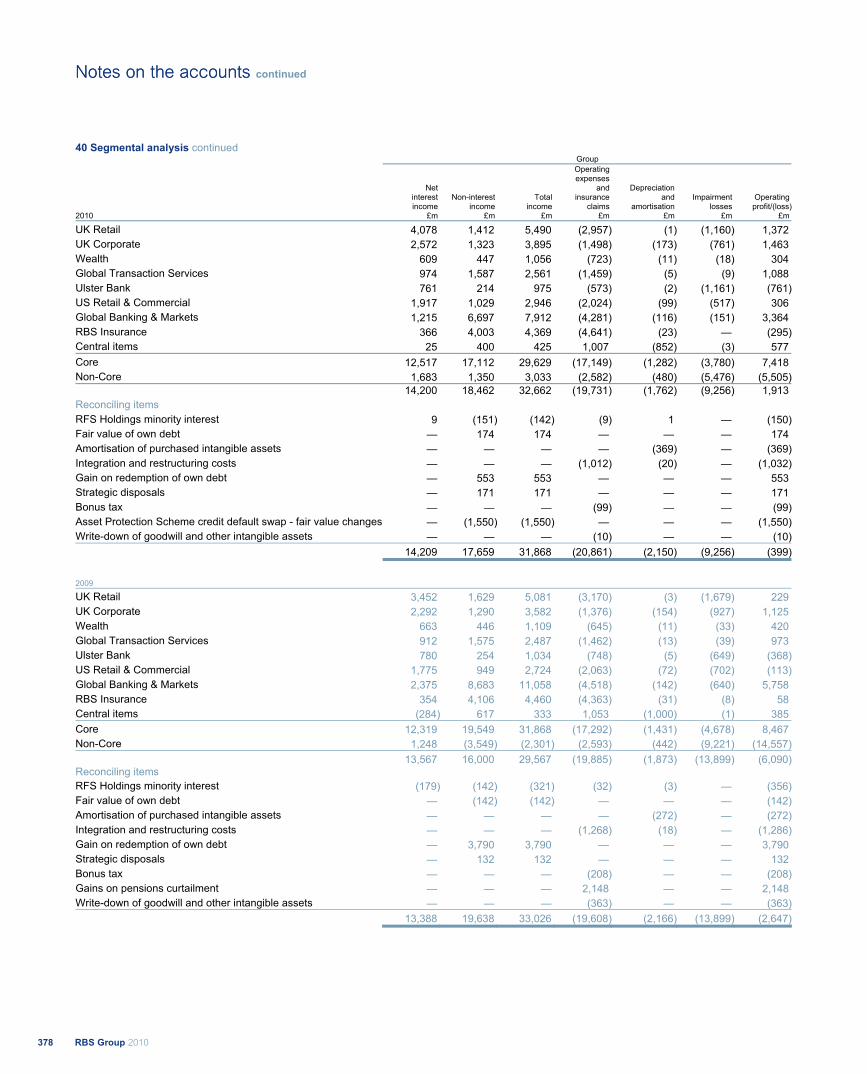
40 Segmental analysis continued Group
Net interest income
Non-interest income
Total income
Operating expenses
and insurance
claims
Depreciation and
amortisation Impairment
lossesOperating profit/(loss)
2010 £m £m £m £m £m £m £m
UK Retail 4,078 1,412 5,490 (2,957) (1) (1,160) 1,372 UK Corporate 2,572 1,323 3,895 (1,498) (173) (761) 1,463 Wealth 609 447 1,056 (723) (11) (18) 304 Global Transaction Services 974 1,587 2,561 (1,459) (5) (9) 1,088 Ulster Bank 761 214 975 (573) (2) (1,161) (761)US Retail & Commercial 1,917 1,029 2,946 (2,024) (99) (517) 306 Global Banking & Markets 1,215 6,697 7,912 (4,281) (116) (151) 3,364 RBS Insurance 366 4,003 4,369 (4,641) (23) — (295)Central items 25 400 425 1,007 (852) (3) 577 Core 12,517 17,112 29,629 (17,149) (1,282) (3,780) 7,418 Non-Core 1,683 1,350 3,033 (2,582) (480) (5,476) (5,505) 14,200 18,462 32,662 (19,731) (1,762) (9,256) 1,913 Reconciling items RFS Holdings minority interest 9 (151) (142) (9) 1 — (150)Fair value of own debt — 174 174 — — — 174 Amortisation of purchased intangible assets — — — — (369) — (369)Integration and restructuring costs — — — (1,012) (20) — (1,032)Gain on redemption of own debt — 553 553 — — — 553 Strategic disposals — 171 171 — — — 171 Bonus tax — — — (99) — — (99)Asset Protection Scheme credit default swap - fair value changes — (1,550) (1,550) — — — (1,550)Write-down of goodwill and other intangible assets — — — (10) — — (10) 14,209 17,659 31,868 (20,861) (2,150) (9,256) (399)
2009
UK Retail 3,452 1,629 5,081 (3,170) (3) (1,679) 229 UK Corporate 2,292 1,290 3,582 (1,376) (154) (927) 1,125 Wealth 663 446 1,109 (645) (11) (33) 420 Global Transaction Services 912 1,575 2,487 (1,462) (13) (39) 973 Ulster Bank 780 254 1,034 (748) (5) (649) (368)US Retail & Commercial 1,775 949 2,724 (2,063) (72) (702) (113)Global Banking & Markets 2,375 8,683 11,058 (4,518) (142) (640) 5,758 RBS Insurance 354 4,106 4,460 (4,363) (31) (8) 58 Central items (284) 617 333 1,053 (1,000) (1) 385 Core 12,319 19,549 31,868 (17,292) (1,431) (4,678) 8,467 Non-Core 1,248 (3,549) (2,301) (2,593) (442) (9,221) (14,557) 13,567 16,000 29,567 (19,885) (1,873) (13,899) (6,090)Reconciling items RFS Holdings minority interest (179) (142) (321) (32) (3) — (356)Fair value of own debt — (142) (142) — — — (142)Amortisation of purchased intangible assets — — — — (272) — (272)Integration and restructuring costs — — — (1,268) (18) — (1,286)Gain on redemption of own debt — 3,790 3,790 — — — 3,790 Strategic disposals — 132 132 — — — 132 Bonus tax — — — (208) — — (208)Gains on pensions curtailment — — — 2,148 — — 2,148 Write-down of goodwill and other intangible assets — — — (363) — — (363) 13,388 19,638 33,026 (19,608) (2,166) (13,899) (2,647)
RBS Group 2010378
Notes on the accounts continuedNotes on the accounts
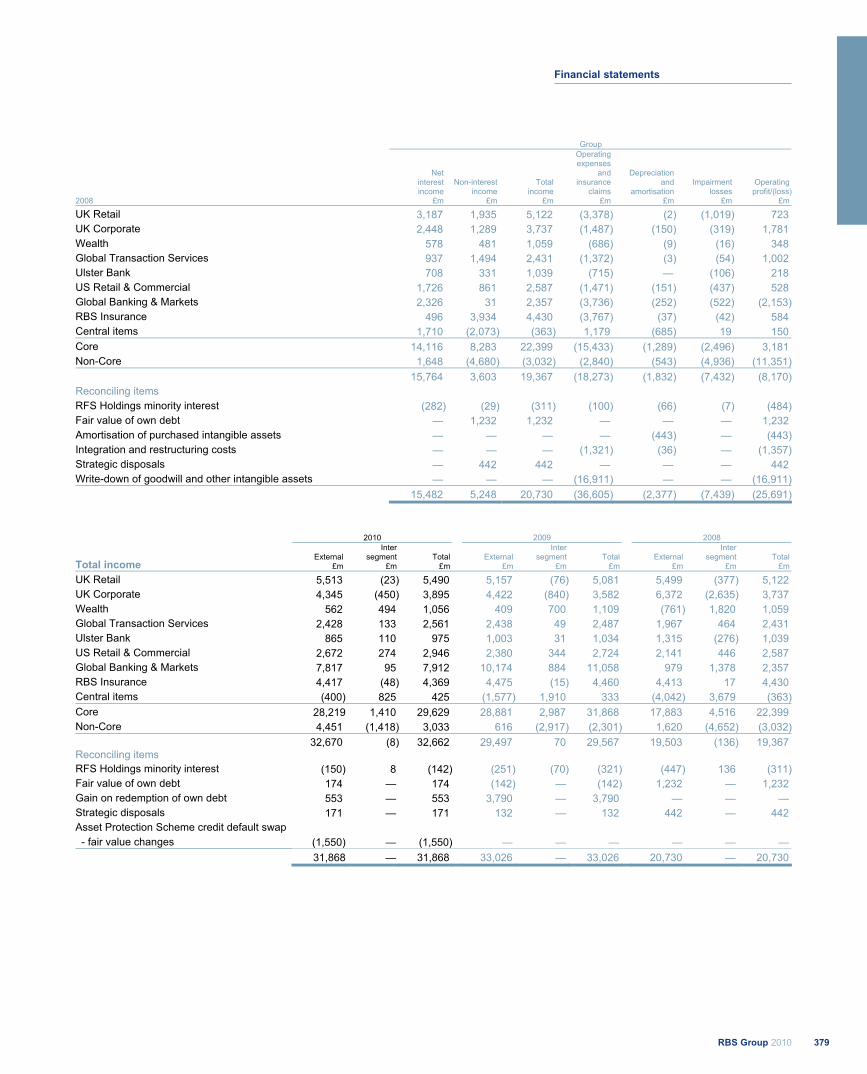
Group
2008
Net interest income
£m
Non-interest income
£m
Total income
£m
Operating expenses
and insurance
claims £m
Depreciation and
amortisation £m
Impairment losses
£m
Operating profit/(loss)
£m
UK Retail 3,187 1,935 5,122 (3,378) (2) (1,019) 723 UK Corporate 2,448 1,289 3,737 (1,487) (150) (319) 1,781 Wealth 578 481 1,059 (686) (9) (16) 348 Global Transaction Services 937 1,494 2,431 (1,372) (3) (54) 1,002 Ulster Bank 708 331 1,039 (715) — (106) 218 US Retail & Commercial 1,726 861 2,587 (1,471) (151) (437) 528 Global Banking & Markets 2,326 31 2,357 (3,736) (252) (522) (2,153)RBS Insurance 496 3,934 4,430 (3,767) (37) (42) 584 Central items 1,710 (2,073) (363) 1,179 (685) 19 150 Core 14,116 8,283 22,399 (15,433) (1,289) (2,496) 3,181 Non-Core 1,648 (4,680) (3,032) (2,840) (543) (4,936) (11,351) 15,764 3,603 19,367 (18,273) (1,832) (7,432) (8,170)Reconciling items RFS Holdings minority interest (282) (29) (311) (100) (66) (7) (484)Fair value of own debt — 1,232 1,232 — — — 1,232 Amortisation of purchased intangible assets — — — — (443) — (443)Integration and restructuring costs — — — (1,321) (36) — (1,357)Strategic disposals — 442 442 — — — 442 Write-down of goodwill and other intangible assets — — — (16,911) — — (16,911) 15,482 5,248 20,730 (36,605) (2,377) (7,439) (25,691)
2010 2009 2008
Total income External
£m
Inter segment
£m Total
£m External
£m
Intersegment
£mTotal
£m External
£m
Intersegment
£mTotal
£m
UK Retail 5,513 (23) 5,490 5,157 (76) 5,081 5,499 (377) 5,122 UK Corporate 4,345 (450) 3,895 4,422 (840) 3,582 6,372 (2,635) 3,737 Wealth 562 494 1,056 409 700 1,109 (761) 1,820 1,059 Global Transaction Services 2,428 133 2,561 2,438 49 2,487 1,967 464 2,431 Ulster Bank 865 110 975 1,003 31 1,034 1,315 (276) 1,039 US Retail & Commercial 2,672 274 2,946 2,380 344 2,724 2,141 446 2,587 Global Banking & Markets 7,817 95 7,912 10,174 884 11,058 979 1,378 2,357 RBS Insurance 4,417 (48) 4,369 4,475 (15) 4,460 4,413 17 4,430 Central items (400) 825 425 (1,577) 1,910 333 (4,042) 3,679 (363)Core 28,219 1,410 29,629 28,881 2,987 31,868 17,883 4,516 22,399 Non-Core 4,451 (1,418) 3,033 616 (2,917) (2,301) 1,620 (4,652) (3,032) 32,670 (8) 32,662 29,497 70 29,567 19,503 (136) 19,367 Reconciling items RFS Holdings minority interest (150) 8 (142) (251) (70) (321) (447) 136 (311)Fair value of own debt 174 — 174 (142) — (142) 1,232 — 1,232 Gain on redemption of own debt 553 — 553 3,790 — 3,790 — — — Strategic disposals 171 — 171 132 — 132 442 — 442 Asset Protection Scheme credit default swap - fair value changes (1,550) — (1,550) — — — — — — 31,868 — 31,868 33,026 — 33,026 20,730 — 20,730
379RBS Group 2010
Financial statements
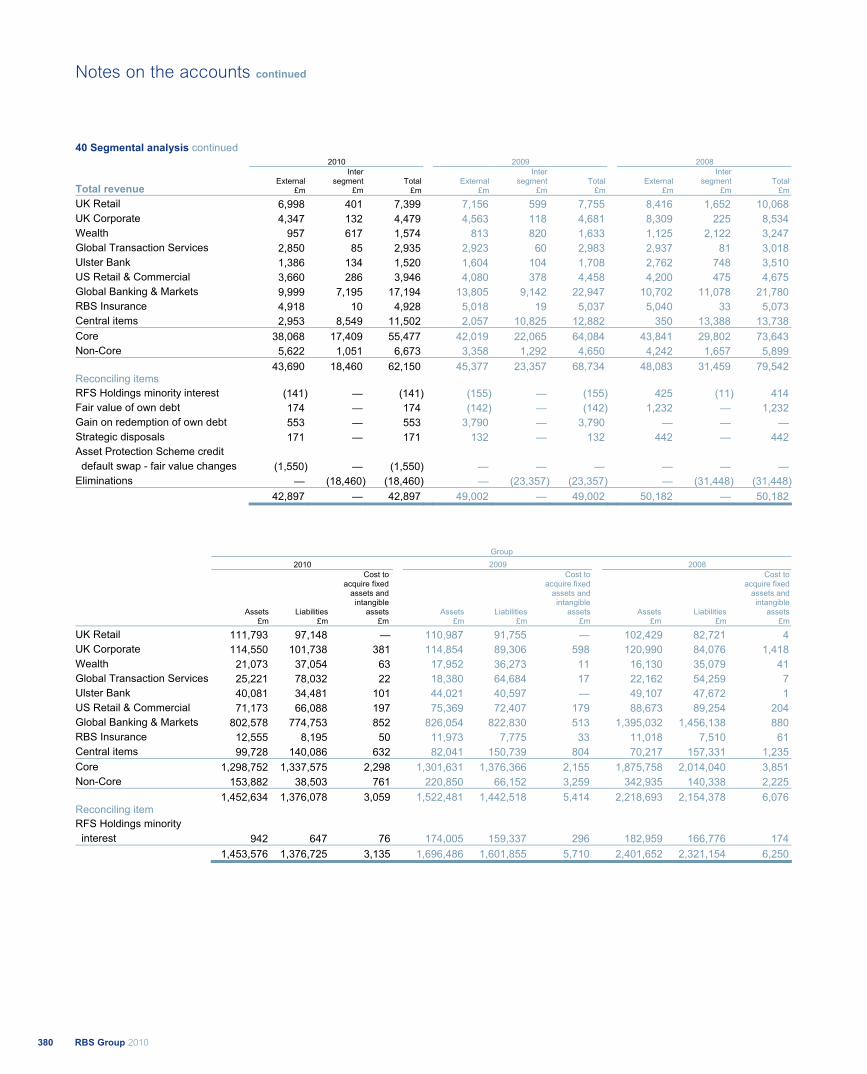
40 Segmental analysis continued 2010 2009 2008
Total revenue External
£m
Inter segment
£mTotal
£m External
£m
Inter segment
£mTotal
£m External
£m
Inter segment
£mTotal
£m
UK Retail 6,998 401 7,399 7,156 599 7,755 8,416 1,652 10,068 UK Corporate 4,347 132 4,479 4,563 118 4,681 8,309 225 8,534 Wealth 957 617 1,574 813 820 1,633 1,125 2,122 3,247 Global Transaction Services 2,850 85 2,935 2,923 60 2,983 2,937 81 3,018 Ulster Bank 1,386 134 1,520 1,604 104 1,708 2,762 748 3,510 US Retail & Commercial 3,660 286 3,946 4,080 378 4,458 4,200 475 4,675 Global Banking & Markets 9,999 7,195 17,194 13,805 9,142 22,947 10,702 11,078 21,780 RBS Insurance 4,918 10 4,928 5,018 19 5,037 5,040 33 5,073 Central items 2,953 8,549 11,502 2,057 10,825 12,882 350 13,388 13,738 Core 38,068 17,409 55,477 42,019 22,065 64,084 43,841 29,802 73,643 Non-Core 5,622 1,051 6,673 3,358 1,292 4,650 4,242 1,657 5,899 43,690 18,460 62,150 45,377 23,357 68,734 48,083 31,459 79,542 Reconciling items RFS Holdings minority interest (141) — (141) (155) — (155) 425 (11) 414 Fair value of own debt 174 — 174 (142) — (142) 1,232 — 1,232 Gain on redemption of own debt 553 — 553 3,790 — 3,790 — — — Strategic disposals 171 — 171 132 — 132 442 — 442 Asset Protection Scheme credit default swap - fair value changes (1,550) — (1,550) — — — — — —Eliminations — (18,460) (18,460) — (23,357) (23,357) — (31,448) (31,448) 42,897 — 42,897 49,002 — 49,002 50,182 — 50,182
Group 2010 2009 2008
Assets £m
Liabilities £m
Cost to acquire fixed
assets and intangible
assets £m
Assets £m
Liabilities £m
Cost to acquire fixed
assets and intangible
assets £m
Assets £m
Liabilities £m
Cost to acquire fixed
assets and intangible
assets £m
UK Retail 111,793 97,148 — 110,987 91,755 — 102,429 82,721 4 UK Corporate 114,550 101,738 381 114,854 89,306 598 120,990 84,076 1,418 Wealth 21,073 37,054 63 17,952 36,273 11 16,130 35,079 41 Global Transaction Services 25,221 78,032 22 18,380 64,684 17 22,162 54,259 7 Ulster Bank 40,081 34,481 101 44,021 40,597 — 49,107 47,672 1 US Retail & Commercial 71,173 66,088 197 75,369 72,407 179 88,673 89,254 204 Global Banking & Markets 802,578 774,753 852 826,054 822,830 513 1,395,032 1,456,138 880 RBS Insurance 12,555 8,195 50 11,973 7,775 33 11,018 7,510 61 Central items 99,728 140,086 632 82,041 150,739 804 70,217 157,331 1,235 Core 1,298,752 1,337,575 2,298 1,301,631 1,376,366 2,155 1,875,758 2,014,040 3,851 Non-Core 153,882 38,503 761 220,850 66,152 3,259 342,935 140,338 2,225 1,452,634 1,376,078 3,059 1,522,481 1,442,518 5,414 2,218,693 2,154,378 6,076 Reconciling item RFS Holdings minority interest 942 647 76 174,005 159,337 296 182,959 166,776 174 1,453,576 1,376,725 3,135 1,696,486 1,601,855 5,710 2,401,652 2,321,154 6,250
RBS Group 2010380
Notes on the accounts continued
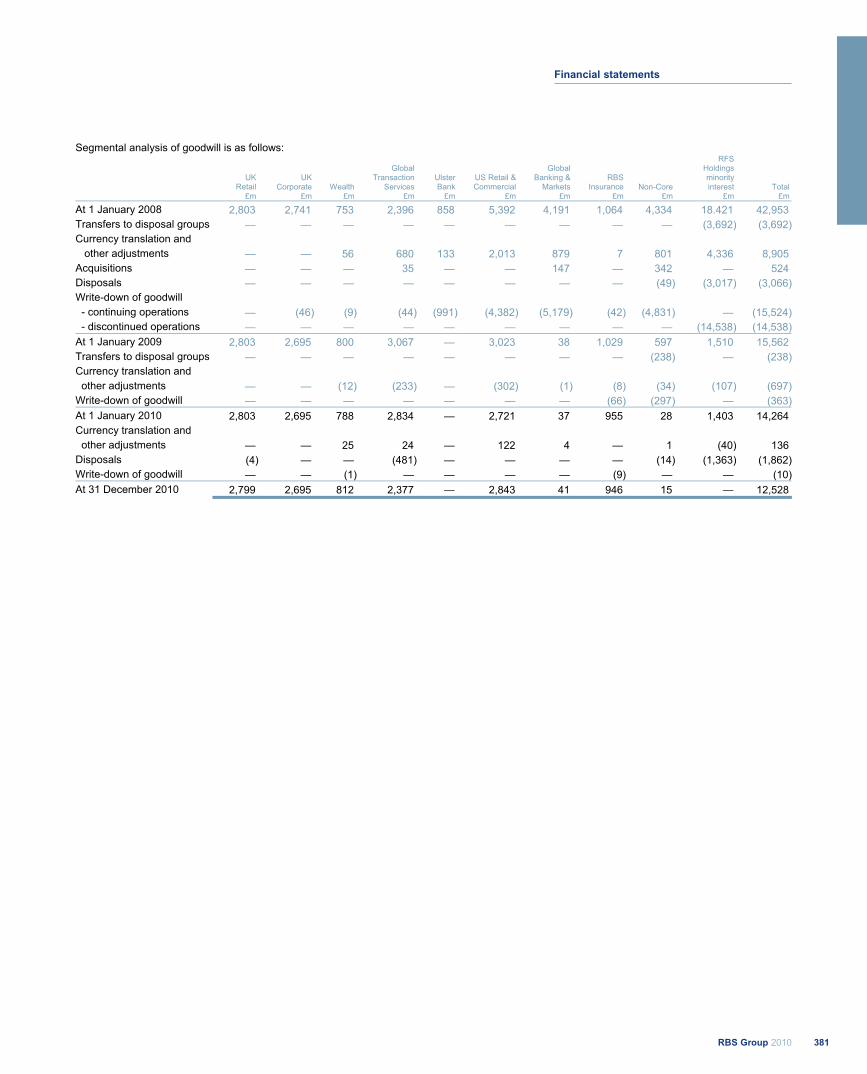
Segmental analysis of goodwill is as follows:
UK
Retail UK
Corporate Wealth
Global Transaction
Services UlsterBank
US Retail & Commercial
Global Banking &
Markets RBS
Insurance Non-Core
RFS Holdings minority interest Total
£m £m £m £m £m £m £m £m £m £m £m
At 1 January 2008 2,803 2,741 753 2,396 858 5,392 4,191 1,064 4,334 18.421 42,953 Transfers to disposal groups — — — — — — — — — (3,692) (3,692)Currency translation and other adjustments — — 56 680 133 2,013 879 7 801 4,336 8,905 Acquisitions — — — 35 — — 147 — 342 — 524 Disposals — — — — — — — — (49) (3,017) (3,066)Write-down of goodwill
- continuing operations — (46) (9) (44) (991) (4,382) (5,179) (42) (4,831) — (15,524) - discontinued operations — — — — — — — — — (14,538) (14,538)At 1 January 2009 2,803 2,695 800 3,067 — 3,023 38 1,029 597 1,510 15,562 Transfers to disposal groups — — — — — — — — (238) — (238)Currency translation and other adjustments — — (12) (233) — (302) (1) (8) (34) (107) (697)Write-down of goodwill — — — — — — — (66) (297) — (363)At 1 January 2010 2,803 2,695 788 2,834 — 2,721 37 955 28 1,403 14,264 Currency translation and other adjustments — — 25 24 — 122 4 — 1 (40) 136 Disposals (4) — — (481) — — — — (14) (1,363) (1,862)Write-down of goodwill — — (1) — — — — (9) — — (10)At 31 December 2010 2,799 2,695 812 2,377 — 2,843 41 946 15 — 12,528
381RBS Group 2010
Financial statements
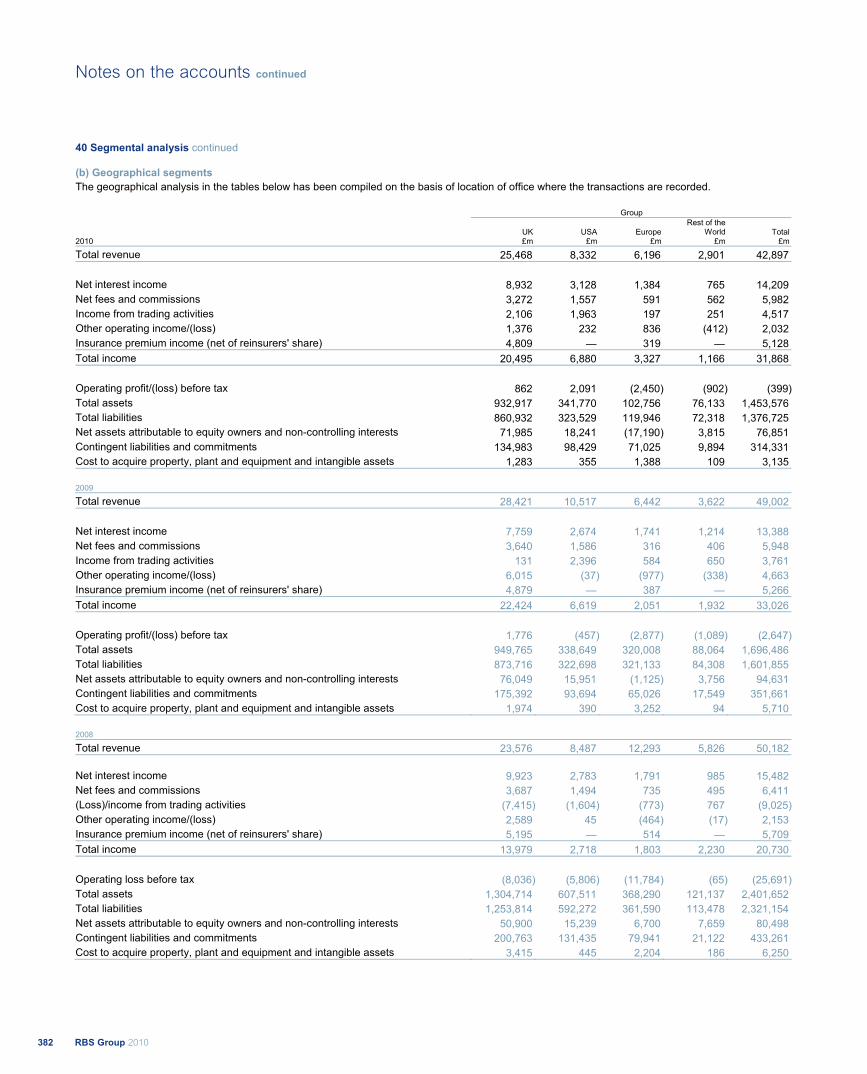
40 Segmental analysis continued (b) Geographical segments The geographical analysis in the tables below has been compiled on the basis of location of office where the transactions are recorded.
Group
2010 UK £m
USA £m
Europe £m
Rest of the World
£mTotal
£m
Total revenue 25,468 8,332 6,196 2,901 42,897
Net interest income 8,932 3,128 1,384 765 14,209 Net fees and commissions 3,272 1,557 591 562 5,982 Income from trading activities 2,106 1,963 197 251 4,517 Other operating income/(loss) 1,376 232 836 (412) 2,032 Insurance premium income (net of reinsurers' share) 4,809 — 319 — 5,128 Total income 20,495 6,880 3,327 1,166 31,868
Operating profit/(loss) before tax 862 2,091 (2,450) (902) (399)Total assets 932,917 341,770 102,756 76,133 1,453,576 Total liabilities 860,932 323,529 119,946 72,318 1,376,725 Net assets attributable to equity owners and non-controlling interests 71,985 18,241 (17,190) 3,815 76,851 Contingent liabilities and commitments 134,983 98,429 71,025 9,894 314,331 Cost to acquire property, plant and equipment and intangible assets 1,283 355 1,388 109 3,135 2009
Total revenue 28,421 10,517 6,442 3,622 49,002
Net interest income 7,759 2,674 1,741 1,214 13,388 Net fees and commissions 3,640 1,586 316 406 5,948 Income from trading activities 131 2,396 584 650 3,761 Other operating income/(loss) 6,015 (37) (977) (338) 4,663 Insurance premium income (net of reinsurers' share) 4,879 — 387 — 5,266 Total income 22,424 6,619 2,051 1,932 33,026
Operating profit/(loss) before tax 1,776 (457) (2,877) (1,089) (2,647)Total assets 949,765 338,649 320,008 88,064 1,696,486 Total liabilities 873,716 322,698 321,133 84,308 1,601,855 Net assets attributable to equity owners and non-controlling interests 76,049 15,951 (1,125) 3,756 94,631 Contingent liabilities and commitments 175,392 93,694 65,026 17,549 351,661 Cost to acquire property, plant and equipment and intangible assets 1,974 390 3,252 94 5,710
2008
Total revenue 23,576 8,487 12,293 5,826 50,182
Net interest income 9,923 2,783 1,791 985 15,482 Net fees and commissions 3,687 1,494 735 495 6,411 (Loss)/income from trading activities (7,415) (1,604) (773) 767 (9,025)Other operating income/(loss) 2,589 45 (464) (17) 2,153 Insurance premium income (net of reinsurers' share) 5,195 — 514 — 5,709 Total income 13,979 2,718 1,803 2,230 20,730
Operating loss before tax (8,036) (5,806) (11,784) (65) (25,691)Total assets 1,304,714 607,511 368,290 121,137 2,401,652 Total liabilities 1,253,814 592,272 361,590 113,478 2,321,154 Net assets attributable to equity owners and non-controlling interests 50,900 15,239 6,700 7,659 80,498 Contingent liabilities and commitments 200,763 131,435 79,941 21,122 433,261 Cost to acquire property, plant and equipment and intangible assets 3,415 445 2,204 186 6,250
RBS Group 2010382
Notes on the accounts continued
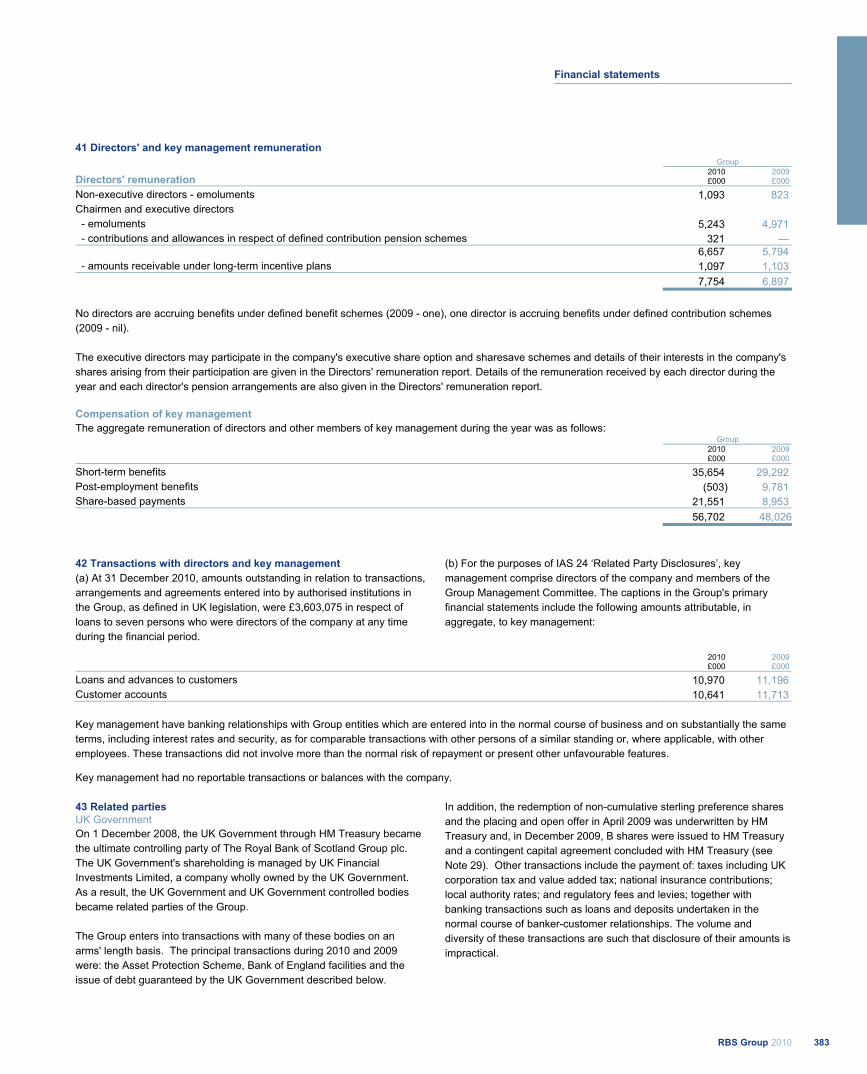
41 Directors' and key management remuneration Group
Directors' remuneration 2010 £000
2009 £000
Non-executive directors - emoluments 1,093 823 Chairmen and executive directors - emoluments 5,243 4,971 - contributions and allowances in respect of defined contribution pension schemes 321 —
6,657 5,794 - amounts receivable under long-term incentive plans 1,097 1,103
7,754 6,897
No directors are accruing benefits under defined benefit schemes (2009 - one), one director is accruing benefits under defined contribution schemes (2009 - nil). The executive directors may participate in the company's executive share option and sharesave schemes and details of their interests in the company's shares arising from their participation are given in the Directors' remuneration report. Details of the remuneration received by each director during the year and each director's pension arrangements are also given in the Directors' remuneration report. Compensation of key management The aggregate remuneration of directors and other members of key management during the year was as follows: Group
2010 £000
2009 £000
Short-term benefits 35,654 29,292 Post-employment benefits (503) 9,781 Share-based payments 21,551 8,953 56,702 48,026
42 Transactions with directors and key management (a) At 31 December 2010, amounts outstanding in relation to transactions, arrangements and agreements entered into by authorised institutions in the Group, as defined in UK legislation, were £3,603,075 in respect of loans to seven persons who were directors of the company at any time during the financial period.
(b) For the purposes of IAS 24 ‘Related Party Disclosures’, key management comprise directors of the company and members of the Group Management Committee. The captions in the Group's primary financial statements include the following amounts attributable, in aggregate, to key management:
2010 £000
2009 £000
Loans and advances to customers 10,970 11,196 Customer accounts 10,641 11,713
Key management have banking relationships with Group entities which are entered into in the normal course of business and on substantially the same terms, including interest rates and security, as for comparable transactions with other persons of a similar standing or, where applicable, with other employees. These transactions did not involve more than the normal risk of repayment or present other unfavourable features.
Key management had no reportable transactions or balances with the company. 43 Related parties UK Government On 1 December 2008, the UK Government through HM Treasury became the ultimate controlling party of The Royal Bank of Scotland Group plc. The UK Government's shareholding is managed by UK Financial Investments Limited, a company wholly owned by the UK Government. As a result, the UK Government and UK Government controlled bodies became related parties of the Group. The Group enters into transactions with many of these bodies on an arms' length basis. The principal transactions during 2010 and 2009 were: the Asset Protection Scheme, Bank of England facilities and the issue of debt guaranteed by the UK Government described below.
In addition, the redemption of non-cumulative sterling preference shares and the placing and open offer in April 2009 was underwritten by HM Treasury and, in December 2009, B shares were issued to HM Treasury and a contingent capital agreement concluded with HM Treasury (see Note 29). Other transactions include the payment of: taxes including UK corporation tax and value added tax; national insurance contributions; local authority rates; and regulatory fees and levies; together with banking transactions such as loans and deposits undertaken in the normal course of banker-customer relationships. The volume and diversity of these transactions are such that disclosure of their amounts is impractical.
383RBS Group 2010
Financial statements
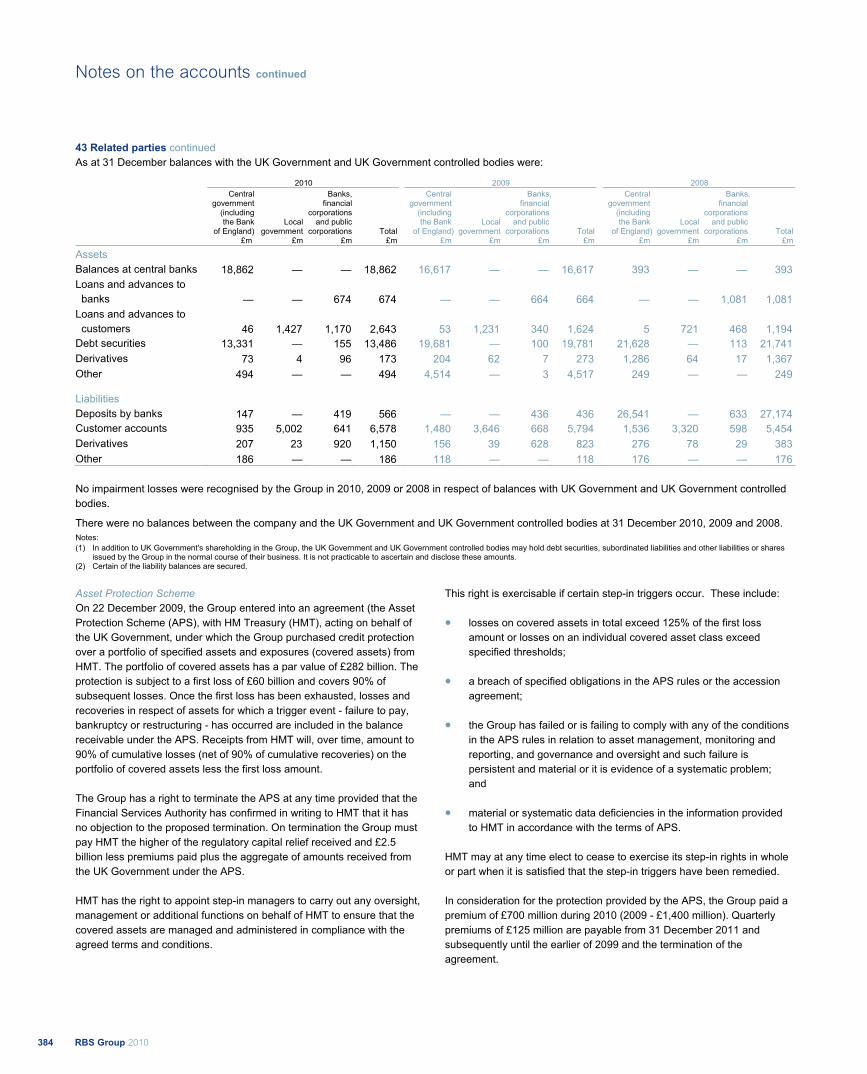
43 Related parties continued As at 31 December balances with the UK Government and UK Government controlled bodies were:
2010 2009 2008
Central government
(including the Bank
of England) Local
government
Banks, financial
corporations and public
corporations
Total
Central government
(including the Bank
of England)Local
government
Banks, financial
corporations and public
corporations Total
Central government
(including the Bank
of England)Local
government
Banks, financial
corporations and public
corporations Total£m £m £m £m £m £m £m £m £m £m £m £m
Assets Balances at central banks 18,862 — — 18,862 16,617 — — 16,617 393 — — 393Loans and advances to banks — — 674 674 — — 664 664 — — 1,081 1,081Loans and advances to customers 46 1,427 1,170 2,643 53 1,231 340 1,624 5 721 468 1,194Debt securities 13,331 — 155 13,486 19,681 — 100 19,781 21,628 — 113 21,741Derivatives 73 4 96 173 204 62 7 273 1,286 64 17 1,367Other 494 — — 494 4,514 — 3 4,517 249 — — 249
Liabilities Deposits by banks 147 — 419 566 — — 436 436 26,541 — 633 27,174Customer accounts 935 5,002 641 6,578 1,480 3,646 668 5,794 1,536 3,320 598 5,454Derivatives 207 23 920 1,150 156 39 628 823 276 78 29 383Other 186 — — 186 118 — — 118 176 — — 176
No impairment losses were recognised by the Group in 2010, 2009 or 2008 in respect of balances with UK Government and UK Government controlled bodies. There were no balances between the company and the UK Government and UK Government controlled bodies at 31 December 2010, 2009 and 2008. Notes: (1) In addition to UK Government's shareholding in the Group, the UK Government and UK Government controlled bodies may hold debt securities, subordinated liabilities and other liabilities or shares
issued by the Group in the normal course of their business. It is not practicable to ascertain and disclose these amounts. (2) Certain of the liability balances are secured.
Asset Protection Scheme On 22 December 2009, the Group entered into an agreement (the Asset Protection Scheme (APS), with HM Treasury (HMT), acting on behalf of the UK Government, under which the Group purchased credit protection over a portfolio of specified assets and exposures (covered assets) from HMT. The portfolio of covered assets has a par value of £282 billion. The protection is subject to a first loss of £60 billion and covers 90% of subsequent losses. Once the first loss has been exhausted, losses and recoveries in respect of assets for which a trigger event - failure to pay, bankruptcy or restructuring - has occurred are included in the balance receivable under the APS. Receipts from HMT will, over time, amount to 90% of cumulative losses (net of 90% of cumulative recoveries) on the portfolio of covered assets less the first loss amount. The Group has a right to terminate the APS at any time provided that the Financial Services Authority has confirmed in writing to HMT that it has no objection to the proposed termination. On termination the Group must pay HMT the higher of the regulatory capital relief received and £2.5 billion less premiums paid plus the aggregate of amounts received from the UK Government under the APS. HMT has the right to appoint step-in managers to carry out any oversight, management or additional functions on behalf of HMT to ensure that the covered assets are managed and administered in compliance with the agreed terms and conditions.
This right is exercisable if certain step-in triggers occur. These include:
losses on covered assets in total exceed 125% of the first loss amount or losses on an individual covered asset class exceed specified thresholds;
a breach of specified obligations in the APS rules or the accession agreement;
the Group has failed or is failing to comply with any of the conditions in the APS rules in relation to asset management, monitoring and reporting, and governance and oversight and such failure is persistent and material or it is evidence of a systematic problem; and
material or systematic data deficiencies in the information provided to HMT in accordance with the terms of APS.
HMT may at any time elect to cease to exercise its step-in rights in whole or part when it is satisfied that the step-in triggers have been remedied. In consideration for the protection provided by the APS, the Group paid a premium of £700 million during 2010 (2009 - £1,400 million). Quarterly premiums of £125 million are payable from 31 December 2011 and subsequently until the earlier of 2099 and the termination of the agreement.
RBS Group 2010384
Notes on the accounts continued
The APS is a single contract providing credit protection in respect of a portfolio of financial assets. Under IFRS, credit protection is treated either as a financial guarantee contract or as a derivative financial instrument depending on the terms of the agreement and the nature of the protected assets and exposures. The Group has concluded, principally because the covered portfolio includes significant exposure in the form of derivatives, that the APS does not meet the criteria to be treated as a financial guarantee contract. The contract has been accounted for as a derivative financial instrument. It is recognised at fair value of £550 million (2009 - £1,400 million) and included within the Derivative asset balance sheet caption. Changes in fair value of £1,550 million (2009 - nil) were recognised in profit or loss within Income from trading activities. Details of the valuation methodology for the APS are set out in Note 12 Financial instruments on pages 320 and 321. There is no change in the recognition and measurement of the covered assets as a result of the APS. Impairment provisions on covered assets measured at amortised cost are assessed and charged in accordance with the Group’s accounting policy; held-for-trading assets, assets designated at fair value and available-for-sale assets within the APS portfolio continue to be measured at fair value with no adjustments to reflect the protection provided by the APS. There is no change in how gains and losses on the covered assets are recognised in the income statement or in other comprehensive income. The Group also participates in a number of schemes operated by the Bank of England and the UK Government and made available to eligible banks and building societies. Bank of England facilities include:
Open market operations - these provide market participants with funding at market rates on a tender basis in the form of short and long-term repos on a wide range of collateral and outright purchases of high-quality bonds to enable them to meet the reserves that they must hold at the Bank of England.
The special liquidity scheme - this was launched in April 2008 to allow financial institutions to swap temporarily illiquid assets for treasury bills, with fees charged based on the spread between 3-month LIBOR and the 3-month gilt repo rate. The scheme will operate for up to three years after the end of the drawdown period (30 January 2009) at the Bank of England's discretion.
As at 31 December 2010, the Group's utilisation of these facilities amounted to £16.1 billion (2009 - £21.4 billion; 2008 - £41.8 billion).
Government credit guarantee scheme Announced in October 2008, the scheme provides a guarantee on eligible new debt issued by qualifying institutions for a fee. The fee, payable to HM Treasury on guaranteed issues is based on a per annum rate of 50 basis points plus 100% of the institution's median five-year credit default swap (CDS) spread during the twelve months to 7 July 2008. As at 31 December 2010, the Group had obtained funding from the Bank of England and issued debt guaranteed by the Government totalling £41.5 billion (2009 - £51.5 billion; 2008 - £32.2 billion). Other related parties a) In their roles as providers of finance, Group companies provide
development and other types of capital support to businesses. These investments are made in the normal course of business and on arm's length terms. In some instances, the investment may extend to ownership or control over 20% or more of the voting rights of the investee company. However, these investments are not considered to give rise to transactions of a materiality requiring disclosure under IAS 24.
b) The Group recharges The Royal Bank of Scotland Group Pension
Fund with the cost of administration services incurred by it. The amounts involved are not material to the Group.
c) In accordance with IAS 24, transactions or balances between Group
entities that have been eliminated on consolidation are not reported. d) The captions in the primary financial statements of the parent
company include amounts attributable to subsidiaries. These amounts have been disclosed in aggregate in the relevant notes to the financial statements.
44 Post balance sheet events There have been no significant events between the year end and the date of approval of these accounts which would require a change to or disclosure in the accounts.
385RBS Group 2010
Financial statements

RBS Group 2010386
387 Financial summary
395 Exchange rates
396 Economic and monetary environment
397 Supervision
398 Regulatory developments and reviews
399 Description of property and equipment
399 Major shareholders
399 Material contracts
405 Risk factors
Additional information
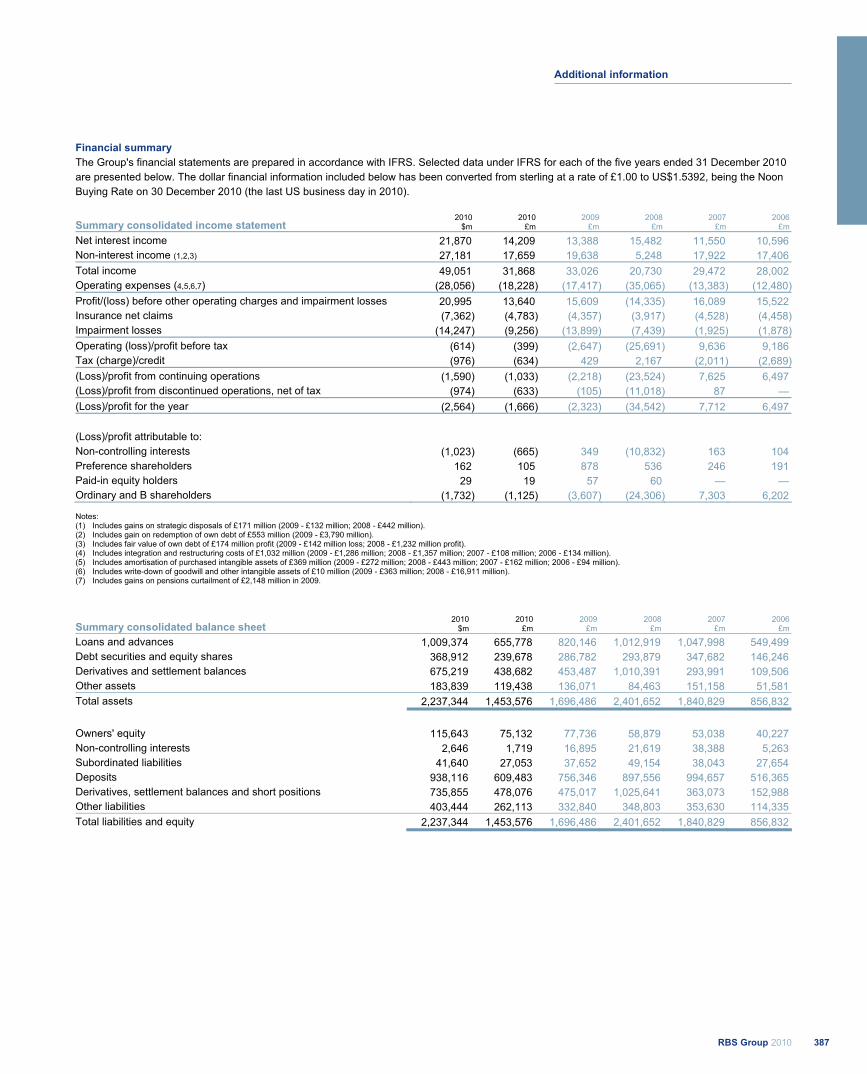
Financial summary The Group's financial statements are prepared in accordance with IFRS. Selected data under IFRS for each of the five years ended 31 December 2010 are presented below. The dollar financial information included below has been converted from sterling at a rate of £1.00 to US$1.5392, being the Noon Buying Rate on 30 December 2010 (the last US business day in 2010).
Summary consolidated income statement 2010
$m2010
£m2009
£m2008
£m2007
£m2006
£m
Net interest income 21,870 14,209 13,388 15,482 11,550 10,596 Non-interest income (1,2,3) 27,181 17,659 19,638 5,248 17,922 17,406 Total income 49,051 31,868 33,026 20,730 29,472 28,002 Operating expenses (4,5,6,7) (28,056) (18,228) (17,417) (35,065) (13,383) (12,480)Profit/(loss) before other operating charges and impairment losses 20,995 13,640 15,609 (14,335) 16,089 15,522 Insurance net claims (7,362) (4,783) (4,357) (3,917) (4,528) (4,458)Impairment losses (14,247) (9,256) (13,899) (7,439) (1,925) (1,878)Operating (loss)/profit before tax (614) (399) (2,647) (25,691) 9,636 9,186 Tax (charge)/credit (976) (634) 429 2,167 (2,011) (2,689)(Loss)/profit from continuing operations (1,590) (1,033) (2,218) (23,524) 7,625 6,497 (Loss)/profit from discontinued operations, net of tax (974) (633) (105) (11,018) 87 — (Loss)/profit for the year (2,564) (1,666) (2,323) (34,542) 7,712 6,497
(Loss)/profit attributable to: Non-controlling interests (1,023) (665) 349 (10,832) 163 104 Preference shareholders 162 105 878 536 246 191 Paid-in equity holders 29 19 57 60 — — Ordinary and B shareholders (1,732) (1,125) (3,607) (24,306) 7,303 6,202
Notes: (1) Includes gains on strategic disposals of £171 million (2009 - £132 million; 2008 - £442 million). (2) Includes gain on redemption of own debt of £553 million (2009 - £3,790 million). (3) Includes fair value of own debt of £174 million profit (2009 - £142 million loss; 2008 - £1,232 million profit). (4) Includes integration and restructuring costs of £1,032 million (2009 - £1,286 million; 2008 - £1,357 million; 2007 - £108 million; 2006 - £134 million). (5) Includes amortisation of purchased intangible assets of £369 million (2009 - £272 million; 2008 - £443 million; 2007 - £162 million; 2006 - £94 million). (6) Includes write-down of goodwill and other intangible assets of £10 million (2009 - £363 million; 2008 - £16,911 million). (7) Includes gains on pensions curtailment of £2,148 million in 2009.
Summary consolidated balance sheet 2010
$m 2010
£m 2009
£m 2008
£m 2007
£m 2006
£m
Loans and advances 1,009,374 655,778 820,146 1,012,919 1,047,998 549,499 Debt securities and equity shares 368,912 239,678 286,782 293,879 347,682 146,246 Derivatives and settlement balances 675,219 438,682 453,487 1,010,391 293,991 109,506 Other assets 183,839 119,438 136,071 84,463 151,158 51,581 Total assets 2,237,344 1,453,576 1,696,486 2,401,652 1,840,829 856,832
Owners' equity 115,643 75,132 77,736 58,879 53,038 40,227 Non-controlling interests 2,646 1,719 16,895 21,619 38,388 5,263 Subordinated liabilities 41,640 27,053 37,652 49,154 38,043 27,654 Deposits 938,116 609,483 756,346 897,556 994,657 516,365 Derivatives, settlement balances and short positions 735,855 478,076 475,017 1,025,641 363,073 152,988 Other liabilities 403,444 262,113 332,840 348,803 353,630 114,335 Total liabilities and equity 2,237,344 1,453,576 1,696,486 2,401,652 1,840,829 856,832
387RBS Group 2010
Additional information
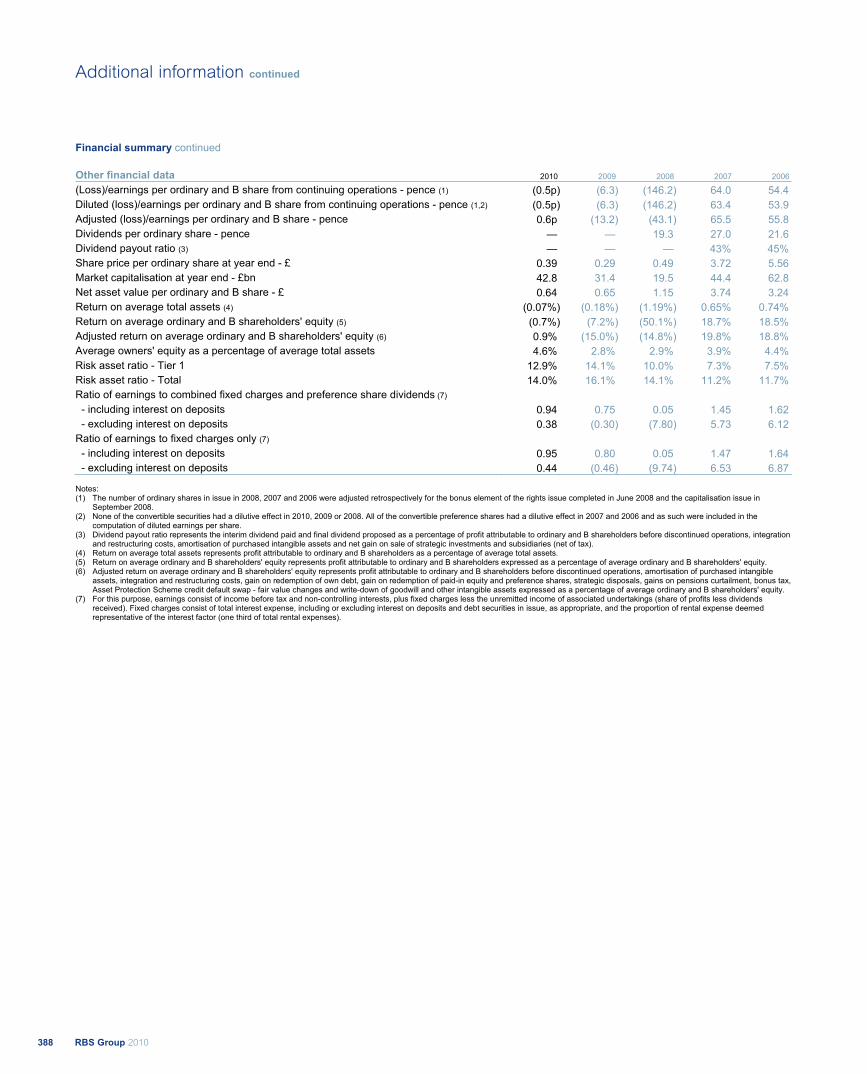
Financial summary continued Other financial data 2010 2009 2008 2007 2006
(Loss)/earnings per ordinary and B share from continuing operations - pence (1) (0.5p) (6.3) (146.2) 64.0 54.4 Diluted (loss)/earnings per ordinary and B share from continuing operations - pence (1,2) (0.5p) (6.3) (146.2) 63.4 53.9 Adjusted (loss)/earnings per ordinary and B share - pence 0.6p (13.2) (43.1) 65.5 55.8 Dividends per ordinary share - pence — — 19.3 27.0 21.6 Dividend payout ratio (3) — — — 43% 45% Share price per ordinary share at year end - £ 0.39 0.29 0.49 3.72 5.56 Market capitalisation at year end - £bn 42.8 31.4 19.5 44.4 62.8 Net asset value per ordinary and B share - £ 0.64 0.65 1.15 3.74 3.24 Return on average total assets (4) (0.07%) (0.18%) (1.19%) 0.65% 0.74% Return on average ordinary and B shareholders' equity (5) (0.7%) (7.2%) (50.1%) 18.7% 18.5% Adjusted return on average ordinary and B shareholders' equity (6) 0.9% (15.0%) (14.8%) 19.8% 18.8% Average owners' equity as a percentage of average total assets 4.6% 2.8% 2.9% 3.9% 4.4% Risk asset ratio - Tier 1 12.9% 14.1% 10.0% 7.3% 7.5% Risk asset ratio - Total 14.0% 16.1% 14.1% 11.2% 11.7% Ratio of earnings to combined fixed charges and preference share dividends (7)
- including interest on deposits 0.94 0.75 0.05 1.45 1.62 - excluding interest on deposits 0.38 (0.30) (7.80) 5.73 6.12 Ratio of earnings to fixed charges only (7)
- including interest on deposits 0.95 0.80 0.05 1.47 1.64 - excluding interest on deposits 0.44 (0.46) (9.74) 6.53 6.87
Notes: (1) The number of ordinary shares in issue in 2008, 2007 and 2006 were adjusted retrospectively for the bonus element of the rights issue completed in June 2008 and the capitalisation issue in
September 2008. (2) None of the convertible securities had a dilutive effect in 2010, 2009 or 2008. All of the convertible preference shares had a dilutive effect in 2007 and 2006 and as such were included in the
computation of diluted earnings per share. (3) Dividend payout ratio represents the interim dividend paid and final dividend proposed as a percentage of profit attributable to ordinary and B shareholders before discontinued operations, integration
and restructuring costs, amortisation of purchased intangible assets and net gain on sale of strategic investments and subsidiaries (net of tax). (4) Return on average total assets represents profit attributable to ordinary and B shareholders as a percentage of average total assets. (5) Return on average ordinary and B shareholders' equity represents profit attributable to ordinary and B shareholders expressed as a percentage of average ordinary and B shareholders' equity. (6) Adjusted return on average ordinary and B shareholders' equity represents profit attributable to ordinary and B shareholders before discontinued operations, amortisation of purchased intangible
assets, integration and restructuring costs, gain on redemption of own debt, gain on redemption of paid-in equity and preference shares, strategic disposals, gains on pensions curtailment, bonus tax, Asset Protection Scheme credit default swap - fair value changes and write-down of goodwill and other intangible assets expressed as a percentage of average ordinary and B shareholders' equity.
(7) For this purpose, earnings consist of income before tax and non-controlling interests, plus fixed charges less the unremitted income of associated undertakings (share of profits less dividends received). Fixed charges consist of total interest expense, including or excluding interest on deposits and debt securities in issue, as appropriate, and the proportion of rental expense deemed representative of the interest factor (one third of total rental expenses).
RBS Group 2010388
Additional information continued
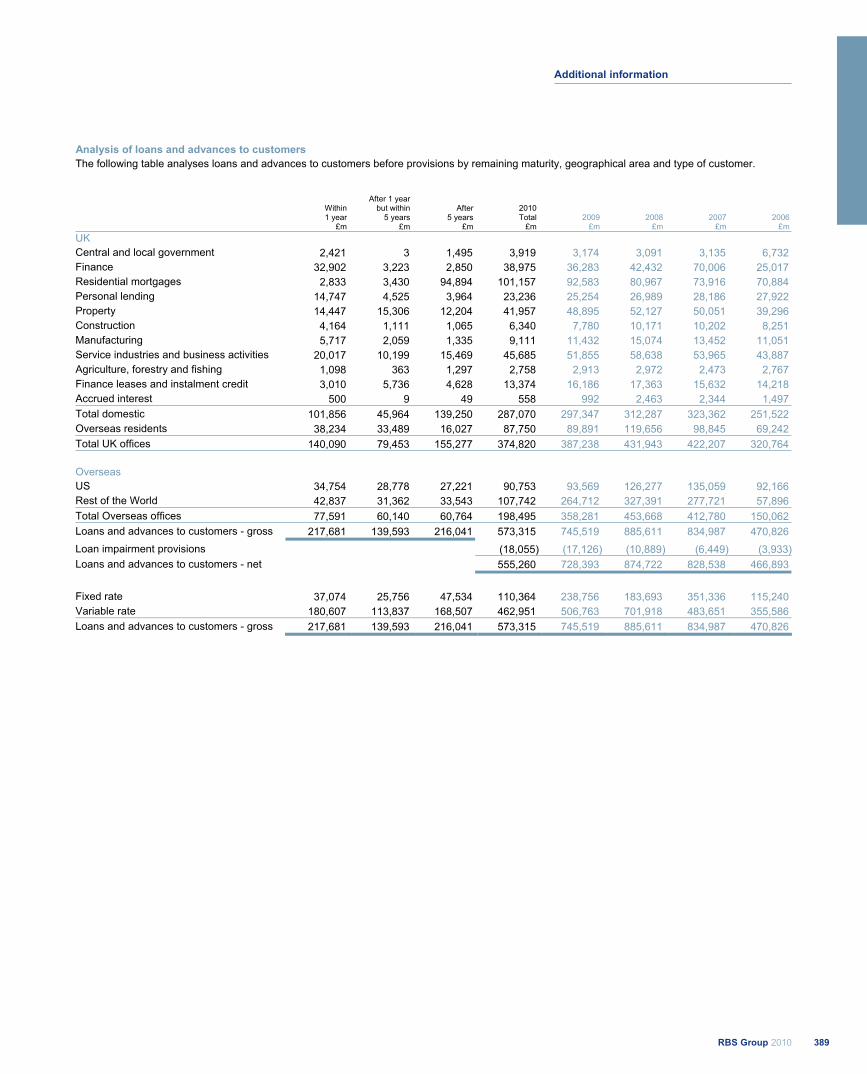
Analysis of loans and advances to customers The following table analyses loans and advances to customers before provisions by remaining maturity, geographical area and type of customer.
Within 1 year
£m
After 1 year but within
5 years £m
After5 years
£m
2010 Total
£m 2009
£m 2008
£m 2007
£m2006
£m UKCentral and local government 2,421 3 1,495 3,919 3,174 3,091 3,135 6,732 Finance 32,902 3,223 2,850 38,975 36,283 42,432 70,006 25,017 Residential mortgages 2,833 3,430 94,894 101,157 92,583 80,967 73,916 70,884 Personal lending 14,747 4,525 3,964 23,236 25,254 26,989 28,186 27,922 Property 14,447 15,306 12,204 41,957 48,895 52,127 50,051 39,296 Construction 4,164 1,111 1,065 6,340 7,780 10,171 10,202 8,251 Manufacturing 5,717 2,059 1,335 9,111 11,432 15,074 13,452 11,051 Service industries and business activities 20,017 10,199 15,469 45,685 51,855 58,638 53,965 43,887 Agriculture, forestry and fishing 1,098 363 1,297 2,758 2,913 2,972 2,473 2,767 Finance leases and instalment credit 3,010 5,736 4,628 13,374 16,186 17,363 15,632 14,218 Accrued interest 500 9 49 558 992 2,463 2,344 1,497 Total domestic 101,856 45,964 139,250 287,070 297,347 312,287 323,362 251,522 Overseas residents 38,234 33,489 16,027 87,750 89,891 119,656 98,845 69,242 Total UK offices 140,090 79,453 155,277 374,820 387,238 431,943 422,207 320,764
Overseas US 34,754 28,778 27,221 90,753 93,569 126,277 135,059 92,166 Rest of the World 42,837 31,362 33,543 107,742 264,712 327,391 277,721 57,896 Total Overseas offices 77,591 60,140 60,764 198,495 358,281 453,668 412,780 150,062 Loans and advances to customers - gross 217,681 139,593 216,041 573,315 745,519 885,611 834,987 470,826 Loan impairment provisions (18,055) (17,126) (10,889) (6,449) (3,933)Loans and advances to customers - net 555,260 728,393 874,722 828,538 466,893
Fixed rate 37,074 25,756 47,534 110,364 238,756 183,693 351,336 115,240 Variable rate 180,607 113,837 168,507 462,951 506,763 701,918 483,651 355,586 Loans and advances to customers - gross 217,681 139,593 216,041 573,315 745,519 885,611 834,987 470,826
389RBS Group 2010
Additional information
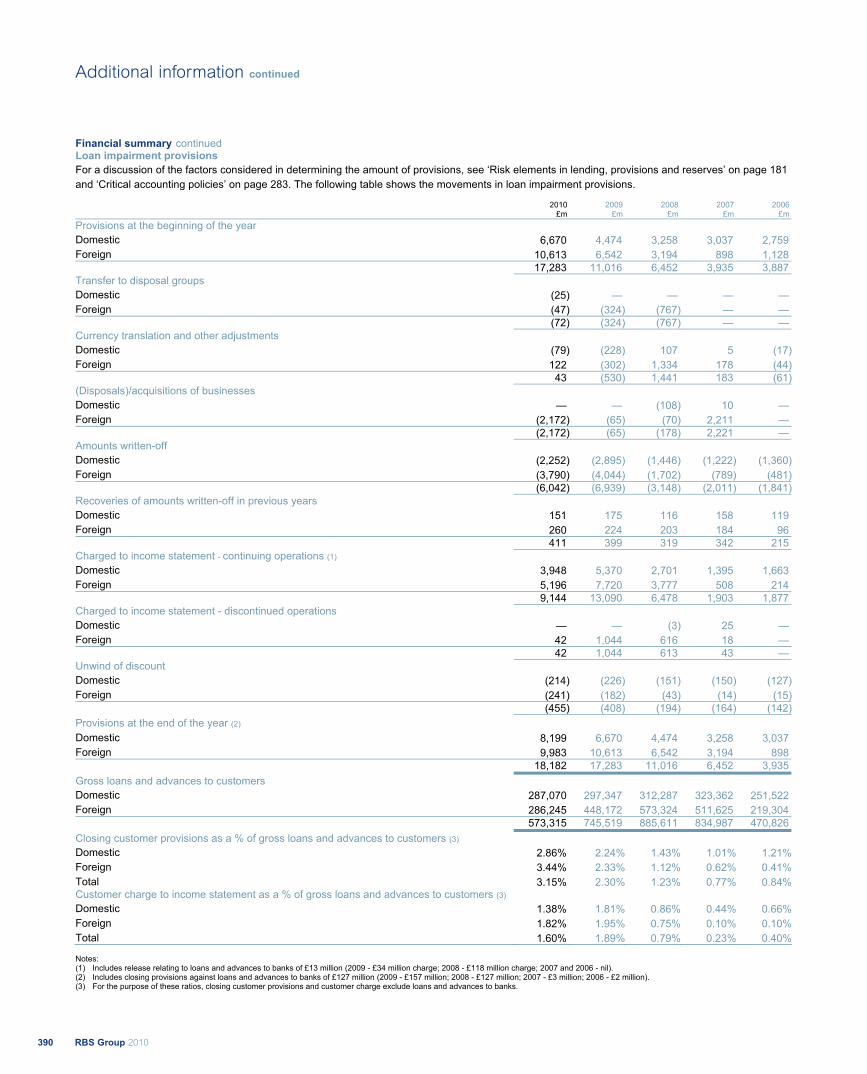
Financial summary continued Loan impairment provisions For a discussion of the factors considered in determining the amount of provisions, see ‘Risk elements in lending, provisions and reserves’ on page 181 and ‘Critical accounting policies’ on page 283. The following table shows the movements in loan impairment provisions.
2010 £m
2009 £m
2008 £m
2007 £m
2006 £m
Provisions at the beginning of the year Domestic 6,670 4,474 3,258 3,037 2,759 Foreign 10,613 6,542 3,194 898 1,128 17,283 11,016 6,452 3,935 3,887 Transfer to disposal groups Domestic (25) — — — —Foreign (47) (324) (767) — — (72) (324) (767) — — Currency translation and other adjustments Domestic (79) (228) 107 5 (17)Foreign 122 (302) 1,334 178 (44) 43 (530) 1,441 183 (61)(Disposals)/acquisitions of businesses Domestic — — (108) 10 — Foreign (2,172) (65) (70) 2,211 — (2,172) (65) (178) 2,221 — Amounts written-off Domestic (2,252) (2,895) (1,446) (1,222) (1,360)Foreign (3,790) (4,044) (1,702) (789) (481) (6,042) (6,939) (3,148) (2,011) (1,841)Recoveries of amounts written-off in previous years Domestic 151 175 116 158 119 Foreign 260 224 203 184 96 411 399 319 342 215 Charged to income statement - continuing operations (1) Domestic 3,948 5,370 2,701 1,395 1,663 Foreign 5,196 7,720 3,777 508 214 9,144 13,090 6,478 1,903 1,877 Charged to income statement - discontinued operations Domestic — — (3) 25 — Foreign 42 1,044 616 18 — 42 1,044 613 43 — Unwind of discount Domestic (214) (226) (151) (150) (127)Foreign (241) (182) (43) (14) (15) (455) (408) (194) (164) (142)Provisions at the end of the year (2) Domestic 8,199 6,670 4,474 3,258 3,037 Foreign 9,983 10,613 6,542 3,194 898 18,182 17,283 11,016 6,452 3,935 Gross loans and advances to customers Domestic 287,070 297,347 312,287 323,362 251,522 Foreign 286,245 448,172 573,324 511,625 219,304 573,315 745,519 885,611 834,987 470,826 Closing customer provisions as a % of gross loans and advances to customers (3) Domestic 2.86% 2.24% 1.43% 1.01% 1.21%Foreign 3.44% 2.33% 1.12% 0.62% 0.41%Total 3.15% 2.30% 1.23% 0.77% 0.84%Customer charge to income statement as a % of gross loans and advances to customers (3) Domestic 1.38% 1.81% 0.86% 0.44% 0.66%Foreign 1.82% 1.95% 0.75% 0.10% 0.10%Total 1.60% 1.89% 0.79% 0.23% 0.40%
Notes: (1) Includes release relating to loans and advances to banks of £13 million (2009 - £34 million charge; 2008 - £118 million charge; 2007 and 2006 - nil). (2) Includes closing provisions against loans and advances to banks of £127 million (2009 - £157 million; 2008 - £127 million; 2007 - £3 million; 2006 - £2 million). (3) For the purpose of these ratios, closing customer provisions and customer charge exclude loans and advances to banks.
RBS Group 2010390
Additional information continued
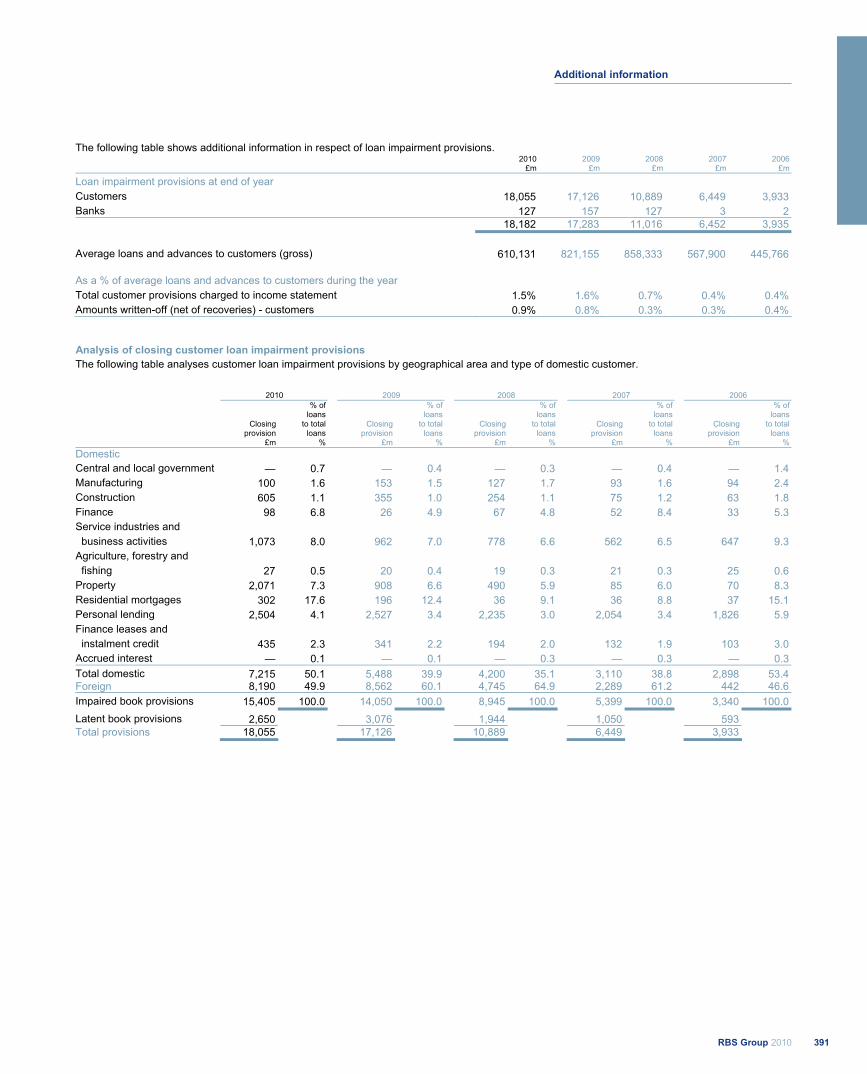
The following table shows additional information in respect of loan impairment provisions. 2010
£m2009
£m2008
£m2007
£m2006
£m
Loan impairment provisions at end of year Customers 18,055 17,126 10,889 6,449 3,933 Banks 127 157 127 3 2 18,182 17,283 11,016 6,452 3,935
Average loans and advances to customers (gross) 610,131 821,155 858,333 567,900 445,766
As a % of average loans and advances to customers during the year Total customer provisions charged to income statement 1.5% 1.6% 0.7% 0.4% 0.4% Amounts written-off (net of recoveries) - customers 0.9% 0.8% 0.3% 0.3% 0.4%
Analysis of closing customer loan impairment provisions The following table analyses customer loan impairment provisions by geographical area and type of domestic customer.
2010 2009 2008 2007 2006
Closing provision
% of loans
to total loans
Closing provision
% of loans
to total loans
Closing provision
% of loans
to total loans
Closing provision
% of loans
to total loans
Closing provision
% of loans
to total loans
£m % £m % £m % £m % £m % Domestic Central and local government — 0.7 — 0.4 — 0.3 — 0.4 — 1.4 Manufacturing 100 1.6 153 1.5 127 1.7 93 1.6 94 2.4 Construction 605 1.1 355 1.0 254 1.1 75 1.2 63 1.8 Finance 98 6.8 26 4.9 67 4.8 52 8.4 33 5.3 Service industries and business activities 1,073 8.0 962 7.0 778 6.6 562 6.5 647 9.3 Agriculture, forestry and fishing 27 0.5 20 0.4 19 0.3 21 0.3 25 0.6 Property 2,071 7.3 908 6.6 490 5.9 85 6.0 70 8.3 Residential mortgages 302 17.6 196 12.4 36 9.1 36 8.8 37 15.1 Personal lending 2,504 4.1 2,527 3.4 2,235 3.0 2,054 3.4 1,826 5.9 Finance leases and instalment credit 435 2.3 341 2.2 194 2.0 132 1.9 103 3.0 Accrued interest — 0.1 — 0.1 — 0.3 — 0.3 — 0.3 Total domestic 7,215 50.1 5,488 39.9 4,200 35.1 3,110 38.8 2,898 53.4 Foreign 8,190 49.9 8,562 60.1 4,745 64.9 2,289 61.2 442 46.6 Impaired book provisions 15,405 100.0 14,050 100.0 8,945 100.0 5,399 100.0 3,340 100.0 Latent book provisions 2,650 3,076 1,944 1,050 593 Total provisions 18,055 17,126 10,889 6,449 3,933
391RBS Group 2010
Additional information
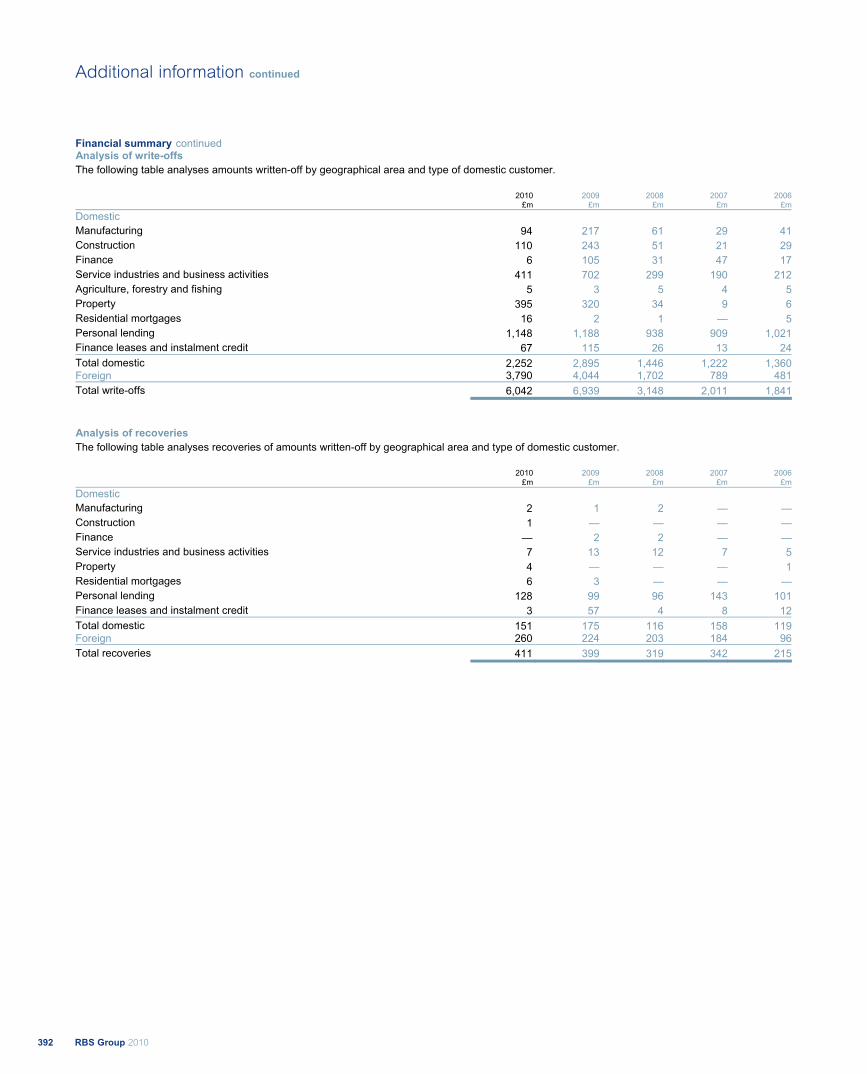
Financial summary continued Analysis of write-offs The following table analyses amounts written-off by geographical area and type of domestic customer.
2010 £m
2009 £m
2008£m
2007£m
2006£m
Domestic Manufacturing 94 217 61 29 41Construction 110 243 51 21 29Finance 6 105 31 47 17Service industries and business activities 411 702 299 190 212Agriculture, forestry and fishing 5 3 5 4 5Property 395 320 34 9 6Residential mortgages 16 2 1 — 5Personal lending 1,148 1,188 938 909 1,021Finance leases and instalment credit 67 115 26 13 24Total domestic 2,252 2,895 1,446 1,222 1,360Foreign 3,790 4,044 1,702 789 481Total write-offs 6,042 6,939 3,148 2,011 1,841
Analysis of recoveries The following table analyses recoveries of amounts written-off by geographical area and type of domestic customer.
2010 £m
2009 £m
2008£m
2007£m
2006£m
Domestic Manufacturing 2 1 2 — —Construction 1 — — — —Finance — 2 2 — —Service industries and business activities 7 13 12 7 5Property 4 — — — 1Residential mortgages 6 3 — — —Personal lending 128 99 96 143 101Finance leases and instalment credit 3 57 4 8 12Total domestic 151 175 116 158 119Foreign 260 224 203 184 96Total recoveries 411 399 319 342 215
RBS Group 2010392
Additional information continued
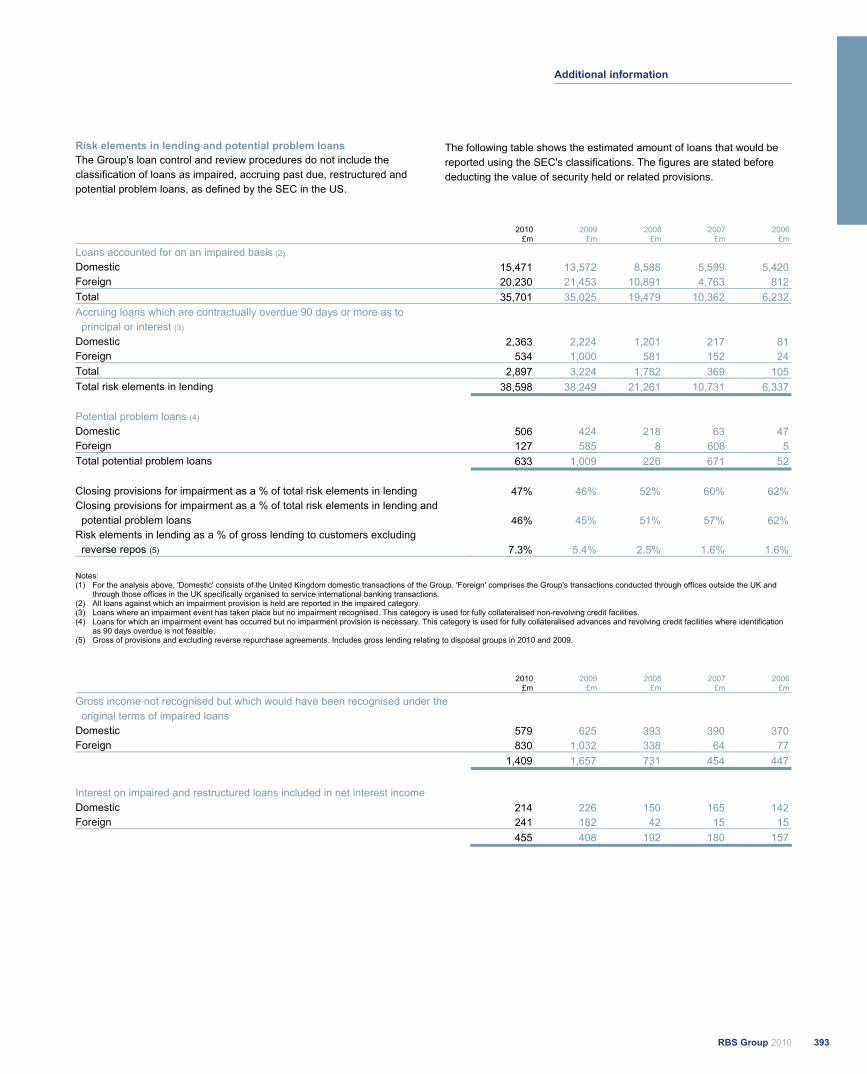
Risk elements in lending and potential problem loans The Group's loan control and review procedures do not include the classification of loans as impaired, accruing past due, restructured and potential problem loans, as defined by the SEC in the US.
The following table shows the estimated amount of loans that would be reported using the SEC's classifications. The figures are stated before deducting the value of security held or related provisions.
2010 £m
2009 £m
2008 £m
2007 £m
2006 £m
Loans accounted for on an impaired basis (2) Domestic 15,471 13,572 8,588 5,599 5,420 Foreign 20,230 21,453 10,891 4,763 812 Total 35,701 35,025 19,479 10,362 6,232 Accruing loans which are contractually overdue 90 days or more as to principal or interest (3) Domestic 2,363 2,224 1,201 217 81 Foreign 534 1,000 581 152 24 Total 2,897 3,224 1,782 369 105 Total risk elements in lending 38,598 38,249 21,261 10,731 6,337
Potential problem loans (4) Domestic 506 424 218 63 47 Foreign 127 585 8 608 5Total potential problem loans 633 1,009 226 671 52
Closing provisions for impairment as a % of total risk elements in lending 47% 46% 52% 60% 62% Closing provisions for impairment as a % of total risk elements in lending and potential problem loans 46% 45% 51% 57% 62% Risk elements in lending as a % of gross lending to customers excluding reverse repos (5) 7.3% 5.4% 2.5% 1.6% 1.6%
Notes: (1) For the analysis above, 'Domestic' consists of the United Kingdom domestic transactions of the Group. 'Foreign' comprises the Group's transactions conducted through offices outside the UK and
through those offices in the UK specifically organised to service international banking transactions. (2) All loans against which an impairment provision is held are reported in the impaired category. (3) Loans where an impairment event has taken place but no impairment recognised. This category is used for fully collateralised non-revolving credit facilities. (4) Loans for which an impairment event has occurred but no impairment provision is necessary. This category is used for fully collateralised advances and revolving credit facilities where identification
as 90 days overdue is not feasible. (5) Gross of provisions and excluding reverse repurchase agreements. Includes gross lending relating to disposal groups in 2010 and 2009.
2010 £m
2009 £m
2008 £m
2007 £m
2006 £m
Gross income not recognised but which would have been recognised under the original terms of impaired loans Domestic 579 625 393 390 370 Foreign 830 1,032 338 64 77 1,409 1,657 731 454 447
Interest on impaired and restructured loans included in net interest income Domestic 214 226 150 165 142 Foreign 241 182 42 15 15 455 408 192 180 157
393RBS Group 2010
Additional information
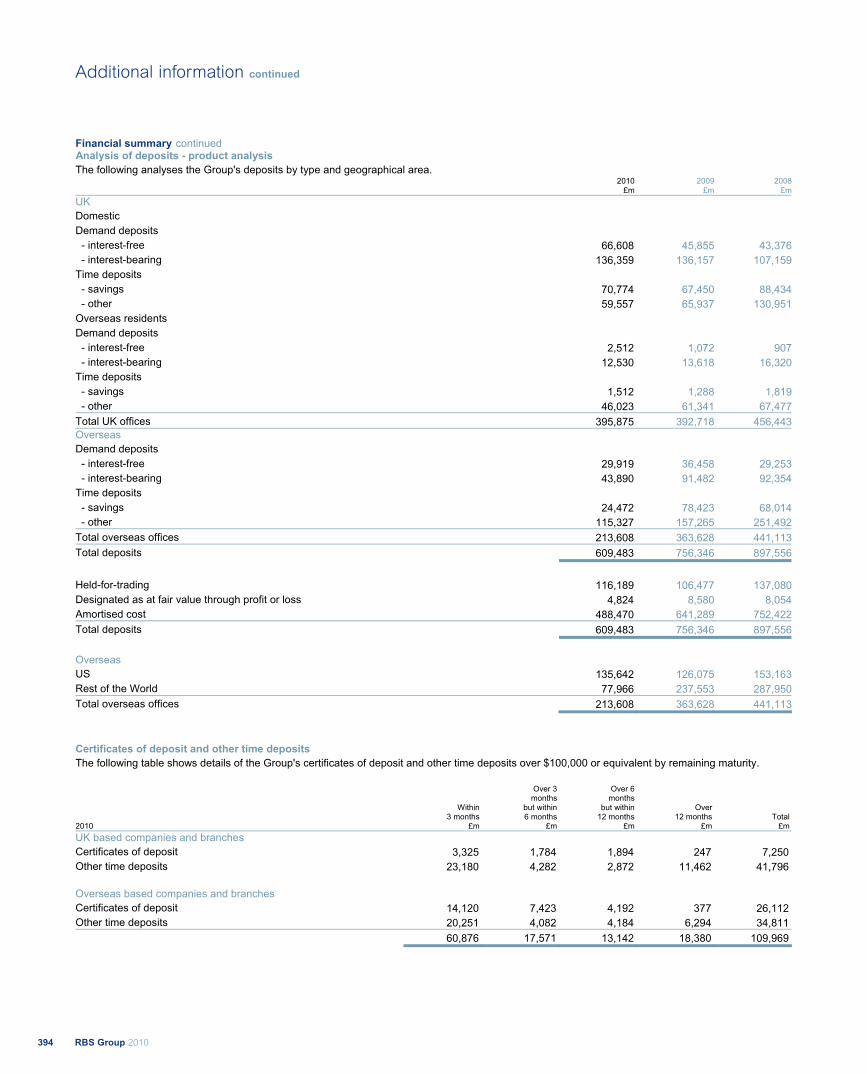
Financial summary continued Analysis of deposits - product analysis The following analyses the Group's deposits by type and geographical area. 2010
£m 2009
£m2008
£mUK Domestic Demand deposits - interest-free 66,608 45,855 43,376 - interest-bearing 136,359 136,157 107,159Time deposits - savings 70,774 67,450 88,434 - other 59,557 65,937 130,951Overseas residents Demand deposits - interest-free 2,512 1,072 907 - interest-bearing 12,530 13,618 16,320Time deposits - savings 1,512 1,288 1,819 - other 46,023 61,341 67,477Total UK offices 395,875 392,718 456,443Overseas Demand deposits - interest-free 29,919 36,458 29,253 - interest-bearing 43,890 91,482 92,354Time deposits - savings 24,472 78,423 68,014 - other 115,327 157,265 251,492Total overseas offices 213,608 363,628 441,113Total deposits 609,483 756,346 897,556
Held-for-trading 116,189 106,477 137,080Designated as at fair value through profit or loss 4,824 8,580 8,054Amortised cost 488,470 641,289 752,422Total deposits 609,483 756,346 897,556
Overseas US 135,642 126,075 153,163Rest of the World 77,966 237,553 287,950Total overseas offices 213,608 363,628 441,113
Certificates of deposit and other time deposits The following table shows details of the Group's certificates of deposit and other time deposits over $100,000 or equivalent by remaining maturity.
2010
Within 3 months
£m
Over 3 months
but within 6 months
£m
Over 6 months
but within 12 months
£m
Over 12 months
£m Total
£m UK based companies and branches Certificates of deposit 3,325 1,784 1,894 247 7,250 Other time deposits 23,180 4,282 2,872 11,462 41,796 Overseas based companies and branches Certificates of deposit 14,120 7,423 4,192 377 26,112 Other time deposits 20,251 4,082 4,184 6,294 34,811 60,876 17,571 13,142 18,380 109,969
RBS Group 2010394
Additional information continued
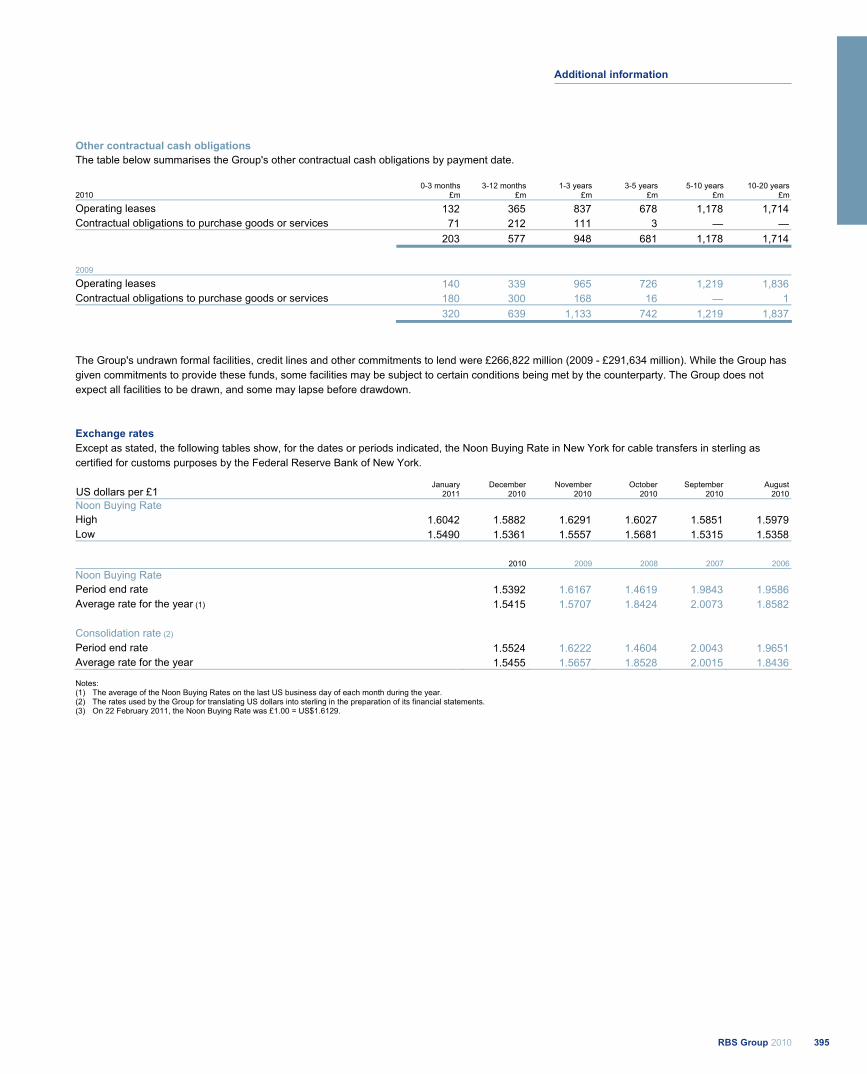
Other contractual cash obligations The table below summarises the Group's other contractual cash obligations by payment date.
2010 0-3 months
£m3-12 months
£m1-3 years
£m3-5 years
£m5-10 years
£m10-20 years
£m
Operating leases 132 365 837 678 1,178 1,714 Contractual obligations to purchase goods or services 71 212 111 3 — — 203 577 948 681 1,178 1,714
2009 Operating leases 140 339 965 726 1,219 1,836 Contractual obligations to purchase goods or services 180 300 168 16 — 1 320 639 1,133 742 1,219 1,837
The Group's undrawn formal facilities, credit lines and other commitments to lend were £266,822 million (2009 - £291,634 million). While the Group has given commitments to provide these funds, some facilities may be subject to certain conditions being met by the counterparty. The Group does not expect all facilities to be drawn, and some may lapse before drawdown.
Exchange rates Except as stated, the following tables show, for the dates or periods indicated, the Noon Buying Rate in New York for cable transfers in sterling as certified for customs purposes by the Federal Reserve Bank of New York. US dollars per £1
January 2011
December 2010
November 2010
October 2010
September 2010
August 2010
Noon Buying Rate High 1.6042 1.5882 1.6291 1.6027 1.5851 1.5979 Low 1.5490 1.5361 1.5557 1.5681 1.5315 1.5358
2010 2009 2008 2007 2006 Noon Buying Rate Period end rate 1.5392 1.6167 1.4619 1.9843 1.9586 Average rate for the year (1) 1.5415 1.5707 1.8424 2.0073 1.8582 Consolidation rate (2) Period end rate 1.5524 1.6222 1.4604 2.0043 1.9651 Average rate for the year 1.5455 1.5657 1.8528 2.0015 1.8436
Notes: (1) The average of the Noon Buying Rates on the last US business day of each month during the year. (2) The rates used by the Group for translating US dollars into sterling in the preparation of its financial statements. (3) On 22 February 2011, the Noon Buying Rate was £1.00 = US$1.6129.
395RBS Group 2010
Additional information
Economic and monetary environment Global recovery has continued in 2010, but the strength of the recovery remains unevenly spread. Although most developed countries have avoided a double-dip, they have been unable to find a firm footing from which to build a solid recovery. This reflects the burden of high levels of public and private sector debt, low consumer confidence and high levels of unemployment. In the UK, the Group’s largest market, economic conditions improved in 2010. Total economic activity, as measured by gross domestic product (GDP), grew by 1.3 per cent in 2010. This followed a contraction of 4.9 per cent in 2009. However, a fall in activity in the final quarter of 2010 served as a timely reminder that, while conditions are generally improving, the recovery is fragile. The UK’s inflation rate increased sharply, reaching 3.7 per cent by the end of the year. Yet policy makers kept the main policy rate unchanged at 0.5 per cent throughout 2010, attributing the pick up in inflation to temporary factors such as rising commodity prices and an increase in VAT. The recovery has helped many of our customers. Company trading profits grew for the first time since 2008. The unemployment rate levelled off at around 8 per cent, which is much higher than at the start of the recession, but still relatively low compared to the peak in other recessions. These factors supported commercial property prices, which were 6 per cent higher in December 2010 than they were a year earlier, according to the International Property Databank. Most of those gains came in the first half of the year. The residential market was less robust; house prices fell in the second half of the year, dragging the year-on-year growth rate to -1 per cent in December 2010, according to the Nationwide index. The US economy registered the fastest growth amongst our principal markets. GDP grew by 2.8 per cent, following a contraction of 2.6 per cent in 2009. Despite this, the unemployment rate remained stubbornly high, which prompted a further loosening of monetary and fiscal policy. Inflationary pressures were generally subdued, but picked up somewhat towards the end of the year. Policy makers pledged to keep Fed funds rate exceptionally low for an extended period of time to provide a necessary support to the economic recovery.
In Ireland, hopes of a recovery in 2010 were dashed, as GDP contracted by an estimated 0.6 per cent. This followed a 7.6 per cent reduction in 2009. The Irish government requested a financial rescue package of €85 billion in November, equivalent to about half of Ireland’s GDP. The general improvement in economic conditions must be viewed against a backdrop of financial market turbulence at various points in the year, most notably the sovereign debt crisis that affected the Eurozone periphery. This led to a marked fall in risk appetite in Q2 2010 and, again, in Q4 2010. Equity prices fell in the banking sector and there was a ‘flight to quality’, which pushed down long-term interest rates on government debt in some countries. This included the UK, where the 10-year gilt rate fell from more than 4 per cent at the start of 2010, to less than 3 per cent in October. UK gilt yields subsequently rose in the final months of 2010, in anticipation of interest rate rises in 2011. The increase in risk aversion also caused some sharp currency movements. At one point the pound was 11 per cent down against the dollar, but sterling rallied in the second half of 2010, to end the year just slightly lower than where it started ($1.57 from $1.61). Sterling rose by 10 per cent against the euro in the first half of the year, before giving up most of these gains, to end the year at €1.17 (from €1.13). The economic outlook We expect the global recovery to be maintained, but to remain uneven. The pace of growth in the major developed economies, including the UK and the US, is likely to remain sluggish by historic standards, and volatile. This reflects high levels of indebtedness, fiscal rebalancing and the expectation that interest rates will gradually rise. Emerging markets, especially Asia, will continue to outperform as they are less encumbered by balance sheet strains. Moreover, growth in countries like China and India will continue to be underpinned by the process of ‘catch-up’ with industrial nations.
RBS Group 2010396
Additional information continued
Supervision United Kingdom The UK Financial Services Authority (FSA) is the consolidated supervisor of the Group. As at 31 December 2010, 30 companies in the Group (excluding subsidiaries of RBS NV), spanning a range of financial services sectors (banking, insurance and investment business), were authorised to conduct financial activities regulated by the FSA. The UK authorised banks in the Group include the Royal Bank, NatWest, Coutts & Co and Ulster Bank Limited. Wholesale activities, other than Group Treasury activities, are concentrated in the Group's Global Banking & Markets and UK Corporate divisions, and are undertaken under the names of the Royal Bank and NatWest. UK retail banking activities are managed by the UK Retail division. The exception is Ulster Bank Limited, which is run as a separate division within the Group. Ulster Bank Group moved to a single brand in the Republic of Ireland during 2010, with First Active merging with Ulster Bank. Ulster Bank Limited provides banking services in Northern Ireland while the banking service in the Republic of Ireland is provided by Ulster Bank Ireland Limited, which is primarily supervised by the Central Bank of Ireland. Investment management business is principally undertaken by companies in the Wealth Management division, including Coutts & Co, Adam & Company Investment Management Limited, and in the Global Banking & Markets division, through RBS Asset Management Limited. General insurance business is principally undertaken by Direct Line Insurance plc and Churchill Insurance Company Limited. The Group is subject to extensive regulations that impose obligations on financial institutions to maintain appropriate policies, procedures and controls to ensure compliance with the rules and regulations to which they are subject. United States The Group is both a bank holding company and a financial holding company within the meaning of the US Bank Holding Company Act of 1956. As such, it is subject to the regulation and supervision of the Board of Governors of the Federal Reserve System (“the Federal Reserve”). Among other things, the Group's direct and indirect activities and investments in the United States are limited to those that are 'financial in nature' or 'incidental' or 'complementary' to a financial activity, as determined by the Federal Reserve. The Group is also required to obtain the prior approval of the Federal Reserve before acquiring directly or indirectly, the ownership or control of more than 5% of any class of the voting shares of any US bank or holding company. Under current Federal Reserve policy, the Group is required to act as a source of financial
strength for its US bank subsidiaries. Among other things, this source of strength obligation could require the Group to inject capital into any of its US bank subsidiaries if any of them became undercapitalised. Anti-money laundering, anti-terrorism and economic sanctions regulations are a major focus of the US government for financial institutions and are rigorously enforced by US government agencies. The Group's US bank and non-bank subsidiaries and the Royal Bank's US branches are also subject to supervision and regulation by a variety of other US regulatory agencies. RBS Citizens NA is supervised by the Office of the Comptroller of the Currency, which is charged with the regulation and supervision of nationally chartered banks. Citizens Bank of Pennsylvania is subject to the regulation and supervision of the US Federal Deposit Insurance Corporation and the Pennsylvania Department of Banking and Insurance. Citizens Financial Group is under the supervision of the Federal Reserve as a bank holding company. The Royal Bank's New York branch is supervised by the New York State Banking Department, and its Connecticut branch is supervised by the Connecticut Department of Banking. Both branches are also subject to supervisory oversight by the Federal Reserve, through the Federal Reserve Bank of Boston. The Group's US broker dealer, RBS Securities Inc. (RBSSI), formerly known as Greenwich Capital Markets, Inc., is subject to regulation and supervision by the US Securities and Exchange Commission (SEC) and the Financial Industry Regulatory Authority (FINRA) with respect to its securities activities. The futures activities of RBSSI are subject to regulation and oversight by the US Commodity Futures Trading Commission (CFTC) and the Chicago Board of Trade (CBOT). The Group's US commodities business, RBS Sempra Commodities LLP and its subsidiaries, which was largely sold in 2010, are primarily regulated by the Federal Reserve Bank of Boston, the Federal Energy Regulatory Commission (FERC), the Commodity Futures Trading Commission (CFTC), the CME Group-owned exchanges, and The Intercontinental Exchange. Netherlands The consolidated supervisor of RBS NV is the Dutch Central Bank, De Nederlandsche Bank (DNB). The DNB operates as prudential supervisor of banks, insurance companies and pension funds, and also as part of the European System of Central Banks. Other jurisdictions The Group operates in over 50 countries through a network of branches, local banks and non-bank subsidiaries and these activities are subject to supervision in most cases by a local regulator or central bank.
397RBS Group 2010
Additional information
Regulatory developments and reviews The Group works with domestic and international trade associations and proactively engages with regulators and other authorities such as the Basel Committee, the EU Commission, Governments and regulators, in order to understand the implications of proposed regulatory change and to contribute to the development of regulatory policy. The Group and its subsidiaries have co-operated fully with various regulatory reviews and developments in the UK and internationally, including enquiries or investigations into alleged or possible breaches of regulations. United Kingdom In the UK, the Group has actively engaged with a large number of legislative and regulatory consultations. Reflecting global developments, financial stability - notably bank prudential requirements and the new regulatory framework - remains a key focus for the UK regulatory authorities. The Group has continued to participate fully in the analysis of the cause of the financial crisis and the development of potential policy and reform. A wide range of ideas and proposals, aimed at strengthening the resilience of the banking system and addressing perceived shortcomings in existing regulation, have been advanced and continue to be developed. With respect to prudential requirements, the Group provided detailed feedback on the FSA's consultations on Strengthening Capital Standards and its Discussion Paper on reviewing trading activities, to name but two. Other consultations included HM Treasury’s consultations on the structure of financial regulation and on the new bank levies. The Group has actively engaged with, and contributed to, a number of inquiries regarding the future of banking. These included the Independent Banking Commission, the OFT’s retail banking review and various Treasury Select Committee inquiries. It has contributed to debates on resolution frameworks, including possible mechanisms such as contingent capital and bail-in arrangements, and is participating in the FSA's pilot for the development of Recovery and Resolution Plans ("Living Wills"). It will be developing suitable Living Wills in line with forthcoming regulatory requirements. The Group has continued to play an active role in the development of requirements impacting products and processes. Examples include the FSA’s review of mortgages (Mortgage Market Review) and of investment advice (Retail Distribution Review). With regard to payment cards, the Group worked closely with the Government (the Department of Business Innovation and Skills) and the industry to develop and implement appropriate measures to improve product features and transparency. With regard to the OFT’s review of Cash ISAs, the Group worked closely with the industry to agree a series of voluntary improvements to the product and switching process. In 2010, the Consumer Credit Directive was transposed into national law and introduced standardised disclosure requirements for all lenders of unsecured consumer credit. It is aimed at improving cross border lending and promoting responsible lending and borrowing.
UK regulated firms within the Group are members of the Financial Services Compensation Scheme (FSCS), which provides compensation to eligible customers of authorised financial services firms that are unable to meet their obligations. The FSCS is a contributor to depositor confidence and financial stability and the Group is supporting the FSCS in increasing awareness amongst UK consumers. In addition, during 2010 RBS developed and implemented a new ‘single customer view’ systems capability, which provides tailored information to the FSCS in order to facilitate fast payment of compensation to depositors within seven days. The FSA, in their 2010/11 Business Plan, emphasised that they would be implementing a new intensive supervision strategy in relation to 'Treating Customers Fairly' (TCF). The Group has implemented TCF governance arrangements for all relevant businesses, and continues to undertake a process of continuous improvement of management information to demonstrate its continued commitment to treating customers fairly throughout the product lifecycle. The Group also continues to co-operate with the Information Commissioner’s Office, the UK’s independent public body set up to uphold information rights in the public interest, promoting openness by public bodies and data privacy for individuals. The Group continues to improve its processes in line with changing guidelines in order to meet information security requirements. European Union/global developments The Group follows closely the work (and recommendations) of the G20, as well as international standard setters such as the Basel Committee on Banking Supervision. Of particular note were the discussions that took place throughout 2010 regarding proposals from the Basel Committee on Banking Supervision for an enhanced capital and liquidity framework. The Group was closely involved in all aspects of the proposals on capital and liquidity, as well as on other related policy areas, such as countercyclical capital buffers and contingent capital, being developed separately. Also notable in 2010 was significant work by the European Commission and the Committee of European Securities Regulators to review the Markets in Financial Instruments Directive in areas such as transparency, investor protection and a widening of the scope of the Directive. Additionally, proposals to revise legislation on market infrastructure, to encourage central clearing of derivative instruments, were put forward by the Commission. The Group provided input in all these areas. Lastly, the EU has also overhauled its supervisory framework, creating a system of EU Supervisory Authorities and the European Systemic Risk Board. Powers of the authorities will include the supervision of national regulators, but also potentially direct supervision of selected financial institutions should it be required in specific circumstances.
RBS Group 2010398
Additional information continued
United States In the US the Group continues to engage constructively with regulators and other bodies on regulatory and legislative change and seeks to ensure proper implementation and compliance. Current issues include regulatory implementation of recently enacted US financial regulatory reform legislation, mortgage and credit card lending and consumer disclosures, debit and credit card interchange fees, and account overdraft protection. Other jurisdictions The Group is active in monitoring regulatory developments in each country in which it operates so that internal policies are sufficient to ensure the effective management of regulatory risk. Description of property and equipment The Group operates from a number of locations worldwide, principally in the UK. At 31 December 2010, the Royal Bank and NatWest had 647 and 1,549 retail branches, respectively, in the UK. Ulster Bank has a foot print of 236 branches and an extensive network of business banking offices across Northern Ireland and the Republic of Ireland. US Retail & Commercial had 1,525 retail banking offices (including in-store branches) covering Connecticut, Delaware, Illinois, Massachusetts, Michigan, New Hampshire, New Jersey, New York, Ohio, Pennsylvania, Rhode Island and Vermont. A substantial majority of the UK branches are owned by the Royal Bank, NatWest and their subsidiaries or are held under leases with unexpired terms of over 50 years. The Group's principal properties include its headquarters at Gogarburn, Edinburgh, its principal offices in London at 135 and 280 Bishopsgate and the Drummond House administration centre located at South Gyle, Edinburgh. Total capital expenditure on premises (excluding investment properties), computers and other equipment in the year ended 31 December 2010 was £656 million (2009 - £1,215 million; 2008 - £1,406 million). Major shareholders Details of major shareholders of the company’s ordinary and B shares are given on page 233. In December 2008, The Solicitor for the Affairs of Her Majesty's Treasury (HM Treasury) acquired 22,854 million ordinary shares representing 57.92% of the company's issued ordinary share capital. During 2009, HM Treasury acquired a further 16,791 million ordinary shares raising their holding to 70.3% of the company's issued ordinary share capital. In December 2009, HM Treasury acquired 51 billion B shares in the company representing the entire issued B share capital.
In 2010, the company converted certain non-cumulative convertible preference shares into ordinary shares in the company. As a result, HM Treasury’s holding in the company’s ordinary shares reduced to 67.8%. Other than detailed above, there have been no significant changes in the percentage ownership of major shareholders of the company's ordinary, B and preference shares during the three years ended 23 February 2011. All shareholders within a class of the company's shares have the same voting rights. At 23 February 2011, the directors of the company had options to purchase a total of 10,455,306 ordinary shares of the company. As at 31 December 2010, almost all of the company's US$ denominated preference shares and American Depository Shares representing ordinary shares were held by shareholders registered in the US. All other shares were predominantly held by shareholders registered outside the US. Material contracts The company and its subsidiaries are party to various contracts in the ordinary course of business. Material contracts include the following: Consortium and Shareholders Agreement (CSA) On 28 May 2007, Fortis Bank Nederland, the company, Santander and RFS Holdings entered into the CSA. Fortis Bank Nederland acceded to the CSA on 26 July 2007. On 3 October 2008, the Dutch State acquired Fortis Bank Nederland. On 24 December 2008 the Dutch State acceded to the CSA following its acquisition of the shares held by Fortis Bank Nederland in RFS Holdings pursuant to a Deed of Accession entered into between RFS Holdings, the company, Fortis Bank Nederland, Santander and the Dutch State. On 1 April 2010 the CSA was restated. The CSA governs the relationships amongst the parties thereto in relation to the acquisition by RFS Holdings of ABN AMRO (now RBS Holdings N.V.). The CSA as restated details, inter alia, the equity interests in RFS Holdings, the governance of RFS Holdings, the arrangements for the transfer of certain ABN AMRO businesses, assets and liabilities to the Dutch State (previously Fortis Bank Nederland), the company and Santander, further funding obligations of the Dutch State, the company and Santander where funding is required by regulatory authorities in connection with the ABN AMRO businesses, the allocation of Core Tier 1 capital, the allocation of taxes and conduct of tax affairs and the steps that the Dutch State, the company and Santander expect to take to enable the company to become the sole shareholder of RFS Holdings.
399RBS Group 2010
Additional information

Material contracts continued Second Placing and Open Offer Agreement Pursuant to a placing and open offer agreement dated 19 January 2009 entered into between the company, UBS, Merrill Lynch International and HM Treasury, (i) the company agreed to invite qualifying shareholders to apply to subscribe for new shares at the issue price of 31.75 pence per new share by way of the Second Open Offer, (ii) UBS and Merrill Lynch International were appointed as joint sponsors, joint bookrunners and joint placing agents and agreed to use reasonable endeavours to procure placees to subscribe for the new shares on such terms as may be agreed by the company and HM Treasury at not less than the issue price of 31.75 pence per new share on the basis that the new shares placed will be subject to clawback to the extent they are taken up under the Second Open Offer and (iii) HM Treasury agreed that, to the extent not placed or taken up under the Second Open Offer and subject to the terms and conditions set out in the Second Placing and Open Offer Agreement, HM Treasury would subscribe for such new shares itself at the issue price of 31.75 pence per new share. Pursuant to the terms of the Second Placing and Open Offer Agreement, the aggregate proceeds of the Second Placing and Open Offer (net of expenses) were used in full to fund the redemption on Admission (as defined in the Second Placing and Open Offer Agreement) of the preference shares held by HM Treasury at 101 per cent of their issue price (£5.05 billion) together with the accrued dividend on the preference shares (from and including 1 December 2008 to but excluding the Date of Admission (as defined in the Second Placing and Open Offer Agreement)) and the commissions payable to HM Treasury under the Second Placing and Open Offer Agreement. HM Treasury is entitled to novate its rights under the Second Placing and Open Offer Agreement to any entity that is owned, directly or indirectly, by HM Treasury. Pre-accession Commitments Letter On 26 February 2009, the Royal Bank entered into a deed poll in favour of HM Treasury, pursuant to which the Royal Bank gave a series of undertakings on behalf of each member of the Group, with immediate effect unless otherwise agreed, in relation to the provision of information and the management of the assets, commitments and exposures (the "Proposed Assets") in the period prior to the Royal Bank's proposed accession to and participation in the UK Government's Asset Protection Scheme (APS). The Royal Bank undertook to HM Treasury, among other things, to: (i) provide all such assistance and information and data as is
reasonably requested which is pertinent to the implementation of the APS and the Royal Bank's potential participation in the APS;
(ii) provide, as soon as practicable, an indicative list of the assets,
commitments and exposures that the Royal Bank propose to include within the APS with a view to agreeing such list by 30 April 2009;
(iii) provide, as promptly as practicable, information and data relating
to the Proposed Assets reasonably requested for due diligence purposes and to provide certain other information concerning the Group's business and the financial performance and risk of the Proposed Assets;
(iv) provide access to the Group's premises, books, records, senior
executives, relevant personnel and professional advisers on reasonable terms;
(v) consult with HM Treasury regarding the management and
operations of the Proposed Assets and to ensure that the management of the Proposed Assets is in accordance with usual business practices and also without regard to the possible benefits under the APS;
(vi) develop and, subject to market conditions, implement a liability
management plan which is designed to enable the Group to meet certain Core Tier 1 capital targets for 2009; and
(vii) use best endeavours (giving regard to reasonable operational
requirements) to maintain regular, adequate and effective monitoring, reporting, risk management and audit controls and procedures in order, among other things, to ensure that risks relating to key business processes which affect the Proposed Assets are identified, assessed and reported and are managed and mitigated appropriately.
In addition, the Royal Bank agreed in principle that, if and only if the Royal Bank accedes to the APS, it would not claim, and would disclaim, certain UK tax losses and allowances arising to members of the Group in respect of any accounting period ending on or after 31 December 2008, provided that this undertaking would not apply in respect of any such tax benefits arising in the earlier of (a) the first accounting period beginning more than five years after the relevant accession date and (b) the first accounting period beginning after the relevant accession date in which the Group becomes profitable. The company's commitments, described in this section have been superseded by the Scheme Rules and the Accession Agreement, (for details of the Accession Agreement, see below), with the exception of a commitment to inform the Department for Business, Innovation and Skills prior to making significant reductions in the level of lending being made available to certain borrowers or counterparties, which will apply until 28 February 2011, in line with the duration of the commitments under the Lending Commitments Letter described below.
RBS Group 2010400
Additional information continued
Lending Commitments Letter On 26 February 2009, the company entered into a deed poll in favour of certain UK Government departments under which it undertook to support lending to creditworthy borrowers in the UK in a commercial manner with effect from 1 March 2009. On 18 May 2009, the company entered into an amendment to this deed poll which took effect from 29 May 2009 and on 20 November 2009, the company executed a further amendment to this deed poll. This lending commitment was a pre-requisite to the company's participation in the APS and other Government backed schemes, the objective of which was to reinforce the stability of the financial system and support the recovery of the economy. Pursuant to this lending commitment, the company agreed to increase its lending in the 12 months commencing 1 March 2009 from its UK banking operations to UK businesses by, in aggregate, £16 billion above the amount previously budgeted. The company also made a commitment to increase lending to homeowners, including first time buyers, in the United Kingdom. The company undertook to increase its residential mortgage lending by at least £9 billion above the amount previously budgeted in the 12 months commencing 1 March 2009. Such additional lending was subject to the company's ordinary course pricing and other terms, and certain commercial, risk, credit and regulatory considerations. The company's compliance with its lending commitments is monitored by the UK Government, and is subject to a reporting process. The company also made certain undertakings as regards marketing in support of its lending commitments and certain other matters relating to its business and residential lending practices and policies. The lending commitments made in the deed poll supersede the commitments given by the company in the First Placing and Open Offer Agreement and the Second Placing and Open Offer Agreement. On 23 March 2010, the company agreed with the UK government certain adjustments to the above lending commitments for the 2010 commitment period (the 12 month period commencing 1 March 2010), to reflect expected economic circumstances over the period. As part of the amended lending commitments, the company has committed, among other things, to make available gross new facilities, drawn or undrawn, of £50 billion to UK businesses in the period 1 March 2010 to 28 February 2011. In addition, the company has agreed with the UK government to make available £8 billion of net mortgage lending in the 2010 commitment period. This is a decrease of £1 billion on the net mortgage lending target that previously applied to the 2010 commitment period which ends on 28 February 2011, to reflect that the mortgage lending commitment for the 2009 commitment period was increased from £9 billion to £10 billion.
B Share Acquisition and Contingent Capital Agreement On 26 November 2009, the company and HM Treasury entered into the Acquisition and Contingent Capital Agreement pursuant to which HM Treasury subscribed for the initial B shares and the Dividend Access Share (the "Acquisitions") and agreed the terms of HM Treasury's subscription for an additional £8 billion in aggregate in the form of further B shares (the "Contingent B shares"), which will be issued on the same terms as the initial B shares. The Acquisitions were subject to the satisfaction of various conditions, including the company having obtained the approval of its shareholders in relation to the Acquisitions. The company and HM Treasury further agreed the terms of the £8 billion Contingent Subscription of the Contingent B shares in the Acquisition and Contingent Capital Agreement. For a period of five years from 22 December 2009 or, if earlier, until the occurrence of a termination event or until the company decides (with FSA consent) to terminate such Contingent Subscription (the "Contingent Period"), if the Core Tier 1 ratio of the company falls below five per cent (and if certain other conditions are met) HM Treasury has committed to subscribe for the Contingent B shares in no fewer than two tranches of £6 billion and £2 billion (or such smaller amounts as the company and HM Treasury may agree). Any unused portion of the £8 billion may be subscribed in one or more further tranches. The company may, subject to certain conditions, at any time terminate the Contingent Subscription in whole or in part, with the consent of the FSA. The company is required to pay an annual fee, for the Contingent Period, in relation to the Acquisitions and the Contingent Subscription of £320 million less four per cent per annum of the value of any B shares subscribed for under the Contingent Subscription. Such fee is payable in cash or, with HM Treasury's consent, by waiving certain UK tax reliefs that are treated as deferred tax assets or through a further issue of B shares to HM Treasury. The annual fee ceases to be payable on termination of the Contingent Subscription and if the company terminates the Contingent Subscription in part, the fee will reduce proportionately. The company gave certain representations and warranties to HM Treasury on the date of the Acquisition and Contingent Capital Agreement, on the date the circular was posted to shareholders, on the first date on which all of the conditions precedent were satisfied, or waived, and on the date of the Acquisitions. The company has agreed to give such representations and warranties again on each date (if any) a Contingent Subscription is triggered and on each date (if any) on which B shares are issued pursuant to a Contingent Subscription. The company agreed to reimburse HM Treasury for its expenses incurred in connection with the Acquisitions and agreed to do so in connection with the Contingent B shares, if the Contingent Subscription is exercised. The company agreed to a number of undertakings, including with respect to: (i) restrictions on the payment of dividends or other distributions on, and the redemption of, certain securities; (ii) expectations regarding the repurchase of the B shares by the company; (iii) renegotiations of the terms of the Contingent Subscription as a result of future legislative or regulatory changes; (iv) negotiating in good faith to maintain the status of the B shares and Dividend Access Share as Core Tier 1 capital; and (v) restrictions in relation to the company's share premium account.
401RBS Group 2010
Additional information
Material contracts continued HM Treasury has agreed to waive its statutory pre-emption rights arising out of the B shares and the Dividend Access Share in respect of any future issue of equity securities by the company other than B shares and has agreed to vote its B shares and the Dividend Access Share, as applicable, in favour of each special resolution to disapply its pre- emption rights under the B shares and/or the Dividend Access Share then held by HM Treasury every time they arise. The pre-emption rights arising out of the B shares and the Dividend Access Share have also been disapplied in the Articles of Association. HM Treasury has agreed that it shall not be entitled to exercise its option to convert B shares into ordinary shares to the extent that it holds more than 75 per cent of the ordinary shares of the company or to the extent that the exercise of such option would result in it holding more than 75 per cent of the ordinary shares of the company. HM Treasury has agreed that it shall not be entitled to vote the B shares or the Dividend Access Share to the extent that votes cast on such B shares and the Dividend Access Share, together with any other votes which HM Treasury is entitled to cast in respect of any other ordinary shares held by or on behalf of HM Treasury, would exceed 75 per cent of the total votes eligible to be cast on a resolution proposed at a general meeting of the company. For as long as it is a substantial shareholder of the company (within the meaning of the UKLA's Listing Rules), HM Treasury has undertaken not to vote on related party transaction resolutions at general meetings and to direct that its affiliates do not so vote. Accession Agreement and the UK Asset Protection Scheme Terms and Conditions The company acceded to the APS through an accession agreement (the "Accession Agreement") entered into with HM Treasury, which became effective on 22 December 2009. Supplemental agreements were signed on 27 August 2010, 20 December 2010 and 10 February 2011. The Accession Agreement incorporates the terms and conditions of the APS set out in the document entitled ‘UK Asset Protection Scheme Terms and Conditions’ which is available on HM Treasury's website (the ‘Scheme Conditions’). The Accession Agreement which incorporates the Scheme Conditions is accounted for as a credit derivative and it tailors the APS to the company (by, amongst other things, setting applicable bank-specific thresholds and addressing a limited number of other bank-specific issues). Under the APS, HM Treasury is liable to make payments to the company in respect of a pre-defined pool of assets and exposures (the "Covered Assets") in respect of which a specified failure to pay, bankruptcy or restructuring trigger occurs or is deemed to occur. Payments under the APS are intended to protect the company, over time, for 90% of the amount by which cumulative losses on the whole portfolio of Covered Assets (as reduced by cumulative recoveries on the portfolio) exceed a fixed first loss threshold of £60 billion. Cumulative losses (as reduced by cumulative recoveries) below the first loss threshold, and a 10% vertical slice of any cumulative losses (as reduced by cumulative recoveries) exceeding the first loss threshold, are for the account of the company.
Protection under the APS is, subject to various requirements under the Scheme Conditions, provided in respect of the Covered Assets on the company's consolidated balance sheet as at 31 December 2008 with an aggregate covered amount of £282 billion. Protection under the APS may be lost or limited in certain specified circumstances, including the failure of a Covered Asset to satisfy certain asset eligibility criteria set out in the Scheme Conditions. During the life of the APS, the company will pay HM Treasury a non-refundable annual fee (payable in advance) of £700 million per annum for the first three years of the APS and £500 million per annum until the earlier of (i) the date of termination of the APS and (ii) 31 December 2099. The annual fee can, subject to HM Treasury's consent, be paid wholly or partly by means of the waiver of certain UK tax reliefs that are treated as deferred tax assets or funded by the issuance of additional B shares to HM Treasury. The company has the right, in certain circumstances, to withdraw from the APS permanently all or part of a Covered Asset. In addition, the company contractually has the right to terminate the APS exercisable at any time provided that the FSA has confirmed in writing to HM Treasury that it has no objection to the proposed termination. An exit fee and, potentially, a refund of HM Treasury's net payments under the APS are payable by the company upon such termination. The Scheme Conditions also contain various provisions and restrictions on the management and administration of the Covered Assets and certain related assets. The company is obliged to manage such assets in accordance with the asset management objective, which is to maximise the expected net present value of such assets (discounted at an HM Treasury rate), including by minimising losses and potential losses and maximising recoveries and potential recoveries. The company also has monitoring and reporting obligations under the Scheme Conditions which are aimed at transparency in respect of the Covered Assets to enable HM Treasury to manage and assess its exposure under the APS. In addition, the company has to establish a separate governance structure for the purposes of the APS. Further, the Scheme Conditions and the Accession Agreement also contain requirements for the development of a remuneration policy for the Group and specific remuneration requirements for certain officers and employees of the company. HM Treasury has the right to appoint one or more step-in managers to exercise extensive step-in rights in relation to all or some of the Covered Assets upon the occurrence of certain specified trigger events. Certain Scheme Conditions are subject to modification at any time with retrospective effect at the discretion of HM Treasury without the company's consent. The modification rights arise broadly and subject to certain conditions where the operation, interpretation or application of such Scheme Conditions conflicts with any of the overriding general principles set out in the Scheme Conditions. There are material restrictions on the form and substance of announcements or public statements (including any required by law or the rules of any securities exchange) made by the Group in relation to the APS or to HM Treasury in connection with the APS without HM Treasury's consent.
RBS Group 2010402
Additional information continued
In connection with its participation in the APS, the company has agreed to a number of behavioural commitments in respect of lending for businesses in the UK, personal current accounts in the UK as well as to develop and implement a capital optimisation exercise designed to increase the Group’s Core Tier 1 capital. The Tax Loss Waiver On 26 November 2009, the company entered into three agreements (together comprising the Tax Loss Waiver) which provide the right, at the company’s option, subject to HM Treasury consent, to satisfy all or part of the annual fee in respect of the APS or the Contingent Subscription arrangement, and the exit fee payable in connection with any termination of the Group’s participation in the APS (but not the refund of the net payments it has received from HM Treasury under the APS), by waiving the entitlement to certain UK tax reliefs that are treated as deferred tax assets. The Tax Loss Waiver contains undertakings designed to prevent the Group from engaging in arrangements which have a main purpose of reducing the net cost to the Group of any waiver of tax reliefs pursuant to the Tax Loss Waiver. State Aid Commitment Deed As a result of the State Aid granted to the company, it was required to work with HM Treasury to submit a State Aid restructuring plan to the European Commission, which has now been approved under the State Aid rules. The company has agreed a series of measures to be implemented over a four year period, which supplement the measures in the company's strategic plan. The Group entered into a State Aid Commitment Deed with HM Treasury which provides that the Group will comply or procure compliance with these measures and behavioural commitments. The Group agreed to do all acts and things necessary to ensure HM Treasury's compliance with its obligations under any European Commission decision approving State Aid to the Group. The State Aid Commitment Deed also provides that if the European Commission adopts a decision that the UK Government must recover any State Aid (a "Repayment Decision") and the recovery order of the Repayment Decision has not been annulled or suspended by the Court of First Instance or the European Court of Justice, then the Group must repay HM Treasury any aid ordered to be recovered under the Repayment Decision. The State Aid Commitment Deed also provides for the Group's undertakings in respect of State Aid to be modified in certain limited circumstances. However, HM Treasury has undertaken that it will not, without the consent of the Group, agree modifications to the Group's undertakings with respect to State Aid which are significantly more onerous to the Group than those granted in order to obtain the State Aid approval.
State Aid Costs Reimbursement Deed Under the State Aid Costs Reimbursement Deed, the Group has agreed to reimburse HM Treasury for fees, costs and expenses associated with the State Aid and State Aid approval. Sale of RBS England and Wales and NatWest Scotland branch based business to Santander UK plc On 4 August 2010, the Royal Bank, NatWest Plc and National Westminster Home Loans Limited entered into a Sale and Purchase Agreement with Santander UK plc pursuant to which the Royal Bank, NatWest Plc and National Westminster Home Loans Limited agreed to sell 311 Royal Bank of Scotland branded branches in England and Wales, seven NatWest branded branches in Scotland, the retail and SME customer accounts attached to these branches, the Direct SME business, and certain mid-corporate businesses and associated assets and liabilities to Santander UK plc for a premium of £350 million to net assets at closing. The consideration will be paid in cash and is subject to certain closing adjustments, including those relating to the performance of the business. The transaction is subject to regulatory, anti-trust and other conditions. RBS Sempra Commodities JV sales On 16 February 2010, the Group announced that RBS Sempra Commodities JV, a joint venture owned by the Royal Bank and Sempra Energy, had agreed to sell to J.P. Morgan Ventures Energy Corporation (JPMorgan) its metals, oils and European energy business lines. The Group announced completion of the transaction on 2 July 2010, for a total cash consideration of US$1.6 billion, post interim distributions of which the company's share is approximately 47 per cent. On 20 September 2010, the Group announced that RBS Sempra Commodities JV had agreed to sell its Sempra Energy Solutions business line to Noble Americas Gas & Power Corp. for consideration of approximately US$317 million in cash, plus the assumption of approximately US$265 million in debt. The Group’s share of the consideration is approximately 51 per cent, or US$162 million. The transaction closed on 1 November 2010. On 7 October 2010, the Group announced that RBS Sempra Commodities JV had agreed to sell substantial assets of its commodities trading North American Power and Gas business lines to JPMorgan. The transaction closed on 1 December 2010 and JPMorgan acquired these net assets for consideration of US$220 million in cash based on the 30 June 2010 balance sheet, of which the Group’s share is approximately 51 per cent, i.e. US$112 million. The value of the gross assets acquired by JPMorgan was US$6 billion (unaudited) as of 30 June 2010.
403RBS Group 2010
Additional information
Material contracts continued Sale of Global Merchant Services business On 6 August 2010, the Royal Bank, Citizens Financial Group, Inc., RBS Netherlands Holdings B.V., Ulster Bank Limited, Ulster Bank Ireland Limited, NatWest Plc and Ship Bidco Limited (a company representing Advent International (‘Advent’) and Bain Capital (‘Bain’) which has now changed its name to WorldPay (UK) Limited) entered into a Transfer Agreement pursuant to which the Royal Bank (either directly or through its group companies) sold 80.01 per cent of its Global Merchant Services business for an enterprise value of up to £2.025 billion. Approximately £1.45 billion (subject to customary post-closing adjustments) was received in cash on closing of the sale of the 80.01 per cent interest. Up to £200 million is receivable in the future if the returns realised by Advent and Bain exceed certain thresholds. The sale completed on 30 November 2010.
The Royal Bank, in its capacity as holder of a retained interest in the Global Merchant Services business, also entered into an Investment Agreement on 6 August 2010 (subsequently amended and restated on 29 November 2010) with Ship Bidco Limited (now WorldPay (UK) Limited), certain other acquisition vehicles, specified management and funds operated by Advent International and Bain Capital relating to the operations of the joint venture company which is the uppermost of the intermediate acquisition vehicles and the ultimate parent company of WorldPay (UK) Limited. The interests of the Royal Bank are insufficient to block major decisions of this joint venture company at the shareholder or board level.
RBS Group 2010404
Additional information continued
Risk factors Set out below are certain risk factors which could adversely affect the Group's future results and cause them to be materially different from expected results. The Group's results could also be affected by competition and other factors. The factors discussed in this report should not be regarded as a complete and comprehensive statement of all potential risks and uncertainties. The company and its UK bank subsidiaries may face the risk of full nationalisation or other resolution procedures under the Banking Act 2009. Under the Banking Act 2009 (the “Banking Act”), substantial powers have been granted to HM Treasury, the Bank of England and the FSA (together, the “Authorities”) as part of a special resolution regime (the “SRR”). These powers enable the Authorities to deal with UK banks, building societies and other institutions with permission to accept deposits pursuant to Part IV of the Financial Services and Markets Act 2000 (“FSMA”) (each, a “relevant entity”) where the conditions set out in the next paragraph headed “The SRR may be triggered prior to the insolvency of the company or its UK bank subsidiaries” are met. The SRR consists of three stabilisation options and two insolvency and administration procedures applicable to UK banks which may be commenced by the Authorities. The stabilisation options provide for: (i) transfer of all or part of the business of the relevant entity to a private sector purchaser; (ii) transfer of all or part of the business of the relevant entity to a “bridge bank” established by the Bank of England; and (iii) temporary public ownership (nationalisation) of the relevant entity or its UK-incorporated holding company. In each case, the Authorities have been granted wide powers under the Banking Act including powers to modify contractual arrangements in certain circumstances and powers for HM Treasury to disapply or modify laws (with possible retrospective effect) to enable the powers under the Banking Act to be used effectively. The following paragraphs of this risk factor headed “The company and its UK bank subsidiaries may face the risk of full nationalisation or other resolution procedures under the Banking Act 2009” set out some of the possible consequences of the exercise of those powers under the SRR. The SRR may be triggered prior to the insolvency of the company or its UK bank subsidiaries. The purpose of the stabilisation options is to address the situation where all or part of the business of a relevant entity has encountered, or is likely to encounter, financial difficulties. Accordingly, the stabilisation options may only be exercised if (a) the FSA is satisfied that a relevant entity such as the company’s UK banking subsidiaries, including the Royal Bank and NatWest, is failing, or is likely to fail, to satisfy the threshold conditions within the meaning of section 41(1) of the FSMA (which are the conditions that a relevant entity must satisfy in order to retain its authorisation to perform regulated activities), (b) following consultation with the other Authorities, the FSA determines that it is not reasonably likely that (ignoring the stabilisation options) action will be taken that will enable the relevant entity to satisfy those threshold conditions, and (c) the Authorities consider the exercise of the stabilisation options to be necessary, having regard to certain public interest considerations (such as the stability of the UK financial systems, public confidence in the UK banking systems and the protection of depositors). It is therefore possible that one of the stabilisation options could be exercised prior to the point
at which any insolvency proceedings with respect to the relevant entity (such as the Royal Bank or NatWest) or the company could be initiated. The stabilisation options may be exercised by means of powers to transfer property, rights or liabilities of a relevant entity and shares and other securities issued by a relevant entity. HM Treasury may also take the parent company of a relevant entity (such as the company) into temporary public ownership provided that certain conditions are met. Temporary public ownership is effected by way of a share transfer order and can be actioned irrespective of the financial condition of the parent company. Various actions may be taken in relation to any securities issued by the company without the consent of the holders thereof. If HM Treasury decides to take the company into temporary public ownership, it may take various actions in relation to any securities issued by the company (the “Securities”) without the consent of holders of the Securities, including (among other things): (i) transferring the Securities free from any contractual, legislative or
other restrictions on transfer; (ii) transferring the Securities free from any trust, liability or other
encumbrance; (iii) extinguishing any rights to acquire Securities; (iv) delisting the Securities; (v) converting the Securities into another form or class (the scope of
which power is unclear, although may include, for example, conversion of the Securities into equity securities);
(vi) disapplying any termination or acceleration rights or events of default under the terms of the Securities which would be triggered by the transfer or certain related events; or
(vii) where property is held on trust, removing or altering the terms of such trust.
Where HM Treasury has made a share transfer order in respect of securities issued by the holding company of a relevant entity, HM Treasury may make an order providing for the property, rights or liabilities of the holding company or of any relevant entity in the holding company group to be transferred and where such property is held on trust, removing or altering the terms of such trust. The taking of any such actions may adversely affect the rights of holders of the Securities, the price or value of their investment in the Securities and/or the ability of the company to satisfy its obligations under the Securities and/or contracts related to the Securities. Where the transfer powers are effected, HM Treasury is required to make certain compensation or resolution fund orders and holders of Securities may have a claim for compensation under one of the compensation schemes contemplated by the Banking Act if any action is taken in respect of the Securities (and if the relevant order provides for the amount of compensation payable to be determined by an independent valuer, then for the purposes of determining an amount of compensation, the independent valuer must disregard actual or potential financial assistance provided by the Bank of England or HM Treasury). However, there can be no assurance that compensation would be assessed to be payable or that holders of the Securities would recover any compensation promptly and/or equal to any loss actually incurred.
405RBS Group 2010
Additional information
Risk factors continued Contractual arrangements between the company, other companies within the Group and/or the bridge bank or private sector purchaser may be created, modified or cancelled. If the company were taken into temporary public ownership and a partial transfer of its or any relevant entity’s business were effected, or if a relevant entity were made subject to the SRR and a partial transfer of its business to another entity were effected, the transfer may directly affect the company and/or its Group companies by creating, modifying or cancelling its or their contractual arrangements with a view to ensuring the provision of such services and facilities as are required to enable the bridge bank or private sector purchaser to operate the transferred business (or any part of it) effectively. For example, the transfer may (among other things) (i) require the company or Group companies to support and co-operate with the bridge bank or private sector purchaser; (ii) cancel or modify contracts or arrangements between the company or the transferred business and a Group company; or (iii) impose additional obligations on the company under new or existing contracts. There can be no assurance that the taking of any such actions would not adversely affect the ability of the company to satisfy its obligations under the issued Securities or related contracts. A partial transfer of the company’s business may result in a deterioration of its creditworthiness. If the company were taken into temporary public ownership and a partial transfer of its or any relevant entity’s business were effected, or if a relevant entity were made subject to the SRR and a partial transfer of its business to another entity was effected, the nature and mix of the assets and liabilities not transferred may adversely affect the company’s financial condition and increase the risk that the company may eventually become subject to administration or insolvency proceedings pursuant to the Banking Act. In such circumstances, holders of Securities may have a claim for compensation under one of the compensation schemes contemplated by the Banking Act, but there can be no assurance that compensation would be assessed to be payable or that such holders would recover any compensation promptly and/or equal to any loss actually incurred. While the main provisions of the Banking (Special Provisions) Act 2008 were in force, which conferred certain transfer powers on HM Treasury, the UK Government took action under that Act in respect of a number of UK financial institutions, including, in extreme circumstances, full and partial nationalisation. There have been concerns in the market in recent years regarding the risks of such nationalisation in relation to the company and other UK banks. If economic conditions in the UK or globally were to deteriorate, or the events described in the following risk factors were to occur to such an extent that they had a materially adverse impact on the financial condition, perceived or actual credit quality, results of operations or business of any of the relevant entities in the Group, the UK Government may decide to take similar action in relation to the company under the Banking Act. Given the extent of the Authorities’ powers under the Banking Act, it is difficult to predict the effect that such actions might have on the Group and any securities issued by the company or Group companies. However, potential impacts may include full nationalisation of the company, the total loss of value in Securities issued by the company and the inability of the company to perform its obligations under the Securities.
If a relevant stabilisation option were effected in respect of the company or the stabilisation options were effected in respect of a relevant entity or its business within the Group, HM Treasury would be required to make certain compensation or resolution fund orders, which would depend on the stabilisation power adopted. For example, in the event that the Bank of England were to transfer some of the business of a relevant entity to a bridge bank, HM Treasury would have to make a resolution fund order including a third party compensation order pursuant to the Banking Act (Third Party Compensation Arrangements for Partial Property Transfers) Regulations 2009. However, there can be no assurance that compensation would be assessed to be payable or that holders of the Securities would recover any compensation promptly and/or equal to any loss actually incurred. The Group’s businesses, earnings and financial condition have been and will continue to be affected by the global economy and instability in the global financial markets. The performance of the Group has been and will continue to be influenced by the economic conditions of the countries in which it operates, particularly the UK, the US and other countries throughout Europe and Asia. The outlook for the global economy over the near to medium term remains challenging, particularly in the UK, the US and other European economies. In addition, the global financial system has yet to fully overcome the difficulties which first manifested themselves in August 2007 and financial markets conditions have not yet fully normalised. These conditions led to severe dislocation of financial markets around the world and unprecedented levels of illiquidity in 2008 and 2009, resulting in the development of significant problems at a number of the world’s largest corporate institutions operating across a wide range of industry sectors, many of which are the Group’s customers and counterparties in the ordinary course of its business. In response to this economic instability and market illiquidity, a number of governments, including the UK Government, the governments of the other EU member states and the US Government intervened in order to inject liquidity and capital into the financial system, and in some cases, to prevent the failure of these institutions. Despite such measures, the volatility and disruption of the capital and credit markets have continued, with many forecasts predicting only modest levels of GDP growth in the near to medium term. Similar conditions are likely to exist in a number of the Group’s key markets, including those in the US and Europe, particularly Ireland. These conditions have exerted, and may continue to exert, downward pressure on asset prices and on availability of credit for financial institutions and upward pressure on the cost of credit for financial institutions, including the company, the Royal Bank, RBS Holdings N.V. and The Royal Bank of Scotland N.V., and will continue to impact the credit quality of the Group’s customers and counterparties. Such conditions, alone or in combination with regulatory changes or actions of other market participants, may cause the Group to incur losses or to experience further reductions in business activity, increased funding costs and funding pressures, lower prices of the ordinary shares, decreased asset values, additional write-downs and impairment charges and lower profitability.
RBS Group 2010406
Additional information continued

In particular, the performance of the Group may be affected by economic conditions impacting EU member states. For example, the financial problems recently experienced by the governments of certain EU member states (including Greece and Ireland) may lead to the issuance of significant volumes of debt by such member states and European Union entities, which may in turn reduce demand for debt issued by financial institutions and corporate borrowers. This, as well as credit rating downgrades experienced by such member states, could adversely affect the Group’s access to the debt capital markets and may increase the Group’s funding costs, which could have a material adverse impact on the Group’s earnings, cash flow and financial condition. In addition, EU member states in which the Group operates have agreed to provide financial assistance to certain member states, currently Greece and Ireland, and may be required to provide financial assistance to other EU member states in the future, which may in turn have a negative impact on the financial condition of those EU member states providing the assistance. The Group’s exposure to the economies of such member states, in particular Ireland, has resulted in the Group making significant provisions. Should the adverse economic conditions currently faced by such member states be replicated in other EU member states, the risks discussed above would be exacerbated. In addition, the Group will continue to be exposed to the risk of loss if major corporate borrowers or counterparty financial institutions fail or are otherwise unable to meet their obligations. The Group is currently exposed to country concentration risk in the US, the UK and the rest of Europe and certain business sector concentration risk relating to personal and banking and financial institution exposures. The Group’s performance may also be affected by future recovery rates on assets and the historical assumptions underlying asset recovery rates, which (as has already occurred in certain instances) may no longer be accurate given the unprecedented market disruption and general economic instability. The precise nature of all the risks and uncertainties the Group faces as a result of current economic conditions cannot be predicted and many of these risks are outside the control of the Group. The Group is subject to a variety of risks as a result of implementing the State Aid restructuring plan and is prohibited from making discretionary dividend or coupon payments on existing hybrid capital instruments (including preference shares and B shares) which may impair the Group’s ability to raise new Tier 1 capital. The Group was required to obtain State Aid approval for the aid given to the Group by HM Treasury as part of the placing and open offer undertaken by the company in December 2008 (the “First Placing and Open Offer”), the issuance of £25.5 billion of B shares in the capital of the company (the “B shares”) which are, subject to certain terms and conditions, convertible into ordinary shares of the company to HM Treasury, a contingent commitment by HM Treasury to subscribe (the “Contingent Subscription”) for up to an additional £8 billion of B shares (the “Contingent B shares”) if certain conditions are met and the Group’s participation in the Asset Protection Scheme (the “APS”) (the “State Aid”). In that context, as part of the terms of the State Aid approval, the Group, together with HM Treasury, agreed the terms of a restructuring plan (the “State Aid restructuring plan”).
As part of the State Aid restructuring plan, there is a prohibition on the making of discretionary dividend (including preference shares and B shares) or coupon payments on existing hybrid capital instruments for a two-year period which commenced on 30 April 2010. These restrictions will prevent the company, the Royal Bank and other Group companies (other than companies in the RBS Holdings N.V. group, (which was renamed from ABN AMRO Holding N.V. on 1 April 2010) which are subject to different restrictions) from paying dividends on their preference shares and coupons on other Tier 1 securities, and the company from paying dividends on its ordinary shares, for the same duration, and it may impair the Group’s ability to raise new capital through the issuance of ordinary shares and other securities issued by the company. The Group is subject to a variety of risks as a result of implementing the State Aid restructuring plan, including required asset disposals. In particular, the Group agreed to undertake a series of measures to be implemented over a four-year period from December 2009, which include disposing of RBS Insurance, the Group’s insurance division (subject to potentially maintaining a minority interest until the end of 2014). The company also agreed to divest its global card payment services business, Global Merchant Services (“GMS”), by the end of 2013, subject to the company retaining up to 20 per cent. of GMS if required by the purchaser, its interest in RBS Sempra Commodities LLP (“RBS Sempra Commodities”), the Group’s joint venture with Sempra Energy and a leading global commodities trader and the Royal Bank branch-based business in England and Wales and the NatWest branches in Scotland, along with the Direct small and medium-size enterprise (SME) customers and certain mid-corporate customers across the UK. The Group has progressed with certain of these disposals over the course of 2010. For further information, see “Material Contracts”. There is no assurance that the price that the Group receives or has received for any assets sold pursuant to the State Aid restructuring plan will be at a level the Group considers adequate or which it could obtain in circumstances in which the Group was not required to sell such assets in order to implement the State Aid restructuring plan or if such sale were not subject to the restrictions contained in the terms thereof. Further, if the Group fails to complete any of the required disposals within the agreed timeframes for such disposals, under the terms of the State Aid approval, a divestiture trustee may be empowered to conduct the disposals, with the mandate to complete the disposal at no minimum price. Furthermore, if the Group is unable to comply with the terms of the State Aid approval, it could constitute a misuse of aid. In circumstances where the European Commission doubts that the Group is complying with the terms of the State Aid approval, it may open a formal investigation. At the conclusion of any such investigation, if the European Commission decided that there had been misuse of aid, it could issue a decision requiring HM Treasury to recover the misused aid which could have a material adverse impact on the Group.
407RBS Group 2010
Additional information
Risk factors continued In implementing the State Aid restructuring plan, the Group will lose existing customers, deposits and other assets (both directly through the sale and potentially through the impact on the rest of the Group’s business arising from implementing the State Aid restructuring plan) and the potential for realising additional associated revenues and margins that it otherwise might have achieved in the absence of such disposals. Further, the loss of such revenues and related income may extend the time period over which the Group may pay any amounts owed to HM Treasury under the APS or otherwise. The implementation of the State Aid restructuring plan may also result in disruption to the retained business and give rise to significant strain on management, employee, operational and financial resources, impacting customers and employees and giving rise to separation costs which could be substantial. The implementation of the State Aid restructuring plan may result in the emergence of one or more new viable competitors or a material strengthening of one or more of the Group’s existing competitors in the Group’s markets. The effect of this on the Group’s future competitive position, revenues and margins is uncertain and there could be an adverse effect on the Group’s operations and financial condition and its business generally. If any or all of the risks described above, or any other currently unforeseen risks, materialise, there could be a materially adverse impact on the Group’s business, operations, financial condition, capital position and competitive position. The Group’s ability to implement its strategic plan depends on the success of the Group’s refocus on its core strengths and its balance sheet reduction programme. In light of the changed global economic outlook, the Group is engaged in a financial and core business restructuring which is focused on achieving appropriate risk-adjusted returns under these changed circumstances, reducing reliance on wholesale funding and lowering exposure to capital intensive businesses. A key part of this restructuring is the programme announced in February 2009 to run-down and sell the Group’s non-core assets and businesses and the continued review of the Group’s portfolio to identify further disposals of certain non-core assets and businesses. Assets identified for this purpose and allocated to the Group's Non-Core division totalled £252 billion, excluding derivatives, as at 31 December 2008. At 31 December 2010, this total had reduced to £137.9 billion, excluding derivatives, largely as a result of the progress made in business disposals and portfolio sales during the course of 2010. This balance sheet reduction programme continues alongside the disposals under the State Aid restructuring plan approved by the European Commission.
Because the ability to dispose of assets and the price achieved for such disposals will be dependent on prevailing economic and market conditions, which may remain challenging, there is no assurance that the Group will be able to sell or run-down (as applicable) those remaining businesses it is seeking to exit either on favourable economic terms to the Group or at all. Tax liabilities could arise on the disposal of assets. Furthermore, where transactions are entered into for the purpose of selling non-core assets and businesses, they may be subject to conditions precedent, including government and regulatory approvals and completion mechanics that in certain cases may entail consent from customers. There is no assurance that such conditions precedent will be satisfied, or consents and approvals obtained, in a timely manner or at all. There is consequently a risk that the Group may fail to complete such disposals by any agreed longstop date. In addition, the Group may be liable for any deterioration in businesses being sold between the announcement of the disposal and its completion. In certain cases, the period between the announcement of a transaction and its completion may be lengthy and may span many months. Other risks that may arise out of the disposal of the Group’s assets include ongoing liabilities up to completion of the relevant transaction in respect of the assets and businesses disposed of, commercial and other risks associated with meeting covenants to the buyer during the period up to completion, the risk of employee and customer attrition in the period up to completion, substantive indemnity obligations in favour of the buyer, the risk of liability for breach of warranty, the need to continue to provide transitional service arrangements for potentially lengthy periods following completion of the relevant transaction to the businesses being transferred and redundancy and other transaction costs. Further, the Group may be required to enter into covenants agreeing not to compete in certain markets for specific periods of time. In addition, as noted above in the context of the State Aid restructuring plan and in the context of other disposals, the Group will lose existing customers, deposits and other assets (both directly through the sale and potentially through the impact on the rest of the Group’s business arising from implementing the restructuring plans) and the potential for realising additional associated revenues and margins that it otherwise might have achieved in the absence of such disposals. Any of the above factors could negatively affect the Group's ability to implement its strategic plan and have a material adverse effect on the Group's business, results of operations, financial condition, capital ratios and liquidity and could result in a loss of value in the Securities.
RBS Group 2010408
Additional information continued
Lack of liquidity is a risk to the Group’s business and its ability to access sources of liquidity has been, and will continue to be, constrained. Liquidity risk is the risk that a bank will be unable to meet its obligations, including funding commitments, as they fall due. This risk is inherent in banking operations and can be heightened by a number of enterprise specific factors, including an over-reliance on a particular source of wholesale funding (including, for example, short-term and overnight funding), changes in credit ratings or market-wide phenomena such as market dislocation and major disasters. During recent years, credit markets worldwide have experienced a severe reduction in liquidity and term-funding. During this time, the market perception of bank credit risk has changed significantly and banks that are deemed by the market to be riskier have issued debt at a premium to the cost of debt for banks that are perceived by the market as being safer. The uncertainty regarding the perception of credit risk across different banking groups also led to reductions in inter-bank lending, and hence, in common with many other banking groups, the Group’s access to traditional sources of liquidity has been, and may again be, restricted. In addition, in common with other banking groups, the Group has experienced pressures to increase the average maturity of its wholesale funding. An increase in the maturity of wholesale funding has the effect of increasing the Group’s overall cost of funding. The Group’s liquidity management focuses on maintaining a diverse and appropriate funding strategy for its assets, controlling the mismatch of maturities and carefully monitoring its undrawn commitments and contingent liabilities. However, the Group’s ability to access sources of liquidity (for example, through the issue or sale of financial and other instruments or through the use of term loans) during recent periods of liquidity stress has been constrained to the point where it, in common with many other banking groups, has had to rely on shorter term and overnight funding with a consequent reduction in overall liquidity, and to increase its recourse to liquidity schemes provided by central banks. While money market conditions improved during the course of 2009 and 2010, with the Group seeing a material reduction of funding from central banks and the issuance of non-government guaranteed term debt, further tightening of credit markets could have a materially adverse impact on the Group. The Group, in common with other banking groups, may need to seek funds from alternative sources and potentially at higher costs than has previously been the case. In addition, there is also a risk that corporate and financial institution counterparties with credit exposures may seek to reduce their credit exposures to banks, given current risk aversion trends. It is possible that credit market dislocation becomes so severe that overnight funding from non-government sources ceases to be available. Like many banking groups, the Group relies on customer deposits to meet a considerable portion of its funding. Furthermore, as part of its ongoing strategy to improve its liquidity position, the Group is actively seeking to increase the proportion of its funding represented by customer deposits. However, such deposits are subject to fluctuation due to certain factors outside the Group’s control, such as a loss of confidence, increasing competitive pressures for retail customer deposits or the encouraged or mandated repatriation of deposits by foreign wholesale or central bank depositors, which could result in a significant outflow of deposits within a short period of time. There is currently heavy
competition among UK banks for retail customer deposits, which has increased the cost of procuring new deposits and impacted the Group’s ability to grow its deposit base. An inability to grow, or any material decrease in, the Group’s deposits could, particularly if accompanied by one of the other factors described above, have a materially adverse impact on the Group’s ability to satisfy its liquidity needs unless corresponding actions were taken to improve the liquidity profile of other deposits or to reduce assets. Significant progress was made during the course of 2010 in reducing non-core asset levels. While the liquidity position of the Group may be materially adversely impacted if it is unable to achieve the run-off and sale of non-core and other assets and businesses as expected, the magnitude of this risk reduced during the course of 2010. Any significant delay in those plans may nevertheless require the Group to consider disposals of other assets not previously identified for disposal to achieve its funded balance sheet target level. The Group has participated in governmental support schemes including the UK Government Credit Guarantee Scheme and the Special Liquidity Scheme. The Credit Guarantee Scheme closed for new issuance in February 2010 and the Special Liquidity Scheme closed for new transactions in January 2009. All of the Group’s financing under the United Kingdom Government Credit Guarantee Scheme and the Special Liquidity Scheme matures in 2011 and 2012. As at 31 December 2010, the total amount outstanding of debt instruments issued by RBS which benefit from the United Kingdom Government Credit Guarantee scheme was £41.5 billion. The Group expects to mitigate the impact of this refinancing concentration through a combination of seeking funds from alternative sources, the continuation of the Group’s balance sheet reduction programme and other reductions in the Group’s net wholesale funding requirement. However, there can be no assurance that such mitigation efforts will be successful. There can be no assurance that the measures described above, alongside other available measures, will succeed in improving the funding and liquidity in the markets in which the Group operates, or that these measures, combined with any increased cost of any funding currently available in the market, will not lead to a further increase in the Group’s overall cost of funding or require the Group to consider disposals of other assets not previously identified for disposal to reduce its funding requirements, each of which could have a material adverse impact on the Group’s financial condition and results of operations or result in a loss of value in the Securities. The financial performance of the Group has been materially affected by deteriorations in borrower credit quality and it may continue to be impacted by any further deteriorations, including as a result of prevailing economic and market conditions, and legal and regulatory developments. Risks arising from changes in credit quality and the recoverability of loans and amounts due from counterparties are inherent in a wide range of the Group’s businesses. Whilst some economies stabilised over the course of the last two years, the Group may continue to see adverse changes in the credit quality of its borrowers and counterparties, for example as a result of their inability to refinance their debts, with increasing delinquencies, defaults and insolvencies across a range of sectors (such as the personal and financial institution sectors) and in a number of geographies (such as the UK, the US and the rest of Europe, particularly Ireland).
409RBS Group 2010
Additional information
Risk factors continued The credit quality of the Group’s borrowers and counterparties is impacted by prevailing economic and market conditions, as well as by the legal and regulatory landscape in their respective markets, and if there is a further deterioration in economic and market conditions in one or more markets in which the Group operates or there are changes to the legal or regulatory landscapes in such markets, this could worsen the credit quality of the Group’s borrowers and counterparties and also impact the Group's ability to enforce contractual security rights. In the United States during the last year there has been disruption in the ability of certain financial institutions to complete foreclosure proceedings in a timely manner (or at all), including as a result of interventions by certain states and local governments. This disruption has lengthened the time to complete foreclosures, increased the backlog of repossessed properties and, in certain cases, has resulted in the invalidation of purported foreclosures. In addition, a number of other financial institutions have experienced increased repurchase demands in respect of US mortgage loans or other related securities originated and sold. However, the Group has not experienced a significant volume of repurchase demands in respect of similar loans or related securities it originated or sold and has not ceased any of its US foreclosure activities. The trends and risks affecting borrower credit quality have caused, and in the future may cause, the Group to experience further and accelerated impairment charges, increased repurchase demands, higher costs, additional write-downs and losses for the Group, and may result in a loss of value in the Securities. The actual or perceived failure or worsening credit of the Group’s counterparties has adversely affected and could continue to adversely affect the Group. The Group’s ability to engage in routine funding transactions has been and will continue to be adversely affected by the actual or perceived failure or worsening credit of its counterparties, including other financial institutions and corporate borrowers. The Group has exposure to many different industries and counterparties and routinely executes transactions with counterparties in the financial industry, including brokers and dealers, commercial banks, investment banks, mutual and hedge funds and other institutional clients. As a result, defaults by, or even the perceived creditworthiness of or concerns about, one or more corporate borrowers, financial institutions, sovereign counterparties or the financial services industry generally, have led to market-wide liquidity problems, losses and defaults and could lead to further losses being incurred by the Group or by other institutions. Many of these transactions expose the Group to credit risk in the event of default of the Group’s counterparty or client and the Group does have significant exposures to certain individual counterparties (including counterparties in certain weakened sectors and geographic markets, particularly the United States and Europe). In addition, the Group’s credit risk is exacerbated when the collateral it holds cannot be realised or is liquidated at prices not sufficient to recover the full amount of the loan or derivative exposure that is due to the Group, which is most likely to occur during periods of illiquidity and depressed asset valuations, such as those experienced in recent years. Any such losses could have an adverse effect on the Group’s results of operations and financial condition or result in a loss of value in the Securities.
The Group’s earnings and financial condition have been, and its future earnings and financial condition may continue to be, materially affected by depressed asset valuations resulting from poor market conditions. Financial markets continue to be subject to significant stress conditions, where steep falls in perceived or actual asset values have been accompanied by a severe reduction in market liquidity, as exemplified by recent events affecting asset-backed collateralised debt obligations, residential mortgage-backed securities and the leveraged loan market. In dislocated markets, hedging and other risk management strategies have proven not to be as effective as they are in normal market conditions due in part to the decreasing credit quality of hedge counterparties, including monoline and other insurance companies and credit derivative product companies. Severe market events have resulted in the Group recording large write-downs on its credit market exposures in recent years. Any deterioration in economic and financial market conditions could lead to further impairment charges and write-downs. Moreover, market volatility and illiquidity (and the assumptions, judgements and estimates in relation to such matters that may change over time and may ultimately not turn out to be accurate) make it difficult to value certain of the Group’s exposures. Valuations in future periods, reflecting, among other things, then-prevailing market conditions and changes in the credit ratings of certain of the Group’s assets, may result in significant changes in the fair values of the Group’s exposures, even in respect of exposures, such as credit market exposures, for which the Group has previously recorded write-downs. In addition, the value ultimately realised by the Group may be materially different from the current or estimated fair value. Any of these factors could require the Group to recognise further significant write-downs in addition to those already recorded or realised or realise increased impairment charges, which may have a material adverse effect on its financial condition and its results of operations or result in a loss of value in the Securities. Further information about the write-downs which the Group has incurred and the assets it has reclassified can be found in the Risk and balance sheet management section of the Business review. The value or effectiveness of any credit protection that the Group has purchased from monoline and other insurers and other market counterparties (including credit derivative product companies) depends on the value of the underlying assets and the financial condition of the insurers and such counterparties. The Group has credit exposure arising from over-the-counter derivative contracts, mainly credit default swaps (“CDSs”), which are carried at fair value. The fair value of these CDSs, as well as the Group’s exposure to the risk of default by the underlying counterparties, depends on the valuation and the perceived credit risk of the instrument against which protection has been bought. Since 2007, monoline and other insurers and other market counterparties (including credit derivative product companies) have been adversely affected by their exposure to residential mortgage linked and corporate credit products, whether synthetic or otherwise, and their actual and perceived creditworthiness has deteriorated rapidly, which may continue. If the financial condition of these counterparties or their actual or perceived creditworthiness deteriorates further, the Group may record further credit valuation adjustments on the credit protection bought from these counterparties under the CDSs in addition to those already recorded and such adjustments may have a material adverse impact on the Group’s financial condition and results of operations.
RBS Group 2010410
Additional information continued
Changes in interest rates, foreign exchange rates, credit spreads, bond, equity and commodity prices, basis, volatility and correlation risks and other market factors have significantly affected and will continue to affect the Group’s business and results of operations. Some of the most significant market risks the Group faces are interest rate, foreign exchange, credit spread, bond, equity and commodity price and basis, volatility and correlation risks. Changes in interest rate levels, yield curves and spreads may affect the interest rate margin realised between lending and borrowing costs, the effect of which may be heightened during periods of liquidity stress, such as those experienced in recent years. Changes in currency rates, particularly in the sterling-US dollar and sterling-euro exchange rates, affect the value of assets, liabilities, income and expenses denominated in foreign currencies and the reported earnings of the company’s non-UK subsidiaries (principally Citizens Financial Group, Inc. (“Citizens”), The Royal Bank of Scotland N.V. (which was renamed from “ABN AMRO Bank N.V.” on 6 February 2010) (“RBS N.V.”) and RBS Securities Inc.) and may affect income from foreign exchange dealing. The company prepares its consolidated financial statements in sterling. Fluctuations in the exchange rates used to translate other currencies into sterling affect the company’s reported consolidated financial condition, results of operations and cash flows from year to year and those of the Group’s operations whose functional currency is not sterling. The performance of financial markets may affect bond, equity and commodity prices and, therefore, cause changes in the value of the Group’s investment and trading portfolios. This has been the case during the period since August 2007, with market disruptions and volatility resulting in significant variations in the value of such portfolios. As part of its ongoing derivatives operations, the Group also faces significant basis, volatility and correlation risks for which materialisation is highly dependent on relative changes in the first order risks referred to above. While the Group has implemented risk management methods to mitigate and control these and other market risks to which it is exposed, it is difficult, particularly in the current environment, to predict with accuracy changes in economic or market conditions and to anticipate the effects that such changes could have on the Group’s financial performance and business operations. The Group’s borrowing costs, its access to the debt capital markets and its liquidity depend significantly on its and the UK Government’s credit ratings. The company, the Royal Bank and other Group members have been subject to a number of credit rating downgrades in the recent past. Any future reductions in the long-term or short-term credit ratings of the company or one of its principal subsidiaries (particularly the Royal Bank) would further increase its borrowing costs, require the Group to replace funding lost due to the downgrade, which may include the loss of customer deposits, and may also limit the Group’s access to capital and money markets and trigger additional collateral requirements in derivatives contracts and other secured funding arrangements. Furthermore, given the extent of the UK Government ownership and support provided to the Group through HM Treasury’s guarantee scheme
(announced by the UK Government on 8 October 2008) (the “Credit Guarantee Scheme”), any downgrade in the UK Government’s credit ratings could materially adversely affect the credit ratings of Group companies and may have the effects noted above. Standard & Poor’s Credit Market Services Europe Limited reaffirmed the UK Government’s “AAA” rating with stable outlook on 26 October 2010 and Moody’s Investors Service Limited reaffirmed the UK Government’s “Aaa” rating on 7 May 2010. Fitch Ratings Limited reaffirmed the UK Government’s “AAA” rating with stable outlook on 31 July 2009 and Moody’s Investors Service Limited reiterated the UK Government’s stable outlook on 23 June 2010. Credit ratings of RBS N.V., Ulster Bank and Citizens are also important to the Group when competing in certain markets, such as over-the-counter derivatives. As a result, any further reductions in the company’s long-term or short-term credit ratings or those of its principal subsidiaries could adversely affect the Group’s access to liquidity and competitive position, increase its funding costs and have a material adverse impact on the Group’s earnings, cash flow and financial condition or result in a loss of value in the Securities. The Group’s business performance could be adversely affected if its capital is not managed effectively or as a result of changes to capital adequacy and liquidity requirements. Effective management of the Group’s capital is critical to its ability to operate its businesses, to grow organically and to pursue its strategy of returning to standalone strength. The Group is required by regulators in the UK, the US and other jurisdictions in which it undertakes regulated activities, to maintain adequate capital resources. The maintenance of adequate capital is also necessary for the Group’s financial flexibility in the face of continuing turbulence and uncertainty in the global economy. Accordingly, the purpose of the issuance of the £25.5 billion of B shares, the grant of the Contingent Subscription and the previous placing and open offers was to allow the Group to strengthen its capital position. The FSA’s liquidity policy statement issued in October 2009 states that UK regulated firms must hold sufficient eligible securities to survive a liquidity stress and that liquidity policy statement, together with the developments described below, has resulted in the Group holding a greater amount of government securities to ensure that it has adequate liquidity in times of financial stress. On 17 December 2009, the Basel Committee on Banking Supervision (the “Basel Committee”) proposed a number of fundamental reforms to the regulatory capital framework in its consultative document entitled “Strengthening the resilience of the banking sector”. On 12 September 2010, the Group of Governors and Heads of Supervision, the oversight body of the Basel Committee, announced further details of the proposed substantial strengthening of existing capital requirements, and the reforms were endorsed by the G-20 leaders after the G-20 Summit in Seoul in November 2010. On 16 December 2010, the Basel Committee published the Basel III rules in documents entitled “Basel III: A global regulatory framework for more resilient banks and banking systems” (containing the reforms relating to capital) and “Basel III: International framework for liquidity risk measurement, standards and monitoring” (containing the reforms relating to liquidity).
411RBS Group 2010
Additional information
Risk factors continued The Basel Committee's package of reforms includes increasing the minimum common equity requirement from 2% (before the application of regulatory adjustments) to 4.5% (after the application of stricter regulatory adjustments). The total Tier 1 capital requirement, which includes common equity and other qualifying financial instruments, will increase from 4% to 6%. The total capital requirement (which comprises Tier 1 capital and Tier 2 capital) remains at 8%. In addition, banks will be required to maintain, in the form of common equity (after the application of deductions), a capital conservation buffer of 2.5% to withstand future periods of stress, bringing the total common equity requirements to 7%. If there is excess credit growth in any given country resulting in a system-wide build up of risk, a countercyclical buffer within a range of 0% to 2.5% of common equity (or possibly other fully loss absorbing capital) is to be applied as an extension of the conservation buffer. In addition, a leverage ratio will be introduced, together with a liquidity coverage ratio and a net stable funding ratio. The liquidity coverage ratio is intended to promote resilience to potential liquidity stress scenarios lasting for a 30-day period. The net stable funding ratio is intended to limit over reliance on short-term wholesale funding and has been developed to provide a sustainable maturity structure of assets and liabilities. The Basel Committee is conducting further work on systemically important financial institutions and contingent capital in close coordination with the Financial Stability Board. The Basel Committee has stated that measures may include capital surcharges, contingent capital and bail-in debt (which could be introduced by statute, possibly impacting existing as well as future issues of debt and exposing them to the risk of conversion into equity and/or write-down of principal amount). Such measures would be in addition to proposals for the write-off of Tier 1 and Tier 2 debt (and its possible conversion into ordinary shares) if a bank becomes non-viable. The Basel Committee is expected to complete by early to mid 2011 a methodology for identifying global systemically important financial institutions with a view to the Financial Stability Board and national authorities determining by mid-2011 those institutions to which the recommendations for global systemically important financial institutions will initially apply. In addition, by mid-2011, the Basel Committee is to complete a study of how much additional loss absorbency capacity global systemically important financial institutions should have and how much of such capacity could be provided by the various proposed instruments (which include contingent capital securities and bail-in debt). The implementation of the Basel III reforms will begin on 1 January 2013, however the requirements are subject to a series of transitional arrangements and will be phased in over a period of time, to be fully effective by 2019. To the extent the Group has estimated the indicative impact that Basel III reforms may have on its RWAs and capital ratios, such estimates are preliminary and subject to uncertainties and may change. In particular,
the estimates assume mitigating actions will be taken by the Group (such as deleveraging of legacy positions and securitisations, including Non-Core, as well as other actions being taken to derisk market and counterparty exposures), which may not occur as anticipated, in a timely manner, or at all. The Basel Committee changes and other future changes to capital adequacy and liquidity requirements in the UK and in other jurisdictions in which it operates, including the European Commission’s public consultation on further possible changes to the Capital Requirements Directive launched in February 2010, may require the Group to raise additional Tier 1 (including Core Tier 1) and Tier 2 capital by way of further issuances of securities, including in the form of ordinary shares or B shares and will result in existing Tier 1 and Tier 2 securities issued by the Group ceasing to count towards the Group’s regulatory capital, either at the same level as present or at all. The requirement to raise additional Core Tier 1 capital could have a number of negative consequences for the company and its shareholders, including impairing the company’s ability to pay dividends on or make other distributions in respect of ordinary shares and diluting the ownership of existing shareholders of the company. If the Group is unable to raise the requisite Tier 1 and Tier 2 capital, it may be required to further reduce the amount of its risk-weighted assets and engage in the disposal of core and other Non-Core businesses, which may not occur on a timely basis or achieve prices which would otherwise be attractive to the Group. In addition, pursuant to the State Aid approval, should the Group’s Core Tier 1 capital ratio decline to below 5 per cent. at any time before 31 December 2014, or should the Group fall short of its funded balance sheet target level (after adjustments) for 31 December 2013 by £30 billion or more, the Group will be required to reduce its risk-weighted assets by a further £60 billion in excess of its plan through further disposals of identifiable businesses and their associated assets. As provided in the Acquisition and Contingent Capital Agreement (as defined below), the Group will also be subject to restrictions on payments on its hybrid capital instruments should its Core Tier 1 ratio fall below 6 per cent. or if it would fall below 6 per cent. as a result of such payment. As at 31 December 2010, the Group’s Tier 1 and Core Tier 1 capital ratios were 12.9 per cent and 10.7 per cent., respectively, calculated in accordance with FSA requirements. Any change that limits the Group’s ability to manage effectively its balance sheet and capital resources going forward (including, for example, reductions in profits and retained earnings as a result of write-downs or otherwise, increases in risk-weighted assets, delays in the disposal of certain assets or the inability to syndicate loans as a result of market conditions, a growth in unfunded pension exposures or otherwise) or to access funding sources, could have a material adverse impact on its financial condition and regulatory capital position or result in a loss of value in the securities.
RBS Group 2010412
Additional information continued
The value of certain financial instruments recorded at fair value is determined using financial models incorporating assumptions, judgements and estimates that may change over time or may ultimately not turn out to be accurate. Under IFRS, the Group recognises at fair value: (i) financial instruments classified as “held-for-trading” or “designated as at fair value through profit or loss”; (ii) financial assets classified as “available-for-sale”; and (iii) derivatives. Generally, to establish the fair value of these instruments, the Group relies on quoted market prices or, where the market for a financial instrument is not sufficiently active, internal valuation models that utilise observable market data. In certain circumstances, the data for individual financial instruments or classes of financial instruments utilised by such valuation models may not be available or may become unavailable due to changes in market conditions, as has been the case during the recent financial crisis. In such circumstances, the Group’s internal valuation models require the Group to make assumptions, judgements and estimates to establish fair value. In common with other financial institutions, these internal valuation models are complex, and the assumptions, judgements and estimates the Group is required to make often relate to matters that are inherently uncertain, such as expected cash flows, the ability of borrowers to service debt, residential and commercial property price appreciation and depreciation, and relative levels of defaults and deficiencies. Such assumptions, judgements and estimates may need to be updated to reflect changing facts, trends and market conditions. The resulting change in the fair values of the financial instruments has had and could continue to have a material adverse effect on the Group’s earnings and financial condition. Also, recent market volatility and illiquidity have challenged the factual bases of certain underlying assumptions and have made it difficult to value certain of the Group’s financial instruments. Valuations in future periods, reflecting prevailing market conditions, may result in further significant changes in the fair values of these instruments, which could have a material adverse effect on the Group’s results of operations and financial condition or result in a loss of value in the Securities. The Group operates in markets that are highly competitive and consolidating. If the Group is unable to perform effectively, its business and results of operations will be adversely affected. The consolidation that has taken place in recent years among banking institutions in the UK, the US and throughout Europe continues to change the competitive landscape for banks and other financial institutions. If financial markets continue to be volatile, more banks may be forced to consolidate. This consolidation, in combination with the introduction of new entrants into the US and UK markets from other European and Asian countries, could increase competitive pressures on the Group. In addition, certain competitors may have access to lower cost funding and/or be able to attract retail deposits on more favourable terms than the Group and may have stronger multi-channel and more efficient operations as a result of greater historical investments. Furthermore, the Group’s competitors may be better able to attract and retain clients and key employees, which may have a negative impact on the Group’s relative performance and future prospects.
Furthermore, increased government ownership of, and involvement in, banks generally may have an impact on the competitive landscape in the major markets in which the Group operates. The effects of the substantial government shareholding and involvement in the banks may differ from jurisdiction to jurisdiction, and such involvement may cause the Group to experience stronger competition for corporate, institutional and retail clients and greater pressure on profit margins. Future disposals and restructurings by the Group and the compensation structure and restrictions imposed on the Group may also have an impact on its ability to compete effectively. Since the markets in which the Group operates are expected to remain highly competitive in all areas, these and other changes to the competitive landscape could adversely affect the Group’s business, margins, profitability, financial condition and prospects or result in a loss of value in the Securities. As a condition to HM Treasury support, the company has agreed to certain undertakings which may serve to limit the Group’s operations. Under the terms of the First Placing and Open Offer, the company provided certain undertakings aimed at ensuring that the subscription by HM Treasury of the relevant ordinary shares and preference shares and the Group’s participation in the Credit Guarantee Scheme offered by HM Treasury as part of its support for the UK banking industry are compatible with the common market under EU law. These undertakings included (i) certain lending commitments in relation to UK residential mortgage lending and lending to SMEs in the UK until 28 February 2011, (ii) regulating management remuneration and (iii) regulating the rate of growth of the Group’s balance sheet. Under the terms of the placing and open offer undertaken by the company in April 2009 (the “Second Placing and Open Offer”), the Group’s undertakings in relation to mortgage lending and lending to SMEs were extended to larger commercial and industrial companies in the UK. Pursuant to these arrangements, the Group agreed to make available to creditworthy borrowers on commercial terms, £16 billion above the amount the company had budgeted to lend to UK businesses and £9 billion above the amount the company had budgeted to lend to UK homeowners in the year commencing 1 March 2009. In relation to the 2009 commitment period, which ended on 28 February 2010, the Group’s net mortgage lending to UK homeowners was £12.7 billion above the amount it had originally budgeted to lend. In relation to its business lending commitment, the Group extended £41 billion of gross new facilities, drawn and undrawn, to UK businesses, including £27 billion to SMEs but, in the economic environment prevailing at the time, many customers were strongly focused on reducing their borrowings and repayments consequently increased. Moreover, the withdrawal of foreign lenders was less pronounced than anticipated, there was a sharp increase in capital market issuance and demand continued to be weak. As a result, the Group’s net lending did not reach the £16 billion targeted.
413RBS Group 2010
Additional information
Risk factors continued In March 2010, the Royal Bank agreed with the UK Government to certain adjustments to the lending commitments for the 2010 commitment period (the 12 month period which commenced on 1 March 2010), to reflect expected economic circumstances over the period. As part of the amended lending commitments, the Royal Bank has committed, among other things, to make available gross new facilities, drawn or undrawn, of £50 billion to UK businesses in the period 1 March 2010 to 28 February 2011. In addition, the Royal Bank has agreed with the UK Government to make available £8 billion of net mortgage lending in the 2010 commitment period. This is a decrease of £1 billion on the net mortgage lending target that previously applied to the 2010 commitment period which ends on 28 February 2011, to reflect that the mortgage lending commitment for the 2009 commitment period was increased from £9 billion to £10 billion. At 31 December 2010, RBS was on track to meet both its business and mortgage lending targets. As discussed above, the Group has also agreed to certain other material commitments under the State Aid restructuring plan approved by the European Commission in relation to State Aid, including an agreement to refrain from making discretionary dividends (including on preference shares and B shares) or coupon payments on existing hybrid capital instruments for a two-year period which commenced on 30 April 2010. It is possible that the Group may, in future, be subject to further restrictions on payments on such hybrid capital instruments, whether as a result of undertakings given to regulatory bodies or otherwise. The Group has also agreed to certain other undertakings in the Acquisition and Contingent Capital Agreement (the “Acquisition and Contingent Capital Agreement”). The undertakings described above may serve to limit the Group’s operations. See also “HM Treasury (or UKFI on its behalf) may be able to exercise a significant degree of influence over the Group.” The Group could fail to attract or retain senior management, which may include members of the Board, or other key employees, and it may suffer if it does not maintain good employee relations. The Group’s ability to implement its strategy depends on the ability and experience of its senior management, which may include directors, and other key employees. The loss of the services of certain key employees, particularly to competitors, could have an adverse impact on the Group’s business. The Group’s future success will also depend on its ability to attract, retain and remunerate highly skilled and qualified personnel competitively with its peers. This cannot be guaranteed, particularly in light of heightened regulatory oversight of banks and heightened scrutiny of, and (in some cases) restrictions placed upon, management and employee compensation arrangements, in particular those in receipt of Government funding (such as the Group). In connection with its accession to the APS, the Group agreed with HM Treasury that it will be at the leading edge of implementing the G-20 principles and to consult
with UK Financial Investments Limited (“UKFI”) in connection with the Group’s remuneration policy and the Group made a commitment to HM Treasury to comply with the FSA Remuneration Code which came into force on 1 January 2010. On 1 January 2011, a revised FSA Remuneration Code came into effect to implement the requirements of the Capital Requirements Directive III. In addition, as a result of its accession to the APS, the Group also has reached agreement with HM Treasury in relation to remuneration arrangements for the executive directors of the Group and certain employees involved in the APS, including approval rights for the Asset Protection Agency on annual APS-related performance targets. The deferral and claw-back provisions implemented by the Group may impair the ability of the Group to attract and retain suitably qualified personnel in various parts of the Group’s businesses. In recent years, the Group has altered certain of the pension benefits it offers to staff and some employees continue to participate in defined benefit arrangements. The following two changes have been made to the main defined benefit pension plans: (i) a yearly limit on the amount of any salary increase that will count for pension purposes; and (ii) a reduction in the severance lump sum for those who take an immediate undiscounted pension for redundancy. In addition to the effects of such measures on the Group’s ability to retain senior management and other key employees, the marketplace for skilled personnel is becoming more competitive, which means the cost of hiring, training and retaining skilled personnel may continue to increase. The failure to attract or retain a sufficient number of appropriately skilled personnel could place the Group at a significant competitive disadvantage and prevent the Group from successfully implementing its strategy, which could have a material adverse effect on the Group’s financial condition and results of operations or result in a loss of value in the Securities. In addition, certain of the Group’s employees in the UK, continental Europe and other jurisdictions in which the Group operates are represented by employee representative bodies, including trade unions. Engagement with its employees and such bodies is important to the Group and a breakdown of these relationships could adversely affect the Group’s business, reputation and results. As the Group implements cost-saving initiatives and disposes of, or runs-down, certain assets or businesses (including as part of its restructuring plans), it faces increased risk in this regard and there can be no assurance that the Group will be able to maintain good relations with its employees or employee representative bodies in respect of all matters. As a result, the Group may experience strikes or other industrial action from time to time, which could have an adverse effect on its business and results of operations and could cause damage to its reputation.
RBS Group 2010414
Additional information continued
Each of the Group’s businesses is subject to substantial regulation and oversight. Significant regulatory developments could have an adverse effect on how the Group conducts its business and on its results of operations and financial condition. The Group is subject to financial services laws, regulations, corporate governance requirements, administrative actions and policies in each jurisdiction in which it operates. All of these are subject to change, particularly in the current regulatory and market environment, where there have been unprecedented levels of government intervention, changes to the regulations governing financial institutions and reviews of the industry, including nationalisations or injections of government capital in the US, the UK and other European countries. In recent years, there has also been increasing focus in the UK, US and other jurisdictions in which the Group operates on compliance with anti-bribery, anti-money laundering, anti-terrorism and other similar sanctions regimes. As a result of the environment in which the Group operates, increasing regulatory focus in certain areas and ongoing and possible future changes in the financial services regulatory landscape (including requirements imposed by virtue of the Group’s participation in government or regulator-led initiatives), the Group expects to face greater regulation and scrutiny in the UK, the US and other countries in which it operates. Although it is difficult to predict with certainty the effect that recent regulatory developments and heightened levels of public and regulatory scrutiny will have on the Group, the enactment of legislation and regulations in the UK, the other parts of Europe in which the Group operates and the US (such as the bank levy in the UK or the Dodd-Frank Wall Street Reform and Consumer Protection Act in the US) is likely to result in increased capital and liquidity requirements and changes in regulatory requirements relating to the calculation of capital and liquidity metrics or other prudential rules relating to capital adequacy frameworks, and may result in an increased number of regulatory investigations and actions. Any of these developments could have an adverse impact on how the Group conducts its business, applicable authorisations and licences, the products and services it offers, its reputation, the value of its assets, its funding costs and its results of operations and financial condition or result in a loss of value in its securities. Areas in which, and examples of where, governmental policies, regulatory changes and increased public and regulatory scrutiny could have an adverse impact on the Group include, but are not limited to:
the monetary, fiscal, interest rate and other policies of central banks and other governmental or regulatory bodies;
requirements to separate retail banking from investment banking, and restrictions on proprietary trading and similar activities within a commercial bank and/or a group which contains a commercial bank;
government-imposed requirements with respect to lending to the UK SME market and larger commercial and corporate markets and residential mortgage lending;
requirements to operate in a way that prioritises objectives other than shareholder value creation;
changes to financial reporting standards (including accounting standards), corporate governance requirements, corporate structures and conduct of business rules;
the imposition of restrictions on the Group’s ability to compensate its senior management and other employees;
regulations relating to, and enforcement of, anti-bribery, anti-money laundering, anti-terrorism or other similar sanctions regimes;
rules relating to foreign ownership, expropriation, nationalisation and confiscation of assets;
other requirements or policies affecting the Group’s profitability, such as the imposition of onerous compliance obligations, further restrictions on business growth or pricing, and the introduction of, and changes to, levies, fees or taxes applicable to the Group’s operations (such as the imposition of financial activities taxes and changes in tax rates that reduce the value of deferred tax assets); and
other unfavourable political, military or diplomatic developments producing social instability or legal uncertainty which, in turn, may affect demand for the Group’s products and services.
For further information about certain investigations, supervisory matters and litigation matters to which the Group is subject, please refer to Note 34 to the Group’s financial statements. The Group is and may be subject to litigation and regulatory investigations that may impact its business. The Group’s operations are diverse and complex, and it operates in legal and regulatory environments that expose it to potentially significant litigation, regulatory investigation and other regulatory risk. As a result, the Group is, and may in the future be, involved in various disputes, legal proceedings and regulatory investigations in the UK, the EU, the US and other jurisdictions, including class action litigation, anti-money laundering charges and sanctions, compliance investigations and review by the European Commission under State Aid rules. Furthermore, the Group, like many other financial institutions, has come under greater regulatory scrutiny in recent years and expects that environment to continue for the foreseeable future, particularly as it relates to compliance with new and existing corporate governance, employee compensation, conduct of business, anti-money laundering and anti-terrorism laws and regulations, as well as the provisions of applicable sanctions programmes. Disputes, legal proceedings and regulatory investigations are subject to many uncertainties, and their outcomes are often difficult to predict, particularly in the early stages of a case or investigation. Adverse regulatory action or adverse judgments in litigation could result in restrictions or limitations on the Group’s operations or have a significant effect on the Group’s reputation or results of operations or result in a loss of value in the Securities.
415RBS Group 2010
Additional information

Risk factors continued The Group’s results have been and could be further materially adversely affected in the event of goodwill impairment. The Group capitalises goodwill, which is calculated as the excess of the cost of an acquisition over the net fair value of the identifiable assets, liabilities and contingent liabilities acquired. Acquired goodwill is recognised initially at cost and subsequently at cost less any accumulated impairment losses. As required by IFRS, the Group tests goodwill for impairment annually or more frequently, at external reporting dates, when events or circumstances indicate that it might be impaired. An impairment test involves comparing the recoverable amount (the higher of the value in use and fair value less cost to sell) of an individual cash generating unit with its carrying value. The value in use and fair value of the Group’s cash generating units are affected by market conditions and the performance of the economies in which the Group operates. Where the Group is required to recognise a goodwill impairment, it is recorded in the Group’s income statement, although it has no effect on the Group’s regulatory capital position. For the year ended 31 December 2008, the Group recorded a £32.6 billion accounting write-down of goodwill and other intangibles principally relating to RBS Holdings N.V. (formerly ABN AMRO Holding N.V.) and NatWest goodwill allocated to non-core businesses. The Group recorded a write down of goodwill and other intangibles of £363 million for the year ended 31 December 2009 and £10 million for the year ended 31 December 2010. The Group may be required to make further contributions to its pension schemes if the value of pension fund assets is not sufficient to cover potential obligations. The Group maintains a number of defined benefit pension schemes for past and a number of current employees. Pensions risk is the risk that the assets of the Group’s various defined benefit pension schemes which are long term in nature do not fully match the timing and amount of the schemes’ liabilities as a result of which the Group is required or chooses to make additional contributions to the schemes. Pension scheme liabilities vary with changes to long-term interest rates, inflation, pensionable salaries and the longevity of scheme members as well as changes in applicable legislation. The scheme’s assets comprise investment portfolios that are held to meet projected liabilities to the scheme members. Risk arises from the schemes because the value of these asset portfolios’ returns from them and any additional future contributions to the schemes may be less than expected and because there may be greater than expected increases in the estimated value of the schemes’ liabilities. In these circumstances, the Group could be obliged, or may choose, to make additional contributions to the schemes, and during recent periods, the Group has voluntarily made such contributions to the schemes. Given the recent economic and financial market difficulties and the prospect that they may continue over the near and medium term, the Group may experience increasing pension deficits or be required or elect to make further contributions to its pension schemes and such deficits and contributions could be significant and have an adverse impact on the Group’s results of operations or financial condition or result in a loss of value in the Securities. A funding valuation of the Group’s major defined benefit pension plan, The Royal Bank of Scotland Group Pension Fund is currently being carried out with an effective date of 31 March 2010.
Operational risks are inherent in the Group’s operations. The Group’s operations are dependent on the ability to process a very large number of transactions efficiently and accurately while complying with applicable laws and regulations where it does business. The Group has complex and geographically diverse operations and operational risk and losses can result from internal and external fraud, errors by employees or third parties, failure to document transactions properly or to obtain proper authorisation, failure to comply with applicable regulatory requirements and conduct of business rules (including those arising out of anti-bribery, anti-money laundering and anti-terrorism legislation, as well as the provisions of applicable sanctions programmes), equipment failures, business continuity and data security system failures, natural disasters or the inadequacy or failure of systems and controls, including those of the Group’s suppliers or counterparties. Although the Group has implemented risk controls and loss mitigation actions, and substantial resources are devoted to developing efficient procedures, to identify and rectify weaknesses in existing procedures and to train staff, it is not possible to be certain that such actions have been or will be effective in controlling each of the operational risks faced by the Group. Any weakness in these systems or controls, or any breaches or alleged breaches of such laws or regulations, could result in increased regulatory supervision, enforcement actions and other disciplinary action, and have an adverse impact on the Group’s business, applicable authorisations and licences, reputation, results of operations and the price of its securities. Notwithstanding anything contained in this risk factor, it should not be taken as implying that the company will be unable to comply with its obligations as a company with securities admitted to the Official List of the UK Listing Authority (the “Official List”) nor that it, or its relevant subsidiaries, will be unable to comply with its or their obligations as supervised firms regulated by the FSA. The Group is exposed to the risk of changes in tax legislation and its interpretation and to increases in the rate of corporate and other taxes in the jurisdictions in which it operates. The Group’s activities are subject to tax at various rates around the world computed in accordance with local legislation and practice. Action by governments to increase tax rates or to impose additional taxes or to restrict the tax reliefs currently available to the Group would reduce the Group’s profitability. Revisions to tax legislation or to its interpretation might also affect the Group’s results in the future. From January 2011, the UK Government increased the standard rate of value added tax from 17.5 per cent. to 20 per cent. and on 1 January 2011, the UK Government introduced the banking levy. These changes, together with any future changes, such as the possible introduction of a financial activities tax, could reduce the Group’s profitability.
RBS Group 2010416
Additional information continued
HM Treasury (or UKFI on its behalf) may be able to exercise a significant degree of influence over the Group. UKFI manages HM Treasury’s shareholder relationship with the company. Although HM Treasury has indicated that it intends to respect the commercial decisions of the Group and that the Group will continue to have its own independent board of directors and management team determining its own strategy, should its current intentions change, HM Treasury's position as a majority shareholder (and UKFI’s position as manager of this shareholding) means that HM Treasury or UKFI may be able to exercise a significant degree of influence over, among other things, the election of directors and the appointment of senior management. In addition, as the provider of the APS, HM Treasury has a range of rights that other shareholders do not have. These include rights under the terms of the APS over the Group's remuneration policy and practice. The manner in which HM Treasury or UKFI exercises HM Treasury’s rights as majority shareholder or in which HM Treasury exercises its rights under the APS could give rise to conflict between the interests of HM Treasury and the interests of other shareholders. The Board has a duty to promote the success of the company for the benefit of its members as a whole. The offer or sale by the UK Government of all or a portion of its stake in the company could affect the market price of the Securities and related securities. The UK Government currently holds approximately 68 per cent. of the issued ordinary share capital of the company. On 22 December 2009, the company issued £25.5 billion of B shares to the UK Government. The B shares are convertible, at the option of the holder at any time, into ordinary shares. The UK Government has agreed that it shall not exercise the rights of conversion in respect of the B shares if and to the extent that following any such conversion it would hold more than 75 per cent. of the total issued shares in the company. The UK Government may sell all or a part of the ordinary shares that it owns at any time. Offers or sales by the UK Government of a substantial number of ordinary shares or securities convertible or exchangeable into ordinary shares, or an expectation that it may undertake such an offer or sale, could affect prevailing market prices for the Securities and related securities. The Group’s insurance businesses are subject to inherent risks involving claims. Future claims in the Group’s insurance business may be higher than expected as a result of changing trends in claims experience resulting from catastrophic weather conditions, demographic developments, changes in the nature and seriousness of claims made, changes in mortality, changes in the legal and compensatory landscape and other causes outside the Group’s control. These trends could affect the profitability of current and future insurance products and services. The Group reinsures some of the risks it has assumed and is accordingly exposed to the risk of loss should its reinsurers become unable or unwilling to pay claims made by the Group against them.
The Group’s operations have inherent reputational risk. Reputational risk, meaning the risk to earnings and capital from negative public opinion, is inherent in the Group’s business. Negative public opinion can result from the actual or perceived manner in which the Group conducts its business activities, from the Group’s financial performance, from the level of direct and indirect government support or from actual or perceived practices in the banking and financial industry. Negative public opinion may adversely affect the Group’s ability to keep and attract customers and, in particular, corporate and retail depositors. The Group cannot ensure that it will be successful in avoiding damage to its business from reputational risk. In the UK and in other jurisdictions, the Group is responsible for contributing to compensation schemes in respect of banks and other authorised financial services firms that are unable to meet their obligations to customers. In the UK, the Financial Services Compensation Scheme (the “Compensation Scheme”) was established under the FSMA and is the UK’s statutory fund of last resort for customers of authorised financial services firms. The Compensation Scheme can pay compensation to customers if a firm is unable, or likely to be unable, to pay claims against it and may be required to make payments either in connection with the exercise of a stabilisation power or in exercise of the bank insolvency procedures under the Banking Act. The Compensation Scheme is funded by levies on firms authorised by the FSA, including the Group. In the event that the Compensation Scheme raises funds from the authorised firms, raises those funds more frequently or significantly increases the levies to be paid by such firms, the associated costs to the Group may have an adverse impact on its results of operations and financial condition. As at 31 December 2010, the Group had accrued £144.4 million for its share of Compensation Scheme management expenses levies for the 2010/2011 and 2011/2012 Compensation Scheme years. In addition, to the extent that other jurisdictions where the Group operates have introduced or plan to introduce similar compensation, contributory or reimbursement schemes (such as in the United States with the Federal Deposit Insurance Corporation), the Group may make further provisions and may incur additional costs and liabilities, which may have an adverse impact on its financial condition and results of operations or result in a loss of value in the Securities. The Group’s business and earnings may be adversely affected by geopolitical conditions. The performance of the Group is significantly influenced by the geopolitical and economic conditions prevailing at any given time in the countries in which it operates, particularly the UK, the US and other countries in Europe and Asia. For example, the Group has a presence in countries where businesses could be exposed to the risk of business interruption and economic slowdown following the outbreak of a pandemic, or the risk of sovereign default following the assumption by governments of the obligations of private sector institutions. Similarly, the Group faces the heightened risk of trade barriers, exchange controls and other measures taken by sovereign governments which may impact a borrower’s ability to repay. Terrorist acts and threats and the response to them of governments in any of these countries could also adversely affect levels of economic activity and have an adverse effect upon the Group’s business.
417RBS Group 2010
Additional information
Risk factors continued The restructuring plan for RBS Holdings N.V. is complex and may not realise the anticipated benefits for the Group. In 2007, the Group acquired an interest, through RFS Holdings B.V., in ABN AMRO Holding N.V. (which was renamed RBS Holdings N.V. on 1 April 2010). The restructuring plan in place for the integration and separation of ABN AMRO Holding N.V. into and among the businesses and operations of the Consortium Members (RBSG, the Dutch State and Santander) is complex, involving substantial reorganisation of RBS Holdings N.V.’s operations and legal structure. The restructuring plan is being implemented and significant elements have been completed within the planned timescales and the integration of the Group’s businesses continues. As part of this reorganisation, on 6 February 2010, the majority of the businesses of RBS Holdings N.V. acquired by the Dutch State were legally demerged from the RBS Holdings N.V. businesses acquired by the Group and were transferred into a newly established company, ABN AMRO Bank N.V. (formerly named ABN AMRO II N.V.). This company was transferred to ABN AMRO Group N.V., a company wholly owned by the Dutch State, on 1 April 2010. Certain assets and liabilities of RBS Holdings N.V. acquired by the Dutch State were not part of the transfer which occurred on 1 April 2010 and remain within ABN AMRO Bank N.V. (now The Royal Bank of Scotland N.V.). These will be transferred to the Dutch State as soon as possible. In addition, certain assets within RBS N.V. continue to be under shared ownership by the Consortium Members. On 31 December 2010, the share capital of RFS Holdings B.V. was amended, such that approximately 98 per cent. of RFS Holdings B.V.’s issued share capital is now held by RBSG, with the remainder being held by Santander and the Dutch State. Ultimately it is expected that RFS Holdings B.V. will become a wholly-owned subsidiary of the company. As the Group does not currently own 100 per cent. of RFS Holdings B.V. and as certain of the assets of RFS Holdings B.V. are owned indirectly by the Dutch State and Banco Santander S.A. (“Santander”), the Group may experience delays in implementing the planned integration of the businesses of RFS Holdings B.V. which are owned by the Group and such integration may place a strain on management, employee, operational and financial resources. Any such delays may also restrict the ability of the Group to realise the expected benefits of the acquisition. In addition, the Group may not realise the benefits of the acquisition or the restructuring when expected or to the extent projected. Any of these events may have an adverse impact on the Group’s financial condition and results of operations. The recoverability and regulatory capital treatment of certain deferred tax assets recognised by the Group depends on the Group's ability to generate sufficient future taxable profits and there being no adverse changes to tax legislation, regulatory requirements or accounting standards. In accordance with IFRS, the Group has recognised deferred tax assets on losses available to relieve future profits from tax only to the extent that it is probable that they will be recovered. The deferred tax assets are quantified on the basis of current tax legislation and accounting standards and are subject to change in respect of the future rates of tax or the rules for computing taxable profits and allowable losses. Failure to generate sufficient future taxable profits or changes in tax legislation or accounting
standards may reduce the recoverable amount of the recognised deferred tax assets. In April 2011, the UK Government will commence a staged reduction in the rate of UK corporation tax from 28 per cent. to 24 per cent. over a four-year period. Such a change in the applicable tax rate would reduce the recoverable amount of the recognised deferred tax assets. There is currently no restriction in respect of deferred tax assets recognised by the Group for regulatory purposes. Changes in regulatory capital rules may restrict the amount of deferred tax assets that can be recognised and such changes could lead to a reduction in the Group’s Core Tier 1 capital ratio. In particular, on 16 December 2010, the Basel Committee published the Basel III rules setting out certain changes to capital requirements (see the risk factor above headed “The Group’s business performance could be adversely affected if its capital is not managed effectively or as a result of changes to capital adequacy and liquidity requirements”). Those rules include a requirement that deferred tax assets which rely on future profitability of the Group to be realised may only receive limited recognition when calculating the common equity component of Tier 1 which therefore limits the amount of deferred tax assets which can count towards that component of Tier 1 capital. The implementation of the Basel III reforms will begin on 1 January 2013, however the restrictions on recognition of deferred tax assets within the common equity component of Tier 1 are subject to a phased-in deduction starting on 1 January 2014, to be fully effective by 1 January 2018. The Group’s participation in the APS is costly and may not produce the benefits expected and the occurrence of associated risks may have a material adverse impact on the Group’s business, capital position, financial condition and results of operations. On 22 December 2009, the Group acceded to the APS with HM Treasury acting on behalf of the United Kingdom Government. Under the APS, the Group purchased credit protection over a portfolio of specified assets and exposures of RBS and certain members of the Group from HM Treasury in return for an annual fee. If losses on assets covered by the APS exceed £60 billion (net of recoveries), HM Treasury will bear 90 per cent. of further losses. In the event of a further severe or prolonged economic downturn, which could result in extreme credit losses on the Group’s asset portfolio, the APS provides additional protection to the Group’s capital ratios and financial position. The APS is a unique form of credit protection over a complex range of diversified assets and exposures (the “Covered Assets”) in a number of jurisdictions. Owing to the complexity, scale and unique nature of the APS and the uncertainty resulting from the recent economic recession, there may be unforeseen issues and risks that are relevant in the context of the Group’s participation in the APS and in the impact of the APS on the Group’s business, operations and financial condition. Such issues or risks may have a material adverse effect on the Group. Moreover, the Group’s choice of assets or exposures to be covered by the APS was based on certain predictions and assumptions at the time of its accession to the APS. There is therefore a risk that the Covered Assets will not be those with the greatest future losses or with the greatest need for protection and the Group’s financial condition, income from operations and the value of any Securities may still suffer due to further impairments and credit write-downs.
RBS Group 2010418
Additional information continued
Notwithstanding the Group’s participation in the APS and the issue of the £25.5 billion of B Shares and, if required, the issue of the £8 billion of Contingent B Shares, the Group remains exposed to a substantial first loss amount of £60 billion (net of recoveries) in respect of the Covered Assets and for 10 per cent. of Covered Assets losses after the first loss amount. There is therefore no assurance that the Group’s participation in the APS and the issue of B Shares and, if required, the Contingent B Shares will achieve the Group’s goals of improving and maintaining the Group’s capital ratios in the event of further losses and improving market confidence in the Group. Moreover, the Group continues to carry the risk of losses, impairments and write-downs with respect to assets not covered by the APS. Therefore, there can be no assurance that any regulatory capital benefits and the additional Core Tier 1 capital will be sufficient to maintain the Group’s capital ratios at the requisite levels in the event of further losses. If the Group is unable to improve its capital ratios sufficiently or to maintain its capital ratios in the event of further losses, its business, results of operations and financial condition will suffer, its credit ratings may fall, its ability to lend and access funding will be further limited and its cost of funding may increase. The occurrence of any or all of such events may cause the price of the Securities to decline substantially and may result in intervention by the Authorities, which could include full nationalisation or other resolution procedures under the Banking Act. In that case, any compensation payable to holders of the Securities would be subject to the provisions of the Banking Act and investors may receive no value for their Securities. If the Group is unable to issue the Contingent B Shares to HM Treasury, it may have a material adverse impact on the Group’s capital position, liquidity, operating results and future prospects. In the event that the Group’s Core Tier 1 capital ratio declines to below 5 per cent., HM Treasury is committed to subscribe for up to an additional £8 billion of Contingent B Shares if certain conditions are met. If such conditions are not met and are not waived by HM Treasury, and RBSG is unable to issue the Contingent B Shares, the Group will be required to find alternative methods for achieving the requisite capital ratios. Such methods could include an accelerated reduction in risk-weighted assets, disposals of certain businesses, increased issuance of Tier 1 capital securities, increased reliance on alternative government-supported liquidity schemes and other forms of government assistance. There can be no assurance that any of these alternative methods will be available or would be successful in increasing the Group’s capital ratios to the desired
or requisite levels. If RBSG is unable to issue the Contingent B Shares, the Group’s business, results of operations, financial condition and capital position and ratios will suffer, its credit ratings may drop, its ability to lend and access funding will be further limited and its cost of funding may increase. The occurrence of any or all of such events may cause the price of the Securities to decline substantially and may result in intervention by the Authorities or other regulatory bodies in the other jurisdictions in which the Group operates, which could include full nationalisation, other resolution procedures under the Banking Act or revocation of permits and licences necessary to conduct the Group’s businesses. Any compensation payable to holders of Securities would be subject to the provisions of the Banking Act, and investors may receive no value for their Securities. There are limits on APS coverage and uncovered exposures and risks may have a material adverse impact on the Group’s business, financial condition, capital position, liquidity and results of operations. As a result of the significant volume, variety and complexity of assets and exposures and the resulting complexity of the APS documents, there is a risk that the Group may have included assets or exposures within the Covered Assets which are, or may later become, ineligible for protection under the APS, which would reduce the anticipated benefits to the Group of the APS. Further, there is no ability to nominate additional or alternative assets or exposures in place of any which may turn out not to be covered under the APS. Protection under the APS may be limited or may cease to be available where (i) Covered Assets are not correctly or sufficiently logged or described, (ii) a Covered Asset is disposed of (in whole or in part) prior to a trigger event, (iii) the terms of the APS do not apply or are uncertain in their application, (iv) the terms of the protection itself potentially give rise to legal uncertainty, (v) certain criminal conduct has or may have occurred in respect of Covered Assets, (vi) a breach of bank secrecy, confidentiality, data protection or similar laws has occurred or may occur, (vii) certain of the extensive governance, asset management, audit and reporting obligations under the UK Asset Protection Scheme Terms and Conditions (the “Scheme Conditions”) are not complied with, (viii) the Group does not comply with the instructions of a step-in manager appointed by HM Treasury or (ix) HM Treasury seeks to appoint a step-in manager in respect of Covered Assets held within the RBS Holdings N.V. group (or in certain other jurisdictions) and it is not possible to obtain consent from the Dutch Central Bank (if required) to such step-in.
419RBS Group 2010
Additional information
Risk factors continued The Group is subject to limitations on actions it can take in respect of the Covered Assets and certain related assets and to extensive governance, asset management, audit and reporting obligations under the Scheme Conditions. The Group’s compliance with the Scheme Conditions is dependent on its ability to (i) implement efficiently and accurately approval processes and reporting, governance and management systems in accordance with the Scheme Conditions and (ii) comply with applicable laws and regulations where it does business. Since the Group’s operational systems were not originally designed to facilitate compliance with these extensive continuing obligations, there is a risk that the Group will fail to comply with a number of these obligations. Where the Group is in breach of its continuing obligations under the Scheme Conditions or otherwise unable to provide or verify information as required under the APS, recovery of losses under the APS may be adversely impacted, may lead to an indemnity claim and HM Treasury may in addition have the right to exercise certain step-in rights, including the right to require the Group to appoint a step-in manager who may exercise oversight, direct management rights and certain other rights. The occurrence of the risks or circumstances referred to above may impact the enforceability and/or level of protection available to the Group and may materially reduce the protection anticipated by the Group for its stressed losses, in which case its business, results of operations and financial condition will suffer, its credit ratings may drop, its ability to lend and access funding will be further limited and its cost of funding may increase. The occurrence of any or all of such events may cause the price of the Securities to decline substantially and may result in intervention by the Authorities, which could include full nationalisation or other resolution procedures under the Banking Act. Any compensation payable to holders of Securities would be subject to the provisions of the Banking Act, and investors may receive no value for their Securities. The extensive governance, asset management and information requirements under the Scheme Conditions and any changes or modifications to the Scheme Conditions may have a negative impact on the expected benefits of the Scheme and may have an adverse impact on the Group. There are extensive governance, asset management and information requirements under the Scheme Conditions in relation to the Covered Assets, other assets and the operations of the Group and HM Treasury also has the right to require the appointment of one or more step-in managers to exercise certain step-in rights in certain circumstances. The step-in rights are extensive and include certain oversight, investigation, approval and other rights, the right to require the modification or replacement of any of the systems, controls, processes and practices of the Group and extensive rights in relation to the direct management and administration of the Covered Assets. Additionally pursuant to the Accession Agreement, HM Treasury has the right to require RBS to appoint one or more Special Advisers (“SOC Special Advisers”) to exercise oversight functions over certain assets in the APS. On 18 June 2010, the Asset Protection Agency required that RBS appoint SOC Special Advisers in relation to certain assets and business areas in order to provide additional support to the Senior Oversight Committee of RBS and there have been four such appointments to date granting certain oversight rights in relation to certain specified assets. The obligations of
the Group and the rights of HM Treasury may, individually or in the aggregate, impact the way the Group runs its business and may serve to limit the Group’s operations with the result that the Group’s business, results of operations and financial condition will suffer. In addition, the market’s reaction to such controls and limitations may have an adverse impact on the price of the Securities. HM Treasury may, following consultation with the Group, modify or replace certain of the Scheme Conditions in such a manner as it considers necessary (acting reasonably) in certain circumstances. Such modifications or replacements may be retrospective and may result in (i) a loss of or reduction in the protection expected by the Group under the APS, (ii) an increase in the risk weightings of the Covered Assets, (iii) a material increase in the continuing reporting obligations or asset management conditions applicable to the Group under the Scheme Conditions, (iv) a material increase in the costs of the APS and/or (v) restrictions or limitations on the Group’s operations. The consequences of any such modifications by HM Treasury are impossible to quantify and are difficult to predict and may have a material adverse effect on the Group’s financial condition and results of operations. Any changes to the expected regulatory capital treatment of the APS, the B Shares and the Contingent B Shares may negatively impact the Group’s capital position. One of the key objectives of the APS and the issuance of £25.5 billion of B Shares and, if required, the £8 billion Contingent B Shares was to improve capital ratios at a consolidated level for the Group and at an individual level for certain relevant Group members. The Group has entered and may in the future enter into further back-to-back arrangements with Group members holding assets or exposures to be covered by the APS in order to ensure the capital ratios of these entities are also improved by virtue of the APS. There is a risk that the interpretation of the relevant regulatory capital requirements by one or more of the relevant regulatory authorities may differ from that assumed by the Group, with the result that the anticipated improvement to the Group’s capital ratios will not be fully achieved. There is a further risk that, given that the current regulatory capital requirements and the regulatory bodies governing these requirements are subject to unprecedented levels of review and scrutiny both globally and locally, the regulatory capital treatment may differ from that assumed by the Group in respect of the APS, the treatment of the B Share issuance or the back-to-back arrangement may also occur. If participation in the APS and the issuance of £25.5 billion of B Shares and, if required, the £8 billion Contingent B Shares are not sufficient to maintain the Group’s capital ratios, this could cause the Group’s business, results of operations and financial condition to suffer, its credit ratings to drop, its ability to lend and access to funding to be further limited and its cost of funding to increase. The occurrence of any or all of such events may cause the price of the Securities to decline substantially and may result in intervention by the Authorities, which could include full nationalisation or other resolution procedures under the Banking Act. Any compensation payable to holders of Securities would be subject to the provisions of the Banking Act and investors may receive no value for their Securities.
RBS Group 2010420
Additional information continued
The costs of the APS may be greater than the benefits received. The costs of participating in the APS incurred by the Group to HM Treasury include, among others, a fee of £700 million per annum, payable in advance for each of the first three years of the APS and £500 million per annum thereafter until the earlier of (i) the date of termination of the APS and (ii) 31 December 2099. The amounts that may be received under the APS (which amounts are difficult to quantify precisely) may be less than the costs of participation which are themselves also difficult to quantify. The aggregate effect of the joining, establishment, operational and exit costs and fees and expenses of, and associated with, the APS may significantly reduce or even eliminate the benefit to the Group of the APS. Participation in the APS may result in greater tax liabilities for the Group and the loss of potential tax benefits. The Group can opt (with the consent of HM Treasury) to satisfy the annual fee in respect of both the APS and the Contingent Subscription and any APS exit fee by waiving certain United Kingdom tax reliefs that are treated as deferred tax assets. The Group has not opted to do so to date, but if the Group so opts in the future, it is difficult to value accurately the cost to the Group, which depends on unascertainable factors including the extent of future losses, the extent to which the Group regains profitability and any changes in tax law. In addition to suffering greater tax liabilities in future years as a result of the waiver of the right to certain United Kingdom tax reliefs that are treated as deferred tax assets (the “Tax Loss Waiver”), the Group may also be subject to further tax liabilities in the United Kingdom and overseas in connection with the APS and the associated intra-group arrangements which would not otherwise have arisen. The Tax Loss Waiver provides that the Group will not be permitted to enter into arrangements which have a main purpose of reducing the net cost of the Tax Loss Waiver. It is unclear precisely how these restrictions will apply, but it is possible that they may limit the operations and future post-tax profitability of the Group.
There are significant costs associated with termination of the Group’s participation in the APS. In order to terminate the Group’s participation in the APS, the Group must have FSA approval and must pay an exit fee. The effect of the payment of the exit fee and potentially the refund of the net pay-outs it has received from HM Treasury under the APS may significantly reduce or even eliminate the anticipated further regulatory capital benefits to the Group of its participation in the APS and could have an adverse impact on the Group’s results of operation or result in a loss of value in the Securities. Alternatively, if the Group is unable to repay to HM Treasury in full the exit fee and potentially the net pay-outs it has received under the APS and, therefore, is unable to terminate its participation in the APS, the Group will be required under the Scheme Conditions to continue to pay the annual fee to HM Treasury until 31 December 2099, which could have an adverse impact on the Group’s results of operation or result in a loss of value in the Securities. Under certain circumstances, the Group cannot be assured that assets of RBS Holdings N.V. (and certain other entities) will continue to be covered under the APS, either as a result of a withdrawal of such assets or as a result of a breach of the relevant obligations. If HM Treasury seeks to exercise its right to appoint one or more step-in managers in relation to the management and administration of Covered Assets held by RBS Holdings N.V. or its wholly-owned subsidiaries, RBS Holdings N.V. will, in certain circumstances, need to seek consent from the Dutch Central Bank to allow it to comply with such step-in. If this consent is not obtained by the date (which will be no less than 10 business days after the notice from HM Treasury) on which the step-in rights must be effective, and other options to effect compliance are not possible (at all or because the costs involved prove prohibitive), those assets would need to be withdrawn by the Group from the APS where permissible under the Scheme Conditions or, otherwise, with HM Treasury consent. If the Group cannot withdraw such Covered Assets from the APS, it would be likely to lose protection in respect of these assets under the APS and/or may be liable under its indemnity to HM Treasury. If the Group loses cover under the APS in respect of any Covered Asset held by RBS Holdings N.V. or its wholly-owned subsidiaries, any losses incurred on such asset will continue to be borne fully by the Group and may have a material adverse impact on its financial condition, profitability and capital ratios. Similar issues apply in certain other jurisdictions but the relevant Covered Assets are of a lower quantum.
421RBS Group 2010
Additional information
Risk factors continued Any conversion of the B Shares, in combination with any future purchase by HM Treasury of ordinary shares, would increase HM Treasury’s ownership interest in the company, and could result in the delisting of the company from the Official List. On 22 December 2009, RBSG issued £25.5 billion of B Shares to HM Treasury. The B Shares are convertible, at the option of the holder at any time, into ordinary shares at an initial conversion price of £0.50 per ordinary share. Although HM Treasury has agreed not to convert any B Shares it holds if, as a result of such conversion, it would hold more than 75 per cent. of the ordinary shares, if HM Treasury were to acquire additional ordinary shares otherwise than through the conversion of the B Shares, such additional acquisitions could significantly increase HM Treasury’s ownership interest in the company to above 75 per cent. of the company’s ordinary issued share capital, which would put the company in breach of the FSA’s Listing Rules requirement that at least 25 per cent. of its issued ordinary share capital must be in public hands. Although the company may apply to the FSA in its capacity as the competent authority under the FSMA for a waiver in such circumstances, there is no guarantee that such a waiver would be granted, the result of which could be the delisting of the company from the Official List and potentially other exchanges where its Securities are currently listed and traded.
Participation in the APS may give rise to litigation and regulatory risk. In order to fulfil (or as a consequence of fulfilling) its disclosure obligations under the APS by disclosing certain information to HM Treasury (and, as a result of notices issued by it, the FSA), the Group may incur the risk of civil suits, criminal liability or regulatory actions. Adverse regulatory action or adverse judgments in litigation could have a significant effect on the Group’s reputation or results of operations or result in a loss of value in the Securities. Alternatively, in order to avoid the risk of such civil suits or regulatory actions or to avoid the risk of criminal liability, the Group may choose to or be required to remove Covered Assets from the APS so as not to be required to disclose such information to HM Treasury, with the result that such assets will not be protected by the APS. The effect of the removal of such Covered Assets will impact the level of protection available to the Group and may materially reduce the protection anticipated by the Group for its stressed losses, in which case its business, results of operations and financial condition will suffer.
RBS Group 2010422
Additional information continued

423RBS Group 2010
424 Financial calendar
424 Shareholder enquiries
425 Analyses of ordinary shareholders
426 Trading market
429 Dividend history
430 Taxation for US Holders
433 Exchange controls
433 Memorandum and Articles of Association
433 Incorporation and registration
433 Code of conduct
434 Glossary of terms
440 Index
443 Important addresses
443 Principal offices
Shareholder information

Financial calendar Annual General Meeting 19 April 2011 at 2pm
RBS Gogarburn Conference Centre Edinburgh, EH12 1HQ
Interim results 5 August 2011
Dividends Payment dates Cumulative preference shares 31 May and 30 December 2011
31 March, 30 June, 30 September and
Non-cumulative preference shares
30 December 2011 Ex-dividend date Cumulative preference shares 4 May 2011 Record date Cumulative preference shares 6 May 2011
For further information on the payment of dividends, see page 429. Shareholder enquiries Shareholdings in the company may be checked by visiting the ‘Shareholder Services’ section of our website (www.rbs.com/shareholder). You will need the shareholder reference number printed on your share certificate or tax voucher to gain access to this information. You may also check your shareholding by contacting our Registrar: Computershare Investor Services PLC The Pavilions Bridgwater Road Bristol BS99 6ZZ Telephone: +44 (0)870 702 0135 Fax: +44 (0)870 703 6009 Web: www.investorcentre.co.uk/contactus Shareholders may also download forms from the 'Shareholder Services' section of our website (www.rbs.com/shareholder) Braille and audio Annual Review and Summary Financial Statement Shareholders requiring a Braille or audio version of the Annual Review and Summary Financial Statement should contact the Registrar on +44 (0)870 702 0135. ShareGift The company is aware that shareholders who hold a small number of shares may be retaining these shares because dealing costs make it uneconomical to dispose of them. ShareGift, the charity share donation scheme is a free service operated by The Orr Mackintosh Foundation (registered charity 1052686) to enable shareholders to donate shares to charity. Should you wish to donate your shares to charity in this way you should contact ShareGift for further information: ShareGift, The Orr Mackintosh Foundation 17 Carlton House Terrace, London SW1Y 5AH Tel: +44 (0)20 7930 3737 www.sharegift.org Donating your shares in this way will not give rise to either a gain or a loss for UK capital gains tax purposes and you may be able to reclaim UK income tax on gifted shares. Further information can be obtained from HM Revenue & Customs.
Warning to shareholders - boiler room scams In recent years, many companies have become aware that their shareholders have received unsolicited phone calls or correspondence concerning investment matters. These are typically from overseas based 'brokers' who target UK shareholders, offering to sell them what often turn out to be worthless or high risk shares in US or UK investments. These operations are commonly known as 'boiler rooms'. These 'brokers' can be very persistent and extremely persuasive, and a 2006 survey by the Financial Services Authority (FSA) has reported that the average amount lost by investors is around £20,000. It is not just the novice investor that has been duped in this way; many of the victims had been successfully investing for several years. Shareholders are advised to be very wary of any unsolicited advice, offers to buy shares at a discount or offers of free company reports. If you receive any unsolicited investment advice:
make sure you get the correct name of the person and organisation;
check that they are properly authorised by the FSA before getting involved by visiting; www.fsa.gov.uk/pages/register;
report the matter to the FSA either by calling +44 (0)845 606 1234 or visiting (www.fsa.gov.uk/pages/consumerinformation); and
if the calls persist, hang up.
If you deal with an unauthorised firm, you will not be eligible to receive payment under the Financial Services Compensation Scheme. The FSA can be contacted by completing an online form at (www.fsa.gov.uk/pages/doing/regulated/law/alerts/form.shtml) Details of any share dealing facilities that the company endorses will be included in company mailings. More detailed information on this or similar activity can be found on the FSA website (www.fsa.gov.uk/pages/consumerinformation)
RBS Group 2010424
Shareholder information
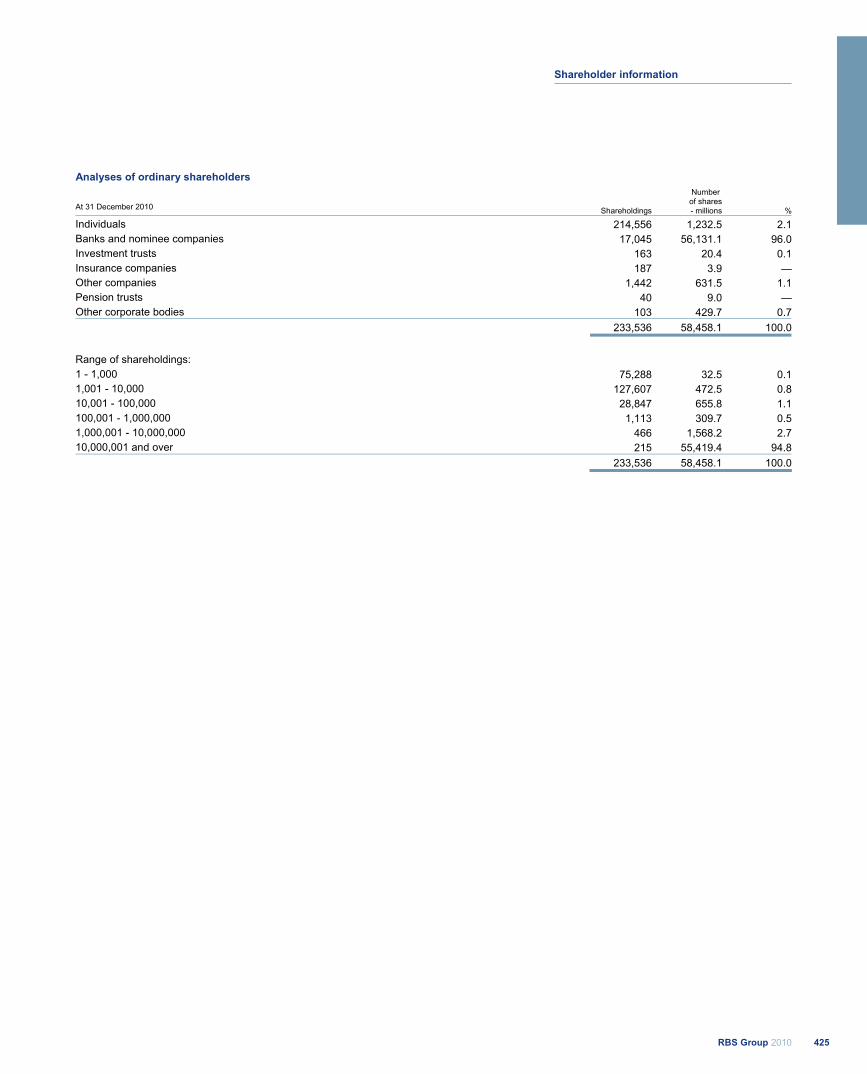
Analyses of ordinary shareholders
At 31 December 2010 Shareholdings
Number of shares - millions %
Individuals 214,556 1,232.5 2.1Banks and nominee companies 17,045 56,131.1 96.0Investment trusts 163 20.4 0.1Insurance companies 187 3.9 —Other companies 1,442 631.5 1.1Pension trusts 40 9.0 —Other corporate bodies 103 429.7 0.7 233,536 58,458.1 100.0
Range of shareholdings: 1 - 1,000 75,288 32.5 0.11,001 - 10,000 127,607 472.5 0.810,001 - 100,000 28,847 655.8 1.1100,001 - 1,000,000 1,113 309.7 0.51,000,001 - 10,000,000 466 1,568.2 2.710,000,001 and over 215 55,419.4 94.8 233,536 58,458.1 100.0
425RBS Group 2010
Shareholder information
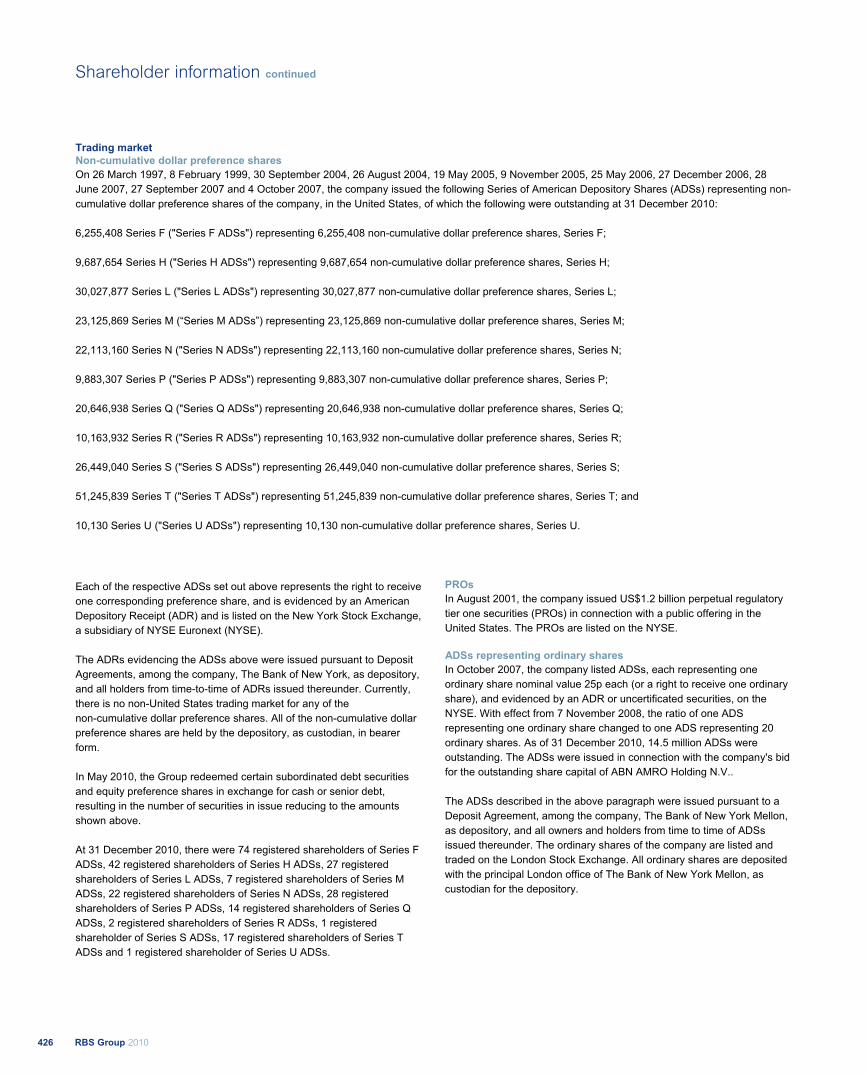
Trading market Non-cumulative dollar preference shares On 26 March 1997, 8 February 1999, 30 September 2004, 26 August 2004, 19 May 2005, 9 November 2005, 25 May 2006, 27 December 2006, 28 June 2007, 27 September 2007 and 4 October 2007, the company issued the following Series of American Depository Shares (ADSs) representing non-cumulative dollar preference shares of the company, in the United States, of which the following were outstanding at 31 December 2010: 6,255,408 Series F ("Series F ADSs") representing 6,255,408 non-cumulative dollar preference shares, Series F; 9,687,654 Series H ("Series H ADSs") representing 9,687,654 non-cumulative dollar preference shares, Series H; 30,027,877 Series L ("Series L ADSs") representing 30,027,877 non-cumulative dollar preference shares, Series L; 23,125,869 Series M (“Series M ADSs”) representing 23,125,869 non-cumulative dollar preference shares, Series M; 22,113,160 Series N ("Series N ADSs") representing 22,113,160 non-cumulative dollar preference shares, Series N; 9,883,307 Series P ("Series P ADSs") representing 9,883,307 non-cumulative dollar preference shares, Series P; 20,646,938 Series Q ("Series Q ADSs") representing 20,646,938 non-cumulative dollar preference shares, Series Q; 10,163,932 Series R ("Series R ADSs") representing 10,163,932 non-cumulative dollar preference shares, Series R; 26,449,040 Series S ("Series S ADSs") representing 26,449,040 non-cumulative dollar preference shares, Series S; 51,245,839 Series T ("Series T ADSs") representing 51,245,839 non-cumulative dollar preference shares, Series T; and 10,130 Series U ("Series U ADSs") representing 10,130 non-cumulative dollar preference shares, Series U.
Each of the respective ADSs set out above represents the right to receive one corresponding preference share, and is evidenced by an American Depository Receipt (ADR) and is listed on the New York Stock Exchange, a subsidiary of NYSE Euronext (NYSE). The ADRs evidencing the ADSs above were issued pursuant to Deposit Agreements, among the company, The Bank of New York, as depository, and all holders from time-to-time of ADRs issued thereunder. Currently, there is no non-United States trading market for any of the non-cumulative dollar preference shares. All of the non-cumulative dollar preference shares are held by the depository, as custodian, in bearer form. In May 2010, the Group redeemed certain subordinated debt securities and equity preference shares in exchange for cash or senior debt, resulting in the number of securities in issue reducing to the amounts shown above. At 31 December 2010, there were 74 registered shareholders of Series F ADSs, 42 registered shareholders of Series H ADSs, 27 registered shareholders of Series L ADSs, 7 registered shareholders of Series M ADSs, 22 registered shareholders of Series N ADSs, 28 registered shareholders of Series P ADSs, 14 registered shareholders of Series Q ADSs, 2 registered shareholders of Series R ADSs, 1 registered shareholder of Series S ADSs, 17 registered shareholders of Series T ADSs and 1 registered shareholder of Series U ADSs.
PROs In August 2001, the company issued US$1.2 billion perpetual regulatory tier one securities (PROs) in connection with a public offering in the United States. The PROs are listed on the NYSE. ADSs representing ordinary shares In October 2007, the company listed ADSs, each representing one ordinary share nominal value 25p each (or a right to receive one ordinary share), and evidenced by an ADR or uncertificated securities, on the NYSE. With effect from 7 November 2008, the ratio of one ADS representing one ordinary share changed to one ADS representing 20 ordinary shares. As of 31 December 2010, 14.5 million ADSs were outstanding. The ADSs were issued in connection with the company's bid for the outstanding share capital of ABN AMRO Holding N.V.. The ADSs described in the above paragraph were issued pursuant to a Deposit Agreement, among the company, The Bank of New York Mellon, as depository, and all owners and holders from time to time of ADSs issued thereunder. The ordinary shares of the company are listed and traded on the London Stock Exchange. All ordinary shares are deposited with the principal London office of The Bank of New York Mellon, as custodian for the depository.
RBS Group 2010426
Shareholder information continued
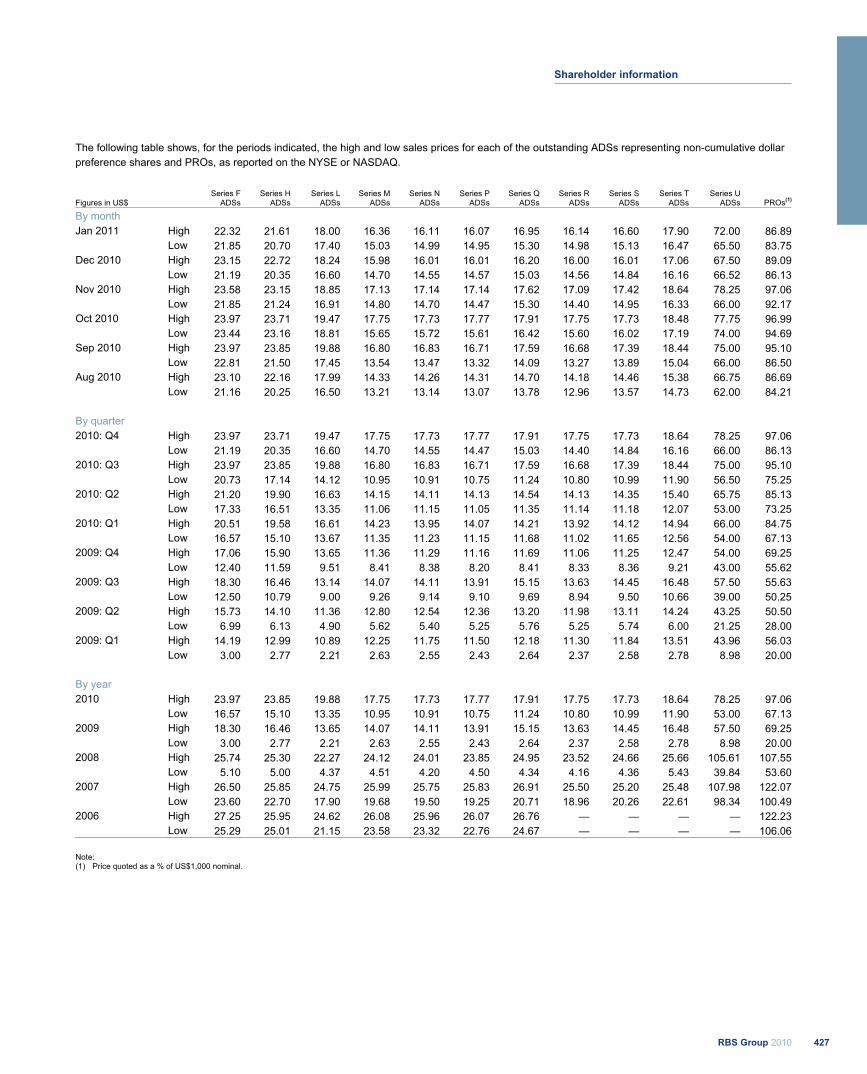
The following table shows, for the periods indicated, the high and low sales prices for each of the outstanding ADSs representing non-cumulative dollar preference shares and PROs, as reported on the NYSE or NASDAQ.
Figures in US$ Series F
ADSsSeries H
ADSsSeries L
ADSsSeries M
ADSsSeries N
ADSsSeries P
ADSsSeries Q
ADSsSeries R
ADSsSeries S
ADSsSeries T
ADSsSeries U
ADSs PROs(1)
By month Jan 2011 High 22.32 21.61 18.00 16.36 16.11 16.07 16.95 16.14 16.60 17.90 72.00 86.89 Low 21.85 20.70 17.40 15.03 14.99 14.95 15.30 14.98 15.13 16.47 65.50 83.75Dec 2010 High 23.15 22.72 18.24 15.98 16.01 16.01 16.20 16.00 16.01 17.06 67.50 89.09 Low 21.19 20.35 16.60 14.70 14.55 14.57 15.03 14.56 14.84 16.16 66.52 86.13Nov 2010 High 23.58 23.15 18.85 17.13 17.14 17.14 17.62 17.09 17.42 18.64 78.25 97.06 Low 21.85 21.24 16.91 14.80 14.70 14.47 15.30 14.40 14.95 16.33 66.00 92.17Oct 2010 High 23.97 23.71 19.47 17.75 17.73 17.77 17.91 17.75 17.73 18.48 77.75 96.99 Low 23.44 23.16 18.81 15.65 15.72 15.61 16.42 15.60 16.02 17.19 74.00 94.69Sep 2010 High 23.97 23.85 19.88 16.80 16.83 16.71 17.59 16.68 17.39 18.44 75.00 95.10 Low 22.81 21.50 17.45 13.54 13.47 13.32 14.09 13.27 13.89 15.04 66.00 86.50Aug 2010 High 23.10 22.16 17.99 14.33 14.26 14.31 14.70 14.18 14.46 15.38 66.75 86.69 Low 21.16 20.25 16.50 13.21 13.14 13.07 13.78 12.96 13.57 14.73 62.00 84.21 By quarter 2010: Q4 High 23.97 23.71 19.47 17.75 17.73 17.77 17.91 17.75 17.73 18.64 78.25 97.06 Low 21.19 20.35 16.60 14.70 14.55 14.47 15.03 14.40 14.84 16.16 66.00 86.132010: Q3 High 23.97 23.85 19.88 16.80 16.83 16.71 17.59 16.68 17.39 18.44 75.00 95.10 Low 20.73 17.14 14.12 10.95 10.91 10.75 11.24 10.80 10.99 11.90 56.50 75.252010: Q2 High 21.20 19.90 16.63 14.15 14.11 14.13 14.54 14.13 14.35 15.40 65.75 85.13 Low 17.33 16.51 13.35 11.06 11.15 11.05 11.35 11.14 11.18 12.07 53.00 73.252010: Q1 High 20.51 19.58 16.61 14.23 13.95 14.07 14.21 13.92 14.12 14.94 66.00 84.75 Low 16.57 15.10 13.67 11.35 11.23 11.15 11.68 11.02 11.65 12.56 54.00 67.132009: Q4 High 17.06 15.90 13.65 11.36 11.29 11.16 11.69 11.06 11.25 12.47 54.00 69.25 Low 12.40 11.59 9.51 8.41 8.38 8.20 8.41 8.33 8.36 9.21 43.00 55.622009: Q3 High 18.30 16.46 13.14 14.07 14.11 13.91 15.15 13.63 14.45 16.48 57.50 55.63 Low 12.50 10.79 9.00 9.26 9.14 9.10 9.69 8.94 9.50 10.66 39.00 50.252009: Q2 High 15.73 14.10 11.36 12.80 12.54 12.36 13.20 11.98 13.11 14.24 43.25 50.50 Low 6.99 6.13 4.90 5.62 5.40 5.25 5.76 5.25 5.74 6.00 21.25 28.002009: Q1 High 14.19 12.99 10.89 12.25 11.75 11.50 12.18 11.30 11.84 13.51 43.96 56.03 Low 3.00 2.77 2.21 2.63 2.55 2.43 2.64 2.37 2.58 2.78 8.98 20.00 By year 2010 High 23.97 23.85 19.88 17.75 17.73 17.77 17.91 17.75 17.73 18.64 78.25 97.06 Low 16.57 15.10 13.35 10.95 10.91 10.75 11.24 10.80 10.99 11.90 53.00 67.132009 High 18.30 16.46 13.65 14.07 14.11 13.91 15.15 13.63 14.45 16.48 57.50 69.25 Low 3.00 2.77 2.21 2.63 2.55 2.43 2.64 2.37 2.58 2.78 8.98 20.002008 High 25.74 25.30 22.27 24.12 24.01 23.85 24.95 23.52 24.66 25.66 105.61 107.55 Low 5.10 5.00 4.37 4.51 4.20 4.50 4.34 4.16 4.36 5.43 39.84 53.602007 High 26.50 25.85 24.75 25.99 25.75 25.83 26.91 25.50 25.20 25.48 107.98 122.07 Low 23.60 22.70 17.90 19.68 19.50 19.25 20.71 18.96 20.26 22.61 98.34 100.492006 High 27.25 25.95 24.62 26.08 25.96 26.07 26.76 — — — — 122.23 Low 25.29 25.01 21.15 23.58 23.32 22.76 24.67 — — — — 106.06
Note: (1) Price quoted as a % of US$1,000 nominal.
427RBS Group 2010
Shareholder information
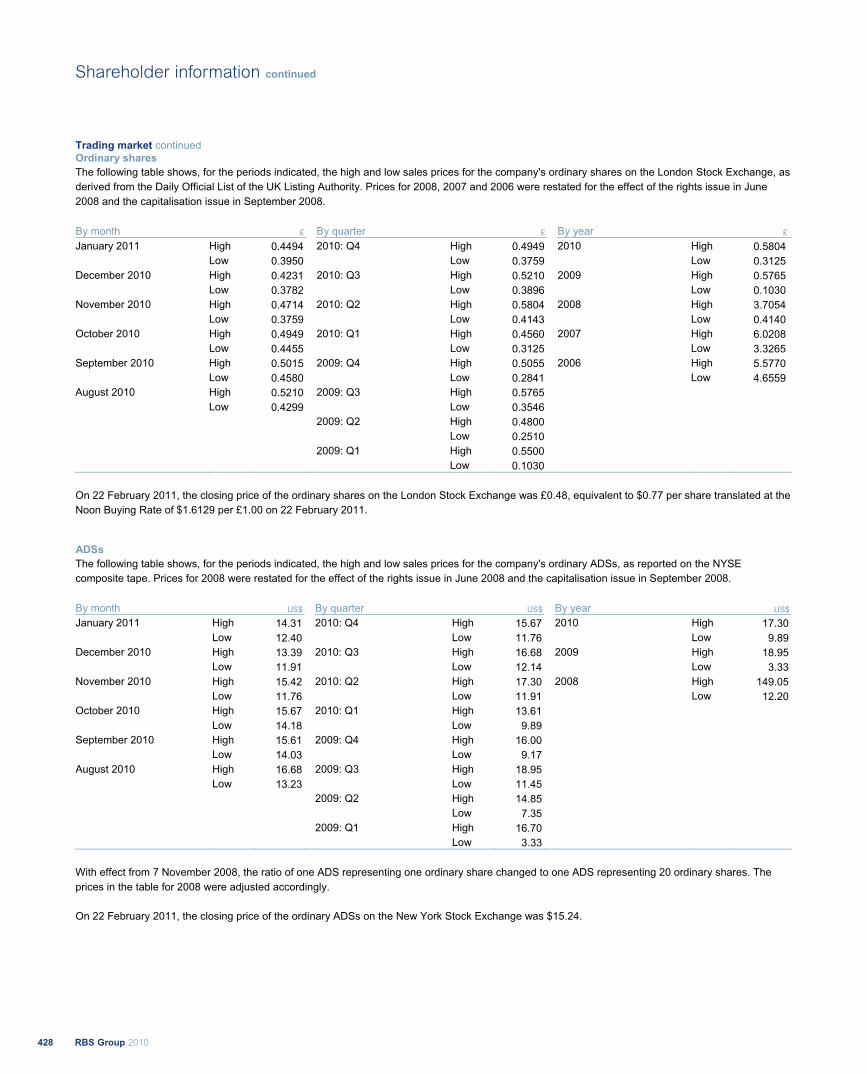
Trading market continued Ordinary shares The following table shows, for the periods indicated, the high and low sales prices for the company's ordinary shares on the London Stock Exchange, as derived from the Daily Official List of the UK Listing Authority. Prices for 2008, 2007 and 2006 were restated for the effect of the rights issue in June 2008 and the capitalisation issue in September 2008. By month £ By quarter £ By year £
January 2011 High 0.4494 2010: Q4 High 0.4949 2010 High 0.5804 Low 0.3950 Low 0.3759 Low 0.3125
December 2010 High 0.4231 2010: Q3 High 0.5210 2009 High 0.5765 Low 0.3782 Low 0.3896 Low 0.1030 November 2010 High 0.4714 2010: Q2 High 0.5804 2008 High 3.7054 Low 0.3759 Low 0.4143 Low 0.4140 October 2010 High 0.4949 2010: Q1 High 0.4560 2007 High 6.0208 Low 0.4455 Low 0.3125 Low 3.3265 September 2010 High 0.5015 2009: Q4 High 0.5055 2006 High 5.5770 Low 0.4580 Low 0.2841 Low 4.6559 August 2010 High 0.5210 2009: Q3 High 0.5765
Low 0.4299 Low 0.3546 2009: Q2 High 0.4800
Low 0.2510 2009: Q1 High 0.5500
Low 0.1030
On 22 February 2011, the closing price of the ordinary shares on the London Stock Exchange was £0.48, equivalent to $0.77 per share translated at the Noon Buying Rate of $1.6129 per £1.00 on 22 February 2011.
ADSs The following table shows, for the periods indicated, the high and low sales prices for the company's ordinary ADSs, as reported on the NYSE composite tape. Prices for 2008 were restated for the effect of the rights issue in June 2008 and the capitalisation issue in September 2008. By month US$ By quarter US$ By year US$
January 2011 High 14.31 2010: Q4 High 15.67 2010 High 17.30 Low 12.40 Low 11.76 Low 9.89
December 2010 High 13.39 2010: Q3 High 16.68 2009 High 18.95 Low 11.91 Low 12.14 Low 3.33 November 2010 High 15.42 2010: Q2 High 17.30 2008 High 149.05 Low 11.76 Low 11.91 Low 12.20 October 2010 High 15.67 2010: Q1 High 13.61
Low 14.18 Low 9.89 September 2010 High 15.61 2009: Q4 High 16.00
Low 14.03 Low 9.17 August 2010 High 16.68 2009: Q3 High 18.95
Low 13.23 Low 11.45 2009: Q2 High 14.85
Low 7.35 2009: Q1 High 16.70
Low 3.33
With effect from 7 November 2008, the ratio of one ADS representing one ordinary share changed to one ADS representing 20 ordinary shares. The prices in the table for 2008 were adjusted accordingly. On 22 February 2011, the closing price of the ordinary ADSs on the New York Stock Exchange was $15.24.
RBS Group 2010428
Shareholder information continued
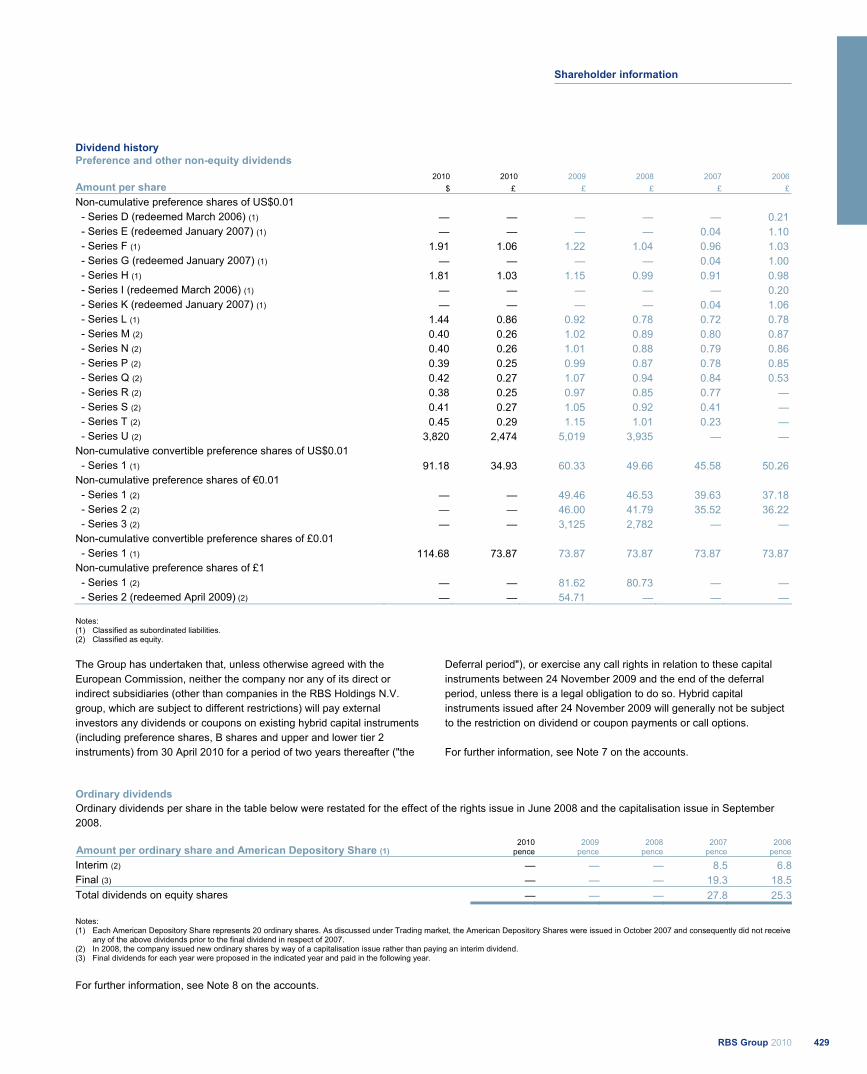
Dividend history Preference and other non-equity dividends 2010 2010 2009 2008 2007 2006 Amount per share $ £ £ £ £ £
Non-cumulative preference shares of US$0.01 - Series D (redeemed March 2006) (1) — — — — — 0.21
- Series E (redeemed January 2007) (1) — — — — 0.04 1.10 - Series F (1) 1.91 1.06 1.22 1.04 0.96 1.03 - Series G (redeemed January 2007) (1) — — — — 0.04 1.00 - Series H (1) 1.81 1.03 1.15 0.99 0.91 0.98 - Series I (redeemed March 2006) (1) — — — — — 0.20 - Series K (redeemed January 2007) (1) — — — — 0.04 1.06 - Series L (1) 1.44 0.86 0.92 0.78 0.72 0.78 - Series M (2) 0.40 0.26 1.02 0.89 0.80 0.87 - Series N (2) 0.40 0.26 1.01 0.88 0.79 0.86 - Series P (2) 0.39 0.25 0.99 0.87 0.78 0.85 - Series Q (2) 0.42 0.27 1.07 0.94 0.84 0.53 - Series R (2) 0.38 0.25 0.97 0.85 0.77 — - Series S (2) 0.41 0.27 1.05 0.92 0.41 — - Series T (2) 0.45 0.29 1.15 1.01 0.23 — - Series U (2) 3,820 2,474 5,019 3,935 — — Non-cumulative convertible preference shares of US$0.01
- Series 1 (1) 91.18 34.93 60.33 49.66 45.58 50.26 Non-cumulative preference shares of €0.01
- Series 1 (2) — — 49.46 46.53 39.63 37.18 - Series 2 (2) — — 46.00 41.79 35.52 36.22 - Series 3 (2) — — 3,125 2,782 — — Non-cumulative convertible preference shares of £0.01
- Series 1 (1) 114.68 73.87 73.87 73.87 73.87 73.87 Non-cumulative preference shares of £1
- Series 1 (2) — — 81.62 80.73 — — - Series 2 (redeemed April 2009) (2) — — 54.71 — — —
Notes: (1) Classified as subordinated liabilities. (2) Classified as equity. The Group has undertaken that, unless otherwise agreed with the European Commission, neither the company nor any of its direct or indirect subsidiaries (other than companies in the RBS Holdings N.V. group, which are subject to different restrictions) will pay external investors any dividends or coupons on existing hybrid capital instruments (including preference shares, B shares and upper and lower tier 2 instruments) from 30 April 2010 for a period of two years thereafter ("the
Deferral period"), or exercise any call rights in relation to these capital instruments between 24 November 2009 and the end of the deferral period, unless there is a legal obligation to do so. Hybrid capital instruments issued after 24 November 2009 will generally not be subject to the restriction on dividend or coupon payments or call options. For further information, see Note 7 on the accounts.
Ordinary dividends Ordinary dividends per share in the table below were restated for the effect of the rights issue in June 2008 and the capitalisation issue in September 2008. Amount per ordinary share and American Depository Share (1)
2010pence
2009 pence
2008pence
2007pence
2006pence
Interim (2) — — — 8.5 6.8Final (3) — — — 19.3 18.5Total dividends on equity shares — — — 27.8 25.3
Notes: (1) Each American Depository Share represents 20 ordinary shares. As discussed under Trading market, the American Depository Shares were issued in October 2007 and consequently did not receive
any of the above dividends prior to the final dividend in respect of 2007. (2) In 2008, the company issued new ordinary shares by way of a capitalisation issue rather than paying an interim dividend. (3) Final dividends for each year were proposed in the indicated year and paid in the following year.
For further information, see Note 8 on the accounts.
429RBS Group 2010
Shareholder information
Taxation for US Holders The following discussion summarises certain US federal and UK tax consequences of the acquisition, ownership and disposition of ordinary shares, non-cumulative dollar preference shares, ADSs representing ordinary shares (ordinary ADSs), ADSs representing non-cumulative dollar preference shares (preference ADSs) or PROs by a beneficial owner that is a citizen or resident of the United States or that otherwise will be subject to US federal income tax on a net income basis in respect of the ordinary shares, non-cumulative dollar preference shares, ordinary ADSs, preference ADSs or PROs (a US Holder). This summary assumes that a US Holder is holding ordinary shares, non-cumulative dollar preference shares, ordinary ADSs, preference ADSs or PROs, as applicable, as capital assets. This summary does not address the tax consequences to a US Holder (i) that is resident (or, in the case of an individual, ordinarily resident) in the UK for UK tax purposes, (ii) that carries on a trade, profession or vocation through a branch, agency or permanent establishment in the UK in connection with which their ordinary shares, non-cumulative preference shares, ordinary ADSs, preference ADSs or PROs, are held, used or acquired, or (iii) generally, that is a corporation which alone or together with one or more associated companies, controls, directly or indirectly, 10% or more of the voting stock of the company, nor does this summary address the tax consequences to US Holders subject to special rules, such as certain financial institutions, dealers or traders in securities who use a mark-to-market method of tax accounting, persons holding ordinary shares, non-cumulative dollar preference shares, ordinary ADSs, preference ADSs or PROs as part of a hedging transaction, straddle, wash sale, conversion transaction or integrated transaction or persons entering into a constructive sale with respect to such securities, persons whose functional currency for US federal income tax purposes is not the US dollar, entities classified as partnerships for US federal income tax purposes, tax-exempt entities or persons that own or are deemed to own 10% or more of the voting stock of the company. The statements and practices set forth below regarding US and UK tax laws, including the US/UK double taxation convention relating to income and capital gains which entered into force on 31 March 2003 (the Treaty), and the US/UK double taxation convention relating to estate and gift taxes (the Estate Taxation Treaty), are based on those laws and practices as in force and as applied in practice on the date of this report. This summary is not exhaustive of all possible tax considerations and holders are advised to satisfy themselves as to the overall tax consequences, including specifically the consequences under US federal, state, local and other laws, and possible changes in taxation law, of the acquisition, ownership and disposition of ordinary shares, non-cumulative dollar preference shares, ordinary ADSs, preference ADSs or PROs by consulting their own tax advisers. The following discussion assumes that the company is not, and will not become, a passive foreign investment company - see ‘Passive Foreign Investment Company (PFIC) considerations’ on page 433.
Ordinary shares, preference shares, ordinary ADSs and preference ADSs Taxation of dividends For the purposes of the Treaty, the Estate Taxation Treaty and the US Internal Revenue Code of 1986 as amended (the Code), US Holders of ordinary ADSs and preference ADSs should be treated as owners of the ordinary shares and the non-cumulative dollar preference shares underlying such ADSs. The US Treasury has expressed concerns that parties to whom depositary receipts are released before shares are delivered to the depositary, or intermediaries, in the chain of ownership between US holders and the issuer of the security underlying the depositary receipts may be taking actions that are inconsistent with the claiming of foreign tax credits for US holders of depositary receipts. Such actions would also be inconsistent with the claiming of the reduced rate of US tax applicable to dividends received by certain non-corporate US holders. Accordingly, the availability of the reduced tax rate for dividends received by certain non-corporate US holders of ordinary ADSs could be affected by actions taken by such parties or intermediaries. The company is not required to withhold UK tax at source from dividend payments it makes or from any amount (including any amounts in respect of accrued dividends) distributed by the company. US Holders who are not resident or ordinarily resident in the UK and who do not carry on a trade, profession or vocation in the UK through a branch, agency or permanent establishment in connection with which their ordinary shares, non-cumulative preference shares, ordinary ADSs or preference ADSs are held, used or acquired will not be subject to UK tax in respect of any dividends received on the relevant shares or ADSs. Distributions by the company (other than certain pro rata distributions of ordinary shares or rights to receive such shares) will constitute foreign source dividend income for US federal income tax purposes to the extent paid out of the current or accumulated earnings and profits of the company, as determined for US federal income tax purposes. Because the company does not maintain calculations of its earnings and profits under US federal income tax principles, it is expected that distributions will be reported to US Holders as dividends. Payments will not be eligible for the dividends-received deduction generally allowed to corporate US holders. Subject to applicable limitations that may vary depending upon a holder's individual circumstances, dividends paid to certain non-corporate US Holders in taxable years beginning before 1 January 2013 will be taxable at a maximum tax rate of 15%. Non-corporate US Holders should consult their own tax advisers to determine whether they are subject to any special rules that limit their ability to be taxed at this favourable rate.
RBS Group 2010430
Shareholder information continued
Dividends will be included in a US Holder's income on the date of the US Holder's (or in the case of ADSs, the depositary's) receipt of the dividend. The amount of any dividend paid in pounds sterling or euros to be taken into income by a US Holder will be the US dollar amount calculated by reference to the relevant exchange rate in effect on the date of such receipt regardless of whether the payment is in fact converted into US dollars. If the dividend is converted into US dollars on the date of receipt, the US Holder generally should not be required to recognise foreign currency gain or loss in respect of the dividend income. If the amount of such dividend is not converted into US dollars on the date of receipt, the US Holder may have foreign currency gain or loss. Taxation of capital gains A US Holder that is not resident (or, in the case of an individual, ordinarily resident) in the UK will not normally be liable for UK tax on capital gains realised on the disposition of an ordinary share, a non-cumulative dollar preference share, an ordinary ADS or a preference ADS unless at the time of the disposal, in the case of a corporate US Holder, such US Holder carries on a trade in the UK through a permanent establishment or, in the case of any other US Holder, such US Holder carries on a trade, profession or vocation in the UK through a UK branch or agency and, in each case, such ordinary share, non-cumulative dollar preference share, ordinary ADS or preference ADS is or has been used, held or acquired by or for the purposes of such trade (or profession or vocation), carried on through such permanent establishment, branch or agency. Special rules apply to individuals who are temporarily not resident or ordinarily resident in the UK. A US Holder will, upon the sale or other disposition of an ordinary share, a non-cumulative dollar preference share, an ordinary ADS or a preference ADS, or upon the redemption of a non-cumulative dollar preference share or preference ADS, generally recognise capital gain or loss for US federal income tax purposes (assuming that in the case of a redemption of a non-cumulative dollar preference share or a preference ADS, such US Holder does not own, and is not deemed to own, any ordinary shares or ordinary ADSs of the company) in an amount equal to the difference between the amount realised (excluding in the case of a redemption any amount treated as a dividend for US federal income tax purposes, which will be taxed accordingly) and the US Holder's tax basis in such share or ADS. This capital gain or loss will be long-term capital gain or loss if the US Holder held the share or ADS so sold, disposed or redeemed for more than one year. A US Holder who is liable for both UK and US tax on a gain recognised on the disposal of an ordinary share, a non-cumulative dollar preference share, an ordinary ADS or a preference ADS will generally be entitled, subject to certain limitations, to credit the UK tax against its US federal income tax liability in respect of such gain.
Estate and gift tax Subject to the discussion of the Estate Tax Treaty in the following paragraph, ordinary shares, non-cumulative dollar preference shares, ordinary ADSs or preference ADSs beneficially owned by an individual may be subject to UK inheritance tax (subject to exemptions and reliefs) on the death of the individual or in certain circumstances, if such shares or ADSs are the subject of a gift (including a transfer at less than market value) by such individual. Inheritance tax is not generally chargeable on gifts to individuals made more than seven years before the death of the donor. Ordinary shares, non-cumulative dollar preference shares, ordinary ADSs or preference ADSs held by the trustees of a settlement may also be subject to UK inheritance tax. Special rules apply to such settlements. An ordinary share, a non-cumulative dollar preference share, an ordinary ADS or a preference ADS beneficially owned by an individual, whose domicile is determined to be the United States for purposes of the Estate Tax Treaty and who is not a national of the UK, will not be subject to UK inheritance tax on the individual's death or on a lifetime transfer of such share or ADS, except in certain cases where the share or ADS (i) is comprised in a settlement (unless, at the time of the settlement, the settlor was domiciled in the United States and was not a national of the UK); (ii) is part of the business property of a UK permanent establishment of an enterprise; or (iii) pertains to a UK fixed base of an individual used for the performance of independent personal services. The Estate Tax Treaty generally provides a credit against US federal estate or gift tax liability for the amount of any tax paid in the UK in a case where the ordinary share, non-cumulative dollar preference share, ordinary ADS or preference ADS is subject to both UK inheritance tax and US federal estate or gift tax. UK stamp duty and stamp duty reserve tax (SDRT) The following is a summary of the UK stamp duty and SDRT consequences of transferring an ADS or ADR in registered form (otherwise than to the custodian on cancellation of the ADS) or of transferring an ordinary share or a non-cumulative dollar preference share. A transfer of a registered ADS or ADR executed and retained in the United States will not give rise to stamp duty and an agreement to transfer a registered ADS or ADR will not give rise to SDRT. Stamp duty or SDRT will normally be payable on or in respect of transfers of ordinary shares or non-cumulative dollar preference shares and accordingly any holder who acquires or intends to acquire ordinary shares or non-cumulative dollar preference shares is advised to consult its own tax advisers in relation to stamp duty and SDRT.
431RBS Group 2010
Shareholder information
Taxation for US Holders continued PROs United States Payments of interest on a PRO (including any UK withholding tax, as to which see below) will constitute foreign source dividend income for US federal income tax purposes to the extent paid out of the current or accumulated earnings and profits of the company, as determined for US federal income tax purposes. Because the company does not maintain calculations of its earnings and profits under US federal income tax principles, it is expected that distributions will be reported to US Holders as dividends. Payments will not be eligible for the dividends-received deduction generally allowed to corporate US holders. A US Holder who is entitled under the Treaty to a refund of UK tax, if any, withheld on a payment will not be entitled to claim a foreign tax credit with respect to such tax. Subject to applicable limitations that may vary depending upon a holder's individual circumstances, dividends paid to certain non-corporate US Holders in taxable years beginning before 1 January 2013 will be taxable at a maximum tax rate of 15%. Non-corporate US Holders should consult their own tax advisers to determine whether they are subject to any special rules that limit their ability to be taxed at this favourable rate. A US Holder will, upon the sale, exchange or redemption of a PRO, generally recognise capital gain or loss for US federal income tax purposes (assuming that in the case of a redemption, such US Holder does not own, and is not deemed to own, any ordinary shares or ordinary ADSs of the company) in an amount equal to the difference between the amount realised (excluding any amount in respect of mandatory interest and any missed payments which are to be satisfied on a missed payment satisfaction date, which would be treated as ordinary income) and the US Holder's tax basis in the PRO. A US Holder who is liable for both UK and US tax on gain recognised on the disposal of PROs will generally be entitled, subject to certain limitations, to credit the UK tax against its US federal income tax liability in respect of such gain. United Kingdom Taxation of payments on the PROs Payments on the PROs will constitute interest rather than dividends for UK withholding tax purposes. However, the PROs will constitute 'quoted eurobonds' within the meaning of section 987 of the Income Tax Act 2007 and therefore payments of interest will not be subject to withholding or deduction for or on account of UK tax as long as the PROs remain at all times listed on a 'recognised stock exchange' within the meaning of section 1005 of the Income Tax Act 2007, such as the main market of the New York Stock Exchange. In all other cases, an amount must be withheld on account of UK income tax at the basic rate (currently 20%) subject to any direction to the contrary by HM Revenue & Customs under the Treaty and except that the withholding obligation does not apply to payments to persons who the company reasonably believes are within the charge to corporation tax or fall within various categories enjoying a special tax status (including charities and pension funds), or are
partnerships consisting of such persons (unless HM Revenue & Customs directs otherwise). Where interest has been paid under deduction of UK withholding tax, US Holders may be able to recover the tax deducted under the Treaty. Any paying agent or other person by or through whom interest is paid to, or by whom interest is received on behalf of an individual, may be required to provide information in relation to the payment and the individual concerned to HM Revenue & Customs. HM Revenue & Customs may communicate this information to the tax authorities of other jurisdictions. HM Revenue & Customs confirmed at around the time of the issue of the PROs that interest payments would not be treated as distributions for UK tax purposes by reason of (i) the fact that interest may be deferred under the terms of issue; or (ii) the undated nature of the PROs, provided that at the time an interest payment is made, the PROs are not held by a company which is 'associated' with the company or by a 'funded company'. A company will be associated with the company if, broadly speaking, it is part of the same group as the company. A company will be a 'funded company' for these purposes if there are arrangements involving that company being put in funds (directly or indirectly) by the company, or an entity associated with the company. In this respect, HM Revenue & Customs has confirmed that a company holding an interest in the PROs which incidentally has banking facilities with any company associated with the company will not be a 'funded company' by virtue of such facilities. Interest on the PROs constitutes UK source income for UK tax purposes and, as such, may be subject to income tax by direct assessment even where paid without withholding. However, interest with a UK source received without deduction or withholding on account of UK tax will not be chargeable to UK tax in the hands of a US Holder unless, in the case of a corporate US Holder, such US Holder carries on a trade in the UK through a UK permanent establishment or in the case of other US Holders, such persons carry on a trade, profession or vocation in the UK through a UK branch or agency in each case in connection with which the interest is received or to which the PROs are attributable. There are also exemptions for interest received by certain categories of agents (such as some brokers and investment managers). EU Directive on taxation of savings income The European Union has adopted a directive regarding the taxation of savings income. The Directive requires member states of the European Union to provide to the tax authorities of other member states details of payments of interest and other similar income paid by a person to an individual or certain other persons resident in another member state, except that Luxembourg and Austria may instead impose a withholding system for a transitional period unless during such period they elect otherwise.
RBS Group 2010432
Shareholder information continued
Disposal (including redemption) A disposal (including redemption) of PROs by a non-corporate US Holder will not give rise to any liability to UK tax on capital gains unless the US Holder carries on a trade (which for this purpose includes a profession or a vocation) in the UK through a branch or agency and the PROs are, or have been, held or acquired for the purposes of that trade, carried on through such branch or agency. A transfer of PROs by a US Holder will not give rise to a charge to UK tax on accrued but unpaid interest payments, unless the US Holder is an individual or other non-corporate taxpayer and at any time in the relevant year of assessment or accounting period carries on a trade, profession or vocation in the UK through a branch or agency to which the PROs are attributable. Annual tax charges Corporate US Holders of PROs may be subject to annual UK tax charges (or relief) by reference to fluctuations in exchange rates and in respect of profits, gains and losses arising from the PROs, but only if such corporate US Holders carry on a trade in the UK through a UK permanent establishment to which the PROs are attributable. Inheritance tax In relation to PROs held through DTC (or any other clearing system), the UK inheritance tax position is not free from doubt in respect of a lifetime transfer, or death of, a US Holder who is not domiciled nor deemed to be domiciled in the UK for inheritance tax purposes; HM Revenue & Customs is known to consider that the situs of securities held in this manner is not necessarily determined by the place where the securities are registered. In appropriate circumstances, there may be a charge to UK inheritance tax as a result of a lifetime transfer at less than market value by, or on the death of, such US Holder. Inheritance tax is not generally chargeable on gifts to individuals made more than seven years before the death of the donor. However, exemption from, or a reduction of, any such UK tax liability may be available under the Estate Tax Treaty (see below). US Holders should consult their professional advisers in relation to such potential liability. PROs beneficially owned by an individual, whose domicile is determined to be the United States for the purposes of the Estate Tax Treaty and who is not a national of the UK, will not be subject to UK inheritance tax on the individual's death or on a lifetime transfer of the PRO, except in certain cases where the PRO (i) is comprised in a settlement (unless, at the time of the settlement, the settlor was domiciled in the United States and was not a national of the UK); (ii) is part of the business property of a UK permanent establishment of an enterprise; or (iii) pertains to a UK fixed base of an individual used for the performance of independent personal services. The Estate Tax Treaty generally provides a credit against US federal estate or gift tax liability for the amount of any tax paid in the UK in a case where the PRO is subject to both UK inheritance tax and US federal estate or gift tax. Stamp duty and SDRT No stamp duty, SDRT or similar tax is imposed in the UK on the issue, transfer or redemption of the PROs.
Passive Foreign Investment Company (PFIC) considerations A foreign corporation will be a PFIC in any taxable year in which, after taking into account the income and assets of the corporation and certain subsidiaries pursuant to applicable 'look-through rules', either (i) at least 75% of its gross income is 'passive income' or (ii) at least 50% of the average value of its assets is attributable to assets which produce passive income or are held for the production of passive income. The company does not believe that it was a PFIC for its 2010 taxable year. Although interest income is generally passive income, a special rule allows banks to treat their banking business income as non-passive. To qualify for this rule, a bank must satisfy certain requirements regarding its licensing and activities. The company believes that it currently meets these requirements. The company's possible status as a PFIC must be determined annually, however, and may be subject to change if the company fails to qualify under this special rule for any year in which a US Holder holds ordinary shares, non-cumulative dollar preference shares, ordinary ADSs, preference ADSs or PROs. If the company were to be treated as a PFIC in any year during which a US Holder holds ordinary shares, non-cumulative dollar preference shares, ordinary ADSs, preference ADSs or PROs, US Holders would generally be subject to adverse US federal income tax consequences. Holders should consult their own tax advisers as to the potential application of the PFIC rules to the ownership and disposition of the company's ordinary shares, non-cumulative dollar preference shares, ordinary ADSs, preference ADSs or PROs. Exchange controls The company has been advised that there are currently no UK laws, decrees or regulations which would prevent the import or export of capital, including the availability of cash or cash equivalents for use by the Group, or the remittance of dividends, interest or other payments to non-UK resident holders of the company's securities. There are no restrictions under the Articles of Association of the company or under UK law, as currently in effect, which limit the right of non-UK resident owners to hold or, when entitled to vote, freely to vote the company's securities. Memorandum and Articles of Association The company's Memorandum and Articles of Association as in effect at the date of this annual report are registered with the Registrar of Companies of Scotland. The Articles of Association were last amended on 28 April 2010. Incorporation and registration The company was incorporated and registered in Scotland under the Companies Act 1948 as a limited company on 25 March 1968 under the name National and Commercial Banking Group Limited, and changed its name to The Royal Bank of Scotland Group Limited on 3 September 1979. On 10 March 1982 it was re-registered under the Companies Acts 1948 to 1980 as a public company with limited liability. The company is registered under Company No. SC45551. Code of conduct As discussed on page 231, the Group has adopted a code of conduct applicable to all Group employees, which will be provided to any person without charge, upon request, by contacting Group Secretariat at the telephone number listed on page 443.
433RBS Group 2010
Shareholder information
Glossary of terms Adjustable rate mortgage (ARM) - in the US a variable-rate mortgage. ARMs include: hybrid ARMs which typically have a fixed-rate period followed by an adjustable-rate period; interest-only ARMs where interest only is payable for a specified number of years, typically for three to ten years; and payment-option ARMs that allow the borrower to choose periodically between various payment options. Alt-A (Alternative A-paper) are mortgage loans with a higher credit quality than sub-prime loans but with features that disqualify the borrower from a traditional prime loan. Alt-A lending characteristics include limited documentation; high loan-to-value ratio; secured on non-owner occupied properties; and debt-to-income ratio above normal limits. Arrears are the aggregate of contractual payments due on a debt that have not been met by the borrower. A loan or other financial asset is said to be 'in arrears' when payments have not been made. Asset-backed commercial paper (ABCP) - a form of asset-backed security generally issued by a commercial paper conduit. Asset-backed securities (ABS) are securities that represent interests in specific portfolios of assets. They are issued by a special purpose entity following a securitisation. The underlying portfolios commonly comprise residential or commercial mortgages but can include any class of asset that yields predictable cash flows. Payments on the securities depend primarily on the cash flows generated by the assets in the underlying pool and other rights designed to assure timely payment, such as guarantees or other credit enhancements. Collateralised bond obligations, collateralised debt obligations, collateralised loan obligations, commercial mortgage backed securities and residential mortgage backed securities are all types of ABS. Assets under management are assets managed by the Group on behalf of clients. Collateralised bond obligations (CBOs) are asset-backed securities for which the underlying asset portfolios are bonds, some of which may be sub-investment grade. Collateralised debt obligations (CDOs) are asset-backed securities for which the underlying asset portfolios are debt obligations: either bonds (collateralised bond obligations) or loans (collateralised loan obligations) or both. The credit exposure underlying synthetic CDOs derives from credit default swaps. The CDOs issued by an individual vehicle are usually divided in different tranches: senior tranches (rated AAA), mezzanine tranches (AA to BB), and equity tranches (unrated). Losses are borne first by the equity securities, next by the junior securities, and finally by the senior securities; junior tranches offer higher coupons (interest payments) to compensate for their increased risk. Collateralised debt obligation squared (CDO-squared) is a type of collateralised debt obligation where the underlying asset portfolio includes tranches of other CDOs.
Collateralised loan obligations (CLOs) are asset-backed securities for which the underlying asset portfolios are loans, often leveraged loans. Collectively assessed loan impairment provisions - impairment loss provisions in respect of impaired loans, such as credit cards or personal loans, that are below individual assessment thresholds. Such provisions are established on a portfolio basis, taking account of the level of arrears, security, past loss experience, credit scores and defaults based on portfolio trends. Commercial mortgage backed securities (CMBS) are asset-backed securities for which the underlying asset portfolios are loans secured on commercial real estate. Commercial paper (CP) comprises unsecured obligations issued by a corporate or a bank directly or secured obligations (asset-backed CP), often issued through a commercial paper conduit, to fund working capital. Maturities typically range from 2 to 270 days. However, the depth and reliability of some CP markets means that issuers can repeatedly roll over CP issuance and effectively achieve longer term funding. Commercial paper is issued in a wide range of denominations and can be either discounted or interest-bearing. Commercial paper conduit is a special purpose entity that issues commercial paper and uses the proceeds to purchase or fund a pool of assets. The commercial paper is secured on the assets and is redeemed either by further commercial paper issuance, repayment of assets or liquidity drawings. Commercial real estate - freehold and leasehold properties used for business activities. Commercial real estate includes office buildings, industrial property, medical centres, hotels, retail stores, shopping centres, agricultural land and buildings, warehouses, garages etc. Constant proportion portfolio insurance notes (CPPI notes) - CPPI is the name given to a trading strategy that is designed to ensure that a fixed minimum return is achieved either at all times or more typically, at a set date in the future. Essentially the strategy involves continuously re- balancing the portfolio of investments during the term of the product between performance assets and safe assets using a pre-set formula. CPPI notes provide investors with a return linked to a CPPI portfolio. Contractual maturity is the date in the terms of a financial instrument on which the last payment or receipt under the contract is due for settlement. Core Tier 1 capital - called-up share capital and eligible reserves plus equity non-controlling interests, less intangible assets and other regulatory deductions. Core Tier 1 capital ratio - core Tier 1 capital as a percentage of risk-weighted assets. Cost:income ratio - operating expenses as a percentage of total income.
RBS Group 2010434
Shareholder information continued

Covered mortgage bonds are debt securities backed by a portfolio of mortgages that is segregated from the issuer's other assets solely for the benefit of the holders of the covered bonds Credit default swap (CDS) is a contract where the protection seller receives premium or interest-related payments in return for contracting to make payments to the protection buyer upon a defined credit event in relation to a reference financial asset or portfolio of financial assets. Credit events usually include bankruptcy, payment default and rating downgrades. Credit derivative product company (CDPC) is a special purpose entity that sells credit protection under credit default swaps or certain approved forms of insurance policies. Sometimes they can also buy credit protection. CDPCs are similar to monoline insurers. However, unlike monoline insurers, they are not regulated as insurers. Credit derivatives are contractual agreements that provide protection against a credit event on one or more reference entities or financial assets. The nature of a credit event is established by the protection buyer and protection seller at the inception of a transaction, and such events include bankruptcy, insolvency or failure to meet payment obligations when due. The buyer of the credit derivative pays a periodic fee in return for a payment by the protection seller upon the occurrence, if any, of a credit event. Credit derivatives include credit default swaps, total return swaps and credit swap options. Credit enhancements - are techniques that improve the credit standing of financial obligations; generally those issued by an SPE in a securitisation. External credit enhancements include financial guarantees and letters of credit from third-party providers. Internal enhancements include excess spread - the difference between the interest rate received on the underlying portfolio and the coupon on the issued securities; and over-collateralisation - on securitisation, the value of the underlying portfolio is greater than the securities issued. Credit risk assets - loans and advances (including overdraft facilities), instalment credit, finance lease receivables and other traded instruments across all customer types. Credit risk spread - is the difference between the coupon on a debt instrument and the benchmark or the risk-free interest rate for the instrument's maturity structure. It is the premium over the risk-free rate required by the market for the credit quality of an individual debt instrument. Credit valuation adjustments - are adjustments to the fair values of derivative assets to reflect the creditworthiness of the counterparty. Currency swap - an arrangement in which two parties exchange specific principal amounts of different currencies at inception and subsequently interest payments on the principal amounts. Often, one party will pay a fixed interest rate, while the other will pay a floating exchange rate (though there are also fixed-fixed and floating-floating arrangements). At the maturity of the swap, the principal amounts are usually re-exchanged. Customer accounts - comprise money deposited with the Group by counterparties other than banks and classified as liabilities. They include
demand, savings and time deposits; securities sold under repurchase agreements; and other short term deposits. Deposits received from banks are classified as deposits by banks. Debt restructuring - see Renegotiated loans. Debt securities are transferable instruments creating or acknowledging indebtedness. They include debentures, bonds, certificates of deposit, notes and commercial paper. The holder of a debt security is typically entitled to the payment of principal and interest, together with other contractual rights under the terms of the issue, such as the right to receive certain information. Debt securities are generally issued for a fixed term and redeemable by the issuer at the end of that term. Debt securities can be secured or unsecured. Debt securities in issue comprise unsubordinated debt securities issued by the Group. They include commercial paper, certificates of deposit, bonds and medium-term notes. Deferred tax asset - income taxes recoverable in future periods as a result of deductible temporary differences - temporary differences between the accounting and tax base of an asset or liability that will result in tax deductible amounts in future periods - and the carry-forward of tax losses and unused tax credits. Deferred tax liability - income taxes payable in future periods as a result of taxable temporary differences (temporary differences between the accounting and tax base of an asset or liability that will result in taxable amounts in future periods). Defined benefit obligation - the present value of expected future payments required to settle the obligations of a defined benefit plan resulting from employee service. Defined benefit plan - pension or other post-retirement benefit plan other than a defined contribution plan. Defined contribution plan - pension or other post-retirement benefit plan where the employer's obligation is limited to its contributions to the fund. Delinquency - a debt or other financial obligation is considered delinquent when one or more contractual payments are overdue. Delinquency is usually defined in terms of days past due. Delinquent and in arrears are synonymous. Deposits by banks - comprise money deposited with the Group by banks and recorded as liabilities. They include money-market deposits, securities sold under repurchase agreements, federal funds purchased and other short term deposits. Deposits received from customers are recorded as customer accounts. Derivative - a contract or agreement whose value changes with changes in an underlying index such as interest rates, foreign exchange rates, share prices or indices and which requires no initial investment or an initial investment that is smaller than would be required for other types of contracts with a similar response to market factors. The principal types of derivatives are: swaps, forwards, futures and options.
435RBS Group 2010
Shareholder information
Glossary of terms continued Discontinued operation - is a component of the Group that either has been disposed of or is classified as held for sale. A discontinued operation is either: a separate major line of business or geographical area of operations or part of a single co-ordinated plan to dispose of a separate major line of business or geographical area of operations; or a subsidiary acquired exclusively with a view to resale. Exposure at default (EAD) - an estimate of the expected level of utilisation of a credit facility at the time of a borrower's default. The EAD may be higher than the current utilisation (e.g. in the case where further drawings may be made under a revolving credit facility prior to default) but will not typically exceed the total facility limit. Fannie Mae (Federal National Mortgage Association) - is a US Government Sponsored Enterprise. It buys mortgages, principally issued by banks, on the secondary market, pools them, and sells them as residential mortgage-backed securities to investors on the open market. Its obligations are not explicitly guaranteed by the full faith and credit of the US Government. Federal Home Loan Mortgage Corporation - see Freddie Mac. Federal National Mortgage Association - see Fannie Mae. FICO score - a FICO score is calculated using proprietary software developed by the Fair Isaac Corporation in the US from a consumer's credit profile. The scores range between 300 and 850 and are used in credit decisions made by banks and other providers of credit. First/second lien - a lien is a charge such as a mortgage held by one party, over property owned by a second party, as security for payment of some debt, obligation, or duty owed by that second party. The holder of a first lien takes precedence over all other encumbrances on that property i.e. second and subsequent liens. Forbearance - is the term generally applied to an agreement, principally in relation to secured loans with retail customers experiencing temporary financial difficulty, to a payment moratorium, to reduced repayments or to roll up arrears. Forbearance loans are a subset of Renegotiated loans.
Forward contract - a contract to buy (or sell) a specified amount of a physical or financial commodity, at an agreed price, at an agreed future date. Freddie Mac (Federal Home Loan Mortgage Corporation) - is a US Government Sponsored Enterprise. It buys mortgages, principally issued by thrifts, on the secondary market, pools them, and sells them as residential mortgage-backed securities to investors on the open market. Its obligations are not explicitly guaranteed by the full faith and credit of the US Government. Futures contract - is a contract which provides for the future delivery (or acceptance of delivery) of some type of financial instrument or commodity under terms established at the outset. Futures differ from forward
contracts in that they are traded on recognised exchanges and rarely result in actual delivery; most contracts are closed out prior to maturity by acquisition of an offsetting position. G10 - the Group of Ten comprises the eleven industrial countries (Belgium, Canada, France, Germany, Italy, Japan, the Netherlands, Sweden, Switzerland, the United Kingdom and the United States) that have agreed to participate in the IMF's General Arrangements to Borrow. Ginnie Mae (Government National Mortgage Association) - is a US Government Agency that guarantees investors the timely payment of principal and interest on mortgage-backed securities for which the underlying asset portfolios comprise federally insured or guaranteed loans - mainly loans insured by the Federal Housing Administration or guaranteed by the Department of Veterans Affairs. Ginnie Mae obligations are fully and explicitly guaranteed as to the timely payment of principal and interest by the full faith and credit of the US Government. Government Sponsored Enterprises (GSEs) - are a group of financial services corporations created by the US Congress. Their function is to improve the efficiency of capital markets and to overcome statutory and other market imperfections which otherwise prevent funds from moving easily from suppliers of funds to areas of high loan demand. They include Fannie Mae and Freddie Mac. Gross yield - is the interest rate earned on average interest-earning assets i.e. interest income divided by average interest-earning assets. Guaranteed mortgages - are mortgages that are guaranteed by a government or government agency. In the US, government loan guarantee programmes are offered by the Federal Housing Administration, the Department of Veterans Affairs and the Department of Agriculture's Rural Housing Service. In the Netherlands, the Gemeentegarantie programme is run partly by the central government and partly by the municipalities. Home equity loan - is a type of loan in which the borrower uses the equity in their home as collateral. A home equity loan creates a charge against the borrower's house. Impaired loans - comprise all loans for which an impairment provision has been established; for collectively assessed loans, impairment loss provisions are not allocated to individual loans and the entire portfolio is included in impaired loans. Impairment allowance - see Loan impairment provisions. Impairment losses - for impaired financial assets measured at amortised cost, impairment losses - the difference between carrying value and the present value of estimated future cash flows discounted at the asset's original effective interest rate - are recognised in profit or loss and the carrying amount of the financial asset reduced by establishing a provision (allowance). For impaired available-for-sale financial assets, the cumulative loss that had been recognised directly in equity is removed from equity and recognised in profit or loss as an impairment loss.
RBS Group 2010436
Shareholder information continued
Individually assessed loan impairment provisions - impairment loss provisions for individually significant impaired loans assessed on a case-by-case basis, taking into account the financial condition of the counterparty and any guarantor and the realisable value of any collateral held. International Accounting Standards Board (IASB) - is the independent standard-setting body of the IASC Foundation. Its members are responsible for the development and publication of International Financial Reporting Standards (IFRS) and for approving Interpretations of IFRS as developed by the International Financial Reporting Interpretations Committee (IFRIC). Interest rate swap - a contract under which two counterparties agree to exchange periodic interest payments on a predetermined monetary principal, the notional amount. Interest spread - is the difference between the gross yield and the interest rate paid on average interest-bearing liabilities. Investment grade - generally represents a risk profile similar to a rating of BBB-/Baa3 or better, as defined by independent rating agencies. Latent loss provisions - loan impairment provisions held against impairments in the performing loan portfolio that have been incurred as a result of events occurring before the balance sheet date but which have not been identified as impaired at the balance sheet date. The Group has developed methodologies to estimate latent loss provisions that reflect historical loss experience (adjusted for current economic and credit conditions) and the period between an impairment occurring and a loan being identified and reported as impaired. Leveraged loans - funding (leveraged finance) provided to a business resulting in an overall level of debt that exceeds that which would be considered usual for the business or for the industry in which it operates. Leveraged finance is commonly employed to achieve a specific, often temporary, objective: to make an acquisition, to effect a buy-out or to repurchase shares. Liquidity enhancements - make funds available to ensure that the issuer of securities, usually a commercial paper conduit, can redeem the securities at maturity. They typically take the form of a committed facility from a third-party bank. Loan impairment provisions - are established to recognise incurred impairment losses on a portfolio of loans classified as loans and receivables and carried at amortised cost. It has three components: individually assessed loan impairment provisions, collectively assessed loan impairment provisions and latent loss provisions.
Loan-to-value ratio - the amount of a secured loan as a percentage of the appraised value of the security e.g. the outstanding amount of a mortgage loan as a percentage of the property's value. Loss given default (LGD) - the economic loss that may occur in the event of default i.e. the actual loss - that part of the exposure that is not expected to be recovered - plus any costs of recovery. Master netting agreement - is an agreement between two counterparties that have multiple derivative contracts with each other that provides for the net settlement of all contracts through a single payment, in a single currency, in the event of default on, or termination of, any one contract. Medium term notes (MTNs) - are debt securities usually with a maturity of five to ten years, but the term may be less than one year or as long as 50 years. They can be issued on a fixed or floating coupon basis or with an exotic coupon; with a fixed maturity date (non-callable) or with embedded call or put options or early repayment triggers. MTNs are most generally issued as senior, unsecured debt. Monoline insurers - are entities that specialise in providing credit protection against the notional and interest cash flows due to the holders of debt instruments in the event of default. This protection is typically in the form of derivatives such as credit default swaps. Mortgage-backed securities - are asset-backed securities for which the underlying asset portfolios are loans secured on property. See Residential mortgage backed securities and Commercial mortgage backed securities. Mortgage servicing rights - are the rights of a mortgage servicer to collect mortgage payments and forward them, after deducting a fee, to the mortgage lender. Mortgage vintage - the year in which a mortgage loan was made to the customer. Negative equity mortgages - mortgages where the value of the property mortgaged is less than the outstanding balance on the loan. Net interest income - is the difference between interest receivable on financial assets classified as loans and receivables or available-for-sale and interest payable on financial liabilities carried at amortised cost. Net interest margin - is net interest income as a percentage of average interest-earning assets. Net principal exposure - is the carrying value of a financial asset after taking account of credit protection purchased but excluding the effect of any counterparty credit valuation adjustment to that protection.
437RBS Group 2010
Shareholder information
Glossary of terms continued Non-conforming mortgages - mortgage loans that do not meet the requirements for sale to US Government agencies or US Government sponsored enterprises. These requirements include limits on loan-to-value ratios, loan terms, loan amounts, borrower creditworthiness and other requirements. Option - an option is a contract that gives the holder the right but not the obligation to buy (or sell) a specified amount of the underlying physical or financial commodity, at a specific price, at an agreed date or over an agreed period. Options can be exchange-traded or traded over-the- counter. Past due - a financial asset such as a loan is past due when the counterparty has failed to make a payment when contractually due. Potential problem loans - are loans other than impaired loans, accruing loans which are contractually overdue 90 days or more as to principal or interest and troubled debt restructurings where known information about possible credit problems of the borrower causes management to have serious doubts about the borrower's ability to meet the loan's repayment terms. Prime - prime mortgage loans generally have low default risk and are made to borrowers with good credit records and a monthly income that is at least three to four times greater than their monthly housing expense (mortgage payments plus taxes and other debt payments). These borrowers provide full documentation and generally have reliable payment histories. Private equity investments - are equity investments in operating companies not quoted on a public exchange. Capital for private equity investment is raised from retail or institutional investors and used to fund investment strategies such as leveraged buyouts, venture capital, growth capital, distressed investments and mezzanine capital. Pro forma cost:income ratio - operating expenses excluding purchased intangibles amortisation, write-down of goodwill and other intangible assets, integration and restructuring costs and share of shared assets expressed as a percentage of total income excluding credit market write-downs and one-off items. Probability of default (PD) - the likelihood that a customer will fail to make full and timely repayment of credit obligations over a one year time horizon. Regular way purchase or sale - is a purchase or sale of a financial asset under a contract whose terms require delivery of the asset within the time frame established generally by regulation or convention in the marketplace concerned.
Renegotiated loans - loans are generally renegotiated either as part of the ongoing banking relationship with a creditworthy customer or in response to a borrower's financial difficulties. In the latter case, renegotiation encompasses not only revisions to the terms of a loan such as a maturity extension, a payment moratorium, a concessionary rate of interest but also the restructuring of all or part of the exposure including debt forgiveness or a debt for equity swap. Loans renegotiated as part of the ongoing banking relationship with a creditworthy customer, are treated as new loans. Repurchase agreement (Repo) - see Sale and repurchase agreements. Residential mortgage backed securities (RMBS ) - are asset-backed securities for which the underlying asset portfolios are residential mortgages. Restructured loans - see Renegotiated loans. Retail loans - are loans made to individuals rather than institutions. The loans may be for car purchases, home purchases, medical care, home repair, holidays and other consumer uses. Reverse repurchase agreement (Reverse repo) - see Sale and repurchase agreements. Risk asset ratio (RAR) - total regulatory capital as a percentage of risk-weighted assets. Risk elements in lending (REIL) - comprise impaired loans, accruing loans which are contractually overdue 90 days or more as to principal or interest and troubled debt restructurings. Risk-weighted assets - assets adjusted for their associated risks using weightings established in accordance with the Basel Capital Accord as implemented by the FSA. Certain assets are not weighted but deducted from capital. Sale and repurchase agreements - in a sale and repurchase agreement one party, the seller, sells a financial asset to another party, the buyer, at the same time the seller agrees to reacquire, and the buyer to resell, the asset at a later date. From the seller's perspective such agreements are repurchase agreements (repos) and from the buyer's reverse repurchase agreements (reverse repos). Securitisation - is a process by which assets or cash flows are transformed into transferable securities. The underlying assets or cash flows are transferred by the originator or an intermediary, typically an investment bank, to a special purpose entity which issues securities to investors. Asset securitisations involve issuing debt securities (asset-backed securities) that are backed by the cash flows of income-generating assets (ranging from credit card receivables to residential mortgage loans). Liability securitisations typically involve issuing bonds that assume the risk of a potential insurance liability (ranging from a catastrophic natural event to an unexpected claims level on a certain product type).
RBS Group 2010438
Shareholder information continued

Special purpose entity (SPE) - is an entity created by a sponsor, typically a major bank, finance company, investment bank or insurance company. An SPE can take the form of a corporation, trust, partnership, corporation or a limited liability company. Its operations are typically limited for example in a securitisation to the acquisition and financing of specific assets or liabilities. Structured Investment Vehicle (SIV) - is a limited-purpose operating company that undertakes arbitrage activities by purchasing highly rated medium and long-term, fixed-income assets and funding itself with short-term, highly rated commercial paper and medium-term notes. Structured notes - are securities that pay a return linked to the value or level of a specified asset or index. Structured notes can be linked to equities, interest rates, funds, commodities and foreign currency. Student loan related assets - are assets that are referenced to underlying student loans. Subordinated liabilities - are liabilities which, in the event of insolvency or liquidation of the issuer, are subordinated to the claims of depositors and other creditors of the issuer. Sub-prime - sub-prime mortgage loans are designed for customers with one or more high risk characteristics, such as: unreliable or poor payment histories; loan-to-value ratio of greater than 80%; high debt-to-income ratio; the loan is not secured on the borrower's primary residence; or a history of delinquencies or late payments on the loan. Super senior CDO - is the most senior class of instrument issued by a CDO vehicle. They benefit from the subordination of all other instruments, including AAA rated securities, issued by the CDO vehicle. Tier 1 capital - core Tier 1 capital plus other Tier 1 securities in issue, less material holdings in financial companies.
Tier 1 capital ratio - Tier 1 capital as a percentage of risk-weighted assets. Tier 2 capital - qualifying subordinated debt and other Tier 2 securities in issue, eligible collective impairment allowances, unrealised available-for-sale equity gains and revaluation reserves less certain regulatory deductions. US Government National Mortgage Association - see Ginnie Mae. Unaudited - unaudited financial information is information that has not been subjected to the audit procedures undertaken by the Group's auditors to enable them to express an opinion on the Group's financial statements. VaR - is a technique that produces estimates of the potential change in the market value of a portfolio over a specified time horizon at given confidence levels. Wrapped security - a wrapped security is a debt security where the holder benefits from credit protection provided by a third party, typically a financial guarantor or monoline insurer. Write down - a reduction in the carrying value of an asset to record a decline in its fair value or value in use.
439RBS Group 2010
Shareholder information
Index Accounting Corporate governance Accounting developments 286 Compliance with the Combined Code 235Accounting policies 275 Risk management 17Critical accounting policies 283 The Board and its committees 235 Approval of accounts 270 Credit market exposures 75 Asset-backed securities 204 Debt securities in issue Business review 191Asset Protection Scheme 221 Consolidated 300 Parent company 304Audit Committee report 240
Deposits Auditors Customer accounts 300Auditor’s remuneration 296 Deposits from banks 300Independent auditor’s report 267
Derivatives 329Available-for-sale financial assets Accounting policies 280 Description of business 53Notes on the accounts 300
Directors Average balance sheet 63 Attendance at Board and committee meetings 238
Biographies 226Balance sheet Interests in shares 264Business review 106 Remuneration 258Consolidated 270 Remuneration policy 250Parent company 270 Report of the directors 230 Service contracts 256Bank levy 368
Dividends Board Risk Committee report 244 History 429
Notes on the accounts 297, 298Business divestments Business review 54 Earnings per share 299Notes on the accounts 341
Employees Capital adequacy Business review 79Capital ratios 112, 126 Costs 289Capital resources 112, 127 Headcount 290Notes on the accounts 365 Report of the directors 231
Cash flow statement Financial instruments Business review 111 Accounting policies 279, 281Consolidated 274 Critical accounting policies 284Notes on the accounts 374, 375, 376 Notes on the accounts 300Parent company 274
Financial statements Central functions/items 38, 53, 100, 377 Balance sheets 106, 270
Cash flow statements 111, 274Chairman’s statement 2 Income statement 57, 268 Statement of changes in equity 271Charitable contributions 234 Statement of comprehensive income 269 Contingent liabilities and commitments 366 Financial Services Compensation Scheme 367
RBS Group 2010440
Shareholder information continued

Financial summary Net interest income Five year financial summary 387 Business review 62
Notes on the accounts 287Forward-looking statements 52
Non-Core 40, 53, 101, 377Global Banking & Markets 34, 53, 94, 377
Non-interest income Global Transaction Services 28, 53, 87, 377 Business review 69
Notes on the accounts 288Glossary of terms 434
Operating expenses Going concern Business review 71Report of the directors 232 Notes on the accounts 289
Goodwill Pensions Accounting policy 277 Accounting policy 276Notes on the accounts 335, 381 Critical accounting policies 284
Directors’ pension arrangements 262Group Chief Executive’s review 4 Notes on the accounts 292 Pension risk 203Impairment Accounting policy 280 Post balance sheet events 233, 385Business review 74Critical accounting policies 283 Presentation of information 50Notes on the accounts 328
Principal subsidiaries 334Income statement Business review 57 Property, plant and equipment Consolidated 268 Accounting policy 277Parent company 298 Notes on the accounts 338 Insurance claims Provisions Accounting policy 278 Accounting policy 279Critical accounting policies 285 Notes on the accounts 328Notes on the accounts 344
Regulatory reviews and developments 398Insurance premium income Accounting policy 278 Related parties 383Notes on the accounts 344
Remuneration Committee Intangible assets Directors’ remuneration report 248Accounting policy 277 Letter from the Chair of the Remuneration Committee 246Goodwill 381Notes on the accounts 335 Risk and balance sheet management
Capital 126Internal control 239 Credit risk 146 Equity risk 145Investigations 369 Funding and liquidity risk 134
Insurance risk 199Litigation 368 Interest rate risk 143
Market risk 193Loans and advances Operational risk 199Loans and advances to banks 300 Other risk exposures 204Loans and advances to customers 300 Pension risk 203 Regulatory risk 202Material contracts 399 Reputation risk 203 Structural foreign currency exposures 144
441RBS Group 2010
Shareholder information

Index continued Risk factors 55, 405 Subordinated liabilities Consolidated 349Risk-weighted assets 78, 112, 126, 129 Parent company 349 Securitisations Summary of Group results 387Notes on the accounts 364Other risk exposures 217 Supervision 397 Segmental reporting Sustainability 42Business review 77Description of business 53 Tax Notes on the accounts 377 Accounting policy 279
Business review 76Share-based payments Critical accounting policies 285Accounting policy 283 Notes on the accounts 297Notes on the accounts 290 Notes on the accounts - deferred tax 342 Share capital UK Corporate 24, 53, 83, 377Additional information 426Notes on the accounts 358 UK Retail 20, 53, 80, 377
Shareholder information Ulster Bank 30, 53, 89, 377Analysis of shareholders 425Annual General Meeting 424 US Retail & Commercial 32, 53, 92, 377Shareholder enquiries 424
Wealth 26, 53, 85, 377Short-term borrowings 136
Value-at-risk (VaR) 193Statement of changes in equity Consolidated 271Parent company 271
Statement of comprehensive income Consolidated 269Parent company 298
Statement of directors’ responsibilities 265
Strategic plan 12
RBS Group 2010442
Shareholder information continued
Important addresses Shareholder enquiries Registrar Computershare Investor Services PLC The Pavilions Bridgwater Road Bristol BS99 6ZZ Telephone: +44 (0)870 702 0135 Facsimile: +44 (0)870 703 6009 Website: www.investorcentre.co.uk/contactus ADR Depositary Bank BNY Mellon Shareowner Services PO Box 358516 Pittsburgh, PA 15252-8516 Telephone: +1 888 269 2377 (US callers) Telephone: +1 201 680 6825 (International) Email: [email protected] Website: www.bnymellon.com/shareowner Group Secretariat The Royal Bank of Scotland Group plc PO Box 1000 Gogarburn Edinburgh EH12 1HQ Telephone: +44 (0)131 556 8555 Facsimile: +44 (0)131 626 3081 Investor Relations 280 Bishopsgate London EC2M 4RB Telephone: +44 (0)207 672 1758 Facsimile: +44 (0)207 672 1801 Email: [email protected] Registered office 36 St Andrew Square Edinburgh EH2 2YB Telephone: +44 (0)131 556 8555 Registered in Scotland No. 45551 Website www.rbs.com
Principal offices The Royal Bank of Scotland Group plc PO Box 1000 Gogarburn Edinburgh EH12 1HQ Telephone: +44 (0)131 626 0000 The Royal Bank of Scotland plc PO Box 1000 Gogarburn Edinburgh EH12 1HQ 280 Bishopsgate London EC2M 4RB National Westminster Bank Plc 135 Bishopsgate London EC2M 3UR Citizens Citizens Financial Group, Inc. One Citizens Plaza Providence Rhode Island 02903 USA Ulster Bank 11-16 Donegall Square East Belfast BT1 5UB George's Quay Dublin 2 RBS Insurance Direct Line House 3 Edridge Road Croydon Surrey CR9 1AG Churchill Court Westmoreland Road Bromley Kent BR1 1DP RBS Holdings USA Inc. 600 Washington Blvd Stamford CT06901 USA Coutts Group 440 Strand London WC2R 0QS The Royal Bank of Scotland International Limited Royal Bank House 71 Bath Street St Helier Jersey Channel Islands JE4 8PJ NatWest Offshore 23/25 Broad Street St Helier Jersey Channel Islands JE4 OYX RBS Holdings N.V. Gustav Mahlerlaan 10 Amsterdam 1082 PP Netherlands
443RBS Group 2010
Shareholder information