Annual Report 2010 - Enea
64
Annual Report 2010
-
Upload
khangminh22 -
Category
Documents
-
view
4 -
download
0
Transcript of Annual Report 2010 - Enea

Annual Report 2010

The world’s communicaTion needs
drive enea
Enea in brief
12Software
18Consulting
Accounts - Group
37Shares
26
The Business6
03 Year in brief04 A word from the CEO 06 The Business 10 Market overview12 Business unit - Software 18 Business unit - Consulting 24 Sustainable development 26 The Enea share 28 Five-year review29 Board of Directors’ report
34 Corporate Governance Report37 Accounts - Group41 Accounts - Parent Company45 Accounting principles 49 Notes 59 Audit Report60 Enea’s Board of Directors 61 Enea’s Executive
Management Team62 Shareholder information
EnEA offErS produCTS And SErviCES for customers developing communication-driven products. The company is organized into two business areas: Software, which includes real-time operating systems and supplementary software and services, and Consulting, which offers technical consultancy services.
Enea’s revenue for 2010 amounted to SEK 726.1 million, which was 6.6 percent lower than in 2009. However, operating profit improved considerably, amounting to SEK 67.4 million, corresponding to an operating margin of 9.3 percent. Enea’s 621 employ-ees are based in Europe, North America and Asia.
Significantly improved profits
Omsättning Mkr
2009 20102010 726,1 2009 777,7 2008 917,6 2007 820,6 2006 750,1
0
200
400
600
800
1 000
06 07 08 09 10
MSEK
Rörelseresultat och marginal, MSEK/%
2009 2010
-10
0
20
40
60
80
10
Rörelseresultat Mkr
-10
0
20
40
60
80
1009080706
Rörelseresultat och marginal, MSEK/%
-10
0
20
40
60
80
9,0, 8,8, 8,0, -0,5, 9,3]
10
8,0
6,0
4,0
2,0
0,0
3,0
5,0
7,0
9,0
-1,0
2006 2009 2008 2009 2010-1
0
2
4
6
8
10
-100
20
40
60
80
06 07 08 09 10-10
2
4
6
8
10100%MSEK
Rörelseresultat och marginal, MSEK/%
-10
0
20
40
60
80
2009 2010-10
0
20
40
60
80
80
100
World-leaders in telecom The world’s leading telecom companies turn to Enea when building global communica-tions infrastructure. Enea’s solutions work in most types of communicating systems, mean-ing that companies in associated segments, such as medical technology, aerospace and automotive are also among Enea’s customers.
Enea is the world’s third-largest player in real-time operating systemsEnea’s operating systems are embedded in so many base stations and mobile phones that five billion calls a day depend on Enea’s technology. That makes Enea the world’s third-largest player in the global market.
Enea’s consultants are among the bestEnea’s consultancy business offers expertise in complex areas such as embedded sys-tems, testing and wireless communications. Enea’s consultants in these areas are among the best in the world.
Antal aktieägare Aktieägare (%) Antal aktier Innehav & Röster (%)Fysiska personer 9 358 93,3 4 200 626 23,2 Jurdiska personer 673 6,7 13 880 545 76,8 Totalt 10 031 100% 18 081 171 100%
52 %Consulting
48 %Software
Omsättning per a�ärsområde
52 %Telekom infrastruktur
9 %Försvar
21 %Övrigt
18 %Mobila enheter
Omsättning per segment
A word from the CEo 4
Content
revenues
revenues per business area
operating profit/loss
revenues per segment

AnnuAl RepoRt 2010 ENEA 3
Year in brief
Key figures 2010 2009 2008 2007 2006
Net sales, SeK m 726.1 777.7 917.6 820.6 750.1Operating profit/loss, SeK m 67.4 -4.1 73.1 72.1 67.6
Operating profit/loss, % 9.3 -0.5 8.0 8.8 9.0
Average number of employees 621 666 688 547 501
Earnings per share, SeK 2.65 0.24 4.90 3.88 2.66
Rörelseresultat per kvartal Mkr
2009 2010
090
20
40
60
80
-40
-20
2009 2010
Kv 1
Kv 2
Kv 3
Kv 4
Kv 1
Kv 2Kv 3
Kv 4
-40-30-20-10
0102030
2009 2010
Q 1
Q 2 Q 3 Q 4 Q 1 Q 2 Q 3 Q 4
0
50
100
150
200
250
2009 2010
Kv 1 Kv 2 Kv 3 Kv 4 Kv 1 Kv 2 Kv 3 Kv 4
Rörelseresultat per kvartal, Mkr
År/Kvartal kv1 kv2 kv3 kv4
2010 11,8 18,3 20,2 20,42009 -36,7 4,6 14,9 13,1
Enea closes the door on a year of restructuring and sets improving its profits as its target for 2010. A strategic cooperation with Freescale is
initiated, providing enea with access to Freescale’s market-leading customer base in telecom. on the product side, enea Hypervisor is launched – a product that makes it possible to run the enea oSe realtime operating system parallel with linux.
In the second quarter, Enea pays shareholders the first dividend in ten years. A strategic partnership is signed with netlogic to improve
enea’s linux offering.
A new competence center for machine to machine communication (M2M) is established in linköping Sweden. Customers are offered consul-
tancy services in hardware and software development, training and support. the year’s largest contract, valued at SeK 20 million is signed with a customer investing in enea Hypervisor and enea’s multicore version of the enea oSe operating system.
On the product side, Enea receives the “Innovation Award” for its multicore version of enea oSe and on the consultancy side, enea’s An-
droid competence center attracts attention for its Android app for the Swedish ice-hockey team Malmö Redhawks. Summing up the year, enea significantly improved its profitability and reported its highest operating margin for ten years.
Year in briefQ1
Q2
Q3
Q4
Sales per quarter, SeK m
Operating profit/loss per quarter, SeK m
2010
operating margin
9.3percent
The world’s leading telecom companies turn to Enea when building global communica-tions infrastructure.
Sales per quarter, SEK m
2009 2010
Omsättning per kvartal, Mkr
År/Kvartal kv1 kv2 kv3 kv4
2010 186,3 192,6 166,1 181,12009 207,3 202,9 172,4 195,1
0
100
200
300
400
500
600
700
800
0
50
100
150
200
250
0
50
100
150
200
250
0
20
40
60
80
100
2009 2010
Q 1 Q 2 Q 3 Q 4 Q 1 Q 2 Q 3 Q 4

4 ENEA AnnuAl RepoRt 2010
In 2010, ENEA has turned the tide from returning a loss to report-ing a profit. Our focus on profitability and improved margins has paid off and we reported our highest operating margin for ten years. This was made possible by a number of adjustments in our operations whereby we established a sustainable cost structure through, for example, fewer headquarters functions and more employees in low-cost countries. The operating margin for the full year ended up at 9.3 percent, compared with a loss in 2009.
Sales in 2010 declined, which was in line with our expectations. However, we are already seeing signs of stronger development in the telecom sector and we have also continued to build on the strategic ventures that we initiated during the year, so 2011 will be the year in which we again achieve growth.
Enea’s cash flow developed positively over the year and we enter 2011 with a further strengthened financial position. This is some-thing that we want to share with our shareholders and the Board has therefore proposed record dividend, equivalent to SEK 5.00 per share in the form of an automatic redemption program.
Business area Software the Software business area showed a stable income trend with an increased operating margin at 14.4 percent for the full year, com-pared with a loss in 2009.
the cooperation with Freescale Semiconductors did not generate the business we had hoped for over the year. progress in developing new customers together is slower than we had envisaged. Freescale has cooperated with Windriver for 15 years and we must respect the fact that it takes time to change the relationships and product awareness that individual salespeople have build up. However, we are convinced that the partnership is on the right path. Most of our customers select their hardware before choosing an operating system and close coop-eration with hardware suppliers is therefore strategically important. And I am convinced that sales will accelerate in 2011.
the transition to multicore, that is hardware chips with not one but several processor cores, is a very promising technology shift cur-rently taking place in our sector. We are seeing that virtually all of our customers’ new projects include multicore. And this is still the area of the market for which most growth is forecast for the next two years.
Another change when it comes to embedded systems involves telecom companies now using both realtime operating systems and linux within the same product. It is no longer sufficient to offer realtime operating systems alone. We will therefore extend our of-fering with combined solutions that help customers achieve leading positions in their fields. We already have considerable knowledge and experience of linux. the difference compared with before is that we will offer customers tools and services to configure and maintain their linux environments although, more importantly, we will use our 40 years of experience of embedded systems and telecom to offer platforms that solve specific customer needs. It may be a mat-ter of customers seeking to migrate from singlecore to multicore or customers who want to build a certain kind of base station. these platforms will contain what the customer needs in the form of com-binations of linux and realtime technology. enea shall become the leading supplier of operating systems for embedded systems.
Business area Consultingthe Consulting business area improved its operating margin each quarter during the year and concluded with a margin of 8.1 percent for the fourth quarter. the operating margin for the full year 2010 amounted to 5.0 percent.
our two latest competence centers, Android and M2M, continued their success. over the past five quarters, the Android competence center has managed to establish a world-leading position in its niche. It is not only enea’s consultancy services that are in demand but also the enea oSe operating system, which is now used in 4G Android-based phones. I am certain that this is largely attributable to the lead-ing edge position that our competence center has established.
We are in an excellent position to grow and capture new market shares
A word from the CEO
– focus on growth
2010

AnnuAl RepoRt 2010 ENEA 5
Kista in March 2011Per Åkerberg
president and Ceo
In 2010, we also opened a competence center for machine to machine communication, M2M. Within the near future, there are expected to be twice as many machines communicating with one another than people. Given this, it is natural that we should continue to build on our in-depth know-how in mobile units and extend this to encompass other types of communicating units.
Geographically, the nordic consultancy business, with Stockholm as the largest unit, has developed very favorably with considerably im-proved profitability and revenue per consultant equivalent to those in 2009. the Öresund region, which has for a long time experienced a tougher market climate than the rest of Sweden, ended the year strongly, which was very gratifying. the uS consultancy business reported both growth and improved profitability, while the Roma-nian consultancy business has stable income levels and somewhat improved profitability from already high levels.
Focusing on growth in 2011Within the near future there will be 50 billion connected devices, which will lead to demand for infrastructure investment and more advanced technology. With its strong market position, award-win-ning technology and expertise in embedded systems, enea enjoys an excellent position from which to grow and capture new share.
Most of the building blocks needed to generate profitable growth are already in place. In 2011, we will focus on getting our partner-ships with hardware suppliers to work even better. the transition to multicore will gather pace as considerably more new projects are being initiated in the telecom sector. We will also be launching our first offering combining linux and realtime operating systems.
on the consultancy side, we will be focusing on securing more fixed-rate projects. In the Öresund region, demand looked promising towards the end of 2010 and we believe it will improve considerably over the coming year.
We have already proven that we have a long-term sustainable or-ganization able to deliver healthy margins. In 2011, we will prove that we can also deliver growth.
However, we will not grow at the expense of profitability. our long-term profitability target, according to which Software shall achieve an operating margin of 20 percent and Consulting an operating margin of 10 percent, stands firm.
As I summarize 2010, it is clear that we took many steps in the right direction and that we are now on our way towards our long-term vision – that of becoming a major, world-leading company that is the obvious choice when it comes to innovative solutions for communi-cation-driven products.
We have quite a way to go before we achieve this long-term vision, but I expect the journey to be gratifying for shareholders, employees and customers.
– focus on profitable growth
2011
A word from the CEO
“enea’s assessment for 2011 is that net sales will increase compared with the previous year and that profitability will continue its positive development.”

6 ENEA AnnuAl RepoRt 2010
Enea’s products and services are not visible in your everyday life. But they are embedded in the devices that we use on a daily basis. Enea’s products form part of millions of smartphones and base stations that we use to communicate. So, even if Enea is not visible in your everyday life, we are there, making sure that things work, every day, all year long.
We are surrounded by a great deal of technology that we use on a daily basis. For many people, mobile phones are a natural way to communicate. other products communicate without us really thinking all that much about it. these include in-car subsystems or pacemakers. one thing all these products have in common is the fact that they contain some kind of software. For software to work, it has to be run on an operating system. enea is one of the best in the world when it comes to operating systems for realtime applications.
SOFTWArE is enea’s business unit for operating systems and related products.
48 percent of revenue and 29 percent of employees. Mainly offers realtime operating systems (RtoS), but also other products used in the development of communication-driven products such as development tools, network protocols, databases and middleware. the third-largest player in the world for realtime operating systems.
An increasing number of products communicate with other systems and therefore need operating sys-tems to be able to work. These products also impose demands on reliable and fast paths of communication, leading to investments in infrastructure such as base stations. This implies strong long-term demand for Enea’s products.
CONSulTINg is enea’s business unit for services.
52 percent of revenue and 68 percent of employees. offers consultancy services in the field of product develop-ment such as pre-studies, application development, test and training. expert knowledge within areas such as linux, Android, test, quality assurance, communication and M2M.
the fifth-largest player in Sweden.
Enea’s consultants are involved in the development of communication-driven products in several sectors. With its specialist expertise in areas including linux, Android, wireless communications, testing and embedded systems, Enea is knowledgeable in areas that are in demand as communications-intensive products and services increase in importance.
The parent company employs 3 percent of the Group’s total workforce.
Realtime systems often have more stringent demands for precision, predictability and performance than operating systems in pCs, and they are often embedded in the technical devices with which we surround ourselves in our daily lives. enea also offers related products which are needed when developing embedded systems such as development tools or databases.
precision, predictability and performance are much appreciated qualities in many technical fields, not just for operating systems. enea started as a consultancy company more than 40 years ago and has a deep knowledge within several technical fields. Many of the custom-ers purchasing operating systems from enea also purchase consultan-cy services. But there are many customers that chose enea because we are one of the best in technical consultancy services with skilled consultants in the fields of It, communications and technology.
What Enea does
The business
Software Consulting

AnnuAl RepoRt 2010 ENEA 7
PrE-STudIES – analyzing the time and cost required to build one or more parts of the product.
APPlICATIONS dEvE- lOPmENT – developing one of the applications in the product.
SYSTEmS dESIgN – designing the system, which can encompass both software and hardware.
TEST ANd QuAlITY ASSur-ANCE – to test if the system in it-self is working, but also to test the system as part of other systems.
PrOjECT mANAgEmENT – for example, developing a project methodology or acting as project manager.
TrAININg – training on every-thing from project management to programming.
PrOjECT uNdErTAKINgS – assuming responsibility, on the customer’s behalf, for a project from start to finish. An assignment of this kind can involve several disciplines, such as project management, appli-cations development and testing.
COmPETENCE CENTErS – col-lective expertise on communica-tions, wireless, certification, M2M, test, linux and Android which can offer complete solutions in their respective areas.
rEAlTImE OPErATINg SYSTEmS (enea oSe/oSeck)
– operating systems which act as the link between the
hardware and the applications.
dEvElOPmENT TOOlS (enea optima) – software used when developing embedded systems.
dATABASES (enea polyhedra) – databases which are particu-larly appropriate in embedded systems.
PrOTOCOlS (enea netbricks) – predefined protocols (based on standards) which are one of the cornerstones in communicating devices. protocols control how the devices communicate with one another.
COmmuNICATION BETWEEN PrOCESSOrS (enea linx) – soft-ware which handles communica-tion between several processors.
mIddlEWArE (enea element) – software that manages certain services between the operating system and the user applications, such as identification, authentica-tion and security.
EnEa offErs its customErs:
The business
Software Consulting
AnnuAl RepoRt 2010 ENEA 7

8 ENEA AnnuAl RepoRt 2010
Employees per function Employees per country
missionto secure customer success by offering solutions that increase com-petitiveness and quality for companies developing communication-driven products.
vision enea shall be the first choice for innovative solutions for communication-driven products: the leading supplier of operating systems for embedded systems, the regional leader of services for product development over the lifecycle.
Strategy
BuSINESS uNIT SOFTWArE
Offering operating systems for embedded developmentMany of enea’s customers use both realtime operating systems, such as enea oSe, and linux side by side in the same product. For this reason, enea will continue to offer both types of operating system to its customers. enea already provides a certain degree of linux support, but not to the extent customers require. During the year,
enea will offer linux via a configuration tool and, later in the year, the company will also be able to assume responsibility for support and quality assurance.
enea will also package its products as platforms, each of which ad-dresses a specific customer need. these platforms will include enea’s realtime operating systems, linux and other enea products.
Continued focus on telecom with emphasis on telecom infrastructuretelecom is the market where the technology shift from a single core to multicore is progressing fastest. this implies a major opportunity for enea, since this technology shift requires most operating systems being exchanged. the telecom sector is where enea already has its strongest foothold and this strength will be further reinforced.
Within telecom, enea takes the view that infrastructure is the area offering the greatest potential. this is based, in part, on the major infrastructure investments that are expected, but also on the fact that multicore will initially have most impact on complex products such as base stations.
value-generating strategies for communication-driven products
The business
EmployeesAt year-end
12%Sales and marketing
52%Services 9%
Finance and administration
27%Research and development
Employees per function
59%Sweden
8% US 4% China3% France
1% UK1% Germany1% Japan
23%Romania
Employees per country

AnnuAl RepoRt 2010 ENEA 9
In its interim report for the first quarter of the 2010, Enea communicated its outlook for the full year. For 2010, the assessment was that the company would show a stable income trend and consider-ably improved operating profit compared with 2009.
Sales for the full year decreased by 6.6 percent, while the target was for income to be in line with
Building strategic relations with key customers enea’s customers are often large, global companies demanding long-term commitment. enea will continue to focus on building rela-tionships with key customers where the client will get local support and global coordination. this will be extended to include customers beyond the current two main customer groups – ericsson and nokia – the company has today.
Strong partnerships with chip manufacturersMost of enea’s customers select their hardware before they choose an operating system. the operating system must also be optimized to be able to take full advantage of the processor used. Conse-quently, enea will continue to develop and extend its relations with hardware suppliers to be able to coordinate product plans, but also to supplement its own sales channels. the strategic partnership with Freescale is an example of enea’s current extensive partnerships.
Best solutions for multicoreenea views the technology shift from single core to multicore as one of its principal opportunities for growth. enea’s customers have be-gun to migrate to multicore technology to achieve better perform-ance and enea must be there with the most innovative, reliable and high-performance solutions. enea’s operating systems have already received recognition as the best in the market in technical terms and enea will continue to develop the product to ensure it remains at the leading edge of the technology.
Offering high-quality services that complement the product offeringenea will offer services that make it simpler for the customer to start using the products quickly and to implement them in their develop-ment environment.
BuSINESS uNIT CONSulTINg
regional strategies based on the core competenciesenea’s consulting operations are concentrated in three regions – Sweden, Romania and the uS. the profile of these regions vary somewhat with regard to local expertise and strong customer rela-tions. enea shall derive benefit from the strengths of the regions, developing local strategies for each.
Creating competence centers for growth areas By creating competence centers in areas such as wireless, M2M, Android, linux and other growth areas, we make our customers more aware of our expertise in areas that are critical for their success. Focusing on a particular area also generates commitment internally and raises the level of competence.
The business
growing off-shoring as a competitive advantage enea’s operation in Romania employs slightly more than 100 engi-neers, some of whom are deployed on consultancy commissions in the uS and Sweden. Continuing to extend this business is giving enea a competitive advantage thanks to its attractive combination of outstanding knowledge and competitive prices.
SHArEd THrOugHOuT THE grOuP
developing the organization’s productivity, focusing on growthover the year, enea will continue to improve its efficiency and productivity with the principal objective of improving the processes that facilitate growth.
Attract and develop individuals with exceptional attitudes and skills,enea will continuously develop its position as an attractive employer and nurture high energy levels and knowledge throughout the organization.
valuesMany companies say that they will offer leading products and serv-ices. How we act to achieve that is what makes us better and faster than our competitors.
We focus on our customers’ success: to contribute to our cus-tomers’ success is a prerequisite for succeeding ourselves.
We provide trusted leadership: We strive to be leaders in eve-rything we do regardless if it is our own product development or how we carry out customer assignments.
We innovate for business reasons: Creativity is adding most value when it creates new business opportunities and solve cus-tomer challenges.
We are team players: to be successful when solving complex customer problems we need to take advantage of our different competences. to take responsibility for our part of the solution and deliver on our promises is key for success.
Financial objectives for 2011the company’s outlook for 2011 is that net sales will increase com-pared with the previous year and that profitability will continue its positive development.
the long-term profit target is for Software to achieve an operat-ing margin of 20 percent and for Consulting an operating margin exceeding 10 percent.
Fullfilment of objectives
2009
-4.1
2010
Operating pro�t/loss SEK m
-20
0
20
40
60
80
67.4
the preceding year. Consequently, the sales target was not achieved.
the operating result improved from a loss of SeK 4.1 million to a profit of SeK 67.4 million and the operating margin improved from a negative 0.5 percent to a posi-tive 9.3 percent. Consequently the target to significantly improve operating profit was achieved.
Since 2009, enea has maintained a long-term profit target whereby
the Software business unit shall achieve an operating margin of 20 percent and the Consulting business unit an operating mar-gin exceeding 10 percent.
Revenues SEK m
0
200
400
600
800
2009 2010
revenues SeK m Operating profit/loss SeK m
In 2010, enea reported an operat-ing margin of 14.4 percent for the Software business unit and 5.0 percent for the Consulting business unit.

10 ENEA AnnuAl RepoRt 2010
Within ten years, as many as 50 billion connected devicles will communicate over the net. This means that mobile data traffic will increase by a factor of 39 according to Cisco’s forecasts. Embedded systems form the core of communication-driven products. And embedded systems also form the core of infra-structure products. Consequently, the underlying demand for Enea’s products and services is clearer than ever.
Communication is more than telecom. In a number of areas, commu-nication-driven products have, or will, change our day-to-day lives.
Households will not only be connected through their computers and phones. In many homes, there are already several entertainment devices that communicate both between one another and externally. to enhance security, sensors can warn of rising freezer temperature and domestic alarm systems can send live video images. Heating, sun-protection awnings and ventilation can be controlled remotely to increase comfort and reduce energy consumption.
Consumer electronics is another category where we can already see numerous communicating products. this can involve every-thing from game consoles, where users can play against others or download new games, to cameras that upload back-up copies of photographs to a server or to training equipment that transmits the user’s results to a computer where the results can be analyzed and compared with others’.
In the transport sector, a trucking company can see where its trucks are in real time, enabling the enhancement of its logistics; mobile phones can be used to find unoccupied parking spots nearby, automated toll stations can register passing vehicles and cars can transmit a tracing signal if reported stolen.
Healthcare is an area where a large amount of technology has been developed that can both increase patient security and cut treatment times. this can involve portable units that transmit eCG data, blood sugar levels and other test results directly to the patient’s physician or
Communication-driven products will surround us
market overview
data traffic Smart phone 10–30 times
10 times
100 times
1,300 times
=
=
=
=
=
Digital photo frame
Video camera
Laptop
Fifty billion communicating units will drive up the amount of data traffic in networks. Not only will an increased number of units cause traffic to increase; as units become more advanced they will also gen-erate more traffic.
the table to the right shows how much traffic each unit generates in compari-son with a traditional mobile phone.
1,300 times Tablet PC/e-reader
Sources: Cisco and Enea

AnnuAl RepoRt 2010 ENEA 11
market overview
automated communications between ambulances and hospitals, ena-bling advance preparation of care measures for acutely sick patients.
At the community level, the technology can be used to improve traffic safety by means of automated alarms and surveillance functions, to even out loads in the electricity network or to compile data in emer-gency situations, such as video footage and still images that can then be used by rescue personnel, enhancing the efficiency of their efforts.
these examples are just a drop in the ocean of possibilities offered by new technologies. Common to all of these examples is the fact that they are driving development in two entirely different ways that together increase the demand for enea’s products and services: they increase the number of units with embedded systems and they contribute to increased data traffic, requiring telecom infrastructure investment.
Fifty billion connected devicesthere are currently about five billion mobile phones in the world. But, as the examples we have seen demonstrate, it is not only mobile phones that communicate. A rapidly expanding area is Machine-to-Machine, or M2M, where devices and machines communicate with one another without that communication having to be initiated by people.
Some analysts predict that within a few years, two out of three mobile connections will be made by machines communicating with other machines. that is twice as many machines as people communicating. ericsson, which is enea’s largest customer, predicts that there will be 50 billion connected devices in the world by 2020.
these will contain some form of circuit board with one or more core processors. And, for the unit to be able to work, one or more operating systems are needed as well as other kinds of software. enea’s software is designed specifically for embedded systems and the special require-ments such systems impose on operating systems and supplementary software. Furthermore, enea has more than 40 years of experience of offering consultancy services in areas including embedded systems and communication in sectors including telecom, aerospace/defense, automotive and medical equipment
Infrastructure investmentthe increasing number of communication-driven products is driv-ing traffic in the telecommunications networks. It is mainly laptop computers and smartphones that account for the large amounts of data traffic. the proportion of smartphones is expected to rise, from about a third of mobile phones in the western world today to about half of the mobile phones in three years from now. each smartphone generates ten times more network traffic than feature phones and some smartphones generate 30 times the amount of traffic.
portable computers generate as much as 1,300 times as much traffic as a feature phone. And that figure does not apply solely to tradi-tional portable computers but also to other types of devices with similar capacity, such as tablets and handheld computers.
According to Cisco, data traffic is forecast to increase by a factor of 39 over a five-year period, which is equivalent to traffic doubling every year. At work and at home, but most of all as we move around in our communities, we demand that connections work. even today, 25 to 45 percent of all data traffic is used by units outside the home or workplace. this all imposes entirely new demands on telecom networks being able to handle increasing data quantities in a fast and reliable way.
Most of the growth towards 50 billion connected devices is expected to be driven by increased use in the business sector and for public service functions. the increase of data traffic in the telecom networks is however driven by new consumer behaviors, leading to increas-ing demands on infrastructure. Within five years, it is estimated that about three fourths of all data traffic will be used by consumers. And it is the data-intensive services, such as streaming of video and music that are expected to account for the largest quantities of data.
For telecom operators and suppliers of network equipment, this en-tails increased demand for additional base stations, switches, routers and other network equipment. not only is more equipment of this type needed, it must also be able to handle larger quantities of data while there will be continued pressure to lower prices per megabyte transferred via the networks.
For enea, this opens up several opportunities. on the one hand, a base station can contain several hundred hardware boards that, in turn, require operating systems. However, price pressure on hardware is also an opportunity for enea. If the number of hardware boards can be decreased by increasing the number of core proces-sors on each board (multiple cores per circuit board = multicore), the cost of the hardware can be reduced.
enea is one of the best companies in the world when it comes to operating systems for multicore. this is another area where enea has the best consultants, able to deal with all aspects from application development, systems design and testing to assuming responsibility for entire development projects.
the world is facing a major transition that will affect how we, and the devices we surround ourselves with, communicate. With its extensive experience in these areas, enea will take advantage of the opportunities this brings and will be a key player in the transition to a simpler, more secure and more communicative daily life.
Increasing data traffic
TBpermonth
2009 2010 2011 2012 2013 2014113094 113094 298981 652846 1322219 233673230242 60251 133827 273782 451264 62161015496 23783 50740 104969 177250 2769524615 11716 27038 62199 110981 1731774579 11245 24918 55821 100028 156829
2009 2010 2011 2012 2013 2014Video 113 094 298 981 652 846 1 322 219 2 336 732M2M 15 496 23 783 50 740 104 969 177 250 276 952Spel 4 615 11 716 27 038 62 199 110 981 173 177IP-telefoni 4 579 11 245 24 918 55 821 100 028 156 829Webb/Data 30 242 60 251 133 827 273 782 451 264 621 610
0
2,000,000
4,000,000
Mobile VoIPMobile GamingMobile P2PMobile Web/DataMobile Video
201420132012201120102009
2009 2010 2011 2012 2013 201435 897 113 094 298 981 652 846 1 322 219 2 336 73215 496 23 783 50 740 104 969 177 250 276 9524 615 11 716 27 038 62 199 110 981 173 1774 579 11 245 24 918 55 821 100 028 156 82930 242 60 251 133 827 273 782 451 264 621 610
Cisco has made the assess-ment that data traffic in networks will increase by a factor of 39 by 2014.The diagram to the right shows how traffic will double each year and the sources from which traffic derives.
Terabyte per month

12 ENEA AnnuAl RepoRt 2010
Affärsområde – Software
åRSReDovISnInG 2010 ENEA 12
SOFTWArE – Embedded for leaders

AnnuAl RepoRt 2010 ENEA 13
PrOduCT dEvElOPmENT ANd CuSTOmEr SuPPOrTenea’s products are developed in Sweden and Romania by more than 100 engineers. Following the acquisition of the Romanian company Ip Devel in 2008, enea has gradually built up parts of its de-velopment department in Bucharest to reduce costs. this has been a successful venture and most teams in the development department now consist of a mix of people from both Bucharest and Kista. enea also has global and local teams consisting of support engineers and consultants providing product-related services.
SAlES ANd mArKETINgenea maintains sales offices in Sweden, Germany, France, Israel, the uS, China and Japan. the sales teams are made up of salespeople responsible for specific customers and field application engineers, who provide technical support for the salespeople. Some 50 people work with sales and marketing within enea.
Business modelEnea’s software revenue is based on two different licensing models: A development license is used over the initial stage when the customer’s product is still being developed and a complete version is not yet available. these development licenses are charged on a per-user basis and the revenue is recognized at the same time as the license is purchased.
Software
Business unit - Software
the production license is charged when sales of the customer’s prod-uct to end users have begun. one part is charged as the price per user in the same way as with the development license. this revenue is recognized when the license is purchased. one part is charged in the form of a royalty on every product sold. Royalties are recognized as income when invoiced by enea; normally on a quarterly basis with a delay of one quarter from the customer’s sale of the product.
SalesBusiness unit Software accounted for 48 (44) percent of total sales. net sales for Software rose by 2.2 (-10.2) percent over the year to SeK 347.1 (339.7) million. new sales of licenses and royalty income decreased somewhat in 2010, while income from support increased. the decline in royalties is mainly attributable to enea’s telecom cus-tomers selling fewer units in 2010. the underlying demand for enea software solutions, on the other hand, is good and there are clear drivers for future growth.
Profitsoperating profit for Software amounted to SeK 49.9 (-11.1) million. the operating margin improved considerably compared with 2009, amounting to 14.4 (-3.3) percent for the full year. the comparison figures for the preceding year include restructuring costs of SeK 6.7 million. enea’s long-term target for the Software business area is an operating margin of 20 percent.
Sales per segment Sales per product groupSales per geographic region
66%Telecom infrastructure
14%Other
20%Wireless devices
Sales per segment
65%Operating systems
17%Product related
services
10 %Middleware
8%Other
Sales per product group
Operativsystem 65%Middleware 10%Produktnära tjänster 17%Övrigt 8%
80%EMEA
13%US
7%Asia
Sales per geographic region

14 ENEA AnnuAl RepoRt 2010
Sales per quarter
0
20
40
60
80
100
Q 1
MSEK
Q 2 Q 3 Q 4 Q 1 Q 2 Q 3 Q 4
2009 2010
Operating pro�t before non-recurring items per quarter
0
200
400
600
800
-60
-50
-40
-30
-20
-10
0
10
20
Q 1 Q 2Q 3 Q 4 Q 1 Q 2 Q 3 Q 4
2009 2010
market trendsAn increasing number of products communicate, leading to demands for investment in infrastructure and more advanced technology in products. While many end-users look forward to this development, it poses a number of challenges for manufacturers:
Continued price pressure. Advanced technology does not mean that end-users will accept sharply increased prices. Increased performance and complexity require completely new technical solutions.
lINux – THE COST-EFFICIENT AlTErNATIvEDuring the first five years of the new millennium, linux began to challenge the established operating systems for embedded software. linux for embedded systems rapidly grew popular, largely because it is free and can be completely adapted according to the user’s wishes due to its open source code. Many sector analysts thought that linux would take over the market and that the other operating systems would decline. But that did not turn out to be the case. Instead, linux found its place alongside the realtime operating systems.
one reason for this development is that “free” does not mean the same as “no cost”. Although linux can be downloaded for free, the user must assume responsibility for development and maintenance. And there is no supplier to assume legal responsibility if anything were to go wrong. Furthermore, the code developed by the user must be donated back to the source code database. Another reason is that linux lacks the realtime characteristics generally required in a telecom system.
In other words, linux is a cost-efficient operating system for embed-ded systems that do not require realtime characteristics, such as the applications part of a mobile phone.
mulTICOrE – THE ANSWEr TO THE TECHNICAl CHAllENgESAn embedded system contains at least one hardware chip, which in turn has a processor core running the software that on the chip. these processors have gradually improved, making them faster and able to handle ever more complex calculations. But now the physical limits are stopping further performance enhancements. the indus-try’s response to the problem was to include more than one proces-sor core on a hardware chip, and hence the multicore chip was born.
When every hardware chip has more than one processor core, this puts entirely new demands of operating systems. they have to be able to handle the distribution of resources between the various cores in a predictable, efficient manner. today, some 40 percent of ongoing projects use multiple processor cores (multicore + multiprocessor) and this is expected to rise to 70 percent within two years. Multicore is thus an area that will drive growth in the market.
CuSTOmErS’ rEAlITYIn other words, enea’s customers are happy to use linux to keep their costs down and gain access to the rich ecosystem of ready-made code, applications and knowledge that linux offers, while requiring realtime operating systems, such as enea oSe, for certain parts of their products. they also begin using multicore to meet demands on performance and complexity.
About 30 percent will use a commercial operating system (such as oSe) and 40 percent will use an operating system with open source code (such as linux) in their next project*. this requires that compa-nies such as enea are able to deliver solutions combining the best of both worlds.
enea must also take the customer’s choice of hardware into account. In their projects, most customers choose a processor first and then the operating system. the performance of the operating system is largely dependent on how well it is adapted to the processor and, for this reason enea cooperates very closely with several hardware manufacturers.
* Source: VDC and Enea’s own estimates
AN rTOS muST BE PrEdICT-ABlE IN TErmS OF rESPONSE TImE compared with an operating system for a pC or mainframe computer where a calculation or printout is correct even if it were to be completed a few seconds too late. Consequently, an RtoS
THE mArKET FOr rEAlTImE OPErATINg SYSTEmS for embedded systems and as-sociated services amounted to about uSD 690 million in
can be assigned responsibility for critical systems where a correct function is performed on time. Another associ-ated requirement is that the predictable time is sufficiently brief to complete the task – an aspect that disqualifies most common operating systems.
realtime operating system, rTOS
market size2009. Annual growth of 7 percent up to 2012. product-related services will grow most – by about 9 percent per year.
Business unit - Software
Source: Enea
Sales per quarter, SeK m Operating profit/loss per quarter, SeK m

AnnuAl RepoRt 2010 ENEA 15
Pernilla rissanen and jacob Ideskog work with sales and technical support for customers in the telecom sector. They are constantly involved in discus-sions regarding multicore.
“there is no doubt that multicore is what is happening right now,” says pernilla. “In discussions with suppliers of telecom infrastructure, multicore is part of all new projects. It’s no surprise given the chal-lenges our customers face. today, a base station must be able to handle so much more traffic and it must be able to cope with several technologies in parallel, such as 2G, 3G and 4G.”
Jacob adds: “not only does multicore allow performance to increase, it can also bring down hardware costs, since fewer hardware boards need to be used. A base station can contain several hundred hardware boards. obviously, if you can decrease the number of cards by a few percent, that affects the cost.”
“But the transition to multicore hasn’t progressed as quickly as we first thought,” pernilla continues. “that could be because the number of new project starts decreasing over the years when the telecom industry made major cutbacks. now the number of new projects is rising again and I’m con-vinced multicore will grow quickly.”
“I agree,” says Jacob. “enea also has an excel-lent opportunity to capture market shares given our flexible approach to multicore. With a large part of their investment having been made in applications, customers don’t want to have to re-write their applications. enea’s multicore solution is excellent in this regard.”
“We can already see that we have a much stronger position in multicore compared to most of our competitors in the market. that’s a position we will build on further and where we offer customers the best technical solution to help them meet their challenges,” pernilla concludes.
multicore is part of all new projects
Business unit - Software
AnnuAl RepoRt 2010 ENEA 15
Pernilla rissanen and jacob Ideskogsales and technical supportfor customers in the telecom sector

16 ENEA AnnuAl RepoRt 2010
Business unit - Software
Our offering Enea OSE – a realtime operating system to be used for embedded systems. the operating system is the software closest to the hardware and acts as the link be-tween the hardware and the software.
Enea OSEck – realtime operating sys-tem specially optimized for use in digital signal processors, that is, the part of the hardware that manages communication.
Enea Optima – a development envi-ronment for software running on enea’s operating system.
Enea Polyhedra – a database devel-oped especially for embedded systems. Databases are used to efficiently store large quantities of data.
Enea Element – software for mid-dleware, i.e. the software that links the operating system with the applications. Middleware runs in the background and makes sure – among other things – that the system is uninterruptible, predict-able and scalable.
Enea linx – software for managing communication between different processor cores. these cores can also run various operating systems.
Enea Netbricks – communication protocols for telecom. protocols can be described in simplified terms as the part of the software in a telecom system that handles the signals between the telephone and the network.
Supplementary services in the form of customizations, training, etc.
In 2011, enea will extend its offering with configuration tools for linux and services for developing, quality-assuring and testing customers’ linux distributions.
research and developmentenea has a long tradition of software development and invested 29 percent of Software’s revenue in research and development in 2010. As enea has some major undertakings with its two largest customer groups, ericsson and nokia, much of the company’s product develop-ers are devoted to customer-specific projects.
Strategic prioritiesenea’s future product initiatives are in line with market trends. Multi-core support will be further improved. the trend towards an increasing number of advanced products running a mix of realtime operating systems and linux is another trend reflected in product development.
Cooperation with hardware manufacturers where the enea’s operat-ing systems are integrated with the hardware chip will also lead to ongoing product development in order to make these offerings even more attractive.
CustomersMost of enea’s customers are in the telecom industry. of enea’s sales, 66 percent are made to customers in the field of telecom infrastruc-
ture, and 20 percent to customers working with wireless devices. other customers include car manufacturers, medical technology companies and the retail sector.
two individual customers stand out due to their major percentage of sales. the customer groups ericsson and nokia (ericsson, St-ericsson, Sony ericsson, nokia and nokia Siemens networks) represent more than half the sales for Software. other customers include Motorola, lSI, Alcatel-lucent, Fujitsu, volvo and Yamaha.
Competitorsthere are many smaller companies that can compete in niche areas, but only a few that can compete on a broad scale. one thing all of these have in common is the fact that they have the operating systems as a central part of their offerings. the biggest competitor is Wind River based in the uS, which was acquired by Intel in 2009. two other major competitors are Green Hills, based in the uS, and QnX, based in Canada. In 2010, QnX was acquired by Research in Motion.
enea is number three on the world market, with a market share of around 11 percent.

With Enea in your 4g phone
The next major technology shift in mobile telecommunications is 4G, which is an umbrella term for the technology succeeding the current 3G standard. the intention is for 4G to offer speeds of about 100 Mbit/s to mobile users compared with 0.384 Mbit/s in current 3G networks.
The launch of the 4g network, or lte (long term evolution), the formal label given by the 3Gpp standardiza-tion organization, has already begun. And it is now possible to make 4G calls on phones with enea’s oSe operating system.
Enea OSE is used in the part of the phone referred to as the modem component, that is, the part controlling communication with the telecommunications network. today, advanced mobile phones contain several hardware chips and each requires an operating system. one part of the phone manages applica-tions seen by the end-user, such as the contacts list, SMS, e-mail, games, web browser, etc. In many units, this part is currently based on linux (e.g. Android), iphone oS or Symbian. the other part manages the basic pro-gram code in the phone and com-munication with the network. this is where realtime operating systems such as oSe really come into play.
Not only is Enea’s software em-bedded in the phone, the company has also performed consultancy assignments for the customer in the form of troubleshooting, testing, technical coordination of the soft-ware and documentation.
“This is a good example of how we combine the best from our two business areas,” says per åkerberg, enea’s president and Ceo. “We have a very high level of expertise in telecom and this is reflected both in our products and our consultancy services. We now look forward to this product being well received by end-users, contributing to increased sales volumes, and consequently to higher royalty income for enea.”
Business unit - Software
The next major technology shift in mobile telecommuni-cations is 4G, which is an umbrella term for the technol-ogy succeeding the current 3G standard.
AnnuAl RepoRt 2010 ENEA 17
“we retain a high competence within telecom, which is reflected in our producs, as well as in our consulting services.”per åkerberg – president and Ceo, enea

18 ENEA AnnuAl RepoRt 2010
Affärsområde – Consulting
AnnuAl RepoRt 2010 ENEA 18
CONSulTINg – Intelligent Connected Systems

AnnuAl RepoRt 2010 ENEA 19
Consulting
Business unit - Consulting
Enea’s consultancy organizationNOrdIC rEgIONnordic consultancy operations are divided across three regions: Stockholm, linköping and Öresund. Stockholm is the largest indi-vidual region with approximately half of nordic revenue. In total, the Swedish consultancy operation employs 249 people and uses the services of a number of sub contractors. Most consulting assign-ments are within the telecom, automotive, medical technology and industrial automation sectors, although customers also include busi-nesses in the banking/finance and gaming sectors.
uSAthe uS consultancy operation is concentrated mainly to phoenix, employs 32 people and uses the services of a number of sub contractors. Most assignments are within the telecom and aerospace/defense sectors.
rOmANIAthe Romanian consultancy operation consists of 143 people. Much of its business is made up of projects for enea’s development department, which is a cost-effective way of getting high qual-ity development tasks done. Another part of its business involves conducting consultancy assignments for external customers, which partly involves staffing consultancy assignments managed and procured in the nordic region and the uS. the lower hourly wage costs in Romania represent a clear competitive advantage for enea in discussions on new customer assignments.
Business modelenea’s income for consultancy services is charged as either: a set price for a predefined result achieved, or price per hour.
Regardless of the price model, the revenue is recognized over the period in which the project is carried out.
SalesConsulting accounted for 52 (56) percent of enea’s total sales. net sales for Consulting in 2010 amounted to SeK 434.7 (488.0) million, which was 10.9 (-20.8) percent lower than in 2009. However, sales per employee in 2010 remained at the same level as in 2009.
In the Swedish consultancy business, sales decreased mainly as a consequence of the reduction in the labor force implemented in 2009 to adjust operations to lower demand. the market situation gradually improved, as was also noted in the Öresund region towards the end of the year, although that region did not see the same level of recovery as the other Swedish regions.
the uS consultancy business showed growth, which is mainly explained by the major consultancy assignment secured towards the end of 2009 and that will continue into 2011. the Romanian business reported stable income over the year.
Sales per segment Sales per geographic region
33%Telecom infrastructure
13%Group internal
24%Other
16%Aerospace/Defense
14%Wireless devices
Sales per segment
71%Nordic region 19%
USA
10%Romania
Sales per geographic region

20 ENEA AnnuAl RepoRt 2010
Operating profit before non-recurring items per quarter, SeK m
Profitsover the year, operating profit for the Consulting business area rose to SeK 21.6 (7.0) million, resulting in an operating margin of 5.0 (1.4) percent. All regions showed improved operating margins compared with 2009. In the fourth quarter, the business area reported a margin of 8.1 percent, the highest margin achieved by the consultancy busi-ness since year 2000.
the long-term target for the Consulting business area is an operating margin of at least 10 percent.
marketenea’s consultants play a part in developing the communication-driv-en products which surround us. these products are being developed mainly in the telecom industry, but also in fields such as the automo-tive, aerospace and medical technology sectors. It is clear that these products are becoming more and more complex and harder to de-velop. this is why enea’s customers demand specialists. Maintaining all the expertise and resources required themselves would be both costly and difficult. enea has a combination of consultants that in some cases have expertise that is unique for the customer and in other cases are resources required for specific projects and/or products.
During 2010, the consultancy market in Sweden gradually improved and it is expected to continue improving in 2011. However, regional differences in demand for consultancy services are still consider-able. In Romania, demand is expected to remain unchanged in 2011 compared with the end of 2010. the demand trend regarding enea’s uS consultancy business is assessed as slightly positive.
Competence centersFor a number of years, enea has been building up competence cent-ers relating to growth areas such as wireless, Android, linux, testing and M2M. this makes it clear to customers and employees where our ambition lies, and it also creates long-term relations and enhances internal levels of expertise. the latest addition in 2010 was a compe-tence center for M2M.
The company had the following competence centers at the start of 2011:
WIrElESS (WIrElESS COmmuNICATIONS)offers manufacturers of mobile phones and other handheld units services in the fields of design, development, integration and testing. these services include not only enea products, but also development for systems such as linux and Android. this competence center also works with technologies for short-distance communications such as near Field Communication (nFC) and Bluetooth low energy (Ble).
Sales per quarter, SeK m
COmmuNICATIONS (TElECOm INFrASTruCTurE)offers expert knowledge for manufacturers in the fields of design, development, integration and testing for infrastructure products such as routers, base stations and media gateways. enea is able to support the entire development process, from the integration of platforms – which includes operating systems, middleware and pro-tocol stacks – to the development and maintenance of applications.
CErTIFICATION (AErOSPACE INduSTrY)offers a range of services in the field of certification for the aerospace industry, focusing on American certification processes. examples of services include the production of plans for hardware and software, analysis of customers’ present processes in relation to certification in accordance with authority rulings, and training in standards and project management.
ANdrOId (mOBIlE TElEPHONY, CONSumEr ElECTrONICS, AuTOmOTIvE SECTOr, ETC.)enea’s competence center for Android combines two of enea’s core areas of expertise – advanced mobile platforms and linux. these services are targeted at hardware suppliers who need to develop drivers, developers who need help with analyzing performance or developing applications, and general training on Android.
m2m (TElECOm, AuTOmOTIvE, INduSTrIAl AuTOmATION)enea’s competence center for M2M (machine to machine) was launched in the third quarter of 2010. enea offers an extensive range of services, from complete M2M solutions tailored to customer needs to parts of solutions integrated with existing systems. enea is also able to offer training, workshops and support in this context.
TESTINg ANd QuAlITY ASSurANCEenea’s competence center for testing and quality assurance embodies in-depth know-how and experience in how to conduct efficient testing and quality assurance processes, in efficient test-ing of different products and systems and in what testing tools should be used. enea has developed an efficient testing process and its test organization employs some 60 people with extensive experience in testing from numerous sectors, including bank-ing and finance, public authorities and administration, medicine, manufacturing, the automotive industry and telecommunications.
lINuxenea’s competence center for linux offers both expertise and training. the major specialty is the development of complete hardware and software platforms with built-in linux systems, although enea is also very well versed in traditional systems for a large number of companies in different sectors.
Business unit - Consulting
Försäljning per kvartal Mkr
0
200
400
600
800
-2-10123456789
Q 1 Q 2 Q 3Q 4
Q 4Q 1 Q 2 Q 3
2009 2010
Sales per quarter
0
200
400
600
800
0
30
60
90
120
150
2009 2010
Q 1 Q 2 Q 3 Q 4 Q 1 Q 2 Q 3 Q 4

Per johannesson
Business unit - Consulting
AnnuAl RepoRt 2010 ENEA 21
Per johannesson, President of Enea Serv-ices linköping and responsible for Enea’s latest competence center, is enthusiastic when talking about m2m.
“Many people can probably envisage that communication in society will increase, but what they might find harder to grasp is that so many devices surrounding us will communicate without any people being involved. there will be more machines communicating with one another than people.”
mACHINES THAT COmmuNICATE WITH EACH OTHEr? CAN YOu gIvE SOmE ExAmPlES?It’s not as strange as it might sound. It may involve gathering information from various types of sensors or controlling equipment via the Internet. For example, we have designed a system to control and monitor large cooling tanks whereby all external communication uses GSM or 3G technology. By monitoring and logging key parameters, such as tempera-ture, fault warnings can be immediately issued to a monitoring unit or an SMS can be sent to a service technician.
In the automotive sector, there are a number of areas of use, including enabling vehicles to issue automatic alarms in the event of an ac-cident or allowing stolen vehicles to be traced.
WHY dId YOu SPECIFICAllY CHOOSE m2m AS THE ArEA FOr A NEW COmPETENCE CENTEr?“this is a fast-growing area that is very well suited to enea since we are able to build on our in-depth experience of realtime systems, mobile devices and communication technology. our current successes with existing customers dem-onstrate that we have the right competence, the right models and the quality that the market demands to be able to run successful projects.”
There will be more machines communicating with one
another than people
22 ENEA AnnuAl RepoRt 2010
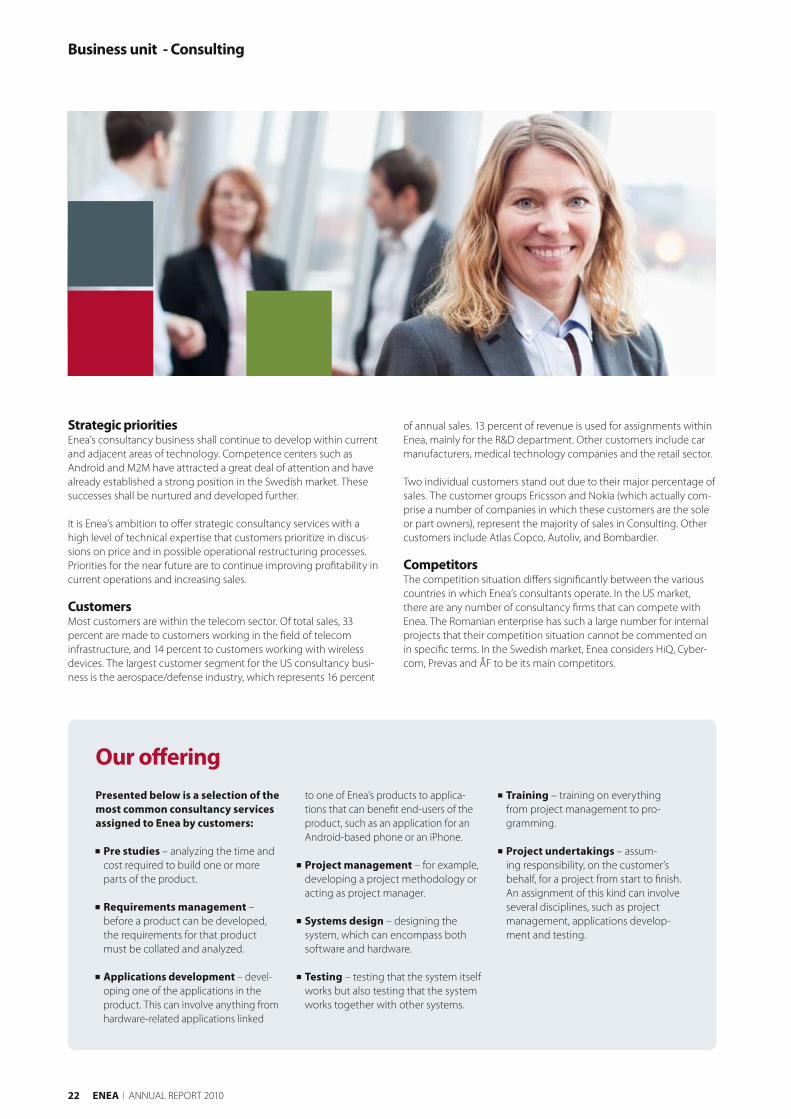
of annual sales. 13 percent of revenue is used for assignments within enea, mainly for the R&D department. other customers include car manufacturers, medical technology companies and the retail sector.
two individual customers stand out due to their major percentage of sales. the customer groups ericsson and nokia (which actually com-prise a number of companies in which these customers are the sole or part owners), represent the majority of sales in Consulting. other customers include Atlas Copco, Autoliv, and Bombardier.
Competitorsthe competition situation differs significantly between the various countries in which enea’s consultants operate. In the uS market, there are any number of consultancy firms that can compete with enea. the Romanian enterprise has such a large number for internal projects that their competition situation cannot be commented on in specific terms. In the Swedish market, enea considers HiQ, Cyber-com, prevas and åF to be its main competitors.
Business unit - Consulting
Our offering
Strategic prioritiesenea’s consultancy business shall continue to develop within current and adjacent areas of technology. Competence centers such as Android and M2M have attracted a great deal of attention and have already established a strong position in the Swedish market. these successes shall be nurtured and developed further.
It is enea’s ambition to offer strategic consultancy services with a high level of technical expertise that customers prioritize in discus-sions on price and in possible operational restructuring processes. priorities for the near future are to continue improving profitability in current operations and increasing sales.
CustomersMost customers are within the telecom sector. of total sales, 33 percent are made to customers working in the field of telecom infrastructure, and 14 percent to customers working with wireless devices. the largest customer segment for the uS consultancy busi-ness is the aerospace/defense industry, which represents 16 percent
Presented below is a selection of the most common consultancy services assigned to Enea by customers:
Pre studies – analyzing the time and cost required to build one or more parts of the product.
requirements management – before a product can be developed, the requirements for that product must be collated and analyzed.
Applications development – devel-oping one of the applications in the product. this can involve anything from hardware-related applications linked
to one of enea’s products to applica-tions that can benefit end-users of the product, such as an application for an Android-based phone or an iphone.
Project management – for example, developing a project methodology or acting as project manager.
Systems design – designing the system, which can encompass both software and hardware.
Testing – testing that the system itself works but also testing that the system works together with other systems.
Training – training on everything from project management to pro-gramming.
Project undertakings – assum-ing responsibility, on the customer’s behalf, for a project from start to finish. An assignment of this kind can involve several disciplines, such as project management, applications develop-ment and testing.

marknad Consulting
Enea cooperates with Scalado and Aptina to develop innovative camera technology for Android
mobile phones.
Scalado, a leading supplier of fast and efficient image processing technolo-gies used enea’s Android competence center to deliver an Android-based proto-type. Scalado needed complete hardware and software implementation to demon-strate its Speedtag camera solution which eliminates the delay between the shutter button being pressed and the image being taken, providing a genuine camera experience on Android. It was important that the actual Android platform not be the factor limiting the benefit offered by this innovative technology.
Camera technology is among the most complex features of a mobile phone since it affects all layers of hard-ware and software. A decisive component in this project entailed replacing, during the development phase, an earlier image sensor with an advanced five-megapixel sensor from leading supplier Aptina with integrated Speedtag technology. A team from Scalado, Aptina and enea secured the integration of the image sensor, firmware, applications and Android.
“It was a major challenge for Enea to complete and deliver this project within the short time available prior to the Mobile World Congress,” says Faid Abbas, CMo/CSo and founder of Scalado. “enea dem-onstrated unique skill in integrating the Aptina image sensor and our application with the Android platform.”
“Scalado’s SpeedTag camera solution improves the user’s experience of our five-megapixel image sensor for mobile phones considerably and helps us dem-onstrate Aptina’s aim to offer user-friendly camera solutions,” says venkat puntam-bekar, Director of Marketing, Mobile Imaging at Aptina. “Working with enea and Scalado to bring this new, integrated offering to the market on Android was a joint effort by three market leaders in the industry.”
“enea demonstrated unique skill in integrating the aptina image sensor and our application with the android platform.”Faid Abbas – CMo/CSo, Scalado
Camera technology is among the most complex features of a mobile phone.
Business unit - Consulting
AnnuAl RepoRt 2010 ENEA 23

24 ENEA AnnuAl RepoRt 2010
Sustainable developments builds on day-to-day consideration and planning
Sustainable development
Sustainable development can take many forms. For Enea it is principally a matter of social commitment, fair business and environmental responsibility. Issues of sustainability are to a very large extent global – affecting all aspects of enterprise, from capital to employees, customers and suppliers. As a global company with some 620 employees, our interfaces with numer-ous types of stakeholders have a bearing on health, safety and social development.
Social responsibilityenea contributes both directly and indirectly to the communities in which it operates. enea’s products are used by millions of people in their communications. Increase communication can, for example, decrease the need for unnecessary travel and enhance security.
enea also contributes directly to various social projects, particularly in Romania, where the company maintains one of its larger offices. In the capital, Bucharest, enea has helped children with cancer and impaired hearing through various activities at clinics and hospitals in the city. this has encompassed everything from donating Christmas gifts to investing in medical equipment and building repairs.
enea bears an economic responsibility to generate growth and prof-itability for all stakeholders. over time, the objective is to increase the company’s value to thereby safeguard sustainable development and a long-term return for our shareholders. We contribute to economic development in society, both through the use of our products and by providing jobs.
enea’s responsibility towards its employees is based on the core val-ues from which its corporate culture stems. We want all employees to feel that they are heard and that they are a part of the company’s
success. We must respect the dignity and human rights of the indi-vidual, develop his/her skills, pay fair wages, provide opportunities for advancement, work to promote open and honest communica-tion and provide a safe and healthy working environment.
COdE OF CONduCT ANd ETHICS POlICY enea’s code of conduct summarizes the Group’s ethical guidelines. Among other aspects, the code of conduct includes guidelines on compliance with regulations and legislation, the rights of the individual, as well as rules regarding ethical business practices and combating corruption.
the purpose of the code of conduct is to emphasize the basic principles according to which enea carries out its operations and handles its relations with employees, business partners and other stakeholders.
enea’s code of conduct builds on the following international principles: the un’s universal Declaration of Human Rights. the un’s Global Compact initiative. the Ilo Declaration on Fundamental principles and Rights at Work.
EQuAl TrEATmENT POlICYenea encourages a trend towards increased diversity. It is because of employees who dared to think in new and different ways that the company is what it is today. Differing backgrounds and experiences are positive aspects that we want to nurture. According to enea’s equal treatment policy, no employee may be treated in a discrimina-tory manner in their employment or duties on the basis of gender, religion, age, disability, sexual orientation, nationality, political views or social or ethnic origin.

AnnuAl RepoRt 2010 ENEA 2525
Hållbar utveckling
åRSReDovISnInG 2010 ENEA
Environmental responsibilityenea’s business concept is to facilitate our customers’ development of communication-driven products. Many of enea’s customers develop products that reduce environmental impact. one example in the M2M area is an electricity meter that automatically submits meter reading, thereby cutting transportation needs.
Improved communications opportunities in medical technology may reduce transportation needs for patients visiting physicians. In telecom, improved communications may reduce the need for face-to-face meetings, with video technology being used to hold virtual meetings instead.
Although enea does not conduct operations requiring permits or reporting in accordance with the Swedish environmental Code, environmental work does form an important part of day-to-day opera-tions. According to our environmental policy, we shall work to, among other things:
Comply with all applicable environmental legislation and other envi-ronmental requirements in the market in which the Group operates.
Avoid wasting resources. take care of the waste we produce by reusing and recycling materials. take environmental considerations into account in the design and
location of our offices. Strive to continuously assess our approach and to identify new
working methods to reduce our environmental impact.
to a large extent, sustainable development is about viewing our operations in a global perspective and being prepared to reassess accustomed notions and procedures. Are we using the right technolo-gy? How can we minimize our environmental impact? Can we identify new ways of working that benefit from the latest technology?

26 ENEA AnnuAl RepoRt 2010
Enea was listed on the Stock Exchange in 1989 and has been listed on the Nasdaq Omx Nordic Exchange in Stockholm for Swedish shares – Small Cap (ENEA) – since july 2007.
Price trendthe price has fluctuated over the year between SeK 36.20 at its low-est and SeK 48.50 at its highest. the closing price at year-end was SeK 46.40. enea’s share price has risen by 10.5 percent over the year, which can be compared with the 23 percent increase of the broad SIX General Index and the 17 percent increase of the It index (SX45pI).
enea’s total market capitalization amounted to SeK 839 million as at 31 December 2010.
Trade volumeIn total, some 3.5 million shares were traded at a total value ap-proaching SeK 150 million. this is equivalent to a turnover rate of 19 percent for 2010. on average, 14,035 shares were traded every trad-ing day over the year.
Ownershipthe number of company shareholders was 10,031 as at 31 December 2010. the holdings of the ten largest shareholders amounted to 60.5 percent of capital and votes. the principal shareholders consist of per lindberg and DnB nor. Foreign ownership amounted to 55 percent.
Stock option programs on 31 December 2010, the stock option program implemented in 2007 matured, but since the redemption price exceeded the share price on the maturity date, the options were not redeemed.As per 31 December, the company has a decided program from 2008 that matures on 31 December 2011 which includes not yet allotted stock options amounting to 37,500.
Number of sharesthe number of shares amounted to 18,081,171 as at 31 December 2010.
Transfer to shareholdersto the annual general meeting, the board of directors has proposed a 2:1 share split in combination with a compulsory redemption pro-cedure. the procedure entails each share being split into an ordinary share and a redemption share. no transfer is made for the 735,198 treasury shares bought back by the company. It is proposed that the redemption shares be redeemed for SeK 5.00 per share, correspond-ing to a transfer of SeK 86,729,865 to the company’s shareholders.
long-term dividend policyFor 2010 and onwards, enea’s Board has also resolved to adopt a long-term dividend policy to the effect that at least 30 percent of profit before non-recurring items and after flat rate tax be distributed to shareholders.
Capital structure If enea is also to be able to continue developing through acquisitions, the company may, over time, be in a position of net indebtedness. For a company such as enea, where software development and sales represent an essential part of operations, the maintenance of a strong financial position is of great importance. Consequently, the Board will therefore always consider the company’s long-term financing needs.
Shares and shareholders
The Enea share
HoldingNumber of
shareholdersNumber of
shares% of votes
and holding
1 – 500 8,514 1,027,554 5,68
501 – 1,000 673 527,394 2,92
1,001 – 5,000 661 1,477,211 8,17
5,001 – 10,000 77 559,598 3,09
10,001 – 15,000 33 421,097 2,33
15001 – 20000 13 225,070 1,24
20,001 - 60 13,843,247 76,56
Total 10,031 18,081,171 100,0
THE TEN lArgEST SHArEHOldErS, grOuPEd BY OWNEr 30 DeCeMBeR 2010
dISTrIBuTION BY SIzE ClASS 30 DeCeMBeR 2010
distribution of ownership
Source: Euroclear
OwnersNumber of
shares% of votes
and capital
Six SIS AG 4,181,972 23.1
per lindberg 3,124,585 17.3
DnB nor 1,111,134 6.2
Infläktor Fast AB 566,400 3.1
Handelsbanken Funds 555,371 3.1
AMF – Insurance and funds 364,907 2.0
Skandia Funds 350,919 1.9
Avanse norden 348,622 1.9
Caceis Bank luxembourg 174,469 1.0
Försäkrings AB Skandia 158,026 0.9
Total, ten largest owners 10,936,405 60.5
enea’s own holding 735,198 4.1
other shareholders 6,409,568 35.4
Total number of shares 18,081,171 100.0

AnnuAl RepoRt 2010 ENEA 27
Aktien
EQuITY rATIOS2010 2009 2008 2007 2006 2005
net worth per share 29.69 29.52 30.43 23.71 20.83 18.62
earnings per share 2.79 0.24 4.9 3.88 2.66 3.81
profit per share after full dilution 2.79 0.24 4.9 3.88 2.64 3.77
Cash flow per share from operating activities 2.05 4.02 4.54 3.62 0.3 2.83
Dividend per share 5.00 1.50 0 0 0 01) If the Annual General Meeting makes a decision in accordance with the proposal of the board.
Year Share capital New shares Number of shares Event
7,680,900 – 1,536,180
1998 7,680,900 4,608,540 6,144,720 Split 4:1
1998 – – – transition to single share class
1999 7,845,284 131,507 6,276,227 non-cash issue
2000 7,920,214 59,944 6,336,171 non-cash issue
2000 8,712,235 633,618 6,969,788 new share issue
2000 8,712,235 167,274,912 174,244,700 Split 25:1
2001 8,877,235 3,300,000 77,544,700 new share issue
2002 8,923,181 918,919 178,463,619 non-cash issue
2003 9,107,843 3,693,243 182,156,862 non-cash issue
2003 18,215,686 182,156,862 364,313,724 new share issue
2004 18,215,686 – 364,313,724 –
2005 18,215,686 – 364,313,724 –
2006 18,265,096 988,192 365,301,916 new share issue
2007 18,355,714 1,812,348 367,114,264 new share issue
2008 18,355,714 – 18,355,714 Reverse split 1:20
2009 18,355,714 – 18,355,714 –
2010 18,081,171 -274,543 18,081,171 Cancellation of shares
2010 18,355,714 – 18,081,171 Bonus issue
Antal aktieägare Aktieägare (%) Antal aktier Innehav & Röster (%)Fysiska personer 9 358 93,3 4 200 626 23,2 Jurdiska personer 673 6,7 13 880 545 76,8 Totalt 10 031 100% 18 081 171 100%
76.8 %Legal persons (number of shares 13,880,545)
23.2%Physical persons
(number of shares 4,200,626)
Antal aktierNumber of shares
dISTrIBuTION BY gEOgrAHIC ArEA
AreaShareholders
(%)% of votes
and holding
Resident in Sweden 96.6 45.3
other nordic countries 0.9 8.6
Rest of europe 1.7 45.2
uSA 0.5 0.8
Rest of europe 0.4 0.1
Total 100.0 % 100.0 %
Antal aktieägare Aktieägare (%) Antal aktier Innehav & Röster (%)Fysiska personer 9 358 93,3 4 200 626 23,2 Jurdiska personer 673 6,7 13 880 545 76,8 Totalt 10 031 100% 18 081 171 100%
Antal aktieägare
93.3%Physical persons (9,358 pers.)
6.7%Legal persons (673 pers.)
Number of shareholders
0
500
1 000
1 500
2 000
2 500
3 000
3 500
Turnover number of shares per month, thousands
201020092008200720060
25
50
75
100
125
150
175
SX45 Information Technology PI
SIX Generalindex
Enea
Share priceSEK Turnover
©
AnnuAl RepoRt 2010 ENEA 27
Shares
1)

28 ENEA AnnuAl RepoRt 2010
Five-year review
Five-year review
INCOME STATEMENT, SEK MILLIONS 2010 2009 2008 2007 2006
net sales 726.1 777.7 917.6 820.6 750.1
operating expenses -658.7 -781.8 -844.5 -748.5 -682.5
operating income 67.4 -4.1 73.1 72.1 67.6
net financial items 0.7 3.3 7.9 4.8 1.7
earnings before tax 68.1 -0.8 81.0 76.9 69.3
tax -22.1 5.0 7.3 -5.7 -20.9
Profit for the year 46.0 4.2 88.3 71.2 48.4
BALANCE ShEET, SEK MILLIONS
Intangible assets 216.7 237.2 273.5 175.1 132.6
other fixed assets 30.9 46.7 46.0 24.9 15.5
trade and other current assets 236.6 258.7 325.4 268.3 265.5
Cash and cash equivalents 176.5 153.9 122.1 156.0 146.4
Total assets 660.7 696 .6 767.0 624.3 560.0
Shareholders’ equity 512.6 516.0 548.4 434.6 379.4
provisions, non-current liabilities and minority 12.7 31.9 31.5 8.9 0.2
Current liabilities 135.4 148.7 187.1 180.8 180.4
Total equity and liabilities 660.7 696.6 767.0 624.3 560.0
CASh fLOw, SEK MILLIONS
Cash flow from current operations 76.1 70.3 81.8 66.4 5.6
Cash flow from investing activities -19.0 -13.2 -121.6 -42.7 -34.6
Cash flow from financing activities -31.7 -21.8 -1.8 -12.8 0.5
Cash flow for the year 25.4 35.4 -41.6 10.9 -28.6
KEy fIgurES
Change in net sales, % -6.6 -15.2 11.8 9.4 3.3
operating margin, % 9.3 -0.5 8.0 8.8 9.0
profit margin, % 9.4 -0.1 8.8 9.4 9.2
Return on capital employed, % 13.9 1.7 17.3 19.5 20.0
Return on equity, % 8.9 0.8 18.0 17.5 13.5
Return on total capital, % 10.6 1.3 12.2 13.4 13.5
Interest coverage ratio, times 19.5 0.9 20.7 30.1 29.2
equity ratio, % 77.6 74.0 71.0 70.0 68.0
liquidity, % 305.0 278.0 239.0 235.0 228.0
Share of risk-bearing capital, % 78.0 75.0 72.0 70.0 68.0
Average number of employees 621 666 688 547 501
number of employees at year-end 620 633 732 567 513
net sales per employee, SeK 1,169 1,168 1,334 1,500 1,497
net asset value per share, SeK 29.55 29.52 30.43 23.71 20.83
earnings per share, SeK 2.65 0.24 4.90 3.88 2.66
Cash flow from current operations per average number of shares 4.38 4.02 4.54 3.62 0.30
Dividend per share* 5.00 1.50 0.00 0.00 0.00
*As proposed to the Annual General Meeting 2011. Refer to page 62 for definitions

AnnuAl RepoRt 2010 ENEA 29
The Board and President of Enea AB (publ), company registra-tion number 556209-7146, hereby submit the Annual report for the parent company and the group for the financial year 1 january-31 december 2010.
Businessenea is a global software and services company listed on the nasdaq oMX Stockholm exchange Small Cap list. enea specializes in solutions for communication-driven products and provides products and know-how that reduce customers’ development time, cut production costs and enhance the reliability of the systems. About half of its cus-tomers are manufacturers of telecom equipment, while the others are divided more equally over the fields of medical technology, industrial automation, vehicles, aerospace and defense.
Software business unitthe Software business unit consists of enea’s global product business, including product-related services, and focuses on enea’s strong position in the market for realtime operating systems (RtoS) for the telecom industry, where enea is a world leader.
the Software business unit accounted for 48 (44) percent of consoli-dated net sales in 2010. Sales mainly take place via the company’s own subsidiaries in Sweden, the uS, France, Germany, Israel, China and Japan, as well as through partners. net sales rose by 2.2 percent over the year to SeK 347.1 (339.7) million. new sales of licenses and royalty income decreased somewhat in 2010, while income from support increased.
Sales by the nordic operations, including those to several key cus-tomers, declined somewhat in 2010 compared with 2009. the smaller units in Germany and France reported growth in 2010.
the north American operations experienced weak development towards the end of the year, mainly due to the postponement of a number of projects, which resulted in sales decreasing for the 2010 full year.
Asia reported growth in 2010 with improved figures for both Japan and China. of all of enea’s operations, the Japanese unit showed most growth, albeit from a low level.
operating profit for Software amounted to SeK 49.9 (loss 11.1) million for 2010. the operating margin improved considerably compared with 2009, amounting to 14.4 (negative 3.3) percent for the full year. the comparison figures for 2009 include restructuring costs of SeK 6.7 million and the writing down of capitalized development expendi-ture by SeK 25.4 million.
the business unit had 179 (184) employees at the end of the year.
Consulting business unitthe Consulting business unit consists of consultancy operations in Sweden, Romania and the uS and focuses on local expertise com-bined with off-shoring services. Assignments include everything from the integration of enea’s products to development and testing of the customer’s own solutions.
Consulting accounted for 52 (56) percent of net sales for the full year. net sales for Consulting declined by 10.9 percent in 2010 to SeK 434.7 (488.0) million compared with 2009. Sales per employee in 2010 remained at the same level as in 2009.
Board of directors’ report
Board of directors’ report
the Swedish consultancy operations account for the majority of the business unit’s sales, with the operations in the Stockholm region being the largest single unit. Despite lower sales, operating profit for the operations in Stockholm and linköping improved compared with 2009. the operations in the Öresund region did not experience the same recovery as the other two units in 2010, but had a good year end with a considerably improved operating margin.
the uS operations reported both higher sales and substantially improved operating profit for 2010. this growth is mainly explained by the major consultancy assignment that was signed in late 2009 and that will extend to the summer of 2011, as well as to a number of newly signed agreements in the defense industry.
the Romanian operations reported stable income with increased profitability compared with 2009. over the year, the business area’s operating profit rose to SeK 21.6 (7.0) million, with an operating mar-gin of 5.0 (1.4) percent.
profit for the full year was affected by restructuring costs of SeK 3.5 million relating to the operations in the Öresund region. excluding re-structuring costs, the margin for the full year amounted to 5.8 percent.
At the end of the year, the business unit had 424 employees (432).
Significant events during the yearStrategic partnerships were signed with Freescale and netlogic. enea and Freescale cooperate on advanced product integration, as well as joint marketing and customer development. the agreement with netlogic involves cooperation on product optimization and the crea-tion of a shared development environment for linux.
the year’s three largest transactions included an agreement valued at SeK 20 million with a supplier of telecom equipment, a transac-tion valued at SeK 8.5 million with a Japanese It company and order amounting to SeK 4.8 million from a medical technology company. these three largest transactions all included enea’s realtime operating system for multicore.
to benefit from the opportunities for rapid growth offered by the market for Machine-to-Machine (M2M) communication, enea has opened a competence center in linköping.
Several transactions were secured in the area of testing; among others, for a Swedish government authority, a media company and a technology company. enea will also be helping an automotive company with vehicle configuration.
the order valued at SeK 37 million (uSD 5.1 million) that enea secured in the fourth quarter of 2009 from a global developer of financial sys-tems solutions developed well in 2010, resulting in additional orders.
Significant events after the end of the periodIn the beginning of 2011, enea has strengthened and improved its linux offering to better support customers building and implement-ing multicore systems. Several of enea’s customers are today using both a realtime operating system, such as enea oSe, and linux in the same product.
the two first activities include an alliance with the leading independ-ent linux company timesys, and a membership in linux Foundation.

30 ENEA AnnuAl RepoRt 2010
Board of directors’ report
enea will also offer system solutions including linux, realtime operat-ing systems and other hardware related environments as integrated platform solutions to help customers reduce complexity when migrating to multicore processors.
Business partnersenea works in cooperation with third-party suppliers such as IBM, Kontron, Radisys, Freescale, texas Instruments, CevA, lSI, Wind River Systems, tail-F Systems, IpInfusion, DataConnection, SnMp Research and Datalight.
research and developmenttechnology development is leading to an increase of software’s share in communication-intensive products such as mobile phones and other telecom equipment, industrial robots, cars, trains and aircraft, which increases the complexity and cost of developing software. the more complex the systems become, the more stringent the demands made of performance, reliability and realtime functionality. enea’s product portfolio contains some 30 products and the users of most of these are to be found among manufacturers of telecom equipment.
there are many usage areas for these products. For example, they are used in over half of the world’s base stations and 3G mobile phones and handle five billion phone calls daily. enea Software’s product portfolio has a core of realtime operating systems and a broad range of middleware, development tools, databases and communication protocols.
enea Software’s R&D unit is one of the foremost in Sweden in the de-velopment of embedded system products and it employs around 155 people in Sweden, Romania, the uK and France. expenses for product development amounted to SeK 99 million (125), and development expenditure of SeK 15.8 million (8) was capitalized over the year. operating earnings were burdened by writedowns of SeK 15.8 million (8.3) on capitalized development expenditure. In 2009, depreciation included a non-recurring impairment of SeK 25 million. Research and development expenses for the year corresponded to 29 percent (37.0) of software income.
revenue and profit developmentenea’s revenue declined by 6.6 percent in 2010 to SeK 726.1 million (777.7) compared with 2009. Adjusted for currency effects, the decline was 4.8 percent. the decline in revenue is primarily attributable to lower income for the Consulting business area.
of total sales for the full year, 48 percent were generated by the Software business unit and 52 percent by the Consulting business unit. Sales are distributed between several customer segments, with telecom infrastructure representing 52 percent, wireless devices 18 percent, aero/defense 9 percent and other segments 21 percent. Compared with 2009, wireless devices have declines while telecom infrastructure has increased.
For the 2010 full year, operating profit was SeK 67.4 million (loss 4.1) and the operating margin was 9.3 percent (negative 0.5). profits for 2010 were affected with restructuring costs of SeK 6.8 million. profits for 2009 were burdened with a nonrecurring writedown of SeK 24.5 million and restructuring costs of SeK 10.1 million.
Both the Software and Consulting business units increased their operating margins compared with the preceding year. nonrecur-ring costs of SeK 3.3 million related to the restructuring of the parent company were charged against profit. Currency effects for the full year had only a marginal effect on consolidated profit.
Costs for product development, sales and marketing decline com-pared with 2009 as a consequence of the savings programs that were implemented. A change in the method applied in the distribution of administration costs between the business units as of 1 January 2010 affected the comparison figures for 2009. In total, administration costs remained at the same level as in 2009.
net financial income for the full year totaled SeK 0.7 million (3.3). profit after tax for the full year was SeK 46.0 million (4.2). earnings per share for the full year rose to SeK 2.65 (0.24). Without adjusting for holdings of treasury shares, earnings per share for the full year amounted to SeK 2.54. Return on equity for the full year was 8.9 percent (0.8).
Investments, depreciation and amortizationthe Group’s investments for the full year amounted to SeK 19.0 million (15.1), of which capitalized development expenditure amounted to SeK 15.8 million (8.3). Amortization for the year amounted to SeK 22.4 million (49.1), of which SeK 9.8 million (37.0) involved amortization of capitalized development expenditure.
Cash flow and financial positionCash flow from current operations amounted to SeK 76.1 million (70.3) for the full year. total cash flow for the full year was SeK 25.4 million (35.3). In the second quarter, SeK 26.0 million (0) was distributed in div-idends and, over the year, shares were repurchased for SeK 7.7 million.
Cash and equivalents and current investments amounted to SeK 176.5 million (153.9) at the end of the year. In addition, the Group had unused credit facilities amounting to SeK 100 million. enea has a continued strong financial position, with an equity ratio of 77.6 percent (74.1).
Parent companythe operations of the parent company, enea AB (publ), focus primarily on Group-wide management. the company provides and sells serv-ices involving finance, administration and management to the other Group companies.
the parent company’s net sales for 2010 amounted to SeK 60.0 million (32.5) and profit before tax amounted to SeK 8.0 million (loss 11.6). the parent company’s net financial income was SeK 12.0 million (15.0), and cash and equivalents amounted to SeK 128.5 million (108.4).
the parent company’s investments amounted to SeK 0.5 million (3.3). the parent company had 17 employees (26) at the end of the year. Since 2002, the parent has had a liability of SeK 96 million to subsidiar-ies involving capital contributions. Since the contributions were never effectuated, the liability was settled against retained earnings in the comparison figures for 2009 since it pertained to an earlier period. the parent company’s risks are primarily attributable to the activities of the subsidiaries.
EmployeesAt the end of the year 620 people (633) were employed by the Group. the average number of employees in the Group during the year was 621 (666).
guidelines on remuneration for senior executivesthe proposed guidelines on remuneration for senior executives are described in detail in notes 4 and 20. At the 2011 Annual General Meeting, it will be proposed that current guidelines should continue to apply until the next Annual General Meeting. If ownership condi-tions change such that there are new majority owners in the com-pany, the Ceo will be entitled to severance pay equal to six months’ salary. the Board of Directors shall be entitled to deviate from these guidelines where specific reasons exist.

AnnuAl RepoRt 2010 ENEA 31
Enea sharesAs at 31 December 2010, registered share capital involved 18,081,171 shares with a nominal value of SeK 1.02. Shareholders are entitled to dividends as determined by the Annual General Meeting. each share entitles the holder to one vote at the Annual General Meeting. there are no limits to the transferability of shares or the vote entitlement of each individual shareholder at the Annual General Meeting due to provisions in the Articles of Association.
Shareholders whose shares represent at least one-tenth of votes for all shares in the company are per lindberg, partly via electro Medicinska AB (a total of 17.7 percent of share capital and votes) and SIS SegaInterSettle AG (23.1 percent of share capital and votes). the number of shareholders as at 31 December 2010 was 10,031 (11,455).
the Annual General Meeting decided to authorize the Board to make decisions on acquisitions and transfer of own shares. Shares in the company may only be acquired on the nasdaq oMX Stockholm (“the Stock exchange”) or in accordance with acquisition offers to all of the company’s shareholders. the number of shares acquired must be such that the treasury shares held by the company at no time exceed 10 percent of all shares in the company. A maximum of 10 percent of the total number of shares in the company may be transferred. the purpose of the acquisition of the company’s own shares is to allow enea’s capital structure to be adapted constantly to enea’s capital requirement and to permit financing – either fully or partially – in connection with corporate acquisitions.
As a consequence of such buybacks, enea AB has a total of 735,198 treasury shares, equivalent to 4.1 percent of the share capital, for which SeK 45.0 million was paid. In 2010, enea AB has bought back 183,751 of its own shares, equivalent to 1.0 percent of the share capital, for which SeK 7.7 million was paid. In 2010, 274,543 shares were can-celed in accordance with the decision of the Annual General Meeting.
In connection with the share savings program approved by the 2010 Annual General Meeting, enea sold 48,163 shares for a total of SeK 2 million.
the 2010 Annual General Meeting authorized the Board to make deci-sions, for the period until the 2011 Annual General Meeting, on one or more occasions, on the issue of new shares without preferential rights for shareholders, with provision regarding in kind or other terms as referred to in Chap. 13, Section 5, first paragraph of the Swedish Com-panies Act, and that the Board in general may decide on the terms of the issue. However, the issue price must be determined under market conditions and must correspond at most to 10 percent of the number of outstanding shares. this authorization was not utilized in 2010.
Environmental aspectsenea sells software and consultancy services. Its products have no environmental impact per se. the company’s environmental impact originates primarily from staff traveling to and from work and on business. videoconferencing equipment has been acquired and will replace some international travel.
Future developmentunderlying demand for enea’s products and services remains good. technological development is making strong progress in areas including multicore-based systems Ip-based communication and enhanced intelligence in mobile units. In addition, mobile broadband is showing significant growth, entailing major long-term investments for enea’s infrastructure customers.
the regional differences in demand for consultancy services are still considerable. In Sweden, demand is expected to continue to rise in 2011. In Romania, demand is considered unchanged compared with the end of 2010. Demand in relation to enea’s uS consultancy busi-ness is assessed as positive.
the long-term profit target is for Software to achieve an operating margin of 20 percent and for Consulting an operating margin exceed-ing 10 percent.
the company’s assessment for 2011 is that net sales will increase compared with the previous year and that profitability will continue its positive development.
risks and uncertainty factorsenea is exposed to a number of risks which could affect the Group’s profit. enea identifies and deals with the company’s risks on a con-tinuous basis. the risks deemed to be of the greatest significance to the company have been classified below as business- related, market-related or financial risks.
Business-related risks
CuSTOmEr STruCTurEIn both its software and consultancy businesses, enea is dependent upon a small number of major customers, such as ericsson, St-ericsson, Sony ericsson Mobile Communications and nokia Siemens networks, all of which are significant suppliers of telecom equipment.
the development of these customers, particularly as regards their production volumes and product development plans, are significant to enea in the short term. Apart from the credit risk of these compa-nies being considered very small, the risk of rapid negative changes are limited due to long-term agreements or other impediments to customers dramatically altering the extent to which they use enea’s products and services. Although enea is working deliberately to reduce its dependency on these customers, the share of income that they represent has risen in recent years.
CONTrACT STruCTurEAbout 40 percent of enea’s income relates to software products. A large proportion of this income is repetitive in nature, in the form of long-term royalty and maintenance contracts, with limited costs incurred in connection with income flows. on the other hand, royalty income is directly linked to the customer’s volume trend for the product in question, and enea is therefore unable to influence the future royalty income. Around one-third of the annual income from software is non-repetitive in nature, but that also has limited direct production costs. on the other hand, every new deal is of course linked with sales costs.
enea can normally gain an overview of income for consultancy work around three months in advance. A small number of consultancy tasks have guaranteed minimum volumes for up to one year.
CONSulTINg uTIlIzATIONMore than half of income derives from consultancy operations. thus a reduction in demand for consultancy poses a risk for enea. A reduc-tion in demand may be due to many reasons, such as an economic downturn, incorrect consultancy expertise, etc. to continuously meet market demand, enea strives to maintain the consultancy expertise that customers demand, even through periods with poorer economic conditions.
Board of directors’ report

32 ENEA AnnuAl RepoRt 2010
Board of directors’ report
COmPETENCE SuPPlYenea’s success is very much linked to its ability to employ, develop, motivate and retain engineers and other qualified personnel. there is strong competition for qualified personnel in the It industry. enea’s combination of products and services, however, gives the company an advantage over its competitors by allowing it to offer broader career paths. enea’s company in Romania is helping to provide a good supply of competence while at the same time achieving cost benefits.
PrOduCT rESPONSIBIlITY, INTANgIBlE rIgHTS ANd lEgAl dISPuTESDespite the fact that possible faults in enea’s products could cause claims for compensation or damages, the Board maintains the view that the company has sufficient insurance coverage with regard to product responsibility for this risk to be considered limited.
Since enea works continuously to protect its company names, pat-ents and brands, the company is well prepared for any infringement disputes, both through its insurance protection and based on the internal and external experience of its legal counsels. neither enea nor its subsidiaries are currently involved in any legal disputes, court or arbitration proceedings, with the exception of a small number of minor disputes that are not expected to have any substantial nega-tive impact on the company’s financial position. the Board is unaware of any circumstances that could lead to a dispute or that could subse-quently damage enea’s financial position to any significant extent.
market-related risk
mACrOECONOmIC dEvElOPmENTenea is dependent upon the growth and financial development of its largest customers. Most of its income comes from customers in the telecom industry, meaning that the economic risks are linked not only with the economic situation in general but also with the specific development of the telecom industry. A generally impaired economic situation mainly has consequences for customers’ current willingness to invest, thus reducing purchases of enea products and services. Structural changes such as an increase in the use of embedded systems in various contexts are of greater significance than changes in the economic situation.
PrOduCTS ANd TECHNOlOgYenea’s competitiveness and market position are largely dependent on the company’s ability to manufacture innovative products. enea has been developing products with a very high technical content for a long time. Close consultation with its largest customers concern-ing product development is of major importance. the increasing presence of software based on open source code means a risk of enea’s customers choosing such solutions instead of the company’s copyright-protected products. As a consequence, enea has built up a business around linux no longer a member of openSAF in early 2011 it became a member of the linux Foundation a body for cooperation on linux.
Within its consultancy operations, competence centers are being established for cutting edge expertise in various service fields.
Semiconductor manufacturers have a major influence on customers’ choice of software. therefore, enea cooperates in various ways with a number of players, which involves – among other things – them selling enea products pre-integrated into their own products.
COmPETITOrSthe market for software for embedded systems is fragmented, with a handful of players of enea’s size or larger. like enea, all of its major competitors operate globally while niche players compete in limited
areas. one form of competition is made up of customers software solutions which they have developed themselves, although this con-stitutes a decreasing proportion of software usage overall.
Within consultancy operations, the market is equally fragmented, with a large number of players active globally, nationally and locally. one particular risk is the pace of globalization of the consultancy market, which will lead to price pressure on local markets, such as competition from suppliers in low-cost countries on the Swedish market. enea offers high quality services from both high and low cost countries, which increases the chances of facing up to the competi-tion successfully.
FINANCIAl rISKSIn its operations, enea is exposed to various financial risks, of which currency risk dominates. the Group’s financial policy was established by the Board and forms a framework with guidelines and rules for dealing with financial risks. the Board is of the view that enea is mainly exposed to the following financial risks:
CurrENCY rISKCurrency risk is the risk of the value of financial instruments vary-ing due to changes in currency exchange rates. enea’s business is international in character, with most of its sales being made in SeK, euR and uSD.
to a great extent, currency exposure is minimized by running the business in subsidiaries that generate income and incur costs in local currencies. the risk of currency exchange rate changes is also han-dled by the company regularly adapting and assessing its price lists. A Group account structure with a number of currencies keeps currency exchanges to a minimum and increases flexibility in respect of the time for exchanges. Major known deposits and outgoing payments in foreign currency are hedged through foreign exchange forwards in accordance with the financial policy.
In 2010, a total of euR 4 million (0) and JpY 0 million (42) was currency hedged. no significant derivative contracts were outstanding at the close of 2010. Foreign subsidiaries are translated to Swedish krona in accordance with the current method, which means that the report on total profit or loss is translated in accordance with the average rate for the period, and the balance sheet is translated according to the rate on the balance sheet date. translation exposure is not hedged.
If the Swedish krona had strengthened/weakened by an average of 5 percent in relation to the euR, with all other variables constant, income for 2010 would have been SeK 5 million lower/higher. If the Swedish krona had strengthened/weakened by 5 percent in relation to the uSD, with all other variables constant, income for 2010 would have been SeK 6.7 million lower/higher.
lIQuIdITY rISKliquidity risk means that financing cannot be acquired, or else it can only be acquired at greatly increased cost. enea’s liquidity risk is limited. At 31 December, cash and equivalents amounted to SeK 176 million (154). the Group has no interest-bearing debts. enea’s cash pool, with mostly cash and equivalents in the Swedish companies, is administrated by the parent company. the Group’s liquidity is reported and reviewed on an ongoing, weekly basis. excess liquidity is invested as a special deposit or as commercial papers with maturity periods from one day to three months with well-established financial institutes. Investments maintain a low risk profile in accordance with the financial policy.

AnnuAl RepoRt 2010 ENEA 33
Board of directors’ report
CAPITAl rISKthe Group’s target concerning the capital structure is to maintain a stable financial position which secures the Group’s ability to continue its operations and generate returns for shareholders and to benefit other stakeholders and engender confidence in the often close and long-term customer relations. to maintain or alter the capital struc-ture, the Group may issue a dividend, repay capital to shareholders, issue new shares or sell assets to decrease its liabilities.
At the end of the year, the Group had no external financing.
INTErEST rISKInterest risk is the risk of the value of financial instruments varying due to changes in market interest rates. enea’s interest risk is low because the Group has no interest-bearing liabilities.
the Group had granted, but unutilized, credits of SeK 100 million on 31 December 2010 and 31 December 2009.
the interest risk in the Group’s cash and equivalents is mainly attribut-able to trends in the Swedish fixed-income market. An increase or decrease of 1 percent in the interest level would result in an increase/decrease in the financial net of about SeK 1.6 million.
CrEdIT rISKCredit risk is the risk that a party to a financial instrument is unable to meet its commitment – consequently, the risk that payment will not be received for accounts receivable constitutes a credit risk. enea reported no credit losses in 2010 or 2009.
the Group’s customers are predominantly large, well-established companies with good payment capacity and distributed among several geographical markets, with most being located in Sweden. to limit the risk of potential credit losses, the company’s credit policy includes guidelines and regulations regarding the credit assessment of new customers, payment terms and procedures for the processing of unpaid receivables.
PrOPOSAl FOr dISTrIBuTION OF ENEA AB’S EArNINgS
the following funds are available to the parent company (SeK): Share premium reserve 1,654,365Retained earnings 246,661,473profit for the year 5,797,755Total 254,113,593
the Board proposes that the accumulated profit be appropriated such that SeK 254,113,593 be transferred to a new account.
TrANSFEr TO SHArEHOldErSIn addition, a 2:1 share split is proposed in combination with a com-pulsory redemption procedure. the procedure entails each share be-ing split into an ordinary share and a redemption share. no transfer is made for the 735,198 treasury shares bought back by the company. It is proposed that the redemption shares be redeemed for SeK 5.00 per share, corresponding to a transfer of SeK 86,729,865 to the company’s shareholders.
For information on the company’s results and general position, please refer to the following income statements, balance sheets and cash flow statements with supplementary notes.
Following the implementation of the proposed appropriation of earnings and the redemption program, the retained earnings and unrestricted funds in the parent company enea AB will amount to SeK 167,384,000 and total equity will be SeK 485,134,000.
Board statement on the proposed redemption program in ac-cordance with the Swedish Companies Act, Chapter 18, Section 4the proposed dividend to shareholders reduces the parent com-pany’s equity ratio from 95.4 percent to 94.6 percent and the Group’s equity ratio from 77.6 percent to 74.2 percent. the equity ratio is satisfactory, given that the operations of the company and the Group continue to be run profitably. It has been assessed that it will be pos-sible to maintain the liquidity in the company and the Group at an equally satisfactory level.
It is the view of the Board that the proposed transfer of value will not impede the company, and other companies forming part of the Group, from fulfilling its obligations in the short and long term, nor from completing necessary investments. the proposed transfer of value can thus be viewed as justifiable, given what is stated in the Swedish Companies Act, Chapter 17, Section 3, paragraphs 2-3.
the Board proposes that the Annual General Meeting authorize the Board to set the record days for the share split and redemption, and the period for trading in redemption shares. However, the record day for the share split is expected to be 18 April 2011 and the record day for the withdrawal of redemption shares is expected to be 10 May 2011. trade in redemption shares is expected to take place from and including 20 April 2011 up to and including 5 May 2011. payment for redemption shares is expected to be executed via euroclear Sweden AB on about 13 May 2011.
the financial reports were approved for issue by the Board of the par-ent company on 23 February 2011.

34 ENEA AnnuAl RepoRt 2010
Corporate governance report, 2010
Corporate governance report
Enea AB (“Enea” or “the Company”) is a Swedish public listed company on the Nasdaq Omx Nordic Exchange in Stockholm. Corporate governance within the Enea group (“Enea” or “the group) is based on Swedish legislation and the rules and recom-mendations issued by relevant organizations, including the Swedish Corporate governance Board, Nasdaq Omx, the Swed-ish Securities Council and others.
governance, management and control at Enea are distributed between the shareholders through the Annual general meeting, the Board and the CEO in accordance with the Swedish Compa-nies Act and the Articles of Association.
Swedish Code of Corporate governanceeffective from 1 July 2008, enea applies the Swedish Code of Corpo-rate Governance. the following account has been prepared in ac-cordance with the Swedish Code of Corporate Governance. over the 2010 financial year, enea complied with the Code with the exception of the point detailed below.
Instruction 2.5: the company is to announce the names of members of the nomination committee on its website no later than six months before the annual general meeting.
Deviation: the information was disclosed later than six months before the Annual General Meeting.
explanation: the Board decided to bring the date of the Annual General Meeting forward, with the consequence that the informa-tion was not disclosed in accordance with the Code.
Shareholdersenea’s ordinary shares have been listed on the nASDAQ oMX Stockholm exchange since 1989. According to the share register maintained by euroclear Sweden, enea had 10,031 shareholders as per 31 December 2010. on 31 December 2010, the share capital in enea amounted to SeK 18,355,713, divided among 18,081,171 ordinary shares, each conveying the same voting rights and participation in the Company’s capital and earnings. enea’s holds 735,198 shares of its own in the Company, corresponding to 4.1 percent of the total shares outstanding. on 31 December 2010, the largest shareholders were SIX SIS AB, with 23.1 percent and per lindberg, with 17.7 percent of shares.
enea complies with the rules applicable in accordance with the listing agreement with the stock exchange and with good practice in the stock market. the nomination Committee for the 2011 Annual General Meeting was appointed later than the six months prior to the Meeting required by the Code. the reason is that, after the nomination Committee’s appointment, the Annual General Meeting was brought forward by about a month compared with earlier years to allow shareholders to benefit from the positive effects of the redemption program as soon as possible. no other infractions of the listing agreement or good practice were made in 2010.
Annual general meetingthe Annual General Meeting, or where applicable, an extraordinary General Meeting, is enea’s highest decision-making body. every shareholder is entitled to participate in the Annual General Meeting, either in person or via a representative with power of attorney. every shareholder has the right to have a matter addressed by the Meet-ing. the 2010 Annual General Meeting of enea AB (publ) took place on 19 April 2010 in Kista, Sweden.
the Annual General Meeting makes decisions regarding its agenda, the appointment of the Board and Chairman of the Board, the elec-tion of auditor, the adoption of the income statement and balance sheet, the disposition of retained earnings, the discharge from liability of the Board and the Ceo, the principles of remuneration for the Ceo and other senior executives, etc. A decision to change the agenda of the Meeting requires a two-thirds majority.
Besides the Annual General Meeting’s decision to ratify the income statement and balance sheet for the company and the Group, the Meeting decided on a dividend of SeK 26 million for the 2009 financial year, to discharge Board members and the Ceo from liability, elected Board members and approved fees for the Board and auditors and guidelines for senior executives and approved the implementation of the share savings program for the executive management team and other key employees.
Kjell Duveblad, åsa landén ericsson and Anders Skarin were ree-lected as regular Board members at the 2010 Annual General Meet-ing. Anders lidbeck was reelected as Board member and Chairman of the Board. Mats lindoff was elected as a regular Board member. In addition, the Board was authorized to make decisions on acquisitions and the transfer of own shares corresponding to no more than 10% of all shares in the company, plus the new issue of shares for share or business acquisitions corresponding to an increase of no more than 10% of the share capital and the cancellation of 274,543 own shares.
the complete minutes from the Annual General Meeting, together with the Meeting’s decision data, can be viewed at www.enea.com/agm.
Nomination committeethe Annual General Meeting shall appoint members of the nomina-tion committee or indicate how these members are to be appointed. enea’s nomination committee for the 2011 Annual General Meeting shall comprise representatives of four major shareholders plus the Chairman of the Board. the Chairman of the Board shall contact the four largest shareholders in terms of number of votes at the end of the third quarter of 2010 to ask them to appoint one member each to the nomination committee. If any of the four biggest shareholders in terms of votes declines to appoint a representative on the election committee, the next shareholder in order of size must be given the opportunity to appoint such a representative. the names of nomina-tion committee members shall be published in the company’s interim report for the first three quarters of the year. the mandate period for the nomination committee appointed shall continue until a new nomination committee has taken over. A representative of the share-holders should be appointed chairman of the nomination committee.
If any significant change takes place to the ownership structure once the nomination committee has been inaugurated, the composition of the nomination committee shall be amended in accordance with the principles above.
the nomination committee shall prepare and submit motions: to the Chairman at the coming Annual General Meeting, for election of a Chairman and other company directors, for Board fees divided among the Chairman and other members of
the Board, along with principles for any payment for committee work, for election of and payment to an auditor and deputy auditor
(where appropriate), and for decisions on principles for the appointment of a nomination
committee.

AnnuAl RepoRt 2010 ENEA 35
the nomination committee for the 2011 Annual General Meeting con-sists of Chairman per lindberg (the largest shareholder in enea), Sverre Bergland (DnB nor), lars-åke Bokenberger (AMF), Robert Andersson (Infläktor Fastighets AB) and Chairman of the Board Anders lidbeck.
The work of the Boardthe Board shall manage the company’s interests and the interest of all shareholders. the tasks of the Board include approving business targets and strategy, appointing, evaluating and – where necessary – dismissing the Ceo, ensuring that effective systems are in place for following up and reviewing the company’s operations, ensuring that there is satisfactory control over the company’s compliance with laws and other rules applicable to the company’s operations, ensuring that the requisite ethical guidelines are approved for the company’s conduct, and ensuring that the company’s provision of information is characterized by openness and is correct, relevant and reliable.
the Ceo participates in every Board meeting and reports on the company’s business situation, future prospects, financial position and events of essential significance, as well as the management’s budget and action plan for the coming financial year. other officers of the company also take part in Board meetings, presenting reports when necessary. the Ceo does not participate in the parts of Board meetings which deal with the relationship between the Ceo and the company, and the work of the Ceo is evaluated at least once a year. the Board members’ shareholdings are detailed in the presentation of the Board, see page 60.
the company’s auditor reports every year to the Board his observa-tions from the review and his assessment of the company’s internal accounting control.
the guidelines for Board work are based on the procedures which regulate the distribution of work between the Board, the Chairman and the Ceo, and indicate which matters are to be discussed at the Annual General Meetings. the Board’s agenda is approved each year at the inaugural Board meeting immediately following the Annual General Meeting and is adjusted as required.
Besides the tasks already stated, the agenda includes approval of the Board’s meeting agenda, an instruction for the Ceo, a decision-mak-ing structure within the company, the relevant division of work and an information arrangement between the company and the Board.
In 2010, matters addressed included the enea Group’s strategy and business operations, regular follow-up and forecasts, interim financial reports and the matters decided on by the Annual General Meeting in April 2010, such as the repurchase of shares and the authorization for the Board to decide on new share issues or acquisitions of opera-tions and matters connected with the share savings program. the work of the Board was evaluated at the end of the year. the Board held a total of 15 meetings in 2010.
the Board will be paid fees of SeK 1,190,000, to be distributed among the Chairman of the Board (SeK 380,000) and to other members appointed by the meeting (SeK 160,000 each), as well as SeK 170,000 to be divided among Board members according to their efforts and participation in committee work. In addition, it was approved that the Board should appropriate SeK 500,000 for use for extraordinary initiatives over and above their regular Board work. this must be reported separately. Details of Board members’ remunerations are presented in note 20.
Besides regular Board work, some members are also members of the company’s audit committee and remuneration committee.
Board independenceAll members were to be considered independent in respect of the company and the executive management team and in respect of major shareholders in the company.
For information on Board members and the Ceo, see pages 60 and 61.
Audit Committeethe audit committee is a sub-committee of the Board and in 2010 consisted of Anders Skarin (Chairman), Anders lidbeck and åsa landén ericsson. enea’s Director of Finance and the company’s external auditor are co-opted to the meetings, which are normally held once a quarter. the work of the audit committee is minuted and reported to the Board.
the audit committee shall stand responsible for preparation of the Board’s work on quality assurance of the company’s financial report-ing, inform itself of the direction and scope of the audit, and discuss coordination between the external and the company’s internal con-trol functions and the view of the company’s risks, approve guidelines concerning which services other than the audit that the company may procure from the company’s auditor, evaluate the audit initiative and notify the company’s nomination committee of the evaluation, and assist the nomination committee with producing proposals for auditors and remuneration.
the audit committee had four meetings in 2010, each in connec-tion with the closing of the accounts for the relevant quarter. All members were present at three of the Audit Committee’s meetings in 2010. one meeting was attended by two of the three members. the formulation of the company’s interim reports, product and customer profitability, risk management, capital immobilization, finance-related issues and internal review were the main topics discussed.
the Group’s auditor reports his findings from the audit to the entire Board each year when the annual accounts are compiled. In addition, the Board meets the company’s auditor at least once a year – with-out the presence of the executive management team – to learn about the focus and scope of the audit, and to discuss coordination between the external audit and the internal review and views of the company’s risks.
the term of office for the company’s firm of auditors, pricewater-houseCoopers AB, with Michael Bengtsson as chief auditor, expires at the 2011 Annual General Meeting. the Board proposes that pricewa-terhouseCoopers AB be reelected with Michael Bengtsson as chief auditor. For information on the audit fee, see note 5.
remuneration Committeethe overall responsibilities of the Board cannot be delegated, but the Board has established a remuneration committee tasked with preparing issues relating to salaries, remuneration and other terms of employment for the Ceo and other members of the executive management team. Reports are made to the Board on an ongoing basis. In 2010, Board members Anders lidbeck (Chairman) and Kjell Duveblad made up the remuneration committee.
the agenda for the remuneration committee is approved annually by the Board. examples of issues which the remuneration commit-tee prepares for the Board include scope, terms and distribution of general option and bonus programs according to proposals from the Ceo, the Ceo’s contract of employment including salary, pension benefits, allocation in option and bonus programs and similar, and remuneration to other senior executives according to proposals from the Ceo. the remuneration committee is convened as required and reports on its work to the Board. the remuneration committee held five meetings in 2010.
Corporate governance report

36 ENEA AnnuAl RepoRt 2010
for compliance with targets and budgets for his/her unit. enea’s organizational structure is communicated on the Group’s intranet so that roles and responsibilities are clear to everyone working with financial information.
At enea, there are instructions for the presidents of the subsidiaries which are based on the principles which apply to the Ceo of enea AB. enea also has a number of policies available to staff via the intranet which control work at enea and which create a foundation for good internal review, including a finance policy, attestation policy, It policy, insider policy and communications policy. the Group also has an accounting and reporting manual which contains instructions on the Group’s accounting policies, reporting instructions and a schedule in order to ensure that consistent, correct accounting information is provided in a timely manner. these guidelines are followed up and updated regularly, as well as being communicated to all employees working directly or indirectly with financial reporting. rISK ASSESSmENTthe objective of enea’s risk assessment is to secure the Group’s profit development and financial position. the Board of Directors at enea AB approves principles and guidelines for risk management at enea, and the Ceo and Group executive hold operational responsibility. Regular risk assessments are carried out within the scope of enea’s monthly financial follow-ups by the managers of each unit, the executive management team and the controller, measures being implemented as required.
rEvIEW ACTIvITIESevery business area at enea is followed up every month by the relevant executive and controller. Results are compared with earlier results and budgets for all units. enea’s Group executive holds scheduled meetings once a month to review operations and the business situation, the financial outcome compared with the budget and preceding periods, to establish sales and profit forecasts and to decide on any measures deemed necessary for good internal control. An aggregated report is sent to the Board every month. If necessary, more precise follow-up is carried out; e.g. in the form of audits of subsidiaries which are carried out by controllers.
In 2010, enea’s auditors carried out a general review in connection with the financial report for the third quarter and submitted their review report in the interim report for the period 1 January – 30 September 2010 and a review of the annual accounts, the company’s auditor submitting his audit report in the company’s annual report for 2010.
Given the scope and limited complexity of the operations, combined with the existing reporting to the Board and the audit committee, the Board does not consider the establishment of a specific internal audit function to be financially viable. the internal review described above is deemed sufficient to be able to assure the quality and control of the financial reporting.
Corporate governance report
Below is an attendance list showing all Board members.
ATTENdANCE BY BOArd mEmBEr
Attendance Attendance Attendance
Board meetings
Audit Committee
remuneration Committee
Anders lidbeck 15/15 4/4 5/5
Kjell Duveblad 14/15 5/5
åsa landén ericsson 15/15 2/3 **
Gösta lemne 4/4 *
Mats lindoff 10/11 **
Jon Risfelt 4/4 * 1/1 *
Anders Skarin 15/15 4/4
* Resigned at the Annual General Meeting on 19 April 2010** elected to the Board by the AGM on 19 April 2010
CEOenea’s Ceo is per åkerberg. His other significant assignments and previous experience are detailed in the presentation of senior execu-tives. per åkerberg has no material shareholdings in companies with whom enea has business relations.
Internal review and risk management in the financial reportingIn accordance with the Swedish Companies Act, the Swedish Annual Accounts Act and the Swedish Code of Corporate Governance, the Board is responsible for internal review. the following account is limited to internal review with regard to the financial reporting.
rEvIEW ENvIrONmENTenea’s objective is to meet the requirements for ongoing work with risk and internal review which follow on from enea applying the Swedish Code for Corporate Governance. At enea, internal review of financial reporting is an integral part of corporate governance. It includes processes and methods in order to assure Group assets and correctness in financial reporting, and through this aims to protect the owners’ investment in the company.
the Board monitors the quality of financial reporting in a number of ways. the Board approves an agenda each year which – among other things – regulates the tasks of the Chairman and Ceo by means of a set of instructions for the Ceo. According to these instructions, the Ceo is responsible for reviewing and ensuring the quality of all finan-cial reporting, and for making sure that the Board in general receives the reports required to allow the Board to assess the financial position of the Group on an ongoing basis. the instructions for the Ceo state the issues on which the Ceo is permitted to exercise his authoriza-tion to represent the company, but only once the Board has given its authorization or approval for this.
At an inaugural Board meeting following the Annual General Meet-ing, the enea Board approves an agenda for the Board, audit commit-tee and remuneration committee. In addition, the instructions for the Ceo, attestation instruction and instruction for trading the company’s shares are approved.
enea’s Ceo and Group executives hold operational responsibility for the internal review. Based on the Board’s guidelines and laws and rules relating to financial reporting, the executive management team has approved the division of roles and responsibilities for employees working with financial reporting within the Group. the Group is divided into units, for which each respective manager is responsible

AnnuAl RepoRt 2010 ENEA 37
Accounts
grOuP rEPOrT ON TOTAl PrOFIT Or lOSS
SEK thousand (1 January - 31 December) Note 2010 2009
Net sales 2 726,121 777,711
Operating expenses
Cost of sold products and services -350,187 -442,654
gross profit 375,934 335,057
Sales and marketing expenses -143,736 -167,039
product development expenses -98,545 -125,856
Administration expenses -66,219 -46,287
Operating profit 3, 4, 5, 6, 7, 11 67,434 -4,125
Financial income 4,378 13,275
Financial expenses -3,686 -9,996
Net financial items 8 8,692 3,279
Earnings before tax 68,126 -846
tax 9 -22,081 5,027
Profit for the year 46,045 4,181
Other comprehensive profit
translation differences -19,783 -15,332
Total profit or loss for the year, net after tax 26,262 -11,151
Profit for the period attributable to parent company shareholders 46,045 4,181
Total profit for the period attributable to parent company shareholders 26,262 -11,151
earnings per share, SeK 15 2.65 0.24
earnings per share, full dilution, SeK 2.65 0.24
group

38 ENEA AnnuAl RepoRt 2010
Accounts
BAlANCE SHEET - grOuP
KSEK (31 december) Note 2010 2009
Assets
Intangible assets 10 216,794 237,213
equipment, tools, fixtures and fittings 11 13,078 17,084
Financial investments 1,375 1,519
Deferred tax assets 9 16,440 28,137
Total fixed assets 247,687 283,953
Accounts receivable 12 209,869 223,221
tax assets 0 9,218
prepaid expenses and accrued income 13 23,570 19,927
other receivables 3,161 6,339
Cash and cash equivalents 176,467 153,945
Total current assets 413,067 412,650
Total assets 660,754 696,603
Share holders equity 14
Share capital 18,356 18,356
other paid-in capital 713,564 713,289
Reserves -19,922 -139
Retained earnings including profit for the year -199,173 -215,535
Total shareholders´equity 512,550 515,971
Provisions
Deferred tax liabilities 9 2,588 4,658
other provisions 317 0
Total provisions 2,905 4,658
Long-term liabilities
long-term liabilities, non-interest bearing 24 9,845 27,295
Total long-term liabilities 9,845 27,295
Current liabilities
Advances from customers 0 5,012
Accounts payable 33,078 39,166
tax liabilities 1,231 0
other liabilities 28,298 24,932
Accrued expenses and deferred income 16 72,847 79,569
Total current liabilities 135,454 148,679
Total shareholders´equity and liabilities 660,754 696,603

AnnuAl RepoRt 2010 ENEA 39
Accounts
SummArY OF CHANgES IN CONSOlIdATEd EQuITY
Share capitalOther capital
contributions reservesret. earnings inc.
profit for yearTotal share-
holders’ equity
Opening equity , 1 jan 2009 18,356 713,289 15,193 -198,403 548,435
Total profit
profit for the year 4,181 4,181
Other comprehensive profit 552,616
translation difference -15,332 -15,332
Other total profit or loss, total -15,332 -15,332
Total profit/loss -15,332 4,181 -11,151
Transactions with shareholders
Stock option programs 475 475
Buy-back of own shares -21,788 -21,788
Total transactions with shareholders -21,313 -29,683
Closing equity 31 dec 2009 18,356 713,289 -139 -215,535 515,971
Opening equity , 1 jan 2010 18,356 713,289 -139 -215,535 515,971
Total profit
profit for the year 46,045 46,045
Other comprehensive profit 562,016
translation difference -19,783 -19,783
Other total profit or loss, total -19,783 -19,783
Total profit -19,783 46,045 26,262
Transactions with shareholders
Dividend -26,030 -26,030
Writedown -275 275 0
Bonus issue 275 -275 0
Stock option programs 1,983 1,983
Buy-back of own shares -7,645 -7,645
Sold, previously repurchased, own shares 2,009 2,009
Total transactions with shareholders 275 -29,958 -29,958
Closing equity 31 dec 2010 18,356 713,564 -19,922 -199,448 512,550

40 ENEA AnnuAl RepoRt 2010
Accounts
CONSOlIdATEd CASH FlOW STATEmENT
SEK thousand (31 December) Note 18, 24 2010 2009
Operating activities
profit before tax 68,126 -847
Adjustment for items not included in cash flow 22,634 48,773
90,760 47,926
paid tax -2,191 -6,541
Cash flow from operating activities before change in working capital 88,569 41,385
Cash flow from change in working capital
Change in operating receivables 8,194 69,413
Change in operating liabilities -20,642 -40,455
Cash flow from change in working capital -12,448 28,958
Cash flow from current operations 76,121 70,343
Investing activities
Acquisition of intangible assets -15,779 -10,089
Acquisition of tangible fixed assets -3,201 -4,591
Acquisition of financial assets -30 1,503
Cash flow from investing activities -19,010 -13,177
Financing activities
Dividend -26,030 -
Buyback of own shares -7,645 -21,788
Sold, previously repurchased, own shares 2,009 -
Cash flow from financing activities -31,666 -21,788
Cash flow for the year 25,445 35,378
Cash and cash equivalents at start of year 153,945 122,144
exchange rate differences in cash and cash equivalents -2,923 -3,577
Cash and cash equivalents at end of period 176,467 153,945

AnnuAl RepoRt 2010 ENEA 41
Accounts
INCOmE STATEmENT - PArENT COmPANY
KSEK (1 januari - 31 december) Note 2010 2009
net sales 2 60,045 32,505
Operating expenses
Administration expenses -64,069 -63,495
Operating income 3, 4, 5, 6, 7, 11 -4,024 -30,990
Income from participations in Group companies 8 0 0
Interest income and similar income items 8 13,084 16,170
Interest expenses and similar expense items 8 -1,091 -1,149
Net financial income/expense 11,993 15,021
Profit after financial items 7,969 -15,969
Appropriations 0 4,443
Profit before tax 7,969 -11,526
tax 9 -2,171 2,868
Profit for the year 5,798 -8,658
Parent Company

42 ENEA AnnuAl RepoRt 2010
Accounts
BAlANCE SHEET - PArENT COmPANY
SEK thousand (31 December) Note 2010 2009
Assets
Intangible assets 10 2,485 3,737
equipment, tools, fixtures and fittings 11 4,118 5,998
participations in Group companies 17 232,534 232,534
Fixed assets, total 239,137 242,269
Current receivables from Group companies 226,829 266,827
tax assets 925 2,885
prepaid expenses and accrued income 13 4,220 5,865
other receivables 76 359
Cash and bank equivalents 128,527 108,386
Current assets, total 360,577 384,322
Total assets 599,714 626,591
Shareholders’ equity 14
restricted equity
Share capital 18,356 18,356
Reserve fund 299,394 299,668
Non-restricted equity
Share premium reserve 1,654 1,380
Accumulated profit or loss 246,662 288,925
profit/loss for the year 5,798 -8,658
Equity, total 571,864 599,671
Provisions
untaxed reserves
Provisions, total 0
Liabilities
Accounts payable 5,259 5,213
tax liability 0 0
Current liabilities to Group companies 19 11,059 14,501
other liabilities 696 781
Accrued expenses and prepaid income 16 10,836 6,233
Current liabilities, total 27,850 26,728
Total shareholders’ equity and liabilities 599,714 626,399

AnnuAl RepoRt 2010 ENEA 43
1) Adjustments refers to capital gain not accomplished
Accounts
SummArY OF CHANgES IN PArENT COmAPNY’S EQuITY
restricted equityl Non-restricted equity
Share capital reserve fundShare pre-
mium reserveAccumulated
profit/lossProfit/loss
the yearTotal share-
holders’ equity
Opening equity, 1 january 2009 18,356 299,668 1,380 205,241 524,645
Adjusting of opening balance 1) 96,698 96,698
Group contributions received, net after tax 8,299 8,299
Stock option programs 475 475
Buy-back of own shares -21,788 -21,788
profit/loss for the year -8,658 -8,658
Closing equity 31 december 2009 18,356 299,668 1,380 288,925 -8,658 599,671
Opening equity 1 january 2010 18,356 299,668 1,380 280,267 599,671
Dividend -26,030 -26,030
Writedown -274 274 0
Bonus issue 274 -274 0
Group contributions received, net after tax -3,923 -3,923
Stock option programs 1,984 1,984
Buy-back of own shares -7,645 -7,645
transfer of repurchased shares 2,009 2,009
profit/loss for the year 5,798 5,798
Closing equity 31 december 2010 18,356 299,394 1,654 246,662 5,798 571,864

44 ENEA AnnuAl RepoRt 2010
Accounts
CASH FlOW STATEmENT - PArENT COmPANY
SEK thousand (31 December) Note 18 2010 2009
Operating activities
profit before tax 7,969 -11,526
Adjustment for items not included in cash flow 5,649 573
13,618 -10,953
paid tax -403 -6,693
Cash flow from operating activities before change in working capital 13,215 -17,646
Cash flow from change in working capital
Change in operating receivables 11,727 89,488
Change in operating liabilities 27,398 -8,612
Cash flow from change in working capital 39,125 80,876
Cash flow from current operations 52,340 63,230
Investment activities
Acquisition of intangible assets - -1,068
Acquisition of tangible assets -533 -2,211
Divestment of intangible assets - 336
Divestment of tangible assets - 31
Cash flow from investing activities -533 -2,912
Investment activities
Dividend -26,030 -
Buyback of own shares -7,645 -21,788
Sold, previously repurchased, own shares 2,009 -
Cash flow from financing activities -31,666 -21,788
Cash flow for the year 20,141 38,530
Cash and cash equivalents at start of year 108,386 69,856
exchange rate differences in cash and cash equivalents - -
Cash and cash equivalents at end of period 128,527 108,386

AnnuAl RepoRt 2010 ENEA 45
Compliance with standards and legislationthe consolidated financial statements have been prepared in accordance with the Swedish Company Accounts Act, International Financial Reporting Standards (IFRS) published by the International Accounting Standards Board (IASB), and interpretation pronouncements from the International Financial Reporting Interpretations Committee (IFRIC) as assumed by the eu. In addi-tion, the Swedish Financial Reporting Board’s recommendation RFR 1 Sup-plementary accounting rules for groups has also been applied.
the parent company applies the same accounting policies as the Group except in the cases stated below in the section on “the parent company’s accounting policies “. the inconsistencies between the parent company’s and the Group’s policies stem from the limited opportunities for applying the IFRS to the parent company as a consequence of the Swedish Company Accounts Act, and in some instances for tax reasons.
Conditions that apply to preparation of the parent com-pany’s financial statements and consolidated financial statementsthe parent company’s functional currency is Swedish krona which also con-stitutes the presentation currency for the parent company and the Group. this means that the financial statements are presented in Swedish kronor. Assets and liabilities are recognized at historical acquisition value.
preparation of the financial statements as per IFRS requires that the com-pany’s management makes assessments, estimates and assumptions that affect the application of the accounting policies and the carrying amounts of assets, liabilities, income and expenses. the estimates and assumptions are based on historical experience and a number of other factors that are deemed reasonable under prevailing circumstances. the result of these estimates and assumptions are then used to assess the carrying amounts of assets and liabilities that are not otherwise clear from other sources. Actual outcomes may deviate from these estimates and assessments.
estimates and assumptions are reviewed regularly. Changes to estimates are reported in the period in which the change is made if the change has only impacted upon this period, or in the period in which the change is made and future periods if the change affects both the current period and future periods.
Assessments made by the company management when applying the IFRS which have a significant impact on the financial reports and assessments made which could result in substantial adjustments to following years’ finan-cial reports are described in greater detail in note 22.
the accounting policies stated below for the Group were applied consist-ently in all periods presented in the consolidated financial statements, unless stated otherwise. the Group’s accounting policies have been applied consist-ently to the reporting and consolidation of the subsidiaries.
Segment reportingthe operating segments are reported in a manner which is compliant with the internal reporting to the highest executive decision-making authority. the Group applies IFRS 8 operating segments as of 1 January 2009. Given the internal control to the Board and executive, business is reported in two segments, Software and Consulting. Software covers the development and sale of enea’s software products and services directly linked with the prod-ucts. Consulting covers enea’s consultancy operations, a not insignificant proportion of which are supplied to Software. Internal sales are based on market conditions. the Board and executive assess the profits for the operat-ing segments on the basis of the operating profit.
Classification, etc.Fixed assets and long-term liabilities in the parent company and Group es-sentially consist only of amounts expected to be recovered or paid after more than twelve months reckoned from the balance sheet date. Current assets and short-term liabilities in the parent company and Group essentially consist only of amounts expected to be recovered or paid within twelve months reckoned from the balance sheet date.
Accounting principlesConsolidation principlesSubSIDIArIESSubsidiaries are companies over which enea AB exercises a controlling influ-ence. Controlling influence entails a direct or indirect right to determine a company’s financial and operational strategies with the purpose of benefit-ing financially. When assessing whether a decisive influence exists, shares providing potential entitlement to votes which can be utilized or converted without delay are taken into account.
Subsidiaries are reported according to the purchase method. this method means that acquisition of a subsidiary is considered to be a transaction through which the Group indirectly acquires the subsidiary’s assets and assumes its liabilities and contingent liabilities. the consolidated acquisition value is calculated in an acquisition analysis in conjunction with the acquisi-tion. the analysis establishes the acquisition value of the participations or the business, the fair value of acquired identifiable assets and liabilities on the acquisition date and contingent liabilities taken over. the cost of the holding in the subsidiary or of the operations consists of the total fair value on the acquisition date of the assets paid, liabilities incurred or assumed, and issued equity instruments submitted as payment for the acquired net assets. In the case of business combinations where the acquisition cost exceeds the net value of the acquired assets and assumed liabilities, as well a contingent liabilities, the difference is recognized as goodwill. Where the difference is negative, this is recognized directly in the income statement.
Subsidiaries’ financial reports are included in the consolidated accounts as of the time of acquisition to the date on which the decisive influence ceases.
TrANSACTIONS TO bE ELImINATED ON CONSOLIDATIONInternal Group receivables and liabilities, income or expenses and unrealized losses arising from internal Group transactions between Group companies are eliminated in their entirety when establishing the consolidated accounts.
unrealized losses are eliminated in the same manner as unrealized profits.
Foreign currencyTrANSACTIONS IN FOrEIgN CurrENCIEStransactions in foreign currencies are translated into the functional currency at the exchange rate in force on the transaction date. Monetary assets and liabilities in foreign currencies are translated into the functional currency at the exchange rate in force on the balance sheet date. exchange rate differ-ences arising from the conversions are recognized in the income statement. exchange differences on non-monetary assets and liabilities are recognized in operating profit, while exchange differences on monetary assets and liabilities are recognized in net financial income. non-monetary assets and liabilities recognized at historical acquisition value are translated at the exchange rate at the time of the transaction. non-monetary assets and liabilities reported at fair value is translated in to the functional currency at the exchange rate in force on the evaluation date for fair value, the exchange rate change is then recognized in the same way as the other value changes in respect of the asset or liability.
Functional currency is the currency in the primary economic environments where the companies included in the Group run their business. the com-panies included in the Group are the parent company and subsidiaries. the parent company’s functional currency and reporting currency is the Swedish krona (SeK). the Group’s reporting currency is the Swedish krona (SeK).
FINANCIAL STATEmENTS OF FOrEIgN OPErATIONSAssets and liabilities in foreign operations, including goodwill and other Group-related surplus and deficit values, are converted to Swedish kronor at the currency exchange rate prevailing on the balance sheet date. Income and expenses in a foreign company are converted to Swedish kronor at an average rate approximating the rates applying on the respective transaction dates. translation differences arising on currency conversion by foreign opera-tions are recognized in other comprehensive profit or loss. on divestment of a foreign operation, the accumulated translation differences attributable to the operation are realized. Accumulated translation differences are presented
Accounting principles

46 ENEA AnnuAl RepoRt 2010
under “Reserves” and include translation differences accumulated as of 1 January 2004. Accumulated translation differences before 1 January 2004 are distributed over other equity categories and are not recognized separately.
IncomerEPOrTINg OF INCOmEServices are executed largely on a current account basis and are recognized in income as the work is carried out. Services which are based on a functional undertaking are recognized in income linearly over the agreed period in which the services are provided. A functional undertaking involves a service function with an indeterminate number of services which are to be maintained over a specific period. projects which are executed at a set price are recognized in income as they are completed, which is determined on the basis of contract costs expended in relation to estimated contract costs for the entire contract in accordance with the percentage of completion method. If a loss risk is deemed to exist, current individual reservations take place. the enterprise also has income from software sales which is based on royalty income, license fees, maintenance contracts and buyouts (where the customer buys the product for an unlimited time). Royalty income and license fees are distributed over a period of time in accordance with the current agreement’s financial substance. license fees and buyouts are recognized in income on full delivery of the software in accordance with contract as no significant obligations remain following the delivery date. Maintenance contracts normally run for a twelve-month period and the income is distributed over the contract period.
A wrITTEN CONTrACT SIgNED by bOTh PArTIES. A written contract signed by both parties. Delivery has taken place. the license fee must be a set amount, or calculated according to a
reliable method, and there are no withdrawal options, or the credit period is less than 12 months.
Assurance that payment will be received.
Operating expenses and financial income and expensesExPENSES CONCErNINg OPErATIONAL LEASESexpenses concerning operational leading contracts are recognized linearly in the income statement over the leasing period. Benefits received in connec-tion with the signing of an agreement recognized as part of the total lease expense in the income statement.
FINANCIAL INCOmE AND ExPENSESFinancial income and expenses may consist of interest income on bank deposits and receivables, interest-bearing securities, interest expenses on loans, dividend income, foreign exchange differences, unrealized and realized gains on financial investments and derivative instruments used in financing activities.
Interest income on receivables and interest expenses on liabilities are cal-culated using the effective interest rate method. the effective interest rate is the interest rate which means that the current value of all future deposits and outgoing payments during the fixed interest term is the same as the reported value of the receivable or liability. Interest income includes accrued amounts of transaction expenses and any discounts, premiums and other differences between the original value of the receivable and the amount received upon maturity. the Group does not capitalize interest on the cost of assets, since its development projects do not extend over a period of more than one year.
FINANCIAL INSTrumENTSthe Group classifies financial instruments into categories. this classification is dependent upon the intention of the acquisition of the financial instrument. the executive management team determines classification at the original time of acquisition. enea has classified financial instruments into the follow-ing categories:
LOANS AND rECEIVAbLESloans and accounts receivable are financial assets which do not constitute a de-rivative with fixed payments or with payments which can be determined and which are not listed on an active market. Receivables are initially recognized at fair value. the receivables arise when companies provide funds, goods and services directly to the borrower with no intention of trading the claim. this category also includes acquired receivables. Subsequent to acquisition, assets
in this category are valued at the accrued cost. Accrued historical cost is deter-mined from the effective interest that is calculated at the date of acquisition. they are included under current assets except for items with due dates more than twelve months after the balance sheet date which are classified as fixed assets. loans and receivables are classified as trade and other receivables in the balance sheet. Receivables are recognized at an amount which is expected to be received following the deduction of distressed debts which are assessed individually. the expected maturity of accounts receivable is short, and so the value has been recognized at a nominal amount without discount.
CASh AND EquIVALENTSCash and equivalents comprise cash, immediately accessible bank balance as well as special deposits and commercial papers with maturity periods of less than three months. these items have been recognized at accrued acquisition value.
OThEr FINANCIAL LIAbILITIESFinancial liabilities which are not held for trading are valued at accrued ac-quisition value. Accrued cost is determined from the effective interest rate calculated at the time the debt was taken out. this means that surplus and deficit values, like direct issue costs, are accrued over the term of the debt.
Financial instruments recognized in the balance sheet include, on the asset side, cash and equivalents and accounts receivable, and liabilities and equity include accounts payable and other current and non-current liabilities. A finan-cial asset or financial liability is posted to the balance sheet when the company becomes a party to the contractual terms of the instrument. Accounts receivable are recognized in the balance sheet when the invoice has been sent. Accounts payable are recognized in the balance sheet when the invoice has been received. A financial asset is excluded from the balance sheet once the contractual rights have been realized, have expired or the company loses control over them. the same applies for part of a financial asset. A financial liability is removed from the balance sheet once the obligation in the contract has been fulfilled or is in some other way extinguished. the same applies for part of a financial liability.
Accounts payable have short expected maturities and are valued at a nominal amount without discounting.
Tangible fixed assetsOwNED ASSETStangible fixed assets are posted as assets in the balance if it is probable that the future financial benefits will accrue to the company and the acquisition value of the asset can be calculated in a reliable way. tangible fixed assets are recognized in the Group at cost less accumulated depreciation and any impairment. Cost includes the purchase price plus expenses directly attribut-able to the asset in order to put it in place and make it appropriate for use in accordance with the purpose of the acquisition. examples of directly attribut-able expenses included in the cost are expenses for delivery and handling, installation, consultancy services and legal services.
LEASED ASSETSIAS 17 is applied in respect of leased assets. leasing is classified in the consoli-dated financial statement either as finance or operating leasing. leases signed are, with no significant exceptions, operational in nature and relate mainly to cars and rent on premises. operational leasing involves the leasing charge being entered as an expense over the term starting from utilization, which may differ from what has been actually paid for leasing over the year. the cost of the lease is recognized on a linear basis across the period of use.
DEPrECIATION PrINCIPLESDepreciation is carried out on a straight-line basis over the asset’s estimated useful life. the estimated useful life for tangible fixed assets such as equip-ment, tools and installations is five years. the useful life and residual value of assets are assessed annually.
Intangible assetsgOODwILLGoodwill represents to the difference between the acquisition value of a busi-ness and the fair value of acquired assets, assumed liabilities and contingent liabilities. Goodwill is valued at acquisition value minus any accumulated impairment. Goodwill is distributed to cash-generating units and is tested at least annually for impairment requirements.
Accounting principles

AnnuAl RepoRt 2010 ENEA 47
rESEArCh AND DEVELOPmENT.Fees for research aimed at obtain new scientific or technical knowledge are recognized as expenses when they arise.
expenditure for development applying research results or other knowledge to achieve new or improved products or processes, is recognized as an asset in the balance sheet once the following criteria have been met when it is technically possible to complete the asset it is the company’s intention to complete the asset and to use or sell it the company has sufficient resources to complete development the asset is expected to generate future financial benefits it is possible to reliably calculate the expenditure required to complete
the asset.the reported value includes charges for materials, direct charges for salaries
and indirect charges which can be attributed to the asset in a reasonable and consistent manner. other charges for development are entered in the income statement as expenses when they arise. Development expenses entered in the balance sheet are reported at the acquisition value minus accumulated depreciation and any impairment.
OThEr INTANgIbLE ASSETSthese consist mainly of trademarks, licenses and contractual customer rela-tions arising through business combinations. the assets are recognized at fair value on the acquisition date minus accumulated depreciation.
DEPrECIATION PrINCIPLESDepreciation is recognized straight-line in the income statement over the estimated useful lives of intangible assets, unless such useful lives are inde-terminate. Goodwill is tested for the need for impairment on a quarterly basis or as soon as there are indications that the asset in question has declined in value. Intangible assets which can be depreciated are depreciated from the date on which they are available for use. the estimated useful life for capitalized development expenditure is five years. Acquired trademarks and licenses are depreciated over five years, while acquired contractual customer relations are depreciated over three years.
Impairmentthe reported values for Group assets, with the exception of deferred tax re-ceivables and financial assets, are tested on every balance sheet date in order to assess whether there is any indication of impairment. If there is any such indication, the recoverable amount of the asset is calculated. For excepted assets as stated above, the values are tested in accordance with the relevant standard. For goodwill and intangible assets which are not yet ready for use, the recoverable value is estimated annually.
If it is not possible to establish materially independent cash flows for a certain asset, when testing for impairment needs the assets are grouped at the lowest level where it is possible to identify materially independent cash flow (known as a cash-generating unit). Impairment is recognized when the recognized value of an asset or cash-generating unit exceeds the recoverable amount. Impairment is charged against the income statement.
Impairment of assets attributable to a cash-generating unit (group of units) is distributed initially to goodwill. After that, proportional impairment of other assets included in the unit (group of units) is implemented.
CALCuLATION OF rECOVErAbLE VALuEthe recoverable value is the highest of fair value minus sales costs and the utility value. When calculating the utility value, future cash flow is discounted at a discount rate which takes into consideration risk-free interest and the risk involved with the specific asset. For an asset which does not generate cash flows which are significantly independent of other assets, the recoverable value is calculated for the cash-generating unit to which the asset belongs.
rEVErSAL OF ImPAIrmENTImpairment of goodwill is not reversed. Impairment of other assets is reversed if a change occurs in the assumptions that formed the basis of calculation of the recoverable amount. Impairment is only reversed to the extent that the asset’s carrying amount after reversal does not exceed the carrying amount that the asset would have had if impairment had not been recognized – ac-counting for depreciation or amortization that would have occurred.
Employee benefitsDEFINED CONTrIbuTION PLANSobligations relating to charges for defined contribution pension plans are recognized as costs in the income statement as they are incurred. All pen-sion solutions in foreign companies are classified and reported as defined contribution plans, which means that the Group’s profit is burdened with pension expenses as the benefits were earned.
Salaried employees in Sweden are covered by the Itp plan, which is reported as a defined contribution plan. Commitments for retirement pensions and family pensions for salaried employees in Sweden are secured through an insurance policy with Alecta. According to a statement from the Swedish Financial Reporting Board’s emerging Issues task Force, uFR 3, this is a defined benefit plan which covers several employers. For the 2010 financial year, the company had no access to such information that would make it possible to recognize this plan as a defined benefit pension plan, which is why it is being recognized as a defined contribution plan. this plan is being financed on an ongoing basis through pension payments. Alecta’s surplus can be distributed to the policyholders and/or the insured persons. Collective funding is the market value of Alecta’s assets as a percentage of insurance commitments, calculated in accordance with Alecta’s calculation assumptions for insurance purposes, which do not comply with IAS 19.
TErmINATION bENEFITSA provision is recognized in connection with termination of personnel only if the company is demonstrably committed to ending an employment situ-ation before the normal date or when benefits are provided as an incentive to encourage voluntary redundancy. If the company terminates personnel, a detailed plan is created which, at the very least, contains workplace, posi-tions and approximate number of affected persons as well as the benefits for each personnel category or position and the time for the plan’s imple-mentation.
rEmuNErATION TO SENIOr ExECuTIVESGuidelines on remuneration for senior executives are laid down by the An-nual General Meeting. For the Group’s executive Management team, salaries and other employment conditions are applied under market conditions. In addition to their fixed annual salaries, members of the Group’s executive Management team also receive variable remuneration based on the profit trend in relation to pre-set targets. Remuneration to certain leading officials within the enea Group is also paid in the form of share-based payments.
ShArE-bASED PAymENTSoutstanding option programs allow employees to acquire shares in the com-pany. the fair value of allocated options is recognized as a payroll expense, with a corresponding increase in equity. the fair value is calculated at the time of allocation and distributed over the earning period. the fair value of the allocated options is calculated according to the Black-Scholes model, and the terms and conditions applicable at the time of allocation are taken into account. the amount recognized as an expense is adjusted in order to reflect the actual number of options earned.
payroll overheads attributable to share-related instruments to employees as remuneration for services purchased are entered as an expense, charged to the period under which services are performed. the provision for payroll overheads is based on the fair value of the options at the time of report-ing. Fair value is calculated using the same valuation model used when the options were issued.
ProvisionsAppropriations are recorded in the balance sheet when the group has an existing legal or informal obligation as a result of an event occurring, and it is likely that an outflow of financial resources will be required to settle the obligation and a reliable estimate of the amount can be made. If the payment date has a significant effect, provisions are calculated through discounting of the expected future cash flow at a pre-tax interest rate that reflects current market assessments of the time value of money and, where applicable, the risks associated with the liability.
rESTruCTurINgA provision for restructuring is reported once the Group has prepared a detailed and informal restructuring plan, and the restructuring has either
Accounting principles

48 ENEA AnnuAl RepoRt 2010
commenced or been publicly announced. no provisions are made for future operating expenses.
ONErOuS CONTrACTSA provision for a future onerous contract is reported when the expected benefits that the Group is expecting to obtain from a contract are lower than the unavoidable costs of fulfilling the terms of the contract.
TaxesIncome taxes comprise current tax and deferred tax. Income taxes are rec-ognized in the income statement, except when the underlying transaction is recognized directly against equity, whereby the appurtenant tax effect is recognized in equity. Current tax is tax that is to be paid or received related to the current year, using the tax rates that were decided or had in practice been decided as at the balance sheet date; this includes adjustment of cur-rent tax relating to earlier periods.
Deferred tax is calculated according to the balance sheet method on the basis of temporary differences between the carrying value and the tax-related value of assets and liabilities. the following temporary differences are not taken into account: temporary differences arising upon the first recognition of goodwill; first recognition of assets and liabilities which are not business acquisitions and which at the time of the transaction did not affect either recognized or taxable profits; nor are temporary differences attributable to participations in subsidiaries which are not expected to be written back in the foreseeable future taken into account. the valuation of deferred tax is based on how reported values of assets or liabilities are expected to be realized or settled. Deferred tax is calculated using the tax rates and tax rules that were decided or had in practice been decided as at the balance sheet date.
Deferred tax receivables in tax-deductible temporary differences and loss carry-forwards are only recognized if it is likely that they can be used in the future. the value of deferred tax receivables is reduced when it is no longer deemed likely that they can be used. Any additional income tax that arises at the time of dividend payment is recognized at the same time that the dividend is recognized as a liability.
FINANCIAL INSTrumENTS by CATEgOrythe category loan and customer receivables includes receivables, cash and equivalents. other financial liabilities include accounts payable and other liabilities.
Financial risksthe greatest financial risk is the exchange rate risk. enea has a financial policy established by the Board which forms a framework of guidelines for dealing with financial risks. there is a detailed description of the financial risks can be found in the Directors’ Report.
Earnings per sharethe calculation of earnings per share is based on the profit for the year within the Group which is attributable to the parent company’s shareholders and on the weighted average number of outstanding shares during the year. In calculating earnings per share after dilution, profit and the average number of shares are adjusted to take into account the effects of potentially diluting common shares, which during the reporting periods are attributable to the promissory notes and options issued to employees. Dilution takes place only when the share price is lower than the stock exchange price. the share price is adjusted by means of a supplement for the value of future services linked to an own capital-regulated stock option program reported as share-based payments in accordance with IFRS 2.
Contingent liabilitiesA contingent liability is recognized when there is a possible commitment that stems from events that have occurred and its existence is only confirmed by one or more uncertain future events or when there is a commitment that is not recognized as a liability or provision, because it is not likely that an outflow of resources will be required.
Parent company’s accounting policiesthe parent Company has prepared its Annual Report in accordance with the Swedish Annual Accounts Act (1995:1554) and Recommendation RFR 2 of the Swedish Financial Reporting Board on Accounting for legal entities. under
RFR 2.2, the parent company in the annual accounts of the legal entity must apply all of the eu-approved IFRS standards and statements provided this is possible within the framework of the Swedish Annual Accounts Act and with due regard for the relationship between accounting and taxes. this recommendation specifies which exceptions and additions must be applied with regard to IFRS. the differences between the accounting principles of the Group and the parent company are described below.
DIFFErENCES bETwEEN ThE grOuP’S AND PArENT COmPANy’S ACCOuNTINg POLICIESthe differences between the accounting principles of the Group and the parent company are described below. the accounting policies stated below for the parent company were applied consistently in all periods presented in the parent company’s financial statements.
SubSIDIArIESparticipations in subsidiaries are reported in the parent company in accord-ance with the cost method. Dividends received are only recognized as revenue if they are derived from profits earned after acquisition. Dividends in excess of such earnings are regarded as repayment of the investment and reduce the carrying amount of the participating interest.
DIVIDENDSDividends to the parent company’s shareholders are reported as liabilities in the consolidated financial reports for the period in which the dividend is ap-proved by the parent company’s shareholders. Anticipated dividends from subsidiaries are reported if the parent company has sole entitlement to make a decision on the size of the dividend and the parent company has made a decision on the size of the dividend before the parent company has published its financial reports.
TAxESthe parent company reports untaxed reserves including deferred tax liabili-ties. However, in the consolidated financial statement untaxed reserves are divided into deferred tax liabilities and equity.
grOuP CONTrIbuTIONS AND ShArEhOLDErS’ CONTrIbuTIONS FOr LEgAL ENTITIESthe company reports Group contributions and shareholders’ contributions as per the statement of the Swedish Financial Accounting Standards Council’s emerging Issues task Force. Shareholders’ contributions are taken directly to the equity of the recipient and are capitalized in the shares and participating interests of the payer, insofar as impairment losses are not required. Group contributions are reported according to their financial significance. this means that Group contributions made so as to minimize the Group’s total tax are charged directly to retained earnings less its current tax effect.
If a Group contribution is given which is ranked as a dividend, this is recog-nized as a dividend. this means that the Group contribution and its current tax effect received is recognized in the income statement. Group contributions paid and the current tax effect are recognized directly in retained earnings.
Group contributions, the equivalent of shareholder contributions, are charged directly to profits for the recipient, taking into consideration cur-rent tax effect. the donor recognizes the Group contribution and its current tax effect as an investment in shares in Group companies, insofar as impair-ment is not required.
New and amended IFrS the Group applies the following new and amended standards and the in-terpretations to be applied for financial years commencing 1 January 2010 or later:
IFrS 3 (rEVISED), “buSINESS COmbINATIONS” AND IAS 27, “CONSOLI-DATED AND SEPArATE FINANCIAL STATEmENTS”the revised standard is to be applied prospectively for business combinations where the time of acquisition occurs during the first financial year commenc-ing 1 July 2009 or later. the standard continues to prescribe the application of the acquisition method for business combinations albeit with certain signifi-cant changes that will affect the amount of goodwill reported, the earnings reported for the period in which the acquisition takes place and the future reported earnings of future acquisitions. For example, all transaction costs
Accounting principles

AnnuAl RepoRt 2010 ENEA 49
associated with the acquisition must be expensed. IAS 27 addresses transac-tions with shareholders lacking a decisive influence, formerly referred to as minority interests. the change is not currently relevant to the Group but may affect the reporting of future transactions and business events.
ias 1 (amendment), “presentation of financial statements”the amendment clarifies that the potential settlement of a liability by means of a share issue is not relevant to its classification as current or non-current. IAS 1 is not expected to have any material impact on the consolidated fi-nancial accounts.
ifric 17 “Distributions of non-cash assets to owners” this interpretation addresses transactions whereby a company distributes material assets to shareholders. the new guidance is not expected to have any material impact on the consolidated financial accounts.
ias 38 (amendment), “intangible assets”the amendment provides clarification on the valuation at fair value of an intangible asset acquired through a business combination. the amendment will not have any material impact on the consolidated financial accounts.
ias 36 (amendment), “impairment of assets”the amendment clarifies that the largest cash generating unit to which good-will is to be allocated with the purpose of testing impairment needs is an operating segment. the amendment is not expected to have any material effect on the consolidated financial accounts.
ifrs 2 (amendment), “share-based payment”this amendment clarifies the definition of accrual terms and details how companies shall report remuneration that is, in actual fact, withdrawn. the amendment has had no effect on the consolidated financial position.
ifrs 5 (amendment), “non-current assets held for sale and discontinued operations”the amendment specifies the disclosure requirements applicable for non-current assets classified as non-current assets held for sale or discontinued operations. the amendment is not expected to have any material effect on the consolidated financial accounts.
the following new standards, amendments and interpretations have not yet come into effect and are not applied prematurely by the Group:
ifrs 9, “financial instruments”IFRS 9 introduces two new requirements for the assessment and classifica-tion of financial assets and may affect the Group’s reporting of its financial assets. the standard applies to financial years commencing 1 January 2013 or later but may be applied prematurely. However, the standard has not yet been adopted by the eu.
ias 24 (revised), “related party disclosures”the revised standard, which shall be applied from 1 January 2011, clarifies and simplifies the definition of a related party. the change is not expected to have any material effect on the consolidated financial accounts.
other changes will not have an effect on the Group’s accounting principles or financial position.
Amounts in thousands of Swedish kronor unless otherwise indicated.
Notes
Operating segments 2009 Software Consulting Other Elimination Group
Internal net sales1 732 49 298 - -50 030 -
External net sales2 339 049 438 662 - - 777 711
Operating profit -11 165 7 040 - - -4 125
Net financial items - - - - 3 279
Profit before tax - - - - -846
Tax - - - - 5 027
Profit for the year - - - - 4 181
Assets3 279 769 213 001 206 700 -2 867 696 603
Investments4 10 078 1 785 3 279 - 15 142
Depreciation 15 948 1 921 3 317 - 21 186
Writedowns 24 400 990 - - 25 390
Operating segments 2010 Software Consulting Other Elimination Group
Internal net sales1 1 109 54 611 - -55 720 -
External net sales2 345 980 380 131 10 - 726 121
Operating profit 49 892 21 565 -4 023 - 67 434
Net financial items - - - - 692
Profit before tax - - - - 68 126
Tax - - - - -22 081
Profit for the year - - - - 46 045
Assets3 314 168 184 607 208 525 -46 546 660 754
Investments4 17 318 1 129 533 - 18 980
Depreciation 15 862 2 113 3 608 -1 656 19 927
Writedowns - - - - -
2010 2009
Assets for which information is to be provided 498 775 492 770
Assets with other companies -30 928 21 751
Cash 176 467 153 945
Deferred tax 16 440 28 137
Total assets 660 754 696 603
2. Business segment reporting
1. Sales between segments take place under market conditions.2. Based on the segment in which the income is entered.3. Based on where the assets are located.4. Intangible and tangible assets.
Information: The operating segments are reported in a manner which is compliant with the internalreporting to the highest executive decision-making authority. These operating segments are Software and Consulting. Software covers the development and sale of Enea’s software products and services directly linked with the products. Consulting covers Enea’s consultancy operations, a not insignificant proportion of which are supplied to Software. Income from external customers in Sweden amounted to SEK 532.3 million (607.9), and total income from other countries amounts to SEK 193.8 million (169.8).Fixed assets in Sweden amounts to SEK 145.5 million (167.5) and in other countries to SEK 102.2 million (116.4).
Distribution of assets TSEK

50 ENEA AnnuAl RepoRt 2010 ÅRSREDOVISNING 2010 ENEA 1
2010 2009
GROUP
7 375 11 528
-8 205 -13 076
PARENT COMPANY
17 67
-5 -106Exchange rate losses on receivables/liabilities operational in character
Exchange rate gains on receivables/liabilities operational in character
Exchange rate losses on receivables/liabilities operational in character
Exchange rate gains on receivables/liabilities operational in character
3. Exchange rate gains and exchange rate losses
4. Human resources and payroll expenses
Average number of employees Total
2010of which
men, % Total
2009of which
men, %
PARENT COMPANY
Sweden 21 60 24 56
21 60 24 56
SUBSIDIARIES
Enea Services Stockholm AB 119 82 135 82
Enea Services Öresund AB 74 85 83 85
Enea Services Linköping AB 59 81 71 81
QiValue Technologies AB 8 100 17 99
Enea Software AB 104 87 108 90
Enea Zealcore AB - - 4 100
55 76 58 86
Enea GmbH, Germany 4 77 5 78
Enea Netbricks SAS, France 13 92 14 88
Enea S.A.R.L, France 3 63 1 100
Enea Software (Beijing) Co. , Ltd. 15 83 13 89
4 98 3 100
Enea Polyhedra Ltd, UK 5 100 7 100
Enea Netbricks Ltd, Israel 3 40 3 52
Enea Romania SRL, Romania 134 84 120 83
Total for subsidiaries 600 83 642 76
Total, Group 621 83 666 75
Board of Directors 5 80 8 88
Other senior executives 8 88 7 86
Salaries, remune-
rationPayroll
over-heads
Salaries, remune-
rationPayroll
over-heads
PARENT COMPANY 16 153 8 252 17 933 7 007
Of which pension expenses1 - 3 177 - 2 566
SUBSIDIARIES 279 849 107 022 322 723 116 538
Of which pension expenses - 32 261 - 34 589
Total, Group 296 002 115 274 340 656 123 545
Of which pension expenses2 - 35 438 - 37 155
Board of Directors and CEO
Other emplyees
Board of Directors and CEO
Other emplyees
PARENT COMPANY
Sweden 3 923 12 230 4 644 13 289
Total for parent company 3 923 12 230 4 644 13 289
SUBSIDIARIES
Sweden 2 926 181 636 5 508 207 865
Germany 773 1 240 818 2 698
Japan 945 1 905 2 067 1 722
China - 2 646 - -
France - 9 990 - 10 650
Salaries, other remunerationand expenses
Gender breakdown in Group executive
Parent company, total
Enea Embedded Technology K.K,Japan
Enea Embedded Technology Inc,USA
1. Of which pension expenses, SEK 786 thousand (539) relates to the Board and CEO, including variable remuneration converted to pension.2. Of the Group's pension expenses, SEK 1, 738 thousand (2,100) relates to the Board and CEO,including variable remuneration converted to pension.
Salaries, other remuneration bycountry and between membersof the Board of Directors, theCEO and other employees
United Kingdom 623 2 381 1 281 3 866
USA 3 725 46 695 1 170 64 193
Romania 1 731 21 536 2 195 17 260
Israel 947 150 888 392
Total for subsidiaries 11 670 268 179 13 927 308 646
Total, Group 15 593 280 409 18 571 321 935
2010 2009
PARENT COMPANY
Salaries and other remuneration 8 245 8 377
of which variable component 801 1 210
Pensions 1 456 881
Number of persons 9 11
SUBSIDIARIES
Salaries and other remuneration 16 494 17 097
of which variable component 4 989 4 183
Pensions 1 441 2 119
Number of persons 14 15
REMUNERATION PRINCIPLES
PENSION AGREEMENTS
SEVERANCE PAY
2010 2009
Remuneration payable to the Board has been paid to
Chairman of the Board 948 900
Other members 742 910
1 690 1 810
Salaries and other remuneration have been paid to
CEO Per Åkerberg 2 189 2 097
of which variable component - 500
of which impacting on the year - 500
Former CEO Åsa Landén Ericsson - 737
Pension agreements
CEO Per Åkerberg 689 246
Former CEO Åsa Landén Ericsson - 188
If the CEO’s employment is terminated, the company shall observe a notice period of six months, and the CEO a notice period of six months. In addition, severance pay will be paid which is equivalent to six months’ set salary if the Board terminates the employment. If ownership conditions change such that there are new majority owners in the company, the CEO will be entitled to severance pay equal to six months’ salary. All termination salaries and severance pay will be settled against any other income from service. For other senior executives, a notice period of three to twelve months will be applied.
The Annual General Meeting decides on fees for the Board. Remuneration to the CEO is decided upon by the Chairman of the Board and members appointed by the committee according to proposals by the remuneration committee. Guidelines on remuneration for senior executives are laid down by the Annual General Meeting. For the Group executive, market conditions are applied to salaries and other employment conditions. In addition to fixed annual salary, the Group executive also receive a variable salary which is capped and based on earnings performance compared with set targets. Remuneration to certain leading officials within the Enea Group may also be paid in the form of share-based payments. For more information, see note 20.
The CEO’s pension agreement means that his pension premiums will amount to 27.5 percent of his set salary. Other senior executives in Sweden have pension contractswithin the scope of the ITP scheme, with a pensionable age of 65, and pension provisions are related to employees’ salaries. Pension premiums are paid regularly. For more information, see note 20.
Remuneration to the Board ofDirector CEO and other seniorexecutives
Notes

AnnuAl RepoRt 2010 ENEA 512 ENEA ÅRSREDOVISNING 2010
United Kingdom 623 2 381 1 281 3 866
USA 3 725 46 695 1 170 64 193
Romania 1 731 21 536 2 195 17 260
Israel 947 150 888 392
Total for subsidiaries 11 670 268 179 13 927 308 646
Total, Group 15 593 280 409 18 571 321 935
2010 2009
PARENT COMPANY
Salaries and other remuneration 8 245 8 377
of which variable component 801 1 210
Pensions 1 456 881
Number of persons 9 11
SUBSIDIARIES
Salaries and other remuneration 16 494 17 097
of which variable component 4 989 4 183
Pensions 1 441 2 119
Number of persons 14 15
REMUNERATION PRINCIPLES
PENSION AGREEMENTS
SEVERANCE PAY
2010 2009
Remuneration payable to the Board has been paid to
Chairman of the Board 948 900
Other members 742 910
1 690 1 810
Salaries and other remuneration have been paid to
CEO Per Åkerberg 2 189 2 097
of which variable component - 500
of which impacting on the year - 500
Former CEO Åsa Landén Ericsson - 737
Pension agreements
CEO Per Åkerberg 689 246
Former CEO Åsa Landén Ericsson - 188
If the CEO’s employment is terminated, the company shall observe a notice period of six months, and the CEO a notice period of six months. In addition, severance pay will be paid which is equivalent to six months’ set salary if the Board terminates the employment. If ownership conditions change such that there are new majority owners in the company, the CEO will be entitled to severance pay equal to six months’ salary. All termination salaries and severance pay will be settled against any other income from service. For other senior executives, a notice period of three to twelve months will be applied.
The Annual General Meeting decides on fees for the Board. Remuneration to the CEO is decided upon by the Chairman of the Board and members appointed by the committee according to proposals by the remuneration committee. Guidelines on remuneration for senior executives are laid down by the Annual General Meeting. For the Group executive, market conditions are applied to salaries and other employment conditions. In addition to fixed annual salary, the Group executive also receive a variable salary which is capped and based on earnings performance compared with set targets. Remuneration to certain leading officials within the Enea Group may also be paid in the form of share-based payments. For more information, see note 20.
The CEO’s pension agreement means that his pension premiums will amount to 27.5 percent of his set salary. Other senior executives in Sweden have pension contractswithin the scope of the ITP scheme, with a pensionable age of 65, and pension provisions are related to employees’ salaries. Pension premiums are paid regularly. For more information, see note 20.
Remuneration to the Board ofDirector CEO and other seniorexecutives
12 960 9 161
of which variable component 3 490 2 207
Sick leave, %
PARENT COMPANY 2,3 4,0
Men 1,6 2,0
Women * 6,4
Up to age 29 * -
30-49 year(s) 2,4 4,6
Age 50 and above * 3,2
Sick leave of at least 60 days as a % of total sick leave 37,2 47,4
* Detailed information not disclosed as the group of employees consists of less than ten individuals.
Salaries and other remuneration have been paid to other senior executives, 7 people (8)
2010 2009
GROUP
PricewaterhouseCoopers
Auditing engagement 1 098 999
Tax engangement 259 75
Other engagements 194 152
Other auditors
Auditing engagement 550 426
Tax engangement 440 319
Other engagements 133 14
2 674 1 985
2010 2009
PARENT COMPANY
PricewaterhouseCoopers
Auditing engagement 904 890
Tax engangement 259 75
Other engagements 194 152
Other auditors
Auditing engagement - -
Tax engangement - 11
Other engagements - 8
1 357 1 136
Audit assignments refer to the reviewing of the annual report, the accounts and theadministration by the Board of Directors and Managing Director. Auditing assignments also include what the company’s auditor is required to perform, advise on or other contributions resulting from observations made during this auditing work or while carrying out these assignments. All other work comes under other assignments.
5. Emoluments and costs for the auditors
2010 2009
Consumables and subconsultants 104 086 147 196
Other external costs 78 748 86 378
Payroll expenses 453 482 499 966
Depreciations and writedowns 22 371 48 297
658 687 781 837
6. Operating expenses, by cost type
Depreciations and writedowns for the year are distributed between cost of sold products and services at SEK 12.1 million (37.9) and administration expenses at SEK 10.3 million (10.4).
Operational leasing relates mainly to cars and rents on
premises. 2010 2009
GROUP
Leasing charges, current year 15 543 17 874
14 039 14 269
46 372 50 109
PARENT COMPANY
Leasing charges, current year 8 794 8 505
7 552 8 950
24 590 35 601
7. Leasing fees related to operating leases
Contractually agreed future minimum leasingfees within 1 year
Contractually agreed future minimum leasingfees within 2-5 years
Contractually agreed future minimum leasingfees within 1 year
Contractually agreed future minimum leasingfees within 2-5 years
2010 2009
GROUP
Interest income 1 316 2 092
Currency gains 3 061 11 183
Financial income 4 377 13 275
Interest expenses -326 -682
Currency losses -3 360 -9 314
Financial expenses -3 686 -9 996
Net financial items 691 3 279
PARENT COMPANY 2010 2009
Dividend, shares and participations in subsidiaries - -
- -
Income from participations in Group companies - -
Interest income, other 881 626
Interest income, Group companies 11 781 14 793
Currency gains 422 751
Interest income and similar income items 13 084 16 170
Interest expenses, other -249 -371
Interest expenses, Group companies -471 -387
Currency losses -371 -391
Interest expenses and similar expense items -1 091 -1 149
Net financial items 11 993 15 021
8. Net financial items
Writedown, shares and participations in Group companies
Notes

52 ENEA AnnuAl RepoRt 2010 ÅRSREDOVISNING 2010 ENEA 3
2010 2009
GROUP
Interest income 1 316 2 092
Currency gains 3 061 11 183
Financial income 4 377 13 275
Interest expenses -326 -682
Currency losses -3 360 -9 314
Financial expenses -3 686 -9 996
Net financial items 691 3 279
PARENT COMPANY 2010 2009
Dividend, shares and participations in subsidiaries - -
- -
Income from participations in Group companies - -
Interest income, other 881 626
Interest income, Group companies 11 781 14 793
Currency gains 422 751
Interest income and similar income items 13 084 16 170
Interest expenses, other -249 -371
Interest expenses, Group companies -471 -387
Currency losses -371 -391
Interest expenses and similar expense items -1 091 -1 149
Net financial items 11 993 15 021
8. Net financial items
Writedown, shares and participations in Group companies
2010 2009
GROUP
Current tax expense
Tax expense for period -9 589 -3 714
-9 589 -3 714
Deferred tax
0 7 141
- tax expense in loss carryforwards utilized during the year -13 535 -422
- tax expense/income relating to temporary differences 1 043 2 022
-12 492 8 741
Total tax expense recognized, Group -22 081 5 027
Reconciliation of effective tax
GROUP
Profit before tax 68 426 -847
Flat rate tax 26.3 % -17 917 223
Tax effect of
- other tax rates in foreign subsidiaries -436 468
- utilization of previously capitalized loss carryforwards 0 1 308
- utilization of previously non-capitalized loss carryforwards 233 0
-3 373 7 141
- non-deductible costs -731 -8 220
- non-taxable income 536 4 048
Other taxes -435 0
Adjustment of tax for previous years 42 59
Total tax expense recognized, Group -22 081 5 027
-32% -594%
2010 2009
PARENT COMPANY
Current tax
Tax for the period -2 171 2 868
-2 171 2 868
PARENT COMPANY
Profit before tax 7 969 -11 526
Tax 26.3 % -2 096 3 031
Tax effect of
- non-deductible costs -51 -95
- non-taxable income 0 0
Adjustment of tax for previous years -24 -69
Total tax recognized, parent company -2 171 2 867
-27% -25%
GROUP
Deferred tax receivables:
- loss carryforwards 11 722 27 187
- temporary differences on intangible assets 514 950
- other temporary differences 4 204 0
Total deferred tax receivables 16 440 28 137
Deferred tax liabilities:
- temporary differences on intangible assets 2 588 4 658
Total deferred tax liabilities 2 588 4 658
9. Taxes
The following components are included in deferredtax receivables and tax liabilities
- tax income in loss carryforwards capitalized during the year
- valuation of future loss carryforwards in foreign companies
2010 2009
GROUP
Current tax expense
Tax expense for period -9 589 -3 714
-9 589 -3 714
Deferred tax
0 7 141
- tax expense in loss carryforwards utilized during the year -13 535 -422
- tax expense/income relating to temporary differences 1 043 2 022
-12 492 8 741
Total tax expense recognized, Group -22 081 5 027
Reconciliation of effective tax
GROUP
Profit before tax 68 426 -847
Flat rate tax 26.3 % -17 917 223
Tax effect of
- other tax rates in foreign subsidiaries -436 468
- utilization of previously capitalized loss carryforwards 0 1 308
- utilization of previously non-capitalized loss carryforwards 233 0
-3 373 7 141
- non-deductible costs -731 -8 220
- non-taxable income 536 4 048
Other taxes -435 0
Adjustment of tax for previous years 42 59
Total tax expense recognized, Group -22 081 5 027
-32% -594%
2010 2009
PARENT COMPANY
Current tax
Tax for the period -2 171 2 868
-2 171 2 868
PARENT COMPANY
Profit before tax 7 969 -11 526
Tax 26.3 % -2 096 3 031
Tax effect of
- non-deductible costs -51 -95
- non-taxable income 0 0
Adjustment of tax for previous years -24 -69
Total tax recognized, parent company -2 171 2 867
-27% -25%
GROUP
Deferred tax receivables:
- loss carryforwards 11 722 27 187
- temporary differences on intangible assets 514 950
- other temporary differences 4 204 0
Total deferred tax receivables 16 440 28 137
Deferred tax liabilities:
- temporary differences on intangible assets 2 588 4 658
Total deferred tax liabilities 2 588 4 658
9. Taxes
The following components are included in deferredtax receivables and tax liabilities
- tax income in loss carryforwards capitalized during the year
- valuation of future loss carryforwards in foreign companies
Deferred tax assets for loss carryforwards pertain mainly to the US subsidiary. In management's assessment, the capitalized loss carryforwards will be utilized within the next few years. Non-capitalized deferred tax receivables for unutilized deficits amount to SEK 1.6 million, of which SEK 0.9 million concerns the UK and SEK 0.8 million concerns France.
Notes

AnnuAl RepoRt 2010 ENEA 534 ENEA årsredovisning 2010
2009 Goodwill
Capitalizeddevelopment
costs
Other intang.
fixedassets Total
GROUP
Accumulated acquisition value
Opening balance, 1 Jan 2009 181 850 108 354 22 905 313 109
Acquisition for the year 1 109 9 267 2 087 12 463
Translation difference for the year -8 321 - - -8 321
Closing balance as at 31 Dec 2009 174 638 117 621 24 992 317 251
Accumulated depreciations and writedowns
Opening balance, 1 Jan 2009 - -36 303 -3 323 -39 626
Depreciations and writedowns for
- -36 543 -3 869 -40 412
Closing balance as at 31 Dec 2009 - -72 846 -7 192 -80 038
174 638 44 775 17 800 237 213
2010 Goodwill
Capitalizeddevelopment
costs
Other intang.
fixedassets Total
GROUP
Accumulated acquisition value
Opening balance, 1 Jan 2010 174 638 117 621 24 992 317 251
Acquisition for the year - 15 779 - 15 779
Divestments/scrapping - -998 - -998
Adjusted payment Netbricks -5 753 - - -5 753
Translation difference for the year -14 872 - -1 012 -15 884
Closing balance as at 31 Dec 2010 154 013 132 402 23 980 310 395
Accumulated depreciations and writedowns
Opening balance, 1 Jan 2010 - -72 846 -7 192 -80 038
Divestments/scrapping - 989 - 989
- -8 112 -7 686 -15 798
Translation difference for the year - - 1 246 1 246
Closing balance as at 31 Dec 2010 - -79 969 -13 632 -93 601
154 013 52 433 10 348 216 794
2010 2009
PARENT COMPANY
Ackumulerade anskaffningsvärden
Opening balance, 1 Jan 6 260 5 680
Acquisition for the year - 1 068
Divestments/scrapping - -488
Closing balance as at 31 Dec 6 260 6 260
Opening balance, 1 Jan -2 523 -1 450
Depreciation for the year -1 252 -1 225
Divestments/scrapping - 152
Closing balance as at 31 Dec -3 775 -2 523
Recognized value as 31 dec 2 485 3 737
Goodwill is attributable to the cash-generating units below.
2010 2009
10. Intangible assets
Other intangible fixed assets
Depreciations and writedowns forthe year
Recognized value asat 31 Dec 2010
Recognized value asat 31 Dec 2009
Enea Software – software business 76 334 90 744
Enea Consulting – consultancy business 77 679 83 894
154 013 174 638
VARIABLE ASSUMED VALUEIncome growth 3-5 % (3-5 %)
Cost trend 3-5 % (3-5 %)
Interest rate 12-14 % (10-12 %)
Terminal value 2% (2%)
Capitalized development expenses within Enea Software relate primarily to internalwork on development of new products. Over the first quarter of 2009, a non-recurringwritedown of SEK 25 million took place. The depreciation time for capitalized development expenses is five years, and for other intangible assets three to five years. Remaining time of writedown of intangible assets amounts to 2-5 years.
Cash-generating units consist of the business areas Software and Consulting. These impairment tests are based on calculations of the utility value, and these calculations have been done in the same way for both units. These calculations are based on estimated future cash flows on the basis of financial budgets that have been approved by management and that cover a five-year period. Cash flows beyond the five-year period have been forecast with long-term stable growth of 2 percent terminal value, as it is known. Enea has carried out a susceptibility analysis of important assumptions in which the executive have found that no reasonable changes to these assumptions will result in writedown as at 31 December 2010. The cash flows forecast have been based on annual income growth for Software of 5 percent (5), and 3 percent (3) for Consulting. Cost development for Software has been forecast at 5 percent (5), and 3 percent (3) for Consulting. The forecast cash flows have been assessed at current value with a discount interest rate of 12 percent (10) and 14 percent (12) before tax for Software and Consulting respectively. The terminal value is calculated at 2 percent (2). Assumptions of growth and cost development are based on the anticipated development of our customers and of the industries in which they are active. The assumptions which are important in the business plan are described in the following list:
IMPAIRMENT TEST FOR GOODWILL
2010 2009 2010 2009
Accumulated acquisition value
At start of year 81 939 87 800 22 818 20 806
Acquisition for the year 3 201 4 696 533 2 211
Divestments/scrapping -13 645 -8 596 -3 675 -199
Translation difference for the year -2 204 -1 961 - -
69 291 81 939 19 676 22 818
At start of year -64 855 -66 374 -16 820 -13 672
Divestments/scrapping 13 166 8 393 3 454 168
-6 573 -8 701 -2 192 -3 316
Translation difference for the year 2 049 1 827 - -
-56 213 -64 855 -15 558 -16 820
Recognized value at year-end 13 078 17 084 4 118 5 998
11. Equipment, tools, fixtures and fittings Parent CompanyGroup
Depreciations are attributable to the cost of sold goods and services, sales and marketing expenses, production development expenses and administration expenses.
Accumulated depreciation according to plan:
Depreciation for the year according to plan
2009 Goodwill
Capitalizeddevelopment
costs
Other intang.
fixedassets Total
GROUP
Accumulated acquisition value
Opening balance, 1 Jan 2009 181 850 108 354 22 905 313 109
Acquisition for the year 1 109 9 267 2 087 12 463
Translation difference for the year -8 321 - - -8 321
Closing balance as at 31 Dec 2009 174 638 117 621 24 992 317 251
Accumulated depreciations and writedowns
Opening balance, 1 Jan 2009 - -36 303 -3 323 -39 626
Depreciations and writedowns for
- -36 543 -3 869 -40 412
Closing balance as at 31 Dec 2009 - -72 846 -7 192 -80 038
174 638 44 775 17 800 237 213
2010 Goodwill
Capitalizeddevelopment
costs
Other intang.
fixedassets Total
GROUP
Accumulated acquisition value
Opening balance, 1 Jan 2010 174 638 117 621 24 992 317 251
Acquisition for the year - 15 779 - 15 779
Divestments/scrapping - -998 - -998
Adjusted payment Netbricks -5 753 - - -5 753
Translation difference for the year -14 872 - -1 012 -15 884
Closing balance as at 31 Dec 2010 154 013 132 402 23 980 310 395
Accumulated depreciations and writedowns
Opening balance, 1 Jan 2010 - -72 846 -7 192 -80 038
Divestments/scrapping - 989 - 989
- -8 112 -7 686 -15 798
Translation difference for the year - - 1 246 1 246
Closing balance as at 31 Dec 2010 - -79 969 -13 632 -93 601
154 013 52 433 10 348 216 794
2010 2009
PARENT COMPANY
Ackumulerade anskaffningsvärden
Opening balance, 1 Jan 6 260 5 680
Acquisition for the year - 1 068
Divestments/scrapping - -488
Closing balance as at 31 Dec 6 260 6 260
Opening balance, 1 Jan -2 523 -1 450
Depreciation for the year -1 252 -1 225
Divestments/scrapping - 152
Closing balance as at 31 Dec -3 775 -2 523
Recognized value as 31 dec 2 485 3 737
Goodwill is attributable to the cash-generating units below.
2010 2009
10. Intangible assets
Other intangible fixed assets
Depreciations and writedowns forthe year
Recognized value asat 31 Dec 2010
Recognized value asat 31 Dec 2009
Notes

54 ENEA AnnuAl RepoRt 2010 ÅRSREDOVISNING 2010 ENEA 5
2010 2009
GROUP
Not due 175 599 189 855
Due 1-60 days 33 039 29 302
Due 61-90 days 798 1 599
Due 90 days- 433 2 465
Total 209 869 223 221
12. Accounts receivable
Accounts receivable not due concern customers with favorable payment capacity and history. Accounts receivable requiring writedown agree with the provision made for distressed debts. Reserves for distressed debts amount to SEK 5.4 million (6.0). The fair value of accounts receivable agrees with the carrying amount. Accounts receivable are predominantly denominated in SEK, EUR and USD. The distribution of accounts receivable in terms of age is detailed below:
Age analysis, accounts receivable
2010 2009
GROUP
Prepaid expenses 11 290 15 070
Accrued income 12 280 4 857
23 570 19 927
PARENT COMPANY
Prepaid insurance 152 1
Prepaid rents 2 097 2 049
Other prepaid expenses 1 971 3 801
Accrued income - 14
4 220 5 865
13. Prepaid expenses and accrued income
GROUPShare capital
Other capital contributions
RESERVES
Translation reserve
2010 2009
Opening translation reserve -139 15 193
Translation difference for the year -19 783 -15 332
Closing translation reserve -19 922 -139
Retained earnings including profit for the year
Statutory reserve
Share premium reserve
Retained earnings
The purpose of the statutory reserve is to retain a part of the net profit which is not allocated to cover balanced losses.
When shares are issued at a premium, i.e. more is paid for the shares than the shares’ nominal amount, an amount equal to the amount received in excess of the nominal value of the shares shall go to the share premium reserve.
Is made up of the previous year’s non-restricted equity after any provisions to the statutory reserve and after any distribution of profits has been paid. Together with profit for the year, this constitutes total non-restricted equity, i.e. the amount available for distribution to shareholders. See also Summary of changes in consolidated equity on page 39 and Summary of changes in parent company’s equity on page 43.
14. Shareholders’ equity
During the year, the share capital was reduced by 274,543 through the cancellation of 274,543 shares. A subsequent bonus issue has been implemented that will restore the share capital without increasing the number of shares. As at 31 December 2010, registered share capital involved 18,081,171 shares with a nominal value of SEK 1.02 per share. Holders of ordinary shares are entitled to dividends, the amount of which is set each financial year and shareholdings convey voting rights at the general meeting of one vote per share. Over the year, the company acquired 183,751 (536,270) and sold 48,163 of its own shares.
Refers to shareholders’ equity contributed by the owners. This includes share premium reserves transferred to a statutory reserve as at 31 December 2005. Provisions for the share premium reserve from 1 January 2006 and onwards are also recognized as contributedcapital.
The translation reserve comprises all exchange rate differences arising when translation of net assets from foreign companies which have prepared their financial reports in a currency different to the currency in which the Group’s financial reports are presented. The parent company and Group present their financial reports in Swedish kronor.
Earnings in the parent company and its subsidiaries are included in retained earnings including profit for the year. Earlier provisions made to a statutory reserve, excluding transferred share premium reserves, are included in this equity item. Over the period 19 November 2007 to 10 December 2010, the parent company bought back 1,057,904 shares on the Nasdaq OMX Nordic Exchange in Stockholm at an average stock exchange price of SEK 42,56. A total of SEK 44,953 thousand was paid for the shares, which has reduced the retained earnings. These shares are held as own shares and were fully paid up as at 31 december 2010. During 2010,48,163 of the repurchased shares were sold at an average market price of SEK 41.72 per share. In total, SEK 2,900 thousand was received for the shares.
PARENT COMPANY
NON-RESTRICTED EQUITY
2010 2009
Earnings per share before dilution
Profit for the year after tax 46 045 4 181
Average number of shares, thousands 17 369 17 482
Earnings per share before dilution, SEK 2,65 0,24
Retained earnings
Profit for the year after tax 46 045 4 181
Average number of shares, thousands 17 369 17 482
Earnings per share after dilution, SEK 2,65 0,24
15. Earnings per share
In accordance with a decision made at the 2008 Annual General Meeting, an option program was assumed for employees of Enea Embedded Technology Inc. equivalent to 37,500 share options following the 1:20 consolidation of shares that took place in 2008. A subscription entitlement provides entitlement to subscribe for shares at a rate of SEK 48.80. This program will run from 2008 to 2011. In accordance with a decision made at the 2007 Annual General Meeting, an option program was assumed for employees of Enea Embedded Technology Inc. equivalent to 75,000 share options following the 1:20 consolidation of shares that took place in 2008. A subscription entitlement provides entitlement to subscribe for shares at a rate of SEK 77.50. This program will run from 2007 to 2010. In accordance with a decision made at the 2006 Annual General Meeting, an option program was assumed for employees of Enea Embedded Technology Inc. equivalent to 100,000 share options following the 1:20 consolidation of shares. A subscription entitlement provides entitlement to subscribe for shares at a rate of SEK 69.50. This program will run from 2006 to 2009. The average number of shares was reduced with average number of treausery shares and was weighted i relation to the time they been outstanding. On 31 December 2009 the share option programme did not result in any dilution.
Notes

AnnuAl RepoRt 2010 ENEA 556 ENEA ÅRSREDOVISNING 2010
CASH AND CASH EQUIVALENTS
2010 2009 2010 2009
1 316 2 088 881 627
-326 -682 -249 -371
Depreciations and writedowns 22 371 48 298 3 444 4 541
-2 008 - 221 -
Employee stock option program 174 475 174 475
Share savings plan 1 810 - 1 810 -
Provisions 222 - - -4 443
Exchange rate differences, net 65 - - -
22 634 48 773 5 649 573
Adjustment for items not included in cash flow
Total
18. Cash flow statement
The subcomponents included in cash and cash equivalents are cash, bank and special deposits or commercial papers which have an insignificant risk of value fluctuations and which can easily be converted into cash and cash equivalents and have a maturity of no more than three months from the time of acquisition.
Group Parent Company
Interest received over the period amounts to
Interest paid over the period amounts to
Information on interest rates
Gain/loss on scrapping of fixed assets
CLOSE ASSOCIATIONS
List of close transactionsGROUP
Close association Year
Sales of goods/
services toassociated
parties
Purchase of goods and
services fromassociated
parties
Liabilities to
associatedparties
on 31 Dec
Receivablesfrom
associatedparties
on 31 Dec
Key people insenior posts
2010 - - - -
Key people insenior posts
2009 - - - -
Other associatedparties
2010 - - - -
Other associatedparties
2009 - - - -
List of close transactionsPARENT COMPANY
Close association Year
Sales of goods/
services toassociated
parties
Purchase of goods and
services fromassociated
parties
Liabilities to
associatedparties
on 31 Dec
Receivablesfrom
associatedparties
on 31 Dec
Subsidiaries 2010 60 045 0 11 059 226 829
Subsidiaries 2009 32 438 1 589 111 199 266 827
Key people insenior posts
2010 - - - -
Key people insenior posts
2009 - - - -
Other associatedparties
2010 - - - -
Other associatedparties
2009 - - - -
Transactions with associated parties are priced in accordance with market conditions. For information on remuneration to key persons in senior positions, see note 4, Employees and payroll expenses, and note 20, Pensions, share-related remuneration, benefits to senior executives.
19. Related parties
The parent company has close associations with its subsidiaries (see note 17) and senior executives (see note 4).
CountryHolding,
%
Enea Services Stockholm AB Sweden 100
Enea Services Öresund AB Sweden 100
Enea Services Linköping AB Sweden 100
QiValue Technologies AB Sweden 100
Enea Services Västerås AB Sweden 100
Enea Software AB Sweden 100
Enea Zealcore AB Sweden 100
Enea Embedded Technology Inc USA 100
Enea GmbH Germany 100
Enea S.A.R.L France 100
Enea Netbricks SAS France 100
Enea Software (Beijing) Co. , Ltd. China 100
Enea KK Japan 100
Enea UK Ltd United Kingdom 100
Enea Polyhedra Ltd United Kingdom 100
Enea Romania SRL Romania 100
Enea Netbricks Ltd Israel 100
Parent Company 2010 2009
Accumulated acquisition value
Opening balance, 1 January 391 130 391 130
Closing balance, 31 December 391 130 391 130
Ackumulerade nedskrivningar
Opening balance, 1 January -158 596 -158 596
Writedowns for the year - -
Closing balance, 31 December -158 596 -158 596
Recognized value at year-end 232 534 232 534
holdings of shares in Number Shareof shares i % 2010 2009
5 900 100 172 034 172 034
5 000 100 60 500 60 500
1 000 100 0 0
232 534 232 534
Enea Software AB,556183-3012, Kista
Enea Services Öresund AB,556586-3494, Kista
Enea Services Västerås AB,556545-4161, Stockholm
17. Group companies
subsidiaries of participations
Subsidiary/co. reg. no./reg. office
Holdings in subsidiaries
Specification of Parent Company's Recognized value
2010 2009
GROUP
Support income 12 563 12 252
Accrued payroll expenses 37 204 40 294
Other 23 078 27 023
72 845 79 569
PARENT COMPANY
Accrued payroll expenses 6 571 5 413
Other 4 265 820
10 836 6 233
16. Accrued expenses and prepaid income
Notes

56 ENEA AnnuAl RepoRt 2010 ÅRSREDOVISNING 2010 ENEA 7
CLOSE ASSOCIATIONS
List of close transactionsGROUP
Close association Year
Sales of goods/
services toassociated
parties
Purchase of goods and
services fromassociated
parties
Liabilities to
associatedparties
on 31 Dec
Receivablesfrom
associatedparties
on 31 Dec
Key people insenior posts
2010 - - - -
Key people insenior posts
2009 - - - -
Other associatedparties
2010 - - - -
Other associatedparties
2009 - - - -
List of close transactionsPARENT COMPANY
Close association Year
Sales of goods/
services toassociated
parties
Purchase of goods and
services fromassociated
parties
Liabilities to
associatedparties
on 31 Dec
Receivablesfrom
associatedparties
on 31 Dec
Subsidiaries 2010 60 045 0 11 059 226 829
Subsidiaries 2009 32 438 1 589 111 199 266 827
Key people insenior posts
2010 - - - -
Key people insenior posts
2009 - - - -
Other associatedparties
2010 - - - -
Other associatedparties
2009 - - - -
Transactions with associated parties are priced in accordance with market conditions. For information on remuneration to key persons in senior positions, see note 4, Employees and payroll expenses, and note 20, Pensions, share-related remuneration, benefits to senior executives.
19. Related parties
The parent company has close associations with its subsidiaries (see note 17) and senior executives (see note 4).
DEFINED CONTRIBUTION PLANS
2010 2009 2010 2009
35 438 39 315 3 177 1 965
SHARE-BASED PAYMENTS
2010 2009
- 67 950
- -
- -850
- -67 100
- -
2010 2009
41 834 46 034
- -
-50 -4 200Forfeited over period
20. Pensions, share-related remuneration, benefits to senior executives
The methods for calculating pension expenses and pension liabilities differ from country to country. The companies report in accordance with local rules, and the reported figures are consolidated in the consolidated accounts. All pension solutions in foreign companies are classified and reported as defined contribution plans, which means that the Group’s profit is burdened with pension expenses as the benefits were earned. Salaried staff employed in Sweden are covered by the ITP scheme, reported as defined contribution pension plans. Commitments for retirement pensions and family pensions for salaried employees in Sweden are secured through an insurance policy with Alecta. According to a statement from the Swedish Financial Reporting Board’s Emerging Issues Task Force, URA 42, this is A1a defined benefit plan which covers several employers. For the 2010 financial year, the company has not had access to such information that would make it possible to recognize this plan as a defined benefit pension plan, which is why it is being recognized as a defined contribution plan. This plan is being financed on an ongoing basis through pension insurance. Charges to Collectum for pension insurance for the year amount to SEK 10,010 (10,841) thousand. The surplus can be distributed to the policyholders and/or the insured persons. Alecta’s surplus in the form of the collective funding level amounted to 146% (141) at the end of 2010. Collective funding is the market value of Alecta’s assets as a percentage of insurance commitments, calculated in accordance with Alecta’s calculation assumptions for insurance purposes, which do not comply with IAS 19.
Group Parent Company
Cost of defined contribution plans
In accordance with a decision made at the 2006 Annual General Meeting, an optionprogram was assumed for employees of Enea Embedded Technology Inc. equivalent to 100,000 share options following the 1:20 merger of shares. A subscription entitlement provides entitlement to subscribe for shares in Enea AB at a rate of SEK 69.50 when employed at the time of the exercise period. Contractual maturity 3.3 years. This allocation has taken place free of charge. In accordance with a decision made at the 2007 Annual General Meeting, an option program was assumed for employees of Enea Embedded Technology Inc. equivalent to 75,000 share options following the 1:20 merger of shares. A subscription entitlement provides entitlement to subscribe for shares in Enea AB at a rate of SEK 77.50 when employed at the time of the exercise period. Contractual maturity 3.3 years. This allocation has taken place free of charge. In April 2010, the Annual General Meeting resolved to offer key employees the opportunity to participate in a share savings plan. The principal objective of the program is to enhance the company’s opportunities to recruit and retain key employees and, by means of the personal long-term ownership commitment of the participants, to stimulate increased interest in operations and profits, to increase motivation and enhance the sense of belonging in the company. The program involves 34 senior executives and other key individuals. By 30 June 2010, the employees had invested in 96,163 Enea shares (“savings shares”). If the employee keeps the shares for three years and remains in the employ of the Enea Group, he/she will be allocated an equivalent number of shares (“matching shares”). On the condition that special performance requirements are met, participants are also entitled to a further allocation of at most three Enea shares (“performance shares”). The allocation of performance shares is conditional on special performance requirements linked to Enea’s EBIT margin between 2010 and 2012 being met. The performance requirement for the performance shares is linked to EBIT margins in the interval of 11 to 17 percent. The fair value of the services performed is based on the share price of the matching shares that are expected to be allocated. The share price is determined at the time of the participants’ investment, adjusted for the dividends that do not accrue to the employee during the vesting period.
Option program maturing in 2009
Option program maturing in 2010
Matured during the period
Allocated over period
Forfeited over period
Outstanding at end of period
Outstanding options at start of period
Outstanding options at start of period
Allocated over period
-41 784
- 41 834
2010 2009
- -
- -
- -
- -
- -
34
Payroll expenses for share-related remunerationGroup 2010 2009
174 475
Share savings plan 1 810 -
REMUNERATION TO SENIOR EXECUTIVESPrinciples
Pension agreements
Severance pay
Remuneration and other benefits, 2009Perfor-mance-related
payOther
benefitsPensionexpense Total
Chairman Anders Lidbeck 900 900Board memberÅsa Landén Ericsson 160 160
Board memberGösta Lemne 160 160
Board memberJon Risfelt 190 190
Board memberKjell Duveblad 180 180
Board memberAnders Skarin 220 220
CEO Per Åkerberg 1 538 500 59 246 2 343Former CEO Åsa Landén Ericsson 737 0 0 188 925Other senior executives (6) 6 732 2 207 220 1 295 10 454
Total 10 817 2 707 279 1 729 15 532
Remuneration and other benefits, 2010Perfor-mance-related
payOther
benefitsPensionexpense Total
Chairman Anders Lidbeck 948 948
Outstanding at end of period
Number of matching shares at beginning of period
Share savings plan
Forfeited during the period
Matured during the period
Outstanding at the end of the period
Number of participants as at 31 December 2010
Matured during the period
Allocated during the period
If the CEO’s employment is terminated, the company shall observe a notice period of six months, and the CEO a notice period of six months. In addition, severance pay will be paid which is equivalent to six months’ set salary if the Board terminates the employment. If ownership conditions change such that there are new majority owners in the company, the CEO will be entitled to severance pay equal to six months’ salary. All termination salaries and severance pay will be settled against any other income from service. For other senior executives, a notice period of three to twelve months will be applied.
Option program Enea Embedded Technology Inc
Basic salary/directors’ fees
Basic salary/directors’ fees
The AGM decides on annual fees for the Board Chairman and Board members. Employee representatives do not receive Board remuneration. Remuneration to the CEO is decided upon by the Chairman of the Board and members appointed by the committee according to proposals by the remuneration committee.
The CEO’s pension agreement means that his pension premiums will amount to a set percentage of his set salary. Other senior executives in Sweden have pension contracts within the scope of the ITP scheme, with a pensionable age of 65, and pension provisions are related to employees’ salaries. The ITP scheme is, by its nature, mainly a defined benefit plan. The ITP scheme is insured through Alecta. Pension premiums are paid regularly.
Notes

AnnuAl RepoRt 2010 ENEA 578 ENEA ÅRSREDOVISNING 2010
23. Contingent liabilities
The group has no pledged assets or contingent liabilities.
Rate on balance sheet date
Currency 2010 2009 2010 2009
EUR 9,00 10,35 9,54 10,62
USD 6,80 7,21 7,20 7,65
GBP 10,55 11,49 11,13 11,93
JPY 0,083 0,082 0,082 0,078
RON 2,09 2,43 2,26 2,43
CNY 1,03 1,06 1,06 1,12
ILS 1,91 1,88 1,92 1,88
Currency Amount
EUR 1 097 9 875
USD 5 911 40 210
GBP 233 2 458
JPY 41 101 3 430
RON 9 087 18 969
CNY 3 017 3 108
ILS 768 1 463
Translated to SEK according to rate on balance sheet date
21. Translation exposure
Average rate
Enea’s foreign subsidiaries are translated to Swedish kronor in accordance with the current method. This means that the balance sheet is translated according to the rate on the balance sheet date, and the income statement in accordance with the average rate for the period.
When converting foreign subsidiaries’ balance sheets to Swedish kronor, the Group isexposed to currency exchange rate fluctuations. The effect on equity in 2010 on translation of foreign subsidiaries’ accounts to Swedish kronor amounted to negative SEK 19,783 thousand (negative 15 332). The Group’s exposure in equity to currency exchange rate fluctuations was as follows on the balance sheet date:
Impairment testing of goodwill
Impairment testing of capitalized development expenses
When calculating the recoverable amount of cash-generating units for assessment of any necessary impairment for capitalized development expenses, a number of assumptions have been made on future conditions and estimates of parameters. Enea has carried out a susceptibility analysis of important assumptions in which the executive have found that no reasonable changes to these assumptions will result in impairment as at 31 December 2010.
22. Critical accounting estimates and assumptionsEstimates and assumptions are evaluated on a running basis and are based on historical experience and other factors, including expectations of future events which are considered reasonable under prevailing conditions.
IMPORTANT ASSESSMENTS ON APPLICATION OF THEGROUP’S ACCOUNTING POLICIESThe corporate executive has discussed with the audit committee the development of, choice of and information on the Group’s important accounting policies and estimates, plus the application of the same. Some important account-related estimates made on application of the Group’s accounting policies are described below.
IMPORTANT SOURCES OF UNCERTAINTY INESTIMATES
When calculating the recoverable amount of cash-generating units for assessment of any necessary impairment of goodwill, a number of assumptions have been made on future conditions and estimates of parameters. Enea has carried out a susceptibility analysis of important assumptions in which the executive have found that no reasonable changes to these assumptions will result in impairment as at 31 December 2010. A report on these can be found in note 10.
-41 784
- 41 834
2010 2009
- -
- -
- -
- -
- -
34
Payroll expenses for share-related remunerationGroup 2010 2009
174 475
Share savings plan 1 810 -
REMUNERATION TO SENIOR EXECUTIVESPrinciples
Pension agreements
Severance pay
Remuneration and other benefits, 2009Perfor-mance-related
payOther
benefitsPensionexpense Total
Chairman Anders Lidbeck 900 900Board memberÅsa Landén Ericsson 160 160
Board memberGösta Lemne 160 160
Board memberJon Risfelt 190 190
Board memberKjell Duveblad 180 180
Board memberAnders Skarin 220 220
CEO Per Åkerberg 1 538 500 59 246 2 343Former CEO Åsa Landén Ericsson 737 0 0 188 925Other senior executives (6) 6 732 2 207 220 1 295 10 454
Total 10 817 2 707 279 1 729 15 532
Remuneration and other benefits, 2010Perfor-mance-related
payOther
benefitsPensionexpense Total
Chairman Anders Lidbeck 948 948
Outstanding at end of period
Number of matching shares at beginning of period
Share savings plan
Forfeited during the period
Matured during the period
Outstanding at the end of the period
Number of participants as at 31 December 2010
Matured during the period
Allocated during the period
If the CEO’s employment is terminated, the company shall observe a notice period of six months, and the CEO a notice period of six months. In addition, severance pay will be paid which is equivalent to six months’ set salary if the Board terminates the employment. If ownership conditions change such that there are new majority owners in the company, the CEO will be entitled to severance pay equal to six months’ salary. All termination salaries and severance pay will be settled against any other income from service. For other senior executives, a notice period of three to twelve months will be applied.
Option program Enea Embedded Technology Inc
Basic salary/directors’ fees
Basic salary/directors’ fees
The AGM decides on annual fees for the Board Chairman and Board members. Employee representatives do not receive Board remuneration. Remuneration to the CEO is decided upon by the Chairman of the Board and members appointed by the committee according to proposals by the remuneration committee.
The CEO’s pension agreement means that his pension premiums will amount to a set percentage of his set salary. Other senior executives in Sweden have pension contracts within the scope of the ITP scheme, with a pensionable age of 65, and pension provisions are related to employees’ salaries. The ITP scheme is, by its nature, mainly a defined benefit plan. The ITP scheme is insured through Alecta. Pension premiums are paid regularly.
Board memberÅsa Landén Ericsson 194 194
Board memberMats Lindoff 160 160
Board member Kjell Duveblad 194 194
Board memberAnders Skarin 194 194
CEO Per Åkerberg 2 110 0 79 689 2 878
Other senior executives (8) 9 207 3 490 263 1 171 14 131
Total 13 007 3 490 342 1 860 18 699
People included in the group of other senior executives have varied over the year. Until Per Åkerberg was appointed CEO, his remuneration was included in the Other senior executives group. The Other senior executives group includes consultancy fees of SEK 0 thousand (1,653). Included in the total amount of remunerations to senior executives is remuneration to one person who left the company with SEK 297 thousand in severance payment and SEK 0 thousand in remuneration after terminated employment.
2010 2009
0 12 646
9 845 14 649
9 845 27 295
Not regulated price, Netbrick SAS
Not regulated price, IP Devel SRL
24. Long-term liabilities
Rate on balance sheet date
Currency 2010 2009 2010 2009
EUR 9,00 10,35 9,54 10,62
USD 6,80 7,21 7,20 7,65
GBP 10,55 11,49 11,13 11,93
JPY 0,083 0,082 0,082 0,078
RON 2,09 2,43 2,26 2,43
CNY 1,03 1,06 1,06 1,12
ILS 1,91 1,88 1,92 1,88
Currency Amount
EUR 1 097 9 875
USD 5 911 40 210
GBP 233 2 458
JPY 41 101 3 430
RON 9 087 18 969
CNY 3 017 3 108
ILS 768 1 463
Translated to SEK according to rate on balance sheet date
21. Translation exposure
Average rate
Enea’s foreign subsidiaries are translated to Swedish kronor in accordance with the current method. This means that the balance sheet is translated according to the rate on the balance sheet date, and the income statement in accordance with the average rate for the period.
When converting foreign subsidiaries’ balance sheets to Swedish kronor, the Group isexposed to currency exchange rate fluctuations. The effect on equity in 2010 on translation of foreign subsidiaries’ accounts to Swedish kronor amounted to negative SEK 19,783 thousand (negative 15 332). The Group’s exposure in equity to currency exchange rate fluctuations was as follows on the balance sheet date:
Notes

58 ENEA AnnuAl RepoRt 2010
Board declaration
the Board and Ceo certify that the principles of consolidation have been prepared in accordance with the International Financial Report-ing Standards (IFRS) as adopted by the eu and the Swedish Annual Accounts Act and provide a true and fair picture of the financial position and result of the Group. the Report of the Directors for the
Group and the parent company provides a true and fair overview of the development of the business, financial position and results of the Group and the parent company and describes significant risks and [un]certainty factors which affect the parent company and the companies forming the Group.
Anders lidbeck Chairman of the Board
Anders SkarinBoard member
Åsa landén EricssonBoard member
Anders dahlenborg employee representative
mats lindoffBoard member
mattias Östholmemployee representative
Kjell duveblad Board member
the Annual Report and consolidated accounts, have, as specified above, been approved for publication by the Board of Directors on 14 March 2011. the consolidated income statement and balance sheet and the parent t company’s income statement and balance sheet will be subject to ratification at the Annual General Meeting on 7 April 2011.
our auditor´s report was submitted on 15 March, 2011pricewaterhouseCoopers AB
michael BengtssonAuthorized public Accountant
Stockholm 14 March 2011enea AB (556209-7146)
AnnuAl RepoRt 2010 ENEA 59
Audit report
We have audited the annual accounts, the consolidated accounts, the accounting records and the administration of the board of direc-tors and the managing director of enea AB (publ.) for the year 2010. the annual accounts and the consolidated accounts of the company are included in the printed version of this document on pages 29-54. the board of directors and the managing director are responsible for these accounts and the administration of the company as well as for the application of the Annual Accounts Act when preparing the annual accounts and the application of international financial report-ing standards IFRSs as adopted by the eu and the Annual Accounts Act when preparing the consolidated accounts. our responsibility is to express an opinion on the annual accounts, the consolidated accounts and the administration based on our audit.
We conducted our audit in accordance with generally accepted auditing standards in Sweden. those standards require that we plan and perform the audit to obtain reasonable assurance that the annual accounts and the consolidated accounts are free of material misstatement. An audit includes examining, on a test basis, evidence supporting the amounts and disclosures in the accounts. An audit also includes assessing the accounting principles used and their application by the board of directors and the managing director and significant estimates made by the board of directors and the manag-ing director when preparing the annual accounts and consolidated accounts as well as evaluating the overall presentation of information in the annual accounts and the consolidated accounts. As a basis for our opinion concerning discharge from liability, we examined sig-nificant decisions, actions taken and circumstances of the company in order to be able to determine the liability, if any, to the company of any board member or the managing director. We also examined whether any board member or the managing director has, in any
other way, acted in contravention of the Companies Act, the Annual Accounts Act or the Articles of Association. We believe that our audit provides a reasonable basis for our opinion set out below.
the annual accounts have been prepared in accordance with the Annual Accounts Act and give a true and fair view of the company’s financial position and results of operations in accordance with gener-ally accepted accounting principles in Sweden. the consolidated accounts have been prepared in accordance with international finan-cial reporting standards IFRSs as adopted by the eu and the Annual Accounts Act and give a true and fair view of the group’s financial position and results of operations. A corporate governance state-ment has been prepared. the statutory administration report and the corporate governance statement are consistent with the other parts of the annual accounts and the consolidated accounts.
We recommend to the annual meeting of shareholders that the income statement and balance sheet of the parent company and report on total profit and balance sheet for the Groupbe adopted, that the profit of the parent company be dealt with in accordance with the proposal in the statutory administration report and that the members of the board of directors and the managing director be discharged from liability for the financial year.
Stockholm, 15 March 2011pricewaterhouseCoopers AB
michael BengtssonAuthorised public Accountant
Audit reportto the annual meeting of the shareholders of enea AB (publ.) Corporate identity number 556209-7146

60 ENEA AnnuAl RepoRt 2010
Board members elected by the Annual general meeting
1. ANDErS LIDBECKBorn 1962.Chairman of the Board since 2009.education: B.Sc (Bus.Adm)other Board assignments: Chairman of Creandum AB and Scalado AB.primary occupation: Board as-signments.Shares: 45,000 (through endow-ment assurance)
2. KJELL DuvEBLADBorn 1954. Board member since 2008. education: B.Sc (Bus.Adm)other Board assignments: Chairman of the Board at Remium Fondkommission AB and Madeo Sourcing Group AB. Board member of 3l System and several unlisted companies.primary occupation: Consultant.Shares: 10,000.
3. ÅSA LANDéN ErICSSONBorn 1965. Board member since 2003. education: Master of engineer-ing and MBA. other Board assignments: Board member of Rejlerkon-cernen AB. primary occupation: Ceo, pointer Sweden AB.Shares: 2,500.
4. ANDErS SKArINBorn 1948. Board member since 2005. education: B. Sc. other Board assignments: Chairman of Cambio Health-care Systems AB, pocketMobile Communications AB, Sörman Information AB, vendator, Österströms International and Infobric. Board member of Acando AB and WSp europe AB. primary occupation: Manage-ment consulting and board work. Shares: 15,000.
5. MATS LINDOffBorn 1961.Board member since 2010.education: Master of engineer-ing, ee.other Board assignments: Board member of tAt, Scalado, ResQu, Bloo and Sigurn.primary occupation: partner in eMA technology and Consult-ing.Shares: 990.
Enea’s Board of directors
Employee representatives 6. ANDErS DAhLENBOrgBorn 1967. employee representative of SI since 2006. education: Master of engineer, Computer Science.other Board assignments: -primary occupation: Group manager, enea Research & Development.Shares: 2,700
7. MATTIAS ÖSThOLMBorn 1970. employee representative for unionen since 2005. education: engineering (college level). other Board assignments: -primary occupation: Senior consultant, enea Services Stockholm.Shares: 0.
Board of directors
1 53
72
6
4
This information relates to holdings as at 31 December 2010.Holdings are specified inclusive of affiliates and companies at 31 December 2010.

AnnuAl RepoRt 2010 ENEA 61
1. PEr ÅKErBErgPresident and CEO.Born: 1966.employed since 2004. education: B.Sc (Bus.Adm), Mid Sweden university, Sundsvall. Former positions: Senior vice president for telelogic Central europe and Scandinavia, vice president for telelogic north America, Head of Sales at telia Megacom AB.number of shares: 15,000.
2. LArS KEvSJÖCFOBorn: 1958.employed since 2009. education: B.Sc (Bus.Adm), Stockholm university. Former positions: CFo at net Insight, Chief Financial officer at Bewator, Chief Financial officer at Cygate, Director of Finance at telia telecom.number of shares: 2,500.
3. ADrIAN LEufvéNSenior vice President, re-search & developmentBorn: 1972.employed since 1998. education: Master of engineer-ing, Royal Institute of technol-ogy, Stockholm. Former positions: vp Strategic outsourcing at enea, vp Support at enea, vp Marketing at enea, Director Asian Sales at enea.number of shares: 9,560.
4. CAThArINA PAuLCéN vice President, Corporate CommunicationsBorn: 1973.employed since 2009. education: B.Sc (International Bus.Adm), universities of lund and Mannheim. Former positions: Branding at IBM nordics, Director of Market-ing at IBM Rational Software, executive vice president Marketing & Communications at telelogic.number of shares: 13,000.
Enea’s Executive management Team
Executive management
1 53 7
82 64
Enea’s Executive Management team at 31 December 2010.Holdings are specified inclusive of affiliates and companies at 31 December 2010
5. hÅKAN rIPPESenior vice President, Cor-porate development and Senior vice President Nordic Consulting. Born: 1968.employed since 2009. education: Master of engineer-ing, Chalmers university of technology, Gothenburg. Former positions: Business Development executive at IBM Rational Software, executive vice president Corporate Devel-opment at telelogic.number of shares: 35,000 (through endowment assur-ance)
6. MAThIAS BÅThSenior vice President, mar-keting and Sales manager for Europe and AsiaBorn: 1963.employed since 2001. education: Business administra-tion (college level), uppsala. Former positions: Head of nor-dic Market Area at enea Soft-ware, Business Area Manager at nocom AB.number of shares: 5,000.
7. frEDrIK SJÖhOLMSales manager EricssonBorn: 1970.employed since 2005. education: B.Sc (International Bus.Adm), lund university and vienna School of economics.Former positions: Sales Direc-tor ericsson nordic at enea, Business Manager Software Sourcing at Sony ericsson, Sales Director nordic and Global Ac-count Director ericsson at telel-ogic, Director Investor Relations at telelogic, Sales executive at Saab Aerospace in Austria.number of shares: 1,500.
8. MIChAEL vENTrELLASales manager for North AmericaBorn: 1973.employed since 2001. education: engineering & Busi-ness, BSee, Clarkson university, MBA program, university of Rochester. Former positions: vice president of Sales, General Manager at enea, Director of Sales at enea, Director of Sales at encirq, Regional Sales at Wind River Sys-tems, Strategic Sales at Ge Fanucnumber of shares: 7,500.

62 ENEA AnnuAl RepoRt 2010
Annual general meeting 2011the Annual General Meeting will be held at 4 pm Cet on 7 April 2011 at enea’s premises at Skalholtsgatan 9, Kista, Sweden. Shareholders wishing to participate at the AGM must be entered in the register of shareholders kept by euroclear Sweden AB (name changed from vpC AB) no later than 1 April 2011.
participants must also register with enea AB by 5 pm Cet on 4 April 2011 at the latest.
registrations can be submitted by post to enea AB (publ), p.o. Box 1033, Se-164 21 Kista, Sweden, by telephone on +46 (0)8 507 144 85, or by e-mail to [email protected]. Registrations must include name, personal ID number or company registration number, shareholding, address, telephone numbers and details of accompanying assistant (if applicable).
reporting dates in 2011
Interim report January-March 29 AprilInterim report April-June 21 JulyInterim report July-September 27 october
All financial information is published on enea’s website www.enea.com.
Financial reports can also be ordered from enea AB, p.o. Box 1033, Se-164 21 Kista, Sweden, or by e-mail: [email protected]
this document is essentially a translation of Swedish language original thereof. In the event of any discrepancies between this translation and the original Swedish document the latter shall be deemed correct.
Shareholder information
Shareholder information
marginsOPErATINg MArgINoperating profit in relation to net sales.
PrOfIT MArgINprofit after financial items in relation to net sales.
returnrETurN ON EquITyprofit after tax in relation to average equity.
rETurN ON CAPITAL EMPLOyEDoperating profit plus financial income in relation to average capital employed.
rETurN ON TOTAL CAPITAL profit after financial items plus finan-cial costs in relation to average total assets.
Capital structureCAPITAL STruCTurEequity including minority interests in relation to total assets.
INTErEST COvErAgE rATIOprofit after financial items plus finan-cial costs in relation to financial costs.
CAPITAL EMPLOyEDtotal assets less non-interest-bearing liabilities including deferred tax liabilities. Average capital employed has been calculated as opening capital employed plus closing capital employed divided by two.
PrOPOrTION rISK-BEArINg CAPITALtotal of equity and deferred tax liabili-ties as a percentage of total assets.
Per share dataEArNINgS PEr ShArE profit after tax in relation to the aver-age number of shares.
NET wOrTh PEr ShArE net worth, equivalent to equity, in relation to the total number of shares outstanding.
DIvIDEND PEr ShArE Dividend for the current financial year divided by the number of shares as per the balance sheet date.
CASh fLOw PEr ShArE frOM OPErATINg ACTIvITIESCash flow from operating activities in relation to the average number of shares.
LIquIDITyCash and equivalents, including cur-rent investments and receivables, in relation to current liabilities.
OtherNET SALES PEr EMPLOyEEnet sales in relation to the average number of employees.
definitions
this annual report has been produced by enea in cooperation with RHR/CC. Graphical work by oxenstierna & partners, photos by Alexander Ruas, patrik engström and Johnér Bildbyrå.

ANNUAL REPORT 2010 ENEA 63
Enea®, Enea OSE®, Netbricks®, Polyhedra® and Zealcore® are trademarks registered by Enea AB or its subsidiaries. Enea OSE®ck, Enea OSE® Epsilon, Enea® Element, Enea® Optima, Enea® Optima Log Analyzer, Enea® Black Box Recorder, Enea® LINX, Enea® Accelerator, Polyhedra® Flashlite, Enea® dSPEED Platform, Enea® System Manager, Accelerating Network Convergence™, Device Software Optimized™ and Embedded for Leaders™ are unregistered trademarks of Enea AB. All rights reserved. © 2011 Enea AB.
SwedenStockholmP.O. Box 1033Skalholtsgatan 9SE-164 21 Kista, SwedenTel.: +46 (0)8 507 140 00
P.O. Box 1168Jan Stenbecks Torg 17, 5th floorSE-164 26 Kista, SwedenTel.: +46 (0)8 507 140 00
linköpingTeknikringen 8SE-583 30 Linköping, SwedenTel.: +46 (0)13 465 58 00
öreSundP.O. Box 702Emdalavägen 8SE-220 07 Lund, SwedenTel.: +46 (0)46 540 96 00
USABoStonNashua Office ParkOne Tara Blvd, Ste 404Nashua, NH 03062, USATel.: +1 603 888 7575
phoenix1711 W. Greentree DriveSuite 108Tempe, AZ 85284, USATel.: +1 480 753 9200
Japantokyo1-4-2 Kanda Ogawa-machiChiyoda-kuTokyo 101-0052, JapanTel.: +81 3 5207 6167
ChinaShanghai repreSentative officeRoom 1203, Silver TowerNo. 218 South XiZang RoadShanghai 200021, ChinaTel.: +86 21 6334 3406
BeijingRM1702, Block C, Reward Building, No. 203, 2nd Section of WangJing LiZe ZhongYuan, ChaoYang DistrictBeijing, 100102, ChinaTel.: +86 010 6439 8390
GermanymunichSchlosserstrasse 4DE-80336 Munich, GermanyTel.: +49 0 89 544 6760
United KingdomShepton malletCharlton BarnLower Charlton Trading EstateShepton MalletSomersetBA4 5QE, UKTel.: +44 1749 346784
FrancepariSBâtiment Mac Kinley1, avenue de l’AtlantiqueFR-91940 Les Ulis, FranceTel.: +33 0 1 76 91 58 20
IsraeljeruSalem11 Beit Hadfus Street(Building Lev Hagiva)Jerusalem 95483, IsraelTel.: +972 2 995 12 53 RomaniaBuchareStSplaiul Independentei 319 C,Trust Center, 060044Bucharest, RomaniaTel.: +40 21 305 15 00
Contact Information

P.O. Box 1033, SE-164 21 Kista, Sweden. Tfn +46 8 507 140 00www.enea.com