RAYMOND KEMBOI - PhD.pdf - University of Kabianga ...
192
i RELATIONSHIP BETWEEN SELECTED RISK GOVERNANCE MECHANISMS, BOARD OVERSIGHT AND FINANCIAL PERFORMANCE OF COMMERCIAL BANKS IN KENYA RAYMOND KIPYEGON KEMBOI A Thesis Submitted to the Board of Graduate Studies in Partial Fulfillment of the Requirement for the Conferment of the Degree of Doctor of Philosophy in Business Administration (Finance) of University of Kabianga UNIVERSITY OF KABIANGA OCTOBER 2019
-
Upload
khangminh22 -
Category
Documents
-
view
2 -
download
0
Transcript of RAYMOND KEMBOI - PhD.pdf - University of Kabianga ...
i
RELATIONSHIP BETWEEN SELECTED RISK GOVERNANCE
MECHANISMS, BOARD OVERSIGHT AND FINANCIAL PERFORMANCE
OF COMMERCIAL BANKS IN KENYA
RAYMOND KIPYEGON KEMBOI
A Thesis Submitted to the Board of Graduate Studies in Partial Fulfillment of
the Requirement for the Conferment of the Degree of Doctor of Philosophy in
Business Administration (Finance) of University of Kabianga
UNIVERSITY OF KABIANGA
OCTOBER 2019

ii
DECLARATION AND APPROVAL
Declaration
I declare that this thesis is my original work and has not been submitted for the
conferment of a degree or award of a diploma in this or any other University:
Signature…………………………. Date………………….………
Raymond Kipyegon Kemboi
PhD/BSA/003/15
Approval
This thesis has been submitted for examination with our approval as University
supervisors: -
Signature………………………….. Date…………………………
Dr. Peter Kimutai Cheruiyot
Department of Finance and Accounting
University of Kabianga
Signature …………………………. Date……………………….
Dr. Isaac Kiprotich Naibei
Department of Finance and Accounting
University of Kabianga
Signature………………………….. Date………………………….
Dr. Peter Kipkosgei Sirmah
Department of Agroforestry & Rural Development
University of Kabianga

iii
COPYRIGHT
No part of this thesis maybe produced, stored in any retrieval system or transmitted in
any form mechanical, photocopying, recording or otherwise without prior permission
from the author or the University of Kabianga.
© Raymond Kipyegon Kemboi, 2019

iv
DEDICATION
Dedicated to my parents Victor and Nelly Rop, my wife Mercy Kemboi and son Hans
Kiplangat.

v
ACKNOWLEDEMENT
This thesis is a product of contributions by several people whose efforts are hereby
fondly acknowledged. First, I would like to thank the Almighty God for His protection,
wisdom and good health while developing this thesis. I also thank my supervisors Dr.
Peter Kimutai Cheruiyot, Dr. Isaac Kiprotich Naibei and Dr. Peter Kipkosgei Sirmah
for their academic and scholarly guidance in producing this thesis. I wish to
acknowledge the positive comments, constructive criticisms and inspirations of my
supervisors in developing and polishing this thesis from the conceptual to the final
stage.
I wish to thank the Faculty members of the School of Business and Economics,
University of Kabianga, Dr. Willitter Rop, Dr. Lydia Langat, Dr. Hellen Sang, Dr.
Alfred Bett, Dr. Joseph Kirui, Dr. Patricia Chepkwony and Dr. Joseph Rotich for their
assistance in form of pieces of advice and guidance while developing the proposal and
the final thesis. I wish to appreciate my classmates for moral support and motivation. I
also thank University of Kabianga, Sotik campus staff for their encouragements.
Special appreciation also goes to the religious facet Reverend Philip Cheriro for the
spiritual support and prayers while developing this thesis.
I also acknowledge the contribution in form of encouragements from friends and family
members and more so my dear wife Mercy Kemboi. Much appreciation also goes to
University of Kabianga for giving me a chance to pursue this degree and more
importantly for providing a conducive environment for study. I finally want to thank

vi
my course lecturers for the valuable inputs and training that assisted me to produce this
thesis. Thank you all.
vii
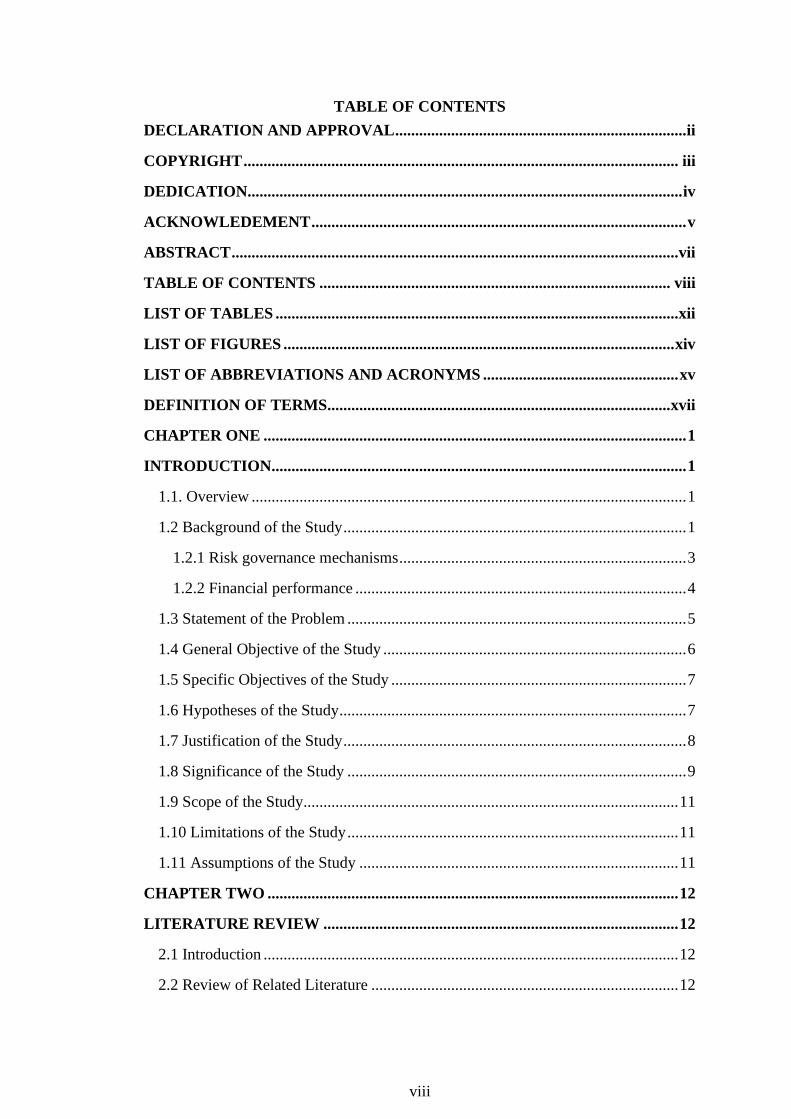
ABSTRACT
Commercial banks in any country play critical role in the growth of the economy. The
shareholders and stakeholders expect the banks to yield good financial returns.
However, performance of banks in Kenya has been declining leading to their collapse
or receivership. This may be attributed to many factors including risk exposure. In bid
to protect the financial sector, Central Bank of Kenya directed all the banks to manage
risks by implementing risk governance mechanisms. However, limited knowledge
exists on the relationship between risk governance mechanisms and financial
performance of financial institutions owing to limited studies and also no study has
attempted to investigate whether board oversight has a moderating effect on the
relationship between risk governance mechanisms and financial performance. This
study therefore sought to establish the relationship between risk committee existence,
audit and credit committee sizes, number of risk governance mechanisms and financial
performance of commercial banks in Kenya and it also established the moderating
effect of board oversight on the relationship between risk governance mechanisms and
financial performance of commercial banks in Kenya. The study is significant to
financial institution management, Central Bank of Kenya, Scholars and the
government. The target population was all the 42 commercial banks operating in
Kenya. The study adopted longitudinal research design covering a period of five years
(2013 - 2017). The study used secondary data extracted from annual audited financial
statements and reports of commercial banks. Regression analysis and multicollinearity
tests were carried out using SPSS. The study found a significant positive relationship
between risk governance mechanisms: risk committee existence, credit committee
size, number of risk governance mechanisms and financial performance. The findings
showed a coefficient of regression of r=0.376, R2= 0.142, p˂0.05. This indicates that
14.2% of the change in financial performance is explained by the risk governance
mechanisms. After introduction of the moderator first measured by board size, change
in R2 became 0.076, p˂0.05 indicating a significant moderating effect of board size on
the relationship between risk governance mechanisms and financial performance.
However, when frequency of board meetings was used as a moderator, change in R2=
0.006 with significance level of p˃0.05 was established indicating that there was no
significant moderating effect of frequency of board meetings on the relationship
between risk governance mechanisms and financial performance. The study concludes
that risk committee existence, credit committee size, number of risk governance
mechanisms have a significant positive relationship with financial performance of
commercial banks in Kenya, audit committee size is not significantly related to
financial performance, board size has a significant moderating effect on the
relationship between risk governance mechanisms and financial performance while
frequency of board meetings does not have a significant moderating effect on the
relationship between risk governance mechanisms and financial performance. The
study recommends commercial banks to focus on risk governance mechanisms so as
to manage risk exposure thus enhancing financial performance.
viii
TABLE OF CONTENTS
DECLARATION AND APPROVAL ......................................................................... ii
COPYRIGHT ............................................................................................................. iii
DEDICATION............................................................................................................. iv
ACKNOWLEDEMENT .............................................................................................. v
ABSTRACT ................................................................................................................ vii
TABLE OF CONTENTS ........................................................................................ viii
LIST OF TABLES ..................................................................................................... xii
LIST OF FIGURES .................................................................................................. xiv
LIST OF ABBREVIATIONS AND ACRONYMS ................................................. xv
DEFINITION OF TERMS...................................................................................... xvii
CHAPTER ONE .......................................................................................................... 1
INTRODUCTION........................................................................................................ 1
1.1. Overview ............................................................................................................. 1
1.2 Background of the Study ...................................................................................... 1
1.2.1 Risk governance mechanisms ........................................................................ 3
1.2.2 Financial performance ................................................................................... 4
1.3 Statement of the Problem ..................................................................................... 5
1.4 General Objective of the Study ............................................................................ 6
1.5 Specific Objectives of the Study .......................................................................... 7
1.6 Hypotheses of the Study ....................................................................................... 7
1.7 Justification of the Study ...................................................................................... 8
1.8 Significance of the Study ..................................................................................... 9
1.9 Scope of the Study.............................................................................................. 11
1.10 Limitations of the Study ................................................................................... 11
1.11 Assumptions of the Study ................................................................................ 11
CHAPTER TWO ....................................................................................................... 12
LITERATURE REVIEW ......................................................................................... 12
2.1 Introduction ........................................................................................................ 12
2.2 Review of Related Literature ............................................................................. 12
ix
2.2.1 Risk committee and financial performance of commercial banks in Kenya
.............................................................................................................................. 12
2.2.2 Audit committee size and financial performance of commercial banks ..... 16
2.2.3 Credit committee size and financial performance of commercial banks ..... 18
2.2.4 Number of risk governance mechanisms and financial performance .......... 22
2.2.5 Board oversight and financial performance ................................................. 24
2.3 Theoretical Literature ......................................................................................... 29
2.3.1 Bank risk management theory ..................................................................... 29
2.3.2 Adverse selection theory ............................................................................. 31
2.3.4 Moral hazard theory ..................................................................................... 37
2.3.5 Agency theory.............................................................................................. 39
2.4 Conceptual Framework ...................................................................................... 42
2.5 Identification of Knowledge Gap ....................................................................... 45
CHAPTER THREE ................................................................................................... 47
RESEARCH METHODOLOGY ............................................................................. 47
3.1 Introduction ........................................................................................................ 47
3.2 Research Design ................................................................................................. 47
3.3 Location of Study ............................................................................................... 47
3.4 Target Population ............................................................................................... 48
3.5 Sample Size and Sampling Procedures .............................................................. 48
3.6 Data Collection Instruments ............................................................................... 49
3.6.1 Validity ........................................................................................................ 49
3.6.2 Reliability .................................................................................................... 49
3.6.3 Pre-test for general multicollinearity ........................................................... 50
3.7 Data Collection Procedures ................................................................................ 51
3.7.1 Risk committee and financial performance ................................................. 51
3.7.2 Audit committee size and financial performance ........................................ 51
3.7.3 Credit committee size and financial performance ....................................... 51
3.7.4 Number of risk governance mechanisms and financial performance .......... 52
3.7.5 Moderating effect of board oversight .......................................................... 52

x
3.8 Data Analysis and Presentation .......................................................................... 52
3.9 Ethical Considerations........................................................................................ 54
CHAPTER FOUR ...................................................................................................... 55
RESULTS AND DISCUSSIONS .............................................................................. 55
4.1 Introduction ........................................................................................................ 55
4.2 Risk Governance Mechanisms and Financial Performance of Commercial
Banks ........................................................................................................................ 55
4.2.1 Return on assets for commercial banks in Kenya ........................................ 56
4.2.2 Risk governance mechanisms of commercial banks ................................... 57
4.2.3 Risk committee existence in commercial banks in Kenya .......................... 58
4.2.4 Relationship between risk committee existence and financial performance
.............................................................................................................................. 59
4.2.5 Audit committee size of commercial banks in Kenya ................................. 62
4.2.6 Credit committee size of commercial banks in Kenya ................................ 65
4.2.6 Number of risk governance mechanisms of commercial banks in Kenya .. 69
4.2.7 Relationship between risk governance mechanisms and financial
performance .......................................................................................................... 74
4.3 Board Size of Commercial Banks in Kenya....................................................... 77
4.3.1 Moderating effect of board size on risk committee existence and return
on assets ............................................................................................................ 78
4.3.2 Moderating effect of board size on audit committee size and the return on
assets ................................................................................................................. 82
4.3.3 Moderating effect of board size on credit committee size and the return
on assets ............................................................................................................ 85
4.3.4 Moderating effect of board size on number of risk governance
mechanisms and return on assets ...................................................................... 88
4.3.5 Moderating effect of board size on risk governance mechanisms and
financial performance ........................................................................................... 91
4.4 Board Meetings of Commercial Banks in Kenya............................................... 95
4.4.1 Moderating effect of board meetings on risk committee and return on
assets ................................................................................................................. 96
xi
4.4.2 Moderating effect of board meetings on audit committee size and
financial performance ....................................................................................... 99
4.4.3 Moderating effect of board meetings on credit committee size and return
on assets .......................................................................................................... 102
4.4.4 Moderating effect of board meetings on number of risk governance
mechanisms and return on assets .................................................................... 106
4.4.5 Moderating effect of board meetings on risk governance mechanisms and
financial performance ..................................................................................... 109
CHAPTER FIVE ..................................................................................................... 113
SUMMARY, CONCLUSIONS AND RECOMMENDATIONS ......................... 113
5.1 Introduction ...................................................................................................... 113
5.2 Summary .......................................................................................................... 113
5.3 Conclusions ...................................................................................................... 115
5.3.1 Risk committee existence and financial performance of commercial banks
in Kenya .............................................................................................................. 115
5.3.2 Audit committee size and financial performance of commercial banks in
Kenya .................................................................................................................. 115
5.3.3 Credit committee size and financial performance of commercial banks
in Kenya .............................................................................................................. 116
5.3.4 Number of risk governance mechanisms and financial performance of
commercial banks in Kenya ............................................................................... 116
5.3.5 Moderating effect of board oversight on the relationship between risk
governance mechanisms and financial performance .......................................... 116
5.4 Recommendations ....................................................................................... 118
5.5 Suggestions for Further Research .................................................................... 119
REFERENCES ......................................................................................................... 121
APPENDICES .......................................................................................................... 135
Appendix 1: List of Commercial Banks in Kenya ................................................. 135
Appendix 2: Data extraction form .......................................................................... 138
Appendix 4: NACOSTI Approvals ........................................................................ 172

xii
LIST OF TABLES
Table 3.1 Category of bank tier ................................................................................... 48
Table 3.2 Pre-test results on multicollinearity ............................................................. 50
Table 4.1 Return on assets for commercial banks in Kenya (2013-2017) ................... 56
Table 4.2 Multicollinearity test for commercial banks selected risk governance
mechanisms .................................................................................................................. 57
Table 4.3 Risk committee existence on commercial banks in Kenya .......................... 58
Table 4.4 Risk committee existence and RoA per tier ................................................. 59
Table 4.5 Linear regression analysis between risk committee existence and ROAs for
commercial banks ........................................................................................................ 60
Table 4.6 Audit committee sizes for commercial banks (2013- 2017) ........................ 62
Table 4.7 Audit committee size and RoA as per tier ................................................... 63
Table 4.8 Regression analysis between audit committee size and RoA ...................... 64
Table 4.9 Credit committee size of commercial banks 2013- 2017 ............................ 66
Table 4.10 Regression analysis as per tier ................................................................... 67
Table 4.11 Regression analysis between credit committee size and return on assets
(2013-2017).................................................................................................................. 68
Table 4.12 Number of risk governance mechanisms adopted by in commercial banks
...................................................................................................................................... 70
Table 4.13 Regression analysis as per tier ................................................................... 71
Table 4.14 Regression analysis between number of risk governance mechanisms and
return on assets ............................................................................................................. 72
Table 4.15 Data on risk governance mechanisms ........................................................ 74
Table 4.16 Regression between risk governance mechanisms and RoA ..................... 75
Table 4.17 Board size of commercial banks in Kenya ................................................ 78
Table 4.18 Regression of moderating effect of board size on the relationship between
risk committee existence and RoA for commercial banks ........................................... 80

xiii
Table 4.19 Regression of moderating effect of board size on the relationship between
audit committee size and return on assets .................................................................... 83
Table 4.20 Moderating effect of board size on the relationship between credit
committee size and return on assets ............................................................................. 86
Table 4.21 Moderating effect of board size on the relationship between number of risk
governance mechanisms and return on assets .............................................................. 89
Table 4.22 Moderating effect of board size on the relationship between risk
governance mechanisms and financial performance ................................................... 92
Table 4.23 Data on the number of board meetings held by commercial banks in Kenya
(2013-2017).................................................................................................................. 95
Table 4.24 Moderating effect of board meetings on the relationship between risk
committee existence and return on assets .................................................................... 97
Table 4.25 Moderating effect of board meetings on the relationship between audit
committee size and return on assets ........................................................................... 100
Table 4.26 Moderating effect of board meetings on the relationship between credit
committee size and return on assets ........................................................................... 103
Table 4.27 Moderating effect of board meetings on the relationship between number
of risk governance mechanisms and return on assets ................................................ 107
Table 4.28 Moderating effect of board meetings on the relationship between risk
governance mechanisms and financial performance ................................................. 110

xiv
LIST OF FIGURES
Figure 2.1 Conceptual framework of risk governance mechanisms and financial
performance…………………………………………………….….44

xv
LIST OF ABBREVIATIONS AND ACRONYMS
AIG America International Group
CBK Central Bank of Kenya
CDS Credit Default Swaps
CEO Chief Executive Officer
CIS Credit Information Sharing
CRA Consumer Reporting Agencies
CRB Credit Reference Bureau
DHG Discovery Health Group
EPS Earning Per Share
ERM Enterprise Risk Management
GDP Gross Domestic Product
KPMG Klynveld Peat Marwick Goerdeler
MBS Mortgage-Backed Securities
MDO Micro Enterprise Development Organization
NACOSTI National Commission for Science, Technology and Innovation
NAMA National Association of Mercantile Agencies

xvi
NGOs Non-Governmental Organizations
PwC Pricewaterhouse Coopers
ROA Return on Assets
ROI Return on Investment
SACCOs Savings and Credit Corporative Societies
SMEs Small Medium Enterprises
SWOT Strength, Weakness, Opportunities, Threats
UK United Kingdom
UN United Nations
US United States
VIF Variable Inflation Factor
xvii
DEFINITION OF TERMS
Audit committee refers to a committee established by the board and assigned the
responsibility of overseeing the audits of the bank and generating reports
for the board.
Board committee refers to the committees established by the board of a bank and
assigned various duties of governance by the board.
Board oversight refers to the duties of governance performed by the board members
of a commercial bank. This is the moderating variable for this study. It is
measured using board size and frequency of board meetings.
Commercial Bank is a financial institution that is regulated by the Central Bank of
Kenya
Credit committee refers to a committee established by the board of a bank with the
responsibility of regulating, controlling, monitoring and rationing bank
credits.
Credit Information refers to both the positive or negative information about a person,
company or any institution and it gives the credit information including the
credit worthiness, credit standing, credit capacity, the history or profile of an
individual or entity with regard to credit, assets, and any financial obligations
Credit Report refers to published, written information by the credit reference bureaus
about the credit information of customers. The report is normally used by the
various institutions to make credit information decisions. The report gives the
customer’s credit ability and past credit records. The credit report can either be
xviii
positive or adverse. The credit report informs the credit report users on the
eligibility of the customers to the credit and their ability to repay the loans.
Credit risk refers to any risk that the commercial banks face while it tries to manage
the use of cash in the bank. It ranges from managing defaults from the debtors,
failure to manage banks capital and loan reserves.
Financial institution refers to commercial bank or a micro finance bank which
provides financial services to the members and the customers and is regulated
by the central bank of Kenya. The financial institution does the function of
advancing loans to its customers and the members.
Financial performance refers to the measure of how the commercial banks perform.
Financial performance is measured by the return on assets.
Hazard refers to any condition that increases the chances of any form of risk occurring.
Hazard is a catalyst of risk.
Negative Information refers to adverse customer information relating to their credit
rating, and normally the negative information is because of the customers
defaulted loans previously, other failure by the customer to honor the financial
obligation, any cases on credit frauds, attempt to defraud any financial
institution.
Micro Finance is a financial institution that provides small amounts of loans to its
customers/members and it is regulated by the Central bank of Kenya.

xix
Risk refers to the occurrence of an unfortunate event that is measurable and whose
occurrence causes financial loss to the bank.
Risk committee refers to a committee established by the board to regulate the risk that
a bank may face during its operation. Risk committee minimizes and eliminates
the various risks that a bank may face that may affect its operations negatively.
Risk governance mechanism refers to the ways and strategies that banks use to
manage risk within the board of governance. The mechanisms include risk
committee of the bank that does the role of managing risk exposure, audit
committee that is responsible for ensuring accountability and eliminating fraud,
credit committee that controls the use and management of credit in the bank and
full board of governance that performs the overall role of oversight.
SMEs refer to the companies whose capital is below one million Kenya shillings.
Tier refers to classification of banks by the Central Bank of Kenya according to the
sizes. Tier I represent banks with a market share of over 5 %, Tier II represents
banks with a market share of between 1-5% and Tier III represents banks with
market share of below 1%. (See Appendix I).

1
CHAPTER ONE
INTRODUCTION
1.1. Overview
This chapter presents the background of the study, the statement of the problem,
purpose of the study, objectives, significance, limitations and the assumptions of the
study.
1.2 Background of the Study
Commercial banks contribute to economic development of both developed and
developing countries (Miencha and Selvam, 2013; Ntow and Laryea, 2012). Despite
this crucial role, the banking industry faces risk exposure challenges that may lead to
their collapse if not managed. After the collapse of various institutions and financial
distress in the world in the 1990s, regulators of financial institutions in various countries
developed policies and strategies to minimizing risk occurrence (Mohamed, 2015). This
led to the passing of the Basel Accord I, Basel Accord II and Basel Accord III that
details the bank supervision rules (Lexicon, 2017). In the United States, the legislators
enacted the Sarbes Oxyley Act in 2002, which acted as a risk prevention mechanism
(Mohamed, 2015).
Commercial banks have also instituted other banking anti-risk mechanism such as the
institution of boards of governance whose mandate includes the bank oversight role
executed through various board committees (Nibedita, 2018). The board committees

2
play the important role in corporate governance of preparing reports for the full board
of governance for development of policies (Chen & Wu, 2016).
Africa has had its share of bank failure that has been attributed to poor management
and excess risk taking (Odipo, 2007). In South Africa, for the past 30 years, over 20
banks have been deregistered because of poor management and liquidity problems
(BusinessTech, 2018). In Democratic Republic of Congo, International Bank for Africa
in Congo was forced to limit its cash withdrawals when the Central Bank terminated its
credit amount because of mismanagement (Napier, 2016).
In general, the main causes of banks failure include lack of risk management
mechanisms, poor management of the banks and too much lending and failure to
comply with directives of the Central Bank (Khomotso, 2015; Kangali, 2016). In East
Africa, several banks have been closed down and their operation licences cancelled or
placed under receivership for breach of capital rules. Twiga Bancorp a state owned
financial institution in Tanzania made huge losses and its management was replaced by
Bank of Tanzania (Githaiga, 2018). In Uganda, Crane Bank was taken over by the
Central Bank after it faced huge undercapitalisation.
In Kenya, 22 commercial banks have collapsed since independence (InfoHub Kenya,
2016). Since 2014, three banks namely Dubai Bank, Imperial Bank and Chase Bank
have been placed under receivership. The trend of collapse of banks is worrying despite
the role they play in the economy. The collapse of banks in Kenya has been attributed
to failed financial obligations, financial malpractices and failure to meet the required

3
financial ratios and undisclosed insider loans respectively (Gathaiya, 2017). In general,
the risk issues affecting commercial banks range from insider dealings, weak corporate
governance practices, weak regulatory and supervision systems, poor risk management
strategies and lack of strong internal controls (Gathaiya, 2017). In particular
Cooperman, Mills and Gardner (2000), classified these forms of risks as due to credit,
interest, operational, political, foreign exchange, market and liquidity risks. Credit risk
is the major determinant of the financial performance of commercial banks (Poudel,
2012). The defaults by the borrowers lead to slow growth or even collapsing of the
institutions and is the major problem facing commercial banks in Kenya (Waweru &
Kalani, 2009).
1.2.1 Risk governance mechanisms
Risk Governance mechanisms refers to various ways through which a firm manages its
risk exposure. It involves identification, analysis and implementing strategies of
reducing and eliminating risk faced by firms (Cetina and Preda, 2005). Commercial
banks can adopt risk management mechanisms such as establishing risk committee,
audit committee, credit committee and board of governance that does the oversight role.
According to Kallamu (2015), good returns are attributed to the existence of risk
committee in the organization. Audit committee does the role of ensuring effective
financial reporting, effectiveness in the internal audit, integrity of the financial
statements and providing oversight on external report from auditors. A study done by
(Samoei and Rono, 2016) found a significant effect of audit committee size on
performance of firms. Credit committee ensures implementation and adherence to
4
credit policies and monitoring credit portfolio while the board of governance does the
overall mandate of oversight (Ndegwa, 2017). Mumbi and Omagwa (2017) did a study
on credit risk management and financial performance of commercial banks in Kenya
and found a significant positive relationship between the two variables. The study
recommended that commercial banks should maintain credit risk at lower levels to
ensure better performance.
1.2.2 Financial performance
Financial performance is a measure of returns of a firm from its operations over a
certain period. It can be measured in terms of return on assets (RoA) and return on
equity (RoE) (Ntuite, 2015). The occurrence of risks and mismanagement directly
results in decrease in the financial performance of banks (Wanjohi and Ndambiri,
2017). To ensure stability in financial performance, banks need to deal with risks by
identifying their various sources (Wanjohi and Ndambiri, 2017). This will require
banks to have better information about the current and potential customers and their
financial conditions. Banks may need to implement risk governance mechanisms to
evaluate money flow and minimize risks that the money is facing (Alshatti, 2015).
Improper management of risk may result in liquidity risk brought about by the
indebtedness of the banks. Commercial banks may collapse if there is poor management
of loans or reduction in the quality of the loans advanced to the creditors (Sufi and
Qaisar, 2015). While the link between risk and financial performance is evident in
literature, the relationship between risk governance mechanisms and financial
performance is not clear owing to limited studies. The risk controls adoption by an

5
institution depends on risk decision made at corporate level as per governance
structures and mechanisms of different institutions.
The major risks faced by commercial banks is due to credit, that changes the net asset
value hence the perceived ability of debtors to meet their contractual obligations (Pyle,
1997). Credit risk occurs when one party to a contract fails to honor their obligations
or agreement to make payments or failure to pay taxes insurance and premium due.
Tshorhe, Aboagye and Coleman (2011) defines credit risk as the probability that some
of the assets of the banks, especially its loans, will decline in value and possibly become
worthless. To deal with the credit risks exposures, commercial banks should identify
the various sources of the risks and to screen their exposures. These exercises mean a
better information of the current and potential customers and their financial conditions,
by implementing new scoring techniques (Alshatti, 2015; Koch and MacDonald, 2000;
Tshorhe, Aboagye and Coleman, 2011).
1.3 Statement of the Problem
Commercial banks in Kenya play a significant role in the economic development by
providing financial access and savings. Over the years, commercial banks have
increased in number, as is the value of their investments. They are expected to report
good financial performance and stability for the interest of the shareholders and all the
stakeholders. Despite the growth and expansion, commercial banks are exposed to risks
hence reporting poor financial performance and subsequently collapse (Labie, 2011).
Indeed, so far, a total of twenty-two commercial banks have collapsed in Kenya, while

6
three namely Chase, Imperial and Dubai Banks have recently been placed under
receivership by the Central Bank of Kenya. Gathaiya (2017) found that the problems
affecting the commercial banks in Kenya range from insider lending, weak corporate
governance practices, weak regulatory and supervisory systems, poor risk management
strategies as well as lack of strong internal controls. Similarly, (Kinuthia, 2007) found
that commercial banks are making losses because of non-performing loans. The
collapse of commercial banks result in loss of shareholder investments, loss of customer
deposits and loss of employment. To curb this trend, the Central Bank of Kenya has
developed a policy requiring all banks in Kenya to minimize risks by adopting various
risk mechanisms. Previous studies on risk management have focused on corporate
governance and types of risks excluding the risk governance mechanisms (Poudel, 2012
and Ojulari 2014). There is no study that has investigated the relationship between
selected risk governance mechanisms and financial performance and also the
moderating effect of board oversight. The current study therefore sought to establish
the relationship between risk governance mechanisms and financial performance of
commercial banks in Kenya. The results is useful to banking industry for improved
financial performance and management.
1.4 General Objective of the Study
The general objective of this study was to establish the relationship between selected
risk governance mechanisms, board oversight and financial performance of commercial
banks in Kenya

7
1.5 Specific Objectives of the Study
The specific objectives of this study were to;
i. Determine the relationship between risk committee existence and the financial
performance of commercial banks in Kenya
ii. Establish the relationship between audit committee size and the financial
performance of commercial banks in Kenya
iii. Derive the relationship between the credit committee size and the financial
performance of commercial banks in Kenya
iv. Establish the relationship between the number of risk governance mechanisms and
the financial performance of commercial banks in Kenya
v. Establish the moderating effect of board size on the relationship between selected
risks governance mechanisms and the financial performance of commercial banks
in Kenya
vi. Establish the moderating effect of frequency of board meetings on the relationship
between selected risks governance mechanisms and the financial performance of
commercial banks in Kenya
1.6 Hypotheses of the Study
The following hypotheses were tested:
Ho1: There is no statistically significant relationship between risk committee existence
and the financial performance of commercial banks in Kenya
8
Ho2: There is no statistically significant relationship between audit committee size and
the financial performance of commercial banks in Kenya
Ho3: There is no statistically significant relationship between the credit committee
size and the financial performance of commercial banks in Kenya
Ho4: There is no statistically significant relationship between the number risk
governance mechanisms and the financial performance of commercial banks in
Kenya
Ho5: There is no statistically significant moderating effect of board size on the
relationship between selected risk governance mechanisms and the financial
performance of commercial banks in Kenya
Ho6: There is no statistically significant moderating effect of frequency of board
meetings on the relationship between selected risk governance mechanisms and the
financial performance of commercial banks in Kenya
1.7 Justification of the Study
The demand for financial services and increasing customers of commercial banks in
Kenya has led to increased savings and deposits. This has subsequently led to increased
borrowings therefore exposing commercial banks to potential mismanagement and risk,
hence affecting their financial performance. Some bank customers borrow funds and
default in the repayment. In the event that the commercial banks fail to manage the
number of defaulters, then its ability to lend will be affected leading to liquidity crisis.
The level of default may become extreme leading to the closure of commercial banks,
9
hence the need to understand relationships between risk governance mechanisms and
bank financial performance.
Previous studies have focused on the types of risks while little attention has been given
to the mechanisms of managing risks by the banks. This therefore, presents a unique
area of study on the relationship between risk governance mechanisms and financial
performance of commercial banks. When a bank collapses, the shareholders and
stakeholders suffer financial losses. This study therefore adds a pool of knowledge on
the effects of various risk governance mechanisms hence enabling the bank
management and policy makers to make informed policy decisions to prevent risks.
1.8 Significance of the Study
The outcome of this research is beneficial to various groups in various ways. The
benefits are as discussed below; -
1.8.1 Financial institution management
The findings from this study are useful to the commercial banks in the management of
risk. Furthermore, the findings inform the commercial banks on the type and a standard
mix of risk mechanisms to adopt.
1.8.2 Central Bank of Kenya
It is in the best interest of the Central Bank of Kenya (CBK) that commercial banks are
sustainable. From the findings of this study, CBK being the regulator of the commercial
banks, it benefits from information about relationship of various risk governance

10
mechanisms studied and the financial performance. Proper proportion of risk
mechanism and financial performance are established. The CBK can pass policies on
the standard ratio of risk governance mechanism that helps the commercial banks to
manage and minimize risks exposures for better financial performance. From the
findings of the research, the CBK will make informed policies to roll out to other
financial sectors.
1.8.3 Scholars
The scholars in the field of financial risk, governance and performance benefits through
referencing when doing similar or related research. The findings provide direction for
researchers interested in this study area. Suggestions for further studies have been made
from the study.
1.8.4 Government
The government is the regulator of the financial system in the country. The published
findings of the study can be referred to by respective government departments when
drafting and passing legislation and formulation of policies. This enables them to
regulate the financial system and prevent it from failure due to risk, hence help its
citizens from losing funds invested in the various banks. Similarly, the findings will
enable the respective Government departments to make informed legislation on risk
management in the country resulting in good performance.
11
1.9 Scope of the Study
This study was limited only to the 42 commercial banks licensed by the Central Bank
of Kenya. The study focused on the risk governance mechanisms in all commercial
banks and their respective financial performance. The risk governance mechanisms
covered by the study are; risk committee, audit committee, credit committee and
number of risk governance mechanisms. The performance of banks was measured by
RoA. The period of the study covered five years 2013-2017.
1.10 Limitations of the Study
While conducting this study, there were limitations. The study intended to use the most
recent financial reports from the commercial banks however the latest financial reports
were for the financial year 2017. This is due to the fact that commercial banks have to
subject the annual financial reports through a series of processes including external
auditing and annual general meetings and this may delay the publication of this reports.
For this study the latest financial reports were used.
1.11 Assumptions of the Study
The study assumed that; risk governance mechanisms exist in all the commercial banks,
that the audited information obtained from the website of banks is true and represents
the true financial and corporate position for the years under study, that banks have been
in operation within the period of study and that at least some banks have risk
committees.
12
CHAPTER TWO
LITERATURE REVIEW
2.1 Introduction
This chapter reviews both theoretical and empirical literature regarding the risk
governance mechanisms and the financial performance of the commercial banks in
Kenya.
2.2 Review of Related Literature
This section reviews literature related to risk governance mechanisms (risk committee
existence, audit, credit committee sizes, number of risk governance mechanisms and
board oversight) and financial performance of commercial banks.
2.2.1 Risk committee and financial performance of commercial banks in Kenya
According to Kithinji (2010), risk management is the procedure that commercial banks
put in place to prevent its financial exposures. Risk committee is a group of members
established by the banks to manage risk exposure. The composition of the risk
committee includes members from the board of directors. The function of the risk
committee is to ensure optimization of assets and liabilities, ensuring compliance with
statutory and legal requirements, reviewing and assessing the quality and integrity of
risk management. The risk committee also ensures risk policies and strategies are
effectively managed (Equity Bank, 2017).

13
The main objective of any business and as is the case of commercial banks is to
maximize the profit level. However, according to Alshatti (2015) there is no banking
practice without risk. All banks face different risks in their operations and therefore it
is important for every bank to manage its risks by analyzing and determining corrective
action of prevention. In the banking industry, there are internal and external indicators
of profit level (Ali, Muhammad and Hafiz, 2011). The internal indicators may include
size of the bank, the efficiency of the operations, capital and credit level, portfolio
composition and asset management of the bank. On the other hand, the external
indicators may include the factors that cannot be controlled by the banks for example
inflation level (Ali et al., 2011).
A study by Cheplel (2013) on the impact of enterprise risk management practices on
the financial performance of commercial banks in Kenya observed that risk
management practices are determined by the extent to which managers understand risk
and risk management. The study outlined, enterprise risk management factors such as
risk control, self-assessment, compliance of both internal and external regulations,
tracking key risk indicators and incident management. This suggested a need to look at
other risk management mechanisms to establish the impact of risk governance
mechanisms on financial performance.
Indeed, according to Kallamu (2015), a risk committee that is composed of independent
directors, increases firm market valuation. The presence of executive in risk
management committee has a significant negative relationship with the return on asset
14
(Kallamu, 2015). These observations were made in a developed country Malaysia,
therefore the findings may not be generalized to developing country Kenya.
Makokha (2014) while conducting a study on the effect of corporate governance on
financial performance of insurance companies in Kenya observed that corporate
governance has an influence on the performance of the insurance companies. However,
number of the risk management committee had no significant relationship with the
performance but the ratio of executive to outside directors did (Makokha, 2014). This
study however focused on the insurance companies therefore the findings may not
apply to the commercial banks.
Kallamu (2015) found out that the experience of the risk management committee in
Malaysia increased both the accounting returns and the market valuation of the
company. However, there is need to carry out a similar study using other risk committee
attributes, especially now that risk mechanisms adopted by commercial banks in Kenya
vary. A study by Kessey (2015), observed that the overall role of risk management lies
with the senior management of the banks, hence a need for the credit risk department
to be operated by proper trained staff. This therefore justified the need of a study on the
impact of existence of risk committee on the financial performance of commercial
banks.
Akong'a (2014) found out that there is a significant relationship between the financial
risk management and the financial performance in Kenyan commercial banks.
Commercial banks should therefore manage such risks in its operations to reduce the
impact of losses. However, there is limited knowledge on the relationship between
15
various risk governance mechanisms and financial performance (Akong’a, 2014).
According to Cheplel (2013), commercial banks in Kenya should establish proper
communication to build proper confidence in the risk management and enhance risk
appetite with the lower level staff.
In contrary Han (2015) found that banks in China had weak infrastructure and warning
system, which increased the risk faced by the commercial banks. Such banks should
therefore improve on credit organization structure and establish effective early warning
system to minimize the risk exposure. However, in such a case, the risk management
department should be independent for effective management of risk (Han, 2015). This
responsibility lies with the board committee on risk. In summary, it is evident that
studies on risk committee has not looked into all attributes of risk committee hence the
proper standard proportion has not been established.
A study by Bhuiyan and Yimei (2013) found that presence of stand alone risk
committee enhances the corporate governnace of a company and improves the financial
performance. The data was collected from all the firms in securities industry research
centre. The study generalised the findings to all companies of different sectors. Elamer
and Benyazid (2018) on impact of risk commmittee on financial performance of UK
financial institutions found that institutions with existence of risk committee performed
poorly compared with institutions that did not have risk committees. This study
concluded that risk committee existence is negatively related to financial performance.
The variation in such studies may be attributed to a GDP of 2,828,640 million dollars

16
in UK and a GDP of 87,908 million dollars in Kenya (Countryeconomy.com, 2018).
This therefore justified a need to carry out similar research here in Kenya.
2.2.2 Audit committee size and financial performance of commercial banks
Audit committee refers to a committee appointed by the board of governance to provide
independent oversight to the bank operations and ensure effective financial reporting,
effectiveness in the internal audit and integrity of the financial statements (Equity Bank,
2017). The members of the audit committee are selected from the board members. The
structure of the audit committee, however, may vary from one bank to another.
Samoei and Rono (2016) observed that the size of audit committee has a significant effect
on the financial performance of financial firms listed in Nairobi Securities Exchange in
Kenya contrary to performance of public listed companies in Malaysia (Sean, Chyi, Choo,
Yi and Hong, 2016). This suggests that there may be cross-border disparity in results or
results may not be generalized across different sectors. Al-Matari, Al-Swidi, Bt Fadzil and
Al-Matari (2012) studied the relationship between governance characteristics; board of
directors, audit committee characteristics and performance of Saudi Arabia listed
companies. The study found a significant relationship between the audit committee size
and the firm financial performance. This mirrored findings of Samoei and Rono (2016)
suggesting a need to carry out a similar study in Kenya.
Berkman and Zuta (2017) found that in Israel, the larger the audit committee sizes, the
higher the likelihood of negative effect occurring, contradicting Samoei and Rono (2016)
on Kenyan firms. These results suggest that variability on the impact of audit committee

17
size on financial performance of commercial banks may exist between developed and
developing economies. Samoei and Rono (2016) further observed that the presence of
audit committee with experience enhances monitoring and lead to good performance of
the firms listed in Nairobi stock exchange, hence, a need to evaluate the financial
performance of commercial banks in Kenya. Berkman and Zuta (2017) observed that the
percentage of the audit committee with expertise in the financial concept is associated with
the likelihood of negative events in the company.
According to Arfan and Nasir (2014), audit committee composed of non-executive
directors has a statistical influence on performance of firms in Pakistan. This study by
Arfan and Nasir (2014) was carried out in Pakistan based on panel data and longitudinal
research design. Salehi (2017), observed a positive relationship between audit committee
and financial performance and contradicts the findings of (Tarighi, 2018) which observed
no significant association between audit committee size and financial performance.
According Mohammad, Wasiuzzaman, Morsali and Zaini, (2018), audit committee size
statistically explains the likelihood of financial performance, however, no relationship was
found to exist between audit size and financial performance. Appiah (2016), revealed that
corporate insolvency is related to audit committee presence and size in firms based in the
United Kingdom but failed to show the relationship between audit committee size and
financial performance.
A study done by Aldamen, Duncan, Kelly, Namara and Nagel (2012) on audit committee
characteristics and firm performance during the global financial crisis found that smaller
audit committee is associated with high performance of firms. The study was done in

18
Australia focussing on listed firms. It is not clear whether similar findings can be replicated
for commercial banks in Kenya. There is need to conduct a study in Kenya with the focus
being commercial banks regulated by Central Bank of Kenya. This study contradicts Omer
and Zuta (2017), who did a study on impact of audit committee size and composition on
the negative events in the life of a company. The study by Omer and Zuta (2017), found
that large audit committee sizes is significantly positvely related to the occurrence of
negative events in a company. The study was done in Israel a developed country while the
study by Aldamen, Duncan, Kelly, Namara and Nagel (2012) was done in Australia. This
may have contributed in the difference in the findings.
2.2.3 Credit committee size and financial performance of commercial banks
Credit committee draws its powers from the board of governance. The responsibility of
the credit committee is to review and monitor credit portfolio quality, ensure
implementation and adherence to credit policies, periodically monitor concentrations in
credit portfolio and assess efficacy of thresholds and action plans in case of threshold
breach in the bank (Equity Bank, 2017).
Muriithi (2016) revealed that, the component of financial risk that has an impact on the
financial performance of commercial banks is the cost to income ratio. Credit risk arises
from crediting activity of the clients hence affect financial performance of the banks
(Alshatti, 2015). Credit risk leads to the change in the net asset value because of the
changes in the perceived ability of the borrower to meet their contractual obligations
(Pyle, 1997). It occurs when one party to a contract fails to honor a contract or
19
agreement to meet payments or failure to pay taxes, insurance and premium due as
agreed with the lender. Tshorhe, Aboagye and Coleman (2011) views credit risk as the
probability that some of the assets of the banks, especially its loans, will decline in
value and possibly become worthless.
In the banking sector, the large portion of the assets comes from the loans. In most
cases, the portfolio of the banks tends to exhibit the highest credit risk (Koch and
MacDonald, 2000). The control of credit risk is important to banks since banks more
often hold small amounts relative to their resource base and that a little percentage of
net loans not performing can make a financial institution to collapse. In this way,
management of credit risk is important to the sustainability of a bank and to the financial
system (Tshorhe et al., 2011).
According to Kinuthia (2007), finance institutions incur losses due to loan default hence
affects the wealth of members. Institutions should therefore provide guidelines on loan
policy and credit extension to members while highlighting the need for integration of
the information system of institutions to employers and the management. Kinuthia
(2007) underscored the need for Ministry of Co-operative Development and Marketing
in Kenya to liaise with Ministry of Immigration and Registration of Persons to be able
to instantly access information on departing employees.
According to Ghosh, Islam and Hasan (2014), to minimize the credit risk there should be
proper framework of risk management. Muriithi (2016) on the other hand found that
financial risk components had a negative impact on the financial performance hence there
is a need to study how other risk governance mechanisms affect the financial performance

20
of commercial banks. Kithinji (2010) observed that the bulk of the profits of the
commercial banks are not influenced by the credit risk. However, Muriithi (2016),
observed that credit risk is the main determinant of financial performance. The two studies
however, failed to look at the credit risk governance mechanisms justifying the need to
establish how credit committee affect the financial performance of the commercial banks.
Magnifique (2013), observed that credit risk management in Rwanda predicts the
financial performance of the commercial banks and that credit analysis has a significant
impact on the financial performance on commercial banks. The study however failed
to explain the extent to which the credit analysis and management affects the financial
performance hence a need to carry out a similar study here in Kenya. Magnifique
(2013), recommended that more studies should be carried out using other mechanisms
of risk governance to establish the effect of the credit risk variables on the financial
performance of the commercial banks. According to Ahmed and Qaisar (2015), credit
risk management practices, had a positive influence on loan performance in Pakistan.
This study adopted the measures of credit to be credit risk control, the credit policy of
the bank, credit terms and policy and client appraisal. There is need therefore to carry
out comparative study here in Kenya and other developing countries.
Alshatti (2015), recommended that the banks should establish adequate risk
management policies and sound credit-granting process and controls. The study,
however, failed to show the effect of risk governance mechanisms on financial
performance, justifying a need to look into how size of credit committee will affect the
financial performance of the commercial banks in Kenya. Mwangi (2012), observed

21
that there is a significant relationship between the credit risk management and financial
performance of the commercial banks suggesting that the banks should adopt credit risk
grading system. The study, however, failed to explain how risk governance mechanisms
affect financial performance. Similarly, it failed to show the extent to which the risk
committee size affects the financial performance. Gathaiya (2017), observed that
collapsed commercial banks in Kenya (2015-2016) was occasioned by weak insider
lending factors, weak corporate governance practices, weak regulatory and supervision
systems and poor risk management.
Ghosh et al., (2014), found that credit monitoring, reliability and assurance have an
impact on the risk management. Whereas the study showed that credit monitoring,
assurance and reliability had an impact on the risk management, there is need to carry
out a similar research here in Kenya to establish how the various risk management
strategies especially by use of credit risk committee affects the financial performance
of commercial banks. Magnifique (2013) found that credit risk management predict the
financial performance of the commercial banks in Rwanda. Similarly, credit risk
scoring and assessment had a significant effect on financial performance in commercial
banks in Rwanda (Magnifique, 2013). The commercial banks in Kenya have adopted
risk governance mechanisms for example by using credit committee to manage risks.
There is however limited knowledge on the effect of credit committee on financial
performance of commercial banks.
Alshatti (2015), observed that credit risk management has a significant impact on the
financial performance of the Jordan commercial banks and suggested that banks can
22
improve on the credit risk management by adopting credit risk mechanisms to achieve
more profits. The study however failed to capture how credit committee can influence
financial performance (Alshatti, 2015).
Kauna (2015), found that there is a significant positive relationship between credit risk
identification, credit risk monitoring and financial performance of the commercial
banks in Kenya. The study recommended that commercial banks should put emphasis
on the credit risk identification (Kauna, 2015). Commercial banks should therefore
emphasize on risk governance as a risk identification strategy by forming credit
committee. The current study therefore adds new knowledge on relationship between
the risk governance through credit committee and the financial performance of the
commercial banks in Kenya.
2.2.4 Number of risk governance mechanisms and financial performance
It is in the board committee meetings where the actual activity of risk management take
place and not the full board of the bank (Chen and Wu, 2016). According to
Kamazima, Mathenge and Ngui (2017), the number of board committees have a
positive influence on the financial performance of stock exchange listed commercial
banks. A comparative study by Kimeu (2017) observed that the number of risk
mechanisms has a statistical influence on performance of commercial banks.
Previous studies (Nibedita, 2018; Arfan and Nasir, 2014; Apollo, Mandalika and Said,
2018) observed that corporate governance, audit committee and board composition has
a positive impact on performance of some commercial banks in Bangladesh and

23
Pakistan. This studies hwever failed to show how the number of risk governance
mechanisms affects the firms performance. Apollo et al., (2018 ) found that the
variables of board composition had no significant influence on the financial
performance of banking industry. This study was done in Indonesia and may not give
a true representation of the banking industry in Kenya. Muturi (2013) observed a
significant relationship between board committees and financial performance of some
other large commercial firms in Kenya. These findings suggests that risk governance
mechanisms adopted by banks vary from region to region and country.
Mohamed (2015) observed that there is a statistically significant relationship between
board committees and market value. The study was carried out in Saudi Arabia and may
not present the same results for commercial banks in Kenya. On contrary, Puni (2015)
found no statistically significant impact of board committees on the financial
performance of the listed firms in Ghana suggesting a need for a comparative study in
other economies such as Kenya. Carter, D’Souza, Simkins and Simpson (2010)
observed that there is no significant relationship between board committees and
financial performance of United States corporations.
From the literature reviewed, there is limited information on the relationship between
risk governnace mechanisms specifically the board committees and financial
performance of firms. Few studies have been done on the Kenyan commercial banks
justifying a need to establish the relationship between the number of risk mechanisms
and financial performance of commercial banks in kenya.

24
2.2.5 Board oversight and financial performance
Different commercial banks have different committees formed by the board of
governance as a mechanism of risk management. The board committee reports are
presented to board of governance for discussion, approval and adoption. The number
of board meetings has a statistically significant influence on the performance of
commercial banks (Kimeu, 2017). However, there is need to look into the moderating
effect of board oversight.
Ekadah and Mboya (2009) observed that board diversity does not affect the
performance of commercial banks in Kenya suggesting a need to investigate how the
frequency of board meetings, expertise and experience of the board members may affect
the financial performance of commercial banks. Ruparelia and Njuguna (2016), board
remuneration affects the financial performance of commercial banks, while Magembe,
Ombuki and Kiweu (2017) found that corporate governance accounts for the
performance of commercial banks. Such observations create a gap since other board
governance factors for example the frequency of the board meetings needs to be
studied. Indeed, according to (Kimeu, 2017) the number of board meetings has an
influence on the performance of commercial banks in Kenya.
Nganga (2017), found that board independence, gender diversity, board size and board-
director duality affect the financial performance of commercial banks in Kenya. The
study, however, failed to show how the board meetings, expertise and experience of the
board affected the financial performance of commercial banks. Muganda and Umulkher

25
(2015), found that board size negatively affects the financial performance of
commercial banks in Kenya while Nganga (2017) found a significant positive
relationship between board size and financial performance. The two studies, however,
failed to explain the relationship between board meetings, experience and expertise and
the financial performance of commercial banks.
According to Makokha (2014), financial performance of insurance companies is not
significantly influenced by board size, however, the findings may be different for
commercial banks. According to Mamatzakis, Zhang and Wang (2017), companies
with higher board sizes are associated with a higher risk taking. This studies, however,
failed to link the board size with the financial performance. Indeed, Shkendije (2014)
found that companies with large board size are associated with dismal performance
becauses of challenges in coordinating a large size. All these studies were done in
outside Kenya and the findings may not be similar if a similar study was conducted in
Kenya.
Ingari (2017) looked at how board membership qualifications, gender diversity and
board independence affects the performace of commercial banks in Kenya. Board
members with higher experience and diversity leads to better performance of the bank.
This study, however, failed to discuss how the number of board meetings affects the
performance of commercial banks. Lundqvist and Vilhelmsson (2018) found that
corporate governance does not significantly affect the credit ratings. The study used
panel data and was carried out in America hence creating the need to carry out simmilar

26
study in Kenya using other research designs. Bernaddette and Corina, (2015) found that
governance mechanisms influences performance of commercial banks. This study was
done in a developed country and the findings can not be generalised to a developing
country.
Koriang (2014) found a positive relationship between number of meetings and the
performance. Kiambati et al., (2013), observed that board size has an effect on the
profitability of commercial banks in Kenya. Ngwenze and Kariuki (2017) showed that
corporate governance has no significant influence on the performance of listed
agricultural firms in Kenya. Ojulari (2014) found a negative relationship between the
number of board meetings and the financial performance in Nigerian firms.
Maniagi (2018) observed a negative relationship between credit risk and financial
performance. The study recommended that bank managers should manage credit risk
but it fails to link the various effect of risk management mechanisms to financial
performance. Chou and Buchdadi (2017) found that meeting attendance increases the
profitability of commercial banks in Indonnesia a country with a different GDP from
Kenya, there is need therefore to carry out a similar study here in Kenya.
Olayinka, Osariemen, Olojede, Opeyemi and Usman (2018) found that risk governance
negatively impacts on the financial performance of commercial banks. Muchemwa and
Padia (2016), found that there is no relationship between board size and performance
of the firm. The study used cross-sectional research design and multiple regression
analysis to analyse data.
27
Muchemwa and Padia, (2016) contradicts a study by Topal and Dogan (2014) on the
impact of board size on the performance of firms that found a positive relationship
between board size and firm performance. Ogada, Achoki and Njuguna (2016) found a
positive relationship between board size and financial performance. This study
focussed on merged institutions and used mixed methodology research design and
purposive sampling method. The results cannot be generalised to the banking sector
since it was limited only to merged institutions.
Kiambati et al (2013) did a study on the role of board size on the financial performance
of commercial banks and found a positive relationship between board size and financial
performance. A similar study was done by Oludele, Oloko and Olweny (2016) on the
impact of board size on the financial performance of the listed manufacturing
companies in Nigeria and that found a positive linear relationship between the two
variables. The study was done in Nigeria and focussed only on manufacturing listed
firms in Nigeria. The findings may not be generalised to the banking sector because of
differences in the operation structure and risk hence there was a need to carry out similar
study here in Kenya.
Orozco and Vargas (2018) found a significant positive relationship between the board
size and financial performance in top companies in Colombia using correlation and
cluster analysis for the period 2008- 2012. Uwuigbe and Fakile (2012) found that banks
with larger board sizes recorded lower profits compared with banks that had smaller
board size. The study by Uwuigbe and Fakile (2012) contradicted the study done by

28
Orozco and Vargas (2018). The difference in the findings may be attributed to the
difference in the sectors.
Shunu, Bii and Ombaba (2017) found a positive relationship between board size and
performance of listed companies in the stock exchange and there is need to carry out a
similar study for commercial banks. Similar findings were observed by Ogada, Achoki
and Njuguna (2016) on the effect of board size on the financial performance of merged
institutions. The study used mixed research design and purposive sampling to collect
primary data. The study found that board size had significant effect on financial
performance of merged institutions.
Hanh, Ting, Kweh, and Hoanh (2018) observed that higher frequency of board meetings
leads to poor performance by firms while Eluyela, et al., (2018) found that a higher
number of board meetings increases the performance of banks in Nigeria. The two
studies used panel regression to analyse the data and recommended that banks should
hold atleast four meetings in a year since this will improve its performance.
Qadorah and Fadzil (2018) using multiple regression method to analyse data found no
relation between the frequency of board meetings with the financial performance in
Jordan while Khaleel, Siti, Saidin, and Shamharir, (2016) using dyamic panel technique
of generalised methods of moments found a significant positive association between
board meetings and firm performance of firms in Amman stock exchange. This study
contradicts the study done by Qadorah and Fadzil (2018) and the variation in the
findings may be as a result of differences in the research design. Similar study done by
(Haque, Islam and Azam (2013) found a significant positive relationship between

29
committee meetings and financial performance in Australia. Australia has a different
GDP from Kenya (Countryeconomy.com, 2018). The findings therefore, cannot be
generalised to the financial firms in Kenya. This therefore justified the need to carry
out similar study Kenya.
In general, most studies have focused on board membership qualifications, gender
diversity and board independence. It is evident that most studies have been done in
developed countries. There is limited knowledge on the moderating effect of the board
oversight on the relationship between risk governance mechanisms and financial
performance of commercial banks. It is at the board level where actual decisions on
governance are made concerning reports from the committees. There was a need
therefore to establish the moderating effect of the board oversight on the relationship
between risk governance mechanisms and the financial performance of commercial
banks in Kenya.
2.3 Theoretical Literature
This section discusses the theories on which the research was based on. This research
was guided by three theories namely bank Risk Management Theory, Adverse
Selection Theory and Moral Hazard Theory.
2.3.1 Bank risk management theory
This study was guided by the Bank risk management theory developed by (Pyle, 1997).
This theory focuses on the need for commercial banks to manage risks to ensure their

30
survival. Mwiya (2010), argued that without an efficient credit risk mangement the banks
profitability, the liquidity and solvency are affected negatively.
In accordance with the banks risk management theory, commercial banks must reduce the
credit hazard by utilizing all options available to it including risk governnace mechanisms
and Credit Reference Bureau (CRB) reports. The major sources of credit hazard include;
wrong credit approaches, poor management and poor credit assessment (Otwori, 2013).
When a customer borrows a loan from any financial institution, they should always
refund. In some instances, the borrowers in the commercial banks default especially if
there is no or less income and this makes the commercial banks to face credit default
risks.
Hazard management is the identification, appraisal and prioritization of the risks (ISO
31000). Risk management is the impact of uncertainty on goals followed by coordinated
and economical use of assets to minimize, screen, and control the likelihood or potential
effect of unfortunate events (Hubbard, 2009). It is important for banks to give much
attention to the sources of credit risk since credit defaults is the most well-known reason
for banks failure and therefore credit risk management is important for the survival of
banks (Alshatti, 2015). It is the duty of lenders to screen out factors that can affect the
repayment of loans and to develop ways of minimizing the occurrence of the credit risk.
To eliminate risk, the banks could increase the required securities for giving loans to its
borrowers, occasional reassessment and periodical examination of the capacity of
clients to generate income to repay their outstanding loan balances to the lenders.

31
There are financial models that creditors can use to analyze default risk, these include
Altman Z-score model (1968), the structural model of default by Robert C Merton
(1976), Jarrow-Turnbull model (1995), the enterprise risk management and credit
information sharing. However, the bank staff can manipulate these models to award
loans to their friends and relatives. This then requires that a bank adopt a risk
governance mechanism to oversee the performance and compliance to risk management
policies. This theory is appropriate because risk governance mechanisms will help in
risk management.
2.3.2 Adverse selection theory
This theory was developed by Arkelof (1970) and was later advanced by Stiglitz (1976).
Arkelof argues that it is difficult to distinguish good borrowers from the bad borrowers
and that lenders are exposed to the adverse selection problem in trying to control the
credit risks associated with money lending. According to (Otwori, 2013), adverse
selection occurs when lenders face challenges in obtaining information on the credit
profile of borrowers. This disadvantages the good borrowers and increases the cost of
credit facilities (Otwori, 2013). The lenders in the context of assymetrical information
settings are forced to price their credit facilities in terms of the probability of the borrowers
to repay (Mwigwi, 2013).
The main reason why some creditors with surplus funds lend funds through the financial
intermediaries rather than lending directly is because of the hazards. Usually, a seller
knows the item more than the purchaser does. Therefore, the purchaser might be
creating or facing a hazard by making purchase. On the other hand, the borrower knows

32
his financial state and his financial projections more than the lender. This presents a
risk since unknown to the lender, the borrower can disappear with the borrowed funds.
A business enterprise selling stocks may face risks by not investing in viable
investments and the funds used to make payment for reimbursement to top managers
or used to pay big bonuses to managers (Spaulding, 2003). The specific forms of the
risk that normally arise because of the information asymmetry is adverse selection and
this normally occurs when the lender cannot differentiate a non-defaulter from a
defaulter.
Risk may also arise because of moral hazard. It normally occurs after the customers
have been awarded loans and they fail to repay. The criteria of choosing whom to lend
your finance or your cash is a totally crucial part of controlling any form or risk and
negative eventualities. If the lender chooses to lend it to a person who does not have
management skills, there will be high chances for the lender to lose the cash. The theory
holds that one should charge moderate price on the loan if there is little or no
information about the borrower. The moderate fee would motivate individuals who are
at higher risks or have higher tendencies of defaulting than those with good reputation
and ability to repay. The good payers will move away and choose to borrow elsewhere
because they believe that they should be rewarded for their ability to repay and this will
result in negative selection.
Adverse selection may occur when borrowers with poor payment history are not able
to repay funds are advanced loans easily compared to the borrowers with high ability
33
to repay. The commercial banks often face a challenge in screening to distinguish the
good borrowers from bad borrowers and may end up giving loans to bad borrowers.
This then presents the case of an adverse selection. In view of information asymmetry,
banks experience considerable difficulties separating good borrowers from bad
borrowers. They charge higher interest rate far beyond the current rates as
compensation for the possible risks emerging out of the defaults. This makes the good
firms disadvantaged and discouraged from obtaining loans from the lenders due to high
interest rates. The bad firms turn out to be exceptionally quick to acquire from such a
bank since they know that judging by the quality of their money streams, they ought to
be charged a much higher financing cost.
A good example of this principle was presented by Akerlof (1978) in an article named
"The Market for Lemons" that won the Nobel Prize in Economics in 2001. This
principle is illustrated as follows; - Suppose there are two people with the same item to
sell, the first person has used the item with good care but the second person has
recklessly used the asset. When the two people approach an asset broker to sell their
asset, and the broker or customers are not in a position to distinguish between the assets,
the dealer would then give quotation price that represents the average price for both
assets and because the customer will not pay a higher price than an average price with
no guarantee that, a higher priced asset is much better as compared to the lower priced
asset. The first owner will not accept any price that is less than what he/she believes
that the asset is worth and on the other hand the second seller knowing a good price for
his/her asset considering its history, happily takes it.

34
In the event that you offer a normal financing cost for your credits, the general
customers who are low risk takers will go somewhere else for their cash, while the high-
risk individuals will readily take your cash (Akerlof, 1978). The moral hazard and
adverse selection result to the overall financing being costly, particularly for little firms,
since lenders are not willing to give loans to borrowers who are not trusted. Such
information asymmetry that has far-reaching effects on the banking sector can be
reduced through risk governance mechanisms. and government participation.
In the advanced world, any firm, which wishes to seek external financing, must seek
clearance by credit referencing firms. Such organizations are positioned by the quality
of their reimbursement capacity. According to the credit referencing bureau rating, a
lender can estimate the likelihood of default of any single borrower and charge a rate
of interest, which is proportionate to the internal risk exposure seen in a business of the
borrower. The need for establishment of CRB services in any financial system therefore
arises because of information asymmetry between lenders and borrowers (Paydaycash,
2010). Banks are given warnings about defaulters yet they fail to use them since they
believe that such warnings give irrelevant data about their clients. A debtor may
therefore fail to repay the loan because of a non-viable investment that ends up in losses.
The borrower moves over to the next bank and secure financing for a similar use and
fails to repay the loan again because of losses in the investment.
Government participation can reduce the adverse selection. However, because of fraud
and corruption in organization frameworks, there have been occurrences of non-

35
genuine guarantee reports, for example, land title deeds (Maina, 2013). Land records
are manual and computerization of enrollment can help reduce frauds and elimination
of risk. There have been cases in which some of the title deeds have been issued on
non-existent land, and if the same fake title deeds are used to secure a loan from a bank,
the bank makes a loss because of non-performing loans and failure to dispose the
collateral to recover back the non-performing loans (Kiplagat, 2018).
Improved loan underwriting can reduce the adverse selection theory. In some
commercial banks, the loan agents are the data entry clerks. They enter in data from an
application form without considering details on the application form hence the passage
of risk. Various risks can be eliminated if this underlying procedure could be done
carefully. There is importance in assessing the income of the borrower, the revenue
stream and the nature of the business and the general history (Belás Jaroslav, 2011).
To solve information asymmetry, commercial banks need to adopt risk governance
mechanisms and have more data about borrowers. Checking the historical information
of the borrower decreases both the moral hazard and adverse selection. There are
numerous databases on people and organizations that can be requested to check their
history. New sources have been approved by the CBK and can be a source of customer’s
credit history. The introduction of Huduma number in Kenya will capture more
information of residents hence can be a source of credible information once it is
operational (Ministry of Public Service, Youth and Gender Affairs, 2019).

36
Banks can check the credit records and financial assessments of borrowers, their work
history, and with the consent of the borrowers, banks can even confirm their amount of
income with the Kenya Revenue Authority before advancing loans (Abuya, 2018).
Similarly, for loan advances to organizations, lenders can check the credit rating issued
by the credit rating agencies or the credit score offices for organizations, for example,
credit reference bureaus. Credit worthiness for companies issuing stocks and bonds can
be easily determined, since they are required by law to report good financial
information before they offer their securities for subscription. They are also required
by law to publish yearly financial statements.
For individuals applying for insurance, insurance providers check the credit reports and
databases, while medical records are checked for the life insurance cover and the health
insurance applicants. Requiring security can likewise decrease data asymmetry
dangers. Security reduces the adverse selection risk by requiring a particular estimate
of guarantee, for example, 30% up front installment on a house. Requiring a certain
minimum net worth, additionally decreases adverse selection since only those
individuals and organizations with adequate assets over liabilities will be considered
for a credit. Risks can reduce because the borrower can be sued if they fail to honor
their part of the contract by making a timely payment on their loans. The Adverse
Selection Theory is appropriate for the study because the risk governance mechanisms
are seen as measures with potential of reducing the negative effects of adverse selection.

37
2.3.4 Moral hazard theory
This theory was developed by Krugman (2008) as an update of the work done in 1999.
Krugman describes moral hazard as any state where an individual makes the decision
about how much risk to take, while someone else bears the cost when there is a negative
outcome.
This study was guided by the moral hazard theory, which argues that the borrower has
an intention to default unless there are implication outcomes to his future credit
applications (Alloyo, 2013). When cash is advanced to a borrower, there is a need to be
certain that it will be repaid with premium. In any case, this is more improbable if the
cash is used for a wrong purpose. It can also happen when there is too much risk taking.
Moral Hazard Theory is based on the assumption that the borrowers of the loan will not
utilize the cash as was proposed or they may decide to take risks or not to be cautious
in reducing the potential dangers.
According to Belás Jaroslav (2011) loan repayment depends not only on capacity of the
customer to repay, but also on their ability and the willingness to repay. This is normally
determined and influenced by identity and character of the borrower. Moral hazard can
happen after the cash has been disbursed to the borrower and in situations when the
borrower may have intention to go against the credit agreements. Despite the high
possibility of benefit to the borrower, they additionally have a high probability of risks
and disappointment, which will have negative impact to the bank. The information
asymmetry may cause moral hazard if there is lack of information by the lenders about
the nature of the activities of borrowers. Moral hazard likewise happens due to the high

38
cost of enforcement of the obligation pledges. In this situation, lenders essentially
choose that it is not worth the effort to continue pursuing borrowers and have them
invest the cash in determined investments. This gives them a free way to put resources
into investments faced by high risks (Lee, Jusup, Podobnik and Iwasa, 2015).
Each person, household and business facing a budget deficit can be financed by
borrowing from the commercial banks. Peria (2014) characterized the three reasons for
holding cash as: Firstly as transaction motive where a person or household borrows to
meet payment such as daily purchases, to pay for wages and pay tax to the government,
Secondly for speculative motive in situations where changes in the prices of
commodities in the market arise from time to time. Example of such price changes is
the sudden decrease in the price of products and decrease in the price of the raw
materials. Thirdly, for precautionary reason whereby a person requires money for
general precautions for example to keep a safety amount or meet sudden money needs
(Peria, 2014). The more predictable the inflows and outflows of money for an
individual, family, organization or a firm the less the amount that should be held for
unforeseen necessities (Peria, 2014).
Individuals who placed resources by investing in American International Group (AIG)
suspected that their cash was generally safe because they were putting resources into
an insurance agency that had the most highly rated score by the credit rating bureaus.
Notwithstanding, AIG was additionally offering credit default swaps (CDS) on contract
sponsored securities that began to default in big numbers in 2008 expecting them to
post more insurance than they had (Gethard, 2017).

39
AIG took risk because the brokers who sold the credit default swaps were getting
immense rewards and AIG was not worried about falling, since it was offering a large
portion of CDSs to banks and different financial specialists. Consequently, if AIG could
not make the installments on the CDSs or post insurance as the CDS contracts required
AIG's credit rating score dropped and at that point the government would need to bail
them out otherwise numerous banks would collapse. At the end the US government
bailed them out, wiping out the investors of the organization. Here, moral hazard arose
because the dealers took the risk for big benefits and rewards (Gethard, 2017). Moral
hazard, happens most often with the insurance, where insurance cover makes the
insured party to be less watchful about controlling risks as they have believe that
insurance cover will always protect them from losses (Alloyo, 2013). This theory is
appropriate because the risk governance mechanisms will prevent the borrowers from
defaulting hence reducing moral hazard.
2.3.5 Agency theory
This theory was developed by Jensen and Meckling (1976). This is majorly based on
the governance of any given company and the nature of relationships that exists
amongst various interested parties. The shareholders who are the owners of the
company are interested in their property for returns. The managers and employees on
the other hand are also interested in the company because of the employment that result
in monthly remuneration. The creditors give loans to finance the company operations
since they are interested in the existence of the company with the aim of recovering
back their credit and interest which forms their profit. The government is also not left

40
out since the existence of the company is a source of revenue to them through taxes
paid by the company.
Jensen and Meckling (1976), argues that there exists a relationship between various
parties in the company. This relationship is called the Agency Theory. For this study,
agency relationship will exist between the shareholders and the board of directors. The
board of directors at all times are expected to represent the shareholders in the
management of the company through effective and efficient governance. There exists
an agency relationship between the managers, employees and the shareholders and the
shareholders expects the managers and all employees to always manage and ensure
good operations of the company. For this relationship, it results to a contract between
all the parties involved. Jensen and Meckling argued that there is no perfect contract
because as the directors and managers makes decisions, the same decisions also affects
their welfare and this may be a challenge to them to priorities the shareholders at their
own expense.
In the banking industry, commercial banks there exists agency relationship between the
shareholders of commercial banks and the appointed board of directors, who will
manage the company on their behalf. Accordingly, the board of directors are expected
to provide oversight on the operation of the bank that will result in the maximization of
value by the shareholders. The board of directors are expected to always prioritize the
interest of their principal (shareholders). However, in most cases the directors end up
prioritizing their own welfare. This then leads to agency conflict between the agent and
principal. Furthermore, the shareholders appoint managers who will be in charge of the

41
daily operation of the banks. These managers are expected to assist the shareholders to
generate maximum possible profit or a high return on the value of assets invested. In
most cases the managers also end up prioritizing their welfare while leaving the
shareholders profit maximization objective. In summary, there exists an agency
relationship in commercial banks between the shareholders and the board of directors
and also the managers. The board of directors are expected to do oversight in the
operation of the bank and the managers are expected to manage the company well so
as to achieve maximum profits. The current study was therefore guided by the agency
theory developed by Jensen and Meckling (1976) that shows the agency relationships
between the shareholders, management and stakeholders in commercial banks.

42
2.4 Conceptual Framework
In this study, the independent variables consisted of risk governance mechanisms of
commercial banks that included; risk committee, audit, credit committee and number
of risk governance mechanisms. Risk committee existence was measured using a scale
of 1 to 2, where one (1) indicated the existence and two (2) the absence of a risk
committee, audit committee size was measured by the number of audit committee
members in a given commercial bank, credit committee size was measured by the
number of credit committee members in a given commercial bank for the respective
financial years under study, number of risk governance mechanisms was measured by
the number of risk governance mechanisms that are used by a given bank to manage its
risk exposure. All these variables were measured for the years under study. All these
vary from one bank to another.
The moderating variable was the board oversight measured by the size of the board and
the frequency of board meetings in a year for each commercial bank. From the literature
reviewed, it indicated that board size and frequency of board meetings were moderators
on the relationship between corporate governance and financial performance in other
sectors. It is for this reason therefore that board size and frequency of board meetings
were used as moderators of the relationship between selected risk governance
mechanisms and financial performance of commercial banks in Kenya. The board size
was measured by the number of members of the board of each commercial bank in each
financial year while frequency of board meetings was measured using the number of
meetings that were held in each commercial bank for the different financial years under

43
study. The dependent variable is financial performance indicated by return on assets
(RoA). The RoA was determined by the net profit of a commercial bank divided by the
value of the total assets of the bank used to generate the net profit. It is for this reason
therefore that RoA was used as a measure of financial performance since it gives a more
accurate and realistic measure of performance based on profit generated in comparison
to the value of the assets that was used to generate the profit. This was measured for
each of the bank and for the various year under study. Figure 2.1 presents the
diagrammatic presentation of the conceptual framework.

44
Independent variables Dependent variable
Risk Governance Mechanisms Financial Performance
Moderating variable
Figure 2.1: Conceptual framework of risk governance mechanisms and financial
performance
Source: Author (2018)
Financial Performance
RoA (Return on
Assets)
Risk committee
existence
Audit committee size
Number of risk
governance mechanisms
Credit committee size
Board Oversight
Board Size
Frequency of
Board meetings
45
2.5 Identification of Knowledge Gap
From the literature reviewed, it is evident that commercial banks in Kenya still face
risks which have a huge impact on the overall financial performance and returns of the
commercial banks. The Central Bank of Kenya (CBK) being the main financial
regulator in the banking industry in Kenya requires all the commercial banks to put in
place strategies to minimize and finally eliminate the risk in the commercial banks.
Further from the literature reviewed, most of the previous research work concentrated
on the forms of risks and the impact of those risks on financial performance (Poudel,
2012 and Ojulari 2014). The board of governance of banks gets reports from the various
committees of the board. Therefore, the board committees are in charge of preparing
reports for discussion and approval by the board of governance. Since 2013 to date,
commercial banks have put in place some risk governance mechanisms to minimize
and eliminate risk. Such strategies include setting up the risk committee, audit
committee, credit committee and other risk governance mechanisms. The overall
boards also review, approve and implement reports from the committees. However,
there is little research in the extant literature on the relationship between risk
governance mechanisms and financial performance of the commercial banks in Kenya.
The few studies done were in developed countries. This study chose 2013-2017 because
from the year 2013 to date commercial banks have faced various risks leading to
collapse or receivership and this has made the banks to put in place mechanisms to
manage risk exposure. The latest financial report when the study was being conducted

46
was for the financial year 2017. Indeed, the literature reviewed indicates that there is
limited knowledge on the selected risk governance mechanisms and the financial
performance of commercial banks in Kenya.
47
CHAPTER THREE
RESEARCH METHODOLOGY
3.1 Introduction
This chapter presents the methodology that was adopted for the study. Specifically, it
presents the research design, location, target population sample and the sampling
procedure that was used. It presents how validity and reliability was determined,
analysis of the data and how ethical issues in research were addressed.
3.2 Research Design
The study employed longitudinal research design. This enabled the analysis and
comparison of secondary data collected from the commercial banks for the study period
(2013-2017). The secondary data was collected from the published audited financial
statements and reports of the targeted commercial banks. Similar studies done
previously by (Kamazima et al, 2017 and Kimeu, 2017) also used longitudinal research
design. For this study, longitudinal research design was ideal since it helped to establish
the relationship between risk governance mechanisms and financial performance of
commercial banks in Kenya, over a 5-year period.
3.3 Location of Study
The research focused on all the commercial banks regulated by the Central Bank of
Kenya (Appendix 1). Most commercial banks have branches all over the country but
they have a centralized management unit located in Nairobi. Performance of each bank

48
is usually compiled and presented in the audited financial statements and reports
published yearly. Such reports are posted on the website of the bank.
3.4 Target Population
The study targeted all the 42 active commercial banks regulated and licensed by the
Central Bank of Kenya (CBK, Annual report and Financial Statements, 2017).
Secondary data from published annual financial statements and consolidated reports
published by the banks each financial year was extracted (Appendix 1).
3.5 Sample Size and Sampling Procedures
The research adopted a census sampling design in which all 42 commercial banks in
Kenya participated in the study. This sampling design was considered appropriate since
the population of the commercial banks in Kenya is not large and therefore it could be
managed through census. Commercial banks in Kenya are categorized into three
different Tiers as shown in Table 3.1.
Table 3.1
Category of bank tier
Category Market share Number Sample size
Tier I Over 5% 8 8
Tier II 1%-5% 11 11
Tier III Below 1% 23 23
Total 42 42
Source: CBK annual report 2017

49
Bank Tier is a term used by the Central Bank of Kenya to categorize banks. Tier I
represent banks with a market share of over 5%, Tier II represents banks with a market
share of between (1-5) % and Tier III represent banks with market share of below 1%.
Data was collected from all the three Tiers of commercial banks as shown in Table 3.1
above.
3.6 Data Collection Instruments
Data was extracted from the annual published audited financial statements and reports
of the commercial banks for a period of five years (2013-2017) using a data extraction
form (Appendix 2).
3.6.1 Validity
Financial risk experts from banks and financial institutions and academia validated the
data extraction form. Pre-testing the data extraction assured its reliability. Before the
data extraction, the data extraction form was sent to experts in the academic field and
also experts in the banking sector. Inputs from all these experts were incorporated and
it helped to improve the data extraction form from its initial form to the final form.
3.6.2 Reliability
Commercial banks are guided by ISA (International Standards of Accounting) and
IFRS (International Financial Reporting Standards) and this ensured reliability of the
data extracted from the annual consolidated financial statements and reports.
Commercial banks normally publish audited financial statements and reports each
financial year and post on their websites. The big four audit firms namely; Ernest and

50
Young, KPMG, Pricewaterhousecoopers (PwC) and Deloitte usually conducts the
audits. The study utilized the audited financial reports and financial statements posted
on the website.
3.6.3 Pre-test for general multicollinearity
In this study, multicollinearity was tested to establish the existence of auto correlations
among the independent variables by means of tolerance and VIF (Variance Inflation
Factor). VIF indicates the extent of the inflation of standard error could be caused by
collinearity where VIF above 10 indicates a multicollinearity Field (2003). The
tolerance is an indicator of how much collinearity a regression analysis can tolerate.
The pre-test results for general multicollinearity are shown in Table 3.2.
Table 3.2
Pre-test results on multicollinearity
Independent variable Collinearity Statistics
Tolerance VIF
(Constant)
Risk committee existence 0.885 1.129
Audit committee size 0.794 1.260
Credit committee size 0.801 1.248
Number of risk mechanisms 0.536 1.866
Frequency of board meetings 0.572 1.749
Board size 0.740 1.351
Dependent Variable: Return on Assets
Source: Research data, 2019
The VIF values ranged from 1.866 to 1.129, hence the extent of the inflation of standard
error caused by collinearity was within the acceptable margins. The tolerance values

51
ranged from 0.536 to 0.885 hence within the acceptable points above 0.1 (Field, 2013).
It is concluded that there is no multicollinearity among the variables.
3.7 Data Collection Procedures
Approval was sought and received from University of Kabianga, Board of Graduate
Studies and NACOSTI (National Council for Science, Technology and Innovation)
prior to commencing data collection. Data on risk committee, audit committee, credit
committee, number of risk governance mechanisms and financial performance was
extracted from the audited financial statements and governance reports posted on the
websites of each of the commercial banks.
3.7.1 Risk committee and financial performance
Websites of all the sampled commercial banks were accessed and their audited
consolidated annual reports of the financial years 2013, 2014, 2015, 2016 and 2017
downloaded. From these audited consolidated annual reports, data on the various risk
committees and return on asset was recorded on the extraction forms.
3.7.2 Audit committee size and financial performance
Websites of all commercial banks was used to access individual audited consolidated
financial reports of the financial years 2013, 2014, 2015, 2016 and 2017. From these
audited financial annual reports, data on the various audit committee sizes and financial
performance was then recorded on the data extraction forms.
3.7.3 Credit committee size and financial performance
Websites of all the commercial banks were accessed and their individual audited
consolidated annual reports for the financial years 2013, 2014, 2015, 2016 and 2017

52
downloaded. The data on the number of the credit committee size and the respective
financial performance of each commercial bank were recorded with the specific measure
of financial performance being return on assets.
3.7.4 Number of risk governance mechanisms and financial performance
To establish this, data on the number of risk governance mechanisms for 2013, 2014,
2015, 2016, and 2017 together with their respective financial performance of each
commercial bank were recorded and analyzed. This information was extracted from the
annual audited reports accessed from the websites of commercial banks.
3.7.5 Moderating effect of board oversight
Websites of all the commercial banks were accessed and data on board oversight extracted,
specifically data on the board size and the number of board meetings were extracted. The
relationship between risk governance mechanisms; risk committee existence, audit
committee size, credit committee size, number of risk mechanisms and financial
performance was established for the financial years 2013, 2014, 2015, 2016 and 2017. The
relationship between the two variables was established again after the introduction of the
moderator.
3.8 Data Analysis and Presentation
Once the data was extracted from the consolidated financial statements, it was
scrutinized for completeness and consistency. Data was then analyzed by use of both
descriptive and inferential statistics. The study used quantitative techniques to analyze
numerical data (Kothari, 2004). Correlation and regression analysis were used to
establish relationship between dependent and independent variable. Moderated

53
regression analysis was used to establish the existence of moderating effect of board
oversight on the relationship between risk governance mechanisms and financial
performance. Data on risk committee existence, audit and credit committee size,
number risk governance mechanisms and board oversight were analysed separately
with the help of Statistical Package for Social Science (SPSS) and suitable regression
model as follows:
The model for testing the main effects: -
Y1 = ᵦ0
+ ᵦ1
𝑋1 + ɛ……………………….…….………(i)
Y2 = ᵦ0
+ ᵦ2
𝑋2 + ɛ ……………………………….……(ii)
Y3 = ᵦ0
+ ᵦ3
𝑋3 + ɛ……………………..…...…….……(iii)
Y4 = ᵦ0
+ ᵦ4
𝑋4 + ɛ……………………………………..(iv)
Overall risk governance mechanisms:
Y1 = ᵦ0
+ ᵦ1
𝑋1 + ᵦ2
𝑋2 + ᵦ3
𝑋3 + ᵦ4
𝑋4 + ɛ………..…(v)
Model for testing the moderating effect of board oversight, frequencies of board size
and board meetings: -
Y1 = ᵦ0
+ ᵦ1
𝑋1 + ᵦ2
𝑋1 ∗ 𝑀1 + ᵦ3
𝑀1 + ɛ……….…..…(1)
Y1 = ᵦ0
+ ᵦ1
𝑋2 + ᵦ2
𝑋2 ∗ 𝑀1 + ᵦ3
𝑀1 + ɛ…………...…(2)
Y1 = ᵦ0
+ ᵦ1
𝑋3 + ᵦ2
𝑋3 ∗ 𝑀1 + ᵦ3
𝑀1 + ɛ………………(3)
Y1 = ᵦ0
+ ᵦ1
𝑋4 + ᵦ2
𝑋4 ∗ 𝑀1 + ᵦ3
𝑀1 + ɛ…………....…(4)
Similar model was applied for frequency of board meetings

54
Where the components and the respective measurements of the variables are: -
ᵦ0- Constant
ᵦ1, ᵦ2, ᵦ3, ᵦ4, ᵦ5= Regression coefficients or change included in Y by each X value/
Coefficient of independent variables
X1-Risk committee existence
X2- Audit committee size
X3- Credit committee size
X4- Number of risk governance mechanisms
M- The moderator, Board oversight measure (𝑀1 is board size and 𝑀2 is the frequency
of board meetings)
ɛ - Error term
3.9 Ethical Considerations
The anticipated ethical problems in most studies include research process, conduct of
individual researcher and the nature of research subjects (Nganga et al., 2004).
Throughout this study, confidentiality of the commercial bank information was
maintained. The data collection instrument was coded to eliminate use of names of the
commercial banks to maintain anonymity. The study however did not use human
subjects, therefore the ethical issues relating to informed consent and voluntary
participation were not applicable.

55
CHAPTER FOUR
RESULTS AND DISCUSSIONS
4.1 Introduction
This chapter presents the results and discussions of the findings. The results are
presented in three approaches; first the results of the descriptive studies for the study
variables are presented. This is then followed by results of the relationship between
risk, credit, number of mechanisms and audit committees on the financial performance
of commercial banks. Thirdly, moderating effect of board oversight is underpinned to
the financial performance of the commercial banks.
4.2 Risk Governance Mechanisms and Financial Performance of Commercial
Banks
Financial performance of commercial banks is indicated by Return on Assets (RoA)
derived for each bank and banks Tiers over a specified period of time. Tier I represent
banks with market share of over five percent, Tier II between one and five percent and
Tier III below one percent. Risk governance mechanisms on the other hand was
measured using the risk committee existence, audit committee size, credit committee
size and the number of risk governance mechanisms adopted by the commercial banks
in Kenya.
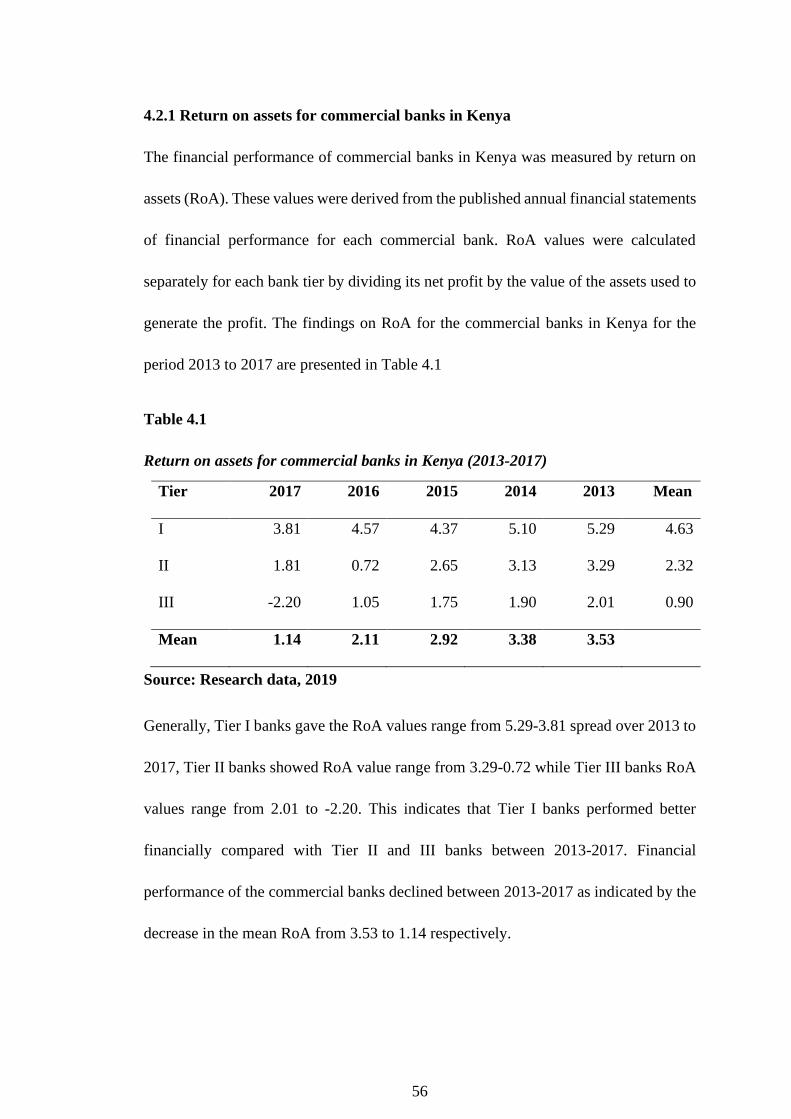
56
4.2.1 Return on assets for commercial banks in Kenya
The financial performance of commercial banks in Kenya was measured by return on
assets (RoA). These values were derived from the published annual financial statements
of financial performance for each commercial bank. RoA values were calculated
separately for each bank tier by dividing its net profit by the value of the assets used to
generate the profit. The findings on RoA for the commercial banks in Kenya for the
period 2013 to 2017 are presented in Table 4.1
Table 4.1
Return on assets for commercial banks in Kenya (2013-2017)
Tier 2017 2016 2015 2014 2013 Mean
I 3.81 4.57 4.37 5.10 5.29 4.63
II 1.81 0.72 2.65 3.13 3.29 2.32
III -2.20 1.05 1.75 1.90 2.01 0.90
Mean 1.14 2.11 2.92 3.38 3.53
Source: Research data, 2019
Generally, Tier I banks gave the RoA values range from 5.29-3.81 spread over 2013 to
2017, Tier II banks showed RoA value range from 3.29-0.72 while Tier III banks RoA
values range from 2.01 to -2.20. This indicates that Tier I banks performed better
financially compared with Tier II and III banks between 2013-2017. Financial
performance of the commercial banks declined between 2013-2017 as indicated by the
decrease in the mean RoA from 3.53 to 1.14 respectively.

57
4.2.2 Risk governance mechanisms of commercial banks
The risk governance mechanisms were measured using the risk committee existence,
audit committee size, credit committee size and number of risk governance
mechanisms. Multicollinearity tests on these predictors were done and the results are
presented in Table 4.2
Table 4.2
Multicollinearity test for commercial banks selected risk governance mechanisms
Coefficientsa
Model Sig. Collinearity Statistics
Tolerance VIF
(Constant) 0.000025
Risk committee 0.000025 0.899 1.112
Audit committee 0.000025 0.835 1.198
Credit committee 0.000025 0.812 1.231
Number of risk mechanisms 0.000025 0.860 1.162
Dependent Variable: Return on Assets
Source: Research data, 2019
Multicollinearity test values among the predictors of risk governance mechanisms
(Table 4.2) shows values within the acceptable range of below 10. The highest VIF was
1.749 while the lowest was 1.129. The highest tolerance was 0.899 and the lowest was
0.812 among the selected risk governance mechanisms. From the anova, it indicated
that the findings were significant.

58
4.2.3 Risk committee existence in commercial banks in Kenya
Data on the existence of risk committee in any one bank was recorded on an arbitrary
scale of 1 to 2, where one (1) indicated the existence and two (2) the absence of a risk
committee. Table 4.3 presents the results of the risk committee existence on tier I to III
commercial banks in Kenya for the period 2013-2017 financial years.
Table 4.3
Risk committee existence on commercial banks in Kenya
Tier 2017 2016 2015 2014 2013 Mean
I 1.00 1.00 1.11 1.00 1.00 1.02
II 1.00 1.00 1.11 1.00 1.00 1.02
III 1.05 1.06 1.08 1.31 1.18 1.14
Mean 1.02 1.02 1.10 1.10 1.06
Source: Research data 2019
Generally, all the commercial banks had risk committees in place during the study
period of 2013-2017. However, some commercial banks in tier III did not hence
pushing the mean arbitrary values towards the 1.6 (Table 4.3) mark suggesting non-
existence. Similar trend was observed in Tier I and II commercial banks in 2015. These
results indicate that most of the commercial banks have adopted risk committees to
minimize risk and improve their financial performance. Comparing the years under
study, 2015 recorded the highest adoption of risk committees.

59
4.2.4 Relationship between risk committee existence and financial performance
To test the relationship between risk committee existence and RoA as per the Tier, a
linear regression analysis was carried out between risk committee existence and RoA
and the results presented in Table 4.4.
Table 4.4
Risk committee existence and RoA per tier
Tier R R2 P value
I 0.143 0.02 0.379
II 0.022 0.001 0.877
III 0.392 0.154 0.000159
Source: Research data, 2019
From Table 4.4 the data reveals that Tier III had the highest relationship between risk
committee existence and RoA with a p value of 0.000. For Tier I the R was 0.143 though
it was not significant. For Tier II the R was 0.022, however the coefficient of correlation
was not significant. In order to determine the relationship between risk governance
existence and financial performance of commercial banks the hypothesis that stated that
there is no significant relationship between risk committee existence and the financial
performance of commercial banks in Kenya was tested. The results are shown in Table
4.5.
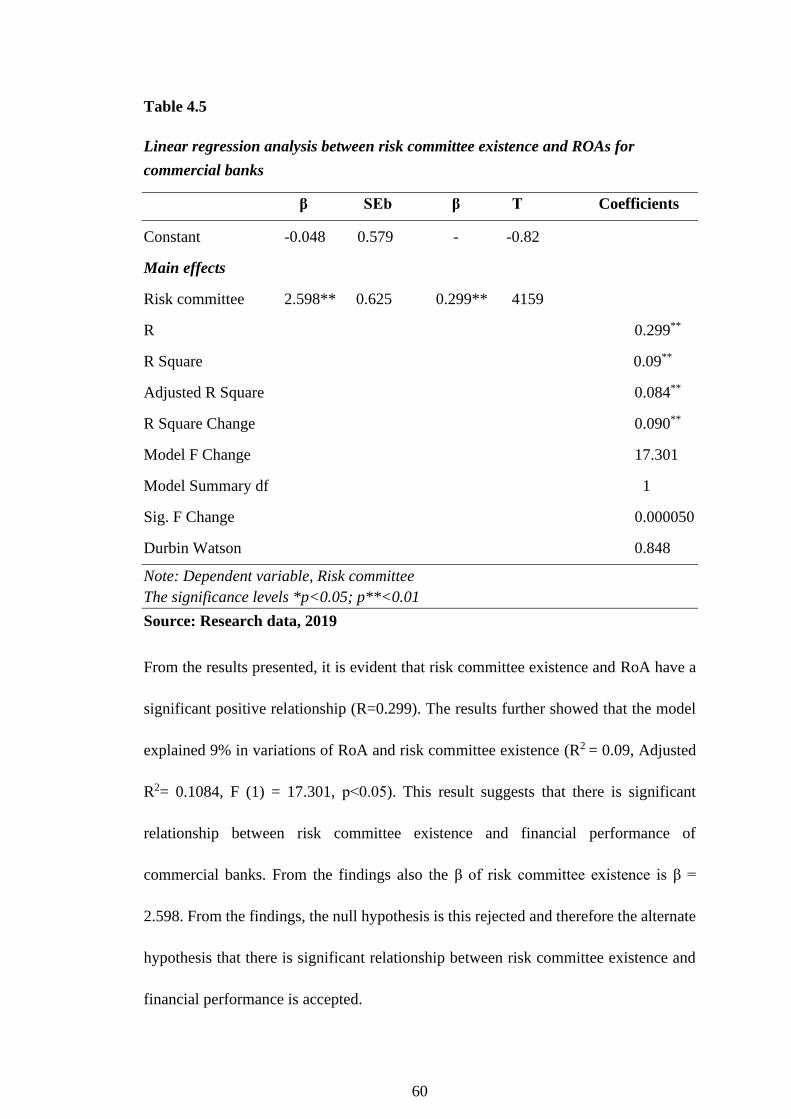
60
Table 4.5
Linear regression analysis between risk committee existence and ROAs for
commercial banks
β SEb β T Coefficients
Constant -0.048 0.579 - -0.82
Main effects
Risk committee 2.598** 0.625 0.299** 4159
R 0.299**
R Square 0.09**
Adjusted R Square 0.084**
R Square Change 0.090**
Model F Change 17.301
Model Summary df 1
Sig. F Change 0.000050
Durbin Watson 0.848
Note: Dependent variable, Risk committee
The significance levels *p<0.05; p**<0.01
Source: Research data, 2019
From the results presented, it is evident that risk committee existence and RoA have a
significant positive relationship (R=0.299). The results further showed that the model
explained 9% in variations of RoA and risk committee existence (R2 = 0.09, Adjusted
R2= 0.1084, F (1) = 17.301, p˂0.05). This result suggests that there is significant
relationship between risk committee existence and financial performance of
commercial banks. From the findings also the β of risk committee existence is β =
2.598. From the findings, the null hypothesis is this rejected and therefore the alternate
hypothesis that there is significant relationship between risk committee existence and
financial performance is accepted.
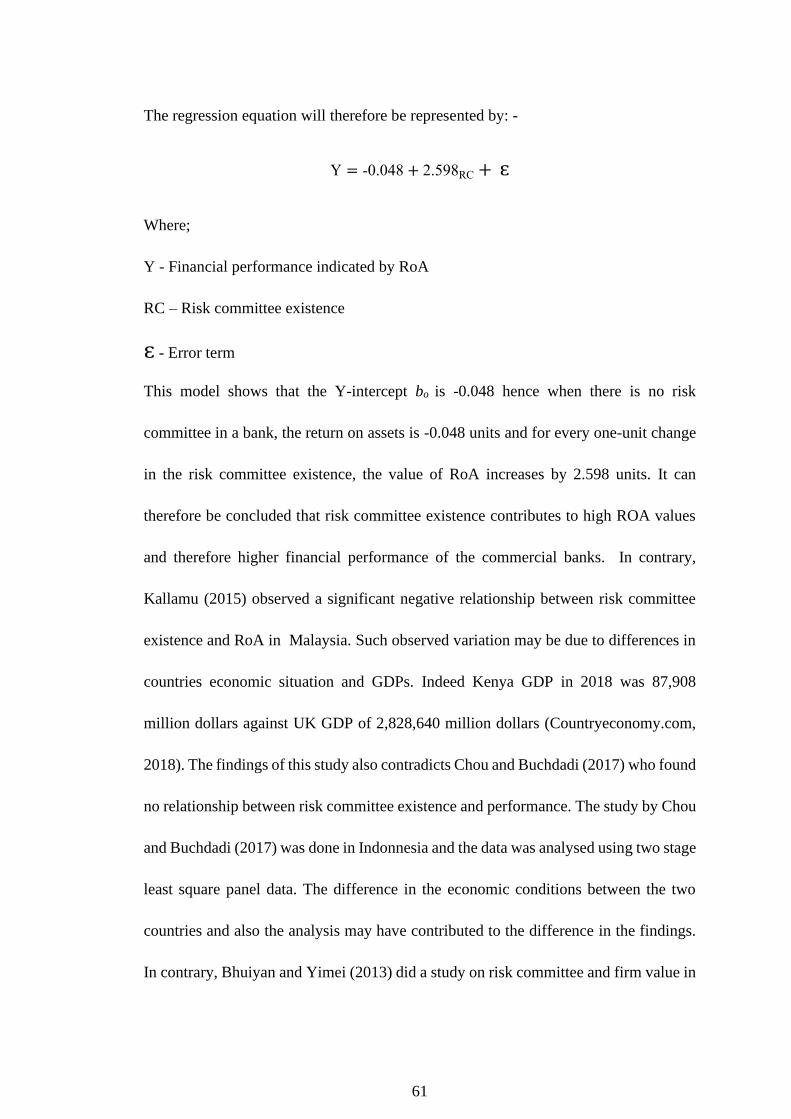
61
The regression equation will therefore be represented by: -
Y = -0.048 + 2.598RC + ɛ
Where;
Y - Financial performance indicated by RoA
RC – Risk committee existence
ɛ - Error term
This model shows that the Y-intercept bo is -0.048 hence when there is no risk
committee in a bank, the return on assets is -0.048 units and for every one-unit change
in the risk committee existence, the value of RoA increases by 2.598 units. It can
therefore be concluded that risk committee existence contributes to high ROA values
and therefore higher financial performance of the commercial banks. In contrary,
Kallamu (2015) observed a significant negative relationship between risk committee
existence and RoA in Malaysia. Such observed variation may be due to differences in
countries economic situation and GDPs. Indeed Kenya GDP in 2018 was 87,908
million dollars against UK GDP of 2,828,640 million dollars (Countryeconomy.com,
2018). The findings of this study also contradicts Chou and Buchdadi (2017) who found
no relationship between risk committee existence and performance. The study by Chou
and Buchdadi (2017) was done in Indonnesia and the data was analysed using two stage
least square panel data. The difference in the economic conditions between the two
countries and also the analysis may have contributed to the difference in the findings.
In contrary, Bhuiyan and Yimei (2013) did a study on risk committee and firm value in

62
Australian firms and the study found that presence of a stand alone risk committee
increases the value of the firm.
4.2.5 Audit committee size of commercial banks in Kenya
To establish the relationship between audit committee size and financial performance
of commercial banks in Kenya, data on the number of audit committee members for the
years 2013 to 2017 were extracted and a regression analysis done. First analysis was
done on the audit committee sizes in various banks that existed for the years under
study. The results are presented in Table 4.6.
Table 4.6
Audit committee sizes for commercial banks (2013- 2017)
Tier 2017 2016 2015 2014 2013 Mean
I 5.13 5.25 4.67 4.57 3.83 4.69
II 5.22 4.67 4.43 5.22 4.38 4.78
III 3.88 4.40 3.83 4.25 4.10 4.09
Mean 4.74 4.77 4.31 4.68 4.10 4.52
Source: Researcher, 2019
The results indicate that generally, there has been a continuous increase (4.52-4.74) in
the size of audit committee from 2013 to 2017 respectively across all the bank tiers.
This is a strategy adopted by commercial banks to reduce risks and improve their
financial performance. Tier II commercial banks recorded a mean of 4.78 audit
committee members and Tier III recorded a mean of 4.09. Regression analysis for audit

63
committee size and financial performance of the various tiers of commercial banks was
carried out and results presented in Table 4.7.
Table 4.7
Audit committee size and RoA as per tier
Tier R R2 Adjusted R2 P value
I 0.29 0.084 0.06 0.069
II 0.081 0.006 -0.014 0.578
III 0.119 0.014 0.003 0.269
Source: Research data, 2019
From Table 4.7, there exist a relationship between audit committee size and RoA for
Tier I with a coefficient of R=0.29 which is significant at p=0.069. For Tier II, there is
a positive relationship with a coefficient of R=0.081, however this relationship is not
significant given that the p value is 0.578 which is greater than 0.05. In Tier III banks,
there is a positive relationship between audit committee size and RoA with a coefficient
of R=0.119, p˃0.05. This indicates that even though there exist a positive relationship,
the relationship is not significant. To establish the relationship that existed between
audit committee size and financial performance of commercial banks, the research
hypothesis that stated that there is no significant relationship between audit committee
size and financial performance of commercial banks in Kenya was tested. The results
are presented in Table 4.8.

64
Table 4.8
Regression analysis between audit committee size and RoA
β SEb β T Coefficients
Constant 2.220 0.718 - 3.093
Main effects
Audit committee size -0.008 0.154 -0.004 -0.050
R 0.004
R Square 0.000
Adjusted R Square -0.006
R Square Change 0.000
Model F Change 0.002
Model Summary df 1
Sig. F Change 0.960
Durbin Watson 0.813
Note: Dependent variable, Risk committee
The significance levels *p<0.05; p**<0.01
Source: Research data, 2019
The results revealed a positive non-significant relationship between audit committee
size and return on assets (R=0.004; p=0.960) as shown in table 4.8. Hence, the study
fails to reject the null hypothesis. Further analysis as per the tiers in table 4.7. showed
that the relationship was still not significant in any of the Tiers. The unstandardized
coefficients which represents the slope of the regression, β = -0.008 means that a unit
change in audit committee size will change the RoA by -0.008 units and the constant β
= 2.220 indicating that when the audit committee size is zero, the RoA will be 2.220
units.
65
The regression equation will therefore be: -
Y = 2.220 + -0.008AC + ɛ
Where;
Y - Financial performance indicated by RoA
AC – Audit committee size
ɛ - Error term
This study confirms a study that was done by Omer and Zuta (2017), who did a study
on impact of audit committee size and composition on the negative events in the life of
a company. The study by Omer and Zuta (2017), found that large audit committee sizes
is significantly positively related to the occurrence of negative events in a company.
Eventhough the study was done in Israel, a developed country, the findings were similar
to the findings of this study that was done in Kenya a developing country. The findings
of this study contradict those of Samoei and Rono (2016) which found that audit
committee size to have significant effect on financial performance. The study by
Samoei and Rono (2016) used explanatory research design with the study area being
listed companies while this study used longitudinal reaserch design to collect data from
secondary sources of commercial banks and this may have caused the difference in the
findings.
4.2.6 Credit committee size of commercial banks in Kenya
Credit committee size was selected as one of the predictors of risk governance
mechanisms in this study. Commercial banks adopt risk committees to help screen out
risk exposures and improve their performance. There is no set standard number on the

66
size of credit committee and therefore commercial banks have different sizes. Data on
credit committee sizes was therefore extracted from all the commercial banks for (2013-
2017). The data was recorded in the extraction form, analyzed and categorized
according to the tiers for the various years under study. The findings are presented in
Table 4.9.
Table 4.9
Credit committee size of commercial banks 2013- 2017
Tier 2017 2016 2015 2014 2013 Mean
I 3.88 3.63 6.13 6.13 5.88 5.13
II 3.80 4.20 3.70 4.40 4.50 4.12
III 3.88 3.79 3.63 3.84 3.74 3.78
Mean 3.85 3.87 4.49 4.79 4.70 4.34
Source: Research data, 2019
From the analysis in Table 4.9, Tier I showed an average size (5.13) while Tier III
commercial banks showed an average of (3.78) of credit committee members
respectively. Even though there was an increase in the credit committee size from 4.9
in 2013 to 4.79 in 2014, this was followed by a decrease to a mean of 3.85 in the year
2017. A regression analysis was done to examine the relationship between credit
committee size and RoA, and also to test whether there is no significant relationship
between credit committee size and financial performance of commercial banks in
Kenya. First, the analysis as per the tiers are presented followed by the general

67
regression analysis for the overall. The findings as per the Tier is presented in Table
4.10
Table 4.10
Regression analysis as per tier
Tier R R2 Adjusted R2 P value
I 0.08 0.006 -0.02 0.625
II 0.552 0.305 0.29 0.000032
III 0.014 0 -0.011 0.9
Source: Research data, 2019
From Table 4.10, the results indicate that there exists a relationship between credit
committee size and RoA for Tier I, however, the relationship is not significant since the
p value is 0.625. For Tier II, the relationship was significant with coefficient R=0.552
with a p value of p=0.000. For Tier III the results showed a positive relationship of
R=0.014 but it was not significant because the p value was 0.9 which is greater than
0.5. A regression analysis was done for the overall and the findings are presented in
Table 4.11.

68
Table 4.11
Regression analysis between credit committee size and return on assets (2013-2017)
β SEb β T Coefficients
Constant 1.167 0.413 - 2.828
Main effects
Credit committee size 0.236** 0.081 0.215** 2.927
R 0.215**
R Square 0.046**
Adjusted R Square 0.041**
R Square Change 0.046**
Model F Change 8.565
Model Summary df 1
Sig. F Change 0.004
Durbin Watson 0.873
Note: Dependent variable, Risk committee
The significance levels *p<0.05; p**<0.01
Source: Research data, 2019
The results indicated a significant positive relationship between credit committee size
and financial performance measured by the return on assets with (coefficients of
regression of R= 0.215, p˂0.05, R2 = 0.046, Adjusted R2= 0.041, p<0.05). From this
result, the null hypothesis is therefore rejected and the alternate hypothesis that states
that there is a statistically significant relationship between credit committee size and
financial performance is accepted. The results presented in Table 4.11 shows that R2 =
0.046 meaning that 4 percent of the variations in RoA can be explained by the size of
credit committee which is significant at p=0.004. The unstandardized coefficients
which represents the slope of the regression β= 0.236, indicates that an increase by one

69
unit of credit committee size will increase the RoA by 0.236 units. The constant β= -
1.167 indicates that when the credit committee size is zero, the RoA will be 1.167 units.
From the regression analysis findings, the regression equation for this model will
therefore be represented by: -
Y = 1.167 + 0.236CC + ɛ
Where;
Y - Financial performance indicated by RoA
CC – Credit committee size
ɛ - Error term
From these findings, it can be concluded that as the size of the credit committee
increases, the financial performance of the commercial bank also increases. Indeed,
Magnifique (2013) observed that credit risk management significantly predict financial
performance, while Alshatti (2015) observed that risk management significantly impact
the financial performance of commercial banks in Jordan a country with different GDP
as compared to Kenya. This study confirms the findings of a study by Kauna (2015),
that found a significant positive relationship between credit risk identification, credit
risk monitoring and financial performance of the commercial banks in Kenya. The
study by Kauna (2015), recommended that commercial banks should put emphasis on
the credit risk identification and this is a role of credit committee in commercial banks.
4.2.6 Number of risk governance mechanisms of commercial banks in Kenya
Commercial banks use different mechanisms to manage risks therefore it is important
to establish whether there exists a relationship between number of risk governance

70
mechanisms and return on assets (RoA). Data on the number of risk governance
mechanisms for different commercial banks in Kenya was therefore extracted. This data
was analyzed for 2013-2017 financial years and presented according to different tiers
of commercial banks. Table 4.11 shows the results on the number of risk governance
mechanisms adopted by the various commercial banks in Kenya between 2013 and
2017.
Table 4.12
Number of risk governance mechanisms adopted by in commercial banks
Tier 2017 2016 2015 2014 2013 Mean
I 4.38 4.25 4.63 4.38 4.13 4.35
II 5.50 6.20 6.20 6.40 6.20 6.10
III 3.88 5.95 5.79 5.63 5.53 5.35
Mean 4.58 5.47 5.54 5.47 5.28 5.27
Source: Research data, 2019
Tier I indicated the lowest mean (4.35) while Tier II showed the highest mean (6.10)
number of risk governance mechanisms. Generally, there has been a decrease in the
mean number of risk mechanisms from 5.28 in the year 2013 to 4.58 in 2017. The study
also hypothesized that there is no significant relationship between the number of risk
governance mechanisms and financial performance of commercial banks in Kenya. To
test this hypothesis a regression analysis was done. The findings are presented first as
per the tiers and secondly the overall. Table 4.13 shows the regression results according
to the tiers.

71
Table 4.13
Regression analysis as per tier
Tier R R2 Adjusted R2 P value
I 0.255 0.065 0.04 0.112
II 0.385 0.148 0.13 0.006
III 0.292 0.085 0.075 0.006
Source: Research data, 2019
The results showed a positive relationship for Tier I banks, however the relationship
was not significant since the p value is 0.112 which is greater than 0.05 the acceptable
margin. For Tier II banks, the relationship showed a significant positive relationship of
coefficient of correlation R=0.385, p˂0.05. In Tier III banks, the coefficient of
correlation was R=0.292 with a p value of 0.006. This shows that there is a significant
positive relationship between number of risk governance mechanisms and RoA for Tier
II and III. An overall regression analysis was done and the findings presented in Table
4.14

72
Table 4.14
Regression analysis between number of risk governance mechanisms and return on
assets
β SEb β T Coefficients
Constant 1.244 0.428 - 2.909
Main effects
Number of risk mechanisms 0.166* 0.064 0.191* 2.581
R 0.191*
R Square 0.036*
Adjusted R Square 0.031*
R Square Change 0.036*
Model F Change 6.660
Model Summary df 1
Sig. F Change 0.011
Durbin Watson 0.827
Note: Dependent variable, Risk committee
The significance levels *p<0.05; p**<0.01
Source: Research data, 2019
From the results, it is established that the number of risk mechanisms adopted by a bank
has a positive relationship with the return on assets (a regression coefficient of R=0.191,
p=0.011, R2 = 0.036, Adjusted R2= 0.031, p<0.05). The null hypothesis is therefore
rejected and the alternate hypothesis that states that there is a statistically significant
relationship between number of risk governance mechanisms and financial
performance is accepted. From the findings, R2 = 0.036 indicates that number of risk
governance mechanisms can explain 3.6 percent of the variations in the RoA which is
significant at p=0.011 and the unstandardized coefficients which represents the slope
73
of the regression β= 0.166 indicates that an increase by one unit of the number of risk
governance mechanisms adopted by the commercial banks will increase the RoA by
0.166 units. The constant β= 1.244 indicates that when the commercial banks have zero
risk governance mechanisms, the RoA will be 1.244 units.
The regression equation model will therefore be: -
Y = 1.244 + 0.166NM + ɛ
Where;
Y - Financial performance indicated by RoA
NM – Number of risk governance mechanisms
ɛ - Error term
It is concluded that number of risk governance mechanisms is significantly related with
financial performance since as the number of risk governance mechanisms increases,
the return on asset also increases. Indeed (Kamazima, Mathenge and Ngui, 2017;
Kimeu, 2017) found a statistical significant relationship between number of risk
mechanisms and financial performance while Bernaddette and Conna (2015) found that
corporate governance mechanisms influences the performance of commercial banks.
However, Carter, D’Souza, Simkins and Simpson (2010) found a negative relationship
between the number of risk governance mechanisms and financial performance. Such
variations may be explained by differences in financial operation sectors and country
GDP differences. Puni (2015) found that board committees had no significant statistical
impact on financial performance on listed firms in Ghana and associated this to industry
operation differences.

74
4.2.7 Relationship between risk governance mechanisms and financial
performance
The predictors of risk governance mechanisms for commercial banks were categorized
as; risk committee existence, audit committee size, credit committee size and number
of risk governance mechanisms. The mean values of these risk predictors (2013-2017)
according to the tiers are shown in Table 4.15.
Table 4.15
Data on risk governance mechanisms
Predictor 2017 2016 2015 2014 2013 Mean
Risk committee
existence 1.02 1.02 1.10 1.10 1.06 1.06
Audit committee size 4.74 4.77 4.31 4.68 4.10 4.52
Credit committee size 3.85 3.87 4.49 4.79 4.70 4.34
Number of
mechanisms 4.58 5.47 5.54 5.47 5.28 5.27
Source: Research data, 2019
In general, commercial banks have adopted risk and credit committees that has declined
continuously from 2013-2017. In contrast audit committees and number of risk
governance mechanisms increased over the same period. There has been an increase in
the number of risk governance mechanisms over the years as a way of commercial
banks reducing risks and improving financial performance. To establish the general

75
relationship between risk governance mechanisms and financial performance, a
regression analysis was done and the findings is presented in Table 4.16.
Table 4.16
Regression between risk governance mechanisms and RoA
Model 1
β SEb β T Coefficients
Constant 0.185 0.788 - 0.235
Risk governance mechanisms
Risk committee 2.358 0.645 0.271 3.655
Audit committee 0.319 0.157 -0.156 -2.027
Credit committee 0.206 0.086 0.188 2.401
Number of mechanisms 0.088 0.066 0.101 1.328
R 0.376
R Square 0.142
Adjusted R Square 0.122
R Square Change 2.83581
Model Summary df 4
F Change 7.129
F-Sig 0.000025
Durbin Watson 1.996
Dependent Variable: Financial performance; Significance levels *p<0.05
Source: Research data, 2019
The results shown in Table 4.16 revealed a significant relationship between risk
governance mechanisms and RoA indicates (R = 0.376, R2 = 0.142, Adjusted R2=
0.122, p˂0.05). It is therefore concluded that risk committee, credit committee and
number of risk governance mechanisms have significant positive relationship with the

76
RoA. The results indicate that R2 = 0.142 meaning that 14.2 percent of risk governance
mechanisms explains the variations in RoA. The unstandardized coefficients which
represents the slope of the regression β= 2.358 of risk committee existence means that
a change by one unit of risk committee existence increases the RoA by 2.358 units,
when β= -0.319 means an increase by one unit of audit committee size changes the RoA
by -0.319 units, β= 0.206 means that a change by one unit of credit committee size
increases the RoA by 0.206 units and β= 0.088 means a change by one unit on number
of risk governance mechanisms changes the RoA by 0.088 units. The β= 0.185 means
that when there are no risk governance mechanisms in a commercial bank, the RoA will
be 0.185 units. Therefore, the findings presented in table 4.12 the regression equation
of the optimal model for the financial performance will therefore be: -
Y = 0.185 + 2.358X1 + 0.319X2 + 0.206X3 + 0.088 + ɛ
Where:
X1 is coefficient of risk committee
X2 is coefficient of audit committee size
X3 is coefficient of credit committee size
X4 is the coefficient of number of risk governance mechanisms
ɛ - Error term
In related previous studies by Nibedita (2018), a positive relationship between
corporate governance mechanisms and financial performance was observed in
Bangladesh. The present study provides a new insight in new knowledge on risk
governance mechanisms in the Kenyan banking sector. Indeed, as the commercial

77
banks increases the use of risk governance mechanisms, the financial performance also
increases. The findings of this study confirm a study by Chou and Buchdadi (2017) that
found that risk governance mechanisms; independent board, audit committee, risk
committee, meeting attendance level having a positive impact on performance. The
findings of this study also confirms a study done by Olayinka et al., (2018) and found
that risk governance has a significant positive impact on the financial performance of
commercial banks. On the otherhand, this study contradicts, Mollah, Farooque,
Mobarek and Molyneux (2019) found that board structure influences the future
cashflows while risk governance mechanisms had no statistical significance with
performance. The findings however found that there were varied results from the
developed and developing countries. The study was done in banks operating across 71
countries and the difference in the country policies may have contributed to the
difference in the findings.
4.3 Board Size of Commercial Banks in Kenya
This study aimed at establishing the moderating effect of board oversight on the
relationship between risk governance mechanisms and financial performance of
commercial banks in Kenya. First the relationship between the risk governance
mechanisms and RoA was established using the board size as a predictor of the
moderator and secondly using the frequency of board meetings.

78
4.3.1 Moderating effect of board size on risk committee existence and return on
assets
To establish the moderating effect of board oversight on the relationship between risk
governance mechanisms and financial performance, board size was used as a predictor
of board oversight. First, data on board size for each commercial bank was extracted,
recorded and analyzed and the results categorized according to the different bank tiers
(2013-2017). The results for the tiers analyzed are presented in Table 4.17.
Table 4.17
Board size of commercial banks in Kenya
Tier 2017 2016 2015 2014 2013 Mean
I 10.88 11.00 10.50 11.43 10.86 10.93
II 11.38 9.67 11.22 11.78 10.25 10.86
III 8.22 9.88 9.64 9.86 10.36 9.59
Mean 10.16 10.18 10.46 11.02 10.49
Source: Research data, 2019
Tier I commercial banks had the highest number of board members (Mean of 10.93)
followed by Tier II and the least is Tier III (with a mean of 9.59). There was a decrease
in the mean size of the board from 10.49 in 2013 to 10.16 in 2017. The results indicate
that Commercial banks in Kenya have adopted large board size as a way of enhancing
the board oversight with the ultimate aim of reducing risk and increasing the financial
performance. To establish the moderating effect of board size on the relationship
between risk committee existence and financial performance, the hypothesis that there

79
is no significant moderating effect of board size on the relationship between risk
committee existence and financial performance of commercial banks in Kenya was
tested. To test this, a linear regression analysis was done between risk committee
existence and financial performance with board size being the moderator (2013-2017).
The regression results are presented in Table 4.18.

80
Table 4.18
Regression of moderating effect of board size on the relationship between risk committee existence and RoA for commercial banks
Model 1 Model 2 Model 3
β SEb β β SEb β β SEb β
Constant -0.048 0.579 0.320 0.795 -7.832 2.649
Step 1
Risk committee 2.598 ** 0.625** 2.701** 0.644** 0.311** 11.309** 2.748** 1.302**
Step 2
Board size -0.045 0.67 -0.050 0.954** 0.371** 1.062**
Step 3
RC*BS -1.043** 0.324** -1.671**
R 0.299 0.303 0.378
R Square 0.090 0.092 0.143
Adjusted R Square 0.084 0.081 0.128
R Square Change 0.000 0.002 0.051
Model F Change 17.301 0.456 10.365
Model Summary df 1 1 1
Sig. F Change 0.000 0.500 0.002
Durbin Watson 0.895
Note: Dependent variable, Risk committee,
The significance levels *p<0.05; p**<0.02
Source: Research data, 2019

81
From the regression analysis, the regression coefficient for the relationship between
risk committee and return on assets was R=0.299 before and R=0.378, after the
introduction of the moderator respectively. At the same time R2 changed from 0.084
before to R2= 0.128 after the moderator. The initial change in R2 was 0.090 in model 1
and 0.002 in model 2 and 0.051 in model 3. This change was significant (p˂0.05). It is
therefore suggested that there is a significant moderating effect of board size on the
relationship between risk committee and RoA. The findings presented in Table 4.18 the
regression equation will therefore be:-
Y = -0.048 + 2.598RC + ɛ….……...….Model 1
Y = 0.320 + 2.701RC + ɛ……..…….Model 2
Y = -7.832 + -1.043RC + ɛ ……..….Model 3
Where:
Y- Financial performance indicated by RoA
RC- Risk committee existence
ɛ - Error term
In contrast, Muchemwa and Padia (2016) found no relation between board size and
financial performance. This variation may be due to difference in the research design
where this study used longitudinal research design and cross sectional research design
as used by Muchemwa and Padia (2016). Shunu et al, (2017) while working on the
effect of board size on the firms performance of listed companies in Nairobi stock
exchange using panel approach observed a significant positive relationship between
board size and performance of firms.

82
4.3.2 Moderating effect of board size on audit committee size and the return on
assets
The study aimed at establishing the moderating effect of board oversight between audit
committee and financial performance. A regression analysis was therefore carried out
between audit committee size of sampled commercial banks and their financial
performances. The indicator of financial performance was RoA values and the
moderating variable being board size. To test the moderating effect of board size on the
relationship between audit committee size and financial performance, the research
hypothesis that stated that there is no significant effect of board size on the relationship
between audit committee size and financial performance of commercial banks in Kenya
was tested. The regression analysis results as shown in Table 4.19.
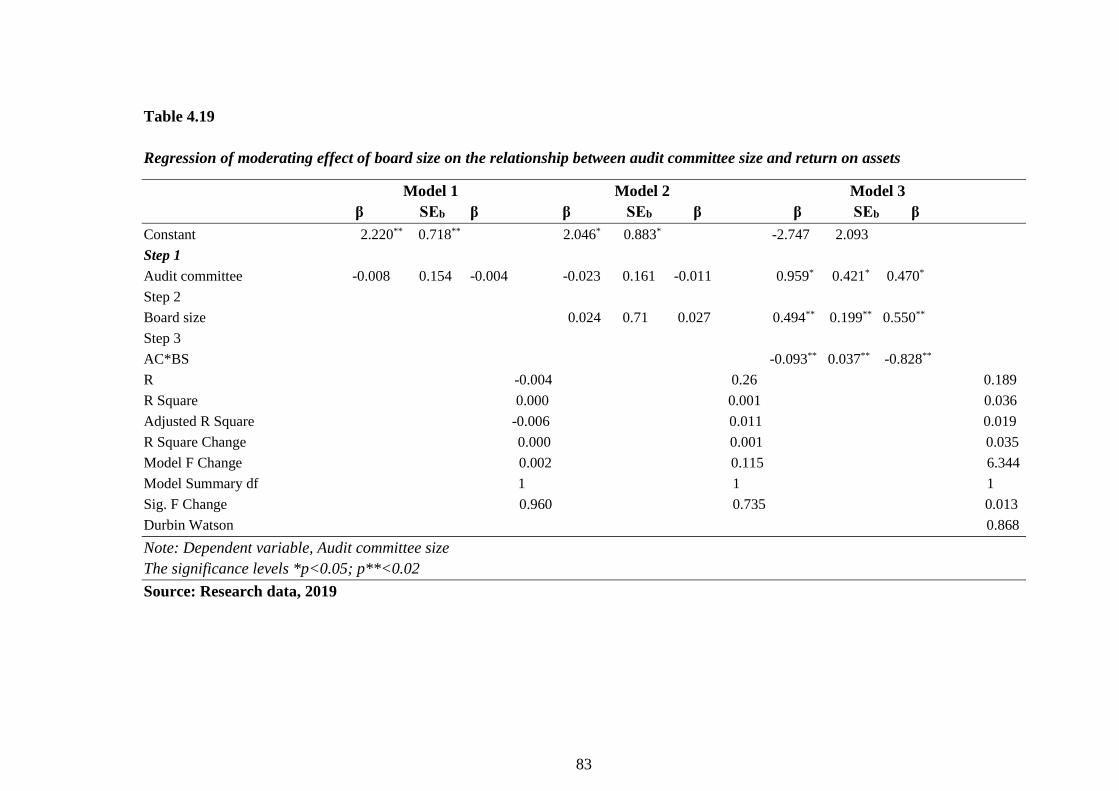
83
Table 4.19
Regression of moderating effect of board size on the relationship between audit committee size and return on assets
Model 1 Model 2 Model 3
β SEb β β SEb β β SEb β
Constant 2.220** 0.718** 2.046* 0.883* -2.747 2.093
Step 1
Audit committee -0.008 0.154 -0.004 -0.023 0.161 -0.011 0.959* 0.421* 0.470*
Step 2
Board size 0.024 0.71 0.027 0.494** 0.199** 0.550**
Step 3
AC*BS -0.093** 0.037** -0.828**
R -0.004 0.26 0.189
R Square 0.000 0.001 0.036
Adjusted R Square -0.006 0.011 0.019
R Square Change 0.000 0.001 0.035
Model F Change 0.002 0.115 6.344
Model Summary df 1 1 1
Sig. F Change 0.960 0.735 0.013
Durbin Watson 0.868
Note: Dependent variable, Audit committee size
The significance levels *p<0.05; p**<0.02
Source: Research data, 2019
84
The results in model 1 indicate a significant moderating effect of board size on the
relationship between audit committee size and return on assets (R= 0.004, R2= 0.000,
Adjusted R2 = -0.006, p˃0.05). In comparison with model 2, (R= 0.26, R2 = 0.001,
p˃0.05. The correlation coefficient between the variables was r=-0.004 before
moderator but changed to R=0.189 after moderator. The model coefficients after the
introduction of the moderator were (R=0.189, change in R2= 0.035, p˂0.05). This
indicates that there is a significant moderating effect of board size on the relationship
between audit committee size and financial performance. From the results in Table
4.19, the regression equation will therefore be: -
Y = 2.220 + 0.718AC + ɛ…..…….Model 1
Y = 2.046 + 0.024AC + ɛ….…..….Model 2
Y = -2.747 + -0.093AC + ɛ……….Model 3
Where:
Y- Financial performance indicated by RoA
AC- Audit committee size
ɛ - Error term
In previous studies Topal and Dogan, (2014) found a positive relationship between
board size and the performance of firms. Muchemwa and Padia (2016) also found a
positive relationship between board size and financial performance. The study was done
in South Africa and the findings are similar to the findings of this study. Similar
findings were obserevd by Ogada , Achoki and Njuguna (2016) who found that board
85
size had a significant effect on financial performance. Eventhogh the study was done
in merged institutions using mixed research design, the findings were similar with the
findings of this study.
4.3.3 Moderating effect of board size on credit committee size and the return on
assets
In this study moderated credit committee size was also used as a predictor of risk
governance mechanisms for commercial banks. Different commercial banks have
different sizes and composition of credit committee that help in finding ways of
minimizing risk exposure to the banks. In our previous unmoderated results, a
significant positive relationship between credit committee size and financial
performance was observed with a regression coefficient R=0.591 (Table 4.11). to test
the hypothesis that stated that there is no significant moderating effect of board size on
the relationship between credit committee size and financial performance of
commercial banks in Kenya, a linear regression was done between moderated values of
credit committee and RoA. The regression analysis of the moderating effect of board
size on the relationship between credit committee size and return on assets is presented
in Table 4.20.

86
Table 4.20
Moderating effect of board size on the relationship between credit committee size and return on assets
Model 1 Model 2 Model 3
β SEb β β SEb β β SEb β
Constant 1.167** 0.413** 1.150 0.762 2.665* 1.245*
Step 1
Audit committee 0.236** 0.081** 0.215 0.236** 0.081** 0.215** -0.159 0.270 -0.145
Step 2
Board size 0.002 0.67 0.002 -0.146 0.117 -0.163
Step 3
CC*BS 0.038 0.025 0.426
R 0.215** 0.215 0.243
R Square 0.046** 0.046 0.059
Adjusted R Square 0.041 0.036 0.043
R Square Change 0.000** 0.000 0.013
Model F Change 8.565** 0.001 2.358
Model Summary df 1 1 1
Sig. F Change 0.004 0.979 0.126
Durbin Watson 0.898
Note: Dependent variable, Credit committee size
The significance levels *p<0.05; p**<0.02
Source: Research data, 2019
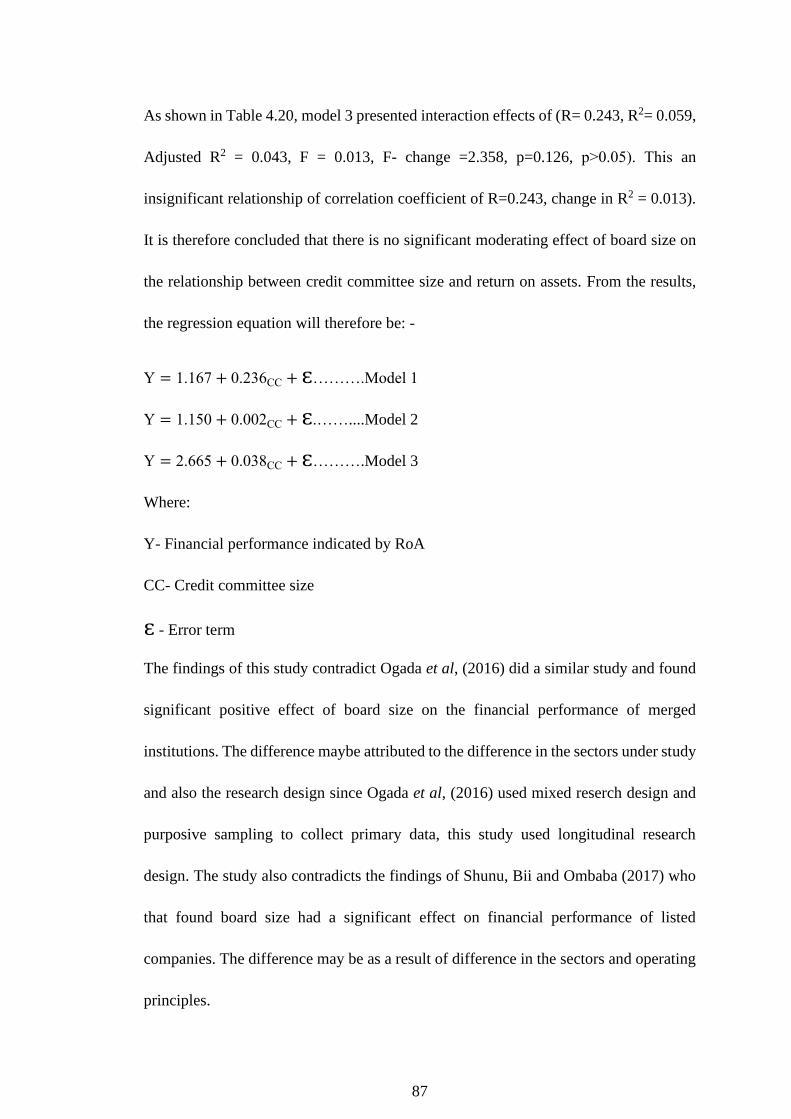
87
As shown in Table 4.20, model 3 presented interaction effects of (R= 0.243, R2= 0.059,
Adjusted R2 = 0.043, F = 0.013, F- change =2.358, p=0.126, p˃0.05). This an
insignificant relationship of correlation coefficient of R=0.243, change in R2 = 0.013).
It is therefore concluded that there is no significant moderating effect of board size on
the relationship between credit committee size and return on assets. From the results,
the regression equation will therefore be: -
Y = 1.167 + 0.236CC + ɛ……….Model 1
Y = 1.150 + 0.002CC + ɛ.……....Model 2
Y = 2.665 + 0.038CC + ɛ……….Model 3
Where:
Y- Financial performance indicated by RoA
CC- Credit committee size
ɛ - Error term
The findings of this study contradict Ogada et al, (2016) did a similar study and found
significant positive effect of board size on the financial performance of merged
institutions. The difference maybe attributed to the difference in the sectors under study
and also the research design since Ogada et al, (2016) used mixed reserch design and
purposive sampling to collect primary data, this study used longitudinal research
design. The study also contradicts the findings of Shunu, Bii and Ombaba (2017) who
that found board size had a significant effect on financial performance of listed
companies. The difference may be as a result of difference in the sectors and operating
principles.

88
4.3.4 Moderating effect of board size on number of risk governance mechanisms
and return on assets
This study aimed at establishing the moderating effect of board oversight on the
relationship between number of risk governance mechanisms and return on assets in
commercial banks. Board sizes of different commercial bank tiers were extracted and
regressed against RoA. Previous unmoderated results indicated that the number of risk
governance mechanisms and financial performance of commercial banks are positively
related however the same relationship could be increased by a moderator. To
understand this, board oversight was introduced as a moderator. The board size was
used as predictor of the moderator while the number of risk governance mechanisms
was used as a predictor of the risk governance mechanism. To establish the moderating
effect of board size on the relationship between number of risk governance mechanisms
and financial performance, the hypothesis that stated that there is no significant
moderating effect of board size on the relationship between the number of risk
governance mechanisms and financial performance of commercial banks in Kenya was
tested. To test this, a regression analysis was done between moderated values of number
of risk governance mechanisms and financial performance. The findings are presented
in Table 4.21.

89
Table 4.21
Moderating effect of board size on the relationship between number of risk governance mechanisms and return on assets
Model 1 Model 2 Model 3
β SEb β β SEb β β SEb β
Constant 1.244** 0.428** 1.707** 0.717** 0.083 1.639
Step 1
Number of risk mechanisms 0.166** 0.064** 0.191** 0.189** 0.071** 0.218** 0.517 0.305 0.594
Step 2
Board size -0.059 0.073 -0.65 0.061 0.131 0.068
Step 3
NM*BS -0.023 0.021 -0.454
R 0.191 0.200 0.216
R Square 0.036 0.040 0.047
Adjusted R Square 0.031 0.029 0.030
R Square Change 0.000 0.004 0.007
Model F Change 6.660 0.649 1.215
Model Summary df 1 1 1
Sig. F Change 0.011 0.421 0.272
Durbin Watson 0.823
Note: Dependent variable, Number of risk mechanisms
The significance levels *p<0.05; p**<0.02
Source: Research data, 2019

90
From the findings presented in table 4.21, indicated the coefficients of regression
R=0.216, R2= 0.047, adjusted R2 = 0.030, p=0.272, p ˃ 0.05. This shows an
insignificant moderating effect of board size on the relationship between number of risk
governance mechanisms and return on assets. This model only explains 4.7% of the
return on assets with p ˃ 0.05. It can therefore be concluded that there is no significant
moderating effect of board size on the relationship between number of risk governance
mechanisms and financial performance for commercial banks in Kenya. From the
results, the regression equation will therefore be:-
Y = 1.244 + 0.166NM + ɛ……….Model 1
Y = 1.707 + -0.059NM + ɛ.……...Model 2
Y = 0.083 + -0.023NM + ɛ……….Model 3
Where:
Y- Financial performance indicated by RoA
NM- Number of risk governance mechanisms
ɛ - Error term
Oludele et al, (2016) found a positive relationship between board size and financial
performance of listed manufacturing firms in Nigeria. This study was done in
commercial banks and the study by Oludele et al, (2016) was limited to manufacturing
firms in Nigeria and therefore, the difference may be atributed to the difference in the
industry and also difference in the policies between the two countries. Orozco & Vargas
(2018) also observed that board size had significant positive relationship with
performance of companies in Colombia. The study by Orozco and Vargas (2018) used

91
correlation cluster analysis and the difference therefore may be attributed to the
difference in research design.
4.3.5 Moderating effect of board size on risk governance mechanisms and
financial performance
This study aimed at establishing the moderating effect of board oversight on the
relationship between risk governance mechanisms and the financial performance of
commercial banks in Kenya. The predictors for the risk governance mechanisms were
risk committee existence, audit committee size, credit committee size and number of
risk governance mechanisms adopted by the commercial banks to minimize its risk
exposure. The unmoderated values of risk mechanisms showed a significant positive
relationship with the coefficients being R= 0.769, R2 = 0.591, adjusted R2= 0.427, F (4)
= 3.613, p˂0.05 as shown in Table 4.16. To establish the moderating effect of board
size, the study hypothesized that there is no significant moderating effect of board
oversight on the relationship between risk governance mechanisms and financial
performance of commercial banks in Kenya. A regression analysis was done to test this
hypothesis and the findings are presented in Table 4.22.

92
Table 4.22
Moderating effect of board size on the relationship between risk governance mechanisms and financial performance
Model 1 Model 2 Model 3
β SEb β T Sig. β SEb β T Sig. β SEb β T Sig
Constant 0.185 0.788 - 0.235 0.814 0.545 0.884 - 0.616 0.539 -9.596 3.162 - -3.035 0.003
Risk governance mechanisms
Risk committee 2.358 0.645 0.271 3.655 0.000 2.431 0.650 0.280 3.737 0.000 -1.217 0.326 -1.950 -3.735 0.000
Audit committee -0.319 0.157 -0.156 -2.027 0.044 -0.286 0.161 -0.140 -1.775 0.078 -0.025 0.037 -0.222 -0.671 0.503
Credit committee 0.206 0.086 0.188 2.401 0.017 0.197 0.086 0.180 2.281 0.024 0.021 0.027 0.234 0.779 0.437
Number of mechanisms 0.88 0.066 0.101 1.328 0.186 0.11 0.071 0.127 1.561 0.120 5.887 0.023 0.001 0.003 0.998
Step 2
Board oversight
Step 3
Risk governance*Board Oversight
R 0.376 0.381 0.471
R Square 0.142 0.146 0.222
Adjusted R Square 0.122 0.121 0.180
R Square Change 0.000 0.004 0.076
F Change 7.129 0.806 4.122
F-Sig 0.000 0.371 0.003
Durbin Watson 1.020
Dependent Variable: Financial performance
Source: Research data, 2019
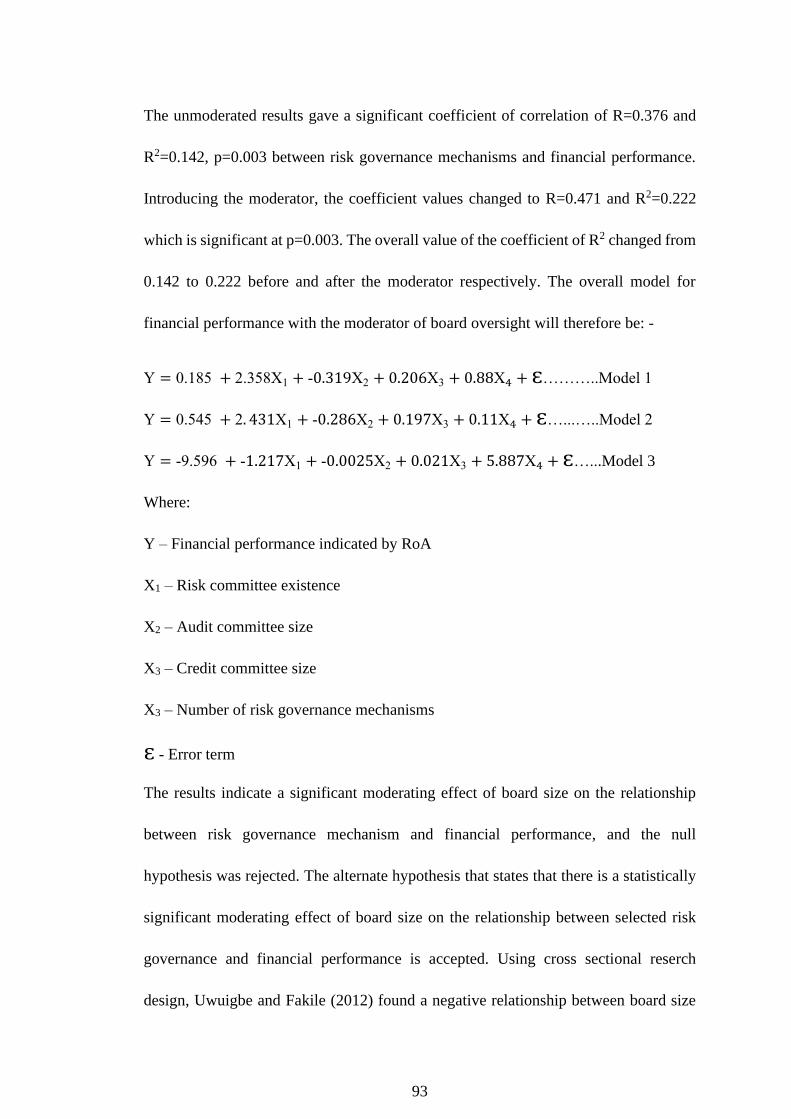
93
The unmoderated results gave a significant coefficient of correlation of R=0.376 and
R2=0.142, p=0.003 between risk governance mechanisms and financial performance.
Introducing the moderator, the coefficient values changed to R=0.471 and R2=0.222
which is significant at p=0.003. The overall value of the coefficient of R2 changed from
0.142 to 0.222 before and after the moderator respectively. The overall model for
financial performance with the moderator of board oversight will therefore be: -
Y = 0.185 + 2.358X1 + -0.319X2 + 0.206X3 + 0.88X4 + ɛ………..Model 1
Y = 0.545 + 2. 431X1 + -0.286X2 + 0.197X3 + 0.11X4 + ɛ…...…..Model 2
Y = -9.596 + -1.217X1 + -0.0025X2 + 0.021X3 + 5.887X4 + ɛ…...Model 3
Where:
Y – Financial performance indicated by RoA
X1 – Risk committee existence
X2 – Audit committee size
X3 – Credit committee size
X3 – Number of risk governance mechanisms
ɛ - Error term
The results indicate a significant moderating effect of board size on the relationship
between risk governance mechanism and financial performance, and the null
hypothesis was rejected. The alternate hypothesis that states that there is a statistically
significant moderating effect of board size on the relationship between selected risk
governance and financial performance is accepted. Using cross sectional reserch
design, Uwuigbe and Fakile (2012) found a negative relationship between board size

94
and financial performance of commercial banks in Nigeria. The variation may be
atrributed to the research design. Shkendije (2014) observed that companies with large
board sizes have low performance and it is attributed to challenges in corrdination of
large numbers. Muganda and Umulker (2015) similarly found that board size negatively
affects financial performance of commercial banks in Kenya. Muchemwa and Padia,
(2016) found that there is no relationship between board size and performance of the
firm. The study used cross-sectional research design and multiple regression analysis
to analyse data while this study used longitudinal research design. The difference in the
findings of the study done by Muchemwa and Padia, (2016) and this study may be
atributed to the difference in the research design. On the other hand, this study confirms
a study done by Orozco and Vargas (2018) that found large board size to be associated
with high financial performance of large companies. It also confirms a study done by
Kiambati et.al (2013) who obsereved that board size has an effect on the profitability
of commercial banks in Kenya. This study also confirms Topal and Dogan (2014) who
carried out a study on the impact of board size on the performance of firms and found
that there is a positive relationship between board size and firm performance. Another
study Ogada et al., (2016) on the effecct of board size on the financial performance
found a positive relationship between board size and finacial performance.

95
4.4 Board Meetings of Commercial Banks in Kenya
The second predictor for the effects of board oversight on financial performance
commercial banks was frequency of board meetings. The boards of commercial banks
hold several meetings in a year to provide oversight on financial performance. There is
no standard number of meetings that the commercial banks should hold in a year and
therefore, there was need to carry out a study to establish the moderating effect of
frequency of board meetings on the relationship between risk governance mechanisms
and financial performance. First, data on the number of board meetings held by different
commercial bank tiers are presented in Table 4.19.
Table 4.23
Data on the number of board meetings held by commercial banks in Kenya (2013-
2017)
Tier 2017 2016 2015 2014 2013 Mean
I 6.25 6.13 6.33 6.57 6.50 6.36
II 8.25 7.22 7.78 8.00 7.00 7.65
III 7.06 7.76 7.21 6.33 6.58 6.99
Mean 7.19 7.04 7.11 6.97 6.69
Source: Research data, 2019
It is observed that there has been an increase in the number of board meetings held over
years (2013-2017) across all the commercial bank tiers. The average number of board
meetings held ranged from 6.69 in 2013 to 7.19 in 2017. Tier II commercial banks held
the highest mean of 7.65 board meetings between (2013-2017) in comparison with a
mean of 6.36 for tier I and mean of 6.99 for Tier III.

96
4.4.1 Moderating effect of board meetings on risk committee and return on assets
To establish the moderating effect of board oversight on the relationship between risk
governance mechanisms and financial performance, data on the risk committee
existence was extracted. This data was recorded using arbitrary values where mean of
values 1-1.5 signified existence of risk committee and mean of values 1.6-2 signified
the absence of risk committee. The analysis was done for the period 2013-2017 and
regression analysis was carried out between the risk committee existence and return on
assets. Previous unmoderated results indicated a significant positive relationship
between risk committee and return on assets (R=0.299, R2= 0.1084, F (1) = 17.301,
p<0.05). To test the hypothesis that stated that there is no significant moderating effect
of frequency of board meetings on the relationship between risk committee existence
and financial performance of commercial banks in Kenya, a regression analysis was
done. The results are presented in Table 4.24.

97
Table 4.24
Moderating effect of board meetings on the relationship between risk committee existence and return on assets
Model 1 Model 2 Model 3
β SEb β β SEb β β SEb β
Constant -0.048 0.579 - 0.346 0.650 -1.190 2.224
Step 1
Risk committee 2.598** 0.625** 2.475** 0.636** 0.285** 3.342 2.276 0.385
Step 2
Board meetings 0.060 0.60 0.074 0.230 0.433 0.283
Step 3
RC*BM -0.173 0.437 -0.250
R 0.299** 0.308 0.309
R Square 0.090** 0.095 0.096
Adjusted R Square 0.084** 0.084 0.080
R Square Change 0.090** 0.005 0.001
Model F Change 17.301** 1.016 0.158
Model Summary df 1 1 1
Sig. F Change 0.000 0.315 0.692
Durbin Watson 0.855
Note: Dependent variable, Risk committee
The significance levels *p<0.05; p**<0.02
Source: Research data, 2019

98
Results in (Table 4.20) revealed that the regression coefficient between risk committee
and return on assets was R=0.299 and R=0.309 before and after the introduction of the
moderator. The R2 changed from R2 = 0.090 to R2= 0.096 before and after the
introduction of the moderator respectively. Regression coefficient for the moderated
values was insignificant with p = 0.692 ˃ 0.05. The study therefore concludes that there
is no significant moderating effect of frequency of board meetings on the relationship
between risk committee existence and financial performance. From the results, the
regression equation will therefore be:-
Y = -0.048 + 2.598RC + ɛ……….Model 1
Y = -0.346 + -0.060RC + ɛ.……...Model 2
Y = -1.190 + -0.173RC + ɛ……...Model 3
Where:
Y- Financial performance indicated by RoA
RC- Risk committee existence
ɛ - Error term
The findings of this study are in agreement to those of Hanh et al., (2018) that found a
negative effect of high frequency on the financial performance of listed firms in
Vietnam. The findings of this study however contradicts a study by Koriang (2014)
who found negligable relationship between number of meetings and the performance.
The study used panel data and this may have contributed to the difference in the
findings.

99
4.4.2 Moderating effect of board meetings on audit committee size and financial
performance
The study aimed at establishing the moderated effect of meetings on the relationship
between audit committee size and return on assets (RoA). Previous analysis on the same
before introduction of the moderator (frequency of board meetings) showed no
significant relationship. To test this relationship, a hypothesis that stated that there is
no significant moderating effect of frequency of board meetings on the relationship
between audit committee size and financial performance of commercial banks in Kenya
was tested through a moderated linear regression analysis. The results of the moderated
regression analysis between audit committee size and return on assets after the
introduction of moderator is presented in Table 4.25.

100
Table 4.25
Moderating effect of board meetings on the relationship between audit committee size and return on assets
Model 1 Model 2 Model 3
β SEb β β SEb β β SEb β
Constant 2.220 0.718 1.711 0.770 0.155 1.707
Step 1
Audit committee size -0.008 0.154 -0.004 -0.058 0.156 -0.029 0.263 0.351 0.129
Step 2
Board meetings 0.109 0.062 0.134 0.353 0.247 0.433
Step 3
AC*BM -0.049 0.048 -0.371
R 0.004 0.132 0.152
R Square 0.000 0.017 0.023
Adjusted R Square -0.006 0.006 0.006
R Square Change 0.000 0.017 0.006
Model F Change 0.002 3.088 1.042
Model Summary df 1 1 1
Sig. F Change 0.960 0.081 0.309
Durbin Watson 0.855
Note: Dependent variable, Audit committee
The significance levels *p<0.05; p**<0.02
Source: Research data, 2019
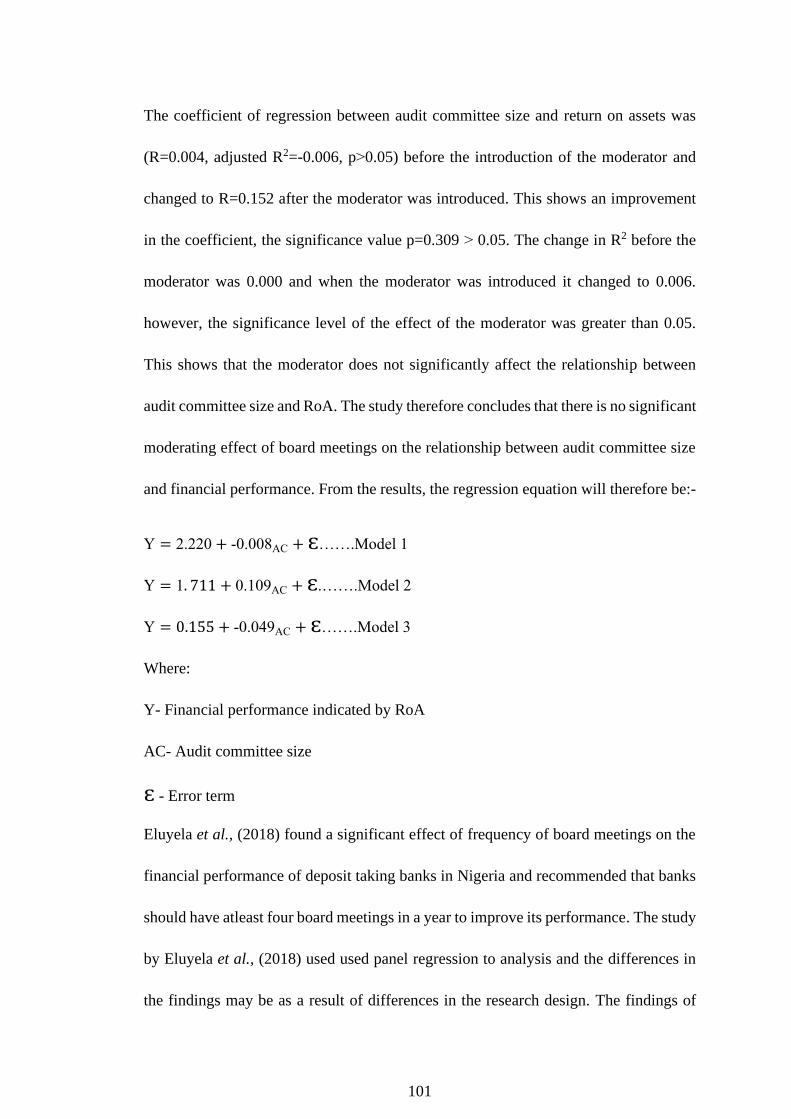
101
The coefficient of regression between audit committee size and return on assets was
(R=0.004, adjusted R2=-0.006, p˃0.05) before the introduction of the moderator and
changed to R=0.152 after the moderator was introduced. This shows an improvement
in the coefficient, the significance value p=0.309 ˃ 0.05. The change in R2 before the
moderator was 0.000 and when the moderator was introduced it changed to 0.006.
however, the significance level of the effect of the moderator was greater than 0.05.
This shows that the moderator does not significantly affect the relationship between
audit committee size and RoA. The study therefore concludes that there is no significant
moderating effect of board meetings on the relationship between audit committee size
and financial performance. From the results, the regression equation will therefore be:-
Y = 2.220 + -0.008AC + ɛ…….Model 1
Y = 1. 711 + 0.109AC + ɛ.…….Model 2
Y = 0.155 + -0.049AC + ɛ…….Model 3
Where:
Y- Financial performance indicated by RoA
AC- Audit committee size
ɛ - Error term
Eluyela et al., (2018) found a significant effect of frequency of board meetings on the
financial performance of deposit taking banks in Nigeria and recommended that banks
should have atleast four board meetings in a year to improve its performance. The study
by Eluyela et al., (2018) used used panel regression to analysis and the differences in
the findings may be as a result of differences in the research design. The findings of

102
this study also confirms a study done by Ojulari (2014) that found a negative
relationship between the number of board meetings and the financial performance in
Nigerian firms.
4.4.3 Moderating effect of board meetings on credit committee size and return on
assets
This study aimed at establishing the moderating effect of board oversight on the
relationship between risk governance mechanisms and financial performance. Data on
the credit committee size was extracted and regression analysis was carried out between
credit committee size and return on assets. The unmoderated coefficients of correlation
(R= 0.591, p=0.020, R2 = 0.350, adjusted R2= 0.300, p<0.05) showed that there is a
significant relationship between credit committee size and return on assets. Further to
this relationship, the relationship may be enhanced by the moderator frequency of board
meetings. To this a hypothesis that stated that there is no significant moderating effect
of frequency of board meetings on the relationship between credit committee size and
financial performance of commercial banks was formulated and tested using a linear
regression analysis. Table 4.26 shows the results of analysis between moderated credit
committee and return on assets.

103
Table 4.26
Moderating effect of board meetings on the relationship between credit committee size and return on assets
Model 1 Model 2 Model 3
β SEb β β SEb β β SEb β
Constant 1.167** 0.413** 0.771 0.533 0.835 1.079
Step 1
Credit committee size 0.236** 0.081** 0.215** 0.216** 0.082** 0.197 0.204 0.203 0.186
Step 2
Board meetings 0.072 0.061 0.088 0.061 0.167 0.075
Step 3
CC*BM 0.002 0.029 0.020
R 0.215 0.232 0.232
R Square 0.046 0.054 0.054
Adjusted R Square 0.041 0.043 0.038
R Square Change 0.000 0.008 0.000
Model F Change 8.565 1.374 0.005
Model Summary df 1 1 1
Sig. F Change 0.004 0.243 0.946
Durbin Watson 0.880
Note: Dependent variable, Credit committee
The significance levels *p<0.05; p**<0.02
Source: Research data, 2019
104
The regression coefficient between credit committee size and return on assets was not
significant (R=0.215, R2= 0.046, adjusted R2= 0.041, p=0.004) before moderator and
(R=0.23, R2=0.054, adjusted R2= 0.038, p˃0.05) after the moderator. This showed an
increase in the coefficient by 0.017. Even though the value of the coefficient of
correlation increased, the significance level was p=0.946. This shows that it is not
statistically significant because the results of the moderated values showed is greater
than 0.05. From the data presented in Table 4.26, the change in R2 moved from 0.000
for the board credit committee size to 0.008 for the board meetings and for the
moderated values the change went to 0.000. This shows that there was no change in R2.
The study therefore concludes that there is no significant moderating effect of board
meetings on the relationship between credit committee size and financial performance.
The regression equation will therefore be: -
Y = 1.167 + 0.236CC + ɛ…….…. Model 1
Y = 0. 711 + 0.072CC + ɛ….……. Model 2
Y = 0.835 + 0.002CC + ɛ…….….. Model 3
Where:
Y- Financial performance indicated by RoA
CC- Credit committee size
ɛ - Error term
A similar study was conducted by Qadorah and Fadzil (2018) using multiple regression
to analyse the data found a negative relationship between frequency of board meetings
and financial performance. The findings of this study agrees with the findings of

105
Qadorah and Fadzil (2018). On the other hand, this study contradicts the findings of
Chou and Buchdadi (2017) who did a study on independent board, audit committee,
risk committee, the meetings aattendance level and its impact on the performance and
found that meeting attendance increases the profitability of commercial banks. The
study was done in Indonnesia and the difference may have resulted because of the
difference in the GDP between the two countries and also the research design used.

106
4.4.4 Moderating effect of board meetings on number of risk governance
mechanisms and return on assets
To establish the moderating effect of board meetings on the relationship between
number of risk governance mechanisms and return on assets, a regression analysis was
done on the moderated values. First, data on the number of risk governance mechanisms
for all commercial banks, was extracted and recorded. The data was analyzed according
to the various bank for (2013-2017). A regression analysis on unmoderated data showed
(R=0.191, p=0.011, R2 = 0.036, Adjusted R2= 0.031, p<0.05). This showed a significant
relationship between number of risk governance mechanisms and RoA. Even though
the findings gave a positive coefficient of regression of R= 0.191, the R2= 0.036 which
indicates that the model only explains 3 percent of the RoA. This the indicates that 97
percent is explained by other factors that may include the moderators. For this reason,
therefore, board meetings were used as a moderator of the relationship between number
of risk governance mechanisms and RoA. The study hypothesized that there is no
significant moderating effect of frequency of board meetings on the relationship
between the number of risk governance mechanisms and financial performance. To test
this hypothesis, a regression analysis was done and the findings are presented in Table
4.27.

107
Table 4.27
Moderating effect of board meetings on the relationship between number of risk governance mechanisms and return on assets
Model 1 Model 2 Model 3
β SEb β β SEb β β SEb β
Constant 1.244** 0.428** 1.214** 0.484** 0.241 1.159
Step 1
Credit committee size 0.166** 0.064** 0.191** 0.159 0.083 0.183 0.330 0.203 0.380
Step 2
Board meetings 0.011 0.078 0.013 0.100 0.125 0.123
Step 3
CC*BM -0.013 0.014 0.288
R 0.191 0.191 0.203
R Square 0.036 0.037 0.041
Adjusted R Square 0.031 0.026 0.025
R Square Change 0.036 0.000 0.005
Model F Change 6.660 0.018 0.853
Model Summary df 1 1 1
Sig. F Change 0.011 0.892 0.357
Durbin Watson 0.826
Note: Dependent variable, Number of risk governance mechanisms
The significance levels *p<0.05; p**<0.02
Source: Research data, 2019

108
Table 4.27 indicates that coefficient of regression changed from R=0.000 to R=0.005
without and with the moderator respectively. This shows that there is a positive effect
by the moderator. However, the significance level showed p=0.357 and this indicates
that the moderating effect is not significant. It is therefore concluded that there is no
significant moderating effect of board meetings on the relationship between number of
risk governance mechanisms and financial performance. From the results, the
regression equations will therefore be: -
Y = 1.244 + 0.166NM + ɛ…….…. Model 1
Y = 1. 214 + 0.011NM + ɛ….……. Model 2
Y = 0.241 + -0.013NM + ɛ.………. Model 3
Where:
Y- Financial performance indicated by RoA
NM- Number of risk governance mechanisms
ɛ - Error term
Khaleel et al, (2016) found a positive relation between board meetings frequency and
firm performance in a dynamic panel technique generalised methods of moments. The
difference in the findings can be attributed to the difference in the research design.
However, the findings of this study confirms a study that was done by Qadorah and
Fadzil (2018) who did a study on the effect of board independence and board meeting
on firm performance with evidence from Jordan banks using multiple regression
method to analyse data and found no relation between the frequency of board meetings
with the financial performance.

109
4.4.5 Moderating effect of board meetings on risk governance mechanisms and
financial performance
Previous unmoderated studies the coefficient of correlation indicated the value (R=
0.376, R2 = 0.142, Adjusted R2= 0.122, p=0.045), hence a significant relationship
between risk governance mechanisms and financial performance. This relationship
could be enhanced further by a moderator. The R2= 0.142 indicating that the model
only explained 14.2 percent of the RoA and that the remaining 85.8 percent was
explained by other factors which may include the moderators. For this, board oversight
was used as a moderator and frequency of board meetings was used to measure the
board oversight. To measure this, a regression analysis was done that tested the
hypothesis that states that there is no significant moderating effect of frequency of board
meetings on the relationship between risk governance mechanisms and financial
performance of commercial banks in Kenya. The results of the regression analysis are
shown in Table 4.28.

110
Table 4.28
Moderating effect of board meetings on the relationship between risk governance mechanisms and financial performance
Model 1 Model 2 Model 3
B SEb Β T Sig. B SEb Β T Sig. B SEb Β T Sig
Constant 0.185 0.788 - 0.235 0.814 0.176 0.809 0.218 0.828 -0.706 2.584 -0.273 0.785
Risk governance mechanisms
Risk committee 2.358 0.645 0.271 3.655 0.000 2.36 0.647 0.271 3.641 0.000 -0.311 -0.460 -0.449 -0.677 0.499
Audit committee -0.319 0.157 -0.156 -2.027 0.044 -0.319 0.158 -0.156 -2.021 0.045 -0.013 0.051 -0.097 -0.252 0.802
Credit committee 0.206 0.086 0.188 2.401 0.017 0.206 0.086 0.188 2.394 0.018 0.002 0.034 0.019 0.055 0.956
Number of mechanisms 0.088 0.066 0.101 1.328 0.186 0.085 0.083 0.098 1.032 0.303 0.015 0.017 0.326 0.861 0.391
Step 2
Board oversight
Step 3
Risk governance*Board Oversight
R 0.376 0.376 0.384
R Square 0.142 0.142 0.147
Adjusted R Square 0.122 0.117 0.102
R Square Change 0.000 0.000 0.006
F Change 7.129 0.003 0.291
F-Sig 0.000 0.958 0.884
Durbin Watson 0.930
Dependent Variable: Financial performance
Source: Research data, 2019

111
From the findings presented in Table 4.28, it indicates the coefficients were (R=0.376,
R2= 0.142, p= 0.000) and (R=0.384, R2= 0.147, change in R2= 0.006, p=0.884) before
and after the introduction of the moderator respectively. This showed an increase in the
value of the coefficient but the significance level for the relationship between risk
governance mechanisms and financial performance was p=0.884. The study therefore
concludes that there was no significant moderating effect of frequency of board
meetings on the relationship between risk governance mechanisms and financial
performance. For the moderating effect of board meetings on the relationship between
risk governance mechanisms and financial performance, the study fails to reject the null
hypothesis. From the results, the regression equations will therefore be: -
Y = 0.185 + 2.358X1 + -0.319X2 + 0.206X3 + 0.88X4 + ɛ……….. Model 1
Y = 0.176 + 2. 36X1 + -0.319X2 + 0.206X3 + 0.085X4 + ɛ...…….. Model 2
Y = -0.706 + -0. 311X1 + -0.013X2 + 0.002X3 + 0.015X4 + ɛ…… Model 3
Where:
Y – Financial performance indicated by RoA
X1 – Risk committee existence
X2 – Audit committee size
X3 – Credit committee size
X3 – Number of risk governance mechanisms
ɛ - Error term
The findings of this study confirm a similar study done by Lundqvist and Vilhelmsson
(2018) even though the study was done in America using panel data. Similar study was

112
done by Haque et al., (2013) on the relationship between committee meetings and
financial performance and found that frequency of meetings is significantly positively
associated with financial performance. The findings of this study contradicts the
findings of the study done by Haque et al., (2013). The differences may be as a result
of the difference in the GDP between the two countries. This study also contradicts a
study by Khaleel et al., (2016) on the relationship between board meeting and
performance of firms in Amman stock exchange using dyamic panel technique of
generalised methods of moments that found a significance positive association between
board meetings and firm performance. The difference in the results may be attributed
to the difference in the research design.

113
CHAPTER FIVE
SUMMARY, CONCLUSIONS AND RECOMMENDATIONS
5.1 Introduction
This chapter presents summary of the findings, conclusions drawn from the findings
and recommendations based on the conclusions as per the study objectives. This chapter
also gives suggestions for further studies and the applications of these research findings.
5.2 Summary
The financial performance of commercial banks in Kenya was measured by return on
assets (RoA). Results showed that financial performance of the commercial banks
declined between 2013- 2017 as indicated by the decrease in the mean RoA from 3.53
to 1.14 respectively. The risk governance mechanisms were measured using the risk
committee existence, audit committee size, credit committee size and number of risk
governance mechanisms based on the multicollinearity on these predictors.
Multicollinearity pre-test values among the predictors of risk governance mechanisms
showed values within the acceptable range of below 10, implying that the study was
free of multicollinearity.
Findings on the existence of risk committee revealed that majority of the commercial
banks had risk committees in place during the study period of 2013-2017 except some
commercial banks in Tier III which did not hence pushing the mean arbitrary values

114
towards the 1.6 (Table 4.3) mark suggesting nonexistence. Similar trend was observed
in Tier I and II commercial banks in 2015. These results indicate that most of the
commercial banks have adopted risk committees to minimize risk and improve their
financial performance.
The study sought to establish the relationship between risk committee existence and
financial performance of commercial banks. Results presented indicated that risk
committee existence and financial performance have a significant positive relationship.
Results indicated that 9 percent of variation in RoA can be explained by risk committee
existence. On the relationship between audit committee size and financial performance,
audit committee size was found to have no significant relationship with RoA. The
results indicated regression coefficient (R=0.004, (p˃0.05) meaning that the
relationship was not statistically significant.
The study also sought to establish the relationship between credit committee size and
financial performance of commercial banks in Kenya. A regression analysis was done
between credit committee size and RoA. The results indicated a significant positive
relationship between credit committee size and financial performance. To establish the
relationship between number of risk governance mechanisms and financial
performance of commercial banks, a regression analysis was done between number of
risk governance mechanisms and the RoA. The findings indicated that there is a
significant positive relationship between the number of risk governance mechanisms
and financial performance.

115
To establish the moderating effect of board oversight on the relationship between risk
governance mechanisms and financial performance of commercial banks, a moderated
regression analysis was used. The findings revealed a moderating effect of board size
on the relationship between risk governance mechanisms and RoA and this is revealed
by the change in the adjusted R2 from 0.142 to 0.222. Frequency of board meetings was
also used as a predictor of board oversight and regression analysis was done for
moderated values of risk governance mechanisms and RoA. The results showed that
there was no significant moderating effect of frequency of board meetings on the
relationship between risk governance mechanisms and RoA.
5.3 Conclusions
From the findings elicited on this study, several conclusions were drawn for each of the
specific objective.
5.3.1 Risk committee existence and financial performance of commercial banks
in Kenya
The study found a significant positive relationship between risk committee existence and
financial performance. This study concludes that risk committee existence is positively
related to financial performance of commercial banks in Kenya.
5.3.2 Audit committee size and financial performance of commercial banks in
Kenya
The study found no statistical significance between audit committee size and financial
performance with coefficients. The study therefore concludes that audit committee size
is not related to financial performance of commercial banks in Kenya.

116
5.3.3 Credit committee size and financial performance of commercial banks
in Kenya
The study found a significant positive relationship between credit committee size and
financial performance. This study therefore concludes that credit committee size is
positively related to financial performance of commercial banks in Kenya.
5.3.4 Number of risk governance mechanisms and financial performance of
commercial banks in Kenya
The study found a significant positive relationship between the number of risk
governance mechanisms adopted by commercial banks and their financial performance.
This study therefore concludes that the number of risk governance mechanisms is
positively related to the financial performance of commercial banks in Kenya.
5.3.5 Moderating effect of board oversight on the relationship between risk
governance mechanisms and financial performance
To establish the relationship between risk governance mechanisms and the financial
performance of commercial banks in Kenya. The study used board size and board
meetings as predictors to measure board oversight.
On the moderating effect of board size on the risk governance mechanisms and financial
performance, the study concludes that:
The board sizes have decreased from a mean of 10.49 to 10.16 from 2013 to 2017
respectively. The study concludes that there is a significant moderating effect of board

117
size on the relationship between risk committee and financial performance of
commercial banks in Kenya.
There is no significant moderating effect of board size on the relationship between
credit committee size and financial performance of commercial banks in Kenya.
There is no significant moderating effect of board size on the relationship between
number of risk governance mechanisms and financial performance for commercial
banks in Kenya.
On overall moderating effect of board size on the relationship between risk governance
mechanisms and financial performance the study concludes that there is a significant
moderating effect of board size on the relationship between risk governance mechanism
and financial performance of commercial banks in Kenya.
On the moderating effect of frequency of board meetings on the relationship between
risk governance mechanisms and financial performance, the study concludes that:
There is no significant moderating effect of frequency of board meetings on the
relationship between risk committee existence and financial performance of
commercial banks in Kenya.
There is no significant moderating effect of board meetings on the relationship between
audit committee size and financial performance commercial banks in Kenya.
There is no significant moderating effect of board meetings on the relationship between
credit committee size and financial performance commercial banks in Kenya.
118
There is no significant moderating effect of board meetings on the relationship between
number of risk governance mechanisms and financial performance commercial banks
in Kenya.
On overall moderating effect of frequency of board meetings on the relationship
between risk governance mechanisms and financial performance, the study concludes
that there is no significant moderating effect of frequency of board meetings on the
relationship between risk governance mechanisms and financial performance
commercial banks in Kenya.
5.4 Recommendations
From the findings and conclusions, the study recommends that commercial banks
should adopt risk committees. Central bank of Kenya should ensure that all commercial
banks establish risk committees. The study also recommends that the commercial banks
increases the board size. This will provide oversight to the operations and also enhance
the performance of the risk committee members. This will enable commercial banks to
manage the risk exposure and improve on financial performance.
The study recommends that commercial banks should have lean audit committees
because it has an inverse relationship with financial performance. The study also
recommends that other studies should be done on other attributes of audit committees
for example training and expertise of audit committee members. This is to establish if
other attributes of audit committees have a relationship with the performance of
commercial banks other than size. This study recommends that commercial banks

119
should fully adopt use to credit committees and also increase the number of members
to this committee. This will help commercial banks to eliminate risk exposure and
improve performance. Central Bank of Kenya being the regulator should also pass a
policy requiring all commercial banks to implement credit committee as a mechanism
of managing risk exposure.
This study therefore recommends that commercial banks increase the number of
mechanisms that they use to manage its risk exposure. Commercial banks should not
rely on few mechanisms but they should come up with more mechanisms. This will
help them screen out risks that may affect its operations negatively. By using higher
number of risk mechanisms, commercial banks will improve its financial performance.
The study recommends that commercial banks should adopt a large board size to
provide oversight in its operations and also to enhance the functioning of risk
governance mechanisms.
5.5 Suggestions for Further Research
This study was limited to a certain extend based on its methodology and findings. The
study therefore makes suggestions for further research based on this limitation. First,
the study focused only on commercial banks in Kenya and the findings cannot be
generalized to the banking sector, and therefore the study recommends that similar
study should be done on other banking sectors for example micro finance banks and
SACCOs. The study also recommends that further research should be done on other
risk governance mechanisms other than the mechanisms studied like training, skills and

120
expertise of staff and the board members. This will enable findings to be made on the
relationship between other risk governance mechanisms and financial performance of
commercial banks. This study focused on two predictors of board oversight, board size
and frequency of board meetings. There is need for future researchers to incorporate
other predictors of board oversight. With the efforts of governments establishing
regional integration, further studies can also focus on cross-border research. This will
enable regional generalization. This study also recommends further studies to be done
using other methodologies like descriptive surveys, cross-sectional research design,
comparative research and also panel data methodology to compare data for different
years. The study also recommends that further study should use other analysis
techniques like multivariate analysis .
121
REFERENCES
Abuya, K. (2018, October Wednesday). KRA Starts mobile money andbank data
corroboration to nab tax cheats. Techweez.
Addae-Korankye, A. (2014, December). Causes and Control of Loan
Default/Delinquency in Microfinance Institutions in. American International
Journal of Contemporary Research, 4(12), 36-45.
Ahmed, M. M., & Onyiego, G. (2018). Effect of risk management on Financial
performance of commercial banks in Kenya: A case of commercial Banks in
Mombasa county. Strategic Journal of Business & Change Management, 5(4),
1605-1630.
Ahmed, S. F., & Qaisar, M. A. (2015). Credit Risk Management and Loan Performance:
Empirical Investigation of Micro Finance Banks of Pakistan. International
Journal of Economics and Financial Issues, 5(2), 574-579.
Akerlof, G. A. (1978). The Market for “Lemons”: Quality Uncertainity and the Market
Mechanism. Elsevier.
Akong'a, C. J. (2014). The Effect of Financial Risk Management on the Financial
Performance of Commercial Banks in Kenya. Nairobi, Kenya: University of
Nairobi.
Aldamen, H., Duncan, K., Kelly, S., Namara, R., & Nagel, S. (2012). Audit committee
characteristics and firm performance during the global financial crisis. Bond
University. Queensland, Australia: Bond University.
Ali, K., Muhammad, A. F., & Hafiz, Z. A. (2011). Bank-Specific and Macroeconomic
Indicators of Profitability - Empirical Evidence from the Commercial Banks of
Pakistan. International Journal of Business and Social Science, 2(6), 235-242.
Alloyo, P. (2013). The effect of credit referencing bureaus on the financial performance
of commercial banks in Kenya. Nairobi, Kenya: University of Nairobi.
Al-Matari, Y. A., Al-Swidi, A. K., Bt Fadzil, F. H., & Al-Matari, E. M. (2012). Board
of Directors, Audit Committee Characteristics and Performance of Saudi Arabia
Listed Companies. International Review of Management and Marketing, 2(4),
241-251.

122
Alshatti, A. S. (2015). The effect of credit risk management on financial performance
of the Jordanian commercial banks. Investment Management and Financial
Innovations, 12(1), 338-345.
Apollo, Mandalika, & Said, D. (2018). Influence of Composition Board of Directors,
Board of Commissioners, and Audit Committees to Banking Financial
Performance (Empirical Study on Banking Industry Listed in BEI 2011-2016).
INternational Journal of Innovative Research & Development, 7(4), 171-176.
Appiah, K. O. (2016). Board audit committee and corporate insolvency. Journal of
Apllied Accounting and Research, 18(3), 298-316.
Arfan, A., & Nasir, S. B. (2014). Impact of Board Characteristics and Audit Committee
on Financial Performance: A Study of Manufacturing Sector of Pakistan. 5(7),
139-143.
Arkelof, G. (1970). The market for “lemons”: Quality uncertainity and the market
mechanism. Quarterly Journal of Economics, 84(3), 488-500.
Belás Jaroslav, C. E. (2011). Internal Model of Commercial Bank as an Instrument for
Measuring Credit Risk of the Borrower in Relation to Financial Performance
(Credit Scoring and Bankruptcy Models). Journal of Competitiveness, 3(4),
104-120.
Berkman, O., & Zuta, S. D. (2017). The Impact of Audit Committee Size and
Compositionon Negative Events in the Life of a Company: The Case of Israel.
The Academic College of Tel-Aviv Yaffo, Jerusalem.
Bernaddette, J. J., & Corina, J. (2015). Corporate Governance Mechanisms and
Financial Performance. Procedia Economics and Finance, 3(1), 117-123.
Bhuiyan, U. B., & Yimei, M. A. (2013). Risk Committee, Corporate Risk-Taking and
Firm Value. Stand-alone risk committee; corporate risk-taking; firm value;
Australia. Canberra, Australia.
Boyd, S., Moolman, J., & Nwosu, N. (2016). Risk Reporting & Key Risk Indicators A
case study analysis. NC STATE: Poole College of Management.
BusinessTech. (2018, March 12). All the South African banks that have failed in the
last 30 years. Retrieved 2018, from
https://businesstech.co.za/news/banking/231009/all-the-south-african-banks-
that-have-failed-in-the-past-30-years/.

123
Carter, D., D’Souza, F., Simkins, B., & Simpson, G. (2010). The Gender and Ethnic
Diversity of US Boards and Board Committees and Firm Financial
Performance. In Corporate Governance: An International Review (Vol. 18, pp.
396–414).
CBK. (2015). Annual Report. Nairobi: CBK.
CBK. (2015). Kenya Multi Sector GIS mapping Project Final Report. Nairobi: Limited,
Brand Fusion Marketing.
CBK. (2016). 2016 Annual report and Financial Statements. Nairobi: Central Bank of
Kenya.
Cetina, K. K., & Preda, A. (2005). The Sociology of Financial Markets. New York:
Oxford University Press.
Chen, K., & Wu, A. (2016). The Structure of Board Committees. Harvard Business
School.
Cheplel, S. M. (2013). The Impact of ERM Practices on the Financial. Nairobi, Kenya:
University of Nairobi.
Chetty, P. (2012, February 26). A brief history of microfinance. Retrieved June
Monday, 5, 2017, from https://www.projectguru.in/publications/a-brief-
history-of-microfinance/.
Chou, T.-K., & Buchdadi, A. D. (2017). Independent Board, Audit Committee, Risk
Committee, the Meeting Attendance level and Its Impact on the Performance:
A Study of Listed Banks in Indonesia. International Journal of Business
Administration, 8(3), 24-36.
Cooperman, E., Mills, D., & Gardner, J. (2000). Managing Financial Institutions: An
Asset/Liability Approach. Orlando: The Dryden Press, Harcout College
Publishers.
Countryeconomy.com. (2018, July 27). Country comparison Kenya vs United
Kingdom. Retrieved July 2019, from
https://countryeconomy.com/countries/compare/kenya/uk.
Ekadah, J. W., & Mboya, J. (2009, April). Effect of Board Gender Diversity on the
Financial performance of Commercial Banks in Kenya. European Scientific
Journal, 8(7), 128-148.

124
Elamer, A., & Benyazid , I. (2018). The impact of risk committee on financial
performance of UK financial institutions. International Journal of Accounting
and Finance, 8(1), 1-30.
Eluyela, F. D., Akintimehin, O. O., Okere, W., Ozordi, E., Osuma, G. O., Ilogho, S. O.,
& Oladipo, O. A. (2018). Board meeting frequency and firm performance:
examining the nexus in Nigerian deposit money banks. Heliyon, 4(10), 1-14.
Equity Bank. (2017). Integrated report and financial statements 2017. Nairobi: Equity
Bank.
Field, A. (2013). Discovering Statistics Using IBM SPSS Statistics. (4th, Ed.) Los
Angeles: Sage publications limited.
fsdafrica. (2016, November). Bank failures in Africa – how to interpret these. Retrieved
from https://www.fsdafrica.org/knowledge-hub/blog/harbingers-of-doom-
bank-failures-in-africa-how-to-interpret-these/.
Gaitho, N. W. (2013). Role of Credit Reference Bureaus on Credit Access in Kenya: A
Survey of Commercial Banks in Kenya. European Scientific Journal, 9(13),
301-314.
Gathaiya, R. (2017, July). Analysis of Issues Affecting Collapsed Banks in Kenya From
Year 2015 to 2016. International Journal of Management & Business Studies,
7(3), 9-15.
Gethard, G. (2017, October Monday). Falling Giant: a case study of AIG. Company
insights. Retrieved March 7, 2018, from
https://www.investopedia.com/articles/economics/09/american-investment-
group-aig-bailout.asp
Ghosh, P., Islam, M., & Hasan, M. (2014). Credit Risk Management: An Empirical
Study on BRAC Bank Ltd. Business Management and Strategy, 5(1), 145-163.
Gitahi, W. R. (2013). The effect of credit reference bureaus on the level of non-
performing loans in commercial banks in Kenya. Nairobi: University of
Nairobi.
Githaiga, H. (2018, January 4). Tanzania cancels licences for 5 banks. The East African.
Han, P. (2015). Credit Risk Management of Commercial Banks. Journal of Business
Administration Research, 4(1), 8-11.

125
Hanh, L., Ting, I. W., Kweh, Q. L., & Hoanh, L. H. (2018). Board meeting frequency
and financial performance: A case of listed firms in Vietnam. 19(2), 464-472.
Haque, M. Z., Islam, R., & Azam, M. N. (2013). Board Committee Meetings and Firm
Financial Performance: An Investigation of Australian Companies.
International Review of Finnace, 13(4), 503-528.
Hubbard, D. (2009). The Failure of Risk Management. New Jersey: John Wiley and
Sons, Inc.
InfoHub Kenya. (2016). A list of Kenyan Banks that have collapsed. Retrieved May
2018, from A list of Kenyan Banks that have collapsed:
http://www.infohub.co.ke/2016/04/a-list-of-collapsed-kenyan-banks.html
Ingari, S. A. (2017). Influence of board composition on performance in the banking
industry in Kenya. United States International University Africa.
International Standard Organization (ISO). (2018). ISO 31000, Risk Management.
Switzerland: International Standard Organization.
Jensen, M., & Meckling, W. (1976). Theory of the firm: Managerial behavior, agency
costs and ownership structure. Journal of Financial Economics, 3(4), 305-360.
Kairu, S. G., & Amadi, A. (2014). Kenya Credit Informatyion Sharing Initiative, A
proosed Mechanism for Alternative Dispute Resolution. Nairobi: Association of
Kenya Credit Providers.
Kallamu, B. S. (2015). Risk Management Committee Attributes and Firm Performance.
International Finance and Banking, 2(2), 1-24.
Kamazima, B., Mathenge, P., & Ngui, T. (2017). Influence of Corporate Governance
Structure on Financial Performance: A Case of Listed Commercial Banks in
Kenya. Journal of Educational and Entrepreneurship, 4(10), 60-82.
Kangali, C. (2016, August 26). The Times of Zambia. Lusaka, Zambia. Retrieved July
Tuesday, 2018, from https://allafrica.com
Kauna, E. K. (2015). Effect of credit risk management practices on the Financial
Performance of commercial banks in Kenya. University of Nairobi. Nairobi,
Kenya: University of Nairobi.
Keeffe, G., Valdez, M., & Nyaggah, K. (2012). Credit Information Sharing in Kenya:
A guidefor credit providers. Nairobi, Kenya: Software Group in partnership
with FinancialSector Deepening.

126
Kepha , M., Nyolei, J., Rotich, I., & Odhiambo, L. (2015). Credit Reference Bureau
(CRB) As a Strategic Control Measure and Its Influence on the Financial
Performance of Commercial Banks in Eldoret, Kenya. IOSR Journal of
Humanities And Social Science (IOSR-JHSS), 20(5), 44-64.
Kessey, K. D. (2015). Assessing Credit Risk Management Practices in the Banking
Industry of Ghana: Processes and Challenges. Global Journal of Management
and Business Research: C Finance, 15(6), 1-10.
Khaleel, I. A.-D., Siti, S., Saidin , S., & Shamharir, A. (2016). Board meeting and firm
performance: Evidence from the Amman stock exchange. Board meeting and
firm performance: Evidence from the Amman stock exchange, 12(2), 6-11.
Khomotso, N. T. (2015). Curatorship as a measure to rescue failing Banks. Pretoria,
South Africa: University of Pretoria.
Kiambati, K., Ngugi, P., Katuse, P., & Waititu, A. (2013). Role of board size on
financial performance of commercial banks. Prime Journal of Social Science,
2(3), 259-262.
Kimando, L. .., Kihoro, J. M., & Njogu, M. G. (2012, June). Factors Influencing the
Sustainability of Micro-Finance Institutions in Murang’a Municipality.
International Journal of Business and Commerce, 2261-2269.
Kimasar, F., & Kwasira, J. (2012, October). Use of Credit Reference Bureaus on Loan
Recovery among selected Commercial Banks in Kenya: A Survey of Nakuru
Sub-County. International Journal of Science and Research, 3(10), 2196-2201.
Kimathi, K. R. (2014). Effect of Credit Refence Bureaus on the Profitability of
Commercial Banks in Kenya. Nairobi, Kenya: University of Nairobi.
Kimeu, W. (2017). Effect of corporate governance on financialperformance of
commercial banks in Kenya. University of Nairobi, Nairobi, Kenya.
Kinuthia, P. (2007). Management of loan default problems in SACCOs in Nairobi
province. Nairobi, Kenya: Jomo Kenyatta University of Agriculture and
Technology.
Kiplagat, S. (2018, July Sunday). Equity, Co-op, and CBA caught up in title deed theft
racket. Business Daily. Retrieved December 2018, from
www.businessdailyafrica.com

127
Kithinji, A. M. (2010). Credit Risk Management and Profitability of Commercial Banks
in Kenya. Nairobi, Kenya: University of Nairobi.
Koch, T., & MacDonald,, S. S. (2000). Bank Management. Hinsdale, IL/Orlando, FL.:
The Dryden Press/Harcourt Colege Publishers.
Konovalova, Kristovska, I., & Kudinska, M. (2016). Credit risk management in
Commercial Banks. Polish Journal of Management Studies, 13(2), 90-100.
Koriang, P. E. (2014). The relationship between board structure and financial
performance of commercial banks in Kenya. University of Nairobi.
Krugman, P. R. (2008). The Return of Depression Economics and the Crisis of 2008.
United States: W.W. Norton & Company.
Labie, M. (2011). The handbook of microfinance. USA: World Scientific Publishing
Co. Pte. Ltd.
Larcker, P. (2005). Proceedings of the 22nd Information Systems. Scandinavia.
Lee, J. H., Jusup, M., Podobnik, B., & Iwasa, Y. (2015). Agent-Based Mapping of
Credit Risk for Sustainable Microfinance. PLoS ONE 10(5):e0126447.
doi:10.1371/journal.pone.0126447.
Lexicon. (2017). Financial Times. (C. r. correspondent, Ed.) Retrieved from
http://lexicon.ft.com/Term?term=Basel-Accord.
Lundqvist, S., & Vilhelmsson, A. (2018). Enterprise risk management and default risk:
Evidence from Bnaking Industry. 85(1), 127-157.
Magembe, J. M., Ombuki, C., & Kiweu, M. (2017). An Empirical Study of Corporate
Governance and Loan Performance of Comercial Banks in kenya. International
Journal of Economics, Commerce and Management, 5(11), 580-604.
Magnifique, U. J. (2013). The effect of credit risk management on the financial
performace of commercial banks in Rwanda. Nairobi, Kenya: University of
Nairobi.
Maina, J. N. (2013). Impact of corruption on service delivery in the ministry of lands
2005-2012. University of Nairobi. Nairobi, Kenya: University of Nairobi.
Makokha, A. W. (2014). The effect of corporate governance on financial performance
of insurance companies in Kenya. Nairobi, Kenya: University of Nairobi.

128
Mamatzakis, E., Zhang, X., & Wang, C. (2017). How the corporate governance
mechanisms affect bank risk taking. University of Sussex, Department of
Business and Management, School of Business, Management and Economics.
United Kingdom: Munich Personal RePEc Archive.
Maniagi, G. M. (2018). Influence of financial risk on Financial performance of
commercial banks in Kenya. Nairobi, kenya: Jomo Kenyatta University of
Agriculture and Technology.
Miencha, I. O., & Selvam, M. (2013). Financial Performance in the Banking Sector: A
Study with special reference to Kenyan Commercial Banks using Data
Envelopment Analysis (DEA). Resaerch Journal of Social Science and
Management, 2(9), 48-53.
Ministry of Public Service, Youth and Gender Affairs. (2019, April Monday). Huduma
Smart Service and Payment Card Information Pack. Retrieved April Thursday
18 April, 2019, from www.hudumakenya.go.ke/card.
Mohamed, S. D. (2015). Correlations Between Corporate Governance Financial
Performance, and Market Value. Walden University.
Mohammad, M. W., Wasiuzzaman, S., Morsali, S. S., & Zaini, R. M. (2018). The effect
of audit committee characteristics on financial restatements in Malaysia.
Financial Restatements in Malaysia, 19(1), 4-22.
Mollah, S., Farooque, O., Mobarek, A., & Molyneux, P. (2019). Bank corporate
governance and future earnings predictability. Journal of Financial Services
Research, 2(1), 1-26.
Muchemwa, R. M., & Padia, N. (2016). Board composition, board size and financial
performance of Lohannesburg stock exchange companies. South African
Journal of Economic and Management Science, 19(4), 497-513.
Muganda, M. M., & Umulkher, A. A. (2015). Corporate Governance Mechanisms and
Financial Performance of Commercial Banks in Kenya. Journal of Business and
Management, 17(3), 25-40.
Mugenda, O., & Mugenda, M. (2003). Research methods: Quantitative and qualitative
Approaches. Nairobi: African Centre for Technology Studies, ACTS. Nairobi.
Muhammed , H., Ketley, R., Nyawira, M., & Tom, N. (2016). Towards positive
selection in the Kenyan credit market: An assessment of the current and
129
prospective future effectiveness of credit information sharing in the Kenyan
market. Nairobi: Financial Sector Deepening.
Mumbi, M. W., & Omagwa, J. (2017, November). Credit risk management and
financial performance of selected commercial banks In Kenya. Journal of
Business and Management, 19(11), 92-98.
Mumbi, M. W., & Omagwa, J. (2017). Credit risk management and financial
Performance of selected commercial banks in Kenya. Journal of Business and
Management, 19(11), 92-98.
Muriithi, J. G. (2016). Effect of financial risk on finnacial performance of commercial
banks in Kenya. Nairobi, Kenya: Jomo Kenyatta University of A griculture and
Technology.
Muriithi, R. G., Dr. Musienga, D., Dr. Shem, J., & Dr. Ondieki, B. A. (2013).
Challenges facing implementation of CRB Regulations in Kakamega
Township. European Journal of Business Mnangement, 5(12), 21-30.
Muturi, A. (2013). The effect of corporate gorvernance structures on the performance
of large manaufacturing firms in Kenya. KCA University, Nairobi, Kenya.
Mwangi, G. (2012). The Effect of Credit Risk Mnagement on Financial Performance of
Commercial Banks in Kenya. Nairobi, Kenya: University of Nairobi.
Mwigwi, T. W. (2013). Credit Monitoring and Recovery Strategies Adopted by
commercial Banks in K. Journal of Modern Accounting, 2(2), 27-30.
Mwiya, B. (2010). Credit Default in the Financial Sector: Need for Credit Reference
and Rating Agencies. Journal of Economics and International Business
Research, 41-43.
Napier, Mark. (2016, November 30). Harbingers of doom? Bank failures in Africa –
how to interpret these. (fsdafrica, Ed.) Retrieved from
https://www.fsdafrica.org/knowledge-hub/blog/harbingers-of-doom-bank-
failures-in-africa-how-to-interpret-these/.
Ndegwa, S. M. (2017). The effect of credit risk on financial performance of
commercialbanks listed at the Nairobi Securities Exchange. Nairobi: University
of Nairobi.

130
Nganga, B. (2017). Influence of Corporate Governance on the financial Performance
of Commercial Banks in Kenya. Nairobi, kenya: United States International
University Africa.
Ngwenze, M., & Kariuki, M. I. (2017). Effect of Corporate Governance Practices on
Financial Performance of Listed Agricultural Firms in The Nairobi Securities
Exchange, Kenya. Journal of Economics and Finance, 8(3), 106-115.
Nibedita, D. (2018). Impact of Corporate Governance on Financial Performance: A
Study on DSE listed Insurance Companies in Bangladesh. Global Journal of
Management and Business Research, 18(2), 33-39.
Njungiri, J. (2012). The Standard Credit Referencing Bureau and Performance of
Multinational Bnaks Operating in the East African Community. Journal of
Emmerging Issues in Economics, Finance and Banking (JEIEFB), 3(3), 27-30.
Ntow, G. M., & Laryea, A. E. (2012). A Financial Performance Comparison of Foreign
VS Local Banks in Ghana. International Jounal of Business and Social
Science(3), 21.
Ntow-Gyamfi, M., & Boateng, S. S. (2013, January 15). Credit risk and loan default
among Ghanian banks: An exploratory study. (3, Ed.) pp. 753–762.
Ntuite, S. (2015, July 14). Analysis of Financial Performance of Commercial Banks in
Rwanda. Retrieved November Tuesday, 2017, from
https://www.grin.com/document/428620:
https://www.grin.com/document/428620
Nyangweso, J. N. (2013). The relationship between credit information sharing and loan
performance- case of commercial banks in Kenya. Kenya: University of
Nairobi.
Odipo, M. (2007). The determinants of Bank failures: A survey of commercial banks in
Kenya. University of Nairobi.
Ogada , A., Achoki , G., & Njuguna, A. (2016). Effect of board size on the financial
performance of merged institutions. American Journal of Finance, 1(2), 107-
125.
Ogilo Fredrick. (2012). The Impact of Credit Risk Management on Financial
Performance of Commercial Banks in Kenya. DBA Africa Management Review,
3, 22-37.
131
Ojulari, O. M. (2014). The Impact of Corporate Governance on Performance of Quoted
companies in Nigeria. Proceedings of the First Middle East Conference on
Global Business, Economics, Finance and Banking, (pp. 10-12). Dubai.
Olayinka, E., Osariemen, A., Olojede, P., Opeyemi, A., & Usman, T. (2018). Risk
governance on the performance of money deposit banks in Nigeria. Academy of
Accounting and Financial Studies Journal, 22(4), 1-14.
Oludele, I. O., Oloko , M., & Olweny , T. (2016). Impact of Board size on the Financial
Performance of the Listed Manufacturing Companies in Nigeria. Journal of
Business and Management, 18(11).
Omari, M. (2012). Credit Reputation as Collateral: A case for Improvement of the Legal
Regme on Credit Referencing in Kenya. Journal of Modern A frican Studies,
2(1), 45-49.
Omer, B., & Zuta, S. (2017). The Impact of Audit Committee Size and Composition on
Negative Events in the Life of a Company in Israel. Jerusalem: The Academic
College of Tel-Aviv Yaffo.
Orozco, L. A., & Vargas, J. (2018). Trends on the relationship betweenboard size and
financial andreputational corporate performance: The Colombian case.
European Journal of Management and Business Economics, 27(2), 183-197.
Otete, E. O., Muturi, W., & Mogwambo, A. V. (2016). Influence of credit information
sharing on the performance of commercial banks operating in kisii county,
Kenya. International Journal of Social Science and Information Technology,
2(10), 1216-1235.
Otwori, C. (2013). The Relationship Between Banks in Kenya. Inernational Journal of
Business, Humanities and Technology, 2(4), 39-43.
Paydaycash. (2010). Will wrong personal information on credit report affect score?
Retrieved November 12, 2016, from
http://www.paydaycash.org/blog/2010/03/will-wrong-personal-information-
on-credit-report-affect-score/.
Peria, M. S. (August 2014). The Impact of Credit Information Sharing Reforms on Firm
Financing. World Bank Group.
Poudel, R. S. (2012). The impact of credit risk management on financial performance
of commercial banks in Nepal. International Journal of Arts and Commerce,
1(5), 9-15.
132
Puni, A. (2015, June). Effect of board committees on corporate financial performance
among companies listed on the Ghana Stock Exchange (GSE). European Centre
for Research Training and Development UK, 3(5), 14-25.
Pyle, D. H. (1997). Bank Risk Management. Journal of Finance and Banking, 22(11),
1461-1485.
Qadorah, A. M., & Fadzil, F. H. (2018). The effect of board independence and board
meeting on firm performance: Evidence from Jordan. Journal of Finance and
Accounting, 6(5), 105-109.
Roselyne, J. (2007). Loan defaulting among members in SACCOs.A case study of
kevom co-operative society. Nairobi, Kenya: Jomo Kenyatta University of
Agriculture and Technology.
Ruparelia, R., & Njuguna, A. (2016). Relationship between Board Remuneration and
Financial Performance in the Kenyan Financial Services Industry. International
Journal of Financial Research, 7(2), 247-255.
Salehi, M. (2017). The effect of characteristics of audit committee and board on
corporate profitability in Iran. Journal of Economic and Administrative
Sciences, 34(1), 71-88.
Samoei, R. K., & Rono, L. (2016). Audit Committee Size, Experience and Firm
Financial Performance. Evidence Nairobi Securities Exchange, Kenya.
Research Journal of Finance and Accounting, 7(15), 87-95.
Sean, C. S., Chyi, C. S., Choo, K. T., Yi, L. X., & Hong, P. Z. (2016). Audit Committee
Characteristics and Firm Performance of Public Listed Companies in
Malaysia. Kuala Lumpur, Malaysia: Universiti Tunku Abdul Rahman.
Shkendije, H. (2014, August). Corporate governance in banks and its impact on risk
and performance: Review of literature on the selected governance mechanisms.
Journal of Central Banking Theory and Practice, 3(3), 53-85.
Shunu, A. H., Bii, P., & Ombaba, K. (2017). Effect of board size on the performance
of listed firms in Nairobi security exchange. European Journal of Business,
Economics and Accountancy, 5(6), 48-51.
Spaulding, D. (2003). Investment Performance Attribution. Washington, D.C.:
McGraw-Hill.

133
Stiglitz, J. (1976). Equilibrium in Competitive Insurance Markets: An Essay on the
Economics of Imperfect Information. The Quarterly Journal of Economics,
90(4), 629–649.
Sufi, F. A., & Qaisar, A. M. (2015). Credit Risk Management and Loan Performance:
Empirical Investigation of Micro Finance Banks of Pakistan. International
Journal of Economics and Financial Issues, 574-579.
Sullivan, A., & Sheffrin, S. M. (2003). Economics: Principles in action. New Jersey
07458: Pearson Prentice Hall.
Tarighi, H., & Salehi, M. (2018, February). The effect of characteristics of audit
committee and board on corporate profitability in Iran. Retrieved March 2019,
from
https://www.researchgate.net/publication/323128626_The_effect_of_character
istics_of_audit_committee_and_board_on_corporate_profitability_in_Iran:
10.1108/JEAS-04-2017-0017
Topal, Y., & Dogan, M. (2014). Impact of board size on financial performance: The
case of BIST manufacturing industry. International Journal of Business
Management and Economic Research, 5(4), 74-79.
Tshorhe, J. S., Aboagye, A. Q., & Coleman, A. K. (2011). Corporate governance and
bank risk managemnet in Ghana. Legon, Ghana: University of Ghana Business
School.
Tulli , J., & Marco, P. (2005). Role and Effects of Credit Information Sharing. Retrieved
January Friday, 2018, from https://core.ac.uk/download/pdf/6925878.pdf
Tuwei, L., Dr. Sakataka, W., & Oteki, E. B. (2015). Credit Reference Bureaus as the
Factor Influencing the Profitability of Commercial Banks in Kenya: A case of
Standard Chartered Bank, Kenya. International Journal of Novel research in
Marketing Management and Economics, 2(3), 122-129.
Uwuigbe, R. O., & Fakile, S. A. (2012). The Effects of Board Size on Financial
Performance of Banks: A Study of Listed Banks in Nigeria. International
Journal of Economics and Finance, 4(2), 260-267.
Wanjohi, S. M., Wanjohi, J. G., & Ndambiri, J. M. (2017). The Effect of Financial Risk
Management on the Financial Performance of Commercial Banks in Kenya.
International Journal of Finance and Banking Research, 3(5), 70-81.

134
Waweru, N., & Kalani, V. (2009). Commercial banking crisis in Kenya causes and
remedies. Global Journal of Finance and Banking, 3(3), 23-27.
Županović, I. (2014). Sustainable Risk Management in the Banking Sector. Journal of
Central Banking Theory and Practice, 3(1), 81-100.

135
APPENDICES
Appendix 1: List of Commercial Banks in Kenya
1 Africa Banking Corporation Limited
2 Bank Of Africa Kenya Limited
3 Bank of Baroda (K) Limited
4 Bank Of India
5 Barclays Bank of Kenya Limited
6 Charterhouse Bank Limited
7 Chase Bank (K) Limited
8 Citibank N.A Kenya
9 Commercial Bank of Africa Limited
10 Consolidated Bank Of Kenya Limited
11 Co-operative Bank of Kenya Limited
12 Credit Bank Limited
13 Development Bank Of Kenya Limited
14 Diamond Trust Bank Kenya Limited
15 DIB Bank (Kenya) Limited
16 Spire Bank Limited
17 Equity Bank Kenya Limited
18 Family Bank Kenya Limited
19 Fidelity Commercial Bank Limited
20 First Community Bank Limited
21 Giro Commercial Bank Limited
22 Guaranty Bank Limited
23 Guardian Bank Limited
24 Gulf Africa Bank Limited
25 Habib Bank A.G Zurich
26 Habib Bank Limited
27 Imperial Bank Limited
28 I&M Bank Limited
29 Jamii Bora Bank Limited

136
30 KCB Bank Kenya Limited
31 Middle East Bank (K) Limited
32 National Bank Of Kenya Limited
33 NIC Bank Limited
34 M-Oriental Bank Limited
35 Paramount Bank Limited
36 Prime Bank Limited
37 Sidian Bank Limited
38 Stanbic Bank Kenya Limited
39 Standard Chartered Bank Kenya Limited
40 Trans-National Bank Limited
41 UBA Kenya Bank Limited
42 Victoria Commercial Bank Limited
Source: (CBK, Annual report and Financial Statements, 2017)
Tier I banks
1 Stanbic Bank Kenya Limited
2 Standard Chartered Bank Kenya Limited
3 Barclays Bank of Kenya Limited
4 Commercial Bank of Africa Limited
5 Co-operative Bank of Kenya Limited
6 Diamond Trust Bank Kenya Limited
7 Equity Bank Kenya Limited
8 KCB Bank Kenya Limited
Source: (CBK, Annual report and Financial Statements, 2017)
Tier II banks
1 Bank of Africa Kenya Limited
2 Bank of Baroda (K) Limited
3 Bank of India
4 Citibank N.A Kenya
5 Family Bank Kenya Limited

137
6 I&M Bank Limited
7 National Bank of Kenya Limited
8 NIC Bank Limited
9 Prime Bank Limited
10 HFC Limited
11 Eco Bank Kenya Limited
Source: (CBK, Annual report and Financial Statements, 2017)
Tier III banks
1 Africa Banking Corporation Limited
2 Charterhouse Bank Limited
3 Consolidated Bank Of Kenya Limited
4 Credit Bank Limited
5 DIB Bank (Kenya) Limited
6 Spire Bank Limited
7 Fidelity Commercial Bank Limited
8 First Community Bank Limited
9 Giro Commercial Bank Limited
10 Guaranty Bank Limited
11 Guardian Bank Limited
12 Gulf Africa Bank Limited
13 Habib Bank A.G Zurich
14 Habib Bank Limited
15 I&M Bank Limited
16 Jamii Bora Bank Limited
17 Middle East Bank (K) Limited
18 M-Oriental Bank Limited
19 Paramount Bank Limited
20 Sidian Bank Limited
21 Trans-National Bank Limited
22 UBA Kenya Bank Limited
23 Victoria Commercial Bank Limited
Source: (CBK, Annual report and Financial Statements, 2017)

138
Appendix 2: Data extraction form
Code of the financial institution
Bank Tier Category
DATA ON RISK COMMITTEE
Does the bank have risk committee?
YES NO
Data on existence of board risk committee
YEAR Risk Committee existence FINANCIAL
PERFORMANCE
YES NO ROA (Return on Assets)
2017
2016
2015
2014
2013

139
DATA ON AUDIT COMMITTEE
Data on audit committee size
YEAR Size of the board
audit committee
FINANCIAL PERFORMANCE
ROA (Return on Assets)
2017
2016
2015
2014
2013
DATA ON CREDIT COMMITTEE
Data on board credit committee size
YEAR Size of the board
audit committee
FINANCIAL PERFORMANCE
ROA (Return on Assets)
2017
2016
2015
2014
2013

140
NUMBER ON RISK GOVERNANCE MECHANISMS
YEAR Number of risk
mechanisms
FINANCIAL PERFORMANCE
ROA (Return on Assets)
2017
2016
2015
2014
2013
Type of risk governance mechanisms
Type 2017 2016 2015 2014 2013
1 Risk committee
2 Audit committee
3 Credit committee
4 Finance and
strategy
5 Human resource
and nominations
6 Information
Technology and
Innovation
7 Supply chain/
Procurement
8 Other

141
BOARD OVERSIGHT
Data on Frequency of board of governance meetings held by the bank
YEAR Number of board
meetings
FINANCIAL PERFORMANCE
ROA (Return on Assets)
2017
2016
2015
2014
2013
Data on the size of the board
YEAR Size FINANCIAL PERFORMANCE
ROA (Return on Assets)
2017
2016
2015
2014
2013

142
Appendix 3: SPSS output
Objective 1: Risk committee and financial performance
Model Summaryb
Model R R Square Adjusted R Square Std. Error of the
Estimate
Change Statistics Durbin-Watson
R Square Change F Change df1 df2 Sig. F Change
1 .299a .090 .084 2.89544 .090 17.301 1 176 .000 .848
a. Predictors: (Constant), Risk committee
b. Dependent Variable: Return on Assets
Coefficientsa
Model Unstandardized Coefficients Standardized Coefficients t Sig. 95.0% Confidence Interval for B Correlations Collinearity
Statistics
B Std. Error Beta Lower
Bound
Upper Bound Zero-
order
Partial Part Tolerance VIF
1 (Constant) -.048 .579 -.082 .935 -1.190 1.095
Risk committee 2.598 .625 .299 4.159 .000 1.365 3.831 .299 .299 .299 1.000 1.000
a. Dependent Variable: Return on Assets

143
ANOVAa
Model Sum of Squares df Mean Square F Sig.
1
Regression 145.047 1 145.047 17.301 .000b
Residual 1475.505 176 8.384
Total 1620.552 177
a. Dependent Variable: Return on Assets
b. Predictors: (Constant), Risk committee
Objective 2: Audit committee
Model Summaryb
Model R R Square Adjusted R Square Std. Error of the
Estimate
Change Statistics Durbin-Watson
R Square Change F Change df1 df2 Sig. F Change
1 -.004a .000 -.006 3.03439 .000 .002 1 176 .960 .813
a. Predictors: (Constant), Audit committee
b. Dependent Variable: Return on Assets

144
Coefficientsa
Model Unstandardized Coefficients Standardized Coefficients t Sig. 95.0% Confidence Interval for B Correlations Collinearity Statistics
B Std. Error Beta Lower Bound Upper Bound Zero-order Partial Part Tolerance VIF
1 (Constant) -2.220 .718 3.093 .002 .803 3.636
Audit committee -.008 .154 -.004 -.050 .960 -.311 .296 -.004 -.004 -.004 1.000 1.000
a. Dependent Variable: Return on Assets
ANOVAa
Model Sum of Squares df Mean Square F Sig.
1
Regression .023 1 .023 .002 .960b
Residual 1620.529 176 9.208
Total 1620.552 177
a. Dependent Variable: Return on Assets
b. Predictors: (Constant), Audit committee

145
Objective 3: Credit committee size and financial performance
Model Summaryb
Model R R Square Adjusted R Square Std. Error of the
Estimate
Change Statistics Durbin-Watson
R Square Change F Change df1 df2 Sig. F Change
1 .215a .046 .041 2.96317 .046 8.565 1 176 .004 .873
a. Predictors: (Constant), Credit committee
b. Dependent Variable: Return on Assets
ANOVAa
Model Sum of Squares df Mean Square F Sig.
1
Regression 75.205 1 75.205 8.565 .004b
Residual 1545.347 176 8.780
Total 1620.552 177
a. Dependent Variable: Return on Assets
b. Predictors: (Constant), Credit committee

146
Coefficientsa
Model Unstandardized Coefficients Standardized Coefficients t Sig. 95.0% Confidence Interval for B Correlations Collinearity Statistics
B Std. Error Beta Lower Bound Upper Bound Zero-order Partial Part Tolerance VIF
1 (Constant) 1.167 .413 2.828 .005 .353 1.982
Credit committee .236 .081 .215 2.927 .004 .077 .395 .215 .215 .215 1.000 1.000
a. Dependent Variable: Return on Assets
OBJECTIVE FOUR
Model Summaryb
Model R R Square Adjusted R Square Std. Error of the
Estimate
Change Statistics Durbin-Watson
R Square Change F Change df1 df2 Sig. F Change
1 .191a .036 .031 2.97858 .036 6.660 1 176 .011 .827
Coefficientsa
Model Unstandardized Coefficients Standardized Coefficients t Sig. 95.0% Confidence Interval for
B
Correlations Collinearity Statistics
B Std. Error Beta Lower Bound Upper Bound Zero-
order
Partial Part Tolerance VIF
1
(Constant) 1.244 .428 2.909 .004 .400 2.088
Number of risk
mechanisms .166 .064 .191 2.581 .011 .039 .293 .191 .191 .191 1.000 1.000
a. Dependent Variable: Return on Assets
ANOVAa

147
Model Sum of Squares df Mean Square F Sig.
1
Regression 59.089 1 59.089 6.660 .011b
Residual 1561.463 176 8.872
Total 1620.552 177
Model Summaryb
Model R R Square Adjusted R Square Std. Error of the
Estimate
Change Statistics Durbin-Watson
R Square Change F Change df1 df2 Sig. F Change
1 .376a .142 .122 2.83581 .142 7.129 4 173 .000 .920
a. Predictors: (Constant), Number of risk mechanisms, Audit committee, Risk committee, Credit committee
b. Dependent Variable: Return on Assets
Overall risk governance mechanisms and financial performance
Model Summaryb
Model R R Square Adjusted R Square Std. Error of the
Estimate
Change Statistics Durbin-Watson
R Square Change F Change df1 df2 Sig. F Change
1 .769a .591 .427 1.48306 .591 3.613 4 10 .045 1.996
a. Predictors: (Constant), NUMBER OF MECHANISMS, AUDIT COMMITTEE, RISK COMMITTEE, CREDIT COMMITTEE
b. Dependent Variable: RETURN ON ASSETS
Coefficientsa

148
Model Unstandardized
Coefficients
Standardized
Coefficients
t Sig. 95.0% Confidence Interval
for B
Correlations Collinearity
Statistics
B Std. Error Beta Lower Bound Upper Bound Zero-
order
Partial Part Tolerance VIF
1
(Constant) -18.074 9.550
-
1.893 .088 -39.352 3.205
RISK COMMITTEE 3.419 5.126 .155 .667 .520 -8.002 14.841 -.216 .206 .135 .753 1.329
AUDIT COMMITTEE 2.231 .935 .555 2.387 .038 .148 4.313 .320 .602 .483 .756 1.323
CREDIT COMMITTEE 1.603 .498 .753 3.222 .009 .494 2.712 .591 .714 .652 .748 1.337
NUMBER OF
MECHANISMS -.014 .486 -.006 -.028 .978 -1.096 1.068 -.219 -.009
-
.006 .839 1.192
a. Dependent Variable: RETURN ON ASSETS
ANOVAa
Model Sum of Squares df Mean Square F Sig.
1
Regression 31.785 4 7.946 3.613 .045b
Residual 21.995 10 2.199
Total 53.779 14
a. Dependent Variable: RETURN ON ASSETS
b. Predictors: (Constant), NUMBER OF MECHANISMS, AUDIT COMMITTEE, RISK COMMITTEE,
CREDIT COMMITTEE

149
Objective 5: Moderating effect of board oversight on the relationship between risk governance mechanisms and financial
performance of commercial banks
1. Moderating effect of board size on relationship between Risk committee on Financial performance
Model Summaryd
Model R R Square Adjusted R
Square
Std. Error of the
Estimate
Change Statistics Durbin-Watson
R Square
Change
F Change df1 df2 Sig. F Change
1 .299a .090 .084 2.89544 .090 17.301 1 176 .000
2 .303b .092 .081 2.89992 .002 .456 1 175 .500
3 .378c .143 .128 2.82538 .051 10.355 1 174 .002 .895
a. Predictors: (Constant), Risk committee
b. Predictors: (Constant), Risk committee, Board size
c. Predictors: (Constant), Risk committee, Board size, RC_BS
d. Dependent Variable: Return on Assets
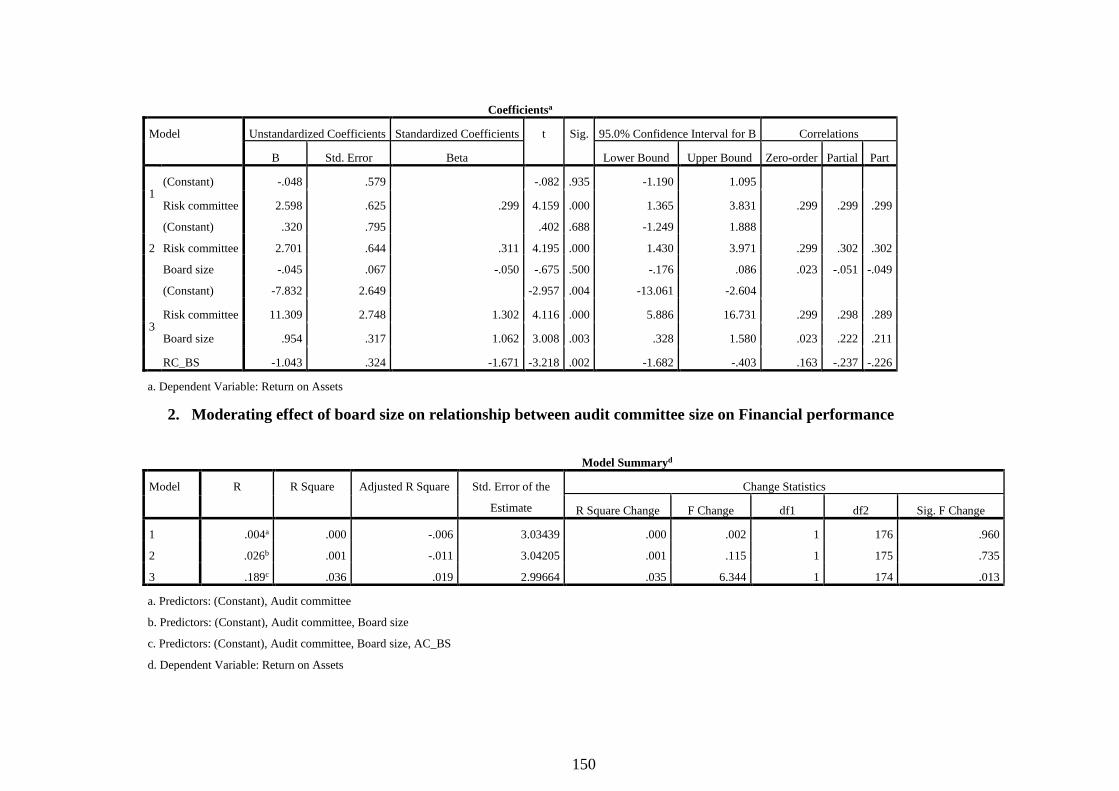
150
Coefficientsa
Model Unstandardized Coefficients Standardized Coefficients t Sig. 95.0% Confidence Interval for B Correlations
B Std. Error Beta Lower Bound Upper Bound Zero-order Partial Part
1 (Constant) -.048 .579 -.082 .935 -1.190 1.095
Risk committee 2.598 .625 .299 4.159 .000 1.365 3.831 .299 .299 .299
2
(Constant) .320 .795 .402 .688 -1.249 1.888
Risk committee 2.701 .644 .311 4.195 .000 1.430 3.971 .299 .302 .302
Board size -.045 .067 -.050 -.675 .500 -.176 .086 .023 -.051 -.049
3
(Constant) -7.832 2.649 -2.957 .004 -13.061 -2.604
Risk committee 11.309 2.748 1.302 4.116 .000 5.886 16.731 .299 .298 .289
Board size .954 .317 1.062 3.008 .003 .328 1.580 .023 .222 .211
RC_BS -1.043 .324 -1.671 -3.218 .002 -1.682 -.403 .163 -.237 -.226
a. Dependent Variable: Return on Assets
2. Moderating effect of board size on relationship between audit committee size on Financial performance
Model Summaryd
Model R R Square Adjusted R Square Std. Error of the
Estimate
Change Statistics
R Square Change F Change df1 df2 Sig. F Change
1 .004a .000 -.006 3.03439 .000 .002 1 176 .960
2 .026b .001 -.011 3.04205 .001 .115 1 175 .735
3 .189c .036 .019 2.99664 .035 6.344 1 174 .013
a. Predictors: (Constant), Audit committee
b. Predictors: (Constant), Audit committee, Board size
c. Predictors: (Constant), Audit committee, Board size, AC_BS
d. Dependent Variable: Return on Assets

151
Coefficientsa
Model Unstandardized Coefficients Standardized Coefficients t Sig. 95.0% Confidence Interval for B Correlations
B Std. Error Beta Lower Bound Upper Bound Zero-order Partial Part
1
(Constant) 2.220 .718 3.093 .002 .803 3.636
Audit committee -.008 .154 -.004 -.050 .960 -.311 .296 -.004 -.004 -.004
2
(Constant) 2.046 .883 2.316 .022 .302 3.789
Audit committee -.023 .161 -.011 -.145 .885 -.341 .294 -.004 -.011 -.011
Board size .024 .071 .027 .339 .735 -.116 .164 .023 .026 .026
3
(Constant) -2.747 2.093 -1.313 .191 -6.877 1.383
Audit committee .959 .421 .470 2.278 .024 .128 1.791 -.004 .170 .170
Board size .494 .199 .550 2.480 .014 .101 .887 .023 .185 .185
AC_BS -.093 .037 -.828 -2.519 .013 -.166 -.020 -.030 -.188 -.187
a. Dependent Variable: Return on Assets
ANOVAa
Model Sum of Squares df Mean Square F Sig.
1
Regression .023 1 .023 .002 .960b
Residual 1620.529 176 9.208
Total 1620.552 177
2
Regression 1.086 2 .543 .059 .943c
Residual 1619.466 175 9.254
Total 1620.552 177
3
Regression 58.055 3 19.352 2.155 .095d
Residual 1562.497 174 8.980
Total 1620.552 177

152
a. Dependent Variable: Return on Assets
b. Predictors: (Constant), Audit committee
c. Predictors: (Constant), Audit committee, Board size
d. Predictors: (Constant), Audit committee, Board size, AC_BS
3. Moderating effect of board size on relationship between credit committee size on Financial performance
Model Summaryd
Model R R Square Adjusted R
Square
Std. Error of
the Estimate
Change Statistics Durbin-Watson
R Square
Change
F Change df1 df2 Sig. F Change
1 .215a .046 .041 2.96317 .046 8.565 1 176 .004
2 .215b .046 .036 2.97162 .000 .001 1 175 .979
3 .243c .059 .043 2.96016 .013 2.358 1 174 .126 .898
a. Predictors: (Constant), Credit committee
b. Predictors: (Constant), Credit committee, Board size
c. Predictors: (Constant), Credit committee, Board size, CC_BS
d. Dependent Variable: Return on Assets

153
Coefficientsa
Model Unstandardized Coefficients Standardized Coefficients t Sig. 95.0% Confidence Interval for B Correlations
B Std. Error Beta Lower Bound Upper Bound Zero-order Partial Part
1
(Constant) 1.167 .413 2.828 .005 .353 1.982
Credit committee .236 .081 .215 2.927 .004 .077 .395 .215 .215 .215
2
(Constant) 1.150 .762 1.509 .133 -.354 2.654
Credit committee .236 .081 .215 2.901 .004 .075 .396 .215 .214 .214
Board size .002 .067 .002 .027 .979 -.130 .133 .023 .002 .002
3
(Constant) 2.665 1.245 2.141 .034 .208 5.122
Credit committee -.159 .270 -.145 -.590 .556 -.691 .373 .215 -.045 -.043
Board size -.146 .117 -.163 -1.249 .213 -.377 .085 .023 -.094 -.092
CC_BS .038 .025 .426 1.536 .126 -.011 .086 .221 .116 .113
a. Dependent Variable: Return on Assets
ANOVAa
Model Sum of Squares df Mean Square F Sig.
1
Regression 75.205 1 75.205 8.565 .004b
Residual 1545.347 176 8.780
Total 1620.552 177
2
Regression 75.212 2 37.606 4.259 .016c
Residual 1545.340 175 8.831
Total 1620.552 177
3
Regression 95.872 3 31.957 3.647 .014d
Residual 1524.680 174 8.763
Total 1620.552 177

154
a. Dependent Variable: Return on Assets
b. Predictors: (Constant), Credit committee
c. Predictors: (Constant), Credit committee, Board size
d. Predictors: (Constant), Credit committee, Board size, CC_BS
4. Moderating effect of board size on relationship between number of risk governance mechanisms and Financial
performance
Model Summaryd
Model R R Square Adjusted R
Square
Std. Error of
the Estimate
Change Statistics Durbin-
Watson R Square
Change
F Change df1 df2 Sig. F Change
1 .191a .036 .031 2.97858 .036 6.660 1 176 .011
2 .200b .040 .029 2.98155 .004 .649 1 175 .421
3 .216c .047 .030 2.97973 .007 1.215 1 174 .272 .823
a. Predictors: (Constant), Number of risk mechanisms
b. Predictors: (Constant), Number of risk mechanisms, Board size
c. Predictors: (Constant), Number of risk mechanisms, Board size, NM_BS
d. Dependent Variable: Return on Assets

155
Coefficientsa
Model Unstandardized Coefficients Standardized Coefficients t Sig. 95.0% Confidence Interval for B Correlations
B Std. Error Beta Lower Bound Upper Bound Zero-order Partial Part
1
(Constant) 1.244 .428 2.909 .004 .400 2.088
Number of risk mechanisms .166 .064 .191 2.581 .011 .039 .293 .191 .191 .191
2
(Constant) 1.707 .717
2.382 .018 .293 3.122
Number of risk mechanisms .189 .071 .218 2.683 .008 .050 .329 .191 .199 .199
Board size -.059 .073 -.065 -.806 .421 -.203 .085 .023 -.061 -.060
3
(Constant) .083 1.639
.050 .960 -3.152 3.317
Number of risk mechanisms .517 .305 .594 1.693 .092 -.086 1.120 .191 .127 .125
Board size .061 .131 .068 .465 .643 -.197 .318 .023 .035 .034
NM_BS -.023 .021 -.454 -1.102 .272 -.065 .018 .150 -.083 -.082
a. Dependent Variable: Return on Assets

156
ANOVAa
Model Sum of Squares df Mean Square F Sig.
1
Regression 59.089 1 59.089 6.660 .011b
Residual 1561.463 176 8.872
Total 1620.552 177
2
Regression 64.862 2 32.431 3.648 .028c
Residual 1555.690 175 8.890
Total 1620.552 177
3
Regression 75.646 3 25.215 2.840 .039d
Residual 1544.906 174 8.879
Total 1620.552 177
a. Dependent Variable: Return on Assets
b. Predictors: (Constant), Number of risk mechanisms
c. Predictors: (Constant), Number of risk mechanisms, Board size
d. Predictors: (Constant), Number of risk mechanisms, Board size, NM_BS
1. Moderating effect of board oversight on relationship between risk governance mechanisms and financial performance
Model Summaryd
Model R R Square Adjusted R Square Std. Error of the
Estimate
Change Statistics
R Square Change F Change df1 df2 Sig. F Change
1 .376a .142 .122 2.83581 .142 7.129 4 173 .000
2 .381b .146 .121 2.83740 .004 .806 1 172 .371
3 .471c .222 .180 2.73969 .076 4.122 4 168 .003
a. Predictors: (Constant), Number of risk mechanisms, Audit committee, Risk committee, Credit committee
b. Predictors: (Constant), Number of risk mechanisms, Audit committee, Risk committee, Credit committee, Board size
c. Predictors: (Constant), Number of risk mechanisms, Audit committee, Risk committee, Credit committee, Board size, CC_BS, AC_BS, NM_BS, RC_BS
d. Dependent Variable: Return on Assets

157
ANOVAa
Model Sum of Squares df Mean Square F Sig.
1
Regression 229.315 4 57.329 7.129 .000b
Residual 1391.237 173 8.042
Total 1620.552 177
2
Regression 235.804 5 47.161 5.858 .000c
Residual 1384.748 172 8.051
Total 1620.552 177
3
Regression 359.560 9 39.951 5.323 .000d
Residual 1260.992 168 7.506
Total 1620.552 177
a. Dependent Variable: Return on Assets
b. Predictors: (Constant), Number of risk mechanisms, Audit committee, Risk committee, Credit committee
c. Predictors: (Constant), Number of risk mechanisms, Audit committee, Risk committee, Credit
committee, Board size
c. Predictors: (Constant), Number of risk mechanisms, Audit committee, Risk committee, Credit
committee, Board size, CC_BS, AC_BS, NM_BS, RC_BS

158
Coefficientsa
Model Unstandardized Coefficients Standardized Coefficients t Sig. 95.0% Confidence Interval for B Correlations
B Std. Error Beta Lower Bound Upper Bound Zero-order Partial Part
1
(Constant) .185 .788 .235 .814 -1.370 1.740
Risk committee 2.358 .645 .271 3.655 .000 1.084 3.631 .299 .268 .257
Audit committee -.319 .157 -.156 -2.027 .044 -.629 -.008 -.004 -.152 -.143
Credit committee .206 .086 .188 2.401 .017 .037 .375 .215 .180 .169
Number of risk mechanisms .088 .066 .101 1.328 .186 -.043 .218 .191 .100 .094
2
(Constant) .545 .884 .616 .539 -1.200 2.289
Risk committee 2.431 .650 .280 3.737 .000 1.147 3.715 .299 .274 .263
Audit committee -.286 .161 -.140 -1.775 .078 -.605 .032 -.004 -.134 -.125
Credit committee .197 .086 .180 2.281 .024 .027 .367 .215 .171 .161
Number of risk mechanisms .111 .071 .127 1.561 .120 -.029 .250 .191 .118 .110
Board size -.065 .072 -.072 -.898 .371 -.207 .078 .023 -.068 -.063
3
(Constant) -9.596 3.162 -3.035 .003 -15.837 -3.354
Risk committee 12.331 2.752 1.420 4.481 .000 6.898 17.764 .299 .327 .305
Audit committee .035 .439 .017 .080 .937 -.833 .902 -.004 .006 .005
Credit committee .001 .292 .001 .004 .997 -.576 .578 .215 .000 .000
Number of risk mechanisms .117 .330 .134 .354 .724 -.534 .768 .191 .027 .024
Board size 1.137 .350 1.266 3.246 .001 .446 1.829 .023 .243 .221
RC_BS -1.217 .326 -1.950 -3.735 .000 -1.860 -.574 .163 -.277 -.254
AC_BS -.025 .037 -.222 -.671 .503 -.099 .049 -.030 -.052 -.046
CC_BS .021 .027 .234 .779 .437 -.032 .073 .221 .060 .053
NM_BS 5.820E-005 .023 .001 .003 .998 -.045 .045 .150 .000 .000
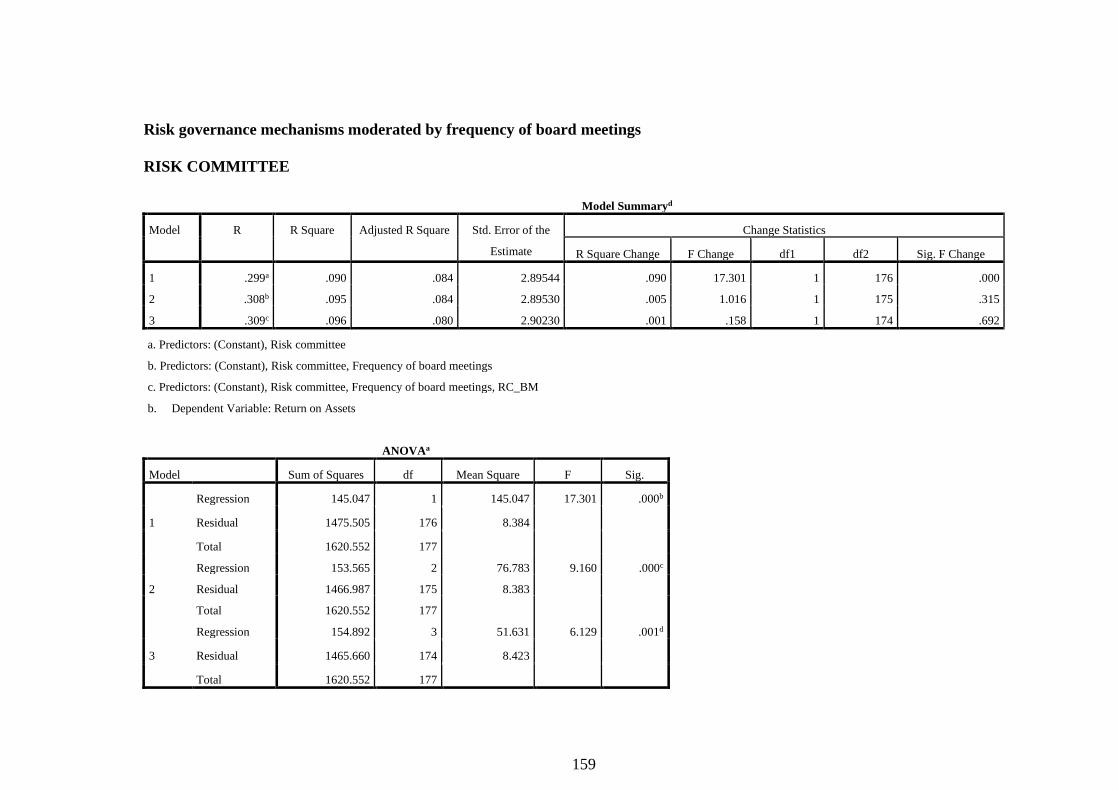
159
Risk governance mechanisms moderated by frequency of board meetings
RISK COMMITTEE
Model Summaryd
Model R R Square Adjusted R Square Std. Error of the
Estimate
Change Statistics
R Square Change F Change df1 df2 Sig. F Change
1 .299a .090 .084 2.89544 .090 17.301 1 176 .000
2 .308b .095 .084 2.89530 .005 1.016 1 175 .315
3 .309c .096 .080 2.90230 .001 .158 1 174 .692
a. Predictors: (Constant), Risk committee
b. Predictors: (Constant), Risk committee, Frequency of board meetings
c. Predictors: (Constant), Risk committee, Frequency of board meetings, RC_BM
b. Dependent Variable: Return on Assets
ANOVAa
Model Sum of Squares df Mean Square F Sig.
1
Regression 145.047 1 145.047 17.301 .000b
Residual 1475.505 176 8.384
Total 1620.552 177
2
Regression 153.565 2 76.783 9.160 .000c
Residual 1466.987 175 8.383
Total 1620.552 177
3
Regression 154.892 3 51.631 6.129 .001d
Residual 1465.660 174 8.423
Total 1620.552 177
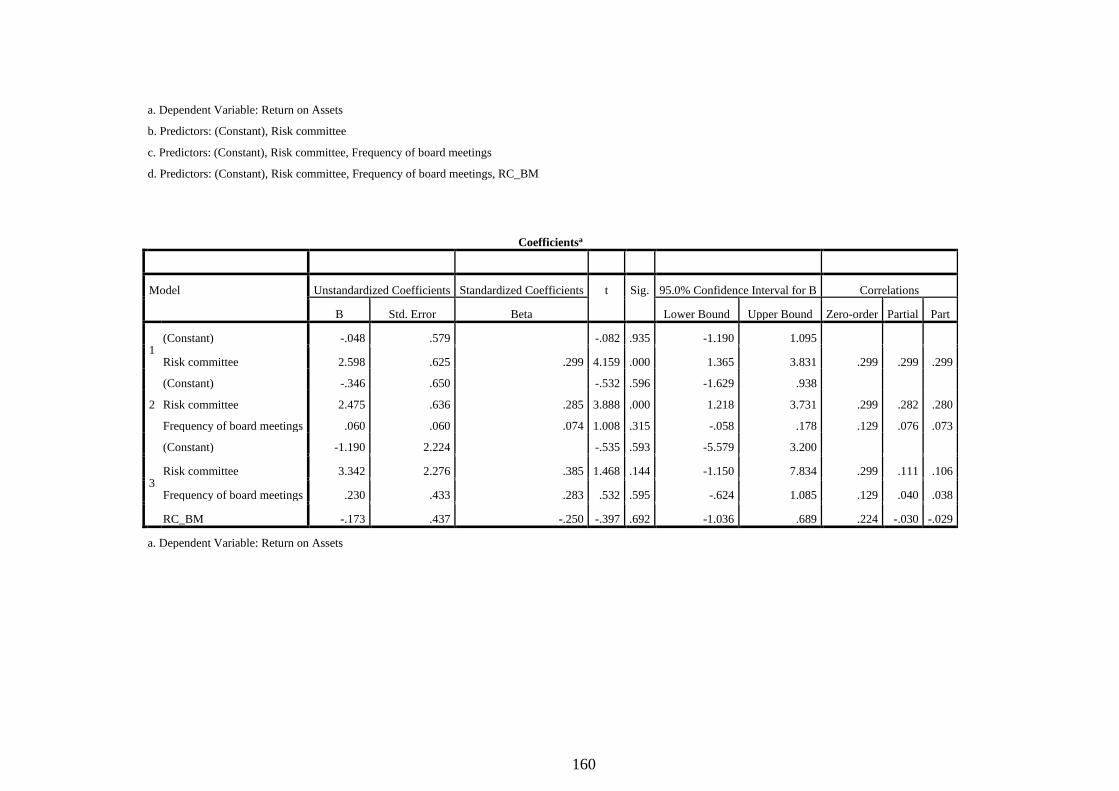
160
a. Dependent Variable: Return on Assets
b. Predictors: (Constant), Risk committee
c. Predictors: (Constant), Risk committee, Frequency of board meetings
d. Predictors: (Constant), Risk committee, Frequency of board meetings, RC_BM
Coefficientsa
Model Unstandardized Coefficients Standardized Coefficients t Sig. 95.0% Confidence Interval for B Correlations
B Std. Error Beta Lower Bound Upper Bound Zero-order Partial Part
1 (Constant) -.048 .579 -.082 .935 -1.190 1.095
Risk committee 2.598 .625 .299 4.159 .000 1.365 3.831 .299 .299 .299
2
(Constant) -.346 .650 -.532 .596 -1.629 .938
Risk committee 2.475 .636 .285 3.888 .000 1.218 3.731 .299 .282 .280
Frequency of board meetings .060 .060 .074 1.008 .315 -.058 .178 .129 .076 .073
3
(Constant) -1.190 2.224 -.535 .593 -5.579 3.200
Risk committee 3.342 2.276 .385 1.468 .144 -1.150 7.834 .299 .111 .106
Frequency of board meetings .230 .433 .283 .532 .595 -.624 1.085 .129 .040 .038
RC_BM -.173 .437 -.250 -.397 .692 -1.036 .689 .224 -.030 -.029
a. Dependent Variable: Return on Assets

161
AUDIT COMMITTEE
Model Summaryd
Model R R Square Adjusted R Square Std. Error of the
Estimate
Change Statistics
R Square Change F Change df1 df2 Sig. F Change
1 .004a .000 -.006 3.03439 .000 .002 1 176 .960
2 .132b .017 .006 3.01655 .017 3.088 1 175 .081
3 .152c .023 .006 3.01620 .006 1.042 1 174 .309
a. Predictors: (Constant), Audit committee
b. Predictors: (Constant), Audit committee, Frequency of board meetings
c. Predictors: (Constant), Audit committee, Frequency of board meetings, AC_BM
d. Dependent Variable: Return on Assets
ANOVAa
Model Sum of Squares df Mean Square F Sig.
1
Regression .023 1 .023 .002 .960b
Residual 1620.529 176 9.208
Total 1620.552 177
2
Regression 28.122 2 14.061 1.545 .216c
Residual 1592.430 175 9.100
Total 1620.552 177
3
Regression 37.598 3 12.533 1.378 .251d
Residual 1582.954 174 9.097
Total 1620.552 177
a. Dependent Variable: Return on Assets
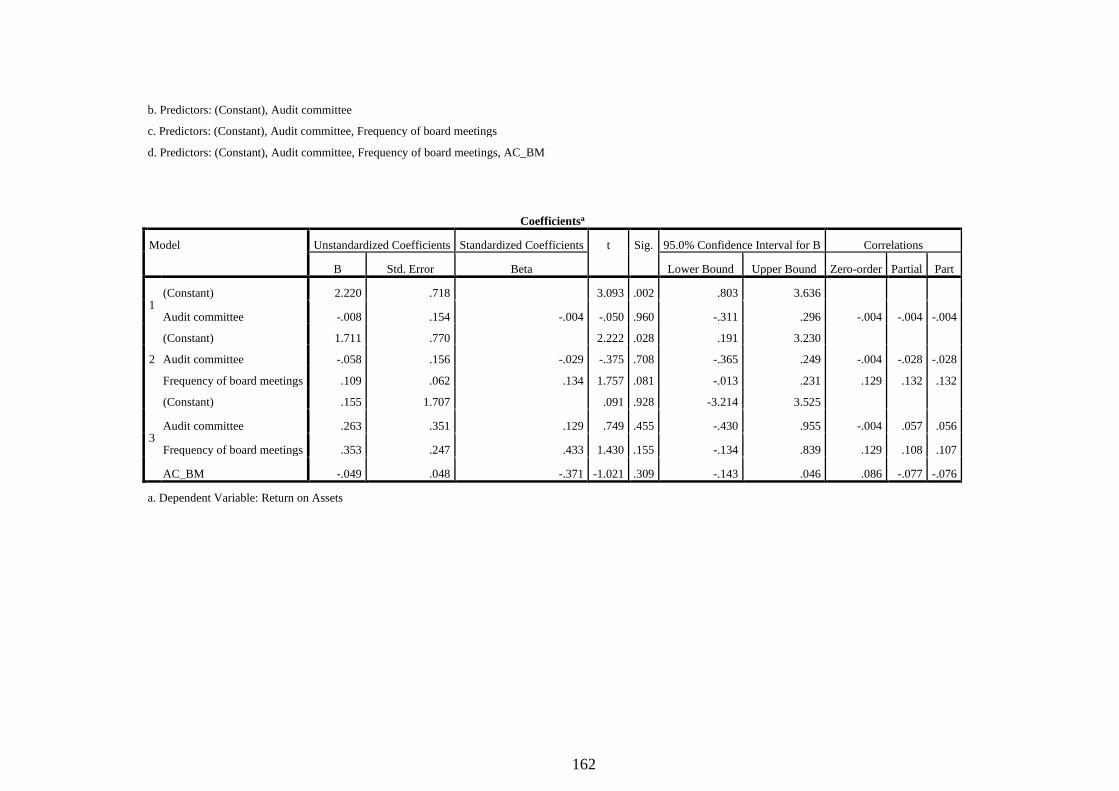
162
b. Predictors: (Constant), Audit committee
c. Predictors: (Constant), Audit committee, Frequency of board meetings
d. Predictors: (Constant), Audit committee, Frequency of board meetings, AC_BM
Coefficientsa
Model Unstandardized Coefficients Standardized Coefficients t Sig. 95.0% Confidence Interval for B Correlations
B Std. Error Beta Lower Bound Upper Bound Zero-order Partial Part
1 (Constant) 2.220 .718 3.093 .002 .803 3.636
Audit committee -.008 .154 -.004 -.050 .960 -.311 .296 -.004 -.004 -.004
2
(Constant) 1.711 .770 2.222 .028 .191 3.230
Audit committee -.058 .156 -.029 -.375 .708 -.365 .249 -.004 -.028 -.028
Frequency of board meetings .109 .062 .134 1.757 .081 -.013 .231 .129 .132 .132
3
(Constant) .155 1.707 .091 .928 -3.214 3.525
Audit committee .263 .351 .129 .749 .455 -.430 .955 -.004 .057 .056
Frequency of board meetings .353 .247 .433 1.430 .155 -.134 .839 .129 .108 .107
AC_BM -.049 .048 -.371 -1.021 .309 -.143 .046 .086 -.077 -.076
a. Dependent Variable: Return on Assets
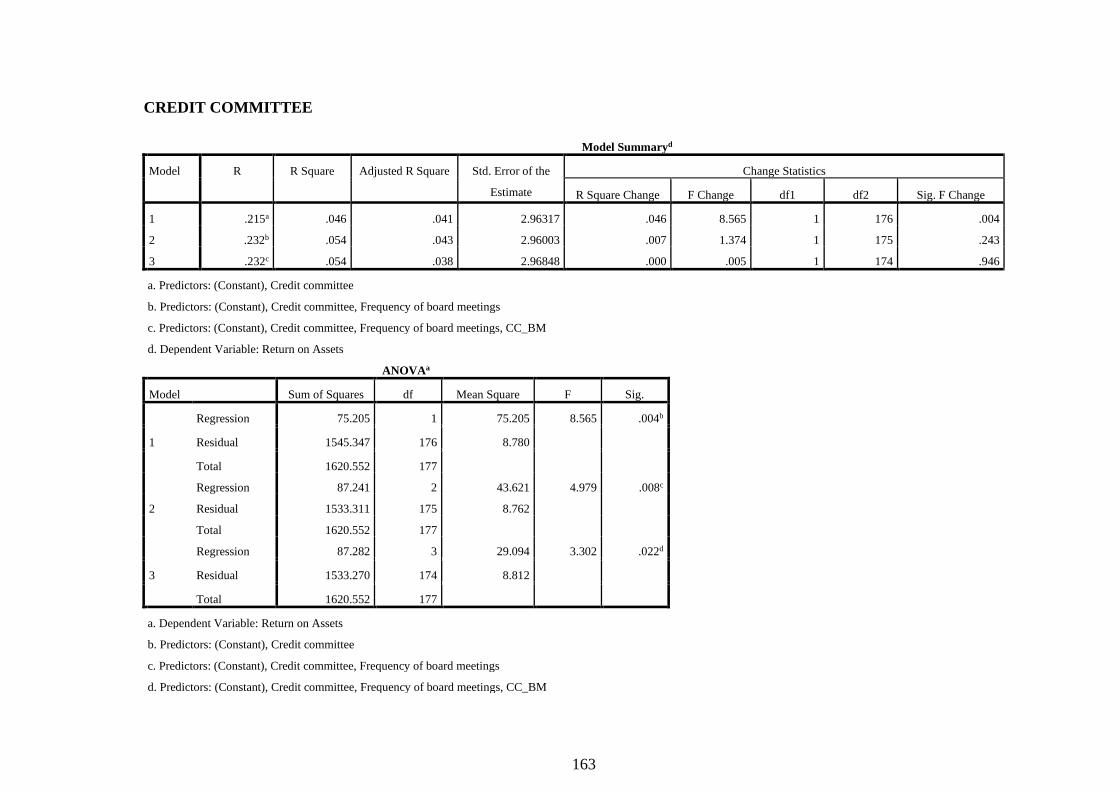
163
CREDIT COMMITTEE
Model Summaryd
Model R R Square Adjusted R Square Std. Error of the
Estimate
Change Statistics
R Square Change F Change df1 df2 Sig. F Change
1 .215a .046 .041 2.96317 .046 8.565 1 176 .004
2 .232b .054 .043 2.96003 .007 1.374 1 175 .243
3 .232c .054 .038 2.96848 .000 .005 1 174 .946
a. Predictors: (Constant), Credit committee
b. Predictors: (Constant), Credit committee, Frequency of board meetings
c. Predictors: (Constant), Credit committee, Frequency of board meetings, CC_BM
d. Dependent Variable: Return on Assets
ANOVAa
Model Sum of Squares df Mean Square F Sig.
1
Regression 75.205 1 75.205 8.565 .004b
Residual 1545.347 176 8.780
Total 1620.552 177
2
Regression 87.241 2 43.621 4.979 .008c
Residual 1533.311 175 8.762
Total 1620.552 177
3
Regression 87.282 3 29.094 3.302 .022d
Residual 1533.270 174 8.812
Total 1620.552 177
a. Dependent Variable: Return on Assets
b. Predictors: (Constant), Credit committee
c. Predictors: (Constant), Credit committee, Frequency of board meetings
d. Predictors: (Constant), Credit committee, Frequency of board meetings, CC_BM

164
Coefficientsa
Model Unstandardized Coefficients Standardized Coefficients t Sig. 95.0% Confidence Interval for B Correlations
B Std. Error Beta Lower Bound Upper Bound Zero-order Partial Part
1
(Constant) 1.167 .413
2.828 .005 .353 1.982
Credit committee .236 .081 .215 2.927 .004 .077 .395 .215 .215 .215
2
(Constant) .771 .533
1.446 .150 -.281 1.823
Credit committee .216 .082 .197 2.626 .009 .054 .379 .215 .195 .193
Frequency of board meetings .072 .061 .088 1.172 .243 -.049 .192 .129 .088 .086
3
(Constant) .835 1.079
.773 .440 -1.295 2.965
Credit committee .204 .203 .186 1.004 .317 -.196 .604 .215 .076 .074
Frequency of board meetings .061 .167 .075 .366 .715 -.268 .390 .129 .028 .027
CC_BM .002 .029 .020 .068 .946 -.055 .059 .212 .005 .005
a. Dependent Variable: Return on Assets
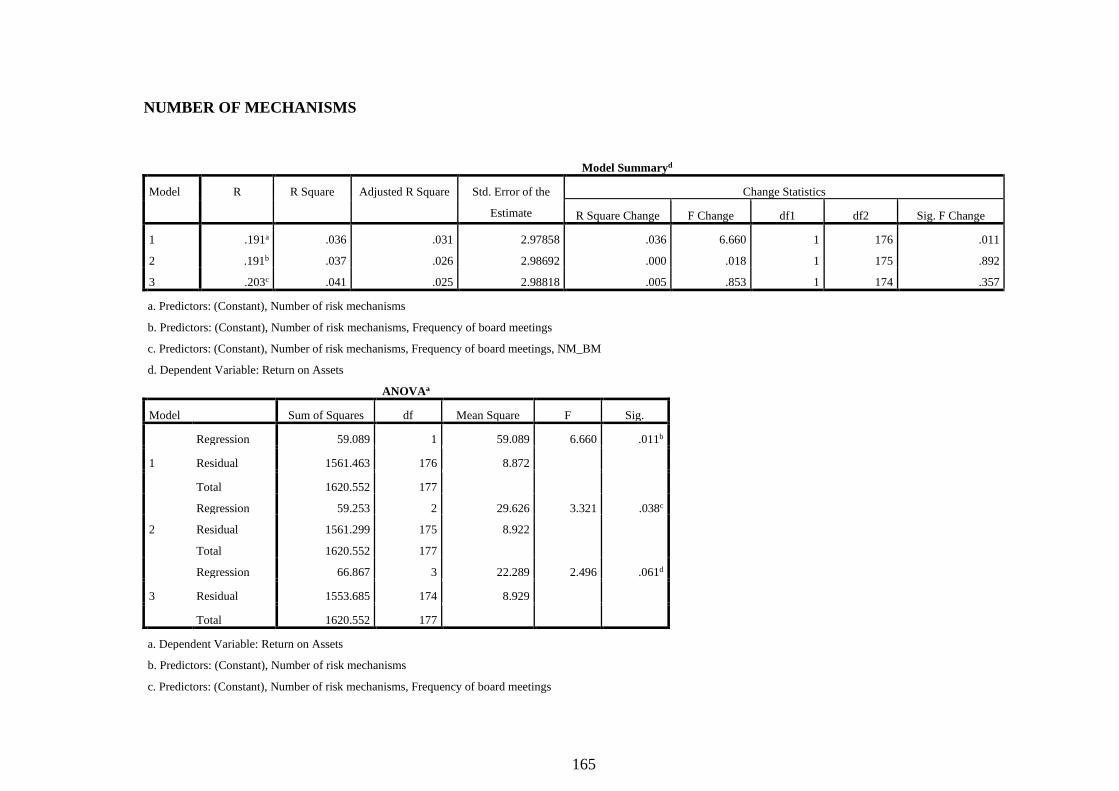
165
NUMBER OF MECHANISMS
Model Summaryd
Model R R Square Adjusted R Square Std. Error of the
Estimate
Change Statistics
R Square Change F Change df1 df2 Sig. F Change
1 .191a .036 .031 2.97858 .036 6.660 1 176 .011
2 .191b .037 .026 2.98692 .000 .018 1 175 .892
3 .203c .041 .025 2.98818 .005 .853 1 174 .357
a. Predictors: (Constant), Number of risk mechanisms
b. Predictors: (Constant), Number of risk mechanisms, Frequency of board meetings
c. Predictors: (Constant), Number of risk mechanisms, Frequency of board meetings, NM_BM
d. Dependent Variable: Return on Assets
ANOVAa
Model Sum of Squares df Mean Square F Sig.
1
Regression 59.089 1 59.089 6.660 .011b
Residual 1561.463 176 8.872
Total 1620.552 177
2
Regression 59.253 2 29.626 3.321 .038c
Residual 1561.299 175 8.922
Total 1620.552 177
3
Regression 66.867 3 22.289 2.496 .061d
Residual 1553.685 174 8.929
Total 1620.552 177
a. Dependent Variable: Return on Assets
b. Predictors: (Constant), Number of risk mechanisms
c. Predictors: (Constant), Number of risk mechanisms, Frequency of board meetings
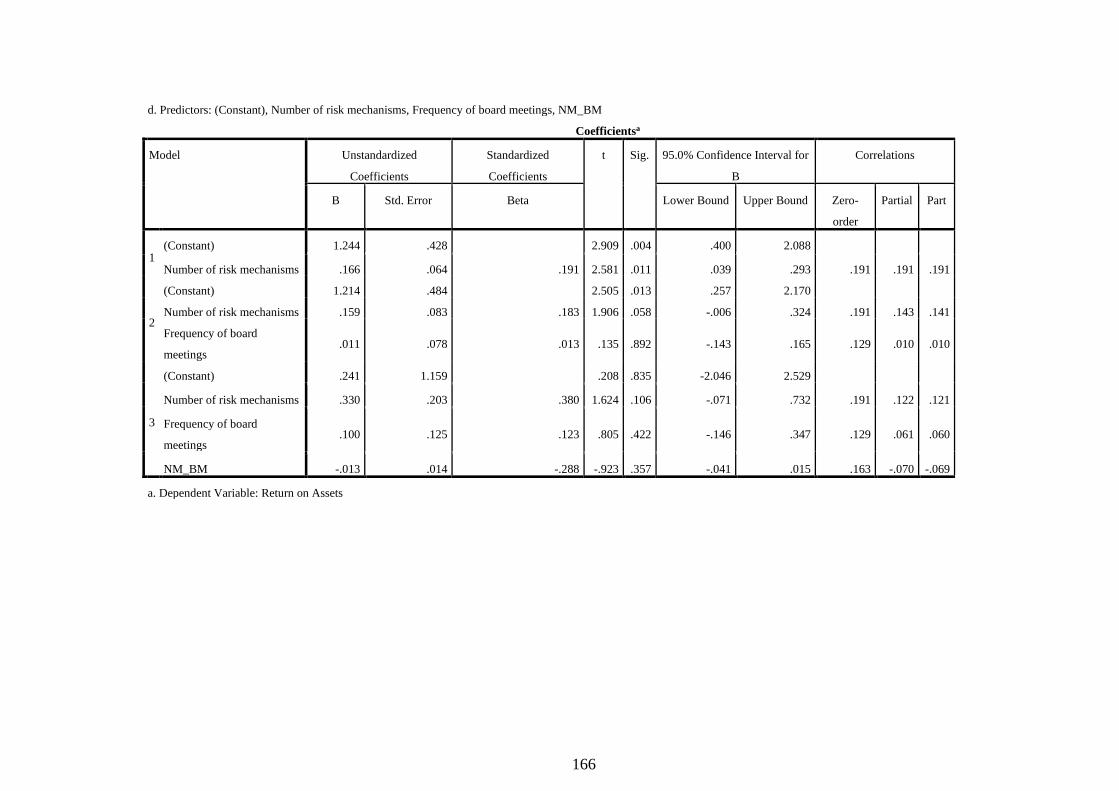
166
d. Predictors: (Constant), Number of risk mechanisms, Frequency of board meetings, NM_BM
Coefficientsa
Model Unstandardized
Coefficients
Standardized
Coefficients
t Sig. 95.0% Confidence Interval for
B
Correlations
B Std. Error Beta Lower Bound Upper Bound Zero-
order
Partial Part
1 (Constant) 1.244 .428 2.909 .004 .400 2.088
Number of risk mechanisms .166 .064 .191 2.581 .011 .039 .293 .191 .191 .191
2
(Constant) 1.214 .484 2.505 .013 .257 2.170
Number of risk mechanisms .159 .083 .183 1.906 .058 -.006 .324 .191 .143 .141
Frequency of board
meetings .011 .078 .013 .135 .892 -.143 .165 .129 .010 .010
3
(Constant) .241 1.159 .208 .835 -2.046 2.529
Number of risk mechanisms .330 .203 .380 1.624 .106 -.071 .732 .191 .122 .121
Frequency of board
meetings .100 .125 .123 .805 .422 -.146 .347 .129 .061 .060
NM_BM -.013 .014 -.288 -.923 .357 -.041 .015 .163 -.070 -.069
a. Dependent Variable: Return on Assets

167
OVERAL RISK GOVERNANCE MODERATED BY BOARD MEETINGS
Model Summaryd
Model R R Square Adjusted R Square Std. Error of the
Estimate
Change Statistics
R Square Change F Change df1 df2 Sig. F Change
1 .376a .142 .122 2.83581 .142 7.129 4 173 .000
2 .376b .142 .117 2.84402 .000 .003 1 172 .958
3 .384c .147 .102 2.86777 .006 .291 4 168 .884
a. Predictors: (Constant), Number of risk mechanisms, Audit committee, Risk committee, Credit committee
b. Predictors: (Constant), Number of risk mechanisms, Audit committee, Risk committee, Credit committee, Frequency of board meetings
c. Predictors: (Constant), Number of risk mechanisms, Audit committee, Risk committee, Credit committee, Frequency of board meetings, CC_BM, NM_BM, AC_BM, RC_BM
d. Dependent Variable: Return on Assets
ANOVAa
Model Sum of Squares df Mean Square F Sig.
1
Regression 229.315 4 57.329 7.129 .000b
Residual 1391.237 173 8.042
Total 1620.552 177
2
Regression 229.338 5 45.868 5.671 .000c
Residual 1391.214 172 8.088
Total 1620.552 177
3
Regression 238.904 9 26.545 3.228 .001d
Residual 1381.648 168 8.224
Total 1620.552 177

168
Coefficientsa
Model Unstandardized
Coefficients
Standardized
Coefficients
t Sig. 95.0% Confidence
Interval for B
Correlations
B Std. Error Beta Lower
Bound
Upper
Bound
Zero-
order
Partial Part
1
(Constant) .185 .788 .235 .814 -1.370 1.740
Risk committee 2.358 .645 .271 3.655 .000 1.084 3.631 .299 .268 .257
Audit committee -.319 .157 -.156 -
2.027 .044 -.629 -.008 -.004 -.152
-
.143
Credit committee .206 .086 .188 2.401 .017 .037 .375 .215 .180 .169
Number of risk
mechanisms .088 .066 .101 1.328 .186 -.043 .218 .191 .100 .094
2
(Constant) .176 .809 .218 .828 -1.420 1.773
Risk committee 2.356 .647 .271 3.641 .000 1.079 3.634 .299 .267 .257
Audit committee -.319 .158 -.156 -
2.021 .045 -.631 -.007 -.004 -.152
-
.143
Credit committee .206 .086 .188 2.394 .018 .036 .375 .215 .180 .169
Number of risk
mechanisms .085 .083 .098 1.032 .303 -.078 .248 .191 .078 .073
Frequency of board
meetings .004 .074 .005 .053 .958 -.143 .151 .129 .004 .004
3 (Constant) -.706 2.584 -.273 .785 -5.808 4.396
Risk committee 4.131 2.501 .476 1.652 .100 -.806 9.067 .299 .126 .118

169
Audit committee -.252 .386 -.124 -.653 .515 -1.014 .510 -.004 -.050 -
.047
Credit committee .205 .248 .187 .827 .409 -.285 .695 .215 .064 .059
Number of risk
mechanisms -.116 .244 -.133 -.474 .636 -.597 .365 .191 -.037
-
.034
Frequency of board
meetings .261 .497 .321 .526 .600 -.720 1.243 .129 .041 .037
RC_BM -.311 .460 -.449 -.677 .499 -1.219 .596 .224 -.052 -
.048
AC_BM -.013 .051 -.097 -.252 .802 -.113 .088 .086 -.019 -
.018
CC_BM .002 .034 .019 .055 .956 -.066 .069 .212 .004 .004
NM_BM .015 .017 .326 .861 .391 -.019 .048 .163 .066 .061
a. Dependent Variable: Return on Assets
OVERAL RISK GOVERNANCE MECHANISMS MODERATED BY BOARD SIZE
Model Summaryd
Model R R Square Adjusted R Square Std. Error of the
Estimate
Change Statistics
R Square Change F Change df1 df2 Sig. F Change
1 .376a .142 .122 2.83581 .142 7.129 4 173 .000
2 .381b .146 .121 2.83740 .004 .806 1 172 .371
3 .471c .222 .180 2.73969 .076 4.122 4 168 .003
a. Predictors: (Constant), Number of risk mechanisms, Audit committee, Risk committee, Credit committee
b. Predictors: (Constant), Number of risk mechanisms, Audit committee, Risk committee, Credit committee, Board size
c. Predictors: (Constant), Number of risk mechanisms, Audit committee, Risk committee, Credit committee, Board size, CC_BS, AC_BS, NM_BS, RC_BS
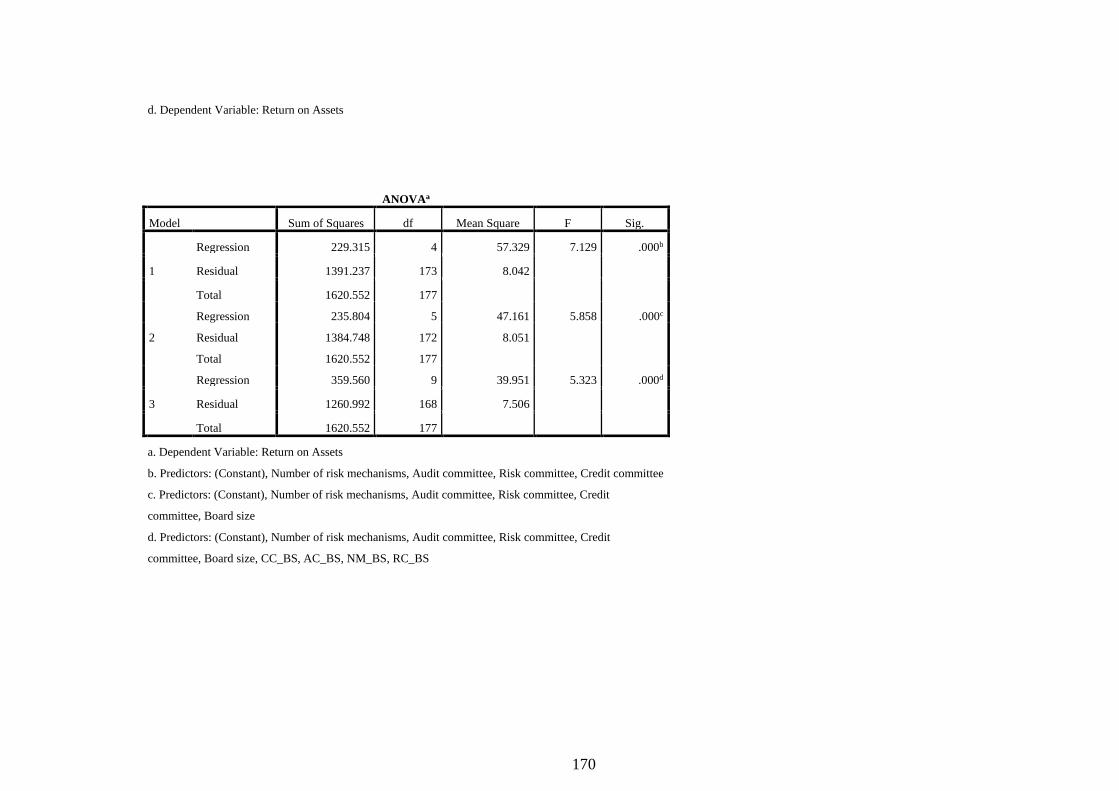
170
d. Dependent Variable: Return on Assets
ANOVAa
Model Sum of Squares df Mean Square F Sig.
1
Regression 229.315 4 57.329 7.129 .000b
Residual 1391.237 173 8.042
Total 1620.552 177
2
Regression 235.804 5 47.161 5.858 .000c
Residual 1384.748 172 8.051
Total 1620.552 177
3
Regression 359.560 9 39.951 5.323 .000d
Residual 1260.992 168 7.506
Total 1620.552 177
a. Dependent Variable: Return on Assets
b. Predictors: (Constant), Number of risk mechanisms, Audit committee, Risk committee, Credit committee
c. Predictors: (Constant), Number of risk mechanisms, Audit committee, Risk committee, Credit
committee, Board size
d. Predictors: (Constant), Number of risk mechanisms, Audit committee, Risk committee, Credit
committee, Board size, CC_BS, AC_BS, NM_BS, RC_BS
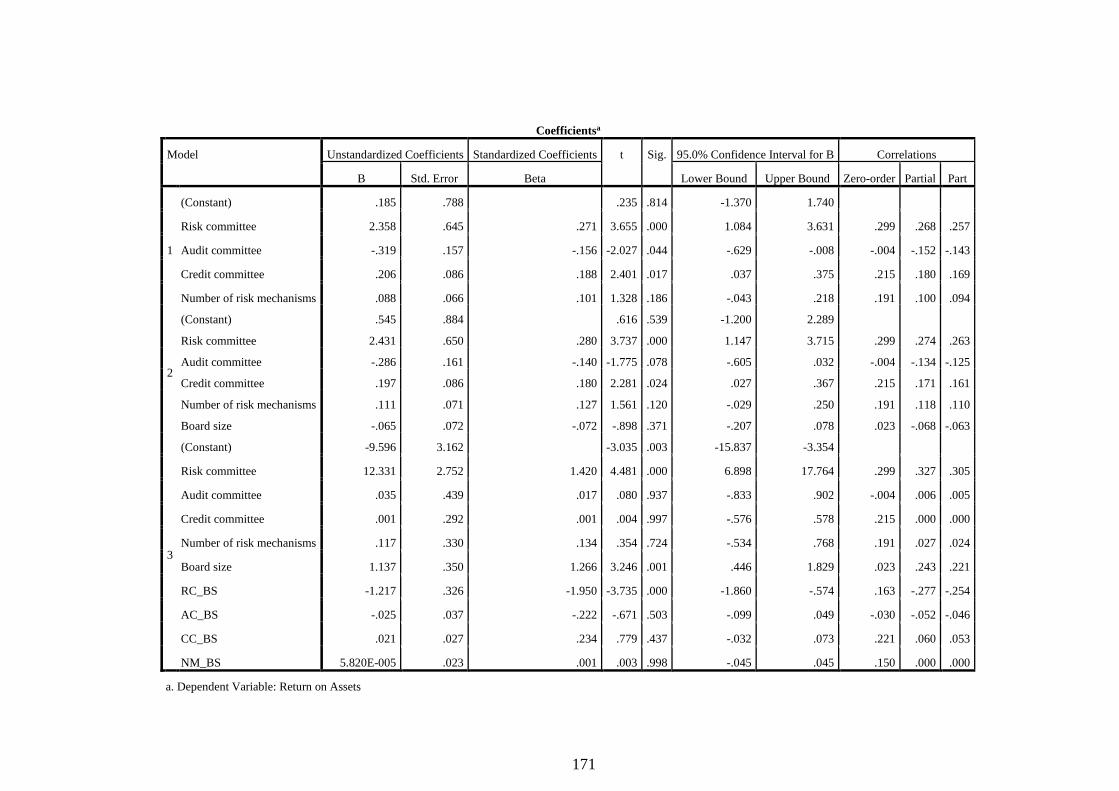
171
Coefficientsa
Model Unstandardized Coefficients Standardized Coefficients t Sig. 95.0% Confidence Interval for B Correlations
B Std. Error Beta Lower Bound Upper Bound Zero-order Partial Part
1
(Constant) .185 .788 .235 .814 -1.370 1.740
Risk committee 2.358 .645 .271 3.655 .000 1.084 3.631 .299 .268 .257
Audit committee -.319 .157 -.156 -2.027 .044 -.629 -.008 -.004 -.152 -.143
Credit committee .206 .086 .188 2.401 .017 .037 .375 .215 .180 .169
Number of risk mechanisms .088 .066 .101 1.328 .186 -.043 .218 .191 .100 .094
2
(Constant) .545 .884 .616 .539 -1.200 2.289
Risk committee 2.431 .650 .280 3.737 .000 1.147 3.715 .299 .274 .263
Audit committee -.286 .161 -.140 -1.775 .078 -.605 .032 -.004 -.134 -.125
Credit committee .197 .086 .180 2.281 .024 .027 .367 .215 .171 .161
Number of risk mechanisms .111 .071 .127 1.561 .120 -.029 .250 .191 .118 .110
Board size -.065 .072 -.072 -.898 .371 -.207 .078 .023 -.068 -.063
3
(Constant) -9.596 3.162 -3.035 .003 -15.837 -3.354
Risk committee 12.331 2.752 1.420 4.481 .000 6.898 17.764 .299 .327 .305
Audit committee .035 .439 .017 .080 .937 -.833 .902 -.004 .006 .005
Credit committee .001 .292 .001 .004 .997 -.576 .578 .215 .000 .000
Number of risk mechanisms .117 .330 .134 .354 .724 -.534 .768 .191 .027 .024
Board size 1.137 .350 1.266 3.246 .001 .446 1.829 .023 .243 .221
RC_BS -1.217 .326 -1.950 -3.735 .000 -1.860 -.574 .163 -.277 -.254
AC_BS -.025 .037 -.222 -.671 .503 -.099 .049 -.030 -.052 -.046
CC_BS .021 .027 .234 .779 .437 -.032 .073 .221 .060 .053
NM_BS 5.820E-005 .023 .001 .003 .998 -.045 .045 .150 .000 .000
a. Dependent Variable: Return on Assets

172
Appendix 4: NACOSTI Approvals
Letter of Introduction

173
Permit