Canada Research STEP Energy Services Ltd. - Raymond ...
48
Canada Research Published by Raymond James Ltd. Please read domestic and foreign disclosure/risk information beginning on page 43 and Analyst Certification on page 44. Raymond James Ltd. | 2100 – 925 West Georgia Street | Vancouver BC Canada V6C 3L2 STEP Energy Services Ltd. June 25, 2018 | 5:41 am EDT STEP-TSX Company Report - Initiation of Coverage Andrew Bradford CFA | 403.509.0503 | [email protected] Michael Shaw CFA (Associate) | 403.509.0534 | [email protected] Oil & Gas Energy Services | Pressure Pumpers Serving Top-tier Economic Performance: S.T.E.P. Recommendation By almost every objective measure, STEP quantifiably screens as a top-tier operator in each basin in which it operates. In addition, it also screens as an extraordinarily value-priced investment, both on an absolute basis and relative to its Canadian and US-based peer groups. Accordingly, we are very comfortable in recommending STEP Energy Services to energy investors with a Strong Buy rating. Our target price is $24.00. Analysis One of STEP’s key differentiating features is its best-in-class margin generation and unit economics. This is true of both its Canadian and US fracturing businesses as well as its coiled tubing service line. A second differentiating feature is the fit of STEP’s coiled tubing business within its broader service offering in Canada. STEP was conceived as a coiled tubing provider before entering the fracturing business. As such, coiled tubing is operated as a distinct service line with dedicated marketing, as opposed to an ancillary service, secondary to fracturing. The result of these combined factors are materially wider coiled tubing margins plus the potential for some measure of marketing advantage for its fracturing services. STEP has demonstrated adaptability to changing customer spending patterns. STEP continued to generate top-tier efficiencies and margins in 4Q17, even when its core customers cut their fracturing operations materially. We expect STEP will need to continue demonstrating this adaptability into 2H18 as its core 2017 customers have less ambitious capital plans for 2018. Canadian E&Ps have been underspending given our estimates of their run-rate cash flows. This is somewhat understandable given the regulatory issues, transportation constrains, and that budgets were set in a lower price environment during 4Q17. We suspect several E&Ps will increase budgets in the coming months. Valuation If STEP were to be priced at parity with its Canadian-listed peer group in terms market value per unit horsepower, EBITDA multiples, or ‘Free EBITDA’ multiples, its share price would be between $13.50 and $15.00, or somewhere between 30% and 45% higher than today. However, we recognize the market is applying a substantial liquidity discount to STEP’s shares (approximately 20% to 25%) owing to some combination of its low public float, low daily trading volumes, and a perceived ‘overhang’ from the combined 61% control blocks held in ARC Financial’s funds. We target STEP at a 20% discount to our typical 7.0x 2019E EBITDA baseline target, yielding our $24.00 target price. EBITDA 1Q 2Q 3Q 4Q Full Revenue Cash (mln) Mar Jun Sep Dec Year (mln) Flow (mln) 2017A C$21 C$16 C$50 C$36 C$124 C$553 C$114 2018E 42A 29 76 71 218 957 164 2019E 76 50 78 76 280 1,172 217 Source: Raymond James Ltd., Thomson One Strong Buy 1 C$24.00 target price Current Price ( Jun-19-18 ) C$10.36 Total Re turn to Target 132% 52-Week Range C$15.93 - C$7.77 Suitability High Risk/Growth Market Data Market Capitalization (mln) C$682 Current Net Debt (m ln) C$226 Enterprise Value (mil.) C$908 Shares Outstanding (mln, f.d.) 79.3 10 Day Avg Daily Volume (000s) 106 Dividend/Yield C$0.00/0.0% Key Financial Metrics 2017A 2018E 2019E EV/EBITDA 4.6x 3.7x 3.1x P/E 13.2x 7.5x 6.1x EPS C$0.78 C$1.38 C$1.68 Capex (mln) C$95 C$424 C$100 BVPS C$7.14 C$8.93 C$11.02 Dividend (mln) C$0 C$0 C$0 Debt/EBITDA 0.1x 1.3x 0.6x ROE 17.3% 20.7% 20.5% Company Description STEP is a North American fracturing business and operates coiled tubing rigs in Canada and the US.
-
Upload
khangminh22 -
Category
Documents
-
view
3 -
download
0
Transcript of Canada Research STEP Energy Services Ltd. - Raymond ...

Canada Research Published by Raymond James Ltd.
Please read domestic and foreign disclosure/risk information beginning on page 43 and Analyst Certification on page 44. Raymond James Ltd. | 2100 – 925 West Georgia Street | Vancouver BC Canada V6C 3L2
STEP Energy Services Ltd. June 25, 2018 | 5:41 am EDT
STEP-TSX Company Report - Initiation of Coverage
Andrew Bradford CFA | 403.509.0503 | [email protected]
Michael Shaw CFA (Associate) | 403.509.0534 | [email protected]
Oil & Gas Energy Services | Pressure Pumpers
Serving Top-tier Economic Performance: S.T.E.P.
Recommendation By almost every objective measure, STEP quantifiably screens as a top-tier operator in each basin in which it operates. In addition, it also screens as an extraordinarily
value-priced investment, both on an absolute basis and relative to its Canadian and
US-based peer groups. Accordingly, we are very comfortable in recommending STEP
Energy Services to energy investors with a Strong Buy rating. Our target price is $24.00.
Analysis One of STEP’s key differentiating features is its best-in-class margin generation and
unit economics. This is true of both its Canadian and US fracturing businesses as
well as its coiled tubing service line.
A second differentiating feature is the fit of STEP’s coiled tubing business within its broader service offering in Canada. STEP was conceived as a coiled tubing provider
before entering the fracturing business. As such, coiled tubing is operated as a distinct service line with dedicated marketing, as opposed to an ancillary service,
secondary to fracturing. The result of these combined factors are materially wider
coiled tubing margins plus the potential for some measure of marketing advantage
for its fracturing services.
STEP has demonstrated adaptability to changing customer spending patterns. STEP
continued to generate top-tier efficiencies and margins in 4Q17, even when its core customers cut their fracturing operations materially. We expect STEP will need to
continue demonstrating this adaptability into 2H18 as its core 2017 customers have
less ambitious capital plans for 2018.
Canadian E&Ps have been underspending given our estimates of their run-rate cash flows. This is somewhat understandable given the regulatory issues, transportation
constrains, and that budgets were set in a lower price environment during 4Q17. We suspect several E&Ps will increase budgets in the coming months.
Valuation If STEP were to be priced at parity with its Canadian-listed peer group in terms
market value per unit horsepower, EBITDA multiples , or ‘Free EBITDA’ multiples, its
share price would be between $13.50 and $15.00, or somewhere between 30% and
45% higher than today. However, we recognize the market is applying a s ubstantial liquidity discount to STEP’s shares (approximately 20% to 25%) owing to some
combination of its low public float, low daily trading volumes, and a perceived
‘overhang’ from the combined 61% control blocks held in ARC Financial’s funds.
We target STEP at a 20% discount to our typical 7.0x 2019E EBITDA baseline target ,
yielding our $24.00 target price.
EBITDA 1Q 2Q 3Q 4Q Full Revenue Cash (mln) Mar Jun Sep Dec Year (mln) Flow (mln)
2017A C$21 C$16 C$50 C$36 C$124 C$553 C$114
2018E 42A 29 76 71 218 957 164
2019E 76 50 78 76 280 1,172 217
Source: Raymond James Ltd., Thomson One
Strong Buy 1 C$24.00 target price
Current Price ( Jun-19-18 ) C$10.36
Total Return to Target 132% 52-Week Range C$15.93 - C$7.77 Suitability High Risk/Growth
Market Data
Market Capitalization (mln) C$682 Current Net Debt (mln) C$226 Enterprise Value (mil.) C$908 Shares Outstanding (mln, f.d.) 79.3
10 Day Avg Daily Volume (000s) 106 Dividend/Yield C$0.00/0.0%
Key Financial Metrics 2017A 2018E 2019E
EV/EBITDA 4.6x 3.7x 3.1x
P/E
13.2x 7.5x 6.1x
EPS
C$0.78 C$1.38 C$1.68
Capex (mln)
C$95 C$424 C$100
BVPS
C$7.14 C$8.93 C$11.02
Dividend (mln)
C$0 C$0 C$0
Debt/EBITDA
0.1x 1.3x 0.6x
ROE
17.3% 20.7% 20.5%
Company Description STEP is a North American fracturing business and operates coiled tubing rigs in Canada and the US.

Canada Research | Page 2 of 48 STEP Energy Services Ltd.
Raymond James Ltd. | 2100 – 925 West Georgia Street | Vancouver BC Canada V6C 3L2
Table of Contents
Investment Overview & Thesis ..................................................................................................................... 3
Company Overview ...................................................................................................................................... 5
Coiled Tubing in Canada and STEP’s Competitive Positioning ....................................................................... 7
The Canadian Fracturing Market and STEP’s Competitive Positioning .......................................................... 15
The Tucker Acquisition................................................................................................................................. 26
Valuation & Recommendation..................................................................................................................... 30
Appendix A: Financial Statements ............................................................................................................... 36
Appendix B: Canadian Oilfield Services Forecasts and Assumptions ............................................................. 38
Appendix C: Canadian Oilfield Services Comparables ................................................................................... 39
Appendix D: Management & Board of Directors ........................................................................................... 40
Risks ............................................................................................................................................................ 41

STEP Energy Services Ltd. Canada Research | Page 3 of 48
Raymond James Ltd. | 2100 – 925 West Georgia Street | Vancouver BC Canada V6C 3L2
Investment Overview & Thesis
STEP is a highly suitable investment for energy investors with tolerances for lower trading
liquidity, though we expect liquidity will improve over time. Based on 4 separate peer group analyses, we estimate that if STEP were to trade on-par with its Canadian and/or US peers it
would be priced at between $13.50 and $15.00 today. We chalk-up the difference between this
range and today’s $10.36 share price to the combination of a liquidity discount and market mispricing.
While we target STEP’s direct competitors in the 7.0x to 7.5x EBITDA range, we think it’s reasonable to expect STEP’s liquidity discount will persist over our 6 to 12 -month target horizon.
As such, we arrive at our $24.00 price target by applying a 20% liquidity discount to our typical
7.0x 2019E EBITDA baseline target. (See Exhibit 28 for an historical view of Canadian fracturing
EBITDA multiple ranges).
STEP is Quantifiably a ‘Top-Tier’ Operator of Fracturing Equipment.
STEP, and its acquired company Tucker, generate more EBITDA from their fracturing equipment
than any of their respective Canadian or US comparable companies. That is, both STEP and Tucker
are demonstrably ‘best in class’ in terms of unit economics. We measure this as EBITDA per unit of both ‘fleet’ horsepower and activated or ‘crewed’ horsepower – though we prefer fleet
horsepower as it is a more consistent/reliable figure. (See “The Canadian Fracturing Market”
section of this report for a comparative analysis of STEP ’s unit economics.)
By Far, STEP Produces Best in Class Performance and Margins from its Canadian Coiled Tubing
Business.
STEP’s Canadian coiled tubing fleet is certainly the most modern, but is also the most
concentrated high-spec fleet available. This has the effect of concentrating STEP’s coiled-tubing business on multi-well leases, which lends to higher average utilization, efficiency, and margins.
Coiled tubing is STEP’s traditional core business, and as such, it has a dedicated marketing
infrastructure for this service line that other fracturing companies have not replicated. We
estimate STEP extracts margins that are as much as 3x greater than comparatively-sized coil fleets.
STEP’s High EBITDA Yield Should have Positive Implications for its Trading Multiple.
Not all EBITDA dollars are created equal. We estimate investors receive 18% more ‘Free EBITDA’
per dollar of reported EBITDA from STEP than from comparable companies. To see this, consider
that STEP’s maintenance costs per horsepower are no different than for any other fracturing company – we estimate that each unit of working horsepower will require $100 to $1 25 in direct
plus accrued maintenance annually. But because STEP generates more EBITDA per unit of
horsepower and maintenance costs are the same, investors receive more ‘Free EBITDA’ per dollar of EBITDA from STEP than from comparable fracturing companies – 18% more by our arithmetic.
Which implies STEP’s EBITDA should be ‘worth’ 18% more and all else equal, should trade at a
higher multiple to reflect this higher yield. We take a pragmatic view to target pricing, so we
don’t include this premium in our target. But we expect investors will realize on this ‘Free EBITDA’ advantage through higher accrued free cash over time. Not incidentally, we estimate STEP
investors today are enjoying a 13% free cash flow yield. (See the Valuation & Recommendation
section for a discussion of ‘Free EBITDA’.)
The Illiquidity in STEP’s Shares Detracts from its Market Value.
STEP is just over 60% owned by two of ARC Financial’s private equity funds; management owns
another 1%. So while STEP has a $682 mln market cap its float cap is only $266 mln – and this is
after giving effect to its recent $56 mln equity issue. As a partial consequence, traditional
institutional involvement in STEP is lower than for comparable companies – STEP’s top 5 institutional investors own 8% of the company versus 21% and 23% for its comparative group.
This could be a contributing factor in its low rate of float turnover – on average 1% of STEP’s
floating shares trade in a day versus 1.6% for comparable companies. The ultimate consequence is that STEP’s daily volume is about $2.9 mln compared to $16.5 mln and $6.6 mln for its direct
Canadian comps.
Rating: Strong Buy
Target: $24.00
Definition: ‘Free EBITDA’:
EBITDA less both incurred and accrued maintenance costs.
Canada Research | Page 4 of 48 STEP Energy Services Ltd.
Raymond James Ltd. | 2100 – 925 West Georgia Street | Vancouver BC Canada V6C 3L2
Canadian Fracturing Economics are in the ‘Goldilocks Range’ – Warm Enough to Generate Attractive Yields on Market Values but Not so Hot as to Drive a ‘New-Build Arms Race’.
Based on our estimates, Canadian fracturing assets will generate $ 156 ‘Free EBITDA’ per unit
horsepower on average over the 2018 calendar year - $180 per unit horsepower in STEP’s case.
The fully-loaded cost of new-build equipment is approximately $1,400 per unit horsepower,
implying a 9.0-year ‘Free EBITDA’ payout for the average fracker in Canada or 7.8-years in STEP’s case. Either way, these economics are insufficient to prompt new builds.
But, the equity markets are effectively valuing Canadian fracturing assets at approximately $ 700 per unit horsepower ($496 for STEP) – and in either event far below new-build costs. At this level,
STEP’s equity investors can enjoy a 2.8-year ‘Free EBITDA’ payback on equipment or a 36% ‘Free
EBITDA’ yield. In short, the economics are attractive relative to market values, but not so
attractive to result in an over-built market.
STEP has Shown that it Can Adapt to Significant Changes in Customer Demands Without
Materially Negative Impacts on its Unit Economics or Margins.
Several of STEP’s larger traditional customers cut their capital spending and fracturing programs significantly in 4Q17. This included Canadian Natural Resources and ARC Resources. Together
these two producers were 38% of STEP’s 3Q17 fracturing business, but th is dropped to just 2% in
4Q17. STEP responded by partially backfilling with increased penetration into its other existing
customers and by adding several new customers to its mix. While there was a detectable impact on STEP’s unit economics, it nonetheless preserved its top-rank position in unit economics among
its Canadian peer group despite losing more sequential revenue than the same group. [See
“Some Specifics on STEP’s Customer Concentration and Penetration” section for a discussion of
STEP’s customer base.)
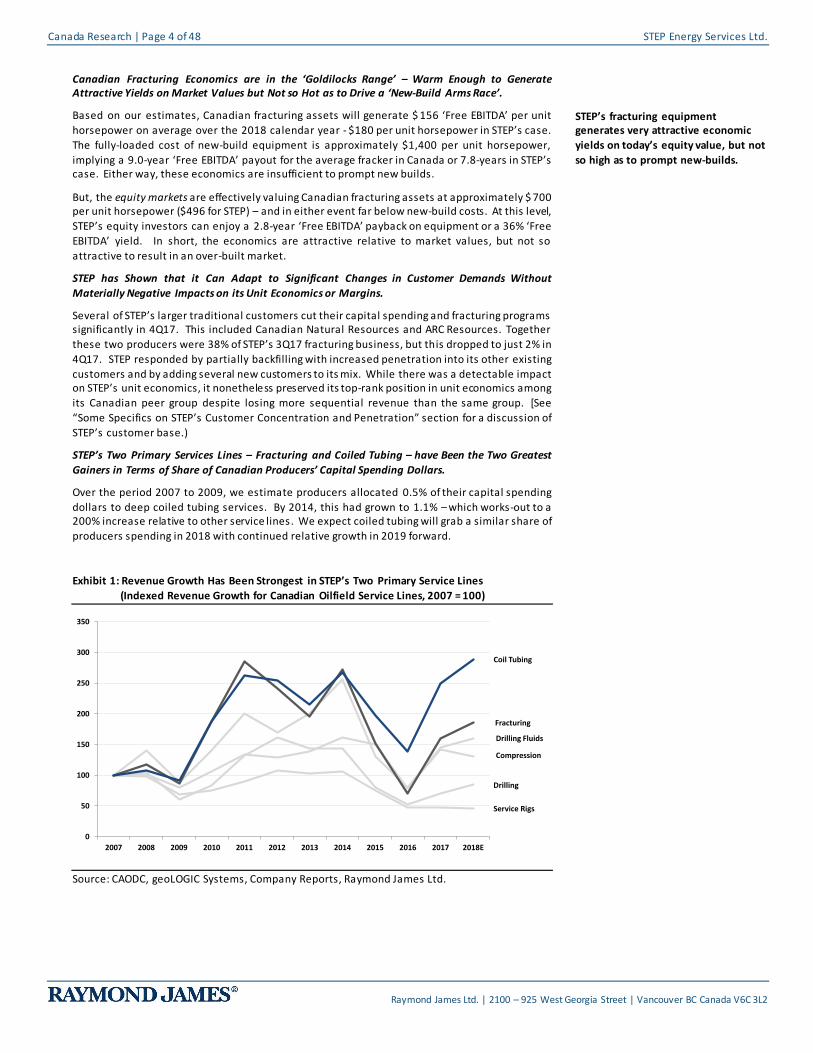
STEP’s Two Primary Services Lines – Fracturing and Coiled Tubing – have Been the Two Greatest
Gainers in Terms of Share of Canadian Producers’ Capital Spending Dollars.
Over the period 2007 to 2009, we estimate producers allocated 0.5% of their capital spending
dollars to deep coiled tubing services. By 2014, this had grown to 1.1% – which works-out to a 200% increase relative to other service lines. We expect coiled tubing will grab a similar share of
producers spending in 2018 with continued relative growth in 2019 forward.
Exhibit 1: Revenue Growth Has Been Strongest in STEP’s Two Primary Service Lines
(Indexed Revenue Growth for Canadian Oilfield Service Lines, 2007 = 100)
Source: CAODC, geoLOGIC Systems, Company Reports, Raymond James Ltd.
Drilling
Drilling Fluids
Service Rigs
Compression
Fracturing
Coil Tubing
0
50
100
150
200
250
300
350
2007 2008 2009 2010 2011 2012 2013 2014 2015 2016 2017 2018E
STEP’s fracturing equipment generates very attractive economic
yields on today’s equity value, but not
so high as to prompt new-builds.

STEP Energy Services Ltd. Canada Research | Page 5 of 48
Raymond James Ltd. | 2100 – 925 West Georgia Street | Vancouver BC Canada V6C 3L2
We Believe $65 WTI Crude is a Reasonable Basis from which to Forecast STEP’s Activity, Pricing, and Margins.
US$65 WTI translates to roughly C$78/bbl for Canadian light and C$87/bbl for condensate. At the
same time, we aren’t expecting producers will generate any netbacks on unhedged dry gas
production, so essentially all of the basin’s economics are predicated on crude and liquids
production. (See Exhibit 33 for a comprehensive outline of our macro-level oilfield services forecasts.)
We’re Expecting Crude and Condensate Producers will Move Capital Budgets Higher over the Coming Weeks and Months.
Canadian producers are spending on aggregate 7% less than we would expect given their run-rate cash flow generation over the last three quarters. This is some what understandable given capital
budgets were set in the lower crude price environment in 4Q17. We’ve already noted some
budgets have moved higher, while other producers have simply been spending at higher rates
than their stated budgets would suggest.
Horsepower Demand was Higher Year-Over-Year in 1Q; We Expect it Will be Lower in 2Q and Roughly Flat in 3Q Before it will Flip Back to Year-Over-Year Growth Again in 4Q and Through
2019.
We’re forecasting overall Canadian horsepower demand to be 13% higher in 2018 versus 2017
and 12% higher again in 2019.
We’re Not Expecting Much in Terms of Pricing Increases Through 2018 or 2019 .
Fracturing pricing recovered 35% through the first three quarters of 2017, though it hasn’t moved much since, nor does our modeling suggest we should expect material pricing gains until perhaps
late in 2019 if demand continues to move higher.
Company Overview
Founded in 2011, and backed by ARC Financial, STEP began providing coiled tubing (“CT”) and
nitrogen services in 2012 after acquiring 2 CT units and 5 nitrogen units as part of its acquisition of
Kamber Nitrogen Services. In 2015, STEP made its first move into the fracturing business when it
acquired Gasfrac Energy Services’ 115,000 horsepower through insolvency proceedings and another 165,000 horsepower from Sanjel Energy Services in 2016 under similar circumstances.
STEP completed its $100 mln IPO in May 2017 at $10 per share.
In April 2018, STEP entered the US fracturing market via the acquisition of Tucker Energy Services
Holdings. STEP acquired Tucker’s 3 fracturing sprea ds with 142,500 horsepower and acquired the
delivery rights of a fourth spread of 50,000 horsepower, delivered late in May 2018. Tucker also operates 2 coiled tubing units and 15 wireline units.
STEP’s fleet today consists of 13 coiled tubing spreads and 297,500 fracturing horsepower (10-15 crews) in Canada and 10 coiled tubing spreads and 192,500 horsepower in the US (Texas,
Louisiana, and Oklahoma). STEP also provides nitrogen and fluid pumping services as non-core
operations that support its fracturing business. STEP has plans to expand its Canadian coiled
tubing fleet to 16 spreads, its Canadian fracturing capacity to 305,000 horsepower and its US coiled tubing fleet to 13 by the end of 2018.
STEP’s two core business lines are fracturing and coiled tubing, each of which is outlined in brief below.
Fracturing: 65% of 2018E and 67% of 2019E EBITDA
With 297,500 hp in Canada, STEP’s fleet ranks as the third largest in Canada (see Exhibit 2). STEP
currently has roughly 225,000 hp crewed and marketed. STEP plans to activate equipment through 2018 to reach 305,000 horsepower.
STEPS’s Major Service Lines
(in order of 2019E EBITDA contribution)
1. Canadian Fracturing 36%
2. US Fracturing 31%
3. US Coiled Tubing 17%
4. Canadian Coiled Tubing 15% 5. US Wireline 1%

Canada Research | Page 6 of 48 STEP Energy Services Ltd.
Raymond James Ltd. | 2100 – 925 West Georgia Street | Vancouver BC Canada V6C 3L2
Exhibit 2: Fracturing Market Shares by Total Fleet Horsepower
Source: Company Reports, Raymond James Ltd.
Coiled Tubing: 34% of 2018E and 32% of 2019E EBITDA
By revenue, STEP is the largest deep coil provider in Canada. STEP has 13 deep CT spreads in
Canada and another 10 in the US (including 2 acquired with Tucker). By the end of 2018, STEP plans to have grown its Canadian CT fleet to 16 and its US fleet to 13.
Exhibit 3: Canadian Deep Coiled Tubing Market Share
Notes: We define ‘Deep Coiled Tubing’ as units with depth capabilities greater than 15,000 feet
using 2-3/8” coil and at least 100,000-lb injector capacities. “Other” providers are based on RJL
estimates.
Source: Company Reports, Raymond James Ltd.
Wireline: 1% of 2018E and 2019E EBITDA
STEP provides wireline services in Oklahoma and Texas through the Tucker acquisiti on. Tucker’s
assets included 10 open hole and 5 cased hole wireline units.
ESN30%
CFW13%
TCW10%
Others10%
STEP37%
$340 mlnRevenue
(2017)
We don’t expect significant changes in coiled tubing market share over 2018,
but STEP’s additions should increase
its market share in 2019.

STEP Energy Services Ltd. Canada Research | Page 7 of 48
Raymond James Ltd. | 2100 – 925 West Georgia Street | Vancouver BC Canada V6C 3L2
Coiled Tubing in Canada and STEP’s Competitive Positioning
Despite its evolution over recent years into a key service line, Canada’s coiled tubing (CT) market
isn’t well-defined for investors. In this section we characterize Canada’s CT market and describe STEP’s positioning within it.
Key takeaways from this section include:
STEP produces, by far, the best performance and EBITDA margins of any coiled tubing operator in Western Canada.
We estimate the relevant coiled tubing market in Canada at roughly $405 mln in 2018
STEP has the largest share of this market at roughly 37%.
Coiled Tubing has been grabbing an increasing share of producers’ capital spending, similar to fracturing.
Similar to drilling rigs, ‘specification creep’ means that newer, larger units have been displacing lower-capacity units. As a relatively new entrant into the CT market, STEP’s
margins aren’t encumbered with a fleet of lower-spec equipment.
While there are Nominally about 375 CT Units in Canada, we Believe the Functional Market is Fewer than 75
Those with a long history in oilfield services investing will recall a time when coiled tubing was ‘all the rage’. Well, maybe not quite all the rage, but many public market companies featured coiled
tubing prominently among their service lines. Similar to other oilfield service li nes, the
specification demands on CT have increased, i.e. more power, smaller footprint, and deeper capacities. As a result, the vast majority of the 375 units in Canada are probably not working
anymore and may never work again.
The bulk of Canadian completions work has migrated to the deeper plays (e.g. Deep Basin,
Duvernay, Montney), which has had a wide range of impacts on oilfield services companies – from
drilling rig specs to fracturing-intensity, and unsurprisingly, to coiled tubing capacities. In
retrospect, prior to the onset of the downturn in 2014, we had been openly suggesting that the reach of coiled tubing was likely a constraining factor on well depths in Cana da.
This became less of an issue when activity plummeted in 2015 and 2016, but the drive to execute on longer horizontal wells is still exerting pressure on CT providers to ‘up their game’ with higher
capacities and greater capabilities.
By contrast, the mass-produced shallow gas and oil wells in the southeast portions of the basin
have been unable to compete economically, and as such, the utilization of the OFS infrastructure
to service them has been in steep decline toward near-extinction. For this reason, we suggest the previous definitions and characterizations of the CT market are things of the past and the focus
for investable coiled tubing operators must be on those with the capabilities to service the deeper
formations of the basin.
This dynamic left traditional shallow coiled service providers with a choice: either invest in higher
capacity units or exit the market (sometimes by choice or, less fortunately, through bankruptcy).
Notable providers who have effectively exited the CT market by ch oice are Precision Drilling, Baker Hughes (BJ Services), Halliburton, and Schlumberger. We believe Baker Hughes , HAL, and
SLB’s decisions not to invest in Canadian CT capacity is emblematic of their philosophies towards
the Canadian market as a whole – that is, Canada is a highly nuanced, seasonal, and small market
(in a global context). The ‘Big Three’ have tended to invest less here, ceding market share to domestic providers. We have seen similar dynamics play-out in their fracturing and drilling fluids
product lines.
As a result of the shift toward higher specified CT units, what was once a low-entry-barrier service
line with dozens of competing operators, collectively marketing hundreds of CT units, is now a
higher-entry-barrier service line in which the top four operators run about 70% of the relevant capacity – and control a higher percentage of the ‘west of 5’ and ‘west of 6’ markets. The
differences between the shallow and deep CT market is most easily visualized by contrasting the
equipment, which we do in Exhibit 4.

Canada Research | Page 8 of 48 STEP Energy Services Ltd.
Raymond James Ltd. | 2100 – 925 West Georgia Street | Vancouver BC Canada V6C 3L2
Exhibit 4: Shallow vs. Deep Coiled Tubing Capacity
Source: Courtesy of National Oilwell Varco.
CT Service Providers are Investing in Equipment with Ever-Greater Capabilities
While the likes of STEP have edged-out or completely displaced traditional CT service providers, it
hasn’t been a free ride. Today’s CT providers have had to invest in their deeper capacity fleets,
changing their configurations and upping their capabilities along the way. Depending on specifications and layout, a deep capacity CT unit costs between $6 mln and $8 mln.
STEP’s new Ultra Capacity CT units likely cost closer to $ 8 mln, though they feature greatly enhanced capabilities.
Why ‘Upgrades’ Aren’t a Substitute for ‘New’ in Coiled Tubing
Those familiar with the US drilling market have grown accustomed to contractors ‘upgrading’ their equipment – sometimes with walking systems, higher-pressure fluid systems, or additional
pumps, etc.
Upgrading is less of an option for CT. To see why, consider the primary factors that effectively
limit a unit’s capacity. We show a conventional CT layout in Exhibit 5. In the text that follows, we
describe how each major component constrains the depth capacity of that unit, such that
changing one component without changing the others usually won’t enhance depth capacity.

STEP Energy Services Ltd. Canada Research | Page 9 of 48
Raymond James Ltd. | 2100 – 925 West Georgia Street | Vancouver BC Canada V6C 3L2
Exhibit 5: A Conventional Coiled Tubing Layout
Source: Raymond James Ltd.
Carrier or Trailer. In conventional CT units, the carrier holds the reel and the injector.
These are heavy items. In fact, CT carriers are usually the heaviest regular loads in the
oilpatch. Ignoring the weight of the spool, the injector, and the trailer itself, the weight
of the coil alone can reach 100,000 lb. Depending on wall thickness, 6,300 meters
(20,700 feet) of standard 2 3/8” coil weighs around 80,000 lb. A trailer designed to carry
a specific load-weight needs to be changed entirely to accommodate lengthier coil.
Reel and Spool. The combination of width, spool diameter, and spool core diameter
jointly determine the amount of coil any reel can hold. But there are other less obvious
limitations to upgrading the reel. Bridge clearance is one. Many bridges in Western
Canada have 17 ½ foot clearances; some are only 15 ½ feet. A large reel from NOV is
15-feet 10-inches, before adding the trailer’s ground clearance. To compensate, some
trailers are slung low to provide maximum spool height, but then these trailers are more
difficult to pull across rough lease roads.
Coiled Tubing. Coiled tubing is described by its outer diameter (“OD”), its wall
thickness, whether it’s straight or tapered (the wall thickness increases from the
beginning to the end), and its composition (different types of steel for corrosive sour gas
applications for instance). In addition, specialized coil may have embedded electrical
lines for logging or perforating. By far, the most popular tubing diameter in Canada is 2
3/8” whether it’s used in shallow applications like the Viking or the deepest 6,000+
meter applications in the Duvernay or Montney.
Injector. It’s the injector’s job to push or “snub” the tubing into the wellbore and to
pull it back out. As such, injectors are typically defined by their snubbing and lifting
capacities. A 130,000 lb lift capacity is sufficiently-specified for just about any of the
deepest onshore applications, though some CT providers in Canada are using 160,000 lb
injectors to widen the safety margin. Beyond cost, the operational trade -off of using a
high-spec injector is the load weight vs. the likelihood of needing that margin of safety.
There isn’t a material weight difference between the HR-680 injector with 80,000 lb lift
capacity used on STEP’s conventional CT units and the CSI -130K injector with 130,000 lb
lift capacity. But the load weight difference between the CSI -130K and the CSI-160K
injector is almost a factor of 2 times or about 7 ,300-lb. This higher weight layers-on an
additional design challenge when it comes to distributing that weight on the traile rs,
and has the potential to limit mobility. By far, the most prevalent injector in Canada is
100,000-lb, with only higher capacity reel units using 130,000 lb or 160,000 lb injectors.
1
2
3
4
5

Canada Research | Page 10 of 48 STEP Energy Services Ltd.
Raymond James Ltd. | 2100 – 925 West Georgia Street | Vancouver BC Canada V6C 3L2
Crane. These need to be sufficiently-spec’d to support the full pulling force of the
injector plus the weight of the injector itself along with associated rigging.
Other key components include:
Power Unit. This provides hydraulic power to the injector and to the reel.
Command Center. A command trailer holds an operating station to control the coil, crane or mast, power unit, and fluid pumps.
Stripper. The stripper provides a lubricated seal around the coil ed tubing above the wellhead and blowout preventor stack.
Fluid Pumps. Pumps are used to circulate fluids in the wellbore.
Exhibit 6: Masted Coiled Tubing Unit
Source: Raymond James Ltd.
Well leases are very crowded with equipment, especially during completion operations. To
minimize the footprint on the lease, CT operators began constructing so-called ‘masted’ coiled
tubing units. These units substituted a mast, in Exhibit 6, for the crane of a conventional unit.
This did away with the crane and guy wires to secure the injector in place, freeing-up considerable space. As CT providers constructed more of these masted units, they simultaneously increased
depth capacities. As such, ‘masted’ units became synonymous with ‘deep capacity’ units.
However, this is a functional oversimplification.

STEP Energy Services Ltd. Canada Research | Page 11 of 48
Raymond James Ltd. | 2100 – 925 West Georgia Street | Vancouver BC Canada V6C 3L2
The U-Turn in Masted CT Unit Popularity
There is a discernible trend away from masted CT units in preference of more conventional crane
layouts.
The primary advantage masted CT units have over their conventional trailer-and-crane
counterpart is that a mast consumes less lease space than a crane. Masted CT units also tend to
rig-up and down faster, which made them especially popular in the ‘cookie cutter’ shallow gas plays in eastern Alberta 10 to 15 years ago.
Masted units have since faded in popularity as the shallow gas plays became less economically appealing. Today masted units present new disadvantages vis -à-vis craned units. High pressure
wells, like those found in the Montney, Duvernay, and Deep Basin, require large well control
stacks, which are often too high to ‘fit ’ under the confines of the mast. Another challenging
feature of masted CT units is the requirement for the trailer to back right up to the wellhead. This crowds the area around well and can present risks and other operational challenges.
Beyond the imitations around ground clearance, the speed advantages that masted units offer with faster rig-up and the smaller surface areas they consume are less important on large multi-
well pads. A conventional crane set up on a multi -well pad can access each well head without
having to rig down and move. These pads are, by definition, larger and can more easily accommodate another truck and trailer.
Masted units also present logistical difficulties versus crane units. While adding a mast to the coil and injector trailer reduces the number of vehicles on a lease, it also adds weight to an already
heavy trailer.
The limitations of the masted units in addition to the weight constraints have resulted in a
resurgence in the popularity of craned CT units in Canada, with some providers converting masted
units to cranes.
Expanding Applications for Coiled Tubing
Coiled tubing units are remarkably handy tools and the scope of their uses has been expanding
since their introduction in the 1970s. While coil has applications to all phases in well construction,
completion, and production, coil has also become important to the fracturing process. Completions activities such as perforating, setting plugs, packers & retainers, mil ling, setting
completion tools, and stimulation and fracturing through coil have become the prevalent
applications.
Exhibit 7: Typical Coil Applications
Source: Raymond James Ltd.
Many of the completion and intervention work performed by coiled tubing can alternatively be
completed with a service rig. But despite the increasing complexity of completions work on modern horizontal wells , demand for service rigs has declined while coil has become increasingly
popular. Between 2007 and 2017, we estimate services rigs’ share of producers capital spending
declined by 50% while coiled tubing’s share grew by 200%.
Well Completion Remedial Work Tool Conveyance
Cementing Cement Squeeze Memory Probes
Perforating Acid Squeeze Logging
Fracturing thru Coil Chemical Wash Cameras
Annular Fracturing Cleanouts Fishing Tools
Nitrogen Injection Setting Velocity Tubes
CO2 Injection
Setting Packers
Setting Bridge Plugs
Milling-Out Packers and Plugs
Well Deepening

Canada Research | Page 12 of 48 STEP Energy Services Ltd.
Raymond James Ltd. | 2100 – 925 West Georgia Street | Vancouver BC Canada V6C 3L2
Coiled Tubing Advantages vis-à-vis Service Rigs
CT units are quicker at running tools into and out of the wellbore. The continuous pipe of a CT unit means that there is no ‘screwing’ and ‘unscrewing’ pieces of straight pipe together.
CT units are safer when working on live wells. The use of one continuous pipe means no making and breaking joints, so they maintain a closed system.
STEP’s Competitive Position Among Deep Coil Providers
STEP’s coiled tubing fleet is well-specified versus the largest deep coil providers in Canada. Coiled tubing units are generally classified by depth capacity at a given outer diameter and injector size.
We have benchmarked STEP’s CT fleet versus the other major providers of coil in Exhibit 8 and 9.
Across the deep CT fleet in Canada, the most prevalent specification /configuration is a reel
capacity between 20,000 – 25,000 ft and a 100,000 lb injector in conjunction with 2 3/8” coil .
Coiled tubing rigs with these specifications are well-suited to the deeper Montney and most
Duvernay wells, which have median measured depths of 17,500 ft and 20,000 ft, respectively.
The deepest Duvernay wells , however, are approaching 24,000 ft measured depth, which is
beyond the capabilities of ‘standard’ deep coiled tubing rigs . Thus the drive to even higher reel capacity units, such as Essential’s Generation IV, Trican’s largest capacity unit, and STEP’s ‘Ultra-
Capacity’ CT unit.
It is worth noting that for operational reasons, CT units are never pushed to the limits of their
nameplate depth capacities as tubing that becomes ‘stuck’ in a well can have enormous financial
consequences.
Exhibit 8: STEP’s Deep Coil Fleet and Peer Fleets
Source: Company Reports, Raymond James Ltd.
STEP’s CT fleet consists of 3 conventional CT units, 4 masted/large conventional CT units and 6
“Ultra Capacity” spreads. Both STEP’s masted and Ultra Capacity units are equipped with 130,000
lb injectors while the conventional units have 100,000 lb injectors. The ‘Ultra -Capacity’ unit has one of the largest capacity reels in the Canadian basin, capable of holding 32,500 ft of 2 3/8” coil,
surpassed only by TCW’s 32,800 ft capacity unit. STEP’s conventional and masted CT units have 2
3/8” reel capacities around 20,000-ft.
The 130,000 lb injector on the masted units are larger than the more common 100,000 lb injectors
on CT units of similar reel capacities from other fracking companies and same as the 130,000 lb
injectors used by ESN. The 100,000 lb injectors are typically sufficient for most deep basin operations in Canada but the 130,000 lb injector does provide STEP with an extra zone of comfort
and allows the units to pull faster at a given weight.
Suitable for Deepest Wells:
Montney Duvernay
Conventional 3 100 19,000
Masted/Large Conventional 4 130 21,600
Ultra 6 130 32,500
Gen I 5 70 8,900
Gen II 14 100 14,800
Gen III 8 130 21,300
Gen IV 4 130 - 160 26,000
4 100 20,700
4 100 25,000
1 100 25,590
2 100-130 32,800
2 80 18,000
3 100 18,000
2 100 19,700
1 100 23,600
2-3/8" Coil
Capacity (ft)
Step
Essential
Trican
Calfrac
OperatorCT Unit
Description
Number
of Units
Injector Pulling
Capacity (lbs)

STEP Energy Services Ltd. Canada Research | Page 13 of 48
Raymond James Ltd. | 2100 – 925 West Georgia Street | Vancouver BC Canada V6C 3L2
Exhibit 9: Canadian Coiled Tubing Fleet Specifications
Source: Company Reports, Raymond James Ltd.
2 7/8" Coil Capacity
8,000 (ft) 10,000 12,000 14,000 16,000 18,000 20,000 22,000 24,000 26,000
2 3/8" Coil Capacity
8,000 (ft) 10,000 12,000 14,000 16,000 18,000 20,000 22,000 24,000 26,000 28,000 30,000 32,000 34,000
2" Coil Capacity
8,000 (ft) 10,000 12,000 14,000 16,000 18,000 20,000 22,000 24,000 26,000 28,000 30,000 32,000 34,000 36,000 38,000 40,000 42,000 44,000 46,000
Typical Montney Wells 12,500 ft - 16,750 ft
The capacity of CT reels at larger diamater tubing limts some units from accessing deeper wells. At a 2 3/8" coil, only the largest units from ESN, TCW, and STEP have the reel capacity to service the deepest Duvernay wells (23,000 ft).
Units are also categorized by injector size. Step's Masted and Ultra-Capacity units are equpied with 130k lbs injectors. ESN's Gen IV are equpied with 130 or 160k lbs injectors and Gen II with 130k. TCW and CFW use a 100K lbs injectors. A larger injector can pull a given weight at a faster rate which, all else equal, would result in less time per job.
Considering both reel capaicity and injector size, Step's Ultra-Capacity units are among the highest spec units in the basin and Step's Masted are in-line with its peers.
TCW CFW
TCW
ESN Gen II
STEP Masted
ESN Gen IVTCW
STEP Ultra
ESN Gen III
ESN Gen II
STEP Masted
ESN Gen IV
STEP Ultra
ESN Gen III
ESN Gen II
STEP Masted
ESN Gen IVTCW
STEP Ultra
ESN Gen III
CFW TCW
TCWTCW
TCW
Typical Duvernay Wells 17,500 ft - 20,000 ft
Longest Duvernay & Montney Wells22,000 - 24,000 ft
Typical Montney Wells 12,500 ft - 16,000 ft
Typical Duvernay Wells 17,500 ft - 20,000 ft
Longest Duvernay & Montney Wells22,000 ft - 24,000 ft

Canada Research | Page 14 of 48 STEP Energy Services Ltd.
Raymond James Ltd. | 2100 – 925 West Georgia Street | Vancouver BC Canada V6C 3L2
STEP’s Coiled Tubing Service Line as a Competitive Advantage/Differentiator
In terms of how companies market their services, pressure pumpers understandably lead with their largest revenue generator first, which is almost always fracturing. By contrast, STEP was
conceived as a coiled tubing provider, and therefore began with a dedicated and well -supported
coiled tubing marketing group. While it might seem trivial, we think this has been an important
differentiator for STEP and has likely helped to advance its fracturing services in a highly competitive market.
A Brief Review of the Interplay between Fracturing and Coiled Tubing Services
Coiled tubing is often provided as an adjunct to fracturing services in completion operations. Most fracturing companies have historically employed their own coiled tubing fleets, and as
producers spec’d coiled tubing equipment for the fracturing treatment, fracturing companies
would invariably supply their own. In busier times, when fracturing p roviders reached the limits
of their respective coil fleets, it would begin to subcontract third-party coiled tubing providers. This was the challenge for Technicoil – acquired by Essential Energy Services in 2011 (and not
incidentally, originally financed by ARC Financial). Despite its competitive high-spec fleet (for the
time), it became the de facto swing provider: its equipment would only become highly utilized
once the fracturing companies exhausted their own fleets. This was particularly true for t he relationship between Calfrac and Technicoil. Investors in Technicoil were afforded little downside
protection as Calfrac protected its own utilization during softer periods.
Fast-forward to today. Well designs are considerably deeper with horizontal ru ns often beyond
8,000 ft. Most investors appreciate these more technical wells have required everything from
higher-spec drilling rigs and more technical drilling fluids to novel downhole tools and exponentially higher sand-loadings. But completing these wells also requires coiled tubing
injectors capable of hoisting the greater lengths of coil to reach the toes of these deeper wells, all
without sacrificing tubing size and without occupying too much available lease area. Just 10-years
ago, a state-of-the-art, high-spec coil unit would be a fraction today’s capabilities. Today, the state-of-the-art coil units have 160,000 lb injectors and can reach up to 35,000’ with 2 3/8” coil.
Since coiled tubing specifications have become increasingly important for the successful completion of deep horizontal wells, E&P companies have increasingly contracted directly with
the coiled tubing provider, independently of the fracturing provider. Th is corresponds with (a)
STEP gaining coiled tubing market share over the last four years and (b) using its coil services to
cross sell into fracturing, thus similarly gaining fracturing market share.
That is, STEP has parlayed its high-spec coiled tubing into a marketing tool to grab fracturing
market share. Ironic that fracturing used to be the differentiated service used to pull -though coiled tubing services and today high-spec coiled tubing is the differentiated service pulling-
though fracturing services. STEP’s coil has acted as a loss leading product that makes a higher
margin than the service it leads.
STEP’s coiled tubing service line is like
a ‘loss leader’ that not only doesn’t lose – it likely generates higher margins than fracturing.

STEP Energy Services Ltd. Canada Research | Page 15 of 48
Raymond James Ltd. | 2100 – 925 West Georgia Street | Vancouver BC Canada V6C 3L2
The Canadian Fracturing Market and STEP’s Competitive Positioning
Key takeaways from this section include:
Fracturing’s share of producer spending continues to increase, supported by higher pricing
and higher fracking intensity.
STEP’s share of the fracturing market has been growing since entering the market in 2016.
STEP’s EBITDA yield per horsepower consistently ranks at the upper end of its peer group.
Despite leveling-off in certain key plays, such as the Montney, basin wide fracturing intensity
continues to grow as producer capital is drawn to the higher returns found in the most fracturing-intensive plays, including the Montney.
Pricing in Canada is up 51% off of the bottom, but still has 11% to go return to 2014 levels. We expect only small pricing gains in fracturing through 2019.
Importantly, we expect Canadian fracturing economics will remain in a range where existing equipment provides attractive returns for equity holders, but not so attractive as to prompt
wholesale equipment additions.
STEP’s 2017 customer mix presents some challenges for 2018. STEP has demonstrated, and
will have to continue demonstrating, an adaptability to preserve superior margins as its customer mix changes.
Producers are Allocating an Increasing Portion of their Capital Spending Dollars to Fracturing Services
The following considerations point to fracturing taking an increased share of the capita l spending
dollar again in 2018:
Pricing for fracturing services is up more year-over-year than for any other major service line. Fracturing pricing is up 9% entering 2018 over the average of 2017. By comparison, pricing
for drilling services by comparison are up 4% entering 2018 over the 2017 average.
The Montney and Duvernay together consume approximately 75% of all fracturing services in
Western Canada – the Montney is approximately 55% by itself. As such, trends in the Montney and Duvernay de facto represent average trends in the Basin. These are the most
fracturing intensive plays in Western Canada and they continue to attract a growing share of
capital spending in the basin, thus increasing basin wide fracturing intensity.
The combination of increased fracturing intensity and pricing means fracturing revenues are
poised to increase by 14% in 2018 while we expect aggregate producer cash flow to increase by 7%. (See Exhibit 15.)
STEP Generates Best in Class Returns from its Fracturing Equipment
Revenue per Unit Horsepower (“Asset Turnover”) Climbing Steadily Relative to Competitor
Group
Because STEP purchased its fracturing equipment though two bankruptcy sales, and because
115,000 horsepower of that equipment was profoundly underutilized at the best of times, STEP’s fracturing fleet started out less utilized than its industry peers in 2016. This re sulted in lower
revenue per fleet horsepower yields than the competitor group (Exhibit 10).
By 3Q17 the revenue gap was almost completely closed. STEP’s aggressive recommissioning
program had put its revenue generation on an equal footing with its competi tors, generating $401
per unit of fleet horsepower compared to $409 for the peer group average.
STEP continued to perform well against its competitor group in 1Q18, generating $430 in revenue
per unit of fleet horsepower compared to $370 for the peer group average.

Canada Research | Page 16 of 48 STEP Energy Services Ltd.
Raymond James Ltd. | 2100 – 925 West Georgia Street | Vancouver BC Canada V6C 3L2
Exhibit 10: Revenue per Unit Horsepower (Canada) – STEP vs. Competitor Group
Note: Competitor group is comprised of Calfrac Well Services, Canyon Technical Group, and Trican Well Service.
Source: Company Reports, Raymond James Ltd.
Regardless of STEP’s Revenue-per-Unit-Horsepower, EBITDA per unit of Fleet Horsepower has
Consistently Been Best in Class
STEP has generated Canada’s highest EBITDA contribution per unit horsepower in every quarter
since beginning operations, with the exception of 1Q17 when it was edged out by Canyon Technical Group. Moreover, STEP has been widening the gap as its revenue per horsepower
caught-up to its competitor group. This is an impressive result considering STEP’s historically
lower revenue yields and its ‘newcomer’ status on the fracturing scene.
In 1Q18, STEP generated $84 EBITDA per unit fleet horsepower compared to $69 average for the
competitor group (both figures are Raymond James Ltd. estimates). In 4Q17, STEP’s EBITDA was
$66 per unit fleet horsepower while its competitors averaged $40. We show STEP’s EBITDA per horsepower and EBITDA margin compared to its competitive group range in Exhibit 11.
$0
$200
$400
$600
$800
$1,000
$1,200
1 2 3 4 1 2 3 4 1 2 3 4 1 2 3 4 1 2 3 4 1 2 3 4 1 2 3 4 1 2 3 4 1 2 3 4
2010 2011 2012 2013 2014 2015 2016 2017 2018
Competitor Range
STEP

STEP Energy Services Ltd. Canada Research | Page 17 of 48
Raymond James Ltd. | 2100 – 925 West Georgia Street | Vancouver BC Canada V6C 3L2
Exhibit 11: EBITDA per Unit Horsepower and EBITDA Margin (Canada) – STEP vs. Competitor Group
Note: Competitor group is comprised of Calfrac Well Services, Canyon Technical Group, and Trican Well Service.
Source: Company Reports, Raymond James Ltd.
It would be impossible for STEP to produce highly competitive EBITDA yields without an abiding focus on efficiency and cost controls. That said, we identify two additional factors that likely
contribute to STEP’s strong EBITDA margins:
First, it’s our view that STEP’s superior margins are partly a function of its clean slate as an
operator. STEP functionally purchased all of its fracturing equipment via bankruptcy proceedings. Therefore, STEP had no legacy cost structure or well grooved procedures to re-
evaluate and rationalize as it began operations, conferring it with a sizeable cost advantage.
Second, STEP doesn’t offer many lower-margin ancillary services to pull down its reported
margins. This favourable service line mix contributes – to some degree – to its best-in-industry margins.
STEP’s EBITDA Yield Advantage Won’t Last Forever, But It Could Easi ly Last Through 2019
STEP’s product mix isn’t likely to change materially – at least not relative to the competitive group
– so we don’t envision the service mix influenc ing relative margins over our forecast horizon. That said, our view is that it’s unlikely any cost structure advantage could survive for long through a
very busy oilpatch. High levels of demand are the breeding ground for mercenary employees
seeking the best compensation schemes amongst STEP and its competitors with little regard for
fealty. However, we are not forecasting a ‘very busy’ oilpatch in either 2018 or 2019. If the oilpatch were to heat up unexpectedly, we could see some closing of the margin gap between
STEP and its competitors, but a very busy oilpatch would be a welcome scenario for all fracturing
company shareholders, STEP’s included.
Some Specifics on STEP’s Customer Concentration and Penetration
STEP provided fracturing services for over 35 different producers in 2017. Shell Canada, ARC Resources, Canadian Natural Resources, and Canbriam Energy jointly represented approximately
58% of STEP’s 2017 fracturing business.
Shell Canada. Shell was STEP’s largest single customer through 2017, accounting for
approximately 24% of its fracturing volumes. However, STEP is Shell’s 2nd
fracturing company behind a US-based multinational. The two split Shell’s fracturing work about 70% / 30%. As
such, STEP has effectively functioned as a swing supplier for Shell behind the multinational.
It’s difficult for a low cost structure to
survive a very busy oilpatch – however, we aren’t forecasting a ‘very busy’ oilpatch.

Canada Research | Page 18 of 48 STEP Energy Services Ltd.
Raymond James Ltd. | 2100 – 925 West Georgia Street | Vancouver BC Canada V6C 3L2
ARC Resources. ARC tied with Canadian Natural Resources in 2017 as STEP’s 2nd
largest customer with about 12% of STEP’s fracturing volumes. That said, ARC has been an
inconsistent customer for STEP quarter-to-quarter. STEP performed about 25% of ARC’s
2017 fracturing volume behind a large multinational fracking company. STEP and the multinational were ARC’s only two providers until 4Q17 when ARC contracted wit h a 3
rd
supplier. STEP’s market share with ARC fell to 5% in 4Q17 and so far, it appears as though
STEP has not regained this lost market share.
Canadian Natural Resources. CNRL tied with ARC as STEP’s 2nd
largest customer in 2017 with about 12% of STEP’s total fracturing volume. A key difference between ARC and CNRL,
however, was in customer penetration. CNRL was 12% of STEP’s 2017 fracturing volumes,
but STEP has been CNRL’s dominant provider performing approx. 90% of CNRL’s 2017 fracturing work. CNRL suspended fracturing altogether in 4Q17 and resumed in 1Q18 with a
different provider.
Canbriam Energy. Canbriam has been STEP’s 4th
largest customer at 10% of STEP’s business
while STEP performed all (100%) of Canbriam’s 2017 fracturing work. Importan tly, Canbriam has been a reasonably consistent customer for STEP quarter-to-quarter.
Exhibit 12: STEP’s 2017 Customer Mix
Source: GeoLOGIC Systems Ltd., Raymond James Ltd.
Shell
Shell
ShellShell
ARX
ARX
ARXCNQ
CNQ
CNQ
Canbriam
Canbriam
Canbriam
Canbriam
Inception
InceptionBNP
BNP
BNP
BNP
SRX
SRX
SRX
CR
CR
BBI
BBI
WCP
WCP
Other
Other
Other
Other
Shell
ARX
CNQ
Canbriam
Inception
BNP
SRX
CR
BBIWCP
Other
1Q17 2Q17 3Q17 4Q17 1.00 2017
Customer Mix & Approx. Volume of Business 1.00 Customer Mix

STEP Energy Services Ltd. Canada Research | Page 19 of 48
Raymond James Ltd. | 2100 – 925 West Georgia Street | Vancouver BC Canada V6C 3L2
Exhibit 13: STEP’s 2017 Custer Concentration and Penetration
Source: GeoLOGIC Systems Ltd., Raymond James Ltd.
A Word on Resiliency and Adaptability
When two of STEP’s largest customers dropped-away in 4Q17, STEP increased its business with
several other customers and maintained it superior margin spread above its competitive grou p.
Referring back to Exhibit 12, ARC and CNRL jointly represented roughly 30% of STEP’s total
fracturing business over the first three quarters of 2017 and 38% in 3Q17. However, this dropped to roughly 2% in 4Q17 as CNRL essentially shut down fracturing and ARC shifted the vast majority
of its work to a multinational competitor.
As a consequence, STEP’s fracturing volumes dropped materially in 4Q17 – by roughly 30%
compared to 3Q17. This wasn’t entirely unique to STEP – overall industry demand sequentially
dropped by 20% in 4Q17. But clearly the loss of business from CNRL and ARC had a differentially negative impact on STEP’s top line.
STEP’s response was to increase its business among several of its o ther important customers, including its top customer: Shell Canada. Moreover, it’s apparent from Exhibit 11 that STEP was
able to make these transitions while at the same time preserving its margin spread over the
competitive group. That is, even though STEP’s revenue declined by more than the industry
average sequentially, it maintained its EBITDA margin spread above the industry average.
STEP’s Adaptability Could Come-In Handy Again in 2018
Producers representing 40% of STEP’s 2017 business have formal plans to reduce their drilling and
completion spending in 2018. These include ARC (28% less), Canadian Natural Resources (4% less
– RJL est.), Bonavista Energy (50% less), and Crew (58% less).
At the same time Whitecap’s planned budget is increasing by 19% in 2018, though Whitecap was
only about 2% of STEP’s fracturing business in 2017, so the impact of Whitecap’s spending is limited.
0%
20%
40%
60%
80%
100%
Shell ARX CNQ Canbriam Inception BNP SRX CR BBI WCP
Concentration: % of STEP's Fracking Business Penetration: % of Producer's Fracking Business

Canada Research | Page 20 of 48 STEP Energy Services Ltd.
Raymond James Ltd. | 2100 – 925 West Georgia Street | Vancouver BC Canada V6C 3L2
Shell screens as STEP’s largest single customer through 2017. Unfortunately, Shell doesn’t
disclose spending plans on a regional basis, but it has outlined a goal for mea ningful production growth from Canada, which suggests at least flat and perhaps growing spending plans in 2018.
And at the other end of the spectrum, STEP derives substantial revenue from smaller producers,
which we feel have much more malleable capital s pending habits than their larger counterparts.
On balance, the tally of budget planning as we know it today suggests STEP’s customers plan to
curtail spending by upwards to 10% in 2018. However, factoring in (a) fracturing’s increased share of spending, (b) that most budgets were formalized in a lower crude price environment and are
more likely to be revised upward than down, and (c) STEP’s demonstrated adaptability in shifting
customer concentration, we believe STEP’s top line fracturing revenue will inc rease 26% in 2018.
Exhibit 14: STEP’s 2017 Customer Mix and 2018 Spending Plans
Source: GeoLOGIC Systems Ltd., Company Reports, Raymond James Ltd.
‘Tailwinds’ on the Macro Front and Attractive Free Cash Flow Yields at Today’s Demand Levels and Share Prices
So far through 2018, producers are generally underspending relative to their aggregate cash flows. We expect this will change as producers adjust spending in light of higher liquids
pricing.
Despite the structural trend of rising horsepower intensity, reduced E&P spending negatively
impacted the demand for Canadian horsepower in 2017. We’re forecasting that this will change in 2018. We expect 13% horsepower demand growth in 2018 as higher cash flows in
the second half of the year drive fracturing demand.
We expect fracturing revenues will be 14% higher in 2018, largely driven by 11% higher
pricing in 2018 vis-à-vis the 2017 average. For context however, our revenue and revenue per unit horsepower forecasts are still well -below historical peaks.
Even so, current demand for fracturing services is sufficient to generate attractive ‘Free EBITDA’ for fracturing companies, with approximately the same EBITDA per horsepower and
‘Free EBITDA’ per unit horsepower as the late-2013/early-2014 time frame.
Shell
ARX
CNQCanbriam
Inception
BNP
SRX
CR
BBIWCP
Other
Direction of CapitalSpending Plans - 2018/2017
IncreasingUnsureDecreasing
Between STEP’s adaptability to
changing conditions, higher-year-
over-year pricing, and further increases in fracturing intensity, we
expect 26% revenue growth for STEP’s
Canadian fracturing business.
Shell does not disclose country level
spending but we suspect increased
spending in Canada given the progression in liquids pricing versus 2017.
Definition: ‘Free EBITDA’:
EBITDA less both incurred and accrued
maintenance costs.

STEP Energy Services Ltd. Canada Research | Page 21 of 48
Raymond James Ltd. | 2100 – 925 West Georgia Street | Vancouver BC Canada V6C 3L2
While current free cash flow is certainly nowhere near the heights seen in 2010 and 2011, it is nonetheless sufficient to imply a 13% free cash flow yield for STEP equity holders at today’s
$10.36 share price.
We foresee little risk in Canadian fracturing companies launching into new-builds over our forecast horizon. ‘Free EBITDA’ generation per unit horsepower is positive, but not
sufficiently positive to prompt new builds. This means cash flow with either build on the
balance sheet, get allocated to geographic expansion (such as STEP’s Tucker acquisition – see
relevant section in this report), or it will find its way back into shareholders’ hands through share buy backs and/or dividends.
Demand for Fracturing Horsepower up 13% in 2018 and 12% in 2019
The demand for fracturing horsepower is moving structurally higher amid increased overall
fracturing intensity across Western Canada. We expect average demand will be 13% higher year-
over-year in 2018 but that it won’t surpass the anomalous spike in 3Q17 that was driven by the non-structural drawdown of the drilled-uncompleted well inventory.
Exhibit 15: Total Canadian Horsepower Demand and E&P Cash Flow
Source: CAPP, Bloomberg, National Energy Board, Company Reports, Raymond James Ltd.
Gap Between Producer Cash Flow and Spending is Unusually Wide – Expect Spending to Catch-
Up
Producers have recently been underspending relative to their cash flow – or at least, they are
allocating a smaller portion of their aggregate cash flow to capital spending than usual. It might
be tempting to chalk this up to a renewed sense of E&P capital discipline, but we believe it relates
more to frustration over pipeline maintenance schedules, takeaway capacity, and Canada’s uncertain policies on pipeline construction/expansion.
Pipeline maintenance schedules should be less of an interruption for summer gas deliverability beyond 2018. This in turn should provide producers with more comfort in allocating cash flow to
5
15
25
35
45
55
65
75
85
95
105
115
125
-750
-500
-250
0
250
500
750
1,000
1,250
1,500
1,750
2,000
2,250
1 2 3 4 1 2 3 4 1 2 3 4 1 2 3 4 1 2 3 4 1 2 3 4 1 2 3 4 1 2 3 4 1 2 3 4 1 2 3 4
2011 2012 2013 2014 2015 2016 2017 2018E 2019E 2020E
$b
ln
Mill
ion
s
Ho
rse
po
wer
Ri
Total Horsepower Demand
E&P Cash Flow(annualized, excl. heavy oil)
We forecast rising horsepower
demand in Canada despite flat E&P cash flows
(See Exhibit 33 for our comprehensive
macro OFS forecasts.)

Canada Research | Page 22 of 48 STEP Energy Services Ltd.
Raymond James Ltd. | 2100 – 925 West Georgia Street | Vancouver BC Canada V6C 3L2
drilling and completion work. However, for the balance of 2018, our estimates embody
US$1.80/mcf AECO-Nymex differentials in the summer months netting a C$1.33 AECO price for the year. Netbacks for unhedged dry gas production are likely negative at this price. Offsetting
the weak gas market, liquids pricing in general and condensate pricing in particular are supporting
producer cash flows and will be the likely motivator for 2H18 horsepower demand.
Fracturing Intensity – Still Growing, But the Rate of Growth Now Slowing
Taken together, the Montney and Duvernay plays represent 75% of all Canadian fracturing
demand. We’ve watched fracturing intensity increase within these two plays since their earliest
days of development – 2009 in the case of the Montney and 2012 in the Duvernay.
It should be clear from Exhibit 16 that intensity is growing sharply in the Duvernay, where
proppant placement per well is up 14% year over year and is showing no signs of slowing.
However, fracturing intensity in the Montney began flattening early in 2017 and at this point isn’t
showing any signs of resuming its former growth trajectory. This flattening is influenced in large part by the play’s two largest producers. These two producers have been, and still are employing
the most fracturing-intensive completion designs within the play, even though their sand
placement per meter has been moving lower. At the same time, most other producers within the
play are increasing proppant loading in their well designs, albeit from a lower base. Our expectation is that the two largest producers will stabilize their fracturing designs while the
smaller producers continue to converge upon the leaders. This impl ies some resumption of
growing intensity in the Montney, though that rate of growth will be noticeably slower than in prior years.
Just over 50% of all Western Canada fracturing demand comes from the Montney and 20% comes from the Duvernay. So on a weighted basis, even if Montney growth were zero, the Duvernay
would push overall growth among these two plays to 5% - sufficient to influence structural growth
in horsepower demand.
Exhibit 16: Average Proppant Placed per Well (tonnes)
Source: GeoLOGIC Systems Ltd., Raymond James Ltd.
Given the historical increases in fracturing intensity within these two key plays, it’s unsurprising
that fracturing demand has grown structurally relative to drilling rig demand (Exhibit 17). Our
horsepower demand forecasts imply and are implied by a moderated continuation of this trend.
‘Fracturing Intensity’ has no
universally agreed-upon definition,
but can be thought of generally as pumping volumes and effort per well,
per stage, per meter of measured depth, or per unit of drilling rig time.

STEP Energy Services Ltd. Canada Research | Page 23 of 48
Raymond James Ltd. | 2100 – 925 West Georgia Street | Vancouver BC Canada V6C 3L2
Exhibit 17: Horsepower Intensity – Horsepower Demand per Active Rig
Source: CAPP, Bloomberg, National Energy Board, Company Reports, Raymond James Ltd.
Further Pricing Increases Won’t Be Required to Meet Demand – Forecasting a 260 bp Increase Over the Remainder of 2018 and Another 260 bp Increase through 2019
Fracturing pricing is highly elastic to equipment and personnel scarcity. When both equipment
and labour are over-supplied pricing can drop until it approaches marginal field costs (which
translated to negative reported EBITDA margins). This was the case in 2015 and 2016 when the
cumulative 60% drop in horsepower demand prompted a corresponding 45% price decline. In 2015 and 2016 the remaining field margin was insufficient for frackers to cover their fixed costs –
primarily salaries. They responded by reducing headcounts and parking 48% of their fracturing
equipment in an effort to ‘right-size’ their operating scales to match current demand.
Then the demand for horsepower reversed, growing 80% in 2017 and strained frackers’ abilities to
rehire and train field personnel. Many field workers had since moved on in their careers within
Alberta and many to other parts of Canada. The shortage of available trained field staff translated into a scarcity of available crewed equipment. So even though 35% of the industry’s fracturing
equipment was still parked at mid-year 2017, pricing had risen 48% as producers competed for
fracturing crews.
Even though we’re forecasting 13% fracturing demand growth in 2018 over 2017, this growth is
largely a function of a rising demand through mid-2017. In other words, most of the year-over-year growth for 2018 has already taken place and so has its i mpact on pricing.
The 12% demand growth we’re forecasting for 2018 begins late in 2018 (after the wider summer gas differentials have passed). In relative terms, 12% is a small change; since 2008 demand
typically rises or falls between 30% and 35% in any given year. Our modeling suggests the
relatively modest 13% demand growth in 2019 should prompt a correspondingly modest 260-
basis point price increase.
0
100
200
300
400
500
600
700
800
900
1,000
1,100
1,200
-3,000
-2,000
-1,000
0
1,000
2,000
3,000
4,000
5,000
6,000
7,000
8,000
9,000
1 2 3 4 1 2 3 4 1 2 3 4 1 2 3 4 1 2 3 4 1 2 3 4 1 2 3 4 1 2 3 4 1 2 3 4
2011 2012 2013 2014 2015 2016 2017 2018E 2019E
Rigs
Hp
/ R
ig
Ri
Active Rig Count(Seasonally-Adjusted)
Horsepower Demand per Active Rig

Canada Research | Page 24 of 48 STEP Energy Services Ltd.
Raymond James Ltd. | 2100 – 925 West Georgia Street | Vancouver BC Canada V6C 3L2
Exhibit 18: Canadian Fracturing Price Index and Estimates (index; 1Q11 = 1)
Source: CAPP, Bloomberg, National Energy Board, Company Reports, Raymond James Ltd.
Equity Investors Earned an Annualized 36% ‘Free EBITDA’ Yield on STEP’s Canadian Horsepower in 1Q18 — We’re Also Expecting a 36% Yield Over Calendar 2018
We estimate STEP generated $84 EBITDA per horsepower from its Canadian fracturing assets in
1Q18. This level of 1Q EBITDA corresponds with approximately $245 EBITDA per horsepower on an annualized basis.
We further estimate annual maintenance capital requirements at $120 per unit of active or fully-utilized horsepower (annualized $65 per fleet horsepower in 1Q18), which covers both incurred
and accrued costs – annual replacement of fluid ends and an eight-year life expectancy on the
equipment as a whole. This level of maintenance requirement takes an approximate 35% bite out
of 1Q18E annualized EBITDA per horsepower, leaving $180 annualized ‘Free EBITDA’ per horsepower over both 2018 and 1Q18 annualized.
This Rate of ‘Free EBITDA’ Generation is Insufficient to Motivate New Equipment Additions, but is Sufficiently High to Provide an Attractive Yield on Current Market Equity Values
The cost of new equipment and related infrastructure is approximately $1 ,400 per unit horsepower, so the ‘Free EBITDA’ yield on new equipment is currently 13% – or a 7.8-year
payback period – too long to justify new investment. However, the market is pricing Canadian
horsepower at approximately $700 per horsepower on average, and $496 per unit horsepower in STEP’s case. This implies a much more generous 36% ‘Free EBITDA’ yield for current equity
holders.
And since organic reinvestment economics aren’t yet attractive, this ‘Free EBITDA’ is more likely
to be allocated to some combination of debt reduction, shareholder distributions,
strategic/geographic expansion, or cash balances. Any one of these has much more potential to
enhance shareholder value than a ‘new-build arms race’ between the fracking companies. On the contrary, Canada is leaking horsepower to the US, which when combined with natural equipment
attrition, means an overall shrinking fleet.
-0.10
-
0.10
0.20
0.30
0.40
0.50
0.60
0.70
0.80
0.90
1.00
-20%
-10%
0%
10%
20%
30%
40%
50%
60%
70%
80%
90%
1 2 3 4 1 2 3 4 1 2 3 4 1 2 3 4 1 2 3 4 1 2 3 4 1 2 3 4 1 2 3 4
2013 2014 2015 2016 2017 2018E 2019E 2020E
Frack Price
Ind
ex
Pri
ce C
han
ge
Fracturing Price Index*
Actual* Estimated
Sequential Leading-Edge Price Changes
Definition: ‘Free EBITDA’: EBITDA less both incurred and accrued maintenance costs.
Canadian fracturing unlikely to enter
into a ‘new-build arms race’ – on the
contrary, it’s shrinking today.

STEP Energy Services Ltd. Canada Research | Page 25 of 48
Raymond James Ltd. | 2100 – 925 West Georgia Street | Vancouver BC Canada V6C 3L2
Exhibit 19: EBITDA and ‘Free EBITDA’ Per Unit Horsepower, Annualized
Source: STEP Energy Services, Calfrac Well Services, Canyon Technical Group, Trican Well Service,
Raymond James Ltd.
Comparing and Contrasting Today to 2013
Exhibit 19 shows that the industry is generating EBITDA and ‘Free EBITDA’ at a rate similar to 2013. There are, however, two key differences worth highlighting.
1. In 2013, fracturing fleets were growing; today they are shrinking. Canadian fracturing companies added about 125,000 horsepower to their fleets in 2013. This year, we are
expecting the fleet to shrink marginally by 30,000 horsepower (see Exhibit 20).
2. In 2013, the equity-market-implied value of Canadian fracturing equipment was
approximately $1,630 per unit horsepower; today it is approximately $ 700.
(200)
-
200
400
600
800
1,000
1,200
1 2 3 4 1 2 3 4 1 2 3 4 1 2 3 4 1 2 3 4 1 2 3 4 1 2 3 4 1 2 3 4 1 2 3 4 1 2 3 4
2010 2011 2012 2013 2014 2015 2016 2017 2018E 2019E
EBITDA per unit horsepower
'Free EBITDA' per unit horsepower (est, pre-tax)
Exhibit 19 shows the progression of
EBITDA and ‘Free EBITDA’ per unit horsepower over time.
So far, with the exception of 3Q17,
Canadian fracturing has only
recovered to 2013-level economics.
Despite similar profitability ($/hp),
the equity market in 2013 valued fracturing horsepower 2.3 times higher than today’s equity market.

Canada Research | Page 26 of 48 STEP Energy Services Ltd.
Raymond James Ltd. | 2100 – 925 West Georgia Street | Vancouver BC Canada V6C 3L2
Exhibit 20: ‘Free EBITDA’ Yield Drives Equipment Orders
Notes: Based on RJL estimates of annualized industry free cash flow using Calfrac Well Services, Canyon Technical Group, STEP Energy Services, and Trican Well Service reported results. Based on
a $1,400 per-horsepower new-build price.
Source: CAPP, Bloomberg, National Energy Board, Company Reports, Raymond James Ltd.
The Tucker Acquisition
STEP closed its acquisition of Oklahoma -based Tucker Energy Services on April 2, 2018. Total consideration was US$275 mln ($348 mln). Tucker’s equipment primarily includes 3 fracturing
spreads with 192,500 horsepower, 10 open hole and 5 cased hole wireline units, and 2 coiled
tubing rigs, plus an additional fracturing spread with 50,000 horsepower, which was delivered post-closing, late in May-2018.
Fracturing was 90% of Tucker’s revenue over the first three quarters of 2017. The remaining 10% came from a combination of wireline and coiled tubing services.
Tucker: Acquisition Economics
The US$275 mln purchase price includes the final US$42 mln instalment for a 4th
spread of
fracturing equipment (comprised of 50,000 horsepower), however; we also expect the spread will require an additional US$6 mln in associated working capital, which was funded
by STEP after the acquisition closed, bringing the total effective acquisition cost to US$281
mln.
We estimate the purchase price at approximately 3.9x 2017E EBITDA (which excludes the cost of the 4
th fracturing spread and associated working capital).
We estimate STEP paid 3.9x 2018E EBITDA based on a weighted-average acquisition price that excludes the cost of the 4
th fracturing spread in 1Q18 and includes it for 2Q through 4Q.
We estimate 3.6x 2018 ‘annualized’ or ‘run-rate’ EBITDA including the 4th
fracturing spread.
We estimate the acquisition price was approximately US$1,210 per unit horsepower inclusive of the 4
th spread of equipment. This is lower than where the market is implicitly
-100k
0k
100k
200k
300k
400k
500k
600k
700k
800k
-100%
-75%
-50%
-25%
0%
25%
50%
75%
100%
125%
1 2 3 4 1 2 3 4 1 2 3 4 1 2 3 4 1 2 3 4 1 2 3 4 1 2 3 4 1 2 3 4 1 2 3 4 1 2 3 4
2010 2011 2012 2013 2014 2015 2016 2017 2018E 2019E
Net h
orse
po
we
r add
ition
s
'Fre
e E
BIT
DA
' Yie
ld
Resulting net horsepower additions over following 12-months
'Free EBITDA' yield on new-build equipment spreads
Canadian pressure pumpers
typically begin adding
capacity when the ‘Free
EBITDA’ yield on that new capacity surpasses 20%.
Given our forecasts for horsepower economics,
Canadian pumpers are
unlikely to add to their fleets
over our forecast horizon.
The acquisition metrics for Tucker imply a highly ‘accretive’ acquisition for STEP shareholders

STEP Energy Services Ltd. Canada Research | Page 27 of 48
Raymond James Ltd. | 2100 – 925 West Georgia Street | Vancouver BC Canada V6C 3L2
pricing horsepower for every US-based public fracturing company in the comparative group,
and is 21% lower than the median for the same group.
Exhibit 21: Estimates and Valuation of Tucker
Source: STEP Energy Services Ltd., Raymond James Ltd.
Tucker: Unit Economics and Financial Outlook
We anticipate Tucker will generate US$54 mln EBITDA for STEP over the 9 months in 2018 that it will have owned the assets. Giving effect to the timing of the 4
th fracturing spread, we extrapolate
this to US$78 mln on an annualized or ‘run-rate’ basis.
Tucker generated US$134 mln revenue during the first 9-months of 2017, of which 90% was from
fracturing services. Assuming we can allocate EBITDA on a similar basis, Tucker’s fr acturing
business generated US$38 mln EBITDA over the 9-months with a weighted average of 110,000 to
115,000 active horsepower (2 spreads working in 1Q, 2 in 2Q, and 3 in 3Q). From this, we derive the following approximations:
Revenue per active unit horsepower was US$1,020 over the 9-months ended Sep-30-2017.
This is in the upper half of a comparative group of US operators that includes Keane, RPC, Mammoth, Propetro, and Calfrac (Exhibit 22).
Tucker generated US$270 EBITDA per active unit horsepower over the same period. This is the highest EBITDA yield per unit horsepower in the US comparative group and is 28%
above the closest comp.
The EBITDA margin was 22% over the same period.
Enterprise Value per Unit Horsepower of Tucker Fracturing Fleet
At Time of
Acquisition
A Acquistition Price before 4th Fracturing Spread ($US) 233
B Cost of 4th Fracturing Spread ($US mln) + 42
C Headline Acquisition Price ($US) = 275 A + B
D Working Capital Investment Required for 4th Fracturing Spread (est, $US mln) + 6
E Total Acquisition Cost ($US) = 281 C + D
Tucker Corporate EBITDA ($US mln)
9-Months Ended Sep-2017 42
F 2017 Calendar Year (est) 59
G 1Q18 Annualized (with 3 spreads, est) 60
H 2018 Calendar Year (est) 69
I 2018E Run Rate with 4 Spreads (est) 78
Acquisition EBITDA Multiples
J 2017 Calendar Year ÷ 3.9x A ÷ F
K 1Q18 Annualized (with 3 spreads) ÷ 3.9x A ÷ G
L 2018 Calendar Year ÷ 3.9x [(A + 3 x E) ÷4] ÷ H
M 2018E Run Rate with 4 Spreads ÷ 3.6x E ÷ I
N Acquisition Price Allocated to Fracturing ($US mln, est) 258 E - 10% x A
Working Capital Allocated to Fracturing as at…($US mln)
3Q17 estimated 18
1Q18 Estimated 15
O 2018E Run Rate 25
P Price Allocated to Fracturing Equipment + Related Infrastructure ($US mln) 233 N - O
Q Horsepower in Tucker Fleet (000) 193
R Price/HP for Tucker Fracturing Fleet + Related Infrastructure ($US/hp) 1,209 P ÷ Q

Canada Research | Page 28 of 48 STEP Energy Services Ltd.
Raymond James Ltd. | 2100 – 925 West Georgia Street | Vancouver BC Canada V6C 3L2
Exhibit 22: Comparative Economic Performance – US Fracturing 9-Months to Sep-2017
Note: Comparative group includes Calfrac Well Service, Keane, Mammoth, Propetro, and RPC
Source: Company Reports, Raymond James Ltd.
A Reasonable Estimate of Tucker’s Quarterly Fracturing Revenues and Margins through 2017
Implies Modestly Higher Run-Rate Unit Economics for the Tucker Assets in 2018.
In short, we estimate Tucker’s fracturing equipment generated approx. US$ 420 EBITDA per
unit active horsepower through calendar 2017 and will generate US$ 360 in calendar 2018.
These unit economics surpass the economic hurdles ordinarily required to justify new-build economics. No surprise then that Tucker had ordered the 4
th fracturing spread.
STEP noted in its disclosures that Tucker generated approximately $6 mln EBITDA per active
fracturing spread per quarter over the 9-months ended Sep-30. Since Tucker is now running 4
active spreads, annualized fracturing EBITDA should equate to $96 mln if pricing, utilization, and margins were unchanged from the 9-month average.
However, we know from the comparative group that revenue per horsepower, EBITDA per horsepower and margins were all on sharply improving tre nds through 2017. In all cases within
the US comparative group, 3Q17 economics were considerably higher than 1Q. For instance, 3Q
EBITDA per unit horsepower was 144% above 1Q for the comparative group on a weighted-
average basis.
We show this in Exhibit 23 where we postulate reasonable revenue per fleet horsepower and
EBITDA per fleet horsepower progression for Tucker over the first 3 quarters of 2017 based on the actual progressions observed in the comparative group. We use this data, along with the 4Q and
1Q actuals and 2Q outlooks to bring our estimates for Tucker up to date and use this as a starting
point to forecast rev/hp and EBITDA/hp though the forward quarters.
0%
5%
10%
15%
20%
25%
30%
$0
$200
$400
$600
$800
$1,000
$1,200
$1,400
Tuck
er
Tuck
er
Tuck
er 1
Revenue / Hp EBITDA / Hp EBITDA Margin
Revenue / Hp EBITDA / Hp EBITDA MarginRevenue / Hp EBITDA / Hp EBITDA Margin
Given Tucker’s high EBITDA and ‘Free
EBITDA’ yields, it’s unsurprising
Tucker ordered a 4th
newly-constructed equipment spread.

STEP Energy Services Ltd. Canada Research | Page 29 of 48
Raymond James Ltd. | 2100 – 925 West Georgia Street | Vancouver BC Canada V6C 3L2
Exhibit 23: Revenue and EBITDA per Fleet Horsepower – STEP and US Comp Group ($USD)
Note: The solid portion of the darkened line represents our estimates of Tucker’s revenue and EBITDA per unit of fleet horsep ower over
the first three quarters of 2017. The dashed portion of the darkened line represents our estimates of these same measures for Tucker
over the two quarters leading-up to the acquisition and over the balance of 2018.
Source: Company Reports, Raymond James Ltd.
The Tucker Acquisition: Strategic Value for STEP
To be fair, we don’t think STEP has much to answer for in terms of strategic rationale given Tucker’s best-in-class unit economics and the attractive purchase price metrics. That said,
Tucker’s platform does provide STEP with a much-needed avenue for growth.
Canada was Going to be a ‘No-Growth’ Market for the Foreseeable Future
Prior to the acquisition, STEP carried essentially no debt, which provided it with substantial capacity with which to finance growth. However, approximately 85% - 90% of its total business,
and 100% of its fracturing business was in Canada, which we don’t envision requiring equipment
additions – at least until later in 2019.
The Strategic Value in STEP’s Acquisition of Tucker Doesn’t Stem from Geography
Tucker’s fracturing, wireline, and coiled tubing business are heavily focused on the key Oklahoma
plays (SCOOP, STACK, and the Woodfords). STEP’s existing coiled tubing business has traditionally
been focused in Texas, and mostly in southern Te xas. It’s quite likely that STEP’s and Tucker’s
equipment has never shared the same highways let alone customer base.
We Expect STEP will Ultimately Seek to Leverage its Texas-Based Coiled Tubing Business to Pull
Fracturing Services into the Suite of Services. For the time being, however, Tucker has earned considerable loyalty from its Oklahoma customer base. We expect STEP will require attractive
contract terms before entering the highly competitive Texas fracturing market.

Canada Research | Page 30 of 48 STEP Energy Services Ltd.
Raymond James Ltd. | 2100 – 925 West Georgia Street | Vancouver BC Canada V6C 3L2
Exhibit 24: Geographic Distribution of STEP and Tucker
Source: STEP Energy Services Ltd., Raymond James Ltd.
Valuation & Recommendation
By every quantifiable measure, STEP screens as highly-competitive, cost-efficient, and attractively-
priced energy investment. Given the rare combination of the foregoing, we foresee above
average potential for superior returns within the oilfield services complex.
STEP’s competitive advantage (leading with coiled tubing) and its cost advantage (starting with an
already low cost structure) are both determinants for financial performance : margins, EBITDA, and free cash generation. But market factors such as future growth prospects, capital allocation
discipline, trading liquidity, and perceived equity overhangs will be the key dete rminants for how
the market values that financial performance.
STEP’s operating efficiency and low cost structure contribute to its top tier unit economics ranking in Canada. Efficiency metrics and unit economics from its US-based Tucker
acquisition are similarly top tier among the US comparative group. As such, we rank STEP’s
management and processes very high in terms of the ir abilities to generate consistently high
free cash flow yields from its equipment.
STEP’s Enterprise Value per Unit Horsepower is 35% to 40% lower than our comparative group analyses would suggest.
STEP’s EV/EBITDA multiple is lower than its Canadian-listed competitive group.
STEP’s EV/EBITDA multiples are lower than the historical range for Canadian pressure pumpers.
Mississippian Lime
SCOOP
STACK
Granite Wash
Permian
Eagle Ford
Haynesville
Barnett
Arkoma Woodford
Ardmore Woodford

STEP Energy Services Ltd. Canada Research | Page 31 of 48
Raymond James Ltd. | 2100 – 925 West Georgia Street | Vancouver BC Canada V6C 3L2
STEP’s high EBITDA per horsepower yield implies higher ‘Free EBITDA’ as a portion of reported EBITDA. This should mean STEP’s EBITDA is ‘worth’ more on average
(approximately 18% more by our arithmetic).
STEP’s major shareholder, ARC Financial, owns 61% of the stock though two private equity funds (40.2 mln shares). ARC has sold down its position from 46.2 mln shares prior to the
initial public offering via a secondary offering in Nov-2017. Notwithstanding, we estimate
the market is effectively applying at least a 20% to 25% liquidity discount on STEP’s shares –
our targeting is not predicated on this discount going away.
STEP has a demonstrable preference for maintaining a low-debt capital structure. We estimate total debt is approximately 1.2x trailing EBITDA (pro forma Tucker).
Enterprise Value per Unit Horsepower Well-Below New-Build Cost
The market is valuing STEP’s North American, and especially its Canadian horsepower , below applicable replacement cost, which we peg at approximately $1,400 per horsepower, fully-loaded
($CAD). This includes not just the equipment but also related infrastructure, such as apportioned
sand storage, rail spurs, repair and maintenance facilities, ancillary equipment and land.
We showed in Exhibit 20 that Canadian fracturing companies have tended to add capacity when
‘Free EBITDA’ yields on that new equipment reached around 20%. From there, the rate of capacity addition is akin to a volume dial – higher ‘Free EBITDA’ yields drives larger capacity
additions.
Today, a requisite 20% ‘Free EBITDA’ yield means we could expect pumpers to begin adding
capacity when ‘Free EBITDA’ reaches $280 per unit horsepower, or $400 of ‘raw EBITDA’ per unit
horsepower. We expect Canadian pumpers will average $156 ‘Free EBITDA’ per horsepower in
2018, or $237 raw EBITDA.
But today’s investors don’t have to pay $1,400 per horsepower for fracturing capacity. The
market’s implied value for STEP’s North American fleet is approximately $ 950 (US$740) – about 35% below replacement cost. Parsing-out the US fleet, the implied value for Canadian
horsepower is lower at $496 per unit horsepower, (US$391) – just over one third of replacement
cost.
Are the Implied Values on STEP’s Assets Attractive?
We estimate STEP will generate $340 of EBITDA - $240 ‘Free EBITDA’ per unit horsepower across
its North American platform in 2018 (annualized to give full -year impact for the Tucker
acquisition). As the market’s implied price for STEP’s horsepower is $ 950, this implies a 25% ‘Free EBITDA’ yield for investors.
Parsing-out the US fracturing business, we estimate STEP will generate $ 271 EBITDA and $180 ‘Free EBITDA’ per unit horsepower from its Canadian fracturing assets in 2018. This implies a 3 6%
‘Free EBITDA’ yield.

Canada Research | Page 32 of 48 STEP Energy Services Ltd.
Raymond James Ltd. | 2100 – 925 West Georgia Street | Vancouver BC Canada V6C 3L2
Exhibit 25: Market Value of STEP’s Horsepower, Free Cash Flow and ‘Free EBITDA’ Yields
Note: Average multiples for well completion businesses in Canada and the US are approximately 4.5x 2018 consensus EBITDA.
Source: Bloomberg, STEP Energy Services Ltd., Company Reports, Raymond James Ltd.
Enterprise Value per Unit Horsepower - Canada
STEP Share Price ($) $10.36
Shares Outstanding (basic, mln, 2Q18E) x 66
A Market Capitalization ($mln) = 682
Net Debt ($mln, est 2Q18E) + 226
B Enterprise Value ($mln) = 908
EBITDA from CT, Wireline & US Fractruing ($mln, 2018E, Tucker Annualized) 156
EBITDA multiple for CT, Wireline & US Fracturing (est) x 4.5x
C Est. Market Value of Can + US Coiled Tubing Assets = 703
Mkt Value Attributable to Canadian Fracking Enterprise ($mln) 205 B - C
Non-Cash Working Capital Assoc w/ Can Fracking ($mln, est) - 54
D Mkt Value of Canadian Fracturing Equipment & Infrastructure ($mln) = 151
E Horesepower in Canadian Fleet (000s) 305
F EV/HP of Canadian Fracturing Fleet + Related Infrastructure ($/hp) = 496 D ÷ E
EV/HP of Canadian Fracturing Fleet + Related Infrastructure (US$/hp) = 388
Enterprise Value per Unit Horsepower - North America
B Enterprise Value ($mln) 908 B
EBITDA from Non-Fracturing Services ($mln, 2018E, Tucker Annualized) 79
EBITDA multiple for Non-Fracturing Services (est) x 4.5x
G Mkt Value of Non-Fracturing Services ($mln) = 355
Mkt Value Attributable to North American Fracturing ($mln) 553 B - G
Non-Cash Working Capital Assoc w/ Fracturing ($mln, est) - 83
H Mkt Value of Fracturing Equipment & Infrastructure ($mln) = 470
I North American Horsepower (000s) 498
J EV/Hp of North American Fleet + Rel Infrastructure ($/hp) 950 H ÷ I
EV/Hp of North American Fleet + Rel Infrastructure (US$/hp) 740
Free Cash Flow Yield
STEP Share Price ($) $10.36
Shares Outstanding (mln, 2Q18E) x 66
A Market Capitalization ($mln) = 682
Cash Flow from Operations ($mln, 2018E) 164
Maintenance Capital Spending ($mln, 2018E) - 77
K Free Cash Flow ($mln, 2018E) = 87
L Free Cash Flow Yield (%, 2018E, After-Tax, Corporate) 13% K ÷ A
'Free EBITDA' Yield per Unit Horsepower - Canada
F EV/Hp of Canadian Fracturing Fleet + Related Infrastructure ($/hp) = 496
Canadian EBITDA per Unit Horsepower ($, 2018E) 271
Maintenance Capital Spending per Unit Horsepower ($, est) - 91
M 'Free EBITDA' per Unit Horsepower Canada (est, $) = 180
T 'Free EBITDA' Yield = 36% M ÷ F

STEP Energy Services Ltd. Canada Research | Page 33 of 48
Raymond James Ltd. | 2100 – 925 West Georgia Street | Vancouver BC Canada V6C 3L2
Exhibit 26: Relating EV/Unit Horsepower to EBITDA per Unit Horsepower
(Size of bubble depicts fleet size, US$)
Note: EBITDA per Unit Horsepower is calculated by annualizing 4Q1 7 and 1Q18 results. Chart
excludes RPC because of its outlier valuation.
Source: Company Reports, Raymond James Ltd.
Exhibit 27: Market Value of Fracturing Horsepower Based on Canada / US Mix
Source: Company Reports, Raymond James Ltd.
STEP
$0
$500
$1,000
$1,500
$2,000
$2,500
$3,000
$3,500
$0 $100 $200 $300 $400 $500 $600
Ente
rpri
se V
alu
e p
er
Un
it H
ors
ep
ow
er
(US$
)
EBITDA per Unit Horsepower (US$)
US Listed Frackers
Canada Listed Frackers
STEP
$0
$500
$1,000
$1,500
$2,000
$2,500
$3,000
100%Canada
100%United States
US Listed Frackers
Canada Listed Frackers
STEP is underpriced relative to the profitability of its equipment across a
North American comparative group.
Exhibit 26 provides validation to the intuitively appealing notion that the
market pays more for horsepower
that generates more EBITDA.
Based solely on STEP’s 4Q17 and 1Q18
annualized EBITDA (we estimate this
was US$211/hp, including Tucker),
STEP’s horsepower should be valued approx. 38% higher than the current
market value.
Canadian Horsepower, STEP’s included, is valued less than US
horsepower, even after correcting for
EBITDA generation.
After we have adjusted for EBITDA
generation per unit horsepower, we
still notice the Canadian-listed
companies trading lower than we would expect.
In short, we find the market currently
values Canadian horsepower at US$415 lower than US horsepower
generating the same EBITDA.
In STEP’s specific case, the market is
valuing STEP’s horsepower US$450 lower than US horsepower.

Canada Research | Page 34 of 48 STEP Energy Services Ltd.
Raymond James Ltd. | 2100 – 925 West Georgia Street | Vancouver BC Canada V6C 3L2
Exhibit 28: STEP’s EV/EBITDA Valuation Versus Canadian Peer History
Note: The weighted-average multiple ranges include Canyon for the years 2010 -2016 inclusive,
Calfrac for the years 2001-2019 inclusive, and Trican for the entire 1996-2019 period.
Source: Company Reports, Raymond James Ltd.
A Supportive Shareholder with a Large Control Block Still Results in a Liquidity Discount
We preface the following with what should be an obvious statement: STEP’s commercial success
is in large part due to the support and stewardship from its private equity sponsor, ARC Financial and its investors.
Notwithstanding, equity markets apportion valuation along many dimensions; trading liquidity and perceived equity overhangs are two of those dimensions. We’d estimate the combination of
these two factors has the overall impact of suppressing STEP ’s equity value by 20% to 25%.
In total, ARC owns a total of 40.2 mln shares (61%) of STEP’s outstanding common shares – 13.6
mln are held in ARC Energy Fund 6 (“Fund 6”) and 26.7 mln shares are held in ARC’s most recent
fund – ARC Energy Fund 8 (“Fund 8”). Fund 6 has a term ending in 2020 and Fund 8 has a term ending in 2027.
Large private equity blocks like ARC’s have the potential to suppress equity values via the resulting low floating share count and concomitant trade illiquidity. It also encourages a measure of
strategic gamesmanship from would-be investors, as in “why buy the stock today when I can just
participate in the block when it comes out?”
Approximately 62% of STEP’s shares are held either by ARC or by STEP management. So while
STEP’s market capitalization is $682 mln, its ‘float capitalization’ is $266 mln, which hasn’t been
sufficiently large to attract meaningful institutional involvement to date. STEP’s top five institutional shareholders (ex-ARC) own just under 8% of its stock in aggregate, whereas
comparable pressure pumping companies are 21% and 23%, respectively.
A consequence of low institutional ownership is a lower rate of trade volume or ‘turnover’ of the
floating stock. We find that since acquiring Tucker, an average of 1.0% of STEP’s floating stock has
changed hands daily, compared to 1.5% and 1.6% for STEP’s Canadian comparison group. Put
0.0x
2.0x
4.0x
6.0x
8.0x
10.0x
12.0x
14.0x
16.0x
18.0x
20.0x1
99
6
19
97
19
98
19
99
20
00
20
01
20
02
20
03
20
04
20
05
20
06
20
07
20
08
20
09
20
10
20
11
20
12
20
13
20
14
20
15
20
16
20
17
20
18
E
20
19
E
STEP
w-Average (CFW + FRC + TCW)
Exhibit 28 shows the history of
weighted-average EBITDA multiples for Canadian pressure pumping
companies, including Calfrac, Canyon,
STEP, and Trican.
STEP’s current-year and 2019
multiples are at the bottom-end of
this historical range.
STEP’s 2018 multiple is 29% below its
comparative group. It’s 2019 multiple
is 17% below.
The ‘choppiness’ of the historical
multiples is a function of multiples
expanding during downturns and contracting during upswings.

STEP Energy Services Ltd. Canada Research | Page 35 of 48
Raymond James Ltd. | 2100 – 925 West Georgia Street | Vancouver BC Canada V6C 3L2
another way, STEP’s average daily trade volume is approximately $3 mln compared to almost $7
mln for Calfrac and $16 mln for Trican.
Exhibit 29: STEP’s Equity Overhang
Source: STEP Energy Services Ltd., Raymond James Ltd.
ARC Has Been Supportive of STEP’s Growth and Orderly in its Disposition
As for the likelihood of ARC flooding the market with stock or issuing blocks in rapid succession,
ARC has demonstrated itself to be both supportive of STEP’s continued growth and orderly in its
monetization of its position. As evidence of the former, we note that ARC did not append a secondary offering to STEP’s recent $50 mln equity raise. And as evidence for the latter, ARC’s
$73 mln disposition of 6.0 mln shares by way of prospectus offering in Nov-2017 has so far been
its only sale.
Keeping-Up with its Low-Debt Tradition
STEP has a demonstrable preference to maintain a safe and flexible balance sheet. We expect
that STEP will be carrying $226 mln net debt on Jun-30-18 (calculated as total debt owing less
cash, i.e. not net of deferred financing charges).
As part of the financing package to acquire Tucker, STEP secured a $330 mln revolving credit
facility, a $10 mln Canadian operating line and a US$7.5 mln US operating line. Based on our
estimate, STEP will have approximately $120 mln of notional spare capacity on its credit lines .
STEP is required to keep its Funded Debt to trailing Adj -bank EBITDA ratio to under 3.0x and its
Fixed Charge Coverage ratio to at least 1.2x. By our estimates STEP’s defined Debt -to-EBITDA ratio is less than 1.5x and its Fixed Charge Coverage ratio is greater than 6.5x – both onside with
its lenders by wide margins. We calculate these ratios pro forma the Tucker acquisition.
A visual representation of the
perceived equity overhang
ARC’s Fund 6 is scheduled to wind
down in 2020 with the potential
supply of $150 mln at today’s equity
price (we expect ARC will look for a higher price realization).
ARC’s Fund 8 has the potential to
introduce an additional $300 mln at today’s share price, though the timeline could stretch as far as 2027.

Canada Research | Page 36 of 48 STEP Energy Services Ltd.
Raymond James Ltd. | 2100 – 925 West Georgia Street | Vancouver BC Canada V6C 3L2
Appendix A: Financial Statements
Exhibit 30: Revenue, EBITDA, Earnings, and Cash Flow
Source: STEP Energy Services Ltd., Raymond James Ltd.
Exhibit 31: Per Share and Valuation Metrics
Source: STEP Energy Services Ltd., Raymond James Ltd.
2017 1Q18 2Q18E 3Q18E 4Q18E 2018E 1Q19E 2Q19E 3Q19E 4Q19E 2019E
Total Revenue ($mln) 553.2 187.6 164.7 305.7 298.8 956.8 315.3 231.1 316.8 308.4 1,171.6
Fracturing - Canada 365.6 127.6 45.1 149.0 139.4 461.1 151.9 83.2 152.1 144.6 531.8
Coiled Tubing - Canada 129.7 37.5 21.9 41.6 41.8 142.8 44.8 28.9 45.4 44.6 163.8
Fracturing - USA 65.5 80.3 80.2 226.0 80.3 80.3 80.3 80.3 321.2
Coiled Tubing/Wireline - USA 57.9 22.5 32.1 34.8 37.5 126.9 38.3 38.6 39.0 39.0 154.8
Gross Margin ($mln) 140.8 47.3 34.6 82.5 77.7 242.1 83.1 56.6 85.8 83.7 309.3
% 25% 25% 21% 27% 26% 25% 26% 25% 27% 27% 26%
EBITDA ($mln) 123.6 41.8 28.8 76.4 71.3 218.2 76.4 49.6 78.4 75.9 280.2
Well Service - CanadaFracturing - Canada (est.) 76.9 24.9 0.6 29.8 25.6 80.8 30.1 11.4 31.2 29.1 101.8
Coiled Tubing - Canada (est.) 30.8 9.3 0.6 12.1 10.4 32.4 11.8 3.6 12.3 11.8 39.4
Fracturing - USA (est.) 16.1 22.4 22.3 60.9 21.4 21.4 21.6 21.6 86.0
Coiled Tubing/Wireline - USA (est.) 15.9 7.6 11.5 12.2 12.9 44.2 13.1 13.2 13.4 13.4 53.0
EBITDA Margin (%) 22% 22% 17% 25% 24% 23% 24% 21% 25% 25% 24%
Fracturing - Canada (est.) 21% 20% 1% 20% 18% 18% 20% 14% 20% 20% 19%
Coiled Tubing - Canada (est.) 24% 25% 3% 29% 25% 23% 26% 12% 27% 26% 24%
Fracturing - USA (est.) 25% 28% 28% 27% 27% 27% 27% 27% 27%
Coiled Tubing/Wireline - USA (est.) 27% 34% 36% 35% 35% 35% 34% 34% 34% 34% 34%
EBIT (Operating Earnings) ($mln) 89.7 31.5 18.2 55.7 50.4 155.8 55.4 28.4 57.2 54.5 195.5
% 16% 17% 11% 18% 17% 16% 18% 12% 18% 18% 17%
Earnings ($mln) 65.5 21.9 13.2 39.2 35.0 109.2 38.8 18.8 41.0 39.0 137.5
% 12% 12% 8% 13% 12% 11% 12% 8% 13% 13% 12%
Cash Flow ($mln) 113.6 27.9 23.3 58.3 54.4 163.9 58.4 38.7 61.1 59.3 217.4
% 21% 15% 14% 19% 18% 17% 19% 17% 19% 19% 19%
2017 1Q18 2Q18E 3Q18E 4Q18E 2018E 1Q19E 2Q19E 3Q19E 4Q19E 2019E
Per Share Metrics
EPS (fd) $0.78 $0.29 $0.16 $0.49 $0.43 $1.38 $0.48 $0.23 $0.50 $0.48 $1.68
EPS (fd - before stock-based comp) $0.86 $0.31 $0.19 $0.51 $0.45 $1.47 $0.50 $0.25 $0.52 $0.50 $1.77
CFPS (fd) $0.00 $0.39 $0.32 $0.75 $0.70 $2.18 $0.75 $0.50 $0.77 $0.75 $2.77
BVPS (tang) $7.14 $7.48 $7.80 $8.40 $8.93 $8.93 $9.52 $9.80 $10.43 $11.02 $11.02
Price Multiples
P/E 13.2 x 7.5 x 6.1 x
P/E (before stock based comp) 12.0 x 7.0 x 5.8 x
P/CF nm 4.8 x 3.7 x
P/B (tang) 1.5 x 1.4 x 1.3 x 1.2 x 1.2 x 1.2 x 1.1 x 1.1 x 1.0 x 0.9 x 0.9 x
Enterprise Multiples
EV/EBITDA 4.6 x 3.7 x 3.1 x
EV/EBITDA (fd) 4.6 x 3.7 x 3.1 x
EV/EBIT (fd) 7.1 x 4.9 x 4.3 x
Net Inv Capital (Mkt) / Net Inv Capital (Book) 1.5 x 1.4 x 1.2 x 1.2 x 1.1 x 1.1 x 1.1 x 1.1 x 1.0 x 1.0 x 1.0 x
Dividends, Yield, Payout Ratios
Dividend per Share (annualized) $0.00 $0.00 $0.00 $0.00 $0.00 $0.00 $0.00 $0.00 $0.00 $0.00 $0.00
Yield 0.0% 0.0% 0.0% 0.0% 0.0% 0.0% 0.0% 0.0% 0.0% 0.0% 0.0%
Payout Ratio (Div / Cash Flow) 0% 0% 0%
Returns on Investment
ROE 17% 21% 20%
ROIC 18% 17% 17%
Shares Outstanding
Shares Out (basic, mln) 60.3 60.4 65.8 65.8 65.8 65.8 65.8 65.8 65.8 65.8 65.8
Shares Out (fd, mln) 73.6 73.7 79.3 79.6 79.8 79.8 80.1 80.3 80.6 80.8 80.8
Weighted Shares Out (basic, mln) 56.1 60.4 63.1 65.8 65.8 63.8 65.8 65.8 65.8 65.8 65.8
Weighted Shares Out (fd, mln) 81.7 73.6 76.5 79.4 79.7 77.3 79.9 80.2 80.4 80.7 80.3
Options Out / Basic Shares Out 7.5% 7.8% 7.5% 7.9% 8.3% 8.3% 8.7% 9.0% 9.4% 9.8% 9.8%
Option Rate (options granted / shares out) 45.6% 1.3% 1.3%

STEP Energy Services Ltd. Canada Research | Page 37 of 48
Raymond James Ltd. | 2100 – 925 West Georgia Street | Vancouver BC Canada V6C 3L2
Exhibit 32: Cash Flow and Capital Structure Summary
Source: STEP Energy Services Ltd., Raymond James Ltd.
2017 1Q18 2Q18E 3Q18E 4Q18E 2018E 1Q19E 2Q19E 3Q19E 4Q19E 2019E
Cash Sources and (Uses)
Cash Flow from Operations ($mln) 113.6 27.9 23.3 58.3 54.4 163.9 58.4 38.7 61.1 59.3 217.4
Net Working Capital Investment ($mln) (64.5) (1.3) 34.5 (50.0) (52.1) (68.8) (0.4) 72.5 (24.3) (54.8) (7.0)
Capital Spending (net, $mln) (95.4) (22.6) (351.5) (25.1) (25.1) (424.2) (25.1) (25.1) (25.1) (25.1) (100.3)
Dividends ($mln) 0.0 0.0 0.0 0.0 0.0 0.0 0.0 0.0 0.0 0.0 0.0
Cash from Financing Activities ($mln) 76.0 (3.1) 273.0 20.0 25.0 314.9 (30.0) (80.0) 0.0 0.0 (110.0)
Other (incl. Disc Ops) ($mln) 5.1 2.5 0.0 0.0 0.0 2.5 0.0 0.0 0.0 0.0 0.0
Net Change in Cash ($mln) 34.9 3.4 (20.6) 3.3 2.2 (11.8) 2.9 6.1 11.7 (20.6) 0.1
2017 1Q18 2Q18E 3Q18E 4Q18E 2018E 1Q19E 2Q19E 3Q19E 4Q19E 2019E
Net Debt
Bank Debt ($mln) 0.0 0.0 0.0 0.0 0.0 0.0 0.0 0.0 0.0 0.0 0.0
Current Portion of Long Term Debt ($mln) 5.5 7.0 7.0 7.0 7.0 7.0 7.0 7.0 7.0 7.0 7.0
Long Term Debt ($mln) 8.0 7.3 232.3 252.3 277.3 277.3 247.3 167.3 167.3 167.3 167.3
Convertible Debentures + Prefs ($mln) 0.0 0.0 0.0 0.0 0.0 0.0 0.0 0.0 0.0 0.0 0.0
Total Debt ($mln) 13.6 14.3 239.3 259.3 284.3 284.3 254.3 174.3 174.3 174.3 174.3
add: Taxes Payable (net, $mln) 0.0 6.8 6.8 6.8 6.8 6.8 6.8 6.8 6.8 6.8 6.8
less: Cash ($mln) (36.9) (40.3) (19.7) (22.9) (25.1) (25.1) (28.0) (34.1) (45.8) (25.3) (25.3)
equals: Net Debt ($mln) (23.3) (19.2) 226.4 243.2 266.0 266.0 233.0 147.0 135.2 155.8 155.8
Invested Capital
Common Shareholder Equity ($mln) 431.0 452.6 513.8 553.0 587.9 587.9 626.8 645.5 686.5 725.4 725.4
Gross Invested Capital ($mln) 444.6 466.9 753.1 812.3 872.3 872.3 881.1 819.9 860.8 899.8 899.8
Net Invested Capital ($mln) 407.8 426.6 733.4 789.4 847.1 847.1 853.0 785.7 815.0 874.5 874.5
Total Assets ($mln) 533.8 579.9 873.2 982.7 1,034.7 1,034.7 1,044.3 965.4 1,031.0 1,059.6 1,059.6
Working Capital
Working Capital ($mln) 121.0 128.1 72.9 126.2 180.4 180.4 183.8 117.4 153.4 187.5 187.5
Non-Cash Working Capital ($mln) 89.7 94.8 60.3 110.3 162.3 162.3 162.8 90.3 114.5 169.3 169.3
Capital Policy
Debt / (Debt + Equity) 3% 3% 32% 32% 33% 33% 29% 21% 20% 19% 19%
Net Debt / (Net Debt + Equity) -6% -4% 31% 31% 31% 31% 27% 19% 16% 18% 18%
Total Debt / Current EBITDA 0.1 x 0.1 x 1.1 x 1.2 x 1.3 x 1.3 x 0.9 x 0.6 x 0.6 x 0.6 x 0.6 x
Total Debt / Trailing EBITDA 0.1 x 0.1 x 1.5 x 1.4 x 1.3 x 1.3 x 1.0 x 0.6 x 0.6 x 0.6 x 0.6 x

Canada Research | Page 38 of 48 STEP Energy Services Ltd.
Raymond James Ltd. | 2100 – 925 West Georgia Street | Vancouver BC Canada V6C 3L2
Appendix B: Canadian Oilfield Services Forecasts and Assumptions
Exhibit 33: Canadian Oilfield Services Forecasts and Assumptions
Source: CAPP, Baker Hughes, Bloomberg, National Energy Board, Raymond James Ltd.
New Estimates Prior Estimates Annual Change
2011 2012 2013 2014 2015 2016 2017 2018 2019 2020 2018 2019 2020 2018 2019 2020
CDN Drilling Rigs
Total Rig Count 415 350 340 362 181 119 205 220 246 235 198 218 232 8% 11% -5%
Q1 542 532 491 500 281 147 294 267 356 321 267 292 315 -9% 34% -10%
Q2 188 177 153 200 97 46 117 107 121 113 98 126 129 -9% 13% -7%
Q3 454 339 345 377 183 112 207 236 245 234 200 217 229 14% 4% -4%
Q4 483 353 370 369 164 172 203 272 260 271 227 236 225 34% -4% 4%
Wells Drilled 12,910 11,055 11,025 11,175 5,375 4,070 7,095 7,600 7,675 7,540 7,375 7,390 7,560 7% 1% -2%
CDN Fracturing
Horsepower Demand (mln hp, est) 1.6 1.3 1.4 1.9 1.3 0.7 1.1 1.2 1.4 1.4 1.3 1.4 1.5 13% 12% 2%
Horsepower per Active Rig 3,850 3,779 4,015 4,914 6,812 6,098 5,362 5,650 5,733 6,099 6,207 6,563 6,674 5% 1% 6%
US Drilling Rigs - Onshore
Total Onshore Rig Count 1,846 1,871 1,705 1,804 948 486 855 1,086 1,204 1,198 1,094 1,206 1,206 27% 11% 0%
Oil 970 1,335 1,334 1,485 728 389 685 874 969 963 881 972 972 28% 11% -1%
Gas 876 536 371 319 220 97 170 211 235 235 213 234 234 24% 11% 0%
Energy Prices and Western Canada Production New Estimates Prior Estimates Annual Change
2011 2012 2013 2014 2015 2016 2017 2018 2019 2020 2018 2019 2020 2018 2019 2020
Natural Gas Pricing
Nat Gas - Nymex ($US/mcf) $4.03 $2.83 $3.73 $4.36 $2.66 $2.57 $3.01 $2.76 $2.25 $2.50 $2.75 $2.75 $2.75 -8% -18% 11%
Nat Gas - AECO (C$/mcf) $3.63 $2.32 $3.22 $4.65 $2.95 $2.19 $2.15 $1.33 $1.10 $1.55 $1.47 $1.95 $2.25 -38% -17% 41%
Crude and Liquids PricingCrude - WTI (US$/bbl) $95.11 $94.15 $98.05 $93.25 $49.22 $43.50 $51.00 $70.00 $70.00 $65.00 $63.00 $60.00 $60.00 37% 0% -7%
Crude - Edmonton Par (C$/bbl) $95.35 $86.29 $93.47 $100.95 $57.20 $53.00 $62.75 $81.75 $81.00 $75.25 $74.25 $72.00 $72.25 30% -1% -7%
Condensate (C$/bbl) $104.35 $100.79 $105.63 $99.90 $61.43 $56.07 $67.31 $90.29 $89.70 $83.98 $81.83 $79.66 $79.92 34% -1% -6%
NGL Barrel (excl Ethane) (C$/bbl) $61.09 $46.62 $51.05 $53.91 $19.35 $21.91 $34.85 $37.77 $36.24 $33.66 $34.57 $32.21 $32.31 8% -4% -7%
Foreign ExchangeUSD / CAD $1.02 $1.01 $0.95 $0.88 $0.75 $0.76 $0.77 $0.79 $0.80 $0.80 $0.79 $0.78 $0.78 2% 2% -1%
Production Mix
Liquid Hydrocarbons
Light Crude (mbbl/d) 556 647 685 711 654 566 589 629 637 655 599 594 605 7% 1% 3%
Condensate (mbbl/d) 142 139 151 185 222 264 327 399 435 458 399 433 453 22% 9% 5%
Heavy Conventional (mbbl/d) 426 453 456 462 430 403 404 401 401 401 401 409 417 -1% 0% 0%
Natural Gas Liquids (mbbl/d) 190 204 209 214 217 246 247 246 249 256 -1% 1% 3%
Total (mbbl/d) 1,313 1,443 1,501 1,572 1,523 1,479 1,567 1,674 1,723 1,770 7% 3% 3%
Gas Hydrocarbons
Natural Gas (mmcf/d) 13,441 13,287 13,179 13,414 13,891 14,764 14,863 14,776 14,989 15,413 15,289 15,176 15,242 -1% 1% 3%
Ethane (mmcfe/d) 1,389 1,344 1,396 1,337 1,366 1,419 1,428 1,420 1,440 1,481 -1% 1% 3%
Total (mmcfe/d) 14,830 14,631 14,575 14,751 15,257 16,183 16,292 16,196 16,430 16,894
Total (boe/d) 3,785 3,881 3,930 4,031 4,066 4,176 4,283 4,374 4,461 4,586
Conventional Producer Cash Flow - RJL Estimated New Estimates Prior Estimates Annual Change
2011 2012 2013 2014 2015 2016 2017 2018 2019 2020 2018 2019 2020 2018 2019 2020
Conventional Revenue ($bln) $60.3 $53.4 $62.5 $71.9 $42.2 $36.8 $44.8 $52.9 $53.0 $54.0 $48.7 $51.5 $54.7 18% 0% 2%
Unhedged Cash Flows ($bln) $39.2 $32.2 $38.4 $46.3 $22.4 $20.3 $27.2 $33.1 $32.1 $32.3 $27.5 $29.0 $31.2 22% -3% 1%
Unhedged Dry Gas Netback ($/mcfe) $2.08 $0.97 $1.57 $2.66 $1.25 $1.01 $0.94 $0.12 -$0.13 $0.24 nm nm nm
Unhedged Liquids Netback ($/bbl) $58.25 $51.45 $54.93 $56.10 $27.83 $26.80 $37.68 $52.84 $52.38 $47.68 40% -1% -9%

STEP Energy Services Ltd. Canada Research | Page 39 of 48
Raymond James Ltd. | 2100 – 925 West Georgia Street | Vancouver BC Canada V6C 3L2
Appendix C: Canadian Oilfield Services Comparables
Exhibit 34: Canadian Oilfield Services Comparables
Source: S&P Capital IQ, Raymond James Ltd.
Company Closing Stock Mkt Cap Debt/Name Symbol Price Rating ($mln) $/sh Yield 17E 18E 19E 17E 18E 19E 17E 18E 19E EBITDA 17E 18E 19E
Contract Drillers
Ensign ESI $5.90 MP 3 $925 $0.48 8.1% ($0.21) ($0.83) ($0.47) $202 $225 $265 8.0x 7.3x 5.9x 3.7x -2% -8% -5%
Precision PD $4.24 SB 1 $1,243 $0.00 0.0% ($0.40) ($0.21) $0.17 $312 $423 $602 9.5x 6.9x 4.4x 5.1x -6% -3% 3%
Trinidad TDG $1.82 OP 2 $498 $0.00 0.0% ($0.25) ($0.20) $0.13 $122 $173 $262 8.0x 6.0x 3.7x 5.5x -5% -5% 3%
Western WRG $1.07 OP 2 $99 $0.00 0.0% ($0.48) ($0.25) ($0.14) $36 $47 $56 8.6x 6.7x 5.1x 6.3x -9% -6% -4%
Pressure Pumpers
Calfrac CFW $5.77 OP 2 $829 $0.00 0.0% ($0.20) $0.36 $0.73 $185 $300 $374 9.2x 5.8x 4.3x 3.9x -3% 9% 16%
STEP STEP $10.36 SB 1 $682 $0.00 0.0% $0.78 $1.38 $1.68 $124 $218 $280 4.6x 3.7x 3.1x 1.5x 17% 21% 20%
Trican TCW $2.94 SB 1 $984 $0.00 0.0% $0.01 $0.11 $0.25 $163 $195 $249 4.2x 3.7x 2.4x 0.3x 0% 3% 7%##
Ancillary Wellsite Svcs
Essential ESN $0.57 OP 2 $81 $0.00 0.0% $0.01 $0.06 $0.16 $22 $31 $52 4.1x 2.8x 1.3x 0.9x 1% 5% 13%
Strad SDY $1.55 SB 1 $89 $0.00 0.0% ($0.12) ($0.04) $0.09 $25 $30 $35 4.4x 3.2x 2.3x 0.5x -5% -2% 4%
Blended Production/Midstream/Wellsite Svcs
CDN Energy Svcs CEU $4.65 SB 1 $1,250 $0.03 0.6% $0.17 $0.18 $0.32 $153 $168 $221 10.6x 9.9x 7.2x 2.4x 10% 11% 15%
Enerflex EFX $14.06 OP 2 $1,241 $0.34 2.4% $1.16 $1.29 $1.39 $254 $295 $317 5.9x 5.2x 4.5x 1.5x 10% 10% 10%
Mullen MTL $14.68 MP 3 $1,522 $0.60 4.1% $0.51 $0.68 $0.95 $182 $189 $219 10.7x 10.3x 8.7x 2.7x 7% 7% 10%
Secure SES $7.28 SB 1 $1,197 $0.26 3.5% ($0.02) $0.05 $0.22 $157 $176 $220 9.0x 8.7x 7.0x 2.0x 2% 4% 7%
Workforce Accommodations
Black Diamond BDI $3.38 OP 2 $186 $0.00 0.0% ($1.59) ($0.03) $0.06 $28 $35 $40 10.1x 7.1x 0.0x 2.9x -32% -3% -1%
Horizon North HNL R R R R R R R R R R R R R R R R R R
Median ($0.07) $0.06 $0.19 8.3x 6.3x 4.4x 2.5x -1% 3% 7%
4.6x
EPS (fd) EBITDA EV/EBITDA
0.5x
0.3x
1.5x
0.7x
0.4x
1.3x
ROEDividends Current
1.0x
2.8x
R
1.2x
P/B (tang.)
0.6x
0.9x
0.9x
1.5x
2.3x

Canada Research | Page 40 of 48 STEP Energy Services Ltd.
Raymond James Ltd. | 2100 – 925 West Georgia Street | Vancouver BC Canada V6C 3L2
Appendix D: Management & Board of Directors
Regan Davis is the President and Chief Executive Officer and a Director of STEP Energy
Services. Mr. Davis is the co-founder of STEP and has held the CEO position since inception;
he was appointed President in December 2013. Prior to his tenure at STEP, Mr. Davis held various positions within the energy industry over the past 25 years including CEO and
president roles at Flexpipe Systems Ltd. and Severo Energy Ltd. Mr Davis is also the chairman
of the Board of Directors for CORE Linepipe. Mr. Davis is a certified director from the
Institute of Corporate Directors.
Steve Glanville is the Vice President, Operations and the Chief Operating Officer of STEP Energy Services. Mr. Glanville is a co-founder of STEP and has held the COO position since
inception; he was appointed to the vice-president operations position in November 2013.
Prior to his time at STEP, Mr. Glanville amassed over 20 years’ of experience in the oil and gas
industry and held management positions within Schlumberger, Sanjel and Calfrac. His prior experience was heavily focused on coiled tubing operations.
Robert W. Sprinkhuysen is the Vice President, Finance and Chief Financial Officer of STEP Energy Services. Mr. Sprinkhuysen has held his current position with STEP since September
2011. Prior to joining STEP, Mr Spinkhuysen held the CFO position at Technicoil Corp. (2008-
2011) and held various finance related roles at Enerflex Ltd. Mr. Spinkhuysen holds the
Chartered Accountant designation.
Douglas Freel is the Chairman of the Board of Directors of STEP Energy Services. Mr. Freel
has served as a director since inception in March 2011. Mr. Freel is a managing director with ARC Financial Corp, and has over 20 years’ experience in the oilfield services industry in both
investment and engineering capacities. Mr. Freel holds a Master of Business Administration
from the University of Toronto.
Jeremy Gackle is a member of the Board of Directors of STEP Energy Services. Mr. Gackle
has served as a director since STEP’s inception in March 2011. My Gackle is a Vice President focused on the oilfield services industry with Arc Financial Corp. Mr. Gackle holds the
Chartered Financial Analyst designation and is a certified director from the Institute of
Corporate Directors.
Jason Skehar is a member of the Board of Directors of STEP Energy Services. Mr. Skehar has
served as a director since June 2012. Mr. Skehar currently holds the position of President and
Chief Exectutive Officer of Bonavista Energy Corp. Mr. Skehar has accumulated over 18 years of E&P experience in western Canada and has held various operational, managerial and
executive roles over his career.
Michael Kelly is a member of the Board of Directors of STEP Energy Services. Mr. Kelly has
served as a director since March 2014. Mr. Kelly has over 20 years’ experience in the energy
industry, and has held various executive roles, including 16 years as an executive at Trican
Well Service where he held the Vice President, Finance and Chief Financial Officer position for 12 years. Mr. Kelly holds the Chartered Accountant designation and is a certified director
from the Institute of Corporate Directors.
James Harbilas is a member of the Board of Directors of STEP Energy Services. Mr. Harbilas
has served as a director since May 2017. Mr. Harbilas has held various finance related roles
over his career including Vice President, Finance and Chief Financial Officer at Fortis Alberta Inc., and senior management roles at SNC-Lavalin and AltaLink. Mr Harbilas currently holds
the position of Exectutive Vice President and Chief Financial Officer at Enerflex. Mr. Harbilas
holds the Chartered Accountant designation and the Ordre des Comptables Agrees du
Quebec and Financial Executive Institute.
Donna Garbutt is a member of the Board of Directors of STEP Energy Services. Ms. Garbutt
has served as a director since May 2017. Ms. Garbutt has amassed over 25 years’ experience in the Energy industry, 20 years of which spent with Schlumberger where she held various
roles including President of Schlumberger Canada. Ms. Garbutt currently serves as the Chief
Exectutive Officer of Maxxam Analytics Corp. Ms. Garbutt holds a Master of Business
Administration from Athabasca University.

STEP Energy Services Ltd. Canada Research | Page 41 of 48
Raymond James Ltd. | 2100 – 925 West Georgia Street | Vancouver BC Canada V6C 3L2
Risks
i. The demand and pricing of fracturing services and coiled tubing services used in oil and
gas well completions is highly dependent on the level of industry acti vity for oil and gas exploration and production companies. The level of industry activity is a function of a
number of factors that are outside the control of STEP Energy Services including, but not
limited to, oil and gas commodity prices, the price of we ll construction inputs, the cost of exploring for and developing resources, and the ability of project oriented resource
companies to raise equity capital or debt financing.
ii. STEP Energy Services (“STEP”) is highly susceptible to drilling cycles in North America.
iii. STEP’s ability to grow its business is highly reliant on its ability to purchase and crew new fracturing and coiled tubing equipment both cost effectively and in a timely manner
– this ability can be constrained in times of high industry demand.
iv. Fracturing is a competitive industry which is subject to the potential for new entrants,
which could hinder STEP’s ability to maintain or grow its market share, and/or render its
services profitably.
v. STEP operates in both Canada and the US which exposes it to risks relating to, but not
limited to, foreign currency fluctuations, changes in tax codes and changes to
legal/regulatory structures.
vi. Attracting and retaining a sufficient number of well -qualified personnel can be
challenging during times of high industry activity, and could have an adverse effect on STEP’s profitability.

Canada Research | Page 42 of 48 STEP Energy Services Ltd.
Raymond James Ltd. | 2100 – 925 West Georgia Street | Vancouver BC Canada V6C 3L2
Company Citations
Company Name Ticker Exchange Currency Closing Price RJ Rating RJ Entity
ARC Resources Ltd. ARX TSX C$ 13.16 2 RJ Ltd.
Baker Hughes, a GE company BHGE NYSE US$ 33.07 S RJ & Associates
Black Diamond Group Limited BDI TSX C$ 3.61 2 RJ Ltd.
Bonavista Energy Corporation BNP TSX C$ 1.41 4 RJ Ltd. Calfrac Well Services CFW TSX C$ 5.78 2 RJ Ltd.
Canadian Natural Resources Limited CNQ TSX C$ 42.64 2 RJ Ltd.
CES Energy Solutions Corp. CEU TSX C$ 4.73 1 RJ Ltd.
Crew Energy Inc. CR TSX C$ 2.00 2 RJ Ltd. Enerflex Ltd. EFX TSX C$ 13.81 2 RJ Ltd.
Ensign Energy Services Inc. ESI TSX C$ 6.01 3 RJ Ltd.
Essential Energy Services Ltd. ESN TSX C$ 0.55 2 RJ Ltd.
Halliburton Company HAL NYSE US$ 45.71 1 RJ & Associates Horizon North Logistics Inc. HNL TSX C$ 2.70 R RJ Ltd.
Mammoth Energy Services, Inc. TUSK NASDAQ US$ 40.07 2 RJ & Associates
Mullen Group Ltd. MTL TSX C$ 14.67 3 RJ Ltd. Precision Drilling Corporation PD TSX C$ 4.28 1 RJ Ltd.
ProPetro Holding Corp. PUMP NYSE US$ 15.89 1 RJ & Associates
Royal Dutch Shell RDSa.AS AMS € 28.98 3 RJEE/RJFI
RPC, Inc. RES NYSE US$ 14.09 2 RJ & Associates Schlumberger Limited SLB NYSE US$ 65.55 3 RJ & Associates
Secure Energy Services Inc. SES TSX C$ 7.32 1 RJ Ltd.
Storm Resources Ltd. SRX TSX C$ 2.64 2 RJ Ltd.
Strad Energy Services Ltd. SDY TSX C$ 1.55 1 RJ Ltd. Trican Well Service Ltd. TCW TSX C$ 2.94 1 RJ Ltd.
Trinidad Drilling Ltd. TDG TSX C$ 1.83 2 RJ Ltd.
Western Energy Services Corp. WRG TSX C$ 1.02 2 RJ Ltd.
Whitecap Resources Inc. WCP TSX C$ 8.33 1 RJ Ltd.
Notes: Prices are as of the most recent close on the indicated exchange and may not be in US$. See Disclosure section for r ating definitions. Stocks that do not trade on a U.S. national exchange may not be registered for sale in all U.S. states. NC=not covered.

STEP Energy Services Ltd. Canada Research | Page 43 of 48
Raymond James Ltd. | 2100 – 925 West Georgia Street | Vancouver BC Canada V6C 3L2
IMPORTANT INVESTOR DISCLOSURES Raymond James & Associates (RJA) is a FINRA member firm and is responsible for the preparation and distribution of rese arch created in
the United States. Raymond James & Associates is located at The Raymond James Financial Center, 880 Carillon Parkway, St. Pet ersburg, FL 33716, (727) 567-1000. Non-U.S. affiliates, which are not FINRA member firms, include the following ent ities which are responsible for
the creation and distribution of research in their respective areas; In Canada, Raymond James Ltd. (RJL), Suite 2100, 925 Wes t Georgia
Street, Vancouver, BC V6C 3L2, (604) 659-8200; In Europe, Raymond James Euro Equities, SAS, 40, rue La Boetie, 75008, Paris, France, +33
1 45 61 64 90, and Raymond James Financial International Ltd., Broadwalk House, 5 Appold Street, London, England EC2A 2AG, + 44 203 798 5600.
This document is not directed to, or intended for distribution to or use by, any person or entity that is a citizen or resident of or located in any locality, state, country, or other jurisdiction where such distribution, publication, availability or use would be contra ry to law or
regulation. The securities discussed in this document may not be eligible for sale in some jurisdictions. This research is not an offer to
sell or the solicitation of an offer to buy any security in any jurisdiction where such an offer or solicitation would be ill egal. It does not constitute a personal recommendation nor does it take into account the particular investment objectives, financial situations, or needs
of individual clients. Information in this report should not be construed as advice designed to meet the individual objectiv es of any
particular investor. Investors should consider this report as only a single factor in making their investment decision. Consultation with
your investment advisor is recommended. Past performance is not a guide to future performance, future returns are not guaranteed, and a loss of original capital may occur.
The information provided is as of the date above and subject to change, and it should not be deemed a recommendation to buy o r sell any security. Certain information has been obtained from third-party sources we consider reliable, but we do not guarantee that such
information is accurate or complete. Persons within the Raymond James family of companies may have information that is not av ailable
to the contributors of the information contained in this publication. Raymond James, including affiliates and employees, may execute
transactions in the securities listed in this publication that may not be consistent with the ratings appearing in this publi cation.
With respect to materials prepared by Raymond James Ltd. (“RJL”), all expressions of opinion reflect the judgment of the Research
Department of RJL, or its affiliates, at this date and are subject to change. RJL may perform investment banking or other ser vices for, or solicit investment banking business from, any company mentioned in this document.
Raymond James (“RJ”) research reports are disseminated and available to RJ’s retail and institutional clients simultaneously via electronic
publication to RJ's internal proprietary websites (RJ Investor Access & RJ Capital Markets). Not all research reports are directly distributed
to clients or third-party aggregators. Certain research reports may only be disseminated on RJ's internal proprietary websites; however
such research reports will not contain estimates or changes to earn ings forecasts, target price, valuation, or investment or suitability rating. Individual Research Analysts may also opt to circulate published research to one or more clients electronically. This electronic
communication distribution is discretionary and i s done only after the research has been publically disseminated via RJ’s internal
proprietary websites. The level and types of communications provided by Research Analysts to clients may vary depending on va rious
factors including, but not limited to, the client’s individual preference as to the frequency and manner of receiving communications from Research Analysts. For research reports, models, or other data available on a particular security, please contact your RJ Sal es
Representative or visit RJ Investor Access or RJ Capital Markets.
Links to third-party websites are being provided for information purposes only. Raymond James is not affiliated with and does not
endorse, authorize, or sponsor any of the listed websites or their respective sponsors. Raymond James is not responsible for the content
of any third-party website or the collection or use of information regarding any website’s users and/or members.
In the event that this is a compendium report (i.e., covers 6 or more subject companies), Raymond James Ltd. may choose to provide
specific disclosures for the subject companies by reference. To access these disclosures, clients should refer to: http://www.raymondjames.ca (click on Equity Capital Markets / Equity Research / Research Disclosures) or call toll‐free at 1‐800‐667‐
2899.
ANALYST INFORMATION
Analyst Compensation: Equity research analysts and associates at Raymond James are compensated on a salary and b onus system.
Several factors enter into the compensation determination for an analyst, including i) research quality and overall productiv ity, including success in rating stocks on an absolute basis and relative to the local exchange composite Index and/or a sector index, ii) recognition from
institutional investors, iii) support effectiveness to the institutional and retail sales forces and traders, iv) commissions generated in
stocks under coverage that are attributable to the analyst’s efforts, v) net re venues of the overall Equity Capital Markets Group, and vi)
compensation levels for analysts at competing investment dealers.

Canada Research | Page 44 of 48 STEP Energy Services Ltd.
Raymond James Ltd. | 2100 – 925 West Georgia Street | Vancouver BC Canada V6C 3L2
The views expressed in this report accurately reflect the personal views of the analyst(s) covering the subject securities. N o part of said
person's compensation was, is, or will be directly or indirectly related to the specific recommendations or views contained i n this research report. In addition, said analyst has not received compensation from any subject company in the last 1 2 months.
RATINGS AND DEFINITIONS
Raymond James Ltd. (Canada) definitions: Strong Buy (SB1) The stock is expected to appreciate and produce a total return of at least
15% and outperform the S&P/TSX Composite Index over the next six months. Outperform (MO2) The stock is expected to appreciate and outperform the S&P/TSX Composite Index over the next twelve months. Market Perform (MP3) The stock is expected to perform
generally in line with the S&P/TSX Composite Index over the next twelve months and is pot entially a source of funds for more highly
rated securities. Underperform (MU4) The stock is expected to underperform the S&P/TSX Composite Index or its sector over th e next
six to twelve months and should be sold.
Raymond James & Associates (U.S.) definitions: Strong Buy (SB1) Expected to appreciate, produce a total return of at least 15%, and
outperform the S&P 500 over the next six to 12 months. For higher yielding and more conservative equities, such as REITs and certain MLPs, a total return of at least 15% is expected to be realized over the next 12 months. Outperform (MO2) Expected to appreciate and
outperform the S&P 500 over the next 12-18 months. For higher yielding and more conservative equities, such as REITs and certain MLPs,
an Outperform rating is used for securities where we are comfortable with the relative safety of the dividend and expect a total return modestly exceeding the dividend yield over the next 12-18 months. Market Perform (MP3) Expected to perform generally in line with the
S&P 500 over the next 12 months. Underperform (MU4) Expected to underperform the S&P 500 or its sector over the next six to 1 2
months and should be sold. Suspended (S) The rating and price target have been suspended temporarily. This action may be du e to
market events that made coverage impracticable, or to comply with applicable regulations or firm policies in certain circumst ances, including when Raymond James may be providing investment banking services to the company. The previous rating and price ta rget are
no longer in effect for this security and should not be relied upon.
Raymond James Europe (Raymond James Euro Equities SAS & Raymond James Financial International Limited) rating definitions:
Strong Buy (1) Expected to appreciate, produce a total return of at least 15%, and outperform the Stoxx 600 over the next 6 to 12
months. Outperform (2) Expected to appreciate and outperform the Stoxx 600 over the next 12 months. Market Perform (3) Expe cted to
perform generally in line with the Stoxx 600 over the next 12 months. Underperform (4) Expected to underperform the Stoxx 600 or its sector over the next 6 to 12 months. Suspended (S) The rating and target price have been suspended temporarily. This action m ay be due
to market events that made coverage impracticable, or to comply with applicable regulations or firm policies in certain circumstances,
including when Raymond James may be providing investment banking services to the company. The previous rating and target pric e are
no longer in effect for this security and should not be relied upon.
In transacting in any security, investors should be aware that other securities in the Raymond James research coverage univer se might
carry a higher or lower rating. Investors should feel free to contact t heir Financial Advisor to discuss the merits of other available investments.
Suitability Ratings (SR)
Medium Risk/Income (M/INC) Lower to average risk equities of companies with sound financials, consistent earnings, and dividend
yields above that of the S&P 500. Many securities in this category are structured with a focus on providing a consistent dividend or return
of capital.
Medium Risk/Growth (M/GRW) Lower to average risk equities of companies with sound financials, consistent earnings growth, the
potential for long-term price appreciation, a potential dividend yield, and/or share repurchase program.
High Risk/Income (H/INC) Medium to higher risk equities of companies that are structured with a focus on providing a meaningful
dividend but may face less predictable earnings (or losses), more leveraged balance sheets, rapidly changing market dynamics, financial and competitive issues, higher price volatility (beta), and potential risk of principal. Securities of companies in this cate gory may have a
less predictable income stream from dividends or distributions of capital.
High Risk/Growth (H/GRW) Medium to higher risk equities of companies in fast growing and competitive industries, with less
predictable earnings (or losses), more leveraged balance s heets, rapidly changing market dynamics, financial or legal issues, higher price
volatility (beta), and potential risk of principal.
High Risk/Speculation (H/SPEC) High risk equities of companies with a short or unprofitable operating history, limited or less predictable
revenues, very high risk associated with success, significant financial or legal issues, or a substantial risk/loss of princi pal.
Note that Raymond James Ltd. (RJL) has developed a proprietary algorithm for risk rating individual securitie s. The algorithm utilizes data
from multiple vendors, and all data is refreshed at least monthly. Accordingly, Suitability Ratings are updated monthly. The Suitability Rating shown on this report is current as of the report’s published date. In the event t hat a Suitability Rating changes after the published
date, the new rating will not be reflected in research materials until the analyst publishes a subsequent report.

STEP Energy Services Ltd. Canada Research | Page 45 of 48
Raymond James Ltd. | 2100 – 925 West Georgia Street | Vancouver BC Canada V6C 3L2
RATING DISTRIBUTIONS
Coverage Universe Rating Distribution* Investment Banking Distribution
RJL RJA RJEE/RJFI RJL RJA RJEE/RJFI
Strong Buy and Outperform (Buy) 71% 56% 50% 38% 22% 0%
Market Perform (Hold) 25% 39% 36% 13% 10% 0%
Underperform (Sell) 4% 5% 14% 22% 5% 0%
* Columns may not add to 100% due to rounding.
RAYMOND JAMES RELATIONSHIP DISCLOSURES
Raymond James Ltd. or its affiliates expects to receive or intends to seek compensation for investment banking services from all companies under research coverage within the next three months.
Company Name Disclosure
STEP Energy Services Ltd. Raymond James Ltd. has received compensation for investment banking services within the last 12
months with respect to STEP.
Raymond James Ltd - the analyst and/or associate has viewed the material operations of STEP.
STOCK CHARTS, TARGET PRICES, AND VALUATION METHODOLOGIES
Valuation Methodology: The Raymond James methodology for assigning ratings and target prices includes a number of qualitative and
quantitative factors including an assessment of industry size, structure, business trends and overall attractiveness; managem ent
effectiveness; competition; visibility; financial condition, and expected total return, among other factors. These factors are subject to
change depending on overall economic conditions or industry- or company-specific occurrences.
Target Prices: The information below indicates our target price and rating changes for STEP stock over the past three years.
Valuation Methodology: We value STEP Energy Services Ltd. on a comparative basis to historical EV / EBITDA multiples and take into account growth potential, financial leverage and market liquidity.
RISK FACTORS
General Risk Factors: Following are some general risk factors that pertain to the businesses of the subject companies and the projected
target prices and recommendations included on Raymond James research: (1) Industry fundamentals with respect to customer dema nd
or product / service pricing could change and adversely impact expected revenues and earnings; (2) Issues relating to major competitors

Canada Research | Page 46 of 48 STEP Energy Services Ltd.
Raymond James Ltd. | 2100 – 925 West Georgia Street | Vancouver BC Canada V6C 3L2
or market shares or new product expectations could change investor attitudes toward the sector or this stock; (3) Unforeseen
developments with respect to the management, financial condition or accounting policies or practices could alter the prospective valuation.
Risks - STEP Energy Services Ltd. i. The demand and pricing of fracturing services and coiled tubing services used in oil a nd gas well completions is highly
dependent on the level of industry activity for oil and gas exploration and production companies. The level of industry activ ity is a
function of a number of factors that are outside the control of STEP Energy Services inc luding, but not limited to, oil and gas commodity prices, the price of well construction inputs, the cost of exploring for and developing resources, and the ability of project oriented
resource companies to raise equity capital or debt financing.
ii. STEP Energy Services (“STEP”) is highly susceptible to drilling cycles in North America.
iii. STEP’s ability to grow its business is highly reliant on its ability to purchase and crew new fracturing and coiled tubing
equipment both cost effectively and in a timely manner – this ability can be constrained in times of high industry demand.
iv. Fracturing is a competitive industry which is subject to the potential for new entrants, which could hinder STEP’s ability to
maintain or grow its market share, and/or render its services profitably.
v. STEP operates in both Canada and the US which exposes it to risks relating to, but not limited to, foreign currency fluctuati ons, changes in tax codes and changes to legal/regulatory structures.
vi. Attracting and retaining a sufficient number of well-qualified personnel can be challenging during times of high industry activity, and could have an adverse effect on STEP’s profitability.
Additional Risk and Disclosure information, as well as more information on the Raym ond James rating system and suitability
categories, is available for Raymond James at rjcapitalmarkets.com/Disclosures/index and for Raymond James Limited at
www.raymondjames.ca/researchdisclosures.
INTERNATIONAL DISCLOSURES
FOR CLIENTS IN THE UNITED STATES:
Any foreign securities discussed in this report are generally not eligible for sale in the U.S. unless they are listed on a U .S. exchange. This report is being provided to you for informational purposes only and does not represent a solicitation for the purchase or sale of a security
in any state where such a solicitation would be illegal. Investing in securities of issuers organized outside of the U.S., i ncluding ADRs, may
entail certain risks. The securities of non-U.S. issuers may not be registered with, nor be subject to the reporting requirements of, the
U.S. Securities and Exchange Commission. There may be limited information available on such securities . Investors who have received this report may be prohibited in certain states or other jurisdictions from purchasing the securities mentioned in this repor t. Please ask
your Financial Advisor for additional details and to determine if a particular securi ty is eligible for purchase in your state.
Raymond James Ltd. is not a U.S. broker‐dealer and therefore is not governed by U.S. laws, rules or regulations applicable to U.S. broker‐dealers. Consequently, the persons responsible for the content of this publ ication are not licensed in the U.S. as research analysts in
accordance with applicable rules promulgated by the U.S. Self Regulatory Organizations.
Any U.S. Institutional Investor wishing to effect trades in any security should contact Raymond James (USA) Ltd., a U.S. broker‐dealer
affiliate of Raymond James Ltd.
FOR CLIENTS IN THE UNITED KINGDOM:
For clients of Raymond James Financial International Limited (RJFI): This document and any investment to which this document relates is intended for the sole use of the persons to whom it is addressed, being persons who are Eligible Counterparties or Profess ional Clients
as described in the FCA rules or persons described i n Articles 19(5) (Investment professionals) or 49(2) (High net worth companies,
unincorporated associations etc) of the Financial Services and Markets Act 2000 (Financial Promotion) Order 2005 (as amended) or any other person to whom this promotion may lawfully be directed. It is not intended to be distributed or passed on, directly or indirectly, to
any other class of persons and may not be relied upon by such persons and is therefore not intended for private individuals o r those who
would be classified as Retail Clients.
For clients of Raymond James Investment Services, Ltd.: This report is for the use of professional investment advisers and managers and
is not intended for use by clients.
For purposes of the Financial Conduct Authority requirements, this research report is classified as independent with respect to conflict of
interest management. RJFI, and Raymond James Investment Services, Ltd. are authorised and regulated by the Financial Conduct
Authority in the United Kingdom.

STEP Energy Services Ltd. Canada Research | Page 47 of 48
Raymond James Ltd. | 2100 – 925 West Georgia Street | Vancouver BC Canada V6C 3L2
FOR CLIENTS IN FRANCE:
This document and any investment to which this document relates is intended for the sole use of the persons to whom it is add ressed, being persons who are Eligible Counterparties or Professional Clients as described in “Code Monétaire et Financier” and Rè glement
Général de l’Autorité des Marchés Financiers. It is not intended to be distributed or passed on, directly or indirectly, to a ny other class of
persons and may not be relied upon by such persons and is therefore not intended for private individuals or those who would be
classified as Retail Clients.
For clients of Raymond James Euro Equities: Raymond James Euro Equities is authorised and regulated by the Autorité de Contrôle
Prudentiel et de Résolution and the Autorité des Marchés Financiers.
For institutional clients in the European Economic Area (EEA) outside of the United Kingdom: This document (and any attachments or
exhibits hereto) is intended only for EEA institutional clients or others to whom it may lawfully be submitted.
Proprietary Rights Notice: By accepting a copy of this report, you acknowledge and agree as follows:
This report is provided to clients of Raymond James only for your personal, noncommercial use. Except as expressly authorized by
Raymond James, you may not copy, reproduce, transmit, sell, display, distribute, publish, broadcast, circulate, modify, disseminate or commercially exploit the information contained in this report, in printed, electronic or any other form, in any manner, witho ut the prior
express written consent of Raymond James. You also agree not to use the information provided in this report for any unlawful purpose.
This report and its contents are the property of Raymond James and are protected by applicable copyright, trade secret or oth er
intellectual property laws (of the United States and other countries). United States law, 17 U.S.C. Sec.501 et seq, provides for civil and
criminal penalties for copyright infringement. No copyright claimed in incorporated U.S. government works.
Additional information is available upon request. This document may not be reprinted without permission.
RJL is a member of the Canadian Investor Protection Fund. ©2018 Raymond James Ltd.

Canada Research | Page 48 of 48 STEP Energy Services Ltd.
Raymond James Ltd. | 2100 – 925 West Georgia Street | Vancouver BC Canada V6C 3L2
RAYMOND JAMES LTD. CANADIAN INSTITUTIONAL EQUITY TEAM WWW.RAYMONDJAMES.CA EQUITY RESEARCH HEAD OF EQUITY RESEARCH
DARYL SWETLISHOFF, CFA 604.659.8246
CONSUMER
CONSUMER & RETAIL KENRIC TYGHE, MBA 416.777.7188 JOANNA CHMIEL (ASSOCIATE) 416.777.7060
ENERGY
OIL & GAS ENERGY SERVICES, HEAD OF ENERGY RESEARCH ANDREW BRADFORD, CFA 403.509.0503 MICHAEL SHAW, CFA (SR ASSOCIATE) 403.509.0534
OIL & GAS PRODUCERS KURT MOLNAR 403.221.0414 GORDON STEPPAN, CFA (SR ASSOCIATE) 403.221.0411
OIL & GAS PRODUCERS JEREMY MCCREA, CFA 403.509.0518 RAHUL PANDEY (ASSOCIATE) 403.509.0562
SR. OIL & GAS PRODUCERS | ENERGY INFRASTRUCTURE CHRIS COX, CFA 416.777.7175 GEORGE HUANG (ASSOCIATE) 416.777.7180
POWER & UTILITIES DAVID QUEZADA, CFA 604.659.8257
FINANCIAL SERVICES
DIVERSIFIED FINANCIALS BRENNA PHELAN, CFA, CPA, CA 416.777.7042
FOREST PRODUCTS
FOREST PRODUCTS DARYL SWETLISHOFF, CFA 604.659.8246 BRYAN FAST, CFA (SR ASSOCIATE) 604.659.8262
HEALTHCARE
BIOTECHNOLOGY, HEALTHCARE DAVID NOVAK 416.777.7029
INDUSTRIAL & TRANSPORTATION
INDUSTRIAL | TRANSPORTATION, HEAD OF INDUSTRIAL RESEARCH BEN CHERNIAVSKY 604.659.8244 MARK BEGERT (ASSOCIATE) 604.659.8380
INFRASTRUCTURE & CONSTRUCTION FREDERIC BASTIEN, CFA 604.659.8232
TRANSPORTATION | CHEMICALS & AGRIBUSINESS STEVE HANSEN, CFA, CPA, CMA 604.659.8208 KANISH PAWAR (ASSOCIATE) 604.659.8238
MINING
BASE & PRECIOUS METALS, HEAD OF MINING RESEARCH BRIAN MACARTHUR, CFA 416.777.4914 CHRIS LAW (ASSOCIATE) 416.777.7144
BASE & PRECIOUS METALS FAROOQ HAMED, CA 416.777.7117 BRANDON THROOP (SR ASSOCIATE) 416.777.7165
PRECIOUS METALS TARA HASSAN, P.ENG 604.659.8064 JEREMY POON (ASSOCIATE) 604.659.8294
REAL ESTATE
REAL ESTATE & REITS KEN AVALOS, MBA 727.567.1756 JOHANN RODRIGUES 416.777.7189
TECHNOLOGY & COMMUNICATIONS
TECHNOLOGY STEVEN LI, CFA 416.777.4918 ANSHU DEORA (ASSOCIATE) 416.777.6414
EQUITY RESEARCH PUBLISHING SENIOR SUPERVISORY ANALYST
HEATHER HERRON 403.509.0509 HEAD OF PUBLISHING | SUPERVISORY ANALYST
CYNTHIA LUI 604.659.8210
TYLER BOS (SUPERVISORY ANALYST | EDITOR) 647.624.1596 INDER GILL (RESEARCH EDITOR) 604.659.8202 KATE MAJOR (RESEARCH PRINCIPAL | EDITOR) 416.777.7173 ASHLEY RAMSAY (SUPERVISORY ANALYST |EDITOR) 604.376.2291
INSTITUTIONAL EQUITY SALES HEAD OF SALES
MIKE WESTCOTT (HEAD OF EQUITIES) 416.777.4935 NICOLE SVEC, CFA (SALES MANAGER US EQUITIES) 416.777.4942 SEAN BOYLE (SALES MANAGER CANADIAN EQUITIES) 416.777.4927
TORONTO (CAN 1.888.601.6105 | USA 1.800.290.4847)
SEAN BOYLE 416.777.4927 JEFF CARRUTHERS, CFA 416.777.4929 RICHARD EAKINS 416.777.4926 JONATHAN GREER 416.777.4930 DAVE MACLENNAN 416.777.4934 ROBERT MILLS, CFA 416.777.4945 NICOLE SVEC, CFA (US EQUITIES) 416.777.4942 NEIL WEBER 416.777.4931 MICHELLE MARGUET (ECM INSTITUTIONAL MARKETING) 416.777.4951 ORNELLA BURNS (ASSISTANT) 416.777.4928 SATBIR CHATRATH (ASSISTANT, CURRENTLY ON LEAVE) 416.777.4915 ARIANA PICCIONE (ASSISTANT) 416.777.4915
VANCOUVER (1.800.667.2899)
SCOT ATKINSON, CFA 604.659.8225 BRADY PIMLOTT 604.659.8220 NICK POCRNIC 604.659.8230 TERRI MCEWAN (ECM CONFERENCES & SPECIAL EVENTS) 604.659.8228
MONTREAL (514.350.4450 | 1.866.350.4455)
JOHN HART 514.350.4462 DAVID MAISLIN, CFA 514.350.4460 TANYA HATCHER (ECM SALES, TRADING & EVENTS) 514.350.4458
LONDON
ADAM WOOD 0.207.426.5612
INSTITUTIONAL EQUITY TRADING
CO-HEAD OF TRADING BOB MCDONALD, CFA 604.659.8222 ANDREW FOOTE, CFA 416.777.4924
TORONTO (CANADA 1.888.601.6105 | USA 1.800.290.4847) MARK ARMSTRONG 416.777.4981 PAM BANKS 416.777.4923 OLIVER HERBST 416.777.4947 ANDY HERRMANN 416.777.4937 MATT MALOWNEY 416.777.4941 ERIC MUNRO, CFA 416.777.4983 PETER MASON (ECM TRADING SYSTEMS) 416.777.7195
VANCOUVER (1.800.667.2899) NAV CHEEMA 604.659.8224 FRASER JEFFERSON 604.659.8218 DEREK ORAM 604.659.8223
MONTREAL (514.350.4450 | 1.866.350.4455) JOE CLEMENT 514.350.4470 PATRICK SANCHE 514.350.4465
INSTITUTIONAL EQUITY OFFICES
Calgary Suite 4250 525 8th Avenue SW Calgary, AB T2P 1G1 403.509.0500
Montreal Suite 3000 1800 McGill College Montreal, PQ H3A 3J6 514.350.4450 Toll Free: 1.866.350.4455
Vancouver Suite 2100 925 West Georgia Street Vancouver, BC V6C 3L2 604.659.8000 Toll Free: 1.800.667.2899
Toronto Suite 5400, Scotia Plaza 40 King Street West Toronto, ON M5H 3Y2 416.777.4900 Toll Free Canada: .888.601.6105 Toll Free USA: 1.800.290.4847
International Headquarters The Raymond James Financial Center 880 Carillon Parkway St.Petersburg, FL USA 33716 727.567.1000