Ratio analysis of apple and china mobile
15
Apple China Mobile Assignment No 1 Financial analysis of Apple and China Mobiles Group Members Shankar Lal Submitted To: Mr Asim Shaikh (Lecturer Sukkur IBA) Pirah Mahar Date : 6 th dec, 2013 Abrar Hyder
Transcript of Ratio analysis of apple and china mobile
Apple China Mobile
Assignment No 1 Financial analysis of Apple and China Mobiles
Group Members
Shankar Lal Submitted To: Mr Asim Shaikh (Lecturer Sukkur IBA)
Pirah Mahar Date : 6th dec, 2013
Abrar Hyder

Financial accounting II Assignment financial analysis of companies 1
Table of content page no
1. Executive summary……………………………………………………………………………...2
2. Introduction………………………………………………………………………………………..2
2.1 Apple’s introduction………………………………………………………………………..2
2.2 china mobile’s introduction ………………………………………………….…………...4
3.1 Difference between IFRS and GAAP…………………………………………………………5
4. Financial analysis…………………………………………………………….…………………..6
4.1 Common size income statement analysis………………………………….……………6
4.2 Selling and general administrative expense…………………………………………….7
4.3 common size balance sheet analysis………………………….………………………...7
5 Ratios analysis…………………………………………………………………………………….8
5.1 Current ratio………………………………………………………………………………....8
5.2 Quick ratio…………………………………………………………………………………...8
5.3 working capital………………………………………………………………………………9
5.4 Debt ratio…………………………………………………………………………………….9
5.5 Gross profit rate……………………………………………………………………..……...10
5.6 operating expense ratio …………………………………………………………………..10
5.7 Operating income……………………………………………………………………….....10
5.8 Earning per share………………………………………………………………………….11
5.9 Price earing ratio …………………………………………………………………………..11
5.10 ROA ……………………………………………………………………………………….11
5.11 ROE ……………………………………………………………………………………….12
5.12 Receivable turn over rate and days to collect receivable…………………………….12
6. Company’s analysis on securities…………………………………………………………....13
6.1 Apple………………………………………………………………………………………..13
6.1.1 share price…………………………………………………………………………….13
6.1.2 Dividends……………………………………………………………………………..13
6.2 China mobile’s share price and dividends………………………………………………...13
6.3 Combine analysis of both companies on share prices and dividends……………….…14
6.4 shares issued by each company……………………………………………………………14
7. References……………………………………………………………………………………..14

Financial accounting II Assignment financial analysis of companies 2
1.1 Executive summary This financial analysis report height two highly profile competitor, apple and china mobile inc in order to considered performance and financial health. Overall company strategies were reviewed and considered along with financial analysis to come to conclusion for recommendation of investment. The report introduce to give an overview to the mobile industry the financial analysis cover both companies common size income statement and balance sheet and various financial statement ratios from 2011 to year 2012 Apple and china both well known companies competiting in ever evolving and expending industry apple mobiles is more mature industry but now a day’s china is also move very fast in mobile technology industry Both companies offers mobile products and other services ,apple has slightly more diverse portfolio and is bit more brand recognizes as trusted and quality company .the marginal operating performance on an average apples was stronger than china mobile operating performance. Apples mobiles has higher sales revenue and dividend paid out along with strong reputable brand name make it an attractive investment , but china mobiles revolutionary process thinking along with its growth potential make a good case for investors to persue.
2) Introduction In fact, mobile phones have significant history regarding to its development. At first, the
mobile phones technology was used in trains throughout Europe during the 1950s. Then it was getting more common as radio communication in taxicabs and emergency vehicles in US. Most of the mobile phones had great size, weight and these were highly cost. It was started to become popular until FCC approved it in 1982.
Speaking of the function of the first generation of mobile phones, there was only an analog transmission cell phone or 1G. The whole protocol transmission the phones used was determined by the FCC regulations based on the bandwidth usage. Thus, the FCC gives the restriction regarding the frequencies allowed to be used by certain licensed company The development of the mobile phones was occurring at the same pace in all over the world especially in Japan and Europe. In 1979, cell phones were firstly launched in Japan, far long before the mobile phone entered the US market. Finally, the mobile phones were launched in US by the American company, Motorola. Moreover, the Japan and Europe also took the 3G phone standards faster than US in 2000s. Now a days there are two leading industry within telecommunication technology namely china mobiles and apple.
2.1 Apple’s Introduction
The Company designs, manufactures and markets mobile communication and media devices, personal networking solutions, and third-party digital content and applications. The Company’s products and services include iPhone, iPad, Mac, iPod, Apple TV, a portfolio of consumer and professional software applications, the iOS and OS X operating systems, iCloud, and a variety of accessory, service and support offerings. The Company also sells and delivers digital content and applications through the iTunes Store, App StoreSM, iBookstoreSM, and Mac App Store. The Company sells its products worldwide through its retail stores, online stores, and direct sales force, as well as through third-party cellular network carriers, wholesalers, retailers, and value-added resellers. In addition, the Company sells a variety of third-party iPhone, iPad, Mac

Financial accounting II Assignment financial analysis of companies 3
and iPod compatible products, including application software, and various accessories, through its online and retail stores. The Company sells to consumers; small and mid-sized businesses (“SMB”); and education, enterprise and government customers. The Company’s fiscal year is the 52 or 53-week period that ends on the last Saturday of September. The Company currently holds rights to patents and copyrights relating to certain aspects of its iPhone, iPad, Mac and iPod devices, peripherals, software and services. The Company has registered or has applied for trademarks and service marks in the U.S. and a number of foreign countries. Although the Company believes the ownership of such patents, copyrights, trademarks and service marks is an important factor in its business and that its success does depend in part on the ownership thereof, the Company relies primarily on the innovative skills technical competence and marketing abilities of its personnel. The Company has historically experienced higher net sales in its first fiscal quarter compared to other quarters in its fiscal year due in part to holiday seasonal demand. Actual and anticipated timing of new product introductions by the Company can also significantly impact the level of net sales experienced by the Company in any particular quarter. However, neither historical seasonal patterns nor historical patterns of product introductions should be considered reliable indicators of the Company’s future net sales or financial performance. Because of the following factors, as well as other factors affecting the Company’s financial condition and operating results, past financial performance should not be considered to be a reliable indicator of future performance, and investors should not use historical trends to anticipate results or trends in future periods Global economic conditions could materially adversely affect the Company. Global markets for the Company’s products and services are highly competitive and subject to rapid technological change, and the Company may be unable to compete effectively in these markets. Future operating results depend upon the Company’s ability to obtain components in sufficient quantities The Company depends on component and product manufacturing and logistical services provided by outsourcing partners, many of whom are located outside of the U.S.
Apple has $145 billion in cash, more than enough for the $100 billion cash return programmed it announced . However, most of its money sits in overseas accounts, and the company does not plan to bring it to the U.S. unless the federal corporate tax rate is lowered. With interest rates so low, it makes sense for Apple to borrow a large sum of money rather than pay a big tax bill’s it is, the $17 billion bond offering is the biggest ever the Journal said Apple borrowed $5.5 billion for 10 years at 2.415 per cent Other yields included 0.511 per cent for three-year bonds and 30-year bonds at 3.883 per cent. The Journal said the rates were comparable to what a
Company with a triple A credit rating could command. Ratings agencies Standard & Poor’s and Moody’s last week rated Apple at one rung below their highest rating for issuers. Moody’s said only four non- financial companies have the highest rating, and Apple doesn’t deserve it because it could adopt an even more shareholder-friendly policy, and its policy of not repatriating cash could force it to borrow more.
Based on latest financial disclosure Apple Inc has 899.74 M of shares currently outstanding. This is 109.79% higher than that of Consumer Goods sector, and 2.88% higher than that of Electronic Equipment industry, The Shares Outstanding for all stocks is 198.81% lower than the firm. Apple mobiles use gaap accounting principle for making financial statement
Financial accounting II Assignment financial analysis of companies 4
2.2 China mobile’s introduction
The company is one of the largest mobile telecommunications companies by market
capitalization today, and it was named as such in March 2011 It is listed on both the NYSE and the Hong Kong stock exchange. As of July 2013, China Mobile is the world's largest mobile phone operator by subscribers with about 740 million. A state-owned enterprise directly controlled by the government of the People's Republic of China and also a public company that is listed on the NYSE and the Hong Kong stock exchanges, China Mobile has dominated Chinese mobile services since its inception. As of 2010 China Mobile controls the vast majority of its domestic mobile services market with a 70% market share. China Unicom and China Telecom have 20% and 10% shares, respectively. ncorporated in 1997 as China Telecom (Hong Kong) Limited, China Mobile was born from the 1999 break-up of China Telecom. (This company continues to provide mobile services, however. China Mobile has historically held a greater share of the rural market than competitors. By 2006, its network had expanded to provide reception to 97% of the Chinese population, and the company has since seen a sustained stream of new, rural mobile customers. China Mobile also offers information services targeted at the rural market, including the Agricultural Information Service, which allows a variety of activities to take place through the use of mobile phones and the Internet. These include the sale and purchase of agricultural products, access to market prices for produce, wire transfers, bank China Mobile bank with drawl and payment. China Mobile expanded overseas in 2007 with the purchase of Paktel in Pakistan launching the ZONG brand there a year later. In February 2013, China Mobile together with Vodafone has participated in bidding for one of the two newly opened Myanmar Mobile licences. China Mobile (Hong Kong), the listed branch of the country's dominant mobile telecom operator, will issue corporate bonds worth 5 billion Yuan (US$603.8 million) in July.
These 10-year bonds will be used to pay part of bank loans the company borrowed last year to acquire mobile businesses in seven provinces from its parent company. The company borrowed 12.5 billion Yuan (US$1.51 billion) from eight banks to fund the acquisitions in October. Repayments worth 5 billion Yuan are due this month, with the remaining 7.5 billion Yuan (US$903 million) due in November 2003. The company's floating rate bonds will be sold to domestic institutional and individual investors only. They are expected to start trading in July. As an overseas-listed company, China Mobile (HK) will issue the bonds through its wholly owned domestic subsidiary Guangdong Mobile Communication Co.
China International Capital Corp was picked as the underwriter for the issue.
"The bond issue will result in a saving of interest payments by the group,'' said Wang Xiaochu, chairman of the company, in a statement. China mobiles financial statement based on GAAP principle
As discussed earlier that one company uses the GAAP and other uses the IFRS there comparison is given below to make it more clearly about companies financial statement.
Financial accounting II Assignment financial analysis of companies 5
3.1 Diffrence between IFRS and GAAP
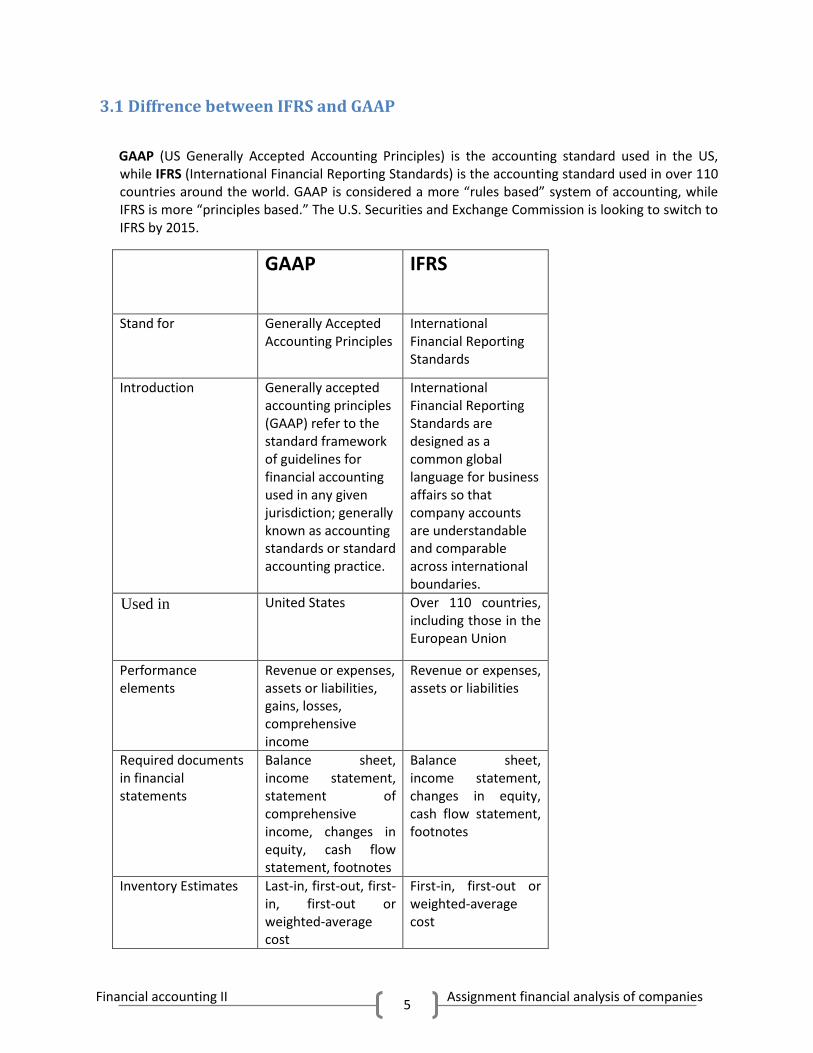
GAAP (US Generally Accepted Accounting Principles) is the accounting standard used in the US, while IFRS (International Financial Reporting Standards) is the accounting standard used in over 110 countries around the world. GAAP is considered a more “rules based” system of accounting, while IFRS is more “principles based.” The U.S. Securities and Exchange Commission is looking to switch to IFRS by 2015.
GAAP IFRS
Stand for Generally Accepted Accounting Principles
International Financial Reporting Standards
Introduction Generally accepted accounting principles (GAAP) refer to the standard framework of guidelines for financial accounting used in any given jurisdiction; generally known as accounting standards or standard accounting practice.
International Financial Reporting Standards are designed as a common global language for business affairs so that company accounts are understandable and comparable across international boundaries.
Used in
United States Over 110 countries, including those in the European Union
Performance elements
Revenue or expenses, assets or liabilities, gains, losses, comprehensive income
Revenue or expenses, assets or liabilities
Required documents in financial statements
Balance sheet, income statement, statement of comprehensive income, changes in equity, cash flow statement, footnotes
Balance sheet, income statement, changes in equity, cash flow statement, footnotes
Inventory Estimates Last-in, first-out, first-in, first-out or weighted-average cost
First-in, first-out or weighted-average cost
Financial accounting II Assignment financial analysis of companies 6
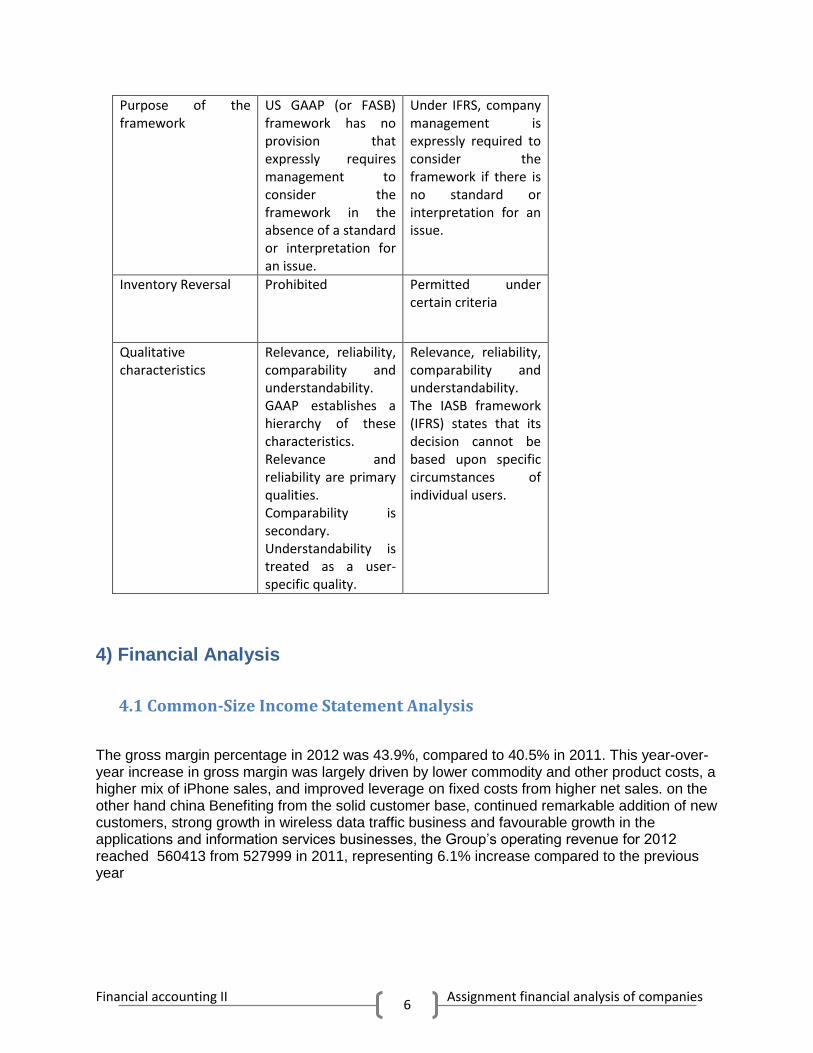
Purpose of the framework
US GAAP (or FASB) framework has no provision that expressly requires management to consider the framework in the absence of a standard or interpretation for an issue.
Under IFRS, company management is expressly required to consider the framework if there is no standard or interpretation for an issue.
Inventory Reversal Prohibited Permitted under certain criteria
Qualitative characteristics
Relevance, reliability, comparability and understandability. GAAP establishes a hierarchy of these characteristics. Relevance and reliability are primary qualities. Comparability is secondary. Understandability is treated as a user-specific quality.
Relevance, reliability, comparability and understandability. The IASB framework (IFRS) states that its decision cannot be based upon specific circumstances of individual users.
4) Financial Analysis
4.1 Common-Size Income Statement Analysis
The gross margin percentage in 2012 was 43.9%, compared to 40.5% in 2011. This year-over-year increase in gross margin was largely driven by lower commodity and other product costs, a higher mix of iPhone sales, and improved leverage on fixed costs from higher net sales. on the other hand china Benefiting from the solid customer base, continued remarkable addition of new customers, strong growth in wireless data traffic business and favourable growth in the applications and information services businesses, the Group’s operating revenue for 2012 reached 560413 from 527999 in 2011, representing 6.1% increase compared to the previous year

Financial accounting II Assignment financial analysis of companies 7
4.2 Selling, General and Administrative (“SG&A”) Expense
SG&A expense increased $2.4 billion or 32% during 2012 compared to 2011 and $2.1 billion or 38% during 2011 compared to 2010. These increases were primarily due to the Company’s continued expansion of its Retail segment, increased headcount and related expenses, higher spending on professional services, marketing and advertising programs, and increased variable costs associated with the overall growth of the Company’s net sales.mean while china experianced ncreased by RMB12.5 billion compared to the previous year. In order to consolidate the leading network advantages,effectively support its customer and business growth, the Group reasonably increased its investments in network optimization, system support, research and development
Over all net income for apple shows the increasment from 2011 to 2012 while chinas net income decrease
4.3 Common-Size Balance Sheet Analysis
The common-size balance sheet of apple reflects a current assets to total assets 2 year average of 51320.5and shows a short term liabilities to total liabilities and shareholders’ equity 2 average of 33256% covering years 2011 to 2012. appless current assets and current liabilities both increased from 2011 to 2012
like wise china mobiles current assets reflects total assets of 2 year average of 414639 a short term liabilities to total liabilities and shareholders’equity average of 12276 covering year 2011 to 2012.urrent assets and current liabilities both increased from 2011 to 2012. The operating expenses in 2012 were approximately RMB409.9 billion, representing an increase of 8.8% compared to the previous year. The Group’s profitability continued to be in a leading position in the industry. Profit attributable to equity shareholders was RMB129.3 billion, representing an increase of 2.7% compared to the previous year. The margin of profit attributable to equity shareholders reached 23.1%. EBITDA was RMB253.6 billion, representing an increase of 1.0% compared to the previous year, with EBITDA margin reaching 45.3% Basic EPS was RMB6.43, representing an increase of 2.6% compared to the previous year
But in apple case Total other income and expense increased $107 million or 26 % to $522 million during 2012 compared to $415 million and $155 million in 2011 and 2010, respectively. The year-over-year increase in other income and expense during 2012 was due primarily to higher interest and dividend income on the Company’s higher cash, cash equivalents and marketable securities balances, partially offset by higher premium expenses on foreign exchange contracts .The Company’s effective tax rates were approximately 25.2%, 24.2%, and 24.4% for 2012, 2011, and 2010, respectively. The Company’s effective rates for these periods differ from the statutory federal income tax rate of35% due primarily to certain undistributed foreign earnings for which no U.S. taxes are provided because such earnings are intended to be indefinitely reinvested outside the U.S.
The china The Group maintained its robust cash flow as a result of its stable business growth, scientifically refined cost control, rational and efficient capital expenditure as well as these significantly prominent economies of scale. In 2012, the Group’s net cash
Financial accounting II Assignment financial analysis of companies 8
generated from its operating activities and free cash flow were approximately RMB230.7 billion and RMB103.3 billion respectively. The total debt to total book capitalization ratio (with total book capitalization representing the sum of total debt and total equity attributable to equity shareholders) and interest coverage multiple (ratio of profit before interest and tax to finance costs) remained at a sound level. The Company currently has a corporate credit rating of Aa3/Outlook Positive from Moody’s Investor Service and AA-/Outlook Stable from Standard & Poor’s, equivalent to China’s sovereign credit rating respectively.
In apple As of September 29, 2012, the Company had $121.3 billion in cash, cash equivalents and marketable securities, an increase of $39.7 billion or 49% from September 24, 2011. The principal components of this net increase was the cash generated by operating activities of $50.9 billion, which was partially offset by payments for acquisition of property, plant and equipment of $8.3 billion, payments for acquisition of intangible assets of $1.1 billion and payments of dividends and dividend equivalent rights of $2.5 billion. As of September 29, 2012, the Company had two customers that represented 10% or more of total trade receivables, one of which accounted for 14% and the other 10%. As of September 24, 2011, there were no customers that accounted for 10% or more of the Company’s total trade receivables. The Company’s cellular network carriers accounted for 66% and 52% of trade receivables as of September 29, 2012 and September 24, 2011, respectively. The additions and write-offs to the Company’s allowance for doubtful accounts during 2012, 2011 and 2010 were not significance.
5) Ratio analysis
Note: All data is given in the excel sheet i.e balance sheet income statement
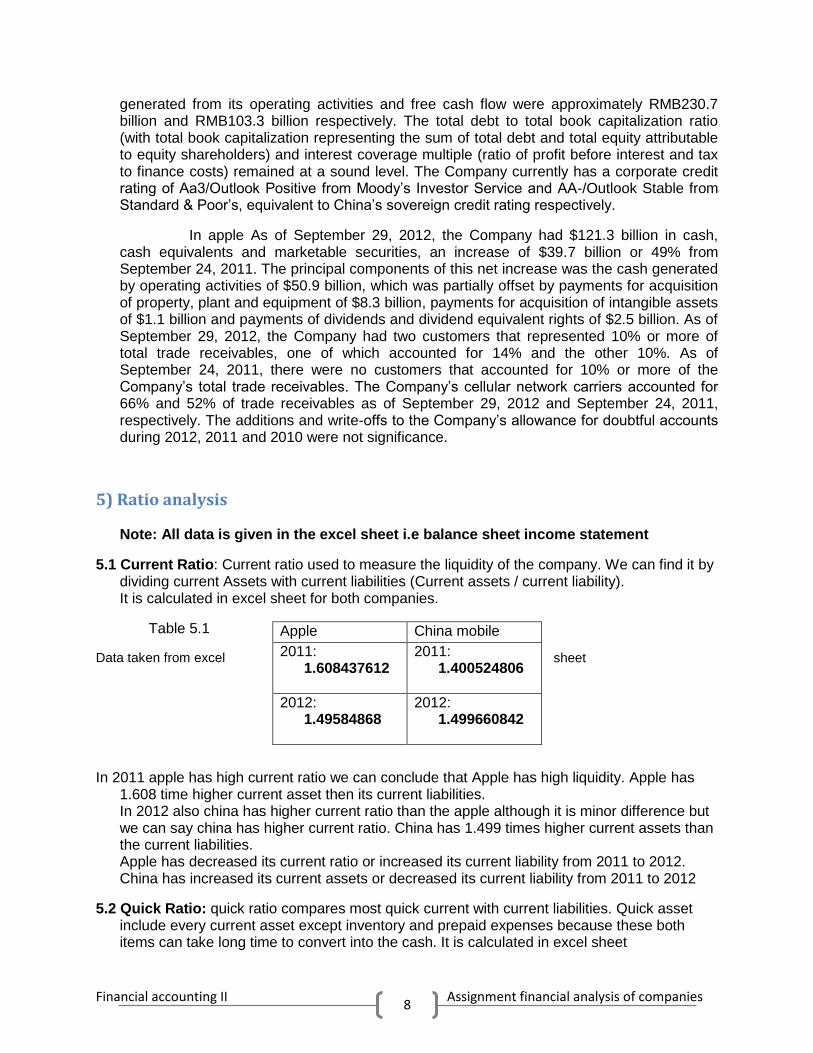
5.1 Current Ratio: Current ratio used to measure the liquidity of the company. We can find it by dividing current Assets with current liabilities (Current assets / current liability). It is calculated in excel sheet for both companies.
Table 5.1
Data taken from excel sheet
In 2011 apple has high current ratio we can conclude that Apple has high liquidity. Apple has 1.608 time higher current asset then its current liabilities. In 2012 also china has higher current ratio than the apple although it is minor difference but we can say china has higher current ratio. China has 1.499 times higher current assets than the current liabilities. Apple has decreased its current ratio or increased its current liability from 2011 to 2012. China has increased its current assets or decreased its current liability from 2011 to 2012
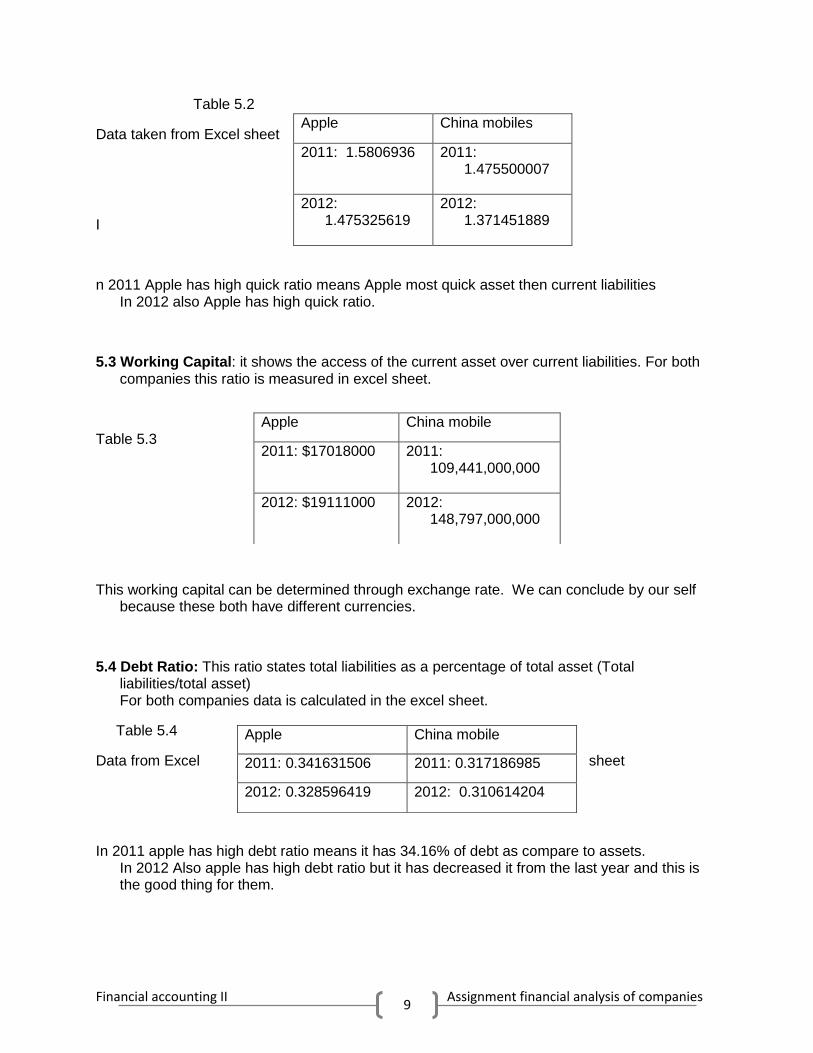
5.2 Quick Ratio: quick ratio compares most quick current with current liabilities. Quick asset include every current asset except inventory and prepaid expenses because these both items can take long time to convert into the cash. It is calculated in excel sheet
Apple China mobile
2011: 1.608437612
2011: 1.400524806
2012: 1.49584868
2012: 1.499660842
Financial accounting II Assignment financial analysis of companies 9
Table 5.2
Data taken from Excel sheet
I
n 2011 Apple has high quick ratio means Apple most quick asset then current liabilities In 2012 also Apple has high quick ratio.
5.3 Working Capital: it shows the access of the current asset over current liabilities. For both companies this ratio is measured in excel sheet.
Table 5.3
This working capital can be determined through exchange rate. We can conclude by our self because these both have different currencies.
5.4 Debt Ratio: This ratio states total liabilities as a percentage of total asset (Total liabilities/total asset) For both companies data is calculated in the excel sheet.
Table 5.4
Data from Excel sheet
In 2011 apple has high debt ratio means it has 34.16% of debt as compare to assets. In 2012 Also apple has high debt ratio but it has decreased it from the last year and this is the good thing for them.
Apple China mobiles
2011: 1.5806936 2011: 1.475500007
2012: 1.475325619
2012: 1.371451889
Apple China mobile
2011: $17018000
2011: 109,441,000,000
2012: $19111000
2012: 148,797,000,000
Apple China mobile
2011: 0.341631506 2011: 0.317186985
2012: 0.328596419 2012: 0.310614204
Financial accounting II Assignment financial analysis of companies 10
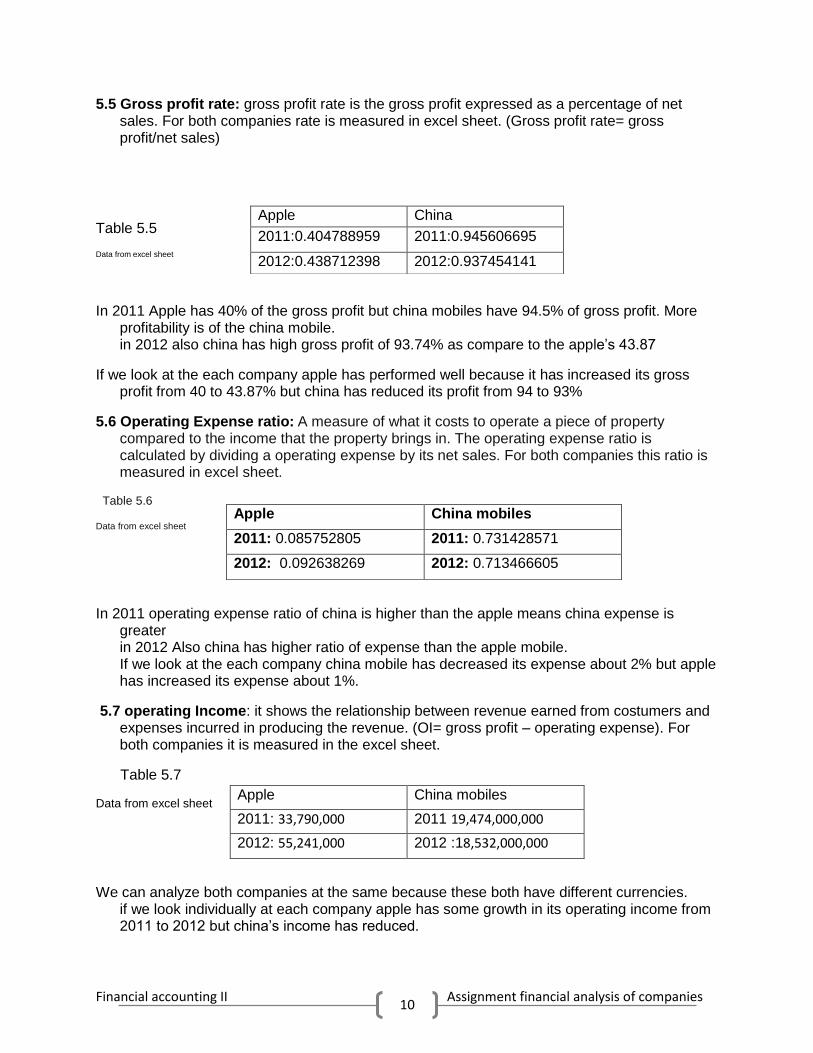
5.5 Gross profit rate: gross profit rate is the gross profit expressed as a percentage of net sales. For both companies rate is measured in excel sheet. (Gross profit rate= gross profit/net sales)
Table 5.5
Data from excel sheet
In 2011 Apple has 40% of the gross profit but china mobiles have 94.5% of gross profit. More profitability is of the china mobile. in 2012 also china has high gross profit of 93.74% as compare to the apple’s 43.87
If we look at the each company apple has performed well because it has increased its gross profit from 40 to 43.87% but china has reduced its profit from 94 to 93%
5.6 Operating Expense ratio: A measure of what it costs to operate a piece of property compared to the income that the property brings in. The operating expense ratio is calculated by dividing a operating expense by its net sales. For both companies this ratio is measured in excel sheet.
Table 5.6
Data from excel sheet
In 2011 operating expense ratio of china is higher than the apple means china expense is greater in 2012 Also china has higher ratio of expense than the apple mobile. If we look at the each company china mobile has decreased its expense about 2% but apple has increased its expense about 1%.
5.7 operating Income: it shows the relationship between revenue earned from costumers and expenses incurred in producing the revenue. (OI= gross profit – operating expense). For both companies it is measured in the excel sheet.
Table 5.7
Data from excel sheet
We can analyze both companies at the same because these both have different currencies. if we look individually at each company apple has some growth in its operating income from 2011 to 2012 but china’s income has reduced.
Apple China
2011:0.404788959 2011:0.945606695
2012:0.438712398 2012:0.937454141
Apple China mobiles
2011: 0.085752805 2011: 0.731428571
2012: 0.092638269 2012: 0.713466605
Apple China mobiles
2011: 33,790,000 2011 19,474,000,000
2012: 55,241,000 2012 :18,532,000,000
Financial accounting II Assignment financial analysis of companies 11
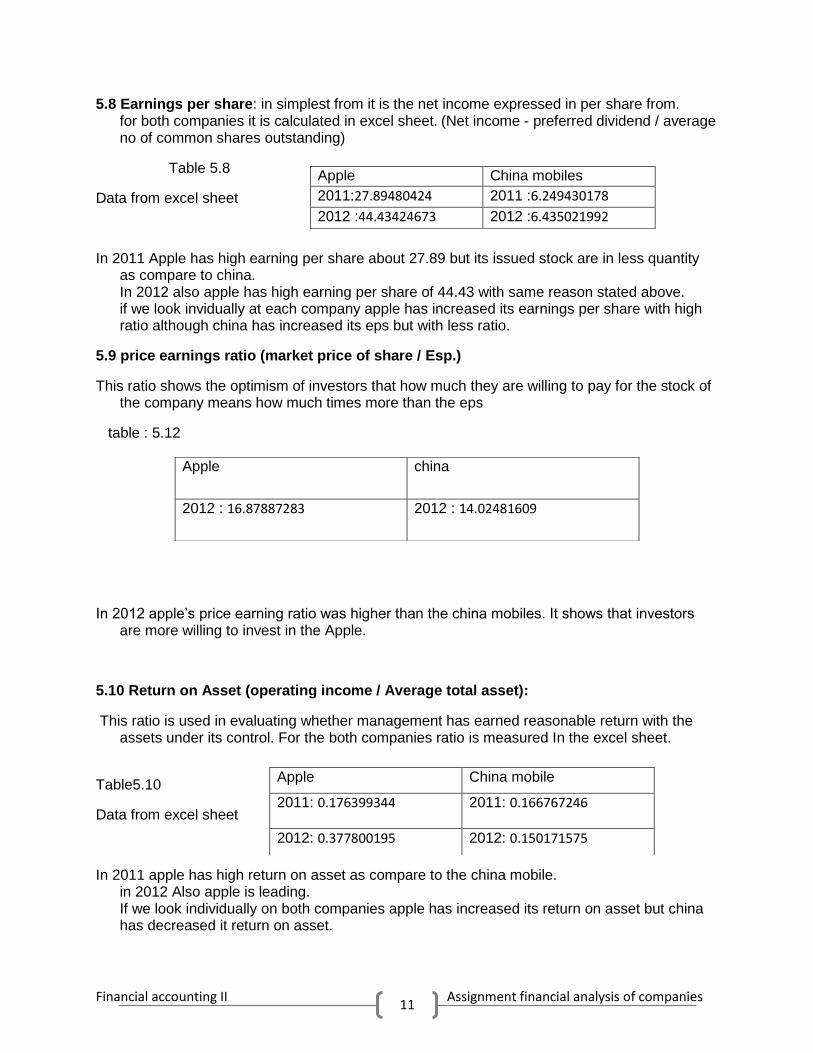
5.8 Earnings per share: in simplest from it is the net income expressed in per share from. for both companies it is calculated in excel sheet. (Net income - preferred dividend / average no of common shares outstanding)
Table 5.8
Data from excel sheet
In 2011 Apple has high earning per share about 27.89 but its issued stock are in less quantity as compare to china. In 2012 also apple has high earning per share of 44.43 with same reason stated above. if we look invidually at each company apple has increased its earnings per share with high ratio although china has increased its eps but with less ratio.
5.9 price earnings ratio (market price of share / Esp.)
This ratio shows the optimism of investors that how much they are willing to pay for the stock of the company means how much times more than the eps
table : 5.12
In 2012 apple’s price earning ratio was higher than the china mobiles. It shows that investors are more willing to invest in the Apple.
5.10 Return on Asset (operating income / Average total asset):
This ratio is used in evaluating whether management has earned reasonable return with the assets under its control. For the both companies ratio is measured In the excel sheet.
Table5.10
Data from excel sheet
In 2011 apple has high return on asset as compare to the china mobile. in 2012 Also apple is leading. If we look individually on both companies apple has increased its return on asset but china has decreased it return on asset.
Apple China mobiles
2011:27.89480424 2011 :6.249430178
2012 :44.43424673 2012 :6.435021992
Apple china
2012 : 16.87887283
2012 : 14.02481609
Apple China mobile
2011: 0.176399344
2011: 0.166767246
2012: 0.377800195 2012: 0.150171575
Financial accounting II Assignment financial analysis of companies 12
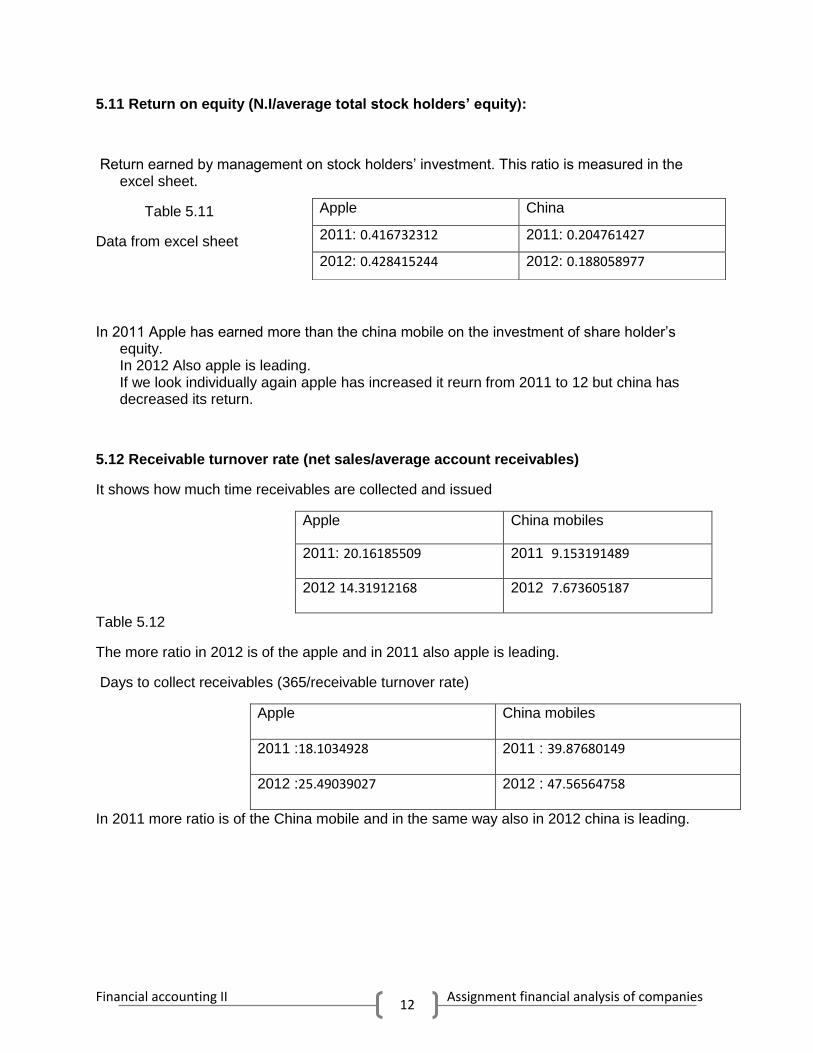
5.11 Return on equity (N.I/average total stock holders’ equity):
Return earned by management on stock holders’ investment. This ratio is measured in the excel sheet.
Table 5.11
Data from excel sheet
In 2011 Apple has earned more than the china mobile on the investment of share holder’s equity. In 2012 Also apple is leading. If we look individually again apple has increased it reurn from 2011 to 12 but china has decreased its return.
5.12 Receivable turnover rate (net sales/average account receivables)
It shows how much time receivables are collected and issued
Apple China mobiles
2011: 20.16185509 2011 9.153191489
2012 14.31912168 2012 7.673605187
Table 5.12
The more ratio in 2012 is of the apple and in 2011 also apple is leading.
Days to collect receivables (365/receivable turnover rate)
Apple China mobiles
2011 :18.1034928 2011 : 39.87680149
2012 :25.49039027 2012 : 47.56564758
In 2011 more ratio is of the China mobile and in the same way also in 2012 china is leading.
Apple China
2011: 0.416732312 2011: 0.204761427
2012: 0.428415244 2012: 0.188058977
Financial accounting II Assignment financial analysis of companies 13
6) Company’s analysis on the securities (bonds, stocks)
6.1 Apple
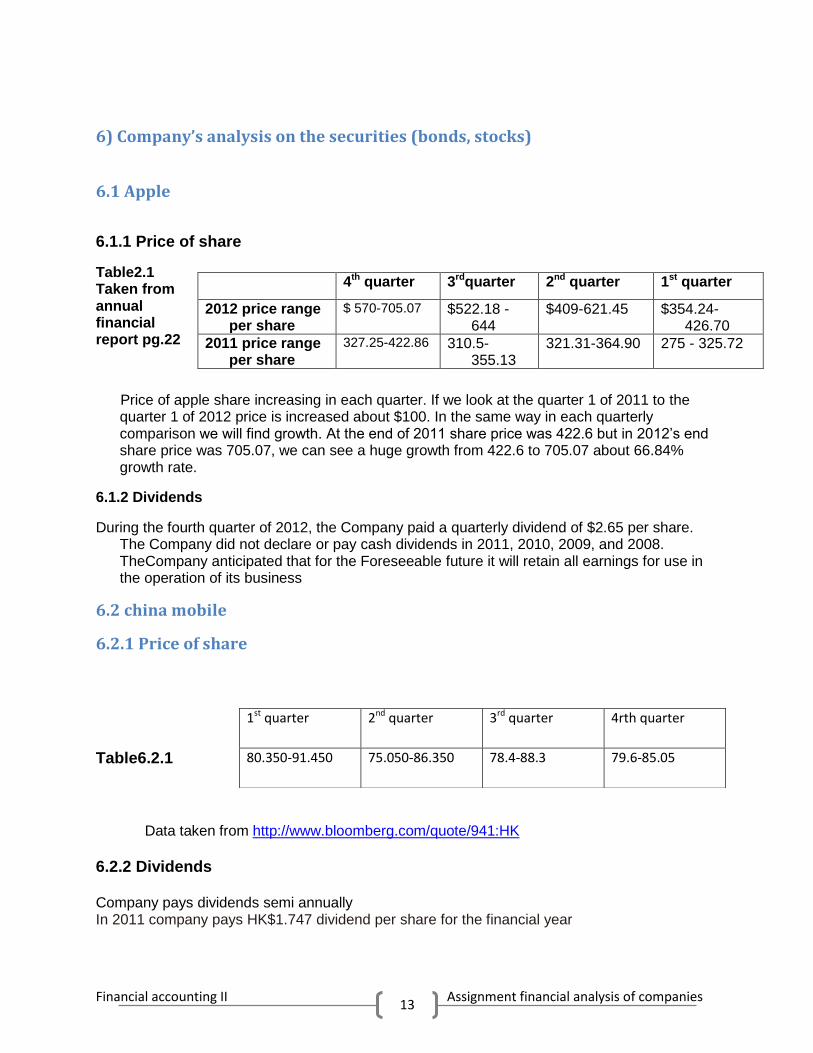
6.1.1 Price of share
Table2.1 Taken from annual financial report pg.22
Price of apple share increasing in each quarter. If we look at the quarter 1 of 2011 to the quarter 1 of 2012 price is increased about $100. In the same way in each quarterly comparison we will find growth. At the end of 2011 share price was 422.6 but in 2012’s end share price was 705.07, we can see a huge growth from 422.6 to 705.07 about 66.84% growth rate.
6.1.2 Dividends
During the fourth quarter of 2012, the Company paid a quarterly dividend of $2.65 per share. The Company did not declare or pay cash dividends in 2011, 2010, 2009, and 2008. TheCompany anticipated that for the Foreseeable future it will retain all earnings for use in the operation of its business
6.2 china mobile
6.2.1 Price of share
Table6.2.1 Data taken from http://www.bloomberg.com/quote/941:HK
6.2.2 Dividends Company pays dividends semi annually In 2011 company pays HK$1.747 dividend per share for the financial year
4th quarter 3rdquarter 2nd quarter 1st quarter
2012 price range per share
$ 570-705.07 $522.18 - 644
$409-621.45 $354.24-426.70
2011 price range per share
327.25-422.86 310.5-355.13
321.31-364.90 275 - 325.72
1st quarter 2nd quarter 3rd quarter 4rth quarter
80.350-91.450 75.050-86.350 78.4-88.3 79.6-85.05

Financial accounting II Assignment financial analysis of companies 14
Ended 31 December 2011 and interim dividend of HK$1.580 per share that was paid initially. Total annual dividend HK$ 3.327.
. In 2012 company pays dividend of HK$1.778 per share for the financial year Ended 31 December 2012 and interim dividend of HK$1.633 per share that was paid initially.
Total dividend for the year was HK$3.41.
6.3 Combine analysis of both companies on their stock prices and divideds
If we look at the dividends then apple is far behind because for 4 years apple had not given the dividends because they want to retain their earnings for investing in some new projects but china has given the dividend abot averagely hks 3.3.
Price of apple’s share was growing instead of falling means there were no much fluctuations but in china’s price there is no stability, only fluctuations we can find.
6.4 Shares Issued by each company (common stock)
Apple (no par value stock) China (fluctuations in par value)
2011 : 929,277,000 2011: 20,102,340,000
2012: 939,208,000 2012: 20,072,070,000
No preferred stock is issued by each company.
REFERENCES
http://www.stock-analysis-on.net/NYSE/Company/China-Mobile-Ltd/Financial-Statement/Assets
http://finance.yahoo.com/q/is?s=CHL+Income+Statement&annual
http://www.aastocks.com/en/stock/CompanyFundamental.aspx?CFType=7&symbol=00941
http://www.bloomberg.com/quote/941:HK