Rapid urban growth in the city of Duhok, Iraqi Kurdistan Region: An integrated approach of GIS,...
17
INTERNATIONAL JOURNAL OF GEOMATICS AND GEOSCIENCES Volume 4, No 2, 2013 © Copyright by the authors - Licensee IPA- Under Creative Commons license 3.0 Research article ISSN 0976 – 4380 Submitted on October 2013 published on November 2013 325 Rapid urban growth in the city of Duhok, Iraqi Kurdistan Region: An integrated approach of GIS, Remote Sensing and Shannon Entropy application Jambally Mohammed School of Planning, University of Duhok; Duhok city, Kurdistan, Iraq [email protected] ABSTRACT Duhok, a mountainous city in Kurdistan Region of Iraq, has witnessed rapid urban growth over the past decade due to population growth and economic improvements. These factors have placed a great pressure on the lands because of the increased need for housing, and have been the major drivers of land use and land cover (LULC) changes. This, together with the absence of sound urban planning systems, has resulted in a rapid urban growth. Therefore, an effective planning system needs to be developed in order to maintain a systematic urban growth pattern and address the current situation. This requires timely identification and analysis of the urban growth trends by measuring and monitoring LULC changes. This study aims to measure and analyze the urban growth patterns in Duhok using four satellite Landsat Thematic Mapper (TM) imageries for 1984, 1998, 2007 and 2011, with an integrated application of remote sensing and GIS techniques, and statistical Shannon entropy (an urban sprawl index). It is also to provide the planners with reliable data for effective planning purposes. Urban/built-up area for each year was extracted and the entropy values were calculated on the basis of a locational factor (distance from the core city center) that was visualized by creating buffers of different sizes and forms. Different models of the entropy have been applied for measuring and analyzing the urban extent from 1984 to 2011, determining the growth patterns in terms of compactness and sprawl, and verifying the results. The entropy values obtained for different zones are almost closer to the threshold values indicating that the study area has been experiencing an increased sprawl in all directions since 1984 with its peak occurring on 1998- 2007. Thus, the entropy method has been proved as an effective tool for identifying the urban growth pattern and the findings can help in preparing effective plans for a more systematic urban growth of the city. Keywords: GIS; remote sensing; Landsat TM; Urban sprawl; Shannon entropy; Duhok. 1. Introduction 1.1 Forms, Measurement and analysis of urban growth and sprawl Sprawl development takes three basic spatial forms: low-density (radial) sprawl, ribbon development and leapfrog development (Barnes et al., 2001). Analysis of urban growth changes is important in the contemporary urban and planning studies. These along with identification and measurement of the rate and trends of urban growth and the patterns of sprawl are helpful for better urban planning practices and delivery of proper infrastructure facilities and utilities (Sudhira et al., 2003). Therefore, it is important to efficiently manage urbanization through better urban land use planning (Soffianian et al., 2010). However, debates exist on how to confine urban sprawl (Ewing, 1997) and there is a general lack of good indicators to measure urban sprawl, assess its impacts, and how to distinguish it from compact
Transcript of Rapid urban growth in the city of Duhok, Iraqi Kurdistan Region: An integrated approach of GIS,...

INTERNATIONAL JOURNAL OF GEOMATICS AND GEOSCIENCES
Volume 4, No 2, 2013
© Copyright by the authors - Licensee IPA- Under Creative Commons license 3.0
Research article ISSN 0976 – 4380
Submitted on October 2013 published on November 2013 325
Rapid urban growth in the city of Duhok, Iraqi Kurdistan Region:
An integrated approach of GIS, Remote Sensing and Shannon Entropy
application Jambally Mohammed
School of Planning, University of Duhok; Duhok city, Kurdistan, Iraq
ABSTRACT
Duhok, a mountainous city in Kurdistan Region of Iraq, has witnessed rapid urban growth over
the past decade due to population growth and economic improvements. These factors have
placed a great pressure on the lands because of the increased need for housing, and have been
the major drivers of land use and land cover (LULC) changes. This, together with the absence
of sound urban planning systems, has resulted in a rapid urban growth. Therefore, an effective
planning system needs to be developed in order to maintain a systematic urban growth pattern
and address the current situation. This requires timely identification and analysis of the urban
growth trends by measuring and monitoring LULC changes. This study aims to measure and
analyze the urban growth patterns in Duhok using four satellite Landsat Thematic Mapper
(TM) imageries for 1984, 1998, 2007 and 2011, with an integrated application of remote
sensing and GIS techniques, and statistical Shannon entropy (an urban sprawl index). It is also
to provide the planners with reliable data for effective planning purposes. Urban/built-up area
for each year was extracted and the entropy values were calculated on the basis of a locational
factor (distance from the core city center) that was visualized by creating buffers of different
sizes and forms. Different models of the entropy have been applied for measuring and
analyzing the urban extent from 1984 to 2011, determining the growth patterns in terms of
compactness and sprawl, and verifying the results. The entropy values obtained for different
zones are almost closer to the threshold values indicating that the study area has been
experiencing an increased sprawl in all directions since 1984 with its peak occurring on 1998-
2007. Thus, the entropy method has been proved as an effective tool for identifying the urban
growth pattern and the findings can help in preparing effective plans for a more systematic
urban growth of the city.
Keywords: GIS; remote sensing; Landsat TM; Urban sprawl; Shannon entropy; Duhok.
1. Introduction
1.1 Forms, Measurement and analysis of urban growth and sprawl
Sprawl development takes three basic spatial forms: low-density (radial) sprawl, ribbon
development and leapfrog development (Barnes et al., 2001). Analysis of urban growth
changes is important in the contemporary urban and planning studies. These along with
identification and measurement of the rate and trends of urban growth and the patterns of
sprawl are helpful for better urban planning practices and delivery of proper infrastructure
facilities and utilities (Sudhira et al., 2003). Therefore, it is important to efficiently manage
urbanization through better urban land use planning (Soffianian et al., 2010). However, debates
exist on how to confine urban sprawl (Ewing, 1997) and there is a general lack of good
indicators to measure urban sprawl, assess its impacts, and how to distinguish it from compact

Rapid urban growth in the city of Duhok, Iraqi Kurdistan Region: An integrated approach of GIS, Remote
Sensing and Shannon Entropy Application
Jambally Mohammed
International Journal of Geomatics and Geosciences
Volume 4 Issue 2, 2013 326
development (Yeh and Li, 2001). Urban growth for an urban area can be quantified by detecting
and measuring the built-up change at different times (Galster et al., 2001). However, urban
sprawl process or pattern is difficult to be quantified if it does not have a universal definition,
quantification and modeling (Wilson et al., 2003).
Sprawl can be measured in both relative and absolute scales (Bhatta et al., 2010); the former
quantifies attributes that can be compared among cities, zones or different temporal spans
(period), while the latter creates an absolute distinction between a sprawled pattern and a
compact pattern. Most of the sprawl measurement techniques are relative measures that can be
used as indicators of sprawl.
1.2 GIS and remote sensing
Development of new spatial data techniques including remote sensing and GIS have
contributed to improved analysis and understanding of urban sprawl (Martin et al., 2003) and
supported accurate monitoring and modeling of urban growth patterns (Sim and Mesev, 2001).
This enables the planners to determine the type, amount, and location of land changes (Yeh
and Li, 2001). Nowadays, remote sensing data and GIS are widely used together with ground
data and statistical techniques for mapping (to understand the spatial pattern), monitoring and
assessing (to understand the process), and modeling (to simulate) the urban growth, land-use,
and sprawl (Angel et al., 2005). This is mainly because remote sensing data sets are easy to
obtain, cost and time effective, and more accurate (Martin et al., 2003). In addition, they are
useful for time scale urban studies because they can detect and measure changes in urban
environments in terms of amount, shape or form, and density which are the focus of urban
planners and researchers (Webster, 1995). Therefore, remote sensing and GIS have great
potentials in urban studies (Jensen and Cowen, 1999). They are successfully applied in a variety
of fields including land-use change monitoring and play an important role in urban planning
for decision making process.
1.3 Shannon’s entropy
Many spatial dispersal statistics and metrics are used to measure sprawl, but Shannon’s entropy
is the best in defining the threshold between sprawling and non-sprawling (Yeh and Li, 2001).
The entropy is more efficient because its value does change with the variation in the numbers
of zones (n), i.e. it is not affected by the size, shape and number of regions or sub-regions in
calculating values (Yeh and Li, 2001; Tsai, 2005). It is widely used to measure spatial
distribution of built-up areas and to determine spatial concentration (compactness) and
dispersion (sprawl) of built-up land growth in the urban areas (Nelson, 1999; Govindu and
Kiros, 2012). Shannon’s entropy, integrated with remote sensing and GIS, has proved to be an
efficient approach for measuring urban sprawl and determining its pattern (Sun et al., 2007).
The degree of sprawl can be measured by the magnitudes of the entropy value, which ranges
from 0 to 1 for relative entropy and from 0 to log(n) (maximum limit of entropy) for absolute
entropy; 0 indicates that the distribution of built-up is compact while a value higher than 0 or
closer to 1 or log(n) reveals that it is dispersed. This value is calculated from the amount of
urban area contained in the buffer zones created around a city center. The dispersion of built-
up areas from the buffer zone leads to an increase in the entropy value (Bhatta et al., 2010).

Rapid urban growth in the city of Duhok, Iraqi Kurdistan Region: An integrated approach of GIS, Remote
Sensing and Shannon Entropy Application
Jambally Mohammed
International Journal of Geomatics and Geosciences
Volume 4 Issue 2, 2013 327
2. Study area
Duhok, an important geographical and economic city in Kurdistan Region, northern Iraq, was
selected for this study (Figure 1). This city has a long history dating back to the Assyrian Period.
It is the center of Duhok district and the capital of Duhok province as well. It is located between
latitudes (N 36º48’32’ and N 36º53’15’) and longitudes (E 42º55’29’ and 43º0’34’), and is 540
m above sea level. It is situated in a NW-SE elongated valley bounded by mountains from three
sides (north, south and east). The city has grown rapidly over the last two decades as a compact
highly dense urban center to a semi metropolitan area where open and green spaces have
become limited. The current study covers the whole Duhok city with its peripheral and
marginal lands within a de facto border drawn by the author that encompasses an estimated
area of 94 km2.
Figure 1: Study area
3. Materials and methods
Many techniques such as GIS, remote sensing, and Shannon's entropy are universally employed
in measuring types of sprawl and differentiating its patterns. This study is designed after the
methodologies used in many international researches. It has focused on measurement and
analysis of the study area urban growth in different spatial and temporal forms and directions,
using impervious surfaces as a potential parameter to measure the urban growth.
3.1 Data collection and processing
The most common approach adopted for urban studies is to understand and visualize the urban
growth patterns and changes using classified remote sensing data and images, which enable
along GIS techniques detection, mapping, monitoring, and analyzing the spatial patterns of
sprawls on landscapes (Lata et al., 2001; Yeh and Li, 2001).
Rapid urban growth in the city of Duhok, Iraqi Kurdistan Region: An integrated approach of GIS, Remote
Sensing and Shannon Entropy Application
Jambally Mohammed
International Journal of Geomatics and Geosciences
Volume 4 Issue 2, 2013 328
Under this study, four Landsat images (bands 1, 2, 3, 4, 5) acquired (with path 170 and row 34)
in July 1984, June 1998, June 2007 and July 2011 were obtained from the United States
Geological Survey (USGS) portal and were processed to detect and quantify the amount of
urban expansion and calculate the entropy values. Four images were used in order to enhance
accuracy of results as reliability of statistical analysis depends on the increase in the number of
the involved variables (Bhatta et al., 2010).
To study the spatio-temporal changes in sprawl over the past 28 years, the four images were
processed according to common methodologies such as stacking, projection, masking,
classification, and post-classification processes (accuracy assessment and detection of the
changes in LULC). Erdas Imagine software was used for different stages of image processing
while ArcGS software was used for spatial analysis and map making.
The results of LULC were classified into three types, based on Anderson classification system
(Anderson et al., 1976): (i) urban/built-up areas (impervious and concrete surfaces), (ii)
vegetation (orchards and forests), and (iii) barren lands (soil with no sparsely vegetated areas
or no urban surfaces).
Accuracy assessment is necessary to determine the quality of data from remote sensing images
(Congalton and Green, 1999) by identifying the degree of coherence between the classified
image and the ground truth through computation of kappa coefficients and overall accuracies
(Congalton et al., 1983). The Kappa coefficient ranges between 0 and 1; values higher than 0.7
are acceptable while those equal to or lower than 0.4 denote that difference (Jensen, 1996). The
four classified images have overall accuracy values above 85% which is the minimum
acceptable level of accuracy for efficient LUCC analysis and modeling (Pontius, 2003). Their
coefficient values are also acceptable since they are above the threshold of 0.7 (Jensen, 1996).
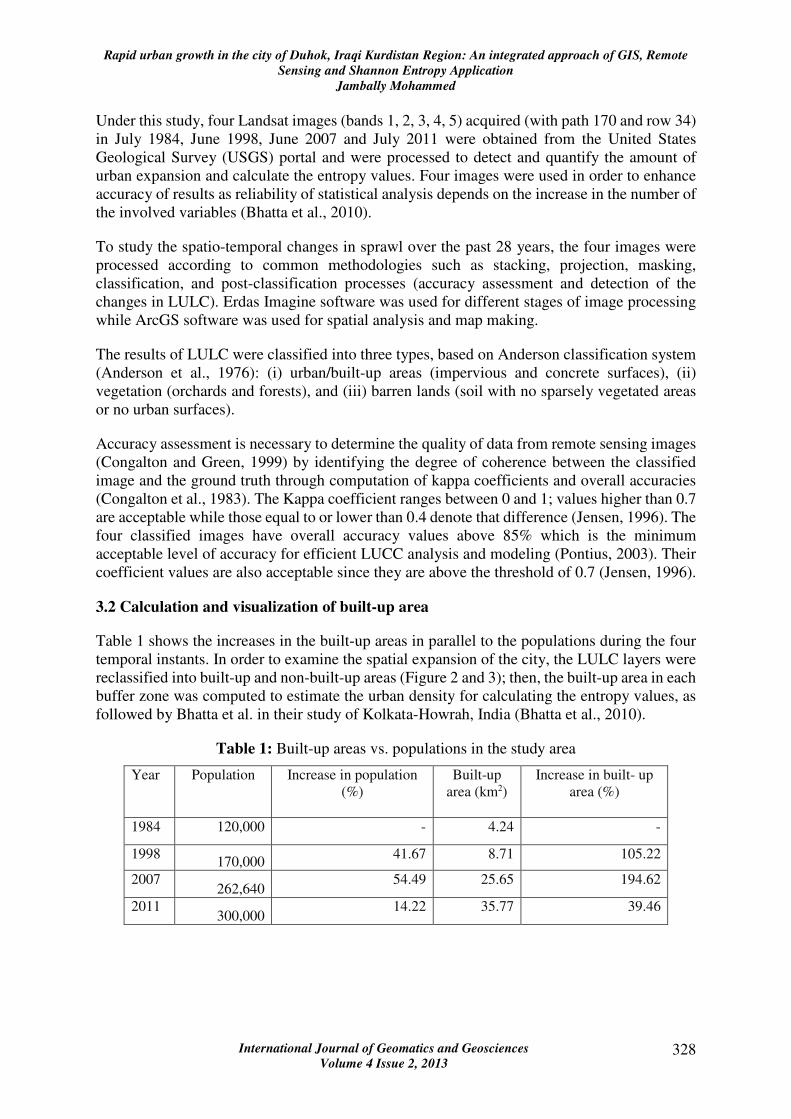
3.2 Calculation and visualization of built-up area
Table 1 shows the increases in the built-up areas in parallel to the populations during the four
temporal instants. In order to examine the spatial expansion of the city, the LULC layers were
reclassified into built-up and non-built-up areas (Figure 2 and 3); then, the built-up area in each
buffer zone was computed to estimate the urban density for calculating the entropy values, as
followed by Bhatta et al. in their study of Kolkata-Howrah, India (Bhatta et al., 2010).
Table 1: Built-up areas vs. populations in the study area
Year Population Increase in population
(%)
Built-up
area (km2)
Increase in built- up
area (%)
1984 120,000 - 4.24 -
1998 170,000
41.67 8.71 105.22
2007 262,640
54.49 25.65 194.62
2011 300,000
14.22 35.77 39.46

Rapid urban growth in the city of Duhok, Iraqi Kurdistan Region: An integrated approach of GIS, Remote
Sensing and Shannon Entropy Application
Jambally Mohammed
International Journal of Geomatics and Geosciences
Volume 4 Issue 2, 2013 329
Figure 2: Classified images of four temporal instants showing built-up area in black.
Figure 3: Overlay of classified images shows the urban expansion in different directions.
Different forms of Shannon’s entropy are used for analyzing the urban pattern of a city and
determining its sprawl for a specific time period (Yeh and Li, 2001). A zone wise method,
based on the distance from the city center, was followed to chart and analyze the direction and
pattern of the urban development of the study area. Different zoning models (circles/rings and
pies) and sizes were used along with the two common entropy models (absolute and relative)
to test the validity of the produced values. GIS software was used to define the buffer zones
and the density of urban/built-up area in each zone. This approach helps visualize the forms of
urban sprawl (Ramachandra et al., 2012). The study area was divided into circular zones of
different sizes and patterns, as followed by Bhatta et al. (2010). All these methods were applied
to the four TM images to map the built-up area in different directions and to ensure a consistent
comparison between the four dates (Yeh and Li, 2001).

Rapid urban growth in the city of Duhok, Iraqi Kurdistan Region: An integrated approach of GIS, Remote
Sensing and Shannon Entropy Application
Jambally Mohammed
International Journal of Geomatics and Geosciences
Volume 4 Issue 2, 2013 330
Initially, the central point of the city (referred to as city center) was used to create the buffer
zones (regions). A large circle with a radius of 12 km was drawn around this point to define
the limits of the urban extent (Yeh and Li, 2001), on an equidistant basis from the city center.
Then, four patterns of smaller circles (of 6, 12, 24 and 48 rings) of respective incrementing
radii of 2, 1, 0.5 and 0.25 km were drawn from the central point (Bharath and Ramachandra,
2012). The large circle was further divided into four (and also eight) pie sections, based on
directions to the central point (N, NE, E, SE, S, SW, W and NW) and superimposed
individually on these rings (Figure 4).
Figure 4: Google earth representation of the study area with 24 buffer zones around central
point.
3.3 Calculating Shannon entropy values
Using the built-up areas extracted from each zone, absolute entropy was calculated as follows
(Yeh and Li, 2001):
)(log ie
n
i
in ppH ∑−= …………………………………………………… Equation 1
Where, Hn is the value of entropy, pi is the proportion of the variable (built-up area) in the i-th
zone (calculated by: built-up proportion in i-th zone by the sum of built-up for all zones) and n
is the number of zones. The zone in this study refers to a circular buffer/ring or a smaller
concentric circle (intersecting a pie) in the particular direction of the city center.
While the values of absolute entropy ranges between 0 and log(n), relative entropy can be used
to scale the values within the range between 0 and 1. Relative entropy is calculated as follows
(Yeh and Li, 2001):
)log(/)/1(log' nppH i
n
i
in ∑= …...………………………………………… Equation 2
Relative entropy is thought to be more accurate when comparing areas with significantly
different means (Sun et al., 2007). Therefore, this method is used to make a comparative
measurement of the years of sprawl. However, this entropy cannot be applied to data with a
density value of zero (for example, parks in a large city) (Tsai, 2005).

Rapid urban growth in the city of Duhok, Iraqi Kurdistan Region: An integrated approach of GIS, Remote
Sensing and Shannon Entropy Application
Jambally Mohammed
International Journal of Geomatics and Geosciences
Volume 4 Issue 2, 2013 331
The difference in entropy between two temporal spans can also be used to indicate the change
in the degree of dispersal of land development or urban sprawl. Therefore, Shannon’s entropy
for each temporal span can be calculated, using the following equation (Yeh and Li, 2001):
)()1(' tHtHH nnn −+=∆ ………………………………………………………… Equation 3
Where ∆Hn is the difference of the relative entropy values between two time periods, Hn (t+1)
is the relative entropy value at time period t+1, and Hn(t) is the relative entropy value at time
period t.
4. Results and discussion
4.1 Urban extent and growth
Creation of individual and composite maps of the built-up and non-built-up areas with
abstracted and highly-simplified visual images helps define the urban extent in each of the
temporal instants (Figure 2 and 3). Moreover, a radar chart for the urban expansion in each
direction was also created for better visualization of the changes in the urban extent during the
period under study (Figure 5).
Figure 5: Radar chart of the study area during the four temporal instants
The pattern with 24 circles has been used as the core of this study, as so adopted by Sun et al.
(2007) and Sarvestani et al. (2011) in their researches. Based on this pattern (Figure 4), the
directional zone-wise values of the built-up area were calculated against the total area extracted
to sum up the built-up area for each zone and temporal instant (Table 2 and Figure 6 and 7).
As it is shown, the city experienced increased expansions in all directions mostly the west.
Table 2: Built-up area (in km2) – eight directional zone-wise circular zones
N NE E SE S SW W NW The City
1984 0.219 0.149 0.777 0.700 0.247 0.230 1.315 0.601 4.238
1998 0.314 0.146 1.677 2.030 0.861 0.608 1.991 1.074 8.700
2007 0.418 0.267 3.224 4.868 1.785 2.296 10.147 2.617 25.622
2011 0.424 0.380 4.836 5.873 2.076 2.788 15.214 4.138 35.729

Rapid urban growth in the city of Duhok, Iraqi Kurdistan Region: An integrated approach of GIS, Remote
Sensing and Shannon Entropy Application
Jambally Mohammed
International Journal of Geomatics and Geosciences
Volume 4 Issue 2, 2013 332
Figure 6: Direction-based built-up area in km2 (left) and in percentage (right)
Figure 7: Overall built-up area in km2
The percentage of the increase in the built-up area was calculated for each two temporal spans,
as shown in Table 3 and Figure 8. The highest built-up rate is seen in W direction followed by
SW.
Table 3: Built-up growth rate for the 28-year study period (in percent) - 8 pie sections with
24 circular zones
N NE E SE S SW W NW The City
1984-
1998 43.07 -2.13 115.86 190.05 248.69 164.54 51.40 78.76 105.31
1998-
2007 33.43 82.81 92.25 139.80 107.36 277.53 409.51 143.75 194.49
2007-
2011 1.29 42.53 50.00 20.64 16.31 21.42 49.95 58.13 39.45

Rapid urban growth in the city of Duhok, Iraqi Kurdistan Region: An integrated approach of GIS, Remote
Sensing and Shannon Entropy Application
Jambally Mohammed
International Journal of Geomatics and Geosciences
Volume 4 Issue 2, 2013 333
Figure 8: Built-up growth rate for 28-year period (in percent)
4.2 Shannon entropy and urban growth
Shannon’s entropy model can be used in different dimensions for the analysis of urban growth
(Bhatta et al., 2010). Buffer zones of different sizes are used to calculate and compare the
entropy values across different zones and to visualize the changes at local levels, the extent and
forms of urban growth including sprawl (Ramachandra et al., 2012).
To substantiate this hypothesis, entropy values were produced for the model of eight pie
sections with 24 circles. As it is visually evident from Figure 9, the absolute values for many
directions are more close to and above the threshold of log(n), which is 1.38; meanwhile, the
relative values are more close to threshold (1). In addition, the values for both entropy models
almost increase year by year. All these indicate that the study area had been experiencing an
increased dispersion in relatively all directions with parallel increases in the built-up areas
(Table 2). The highest dispersions are observed in E, W and NW for both types of entropy;
these results substantiate earlier findings and demonstrate the accuracy and efficiency of the
entropy types. It also appears that the entropy values increase with the increases in the built-up
area (Table 2).
Figure 9: Absolute (left) and relative (right) entropy values for 8 pie sections with 24
concentric zones
Rapid urban growth in the city of Duhok, Iraqi Kurdistan Region: An integrated approach of GIS, Remote
Sensing and Shannon Entropy Application
Jambally Mohammed
International Journal of Geomatics and Geosciences
Volume 4 Issue 2, 2013 334
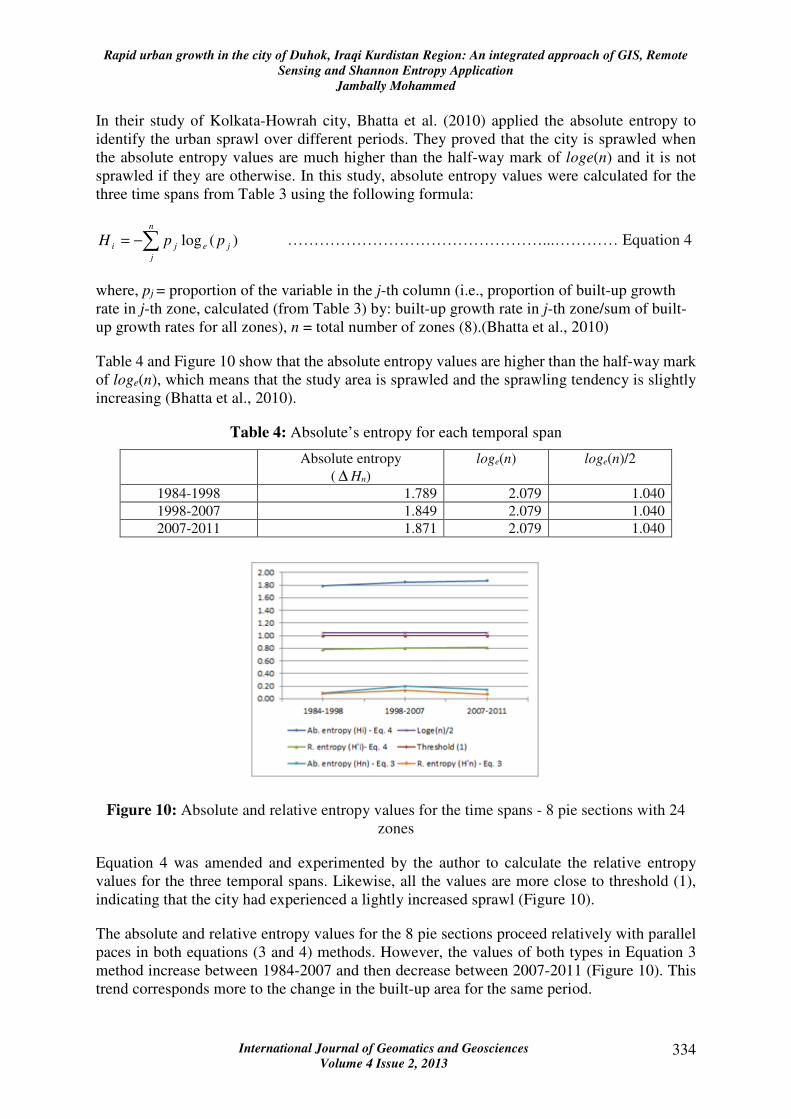
In their study of Kolkata-Howrah city, Bhatta et al. (2010) applied the absolute entropy to
identify the urban sprawl over different periods. They proved that the city is sprawled when
the absolute entropy values are much higher than the half-way mark of loge(n) and it is not
sprawled if they are otherwise. In this study, absolute entropy values were calculated for the
three time spans from Table 3 using the following formula:
)(log je
n
j
ji ppH ∑−= …………………………………………...………… Equation 4
where, pj = proportion of the variable in the j-th column (i.e., proportion of built-up growth
rate in j-th zone, calculated (from Table 3) by: built-up growth rate in j-th zone/sum of built-
up growth rates for all zones), n = total number of zones (8).(Bhatta et al., 2010)
Table 4 and Figure 10 show that the absolute entropy values are higher than the half-way mark
of loge(n), which means that the study area is sprawled and the sprawling tendency is slightly
increasing (Bhatta et al., 2010).
Table 4: Absolute’s entropy for each temporal span
Absolute entropy
( ∆ Hn)
loge(n) loge(n)/2
1984-1998 1.789 2.079 1.040
1998-2007 1.849 2.079 1.040
2007-2011 1.871 2.079 1.040
Figure 10: Absolute and relative entropy values for the time spans - 8 pie sections with 24
zones
Equation 4 was amended and experimented by the author to calculate the relative entropy
values for the three temporal spans. Likewise, all the values are more close to threshold (1),
indicating that the city had experienced a lightly increased sprawl (Figure 10).
The absolute and relative entropy values for the 8 pie sections proceed relatively with parallel
paces in both equations (3 and 4) methods. However, the values of both types in Equation 3
method increase between 1984-2007 and then decrease between 2007-2011 (Figure 10). This
trend corresponds more to the change in the built-up area for the same period.

Rapid urban growth in the city of Duhok, Iraqi Kurdistan Region: An integrated approach of GIS, Remote
Sensing and Shannon Entropy Application
Jambally Mohammed
International Journal of Geomatics and Geosciences
Volume 4 Issue 2, 2013 335
In order to determine the entropy for each zone across all time spans, Equation 4 can be
amended as follows (Bhatta et al., 2010):
)(log ie
s
i
ij ppH ∑−= …………………………………………………… Equation 5
where, pi= proportion of the variable in the i-th row (i.e., proportion of built-up growth rate in
i-th temporal span, calculated (from Table 2) by: built-up growth rate in i-th temporal span/
sum of built-up growth rates for all time spans), s = Total number of temporal spans (3).
Relative entropy was experimented in the same manner. The results of both entropy types
(Figure 11) show that the entropy values for all directions are higher than the half-way marks
of loge(s) which means that the zones are sprawling.
Figure 11: Entropy values for different zones over the three time spans (8 pie sections with
24 zones)
In both models, the highest degree of sprawl is observed in E, followed by NW and SE (Figure
11). The results further substantiate efficiency of the two entropy types. Moreover, the
directional-based values for the absolute entropy for the overall study time span (1984-2011)
resemble to an extent those obtained for individual time instants where E is the direction where
the highest degree of dispersion is recorded.
The overall sprawl for the study area can also be calculated by the following formula:
)(log ije
n
j
ij
s
i
o ppH ∑∑−= …………………………………………………… Equation 6
where, pti = proportion of the variable in the i-th row and j-th column (i.e., proportion of built-
up growth rate in i-th temporal span and j-th zone, calculated (from Table 3) by: built-up growth
rate in i-th temporal span and j-th zone/the grand total of all variables).

Rapid urban growth in the city of Duhok, Iraqi Kurdistan Region: An integrated approach of GIS, Remote
Sensing and Shannon Entropy Application
Jambally Mohammed
International Journal of Geomatics and Geosciences
Volume 4 Issue 2, 2013 336
The results point out to an overall sprawl of 2.33562 which is higher than the half-way mark
of loge (s x n) (i.e., 1.58902). The upper limit of overall sprawl was 3.17805 as calculated from
loge (s x n). This equation also confirms that the city has a high overall sprawl during the study
period.
Similarly, the same equation was amended and experimented to calculate relative values. It
was found that the value is 1.20488
)log(/)/1log( ijppH ij
n
j
ij
s
i
o ∑∑−= …………………………………………… Equation 7
4.3 Advantages and disadvantages of Shannon Entropy
Researches have proved that the more wide the zone is, the more information will be lost due
to aggregation. Hekkila and Hu (2006) advise not to use too many zones as it would
overestimate the level of entropy. In their study of Dongguan City, Yeh and Li (2001)
demonstrated that the relative entropy of a city will increase as the zone size gets smaller. To
test the validity of this methodology, additional zone sizings (6, 12 and 48 circles/rings) were
used, besides 24 zones, to calculate and verify accuracy of relative entropy across the four
instants (Yeh and Li, 2001)
Using equations 1 and 2, the entropy values were calculated for the four instants and the
different zone patterns. As it is visually clear form Figures 12, 13 and 14, the entropy values
for both models increase with the increase in temporal instants or zones. This confirms earlier
findings that the more wide the zone is, the higher entropy value will be. In addition, the entropy
values for all the instants and patterns are above the thresholds, indicating a dispersed
distribution of the built-up. It can be observed that the relative values for the two pie section
models (4 and 8) are more close to the relative values obtained through the four circular models
(6, 12, 24 and 48).
Figure 12: Changes of absolute (left) and relative (right) entropy values from 1984 to 2011,
based on the number of (circular) zones

Rapid urban growth in the city of Duhok, Iraqi Kurdistan Region: An integrated approach of GIS, Remote
Sensing and Shannon Entropy Application
Jambally Mohammed
International Journal of Geomatics and Geosciences
Volume 4 Issue 2, 2013 337
Figure 13: Changes of absolute (left) and relative (right) entropy values from 1984 to 2011,
based on the number of concentric circles within 4 pie sections
Figure 14: Changes of absolute (left) and relative (right) entropy values from 1984 to 2011,
based on the number of concentric circles within 8 pie sections
Interestingly, the percentage of change in relative entropy values for this model goes parallel
with that of the built-up density – it increases in 1998 and 2007 but drops down in 2011 (Figure
15). The percentage of change in the population relatively follows that trend, but that in
absolute values take a different turn in 2007.
Figure 15: Percentages of change in population, built-up area, built-up land per capita,
relative and absolute entropy values

Rapid urban growth in the city of Duhok, Iraqi Kurdistan Region: An integrated approach of GIS, Remote
Sensing and Shannon Entropy Application
Jambally Mohammed
International Journal of Geomatics and Geosciences
Volume 4 Issue 2, 2013 338
The temporal change of spatial patterns of urban development can be easily measured from the
change of relative entropy using Equation 3 (Yeh and Li, 2001). It was found the average
increases of both absolute and relative entropy values for the whole city were more between
the two periods (1984-1998 and 1998-2007) but less in 2007-2011. This proves that the city
experienced an increased sprawl between 1984 and 2007 but then the sprawl trend decreased
by 2011.
5. Conclusions and findings
Extensive literature was provided under this report concerning the patterns of urban growth,
particularly sprawl. However, there is a general lack of research at the local level on the
quantification and study of urban growth and sprawl. There is also an urgent need to provide
government officials and planners a labor, time and cost effective method to measure and
monitor urban sprawl. This paper has demonstrated how entropy can be used to measure,
monitor, and identify spatio-temporal patterns of urban sprawl by integrating GIS and remote
sensing and making use of TM images to provide spatial inputs and test the statistical model
describing growth.
As earlier mentioned, the main objective of the study was to introduce new methods and models
for measuring urban growth and pattern; this could be a unique research in Iraq. The study has
considered a circular area equidistant from the city-center. It is based on the locational factor
of the distance from the city center and it does not consider growth along major road networks.
In an attempt to test the validity of the entropy results across the four temporal instants, the
study area was divided into different zones where the entropy values were calculated based on
the built-up areas in each zone. Using different entropy equations, the entropy has proved to be
efficient in terms of the produced data
The results show that there is a substantial conformity in the trends of urban sprawl among the
time instants. Generally, the urban sprawl or dispersion is quite obvious in the whole study area.
In almost all of the entropy models, the results were closer to maximum threshold values which
indicate that the city had been on sprawl during the 28 years of the study period. The results of
almost all zone patterns and sizes indicate that the city had witnessed an increased sprawling
during the study period. A slight variation was found in the results of the model of 8 pie sections
with 48 circles where the relative and absolute entropy values increased from 1984 to 1998,
decreased in 2007, and then increased in 2011. Thus, the entropy is a good indicator for the
measurement and monitoring of land development and the identification of urban sprawl
patterns in the region.
This study has demonstrated usefulness of remote sensing and GIS to analyze the urban sprawl
and detect changes of urban land use over different years. Satellite data are found to be useful
in mapping and quantifying the extent of urban area in different time periods. Remote sensing
and GIS prove to be are very useful tool in urban studies. The study further shows that
remotely sensed data coupled with Shannon entropy approach provide a good indicator
to recognize and measure the spatial extends of land development both at regional and local
levels and to identify the spatial problems of land development.
The study would be helpful for the local authorities and planning departments in terms of
guiding future planning and policy-making. It has provided useful information for government
officials and planners to monitor the land development process and to identify land-use

Rapid urban growth in the city of Duhok, Iraqi Kurdistan Region: An integrated approach of GIS, Remote
Sensing and Shannon Entropy Application
Jambally Mohammed
International Journal of Geomatics and Geosciences
Volume 4 Issue 2, 2013 339
problems. Government officials and planners can use the method and results of the study to
control and monitor such development patterns for making better use of land resources at the
urban fringe areas. It is necessary that with reliable data and effective planning, urban
expansion should be monitored and managed in a sustainable way to protect the natural land
covers of the region.
Based on the field observation and discussions with concerned bodies the major driving forces
behind the land use change and urban sprawl in the study area can be attributed to: Population
growth, particularly after 2003; displacement of large number of Iraqi citizens from central and
southern areas into the city; economic developments and improved living conditions for the
people; and subsequent need for housing and the desire to have housing units which have still
created a large pressure and demand on land for residential and commercial purposes. All these
together with the absence of a clear land use policy and effective planning system, have
ultimately resulted in an uncoordinated and uncontrolled growth. The urban expansion has
resulted in the loss of large prime agricultural lands with profound impacts on sustainable
development in the region. This is particularly when it has disabled the main function for which
Duhok Dam was built in 1980s. This dam was mainly intended to irrigate large flat lands that
extend from the western perimeter of the city toward the neighboring Semel town.
6. References
1. Altshuler, A., GómezIbáñez, J., (1993), Regulation for Revenue: The Political
Economy of Land Use Exactions. Cambridge, MA: The Lincoln Institute of Land
Policy.
2. Anderson, J., Hardy, E., Roach, J., Witner, R., (1976), A land use and land cover
classification system for use with remote sensor data Geological. Survey Professional
Paper 964, USGS, Washington D.C., pp 1-26.
3. Angel, S., (2005), The dynamics of global urban expansion. Transport and Urban
Development Department, The World Bank, Washington, DC, p 200.
4. Barnes, K., (2001), Sprawl development: its patterns, consequences, and
measurement. Towson University, Towson,
http://chesapeake.towson.edu/landscape/urbansprawl/download/Sprawl_white_paper.
5. Bekele, H., (2005), Urbanization and urban sprawl.
http://www.kth.se/polopoly_fs/1.21420!294.pdf Accessed 12.02.2008.
6. Bhatta, B. et al., (2010), Urban sprawl measurement from remote sensing data. Applied
geography, 30(4), pp 731–740.
7. Bharath, H., Ramachandra, T., (2012), Spatial pattern analysis of two urbanising Tier
II cities in Karnataka using open source GIS – Grass OSGEO-India: FOSS4G 2012-
First National Conference "Open source geospatial resources to spearhead development
and growth” 25-27th October 2012.
8. Bhatta B., Saraswati, S., Bandyopadhyay, D., (2010), Urban sprawl measurement from
remote sensing data. Applied geography, 30 (4), pp 731–740.

Rapid urban growth in the city of Duhok, Iraqi Kurdistan Region: An integrated approach of GIS, Remote
Sensing and Shannon Entropy Application
Jambally Mohammed
International Journal of Geomatics and Geosciences
Volume 4 Issue 2, 2013 340
9. Congalton, R. G., Oderwald, R. G., Mead, R. A., (1983), Assessing Landsat
classification accuracy using discrete multivariate analysis statistical techniques.
Photogrammetric Engineering and remote sensing, 49, pp 1671–1678.
10. Congalton, R. G., Green, K., (1999), Assessing the accuracy of remotely sensed data:
principles and practices. Boca Raton: Lewis Publishers.
11. Ewing, R., (1997), Is Los Angles-Style sprawl Desirable? Journal of the American
Planning Association 63 (1), pp 107-126.
12. Galster, G., (2001), Wrestling sprawl to the ground: defining and measuring an elusive
concept. House policy debate, 12 (4), pp 681–717
13. Gordon, P., Richardson, H., (1997), Are Compact Cities a Desirable Planning Goal?.
Journal of the American planning association, 63 (1), pp 95-106.
14. Govindu V., Kiros, M. N., (2012), GIS and remote sensing based urban sprawl
detection and its implications on sustainable development. International journals of
multidisciplinary research academy 2 (9). ISSN: 2249-0558
15. Hekkila E. J., Hu, L., (2006), Adjusting spatial-entropy measures for scale and
resolution effects. Environment and planning B: Planning and design, 33, pp 845- 861.
16. Jensen, J. R., (1996), Introductory digital image processing: A remote sensing
perspective (2nd ed.). Englewood Cliffs, New Jersey: Prentice-Hall
17. Jensen, J. ., Cowen, D. C., (1999), Remote sensing of urban/suburban infrastructure and
socio-economic attributes. Photogrammetric engineering and remote sensing, 65 (5),
pp 611- 622.
18. Lata, K. M., Rao, C. H. S., Prasad, V. K., Badarinath, K. V. S., Raghavaswamy, V.,
(2001), Measuring Urban Sprawl: A case study of Hyderabad. GIS Development, 5
(12), pp 26-29.
19. Li, X., Yeh A. G. O., (1998), Principal component analysis of stacked multi-temporal
images for the monitoring of rapid urban expansion in the Pearl River Delta.
International journal of remote sensing, 19 (8), pp 1501-1518.
20. Martin et al., (2003), The spatiotemporal form of urban growth: measurement, analysis
and modeling. Remote sensing of environment, 86 (3).
21. Nelson, A. C., (1999), Comparing states with and without growth management analysis
based on indicators with policy implications. Land use policy, 16, pp 121–127.
22. Rahnama, M. R., Abbaszadeh, G. R., (2006), The comparative study of sprawl and
compression in Sidney and Mashhad metropolitans. Geography and regional
development magazine, 3.
23. Ramachandra, T. V., Bharath, A. H., Sreekantha, S., (2012), Spatial metrics based
landscape structure and dynamics assessment for an emerging Indian Megalopolis.
International journal of advanced research in artificial intelligence, 1(1), pp 48-57.

Rapid urban growth in the city of Duhok, Iraqi Kurdistan Region: An integrated approach of GIS, Remote
Sensing and Shannon Entropy Application
Jambally Mohammed
International Journal of Geomatics and Geosciences
Volume 4 Issue 2, 2013 341
24. Omid, M., Jamal, M., Asghar, Z., (2012), Urban form and sustainable development:
The case of Urmia City. Journal of geography and geology, 4 (2),
doi:10.5539/jgg.v4n2p1.
25. Sarvestani, M. S., (2011), Three decades of urban growth in the city of Shiraz, Iran: A
remote sensing and geographic information systems application. Cities 28, pp 320–329.
26. Sim, S., Mesev, V., (2011), Measuring urban sprawl and compactness: Case study
Orlando, USA. International Cartographic Conference, Paris, France.
27. Soffianian, A., Nadoushan, M. A., Yaghmaei, L., Falahatkar, S., (2010), Mapping and
analyzing urban expansion using remotely sensed imagery in Isfahan, Iran. World
applied sciences journal 9 (12), pp 1370-1378.
28. Sudhira, H. S., Ramachandra, T. V., Jagadish, K. S., (2003), Urban sprawl pattern
recognition and modeling using GIS. Map India, pp 28–31.
29. Sun, H., Forsythe, W., Waters, N., (2007), Modeling urban land use change and urban
sprawl: Calgary, Alberta, Canada. Networks and spatial economics 7, pp 353-376. DOI
10.1007/s11067-007-9030-y
30. Tsai, Y. H., (2005), Quantifying urban form compactness vs sprawl. Urban Studies 42,
pp 141-161.
31. Webster, C. J., (1995), Urban morphological fingerprints. Environment and planning
B, 22, pp 279-297.
32. Wilson, E. H., (2003), Development of a geospatial model to quantify, describe and
map urban growth. Remote sensing environment, 86 (3), pp 275–285.
33. Yeh, A. G. O., Li, X., (2001), Measurement and Monitoring of Urban Sprawl in a
Rapidly Growing Region Using Entropy. photogrammetric engineering and remote
sensing, 67 (1), pp 83-90.