
Improvement of the Iraqi Super Grid Performance Using ...
19
Citation: Hussein, I.I.; Essallah, S.; Khedher, A. Improvement of the Iraqi Super Grid Performance Using HVDC/HVAC Links by the Integration of Large-Scale Renewable Energy Sources. Energies 2022, 15, 1142. https://doi.org/10.3390/ en15031142 Academic Editor: Javier Contreras Received: 29 December 2021 Accepted: 1 February 2022 Published: 3 February 2022 Publisher’s Note: MDPI stays neutral with regard to jurisdictional claims in published maps and institutional affil- iations. Copyright: © 2022 by the authors. Licensee MDPI, Basel, Switzerland. This article is an open access article distributed under the terms and conditions of the Creative Commons Attribution (CC BY) license (https:// creativecommons.org/licenses/by/ 4.0/). energies Article Improvement of the Iraqi Super Grid Performance Using HVDC/HVAC Links by the Integration of Large-Scale Renewable Energy Sources Israa Ismael Hussein * , Sirine Essallah * and Adel Khedher LATIS—Laboratory of Advanced Technology and Intelligent Systems, Ecole Nationale d’Ingénieurs de Sousse, Université de Sousse, Sousse 4023, Tunisia; [email protected] * Correspondence: [email protected] (I.I.H.); [email protected] (S.E.) Abstract: The increasing use of renewable energy sources (RES) and their integration into transmis- sion systems requires extensive studies to get more benefits from these sources. Stability analysis is one of the most crucial issues in these systems, and therefore needs to be studied in depth. In this paper, an analytical study was conducted for the stability assessment of the Iraqi super grid after adding a solar power plant with a capacity of 1000 MW using both HVAC and HVDC links for comparison purposes. Thus, the objective of this study was to determine the best way to integrate RES into the power grid while improving its performance. The system’s stability was evaluated for two types of faults: line and bus disturbances. The strength of the grid and its ability to absorb the newly added energy was also studied. The simulations were performed with the PSS/E software using the Newton-Raphson method for a 500 km transmission line length. The results showed that the HVDC link outperforms the HVAC link in improving the overall performance of the power system. Keywords: stability analysis; power flow; HVAC; HVDC; transmission line; RES; SCR 1. Introduction Currently, the electric power system faces new challenges, such as combating air pollution and reducing dependence on fossil fuels. Renewable energy sources (RES), although unconventional, can provide promising solutions to these challenges, but the integration of RES into the regular power system planning and operation is still limited [1,2]. Renewable energy sources are critical components of contemporary systems and one of the answers for meeting rising demand. Renewable energy is included in the generating mix, making it a suitable solution to the issue of electricity scarcity [3]. The ever-increasing need for electrical energy has been satisfied mainly through burning fossil fuels and converting their heat to electrical power. Excessive exploitation of natural resources has raised worries about greenhouse gas emissions, pollution, and harmful environmental consequences. Additionally, it emphasizes the sustainability of the generation necessary to fulfil the world’s energy demand in the following decades using non-renewable fossil fuels. Renewable energy sources such as the sun, wind, and tides answer these problems [4]. Recent expansion in the electric power market and increased integration of RES into the power system have created new network design and management problems. As a result, it is necessary to conduct thorough research and analysis of the influence of integrated renewable energy sources on the current power system [5–7]. As electricity demand increases, the power system has extended [8]. As a result, the continuous load increase and the power system expansion may affect voltage stability and make the reactive power unstable [9–11]. The HVAC power transmission line is one major components of the electric power system, whose primary function is to transport electric power from the production centre to a load centre (usually separated by long distances) with minimal losses [12–14]. Energies 2022, 15, 1142. https://doi.org/10.3390/en15031142 https://www.mdpi.com/journal/energies
-
Upload
khangminh22 -
Category
Documents
-
view
0 -
download
0
Transcript of Improvement of the Iraqi Super Grid Performance Using ...
�����������������
Citation: Hussein, I.I.; Essallah, S.;
Khedher, A. Improvement of the
Iraqi Super Grid Performance Using
HVDC/HVAC Links by the
Integration of Large-Scale Renewable
Energy Sources. Energies 2022, 15,
1142. https://doi.org/10.3390/
en15031142
Academic Editor: Javier Contreras
Received: 29 December 2021
Accepted: 1 February 2022
Published: 3 February 2022
Publisher’s Note: MDPI stays neutral
with regard to jurisdictional claims in
published maps and institutional affil-
iations.
Copyright: © 2022 by the authors.
Licensee MDPI, Basel, Switzerland.
This article is an open access article
distributed under the terms and
conditions of the Creative Commons
Attribution (CC BY) license (https://
creativecommons.org/licenses/by/
4.0/).
energies
Article
Improvement of the Iraqi Super Grid Performance UsingHVDC/HVAC Links by the Integration of Large-ScaleRenewable Energy SourcesIsraa Ismael Hussein * , Sirine Essallah * and Adel Khedher
LATIS—Laboratory of Advanced Technology and Intelligent Systems, Ecole Nationale d’Ingénieurs de Sousse,Université de Sousse, Sousse 4023, Tunisia; [email protected]* Correspondence: [email protected] (I.I.H.); [email protected] (S.E.)
Abstract: The increasing use of renewable energy sources (RES) and their integration into transmis-sion systems requires extensive studies to get more benefits from these sources. Stability analysisis one of the most crucial issues in these systems, and therefore needs to be studied in depth. Inthis paper, an analytical study was conducted for the stability assessment of the Iraqi super gridafter adding a solar power plant with a capacity of 1000 MW using both HVAC and HVDC links forcomparison purposes. Thus, the objective of this study was to determine the best way to integrateRES into the power grid while improving its performance. The system’s stability was evaluated fortwo types of faults: line and bus disturbances. The strength of the grid and its ability to absorb thenewly added energy was also studied. The simulations were performed with the PSS/E softwareusing the Newton-Raphson method for a 500 km transmission line length. The results showed that theHVDC link outperforms the HVAC link in improving the overall performance of the power system.
Keywords: stability analysis; power flow; HVAC; HVDC; transmission line; RES; SCR
1. Introduction
Currently, the electric power system faces new challenges, such as combating airpollution and reducing dependence on fossil fuels. Renewable energy sources (RES),although unconventional, can provide promising solutions to these challenges, but theintegration of RES into the regular power system planning and operation is still limited [1,2].
Renewable energy sources are critical components of contemporary systems and oneof the answers for meeting rising demand. Renewable energy is included in the generatingmix, making it a suitable solution to the issue of electricity scarcity [3]. The ever-increasingneed for electrical energy has been satisfied mainly through burning fossil fuels andconverting their heat to electrical power. Excessive exploitation of natural resources hasraised worries about greenhouse gas emissions, pollution, and harmful environmentalconsequences. Additionally, it emphasizes the sustainability of the generation necessary tofulfil the world’s energy demand in the following decades using non-renewable fossil fuels.Renewable energy sources such as the sun, wind, and tides answer these problems [4].
Recent expansion in the electric power market and increased integration of RES intothe power system have created new network design and management problems. As a result,it is necessary to conduct thorough research and analysis of the influence of integratedrenewable energy sources on the current power system [5–7].
As electricity demand increases, the power system has extended [8]. As a result, thecontinuous load increase and the power system expansion may affect voltage stability andmake the reactive power unstable [9–11]. The HVAC power transmission line is one majorcomponents of the electric power system, whose primary function is to transport electricpower from the production centre to a load centre (usually separated by long distances)with minimal losses [12–14].
Energies 2022, 15, 1142. https://doi.org/10.3390/en15031142 https://www.mdpi.com/journal/energies
Energies 2022, 15, 1142 2 of 19
The high voltage level of power transmission has reduced losses and made transmis-sion more cost-effective. However, due to some limitations of AC transmission, such as thelack of power flow control in AC lines and the inability to connect two asynchronous ACsystems, the need for further study and investigation of DC transmission was reestablished.Even after discovering mercury-arc valves, which allowed conversion of AC to DC, theratings remained insufficient to re-establish DC transmission in bulk power systems [15].
The development of a new generation of mercury arc valves with more complexproperties by Uno Lamm enabled the reintroduction of DC transmission in 1950 [16,17].Afterwards, significant advances in HVDC technology have occurred in recent decades.Many studies have been performed to investigate it in detail further to better understandits components and benefits over traditional AC systems [18,19]. HVDC transmissionenables RES to transfer many thousand kilometres with low losses. This method permitsthe integration of enormous amounts of solar energy into the existing power system [16].This integration affects several aspects of HVAC, including power flow, losses, stability,and short-circuit levels. As a result, it is critical to examine the consequences, as notedearlier, when adding new production stations and lines to the traditional network [20,21].
In [20], Md. Mizanur Rahman et al. compared HVAC and HVDC power transmissionsystems. The study was accomplished for both topologies through the multi types of faults.The findings reveal that the ‘fault current’ in the HVAC transmission system is much higherthan in the HVDC transmission system for every given fault scenario. The consequencesof ‘fault current’ are particularly damaging in HVAC transmission systems, but they aresoft, insignificant, and less dangerous in HVDC transmission systems.
Other researchers have investigated the integration of solar energy with the grid.In [22], the researcher explored the reasons, advantages, and challenges of integrating RESinto the power system. Authors in [21] reviewed solar technologies. They concluded thattheir increased efficiency, low cost, and low pollution have resulted in their applicationin various energy projects, including building-integrated systems, pumps, solar homesystems, desalination plants, and photovoltaic and thermal (PVT) collector technology.
In [23], a single-layer control system for coordinating the operation of battery energystorage system (BESS) and wind power plants via multi-terminal high voltage directcurrent (HVDC) were presented and demonstrated. The findings of this study have shownthe suitability of the proposed coordinated controller to provide flexibility and decreaserequirements for balancing power.
The study in [24] proposed the installation of a diode rectifier HVDC (DR-HVDC)for the new offshore wind farm (OWF) in the Jeju Island power system. The outcomes ofthis study revealed that the power system in steady and transient states is more stable,and the application of the DR-HVDC reduces costs and increases the reliability of an OWFcompared to a conventional HVDC.
The aforementioned overviews mainly focused on the comparison of HVAC andHVDC system performances in the presence of renewable energy sources in normal andfault conditions. Consequently, this paper investigates the RES integration possibilitiesin the Iraqi super grid and examines its impact on HVAC and HVDC systems. The mainobjective is to assess the power system stability in normal and fault conditions in thepresence of RES and to evaluate its performance and strength for HVAC and HVDC links.
This paper is structured as follows: Section 2 presents a power flow and short circuitlevel analysis of the HVDC and HVAC systems in the presence of large-scale renewableenergy sources. HVDC modelling and control are described in Section 3. Section 4 detailsthe stability analysis of the HVDC/HVAC power system integrated with large-scale solarplant energy. The results and the discussion are summarized in Section 5. Finally, the mainconclusions are stated in the last section.
Energies 2022, 15, 1142 3 of 19
2. Power Flow and Short Circuit Level Analysis2.1. Power Flow Problem Formulation
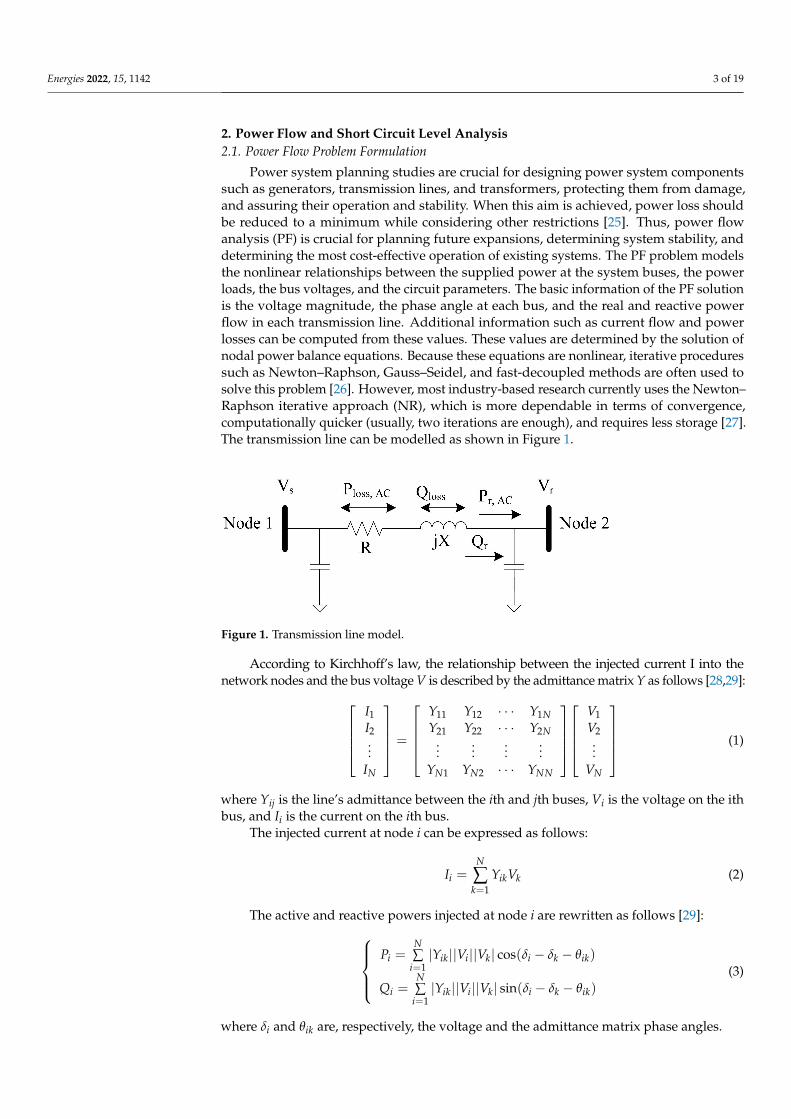
Power system planning studies are crucial for designing power system componentssuch as generators, transmission lines, and transformers, protecting them from damage,and assuring their operation and stability. When this aim is achieved, power loss shouldbe reduced to a minimum while considering other restrictions [25]. Thus, power flowanalysis (PF) is crucial for planning future expansions, determining system stability, anddetermining the most cost-effective operation of existing systems. The PF problem modelsthe nonlinear relationships between the supplied power at the system buses, the powerloads, the bus voltages, and the circuit parameters. The basic information of the PF solutionis the voltage magnitude, the phase angle at each bus, and the real and reactive powerflow in each transmission line. Additional information such as current flow and powerlosses can be computed from these values. These values are determined by the solution ofnodal power balance equations. Because these equations are nonlinear, iterative proceduressuch as Newton–Raphson, Gauss–Seidel, and fast-decoupled methods are often used tosolve this problem [26]. However, most industry-based research currently uses the Newton–Raphson iterative approach (NR), which is more dependable in terms of convergence,computationally quicker (usually, two iterations are enough), and requires less storage [27].The transmission line can be modelled as shown in Figure 1.
Figure 1. Transmission line model.
According to Kirchhoff’s law, the relationship between the injected current I into thenetwork nodes and the bus voltage V is described by the admittance matrix Y as follows [28,29]:
I1I2...
IN
=
Y11 Y12 · · · Y1NY21 Y22 · · · Y2N
......
......
YN1 YN2 · · · YNN
V1V2...
VN
(1)
where Yij is the line’s admittance between the ith and jth buses, Vi is the voltage on the ithbus, and Ii is the current on the ith bus.
The injected current at node i can be expressed as follows:
Ii =N
∑k=1
YikVk (2)
The active and reactive powers injected at node i are rewritten as follows [29]:Pi =
N∑
i=1|Yik||Vi||Vk| cos(δi − δk − θik)
Qi =N∑
i=1|Yik||Vi||Vk| sin(δi − δk − θik)
(3)
where δi and θik are, respectively, the voltage and the admittance matrix phase angles.
Energies 2022, 15, 1142 4 of 19
The power flow problem consists of solving a system of non-linear equations todetermine the voltage magnitude and phase angle at each bus i of the network. Thus, thepower problem is formulated as follows:
∆Pi = Pgi − Pci −N∑
i=1|Yik||Vi||Vk| cos(δi − δk − θik) = 0
∆Qi = Qgi −Qci −N∑
i=1|Yik||Vi||Vk| sin(δi − δk − θik) = 0
(4)
where Pgi and Qgi are the generated active and reactive powers, respectively, and Pci andQci are the active and reactive loads, respectively.
The voltage magnitude and phase angle of each bus are computed as follows:{|Vk|(r+1) = |Vk|r + |∆Vk|r
δ(r+1)k = δr
k + ∆δrk
(5)
where r is the number of iterations.
2.2. Short-Circuit Analysis
Short-circuit level (SCL) is an electrical fault that occurs when a large current flowsdown an alternate channel, resulting in severe equipment damage, power failure, physicalinjury, or death [10]. Short circuit analysis determines the system’s ability to create a shortcircuit current, the electrodynamic resistance capability of the wire and equipment, andthe magnitude of the short circuit current relative to the interrupting power of overcurrentprotection devices. The effects of a short-circuit often depend on the type, duration, andlocation (near sparking or arcing locations) of the fault. Phase-to-ground faults accountfor 80% of faults; three-phase faults account for less than 5% of initial faults, and 15% arephase-to-phase faults [30].
• Phase-to-ground fault
This form of failure activates the zero-sequence impedance, Z0. Unless spinningequipment is involved, short-circuit current, ISC0 is less than three-phase fault current(lower zero-sequence impedance). Calculations for ISC0 may be necessary depending onthe neutral system (earthing system configuration), assuming the established thresholdsfor zero-sequence (high voltage) or earth-fault (low voltage) safety devices [31].
• Three-phase fault
This fault manifests itself in all three phases; short-circuit current can be expressed as:
ISC =U/√
3ZSC
(6)
where U refers to the phase-to-phase voltage that corresponds to the transformer’s no-loadvoltage. It is approximately 3% to 5% higher than the on-load voltage across the terminals.Computing the short-circuit current involves the calculation of ZSC, which is equal to thesum of all impedances through which ISC flows from the generator to the point of failure.The impedances of the power sources and the lines are defined as the impedance per phasethat is “Positive-sequence”:
ZSC =
√(∑ R)2
+ (∑ X)2 (7)
where ∑ R and ∑ X are the total resistance and reactance of a sequence, respectively.
3. HVDC System: Modelling and Control
The prospects of a future HVDC grid are anticipated to meet the rising power demandand incorporate renewable energy sources into the grid [32–35]. An HVDC grid can provide
Energies 2022, 15, 1142 5 of 19
the extra required power capacity, and its economy for long-distance transmission is idealfor integrating remote renewable sources into the grid.
Popular HVDC converter topologies are the line commutated converter (LCC), thevoltage source converter (VSC), and the newly developed modular multilevel converter(VSC-MMC) [36–39]. Historically, LCCs have been employed as rectifiers and invertersin an HVDC system. MMCs, however, offer many advantages over LCCs, includinga smaller footprint, low harmonic output, control of both real and reactive power, blackstart capability, and no chance of commutation failure [32,35,36,40]. These characteristicsmake MMCs excellent for use as inverters in urban load centres where compactness, faultrecovery, and power quality are critical [34,35]. However, LCCs offer a higher currentcapacity and are more economical and technologically mature compared to MMCs [41].The drawbacks of an LCC are typically not a concern at the rectifier due to the generalavailability of land at a remote location and proximity to generation [34,35]. The hybridLCC-MMC system can be a practical solution for riding through DC side faults and multi-terminal connections, which are foreseen in the future HVDC grid. This paper paysattention to the LCC-HVDC topology applied to the Iraqi super grid.
3.1. LCC-HVDC System
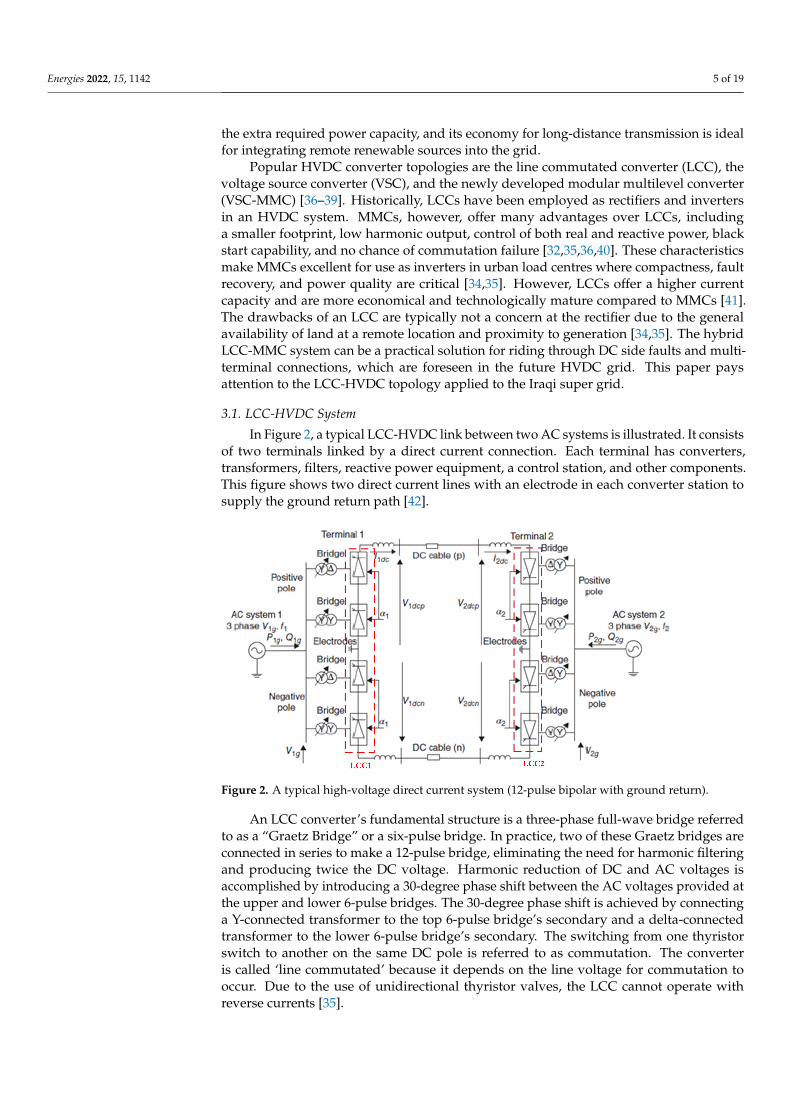
In Figure 2, a typical LCC-HVDC link between two AC systems is illustrated. It consistsof two terminals linked by a direct current connection. Each terminal has converters,transformers, filters, reactive power equipment, a control station, and other components.This figure shows two direct current lines with an electrode in each converter station tosupply the ground return path [42].
Figure 2. A typical high-voltage direct current system (12-pulse bipolar with ground return).
An LCC converter’s fundamental structure is a three-phase full-wave bridge referredto as a “Graetz Bridge” or a six-pulse bridge. In practice, two of these Graetz bridges areconnected in series to make a 12-pulse bridge, eliminating the need for harmonic filteringand producing twice the DC voltage. Harmonic reduction of DC and AC voltages isaccomplished by introducing a 30-degree phase shift between the AC voltages provided atthe upper and lower 6-pulse bridges. The 30-degree phase shift is achieved by connectinga Y-connected transformer to the top 6-pulse bridge’s secondary and a delta-connectedtransformer to the lower 6-pulse bridge’s secondary. The switching from one thyristorswitch to another on the same DC pole is referred to as commutation. The converteris called ‘line commutated’ because it depends on the line voltage for commutation tooccur. Due to the use of unidirectional thyristor valves, the LCC cannot operate withreverse currents [35].
Energies 2022, 15, 1142 6 of 19
The DC terminal voltage, Vdc, is the difference between the positive and negative polevoltages, Vdcp and Vdcn, respectively. For rectifier operation, Vdc may be mathematicallydescribed as follows:
Vdc = Vdc0 cos α− IdcBRc (8)
with
Vdc0 =3√
2BTVLLπ
In Equation (8), Vdc0 is the voltage at zero ignition angle α, Rc is the commutationresistance, B denotes the number of six-pulse bridges, Idc is the DC line current, VLL is theline-to-line voltage of the AC grid, and T is the transformer ratio. The ignition angle is usedto postpone valve commutation. The commutation resistance Rc =
3π × Xc is equal to the
voltage drop across the source side line inductance, Lc.For inverter operation, a comparable equation is defined as:
Vdc = −Vdc0 cos γ + IdcBRc (9)
where γ is the extinction angle.
3.2. HVDC System Control with LCC Converters
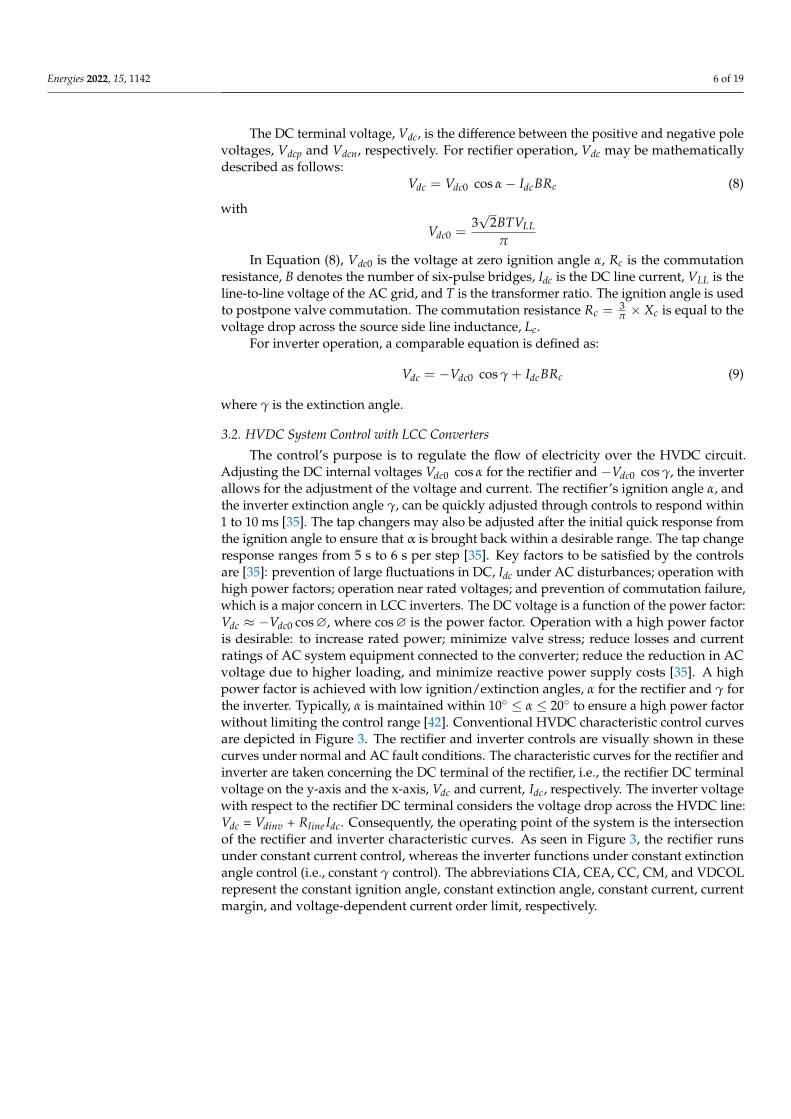
The control’s purpose is to regulate the flow of electricity over the HVDC circuit.Adjusting the DC internal voltages Vdc0 cos α for the rectifier and −Vdc0 cos γ, the inverterallows for the adjustment of the voltage and current. The rectifier’s ignition angle α, andthe inverter extinction angle γ, can be quickly adjusted through controls to respond within1 to 10 ms [35]. The tap changers may also be adjusted after the initial quick response fromthe ignition angle to ensure that α is brought back within a desirable range. The tap changeresponse ranges from 5 s to 6 s per step [35]. Key factors to be satisfied by the controlsare [35]: prevention of large fluctuations in DC, Idc under AC disturbances; operation withhigh power factors; operation near rated voltages; and prevention of commutation failure,which is a major concern in LCC inverters. The DC voltage is a function of the power factor:Vdc ≈ −Vdc0 cos∅, where cos∅ is the power factor. Operation with a high power factoris desirable: to increase rated power; minimize valve stress; reduce losses and currentratings of AC system equipment connected to the converter; reduce the reduction in ACvoltage due to higher loading, and minimize reactive power supply costs [35]. A highpower factor is achieved with low ignition/extinction angles, α for the rectifier and γ forthe inverter. Typically, α is maintained within 10◦ ≤ α ≤ 20◦ to ensure a high power factorwithout limiting the control range [42]. Conventional HVDC characteristic control curvesare depicted in Figure 3. The rectifier and inverter controls are visually shown in thesecurves under normal and AC fault conditions. The characteristic curves for the rectifier andinverter are taken concerning the DC terminal of the rectifier, i.e., the rectifier DC terminalvoltage on the y-axis and the x-axis, Vdc and current, Idc, respectively. The inverter voltagewith respect to the rectifier DC terminal considers the voltage drop across the HVDC line:Vdc = Vdinv + Rline Idc. Consequently, the operating point of the system is the intersectionof the rectifier and inverter characteristic curves. As seen in Figure 3, the rectifier runsunder constant current control, whereas the inverter functions under constant extinctionangle control (i.e., constant γ control). The abbreviations CIA, CEA, CC, CM, and VDCOLrepresent the constant ignition angle, constant extinction angle, constant current, currentmargin, and voltage-dependent current order limit, respectively.
Energies 2022, 15, 1142 7 of 19
Figure 3. Characteristic control curve for HVDC line with LCC converters.
3.3. Fault Handling Strategy
This section summarizes an LCC’s technique for dealing with AC and DC problems.
3.3.1. AC Faults
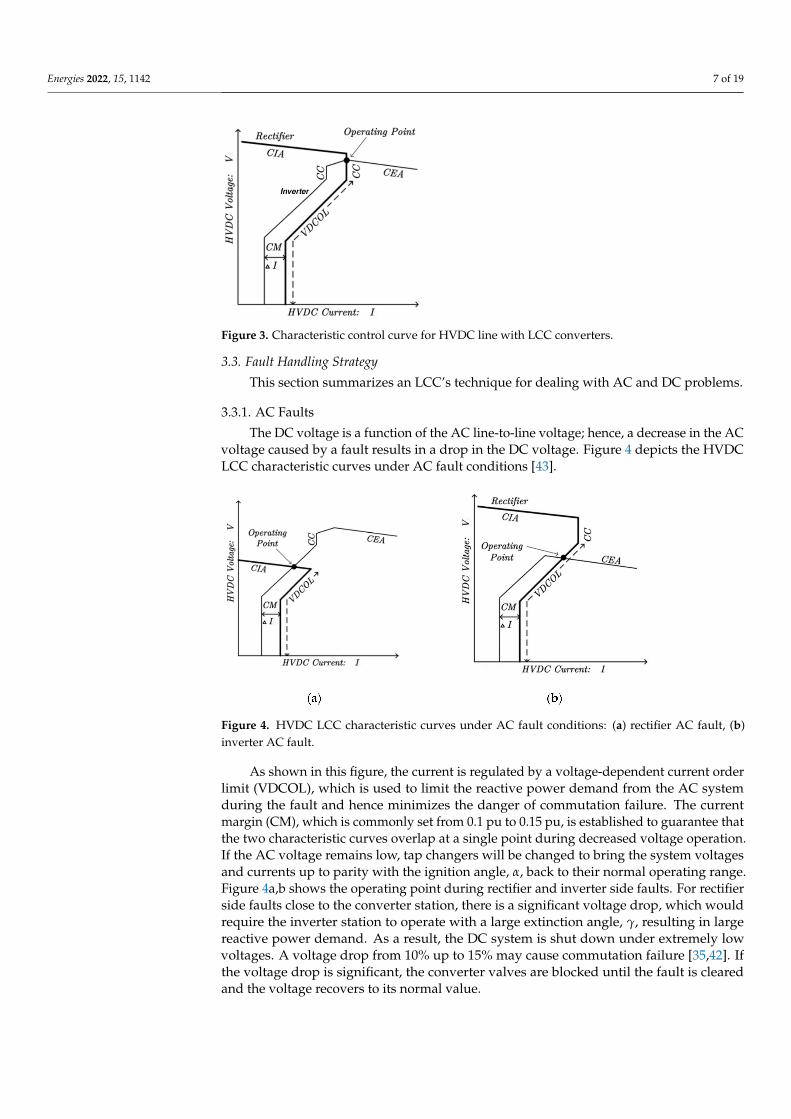
The DC voltage is a function of the AC line-to-line voltage; hence, a decrease in the ACvoltage caused by a fault results in a drop in the DC voltage. Figure 4 depicts the HVDCLCC characteristic curves under AC fault conditions [43].
Figure 4. HVDC LCC characteristic curves under AC fault conditions: (a) rectifier AC fault, (b)inverter AC fault.
As shown in this figure, the current is regulated by a voltage-dependent current orderlimit (VDCOL), which is used to limit the reactive power demand from the AC systemduring the fault and hence minimizes the danger of commutation failure. The currentmargin (CM), which is commonly set from 0.1 pu to 0.15 pu, is established to guarantee thatthe two characteristic curves overlap at a single point during decreased voltage operation.If the AC voltage remains low, tap changers will be changed to bring the system voltagesand currents up to parity with the ignition angle, α, back to their normal operating range.Figure 4a,b shows the operating point during rectifier and inverter side faults. For rectifierside faults close to the converter station, there is a significant voltage drop, which wouldrequire the inverter station to operate with a large extinction angle, γ, resulting in largereactive power demand. As a result, the DC system is shut down under extremely lowvoltages. A voltage drop from 10% up to 15% may cause commutation failure [35,42]. Ifthe voltage drop is significant, the converter valves are blocked until the fault is clearedand the voltage recovers to its normal value.

Energies 2022, 15, 1142 8 of 19
3.3.2. DC Pole-to-Ground Fault
At a DC pole-to-ground fault, the converter switches from a constant angle extinctioncommand to constant current control. The converter operates at a reduced current order forthe rectifier of the CM quantity. The reduced current restricts the reactive power demandof the AC system. The rectifier switches its operating mode from constant current controlto constant ignition angle control, α. During the DC fault condition, a fault current equal tothe CM is sustained. Otherwise, fast-acting line protection can be employed during a pole-to-ground DC fault. The rectifier and inverter both operate to invert their DC terminalvoltage. The fault current is seeking to exit the fault trail and enter the converters. However,due to the unidirectional diodes, the current rapidly decreases to zero.
4. Stability Analysis of the HVDC/HVAC Power System in the Presence of Large-ScaleSolar Plant4.1. System Strength Evaluation4.1.1. Short Circuit Ratio (SCR)
When it comes to incorporating renewable energy sources, system stability is a preva-lent issue. The system strength, which indicates the system variables’ sensitivity to differentdisturbances, affects the performance of various components in a power system. Shortcircuit ratio (SCR) is a metric that indicates the strength of a network bus compared to therated power of a device. Frequently, the SCR is used to indicate the system’s strength. Whendisturbances are introduced, a more robust system generates few fluctuations in voltageand other variables. The equipment’s SCR is defined as its short circuit capacity ratio toits MW rating on the bus [44,45]. A robust system has an SCR of more than 3, whereasa poor or severely weak system has an SCR between 3 and 2 or less. The short circuitratio is a critical parameter in power electronic applications such as the power convertersthat connect renewable energy sources (wind and solar energy) to conventional powergrids. When used with insufficient AC systems, HVDC/FACTs devices based on currentsource converters exhibit problems. When HVDC/FACTs devices are coupled to weak ACsystems, particular technologies are frequently needed (short circuit ratio of less than 3).
When the SCR is close to one, capacitor-commutated or voltage-source-based convert-ers are used for HVDC applications. If such technologies are not accessible, specializedstudies will be necessary to assess the impact and provide solutions for avoiding or mit-igating harmful consequences. Low levels of SCR may result in difficulties such as highovervoltages, low-frequency resonances, and control system instability [46,47].
SCR is often described as the ratio of the short circuit capacity of the bus on whichthe device is placed to the MW rating of the device. According to this definition, SCR isexpressed as follows:
SCR =SiPdc
(10)
where Si denotes the short circuit capacity of the bus before the device’s connection, andPdc denotes the device’s MW rating.
Table 1 summarizes the system strength assessment categorization.
Table 1. Short circuit ratio and AC system strength.
Classification Short Circuit Ratio (SCR)
Strong system SCR > 3Weak system 2 < SCR ≤ 3
Very weak system SCR < 2
Energies 2022, 15, 1142 9 of 19
4.1.2. Weighted Short Circuit Ratio (WSCR)
The weighted short circuit ratio (WSCR) is a more suitable indicator, as it considers theinfluence of system interactions and provides a more accurate estimate of system strength.WSCR is given by:
WSCR = weightedSiN∑i
Pdci
WSCR =
N∑i
Si×Pdci/N∑i
Pdci
N∑i
Pdci
WSCR =
N∑i
Si×Pdci(N∑i
Pdci
)2
(11)
where Si denotes the short circuit capacity of bus i before connecting solar plant i, Pdcidenotes the MW rating of the solar plant i to be connected, N is the number of solar plantsthat are completely interconnected, and i denotes the solar plant index [45].
4.2. Stability Analysis
The term “power system stability” refers to studying the dynamics of the powersystem in the presence of failures. After being exposed to a disturbance, the stability ofa power system refers to its capacity to resume regular or steady operation. When a specificdisturbance occurs in the system, power system instability may be defined as the loss ofsynchronism (i.e., specific synchronous machines moving out of phase). Three distinctkinds of stability are affected: steady-state, transient, and dynamic stability [27,29].
System frequency and voltage levels are two critical parameters in alternating currentpower systems. Furthermore, most electric power produced in power systems is a three-phase alternating current where generators operate synchronously. During the normaloperation of a power system, the mechanical and electromagnetic torques acting on eachgenerator must balance, and all synchronous generators must revolve at the same electricalspeed in phase with the system frequency [48].
If the power system is subjected to severe disturbances such as short-circuit defects intransmission lines, it is possible to preserve generator synchronism. Transient stability isdescribed in [48,49] as the system’s capacity to sustain generator synchronization in thepresence of substantial failures. Otherwise, a lack of transient stability might continuallyinduce rotor-angle variations and self-exciting power oscillations, further damaging powersystem components such as generators and transmission lines or even resulting in powersystem blackout [48].
As a result, the physical nature and methodology for transient stability should be thor-oughly investigated to ensure power system security, particularly when new technologiessuch as high voltage direct current (HVDC) and renewable energy are integrated into powersystems and have their own dynamic characteristics for transient stability. Consequently,the dynamic implications of such new technologies on the transient stability of powersystems should be thoroughly researched for the intent of power system security [48].
Within this context, this paper assesses the power system’s stability and evaluates itsstrengths versus disturbances after integrating large-scale renewable energy. Small signalrotor angle stability, which refers to the power system’s ability to retain its synchronismunder disturbances, is the considered one. The instability appears in rotor oscillationswith increased amplitude owing to the lack of damping torque and an aperiodic modestemming from the lack of synchronizing torque. The study is conducted on the Iraqi supergrid, where the dynamic system behaviour is investigated before and after integrating thesolar power plant using HVDC and HVAC links. The impact of line and bus outages on thesystem stability is examined for different cases using the PSS/E software. The latter utilizesstatistics channels called spread angle, largest angle, smallest angle, and average angle. Thesmallest angle can be defined as the trace for smaller rotor angles recorded when applying
Energies 2022, 15, 1142 10 of 19
disturbance. The largest rotor angle represents the trace of a larger angle recorded throughdisturbance. In contrast, the average rotor angle is the average value of the rotor anglerecorded when applying disturbance. Finally, the spread rotor angle is the deviation ofthe angle when applying disturbance with respect to the steady-state rotor angle. If anygenerator goes out of step in the simulation, the angle spread will increase. Angle spreadis, therefore, a good indicator of rotor angle instability.
The reference of stability limits, and all issues noted above, is the steady state analysisof the system in load flow equilibrium, which means that the smallest deviation in spreadangle, largest angle, smallest angle, and average angle led to a good stability response.
5. Results and Discussion5.1. Iraqi Power System
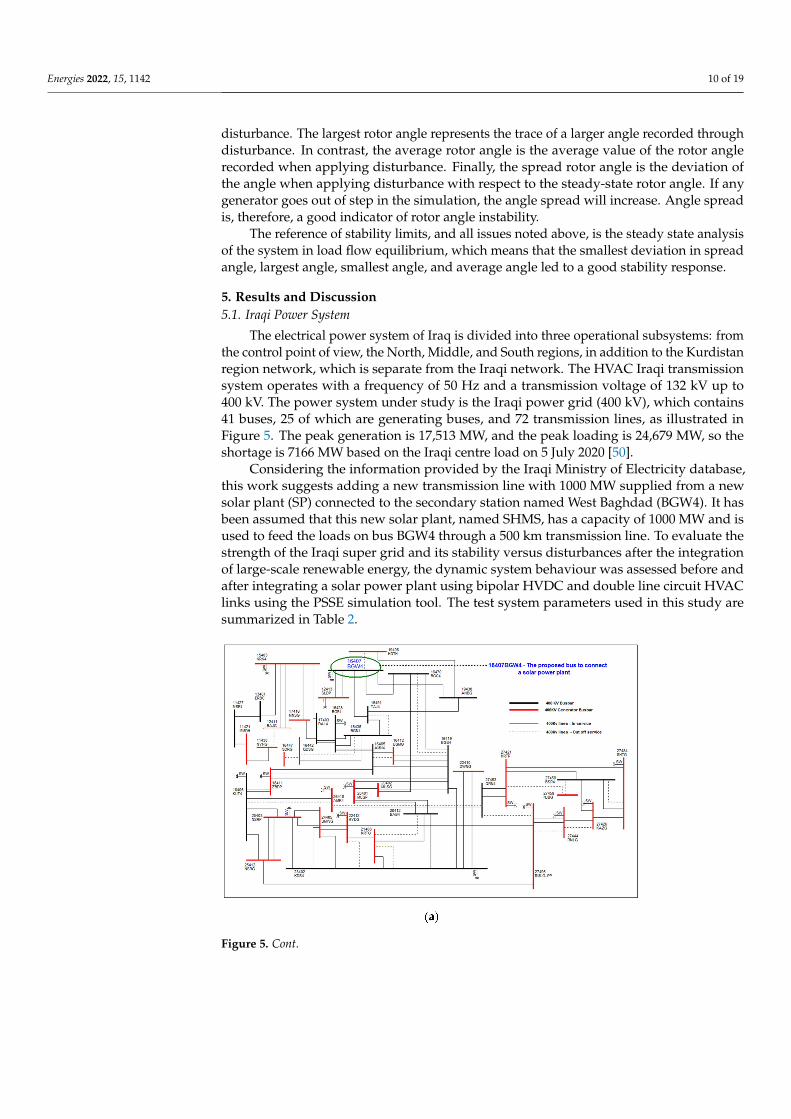
The electrical power system of Iraq is divided into three operational subsystems: fromthe control point of view, the North, Middle, and South regions, in addition to the Kurdistanregion network, which is separate from the Iraqi network. The HVAC Iraqi transmissionsystem operates with a frequency of 50 Hz and a transmission voltage of 132 kV up to400 kV. The power system under study is the Iraqi power grid (400 kV), which contains41 buses, 25 of which are generating buses, and 72 transmission lines, as illustrated inFigure 5. The peak generation is 17,513 MW, and the peak loading is 24,679 MW, so theshortage is 7166 MW based on the Iraqi centre load on 5 July 2020 [50].
Considering the information provided by the Iraqi Ministry of Electricity database,this work suggests adding a new transmission line with 1000 MW supplied from a newsolar plant (SP) connected to the secondary station named West Baghdad (BGW4). It hasbeen assumed that this new solar plant, named SHMS, has a capacity of 1000 MW and isused to feed the loads on bus BGW4 through a 500 km transmission line. To evaluate thestrength of the Iraqi super grid and its stability versus disturbances after the integrationof large-scale renewable energy, the dynamic system behaviour was assessed before andafter integrating a solar power plant using bipolar HVDC and double line circuit HVAClinks using the PSSE simulation tool. The test system parameters used in this study aresummarized in Table 2.
Figure 5. Cont.
Energies 2022, 15, 1142 11 of 19
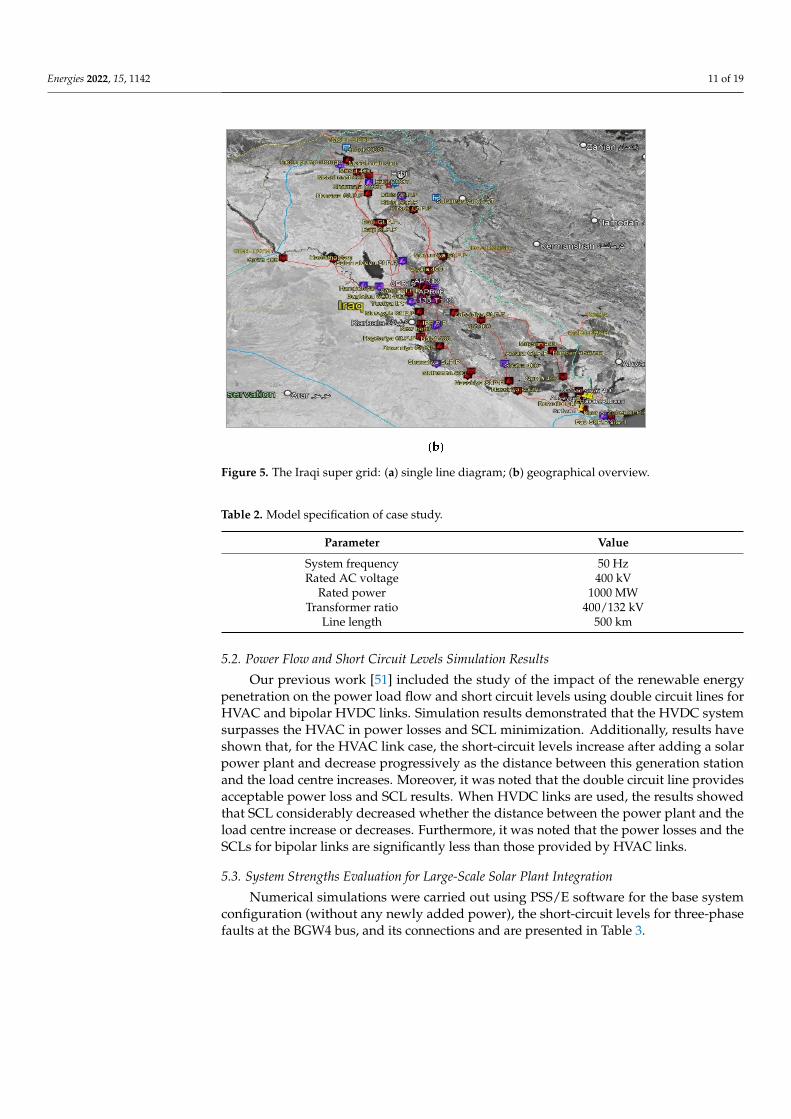
Figure 5. The Iraqi super grid: (a) single line diagram; (b) geographical overview.
Table 2. Model specification of case study.
Parameter Value
System frequency 50 HzRated AC voltage 400 kV
Rated power 1000 MWTransformer ratio 400/132 kV
Line length 500 km
5.2. Power Flow and Short Circuit Levels Simulation Results
Our previous work [51] included the study of the impact of the renewable energypenetration on the power load flow and short circuit levels using double circuit lines forHVAC and bipolar HVDC links. Simulation results demonstrated that the HVDC systemsurpasses the HVAC in power losses and SCL minimization. Additionally, results haveshown that, for the HVAC link case, the short-circuit levels increase after adding a solarpower plant and decrease progressively as the distance between this generation stationand the load centre increases. Moreover, it was noted that the double circuit line providesacceptable power loss and SCL results. When HVDC links are used, the results showedthat SCL considerably decreased whether the distance between the power plant and theload centre increase or decreases. Furthermore, it was noted that the power losses and theSCLs for bipolar links are significantly less than those provided by HVAC links.
5.3. System Strengths Evaluation for Large-Scale Solar Plant Integration
Numerical simulations were carried out using PSS/E software for the base systemconfiguration (without any newly added power), the short-circuit levels for three-phasefaults at the BGW4 bus, and its connections and are presented in Table 3.
Energies 2022, 15, 1142 12 of 19
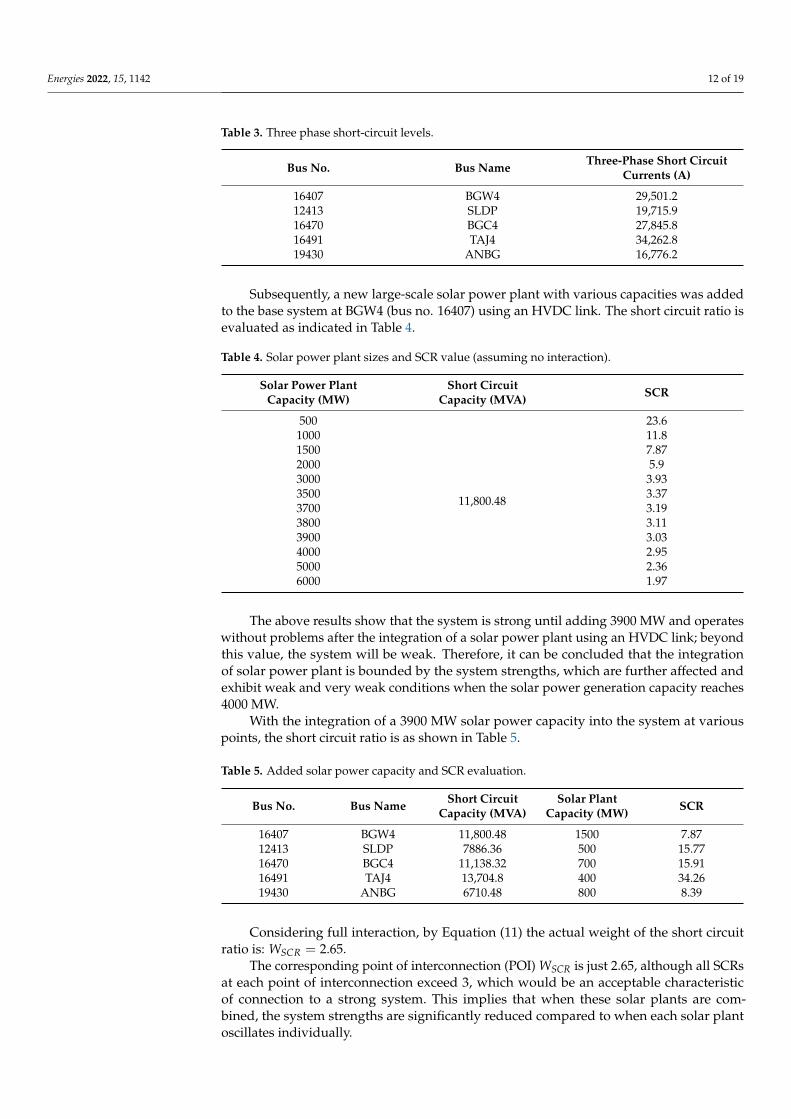
Table 3. Three phase short-circuit levels.
Bus No. Bus Name Three-Phase Short CircuitCurrents (A)
16407 BGW4 29,501.212413 SLDP 19,715.916470 BGC4 27,845.816491 TAJ4 34,262.819430 ANBG 16,776.2
Subsequently, a new large-scale solar power plant with various capacities was addedto the base system at BGW4 (bus no. 16407) using an HVDC link. The short circuit ratio isevaluated as indicated in Table 4.
Table 4. Solar power plant sizes and SCR value (assuming no interaction).
Solar Power PlantCapacity (MW)
Short CircuitCapacity (MVA) SCR
500
11,800.48
23.61000 11.81500 7.872000 5.93000 3.933500 3.373700 3.193800 3.113900 3.034000 2.955000 2.366000 1.97
The above results show that the system is strong until adding 3900 MW and operateswithout problems after the integration of a solar power plant using an HVDC link; beyondthis value, the system will be weak. Therefore, it can be concluded that the integrationof solar power plant is bounded by the system strengths, which are further affected andexhibit weak and very weak conditions when the solar power generation capacity reaches4000 MW.
With the integration of a 3900 MW solar power capacity into the system at variouspoints, the short circuit ratio is as shown in Table 5.
Table 5. Added solar power capacity and SCR evaluation.
Bus No. Bus Name Short CircuitCapacity (MVA)
Solar PlantCapacity (MW) SCR
16407 BGW4 11,800.48 1500 7.8712413 SLDP 7886.36 500 15.7716470 BGC4 11,138.32 700 15.9116491 TAJ4 13,704.8 400 34.2619430 ANBG 6710.48 800 8.39
Considering full interaction, by Equation (11) the actual weight of the short circuitratio is: WSCR = 2.65.
The corresponding point of interconnection (POI) WSCR is just 2.65, although all SCRsat each point of interconnection exceed 3, which would be an acceptable characteristicof connection to a strong system. This implies that when these solar plants are com-bined, the system strengths are significantly reduced compared to when each solar plantoscillates individually.

Energies 2022, 15, 1142 13 of 19
5.4. Dynamic Simulation Results and Discussion
A two-terminal HVDC line was simulated using the CDC4T-DC line control model, asshown in Figure 6.
Figure 6. CDC4T-DC transmission line control model.
The CDC4T model assumes that an instantaneous response of the DC system todisturbances is coming from adjacent grids. It uses the same algebra as the power flowmodel to update converter parameters (α, γ) at every integration step. It assumes thatconverters can maintain the steady-state control algorithm using the same setpoints as inpower flow. There is a special algorithm for simulating blocking and by-passing HVDCthat uses some threshold voltages on AC and DC sides. Setting up these thresholdsrequires experience because they are very sensitive to how strong the interconnection tothe system is.
The parameters of HVDC system control are shown in Table 6.
Table 6. Parameters of the HVDC system model.
System Parameters Rectifier Inverter
AC voltage base (kV) 400 400Tap setting (pu) 1.10 1.10
Nominal DC voltage (kV) ±400 ±400Nominal DC current (kA) 1.250 1.250
Transformer impedance (pu) 0.14 0.14System frequency (Hz) 50 50Minimum angle (deg) α = 15.863◦ α = 18◦
Power (MW) 1000 1000
In this study, the impact of line and bus outages on the system stability has beensimulated for three cases:
1. First case: the base system;2. Second case: after the integration of the solar plant using an overhead AC double-
circuit line;3. Third case: after integrating the solar plant using a bipolar DC link for each pole.
Energies 2022, 15, 1142 14 of 19
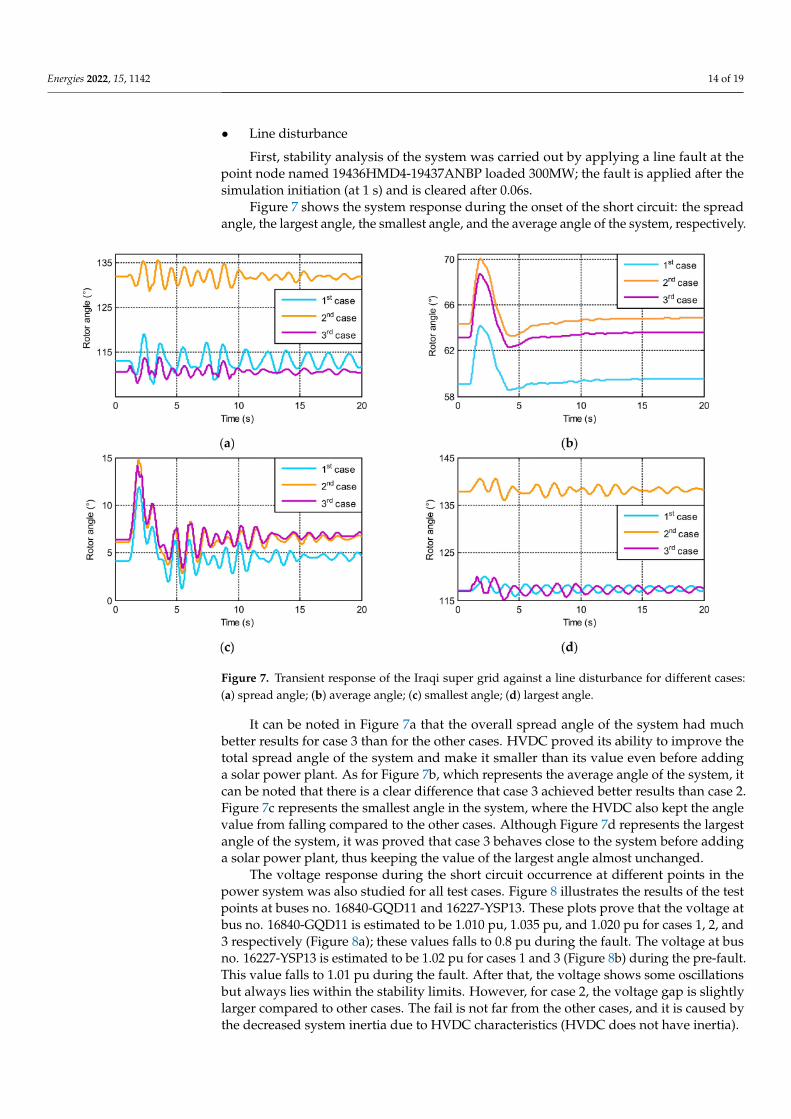
• Line disturbance
First, stability analysis of the system was carried out by applying a line fault at thepoint node named 19436HMD4-19437ANBP loaded 300MW; the fault is applied after thesimulation initiation (at 1 s) and is cleared after 0.06s.
Figure 7 shows the system response during the onset of the short circuit: the spreadangle, the largest angle, the smallest angle, and the average angle of the system, respectively.
Figure 7. Transient response of the Iraqi super grid against a line disturbance for different cases:(a) spread angle; (b) average angle; (c) smallest angle; (d) largest angle.
It can be noted in Figure 7a that the overall spread angle of the system had muchbetter results for case 3 than for the other cases. HVDC proved its ability to improve thetotal spread angle of the system and make it smaller than its value even before addinga solar power plant. As for Figure 7b, which represents the average angle of the system, itcan be noted that there is a clear difference that case 3 achieved better results than case 2.Figure 7c represents the smallest angle in the system, where the HVDC also kept the anglevalue from falling compared to the other cases. Although Figure 7d represents the largestangle of the system, it was proved that case 3 behaves close to the system before addinga solar power plant, thus keeping the value of the largest angle almost unchanged.
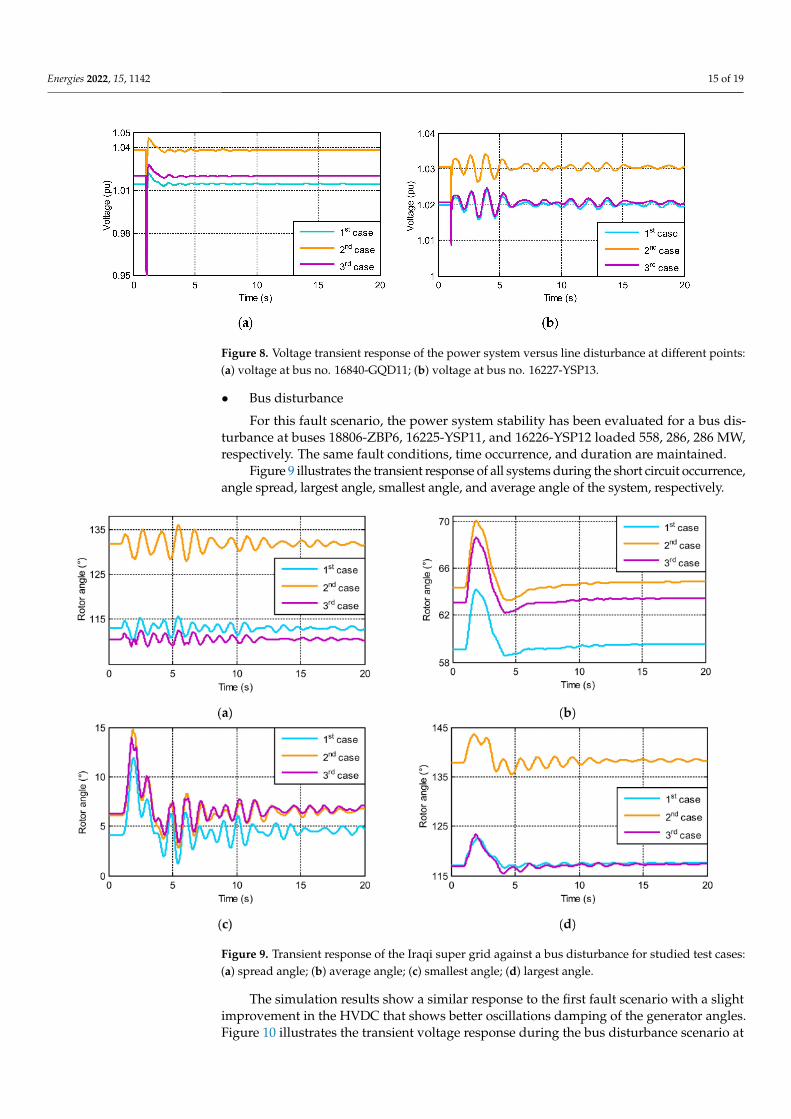
The voltage response during the short circuit occurrence at different points in thepower system was also studied for all test cases. Figure 8 illustrates the results of the testpoints at buses no. 16840-GQD11 and 16227-YSP13. These plots prove that the voltage atbus no. 16840-GQD11 is estimated to be 1.010 pu, 1.035 pu, and 1.020 pu for cases 1, 2, and3 respectively (Figure 8a); these values falls to 0.8 pu during the fault. The voltage at busno. 16227-YSP13 is estimated to be 1.02 pu for cases 1 and 3 (Figure 8b) during the pre-fault.This value falls to 1.01 pu during the fault. After that, the voltage shows some oscillationsbut always lies within the stability limits. However, for case 2, the voltage gap is slightlylarger compared to other cases. The fail is not far from the other cases, and it is caused bythe decreased system inertia due to HVDC characteristics (HVDC does not have inertia).
Energies 2022, 15, 1142 15 of 19
Figure 8. Voltage transient response of the power system versus line disturbance at different points:(a) voltage at bus no. 16840-GQD11; (b) voltage at bus no. 16227-YSP13.
• Bus disturbance
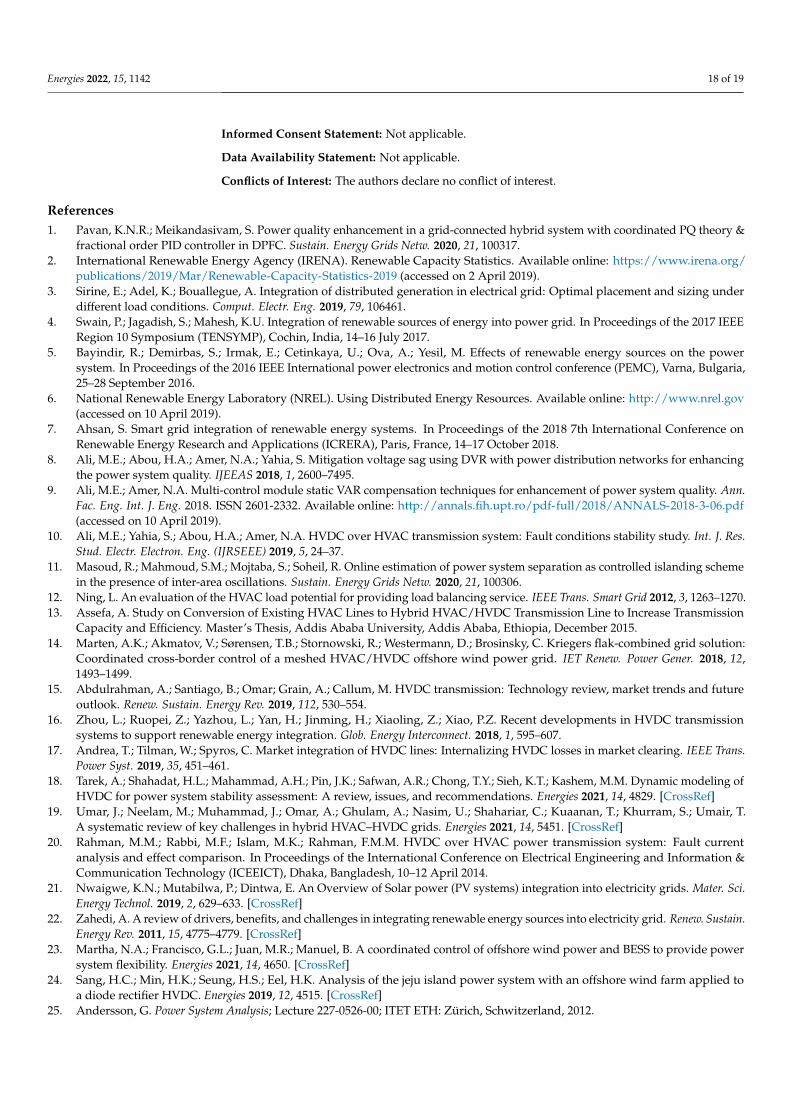
For this fault scenario, the power system stability has been evaluated for a bus dis-turbance at buses 18806-ZBP6, 16225-YSP11, and 16226-YSP12 loaded 558, 286, 286 MW,respectively. The same fault conditions, time occurrence, and duration are maintained.
Figure 9 illustrates the transient response of all systems during the short circuit occurrence,angle spread, largest angle, smallest angle, and average angle of the system, respectively.
Figure 9. Transient response of the Iraqi super grid against a bus disturbance for studied test cases:(a) spread angle; (b) average angle; (c) smallest angle; (d) largest angle.
The simulation results show a similar response to the first fault scenario with a slightimprovement in the HVDC that shows better oscillations damping of the generator angles.Figure 10 illustrates the transient voltage response during the bus disturbance scenario at

Energies 2022, 15, 1142 16 of 19
system points no. 16840-GQD11, and no. 16227-YSP13. Figure 10b shows that the voltagedrop for this fault scenario has reached 0.18 pu. However, the power system has regainedits stability after removing the fault.
Figure 10. Voltage transient response of the power system versus bus disturbance at different points:(a) voltage at bus no. 16840-GQD11; (b) voltage at bus no. 16227-YSP13.
• Line and bus disturbance
In this scenario, both line and bus disturbances have been applied. The Iraqi supergrid stability has been examined for a line outage at 19436HMD4-19437ANBP and busdisconnection at buses no. 18806-ZBP6, no. 16225-YSP11, and no. 16226-YSP12. For thisfault scenario, a total generation of 1730 MW is disconnected. Figures 11 and 12 illustratethe transient response of the power system angles and voltages to this fault scenario.
The simulation results described in the figures above show that when the line andbus faults are applied simultaneously, the angle deviation of the power system is greaterthan for the case where each fault is applied separately. Nevertheless, the Iraqi super gridhas proven its resilience to such a severe fault. Moreover, as for previous fault scenarios,the HVDC system has outperformed the HVAC system, showing a better resilience tofaults, resulting in a small deviation of the angle and better damping of the oscillations.Furthermore, the transient voltage response depicted in Figure 12 shows a similar result asfor the bus disturbance case, which demonstrates that this type of fault affects the systemvoltage more than the line outage. However, after the fault clears, the system voltage showssome oscillations but lies within the stability limits.
Figure 11. Cont.

Energies 2022, 15, 1142 17 of 19
Figure 11. Transient response of the studied power system versus a simultaneous line and bus distur-bance for studied test cases: (a) spread angle; (b) average angle; (c) smallest angle; (d) largest angle.
Figure 12. Voltage transient response of the power system versus a simultaneous line and bus distur-bance at different points: (a) voltage at bus no. 16840-GQD11; (b) voltage at bus no. 16227-YSP13.
6. Conclusions
This paper discussed the impact of large-scale renewable energy integration withboth HVAC and HVDC systems, considering stability analysis. Simulation results provethat despite the severity of the applied faults, the Iraqi super grid has demonstrated itsresilience to such a fault. Additionally, the HVDC system has outperformed the HVACsystem, showing a better resilience to faults, resulting in a small deviation of the angle andbetter damping of the oscillations. The dynamic system behaviour in the presence of HVDClines has shown better performance and a more stable state for permanent faults than pureHVAC networks. Moreover, the HVDC lines have a better performance when comparingtransient with permanent faults. It provides additional voltage support to congestedtransmission lines, leading to system stability and reliability improvement. However,the most significant benefit of adding an HVDC line in accidents is the system’s abilityto withstand a considerable loss of power without significantly impacting the network’sstability, which was observed when studying the line and bus disturbance.
Author Contributions: Conceptualization, I.I.H. and S.E.; methodology, I.I.H. and S.E.; software,I.I.H.; validation, S.E. and A.K.; investigation, I.I.H.; writing—original draft preparation, I.I.H.;writing—review and editing, S.E.; visualization, I.I.H.; supervision, S.E. and A.K. All authors haveread and agreed to the published version of the manuscript.
Funding: This research received no external funding.
Institutional Review Board Statement: Not applicable.
Energies 2022, 15, 1142 18 of 19
Informed Consent Statement: Not applicable.
Data Availability Statement: Not applicable.
Conflicts of Interest: The authors declare no conflict of interest.
References1. Pavan, K.N.R.; Meikandasivam, S. Power quality enhancement in a grid-connected hybrid system with coordinated PQ theory &
fractional order PID controller in DPFC. Sustain. Energy Grids Netw. 2020, 21, 100317.2. International Renewable Energy Agency (IRENA). Renewable Capacity Statistics. Available online: https://www.irena.org/
publications/2019/Mar/Renewable-Capacity-Statistics-2019 (accessed on 2 April 2019).3. Sirine, E.; Adel, K.; Bouallegue, A. Integration of distributed generation in electrical grid: Optimal placement and sizing under
different load conditions. Comput. Electr. Eng. 2019, 79, 106461.4. Swain, P.; Jagadish, S.; Mahesh, K.U. Integration of renewable sources of energy into power grid. In Proceedings of the 2017 IEEE
Region 10 Symposium (TENSYMP), Cochin, India, 14–16 July 2017.5. Bayindir, R.; Demirbas, S.; Irmak, E.; Cetinkaya, U.; Ova, A.; Yesil, M. Effects of renewable energy sources on the power
system. In Proceedings of the 2016 IEEE International power electronics and motion control conference (PEMC), Varna, Bulgaria,25–28 September 2016.
6. National Renewable Energy Laboratory (NREL). Using Distributed Energy Resources. Available online: http://www.nrel.gov(accessed on 10 April 2019).
7. Ahsan, S. Smart grid integration of renewable energy systems. In Proceedings of the 2018 7th International Conference onRenewable Energy Research and Applications (ICRERA), Paris, France, 14–17 October 2018.
8. Ali, M.E.; Abou, H.A.; Amer, N.A.; Yahia, S. Mitigation voltage sag using DVR with power distribution networks for enhancingthe power system quality. IJEEAS 2018, 1, 2600–7495.
9. Ali, M.E.; Amer, N.A. Multi-control module static VAR compensation techniques for enhancement of power system quality. Ann.Fac. Eng. Int. J. Eng. 2018. ISSN 2601-2332. Available online: http://annals.fih.upt.ro/pdf-full/2018/ANNALS-2018-3-06.pdf(accessed on 10 April 2019).
10. Ali, M.E.; Yahia, S.; Abou, H.A.; Amer, N.A. HVDC over HVAC transmission system: Fault conditions stability study. Int. J. Res.Stud. Electr. Electron. Eng. (IJRSEEE) 2019, 5, 24–37.
11. Masoud, R.; Mahmoud, S.M.; Mojtaba, S.; Soheil, R. Online estimation of power system separation as controlled islanding schemein the presence of inter-area oscillations. Sustain. Energy Grids Netw. 2020, 21, 100306.
12. Ning, L. An evaluation of the HVAC load potential for providing load balancing service. IEEE Trans. Smart Grid 2012, 3, 1263–1270.13. Assefa, A. Study on Conversion of Existing HVAC Lines to Hybrid HVAC/HVDC Transmission Line to Increase Transmission
Capacity and Efficiency. Master’s Thesis, Addis Ababa University, Addis Ababa, Ethiopia, December 2015.14. Marten, A.K.; Akmatov, V.; Sørensen, T.B.; Stornowski, R.; Westermann, D.; Brosinsky, C. Kriegers flak-combined grid solution:
Coordinated cross-border control of a meshed HVAC/HVDC offshore wind power grid. IET Renew. Power Gener. 2018, 12,1493–1499.
15. Abdulrahman, A.; Santiago, B.; Omar; Grain, A.; Callum, M. HVDC transmission: Technology review, market trends and futureoutlook. Renew. Sustain. Energy Rev. 2019, 112, 530–554.
16. Zhou, L.; Ruopei, Z.; Yazhou, L.; Yan, H.; Jinming, H.; Xiaoling, Z.; Xiao, P.Z. Recent developments in HVDC transmissionsystems to support renewable energy integration. Glob. Energy Interconnect. 2018, 1, 595–607.
17. Andrea, T.; Tilman, W.; Spyros, C. Market integration of HVDC lines: Internalizing HVDC losses in market clearing. IEEE Trans.Power Syst. 2019, 35, 451–461.
18. Tarek, A.; Shahadat, H.L.; Mahammad, A.H.; Pin, J.K.; Safwan, A.R.; Chong, T.Y.; Sieh, K.T.; Kashem, M.M. Dynamic modeling ofHVDC for power system stability assessment: A review, issues, and recommendations. Energies 2021, 14, 4829. [CrossRef]
19. Umar, J.; Neelam, M.; Muhammad, J.; Omar, A.; Ghulam, A.; Nasim, U.; Shahariar, C.; Kuaanan, T.; Khurram, S.; Umair, T.A systematic review of key challenges in hybrid HVAC–HVDC grids. Energies 2021, 14, 5451. [CrossRef]
20. Rahman, M.M.; Rabbi, M.F.; Islam, M.K.; Rahman, F.M.M. HVDC over HVAC power transmission system: Fault currentanalysis and effect comparison. In Proceedings of the International Conference on Electrical Engineering and Information &Communication Technology (ICEEICT), Dhaka, Bangladesh, 10–12 April 2014.
21. Nwaigwe, K.N.; Mutabilwa, P.; Dintwa, E. An Overview of Solar power (PV systems) integration into electricity grids. Mater. Sci.Energy Technol. 2019, 2, 629–633. [CrossRef]
22. Zahedi, A. A review of drivers, benefits, and challenges in integrating renewable energy sources into electricity grid. Renew. Sustain.Energy Rev. 2011, 15, 4775–4779. [CrossRef]
23. Martha, N.A.; Francisco, G.L.; Juan, M.R.; Manuel, B. A coordinated control of offshore wind power and BESS to provide powersystem flexibility. Energies 2021, 14, 4650. [CrossRef]
24. Sang, H.C.; Min, H.K.; Seung, H.S.; Eel, H.K. Analysis of the jeju island power system with an offshore wind farm applied toa diode rectifier HVDC. Energies 2019, 12, 4515. [CrossRef]
25. Andersson, G. Power System Analysis; Lecture 227-0526-00; ITET ETH: Zürich, Schwitzerland, 2012.
Energies 2022, 15, 1142 19 of 19
26. Umar, H.R.; Mahmoud, S.; Joakim, M.; Joakim, W.; Nicholas, E. Review of probabilistic load flow approaches for powerdistribution systems with photovoltaic generation and electric vehicle charging. Electr. Power Energy Syst. 2020, 120, 106003.
27. John, J.G.; William, D.S. Power System Analysis, International ed.; McGraw-Hill: Singapore, 1994; pp. 329–376.28. Archita, V.; Sweety, J.; Sneha, M.; Vinita, G.; Mahendra, L. Comparison between different load flow methodologies by analyzing
various bus systems. Int. J. Electr. Eng. 2016, 9, 127–138.29. Saadat, H. Power System Analysis; Mc Grawhill: New York, NY, USA, 1999; Volume 2.30. Subhan, R. Load flow based electrical system design and short circuit analysis. Master’s Thesis, Kadir Has University, Istanbul,
Turkey, February 2019.31. Benoît, d.M.N.; Frédéric, D.; Christophe, P. Calculation of Short-Circuit Currents, Cahier Technique no.; 158, Schneider Electric.
2005, p. 35. Available online: https://www.se.com/ww/en/download/document/ECT158/ (accessed on 10 July 2020).32. Noman, A.; Arif, H.; Dirk, V.H.; Lidong, Z.; Hans, P.N. Prospects and challenges of future HVDC supergrids with modular
multilevel converters. In Proceedings of the 14th European Conference on Power Electronics and Applications, EuropeanConference, Birmingham, UK, 30 August–1 September 2011.
33. Noman, A.; Staffan, N.; Hans, P.N.; Arif, H.; Dirk, V.H.; Lidong, Z.; Lennart, H. HVDC supergrids with modular multilevelconverters; the power transmission backbone of the future. In Proceedings of the International Multi-Conference on Systems,Signals and Devices, Chemnitz, Germany, 20–23 March 2012.
34. Spahic, E.; Schettler, F.; Varma, D.; Dorn, J. Impact of the DC technology on transmission grids. In Proceedings of the 11th IETInternational Conference on AC and DC Power Transmission, Birmingham, UK, 10–12 February 2015.
35. Udeesha, S.A. Hybrid LCC and multi-terminal full-bridge modular multilevel converters for HVDC transmission. Master’sThesis, University of Toronto, Toronto, ON, Canada, 2015.
36. Younggi, L.; Shenghui, C.; Sungmin, K.; Seung, K.S. Control of hybrid HVDC transmission system with LCC and FB-MMC. InProceedings of the Energy Conversion Congress and Exposition (ECCE), Pittsburgh, PA, USA, 14–18 September 2014.
37. Mike, B.; Damian, S.V.R.; Roger, S. HVDC Circuit Breakers—A Review. IEEE Access 2020, 8, 211829–211848.38. Yunkai, L.; Ting, L.; Quan, T.; Yunling, W.; Chuan, Y.; Xiaoxi, Y.; Yang, L. Comparison of UPFC, SVC and STATCOM in improving
commutation failure immunity of LCC-HVDC systems. IEEE Access 2020, 8, 135298–135307.39. Xiaodong, L.; Zheng, X. Feasibility evaluation on elimination of DC filters for line-commutated converter-based high-voltage
direct current projects in new situations. Energies 2021, 14, 5770. [CrossRef]40. Alireza, N.; Jiaqi, L.; Frans, D.; Georgios, D.D. Modular multilevel converters for HVDC Applications: Review on converter cells
and functionalities. IEEE Trans. Power Electron. 2014, 30, 18–36.41. Geng, T.; Zheng, X. A LCC and MMC Hybrid HVDC Topology with DC Line Fault Clearance Capability. Electr. Power Energy Syst.
2014, 62, 419–428.42. Drgan, J.; Khaled, A. High-Voltage Direct-Current Transmission, 1st ed.; John Wiley & Sons: Chichester, UK, 2015; pp. 5–118.43. Zhao, J.; Tao, Y. Control Characteristic Analysis and Coordinated Strategy Design for Hybrid HVDC With Multi-Infeed MMC
Inverters. Front. Energy Res. 2021, 558. [CrossRef]44. Abbey, C.; Khodabakhchian, B.; Zhou, F.; Dennetière, S.; Mahseredjian, J.; Joos, G. Transient modeling and comparison of wind
generator topologies. In Proceedings of the International Conference on Power Systems Transients, Montreal, QC, Canada,19–23 June 2005.
45. Yang, Z.; Shun, H.F.H.; John, S.; José, C.; Jeffrey, B.; Ehsan, R. Evaluating system strength for large-scale wind plant integration. InProceedings of the 2014 IEEE PES General Meeting, Conference & Exposition, National Harbor, MD, USA, 27–31 July 2014.
46. ABB. Comp. ERCOT CREZ Reactive Power Compensation Study. 2010. Available online: https://www.hitachienergy.com/ru/ru/case-studies/reference-crez (accessed on 3 August 2020).
47. Huang, S.H.; Schmall, J.; Conto, J.; Adams, J.; Zhang, Y.; Carter, C. Voltage Stability Concerns on Weak Grids with HighPenetration of Wind Generation: ERCOT Experience. In Proceedings of the IEEE PES General Meeting, San Diego, CA, USA,22–26 July 2012.
48. Kong, D. Advanced HVDC systems for renewable energy integration and power transmission: Modelling and control for powersystem transient stability. Ph.D. Thesis, University of Birmingham, Birmingham, UK, June 2013.
49. Prabha, K.; John, P.; Venkat, A.; Göran, A.; Anjan, B.; Claudio, C.; Nikos, H.; David, H.; Alex, S.; Carson, T.; et al. Definiation andclassification of power system stability. IEEE Trans. Power Syst. 2004, 19, 1387–1401.
50. The Republic of Iraq, Ministry of Electricity, Planning and Studies Office. Yearly Report; Ministry of Electricity, Planning andStudies Office: Baghdad, Iraq, 2017.
51. Israa, I.H.; Sirine, E.; Adel, K. Comparative study of HVDC and HVAC systems in presence of large scale renewable energysources. In Proceedings of the 20th International Conference IEEE on Sciences and Techniques of Automatic Control andComputer Engineering (STA IEEE Conference), Monastir, Tunisia, 20–22 December 2020.