Rapid turnover of T cells in acute infectious mononucleosis
11
Rapid turnover of T cells in acute infectious mononucleosis Derek C. Macallan 1 , Diana L. Wallace 2 , Andrew J. Irvine 1 , Becca Asquith 3 , Andrew Worth 2 , Hala Ghattas 1 , Yan Zhang 1 , George E. Griffin 1 , DavidF. Tough 2 and Peter C. Beverley 2 1 Department of Infectious Diseases, St George’s Hospital Medical School, London, GB 2 Edward Jenner Institute for Vaccine Research, Compton, Newbury, GB 3 Department of Immunology, Wright-Fleming Institute, Imperial College, London, GB During acute infectious mononucleosis (AIM), large clones of Epstein-Barr virus-specific T lymphocytes are produced. To investigate the dynamics of clonal expansion, we measured cell proliferation during AIM using deuterated glucose to label DNA of dividing cells in vivo, analyzing cells according to CD4, CD8 and CD45 phenotype. The proportion of labeled CD8 + CD45R0 + T lymphocytes was dramatically increased in AIM subjects compared to con- trols (mean 17.5 versus 2.8%/day; p 0.005), indicating very rapid proliferation. Labeling was also increased in CD4 + CD45R0 + cells (7.1 versus 2.1%/day; p 0.01), but less so in CD45RA + cells. Mathematical modeling, accounting for death of labeled cells and changing pool sizes, gave estimated proliferation rates in CD8 + CD45R0 + cells of 11–130% of cells pro- liferating per day (mean 47%/day), equivalent to a doubling time of 1.5 days and an appear- ance rate in blood of about 5×10 9 cells/day (versus 7×10 7 cells/day in controls). Very rapid death rates were also observed amongst labeled cells (range 28–124, mean 57%/day), indi- cating very short survival times in the circulation. Thus, we have shown direct evidence for massive proliferation of CD8 + CD45R0 + T lymphocytes in AIM and demonstrated that rapid cell division continues concurrently with greatly accelerated rates of cell disappearance. Key words: Lymphocyte / Infectious mononucleosis / Epstein-Barr virus infections / Lymphocyte activation / Cell death Received 20/6/03 Revised 11/7/03 Accepted 18/7/03 [DOI 10.1002/eji.200324295] Abbreviation: AIM: Acute infectious mononucleosis 1 Introduction Infection with Epstein-Barr virus (EBV) during adoles- cence and adulthood causes acute infectious mononu- cleosis (AIM), an acute systemic febrile illness. The pri- mary cellular target for infection is the B lymphocyte, but powerful T cell responses are elicited as demonstrated by massive increases in circulating activated CD8 + T cells. Such T cell responses are thought to be crucial in suppressing viral replication to low levels such that indi- viduals remain healthy thereafter, despite life-long per- sistence of virus. A minority suffers from a more chronic viral illness with persisting higher level virus replication. Early events in the response to virus infections may be critical in determining long term outcome [1, 2]. AIM may therefore be a useful model to understand the regulation of clonal proliferation and how the immune system either succeeds or fails to suppress virus production ade- quately. CD8 expansion in AIM is characterized by major expan- sions of a relatively small number of clones that are read- ily detectable ex vivo, while CD4 clones are not. Other evidence suggests that CD4 responses are spread across a broader range of smaller clones [3, 4]. Recent studies using EBV-specific tetramers and heteroduplex analysis of T cell receptors have shown that a high pro- portion of the activated CD8 cells are specific for EBV antigens and that the response is focussed on a small number of dominant epitopes [5]. The increase in cell numbers in peripheral blood thus reflects the presence of large numbers of virus-specific T cells that have undergone dramatic expansion from rare precursors in the naive T cell pool. With resolution of the acute infec- tion, cell numbers decrease rapidly, typically returning to resting values, but with preservation of a pool of antigen- specific primed lymphocytes [6]. Such a dynamic response must occur within the context of the normal homeostatic regulation of the T cell pool; in healthy individuals, both the number of peripheral T cells and the proportions that are naive and primed remain rel- atively constant over time [7]. In addition, animal model Eur. J. Immunol. 2003. 33: 2655–2665 T cell turnover in acute infectious mononucleosis 2655 © 2003 WILEY-VCH Verlag GmbH & Co. KGaA, Weinheim
Transcript of Rapid turnover of T cells in acute infectious mononucleosis

Rapid turnover of T cells in acute infectiousmononucleosis
Derek C. Macallan1, Diana L. Wallace2, Andrew J. Irvine1, Becca Asquith3, AndrewWorth2, Hala Ghattas1, Yan Zhang1, George E. Griffin1, David F. Tough2 and Peter C.Beverley2
1 Department of Infectious Diseases, St George’s Hospital Medical School, London, GB2 Edward Jenner Institute for Vaccine Research, Compton, Newbury, GB3 Department of Immunology, Wright-Fleming Institute, Imperial College, London, GB
During acute infectious mononucleosis (AIM), large clones of Epstein-Barr virus-specific Tlymphocytes are produced. To investigate the dynamics of clonal expansion, we measuredcell proliferation during AIM using deuterated glucose to label DNA of dividing cells in vivo,analyzing cells according to CD4, CD8 and CD45 phenotype. The proportion of labeledCD8+CD45R0+ T lymphocytes was dramatically increased in AIM subjects compared to con-trols (mean 17.5 versus 2.8%/day; p X 0.005), indicating very rapid proliferation. Labelingwas also increased in CD4+CD45R0+ cells (7.1 versus 2.1%/day; p X 0.01), but less so inCD45RA+ cells. Mathematical modeling, accounting for death of labeled cells and changingpool sizes, gave estimated proliferation rates in CD8+CD45R0+ cells of 11–130% of cells pro-liferating per day (mean 47%/day), equivalent to a doubling time of 1.5 days and an appear-ance rate in blood of about 5×10⁹ cells/day (versus 7×10⁷ cells/day in controls). Very rapiddeath rates were also observed amongst labeled cells (range 28–124, mean 57%/day), indi-cating very short survival times in the circulation. Thus, we have shown direct evidence formassive proliferation of CD8+CD45R0+ T lymphocytes in AIM and demonstrated that rapidcell division continues concurrently with greatly accelerated rates of cell disappearance.
Key words: Lymphocyte / Infectious mononucleosis / Epstein-Barr virus infections / Lymphocyteactivation / Cell death
Received 20/6/03Revised 11/7/03Accepted 18/7/03
[DOI 10.1002/eji.200324295]
Abbreviation: AIM: Acute infectious mononucleosis
1 Introduction
Infection with Epstein-Barr virus (EBV) during adoles-cence and adulthood causes acute infectious mononu-cleosis (AIM), an acute systemic febrile illness. The pri-mary cellular target for infection is the B lymphocyte, butpowerful T cell responses are elicited as demonstratedby massive increases in circulating activated CD8+ Tcells. Such T cell responses are thought to be crucial insuppressing viral replication to low levels such that indi-viduals remain healthy thereafter, despite life-long per-sistence of virus. A minority suffers from a more chronicviral illness with persisting higher level virus replication.Early events in the response to virus infections may becritical in determining long term outcome [1, 2]. AIM maytherefore be a useful model to understand the regulationof clonal proliferation and how the immune system eithersucceeds or fails to suppress virus production ade-quately.
CD8 expansion in AIM is characterized by major expan-sions of a relatively small number of clones that are read-ily detectable ex vivo, while CD4 clones are not. Otherevidence suggests that CD4 responses are spreadacross a broader range of smaller clones [3, 4]. Recentstudies using EBV-specific tetramers and heteroduplexanalysis of T cell receptors have shown that a high pro-portion of the activated CD8 cells are specific for EBVantigens and that the response is focussed on a smallnumber of dominant epitopes [5]. The increase in cellnumbers in peripheral blood thus reflects the presenceof large numbers of virus-specific T cells that haveundergone dramatic expansion from rare precursors inthe naive T cell pool. With resolution of the acute infec-tion, cell numbers decrease rapidly, typically returning toresting values, but with preservation of a pool of antigen-specific primed lymphocytes [6].
Such a dynamic response must occur within the contextof the normal homeostatic regulation of the T cell pool; inhealthy individuals, both the number of peripheral T cellsand the proportions that are naive and primed remain rel-atively constant over time [7]. In addition, animal model
Eur. J. Immunol. 2003. 33: 2655–2665 T cell turnover in acute infectious mononucleosis 2655
© 2003 WILEY-VCH Verlag GmbH & Co. KGaA, Weinheim

Table 1. Clinical attributes of subjects
Subject Age Gender Duration ofsymptomsa)
Time frommaximal
symptomsa)
Local disease(pharyngitis)
Systemic disease Lymphocytecount
Years Days Days ×103/ ? l
1 19 M 14 0 severe severe 6.6
2 21 M 10 6 moderate moderate 11.1
3 18 F 14 7 moderate moderate 2.0
4 19 M 4 1 severe severe 17.8
5 18 M 8 5 severe mild 4.9
Median 19 10 5 – – 6.6
a) Times are expressed as days relative to day of labeling. Normal range for lymphocyte count 1.0–4.0×10³/ ? l.
experiments using cell surface markers to distinguish“naive-phenotype” from “memory-phenotype” T cellshave shown that cell numbers in these two subpopula-tions are maintained by different mechanisms [8]. Thusnaive T cells appear to persist mainly as long-lived cellsthat divide infrequently, while memory-phenotype T cellsundergo cell division more often, presumably balancedby higher rates of cell death [9–11].
Alterations in T cell homeostasis which occur in acuteviral infection are the consequence of changes in bothproduction and death rates; thus a clone may becomeenlarged by increased proliferation or increased longev-ity. Full understanding of the magnitude of such changesand the relative importance of increased proliferationand altered longevity for acute clonal enlargement andlong-term persistence hinge on methods allowing directmeasurement of the underlying cellular kinetics. Suchmethodologies using stable (non-radioactive) isotopelabeling of dividing cells applicable to human in vivostudies have recently been developed [12] and applied tostudy lymphocyte homeostasis during chronic humanimmunodeficiency virus (HIV) infection [10, 13, 14]. Wehave applied such methodologies to investigate thekinetics of lymphocytes in vivo during AIM in human vol-unteers.
2 Results
2.1 Subjects and clinical observations
Five previously healthy subjects with AIM were investi-gated. All had positive monospot, EBV-specific IgM andfever, pharyngitis and fatigue. Clinical details are shownin Table 1, including symptom severity graded as: none,
mild, moderate, or severe for local and systemic fea-tures. Investigation was performed 4–14 days from onsetof symptoms and 0–7 days from maximal symptoms, asjudged by the subject. All made a prompt complete clini-cal recovery subsequent to investigation. Control sub-jects (n=8) were healthy young volunteers of similarmedian age (23 years; 4M:4F); control data have beenfully presented elsewhere [11].
2.2 Lymphocyte phenotype
Examination of peripheral blood lymphocyte phenotyperevealed an elevated lymphocyte count in four out of fivesubjects (Table 1) and an increased percentage of CD8+
T cells relative to total lymphocytes in all subjects. Suchcells were predominantly CD45R0+, as previouslydescribed [15], and most demonstrated an activatedphenotype. On average, 48.7% (range 39–89%, n=5)and 64.5% (44–81%, n=4) of CD8+ cells were positive forHLA-DR or CD38, respectively at first measurement inAIM subjects (Fig. 1), whereas only 17 and 19%, respec-tively of cells were positive in controls. The percentage ofHLA-DR+ and CD38+ cells declined during the course ofthe study in all AIM subjects, commensurate with clinicalrecovery from AIM.
Subject 1 was unusual, in that he was found to be het-erozygous for the CD45 C77G allelic variant known tocause altered splicing of CD45 [16]. This mutation, foundin approximately 1:60 of the UK population, results in aninability to generate low molecular weight isoforms of theCD45 molecule encoded by that allele [17]. Hence, sub-ject 1 had no single-positive CD45R0+RA– cells (allCD45R0+ cells were also CD45RA+). It is interesting thatthis individual exhibited the most severe symptoms in
2656 D. C. Macallan et al. Eur. J. Immunol. 2003. 33: 2655–2665
© 2003 WILEY-VCH Verlag GmbH & Co. KGaA, Weinheim

Fig. 1. Activation status of CD8+ T cells during and followingAIM. Expression of (a) HLA-DR and (b) CD38 gated on CD8+
T cells. Individual curves are shown for each subject: 1 ( ß ),2 ( Y ), 3 ( a ), 4 ( 1 ), 5 ( ‡ ), with a mean control value ( | – dot-ted line, n=8). Data are not available for CD38 expression forsubject 1, day 3/4 and subject 2, day 10.
the cohort since an increased frequency of the C77Gallele has been found to be associated with susceptibilityto other viral infections such as HIV [18].
2.3 CD8+ T cell kinetics in AIM
Cell kinetics were calculated from the quantitative incor-poration of deuterium from deuterated glucose into DNAof dividing cells following a 24-h infusion of deuterium-labeled glucose [12]. Acquisition and loss of label byperipheral blood T cells are shown in Fig. 2. When CD8+
T cells were analyzed (Fig. 2a), there were three notablefindings. First, there was a dramatic increase in peaklabeling in AIM subjects compared to controls, consis-tent with very rapid cellular proliferation in AIM. Althoughthere was a high degree of variability between subjectswith AIM, mean peak proportion of labeledCD8+CD45R0+ cells (17.5±7%) was much higher thanthat in control subjects (2.8 5±2.1%, p X 0.01; Table 2).The highest value was seen in subject 1 where nearly30% of CD8+CD45R0+ cells (which were also CD45RA+)were labeled on day 3. Such dramatically increased
labeling occurred in the context of an expanded CD8+ Tlymphocyte pool, indicating greatly increased total ratesof CD8+ T lymphocyte production, as discussed below.
Secondly, peak labeling appeared to occur earlier in AIMsubjects. In control subjects, peak labeling wasobserved with equal frequency at days 3 and 4 with thisprotocol, whereas, in AIM subjects, day 3 values alwaysexceeded those on day 4; indeed the peak may havepreceded the first sampling on day 3. This suggests thatthe normal post-mitotic residence time of lymphocytes(presumably in lymph nodes) prior to release into periph-eral blood, is reduced in AIM.
Thirdly, labeled cells in the CD8+CD45R0+ pool disap-peared very rapidly from the circulation. Thus, in all sub-jects there was a considerable fall in labeling from day 3to 4 and by day 10 labeling was about a quarter of peakvalues (Fig. 2a).
When CD8+CD45RA+ cells were examined, increasedlabeling was noted in two subjects, while, in two others,values were very close to controls (Fig. 2b). In subject 1,labeling was very high but this was attributed to thesplicing variant in this individual (Fig. 2b inset). The meanvalue, excluding subject 1, was increased compared tocontrol values (Table 2; p X 0.05) but the magnitude wasconsiderably less than that seen in CD8+CD45R0+ cells.Thus, a massive alteration in the kinetic behavior of theCD8+CD45R0+ T cell pool was associated with relativelyminor changes in the CD45RA+ pool in most subjects,consistent with independent regulation of these T cellsub-populations.
2.4 CD4 lymphocyte proliferation
When CD4+ lymphocytes were analyzed, AIM was foundto be associated with a substantial increase in the pro-portion of labeled CD45R0+ memory-phenotype cells inperipheral blood at day 3 (Fig. 2c), with peak valuesabout three times higher than controls; 7.1% versus2.1% (Table 2, p X 0.01). As for CD8+ cells, thereappeared to be more rapid release of labeled CD45R0+
cells into the circulation. Such results reveal a hithertounrecognized sizeable alteration in CD4+CD45R0+ T cellkinetics during AIM. By contrast, for CD4+CD45RA+ cells,we found similar rates of labeling in AIM subjects andcontrols, except for subject 1 with the splicing variant(Table 2; Fig. 2c).
Eur. J. Immunol. 2003. 33: 2655–2665 T cell turnover in acute infectious mononucleosis 2657
© 2003 WILEY-VCH Verlag GmbH & Co. KGaA, Weinheim
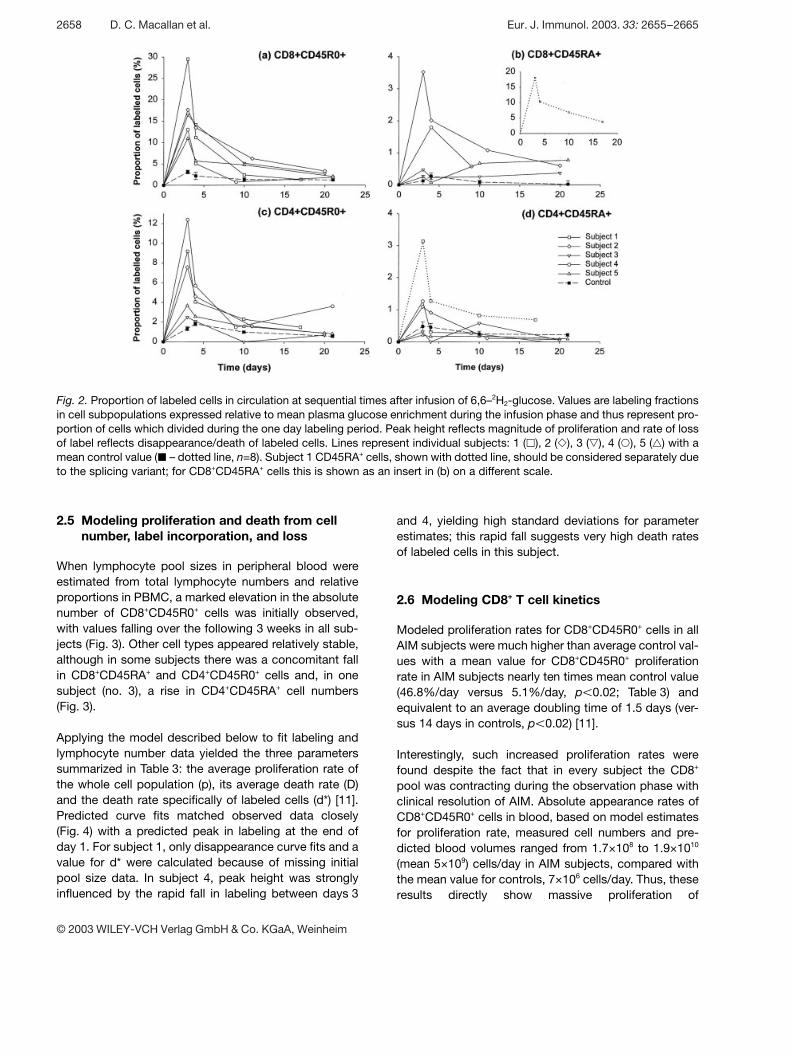
Fig. 2. Proportion of labeled cells in circulation at sequential times after infusion of 6,6–2H2-glucose. Values are labeling fractionsin cell subpopulations expressed relative to mean plasma glucose enrichment during the infusion phase and thus represent pro-portion of cells which divided during the one day labeling period. Peak height reflects magnitude of proliferation and rate of lossof label reflects disappearance/death of labeled cells. Lines represent individual subjects: 1 ( ß ), 2 ( Y ), 3 ( a ), 4 ( 1 ), 5 ( ‡ ) with amean control value ( | – dotted line, n=8). Subject 1 CD45RA+ cells, shown with dotted line, should be considered separately dueto the splicing variant; for CD8+CD45RA+ cells this is shown as an insert in (b) on a different scale.
2.5 Modeling proliferation and death from cellnumber, label incorporation, and loss
When lymphocyte pool sizes in peripheral blood wereestimated from total lymphocyte numbers and relativeproportions in PBMC, a marked elevation in the absolutenumber of CD8+CD45R0+ cells was initially observed,with values falling over the following 3 weeks in all sub-jects (Fig. 3). Other cell types appeared relatively stable,although in some subjects there was a concomitant fallin CD8+CD45RA+ and CD4+CD45R0+ cells and, in onesubject (no. 3), a rise in CD4+CD45RA+ cell numbers(Fig. 3).
Applying the model described below to fit labeling andlymphocyte number data yielded the three parameterssummarized in Table 3: the average proliferation rate ofthe whole cell population (p), its average death rate (D)and the death rate specifically of labeled cells (d*) [11].Predicted curve fits matched observed data closely(Fig. 4) with a predicted peak in labeling at the end ofday 1. For subject 1, only disappearance curve fits and avalue for d* were calculated because of missing initialpool size data. In subject 4, peak height was stronglyinfluenced by the rapid fall in labeling between days 3
and 4, yielding high standard deviations for parameterestimates; this rapid fall suggests very high death ratesof labeled cells in this subject.
2.6 Modeling CD8+ T cell kinetics
Modeled proliferation rates for CD8+CD45R0+ cells in allAIM subjects were much higher than average control val-ues with a mean value for CD8+CD45R0+ proliferationrate in AIM subjects nearly ten times mean control value(46.8%/day versus 5.1%/day, p X 0.02; Table 3) andequivalent to an average doubling time of 1.5 days (ver-sus 14 days in controls, p X 0.02) [11].
Interestingly, such increased proliferation rates werefound despite the fact that in every subject the CD8+
pool was contracting during the observation phase withclinical resolution of AIM. Absolute appearance rates ofCD8+CD45R0+ cells in blood, based on model estimatesfor proliferation rate, measured cell numbers and pre-dicted blood volumes ranged from 1.7×10⁸ to 1.9×10¹⁰
(mean 5×10⁹) cells/day in AIM subjects, compared withthe mean value for controls, 7×10⁶ cells/day. Thus, theseresults directly show massive proliferation of
2658 D. C. Macallan et al. Eur. J. Immunol. 2003. 33: 2655–2665
© 2003 WILEY-VCH Verlag GmbH & Co. KGaA, Weinheim

Table 2. Peak proportion of labeled cells in lymphocyte subpopulations (F) in AIM and control subjects following labeling for1 daya)
Subject CD8+CD45R0+ CD8+CD45RA+ CD4+CD45R0+ CD4+CD45RA+
% labeled cells % labeled cells % labeled cells % labeled cells
AIM1 29.5 18.1 9.2 3.12 17.6 3.5 7.6 1.13 16.5 0.5 2.5 0.64 13.0 1.8 12.4 1.35 11.0 0.8 3.7 0.2
Mean 17.5c) 1.7b) 7.1c) 0.8SD 7.2 1.4 4.0 0.5n 5 4 5 4
Controls1 0.5 0.1 1.6 1.12 1.4 0.6 1.9 0.33 0.9 0.2 1.3 0.44 3.2 0.4 2.2 0.75 2.6 0.4 5.1 0.76 4.1 0.7 1.4 0.87 3.0 0.0 1.5 0.38 6.9 0.2 1.7 0.2
Mean 2.8 0.3 2.1 0.6SD 2.1 0.2 1.3 0.3n 8 8 8 8
a) Values are expressed relative to the enrichment of glucose and thus represent the proportion of cells dividing during thelabeling phase and present in the circulation at peak (day 3 or 4 post infusion). Means for AIM subjects exclude CD45RA+ datafrom subject 1 (in italics) in view of the splicing defect in this subject.
b) p X 0.05, c)p X 0.01 versus control by Mann-Whitney U test (2 tailed).
CD8+CD45R0+ T cells, even during resolution of acuteEBV infection, with a high proportion of this poolreplaced daily from rapidly dividing precursors. Interest-ingly, CD8+ T cell proliferation rates appeared to correlatewith crude clinical assessments of disease severity.
The two measures of cell disappearance, the mean ratefor labeled cells (d*), and the overall rate for the wholepool, including both labeled and unlabeled cells (D), werefound to be markedly elevated for CD8+CD45R0+ cells inAIM subjects (Table 3). Thus, labeled CD8+CD45R0+ cellsdisappeared at a rate of over 80%/day in AIM subjects,compared to 8.8%/day in controls, while overall corre-sponding disappearance rates (D) for CD8+CD45R0+
cells were 71.3%/day and 5.1%/day, respectively(Table 3, p X 0.01 for both d* and D). Such values are par-ticularly striking when it is considered that a mean rate ofdisappearance of 70%/day is equivalent to a half-life ofless than 1 day. The average death rate of the wholepopulation (D) and the rate of loss of labeled cells (d*)were closely correlated (r G 0.95; p X 0.01 by Spearmanrank, 2-tailed test), suggesting that the contraction of thepopulation is largely attributable to the death of prolifer-
ating cells. The rapid death rate of unlabeled cells proba-bly represents death of proliferating cells which are unla-beled because they divided before or after the 24-hlabeling period rather than contraction of non-proliferating pools.
2.7 Modeling CD4+ T cell kinetics
Proliferation rates of CD4+CD45R0+ cells were alsomarkedly elevated compared to control subjects; 23.7%/day versus 2.7%/day, respectively (Table 3, p X 0.02).When increased pool size was taken into account, thisconstituted an absolute increase in CD4+CD45R0+ T cellproduction of about fifty times control values (1.1×10⁹
versus 2.2×10⁷ cells per day in blood; p X 0.01). Disap-pearance rates of both labeled (d*) and unlabeled cells(D) were also both elevated compared to control subjectvalues (Table 3, p X 0.02). Thus modeling confirms a dra-matic increase in both proliferation and disappearance ofCD4+CD45R0+ cells in AIM.
Eur. J. Immunol. 2003. 33: 2655–2665 T cell turnover in acute infectious mononucleosis 2659
© 2003 WILEY-VCH Verlag GmbH & Co. KGaA, Weinheim

Fig. 3. Lymphocyte numbers in peripheral blood in AIM. Cell numbers according to phenotype: CD8+CD45R0+ ( Æ ), CD45RA ( 1 )and CD4+CD45R0+ ( ? ), CD45RA+ ( a ), with time from beginning of infusion by subject; * data not available for subject 1 day 0.
2.8 Modeling kinetics of CD45RA+ T cells
Fitting CD45RA+ data for both CD4+ and CD8+ cells wasdifficult because of the low enrichment values seen inthese slow turnover populations. Values obtained areshown in Table 3 but it is difficult to draw conclusionsbecause of the small number of values obtained, the lowlevels of enrichment and the need to exclude data fromsubject 1 because of his splicing variation. However, itcan be seen that proliferation rates of CD45RA+ cells fellbelow those of their CD45R0+ counterparts in all sub-jects. Where significant numbers of CD45RA+ cells werelabeled, death rates of labeled cells did appear to berapid suggesting that there may be a small subpopula-tion of CD45RA+ responding to AIM by proliferation andrapid death. For CD4+CD45RA+ cells, d* alwaysexceeded D, suggesting that such subset proliferationmay occur within the context of a larger pool of cellswhich retain their slower proliferation and death ratesdespite active AIM and a massive ongoing response inthe CD45R0+ compartment.
3 Discussion
This study has quantified the proliferative response oflymphocytes to acute EBV infection in man. The implica-tions for turnover in the activated CD8+ T cell pool arestriking: in the five subjects studied, between 11 and30% of CD8+CD45R0+ cells were labeled at day 3 afteronly a single days labeling. Modeling such labeling,accounting for changes in pool size and loss of labeledcells, gave estimates of proliferation of between 11 and130%/day equivalent to doubling times for the wholeactivated CD8+ population of about 1–2 days. The abso-lute appearance rate of new cells in peripheral blood wasincreased several hundred-fold compared to healthycontrols. The extent of such clonal proliferation in AIMrefers to proliferation within the entire CD8+CD45R0+ Tcell pool. Although it is possible that some “bystander”activation of memory cells may have occurred [19], it islikely that the non-EBV-specific fraction is proliferatingmuch more slowly than EBV-specific cells. The actualvalue for EBV-specific cells may therefore be even higherthan the values above.
2660 D. C. Macallan et al. Eur. J. Immunol. 2003. 33: 2655–2665
© 2003 WILEY-VCH Verlag GmbH & Co. KGaA, Weinheim

Table 3. Proliferation (p) and disappearance (d*, D) rates of lymphocytes in AIM derived from kinetic modeling
CD45R0+ CD45RA+
Subset Group Subject p SD d*a) SD Da) SD p SD d*a) SD Da) SD
%/day %/day %/day %/day %/day %/day
CD8+ AIM 1 – – 178.2 2.9 – – – – 13.0 6.9 – –2 22.0 1.5 30.1 4.0 40.6 3.9 4.2 0.8 62.4 25.7 53.6 23.33 23.5 2.2 27.9 4.0 36.9 3.8 0.3 0.1 4.6 4.4 4.8 3.94 130.3 68.2 124.3 28.1 161.0 72.9 – – – – – –5 11.4 2.2 45.0 19.8 46.7 18.5 – – – – – –
Mean 46.8b) 81.1b) 71.3b) 2.2 33.5 29.2SD 55.9 67.1 59.9 2.7 40.9 34.5n 4 5 4 2 2 2
t1⁄2 or t2 1.5 0.9 1.0 31.5 2.1 2.4
Controls Mean 5.09 8.83 5.09 0.45 11.8 0.45SD 5.97 8.02 5.97 0.47 10.4 0.47n 7 7 7 6 5 6
t1⁄2 or t2 13.6 7.9 13.6 154 5.9 154
CD4+ AIM 1 – – 96.0 19.0 – – – 81.0 124.5 – –2 11.5 2.5 24.4 6.9 15.1 3.0 3.0 2.5 34.7 29,2 0.0 2.63 2.9 0.3 9.8 2.5 5.0 1.34 76.1 34.5 78.2 22.4 80.6 38.7 42.8 32.1 144.9 34.1 43.2 34.75 4.2 0.4 11.7 2.2 6.3 1.0 0.2 0.0 3.5 2.3 0.0 1.3
Mean 23.7c) 44.0c) 26.8c) 15.3 61.0c) 14.4SD 35.1 40.2 36.2 23.8 74.3 24.9n 4 5 4 3 3 3
t1⁄2 or t2 2.9 1.6 2.6 4.5 1.1 4.8
Controls Mean 2.65 7.37 2.65 0.59 7.25 0.59SD 2.12 5.81 2.12 0.45 2.37 0.45n 8 8 8 8 5 8
t1⁄2 or t2 26.2 9.4 26.2 118 9.6 118a) For the EBV population, as the population is changing in size, both the death rate of labeled cells (d*) and the average death
rate (D) are shown. For control subjects, it is assumed that lymphocyte populations are of constant size during theexperiment, hence D is taken to be equal to p. Columns for SD show the error of the estimate of p, d* or D. Mean values forCD45RA+ cells exclude subject 1 (in italics) because of the splicing variant in this subject.
b) p X 0.05, and c)p X 0.01 versus control by Mann-Whitney U test (2 tailed).
In addition we have demonstrated very rapid loss oflabeled CD8+CD45R0+ cells from the circulation with ahalf-life of only 1–2 days. Loss of labeled cells may resulteither from death or disappearance of activated effectorsfrom the circulation, for example by migration intoinflamed tissues. The lack of reappearance of label atlater time points suggest that such loss is irreversibleand we suggest that it represents death of activatedcells, either in the circulation or in situ in tissues, after avery short lifespan. This suggestion is consistent with thefinding that pro-apoptotic factors such as CD95 are up-regulated and the anti-apoptotic molecule bcl-2 is down-regulated in CD8 lymphocytes in AIM [20]. Furthermore,CD8+ T cell clones may depend upon cytokine stimula-tion for their survival in vivo and rapid turnover may drivesome cells into cytokine starvation. Indeed, there is evi-
dence that EBV-specific clones may be rescued fromapoptosis ex vivo by cytokines [20]. Death of respondingcells might represent a mechanism for immune evasion,although it has been demonstrated that most clones arenot exhausted and can be found months after resolutionof the initial infection [3].
Thus it appears that the great majority of activated cellsare culled within a few days of appearance, at least at orshortly after the peak of the immune response. Thisraises some interesting questions. First, why does ele-vated cellular proliferation persist in the context of reso-lution of AIM as total lymphocyte counts are decreasing?Does this seemingly inefficient and energy consumingprocess occur during other infections? The only otherhuman studies of in vivo proliferation and death of lym-
Eur. J. Immunol. 2003. 33: 2655–2665 T cell turnover in acute infectious mononucleosis 2661
© 2003 WILEY-VCH Verlag GmbH & Co. KGaA, Weinheim

Fig. 4. Curve fits from modeling of cell proliferation and celldeath. Curve fits take into account both change in labelingand change in pool size. For subject 1, proliferation couldnot be modeled because of missing data on day zero poolsize, hence no lines are shown from day 0 to day 3. Note dif-ferent scales for subject 1 CD8+ and subject 4. Cell types:CD8+CD45R0+ ( Æ ), CD8+CD45RA+ ( 1 ), CD4+CD45R0+ ( ? ),and CD4+CD45RA+ ( a ).
phocytes are those performed in HIV infection; suchstudies have shown parallel increases in proliferation anddeath rates during chronic infection [14, 21], findingswhich are qualitatively similar, albeit quantitatively muchsmaller, than those described in this study in an acuteviral infection. Secondly, how is a small but criticallyimportant portion of the activated EBV-specific popula-tion of cells retained as a memory population? Ourobservations of the highly dynamic nature of proliferationand death of CD8+ T cells in AIM suggest that very smallchanges in the proportion of cells which die will make avery large difference to the size of the surviving clonalpool.
CD8+ T cell clones in acute EBV infection may reachbetween 108 and 109 cells, according to studies of V-betautilization [3]. The size of such clones before infection isnot known but, from numbers of T cell receptors andnumbers of lymphocytes in humans, is likely to be of theorder of 104 [22]. To reach a clone size of 108 wouldtherefore require a minimum of the order of 15 divisions,assuming all progeny cells survive. However, the datapresented here suggest that proliferation is accompa-nied by substantial cell death, implying that considerablymore rounds of division may be required. In view of thisextensive proliferation, the up-regulation of telomerasethat has been shown to occur during clonal expansion inAIM may be crucial in preventing clonal exhaustion dur-ing the acute response [23].
Although the CD8+ response is dominant in AIM, we haveshown that there is considerable proliferation in theCD4+CD45R0+ population. This accords with the pres-ence of high IgG titers to viral antigens consistent withactive helper T cell involvement in acute EBV infection.Nevertheless, our failure to demonstrate CD4 clones exvivo in AIM [3] and the relatively modest proliferationdetected here, suggest that clonal expansion amongCD4+ is much less than among CD8+ cells [24].
Similarly, the absence of substantial proliferation amongCD45RA+ cells in AIM would argue that the CD45R0+ andCD45RA+ pools are regulated independently, a view sup-ported by murine data [25]. Our data also imply that evenunder conditions of massive clonal expansion, bystandereffects on CD45RA+ (naive) cells are minimal, consistentwith murine data showing that administration of cytokineinducers or cytokines to mice induces proliferation ofmemory/effector phenotype cells with little effect onnaive cells [19, 26, 27]. The rate of proliferation ofCD45RA+ cells might be underestimated if they rapidlyconverted to a CD4R0+ phenotype on activation [28] butthis is not the case for T cells stimulated with certaincombinations of cytokines [29]. Primed CD8 T cells in theCD45RA+ subset [3, 4, 30] may contribute to theincreased proliferation rates seen in this population insome AIM subjects.
Our data are limited by our ability to sample only periph-eral blood. Although studies in sheep suggest relativelyhomogeneous and rapid mixing of different lymphoidcompartments [31], this may not be the case for T cellsentering non-lymphoid tissues [32]. Specifically, it is pos-sible that EBV-specific T cells that were previouslytrapped in lymph node are released into the circulationas AIM resolves.
In conclusion, we have directly measured very rapid pro-liferation of lymphocytes in vivo in humans during an
2662 D. C. Macallan et al. Eur. J. Immunol. 2003. 33: 2655–2665
© 2003 WILEY-VCH Verlag GmbH & Co. KGaA, Weinheim

acute infection, with appearance rates of CD8+CD45R0+
lymphocytes in blood about 500 times normal. Decaykinetics indicate that cell death is also accelerated imply-ing that such extensive clonal expansion must involvemany cell divisions. These data indicate that clonalexpansion in AIM is a balance between increased ratesof cell division and cell death. Interventions that couldaffect either of these parameters may have dramaticeffects on immune memory and this has implications forthe efficacy of vaccination procedures.
4 Materials and methods
4.1 Subjects and measurement of cell turnover
All subjects gave written informed consent. The protocolwas approved by the local research ethics committee.Labeling consisted of a primed 24-h intravenous infusion of1 g/kg 6,6–2H2-glucose (Cambridge Isotopes, MA) duringwhich diet was restricted to small, low-energy meals. Bloodfor measurement of plasma glucose deuterium (2H) enrich-ment was taken at 1 h and approximately 4-hourly thereaf-ter. Blood samples for estimation of deuterium enrichment inDNA were taken 3, 4, 10 and 21 days after infusion; in sub-jects not available on day 21, blood was taken on the closestday possible.
4.2 Cell sorting
PBMC were isolated from 50 ml of heparinized fresh bloodsamples by Ficoll-Paque (Pharmacia, St Albans, GB) densitygradient centrifugation. Cells (1×10⁷/ml in PBSA+0.2% BSA)were stained with CD3-RPE (Serotec Ltd, Oxford, GB) for30 min on ice, then sorted into CD3+ and CD3– fractionsusing a MoFlo cytometer (Cytomation, Colorado). CD3+ cellswere further stained with biotinylated anti-CD8 (Serotec)antibody + streptavidin-allophycocyanin (Sav-APC, Phar-Mingen, San Diego, CA) together with CD45RA-RPE-CY5(Serotec) and sorted into CD8+CD45RA+, CD8–CD45RA+,CD8+CD45RA– and CD8–CD45RA– subsets.
4.3 Immunofluorescence staining
PBMC (2×10⁵), or sorted CD3+ cells were stained with CD8-APC (PharMingen), CD4-RPE-CY5 (Serotec) and eitherHLA-DR-FITC (Caltag, Burlingame, CA) or CD38-FITC (Phar-Mingen) in a single step at 4°C for 30 min. Isotype-matchedmAb were used as controls. In total 10,000 events were col-lected on a FACSCalibur flow cytometer (Becton Dickinson,San Jose, CA) and analyzed using CellQuest software.
4.4 Analysis of deuterium enrichment
Enrichment of deuterium in DNA was assayed essentially asdescribed [12, 33]. DNA from sorted subsets was extractedand digested enzymatically to deoxynucleosides. Deoxy-adenosine, purified by C-18 SPE column chromatography,was converted to its aldononitrile acetate derivative by reac-tion with hydroxylamine/pyridine (1% w/v, 100°C, 45 min)
and acetic anhydride (room temperature, 30 min) and ana-lyzed by GCMS, monitoring ions m/z 198 and 200 by PCI inSIM (HP-225 column, HP 6890/5973 GCMS; Hewlett Pack-ard, Bracknell, GB) [33]. Abundance-matched samples wereanalyzed in triplicate alongside a standard curve derivatizedconcurrently. Plasma glucose enrichment was measuredusing the same derivatization (m/z 328 and 330). Typical pre-cision of reproducibility of the M+2/M+0 ratio was ± 0.02%.
4.5 Modeling
Results were expressed as the fraction of labeled cells (F)present on each day, given by the ratio of the enrichment oflabel in DNA (E) and the precursor enrichment, b (mean glu-cose enrichment ×0.65) [12]. The magnitude of the peakvalue for F represents a crude measure of the cellular prolif-eration rate. Because this estimate does not take intoaccount either cell death between the end of labeling andsampling on day 3 or changes in pool sizes, appearance anddisappearance of labeled cells were modeled as described[11, 34], with a modification to allow for changing lympho-cyte subpopulation pool sizes.
The observed proportion of labeled cells at a given time willdepend, first, upon the rate of proliferation during labelingand subsequent loss of labeled cell loss, and, secondly,upon the expansion and contraction of each lymphocytepool. The rate of change of deoxyadenosine (A) and labeleddeoxyadenosine (A*) is given by:
during the whole experiment
during the labeling period
after the labeling period
where p is the average proliferation rate of the whole popula-tion of interest, D the average death rate of the whole popu-lation, d* the rate of loss of labeled cells and b the precursorenrichment [11]. These equations can be solved to find theamount of deoxyadenosine (A) which is proportional to thenumber of cells and the fraction of labeled cells F=A*/Ab
during the labeling period
after the labeling period
Eur. J. Immunol. 2003. 33: 2655–2665 T cell turnover in acute infectious mononucleosis 2663
© 2003 WILEY-VCH Verlag GmbH & Co. KGaA, Weinheim

For a population of constant size the average proliferationrate of the whole population equals the average loss rate ofthe whole population (p=D) and the equations above reduceto the form in Asquith et al. [34]. These equations were fitsimultaneously to the lymphocyte count (scaled to avoid adisproportionate effect) and labeling data to estimate thethree parameters p, d* and D.
An alternative, related model was also considered in whichthe assumption that the change in lymphocyte count couldbe described by simple exponential growth was removed.Labeling data were normalized using lymphocyte counts toallow for (1) the change in population that can potentially belabeled during the labeling phase and (2) the change in thepopulation size post-labeling (which has the effect of con-centrating or diluting the label depending on whether thepopulation is contracting or expanding). In theory, the alter-native model based on normalization is better because itdoes not assume simple exponential growth. When resultsfrom the two models were compared, very similar parameterestimates of p and d* were found. We therefore presentresults derived from the model assuming exponential decay,as we feel it is intuitively more obvious.
Where proliferation is expressed as doubling time or disap-pearance as half-life, these were calculated as ln2/p and ln2/d, respectively. Data are expressed as mean ± 1 SD; stan-dard deviation of the parameter estimates was approxi-mated using the asymptotic covariance matrix method(shown to be more efficient than the bootstrap method forthis model in a large number of numerical simulations).Comparisons between groups were made by Mann-WhitneyU-test (2-tailed).
Acknowledgements: We wish to thank Nadine Clifford andElka Giemza for technical and nursing assistance in per-forming the studies and thank the subjects who willinglytook part. This work was supported by the Edward JennerInstitute for Vaccine Research (publication number 54). DMwas supported by a Fellowship from Serono InternationalS.A., and a Medical Research Council Glaxo-Wellcome Cli-nician Scientist Fellowship. BA was supported by the Well-come Trust (ref: 054451).
References
1 Pantaleo, G., Demarest, J. F., Schacker, T., Vaccarezza, M.,Cohen, O. J., Daucher, M., Graziosi, C., Schnittman, S. S.,Quinn, T. C., Shaw, G. M., Perrin, L., Tambussi, G., Lazzarin,A., Sekaly, R. P., Soudeyns, H., Corey, L. and Fauci, A. S., Thequalitative nature of the primary immune response to HIV infec-tion is a prognosticator of disease progression independent ofthe initial level of plasma viremia. Proc. Natl. Acad. Sci. USA1997. 94: 254–258.
2 Lechner, F., Wong, D. K., Dunbar, P. R., Chapman, R., Chung,R. T., Dohrenwend, P., Robbins, G., Phillips, R., Klenerman, P.and Walker, B. D., Analysis of successful immune responses in
persons infected with hepatitis C virus. J. Exp. Med. 2000. 191:1499–1512.
3 Maini, M. K., Gudgeon, N., Wedderburn, L. R., Rickinson, A. B.and Beverley, P. C., Clonal expansions in acute EBV infection aredetectable in the CD8 and not the CD4 subset and persist with avariable CD45 phenotype. J. Immunol. 2000. 165: 5729–5737.
4 Maini, M. K., Casorati, G., Dellabona, P., Wack, A. andBeverley, P. C., T cell clonality in immune responses. Immunol.Today 1999. 20: 262–266.
5 Callan, M. F., Tan, L., Annels, N., Ogg, G. S., Wilson, J. D.,O’Callaghan, C. A., Steven, N., McMichael, A. J. and Rickin-son, A. B., Direct visualization of antigen-specific CD8+ T cellsduring the primary immune response to Epstein-Barr virus in vivo.J. Exp. Med. 1998. 187: 1395–1402.
6 Ahmed, R. and Gray, D., Immunological memory and protectiveimmunity: understanding their relation. Science 1996. 272:54–60.
7 Marrack, P., Bender, J., Hildeman, D., Jordan, M., Mitchell, T.,Murakami, M., Sakamoto, A., Schaefer, B. C., Swanson, B.and Kappler, J., Homeostasis of alpha beta TCR+ T cells. Nat.Immunol. 2000. 1: 107–111.
8 Mackay, C. R., Marston, W. L. and Dudler, L., Naive and mem-ory T cells show distinct pathways of lymphocyte recirculation. J.Exp. Med. 1990. 171: 801–817.
9 Michie, C. A., McLean, A., Alcock, C and Beverley, P. C., Life-span of human lymphocyte subsets defined by CD45 isoforms.Nature 1992. 360: 264–265.
10 McCune, J. M., Hanley, M. B., Cesar, D., Halvorsen, R., Hoh,R., Schmidt, D., Wieder, E., Deeks, S., Siler, S., Neese, R. andHellerstein, M., Factors influencing T cell turnover in HIV-1-seropositive patients. J. Clin. Invest. 2000. 105: R1-R8.
11 Macallan, D. C., Asquith, B., Irvine, A., Wallace, D., Worth, A.,Ghattas, H., Zhang, Y., Griffin, G. E., Tough, D. and Beverley, P.C., Measurement and modeling of human T cell kinetics. Eur. J.Immunol. 2003. 33: 2316–2326.
12 Macallan, D. C., Fullerton, C. A., Neese, R. A., Haddock, K.,Park, S. and Hellerstein, M. K., Measurement of cell prolifera-tion by labeling of DNA with stable isotope-labeled glucose:Studies in vitro, in animals and in humans. Proc. Natl. Acad. Sci.USA 1998. 95: 708–713.
13 Hellerstein, M., Hanley, M. B., Cesar, D., Siler, S., Papageor-gopoulos, C., Wieder, E., Schmidt, D., Hoh, R., Neese, R.,Macallan, D., Deeks, S. and McCune, J. M., Directly measuredkinetics of circulating T lymphocytes in normal and HIV-1-infected humans. Nat. Med. 1999. 5: 83–89.
14 Mohri, H., Perelson, A. S., Tung, K., Ribeiro, R. M., Ramrat-nam, B., Markowitz, M., Kost, R., Hurley, A., Weinberger, L.,Cesar, D., Hellerstein, M. K. and Ho, D. D., Increased turnoverof T lymphocytes in HIV-1 infection and its reduction by antiretro-viral therapy. J. Exp. Med. 2001. 194: 1277–1287.
15 Callan, M. F., Steven, N., Krausa, P., Wilson, J. D., Moss, P. A.,Gillespie, G. M., Bell, J. I., Rickinson, A. B. and McMichael, A.J., Large clonal expansions of CD8+ T cells in acute infectiousmononucleosis. Nat. Med. 1996. 2: 906–911.
16 Zilch, C. F., Walker, A. M., Timon, M., Goff, L. K., Wallace, D. L.and Beverley, P. C., A point mutation within CD45 exon A is thecause of variant CD45RA splicing in humans. Eur. J. Immunol.1998. 28: 22–29.
17 Tchilian, E. Z., Wallace, D. L., Imami, N., Liao, H. X., Burton, C.,Gotch, F., Martinson, J., Haynes, B. F. and Beverley, P. C., Theexon A (C77G) mutation is a common cause of abnormal CD45splicing in humans. J. Immunol. 2001. 166: 6144–6148.
2664 D. C. Macallan et al. Eur. J. Immunol. 2003. 33: 2655–2665
© 2003 WILEY-VCH Verlag GmbH & Co. KGaA, Weinheim
18 Tchilian, E. Z., Wallace, D. L., Dawes, R., Imami, N., Burton, C.,Gotch, F. and Beverley, P. C., A point mutation in CD45 may beassociated with an increased risk of HIV-1 infection. AIDS 2001.15: 1892–1894.
19 Tough, D. F., Borrow, P. and Sprent, J., Induction of bystander Tcell proliferation by viruses and type I interferon in vivo. Science1996. 272: 1947–1950.
20 Borthwick, N. J., Bofill, M., Hassan, I., Panayiotidis, P.,Janossy, G., Salmon, M. and Akbar, A. N., Factors that influ-ence activated CD8+ T cell apoptosis in patients with acute her-pesvirus infections: loss of costimulatory molecules CD28, CD5and CD6 but relative maintenance of Bax and Bcl-X expression.Immunology 1996. 88: 508–515.
21 Hellerstein, M., Hanley, M. B., Cesar, D., Siler, S., Papageor-gopoulos, C., Wieder, E., Schmidt, D., Hoh, R., Neese, R.,Macallan, D., Deeks, S. and McCune, J. M., Directly measuredkinetics of circulating T lymphocytes in normal and HIV-1-infected humans. Nat. Med. 1999. 5: 83–89.
22 Arstila, T. P., Casrouge, A., Baron, V., Even, J., Kanellopoulos,J. and Kourilsky, P., A direct estimate of the human alphabeta Tcell receptor diversity. Science 1999. 286: 958–961.
23 Maini, M. K., Soares, M. V., Zilch, C. F., Akbar, A. N. andBeverley, P. C., Virus-induced CD8+ T cell clonal expansion isassociated with telomerase up-regulation and telomere lengthpreservation: a mechanism for rescue from replicative senes-cence. J. Immunol. 1999. 162: 4521–4526.
24 Maini, M. K., Wedderburn, L. R., Hall, F. C., Wack, A., Casorati,G. and Beverley, P. C., A comparison of two techniques for themolecular tracking of specific T cell responses; CD4+ human Tcell clones persist in a stable hierarchy but at a lower frequencythan clones in the CD8+ population. Immunology 1998. 94:529–535.
25 Tanchot, C. and Rocha, B., The peripheral T cell repertoire:independent homeostatic regulation of virgin and activated CD8+
T cell pools. Eur. J. Immunol. 1995. 25: 2127–2136.
26 Tough, D. F., Sun, S. and Sprent, J., T cell stimulation in vivo bylipopolysaccharide (LPS). J. Exp. Med. 1997. 185: 2089–2094.
27 Zhang, X., Sun, S., Hwang, I., Tough, D. F. and Sprent, J.,Potent and selective stimulation of memory-phenotype CD8+ Tcells in vivo by IL-15. Immunity 1998. 8: 591–599.
28 Akbar, A. N., Terry, L., Timms, A., Beverley, P. C. and Janossy,G., Loss of CD45R and gain of UCHL1 reactivity is a feature ofprimed T cells. J. Immunol. 1988. 140: 2171–2178.
29 Unutmaz, D., Pileri, P. and Abrignani, S., Antigen-independentactivation of naive and memory resting T cells by a cytokine com-bination. J. Exp. Med. 1994. 180: 1159–1164.
30 Hamann, D., Baars, P. A., Rep, M. H., Hooibrink, B., Kerkhof-Garde, S. R., Klein, M. R. and Van Lier, R. A., Phenotypic andfunctional separation of memory and effector human CD8+ Tcells. J. Exp. Med. 1997. 186: 1407–1418.
31 Young, A. J. and Hay, J. B., Rapid turnover of the recirculatinglymphocyte pool in vivo. Int. Immunol. 1995. 7: 1607–1615.
32 Masopust, D., Vezys, V., Marzo, A. L. and Lefrancois, L., Pref-erential localization of effector memory cells in nonlymphoid tis-sue. Science 2001. 291: 2413–2417.
33 Neese, R. A., Siler, S. Q., Cesar, D., Antelo, F., Lee, D., Misell,L., Patel, K., Tehrani, S., Shah, P. and Hellerstein, M. K.,Advances in the stable isotope-mass spectrometric measure-ment of DNA synthesis and cell proliferation. Anal. Biochem.2001. 298: 189–195.
34 Asquith, B., Debacq, C., Macallan, D. C., Willems, L. andBangham, C., Lymphocyte kinetics: the interpretation of labellingdata. Trends Immunol. 2002. 23: 596–601.
Correspondence: Derek C. Macallan, Department of Infec-tious Diseases, St George’s Hospital Medical School, Cran-mer Terrace, London SW17 0RE, GBFax: +44-20-8725-3487e-mail: macallan — sghms.ac.uk
Eur. J. Immunol. 2003. 33: 2655–2665 T cell turnover in acute infectious mononucleosis 2665
© 2003 WILEY-VCH Verlag GmbH & Co. KGaA, Weinheim