Rapid neurogenesis through transcriptional activation in human stem cells
22
Article Rapid neurogenesis through transcriptional activation in human stem cells Volker Busskamp 1,2,†,‡ , Nathan E Lewis 1,2,3,4,† , Patrick Guye 5,† , Alex HM Ng 1,2,6 , Seth L Shipman 1,2 , Susan M Byrne 1,2 , Neville E Sanjana 7,8 , Jernej Murn 9,10 , Yinqing Li 5 , Shangzhong Li 11 , Michael Stadler 12,13,14 , Ron Weiss 5 & George M Church 1,2,* Abstract Advances in cellular reprogramming and stem cell differentia- tion now enable ex vivo studies of human neuronal differentia- tion. However, it remains challenging to elucidate the underlying regulatory programs because differentiation proto- cols are laborious and often result in low neuron yields. Here, we overexpressed two Neurogenin transcription factors in human-induced pluripotent stem cells and obtained neurons with bipolar morphology in 4 days, at greater than 90% purity. The high purity enabled mRNA and microRNA expression profil- ing during neurogenesis, thus revealing the genetic programs involved in the rapid transition from stem cell to neuron. The resulting cells exhibited transcriptional, morphological and func- tional signatures of differentiated neurons, with greatest tran- scriptional similarity to prenatal human brain samples. Our analysis revealed a network of key transcription factors and microRNAs that promoted loss of pluripotency and rapid neuro- genesis via progenitor states. Perturbations of key transcription factors affected homogeneity and phenotypic properties of the resulting neurons, suggesting that a systems-level view of the molecular biology of differentiation may guide subsequent manipulation of human stem cells to rapidly obtain diverse neuronal types. Keywords gene regulatory networks; microRNAs; neurogenesis; stem cell differentiation; transcriptomics Subject Categories Methods & Resources; Stem Cells; Neuroscience DOI 10.15252/msb.20145508 | Received 20 June 2014 | Revised 14 October 2014 | Accepted 16 October 2014 Mol Syst Biol. (2014) 10: 760 Introduction To cope with the vast complexity of the human brain with its billions of cells and trillions of synapses (Herculano-Houzel, 2009; Rockland, 2002), research efforts usually take deconstructive approaches by focusing on individual brain regions of model organ- isms. Ethical constraints limit the breadth of feasible research on primary human brain tissues from healthy, living subjects, and the availability of high-quality post-mortem tissues is limited. Thus, it is desirable to develop in vitro systems that mimic properties of the human brain. Advances in stem cell differentiation and transdiffer- entiation of somatic cells into neurons now allow the use of comple- mentary constructive tactics to understand human brain functions (Amamoto & Arlotta, 2014). This can be done in vitro by generating neurons and by finding ways to connect and mature them into func- tional neuronal circuits. However, the lack of fast and efficient protocols to generate neurons remains a bottleneck in neuronal circuit fabrication. Moreover, successful generation of particular neuronal subtypes may also enable therapeutic cell replacement strategies for neurological disorders (Barker, 2012; Lescaudron et al, 2012). Both human embryonic (ES) and human-induced pluripotent stem cells (iPS) have been successfully used to generate neurons. 1 Department of Genetics, Harvard Medical School, Boston, MA, USA 2 Wyss Institute for Biologically Inspired Engineering at Harvard University, Boston, MA, USA 3 Department of Biology, Brigham Young University, Provo, UT, USA 4 Department of Pediatrics, University of California, San Diego, CA, USA 5 Department of Biological Engineering, Massachusetts Institute of Technology, Cambridge, MA, USA 6 Department of Systems Biology, Harvard Medical School, Boston, MA, USA 7 Broad Institute of MIT and Harvard, Cambridge Center, Cambridge, MA, USA 8 McGovern Institute for Brain Research, Department of Brain and Cognitive Sciences, Department of Biological Engineering, Massachusetts Institute of Technology (MIT), Cambridge, MA, USA 9 Department of Cell Biology, Harvard Medical School, Boston, MA, USA 10 Division of Newborn Medicine, Boston Children’s Hospital, Boston, MA, USA 11 Department of Bioengineering, University of California, San Diego, CA, USA 12 Friedrich Miescher Institute for Biomedical Research, Basel, Switzerland 13 Swiss Institute of Bioinformatics, Basel, Switzerland 14 University of Basel, Basel, Switzerland *Corresponding author. Tel: +1 617 432 1278; E-mail: [email protected] † These authors contributed equally to this work ‡ Present address: Center for Regenerative Therapies Dresden (CRTD), Dresden, Germany ª 2014 The Authors. Published under the terms of the CC BY 4.0 license Molecular Systems Biology 10: 760 | 2014 1 Published online: November 17, 2014
Transcript of Rapid neurogenesis through transcriptional activation in human stem cells

Article
Rapid neurogenesis through transcriptionalactivation in human stem cellsVolker Busskamp1,2,†,‡, Nathan E Lewis1,2,3,4,†, Patrick Guye5,†, Alex HM Ng1,2,6, Seth L Shipman1,2,
Susan M Byrne1,2, Neville E Sanjana7,8, Jernej Murn9,10, Yinqing Li5, Shangzhong Li11,
Michael Stadler12,13,14, Ron Weiss5 & George M Church1,2,*
Abstract
Advances in cellular reprogramming and stem cell differentia-tion now enable ex vivo studies of human neuronal differentia-tion. However, it remains challenging to elucidate theunderlying regulatory programs because differentiation proto-cols are laborious and often result in low neuron yields. Here,we overexpressed two Neurogenin transcription factors inhuman-induced pluripotent stem cells and obtained neuronswith bipolar morphology in 4 days, at greater than 90% purity.The high purity enabled mRNA and microRNA expression profil-ing during neurogenesis, thus revealing the genetic programsinvolved in the rapid transition from stem cell to neuron. Theresulting cells exhibited transcriptional, morphological and func-tional signatures of differentiated neurons, with greatest tran-scriptional similarity to prenatal human brain samples. Ouranalysis revealed a network of key transcription factors andmicroRNAs that promoted loss of pluripotency and rapid neuro-genesis via progenitor states. Perturbations of key transcriptionfactors affected homogeneity and phenotypic properties of theresulting neurons, suggesting that a systems-level view of themolecular biology of differentiation may guide subsequentmanipulation of human stem cells to rapidly obtain diverseneuronal types.
Keywords gene regulatory networks; microRNAs; neurogenesis; stem cell
differentiation; transcriptomics
Subject Categories Methods & Resources; Stem Cells; Neuroscience
DOI 10.15252/msb.20145508 | Received 20 June 2014 | Revised 14 October
2014 | Accepted 16 October 2014
Mol Syst Biol. (2014) 10: 760
Introduction
To cope with the vast complexity of the human brain with its
billions of cells and trillions of synapses (Herculano-Houzel, 2009;
Rockland, 2002), research efforts usually take deconstructive
approaches by focusing on individual brain regions of model organ-
isms. Ethical constraints limit the breadth of feasible research on
primary human brain tissues from healthy, living subjects, and the
availability of high-quality post-mortem tissues is limited. Thus, it is
desirable to develop in vitro systems that mimic properties of the
human brain. Advances in stem cell differentiation and transdiffer-
entiation of somatic cells into neurons now allow the use of comple-
mentary constructive tactics to understand human brain functions
(Amamoto & Arlotta, 2014). This can be done in vitro by generating
neurons and by finding ways to connect and mature them into func-
tional neuronal circuits. However, the lack of fast and efficient
protocols to generate neurons remains a bottleneck in neuronal
circuit fabrication. Moreover, successful generation of particular
neuronal subtypes may also enable therapeutic cell replacement
strategies for neurological disorders (Barker, 2012; Lescaudron et al,
2012).
Both human embryonic (ES) and human-induced pluripotent
stem cells (iPS) have been successfully used to generate neurons.
1 Department of Genetics, Harvard Medical School, Boston, MA, USA2 Wyss Institute for Biologically Inspired Engineering at Harvard University, Boston, MA, USA3 Department of Biology, Brigham Young University, Provo, UT, USA4 Department of Pediatrics, University of California, San Diego, CA, USA5 Department of Biological Engineering, Massachusetts Institute of Technology, Cambridge, MA, USA6 Department of Systems Biology, Harvard Medical School, Boston, MA, USA7 Broad Institute of MIT and Harvard, Cambridge Center, Cambridge, MA, USA8 McGovern Institute for Brain Research, Department of Brain and Cognitive Sciences, Department of Biological Engineering, Massachusetts Institute of Technology (MIT),
Cambridge, MA, USA9 Department of Cell Biology, Harvard Medical School, Boston, MA, USA10 Division of Newborn Medicine, Boston Children’s Hospital, Boston, MA, USA11 Department of Bioengineering, University of California, San Diego, CA, USA12 Friedrich Miescher Institute for Biomedical Research, Basel, Switzerland13 Swiss Institute of Bioinformatics, Basel, Switzerland14 University of Basel, Basel, Switzerland
*Corresponding author. Tel: +1 617 432 1278; E-mail: [email protected]†These authors contributed equally to this work‡Present address: Center for Regenerative Therapies Dresden (CRTD), Dresden, Germany
ª 2014 The Authors. Published under the terms of the CC BY 4.0 license Molecular Systems Biology 10: 760 | 2014 1
Published online: November 17, 2014

In vivo, neuronal differentiation is a complex process involving
many transcription factors and regulatory cascades (He & Rosenfeld,
1991). Through the process, cells pass via progenitor cell states
(Molnar & Clowry, 2012) prior to becoming neurons. Standard
neuronal differentiation protocols try to mimic developmental stages
by applying stepwise environmental perturbations to cells, pushing
them from one state to the next. However, these differentiation
protocols have been suboptimal, with multiple steps, including the
application of different soluble bioactive factors to the culturing
media, ultimately requiring months to complete. In addition, these
protocols often suffer from high variability and relatively low yields
of desired neurons (summarized by (Zhang et al, 2013)).
Another approach has been taken to derive neurons in vitro by
transdifferentiating human fibroblasts with cocktails of neural tran-
scription factors and/or microRNAs (miRNAs), yielding induced
neurons (Vierbuchen & Wernig, 2012). Fibroblast-derived induced
neurons are generally considered safer for transplantation because
they eliminate the chance of having non-differentiated stem cells
form tumors following transplantation (Vierbuchen & Wernig,
2011). However, these approaches start with slow-growing fibro-
blasts and suffer from low yields of induced neurons. Moreover,
in transdifferentiation experiments, the neuronal differentiation
process is direct; natural proliferative neuronal progenitor stages
that occur during neuronal development are skipped (Liu et al,
2013). Culture time and neuronal yields were recently improved by
induced transcription factor expression in human stem cells with a
new protocol that achieved highly pure neurons from human stem
cells via a selection system over 2 weeks (Zhang et al, 2013). This
differentiation route is thought to have many similarities with trans-
differentiation, although those have not been assessed directly.
To date, combinations of transcription factors and miRNAs used
in differentiation protocols have been selected based on their
involvement in brain development, assuming that they would func-
tion similarly in stem cells. Although resulting neurons are charac-
terized extensively after differentiation at their endpoints, the
underlying gene regulatory pathways during their differentiation are
mostly unknown. Recent work in stem cell-derived neurons shed
some light on potential transcriptional regulators activating various
neuronal differentiation programs (Gohlke et al, 2008; Mazzoni
et al, 2013; Stein et al, 2014; van de Leemput et al, 2014; Velkey &
O’Shea, 2013; Wapinski et al, 2013), and other studies have identi-
fied key miRNA regulators in neuronal differentiation in vivo and
in vitro (Akerblom et al, 2012; Le et al, 2009; Yoo et al, 2011).
However, we have little knowledge on the underlying gene regula-
tory mechanisms in stem cell-derived neurogenesis because of the
aforementioned long time lines and heterogeneous neuronal popula-
tions. A coherent understanding of potential gene regulatory mecha-
nisms would allow targeted interventions to guide, fine-tune and
accelerate the differentiation processes towards neurons of interest.
To simplify neuronal differentiation protocols and facilitate the
elucidation of gene regulatory mechanisms underlying stem cell-
derived neurons, we present a novel rapid and robust differentiation
protocol that yields highly homogeneous neurons. Neuronal differ-
entiation in this protocol is triggered by overexpression of a pair of
transcription factors (Neurogenin-1 and Neurogenin-2) in human
iPS cells and results in a homogeneous population of functional
bipolar neurons within 4 days. We performed RNA sequencing and
quantitative miRNA profiling over the time course of differentiation
to reveal regulators contributing to the rapid neurogenesis. Our
results indicated that Neurogenin-mediated neurogenesis proceeds
indirectly via unstable progenitor states. We elucidated a network of
key transcription factors and miRNAs that contributed to differentia-
tion. By perturbing individual members and combinations thereof,
we demonstrated that while the differentiation was robust, perturba-
tions to the network induce significant variations in resulting cell
morphology.
Results
Neurogenin induction drives iPS cells rapidly and homogeneouslyto bipolar neurons
Transcription factors of the Neurogenin family are important for
neuronal development in vivo (Morrison, 2001), and individual
Neurogenins have been used previously with some success to
induce neuronal differentiation from mouse cancer and ES cells
(Farah et al, 2000; Reyes et al, 2008; Thoma et al, 2012; Velkey &
O’Shea, 2013), to differentiate neurons from multipotent human
neural progenitor cells (Serre et al, 2012), and to transdifferentiate
human fibroblasts (Ladewig et al, 2012) and stem cells (Zhang et al,
2013). Furthermore, when Neurogenin-2 was induced in human
stem cells and followed by glia cell co-cultures, stepwise application
of bioactive factors and the usage of a selection system, high yields
of neurons were achieved in only 2 weeks (Zhang et al, 2013). Since
both Neurogenins alone can drive stem cells into neuronal lineages,
▸Figure 1. Rapid neuronal differentiation by induced Neurogenin overexpression in human iPS cells.
A General scheme of Neurogenin 1+2 induction to yield differentiated neurons from human iPS cells after 4 days.B Proportion of uninduced (white) and 4 days induced (black) iNGN cells analyzed by flow cytometry for the pluripotency marker Tra-1/60, demonstrating a nearly
complete differentiation of iPS cells.C Representative transmission light microscopy image of a bipolar-shaped iNGN cell at day 4 of differentiation.D Quantification of bipolar-cell-shaped morphology on day 4, 78 cells analyzed in total.E Immunostaining for MAP2 and nuclear DAPI staining of neurons induced for 4 days (upper row) and uninduced iPS cells (lower row).F Quantification of MAP2-expressing cells. n refers to the number of cells from three independent experiments as in (E).G Immunostaining for SYN1 of neurons induced for 4 days (upper row) and uninduced iPS cells (lower row).H Quantification of SYN1-expressing cells. n refers to the number of cells from three independent experiments performed as in (G).I, J Characterization of action potentials across 10 cells recorded at 4 days (I) or 14 days (J) postinduction. Traces show response to a 20 pA injected current over 0.5 s.
Inset shows a representative action potential waveform (in red) with corresponding dV/dt trace (in gray), highlighting threshold and width parameters.Left scale bar: 50 ms/20 mV. Inset scale bar gray: 5 ms/25 mV/ms, red: 25 mV.
K Percentage spiking and non-spiking cells at 4 days and 14 days postinduction.
Data information: Scale bars (C, E, G), 20 lm. Two-sample Student’s t-test, ***P-value ≤ 0.001. Error bars, � SEM.
Molecular Systems Biology 10: 760 | 2014 ª 2014 The Authors
Molecular Systems Biology Transcriptomic basis of rapid neurogenesis Volker Busskamp et al
2
Published online: November 17, 2014

and since they are co-expressed in some neuronal progenitor cells
in vivo (Britz et al, 2006), we wondered if there were beneficial
effects on differentiation speed and yield from overexpressing
Neurogenin-1 and Neurogenin-2 together (hereafter referred to
together as Neurogenins, see also Supplementary Text). Therefore,
we developed a bicistronic doxycycline-inducible Neurogenin
expression cassette to trigger neurogenesis in human iPS cells
(Fig 1A; Supplementary Fig S1). We used lentiviral gene delivery to
introduce the inducible Neurogenin expression cassette into human
PGP1 iPS cells (Lee et al, 2009) leading to a stable and small
molecule-inducible Neurogenin iPS line, hereafter referred to as
iNGN cells. Notably, the differentiation occurred in defined stem cell
media in the absence of additional selection markers or neuro-
trophic factors, and differentiation was successful in additional stem
cell lines we tested (Supplementary Fig S1G and H).
Neurogenin protein expression in iNGN cells occurred in a
doxycycline-dependent manner, and its activation triggered rapid
differentiation of stem cells (Supplementary Fig S1), as demonstrated
Neurogenin1+2induction
4 days
humaniPS iNGN
Neuronal differentiation
A
0
20
40
60
80
100
Tra-1/60 signal −>
Cou
nts
iNGN0.8%
uninduced97.1%
B
DAPI MAP2
unin
duce
diN
GN
E
D
0
25
50
75
100
Frac
tion
of c
ells
(%)
Bipolar
Uncertain
***
dV/dt
I 4 Days post-induction J 14 Days post-induction K 4 Days
14 Days
SpikingNon-spiking
dV/dt
50ms
20mV
5ms
25mV/ms
25mV
5ms
25mV/ms
25mV
50ms
20mV
SYN1
unin
duce
diN
GN
GF
0
25
50
75
100
Frac
tion
of c
ells
(%)
n =1185
n =6198
***MAP2
iNGN
uninduced0
25
50
75
100
Frac
tion
of c
ells
(%)
iNGN
uninduced
n =1205
n =6271
***H SYN1
C
iNG
N
Figure 1.
ª 2014 The Authors Molecular Systems Biology 10: 760 | 2014
Volker Busskamp et al Transcriptomic basis of rapid neurogenesis Molecular Systems Biology
3
Published online: November 17, 2014

by the loss of the pluripotency marker Tra-1/60. In uninduced cells,
97.1% of the cells were tested positive for this marker compared to
0.8% iNGN cells at 4 days postinduction (Fig 1B). The efficiency of
neuronal conversion at day 4 was high and homogeneous; about
90 � 4% of the induced iNGN cells had a bipolar-shaped morphology
with long neurite projections on opposing sites (Fig 1C and D; Supple-
mentary Fig S1 and Supplementary Video S1). On day 4 of induction,
more than 90% of the cells stained positively for microtubule-
associated protein 2 (MAP2) and Synapsin 1 (SYN1), consistent with
the acquisition of neuronal identity (Fig 1E–H). These cells were
also immuno-positive for several additional neural markers (Supple-
mentary Fig S2). After induction, the proliferation rate decreased
considerably and iNGN cells became postmitotic, as is common for
differentiated neurons (Bhardwaj et al, 2006) (Supplementary Figs
S1 and S2, Supplementary Video S1).
Next, we functionally characterized the induced neurons by
whole-cell patch-clamp electrophysiology. If maintained in stem cell
media, the neurons failed to fire action potentials on day 4 (Supple-
mentary Fig S2). However, cells would fire single action potentials
upon current injection when the cells were co-cultured with astro-
cytes (see Materials and Methods). By day 14, iNGN cells were able
to fire trains of action potentials (Fig 1I and J). The number of elec-
trically excitable cells increased from 50% at day 4 to 100% after
two weeks of induction. At later time points, we detected occasional
spontaneous postsynaptic currents indicating functional synaptic
activity (Supplementary Fig S2). Taken together, Neurogenin induc-
tion drove human iPS cells rapidly to differentiated neurons that
were competent to achieve functional maturation.
iNGN gene expression profiles are consistent withneuronal transcription
To understand the molecular events occurring during rapid iNGN
neurogenesis, we aimed to capture the transcriptomic changes over
the time course of neuronal differentiation. Previous differentiation
protocols have not permitted the acquisition of high-resolution
temporal transcriptomic analysis of neurogenesis from human iPS
cells, due to the highly heterogeneous cell populations. Our iNGN
cells, on the other hand, demonstrate morphological and immuno-
histochemical homogeneity (Fig 1; Supplementary Figs S1 and S2).
Therefore, iNGN cells are well suited to reveal transcriptional
changes during neurogenesis when analyzed in cell cohorts. We
conducted RNA sequencing (RNA-Seq) experiments of iNGN cells
with biological triplicates at four time points (day 0, 1, 3 and 4)
(Supplementary Fig S3 and Supplementary Table S1). Cells on day 2
were morphologically similar to day 1 induced cells and were there-
fore not assayed (Supplementary Fig S1).
During differentiation, thousands of genes were differentially
expressed (q < 0.05, > 1.5-fold change). Consistent with our macro-
scopic findings, mRNA abundance decreased for most canonical
stem cell factors. For example, the stem cell markers NANOG and
POU5F1 (OCT4) decreased 58- and 39-fold, respectively (Fig 2A). In
line with neuronal cell fate commitment, most neural marker tran-
scripts were significantly upregulated by day 4, including MAP2
(30-fold) and SYN1 (3.7-fold) (Fig 2B). Also, as expected, the neural
repressor RE1-silencing transcription factor (REST) decreased
27-fold. In addition, many neuronal transcription factors previously
used for transdifferentiation experiments (Vierbuchen & Wernig,
2012) were also upregulated more than 50-fold (Fig 2C). Thus, tran-
scription factors that are currently used for forced neuronal induc-
tion are activated downstream of the Neurogenins. Consistent with
the transcriptomic changes, we also witnessed differential protein
expression, as shown by corresponding immunostainings (Fig 1E
and G; Supplementary Figs S1 and S2).
In addition to the expression of proneural transcription factors,
we found a rapid upregulation of transcripts that encode key neuro-
nal components. Specifically, we found the upregulation of synaptic
machinery components (Fig 2D and E) as well as those of the axon
initial segment (Supplementary Fig S4), where action potentials are
generated. Notably, at the presynaptic side, transcripts associated
with the synthesis and secretion of the neurotransmitters glutamate
and acetylcholine were upregulated. We tested protein expression at
a single-cell level to see whether iNGN cells represented a mix of
different neuron types or a homogeneous culture of cells showing
co-transmission of glutamate and acetylcholine, which is thought to
be rare, but has been previously reported in vivo (Guzman et al,
2011). When iNGN cells were subjected to immunostaining for
VGLUT1 and ChAT (Fig 2F), 100% of the neurons tested positive
for vGLUT1 and 98% for ChAT (Fig 2G), and stainings were co-
localized (Fig 2H), suggesting that iNGN cells might be co-releasing
glutamate and acetylcholine. Thus, together with the aforemen-
tioned analyses, the iNGN cells consist of a homogenous population
and could express many major neuronal components within 4 days
of Neurogenin induction.
iNGN differentiation resembles in vivo processes
While differentiating, iNGN cells underwent a dramatic change in
morphology (Supplementary Fig S1 and Supplementary Video S1).
They first dissociated from stem cell colonies and until day 2
▸Figure 2. Rapid transcriptional induction of neural markers including the synaptic machinery in iNGN cells.
A–C Gene expression levels of (A) stem cell markers, (B) neural markers and (C) transcription factors previously used for transdifferentiation experiments, as measuredby RNA-Seq. Error bars represent the 95% confidence interval of mRNA abundance.
D, E There was a rapid transcriptional induction of the synaptic machinery in iNGN cells over the time course of differentiation. Heatmaps represent the Z-score forexpression levels for all isoforms over the four time points assayed. A schematic outline of presynaptic terminal components (D) shows a general trend ofupregulation during iNGN development. Similarly, postsynaptic components and their contributions to neuronal function are shown in (E). Cellular processes arecolor-coded and indicated in the figure.
F Immunostainings for vGLUT1 and ChAT of iNGN cells at day 4.G Quantification of vGLUT1- and ChAT-positive iNGN cells (in triplicates); error bar, SEM.H The signals co-localize, indicating the presence of a homogeneous neuronal population with abilities to co-transmit glutamate and acetylcholine.
Data information: Scale bars, 20 lm. FPKM, fragments per kilobase of transcript per million mapped reads.
Molecular Systems Biology 10: 760 | 2014 ª 2014 The Authors
Molecular Systems Biology Transcriptomic basis of rapid neurogenesis Volker Busskamp et al
4
Published online: November 17, 2014

day 0 day 1 day 3 day 410
−2
10−1
100
101
102
103
Gen
e ex
pres
sion
leve
l (F
PK
M)
SYN1 MAP2RBFOX3 (NeuN)TUBB3
DCXREST
BA
day 0 day 1 day 3 day 410
−2
10−1
100
101
102
103
Gen
e ex
pres
sion
leve
l (F
PK
M)
NANOG KLF4MYCZFP42
SOX2POU5F1
C
NSF
Na+
Regulationof neuronalexcitability
Synapticplasticity
KA
Ca2+
Ca2+
Ca2+Na+ Na+ Na+K+
βArrIIPP2A
AktAC PLC
GsJAK2
Fyn
PI3K Bcl-2
GIRK AMPA NMDARGABA B mGluRM4nAChR 5-HT7 D2
PSD95GKAP
SHANKHomer
VSSC VGCC
IP3R
Ca2+
Survival &development
Ca2+
TRPC1
Ca2+ Na+
Rab3A
RIM
Munc18
Complexin
SYT
VGCC
VAMP
SNAP25
Sytaxin
Munc13
α-SNAP
AP2
Clathrin
Dynamin
GIRK (pre)
KA
GlutamateCholine
K+ EAAT Dopamine
DAT
H+
V-ATPaseGlutamateAcetylcholine
GlutamineGLS
GLNT
ChAT AchE
vGLUT
vAChT
vMAT
Acetyl-CoA AcetateCholine
CHT
Serotonin
DDCOxitriptan
Dopamine
L-Dopa
GABA
AcetylcholineSerotonin
Dopamine
<−2
−1.5
−1
−0.5
0
0.5
1
1.5
>2 Z-Score for gene expression level
Day 0
Day 1
Day 3
Day 4
5-HT3
Gi/o
Kinesin
D
E
vGLUT1 ChAT vGLUT/ChAT calculated colocalizationF
96.2 %
day 0 day 1 day 3 day 410−2
10−1
100
101
102
103
Gen
e ex
pres
sion
leve
l (F
PK
M)
ISL1LHX2
NEUROD4
NEUROD1NEUROD2
POU3F2MYT1LOLIG2
50
100
0
vGLUT1ChAT
Fra
ctio
n o
f ce
lls (
%)
G H
Figure 2.
ª 2014 The Authors Molecular Systems Biology 10: 760 | 2014
Volker Busskamp et al Transcriptomic basis of rapid neurogenesis Molecular Systems Biology
5
Published online: November 17, 2014

expanded and retracted small processes, while occasionally divid-
ing. On day 3, larger processes emerged, finally resulting in neurons
with bipolar morphology by day 4. These dynamic morphological
changes showed similarities to in vivo differentiation steps, so we
wondered whether iNGN differentiation represented a direct conver-
sion from the stem cell lineage toward neuronal cell fate or whether
the iNGN cells differentiate more ‘naturally’ via progenitor stages.
Thus, to obtain a global and unbiased view of which biological
processes significantly changed between days 0 and 4 (Fig 3A;
Supplementary Tables S2 and S8), we performed a Gene Ontology
(GO) terminology analysis (Ashburner et al, 2000). By day 4, genes
annotated as relevant for cell cycle and nucleic acid metabolism
were significantly downregulated. On the other hand, GO classes
relevant to neuronal differentiation, physiology and neuronal cell
adhesion were significantly enriched in upregulated genes, showing
that iNGN cells broadly express the necessary genes for neuronal
fate commitment and the assembly of neuronal compartments such
as synapses and axons. In accordance with our functional data
(Fig 1; Supplementary Fig S2), the process of ‘synapse assembly’
was still ongoing as indicated by increasing gene expression at
day 4 (Supplementary Fig S4).
Genes expressed in neuronal progenitors and classified by the
GO terminology as ‘regulation of neurogenesis’ were highly acti-
vated (inset in Fig 3A), except for two repressors of neural genes:
HES3 and HES1. The expression of NOTCH1, its ligands DLL4 and
DLL1 and the NOTCH target HES5 followed a pulsed expression
pattern, an initial increase followed by reduced expression by day 4.
In addition, similar activation was seen for members of the ‘cell fate
determination’ GO class (Supplementary Fig S4), suggesting that
iNGN cells traversed some typical neuronal progenitor states. Addi-
tionally, many neuronal progenitor markers, such as FABP7 and
NTN1, were initially upregulated and subsequently downregulated
(Supplementary Fig S4), suggesting the presence of a transient
progenitor identity.
Taken together, during the rapid differentiation, iNGN cells
differentiated indirectly and exhibited a brief signature of neuronal
progenitor cells. Hence, these cells likely take differentiation routes
similar to the ones found in vivo.
iNGN gene expression shows similarities to the developinghuman brain
Both functional and transcriptomic analyses point to a neuronal
trajectory that mirrors typical developmental steps. Therefore, we
investigated whether the cells resulting from Neurogenin induction
exhibit similarities to neurons in the human brain. Stem cell-derived
and induced neurons are generally categorized based on morphol-
ogy, electrical properties and a handful of transcripts and immuno-
markers gained from animal models as references. For example,
bipolar neurons are found in the retina (Masland, 2001) and spinal
ganglia (Matsuda et al, 1996). Given our wealth of transcriptomic
information on these cells, we sought to refine this definition by
comparing our RNA-Seq data with the BrainSpan Atlas dataset from
the Allen Institute for Brain Science (Miller et al, 2014) (http://
brainspan.org/). This dataset covers RNA-Seq data for mixed cell
types of 16 cortical and subcortical structures across the full course
of human brain development. This dataset lacks single-cell resolu-
tion, but it comprises the most comprehensive temporal and spatial
human brain reference thus far, allowing brain mapping of in vitro
derived neurons (Stein et al, 2014; van de Leemput et al, 2014).
The transcriptomic profile of iNGN cells, 4 days postinduction corre-
lated best with human fetal brain 12 to 26 weeks postconception
(Pearson coefficient > 0.7). The correlation of the induced cells was
significantly higher than seen in the uninduced iNGN cells (day 0)
(Fig 3B). Furthermore, we found our cells had higher correlations
with the mediodorsal nucleus of thalamus, amygdaloid complex,
hippocampus and the cerebellar cortex compared to the cortical
areas (Fig 3C). These higher correlations likely do not result from
having higher neuronal content in the brain regions (see Supple-
mentary Text). Thus, despite the heterogeneous composition of the
BrainSpan reference samples, iNGN gene expression shows
increased similarity to expression signatures of human brain tissue
as compared with uninduced cells.
miRNA profile changes support neuronal fate induction and theloss of pluripotency
Several recent studies have implicated various miRNAs as key regu-
lators in neuron differentiation; therefore, we examined the role of
miRNAs as regulators in iNGN cell differentiation by quantitatively
profiling 654 different miRNAs from the same samples used for
RNA-Seq (Supplementary Tables S3 and S4). Using Nanostring’s
nCounter technology to count individual miRNA molecules, we
found that 116 and 155 miRNAs were detected above background
levels at day 0 and day 4, respectively. At day 0, the uninduced
iNGN samples had miRNA signatures of stem cells; the miR-302/
367 cluster dominated their profile (50.3% of the total amount of
miRNAs) (Fig 4A; Supplementary Fig S5) consistent with previous
studies that demonstrated its role in regulating self-renewal and
preserving pluripotency (Lipchina et al, 2012; Wang et al, 2013).
▸Figure 3. Global neuronal cell fate commitment and spatio-temporal cell mapping of iNGN cells.
A Gene Ontology (GO) annotation was used to identify gene classes containing an overrepresentation of genes that were differentially expressed between day 0 andday 4 in iNGN cells. The majority of GO terms with an overrepresentation of downregulated genes (green) are related to cell cycle and nucleic acid metabolism, whileGO terms with many upregulated genes (purple) include classes related to neuron development and physiology. For example, most genes in the Gene Ontologyclassification of ‘regulation of neurogenesis’ (inset) including neural progenitor markers are significantly upregulated as shown in the heatmap.
B RNA-Seq data of uninduced iNGN (day 0, blue) and iNGN cells (day 4, black) are compared to the Allen BrainSpan data, by computing the Pearson’s correlationcoefficients between the iNGN cells and all brain samples at each developmental time point. This shows that iNGN gene expression is more consistent with prenatalbrain gene expression, and the correlation is significantly higher for day 4 iNGN cells, compared to day 0 cells (one-sided two-sample t-test, with P-values shown inred dots).
C Pearson’s correlation coefficients were subsequently computed between day 4 iNGN cells and profiles for brain regions at each time point. The 500 most highlyupregulated genes in day 4 iNGN cells were used as a neuronal signature. At each time point, Z-scores were computed for each brain region to assess their relativesimilarity to the iNGN signature, in comparison with the remaining brain regions. This demonstrated less similarity of iNGN cells to cortical brain structures andindicated higher similarities to the mediodorsal nucleus of thalamus, amygdaloid complex, hippocampus and cerebellar cortex. Pcw, postconception weeks.
Molecular Systems Biology 10: 760 | 2014 ª 2014 The Authors
Molecular Systems Biology Transcriptomic basis of rapid neurogenesis Volker Busskamp et al
6
Published online: November 17, 2014

Regulation ofaxonogenesis
Regulationof neuronprojection
development
Regulationof neuron
differentiation
Regulation ofcell projectionorganization
Regulation ofneurogenesis
Regulation ofnervous system
development
Regulation ofcell differentiation
Regulation ofsecretion
Regulation ofexocytosis
Regulation ofbiologicalprocess
Regulationof synaptic
transmission
Regulation oftransmission ofnerve impulse
Regulationof signal
transduction
Glutamatesecretion
Secretionby cell
Neurotransmittersecretion
Neurotransmittertransport
Locomotion
Signaltransduction
Neuronmigration
Synapseorganization
Synapseassembly
Single-organismcellular process
Neurondifferentiation
AxonogenesisNeuron projectionmorphogenesis
Developmentalprocess
Anatomicalstructure
development
Nervoussystem
development
Axonguidance
Gene OntologyBiologicalProcess
Regulation ofcell cycle
Regulation ofcell cycle arrest
Cell cyclecheckpoint
M phase ofmitotic cell cycle
S phase ofmitotic cell cycle
M phase
MitosisNucleardivision
Organellefission
Ribonucleoproteincomplex biogenesis
Cellularcomponentorganizationor biogenesis
S phase
Mitoticprometaphase
Cell cyclephase
G1/S transition ofmitotic cell cycle
M/G1 transition ofmitotic cell cycle
Cell cycleprocess
Translationalinitiation
Translationaltermination
Celldivision
Cellcycle
Mitotic cellcycle
DNArepair
DNAreplication
DNArecombination
DNA metabolicprocess
RNA metabolicprocess
Metabolicprocess
RNA catabolicprocess
mRNA metabolicprocess
ncRNA metabolicprocess
RNAprocessing
rRNAprocessing
Homophiliccell adhesion
Calcium dependentcell-cell adhesion
Synaptictransmission
Cell-celladhesion
Cell-cellsignaling
Cellcommunication
Celladhesion
NeuronrecognitionNeuron
migration
Axonalfasciculation
Regulation ofneurological
system processRegulation of cellcommunication
Regulationof signaling
Ribosome
Cell adhesion
M
SG1 G0
G2
Cell cycleand division
Nucleic acidMetabolism
Neuron developmentand physiology
Up-regulatedprocesses
Down-regulatedprocesses
P-value
>10 -3
<10 -9
10 -3 - 10 -5
10 -5 - 10 -7
10 -7 - 10 -9
<10 -9
10 -3 - 10 -510 -5 - 10 -710 -7 - 10 -9
day
HES3HES1
NOTCH1HES5DLL4DLL1EZH2
POU4F1PAX6
−2
−1.
5
−1
−0.
5
00.5
11.5
2
Z-Score for gene expression level
0 1 3 4
0.4
0.5
0.6
0.7
0.8
Pea
rso
n’s
Co
rrel
atio
n
0
10
20
30
40
50
−lo
g10
(P−v
alu
e)
8 pc
w9
pcw
12 p
cw13
pcw
16 p
cw17
pcw
19 p
cw21
pcw
24 p
cw26
pcw
4 m
os6
mos
10 m
os1
yrs
2 yr
s3
yrs
4 yr
s8
yrs
11 y
rs13
yrs
15 y
rs18
yrs
19 y
rs21
yrs
23 y
rs30
yrs
36 y
rs37
yrs
40 y
rs
p−valuep=0.05Day 0Day 4
B
A
C
8 pcw9 pcw
12 pcw13 pcw16 pcw17 pcw19 pcw21 pcw24 pcw25 pcw4 mos6 mos
10 mos1 yrs2 yrs3 yrs4 yrs8 yrs
11 yrs13 yrs15 yrs18 yrs19 yrs21 yrs23 yrs30 yrs36 yrs37 yrs40 yrs
−2
−1
0
1
2
Z-S
core for correlation to brain region
Med
iod
orsal n
ucleu
s of th
alamu
sA
myg
dalo
id co
mp
lexH
ipp
ocam
pu
sC
erebellar co
rtexIn
ferolateral tem
po
ral cortex
An
terior cin
gu
late cortex
Ven
trolateral p
refron
tal cortex
Do
rsolateral p
refron
tal cortex
Prim
ary aud
itory co
rtexP
osterio
r sup
erior tem
po
ral cortex
Orb
ital fron
tal cortex
Prim
ary mo
tor co
rtexP
rimary so
mato
senso
ry cortex
Po
steroven
tral parietal co
rtexP
rimary visu
al cortex
Striatu
m
Figure 3.
ª 2014 The Authors Molecular Systems Biology 10: 760 | 2014
Volker Busskamp et al Transcriptomic basis of rapid neurogenesis Molecular Systems Biology
7
Published online: November 17, 2014

This cluster is transcriptionally regulated by NANOG, POU5F1 and
SOX2 (Barroso-del Jesus et al, 2009), and since these pluripotency
factors were downregulated, the decrease in the miR-302/367 clus-
ter levels was expected.
We also measured miR-124, a brain-enriched miRNA (Akerblom &
Jakobsson, 2013), by qRT–PCR (Supplementary Fig S5) and
normalized its expression levels to nCounter results (see Materials
and Methods). This miRNA is known to be important for neuronal
C
Day 0 Day 1 Day 3 Day 410
12
14
16
18
20
22
Co
un
ts (
log
2)
miR-96miR-92amiR-302amiR-103
miR-302bmiR-302c
miR-124X
a
hsa miR-517a
hsa miR-520g
hsa miR-371-3p
hsa miR-217
hsa miR-135b
hsa miR-205
hsa miR-92b
hsa miR-200c
hsa miR-1274a
hsa miR-515-5p
hsa miR-373
hsa miR-221
hsa miR-372
hsa miR-367
hsa miR-302d
hsa miR-302c
hsa miR-302b
hsa miR-302a
5 4 3 2 1 0log2 counts (Day n/Day 0)
DownregulatedD
10 3 4Day
miR-449amiR-149miR-128miR-129-3pmiR-345miR-324-5pmiR-151-3pmiR-218miR-598miR-1246miR-423-5pmiR-885-5pmiR-484miR-30amiR-219-2-3pmiR-30cmiR-151-5pmiR-342-3pmiR-125bmiR-34amiR-216amiR-362-3pmiR-301bmiR-30bmiR-101miR-29amiR-135amiR-590-5pmiR-331-3pmiR-335miR-374bmiR-93miR-125a-5pmiR-24miR-107miR-148bmiR-191miR-99bmiR-551bmiR-340miR-27bmiR-301amiR-375miR-106bmiR-21miR-148amiR-137miR-183miR-26amiR-15amiR-25miR-9miR-16miR-103miR-96
0 2 4 6 8log2 counts (Day n/Day 0)
UpregulatedE
10 3 4Day
miR-124X
A
miR-302a
27.4%
miR-124X
12.8%
miR-302b
9.6%8.4%miR-92a
miR-19b
miR-720
miR-302d
6%
5.6%
4.4%
13.4%
miR-26a (0.6%)
miR-16 (0.7%)
miR-25 (0.8%)
miR-103 (1.1%)
miR-367 (1.3%)
miR-96 (1.4%)
miR-20ab (2.9%)
other miRsDay 0 iNGN
miR-302c
3.6%
miR-96
other miRs
B Day 4 iNGN
3.2%
miR-720 (0.9%)
miR-103 (0.9%)
miR-302a (1.3%)
miR-19b (1.9%)
miR-92a (1.9%)
79%
6.2%miR-124X
Figure 4. Dynamic miRNA changes during iNGN differentiation.
A, B Relative abundance of microRNAs in (A) uninduced and (B) 4-days differentiated iNGN cells. The miRNAs associated with stem cell fate are indicated in blue, whilethe neuronal miRNAs are in red.
C Dynamic miRNA changes of representative miRNAs during the differentiation of iNGN cells. Error bars, SEM. miR-124X refers to estimated counts from qRT–PCR.D, E Heatmaps of all significantly (D) down- and (E) upregulated miRNAs within the first 4 days of iNGN differentiation, rank-ordered by expression levels (ANOVA
q-values < 0.05).
Molecular Systems Biology 10: 760 | 2014 ª 2014 The Authors
Molecular Systems Biology Transcriptomic basis of rapid neurogenesis Volker Busskamp et al
8
Published online: November 17, 2014

differentiation, since inhibition of miR-124 in vivo blocked adult
neurogenesis in the mouse subventricular zone and its overexpres-
sion depleted the neural stem cell pool (Akerblom et al, 2012).
Knockout experiments of miR-124 in mice resulted in brain abnor-
malities and increased apoptosis in retinal neurons (Sanuki et al,
2011). In our cells, miR-124 accounted for 12.8% of total miRNAs at
day 0 and increased to 79% by day 4. We also observed increases in
the abundance of the neuronal miR-96 (10-fold) and miR-9 (57-fold)
(Fig 4B and E; Supplementary Fig S5) among others (Fig 4C). In
total, by day 4, the levels of 18 miRNAs were significantly decreased
in expression (q < 0.05) and 55 miRNAs were significantly upregu-
lated (q < 0.05) (Fig 4D and E, and Supplementary Fig S5). Thus,
miRNA profiles rapidly changed in the course of iNGN differentia-
tion, consistent with the loss of pluripotency (miR-302 cluster) and
the establishment of neuronal miRNA signatures (miR-124, miR-96
and miR-9).
To further identify particular miRNA contributions, we used a
probabilistic modeling approach to detect dynamic regulatory
networks consisting of miRNAs and transcription factors (Schulz
et al, 2013). Cross-correlating our RNA-Seq and miRNA data over
time by this probabilistic modeling method revealed additional
groups of dynamically changing miRNA molecules that were likely
aiding in gene expression regulation during iNGN differentiation at
each measured time point (Supplementary Fig S6).
A network of transcription factors drives the rapid neurogenesis
Homogeneous bipolar neuron cultures are achieved following Neuro-
genin induction, but the robust regulatory network underlying the
response is not known. The GO terminology and BrainSpan analy-
ses indicated similarities with ‘natural’ differentiation processes,
but it is not clear which transcription factors were key players in
the regulatory network driving iNGN differentiation. Thus, we
analyzed the time course of mRNA expression data in the context
of known transcription factor interactions in the Ingenuity Path-
ways Analysis (IPA) database (see Materials and Methods). To
identify potential regulators, an enrichment test (Kramer et al,
2014) was conducted to identify transcription factors that had an
overrepresentation of differentially expressed targets and had their
targets changing expression in the direction consistent with the acti-
vation and repression activities of the transcription factors of inter-
est (Supplementary Table S5). We focused here on a network of
transcription factors that met these criteria and that were also
connected to the Neurogenins through direct and indirect gene
regulatory interactions that had been validated in other cell types
and/or organisms, as catalogued in the IPA database.
Our analysis revealed a suppression of key stem cell factors by
day 1. Regulatory targets of the stem cell factors POU5F1 (OCT4),
NANOG and SOX2 were significantly differentially expressed
(P < 7.2 × 10�4), consistent with the inhibition of their regulatory
activities (Fig 5A). Our analysis further revealed several direct and
indirect interactions through which Neurogenins likely repressed
the stem cell factors (Fig 5A). Specifically, our analysis suggested
that the Neurogenins inhibit SOX2, which leads to the inhibition of
NANOG and POU5F1. Additional indirect interactions could further
repress stem cell factors through NEUROD1, p300/CREBBP, STAT3,
SPARC, FOXO1, and others, as suggested by our analysis (Fig 5A;
Supplementary Text). In summary, our analysis identified pathways
through which Neurogenins may repress stem cell factors and desta-
bilize the cell’s pluripotency.
As the stem cell state is inhibited, we aimed to identify
portions of the network that could specifically lead to the neuro-
nal phenotype. We identified 1,295 genes associated with neuro-
nal GO terms (Supplementary Table S7) and found a subnetwork
that could involve all transcription factors that were significantly
enriched in neuronal gene targets (Fig 5B). NEUROG1 and
NEUROG2 have been previously shown to directly activate
NEUROD1 (Roybon et al, 2010), a key factor in adult neurogene-
sis (Gao et al, 2009), and our data suggest that its regulatory
functions are strongly activated on day 1 and fortified each day
thereafter (Fig 5B). NEUROD1 could then activate other neuronal
transcription factors including NEUROD2. Our analysis further
suggests that the Neurogenin expression also induces neuronal
transcription factors, such as ISL1, PAX6, POU3F2, POU4F1,
TLX3, and ZEB1. Furthermore, inhibitors of neurogenesis were
repressed, including HES1 and REST (P < 0.003; Fig 5B), thus
activating a few dozen neuronal genes. As the Neurogenins acti-
vate the transcription factors in our neuronal subnetwork, many
downstream neuronal genes were expressed in the iNGN cells,
resulting in a concerted activation of neuronal fate commitment.
Thus, these transcription factors likely guide the suppression of
stem cell factors and the activation of proneural factors, therein
forming a connected gene regulatory network that drives human
stem cells rapidly into a highly homogenous population of
neurons with bipolar morphology.
miRNAs assist in neuronal differentiation
Having identified key transcription factors, we considered the
contributions of expressed miRNAs. We initially analyzed the
correlations between the expression levels of miR-302a-d, miR-124,
miR-96, miR-9 and miR-103 and their experimentally validated
(miRTarBase 4.4 (Hsu et al, 2011)) mRNA targets that are expressed
in iNGN cells (Supplementary Fig S8). Several mRNAs targeted by
neuronal miRNAs (i.e., miR-124, miR-9 and miR-96) were downreg-
ulated upon increased miRNA expression, consistent with expecta-
tions of the role of miRNAs in repressing downstream targets,
whereas for the decreasing miR-302 cluster and miR-103, similar
proportions of the targets were up- and downregulated. These data
suggest that during iNGN cell differentiation, miRNA functions are
more biased toward de novo repression of upregulated miRNA
targets than in disinhibition (activation) of targets of decreasing
miRNAs.
We specifically found 66 miRNA interactions with the transcrip-
tion factors in our regulatory network, of which 10 were signifi-
cantly negatively correlated in expression with neuronal
transcription factors (depicted in Fig 6A; Supplementary Figs S7 and
S9). For example, REST, a validated miR-9 target (Packer et al,
2008), decreased in expression after day 0, consistent with the
increase in miR-9 levels (Fig 6A; Supplementary Fig S8). In addi-
tion, ZEB1 and ZEB2 expression also increased over time correlating
with decreased levels of corresponding miRNAs (miR-200c, miR-205
and miR-221). Beyond a couple dozen validated miRNA/transcrip-
tion factor target pairs within our constrained regulatory network,
we found hundreds of validated instances of miRNA regulation on
neuronal and stem cell genes (Fig 6B and C).
ª 2014 The Authors Molecular Systems Biology 10: 760 | 2014
Volker Busskamp et al Transcriptomic basis of rapid neurogenesis Molecular Systems Biology
9
Published online: November 17, 2014

ISL114
0123 NEUROD2
day 1day 3
day 4
Act
iv.
Z−s
core0
123 NEUROD1
Act
ivat
ion
Z−s
core
day 1day 3
day 4
0123 PAX6
Act
ivat
ion
Z−s
core
day 1day 3
day 4−1
012
POU4F1
Act
ivat
ion
Z−s
core
day 1day 3
day 4
0123 TLX3
day 1day 3
day 4
Act
ivat
ion
Z−s
core
day 1day 3
day 4−2−1
012 ISL1
Act
ivat
ion
Z−s
core
0123 POU3F2
Act
ivat
ion
Z−s
core
day 1day 3
day 40123 ZEB1
day 1day 3
day 4Act
ivat
ion
Z−s
core
0123 SPARC
Act
ivat
ion
Z−s
core
day 1day 3
day 4
0123 ZEB2
Act
ivat
ion
Z−s
core
day 1day 3
day 4
Progenitor andstem cell factors
REST38
HES114
28
TLX34
POU4F128
NEUROD1
10
POU3F25
NEUROD2
6
SOX212
EP300
CREBBP
SMAD15
18
15
Neurogenins
PAX626
ZEB12
ZEB23
SPARC9
SNAI18 STAT3
25
FOXO114
−3−2−1
0
HES1Act
iv.
Z−s
core
day 1day 3
day 4
−3−2−1
0REST
day 1day 3
day 4Act
iv.
Z−s
core
−3−2−1
0
G+ POU51/NANOGGGG
day 1day 3
day 4
Act
ivat
ion
Z−s
core
Proportion of genes regulated bytranscription factor associatedwith neuronal GO termsNeuronal
Non-neuronal
1 0.5 0.1 0.05
FDR (q-value) for neuronal gene enrichment
0.01 10-4 10-8 <10-8
#Number of neuronal genes
0123 SPARC
Act
ivat
ion
Z−s
core
day 1day 3
day 4
PAX6
SPARC
POU5F1
SOX2
STAT3
NEUROD1
ZEB2SNAI1
NANOG
FOXO1
Neurogenins
EP300
CREBBP
SMAD1
0123 NEUROD1
Act
ivat
ion
Z−s
core
day 1day 3
day 4
0123 PAX6
Act
ivat
ion
Z−s
core
day 1day 3
day 4
0123 ZEB2
Act
ivat
ion
Z−s
core
day 1day 3
day 40123 SNAI1
Act
ivat
ion
Z−s
core
day 1day 3
day 4
−3−2−1
0
FOXO1
day 1day 3
day 4
Act
ivat
ion
Z−s
core
−3−2−1
0
SMAD1
−3−2−1
0
EP300
−3−2−1
0
CREBBP
Act
ivat
ion
Z−s
core
day 1day 3
day 4
−3−2−1
0
STAT3
day 1day 3
day 4
Act
ivat
ion
Z−s
core
−3−2−1
0
POU5F1
day 1day 3
day 4
Act
ivat
ion
Z−s
core
−3−2−1
0
NANOGAct
ivat
ion
Z−s
core
day 1day 3
day 4
−3−2−1
0
SOX2
day 1day 3
day 4
Act
ivat
ion
Z−s
core
Stem cell factors
B
A
−3−2−1
0
SOX2/OCT4/NANOG complex
day 1day 3
day 4
Act
ivat
ion
Z−s
core
SOX2
Figure 5. Neurogenins induce a network of transcription factors that mediate iNGN neurogenesis.A network of transcription factors involved in iNGN neurogenesis was elucidated from the transcription profiles using Ingenuity IPA (see Materials and Methods andSupplementary Fig S7).
A Within this network, there is a subnetwork of transcription factors that represses stem cell factors following Neurogenin activation. The downstream genes regulatedby each transcription factor were used to determine whether each transcription factor was activated (positive activation Z-score; red) or inhibited (negativeactivation Z-score; blue), based on differential gene expression changes seen each day (i.e., day 0 versus day 1, day 1 versus day 3, and day 3 versus day 4).
B Neuronal transcription factors in our network were identified by looking for a significant overrepresentation (hypergeometric test, q < 0.05) of neuronal genes amongtheir known target genes (using a list of 1,295 neuronal genes based on Gene Ontology). The fraction of neuronal gene targets for each transcription factor is shownin the pie charts, with the significance of overrepresentation of neuronal genes shown with color intensity. A minimal subnetwork linking all neuronal transcriptionfactors back to the Neurogenins was identified, showing that the Neurogenins activate proneural transcription factor cascades and suppress transcription factorsinhibiting neuronal genes.
Molecular Systems Biology 10: 760 | 2014 ª 2014 The Authors
Molecular Systems Biology Transcriptomic basis of rapid neurogenesis Volker Busskamp et al
10
Published online: November 17, 2014

Overall, miRNA-mediated repression seemed to be interweaved
with transcription factor effects that occasionally must have outpaced
miRNA functions, resulting in positive correlations among validated
miRNA/target pairs. Consistent with this view, fold changes of vali-
dated miR-124, miR-96 and miR-9 targets were often smaller than the
targets of the proneural transcription factors in our network (Fig 6D).
●
●
● ●
hsa−miR−200c on ZEB1cor=−0.88 q=0.0011
050
015
00
●●
●●
020
4060
80
0 1 3 4
T
arg
et (
FP
KM
)
Daymic
roR
NA
co
un
ts●
●● ●
hsa−miR−205 on ZEB1cor=−0.79 q=0.0063
040
080
014
00
●●
●●
020
4060
80
0 1 3 4
T
arg
et (
FP
KM
)
Daymic
roR
NA
co
un
ts●
●
●●
hsa−miR−9 on EP300cor=−0.75 q=0.012
050
0015
000
● ● ●●
05
1525
0 1 3 4
T
arg
et (
FP
KM
)
Daymic
roR
NA
co
un
ts
A
B C
miR-## upregulated
downregulated
642
102140
411
Not directly regulated by network
Regulated by Transcription factors
Regulated by Transcription factors and microRNAs
Regulated by microRNAs
Neuronal genes
58
525
44
Stem cell genes
-10 -5 0 5 10 15
0
0.1
0.2
0.3
Regulated genes’ fold changes (log2(Day4/Day0))
Den
sity
Difference in variancep = 4.63 x 10⁻¹¹
D
NEUROG2
NEUROG3
NEUROD1NEUROD2
PAX6
SPARCSNAI1SNAI2ZEB1ZEB2
Transcription factors
miR-124miR-9
miR-96
microRNAs
●●
●●
hsa−miR−9 on RESTcor=−0.89 q=0.0011
050
0015
000
●
●
● ● 05
1015
0 1 3 4
T
arg
et (
FP
KM
)
Daymic
roR
NA
co
un
ts
ISL1
HES1
POU4F1
NEUROD1
NEUROD2
PAX6
SPARC
miR-21
miR-26a
miR-29a
miR-93
miR-335
miR-9
miR-335
miR-30a
miR-124
miR-125b
miR-128
miR-34amiR-96
miR-183miR-16EP300
CREBBP
SMAD1
ZEB2
miR-200cmiR-205
miR-221
FOXO1SOX2
REST
STAT3
POU5F1
NANOG
SNAI1
ZEB1POU3F2
TLX3
Neurogenins
miR-##
●
●● ●
hsa−miR−221 on POU3F2cor=−0.81 q=0.005
010
0025
00
●●
●●
010
30
0 1 3 4
Tar
get
(F
PK
M)
Daymic
roR
NA
co
un
ts
●
●● ●
hsa−miR−205 on ZEB2cor=−0.88 q=0.0011
040
080
014
00
●
●
●
●
020
4060
0 1 3 4
T
arg
et (
FP
KM
)
Daymic
roR
NA
co
un
ts
T
arg
et (
FP
KM
)●
●
● ●
hsa−miR−200c on ZEB2cor=−0.87 q=0.0011
nts
050
015
00
●
●
●
●
020
4060
0 1 3 4
●
●● ●
hsa−miR−221 on ZEB2cor=−0.83 q=0.0032
010
0025
00
●
●
●
●
020
4060
0 1 3 4
T
arg
et (
FP
KM
)
Daymic
roR
NA
co
un
ts
●● ●
●
hsa−miR−335 on RESTcor=−0.67 q=0.04
050
015
00
●
●
● ● 05
1015
0 1 3 4
T
arg
et (
FP
KM
)
Daymic
roR
NA
co
un
ts
● ●●
●
hsa−miR−124 on SNAI1cor=−0.66 q=0.04
010
0000
0
●
●
●
●
02
46
810
0 1 3 4
T
arg
et (
FP
KM
)
Daymic
roR
NA
co
un
ts
Day
Figure 6. miRNAs contribute to the gene regulatory network.
A Validated transcription factor targets for differentially expressed miRNAs were identified from miRTarBase. The miRNA interactions (black) have been superimposedon the previously generated regulatory network (light gray). Most interactions involved upregulated miRNAs that suppress stem cell factors in our network. Insetplots show cases with significant anticorrelation between miRNAs (green) and their transcription factor targets (black).
B, C The miRNAs and transcription factors regulate many additional downstream (B) neuronal and (C) stem cell genes during iNGN differentiation. Neuronal and stemcell genes were determined based on GO terms listed in Supplementary Table S7.
D The fold changes of downstream-regulated genes by neuronal miRNAs (red) and selected neuronal transcription factors in our network (black) were compared andindicated that regulation by transcription factors exhibits a higher impact, that is, broader range of fold change, than seen for miRNA targets (Levene’s test).
ª 2014 The Authors Molecular Systems Biology 10: 760 | 2014
Volker Busskamp et al Transcriptomic basis of rapid neurogenesis Molecular Systems Biology
11
Published online: November 17, 2014
To further test the impact of miRNAs in iNGN cell differentiation,
we knocked down the expression of the miR-302/367 cluster and
miR-124 in iNGN cells by miRNA sponges (Ebert et al, 2007). We
analyzed some of their validated targets by qRT–PCR and detected
significant increases in expression levels during differentiation.
However, perturbations to miRNAs did not induce noticeable
changes in iNGN differentiation or iNGN cell morphology (Supple-
mentary Fig S10). Thus, the overall regulation impact of the
proneural transcription factors during iNGN differentiation appeared
to be more potent compared to upregulated miRNAs.
Validating and challenging the genetic program in iNGN cells
Our transcriptomic analysis identified several regulators that may
contribute to the rapid differentiation of neurons. To verify the
contribution of key factors in our network, we perturbed their
expression by small hairpin (shRNA) as well as small interfering
(siRNA) RNAs and assessed the morphological impact and expres-
sion of several downstream neuronal genes.
NEUROD1 is a central factor in our network and is a direct down-
stream target of the Neurogenins (Roybon et al, 2010). Its strong
activation on day 1 should further activate at least 10 genes with
neural annotation plus several other transcription factors, based on
reported targets in IPA. We knocked down NEUROD1 with shRNAs
against NEUROD1, in a construct with a GFP reporter and a puromy-
cin selection marker to enable visualization and selection of trans-
fected iNGN cells (Fig 7A). The shRNAs downregulated NEUROD1
levels to 22 � 16% of the control shRNA samples. In our gene regu-
latory network analysis, only one gene, SLIT2, seemed to be under
unique NEUROD1 control during neuronal differentiation, whereas
other regulatory factors can compensate for all other NEUROD1-
controlled genes following its suppression (Supplementary Fig S11).
Indeed, SLIT2 expression levels were significantly reduced on day 4
as compared with a control shRNA (Fig 7C) whereas the lack of
NEUROD1 resulted in non-significant expression level changes of
NEUROD2 and SOX2 (Supplementary Fig S11). Since SLIT2 influ-
ences axon development and branching (Ozdinler & Erzurumlu,
2002), we assessed the morphology of iNGN cells in which
NEUROD1 was knocked down (Fig 7D). Expression of the
NEUROD1 shRNA significantly changed the morphology and the
quantity of non-bipolar neurons but did not affect neuronal cell fate
commitment (Fig 7E and F). Thus, NEUROD1 influences the
bipolar-cell-shaped morphology.
To further perturb the network, we transiently transfected iNGN
cells with siRNAs against additional key transcription factors. We
individually targeted NEUROD1, NEUROD2, POU3F2 and ZEB1 as
well as combinations for NEUROD1/NEUROD2 and NEUROD1/
PAX6. The siRNAs were transfected 1 day prior to Neurogenin
induction, effectively knocking down all targets (Supplementary Fig
S12). Expression levels of downstream neural genes as suggested by
IPA were measured by qRT–PCR at day 1 and day 3 (Fig 7G). For
example, CNTN2, regulated by NEUROD2, was significantly reduced
in its expression upon NEUROD2 and NEUROD1/NEUROD2 siRNA
treatment. Indeed, almost all measured downstream targets showed
reduced expression, except DCX, which likely was not affected since
it is also directly regulated by the Neurogenins (Ge et al, 2006).
REST and HES1 were initially reduced but showed increased expres-
sion compared with control at day 4; both are typically repressed by
the targeted transcription factors (Fig 7G). Representative immuno-
stainings for neuronal markers were conducted to assess whether
transient siRNA expression interrupted neurogenesis (Supplemen-
tary Fig S11). Consistent with the NEUROD1-shRNA knockdown,
siRNA treatments failed to inhibit neurogenesis, but resulted in
significantly increased fractions of non-bipolar cell neurons
(Fig 7H). In addition, overexpression of REST resulted in an
increase in soma size (Supplementary Fig S11).
The siRNA manipulations resulted in expected changes in expres-
sion levels of downstream neural genes, suggesting that the factors
in our network indeed contribute to iNGN development through the
interactions suggested in our analysis. As a whole, the underlying
regulatory network is robust against perturbations: Rather than
grossly impeding neurogenesis, these perturbations drive the cells to
morphologically altered neurons. Gaining a systems-level view of
this regulatory network and altering key nodes highlights the possi-
bilities to fine-tune the final neuronal fate.
Discussion
Here, we demonstrated that overexpression of Neurogenin in
human iPS cells yields a homogeneous population of neurons
with bipolar morphology within 4 days. The homogeneity of
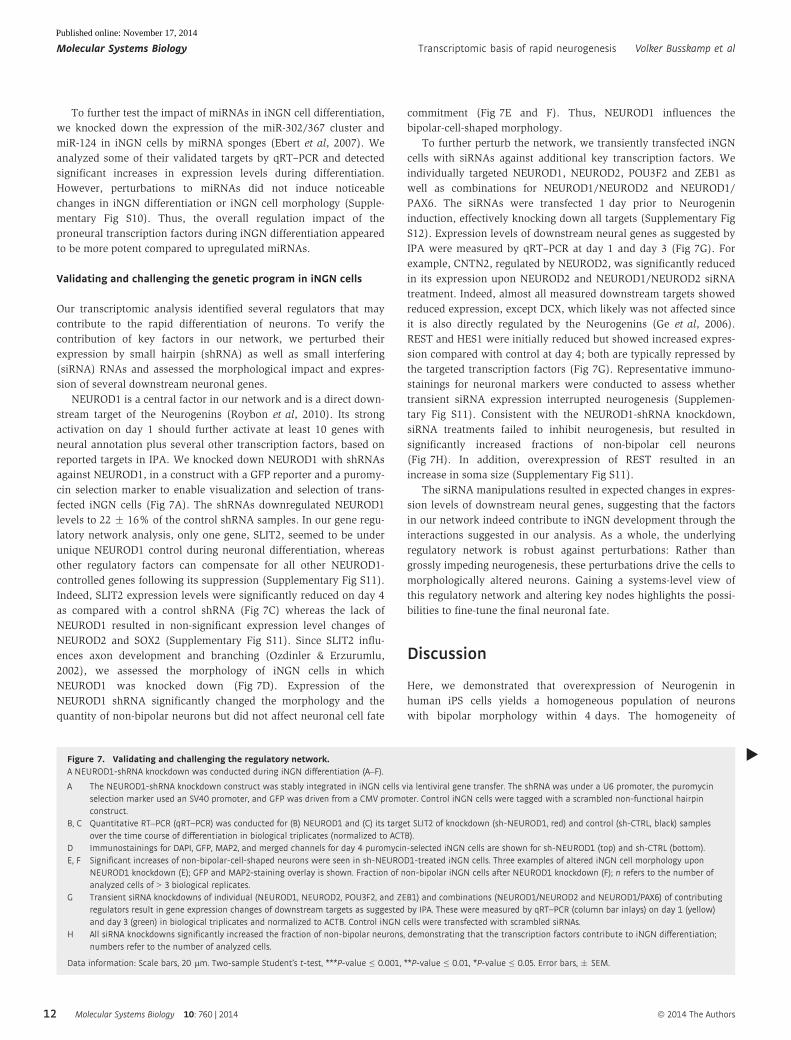
▸Figure 7. Validating and challenging the regulatory network.A NEUROD1-shRNA knockdown was conducted during iNGN differentiation (A–F).
A The NEUROD1-shRNA knockdown construct was stably integrated in iNGN cells via lentiviral gene transfer. The shRNA was under a U6 promoter, the puromycinselection marker used an SV40 promoter, and GFP was driven from a CMV promoter. Control iNGN cells were tagged with a scrambled non-functional hairpinconstruct.
B, C Quantitative RT–PCR (qRT–PCR) was conducted for (B) NEUROD1 and (C) its target SLIT2 of knockdown (sh-NEUROD1, red) and control (sh-CTRL, black) samplesover the time course of differentiation in biological triplicates (normalized to ACTB).
D Immunostainings for DAPI, GFP, MAP2, and merged channels for day 4 puromycin-selected iNGN cells are shown for sh-NEUROD1 (top) and sh-CTRL (bottom).E, F Significant increases of non-bipolar-cell-shaped neurons were seen in sh-NEUROD1-treated iNGN cells. Three examples of altered iNGN cell morphology upon
NEUROD1 knockdown (E); GFP and MAP2-staining overlay is shown. Fraction of non-bipolar iNGN cells after NEUROD1 knockdown (F); n refers to the number ofanalyzed cells of > 3 biological replicates.
G Transient siRNA knockdowns of individual (NEUROD1, NEUROD2, POU3F2, and ZEB1) and combinations (NEUROD1/NEUROD2 and NEUROD1/PAX6) of contributingregulators result in gene expression changes of downstream targets as suggested by IPA. These were measured by qRT–PCR (column bar inlays) on day 1 (yellow)and day 3 (green) in biological triplicates and normalized to ACTB. Control iNGN cells were transfected with scrambled siRNAs.
H All siRNA knockdowns significantly increased the fraction of non-bipolar neurons, demonstrating that the transcription factors contribute to iNGN differentiation;numbers refer to the number of analyzed cells.
Data information: Scale bars, 20 lm. Two-sample Student’s t-test, ***P-value ≤ 0.001, **P-value ≤ 0.01, *P-value ≤ 0.05. Error bars, � SEM.
Molecular Systems Biology 10: 760 | 2014 ª 2014 The Authors
Molecular Systems Biology Transcriptomic basis of rapid neurogenesis Volker Busskamp et al
12
Published online: November 17, 2014

these cells and the rapid neurogenesis allowed us to systemati-
cally characterize the neurons at the molecular level and track
the transcriptional changes during the neuronal differentiation
process. This was particularly valuable since it enabled us to
elucidate coherent transcriptional regulatory mechanisms through
which the Neurogenins inhibit stem cell maintenance/renewal
and initiate a broad neuronal differentiation program. By using
homogeneous differentiated cell populations, one can elucidate
gene regulatory programs contributing to the differentiation
process, thus providing detailed molecular knowledge that can
guide the development of additional cell populations of interest.
In addition, we identified key regulators responsible for Neurogenin-
mediated neurogenesis and demonstrated that miRNAs play a
complementary role to neurogenesis, likely by helping to shape
neuronal differentiation. It has also been recently shown that
miRNAs can repress the translation of bound target mRNAs
U6 SV40 CMVshRNA Puro GFP
A
iNG
N-s
h-N
EU
RO
D1
(4 d
ays
ind
uce
d)
iNG
N-s
h-C
TR
L(4
day
s in
du
ced
)
DAPI GFP MAP2 merged
DAPI GFP MAP2 merged
GFP/MAP2 GFP/MAP2 GFP/MAP2
0
10
20
30
sh-N
EU
RO
D1
sh-C
TR
L
**
No
n-b
ipo
lar
(%)
n=462 n=635
iNGN-sh-NEUROD1 (4 days induced)
SLIT2
0
1
2
3
n=3
Day 0Day 1
Day 2Day 3
Day 4Rel
ativ
e ex
pre
ssio
n (
-)
0
0.5
1sh-CTRL
sh-NEUROD1
NEUROD1
n=3
Day 0Day 1
Day 2Day 3
Day 4Rel
ativ
e ex
pre
ssio
n (
-)
] **
] *
B
C
D
E
D
F
Day 1
Day 3
G
10
0
20
30
No
n-b
ipo
lar
(%
)
NC
ΔN
EUR
OD
1Δ
NEU
RO
D2
ΔN
EUR
OD
1+2
ΔN
EUR
OD
1+Δ
PAX6
ΔPO
U3F
2Δ
ZEB
1
427
413
651
246
349
371
499
***
* ***
** **
Change of morphologyH
ISL1
REST
HES1
TLX3
POU4F1
NEUROD1
POU3F2
NEUROD2
SOX2
EP300
CREBBP
SMAD1Neurogenins
PAX6
ZEB1
ZEB2
SPARC
SNAI1STAT3
FOXO1
ΔNEUROD1
+ΔPAX6
−1
0
1 TUBB3
log 2
ΔF
old
vs. N
C
ΔPOU3F2−1
0
1 CDK5R2
log 2
ΔF
old
vs. N
C
ΔNEUROD2
ΔNEUROD1+2−3
−2
−1
0
CNTN2log 2
ΔF
old
vs. N
C
ΔNEUROD1
+Δ
PAX6
−1
0
1 HES1
log 2
ΔF
old
vs. N
C
ΔNEUROD1
ΔNEUROD1+2
ΔNEUROD1+ΔPAX6−1
0
1 SOX2
log 2
ΔF
old
vs. N
C
*
*
* *
ΔNEUROD2ΔNEUROD1+2
−1
0GAP43
log 2
ΔF
old
vs. N
C
** *
*
* * *
ΔZEB1−1
0
1 REST
log 2
ΔF
old
vs. N
C
*ΔPOU3F2
ΔNEUROD1
ΔNEUROD1+2
ΔNEUROD1
+Δ
PAX6
−1
0
1 NCAM1
log 2
ΔF
old
vs. N
C
** * *
ΔNEUROD1
ΔNEUROD1+2
ΔNEUROD1
+Δ
PAX6
−1
0
1 DCX
log 2
ΔF
old
vs. N
C
* *
Figure 7.
ª 2014 The Authors Molecular Systems Biology 10: 760 | 2014
Volker Busskamp et al Transcriptomic basis of rapid neurogenesis Molecular Systems Biology
13
Published online: November 17, 2014
(Meijer et al, 2013). Thus, it is possible that some miRNAs that
did not show anticorrelation with target expression levels could
be still aiding in regulation of differentiation through translational
inhibition.
By perturbing key transcription factors, we found that this regu-
latory network is robust, but malleable, with perturbations leading
to morphological variations in the resulting neurons. Using RNA-
Seq, we demonstrated similarities between iNGN neurons and the
transcriptomes of cells in the human developing brain.
Traditional neuronal differentiation protocols require long time
lines with multistep protocols to push cells from one cellular state to
the next. Here, we demonstrate the existence of differentiation path-
ways that continuously traverse intermediate states without addi-
tional culturing steps, thus providing the possibility of simpler and
more effective differentiation protocols. In our study, the iNGN cells
were kept in defined, commercially available stem cell media. Even
though this medium contains growth factors that normally counter-
act neuronal differentiation, the Neurogenin-induced program over-
came this differentiation roadblock efficiently and yielded an almost
complete and homogeneous conversion to bipolar neurons. None-
theless, neuronal maturation and electrical activity needed addi-
tional extrinsic factors despite expression of the synaptic machinery
within 4 days in stem cell media. Thus, although neurogenesis can
be efficiently induced even in the presence of pro-pluripotency
factors, complete functional maturation still requires extrinsic
neurotrophic factors.
Previous work reported that induced neurons from fibroblasts
skipped neuronal progenitor states to directly become neurons (Liu
et al, 2013). On the other hand, previous protocols using stem cells
usually slowly traverse unstable progenitor states (Espuny-Camacho
et al, 2013; Nicholas et al, 2013), thus usually leading to heteroge-
neous populations of cells and a low yield of desired neurons. The
increase and subsequent rapid downregulation of neural progenitor
markers and corresponding GO classes over the course of iNGN
differentiation suggested a neurogenesis through progenitor states.
However, SOX1, the earliest neuroectoderm lineage marker (Pevny
et al, 1998), was not highly activated, suggesting that iNGN cells
traversed later, SOX1-independent, progenitor stages in an acceler-
ated and continuous fashion. Nevertheless, the existence of these
progenitor states could present a time frame and potentially an
opportunity to alter the final neuronal type, in contrast to previous
transdifferentiation work where a terminal cell fate is induced
directly.
One uncertainty of stem cell-derived neurons is whether fabri-
cated neurons are relevant to in vivo cells. We analyzed our differ-
entiated cells in the context of the human BrainSpan Atlas, allowing
the use of hundreds of markers along with their expression levels
to analyze differentiated neurons. Thus, a systematic, top-down
approach (Stein et al, 2014; van de Leemput et al, 2014) can be
taken to suggest which neurons resemble our iNGN cells. Direct
proof of cell identity will be possible in the future as limitations
from tissue heterogeneity, batch effects (Leek et al, 2010), and
experimental variability (Robasky et al, 2014) are decreased by the
improvement of protocols, technologies, and the development of
higher resolution human brain RNA-Seq libraries, especially with
single-neuron gene expression measurements (Kodama et al, 2012)
and fluorescent in situ sequencing techniques (Lee et al, 2014). The
currently available BrainSpan dataset demonstrated that day 4 iNGN
cells show greater similarity to non-cortical areas of the prenatal
human brain.
Neural transcription factors used in previous stem cell differen-
tiation and transdifferentiation protocols were also upregulated in
iNGN cells, suggesting an activation of similar neuronal differenti-
ation programs. These common regulatory elements likely drive
stem cells to related neuronal cell types; consistent with this,
published work shows a bias toward excitatory neurons with
current protocols (Vierbuchen & Wernig, 2012; Zhang et al, 2013).
To expand the range of neurons that can be generated in vitro, the
genome-scale data obtained from these cells serve as a molecular
blueprint of neurogenesis from stem cells, which can guide the
development of additional cell populations of interest by inducing
Neurogenin-decoupled transcription factors or through targeted
modification of iNGN cells. For example, our interventions to the
network, such as the NEUROD1 knockdown, altered the morphol-
ogy of iNGN cells. One could overexpress or knockout neuronal
miRNAs or use additional transcription factors or small molecules
(Chambers et al, 2012; Ladewig et al, 2012). Consequently, it is
possible to use iNGN cells—exploiting its speed and homogeneity—
as a platform for further rational modifications to increase the
variety of fabricated neurons.
Generally, each transcription factor can be considered as an
important molecular ‘knob’ within the regulatory network, which if
turned correctly, will further allow targeted engineering of differenti-
ated cells from pluripotent cells. However, to reliably predict the
outcome of subsequent perturbations to specific transcription
factors, we would need additional high-resolution temporal tran-
scriptional data of other stem cell-derived neurons. While this study
successfully tied together known interactions to identify transcrip-
tion factors that contribute to the regulatory network, we anticipate
that as additional perturbed iNGN cells are also expression profiled
in the future, more unbiased network inference algorithms can be
employed to discover additional transcription factors that contribute
to iNGN differentiation. Ultimately, as the network is more comple-
tely characterized, synthetic biology tools could be used to control
the expression of genetic factors for targeted, rational molecular
engineering of human neurons.
Materials and Methods
DNA constructs and lentiviral production
Mouse Neurog1 (MMM1013-202804808, Thermo Scientific) and
Neurog2 (MMM1013-9334809, Thermo Scientific) were PCR-amplified
from cDNA. A nested PCR was used to link the PCR products
for Neurog2 and Neurog1 yielding B1_Kozak_Ngn2-2A-Ngn1_B2.
This product was recombined into pDONR221 using BP clonase
(11789-020, Life Technologies) to pENTR_L1_mNgn2-2A-
mNgn1_L2. The cDNA-containing pENTR vectors were recombined
using the LR reaction (Life Technologies) into customized lentiviral
vectors based on FUW (Lois et al, 2002) containing a Gateway
selection cassette (Life Technologies) called pLV_TRET_Ngn2-2A-
Ngn1. The inducible REST overexpression vector was generated by
replacing Ngn2-2A-Ngn1 by PCR-amplified REST (Addgene Plasmid
41903: LPC-flag-REST-WT, kind gift of Stephen Elledge) resulting in
pLV_TRET_REST. The reverse tetracycline transactivator (rTA3)
Molecular Systems Biology 10: 760 | 2014 ª 2014 The Authors
Molecular Systems Biology Transcriptomic basis of rapid neurogenesis Volker Busskamp et al
14
Published online: November 17, 2014

was PCR-amplified from pTRIPZ (Thermo Scientific) and cloned into
a FUW lentiviral vector containing the human EF1a promoter. The
NEUROD1 shRNA vectors were purchased from Origene. Four
29-mers for NEUROD1 were applied. The following sequences were
used within the pGFP-C-shLenti (TR30023, Origene) backbone
including a GFP reporter and puromycin selection cassette:
a-GTCCAGAATAAGTGCTGTTTGAGATGTGA,
b-GGATCAAAGTTCCTGTTCACCTTATGTAT,
c-GCTGCTTGACTATCACATACAATTTGCAC,
d-GCCGCTCAGCATGAATGGCAACTTCTCTT.
For control transfections, a 29-mer non-effective shRNA Scram-
bled cassette (TR30021, Origene) within the pGFP-C-shLenti back-
bone was used. All shRNAs against NEUROD1 resulted in
significant morphological changes of day 4 iNGN neurons. For qRT–
PCR experiments, shRNA ‘b’ and the 29-mer non-effective shRNA
Scrambled cassette were used.
The miRNA sponge sequences for hsa-miR-124 and the hsa-
miR-302/367 cluster were in silico designed as previously
described by Krol et al (2010), synthesized (Genewiz), PCR-
amplified and placed downstream of a GFP-T2A-puromycin
cassette driven by the EF1a promoter within a lentiviral vector
(Addgene Plasmid 12252: pRRLSIN.cPPT.PGK-GFP.WPRE back-
bone, a kind gift of Didier Trono). All vector sequences were
verified by sequencing. A vector containing only the GFP-T2A-
puromycin cassette served as a control.
Lentiviral particles were made as previously described (Barde
et al, 2010). For concentration, a PEG Virus Precipitation Kit
(K904-50, Biovision) was used, and we determined a titer threshold
by Lenti-XTM GoStixTM (631244, Clontech).
Cell culture
The Personal Genome Project iPS cell line, derived from Participant #1
(PGP1, hu43860C), can be obtained from Coriell (GM23338, the
matching primary fibroblast line is GM23248). The human embry-
onic stem cell line CHB-8 (NIH registration number 0007, NIH
approval number NIHhESC-09-0007) was a kind gift from George
Daley (Harvard Medical School, Boston, USA). PGP1 and PGP9
human iPS cells (Lee et al, 2009) as well as CHB-8 were cultured
under sterile conditions in mTeSR media (05850, StemCell Technolo-
gies). These human stem cell lines were genetically modified by
lentiviral gene transfer and genomic integration of the doxycycline-
inducible Neurogenin and rTA3 vectors. The modified PGP1 cell line
was named iNGN cells, and all experiments in this study were done
on the PGP1 derived iNGN line unless stated otherwise. Standard
tissue culture plates were coated with Matrigel hESC-qualified Matrix
(354277, BD Biosciences) for 1 h at room temperature. For passag-
ing, the cells were dissociated using TrypLETM Express (12604013,
Gibco), washed with phosphate-buffered saline (pH 7.4) (10010031,
Gibco) and replated using mTeSR supplemented with 3 lg/ml InSo-
lutionTM Y-27632 Rho Kinase inhibitor (688001, EMD Millipore) and/
or frozen using mFreSR media (05854, StemCell Technologies). The
doxycycline (D9891-5G, Sigma) concentration for induction was
0.5 lg/ml. Even a 1-day period of doxycycline administration was
sufficient to induce neurogenesis (Supplementary Fig S1). For func-
tional studies, rat astrocytes (N7745100, Gibco) were plated on
3.5-cm poly-d-lysine-coated glass-bottom dishes (P35GC-0-14-C,
MatTek) and cultured with astrocyte medium (A1261301, Gibco) for
24 h. Next, iNGN cells were added in the presence of Y-27632 and
doxycycline in mTeSR media. After 24 h, the media were changed to
mTeSR containing doxycycline. After 3 days, the media were
changed to (1:1) mTeSR and neurobasal A media (NBA) (10888022,
Gibco) containing N-2 (17502048, Gibco) and B27 (17504044, Gibco)
supplement. Notably, the supplements and the astrocyte co-cultures
influenced the morphology of iNGN cells toward a higher fraction of
non-bipolar shapes, and therefore, we applied these factors only for
functional tests. After day 4, iNGN astrocyte co-cultures were kept in
NBA (plus N-2 and B27) media.
siRNA knockdown experiments
IDT TriFECTaTM 27-mer duplexes (three duplexes per target)
HSC.RNAI.N00250.12 (NEUROD1), HSC.RNAI.N006160.12 (NEUROD2),
HSC.RNAI.N000280.12 (PAX6), HSC.RNAI.N005604.12 (POU3F2)
and HSC.RNAI.N001128128.12 (ZEB1) were used according to the
manufacturer guidelines including the TYE-563-DS-transfection
control (IDT, TriFECTaTM kit) and the negative control NC1 Control
Duplex (IDT, TriFECTaTM kit). In total, 50 nM siRNA duplexes (1/4
of each duplex + 1/4 TYE-563-DS-transfection control for single
siRNA targets and 1/8 of each duplex for two targets+ 1/4 TYE-563-
DS-transfection control) were transfected per 96-well plate (contain-
ing 10,000 iNGN cells plated 1 day prior to siRNA transfection)
using the DharmaFECT siRNA transfection kit (T-2001–02, Thermo
Scientific) according to the user manual (0.5 ll of DharmaFECT
reagent per transfection). The transfections were performed in inde-
pendent biological triplicates and related to iNGN cells transfected
with 50 nM (3/4 negative control NC1 Control Duplex and 1/4 TYE-
563-DS-transfection control). After 24 h, the transfections were
monitored for the fluorescent TYE-563 probes and the doxycycline
induction was started. Cell samples were harvested 1 and 3 days
post doxycycline induction using the Power SYBR Green Cells-to-
CTTM Kit (4402953, Ambion).
Quantitative real-time PCR
20,000 iNGN cells (lentiviral transfected lines or siRNA-treated cells)
were plated in Matrigel-coated 96-well plates and induced with
doxycycline. The cells (< 100,000 cells per sample) were lysed at
indicated time points using the Power SYBR Green Cells-to-CTTM Kit
(4402953, Ambion), and RNA samples were processed for quantita-
tive RT–PCR according to the user manual. Diluted cell lysates
served as no reverse transcription (noRT) controls. The 480 SYBR
Green I Master Mix (04707516001, Roche) and a LightCycler 96
System (Roche), according to the manufacturer’s guidelines, were
used for the quantitative PCRs. Three biological replicates were used
for each condition and normalized on ACTB expression levels at
indicated time points. Primers (IDT PrimeTime primer sets) used
are the following:
ACTB.rev-CCTGGATAGCAACGTACATGG,
ACTB.for-ACCTTCTACAATGAGCTGCG,
REST.rev-TGGCGGGTTACTTCATGTTG,
REST.for-TGTCCTTACTCAAGTTCTCAGAAG,
NEUROD1.rev-TCCTGAGAACTGAGACACTCG,
NEUROD1.for-CCAGGGTTATGAGACTATCACTG,
ª 2014 The Authors Molecular Systems Biology 10: 760 | 2014
Volker Busskamp et al Transcriptomic basis of rapid neurogenesis Molecular Systems Biology
15
Published online: November 17, 2014

NEUROD2.rev-TGGTGAAGGTGCATATCGTAAG,
NEUROD2.for-ACCACGAGAAAAGCTACCAC,
ZEB1.rev-GGCATACACCTACTCAACTACG,
ZEB1.for-CCTTCTGAGCTAGTATCTTGTCTTTC,
POU3F2.rev-GGTAGCAGGTGTAATGATGTGT,
POU3F2.for-ATCACACACTCTCCTCACTCT,
SOX2.rev-GTACAACTCCATGACCAGCTC,
SOX2.for-CTTGACCACCGAACCCAT,
CDK5R2.rev-CTCCTGTCATGTGTCACCATC,
CDK5R2.rev-GCACCTCAGTCGATCCAAA,
CNTN2.rev-ACCAGGAGGAAGCCACA,
CNTN2.rev-CTGGGAATAGCACACTGAGG,
DCX.rev-GGATCCAGGAAGATCGGAAG,
DCX.for-TTACGTTGACAGACCAGTTGG,
GAP43.rev-AGCCAAGCTGAAGAGAACATAG,
GAP43.for-TTCTTAGAGTTCAGGCATGTTCT,
C21ORF33.rev-TGTCTGGATGCGGAGTCTA (HES1),
C21ORF33.for-TCAGGAGCAAAGATCTGGAC (HES1),
TUBB3.rev-GGCCTTTGGACATCTCTTCAG,
TUBB3.for-CCTCCGTGTAGTGACCCTT,
NCAM1.rev-GACCATCCACCTCAAAGTCTT,
NCAM1.for-GAGGCTTCACAGGTAAGAGTG,
SLIT2.rev-CCTGCATCAGTAACCCATGT,
SLIT2.for-TCTCCTTCAAATCCATCAGCAC.
NGDN.rev-AGTTCAAGCTGGTGCCTATC,
NGDN.for-AGAATGAGGTGGGTCAAATCC.
GGA2.rev-TGATGCTGATGAAGAAAAGTCCA,
GGA2.for-TCCTCCTTGACCAAATTCTTGA.
KLF13.rev-ATCTTCGCACCTCAAGGC,
KLF13.for-GGGCAGCTGAACTTCTTCTC.
The data were analyzed using the DDCT method (Livak &
Schmittgen, 2001).
Immunohistochemistry
Cells were grown on Matrigel-coated glass coverslips and fixed for
20 min in fixation buffer (420801, Biolegend), then washed three
times in phosphate-buffered saline (PBS), permeabilized in PBS
containing 0.2% Triton X-100 for 15 min, and washed again three
times in PBS. The coverslips were subsequently blocked for 20 min
in PBS with 8% BSA and incubated for 3 h with primary antibodies
in PBS containing 4% BSA followed by washing three times with
PBS. Incubation with the secondary antibodies in PBS and 4% BSA
was performed for 1 h, followed by washing three times in PBS.
Finally, the coverslips were embedded on glass slides in ProLong
Gold Antifade (P36934, Life Technologies), allowed to cure over-
night, and sealed with nail polish. Primary antibodies used were the
following: rabbit anti-Map2 (Abcam, ab32454), rabbit anti-Synapsin
(Millipore, ab1543), chicken anti-beta-III-tubulin (Millipore,
ab9354), mouse anti-NeuN (Millipore, MAB377), rabbit anti-Nanog
(Cell Signaling, 3580S), goat anti-DCX (Doublecortin) (Santa Cruz,
sc-8066), rabbit anti-GAT3 (GABA-transporter) (Invitrogen,
480018), mouse anti-N-Cadherin (BD, 610920), goat anti-Sox2
(Santa Cruz, sc-17319), mouse anti-Pax6 (R&D, MAB1260), rabbit
anti-PSD95 (Invitrogen, 51-6900), and mouse anti-GluR2 (Invitro-
gen, 32-0300). Secondary antibodies/stains used were the following:
40, 6-diamidino-2-phenylindole (DAPI, Roche, 10 lg/ml), donkey
anti-rabbit Alexa Fluor 488 (Life Technologies, A-21206), donkey
anti-chicken Cy3 (Jackson Labs, 703-165-155), donkey anti-goat
Alexa Fluor 568 (Invitrogen, A11057), and donkey anti-mouse Alexa
Fluor 647 (Life Technologies, A31571).
Flow Cytometry analysis
Cells were dissociated using TrypLE Express (12604013, Gibco) and
washed in FACS buffer: PBS (Invitrogen) + 0.2% bovine serum albu-
min (Sigma). Cells were stained in FACS buffer plus anti-human
TRA-1/60 antibody (clone TRA-1/60, eBioscience) and 10% fetal
calf serum for 30 min at 4°C. Cells were washed twice in FACS
buffer and then resuspended in FACS buffer with the viability dye
SYTOX Blue (Invitrogen). Samples were collected on a BD LSRFort-
essa flow cytometer and analyzed using FlowJo software (Tree Star).
SDS–PAGE and Western blotting
Whole-cell lysates of iNGN cells incubated with or without doxycy-
cline for one or 4 days were run on SDS–polyacrylamide gels and
transferred to supported nitrocellulose membrane (Bio-Rad) by stan-
dard methods. Membranes were blocked for 1 h in 5% non-fat dry
milk in 1× TBS with 0.1% Tween-20 (TBST), rinsed, and incubated
with primary antibody diluted in 3% BSA in TBST overnight at 4°C.
The following primary antibodies were used: anti-NeuroG1
(sc-19231, Santa Cruz Biotechnology), anti-NeuroG2 (ab26190,
Abcam), anti-MAP2 (AB5622, Millipore), anti-VGluT1 (ab72311,
Abcam), anti-b-Actin-Peroxidase (A3854, Sigma-Aldrich), and anti-b-Actin (ACTB) (Sigma-Aldrich, A3854). Blots were washed in TBST,
incubated with HRP-conjugated secondary antibodies in 5% milk in
TBST for 1 h (except for anti-b-actin-peroxidase antibody), and
washed again. HRP signal was detected by Enhanced ChemiLumines-
cence (Perkin Elmer).
Imaging
An Observer.Z1 microscope (Zeiss) equipped with a Plan-
Apochromat 20×/0.8 objective (Zeiss), a four channel LED light
source (Colibri) and an EM-CCD digital camera system (Hamamatsu)
as well as a Evos FL microscope (Life Technologies) equipped with
DAPI and EGFP filter cubes and a Zeiss Axiovert 200 M microscope
equipped with a cooled ORCA-ER charge-coupled device camera
(Hamamatsu) were used. Exposure time, light intensities, and
camera sensitivity were kept constant among the different samples
with corresponding controls as well as image processing settings.
Immunohistochemically labeled cells were automatically quantified
in at least biological triplicates using Imaris software, ‘Spots’ in
Surpass view (Bitplane AG), or manually with ImageJ v1.47 ‘multi-
point’ tool. DAPI-stained nuclei served as a reference for total cell
numbers. Statistical analysis on co-localization was performed with
the ‘ImarisColoc’ plugin (Bitplane AG).
For live cell imaging, iNGN cells were plated in a 3.5-cm
glass-bottom dish and induced with doxycycline in mTeSR media
for 48 h. They were then imaged on a Zeiss Axio Observer Z1 every
15 min over 48 h in an environmental chamber set to 5% CO2 and
heated to 37°C. The images were processed using the ‘Auto
Contrast’ plug-in and compiled to a movie file in ImageJ v1.47. This
file was converted to mpeg codec by iMovie 10.0.1 (Apple Inc.).
Molecular Systems Biology 10: 760 | 2014 ª 2014 The Authors
Molecular Systems Biology Transcriptomic basis of rapid neurogenesis Volker Busskamp et al
16
Published online: November 17, 2014

Electrophysiology
Electrophysiological recordings were carried out at 20–25°C on a
Nikon Eclipse TE2000-U after 4 and 14 days of treatment with doxy-
cycline. iNGN cells were bathed in artificial cerebral spinal fluid
(ACSF) containing (in mM) 140 NaCl, 2.5 KCl, 2 CaCl2, 1 MgCl2,
10 HEPES, and 10 glucose. Intracellular recordings were obtained
using 3- to 5-MOhm glass micropipettes filled with an internal solu-
tion containing (in mM) 142 KMeSO3, 5 HEPES, 0.75 MgCl2, and
1.1 EGTA. Traces were collected using an Axopatch 200 amplifier
(Molecular Devices), filtered with a 2 kHz Bessel filter, digitized at
10 kHz using a Digidata 1322A digitizer (Molecular Devices), stored
using Clampex 10 (Molecular Devices), and analyzed off-line using
customized procedures in Igor Pro (WaveMetrics). Cells were
assessed for the presence of spontaneous EPSCs (sEPSCs) in voltage-
clamp mode while being held at �70 mV. In current-clamp, a hold-
ing potential between �65 mV and �70 mV was maintained by
constant current injection. Intrinsic properties were assessed by the
injection of a set of current steps, ranging from �40 pA to 100 pA in
15-pA increments, with a duration of 0.5 s. Action potential
parameters were quantified using the first action potential evoked at
the lowest current injection that resulted in an action potential.
Threshold was defined as the voltage at which dV/dt of the
action potential waveform reached 10% of its maximum value,
relative to a dV/dt baseline taken 10 ms before the peak. Action
potential amplitude was defined as the difference between the
threshold value (in mV) and the maximum voltage at the peak of
the action potential. Width was measured at half-maximum
amplitude.
RNA sequencing
iNGN cells were plated in Matrigel-coated 6-well plates in the pres-
ence of Rho Kinase inhibitor in mTeSR media for 24 h. The media
were changed to plain mTeSR, and the cells were cultured for
another day until the doxycycline was added to mTeSR media.
Two wells per plate were pooled for one biological replicate. In
total, we generated triplicates for each time point. The day 0
samples were not treated with mTeSR plus 0.5 lg/ml doxycycline
(Sigma). The cells were enzymatically dissociated, washed with
phosphate-buffered saline (pH 7.4) (Gibco), and stored at 4°C
overnight in RNAlater solution (Ambion). The next day, the
samples were frozen at �20°C until RNA extraction. The day 1,
day 3 and day 4 samples were harvested and treated accordingly.
The RNA extraction was performed using the mirVanaTM miRNA
Isolation Kit (AM1560, Ambion) following their protocol. The
protocol was interrupted after the first column purification step to
obtain the total RNA. The isolated RNA was stored at �80°C and
submitted to the Broad Institute (Cambridge, MA) where the qual-
ity control, library preparation (Illumina dUTP RNA-Seq Library
(PolyA method)) and RNA sequencing (Illumina HiSeq (Paired End
Run 101 Base)) were performed. Sequencing statistics can be
found in Supplementary Fig S3 and Supplementary Table S6.
miRNA profiling
100 ng of total RNA (aliquots of the same samples used for RNA-
Seq) were used for miRNA profiling by the nCounter technology
(Nanostring). A 12-reaction size kit for human miRNAs (v1) was
used. All samples were processed according to the manufacturer’s
manual at the Broad Institute (Cambridge, MA).
Selected miRNAs were validated by miRCURY LNATM (Exiqon
Inc.) quantitative RT–PCR according to the manufacturer’s manual.
Briefly, 20 ng of the total RNA samples taken for RNA-Seq and
nCounter experiments was used for the RT–PCR (Universal cDNA
Synthesis Kit II. 8, #203301, Exiqon). A 1/80 dilution of cDNA was
subsequently used for quantitative PCR using primer sets for hsa-
miR-302a-3p (#204157, Exiqon), hsa-miR-124-3p (#204319, Exiqon),
hsa-miR-103a-3p (#204063, Exiqon), hsa-miR-9-5p (#204513,
Exiqon), and hsa-miR-96-5p (#204157, Exiqon). Each time point
represented three biological replicates, and each reaction was
normalized on 5S rRNA (hsa, mmu) (#203906, Exiqon). We used a
2× FastStart SYBR Green Master Mix (04673484001, Roche Applied
Science) and a LightCycler 96 System (Roche), according to the
manufacturer’s guidelines. The data were analyzed using the DDCT
method (Livak & Schmittgen, 2001).
The nCounter and qRT–PCR fold changes correlated well
(Supplementary Fig S5), thus allowing the reliable estimation of
miR-124, which nCounter could not detect. At every time point and
for each replicate, the relative miR-124 qRT–PCR expression levels
were normalized to miR-302a and miR-96 and these ratios were
multiplied with corresponding nCounter counts for miR-302a and
miR-96 separately. We used the average value for the estimated
miR-124 (miR-124X) counts.
miRNA data processing and analysis
miRNA counts were normalized to the sum of positive control
probes for each replicate according to manufacturer’s manual, and
miRNAs with < 500 counts in all 12 samples were removed. The
ANOVA test was used to find differentially expressed miRNAs with
the null hypothesis that the mean count of all 4 days is the same.
ANOVA P-values were corrected for multiple hypothesis testing
using the false discovery rate method (Storey & Tibshirani, 2003),
and miRNAs with q-values < 0.05 were considered statistically
significant. miRNAs whose counts increased in day 4 compared to
day 0 were considered upregulated, and those that decreased were
considered downregulated. Normalized values for differentially
expressed miRNAs are found in Supplementary Tables S3 and S4.
The probabilistic modeling approach for detecting dynamic
miRNA contributions was performed as previously described
(Schulz et al, 2013).
Validated miRNA targets (Hsu et al, 2011) were used for correla-
tion analysis with miR-302a-d, miR-9, miR-96, and miR-103. Pear-
son’s correlation coefficients were computed and plotted on a
histogram. P-values were calculated and corrected using the false
discovery rate method to yield q-values (Storey & Tibshirani, 2003).
Validated targets for active transcription factors (having positive
activation score: NEUROG2, NEUROG3, NEUROD1, NEUROD2,
SPARC, SNAI1, SNAI2, ZEB1, and ZEB2) and upregulated miRNAs
(miR9, miR96, miR124) were combined, respectively. Expression of
their targets was averaged over the triplicates and log-transformed
to yield log2 (day 4/day 0), then plotted as a smooth histogram with
standard deviations, and variances computed. Since the variances of
the two distributions were not necessarily normally distributed,
Levene’s test was used.
ª 2014 The Authors Molecular Systems Biology 10: 760 | 2014
Volker Busskamp et al Transcriptomic basis of rapid neurogenesis Molecular Systems Biology
17
Published online: November 17, 2014

RNA sequencing data processing and analysis
RNA sequencing reads were aligned to the human genome
(Build 37, GRCh37.70). Expression levels and differential expression
were determined using Cuffdiff 2 (Trapnell et al, 2013) in the
Cufflinks package (v.2.0.2). For this study, genes were considered
differentially expressed if their expression level increased by 50% in
one sample, and if the q-value < 0.05. In total, 2,003 and 1,878
genes were significantly up- and downregulated, respectively
(q-value < 0.05; > 1.5-fold) on day 1 compared to day 0. The
number increased to 2,832 and 3,378 up- and downregulated genes
by day 3, and 3,853 and 4,305 up- and downregulated genes by
day 4. FPKM values are provided in Supplementary Table S1.
Gene Ontology analysis was conducted as follows. Differentially
expressed genes were determined by comparing the day 0 RNA-Seq
datasets to data from each subsequent day using Cuffdiff 2. All
significantly up- and downregulated genes were identified. A list of
background genes was also determined that included all genes for
which transcripts were detected. These lists were used to look for
overrepresentation of up- or downregulated genes in Biological
Process Gene Ontology terms using GOrilla (Eden et al, 2009). All
Gene Ontology Biological Process terms that were significantly
enriched are reported in Supplementary Tables S2 and S8.
Identification of GO terms containing neuronal and stemcell genes
To identify neuronal and stem cell genes that are regulated in the
induced neurons, we curated the list of GO terms showing statisti-
cally significant enrichment of differentially expressed genes. Simi-
larly, enriched GO terms associated with stem cells were also
identified. All GO terms selected to identify neuronal and stem cell
genes are listed in Supplementary Table S7.
Transcription factor analysis
Analysis of transcription factor subnetwork activation was
conducted using Ingenuity Pathway Analysis (IPA; www.ingenuity.
com/ipa), and details of their algorithm have been published previ-
ously (Kramer et al, 2014). Briefly, fold change and differential
expression significance were determined for each day of the
experiment, compared to the previous day (e.g., day 4 versus day 3).
Fold change levels for all genes were loaded into the IPA soft-
ware, and upstream regulator analysis was conducted, which
identifies regulators that could be active, based on differentially
expressed genes. IPA was used with its default parameters, except
for the following. The fold change cutoff was set at 1.5. IPA
contains experimentally validated interaction data, and some
predicted interactions (mostly for miRNAs). Both classes of inter-
action data were used for this analysis. We also used our list of
expressed genes as a background list for all statistics. Lastly, since
our aim was to find cascades of regulatory proteins, we did not
include chemical regulators or miRNAs at this stage of the analy-
sis. For each transcription factor or regulator, IPA first computes
an overrepresentation P-value for each transcription factor using a
one-sided Fisher’s exact test to see whether more of its targets
are differentially expressed than expected by random chance.
Then, IPA computes an activation Z-score as described in detail
previously (Kramer et al, 2014). Briefly, this is done by first
enumerating all regulatory interactions in which the regulation
directionality (i.e., activation or suppression) is well defined and
then comparing up- and downregulation of each gene with the
activities of an upstream transcription factor (i.e., whether the
factor activates or represses a given gene). All agreements and
conflicts with known regulatory mechanisms are compiled and
used to compute a Z-score comparing the overlap of differential
expression direction and regulation directionality, based on
comparison to a null model. Thus, a quantitative measure is
provided to assess how likely it is that the transcription factor is
activated or repressed.
Following the identification of transcription factors that explain
the patterns in differential expression, the list was analyzed to
focus on transcription factors with the strongest evidence of being
specific to neurogenesis in the iNGN cells. First, we focused on
transcriptional regulators and regulatory complexes, which were
annotated by IPA as ‘transcription regulator’, ‘translation regula-
tor’, ‘complex’, ‘group’, and ‘other’ in order to capture the tran-
scription factors involved in differentiation. Second, all regulators
with an absolute activation/repression score less than 1.5 or
enrichment P-values greater than an Benjamini FDR-corrected
value of 0.05 were removed (the SOX2-OCT4 and SOX2-OCT4-
NANOG complexes in IPA had scores above threshold, and so the
scores for SOX2 outside of these complexes are also reported,
despite being below threshold). Third, to find candidate transcrip-
tion factors, those that were not significantly expressed (average
FPKM < 0.5 in our datasets) were discarded, while retaining all
Neurogenins. Since the mouse homologs of the Neurogenins were
overexpressed here, the sequencing reads do not align to the
human reference genome. Fourth, regulators were removed if there
was a discrepancy in differential expression and activation state
for a given day, and no further days exhibited a significant concor-
dance. If, for example, the mRNA of the transcription factor signifi-
cantly decreased, but it was predicted that the regulator was
significantly increasing its activity, it would be removed unless,
for another day, the mRNA was further significantly decreased
with an accompanying prediction of decreasing activity. Fifth,
regulators were removed if they were not connected upstream to
the Neurogenins, since we were interested in finding the central
factors that are specifically in cascades influenced by the Neuroge-
nins. Since our goal was to identify local regulators that were
important for iNGN differentiation, we identified more global regu-
lators (i.e., transcription factors with more than 15 interactions
within our list of transcription factors). We then repeated the fifth
step without these global regulators, in order to allow the identifi-
cation of pathways specific to iNGN differentiation. This resulted
in a network of regulators seen in Supplementary Fig S7. See also
Supplementary Table S5 for details on the network, including the
aforementioned global regulators.
BrainSpan analysis
RNA-Seq data were acquired from the Allen BrainSpan Atlas of the
developing brain (http://www.brainspan.org/). The data available
for download included RNA-Seq data from multiple individuals,
spanning from 8 weeks postconception until 40 years old for both
male and female human subjects, and from 26 different brain
Molecular Systems Biology 10: 760 | 2014 ª 2014 The Authors
Molecular Systems Biology Transcriptomic basis of rapid neurogenesis Volker Busskamp et al
18
Published online: November 17, 2014

structures. While expression had been acquired prior to 8 weeks
postconception, these datasets were not available for download.
The Pearson’s correlation coefficient was computed for gene expres-
sion levels between each BrainSpan sample and the day 0 and day 4
iNGN cells. To decrease bias from unexpressed genes, all genes that
had a mean FPKM level less than 0.1 were filtered out of this analy-
sis. To test the temporal correlation of our cell lines with different
developmental time points in the human brain, we computed corre-
lation coefficients between our cell lines and each sample in the
BrainSpan Atlas. Then, we computed a one-sided two-sample t-test
to test whether the correlation coefficients for the day 4 data were
higher than the day 0 correlation coefficients for all samples for each
given point in the Brain Span data.
To test the brain region similarity between our iNGN cells and
the human brain, we first identified 500 genes showing the largest
increase in expression in our iNGN cells on day 4, with respect to
day 0. Using only these 500 genes (analysis results were qualita-
tively robust to variations in the number of genes), we computed
the correlation coefficients between the day 4 data and data for
each brain region at each time point. We then computed a Z-score
to see whether a given brain region correlates more highly than
the remaining brain regions at each time point. Z-scores were used
since they allowed the identification of brain regions that continu-
ally show higher correlation than others, and allowed enhanced
comparison between brain regions since it helped to control
against general transcriptomic changes seen in brain tissue over
time, thus strengthening the support of a specific brain region
being more similar to the iNGN cells. We note that cerebellum and
cerebellar cortex data from the BrainSpan Atlas were grouped for
all analyses because they did not overlap in sampling time points.
However, this grouping did not qualitatively change the results of
our study.
Data availability
Datasets have been deposited at the NCBI Gene Expression Omnibus
and can be accessed with the following accession numbers:
GSE60548 (Illumina RNA-Seq), GSE62145 (nCounter miRNA), and
GSE62146 (Agilent microarray).
Supplementary information for this article is available online:
http://msb.embopress.org
AcknowledgementsWe would like to thank Dr. Yoav Mayshar and Dr. Arend Hintze for comment-
ing on the manuscript. The project was supported by NIH Grant P50
HG005550 and a grant provided by Richard Merkin to GMC. RW received
support by NSF STC EBICS Grant 0939511 and NSF ERC SynBERC Grant
0540879. The Human Frontiers Science Program Organization and the
Volkswagen Foundation supported VB. The Swiss National Science Foundation
provided funding to VB and PG. The Ernst Schering Foundation supported PG.
AHMN was supported by the Canadian National Science and Engineering
Research Council, and the Lynch Foundation. SLS received support from the
National Institute on Aging (5T32AG000222-22).
Author contributionsVB conceived the project, designed and performed experiments, analyzed
data, and wrote the paper. VB did not work with human ES cells. NEL
analyzed RNA-Seq, microarray, and nCounter data and wrote the paper. PG
developed the iNGN cell line, performed experiments, and wrote the paper.
AHMN, SLS, SMB, NES, SL, and JM performed experiments and analyzed
data. MS designed miRNA sponge sequences. YL provided material. RW
provided material, supervised the work, and edited the paper. GMC edited
the paper, supervised, and guided the research. All authors commented on
the manuscript.
Conflict of interestThe authors declare that they have no conflict of interest.
References
Akerblom M, Sachdeva R, Barde I, Verp S, Gentner B, Trono D, Jakobsson J
(2012) MicroRNA-124 Is a subventricular zone neuronal fate determinant.
J Neurosci 32: 8879 – 8889
Akerblom M, Jakobsson J (2013) MicroRNAs as neuronal fate determinants.
Neuroscientist 20: 235 – 242
Amamoto R, Arlotta P (2014) Development-inspired reprogramming of the
mammalian central nervous system. Science 343: 1239882
Ashburner M, Ball CA, Blake JA, Botstein D, Butler H, Cherry JM, Davis AP,
Dolinski K, Dwight SS, Eppig JT, Harris MA, Hill DP, Issel-Tarver L, Kasarskis
A, Lewis S, Matese JC, Richardson JE, Ringwald M, Rubin GM, Sherlock G
(2000) Gene ontology: tool for the unification of biology. The Gene
Ontology Consortium. Nat Genet 25: 25 – 29
Barde I, Salmon P, Trono D (2010) Production and titration of lentiviral
vectors. Current Protocols in Neuroscience 53: 4.21.1 – 4.21.23
Barker RA (2012) Stem cells and neurodegenerative diseases: where is it all
going? Regen Med 7: 26 – 31
Barroso-del Jesus A, Lucena-Aguilar G, Menendez P (2009) The miR-302-367
cluster as a potential stemness regulator in ESCs. Cell Cycle 8:
394 – 398
Bhardwaj RD, Curtis MA, Spalding KL, Buchholz BA, Fink D, Bjork-Eriksson T,
Nordborg C, Gage FH, Druid H, Eriksson PS, Frisen J (2006) Neocortical
neurogenesis in humans is restricted to development. Proc Natl Acad Sci
USA 103: 12564 – 12568
Britz O, Mattar P, Nguyen L, Langevin LM, Zimmer C, Alam S, Guillemot F,
Schuurmans C (2006) A role for proneural genes in the maturation of
cortical progenitor cells. Cereb Cortex 16(Suppl 1): i138 – i151
Chambers SM, Qi Y, Mica Y, Lee G, Zhang XJ, Niu L, Bilsland J, Cao L, Stevens
E, Whiting P, Shi SH, Studer L (2012) Combined small-molecule inhibition
accelerates developmental timing and converts human pluripotent stem
cells into nociceptors. Nat Biotechnol 30: 715 – 720
Ebert MS, Neilson JR, Sharp PA (2007) MicroRNA sponges: competitive
inhibitors of small RNAs in mammalian cells. Nat Methods 4:
721 – 726
Eden E, Navon R, Steinfeld I, Lipson D, Yakhini Z (2009) GOrilla: a tool for
discovery and visualization of enriched GO terms in ranked gene lists.
BMC Bioinformatics 10: 48
Espuny-Camacho I, Michelsen KA, Gall D, Linaro D, Hasche A, Bonnefont J,
Bali C, Orduz D, Bilheu A, Herpoel A, Lambert N, Gaspard N, Peron S,
Schiffmann SN, Giugliano M, Gaillard A, Vanderhaeghen P (2013)
Pyramidal neurons derived from human pluripotent stem cells integrate
efficiently into mouse brain circuits in vivo. Neuron 77: 440 – 456
Farah MH, Olson JM, Sucic HB, Hume RI, Tapscott SJ, Turner DL (2000)
Generation of neurons by transient expression of neural bHLH proteins in
mammalian cells. Development 127: 693 – 702
ª 2014 The Authors Molecular Systems Biology 10: 760 | 2014
Volker Busskamp et al Transcriptomic basis of rapid neurogenesis Molecular Systems Biology
19
Published online: November 17, 2014

Gao Z, Ure K, Ables JL, Lagace DC, Nave KA, Goebbels S, Eisch AJ, Hsieh J
(2009) Neurod1 is essential for the survival and maturation of adult-born
neurons. Nat Neurosci 12: 1090 – 1092
Ge W, He F, Kim KJ, Blanchi B, Coskun V, Nguyen L, Wu X, Zhao J, Heng JI,
Martinowich K, Tao J, Wu H, Castro D, Sobeih MM, Corfas G, Gleeson JG,
Greenberg ME, Guillemot F, Sun YE (2006) Coupling of cell migration with
neurogenesis by proneural bHLH factors. Proc Natl Acad Sci USA 103:
1319 – 1324
Gohlke JM, Armant O, Parham FM, Smith MV, Zimmer C, Castro DS, Nguyen
L, Parker JS, Gradwohl G, Portier CJ, Guillemot F (2008) Characterization of
the proneural gene regulatory network during mouse telencephalon
development. BMC Biol 6: 15
Guzman MS, De Jaeger X, Raulic S, Souza IA, Li AX, Schmid S, Menon RS,
Gainetdinov RR, Caron MG, Bartha R, Prado VF, Prado MA (2011)
Elimination of the vesicular acetylcholine transporter in the striatum
reveals regulation of behaviour by cholinergic-glutamatergic
co-transmission. PLoS Biol 9: e1001194
He X, Rosenfeld MG (1991) Mechanisms of complex transcriptional
regulation: implications for brain development. Neuron 7: 183 – 196
Herculano-Houzel S (2009) The human brain in numbers: a linearly
scaled-up primate brain. Front Hum Neurosci 3: 31
Hsu SD, Lin FM, Wu WY, Liang C, Huang WC, Chan WL, Tsai WT, Chen GZ,
Lee CJ, Chiu CM, Chien CH, Wu MC, Huang CY, Tsou AP, Huang HD (2011)
miRTarBase: a database curates experimentally validated microRNA-target
interactions. Nucleic Acids Res 39: D163 –D169
Kodama T, Guerrero S, Shin M, Moghadam S, Faulstich M, du Lac S (2012)
Neuronal classification and marker gene identification via single-cell
expression profiling of brainstem vestibular neurons subserving cerebellar
learning. J Neurosci 32: 7819 – 7831
Kramer A, Green J, Pollard J Jr, Tugendreich S (2014) Causal analysis
approaches in Ingenuity Pathway Analysis. Bioinformatics 30: 523 – 530
Krol J, Busskamp V, Markiewicz I, Stadler MB, Ribi S, Richter J, Duebel J, Bicker
S, Fehling HJ, Schubeler D, Oertner TG, Schratt G, Bibel M, Roska B,
Filipowicz W (2010) Characterizing light-regulated retinal microRNAs
reveals rapid turnover as a common property of neuronal microRNAs. Cell
141: 618 – 631
Ladewig J, Mertens J, Kesavan J, Doerr J, Poppe D, Glaue F, Herms S, Wernet
P, Kogler G, Muller FJ, Koch P, Brustle O (2012) Small molecules enable
highly efficient neuronal conversion of human fibroblasts. Nat Methods 9:
575 – 578
Le MT, Xie H, Zhou B, Chia PH, Rizk P, Um M, Udolph G, Yang H, Lim B,
Lodish HF (2009) MicroRNA-125b promotes neuronal differentiation in
human cells by repressing multiple targets. Mol Cell Biol 29: 5290 – 5305
Lee JH, Park IH, Gao Y, Li JB, Li Z, Daley GQ, Zhang K, Church GM (2009) A
robust approach to identifying tissue-specific gene expression regulatory
variants using personalized human induced pluripotent stem cells. PLoS
Genet 5: e1000718
Lee JH, Daugharthy ER, Scheiman J, Kalhor R, Yang JL, Ferrante TC,
Terry R, Jeanty SS, Li C, Amamoto R, Peters DT, Turczyk BM,
Marblestone AH, Inverso SA, Bernard A, Mali P, Rios X, Aach J, Church
GM (2014) Highly multiplexed subcellular RNA sequencing in situ.
Science 343: 1360 – 1363
Leek JT, Scharpf RB, Bravo HC, Simcha D, Langmead B, Johnson WE, Geman
D, Baggerly K, Irizarry RA (2010) Tackling the widespread and critical
impact of batch effects in high-throughput data. Nat Rev Genet 11:
733 – 739
van de Leemput J, Boles NC, Kiehl TR, Corneo B, Lederman P, Menon V, Lee C,
Martinez RA, Levi BP, Thompson CL, Yao S, Kaykas A, Temple S, Fasano CA
(2014) CORTECON: a temporal transcriptome analysis of in vitro human
cerebral cortex development from human embryonic stem cells. Neuron
83: 51 – 68
Lescaudron L, Naveilhan P, Neveu I (2012) The use of stem cells in
regenerative medicine for Parkinson’s and Huntington’s Diseases. Curr Med
Chem 19: 6018 – 6035
Lipchina I, Studer L, Betel D (2012) The expanding role of miR-302-367 in
pluripotency and reprogramming. Cell Cycle 11: 1517 – 1523
Liu ML, Zang T, Zou Y, Chang JC, Gibson JR, Huber KM, Zhang CL (2013) Small
molecules enable neurogenin 2 to efficiently convert human fibroblasts
into cholinergic neurons. Nat Commun 4: 2183
Livak KJ, Schmittgen TD (2001) Analysis of relative gene expression data using
real-time quantitative PCR and the 2(-Delta Delta C(T)) Method. Methods
25: 402 – 408
Lois C, Hong EJ, Pease S, Brown EJ, Baltimore D (2002) Germline transmission
and tissue-specific expression of transgenes delivered by lentiviral vectors.
Science 295: 868 – 872
Masland RH (2001) The fundamental plan of the retina. Nat Neurosci 4:
877 – 886
Matsuda S, Baluk P, Shimizu D, Fujiwara T (1996) Dorsal root ganglion
neuron development in chick and rat. Anat Embryol (Berl) 193: 475 – 480
Mazzoni EO, Mahony S, Closser M, Morrison CA, Nedelec S, Williams DJ, An D,
Gifford DK, Wichterle H (2013) Synergistic binding of transcription factors
to cell-specific enhancers programs motor neuron identity. Nat Neurosci
16: 1219 – 1227
Meijer HA, Kong YW, Lu WT, Wilczynska A, Spriggs RV, Robinson SW,
Godfrey JD, Willis AE, Bushell M (2013) Translational repression and
eIF4A2 activity are critical for microRNA-mediated gene regulation.
Science 340: 82 – 85
Miller JA, Ding SL, Sunkin SM, Smith KA, Ng L, Szafer A, Ebbert A, Riley ZL, Royall
JJ, Aiona K, Arnold JM, Bennet C, Bertagnolli D, Brouner K, Butler S, Caldejon
S, Carey A, Cuhaciyan C, Dalley RA, Dee N et al (2014) Transcriptional
landscape of the prenatal human brain. Nature 508: 199 – 206
Molnar Z, Clowry G (2012) Cerebral cortical development in rodents and
primates. Prog Brain Res 195: 45 – 70
Morrison SJ (2001) Neuronal differentiation: proneural genes inhibit
gliogenesis. Curr Biol 11: R349 –R351
Nicholas CR, Chen J, Tang Y, Southwell DG, Chalmers N, Vogt D, Arnold CM,
Chen YJ, Stanley EG, Elefanty AG, Sasai Y, Alvarez-Buylla A, Rubenstein JL,
Kriegstein AR (2013) Functional maturation of hPSC-derived forebrain
interneurons requires an extended timeline and mimics human neural
development. Cell Stem Cell 12: 573 – 586
Ozdinler PH, Erzurumlu RS (2002) Slit2, a branching-arborization factor for
sensory axons in the Mammalian CNS. J Neurosci 22: 4540 – 4549
Packer AN, Xing Y, Harper SQ, Jones L, Davidson BL (2008) The bifunctional
microRNA miR-9/miR-9* regulates REST and CoREST and is downregulated
in Huntington’s disease. J Neurosci 28: 14341 – 14346
Pevny LH, Sockanathan S, Placzek M, Lovell-Badge R (1998) A role for SOX1 in
neural determination. Development 125: 1967 – 1978
Reyes JH, O’Shea KS, Wys NL, Velkey JM, Prieskorn DM, Wesolowski K, Miller
JM, Altschuler RA (2008) Glutamatergic neuronal differentiation of mouse
embryonic stem cells after transient expression of neurogenin 1 and
treatment with BDNF and GDNF: in vitro and in vivo studies. J Neurosci
28: 12622 – 12631
Robasky K, Lewis NE, Church GM (2014) The role of replicates for
error mitigation in next-generation sequencing. Nat Rev Genet 15: 56 – 62
Rockland KS (2002) Non-uniformity of extrinsic connections and columnar
organization. J Neurocytol 31: 247 – 253
Molecular Systems Biology 10: 760 | 2014 ª 2014 The Authors
Molecular Systems Biology Transcriptomic basis of rapid neurogenesis Volker Busskamp et al
20
Published online: November 17, 2014

Roybon L, Mastracci TL, Ribeiro D, Sussel L, Brundin P, Li JY (2010)
GABAergic differentiation induced by Mash1 is compromised by the
bHLH proteins Neurogenin2, NeuroD1, and NeuroD2. Cereb Cortex 20:
1234 – 1244
Sanuki R, Onishi A, Koike C, Muramatsu R, Watanabe S, Muranishi Y, Irie S,
Uneo S, Koyasu T, Matsui R, Cherasse Y, Urade Y, Watanabe D, Kondo M,
Yamashita T, Furukawa T (2011) miR-124a is required for hippocampal
axogenesis and retinal cone survival through Lhx2 suppression. Nat
Neurosci 14: 1125 – 1134
Schulz MH, Pandit KV, Lino Cardenas CL, Ambalavanan N, Kaminski
N, Bar-Joseph Z (2013) Reconstructing dynamic microRNA-
regulated interaction networks. Proc Natl Acad Sci USA 110:
15686 – 15691
Serre A, Snyder EY, Mallet J, Buchet D (2012) Overexpression of basic
helix-loop-helix transcription factors enhances neuronal differentiation of
fetal human neural progenitor cells in various ways. Stem Cells Dev 21:
539 – 553
Stein JL, de la Torre-Ubieta L, Tian Y, Parikshak NN, Hernandez IA,
Marchetto MC, Baker DK, Lu D, Hinman CR, Lowe JK, Wexler EM, Muotri
AR, Gage FH, Kosik KS, Geschwind DH (2014) A quantitative framework
to evaluate modeling of cortical development by neural stem cells.
Neuron 83: 69 – 86
Storey JD, Tibshirani R (2003) Statistical significance for genomewide studies.
Proc Natl Acad Sci USA 100: 9440 – 9445
Thoma EC, Wischmeyer E, Offen N, Maurus K, Siren AL, Schartl M, Wagner TU
(2012) Ectopic expression of neurogenin 2 alone is sufficient to induce
differentiation of embryonic stem cells into mature neurons. PLoS One 7:
e38651
Trapnell C, Hendrickson DG, Sauvageau M, Goff L, Rinn JL, Pachter L (2013)
Differential analysis of gene regulation at transcript resolution with
RNA-seq. Nat Biotechnol 31: 46 – 53
Velkey JM, O’Shea KS (2013) Expression of Neurogenin 1 in mouse
embryonic stem cells directs the differentiation of neuronal precursors
and identifies unique patterns of down-stream gene expression. Dev
Dyn 242: 230 – 253
Vierbuchen T, Wernig M (2011) Direct lineage conversions: unnatural but
useful? Nat Biotechnol 29: 892 – 907
Vierbuchen T, Wernig M (2012) Molecular roadblocks for cellular
reprogramming. Mol Cell 47: 827 – 838
Wang Y, Melton C, Li YP, Shenoy A, Zhang XX, Subramanyam D, Blelloch R
(2013) miR-294/miR-302 promotes proliferation, suppresses G1-S
restriction point, and inhibits ESC differentiation through separable
mechanisms. Cell Rep 4: 99 – 109
Wapinski OL, Vierbuchen T, Qu K, Lee QY, Chanda S, Fuentes DR, Giresi PG,
Ng YH, Marro S, Neff NF, Drechsel D, Martynoga B, Castro DS, Webb AE,
Sudhof TC, Brunet A, Guillemot F, Chang HY, Wernig M (2013)
Hierarchical mechanisms for direct reprogramming of fibroblasts to
neurons. Cell 155: 621 – 635
Yoo AS, Sun AX, Li L, Shcheglovitov A, Portmann T, Li Y, Lee-Messer
C, Dolmetsch RE, Tsien RW, Crabtree GR (2011)
MicroRNA-mediated conversion of human fibroblasts to neurons. Nature
476: 228 – 231
Zhang Y, Pak C, Han Y, Ahlenius H, Zhang Z, Chanda S, Marro S, Patzke C,
Acuna C, Covy J, Xu W, Yang N, Danko T, Chen L, Wernig M, Sudhof TC
(2013) Rapid single-step induction of functional neurons from human
pluripotent stem cells. Neuron 78: 785 – 798
License: This is an open access article under the
terms of the Creative Commons Attribution 4.0
License, which permits use, distribution and reproduc-
tion in any medium, provided the original work is
properly cited.
ª 2014 The Authors Molecular Systems Biology 10: 760 | 2014
Volker Busskamp et al Transcriptomic basis of rapid neurogenesis Molecular Systems Biology
21
Published online: November 17, 2014

Published online: November 17, 2014