Rapid Label-Free Identification of Estrogen-Induced Differential Protein Expression In Vivo from...
20
Rapid Label-Free Identification of Estrogen-Induced Differential Protein Expression In Vivo from Mouse Brain and Uterine Tissue Laszlo Prokai * , Stanley M. Stevens Jr. † , Navin Rauniyar, and Vien Nguyen Department of Molecular Biology and Immunology, University of North Texas Health Science Center, 3500 Camp Bowie Boulevard, Fort Worth, TX 76107, USA. Abstract Protein abundance profiling from tissue using liquid chromatograph—tandem mass spectrometry- based ‘shotgun’ proteomics and label-free relative quantitation was evaluated for the investigation of estrogen-regulated protein expression in the mouse brain and uterus. Sample preparation involved a 30-min protein extraction in 8 M aqueous urea solution, followed by disulphide reduction, thiol alkylation and trypsin digestion of the extracted proteins, and was performed on 3–4 mg of tissue in order to evaluate the suitability of this methodology to expedite the survey of cellular pathways that are affected in vivo by an experimental therapeutic intervention in an animal model. The label-free proteomic approach (spectral counting) was suitable to identify even subtle changes in cortical protein levels and revealed significant estrogen-induced upregulation of ATP synthase (both α- and β-isoforms), aspartate aminotransferase 2 and mitochondrial malate dehydrogenase without any prior subcellular fractionation of the tissue or the use of multidimensional chromatographic separation. The methodology was also suitable to observe various up- and downregulated proteins in the uterine tissue of ovariectomized mice upon treatment with 17β-estradiol. In addition to confirming a very significant decrease in the abundance of glutathione S-transferase recognized as a marker of estrogen’s impact, our studies have also revealed potential new protein markers such as desmin and lumican that are critical components of cytoskeletal arrangement and, hence, regulation of their abundance could contribute to major morphological changes in the uterus occurring upon estrogenic stimulation. Keywords estrogen; cortex; uterus; LC—MS/MS; label-free differential proteomics; spectral counting; extracted-ion chromatograms INTRODUCTION The demand for high-throughput methodologies for the analysis of differentially expressed proteins from a variety of biological matrices (cell culture, tissue, etc.) has prompted the development of rapid sample preparation and mass spectrometry-based proteomic techniques. For example, a recent study in which minimal sample processing for protein extraction was *To whom correspondence should be addressed: Department of Molecular Biology & Immunology, University of North Texas Health Science Center, 3500 Camp Bowie Boulevard, Fort Worth, TX 76107. Tel.: (817) 735-2206; Fax: (817) 735-2118; [email protected]. † Current Address: Division of Cell Biology, Microbiology and Molecular Biology, University of South Florida, Tampa. Supporting Information Available: A representative list of proteins identified from mouse cortex extract by conventional (overnight) versus microwave-assisted (60 min) tryptic digestion, immobility times in forced swim test before tissue harvesting, uterine wet weights, Western blot analysis of ATP synthase β-subunit in cortical protein extracts and ATP synthase α-subunit in uterine tissue extracts of control versus E2-treated ovariectomized mice. This material is available free of charge via the Internet at http://pubs.acs.org. NIH Public Access Author Manuscript J Proteome Res. Author manuscript; available in PMC 2010 August 1. Published in final edited form as: J Proteome Res. 2009 August ; 8(8): 3862–3871. doi:10.1021/pr900083v. NIH-PA Author Manuscript NIH-PA Author Manuscript NIH-PA Author Manuscript
-
Upload
independent -
Category
Documents
-
view
2 -
download
0
Transcript of Rapid Label-Free Identification of Estrogen-Induced Differential Protein Expression In Vivo from...

Rapid Label-Free Identification of Estrogen-Induced DifferentialProtein Expression In Vivo from Mouse Brain and Uterine Tissue
Laszlo Prokai*, Stanley M. Stevens Jr.†, Navin Rauniyar, and Vien NguyenDepartment of Molecular Biology and Immunology, University of North Texas Health ScienceCenter, 3500 Camp Bowie Boulevard, Fort Worth, TX 76107, USA.
AbstractProtein abundance profiling from tissue using liquid chromatograph—tandem mass spectrometry-based ‘shotgun’ proteomics and label-free relative quantitation was evaluated for the investigationof estrogen-regulated protein expression in the mouse brain and uterus. Sample preparation involveda 30-min protein extraction in 8 M aqueous urea solution, followed by disulphide reduction, thiolalkylation and trypsin digestion of the extracted proteins, and was performed on 3–4 mg of tissue inorder to evaluate the suitability of this methodology to expedite the survey of cellular pathways thatare affected in vivo by an experimental therapeutic intervention in an animal model. The label-freeproteomic approach (spectral counting) was suitable to identify even subtle changes in corticalprotein levels and revealed significant estrogen-induced upregulation of ATP synthase (both α- andβ-isoforms), aspartate aminotransferase 2 and mitochondrial malate dehydrogenase without any priorsubcellular fractionation of the tissue or the use of multidimensional chromatographic separation.The methodology was also suitable to observe various up- and downregulated proteins in the uterinetissue of ovariectomized mice upon treatment with 17β-estradiol. In addition to confirming a verysignificant decrease in the abundance of glutathione S-transferase recognized as a marker ofestrogen’s impact, our studies have also revealed potential new protein markers such as desmin andlumican that are critical components of cytoskeletal arrangement and, hence, regulation of theirabundance could contribute to major morphological changes in the uterus occurring upon estrogenicstimulation.
Keywordsestrogen; cortex; uterus; LC—MS/MS; label-free differential proteomics; spectral counting;extracted-ion chromatograms
INTRODUCTIONThe demand for high-throughput methodologies for the analysis of differentially expressedproteins from a variety of biological matrices (cell culture, tissue, etc.) has prompted thedevelopment of rapid sample preparation and mass spectrometry-based proteomic techniques.For example, a recent study in which minimal sample processing for protein extraction was
*To whom correspondence should be addressed: Department of Molecular Biology & Immunology, University of North Texas HealthScience Center, 3500 Camp Bowie Boulevard, Fort Worth, TX 76107. Tel.: (817) 735-2206; Fax: (817) 735-2118; [email protected].†Current Address: Division of Cell Biology, Microbiology and Molecular Biology, University of South Florida, Tampa.Supporting Information Available: A representative list of proteins identified from mouse cortex extract by conventional (overnight)versus microwave-assisted (60 min) tryptic digestion, immobility times in forced swim test before tissue harvesting, uterine wet weights,Western blot analysis of ATP synthase β-subunit in cortical protein extracts and ATP synthase α-subunit in uterine tissue extracts ofcontrol versus E2-treated ovariectomized mice. This material is available free of charge via the Internet at http://pubs.acs.org.
NIH Public AccessAuthor ManuscriptJ Proteome Res. Author manuscript; available in PMC 2010 August 1.
Published in final edited form as:J Proteome Res. 2009 August ; 8(8): 3862–3871. doi:10.1021/pr900083v.
NIH
-PA Author Manuscript
NIH
-PA Author Manuscript
NIH
-PA Author Manuscript
performed identified approximately 1,000 proteins from a single LC-MS/MS analysis of mouseliver tissue.1
Conventional methodologies typically used for this purpose have employed two-dimensional(2D) gel electrophoresis (GE) followed by mass spectrometric analysis. Unfortunately, a largepercentage of hydrophobic/membrane proteins as well as proteins exhibiting extremely basicor acidic isoelectric point values and exceedingly large or small molecular weights are oftenunder-represented using this technique.2 In addition, quantitation inaccuracies can occur giventhe high variation in protein mobility on a 2D gel as a result of common in vivo and/or exvivo protein modifications such as phosphorylation, oxidation, or proteolytic processing. Massspectrometry-based methods using stable-isotope labeling3 have enhanced proteomic analysisin this regard; however, certain limitations of this approach have become evident in ourexperience including decreased experimental throughput and sensitivity as a consequence oflabeling and purification steps, limited dynamic range of quantitation, compromise of sampleintegrity due to side-reactions upon chemical derivatization and the strong dependency oflabeling efficiency on sample composition. As a result, label-free approaches such as spectralcounting have gained recent interest for abundance-based profiling and have benefitedsignificantly from current advances in MS instrumentation regarding rapid data-dependentacquisition, ultra-high sensitivity and dynamic range. The combination of tissue proteomicsthat involves a 30-min protein extraction from tissue followed by LC-MS/MS-based shotgunproteomics1 with label-free relative quantitation through spectral counting4,5 or integration ofextracted ion chromatograms5,6 could potentially allow for a powerful methodology to identifydifferentially expressed proteins from relatively small amounts of tissue. Based on the highprotein coverage obtained from mouse liver tissue by a single LC—MS/MS run, Shi et al. hassuggested that this approach, with its obvious advantages over 2DE-based proteomics, wouldbe useful in toxicological or clinical studies of the liver.1
Drug discovery is an additional area where accelerated tissue proteomics would be beneficialin the process of target identification—both by aiding the elucidation of primary mechanismsof action and by surveying unanticipated “off-target” actions.7 Efforts to find new potentialtherapeutical value for many already established drugs8 and the growing recognition ofmultiple-ligand design as an emerging drug discovery paradigm,9 especially to combatneurodegenerative diseases,10 provide further impetus to introduce such methods in this field.
Estrogens have been implicated in the maintenance of a healthy brain in females via multiple,yet often poorly understood molecular mechanisms,11 and estrogen deprivation has beenassociated with various neurological conditions and vulnerability to neurodegenerativediseases.12 The strategy to first observe in vivo the overall effect of estrogens on tissue to gainan initial insight into their most relevant effect(s) at the protein level has been recommendedpreviously.13 Using this “global” approach and relying on 2D-GE, image analysis and LC—MS/MS-based protein identification from the gel spots that showed differential stain intensitycompared to those of untreated control animals, estrogen-regulated proteins (linked to vesiculartransport and membrane trafficking, neuronal plasticity, energy production and signaltransduction pathways) have been identified from the rat ventromedial nucleus of thehypothalamus recently.14 Although regulation of a few mitochondrial proteins involved inenergy production has been inferred directly from the analysis of the brain tissue, half of themwere matched only a single peptide to the reported protein. Also employing 2D-GEmethodology, in vivo regulation of mitochondrial proteins by E2 has been explored throughthe isolation of the organelle from the entire forebrain region.15 ATP synthase alpha was foundto be upregulated in both studies. However, upregulation was reported for NADHdehydrogenase (ubiquinone) Fe—S protein 1 (Ndufs1) upon analyzing the tissue directly,14
while downregulation of this protein was observed when the mitochonria were isolated before2D-GE.15
Prokai et al. Page 2
J Proteome Res. Author manuscript; available in PMC 2010 August 1.
NIH
-PA Author Manuscript
NIH
-PA Author Manuscript
NIH
-PA Author Manuscript
The known restrictions and limited throughput of proteomics strategies based on 2D-GE2,13
have prompted us to consider a gel-free methodology for global tissue proteomics, especiallywhen mice are preferred as experimental species or small brain areas are to be analyzed withoutresorting to sample pooling. Also considering requirements to increase throughput forapplications in drug discovery, we have tested whether suitable protein profiles manifestingthe impact of E2 could be obtained by adapting the method explored for the liver by Shi et al.1 and employed a 30-min protein extraction with aqueous urea solution followed by shotgunproteomics based on one-dimensional reversed-phase LC—MS/MS analysis for other tissues.In addition to the brain that is relatively soft compared to tissues of other organs such as theliver, our studies included the mouse uterus representing a much harder tissue. The latter organis a well known target for estrogens functioning as primary female sex hormones.16 Therefore,any therapeutic strategy that targets estrogen-associated pathways in the central nervous systemhas to address a potential impact on the uterus. Our aim also was to introduce, according to therecommendation of Shi et al., and evaluate label-free differential quantitation to pursue tissueproteomics.
Experimental MethodsChemicals and Reagents
All chemicals and reagents were purchased from Sigma Aldrich (St. Louis, MO) unlessotherwise specified.
AnimalsSwiss-Webster mice (30±2 g body weight) were used for all experiments conducted inaccordance with the guidelines set forth in the Declaration of Helsinki and the GuidingPrinciples in the Care and Use of Animals (DHEW Publication, NIH 80-23) and approved bythe Institutional Animal Care and Use Committee at the University of North Texas HealthScience Center.
Ovariectomy of the animals was done by their supplier (Charles River Laboratories,Wilmington, MA). The animals were shipped approximately one week after ovariectomy andwere allowed to adapt in the animal facility of the University of North Texas Health ScienceCenter for approximately two weeks before starting daily injections with the vehicle (corn oil,60 μl per injection) control or E2 (50 μg/kg body weight in corn oil vehicle) for 5 consecutivedays between 10:00 am and 12:00 am. The animals were sacrificed by cervical dislocation,decapitated, and their brains were removed. An abdominal incision was then made and theuterus was removed by cutting at the junction of the uterus and vagina and at the site of theovariectomy on each horn. Excess fat and connective tissues were removed and the organ wasblotted and weighed. All tissues were stored at -80 °C until analysis.
Sample PreparationThree to four milligrams of tissue (mouse brain from frontal cortex and uterus, respectively)were incubated in 25 μl of 8 M aqueous urea solution for 30 min, according to the procedurewe adapted from Shi et al.1 For the verification of the spectral counting method under ourexperimental conditions, different amounts of bovine serum albumin (BSA) corresponding to1 μg, 500 ng, 250 ng, and 125 ng were spiked into brain tissue samples from separate controlanimals prior to incubation in the 8 M aqueous urea solution. After centrifugation, 10 μl of thesupernatant was treated with 1mM dithiothreitol and incubated at 65 °C for 30 min.Carbamidomethylation of thiol groups was performed by addition of 5 mM iodoacetamide andincubation for 30 min in the dark at room temperature. The samples were then diluted 4-foldwith 50 mM ammonium bicarbonate and incubated overnight at 37 °C with 1 μg of sequencing
Prokai et al. Page 3
J Proteome Res. Author manuscript; available in PMC 2010 August 1.
NIH
-PA Author Manuscript
NIH
-PA Author Manuscript
NIH
-PA Author Manuscript
grade trypsin (Promega, Madison, WI). The enzymatic digestion was then quenched byacidifying the sample with 1 μl of acetic acid.
For comparison with the overnight reaction with trypsin, processing of two control brainsamples were finished with a microwave-assisted procedure in a CEM (Matthews, NC)Discover system. Maximum power and temperature were set to 50 W and 55 °C, respectively.After 60 min of digestion, the solution was allowed to cool and 1 μl of acetic acid was added.
LC-MS/MS AnalysesOnline reversed-phase LC-MS/MS analysis of mouse brain protein digests was performedusing a hybrid linear ion trap (LTQ) — Fourier transform ion cyclotron resonance (FTICR, 7Tesla) mass spectrometer (LTQ-FT, Thermo, San Jose, CA) equipped with a nanoelectrosprayionization source and operated with the Xcalibur (version 2.2) data acquisition software.Protein digests were loaded onto a PepMap C18 capillary trap (LCPackings, Bannockburn, IL)and desalted with 3% acetonitrile, 1% acetic acid for 5 min prior to injection onto a 75 μm i.d.× 10 cm PicoFrit C18 analytical column (New Objective, Woburn, MA). Following peptidedesalting and injection onto the analytical column, a linear gradient provided by a NanoLC-2D(Eksigent) was carried out to 40% acetonitrile in 60-120 min at 250 nL/min. A 30 min gradientwas utilized for BSA relative quantitation experiments as well as for the experiments to evaluatebiological and analytical variability. ESI spray voltage and capillary temperature during thegradient run were maintained at 2.0 kV and 250 °C, respectively. The data-dependent modeof acquisition was utilized in which an accurate m/z survey scan is performed in the FTICRcell followed by parallel MS/MS linear ion trap analysis of the top five most intense precursorions. FTICR full-scan mass spectra were acquired at 100,000 mass resolving power (m/z 400)from m/z 350 to 1500 using the automatic gain control mode of ion trapping. CID in the linearion trap was performed using a 3.0-u isolation width and 35% normalized collision energy withhelium as the target gas. The precursor ion that had been selected for CID was dynamicallyexcluded from further MS/MS analysis for 60 s.
Database SearchingMS/MS data generated by data dependent acquisition via the LTQ-FT were extracted byBioWorks version 3.3 and searched against a composite IPI mouse (version 3.35, number ofentries is 51490 × 2) protein sequence database containing both forward and randomizedsequences using the Mascot v 2.2 (Matrix Science, Boston, MA) search algorithm. Mascot wassearched with a fragment ion mass tolerance of 0.80 Da and a parent ion tolerance of 15.0 ppmassuming the digestion enzyme trypsin with the possibility of one missed cleavage.Carbamidomethylation of cysteine was specified as a fixed modification while oxidation ofmethionine, N-terminal protein acetylation, N-terminal peptide and lysine carbamoylation, andphosphorylation of serine and threonine were specified as variable modifications. In general,probability-based MOWSE scores corresponding to a significance threshold of P<0.05 wereconsidered for peptide identification in addition to manual validation of the MS/MS data.
Data Compilation and Relative QuantitationThe software program Scaffold (version Scaffold 2.0, Proteome Software Inc., Portland, OR)was employed to validate MS/MS-based peptide and protein identifications. Initial peptideidentifications were accepted if they could be established at greater than 95.0% probability asspecified by the Peptide Prophet algorithm.17 Protein identifications were accepted if theycould be established at greater than 99.0% probability and contained at least 2 identifiedpeptides. Protein probabilities were assigned by the Protein Prophet algorithm.18 Theseidentification criteria typically established a <0.01% false discovery rate based on a decoydatabase search strategy. Scaffold allows for simultaneous comparison of multiple proteomicdata sets in which the list of identified proteins can be sorted by various parameters. The spectral
Prokai et al. Page 4
J Proteome Res. Author manuscript; available in PMC 2010 August 1.
NIH
-PA Author Manuscript
NIH
-PA Author Manuscript
NIH
-PA Author Manuscript
counting technique for relative protein quantitation utilizes the total number of MS/MS spectraidentified for a particular protein as a measure of protein abundance and consequently thisparameter was used to classify the mouse brain protein identifications within Scaffold. Themethod for relative quantitation followed published protocols5,6 in which the change inabundance was determined by the ratio as follows:
(1)
where nE2-treated and ncontrol are the total number of identified MS/MS spectra (normalizedspectral count from Scaffold) for a particular protein in the E2-treated and control group,respectively. A 50% peptide probability was used for the initial list of high-confidenceidentifications (99% protein confidence, 95% peptide confidence and containing 2 uniquepeptides) in order to include peptides with lower Mascot scores that represent true positiveidentifications and would improve the overall spectral counting sensitivity. Ratios for proteinsshowing zero spectral counts in either control or E2-treated groups were tabulated as UC(unique in control) or UE (unique in E2-treated). A G statistic test (likelihood ratio test forindependence) was then utilized to determine statistical significance for each protein ratio:5,19
(2)
where G is the G test statistic; ccontrol is (ncontrol + 1); cE2-treated is [(nE2-treated + 1)]; and tct is(ccontrol + cE2-treated)/2. The G statistic value is approximately characterized by a χ2 distributionwith one degree of freedom, allowing P-value calculations for each ratio value. Ratios wereconsidered significant at P<0.05 unless validated by integration of corresponding peptideextracted ion chromatograms or Western blotting in which the criterion P<0.05 was utilized.
Relative quantitation based on extracted ion chromatograms, which was utilized to validatespectral counting results for selected peptides and proteins, followed a similar routine as thespectral counting method. However, rather than total number of identified spectra as a measureof protein abundance, the mass spectrometric response value (based on ion current) forindividual peptides from a given protein was utilized. Extracted ion chromatograms (XICs) ofpeptides were generated automatically via the Sieve™ program (version 1.1.0; Thermo) usingits default parameters for chromatographic alignment and data framing typical for data acquiredon the LTQ-FT instrument.
Functional ClassificationCytoscape 2.6.0 equipped with the BiNGO 2.0 plug-in(http://www.psb.ugent.be/cbd/papers/BiNGO/) was used to determine over- or under-represented gene ontology (GO) categories from the mouse brain and uterus proteome datasets corresponding to proteins identified at 99% protein confidence, 95% peptide confidence,and contained at least 2 unique peptides. Parameters selected in the analysis includehypergeometric statistical test, cellular component GO terms, and correction for multiple termtesting by Benjamini and Hochberg false discovery rate corrections.20 GO annotations fromGOA Mouse (version 38.0, available at http://www.ebi.ac.uk/GOA/) that contained 173476total associations and 32068 total distinct proteins were used to create a reference set for theIPI mouse v3.35 protein database. Ingenuity Pathway Analysis 5.0 (Ingenuity Systems,Redwood City, CA) was also utilized to determine over-represented biological processes fromthe same proteome data sets. Over-represented molecular functions and biological processeswere accepted at the significance level of P<0.05 (right-tailed Fisher’s exact test).
Prokai et al. Page 5
J Proteome Res. Author manuscript; available in PMC 2010 August 1.
NIH
-PA Author Manuscript
NIH
-PA Author Manuscript
NIH
-PA Author Manuscript
Results and DiscussionMethod Development
We have adapted an abundance-based protein-profiling assay based on a method previouslyreported by Shi et al.1 that involves minimal sample preparation for protein extraction(incubation of 2 mg tissue in 8M urea for 30 min) and combined it with label-free MS-basedrelative quantitation4,5 (Figure 1). Approximately 3-4 mg of tissue is used for the procedure,and the throughput of the method allows for a proteomic survey of two samples (e.g., controlversus treatment) within several hours, excluding the overnight proteolytic digestion donesimultaneously for all samples. Correlations between spectral counts and protein abundancelevels have been demonstrated convincingly by Liu et al.4 To verify the applicability of themethod for quantitative survey under our experimental conditions, mouse brain tissue wasprepared and spiked with different amounts of bovine serum albumin (BSA) prior to incubationin 8M urea, protein digestion with trypsin and subsequent LC-MS/MS analysis. The spectralcounting approach permitted the identification of ≥2-fold changes in protein abundance withinthe concentration range of BSA used for assay verification (Figure 2a). Similarly to an earlierreport that introduced the methodology,4 high correlation (r2=0.9999) was obtained betweenthe experimentally derived relative abundance ratios, using the largest BSA concentration (304fmol/μl) as a reference point, and the theoretical ratios calculated based on the known BSAquantities spiked into the brain samples (Figure 2b).
Comparison of protein extracts obtained from the frontal cortex of three different controlanimals and duplicate injections of each biological replicate were performed to evaluatepotential biological and analytical variability. Several proteins derived from blood wereidentified, but were not included in subsequent protein expression analyses, since variation incontamination or biologically significant changes in abundance of these proteins is difficult todetermine. Additionally, differentially expressed proteins containing peptide sequencesidentical with other isoforms were reported with multiple accession numbers; however, theseparticular proteins were not reported if grouping ambiguity occurred (as indicated by theScaffold program).
The analytical replicate analysis showed no statistically significant changes in spectral countsfor proteins identified at >99% probability (containing at least 2 peptides) and based on astatistical G-test (P<0.05). The same statistical test was then utilized for comparison ofbiological replicates in order to determine the potential impact of biological and proteinextraction variability on the quantitation sensitivity of the label-free methodology. The medianP-value obtained from all proteins identified at >99% probability (containing at least 2 uniquepeptides) was 0.59 ± 0.18 (± SD) with the lowest P-value equal to 0.22 suggesting P<0.05 isan adequate criterion for the identification of statistically significant changes in proteinexpression using this approach and tissue type (Figure 3).
In a pilot feasibility study to further accelerate sample processing, we have evaluatedmicrowave-assisted tryptic digestion.21 The latter procedure, requiring about an hour tocomplete for the protein extract from brain tissue, afforded protein coverage similar to that ofthe overnight incubation in a water bath (Supplementary Tables 1 and 2). Microwave-assistedand conventional digestion (overnight in shaking water bath) afforded 2642 (782 identified)and 2019 (671 identified) MS/MS spectra, respectively, after one-dimensional reversed-phaseLC separation from dupplicate samples. Altogether, 112 proteins were identified after bothmicrowave-assisted and conventional digestion, while 16 and 20 proteins were only fund intissue processed with and without employing microwaves, respectively. However, subsequentexperiments were performed using the conventional digestion procedure to match withconditions employed by others in previous studies aimed at finding estrogen-regulated proteinsin the brain proteome or its mitochondrial subproteme.14,15
Prokai et al. Page 6
J Proteome Res. Author manuscript; available in PMC 2010 August 1.
NIH
-PA Author Manuscript
NIH
-PA Author Manuscript
NIH
-PA Author Manuscript
A Rapid Survey of Proteins Regulated by 17β-Estradiol in the Female Mouse BrainWe conducted our study in an animal model for menopausal depressive-like symptoms(manifested by, e.g., the prolongation of immobility time in a forced swim test and can beinduced by ovariectomy in female mice) that are effectively relieved by E2 treatment.22 Weconfirmed by the forced swim test that E2-treatment, indeed, mitigated the depression-likestate caused by ovariectomy (Supplementary Figure 1a online).
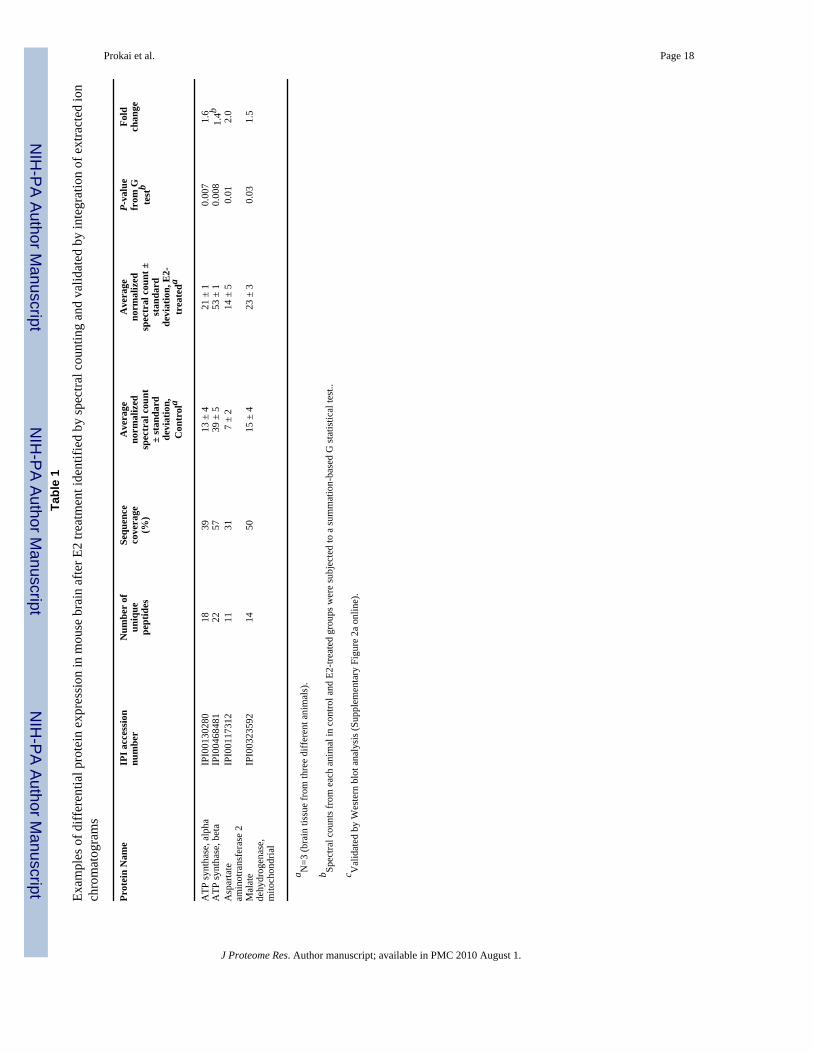
Our label-free proteomic survey using the spectral counting-based approach has been suitableto identify even subtle (as low as a 1.4-fold) change in cortical protein expression in theovariectomized mouse upon treatment with an estrogen (Table 1). However, the number ofproteins identified with high confidence from the mouse cortex after 30-min protein extractionwith 8 M aqueous urea solution followed by shotgun proteomics employing reversed-phaseLC—MS/MS analysis without any prior sample fractionation (Supplementary Table 1 online)fell short of that reported for mouse liver (>1,000) using the procedure we adapted from Shiet al.1 Apparently, the brain tissue would need either a more efficient protein extractionprocedure than the one adapted for our survey, or would require sample fractionation to reducecomplexity of the extracted protein mixture before LC—MS/MS analysis. Nevertheless,several differentially expressed proteins were identified and validated via integration of XICsby SIEVE™ (Figure 4). Specifically, XICs of the tryptic peptidesVVDALGNAIDGKGPIGSK (matched to the ATP synthase α-subunit),VLDSGAPIKIPVGPETLGR (matched to the ATP synthase β-subunit),NLDKEYLPIGGLAEFCK (matched to the mitochondrial malate dehydrogenase) andDKEYLPIGGLAEFCK (matched to the mitochondrial aspartate aminotransferase 2) showedincreased expression of the proteins in the cortex of E2-treated mice (blue traces) consistentlyand in a statistically significant extent (P<0.05) compared to the ovariectomized controlanimals (red traces). An increased abundance of the ATP synthase β-subunit in the E2-treatedanimals was also confirmed by Western blot analysis (Supplementary Figure 2a online).
Interestingly, the differentially expressed brain proteins upon estrogen treatment we found inthe present study (Table 1 and Fig. 4) were resident in or associated with the mitochondrialinner membrane, which confirmed the validity of mitochondria-focused studies regardingestrogen’s actions on the brain.15,23 The mitochondrion is an intracellular compartment thatserves as a major energy source within the cell by ATP production through the oxidation ofcellular nutrients.24 Two subunits of Complex V (ATP synthase) of the electron transport chainrevealed higher abundance in the frontal cortex after E2 treatment when compared to controlanimals. This protein complex represents a component of the oxidative phosphorylationpathway in which ATP is synthesized from ADP, a process that is coupled to protontranslocation across the mitochondrial membrane through channels within the complex. Theaccumulation of protons occurs partly in response to the conversion of NAD+ to NADH, acofactor utilized in the mitochondrial electron transport chain for subsequent ATP production.NADH and NAD+ cannot permeate through the inner mitochondrial membrane and,consequently, biochemical mechanisms such as the malate-aspartate shuttle exist to translocateelectrons across this membrane to provide an electron source for the oxidative phosphorylationpathway.24 This particular shuttle system contains both cytosolic and mitochondrial forms ofaspartate aminotransferase and malate dehydrogenase responsible for the interconversion ofvarious small molecules such as malate and oxaloacetate. The biochemical reactions associatedwith the malate-aspartate shuttle are coupled to the production of NADH and NAD+ in themitochondrial matrix and cytosol, respectively. NADH produced in the mitochondrial matrixthrough the malate-aspartate shuttle is an efficient mechanism for ATP production in terms ofthe enhanced quantity of ATP generated from the electron transport system as compared toother pathways that produce FADH2 for this purpose.24 An increased abundance of ComplexV components and key proteins involved in the malate-aspartate shuttle after E2 treatment
Prokai et al. Page 7
J Proteome Res. Author manuscript; available in PMC 2010 August 1.
NIH
-PA Author Manuscript
NIH
-PA Author Manuscript
NIH
-PA Author Manuscript
suggests a potentially novel mechanism for estrogen-mediated effects in the brain through theenhancement of pathways associated with mitochondrial-mediated cellular bioenergetics.
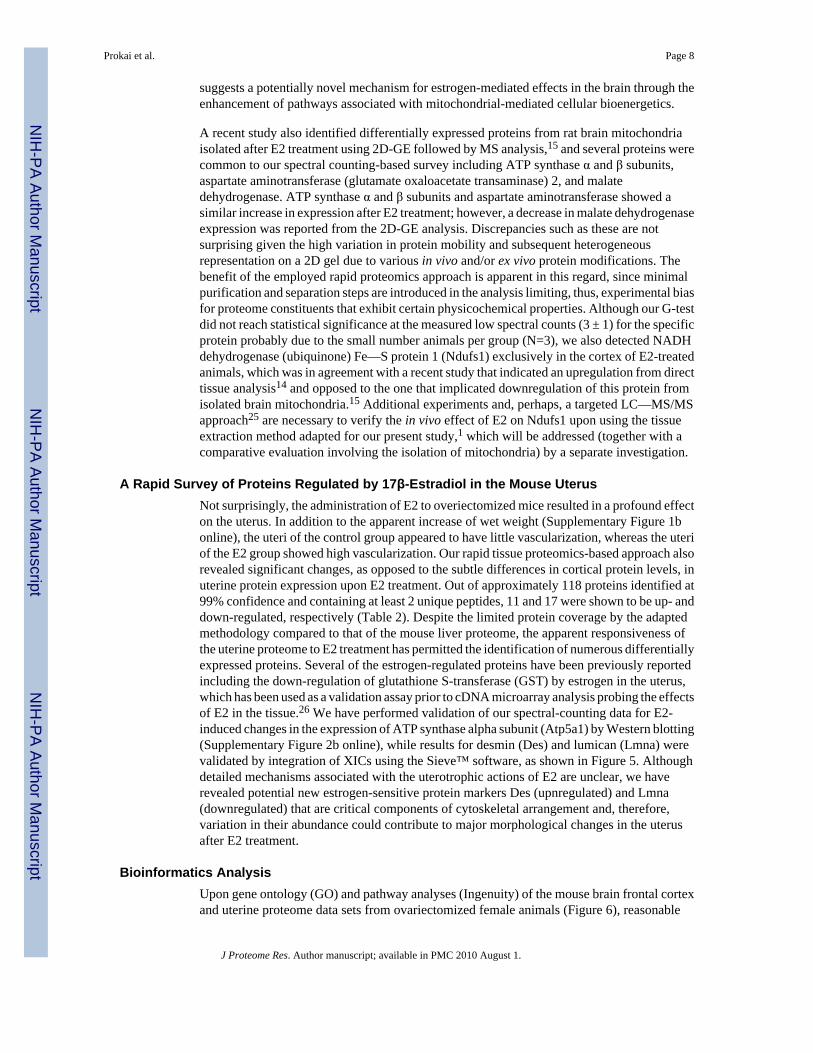
A recent study also identified differentially expressed proteins from rat brain mitochondriaisolated after E2 treatment using 2D-GE followed by MS analysis,15 and several proteins werecommon to our spectral counting-based survey including ATP synthase α and β subunits,aspartate aminotransferase (glutamate oxaloacetate transaminase) 2, and malatedehydrogenase. ATP synthase α and β subunits and aspartate aminotransferase showed asimilar increase in expression after E2 treatment; however, a decrease in malate dehydrogenaseexpression was reported from the 2D-GE analysis. Discrepancies such as these are notsurprising given the high variation in protein mobility and subsequent heterogeneousrepresentation on a 2D gel due to various in vivo and/or ex vivo protein modifications. Thebenefit of the employed rapid proteomics approach is apparent in this regard, since minimalpurification and separation steps are introduced in the analysis limiting, thus, experimental biasfor proteome constituents that exhibit certain physicochemical properties. Although our G-testdid not reach statistical significance at the measured low spectral counts (3 ± 1) for the specificprotein probably due to the small number animals per group (N=3), we also detected NADHdehydrogenase (ubiquinone) Fe—S protein 1 (Ndufs1) exclusively in the cortex of E2-treatedanimals, which was in agreement with a recent study that indicated an upregulation from directtissue analysis14 and opposed to the one that implicated downregulation of this protein fromisolated brain mitochondria.15 Additional experiments and, perhaps, a targeted LC—MS/MSapproach25 are necessary to verify the in vivo effect of E2 on Ndufs1 upon using the tissueextraction method adapted for our present study,1 which will be addressed (together with acomparative evaluation involving the isolation of mitochondria) by a separate investigation.
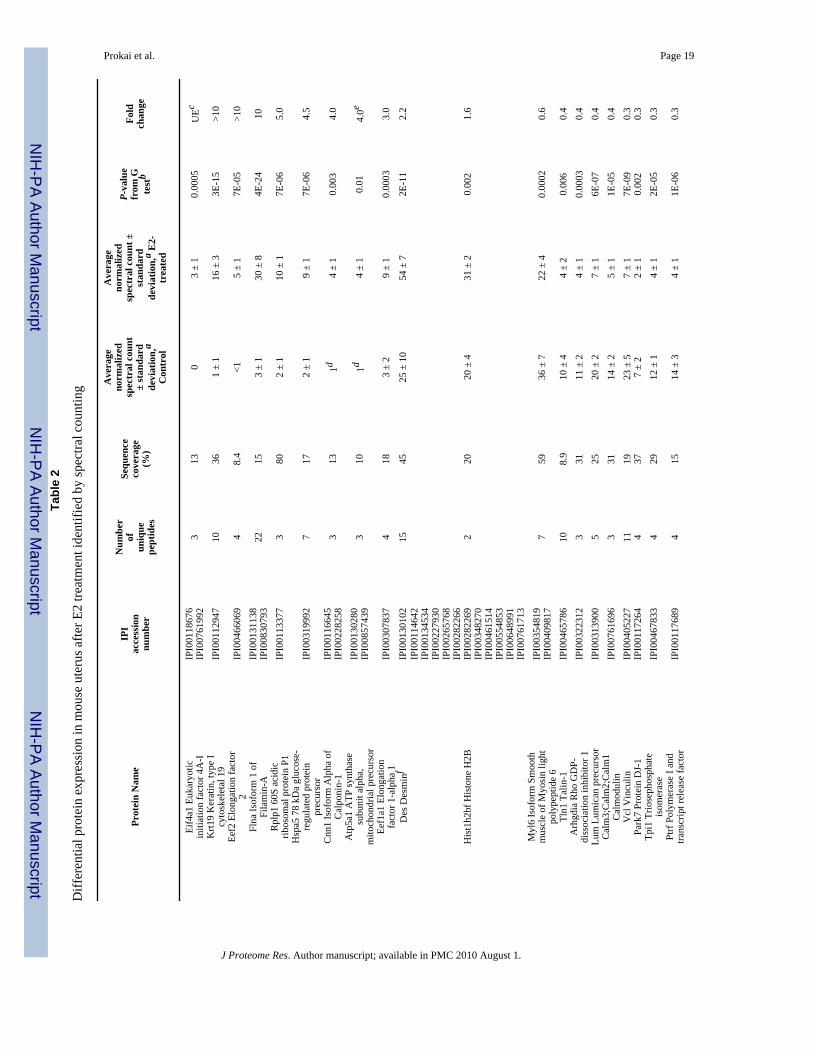
A Rapid Survey of Proteins Regulated by 17β-Estradiol in the Mouse UterusNot surprisingly, the administration of E2 to overiectomized mice resulted in a profound effecton the uterus. In addition to the apparent increase of wet weight (Supplementary Figure 1bonline), the uteri of the control group appeared to have little vascularization, whereas the uteriof the E2 group showed high vascularization. Our rapid tissue proteomics-based approach alsorevealed significant changes, as opposed to the subtle differences in cortical protein levels, inuterine protein expression upon E2 treatment. Out of approximately 118 proteins identified at99% confidence and containing at least 2 unique peptides, 11 and 17 were shown to be up- anddown-regulated, respectively (Table 2). Despite the limited protein coverage by the adaptedmethodology compared to that of the mouse liver proteome, the apparent responsiveness ofthe uterine proteome to E2 treatment has permitted the identification of numerous differentiallyexpressed proteins. Several of the estrogen-regulated proteins have been previously reportedincluding the down-regulation of glutathione S-transferase (GST) by estrogen in the uterus,which has been used as a validation assay prior to cDNA microarray analysis probing the effectsof E2 in the tissue.26 We have performed validation of our spectral-counting data for E2-induced changes in the expression of ATP synthase alpha subunit (Atp5a1) by Western blotting(Supplementary Figure 2b online), while results for desmin (Des) and lumican (Lmna) werevalidated by integration of XICs using the Sieve™ software, as shown in Figure 5. Althoughdetailed mechanisms associated with the uterotrophic actions of E2 are unclear, we haverevealed potential new estrogen-sensitive protein markers Des (upnregulated) and Lmna(downregulated) that are critical components of cytoskeletal arrangement and, therefore,variation in their abundance could contribute to major morphological changes in the uterusafter E2 treatment.
Bioinformatics AnalysisUpon gene ontology (GO) and pathway analyses (Ingenuity) of the mouse brain frontal cortexand uterine proteome data sets from ovariectomized female animals (Figure 6), reasonable
Prokai et al. Page 8
J Proteome Res. Author manuscript; available in PMC 2010 August 1.
NIH
-PA Author Manuscript
NIH
-PA Author Manuscript
NIH
-PA Author Manuscript
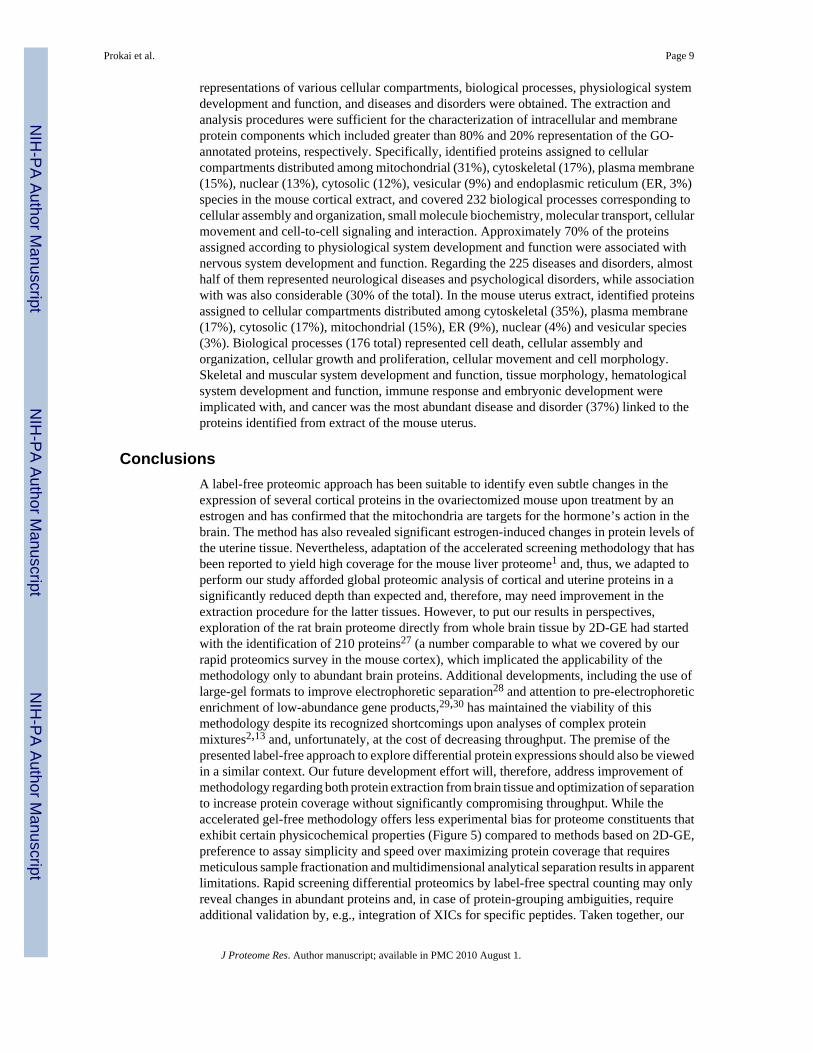
representations of various cellular compartments, biological processes, physiological systemdevelopment and function, and diseases and disorders were obtained. The extraction andanalysis procedures were sufficient for the characterization of intracellular and membraneprotein components which included greater than 80% and 20% representation of the GO-annotated proteins, respectively. Specifically, identified proteins assigned to cellularcompartments distributed among mitochondrial (31%), cytoskeletal (17%), plasma membrane(15%), nuclear (13%), cytosolic (12%), vesicular (9%) and endoplasmic reticulum (ER, 3%)species in the mouse cortical extract, and covered 232 biological processes corresponding tocellular assembly and organization, small molecule biochemistry, molecular transport, cellularmovement and cell-to-cell signaling and interaction. Approximately 70% of the proteinsassigned according to physiological system development and function were associated withnervous system development and function. Regarding the 225 diseases and disorders, almosthalf of them represented neurological diseases and psychological disorders, while associationwith was also considerable (30% of the total). In the mouse uterus extract, identified proteinsassigned to cellular compartments distributed among cytoskeletal (35%), plasma membrane(17%), cytosolic (17%), mitochondrial (15%), ER (9%), nuclear (4%) and vesicular species(3%). Biological processes (176 total) represented cell death, cellular assembly andorganization, cellular growth and proliferation, cellular movement and cell morphology.Skeletal and muscular system development and function, tissue morphology, hematologicalsystem development and function, immune response and embryonic development wereimplicated with, and cancer was the most abundant disease and disorder (37%) linked to theproteins identified from extract of the mouse uterus.
ConclusionsA label-free proteomic approach has been suitable to identify even subtle changes in theexpression of several cortical proteins in the ovariectomized mouse upon treatment by anestrogen and has confirmed that the mitochondria are targets for the hormone’s action in thebrain. The method has also revealed significant estrogen-induced changes in protein levels ofthe uterine tissue. Nevertheless, adaptation of the accelerated screening methodology that hasbeen reported to yield high coverage for the mouse liver proteome1 and, thus, we adapted toperform our study afforded global proteomic analysis of cortical and uterine proteins in asignificantly reduced depth than expected and, therefore, may need improvement in theextraction procedure for the latter tissues. However, to put our results in perspectives,exploration of the rat brain proteome directly from whole brain tissue by 2D-GE had startedwith the identification of 210 proteins27 (a number comparable to what we covered by ourrapid proteomics survey in the mouse cortex), which implicated the applicability of themethodology only to abundant brain proteins. Additional developments, including the use oflarge-gel formats to improve electrophoretic separation28 and attention to pre-electrophoreticenrichment of low-abundance gene products,29,30 has maintained the viability of thismethodology despite its recognized shortcomings upon analyses of complex proteinmixtures2,13 and, unfortunately, at the cost of decreasing throughput. The premise of thepresented label-free approach to explore differential protein expressions should also be viewedin a similar context. Our future development effort will, therefore, address improvement ofmethodology regarding both protein extraction from brain tissue and optimization of separationto increase protein coverage without significantly compromising throughput. While theaccelerated gel-free methodology offers less experimental bias for proteome constituents thatexhibit certain physicochemical properties (Figure 5) compared to methods based on 2D-GE,preference to assay simplicity and speed over maximizing protein coverage that requiresmeticulous sample fractionation and multidimensional analytical separation results in apparentlimitations. Rapid screening differential proteomics by label-free spectral counting may onlyreveal changes in abundant proteins and, in case of protein-grouping ambiguities, requireadditional validation by, e.g., integration of XICs for specific peptides. Taken together, our
Prokai et al. Page 9
J Proteome Res. Author manuscript; available in PMC 2010 August 1.
NIH
-PA Author Manuscript
NIH
-PA Author Manuscript
NIH
-PA Author Manuscript
study has demonstrated the utility of a mass spectrometry-based label-free approach to screentissue for protein biomarkers, which may be explioted in numerous applications ranging fromdrug discovery and development, toxicology, and characterization of pathological specimens.
Supplementary MaterialRefer to Web version on PubMed Central for supplementary material.
AcknowledgmentsThis research was supported by the National Institutes of Health (grant numbers NS044765, AG025384 andAG027956). Laszlo Prokai is the Robert A. Welch Professor of the University of North Texas Health Science Center(endowment number BK-0031). The authors thank Darius V. Bonds and Jingwei Fu for their excellent technicalassistance and Thermo Electron for the evaluation copy of the SIEVE™ software.
Abbreviations2DE-GE, two dimensional gel electrophoresisBSA, bovine serum albuminDes, desminE2, 17β-estradiolFTICR, Fourier transform ion cyclotron resonanceGO, gene ontologyLC, liquid chromatographyLmna, lumicanLTQ, linear quadrupole ion trapMS, mass spectrometryMS/MS, tandem mass spectrometryXIC, extracted ion chromatogram
References1. Shi R, Kumar C, Zougman A, Zhang Y, Podtelejnikov A, Cox J, Wisniewski JR, Mann M. Analysis
of the mouse liver proteome using advanced mass spectrometry. J. Proteome Res 2007;6:2963–2972.[PubMed: 17608399]
2. Wu CC, Yates JR 3rd. The application of mass spectrometry to membrane proteomics. Nat. Biotechnol2003;21:262–267. [PubMed: 12610573]
3. Chen X, Sun L, Yu Y, Xue Y, Yang P. Amino acid-coded tagging approaches in quantitativeproteomics. Expert Rev. Proteomics 2007;4:25–37. [PubMed: 17288513]
4. Liu H, Sadygov RG, Yates JR 3rd. A model for random sampling and estimation of relative proteinabundance in shotgun proteomics. Anal. Chem 2004;76:4193–4201. [PubMed: 15253663]
5. Old WM, Meyer-Arendt K, Aveline-Wolf L, Pierce KG, Mendoza A, Sevinsky JR, Resing KA, AhnNG. Comparison of label-free methods for quantifying human proteins by shotgun proteomics. Mol.Cell. Proteomics 2005;4:1487–1502. [PubMed: 15979981]
6. Higgs RE, Knierman MD, Gelfanova V, Butler JP, Hale JE. Comprehensive label-free method for therelative quantification of proteins from biological samples. J. Proteome Res 2005;4:1442–1450.[PubMed: 16083298]
7. Sleno L, Emili A. Proteomic methods for drug target discovery. Curr. Opin. Chem Biol 2008;12:46–54. [PubMed: 18282485]
8. Cavalla D. Therapeutic switching: A new strategic approach to enhance R and D productivity. IDrugs2005;8:914–918. [PubMed: 16254785]
9. Morphy R, Rankovic Z. Designed multiple ligands. An emerging drug discovery paradigm. J. Med.Chem 2005;48:6523–6543. [PubMed: 16220969]
Prokai et al. Page 10
J Proteome Res. Author manuscript; available in PMC 2010 August 1.
NIH
-PA Author Manuscript
NIH
-PA Author Manuscript
NIH
-PA Author Manuscript
10. Cavalli A, Bolognesi ML, Minarini A, Rosini M, Tumiatti V, Recanatini M, Melchiorre C. Multi-target-directed ligands to combat neurodegenerative diseases. J. Med. Chem 2008;51:347–372.[PubMed: 18181565]
11. Behl C. Oestrogen as a neuroprotective hormone. Nat. Rev. Neurosci 2002;3:433–442. [PubMed:12042878]
12. McEwen B. Invited review: Estrogens effects on the brain: multiple sites and molecular mechanisms.J. Appl. Physiol 2001;91:2785–2801. [PubMed: 11717247]
13. Pastorelli R, Carpi D, Airoldi L, Chiabrando C, Bagnati R, Fanelli R, Moverare S, Ohlsson C.Proteome analysis for the identification of in vitro estrogen-regulated proteins in bone. Proteomics2005;5:4936–4945. [PubMed: 16237733]
14. Mo B, Callegari E, Telefont M, Renner KJ. Estrogen regulation of proteins in the rat ventrometrialnucleus of the hypothalamus. J. Proteome Res 2008;7:5040–5048. [PubMed: 18841879]
15. Nilsen J, Irwin RW, Gallaher TK, Brinton RD. Estradiol in vivo regulation of brain mitochondrialproteome. J. Neurosci 2007;27:14069–14077. [PubMed: 18094246]
16. Ganong, WF. Review of Medical Physiology. McGraw-Hill; New York: 2005. p. 441-442.17. Keller A, Nesvizhskii AI, Kolker E, Aebersold R. Empirical statistical model to estimate the accuracy
of peptide identifications made by MS/MS and database search. Anal. Chem 2002;74:5383–5392.[PubMed: 12403597]
18. Nesvizhskii AI, Keller A, Kolker E, Aebersold R. A statistical model for identifying proteins bytandem mass spectrometry. Anal. Chem 2003;75:4646–4658. [PubMed: 14632076]
19. Sokal, RR.; Rohlf, FJ. Biometry: The Principles and Practice of Statistics in Biological Research.W.H. Freeman and Company; New York, NY: 1995. p. 729-731.
20. Benjamini Y, Hochberg Y. Controlling the false discovery rate: a practical and powerful approach tomultiple testing. J. Roy. Stat. Soc. Ser. B 1995;57:289–300.
21. Lill JR, Ingle ES, Liu PS, Pham V, Sandoval WN. Microwave-assisted proteomics. Mass Spectrom.Rev 2007;26:657–671. [PubMed: 17474122]
22. Bekku N, Yoshimura H. Animal model of menopausal depressive-like state in female mice:prolongation of immobility time in the forced swimming test following ovariectomy.Psychopharmacology 2005;183:200–207.
23. Simpkins JW, Wang J, Wang X, Perez E, Prokai L, Dykens JA. Mitochondria play a central role inestrogen-induced neuroprotection. Curr. Drug Targets CNS Neurol. Disord 2005;4:69–83. [PubMed:15723615]
24. Lodish, H., et al. Molecular Cell Biology. Vol. 6th Ed. W.H. Freeman and Company; New York, NY:2008. p. 479-510.
25. Gerber SA, Rush J, Stemman O, Kirschner MW, Gygi SP. Absolute quantification of proteins andphosphoproteins from cell lysates by tandem MS. Proc. Natl. Acad. Sci. U.S.A 2003;100:6940–6945.[PubMed: 12771378]
26. Hong SH, Nah HY, Lee JY, Gye MC, Kim CH, Kim MK. Analysis of estrogen-regulated genes inmouse uterus using cDNA microarray and laser capture microdissection. J. Endocrinol2004;181:157–167. [PubMed: 15072576]
27. Fountoulakis M, Schuller E, Hardmeier R, Berndt P, Lubec G. Rat brain proteins: Two-dimensionalprotein database and variations in the expression level. Electrophoresis 1999;20:3572–3579.[PubMed: 10612283]
28. Klose J, Nock C, Herrmann M, Stuhler K, Marcus K, Bluggel M, Krause E, Schalkwyk LC, RastanS, Brown SDM, Bussow K, Himmelbauer H, Lehrach H. Genetic analysis of the mouse brainproteome. Nature Genet 2002;30:385–393. [PubMed: 11912495]
29. Krapfenbauer K, Fountoulakis M, Lubec G. A rat brain protein expression map including cytosolicand enriched mitochondrial and microsomal fractions. Electrophoresis 2003;24:1847–1870.[PubMed: 12783461]
30. Xixi E, Dimitraki P, Vougas K, Kossida S, Lubec G, Fountoulakis M. Proteomic analysis of the mousebrain following protein enrichment by preparative electrophoresis. Electrophoresis 2006;27:1424–1431. [PubMed: 16518779]
Prokai et al. Page 11
J Proteome Res. Author manuscript; available in PMC 2010 August 1.
NIH
-PA Author Manuscript
NIH
-PA Author Manuscript
NIH
-PA Author Manuscript
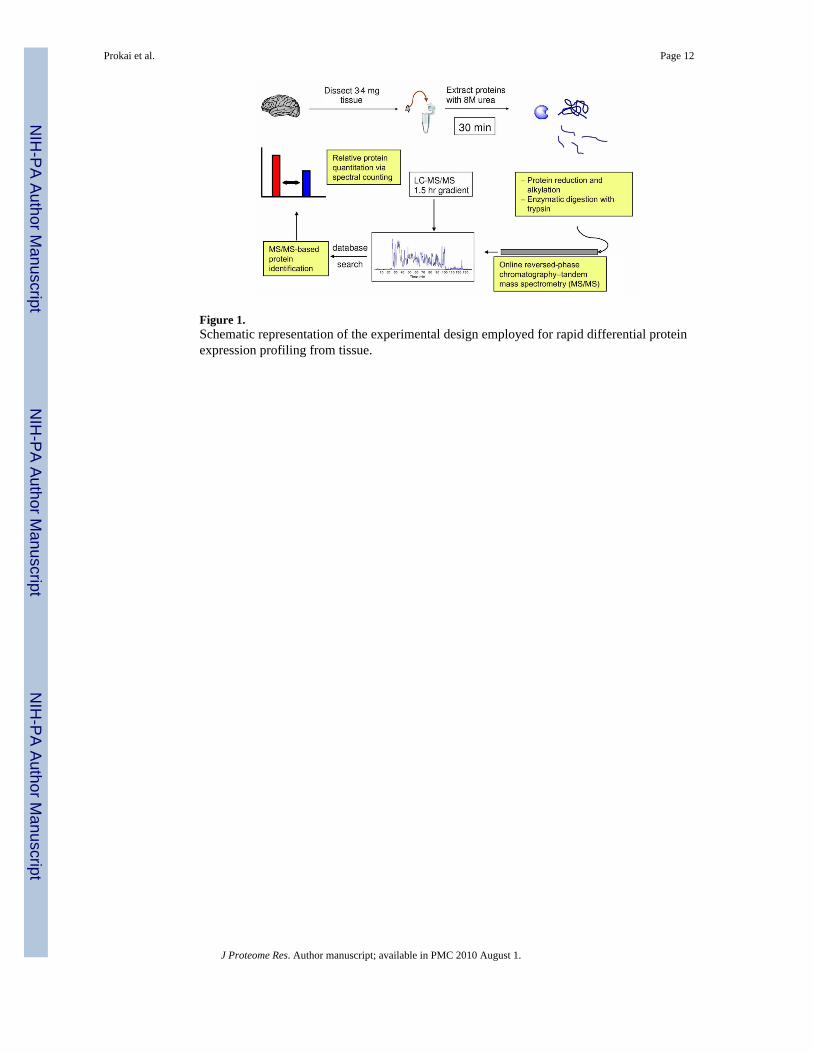
Figure 1.Schematic representation of the experimental design employed for rapid differential proteinexpression profiling from tissue.
Prokai et al. Page 12
J Proteome Res. Author manuscript; available in PMC 2010 August 1.
NIH
-PA Author Manuscript
NIH
-PA Author Manuscript
NIH
-PA Author Manuscript
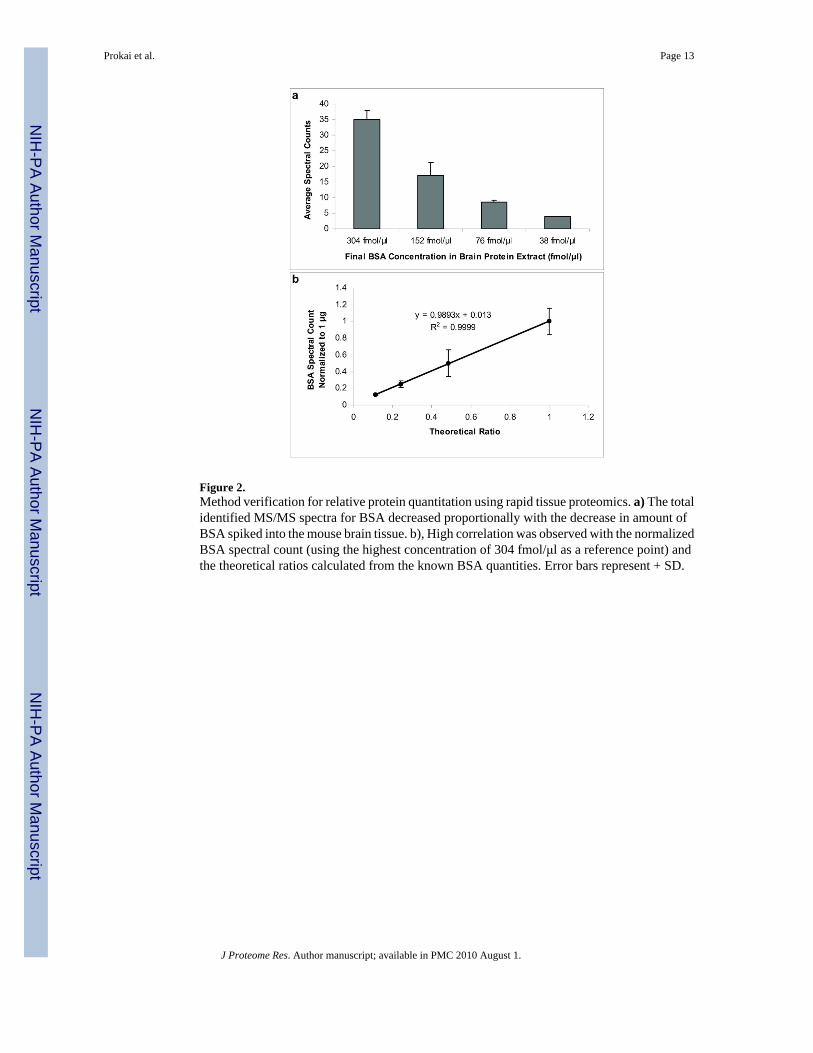
Figure 2.Method verification for relative protein quantitation using rapid tissue proteomics. a) The totalidentified MS/MS spectra for BSA decreased proportionally with the decrease in amount ofBSA spiked into the mouse brain tissue. b), High correlation was observed with the normalizedBSA spectral count (using the highest concentration of 304 fmol/μl as a reference point) andthe theoretical ratios calculated from the known BSA quantities. Error bars represent + SD.
Prokai et al. Page 13
J Proteome Res. Author manuscript; available in PMC 2010 August 1.
NIH
-PA Author Manuscript
NIH
-PA Author Manuscript
NIH
-PA Author Manuscript
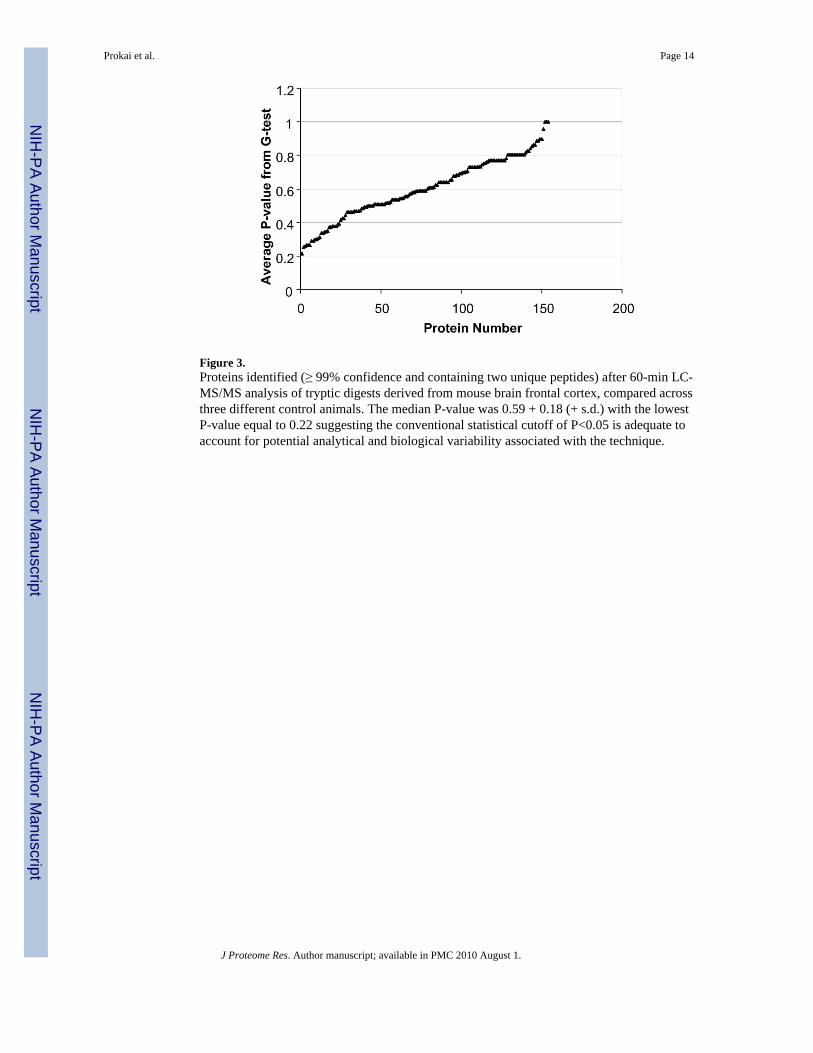
Figure 3.Proteins identified (≥ 99% confidence and containing two unique peptides) after 60-min LC-MS/MS analysis of tryptic digests derived from mouse brain frontal cortex, compared acrossthree different control animals. The median P-value was 0.59 + 0.18 (+ s.d.) with the lowestP-value equal to 0.22 suggesting the conventional statistical cutoff of P<0.05 is adequate toaccount for potential analytical and biological variability associated with the technique.
Prokai et al. Page 14
J Proteome Res. Author manuscript; available in PMC 2010 August 1.
NIH
-PA Author Manuscript
NIH
-PA Author Manuscript
NIH
-PA Author Manuscript
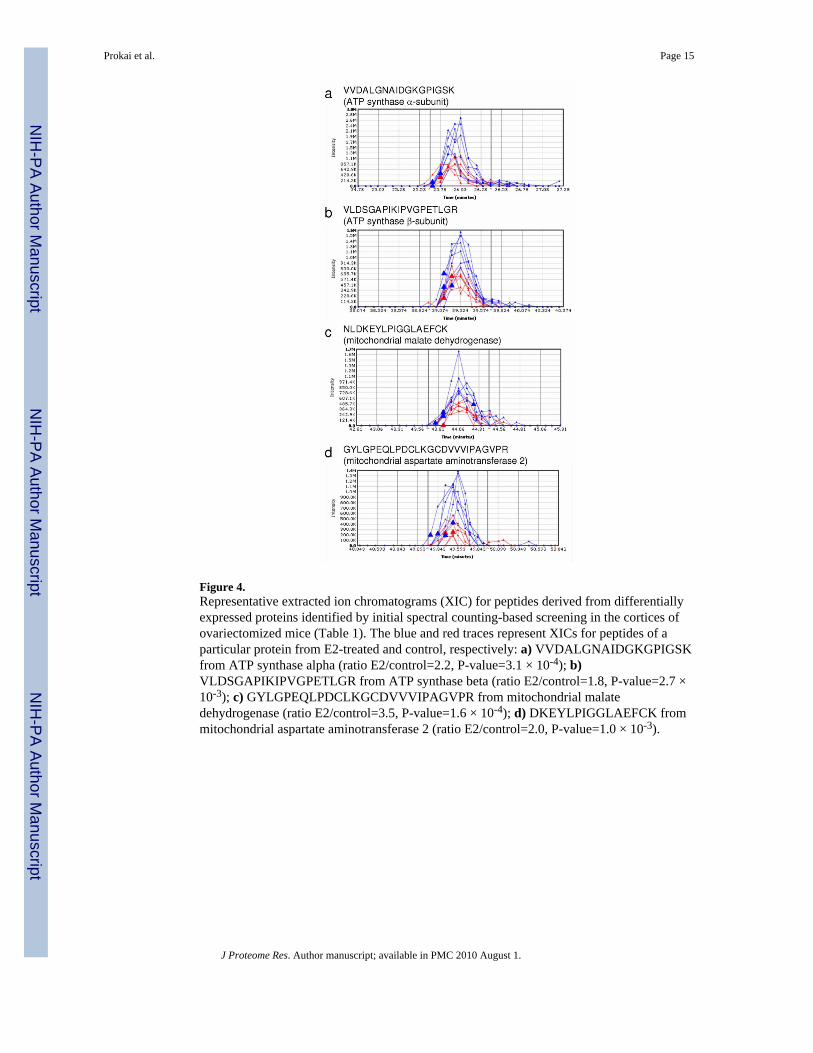
Figure 4.Representative extracted ion chromatograms (XIC) for peptides derived from differentiallyexpressed proteins identified by initial spectral counting-based screening in the cortices ofovariectomized mice (Table 1). The blue and red traces represent XICs for peptides of aparticular protein from E2-treated and control, respectively: a) VVDALGNAIDGKGPIGSKfrom ATP synthase alpha (ratio E2/control=2.2, P-value=3.1 × 10⁻⁴); b)VLDSGAPIKIPVGPETLGR from ATP synthase beta (ratio E2/control=1.8, P-value=2.7 ×10⁻³); c) GYLGPEQLPDCLKGCDVVVIPAGVPR from mitochondrial malatedehydrogenase (ratio E2/control=3.5, P-value=1.6 × 10⁻⁴); d) DKEYLPIGGLAEFCK frommitochondrial aspartate aminotransferase 2 (ratio E2/control=2.0, P-value=1.0 × 10⁻³).
Prokai et al. Page 15
J Proteome Res. Author manuscript; available in PMC 2010 August 1.
NIH
-PA Author Manuscript
NIH
-PA Author Manuscript
NIH
-PA Author Manuscript
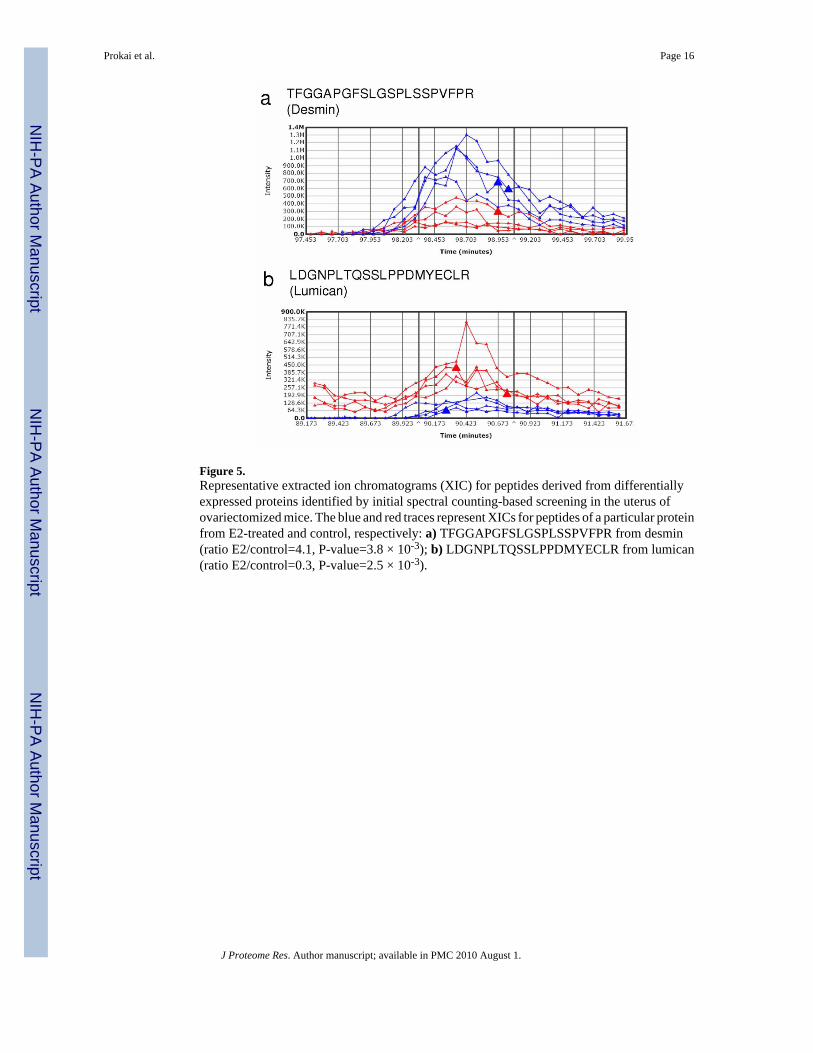
Figure 5.Representative extracted ion chromatograms (XIC) for peptides derived from differentiallyexpressed proteins identified by initial spectral counting-based screening in the uterus ofovariectomized mice. The blue and red traces represent XICs for peptides of a particular proteinfrom E2-treated and control, respectively: a) TFGGAPGFSLGSPLSSPVFPR from desmin(ratio E2/control=4.1, P-value=3.8 × 10⁻³); b) LDGNPLTQSSLPPDMYECLR from lumican(ratio E2/control=0.3, P-value=2.5 × 10⁻³).
Prokai et al. Page 16
J Proteome Res. Author manuscript; available in PMC 2010 August 1.
NIH
-PA Author Manuscript
NIH
-PA Author Manuscript
NIH
-PA Author Manuscript
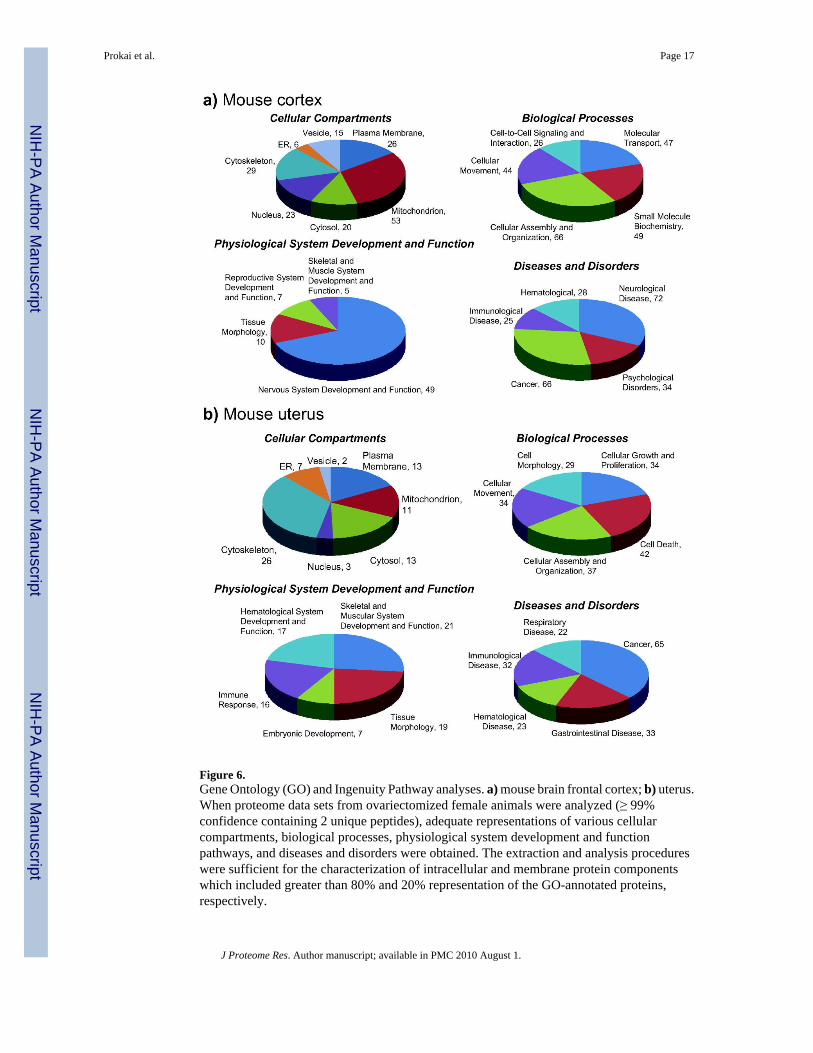
Figure 6.Gene Ontology (GO) and Ingenuity Pathway analyses. a) mouse brain frontal cortex; b) uterus.When proteome data sets from ovariectomized female animals were analyzed (≥ 99%confidence containing 2 unique peptides), adequate representations of various cellularcompartments, biological processes, physiological system development and functionpathways, and diseases and disorders were obtained. The extraction and analysis procedureswere sufficient for the characterization of intracellular and membrane protein componentswhich included greater than 80% and 20% representation of the GO-annotated proteins,respectively.
Prokai et al. Page 17
J Proteome Res. Author manuscript; available in PMC 2010 August 1.
NIH
-PA Author Manuscript
NIH
-PA Author Manuscript
NIH
-PA Author Manuscript
NIH
-PA Author Manuscript
NIH
-PA Author Manuscript
NIH
-PA Author Manuscript
Prokai et al. Page 18Ta
ble
1
Exam
ples
of d
iffer
entia
l pro
tein
exp
ress
ion
in m
ouse
bra
in a
fter E
2 tre
atm
ent i
dent
ified
by
spec
tral c
ount
ing
and
valid
ated
by
inte
grat
ion
of e
xtra
cted
ion
chro
mat
ogra
ms
Prot
ein
Nam
eIP
I acc
essi
onnu
mbe
rN
umbe
r of
uniq
uepe
ptid
es
Sequ
ence
cove
rage
(%)
Ave
rage
norm
aliz
edsp
ectr
al c
ount
± st
anda
rdde
viat
ion,
Con
trol
a
Ave
rage
norm
aliz
edsp
ectr
al c
ount
±st
anda
rdde
viat
ion,
E2-
trea
teda
P-va
lue
from
Gte
stb
Fold
chan
ge
ATP
synt
hase
, alp
haIP
I001
3028
018
3913
± 4
21 ±
10.
007
1.6
ATP
synt
hase
, bet
aIP
I004
6848
122
5739
± 5
53 ±
10.
008
1.4b
Asp
arta
team
inot
rans
fera
se 2
IPI0
0117
312
1131
7 ±
214
± 5
0.01
2.0
Mal
ate
dehy
drog
enas
e,m
itoch
ondr
ial
IPI0
0323
592
1450
15 ±
423
± 3
0.03
1.5
a N=3
(bra
in ti
ssue
from
thre
e di
ffer
ent a
nim
als)
.
b Spec
tral c
ount
s fro
m e
ach
anim
al in
con
trol a
nd E
2-tre
ated
gro
ups w
ere
subj
ecte
d to
a su
mm
atio
n-ba
sed
G st
atis
tical
test
..
c Val
idat
ed b
y W
este
rn b
lot a
naly
sis (
Supp
lem
enta
ry F
igur
e 2a
onl
ine)
.
J Proteome Res. Author manuscript; available in PMC 2010 August 1.
NIH
-PA Author Manuscript
NIH
-PA Author Manuscript
NIH
-PA Author Manuscript
Prokai et al. Page 19Ta
ble
2
Diff
eren
tial p
rote
in e
xpre
ssio
n in
mou
se u
teru
s afte
r E2
treat
men
t ide
ntifi
ed b
y sp
ectra
l cou
ntin
g
Prot
ein
Nam
eIP
Iac
cess
ion
num
ber
Num
ber
ofun
ique
pept
ides
Sequ
ence
cove
rage
(%)
Ave
rage
norm
aliz
edsp
ectr
al c
ount
± st
anda
rdde
viat
ion,
aC
ontr
ol
Ave
rage
norm
aliz
edsp
ectr
al c
ount
±st
anda
rdde
viat
ion,
a E2-
trea
ted
P-va
lue
from
Gte
stb
Fold
chan
ge
Eif4
a1 E
ukar
yotic
initi
atio
n fa
ctor
4A
-IIP
I001
1867
6IP
I007
6199
23
130
3 ±
10.
0005
UEc
Krt1
9 K
erat
in, t
ype
Icy
tosk
elet
al 1
9IP
I001
1294
710
361
± 1
16 ±
33E
-15
>10
Eef2
Elo
ngat
ion
fact
or2
IPI0
0466
069
48.
4<1
5 ±
17E
-05
>10
Flna
Isof
orm
1 o
fFi
lam
in-A
IPI0
0131
138
IPI0
0830
793
2215
3 ±
130
± 8
4E-2
410
Rpl
p1 6
0S a
cidi
crib
osom
al p
rote
in P
1IP
I001
1337
73
802
± 1
10 ±
17E
-06
5.0
Hsp
a5 7
8 kD
a gl
ucos
e-re
gula
ted
prot
ein
prec
urso
rIP
I003
1999
27
172
± 1
9 ±
17E
-06
4.5
Cnn
1 Is
ofor
m A
lpha
of
Cal
poni
n-1
IPI0
0116
645
IPI0
0228
258
313
1d4
± 1
0.00
34.
0A
tp5a
1 A
TP sy
ntha
sesu
buni
t alp
ha,
mito
chon
dria
l pre
curs
orIP
I001
3028
0IP
I008
5743
93
101d
4 ±
10.
014.
0e
Eef1
a1 E
long
atio
nfa
ctor
1-a
lpha
1IP
I003
0783
74
183
± 2
9 ±
10.
0003
3.0
Des
Des
min
fIP
I001
3010
215
4525
± 1
054
± 7
2E-1
12.
2
His
t1h2
bf H
isto
ne H
2B
IPI0
0114
642
IPI0
0134
534
IPI0
0227
930
IPI0
0265
768
IPI0
0282
266
IPI0
0282
269
IPI0
0348
270
IPI0
0461
514
IPI0
0554
853
IPI0
0648
991
IPI0
0761
713
220
20 ±
431
± 2
0.00
21.
6
Myl
6 Is
ofor
m S
moo
thm
uscl
e of
Myo
sin
light
poly
pept
ide
6IP
I003
5481
9IP
I004
0981
77
5936
± 7
22 ±
40.
0002
0.6
Tln1
Tal
in-1
IPI0
0465
786
108.
910
± 4
4 ±
20.
006
0.4
Arh
gdia
Rho
GD
P-di
ssoc
iatio
n in
hibi
tor 1
IPI0
0322
312
331
11 ±
24
± 1
0.00
030.
4Lu
m L
umic
an p
recu
rsor
IPI0
0313
900
525
20 ±
27
± 1
6E-0
70.
4C
alm
3;C
alm
2;C
alm
1C
alm
odul
inIP
I007
6169
63
3114
± 2
5 ±
11E
-05
0.4
Vcl
Vin
culin
IPI0
0405
227
1119
23 ±
57
± 1
7E-0
90.
3Pa
rk7
Prot
ein
DJ-
1IP
I001
1726
44
377
± 2
2 ±
10.
002
0.3
Tpi1
Trio
seph
osph
ate
isom
eras
eIP
I004
6783
34
2912
± 1
4 ±
12E
-05
0.3
Ptrf
Pol
ymer
ase
I and
trans
crip
t rel
ease
fact
orIP
I001
1768
94
1514
± 3
4 ±
11E
-06
0.3
J Proteome Res. Author manuscript; available in PMC 2010 August 1.

NIH
-PA Author Manuscript
NIH
-PA Author Manuscript
NIH
-PA Author Manuscript
Prokai et al. Page 20
Prot
ein
Nam
eIP
Iac
cess
ion
num
ber
Num
ber
ofun
ique
pept
ides
Sequ
ence
cove
rage
(%)
Ave
rage
norm
aliz
edsp
ectr
al c
ount
± st
anda
rdde
viat
ion,
aC
ontr
ol
Ave
rage
norm
aliz
edsp
ectr
al c
ount
±st
anda
rdde
viat
ion,
a E2-
trea
ted
P-va
lue
from
Gte
stb
Fold
chan
ge
Hnr
npa2
b1 Is
ofor
m 3
of
hete
roge
neou
s nuc
lear
ribon
ucle
opro
tein
sA
2/B
1
IPI0
0405
058
IPI0
0622
847
IPI0
0828
488
IPI0
0853
914
319
5 ±
21
± 1
0.00
040.
2
Ogn
Mim
ecan
prec
urso
rIP
I001
2084
83
1216
± 3
3 ±
18E
-10
0.2
Anx
a6 a
nnex
in A
6IP
I003
1024
0IP
I005
5489
4IP
I006
4915
26
167
± 1
1 ±
10.
0001
0.2
Pebp
1Ph
osph
atid
ylet
hano
l-am
ine-
bind
ing
prot
ein
1IP
I001
3773
05
5810
± 2
1 ±
15E
-08
0.1
Gst
m1
Glu
tath
ione
S-
trans
fera
se M
u 1
IPI0
0230
212
IPI0
0649
135
320
7 ±
20
4E-0
8U
Cg
Prel
p Pr
olar
gin
prec
urso
rIP
I001
2229
32
6.9
5 ±
20
2E-0
6U
Cg
Prdx
6 Pe
roxi
redo
xin-
6IP
I005
5505
9IP
I007
5802
43
264
± 1
03E
-05
UC
g
Fabp
4 Fa
tty a
cid-
bind
ing
prot
ein,
adip
ocyt
eIP
I001
1670
52
203
± 2
00.
0002
UC
g
a N=4
(ute
rine
tissu
e fr
om fo
ur d
iffer
ent a
nim
als)
b Spec
tral c
ount
s fro
m e
ach
anim
al in
con
trol a
nd E
2-tre
ated
gro
ups w
ere
subj
ecte
d to
a su
mm
atio
n-ba
sed
G st
atis
tical
test
(P<0
.05)
.
c Uni
que
in E
2-tre
ated
ani
mal
s.
d Stan
dard
dev
iatio
n <0
.5
e Val
idat
ed b
y W
este
rn b
lotti
ng (S
uppl
emen
tary
Fig
ure
2b o
nlin
e).
f Prot
ein
grou
ping
am
bigu
ity re
porte
d by
Sca
ffol
d w
as re
solv
ed b
y X
IC q
uant
itatio
n of
sequ
ence
-spe
cific
pep
tide
g Uni
que
in c
ontro
l (ve
hicl
e-tre
ated
) ani
mal
s.
J Proteome Res. Author manuscript; available in PMC 2010 August 1.