Raman
39
© Wiley 2010 1 Chapter 9– Capacity Planning & Facility Location Operations Management by R. Dan Reid & Nada R. Sanders 4th Edition © Wiley 2010
Transcript of Raman

© Wiley 2010 1
Chapter 9– Capacity Planning & Facility Location
Operations Managementby
R. Dan Reid & Nada R. Sanders4th Edition © Wiley 2010
© Wiley 2010 2
Learning Objectives Define capacity planning Define location analysis Describe relationship between capacity planning and location, and their importance
Explain the steps involved in capacity planning and location analysis
© Wiley 2010 3
Learning Objectives – con’t
Describe the decision support tools used for capacity planning
Identify key factors in location analysis
Describe the decision support tools used for location analysis
© Wiley 2010 4
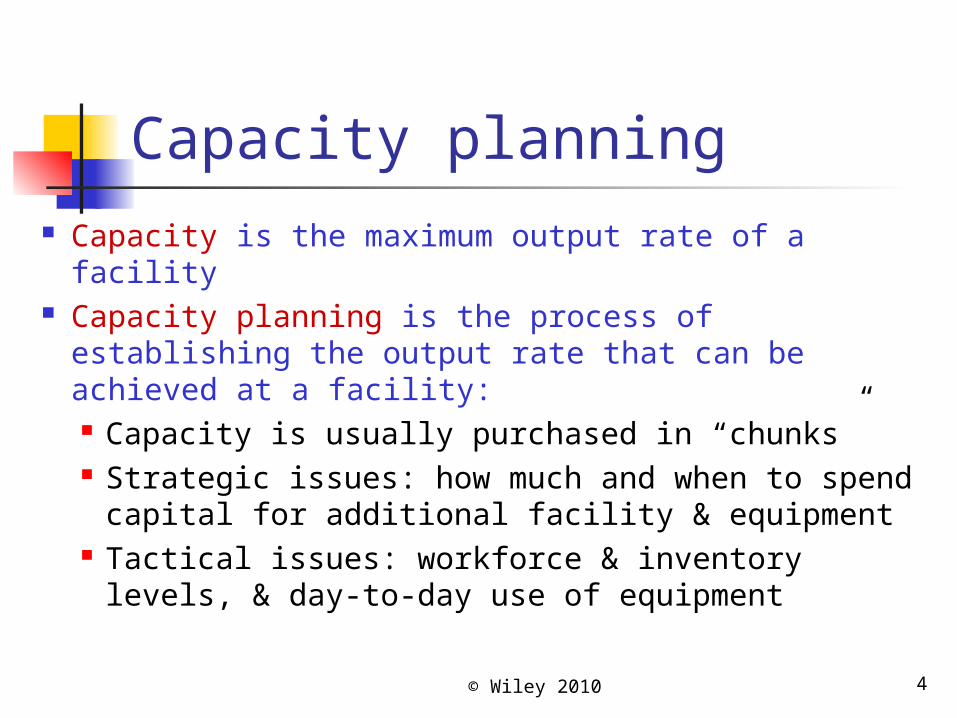
Capacity planning Capacity is the maximum output rate of a facility
Capacity planning is the process of establishing the output rate that can be achieved at a facility: Capacity is usually purchased in “chunks” Strategic issues: how much and when to spend capital for additional facility & equipment
Tactical issues: workforce & inventory levels, & day-to-day use of equipment
© Wiley 2010 5
Measuring Capacity Examples
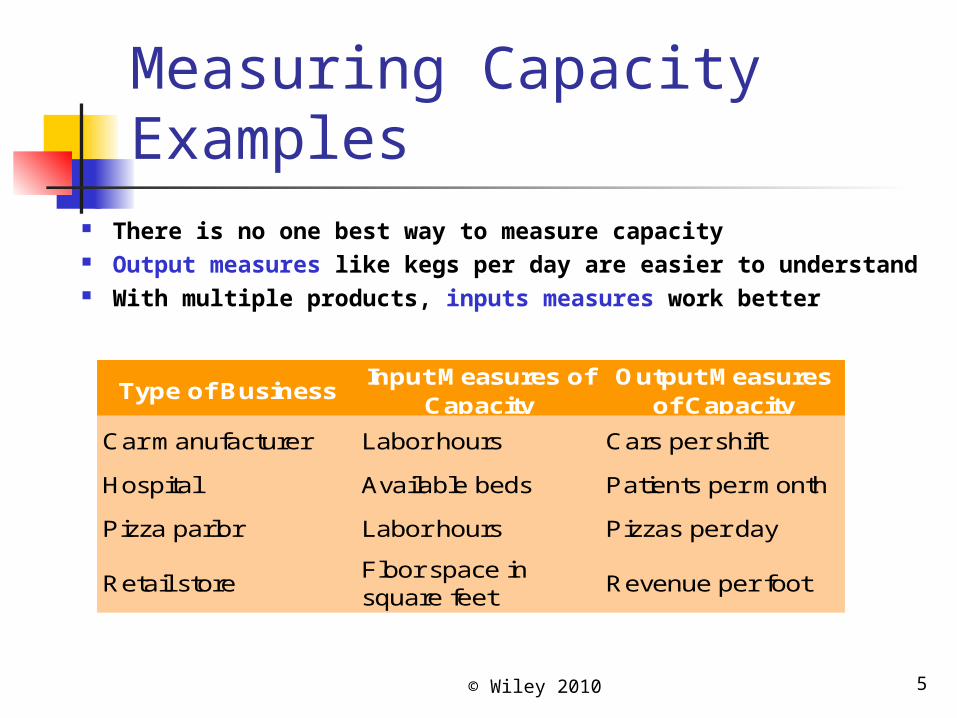
There is no one best way to measure capacity Output measures like kegs per day are easier to understand With multiple products, inputs measures work better
Type of Business Input M easures of Capacity
Output M easures of Capacity
Car m anufacturer Labor hours Cars per shiftHospital Available beds Patients per m onthPizza parlor Labor hours Pizzas per day
Retail store Floor space in square feet Revenue per foot
© Wiley 2010 6
Measuring Available Capacity
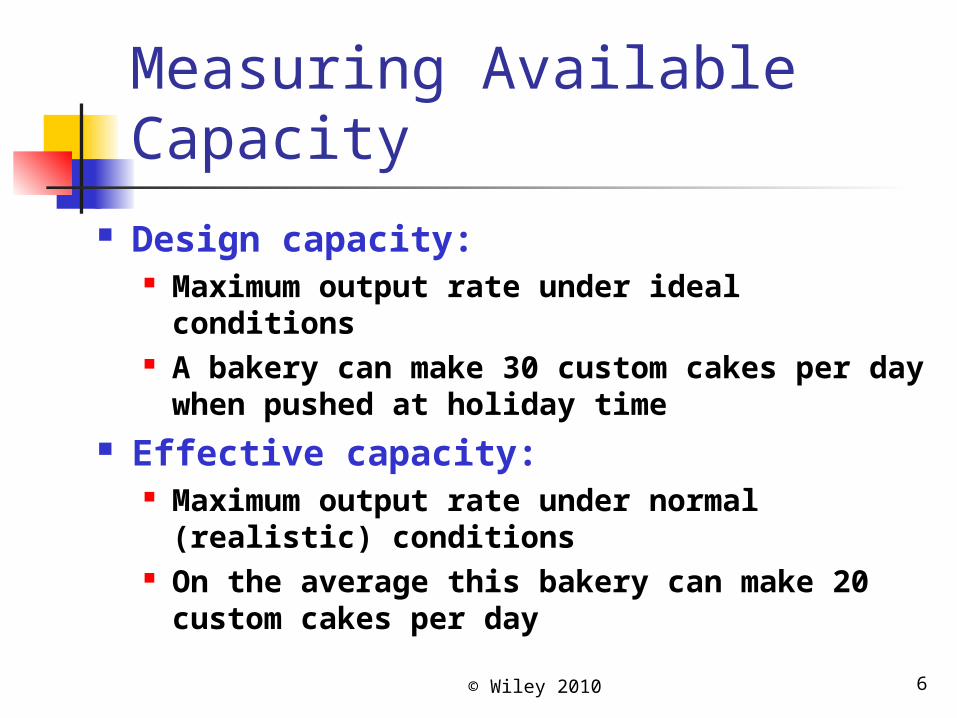
Design capacity: Maximum output rate under ideal conditions
A bakery can make 30 custom cakes per day when pushed at holiday time
Effective capacity: Maximum output rate under normal (realistic) conditions
On the average this bakery can make 20 custom cakes per day
© Wiley 2010 7
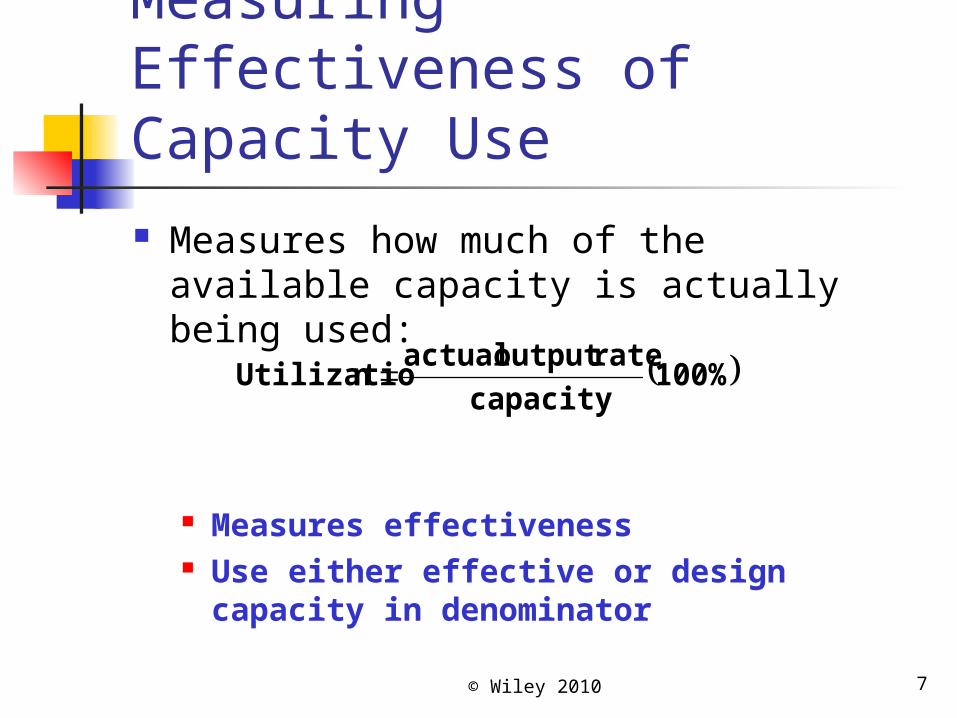
Measuring Effectiveness of Capacity Use Measures how much of the available capacity is actually being used:
Measures effectiveness Use either effective or design capacity in denominator
100%capacityrateoutput actualnUtilizatio
© Wiley 2010 8
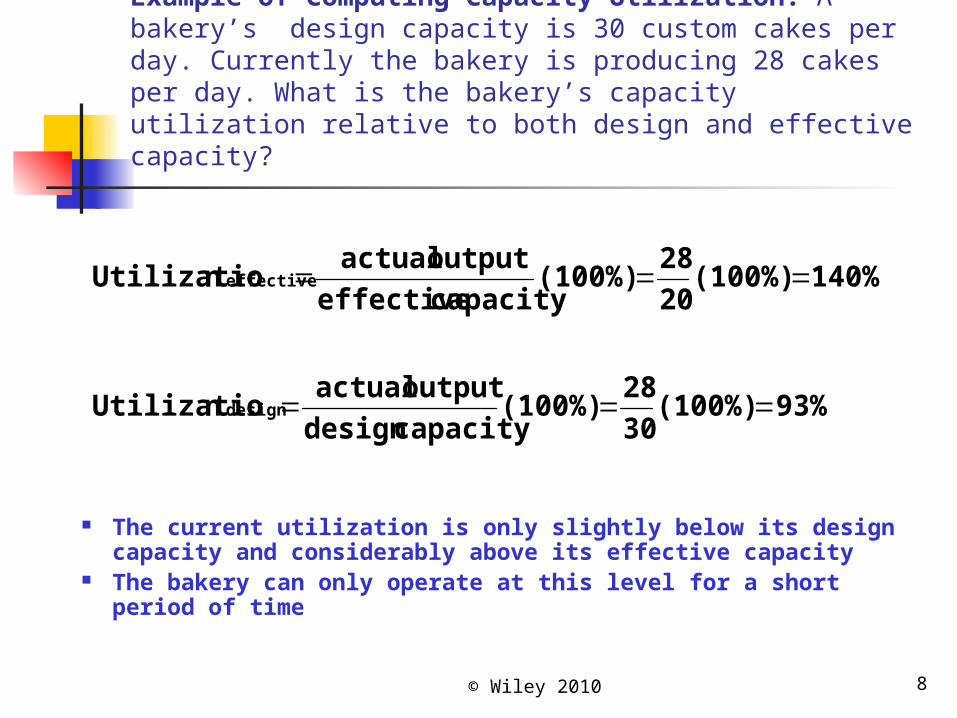
Example of Computing Capacity Utilization: A bakery’s design capacity is 30 custom cakes per day. Currently the bakery is producing 28 cakes per day. What is the bakery’s capacity utilization relative to both design and effective capacity?
93%(100%)3028(100%)capacity design
output actual nUtilizatio
140%(100%)2028(100%)capacity effective
output actual nUtilizatio
design
effective
The current utilization is only slightly below its design capacity and considerably above its effective capacity
The bakery can only operate at this level for a short period of time
© Wiley 2010 9
Capacity Considerations
The Best Operating Level is the output that results in the lowest average unit cost
Economies of Scale: Where the cost per unit of output drops as volume of output increases
Spread the fixed costs of buildings & equipment over multiple units, allow bulk purchasing & handling of material
Diseconomies of Scale: Where the cost per unit rises as volume increases Often caused by congestion (overwhelming the process with too much work-in-process) and scheduling complexity
© Wiley 2010 10
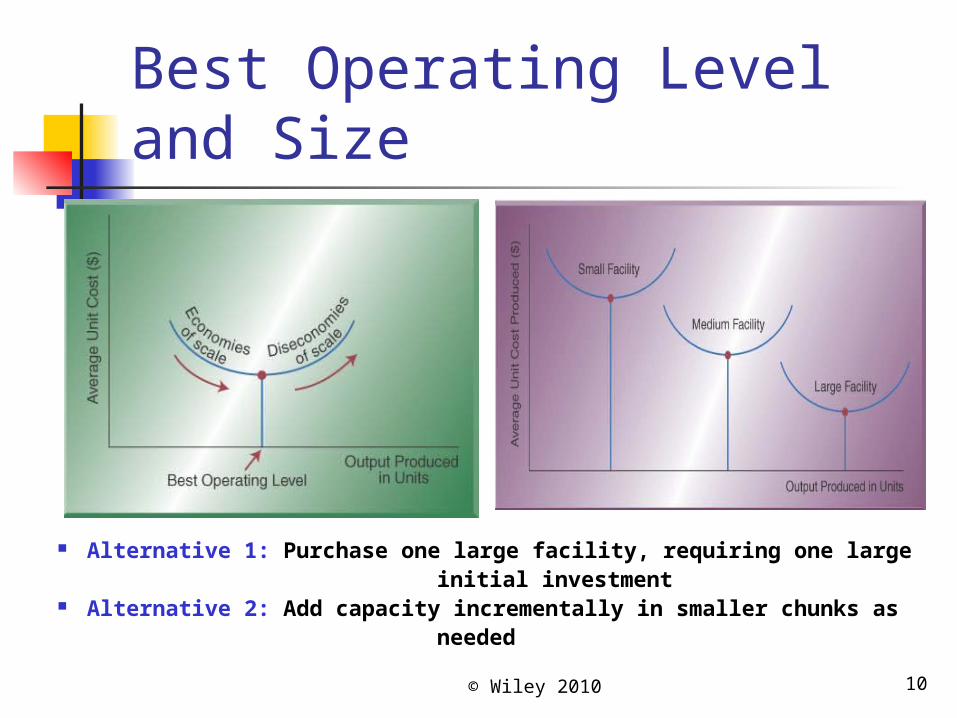
Best Operating Level and Size
Alternative 1: Purchase one large facility, requiring one large initial investment Alternative 2: Add capacity incrementally in smaller chunks as needed
© Wiley 2010 11
Other Capacity Considerations Focused factories:
Small, specialized facilities with limited objectives
Plant within a plant (PWP): Segmenting larger operations into smaller operating units with focused objectives
Subcontractor networks: Outsource non-core items to free up capacity for what you do well
© Wiley 2010 12
Making Capacity Planning Decisions
The three-step procedure for making capacity planning decisions is as follows:
1. Identify Capacity Requirements2. Develop Capacity Alternatives3. Evaluate Capacity Alternatives
© Wiley 2010 13
Identifying capacity requirements
Forecasting Capacity: Long-term capacity requirements based on future demand Identifying future demand based on forecasting Forecasting, at this level, relies on qualitative forecast models
Executive opinion Delphi method
Forecast and capacity decision must included strategic implications
Capacity cushions Plan to underutilize capacity to provide flexibility
Strategic Implications How much capacity a competitor might have Potential for overcapacity in industry a possible hazard
© Wiley 2010 14
Developing & Evaluating Capacity Alternatives
Capacity alternatives include Could do nothing, expand large now (may included capacity cushion), or
expand small now with option to add later
Use decision support aids to evaluate decisions (decision tree most popular)
© Wiley 2010 15
Decision treesDiagramming technique which uses
Decision points – points in time when decisions are made, squares called nodes
Decision alternatives – branches of the tree off the decision nodes
Chance events – events that could affect a decision, branches or arrows leaving circular chance nodes
Outcomes – each possible alternative listed
© Wiley 2010 16
Decision tree diagramsDecision trees developed by
Drawing from left to right Use squares to indicate decision points Use circles to indicate chance events Write the probability of each chance by the chance (sum of associated chances = 100%)
Write each alternative outcome in the right margin
© Wiley 2010 17
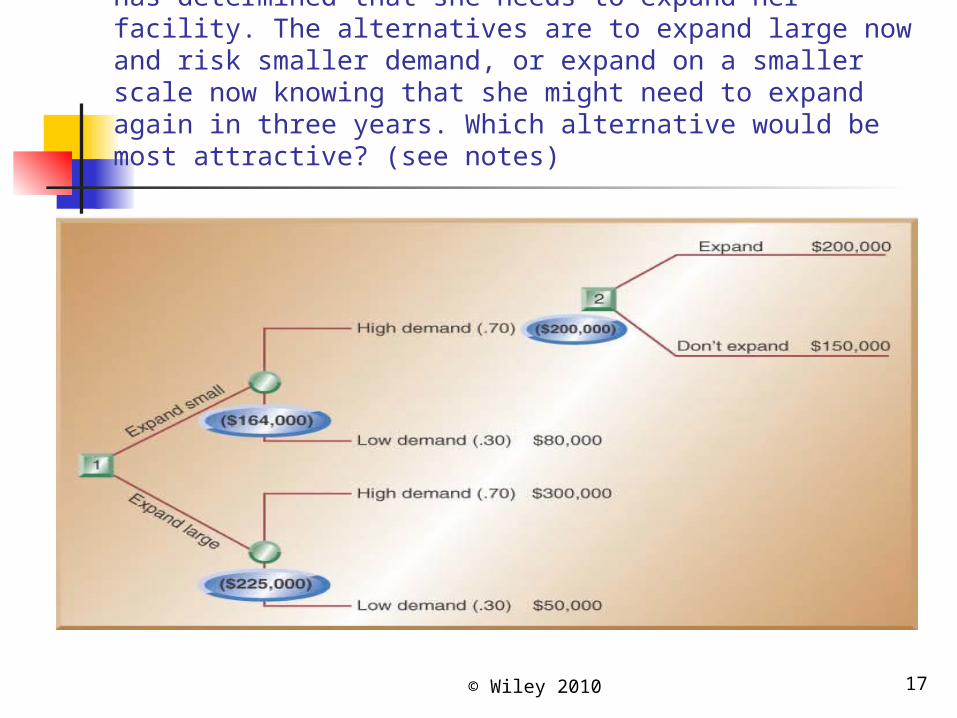
Example Using Decision Trees: A restaurant owner has determined that she needs to expand her facility. The alternatives are to expand large now and risk smaller demand, or expand on a smaller scale now knowing that she might need to expand again in three years. Which alternative would be most attractive? (see notes)
© Wiley 2010 18
Evaluating the Decision Tree
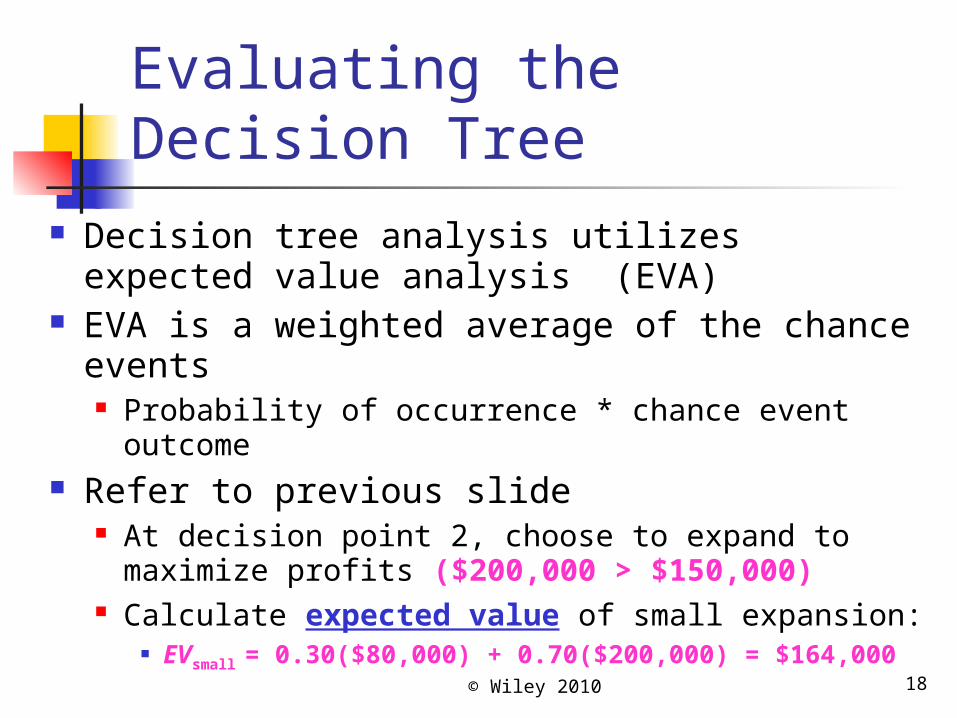
Decision tree analysis utilizes expected value analysis (EVA)
EVA is a weighted average of the chance events Probability of occurrence * chance event outcome
Refer to previous slide At decision point 2, choose to expand to maximize profits ($200,000 > $150,000)
Calculate expected value of small expansion: EVsmall = 0.30($80,000) + 0.70($200,000) = $164,000
© Wiley 2010 19
Evaluating the Decision Tree con’t
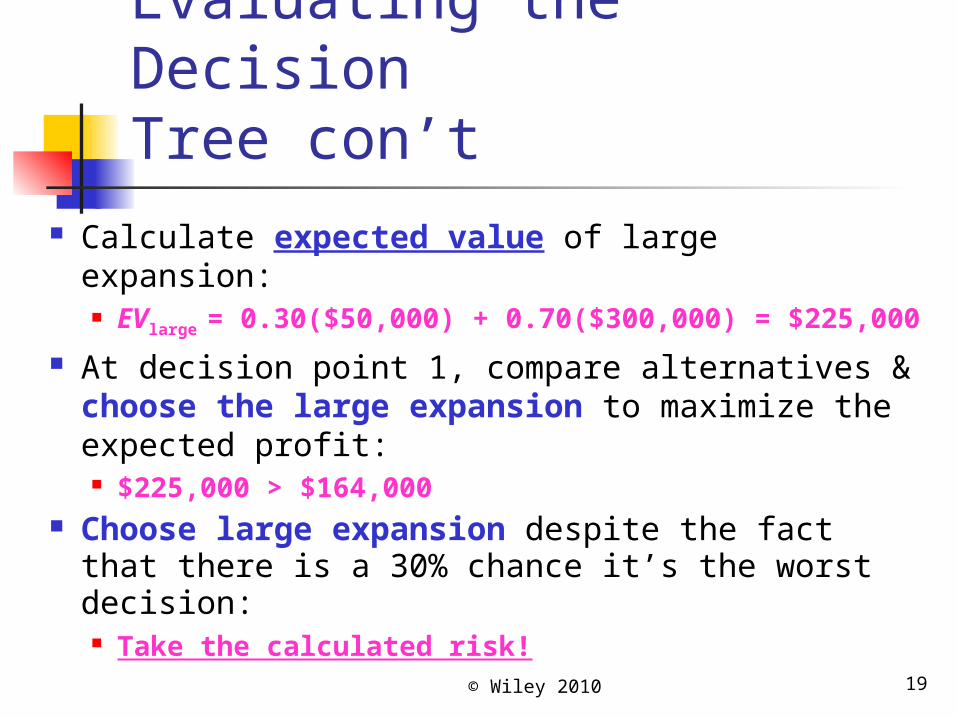
Calculate expected value of large expansion: EVlarge = 0.30($50,000) + 0.70($300,000) = $225,000
At decision point 1, compare alternatives & choose the large expansion to maximize the expected profit: $225,000 > $164,000
Choose large expansion despite the fact that there is a 30% chance it’s the worst decision: Take the calculated risk!
© Wiley 2010 20
Location Analysis Three most important factors in real
estate:1. Location2. Location3. Location
Facility location is the process of identifying the best geographic location for a service or production facility
© Wiley 2010 21
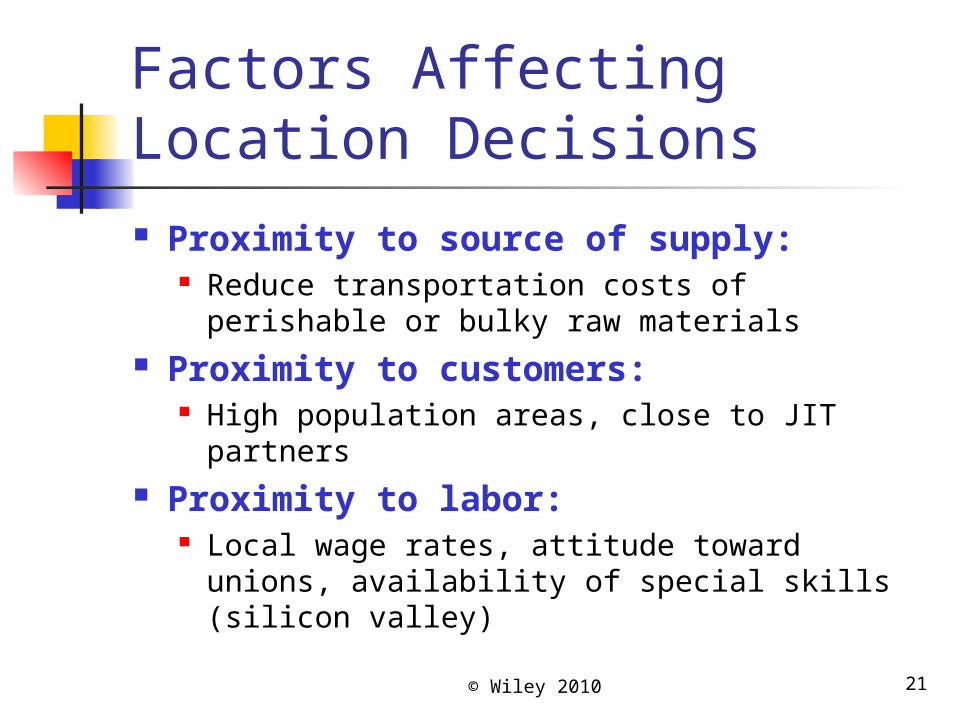
Factors Affecting Location Decisions Proximity to source of supply:
Reduce transportation costs of perishable or bulky raw materials
Proximity to customers: High population areas, close to JIT partners
Proximity to labor: Local wage rates, attitude toward unions, availability of special skills (silicon valley)
© Wiley 2010 22
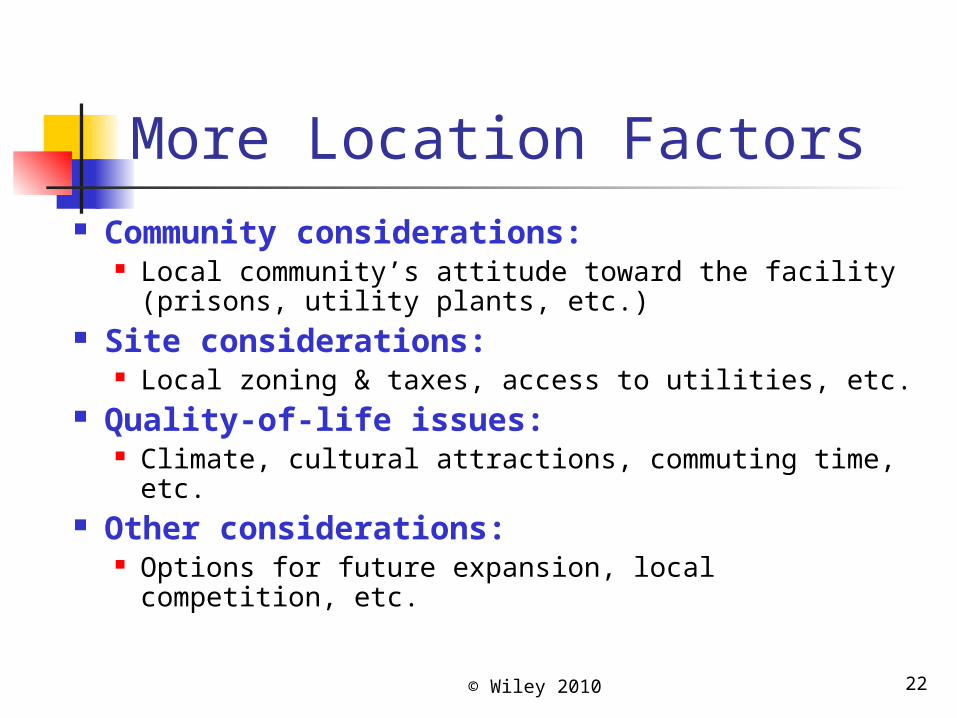
More Location Factors Community considerations:
Local community’s attitude toward the facility (prisons, utility plants, etc.)
Site considerations: Local zoning & taxes, access to utilities, etc.
Quality-of-life issues: Climate, cultural attractions, commuting time, etc.
Other considerations: Options for future expansion, local competition, etc.
© Wiley 2010 23
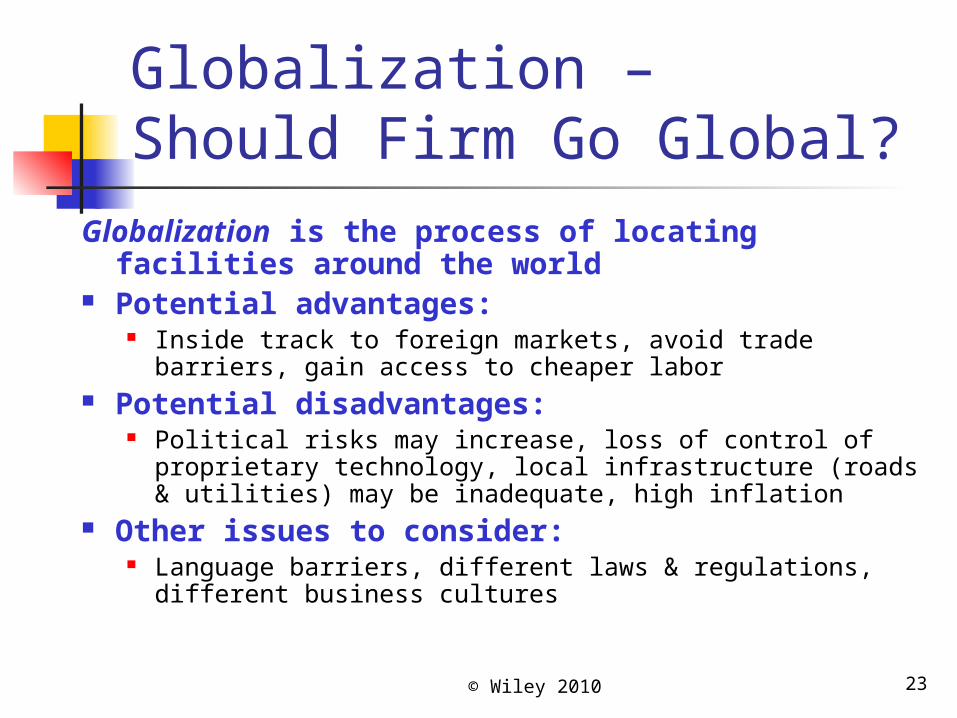
Globalization – Should Firm Go Global?
Globalization is the process of locating facilities around the world
Potential advantages: Inside track to foreign markets, avoid trade barriers, gain access to cheaper labor
Potential disadvantages: Political risks may increase, loss of control of proprietary technology, local infrastructure (roads & utilities) may be inadequate, high inflation
Other issues to consider: Language barriers, different laws & regulations, different business cultures
© Wiley 2010 24
Making Location Decisions
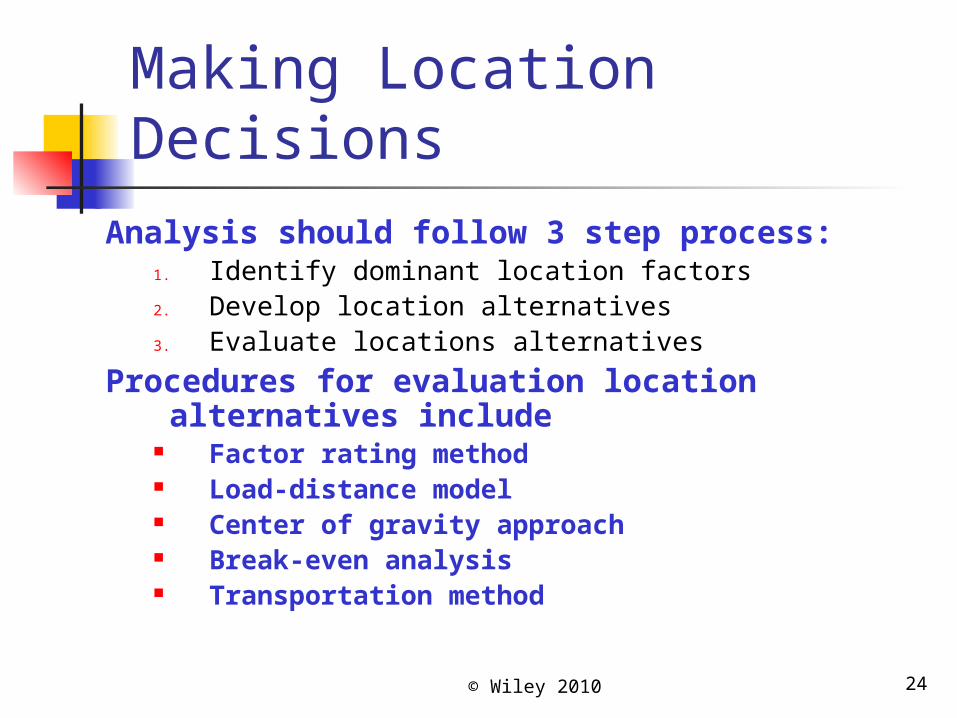
Analysis should follow 3 step process:1. Identify dominant location factors2. Develop location alternatives3. Evaluate locations alternatives
Procedures for evaluation location alternatives include
Factor rating method Load-distance model Center of gravity approach Break-even analysis Transportation method
© Wiley 2010 25
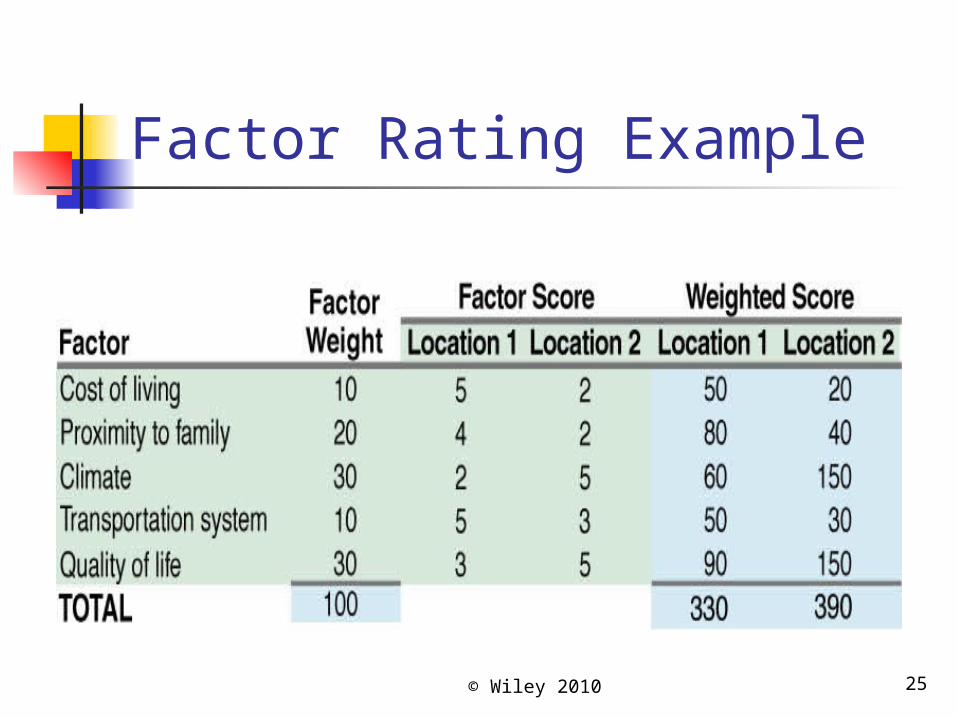
Factor Rating Example
© Wiley 2010 26
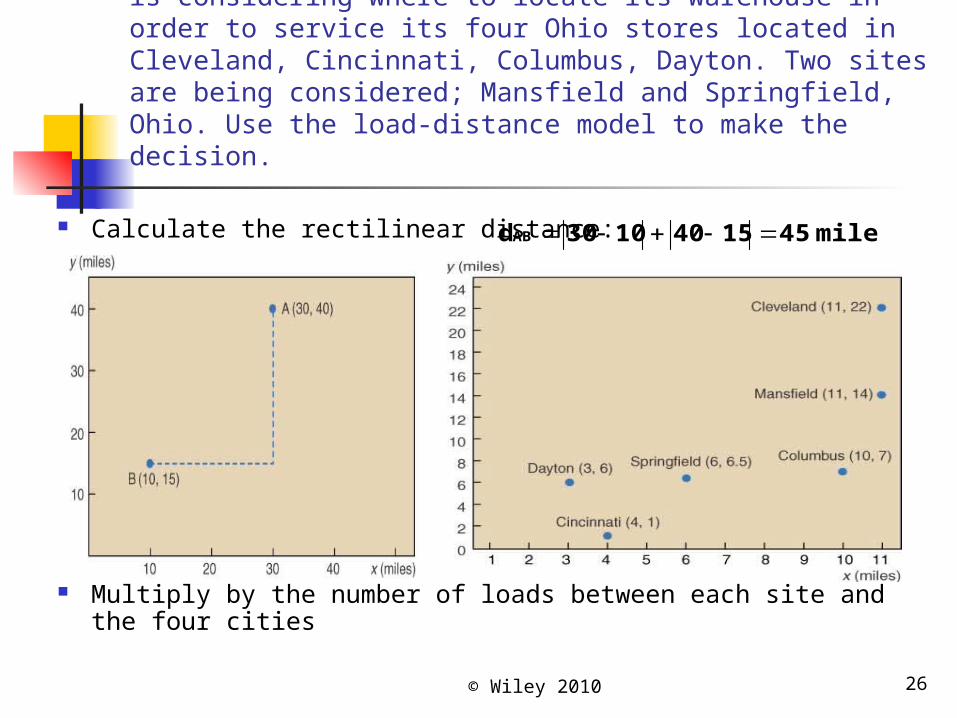
A Load-Distance Model Example: Matrix Manufacturing is considering where to locate its warehouse in order to service its four Ohio stores located in Cleveland, Cincinnati, Columbus, Dayton. Two sites are being considered; Mansfield and Springfield, Ohio. Use the load-distance model to make the decision.
Calculate the rectilinear distance:
Multiply by the number of loads between each site and
the four cities
miles 4515401030dAB
© Wiley 2010 27
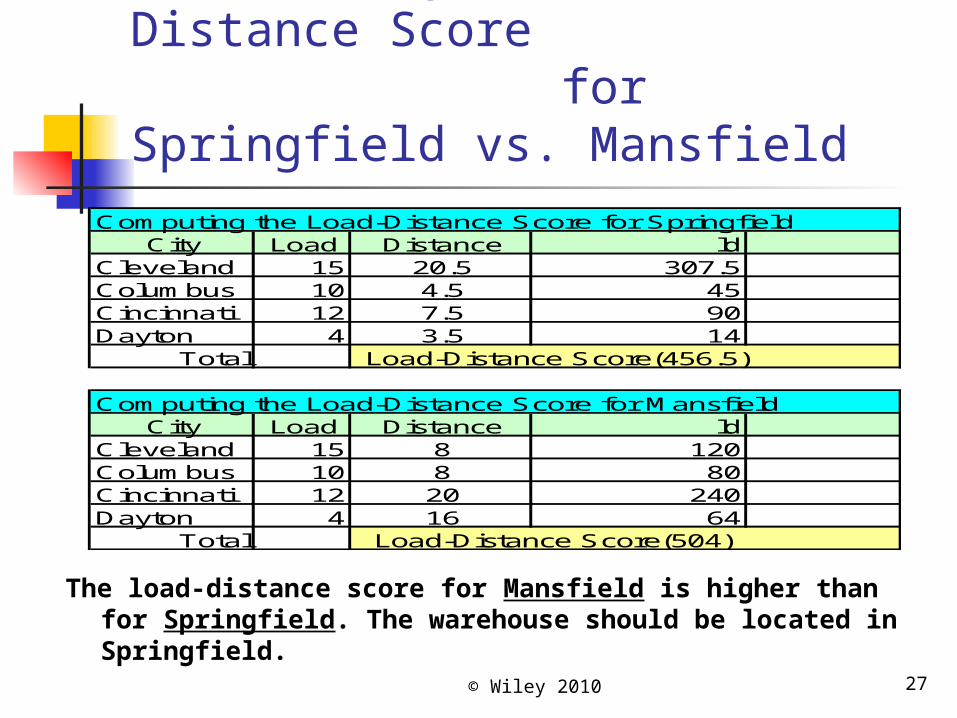
Calculating the Load-Distance Score for Springfield vs. Mansfield
The load-distance score for Mansfield is higher than for Springfield. The warehouse should be located in Springfield.
Com puting the Load-Distance Score for SpringfieldCity Load Distance ld
Cleveland 15 20.5 307.5Colum bus 10 4.5 45Cincinnati 12 7.5 90Dayton 4 3.5 14
Total Load-Distance Score(456.5)
Com puting the Load-Distance Score for M ansfieldCity Load Distance ld
Cleveland 15 8 120Colum bus 10 8 80Cincinnati 12 20 240Dayton 4 16 64
Total Load-Distance Score(504)
© Wiley 2010 28
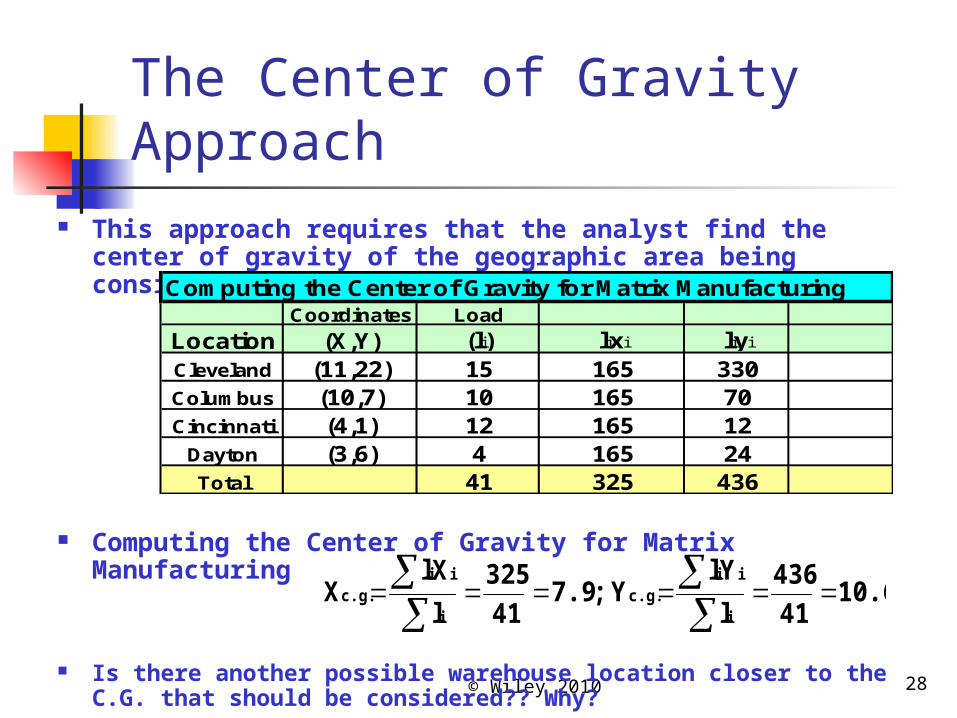
The Center of Gravity Approach
This approach requires that the analyst find the center of gravity of the geographic area being considered
Computing the Center of Gravity for Matrix Manufacturing
Is there another possible warehouse location closer to the C.G. that should be considered?? Why?
10.641436
lYlY ; 7.941
325lXlX
i
iic.g.
i
iic.g.
Com puting the Center of Gravity for M atrix M anufacturingCoordinates Load
Location (X,Y) (li) lixi liyiCleveland (11,22) 15 165 330Colum bus (10,7) 10 165 70Cincinnati (4,1) 12 165 12Dayton (3,6) 4 165 24Total 41 325 436
© Wiley 2010 29
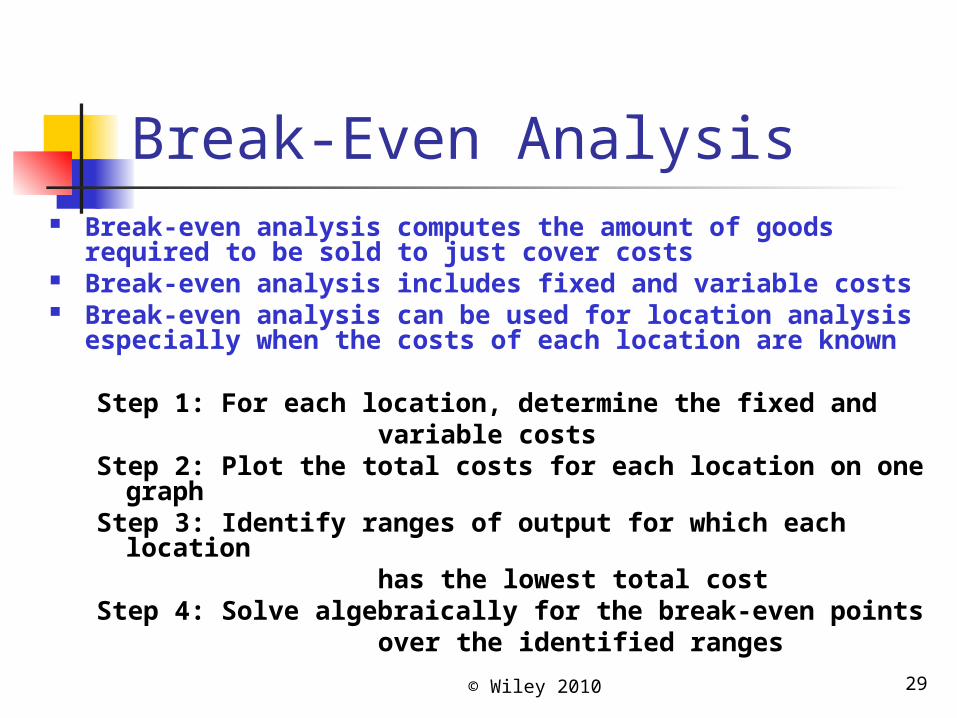
Break-Even Analysis Break-even analysis computes the amount of goods
required to be sold to just cover costs Break-even analysis includes fixed and variable costs Break-even analysis can be used for location analysis
especially when the costs of each location are known
Step 1: For each location, determine the fixed and variable costsStep 2: Plot the total costs for each location on one graph
Step 3: Identify ranges of output for which each location
has the lowest total costStep 4: Solve algebraically for the break-even points over the identified ranges
© Wiley 2010 30
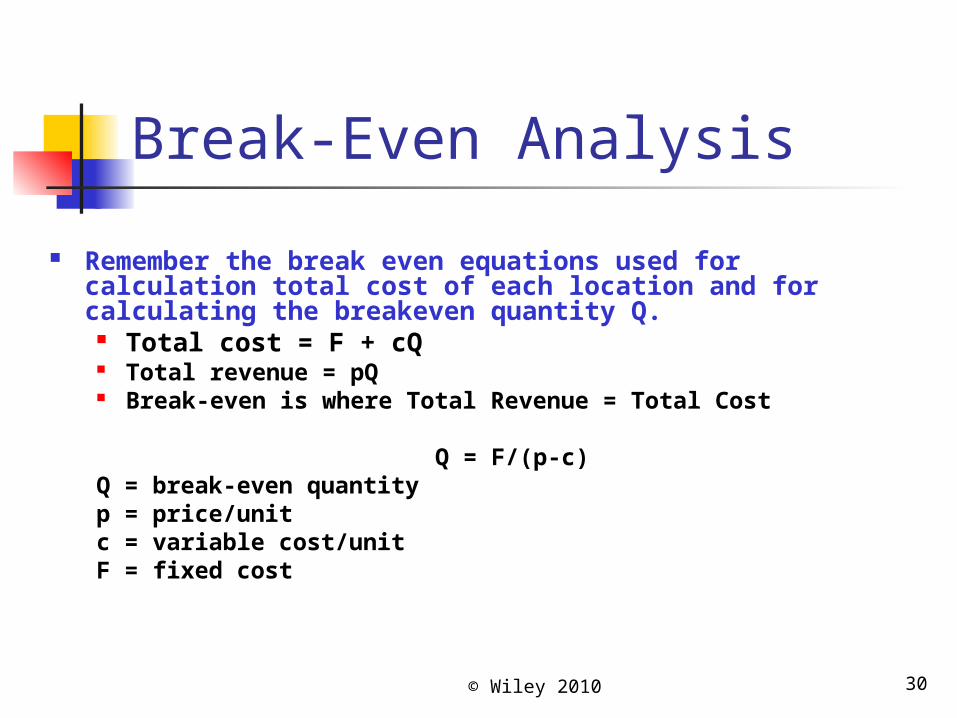
Break-Even Analysis Remember the break even equations used for
calculation total cost of each location and for calculating the breakeven quantity Q.
Total cost = F + cQ Total revenue = pQ Break-even is where Total Revenue = Total Cost
Q = F/(p-c)Q = break-even quantityp = price/unitc = variable cost/unitF = fixed cost
© Wiley 2010 31
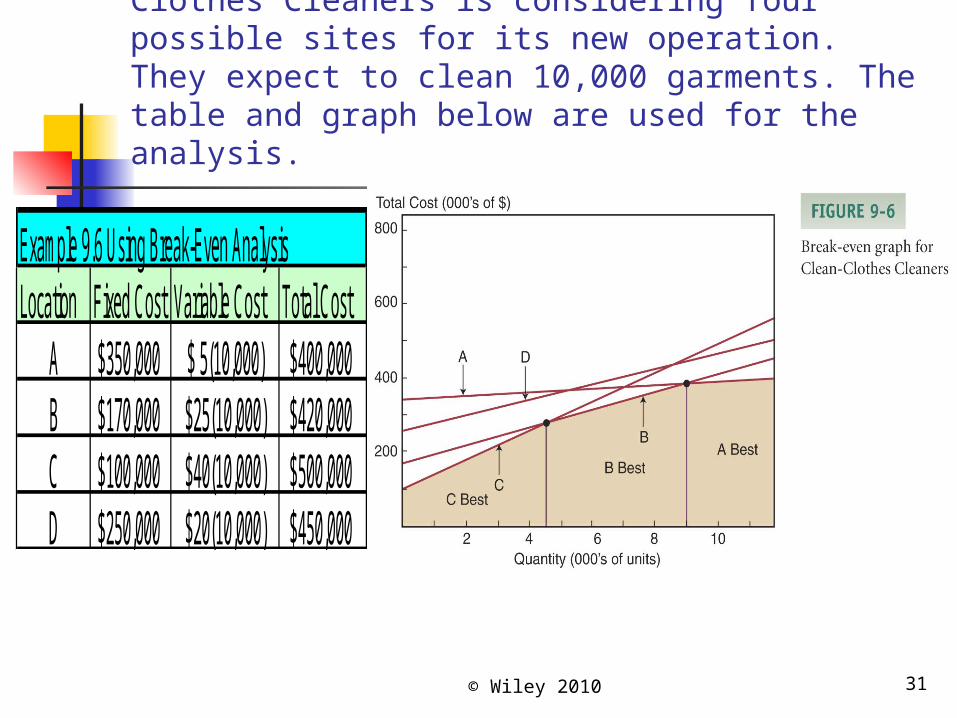
Example using Break-even Analysis: Clean-Clothes Cleaners is considering four possible sites for its new operation. They expect to clean 10,000 garments. The table and graph below are used for the analysis.
Exam ple 9.6 Using Break-Even AnalysisLocation Fixed Cost Variable Cost Total Cost
A $350,000 $ 5(10,000) $400,000B $170,000 $25(10,000) $420,000C $100,000 $40(10,000) $500,000D $250,000 $20(10,000) $450,000
© Wiley 2010 32
The Transportation Method
Can be used to solve specific location problems
Is discussed in detail in the supplement to this text
Could be used to evaluate the cost impact of adding potential location sites to the network of existing facilities
Could also be used to evaluate adding multiple new sites or completely redesigning the network
© Wiley 2010 33
Capacity Planning & Facility Location within OM Decisions about capacity and location are highly dependent on forecasts of demand (Ch 8).
Capacity is also affected by operations strategy (Ch 2), as size of capacity is a key element of organizational structure.
Other operations decisions that are affected by capacity and location are issues of job design and labor skills (Ch 11), choice on the mix of labor and technology, as well as choices on technology and automation (Ch 3).
© Wiley 2010 34
Capacity Planning and Facility Location Across the Organization
Capacity planning and location analysis affect operations management and are important to many others Finance provides input to finalize capacity decisions
Marketing impacted by the organizational capacity and location to customers
© Wiley 2010 35
Chapter 9 Highlights Capacity planning is deciding on the maximum output rate of a facility
Location analysis is deciding on the best location for a facility
Capacity planning and location analysis decision are often made simultaneously because the location of the facility is usually related to its capacity.
© Wiley 2010 36
Chapter 9 Highlights – con’t
In both capacity planning and location analysis, managers must follow three-step process to make good decision. The steps are assessing needs, developing alternatives, and evaluating alternatives.
To choose between capacity planning alternatives managers may use decision trees, which are a modeling tool for evaluating independent decisions that must be made in sequence.
© Wiley 2010 37
Chapter 9 Highlights – con’t
Key factors in location analysis included proximity to customers, transportation, source of labor, community attitude, and proximity to supplies. Service and manufacturing firms focus on different factors. Profit-making and nonprofit organizations also focus on different factors.
© Wiley 2010 38
Chapter 9 Highlights – con’t
Several tools can be used to facilitate location analysis. Factor rating is a tool that helps managers evaluate qualitative factors. The load-distance model and center of gravity approach evaluate the location decision based on distance. Break-even analysis is used to evaluate location decisions based on cost values. The transportation method is an excellent tool for evaluating the cost impact of adding sites to the network of current facilities.
Chapter 9 Homework Hints
Problem 9.5: calculate utilizations based on design and effective capacities (see example 9.1). Present conclusions.
Problem 9.14: use factor rating method to compare the possible locations (see example 9.3).
Problem 9.15: use load-distance model to compare locations (see example 9.4).
Problem 9.16: use center-of-gravity method. Use data from problem 15 (e.g. load between city and warehouse) to determine desired coordinates for the new warehouse.