Rainfall and temperature affect tree species distribution in Ghana
13
Journal of Tropical Ecology http://journals.cambridge.org/TRO Additional services for Journal of Tropical Ecology: Email alerts: Click here Subscriptions: Click here Commercial reprints: Click here Terms of use : Click here Rainfall and temperature affect tree species distribution in Ghana Lucy Amissah, Godefridus M. J. Mohren, Frans Bongers, William D. Hawthorne and Lourens Poorter Journal of Tropical Ecology / Volume 30 / Issue 05 / September 2014, pp 435 - 446 DOI: 10.1017/S026646741400025X, Published online: 26 June 2014 Link to this article: http://journals.cambridge.org/abstract_S026646741400025X How to cite this article: Lucy Amissah, Godefridus M. J. Mohren, Frans Bongers, William D. Hawthorne and Lourens Poorter (2014). Rainfall and temperature affect tree species distribution in Ghana. Journal of Tropical Ecology, 30, pp 435-446 doi:10.1017/ S026646741400025X Request Permissions : Click here Downloaded from http://journals.cambridge.org/TRO, IP address: 83.162.254.70 on 08 Aug 2014
Transcript of Rainfall and temperature affect tree species distribution in Ghana

Journal of Tropical Ecologyhttp://journals.cambridge.org/TRO
Additional services for Journal of Tropical Ecology:
Email alerts: Click hereSubscriptions: Click hereCommercial reprints: Click hereTerms of use : Click here
Rainfall and temperature affect tree species distribution in Ghana
Lucy Amissah, Godefridus M. J. Mohren, Frans Bongers, William D. Hawthorne and Lourens Poorter
Journal of Tropical Ecology / Volume 30 / Issue 05 / September 2014, pp 435 - 446DOI: 10.1017/S026646741400025X, Published online: 26 June 2014
Link to this article: http://journals.cambridge.org/abstract_S026646741400025X
How to cite this article:Lucy Amissah, Godefridus M. J. Mohren, Frans Bongers, William D. Hawthorne and Lourens Poorter (2014). Rainfall andtemperature affect tree species distribution in Ghana. Journal of Tropical Ecology, 30, pp 435-446 doi:10.1017/S026646741400025X
Request Permissions : Click here
Downloaded from http://journals.cambridge.org/TRO, IP address: 83.162.254.70 on 08 Aug 2014

Journal of Tropical Ecology (2014) 30:435–446. © Cambridge University Press 2014doi:10.1017/S026646741400025X
Rainfall and temperature affect tree species distribution in Ghana
Lucy Amissah∗,†,1, Godefridus M. J. Mohren∗, Frans Bongers∗, William D. Hawthorne‡ andLourens Poorter∗
∗ Forest Ecology and Forest Management Group, Wageningen University, P.O. Box 47, 6700 AA, Wageningen, the Netherlands† CSIR-Forestry Research Institute of Ghana, P.O. Box UP63, KNUST, Kumasi, Ghana‡ Department of Plant Sciences, University of Oxford, South Parks Road, Oxford OX1 3RB, UK
(Received 4 September 2013; revised 26 May 2014; accepted 26 May 2014; first published online 26 June 2014)
Abstract: We evaluated the relative importance of annual rainfall, temperature and their seasonality to tree speciesdistribution in Ghana. We used species presence/absence data from 2505 1-ha plots systematically distributed overGhana’s forests. Logistic regression was used to determine species responses to four climatic variables generated fromthe Worldclim database. The distribution of 95% of 20 species was significantly associated with annual rainfall, 60%with rainfall seasonality, 45% with isothermality and 40% with temperature seasonality. Annual rainfall explainedon average most of the variation (17%, range = 0.5–52%) in species distribution, followed by rainfall seasonality5% (range = 0.5–27%), isothermality 4% (range = 0.8–24%) and temperature seasonality 1% (range = 0.4–4.5%).Our results suggest that, out of the climatic variables investigated, rainfall is the main factor determining tree speciesdistribution in Ghana; temperature also influences the distribution of a number of species, although it explains muchless of the variation. The reduction in annual rainfall that prevailing climate-change scenarios predict for the regionwill result in a shift in the distribution of most species, whereas the predicted increase in temperature variation is likelyto have little effect.
Key Words: climate, distribution, drought, plant-climate interactions, species response curves, temperature, tropicalforest
INTRODUCTION
Insight into how individual species respond to resourcesin tree communities is critical for understandinghow environmental factors influence the distribution,abundance and coexistence of tropical tree species (Conditet al. 2013). At a large scale, rainfall has been shownto influence species richness (ter Steege et al. 2006),composition (Hall & Swaine 1976) and distribution(Bongers et al. 1999, Engelbrecht et al. 2007, Swaine1996, Toledo et al. 2012), whereas at smaller scalessoil fertility, topography and irradiance can affect speciesdistribution (John et al. 2007, Veenendaal et al. 1996).Most tropical forests show seasonal variation in rainfall,and species drought performance and physiologicaldrought tolerance have therefore been found to determinethe distribution of tropical species (Baltzer et al. 2008,Engelbrecht et al. 2007).
1 Corresponding author. Email: [email protected]
A number of studies (Hall & Swaine 1976, John et al.2007, Toledo et al. 2012) have used composite axesof multivariate environmental gradients and vegetationgradients to analyse species distribution, but the use ofsuch axes does not give insight into how individual speciesrespond to specific environmental factors (Condit et al.2013). For example, several species in Ghana (e.g. Khayaanthotheca and Pericopsis elata) do not follow the mainvegetation gradient that parallels the annual rainfallgradient, and by inference may not follow the rainfallgradient (Hawthorne 1995). Studies that have evaluatedthe response of tropical tree species to individualenvironmental gradients have focused on soil nutrients,rainfall and water availability, but far less attention hasbeen paid to the role of temperature. Seasonal variationin temperature is rather minor across most tropicalforests, but recent studies suggest that small changesin temperature are likely to affect species distributionpatterns (Wright 2010), although there are still fewdata to support this point. Determination of individualspecies response curves to a range of climatic variablesis imperative to identify the climatic variables that are

436 LUCY AMISSAH ET AL.
biologically most relevant to individual plant species, asthey can help to predict the possible consequences ofclimate change for tropical forests (Borchert 1998).
Vegetation structure and composition vary continu-ously along environmental gradients and theoreticalmodels assume that species show bell-shaped, symmet-rical responses to gradients (Gauch & Whittaker 1972)especially when the gradient is long such as the rainfallgradient in Ghana. However, there is growing evidencethat many species show asymmetrical response curves toenvironmental gradients (e.g. Oksanen & Minchin 2002).
In this study, we evaluated the distributions of 20Ghanaian woody tree species that are economicallyimportant (for timber or non-timber products), havecontrasting distributions within forest types and that differin shade tolerance. We described species distributionsusing detailed inventory data from 2505 1-ha plotsacross a steep rainfall gradient (1100–2000 mm y−1)in Ghana. We determined the influence of annualrainfall, temperature and their seasonality on speciespresence/absence. The size of this study (2505 plots) is anorder of magnitude larger than has been studied so far (e.g.220 plots by Toledo et al. 2012; 72 plots by Condit et al.2013). Two questions were addressed: First, what is therelative importance of annual rainfall, temperature andtheir seasonality for species distribution? We hypothesizedthat annual rainfall, and especially rainfall seasonalitywill be stronger drivers of species distribution thantemperature (seasonality). Second, what is the shapeof species response curves along these environmentalgradients? We hypothesized that unimodal responsecurves will be more associated with rainfall gradient thantemperature gradient because under relatively benignconditions environmental resources (such as water)are more important in shaping species responses thanenvironmental conditions such as temperature.
MATERIALS AND METHODS
Study site
The study was based on Ghanaian national forestinventory data summarized by Hawthorne (1995, 1996)and Hawthorne & Abu-Juam (1995). The study areawas located between latitudes 4.7°–8.0°N and longitudes3.2°E–0.6°W. Based on floristic composition, the forestvegetation of Ghana has been classified into seven mainforest types: wet evergreen, moist evergreen, uplandevergreen, moist semi-deciduous, dry semi-deciduous,southern marginal and south-east outlier forests (Hall &Swaine 1976). The forests are characterized by a rainfallgradient which varies from < 750 to > 2000 mm y−1.Mean annual temperature in the forest zone (1961–2000) ranges from 26.4–27.2 °C. Over the same period
mean annual maximum and minimum temperatures inthe forest zone range from 29.3–32.0 °C and 21.8–23.6°C respectively (Ghana Meteorological Agency records,22 synoptic weather stations across Ghana). Meanmonthly maximum temperature in the hottest month(February or March) is 31–33 °C and mean monthlyminimum temperature of the coldest month (August)is 19–21 °C (Hall & Swaine 1981). Annual rainfall (inthe period 1961–2000) ranges from 1300 mm to 2032mm in the forest zone (Ghana Meteorological Agencyrecords, 22 synoptic weather stations across Ghana).In a recent analysis of data from 77 weather stationsdistributed all over Ghana, mean annual rainfall for theperiod 1981–2010 ranged from 1000 mm to 1900 mmin the forest zone (Logah et al. 2013). Means, ranges andratios (maximum over minimum) of the four variables(Worldclim data) for the plots used in the analysis areprovided in Appendix 1.
Forest inventory data
Ghana has a total forest cover of 7 665 900 ha (FAO2010) including 214 forest reserves designated fortimber production, watershed protection and biodiversityconservation. Within these forest reserves, a systematicforest inventory was carried out between 1986 and1991 (Hawthorne 1995, 1996; Hawthorne & Abu-Juam1995). The inventory covered 127 of the forest reserveswhich represent most of the forest gradient in Ghana.These reserves were sampled systematically in a 2 ×2-km grid with 1-ha plots at the grid intersections. Intotal, 2505 1-ha plots were inventoried with a nesteddesign. All trees � 30-cm diameter at breast height(dbh) were identified over the entire plot. Trees 10–30cm dbh were identified in 0.1-ha subplots, and trees 5–10 cm dbh were identified in 0.05-ha subplots. For thisanalysis, species abundance data were converted intopresence and absence data. Presence and absence datawere preferred over abundance data because differencesin species abundances respond to a wide range of processessuch as competition, and recovery from past disturbances(Toledo et al. 2012). We selected 20 species based on theireconomic importance for society (for timber or as a sourceof medicine), distribution in contrasting forest types andrepresentation of different guilds (Table 1). The foresttypes are related to several factors (e.g. soils, topography,rainfall and temperature) and these together determinethe actual water availability over the year (Swaine 1996).We recognize that the selection is partly based on rainfallbut emphasize that this is only one factor among several(Table 1). Therefore we are confident this is not interferingstrongly with our main results. Of the 20 species seven arepioneers (species require gaps for seedling establishmentand growth); seven are non-pioneer light-demanders

Rainfall affects tropical tree distributions 437
Table 1. The 20 Ghanaian woody species studied, their family, ecological guild and preference for a differentforest type based on Hall & Swaine (1981), Hawthorne (1995), Hawthorne & Jongkind (2006) and Hawthorne& Gyakari (2006). NPLD, Non-pioneer light demander; SB, Shade bearer; P, Pioneer.
Species Abbrev. Family Forest type Guild
Heritiera utilis Sprague Hu Sterculiaceae Wet NPLDCynometra ananta Hutch. and Dalz. Ca Caesalpiniaceae Wet SBDiospyros sanza-minika A. Chev. Ds Ebenaceae Wet SBPentadesma butyracea Sabine Pb Caesalpiniaceae Wet SBEntandrophragma angolense (Welw). DC Ea Meliaceae Moist NPLDTurraeanthus africanus (Welw. ex C.DC.) Peller Ta Meliaceae Moist SBPetersianthus macrocarpus (Beauv.) Liben Pm Lecythidaceae Moist PPiptadeniastrum africanum (Hook.f.) Brenan Pa Mimosaceae Moist NPLDRicinodendron heudelotii (Baill.) Pierre ex Pax Rh Euphorbiaceae Dry PNewbouldia laevis (P.Beauv.) Seeman ex Bureau Nl Bignoniaceae Dry PMansonia altissima (A.Chev.) A.Chev. Ma Sterculiaceae Dry NPLDNesogordonia papaverifera (A.Chev.) R.Capuron Np Sterculiaceae Dry SBCeiba pentandra (Linn.) Gaertn. Cp Bombacaceae Dry PCeltis adolfi-friderici Engl. Ce Ulmaceae Dry PAlbizia zygia (DC.) J.F. Macbr. Az Mimosaceae Dry NPLDPericopsis elata (Harms) Van Meeuwen Pe Papilionaceae Dry NPLDAntiaris toxicaria Leschenault At Moraceae Ubiquitous NPLDStrombosia pustulata J.Leonard Sp Olacaceae Ubiquitous SBTerminalia ivorensis A.Chev. Ti Combretaceae Ubiquitous PTerminalia superba Engl. & Diels Ts Combretaceae Ubiquitous P
(seedlings are present in the shaded understorey butrequire light environment to reach adult size); and sixare shade tolerant (species that are able to establish andcontinue to grow in forest shade; Hawthorne 1995).
Climate data
Nineteen climatic variables were obtained from theWorlclim database (Hijmans et al. 2005). The datawere derived from a compilation of monthly averagesof climatic variables measured from a large number ofweather stations across the globe, mostly between theperiods 1950–2000 (Hijmans et al. 2005). These datawere interpolated using ANNUSPLIN to create a globalclimate dataset meaningful for ecological analysis. Thedataset has a 1-km resolution and consists of 19 climaticvariables. For details see Hijmans et al. (2005). Weused plot coordinates and in some cases forest reservecoordinates to estimate the values of each of the 19climatic variables for the study locations. We considerthe Wordclim data to be of sufficient resolution for ourstudy. Fauset et al. (2012) have shown that habitatscores on the ordination axis 1 of Hall & Swaine (1976,1981) and Hawthorne & Abu-Juam (1995) are stronglycorrelated with precipitation data from the Worldclimdata. This same axis is also correlated with rainfall data(data from 5 y prior to 1963) from 170 weather stationsin Ghana used in the classification of forest types by Hall& Swaine (1976). In the Worldclim database variation inthe density of climatic stations was taken into accountin the generation of the bioclimatic variables (details in
Hijmans et al. 2005). Our plots were located inside forestreserves and their microclimate is relatively less disturbed,although past disturbance may have led to increaseddryness of the forest and to an increase in the presenceof light-demanding species.
Selection of climatic variables
A principal component analysis (PCA) (Appendix 2) wasconducted to evaluate how all 19 climatic variableswere associated for the 2505 plots. The first two PCAaxes explained 81% of the variation. We selected fourclimatic variables that described the two main axes ofclimatic variation and that were relatively independentfrom each other; annual rainfall and rainfall seasonality(the coefficient of variation of mean monthly rainfall,in %), temperature seasonality (calculated as standarddeviation of mean monthly temperature × 100, in°C), and isothermality (the ratio of mean diurnaltemperature range and annual temperature range ×100, in %). An isothermality value of 100 represents asite where the diurnal temperature range is equivalentto the annual temperature range. Values less than100 indicate a smaller level of diurnal temperaturevariability (mean of monthly (maximum–minimumtemperature)) relative to the temperature variabilityin a year (maximum temperature of the warmestmonth–minimum temperature of the coldest month). Theselection of the four variables was also based on the factthat they reflected a resource (rainfall) and an importantcondition (temperature) that physiologically affects the
438 LUCY AMISSAH ET AL.
growth of plants (Pausas & Austin 2001), and arepredicted to change with climate change. Seasonality mayrepresent a bottleneck for plant performance (Clark et al.2010). Isothermality has been shown to influence plantheight growth across latitudes though the relationshipis weak (Moles et al. 2009). Temperature seasonalityis important for species growth and hence for theirdistribution because most annual net primary productionof trees in seasonal forests is concentrated in the monthswith high rainfall and growth is likely to be most sensitiveto temperature variability during this time of the year(Vlam et al. 2014). All four variables were moderatelyto highly correlated with one of the first two PCA axes.The first axis of the PCA explained 46% of the variationand showed a strong Pearson correlation with annualrainfall (r = 0.93), temperature seasonality (r = 0.66)and isothermality (r = 0.73). Rainfall seasonality alsowas moderately correlated with the second axis (r =0.50) that explained 35% of the variation. We testedfor multicollinearity among the four variables usingcollinearity statistics. The variance inflation factor was< 3 indicating that all four variables could be includedin a regression analysis (Zuur et al. 2010). Correlationsamong the four variables are shown in Appendix 3.
Species response to climatic variables
For each of the species, we conducted a forward multiplelogistic regression analysis of presence/absence on thefour climatic variables and their quadratic terms. To beable to construct bell-shaped responses both the simpleand quadratic terms for each climatic variable wereincluded. We also included interaction terms but theinteractions contributed little to the variation (data notshown). For each species the regression model withthe lowest deviance (−2 log likelihood) and highestNagelkerke R2 was selected (Field 2009). Area underthe curve (AUC) of a receiver operating characteristiccurve (ROC) (Metz 1978) was used to measure the overallmodel accuracy (Pearce & Ferrier 2000). We interpretedAUC using the scale proposed by Swets (1988): good= AUC > 0.9; useful = 0.9 > AUC > 0.7 and poorAUC < 0.7. The partial variation contributed by eachenvironmental variable was calculated as the increasein variation when the variable was included in themodel. Parameters (Appendix 4) derived from the species-specific regression models were used to calculate theprobability of occurrence for each species for all fourenvironmental variables using the formula: P = 1/ (1+ Exp (−bo−b1×1−b2×1
2 . . . . . . . . . ..−b7×4−b8×42)),
where P = probability of occurrence, Exp = exponential,bo =a constant, X1–4 = the four bioclimatic variables used,b1–b8 = coefficients for the four bioclimatic variables andtheir quadratic terms.
We constructed the response curves for each speciesagainst the individual climatic variables using thecalculated probabilities, while keeping the other threeclimatic factors constant. When we kept the other threeenvironmental variables constant, we used their meanvalues across all 2505 plots in Ghana. Using constantvalues for the other variables is the only way to directlycompare the response curves of different species toan individual climatic variable. We acknowledge thatindividual species may have their peak occurrence indifferent parts of the climate space for the other threeclimatic variables than the mean values for Ghana thatwe used, which may lead to over- or underestimationsof the responses at some part of the climatic gradientfor a particular species. The mean values used were1514 mm y−1 for annual rainfall, 53% (coefficient ofvariation) for rainfall seasonality, 72% for isothermalityand 1028 °C for temperature seasonality (temperatureseasonality being calculated as standard deviation ofmean monthly temperature ×100). The temperaturedata were in units of °C ×10. Hence this means thatin normal degrees the average temperature seasonalityfor the plots is 1.028 °C. Species rainfall optimum (Ropt)and range (Rrange) were derived from the species responsecurves. Rainfall optimum was the value at which speciesoccurrence reached the maximum (ecological optimum).Rrange was the range of rainfall conditions under whichthe species occur computed as the difference between theminimum rainfall (rainfall at the 10th percentile) andthe maximum rainfall (rainfall at the 90th percentile)(Maharjan et al. 2011). All statistical analyses wereconducted using Predictive Analytics Software (PASW)statistics for windows version 18.0 (SPSS Incorporated,Chicago, IL).
RESULTS
Relative importance of climatic variables for speciesdistribution
Species showed different responses to the four climaticvariables studied. Most of the selected regression models(75%) had AUC > 0.7 (Appendix 4) indicating thatthe models are useful for predicting the occurrence ofspecies using the four climatic variables and presence-absence data. Most of the 20 woody species (95%)showed a significant response to rainfall, followed byrainfall seasonality (60%), isothermality (45%) andtemperature seasonality (40%). The logistic regressionmodels explained on average 28% (range = 3–60%across species) of the variation in species occurrence.On average, 17% (range = 0.8–52%) of the variationin species occurrence was explained by annual rainfall,5% (range = 0.5–27.5%) by rainfall seasonality,
Rainfall affects tropical tree distributions 439
0.0
0.1
0.2
0.3
0.4
0.5
0.6
Pb Ma Ds Pe Ca Hu Np Ce Cp Ts At Ta Ea Rh Ni Ti Az Pa Sp Pm
Par
tial
var
ianc
e ex
plai
ned
Species
Temperature seasonalityIsothermalityRainfall seasonalityAnnual rainfall
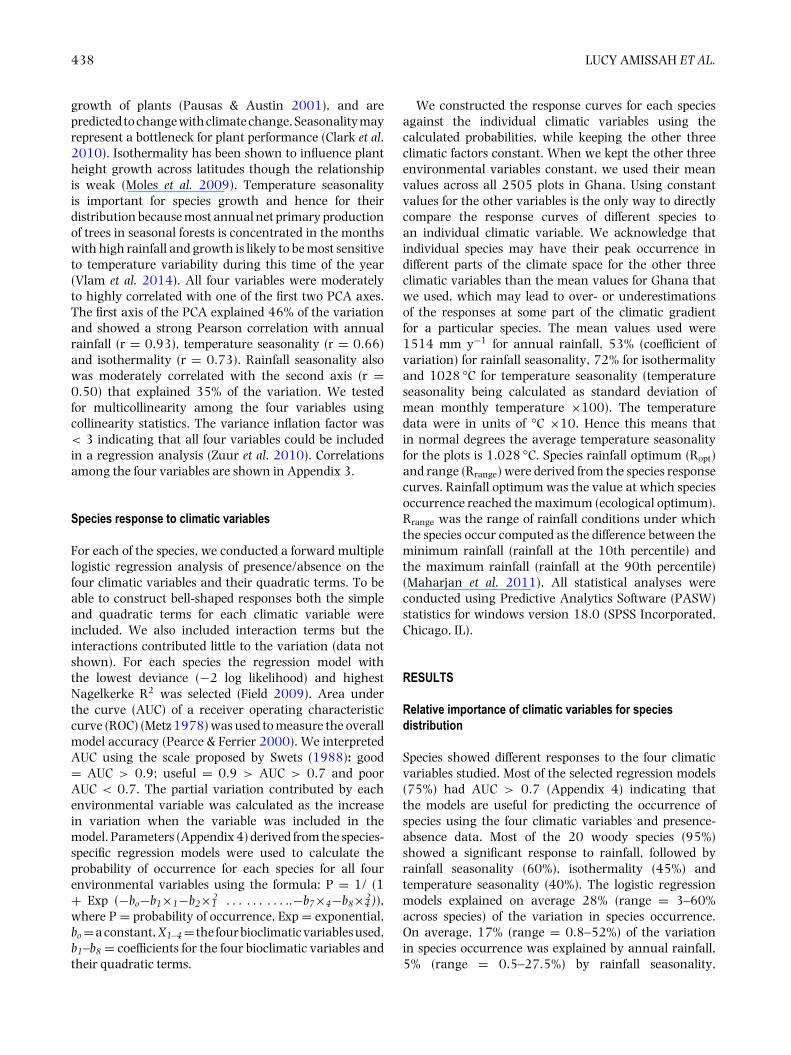
Figure 1. Bar graph displaying variation in species occurrence explained by four climatic variables in multiple logistic regression models for 20Ghanaian woody tree species. Climatic variables included are: RAN, annual rainfall; RSEAS, rainfall seasonality; ISO, isothermality; TSEAS,temperature seasonality. The species are ordered based on the variation explained by annual rainfall. At, Antiaris toxicaria; Az, Albizia zygia; Ca,Cynometra ananta; Ce, Celtis adolfi-friderici; Cp, Ceiba pentandra; Ds, Diospyros sanza-minika; Ea, Entandrophragma angolense; Hu, Heritiera utilis; Ma,Mansonia altissima; Ni, Newbouldia laevis; Np, Nesogordonia papaverifera; Pa, Piptadeniastrum africanum; Pb, Pentadesma butyracea; Pe, Pericopsis elata;Pm, Petersianthus macrocarpus; Rh, Ricinodendron heudelotii; Sp, Strombosia pustulata; Ta, Turraeanthus africanus; Ti, Terminalia ivorensis; Ts, Terminaliasuperba.
4% (range = 0.8–24%) by isothermality and 1% (range =0.4–4.5%) by temperature seasonality. For 12 of the 20species annual rainfall explained, amongst the four factorsstudied, most of the variation in occurrence (Figure 1).Examples of species affected by annual rainfall are:Heritiera utilis and Pentadesma butyracea, which are typicalwet-forest species; Mansonia altissima, which is a typicaldry-forest species; and Terminalia superba, which is foundin all main (wet, moist and dry) forest types in Ghana(Figures 1 and 2). For six of the species rainfall seasonalityexplained most of the variation of the four factors studiedand these were mostly species with peak occurrencein moist forests such as Entandrophragma angolense andTurraeanthus africanus (Figures 1 and 2). For two ofthe species (Strombosia pustulata and Piptadeniastrumafricanum), isothermality explained most of the variationin occurrence with reference to the four factors studied.Temperature seasonality did not explain the most (of fourfactors studied) important variation in the occurrence forany of the 20 species studied (Figure 1).
Species response to climatic variables
Species showed different response curve types to the fourclimatic variables studied: unimodal response (Figure 3a),decreasing response (Figure 3b), increasing response
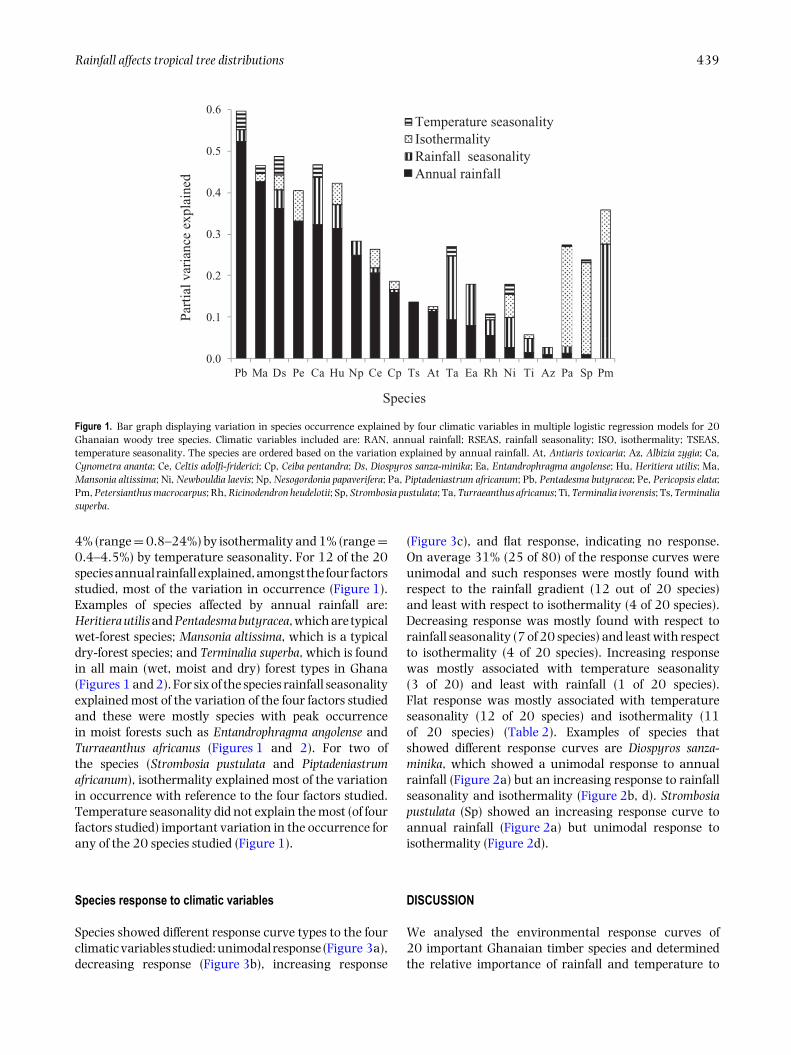
(Figure 3c), and flat response, indicating no response.On average 31% (25 of 80) of the response curves wereunimodal and such responses were mostly found withrespect to the rainfall gradient (12 out of 20 species)and least with respect to isothermality (4 of 20 species).Decreasing response was mostly found with respect torainfall seasonality (7 of 20 species) and least with respectto isothermality (4 of 20 species). Increasing responsewas mostly associated with temperature seasonality(3 of 20) and least with rainfall (1 of 20 species).Flat response was mostly associated with temperatureseasonality (12 of 20 species) and isothermality (11of 20 species) (Table 2). Examples of species thatshowed different response curves are Diospyros sanza-minika, which showed a unimodal response to annualrainfall (Figure 2a) but an increasing response to rainfallseasonality and isothermality (Figure 2b, d). Strombosiapustulata (Sp) showed an increasing response curve toannual rainfall (Figure 2a) but unimodal response toisothermality (Figure 2d).
DISCUSSION
We analysed the environmental response curves of20 important Ghanaian timber species and determinedthe relative importance of rainfall and temperature to

440 LUCY AMISSAH ET AL.
0.0
0.2
0.4
0.6
0.8
1.0
800 850 900 950 1000 1050 1100 1150 1200
Pro
babi
lity
of
occu
rren
ce
Temperature Seasonality (oC)
DS
Az
TaNi CaPb Pe
0.0
0.2
0.4
0.6
0.8
1.0
64 66 68 70 72 74 76 78
Isothermality (%)
d)
Rh
Np
Pm
AtNi
Cp
Ts
Ce
Ca
0.0
0.2
0.4
0.6
0.8
1.0
40 50 60 70 80Rainfall seasonality (%)
b)
Rh
Az
Ni
0.0
0.2
0.4
0.6
0.8
1.0
1000 1200 1400 1600 1800 2000
Pro
babi
lity
of
occu
rren
ce
Annual rainfall (mm y −1)
PaEa
Ce
Ca PmPe
Ts Rh
MaAz
Pb
Hu
Ta
NiTi
a)
c)
NpSp
AtCp
Ds
Ea, Ti, Hu,
SpDsNp
Ce
At
Pm
Ta
TsCp
Ma
Ca
PePb
Ea, Ti, Hu, Pa Sp
Np
Rh
PmAt
Ts
CpMa
Ea, Hu, Pa, Ti
Sp
Ma
Ta
Az
Pb, Pe
Ds
Ce
Figure 2. Species response curves showing the probability of occurrence of 20 tropical woody tree species of Ghana in relation to annual rainfall,rainfall seasonality, isothermality and temperature seasonality. Curves give the results of fitted logistic regression models (Appendix 4). Thetemperature data were in units of °C ×10. Hence temperature seasonality values have been multiplied by 1000. At, Antiaris toxicaria; Az, Albiziazygia; Ca, Cynometra ananta; Ce, Celtis adolfi-friderici; Cp, Ceiba pentandra; Ds, Diospyros sanza-minika; Ea, Entandrophragma angolense; Hu, Heritiera utilis;Ma, Mansonia altissima; Ni, Newbouldia laevis; Np, Nesogordonia papaverifera; Pa, Piptadeniastrum africanum; Pb, Pentadesma butyracea; Pe, Pericopsiselata; Pm, Petersianthus macrocarpus; Rh, Ricinodendron heudelotii; Sp, Strombosia pustulata; Ta, Turraeanthus africanus; Ti, Terminalia ivorensis; Ts,Terminalia superba. Annual rainfall (a), rainfall seasonality (coefficient of variation) (b), temperature seasonality (calculated as standard deviation ofmean monthly temperature × 100) (c), and isothermality (ratio of mean diurnal temperature range and annual temperature range × 100) (d).
their distribution. Species showed differential responsesto the climatic variables but the distributions of mostspecies were more strongly influenced by rainfall thanby temperature.
Importance of annual rainfall, temperature and theirseasonality for species distribution
Rainfall. This study focused on the relative importanceof annual rainfall and its seasonality, temperatureseasonality and isothermality for species occurrence andtested the hypothesis that most of the species will respondto annual rainfall and especially rainfall seasonality. Wefound that nearly all (95%) species were significantly
affected by annual rainfall and that annual rainfallexplained more (on average 17%) of the variation inspecies occurrence than the other three factors evaluated(Figure 2). Other studies also found that rainfall was themain driver of large-scale distribution patterns of tropicalplant and tree species (Bongers et al. 1999, Holmgren& Poorter 2007, Maharjan et al. 2011, Toledo et al.2011, 2012). It is surprising that rainfall seasonalityexplained only 5% of the variation contrary to the widelyheld view that it strongly influences species distribution(Borchert 1998, Kato et al. 2000). In a recent study, dry-season intensity was found to be among the main driversof individual species distribution in Panama (Conditet al. 2013). The, at first sight, low percentage variationexplained by annual rainfall may have resulted from the

Rainfall affects tropical tree distributions 441
0.0
0.2
0.4
0.6
0.8
1.0
1000 1200 1400 1600 1800 2000
Pro
babi
lity
of
occu
rren
ce Entandrophragma angolense
a) R2 = 0.1 8
0.0
0.2
0.4
0.6
0.8
1.0
1000 1200 1400 1600 1800 2000
Pro
babi
lity
of
occu
rren
ce Ceiba pentandrab) R2 = 0.1 9
0.0
0.2
0.4
0.6
0.8
1.0
1000 1200 1400 1600 1800 2000
Pro
babi
lity
of
occu
rren
ce
Annual rainfall (mm y −1)
Strombosiapustulata
c)R2 = 0.24
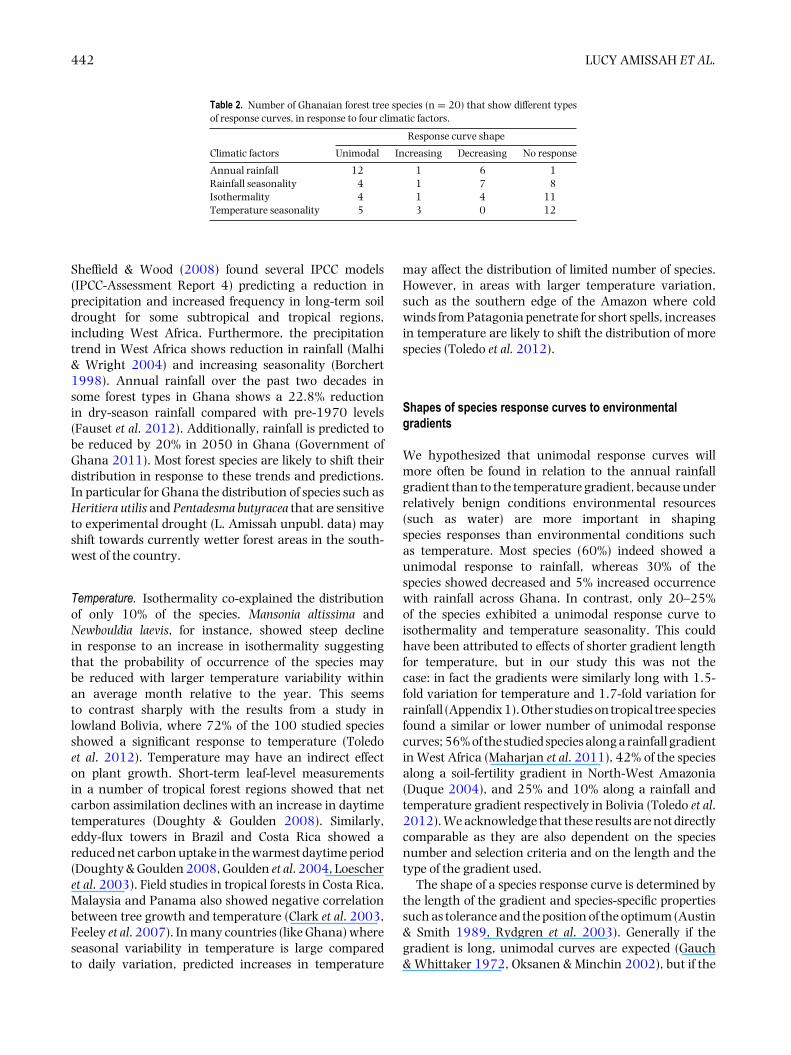
Figure 3. Examples of different species response curves of three of 20Ghanaian woody tree species to annual rainfall. Species responses (interms of probability of occurrence) are fitted with logistic regressionmodels. Regression lines show the predicted occurrence in relationto rainfall, while the three other climatic factors (rainfall seasonality,temperature seasonality and isothermality) are kept constant. Dotsshow the average observed probability of occurrence for rainfall classintervals of 150 plots. To make sure that each rainfall class contained150 plots, the rainfall classes had variable widths. Unimodal response(a), decreasing response (b) and increasing response (c).
small plot size (1-ha) used. The smaller plot size, however,allowed more replicates, and thus a higher statisticalpower to detect independent variation of various climaticvariables affecting the distribution of the species.
Recently, Fauset et al. (2012) evaluated the effects ofdrought on changes in plants’ functional compositionand biomass over a 20-year period in a variety of foresttypes in Ghana. They found that during this period
wet-forest evergreen and subcanopy shade-tolerantspecies decreased in abundance, whereas dry-forestdeciduous and canopy species increased in abundance.It is possible that these changes are not only driven by anincrease in drought, but also by general increasing levelsof disturbance in the forest zone of Ghana over the sampledperiod. Drier climate coupled with other human activitiesmay result in incidence of fire which leads to furtherchanges in forest composition. Experimental studies (field:Engelbrecht et al. 2007, Nepstad et al. 2007; greenhouse:Deines et al. 2011) showed that seasonal drought has astrong effect on growth and survival of individual treespecies, and that drought tolerance is a good predictorof species distribution along the rainfall gradient (Baltzeret al. 2008, Engelbrecht et al. 2007, Sterck et al. 2014).Repeated incidental (El Nino) drought also resulted in highmortality of especially trees with low wood density in theAmazon forest (Phillips et al. 2010). Additionally, in anAmazonian forest an experimental drought caused a rapidand strong decline in above-ground wood production(Brando et al. 2008). In combination, these studies suggestthat species drought tolerance is a major determinantexplaining species distribution along the rainfall gradient.However, other associated factors such as soil fertility,herbivory and pathogens, and perhaps most significantly,natural and human-induced disturbances such as forestfire, large wind blows and selective logging, can also co-influence species distribution along the rainfall gradient.Disturbance (and density of light-demanding species) alsoincreases with dryness of forest type (Hawthorne 1996).In addition, dispersal limitation may also influence thedistribution of species (Duncan et al. 2009). In general,soil fertility declines with increasing rainfall in Ghanaand Panama (Brenes-Arguedas et al. 2008, Swaine 1996,Veenendaal & Swaine 1998), probably because soilsin wetter areas are more leached as has been shownfor Ghana (Swaine 1996). Controlled experiments thatevaluated species growth responses to different wet-,moist- and dry-forest soils in Ghana (L. Amissah et al.unpubl. data, Veenendaal et al. 1996) found that thegrowth of very few species was significantly affectedby these soil differences. Planted seedlings in Panamashowed a higher overall growth in soils from the drierpart of the Isthmus than in soils from the wetter part.Insect herbivore damage and pathogen mortality weremore associated with wet forest than dry forest inPanama, suggesting an increasing pest pressure alongthe rainfall gradient (Brenes-Arguedas et al. 2009).However, no significant differences in pest attack levelsof wet-forest species and dry-forest species were found.Brenes-Arguedas et al. (2009) concluded therefore, thatseasonal drought was a stronger determinant of speciesdistribution than pests.
Although the projection of future climate for WestAfrica is not unequivocal (Christensen et al. 2007),
442 LUCY AMISSAH ET AL.
Table 2. Number of Ghanaian forest tree species (n = 20) that show different typesof response curves, in response to four climatic factors.
Response curve shape
Climatic factors Unimodal Increasing Decreasing No response
Annual rainfall 12 1 6 1Rainfall seasonality 4 1 7 8Isothermality 4 1 4 11Temperature seasonality 5 3 0 12
Sheffield & Wood (2008) found several IPCC models(IPCC-Assessment Report 4) predicting a reduction inprecipitation and increased frequency in long-term soildrought for some subtropical and tropical regions,including West Africa. Furthermore, the precipitationtrend in West Africa shows reduction in rainfall (Malhi& Wright 2004) and increasing seasonality (Borchert1998). Annual rainfall over the past two decades insome forest types in Ghana shows a 22.8% reductionin dry-season rainfall compared with pre-1970 levels(Fauset et al. 2012). Additionally, rainfall is predicted tobe reduced by 20% in 2050 in Ghana (Government ofGhana 2011). Most forest species are likely to shift theirdistribution in response to these trends and predictions.In particular for Ghana the distribution of species such asHeritiera utilis and Pentadesma butyracea that are sensitiveto experimental drought (L. Amissah unpubl. data) mayshift towards currently wetter forest areas in the south-west of the country.
Temperature. Isothermality co-explained the distributionof only 10% of the species. Mansonia altissima andNewbouldia laevis, for instance, showed steep declinein response to an increase in isothermality suggestingthat the probability of occurrence of the species maybe reduced with larger temperature variability withinan average month relative to the year. This seemsto contrast sharply with the results from a study inlowland Bolivia, where 72% of the 100 studied speciesshowed a significant response to temperature (Toledoet al. 2012). Temperature may have an indirect effecton plant growth. Short-term leaf-level measurementsin a number of tropical forest regions showed that netcarbon assimilation declines with an increase in daytimetemperatures (Doughty & Goulden 2008). Similarly,eddy-flux towers in Brazil and Costa Rica showed areduced net carbon uptake in the warmest daytime period(Doughty & Goulden 2008, Goulden et al. 2004, Loescheret al. 2003). Field studies in tropical forests in Costa Rica,Malaysia and Panama also showed negative correlationbetween tree growth and temperature (Clark et al. 2003,Feeley et al. 2007). In many countries (like Ghana) whereseasonal variability in temperature is large comparedto daily variation, predicted increases in temperature
may affect the distribution of limited number of species.However, in areas with larger temperature variation,such as the southern edge of the Amazon where coldwinds from Patagonia penetrate for short spells, increasesin temperature are likely to shift the distribution of morespecies (Toledo et al. 2012).
Shapes of species response curves to environmentalgradients
We hypothesized that unimodal response curves willmore often be found in relation to the annual rainfallgradient than to the temperature gradient, because underrelatively benign conditions environmental resources(such as water) are more important in shapingspecies responses than environmental conditions suchas temperature. Most species (60%) indeed showed aunimodal response to rainfall, whereas 30% of thespecies showed decreased and 5% increased occurrencewith rainfall across Ghana. In contrast, only 20–25%of the species exhibited a unimodal response curve toisothermality and temperature seasonality. This couldhave been attributed to effects of shorter gradient lengthfor temperature, but in our study this was not thecase: in fact the gradients were similarly long with 1.5-fold variation for temperature and 1.7-fold variation forrainfall (Appendix 1). Other studies on tropical tree speciesfound a similar or lower number of unimodal responsecurves; 56% of the studied species along a rainfall gradientin West Africa (Maharjan et al. 2011), 42% of the speciesalong a soil-fertility gradient in North-West Amazonia(Duque 2004), and 25% and 10% along a rainfall andtemperature gradient respectively in Bolivia (Toledo et al.2012). We acknowledge that these results are not directlycomparable as they are also dependent on the speciesnumber and selection criteria and on the length and thetype of the gradient used.
The shape of a species response curve is determined bythe length of the gradient and species-specific propertiessuch as tolerance and the position of the optimum (Austin& Smith 1989, Rydgren et al. 2003). Generally if thegradient is long, unimodal curves are expected (Gauch& Whittaker 1972, Oksanen & Minchin 2002), but if the

Rainfall affects tropical tree distributions 443
optimum of the species is close or beyond the extreme endof the gradient truncated curves are expected (Rydgrenet al. 2003, ter Braak & Looman 1986). Few unimodalresponse curves were found for temperature seasonalityand isothermality and 55–60% of the species showedno response. Other environmental factors may drive theshape of the response curve for these species (Austin &Gaywood 1994, Duque 2004), overruling temperatureseasonality and isothermality. In sum, this study showsthat annual rainfall and seasonality are the main climaticfactors influencing distribution of individual tree speciesin Ghana, though temperature influences the distributionof some species. Predicted increases in frequency andseverity of drought may cause shifts in the distribution ofspecies that occur at the wetter side of the rainfall gradient.
ACKNOWLEDGEMENTS
LA was supported by a grant from Wageningen Universityand the Netherlands Fellowship Programme (NUFFIC).We thank Dr Mike Swaine for providing advice on speciesselection and allowing us to use his database of speciesand their ordination scores, and an anonymous reviewerfor their helpful comments.
LITERATURE CITED
AUSTIN, M. P. & GAYWOOD, M. J. 1994. Current problems of
environmental gradients and species response curves in relation to
continuum theory. Journal of Vegetation Science 5:473–482.
AUSTIN, M. P. & SMITH, T. M. 1989. A new model for the continuum
concept. Vegetatio 83:35–47.
BALTZER, J. L., DAVIES, S. J., BUNYAVEJCHEWIN, S. & NOOR, N.
2008. The role of desiccation tolerance in determining tree species
distributions along the Malay–Thai Peninsula. Functional Ecology
22:221–231.
BONGERS, F., POORTER, L., VAN ROMPAEY, R. S. A. R. & PARREN,
M. P. E. 1999. Distribution of twelve moist forest canopy tree species
in Liberia and Cote d’Ivoire: response curve to a climate gradient.
Journal of Vegetation Science 10:371–382.
BORCHERT, R. 1998. Responses of tropical trees to rainfall seasonality
and its long-term changes. Climatic Change 39:381–393.
BRANDO, P. M., NEPSTAD, D. C., DAVIDSON, E. A., TRUMBORE, S.
E., RAY, D. & CAMARGO, P. 2008. Drought effects on litterfall,
wood production and belowground carbon cycling in an Amazon
forest: results of a throughfall reduction experiment. Philosophical
Transactions of the Royal Society B: Biological Sciences 363:1839–
1848.
BRENES-ARGUEDAS, T., RIOS, M., RIVAS-TORRES, G., BLUNDO, C.,
COLEY, P. D. & KURSAR, T. A. 2008. The effect of soil on the growth
performance of tropical species with contrasting distributions. Oikos
117:1453–1460.
BRENES-ARGUEDAS, T., COLEY, P. D. & KURSAR, T. A. 2009. Pests vs.
drought as determinants of plant distribution along a tropical rainfall
gradient. Ecology 90:1751–1761.
CHRISTENSEN, J. H., HEWITSON, B., BUSUIOC, A., CHEN, A., GAO,
X., HELD, I., JONES, R., KOLLI, R. K., KWON, W.T., LAPRISE, R.,
MAGANA RUEDA, V., MEARNS, L., MENENDEZ, C. G., RAISANEN,
J., RINKE, A., SARR, A. & WHETTON, P. 2007. Regional climate
projections. Pp. 848–940 in Soloman, S., Qin, D., Manning, M., Chen,
Z., Marquis, M., Averyt, K. B., Tignor, M. & Miller, H. L (eds.). Climate
change: the physical science basis. Contribution of Working Group I to
the Fourth Assessment Report of the Intergovernmental Panel on
Climate Change. Cambridge University Press, Cambridge.
CLARK, D. A., PIPER, S. C., KEELING, C. D. & CLARK, D. B. 2003. Tropical
rain forest tree growth and atmospheric carbon dynamics linked to
interannual temperature variation during 1984–2000. Proceedings
of the National Academy of Sciences USA 10:5852–5857.
CLARK, D. B., CLARK, D. A. & OBERBAUER, S. F. 2010. Annual wood
production in a tropical rain forest in NE Costa Rica linked to climatic
variation but not to increasing CO2. Global Change Biology 16:747–
759.
CONDIT, R., ENGELBRECHT, B. M., PINO, D., PEREZ, R. & TURNER,
B. L. 2013. Species distributions in response to individual soil
nutrients and seasonal drought across a community of tropical
trees. Proceedings of the National Academy of Sciences USA 110:5064–
5068.
DEINES, J. M., HELLMANN, J. J. & CURRAN, T. J. 2011. Traits
associated with drought survival in three Australian tropical
rainforest seedlings. Australian Journal of Botany 59:621–629.
DOUGHTY, C. E. & GOULDEN, M. L. 2008. Are tropical forests near
a high temperature threshold? Journal of Geophysical Research 113,
G00B07. doi: 10.1029/2007JG000632.
DUNCAN, R. P., CASSEY, P. & BLACKBURN, T. M. 2009. Do climate
envelope models transfer? A manipulative test using dung beetle
introductions. Proceedings of the Royal Society B: Biological Sciences
267:1449–1457.
DUQUE, A. J. 2004. Plant diversity scaled by growth forms along spatial
and environmental gradients. PhD thesis, University of Amsterdam,
the Netherlands.
ENGELBRECHT, B. M., COMITA, L. S., CONDIT, R., KURSAR, T. A.,
TYREE, M. T., TURNER, B. L. & HUBBELL, S. P. 2007. Drought
sensitivity shapes species distribution patterns in tropical forests.
Nature 447:80–82.
FAUSET, S., BAKER, T. R., LEWIS, S. L., FELDPAUSCH, T. R., AFFUM-
BAFFOE, K., FOLI, E. G., HAMER, K. C. & SWAINE, M. D. 2012.
Drought-induced shifts in the floristic and functional composition of
tropical forests in Ghana. Ecology Letters 15:1120–1129.
FEELEY, K. J., WRIGHT, S. J., NUR SUPARDI, M. N., KASSIM, A. R.
& DAVIES, S. J. 2007. Decelerating growth in tropical forest trees.
Ecological Letters 10:461–469.
FIELD, A. 2009. Discovering statistics using SPSS. (Third edition). Sage,
London. 896 pp.
FOOD AND AGRICULTURE ORGANIZATION OF THE UNITED NATIONS
(FAO) 2010. Global Forest Resources Assessment, 2010. Country
Report, Ghana. FRA 2010/077. Food and Agriculture Organization,
Rome. 49 pp.

444 LUCY AMISSAH ET AL.
GAUCH, H. G. & WHITTAKER, R. H.1972. Coenocline simulation.
Ecology 53:446–451.
GOULDEN, M. L., MILLER, S. D., DA ROCHA, H. R., MENTON, M. C.,
DE FREITAS, H. C., E SILVA FIGUEIRA, A. M. & DE SOUSA, C. A.
D. 2004. Diel and seasonal patterns of tropical forest CO2 exchange.
Ecological Applications 14:42–54.
GOVERNMENT OF GHANA. 2011. Ghana’s second national communica-
tion to UNFCC. Environmental Protection Agency, Accra. 168 pp.
HALL, J. B. & SWAINE, M. D. 1976. Classification and ecology of close-
canopy forest in Ghana. Journal of Ecology 64:913–951.
HALL, J. B. & SWAINE, M. D. 1981. Distribution and ecology of vascular
plants in a tropical rain forest. Forest vegetation in Ghana. Geobotany 1.
Dr. W. Junk Publishers, The Hague. 383 pp.
HAWTHORNE, W.D. 1995. Ecological profiles of Ghanaian forest trees.
Tropical Forestry Paper 29. Oxford Forestry Institute, Oxford. 345 pp.
HAWTHORNE, W. D. 1996. Holes and the sums of parts in Ghanaian
forest: regeneration, scale and sustainable use. Proceedings of the Royal
Society of Edinburgh. Section B. Biological Sciences 104b:75–176.
HAWTHORNE, W. D. & ABU-JUAM, M. 1995. Forest protection in Ghana.
IUCN, Gland and Cambridge. 219 pp.
HAWTHORNE, W. D. & GYAKARI, N. 2006. Photo guide for the forest
trees of Ghana. A tree-spotter’s field guide for identifying largest trees.
Oxford Forestry Institute, Oxford. 432 pp.
HAWTHORNE, W. D & JONGKIND, C. 2006. Woody plants of western
African forests. A guide to the forest trees, shrubs and lianas from Senegal
to Ghana. Royal Botanic Gardens, Kew. 1040 pp.
HIJMANS, R. J., CAMERON, S. E., PARRA, J. L., JOHNS, P. G. & JARVIS,
A. 2005. Very high resolution interpolated climate surfaces for global
land areas. International Journal of Climatology 25:1965–1978.
HOLMGREN, M. & POORTER, L. 2007. Does a ruderal strategy dominate
the endemic flora of the West African forests? Journal of Biogeography
34:1100–1111.
JOHN, R., DALLING, J. W., HARMS, K. E., YAVITT, J. B., STALLARD, R.
F., MIRABELLO, M., HUBBELL, S. P., VALENCIA, R., NAVARRETE,
H. & VALLEJO, M. 2007. Soil nutrients influence spatial distributions
of tropical tree species. Proceedings of the National Academy of Sciences
USA 104:864–869.
KATO, M., ITIOKA, T., SAKAI, S., MOMOSE, K., YAMANE, S., HAMID,
A. A. & INOUE, T. 2000. Various population fluctuation patterns
of light-attracted beetles in a tropical lowland dipterocarp forest in
Sarawak. Population Ecology 42:97–104.
LOESCHER, H., OBERBAUER, S., GHOLZ, H. & CLARK, D. 2003.
Environmental controls on net ecosystem-level carbon exchange and
productivity in a Central American tropical wet forest. Global Change
Biology 9:396–412.
LOGAH, F. Y., OBUOBIE, E., OFORI, D. & KANKAM-YEBOAH, K. 2013.
Analysis of rainfall variability in Ghana. International Journal of Latest
Research in Engineering and Computing 1:1–8.
MALHI, Y. & WRIGHT, J. 2004. Spatial patterns and recent trends in
the climate of tropical rainforest regions. Philosophical Transactions of
the Royal Society of London. Series B: Biological Sciences 359:311–329.
MAHARJAN, S. K., POORTER, L., HOLMGREN, M., BONGERS, F.,
WIERINGA, J. J. & HAWTHORNE, W. D. 2011. Plant functional
traits and the distribution of West African rain forest trees along the
rainfall gradient. Biotropica 43:552–561.
METZ, C. E. 1978. Basic principles of ROC analysis. Seminar in Nuclear
Medicine 8:283–298.
MOLES, A. T., WARTON, D. I., WARMAN, L., SWENSON, N. G.,
LAFFAN, S. W., ZANNE, A. E., PITMAN, A., HEMMINGS, F. A. &
LEISHMAN, M. R. 2009. Global patterns in plant height. Journal of
Ecology 97:923–932.
NEPSTAD, D. C., TOHVER, I. M., RAY, D., MOUTINHO, P. & CARDINOT,
G. 2007. Mortality of large trees and lianas following experimental
drought in an Amazon forest. Ecology 88:2259–2269.
OKSANEN, J. & MINCHIN, P. R. 2002. Continuum theory revisited: what
shape are species responses along ecological gradients? Ecological
Modelling 157:119–129.
PAUSAS, J. G. & AUSTIN, M. 2001. Patterns of plant species richness in
relation to different environments: an appraisal. Journal of Vegetation
Science 12:153–166.
PEARCE, J. & FERRIER, S. 2000. Evaluating the predictive performance
of habitat models developed using logistic regression. Ecological
Modelling 133:225–245.
PHILLIPS, O. L., VAN DER HEIJDEN, G., LEWIS, S. L., LOPEZ-GONZALEZ,
G., ARAGAO, L. E., LLOYD, J., MALHI, Y., MONTEAGUDO, A.,
ALMEIDA, S., DAVILA, E. A., AMARAL, I., ANDELMAN, S.,
ANDRADE, A., ARROYO, L., AYMARD, G., BAKER, T. R., BLANC,
L., BONAL, D., DE OLIVEIRA, A. C., CHAO, K. J., CARDOZO, N.
D., DA COSTA, L., FELDPAUSCH, T. R., FISHER, J. B., FYLLAS, N.
M., FREITAS, M. A., GALBRAITH, D., GLOOR, E., HIGUCHI, N.,
HONORIO, E., JIMENEZ, E., KEELING, H., KILLEEN, T. J., LOVETT,
J. C., MEIR, P., MENDOZA, C., MOREL, A., VARGAS, P. N., PATINO,
S., PEH, K. S., CRUZ, A. P., PRIETO, A., QUESADA, C. A., RAMIREZ,
F., RAMIREZ, H., RUDAS, A., SALAMAO, R., SCHWARZ, M., SILVA,
J., SILVEIRA, M., SLIK, J. W., SONKE, B., THOMAS, A. S., STROPP,
J., TAPLIN, J. R., VASQUEZ, R. & VILANOVA, E. 2010. Drought-
mortality relationships for tropical forests. New Phytologist 187:631–
646.
RYDGREN, K., ØKLAND, R. H. & ØKLAND, T. 2003. Species response
curves along environmental gradients. a case study from SE
Norwegian swamp forests. Journal of Vegetation Science 14:869–
880.
SHEFFIELD, J. & WOOD, E. F. 2008. Projected changes in drought
occurrence under future global warming from multi-model,
multi-scenario, IPCC AR4 simulations. Climate Dynamics 31:79–
105.
STERCK, F., MARKESTEIJN, L., TOLEDO, M., SCHIEVING, F. &
POORTER, L. 2014. Sapling performance along resource gradients
drives tree species distributions within and across tropical forests.
Ecology in press.
SWAINE, M. 1996. Rainfall and soil fertility as factors limiting
forest species distributions in Ghana. Journal of Ecology 84:419–
428.
SWETS, J. A. 1988. Measuring the accuracy of diagnostic systems.
Science 240:1285–1293.
TER BRAAK, C. J., & LOOMAN, C. W. 1986. Weighted averaging, logistic
regression and the Gaussian response model. Vegetatio 65:3–11.
TER STEEGE, H., PITMAN, N. C., PHILLIPS, O. L., CHAVE, J., SABATIER,
D., DUQUE, A., MOLINO, J.-F., PREVOST, M.-F., SPICHIGER, R.
& CASTELLANOS, H. 2006. Continental-scale patterns of canopy
Rainfall affects tropical tree distributions 445
tree composition and function across Amazonia. Nature 443:444–
447.
TOLEDO, M., POORTER, L., PENA-CLAROS, M., ALARCON, A.,
BALCAZAR, J., CHUVINA, J., LEANO, C., LICONA, J. C., TER
STEEGE, H. & BONGERS, F. 2011. Patterns and determinants of
floristic variation across lowland forests of Bolivia. Biotropica 43:
405–413.
TOLEDO, M., PENA-CLAROS, M., BONGERS, F., ALARCON, A.,
BALCAZAR, J., CHUVINA, J., LEANO, C., LICONA, J. C. & POORTER,
L. 2012. Distribution patterns of tropical woody species in response
to climatic and edaphic gradients. Journal of Ecology 100:253–263.
VEENENDAAL, E. M. & SWAINE, M. D. 1998. Limits to trees species
distribution in lowland tropical rain forest. Pp. 163–191 in Newbery,
D. M., Prins, H. H. T. & Brown, N. D. (eds.). Dynamics of tropical
communities. The 37th Symposium of the British Ecological Society.
Blackwell Science, Oxford.
VEENENDAAL, E., SWAINE, M., LECHA, R., WALSH, M., ABERBRESE,
I. & OWUSU-AFRIYIE, K. 1996. Responses of West African forest tree
seedlings to irradiance and soil fertility. Functional Ecology 10:501–
511.
VLAM, M., BAKER, P. J., BUNYAVEJCHEWIN, S. & ZUIDEMA, P. A.
2014. Temperature and rainfall strongly drive temporal growth
variation in Asian tropical forest trees. Oecologia 174:1449–1461.
WRIGHT,, S. J. 2010. The future of tropical forests. Annals of the New
York Academy of Sciences 1195:1–27.
ZUUR, A. F., IENO, E. N. & ELPHICK, C. S. 2010. A protocol for data
exploration to avoid common statistical problems. Methods in Ecology
and Evolution 1:3–14.
Appendix 1. Mean, range and ratio (maximum divided by the minimum)of climatic variables of 2505 forest plots of Ghana. The mean, range andratio are based on climatic data obtained from the Worldclim database(Hijmans et al. 2005).
Parameters Mean Range Ratio
Annual rainfall (mm) 1510 1160–1940 1.66Rainfall seasonality (%) 53 44–73 1.37Temperature seasonality (°C) 1030 816–1210 1.48Isothermality (%) 72 66–77 1.16
-1.0
-0.5
0.0
0.5
1.0
-1.0 -0.5 0.0 0.5 1.0
TMAX
RSEAS
TSEAS
TRANGE
TDIU
RCOLD
TWET
TMIN
ISORWARM
RMAX
RWETRMINRANRDRY
TCOLDTDRY
Axis
2 (3
5.2%
)
Axis 1 (45.5%)
TAMTWARM
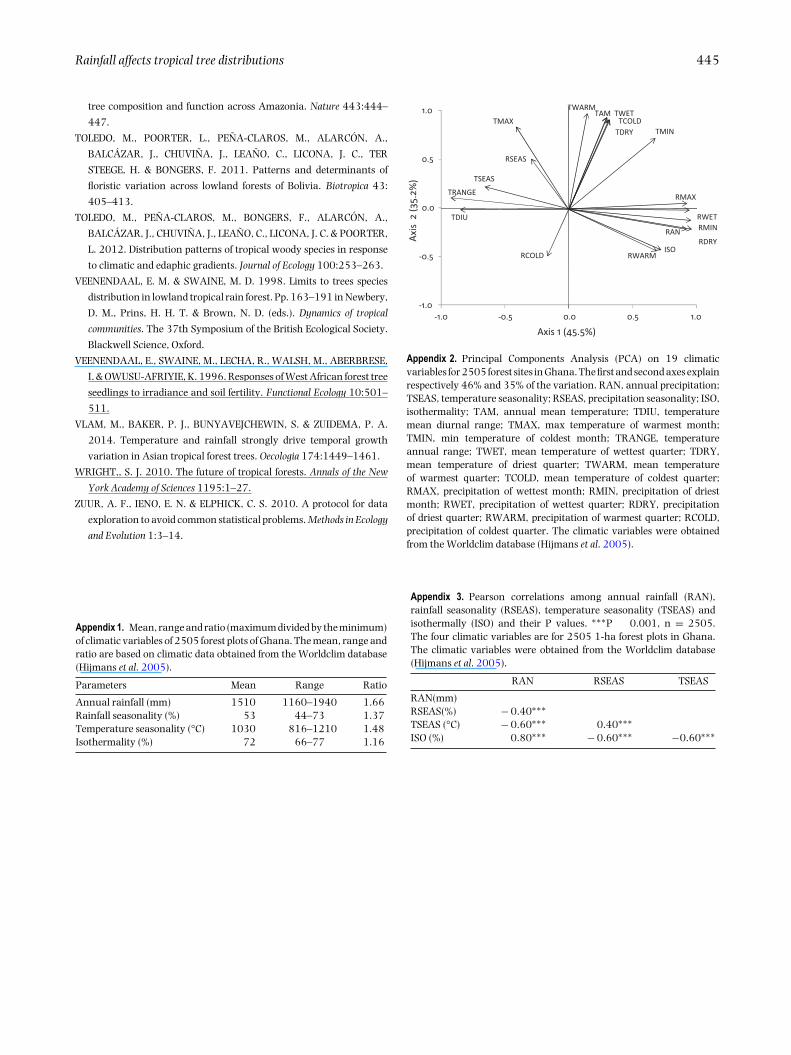
Appendix 2. Principal Components Analysis (PCA) on 19 climaticvariables for 2505 forest sites in Ghana. The first and second axes explainrespectively 46% and 35% of the variation. RAN, annual precipitation;TSEAS, temperature seasonality; RSEAS, precipitation seasonality; ISO,isothermality; TAM, annual mean temperature; TDIU, temperaturemean diurnal range; TMAX, max temperature of warmest month;TMIN, min temperature of coldest month; TRANGE, temperatureannual range; TWET, mean temperature of wettest quarter; TDRY,mean temperature of driest quarter; TWARM, mean temperatureof warmest quarter; TCOLD, mean temperature of coldest quarter;RMAX, precipitation of wettest month; RMIN, precipitation of driestmonth; RWET, precipitation of wettest quarter; RDRY, precipitationof driest quarter; RWARM, precipitation of warmest quarter; RCOLD,precipitation of coldest quarter. The climatic variables were obtainedfrom the Worldclim database (Hijmans et al. 2005).
Appendix 3. Pearson correlations among annual rainfall (RAN),rainfall seasonality (RSEAS), temperature seasonality (TSEAS) andisothermally (ISO) and their P values. ∗∗∗P � 0.001, n = 2505.The four climatic variables are for 2505 1-ha forest plots in Ghana.The climatic variables were obtained from the Worldclim database(Hijmans et al. 2005).
RAN RSEAS TSEAS
RAN(mm)RSEAS(%) − 0.40∗∗∗TSEAS (°C) − 0.60∗∗∗ 0.40∗∗∗ISO (%) 0.80∗∗∗ − 0.60∗∗∗ −0.60∗∗∗

446 LUCY AMISSAH ET AL.
Appendix 4. Regression models fitted for presence absence data of 20 woody tree species of Ghana, the deviance (−2 log likelihood), Nagelkerke R2,significant levels, and model accuracy; Area Under the Curve (AUC). RAN, annual rainfall; RSEAS, rainfall seasonality; ISO, isothermality; TSEAS,Temperature seasonality. Significant levels are at ∗P ˂ 0.05, ∗∗P ˂ 0.01, ∗∗∗P ˂ 0.001, ns = not significant.
Coefficient of variables
Constant RAN RAN2 RSEAS RSEAS2 ISO ISO2
Heritiera utilis −1750∗∗∗ 0.17∗∗∗ 0.00005∗∗∗ 0.29∗∗∗ – 44.3∗∗∗ − 0.31∗∗∗Cynometra ananta −490∗∗∗ 0.40∗∗∗ 0.00012∗∗∗ 2.91∗∗∗ − 0.02∗∗∗ – –Diospyros sanza-minika −320∗∗∗ 0.25∗∗∗ 0.00008∗∗∗ − 0.76∗∗∗ 0.01∗∗∗ 0.33∗∗∗ –Pentadesma butyracea −490∗∗∗ 0.33∗∗∗ 0.00010∗∗∗ 2.04∗∗∗ − 0.02∗∗∗ – –Entandrophragma angolense 43∗∗∗ 0.06∗∗∗ 0.00002∗∗∗ – 0.00∗∗∗ – –Turraeanthus africanus −50∗∗∗ 0.08∗∗∗ 0.00002∗∗∗ − 0.84∗∗∗ 0.01∗∗∗ – –Petersianthus macrocarpus −630∗∗∗ – – − 1.52∗∗∗ 0.01∗∗∗ 18.6∗∗∗ − 0.13∗∗∗Ricinodendron heudelotii 14ns 0.02∗∗∗ 0.00001∗∗∗ − 0.07 – – − 0.00∗∗Newbouldia laevis 140∗ 0.09∗∗∗ 0.00003∗∗∗ – − 0.0∗∗∗ − 5.11∗ 0.03∗Mansonia altissima 1.2ns 0.10∗∗∗ 0.00004∗∗∗ – – – − 0.002∗∗∗Nesogordonia papaverifera −5.0ns 0.02∗∗ 0.00001∗∗∗ – − 0.00∗∗∗ – –Ceiba pentandra 220∗∗∗ − 0.00∗∗∗ – − 0.07∗∗∗ – − 5.72∗∗∗ 0.04∗∗∗Celtis adolfi-friderici −460∗∗∗ – 0.000∗∗∗ – − 0.00∗∗∗ 13.2∗∗∗ − 0.09∗∗∗Albizia zigyia 4.3∗∗∗ – 0.000∗∗∗ − 0.08∗∗∗ – – –Pericopsis elata −1080∗∗∗ − 0.02∗∗∗ – – – 31.8∗∗∗ − 0.23∗∗∗Piptadeniastrum africanum −57∗∗∗ 0.03∗∗∗ 0.00001∗∗∗ − 0.04∗ – 0.23∗∗∗ –Antiaris toxicaria 14∗∗∗ – 0.000∗∗∗ – − 0.00∗∗∗ − 0.13∗∗∗ –Strombosia pustulata −370∗∗∗ 0.00∗∗∗ – – 9.90∗∗∗ − 0.07∗∗∗Terminalia ivorensis −5.40ns 0.03∗∗ 0.00001∗∗ − 0.89∗∗ 0.00∗∗ 0.12∗ –
Terminalia superba −19∗∗∗ 0.03∗∗∗ 0.00001 – – – –Species TSEAS TSEAS2 Deviance R2 AUCHeritiera utilis – – 1360 0.42 0.89Cynometra ananta 0.12∗∗∗ 0.00006∗∗∗ 880 0.47 0.92Diospyros sanza-minika 0.21∗∗∗ 0.00011∗∗∗ 1750 0.49 0.88Pentadesma butyracea 0.30∗∗∗ 0.00016∗∗∗ 890 0.60 0.95Entandrophragma angolense – – 3110 0.18 0.73Turraeanthus africanus 0.01∗∗∗ – 2430 0.27 0.78Petersianthus macrocarpus – – 2680 0.36 0.76Ricinodendron heudelotii −0.03∗ 0.00001∗ 3250 0.11 0.65Newbouldia laevis – 0.00∗∗∗ 1830 0.18 0.76Mansonia altissima −0.12∗∗∗ 0.00006∗∗∗ 1880 0.46 0.87Nesogordonia papaverifera – – 2680 0.28 0.78Ceiba pentandra – – 3080 0.19 0.70Celtis adolfi-friderici – – 2810 0.26 0.78Albizia zigyia – – 2750 0.03 0.60Pericopsis elata – – 333 0.40 0.95Piptadeniastrum africanum 0.04∗ 0.00002∗∗∗ 2290 0.27 0.77Antiaris toxicaria – – 3200 0.13 0.68Strombosia pustulata 0.00∗∗ – 2020 0.24 0.74Terminalia ivorensis – – 1490 0.06 0.65Terminalia superba – – 3200 0.14 0.68