Rainbow Smelt (Osmerus mordax) age and growth in ...
23
Rainbow Smelt (Osmerus mordax) age and growth in Whitefish Bay, Lake Superior, with an analysis of age estimation effort. Joseph T. Mrnak 1&2 1 Northland College, Department of Natural Resources, 2 United States Geological Survey Lake Superior Biological Station May, 2016
-
Upload
khangminh22 -
Category
Documents
-
view
1 -
download
0
Transcript of Rainbow Smelt (Osmerus mordax) age and growth in ...

Rainbow Smelt (Osmerus mordax) age and
growth in Whitefish Bay, Lake Superior,
with an analysis of age estimation effort.
Joseph T. Mrnak1&2 1Northland College, Department of Natural Resources,
2United States Geological Survey Lake Superior
Biological Station
May, 2016

Mrnak 2
Abstract
In the Laurentian Great Lakes, nonnative Rainbow Smelt (Osmerus mordax)
provide forage for Lake Trout (Salvelinus namaycush) and other predatory fish and
are potential competitors with and predators of young Coregonus species. In recent
years, Rainbow Smelt populations have declined across the Laurentian Great Lakes.
This study is centered on Whitefish Bay, located at the Eastern end of Lake Superior,
which is warmer and has a lower abundance of Lake Trout than other parts of Lake
Superior. I compared age, after identifying an appropriate ageing structure, and
growth metrics between Rainbow Smelt collected from Whitefish Bay in 2015 to
collections made from other times and locations. I found no significant bias in
estimated ages between readers for thin sectioned and whole cleared otoliths, but a
significant bias between readers was detected for whole uncleared otoliths.
Average coefficient of variation between readers was lowest for thin sectioned
otoliths. For the same reader, the only significant bias detected was where whole
uncleared otoliths underestimated the age for fish with an estimated otolith thin
section age of 3. Results indicate that thin sectioned otoliths appear to be the
superior structure for estimating the age of Rainbow Smelt. Maximum ages and
growth rates differed between Rainbow Smelt from Whitefish Bay in 2015 and
those from many of the other times and locations examined. The oldest fish in 2015
was 3 years old, whereas 5 and 6 year old fish were found in all of the other studies.
Mean lengths-at-age for age-1 and age-2 Rainbow Smelt from Whitefish Bay in 2015
were intermediate compared to all other studies. However, age-3 Rainbow Smelt
from the 2015 sample were noticeably smaller than from all other studies. The
maximum age and growth differences for Rainbow Smelt among these periods and
locations may be related to the observed population declines. Additional studies
will be required to determine if this pattern is evident in other years and locations
in Lake Superior.

Mrnak 3
Introduction
Rainbow Smelt (Osmerus mordax) are native to the northern drainages of the
Western Atlantic, Pacific, and Arctic oceans (Figure 1; Scott and Crossman 1973;
McClane 1974). They invaded the Laurentian Great Lakes in the early 20th century
and found their way into Lake Superior in the early 1930s (Van Oosten 1937). Since
their invasion, Rainbow Smelt have played an important ecological role in all of the
Laurentian Great Lakes (Feiner et al. 2015), particularly as forage for Lake Trout
(Salvelinus namayacush; Dryer et al. 1965; Ray et al. 2007) and as potential
competitors with and predators of young Coregonus species (Selgeby et al. 1978;
Myers et al. 2009). As reported by commercial harvest, which is often biased due to
concentrated effort, populations in Lake Superior peaked in 1950-1960 (Baldwin et
al. 1979). Since the mid to late 1980s, populations have fluctuated, but the overall
trend has been downward, particularly since 2001 (Gorman 2007; Pratt et al. 2016).
Figure 1. Rainbow Smelt native range (shaded areas; USGS 2016).
Rainbow Smelt are a short-lived species that can reach a maximum age of
seven in their native range (Bailey 1964). In Lake Superior, Rainbow Smelt age and
growth were described for Western Lake Superior in the early 1960s (Bailey 1964),

Mrnak 4
during 1976 and 1977 (Schaefer et al. 1981), and between 1977-1980 (Luey and
Adelman 1984). Similar studies have not been conducted in Eastern Lake Superior.
Whitefish Bay, located on the Eastern side of Lake Superior (Figure 2), was chosen
for this study to address this lack of data. Furthermore, Whitefish Bay was chosen
for this study based on the unique dynamics of the ecosystem. Whitefish Bay is
relatively warmer than most of Lake Superior (NOAA Great Lakes Surface
Environmental Analysis 2015; USGS unpublished data), there is a low abundance of
Lake Trout relative to much of the lake (Sitar et al. 2000; Wilberg and Hansen 2003;
USGS unpublished data), and there is also low interspecific competition between
Rainbow Smelt and Coregonus species due to recent population declines in Cisco
(Coregonus artedi), Bloater (Coregonus hoyi), and Lake Whitefish (Coregonus
clupeiformis; Pratt et al. 2016; USGS unpublished data).
Figure 2. Lake Superior with Whitefish Bay highlighted by the yellow box (Landsat
2007).
Knowing the age of a fish (or having a precise estimate) allows fisheries
scientists to create models that provide a better understanding of the dynamics of
the stock and how the population changes in response to environmental and
anthropogenic changes. The age of Rainbow Smelt has been estimated using scales

Mrnak 5
(McKenzie 1958, Bailey 1964, Jilek et al. 1979, Schaefer et al. 1981, Luey and
Adelman 1984, Henderson and Nepszy 1989, Elzey et al. 2010), fin rays (Walsh et al.
2008), and whole otoliths (Sirois et al. 1998, Walsh et al. 2008). Walsh et al. (2008)
found that ages estimated from sectioned fin rays were most precise among three
readers, followed by whole cleared otoliths and then whole uncleared otoliths.
Walsh et al. (2008) did not evaluate thin sectioned otoliths for assigning age
estimates to Rainbow Smelt.
The primary objective of this study is to compare precision in ages among
whole cleared otoliths, whole uncleared otoliths, and thin sectioned otoliths. Then,
using the most precise ageing structure, describe the age distribution, growth
(length-at-age), and weight-length relationship for Rainbow Smelt from Whitefish
Bay in 2015. I then describe potential temporal changes in the age distribution and
growth metrics by comparing my results to results from previous studies on
Rainbow Smelt in Lake Superior. I hypothesize that Rainbow Smelt from Whitefish
Bay will be older and larger than Rainbow Smelt from other areas of the lake due to
the lack of predators such as Lake Trout, low competition via reduced Coregonus
species density, and warmer water than compared to the other parts of Lake
Superior.
The secondary objective of this study is to compare the time (effort) required
to process each ageing structure for all three methods. Additionally, I will
summarize the age distributions and growth using the ages from each structure to
determine if these metrics differ among structures. These results will guide
managers and supervisors to make the most cost-effective and scientifically sound
decisions for their respective agencies with respect to estimating the age of
Rainbow Smelt.
Methods
Rainbow Smelt were collected from Whitefish Bay, Lake Superior during June
2015. A Yankee bottom trawl (11.9-m headrope and 6.4-mm mesh cod end) was
towed cross-contour with the United States Geological Survey (USGS) R/V Kiyi.
Starting depths ranged from 10.1m to 37.0m with an average of 22.6m. Ending

Mrnak 6
depths ranged from 65.8m to 100.0m with an average of 76.5m. Once on deck, a
total of 20 fish per 10mm length bin and all fish > 160mm were frozen in water to be
processed in the laboratory two to three months later.
In the laboratory, fish were thawed by placing the plastic bag in a sink with
room temperature water. Once thawed, individual fish were measured (total length;
TL) to the nearest millimeter, weighed to the nearest 0.1 gram, and saggital otoliths
were removed and stored in micro-centrifuge tubes with a unique identification
label. The sagittal otoliths were immersed in dilute (10%) bleach (NaOCl) to clean
and then rinsed with distilled water so that bleach crystals did not form on the
surface (Secor et al. 1991). Water was removed from the otolith surface with a
paper towel and then covered with 95% ethanol for 5 minutes to remove water
from within the otolith (Secor et al. 1991). After cleaning, otoliths were allowed to
air dry before being stored in a micro-centrifuge tube. One otolith from each fish
was cleared by immersing it in a 70:30 ethanol:glycerin solution for 30 days (Walsh
et al. 2008). After viewing the other otolith whole, it was mounted in EpoKwickTM
fast cure epoxy resin with the sulcus facing downward. A 0.3mm-0.5mm thick thin
section of the transverse plane from the dorsal to the ventral side (Secor et al. 1991)
was cut with a BuehlerTM low-speed isomet saw (Buehler, Isomet Model 11-1180,
Lake Bluff, Illinois). Sections were mounted on a clear glass microscope slide with
EpoKwickTM fast cure epoxy resin. A drop of mineral oil was applied to all otoliths
for viewing with a Nikon Eclipse E200 compound microscope using reflected light at
40-100x magnification.
Ages were estimated by two readers (one more experienced than the other)
from whole cleared, whole uncleared, and thin sectioned otoliths. The readers did
not have any knowledge of fish size, sex, or maturity, which may bias the reader’s
interpretation of age (Morison et al. 1998). Scales were not used to estimate age as
the majority of fish in the trawl collections retained few if any scales. Furthermore,
sectioned fin rays were not used as the handmade chuck and three-blade set up
used by Walsh et al. (2008) could not be replicated.
Bias in age estimates between readers with the same structure and between
different structures with the same reader were estimated with age-bias plots

Mrnak 7
(Campana et al. 1995) and by testing for symmetry in an age-agreement table
(Evans and Hoenig 1998) with ageBias() from the FSA package v0.7.9 (Ogle 2015) in
the RTM statistical environment v3.2.2 (R Development Core Team, 2015). If no
significant bias between readers or between structures was detected, precision
between readers and between structures was described with the average coefficient
of variation (ACV; Chang 1982; Kimura and Lyons 1991) as computed with
agePrecision() from the FSA package, and as the percentage of fish for which the
ages differed by zero years (full agreement).
An age-length key (ALK; Fridriksson 1934; Ketchen 1949) was derived for
Rainbow Smelt from Whitefish Bay in 2015 from the more experienced reader’s thin
sectioned otolith age estimates and using 10mm length bins. The subsample of fish
for which ages were estimated from the otoliths did not cover the full range of
lengths in the original sample; therefore, I assumed that fish with lengths not
represented in the ALK had the same distribution of ages as fish in the closest length
bin. Specific ages were assigned to all Rainbow Smelt captured in Whitefish Bay in
2015 using the ALK and the method described by Isermann and Knight (2005) as
implemented in the alkIndivAge() function from the FSA package. From this, mean
length-at-age and the age distribution were computed.
To determine the effort required to process each otolith with each
methodology, the times required for each step (removal, preparation, and reading;
excluding epoxy cure time and clearing time) in the preparation were recorded to
the nearest 0.25 minute (15 seconds). A one-way ANOVA followed by a Tukey HSD
comparison were used to determine statistical differences in the mean total
preparation time among the three methodologies.
The weight-length relationship was described by fitting a linear regression to
common log-transformed weights and lengths.
All statistical tests used α=0.05 to determine statistical significance.

Mrnak 8
Results
No significant bias in estimated ages was detected between readers for thin
sectioned otoliths (p=0.527) and whole cleared otoliths (p=0.593; Figure 3-left).
There was, however, a significant bias between readers for whole uncleared otoliths
(p<0.0005), where Reader 2 (the less experienced reader) provided consistent
overestimates for age-1 through age-3 compared to Reader 1 (Figure 3-left). For the
same reader (Reader 1) using different structures, no significant bias was detected
between whole cleared and whole uncleared otoliths (p=0.421) and between whole
cleared and thin sectioned otoliths (p=0.429; Figure 3-right). A significant bias was
detected between thin sectioned and whole uncleared otoliths with the same reader
(p=0.032), where a higher mean estimated age was given for the whole uncleared
otoliths for age-3 fish (Figure 3-right).
The ACV between readers was 6.2 and 14.4 for thin sectioned otoliths and
whole cleared otoliths, respectively (Figure 3 left). The ages for the two readers
agreed for 64% of the whole cleared otoliths and for 83% of the thin sectioned
otoliths (Figure 3-left). For different structures with the same reader, the ACV was
12.4 for whole uncleared and whole cleared otoliths and 9.5 for whole cleared and
thin sectioned otoliths (Figure 3-right). Whole cleared and whole uncleared otoliths
agreed for 65% of the fish while whole cleared and thin sectioned otoliths agreed
for 76% of the fish (Figure 3-right).
The total length of the 393 Rainbow Smelt collected ranged from 38 –
193mm with a mean (± SD) of 110.3 (±37.2) mm. The age distribution and mean
lengths-at-age for the 393 Rainbow Smelt captured in Whitefish Bay are reported in
Table 1.
The length-weight relationship fit to the 393 Rainbow Smelt sampled from
Whitefish Bay is log10 (Weight) = -5.906 + 3.266log10(Total Length) (r2=0.9917)
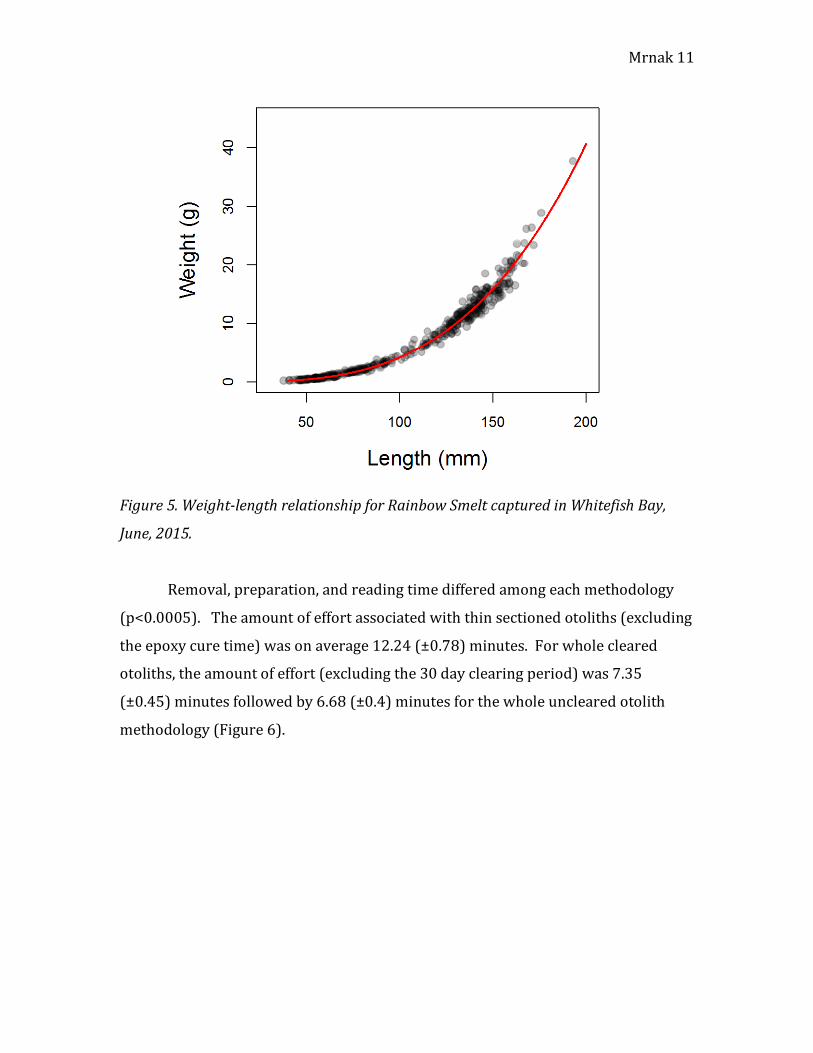
(Figure 4) or Weight = 0.00000124165L3.266 (Figure 5).

Mrnak 9
Figure 3. Age-bias plots for whole uncleared (WUC), whole cleared (WC) and thin
sectioned (TS) otoliths between readers (left) and between pairs of structures (right).
Superimposed on the plot are the percent full agreement (Full Agree), the Evans-
Hoenig test of symmetry p-value (E-H p), and the average coefficient of variation
(ACV) for Rainbow Smelt captured in Whitefish Bay, June 2015. The red confidence
intervals correspond to significantly different age estimates while the black confidence
intervals indicate non-statistically different age estimates. The dashed line represents
perfect agreement between the ages.

Mrnak 10
Table 1. Age distribution (percentage), sample size (n), and mean, standard deviation
(SD), and standard error (SE) length-at-age (mm) for Rainbow Smelt sampled from
Whitefish Bay in June, 2015.
Age
Distribution n Mean SD SE
Age I 39.9% 157 69.5 15.97 1.27 Age II 28.5% 112 130.6 15.56 1.47 Age III 31.6% 124 143.8 15.52 1.39
Figure 4. Common log-transformed linear regression of the weight-length relationship
for Rainbow Smelt captured in Whitefish Bay, June 2015.
Mrnak 11
Figure 5. Weight-length relationship for Rainbow Smelt captured in Whitefish Bay,
June, 2015.
Removal, preparation, and reading time differed among each methodology
(p<0.0005). The amount of effort associated with thin sectioned otoliths (excluding
the epoxy cure time) was on average 12.24 (±0.78) minutes. For whole cleared
otoliths, the amount of effort (excluding the 30 day clearing period) was 7.35
(±0.45) minutes followed by 6.68 (±0.4) minutes for the whole uncleared otolith
methodology (Figure 6).

Mrnak 12
Figure 6. Plot of mean (with 95% confidence interval) amount of effort (minutes) by
age estimation methodology (thin sectioned (TS); whole cleared (WC); and whole
uncleared (WUC)). Different letters indicate means that are significantly different.
Discussion
For this study, the true age of these Rainbow Smelt cannot be determined,
thus validation of the age estimations is impossible. Campana et al. (1995) stated
that when age estimates cannot be verified, researchers should strive for
consistency in age estimation. For the three methodologies proposed in this report,
thin sectioned otoliths provided the most consistent (lowest bias, highest precision)
between reader age estimates for Rainbow Smelt located in Whitefish Bay. Between
whole cleared and whole uncleared otoliths, it was found that whole cleared otoliths
provided more precise and less bias age estimates between readers. These results
corroborate the findings of Walsh et al. (2008) that whole cleared otoliths are better
for estimating the age of Rainbow Smelt than are whole uncleared otoliths. Further
research should now compare bias and precision for age estimations between thin

Mrnak 13
sectioned otoliths (most precise in this study) and sectioned fin rays (most precise
in Walsh et al. 2008 study) for Rainbow Smelt.
Removal, preparation, and reading time varied between the three
methodologies, ranging from about 7 minutes for whole uncleared otoliths to 12
minutes for thin sectioned otoliths. These effort results may be used by managers to
make decisions about how to allocate time and energy for estimating the ages of
Rainbow Smelt. Is funding a limiting resource that would make whole cleared
otoliths more ideal or do differences in the ACV create large enough changes in the
results to warrant the more time-costly method of thin sectioned otoliths?
To help answer this question, I computed the amount of time and money
(based on an hourly wage of $11.00/hr) associated with various sample sizes of fish
to estimate the age of (Table 2). I also applied the age summary methods described
previously for thin sectioned otoliths to the other two methods to describe how
metrics of growth and age distribution would differ based on the structure used to
estimate the ages (Tables 3 and 4). When comparing the two extremes (i.e., the
most precise and time costly thin sectioned otoliths and the least precise and time
costly whole uncleared otoliths), the age distribution and mean lengths-at-age for
age-1 through age-3 are nearly identical with the only striking difference being the
single age-4 individual in the whole uncleared otolith sample (Table 3). However,
the amount of effort required is 53% greater for thin sectioned than whole
uncleared otoliths. The differences in population metrics based on the method used
is minimal and does not warrant the use of the significantly more time costly
method. However, it is important to note that this population consists of only three
(or four) age classes. I would hypothesize that larger discrepancies may arise in the
population characteristics if more age classes existed.

Mrnak 14
Table 2. Time (hours; hrs) and cost (U.S. $) associated with different sample sizes of
fish for the various age estimation methodologies.
Thin Sectioned Whole Cleared Whole Uncleared
# fish Time Cost Time Cost Time Cost
100 20.4 hrs $224.40 12.25 hrs $134.75 11.13 hrs $122.46
500 102 hrs $1,122.00 61.25 hrs $673.75 56.67 hrs $612.33
1000 204 hrs $2,244.00 122.5 hrs $1,347.50 111.33 hrs $1,224.76
Table 3. Age distribution (percentage) for Rainbow Smelt from Whitefish Bay based on
using either whole uncleared or whole cleared otoliths to estimated their ages. Results
for thin sectioned otoliths are in Table 1.
Whole Uncleared Whole Cleared
Age I 40.7% 40.5%
Age II 30.8% 32.6%
Age III 28.2% 29.5%
Age IV <1% --
Table 4. Mean length-at-age (mm) and associated standard error (SE) for Rainbow
Smelt from Whitefish Bay based on using either whole uncleared or whole cleared
otoliths to estimate their ages. Results for thin sectioned otoliths are in Table 1.
Whole Uncleared Whole Cleared
Age I 70.1 (1.42) 70.5 (1.42)
Age II 131.3 (1.37) 130.8 (1.57)
Age III 144.9 (1.43) 144.2 (1.35)
Age IV 160.0 (--) -- (--)

Mrnak 15
Taking into account sampling variability, the mean lengths-at-age for
Rainbow Smelt sampled from Whitefish Bay in 2015 (based on thin sectioned
otolith age estimates) differ from most other studies examined (Table 5). In 2015,
age-1 Rainbow Smelt from Whitefish Bay had about half the studies report higher
mean lengths-at-age and about half report lower mean lengths-at-age. Mean length-
at-age for age-3 fish from Whitefish Bay 2015 were significantly shorter than all
other reported findings. However, the mean length-at-age for age-2 fish from this
study was the same result produced by three other studies, one of which was
Whitefish Bay 1978-1981.
Table 5. Mean length-at-age (mm) and age distribution (percentage) for Rainbow
Smelt from various dates and locations around Lake Superior. The standard error
derived from the 2015 Whitefish Bay mean length-at-age data is shown in the last row.
(Whitefish Bay, WFB; Wisconsin Waters, WI; Lake Superior, L. Sup; Western Lake
Superior, W. L. Sup; A, (Bailey 1964); B, (Schaefer 1981); C, (Luey and Adelman 1984)).
Location/Date/Study Age I Age II Age III Age IV Age V Age VI
WFB (Mrnak 2015) 69.5 (40%)
130.6 (30%)
144.3 (30%)
-- (--)
-- (--)
-- (--)
WFB (USGS 1978-1981) 74.2 (48%)
130.6 (32%)
160.4 (15%)
190.3 (3%)
215.6 (<1%)
NA (--)
WI (USGS 1992-2001) 88 (14%)
126 (37%)
151 (34%)
172 (11%)
187 (2%)
226 (<1%)
WI (USGS 1978-1981) 67.8 (52%)
131.8 (20%)
167.3 (17%)
186.7 (9%)
207.5 (2%)
213.2 (<1%)
L. Sup (USGS 1992-2001) 83 (23%)
126 (34%)
156 (27%)
183 (11%)
203 (2%)
229 (<1%)
L. Sup (USGS 1978-1981) 66.2 (58%)
129.9 (20%)
164.6 (14%)
186.5 (7%)
208.5 (<1%)
215.2 (<1%)
W. L. Sup (A; 1958-1960) 66.0 (45%)
151.1 (25%)
190.5 (13%)
210.8 (11%)
228.6 (5%)
248.92 (1%)
W. L. Sup (B; 1976-1977) 101 (11%)
137 (27%)
166 (37%)
186 (20%)
204 (4%)
NA (--)
W. L. Sup (C; 1977-1980) 86.9 (--)
136.8 (--)
169.6 (--)
186.1 (--)
198.3 (--)
204.5 (--)
Standard Error derived from 2015 data set
1.3mm 1.5mm 1.4mm -- -- --

Mrnak 16
It is key to note that the standard error (SE) in this study is going to be
different than the reference studies due to sample size. My largest sample size was
for the age-1 group (n=157), whereas the reference studies used a range of sample
sizes from 13,543 fish (USGS; Whitefish Bay 1978-1981) to 86 fish (USGS; Wisconsin
Waters 1992-2001). Although the SE is different for each data set, I feel that
conclusions can still be reasonably made and based more on practical significance
rather than statistical significance. From a practical standpoint, the only major
discrepancy is with age-3 Rainbow Smelt sampled from Whitefish Bay in 2015. The
mean length-at-age for 2015 age-3 Rainbow Smelt is noticeably smaller than all
other reported mean lengths-at-age. Furthermore, while still using the practical
significance lens, it can be reasonably argued that the mean length-at-age has not
drastically changed between locations and times for age-1 and age-2 Rainbow Smelt
(two minor exceptions are for age-1 fish in Western Lake Superior in the mid-1970s
and age-2 fish in Western Lake Superior in the late 1950s).
It appears that age-3 Rainbow Smelt located in Whitefish Bay during 2015
grow more slowly than most other stocks (past and present) around the lake
despite population declines, which in theory would lead to less density-dependent
influences upon the stock, resulting in increased growth. Possible contributors to
this finding could be a lack of food availability that is targeted by these age-3 fish
(e.g., juvenile Coregonus species), increased intraspecific competition amongst this
age class, or possibly a chemical or nutrient change in the water that has reduced
primary production, which may ultimately influence the forage base targeted by
these age-3 fish. Research should be conducted to see if the slow growth of
Rainbow Smelt age-3 and older is present in other locations and during other times
around the lake.
It is also noteworthy that no fish older than age-3 appeared in the 2015
Whitefish Bay sample. Most other studies found Rainbow Smelt up to age-6 and all
found age-5 fish (Table 5). The age distribution among all the studies was fairly
similar (i.e., age-1 or age-2 fish dominated the sample, except for the Schaefer et al.
1976-1977 data set where age-3 fish made up the majority of the sample; Table 5).
Older fish (age 5+) make up a very small percentage of these populations ranging

Mrnak 17
from less than 1% to a maximum of 5% (Table 5). Thus, it could be assumed that if
the sampling effort was increased for this study, older Rainbow Smelt might have
appeared in the sample. Support for this assumption comes about when looking at
the age distribution for the 2015 caught Rainbow Smelt. Age-3 fish make up about
30% of the population with no age-4 fish present. I find it very hard to believe that
all 30% of these fish succumb to mortality on an annual basis. Furthermore, all
studies used different gear (seines, electrofishing, dip nets, trawls, etc.) so it is
reasonable to have different proportions of age classes for each different study due
to gear selectivity. I believe that the same possibilities as to why 2015 Whitefish
Bay Rainbow Smelt have reduced growth (food, competition, nutrients) could also
be contributing to the truncated size structure by not allowing the fish to reach their
historic growth and life history potential.
My hypothesis that Rainbow Smelt sampled from Whitefish Bay in 2015 will
be older and larger was incorrect. In 2015, Rainbow Smelt from Whitefish Bay
exhibited a lower maximum age and slowed growth rates past age-2. A potential
explanation for this finding (excluding the general statements above) could be due
to Rainbow Smelt being a highly cannibalized species in the absence of readily
available resources (Gorman 2008; Feiner et al. 2015). These age-3 fish could be
feeding upon each other at such a high rate that it is truncating the population
(despite the lack of top-down control via Lake Trout), resulting in less older fish.
However, cannibalism tends to be felt more by smaller fish (i.e., big fish eat small
fish). So, unless Rainbow Smelt exhibit an aggressive feeding behavior similar to
Northern Pike (Esox lucius; eats very large prey relative to body size), then I do not
believe cannibalism is the reason. Pratt et al. (2016) noted that Lake Trout
abundance has been on the rise in recent years (i.e., 2006-2011) across Lake
Superior. The truncated size structure finding could be a result of a newly
established Lake Trout stock in Whitefish Bay, which would explain away the
slowed growth finding (i.e., Lake Trout are targeting and predating on the big age-3
fish, resulting in the apparent ‘slowed growth’). However, cannibalism or predation
(or any other form of mortality) would also result in less density-dependent
influences, which would lead to increased growth, unless another influence wields a

Mrnak 18
greater effect on the population (e.g., lack of production). Pratt et al. (2016)
mentioned that since about 1980, Rainbow Smelt population structure around Lake
Superior has shifted towards smaller age-1-2 fish. Moreover, Pratt et al. (2016) said
that of 35 Rainbow Smelt year classes that have been measured, the eight weakest
have occurred in the last 13 years resulting in little recruitment to larger size
classes. Gorman (2012) stated that this pattern is consistent with increasing
predation pressure. My findings, which are in accordance with Pratt et al. (2016)
and Gorman (2012), lead me to hypothesize that there is in fact a new population of
predators feeding upon these large age-3 Rainbow Smelt at a rather fast rate.
Additional studies will be required to determine if this pattern (reduced growth
past age-2 and a truncated population structure) is occurring in other years and
other locations around Lake Superior and to identify other possible contributors to
these findings.
Conclusions
Thin sectioned otoliths are statistically superior to uncleared and cleared
whole otoliths for estimating the age of Rainbow Smelt (most precise and least
biased). However, the difference in the 2015 Whitefish Bay Rainbow Smelt
population characteristics based on the structure used for age estimation are not
large enough to warrant the use of this more time costly method. My
recommendation is for the USGS Lake Superior Biological Station to use whole
cleared otoliths to estimate the ages of Rainbow Smelt (ideal middle ground), but to
also keep in mind that thin sectioned otoliths produce the least biased and most
precise age estimates.
Rainbow Smelt from Whitefish Bay exhibited a lower maximum age and
slowed growth beyond age-2 compared to many other locations and times. I
recommend that Whitefish Bay’s limnological characteristics, the prey/predator
species abundance (past, present, and future), and the Rainbow Smelt’s diet be
looked at more in-depth with hopes of explaining these findings.

Mrnak 19
Acknowledgements
I would like to thank Dr. Derek Ogle and Dr. Mark Vinson for their
constructive criticism and prevalent support. I also thank the crew of the R/V Kiyi
for all of their hard work and open arms, and I would like to thank Amber Acker for
being a wonderful laboratory assistant.
“See a job, do a job.” -MRV

Mrnak 20
References
Bailey, M.M. 1964. Age, growth and sex composition of the American Smelt (Osmerus mordax), of Western Lake Superior. Transactions of the American Fisheries Society. 93:382-395.
Baldwin, N.S., Sallfeld, R.W., Ross, M.A., and Buettner, H.J. 1979. Commercial Fish
Production in the Great Lakes 1867–1977. Ann Arbor, MI: Great Lakes Fishery Commission Technical Report 3.
Bronte, C.R., Ebener, M.P., Schreiner, D.R., Devault, D.S., Petzold, M.M., Jensen, D.A.,
Richards, C., and Lozano, S.J. 2003. Fish community change in Lake Superior, 1970–2000. Canadian Journal of Fisheries and Aquatic Sciences. 60:1552–1574.
Campana, M.C., Annand and J.I., McMillan. 1995. Graphical and statistical methods
for determining the consistency of age determinations. Transactions of the American Fisheries Society. 124:131-138.
Chang, W.Y.B., 1982. A statistical method for evaluating the reproducibility of age determination. Canadian Journal of Fisheries and Aquatic Sciences. 39:1208-1210.
Dryer, W.R., Erkkila, L.F., and Tetzloff, C.L. 1965. Food of the Lake Trout in Lake Superior. Transactions of the American Fisheries Society. 94:169–176.
Elzey, S., Centerline, C., and Fischer, J., 2010. Improving Methods to Accurately Age Rainbow Smelt. American Fisheries Society Meeting.
Evans, G.T., and J.M., Hoenig. 1998. Testing and viewing symmetry in contingency tables, with application to readers of fish ages. Biometrics. 54:620-629.
Feiner, Z.S., Bunnell, D.B., Höök, T.O., Madenjian, C.P., Warner, D.M., and
Collingsworth, P.D. 2015. Non-stationary recruitment dynamics of Rainbow Smelt: The influence of environmental variables and variations in size structure and length-at-maturation. Journal of Great Lakes Research. 41:246-258.
Fridriksson, A. 1934. On the calculation of age-distribution within a stock of cod by
means of relatively few age-determinations as a key to measurements on a large scale. Rapports et procès-verbaux des reunions: Conseil permanent international pour l'exploration de la mer. 86:1-5.
Gorman, O.T. 2007. Changes in a population of exotic Rainbow Smelt in Lake
Superior: Boom to bust, 1974–2005. Journal of Great Lakes Research. 33:75-90. Gorman, O.T. 2012. Successional change in the Lake Superior fish community:

Mrnak 21
population trends in ciscoes, rainbow smelt, and lake trout, 1958-2008. Advanced Limnology. 63: 337-362.
Henderson, B.A., and Nepszy, S.J. 1989. Factors Affecting Recruitment and Mortality
Rates of Rainbow Smelt (Osmerus mordax) in Lake Erie, 1963–1985. Journal of Great Lakes Research. 15:357–366.
Isermann, D.A., and Knight, C.T. 2005. A computer program for age-length keys
incorporating age assignment to individual fish. North American Journal of Fisheries Science. 25:1153-1160.
Jilek, R., Cassell, B., Peace, D., Garza, Y., and Siewart, T. 1979. Spawning population
dynamics of Smelt, (Osmerus mordax). Journal of Fish Biology 15:31–35. Ketchen, K.S. 1949. Stratified subsampling for determining age distributions.
Transactions of the American Fisheries Society. 79:205-212. Kimura, D.K., and Lyons, J.J. 1991. Between reader bias and variability in age-
determination process. Fishery Bulletin. 89:53-60. Landsat. 2007. Lake Superior Nasa. Accessed April 28th 2016. URL
http://www.cs.mcgill.ca/~rwest/link-suggestion/wpcd_2008-09_augmented/images/889/88926.jpg.htm
Lawrie, A.H. 1978. The fish community of Lake Superior. Journal of Great Lakes
Research. 4:513–549. Luey, J.E., and Adelman, I.R. 1984. Stock structure of Rainbow Smelt in Western Lake
Superior: Population characteristics. Transactions of the American Fisheries Society. 113:709-715.
McClane, A.J. 1974. Field Guide to Freshwater Fishes of North America. Henry Holt
and Company, LLC, New York, New York. McKenzie, R.A. 1958. Age and growth of Smelt, (Osmerus mordax) of the Miramichi
River, New Brunswick. Journal of the Fisheries Research Board of Canada. 15:1313–1327.
Morison, A.K., Robertson S.G., and Smith D.C. 1998. An integrated system for
producing fish aging: Image analysis and quality assurance. North American Journal of Fisheries Management. 18:587-598.
Myers, J.T., Jones, M.L., Stockwell, J.D., Yule, D.L. 2009. Reassessment of the
predatory effects of Rainbow Smelt on Ciscoes in Lake Superior. Transactions of the American Fisheries Society. 138:1352–1368.

Mrnak 22
NOAA Great Lakes Environmental Research Laboratory (CoastWatch). 2015. Great Lakes Environmental Analysis (GLSEA). URL http://coastwatch.glerl.noaa.gov/glsea/glsea.html
Ogle, D.H., 2015. FSA: Fisheries stock analysis. URL
http://fishr.wordpress.com/fsa/. Pratt, T.C., Gorman, O.T., Mattes, W.P., Myers, J.T., Quinlan, H.R., Schreiner, D.R.,
Seider, M.J., Sitar, S.P., Yule, D.L., and Yurista, P.M. 2016. The state of Lake Superior in 2011. URL http://www.glfc.org/pubs/SpecialPubs/Sp16_01.pdf.
U.S. Geological Survey. 2016. Nonindigenous Aquatic Species Database. Gainesville,
Florida. Accessed April, 28th 2016. Van Oosten, J. 1937. The dispersal of Smelt, (Osmerus mordax) in the Great Lakes
region. Transactions of the American Fisheries Society. 66:160–171. R Development Core Team. 2015. R: a language and environment for statistical
computing. R Foundation for Statistical Computing. Vienna, Austria. URL http://R-project.org.
Ray, B.A., Hrabik, T.R., Ebener, M.P., Gorman, O.T., Schriener, D.R., Schram, S.T., Sitar,
S.T., Mattes, W.P. andBronte, C.R. 2007. Diet and prey selection by Lake Superior lake trout during spring, 1986-2001. Journal of Great Lakes Research 33:104–113.
Schaefer, W.F., Swenson, W.A., and Heckmann, R.A. 1981. Age and growth and total
mortality of Rainbow Smelt in Western Lake Superior. Journal of Great Lakes Research. 7:37-41.
Scott, W.B., and Crossman, E. J. 1973. Freshwater fishes of Canada. Fisheries
Research Board of Canada Bulletin. 184. Secor, D.H., Dean, J.M., and Laban, E.H. 1991. Manual for otolith removal and
preparation for microstructural examination. Electric Power Research Institute and Belle W., Baruch Institute for Marine Biology and Coastal Research, Milwaukee, Wisconsin and Columbia, South Carolina respectively.
Selgeby, J.H., Bronte, C.R., and Slade, J.W. 1994. Forage species. In The state of Lake
Superior in 1992, M.J. Hansen, ed. Great Lakes Fisheries Commission Special Publication 94-1. Great Lakes Fishery Commission, Ann Arbor, MI.
Sirois, P., Lecomte, F., and Dodson, J.J. 1998. An Otolith-based back-calculation
method to account for time-varying growth rate in Rainbow Smelt (Osmerus

Mrnak 23
mordax) larvae. Canadian Journal of Fisheries and Aquatic Sciences. 55:2662-2671.
Sitar, S., Bronte, C., Ebener, M., Fratt, T., Gebhardt, K., Halpern, T., Mattes, B., Mensch,
G., Petzold, M., Schram, S., and Schreiner, D. 2000. Status of Lake Trout in Lake Superior 1993-2000. Special Report: Great Lakes Fisheries Commission, Ann Arbor, MI.
Walsh, M.G., Maloy, A.P., and O’Brien, T.P. 2008. Comparison of Rainbow Smelt age
estimates from fin rays and otoliths. North American Journal of Fisheries Management. 28:42-49.
Wilberg, M.J., and Hansen, M.J. 2003. Historic and modern abundance of wild Lean
Lake Trout in Michigan waters of Lake Superior: Implications for restoration goals. North American Journal of Fisheries Management. 23:100-108.