Railways Statement - Papers Past
124
-
Upload
khangminh22 -
Category
Documents
-
view
0 -
download
0
Transcript of Railways Statement - Papers Past

D.—2,
1929.NEW ZEALAND.
RAILWAYS STATEMENTBY THE MINISTER OF RAILWAYS, THE HON. W. B. TAVERNER.
Mr. Speaker,—In presenting the Railways Statement for the year ended 31st March, 1929.
I have the honour to report that the gross income from all sources was £8,747,975, anincrease of £223,437 on that of the previous year, whilst the expenditure was£6,849,383, an increase of £164,260. The net earnings were £1,898,592, as comparedwith £1,839,415, an improvement of £59,177 on the results in the previous year.
On the 31st March, 1929, the capital invested in the lines open for traffic,including the steamers and plant on Lake Wakatipu and other subsidiary services,was £56,568,598, an increase of £5,381,222 on the capital account for the previousyear.
The increase in capital comprises £3,464,578 construction charges on 107 miles ofnew lines taken over from the Public Works Department during the year, £368,886expended on new works and charged against capital account under "Additions toopen lines," and £1,547,758 expended under the Railways Improvement Autho-rization Act, 1914, on works such as new workshops and the Westfield and TawaPlat Deviations.
Included in the gross income is the sum of £498,937 credited in respect ofdevelopmental lines, a sum £9,369 higher than the amount received under the sameheading for the previous year.
A sum of £655,986 was charged against revenue for depreciation and provisionfor renewals, and the amount expended from this fund was £258,836 for assetswritten off or renewals effected during the year. The accumulated credit balance inthis fund at the 31st March, 1929, was £1,328,020, an increase of £397,150 over thebalance at the 31st March, 1928.
Interest charges amounted to £2,331,335, as compared with £2,130,867 in theprevious year, an increase of £200,468.
The deficit on account of revenue and expenditure on the year's working was£432,743, as compared with £291,452 for the previous year, an increase of £141,291;and this increase is principally due to the unprofitable nature of the new lines takenover during the year, the revenue from which was insufficient to pay working-expenses, thus leaving no margin for interest charges.
The revenue from passenger traffic totalled £2,124,746, as compared with£2,145,296 in the previous year, a decrease of £20,550, or 0'96 per cent. While thesefigures are more satisfactory than those for the previous year, when the decrease was£158,884, the fact must not be overlooked that the decrease in ordinary passengertraffic still continues. Por the year under review the revenue from ordinarypassenger traffic decreased by £148,476, but owing to the fact that Good Friday fellon the 29th March, 1929, as compared with the Bth April, 1928, the bookings for1929 include the major part of two Easter holidays, and the heavy decrease inordinary bookings is partially balanced by the increase in the holiday excursionissues.
i—D. 2.
D.—2 II
It is satisfactory to note that the efforts of the Department in catering forweek-end and picnic traffic and special events have resulted in an increase of £14,992in the revenue from passengers carried at reduced fares.
Freight revenue totalled £4,846,125, an increase of £165,990, or 3"55 per cent.,as compared with the figures for the previous year. The principal increases were ingrain, butter, cheese, wool, agricultural lime, soft coal, road metal, benzine, andartificial manures.
The live-stock traffic totalled 10,319,768 head, an increase of 560,311 ascompared with the previous year.
The gross expenditure was £6,849,383, as compared with £6,685,123 in 1928, anincrease of £164,260. The principal increases were in maintenance of rolling-stock(£43,439) and traffic transportation (£65,506). The increase in the former item isdue to the greater provision necessary for renewals and overhead expenses in respectto the workshops reorganization, while the larger expenditure on the traffic side isdue chiefly to the expense incurred in working the additional mileage taken overduring the past year and the cost of providing additional services such as the nightexpresses in the South Island.
Immediately on my assuming office I took the opportunity of making myselfpersonally acquainted with so much of the railway system as circumstancespermitted.
In the course of my tour I received many representations regarding a varietyof matters affecting the Department's operations—a large proportion of these hadreference to improvements that were desired. So far as these requests involved theundertaking of new works, I found myself considerably restricted in meeting therequests by financial considerations. The very large commitments in which theDepartment was involved to carry out the extensive works that are now in handand must be carried to completion absorbed practically the whole of the availablefinance. I deal more particularly with the works in hand in another portion of thispresent Statement.
I have also given very careful consideration to the question of the financialposition of the Department.
Dealing with the position of the railways from an historical point of view, westart from the point that the railways, in the first place, were undoubtedly con-structed as a developmental institution rather than as a profit-making institution.Indeed, it is scarcely possible to conceive that much of the mileage of the presentrailway system, even of the main lines, would have been constructed at all if at thetime when their construction was decided upon the question as to whether theyshould be gone on with or not had been decided on a profit-making basis. As theyears have gone on this policy has been continued. Nor has it been confined toconstruction only; it has extended also to operations, and many services and tariffconcessions have been given in the past on the basis of the developmental aspect ofthe railway policy.
It is, I think, absolutely essential to a proper interpretation of the railwayaccounts that we should keep these facts clearly in our mind. More especially doI think it timely to emphasize this fact, as there has undoubtedly grown a tendencyto regard the deficit as shown in the annual Statement as a "loss."
In the light of the policy as above enunciated this is quite unjustified. It isbeyond the possibility of question that the country has reaped very material indirectreturn from the existence of the railways. This return, however, lias not beenreflected in the annual Railways Statements. It is none the less real. The wholequestion resolves itself into one as to whether the time has arrived when the countryis paying through the deficit on account of the railway work too much for theindirect returns that it is getting.
At this point a very great difficulty is encountered. It cannot be denied thatthe railway position in this as in every country in the world has been very adverselyaffected by the introduction of road-motor transport.
If we take the passenger figures alone we find that as compared with pre-warthe revenue is down some £600,000. Taking also the natural increase that tookplace in the Department's passenger revenue prior to the advent of the road motorwe could confidently have expected that the passenger revenue alone, but for the

D—2III
influence of the road motors, would have approximated to the amount of the presentdeficit, and the extra revenue would have been earned with comparatively smallincrease in expenditure.
The question therefore arises as to what proportion of the railway deficit shouldbe regarded as properly payable in respect of the developmental work of the railways.This obviously will depend on what the railways can be made to earn in the face ofthe fact that road-motor transport has now to be accepted as a permanent factor inthe transport industry.
Before this can be determined it is essential that the respective spheres of rail-ways and road transport should be determined and the fullest possible measure ofco-ordination obtained. As matters are at present, it would be impossible to saywith any degree of certainty what the railways are worth as a revenue-earninginstitution. The first step, as it appears to me, clearly is to so regulate the transportindustry that the true value of each method of transport can be made clear.
The policy of the Government in this connection has already been enunciated inthe Budget and need not be here repeated. I desire only to emphasize my firmconviction that the carrying-out of that policy is the first and most essential step inthe development of a policy for a solution of the financial problem in regard torailways.
WORKSHOPS REORGANIZATION.The position in regard to the carrying-out of the scheme of the reorganization of
the workshops is fully set out in the report of the General Manager. As I under-stand the genesis of this scheme, it arose out of two factors—(1) The unsuitabilityof the old workshops for the purpose for which they were being used, and (2) thedirect financial benefit that was to be obtained from the undertaking of the scheme.
With regard to (1), there seems to be no doubt that with the age of the shops—andthe fact that they had developed, as was unavoidable, on more or less of a patchworksystem as requirements necessitated from time to time—they had arrived at thestage when their operation could not be carried on with a degree of convenience andcomfort to the staff that one would wish for. This would in itself raise a questionas to the desirability of undertaking some scheme for improving them, but it stillremains to be determined whether the particular scheme that was adopted was theone that should have been undertaken.
This raises the second question—i.e, the financial results that were expected toaccrue from the expenditure that has been undertaken. Estimates on such a matteras that seem to me to hinge very largely on the question of the full utilization of theshops when completed. This in turn will depend on the future requirements of theDepartment and the ability of the country to provide the finance necessary toenable the various works to be undertaken. Whatever the position in regard tothese matters may have been when the scheme was formulated and decided upon,it is undeniable that at present it is obscure. The future expansion of the railwayscan hardly be as great as it has been in the past, while the pressure of other Stateactivities on public finance will tend to make it more difficult to provide money forthe. railways on the same scale as has been done in the last decade. What theactual financial result of the reorganization will be is a matter that lies very muchin the future and depends on factors that cannot in present circumstances bedetermined with any real degree of certainty.
One of the salient features of the workshops-reorganization scheme was thecentralization of the heavier varieties of work. There seems to be some mis-understanding as to the question to which the work of centralization is beingcarried. All running repairs and the lighter types of work to rolling-stock will beundertaken at the various centres, much as has been the case hitherto. It is onlythe heavier repair work that is being centralized. This work requires the provisionof up-to-date machinery. This machinery is expensive and requires to be worked toits maximum capacity, in order that the full economies of its installation may beobtained. It would not be economical to duplicate it, as there is not enough workin either Island to keep more than one set of the heavy machinery employed.
Another aspect of the question of centralization that I would like to touch onis that of the haulage of rolling-stock that requires to be dealt with at the centralized
D.—2, IV
shops. It is not correct to assume that tlie centralization of the heavy repair workwill involve the dead haulage of the rolling-stock that will be dealt with at thosepoints. Except in the case of disablement, the rolling-stock will be "worked" tothe centralized points. Engines, for example, as and when they come due for over-haul, will have their runs so arranged that they will do work on their way to theshops. The cases of total disablement are a comparative small proportion of theheavy repairs that are carried out, and the amount of dead haulage should not bea very serious matter. It may be added that under any arrangement a certainamount of dead haulage is unavoidable.
NEW WORKS.I have paid much attention to the matter of new works which the Department
have in hand and which are in contemplation as disclosed by the programmes thathave been formulated. All those in hand will, with the exception of the PalmerstonNorth Deviation, be carried to completion. These works are of considerablemagnitude, and the sums required to enable them to be carried on have, as far asthe present year is concerned, absorbed all the money that could be made availableto the Railway Department for the purpose of new works of this character, andthis position is likely to continue for at least the next year or two.
As far- as Palmerston North Deviation is concerned, an announcement hasalready been made regarding that work, and I think this may be a convenient placeto put on official record the reasons which led to that decision.
The broad basis of the decision to undertake the work of the deviation atPalmerston North was the fact that the increase in traffic at and passing throughthat station had up to the time when the decision was made been such as to indicatethat if the increase were maintained the traffic would within a few years outgrow thefacilities. Subsequent traffic developments have shown that the increase has notbeen maintained. This obviously called for a review of the situation, and on goinginto the whole matter it was found that, due partly to the failure of the traffic todevelop as was expected and partly to the recasting of the traffic arrangements, thepressure at Palmerston North had been much relieved, and it was possible to evolvea scheme of improvements on the present site that would enable the work to becarried on there with a reasonable measure of convenience.
The cost of these improvements is estimated to be in the vicinity of £33,000;against this we have an estimated cost to complete the deviation and facilities inconnection therewith of approximately £725,000. On the basis of cost, therefore, itwas quite clear that the completion of the deviation would not be justified unlesssome other very substantial advantages were definitely in view.
Further examination showed that no such advantages could be perceived. Onthe contrary, there were further material disadvantages associated with the removalof the station from its present to the proposed site. On the new site the stationwould be removed a considerable distance farther from the business centre*of thetown, and, having particular regard to the keen competition from road carriers withwhich the railways are now faced, such a circumstance could not do other thanoperate to the disadvantage of the railways. Furthermore, there was no economy inworking to be obtained by the change; on the contrary, it is estimated that the newstation and yards as designed would involve an increase in the operating expenditureof some 50 per cent.
All these facts made an incontestable case in favour of the stoppage of the workand amply justified the Government's decision not to carry on the work inconnection with the deviation and to provide the improved facilities on the presentsite.
As regards other works in the programme which have not yet been completed, Idesire to say that I propose to review these progressively as time for their com-mencement approaches. I do not think it wise at the present time to make anyfinal decision as to what might be done some years ahead, principally for the reasonthat the railway position is in such a state of flux as may make a decision to-daymore or less valueless in a few years. The correctness of this position has, I think,been already amply demonstrated. An outstanding example is the case of the
D.—2V
Palmerston. North. Deviation, as to which, however correct the decision might havebeen at the time when it was decided to undertake the work, there is not theslightest doubt that the conditions as they exist to-day called for a review of thesituation, and justified the Government in its decision to stop the work.
For those reasons I do not think that any other course of action can be fittinglyadopted under present circumstances than to do as I have already indicated—
namely, carry to completion the large works now in hand, and as financial possibili-ties and other circumstances permit review all other propositions for railway-improvement.
One of the aspects of new works required to be undertaken that I think isimportant is that of the means of communication. From my own experience inmoving about, and from consideration of the great changes that have taken placein the machinery of communication during recent years, I gathered the decidedimpression that the Department was working at great disadvantage so far as thesefacilities are concerned. The matter has been specially investigated, and the reportshows that it is very necessary for efficiency and will certainly make for materialeconomy if improvements are made in the Department's communication facilities.
On the economy side special significance attaches to the system of train-control;a system by which movements of trains on the various sections are controlled froma central office by means of a special telephone system. Train-control is already inoperation on certain parts of the railways, and experience has shown that veryconsiderable economy has resulted and much more satisfactory service has beenmade possible from the point of view of the more expeditious working of the trains.
The system of train-control has a special value in New Zealand with our highproportion of single-line working, which calls for a higher standard of organizationto reduce delays to trains resulting from initial delay of any particular train. Inthe allocation of available finance in future I propose to pay special attention to therequirements of the Department's means of communication. For the year nowcurrent the sum of £51,000 has been allocated under this heading.
TRAIN SERVICES.I have commenced an investigation into the train services with a view to seeing
whether improvements might not be possible to ensure better running or improvedservices. Some adjustments have already been made in the schedules affectingpassenger trains in the South Island and on the Rotorua and East Coast Main Trunklines.
The running of the night trains in the South Island has been continued, and hasgiven a large measure of satisfaction, especially to the business community. It willbe my policy to develop night-passenger services as far as possible, as I am convincedthat this is a field in which the railways should have considerable scope for thedevelopment of a traffic that should become both profitable to the Department andincreasingly appreciated by the community.
ROAD-MOTOR SERVICES.Another matter of growing importance, and one which will come more frequently
up for decision in connection with the Department's operations in the future, is thatof the working of traffic by the Department through the medium of road vehicles.
My own view is that such operations should be decided upon with very greatcaution. We are by no means in a position to say that the road-motor operationsthat are now being carried on in the community are on a sound basis, and I feel thatany action on the part of the Department in the direction of embarking on road-motor operations to any great extent requires careful examination as it might haveserious results on the Department's financial position.
I can quite realize, however, that there may well be cases where the Departmentcould, with advantage to itself and for better service to the community, undertakeroad-motor work; and when a case is clearly established for sound working on theselines then I think there is no good reason why the Department should not undertakethe work.

D.—2. VI
I am impelled to make these observations, because there have been suggestionsthat the Department should not carry on road-motor services. Ido not think thatthe matter can be carried to the point of absolute prohibition of any such action onthe part of the Department; first and foremost the Department is a transportinstitution and its duty is clearly to give the transport service for which it isprovided by the cheapest and most efficient means. Only when a road propositionis definitely ascertained by examination of all the facts to be the cheapest andmost efficient means, and not till then, should the Department turn to that form oftransport to enable it to carry on its services.
MAINTENANCE OF BUILDINGS.As I have moved about the railway system it has been increasingly borne in
upon me that the standard of the railway buildings is not up to modern ideas.Many of the buildings are very old, and, though they may be reasonably adequatefor the purposes of the business, they are architecturally out of date and liave theeffect of giving the railway surroundings a somewhat drab appearance.
The great majority of the buildings are constructed of wood, and have doneduty in many cases over a very long period of years. Especially with woodenbuildings, maintenance costs tend to grow proportionately higher with increasing age,and I think we must look forward in the near future to rising maintenance-costs inrespect of our buildings.
LYTTELTON TUNNEL ELECTRIFICATION.This important improvement was completed and the length opened for traffic
on 14th February, 1929. The total cost of the work was £145,000. While theexpenditure is not expected to bring in any substantial increase of revenue, it wasundoubtedly justified from the standpoint of comfort and is in accord with thedemand for better travel facilities, a demand, it may be mentioned, with which theDepartment is faced in many other directions.
BRANCH LINES.Considerable attention has already been given to investigating the position
of the branch lines so as to determine their value as compared with possiblealternative forms of transport.
As far as the internal working of the Department is concerned, and assumingthat the branch lines still remain, consideration of the matter at once raises thequestion of the more extended use of rail-cars. A committee of executive Officersof the Department, representing every phase of railway operation that may have abearing on the question, is now undertaking a thorough and systematic examinationof the position with a view to the formulation of definite recommendations—-firstly,as to the best method of working the traffic: that is, whether by rail-cars, roadservices, or trains; and, secondly, in the event of rail-cars being recommended,what is the most useful type for the particular service required in each case.In this latter connection the rapid development that has taken place in recent yearsin connection with various types of rail-cars, particularly Diesel electric and othersimilar types, renders it very desirable, more especially in view of the very largeissues involved, that we should have first-hand information regarding the mostmodern types of vehicles and their adaptability to our conditions. To that end Ipropose to send abroad immediately a competent officer to inquire on the spot intothe actual performance of the various kinds of rail-cars on railway systems wherethey have been adopted. I confidently expect that during the coming year we shallbe able to formulate definite proposals.
LOCOMOTIVES.The standard of our locomotives has been a matter that has come pointedly
under my notice. This has been brought about by some failures of locomotives ofa greater or lesser magnitude, in some cases involving disorganization of thepassenger service. Investigations made at my request have shown that certaindifficulties which appeared unavoidable have had a direct bearing on the questionof the efficiency of our locomotives.
D.—2VII
It was inseparable from a change over from the old workshops to the new onesthat the work of passing the locomotives through the shops should become somewhatdisorganized and fall into arrear. Joined with this fact was the circumstance of apeak pressure of traffic. We had during the concluding portion of the year a recordtonnage, and our locomotives were kept continuously employed, considerablyrestricting the opportunities for running repairs and general overhaul. Thisconjunction of circumstances is, however, a passing phase, and definite arrange-ments have now been made for the overhaul of locomotives to be rigorously pursuedso that the standard of efficiency of our engines will be fully up to requirements forthe next ensuing busy season.
A further aspect of the question that has engaged my attention is that of thecleaning of locomotives. The necessity for rigid economy has prevented the samestandard of polish being given to engines as was the case in past years. I desire tomake it clear, however, that economy in this direction will be confined only to suchparts of the cleaning process as do not affect the efficiency of the engines. Allmoving parts will require to be thoroughly cleaned, and my policy will be tosee that there is no sacrifice of efficiency to economy in this connection.
While so laying down the policy, however, I would mention that in the matterof the cleaning of the essential parts of the engines we are pursuing investigationswith a view to enabling the work to be done more cheaply than has been the case inthe past. This will generally take the line of adopting other methods than hand-cleaning of the engines, and a practical commencement has already been made by theinstallation at Dunedin of a process of cleaning by means of a steam jet. Theresults will be carefully watched, and if proved satisfactory and economical thesystem will be further extended.
UTILIZATION OF NEW ZEALAND COAL.The figures supplied in the General Manager's report under the heading of "Coal
Supplies" indicate the pleasing fact that the quantity of New Zealand coal utilizedduring the past year amounted to the unprecedented figure of 356,724 tonsrepresenting 84-25 per cent, of the total coal consumed.
It will also be noted that whereas in 1925 the total importations from overseasamounted to 313,107 tons, which represented a percentage of 76*84 of the totalconsumption, this figure dropped in the year under review to 66,675 tons, or apercentage of 15"75.
It is very gratifying to be able to record that the Department has been able toutilize the local product in an increasing ratio, thus assisting in the maintenance ofone of our great national industries.
RENEWAL FUND PROVISION.I desire to record the fact that prior to 1925 the railway accounts did not
include a Renewal Fund for the replacement of items of plant which had becomeobsolete or worn out. A Renewal Fund was established in that year with acontribution from the Revenue Account of £553,891. Up to the end of the financialyear 1928-29 a total contribution of £2,397,988 had been made out of revenue.During the same period the fund had been called upon to the extent of £1,069,968for the purpose for which it was established, leaving a credit of £1,328,020 as at31st March last.
It is necessary to point out that the making of adequate provision for renewalsin a system as vast as that of the railways, and one in which such a large amount ofcapital has been invested in assets, which rightly must be regarded as of a wastingnature, is a matter on which opinions might differ as to what is or is not adequateprovision. It is admittedly difficult when any business is conducted at a loss to keepcontributions of this nature up to a correct standard. At the same time it isobvious and needs no demonstration that unless that standard of contribution ismaintained the ultimate strain upon the revenue of the Department for renewals andreplacements must be in an increasing ratio as the years pass.
D.—2 VIII
The position in this regard is very vividly brought out by the reference made inthe General Manager's report under the heading of "Bridges."
The Department has over fifty miles of bridges, many of which are now due forrenewal or strengthening. This will call for a heavy outlay, and the point that Iwould emphasize at the present juncture is that the additional financial provisionthat now has to be made for renewals in consequence of the inadequate provisionsmade in the past cannot be rightly regarded as loss on present or future working.The country in making up this deficiency is simply paying back something it shouldnot have had in the first place.
CONCLUSION.In conclusion, I would like to say that in the time afforded me since assuming
office there has not been opportunity for working out a detailed policy in connectionwith the Department. It will be understood that in consequence of a change in theadministration not only in respect to the Ministry, but also in respect to themanagement, much inquiry was necessary, in order that a sound foundation of datamight be obtained for the building-up of a policy for the future.
I have in the course of this statement dealt with some of the matters of moreimmediate moment that we have been able to deal with to a greater or less extentup to the present. Further than that I can but lay down the general lines of mypolicy, which, stated in the fewest possible words, will be to give the greatestmeasure of service to the community at the lowest cost that the circumstances willallow. The strictest economy consistent with proper efficiency will be aimed at sofar as the internal working of the Department is concerned. As regards its externalrelationships with other factors in the transport industry, it will be my policy towork to the fullest possible degree in harmony with other forms of transport,constantly endeavouring to give the fullest measure of usefulness to the communityout of the transport industry as a whole.
The acquaintance which I have already formed with the detailed working of theDepartment has convinced me that we have a staff able and enthusiastic, imbuedwith high principles of service and desirous not only of carrying out their dailyvocations as a means of livelihood, but also to make the railway service somethingthat will stand to the credit of the Dominion.
Before concluding I desire to express my personal appreciation for the invaluableassistance rendered to me by Mr. H. H. Sterling, General Manager, in my endeavourto grasp the intricate details of railway-management.
I regard Mr. Sterling as a man of exceptional ability, and one in every waycapable of carrying out to successful conclusions the extremely important work inwhich he has been engaged by the State.

D.—2IX
RESULTS OF WORKING.The following is a statement of the results of working for the past four years
ii—D. 2.
Year ended 31st March,Particulars. —
1929. 1928. i 1927. : 1926.;
. ' ■■ I I |
Total miles open, for traffic .. .. .. 3,287 3,180 3,164 3,138Average miles open for year .. .. 3,254 3,178 3,157 3,103
Capital cost of opened and unopened lines .. £62,276,214 £58,797,458 £56,028,477 £53,716,455Capital cost of open lines .. .. .. £56,568,598 £51,187,376 £49,183,916 £47,608,676Capital cost per mile of open lines .. .. £17,210 £16,097 £15,545 £15,172Gross earnings .. .. .. .. £8,747,975 £8,524,538 £8,434,654 £8,460,762Working-expenses .. ... .. .. £6,849,383 £6,685,123 £6,490,880 £6,468,428NET EARNINGS .. .. .. .. £1,898,592 £1,839,415 £1,943,774 £1,892,334
Interest charges .. .. .. .. £2,331,335 £2,130,867 £2,043,433 £1,913,311Appropriation for betterments .. .. .. ..
.. £58,000Unappropriated surplus .. .. .. .. .. .. I £21,023Deficit .. .. .. .. .. £432,743 £291.452 £99,659percentage" of total working-
EXPENSES TO GROSS EARNINGS .. 78-30 78-42 76-95 76-45
PERCENTAGE OF NET EARNINGS TOCAPITAL INVESTED .. .. .. 3-45 3-64 3-99 4-35
Railway operating earnings .. .. .. £7,524,864 £7,343,845 £7,423,472 £7,589,274Railway operating expenses .. .. .. £6,374,579 £6,302,119 £6,158,283 £6,164,570NET RAILWAY OPERATING EARNINGS ..
£1,150,285 £1,041,726 £1,265,189 £1,424,704PERCENTAGE OF RAILWAY OPERATING
EXPENSES TO EARNINGS .. .. 84-71 85-81 82-96 81-23
Operating earnings per average mile open .. £2,312 £2,310 £2,351 £2,446Operating expenses per average mile open .. £1,959 £1,983 £1,951 £1,987NET OPERATING EARNINGS PER AVERAGE
MILE OPEN .. .. .. .. £353 £327 £400 £459
d. d. d. d.Operating earnings per train-mile .. .. 162-50 162-62 166-14 176-51
Operating expenses per train-mile .. .. 137-66 139-55 137-82 143*37NET OPERATING EARNINGS PER TRAIN-
MILE .. .. .. .. .. 24-84 23-07 28-32 33 14
Passengers, ordinary .. .. .. 9,074,993 9,299,157 10,305,065 11,813,480Season tickets .. .. .. .. 656,169 632,763 585,094 600,292Total passenger journeys .. .. .. 25,574,843 25,379,665 26,002,137 27,653,414Goods tonnage .. .. .. .. 7,086,680 6,854,865 6,833,436 6,808,603Live-stock tonnage .. .. .. .. 535,951 511,897 475,013 447,539Train-mileage .. .. .. .. 11,113,482 10,838,594 10,723,864 10,319,10?Engine-mileage .. .. .. .. 16,150,146 15,383,051 15,212,086 14,657,039
For the current year I anticipate the revenue will reach £8,800,000, and the expenditure£6,658,579.
D.—2 X
ANNUAL REPORT OF THE GENERAL MANAGER OF THE NEWZEALAND GOVERNMENT RAILWAYS.
The Hon. the Minister of Railways. New Zealand Government Railways,Head Office, Wellington,
Sir,— 2nd September, 1929.I have the honour to report on the working of the railways for the financial year 1928-29.
On retirement of the members of the Board of Management I entered upon office as GeneralManager on the Ist June, 1928. Owing, however, to its being found impossible to at once release mefrom the position then held by me as general manager of the New Zealand Co-operative Dairy Co.,Ltd., I was not able to give my full time to the work of the Department until the termination of myperiod of service with that company on the 30th November of that year. I assumed full control ofthe Department on the Ist December, 1928.
Before dealing in detail with the various branches of railway working 1 purpose reviewing brieflythe year's results and commenting upon some of the more important aspects of the Railway Depart-ment's activities.
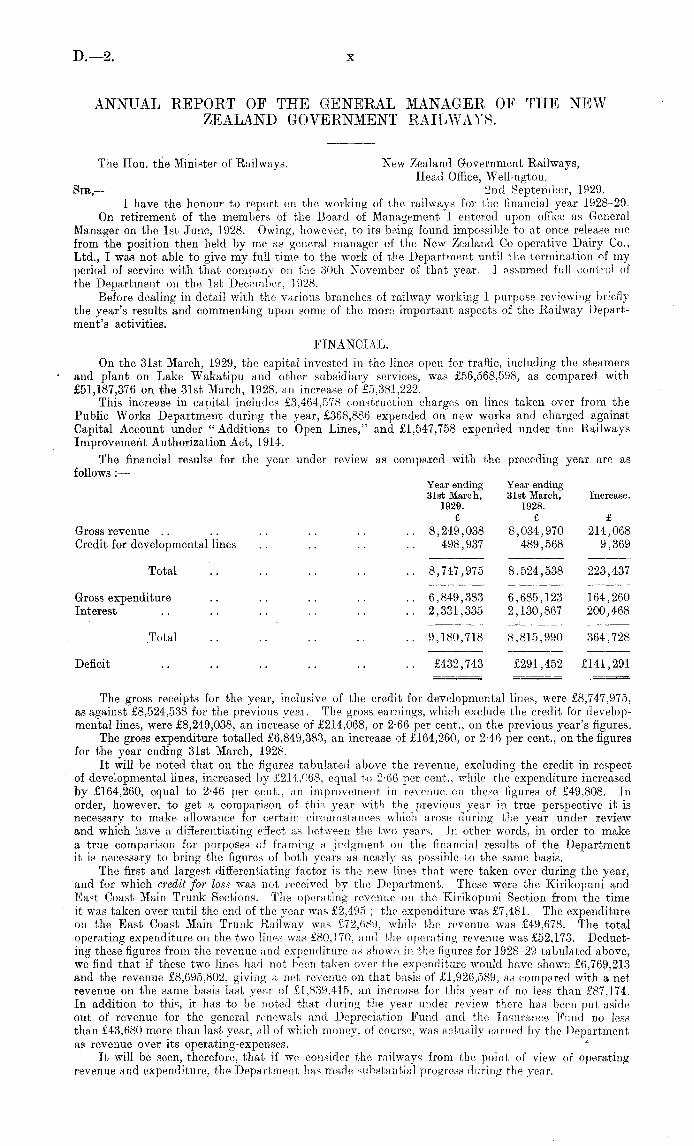
FINANCIAL.On the 31st March, 1929, the capital invested in the lines open for traffic, including the steamers
and plant on Lake Wakatipu and other subsidiary services, was £56,568,598, as compared with£51,187,376 on the 31st March, 1928, an increase of £5,381,222.
This increase in capital includes £3,464,578 construction charges on lines taken over from thePublic Works Department during the year, £368,886 expended on new works and charged againstCapital Account under "Additions to Open Lines," and £1,547,758 expended under the RailwaysImprovement Authorization Act, J 914.
The financial results for the year under review as compared with the preceding year are asfollows :—
Year ending Year ending31st March, 31st March, Increase.
1929. 1928.£ £ £
Gross revenue .. .. .. .. .. .. 8,249,038 8,034,970 214,068Credit for developmental lines .. .. .. .. 4-98,937 489,568 9,369
Total .. .. .. .. .. 8,747,975 8,524,5.38 223,437
Gross expenditure .. .. .. .. .. 6,849,383 6,685,123 164,260Interest .. .. .. .. .. .. 2,331,335 2,130,867 200,468
Total .. .. .. . .. 9,180,718 8,815,990 364,728
Deficit .. .. .. .. .. .. £432,743 £291,452 £141,291
The gross receipts for the year, inclusive of the credit for developmental lines, were £8,747,975,as against £8,524,538 for the previous year. The gross earnings, which exclude the credit for develop-mental lines, were £8,249,038, an increase of £214,068, or 2-66 per cent., on the previous year's figures.
The gross expenditure totalled £6,849,383, an increase of £164,260, or 2-46 per cent.., on the figuresfor the year ending 31st March, 1928.
It will be noted that on the figures tabulated above the revenue, excluding the credit in respectof developmental lines, increased by £214,068, equal to 2-66 per cent., while the expenditure increasedby £164,260, equal to 2-46 per cent., an improvement in revenue, on these figures of £49,808. Inorder, however, to get a comparison of this year with the previous year in true perspective it isnecessary to make allowance for certain circumstances which arose during the year under reviewand which have a differentiating effect as between the two years. In other words, in order to makea true comparison for purposes of framing a judgment on the financial results of the Departmentit is necessary to bring the figures of both years as nearly as possible to the same basis.
The first and largest differentiating factor is the new lines that were taken over during the year,and for which credit for loss was not received by the Department. These were the Kirikopuni andEast Coast Main Trunk Sections. The operating revenue on the Kirikopuni Section from the timeit was taken over until the end of the year was £2,495 ; the expenditure was £7,481. The expenditureon the East Coast Main Trunk Railway was £72,689, while the revenue was £49,678. The totaloperating expenditure on the two lines was £80,170, and the operating revenue was £52,173. Deduct-ing these figures from the revenue and expenditure as shown in the figures for 1928-29 tabulated above,we find that if these two lines had. not been taken over the expenditure would have shown £6,769,213and the revenue £8,695,802, giving a net revenue on that basis of £1,926,589, as compared with a netrevenue on the same basis last year of £1,839,415, an increase for this year of no less than £87,174.In addition to this, it has to be noted that during the year under review there has been put asideout of revenue for the general renewals and Depreciation Fund and the Insurance Fund no lessthan £43,680 more than last year, all of which money, of course, was actually earned by the Departmentas revenue over its operating-expenses.
It will be seen, therefore, that if we consider the railways from the point of view of operatingrevenue and expenditure, the Department has made substantial progress during the year.

D.—:2XI
Coming to the non-operating aspect of the figures, we find that the net income was equal to 3-45per cent, on the capital invested in lines open for tfaffic. The interest charges for thepast year totalled£2,331,335, an increase of £200,468 as compared with the figures for the previous year.
The sum charged against revenue for depreciation and provision for renewals was £655,986, andthe amount expended from the Depreciation and Renewals Fund was £258,836 for assets written offor renewals effected during the year. The accumulated credit balance in this fund at the 31st March,1929, was £1,328,020, an increase of £397,150 over the balance at the 31st March, 1928.
The position in regard to the undermentioned equalization funds is as follows :—
The extension of the railway from Miller's Flat to Roxburgh., which was taken over on the18th April, 1928, resulted in an increased loss on the total section from Clarkesville to Roxburgh of£10,093. This is included in the credit received on account of developmental lines.
No credit was received in respect of the Waiotira-Kirikopuni and Tahawai-Taneatua lines, whichwere taken over during the year, and the loss on these two sections was £40,428 and £90,547respectively, including interest for the period for which the lines were under the control of the RailwayDepartment.
Comparisons with the Results of Previous Years.The extent to which the accounting and financial reorganization brought into operation on the
Ist April, 1925, has affected the annual statement of results and the financial position of the Depart-ment is not generally recognized.
If the differentiating factors are not allowed for, erroneous deductions and misleading comparisonsmay easily be made. This remark applies more particularly to the expenditure shown in the accountsin respect of maintenance of the permanent-way and works and the rolling-stock and equipment.
Under the old system there was no pro vision for setting aside reserves to meet accrued depreciationor obsolescence, or for equalizing the widely fluctuating expenditure resulting from fire, flood, oraccident. The railway accounts were not charged with the cost of subsidies to the SuperannuationFund, and interest was computed at a policy rate, which, at least in later years, was considerably belowthe actual rate.
The following summary makes a comparison of some of the main items charged against expensesduring the four years ended 31st March, 1925, and 31st March, 1929, respectively : —
Four Years ended 31st March,1929. 1925.
£ £
Reserves accumulated for renewals and depreciation.. .. 1,328,020Reserves against fire, flood, and accident ..
.. .. .. 70,219Old and obsolete rolling-stock and equipment written off .. .. 415,596 89,435Superannuation Fund subsidies .. .. .. ..
.. 706,477 80,000
£2,520,312 £169,435
In addition to these items the higher rate of interest now payable on capital increased the interestbill by £910,995 in the four years ended in 1929.
The total amount of credit received in respect of the working of non-paying lines in the sameperiod was £1,793,266, or little more than sufficient to meet the additional cost of interest and Super-annuation Fund subsidies.
I regard the foregoing as important, as already some public writers have been led to make falsedeductions regarding the railway situation as a result of their failure to take account of the circum-stances mentioned.
Earnings.
The income in respect of railway operation under the main headings, and the percentage undereach heading to total income, compared with the two previous years is as follows :—
Credit Balance i „ , Credit Balance! brought for- 4™' at 31st March,ward from 1928. 1928~"J- 1928-29. 1929_
£ £ £ £
Slips, Floods, and Accidents Fund .. 26,600 21,504 21,202 26,902Workers' compensation .. .. .. 18,260 44,582 44,344 18,498Insurance .. .. .. .. 18,129 15,642 8,952 24,819
62,989 81,728 74,498 70,219: I . '
Per Gent. Per Cent. Per Cent.1928-29. of Operating 1927-28. of Operating 1926-27. of Operating
Revenue. Revenue. Revenue.
£ £ £
Passengers, ordinary .. 1,868,048 24-82 1,886,833 25-69 ! 2,045,348 27-5,6Season tickets .. .. 256,699 3-41 258,463 3-52 258,832 3-49Parcels, luggage, and mails .37.8,141 5-03 379,933 5-17 .- I 377,367 . 5-08Goods .. .. 4,846,125 64-40 , 4,680,135 63-73 4,596,166 '61-91Labour, demurrage, &c. .. 175,851 2-34 138,481 1-89 145,759 1-96
7,524,864 100-00 7,343,845 100-00 ; 7,423,472 100-00
D.—2 XII
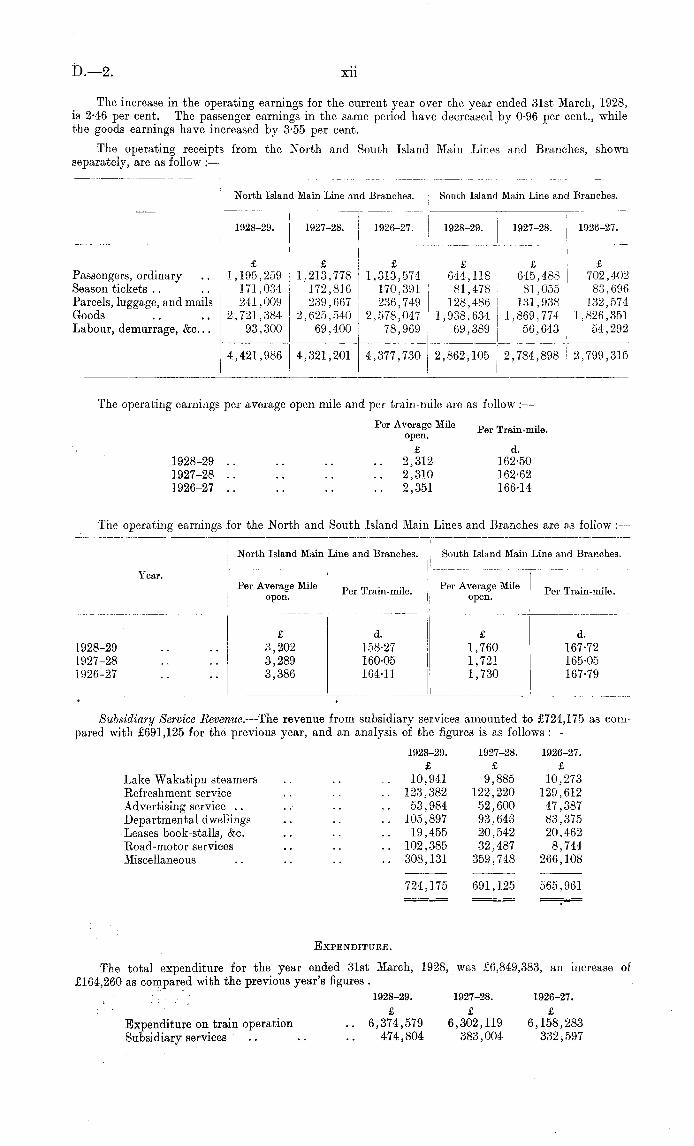
The increase in the operating earnings for the current year over the year ended 31st March, 1928,is 2-46 per cent. The passenger earnings in the same period have decreased by 0-96 per cent., whilethe goods earnings have increased by 3-55 per cent.
The operating receipts from the North and South Island Main Lines and Branches, shownseparately, are as follow :—
The operating earnings per average open mile and per train-mile are as follow : —
Per Average Mile p Train . mile .open.
£ d.1928-29 .. .. .. .. 2,312 162-501927-28 .. .. .. .. 2,310 162-621926-27 .. .. .. .. 2,351 166-14
The operating earnings for the North and South Island Main Lines and Branches are as follow :—
Subsidiary Service Revenue.—The revenue from subsidiary services amounted to £724,175 as com-pared with £691,125 for the previous year, and an analysis of the figures is as follows :—
1928-29. 1927-28. 1926-27.£ £ £
Lake Wakatipu steamers .. .. .. 10,941 9,885 10,273Refreshment service .. .. .. 123,382 122,220 129,612Advertising service .. .. .. .. 53,984 52,600 47,387Departmental dwellings .. .. .. 105,897 93,643 83,375Leases book-stalls, &c. .. .. .. 19,455 20,542 20,462Road-motor services .. .. .. 102,385 32,487 8,744Miscellaneous .. .. .. .. 308,131 359,748 266,108
724,175 691,125 565,961
Expenditure.
The total expenditure for the year ended 31st March, 1928, was £6,849,383, an increase of£164,260 as compared with the previous year's figures .
1928-29. 1927-28. 1926-27.£ £ £
Expenditure on train operation .. 6,374,579 6,302,119 6,158,283Subsidiary services ..
.. .. 474,804 383,004 332,597
North Island Main Line and Branches. South Island Main Line and Branches.
I |1928-29. 1927-28. 1926-27. 1928-29. I 1927-28. 1926-27.
j I
£ £ £ £ £ £
Passengers, ordinary .. 1,195,259 1,213,778 1,313,574 644,118 645,488 702,402Season tickets .. .. 171,034 172,816 170,391 81,478 81,055 83,696Parcels, luggage, and mails 241,009 239,667 236,749 128,486 131,938 132,574Goods .. .. 2,721,384 2,625,540 2,578,047 1,938,634 1,869,774 1,826,351Labour, demurrage, &c... 93,300 69,400 78,969 69,389 56,643 54,292
4,421,986 4,321,201 4,377,730 2,862,105 2,784,898 ! 2,799,315
North Island Main Line and Branches. South Island Main Line and Branches.
Year.Per Average Mile t> tr • i Per Average Mile -n rr • -i6 Per Iram-mue. ° Per Irain-mue.open. ! open.
£ d. £ d.1928-29 .. .. 3,202 158-27 1,760 167-721927-28 .. .. 3,289 160-05 1,721 165-051926-27 .. .. 3,386 164-1] 1,730 167-79

D.—2XIII
The operating expenditure per average mile open and per train-mile is as follows :—
Per Average PerMile open. Train-mile.
£ d.1928-29 .. ..
.. ..1,959 137-661927-28 .. .. .. .. 1,983 139-551926-27 .. .. .. ..1,951 137-82
Subsidiary Services Expenditure. —The particulars of the expenditure in connection with subsidiaryservices are as follow :—
1928-29. 1927-28. 1926-27.£ £ £
Lake Wakatipu steamers .. .. .. 17,425 15,627 15,859Refreshment service .. .. .. 116,391 114,644 119,567Advertising service .. .. .. ..
50,720 48,921 42,509Departmental dwellings .. .. .. 170,073 162,263 137,547Leases book-stalls, &c. .. .. .. 8,483 8,828 8,271Road-motor services .. .. ..
111,712 32,721 8,844
474,804 383,004 332,597
jPer Cent, of; IPer Cent, of I j Per Cent, ofi 1928-29. j Operating 1927-28. ! Operating j 1926-27. 1 Operating
Revenue. ; Revenue, j ! Revenue.
j £ I £ £
Maintenance—Way and works 1,111,229 14-77 1,147,067 15-62 1,074,334 14-47Maintenance—Signals .., 112,206 1-49 102,871 1-40 100,861 1-36Maintenance—Rolling-stock .. 1,424,165 18-93 1,380,726 18-80 1,303,444 17-56Examination, lubrication, and 67,023 0-89 62,512 0-85 60,095 0-81
lighting of vehiclesTransportation—Locomotive 1,583,770 21-05 1,599,562 21-78 1,609,257 21-68Transportation—Traffic .. 1,825,965 24-26 1,760,459 23-97 1,752,998 23-61Head Office and general charges 80,943 1-07 75,048 1-02 82,287 1-11Superannuation subsidy .. 169,278 2-25 173,874 2-37 175,007 2-36
6,374,579 84-71 6,302,119 85-81 6,158,283 82-96

D.—2. XIV
Passengers.
An analysis of the passenger revenue for the year is as follows :—
The variations, exclusive of season tickets, were distributed as follows :—
The revenue from passenger traffic was £2,124,747, a decrease of £20,549 as compared with thefigures for the previous year ; and, while these figures show an improvement on the previous year'sresults (when the decrease in passenger traffic was £158,884), the shrinkage of passenger earnings isstill proceeding.
The figures for the year under review show that the decrease in ordinary and suburban ticketsis again the principal cause of the decline in passenger revenue. This decrease is due to the extensiveuse of the private motor-car, together with (in a lesser degree) the service-car organizations whichhave established services throughout the Dominion. The mobility of the motor-vehicle is such thatfor certain classes of travel the railway cannot hope to compete with it on an economic basis, andfurther decreases in passenger traffic by rail under the headings mentioned must be expected. Forexample, the service-car organizations run a number of services between the principal towns at statedhours daily, and this smallerand more mobileunit is at a great advantage in catering for the passengerswho may not find it convenient to travel by the scheduled trains which run between those places. Itwould obviously be quite unsound for the Railway Department to endeavour to cater for this classof traffic by providing additional trains for the small number of passengers which a service-car conveys.There is another factor which, in my opinion, contributes largely to the decline in passenger traffic.People in country areas cannot conveniently use the rail for travel between neighbouring stations,because in respect to their intended journeys the location of the railway-station in many instancesinvolves a more or less substantial measure of travel to and from the railway-stations. On the otherhand, the motor-vehicle can give continuous service all along the road, whereas with trains the railwaycan only do so at stations which are in most cases some miles apart.
So far as the remaining figures are concerned, the results obtained from holiday excursions,week-end, and other reduced fares indicate that the railway still has a definite field in catering forbulk movement of passengers in addition to the long-distance traveller, and it is satisfactory to notethat during the past year the efforts of the Department in catering for special excursion, week-endtrips, and picnic parties have resulted in an increase in this class of traffic. Owing to the fact thatGood Friday fell on the 29th March, 1929, as compared with the Bth April, 1928, the bookings for 1929include the greater part of two Easter holidays. After allowing for the Easter traffic, however, thereturns from holiday-excursion tickets are approximately £50,000 ahead of the previous year's figures,
1929. 1928. . Variation. Per Cent.|
IPassenger journeys—
Ordinary.. .. ,. .. 9,046,267 9,272,547 -226,280 2-44Season .. .. .. .. 16,496,596 16,075,694 +420,902 2-62
25,542,863 25,348,241 +194,622 0-77
Revenue— £ £ £
Ordinary.. .. .. .. 1,868,048 1,886,833 -18,785 1-00Season .. .. .. .. 256,699 258,463 -1,764 0-68
2,124,74-7 2,145,296 -20,549 0-96
Passenger train-miles.. .. .. 4,833,991 4,644,905 +189,086 4-07
Revenue—Per mile of line .. ..
.. £653 £675 -£22 3-26Per train-mile .. ..
. . 105-49d. 110-85d. —5-36d. 4-84
1929 compared with 1928. 1928 compared with 1927.
Journeys. Revenue. Journeys. Revenue.
I Number. £ Number. £
Ordinary fares .. .. .. -413,648 -148,476 -613,643 -136,994Suburban fares .. .. .. —195,186 —10,912 —268,574 —16,036Holiday excursion and week-end .. ; +114,476 +108,997 —32,548 —6,461Other reduced fares .. .. .. +268,744 +14,992 —87,566 —8,767
I
D.—2XV
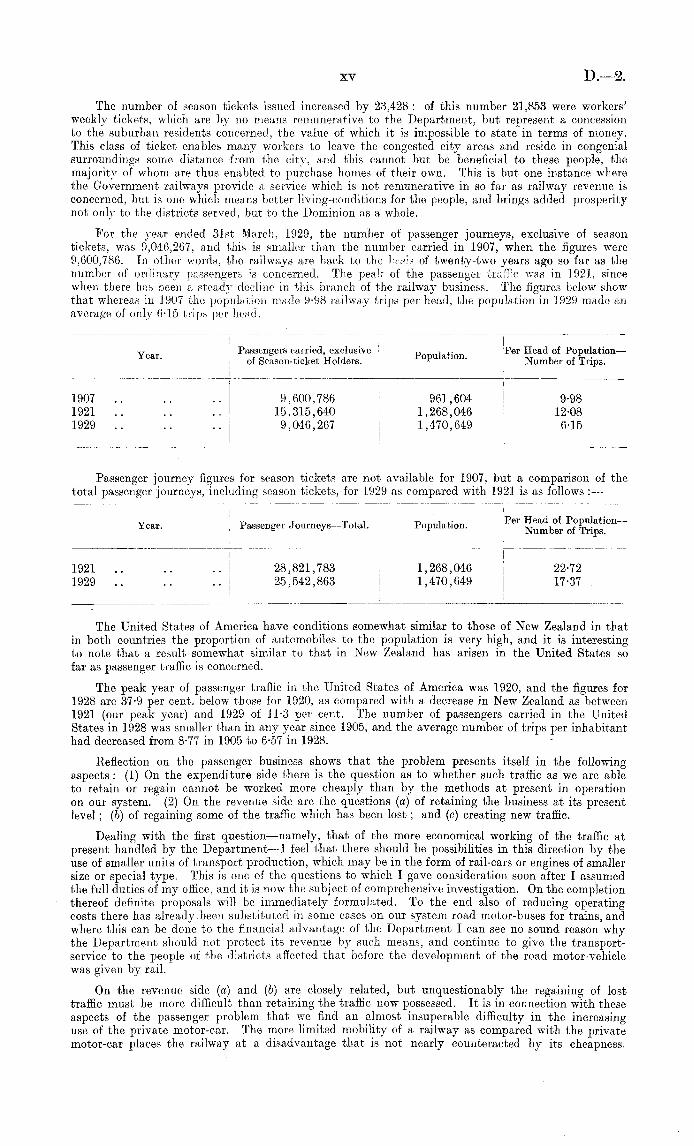
The number of season tickets issued increased by 23,428 : of this number 21,853 were workers'weekly tickets, which are by no means remunerative to the Department, but represent a concessionto the suburban residents concerned, the value of which it is impossible to state in terms of money.This class of ticket enables many workers to leave the congested city areas and reside in congenialsurroundings some distance from the city, and this cannot but be beneficial to these people, themajority of whom are thus enabled to purchase homes of their own. This is but one instance wherethe Government railways provide a service which is not remunerative in so far as railway revenue isconcerned, but is one which means better living-conditions for the people, and brings added prosperitynot only to the districts served, but to the Dominion as a whole.
For the year ended 31st March, 1929, the number of passenger journeys, exclusive of seasontickets, was 9,046,267, and this is smaller than the number carried in 1907, when the figures were9,600,786. In other words, the railways are back to the basis of twenty-two years ago so far as thenumber of ordinary passengers is concerned. The peak of the passenger traffic was in 1921, sincewhen there has been a steady decline in this branch of the railway business. The figures below showthat whereas in 1907 the population made 9-98 railway trips per head, the population in 1929 made anaverage of only 6-15 trips per head.
Passenger journey figures for season tickets are not available for 1907, but a comparison of thetotal passenger journeys, including season tickets, for 1929 as compared with 1921 is as follows : —
The United States of America have conditions somewhat similar to those of New Zealand in thatin both countries the proportion of automobiles to the population is very high, and it is interestingto note that a result somewhat similar to that in New Zealand has arisen in the United States sofar as passenger traffic is concerned.
The peak year of passenger traffic in the United States of America was 1920, and the figures for1928 are 37-9 per cent, below those for 1920, as compared with a decrease in New Zealand as between1921 (our peak year) and 1929 of 11-3 per cent. The number of passengers carried in the UnitedStates in 1928 was smaller than in any year since 1905, and the average number of trips per inhabitanthad decreased from 8-77 in 1905 to 6-57 in 1928.
Reflection on the passenger business shows that the problem presents itself in the followingaspects : (1) On the expenditure side there is the question as to whether such traffic as we are ableto retain or regain cannot be worked more cheaply than by the methods at present in operationon our system. (2) On the revenue side are the questions (a) of retaining the business at its presentlevel; (b) of regaining some of the traffic which has been lost; and (c) creating new traffic.
Dealing with the first question—namely, that of the more economical working of the traffic atpresent handled by the Department—I feel that there should be possibilities in this direction by theuse of smaller units of transport production, which may be in the form of rail-cars or engines of smallersize or special type. This is one of the questions to which I gave consideration soon after I assumedthe full duties of my office, and it is now the subject of comprehensive investigation. On the completionthereof definite proposals will be immediately formulated. To the end also of reducing operatingcosts there has already been substituted in some cases on our system road motor-buses for trains, andwhere this can be done to the financial advantage of the Department I can see no sound reason whythe Department should not protect its revenue by such means, and continue to give the transport-service to the people of the districts affected that before the development of the road motor-vehiclewas given by rail.
On the revenue side (a) and (b) are closely related, but unquestionably the regaining of losttraffic must be more difficult than retaining the traffic now possessed. It is in connection with theseaspects of the passenger problem that we find an almost insuperable difficulty in the increasinguse of the private motor-car. The more limited mobility of a railway as compared with the privatemotor-car places the railway at a disadvantage that is not nearly counteracted by its cheapness.
I IPassengers carried, exclusive ,, , ,. ! Per Head of Population—Ycar" of Season-ticket Holders. Population. j Number of rip3 .
1907 .. .. .. 9,600,786 961,604 9-981921 .. .. .. 15,315,640 1,268,046 12-081929 .. .. .. 9,046,267 | 1,470,649 6-15I
Year. Passenger Journeys—Total. ' Population. Nurnb°r of'Trip^0'1
1921 .. .... 28,821,783 1,268,046 22-72
1929 .... .. j 25,542,863 1,470,649 I 17-37
D.—2 XVI
The railway encounters a difficulty in tliis connection not only arising from its physical nature, whichrequires it to run on rails, hut also resulting from the fact that it deals with traffic in the mass, whilethe mobility of the private motor-car depends practically entirely on the necessities of very fewindividuals.
Experience has shown that the question of cost has a very remote influence in overcoming thehandicap that the railways suffer in this connection, We find people freely using their motor-cars ata cost, when taking all factors into account, that must be considerably higher than that at whichtransport could be secured by rail. A further difficulty in connection with the competition of privatemotors is to be found in the practice, which is assuming large proportions in this country, of privatemotor-car owners who make regular use of their cars in travelling between the suburbs and the cities,picking up their friends en route. Allied to this there is also the practice which has arisen at holidaytimes of persons sharing their motor-cars with their friends for the purpose of extensive trips throughoutthe country. This must inevitably have an effect on the holiday traffic at such periods as Christmasand Easter. The railways have endeavoured to counteract these factors by increasing the attractive-ness of their service, more particularly from the points of view of safety, comfort, and speed.
It is in these aspects that the railways will, it seems to me, be able to set a constantly improvingstandard that will always have a limiting effect on the development of the service-car business. Sofar as safety is concerned the superiority of the railways cannot be seriously challenged by the road-vehicles. The record of the railways as regards injuries to passengers is one with which the road servicescannot compare, and from the nature of the two forms of transport it seems beyond question that theadvantage in this connection will continue to remain with the railways. So far as the maintenance ofour present standard may depend on mechanical appliances I would say that our system is wellequipped with the best modern equipment that is applicable to our conditions. These are almostwholly designed to reduce the possibility of danger from human error. There will, however,always be a residuum of human responsibility. To meet this there has been constantly inculcatedinto our staff the necessity for the highest possible standard of care. On both aspects of the safetyquestion it will be our constant endeavour to work continuously to a higher standard, both by theadoption of such mechanical improvements as will tend to that end and also by so directing theviewpoint and capacity of our staff by training in a practical way, education by " Safety first " litera-ture and discussion and (more remotely) by a judicious administration of our disciplinary system, aswill reduce the factor of human error to a minimum.
On the question of comfort we have a rather extraordinarily paradoxical position. We find thepublic continually demanding an increasing standard of comfort in the railway-carriages, while on theother hand we find the public willing to sit more or less cramped in service-cars with a comfort that mustoften be conspicuous by its absence. The freedom of movement and the greater measure of conveniencethat railway travel affords makes me feel that this position cannot be regarded as a permanent one,and when the novelty of motor transport has, as I think it will with the passage of time, ceased to bea factor, T think that the advantages which the railway has in the matter of comfort will make themselvesfelt and will make it increasingly difficult for the road-motors to maintain their position.
I regard it, however, as imperatively necessary that an improvement should be made in thestandard of our passenger rolling-stock. We have drawn up a programme of rolling-stock constructionto this end, but our capacity to carry out this programme is, of course, limited by the amount offinance that can be made available, and I desire to express the opinion that the improvement or, indeed,the maintenance of the position of the railways will depend on the making of such financial provisionas will not hamper our efforts in this connection.
As regards the matter of speed, I think that improvements in this connection will be in thedirection of running long-distance trains with fewer stops while working the intermediate trafficrequiring more frequent stoppages at the less important stations by means of smaller rail units havinga relatively high rate of acceleration, or by road services. As I have already indicated, we are nowactively investigating the position in this regard with a view to collating the data necessary to enablesound decisions as to the modes of future development in this direction to be arrived at. We are alsoreviewing time-tables and rolling-stock. The former will be the subject of progressive development,and the latter is already covered.
So far as the competition of the hired road-vehicle affects retaining or regaining of traffic, theposition is that the principal factor is undoubtedly the large motor-omnibus operating between thecities and the suburbs. An unfortunate aspect of this business from the point of view of the railwayfinancial returns is that the railways are still left with the unremunerative workers' traffic while thebuses reap the benefit of the better-paying casual suburban traffic. This is very vividly brought outin the passenger figures shown in this report. It will be seen that while the casual suburban businessfell off as compared with last year by no less than 195,000 passenger-journeys, the workers' suburbantraffic increased by no less than 262,000 passenger-journeys. The point here is that while therailway revenue for its passenger business in the suburban areas has substantially decreased, thequantity of service which it has rendered to the public in those areas has actually increased. Inother words, if the position of the railways in the community as regards this branch of its businesscould be judged by units of service instead of bv units of money received, the position of the railwayswould take on quite a different aspect.
The bus also has the advantage that, so far at least as its physical characteristics are concerned,it can keep in immediate contact with the areas of greatest traffic, whereas the railway route isfixed, and may be, and is, more or less remote from the traffic areas. The smallness of the bus also

D,—2XVII
as a transport production unit enables it to pick up traffic en route in a way that is not practicablein the case of the railway, and this is of a special significance so far as the suburban passenger trafficis concerned. The necessity of walking to and from a railway-station is one of the most potentfeatures operating against the railways in connection with this class of traffic.
So far as the hired road-vehicle is concerned, with traffic outside the suburban areas I feel thatit is not nearly so serious a competitor as it is in the suburban districts. It has, of course, the advantageof a door-to-door traffic, and in some cases where the rail route between given points is more circuitousand more affected by adverse conditions than the road route the service-car is able to maintainits position against the railway. The service-car also tends to create a traffic for itself by reason ofits being able to make journeys for a comparatively small number of passengers, and in cases wherepeople desire to travel at abnormal times the service-car will have a traffic of its own. I feel, however,that service-car competition with the railways is not responsible in any great measure for thecontinuance of the decline in railway passenger traffic.
In the foregoing brief review I have not hesitated to state what I conceive to be points ofweakness in the position of the railways from a competitive point of view. Ido not, however, do thisin any pessimistic sense (because I think that for many years to come there will continue to be a largefield open for railway activity), but because I think that a recognition of these points and the causesunderlying them is a necessary preliminary to the devising and applying of proper remedial measureswhere such are found possible.
Coming to the question of the methods that might be adopted by the railways to meet theposition, I would express the opinion that as to the suburban areas the railways will continue to workthe great bulk of the workers' traffic, but will not be able to successfully compete for the casual traffic.Even if electrification could be justified by circumstances such as intensity of traffic and the otherconditions which form the economic basis of that form of transport, I am doubtful whether therailways in New Zealand could even then maintain their position as regards this latter traffic.
So far as the traffic other than suburban is concerned, I think the railways will continue to holdthe long-distance traffic against its road competitors by improved methods of traction combined withdevelopment of higher standards of services and facilities. The traffic lying between long-distancetraffic and the suburban traffic will continue to feel the effect of motor competition, but I think thatit might be possible to meet the position in some measure by the institution of more frequent servicesby means of rail-cars or road services having a greater measure of elasticity in the matter of stopping-places than is possible in the case of trains.
We still have the third point to deal with—namely, that of creating new traffic. It is obvious thatwith the high proportion of fixed charges that is inevitable in the railway industry anything that canbe done along this line is of special value. In this connection we have been active in the developmentof touring trains and special point-to-point excursions, and we have already created quite asubstantial amount of new business along these lines.
I think also a field of new traffic that might be developed is that of night passenger services.In the South Island we have already made a commencement in that direction, and the results havebeen sufficiently encouraging to warrant the belief that this matter might be pursued with benefitto the Department both from a financial point of view and from the point of view of service to thepublic. The latter aspect has a bearing that I regard as important. In the South Island, for instance,although the night passenger-trains have not resulted in a very striking addition to the total numberof passengers carried, they are nevertheless giving a degree of service that the reports show to be verymuch appreciated by the public at large and by the business community in particular.
The great advantage to business men of being able to travel long distances in comparative comfortby night, enabling a full measure of business to be done during the day, is one that is being increasinglyappreciated by them. The points between New Plymouth and Wellington, and Napier and Wellington,seem to offer the most attractive prospects at present. It seems certain, however, that for some timeto come the traffic is not likely to be large enough to warrant the running of trains, but I feel that itmay be possible to develop a rail-unit to suit the traffic, and apart from the general question of theuse of rail-units we are prosecuting particular inquiries in regard to this traffic.
I am hopeful that the new traffic which we shall be able to create in the directions I have indicatedwill do much to counteract the losses we are suffering in passenger traffic in other directions.
Parcels, Luggage, and Mails.The revenue under this heading totalled £378,141, a decrease of £1,792 as compared with the
figures for the previous year.An analysis of this branch of the Department's revenue is as follows : —
1929. 1928. Variation.£ £ £
Parcels .... ..
.... 200,387 201,462 -1,075
Excess luggage .. .. .. .. 13,956 .14,429 —473Left-luggage, checks, bicvcles, and dogs .. .. 47,798 48,532 —734Mails
'
.. .....
.. 116,000 115,510 +490£378,141 £379,933 -£1,792
The decrease in parcels revenue is due to motor competition, and the decrease in luggage receiptsis in sympathy with the falling-off in passenger traffic,
iii—P. 2,

D.—2. XVIII
Goods and Live-stock.The revenue from goods and live-stock for the year ended 31st March, 1929, was £4,846,125, an
increase of £165,990, or 3-55 per cent., as compared with the figures for the previous year. A com-parison of this year's results with those of the previous year is as follows :—
1929. 1928. Variation. Per Cent.Revenue .. .. .. £4,846,125 £4,680,135 +£165,990 3-55Tonnage .. .. .. 7,613,445 7,358,388 +-255,057 3-47
The tonnage of goods and live-stock carried was the highest for any year on record, and thefollowing figures illustrate the tonnage carried since 1925 : —
Tonnage.Increase over Previous Year.
Year. Tons. Tons. Per Cent.1929 .. .. .. .. .. 7,613,445 255,057 3-471928 .. .. .. .. .. 7,358,388 49,939 0-681927 .. .. .. .. .. 7,308,449 52,307 0-721926 .. .. .. .. .. 7,256,142 222,683 3-171925 .. .. .. .. .. 7,033,459 107,942 1-56
Revenue.Increase over Previous Year.
Year. £ £ Per Cent.1929 .. .. .. .. .. 4,846,125 165,990 3-551928 .. .. .. .. .. 4,680,135 83,969 1-831927 .. .. .. .. .. 4,596,166 97.006 2-151926 .. .. .. .. .. 4,499,160 381,414 9-281925 .. .. .. .. .. 4,117,746 168,159 4-25
While the total tonnage handled continues to increase, the fact must not be overlooked that thegain is principally in low-rated commodities such as artificial manures, grain, coal, and road metal.Until towards the close of the financial year the goods traffic showed slight variation as comparedwith the previous year, but in the last three months of the year a considerable improvement wasmade. The Railway Department shared in the beneficial effects of the favourable season, and thetonnage of live-stock, wool, grain, and dairy-produce handled was such as to tax the available rolling-stock to the limit.
The principal increases during the year under review were as follow :—
North Island. South Island. Revenue.Tons. Tons. £
Grain and flour .. .. .. ..10,533 46,592 24,546Butter .. .. .. .. .. 6,051 595 4,674Cheese .. .. .. .. ~ 23,770 535 14,171Wool ..
.. .. .... 2,273 3,063 6,598
Lime, agricultural .. .. .. .. 11,277 14,237 8,628Coal, New Zealand hard .. .. .. 1,048 14,181 2,498Coal, New Zealand soft ~
.... 2,151 16,207 dec. 3,951 dec.
Road metal .. .. .. .. 26,190 47,553 8,689Benzine .. .. ..
.. .. 8,287 25,177 26,955Manures, artificial .. ..
.... 92,499 33,954 65,530
With the continued decrease in passenger traffic, to which I have already referred, the railwaysmust look more and more to the goods revenue for the major part of the receipts. The ton-mile receiptfor the year under review was 2-41d., and in order to balance the accounts (exclusive of the creditreceived in re pect of developmental lines) a ton-mile receipt of 2-86d. would have produced arevenue f r goods t affic of £5,812,395. While at first it may appear a somewhat easy matter toincrease the rates by an amount representing an increase of 0-45d. per ton per mile in railage, theproblem becomes somewhat difficult when all the factors of the situation are taken into considerationas is hereunder set out at more length.
There are three ways in which theoretically the deficiency may be removed : (1) Reduction inworking-expenses to enable transportation to be produced more cheaply ; (2) an increasing trafficsufficient to make good the loss now iuvolved ; (3) increased charges on the traffic now conveyedby rail.
With regard to No. 1 : This is a matter that is constantly engaging the attention of everyrailway authority. No condition is regarded as permanent, and the whole scope of operations isfrom time to time kept under review and checked up by reference to statistical matter, reports andcontact of supervisory staff with the actual operations of the Department. Such matters as theprovision of more powerful locomotives, the strengthening of structures to enable this to be done,rearrangement of running duties, reorganization of workshops, and other similar matters are alldirected to this end. There is scarcely a day goes by that some aspect of the Department's operationsis not being rearranged or modified in order to secure reduced working-costs, and the statisticalmatter which is presented in this report will indicate that the year has not been barren of achievementin this direction. As costs are brought down so further reductions tend to become more difficult.Frequently progress along these lines depends upon the discovery of new processes or inventions that

D.—2XIX
cannot now be foreseen, and this makes it difficult to forecast the future so far as the matter of reducedworking-costs is concerned. All that can be said in this connection is that a policy of constantreview will be rigorously pursued, and there will be no relaxation of effort in this connection. The matterof working-costs is dealt with in more concrete form in the comment set out in this report under theheading of " Statistics."
Regarding No. 2, this is a matter which not only lies with the Department but also with thecommunity. So far as the Department is concerned, we are, by improved facilities and the adoptionof commercial methods in seeking and attracting business, endeavouring to develop rail-borne traffic.In this connection, however, we find ourselves faced with serious difficulties arising out of motorcompetition, which is dealt with subsequently in this report under the heading of " Regulation ofTransport."
Question No. 3 involves considerations of policy which do not come within the province of themanagement as such. A few thoughts, however, might be helpful as possibly clarifying the issues.In the first place I would say that it should not be impossible to raise the rates to an extent thatwould be sufficient to produce the revenue required to meet all charges. It will be seen that anaverage increase of 045d. per ton-mile would be required. The capacity of the railways to raise therates on the commodities in the higher classes is very definitely affected by the motor competition,such competition being confined, as it almost wholly is, to traffic in those classes. The great volumeof the tonnage is, however, in the lower classes, and the amount by which those classes would requireto be increased would not be substantially more than the figure above mentioned. Whether the ratesof these lower classes should be so increased is the policy question involved. I desire, however, atthis stage to emphasize the aspect of the effect that is likely to accrue from a growth of the practiceof allowing the road motors to take high-class goods, while leaving those in the lower classes to therailways. The inevitable results of such a procedure are, I think, such as call for the very seriousconsideration of every member of the community.
The capital invested in the railways is irretrievable, and it is, moreover, borrowed capital. Theoverhead costs remain more or less fixed, and, however good the management may be, costs cannot bereduced in proportion to the loss of business diverted to the roads. The expenses hitherto recoveredfrom passenger or high-grade-goods traffic must be recovered from the business thatremains or be passedon to the taxpayer. If such expenses are charged against the long-distance or lower-grade traffic aserious position must arise. An increase in the long-distance rates will penalize the inland areas,which, being almost entirely dependent on rail transport, will pay more for their imports and canexport only at higher cost. The cost of primary production will rise owing to increased freights onsuch low-rated goods as coal, fertilizers, timber, grain, fruit, live-stock, and road metal, whether forlong or short distances.
Coastal districts that already reap the benefit of short-haul-road-transportation rates will receiveno additional benefits, but will pay more on bulk traffic.
Speaking broadly, it appears that the tendency will be to reduce the cost of imported goods indistricts adjacent to sea ports and to increase the costs of primary production in all districts, atendency which may result in disaster to a country depending so largely on its exports of primaryproducts.
The further question arises out of the ambiguity of the phrase " making the railways pay." Thismay mean either of two things : Firstly, whether the revenue accruing from the railway operationsshould be sufficient to meet the railway expenditure and interest charges, or, secondly, whether therailways are to be regarded not in an abstract way, but as a community investment bringing advantagesto the community both directly financial and indirectly in other respects. If the former inter-pretation of the phrase is adopted, then we have the advantage of knowing, so far as the position isdisclosed by the railway accounts, the amount that would require to be made up' through the mediumof an increase in rates. On the other hand, we would be undoubtedly placing a burden on the railwaysthat would not be expected of a privately-owned railway, and which might lead not only to wrongjudgments regarding the efficiency of the organization, but also to inequity by placing a burden ofadvantage on the shoulders of those who are not necessarily the sole beneficiaries thereof.
So far as the first matter is concerned—namely, the question of wrong judgments as regards theworking of the organization—it will be clear that if certain concessions are allowed as a matter of" policy " which would not be allowed by a privately-owned railway established for the earning ofdividends, then if the organization is required not only to earn the dividend which the privately-ownedrailway would earn but also to make up the deficiency involved in the "policy" concessions, then, tothe extent that we may presume that the privately-owned railway is extracting every penny out of theindustry that it economically can, an impossible burden is being placed on the State-owned railwayin asking it not only to do this but also to make up the additional margin involved in the policyconcessions.
As regards the second, it seems undoubted that there are many policy concessions given throughthe medium of the railways, the justification of which is not the concession to the individual so muchas the community benefit that will result. An outstanding illustration of this principle is to be foundin workers' tickets and concessions in connection with our primary and secondary industries. As regardsthe workers' tickets, it is generally recognized that the policy in this connection is justified by thesocial betterment accruing to the community by the facilities afforded for better living-conditionsand the prevention of slums in our city areas. Policy concessions to our industries aregenerally founded on the benefit that will, accrue to the community as a whole through thedevelopment of those industries that are helped by the concessions; but, inasmuch as thecommunity as a whole benefits, should not the community as a whole make some paymentin the sense that as the railways stand the primary loss involved (which is the investment made)
D.—2 XX
they should be credited with the resulting advantage. It is true that it may be difficult to statethe value of such community advantages in terms of money so as to present a complete account showingthe financial position of the railways as a community investment, but this difficulty does not in anyway affect the principle involved. Prima facie, when a concession of this kind is given it is becauseit will " pay "—i.e., it is worth while in the interests of the community that the concessions shouldbe given ; and in assessing what deficiency there is in the railway return for the purpose of the matternow under consideration—namely, that of an increase in rates—it would certainly seem that thereare definite questions of policy that require to be considered before the quantum of increased revenuethat should be obtained through this medium is determined. True it is that the Department underthe form of accounts as now adopted receives some credit for its community service through themedium of the allowance made in respect of what are called developmental lines. The question maybe raised here, however, as to whether this allowance, while admitting the principle, covers the wholefield. It would seem that consideration of the matter in terms of service rather than in terms of moreor less arbitrary sections of the line would be more logical though undoubtedly somewhat difficult ofpractical application. When the Department works a line which is not able to meet all charges it issimply giving a service that is not radically different from any unremunerative or not whollyremunerative service it may give in any other respect, such as workers' tickets, low rates for thecarriage of fertilizers, &c. Certain it is that before the question of an increase in rates can be settledthe prior question of the amount of increased revenue required has also to be settled, and this involvesthe questions I have attempted to set out above. The impossibility of calculating the benefits in termsof money will undoubtedly make any such assessment more or less arbitrary, but this seems clearlyto be unavoidable in any system that might be adopted.
Prompted by consideration of railway charges and by recent experiences which we have had inconnection with the transport business of the rural community, I desire to make the following remarks,which I think might be worthy of consideration by the farmers of the Dominion :—
The transportation of the products of our farms is attended by difficulties which are not alwaysrecognized. For example, live-stock must be handled with promptness in special wagons. Fat-stocktraffic is such that in season the demand for wagons is so abnormal that many additional services re-quire to be provided to facilitate the turnover of stock-wagons. By way of illustration of this point itmay be mentioned that in the North Island the peak stock month of the year 1928-29 was the four weeksended 2nd March, when 1,143,471 head of sheep were conveyed by rail. Taking the number of sheep-wagons on the North Island Main Line and Branches as 1,321, it will be seen that the handling of thistraffic called for a turnover of all such wagons three and a half times per week. In the South Islandthe peak stock period is slightly later, and for the four weeks ended 31st March a total of 940,789 headof sheep was conveyed on the South Island Main Line and Branches. The number of sheep-wagons onthe latter section is 1,096, and to handle the peak traffic all these vehicles would require to be turnedover three and one-third times per week.
During the slackest months of the year the traffic in sheep drops to 56,000 and 51,000 per four-weekly period in the North and South Islands respectively, and from my brief remarks regarding thepeak traffic it must be apparent that for traffic such as this it would not be a sound proposition for theDepartment to construct sufficient rolling-stock to cope with the peak traffic when such equipmentwould be lying idle for approximately nine months of the year.
Moreover, a fair proportion of other farm-products are seasonal, and result in an unusual demandat certain periods for transport equipment, and this involves expensive empty-wagon haulage in orderto have the wagons at the various loading-stations to meet requirements.
The railways also afford direct advantages to the farming community by concessions that havebeen frequently stated- and are wellknown, such as low rates for agricultural lime and artificial manures,&c., and these concessions represent a definite investment by the community at large in the venturesof the farming industry. It is really equivalent to the community finding some portion of thecapital necessary for the adequate development of the business of the farmer. What is the communityentitled to expect from the farmers in return ? Surely no less than that the farmers will, by makinguse of the railways, give the community an opportunity of recouping itself at least in some measurefor its outlay on their behalf. It is regrettable indeed that we find on some occasions farmers'organizations taking an all-too-narrow view of their obligation in this regard. They entirely ignorethe advantages they have received from the policy of the railways and have deserted the nationalinstitution that has done and is doing so much for them to accept a comparatively small advantagethat in many cases must be evanescent in character. Such a policy on the part of the rural communityif persisted in must have an inevitable reaction. Unjust conditions cannot be permanent. It isobviously unjust for the Railways to make sacrifices in the interests of the farmer who, when theopportunity arises for him to show appreciation of this in a practical way, declines to pursue thatcourse. Ido not wish my statement in this regard to be misconstrued into a threat—nothing of thekind is intended—I merely state the obvious fact that the searchlight of public criticism is beingdirected on the financial policy of the Railways. Its financial operations must come under review,and if the community does not, through the failure of certain sections to recognize and act up to theirmoral obligations, obtain the return from its investments on behalf of the rural community to whichit is morally entitled, action will be compelled by the interests of public finance, which cannotindefinitely sustain a growth in the financial burden which the railways may be on the taxpayer.We have found that the greater proportion of the farming community appreciate the position andaccord us their loyal support. I would plead with the remainder to consider the position well, asthey are in danger of doing an injury not only to themselves, but to the farming community asa whole.
D—2,XXI
I am well aware of the necessity of providing rates for tlie conveyance of our valuable exportson a scale which will enable them to compete successfully in the world's markets, and I think itit will be found that, when all the circumstances of the case are taken into consideration, the ratescharged for the commodities which constitute the principal items in the railage bill of the man on theland are now on such a basis as will achieve this desirable object and at the same time assist materiallyin the further development of the agricultural and pastoral wealth of the Dominion.
I am optimistic enough to think that with the development which has taken place in the top-dressing of the lands of the Dominion (in which low railway rates for fertilizers play no small part),and the valuable research and experimental work being carried out by the Agricultural Department,the two agricultural colleges, and the various experimental farms throughout the Dominion, theindications point to a considerable increase in our export trade. For bulk transport, which constitutesthe major part of our exports, the Railway Department has the facilities and equipment to dealefficiently with such traffic, and there is no doubt that the railways alone can in the future, as in thepast, provide that measure of assistance to our rural industries through the medium of transport thatis so necessary for the expeditious development of those industries. But to do this adequately therailways themselves must be in a healthy condition, and any action that tends to weaken the railwayswill likewise affect adversely their power for service, and the'rural industries will undoubtedly suffer.
STATISTICS.I have already mentioned that, considered from the point of view of the financial return from
the Department's operations, substantial progress has been made. I do not, however, regard thesefigures as adequate for the purposes of any judgment on the Department from a managerial point ofview. I have dealt with some of the reasons for this (though from another standpoint) in my commentregarding the question of increasing rates for the purpose of making good the difference betweenrevenue and all charges. Summarizing the position, it is that while on the expenditure side thewhole of the costs necessary to give the service to the community that is given through the railways(including both " policy " service and what might be called " commercial " service) are included,the whole of the return to the community resulting from such expenditure is not reflected in therailway revenue statement. Whether the revenue and expenditure accounts may be a sound founda-tion for a judgment on the railway results from a standpoint that comprehends the whole railwayissue (including the policy under which the railways are worked) is not a matter that can be herediscussed, but I do submit that in considering the railways from a managerial point of view theseaccounts are not necessarily a sound basis for judgment, and they may be positively misleading. Toconclude that a debit balance as between these accounts is evidence of defect in the management isas unfair as it is incorrect, inasmuch as it ignores factors vitally bearing on the balance on theseaccounts, over which the management, as such, has no control whatever. Such factors may becollectively subsumed under the heading of " policy " and those factors, qua policy, are non-managerial.
Are we then to have no test of managerial efficiency ? To answer this question I think we mustconsider what can and should be expected of the management. Stated in the fewest words, it seemsto me that the duty of the management of a railway system such as ours is to carry out the policy setfor the working of the Department at the lowest cost that the carrying-out of such policy permits of.Obviously we cannot eliminate all the factors that might be held to vitiate the test, but we can geta nearer approximation to such elimination than the above-mentioned accounts afford. I think thatbetter information on the internal working of the Department can be obtained by reference to theoperating statistics. Even these do not wholly eliminate non-managerial factors. As beingprincipally concerned (as regards the financial figures) with the working-costs, they will be affected bysuch non-managerial questions as decisions of the staff Appeal Board (the constitution of which,among other things, takes the final determination of all appeals in respect of the remuneration to bepaid for First Division positions out of the hands of the management) ; the policy in respect tounemployment (which may require the Department to carry a larger staff than is really necessary forthe demands of its business) ; the policy regarding preference to locally-made or Empire-madematerials (which may require the Department to pay more for its materials than it otherwise would).I do not wish to be misconstrued as implying any judgment (adverse or otherwise) on these matters.I merely mention them in an endeavour to assist towards a clear judgment on the railway position ;
and while an interpretation of the statistics may entail consideration of, and allowance for, such factorsas those mentioned, I think they approach much more nearly to an elimination of non-managerialfactors than the mere balance of the revenue and expenditure accounts.
In order to apply such practical tests of managerial efficiency, advantage has been thegross ton-mile statistics now available to compile unit costs and operating-performance statistics foreach locomotive and traffic district. The value of the figures is somewhat discounted by the overlapbetween Locomotive and Traffic districts, such districts not being coextensive, making it difficult toget a complete statement of all transportation costs or performances in any one district. This defectwill, however, be overcome in the future by an arrangement for the further development of divisionalcontrol as elsewhere outlined. The statements are, however, as complete as it is possible to makethem, and as an indication of operating efficiency will repay careful study. The basic figures on theone hand are the costs in terms of money and in man-hours, fuel and oil consumption, and on the otherthe production measured by several different units such as train-miles, train-hours, gross and netton-miles, vehicle-miles, engine-miles, and engine-hours. From these figures are derived the costper unit of production, and indexes of operating efficiency such as the average train-speed, averagetrain-load, gross and net ton-miles per train and engine-hour, net ton-miles as a percentage of gross,vehicles per train, average wagon-load, and percentage of empty to total wagon-miles.

D.—2. XXII
Proceeding to an examination of the statistical figures, the following may be interesting andhelpful:—
Freight Traffic Averages.
1928-29. 1927-28. Variation.Per Mile of Line No. No. No. Per Cent.
Freight tonnage .. .. 2,343 2,315 + 28 +1-21Freight net ton-miles .. .. 149,893 147,236 + 2,657 -j-1-80Freight gross ton-miles .. .. 481,593 467,168 +14,425 +3-09
These figures are a reflection of the increase in the goods tonnage carried.1928-29. 1927-28. Variation.
Per Freight Train-mile:— No. No. No. Per Cent.Train-load, gross .. .. .. 232 228 + 4 +1-75Train-load, net .. .. .. 87 87Number of vehicles, loaded .. .. 18-81 18-65 +0-16 +0-86Number of vehicles, empty ..
.. 9-12 8-91 4-0-21 -j-2-36These figures indicate that we have been able to get better loading for our trains but that more
empty haulage was necessary, a condition which usually accompanies abnormal peak demands, suchas were experienced during the year.
1928-29. 1927-28. Variation.Per 1,000 Gross Ton-miles£ £ £ Per Cent.
Freight revenue .. .. .. 3-09 3-15 —0-06 —1-90No. No. No.
Net ton-miles .. .. .. 376 380 — 4 —1-05The decreased revenue per 1,000 gross ton-miles is due to the greater proportion of empty
haulage.1928-29. 1927-28. Variation.
Wagon user £ £ £ Per Cent.Revenue per ordinary goods vehicle .. 183 176 + 7 +3-98Revenue per live-stock vehicle .. .. 173 169 + 4 +2-37
Tons. Tons. Tons.Average wagon-load .. .. .. 4-64 4-65 —0-01 —0-22
The decreased wagon-load is due to the net ton-mileage of traffic with a relatively low wagon-loadsuch as live-stock and merchandise, increasing in a greater ratio than heavy traffic such as mineralsand timber.
1928-29. 1927-28. Variation.No. No. No. Per Cent.
Average miles per wagon per day .. 22-48 21-38 +1-10 +5-14Average net ton-miles per wagon per annum
(ordinary goods) .. .. ..23,429 22,484 + 945 +4-20Average net ton-miles per wagon per annum
(live-stock) .. .. ..11,827 11,343 + 484 +4-27These figures show that the turnover of the trucks has been much better. Each truck travelled
farther, and carried more goods.
Coaching Traffic Variations.Per Cent.
Coaching revenue decreased .. .. .. .. .. 0-88Coaching train-miles increased .. .. .. .. .. 4-07Coaching train-hours ~
.. .. .. .. 3-13Coaching vehicle-miles ~ .. ..
.. .. .. 2-47Coaching Revenue:—
Per train-mile decreased .. ..
.. .. .. 4-78Per train-hour ~ .. .. .. .. .. .. 3-90Per vehicle-mile „ .. .. .. .. .. .. 2-64
Freight Traffic Variations.Freight revenue increased .. .. .. .. .. 4-22Freight train-miles ~
.. .. .. .. .. 3-78Freight train-hours ~ .. .. .. .. .. 0-93Freight gross ton-miles ~ .. .. .. .. .. 5-55Freight net ton-miles ~
.. .. .. .. .. 4-51Freight vehicle-miles ~
.. .. .. . . .. 5-17Net ton-miles as a percentage of gross decreased .. . . . . 0-97Empty-vehicle miles as a percentage of total vehicle-miles increased .. 1-02
Freight Revenue:—Per train-mile increased ..
..
.. .. 0-41Per train-hour ~
.. .. .. . . 3-26Per thousand gross ton-miles decreased . . .. . . .. 1-26Per thousand net ton-miles „
.. .. .. 0-28Per vehicle-mile „
.. .. .. .. 0-78

D.—2XXIII
Railway Operating Averages : Coaching and Freight.Per Cent.
Operating revenue increased .. .. .. .. .. 2-46Operating expenditure „
.. .. .. .. .. 1-15Train-miles ~ .. .. .. .. .. 3-90Train-hours ~
.. .. .. .. .. 1-60Engine-miles ~
.. .. .. .... 3-44
Engine-hours ~.. .. .. .. .. 2-35
Gross ton-miles ~.. .. .. .. .. 4-91
Revenue. Expenditure.Per Cent. Per Cent.
Per train-mile decreased 1-52 decreased 2-65Per train-hour increased 0-85 „ 0-45Per engine-mile decreased 0-94 „ 2-22Per engine-hour increased OTI ~ I*l6Per thousand gross ton-miles decreased 2-33 „ 3-59
The above figures require little comment. They show an increase in total revenue and a lesserincrease in total expenditure. The decrease in the revenue per train-mile and engine-mile is insympathy with the lighter loading of wagons and the increased empty haulage, as indicated in thefigures showing the proportion of net ton-miles to gross ton-miles. The increase per train-hour andper engine-hour as compared with the decrease per train-mile and engine-mile indicates greaterefficiency in the handling of trains and better utilization of locomotives and rolling-stock.
Railway Operating Expenditure.
Railway operating expenditure increased by £72,460, or 1-15 per cent., as compared with anincrease of £181,019, or 2-46 per cent., in the revenue. The principal variations are as follow :—
Maintenance of Way and Works: — 1928-29. 1927-28. Decrease.Total expenditure .. .. .. £1,111,229 £1,147,067 £35,838Per mile of line ..
.. .. £340-35 £359-24 £18-89The expenditure on the running-tracks decreased by £35,689. The expenditure of the previous
year was high, as it was found necessary to improve the condition of the track owing to the greatervolume of fast and heavy traffic.
The average mileage of line under maintenance for the year was 3,268 miles, as compared with3,192 miles in the previous year.
Maintenance ofSignals and Electrical Appliances 1928-29. 1927-28. Increase.Total expenditure .. .. .. £112,206 £102,871 £9,335Per mile of line ..
.. .. £34-37 £32-22 £2-15The increase under this heading was due to the growth of the work of the Branch by the extension
of signal, interlocking, and electrical appliances, also to increased maintenance charges on the automaticsignalling on the Midland line, as a result of damage done by snowstorms.
Maintenance of Rolling-stock.1928-29. 1927-28. Variation.
£ £ £
Superintendence .. .. .. 29,344 33,056 — 3,712Locomotives .. .. .. 586,105 593,454 — 7,349Cars and vans .. .. .. 248,795 237,861 4-10,934Wagons .. .. .. .. 559,921 516,355 +43,566
Totals .. .. .. £1,424,165 £1,380,726 +£43,439
Locomotives.—Owing to increased wagon repairs and the greater volume of capital work (mostly onaccount of workshops reorganization), the direct cost of locomotive repairs decreased by approximately£31,080, but additional overhead expenses in connection with workshops reorganization (£9,475),increased contributions to Locomotive Renewal Fund (£5,416), and amounts for engine-hire previouslycredited to this account but now credited to revenue, have reduced the decrease to £7,349.
Cost per Vehicle. Cost per Vehicle-mile.
1928-29. | 1927-28. Variation. 1928-29. 1927-28. Variation.•
£ £ £ d. d. d.Locomotives .. .. 870 860 +10 8-69 9-10 —041Cars and vans .. 119 113 + 6 1-49 1-46 +0'03Wagons .. .. 20 19 + 1 0-71 0-69 +0-02
D.—2. XXIV
Cars and Vans.—The direct cost of maintaining cars and vans decreased by £4,070, but additionaloverhead charges (£9,763) and increased contributions to Car Renewal Fund (£5,241) are responsiblefor an increased expenditure of £10,934.
Wagons. —The greater number of wagons requiring repair increased the expenditure on thisaccount by £9,821. The balance of the increase (£33,745) is due to contributions to Wagon RenewalFund (£15,198) amd additional overheads (£18,547.)
The increased cost of maintaining rolling-stock is due to two main causes—viz., greater provisionfor renewals and overhead expenses arising out of the workshops reorganization. It is anticipatedthat expenditure under this heading will remain somewhat above normal until the reorganization iscompleted.
Locomotive Transportation.1928-29. 1927-28. Decrease.
Total expenditure .. .. .. £1,583,769 £1,599,564 £15,795Cost per engine-mile .. .. .. 23-49d. 24-52d. l-03d.
Locom otive-runnivg Statistics.1928-29. 1927-28. Increase. Increase.Number. Number. Number. Per Cent.
Total engine-miles .. .. 16,183,798 15,658,700 525,098 3-35Total engine-hours .. .. 1,635,310 1,598,358 36,952 2-31Gross ton-miles .. .. 2,326,926,374 2,218,085,881 108,840,493 4-91The ratio of increase in engine-miles is higher than in engine-hours, giving indication of greater
efficiency in handling the traffic.1928-29. 1927-28.
Averages:—■ d. d.Cost per engine-mile .. .. .. .. .. 23-49 24-52Cost per train-mile .. .. .. .. .. 34-20 35-42Cost per engine-hour .. .. .. .. .. 232-44 240-18Cost per 1,000 gross ton-miles .. .. .. .. 163-35 173-08Engine-miles per engine-hour .. .. .. .. 9-90 9-80Engine-miles per locomotive-day .. .. .. .. 79-20 78-40Gross ton-miles per engine-hour ..
.... .. 1,423 1,388
The principal variations in locomotive transportation costs were an increase in drivers' andfiremen's wages of £25,000, and a decrease in fuel of about £40,000. Increased train-services chieflyaccounted for the increase in wages. Particulars regarding fuel are as follows :—
The total number of tons consumed increased by 7,672 tons, or 1-91 per cent., while net ton-mileage of locomotive coal hauled increased by 21'5 per cent.
There has been a saving in cost of fuel consumed of about £40,000, against which has to be setthe increased haulage (7,908,000 net ton-miles) resulting from the increased use of New Zealand coal.Allowing for this at, say, fd. per net ton-mile, it will be seen that there has been a saving on accountof fuel of about £15,000.
Traffic Transportation.1928-29. 1927-28. Increase.
£1,825,965 £1,760,459 £65,506The principal variations under this heading are as follow :—
Publicity and Commercial Branches account for about £10,000 increase. These are two newbranches that have been brought into being as a result of the conditions now obtaining. Expenditurein respect thereof will tend to increase with the greater pressure of competition.
The introduction of the train-control system, scale increases in salaries, and printing and adver-tising account for an increase of about £11,000.
Under the subheading of " Station Expenses " an increase of approximately £26,000 is accountedfor by the addition of the East Coast Main Trunk line to the working railways system, the workingof Middleton marshalling-yard, and increases in goods-shed and wharf working-expenses due to shippingtraffic at Lyttelton.
Under the subheading of " Train Expenses " there is an increase of £12,600, principally onaccount of the additional week-end excursions that have been run, the inauguration of night trainsin the South Island, the opening of the East Coast Main Trunk Railway, and the appointment oftrain attendants on the mail and express trains. Miscellaneous expenses increased by £4,700 onaccount of the Glenhope-Murchison cartage contract. This is an arrangement that was entered intowhereby a cartage service was instituted between the places mentioned, the charges between Glenhopeand Murchison being on the basis of railway rates. The sum mentioned represents the deficit incurredby the Department on account of that service,
Total Tons. Total Cost! Locomotive Coal Haulage in 1000'sof -Net Ton-miles.
"
1 ' !1928-29. 1927-28. 1928-29. 1927-28. 1928-29. 1927-28.
j |
409,677 402,005 £726,430 £768,357 44,670 36,762I I I
D.—2,XXV
General Charges.1928-29. 1927-28. Increase.
£250,221 £248,921 £1,300.Under this heading are included charges for Head Office, Appeal Board, Chief Accountant's
Branch, Divisional Superintendents, and superannuation subsidies. The variation does not call forany special comment.
TRAFFIC.The following are the leading features of the traffic in the various districts in comparison with
the previous year : —
Kaihu Section.—Revenue, £7,158 ; increase, £496. Passengers decreased 1,331 ; parcels, &c.,increased £81 ; sheep decreased 399 ; timber decreased 57 tons ; all other goods increased 415 toDS.
Gisborne Section.—Revenue, £36,601 ; increase, £2,562. Passengers increased 3,891 ; parcels,luggage, &c., increased £166 ; cattle increased 66, and sheep decreased 8,378 ; timber increased 132tons, and all other goods increased 1,130 tons.
North Island Main Line and Branches. —Revenue, £4,421,986 ; increase, £100,785. The principalitems of traffic were : Passengers, 4,826,844 ; decrease, 191,636. Season tickets, 480,421 ; increase,16,483. Parcels, luggage, and mails—revenue £241,009; increase, £1,342. Live-stock, 5,343,070;increase, 229,357. Goods tonnage, 3,155,752 ; increase, 131,728 tons. Timber decreased 27,621 tons ;
all other goods increased 159,349 tons. The revenue per mile of railway decreased from £3,289 9s. Id.to £3,202 Bs. 5d., and decreased per train-mile from 13s. 4d. to 13s. 2d.
The variations in the individual districts were approximately as follows : —
Northern District. —Revenue, £2,125,834; increase, £66,029. Passengers decreased 54,190;season tickets increased 5,633 ; parcels, luggage, &c., increased £4,569 ; cattle increased 91,343, andsheep 126,658 ; timber decreased 18,923 tons, and all other goods increased 86,376 tons.
Middle District.—Revenue, £500,082; decrease, £6,991. Passengers decreased 13,246, andseason tickets increased 241 ; parcels, luggage, &c., decreased £615 : cattle increased 4,479, andsheep decreased 12,762 ; timber decreased 9,464 tons, and all other goods increased 8,991 tons.
Western District. —Revenue, £491,582; increase, £8,204. Passengers decreased 11,023, andseason tickets increased 61 ; parcels and luggage decreased £1,556 ; cattle increased 51,460, and sheepdecreased 21,575 ; timber increased 1,765 tons, and all other goods increased 27,225 tons.
Southern District.—Revenue, £1,304,488; increase, £33,543. Passengers decreased 113,177,but season tickets increased 10,548 ; parcels and luggage decreased £1,056 ; cattle increased 26,218,and sheep decreased 36,464; timber decreased 999 tons, and all other goods increased 36,757 tons.
Picton Section.—Revenue, £37,516 ; decrease, £334. Passengers increased 601, and season ticketsdecreased 291 ; cattle decreased 118, and sheep increased 24,202 ; timber decreased 466 tons, and allother goods 3,629 tons.
Nelson Section.—Revenue, £24,753 ; increase, £3,315. Passengers decreased 3,792, and seasontickets increased 24 ; cattle increased 568, and sheep 8,829 ; timber increased 10 tons, and all othergoods 922 tons.
Westport Section.—Revenue, £134,746 ; decrease, £3,011. Passengers decreased 7,660, and seasontickets 153 ; parcels, luggage, &c., decreased £74; cattle increased 66, sheep decreased 909 ; timberincreased 1,060 tons ; all other goods decreased 16,575 tons.
South, Island Main Line and Branches.—Revenue, £2,862,105 ; increase, £77,207. The principalitems of traffic were ; Passengers, 3,944,353 ; decrease, 26,353. Season tickets, 173,650; increase,7,395. Parcels, luggage, and mails—revenue, £128,486 ; decrease, £3,452. Live-stock, 4,634,221 ;
increase, 307,023. Timber, 260,969 tons ; increase, 24,410. All other goods, 2,879,950 tons ; increase,91,841 tons. The revenue per mile of railway increased from £1,721 4s. to £1,759 10s. Id., and increasedfrom 13s. 9d. per train-mile to 14s.
The variations of traffic in the individual districts were approximately as follows :—
Northern District.—Revenue, £1,271,901 ; increase, £60,562. Passengers decreased 2,214, andseason tickets increased 1,138; parcels, luggage, &c., decreased £491 ; cattle increased 707, andsheep decreased 2,365 ; timber increased 31,039 tons, and all other goods increased 67,141 tons.
Middle District.-—Revenue, £991,305 ; increase, £126,001. Passengers increased 69,531, and seasontickets 6,239 ; parcels, luggage, &c., increased £1,712 ; cattle increased 7,545, and sheep increased349,159 ; timber increased 16,162 tons ; all other goods increased 145,913 tons.
Southern District. —Revenue, £598,899 ; decrease, £109,356. Passengers decreased 93,670, andseason tickets increased 18 ; parcels, luggage, &c., decreased £4,673 ; cattle decreased 7,686, andsheep 40,337 ; timber decreased 22,791 tons, and all other goods decreased 121,213 tons. The generaldecrease in the Southern (or Invercargill) District was caused through the reallocation of districts.Balclutha and Catlins River Branch figures, which were formerly included in the Southern District,are included in the Middle (or Dunedin) District.
Lake Wakatipu Steamer.—Revenue, £10,941 ; increase £1,056. Passengers increased 2,116 ; sheepdecreased 2,717 ; timber increased 295 tons ; all other goods increased 599 tons.
TRANSPORTATION.The total revenue train-miieage was 11,113,482 miles, as compared with 10,838,594 miles for the
previous year, an increase of 274,888 miles. Of the total train-mileage 4,833,991 were passenger-milesand 6,279,491 were goods-miles, an increase of 189,086 and 85,802 respectively over the figures for theprevious year. This additional mileage is due principally to the train services provided on the newlines taken over during the past year, and also to additional services run to cope with heavy seasonaltraffic.
iy—D. 2.
D.—2 XXVI
The particulars of the mileage run in the various sections of railway are as follows :—
j I I
During the past year fast passenger-trains have been provided between Wanganui and NewPlymouth, and between Napier and Palmerston North. The Wanganui - New Plymouth train has aconnection from Marton with the Limited express from Auckland, while the Napier - PalmerstonNorth train connects at Palmerston North with the Limited express for Auckland and with a fasttrain for Wellington. The provision of these services has therefore opened a good connecting-link withthe Auckland-Wellington Limited expresses. The Aucldand-Whangarei-Opua expresses whichterminated at Whangarei on three days of the week during a portion of the year were made throughtrains from September, thus giving the northern district facilities for daily communication withAuckland.
The suburban services radiating from the main centres received close attention during the year.Additional trains were provided, and a number of adjustments were made to better meet the convenienceof passengers. In the Wellington suburban area it was possible by co-ordination of the Department'sroad and rail services to effect substantial economies, certain of the trains during the slack portionof the day being eliminated and the passenger traffic transferred to the Department's buses.
Punctuality of Trains.The record of train punctuality, while not up to last year's standard, is satisfactory, considering
the many and varied adverse circumstances contended with. Certain seasonal commodities have beenheavy this year, and, instead of producing a steady flow of traffic over a period, weather conditions havecaused peak rushes to form. An extraordinary peak tends to congestion, from which initial delaysexpand and have far-reaching effects. The sheep traffic this year, for instance, was somewhat later thanusual in moving, and the unusual movement is reflected in the time-keeping of trains towards the closeof the year.
The Easter traffic for 1929 was handled in March, and the consequential delays which arise out ofheavy holiday traffic have caused an inflation of the figures for the 1928-29 year.
A number of mishaps (engine-failures, derailments, and other line-interruptions) have occurredat a time of the day which caused a maximum of interference with passenger services. Severe damagecaused in August by a storm to the sea-wall protecting the Hutt line has been responsible for muchlata running of the suburban trains. The unpunctuality is not confined to the suburban area only,and its effect is far-reaching. The checks received in the suburban area are often reflected on trainspassing through the Wairarapa, and even affect express and other trains connecting at Woodville.
Average Late Arrivals of Trains, Year ended 31st March, 1929.
Section. 1928-29. j 1927-28. Increase.I !
Miles.Kaihu .. ..
.. .. .. 17,393 17,738 Dec. 345Gisborne .. ..
.. .. .. 76,586 82,211 Dec. 5,625North Island Main Line and Branches .. .. 6,705,512 6,479,921 225,591South Island Main Line and Branches .. .. 4.095,546 4,049,450 46,096Westport ..
.. .. .. .. 92,311 94,140 Dec. 1.829Nelson .. .. .. .. .. 59,725 63,292 Dec. 3,567Picton .. ..
.. .. .. 66,409 51,842 14,567
11,113,482 10,838,594 274,888
Period ended AveraseVear ended • torYear
April. May. June. July. August. Sept. Oct. Nov. Dec. Jan. Feb. M|rch March Minutes
' Express and Mail Trains.31st March, 1929 I 8-48 j 7-20 j 6-62 I 5-06 I 4 32 ) 4-84 I 3-19 ; 3-97 I 3-75 | 9-95 | 6-25 i 9-09 I 13-76 6 6531st March, 1928! 10 15 ! 5-50 ! 0-25 I 3-77 [10-34 110-98 1 2-40 3-06 ! 3-11 ; 910 ! 6-46 1 5-65 | 4-05 ! 6 22
Long-distance Mixed Trains.31st March, 1929 111-43 j 8-64 j 6-28 , 4-67 j 4-33 1 4-70 4 73 4-85 5-64- 8-35 I 7-68 111-47 13-39 i 7-4031st March, 1928 [ 11-87 ! 7-81 ' 6 26 1 4-35 ! 5-96 ' 4-23 ! 3-27 3-95 3 84 6-37 I 6-79 | 6-26 | 7-96 6-07
Suburban Trains.31st March, 1929 j 0-62 0 50 0-58 0-61 1 69 2-90 ! 0-93 j 1-13 0-79 1-33 1-18 1-36 1-67 1 1731st March, 1928 J 1 47 0 77 0-76 0-62 0 71 0-55 ; 0-4.6 ! 0-55 0-58: 0-76 0-78 0-93 0-69 ; 0-79
I ! I I !
These figures include delays arising from ali causes, including floods, slips, washouts, engine and othermechanical failures, and traffic delays at stations.

D.—2,XXVII
LAKE WAKATTPU STEAMERS.1929. 1928. Variation. Per Cent.
£ £ £
Revenue .. .. .. .. .. 10,941 9,885 +1,056 10-68Expenditure .. .. .. .. .. 17,425 15,627 +1,798 11-51
Net loss .. .. .. .. £6,484 £5,742 +£742 12-92
The revenue from the lake steamers shows a substantial increase, due to the good year experiencedin tourist traffic, and in traffic in motor-cars, merchandise, and timber. Live-stock shows a slightdecrease. Large quantities of pipes for irrigation works at Arrowtown were carried in the closingmonths of the year. The increase is made up as follows :—
£
Passengers .. .. .. .. .. .. 234Parcels, luggage, and mails .. .. .. .. 22Goods ..
.. .. .. .. .. 763Miscellaneous ..
....
.. .. 37
£1,056
The cost of repairs to steamers for the year was £3,850, as against £2,197 last year—increase£I,6s3—this item being mainly responsible for the large increase in expenditure and for the increasein net loss on the year's operations. The steamer "Ben Lomond " was completely refitted duringthe year.
The mileage run for the year was 24,225, as compared with 23,928 for the previous year, anincrease of 297 miles.
The Lake Wakatipu steamer service has been a losing proposition to the Department for someyears. The service being self-contained there is no real justification for this, and the matter seems tobe resolving itself into the position that the charges for the services rendered are too low.
I have had the matter very carefully gone into with a view to seeing whether any materialsavings can be effected, but it does not appear that much can be done in this direction if the servicesare to be maintained at their present standard. On the contrary, I conclude that the time has nowarrived when we have to give consideration to the question of supplementing the fleet on the lake bya new vessel if the standard of the service is to be kept up, or any improvement in that respect isto be made. It would, however, be difficult to justify the expenditure on a new vessel unless thereis some reasonable prospect that an increase in revenue can be obtained not only to meet the presentloss, but also to balance the additional charge that would be involved by the provision of a new vessel.
The fleet at present consists of the " Earnslaw," the "Ben Lomond," and the " Mountaineer."The " Earnslaw "is in quite good condition, and is the mainstay of the service. The "Ben Lomond "
has just been reconditioned, but it is a very small vessel, and cannot be regarded as any other thanan emergency unit in the fleet. The other vessel, the " Mountaineer," is a paddle steamer of obsoletetype. It is slow and not of a standard generally that would enable it to give a satisfactory servicecomparable to that of the " Earnslaw." Whenever the piresent service cannot be maintainedwith one vessel it is necessary that the " Mountaineer " be used, and this gives rise to public dis-satisfaction. The "Mountaineer" is due for complete overhaul and refitting this year. It isdiffioult to estimate what the cost of refitting will be, as many defects are not disclosed until dismantlingis commenced. On such an examination of the vessel as is now possible it appears doubtful whetherthe vessel will be worth repairing for this service. Eor the purpose of the following calculations,however, I have assumed that the boat might be given another ten years' life by an expenditure of£3,000. I have gone into the question of the provision of a new boat, and in the following table acomparison is made of the annual capital charges on the assumption that the cost of refitting the tw Toold boats is capitalized and the wr hole amount written off in an estimated remaining life of ten years,while the rate of 3 per cent, written off the " Earnslaw " since 1926 remains unaltered, and thenew boat is written off at per cent, on the original cost (forty-years life). Interest is computedat 4 Jper cent. The ships will have little or no residual value.
"Ben Lomond." "Mountaineer." "Earnslaw." New Boat.£ £ £ £
Original cost .. .. .. .. 2,567 7,433 22,678 25,000Less depreciation (four years) .. .. 309 891 2,720
Present book value .. .... 2,258 6,542 19,958 25,000
Cost of refitting, add .. .. .. 1,800 3,000
£4,058 £9,542 £19,958 £25,000£ £ £ £
Annual depreciation over remaining life .. 406 954 690 625Interest .. .. .. .. 183 429 898 1,125
Annual capital charge .. .. £589 £1,383 £1,588 £1,750
D.—2. XXVIII
The annual capital charges on the two old boats would be £1,972, as compared with £1,750 on thenew boat. The latter, being a larger and faster boat, would require two additional men (one deckhand and one fireman)—say, £500 per annum—and would cost about £700 per annum more for coal.
The total comparative costs per annum of the service under the two proposals would be asfollow
(A.) (B.)Throe Boats. Two Boats.
£ £
Shore expenses .. .. .. .. .. 1,900 1,900Running expenses—
Salaries and wages .. .. .. .. 5,400 5,900Coal and stores .. .. .. .. 2,800 3,500
Repairs—
Steamer .. .... ..
.. 2,000 1,900Wharf ..
.. .. ....
.. 700 700Insurance .. .. .. .. .. .. 150 195Depreciation—
Steamers .. .. .. .. .. .. 2,050 1,315Structures .. .. ..
.. .. 234 234Interest .. .. .. .. .. 1,995 2,508
£17,229 18,152
Allow for amortization, interest and principal, old boats .. .. 1,077
£19,229
The total cost of proposal B, including an allowance for writing off interest and principal on thetwo old boats in about twelve years and a half, would be £2,000 in excess of the cost of proposal Afor about ten years, after which the provision of a new boat must be faced. The revenue averagesabout £10,000 per annum.
Revenue.In considering the possibilities of increases in the lake traffic and revenue in the future a survey
of the business since it was taken over by the Department in November, 1902, will be useful.In 1903 a general reduction of 25 per cent, was made in the charges in force on the lake.From 1902 until 1924 the number of passengers carried showed little variation except for a
substantia] decrease during and after the war. Since 1925 an increase of 3,000 to 4,000 passengers perannum over 1904 has been recorded, equal to about 15 per cent. Passenger revenue remained atpractically the same level (£3,300) until 1920, and it is now about £4,300, or about 30 per cent.,above 1904. The fare basis is now 25 per cent, higher than in 1904 owing to the war increases, butthe revenue has not increased in proportion to the number of passengers and the ordinary farebasis, much of the additional traffic having been induced by specially cheap excursion fares. Thefare basis is still about 6 per cent, below the rates ruling in 1902.
The total tonnage of goods carried showed a decrease of 28 per cent, between 1904 and 1919, thedecline in the mining industry being the principal contributing factor, and the traffic did not get backto the 1904 level until 1928. The quantity of live-stock carried doubled in the twenty-five years, buttimber decreased by 35 per cent. Goods carried by weight were practically the same in 1928 as in1904. Freight revenue is now 40 per cent, above the 1904 level, the respective figures being £3,231and £4,525, due to the tariff increases arising out of war conditions. Notwithstanding the latterincreases, the goods rates are only 5 per cent, higher than they were in 1902.
The revenue from parcels, luggage, and mails increased from £400 to £1,000, and the total revenuefrom £7,000 to £10,000, or by 43 per cent., in the twenty-five year period.
I do not think it safe to anticipate any marked increase in passenger traffic in the near future.A faster and more comfortable boat on the Head of Lake service would, however, undoubtedlypopularize the Paradise trip, which is becoming of steadily increasing importance owing to the largenumber of tourists arriving in Queenstown by road from Cromwell or Wanaka, from whom theDepartment may derive no revenue if an attractive service is not provided.
A great handicap on the lake is the seasonal nature of the passenger traffic, which varies betweentwo thousand and seven thousand passengers per four-weekly period in the season December to April,and between four hundred and one thousand passengers for the rest of the year.
With respect to goods traffic, it is understood that irrigation works now proceeding in the vicinityof Arrowtown will bring 7,000 to 8,000 acres of land under cultivation for grain-growing, creating aconsiderable amount of additional traffic on the lake.
There does not appear to be much prospect of any material improvement in either the mining orthe pastoral industries.
Expenditure.
The expenditure on the lake service was maintained at slightly in excess of £5,000 per annumuntil 1912, when the " Earnslaw " was put into commission. During that period the earnings weresufficient to pay working-expenses, interest, and depreciation, although uo allowance for the latterwas made in the accounts, and the cost of the new boat was wholly capitalized.
As a result of commissioning the "Earnslaw " working-expenses immediately increased4by £1,000and capital charges by £1,400 (including depreciation). Additional wharves and a new slipway were
D.—2.XXIX
constructed, largely for the accommodation of the bigger vessel, at a capital cost of £4,300 and anannual cost of £300. In all, the increased annual expenditure due directly or indirectly to the newboat was at least £2,700. The increase in business was negligible, and no adjustment of charges wasmade to cover the cost of a much improved service. It should, however, be noted that the out-break of war made it impossible to gauge the effect of an improved service on the passenger revenue,and it is only of recent years that tourist traffic is getting back to normal.
Since 1914 the cost of wages and salaries has increased by 75 per cent., coal by 200 per cent.,and the total working-costs by 100 per cent. (£6,000).
Since 1904 working-expenses have increased from £5,000 to £12,000, capital charges from £1,000to £3,500, and the total expenses from £6,000 to £15,000, as compared with a revenue increase from£7,000 to £10,000.
To cover increased costs and provide for accrued depreciation the revenue requires to be raisedfrom £10,000 to £17,250 (proposal A) or £19,250 (proposal B).
Two questions call for immediate consideration at this juncture—(1) That steps should be takento balance the accounts of the lake service ; (2) whether a new steamer should be provided.
With regard to the former question, this clearly resolves itself into the question of the revisionof the lake tariff. Definite proposals in this connection are now being formulated, and, in accordancewith the policy that is being adopted, will be discussed with the parties particularly interested beforebeing finalized. Arrangements are being made for this to commence practically immediately.
With regard to the second question, this is largely dependent on what is done in connection withthe revision of the tariff, and is also directly affected by the matter of the construction of the newroad from Queenstown to Kingston. I am definitely of the opinion that if this road is carried tocompletion we would not be justified in incurring the expenditure that would be necessary for theprovision of the new boat.
ROAD-MOTOR SERVICES.The total number of passengers carried by the Department's road-motor services during the past
year was 2,919,605, of which the Hutt Valley service was responsible for the largest proportion—2,336,651 passengers.
The balance of expenditure, including interest and depreciation, over revenue in the road-motorservices accounts was £9,327. While we aim, of course, to obtain the best possible return from therunning of the buses themselves, the foregoing sum must not necessarily be regarded as a loss from theDepartment's point of view. Railway authorities generally run road services for one or both of tworeasons—namely, (1) to protect its business against competition, and (2) to enable savings to beeffected on its train services where it is found that the traffic can be worked more cheaply by meansof road-vehicles than by means of the rail. The position, however, as disclosed by the accounts issuch that, I believe, will afford room for improvement, and I desire to comment on these servicesas follows :—
Hutt Valley Services.Of the aforementioned sum these services account for £7,200. This is principally due to the very
high maintenance costs that were incurred during the year. The difficulty with which we found our-selves faced was that the buses which were purchased from the various private concerns running onthe Hutt Road had arrived at the stage where maintenance had become a very considerable item.Indeed, a thorough investigation showed that many of the buses were not in a condition to justifythe large amount necessary to keep them in proper condition.
The position was very considerably accentuated by the coming into full operation of the MotorRegulations, which requires a very much higher standard than had previously been the case. Wealso found ourselves faced with the necessity for reducing the seating in order to comply with theregulations, and this, of course, had a directly depressing effect on the earning-capacity of the variousvehicles.
A complete review of this fleet brought us to the conclusion that it was hopeless to expect to givesatisfaction in the matter of service or to show a reasonable financial return with the vehicles thatwere purchased from the various private concerns that were operating the service prior to the Depart-ment taking it over. It was therefore decided to at once purchase ten more buses, and tenders wereduly called and a tender accepted. These buses are now in course of delivery, and are already enablingus to materially improve the service. The whole of these ten buses were of the four-wheeled single-decker type. Further buses will be required during the coming year to replace vehicles that haveceased to be economically efficient. Before embarking on further purchases, however, inquiries arebeing made as to the suitability of other types of buses, such as six-wheeled single-decker and double-decker buses, in order that we may build up the fleet in a way that will give us the best results bothfrom a traffic and financial point of view.
Another very material factor affecting the financial return on the Hutt services has been the writing-off of the amount represented by goodwill in the purchase price of the buses. The difference betweenthe valuation of the buses as taken over and the total amount paid to the previous owners is £16,530,and this, of course, represents the amount paid by way of goodwill. I think it is desirable that thisshould be written off as quickly as possible, and we are aiming to eliminate it from the accounts:infive years. This involves a writing-off of £3,300 each year, and this amount, of course, represents a burdenon the working-expenses that will continue until the total sum is finally disposed of.
Another factor which bore materially on the financial results was the imposition of the petrol-taxthat was brought into operation during the year. This accounted on the Hutt service for no less than£2,284.
By way of set-off against the debit on account of the buses, we have the saving on account ofadjustment of train services which was made possible by the running of the buses. This saving isestimated at £5,000 per annum.

D.—2 XXX
Napier-Hastings Service.This service showed a debit of approximately £600, this being brought about by an increase in
costs resulting from an additional59,525 miles having to be run owing to the diversion of traffic duringroad repairs, also to the imposition of the petrol-tax, which alone was responsible for approximately£760.
As in the case of the Hutt services, maintenance costs were very high, showing an increase overthe previous year of £891. Here again we find the fleet arriving at the stage where extensive main-tenance work has to be undertaken, while the alterations necessary to comply with the MotorRegulations helped to swell the bill. This service has been the subject of some complaint, and inorder to enable the public need to be more adequately met arrangements were made for the fleet tobe augmented immediately by the addition of new buses. These will considerably increase theearning-power of this service, and with the superior type of bus and lower maintenance costs wecould, if other factors were equal, look confidently for a better return.
Unfortunately, this service has been made the subject of some very keen and irregular com-petition by taxi-cars of the ordinary motor-car type, a number of which are now running in directopposition to our service, notwithstanding that additional omnibus licenses were not granted by thelicensing authority. Ido not doubt the ability of our service to ultimately cope with this competition,but in the meantime a grave injustice is being done to the Department, which holds the necessarylicenses for this service and is providing a fleet that is quite ample for the needs of the traffic. Thenet result is that harm is being done to the authorized service, and I am confident that in the long-run no benefit will accrue to those who are engaging in this irregular competition. It is certainlyunfortunate that such a state of affairs should be allowed to continue.
The saving in train services as a result of the bus operations is estimated at £2,500 per annum.
Christchurch-Midland Service.This service shows a debit of £1,114, which has been largely contributed to, as in the case of the
other bus services, by the imposition of the petrol-tax.We have also had a special debit on this service respecting the altering and repairing of one of the
buses, which is of a non-recurring nature.This service is essentially one that has been put on in order to protect the Department's business,
though it has also allowed some economy to be effected in train-working, the cost of which it ispractically impossible to estimate.
Oamaru-Tokarahi Service.The debit on this service is £380. as compared with £655 last year. This service is run to enable
economies in train-working to be effected on the Ngapara and Tokarahi Branches. It is estimatedthat the saving on the train services amounts to £800 per annum.
In conclusion on the question of the bus services, I desire to say that in my opinion this is abranch of the business of the Department that must inevitably grow. The improvement in the roadsand in the design and efficiency of road-motors will, I consider, necessitate the Department under-taking road services for both the reasons that I mentioned at the opening of my remarks under thisheading—namely, in order to protect its business and to effect savings in providing the various facilities.
The immediate care of a road-carrying organization is one that is becoming a work requiring a
great deal of specialized knowledge which can only be gained by a person devoting himself only tothis type of transport and building up an organization that will make for efficiency and economy. Tothat end a Bus-manager has been appointed, whose duties will be to control the whole of the operationsconnected with our road-motor services ; and with the advance in knowledge and experience that wewill get from the specialized work of the Bus-manager and the organization under him, coupled withthe improvements that are being made in the bus fleets, I feel confident that we may look for betterfinancial results from these services in the future.
THROUGH BOOKING OF PASSENGERS, PARCELS, AND GOODS BETWEEN NORTH ANDSOUTH ISLANDS.
A branch of our service that has been instituted in recent years and which is being increasinglyavailed of by the public is the through booking between the North and South Islands.
During the past year the value of the parcels and goods traffic under this heading was £21,481,as compared with £17,094 in tie previous year. This shows an increase of approximately 25 percent, in one year. The passenger bookings also showed an increase of 13 per cent.
We have received many expressions of appreciation of our services in this connection, and theforegoing figures will show that these sentiments are shared by the community at large, as is evidencedfrom the rapid growth that has taken place in this branch of our business.
Hitherto the service has been confined to transport between Wellington, Lyttelton, Picton, andNelson. The scope of the arrangement has now been considerably extended so as to cover transportfrom many of the other ports of New Zealand that are served by rail.
D.—2XXXI
ADVERTISING SERVICE.1929. 1925. Variation. Per Cent.
£ £ £
Revenue .. .... .. 53,984 52,600 +1,384 2-63
Expenditure .. .. .. 50,719 48,921 +1,798 3-68
Net profit .. .. £3,265 £3,679 -£414 11*25
The increase in revenue is mainly due to the increase in new business obtained this year, and toadditional miscellaneous work done for other branches and departments.
New business written up during the last three years is as under :—
1928-29. 1927-28. 1926-27. *
£ £ £
Outdoor advertising .. .. .. 72,230 44,454 66,245Publications .. .. .. .. 4,597 2,079 2,551Printing .. .. .. .. 2,633 2,802 2,926Miscellaneous .. .. .. .. 1,534 1,063 2,045Buses .. ..
.. .. .. 1,019 874
£82,013 £51,272 £73,767
It should be noted that the net profit of £3,265 on the operations of the Advertising Serviceduring the year does not represent the whole of the revenue derived by the Department fromadvertising, but the figures have been shown as above in order that a comparison might be madewith last year, when they were shown in the same form. By way of further elucidation of the figuresI would mention that, in accordance with the policy that was adopted when the accounts werereorganized, of putting the subsidiary services as nearly as possible on the same basis as independentbusinesses, the Advertising Service has been debited with charges for the right to display advertise-ments on railway premises, rent for land and buildings, commission on cash collected by other branches,railage at ordinary tariff rates, and interest on the capital employed in the business, amounting inthe aggregate to £15,879. These all represent money earned by the Advertising Branch. The totalfinancial benefits derived from advertising was therefore £19,144, being the balance between actualearnings and actual expenditure of the branch (including depreciation).
The substantial increase in new business written up during the year ended 31st March, 1929, will not,however, be reflected in the revenue of the branch until the advertisements have been erected, andthis should show a substantial improvement during the current year.
Some very large contracts were obtained during the year, and in most cases these were fromclients who have been using the Department's advertising service for a number of years, indicatingsatisfaction with the results they are obtaining from railway advertising and the service the Depart-ment is rendering. Apart from the outdoor activities of the branch, considerable progress has beenmade with publication advertising—Railway Magazine, Pocket Guide, &c. —and for the more efficienthandling of this class of business two specialist salesmen were taken on during the year to handlepublications exclusively. The art and signwriting studios were kept working at high pressurethroughout the whole year, and the indications are that the new financial year will be a very busyone indeed in the branch.
A pleasing feature of the year's operations has been the fewness of the complaints that havebeen received from the public and local authorities with regard to the erection of our hoardings.This I ascribe to two main factors — namely, the high artistic standard that has been maintained,and the readiness of the Department to meet all reasonable objections. Whenever any localauthority or individual has indicated objection to the erection of a particular hoarding we have madea point of discussing the matter in a broad light. It is quite recognized by the Department thatevery location may not be suitable for the erection of hoardings, and that a generous considerationshould be given to all features that tend to render the erection of a hoarding in any particularlocality undesirable. This policy will continue to be pursued. I feel that the Department mightcarry on with its present service with full confidence as to both its success as a revenue-producer, andthe favourable light with which the public geneTally will regard its activities.
DEPARTMENTAL DWELLINGS.1929. 1928. Variation. Per£ £ £ Cent.
Revenue .. .. .. ..105,897 93,643 +12,254 13-09Expenditure .. .. .. 170,073 162,263 + 7,810 4-81
Net loss .. .. £64,176 £68,620 -£4,444 6-48
The increase in revenue is due to rentals received from houses completed in accordance with theDepartment's housing scheme and to houses taken over from the Public Works Department. Therevenue per dwelling is—1929, £31 10s.; 1928, £29 6s.

D.—2, XXXII
The following is an analysis of the dwellings expenditure:—
The decrease in maintenance is due to heavy expenditure incurred last year, renovating houses takenover from the Architectural Branch and built five years previously. The increase of £9,683 fordepreciation, interest, and insurance is due to increased capitalization.
It is hardly to be expected that our housing will be a source of revenue to the Department, butit does seem that the cost to the Department in the way of the loss on the housing of the staff lias grownto a magnitude that calls for serious consideration. There are also anomalies in connection with thecharging of rents, more especially as between the more recently erected houses and those of the oldertype, and these anomalies give rise to some dissatisfaction among the various members of the staff.I propose to give consideration to this matter during the coming year, with a view to seeing whether some-thing cannot be done to meet the position without imposing any undue burden on the. staff who occupydepartmental dwellings.
During the year 50 houses were cut at the Frankton Junction House-factory, 91 which had beencut the previous year were on hand on the Ist April, 1928, and 96 were under erection (incomplete)on the Ist April, 1928, making a total of 237.
For the Department 177 houses were erected during the year, for the Hutt Valley HousingCommittee 27, and for the Public Works Department 16, making a total of 220.
The number of houses in course of erection and incompleted at the 31st March, 1929, was—Departmental, 12 ; non-departmental, nil : total, 12. Since the inauguration of the housing schemethe total number of houses erected is—Departmental, 1,277 ; non-departmental, 314 : total, 1,591.
A number of hot and cold water services have been provided, and electric light and sewerageinstalled where available.
The house-factory and sawmill adjacent thereto at Frankton Junction, which were established in1923 for the primary purpose of enabling houses to be constructed for the staff, have, with thecompletion of the housing programme, been closed. As much of the machinery as can be madeeconomical use of is being transferred to the workshops, and the Realization Account in respect ofthe factory and sawmill is being credited with the value thereof. Some machinery that cannot betransferred to the workshops will still remain and will require to be realized upon to the best-advantage. Similar considerations apply also to the land and buildings.
It seems inevitable that there will be a debit to be disposed of when the accounts of the factoryand sawmill are finally wound up, and this will principally fall on the Housing Branch. This willmake the debit on account of our housing operations as above set out rather greater than appearsat present.
LAND BRANCH.The number of leases registered during the year was 536, the aggregate annual rental of these
amounting to £4,584 16s. lid. The total number of leases current on the 31st March, 1929, was6,910, the total annual rental being £54,348 6s.
The total fees for preparation of deeds, dealing with documents, and for supplying advices tothe Valuation Department was £780 16s.
The number of Proclamations, Orders in Council, notifications, and other documents issued takingand giving up land was 47. The number of transactions purchasing land by certificate of title was 23,the compensation paid for the land acquired totalling £40,999 ss.
During the year the work of reviewing our leases of railway land has been carried on, and in agreat number of cases improved leases have been arranged under the legislation that was passed inthis connection in 1928. This has given lessees a better tenure of the lands and has enabled themto use the land to better advantage. The change undoubtedly will work to the benefit both of theDepartment and of its tenants.
An investigation into the use of lands that are lying idle has also been carried on during the year,and, where possible, the lands have been let. It is fully realized that even when it is necessary to letlands at a very low rental it is better to have them in occupation than lying idle. We are experiencingsome difficulty in this connection, however, owing to the state of the law in regard to rating. Manyof our lands, by reason of their being in boroughs, become liable for rates that render them anuneconomical proposition to prospective tenants. We find ourselves in many cases unable to givea tenancy that would warrant the use of the land for building purposes, and the amount of the ratesrenders them unprofitable for farming purposes. Within the limits, however, of the difficulties weencounter in the various places we are aiming to have all railway lands made some use of.
! 1929. Per Dwelling. 1928. Per Dwelling. Variation. peT Dwelling
£ £ s. d. £ £ s. d. £ £ s. d.Maintenance .. 54,670 16 4 11 56,543 17 14 5 -1,873 —1 9 6Depreciation .. 33,612 9 19 10 30,918 9 13 9 +2,694 +0 6 1Interest ..
.. 77,380 22 19 11 70,742 22 3 5 +6,638 +0 16 6Insurance .. .. 4,411 1 6 2 4,060 1 5 5 + 351 +0 0 9
170,073 50 10 10 162,263 50 17 0 +7,810 -0 6 2
D.—2XXXIII
REFRESHMENT BRANCH.1929. 1928. Variation. Per Cent.
£ £ £
Revenue .... .. .. 123,059 122,220 + 839 0-69
Expenditure .... .. 116,090 114,644 +1,446 1-26
Net profit.. .. .. £6,969 £7,576 —£607 8-01
An analysis of the revenue discloses the following variations :—
1929. 1928. Variation,£ £ £
Dining-rooms.. .. .. .. .. 26,005 27,371 —1,366Counter-rooms
.. .. .. .. 94,063 92,472 -f1,591Miscellaneous..
.. .. .. .. 2,991 2,377 + 614
£123,059 £122,220 + £839
The opening for traffic of the East Coast Main Trunk Section of railway to Taneatua necessitatedthe erection of a refreshment-room at Tauranga. This room was opened in December last, andthe Department now controls twenty-nine refreshment-rooms, in addition to the catering on theLake Wakatipu steamers.
The refreshment-room revenue for the year amounted to £123,059, or £839 more than last year.The expenditure was well regulated, with the result that the year's trading was satisfactory.
The refreshment-rooms derived considerable business from week-end and excursion trains, andadditional business was obtained through placing sales-boys on some of these trains for the purposeof vending ices, sweets, smokers' requisites, fruit, &c.
The inauguration of the dining-room service in the Hillside Workshops, with the proposedextension to the Hutt and Otahuliu Workshops at an early date, and later at Addington Workshops,marks a new era in departmental catering. In the well-equipped dining-room the men may obtainlight luncheon at a nominal charge. Facilities are also provided to enable those who do not desire topartake of a full lunch to obtain tea or coffee and consume same in the dining-room. A counter, atwhich smokers' requisites, &c., are obtainable, is also provided.
Arrangements are now being made to provide kitchenettes in the De Luxe sleeping-cars on the"Limited" express trains, for the purpose of enabling all sleeping-car passengers who desire it tobe supplied in the morning with tea, coffee, bread roll, bread and butter, or hot scones. It isanticipated that this service will enable the requirements of passengers on this train to be met quitesatisfactorily.
The system of cushion-hire has now been extended to the South Island, and also to the principaldaylight express trains. The number hired during the year was 99,939, compared with 82,143 in1927—28. During the holiday periods there is a heavy demand for cushions, and this service is mostpopular.
PUBLICITY BRANCH.Extended scope has been given to the operations of the Publicity Branch during the past year.
The main objective has been to make more generally and easily available any information likely to behelpful in letting the public understand the range and quality of services which the Department hasavailable for its patrons. Allied to this has been such action as would tend to remove those misunder-standings which arise from uninformed criticism of the Department. A further application ofrailway publicity has been in the direction of creating and stimulating interest in travel within theDominion.
The publicity campaign has included regular weekly features in the principal newspapers, and ineach issue of several magazines, dealing with special phases of railway operations. This has beensupported by a liberal use of hoardings and other effective means of reaching the public.
The principal pa.ssenger services, and tables of fares, have been comprehensively advertised thriceweekly in the city newspapers of the Dominion. Special articles and " write-ups" have been suppliedto, and published by, the press and vocational journals in New Zealand and abroad.
An extensive distribution has been made of a number of specially prepared publications such as" The State Railways of New Zealand," and " Top Dressing for Top Prices," the latter being issuedto show how railway freights for artificial manure assist primary production.
v- D. 2,
D.—? XXXIV
A new illustrated booklet entitled. " Freight by Rail " explains briefly the advantages obtainableby the people of New Zealand in the use of their own railways. For the first time a comprehensivetime-table of goods-train services has, through this medium, been made available to business houses.
Two maps of the North and South Island respectively, indicating by colours the contour and othersurface characteristics of New Zealand in relation to the railways system, have been prepared forsuitable distribution.
The " Romance of the Rail, No. 2," descriptive of travel by the South Island Main Trunk Railway,was also published during the year.
A competition, open to all art students, for a poster design advertising the New Zealand Railways,was arranged during the year. The response was particularly good, and the standard of work wasof a high order. The two prize-winning designs were distinctly modern in conception, andeffective examples of finished poster-work.
An essay competition, open to all primary, secondary, and technical school pupils, caused a greatdeal of interest in railway matters and produced some thoughtful contributions. The winning essayswere published in the New Zealand Railivays Magazine.
From time to time lecturettes on railway subjects have been broadcast by wireless, in addition todescriptive accounts of trips to scenic resorts reached by rail, and other information likely to be ofassistance to travellers.
Particular attention has been paid to publicity in connection with week-end, seaside, and farmers'excursions. The principal mediums employed were electric talking signs, theatre screens andprogrammes, newspaper advertisements, local window displays, large calico signs, attractive handbills,tramcar dash-boards, three-coloured posters, and two-coloured art circulars. A suitable mailing-listis also used to give a wide distribution of publicity matter featuring these excursions.
The work of the Publicity Branch is co-ordinated with that of the Government Overseas PublicityBoard. This is designed to avoid overlapping of functions and makes for the wider use of modernpublicity in featuring the Department's work.
THE NEW ZEALAND RAILWAYS MAGAZINE.The Department's official monthly Magazine has now entered upon the fourth year of its
publication, and continues to receive a most favourable reception from the Railway Staff, the press,and the public throughout New Zealand and overseas.
The Magazine has a circulation of twenty-three thousand copies monthly. It is an eminentlyconvenient and effective medium for the diffusion of current railway information to the employeesof the Department, and also to the commercial and farming community immediately interested inthe business of railway transport in the Dominion. The publication of special articles by accreditedexperts in the science of transportation, and of articles and news items by members of the staff featuringthe many activities of the Department, is serving to accumulate a definite store of authoritative know-ledge of great value to the Railway service as a whole.
Moreover, as a publicity medium within the Dominion and overseas the Magazine can rightly beregarded as a valuable departmental investment. " The Magazine constitutes one of our main infor-mation sources regarding New Zealand," is an opinion received from the Institute International duCommerce, Brussels, Belgium. Equally impressive communications indicative of the utility of theMagazine in its publicity aspects are being constantly received.
There has been a substantial increase in the number of advertisers, and it is safe to predict thatwhen the advertising side of the Magazine is more fully developed the revenue from advertisementswill materially lessen the cost of production, which is already low in relation to the size, quality, andcirculation of the journal.
All branches of the service are proud of their own Magazine, to which they look for light andguidance in coping with the difficulties surrounding the operations of the Department.
SHORTAGE OF ROLLING-STOCK.The question of shortage of rolling-stock is an ever-recurring one, and is one in regard to which
there is a good deal of misunderstanding. There seems to be a conclusion, all too hastily arrived at,that whenever a full supply of trucks cannot be placed at every point as and when required thereis a shortage of rolling-stock. Such circumstances do not necessarily justify any such conclusion.A little consideration of the incidence of railway traffic must make it obvious to any one that theDepartment could not possibly maintain a supply of rolling-stock to meet the needs of every periodof peak loading, however short that period might be.
During recent months the question has been more particularly felt in the South Island, and in orderto make the foregoing position clear I append hereunder a graph showing the variations in the goodstraffic in that Island from 1926 to 1929. This graph brings out very vividly the traffic shocks whichtheDepartment is expected to absorb. The variations, as will be readily seen, cover a very wide range,and it will be noticed that in 1929 we reached a record of traffic. Within a period of eight weeks in 1929the traffic varied from below 180,000 to above 270,000, while the general average of traffic over thefive years was in the neighbourhood of 220,000. To have maintained a quantity of rolling-stock
I).-—2XXXV
sufficient to meet the peak loading in 1929 would have meant that at least some of that stock would havebeen continuously out of traffic right up to the time when that period was reached. Clearly that wouldnot be an economical proposition, and any attempt to arrive at that stage would require a substantialincrease in the railway deficit.
The statistics which are dealt with elsewhere in this report show that the efforts of the Departmentto meet the position with the available rolling-stock were well directed in that we had a more rapidturnover of the wagons. It is in this connection that the users of the railways can do much to helpthemselves.
W$ find in periods of so-called shortage of rolling-stock that wagons are held up at countrystations awaiting unloading for periods that very considerably restrict the Department's turnoverof its rolling-stock, while the vagaries of the shipping traffic are an ever-recurring difficulty which ispractically beyond the control of the Department. Trucks are ordered to load for ships at given times,and the spectacle is not uncommon of having large numbers of trucks under load waiting for ships which
D.—2. XXXVI
have not arrived at the time for which loading was made. The difficulties associated with shippingare felt in New Zealand to a degree not generally experienced in other countries. This is due to therelatively large number of ports dotted along our coast, and the high proportion of the total quantityof rolling-stock that is engaged in connection with shipping traffic.
Such occurrences as bad weather, delay in working of ships in ports, also retard the turnover ofwagons.
All these shocks, however, the Department is expected to absorb, and does so to the best of itsability. In times of stress we do not hesitate to put on special train services at short notice to facilitatethe transfer of rolling-stock to points where it is most needed, while in mapping out our rolling-stockprogramme from year to year we are constantly aiming to improve the supply of vehicles of the typesmost required. As I have remarked elsewhere, our ability to augment our stock is almost invariablylimited by the amount of finance that can be made available to us.
It will be seen, therefore, that the conditions which give rise to difficulties regarding the supply ofrolling-stock during periods of shortage are almost wholly beyond the control of the Department.I feel sure that, having regard to the circumstances, more particularly the violent variation in thetraffic as indicated in the graph, the business is carried on with a minimum of inconvenience thaton an impartial review of the situation may well be claimed to be creditable to the Department.
REGULATION OF TRANSPORT.As I have already indicated in this report, we find ourselves, in connection with the increasing
of our business to make good the present financial deficiencies, faced with serious difficulties, thechief of which is, of course, the unregulated competition of road motor-vehicles. These servicesstart with the great advantage of having a road provided for them, a circumstance which has no counter-part in connection with railways. Large sums of money are being spent on the improvement ofroads paralleling the railway, thus making increasingly possible the competition of road services withthe railways. To the extent that this is being done the country is duplicating, and in some cases(as when sea transport also exists) triplicating, the means of transport. More especially in a countrysuch as New Zealand, where the railways are the property of the community, this raises a definitequestion as to whether it is in the interests of the community that this should continue. If thecommunity by the expenditure of money on a new facility depreciates an existing one, then on anyadequate review of the situation such depreciation should be taken into account and provided for.True, the community may prefer road transport to rail transport even at the expense of duplication ;but the money invested in the railways has to be provided for, and the two services have inevitablyto be paid for though only one is used. The difficulty arises largely from the fact that the responsibilityis communal, while the advantage is largely individual. Individuals desirous of running, or takingadvantage of, motor services clamour for improved roads to be provided by the community, whilethe benefit is reaped by comparatively few. It must be remembered that the railways are still anindispensable factor in our transport system. It would not only be a physical impossibility forroad services to cope with the whole of the traffic, either passenger or goods, but it wouldbe an economicimpossibility also. This will be quite clear from a consideration of the fact that the average revenueper ton-milenecessary to have covered all railway charges last year would have been only 2-86d. (withoutthe necessity even for a credit on account of developmental lines). Obviously road servicescould not produce the necessary transport at that price. As the figures show, the competitionby road services is confined to the more highly rated commodities. The net result of thisis to weaken the position of the railways from the point of view both of service and price, and thecommunity as a whole suffers. Nor is the competition of road services on a basis'of equity oreconomic soundness. As already mentioned, the road hauliers start with a road already provided ;
they skim the cream of the traffic, having a scope for choice of what they will transport that isincomparably wider than that which exists in the case of the railways ; and they have a power ofdifferential treatment that has an immense influence on their power to secure traffic by bargaining,and which is almost entirely absent in the case of the railways.
There is no doubt that much of the motor competition with the railways is not on an economicbasis. We are repeatedly coming across cases where prices are quoted by motor-lorry owners thatcannot possibly be remunerative if all costs are taken into account. There are a large number ofowner-drivers operating on our roads who have had no business training whatever, and it is notsurprising, therefore, to find that their operations show little evidence of capacity to see ahead andcalculate in a businesslike way what prices they can afford to charge. It may be replied that thesepeople will inevitably drop out. So they do ; but not only does the supply seem to be inexhaustible,but during the course of their career they do an infinite amount of harm, and they enable theindividuals who make use of their services to get an advantage at the expense of the community,which not only pays through the expenditure on road repairs and deficiencies on the railways, but hasalso in the long-run to bear the losses arising out of insolvency of individual enterprises (a factortoo apt to be overlooked).
It was inevitable that the rapid development of road motor traction that has taken place shouldhave a very disturbing effect on the transport industry. As in the case of every new thing of thiskind, it was nurtured in its infancy by propaganda. Its principal competitor, the railways, wasdepreciated to an exaggerated degree, and the " infant " was just as extravagantly and undeservedlyextolled. Railways were talked of as a thing of the past, an assertion which even a cursoryexamination of the facts would have shown to be quite unjustifiable. The result was confusion' ofthought, and an unfortunate degree of competition where a friendly spirit of " get together " wouldhave produced benefits to all concerned of a more real and lasting character. There are notwanting signs that improvement is taking place in both these aspects, but the process of stabilizationby " natural forces " is likely to be a long and painful one.
XXXVII D.—2.A further very vital matter calling for rectification of the conditions now ruling in the
transport industry is the impossibility of framing any permanent policy withinj.the industry whilesuch conditions continue. The introduction of the motor-vehicle into the transport industry hascreated a totally new position, to which that of the other sections of the industry, such as therailways, have to be adjusted.
The first essential to a proper adjustment is a determination of the proper economic position ofeach part of the industry. Uneconomic conditions such as unfair or unsound competition can on theplea of " natural forces " only be met by uneconomic action. A policy framed on such action cannotpossibly be permanent, and it might well be that on the adoption of a policy on that basis the lastposition might be worse than the first. It is inevitable that later, when the long and painful process ofadjustment by natural forces had worked itself out, there would have to be another adjustment ofrelationships, and there seems no good reason why two such adjustments, separated only by a longand undesirable period of time, should be adopted if the result can be obtained by more expeditiousand desirable methods. To illustrate the position by referring to a concrete case, I may refer againto the fact that we find traffic lost, to the railways in many cases through the quotation by roadhauliers of prices for the transport of the goods concerned that we know cannot possibly be on aneconomic basis. Obviously, as it was the price that lost the traffic, we may assume that if we quoteda price below that of the road hauliers we would retain the traffic; but such quotations, being forcedby uneconomic conditions, cannot possibly be permanent, and it is not difficult to imagine thedisturbance that would take place if the Bailway Department adopted a policy of quoting rates basedon uneconomic conditions, and, when such action forced the competitor out of business, it raised its ratesagain. Such action would undoubtedly lead to ill will and the upsetting of business relationshipsby the uncertainty that would arise in regard to actual transport costs, and we would have confusionworse confounded. We certainly seem justified in at least saying that if the occasion for such actioncan be avoided, then it should be avoided.
All these circumstances seem to me to justify resort to the regulative power of thecommunity to expedite the bringing of the industry on to a proper basis. There is nothingnew in such action — and it has long been known in the transport industry, where it hasbeen applied to railways practically from their inception, and has already been developed to someextent in connection with the passenger side of road transport. In the case of State-owned railwayssuch as in New Zealand, this community power operates through the railway statutes, and the effectof public opinion as reflected through the parliamentary institutions. In the case of privately-ownedrailways, they have been rigidly controlled by statutory authorities such as (in England) the Board ofTrade and (in the United States of America) the Interstate Commerce Commission. Two principleshave been the basis of this action—first, that the community interest in transport shall be adequatelyprotected (this has led, e.g., to the limitation of financial return, the fixation of rates, and the runningof certain essential services, such as " cheap " trains) ; and, second, that all persons shallhave equal treatment—-there shall be no undue preference. Such regulation was no doubt felt to beirksome by railway authorities, as it might also be expected to be by some sections of the motor-transport industry (especially those whose business is not a sound community proposition). Butthat does not prove that such regulation is inherently wrong—rather the contrary. The railwayssurvived and extended under it with a. rapidity and vigour that was phenomenal; but essentiallythe general interest was protected by the regulative power of the community actively operatingthrough legal enactment. Such regulation is sometimes objected to as " legislating the motor-carryingindustry out of existence" or "bolstering-up the railways." It seems to me that both of thesestatements are nothing more than unjustifiable assumptions. The motor-vehicle is here to stay, andunquestionably has a place in the transport industry. But why should such objectors assume thatproper regulation will push the motor-carrying industry out ? Such an objection would seem toimply a more or less conscious weakness in their case, with a consequent disinclinationto face the issue.The railways under private enterprise were regulated, but they did not go out of existence—theyflourished and did undoubted good work for the community; and if history means anything at allwe may rather assume that the same may happen to the motor carriers. Similar considerations applyto the " bolstering-up of the railways." Opprobrious epithets are not arguments : they generallyrather betoken an absence of valid grounds. If on examination of all the facts it were found that aparticular service could be given by road-motor more economically than by rail (and there would bemany such cases) it would be irrational to perform the service by rail, and no regulating institutionwhose decisions were irrational could long survive.
For the foregoing reasons I conclude that regulative action is necessary and desirable to expeditethe stabilization of the transport industry, and I believe that such stabilization would be in the bestinterests of the motor-carrying industry itself as well as of the railways and the community at large.
Another matter in connection withroad transport that I think worthy of mention is the desirabilityof there being prepared by some responsible authority an annual balance-sheet of the road operationsof the Dominion. At present the information regarding expenditure and revenue in respect of roadsis more or less scattered throughout the various records. Especially in view of the fact that the questionof the distribution of tranport-costs among the various sections of the community is such a live one,I think it would be very advantageous if the whole facts were brought together in a comprehensiveand readily understood annual statement. The whole question of railway and road finance is reallyone of the distribution of the total transport costs of the community, and in order that clear judgmentsmay be formed as to the equity or otherwise of such distribution the first essential seems to be to haveall the.facts.of,revenue and expenditure in.connection with the transport operations clearly before us.
D, -2. XXXVIII
PUBLIC RELATIONS.Public relations are an aspect of the Department's work to which I have given particular personal
attention since assuming office. I have felt strongly impressed with the increasing necessity, with thegrowth of competition, of having a proper understanding in the minds of the people of what theDepartment is able and willing to do in the way of service to its clients. A valuable channel hasalready been established through the medium of the Magazine and the Commercial Branch, both ofwhich have materially assisted in bringing knowledge to the people and in clearing up misunder-standings.
It was inevitable that, with such conditions as arose from the rapid development of competitionwith the railway, many issues should be clouded by the upsetting of well-established ideas,and more particularly by the dissemination of propaganda of the kind that is almostinvariably associated with the introduction of a new competitive factor into an industry.The necessity for some counteracting influence has made the question of public relations aparamount one in connection with the Department's business. We have accordingly taken everyopportunity that has been presented to get into personal touch with representative bodies andindividuals with a view to obtaining an exchange of ideas regarding the problems confronting thetransportation industry in general and the Department in particular.
I desire in this connection to express my great indebtedness to the various Chambers of Commerce,Farmers' Unions, Progress Leagues, importers' associations, commercial travellers' associations, andother bodies who have been good enough to extend to us invitations to be present at their gatheringsand speak on railway matters. The receptions which we have received on these occasions have beenvery gratifying and even where, as must inevitably happen, there has arisen difference of opinion,I am happy to say that the discussions have been carried out in a constructive and friendly spirit andhave very much helped in the solution of the problem of equating the transport supply to the demandso far as the railways are concerned. We have had through the medium of contact thus establishedvery many valuable suggestions, which we have not hesitated to follow up, and, when found to fitin to our conditions, to put them into operation and make due acknowledgment to the originators.
I desire to take this opportunity of indicating that I warmly welcome the co-operation of everysection of the community in making the railways the power for service that we would all wish themto be. Criticism of a constructive type is always helpful, even though the ideas of the critic may notbe agreed with by the railway authorities, as such criticism tends to turn one's thoughts inwards, soto speak, and develop a process of self-examination which is the surest way to understanding short-comings and paving the way to removing them. I recognize that the fullest measure of usefulness fromwork on the railways cannot be the result of the efforts of any one individual or even of all thosewho make up the Department's staff. The efforts of all those must be supplemented by the co-operation of the public both as owners and users of the railways (in both of which capacities they havea definite responsibility), and I feel that with that co-operation the railway staff will be encouragedto that degree of effort in the application of their knowledge and experience as will enable the railwaysto give the maximum satisfaction to the community that their nature and circumstances permit.
COMMERCE TRAINS AND FARMERS' EXCURSION TRAINS.A feature of our working that has been particularly developed during the past year has been
that of the running of special excursion trains for commercial men and farmers. The CommerceTrain, which was arranged under the auspices of the Auckland Chamber of Commerce, was anoutstanding success from every point of view. The train covered a wide extent of country, and notonly demonstrated the Department's capacity for efficient service and organization, but also enableda valuable work to be done for the Dominion in bringing the business men of the town into immediatecontact with the rural people.
Similarly, in the case of the Farmers' Trains, we have given a valuable service to the ruralcommunity, and have enabled them to gain knowledge of their country that would probably nototherwise have been afforded them.
The development of the farmers' excursions took its rise in the first place from the many requestswe had from time to time for concessions in the matter of fares to farmers during the slack season inthe farming industry. We could not, as a matter of railway economics, justify an issue of excursiontickets to farmers alone as a class. We felt, however, that the matter should not be allowed to rest atthat, and it was concluded that, if conditions could be created that would assimilate the farmers' trafficto that of an excursion traffic which has its principal justification in large bodies of people travellingtogether, it might be possible to do something to meet the demand of the rural community in thematter of the above-mentioned request. To that end the Department has organized farmers' excur-sions from point to point, and their efforts in this direction have been entirely successful. We havereceived many expressions of very warm appreciation of our efforts in this direction. The success ofthe Department's work has not only again demonstrated its capacity for service in a direction that ispeculiarly its own, but has also provided a means for the betterment of the Dominion as a whole byaffording facilities for the farming community in the various districts to exchange views with oneanother, to the undoubted enrichment of their knowledge and their capacity to get the best resultsfrom their farming operations.
Dependent as this Dominion is for its welfare on its primary products, it will be apparent thatthe expansion of knowledge among the farmers afforded by means of these excursions must have avalue far beyond the comparatively small outlay involved in making the various trips.
I cannot pass from this subject without expressing my appreciation of the co-operation of thelocal authorities, farmers' unions, and other organizations in the various places visited by the farmers'excursions for the way in which they have risen to the occasion and have helped to make the excursionsthe undoubted success that they have been.

D.—2XXXIX
NEW WORKS.The position in regard to the various new works that are being carried out, and the new rolling-
stock that has been constructed during the year or is now on order, is set forth in the report of theChief Engineer and the Chief Mechanical Engineer attached hereto, and need not be here repeated.
The large works involved in the workshops reorganization, the Auckland-Westfield Deviation,and the Auckland new station and yard are now coming towards completion. The contractors forthe erection of the station building at Auckland are well up to time in the progress of their contract,and it is expected that the station will be ready for use towards the end of next year. Goods trafficon a single line is expected to be commenced on the Auckland-Westfield Deviation early in September,1929, and the double line will be brought into full working at the same time as the new station andyard at Auckland are brought into operation.
The work in connection with the Wellington new station and yard is also proceeding steadily,though some delay in carrying out the necessary reclamation has occurred through difficulties whichhave been encountered in constructing the storm-water culverts across the reclaimed area-. Theseculverts are now nearing completion, and the work of reclamation will then be resumed and carriedto finality. The land is being cleared for the construction of the new goods-shed, and tenders for itserection will be called at an early date. Plans are also in course of preparation for the station buildingitself. As soon as the new goods-shed is completed the present shed at Lambton will be removedto permit of work being carried on in preparation for the new yard and new station-site.
TRAIN-CONTROL.—TELEGRAPH AND TELEPHONE FACILITIES.A commencement has already been made in the adoption of the principle of central train-control.
Under this system the whole of the working of the trains in the controlled areas is co-ordinated andbrought into harmony so as secure the most expeditious handling of the traffic. The utility of thecontrol system is particularly felt in making the rearrangements that inevitably follow—and which haveto be made at a moment's notice—whenever a train runs late and gets away from its time-table schedule.Through this method of control the controller has the whole of the train operations immediately underhis view, and is able to make such arrangements as will not only do the best possible for the trainaffected, but will also minimize the ill effects that must result from such circumstances, especially ona single line. This has not only led to a better handling of our trains from the point of view ofworking them forward, but has also enabled us to effect very considerable economy in that better useis made of the train appliances and the time of the staff. Train-control essentially depends for itsefficacy on good means of communication. This is an aspect of our business that opens up verymaterial room for improvement. There seems little doubt that our means of communication havebecome obsolescent and have not kept pace with the demands of the business. This matter not onlyaffects the extension of the train-control system, but also has a very direct bearing on the generalcarrying-on of the business of the Department. In a system such as the railways, which extendsthroughout the length and breadth of the country, good means of communication have a very directbearing on general efficiency and the capacity of the Department to satisfactorily handle its business.Improvement on our present facilities I regard as absolutely essential, and proposals therefor havebeen embodied in the programme of works that will require to be undertaken.
COLLECTION AND DELIVERY: CENTRAL BOOKING-OFFICES AND PARCEL-DEPOTS.One aspect of the problem of increasing the usefulness of the railways to which I have given
considerable thought, and regarding which I have had many suggestions from prominent businessmen, has been that of the collection and delivery of parcels and goods requiring to be transported.The delivery side does not present so great a difficulty as the collection side. So far as parcels areconcerned the railways in this country have been able to give a service that has apparently givensubstantial satisfaction to the public in that it has not given rise to complaint. The difficulty is,however, that the first transporter that obtains possession of the parcels has a definite advantage in thematter of their ultimate carriage to their destination. It is on this point that the motor carrier is placedin a very advantageous position as compared with the railway. Realizing the importance of thisfactor we have gone very carefully into the question of the collection of parcels for the purpose oftransport by rail. Consideration of the various factors with particular reference to the incidence ofthe traffic has shown that the institution of collection services is, by reason of the sparsity of trafficin any particular locality, not an economic possibility at the present stage. The greatest proportionof the parcels traffic has its origin from the cities outwards, and experience has shown that one of themost potentially operating factors against the transport of the parcels by rail is the necessity of havingthem carried greater or less distances to a railway-station. It was felt that even if we could not insti-tute a regular parcels-collection service we could go a very considerable distance along the lines ofmeeting the difficulty. To that end we have established passenger-booking offices and/or parcels-depots at the following localities : Queen Street, Auckland ; Karangahape Road, Auckland ; UpperSymonds Street, Auckland; and Tennyson Street, Napier. We are about to establish one atCourtenay Place, Wellington. A similar depot had previously been established at Hereford Street,Christchurch. In addition to the places mentioned, we have a passenger-booking office in WakefieldStreet, Wellington. In every case we have selected sites where it appeared they would be of mostservice to the public. Except at Queen Street, Auckland, and Wakefield Street, Wellington, parcelscan be consigned at these offices, and there are regular cartage services between the offices and therailway-stations which are so arranged as to fit in with the train services. The volume of trafficwhich is already flowing through these offices shows that they are meeting a real need, and I do notdoubt that they will serve to hold much traffic to the railways that would otherwise have been lost.
D.—2 XL
On the goods side we are making it our policy to work as far as possible through establishedcarrying concerns. I feel, however, that there will still be a fairly large measure of potential businessthat will, in some places at any rate, render it necessary for the Department to supplement theservices of the carrying concerns with an organization of its own. This is a matter that is nowin hand.
Another means by which we are endeavouring to get closer to our customers is by the appointmentof suitable persons or firms as railway agents. These people will work in much the same way as centralbooking-offices and parcels-depots, and will, as the number increases, become a valuable connecting-link between the Department and the public.
LEVEL CROSSINGS.During the year the problem of level crossings has continued to engage our attention, and the
policy of progressive development in the protection of level crossings has been pursued. A few figuresin connection with this work may be of interest. The Department employs a total of eighty crossing-keepers at thirty-seven crossings, at an annual cost of £13,122. of which £1,107 is recovered fromlocal bodies. The expenditure on the elimination of crossings by overhead bridges or subways hasbeen approximately £150,000. There have been warning-bells installed at fifty-four crossings, "wigwag "
signals at thirty-two crossings, and flashing light signals at four crossings, at a total cost of £19,080.Every crossing has been provided with standard " AVarning " notices at a cost of approximately£26,000. The total expenditure on the protection of level crossings is in the vicinity of £195,080, ofwhich amount the Highways Board has spent £13,000 and the local bodies have spent £24,000, andthere have been minor amounts provided by other persons or bodies, such as associations of motorinterests. The annual cost to the Railway Department of the upkeep of warning-devices amountsto £3,880. Adding this to the wages-bill for the crossing-keepers it will be seen that the recurringexpense to the Department on these two aspects of its operations is approximately £16,000.
During the year consideration was given to the question of the state of the law governing theuse of level crossings. The position as it existed prior to the 1928 session of Parliament was thatevery person driving a motor-vehicle was required to stop before driving over a level crossing nomatter how good the view might be thereat. It was felt that this was an unnecessary restriction onthe freedom of action of motor-drivers, and that it tended to bring the law into disuse. Afterconsultation with representatives of motor interests it was decided to promote an alteration' in the lamin the direction of classifying level crossings into those at which it should be compulsory to stop beforegoing on to the crossing and those at which it was unnecessary to do this. This amendment was dulypassecLJlf Parliament, and came into operation on the Ist June, 1929.
In the meantime all crossings were classified as indicated above, and the necessary notices, inthe form laid down by the Regulations under the Motor-vehicles Act, have been erected at com-pulsory-stop crossings.
I venture to express the hope that motorists will see that, in thus assisting to ease the law, theDepartment has given consideration to their convenience, and that they will give a closer adherenceto the law as it now stands, which is designed for their own protection as well as for that of those whotravel on the railway. I cannot help but think that it is too often overlooked when a collision occursat a level crossing that the motorist who, by neglect of adequate precautions, was the cause of thesame not only jeopardized his own safety, but also that of the passengers and crew on the train. Thepresent provisions are the minimum that can be reasonably required for safe working, and shouldnot be found to be unduly irksome to motorists.
A further aspect of the level-crossing problem to which consideration has been given is that ofthe signal which is shown by crossing-keepers. Hitherto crossing-keepers have shown a green flagby day and a green light by night to indicate the approach of a train, but with the growth of motortraffic and the adoption of signals for the regulation thereof it has become recognized that the colourindicating a danger signal to a motorist is red. This has tended to cause some confusion at level cross-ings, and it could not be but concluded that the time had arrived when some change should be madeto avoid this difficulty. This is being done in consultation with representatives of the motor associa-tions, and it is expected that new signals for crossing-keepers will shortly be decided upon, which willin future entirely obviate any difficulty such as that mentioned above.
The foregoing will, I think, serve to indicate that the Department is anxious to do its best toprovide for the safety and convenience of the motorists, and I feel sure that if they will respond withtheir active co-operation in the matter of the careful use of level crossings, and obedience to thelaw and various signals established for their protection, the problem of the level crossing shouldassume very small dimensions.
ORGANIZATION OF THE DEPARTMENT.It will be recollected that some few years ago it was decided to organize the operating side of
the Department on the divisional plan with a view to bringing those branches of the Department thatare more directly concerned with operating into more intimate contact with one another, and generallybring about closer liaison between the various branches than exists under the departmental system.I feel, however, that we have not yet reached the stage of obtaining the fullest measure of advantagefrom the divisional system, and the observations which I was able to make in Australia regarding theoperation of divisional control there confirm me in that view.
Although we have instituted Divisional Superintendents, we still have district officers organizedon the departmental system, and there is a tendency to think in terms of the departmental ratherthan the divisional system. The bringing of the Maintenance, Locomotive-running, and Traffic officers
XLI D. 2
under the control of the Divisional Superintendents has undoubtedly had some tendency to bring theseofficers into more intimate contact with one another. It seems to me; however, that we need tocarry the matter further from the departmental system of district officers, each with his separateoffice organization, in the direction of unifying the administrative activities of these officers under thesingle organization of the Divisional Superintendents. I think the district officers (in the operatingbranches, at any rate) instead of being regarded in the light of district officers, as they have been inthe past, having a greater or less degree of independence and autonomy as district officers, should beactually on the staff of the Superintendents.
The superimposition of the Divisional Superintendents 011 the old departmental system has takenthe matter a certain distance, and I feel that it should go still further, and may do so advantageouslyboth from the points of view of efficiency and economy. I think that the Traffic Section might becompletely merged into the position of Divisional Superintendent, the Locomotive-running officersbeing technical members of the Superintendent's staff. This would entail the entire abolition of theoffices of District Traffic Manager. Under the present organization the Locomotive (Running)Engineers are on the staff of the Divisional Superintendents, and would so continue.
The office of General Superintendent of Transportation would continue, much as at present, tobe a branch of the general management, operating to collate the various matters affecting the trans-port side of the business and maintaining a general control, under the General Manager, of all mattersconnected with the traffic side. The Chief Mechanical Engineer would fix the standards and act in aninspectorial capacity for the purpose of seeing that the standards set were maintained. He wouldalso have charge of all capital works on the mechanical side, and would have control of the work*shops, while the running-repair depots would, as at present, be under the charge of the Superintendents.The Chief Mechanical Engineer would not have direct contact with the Locomotive Engineers, butwould work wholly through the organization of the Divisional Superintendents.
The foregoing is a general outline of the mode by which I think divisional control could be furtherdeveloped, and concrete proposals in connection therewith will be worked out during the coming year.
RAILWAY WORKSHOPS REORGANIZATION.The new railway workshops in the four main centres—Otahuhu, Hutt Valley, Addington, and
Hillside—are now nearing completion, and it has been possible to transfer the staff from Petone tothe Hutt Valley shops, and from Newmarket to Otahuhu. At Addington and Hillside approximately80 per cent, of the new workshops has been completed, and the staff have been enabled to work withthe new machinery which has been installed.
The layout and design of the workshops and machinery have been carried out in accordance withthe most modern practice, and have been found on completion to be satisfactory and adequatelymeet the Department's requirements in every way.
The general arrangement of the workshops is such that the handling of material is reduced to aminimum by the use of modern cranes and industrial trucks.
Detailed considerations of the layout during the progress of the work have resulted in additionsto the original scheme and extra expenditure which was considered to be fully warranted. Similarly,the extension of electrification to every form of activity in the workshops consequent upon hydro-electric power being available has also materially increased the efficiency of the undertaking, and inaddition to this has ensured that the operation of the workshops in close proximity to suburban areaswill cause no inconvenience to the residents, particularly in regard to the smoke nuisance.
Opportunity was afforded me to compare the latest workshops which have been erected inAustralia with the workshops erected in New Zealand, and there is no doubt that the New Zealandworkshops compare favourably in their layout and equipment with a,nv similar establishmentsexisting in Australia. lam also assured by officers who have been abroad that the standard of ourworkshops equals that of the most modern workshops on other railway systems.
The Department will welcome visits to the workshops from industrialists throughout theDominion, in order that they may appreciate the completeness and the efficiency of the undertakings.Some parties have already inspected the installations, and have been impressed with the efficienthandling of the Department's repair and construction activities.
Oil final completion of the workshops the Department will be in a position to manufacture thebulk of its requirements. In the past the Department has been compelled to import considerablymore rolling-stock and other manufactured materials than it has been capable of producing in its ownworkshops. The advantage to the Dominion as a whole of importing raw materials rather thanfinished products need not be emphasized.
As a result of the reconstruction of the workshops it is confidently believed that there will beconsiderable savings in the manufacture and repair of practically the whole of the appliances necessaryfor the running of the railways.
The old workshops had arrived at the stage that they were obsolete and inadequate to thedemands of the Department's business, and they were also in a condition that did not enable the staffto do themselves justice. A fair proportion of the men were working without cover, and those whowere in the workshops were not in surroundings that enabled them to have that degree of comfortand convenience in connection with their work to which they were entitled, and which would enablethem to give the best measure of service to the Department. The improvement that has been madein this respect in the workshop is, I belive, not the least important of the factors tending to justifythe reorganization.
vi—D. 2.

D. 2 XLII
It must not be overlooked that the old workshops had been a matter of growth over a long periodof years, and inevitably a point arrives in the process of such growth at which the more or less patch-work method breaks down and a clean sweep has to be made. It is plainly indicated in the report ofthe Fay-Raven Commission that this point had definitely been reached in connection with our oldworkshops.
The tinai estimated cost is £2,279,459. The scheme as originally planned was estimated at£1,880,000, including £60,000 which had previously been allocated for electrification of the old shops.
All additions to and variations of the original scheme were subjected to the closest scrutiny andexamination by special technical committees set up for the purpose, and no alterations or additionswere made unless the expenditure was considered to be justified.
The variations and additions are as followsOriginal Final Increase
Estimate. Estimate.£ £ £
Land .. .. .... 42,900 83,226 40,326
Buildings and layout .. .. .. 1,193,300 1,175,967 17,333 Dec.Machinery and equipment. . 583,800 849,225 265,425Electrification .. .. 60,000 171,041 111,041
Totals .. .. £1,880,000 £2,279,459 £399,459
The additions and variations are fully discussed in the following paragraphs under the respectiveheadings
Land.Original Final T
Estimate. Estimate. n^rease.
£ £ £
42,900 83,226 40,326
In acquiring land it was assumed that the development of the country would continue, andprovision has been made for the future extension of the workshops when necessary.
The additional expenditure on land was incurred at—Otahuhu, £30,000; Hutt, £3,500 ; Addington,£5,000 ; and Hillside, £2,000.
At Otahuhu the land cost £12,000 in excess of the amount allowed (£2.1,500) and £18,000 was spenton levelling. The area acquired is greater than is necessary for present requirements of locomotiveand rolling-stock activities only, and allowance has been made for concentrating at Otahuhu theMaintenance Branch shops (now at Penrose) and the Railway stores (now at Newmarket).
The area of land purchased at Hutt is sufficient to accommodate the Locomotive, Maintenance,and Signal and Electrical workshops, Railway stores, and garage for the Hutt Valley road - motorservice, also for future extensions of all these facilities, some of which developed after the initialschemes were prepared.
At Addington it was found necessary to purchase a small area of land to compensate for a portionof the workshops yard required to give access to the Middleton yard for traffic purposes.
Land was purchased at Hillside, outside the workshops yard, Cargill Road, for a site for a dining-room and social hall not provided for in the original estimates.
The following sites occupied by the old workshops and stores, all of which are in valuable cityor suburban areas, will be vacated and made available for leasing or for other railway purposes : —-
lii addition to these areas, 4-8 acres on the new Wellington reclamation, costing approximately£9,000 per acre, or £43,000, previously set aside for Railway stores and Signal and Electrical workshops,will now be available for leasing at an annual rental of, say, £2,000.
Approximate Value of Area availableApproximate Area ! for Leasing.
Location. Total Area. available for !Leasing.
Capital. Annual.
A. R. p. A. B. p. | £ £
Newmarket (shops) .. .. 18 2 37 15 0 0 100,000 6,000Newmarket (stores) 1 2 0 1 2 0 3,000 150Penrose .. .. .. 5 0 30 4 0 0 5,000 250AVellington (Waterloo Quay)—-
Stores shipping shed and yard 1 1 24 1 1 24- 60,000 3,000Signal workshop .. .. 0 1 20Stationery store .. .. 0 1 20
Kaiwarra .. .. . . 1 3 32 1 3 32 7,000 500Petone .. .. .. 17 3 35 10 0 0 25,000 1,500
47 1 38 33 3 16 200,000 ; 11,400I I

XLIII D.—2,
The land now occupied by the Signal and Electrical workshops and stationery store at Wellingtonwill form part of the new Wellington yard. Portions of the land at Newmarket, Penrose, and Petonehave been reserved for railway or roading purposes.
It is proposed to apply the rentals derived from these properties to writing off that portion ofthe capital cost of demolished or scrapped buildings and plant not covered bv depreciation funds.
Buildings and Layout.
Original Final Under-Estimate. Estimate. expenditure.
£ £ £
1,193,300 1,175,967 17,333As a result of the low tenders received for the erection of the buildings the final estimated cost
is within the original estimate, notwithstanding a number of additions made to the original layoutto accommodate extensions of the original plan.
Machinery and Equipment.Original Final ,
Estimate. Estimate. ncrease.£ £ £
583,800 849,225 265,425
Electrification.Original Final T
Estimate. Estimate. ncrease.£ £ £
60,000 171,041 111,041The original proposals provided for a partial electrification of the new shops, and the sum of
£60,000 previously allocated for electrification of the old shops was considered to be sufficient for thepurpose.
With the twofold object of taking full advantage of the greater economy of electrical energy andof eliminating the smoke nuisance in residential areas, it was finally decided to purchase hydro-electric power in bulk at all centres, and to make the installation completely electrical.
This decision made it possible to install a number of additional appliances designed to make useof the night load. As the scheme progressed it was also considered advisable to include new andimproved machines and processes which will make it possible to undertake in the Dominion notonly the whole of the rolling-stock construction, but also the fabrication of all classes of metal-work, much of which has hitherto been imported from abroad.
While the initial capital costs were materially increased, the great_savings to be effected in thecost of the output will, it is expected, more than compensate for the annual charges for interest,maintenance, and depreciation.
The principal factors contributing to the increased machinery costs are—£
Additional machinery and appliances, including cost of raising loans .. 204,813Pipe-line reticulation within buildings charged against machinery and
equipment but included in building estimates .. .. .. 20,000Unforeseen expenditure .. .. .. .. .. .. 40,612
Total .. .. .. .. .. .. £265,425
The unforeseen expenditure was due to the following : (1) An increase of ljd. per hourin the average rate of wages of workshops staff, £4,855; (2) the reassessment under the newaccounting system of overhead charges on capital works and on workshops and Stores Branch operations,£32,000. The altered overhead rates had not been determined when the estimates were framed.
The increase of £111,041 in the electrical costs is due partly to the decision to completely electrifythe shops (approximately £81,000) and partly to the additionalappliances added to the original scheme(£30,000). The reassessment of overhead charges is also a factor that is difficult to estimate, but itwould probably account for £10,000 of the total.
In determining the size and capacity of the shops the following factors have been taken intoconsideration. During the last ten years a considerable proportion of the new rolling-stock has beenimported or purchased, as shown in the following table : —
Built by .Depart- Purchased. Total. VE
v-a?t
ment. Por 6
Locomotives (steam) .. .. .. .. 45 111 156 15-6Locomotives (electric) .. .. .. .... 6 6 0-6Cars and vans ..
.. .. .. .. 227 .. 227 22-7Bail-cars .. .. .. .. .... 3 3 0-3Wagons .. .. .. .. .. 2,378 2,500 4,878 487-8With regard to the future, a Survey has been made of the whole of the locomotives and rolling-
stock. As a result of this survey it was found that a large number of worn-out or obsolete types ofengines had reached the stage when scrapping was necessary in the interests of economy andefficiency, and the position in regard to cars and wagons is similar to the locomotives.

t>.—2 XLIV
This could not be done with the limitedfacilities available in the old shops, and as a result a greatnumber of uneconomical partial repairs had to be carried out. The survey disclosed that during thenext five years an annual building programme of twenty engines, eighty-four cars and vans, andseven hundred wagons would be required to bring the rolling-stock up to the standard necessary forefficient traffic operation.
The foregoing outlines the position so far as replacements are concerned, but does not make anyallowance for the necessary additional stock.
The new workshops, in addition to being able to cope with the rolling-stock requirements, havebeen equipped with reclaim depots to enable apparatus and material, which in the past has beenpractically valueless, to be salvaged and reconditioned for further use.
The electric steel furnaces in particular will enable scrap materials such as axles, tyres, and railsto be utilized in making steel castings at low cost.
As indicated above, the programme of work which we have in view will, if it can be maintained,keep the shops fairly fully employed for some years to come. It has been our experience, however,that the amount of our programme which is actually carried out year by year is determined not bythe extent of the proposals contained in the programme, but by the amount of money that can bemade available. I have already stressed the great desirability of improving the quantity and standardof our rolling-stock, and the necessity for adequate financial provision in this connection will, as theforegoing particulars show, find a second reason in the economics of the workshops reorganization.Inasmuch also as one of the essential features of the reorganization has been the provision of a largeamount of new and costly machinery of modern type, which will reduce labour to a minimum, it willbe very necessary for the best results that the maximum output should be obtained from thesemachines.
I think that the introduction of some schemes which will give the staff an incentive to get thegreatest possible output from the machines might be adopted with advantage both to the staff andto the Department. This is a matter to which we propose to give attention during the coming year.
A method which is already in course of adoption for concentrating the greatest measure of workavailable into the new shops is the amalgamation of the Locomotive and Maintenance workshops.Hitherto the work requiring to be done for these two branches has been carried out in separate work-shops under the control of each branch. This led to duplication of machinery and organization.To overcome this, and to direct the greatest volume of work available in the Department into thereorganized Locomotive shops, the Maintenance workshops are being merged into the Locomotiveshops, and the former, as a separate organization, will cease to exist.
LYTTELTON TUNNEL ELECTRIFICATION.The electrification of the section of the line between Christchurch. and Lyttelton has been completed,
and all trains on that section are now being run with the electric locomotives. The work was wellcarried out by the Departmental staff and the equipment was supplied by the English Electric Co.to the Department's specifications, and there has been no serious difficulty since the workingcommenced. The new conditions, so far as the tunnel is concerned, constitute a substantial advanceon those previously existing. Some unpleasantness arose during the early stages through theexistence in the tunnel of the soot deposits that had accumulated over many years of steam working.Steps were taken, however, to remove these deposits, and with the completion of the work the troublethat was experienced in this connection has been eliminated.
The time-table schedules were completely revised to suit electric working, and the benefits thathave accrued from the altered conditions have been appreciated both by the staff and the public.
DIESEL ELECTRIC LOCOMOTIVES.Mention of the electrification of the Christchurch-Lyttelton Section prompts me to remark that
we have been interesting ourselves in the matter of Diesel electric locomotives for the purpose ofdetermining whether they can be used to advantage on our system. Locomotives of this type arebeing operated in Canada, England, and elsewhere, and we are placing ourselves in touch with theRailwayauthorities in both countries with a view to obtaining such information as they can afford us regardingthe performance and characteristics of this form of traction. We are also in touch with the localrepresentatives of one of the large engineering concerns in Great Britain which has given particularattention to locomotives of this type, so that we may obtain all the information that might assist ustowards determining the question of the suitability of these locomotives to our conditions. We areat present awaiting this information before proceeding to determination of this question.
BRIDGES.The matter of strengthening or renewing our bridges is one that has been pressing on the
attention of the Department, and the matter has been made the subject of a comprehensive review.This was necessitated both by reason of the age of many of our bridges as well as by considerationsof their strength and consequent ability to stand the increased axle-load weight of the modern type ofengines passing over the bridges.
The position resolves itself into one of adequate financial arrangement for the work of renewaland strengthening to be undertaken, and an investigation has been made with the object of ascertainingwhat financial provision would require to be made.
The original cost and probable remaining life has been estimated for each of the larger bridges,and from this has been determined the annual amount that should be contributed to a bridge renewalsfund which will make provision for writing off the original capital cost of the bridge when its
*•

XLV i). 2
reconstruction becomes necessary. Owing to the fact that no adequate provision has been made inthe past for the renewal of bridges, the annual contribution now required in respect of many bridgeswith short remaining lives is very. high. Hough estimates of the cost of reconstruction have beenmade for most of the bridges.
The smaller bridges, for which the cost of reconstruction is below about £6,000, have been eliminatedfrom the present investigation. The original costs of these bridges, being comparatively small amounts,will be written off as a direct charge to working-expenses when the bridges are replaced.
Most steel and iron bridges are not appreciably deteriorated, and can. be strengthened andretained in service for further long periods. For this type it is proposed in the meantime to applya flat rate for depreciation of lj per cent, per annum on the original cost—that is, an average life ofsixty-six years is assumed for all steel and iron bridges. Eventually it may be found advisableto deal separately with some bridges subjected to unusually severe conditions, and for which theproposed flat rate would be inadequate. It is not anticipated, however, that any such specialprovisions would materially affect the aggregate requirements as now estimated.
Many large timber bridges, however, will require extensive reconstruction within a comparativelyshort time, according to the age and condition of their timbers and their standard of strength, andit is chiefly on account of these bridges that the larger contributions to the renewals fund arerequired. The only sound method of dealing with these bridges will in general be to renew thesuperstructure in steel, and in most cases also the sub-structures in concrete.
The schedules appended to this report show the details of the investigations. These are subjectto revision from time to time as more definite information can be obtained with respect to eachbridge dealt with. They serve, however, to indicate the true position as nearly as is possible toascertain it with the information available at present.
Programmes of bridge strengthening and reconstruction have also been prepared indicating whatworks it is proposed to put in hand within the next few years.
The position with regard to the reconstruction of some long combined road and railway bridgeswill require special investigation. For instance, the proposals for the Rakaia and Waitaki Bridgesprovide for constructing railway-bridges alongside the existing combined road and railway bridges,and abandoning the existing bridges for roadway use only, for which purpose they should servesatisfactorily for a farther long term. This will require negotiation with the Main Highways Board,and the matter is now in hand.
A programme of bridge strengthening and reconstruction extending over the next five yearshas been drawn up, and is also shown in a schedule attached to this report. The programme wasarrived at after careAl consideration by members of the executive staff immediately concerned withthe operating conditions as affected by the carrying-capacity of the bridges.
The work is planned so that improved operating conditions will be obtained on important sectionsas soon as possible after the programme is put in hand. It is proposed, therefore, to concentrate mostof the expenditure for the first two years on the Auckland-Wellington Section, and complete thestrengthening or reconstruction of all weak bridges on. that section as soon as possible.
The total annual contribution required for the bridge renewals fund as determined on the abovelines is about £105,000. This amount is very large, and represents in a great part the burden of depre-ciation that has accumulated over the past years, and for which little or no provision was made.This illustrates very clearly a difficulty of changing from a non-commercial policy to a commercialone in an institution such as the railways. Money which should have been set aside as a reserve fordepreciation in past years has gone, and the public have had the benefit of it, and this applies not onlyto bridges but also to the whole of our depreciating assets. Notwithstanding the fact that no financialprovision was made, the depreciation has gone on, and all the money that should have been put asideto meet that depreciation must be recovered in some way. If it is to be a charge against the futurerevenues of the Department, then not only will the Department be hampered by having to earn moremoney than it would now be required to do if a proper provision had been made in the past, but it alsoinvolves inequity by making the future users of the railways pay for benefits that have accrued to pastusers and owners of the railway. It is equally unfair to regard the provision which now requires to bemade for the accumulated depreciation as a " loss "on future railway-working. The country has hadthe benefit of the higher financial return from the railways in the past through the non-provision of thesums necessary for depreciation, and on any plan for bringing the railways on to a commercial basisallowance should be made for that amount, and the railway accounts should be written down bya sum that will bring them down to their present-day value—in other words, that will make thatprovision for depreciation that should have been made in past years.
STORES BRANCH.The amount expended in connection with the purchase of stores and material during the year
was £2,487,365 3s. lid. This expenditure was divided as follows : —
£ s. d.To merchants, manufacturers, and others in New Zealand .. 756,732 10 8Through High Commissioner, London .. .. .. 602,741 13 4Material manufactured in railway workshops .. .. 290,376 14 2Coal and coke .. .. ..
.. ~ .. 713,589 411Stationery .. .. .. .. ... .. 33,233 1 8For manufactured and used material recovered from other railway
branches .. .. .... .. .. 90,691 19 2
Total .. .. .. .. ..£2,487,365 311
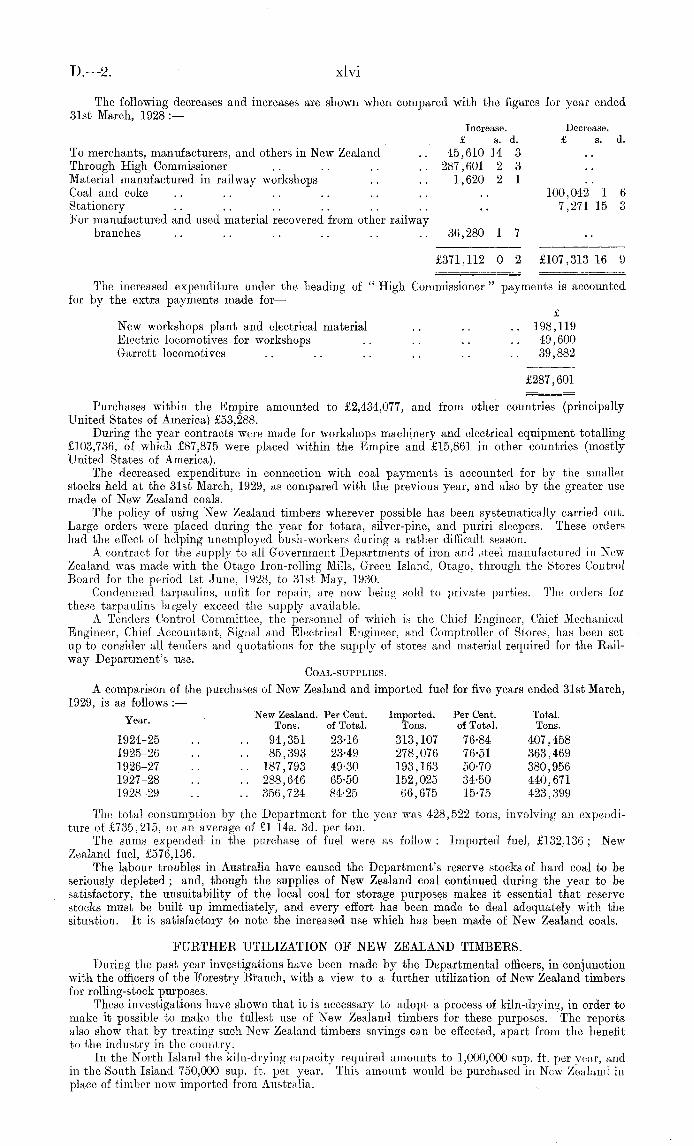
D.—2 XLVIThe following decreases and increases are shown when compared with the figures for year ended
31st March, 1928 : —-
Increase. Decrease.£ s. d. £ s. d.
To merchants, manufacturers, and others in New Zealand .. 45,610 14 3Through High Commissioner .. .. .. .. 287,601 2 3Material manufactured in railway workshops .. .. 1,620 2 1Coal and coke .. .. .. .. .. .. .. 100,042 1 6Stationery .. ..
.. .. .... .. 7,271 15 3
For manufactured and used material recovered from other railwaybranches .. .. .. .. .. 36,280 17
£371,112 0 2 £107,313 16 9
The increased expenditure under the heading of " High Commissioner " payments is accountedfor by the extra payments made for—
£
New workshops plant and electrical material .. .. .. 198,119Electric locomotives for workshops .. .. .. .. 49,600Garrett locomotives .. .. .. .. .. 39,882
£287,601
Purchases within the Empire amounted to £2,434,077, and from other countries (principallyUnited States of America) £53,288.
During the year contracts were made for workshops machinery and electrical equipment totalling£103,736, of which £87,875 were placed within the Empire and £15,861 in other countries (mostlyUnited States of America).
The decreased expenditure in connection with coal payments is accounted for by the smallerstocks held at the 31st March, 1929, as compared with the previous year, and also by the greater usemade of New Zealand coals.
The policy of using New Zealand timbers wherever possible has been systematically carried out.Large orders were placed during the year for totara, silver-pine, and puriri sleepers. These ordershad the effect of helping unemployed bush-workers during a rather difficult season.
A contract for the supply to all Government Departments of iron and steel manufactured in NewZealand was made with the Otago Iron-rolling Mills, Green Island, Otago, through the Stores ControlBoard for the period Ist June, 1928, to 31st May, 1930.
Condemned tarpaulins, unfit for repair, are now being sold to private parties. The orders forthese tarpaulins largely exceed the supply available.
A Tenders Control Committee, the personnel of which is the Chief Engineer, Chief MechanicalEngineer, Chief Accountant, Signal and Electrical Engineer, and Comptroller of Stores, has been setup to consider all tenders and quotations for the supply of stores and material required for the Kail-way Department's use.
Coal-supplies.
A comparison of the purchases of New Zealand and imported fuel for five years ended 31st March,1929, is as follows : —
v New Zealand. Per Cent. Imported. Per Cent. Total.Tons. of Total. Tons. of Total. Tons.
1924-25 .. .. 94,351 23-16 313,107 76-84 407.4581925-26 .. .. 85,393 23-49 278,076 76-51 363,4691926-27 .. .. 187,793 49-30 193,163 50-70 380,9561927-28 .. .. 288,646 65-50 152,025 34-50 440,6711928-29 .. .. 356,724 84-25 66,675 15-75 423,399
The total consumption by the Department for the year was 428,522 tons, involving an expendi-ture of £735,215, or an average of £1 14s. 3d. per ton.
The sums expended in the purchase of fuel were as follow : Imported fuel, £132,136 ; NewZealand fuel, £576,136.
The labour troubles in Australia have caused the Department's reserve stocks of hard coal to beseriously depleted ; and, though the supplies of New Zealand coal continued during the year to besatisfactory, the unsuitability of the local coal for storage purposes makes it essential that reservestocks must be built up immediately, and every effort has been made to deal adequately with thesituation. It is satisfactory to note the increased use which has been made of New Zealand coals.
FURTHER UTILIZATION OF NEW ZEALAND TIMBERS.During the past year investigations have been made by the Departmental officers, in conjunction
with the officers of the Forestry Btanch, with a view to a further utilization of New Zealand timbersfor rolling-stock purposes.
These investigations have shown that it is necessary to adopt a process of kiln-drying, in order tomake it possible to make the fullest use of New Zealand timbers for these purposes. The reportsalso show that by treating such New Zealand timbers savings can be effected, apart from the benefitto the industry in the country.
In the North Island the kiln-drying capacity required amounts to 1,000,000 sup. ft. per year, andin the South Island 750,000 sup. ft. per year. This amount would be purchased in New Zealand inplace of timber now imported from Australia.
XLVII D.—2
One of the principal difficulties the Department has had to face in the past has been the procuringof properly seasoned timbers of suitable kind in required quantities. If the Department were toundertake to air-dry its own timber it would necessitate large stocks being held. Unfortunately, NewZealand timbers have a high rate of deterioration, and this would render the process o! air-dryinguneconomical.
Added to this is the fact that some New Zealand timbers when air-seasoned are not suitable forour purpose, but become so when kiln-dried.
By the expenditure of approximately £20,000 adequate facilities to kiln-dry the Department'srequirements can be obtained, resulting in relatively small stocks being required to be kept on hand,better service in the finished product, decreased maintenance costs, and materially assisting a localindustry that does not appear to be in a thriving condition.
STAFF.The total number of staff employed on the 31st March, 1929, including those engaged on works
charged to capital, was 19,086, as compared with 13,584 the previous year, and the average numberactually at work throughout the year was 18,536, as compared with 18,541 the previous year. Ofthe average number of staff at work during the year 13,598 were permanent employees, while 4,938were casuals. The average number of men engaged on works charged to capital was 1,301, as against1,087 last year.
Fifty-two members of the Second Division were promoted to the First Division, 156 membersresigned, 92 retired on superannuation, 49 died, 45 were dismissed, and 573 engaged.
The sum of £44,344 was paid under the Workers' Compensation Act during the yea,r to membersof the Second Division who suffered injury in the course of their employment.
The new workshops at Otahuhu, Hutt, and Hillside were occupied by the staff during the year,and the work in connection with the change from the old to the new shops accounts for the increasein the average number of men engaged on works charged to capital.
I have under another heading in this report referred to the sick-benefit fund that has been esta-blished. Staff welfare work has also been carried on in other directions, notably in the provision ofvery well-equipped social halls at the workshops. We are also providing dining-rooms at the shops,and an organization which will enable the employees to obtain hot meals of high quality at the lowestpossible price. In connection with the provision of recreational facilities for the staff we have pursueda policy of providing the materials at the cost of the Department where the staff themselves werewilling to provide the necessary labour. lam glad to say that this arrangement has been availed ofby sections of the staff at various places during the year.
Staff welfare work is an aspect of our business in which I am particularly interested as makingnot only for physical welfare and contentment among the staff, but as also tending to bring the staffand their families into more intimate social contact, and so leading the way to better understandingand a development of that esprit de corps which is so essential to the best results in an industry suchas the railways, depending—as it does—so much on organization and the smooth working of its varioussections.
I desire also to express my appreciation of the loyal co-operation which I have had from the staffgenerally in connection with the Department's business. Soon after I took office I emphasized thatit was the man on the spot who could do the best service for the Department in the matter of obtainingbusiness as against competitors. The essential relationship of the Commercial Branch in business-getting, so far as the internal organization of the Department was concerned, was to serve as a connecting-link between the management and the staff who are spread throughout the length and breadth of therailway system. Essentially the actual work of business-getting must principally rest with the staffwho are giving the service and coming into daily contact with those requiring transport. lam verygratified to be able to record that during the year my appeal for the active co-operation of the staffhas been responded to in a measure that has given me the greatest satisfaction. I have found manycases of members going out of their way to protect the Department's interests, and I desire to placeon record my tribute to the staff for their loyalty and valuable assistance in this connection.
I wish also to place on record the good conduct of the staff during the past year, and the cordialrelations that have existed between the various sections right throughout the organization.
SICK-BENEFIT FUND.During the year the arrangements for the establishment of a sick-benefit fund for the purpose
of assisting members of the wages staff of the Department during periods of incapacity through sicknesswere brought to completion. Previously to the establishment of this fund members of the wagesstaff who were off duty through sickness received no pay during these periods, and were dependentfor their income on the various benefit societies that have been established by the staff themselvesgenerally through their staff associations.
It has been a request that has been made on behalf of the wages staff for a good many yearsthat they should receive some assistance during periods of sickness. The solution of this problem waseventually found in the formation of the Government Railway Employees' Sick Benefit Society.Under the arrangement now arrived at the members of the staff will make contributions to the sick-benefit fund, such as they have been accustomed to do in connection with the funds previouslyestablished, and in addition the Department will subsidize these contributions to the extent of 10s. in.the pound with a maximum annual subsidy of £8,000. The accounts of the fund will be kept, by theDepartment, and the fund will be administered by a central committee, on which the staff organiza-tions and the Department will be represented, and by various district committees somewhat similarlyconstituted.
The arrangement is now in operation, and has worked with practically an entire absence ofdifficulty right from its inception. I feel that the establishment of the fund marks a very substantialadvance in the industrial welfare of the railway employees.

D—2. XLVIII
REVISION OF INSTRUCTION-BOOKS.With the growth in the extent and complexity of the Department's operations the various
instruction-books have both increased in number by the inevitable addition of fresh books dealingwith new pliases of the Department's working, and have also been the subject of numerous amendmentsto the books already existing. Some of the older books have not been revised for a number of years,and the position was reached where a revision and consolidation of the various departmentalinstructions could not be longer postponed with due regard to the convenience of the staff and efficientand safe working. This work has accordingly been put in hand, and a definite staff has been allocatedfor the purpose, with the intention that the work shall now be pursued continuously until finality isreached and the various instruction-books are brought up to date and arranged in the best possibleorder. This is a work that I feel sure will be much appreciated by the staff, and will be of materialassistance to them in the proper discharge of their various duties.
CORRESPONDENCE COURSE AND TRAINING-SCHOOL.The total number of students receiving tuition in the various phases of railway work numbered
615 at the end of March. Four hundred and sixteen members passed the various departmentalexaminations during the year. A great measure of success was secured at the examinations by thosemembers who availed themselves of the facilities provided by the Correspondence School.
Ninety-seven cadets have undergone the course of training in the school during the year, andthe results have been very satisfactory. Fifty per cent, of these cadets matriculated prior toappointment to the service, and a number are continuing their studies at the University and TechnicalCollege.
The Cadets' Hostel is still fulfilling its useful purpose, and parents have expressed appreciationat the manner in which the Department is attending to the welfare of cadets away from home. Atennis-court has been provided, and cricket and football clubs have been formed in order to providerecreation for the cadets.
SUGGESTIONS AND INVENTIONS.The Department's Suggestions and Inventions Committee dealt with 1,491 suggestions during
the year, as against 1,739 during the previous year. Of these, 122 were recommended for adoptioneither wholly or partially ; 447 were referred to heads of branches for their consideration, or werealready in operation, or related to matters of policy; 812 were rejected; and 110 were under trialor investigation at the 31st March.
Monetary awards totalling £168 were made in respect of thirty-five suggestions, and commendationswere noted on the official records of eighty-one suggesters.
During the year wider publicity has been given to the existence of the Suggestions and InventionsCommittee, a recent innovation being the erection at the principal stations of " Suggestions " boxeswith appropriate cards provided for making suggestions. It is anticipated that this will furtherinduce train travellers, as well as members of the service, to submit any ideas they may have forimprovements to our railway system.
Many of the suggestions submitted during the year were not original, a large number having beenpreviously brought under notice, or related to matters which were already engaging the attention ofthe Department. Nevertheless, suggestions of considerable value are frequently received, and it isfelt that the benefit obtained from these fully compensates for the time spent in sifting out the usefulones.
SUPERANNUATION FUND.The report of the Government Railways Superannuation Fund Board for the year ended 31st
March, 1929, shows the position to be as follows : —■Annual liability, £258,632. £
Members' contributions .. .. .. .. .. .. 166,439Interest .. .. .. .. .. .. .. 65,537Deficit to be drawn from subsidy .. .. .. .. 26,656
£258,632
At the same date the liability to contributors in respect of amounts paid £
in was ....
.. .. .. .. 1,505,554:The total accumulated fund was ..
.. .... 1,238,674
Leaving deficit of ....
.. -. .. £266,880
The annual liability, £258,632, is in respect of 1,478 members, 485 widows, and 452 children,making a total of 2,415 persons actually on the fund on the 31st March, 1929.
The amount standing in the Investment Account in the balance-sheet is represented by thefollowing securities : —• £
Mortgages .. .. .. ..
"
.. .. 843,122Local bodies' debentures .. .. .. .. .. 193,615Government securities .. .. .. .. .. .. 135,000In hand awaiting investment .. .. .. .. .. 4,824
£1,176,561
The average rate of interest on securities held on the 31st March, 1929, was 5-823 per cent,The average rate of interest earned on the mean funds was 5r 761 per cent,
XLIX D.—2.The last actuarial examination of the Government Railways Superannuation Fund was made in
1919-20. In the report that was then made it was recommended that the subsidy to be paid by theGovernment into the fund should be at the rate of £170,000. The subsidy was accordingly increasedfrom that time year by year until it reached the sum named in 1926, since which time it has remainedat that figure. A further actuarial investigation is now being made, and it is expected that it willbe concluded at an early date.
CONCLUSION.I have elsewhere in this report mentioned that we are by improved facilities and the adoption
of commercial methods in seeking and attracting business endeavouring to develop rail-borne traffic.I wish, in conclusion, to express some thoughts in regard to what might be termed the commercializationof the railways. Since the advent of motor competition and the growth of the debit balance asbetween revenue and expenditure there has been a growing tendency to judge the railways on theresults of their working from a commercial standpoint. To this no possible exception could be takenif the railways were in fact a commercial institution, and the fact is that at present they are not. AsI have indicated, we have in the internal working of the Department adopted commercial methods,but there is a limit to which the management as such can carry this commercialization process. Wefind in most of the major and a good many of the minor questions that come up for settlementnon-commercial aspects entering into the matter. Whether this should continue or not is not amatter that is within our province to discuss, our purpose here being merely to point out the fact inorder that no injustice should be done or misunderstanding arise as regards the position of therailways from a working point of view. To judge the results of the working of the Department froma commercial standpoint when the Department is not a commercial institution is as unfair as it ispositively harmful.
The growth of the idea of the commercialization of the railways is one of the most outstandingfeatures of the railway problem to-day. The pressure on the State finances of deficits on accountof the working of the railways has been a growing one, until it has assumed dimensions that compelserious consideration. It has been too often assumed that this growth has been due to some defectin the working of the system. An analysis of the position does not support any such assertion. Thepolicy is determined from time to time by the Government of the day and has to be accepted bythe management, which then is charged to do its best to apply that policy to the working of thesystem. In applying the policy commercial methods are being used to the utmost possible extent;but unless the policy is commercialized, then at the very source of our operations we have a non-commercial factor which operates throughout the whole and sets definite limitations on the capacityof the management to get commercial results.
Commercialization means nothing else but the adoption of such a policy and such methods ofworking as will ensure the best financial results directly through the revenue and expenditure accounts.If this result is aimed at, then the only logical thing to do is not only to commercialize the methodsof working, but also to commercialize the policy. The latter is unquestionably the governing factorand definitely circumscribes the operations of the former. Whether the Department should bethoroughly commercialized is a policy question which this is not the place to discuss. I feel,however, that in justice to the railwaymen—and, indeed, to the country itself—the issue should belaid bare.
Some steps have already been taken which seem to be consistent only with a policy ofcommercializing the Department. The action taken in that direction cannot, however, be fully effectiveuntil all non-commercial influences have been eliminated. The point is that to get the best resultsunder either system—that is, under a non-commercial or commercial policy—one or the other shouldbe definitely adopted both as a standard for the operations of the Department and as a standard bywhich to test its results. To adopt one for one purpose and the other for the other purpose isinconsistent, futile, and harmful.
The position that has arisen in South Africa is in many respects analogous to that which hasarisen here and has been made the subject of a very able work, entitled " The Railway Policy ofSouth Africa," by Dr. S. H. Frankel, Professor of Economics and Economic History at WitwatersrandUniversity, Johannesburg, and, while not necessarily agreeing with all the conclusions arrived attherein, I would commend this work to the study of all those who are interested in the railwayproblem in New Zealand.
I have endeavoured in this report not only to give an account of our stewardship for the pastyear, but also to state the major questions involved in the railway problem in New Zealand as I seeit, and, as far as I might do, I have endeavoured to point the way to a solution.
I have the honour to be,Sir,
Your obedient servant,
LLK ' MJnst - T ->
ff General Manager.
vii—D. 2.
D.—2 L
REPORTS FROM HEADS OF BRANCHES.
MAINTENANCE.Mr. F. C. Widdop, M.lnst.C.E., Chief Engineer, reports as follows :—
The track, structures, buildings, and appliances have been maintained in good order and repair.Permanent-way.—The relaying done during the year was as follows :—
Main line and branches, 53 lb., 55 lb., 56 lb., 65 lb., and 70 lb., relaid with 70 lb. Miles.material .. .. .. .. .. .. .. .. 36^
Main line and branches, 40 lb., 53 lb., 55 lb., and 56 lb. relaid with 55 lb.material .. .. .. .. .. .. .. .. J
Main line and branches relaid with second-hand 53 lb., 55 lb., 56 lb., and 70 lb.material removed from main line .. .. .. .. 5|
Total relaid for year .. .. .. .. .. 42JSleepers.—The number of new sleepers placed in the track during the year was 152,161.Ballasting. —143,121 cubic yards of ballast were placed on the track.Slips, Floods, &c.—During the year the Kaihu Section between 11m. and 15 m. was flooded on
two occasions, causing slight delays to traffic.On the 30th April, 1928, a heavy gale at Te Aroha caused considerable damage to dwellings and
buildings.On the 10th July, 1928, a heavy flood in the Waihou River caused several small washouts between
Mangaiti and Tirohia, involving train-delays.On the 24th, 25th, and 29th July, 1928, slips and washouts occurred on the main line, North
Auckland, East Coast Main Trunk, Thames and Glen Afton Branches, causing interruptions to traffic.On the Ist November, 1928, a slip of rock at 134 m., North Auckland line, between Onoke and
Kauri, damaged the track and caused slight delay to traffic.As the result of continuous heavy rain on the 30th and 31st October and Ist November, 1928, a
slip came down in the Manawatu Gorge on the 2nd November, 1928, causing a stoppage of traffic.Line was cleared for traffic on the 3rd November, 1928.
Traffic was suspended on the Foxton Branch on the 2nd November, 1928, owing to a washoutat Rangiotu, and resumed on the afternoon of the 3rd.
On the 19th June, 1928, a southerly gale caused damage to the sea-wall in several places betweenKaiwarra and Ngahauranga. There was no delay to trains.
On the 16th August, 1928, a southerly gale caused heavy damage to the sea-wall between Kaiwarraand Petone. Traffic was suspended on the 16th August, but was resumed for single-line working onthe afternoon of the 17th idem. Double-line working was resumed between Kaiwarra andNgahauranga on the 20th August, and between Ngahauranga and Petone on the 14th September.The wall has been repaired and strengthened with a toe of heavy rubble and concrete blocks.
A slip of about 300 cubic yards came down at 82 m. 12 ch., Wairarapa line, between Mangamahoeand Eketahuna, on the Ist November, 1928. An engine of a train was derailed, and line was blockeduntil the following morning.
On the 9th April, 1928, and the sth and 6th March, 1929, slips and washouts occurred on theWestport Section, causing delay to traffic.
Several washouts and slips occurred on the Otira line between Te Kinga and Inchbonnie, involvingtrain delays.
On the 26th April, 1928, the approaches to Bridge No. 78a, Reefton line, between Cronadun andRotokohu, were washed out, blocking the line until the 28th April, 1928.
On the 9th March, 1929, a severe earthquake at Arthur's Pass caused considerable damage tothe formation and to the railway houses and station. It was necessary to employ a work-train to makeup the formation. Practically all the chimneys of the houses were shaken down at the roof.
Owing to exceptionally heavy rain on the 18th and 19th March, 1929, several washouts occurredin the Dunedin district and caused blockage of traffic. On the Otago Central line, owing to the rapidrising of the Taioma Creek, a bank about 25 ft. high near Salisbury was scoured out at the toe, theembankment collapsing under the train, and the leading engine being precipitated into the creek. Adeviation of the line was effected and traffic resumed on the 23rd March. On the Outram Branch,owing to washouts, traffic was blocked from the 20th to the 25th March, 1929.
On the 24th January, 1929, an exceptional downpour of rain caused a severe flood on the Kingstonline, especially between Parawa and Athol, where the water was 18 in. over rail-level. No damagewas caused to track or bridges.
Bridges.—These have been maintained in good order. A considerable number of bridges havebeen overhauled and repaired, also a number renewed in rolled-steel joists. Bridge-strengthening toenable heavier engines to run has continued on a number of lines.
'Water-services.—These have received the necessary attention. Electric pumping-plant has beeninstalled at a number of stations.
Wharves. —The wharves under the control of the Department have been efficiently maintained.During the year the Port Chalmers wharves were sold to the Otago Harbour Board, and portion ofthe Onerahi Wharf to the Whangarei Haibour Board.
Buildings. — Buildings have been maintained in good repair. The following buildings weredestroyed by fire : Swanson, signal-cabin ; Donnelly's Crossing, goods-shed ; Otahuhu, washhouse ofdwelling ; Woodville, engine-drivers' room ; Cross Creek, cottage ; Romahapa, cottage ; Glenhope,hut; and Kurow Station building and Post-office.
LI D.—2
Station-yards.—lncreased siding and station accommodation has been provided at a number ofstations.
Railway Improvements.—The expenditure under the Railways Improvement AuthorizationAccountfor the last year was £857,164, as against £920,009 for the previous year. This amount does notinclude the expenditure under this account on the Auckland-Westfield, Palmerston North, and TawaFlat Deviations and Hutt Valley Railway, carried out by the Public Works Department, whichamounted to £487,714 ; Signal Branch charges, £222,560 ; and Locomotive Branch charges, £456,054.
Auckland New Yard.—Good progress has been made during the year with the rearrangement ofAuckland yard. The new Outwards Goods-shed was completed and opened for use. A new motorweighbridge was erected, also two underslung jib traversing cranes and new platform scales. Newshunters' quarters were completed and brought into use. A new office was built for the LocomotiveForeman. The new outward marshalling-sidings were completed, and the new intermediate car-sidingswest of the new platform brought into use. The lease of a block of Harbour Board land on the easternside of Quay Street was acquired, and was laid out and used for temporary Inward Goods-shed andGoods-yard. The old B Goods-shed was dismantled, and re-erected on the Harbour Board land fortemporary use. The old wharf exchange group of sidings was lifted, and wharf approach sidingsrearranged, including alterations to the lay-out of private sidings crossing Quay Street.
Auckland New Station Building.—Good progress has been made with the contract, and it isanticipated that the work will be completed close to the allotted time. Foundation piles to the numberof 1,260 have been driven under the main building, and the steel structure is practically finished.Some delay has been occasioned by the stonemasons employed on the preparation of building-stonerefusing to operate certain machinery and consequently being paid off. Subsidiary work, such assubways, station verandas, and retaining-walls are well in hand.
Wellington New Yard.—In connection with Wellington new station-yard considerable progresshas been made in the filling for the new yard. Dredging had to be suspended to permit of theconstruction of large storm-water sewers. The interruption of dredging will have no effect on thegeneral progress. One storm-water sewer has been completed and the other is well forward.
A permanent site with sidings has been prepared for the new goods-shed, and the plans of the shedare completed. A number of permanent local loading-sidings and adjoining cartways have been laiddown.
Considerable improvement in the handling of goods-trains has been effected by the provision ofa temporary junction at Thorndon and a large holding-grid on the site of the old Esplanade.
The plans of the new station building are well advanced, and will be ready for the commencementof building operations when the site is available. The clearing of the site is contingent upon thecompletion of the new goods-shed.
Hutt Valley Railway.—An extension of the industrial line to serve the industrial area is in hand,and private sidings have been provided to suit industries established in this area.
General.—The duplication of the track between Frankton and Horotiu is in hand. Platelayinghas been completed and earthwork is nearly completed. Ballasting is in progress.
A crossing-loop has been laid at Kimihia, and the laying of one between Mercer and Whangamarinois in hand.
Temporary work in connection with the new bridge at Ngaruawahia has been commenced.The replacing of level crossings at Piripiri and Tumai by overbridges, and at Hawera by subway,
was completed.Bridge-strengthening has been carried out in various districts. A programme has been drawn up
for extensive strengthening and reconstruction of bridges to enable more powerful engines to beoperated on heavy-traffic lines.
The Ravensbourne-Burke's duplication is proceeding steadily. Considerable work has been donein connection with the reclamation and sea-wall.
New Workshops.—North Island shops : The Car and Wagon Shops at Otahuhu and the LocomotiveShops at Hutt Valley are completely erected and equipped and are now in operation. Water anddrainage reticulations are complete, as well as roadways and siding layouts, with the exception of asmall amount of ballasting at Hutt Valley.
At Hutt Valley a repair-shed and shelter for buses are being provided and will shortly be completed.South Island shops : The reorganization of the South Island shops provides for Car and Wagon
Shops at Addington and Locomotive Shops at Hillside. The rebuilding and reorganization of bothshops has been carried on concurrently, and the work is now nearing completion. Most of the mainbuildings, including water and drainage reticulations, are practically completed.
At Addington all main buildings are completed with the exception of the Steel Wagon Shop andStores. The Steel Wagon Shop is now under construction. The erection of the Stores building,painting-sheds, dining-room, &c., will be started at an early date, as well as the construction of road-ways and rearrangement of sidings.
At Hillside all main buildings are practically completed except the Pattern Shop and Stores, andthe erection of these buildings will be started at an early date.
The Power-house, Reclaim Depot, Locomotive Erecting and Boiler Shops, and Steel Wagon Shopsare in operation, and machinery installations are in hand in the Machine Shops and Foundry.
The following R.I.A. works are being carried out by the Public Works Department:—Auckland-Westfield Deviation.—The formation throughout the deviation is practically completed,
and the platelaying and ballasting of the permanent double track is now in hand. The railway-bridgesare nearing completion, and road traffic has been turned over all the road-crossings which are providedwith overbridges or subways. Good progress has been made with the erection of the six stationbuildings and platforms, and work in connection with the station-yards is in hand. Expenditure forthe year, £89,386.
viii—l). 2
D.—2 LII
Palmerston North Deviation.—Duciag the year more labour and plant were engaged on this work,and considerable progress was made with earthworks and culverting. The formation for main linewas completed to within 42 chains of the Main Trunk Railway. An overbridge was erected at Milson'sLine, and improvements to the channel of the Mangaone Stream were carried out. Expenditure forthe year, £99,905.
Tawa Flat Deviation.—Considerable progress has been made with the work during the year.Some 7 chains of sea-wall on the harbour reclamation and a total of 23 chains of heavy earthwork havebeen completed. Both portals of No. 1 tunnel and 12 chains of full-section tunnel were completed ;
55 chains out of a total of 63 chains of bottom-heading work, 10ft. by 8 ft,, were completed. To enabletunnel-spoil to be easily disposed of an adit 12 chains in length was driven at Ngahauranga. InNo. 2 tunnel both portals and 5 chains of full section of tunnel have been completed ; 38 chains ofbottom heading, 10ft. by 8 ft., have been driven. At s|-mile peg a2O ft. by 8 ft. shaft was sunk to adepth of 130 ft., and from this point headings are being driven in both directions.
The double-track bridge over the Hutt Road has been practically completed with the exceptionof track-laying and painting.
The bridge over the Ngahauranga Gorge Road has been completed, also the piers of bridges at6 m. 38 ch,, 7 m. 28 ch., and 7 m. 51 ch.
Huts for the accommodation of workmen have been provided, and tunnelling equipment, consistingof air-compressors, &c., and electric locomotives, is now in use. Expenditure for year, £286,442.
Additions to Open Lines.—The expenditure under this account was £52,899, the principal worksbeing: Additional siding accommodation at Motatau, Rotorua, Wanganui (part), Thorndon,Mangatainoka, Woburn, Riccarton (part), Glasnevin, Christchurch, Ranfurly, Wyndham (part), Otautau ;
provision of crossing-loop between. Mangaiti and Tirohia ; alterations to District Offices, Whangarei ;
turntables, Opua and Otira ; 12,000-gallon vat, Paekakariki; crushing plant, Mount Smart; newhouses at Clinton, Middleton, and Romahapa (part); purchase of houses at Paekakariki and Woolston;loading-banks, Ngapara and Gore ; overbridge at Tuakau; stock-yards, Tatuanui, Kopu (part),Mangaiti, and Greenhills ; sewerage, Frankton ; new station-buildings at Mataroa and Elmer Lane ;
additions, Tauranga Station building ; additions to locomotive depot, Tauranga (part) and Taneatua(part) ; refreshment-rooms, Tauranga ; veranda at Milton ; flood-control, Taieri Plains (part) ; tarringStation Street, Timaru ; sandhouse, Frankton Junction ; land for locomotive depot, Frankton Junction ;
artesian well, Invercargill (part) ; extension of centre rail, Rewanui ; land for rearrangement of yard,Milton ; motor-garage, Hutt Shops (part) ; portable rock-drilling plant; bridge at 130 m., Puketutu(part) ; mechanical appliances for goods-sheds, Christchurch.
Betterments.—Expenditure charged to "Betterments " during the year was £23,991 Bs. 4d., theprincipal works being : Provisions of additional siding-accommodation at Paeroa, Morrinsville, andNgatira ; alterations to sidings on No. 3 jetty, Lyttelton ; improvements to bridges Nos. 148 and150, North Auckland line (part) ; provision of additional stockyards ; improvements to stockyards
and improved stock-handling facilities at several stations ; improvements to clearances in RoundHill Tunnel, Dunedin district; provision of office for Bridge Inspector at Te Aroha ; additions toDistrict Engineer's Office, Wellington ; fitting up Central Booking-office at Auckland ; conversionof general waiting-room into bookstall at Christchurch ; paving Wharf Street, Dunedin ; improvedwater-services at several stations ; installation of coin-in-slot locks at a large number of stations ;
and equipment of frame levers in lieu of " goose-neck " levers at crossing-loops (part).Expenditure.—The expenditure for the year was as follows : Maintenance (charged to working
expenses), £1,111,229 ; new works (charged to capital), £910,063. The maintenance expenditurecharged to working-expenses amounted to £340 per mile, as compared with £359 in 1927-28, £338 in1926-27, £369 in 1925-26.
Mileage.—The mileage open for traffic on the 31st March, 1929, was 3,299 miles 76 chains. Duringthe year 106 miles 39 chains additional lines were opened for traffic.
Staff. Maintenance Branch.—Working staff, 4,067 ; office staff, 179 : total, 4,246.
LOCOMOTIVE.Mr. G. S. Lynde, M.l.Mech.E., M.1.L0c0.E., Chief Mechanical Engineer, reports as follows : —
The rolling-stock, machinery, and tools have been maintained in good working-order during theyear.
Locomotives. —On the 31st March, 1929, there were 667 engines in service. During the year oneClass G Garratt articulated locomotive, imported from Messrs. Beyer, Peacock, and Co., Manchester,was assembled in the Government railway workshops, three Wr Class were built by Messrs. A. andG. Price, Ltd., Thames, and six electric locomotives were imported from United Kingdom for theLyttelton-Christchurch service. Twenty-one engines were written off during the year.
There was a decrease of 65,804 lb. (equal to 0-586 per cent.) in the tractive power available.There were, at the close of the year, two Class G articulated Garratt locomotives under
erection in the Hutt Workshops. These two locomotives will be completed and put into serviceduring May of the present year. There were twenty-four Class C shunting-engines on order to bebuilt in the Government railway workshops.
During the year 662 engines were passed through the workshops, of which 153 received athorough overhaul.
Boilers.—Six locomotive boilers were built during the year, and fourteen boilers were, in handat the close of the year.
Carriages. —On the 31st March, 1929, there were 1,598 cars. Ten suburban cars built in theGovernment railway workshops were added to the stock, and eighteen old cars were written off, andone postal car convei ted to brake-van. Twenty-seven cars were on order at the end of the year.
LIII D.—2
During the year 1,989 cars were passed through the workshops, of which number 1,163 receivedheavy repairs.
Six day cars were converted to sleepers on the South Island main line and branches.Bail-cars. —There were five rail-cars on the line on the 31st March, 1929.Brake-vans.—On the 31st March, 1929, there were 480 brake-vans. Six bogie vans built in the
Government railway workshops were added to the stock, and one postal car converted to brake-van.during the year. Eighteen old vans were written off and one converted to a sleeping-van.
Altogether 615 vans were passed through the workshops, of which 299 received heavy repairs.Wagons.—On the 31st March, 1929, there were 26,823 wagons in stock. The additions during
the year were six bogie and 49i. four-wheel wagons built in the Government railway workshops.Thirty-five wagons purchased from the Public Works Department, East Coast Railway, were alsoadded to the stock, and three old vans were converted to wagons. Five wagons were sold and 443were written off during the year. The carrying-capacity was increased by 2,066 tons.
During the year 23,437 wagons were passed through the workshops, of which 11,675 receivedheavy repairs.
There were on order at the end of the year sixty-five bogie and ninety four-wheel wagons.Tank-wagons.—During the year twelve rail tank-wagons were built for oil companies for the
carriage of motor-spirit in bulk.Tarpaulins.—The tarpaulin stock on the 31st March, 1929, was 22,875. Five hundred new
tarpaulins were manufactured in the railway workshops during the year, and 5,539 tarpaulins werereplaced with a similar number of new sheets ; 22,253 sheets were repaired in the workshops.
Axles.—During the year 487 car, van, and wagon axles were replaced with modern steel axles ;
549 axles were prepared for new rolling-stock.Train-lighting.—On the 31st March, 1929, there were 389 cars fitted with electric light.Engine Headlights.—The total number of locomotives fitted with electric headlights on the 31st
March, 1929, was 209.
SIGNAL AND ELECTRICAL.Mr. H. J. Wynne, A.M.1.C.E., Signal and Electrical Engineer, reports as followsFixed Signals at Officered Stations.—Home signals have been provided at Birchfield and Fairdown.The total number of officered stations (including tablet stations) is 489, of which 321 are equipped
with fixed signals, 9 are equipped with light signals as unattended crossing-loops, 121 are interlocked,and 38 are unequipped.
Interlocking of Points and Signals.—lnterlocking with the tablet system has been installed at thefollowing : Atlantic Union Oil Co.'s private siding (between Terrace End and Bunnythorpe) ; temporaryservice siding. Otokia ; Quarry siding, Hoteo ; Wayby Station ; Huarau Station ; Mareretu Station ;
Te Hana Station ; Renown Colliery siding, near Rotowaro ; W. Cook and Son's siding, near Himatangi;Bickerstaffe Station ; Ranganui Station ; Service siding, between Willowbridge and Morven ; Ruata-ngata Springs Station ; Mair Station ; Otonga Station ; Patea Co-operative Freezing Co.'s privatesiding, Moturoa ; Southern Cross Glass Co.'s siding, Ashburton ; Vacuum Oil Co.'s siding, Waipukurau ;Public Works Department's siding, Kartigi Beach ; Atlantic Oil Co.'s siding, Masterton; OakleyStation ; Waikiekie Station.
The total number of interlocking® is now 121, of which 19 are power interlocked; tramwaycrossings, 7 ; sidings and flag stations interlocked with tablet, 266 ; stations fitted with Woods locks,328. Woods locks have been provided at Birchfield (4), Fairdown (2). One Woods lock has beenremoved at- Ranfurly.
Automatic and Power Signalling.—Single-line automatic signalling has been brought into usebetween Greymouth and Elmer Lane engine-depot (51 chains). In connection with the aboveinstallation, an additional switch-locked siding has been installed at Greymouth.
The total mileage now equipped with automatic signalling is—Double line, 37 miles 57 chains ;
single line, 159 miles 62 chains.Automatic signalling between Mercer and Frankton is nearing completion and will be brought
into operation shortly, and the automatic signalling on the Westfield Deviation between Aucklandand Westfield is in hand.
The total number of unattended crossing-loops equipped with automatic signalling is now thirty,and switch-locked sidings twenty-six.
Paeroa Station has been converted from mechanical interlocking to power interlocking.Alterations to signalling and interlocking have been carried out at Thorndon, Mount Eden,
Middleton, Greymouth, Otahuhu, and Swanson.Materials have been ordered for power signalling and interlocking for Auckland new station.Electric Tablet and Block Working. —The following work in connection with electric tablet has
been carried out: Swanson, new tablet instruments installed to replace instruments destroyed byfire.
The number of tablet instruments now in use is 883, at 371 stations.The total number of automatic exchangers in use is 333.The total mileage equipped with electric tablet is 1,709 miles of single line out of a total of 3,292.The total mileage equipped with lock-and-block is 16| miles of double line. The number of lock-
a,ud-block instruments- in use is twenty-six, at twelve stations.The following tablet-locked sidings have been removed : W. Cook and Son's, near Foxton ; Te
Kuha Junction ; Orari ballast-pit.

D.—2. LIV
Telegraph and Telephone Facilities.—lo7 miles of poles have been erected and 402 miles of wirehave been run during the year; fifty-nine connections to railway telephone circuits have beenprovided ; thirty-five new connections to public exchanges have been provided ; fifteen electric bellshave been installed.
Metallic circuiting of telephone-lines has been completed on the following sections : Whangarei-Opua ; Otiria-Kaikohe ; Wanganui - East Town ; Wingatui-Middlemarch ; Timaru-Normanby ;
Woburn-Hutt Park; Lepperton Junction - Waitara ; Riverton-Tuatapere ; Millers Flat - Rox-burgh ; Waiotira Junction - Kirikopuni; Tahawai-Matata.
Telephones have been superimposed over the existing Morse lines between Lambton andMasterton.
An exchange connected to the public automatic has been installed in the Auckland Goods Office,comprising three trunk lines and twelve intercommunication lines.
Automatic intercommunication exchanges (PBX system) are now being installed in the followingworkshops: Otahuhu, Hutt Valley, Addington, Hillside.
The totals now in use are—-Morse instruments, 286 ; telephones, 2,156 ; electric bells, 403 ;
miles of wire, 1 ] ,641 ; miles of poles, 3,044 ; separate connections to public exchanges, 590.Electric-lighting Installations.—During the year flood lighting has been installed in the following
station-yards : Mercer, Napier, Westport, Auckland (additional). At Newmarket a special hoardingin workshops yard has been flood-lighted.
The following stations have been equipped with electric lighting : Woburn Station ; WaterlooStation; Onehunga Wharf, Station, yard, and signals ; Oratia Station; Onehunga Station andlocomotive-shed ; Napier Station, yard, goods-shed, locomotive shed, and signals ; Waimauku Stationand yard ; Helensville South Station ; Riversdale Station and yard ; Lumsden Station and yard ;
TJtiku Station and yard ; Ohingaiti Station and yard ; Riverton Station and yard ; PlimmertonStation and yard ; Otaki Station and yard ; Carterton Station and yard ; Waipahi Station and yard ;
Westport Station and yard, locomotive shed, workshops, and signals; Turakina Station and yard ;
Tauranga Station and Yard, and refreshment-room; Paengaroa Station; Dunsandel Stationand yard ; Greatford Station and yard ; Te Kauwhata Station and yard ; Ward Station and yard ;
Porirua Station and yard; Fordell Station and yard; Beach Street Station; Horopito Stationand yard ; Halcombe Station and yard ; Avondale Station and yard, and signals ; Glen Eden Stationand yard, and signals ; St. Andrews Station and yard ; Washdyke Station and yard, and signals ;
Mercer Station and yard, signals, refreshment-rooms, and locomotive shed; Ngahere Stationand yard ; Bay View Station and yard.
At Auckland the electric lighting and heating of the new Outwards Goods-shed and offices, combinedTourist and Railway booking-offices, Queen Street, and Parcels and Booking Office, Symonds Street,have been completed, and at Greymouth the electric lighting of the Elmer Lane new locomotive-depothas been completed.
The following shops, halls, &c., have been equipped with electric lighting : Oamaru, social hall;Gore, engine-shed ; Invercargill, main store, and foreman of works' trust store ; Kumeu, stock-yard ;
Addington, foreman of works' trust store ; Blenheim, goods-office ; Moumahaki, stock-yard ; Auckland,yard foreman's office ; Ashhurst, cattle-yard ; Tokomaru, stock-yard ; Wanganui, miniature riflerange ; Arthur's Pass, reticulation of public street and connecting of twenty-six private houses torailway supply completed during year.
The electric lighting of the existing workshops at East Town is completed.The electric lighting of the new workshops and flood-lighting of the workshop yards at Otahuhu,
Hutt Valley, Addington, and Hillside is in hand and nearing completion.A contract has been let for the electric lighting and heating of the new station and platforms at
Auckland.Alterations involving 160 new lighting-points have been made to existing installations of all
kinds, and fourteen heating and power points.During the year 343 railway houses have been equipped with electric light.The total number of stations lit with electricity is now 219. The total number of station-yards
equipped with flood lighting is twelve. The total number of railway houses electrically lit is now2,062.
Electric-power Installations.—Through the year the electrification of Elmer Lane locomotive depothas been completed.
The electrification of the new workshops at Otahuhu, Hutt Valley, Addington, and Hillside, alsoexisting workshops at Napier, is in hand and nearing completion.
At the Otahuhu, Hutt Valley, Addington, and Hillside workshops, substation equipment hasbeen provided for the following maximum demand : Otahuhu, 1,500 kv.a. ; Hutt Valley, 2.100 kv.a.;Addington, 1,500 kv.a. ; Hillside, 1,500 kv.a. There is now approximately 10,000 h.p. installed.
Railway Electrification.—The Lyttelton to Christchurch electrification has been completed andopened for traffic.
Complete schemes and detailed estimates have been prepared for the electrification of existinglines, including Upper Hutt - Summit, Wellington-Paekakariki.

LV D.—2
Level - crossing Warning - devices. — Warning signals have been installed at the following levelcrossings : Morningside - Argyle Street (flashlight signal) ; Taumarunui - 173 m. 61 oh. (Pearson'swigwag); Mount Albert - Woodward Road (flashlight signal); Dannevirke -33 m. 79 ch. (Pearson'swigwag); Wanganui - Grey Street (Pearson's wigwag); Hamilton - Lake Road (Pearson's wigwag—previously bells only).
Warning signal has been taken out at the following level crossing : ongarue-160m. 57 ch. (bells).The total number of level crossings fitted with warning devices is 100.Expenditure on Signals, &c. —Capital expenditure for the year for signals, &c., amounted to
£224,345, of which £31,998 was on signals and interlocking, £13,083 on electric lighting, £75,406 onelectrification of locomotive workshops, and £99,571 on the electrification of the Lyttelton-Christchurchline. The maintenance expenditure chargeable against revenue was £112,206.
STORES.Mr. E. J. Guiness, Comptroller of Stores, reports as follows:—The value of stores material and plant (purchased under Railway vote) on hand at the 31st
March, 1929, at the various stores, depots, and sawmills amounted to £1,065,114 17s. 3d., as against£1,114,989 ss. on the 31st. March, 1928.
The whole of the stock is in good order, has been systematically inspected, and is value for theamount stated.
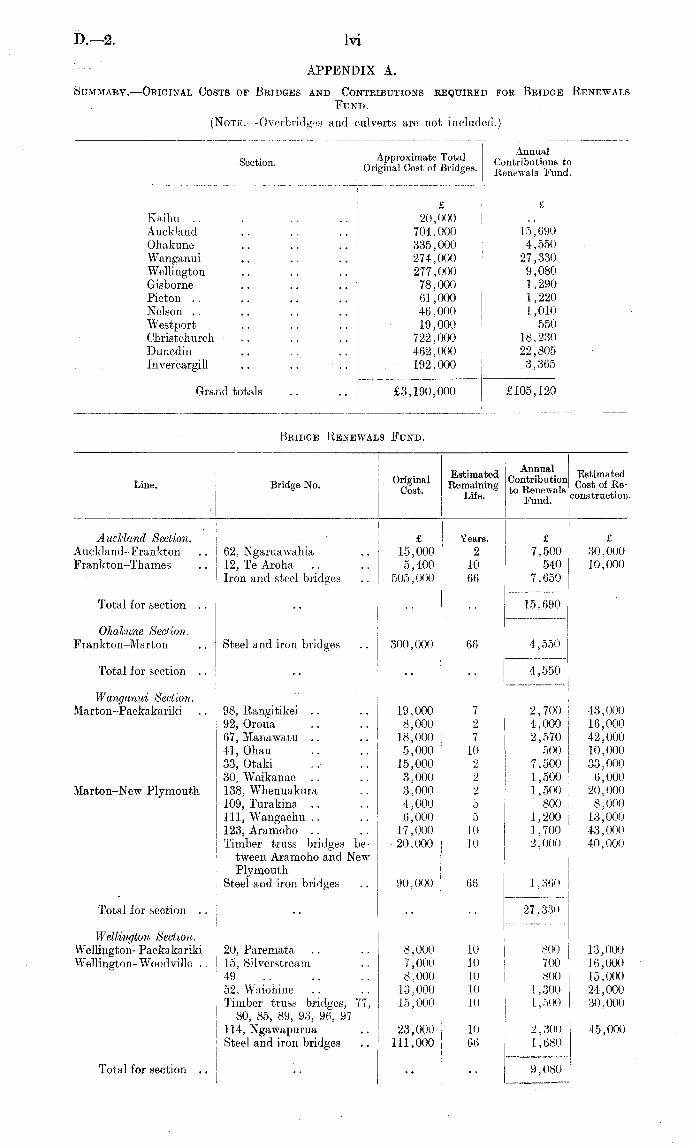
D.~2 LVIAPPENDIX A.
Summary.—Original Costs of Bridges and Contributions required for Bridge RenewalsFund.
Bridge Renewals Fund.
(Note. —Over'bridges and culverts are not included.)
Section. Approximate Total ContribStkL toOriginal Cost of Bridges. Renewalg Flmd .
£ £
Kaihu .. .: ,, .. 20,000Auckland .. .. .. 704,000 15,690Ohakune .. .. 335,000 4,550Wanganui .. .. .. 274,000 27,330Wellington .. .. .. 277,000 9,080Gisborne .. .. .. 78,000 1,290Picton .. .. .. .. 61,000 1,220Nelson .. .. .. .. 46,000 1,010Westport ..
.... 19,000 550
Christchurch .. .. .. 722,000 18,230Dunedin .. .. .. 462,000 22,805Invercargill .. .. .. 192,000 3,365
Grand totals .. .. £3,190,000 £105,120
. , Estimated n EstimatedLine. Bridge No. gg™ Remaining to
°
Renewals Cost of Re-Lsfe. Fund construction.
. IAuckland Section. £ Years. £ £
Auckland-Frankton .. 62, Ngaruawahia .. 15,000 2 7,500 30,000Frankton-Thames .. 12, Te Aroha .. .. 5,400 10 540 10,000
Iron and steel bridges .. 505,000 66 7,650
Total for section .. .. ..
. . 15.690
Ohakune Section.Fiankton-Marton .. Steel and iron bridges .. 300,000 66 4,550
Total for section .. .. .. .. 4,550
Wanganui Section.Marton-Paekakariki .. 98, Rangitikei .. .. 19,000 7 2,700 43,000
92, Oroua .. .. 8,000 2 4,000 16,00067, Manawatu .. .. .18,000 7 2,570 42,00041, Ohau .. .. 5,000 i 10 500 10,00033, Otaki .. .. 15,000 1 2 7,500 33,00030, Waikanae .. .. 3,000 2 1,500 6,000
Marton-New Plymouth 138, Whenuakura .. 3,000 2 1,500 20,000109, Turakina .. .. 4,000 5 800 8,000111, Wangaehu .. .. 6,000 5 1,200 13,000123, Aramoho .. .. 17,000 10 1,700 43,000Timber truss bridges be- 20,000 : 10 2,000 40,000
tween Aramoho and NewPlymouth
Steel and iron bridges .. 90,000 66 1,360
Total for section .. .. .. .. 27,330
Wellington Section.Wellington-Paekakariki 20, Paremata .. .. 8,000 10 800 13,000Wellington-Woodville .. \ 15, Silverstream .. 7,000 10 | 700 16,000
49 .. .. .. 8,000 10 800 15,00052, Waiohine .. .. 13,000 10 1,300 24,000Timber truss bridges, 77, 15,000 10 1,500 30,000
80, 85, 89, 93, 96, 97114, Ngawapurua .. 23,000 10 2,300 45,000
: Steel and iron bridges .. 111,000 66 1,680|
Total for section ..J .. .. .. 9,080
LVII D.—2
Bridge Renewals Fund—continued.
I 1 I i ■1 Annual EstimatedI inf -fj Original Tj Contribution Cost
. Lme ' Bridge No. CSBt. | ito Renewals, of Recon.Fund. struction.
Nelson Section. £ Years. £ £
Nelson-Glenhope ..13 .. 3,000 20 • 150 9,00038. Motueka .. 10,000 20 500 26,000Steel and iron bridges . . 24,000 66 360
Total for section .. .. .. .. 1,010
Picton Section.Picton -Blenheim ..20 .. .. .. 10,000 20 500 20,000
30 .... .. 6,000 20 300 12,000
Steel and iron bridges .. 28,000 66 420
Total for section .. .. .. .. 1,220
Gisborne Section.Gisborne .. 9, Waipaoa .. .. 8,000 20 400 16,000
19, Waikohu .. .. 9,000 20 450 15,000Steel and iron bridges .. 29,000 66 440
Total for section .. ... . ... 1,290
Westfort Section.30, Ngakawau ..
.. 4,000 20 200 10,000Steel and iron bridges .. 23,000 66 350
Total for section .. ... .
.. 550
Christnkurch Section.Main South line .. 10, Rakaia .. .. 25,000* 5 5,000 124,000
18, Ashburton .. .. 12,0001 5 2,400 20,000Stillwater-Reeftori 71, Inangahua. .. .. 7,000 20 350 20,000
74, Waitahu .. .. 6,000 20 300 16,00079, Larry's Creek .. 3,500 20 175 9,00086, Inangahua River .. 7,500 20 375 15,000
Greymouth-Ross .. 27, Arahura .. .. 8,000 20 400 20,00032, Hokitika .. .. 29,000 20 1,450 70,00046, Totara .. .. 9,000 20 450 18,000
Addington-Waiau.. 40, North Kowai .. 7,000 20 350 16,000
41, Waipara .. .. 9,000 20 450 18,00052, Hurunui .. .. 15,000 20 750 30,000
Waipara-Parnassus .. 26, Waiau-au .. .. 23,000 20 1,150 49,000Steel and iron bridges .. 306,000 66 4,630
Total for section .... .. .. 18,230
Dunedin Section.Main South Line .. 35, Rangitata North .. | 35,000 5 7,000 66,000
5l' oX" " | 20,000 7 2,860 58,00072'Otaio .. .. 4,000 7 770 9,000114, Waitaki .. .. 30,000* 5 6,000 80,000210, Otokia .. ..
6,000 10 600 16,000217, Waihola .. .. 7,000 10 700 2,000
Duntroon Branch .. 21,24,26,30,35,36 .. 24,000 20 1,200 60,000Fairlie Branch .. 23, Tangawai .. .. 4,500 20 225 8,000Lawrence Branch .. 3, Glenore .. .. 3,000 20 150 6,000
Steel and iron bridges (ex- 217,000 66 3,300cept Waitaki)
Total for section .. .. .. .. 22,805
Invercargill Section.Main South Line .. 236, Clutha .. .. 15,000+ 10 1,500 40,000
278, Gore .. .. 3,000§ 10 300 7,000Riversdale-Switzers .. 3, Mataura .. .. 5,200 20 265 12,000Glenham Branch ..1 .. .. ..10,000 20 500 20,000Orepuki .. ..29 .. .. .. j 5,000 20 250 12,000Mossburn .. ..1 .. .. .. 5,000 20 250 12,000
Steel and iron bridges .. 20,000 66 300
Total for section .. .. J ..3,365
* After making allowance for probable residual value. f Partial reconstruction only proposed. £12,000 =
original cost of portion reconstructed. J Partial reconstruction only; £15,000 cost of portion to be recon-structed. § Partial reconstruction only; £3,000 cost of portion to be reconstructed.
D.—2.
Bridge StrengtheningandReconstruction.—Estimated Expenditure.LVIII
TotalEstimatedCostof
EstimatedAnnual
Expenditure.
Line.
BridgeNumber.
Strengtheningor
Remarks.
Reconstruction.1929-30.1930-31.1931-32.1932-33.1933-34.
I
AucklandSection.
£
£
£
£
£
£
Auckland-Frankton..
..
62,
Ngaruawahia..
..
35,000
20,00015,000
....
..
Oldtimber
bridge;weakforpresentengines.
Reconstruction.Work
authorizedandinhand.
Frankton-Thames..
..1,
Hamilton..
..
5,000
........5,000
Steelandiron;weakforpresentenginesinfloor
systemand
pin-joints.Tobe
strengthened.
Speed-restrictionmeantime.
OhakuneSection.
Frankton-Marton
....
157,Makohine
..
..
12,000
6,0006,000
..
..
..
Steelandiron;weakforpresentenginesinfloor
system.Speed-restriction.Floor
systemtobe
renewed.Thiswillenableallclassesof
engines
torun.
WanganuiSection. Marton-Paekakariki
....
98,Rangitikei
....5,000
3,0002,000
..
..
..
Timbertrussesinfairorder.Rodsand
floor-beams
tobe
strengthened.
92,Oroua
..
....
16.000
10,0006,000
......Oldtimbertrusses;weakforpresentengines.
Reconstruction.
67,Manawatu
..
..
3,000
3,000........Timber
trussesinfairorder.
Rodsand
floor-beams
tobe
strengthened.
33,Otaki
..
....
27,000
10,00017,000
f
Oldtimber
trasses;weakforpresentengines.
30,Waikanae
..
..8,000
3,0005,000J*"\
Reconstruction.
Marton
-New
Plymouth
..109,
Turakina....8,000....8,000\
w,
,
,
x>
+
+•
111,Wangaehu
....
13,000....1Z,000/'"
Weaktimbertrusses.
Reconstruction.
138,Whenuakura
..
..20,000
12,0008,000
..••..Weaktimber;temporarystructure.
Reconstruc-
tion.Work
authorizedandinhand.
Timbertrusses
betweenAra-
40,000....10,00011,00019,000
Weaktimbertrusses.
Reconstruction.
mohoand
NewPlymouth
WellingtonSection.
Wellington-Napier..
..
15,35,171,175....10,000
5,0005,000
..
..
..
Weaktimber
trussesandsteelgirders.
Strengthen-
ing.
ChristchurchSection.,
Mainsouthline
....10,
Rakaia......124,000..9,000
30,00040,00045,000
Weaktimber
bridge.Combined
roadand
railway.
Reconstruction.
18,Ashburton
..
..
20,000
5,0005,000
5,0005,000..Oldweaktimbertrusses.
Partialreconstruction.
Greymouth
-Arthur'sPass
..
30,Crooked
River..
..
\
q
q
/
Weakirongirders.
Strengthening.Workautho-
45,TeremakauRiver
..J
'
''*'**
*
\
rizedandinhand.
DunedinSection.
MamSouthLine
..
..
35,Rangitata
North..\66,000
10,00010,000
10,00020,000
16,000Oldweaktimbertrusses.
Reconstruction.
Jo,Rangitata
South
..
J
114,Waitaki
..
..80,000
..
8,00020,00020,000
32,000Weakirongirders.
Combinedroadand
railway
bridge.Reconstruction
alongside.
OtagoCentral
Branch
..TaieriGorgebridges..20,000
4,0004,0004,0004.000
4,000Weakirongirders.
Strengthening.
521,000
100,000100,000100,000100,000
121,000
D.—2.
BALANCE-SHEETS,a
STATEMENTS OF ACCOUNTS,
AND
STATISTICAL RETURNS,
1929.

D.—2,
INDEX OF STATEMENTS
ACCOMPANYING ANNUAL REPORT OF THE GENERAL MANAGER OF THE NEW ZEALANDGOVERNMENT RAILWAYS, 1928-29.
No. 1. Capital Account.General Balance-sheet.
No. 2. Income and Expenditure of the Whole Undertaking.Net Revenue Account.Net Revenue Appropriation Account.
No. 3. Income and Expenditure in respect of Railway Operation.Abstract A—Maintenance of Way and Works.Abstract B—Maintenance of Signals and Electrical Appliances.Abstract C—Maintenance of Rolling-stock.Abstract D—Examination, Lubrication, and Lighting of Vehicles.Abstract E—Locomotive Transportation.Abstract F—Traffic Transportation.Abstract G—Head Office and General Charges.Summary of Expenditure Abstracts.
No. 4. Income and Expenditure in respect of Lake Wakatipu Steamers.No. 5. Income and Expenditure in respect of Refreshment Service.No. sa. Income and Expenditure in respect of Bookstall Service.No. 6. Income and Expenditure in respect of Advertising Service.No. 7. Income and Expenditure in respect of Departmental Dwellings.No. 8. Income and Expenditure in respect of Buildings occupied by Refreshment Service, Bookstall Proprietors, &oNo. Ba. Income and Expenditure in respect of Road Motor Services.No. 9. Railway Sawmills and Bush Accounts.No. 9a. Railway Employees' Sick Benefit Society.No. 10. Statement of Subsidy from Consolidated Fund in respect of Services rendered by Non-paying Developmen ta
Branch Lines and Isolated Sections.No. 11. Statement of Cash Receipts and Payments—Working Railways Account.
Reconciliation Statement.No. 12. General Reserve Account.
Renewals, Depreciation, and EqualizationFunds.Slips, Floods, and Accidents Equalization Fund.Workers' Compensation Fund.Fire Insurance Fund.General Renewals and Depreciation Fund.Betterments Fund.
No. 13. Expenditure on Construction of Railways, Rolling-stock, &c.Net Revenue, and Rate of Interest earned on Capital expended on Opened Lines.
No. 14. Expenditure under Vote " Additions to Open Lines " charged to Capital Account; also Expenditure underthe Railways Improvement Authorization Act. 1914, Section 7 of the Finance Act, 1924, Section 10of the Finance Act, 1925, and Section 3 of the Finance Act, 1926.
No. 15. Comparative Statement of Operating Traffic and Revenue.(1) Operating Traffic.(2) Operating Revenue.
No. 16. Statement of Season Tickets issued.No. 17. Statement of Passenger Bookings at Excursion Fares.No. 18. Traffic and Revenue for each Station.No. 18a. Classification of Goods and Live-stock Traffic and Earnings by Commodities.No. 19. Comparative Statement of Mileage, Capital Cost, Earnings, Expenditure, and Traffic, New Zealand Government
Railways.No. 20. Comparative Statement of Mileage, Capital Coat, Earnings, and Expenditure on Australasian Railways.No. 21. Number of Employees.No. 22. Accidents.No. 23. Renewals of Rails.No. 24. Renewals and Removals of Sleepers.No. 25. Number of Stations and Private Sidings.No. 26. Mileage of Railways open for Traffic and under Maintenance.No. 27. Weights of Rails in various Lines.No. 28. Sleepers laid and removed each year.No. 29. Carriage and Wagon Stock and Tarpaulins.No. 30. Locomotive Stock.No. 31. Locomotive Performances.
I—D. 2.
D.—2 2
STATEMENTNo.1.CapitalAccountasat31stMarch,1929.
Totalto31st
March,
Yearended
Totalto31st
March,
!Totalto31si
March,
YearendedTotaltoSlstMarch,
1928.
31stMarch,
1929.
1929.
|
'
1928.
31stMarch,
1929.
1929.
Expenditure.
£
s.d.
£
s.d.
£
s.d.
Receipts.
£
s.d.
£
s.d.
£
s.d.
Permanentway,
andworks,
buildings,40,484,741118
5,110,4970
8
45,595,238124
FromGeneral
GovernmentFunds
—machinery,andplant(lines
openfor
PublicWorks
Fund ....44,179,3184
4
3,776,992113
47,956,310157
traffic)
s
Wellington-HuttRailwayImprove-
228,3735
5
..228,3735
5
Rolling-stock
......10,448,2409
2
256,017155
10,704,2584
7
mentAccount
Newlinesin
courseofconstructionby
563,0068
5
475,7333
4
1,038,739119
RailwaysImprovementAccount,
1904641,2757
8
..641,2757
8
PublicWorks
Departmentcharged
RailwaysImprovement
Authoriza-4,362,079165
1,997,3168
7
6,359,3965
0
againstRailways
ImprovementAu-
tionAct
1914Account
thorizationAct
1914Account
ConsolidatedFund
..
..
4,2967
10
.,
4,2967
10
LakeWakatipu
steamerservice
..
44,3873
3..44,3873
3
WestportHarbour
Loans..350,0000
0
..350,0000
0
Roadmotor
services..
..
53,1932
0
14,7061711
67,8991911
Worksconstructedfrom
Harbour
House-factoryandsawmillat
Frankton156,813
171..
156,813171
Boardfunds
—Junction
Westport..••71,6400
0
..71,6400
0
Greymouth
..••■■47,5080
0..47,5080
0
Worksconstructedby
provincesand
1,787,7410
0..1,787,741
0
0
MidlandRailwayCompanyat
valuation
= 51,672,2321
8
5,774,3081910
57,446,5411
6
I
Advancesto
CapitalAccountfrom..145,6960
9
145,6960
9
WorkingRailways
AccountOutstandingliabilities
......15,1006
8
15,1006
8
51,750,382117
5,856,954174
57,607,3378
11
51,672,2321
8
5,935,1057
3
57,607,337811
.I
Note.—Unopenedlines
areunderthecontrolofthe
PublicWorks
Department,andall
expenditureoutofthe
PublicWorksFundin
connectiontherewithisincludedin
theaccountsof
thatDepartment.
3 D.—2
STATEMENTNo. 1—continued.
GeneralBalance-sheet
asat
31stMarch,
1929.
Liabilities.
Assets.
Sundrycreditors— £s.d.
£
s.d.Sawmills—£s.d.
£
s.d.
Generalcreditors
(including
Stocksoftimber,&c.......
258,828190
unpaidwages)
....290,187187
Storesandmaterial
onhand— GovernmentDepartments.. 19,8816
11
StoresBranch
..
..
806,285183
310,0695
6
AdvertisingBranch.. 1,6114
6
Collectionsfor
refunds to—RefreshmentBranch
..6,793
2
1
HarbourBoards,shippingcom-
Training-schoolHostel
..717
2
panies,andother
carriers..
23,968180
814,761120
GovernmentDepartments.. 1,062100
Sundryassets— 25,0318
0
AdvertisingBranch
..
54,216210
GeneralReserveFund
.... ..1,378,3161011
RefreshmentBranch
..
26,8360
4
GeneralRenewals,Betterments,and
Depreciation
HousingImprovement
..
11,183147
Funds..
..
.... ..1,358,921121
92,235179
InsuranceFunds
..
...... 43,3166
8
Sundry debtors—SickBenefitFund
.. ......6,303189
Advancestocapital
.. 145,6960
9
Itemstobewrittenoff
onreceiptof
parliamentary
GovernmentDepartments
...
10,2773
7
authority..
..
......2,788194
AdvancesunderHuttValley
LandsSettlementAct,
192510,701
118
Advancesto
RailwayEm-
ployeesundersection15(5)
ofthe
GovernmentRailways
Act,1927
.... 34,9849
5
Workin
progressandsundry
debtors....
.".
60,4434
2
262,1029
7
Lessamountspaidin
advance102,360
1111
159,741178
Accruedinterest
oninvestments2,7082
6
Accruedsubsidy
onbranchlines
andisolatedsections
..
38,1301110
40,838144
j
Outstandingatstations— Cash
inhand.. ..78,058169
Freightowingby
GovernmentDepartments .. ..
47,422149
Freightowingby
sundry
debtors...»
..
144,7927
9 ——270,273193
Investments..
..
345,0000
0
Cashin
WorkingRailwaysAc-
count......
340,2361
6
*
685,2361
6
NetRevenue
Account..
..
..
802,830199
£3,124,7481
3
£3,124,7481
~3
H.
Valentine,A.R.A.N.Z.
ChiefAccountant.
D.—2.
STATEMENT No. 2IncomeandExpenditure oftheWhole Undertaking for theYear ended 31stMarch, 1929.
4
Year1928-29.
Year1927-28.
Statement
1.No.
I
GrossRevenue.
Expenditure.Net
Revenue.
GrossRevenue.
Expenditure.Net
Revenue.
£
s.d.
£
s.d.
£
s.d.
£
s.d.
£
s.d.
£
s.d.
Railwayoperation
........
..
7,524,8641
3
6,374,5791
9
1,150,284196
7,343,844151
6,302,118152
1,041,7251911
LakeWakatipu
steamers..
....4
10,9409
8
17,424163
Dr.6,4846
7
9,885111
15,626134
Dr.5,741115
Refreshmentservice
........5
123,058198
116,0906
5
6,968133
122,2207
5
114,643149
7,576128
Book-stallservice
..
......5a
3228
5
300148
21139
j
Advertisingservice
........
6
53,983153
50,7199
7
3,2645
8
1
52,6002
2
48,921611
3,678153
Dwellings..
..
..
..
..7
105,8977
5
170,0738
9
Dr.64,1761
4|93,6430
1
162,263107
Dr.68,620106
Buildingsoccupiedby
refreshmentservice,
book-8
19,4551
0
8,4830
7
10,9720
5,20,5422
0
8,827125
11,7149
7
stallproprietors,&c.
Roadmotor-services
..
..
..
..
8a
102,3857
7
111,7128
5
Dr.9,327010
32,4861010
32,7218
3
Dr.
234175
Miscellaneousrevenue
......
..
308,1312
7
..
308,1312
7
359,747169
..359,747169
8,249,0381210
6,849,3836
5
8,034,969163
6,685,1231
5
Totalnet
revenuetoNet
RevenueAccount
....
....1,399,6556
5....1,349,846
1410
NetRevenue
Account.
Dr.
1928-29.
1927-28.
Cf.
1928-29.
1927-28.
£
s.d.
£
s.d.
£
s.d.
£
s.d.
ToInterest
oncapital
..
......2,331,334145
2,130,8661710
ByNetearnings
beforecharginginterest
oncapital
..1,399,655
6
5
1,349,8461410
Subsidy,branchlinesandisolated
sections..498,9361311
489,567196
DeficitcarriedtoNet
RevenueAppropriation432,742141
291,4523
6
Account
2,331,334145
2,130,8661710
2,331,334145
2,130,8661710
NetRevenue
AppropriationAccount.
Dr.
1928-29.
1927-28.
Cr.
1928-29.
1927-28.
£
s.d.
£
s.d.
£
s.d.
£
s.d.
ToBalance
fromprevious
year
......
370,0885
8
78,6362
2
ByBalance
carriedforward
..
••
••802,830199
370,0885
8
NetRevenue
Account..
..
..
432,742141
291,4523
6
802,830199
370,0885
8
802,830199
370,0885
8
5 D.—2
STATEMENT No. 3.IncomeandExpenditure inrespect ofRailway Operation,Year ended 31stMarch, 1929.gPer
Cent,of
"g
PerCent,of
£
OperatingRevenue.
g.Operating
Revenue.
EXPENDITURE.«
1928-29.
1927-28.
REVENUE.
Jgo
1928-29.
1927-28.
g
1928-29.1927-28.j
|
1928-29.1927-28.
m
\
£
s.d.
£
s.d.
'
£
s.d.
£
s.d.
Maintenanceof
wayandworks
....A
1,111,2281411
1,147,0671
2
14-7715-62
Passengers,ordinary......15
1,868,047120
1,886,833811
24-8225-59
Maintenanceof
signalsand
electricalap-B
112,2060
2
102,870120
1-491-40
\
Passengers,seasontickets....15
256,6981610
258,462173
3-413-52
pliances
Parcels,luggage,andmails....15
378,140170
379,9321311
5-035-17
Maintenanceof
rolling-stock
....0
1,424,165103
1,380,7269
3
18-9318-80
Goods.
.
..
..
..154,846,1252
4
4,680,1352
1
64-4063-73
Examination,lubrication,
andlightingof
D
67,022196
62,511183
0-890-85\
Labour,demurrage,
&c.....15
175,851131
138,4801211
2-341-89
vehiclesLocomotivetransportation
....E
1,583,769169
1,599,5523
3
21-0521-78
Traffictransportation
......F
1,825,965311
1,760,4598
4
24-2623-97|
HeadOfficeand
generalcharges..
..
G
80,942103
75,047112
1-07
102I
£
s.d.
Superannuationsubsidy..186,8178
4
Lessamount
allocatedtosubsidiaryservices,
&c.
17,5392
4
—G
169,2786
0
173,873119
2-252-37
Totaloperating
expenses....6,374,579
1
9
6,302,118152
84-7185-81
Netoperating
revenue..
..
1,150,284196
1,041,7251911
15-2914-19
;
7,524,8641
3
7,343,844151
100-00100-00
1 ..7,524,8641
3
7,343,844151
100-00100-00
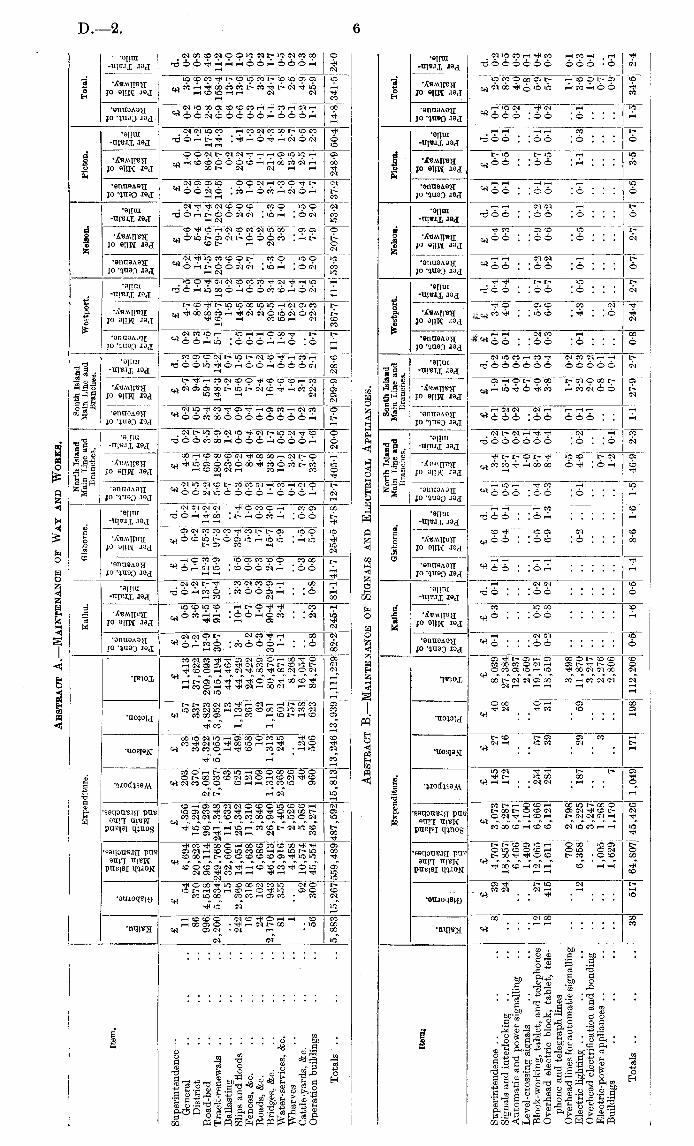
D.—2 6
AbstractA.—Maintenance ofWayand Works. AbstractB.—Maintenance ofSignalsandElectrical Appliances.NorthIslandSouth
Island
Expenditure.
Kaihu.
Gisborne.Main
LineandMain
Lineand
Westport.Nelson.
Picton.
Total.
Branches.Branches.
Item-
.!§!
Isl
°
a
a
°«
j
°
£
I
a
°°
£
o
"3.
a
°
®
°
a
s
°
*
M
a
S3!
o
..SflaSliSa
Sis«
!dcSSSSia«
IS
5!SiSsSSSilas?!«
s
1
2«gSa|£
§
g
~
ha|H|$?
a|H|3|a|
h~a§i
a|hsassa|flf||
SS63ssa|hs38s|
£3
fQ
2
js
-ij
o
fnc
..
®.®5
r:K -9
.,
«
**�«
©.
«,shC.cj.ce
l,s
o
cs
fl
©
mG,®
.33
p_<m
�3
~
oS-c.§S-gI
®
S
-S
©M©PH
©WSp3£
StfStf£
g*|£
£
S3Srt£
Stffe«£
M
O
!z
fl
W
«
PH
EH
pH
P-l
>H
PHAHM
CL|^M
PH
.PH
M
pHiaHW
fL(
|l<
P*PHPHW
pHpHihH
eg
«
'
Superintendence
—£
£
£
£
£
£
£
£
£
£
d.
£
£
d.
£
£
d.
£
£
d.
£
£
d.
£
£
d.
£
£
d.
£
£
d.
General
......11
54
6,6944,356203
38
57
11,4130-20-50-20-10-90-20-24-80-20-22-70-30-24-70-50-20-60-20-21-0
0-20-23-50-2
District
....
..
86
37020,823
15,29137034533737,6221-2
3-61-21-0
6-21-20-5
15-10-70-59-40-90-38-61-01-4
5-41-4
0-96-01-20-511-6
0-8
Road-bed
......
9964,51896.114
96,2392,0814,3224,823209,09313-9
41-513-712-3
75-314-22-269-63-53-459-15-61-5
48-45-4
17-567-5
17-412-9
86-217-5
2-864-34-6
Track-renewals
......
2,2005,834249,768241,348
7,0375,0553,952515,19430-791-630-4
15-997-3
18-25-6
180-88-98-3
148-314-25-1
163-718220-379-120-2
10-570-7
14-36-9
158-411-2
Ballasting
....
....1532,600
11,63263
141
13;
44,464
0-3..0-723-61-2
0-47-20-7
..
1-50-20-6
2-20-6
..0-2
..
0-613-7
1-0
Slipsandfloods
..
..
..2422,366
14,05125,342625489
1,13444,2493-
10-13-36-539-47-40-3
10-20-50-9
15-61-5
0-514-51-6
2-07-62-03-020-24-10-6
13-61-0
Fences,&c.
......16
31811,63811,310
121658;36124,4220-20-70-20-95-31-0
0-38-40-40-47-00-70-12-80-32-7
10-32-61-0
6-41-3
0-37-50-5
Roads,&c.
......
24
1026,6863,846109
10
62
10,8390-31-0
0-30-31-70-30-24-80-20-12-40-20-12-50-3
..
0-2
..0-21-10-20-13-30-2
Bridges,&c.
......
2,17094346,61326,940
1,3101,3131,181
80,47030-490-429-92-6
15-73-01-1
33-81-70-9
16-61-61-0
30-53-45-320-55-33-121-14-31-1
24-71-7
Water-services,&c.
..■■81
35513,916
7,4052,36824550124,8711-13-411
1-05-91-10-3
10-10-50-34-60-41-8
55-16-21-0
3-81-01-3
8-91-8
0-37-60-5
Wharves
....--1
..4,4582,526526
..
757
8,268
0-13-20-20-11-6010-4
12-21-4
2-013-52-70-12-50-2
Cattle-yards,&c.
...-..
9210,574
5,08640
124138
16,054
0-31-50-30-27-70-40-23-10-3
..0-90-10-51-9
0-50-4
2-50-50-24-9
0-3
Operationbuildings
....56
30045,55436,27196050662384,2700-82-30-80-85-00-91-0
33-01-61-3
22-32-10-722-32-52-07-92-01-711-1
2-31-1
25-91-8
Totals..
....5,88315,267
559,489487,59215,81313,24613,9391,111,22982-2245-181-141-7254-547-8
12-7405-120-0
17-0299-928-611-7
367-741-153-5207-053-237-2248-950-4
14-8341-524-0
NorthIslandSouth
Island
Expenditure.
Kaihu.
Gisborne.Main
LineandMain
Lineand
Westport.Nelson.
Picton.
Total.
Branches.Branches.
Itomi
•
111la!
J
g
°.§
a
.9
°.§
a
°.§
1>.a
°|
i
a
°s
|i
S
33g
8
J
.Sa=«
SJen
=?
Sb;3?S«'
=ss»'So5?SdSaaSSJSaa?Si
sJiSj
S
o
■=«»!SsJ&
§
§
5
s;
H=gg
a!H|s>S3
a|h=gg
a|h=$!>
aSh=sg
al
®gali^f
£
£
i
+3-3-HM
to
is
S3
<D
C-
MR
o
(J
(HC
oI
e3MS,©l«3|^a#<u,o«MS©
cS
MH
.©
C3MHO
rit,"
«
■?
§!■«i?
5
~
o
asjg
asgss
|
s«
•«
s«£
ss
£
s«
g
ss
g
ssss i»
p
'»
i
£
£
£
£
£
£
£
£
£
£
d.
£
£
d.|
£
£
d.
£
£
d.
£
£
d.
£
£
d.
£
£
d.
£
£
d.
Superintendence..
....
8
39
4,7073,073145
27
40
8,0390-10-30-10-10-60-10-13-40-20-11-9
0-20-13-40-40-10-40-10-10-70-10-12-50-2
Signalsand
interlocking
......
2418,857
8,287172
16
28
27,384
0-10-40-10-5
13-70-70-25-10-50-14-00-40-10-30-10-10-50-10-58-30-5
Automaticand
powersignalling
......
6,4666,471....- -12,937......0'14'70'20-24'00-3
..
....0'24-00'3
Level-crossingsignals
........1,4091,100......2,509..1-0
0'1..0-70-1
..0'80'1
Block-working,tablet,
andtelephones12
2712,065
6,666254
57
40
19,1210-20-50-20-10-50-10-48-70-40-24-00-30-25-90-70-20-90-20-10-70-10-45-90-4
Overheadelectric
block,tablet,tele-18
41511,611
6,121284
39
18,5190-20-80-21-16-91-3
0-38-40-40-13-80-40-36-60-70-20-60-20-10-50-10-25-70-3
phoneandtelegraphlines
'
Overheadlinesfor
automaticsignalling
..
..
7002,798
..
..
..
3,498..0'5..
0'11-70'2
..
1-10-1
Electriclighting
..
....
..
12
6,3585,225187
29
59
11,870
0-2..
0-14-60-20-13-20-30-14-30-50-10-50-10-11-10-30-13-60-3
Overheadelectrificationandbonding
..
..
..
3,247..
..
..
3,247
0-12'00-2
1-00-1
Electric-powerappliances
......
..1,0051,268..3
2,276..
0-7....0-80-1
..0-7
..Buildings
..
..
1,6291,1707....2,806
1-20-1..0-70-1
..0-2
0-90-1
Totals..
..
..
38
51764,80745,426
1,049171198
112,2060-51-6
0-51-4
8-6|l-6j
1-546-92-3,1-1
27-92-70-824-42-70-72-70-70-53-50-71-5
34-52-4

7 D.—2
AbstractD.—Examination,Lubrication, andLighting ofVehicles.Abstract C.—Maintenance ofRolling-stock. NorthIslandSouthIsland
Expenditure.
Kafhn.
Gisborne.Main
LineandMain
Lineand
Westport.Nelson.
Picton.
Total.
Branches.Branches.
Item-
.Is!i§!
J
%
i
a
°s>
9
<3
a
a
°°
i
°
i
°
.i
«
S
S3g
g
..
S5S«SiSa5SSiS«I?!•
*!
=|
SJSo=!
rj»?3SSSiSaS;
».•
SaSS!<
i
3
SagSag£■
§
g
-a
3?a|
8Ss|h=
sqh=5g
a|h~6Ss|5=ggg|h|ggg|SfJfgS*
=
rS
to
J2
+5
©
eSfc-W©
c3»hS©
eSu-H
3
=
ol-ag|-a
£
£
2
|
s«S«£
SriSri£
SriSri£
SriSri£
SriSri£
SriSri5
SriSri,£
SriSri£
__£
£
£
£
£
:
£
£
£
|
£
£
d.
£
£
d.
£
£
d.
£
£
d.
£
£
d.
£
£
d.
£
£
d.
£
£
d.
Generalsuperintendence
..
..21
10813,151
8,562403174
11122,430,0-30-90-30-31-8
0-30-39-50-50-35-30-50-39-4;1-0
0-31-20-30-32-00-40-36-90-5
Locomotives(includingrailand
elec-5972,725337,664229,3738,1243,4734,149586,1058-324-98-27-445-48-57-7244-5
12-18-0
141-013-4
6-0188-9;21-2
14'154-2
14-011-0
74-215-0
7-8180-1
12-7
trie) Carand
wagonsupervision
3,9043,010......6,914
0-12-80-10-11-90-2..
..0'12'10'1
Cars..
..
..
..103
1,628130,05079,287
1,440556658213,7221-44-31-44-427-15-12-994-24-72-848-84-6M33-53-72-28-72-21-811-7
2-42-865-74-6
Vansandpostal
vans..
..13
18320,414
13,364767
196136
35,073'0-20-50-20-53-10-60-5
14-80-70-58-20-80-6
17-82-00-83-10-80-42-40-50-5
10-80-8
Wagons
....
..4284,250259,385i225,626
11,6071,274|
1.812504,382'6-0
17-85-9
11-7709
13-45-9
187-89-37-8
138-713-3
8-6269-930-35-1
19-95-14-832-36-56-7
155-110-9
Servicevehicles
..
..
..
6
38
5,786,5,154127
45
35
11,1910-10-30-10-10-60-10-14-20-20-23-20-30-13-00-30-20-70-20-10-60-10-13-40-2
Tarpaulins,ropes,andnets
..
5
13319,830j22,778246476880
01
0-20-10-42-20-40-4
14-40-70-8
14-01-30-2
5-70-6
-7-41-9
2-315-7
3-20-6
13-61-0
Totals
....
..
1,1739,065
790,184587,15422,7146,094!7,781
1,424,165'16-4
48-916-21
24-8151-1
28-417-9
572-228-320-5361-134-4
16-9528-2
i59-1
24-695-224-520-7
138-928-1
18-9437-730-8
I
I
I
''I'V ,'1
:
- NorthIsland
SouthIsland
j
Expenditure.
Kaihu.
Giaborne.Main
LineandMain
Lineand
Westport.Nelson.
Picton.
Total.
Branches.Branches.
Item.
.gglIs!
J
«
°.S
a
°.£
a
°.£
a
a
°-s
a
°-s
I
i
§
Sa2
"
§
g
-i
Is
H=.Q2siB=®g
s|H=ss
H=gg
His=s»
a|
b=ag
h=
al
.a
5-3
PP
M
«
2
u£
«eMB,©e
©,cemPtj
es
MH
|3
"
O|B
g|«£
5
s
S
8f§8«£
Srt£
SMfe«£
Si3
(S
fed?Srt£
grtStf£
MMj
SSrtStf
®
W
C5
S
§
.PH
H
fL)
pH
W
AHP4hH
0HCL,t,i|
PL)
PH^1
P4P4l,i,
PHpMhM
(l(pL|hH
P^PM^
£
£
£
£
£
£
£
£
£
£
d.
£
£
d.
£
£
d.
£
£
d.
£
£
d.
£
£
d.
£
£
d.
£
£
d.
Examinationandlubricationof
cars,36
14517,890
15,377892
16620334,7090-51-5
0-50-4
2-40-50-4
13-00-60-69-50-90-720-82-30-72-60-70-53-60-70-4
10-70-7
vans,andwagons
Lighting,rolling-stock,
Pintsch,and
19
8714,162
6,655182
95
55
21,2550-30-80-30-21-5
0-20-3
10-20-50-24-10-40-14-20-50-41-5
0-40-21-0
0-20-36'50-5
acetylenegas
Electriclightingofvehicles
..
.
,
..
5,0841,623
..
..
.
.
6,707
0-13-70-20-11-0
0-1
0-12-10-1
Depotexpenses
....
2,9861,366
4,352
0-12-20-1..0-8
0-11-3
0-1
Totals..
..
..
55
23240,122
25,0211,074
26125867,0230-82-30-80-63-90-70-929-11-4
0-915-41-408
25-02-6
1-14-111
0-74-60-90-920-61-4
i■■■; ...I-
m-
I

D.-2. 8
AbstractE.—Locomotive Transportation. AbstractF.—Traffic Transportation.NorthIslandSouthIsland
Expenditure.
Kalhu.
Glsborat.Main
LineandMain
Lineand
Wostport.Nelaon.
Picton.
Total.
Branches.Branches.
I««m-
.
gS-SSa-S
J
°d°t
;a°
»
°
£
a
°
s
°
xa
%
a
°.v
a
°£
°
a
°
°a°
o
°
a
§
Sag3ag
.
.
sas!ji
S3s!
S»a?!i(I5SS.'
S3aSSiSa3{!•
S35S!iS3=!
3«
i
s
SalSaJ5-
§
§
3?a|
sl
s>a|H|g®
s|H|ggs|fi|g»
«|
B|3£
»|
H|
siH|
»S
£)
+3'jH
-4-S'w-PCO
M
*
0>
<3
t-l«
©
MB
®
MH
C
«
twS3
<U
*
S
V
.*•
f-iP
(D
.&
hB
©
c3
M
w
-5
Sst!§|t>
£
£
-2
o
BtfoPh£
S3SM£
SMBPS,2
SrtS«£
SrtfeM£
Btf8«£
BW8«£
SfiSS£
rf
g
.£
£
£
£
£
£
£
£
£
£
d.
£
£
d.
£
£
d.
£
£
d.
£
£
d.
£
£
d.
£
£
d.
£
£
d.
Districtsuperintendence
..
..
..
..
5,8255,577
......11,402....0*14*20*20*23*40*3
......0-23*50*2
Depotsupervision
..
..1
34627,604
17,459902
173149
46,634
0-95-811
0-620-01-0
0-610-71-0
0-721-02-30-72-70-70-42-70-50-6 114-31-0
allowances,and
expenses
..7312,742
324,712215,2627,5703,0003,257557,27410-330-510-2
7-545-78-67-3235-1
11-67-51324
12-65-6
176-119-712-1
46-912-0
8-758-2
11-87*4
171-312-1
Fuel..
..
....5396,467466,768267,1346,0583,5464,201754,7137-522-57-4
17-7107-7
20-410-6
338-116-7
9-4164-3
15-74-5
140-915-814-4
55-414-311-2
75-015-210-0
231-916-3
Water..
..
..
-1716814,519
8,988281123
85
24,1810-20-70-20-52-80-50-3
10-50-50-35-50-50-26-50-70-51-9
0-50-21-5
0-30-3;7-40-5
Stores
......
..£36
14213,444
8,540302109116
22,6890-51-5
0-50-4
2-40-40-39-70-50-35-30-50-27-00-80-41-70-40-32-10-40-37-00-5
Shedexpenses..
..
..217
1,09999,89661,4432,811693718
166,8773-09-03-03-0
18-33-42-372-33-62-137-83-62-165-37-32-8
10-82-81-912-8
2-62-251-33-6
Totals..
..
..
1,54110,964
952,768j584,403
17,9247,644
8,5261,583,77021-564-221-330-0
182-734-421-5
689'934-120-4359-434-2
13-3416-846-630-9
119-430-722-7
152-3;30-821-0486-734-2
NorthIslandSouthIsland
Expenditure.
Kaihu.
Gigborne.Main
LineandMain
Lineand
Westport.Nelson.
Picton.
Total.
Branches.Branches.
Item.
.|s!Is!
-
=,
p
a
°
s
°
*
.£?
g
°
£
3
%
"'Ji°
d
°
a
"i
i
%
.9
s
»Sa«3og
.
.aa=5Si
Sn5|Siaa=?
S»an='|
!iSa351iS«
8b5SSdIsaj!i
•£
c3
c3
2
rj
qjcd
am«-i
"z:
o115
15,C
S
z—i
~c-a>-r-i<
~oo*s2Ji
Eh~
%
&
s-ffl5-S5§
I
|
-3
s?
a5
.a
,3t!s
"a°5
'B
"3
J
'S
.2
SgTi
gS-o
&
«
.2
o
SSMSStf£
SMSrt£
StfStf£
j3«£
Sf3fetf£
StfStf£
S3«feM£
S«SPi£
W
O
K
3
ooA
£5
PH
H
P-IP-I
Superintendence—
£
£
£
£
£
£
£
£
£
£
d.
£
£
d.
£
£
d.
£
£
d.
£
£
d.
£
£
!
d.
£
£
d.
£
d.
General..
..
..
43
22527,486
17,817852153
23246,808
0-61-8
0-60-63-80-7
0-619-91-0
0-611-01-0
0-619-8
2-20-62-40-60-64-10-8
0-614-41-0
District
....
..
171,176
63,53250,027
1,4941,5731,378119,197
0-20-70-23-2
19-63-81-4
46-02-31-7
30-82-911
34-73-96-424-66-23-724-65-11-6
36-62-6
Stationexpenses— Supervision
andoffice
..
..1,024
2,191247,824202,8123,6232,4882,455
462,41714-3
42-814-16-136-4
6-95-7
179-58-97-2
124-711-9
2-784-39-4
10-038-9
10-06-643-88-9
6-1142-010-0
Platform
....
..
142
71
86,926-48,1131,702112
311137,377
2-05-92-00-21-2
0-22-062-93-11-7
29-62-81-3
39-64-40-51-8
0-50-85-61-11-8
42-23-0
Signalling
......13
552106,585
60,8372,158218
6
170,3690-20-50-2
1-59-21-72-477-23-82-137-43-61-6
50-25-60-93-40-9
..0-1
..2-352-43-7
Shuntingand
marshallingyards
..101
498114,35898,1224,921541607
219,1481-442
1-41-4
8-31-6
2-682-84-13-460-35-73-7
114-412-9
2-28-52-21-610-8
2-22-967-34-7
Goods-shedsand
goods-yards..
130299
100,416118,654440593
1,588222,1201-85-41-8
0-85-00-9
2-372-73-64-273-07-10-3
10-21-1
2-49-32-44-328-45-73-068-34-8
Wharves
..
..
..
49
..
23,29583,562
16,364..
2,965126,235
0-72-00-7
0-516-9
0-82-951-44-9
12-2380-742-5
7-953-1
10-71-738-82-7
Fuel,water,stationery,andother102
45621,163
17,277285345314
39,9421-44-21-41-27-61-40-515-3
0-80-6
10-61-0
0-26-60-71-45-41-40-85-61-10-5
12-30-9
stationexpenses
Trainexpenses— Running
..
..
..
3781,128115,468
77,4762,064
1,1331,201198,848
5-315-8
5-23-1
18-83-5
2-683-74-12-747-64-51-548-05-44-6
17-74"53'2
21-44-32-661-14-3
Cleaningandheating
vehicles..
20
41936,04620,298139
315282
57,5190-30-80-31-1
7-01-3
0-826-11-3
0-712-51-20-13*20*41-3
4-91-3
0-85-01-00-8
17-71-2
Sleeping-cars..
..
9,5981,799
11,397
0-26-90-30-11-1
0-1
0-23-5
0-2
Miscellaneous..
..
..
..2924,8703,4279
5,97317
14,588
0-84-90-90-13-5
0-20-12-10-2
..0-2
..24-093-224-0
..0-30-10-24-50-3
Totals..
..
2,0197,307
957,567800,22134,05113,444
11,3561,825,96528-284-1
27-9j20-0
121-822-921-7693-434-3
28-0492-146-925-3791-988-554-3210-154-030-3202-841-024-3561-139-4
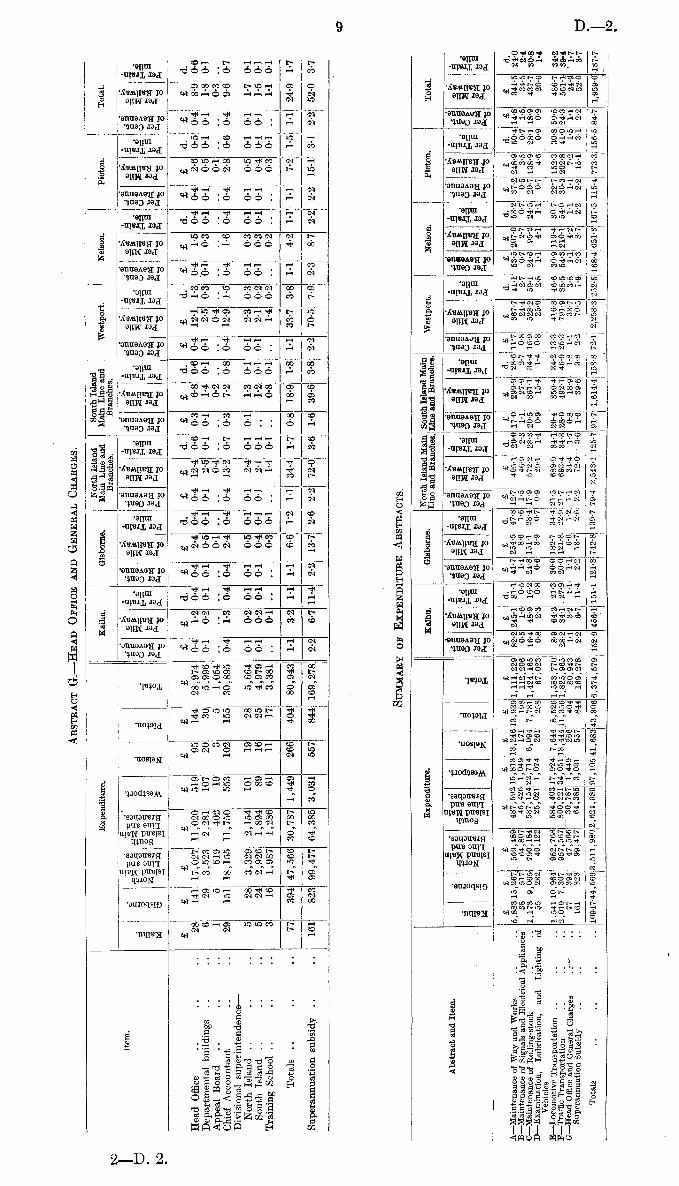
9 D.—2,
Abstract G.—HeadOfficeand GeneralCharges. Summary ofExpenditure Abstracts.2—D. 2.
Expenditure.
Kaihu.
Gisborne.LtoandBraMhS.
LtofandBrtndlls.
Westport.Nelson.
Picton.
Total.
AbstractandItem.
-I
|||I
|||
|
j
|f||
|
||
||
|
||
g|J
||
||
|
||
||
|
||
||
|
|f||
|
||
||
|
g
I
:
g'Ssgi
f
I
I
i
-3
SgOS
51
D>Sg
£|
o>S-g
oS
Sa
ogS-ggacg
»ag|
3
If
S-J!!
"".SglI
|
-3
O
Stf£«
gsIpi
£«
feS
8rt®«
»
8
,§«
(£rt
sa
®«
S3
fert®Pig
a
_M
O
I
j
g
j?i
fa
I
H
Pn-g
P<
fa-g
°
o
p<
"S
P-
*"g
o
P<
ft
P"g*"8
Ph
P"S
o
S
£
'£
£
£
£
£
£
£
£
£
d.
£
£
d.
£
£
d.
£
£
d.
£
£
d.
£
£
d.
£
£
d.i
£
£
d.
A—MaintenanceolWayandWorks
....5,88315,267
_559,489487,592
15,81313,24613,939
1,111,22982-2245-181-1
41-7254-547-8
12-7405-120-0
17-0299-928-611*7367-741-153-5
207-053-237-2248-950-4,14-8341-524-0
B—Maintenanceof
Signalsand
ElectricalAppliances38
517
64,80745,426
1,049171198
112,2060-51-6
0-51-4
8-61-61-5
46-92-31-1
27-92-70-8
24-42-7
0-72-70-70-53-5
0-7|1-5
34-52-4
C—Maintenanceol
Boiling-stock
....1,173
9,065790,184587,15422,7146,0947,781
1,424,16516-4
48-916-2
24-8151-1
28-417-9
572-228-3
20-5361-134-416-9
528-259-124-6
95-224-520-7
138-928-1
18-9437-730-8
D—Examination,Lubrication,
andLightingof
55
232
40,12225,021
1,074261258
67,0230-82-3
0-80-63-90-70-9
29-11-4
0-915-41-4
0-8
25-02-81-1
4-11-1
0-74-60-9
!0-9
20-61-4
Vehicles
i
E—LocomotiveTransportation
....
..
1,54110,964
952,768584,40317,9247,644
8,5261,583,7708-964-2
21-330-0182-7
34-421-5689-934-120-4359-4
34-233-3
416-846-630-9
119-4307
22*7152-3
30-850-5486-734-2
F—TrafficTransportation
....
..
2,019.7,307957,567
800,22134,051
13,44411,3561,825,965
28-284-1
27-920-0
121-822-921-7693-434-328-0492-146-9
25-3791-988-554-3
210-154-030-3202-841-024-3561-139-4
G—HeadOfficeand
GeneralCharges
'.-77!394
47,56630,787
1,449206404
80,9431-1
3-21-11-1
6-61-21-1
34-41-7
0-8
18-91-81-1
33-73-81-1
4-21-11-1
7-21-51-1
24-91-7
SuperannuationSubsidy
......161]
823
99,47764,3853,031557844
169,2782-2
6-711-4
2-213-7
2-62-2
72-03-61-6
39-63-82-2
70-57-92-3
8-72-22-2
15-13-12-2
52-03-7
Totals
..
......
I0947j44,5693,
511,9802,624,98997,
10541,68343,3066,374,579
152-9456-1151-1121-8
742-8139-7
79-42,543-1
125-791-7
1,614-4153-8
72-12,258-3252-5|
168-4651-3
167-5115-4
773-3156-5
84-71,959-0137-7
NorthIsland
SouthIsland
Expenditure.
Kaihu.
Gisborne.Main
Lineand
MainLineand
Westport.Nelson.
Picton.
Total.
Branches.Branches.
C
£3
I
I
o5
•
fl5I
•
o
i
i
©
•
«5i
>»
1
c>-
item.
„•
'Stsm
»
-g
I
!
■*>g
®
a
43s!
oce
Id
-gP
®
eei
£
-g3
<e«e1£
3
®
.S
-g3
,2g
.2
-g3
.2£
.2
-£*3is
.2
S
SSg.0SSigSo
d
.@Ss£go*gS:=5s«d
SS
a4g«s
SS
a£g«>
IS
goiSSg5
goSS
ss«iS§
3|
'2«j
I
I
S'gofl:g«®of
1
1
-3"
SiSS°S:
?j
OS3
H3
Ba
,2
Ha05
B=
o>HaH
_
i
I
■
Ȥ.SSI
■S
3
-g
S«»«
gs
8««pi
g6
»sS
a
8p!,?«
ssSf4
SsStf
SS
$3i»«gR
Sfi
8S
H
a
giJM
£
izi
ft
H
"■gft
PM'S"*"8ft
"-gft
R"g
ft
w,sft
£og
o
P<
'S
fc-gft,g
ft
£
£
£
£
£
£
£
£
£
£
d.
£
£
d.
£
£
j
d.
£
£
d.
£
£
d.i
£
£
d.
£
£
d.
£
£
d.
HeadOffice
..
..
..28
14117,027
11,020519
95
14428,9740-41-20-40-42-40-40-412-4
0-60-36-80-60-412-11-3
0-41-5
0-40-42-60-50-48-90-6
Departmentalbuildings
....6
29
3,5232,281107
20
30
5,9960-10-20-10-10-50-10-12-50-10-11-4
0-10-12-50-30-10-30-10-10-50-10-11-8
0-1
AppealBoard
..
....1
5
619
402
19
3
5
1,054
01....0-4....0-2..
..
0-4
0-1
....0-3
..
ChiefAccountant
....29
15118,15511,750
553102155
30,8950-41-3
0-40-42-40-40-4
13-20-70-37-20-80-4
12-91-5
0-41-60-4
0-42-80-60-49-60-7
Divisionalsuperintendence— North
Island
......5
28
3,3292,154101
19
28
5,6640-10-20-10-10-50-10-12-40-10-11-3
0-10-12-30-30-10-30-10-10-50-10-11-70-1
SouthIsland
......5
24
2,9261,894
89
16
25
4,9790-10-20-10-10-40-10-12-10-1..1-20-10-12-10-20-10-30-10-10-40-10-11-5
0-1
TrainingSchool
......3
16
1,9871,286
61
11
17
3,381..
0-1..
..
0-30-1..1-40-1..0-801
..1-40-2
..0-2
....0-30-1
..1-10-1
Totals..
..
..
77
39447,56630,787
1,449266404
80,943|1-13-2M116-6l'2j
1-134-4(
1-70-8
18-91-81-1
33-73-81-14-21-11-1
7-21-51-1
24-91-7
Superannuationsubsidy
..
..
16182399,47764,3853,031557844
169,278!2-2
6-711-4
2-213-7
2-6i2-2
72-oj3-61-6
39-63-82-2
70-517-92-38-72-22-2
15-13-1
2-2|52-03-7
!
I
i
l_
I
1
D.—2 10
STATEMENT No. 4.IncomeandExpenditure inrespect ofLake Wakatipu Steamers.STATEMENTNo.5
IncomeandExpenditureinrespect foRefreshment Service.
PerCent,of
Revenue.
PerCent,of
Revenue.
EXPENDITURE.1928-29.
1927-28.--
REVENUE.
1928-29.
1927-28.;
;
1928-29.1927-28.
1928-29.1927-28
£
s.d.
£
s.d.
£
s.d.
£
s.d.
Salariesand
wages,shorestaff
..
..
1,5207
2
1,5470
0
13-9015-65
Ordinarypassengers..
..
..
4,425168
4,177111
40-4542-26
Salariesand
wages,steamerstaff
..
...
5,4025
10
5,2502
8
49-3853-12Seasontickets
..
..
..
1540
8
168910
1-411-70
Coaland
stores
..
....2,9192
8
2,6984
4
26-6727-30
Parcels,luggage,andmails
..
...
994102
973118
9-099-85
Repairs,steamers.J
..
..3,8500
8
2,1974
5
35-1922-23Goods
..
..
..
..
5,288100
4,5241310
48-3445-78
Repairs,wharves,&c.
..
..
..149114
4601111-37
4-65Miscellaneous
..
..
..
77122
40156
0-71
0-41
Insurance,renewals,
interest,&c.
..■■3,5838
7
3,4740
0
32-7635-13 ———;
Totalrevenue
......10,940j|98
100-00100-00
Losson
operation......6,484
6
7
5,741115
59-2758-08
17,424163
15,626134
159-27158-08
17,424163
15,626134
159-27158-08
I
PerCent,of
Revenue.
EXPENDITURE.1928-29.
1927-28.
REVENUE.
1928-29.
1927-28.
1928-29.1927-28.
£
s.d.
£
s.d.
.£
a.d.
£
s.d.
Salariesand
wages..
..
..
38,6208
8
38,5556
8
31-3831-55
Receiptsfrom
refreshment-room..
..
..
123,058198
122,2207
5
Provisionsconsumed
..
..
..
48,8799
1
48,1384
5
39-7339-38
Light,fuel,and
water..
..
..
2,7681911
2,688185
2-252-20
Freights..
..
..
..
2,9710
1
3,0328
0
2-412-48
Rents
..
..
..
..
10,7250
0
11,1320
0
8-729-11
Renewals..
..
..
..
2,9498
11
3,5270
7
2-392-89
Betterments....
..
..
2,0000
0
1,433145
1-631-17I
Interest,insurance,and
miscellaneous..
7,175199
6,1362
3
5-835-02
Totalexpenditure
..
..116,0906
5I
114,643149
94-3493-80
i
Netprofit
..
..
..
6,96813
s{
7,576128
5-666-20j
;
123,058198
|122,220
7
5
100-00100-00
123,058198
122,2207
5
' 1"
11 D.—2
STATEMENT No. 5a.IncomeandExpenditure inrespect ofBook-stall Service. STATEMENT No. 6.IncomeandExpenditure inrespect ofAdvertisingService. STATEMENTNo.7.IncomeandExpenditure inrespect ofDepartmental Dwellings.Per
Cent,of
Revenue.,
!
PerCent,of
Revenue.
EXPENDITURE*1928-29.
1927-28.—REVENUE.
1928-29.
1927-28.
1928-29.1927-28.
I
;
1928-29.1927-28.
1■I£
s.d.
£
s.d.
£
s.d.
£
s.d.
Salaries,wages,and
allowances
....13,675194
12,340125
25-3423'84
Advertising-signs,printing,&c.
....52,449154
51,5371
3
97-1697-98
Storesand
materials..
..
..
2,8651611
2,875180
5-315-47
Miscellaneousreceipts....
..
1,5331911
1,063Oil2-842-02
Rentofpremises,sites,
andcommission..13,4229
0
15,3671011
24-8629-22
Officeand
generalexpenses
..
..
3,670160
3,6783
9
6-806-99
Interest,insurance,and
depreciation..16,8841210
14,4591
10
31-2727-49
Betterments........199
156
..
0-37
Totalexpenditure
..
..
50,7199
7
48,921611
93-9593-01
Netprofit
..
....3,2645
8
3,678153
6-056-99
53,983153
52,6002
2
100-00100-00
53,983153
52,6002
2
100-00100-00
PerCent,of
Revenue.
PerCent,of
Revenue.
EXPENDITURE.1928-29.
1927-28.
REVENUE.
1928-29.
1927-28.
1928-29.1927-28.
1928-29.j
1927-28.
£
s.d.
£
s.d.
£
s.d.
£
s.d.
Wagesandcharges
....41,705190
43,773182
39-3846-75
Rentals..
..
..
..
105,8977
5
93,6430
1
100-00100-00
Materials
....
••
■■
12,9649
9
12,770125
12-2413-64
Netloss........64,1761
4
68.620106
60-6073-28
Insurance..
••••••4,4110
0
4,0590
0
4-174-33
Interest
....••••77,3800
0
70,7420
0
73-0775-54
Renewals..
..••■■33,6120
0
30,9180
0
31-7433-02
170,0738
9
162,263107
160-60173-28
!
170,0738
9
162,263107
160-60173-28
EXPENDITRE.
1928-29.Revenue"'
BEVENUE.
!
1928-29.
____._.-_;.£
s.d.
£
s.d.
Wages
....
..
........374
9
11-55Receipts..............
..
3228
5
Stores
....
..........215128
66'88
Bent..
....
........
..
298
4
9-12
Miscellaneous..............
188
11
5-72
Totalexpenditure
..300148
93'27
Netprofit
..
........21139
6-73
3228
5
__3228
5
100-00

D.—2 12
STATEMENT No. 8.IncomeandExpenditure inrespect ofBuildings occupiedbyRefreshment Service,Book-stall Proprietors, etc.
STATEMENTNo8a.IncomeandExpenditureinrespect ofRoad MotorServices.
PerCent,of
Revenue.
EXPENDITURE.1928-29.
1927-28.
: —REVENUE.
1928-29.
1927-28.
1928-29.1927-28.
£
s.d.
£
8.d.
£
*s.d.
£
s.d.
Wagesandcharges
..
..
..1,537511
1,689114
7-908-22
Rentals ......
..
..
..
19,4551
0
20,5422
0
Materials..
..
..
..
369148
5621
1
1-902-74
Insurance,interest,and
renewals ..6,5760
0
6,5760
0
33-8032-01
Totalexpenditure
..
..
8,4830
7
8,827125
43-6042-97
Netprofit
..
..
..
10,9720
5
11,7149
7
56-4057-03
19,4551
0
20,5422
0
100-00100-00
19,4551
0
20,5422
0
i
PerCent,of
Revenue.
PerCent,of
Revenue.
EXPENDITURE.1928-29.
1927-28.
REVENUE.
1928-29.
1927-28.
1928-29.1927-28.
1928-29.1927-28.
£
9.d.
£
s.d.
£
s.d.
£
s.d.
Superintendence—Salariesandoffice
ex-10,844
131
3,4070
2
10-5910-49
Passengers........
100,597010
31,3811310
98-2596-60
penses
Parcels........
1,6544
2
1,0451211
1-62
3-22
Maintenancecharges
..
....
25,2297
8
4,953153
24-6415-25
Advertising..
....1342
7
594
1
0-130-18
Runningexpenses
..
..
..
46,767010
15,8752
5
45-6848-86
Licensefees
....
....2,555136
837150
2-502-58
Totalrevenue ......I
102,3857
7
32,4861010
100-00100-00
Interest,insurance,and
depreciation
..22,867185
7,435157
22-3322-89
Netoperatingloss
..
..
5,879511
22177
5-740-07
108,264136
32,5098
5
105-7410G-07 1108,264136
32,5098
5
105-74100-07
Netoperatingloss
..
..
..
5,879511
22177
Netloss....
..!
9,327010
234175
Preliminaryexpenses
..
..
..
3,4471411
2111910
9,327010
234175
9,327010
j
234175
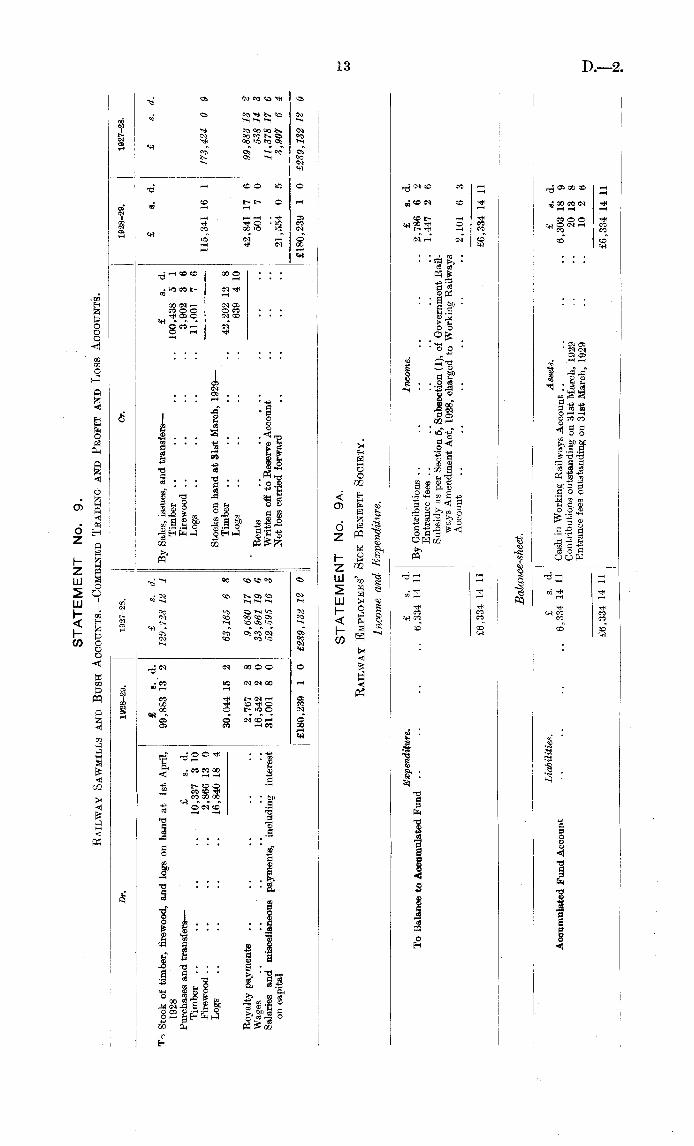
STATEMENT No. 9.Railway SawmillsandBush Accounts.—Combined TradingandProfit andLoss Accounts.STATEMENT No. 9a.Railway Employees' SickBenefit Society.
D.—2.13
Dr.
1928-29.
1927-28.
Or.
1928-29.
1927-28.
£
s.d.
£
s.d.
£
s.d.
£
s.d.
T*Stockoftimber,
firewood,andlogs
onhandat1st
April,
99,-883132
129,728121
BySales,issues,
andtransfers
—£
s.d.
1928
Timber..
..
..
..
100,4385
1
Purchasesandtransfers
—£
s.d.
Firewood..
..
..
..
3,9023
6
Timber..
..
..
..10,337310
Logs
..
..
..
..11,001
7
6
Firewood....
..
..
2,866130——
115,341161
173,4240
9
Logs
..
..
..
..
16,840184
Stockson
handat31st
March,1929
— 30,044152
63,1656
8
Timber......
..42,202128
Logs
........639410
Royaltypayments
..
..
..
....2,7672
8
9,680176———42,841176
99,883132
Wages..
..
..
..
....
16,5422
0
33,961196
Bents..
..
..
..
5017
0
538143
Salariesand
miscellaneouspayments,includinginterest31,0018
0
52,595163
Writtenoffto
ReserveAccount
..
....
..11,378
176
oncapital
Netlosscarriedforward
..
..
..
..
21,5540
5
3,9076
4
£180,2391
0
£289,132120
£180,2391
0
£289,132120
Incomeand
Expenditure.
Expenditure.
£
s.d.
Income.
£
s.d.
ToBalanceto
AccumulatedFund
........6,3341411
ByContributions....
..
....
..
2,7866
2
Entrancefees
..
..
..
..
..
..
1,4472
6
SubsidyasperSection5,
Subsection(1),of
GovernmentRail-
waysAmendmentAct,
1928,chargedto
WorkingRailways
Account..
..
..
......2,1016
3
£6,3341411
£6,3341411
Balance-sheet.
Liabilities.
£
s.d.
Assets.
£
s.d.
AccumulatedFund
Account
........6,3341411
Cashin
WorkingRailways
Account......
..
6,303189
Contributionsoutstanding
on31stMarch,
1929....
20138
Entrancefeesoutstanding
on31stMarch,
1929....
102
6
£6,3341411
£6,3341411

a—2.
STATEMENT No. 10.Statement ofSubsidy fromConsolidatedFund inrespect ofServicesrendered by Non-payingDevelopmentalBranchLines and Isolated Sections: 1stApril, 1928,to 31stMarch, 1929.14
AverageperMileof
Line.
Branchesshowing
Loss.
Mileage.Loss
onWorking.
FeederValue.TotalNet
Loss.
,
~ _,,
j~
interest,
FeederValue.TotalAvenue.
»»
j
Interest.I TotaiLoss.
-j
£
s.d.
£
s.d.
£
s.d.
£
s.d.
£
£
£
£
£
£
Kaikohe
....
..
25
7,3892
10
6,0298
3
1,359147
16,184172
317
241
558
613
593
648
Waiuku
......13
3,9471
1
3,1508
5
796128
9,7351510
423
242
665
727
688
750
Toko
......
48
12,1574
5
2,5962
8
9,5611
9
41,7911310
329
54
383
582
671
870
Opunake
......
23
4,3398
3
3,2981711
1,040104
20,1164
2
198
143
341
387
829
875
Greytown
..
..
..
3
2,687174
1,627159
1,0601
7
1,5981310
184
543
727
1,080
180
533
Eskdale..
..
..
12
3,1169
5
1,350164
1,765131
9,2400
1
336
113
449
595
623
769
NorthIslandtotals
..
124
33,6373
4
18,0539
4
~l5,583140
98,667411
309
146
455
581
670
976
Eyreton-Oxford..
..
54
8,8480
8
1,858170
6,9893
8
13,840172
176
34
210
340
127
257
Cheviot..
..
..
44
11,9277
0
1,8661
10
10,0615
2
26,2778
0
407
42
449
678
369
598
LittleRiver
..
..
23
6,8072
2
4201810
6,3863
4
11,4310
3
413
18
431
709
219
497
Southbridge..
..
26
5930
5*
2,0214
3
2,6144
8*
2,2881010
917
78
995
894
189
88
Methven
..
..
..
23
509162*
3,7370
7
4,246169*
5247
9*
597
162
759
574
162
23*
Springburn
..
..
..
28
5,1889
0
1,0615
9
4,1273
3
7,119147
206
38
244
391
107
254
Fairlie
..
..
..
37
5,897128
2,155132
3,741196
10,712165
455
58
513
614
188
289
Waimate
....
..
13
6,120117
3,7491211
2,370188
4,7221311
338
288
626
809
181
364
Kurow
..
..
..
38
4,033194
2,7192
2
1,314172
7,4891
4
356
72
428
462
162
196
Ngapara-Livingstone
..27
3,3795
9
1
1,0284
4
2,3511
5
9,571172
161
38
199
286
267
354
Waihemo
..
..
..9
1,600179
1,2898
8
3119
1
1,8863
9
185
143
328:
363
175
210
OtagoCentral
..
..
147
14,228135
3,942138
10,285199
74,6622
10
685
27
712i
782
438
508
Roxburgh
....
..
61
16,307145
i
2,9495
3
13,3589
2
43,802140
308
48
356
576
499
719
Tapanui
......27
7,0341010
2,814162
4,219148
9,753196
249
104
353
510
205
362
Waikaka
......13
2,1290
8
1,1291711
9992
9
4,060118
203
87
290
367
235
312
Switzers..
....14
3,3659
5,
8447
7
2,5211
10
!
6,0743
4
116
60
176
356
254
434
Glenham..
..
..
10
6,312104
1,529121
4,782183
7,1875
4
151
153
304
783
240
719
SeawardBush
..
..
34
4,0895
8
1,6162
6
2,4733
2
10,732101
415
48
463
535
243
315
Orawia..
..
..
9
2,0596
5
683145
1,375120
6,0833
5
81
76
157
310
523
676
ForestHill
..
..
..
13
2,3785
4
1,463107
914149
2,1137
9
210
113
323
393
92
162
Mararoa
....
..
12
1,538144
59310Jt
9454
0
2,1304
5
94
49
143
222
99
178
SouthIslandtotals
..
662
112,1440
2
39,4750
0
72,6690
2
261,9405
9
410
60
470
580
285
395
CapeFoulwind
..
..
8
1,289II1
63128
1,225185
4,860132
141
8
149
302
454
607
Lossesfrom4thMarch,
1928,to
794
147,070147
57,5922
0
89,478127
365,468310
392
73
465
577
347
459
2ndMarch,
1929
Estimatedlossfrom3rdto31st........28,112189
March,1929
Lessestimatedlossfrom4th......
••
27,417128
to31stMarch,
1928
6956
1
,
,
„
.366,163911
IsolatedSections.
Kaihu
....
..
24
4,5331310..4,5331310
12,120107....281
456
330
505
Gisborne
..
..
..
60
9,5381
9..9,5381
9
44,771178....
591
743
594
746
Nelson
..
..
..
64
17,40518..17,4051
8
41,1960
7....
385
651
378
644
Picton
..
..
..
56
7,1446
0
i ..7,1446
0
;
34,684152
..
..
663
773
509
619
Totals
..
..204
38,6213
3
38,6213
3
132,7734
0
..
..
510
689
472
651
Grandtotals
..
998
185,6911710
57,5922
0
128,0991510
498,9361311
„
„
..
I
.... *
Indicatesprofit.

D—2,15
STATEMENT No. 11.Statement of Cash Receipts and Payments—Working Railways Account.
Receipts. £ s. d. Payments. £ s. d*To Balance brought forward .. 247,657 12 7 By Wages and vouchers .. .. 7,639,245 8 8
Investments realized .. .. 250,000 0 0 Refunds to Harbour Boards, ship-Revenue receipts
.. .. 8,211,727 15 7 ping companies, and other carriers 268,699 8 0"Credits in aid" (Working Rail- Interest on capital
~ .. 2,331,334 14 5ways expenditure)
.. .. 1,558,349 13 0 Investments .. .. .. 200,000 0 0Receipts from Consolidated Fund Balance as per general balanoe-
under subsection I (b) of section 37 sheet .. .. .. 340,236 1 6of Government Railways Act,1926 (Subsidy—Branch lines andisolated sections)
.. .. 496,578 811Interest on investments ~
.. 15,202 2 6
£10,779,515 12 7 £10,779,515 12 7
Reconciliation Statement.£ b. d.
Credit balanee in Working Railways Account as per Treasury figures .. 288,586 17 0Add Imprests outstanding
.. .. .. .. .. .. 51,649 4 6
Credit balance as per above statement .. .. .. .. £340,236 1 6
STATEMENT No. 12.GENERAL RESERVE ACCOUNT.
Expenditure. £ s. d. Income. £ s. d.To Betterments Fund ..
.. 55,916 10 6j By Balance .. .. .. 1,375,662 6 1Balance
.. .. .. 1,378,316 10 11 J suspense (surplus stock) .. 58,570 15 4
£1,434,233 1 5 £1,434,233 1 5
By Balance .. .. .. £1,378,316 10 11
RENEWALS, DEPRECIATION, AND EQUALIZATION FUNDS.Slips, Floods, and Accidents Equalization Fund.
Expenditure. £ s. d. Income. £ s. d"To Repairs to bridges, slips,.and washouts 21,201 18 5 By Balance from previous year .. 26,600 010
Balance .. .. .. .. 26,902 2 5 Contributions debited to working-expenses .. .. .. 21,504 0 0
£48,104 0 10 £48,104 0 10
By Balance .. .. .. £26,902 2 5
Workers' Compensation Fund.Expenditure. £ s. d. Income. £ s. d.
To Accident payments .. .. 44,344 711 By Balance from previous year .. 18,259 17 6Balance ..
.. .. 18,497 3 11 Premiums debited to working-expenses 44,581 14 4
£62,841 11 10 £62,841 11 10
By Balance .. .. .. £18,497 311Insurance Fund.
Expenditure. £ s. d. I Income. £ s. d.To Losses ..
....
.. 5,815 511 By Balance from previous year .. 18,128 8 6Upkeep Railway fire brigades and lire Premiums debited to working-expenses 15,642 18 0
appliances.. .. .. 3,136 17 10
Balance .... .. •• 24,819 2 9
£33,771 6 6 j £33,771 6 6
By Balance .. .. .. £24,819 2 9General Renewals and Depreciation Fund.
Expenditure. £ s. d. Income. £ s. d.To Relaying of track .. .. 115,641 16 6 I By Balance from previous year .. 930,870 1 11
Bridges, buildings, &c. .. .. 11,982 1 2 Contributions debited to working-Rolling-stock
.. .. .. 119,155 910 expenses .. .. .. 655,986 0 0Locomotive workshops and plant . . 4,884 17 10Dwellings
.... •• 1,621 17 1
Signal appliances .... 2,053 9 10
Road motors .. .. .. 3,497 0 0Balance .. .. . . 1,328,019 9 8
£1,586,856 1 11 £1,586,856 1 II
By Balance .. .. .. £1,328,019 9 8
Betterments Fund.Expenditure. £ s. d. Income. £ s. d.
To Balance ....
•• 24,074 15 9 1 By General Reserve .. .. .. 55,916 10 6Way, works, buildings, and structures 23,991 8 4 Contributions debited to working-Signals, &c. .. .. •• 1,592 0 7 expenses (refreshment service)
... 2,000 0 0Boiling-stock .. ..
.. 4,258 510Balance .. .. .. .. 4,000 0 0
£57,916 10 6 | £57,916 10 6
i By Balance ~ .. .. £4,000 0 0

D.—2, 16
STATEMENT No. 13.Expenditure on Construction of Railways, Rolling-stock, etc., to 31st March, 1929; Net
Revenue and Rate of Interest earned on Capital expended on Opened Lines forYear ended same Date.
Opened Lines.
Section of Railway. 7 j j ! Unopened InterestLines and I Rolling- T . , j Lines - Revenue. earned.
Works. ' stock. 1 Xotal- |
£ £ | £ £ £ £ s. d.Kaihu .. .. .. .. .. 176,136 13,043 189,179] .. -3,787Gisborne .. .. .. .. 774,438 73,628 848,066 .. -7,981
a .. • • .. .- .. .. .. 733 80]North Island Main Lines and Branches .. 23,492,057 5,809,991 29,302,048 .. 910,070 3 5 5
4,482,076South Island Main Lines and Branches .. 17,349,249 4,565,502 21,914,751 .. 237,099 1 1 11
,, ,, .... .. .. 72.164
Westport '..
.'... .. 550,749 148,524 699,273 .! 37,587 5 *7 8
248,640Nelson.. .. .. .. .. 532,014 42,632 574,646 .. -16,920
„ .. .. .. .. .. .... 101,546
Picton .. .. .. .. .. 631,238 50,939 682,177 .. -5,783„ .. .. .. .. .. ..
.. 17,514
43,505,881 10,704,259 54,210,140 5,655,741 1,150,285 2 3 8
Lake Wakatipu steamer service .. .. 44,387 .. 44,387 .. —6,484Subsidiary Services, &c. .. .. .. 2,284,532 .. 2,284,532 .. 255,854 11 4 0Subsidy, Branch Lines and Isolated Sections .. .. .. .. 498,937In suspense—
Surveys, North Island .. .. .. .. .. .. 29,862Miscellaneous, North Island .. .. .. .. .. 5,169Surveys, South Island .. .. .. .. .. .. 5,763Miscellaneous, South Island .. .. .. .. .. 5,168General .. .. .. .. 29,539 .. 29,539P.W.D. stock of permanent way .. .. .. .. .. 5,913
45,864,339 10,704,259 56,568,598 .. 1,898,592 3 9 05,707,616
< v >—.———
Total cost of opened and unopened lines at .. .. 62,276,214 .. 3 1 731st March, 1929
Note. —The amount stated in this return as the cost of construction of opened lines includes the Provincial and General Governmentexpenditure on railways. It also includes the Midland Railway and expenditure by the Greymouth and Westport Harbour Boards onrailways and wharves under the provisions of section 7 of the Railways Authorization Act, 1885, the information regarding the last-mentionedb:ung furnished by the respective Boards. The rate of interest earned has been computed on cost proportionately to the time during whichthe lines, taken over by the Working Railways Department, within the financial year were earning revenue, thus:—
North Island Main Lines and Branches : Waiotira-Kirikopuni, opened for traffic 15th May, 1928; Tahawai-Tauranga, opened fo rtraffic 18th June, 1928 ; Tauranga-Taneatua, opened for traffic 2ndISeptember, 1928.
South Island Main Lines and Branches: Miller's Flat - Roxburgh, opened for traffic 18th April, 1928.
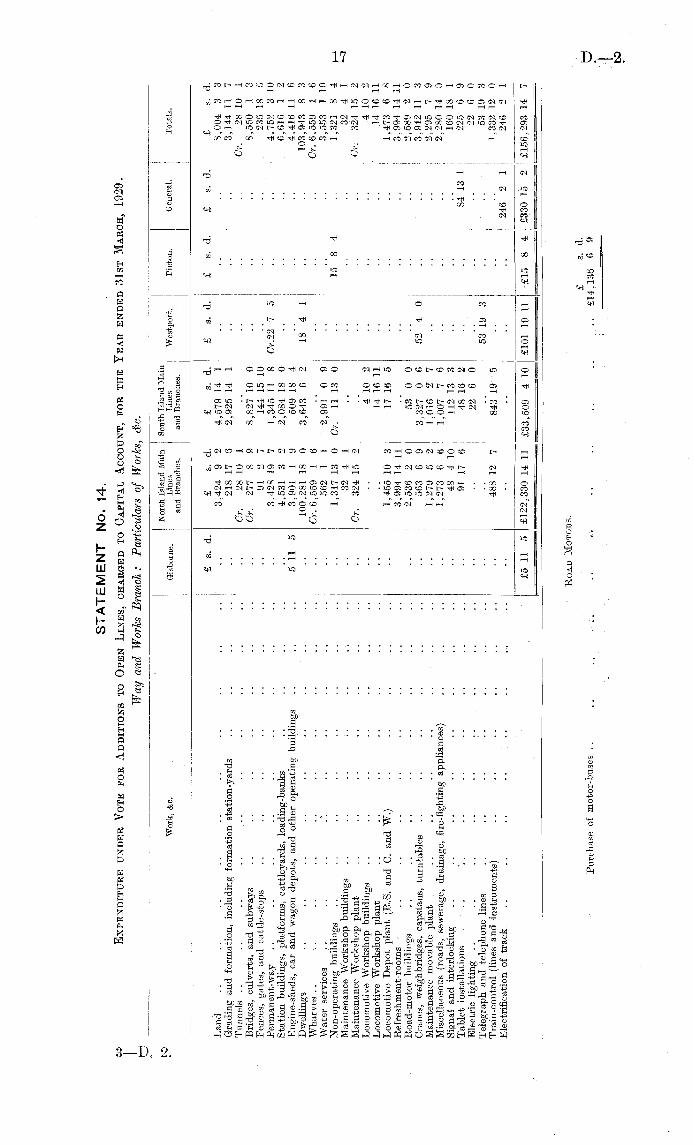
17 D.—2
RoadMotoks.
£
s.d.
Purchaseofmotor-buses
..
..
.......... ........£14,1366
9
STATEMENT No. 14.Expenditure underVote forAdditions toOpenLines, charged toCapitalAccount,for theYear ended 31stMarch, 1929.
Wayand WorksBranch:Particulars ofWorks,&c.3-D. 2,
NorthIslandMainSouth
IslandMain
Work,&c.
Gisborne.Lines
Lines
Westport. iPicton.General.:
Totals.
andBranches.and
Branches.
£
s.d.
£
s.d.
£
s.d.
£
s.d.
£
s.d.
£
s.d.
£
s.d.
Land
......................3,4249
21
4,579141......8,0043
3
Gradingand
formation,includingformationstation-yards..........218176
2,925141....■..
3,144117
Tunnels..
..
..
..............j..
Or.
28101
..
..
....Or.
28101
Bridges,culverts,andsubways
................Cr.2178
9
8,827100
..
..
..8,5501
3
Fences,gates,
andcattle-stops
................912
7
1441510
..
....
235185
Permanent-way..
..................3,428197
1,345118
Cr.227
5
..
..
4,7523
10
Stationbuildings,platforms,
cattleyards,loading-banks..........4,5313
2j
2,084180......
6,6161
2
Engine-sheds,car
andwagondepots,
andotheroperating
buildings......5115
3,9011
9
!
509184......
4,416116
Dwellings
.....................100,281180!
3,6436
2
184
1
....103,943
8
3
Wharves
......................Cr.6,5591
6:........Cr.6,5591
6
Waterservices
..................5621
1
2,9910
9......3,5531
10
Non-operatingbuildings
..................1,317130
Cr.11130..158
4
..1,3218
4
MaintenanceWorkshopbuildings
................324
1
........324
1
MaintenanceWorkshopplant
................Cr.324152
....••■.Cr.324152
LocomotiveWorkshopbuildings
....
..............4102....•.4102
LocomotiveWorkshopplant
....
..............141611..••••141611
LocomotiveDepotplant(R.S.andC.andW.)
............1,455103
17165....
..
1,4736
8
Refreshment-rooms
................3,9941411..
..
..
..
3,9941411
Road-motorbuildings
..
................
2,53620
5300......2,58920
Cranes,weighbridges,
capstans,turntables
..............
56369
3,327065240
....3,942113
Maintenancemovableplant
................1,2795
2
1,0162
7......2,2957
9
Miscellaneous(roads,
sewerage,drainage,
fire-fightingappliances)........1,2736
6
1,0077
6......2,280140
Signaland
interlocking
..................48410
112133......160181
Tabletinstallations
.................91176
48162....84131
2256
9
Electriclighting
..
....................226
0....••226
0
Telegraphandtelephonelines
..
.............•.....53193
..■•53193
Train-control(linesand
instruments)
..■■..........488127
843195....••1,332
120
Electrificationoftrack
..
.......................2462
1
2462
1
£5115
£122,3301411
£33,509410
£1011911
£158
4
£330152
£156,293147

D.—'2 18
STATEMENT No. 14—continued.
Expenditure under Vote for Additions to Open Lines, charged to Capital Account, forthe Year ended 31st March, 1929—continued.
Locomotive Branch: Particulars of Rolling-stock, etc.
Reconciliation Statement.Expenditure charged to Vote £ s. d. £ s. d. Expenditure— £ s. d-
No. 43 by Treasury .. 410,287 2 7 Way and Works Branch .. 156,293 14 7Vouchers outstandingprevious Road Motor Services .. 14,136 6 9
year .. .. Cr. 18,562 810 Locomotive Branch .. 198,455 15 5
428,849 11 5Less recoveries on account of
expenditure inpreviousyears 196,882 0 4231,967 11 1
Cost of raising loans, 1925-29 .. .. 99,010 0 0Vouchers outstanding at 31st March, 1929 37,908 5 8
£368,885 16 9 £368,885 16 9
Number Number NumberIncomplete Complete Incomplete Expenditure,
Description of Stock ordered. on on on Year ended31st March, 31st March, 31st March, 31st March, 1929.
1928. 1929. 1929.
£ B. d.Locomotives, Class C (new design) ..
.. .. .. ..24 2,181 9 5
Locomotives, Class G (Garrett) .. .. .. .. 1 2 49,730 13 3Locomotives, Class Wi (A. and G. Price, Ltd.) .. 3 3 .. 8,716 13 0Spare boilers .. .. . . .. .. .. .. ..
709 16 4Boiler-mountings for new boilers .. .. .. .. .. ..
113 12 3Pitting superheaters to locomotives .. .. .. .. i .. .. 3,114 7 10Electric headlights for locomotives .. .. .. .. j
.... 3,330 19 2
Spare sets engine-wheels .. . . . . . . .. .. 1 146 0 4Spare tender bogies .. . . .. . . .. .. 2 126 16 10Carriages, Class A .. .. .. . .
..11
.. 26Carriages, Class Aa (suburban) .. .. .. .. 10 .. 22,073 15 9Carriages, Class Aa (sleeping) . . .. .. .. .. .. 13 9 7Carriages, Class Aa (day) .. .. .. .. .. .. 7 3,818 8 1Spare bogies for carriages .. . . .. . . .. .. 22 1,743 14 4Gibbons spring frame bogies for carriages .. .. .. 2 .. 580 14 9Bogies for Royal train .. . . . . .. .. .. .. Cr. 987 8 4General Manager's carriage .. .. . . .. .. .. 1 25 15 8Electric lighting for cars .. .. .. .. .. .. .. 12,058 19 0Brake-vans, Class E .. .. .. .. 6 6 3 16,665 5 9Wagons, Class J .. .. .. .. .. 40 131 30 56,623 18 4Wagons, Class La .. .. .. .. .. 240 262 40 74,247 10 11Wagons, Class Uq .. ..
.. .. .. 5 5 5 7,479 5 10Wagons, Class W . . .. . .
.. .. .. .. 20 94 15 1Wagons, Class Xa ..
.. .. .. .. 54 54 .. 11,474 12 9Wagons, Class Xb . .
.. .. .. .. 6 6 .. 2,029 1 4Wagons, Class Yb .. .. .. .. .. 38 38 ..
892 3 2Wagons, Class Zp
.. .... .. ..
10..
40 5,597 18 1Pneumatic coaling-cranes
.. .. .. .. .. 4 ..1,107 17 5
Tarpaulins .... .. .. .. .. 500 .. 2,822 3 7
Transfer of rolling-stock.. .. .. .. .. .. .. 147 5 10
Spare bogies for wagons .. .. .. .. .. .. 24 2,617 17 5Pitting dynamo-meter to Zp wagon .. .. .. .. 1 .. 106 198Petrol tower wagon .. .. .. .. .. 1 .. 1,723 1 2Eord motor-car .. .. .. .. .. .. 1 .. 204 16 6New bus-bodies .. .. .. .. .. .. .. .. 570 11 2Obsolete locomotives written off .. .. .. .. .. .. Cr. 46,636 0 0Sale of obsolete rolling-stock .. .. .. .. .. .. Cr. 6,518 3 0Obsolete rolling-stock written off .. .. .. .. .. .. Or.88,061 10 0Sale of obsolete machinery .. .. .. .. .. .. .. Or. 2,920 12 10Obsolete machinery written offCost of raising loans, 1925-29 .. .. .. .. .. .. 50,629 0 0
Total .. .. .. .. .. .. .. 198,455 15 5
Total locomotives .. .. .. 3 4 26,,
carriages.. .. .. 11* 10 27
,, brake-vans ....... 6 6 3„ wagons, bogie
.. .. 15 5 45,,
wagons, four-wheeled .. .. 378f 491 90
* Decreased by 5. t Decreased by 7.

D.—219
STATEMENT No. 14—continued.Expenditure under theRailways Improvement Authorization Act, 1914,and Section7 ofFinance Act, 1924,and Section 10ofFinance Act, 1925,and Section 3ofFinance Act, 1926,charged tocapitalAccount, for theYear ended 31stMarch, 1929. £
s.d.
£
s.d.
£
s.d.
ExpenditurechargedbyTreasury ....•• 1,899,5328
2
Lessoutstandingsprevious
year....•• 96,71218
9
1,802,8199
5
Balanceofcostof
raisingloan,31stMarch.
1928..••15,874
133
Costof
raisingloan,
1928-29........ 81,9097
2
97,7840
5
Vouchersoutstandingat31stMarch, 1929....■■ 122,8881
9
£2,023,491117
WoIt'
&c
"Kaita
-i
®sbome'iIiKffii
Westport.|
Nelson.Picton.
General.
Total.
!
I
i
I
I
!
s.d.
£
s.d.
£
s.d.
£
s.d.
£
s.d.
£
s.d.
£
s.d.
£
s.d.
£
s.d.
Land
..
..........'....36,7121
2
6,064210..1613
5
....42,9377
5
Gradingandformation,includingformation
station-yards......58,025133
4,481146........
62,5077
9
Bridges,culverts,andsubways
..........11,0622
7
10,0577
8....
..••21,119103
Fences,gates,
andcattle-stops
............1,1641
11......
....1,164111
Permanent-way
........
......92,755103
6,649143..
..
..
••99,4054
6
Stationbuildings,platforms,cattleyards,loading-banks......124,2228
4........
..
124,2228
4
Engine-sheds,car
andwagon
depots,andother
operating....16,987158
4,173103......
21,1615
11
buildings Water-services
..............Cr.1151711
1,962181......■■1,8470
2
Non-operatingbuildings
............290
5........290
5
LocomotiveWorkshopbuildings
..........328,374189
180,9211610......1,584165
510,881120
LocomotiveWorkshopplant
..........442
9
296,1241010
154,0635
0
147148
940
7
253183
1,750.1311
452,4786
0
LocomotiveDepotplant(R.S.andC.andW.)
....649
3
..
1,3686
5
7,7545
9
..
..
....9,1871
5
Refreshment-rooms
......
..
......Cr.44133....
..
..
..Cr.44133
Roadmotor
buildings
..
..
........243167....
..
..
..243167
Cranes,weighbridges,capstans,turntables
........3,4130
4
2,9531
5......••6,3661
9
Maintenancemovableplant
............851611
48131....••
••
134100
Miscellaneous(roads,
sewerage,drainage,
fire-fighting..262911
23,034182
6031710......
••
23,9015
11
appliances) Signaland
interlocking
............8,416148
715175
326199....
Cr.732148
8,726172
Automaticand
powersignalling
..........32,221175
1252
3
......••32,346198
Electriclighting
............901710
7,4991
5
4,6113
4
1,869181
..
3621011
..14,433117
Telegraphandtelephonelines
............1,681153
2,477134..294138
..Or.
1,375110
3,078113
Safetyappliances(warningbells,
wig-wags,&c.)
........1,1436
7
747157..
..
..1886
2
2,0798
4
Electrificationoftrack
..............
42,3596
3...••••■42,3596
3
Electriclocomotives
..
..
..
..
..
......55,211184....
-■
••55,211184
649
3
397106
1,044,3775
4
486.0124
5
2,344126
549178
6169
2
1,4151010
1,535,777198
Expenditurechargedby
PublicWorks
Department
—Newline—Auckland-Westfield
..........89,3869
5..........89,3869
5
HuttValley
Railway
............11.9808
7..........11,980
8
7
Deviations:TawaFlatand
PalmerstonNorth
......386,3461311........••
386,3461311
..
|
~487.7131111
..
..
..••487,7131111
i
—Grandtotal
......
..
£649
3
j
£397106
£1,532,090173
£486,0124
5
£2344126
£549178
£6169
2
£1.4151010
£2,023,491117
ReconciliationStatement.
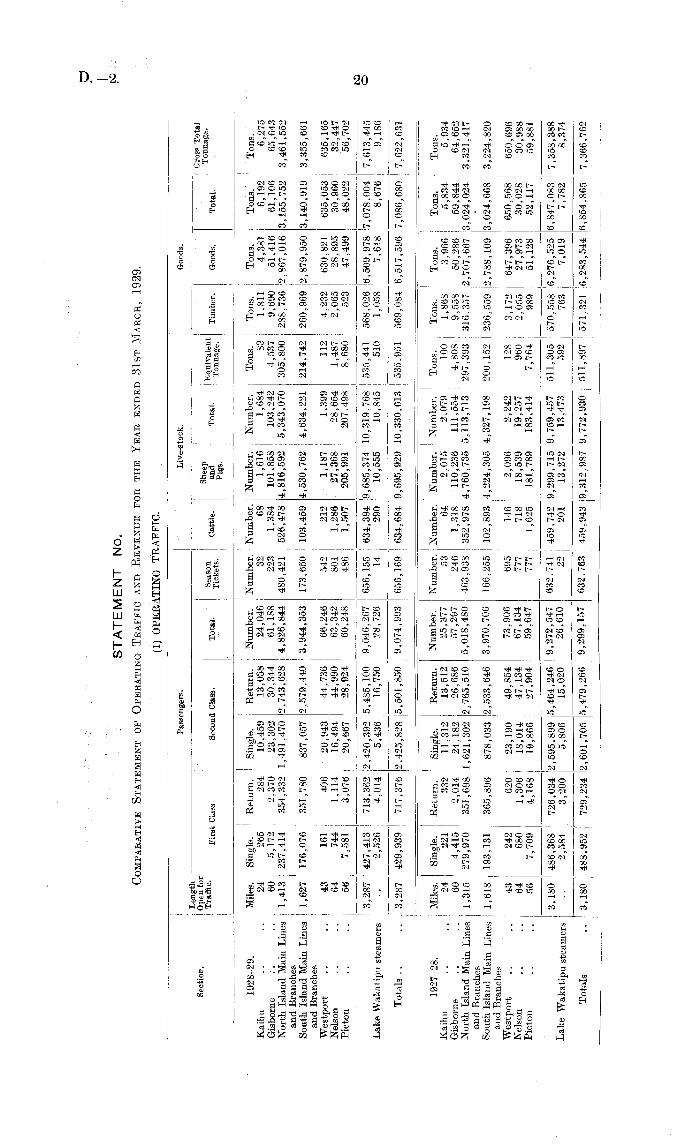
D.—2. 20
STATEMENT No.ComparativeStatement ofOperatinvTrafficandRevenue for theYear ended 31stMarch, 1929.
(1) OPERATING TRAFFIC. Passengers.
Live-stock.
Goods.
Section.
I
Openfor
I
SheenI
I
Traffic.First
Class.
j
SecondClass.
Total.'
Tickets.'
Cattle-
and
!
Totai-'SfTimber.Goods.Total.
"
1928-29.Miles.Single.
Return.Single.
Return.Number.Number.Number.Number.Number.Tons.Tons.Tons.Tons.Tons.
Kaihu
....
24
265
284
10,45913,038
24,04632
68
1,616
1,684
83
1,811
4,381
6,192
6,275
Gisborne
....60!
5,1722.37023,30230,344
61.188223
1,384101,858103,242
4,5379.69051,41661,10665,643
NorthIslandMain
Lines1,413
237,414354,332
1,491,4702,743,6284,826,844480,421526,4784,816,592
5,343,070305,800288,7362,867,0163,155,7523,461,552
andBranches
SouthIslandMain
Lines1,627
176,076351,780837,0572,579,4403,944,353
173,650103,459
4,530,7621
4,634,221214,742260,9692,879,9503,140,9193,355,661
andBranches Westport
....43
161
406
20.94344,736
66,246542
212
1,187
1,399
112
4,232630,821635,053635,165
Nelson
....64
744
1,11416,494
44,99063,342801
1,28627,36828,654
1,4872,06528,89530,96032,447
Picton
....56
7,5813,07620,66728,924
60,248486
1,507205,991; 207,4988,680523
47,49948,02256,702
3,287427,413713,3622,420,392
5,485,1009,046,267
!
656,155634,3949,685,374
10,319,768535,441568,0266,509,9787,078,0047,613,445
LakeWakatipu
steamers..
2,5264,0145,436
16,75028,726
:
14,290j
10,555 j10,845510
1,058
7,618
8,676
9,186
Totals..
..3,287429,939
717,3762,425,828
5,501,8509,074,993
I
656,169!
634,684!
9,695,929
10,330,613535.951569,084
6,517,5967,086,6807,622,631
1927-28.Miles.Single.
Return.Single.
Return.Number.Number.Number.Number.Number.Tons.Tons.Tons.Tons.Tons.
Kaihu
....24
221
332
11,31213,512
25,37753
64
2,015,2,079
100
1,868
3,9665,834
5,934
Gisborne..
..60
4,4152,01424,182
26,68657,297246
1,318110.236
111,5544,8089,55850,28659,844
64,652
NorthIslandMainLines
1,315279,970351,698
1,621,3022,765,510
5,018,480463,938352,9784,760,7355,113,713297,393316,3572,707,6673,024,024
3,321,417
andBranches
SouthIslandMainLines
1,618193,131
365,896878,0332,533,646
3,970,706166,255102,893
4,224,3054,327,198200,152236,5592,788,1093,024,6683,224,820
andBranches Westport
..
..43
242
620
23,19049,854
73,906695
146
2,0962,242
128
3,172647,396650,568650,696
Nelson..
..64
680
1,30618,014
47,13467,134777
718
18,53919,257
960
2,05527,97330,02830,988
Picton
....56
7,7094,168
19,86627,904
59,647777
1,625181,789183,414
7,764989
51,12852,11759,881
'jj
3,180486,368
726,0342,595,899
5,464,2469,272,547632,741
459,7429,299,7159,759,457
511,305570,5586,276,5256,847,083■7,358,388
LakeWakatipu
steamers
..2,5843,2005,806
15,02026,61022
201
13,27213,473
592
763
7,0197,782
8,374
Totals
..
3,180488,952
729,2342,601,7055,479,266
9,299,157632,763
459,9439,312,9879,772,930
'
511,897571,3216,283,5446,854,865
7,366,762

21 D.—2'
STATEMENTNo. 15—continued.ComparativeStatementofOperatingTrafficandRevenuefortheYearended31stMarch,1929—continued.
(2) OPERATINGREVENUE.Revenue.
Mileage.
Length
j
::
"T
Section.
°.P®n
PerMileof
Traffic.p
°».
SeasonTickets.
TotalCoaching.
Goods.
TotalGoods.
j
To^«illg
p^mPe^in
Train.Shunting,4cTotal.
(Average).
1928-29.Miles.
£
s.d.
£
s.d.
£
s.d.
£
s.d.
£
s.d.
£
s.d.
£
s.d.
£
s.d.
£
s.d.
d.
Number.Number.
Number.
Kaihu
..
..24
2,5971611
309199
1,217165
4,125131
2,9620
4
701
5
3,0321
9
7,1571410
2984
9
98-7717,393
5,04622,439
Gisborne
....60
8,6785
7
783148
2,4391211
11,901132
24,3444
4
354168
24,6991
0
36,600142
6100
3
114-7076,586
16,15692,742
NorthIslandMain
Lines1,413
1,195,258157
171,033198
241,0093
5
1,607,301188
2,721,3840
0
93,3000
7
2,814,6840
7
4,421,985193
3,2028
5
158-276,705,5122,877,1839,582,695
andBranches
SouthIslandMain
Lines1,627
644,1184
5
81,4786
1
128,485187
854,0829
1
1,938,633138
69,388116
2,008,0225
2
2,862,104143
1,759101
167-724,095,546
2,001,2436,096,789
andBranches Westport
..
..43
5,2003
8
768135
1,306117
7,2758
8
117,9587
6
9,5122
2
127,4709
8
134.745184
3,133126
350-3392,311
81,757174,068
Nelson
....
64
5,3690
7
1,332112
1,897145
8,5996
2
15,215123
937146
16,1536
9
24,7521211
386152
99-4759,72525.73085,455
Picton..
....56
6,8255
3
991121
1,783198
9,600170
25,6274
3
2,2886
3
27,915106
37,5167
6
669188
135-5866,40929,54995,958
3,2871,868,047
120
256,6981610
378,140170
2,502,887510
4,846,1252
4
175,851131
5,021,976155
7,524,8641
3
2,3123
1
162-5011,113,482
5,036,66416,150,146
LakeWakatipu
steamers..
..
4,425168
1540
8
994102
5,5747
6
5,288100
77122
5,3662
2
10,9409
8
Totals
....3,287
1,872,4738
8
256,852176
379,1357
2
2,508,461134
4,851,413124
175,9295
3
5,027,342177
7,535,8041011
2,3123
1
16250
11,113,4825,036,664
16,150,146
1927-28.Miles.£
s.d.
£
s.d.
£
s.d.
£
s.d.
£
s.d.
£
s.d.
£
s.d.
£
s.d.
£
s.d.
d.
Number.Number.Number.
Kaihu..
....24
2,2665
9
327188
1,1361511
3,7310
4
2,7689'101621110
2,9311
8
6,6622
0
277119
90-1417,738
5,68623,424
Gisborne..
..60
7,989155
844188
2,2731411
11,1089
0
22,614110
3163
1
22,930141
34,0393
1
5676
5
99-3782,211
16,15598,366
NorthIsland
MainLines
1,3151,213,778
1
3
172,8151810
239,666190
1,626,260191
2,625,539140
69,4008
2
|2,694,9402
2
4,321,2011
3
3,2899
1
160-056,479,921
2,663,7789,143,699
andBranches
SouthIsland
MainLines
1,618645,488111
81,054113
131,9385
7
858,481711
1,869,7740
6
56,6429
1
1,926,4169
7
2,784,897176
1,7214
0
165-054,049,450
1,726,3775,775,827
andBranches Westport
..
..43
5,5016
0
907191
1,380196
7,7904
7
120,459116
9,507128
129,9674
2
137,7578
9
3,203133
351-2094,14081,328
175,468
Nelson..
..64
5,515123
1,289910
1,7065
1
8,5117
2
12,782139
143103
12,9264
0
21,437112
334193
81-2963,292
18,63881.930
Picton..
....56
6,293172
1,222011
1,8291311
9,345120
26,1961
6
2,3071710
28,503194
37,849114
675179
175-2251,84232,49584,337
3,1801,886,833
811
258,462173
379,9321311
2,525,2290
1
4,680,1352
1
138,4801211
4,818,615150
7,343,844151
2,3107
3
162-6210,838,594
4,544,45715,383,051
LakeWakatipu
steamers
....4,177111
1689
10
973118
5,319127
4,5241310
40156
4,5659
4
9,885111
Totals..
..
3,1801,891,011
0
0
258,6317
1
j380,9065
7
2,530,548128
4,684,6591511
138,5218
5
4,823,1814
4
7,353,729170
2,3107
3
162-6210,838,594
4,544,45715,383,051
i ■
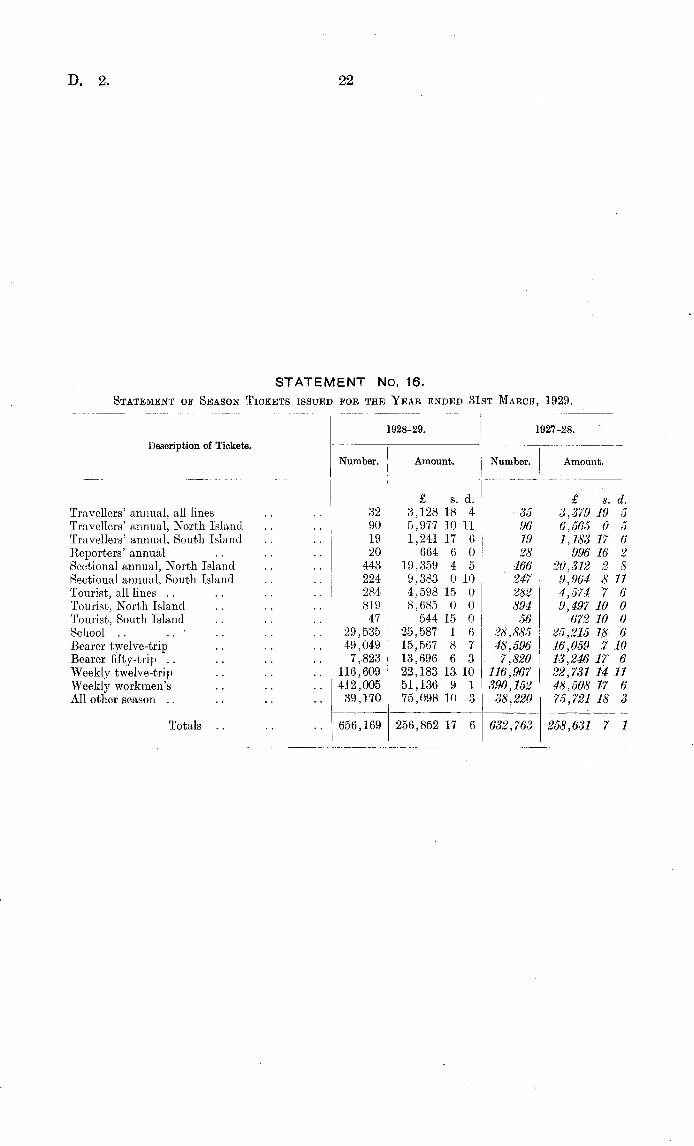
D. 2 22
STATEMENT No. 16.Statement of Season Tickets issued for the Year ended 31st March, 1929.
1928-29. 1927-28.Description of Tickets. .
Number. Amount. i Number, j Amount.j n I
£ s. d. £ s. d.Travellers'annual, all lines .. .. 32 3,128 18 4 35 3,379 19 5Travellers' annual, North. Island .. .. 90 5,977 10 11 96 6,565 0 5Travellers'annual, South Island .. .. 19 1,241 17 6 19 1,183 17 6Reporters' annual .. .. .. 20 664 6 0 28 996 16 2Sectional annual, North Island . . . . 443 19,359 4 5 466 20,312 2 8Sectional annual, South Island ..
.. 224 9,383 0 10 247 9,964 8 11Tourist, all lines .. .. .. .. 284 4,598 15 0 282 4,57-4 '7 6Tourist, North Island 819 8,685 0 0 894 9,497 10 0Tourist, South Island ..
.. .. 47 544 15 0 56 672 10 0School .. ' 29,535 25,587 1 6 28,885 25,215 18 6Bearer twelve-trip .. .. .. 49,049 15,567 8 7 48,596 16,059 7 10Bearer fifty-trip .. ..
.. .. 7,-823 13,696 6 3 7,820 13,246 17 6Weekly twelve-trip .. ..
.. 116,609 22,183 13 10 116,967 22,731 14 11Weekly workmen's .. .. ..412,005 51,136 9 1 390,152 48,508 17 6All other season .. .. .. .. 39,170 75,098 10 3 38,220 75,721 18 3
Totals .. .... 656,169 256,852 17 6 632,763 258,631 7 1
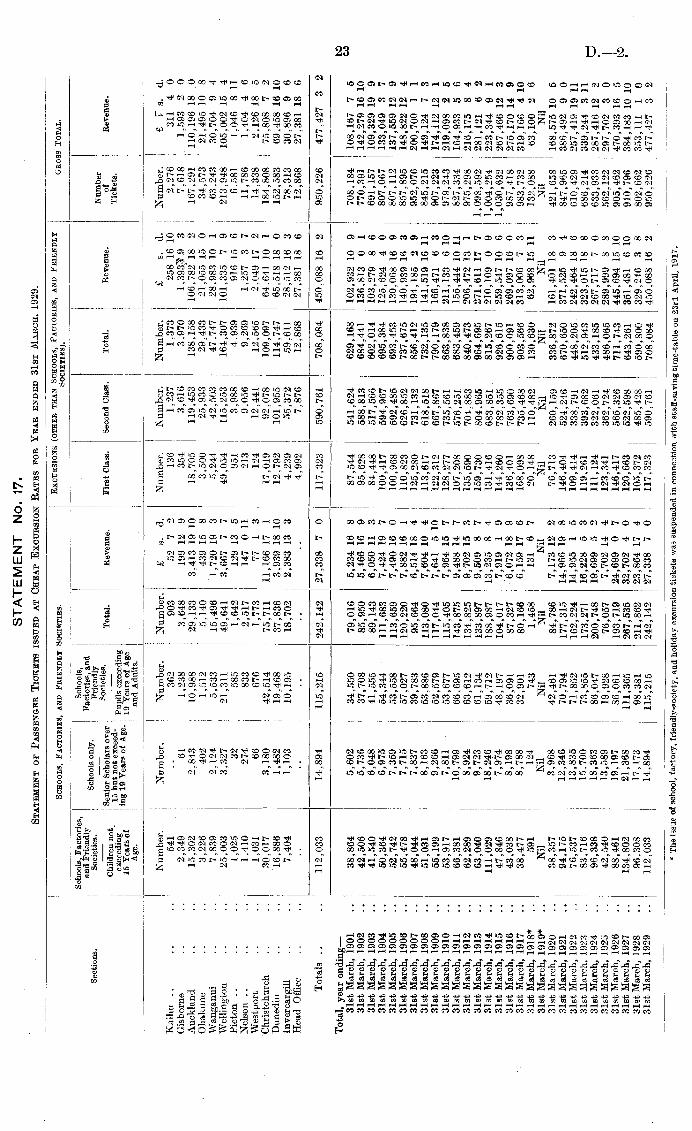
23 D.—2.
STATEMENT No. 17.Statement ofPassenger Tickets issuedat CheapExcursionRates forYear ended 31stMarch, 1929.Schools,
Factories,and
FriendlySocieties.
Excursions(otherthan
Factories,and
Friendly
GrossTqtal
Schools,Factories,
Schools,
I
andFriendly
Qohnni*nniv
Factories,and
Sections.
Societies.Schoolsonly.
Friendly
Number
phiiHr„n
_,
SeniorScholars
overSocieties.
Total.i
Revenue.First
Class.SecondClass.
Total.
Revenue.
of
Revenue.
exceeding«
15Yearsof
lng19
YearsofA§e"
19YearsofAge
Age.
andAdults.
Number.Number.Number.Number.£
s.d.
Number.Number.Number.£
s.d.
Number.£
'
s.d.
Kaihu
......541
..
362
903
527
2
136
1,237
1,373
2581610
2,276
3114
0
Gisborne
..
..
2,349
61
1,238
3,648
199129
354
3,616
3,970
1,393193
7,618
1,5932
0
Auckland
..
..
15,302
2,843
10,988
29,1333.4131910
18,705119,453138,158106,782
182
167,291110,196
180
Ohakune..
..
3,226
402
1,512
5,140439158
3,500
25,93329,43321,055150
34,57321,495108
Wanganui..
..
7,839
2,124
5,533
15,4961,720
193
5,244
42,50347,74728,983101
63,24330,7049
4
Wellington
....25,003
3.327
21,311
49,6413,6677
7
49,054115,253164,307101,335
7
9
213,948105,002
154
Picton
......1,025
32
585
1,642
129135
951
3,988
4,939
916156
6,581
1.0468
11
Nelson..
....1,410
274
833
2,-517
147011
213
9.056
9,2691,2573
7
11,7861,4044
6
Westport
....1,031
66
676
1,773
771
3
124
12,441
12,5652,049172
14,3382.126185
Christchurch
....30,017
3,180
42,514
75,71111,166
171
|
17,01992,078
109,09764.641101
184,80875.8087
2
Dunedin
....16,886
1,482
19,468
37,8363,9391810
12,792101,955114,747
65,518180
152,58369,4581610
Invercargill
....7,404
1,103
10,195
18,7022,383133
4,239
55,37259,61128,512163
78,31330,8969
6
HeadOffice
..
..
..
........
4,992
7,876
12,86827,381186
12,86827,381186
Totals..
..112,033
14,894
115,215242,142
27,3387
0
117,323590,761
708,084450,088162
950,226477,4273
2
Total,year
ending— 31stMarch,
1901..
38,864
5,602
34,550
79,0165,234168
87,544541,624629,168
102,932109
708,1S4
108,1677
5
31stMarch,
1902..
42,506
5,736
37,708
85,9505,466169
95,628588,813684,441
136,8130
1
770,391142,279
1610
31stMarch,
1903..
41,540
6,048
41,555
89,1436,050113
84,448517,566602,014
103,2798
6
691,157109,329199
31stMarch,
1904..
50,364
6,975
54,344111,683
7,424197
100,417594,967
695,384125,624
4
0
807,067133,049
3
7
31stMarch,
1905
..52,742
7,359
53,558
113,6597,490160
100,968592,485693,453
130,068169
807,112137,559
129
31stMarch,
1906
..55,478
7,715
57,027
120,2207,882161
110,823626,852
737,675140,939163
857,895148,822
124
31stMarch,
1907
..48,044
7,837
39,783
95,6646,514184
125,280731,132
856,412194,1852
9
952,076200,7001
1
31stMarch,
1908..
51,031
8,163
53,886
113,0807,604104
113,617618,518732,135
141,5191611
845,215149,124
7
3
31stMarch,
1909
..55,199
9,266
52,579
117,0447,641510
122,312667,867790,179
166,4716
3
907,223174,112
121
31stMarch,
1910
..53,917
7,811
53,677
115,4057,964157
128,277735,561863,838211,1336
10
979,243219,0982
5
31stMarch,
1911..
66,381
10,799
66,695
143,8759,488147
107,208576,251
683,459155,4441011
827,334164,933
5
6
31stMarch,
1912..
62,289
8,924
63,612
134,8259,702153
135,590704,883840,473
206,472131
975,298216,1758
4
31stMarch,
1913..
63,040
9,723
61,134
133,8979,5098
7
159,730804,965964,695
271,611177
1,098,592281,1216
2
31stMarch,
1914
..111,029
18,246
59,712
188,98713,235
8
4
131,416683,851815,267
210,1090
9
1,004,254223,3449
1
31stMarch,
1915
..47,846
7,974
48,197
104,0177,9191
9
144,260782,355926,615
259,547106
1,030,632267,466123
31stMarch,
1916
..43,038
8,198
36,091
87,3276,072189
136,401763,690900,091
269,097160
987,418275,170149
31stMarch,
1917..
38,477
8,788
32,901
80,1666,159176
168,098735,468903,566
313,0067
3
983,732319,1664
10
31stMarch,
1918*
..591
124
743
1,458
1316
7
20,148110,482130,630
62,9681511
132,08863,1002
6
31stMarch,
1919*..
Nil
Nil
Nil
Nil
Nil
Nil
Nil
Nil
Nil
Nil
Nil
31stMarch,
1920
..38,357
3,968
42,461
84,7867,173122
76,713260,159336,872
161,401183
421,658168,575
105
31stMarch,
1921..
94,175
12,346
70,794
177,31514,966
198
146,404524,246
670,650371,5259
4
847,965386,4929
0
31stMarch,
1922
..76,537
13,835
71,852
162,22414,955
1
5
109,414338,791448,205242,464186
610,429257,4191911
31stMarch,
1923
..83,716
15.700
73,855
173,27116,228
5
3
119,261393,682
512,943323,015188
686,214339,244311
31stMarch,
1924
..96,338
18,363
86,047
200,74819,699
5
2
111,124322,061433,185267,7177
0
633,933287,416122
31stMarch,
1925
..42,540
13,589
19,928
76,0577,702144
123,341362,724486,065289,9998
8
562,122297,7023
0
31stMarch,
1926
..8S.461
19,197
86,061
193,71924,6990
7
146,417565,326
711,743445,6941510
905,462470,393165
31stMarch,
1927..
134,802
21,368
111,365267,535
32,7024
0
120,663522,598643,261351,481610
910,796384,1831010
31stMarch,
1928
..96,308
17,173
98,381
211,86223,864174
105,372485,428590,800329,2463
8
802,662353,1111
0
31stMarch,
1929..
112,033
14,894
115,215242,14227,3387
0
117,323590,761708,084450,088162
950,226477,4273
2
*
Theissueofschool,factory,friendly-society,andholiday
excursiontiekets
wassuspendedin
connectionwithstaff-savingtime-table
on23rdApril,
1917.

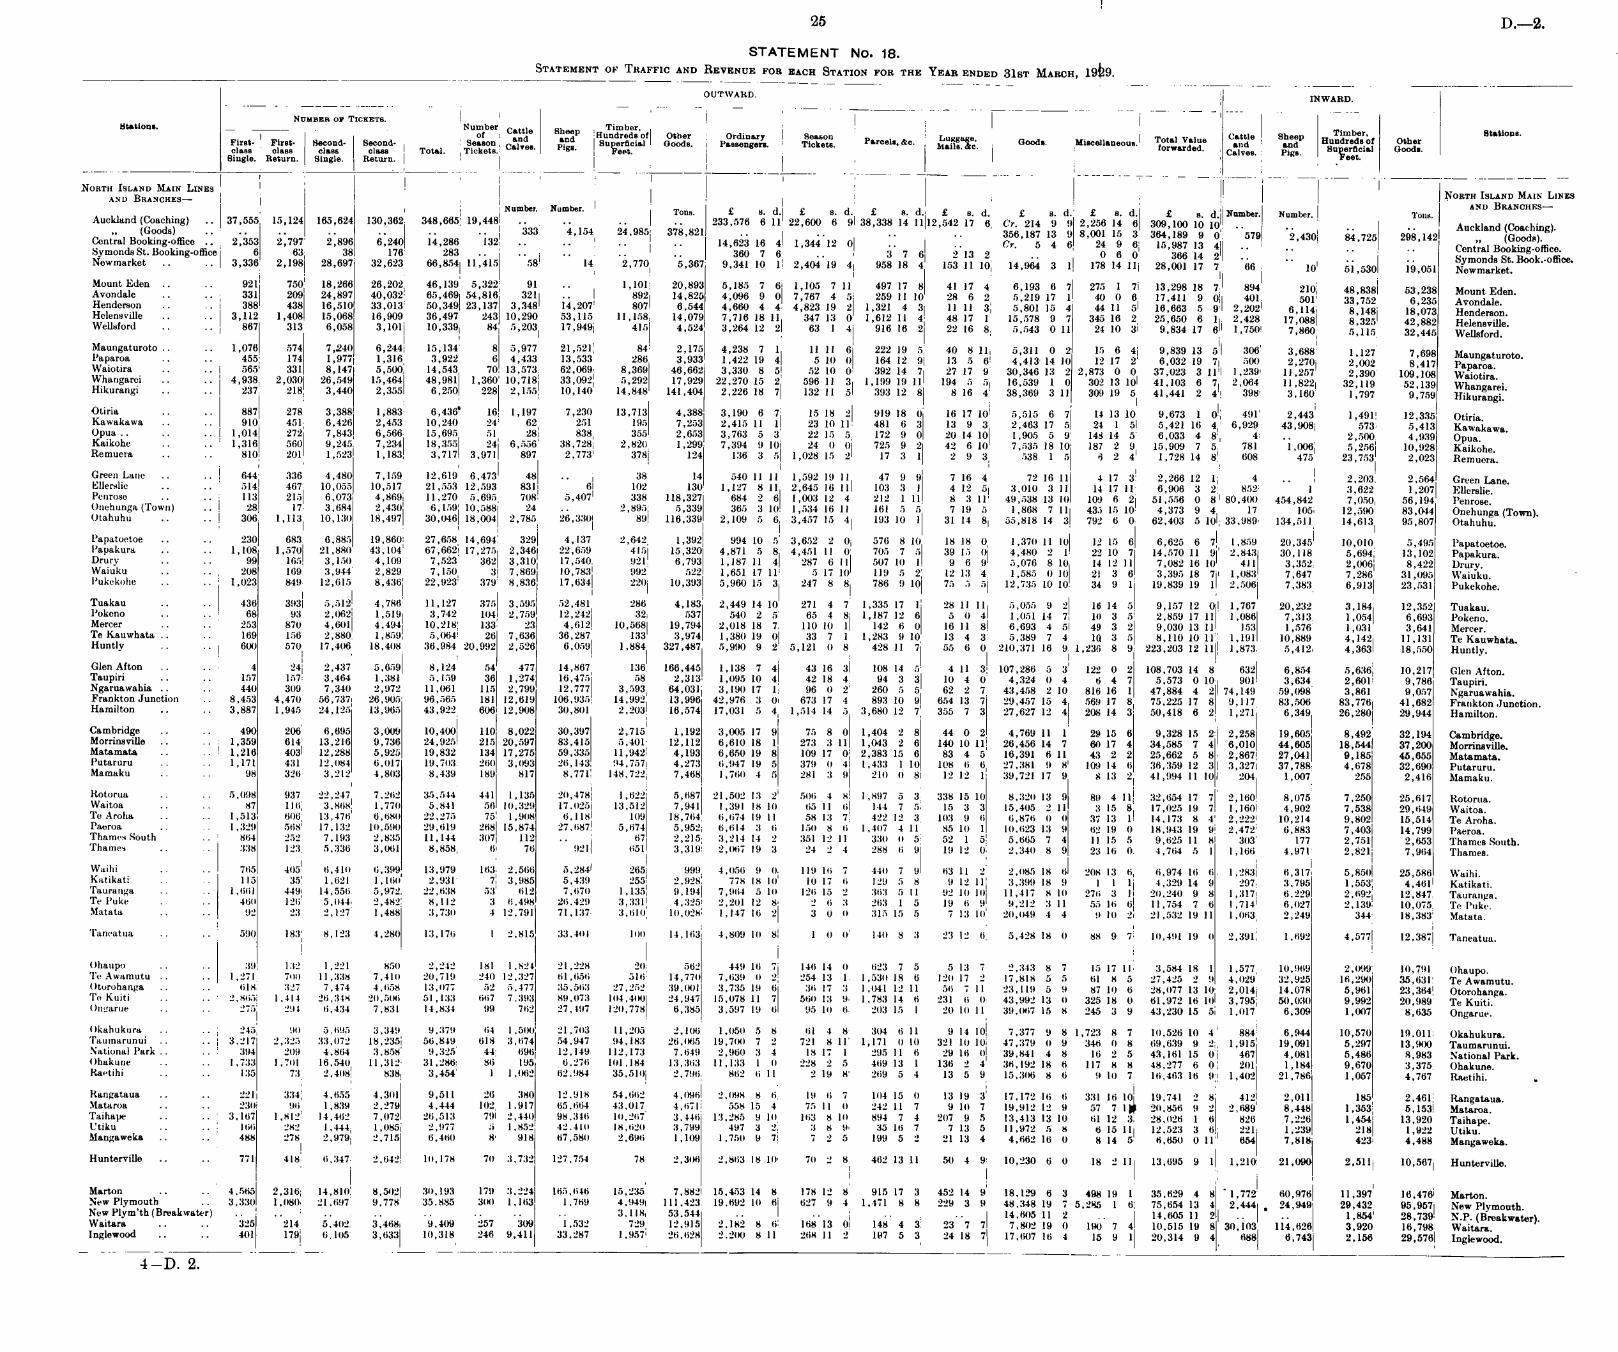
25 D.—2.
STATEMENT No. 18.Statement of Traffic and Revenue for each Station for the Year ended 31st March, 1929.
4—D. 2.
OUTWARD. INWARD.
Number op Tickets.Stations. Number 0att je Sheep Timber,
First- ' First- Second- Second- ; Season ca,nd Superficial Goods. Passengers. Tickets. Parcels, &c. Goods. Miscellaneous. 'forwarded6 C
and6 S
andP Hundreds of Other
class class class class Total. Tickets. WQB - P»gs. Feet* Mans, <xc. forwarded. Calve8. Pig8> Superficial Goods.
Single. I Return. Single. Return, j Feet.
North Island Main Lines „
and Branches— ! North Island Main Lines
, , , JNumber' Number' Tons. £ s. d. £ g. d. £ g. d. £ s. d. £ 8. d. £ 8. d. £ g d Number. Number Tons
BrANCHES~Auckland (Coaching) .. 37,555 15,124 165,624 130,362 348,665 19,448 .. .. .. .. 233,576 6 11 22,600 6 9 38,338 14 1112,542 17 6 Cr. 214 9 9 2,256 14 6 309,100 10 10 '
.(Goods) 333 4,154 24,985 378,821 ..
.. .. .. 356,187 13 9 8,001 15 3 364 189 9 0 '*579 '9430 84 7<>5 298 142Central Booking-office .. 2,353 2,797 2,896 6,240 14,286 132 .. ..
.. .. 14,623 16 4 1,344 12 0 .. .. Cr 5 4 6 24 9 6 15 987 13 484,725 298,142 (Goods).
Symonds St. Booking-office 6 63 38 176 283 .. .. .. .. 360 7 6 .. 3 7 6 2 13 2 . 0 6 0 366 14 2"
" " Central Booking-office.Newmarket .. .. 3,336 2,198 28,697 32,623 66,854 11,415 58 14 2,770 5,367 9,341 10 1 2,404 19 4 958 18 4 153 11 10 14,964 3 1 178 14 11 28,001 17 7
*
66"
10 5i,530 19,051 NewZTket '
MountEden .. .. 921 750 18,266 26,202; 46,139 5,322 91 .. 1,101 20,893 5,185 7 6 1,105 7 11 497 17 8 41 17 4 6,193 6 7 275 1 7 13,298 18 7 894 210 48 818 11218 w ,
Avondale .. .. 331 209 24,897 40,032 65,469 54,816 321 .. 892 14,825 4,096 9 0 7,767 4 5 259 11 10 28 6 2 5,219 17 1 40 0 6 17,411 9 0 401 501 I'tfr 7 5 ,Henderson .. .. 388 438 16,510 33,013 50,349 23,137 3,348 14,207 807 6,544 4,660 4 4 4,823 19 2 1,321 4 3 11 11 3 5,801 15 4 44 11 5 16,663 5 9 2,202 6 114 8 148 is'nvi Avondale.Helens ville .. .. 3,112 1,408 15,068 16,909 36,497 243 10,290 53,115 11,158 14,079 7,716 18 11 347 13 0 1,612 11 4 48 17 1 15,578 9 7 345 16 2 25,650 6 1 2,428 17 ()88 k'i2<s 40'009 era.?.n -
WeOsford .. .. 867 313 6,058 3,101 10,339 84 5,203 17,949 415 4,524 3,264 12 2 63 1 4 916 16 2 22 16 8 5,543 0 11 24 10 3 9,834 17 6 1,750 7'860 5 Jig WeUsfordMaungaturoto
.. .. 1,076 574 7,240 6,244 15,134 8 5,977 21,521 84 2,175 4,238 7 1 11 11 6 222 19 5 40 8 11 5,311 0 2 15 6 4 9,839 13 51 306 3,688 1 127 7 698Paparoa .. .. 455 174 1,977 1,316 3,922 6 4,433 13,533 286 3,933 1,422 19 4 5 10 0 164 12 9 13 5 6 4,413 14 10 12 17 2 6,032 19 7 500 2 270 2 002 8 417™,n «aturoto"
Waiotira .. .. 565 331 8,147 5,500 14,543 70 13,573 62,069 8,369 46,662 3,330 8 5 52 10 0 392 14 7 27 17 9 30,346 13 2 2,873 0 0 37,023 3 11 1,239 11,257 2 390 109 108 wJw?™Whangarei.. .. 4,938 2,030 26,549 15,464 48,981 1,360 10,718 33,092 5,292 17,929 22,270 15 2 596 11 3 1,199 19 11 194 5 5 16,539 1 0 302 13 10 41,103 6 7 2,064 11,822 32 119 5->'l3<) ;Hikurangi .. .. 237 218 3,440 2,355 6,250 228 2,155 10,140 14,848 141,404 2,226 18 7 132 11 5 393 12 8 8 16 4 38,369 3 11 309 19 5 41,441 2 4 398 3,160 <(,'759 Hikurfngi
Otiria .. .. 887 278 3,388 1,883 6,436" 16 1,197 7,230 13,713 4,388 3,190 6 7 15 18 2 919 18 0 16 17 10 5,515 6 7 14 13 10 9,673 1 0, 491 2,443 1,491 12 335 Otiri»Kawakawa .. .. 910 451 6,426 2,453 10,240 24 62 251 195 7,253 2,415 11 1 23 10 11 481 6 3 13 9 3 2,463 17 5 24 1 5 5,421 16 4 ! 6,929 43,908 573 5U13 Kawal-awnOpua.. .. .. 1,014 272 7,843 6,566 15,695 51 28 838 355 2,653 3,763 5 3 22 15 5 172 9 0 20 14 10 1,905 5 9 148 14 5 6,033 4 8 4 2,500 4,939 OduhKaikohe .. .. 1,316 560 9,245 7,234 18,355 24 6,556 38,728 2,820 1,299 7,394 9 10 24 0 0 725 9 2 42 6 10 7,535 18 10 187 2 9 15,909 7 5 781 1,006 5,256 10,928 KaikoheRemuera .. .. 810 201 1,523 1,183 3,717 3,971 897 2,773 378 124 136 3 5 1,028 15 2 17 3 1 2 9 3 538 1 5 6 2 4 1,728 14 8 608 475 23,753 2>23 Remuera.Green Lane .. .. 644 336 4,480 7,159 12,619 6,473 48 .. 38 14 540 11 11 1,592 19 11 47 9 9 7 16 4 72 16 11 4 17 3 2,266 12 1 4 .. 2,203 2,564 Green LaneEllershe .. .. 514 467 10,055 10,517 21,553 12,593 831 6 102 130 1,127 8 11 2,645 16 11 103 3 1 4 12 5 3,010 3 11 14 17 11 6,906 3 2 852 1 3,622 1,207 EllersliePenrose .. .. 113 215 6,073 4,869 11,270 5,695 708 5,407 338 118,327 684 2 6 1,003 12 4 212 1 11 8 3 11 49,538 13 10 109 6 2 51,556 0 8 80,400 454,842 7,050 56,194 PenroseOnehunga(Town) .. 28 17 3,684 2,430 6,159 10,588 24 .. 2,895 5,339 365 3 10 1,534 16 11 161 5 5 7 19 5 1,868 7 11 435 15 10 4,373 9 4 17 105 12,590 83,044 Onehunea (TownlOtahuhu .. .. 306 1,113 10,130 18,497 30,046 18,004 2,785 26,330 89 116,339 2,109 5 6 3,457 15 4 193 10 1 31 14 8 55,818 14 3 792 6 0 62,403 5 10 33,989 134,511 14,613 95,807 Otahuhu.Papatoetoe .. .. 230 683 6,885 19,860 27,658 14,694 329 4,137 2,642; 1,392 994 10 5 3,652 2 0 576 8 10 18 18 0 1,370 11 10 12 15 6 6,625 6 7I 1,859 20,345' 10,010 5,495 PavatoetoePapakura
.. .. 1,108 1,570 21,880 43,104 67,662 17,275 2,346 22,659 415 15,320 4,871 5 8 4,451 11 0 705 7 5 39 15 0 4,480 2 1 22 10 7 14,570 11 9 2,843 30,118 5 694 13 102 PanakuraDrury
.. .. 99 165 3,150 4,109 7,523 362 3,310 17,540 921 6,793 1,187 11 4 287 6 11 507 10 1 9 6 9 5,076 8 10 14 12 11 7,082 16 10 411 3,352 2,006 8 422 Drurv 'Waiuku •• •• 208 169 3,944 2,829 7,150 3 7,869 10,783 992 522 1,651 17 11 5 17 10 119 5 2 12 13 4 1,585 0 10 21 3 6 3,395 18 7 1,083 7,647 7,286 31,095 WaiukuPukekohe .. .. 1,023 849 12,615 8,436 22,923 379 8,836 17,634 220 10,393 5,960 15 3 247 8 8 786 9 10 75 5 5 12,735 10 10 34 9 1 19,839 19 1 2,506 7,383 6,913 23,531 Pukekohe.Tuakau .. .. 436 393 5,512 4,786 11,127 375 3,595 52,481 286 4,183 2,449 14 10 271 4 7 1,335 17 1 28 11 11 5,055 9 2 16 14 5 9,157 12 0 1,767 20,232 3,184 12 352 TuakauPokeno •• •• 68 93 2,062 1,519 3,742 104 2,759 12,242 32 537 540 2 5 65 4 8 1,187 12 6 5 0 4 1,051 14 7 10 3 5 2,859 17 11 1,086 7,313 1,054 6,693 Pokeno"Mercer •• •• 253 870 4,601 4,494 10,218j 133 23 4,612 10,568 19,794 2,018 18 7 110 10 1 142 6 0 16 11 8 6,693 4 5 49 3 2 9,030 13 11 153 1,576 1,031 3,641 MercerTe Kauwhata .. .. 169 156 2,880 1,859 5,064 26 7,636 36,287 133 3,974 1,380 19 0 33 7 1 1,283 9 10 13 4 3 5,389 7 4 Id 3 5 8,110 10 11 1,191 10,889 4,142 11,131 Te KaiiwhataHuntly
•• •• 600 570 17,406 18,408 36,984j 20,992 2,526 6,059 1,884 327,487 5,990 9 2 5,121 0 8 428 11 7 55 6 0 210,371 16 9 1,236 8 9 223,203 12 11 1,873 5,412 4,363 18,550 Huntly.Glen Afton .. .. 4 24 2,437 5,659 8,124 54 477 14,867 136 166,445 1,138 7 4 43 16 3 108 14 5 4 11 3 107,286 5 3 122 0 2 108,703 14 8 632 6,854 5,636 10,217 Glen AftonTaupiri .. .. 157 157 3,464 1,381 5,159 36 1,274 16,475 58 2,313 1,095 10 4 42 18 4 94 3 3 10 4 0 4,324 0 4 6 4 7 5,573 0 10 901 3,634 2,601 9,786 TaupiriNgaruawahia
.. .. 440 309 7,340 2,972 11,061 115 2,799 12,777 3,593 64,031 3,190 17 1 96 0 2 260 5 5 62 2 7 43,458 2 10 816 16 1 47,884 4 2 74,149 59,098 3,861 9 057 NearuawahiaFrankton Junction .. 8,453 4,470 56,737 26,905 96,565 181 12,619 106,935 14,992 13,996 42,976 3 0 673 17 4 893 10 9 654 13 7 29,457 15 4 569 17 8 75,225 17 8 9,117 83,506 83,776 41,682 Frankton JunctionHamilton .. .. 3,887 1,945 24,125 13,965 43,922 606 12,908 30,801 2,203 16,574 17,031 5 4 1,514 14 5 3,680 12 7 355 7 3 27,627 12 4 208 14 3 50,418 6 2 1,271 6,349 26,280 29,944 Hamilton.Cambridge ..
.. 490 206 6,695 3,009 10,400 110 8,022 30,397 2,715 1,192 3,005 17 9 75 8 0 1,404 2 8 44 0 2 4,769 11 1 29 15 6 9,328 15 2 2,258 19,605 8,492 32,194 CambridgeMorrinsville .. .. 1,359 614 13,216 9,736 24,925 215 20,597 83,415 5,401 12,112 6,610 18 1 273 3 11 1,043 2 6 140 10 11 26,456 14 7 60 17 4 34,585 7 4 6,010 44,605 18,544 37,200 MorrinsvilleMatamata .. .. 1,216 403 12,288 5,925 19,832 134 17,275 59,335 11,942 4,193 6,650 19 8 109 17 0 2,383 15 6 83 4 5 16,391 6 11 43 2 2 25,662 5 8 2,867 27,041 9,185 45,655 Matamata'
Putararu .. .. 1,171 431 12,084 6,017 19,703 260 3,093 26,143 94,757 4,273 6,947 19 5 379 0 4 1,433 1 10 108 6 6 27,381 9 8 109 14 6 36,359 12 3 3,327 37,788 4,678 32 690 Putaruru'
Mamaku .. .. 98 326 3,212 4,803 8,439 189 817 8,771 148,722 7,468 1,760 4 5 281 3 9 210 0 8 12 12 1 39,721 17 9 8 13 2 41,994 11 10 204 1,007 255 2,416 Mamaku.'Rotorua .. .. 5,098 937 22,247 7,262 35,544 441 1,135 20,478 1,622 5,687 21,502 13 2 506 4 8 1,897 5 3 338 15 10 8,320 13 9 89 4 11 32,654 17 7 2,160 8,075 7,250 25,617 Rotorua.Waitoa .. .. 87 116 3,868 1,770 5,841 56 10,329 17,025 13,512 7,941 1,391 18 10 65 11 6 144 7 5 15 3 3 15,405 2 11 3 15 8 17,025 19 7 1,160 4,902 7,538 29,649 Waitoa.Te Aroha .. .. 1,513 606 13,476 6,680 22,275 75 1,908 6,118 109 18,764 6,674 19 11 58 13 7 422 12 3 103 9 6 6,876 0 0 37 13 1 14,173 8 4 2,222 10,214 9,802 15 514 Te Aroha.Paeroa .. .. 1,329 568 17,132 10,590 29,619 268 15,874 27,687 5,674 5,952 6,614 3 6 150 8 6 1,407 4 11 85 10 1 10,623 13 9 62 19 0 18,943 19 9 2,472 6 883 7,403 14 799 PaeroaThames South .. 864 252 7,193 2,835 11,144 307 112 .. 67 2,215 3,214 14 2 351 12 11 330 0 5 52 1 5 5,665 7 4 11 15 5 9,625 11 8l 303 177 2,751 2',653 Thames SouthThames .. .. 338 123 5,336 3,061 8,858 6 76 921 651 3,319 2,067 19 3 24 2 4 288 6 9 19 12 0 2,340 8 9 23 16 0 4,764 5 1 1,166 4,971 2,821 7,964 Thames.Waihi .. .. 765 405 6,410 6,399 13,979 163 2,566 5,284 265 999 4,056 9 0 119 16 7 440 7 9 63 11 2 2,085 18 6 208 13 6 6,974 16 61 1,283 6,317 5,850 25,586 Waihi.Katikati .. .. 115 35 1,621 1,160 2,93l' 7 3,985 5,439 255 2,928 778 18 10 10 17 6 129 5 8 9 12 11 3,399 18 9' 111 4,329 14 9 297 3.795 1,553 4 461 Katikati.Tauranga .. .. 1,661 449 14,556 5,972 22,638 53 612 7,670 1,135 9,194 7,964 5 10 126 15 2 363 5 11 92 10 10 11,417 8 10 276 3 1 20,240 9 8 1,317 6,229 2,692 12 847 TaurantraTe Puke .. .. 460 126 5,044 2,482 8,112 3 6,498 26,429j 3,331 4,325 2,201 12 8 2 6 3 263 1 5 19 6 9 9,212 3 11 55 16 6 11,754 7 6 1,714 6,027 2,139 10 075 Te PukeMatata .. .. 92 23 2,127 1,488 3,730 4 12,791 71,137> 3,610 10,028 1,147 16 2 3 0 0 315 15 5 7 13 10 20,049 4 4 9 10 2 21,532 19 11 1,063 2,249 344 Matata.Taneatua .. .. 590 183 8,123 4,280 13,176| 1 2,815 33,404| 100 14,163 4,809 10 8 1 0 0 140 8 3 23 12 6 5,428 18 0 88 9 7 10,491 19 0 2,391 1,692 4,577 12,3871 Taneatua.
Ohaupo .. .. 39 132 1,221 850 2,242 181 1,824 21,228 20 562 449 16 7 146 14 0 623 7 5 5 13 7 2,343 8 7 15 17 11 3,584 18 1 1,577 10,969 2,099 10,791 OhauDoTe Awamutu .. .. 1,271 700 11,338, 7,410 20,719 240 12,327 61,656 516 14,770 7,639 0 2 254 13 1 1,530 18 6 120 17 2 17,818 5 5 61 8 5 27,425 2 9 4,029 32,925 16,290 35,631 Te AwainutuOtorohanga .. .. 618 327 7,474 4,658 13,077 52 5,477 35,563 27,252 39,001 3,735 19 6 36 17 3 1,041 12 11 56 7 11 23,119 5 9 87 10 6 28,077 13 10 2,014 14,078 5,961 23,364 Otorohan^aTe Kuiti .. .. 2,865 1,414 26,348 20,506 51,133 667 7,393 89,073 104,400 24,947 15,078 11 7 560 13 9 1,783 14 6 231 6 0 43,992 13 0 325 18 0 61,972 16 10 3,795 50,030 9,992 20,989 TeKuitiOngarue .. .. 275 294 6,434 7,831 14,834 99 762 27,497 120,778 6,385 3,597 19 6 95 10 6 203 15 1 20 10 11 39,067 15 8 245 3 9 43,230 15 5 1,017 6,309 1,007 8,635 Ongarue."Okahukura .. .. 245 90 5,695 3,349 9,379 64 1,500 21,703 11,205 2,106 1,050 5 8 61 4 8 304 6 11 9 14 10 7,377 9 8 1,723 8 7 10,526 10 4 884 6,944 10,570 19,011 OkahukuraTaumarunui .. .. 3,217 2,325 33,072 18,235 56,849 618 3,674 54,947 94,183 26,065 19,700 7 2 721 8 11 1,171 0 10 321 10 10 47,379 0 9 346 0 8 69,639 9 2 1,915 19,091 5,297 13.9(H) TaumarunuiNational Park .. .. 394 209 4,864 3,858 9,325 44 696 12,149 112,173 7,649 2,960 3 4 18 17 1 295 11 6 29 16 0 39,841 4 8 16 2 5 43,161 15 0 467 4,081 5,486 8,983 National ParkOhakune .. .. 1,733 1,701 16,540 11,312 31,286 86 195 6,270 101,184 13,363 11,133 1 0 228 2 5 469 13 1 136 2 4 36,192 18 6 117 8 8 48,277 6 0 201 1,184 9,670 3,375 Ohakune.Raetihi .. .. 135 73 2,408 838 3,454 1 1,062 62,984 35,510 2,796 862 6 11 2 19 8 269 5 4 13 5 9 15,306 8 6 9 10 7 16,463 16 9 1,402 21,786 1,057 4,767 Raetihi.Rangata.ua 221 334 4,655 4,301 9,511 26 380 12,918 54,662 4,096 2,098 8 6 19 6 7 104 15 0 13 19 3 17,172 16 6 331 16 10 19,741 2 8 412 2,011 185 2,461 RaneatauaMataroa .. .. 230 96 1,839 2,279 4,444 102 1,917 65,664 43,017 4,671 558 15 4 75 11 0 242 11 7 9 10 7 19,912 12 9 57 7 1H 20,856 9 2 2,689 8,448 1,353 5,153 MataroaTaihape .. .. 3,167 1,812 14,462 7,072 26,513 79 2,440 98,346j 10,267 3,446 13,285 9 10 163 8 10 894 7 4 207 9 5 13,413 13 10 61 12 F 28,026 1 6 826 7,226 1,454 13,920 TaihaneUtiku .. .. 166 282 1,444 1,085 2,977 5 1,852 42,410 18,620 3,799 497 3 2 3 8 9 35 16 7 7 13 5 11,972 5 8 6 15 11 12,523 3 6 221 1,239 218 1,922 Utiku.Mangaweka .. .. 488 278 2,979 2,715 6,460 8 918 67,580 2,696 1,109 1,750 9 7 7 2 5 199 5 2 21 13 4 4,662 16 0 8 14 5 6,650 0 11 654 7,818 423 4,488 Mangaweka.Hunterville .. .. 771 418 6,347 2,642 10,178 70 3,732 127,754 78 2,306 2,863 18 10 70 2 8 462 13 11 50 4 9 10,230 6 0 18 2 11 13,695 9 1 1,210 21,090 2,511 10,567 HunterviUe.
Marton .. .. 4,565 2,316 14,810 8,502 30,193 179 3.224 165,646 15,235 7,882 15,453 14 8 178 12 8 915 17 3 452 14 (1 18,129 6 3 498 19 1 35,629 4 8*
1,772 60,976 11,397 16,476 MartonNew Plymouth.. 3,330 1,080 21,697| 9,778 35.885 300 1,163 1,769 4,949 111,423 19,692 10 6 627 9 4 1,471 8 8 229 3 9 48,348 19 7 5,285 1 6 75,654 13 4 2,444 24,949 29,43" 95 957 New Plymouth
New Plym'th (Breakwater).. .. .. .. .. .. .. .. 3,118 53,544 .. .. ..
.. 14,605 11 2 .. 14,605 11 2 1,854 28,739 N.P (BreakwaterWaitara .. .. 325 214 5,402: 3,468 9,409 257 309 1,532 729 12,915 2,182 8 6 168 13 0 148 4 3 23 7 7 7,802 19 0 190 7 4 10,515 19 8 30,103 114,626 3,920 16,798 WaitaraInglewood .. .. 401 179 6,105 3,633 10,318 246 9,411 33,287 1,957 26,628 2.200 8 11 268 11 2 197 5 3 24 18 7 17,607 16 4 15 9 1 20,314 9 4 688 6,743 2,156 29,576 Inglewood.
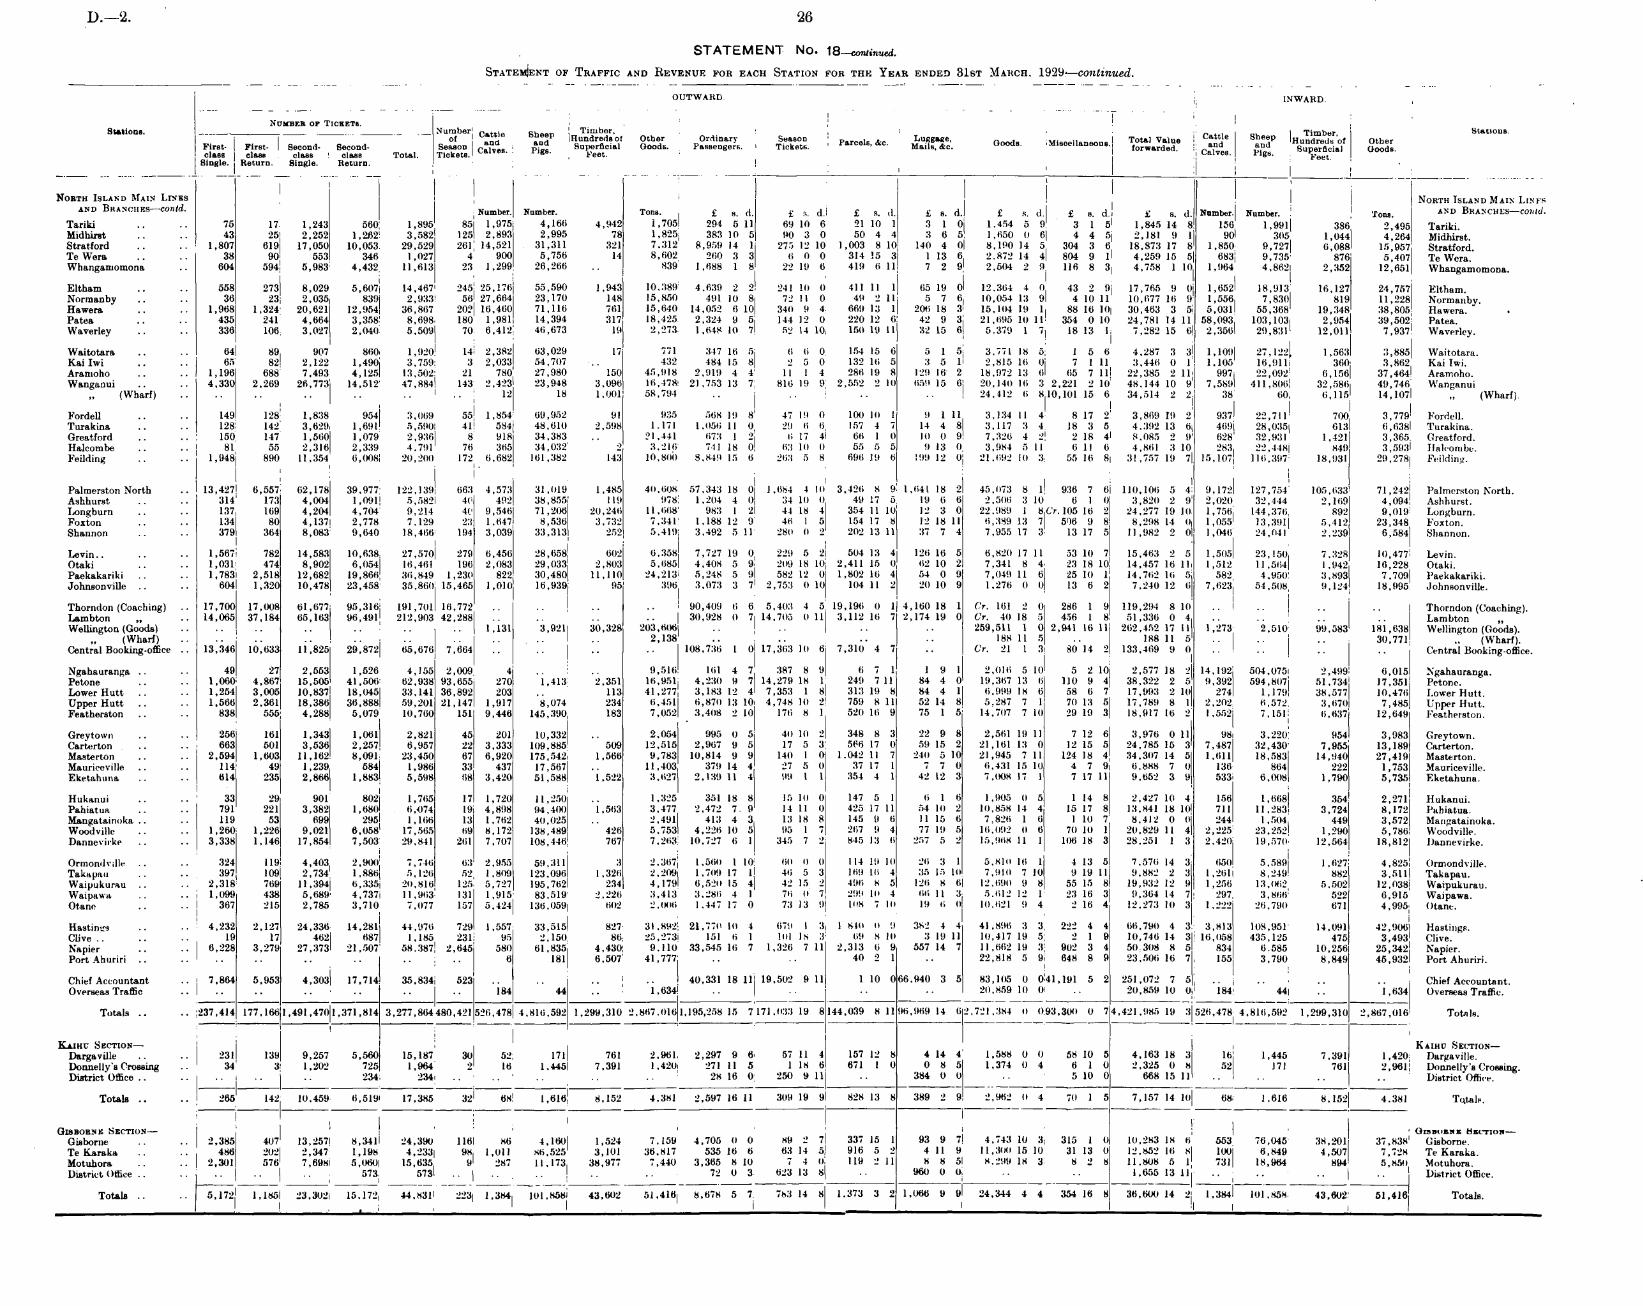
D.—'2. 26
STATEMENT No. 18—continued.Statement of Traffic and Revenue for each Station for the Year ended 31st March. 1929—continued.
OUTWARD. INWARD., *
Number op Tickets.Stations. - Number sh . on Timber, Timber. Stations.
of ,Hundredsof Other Ordinary Season n.,..,..,], «... Luggage, , ..._ Total Value Cattle Sheep Hundreds of other
First- First- Second- Second- Season Calves pie g Superficial Goods. Passengers. Tickets. Pa oels ' &0 ' Mails, &c. Goods. Miscellaneous. forwarded. ,,
and and Superficial Goodsclass class class class Total. TicketB. Lalves ' tlgs' Feet. Calves. Pigs, eetSingle. Return. Single. J Return.- -
North Island Main Lines North Island Main Linesand Branches contd. Number. Number. Tons. £ s. d. £ s. d. £ s. d. £ s. d. £ s. d. £ s. d. £ s. d. Number. Number. Tons. AND Branches—conld.
Tariki .. .. 75 17 1,243 560 1,895 85 1,975 4,166 4,942 1,705; 294 5 11 69 10 6 21 10 1 3 1 0 1.454 5 9 3 1 5 1,845 14 8 156 1,991 386 2 495 TarikiMidhirst .. .. 43 25 2,252 1,262! 3,582 125 2,893 2,995 78 1,825 383 10 5 90 3 0 50 4 4 3 6 5 1,650 0 6 4 4 5 2,181 9 1 90 305 1,044 4,264 MidhirstStratford .. .. 1,807 619 17,050 10,053 29,529 261 14,521 31,311 321 7.312 8,959 14 1 275 12 10 1,003 8 10 140 4 0 8,190 14 5 304 3 6 18,873 17 8 1,850 9,727 6,088 15,957 StratfordTeWera .. .. 38 90 553 346 1,027 4 900 5,756 14 8,602 260 3 3 6 0 0 314 15 3 1 13 6 2.872 14 4 804 9 1 4,259 15 5 683 9,735 876 5,407 Te WeraWhangamomona .. 604 594 5,983 4,432! 11,613 23 1,299 26,266 ..
839 1,688 1 8 22 19 6 419 6 11 7 2 9 2,504 2 9 116 8 3 4,758 1 10 1,964 4,862 2,352 12,651 Whangamomona.
Eltham .. .. 558 273 8,029 5,607 14,467 245 25,176 55,590 1,943 10,389 4,639 2 2 241 10 0 411 11 1 65 19 0 12.364 4 0 43 2 9 17,765 9 0 1,652 18,913 16,127 24,757 ElthamNormanby .. .. 36 23 2,035 839 2,933 56 27,664 23,170 148 15,850 491 10 8 72 11 0; 49 2 11 5 7 6 10,054 13 9 4 10 11 10,677 16 9 1,556 7,830 819 11,228 NormanbyHawera .. .. 1,968 1,324 20,621 12,954! 36,867 202 16,460 71,116 761 15,640 14,052 6 10 340 9 4 669 13 1 206 18 3 15,104 19 1 88 16 10 30,463 3 5 5,031 55,368 19,348 38,805 Hawera.Patea .. .. 435 241 4,664 3,358 8,698 180 1,981 14,394 317 18,425 2,324 9 5 144 12 0 220 12 6 42 9 3 21,695 10 11 354 0 10 24,781 14 11 58,093 103,103 2,954 39,502 Patea.Waverley .. .. 336 106 3,027 2,040 5,509 70 6,412 46,673 19 2,273 1,648 10 7 52 14 10 150 19 11 32 15 6 5,379 1 7 18 13 1 7,282 15 6 2,356 29,831 12,011 7,937 Waverley.
Waitotara .. .. 64 89 907 860 1,920 14 2,382 63,029 17 771 347 16 5 6 6 0 154 15 6 5 1 5 3,771 18 5 1 5 6 4,287 3 3 1,109 27,122 1,563 3,885 Waitotara.Kailwi .. .. 65 82 2,122 1,490 3,759 3 2,033 54,707 ... 432 484 15 8 2 5 0 132 16 5 3 5 1 2,815 16 0 7 1 11 3,446 0 1 1,105 16,911 360 3,862 Kai Iwi.Aramoho .. .. 1,196 688 7,493 4,125 13,502 21 780 27,980 150 45,918 2,919 4 4 11 1 4 286 19 8 129 16' 2 18,972 13 6 65 7 11 22,385 2 11 997 22,092 6,156 37,464 Aramoho.Wangamii .. .. 4,330 2,269 26,773 14,512 47,884 143 2,423 23,948 3,096 16,478 21,753 13 7 816 19 9 2,552 2 10 659 15 6 20,140 16 3 2,221 2 10 48.144 10 9 7,589 411,806 32,586 49,746 Wanganui
(Wharf).. .. .. .. 12 18 1,001 58,794
.. .... .. 24,412 6 810,101 15 6 34,514 2 2 38 60 6,115 14,107 „ (Wharf).
Fordell .. .. 149 128 1,838 954 3,069 55 1,854 69,952 91 935 568 19 8 47 19 0 100 10 1 9 1 11 3,134 11 4 8 17 2 3,869 19 2 937 22,711 700 3,779 Fordell.Turakina ..
.. 128 142 3,629 1,691 5,590 41 584 48,610! 2,598 1,171 1,056 11 0 29 6 6 157 4 7 14 4 8 3,117 3 4 18 3 5 4,392 13 6 469 28,035 613 6,638 Turakina.Greatford .. .. 150 147 1,560 1,079 2,936 8 918 34,383 .. 21,441 673 1 2 6 17 41 66 1 0 10 0 9 7,326 4 2 2 18 4 8.085 2 9! 628 32,931 1,421 3,365 Greatford.Halcombe .. .. 81 55 2,316 2,339i 4,791 76 365 34,032 2 3,2161 741 18 0 63 10 0 55 5 5 9 13 0 3,984 5 11 6 11 6 4,861 3 10 283 22,448 849 3,593 Halcombe.Feilding .. .. 1,948 890 11,354 6,0081 20,200 172 6,682 161,382 143 10,800! 8,849 15 6 263 5 8 696 19 6 199 12 0 21,692 10 3 55 16 8 31,757 19 7 15,107 116,397 18,931 29,278 Feilding.
Palmerston North .. 13,427 6,557 62,178 39,977! 122,139 663 4,573 31,019 1,485 40,608! 57,343 18 0 1,684 4 10! 3,426 8 9 1,641 18 2 45,073 8 1 936 7 6| 110,106 5 4! 9,172 127,754 105,633 71,242 Palmerston North.Ashhurst .. 314 173 4,004 1,091 5,582 40 492 38,855 119 978 1,204 4 0 34 10 0 49 17 5 19 6 6 2,506 3 10 6 1 0 3,820 2 9j 2,020, 32,444 2,169 4,094 Ashhurst.Longburn .. .. 137 169 4,204 4,704 9,214 40 9,546 71,206 20,246 11,668 983 1 2 44 18 4 354 11 10 12 3 0 22,989 1 8CV.105 16 2 24,277 19 10 1,756 144,376 892 9,019 Longburn.Foxton ..
.. 134 80 4,137 2,778 7,129 23 1,647 8,536 3,732 7,341 1,188 12 9 46 1 5 154 17 8 12 18 11 6,389 13 7 506 9 8 8,298 14 0 1,055 13,391 5,412 23,348 Foxton.Shannon ..
.. 379! 364 8,083 9,640 18.466 194 3,039 33,313 252 5,419 3,492 5 11 280 0 2 202 13 11 37 7 4 7,955 17 3 13 17 5 11,982 2 0 1,046 24,041 2,239 6,584 Shannon.
Levin.. .. .. 1,567 782 14,583 10,638 27,570 279 6,456 28,658 602 6,358 7,727 19 0 229 5 2 504 13 4 126 16 5 6,820 17 11 53 10 7 15,463 2 5 1,505 23,150 7,328 10,477 Levin.Otaki ..
.. 1,031 474 8,902 6,054 16.461 196 2,083 29,033 2,803 5,685 4,408 5 9 209 18 10 2,41115 0 62 10 2 7,341 8 4 23 18 10 14,457 16 11 1,512 11,564 1,942 16,228 Otaki.Paekakariki .. .. 1,783 2,518 12,682 19,866 36,849 1,230 822 30,480 11,110 24,213 5,248 5 9 582 12 0 1,802 16 4 54 0 9 7,049 11 6 25 10 1 14,762 16 5 582 4.950 3,893 7,709 Paekakariki.Johnsonville .. .. 604 1,320 10,478 23,458 35,860 15,465 1,010 16,939 95 396 3,073 3 7 2,753 0 10 104 11 2 20 10 9 1,276 0 0 13 6 2 7,240 12 6 7,623 54,508 9,124 18,995 Johnsonville.
Thorndon (Coaching) .. 17,700 17,008 61,677 95,316 191,701 16,772 .... .. .. 90,409 6 6 5,403 4 5 19,196 0 1 4,160 18 1 Cr. 161 2 0 286 1 9 119,294 8 10 ..
.. .. .. Thorndon (Coaching).Lambton „
.. 14,065 37,184 65,163 96,491 212,903 42,288 .. .. .. .. 30,928 0 7 14,705 0 11 3,112 16 7 2,174 19 0 Cr. 40 18 5 456 1 8 51,336 0 4.. .. .. .. LambtonWellington (Goods)
.. .. .. .. 1,131 3,921 30,328 203,606 .. .. .. .. 259,511 1 0 2,941 16 11 262,452 17 11 1,273 2,510 99,583 181,638 Wellington (Goods).(Wharf) .. .. .. .. ..
... .. 2,138 .. .. .. .. 188 11 5 .. 188 11 5 .. .. .. 30,771 „ (Wharf).
Central Booking-office .. 13,346 10,633 11,825 29,872 65,676 7,664 .. .... .. 108,736 1 0 17,363 10 6 7,310 4 7 .. Cr. 21 1 3 80 14 2 133,469 9 0.. .. .. .. Central Booking-office.
Ngahauranga .... 49 27 2,553 1,526 4,155 2,009 4 .. ..
9,516 161 4 7 387 8 9 6 7 1 1 9 1 2,016 5 10 5 2 10 2,577 18 2 14,192 504,075 2,499 6,015 Ngahauranga.Petone .. .. 1,060 4,867 15,505 41,506 62,938 93,655 270 1,413 2,351 16,951 4,230 9 7 14,279 18 1 249 7 11 84 4 0 19,367 13 6 110 9 4 38,322 2 5 9,392 594,807 51,734 17,351 Petone.Lower Hutt .. .. 1,254 3,005 10,837 18,045 33.141 36,892 203 .. 113 41,277 3,183 12 4 7,353 1 8 313 19 8 84 4 1 6,999 18 6 58 6 7 17,993 2 10 274 1,179 38,577 10,476 Lower Hutt.UpperHutt .. .. 1,566 2,361 18,386 36,888 59,201 21,147 1,917 8,074 234 6,451 6,870 13 10 4,748 10 2 759 8 11 52 14 8 5,287 7 1 70 13 5 17,789 8 1 2,202 6,572 3,670 7,485 Upper Hutt.Featherston .. .. 838 555 4,288 5,079 10,760 151 9,446 145,390 183 7,052 3,408 2 10 176 8 1 520 16 9 75 1 5 14,707 7 10 29 19 3 18,917 16 2 1,552 7,151; 6,637 12,649 Featherston.
Greytown .... 256 161 1,343 1,061 2,821 45 201 10,332 ..
2,054 995 0 5 40 10 2 348 8 3 22 9 8 2,561 19 11 7 12 6 3,976 0 11 98 3,220 954 3,983 Greytown.Carterton .. ..
663 501 3,536 2,257 6,957 22 3,333 109,885 509 12,515 2,967 9 5 17 5 3 566 17 0 59 15 2 21,161 13 0 12 15 5 24,785 15 3 7,487 32,430 7,955 13,189 Carterton.Masterton ..
.. 2,594 1,603 11,162 8,091 23,450 67 6,920 175,542 1,566 9,783 10,814 9 9 140 1 0 1,042 11 7 240 5 10 21,945 7 11 124 18 4 34,307 14 5 1,611 18,583 14,940 27,419 Masterton.MauriceviUe .. .. 114 49 1,239 584 1,986 33 437 17,567 ..
11,403 379 14 4 27 5 0 37 17 1 7 7 0 6,431 15 10 4 7 9 6,888 7 0 136 864 222 1,753 Mauriceville.Eketahuna .. .. 614 235 2,866 1,883 5,598 68 3,420 51,588 1,522 3,627 2,139 11 4 99 1 1 354 4 1 42 12 3 7,008 17 1 7 17 11 9,652 3 9 533 6,008 1,790 5,735 Eketahuna.
Hukanui .... 33 29 901 802 1,765 17 1,720 11,250 .. 1,325 351 18 8 15 10 0 147 5 1 6 1 6 1,905 0 5 1 14 8 2,427 10 4 156 1,668 354 2,271 Hukanui.
Pahiatua .... 791 221 3,382 1,680 , 6,074 19 4,898 94,400 1,563 3,477 2,472 7. 9 14 11 0 425 17 11 54 10 2 10,858 14 4 15 17 8 13,841 18 10 711 11,283 3,724 8,172 Pabiatua.
Mangatainoka .. .. 119 53 699 295 1,166 13 1,762 40,025 ..2,491 413 4 3 13 18 8 145 9 6 11 15 6 7,826 1 6 1 10 7 8,412 0 0 244 1,504 449 3,572 Mangatainoka.
Woodville .. .. 1,260 1,226 9,021 6,058 17,565 69 8,172 138,489 426 5,753 4,226 10 5 95 1 7 267 9 4 77 19 5 16,092 0 6 70 10 1 20,829 11 4 2,225 23,252 1,290 5,786 Woodville.Dannevirke .. .. 3,338 1,146 17,854 7,503 29,841 261 7,707 108,446 767 7,263 10,727 6 1 345 7 2 845 13 6 257 5 2 15,968 11 1 106 18 3 28,251 1 3 2,420 19,570 12,564 18,812 Dannevirke.
Ormondville .. .. 324 119 4,403 2,900 7,746 63 2,955 59,311 3 2,367 1,560 1 10 60 0 0 114 19 10 26 3 1 5,810 16 1 4 13 5 7,576 14 3 650 5,589 1,627 4,825 Ormondville.Takapau .. .. 397 109 2,734 1,886 5,126 52 1,809 123,096 1,326 2,209 1,709 17 1 46 5 3 169 16 4 35 15 10 7,910 7 10 9 19 11 9,882 2 3 1,261 8,249 882 3,511 Takapau.Waipukurau .. .. 2,318 769 11,394 6,335 20,816 125 5,727 195,762 234 4,179 6,520 15 4 42 15 2 496 8 5 126 8 6 12,690 9 8 55 15 8 19,932 12 9| 1,256 13,062 5,502 12,038 Waipukurau.Waipawa .. .. 1,099 438 5,689 4,737 11,963: 131 1,915 83,519 2,226| 3,413 3,286 4 1] 76 0 7 299 10 4 66 11 3 5,612 12 1 23 16 3 9,364 14 7| 297 3,866 522 6,915' Waipawa.Otane .. .. 367 215 2,785! 3,710 7,077 157 5,424 136,059 602 2,006 1,447 17 0 73 13 9 108 7 10 19 6 0 10,621 9 4 2 16 4 12,273 10 3 1,222 26,790 671 4,995| Otant.
IHastings .. .. 4,232 2,127 24,336 14,281 44,976 729 1,557 33,515 827 31,892 21,770 10 4 679 1 3 1,840 0 9 382 4 4 41,896 3 3 222 4 4 66,790 4 3 3,813 108,951 14,091 42,906 Hastings.Clive.. .. .. 19 17 462 687 1,185 231 95 2,150 86 25,273 151 6 1 101 18 3 69 8 10 3 19 11 10,417 19 5 2 1 9 10,746 14 3 16,058 435,1251 475 3,493 Clive.Napier .. .. 6,228 3,279 27,373 21,507 58.387 2,645 580 61,835 4,430; 9,110 33,545 16 7 1,326 7 11 2,313 6 9 557 14 7 11,662 19 3 902 3 4 50,308 8 5 834 6.585! 10,256 25,342 Napier.Port Ahuriri ..
.. .. .. .. 6 181 6,507| 41,777 .... 40 2 1 .. 22,818 5 9 648 8 9 23,506 16 7 155 3,790 8,849 45,932 Port Ahuriri.
Chief Accountant .. 7,864 5,953 4,303 17,714 35,834 523 .. .. .. .. 40,331 18 11 19,502 9 11 1 10 0 66,940 3 5 83,105 0 0 41,191 5 2 251,072 7 5.. .. .. .. Chief Accountant.Overseas Traffic .• •» .. .. •• .. .. 184 44 .. 1,634 ..
.. •• .. 20,859 10 0| .. - 20,859 10 0 184 44 1,634 Overseas Traffic.
Totals .... 237,414 177,1661,491,4701,371,814 3,277,864480,421526,478 4,816,592 1,299,310| 2,867,0161,195,258 15 7171,033 19 8144,039 8 1196,969 14 62,721,384 0 o|93,300 0 74,421,985 19 3 526,478 4,816,592 1,299,310 2,867,016 Totals.
Kaiku Suction— Kaihu Section—Dargaville .. .. 231 139 9,257 5,560 15,187 30 52 171 761 2,961 2,297 9 6 57 11 4 157 12 8 4 14 4 1,588 0 0 58 10 5 4,163 18 :i 16 1,445 7,391 1,420 Dargaville.Donnelly's Crossing .. 34 3 1,202 725 1,964 2 16 1,445 7,391 1,420 271 11 5 1 18 6 671 1 0 0 8 5 1,374 0 4 6 1 0 2,325 0 * 52 171 761 2,961 Donnelly's Crossing.District Office .. 234 234 .. .. .. .. .. 28 16 0; 250 9 11 .. 384 0 0 .. 5 10 0 668 15 11
.. .. .. District Office.
Totals .. .. 265 142 10,459j 6,519 17,385 32 68 1,616 8,152 4,381 2,597 16 11 309 19 9 828 13 8 389 2 9 2,962 0 4 70 1 5 7,157 14 10 68| 1,616 8,152 4,38l' Totals.
Gisborne Section— Gismorthjc Bbctiow—Gisborne .. .. 2,385 407 13,257 8,341 24,390 116 86 4,160 1,524 7,159 4,705 0 0 89 2 7 337 15 1 93 9 7 4,743 10 3 315 1 0 10,283 18 ti 553 76,045 38,201 37.S3S Gisborne.Te Karaka .. .. 486 202 2,347 1,198 4,233 98 1,011 86,525 3,101 36,817 535 16 6 63 14 5 916 5 2 4 11 9 11,300 15 10 31 13 0 12,852 16 8 100 6,849 4,507 7,728 Te Karaka.Motuhora .. .. 2,301 576 7,698 5,060 15,635 9 2*7 11,173 38,977 7,440 3,365 8 1(1 7 4 0 119 2 11 8 8 5 8,299 18 3 8 2 8 11,808 5 1 731 18,964 894 5,850 Motuhora.District Office .. ..
.. .... 573 573 .. .. .. ..
.. 72 0 3 623 13 8 .. 960 0 0 .. .. 1,655 13 11 .. .. .. ,. District Office.
Totals .. .. 5,172 1,185 23,302| 15.172 44,831 223 1,384 101,8581 43,602 51,416 8,678 5 7 783 14 8 1.373 3 2 1,066 9 9 24,344 4 4 354 16 8 36,600 14 2 1,384 101,858 43,602 51,416 Totals.J !
,! 1 —
! ! !
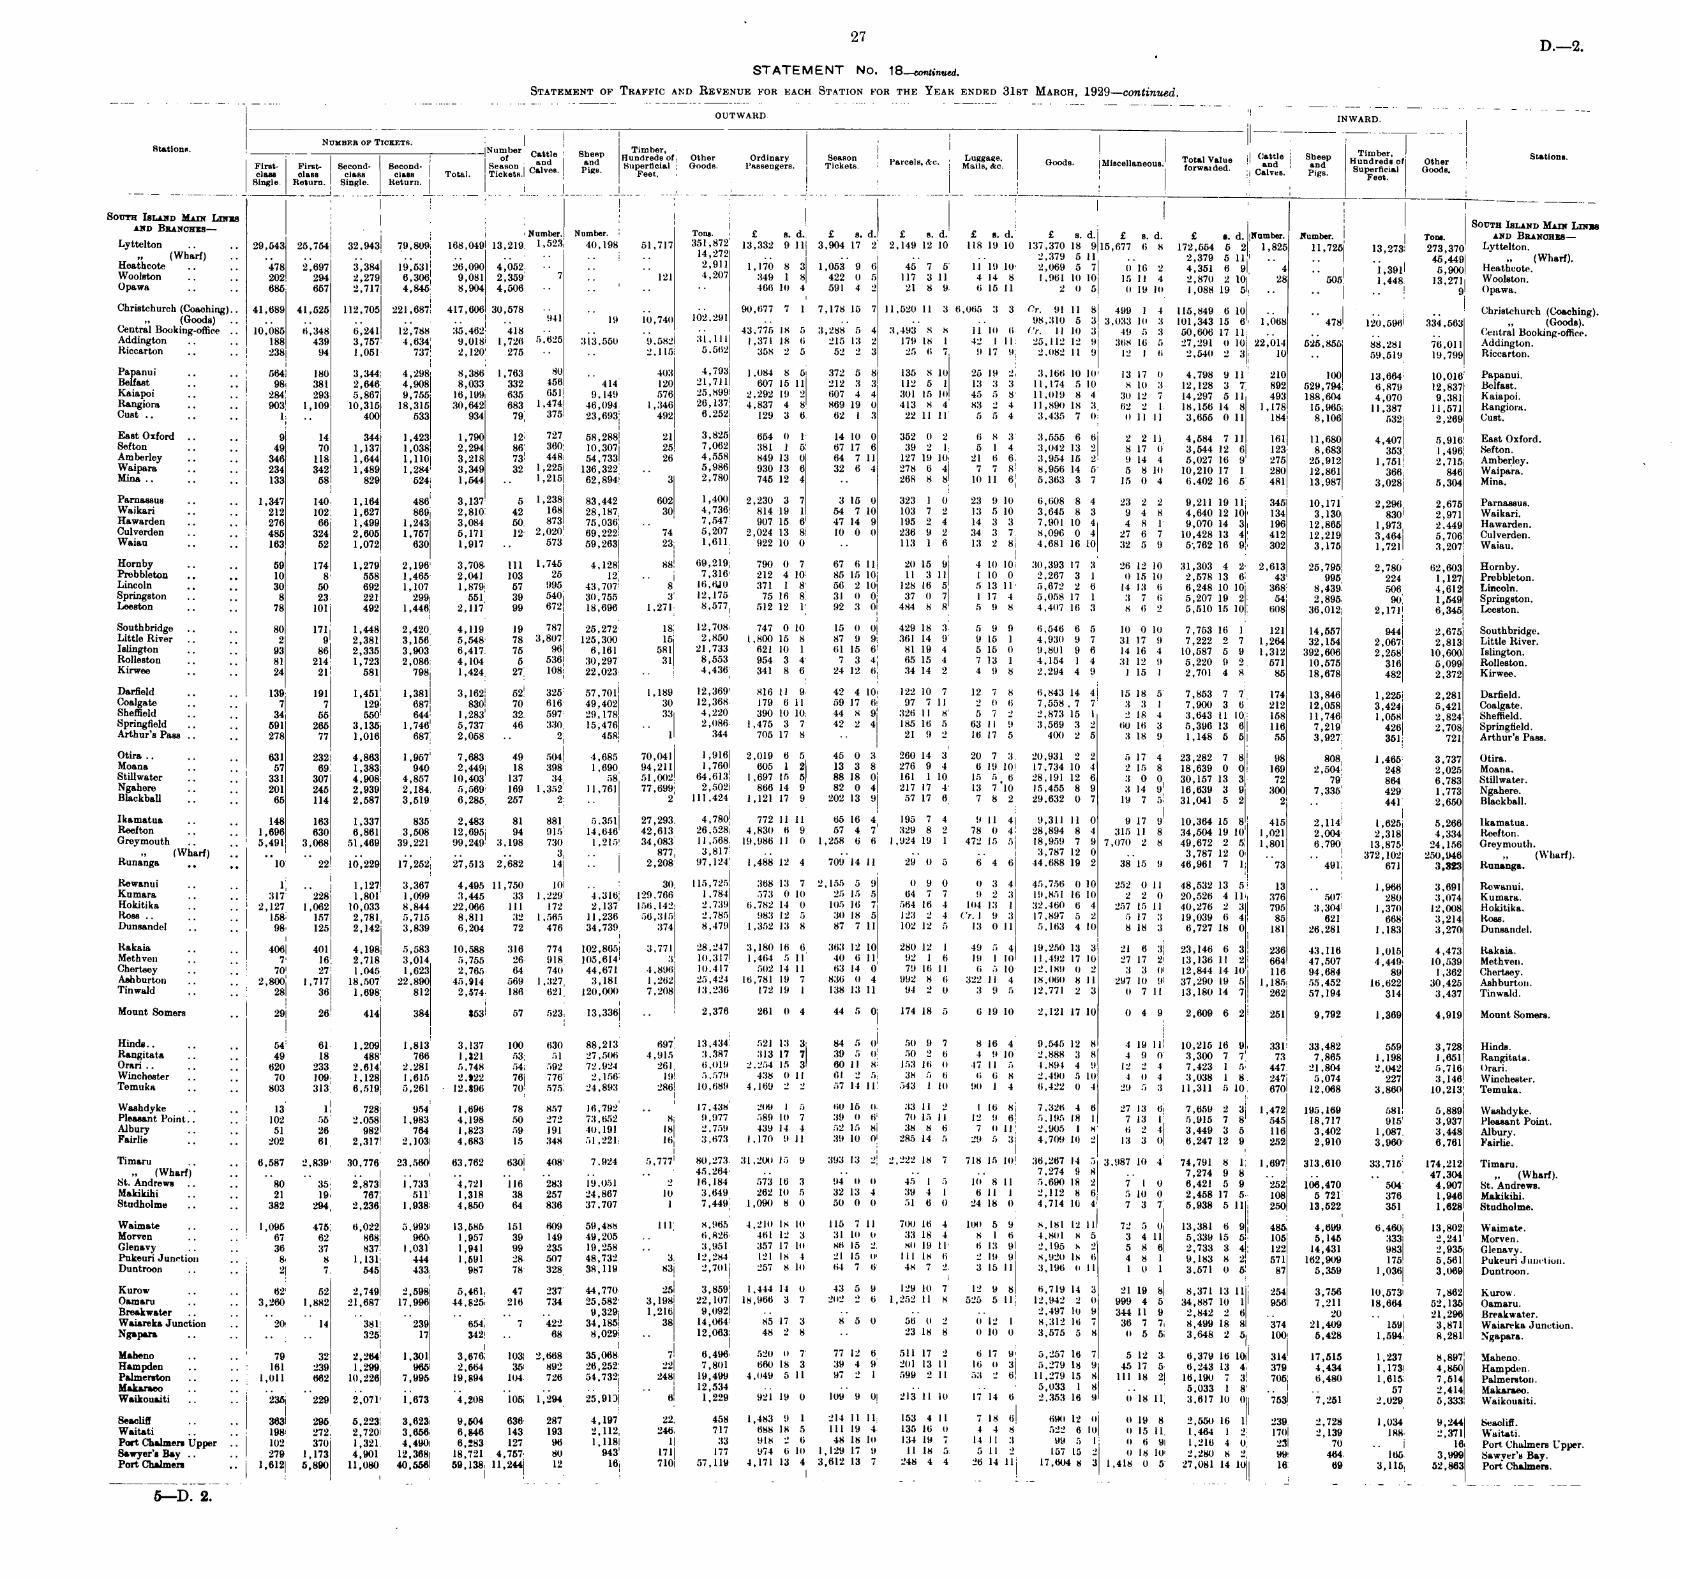
27 D.—2STATEMENT No. 18—continued.
Statement of Traffic and Revenue for each Station for the Year ended 31st March, 1929—continued.
5—D. 2.
OUTWARD. INWARD.
Number op Tickets.Stations. Number| p ... BVlootl Timber,
_ Timber°f o«?i o«/i Hundreds of Other Ordinary Season T>ov«oia Mm Luggage, vr. „ Total Value Cattle Sheep HnnHMdsnf n«-v.«v Stations.First- First- Second- Second- Season r ., Pi„ R
Superficial Goods. Passengers. Tickets. * * Mails, <tec. Goods. Miscellaneous. forwaided. r-aind
™
nd Superficial Goodsclass class class class Total. Tickets. oalves - Feet Calves. Pigs. plet wooa8-
Single. Return. Single. Return.
South Island Main Lines 0 t
and Branches south Island Main LinesNumber. Number. Tons. £ s. d. £ s. d. £ s. d. £ s. d. £ s. d. £ s. d. £ s. d. Number. Number. Tons and Branches—
Lyttelton..
.. 29,543 25,7541 32,943 79,809 168,049 13,219 1.523 40,198 51,717 351,872 13,332 9 11 3,904 17 2 2,149 12 10 118 19 10 137,370 18 9 15,677 6 8 172,554 5 2 1,825 11,725 13 273 273 370 Lyttelton.,, (Wharf) .. .. .. | ••
.. ..14,272
.. .. .. .. 2,379 5 11.. 2,379 5 11! .. 45'449 .. (Wharf).Heathcote .. .. 478 2,697 3,384 19,531 26,090 4,052 ••
.. ..2,911 1,170 8 3 1,053 9 6 45 7 5 11 19 10s 2,069 5 7 0 16 2 4,351 6 9 4 1 391 5 900 Heathcote
Woolston .... 202 294 2,279 6,306 9,081 2,359( 7
.. 121 4,207 349 1 g 422 0 5 117 3 11 4 14 8j 1,961 10 10 15 11 4 2,870 2 10 ! 28 505 l'448 13'271 Woolston.Opawa .... 685 657 2,717 4,845 8,904 4,5061 ••
....
•• 466 10 4 591 4 2 21 8 9 6 15 11 2 0 5 0 19 10: 1,088 19 5j .. .. '9 Opawa.
Christchurch (Coaching).. 41,689 41,525 112,705 221,687 417,606 30,578 .. i ..
•• 90,677 7 1 7,178 15 7 11,520 11 3 6,065 3 3 Gr. 91 11 8 499 1 4 1 115,849 6 10 ....
Christchurch (Coaching).(Goods) .. .. .. ..
941 19 10,740 102,291.. .. .. .. 98,310 5 3 3,033 10 3! 101,343 15 6 1,068 478 120,596 334,563 „ (Goods).Central Booking-office .. 10,085 6,348 6,241 12,788 35,462 418 ••
.. ..
•• 43,775 18 5 3,288 5 4 3,493 8 8 11 10 6 Gr. 11 10 3 49 5 3l 50,606 17 11 .. Central Booking-officeAddington .. .. 188 439 3,757 4,634 9,018 1,726 5,625 313,550 9,582 31,111 1,371 18 6 215 13 2 179 18 I 42 111 25,112 12 9 368 16 5 27,291 0 10 22,014 525 855 88 281 76 011 Addington.Riccarton ..
.. 238 94 1,051 737 2,120 275 ••
.. 2,115 5,562 358 2 5 52 2 3 25 6 7 9 17 9 2,082 11 9 12 I 6 2,540 2 3 10..
Riccarton.Papanui ..
.. 564 180 3,344 4,298 8,386 1,763 80.. 403 4,793 1,084 8 5 372 5 8 135 8 10 25 19 2\ 3,166 10 10 13 17 0! 4,798 9 11 210 100 13 664! 10 016 PapanuiBelfast ..
.. 98 381 2,646 4,908 8,033 332 456 414 120 21,711 607 15 11 212 3 3 112 5 1 13 3 3 11,174 5 10 8 10 3 12,128 3 7 892 529 794 e'879 12'837 BelfastKaiapoi.. .. 284 293 5,867 9,755 16,199 635 651 9,149 576 25,899 2,292 19 2 607 4 4 301 15 10 45 5 8: 11,019 8 4 30 12 7 14,297 5 11 493 188 604 4'o70! 9'381 Kaiapoi.Rangiora.. .. 903 1,109 10,315 18,315 30,642 683 1.474 46,094 1,346 26,137 4,837 4 8 869 19 0 413 8 4 83 2 4 11,890 18 3 62 2 I 18,156 14 8 1,178 15 965 ll'387 n '571 Rangiora.Oust 1 .. 400 533 934 79 375 23,693 492 6,252 129 3 6 62 1 3 22 11 11 5 5 4 3,435 7 0 0 11 11 3,655 0 11 184 8,106 '532! Cust.
East Oxford .. .. 9 14 344 1,423 1,790 12 727 58,288 21 3,825 654 0 1 14 10 0 352 0 2 6 8 3 3,555 6 6 2 2 11 4,584 7 11 161 11 680 4 407 5 916 East OxfordSefton .... 49 70 1,137 1,038 2,294 86 360 10,307 25 7,062 381 1 5 67 17 6 39 2 1 5 1 4 3,042 13 2 8 17 0 3,544 12 6 123 8 683 '353 l'496 SeftonAmberley
.. .. 346 118 1,644 1,110 3,218 73 448 54,733 26 4,558 849 13 0 64 7 11 127 19 10 21 6 6 3,954 15 2 9 14 4 5,027 16 9 275 25 912 1 751 2'715 Amberley.Waipara .... 234 342 1,489 1,284 3,349 32 1.225 136,322 ..
5,986 930 13 6 32 6 4 278 6 4 7 7 8 8,956 14 5 5 8 10 10,210 17 1 280 12 861 '366 '846 WaiparaMina.... .. 133 58 829 524 1,544 .. ! 1.215 62,894 3 2,780 745 12 4 .. 268 8 8 10 11 6 5,363 3 7 15 0 4 6,402 16 5 481 13,987 3,028 5,304 Mina.
Parnassus.. .. 1,347 140 1,164 486 3,137 5! 1,238 83,442 602 1,400 2,230 3 7 3 15 0 323 1 0 23 9 10 6,608 8 4 23 2 2 9,211 19 11 345 10 171 2 296 2 675 ParnassusWaikari.. .. 212 102 1,627 869 2,810 42 168 28,187 30 4,736 814 19 1 54 7 10 103 7 2 13 5 10 3,645 8 3 9 4 8 4,640 12 10 134 3 130 '830 2'971 Waikari.Hawarden .. .. 276 66 1,499 1,243 3,084 50 873 75,036 ..
7,547 907 15 6 47 14 9 195 2 4 14 3 3 7,901 10 4 4 8 1 9,070 14 3 196 12,865 1 973 2'449 Hawarden.Culverden ..
.. 485 324 2,605 1,757 5,171 12 2,020 69,222 74 5,207 2,024 13 8 10 0 0 236 9 2 34 3 7 8,096 0 4 27 6 7 10,428 13 4 412 12,219 3*464 5*706 Culverden.Waiau .. .. 163 52 1,072 630 1,917 .. 573 59,263 23 1.611 922 10 0 .. 113 1 6 13 2 8 4,681 16 10 32 5 9 5,762 16 9 302 3,175 1)721 Waiau.Hornby ..
.. 59 174 1,279 2,196 3,708 111 1.745 4,128 88 69,219 790 0 7 67 6 11 20 15 9 4 10 10 30,393 17 3 26 12 10 31,303 4 2 2,613 25,795 2 780 62 603 Hornby.Prebbleton ..
.. 10 8 558 1,465 2,041 103 25 12 ..7,316 212 4 10 85 15 10 11 3 11 1 10 0 2,267 3 1 0 15 10 2,578 13 6 43 995 '224 1 127 Prebbleton.
Lincoln .. .. 30 50 692 1,107 1,879 57 995 43,707 8 16,6J0 371 1 8 56 2 10 128 16 5 5 13 11 5,672 2 6 14 13 6 6,248 10 10 368 8,439 506 4'612 Lincoln.Springston.. .. 8 23 221 299 551 39 540 30,755 3 12,175 75 16 8 31 0 0 37 0 7 1 17 4 5,058 17 1 3 7 6 5,207 19 2 54 2,895 90 l'549 Springston.
Leeston ....
78 101 492 1,446 2,117 99 672 18,696 1,271 8,577 512 12 1 92 3 0 484 8 8 5 9 8 4,407 16 3 8 6 2 5,510 15 10 608 36,012 2,171 Leeston.
Southbridge .... 80 171 1,448 2,420 4,119 19 787 25,272 18 12,708 747 0 10 15 0 0 429 18 3 5 9 9 6,546 6 5 10 0 10 7,753 16 1 121 14,557 944 2 675 Southbridge.
Little River .... 2 9 2,381 3,156 5,548 78 3,807 125,300 15 2,850 1,800 15 8 87 9 9 361 14 9 9 15 1 4,930 9 7 31 17 9 7,222 2 7 1,264 32,154 2 067 2'813 Little River.Islington..
.. 93 86 2,335 3,903 6,417 75 96 6,161 581 21,733 621 10 1 61 15 6 81 19 4 5 15 0 9,801 9 6 14 16 4 10,587 5 9 1,312 392,606 2'258 10'600 Islington.Rolleston ..
.. 81 214 1,723 2,086 4,104 5 536 30,297 31 8,553 954 3 4 7 3 4 65 15 4 7 13 1 4,154 1 4 31 12 9 5,220 9 2 571 10,575 316 5 099 Rolleston.Kirwee ..
.. 24 21 581 798 1,424 27 108 22,023 .. 4,436 341 8 6 24 12 6 34 14 2 4 9 8 2,294 4 9 1 15 1 2,701 4 8 85 18,678 482 Kirwee.Darfield ..
.. 139 191 1,451 1,381 3,162 52 325 57,701 1,189 12,369 816 11 9 42 4 10 122 10 7 12 7 8 6,843 14 4 15 18 5 7,853 7 7 174 13,846 1 225 2 281 Darfield.Coalgate .... 7 7 129 687 830 70 616 49,402 30 12,368 179 6 11 59 17 6 97 7 11 2 0 6 7,558 7 7 3 3 1 7,900 3 6 212 12,058 3'424 5*421 Coalgate.Sheffield ..
.. 34 55 550 644 1,283 32 597 29,178 33 4,220 390 10 10 44 8 9 326 11 8 5 7 2 2,873 15 1 2 18 4 3,643 11 10 158 11,746 1 058 2 824 Sheffield.Springfield ..
.. 591 265 3,135 1,746 5,737 46 330 15,476 .. 2,086 1,475 3 7 42 2 4 185 16 5 63 11 9 3,569 3 2 60 16 3 5,396 13 6 116 7,219 426 2*708 Springfield.Arthur'sPass .. .. 278 77 1,016 687 2,058 .. 2 458 1 344 705 17 8 .. 21 9 2 16 17 5 400 2 5 3 18 9 1,148 5 5 55 3,927 351 '721 Arthur's Pass.Otira.. ..
.. 631 232 4,863 1,957 7,683 49 504 4,685 70,041 1,916 2,019 6 5 45 0 3 260 14 3 20 7 3 20,931 2 2 5 17 4 23,282 7 8 98 808 1 465 3 737 Otira.Moana .. .. 57 69 1,383 940 2,449 18 398 1,690 94,211 1,760 605 1 2 13 3 8 276 9 4 6 19 10 17,734 10 4 2 15 8 18,639 0 0 169 2,504 '248 2*025 Moana.Stillwater .. .. 331 307 4,908 4,857 10,403 137 34 58 51,002 64,613 1,697 15 5 88 18 0 161 1 10 15 5
,6 28,191 12 6 3 0 0 30,157 13 3 72 79 864 6 783 Stillwater.
Ngahere .... 201 245 2,939 2,184 5,569 169 1,352 11,761 77,699 2,502 866 14 9 82 0 4 217 17 4 13 7 10 15,455 8 9 3 14 9 16,639 3 9 300 7,335 429 l'773 Ngahere.
Blackball .. .. 65 114 2,587 3,519; 6,285 257 2 2 111,424 1,121 17 9 202 13 9 57 17 6 7 8 2 29,632 0 7 19 7 5 31,041 5 2 2 441 Blackball.Ikamatua ..
.. 148 163 1,337 835 2,483 81 881 5.351 27,293 4,780 772 11 11 65 16 4 195 7 4 9 11 4 9,311 11 0 9 17 9 10,364 15 8 415 2,114 1 625 5 266 Ikamatua.Reefton ..
.. 1,696 630 6,861 3,508; 12,695 94 915 14,646 42,613 26,528 4,830 6 9; 57 4 7 329 8 2 78 0 4 28,894 8 4 315 11 8! 34,504 19 10 1,021 2,004 2*318 4'334 Reefton.Greymouth ..
.. 5,491 3,068 51,469 39,221 99,249 3,198 730 1,215 34,083 11,568 19,986 11 0 1,258 6 6 1,924 19 1 472 15 5 18,959 7 9 7,070 2 8 49,672 2 5 1,801 6,790 24,156 Greymouth.„ (Wharf) .. .. .. .. .. .. .. 3 .. 877 3,817 .. .. ..
.. 3,787 12 0.. 3,787 12 0
.. .. 372J02 25o]946„
(Wharf).Runanga
.. .. 10 22 10,229 17,252 27,513 2,682 14 .. 2,208 97,124 1,488 12 4 709 14 11 29 0 5 6 4 6 44,688 19 2 38 15 9 46,961 7 1 73 491 671 3,323 Runanga.Rewanui ..
.. 1 .. 1,127 3,367 4,495 11,750 10 .. 30 115,725 368 13 7 2,155 59 09 0 034 45,756 0 10 252 0 11 48,532 13 5 13 1 966 3 691 Rewanui.Kumara .. .. 317 228 1,801 1,099 3,445 33| 1,229 4,316 129,766 1,784 573 0 10 25 15 5 64 7 7 9 2 3 19,851 16 10 2 2 0 20,526 4 11 376 507 '28O 3*074 Kumara.Hokitika
.. .. 2,127 1,062 10,033 8,844 22,066 111 172 2,137 156,142 2,739 6,782 14 0 105 16 7 564 16 4 104 13 1 32,460 6 4 257 15 11 40,276 2 3 795 3,304 1 370 12 008 Hokitika.Ross..
.. .. 158 157 2,781 5,715 8,811 32 1,565 11,236 56,315 2,785 983 12 5; 30 18 5 123 2 4 Gr. 1 9 3 17,897 5 2 5 17 31 19,039 6 4 85 621 668 3 214 Ross.Dunsandel .... 98 125 2,142 3,839; 6,204 72 476 34,739 374 8,479 1,352 13 8 87 7 11 102 12 5 13 0 11 5,163 4 10 8 18 3 6,727 18 0 181 26,281 1,183 3,270 Dunsandel.
Rakaia.. .. 406 401 4,198 5,583 10,588 316 774 102,865 3,771 28,247 3,180 16 6 363 12 10 280 12 1 49 5 4 19,250 13 3 21 6 3 23,146 6 3 236 43,116 1 015 4 473 Rakaia.
Methven.. .. 7 16 2,718 3,014 5,755 26 918 105,614 3 10,317 1,464 5 11 40 6 11 92 1 6 19 1 10 11,492 17 10 27 17 2 13,136 11 2 664 47,507 4'449 10 539 Methven.Chertsey ..
.. 70 27 1,045 1,623 2,765 64 740 44,671 4,896 10,417 502 14 11 63 14 0 79 16 11 6 5 10 12,189 0 2 3 3 0 12,844 14 10 116 94,6841 '89 1 362 Chertsey.Ashburton ..
.. 2,800 1,717 18,507 22.890 45,914 569 1,327 3,181 1,262 25,424 16,781 19 7 836 0 4 992 8 6 322 11 4 18,060 8 11 297 10 9 37,290 19 5 1,185 55,452 16 622 30 425 Ashburton.Tinwald
.. 28 36 1,698 812 2,574 186 621 120,000 7,208 13,236 172 19 1 138 13 11 94 2 0 3 9 5 12,771 2 3 0 7 11 13,180 14 7 262 57,194 314 3,437 Tinwald.Mount Somers 29 26 414 384 853 57 523 13,336 ..
2,376 261 0 4 44 5 0 174 18 5 6 19 10 2,121 17 10 0 4 9 2,609 6 2 251 9,792 1,369 4,919 Mount Somers.
Hinds.. .. .. 54 61 1,209 1,813 3,137 100 630 88,213 697 13,434 521 13 3 84 5 0 50 9 7 8 16 4 9,545 12 8 4 19 11 10,215 16 9 331 33,482| 559 3,728 Hinds.Rangitata .. ..
49 18 488 766 1,J21 53 51 27,506 4,915 3,387 313 17 7 39 5 0 50 2 6 4 9 10 2,888 3 8 4 9 0 3,300 7 7 73 7,865 1,198 1,651 Rangitata.Orari.. .. .. 620 233 2,614 2,281 5,748 54 592 72,924 261 6,019 2,254 15 3 60 11 8 153 16 0 47 11 5 4,894 4 9 12 2 4 7,423 1 5 447 21,804 2 042 5,716 OrariWinchester .. .. 70 109 1,128 1,615 2,922 76 776 2,156 19 5,579 438 0 11 61 2 5 38 5 6 6 6 8 2,490 5 10 4 0 4 3,038 1 8 247 5,074 227 3,146 Winchester.Temuka ..
.. 803 313 6,519 5,261 • 12,896 70 575 24,893 286 10,689 4,169 2 2 57 14 11 543 1 10 90 1 4 6,422 0 4 29 5 3 11,311 5 10 670 12,068 3,860 10,213 Temuka.Washdyke .. .. 13 1 728 954 1,696 78 857 16,792 .. 17,438 209 1 5 60 15 0 33 11 2 1 16 8 7,326 4 6 27 13 6 7,659 2 3 1,472 195,169 581 5,889 WaahdvkePleasant Point.. .. 102 55 2,058 1,983 4,198 50 272 73,652 8 9,977 589 10 7 39 0 6 70 15 11 12 9 6 5,195 18 1 7 13 1 5,915 7 8 545 18,717 915 3,937 Pleasant Point.Albury ..
.. 51 26 982 764 1,823 59 191 40,191 18 2,759 439 14 4 52 15 8 38 8 6 7 0 11 2,905 1 8 6 2 4 3,449 3 5 116 3,402 1,087 3,448 Alburv.Fairlie .. .. 202 61 2,317 2,1031 4,683 15 348 51,221 16 3,673 1,170 9 11 39 10 0 285 14 5 29 5 3 4,709 10 2 13 3 0 6,247 12 9 252 2,910 3,960 6,761 Fairlie.Timaru .. 6,587 2,839 30,776 23,560 63,762 630 408 7,924 5,777 80,273 31,200 15 9 393 13 2 2,222 18 7 718 15 10 36,267 14 5 3,987 10 4 74,791 8 1 1,697 313,610 33,715 174,212 Timaru.
„ (Wharf).. .. .. .. .. .. .. .. .. .. 45,264 .. .. ..
.. 7,274 !) 8 .. 7,274 9 8 .. .. .. 47,304 „(Wharf).
St. Andrews .. .. 80 35 2,873 1,733 4,721 116 283 19,051 2 16,184 573 16 3 94 0 0 45 1 5 10 8 11 5,690 18 2 7 1 0 6,421 5 9 252 106,470 504 4.907 St. Andrews.Makikihi .. .. 21 19 767 511 1,318 38 257 24,867 10 3,649 262 10 5 32 13 4 39 4 1 6 11 1 2,112 8 6 5 10 0 2,458 17 5 108 5 721 376 1,946 Makikihi.Studholme ..
.. 382 294 2,236 1,938 4,850 64 836 37,707 1 7,449 1,090 8 0 50 0 0 51 6 0 24 18 0 4,714 10 4 7 3 7 5,938 5 11 250 13,522 351 1,628 Studholme.
Waimate .... 1,095 475 6,022 5,993 13,585 151 609 59,488 111 8,965 4,210 18 10 115 7 11 700 16 4 100 5 9 8,181 12 11 72 5 0 13,381 6 9 485 4,699 6,460 13,802 Waimate.
Morven .. .. 67 62 868 960 1,957 39 149 49,205 .. 6,826 461 12 3 31 10 0 33 18 4 8 1 6 4,801 8 5 3 4 11 5,339 15 5 105 5,145 333 2,241 Morven.Glenavy.. .. 36 37 837 1,031 1,941 99 235 19,258 .. 3,951 357 17 101 86 15 2 80 19 11 6 13 9 2,195 8 2 5 8 6 2,733 3 4 122 14,431 983 2,935 Glenavy.
Pukeuri Junction .. 8 8 1,131 444 1,691 28 507 48,732 3 12,284 121 18 4 21 15 0 111 18 6 2 19 9 8,920 18 6 4 8 1 9,183 8 2 571 162,909 175 5,561 Pukeuri Junction.Duntroon .. .. 2 7 545 433 987 78 328 38,119 83 2,701 257 8 10 64 7 6 48 7 2 3 15 11 3,196 0 11 1 0 1 3,571 0 5 87 5,359 1,036 3,069 Duntroon.Kurow .. .. 62 52 2,749 2,598 5,461 47 237 44,770 25 3,859 1,444 14 0 43 5 9 129 10 7 12 9 8 6,719 14 3 21 19 8 8,371 13 11 254 3,756 10,573 7,862 Kurow.Oamaru ..
.. 3,260 1,882 21,687 17,996 44,825 216 734 25,582 3,198 22,107 18,966 3 7 202 2 6 1,252 11 8 525 5 11 12,942 2 0 999 4 5 34,887 10 1 956 7,211 18,664 52,135 Oamaru.Breakwater .. .. ..
.... .. .. .. .. 9,329 1,216 9,092 .. .. ..
.. 2,497 10 9 344 11 9 2,842 2 6 .. 201.. 21 296 Breakwater
Waiareka Junction .. 20 14 381 239 654 7 422 34,185 38 14,064 85 17 3 8 5 0 56 0 2 0 12 1 8,312 16 7 36 7 7 8,499 18 8 374 21,409 159 3,871 Waiareka Junction.Ngapara
.. .. .. .. 325 17 342 68 8,029 .. 12,063 48 2 8 .. 23 18 8 0 10 0 3,575 5 8 0 5 5 3,648 2 5 100 5,428 1,594 8,281 Ngapara.Maheno .. .. 79 32 2,264 1,301 3,676 103 2,668 35,068 7 6,496 520 0 7 77 12 6 511 17 2 6 17 9 5,257 16 7 5 12 3 6,379 16 10 314 17,515 1,237 8,897 Maheno.Hampden .. .. 161 239 1,299 965 2,664 35 892 26,252 22 7,801 660 18 3 39 4 9 201 13 II 16 0 3 5,279 18 9 45 17 5 6,243 13 4 379 4,434 1,173 4,850 Hampden.Palmerston .. .. 1,011 662 10,226 7,995 19,894 104 726 54,732 248 19,499 4,049 5 11 97 2 1 599 2 II 53 2 6 11,279 15 8 111 18 2 16,190 7 3 705 6,480 1,615 7,514 Palmerston.Makaraeo .. .. .. .. .. .. .. .. .. .. .. 12,534 .. .. .. .. 5,033 1 8
.. 5,033 1 8.. .. 57 2,414 Makaraeo
Waikouaiti .. .. 235 229 2,071 1,673 4,208 105 1,294 25,913 6 1,229 921 19 0 109 9 0 213 11 10; 17 14 6 2,353 16 9 0 18 11 3,617 10 0 753 7,251 2,029 5,333 Waikouaiti.
Seacliff .. .. 363 295 5,223 3,623 9,504 636 ; 287 4,197 22 458 1,483 9 1 214 11 II 153 4 11 7 18 6 690 12 (I 0 19 8 2,550 16 1 239 2,728 1,034 9,244 Seaclifi.Waitati .. .. 198 272 2,720 3,656 6,846 143 193 2,112 246 717 688 18 5! Ill 19 4 135 16 it 4 4 8 522 6 10 0 15 11 1,464 1 2 170 2,139 188 2 371 WaitatiPort Chalmers Upper
..102 370 1,321; 4,4901 6,283 127 96 1,118 1 33 918 2 6 48 18 10 134 19 7 14 11 3 99 5 1 0 6 9 1,216 4 0 23 70 .. 16 Port Chalmers Upper
Sawyer's Bay .... 2791 1,173 4,901: 12,3681 18,721 4,757 80 943 171 177 974 6 10 1,129 17 9 11 18 5 5 11 2 157 15 2 0 18 loj 2,280 8 2 99 464 165 3,999 Sawver's Bav.
Port ChalmerB .. 1,612 5,890 11,080 40,556 59,138 11,244 12 16 710 57,119 4,171 13 4 3,612 13 . 248 4 4 26 14 11 17,604 8 3 1,418 0 5: 27,081 14 10 10 69 3,115 52,863 Port Chalmers.
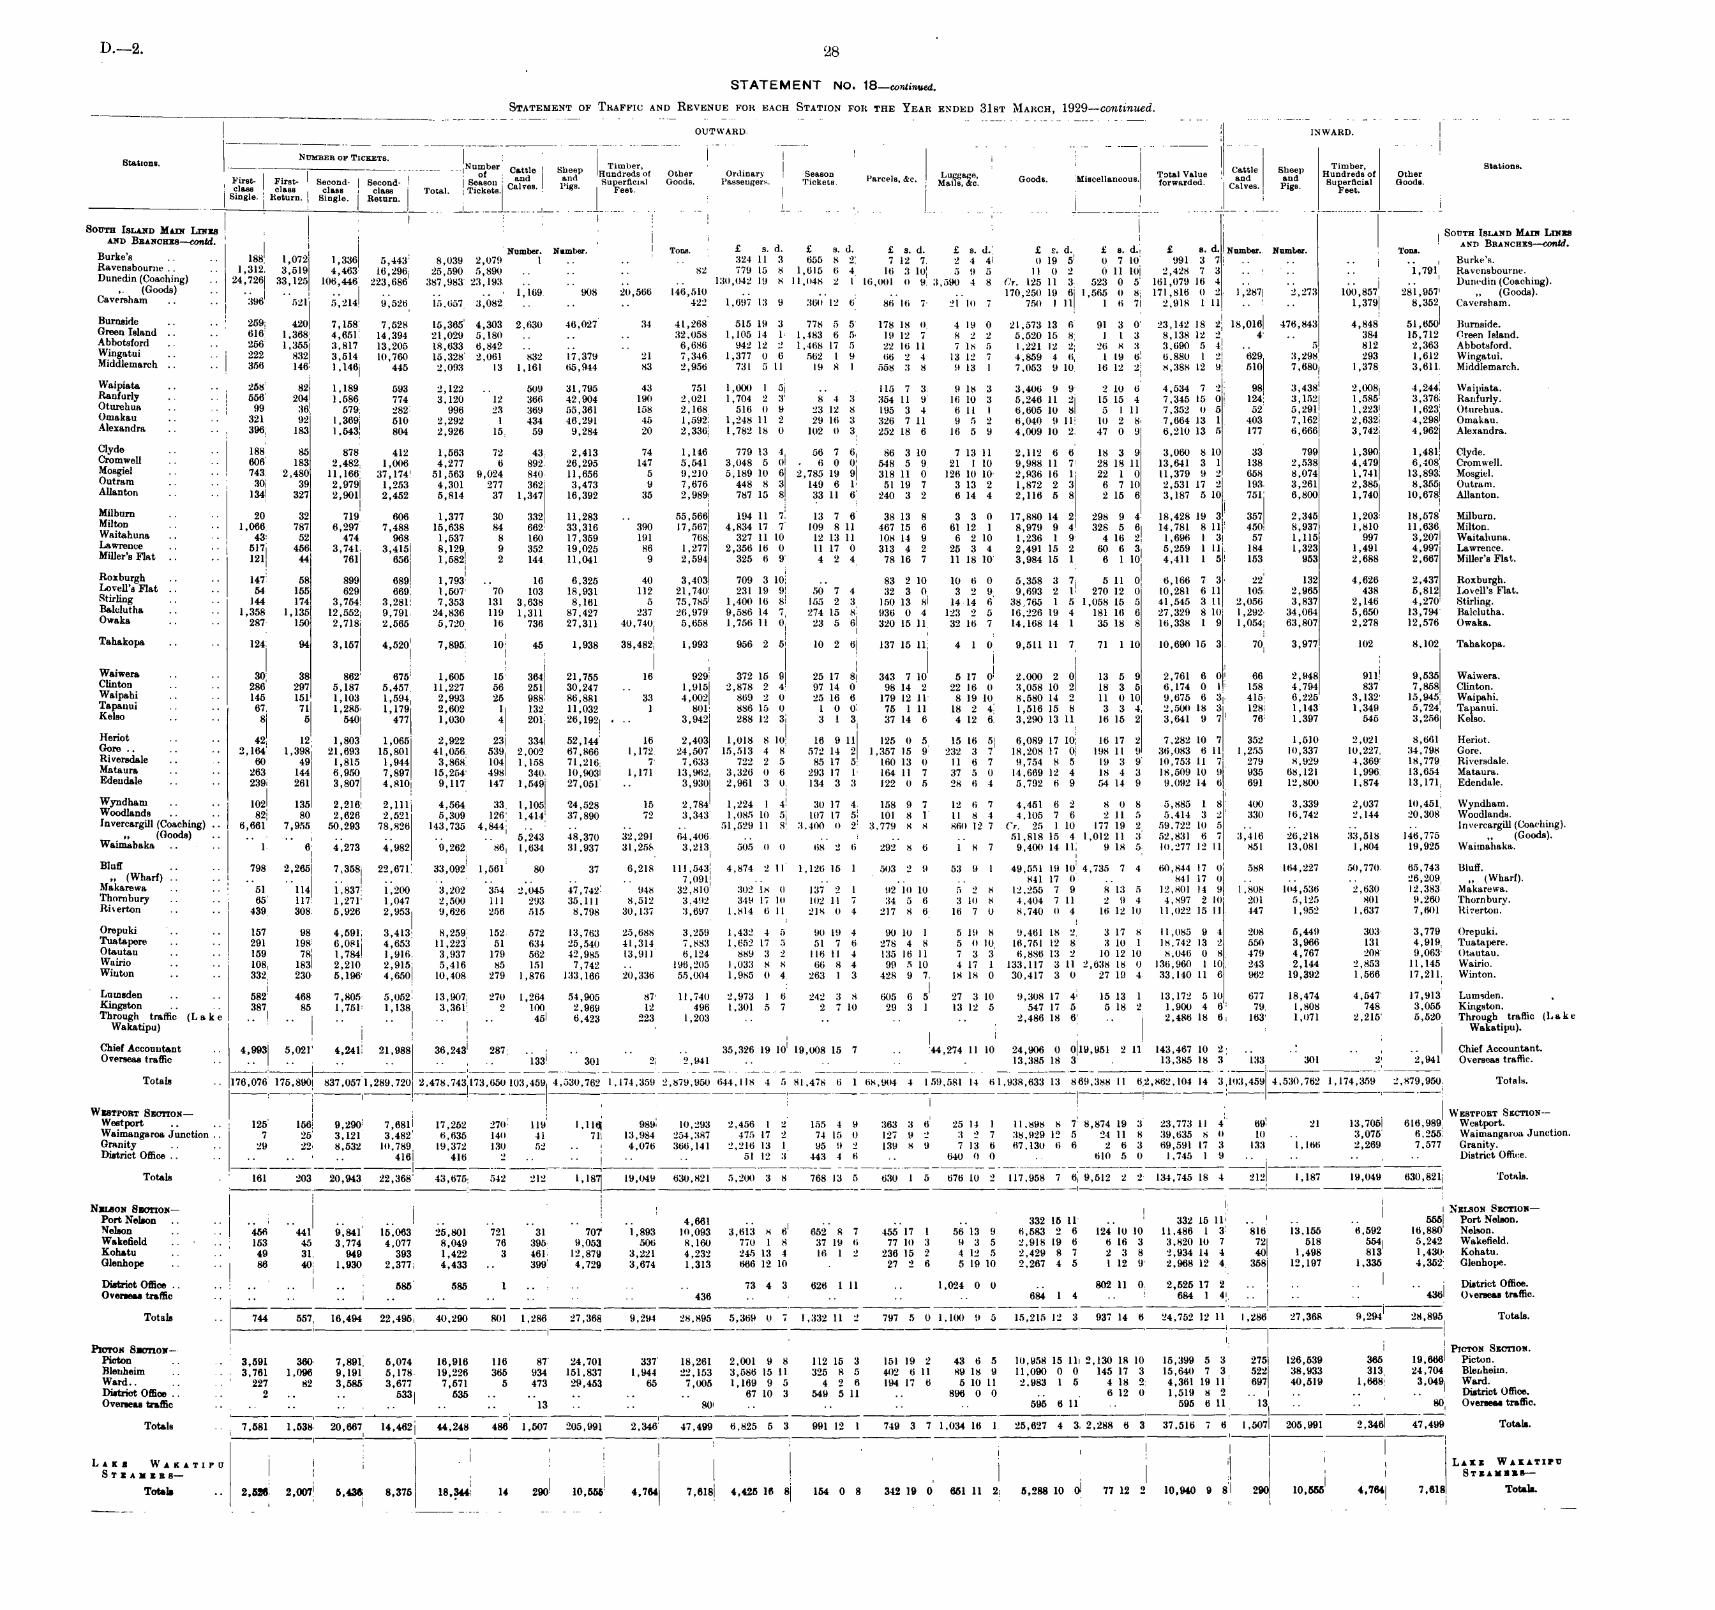
D._2 28
STATEMENT No. 18—continued.Statement of Traffic and Revenue for each Station for the Year ended 31st March, 1929—continued.
OUTWARD. INWARD.
c Number of Tickets.btations. Number rattlp Sheet) Timber, Cattle Sheet) Timber, Stations.
of Hundreds of Other Ordinary Season „.
. Luggage, « , , T-
„ Total Value Hundreds of OtherFirst- First- Second- Second- Season p ias Superficial Goods. Passengers. Tickets. Parcels, &c. Mails, &c. Goods. Miscellaneous. forwarded. P J]vpC! p .? Superficial Goods.
; class class class class Total. Tickets. Calves- FlS8 - Feet. calves. ifigs. FeetSingle. Return. Single. Return.
! ! II I I I r
]South Island Main Lines South Island Main Lines
and Branches—contd. ,, and Branches—contd.
Number. Number. Tons. - s. a. t s. d. £ s. a. £ s. d. £ s. d. £ s. d. £ s. a. Number. Number. Tons.Burkes.. .. 188| 1,072 1,336 5,443 8,039 2,079 1 .. .. .. 324 11 3 655 8 2 7 12 7 2 4 4 0 19 5 0 7 10 991 3 7 .. .. .. Burke's.
Ravensbourne .. .. 1,312i 3,519 4,463 16,296 25,590 5,890 .. .... 82 779 15 8 1,615 6 4| 16 3 10 5 9 5 11 0 2 0 11 10 2,428 7 3 .. .. .. 1,791 Ravensbourne.
Dunedm (Coaching) .. 24,726 33,125 106,446 223,686 387,983! 23,193 .... .. .. 130,042 19 8 11,048 2 1 16,001 0 9 3,590 4 8 Or. 125 11 3 523 0 5 161,079 16 4 .. .. .. .. Dunedin (Coaching).
>• (Goods).. .. .. .. 1,169 908 20,566 146,510 .. ..
.. .. 170,250 19 6 1,565 0 8 171,816 0 2 : 1,287 2,273 100,857 281,957 „ (Goods).Gaversham .. .. 396 521 5,214 9,526 15,657 3,082 .. .. ..
422 1,697 13 91 360 12 6 86 16 7 21 10 7 750 1 11 1 6 7 2,918 1 11 .. .. 1,379 8,352 Caversham.Burnside
.. .. 259 420 7.158 1 7,528 15,365 4,303 2,630 46,027 34 41,268; 515 19 3 778 5 5 178 18 (I 4 19 0 21,573 13 6 91 3 01 23,142 18 2 18,016 476,843 4,848: 51,650 Burnside.Green Island .. .. 616 1,368 4,651 14,394 21,029 5,180 .. .. ..
32,058 1,105 14 I 1,483 6 5 19 12 7 8 2 2i 5,520 15 8 1 1 3 8,138 12 2 4 ..384 15,712 Green Island.
Abbotsford .. .. 256 1,355 3,817 13,205 18,633 6,842 .. .. .. 6,686 942 12 2 1,468 17 5 22 16 11 7 18 5 1,221 12 2 26 8 S\ 3,690 5 4.. 5 812 2,363 Abbotsford.VVingatui
.. 222 832 3,514 10,760 15.328 2,061 832 17,379 21 7,346 1,377 0 6 562 1 9 66 2 4 13 12 7 4,859 4 6 1 19 61 6.880 1 2 629 3,298 293 1,612 Wingatui.Middlemarch .. .. 356 146 1,146 445 2,093 13 1,161 65,944 83 2,956 731 5 11 19 8 t 558 3 8 9 13 I 7,053 9 10; 16 12 2 8,388 12 9 510 7,680 1,378 3,611 Middlemarch.Waipiata .. 258 82 1,189 593 2,122 .. 509 31,795 43 751 1,000 1 5 .. 115 7 3 9 18 3 3,406 9 9 2 10 6 4,534 7 2 98 3,438 2,008 4,244 Waipiata.Ranfurly .. .. 556 204 1,586 774 3,120 12 366 42,904 190 2,021 1,704 2 3 8 4 3 354 11 9 16 10 3 5,246 11 2 15 15 4 7,345 15 0 124 3,152 1,585 3,376 Ranfurly.Oturehua .. 99 36 579 282 996 23 369, 55,361 158 2.168 1 516 0 9 23 12 8 195 3 4 6 11 1 6,605 10 8 5 1 11 7,352 0 5 52 5,291 1,223 1,623 Oturehua.Omakau .. .. 321 92 1,369 510 2,292 1 434 46,291 45 1,592 1,248 11 2 29 16 3 326 7 11 9 5 2 6,040 9 11 10 2 8 7,664 13 1 403 7,162 2,632 4,298 Omakau.Alexandra .. .. 396 183 1,543 804 2,926 15 59 9,284 20 2,336 1,782 18 0 102 0 3 252 18 6 16 5 9 4,009 10 2 47 0 9 6,210 13 5 177 6,666 3,742 4,962 Alexandra.
Cly de •• 188| 85 878! 412 1,563 72 43! 2,413 74 1,146 779 13 4 56 7 6 86 3 10 7 13 11 2,112 6 6 18 3 9 3,060 8 10 33 799 1,390 1,481 Clyde.Cromwell .. .. 606: 133 2,482 1,006 4,277 6 892 26,295 147 5,541 3,048 5 0 - 6 0 0 548 5 9 21 1 10 9,988 11 7 28 18 11 13,641 3 1 138 2,538 4,479 6,408 Cromwell.Mosgiel .. .. 743 2,480 11,166 37,174 51,563 9,024 840 11,656 5 9,210 5,189 10 6 2,785 19 9 318 11 0 126 10 10 2,936 16 1 22 1 0 11,379 9 2 658 8,074 1,741 13,893 Mosgiel.Outram ..
.. 30 39 2,979 1,253 4,301 277 362 3,473 9 7,676 448 8 3 149 6 1 51 19 7 3 13 2 1,872 2 3 6 7 10 2,531 17 2 193 3,261 2,385 8,355 Outram.Allanton .. .. 134 327 2,901 2,452 5,814 37 1,347 16,392 35 2,989 787 15 8 33 11 6 240 3 2 6 14 4 2,116 5 8 2 15 6 3,187 5 10 751 6,800 1,740 10,678 Allanton.
J®Jburn 20 32 719 606 1,377 30 332 11,283 .. 55,566 194 11 7 13 7 6 38 13 8 3 3 0 17,880 14 2 298 9 4 18,428 19 3 357 2,345 1,203 18,578 Milburn.•• •• 1,066; 787 6,297 7,488 15,638 84 662 33,316 390 17,567 4,834 17 7 109 8 11 467 15 6 61 12 1 8,979 9 4 328 5 6 14,781 8 11 450 8,937 1,810 11,636 Milton.
Waitahuna .. 43 52 4741 968 1,537 8 160 17,359 191 768 327 11 10 12 13 11 108 14 9 6 2 10 1,236 1 9 4 16 2 1,696 1 3 57 1,115 997 3,207 Waitahuna,Lawrence .. .. 517 456 3,741 3,415 8,129 9 352 19,025 86 1,277 2,356 16 0 11 17 0 313 4 2: 25 3 4 2,491 15 2 60 6 3 5,259 1 11 184 1,323 1,491 4,997 Lawrence.Miller'sFlat ..
.. ] 2 i 44 761 656 1,582 2 144 11,041 9 2,594 325 6 9 4 2 4 78 16 7 11 18 10 3,984 15 1 6 1 10 4,411 1 5 153 953 2,688 2,667 Miller'sFlat.
Roxburgh .. 147 58 899 689 1,793 .. 16 6,325 40 3,403 709 3 10 .. 83 2 10 10 6 0 5,358 3 7 5 11 0 6,166 7 3 22 132 4,626| 2,437 Roxburgh.Lovell's Flat .... 54 155 629 669 1,507 70 103 18,931 112 21,740 231 19 9 50 7 4 32 3 0 3 2 9 9,693 2 1 270 12 0 10,281 6 11 105 2,965 438 5,812 Loveil's Flat.
Stirling .... ]44 174 3,754 3>28l 7,353 131 3,638 8,161 5 75,785 1,400 16 8 155 2 3 150 13 8- 14 14 6 38,765 1 5 1,058 15 5 41,545 3 11 2,056 3,837 2,146 4,270 Stirling.
Balclutha .. .. 1,358 1,135 12,552 9,791 24,836 119 1,311 87,427 237 26,979 9,586 14 7 274 15 8 936 0 4 123 2 5 16,226 19 4 18116 6 27,329 8 10 1,292 34,064 5,650 13,794 Balelutha.Owaka
•• 287 150 2,718 2,565 5,720 16 736 27,311 40,740 5,658 1,756 11 0 23 5 6 320 15 11 32 16 7 14,168 14 1 35 18 8 16,338 1 9 1,054 63,807 2,278: 12,576 Owaka.
Tahakopa.. .. 124 94 3,157 4,520 7,895; 10 45 1,938 38,482 1,993 956 2 5 10 2 6 137 15 11 4 1 0 9,511 11 7 71 1 10 10,690 15 3 70 3,977 102 8,102 Tahakopa.
Waiwera .. .. 30 38 862 675 1,605 15 364 21,755 16 929 372 15 9 25 17 8 343 7 10 5 17 Oi 2.000 2 0 13 5 9 2,761 6 0 66 2,948 911 9,535 Waiwera.~™ton
.. .. 286 297 5,187 5,457 11,227 56 251 30,247 .. 1,915 2,878 2 4 97 14 0 98 14 2 22 16 0 3,058 10 2 18 3 5 6,174 0 1 158 4,794 837 7,858 Clinton.Waipahi .. .. 1451 151 i,i0 3i 1,594 2,993 25 988 86,881 33 4,002 869 2 0 25 16 6 179 12 11 8 19 10 8,580 14 2 11 0 10 9,675 6 3| 415 6,225 3,132 15,945 Waipahi.Tapanui .. .. 67 71 1,285 1,179 2,602 1 132 11,032 I 801 886 15 0 1 0 0 75 1 11 18 2 4 1,516 15 8 3 3 4 2,500 18 3 128 1,143 1,349 5,724 Tapanui.Kelso
•• •• 8 5 540 477 1,030; 4 201 26,192 .. 3,942 288 12 3 3 1 3 37 14 6 4 12 6 3,290 13 11 16 15 2 3,641 9 7 76 1,397 545 3,256 Kelso.
Heriot •• •• 42 12 1,803 1,065 2,922j 23 334 52,144 16 2,403 1,018 8 10 16 9 11 125 0 5 15 16 5 6,089 17 10 16 17 2 7,282 10 7 352 1,510 2,021 8,661 Heriot.Gore •• •• 2,164! 1,398 21,693 15,801 41,056 539 2,002 67,866 1,172 24,507 15,513 4 8 572 14 2 1,357 15 9 232 3 7 18,208 17 0 198 11 9 36,083 6 11 1,255 10,337 10,227 34,798 Gore.Riversdale .. . 60 49 1,815 1,944 3,868 104 1,158 71,216 7 7,633 722 2 5 85 17 5 160 13 0 11 6 7 9,754 8 5 19 3 9 10,753 11 7 279 8,929 4,369 18,779 Riversdale.Mataura .. .. 263 144 6,950 7,897 15,254 498 340 10,903 1,171 13,962 3,326 0 6 293 17 1 164 11 7 37 5 0 14,669 12 4 18 4 3 18,509 10 9 935 68,121 1,996 13,654 Mataura.Edendale .. 239! 261 3,807 4,810 9,117 147 1,549 27,051 •• 3,930 2,961 3 0 134 3 3 122 0 5 28 6 4 5,792 6 9 54 14 9 9,092 14 6 691 12,800 1,874; 13,171 Edendale.Wyndham .. .. 102 135 2,216: 2,111 4,564 33 1,105 24,528 15 2,784 1,224 1 4 30 17 4 158 9 7 12 6 7 4,451 6 2 8 0 8 5,885 1 8 400 3,339 2,037: 10,451 Wyndham.Woodlands .. .. 82 80 2,6261 2,521 5,309 126 1,414 37,890 72 3,343 1,085 10 5 107 17 5 101 8 1 11 8 4 4,105 7 6 2 11 5 5,414 3 2 330 16,742 2,144 20,308 Woodlands.Invercargill (Coaching) .. 6,661 7,955 50,293 78,826 143,735 4,844 .. ..
.. .. 51,529 11 8 3,400 0 2 3,779 8 8 860 12 7 Cr. 25 1 10 177 19 2 59,722 10 5 .. .. .. .. Invercargill (Coaching).(Goods) .. .. .. : .. .. .. 5,243 48,370 32,291 64,406 ..
.. .. .. 51,818 15 41 1,012 11 3 52,831 6 7 3,416 26,218 33,518 146,775 „ (Goods).Waimahaka .... 1 6 4,273 4,982 9,262 86 1,634 31,937 31,258 3,213 505 0 0 68 2 6 292 8 6 1 8 7 9,400 14 11 9 18 5 10,277 12 11 851 13,081 1,804 19,925 Waimahaka.
Bluff •• 798 2,265 7,358 22,671 33,092 1,561 80 37 6,218 111,543 4,874 2 11 1,126 15 1 503 2 9! 53 9 1 49,551 19 10 4,735 7 4 60,844 17 0 588 164,227 50,770; 65,743 Bluff.„ (Wharf) ..
.. .. I .. .. .. .. .. .. .. 7,091 .... .. .. 841 17 01 .. 841 17 0 .. .. 26,209 „ (Wharf).
Makarewa .. .. 51 114 1,837 1,200 354 2,045 47,742 948 32,810 302 18 0 137 2 1 92 10 10 5 2 8 12,255 7 8 13 5 12,801 14 9 1,808 104,536 2,630 12,383 Makarewa.Thornbury ..
.. 65 117 1,271 1,047 2,500 111 293 35,111 8,512 3,492 349 17 10 102 11 7 34 5 6; 3 10 8 4,404 7 11 2 9 4 4,897 2 10 201 5,125 801 9,260 Thornbury.Riverton .. .. 439. 308 5,926 2,953 9,626: 256 515 8,798 30,137 3,697 1,814 6 11 218 0 4 217 8 6 16 7 0 8,740 0 4 16 12 10 11,022 15 11 447 1,952 1,637 7,601 Riverton.
Orepuki.. .. 157; 98 4,591 3,413 8,259 152 572 13,763 25,688 3,259 1,432 4 5: 90 19 4 90 10 1 5 19 8 9,461 18 2 3 17 8 11,085 9 4 208 5,449 303 3,779 Orepuki.Tuatapere
.. 291 198 6,081 4,653 11,223 51 634 25,540 41,314 7,883 1,652 17 5 51 7 6 278 4 S 5 0 10 16,751 12 8 3 10 1 18,742 13 2 550 3,966 131 4,919 Tuatapere.Otautau
.. .. 159 78 1,784 1,916 3,937 179 562 42,985 13,911 6,124 889 3 2 116 11 4 135 16 11 7 3 3 6,886 13 2 10 12 10 8,046 0 8 479 4,767 208; 9,063 Otautau.Wairio .. .. 108 183 2,210 2,915 5,416 85 151 7,742 .. 196,205 1,033 8 8 66 8 4 99 5 10 4 17 1 133,117 3 11 2,638 18 0 136,960 1 10 243 2,144 2,853 11,145 Wairio.Win ton .. .. 332 230 5,196 4,650 10,408 279 1,876: 133,166 20,336 55,004 1,985 0 4 263 1 3 428 9 7 18 18 0 30,417 3 0 27 19 4 33,140 11 6 962 19,392 1,566 17,211 Winton.
Lumsden .. .. 582 468 7,805 5,052 13,907 270 1,264 54,905 87 11,740 2,973 1 ti 242 3 8 605 6 5 27 3 10 9,308 17 4 15 13 1 13,172 5 10 677 18,474 4,547 17,913 Lumsden.Kingston .. . 387 85 1,751 1,138 3,361 2 100 2,969 12 496 1,301 5 7 2 7 10 29 3 1 13 12 5 547 17 5 5 18 2 1,900 4 6 79 1,808 748 3,055 Kingston.Through traffic (Lake .. .. .. .. .. 45 6,423 223 1,203 .. .. .. .. 2,486 18 6 .. 2,486 18 6 163 1,071 2,215 5,520 Through traffic (Lake
Wakatipu) Wakatipu).
Chief Accountant.. 4,993 5,021 4,241 21,988 36,243 287 .. .. .. .. 35,326 19 10 19,008 15 7 .. 44,274 11 10 24,906 0 019,951 2 11 143,467 10 2 ..
.!.. .. Chief Accountant.
Overseas traffic .... .... .. .. .. 133 301 2 2,941 .. .. .. . 13,385 18 3 .. 13,385 18 3 133 301 2 2,941 Overseas traffic.
—_
— 1 —
Totals .. 176,076 175,890 837,057 1,289,720 2,478,743173,650 103,459 4,530,762 1,174,359 2,879,950 644,118 4 5 81,478 6 1 68,904 4 159,581 14 61,938,633 13 869,388 11 62,862,104 14 3 103,459 4,530,762 1,174,359 2,879,950 Totals.
Westport Section— Westport Section —
Westport .. .. 125 156 9,290 7,681 17,252 270 119 1,116| 989 10,293 2,456 1 2 155 4 9 363 3 6 25 14 1 11,898 8 7 8,874 19 3 23,773 11 4 69 21 13,705 616,989 Westport.Waimangaroa Junction .. 7 25 3,121 3,482 6,635 140 41 71 13,984 254,387 475 17 2 74 15 0 127 9 2 3 2 7 38,929 12 5 24 11 8 39,635 8 (I 10 .. 3,075 6,255 Waimangaroa Junction.Granity .. .. 29 22 8,532 10,789 19,372 130 52 .. 4,076 366,141 2,216 13 1 95 9 2 139 8 9 7 13 6 67,130 6 6 2 6 3 69,591 17 3 133 1,166 2,269 7,577 Granity.District Office .. .. .. .. .. 416 416 2 .. .. .. 51 12 3 443 4 6 .. 640 0 0 .. 610 5 0 1,745 1 9 j .. .. .. District Office.
Totals 161 203 20,943 22,368 43,675 542 212 1,187 19,049 630,821 5,200 3 8 768 13 5 630 1 5j 676 10 2 117,958 7 6 9,512 2 2 134,745 18 4 212 1,187 19,049 630,821 Totals.
1 !Nelson Section— Nelson Section—
Port Nelson .. .... .. .. .. .. .. .. .. .. 4,661 .. .. .. .. 332 15 11 .. 332 15 11 .. .. .. 555 Port Nelson.
Nelson .. .. 466 441 9,841 15,063 25,801 721 31 707 1,893 10,093 3,613 8 6 652 8 7 455 17 1 56 13 9 6,583 2 6 124 10 10 11,486 1 3 816 13,155 6,592 16,880 Nelson.Wakefield 153 45 3,774 4,077 8,049 76 395 9,053 506 8,160 770 1 8 37 19 6 77 10 3 9 3 5 2,918 19 6 6 16 3 3,820 10 7 72 518 554 5,242 Wakefield.Kohatu .. .. 49 31 949 393 1,422 3 461 12,879 3,221 4,232 245 13 4 16 1 2 236 15 2 4 12 5 2,429 8 7 2 3 8 2,934 14 4 40 1,498 813 1,430 Kohatu.Glenhope .. .. 86 40 1,930 2,377 4,433 .. 399 4,729 3,674 1,313 666 12 10 .. 27 2 « 5 19 10 2,267 4 5 1 12 9 2,968 12 4 358 12,197 1,335 4,352 Glenhope.
District Office .... 585 585 1 .. .. .. 73 4 3 626 1 11 .. 1,024 0 0 .. 802 11 0 2,525 17 2 .. .. .. District Office.
Overseas traffic .... .. .. .. .. .. ..
.... 436 .. .. .. .. 684 1 4 .. 684 1 4 .. .. 436 Overseas traffic.
1 ij 1 1Totals ... 744 557 16,494 22,495 40,290 801 1,286 27,368 9,294 28,895 5,369 0 7 1,332 11 2 797 5 0 1,100 9 5 15,215 12 3 937 14 6 24,752 12 11 1,286 27,368 9,294 28,895 Totals.
Pioton Section— Picton Section.Picton .. .. 3,591 360 7,891 5,074 16,916 116 87 24,701 337 18,261 2,001 9 8 112 15 3 151 19 2 43 6 5 10,958 15 11 2,130 18 10 15,399 5 3 275 126,539 365 19,666 Picton.Blenheim .. 3,761 1,096 9,191 5,178 19,226 365 934 151,837 1,944 22,153 3,586 15 11 325 8 5 402 6 11 89 18 9 11,090 0 0 145 17 3 15,640 7 3 522 38.933 313 24,704 Blenheim.Ward.. .. .. 227 82 3,585 3,677 7,571 5 473 29,453 65 7,005 1,169 9 5 4 2 6 194 17 6 5 10 11 2,983 1 5 4 18 2 4,361 19 11 697 40,519 1,668 3,049 Ward.District Office .. .. 2 .. 533 535 .. .. .. .. 67 10 3 549 5 11 .. 896 0 0 .. 6 12 0 1,519 8 2.. ..
.. .. District Office.Overseas traffic .... .. .. I .. .. .. 13 .. 80 .. .. ..
.. 595 6 11 .. 595 6 11 13 .. 80 Overseas traffic.
Totals 7,581 1,538 20,667 14,462 44,248 486 1,507 205,991 2,346 47,499 6,825 5 3 991 12 1 749 3 T 1,034 16 1 25,627 4 3 2,288 6 3 37,516 7 6 1,507 205,991 2,346 47,499 Totals._
-
Lake Wakatipu * Lake WakatipuS T E A M E E S— S T E A M E E 8 —
Totals .. 2,526 2,007 5,436 8,375 18,344 14 290 10,555 4,764 7,618 4,425 16 8 154 0 8 342 19 0 651 11 2 5,288 10 0 77 12 2 10,940 9 8 290 10,555 4,764 7,618 Totals.

6 —D. 2,
D—2.
STATEMENT No. 18a.Classification of GoodsandLive-stock TrafficandEarnings by Commodities.
29
Yearended31st
March,1929.
Yearended31stMarch,
1928.
Revenue.
Revenue.
Commodity-
i
,
__TonnagePerCent.T
Mil
Average
TonnagePerCent.
Tn-aAT1_m;)a
Average
j
[
carried.otGross.10118
oneMlle
'Haul.
I
Per
Per
carried.ofGross.
Tonsone
Mlle-Haul.
Per
Per
Total.;
Cent.PerTon.Ton
Total.Cent,PerTon.
!
Ton
ofGross.
Mile.
ofGross.
Mile.
I
i
I
Productsof
Agriculture.
•
Miles.
£
£
s.d.
d.
Miles,i
£
£
sd
d
Grain..
..
..355,5224-67
15,948,02645
151,3543090
8
6!2-28
i
300,0474-08
13,498,14545\
127,361j
2-700
8
6
2-26
Meals
......121,283
1-59
7,401,39561
62,9471-29
0105:2-04;
126,5801-72
7,269,04357
63,333!
1-3401010
2-09
Fruit,N.Z.andCook
Islands41,2390-54
7,316,438177
49,7151-011
4
1
1-63I
37,7920-51
6,784,803180
46,393\
0-981
4
7
1-63
Rootcrops,fodder..
..162,033
2-13
10,314,75064
79,4251-620
9
10
1-84
163,8972-23
9,929,45761
78,2061-660
9
7
1-88
Flax,greenand
dressed
..27,0250-36
1,361,77150
16,1380-330120
2-84
36,6620-50
1,912,43552
21,5260-460119
v-70
Seeds..
....24,2760-32
1,380,03757
17,2510-350143
3-00
27,2320-37
1,525,01256
19,0450-400140
2-99
731,3789-61
|
43,722,41760
376,8307-690
104j
2-06
692,2109-41
40,918,89559
355,8647-540
103
2-08
Animalsandtheir
Products.
Cattleandhorses
....144,257
1-89
11,662,71681
196,4644-011
7
3
4-04
139,3171-89
10,622,85776
185,7043-941
6
8
4-19
Sheepandpigs
..
..391,1945-14
28,260,60272
391,4867-991
0
0
3-32
371,4395-0427,339,33474
381,8118-091
0
7
3-35
Meat..
..
..
171,9642-26
4,459,36926
110,6502-2601211
5-95
178,5902-43
4,343,93024
110,5572-340125
6-10
Butter..
..
..
101,8461-34
6,684,88966
111,5942-281
1
11
4-00
94,9821-29
5,930,09962
106,5872-261
2
5
4-31
Cheese..
..
..
99,6911-31
4,240,39843
89,1381-820
1711
5-04
75,2751-02
3,378,54445
74,9121-5901911
5-32
Wool
..
..
..141,235
1-86
7,554,64953
144.3882-951
0
6
4-59
135,1841-84
7,181,12253
137,4072-911
0
4
4-59
Dairyby-products
..
..
16,9890-22
1,318,07278
16,6410-340
197
3-03
16,0070-22
1,359,19985
17,1320-361
1
5
3-02
Fat,hides,skins
..
..
33,3540-44
1,463,49944
34,1390-701
0
6
5-60
36,4670-50
1,567,66143
38,4840-82
1115-88
Fish
....
..
7,7430-10
1,232,316159
11.8380-241
107
2-30
6,7940-09
1,124,926166
10,1250-211
910
2-16
1,108,27314-56
66,876,51060
1,106,33822-591
0
0
3-961,054,055
14-3262,847,67260
1,062,71922-521
0
2
4-05
ProductsofMines.
~!
Agriculturallime
..
..142,213
1-87
8,839,38362
45,6680-930
6
5
1-24I
116,4281-58
7,090,31061
36,9810-780
6
4
1-25
Coal,imported
..
..
59,6610-78
1,652,59828
25,4320-520
8
7
3-69
75,5421-03
1,940,35426
31,4300-670
8
4
3-88
Coal,N.Z.hard
..
..
1,105.50914-52
34,161,72431
287,4115-870
5
2
2-02!
1,102,18314-98
36,883,44633
286,5376-070
5
2
1-86
Coal,N.Z.brown
..
..999,017
13-12120,913,304
121
572,26811-68
0116
114i
1,012,94613-77
121,434,819120
576,34312-21
0115
1-13
Road-metal
..
..
354.1594-65
7,610,16521
59,0431-210
3
4
1-86
277.2173-77
6,833,61325
49,8111-060
5
7
1-74
Limeandcoke
....60,7340-80
3,382,93956
25,1100-510
8
3
1-78
54,5960-74
3,370,86562
24,5890-520
9
0
1-74
2,721,293|
35-74176,560,113
65
1,014,93220-720
7
6
1-372,638,91235-87
177,5-53,40767
1,005,69121-310
7
8
1-35
Productsof
Forests.~~Timber,imported
....29,769
0-39
1,437,80349
29,2590-600198
4-88
32,7070-44
1,628,80450
33,6750-711
0
7
4-96
Timber,N.Z.
....538,252
7-07
60,980,958113
495,92910-12
0185
1-951
537,8567-3160,709,948113
501,53010-640188
1-98
Firewood,posts,&e.
..126,693
1-66
10,002,51079
50,9361-040
8
1
1-22
127,9971-74
9,690,93876j
49,2771-040
7
9
1-21
694,7149-12
72,421,271104
576,12411-76
0167
1-90
698,5609-49
72,029,690103
584,48212-390169
1-94
Manufactures,&c.
~j"'Benzine,
gasoline,kerosene
..123,937
1-63
9,030,98273
200,2394-091
124
5-32
89,9771-22j
7,635,27685
172,7473-661
1810
5-42
Cement,N.Z.
....70,6790-93
5,484,47878
55,1301130158
2-41
78,4811-07I
9,519,346121
75,8421-610194
1-91
Manures
......712,7419-3647,242,94966
326,9396-670
9
2
1-66
586,0077-96
36,371,28762
261,3135-540
8111-72
907,35711-92
61,758,40968
582,30811-8901210
2-26
754,46510-25
\
53,525,90971j
509,90210-810136
2-28
Miscellaneous..
..1,450,430
19-0566,414,67846
1,241,85925-350171
4-481,520,195
20-66.62,035,70241
1,199,94025-43015104-64
Totals
....7,613,445
100-00487,753,39864
4,898,391100-00
01211
2-417,358,397
100-00\468,911,275
64\
4,718,598100-00
012102-41
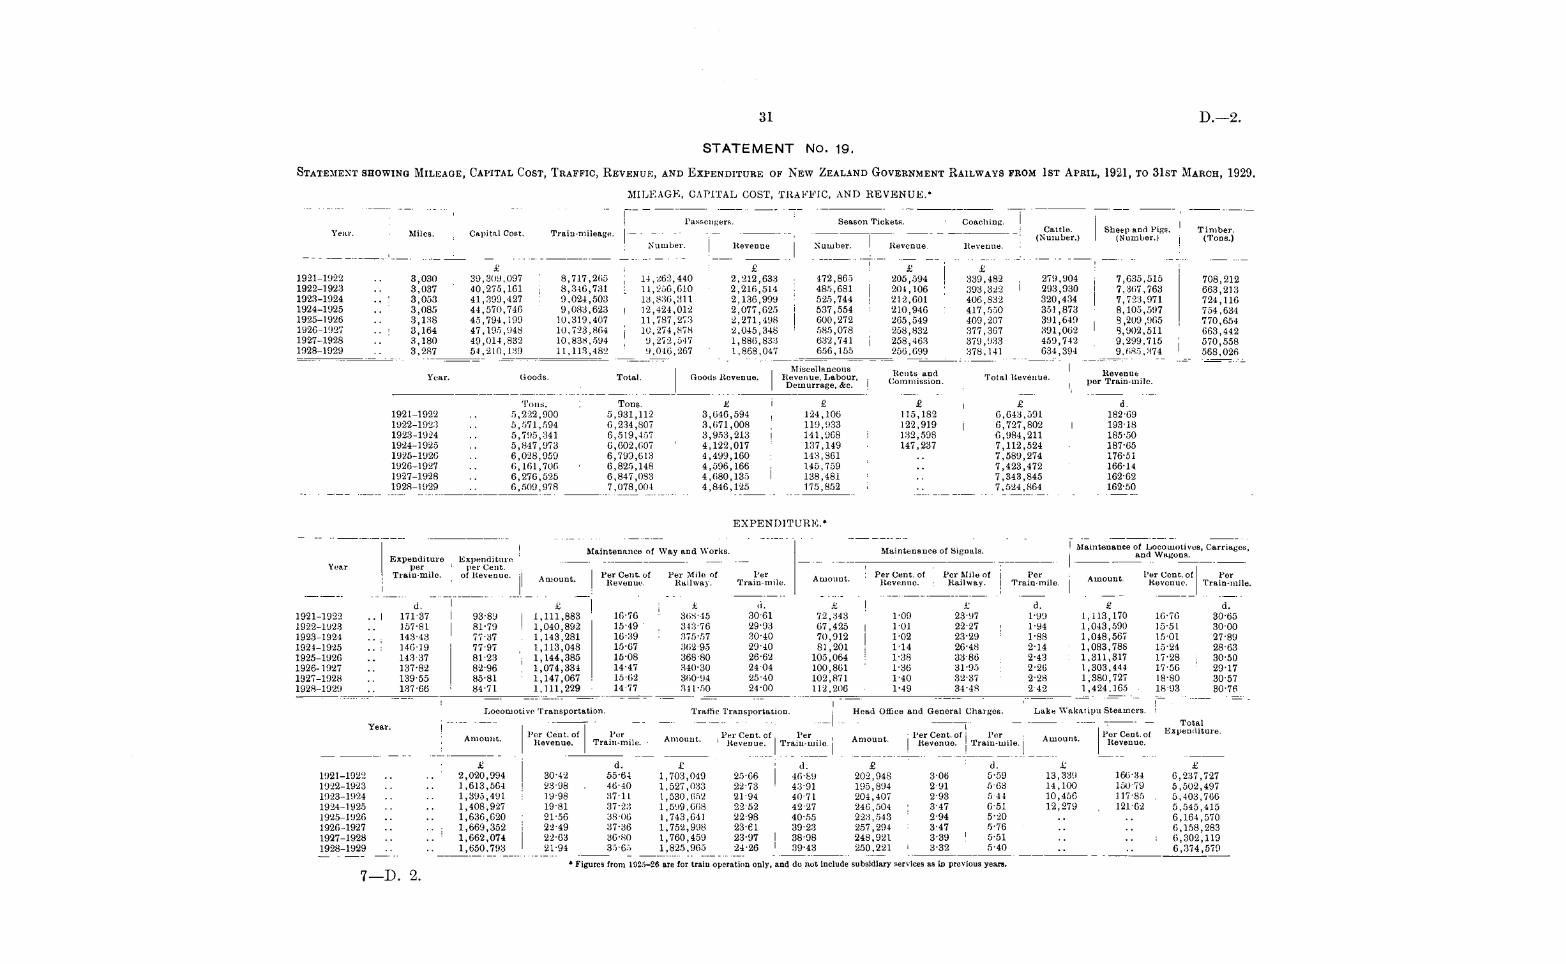
D.—231
STATEMENT No. 19.
Statement showing Mileage, Capital Cost, Traffic, Revenue, and Expenditure of New Zealand Government Railways from 1st April, 1921, to 31st March, 1929,
MILEAGE, CAPITAL COST, TRAFFIC, AND REVENUE.*
7—D. 2
Passengers. Season Tickets. Coaching.Year. Miles. Capital Cost. Train-mileage. = (Number.)
Number. Revenue, Number. Revenue. Revenue.
£ ! £ £ £
1921-1922.. 3,030 39,309,097 8,717,265 14,262,440 2,212,633 472,865 205,594 339,482 279,904 7,635,515 708,212
1922-1923 .. 3,037 40,275,161 8,346,731 14,256,610 2,216,514 485,681 204,106 393,322 293,930 7,367,763 663,2131923-1924 .. 3,053 41,399,427 9,024,503 13,836,311 2,136,999 525,744 212,601 406,832 320,434 7,723,971 724,1161924-1925 .. 3,085 44,570,746 9,083,623 12,424,012 2,077,625 537,554 210,946 417,550 351,873 8,105,597 754,6341925-1926 .. 3,138 45,794,199 10,319,407 11,787,273 2,271,498 600,272 265,549 409,207 391,649 8,209,965 770,6541926-1927 .. 3,164 47,195,948 10,723,864 10,274,878 2,045,348 585,078 258,832 377,367 391,062 8,902,511 663,4421927-1928 .. 3,180 49,014,832 10,838,594 9,272,547 1,886,833 632,741 258,463 379,933 459,742 9,299,715 570,5581928-1929 .. 3,287 54,210,139 11,113,482 ! 9,046,267 1,868,047 656,155 256,699 378,141 634,394 9,685,374 568,026
Year. Goods. Total. Goods Revenue. Commission. Total Revenue. per Trlta-mile.Tons. Tons. £ £ £ £ d.
1921-1922 .. i 5,222,900 5,931,112 3,646,594 124,106 115,182 6,643,591 182-691922-1923
.. ! 5,571,594 6,234,307 3,671,008 119,933 122,919 6,727,802 193-181923-1924 .. 5,795,341 6,519,457 3,953,213 141,968 132,598 6,984,211 185-501924-1925 .. 5,847,973 6,602,607 4,122,017 137,149 147,237 7,112,524 187-651925-1926 .. 6,028,959 6,799,613 4,499,160 143,861 .. 7,589,274 176-511926-1927 .. 6,161,706 6,825,148 4,596,166 145,759 .. 7,423,472 166-1419-27-1928 .. 6,276,525 6,847,083 4,680,135 138,481 .. 7,343,845 162-621928-1929 .. 6,509,978 7,078,004 4,846,125 175,852 .. 7,524,864 162-50
.1EXPENDITURE. *
Maintenance of Way and Works. Maintenance of Signals. Maintenance Carriages,Expenditure Expenditure ana wagons.
Year. per per Cent.Train-mile. of Revenue. Per Cent, of i Per Mile of Per Per Cent, of Per Mile of Per Per Cent, of PerAmount. Revenue. Railway. Train-mile. Revenue. Railway. Train-mile. Revenue. Train-mile.
d. £ £ d. £ £ d. £ d.1921-1922 .. 171-37 93-89 1,111,883 16-76 368-45 30-61 72,343 1-09 23-97 1-99 1,113,170 16-76 30-651922-1923 .. 157-81 81-79 1,040,892 15-49 343-76 29-93 67,425 1-01 22-27 1-94 1,043,590 15-51 30-001923-1924 .. 143-43 77'37 1,143,281 16-39 375-57 30-40 70,912 1-02 23-29 1-88 1,048,567 15-01 27-891924-1925 .. 146-19 77-97 1,113,048 15*67 362 95 29-40 81,201 1-14 26*48 2-14 1,083,788 15*24 28-631925-1926 .. 143-37 81*23 1,144,385 15*08 368*80 26-62 105,064 1-38 33 86 2-43 1,311,317 17-28 30*501926-1927 ..
137*82 82*96 1,074,334 14*47 340*30 24*04 100,861 1*36 31*95 2*26 1,303,444 17*56 29*171927-1928 .. 139*55 85*81 1,147,067 15*62 360*94 25*40 102,871 1*40 32*37 2*28 1,380,727 18*80 30-571928-1929 .. 137*66 84*71 1,111,229 14-77 341*50 24*00 112,206 1-49 34-48 2*42 1,424,165 18*93 30*76
Locomotive Transportation. Traffic Transportation. Head Office and General Charges. Lake Wakatipu Steamers.
Year. [" : TotalPer Cent, of Per Per Cent, of Per Per Cent, of Per , mm_, PerCent.of Expenditure.
A ount. Revenue. Train-mile, j Amount. Revenue. Train-mile. Amount. Revenue. Train-mile. Amount. Revenue.
£ d. £ d. £ d. £ £
1921-1922 .. .. 2,020,994 30*42 55*64 1,703,049 25*66 46*89 I 202,948 3*06 5*59 13,339 166*34 6,237,7271922-1923 .. .. 1,613,564 23*98 46*40 1,527,033 22-73 43 91 195,894 2 91 5-63 14,100 150*79 5,502,4971923-1924 .. .. 1,395,491 19-98 37-1L | 1,530,652 21*94 40 71 204,407 2'93 5 44 10,456 117*85 5,403,7661924-1925 .. .. 1,408,927 19*81 37*23 ' 1,599,668 22*52 42 27 246,504 3*47 6*51 12,279 121-62 ! 5,545,4151925-1926 .. .. 1,636,620 21-56 38-06 1,743,641 22-98 40*55 223,543 2*94 5*20 .. .. 6,164,5701926-1927 .. ... 1,669,352 22*49 37*36 I 1,752,998 23-61 39-23 257,294 3-47 5-76 .. .. 6,158,2831927-1928 .. .. 1,662,074 22-63 36*80 1,760,459 23*97 38*98 248,921 3*39 5*51
.. .. 6,302,1191928-1929 .. .. 1,650,793 21*94 35*65 1,825,965 24*26 39*43 250,221 3*32 5*40
.. .. 6,374,579* Figures from 1925-26 are for train operation only, and do not include subsidiary services as in previous years.
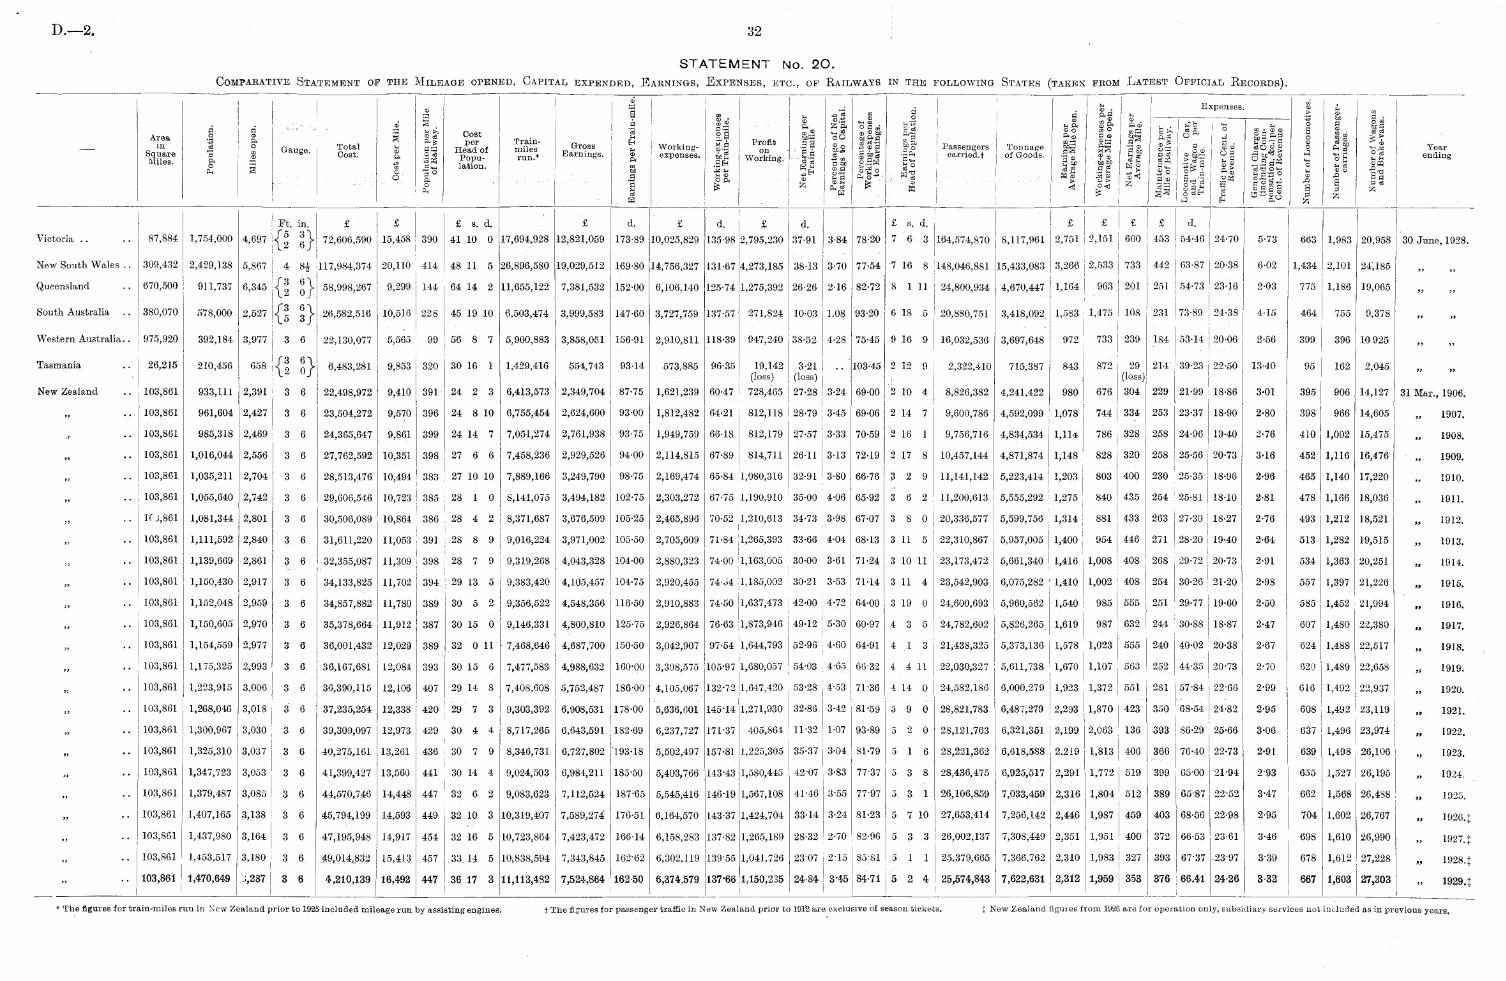
D.—2. 32
STATEMENT No. 20.Comparative Statement of the Mileage opened, Capital expended, Earnings, Expenses, etc., of Railways in the following States (taken from Latest Official Records).
I <D I ' I i 05® a a a a ' I,a I Expenses. ® i a
Area I ® I S Costm !l &S Sal |l , f| &>g ®
®"° 1,3a§ 1 Ig If
iQ 2 ° Gauge Total g as niUes Gross Working- g.S - '! SS ~S ?S Passengers Tonnage |>g ag 5® a So I s ■".* YearSquare| J «• Cost. * || run.* F«gs.
|expenses. . || WorkingJ|| J ||g |* carried.! of Goods. |j |g |l ||| || |||| 5 || jj enCliCg
5 r f |& 2|5 | i v r ii hi f mi i i i 1H I I [ ) J H ft° Z
Ft. in. £ £ £ s. d. £ d. £ d. I £ d. £ s. d. £ £ £ £ d.Victoria .. .. 87,884 1,754,000 4,697 72,606,590 15,458 390 41 10 0 17,694,928 12,-821,059 173-89 10,025,829 135-98 2,795,230 37-91 3-84 78-20 7 6 3 164,574,870 S,117,961- 2,751 2,151 600 453 54-46 24-70 5-73 663 1,983 20,958 30 June, 1928.
New South Wales .. 309,432 2,429,138 5,867 4 8£ 117,984,374 20,110 414 48 11 5 26,896,580 19,029,512 169-80 14,756,327 131-67 4,273,185 38-13 3-70 77-54 7 16 8 148,046,881 15,433,083 3,266 2,533 733 442 63-87 20-38 6-02 1,434 2,101 24;i85
Queensland .. 670,500 911,737 6,345 58,998,267 9,299 144 64 14 2 11,655,122 7,381,532 152-00 6,106,140 125-74 1,275,392 26-26 2-16 82-72 8 111 24,800,934 4,670,447 1,164 963 201 251 54-73 23-16 2-03 775 1,186 19,065
South Australia .. j 380,070 578,000 2,527 gj- 26,582,516 10,516 228 45 19 10 6,503,474 3,999,583 147-60 3,727,759 137-57 271,824 10-03 1.08 93-20 |b 18 5 20,880,751 3,418,092. 1,583 1,475 108 231 73-89 24-38 4-15 464 755 9,378
Western Australia.. 1975,920 392,184 3,977 3 6 22,130,077 5,565 99 56 8 7 5,900,883 3,858,051 156-91 2,910,811 118-39 947,240 38-52 4-28 75-45 9 16 9 16,032,536 3,697,648 972 733 239 184 53-14 j 20-06 2-56 399 396 10 925
Tasmania .. 26,215 210,456 658 <ff 6,483,281 9,853 320 30 16 1 1,429,416 554,743 93 14 573,885 96-35 19,142 3-21 ..103-45 2 12 9 2,322,410 715,387 843 872 29 214 39-23 22-50 13-40 95 162 2,045* (loss) (loss) (loss)
New Zealand .. j 103,861 933,111 2,391 3 6 22,498,972 9,410 391 24 2 3 6,413,573 2,349,704 87-75 1,621,239 60-47 728,465 27-28 3-24 69-00 2 10 4 8,826,382 4,241,422 980 676 304 229 21-99 18-86 3-01 395 906 14,127 31 Mar., 1906... I 103,861 961,604 2,427 3 6 23,504,272 9,570 396 24 8 10 6,755,454 2,624,600 93-00 1,812,482 64-21 812,118 128-79 3-45 69-06 2 14 7 9,600,786 4,592,099 1,078 j 744 334 253 23-37 18-90 2-80 398 966 14,605 J „ 1907... 103,861 985,318 2,469 3 6 24,365,647 9,861 399 24 14 7 7,051,274 2,761,938 1 93-75 1,949,759 66-18 812,179 27-57 3-33 70-59 J 16 1 9,756,716 4,834,534 1,114 I 786 328 258 24-96 19-40 2-76 410 1,002 15,475 „ 1908... 103,861 1,016,044 2,556 3 6 27,762,592 10,351 398 27 6 6 7,458,236 2,929,526 94-00 2,114,815 67-89 814,711 26-11 3-13 72-19 f 17 8 10,457,144 4,871,874 1,148 828 320 258 25-56 20-73 3-16 452 1,116 16,476 „ 1909... 1103,861 1,035,211 2,704 3 6 28,513,476 10,494 383 27 10 10 7,889,166 3,249,790 98-75 2,169,474 6-5-84 1,080,316 32-91 13-80 66-76 1 2 9 11,141,142 5,223,414 1,203 803 400 230 25-35 18-96 2-96 465 1,140 17,220 „ 1910... 103,861 1,055,640 2,742 3 6 29,606,546 10,723 1 385 28 1 0 8,141,075 3,494,182 102-75 2,303,272 67-75 1,190,910 35-00 4-06 65-92 3 6 2 11,200,613 5,555,292 1,275 840 435 254 25-81 18-10 2-81 478 1,166 18,036 „ 1911... If J,861 1,081,344 2,801 3 6 30,506,089 10,864 386 28 4 2 8,371,687 3,676,509 105-25 2,465,896 70-52 1,210,613 34-73 3-98 67-07 '3 8 0 ! 20,336,577 I 5,599,756 1,314 881 433 263 27-30 18-27 2-76 493 1,212 18,521 „ 1912... 103,861 1,111,592 2,840 3 6 31,611,220 ; 11,053 391 28 8 9:9,016,224 3,971,002 105-50 2,705,609 71-84 1,265,393 33-66 4-04 68-13 3 11 5 j 22,310,867 5,957,005 1,400 954 | 446 271 28-20 19-40 2-64 513 1,282 19,515 „ 1913.
.. 103,861 1,139,669 2,861 3 6 32,355,087 11,309 398 28 7 9 9,319,268 4,043,328 104-00 2,880,323 74-00 1,163,005 30-00 3-61 71-24 3 10 11 23,173,472 5,661,340 1,416 . 1,008 408 268 29-72 20-73 2-91 534 1,363 20,251 „ 1914.
.. 103,861 1,150,430 2,917 3 6 34,133,825 11,702 394 29 13 5 9,383,420 4,105,457 104-75 2,920,455 74 54 1,185,002 30-21 3-53 71-14 B 11 4 23,542,903 6,075,282 1,410 1,002 1 408 254 30-26 21-20 2-98 557 1,397 21,226 „ 1915.
.. 103,861 1,152,048 2,959 3 6 34,857,882 11,780 389 30 5 2 9,356,522 4,548,356 116-50 2,910,883 74-50 1,637,473 42-00:4-72 64-00 3 19 0 24,600,693 5,960,562 1,540 985 555 251 29-77 19-60 2-50 585 1,452 21,994 „ 1916.
.. 103,861 1,150,605 2,970 3 6 35,378,664 11,912 387 30 15 0 9,146,331 4,800,810 125-75 2,926,864 76-63 1,873,946 49-12 j 5-30 60-97 4 3 5 24,782,602 5,826,265 1,619 987 632 244 30-88 18-87 2-47 607 1,480 22,380 „ 1917.
.. 103,861 1,154,559 2,977 3 6 36,001,432 12,029 389 32 0 11 7,468,646 4,687,700 150-50 3,042,907 97-54 1,644,793 52-96 4-60 64-91 4 1 3 21,438,325 5,373,136 j 1,578 1,023 555 240 ; 40-02 20-38 2-67 624 1,488 22,517 „ 1918.
.. 103,861 1,175,325 2,993 3 6 36,167,681 12,084 393 30 15 6 7,477,583 4,988,632 160-00 3,308,575 105-97 1,680,057 54-03 4-65 66-32 4 4 11 22,030,327 5,611,738 ! 1,670 1,107. 563 252 ' 44-35 | .20*73 2-70 620 1,489 22,658„ 1919.
.. 103,861 1,223,915 3,006 3 6 36,390,115 12,106 407 29 14 8 7,408,608 5,752,487 186-00 4,105,067 132-72 1,647,420 53-28 4;53 71-36 4 14 0 24,582,186 6,000,279 : 1,923 1,372 j 551 281 j 57-84 | 22-66 2-99 616 1,492 22,937 „ 1920.
.. 103,861 1,268,046 3,018 3 6 37,235,254 12,338 420 29 7 3 9,303,392 6,908,531 178-00 5,636,601 145-14 1,271,930 32-86 3-42 81*59 5 9 0 28,821,783 6,487,279 1 2,293 j 1,870 j 423 350 68-54 j 24-82 2-95 608 , 1,492 23,119 „ 1921.
.. 103,861 1,300,967 3,030 3 6 39,309,097 12,973 429 30 4 4 8,717,265 6,643,591 182-69 6,237,727 171-37 405,864 11-32 1-07 93-89 5 2 0 28,121,763 6,321,351 2,199 2,063 136 393 86-29 25-66 3-06 637 1,496 23,974 „ 1922... 103,861 1,325,310 3,037 3 6 40,275,161 13,261 436 30 7 9 8,346,731 6,727,802 193-18 5,502,497 157-81 1,225,305 35-37 3-04 81-79 5 1 6 28,221,362 6,618,588 2.219 1,813 | 406 366 76-40 22-73 2-91 ! 639 1,498 26,106 „ 1923... 103,861 1,347,723 3,053 3 6 41,399,427 13,560 441 30 14 4 9,024,503 6,984,211 185-50 5,403,766 143-43 1,580,445 42-07 3-83 77'37 5 3 8 28,436,475 6,925,517 2,291 1,772 519 399 65-00 21-94 293 655 1,527 26,195 „ 1924... 103,861 1,379,487 3,085 3 6 44,570,746 14,448 447 32 6 2 9,083,623 7,112,524 187-65 5,545,416 146-19 1,567,108 41-46 3:55 77-97 5 3 1 26,106,859 7,033,459 2,316 1,804 1 512 389 6587 22-52 3-47 662 1,568 26,488 „ 1925.
.. 103,861 1,407,165 3,138 3 6 45,794,199 14,593 449 32 10 3 10,319,407 7,589,274 176-51 6,164,570 143-37 1,424,704 33-14 3-24 81-23 |5 7 10 27,653,414 7,256,142 2,446 1,987 459 403 68-56 22-98 2-95 704 1,602 26,767 „ 1926.+
.. 103,861 1,437,980 3,164 3 6 47,195,948 14,917 454 32 16 5 10,723,864 7,423,472 166-14 6,158,283 137-82 1,265,189 28-32 2-70 82-96 5 3 3 26,002,137 7,308,449 2,351 1,951 ; 400 372 66-53 23-61 3-46 698 1,610 26,990 „ 19274
.. 103,861 1,453,517 3,180 3 6 49.014.832 15.418 457 .33 14 5 10,838,594 7,343,845 162-62 6,302,119 139*55 1,041,726 23*07 2*15 85*81 5 1 1 25,379,665 7,366,762 2,310 1,983 327 393 67*37 23*97 3*39 678 1,612 27,228 „ 19284. - ! 103,861 1,470,649 J,287 3 6 4,210,139 16,492 447 38 17 3 11,113,482 7,524,864 162-50 6,374,579 137-66 1,150,235 24-84 3*4-5 84-71 J5" 2 4 25,574,843 7,622,631 2,312 1,959 353 376 66.41 24-26 3-32 667 1,603 27,303
„ 19294* The figures for train-miles run in New Zealand prior to 1925 included mileage run by assisting engines. t The figures for passenger traffic in New Zealand prior to 19l£are exclusive of season tickets. J New Zealand figures from 1926 are for operation only, subsidiary services not included as in previous years.
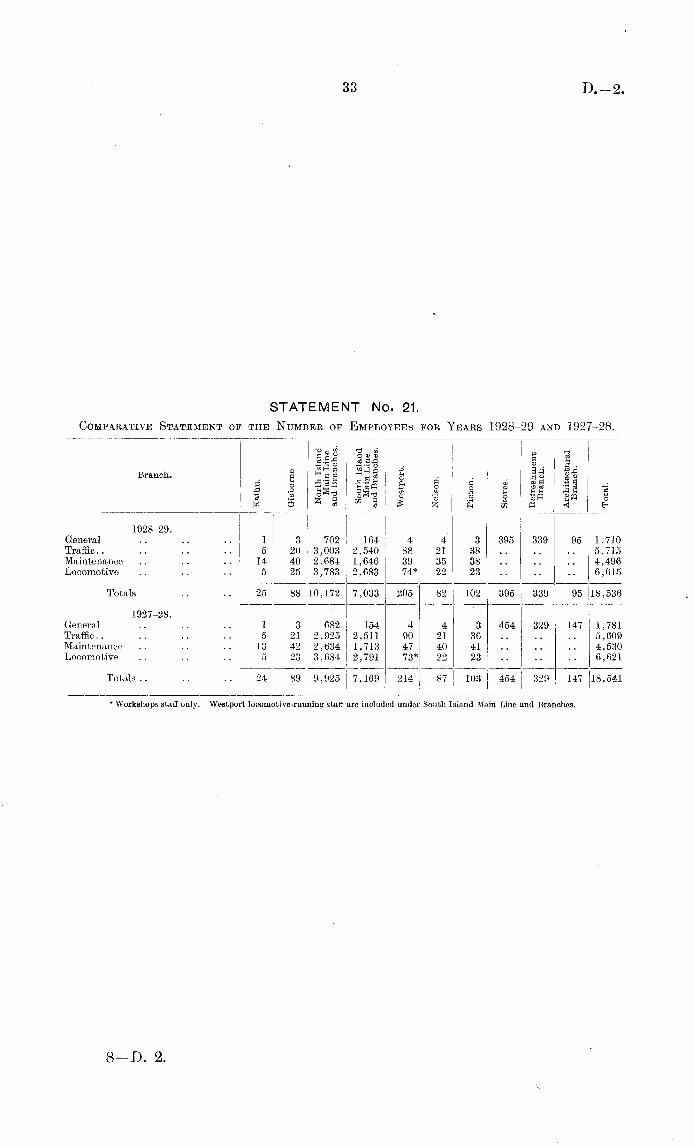
D.—2.
STATEMENT No. 21.Comparative Statement of the Number of Employees for Years 1928-29 and 1927-28.
B—JD. 2.
33
0 co as ! f-ng.s| §S| i I jjBranch. § 3 a | 1 | . |"S |"S
e I 333 sis I § § I 1 1s 19 -j•3 M . OT CQ -glSH '■*'-< £'3 22 vS rt CD i O O "SCQ ? £Q!S2 !Z & rf) . 'H i S-<" OM 0 * «a 50 3 > 55 PmIgqW <j EH
1928-29.General .. .. .. 1 3 702 164 4 4 3 395 339 95 1,710Traffic.. .. .. .. 5 20 3,003 2,540 88 21 38 5,715Maintenance .. .. .. 14 40 2,684 1,646 39 35 38 .. .. .. 4,496Locomotive ..
.. .. 5 25 3,783 2,683 74* 22 23 6,615
Totals .... 25 88 10,172 7,033 205' 82 102 395 I 339 95 18,536
1927-28.General .. ..
.. 1 3 682 154 4 4 3 454 329 147 1,781Traffic.. .. .. .. 5 21 2,925 2,511 90 21 36 5,609Maintenance .. .. .. 13 42 2,634 1,713 47 40 41 4,530Locomotive .. .. .. 5 23 3,684 2,791 73* 22 23 6,621
i
Totals.. .. .. 24 89 9,925 | 7,169 { 214 87 103 j 454 [ 329 147 18,541
* Workshops staff only. Westport locomotive-runningstaff are included under South Island Main Line and Branches.

D.—2 34
STATEMENTNo.22.
Statement ofAccidentsfor theYearended31stMarch, 1929.
|
TrainAccidents.
AccentsonLine
(otherthanTrain
ShnntingAccident,.
Mg-I
personsj
—7
j
j
Duty"withininjured°at!
Trespassers.Miscellaneous.
Total.
Section.
Passengers.
!Employees.
Passengers.Employees.
Passengers.Employees.; BoSyf°
r0SSingS
-Empires.P^ons.
T3
."O
i
.
1
.|T3
"2.*D
.TJ'.tj
.
T3
,
"Oj
.
13
.
"d
.**3
T3
£
ri
9
\
n■p-OP'UPT3
-a
£
T3
£
T3
p
:
£
t:
£
-a
P■PPT3
£
2
S
2
3
'
£
i
a
1
S
S
3
.8,33
3
s
g
1
S
i
A
s
3
is
§
J;
3
j>
S
.2
8
9
S
M
>5
wI
5
S
5*
0
5
SIS5
5
5
5
3
5
5
8
S
5
S
5*I
3
5
SI
3
5
5*
*j
:
.i
i
j
i
i
:
j
j
|
j
i
j
|
1
j
i
i
7
T
Kaihu..
\
..
|
..
I
....1
1
Gisborne..
....4
..
2
2......j....
3
1
21
j
4
..
1
17
NorthIslandMain
Line..
3
1
3
23
1
23
8
6
1....2
81
1
1
1
16
35
....
3
510
1
298
....
35
982
andBranches
SouthIslandMain
Line..
3
1
1
3
2I
3
3
21..!..
2
49
..
3
..
1
5
6
..
1
347
..
206..
..14
624
andBranches
'
!
i
:
j
Westport..
....i
...
....|
3
1
1
6
..
9
....I
19
Nelson..
..
....
..1
2....1
2
6
Picton..
..
..1
1
5
7
..
1
13
■!Totals
....10
..
5
4
26
3
28
11
8
4
138
1
5
1
3
23
49
4
877
1
513
....
52'
1,662
1
I
'I
I
I
1
1
!
___
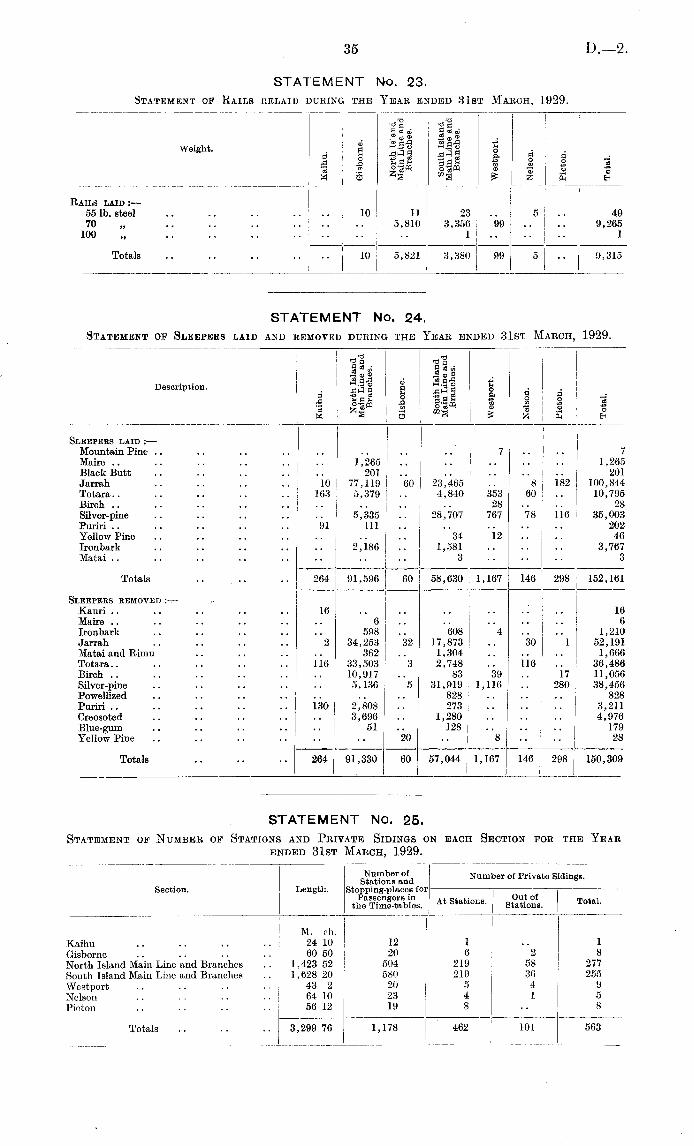
D.—2.
STATEMENT No. 23.Statement of Rails relaid during the Year ended 31st March, 1929.
STATEMENT No. 24.Statement of Sleepers laid and removed during the Year ended 31st March, 1929.
STATEMENT No. 25.Statement of Number of Stations and Private Sidings on each Section for the Year
ended 31st March, 1929.
35
r^'' d rr!*0A O A3 tn 2 co* o $ - ® 2QJ <3 "PWeight. a "-a® M-~ g §
0 s | § a JrS -0 13 -2 $ M 03 -2 <g3 .2 SjS™ ,9 a® £ ® .2 oM © 3 SS £ S5 S En
|
Rails laid :—
55 1b. steel .. .. .. .... 10 11 23 5 4970 „ .. .. .. 5,810 3,356 99 .. .. 9,265
100 .. .. .... 1 1
Totals .. .. .. .. .. 10 5,821 3,380 99 5 9,315I i
a S "S 0.
ua ai 9 03 00■3 ® 2 ~® SJ2 a -3 „i ra a ■*=>
Description. a3 | g ~g | | d| IsJ $ g|| fjl 33 2i5 K .a £ ® .2 oM 3 O 3 2; Ph EH
Sleepers laid : —
Mountain Pine .. .. .. .. .. -. .. j 7 .. 7Maire .. .. .. .. .. .. 1,265 .. .. .. ..
.. 1,265Black Butt .. .. .. .. .. 201 .. .. ..
• •.. 201
Jarrah .. .. .. .. 10 77,119 60 23,465 .. 8 182 100,844Totara.. .. .. .. ..163 5,379 .. 4,840 353 60 .. 10,795Birch .. .. .. .. .. i .. .. .. 28 .. 28Silver-pine .. .. .. .. .. 5,335 .. 28,707 767 78 116 35,003Puriri.. .. .. .. .. 91 111 .. 202Yellow Pine .. .. .. .. .. .. .. 34 12 .. 46Ironbark .. .. .. ..
.. 2,186 .. 1,581 j 3,767Matai .. .. .. .. .. .. .. .. 3 i •. .. 3
Totals .. .. .. 264 91,596 60 58,630 | 1,167 146 298 152,161Sleepers removed
Kauri .. .. .. .. .. 16 .. .... 16
Maire .. .. .. .. ..
. ■ 6 ' ....
6Ironbark .. .. .. .. .. 598 .. 608 4 ..
.. 1,210Jarrah ..
.. .. .. 2 34,253 32 17,873 .. 30 I 1 52,191Matai and Rimu .. .. .. .. 362
.. 1,304 .. .... 1,666Totara.. .. ..
.. .. 116 33,503 3 2,748 .. 116 .. 36,486Birch .. .. .. .. ..
.. 10,917 .. 83 39 17 11,056Silver-pine .. .. .. .. .. 5,136 5 31,919 1,116 .. 280 38,456Powellized ..
.. .. .. ....
.. 828 .. .. .. 828Puriri .. ..
.. .. .. 130 2,808 .. 273 3,211Creosoted .. ..
.. .. .. 3,696 .. 1,280. 4,976Blue-gum .. .. .. ..
.. 51 .. 128 ! .. .. .. 179Yellow Pine .. .. .. .. .. .. 20 .. 8 .. .. 28
Totals .. .. .. 264 91,330 60 57,044 1,167 146 298 150,309t i i
Numberof Number of Private Sidings.Stations anaSection. Length. Stopping-places for
Passengers in .. stfl«nT iHOut of T t ,
the Time-tables. At btations. stations. 10taL
M. ch.Kaihu .. ..
. ••
• 24 10 12 1 .. 1Gisborne .. .. .. ..
60 50 20 6 2 8North Island Main Line and Branches ..
1,423 52 504 219 58 277South Island Main Line and Branches .. j 1,628 20 580 219 36 255Westport .. • • • • • • 43 2 20 5 4 9Nelson . . . .
.. ..64 10 23 4 1 5
Picton .. • • • • .. I 56 12 19 8 .. 8
Totals .. .. .. 3,299 76 1,178 462 101 563;

r>.—2, 36
STATEMENTNo. 26.ComparativeStatement ofMileage ofRailways openforTrafficand underMaintenanceon 31stMarch. 1929.j
j
Equivalent
Mileageopen
AdditionalLengths
openedduring
Year.
ReducedMileage
Lengthclosedduring
Year.!NetAddition|
NetAdditionTotalMileage
~
forTrafficon
equivalentto
1
toMileageto
Mileageopenfor
Traffic
Sectl0n
31stMarch,
MaintenanceforI
open
underon
31stMarch,
/rendpri
192S.
!
Lengthwhole
Period.
forTraffl°-
Maintenance.1929.siw
March,
Lineopened.
Dateof
Opening.}
Line.
j
Length.
I
1929.
M.ch.
'M.ch.
M.ch.
I
M.ch.
M.ch.
M.ch
M.ch.
M.ch.
Kaihu..
....
2410
....--•-..••
2410
2410
nwv,ToionriMoint
innoonrii
f
Waiotira-Kirikopuni..
15thMay,
1928..
1371
12
17"]
OpunakeBranch")
_-North
IslandMam
Linesand1
1>32626
Tahawai-Tauranga..
18thJune,1928
..
!2364
1857X
22m.72c.-22m.y
5
9726
6530
1,42352
1,39156
ran
Tauranga-Taneatua..2ndSeptember,
19285956
3441J
77c.
J
Gisborne
..
..
6050
...•...• --••6050
6050
SouthIslandMain
Linesand
1,61907
Miller'sFlat-Roxburgh
18thApril,
1928..
9
13
8
59•••.9
13
8
59
1,62820
1,62766
Branches Westport
....
4302
..-..••••
•
..
4302
4302
Nelson
..
..
6410
..•....••••6410
6410
Picton
....
..
5612
......•..5612
5612
Totals
..
..
3,19337
10644
7414
..-5
10639!
7409
3,29976
'3,26746
I
[__
m'k?.--4
I
1
I
.

D.—237
STATEMENT No. 27.Statement showingWeights ofRails invariousLines on 31stMarch, 1929.T
-401b.
401b.|
521b.
521b.
531b.
551b.I
561b.!
651b.1
701b.
1001b.
.„t
,Iron.
Steel.j
Iron.
Steel.
Steel
Steel.
Steel.
Steel.
Steel.
Steel.
lotal.
!
!
I
j
|
I
I
KaikuSection
—M.ch.
M.ch.
M.ch.
M.ch.
M.ch.
M.ch.
|
M.ch.
M.ch.
M.ch.
M.ch.
M.ch.
KaihnBranch
....
............1715
675
j ........
2410
NorthIslandMain
Linesand
Branches—
KaikoheBranch
................j....2459
..
....
..
2459
KirikopuniBranch
............j....1371....
..
..
1371
OnerahiBranch
..
..
..
............
020
257..
..
1
23
j
..
420
Auckland-Wellington..
..
..
........j..0
5
..
0
5
105
41550
..
42565
NorthAucklandLine
....
..
..........018
10237
2037
..5807
..18119
OnehungaBranch
..........
010
..
j
..
057
..
148
..024
..259
WaiukuBranch
........
............1270........1270
Huntly-AwaroaRailway
............I.•..9
6........9
6
ThamesBranch
..........
......j
..
0
33..1775
..4447
..6275
EastCoastMainTrunk
Line
..
..
..
......! ....9718
1137
..111
..109
66
CambridgeBranch
..............
I..6
75
236
242
..0
8
..121
RotoruaBranch
..
............j..1347..0
3
..5510
..
6860
RaetihiBranch
..
..
..
........j..6
35
2
3....
..
..
838
Marton-NewPlymouth
..
..
..
.......•••016..6
62
..
1305
..1373
WaitaraBranch
..
......
....029
..
..
369
..
044
....j
..462
TokoBranch
............
....i..1545
3134
031
......4730
OpunakeBranch..
..................2272........2272
MountEgmontBranch
........••....'
....62
..
....
62
WanganuiBranch
..............:••0
9
1
69
..
1
22
..
320
FoxtonBranch
..............0
2
..
1070..841
......1933
PalmerstonNorth-Eskdale
..............
0
21
1173
140
..9762
..123
76
PortAhuriri
Branch
..............•
•
1
65
0
4....
0
1
..170
Wellington-Woodville
......••.....•••..0
1
451
..109
71
..114
43
HuttValley
Branch..
....
..
..
..
..
..
..
......265
..
265
GreytownBranch
............37........
..
..
..
37
GisborneSection— Gisborne
Line
....
.■■•020
..
......318
1762
..
..
..4910
NgatapaBranch
..
..
........••1140........1140
SouthIslandMain
Linesand
Branches— Lyttelton—
Bluff
......•-•.
0
8
0
3
..
0
1......39021
148
3921
MainNorth
Line..
..
..■--
-
••..■•••2826
1279..
..
3927
..
8052
OxfordBranch
.......-■•■•1145
..••IB35
0
3
336
..0
6
..3345
EyretonBranch
......••••••..■•••2014
0
7....
..
..
2021
CheviotBranch
..
..
..■•••..••■•■•1253
3125
..0
3
..441
SouthbridgeBranch
..
..
..........
2312
1
0
1
20
..
0
7
..2539
LittleRiverBranch
..
..■•••0
9■■••048
1745
425
•.0
1
..2248
MidlandLine
..
..
..•••■••...■••••0
1....12214
850
13065
WhiteCliffsBranch
.....•••..••••1129..0
10
..
0
7
..
1146
MethvenBranch
..............2216..0
1....
0
3
..
2220
Carriedforward
..
..
-.
020
1221
312
2216
18036
42762
1555
105
1,47015
1018
2,29150

D.—2 38
STATEMENT No. 27—continued.Statement showingWeights ofRails invariousLines on 31stMarch, 1929—continued.T
-401b.
401b.
521b
521b.
531b.
551b.
561b.
651b.
701b.
1001b.
Iron.
Steel.
Iron.
Steel.
Steel.
Steel.
Steel.
Steel.
Steel.
Steel.
local.
M.ch.
M.ch.
M.ch.
M.ch.
M.ch.
M.oh.
M.ch.
M.oh.
M.ch.
M.ch.
M.ch.
Broughtforward
......020
1221
3
12
2216
18036
42762
1555
105
1,47015
1018
2,29150
SouthIslandMain
Linesand
Branches—continued.
SpringburnBranch
..
.,
..
..219
030
..
..
1
2
453
1870
..022
..2738
AlburyBranch
..
..
..
..
..065......2240
478
7
66
..
0
4
..3613
WaimateBranch
..
..
..
..
..
..
22
244
..
..
..
..
..
446
WaimateGorge
Branch..
....
......721
..
1
0
..
..
..
..
..
821
DuntroonBranch
........1
16..0
4..2851
361
3
69
......3741
OamaruBreakwaterBranch
....023......040
..........063
Ngapara.Branch
......
..........1144..3
45
......159
TokarahiBranch
..................1036
1
39■.....1175
DunbackBranch
..........6
76
053..016..1
0
•.....865
PortChalmers
Branch
................016......1
10
..
126
WaltonParkBranch
......0
2......1
48
019
048
..0
1
..
238
FernhillBranch
....
..
..
..........1
57........
..
157
OtagoCentral
Railway
....
..
..........6113
1527
6558
..460
..
14678
OutramBranch
..........01......626
073
1
53
..07
..
90
LawrenceBranch
...,............1
40
4220
158
....
..
5868
Catlin'sRiverBranch
..............1526
205
346
..4
1
..4278
TapanuiBranch
..................1040
9
3
65S
......2621
WaikakaBranch..
....
..
..
........1256....0
1■■1257
GlenhamBranch..
................664..217
..034
..935
SeawardBushBranch
................1
52
259
7
4
......3365
KingstonBranch
....
..
..........4247..2564
..1847
..
8678
TuatapereBranch
....
....
........6
60
1633
2015
..138
..5636
WairioBranch
........
..............,.
..2244
..
2244
HedgehopeBranch
......
060
4
1..,.466
3
18
0
1
..
..
..
1266
MossburnBranch
..........1016
....024
..
0
1
..
..
..
1
1041
WaimeaPlainsBranch
........................3637
..j
3637
SwitzersBranch
..
..
..,...........177
1169....0
1
..1367
Greymouth-Ross..
..................1426
..243
••3829
Stillwater-Jnangahua..
..............2764
1454
875
..540
..5673
BlackballBranch
...............,..1
0
231
..
..
..
331
PointElizabethBranch
................0
15
..
446
..324
..8
5
7-MileBranch
....,...............243....
..
..
243
Westport-Mokihinui
......
..........0
17
0
1
8
67
..2112
..
3017
Westport
-Te
Kuha
....
..
............557
0
4
......561
CapeFoulwindLine
....
..
............
..
74....
..
74
NelsonLine
..
..
..
.
..........2538
2150
1673
..0
9
..6410
PictonLine
..
..
,.,
,.........1711
2254
1624
..0
3
..5612
Totals
...
..
546
3364
1110
2418
48234
6771
41957
105
1,62563
1018
3,29976

D.—239
STATEMENT No. 28.Statement showing approximately Sleepers laid and removed up to 31st March, 1929.
Approximate Length opened each Year. Sleepers.
Year. TifnV1 RemovedNorth Island. Middle Island. Total. during
|Construction. Maintenance.*
rM. oh. M. oh. M. oh.
1867 .. .. .. 45 7° 45 7° 96,3381870-71 .. .. .. 18 58 18 58 39,3231871-72 .. ..
.. 11 68 11 68 24,8851872-73 .. .. .. 27 62 27 62 58,3271873-74 •• •• 10 55 11 21 21 76 4 6 , 0951874-75 .. .. 61 19 126 78 188 17 395,2461875-76 .. .. 69 23 248 4 317 27 666,4091876-77 .. .. 64 24 152 39 216 63 455,2541877-78 .. .. 103 76 94 58 198 54 417,2171878-79 .. .. 27 19 56 46 83 65 176,0061879-80! .. ..
26 33 4° 73 67 26 141>3821880-81 .. .. 68 39 32 71 101 30 212,888 74,2611881-82 .. .. [ 22 67 40 16 63 3 132,379 73,9471882-83 .. .. 22 40 19 42 21 | 88,751 106,7631883-84 .. .. 22 19 22 50 44 69 94,2ii 125,6321884-85 .. .. 56 o 24 o 80 o 168,000 148,3251885-86 .. .. 43 26 47 52 9° 78 191,048 137,9931886-87 .. .. 58 72 11 39 7° 31 147,814 I 39,°4°1887-88 .. .. 11 47 17 32 28 79 60,874 122,0271888-89 .. .. 18 31 .. 18 31 42,814 108,6901889-90 .. .. 11 57 20 68 32 45 68,381 129,6341890-91 .. ..
28 21 5 68 34 9 7 1 >636 133,9541891-92 .. ..
.. 27 27 27 27 57,408 139,9121892-93 .. .. 17 26 .. 17 26 36,382 132,5691893-94 28 38 33 58 62 16 130,620 155,8271894-95 .. .. 16 62 27 24 44 6 92,558 170,6811895-96 .. .. 14 73 3 48 18 41 38,876 188,2911896-97 .. .. 3 64 1 11 4 75 10,370 210,5881897-98 .. .. 27 46 10 2 37 48 78,960 243,4791898-99 ..
.. 22 46 11 13 33 59 70,848 282,3261899-1900 ..
.. .. 19 26 19 26 40,582 3°2,3541900-1901 ..
.. 4 30 103 38 107 68 226,485 345,4331901-1902 .. .. 11 20 12 32 23 52 49,665 369,3391902-1903 .. .. 28 40 27 43 56 3 "7,679 330,0291903-1904 ..
.. 33 12 4 44 37 56 79,170 309,2961904-1905 ..
.. 17 61 27 75 45 56 95,97° 302,2521905-1906 ..
.. 23 5 8 52 31 57 66,596 309,1831906-1907 .. .. .. 5° 7 50 7 105,184 283,2931907-1908 .. ..
10 38 4 61 15 19 31,999 331,6781908-1909 .. ..
186 21 23 21 209 42 440,003 279,1901909-1910 ..
.. 3 60 31 43 35 23 74, io4 236,3901910-1911 ..
.. ■ 14 64 29 76- 44 60 93,975 282,6821911-1912 .. ..I 23 30 23 1 46 31 97,4 X4 273,5861912-1913 .. .. 25 37 26 77 52 34 110,092 235,3781913-1914 .. .. .. 36 36 6,45s 261,7481914-1915 .. .. 40 22 5 1 3 91 25 191,756 227,6741915-1916 .. .. 7 43 7 73 15 36 32,445 157,9701916-1917 .. .. .. .. .. .. 86,5951917-1918 .. .. 22 70 .. 22 70 48,038 88,5401918-1919 .. .. ..
....
.. 7o,7431919-1920 ..
.. .. 12 75 12 75 27,169 78,6631920-1921 ..
.. 11 54 07 11 61 24,701 100,2801921-1922 .. .. .. 12 27 12 27 25,909 139,1871922-1923 .. .. 7 7° •• 7 7° 16,538 163,7351923-1924 .. .. 24 66 2 43 27 29 57,46i 227,0751924-1925 .. ..
18 8 14 75 33 3 69,379 184,0361925-1926 .. .. 30 41 20 66 51 27 107,809 235,2661926-1927 .. .. 24 22 3 7° 28 12 67,560 97,5861927-1928 .. .. 16 67 .. 16 67 40,410 175,9691928-1929 .. .. 97 26 9 13 106 39 255,570 150,309
Totals .. ....
.. 6,911,421 9,459,398
* Complete information not recorded until 1880 -81. t Nine months only.

D, —2.
STATEMENT No. 29.
Statement of Carriage, Rail-car, Brake-van, and Wagon Stock, and Tarpaulins, forthe Year ended 31st March, 1929.
40
n-«r°9 c3 Cfl 9 & 03! ® a ® I t
Description. Class. d "g§ S g °g ri■a log •§ IrtS S g 2 3'3 s-fm .3 §■§« £ ® .2 oM fcg a cog £ a< p
Carriages.Saloon, bogie, 56 ft. .. .. .. .. Aa .. 1 I .. .. .. .. .. i 1Sleepers, bogie, 56 ft. .. .. .. .. Aa .. 5 : .. . . ....!.. 5
„ 50 ft. .. .. .. Aa 10 10First-class, bogie, 50 ft. .. .. .. .. Aa .. 49 .. .. • • ! .. 49Ladies' (composite), bogie, 50 ft. .. .. .. Aa . . 6 .. .. .. j .. .. 6Second-class bogie, 50 ft. .. .. .. .. Aa .. 64 .. .. .... .. 64Royal saloon, bogie, 50 ft. .. .. .. .. Aa .. 1 ..
. . ; I 1Saloon, bogie, 50 ft.
.. .. .. . . Aa .. 2 .. .. ! 2Postal, bogie, 50 ft. .. .. .. Aa 1 .. .. 1Sleepers, bogie, 47J ft. .. .. .. .. A .. .. .. 6 6Royal saloon, bogie, 44 ft. .. . . .. .. A .. .. .. 1 1Gallery-cars, bogie, 44 ft. .. .. .. A .. .. .. 5 I 5Saloon, bogie, 47$ ft. .. .. .. .. A .. 1 .. 1 j 2
., 44 ft. .. .. .. .. A 1 1„ 41 ft. ..
.. .. A 5 4 9„ 39$ ft. ..
.. .. .. A .. 6 .. 7 13„ 37$ ft. .. .. .. A 2 2„ 35 ft. .. .. .. . . A
.. 1 ..2 3
Ladies' (composite), bogie, 47$ ft. ..A
.. ..4 4
„ 50 ft A .. 9 9Motor-train, bogie, 60 ft. .. .. .. A . . 4 . . I 5First-class, bogie, 50 ft. .. ..
.. .. A .. 46 .. .. . . .. | . . 46„ 47$ ft. .. .. .. .. A .. 40 .. 82 .. .. 2 124„ 44 ft. . .
.. .... A . . 3
..3
....
! 1 7„ 43 ft. .. .. . .
.. A .. 11 .. 1 .. 11„ 30 ft. .. . . .. .. B 1 ...... 1
Composite, bogie, 60 ft. .. .. .. .. A .. 8..
.. ....(.. 8„ 50 ft. .. .. .. .. A .. 52
..1 ....!.. 53
„ 47$ ft. .. .. A I .. ; 105 2 105 I 1 4 I 2 219„ 46 ft. .. .. .. .. A | .. 1 .. 5 5„ 44 ft. .. .. .. A .. 65 : 7 80 2 1 ! 2 157„ 43 ft. .. .. .. .. A .. 7 7„
42$ ft. .. ... .
.. A .. 15 . . 30 45„ 39$ ft. .. .. A 2 4 1 2 1 1 10„ 30 ft. .. . . .. . . B 12 . . 19 ...... 31
,, 6-wheel . ...
. . . . C 2 . . . . 1 ...... 3Second-class, bogie, 52 ft. ..
. ... A . . 1 .. .. 1
„ 50 ft. .. .. .. .. A | .. | 104 I .. 1 1 105., 47$ ft. .. .. .. .. A .. 96 .. 137 3 236„ 46 ft. .. . . . . . . A .. j .. .. 6 ....;.. 8„ 44ft. .. .. .. .. A ; .. 86 ; 4 116 3 3 4 216„ 43 ft. ..
. . . ... A : . 18 ! . . 18
„ 42$ ft,.. .. .. .. A .. 3 .. 14 17
„ 39£ ft. .. .. .. A .. 9 .. 3 12„ 35 ft. .. .. .. .. A .. 3 3„ 30 ft. .. .. ..
. . B .. 6 . . 16 i 226-wheel .. .. .. .. C 2 2
..2:2 4... 12
„ 4-wheel .. .. .. .. D .. .. .. .. 4- .... 4Postal, bogie, 50 ft. .. .. .. .. A .. 7 .. 3 10
„ 44 ft. . . . . .. A 4 4 ...... 8„ 39$ ft.
.. .. .. .. A .. 2 2
Totals .. .. .. .. .. .. 4 | 874 13 665 16 14 12 1,598Rait,-cars.
Rail-car, 58 ft. (Clayton) .. .. . . .. .. .. .. .. 1 1„ 56$ ft. (Sentinel) .. .. . . . .
.. j .. 1 .. .. 1,, 551 ft. (Edison) . . .. . . . . . . j
.. ... . .1 1
16 ft. (Ford) . . .. .. . . | 2 2
Totals .. .. .. . . ......
1.. 4 5
Brake-vans.Brake-vans, 4-wlieel .. . . .. .. F 2 11 . 33 4 3;.. 53
bogie .. .. .. .. .. F .. 238 4 162 5 3 4 416Fell .. .. .. .. .. F .. 7
.. 4 11
Totals .. .. .. .. .. .. 2 256 | 4 199 9 6 4 480
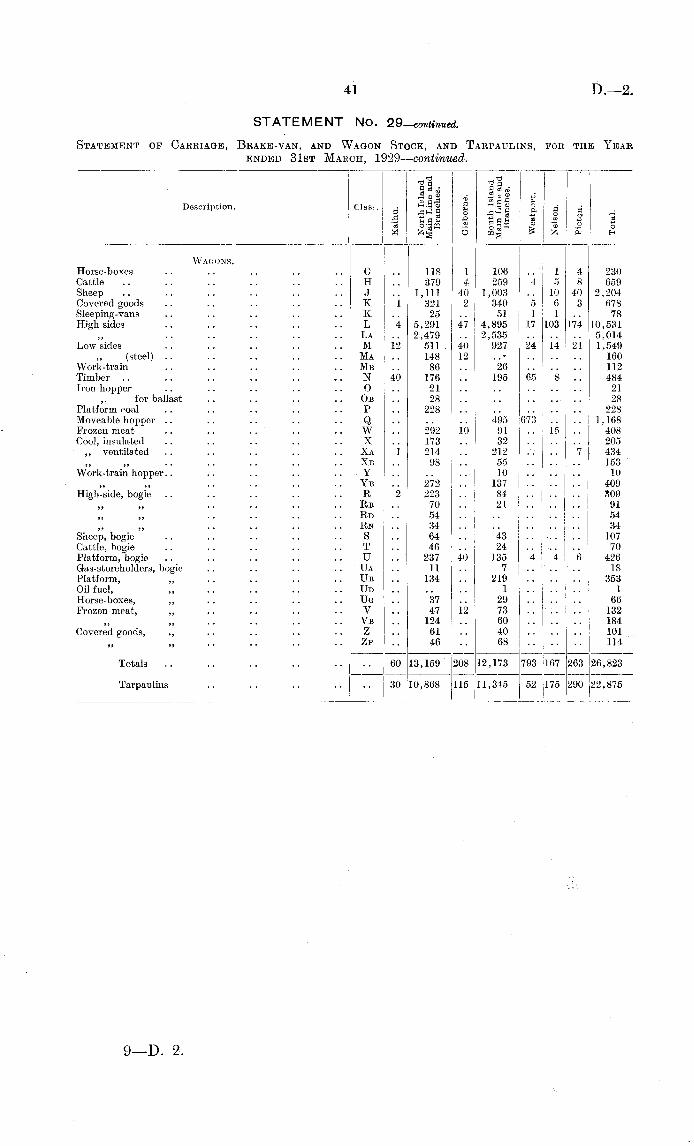
D.—2.STATEMENT No. 29—continued.
Statement of Carriage, Brake-van, and Wagon Stock, and Tarpaulins, for the Yearended 31st March, 1929—continued.
9—D. 2.
41
r_ ,dg 3 oS g c6 CO
Mrt-S 2 *
Description. Clasp. S3 § § «3 a a 9 a•5 £ n £ ■= ? a 2 ®
§ & 1ee O'SM -2 o 3 £ ® -8 oM fcy O DD« fe Sq HI . 3 J !
Wagons.Horse-boxes .. .. .. .. .. G .. 118 I 106 .. 1 4 230Cattle .. .. .. .. .. H .. 379 4 259 4 5 8 659Sheep .. .. .. .. .. .. J .. 1,111 40 1,003 .. 10 40 2,204Covered goods .. .. .. .. K 1 321 2 340 5 6 3 678Sleeping-vans ..
.. .. .. K 25 51 1 1.. 78High sides .. .. .. .. L 4 5,291 47 4,895 17 103 174 10,531
La 2,479 .. 2,535 .. .. .. 5,014Low sides .. ..
.. ..M 12 511 40 927 24 14 21 1,549
(steel) .... .. .. ..
Ma.. 148 12 . 160
Work-train .. .. .. .. ..Mb
.. 86 ..26 112
Timber .. .. .. .... N 40 176 .. 195 65 8 484
Iron hopper .. .. .. .. .. 0 .. 21 .. ........ 21
,, for ballast .. .. .. .. Ob .. 28 .. ........ 28
Platform roal .. .. .. .. .. P .. 228 .. .. .... .. 228Moveable hopper .. .. .. .. .. Q .. .. .. 495 673 .. .. 1,168Frozen meat .. .. .. .. .. W .. 292 10 91 .. 15 .. 408Cool, insulated .. .. .. .. .. X .. 173 .. 32 .. .... 205
,, ventilated .. .. .. .. .. Xa 1 214 .. 21.2 .. .. 7 434.. Xb 98 55 .... .. 153
Work-train hopper.. .. .. .. .. Y .. .. .. 10 10Yb 272 137 409
High-side, bogie .. .. .. .. .. R 2 223 .. 84 .. .... 809Rb 70 21 91Rd .. 54 54
.. Rn 34 34Sheep, bogie .. .. .. .. .. S .. 64 .. 43 I .. 107Cattle, bogie .. .. .. . . .. T .. 46 ..
24.. j ... .. 70
Platform, bogie.. .. .. ..
.. U .. 237 40 135 4 1 4 ! 6 | 426Gas-storeholders, bogie
.. .. .. .. Ua .. 11 ..7 ...... 18
Platform, „ .. .. .. .. Ub .. 134 ..219
.... .. 353Oil fuel, ,, .. .. ..
.. Ud ....
.. 1 1Horse-boxes, ,, .. .. ..
..Ug
.. 37..
29 66Frozen meat, ,, .. .. ..
.. V .. 47 12 73 ...... j 132Vb 124 60 |184
Covered goods, ,, .. .. .. ..Z
..61
..40 101
Zp 46 68 114
Totals .. .. .. .. .. .. 60 13,159 208 12,173 793 167 263 26,823
Tarpaulins .. .. .. .. j 30 10,868 115 11,315 52 175 290 22,875

D.—2.
STATEMENT No. 30.
Statement of Locomotive Stock for the Year ended 31st March, 1929.
42
I T3r °rvlinflfir Coupled Track g § I 3 3 dCylinder. Wheels. Wheels. * a> J i".So a a.S'g s . .
Type. g g jjaagc.2 Dia " Stroke No Dia"
No Dl>" "3 S'gW S ' IjS | 3 ! IO meter. meter. ' meter. £j 53 jg 5 l £ £ pm eh
! iIn. In. Ft. in. In.
A Tender (4-cyl. balanced com- 12 &19 22 6 4 6 6 .. 50 .. 7 . . | ..j .. 57pound), (17 superheated) ..
Aa Tender (superheated) .. 18 24 6 4 1 6 .. 10 10AB „ „ 17 26 6 4 6 | .. 87 . . 54 141Ab „ (409) „ .. 17 26 6 4 6 6 30} 1 1B „ (3 superheated) .. 16 22 8 3 6} 4 30} ..
.. . . 8 8Ba „ (superheated) .. 16 22 8 3 6} 4 26}
.. . . .. 10 10BB „ „ 17 22 8 3 6} 4 26} 30 30F Tank .. .. ..
10} 18 6 3 0}.. .. 2 23..
37 4 1 .. 67Fa „ .. .. 12 18 6 3 0J 2 24 .. 7 3 2 3 2 17G "Garratt" (articulated) ..
16} 24 6 4 9 4 33 .. I 1H Tank (Fell) .. .. 14 16 4 2 8 2 30} .. 6 • .. 6J Tender .. .. .. 14 20 6- 3 6} 2 24f .. 9 .. 11 20L Tank .. .. 12 18 4 3 6J 6 26| .. 3 ..
1 4N Tender .. .. .. 15 20 6 4 lj 4 28J .. 3 3N „ .. .. .. 15 20 6 4 l| 4 301 1 1Na „
(compound).... 10 &17 20 6 4 1 4 30|
.. 1 1Nc ,. „
.. 10&17 20 6 4 1 4 30} .. 1 1Oa „ „ .. 11 &18 20 8 3 7 2 30} .. 1 1OB „ .. .. ..
16 20 8 3 7 2 30} .. 2 2Oc „
(compound).. 11 &18 20 8 3 7 2 30} .. 1 1
P „.. .. .. 15 20 8 3 5 2 26} .. .. .. 1 1
Q „ (2 superheated) .. 16 22 6 4 1} .. j 6 .. 7 13R Single Fairlie .. .. 12J 16 6 3 0} 4 36} . . .. . . 5 5U Tender (superheated) .. 16 20 6 4 6 4 30} ..
.... 9 9
Ua „ (2 superheated) .. 16 20 6 4 I \ 4 30 2 ■ • • ■ • • 6 6Ub „ (3 superheated) .. 16 20 6 4 1} 4 26} .. .. .. 20 20Ub „ (1 superheated) .. 16 22 6 4 1} 4 30} .. .. .. 2 2Ug
„ .. .. .. 16 22 6 4 1} 4 30} 10 10Ud „ .. .. 16} 22 6 4 10 4 28 .. 2 2W Tank .. .. .. 14 20 6 3 0} 4 26} 2 2Wa „ .. .. .. 14 20 6 3 3| 4 28} .. 1 6 3 10Wa „
(converted) .. .. 14 20 6 3 6} 4 24f .. 3 .. 1 4Wad ,, (superheated).. .. 17 26 6 4 6 ®
■■ 1"Wb „ .. .. .. 14 20 6 3 3| 4 25' .. 4 .. .. 6 .... 10WD „ .. .. .. 14 20 6 3 3} 6 25 .. 11 .. 7 18We „ (1 superheated) .. 16 22 6 3 6} 8 30} .. .. .. 2 2Wf „ .. . . 14 22 6 3 9 6 30} 17 .. 17 .. 3 4 41Wo „ (8 superheated) .. 14 22 6 3 9 8 26} .. 20 20
Ws „ (superheated).. .. 17 26 6 4 6 ■■ '4 ]4
Ww „ „ .. .. 15} 22 6 3 9 8 26} .. 48 .. 2 50X Tender (4-cyl. balanced com- 13}&\00 0 „ „ f 2 30}\ , „ „
pound) 22 J \4 26if " lh 18. Electrio .. 8 3 8} 11 11
: Battery .. . . .. .. .. 8 3 0}.. . . .. .. .. 1 1
Totals .. | 2 385 6 249 12 7 6 667
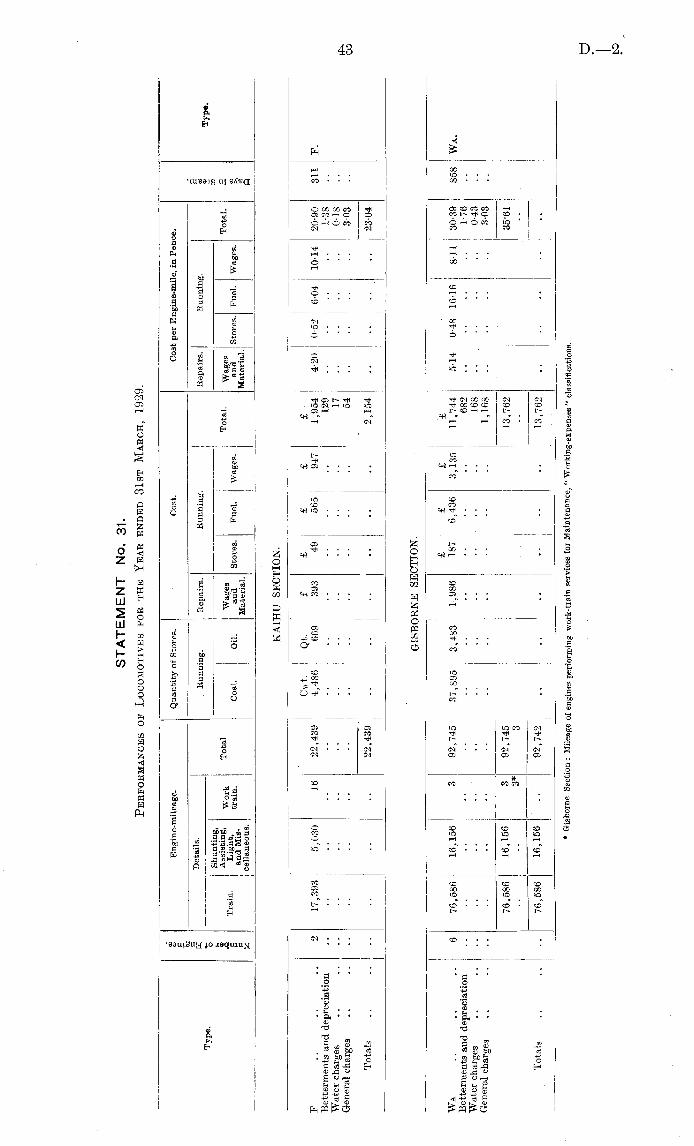
43 D.—2
STATEMENT No. 31.
Performances ofLocomotives for theYear ended 31stMarch. 1929.$
Engine-mileage.
QuantityofStores.
Cost.
Costper
Engine-mile,in
Pence.
.9'5c
.g
Details.
Running.
Repairs.
Running.
Repairs.
Running.|
5
m
Type.
*2
-2
J-YP®.
u
Shunting,
:
20
Train
WorkTotal
Wages
Total.Wages
Total..2
9
train.
Coal.
Oil.
andStores.
Fuel.Wages.
andStores.
Fuel.Wages.
>,
ceUaneous.
_g
KAIHUSECTION.
Cwt.Qt.
£
£
£
£
£
F
......
2
17,3935,03016
22,4394,486669
393
49
565
947
1,9544-200-526-04
10-1420-90311F.
Bettermentsand
depreciation
......................129
......,.
1-38
Watercharges
..
........................17
|
......0-18
Generalcharges
..
....
....................54
......
..
303
Totals..
..
..
..
..
..22,439........
..
..
2,154..
..
..
..
2304
GIK
BORNESECTION.
i
£
£
£
£
Wa
..
..
..
6
76,58616,156'392,745
37,8953,4831,986187
6,4363,135
11,7445-140-48
16-168-11
30-39858WA.
Bettermentsand
depreciation..
..
..•■••......••■•..682
......
..
1-76
Watercharges
..
..
..
..
..•■••........168
....
..
..
0-43
Generalcharges
..
....
..
.■••••.....•••••
..
1,168..
..
..
..3-03
76,58616,1563
92,745
13,762
35"61
3*
3
j
Totals..
....76,58616,156
..
92,742! ..
..
..
..
13,762
*
GisborneSection:
Mileageof
enginesperformingwork-tiain
servicesforMaintenance,"
Working-expenses"
classifications.
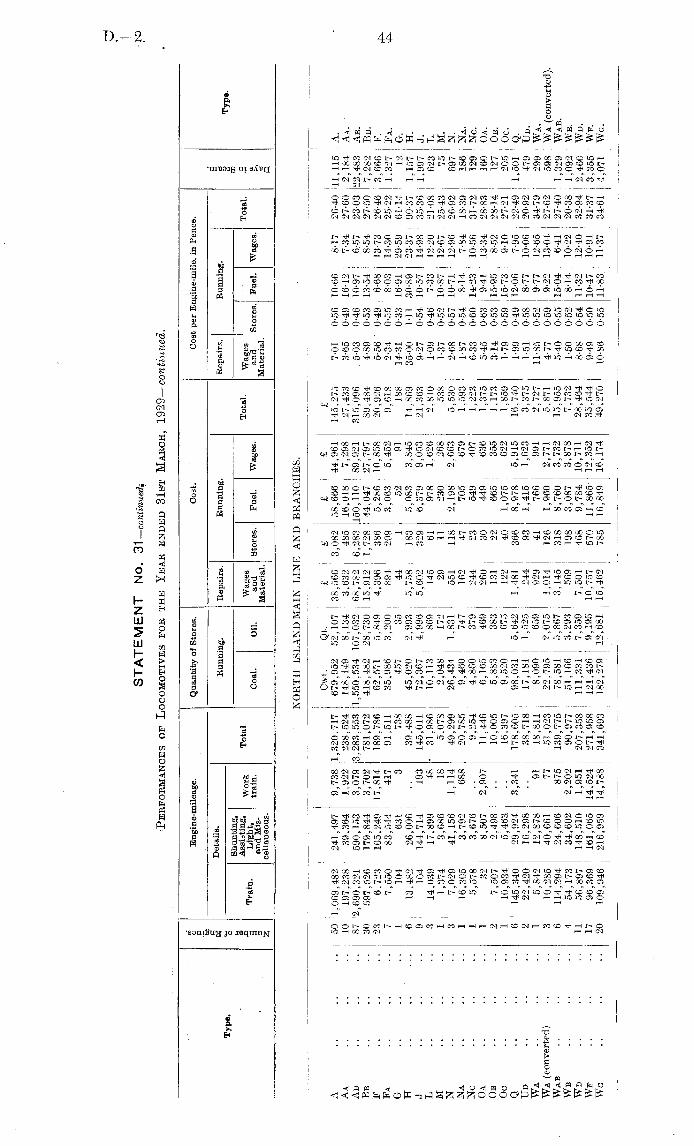
Db— 2. 44
STATEMENTNo. 31—continued.Performances ofLocomotives for theYear ended 31stMarch, 1929—continued.
o
Engine-mileage.
QuantityofStores.
Cost.
Costper
Engine-mile,in
Pence.
a He
-— —H
Details.
Running.
Repairs.
Running.
Repairs.
Running.
<rf
Type.
'g
-2
Type.
u
Shunting,
—j
m
*
TV„i„A
T8iili tng'
w°*k
Total
Wages
T°'»l-Wages
Total..3
9
JtvtVctrain.
Coal.
Oil.
andStores.
Fuel.Wages.
andStores.
Fuel.Wages.
5,
I
cena3
—
Material
-a
NORTHISLANDMAIN
LINEAND
BRANCHES.
Cwt.
Qt.
£
£
£
i
£
£
A
....
..
50
1,069,482241,4979,738
!1,320,
717
679,95252,10738,5663,08258,66644,961
145,2757-010-56
10-668-1726-40
11,115A.
Aa
......10
197,23839,364
1.922238.524
148,1498,1343.632485
16,018j
7,29827.4333-650-49
16-127-3427-602,184Aa.
AB
......872,690,321
590,1533,079
3,283,5531,550,534
107,03268,7826,283
150,11089,921315,0965-030-46
10-976:5723-0322,483AB.
Bb
......30597,526
179,8443,702.781,072418,48228,730
15,9121,728
44,047I
27,79789,4844-890-53
13-548-5427-507,282:
BB.
F
......236,723
165.24917,814189,786
62,5715,8494,3963865,286
10,85820,9265-560-496-68
13-7326-463,666F.
Fa
......7
7,55083.544417
91,51135,9863,200;894
2093,063
5,4529,6182-340-558-03
14-3025-22
1,327Fa.
G
......1104
631
3
738
457
35
44
1
52
91
18814-31
0-3316-91
29-5961-1412G.
H
..6
13,48226,006
..
39,48845,0202,9935,758183
5,0833,845
14,86935-00
1-1130-8923-3790-37
1,157H.
J
..
..
..
9
104
144,714193
145,01172,3674,996!
5,602329
6,3799,05321,3639-270-54
10-5714-98
35-361,997J.
L
..
..
..
3
14,03917,899
48•
31.98610,113
869
145
61
9781.626
2,8101-09
0-467-33
12-2021-08623L.
M
..
..
..
1
1,3743,68618
5,0782,048172
29
11
230
268
538
1-370-52
10-8712-67
25-4375M.
N
..
..
..3
7,02941,156
1,11449,29926,434
1,831551
118
2,1982,6635,5302-68
0-5710-7112-96
26-92697N.
Na
..
..
..1
16,3053.792688
20,7859,460747
162
47
705
679
1.5931-87
0-548-147-84
18-39186
NA.
No
......1
5,5783,676..9,2544,860379
244
23
549
407
1,2236-33
0-6014-2310-56
31-72129
Nc.
Oa
......1
32
8,5072,907
11.4466,165469
260
30
449
636
1,3755-450-639-41
13-3428-83160
OA.
Ob
......2
7,5072.498..10.005
5,883383
131
22
665
355
1,1733-140-53
15-958-5228-14127
OB.
Oo
..
..
..1
10,9345,463••16,3979,520675 i122
40
1,075622
1,8591-79
0-5915-73
9-1027-21205Oc.
Q
6
145,34029,9243,341
178,60598,0315,642I ]
,481
366
8,9785,915
16,7401-99
0-49]2-067-9522-49
1,501Q.
Ud
......2
22.42016.298..i38,718
17.1811,525: 244
93
1,4151,623
3,3751-51
0-588-77
10-0620-92479UD.
Wa
......1
5,84212,878
91
18,8118,090659 j929
41
766
991
2,72711-85
0-529-77
12-6534-79299Wa.
Wa(converted)
....3
10,28540,66177
51,02322.7952,075
1,014126
1,9602,771
5,8714-770-599-22
13-0427-62598
Wa(converted).
Wab
......6
114,29424,606875
139,77578.5815,8673,145318
8,7603,732
15,9555-400-55
15-046-4127-40
1,329WAB.
Wb
..••
..
4
|
54,17334,6022,20290,97751.1663,293569
198
3,0873,878
7,7321-50
0-528-14
10-2220-38
1,092WB.
Wn
..••
..11
56.897148,510
1,951207,358
111,3317.3597,501468
9,78410,711
28,4648-680-54
11-3212-40
32-942,460
Wd.
Wf
....
-.1796,369
161,06514,524
271,958121,436
9,19510,757
57011,865'12,352
35,5449-490-50
10-4710-91
,31-373,355
WF.
Wo
..••20
I
109,946216,959
14,788341,693
182,27912,68115,462
78516,84916,174
49,27010-86
0-5511-8311-37
I
34-614,071
Wa.
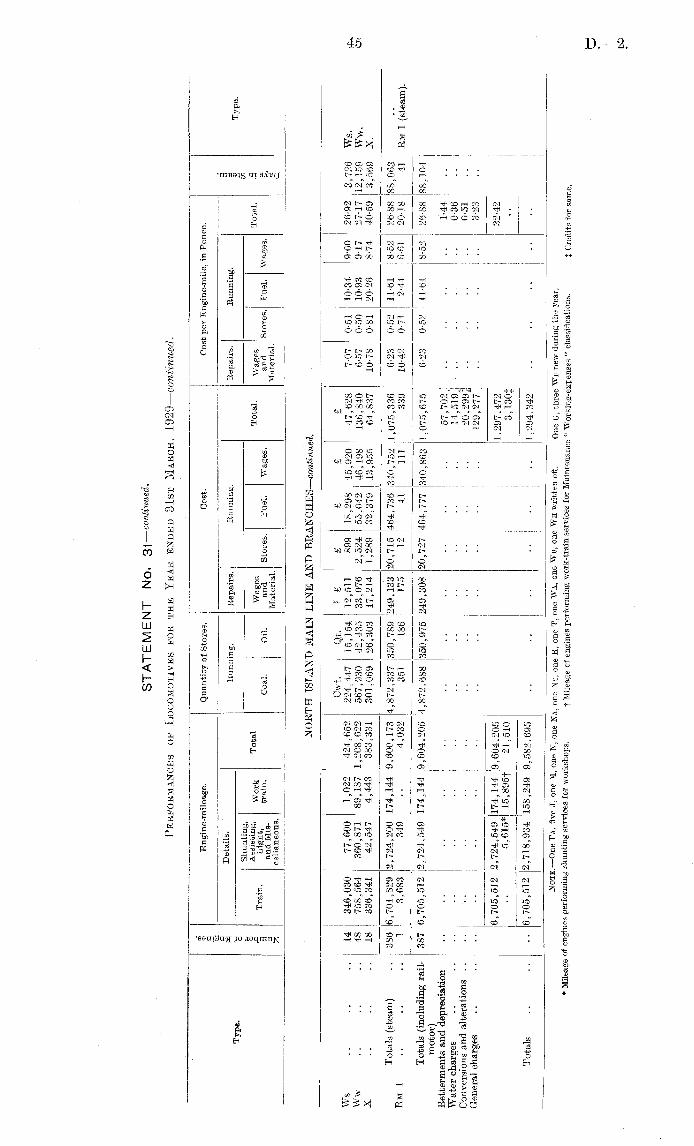
45 D.—2
STATEMENT No. 31—continued.Performances ofLocomotives for theYear ended 31stMarch, 1929—continued.
®
Engine-mileage.
QuantityofStores.
Cost.
Costper
Engine-mile,in
Pence.
*5:
.——g
Details.
Running.Repairs.
Running.
Repairs.
Running.
aj
m
Type.
:
°
v
®
Type.
2
Shunting,
I
Train
WmkT°tal
Wages
Total.Wages
Total..S
S
'nnAri
'
train.
Coal.
Oil.
andStores.
Fuel.Wages.
andStores.
Fuel.Wages.
>>
g
eetn™,l
Material,
Material
-g
NORTHISLANDMAIN
LINEAND
BRANCHES
—continued.
Cwt.
Qt.
•'
K
£
£
£
£
Ws
..
..
..14346,03077,600
1,022424,652224,447
15.15412,511
89918,29815,920
47,6287-070-51
10-349-0026-923,726Ws.
Ww
......48
758.564360,87189,187
1,208,622567,93042,435
33.0762,52455,04246,198
136,8406-570-50
10-939-1727-17
12,159Ww.
X
......18336,34142,5474,443383,331301,06926,303
17,2141,289
32,37913,955
64,83710-78
0-8120-26S-7440-593,569X.
Totals(steam)
..386
|6,701,8292,724,200
174,1449,600,1734,872,337
1350,789249,133
20,715464,736
340,7521,075,336
6-230-52
11-618-5226-8888,063
Rm1
......1
3,683
349..4,032
351
186
175
12
41
111
339
10-420-71
2-446-6120-1841Rm1
(steam).
Totals(includingrail-
3876,705,5122,724,549
174,1449,604,2054,872,688
350,975249,30820,727464,777
340,8631,075.675
6-230-52
11-618-5226-8888,104
motor)Bettermentsand
depreciation
....................._57,702;
........1-44
Watercharges
........................14)519':
........0-36
Conversionsandalterations
........................20,2991
........0-51
Generalcharges
..........................
129277
........3-23
6,705,5122,724,549
174,1449,604,205
].
097472
~~32-42
5,615*15,8951,
21,510
j
j
'
3)i
30±
Totals
....6,705,5122,718,934
158,249|9,582,
695............1,294,342~
~Note.OneFa,fiveJ,oneM,oneN",oneJSTa,one
Nc,oneR,oneT,one
Wa,one
Wb,oneWh
writtenoff.
OneG,threeWf
newduringtheyear.
*
Mileageof
enginesperformingshuntingservicesforworkshops.f
Mileageof
enginesperforming
work-trainservicesforMaintenance"
Working-expenses"
classifications.+
Creditsfor
same.
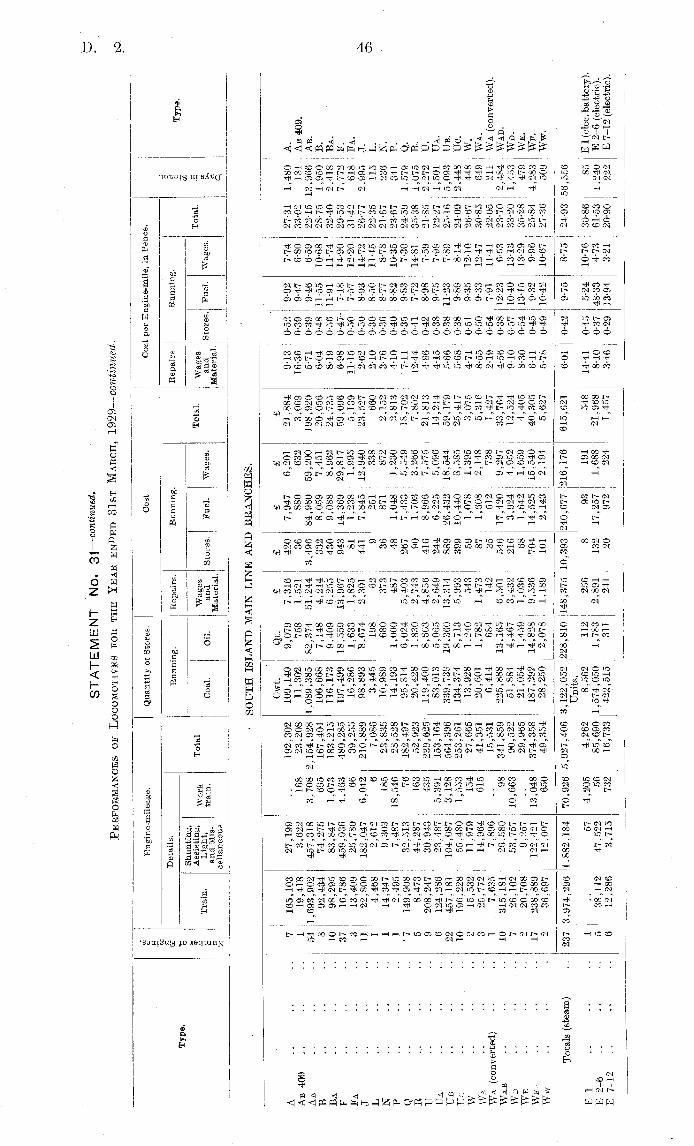
D.—2 46
STATEMENTNo.31—continued.PerformancesofLocomotivesfortheYearended31stMarch,1929—continued.
S
Engine-mileage.
QuantityofStores.
Cost.
!
Costper
Engine-mile,in
Pence.
a '5c
—-——:::
rj
g
Details.
Banning.
Repairs.
Running.
Repairs.
Running.
S
Type.
'S
m
u
Shunting,
;
£
_.Assisting,
WorkTotal
Wages
Total.Wages
Total..3
a
lrain.Iiigbt,
train.
Coal.
Oil.
andStores.
Fuel.Wages.
andStores.
Fuel.Wages.
>,
3
andMis-
Material.
Material.
g
cellaneous.
w
•
SOUTHISLANDMAIN
LINEAND
BRANCHES.
Cwt.
Qt.
£
£
£
£
£
A
7
165103
27199..192.302109,140
9,0797,3164207,9476,20121,8849-130-529-927-7427-31
1,480A.
Ab409
"
"
1
19418
3
622
168
23,20811,302
7581.521
36
880
632
3,06916-36
0-399-476-8033-02181
AB409.
Ab
""
54]
693'902457318
3,7082,154.928
1,089,38582.374
:51.2443,49684,98059,200
198,9205-710-399-466-5922-15
13,966AB.
B
""8
'
92
74275
695
167,404106,668
7,1484,2143328,0597,45120,0566-040-48
11-5510-68
28-751,950
B.
Ba
"""jo
98295
83,8471,073183,215116,173
9,4096.2554309.0888,96224,7358-190-56
11-9111-74
32-402,418BA.
P
""37
16786459036
4,463480,285
197,49918,55913,967
94314,369
29,81759.0966-98,0-477-18
14-9029-53
7,772E.
F.
"" .3
13409
25,78066
39,25516.286
1,6331,825
81
1,2381.995
5,13911-15
0-507-57
12-2031-42618!
Ea.
t
"H
22'800182,047
6,042210,889
98,8938,6742,301441
7,84512,940
23.5272-62!0-508-93
14-7226-772,995J.
L
"1
4'4682612
6
7.0863,445198
62
9
251
338
660
2-100-308-50
11-45!22-35115
L.
at
1
14'3479303
185
23,83510,989
680
373
36
871
872
2,1523-760-368-778-7821-67236N.
p
...
L
2'
4g5
7>4g718>546
28,52814,1931,000
487
48
1.0481,230
2,8134-100-408-82
10-35!
23-67341P.
O
'7
149'908
32513
76
182,49795,8146,0245,403267
7,4835,549
18,7027-110-359-837-3024-59
1,579Q.
2
g
§'47344287
163
52.92320.428
1.8302.74390
1,7033.266
7,80212-44
0-417-72
14-8135-38
1,075R.
U
"9
208'24730943
435
239,625119,400
8,6034,8564168.966
7,57521,8134-86
.0-428-987-5921-852,272U.
tja
"6
124'286234875,391
153.16483,013
5,065:2,6492446,225
5,09614,214
4-15'
0-389-757-9922-27
1,501UA.
tjb
29
457'181104
087
3,128564,396339,739
19,36013,314
88926,432
18,54459,1795-660-38
11-237-89i
25-165,093Ub.
tj„
'10
196'928
554801
553253.261
134,3748,7135.993399
10,4408,58525,4175-680-389-898-1424-09
j
2,4-48Uc.
w
'2
15'53211979
154
27,66513,9281,240
543
59
1.0781,395
3,0754-710-519-35
12-1026-67
1
448W.
Wa
3
25'77214964
615
41,35120,601
1,7821,473
87
1.6082,1485,3168-550-509-33
12-4730-85
:
649WA.
Wa(converted1!
1
7'6357
896.15,-5316,414684
142
35
512
738
1,4272-190-547-91
11-4122-05:211Wa
(converted).
WabV
'
10
315181'
26580
98
341,859225,888
13.1656,501546
17,4209,29733,7644-560-38
12-236-53 123-70
12,484WAB.
Wd
'
7
26'102
53757
10,66390,522
51,8844,4673,4322163,924
4,95212,524
9-100-57
10-4013-13
i
33-20 j1,453Wd.
We
"
2
2o'7089'257..29,96521,054
1,4591.036
68
1,642j
1,659
4,4058-300-54
13-1513-29
35-28
!479We.
Wp
'17
238'889122
42113,048
374,358187.292
14.828!
9,536704
14.52515.540
40,3056-1)0-459-329-9625-844,283Wi.
Ww
...2
36'69712'007650
49,35428,2502,078
1,189101
2,1432,1945,6275-780-49
10-4210-67
27-36509Ww.
Totals(steam)
..~237~
3,974,2961,882,184
70,9265,927,4063,122,052
228,810148,375
llO,393240,677
216,176615,6216-01|
0-429-758-7524-93
!56,556
Units.
Ei
..
.1
57
4,2054,2628,562112
|
256
8
93
191
54814-41j
0-455-24
10-7630-86 j85E1
(elec.battery).
E9_6
.g
38112
47592
56
85,6.901.574,050
1.783j
2,891132
17,2571,688
21,9688-100-3748-334-7361-53I 1,240E2-6
(electric).
E7
_12
"
..
..6
12'2863'715
732
16.733422,515
311
241
20
972
224
1,4573-460-29
13-943-2120-90222E7-12
(electric).
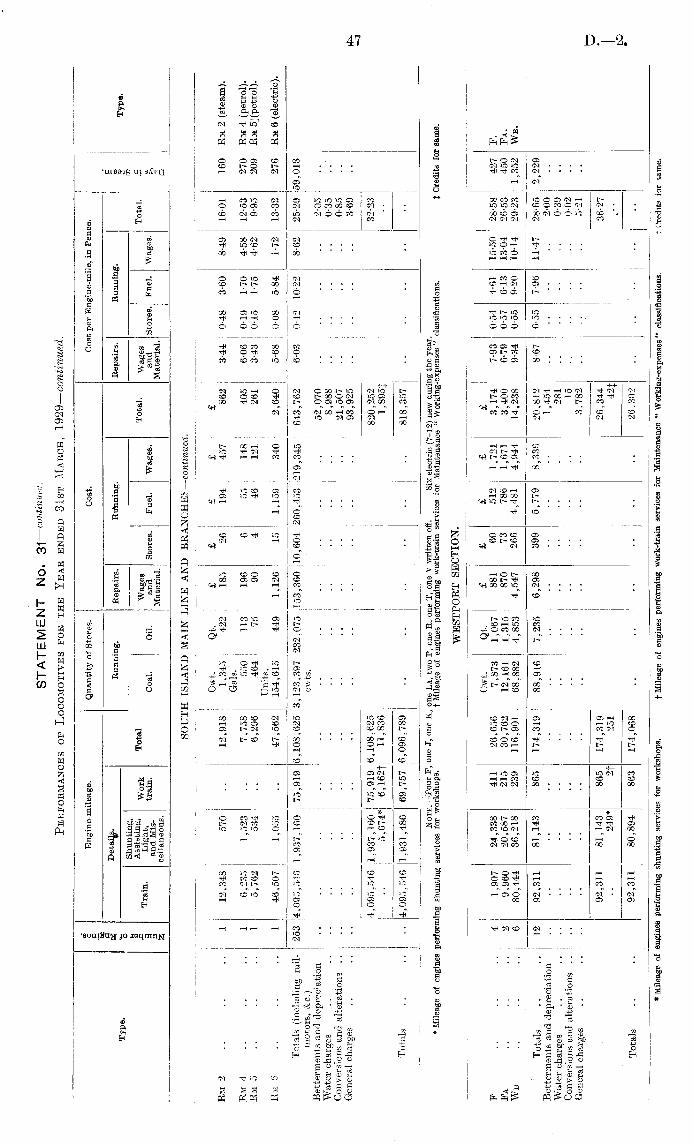
D.—2.47
STATEMENT No. 31—continued.Performances ofLocomotives for theYear ended 31stMarch, 1929—continued.®
Engine-mileage.
QuantityofStores.
Cost.
Costper
Engine-mile,in
Pence.
"5:
_®
Details.
Running.
Repairs.
Riftming.
Repairs.
Running.
3
m
Type.
'g
2
-Lyp®«
u
Shunting,
i
co
nv,inA
rSf»h?g
'
WorkTotal
Wages
Total-Wages
Total..3
2
'ana-Mia
train.
Coal.
Oil.
andStores.
Fuel.Wages.
andStores.
Fuel.Wages.
®
___I
ce"ous.
Material
-5
SOUTHISLANDMAIN
LINEAND
BRANCHES—continued.
Cwt.
Qt.
£
£
£
£
£
Km2
....
..
1
12,348
570..12,9181,345
422
185
26
194
457
862
3-440-483-608-49
16-01160
Rm2
(steam).
Gals.
Rm4
......1
6,2351,523..7,758
550:113
196
6
55
148
405
6-060-19
1-704-58
12-53270
Rm4
(petrol).
Rm5
......1
5,762
534..6,296
464
75
90
4
46
121
261
3-430-151-75
4-629-95209
Rm5,:(petrol).
Units.
RmS
......1
46,5071,055..47,562
154,615449
1,12615
1,159340
2,6405-680-085-84
1-7213-32
276Rm6
(electric).
Totals(includingrail-2534,095,546
1,937,160j
75,9196,108,6253,123,397232,075
153,36010,604
260,453219,345643,7626-030-42
10-228-6225-2959,018
motors,&c.)
i |cwts.
Bettermentsand
depreciation
..
..
..................52,070
..
..
..
..
2-05
Watercharges
..........................8,988
..
......0-35
Conversionsand
alterations..
..
....................21,507
..
......0-85
Generalcharges
..
..
..
............I ....93,925
........3-69
4,095.546jl,937,
16075,9196,108,625
|
820,252
32-23
5,674*6,162t
11,836
1,8951
Totals
....j
..4,095,5461,931,486
j
69,7576,096,789..]
I
......
818,357
j
'.1
_
"irt'iI
:
;
I
1
I
I
i
Note.—FourF,
oneJ,
oneK,
oneLa,twoP,
oneR.oneT,oneV
writtenoff.
Sixelectric
(7-12)newduringthe
year.
*
Mileageofengines
performingshuntingservicesfor
workshops.
t
Mileageof
enginesperformingwork-crainservicesforMaintenance"
Working-expenses"
classifications.
J
Creditsfor
same.
WESTPORTSECTION.
Cwt.
Qt.
£
£
£
£
£
F
..
..41,907
24,338411
26,6567,873
1,067881
60
512
1,7213,1747-930544-61
15-5028-58427P.
Pa
2
9,96020,587215
30,76212,1611,315
870
73
786
1,6713,4006-790-576-13
13-0426-53450
FA.
WB
......6
80,44436,218239
116,90168,8824,8534,547
2664,4814,944
14,2389-340-559-20
10-1429-23
1,352We.
Totals
....12
92,31181,143865
174,319i
88,9167,2356,2983995,7798,33620,8128-670-557-96
11-4728-652,229
Bettermentsand
depreciation
....
••••....••••••••1,454
........2-00
Watercharges
......•-
••--••....••----•281
....-•
..
0-39
Conversionsand
alterations....
•■•••••■....■••■••••15
...■...0-02
Generalcharges
..
..
••••....••••••••3,782
....
....5-21
92,31181,143865
174,319
26,344
36-27
249*
2t
251
:
42}
i
Totals
....92,31180,894863
174,068...........
..26.302
..
..
*
Mileageof
enginesperformingshuntingservicesforworkshops.f
Mileageof
enginesperforming
work-trainservicesforMaintenance"
Working-expenses"
classifications.t
Creditsior
same.
D.—2 48
STATEMENT No. 31—continued.Performances ofLocomotives for theYear ended 31stMarch, 1929—continued.
©
Engine-mileage.
QuantityofStores.
Cost.
Costper
Engine-mile,in
Pence.
3 H
Details.
Running.
Repairs.
Running.
Repairs.
Running.
g
Tvoe
-
J-yPw-
„
Shunting,
®
•2
A8 TSii
"ii?
g'
WorkTotal
Wages
Total.Wages
Total..3
g
„
train.
Coal.
Oil.
andStores.
Fuel.Wages.
andStores.
Fuel.Wages.
£
§
MaterM
- NELSONSECTION.
Cwt.
Qt.
£
I
£
£
£
£
F
..
....1110
425
6,1476,682
1,188175
40
8
147
251
446
1'440'295*28
9-0116'02
93P.
Fa
....
..
3
13,46411,379
103
24,9467,764928
938
46
968
1,039
2,9919-020-449-31lO'Ol
28-78438
FA.
Wi
......3
46,1517,664
12
53,82719,7941,935
2,01494
2,4651,547
6,1208*980-42
10-996-9027-29573Wv.
Totals
....7
59,72519,468
6,26285,45528,7463,0382,992148
3,5802,837
9,5578-400-42
10-057-9726-84
1,104
Bettermentsand
depreciation..
..
..............j
....461
........1-29
Watercharges
..
..
..
......
...•••........123
........0-35
Generalcharges
..
..
......................1,034
........2-90
Totals
..........................11,175
........31-38
PICTONSECTION.
Cwt.
Qt,
£
£
£
£
£
Fa
..
..
..
2
3,6182,707..6,325
2,336218
1,86211
290
257
2,42070-650-42
11-019-7591-8397
FA.
Wf
....
..
4
62,79126,79698
89,68531,872
2,7411,658138
3,9603,0718,8274-440-37
10-608-2123-62
897WF.
Totals
..
..
6
66,40929,50398
96,01034,2082,9593,520149
4,2503,328
11,2478-800-37
10-628-32
.28-11994
Bettermentsand
depreciation
......................496
....
..
..1-24
Watercharges
......
..
..................85
...
...
..0-21
Generalcharges
..........................940
......
..
2-36
66,40929,50398
96,010
12,768
31-92
....52*
52
7f
Totals..
..
..66,40929,o0346
95,958..
I ••..
..
12,761
J
I
|
*
Mileageof
enginesperforming
work-trainservices
forMaintenance"
Working-expenses"
classifications.fCreditsfor
same.
D.—249
STATEMENTNo.31—continued.
Summary.
Authority : W. A. G. Skinner, Government Printer, Wellington.—l929.
10—D. 2.
Engine-mileage.
QuantityofStores.
Cost.
.9
Detail.
Running.
Repairs.
Running.
ei
Section.
3
T
Section.
2
SSrttaf'
Tote'-
Recoverable
w
|
Total.
a
Train.
Light,''Work-
Mileage.
°
Coal>
oil_
and
Stores.Fuel.
Wages.
3
andMis-
tram-Material.
cellaneous.5
__! ____ ALLSECTIONS.
Cwt.
Qt.
£
£
£
£
£
Kaihu..
..
..2
17,3935,030
16
22,439..22,439
4,486669:
393
49
565
947
1,954Kaihu.
Gisborne
....6
76,58616,156
3
92,745
3
92,742
37,8953,483
1,986187
6,4363,135
11,744Gisborne.
N.I.M.L.andbranches
..3876,705,5122,724,549
174,1449,604,20521,5109,582.6954,872,688350,975249,30820,727
464,777340,863
1,075,675N.I.M.L.andbranches.
S.I.M.L.and
branches
..2534,095,546
1,937,16075,9196,108,625
11,8366,096,7893,123.397232,075
153,36010,604
260,453*219,345643,762S.I.M.L.andbranches.
Westport
....12
92,31181,143865
174,319251
174,-068
88,9167,2356,2983995,7798,33620,812
Westport.
Nelson
....7
59.72519,468
6,26285,455
..
85,455
28,7463,038:
2,992148
3,5802,8379,557Nelson.
Picton..
....6
66,40929,50398
96,01052
95,958
34,2082,9573,520149
4,2503,328
11,247Picton.
Totals
....673
11,113,4824,813,009257,307
|l6,183,798|
33,65216,150,146
8,190,336600,432417,85732,263
745,840578,791
1,774,751
Costper
Engine-milein
Pence.
q®
g,"
§
.5
II
I
M&
2"Knf"1
cnai
£
h!
fcD
.5
be
G
•—
<
£
cer3
xja.
§
tap*xtS
(2
•®
"3
3
<3
H.OCS
--H
O
CD
rQ
£5
Repairs.
Running.
<o
"3<»*
S,
So_g
*
.
£
5£l~
2
K
Section.
g>
\
H
|
S£|g||
§§
Total
*J
gg
|
Daysin
Total.||
I
|
||
|
HIII,
Si
11
3
Mater-St0res
-Fuel
-Wage*.
g
I
I
-.egi®
„
S
*J1|„§
3f
.
§
8
iais.
|p.
g
j
|S
|
olsaI&5Jq|gas
£
a
I
._-—________ £
£
£
£
£
£
£
Kaihu
....4-200-52604
10-1420-90129
17
..
54
1-380-18..0-58
2,15423-04
..2,154311
Kaihu.
Gisborne
....5-140-481666
8-1130-39682
168
..
1,1681-76
0-43..3-0213.762
35-61
..13,762
858Gisborne.
N.I.M.L.and
branches..
6-23052
11-618-5226-8857,702
14,51920,299
129,2771-44
0-360-513-23
1.297.47232-42
3,1301,294,342
88,104N.I.M.L.and
branches.
S.I.M.L.and
branches
..6-030-42
10-228-6225-2952,0708,988
21.50793,9252-050-350-853-69
820,25232-23
1,895818,35759,018S.I.M.L.andbranches.
Westport
....8-670-557-96
11-4728-65
1,454281
15
3,7822-000-390-025-21
26.34436-2742
26,3022,229Westport.
Nelson
....8-400-42
10-057-97
26-84461
123..1,0341-29
0-35..2-90
11,17531-38
..11,1751.104
Nelson.
Picton..
....8-800-37
10-628-3228-11496
85..9401-24
0-21..2-36
12,76831-927
12,761994
Picton.
Totals
....6-200-48
11-0685826"32
112,99424,18141,821
230,1801-68
0-3.60-623-412,183,92732-395,0742,178,853
152,618
Includescostof1,014
gallonsbenzineand
2,159,742unitselectriccurrent.
D.—2.
Revenue and Expenditure, Year ended 31st March, 1929.

D.—2.
Revenue and Expenditure, Year ended 31st March, 1928.

D-2NEW ZEALAND GOVERNMENT RAILWAYS.
Number of Engines and Tractive Power. Number of Carriages and Seating-accommodationNumber of Wagons and Carrying-capacity in use from 1919 to 1929.
Percentage of Increase,1919-1929
Engines7 58 per cent.
Tractive Power27*40 per cent.
Percentage of Increase,1919-1929
Carriages7"65 per cent.
Seating-accommodation574 per cent.
Percentage of Increase1919-1929
Wagons20'75 per cent.
Carrying-capacity28*69 per cent.
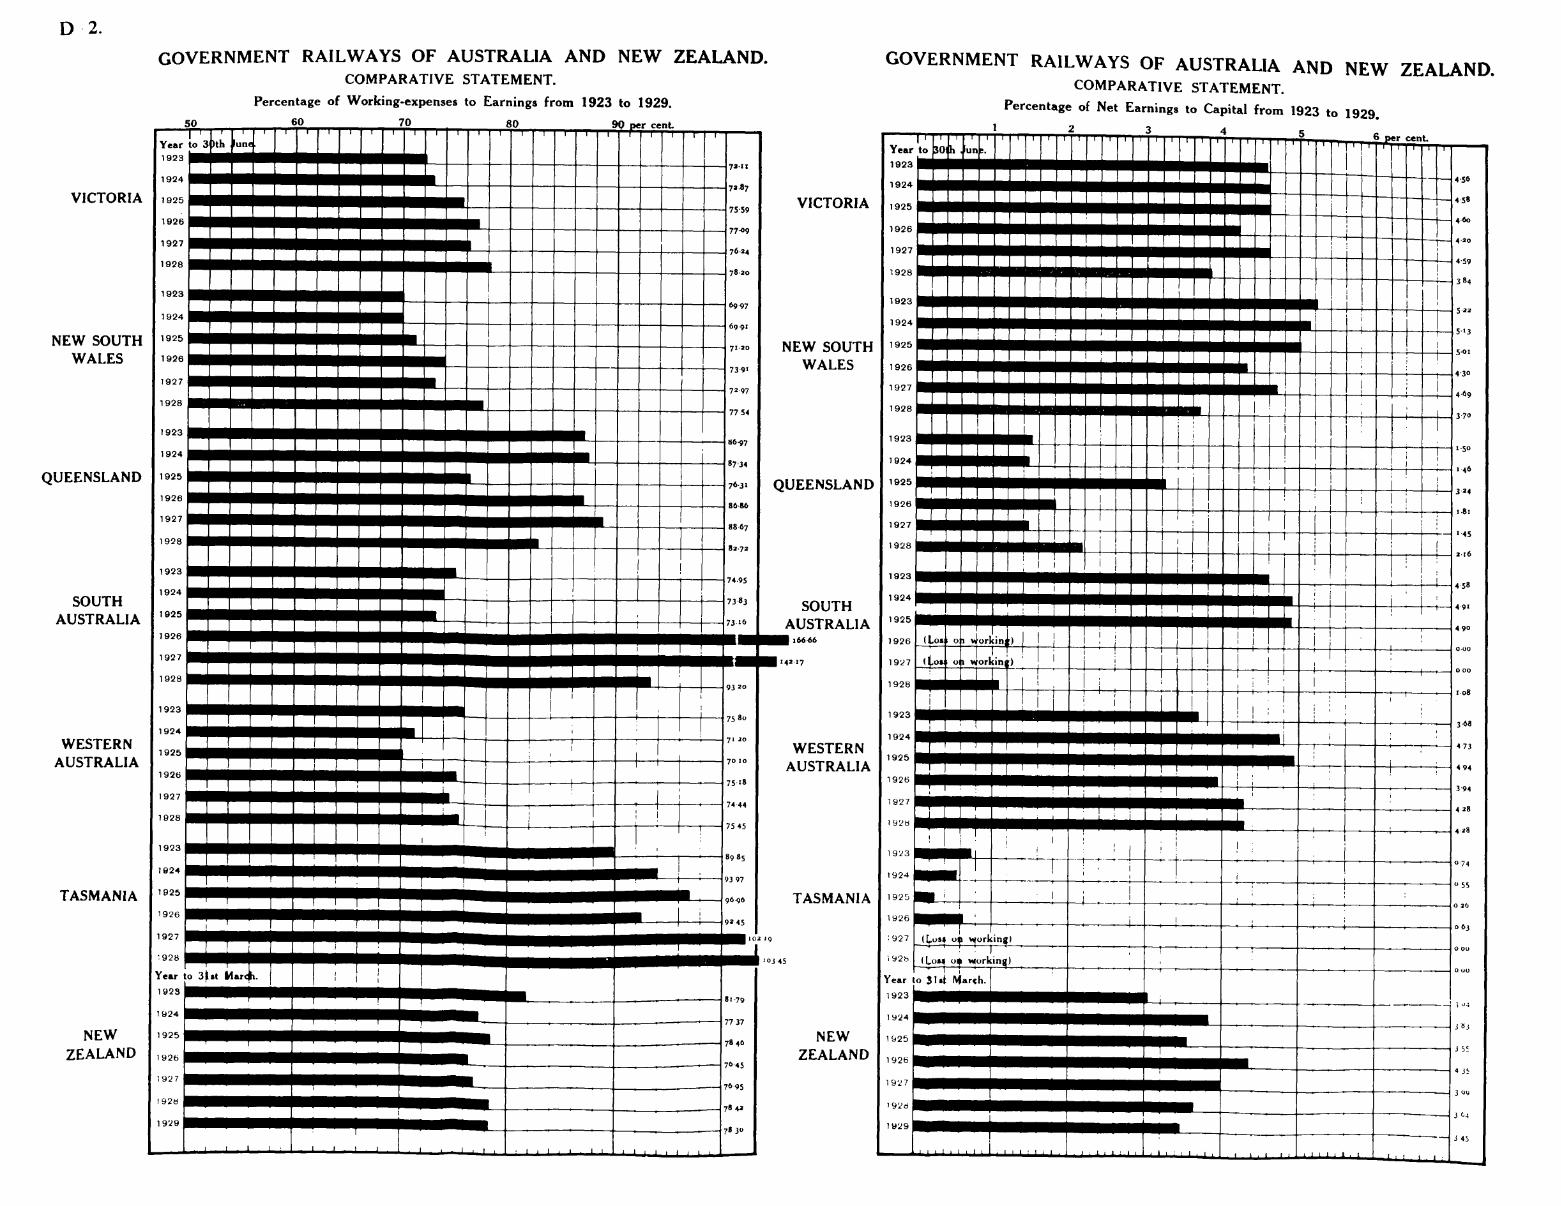
D 2
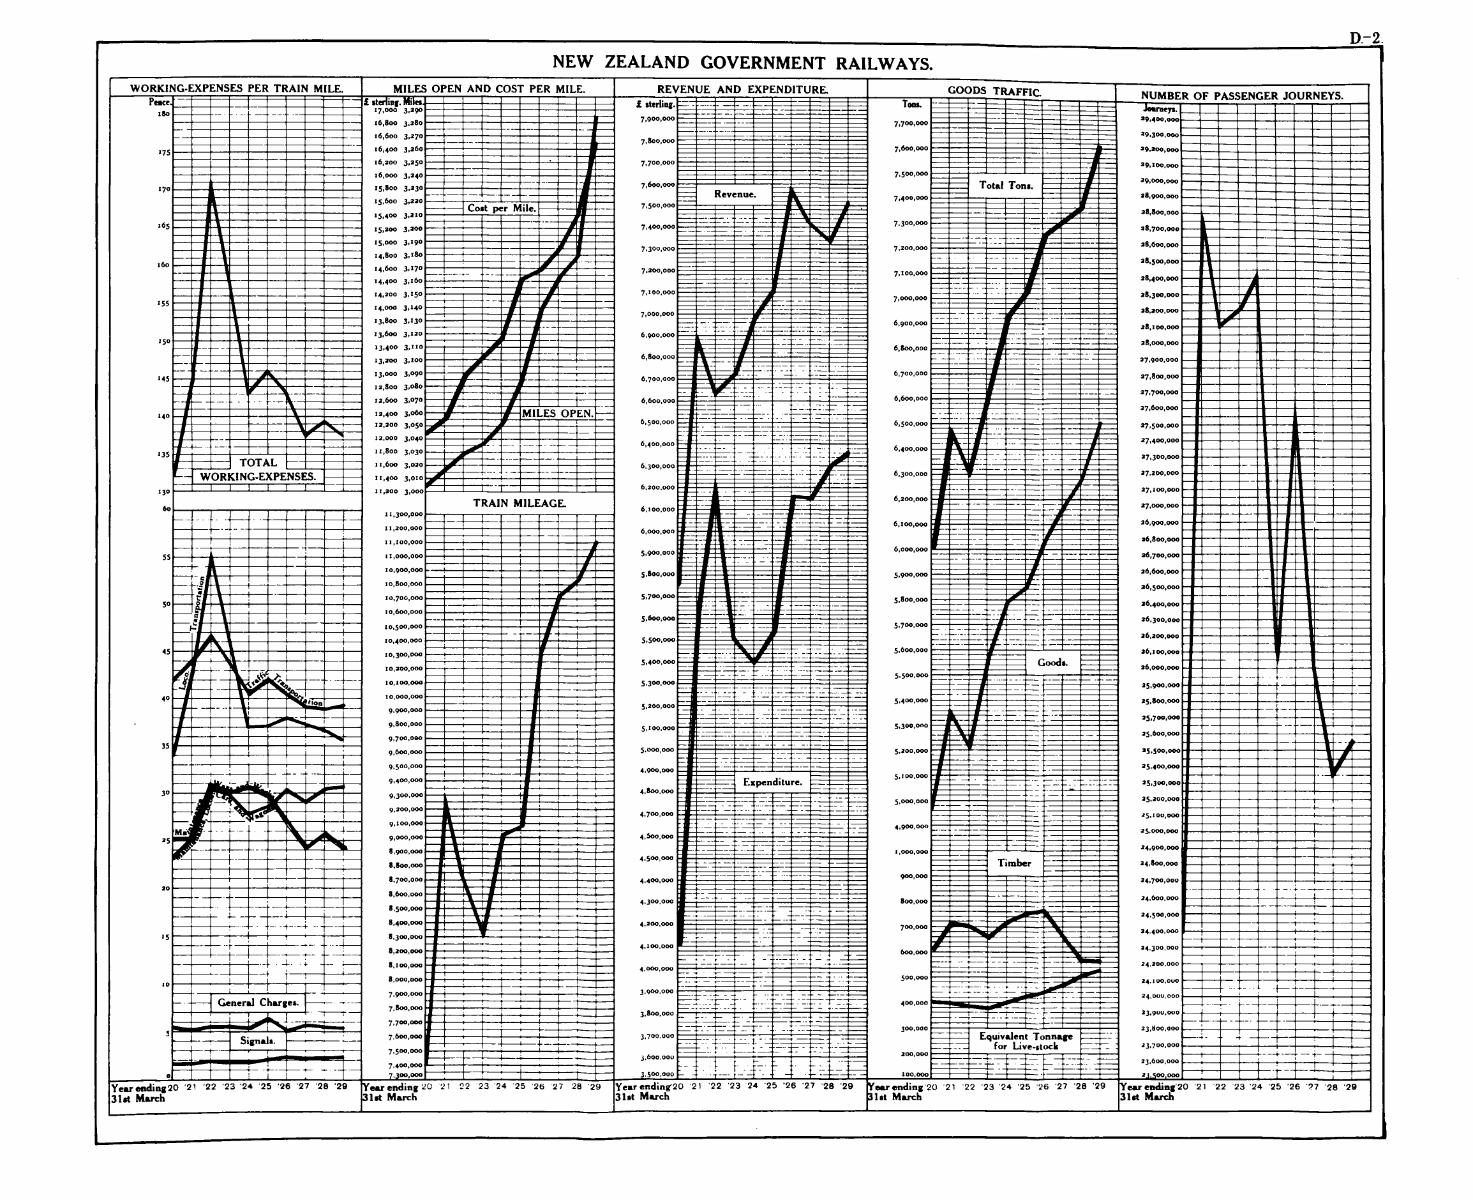
D-2NEW ZEALAND GOVERNMENT RAILWAYS.


D.—2.
NewRailway-station, Auckland,underConstruction.

D.—2.
Heavy-machine Shop, Hutt Valley.
Aerial Photograph of New Workshops, Otahuhu.

D.—2.
Locomotive-erecting Shop, Hutt Valley.
Interior of Machine Shop, Otahuhu.

D.—2
Interior of Blacksmiths' Shop, Otahuhu.
Interior of No. 2 Car Shop, Otahuhu.
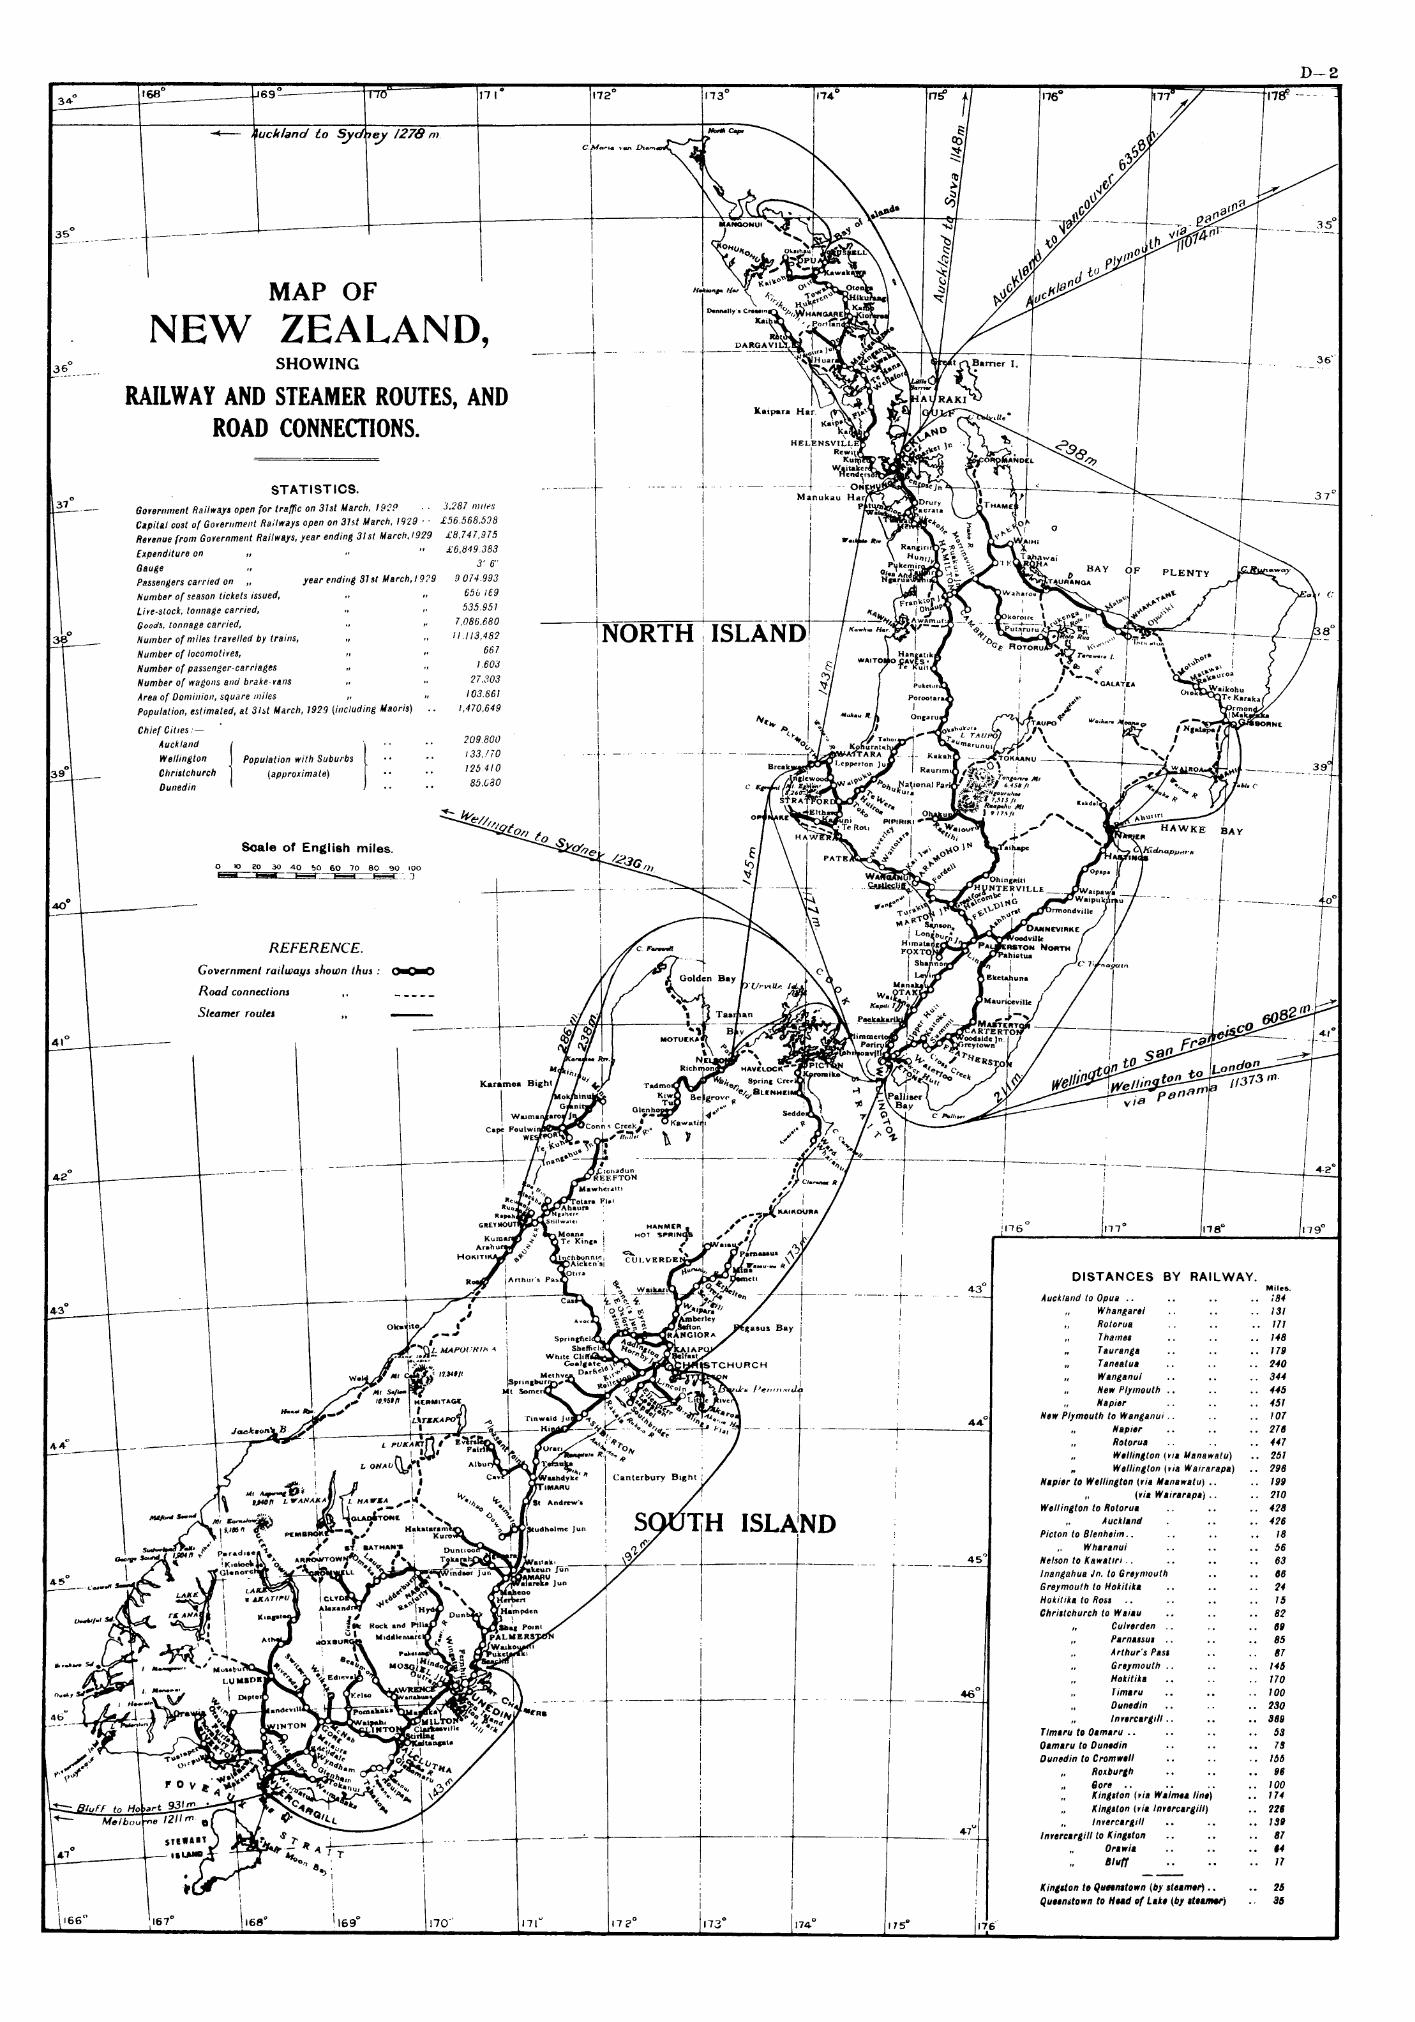
D—2
MAP OF
NEW ZEALAND,SHOWING
RAILWAY AND STEAMER ROUTES, ANDROAD CONNECTIONS.


D.—2
Locomotive-boiler Shop, Hutt Valley.
New Outward-goods Shed, Auckland.
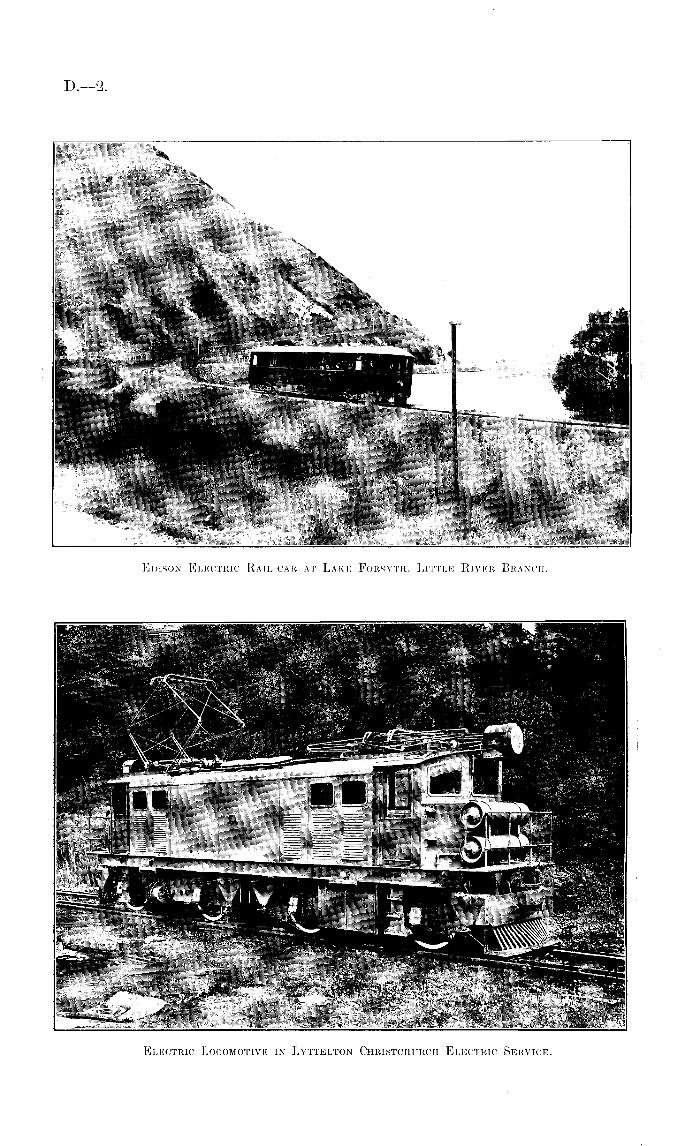
D.—2.
Edison Electric Rail-car at Lake Forsyth, Little River Branch.
Electric Locomotive in Lyttelton-Christchurch Electric Service.