Quality of Map-Matching Procedures Based on DGPS and Stand-Alone GPS Positioning in an Urban Area
Upload
khangminh22Category
view
2download
0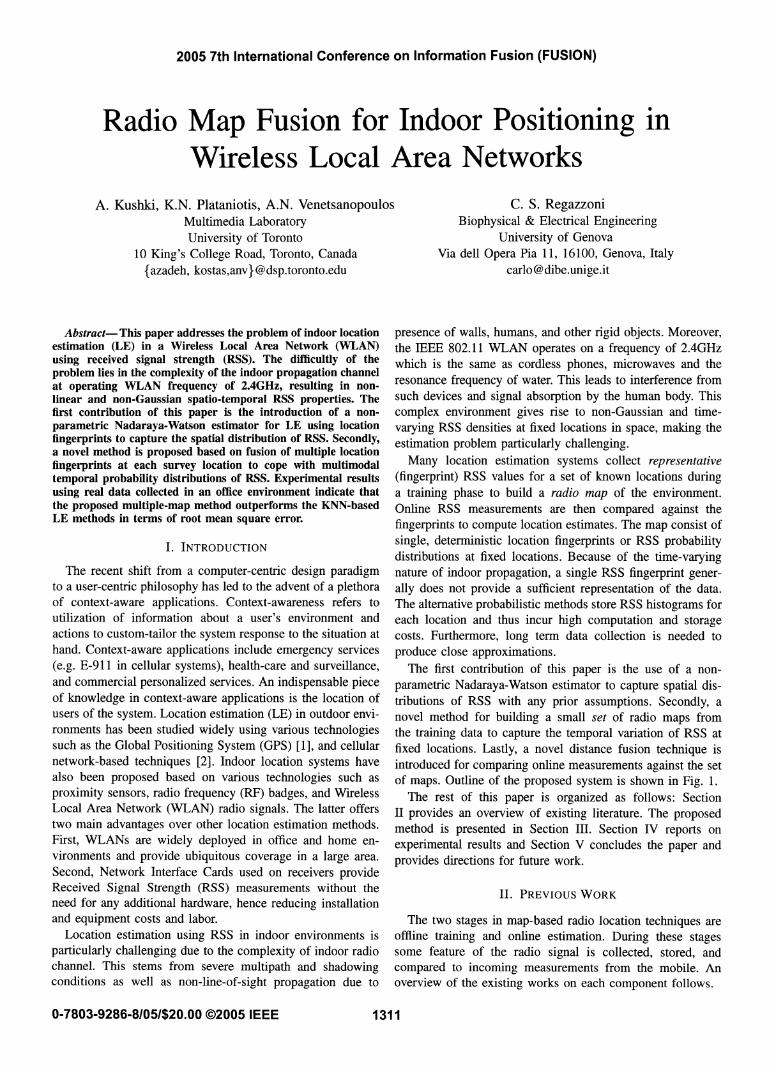
2005 7th International Conference on Information Fusion (FUSION)
Radio Map Fusion for Indoor Positioning inWireless Local Area Networks
A. Kushki, K.N. Plataniotis, A.N. VenetsanopoulolMultimedia LaboratoryUniversity of Toronto
10 King's College Road, Toronto, Canada{azadeh, kostas,anv}@dsp.toronto.edu
Abstract- This paper addresses the problem of indoor locationestimation (LE) in a Wireless Local Area Network (VLAN)using received signal strength (RSS). The difficultly of theproblem lies in the complexity of the indoor propagation channelat operating WLAN frequency of 2.4GHz, resulting in non-linear and non-Gaussian spatio-temporal RSS properties. Thefirst contribution of this paper is the introduction of a non-parametric Nadaraya-Watson estimator for LE using locationfingerprints to capture the spatial distribution of RSS. Secondly,a novel method is proposed based on fusion of multiple locationfingerprints at each survey location to cope with multimodaltemporal probability distributions of RSS. Experimental resultsusing real data collected in an office environment indicate thatthe proposed multiple-map method outperforms the KNN-basedLE methods in terms of root mean square error.
I. INTRODUCTION
The recent shift from a computer-centric design paradigmto a user-centric philosophy has led to the advent of a plethoraof context-aware applications. Context-awareness refers toutilization of information about a user's environment andactions to custom-tailor the system response to the situation athand. Context-aware applications include emergency services(e.g. E-911 in cellular systems), health-care and surveillance,and commercial personalized services. An indispensable pieceof knowledge in context-aware applications is the location ofusers of the system. Location estimation (LE) in outdoor envi-ronments has been studied widely using various technologiessuch as the Global Positioning System (GPS) [1], and cellularnetwork-based techniques [2]. Indoor location systems havealso been proposed based on various technologies such asproximity sensors, radio frequency (RF) badges, and WirelessLocal Area Network (WLAN) radio signals. The latter offerstwo main advantages over other location estimation methods.First, WLANs are widely deployed in office and home en-vironments and provide ubiquitous coverage in a large area.Second, Network Interface Cards used on receivers provideReceived Signal Strength (RSS) measurements without theneed for any additional hardware, hence reducing installationand equipment costs and labor.
Location estimation using RSS in indoor environments isparticularly challenging due to the complexity of indoor radiochannel. This stems from severe multipath and shadowingconditions as well as non-line-of-sight propagation due to
C. S. RegazzoniBiophysical & Electrical Engineering
University of GenovaVia dell Opera Pia 11, 16100, Genova, Italy
presence of walls, humans, and other rigid objects. Moreover,the IEEE 802.11 WLAN operates on a frequency of 2.4GHzwhich is the same as cordless phones, microwaves and theresonance frequency of water. This leads to interference fromsuch devices and signal absorption by the human body. Thiscomplex environment gives rise to non-Gaussian and time-varying RSS densities at fixed locations in space, making theestimation problem particularly challenging.Many location estimation systems collect representative
(fingerprint) RSS values for a set of known locations duringa training phase to build a radio map of the environment.Online RSS measurements are then compared against thefingerprints to compute location estimates. The map consist ofsingle, deterministic location fingerprints or RSS probabilitydistributions at fixed locations. Because of the time-varyingnature of indoor propagation, a single RSS fingerprint gener-ally does not provide a sufficient representation of the data.The alternative probabilistic methods store RSS histograms foreach location and thus incur high computation and storagecosts. Furthermore, long term data collection is needed toproduce close approximations.The first contribution of this paper is the use of a non-
parametric Nadaraya-Watson estimator to capture spatial dis-tributions of RSS with any prior assumptions. Secondly, anovel method for building a small set of radio maps fromthe training data to capture the temporal variation of RSS atfixed locations. Lastly, a novel distance fusion technique isintroduced for comparing online measurements against the setof maps. Outline of the proposed system is shown in Fig. 1.The rest of this paper is organized as follows: Section
II provides an overview of existing literature. The proposedmethod is presented in Section III. Section IV reports onexperimental results and Section V concludes the paper andprovides directions for future work.
II. PREVIOUS WORK
The two stages in map-based radio location techniques areoffline training and online estimation. During these stagessome feature of the radio signal is collected, stored, andcompared to incoming measurements from the mobile. Anoverview of the existing works on each component follows.
0-7803-9286-8/05/$20.00 ©2005 IEEE 1311
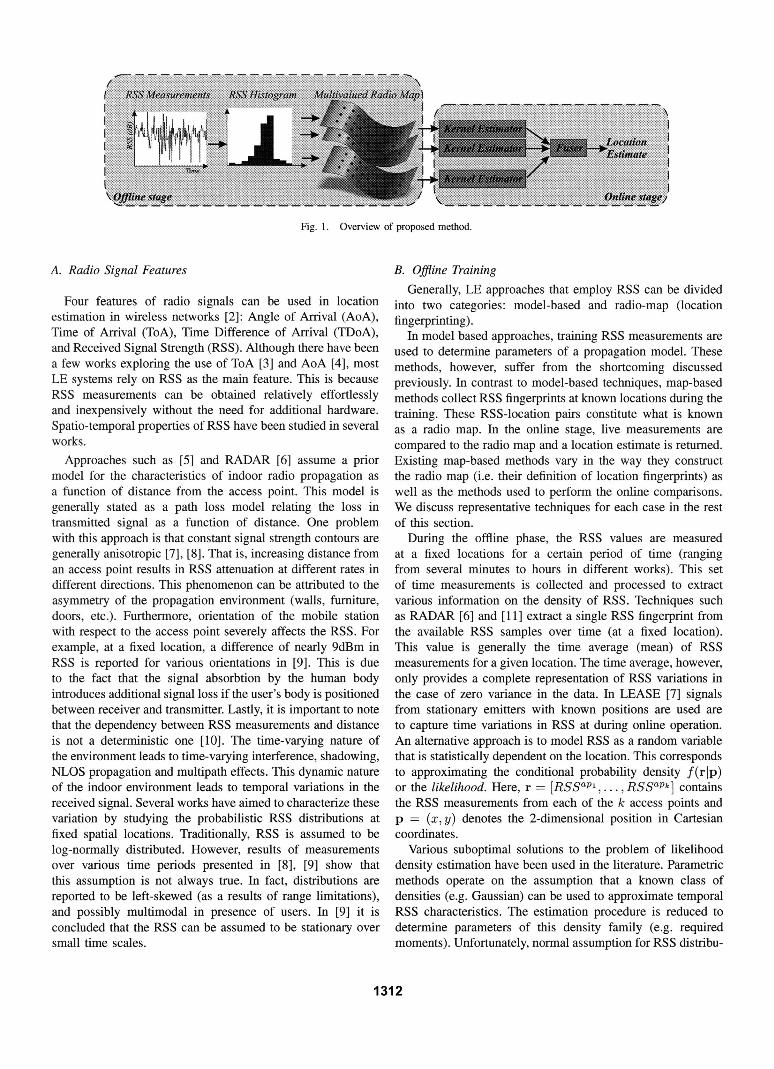
Fig. 1. Overview of proposed method.
A. Radio Signal Features
Four features of radio signals can be used in locationestimation in wireless networks [2]: Angle of Arrival (AoA),Time of Arrival (ToA), Tine Difference of Arrival (TDoA),and Received Signal Strength (RSS). Although there have beena few works exploring the use of ToA [3] and AoA [4], mostLE systems rely on RSS as the main feature. This is becauseRSS measurements can be obtained relatively effortlesslyand inexpensively without the need for additional hardware.Spatio-temporal properties of RSS have been studied in severalworks.
Approaches such as [5] and RADAR [6] assume a priormodel for the characteristics of indoor radio propagation asa function of distance from the access point. This model isgenerally stated as a path loss model relating the loss intransmitted signal as a function of distance. One problemwith this approach is that constant signal strength contours aregenerally anisotropic [7], [8]. That is, increasing distance froman access point results in RSS attenuation at different rates indifferent directions. This phenomenon can be attributed to theasymmetry of the propagation environment (walls, furniture,doors, etc.). Furthermore, orientation of the mobile stationwith respect to the access point severely affects the RSS. Forexample, at a fixed location, a difference of nearly 9dBm inRSS is reported for various orientations in [9]. This is dueto the fact that the signal absorbtion by the human bodyintroduces additional signal loss if the user's body is positionedbetween receiver and transmitter. Lastly, it is important to notethat the dependency between RSS measurements and distanceis not a deterministic one [101. The time-varying nature ofthe environment leads to time-varying interference, shadowing,NLOS propagation and multipath effects. This dynamic natureof the indoor environment leads to temporal variations in thereceived signal. Several works have aimed to characterize thesevariation by studying the probabilistic RSS distributions atfixed spatial locations. Traditionally, RSS is assumed to belog-normally distributed. However, results of measurementsover various time periods presented in [8], [9] show thatthis assumption is not always true. In fact, distributions arereported to be left-skewed (as a results of range limitations),and possibly multimodal in presence of users. In [9] it isconcluded that the RSS can be assumed to be stationary oversmall time scales.
B. Offline TrainingGenerally, LE approaches that employ RSS can be divided
into two categories: model-based and radio-map (locationfingerprinting).
In model based approaches, training RSS measurements areused to determine parameters of a propagation model. Thesemethods, however, suffer from the shortcoming discussedpreviously. In contrast to model-based techniques, map-basedmethods collect RSS fingerprints at known locations during thetraining. These RSS-location pairs constitute what is knownas a radio map. In the online stage, live measurements arecompared to the radio map and a location estimate is returned.Existing map-based methods vary in the way they constructthe radio map (i.e. their definition of location fingerprints) aswell as the methods used to perform the online comparisons.We discuss representative techniques for each case in the restof this section.
During the offline phase, the RSS values are measuredat a fixed locations for a certain period of time (rangingfrom several minutes to hours in different works). This setof time measurements is collected and processed to extractvarious information on the density of RSS. Techniques suchas RADAR [6] and [11] extract a single RSS fingerprint fromthe available RSS samples over time (at a fixed location).This value is generally the time average (mean) of RSSmeasurements for a given location. The time average, however,only provides a complete representation of RSS variations inthe case of zero variance in the data. In LEASE [7] signalsfrom stationary emitters with known positions are used areto capture time variations in RSS at during online operation.An alternative approach is to model RSS as a random variablethat is statistically dependent on the location. This correspondsto approximating the conditional probability density f(rjp)or the likelihood. Here, r = [RSSaP, ...., RSSP'k] containsthe RSS measurements from each of the k access points andp = (x, y) denotes the 2-dimensional position in Cartesiancoordinates.
Various suboptimal solutions to the problem of likelihooddensity estimation have been used in the literature. Parametricmethods operate on the assumption that a known class ofdensities (e.g. Gaussian) can be used to approximate temporalRSS characteristics. The estimation procedure is reduced todetenmine parameters of this density family (e.g. requiredmoments). Unfortunately, normal assumption for RSS distribu-
1312
tions has been contradicted in several cases [8], [12]. Anothercommon approach is to build a histogram of RSS values forknown locations and obtain a discrete version of densities[12]-[15]. Lastly, a non-parametric shaping filter is used in[8] to generate the likelihood.Once the likelihood density f(rlp) is obtained, the poste-
rior density f(plr) is obtained through Bayes theorem andknowledge of the prior density f(p). Specifically,
fpf(rlp)f(p)dp(The posterior density, represented as a discrete histogram, isthen stored in the radio map for each survey location.We denote the radio map mathematically as follows:
MA4 = |{Pi, (R1, a,)},... , {PN, (RN, aN)}I (2)1 -1~~~~~~~~0
survey point 1 survey point N
In Equation (2), N is the number of survey points andthe M x k matrix Ri = [r1, ... , rm] contains the set of MRSS vectors needed to produce a fingerprint at the ith surveypoint. Finally, aor contains any other parameters needed in therepresentation. For example, in systems using deterministicsample mean, M - 1, ri is the mean RSS value from theaccess points and ao is null. Similarly, for systems with thelog-normal distribution assumption, M = 1, ri is the RSSmean whereas ao contains the covariance of the distribution.Lastly, in histogram-based methods, M > 1, ri correspondsto the histogram bins and ai contain their relative frequencies.
C. Online Location EstimationAfter building the radio map defined in Equation (2), the
online measurement from mobile stations are compared to themap and a location estimate is obtained.
For the case of deterministic radio maps, the incomingRSS measurement is compared against the deterministic storedvalue (e.g. mean) using the Euclidean distance or its variations[6], [l1]. Either the survey point with smallest distance isreturned as the user location, or the k top matches are averageto obtain the estimate.The stochastic-based systems exploit the stored posterior
together with an optimality criterion estimate the location ofthe mobile user. For example, the well known Minimum MeanSquare Error (MMSE) [15] and Maximum a Posteriori (MAP)[14] estimates are obtained as follows:
PMMSE = E{plr} = J f(plr)dp (3)PMAP =argmaxf(pJr) argmaxf(piJr) (4)
p Pi
III. PROPOSED NON-PARAMETRIC ESTIMATION METHODThe first contribution of this paper is the proposal of the
Nadaraya-Watson estimator for indoor location estimation.This method uses the set of location fingerprints to approx-imate the joint density f(p, r) and ultimately provide the
MMSE estimate of the location as a weighted average ofthe survey points. The second contribution is the use of amulti-valued radio map and a novel fusion technique forrepresentation of multimodal distributions. The rest of thissection describes the details of the proposed methods.
A. Offline Map ConstructionAs depicted in Figure 1, the offline stage of the proposed
method corresponds to the construction of the radio map.The purpose of radio map building is to detennine the pairs{pi,(ri,ai)} for i = 1,...,N as in Equation (2). In doingthis, several issues are considered and discussed below.
1) Survey points: A set of survey points {pi} with knownlocations are needed where RSS fingerprints will be produced.The spatial distribution of these points and their number Naffect the performance of a radio-map based techniques. Sinceno prior information is available on the location of the mobileuser, a uniform grid is assumed for the survey points. Thenumber of survey points N is also an important parameter.If this number is too large, fingerprint locations may reportredundant information whereas a small number may result ininsufficient resolution. The work of [2] provides a theoreticalupper-bound on the number of needed survey points. Further-more, experiments with varying number of points are reportedin Section IV.
2) Extraction of location fingerprints: Given the surveylocations {pi}' 1, we proceed to determine the fingerprints(ri, ai) at each location. In order to capture some of thetime-varying properties of RSS, a set of RSS measurementsare collected over a short duration (around 5 minutes) ateach survey location. From these measurements, a histogramapproximation is built to the density of RSS at each pi. Notethat this results in a suboptimal approximation for severalreasons. First, RSS measurements over sampling periods inorder of seconds are correlated [16]. Second, RSS is notstationary over long time intervals [9]. Clearly, the fingerprintat each location depends on properties of RSS distributionssuch as those discussed in Section II. Since RSS is non-stationary, the fingerprint derived from a short-time windowmay not be suitable for use at a later time. To this end, itis encouraging to note that the results of [8] suggest that thelong term (several hours) time average is similar to the shortterm (ten minutes) sample mean for the distributions. Unfortu-nately, however, the distributions are generally reported to benon-Gaussian. More specifically, they are mainly asymmetric(mostly left-skewed) and possibly multimodal [8], [9], [12],[13]. This means that the sample mean may not provide thebest possible representation. Section IV reports on variousfingerprints derived from the series. Namely, we consider thesample mean, median, and various trimmed means.The possible multimodality of the distributions leads consid-
eration of multiple fingerprints at a given location. We proposeachieve this multi-valued representation by extracting a set ofdominant values from the RSS distribution at a fixed location.To this end, the kmeans algorithm [17] is used to produce Cclusters from the time measurements at each location. In this
1313

case, R C and ris correspond to the cluster means in theradio map of Equation (2). Note that this clustering techniqueignores the time correlation of the RSS measurements and isthus suboptimal. At this stage, it is not clear what the optimumvalue of C should be. Since multimodal distributions arise inthe presence of users and severe noise conditions, we mayconclude that this value is dependent on the environmentalconditions. Experiments for determining the best value of Care reported in Section IV. Based on our experimental datathis value is generally small (C < 5).
B. Online Non-parametric Estimation
During the online phase, a vector of RSS measurements isreceived from the mobile client, compared to the radio map,and a location estimate is returned. As shown in Equations(3) and (4), both MMSE and MAP estimates of the locationrequire knowledge of the posterior pdf f(plr). Since the shapeof this density is unknown in many cases, our approach straysaway from parametric techniques. Instead, a non-parametrickernel estimator is used to estimate the density from thefingerprints at survey points. This technique does not requireany assumptions on the functional form of the density function.
1) Kernel Estimator: Given the RSS fingerprints derivedin the previous section and the assumption of their indepen-dence, the joint density of location and RSS measurements isestimated as follows [18]:
in r h hfpr) E (hP)2(h,)K ( jp K (' 'r),(5)
where k is the dimension of rcorresponding to the numberof access points. K(-) is a zero mean kemel function withunit area, and hp and hr are smoothing parameters [18]. Twowell known examMples of kernel functions include the Gaussian(K(x) = (27r)-2TJCJ-2 exp (_-1xTC-1x)) and Exponential(K(x) = 2 exp (-l IxI j)) functions. The smoothing parametersare used to control the width of the kernels, or the region ofinfluence of each survey value. As it is evident from the formof the kernel functions under consideration, the smoothingparameter hr has a direct relationship to the variance ofthe measurements [2]. The choice of these parameters isnot trivial and is done manually using the training data forthe proposed system. Theoretical methods for choosing thesmoothing parameters can be found in [18].
Using (5) and a non-parametric estimate of f(r), the MMSEestimate of location becomes:
N
p =E wiPi7i--=
K ( r
Zzi1K (hr)
The estimator of Equation (6) is known as the Nadaraya-Watson estimator. The location estimate is a weighted averageof the survey points with weights determined by the kernelfunction and the smoothing parameter, hr.Note that the non-parametric version of the MAP estimator
corresponds to the nearest neighbour matching method used
in the literature. In that case,
p = pj, where j -arg min Ir - ril2 (7)
Properties of the Nadaraya estimator in terms of bias andvariance have been well studied and a detailed account canbe found in [19]. Furthermore, theoretical performance ofthe estimator in the context of location estimation in cellularnetworks has been investigated in [2], [20]. In the interest ofspace, we refrain from repeating these results.
2) Estimation with a Multi-valued Map: The kernel esti-mator of (6) uses one RSS fingerprint per survey location toproduce the appropriate weight for that location. We proposeto determine the weight for each survey point in the averageof Equation (6) by fusion of multiple fingerprints. Specifically,the ith survey point pi, the weight is obtained by fusing a setof weights {w(c)C l1 based on each of the C fingerprints.That is,
K (r-r(c)(c) _h
Wi E (r- )D c? =? .... C. (8)
The fusion of weights for each pi must be performed in aflexible manner to take into account varying degrees of noisepresent at different survey locations. To this end, we use acompensatory operator to perform this aggregation [21]. Thatis,
Wi = -yi min(w$ ) + (1 - -Yi) max(wjC)). (9)
In this operator, -Yi is a parameter that can adjust the logicalbehaviour of this operator. The extreme case of ty = 0 leadsto a logical OR operator. In this case, a given survey pointreceives a high weight if the measurement matches any of theclusters for the location. A pure disjunctive aggregation, how-ever, may be too optimistic in the sense that the measurementmay be deemed "close" to many survey points. At the otherextreme, -y = 1 corresponds to a logical AND operator. For allother values of -y the result is a compromise between the twoextremes. The next section experiments with various values of-y and the effect on accuracy of location estimation.
Using the aggregation operator in (9), it is also possibleto assign unequal importance to each cluster. For example,clusters that contain majority of the data points can receivea higher weight. This would mean that an observation thatmatches a cluster with the majority of data points at agiven location receives a higher score than an observationmatching a cluster with very few elements at that location.We have adopted an exponential weighing scheme [22] suchthat w(c)= (w(c))w- where wc oc Nc. Here, N, is the numberof measurements in cluster c and Nt is the total number oftime measurements. The weights obtained,from Equation (9)for each survey point pi are then used in the weighted averagesof Equation (6) to yield the final estimate.
1314
IV. EXPERIMENTAL RESULTS
Evaluation of WLAN based positioning systems is nottrivial due to the lack of standardized test environmentsand performance measures. In this section, we report on theaccuracy of the proposed methods for 2-dimensional absolute(as opposed to symbolic) location estimation in an indooroffice environment. Details of our experimental setup as wellas the adopted figure of merit are presented in sections thatfollow.
A. Setup
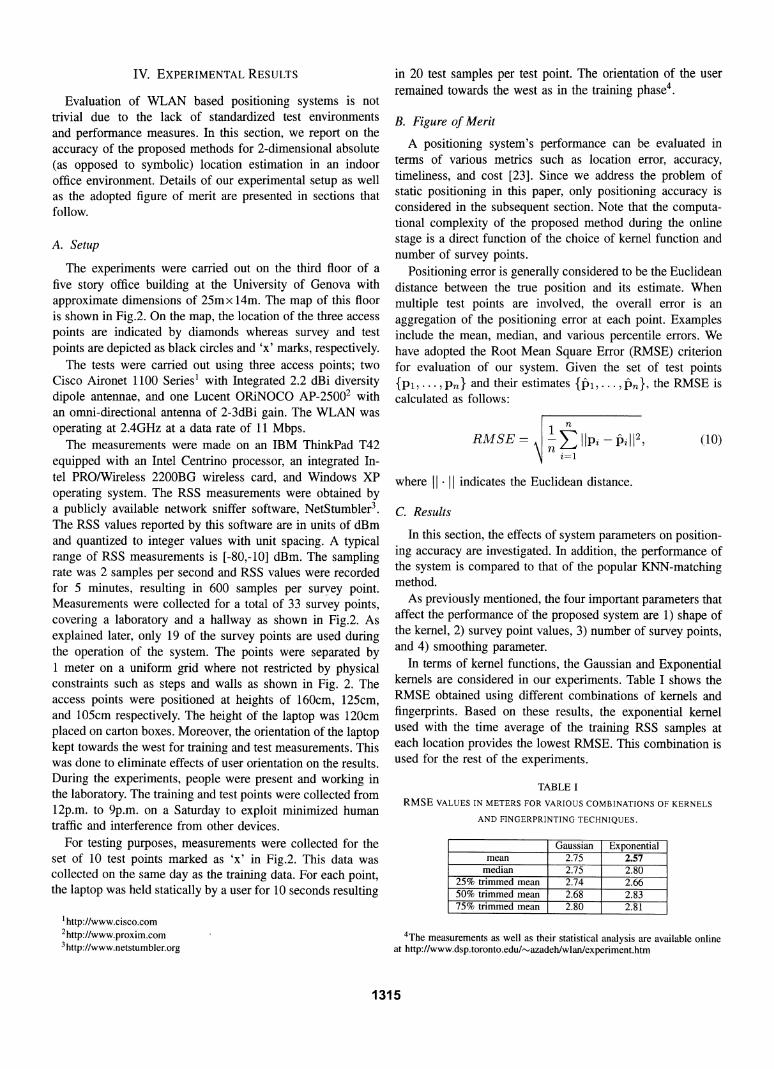
The experiments were carried out on the third floor of afive story office building at the University of Genova withapproximate dimensions of 25mx 14m. The map of this flooris shown in Fig.2. On the map, the location of the three accesspoints are indicated by diamonds whereas survey and testpoints are depicted as black circles and 'x' marks, respectively.
The tests were carried out using three access points; twoCisco Aironet 1100 Series1 with Integrated 2.2 dBi diversitydipole antennae, and one Lucent ORiNOCO AP-25002 withan omni-directional antenna of 2-3dBi gain. The WLAN wasoperating at 2.4GHz at a data rate of 11 Mbps.The measurements were made on an IBM ThinkPad T42
equipped with an Intel Centrino processor, an integrated In-tel PRO/Wireless 2200BG wireless card, and Windows XPoperating system. The RSS measurements were obtained bya publicly available network sniffer software, NetStumbler3.The RSS values reported by this software are in units of dBmand quantized to integer values with unit spacing. A typicalrange of RSS measurements is [-80,-10] dBm. The samplingrate was 2 samples per second and RSS values were recordedfor 5 minutes, resulting in 600 samples per survey point.Measurements were collected for a total of 33 survey points,covering a laboratory and a hallway as shown in Fig.2. Asexplained later, only 19 of the survey points are used duringthe operation of the system. The points were separated by1 meter on a uniform grid where not restricted by physicalconstraints such as steps and walls as shown in Fig. 2. Theaccess points were positioned at heights of 160cm, 125cm,and 105cm respectively. The height of the laptop was 120cmplaced on carton boxes. Moreover, the orientation of the laptopkept towards the west for training and test measurements. Thiswas done to eliminate effects of user orientation on the results.During the experiments, people were present and working inthe laboratory. The training and test points were collected from12p.m. to 9p.m. on a Saturday to exploit minimized humantraffic and interference from other devices.
For testing purposes, measurements were collected for theset of 10 test points marked as 'x' in Fig.2. This data wascollected on the same day as the training data. For each point,the laptop was held statically by a user for 10 seconds resulting
1 http:llwww.cisco.com2http://www.proxim.com3http://www.netstumbler.org
in 20 test samples per test point. The orientation of the userremained towards the west as in the training phase4.
B. Figure of MeritA positioning system's performance can be evaluated in
terms of various metrics such as location error, accuracy,timeliness, and cost [23]. Since we address the problem ofstatic positioning in this paper, only positioning accuracy isconsidered in the subsequent section. Note that the computa-tional complexity of the proposed method during the onlinestage is a direct function of the choice of kernel function andnumber of survey points.
Positioning error is generally considered to be the Euclideandistance between the true position and its estimate. Whenmultiple test points are involved, the overall error is anaggregation of the positioning error at each point. Examplesinclude the mean, median, and various percentile errors. Wehave adopted the Root Mean Square Error (RMSE) criterionfor evaluation of our system. Given the set of test points{p1, ... pn} and their estimates {P1,... Pn}, the RMSE iscalculated as follows:
RMSE = q-E |-Pill'7Ti-
(10)
where - II indicates the Euclidean distance.
C. Results
In this section, the effects of system parameters on position-ing accuracy are investigated. In addition, the performance ofthe system is compared to that of the popular KNN-matchingmethod.As previously mentioned, the four important parameters that
affect the performance of the proposed system are 1) shape ofthe kernel, 2) survey point values, 3) number of survey points,and 4) smoothing parameter.
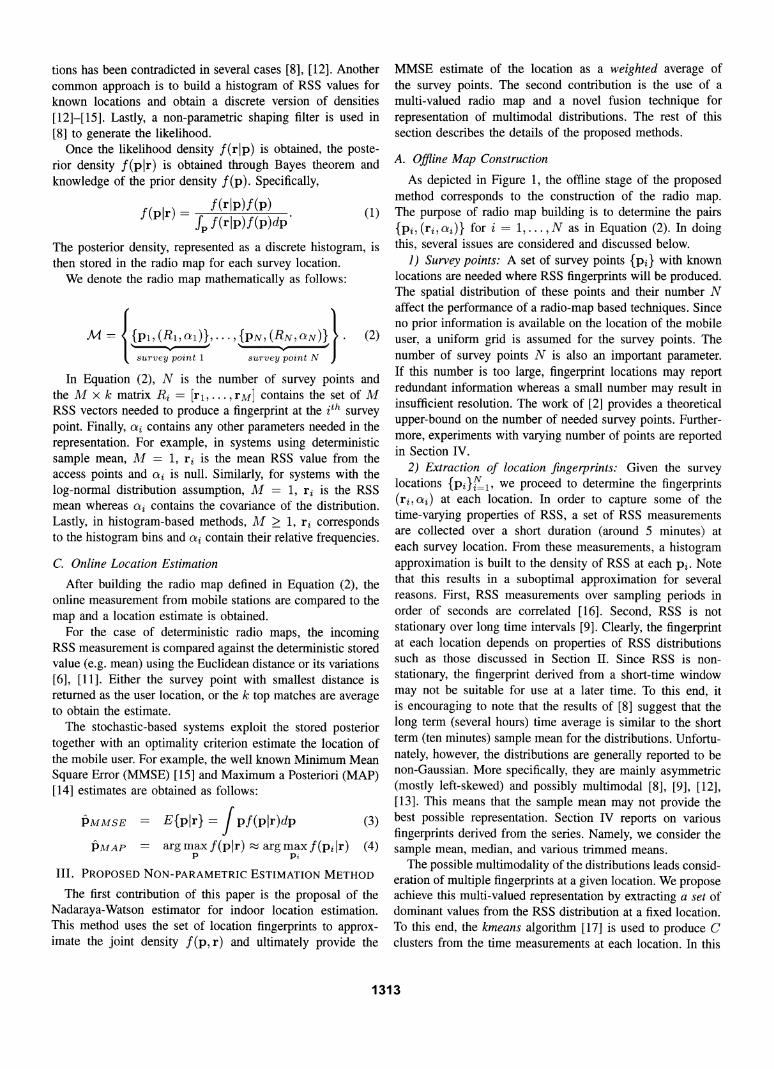
In terms of kernel functions, the Gaussian and Exponentialkernels are considered in our experiments. Table I shows theRMSE obtained using different combinations of kernels andfingerprints. Based on these results, the exponential kernelused with the time average of the training RSS samples ateach location provides the lowest RMSE. This combination isused for the rest of the experiments.
TABLE IRMSE VALUES IN METERS FOR VARIOUS COMBINATIONS OF KERNELS
AND FINGERPRINTING TECHNIQUES.
Gaussian Exponentialmean 2.75 2.57median 2.75 2.80
25% trimmed mean 2.74 2.6650% trimmed mean 2.68 2.8375% trimmed mean 2.80 2.81
4The measurements as well as their statistical analysis are available onlineat http://www.dsp.toronto.edu/-azadeh/wlan/experiment.htm
1315
I a 19m
f ZMT7pt __
2.1n4 . r.X7. * X.8 . .X9. x. 10K4.25mIU}TJ H ,24m
Fig. 2. Map of the experimentation environment.
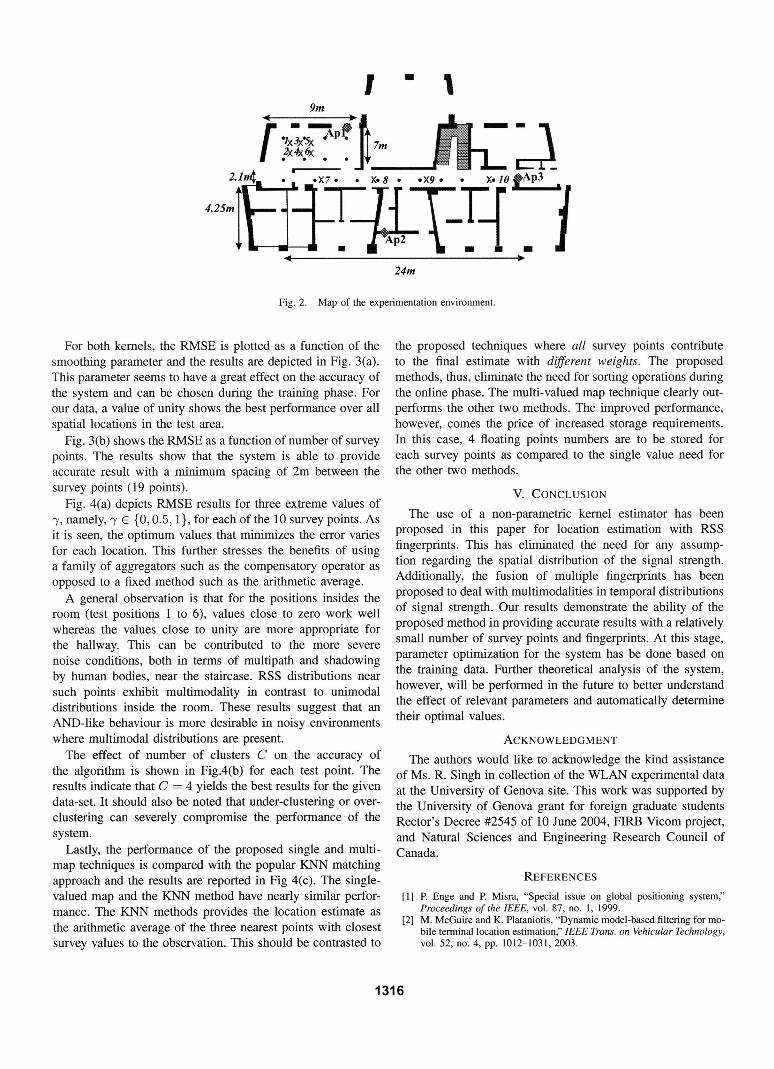
For both kernels, the RMSE is plotted as a function of thesmoothing parameter and the results are depicted in Fig. 3(a).This parameter seems to have a great effect on the accuracy ofthe system and can be chosen during the training phase. Forour data, a value of unity shows the best performance over allspatial locations in the test area.
Fig. 3(b) shows the RMSE as a function of number of surveypoints. The results show that the system is able to provideaccurate result with a minimum spacing of 2m between thesurvey points (19 points).
Fig. 4(a) depicts RMSE results for three extreme values of-y, namely, -y E {0, 0.5, 1}, for each of the 10 survey points. Asit is seen, the optimum values that minimizes the error variesfor each location. This further stresses the benefits of usinga family of aggregators such as the compensatory operator asopposed to a fixed method such as the arithmetic average.A general observation is that for the positions insides the
room (test positions 1 to 6), values close to zero work wellwhereas the values close to unity are more appropriate forthe hallway. This can be contributed to the more severenoise conditions, both in terms of multipath and shadowingby human bodies, near the staircase. RSS distributions nearsuch points exhibit multimodality in contrast to unimodaldistributions inside the room. These results suggest that anAND-like behaviour is more desirable in noisy environmentswhere multimodal distributions are present.The effect of number of clusters C on the accuracy of
the algorithm is shown in Fig.4(b) for each test point. Theresults indicate that C = 4 yields the best results for the givendata-set. It should also be noted that under-clustering or over-clustering can severely compromise the performance of thesystem.
Lastly, the performance of the proposed single and multi-map techniques is compared with the popular KNN matchingapproach and the results are reported in Fig 4(c). The single-valued map and the KNN method have nearly similar perfor-mance. The KNN methods provides the location estimate asthe arithmetic average of the three nearest points with closestsurvey values to the observation. This should be contrasted to
the proposed techniques where all survey points contributeto the final estimate with different weights. The proposedmethods, thus, eliminate the need for sorting operations duringthe online phase. The multi-valued map technique clearly out-performs the other two methods. The improved performance,however, comes the price of increased storage requirements.In this case, 4 floating points numbers are to be stored foreach survey points as compared to the single value need forthe other two methods.
V. CONCLUSIONThe use of a non-parametric kernel estimator has been
proposed in this paper for location estimation with RSSfingerprints. This has eliminated the need for any assump-tion regarding the spatial distribution of the signal strength.Additionally, the fusion of multiple fingerprints has beenproposed to deal with multimodalities in temporal distributionsof signal strength. Our results demonstrate the ability of theproposed method in providing accurate results with a relativelysmall number of survey points and fingerprints. At this stage,parameter optimization for the system has be done based onthe training data. Further theoretical analysis of the system,however, will be performed in the future to better understandthe effect of relevant parameters and automatically determinetheir optimal values.
ACKNOWLEDGMENTThe authors would like to acknowledge the kind assistance
of Ms. R. Singh in collection of the WLAN experimental dataat the University of Genova site. This work was supported bythe University of Genova grant for foreign graduate studentsRector's Decree #2545 of 10 June 2004, FIRB Vicom project,and Natural Sciences and Engineering Research Council ofCanada.
REFERENCES[1] P. Enge and R Misra, "Special issue on global positioning system,'
Proceedings of the IEEE, vol. 87, no. 1, 1999.[2] M. McGuire and K. Plataniotis, "Dynamic model-based filtering for mo-
bile terminal location estimation," IEEE Trans. on Vehicular Technology,vol. 52, no. 4, pp. 1012-1031, 2003.
1316

Gaussian kemel5F5kernt
5 _ ...~~~~~~~~~~~~~~~~~~~~~~~3
5
r33 ,, 2-
2 n __*.. l
0.5
2.
0 1 2 3 4 5 01Smmothing paramr Ii2 7 1a 19 33mtrh
N-,,-b.-o.~ y po115
(a) RMSE vs. smoothing paramneter. (b) RMSE vs. the number of survey points.
Fig. 3. Effects of system parameters on RMSE.
8 y= 0 y= 0.5 Z y= 1....
7-
cfl 4
2
1 2 3 4 5 6 7 8 9 10Test position
(a) RMSE versus the value of y for each test position.6-
1 cluster 2 clusters 3 clusters 4 clusters E1 5 clustersj5-
4
coE 3
.. ...........cc2
1 2 3] 4 5 6 71 -Ml =- u-En-mi -1n--i1 2 3 4 5 6 7 8
Test position
(b) RMSE versus the number of clusters for each test position.
9 10
_ _ Single representation ........I.... ...-..........Multi-valued representation
CI I KNN matching .... ........ ....................
--1i[[i L1 2 3 4 5 6 7
Test position
(c) RMSE: proposed methods versus KNN matching.
Fig. 4. Effects of system parameters on RMSE.
8 9 10
[3] X. Li and K. Pahlavan, "Super-resolution TOA estimation with diversityfor indoor geolocation:' IEEE Trans. on Wireless Communications,vol. 3, no. 1, pp. 224-234, 2004.
[4] D. Niculescu and B. Nath, "VOR base stations for indoor 802.11positioning," in MobiCom '04: Proceedings ofthe 10th Annual Int. Confon Mobile computing and networking, 2004, pp. 58-69.
[5] K. H. Kim, J. H. Kim, Y. J. Yoon, J. H. Seok, and J. W. Lim,"Propagation model for the WLAN service at the campus environments:,in Proceedings of The 57th IEEE Semiannual Vehicular Technology
Conf., vol. 1, 2003, pp. 196-200.[6] P. Bahl and V. Padmanabhan, "RADAR: an in-building RF-based user
location and tracking system,' in Proceedings of IEEE Infocom, vol. 2,2000, pp. 775-784.
[7] P Krishnan, A. Krishnakumar, W.-H. Ju, C. Mallows, and S. Ganu, "Asystem for LEASE: Location estimation assisted by stationary emittersfor indoor RF wireless networks," in Proceedings of IEEE Infocom,vol. 2, 2004, pp. 1001-1011.
[8] Z. Xiang, S. Song, J. Chen, H. Wang, J. Huang, and X. Gao, "A wireless
1317
3.5
3
2.5
uu 2rnr 1.5
1
0.5
LAN-based indoor positioning technology," IBM Journal of Researchand Development, vol. 48, no. 5/6, pp. 617-626, 2004.
[9] K. Kaemarungsi and P. Krishnamurthy, "Properties of indoor receivedsignal strength for WLAN location fingerprinting," in Proceedings ofthe The First Annual Int. Conf on Mobile and Ubiquitous Systems:Networking and Services (MOBIQUITOUS), 2004, pp. 14-23.
[10] R. Battiti, M. Brunato, and A. Villani, "Statistical learning theory forlocation fingerprinting in wireless LANs," Dipartimento di Informaticae Telecomunicazioni, Universita di Trento, Tech. Rep. DIT-020086,October 2002.
[11] P., Prasithsangaree, P. Krishnamurthy, and P. Chrysanthis, "On indoorposition location with wireless LANs," in The 13th IEEE Int. Symposiumon Personal, Indoor and Mobile Radio Communications, vol. 2, 2002,pp. 720-724.
[12] A. Haeberlen, E. Flannery, A. M. Ladd, A. Rudys, D. S. Wallach, andL. E. Kavraki, "Practical robust localization over large-scale 802.11wireless networks," in Proceedings of the Tenth ACM Int. Conf onMobile Computing and Networking (MOBICOM), Philadelphia, PA,2004, pp. 70-84.
[13] A. M. Ladd, K. E. Bekris, A. Rudys, G. Marceau, L. E. Kavraki,and D. S. Wallach, "Robotics-based location sensing using wirelessethernet," in Proceedings of the Eighth ACM Int. Conf on MobileComputing and Networking (MOBICOM), Atlanta, GA, 2002, pp. 227-238.
[14] M. Youssef, A. Agrawala, and A. U. Shankar, "WLAN location deter-mination via clustering and probability distributions," in Proceedings ofthe First IEEE Int. Conf on Pervasive Computing and Communications,2003, pp. 143-150.
[15] M. Youssef and A. K. Agrawala, "Continuous space estimation forWLAN location determination systems," in IEEE Thirteenth Int. Confon Computer Communications and Networks, 2004.
[16] , "Handling samples correlation in the horus system," in Proceed-ings of IEEE Infocom, 2004.
[17] T. K. Moon and W. C. Stirling, Mathematical Methods and Algorithmsfor Signal Processing. Prentice Hall, 2000.
[18] K. Plataniotis, D. Androutsos, S. Vinayagamoorthy, and A. Venet-sanopoulos, "Color image processing using adaptive multichannel fil-ters," IEEE Trans. on Image Processing, vol. 6, no. 7, pp. 933-949,1997.
[19] D. W. Scott, Multivariate Density Estimation. John Wiley and Sons,1992.
[20] M. McGuire, K. Plataniotis, and A. Venetsanopoulos, "Data fusionof power and time measurements for mobile terminal location," IEEETrans. on Mobile Computing, vol. 4, no. 2, pp. 142-153, 2005.
[21] A. Kushki, P. Androutsos, K. Plataniotis, and A. Venetsanopoulos,"Retrieval of images from artistic repositories using a decision fusionframework"' IEEE Trans. on Image Processing, vol. 13, no. 3, pp. 277-292, 2004.
[22] H. Zimmermann, Fuzzy sets, decision making and expert systems.Kluwer Academic, 1976.
[23] E. Blasch, M. Pribilski, B. Daughtery, B. Roscoe, and J. Gunsett, "Fusionmetrics for dynamic situation analysis,," in Proceedings of SPIE, vol.5429, 2004, pp. 428-438.
1318
Copyright © 2022 FDOKUMEN