Chiarelli C. , David Lees. L'Italia nelle fotografie di LIFE. 2003
Page | 1
EMaVE Consortium - Vinifera Euromaster
European Master of Science (MSc) in Viticulture and Enology
UNIVERSITA’DEGLI STUDI DI UDINE
Laurea Magistrale in Viticoltura, Enologia e Mercati vitivinicoli
“Radical scavenging activity and oxygen consumption of different
oenological products and additives ”
MASTER THESIS developed in the
Food Science Department of the University of Udine
Presented by Mariana Silvina Páez
Vinifera Euromaster 2010-2012
Main Supervisor: Professore Roberto Zironi
Co- Supervisor: Dottore Piergiorgio Comuzzo
Academic Year 2010-2012
Page | 2
ABSTRACT
The use of sulfur dioxide in winemaking seems indispensable for its properties of
antiseptic, antioxidasic and antioxidant.
Other molecules and additives have been proposed for replacing it in winemaking,
but poor investigations on their effectiveness are available from the technological
point of view.
For this reason, in this study, some oenological additives and products (ascorbic
acid, glutathione, yeast lees, and an inactive dry yeast preparation) have been
compared with sulfur dioxide for their radical scavenging activity (DPPH assay)
and oxygen consumption capacity. Experiments were carried out in wine- like
solution and in wine.
Concerning DPPH assay, results demonstrated that some of the tested products
showed good performances as radical-scavengers, compared to sulfites; but
others, like ascorbic acid, behaved very similar to SO2. In addition, yeast lees and
extracts (IDY) showed the highest radical scavenging activity and huge sulfite
concentrations (500 mg/L) were needed to give similar effects.
Glutathione ability to discolor DPPH, in comparison with sulfur dioxide, was
different in model solution and in the different wines tested, so that the anti-
radical action of both these additives in wine could seem also connected with wine
characteristics and composition.
Different wines had different oxygen consumption curves and the effect of the
tested treatments was differently evident in the two tested wines, being less clear
in the youngest one. Yeast lees generally demonstrated a higher ability to promote
oxygen consumption; their action was similar to that of ascorbic acid. Contrarily,
inactive dry yeasts (IDY), gave high oxygen consumption at the beginning of the
monitoring time, reducing the consumption rate after some days; at the end of the
monitoring period (two weeks) the wines treated with IDY showed generally the
highest oxygen concentration. IDY could sometimes give positive effects on wine
color protection.

Page | 3
Index
1.INTRODUCTION ....................................................................................... ¡ERROR! MARCADOR NO DEFINIDO.
1.1. MECHANISMS OF OXIDATION IN WINE ..................................................................................................... 6
1.1.1. Enzymatic oxidation ....................................................................................................................... 10
1.1.2.Non- enzymatic oxidation ................................................................................................................... 11
1.2. SUBSTANCES USED IN VINIFICATION AS ANTIOXIDANTS ............................................................................... 12
1.2.1. Sulphur dioxide .............................................................................................................................. 12
1.2.2. Ascorbic acid .................................................................................................................................. 14
1.2.3. Glutathione .................................................................................................................................... 15
1.2.4. Yeast lees and Yeast derivatives (inactive dry yeast) ..................................................................... 18
1.2.5. Combined effect of wine antioxidants ........................................................................................... 20
1.3. AIM OF THIS WORK ............................................................................................................................ 22
2. MATERIALS AND METHODS ................................................................................................................... 23
2.1. CHEMICALS AND OENOLOGICAL PRODUCTS .............................................................................................. 23
2.2. EVALUATION OF THE RADICAL SCAVENGING ACTIVITY OF DIFFERENT OENOLOGICAL ADDITIVES AND PRODUCTS ......... 23
2.2.1.Samples preparation ........................................................................................................................... 23
2.2.2. DPPH assay .................................................................................................................................... 24
2.3. EFFECT OF DIFFERENT OENOLOGICAL ADDITIVES AND PRODUCTS ON WINE OXYGEN CONSUMPTION ....................... 24
2.3.1. Samples preparation ...................................................................................................................... 24
2.3.3. Spectrophotometric measurements .............................................................................................. 27
2.4. STATISTICAL ANALYSIS ........................................................................................................................ 28
3. RESULTS AND DISCUSSION .................................................................................................................... 29
3.1. STUDY OF THE BEHAVIOR OF SOME ANTIOXIDANT AGENTS IN WINE-LIKE BUFFER AND IN WHITE WINE USING DPPH
STABLE FREE RADICAL. ...................................................................................................................................... 29
3.1.2. Results of DPPH trials in white wine .............................................................................................. 30
3.1.3. Results of DPPH trials in white wine and the antioxidant agents in pairs ..................................... 32
3.2. EFFECT OF DIFFERENT OENOLOGICAL ADDITIVES AND PRODUCTS ON WINE OXYGEN CONSUMPTION CAPACITY .......... 34
4. CONCLUSIONS ....................................................................................................................................... 45
5. BIBLIOGRAPHY ....................................................................................................................................... 46

Page | 4
List of figures and tables
Figure 1: Most common flavonoid compounds in wine. .......................................................... 7
Figure 2: Most common Non-flavonoid compounds in wine. ............................................... 8
Figure 3: Oxygen reduction ................................................................................................................. 9
Figure 4: Enzymatic browning process in grape must. ........................................................... 10
Figure 5: Fenton reaction .................................................................................................................. 12
Figure 6: Reduction of copper by ascorbic acid and next oxidation by hydroxy
peroxide .................................................................................................................................................... 15
Figure 7: Glutathione .......................................................................................................................... 17
Figure 8: Glutathione oxidation ...................................................................................................... 17
Figure 9: OxySense® equipment to measure the oxygen consumption. ....................... 27
Figure 10: POM -test calculation .................................................................................................... 27
Figure 11: DPPH-test. Radical scavenging activity of different enological additives
and products, in wine-like solution ................................................................................................ 29
Figure 12: DPPH- test. Radical scavenging activity of a table wine treated with
different enological additives and products ............................................................................... 31
Figure 13: DPPH test. Radical scavenging activity of different enological additives
and products isolated and in pairs in a table white wine ....................................................... 33
Figure 14: Oxygen consumption curves of a white wine (Friulano, D.O.C. Colli
Orientali del Friuli- Italy, vintage 2007) treated with different enological additives
and products. .......................................................................................................................................... 35
Figure 15: One way ANOVA, carried out on the slopes of the lines obtained by
linearization (log 10) of the curves in figure 14. .......................................................................... 36
Figure 16: Oxygen consumption curves registered in a white wine ( Chardonnay,
D.O.C. Grave del Friuli- Italy, vintage 2011) treated with different enological
additives and products. ....................................................................................................................... 40
Figure 17: One way ANOVA, carried out on the slopes of the lines obtained by
transformation ( log 10) of the curves in Figure 16. ................................................................. 41
Table 1: Amounts of enological additives and products added in the two sets of
trials ............................................................................................................................................................ 25
Table 2: Equations of the trend lines obtained by transforming (log 10) the curves
of oxygen consumption as detected for the different Friulano wine samples
analyzed in Figure 14 (average curves) and Figure 15 (ANOVA on slopes). Slopes
and R2 values are reported. ............................................................................................................... 37
Table 3: Oxygen concentration, DO 420nm and POM test detected for the Friulano
wine at the end of the measures ..................................................................................................... 38

Page | 5
Table 4: Equations of the trend lines obtained by transforming (log 10) the curves
in Figure 16 (average curves) and figure 17 (ANOVA on slopes). Slopes and R2
values are reported ............................................................................................................................... 42
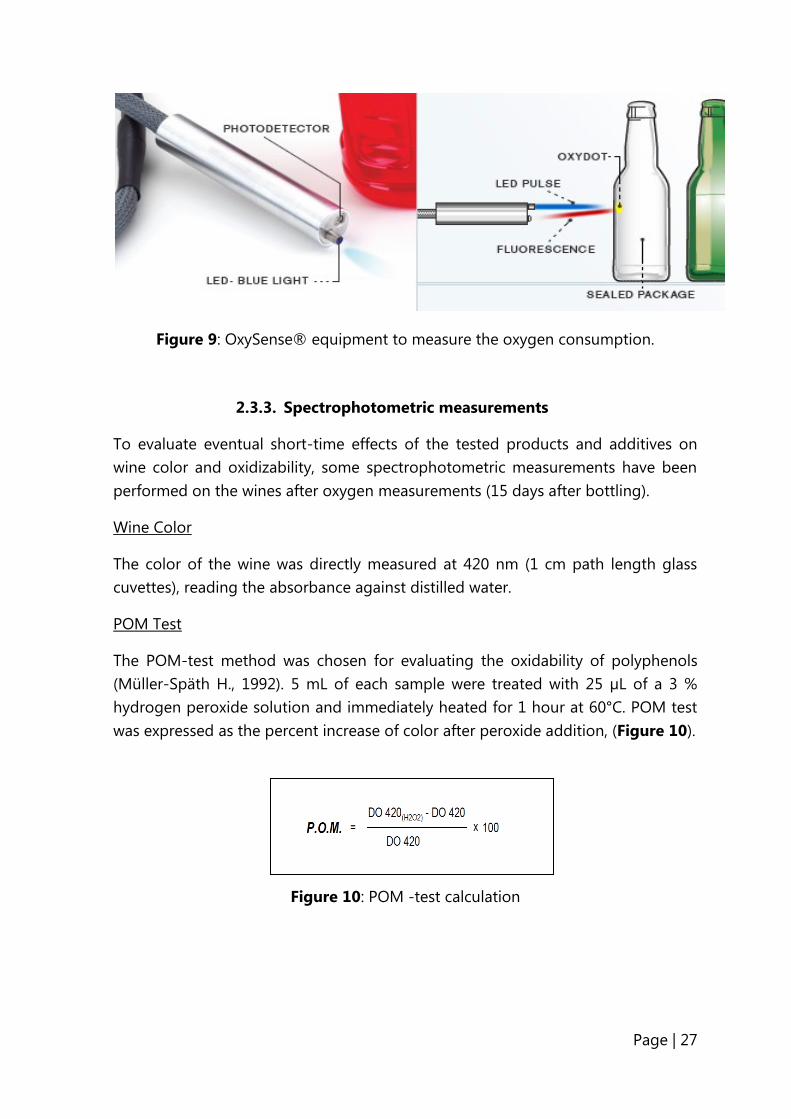
Table 5: Oxygen concentration, DO 420nm and POM test detected for the wines at
the end of the measures ..................................................................................................................... 43
Page | 6
1. INTRODUCTION
1.1. Mechanisms of oxidation in wine
Oxidative browning is a long-standing problem in winemaking.
Wine oxidation can be divided in enzymatic oxidation and non-enzymatic
oxidation. Enzymatic oxidation almost entirely occurs in grape must and is largely
correlated with the content of phenols like the hydroxycinnamates, such as
caffeoyltartaric acid, paracoumaroyltartaric acid, and flavan-3-ols. Non-enzymatic
oxidation, also called chemical oxidation, prevails in wine and begin by the
oxidation of polyphenols containing a catechol or a galloyl group, in presence of
catalysts (e.g. iron, or copper). These phenolic reactions, both enzymatic and non-
enzymatic, result in by-products named quinones, (C.M. Oliveira et al., 2011).
Constituents of both red and white wines are capable of reacting with significant
amounts of oxygen, polyphenols being among the most readily oxidized wine
constituents.
Phenolic substances
Wine polyphenolic substances are usually subdivided into two groups: flavonoids
and Non-flavonoid compounds, (Figure 1, and Figure 2).

Page | 7
Figure 1: Most common flavonoid compounds in wine.

Page | 8
Figure 2: Most common Non-flavonoid compounds in wine.
The concentration of flavonoids in wine is strongly affected by the winemaking
practices and the degree of extraction from skins and seeds. Flavan-3-ols are
found in the solid parts of the berry (seed, skin and stem) in monomeric,
oligomeric, or polymeric forms. The latter two forms are also known as
proanthocyanidins or condensed tannins. While seed tannins are oligomers and
polymers composed of the monomeric flavan-3-ols (+)-catechin, (−) epicatechin,
and (−)-epicatechin gallate (Prieur, C et al., 1994), skin tannins also contain (−)-
epigallocatechin and trace amounts of (+)- gallocatechin and (−)-epigallocatechin
gallate (Escribano-Bailón, M. T.et al., 1995); (Souquet, J. M. et al. , 1996) .Flavan-3-
ols have been reported to exhibit several health beneficial effects by acting as
antioxidant, anticarcinogen, cardiopreventive, antimicrobial, anti-viral, and neuro-
protective agents ( P.M.Aron and J.A.Kennedy, 2007). The seeds contain higher
concentrations of monomeric, oligomeric, and polymeric flavan-3-ols than the
skins. Levels of proanthocyanidins or condensed tannins are between 1 g/L and 4
g/L in red wines while in white wine, levels are in the range of 100 mg/L and highly
dependent on pressing techniques, (Ribéreau-Gayon, P., Glories, Y., Maugean, A., &
Dubourdieu, D. ,2000).

Page | 9
Non-flavonoid compounds are mainly derivatives of benzoic acid and of cinnamic
acid. Another class of non-flavonoids in grape includes the stilbenes and stilbene
glycosides, trans resveratrol being the best known example (Figure 2). A different
class of nonflavonoids in wines are the hydrolysable tannins that are derived from
oak. (C.M. Oliveira et al., 2011)
Red wines contain polyphenols at a higher concentration than white wines
(Castellari, M.et al., 2000). White wines containing mainly hydroxycinnamic acids,
but these remain very important for oxidation related issues in wine browning and
losses of varietal aroma. (Betes-Saura, C. et al., 1996)
Reactive oxygen species
Reactive oxygen species (ROS) is a collective term used to describe oxygen
radicals, such as superoxide anion (O2•−) and its conjugate acid hydroperoxyl
(HOO•), hydroxyl (HO•), peroxyl (ROO•), alkoxyl (RO•) radicals, and certain other
non-radicals that are either potential oxidizing agents or are easily converted into
radicals, such as hydrogen peroxide (H2O2), ozone (O3), hypochlorous acid (HOCl),
singlet oxygen (1O2), and lipid peroxides (LOOH),(Pourova, J. et al., 2010).
In wine, ROS can be produced by reduced transition metals ions [e.g. Fe(II)]. The
initial transfer of an electron leads to the formation of superoxide radical anion
(O2 •−), which at wine pH exists in the protonated form hydroperoxyl radical
(HOO•) .The transfer of a second electron will produce peroxide anion (O22−), which
at wine pH exists in the protonated form hydrogen peroxide (H2O2) . The next
reduction step creates an even more reactive oxidant, the hydroxyl radical (HO•),
which can abstract a hydrogen atom from organic compounds to produce water,
the final oxygen reduction product, (Figure 3), (Danilewicz, J. C., 2003);
(Waterhouse, A. L., & Laurie, V. F, 2006).
Figure 3: Oxygen reduction (Waterhouse & Laurie, 2006)

Page | 10
1.1.1. Enzymatic oxidation
The enzymatic oxidation occurs almost entirely in grape must. A likely mechanism
for oxidation of phenolic compounds involves hydroxylation to the ortho-position
adjacent to an existing hydroxyl group of the phenolic substrate (monophenol
oxidase activity), and oxidation of ortho-dihydroxybenzenes to ortho-
benzoquinones (diphenol oxidase activity). Several classes of enzymes,
oxidoreductases, can catalyze these reactions. This class of enzymes includes the
well known Polyphenoloxidase, Peroxidase and laccase. (C.M. Oliveira et al., 2011)
In grape must, enzymatic browning (Figure 4) is largely correlated with the
content of hydroxycinnamates such as caffeoyltartaric acid (caftaric acid) and para-
coumaroyltartaric acid (coutaric acid), ( Cheynier, V. F.et al., 1986.), and is promoted
by flavan-3-ols . When grapes are crushed, polyphenoloxidases (PPO) are released,
and rapidly oxidize the hydroxycinnamates to benzoquinones. Meanwhile, the
benzoquinones produced by enzymatic oxidation will undergo further reactions,
according to their redox properties and electronic affinities.(Robards, K., et al.
,1999.). Being oxidants, quinones, can oxidize substances which have a lower
potential such as polyphenols and ascorbic acid as well SO2. The quinone is then
reduced back to its original catechol. (Kutyrev & Moskva, 1991).
Figure 4: Enzymatic browning process in grape must. (Li, H., Guo, A., & Wang, H.,
2008)
White must hyperoxygenation decreases the browning potential of wine in two
ways: by the tyrosinase disappearance and by the depletion of oxidable
polyphenols during the oxidation reactions. These results in wines with low
polyphenol concentrations and high GRP (Grape reaction Product) content (see in
the section 1.2.3. Glutathione oxidation), which are more stable than those made
from non-oxidized juice, in which high polyphenols contents are maintained with a
high browning potential (Li, H., Guo, A., & Wang, H. ,2008).

Page | 11
1.1.2. Non- enzymatic oxidation
Non-enzymatic oxidation, also called chemical oxidation, prevails in wine with the
characteristics of regeneration and autocatalysis, and it may also occur through the
direct reaction with light (Main, G. L., 1992). O-Diphenols, mainly including caffeic
acid and its esters, catechin, epicatechin, anthocyanins and their derivatives, and
gallic acid, are considered to be the most susceptible to oxidation in non-
enzymatic browning process, and the levels of flavan 3-ols are most significantly
correlated to the browning degree of most white wines (Fernández-Zurbano, P.,
Ferreira, V., Escudero, A., & Cacho, J., 1998);(Fernández-Zurbano, P. et al., 1995);
(Lopez-Toledano, A et al., 2002); (Saucier, C. T., & Waterhouse, A. L., 1999)
Non-enzymatic browning in wine can arise through several pathways related to
phenols, and one of them is the oxidation of phenols and subsequent
polymerization of the oxidized products, the first process catalyzed by copper and
iron. Other routes involve polymerization reactions between phenols and other
compounds present in wine, including condensation with acetaldehyde or glyoxylic
acid (derived from the oxidation of tartaric acid). The oxidation of ethanol
catalyzed by transition metals or through coupled oxidation of phenols produce
some acetaldehyde in wine (Sullivan, P. J.,2002); (Wildenradt, H. L.,&Singleton, V. L.,
1974).
It had been examinated a mechanism by which oxygen and its intermediate
reducing products react with wine constituents, as well the participation of
transition metal ions in these reactions with the conclusion that oxygen does not
react directly with phenolic compounds without the presence of transition metal
ions, (Waterhouse, A. L., & Laurie, V. F, 2006).
During the process of non-enzymatic oxidation of wine, o-diphenols are oxidized
to o-quinones and semi-quinone, and free radicals may be produced, while oxygen
is reduced to H2O2, (Waterhouse, A. L., & Laurie, V. F, 2006).
The quinones formed during the process as the primary products are unstable and
may undergo further reactions. These reactions, which may cause pigment
formation, are similar to those taking place in enzymatic browning despite the
quinones from enzymatic or non-enzymatic oxidation (Robards, K. et al.,1999).;
(Singleton, V. L.,1987), for example, condensation reactions to form colored
products with high molecular weight or reduction reactions to generate original
phenols through trapping hydrogen atoms from other compounds.
Hydrogen peroxide (H2O2) may be formed during the oxidation of wine phenols,
which has been widely accepted.
Some authors also state that the main antioxidant function of SO2 in wine is to
react with H2O2, thus limiting the oxidation of ethanol and other saturated
hydroxyl compounds (Danilewicz, J. C., 2007). This should be taken into account,
Page | 12
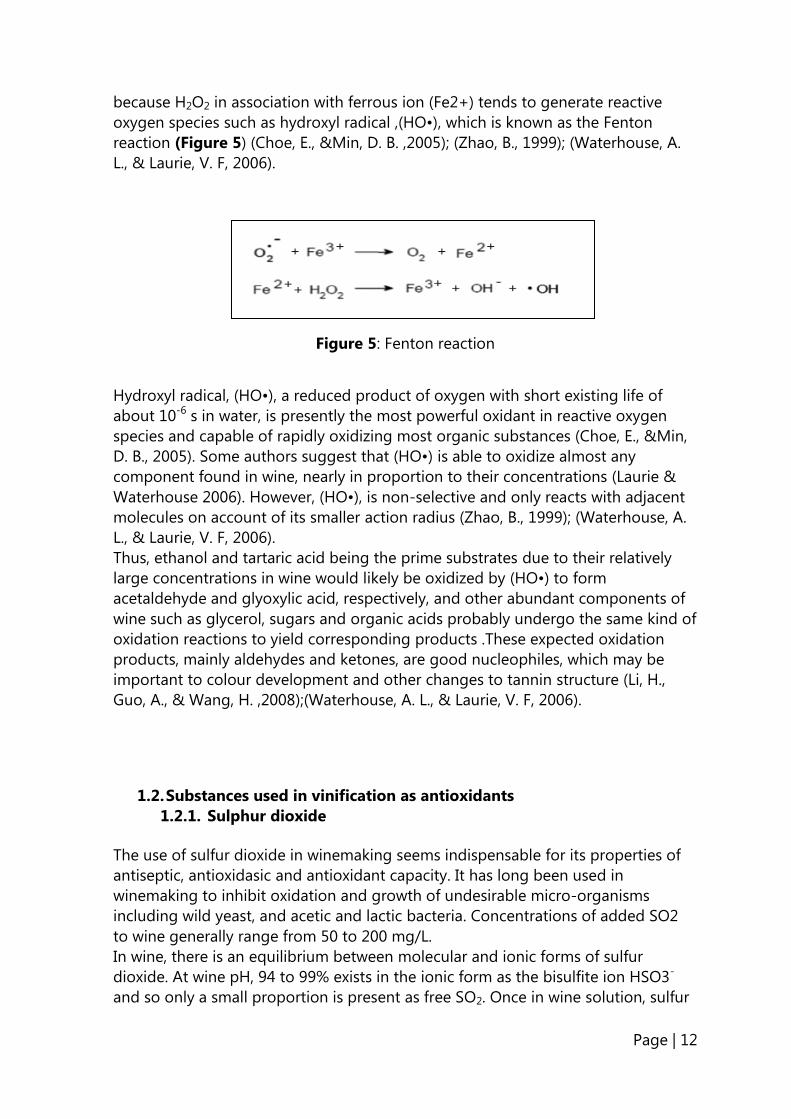
because H2O2 in association with ferrous ion (Fe2+) tends to generate reactive
oxygen species such as hydroxyl radical ,(HO•), which is known as the Fenton
reaction (Figure 5) (Choe, E., &Min, D. B. ,2005); (Zhao, B., 1999); (Waterhouse, A.
L., & Laurie, V. F, 2006).
Figure 5: Fenton reaction
Hydroxyl radical, (HO•), a reduced product of oxygen with short existing life of
about 10-6 s in water, is presently the most powerful oxidant in reactive oxygen
species and capable of rapidly oxidizing most organic substances (Choe, E., &Min,
D. B., 2005). Some authors suggest that (HO•) is able to oxidize almost any
component found in wine, nearly in proportion to their concentrations (Laurie &
Waterhouse 2006). However, (HO•), is non-selective and only reacts with adjacent
molecules on account of its smaller action radius (Zhao, B., 1999); (Waterhouse, A.
L., & Laurie, V. F, 2006).
Thus, ethanol and tartaric acid being the prime substrates due to their relatively
large concentrations in wine would likely be oxidized by (HO•) to form
acetaldehyde and glyoxylic acid, respectively, and other abundant components of
wine such as glycerol, sugars and organic acids probably undergo the same kind of
oxidation reactions to yield corresponding products .These expected oxidation
products, mainly aldehydes and ketones, are good nucleophiles, which may be
important to colour development and other changes to tannin structure (Li, H.,
Guo, A., & Wang, H. ,2008);(Waterhouse, A. L., & Laurie, V. F, 2006).
1.2. Substances used in vinification as antioxidants
1.2.1. Sulphur dioxide
The use of sulfur dioxide in winemaking seems indispensable for its properties of
antiseptic, antioxidasic and antioxidant capacity. It has long been used in
winemaking to inhibit oxidation and growth of undesirable micro-organisms
including wild yeast, and acetic and lactic bacteria. Concentrations of added SO2
to wine generally range from 50 to 200 mg/L.
In wine, there is an equilibrium between molecular and ionic forms of sulfur
dioxide. At wine pH, 94 to 99% exists in the ionic form as the bisulfite ion HSO3-
and so only a small proportion is present as free SO2. Once in wine solution, sulfur

Page | 13
dioxide can bind with several molecules such as acetaldehyde, anthocyanins,
pyruvic acid, ketoglutaric acid, glucose or phenolic compounds, particularly,
caffeic acid and p-coumaric acid. There are commonly two fractions of SO2 in wine:
the “free SO2”, referred to HSO3- and SO2, and the“bound SO2”, indicating
sulfur dioxide that is mainly bound to unsaturated compounds. Sulfur dioxide does
not react directly with oxygen but with the oxygen reduced form, hydrogen
peroxide (Elias, R. J., Andersen, & Waterhouse, A. L., 2010) .In this way, SO2 can
inhibit aldehydes formation by competing for hydrogen peroxide. Sulphur dioxide
also plays an important role in reducing quinones formed during oxidation process
back to their phenol form, (C.M. Oliveira et al., 2011).
However, as a result of potential health problems that may arise like some allergies
caused by SO2-derived compounds, namely the sulfites, causing symptoms such as
headaches, nausea, gastric irritation, and breathing difficulties in asthma patients.
Consequently, the legislated maximum concentration of SO2 allowed in wines has
been gradually reduced, (MC Santos et al., 2011).
Some wineries make wines in total or near-total absence of sulfur dioxide but it
would certainly be presumptuous to claim that all of the wines produced in the
various wineries throughout the world could be made in this manner. It must also
be taken into account that yeasts produce small quantities of SO2 during
fermentation. The commercial yeast normally used in winemaking, produce rarely
more than 10 mg/L but sometimes more than 30mg/L. Therefore we can not find a
wine without sulfur dioxide even in the absence of sulfiting, (P. Ribéreau-Gayon, D.
Dubourdieu, B. Donéche and A.Lonvaud, 2006). Other authors have found that
most yeast strains produce less than 30 mg/L total SO2, although some have been
reported to produce more than 100 mg/L (Osborne and Edwards, 2005
Eschenbruch, 1974; Weeks, 1969).
In Europe, wines must now prominently display on the bottle, next to restrictions
required by law, the presence of total sulfites in excess of 10 mg/L (European
Union Regulation 1991/2004).
In recent years as a result of potential health problems that may arise, the use of
sulphur dioxide in wine has recently come under review, (COMMISSION
REGULATION (EC) No 606/2009 of 10 July 2009, Annex IB). They have reduced in
10 mg/L the maximum total sulphur dioxide content in wines. For example, before
this law, for white wines the total sulphur dioxide content allowed was 210 mg/L
and now the maximum is 200 mg/L.
The use of sulphur dioxide in excessive doses must be avoided not only for health
reasons but also because, from an enological point of view, it can cause
organoleptic alterations in the final product, neutralize the aroma and even
produce characteristic aroma defects, (Ribéreau-Gayon P, Glories Y, Maujean A,
Dubourdieu D,2006).

Page | 14
We can produce a wine reducing the total use of sulfur dioxide using some tools.
Winemakers are therefore faced with the problem of finding other preservatives
and innovative technologies, harmless to health, that can replace or at least
complement the action of SO2, making possible to reduce its levels in wines.
1.2.2. Ascorbic acid
Ascorbic acid is a natural compound which is found in most fruits and vegetables.
In grapes the level of ascorbic acid is generally found to vary between 5 to 150
mg/kg of fruit, (Zoecklein et al., 1995). The content after crushing and pressing
ranges from 10 to100 mg/L, (Rankine B., 2002).
Ascorbic acid has long been used in the wine industry as an antioxidant, the reason
being its ability to rapidly remove molecular oxygen from juice or wine. It is readily
oxidized under the conditions found in white wine. This is claimed as the basis of
its ability to protect other oxidizable wine constituents, including phenolic and
flavor compounds.
Due to the limited number of microbiological spoilage inhibitory functions of
ascorbic acid compared with those of sulfur dioxide, it was appreciated that
ascorbic acid should only be employed in a complementary role with sulfur dioxide
and not as a replacement. The combined use of ascorbic acid and sulfur dioxide
was initially seen to have many advantages over the use of either compound alone,
(Zoecklein et al., 1995); (Rankine B., 2002). These advantages included a reduction
in the level of required sulfur dioxide reducing the severe health problems allergy-
like reactions, (M. P. Bradshaw, et al., 2011)
The benefit of ascorbic acid as an antioxidant in white wine is its capacity to
scavenge molecular oxygen before the oxidation of phenolic compounds. In
comparison, sulfur dioxide is not nearly as efficient at scavenging molecular
oxygen (Danilewicz et al., 2008). Furthermore, if oxidation of phenolic compounds
does occur then ascorbic acid is also suggested to readily reduce the oxidized
products (i.e., ortho-quinones) back to the original phenolic state (Boulton et al.,
1996).
The“crossover”effect
It was demonstrated that ascorbic acid can exhibit a “crossover” effect
depending upon the level of the acid; (Buettner, G. R. and Jurkiewicz, B. A., 1996). It
was shown that at higher concentrations, ascorbic acid could act as an antioxidant,
while at lower concentrations a pro-oxidant influence could be demonstrated. The
authors, Buettner and Jurkiewicz, proposed that the crossover effect resulted from
the generation of radical species derived from the metal- catalized oxidation of
ascorbic acid.

Page | 15
Ascorbic acid in the presence of metal ions and in the absence of sulfur dioxide
can actually acts as a free-radical initiator. There is evidence to suggest that under
certain conditions ascorbic acid may display pro-oxidant activity in the case where
sulfur dioxide is not present. The mechanism of this activity may be linked to the
presence of catalytic metals such as Fe3+ and Cu2+, which may be reduced by
ascorbic acid and enter redox cycling reactions.
For example, Moreaux et al. (1996), have shown that ascorbic acid may reduce Cu2+
to Cu+. (Figure 6)
AH2 + O2 + Cu2+
→ A + H2O2 + Cu+
H2O2 + Cu+ →• OH + OH
– + Cu
2+
Figure 6: Reduction of copper by ascorbic acid and next oxidation by hydroxy
peroxide
With the generated hydroxyl radicals and so, initiating damaging chain reactions.
Similarly Fe3+ may be reduced to Fe2+ by ascorbic acid. The difference between ascorbic acid acting as an antioxidant or pro-oxidant in the
absence of sulfur dioxide is then related to the relative concentrations of ascorbic
acid and the catalytically active metal ions, (M.P. Bradshaw et al., 2011). With high
concentrations of ascorbic acid, the chain length of the radical processes will be
small, due to its antioxidant effect. That is, radicals generated will be quenched by
the presence of ascorbic acid. However, as the concentration of ascorbic acid is
lowered, initiation processes will be slowed, but so too will antioxidant reactions.
Thus there will be a corresponding increase in the chain length of oxidatively-
damaging reactions. Hence under these conditions, ascorbate will have pro-
oxidant activity (M.P. Bradshaw et al., 2011), (Buettner, G. R. and Jurkiewicz, B. A.,
1996).
1.2.3. Glutathione
Glutathione, γ-L-Glutamyl-L-cysteinylglycine (GSH), is an important antioxidant
coming from the grapevine as it aids in decreasing aroma loss and the browning
that occurs due to oxidative processes in white wine.
In grapes, GSH concentration can exceed 100 mg/ kg according to grape cultivar,
environmental conditions and viticultural practices. The GSH content in grape juice
ranges from 10 to 100 mg /L (Cheynier, V., Souquet, J. M., & Moutounet, M., 1989)
and factors such as exposure to oxygen, tyrosinase activity and grape skin
maceration during pre-fermentation can affect its concentration (Du Toit, W. J.et
al.,2007); (Maggu, M.et al., 2007).

Page | 16
The concentration of GSH in wine is lower than in juice and grapes and it ranges
from 1 to 20 mg/ L (Cassol, T., & Adams, D. O, 1995); (Du Toit, W. J.et al., 2007). In
instances where the concentration of GSH in white wine exceeds 6–10 mg/ L, both
colour and aroma are better preserved during ageing and storage (Lavigne, V., &
Dubourdieu, D.,2004). Saccharomyces cerevisiae can also affect the GSH content in
wine during alcoholic fermentation as well as during the ageing on the lees
(Lavigne, V., Pons, A., & Dudourdieu, D., 2007). Sonni, F. et al., 2011 mentioned
normal concentrations of Glutathione found in wine of 30 mg/L.
GSH plays a crucial role in the limitation of phenol oxidation during winemaking as
it can react with caftaric acid, generating 2-S-glutathionyl caftaric acid, also known
as Grape Reaction Product (GRP). In this way the formation of o-quinones and,
consequently, the production of browning polymers, is limited. GSH can thus have
a positive effect on white wine colour, appearing to make the color more stable
during ageing (Fracassetti D. et al., 2011).
GSH exerts a protective effect on certain wine aromas (Lavigne, V., & Dubourdieu,
D., 2004). It may lead to lower o-quinone-thiol associations, by competing for the
o-quinones, thereby leading to higher amounts of thiol-related aromas in wine.
GSH can also preserve aroma compounds, such as isoamyl acetate (3-methyl-1-
butyl acetate), ethyl hexanoate, and linalool (3, 7-dimethylocta-1, 6-dien- 3-ol)
during bottle storage (Papadopoulou, D., & Roussis, I. G., 2008). This aromatic
protection by GSH seems to be highly active in the presence of phenols, especially
when caffeic acid is dissolved in wine at certain levels (Roussis, I. G., Lambropoulos,
I., & Tzimas, P., 2007). It can also reduce the formation of sotolon (3-hydroxy-4,5-
dimethyl-2(5H)furanone), a compound responsible for the atypical ageing
character of white wine (Lavigne, V., & Dubourdieu, D., 2004).
Glutathione oxidation:
The thiol group (–SH) of the cystein in GSH acts as proton donor for unstable
molecules (reactive oxygen species, ROS, for example: H2O2), GSH assist in
preventing ROS damage by scavenging free radicals. GSH reduces disulfide bonds
and is converted to its oxidized form, Glutathione disulfide (GSSH), (Figure 7 &
Figure 8).
Once oxidized, glutathione can be reduced back by glutathione reductase, using
NADPH as an electron donor. The ratio of reduced glutathione to oxidized
glutathione is often used as a measure of oxidative stress. Generally glutathione is
found like GSH, if does exist GSSG in bigger quantity we can consider the
oxidation.

Page | 17
Figure 7: Glutathione
H2O2 + 2GSH------- GSSG + 2 H2O.
Figure 8: Glutathione oxidation
GSH in the winemaking process:
GSH represents the 1% of the dry weight of S. cerevisiae, having in this way GSH in
the preparations of Inactive dry yeast (IDY). It had been proved that the content of
GSH depends of the yeast strain present in the wine. Therefore, the IDY
preparations could release different contents of GSH in the wine depending on the
yeast strain used in its industrial production having different effect on the wine
treated with them.
It had been proved that the addition of GSH (10 mg/L) before bottling of wine can
reduce the oxidation phenomena, maintaining the color and varietal aroma and
decreasing the formation of negative aroma compounds (Pozo-Bayón M.A. et al.,
2009).
The role of GSH in grape must oxidation:
In must oxidation, the initial oxygen uptake by o-dihydroxybenzenes is slowed by
addition of thiols like cysteine (Cys) or glutathione (GSH).When caftaric acid is
oxidized to its corresponding quinone by tyrosinase, GSH will quickly react with
the quinone forming a colorless product called grape reaction product (GRP; 2-S-
glutathionyl caftaric acid) which is no longer a substrate for further oxidation by
tyrosinase. Therefore, the formation of GRP is believed to limit the must browning
and depends on the relative amounts of GSH. Analysis of aged bottled wines
shows that GRP is slowly hydrolyzed to the GSH-caffeic acid derivative (the tartrate
ester is hydrolyzed). The specific brown products are not well characterized, but it
appears that the hydroxycinnamate quinones react with flavan-3-ols to form
colored products (C.M. Oliveira et al., 2011 ).
Page | 18
Sulphur dioxide (SO2) inhibits tyrosinase (Dubernet, M., & Ribereau-Gayon, P.,
1973) and prevents the production of GRP, which will maintain a high level of free
hydroxycinnamates with high browning potential. Moreover, unlike tyrosinase,
laccase will readily oxidize GRP. GRP was shown to be oxidized by laccase from
Botrytis cinerea to the corresponding o-quinone with substitution of the latter by
glutathione. When no glutathione is available, polymerization of the quinones led
to browning of the juice. It is accepted that tyrosinase is more sensitive to SO2,
while laccase is more resistant to SO2 and has a wider substrate oxidation
spectrum (Du Toit, W. J. et al., 2006).
1.2.4. Yeast lees and Yeast derivatives (inactive dry yeast)
Contact with yeast lees seems to protect wine from oxidation, contributing to the
prevention of browning (Caridi, A., 2006), (Pérez-Serradilla, J.A. & Luque de Castro,
M.D., 2008), (Palomero et al., 2009) and the development of oxidation-related
volatiles (Cullere et al., 2007).
Different accelerated oxidation tests showed a significantly lower degree of
oxidative alteration when assayed in the presence of yeasts lees. The prevention of
wine browning could be an indirect effect of the absorption of colored compounds
by lees but this resistance could also be ascribed to yeast-promoted protection.
The protective effect of lees could be largely due to the release of intracellular
compounds to the wine, as well as to membrane lipids, which consume oxygen
during wine aging, thus preventing wine oxidation (A.López-Toledano et al, 2006).
The cell wall makes up between 25 and 50% of cell volume (Lipke, P.N., Ovalle, R.,
1998) and consists of an inner three-dimensional network of ramified glucans and
outer layer of mannoproteins (Kath, F. and Kulicke, W.M., 1999), (Gemmill, T.R.and
Trimble, R.B., 1999). Yeast cells are enclosed by a cell wall containing 29–64% b-
glucans, 31% mannans, 13% proteins, 9% lipids and 1–2% chitin. The exact
structure and composition of the yeast cell wall depends strongly on the
cultivation conditions and with the mode of cell cultivation. It was found that the
dry mass and polysaccharides content of the cell wall could vary by more than 50%
with the nature of the carbon source, nitrogen limitation, pH, temperature and
aeration”, and with the mode of cell cultivation and strain (Aguilar-Uscanga, B., &
Francois, J. M., 2003).
The antioxidant activity of these wall biomolecules could also occur during sur lie
aging contributing to prevent oxidation, and these interactions deserve to be
clarified.
The studies on spent brewer's yeast have demonstrated that much of yeast wall
activity depends on the exposure of the reactive groups, such as protein aromatic
side chains and thiols, to substrate. The antioxidant activity of different cell wall
fractions of spent brewer's yeast (Saccharomyces cerevisiae), proved the significant

Page | 19
antioxidant activity for wall proteins and glucans (Jaehrig et al., 2007); (Jaehrig et
al,2008).
At enological aging conditions, i.e. without cell disruption and fraction isolation,
some of these biomolecules may hardly interact with the wine because they
constitute inner layers of the cell wall or because intra and intermolecular
interactions make the reactive groups inaccessible.
It had been found that (1-3)-b-D-glucan cell wall polysaccharide from the yeast
Saccharomyces cerevisiae exhibits antioxidative capabilities. In some studies, the
antioxidative activity of glucans from the cell walls of S. cerevisiae grown on
different media was investigated. The results show significant differences in the
glucan content of the cell walls and in their antioxidative activities depending on
growth medium. However, glucan itself seems to have a low antioxidative activity
in contrast to other cell wall fractions e.g. proteins (Jaehrig et al, 2008). Also it had
been found that carboxymethylated (1-3)-b-D-glucan from S. cerevisiae cell walls
exhibits antioxidative activity in terms of free radical scavenging (Kogan, G., Stasko,
A., Bauerova, K., Polovka, M., Soltes, L., Brezova,V., et al. (2005). Saccharomyces cerevisiae not only contains antioxidants in the cell wall but also in the cytoplasm
which holds several endogenous antioxidants (Demasi, A. P., Pcrcira, G. A., & Netto,
L. E., 2001). The role of lees surface in protecting wine from oxidation during sur lie aging should be then investigated on the entire cell (Martínez-Rodríguez, et al.,
2001).
However, the yeast cell wall contains more potentially antioxidant constituents
than just glucan (e.g. mannans and proteins). Therefore, the contribution of the
other cell wall components to the antioxidative activity was investigated too
(Jaehrig et al. 2008).
Cell wall degradation during autolysis is expected to affect the antioxidant capacity
of lees surface by improving the accessibility of the reactive groups and their
exposition to the medium (Gallardo-Chacón, J.J. et al., 2010).
However, the progressive loss of structural biomolecules (Pueyo et al. 2000) could
reduce the number of reactive groups. The balance between these phenomena
would determine the effective participation of lees surface in preventing wine
oxidation during sur lie aging.
Gallardo-Chacón J.J. et al., (2010) said that lees surfaces seem to progressively lose
their antioxidant activity the longer they are in contact with the wine. This leads to
the supposition that, subsequent to oxidation and the loss of structural
biomolecules, the effect of lower active group availability prevails over higher
accessibility due to weakening in the cell wall.
Inactive dry yeast (IDY) are commonly used in winemaking for several purposes.
They can be classified in four types, depending on the manufacturing process: 1
inactive yeasts (obtained by thermal inactivation of the yeasts and drying), yeast

Page | 20
autolysates (thermal inactivation followed by an incubation allowing enzymatic
activities and cell wall degradation), yeast hulls or walls (yeast walls without
cytoplasmic content), and yeast extracts (the soluble part of the autolysates, after
elimination of the cell walls) ( o o- ay n, et al. 2009, b).
The use of inactive dry yeast (IDY) delayed browning in wines, measured in terms
of the absorbance at 420 nm, the effect increase with the increase in yeast
concentration. The addition of IDY was also found to affect phenolic compounds,
particularly decreasing the concentrations of brown compounds (Lopez-Toledano,
A. et al., 2006).
Although the mechanism of interactions is unknown, some yeasts and yeast
derivatives have been found to retain anthocyanins in wine and to interact with
other polyphenols in model solutions (Lopez-Toledano A.,et al.,2006). In this
respect, some authors have proposed the use of yeast in wine fining treatments on
account of the selectivity of their cell walls to brown polymers (Bonilla, Mayen,
Merida, and Medina 2001);(Razmkhab et al., 2002). However, in addition to this
retention ability, yeasts in contact with model solutions of some flavans have been
found to delay browning, which have been ascribed to an inhibitory effect on the
formation of coloured compounds (Lopez- Toledano et al., 2002).
1.2.5. Combined effect of wine antioxidants
Sulphur dioxide in combination with ascorbic acid and glutathione The main preservative utilized in white wine to prevent oxidative spoilage is sulfur
dioxide (SO2). Often sulfur dioxide is used in combination with ascorbic acid,
because the latter can efficiently scavenge oxygen before reaction of oxygen with
phenolic compounds (Sonni,F. et al., 2011). If ascorbic acid is used without sulfur
dioxide, then the hydrogen peroxide and dehydroascorbic acid degradation
products can lead to the formation of spoilage pigments (yellow xanthylium
cations formed from the skin- and seed-derived flavonoid (+)-catechin) upon the
near depletion of ascorbic acid (Bradshaw, M. P. et al., 2003).
Another compound studied as complementary with SO2 is the tripeptide
Glutathione, γ-L-Glutamyl-L-cysteinylglycine(GSH). It has shown some potential to
assist sulfur dioxide in its role as an antioxidant. Certainly, glutathione is already
known to be capable of performing the main antioxidant reactions of sulfur
dioxide, although this has not always been in a wine-related matrix. Glutathione is
known to scavenge o-quinone compounds efficiently in wine/juice conditions. It
can react with hydrogen peroxide and undergo addition reactions with aldehyde
compounds, although these reactions have not been studied in wine-like

Page | 21
conditions. Some authors examined the oxidation of caffeic acid in the presence of
a variety of thiols, including glutathione, and showed a protective effect of the
thiols against both caffeic acid loss and oxidative color production (Cilliers, J. J. L.;
Singleton, V. L., 1990). However, this study was in alkaline aqueous solutions,
without added ethanol, metal ions, or (+)-catechin (Sonni F.et al., 2011).
Ascorbic acid with glutathione
Because ascorbic acid has a dual role in coloration reactions (protective vs.
enhancing), it had been examined the impact of glutathione on pigment
production in model wines both with and without ascorbic acid (Sonni F. et al.,
2011).
The ascorbic acid and glutathione in combination offers greater protection against
oxidative coloration when present together rather than in isolation. However, the
extent of protection was favored by the higher glutathione to ascorbic acid ratio
(Glutathione was utilized at concentrations 20-fold higher (860 mg/L) than the
normally found in wine to afford ascorbic acid (500 mg/L) to glutathione ratios of
1:1). Glutathione was able to delay ascorbic acid degradation and also inhibit the
formation of a known pigment precursor formed from an ascorbic acid
degradation product. Alternative caffeic acid degradation products were formed
from the glutathione/ascorbic acid combination that upon decay led to a diverse
range of polymeric pigments that were undefined.
It had been provided mechanistic insights into the role of glutathione, and the
glutathione/ ascorbic acid combination, during the storage of a model wine
system in oxidizing conditions. It was demonstrated the protective effect possible
with the antioxidants and their ability to change the range of pigments generated
along with the corresponding pigment precursors, (Sonni F. et al., 2011).

Page | 22
1.3. Aim of this work
On the basis of what was discussed, besides sulfur dioxide, different solutions
could be adopted to protect wines from oxidation; nevertheless, sulfites are still
considered not replaceable by any other additive. Moreover, the antioxidant
capacity of certain compounds has still to be well investigated: the activity of
glutathione, for example, has been well established on the musts, but in wine, very
few studies report useful results to confirm or not the possibility to use it to
partially replace sulfites.
For this reason, the aim of this work was to investigate the antioxidant behavior of
different additives and enological products in comparison with sulfur dioxide,
considering both their scavenging activity towards free radicals (DPPH) and their
ability to affect wine oxygen consumption rate and oxidizability, in order to
evaluate the possibility to use them in replacing or in reducing overall SO2 content
in wines. Trials have been performed on both model solution and wine.

Page | 23
2. Materials and Methods
2.1. Chemicals and oenological products
Potassium metabisulfite, sodium hydroxide, tartaric acid, 96 % v/v ethanol, 37 %
hydrochloric acid and sodium acetate were from Carlo Erba Reagents (Milan, Italy);
ascorbic acid, glutathione, 1,1-diphenyl-2-picryl-hydrazyl (DPPH) free radical and
HPLC grade methanol were from Sigma-Aldrich (St. Louis, MO, USA).
The inactive dry yeast was a thermal yeast autolysate, prepared as reported by
Comuzzo et al., (2012).
Yeast lees were obtained after alcoholic fermentation and racking of a white table
wine from Friuli Venezia Giulia region (Italy, harvest 2011).
2.2. Evaluation of the radical scavenging activity of different oenological
additives and products
To evaluate the radical scavenging activity of the previously mentioned antioxidant
products (yeast autolysate and lees) and compounds (sulfites, ascorbic acid and
glutathione) toward DPPH free radical, some trials have been performed both in
wine and in model solution.
2.2.1.Samples preparation
Model solution
For the trials performed in model buffer, wine-like solution was a tartaric
hydroalcoholic buffer (0,03 M tartaric acid, buffered at pH 3,2 with 10 M sodium
hydroxide). As concerns the three pure antioxidant compounds (potassium
metabisulfite, ascorbic acid and GSH) a stock solution (500 mg/L) was prepared
fresh daily, and then used (100 µL) for DPPH trials, at the following concentrations:
50 mg/L (dilution 1:10) and 500 mg/L (no dilution; not performed for ascorbic
acid). Regarding inactive dry yeast, a 2,5 % w/v suspension was prepared in model
buffer, and 100 µL was subjected to DPPH assay, as reported below. Finally, yeast
lees was diluted in model buffer (2,5 mL/100 mL) and then used for DPPH analysis.
Wine
Trials on model buffer were repeated on a white Table wine from Friuli Venezia
Giulia (Italy), vintage 2010; in this case a control wine was also included in the
experimental project.
Page | 24
All the experiments were carried out in three repetitions for both wines and model
solutions.
2.2.2. DPPH assay
The use of the stable free radical 1,1-diphenyl-2-picryl-hydrazyl (DPPH) to estimate
antioxidant activity was performed by a modification of the methods reported by
Brand-Williams et al. (1995) and Gallardo-Chacón et al. (2010). Trials were made in
model solution and in white wine.
Briefly, the DPPH was dissolved in a 60:40 mixture of methanol and 0,1 M acetate
buffer (sodium acetate, buffered at pH 4,5 with 6 M hydrochloric acid) until the
absorbance of the solution (515 nm) was 0,700; this stock solution was prepared
fresh daily; 3 mL of DPPH stock solution was introduced in a 1 cm path length
glass cuvette. Fresh prepared antioxidant solutions (100 µL) were added, and DPPH
discoloration was followed at 515 nm during 10 min. Results were expressed as the
percent diminution of the original absorbance in 10 min [Abs 515 nm (%)].
For yeast lees and yeast extract, whose solubility is not complete, the reaction with
DPPH has been carried out in a test tube (3 mL of DPPH and 100 µL of yeast lees
or autolysate suspension, prepared as previously reported) for 10 min and then the
reaction mixture has been filtered on a 0,80 µm nylon membrane, before
spectrophotometric measurement (as suggested by Gallardo-Chacón et al., 2010).
2.3. Effect of different oenological additives and products on wine
oxygen consumption
2.3.1. Samples preparation
Two white wines were used respectively for two different set of trials: the first one
was a Friulano, D.O.C. Colli Orientali del Friuli (Italy), vintage 2007; the second was
a Chardonnay, D.O.C. Grave del Friuli (Italy), vintage 2011.
Each wine was used to fill 0,75 mL uncolored glass bottles, in which an Oxy2Dot®
sensor (OxySense Inc., Dallas, TX, USA) was previously introduced; samples were
vigorously mixed, until oxygen saturation was reached (temperature: 20 °C);
antioxidant compounds and products were then added and bottles were crown
capped and stored at 20-22 °C during all the time needed for the measurements
(two weeks).

Page | 25
All the trials were performed in three replicates; a control sample, without any
product addition was also prepared for each set of experiments. The amounts of
each antioxidant added for the two sets of trials are reported in
Table 1.
Table 1: Amounts of enological additives and products added in the two sets of
trials performed in section 2.3
Additive / product added
TRIAL 1
Control (no addition)
Sulfur dioxide 50 mg/L
Ascorbic acid 50 mg/L
Glutathione 50 mg/L
Yeast extract 500 mg/L
Yeast lees 2 % v/v
TRIAL 2
Control (no addition)
Sulfur dioxide 100 mg/L
Ascorbic acid (50 mg/L) + Sulfur dioxide
(50 mg/L)
Glutathione (50 mg/L) + Sulfur dioxide
(50 mg/L)
Ascorbic acid (50 mg/L) + Glutathione (50
mg/L)
Yeast Extract 1 g/L

Page | 26
2.3.2. Oxygen consumption measures
Oxygen levels (in mg/L) were measured inside the bottles filled with wines treated
with the different antioxidant agents, to establish how the products themselves
could affect wine oxygen consumption after bottling. The measures began
immediately after antioxidant addition and crown capping and then continued at
regular intervals (each hour during the first half a day and each day during two
weeks), as soon as the oxygen was almost totally consumed in one of the
treatments.
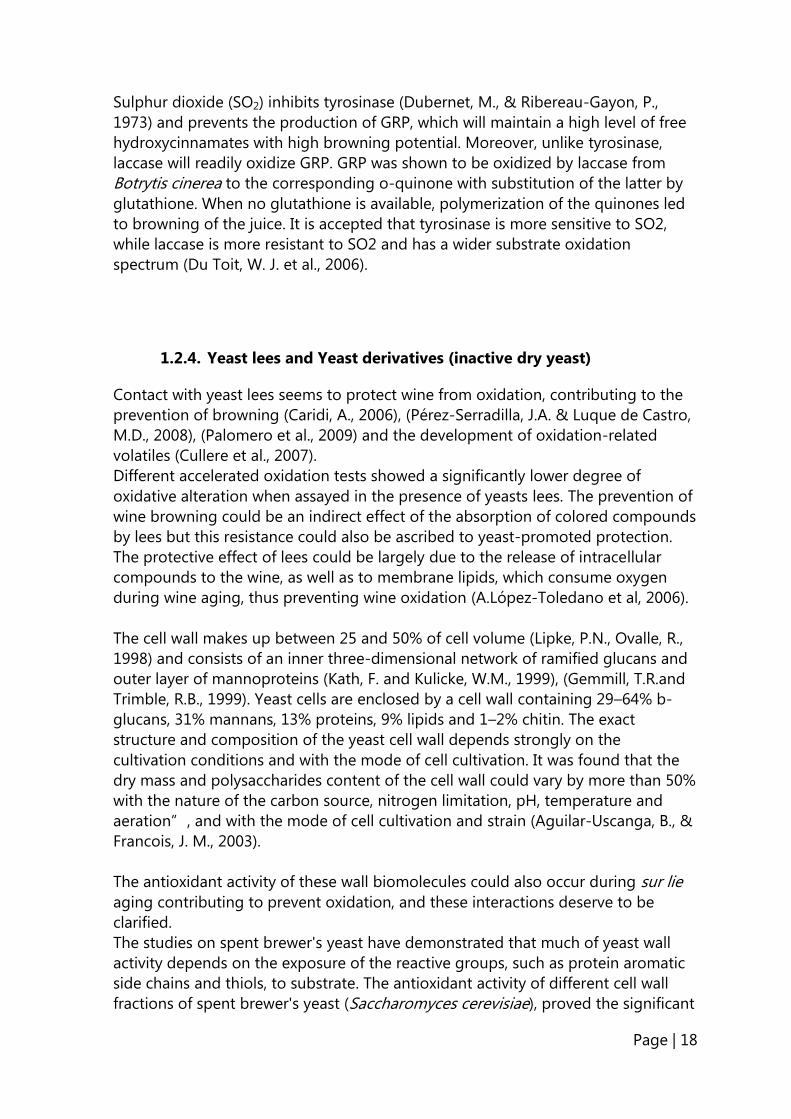
Dissolved oxygen was measured by means of an OxySense® fluorimeter
(OxySense Inc., Dallas, TX, USA –Figure 9); the method was based on the ability of
oxygen to quench the fluorescence of certain ruthenium (II) complexes.
Before filling the bottles with wine, an Oxy2Dot® sensor (OxySense Inc., Dallas, TX,
USA), on which surface a thin layer of one of such ruthenium complexes was
immobilized, was glued to the inner surface of the glass with a specific silicon
based oxygen permeable adhesive.
When this sensor is illuminated by a pulsed blue light ( 400-500 nm) emitted by a
led of the OxySense® equipment, ruthenium complex is excited, so that it emits a
red light by fluorescence ( 600 nm) when it returns to its ground state.
The oxygen measurement is based upon the quenching of such fluorescence by
oxygen. The presence of O2 quenches the fluorescent light from the complex as
well as its lifetime. The quenching process is a purely collisional dynamic where the
energy from the excited fluorescent dye is transferred to the oxygen molecule
during a collision, hence, reducing the emission intensity as well as the fluorescent
lifetime of the complex. The quenching is proportional to oxygen concentration
and the oxygen content is not changed by the measurement process.
Page | 27
Figure 9: OxySense® equipment to measure the oxygen consumption.
2.3.3. Spectrophotometric measurements
To evaluate eventual short-time effects of the tested products and additives on
wine color and oxidizability, some spectrophotometric measurements have been
performed on the wines after oxygen measurements (15 days after bottling).
Wine Color
The color of the wine was directly measured at 420 nm (1 cm path length glass
cuvettes), reading the absorbance against distilled water.
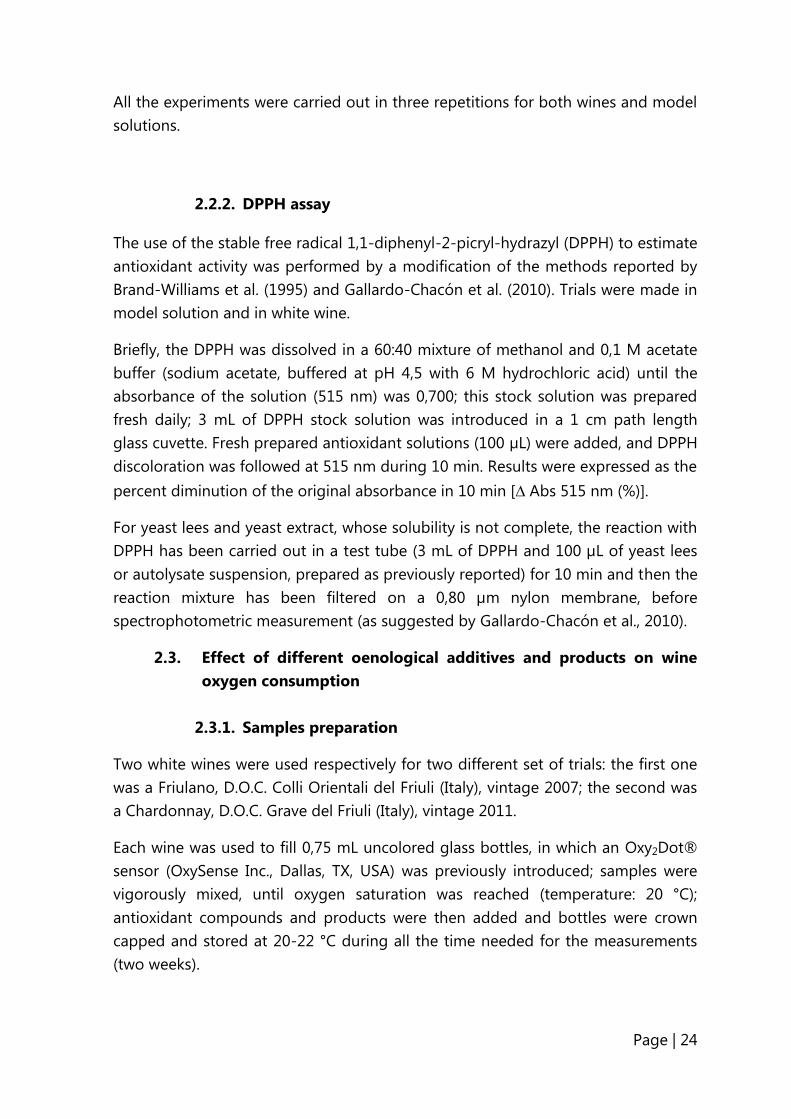
POM Test
The POM-test method was chosen for evaluating the oxidability of polyphenols
(Müller-Späth H., 1992). 5 mL of each sample were treated with 25 µL of a 3 %
hydrogen peroxide solution and immediately heated for 1 hour at 60°C. POM test
was expressed as the percent increase of color after peroxide addition, (Figure 10).
Figure 10: POM -test calculation

Page | 28
2.4. Statistical analysis
The results of the experiments were analyzed statistically using the software
Statistica for Windows, version 8.0 (StatSoft, Inc., Tulsa, OK, USA).
As concerns DPPH trials, One Way ANOVA was carried out on the Abs 515 nm
(%); means and standard deviations were calculated, and significant differences
were evaluated by Tukey HSD test, at p < 0,001.
To assess the differences in oxygen consumption rates, the curves obtained by
monitoring oxygen concentration were transformed as follows: at first, all data
were expressed in percentage respect to the initial O2 concentration; then,
logarithm (log10) was used to linearize the curves. Slopes and R2 have been
calculated and slopes were subjected to One Way ANOVA and Tukey HSD test, to
assess significant differences between oxygen consumption curves (p < 0,05).
Regarding spectrophotometric measures (Abs 420 nm and POM test values) and
final oxygen concentration in wines, One Way ANOVA and Tukey HSD test were
carried out as reported for DPPH assay; resulst were significant at p < 0,05.

Page | 29
3. Results and Discussion
3.1. Study of the behavior of some antioxidant agents in wine-like
buffer and in white wine using DPPH stable free radical.
3.1.1. Results of DPPH trials in wine-like buffer
In the first graph (Figure 11) we can observe the results of the measurements in
wine-like buffer. In this case, the Lees (2, 5%) showed the highest radical
scavenging activity in comparison to all the other treatments. Then, the Yeast
Extract (2, 5%) and SO2 (500mg/L) behaved similarly among them, having a
better antioxidant activity than the GSH (500mg/L) treatment. The latter behaved
similar to the Ascorbic acid (50mg/L) which behaved statistically similar than the
SO2 (50mg/L), both with the same concentration. Finally the GSH with the lesser
concentration (50mg/L) had the lesser antioxidant activity of all the treatments.
Figure 11: DPPH-test. Radical scavenging activity of different enological additives
and products, in wine-like solution: results of ANOVA analysis and Tukey HSD test;
different letters mark significant differences at p < 0,001
Mean ±SD Min-Max
b
d
a
b
c
e
cd
SO
2 5
00
mg
/L
SO
2 5
0 m
g/L
Le
es (
2,5
%)
Ye
ast E
xtr
act (2
,5 %
)
GH
S 5
00
mg
/L
GH
S 5
0 m
g/L
Asco
rbic
Acid
5
0 m
g/L
-100
-90
-80
-70
-60
-50
-40
-30
-20
-10
0
a
bs
515
nm
(%)

Page | 30
As a summary of Figure 11 we can say that SO2 and Glutathione at the normal
levels found in wine ( 50mg/L), have the lowest radical scavenging activity, what is
more the Glutathione showed the lesser activity of all the treatments. Observing
these behaviour in comparision with yeast lees and yeast extract treatments; we
can see in the graph that we need ten times higher levels of sulfites (500 mg/L),
than the normal amounts found in wine, to simulate the antioxidant activity of
yeast extract. Anyway, the amount of extract used is higher than those normally
used in winemaking (lower than 1 g/L); the interesting thing is that lees antioxidant
capacity in model buffer, remains higher than the huge amounts tried of SO2 and
GSH (500 mg/L), this antioxidant capacity is due to lees polyphenols but also to
other molecules derived from yeasts. From this results we can say that probably
glutathione is not the only antioxidant compound present in the less to give them
this activity .
3.1.2. Results of DPPH trials in white wine
The same trials made in wine-like buffer were performed at this time on a white
table wine (from Friuli- Italy, vintage 2011). Even in this case, we can observe in
Figure 12, the Lees (2, 5%) treatment with the most radical scavenging activity
respect to the Control wine and the other treatments. Then, the Yeast Extract (2,
5%) together with the GSH (500mg/L) and Ascorbic acid (50mg/l) treatments
behaved statistically similar having more antioxidant activity than the other three
treatments: SO2 (500mg/L) , SO2 (50mg/L) and GSH (50mg/L) that behaved in
the same way, having the lesser activity as antioxidants in these trials. Naturally the
Control wine showed the lesser antioxidant activity respect to all the treated
samples with antioxidants.

Page | 31
Figure 12: DPPH- test. Radical scavenging activity of a table wine treated with
different enological additives and products: results of ANOVA analysis and Tukey
HSD test; different letters mark significant differences at p < 0,001
The behavior of some antioxidant agents in wine is different to what was observed
in wine-like buffer. In wine, the differences related to different amounts (50 or 500
mg/L) of SO2 and GSH found in wine-like solution seem less significant, probably,
wine components are also able to react with DPPH, leveling the effects of the
treatments. GSH and SO2 show the same effect (no significant difference),
contrarily to what was observed in wine-like buffer, where GSH was less effective in
discoloring DPPH (Figure 11).
Mean ±SD Min-Max
bb
a
ab ab
bab
c
SO
2 5
00
mg
/L
SO
2 5
0 m
g/L
Le
es (
2,5
%)
Ye
ast E
xtr
act (2
,5 %
)
GH
S 5
00
mg
/L
GH
S 5
0 m
g/L
Asco
rbic
Acid
5
0 m
g/L
Co
ntr
ol-100
-90
-80
-70
-60
-50
-40
-30
-20
-10
0
a
bs
515
nm
(%)

Page | 32
3.1.3. Results of DPPH trials in white wine and the antioxidant
agents in pairs
These trials were performed on the same table white wine but sampled in a
different time and way. In this time we used some of the antioxidant agents in pair
and measurement at 515nm wavelengths were performed. We proved the pairs:
Ascorbic acid + Sulphur dioxide, Glutathione + Sulphur dioxide SO2 and
Glutathione +Ascorbic acid, all of them at a concentration of 50mg/L.
As we can see in the Figure 13, the wines treated with SO2 (50mg/L), Ascorbic
acid (50mg/L) and the couple SO2/Ascorbic acid (50mg/L) behaved statistically
similar to the Control showing the lesser antioxidant activity respecting to the
other treatments. Then, the wines treated with GSH (50mg/L) isolated and in pairs
(GSH/SO2 and GSH/Ascorbic acid), showed a better radical scavenging activity
respecting to the previous ones. Finally the treatments with Yeast lees (2, 5%) and
Yeast Extract (2, 5%) behaved as the best antioxidants among all the treatments.

Page | 33
Figure 13: DPPH test. Radical scavenging activity of different enological additives
and products isolated and in pairs in a table white wine: results of ANOVA analysis
and Tukey HSD test;different letters mark significant differences at p < 0,001
As summarize the result observed in Figure 13, we can say that the pairs did not
react as was expected and the yeast lees and yeast extract treatments behaved
very efficiently as radical scavengers. The Ascorbic acid, reacting alone or in pairs,
does not show significant differences respect to the Control and to the S02
(50mg/L), for that we can think that maybe the acid was already oxidized in the
stock solution. The GSH, alone and in pairs, behaved better than the Ascorbic
acid.
The pair GSH/Ascorbic acid had a higher radical scavenging activity than the acid
in combination with other antioxidants. In this case we can say that the GSH was
the compound that led the reaction, confirming that the Ascorbic acid had a lower
activity maybe due to a possible oxidation of the stock solution.
Also the GSH in this wine, in comparison with what occurred in the previous trial
(Figure 12), showed significative differences with the SO2 treatment, both at the
same concentration of 50 mg/L. This means that the wine influenced the activity of
the GSH. Depending of the wine composition, the activity of the GSH will be
different.
Mean ±SD Min-Max
c
aa
b
cc
b
c
b
SO
2 5
0 m
g/L
Le
es (
2,5
%)
Ye
ast E
xtr
act (2
,5 %
)
GH
S 5
00
mg
/L
GH
S 5
0 m
g/L
Asco
rbic
Acid
5
0 m
g/L
Co
ntr
ol
GH
S /S
O2
(5
0 m
g/L
)
AS
C/S
O2
(5
0m
g/L
)
GS
H/A
SC
(5
0m
g/L
)-100
-90
-80
-70
-60
-50
-40
-30
-20
-10
0
A
bs 5
15
nm
(%
)

Page | 34
3.2. Effect of different oenological additives and products on wine
oxygen consumption capacity
FIRST SET OF TRIALS
In these first trials we used a white wine Friulano, D.O.C. Colli Orientali del Friuli
(Italy), vintage 2007. Figure 14 shows the oxygen concentration in milligrams per
litre (mg/L) versus the time (in hours). In this case, the fastest additives that
consumed almost all the oxygen were ascorbic acid (50mg/L) and yeast lees (2,
5%), they showed the highest oxygen consumption rate activity in comparison
with all the other treatments and the Control wine.
At the beginning yeast extract treatment was faster than the SO2, Control and
GSH ones but at the end of the measurements, the SO2 reached the lesser Oxygen
concentration. We can see that the Glutathione behaved very similar to the
Control wine, only having a little effect in oxygen consumption respect to it and
both having the lesser oxygen consumption in the time of measurements.

Page | 35
Figure 14: Oxygen consumption curves of a white wine (Friulano, D.O.C. Colli
Orientali del Friuli- Italy, vintage 2007) treated with different enological additives
and products. Means and standard deviations of three repetitions are reported.
The oxygen consumption was very fast in this trial. In futures proves it can be
useful to evaluate the content of some metals acting as catalysts, like copper and
iron, to understand better the trend of the curves. This general fast oxygen
consumption and the differences observed between the different antioxidants, in
comparison with the behavior of the antioxidant agents in the second set of trials
on young wine (see below in Figure 16) where we could not observed big
differences between the treatments, can be due to the state of the polyphenols in
the aged wine that maybe were already oxidized. So the performance of the curves
could be due only to the behavior of the antioxidant agent itself in the oxygen
consumption and, in a lesser extension, due to the polyphenols of this wine.
The graph in Figure 15 has been prepared as reported in Materials and Methods
(section 2.4. Statistical analysis). In the table 2 we have reported the equations of
the trend lines, their slopes and R2 values.
0,00
1,00
2,00
3,00
4,00
5,00
6,00
7,00
8,00
9,00
0 100 200 300 400
Ox
yg
en
co
nce
ntr
ati
on
(m
g/L
)
Time (hours)
Control
SO2 50 mg/L
Yeast extract 500 mg/L
Yeast lees 2 % v/v
Ascorbic acid 50 mg/L
Glutathione 50 mg/L

Page | 36
On the basis of these results we can confirm in Figure 15 what we observed in
Figure 14, having the yeast lees and ascorbic acid (distinct with “a”) as the best
antioxidants respect to the others which in this statistical analysis behaved in the
same way as a cluster (distinct with “b”).
Figure 15: One way ANOVA, carried out on the slopes of the lines obtained by
linearization (log 10) of the curves in figure 14. Means and standard deviations were
calculated and significant differences were assessed by Tukey HSD test at p < 0,05
Mean ±SD Min-Max
b b b
a
b
a
Contr
ol
SO
2 5
0 m
g/L
Glu
tath
ione 5
0 m
g/L
Yeast
lees 2
% v
/v
Yeast
extr
act
500 m
g/L
Ascorb
ic a
cid
50 m
g/L
-0,0140
-0,0120
-0,0100
-0,0080
-0,0060
-0,0040
-0,0020
0,0000
Slo
pe
(m
)

Page | 37
Table 2: Equations of the trend lines obtained by transforming (log 10) the curves
of oxygen consumption as detected for the different Friulano wine samples
analyzed in Figure 14 (average curves) and Figure 15 (ANOVA on slopes). Slopes
and R2 values are reported.
Sample Repetition log [O2 conc.] = -m (time) + q R2 Slope (m)
Control
1 y = -0,0043 x + 1,9689 0,9676 -0,0043
2 y = -0,0040 x + 2,0027 0,9632 -0,0040
3 y = -0,0040 x + 1,9713 0,9614 -0,0040
SO2 50
mg/L
1 y = -0,0040 x + 1,9989 0,9724 -0,0040
2 y = -0,0039 x + 1,9576 0,9787 -0,0039
3 y = -0,0045 x + 1,9685 0,9814 -0,0045
Glutathione
50 mg/L
1 y = -0,0047 x + 2,0148 0,9593 -0,0047
2 y = -0,0043 x + 1,9660 0,9557 -0,0043
3 y = -0,0035 x + 1,9622 0,9706 -0,0035
Yeast lees 2
% v/v
1 y = -0,0052 x + 2,0766 0,9214 -0,0052
2 y = -0,0079 x + 1,9130 0,9255 -0,0079
3 y = -0,0091 x + 1,9200 0,9657 -0,0091
Yeast
extract 500
mg/L
1 y = -0,0045 x + 1,9709 0,9613 -0,0045
2 y = -0,0039 x + 1,9780 0,9399 -0,0039
3 y = -0,0033 x + 1,8989 0,8675 -0,0033
Ascorbic
acid 50
mg/L
1 y = -0,0089 x + 1,9730 0,9943 -0,0089
2 y = -0,0095 x + 1,9727 0,9937 -0,0095
3 y = -0,0097 x + 1,9896 0,9974 -0,0097

Page | 38
Table 3: Oxygen concentration, DO 420nm and POM test detected for the Friulano
wine at the end of the measures (two weeks of bottle storage). Different letters
represent means which are significantly different (one way ANOVA and Tukey HSD
test) at p < 0,05
Sample
Oxygen concentration
(mg/L)
Mean + St. Dev.
Ascorbic acid 50 mg/L 0,13 + 0,01 a
Control 0,93 + 0,16 c
Glutathione 50 mg/L 0,81 + 0,19 c
SO2 50 mg/L 0,63 + 0,17 bc
Yeast extract 500 mg/L 0,89 + 0,32 c
Yeast lees 2 % v/v 0,14 + 0,02 ab
Sample DO 420 nm
Mean + St. Dev.
Ascorbic acid 50 mg/L 0,198 + 0,001 a
Control 0,204 + 0,002 a
Glutathione 50 mg/L 0,205 + 0,001 a
SO2 50 mg/L 0,182 + 0,002 a
Yeast extract 500 mg/L 0,206 + 0,024 a
Yeast lees 2 % v/v 0,273 + 0,010 b
Sample P.O.M. test
Mean + St. Dev.
Ascorbic acid 50 mg/L 42 + 1 a
Control 35 + 15 a
Glutathione 50 mg/L 42 + 5 a
SO2 50 mg/L 69 + 5 b
Yeast extract 500 mg/L 43 + 14 ab
Yeast lees 2 % v/v 30 + 9 a
The final effects of the treatments on wine composition have been evaluated after
a short-time storage period (two weeks). Observing the data, we can see that
oxygen concentration reflects what was already told in the previous pages.
Color measurements at 420 nm wavelength, demonstrated that only the treatment
with Lees behaved as significantly different to the others. The higher color
measured for the lees added wine, can be determined just by the color of the

Page | 39
added lees itself, but more probably just the higher oxygen consumption observed
for the lees treated samples could have determined this change in color.
The POM-test showed in this case that the different treatments are statistically
similar, only the SO2 treatment behaved as statistically different.
Talking about the mean values we can see that the Yeast lees treatment showed
the lowest value. Also this treatment obtained the lowest oxygen concentration at
the end of the 15 days of measurements (0,14mg /L) among all the treatments.
This low value means that the wine is the more stable in terms of polyphenols
oxidability, but looking at the color, we can also say that some oxidations could
have already occurred.
The wine treated with SO2 (50mg/L) showed the highest POM- test value; we
could say that the polyphenols in this case were well protected by the SO2 and
after the addition of the H2O2, a higher amount of polyphenols were available to
be oxidize and this increased the measured value. In effect, POM test is typically
higher in wines produced by hyper-reductive technologies.
Is very probable that these results are due to the age of the wine, which in this
case was an aged white wine as we already told. Regarding that the POM-test
must consider the type of wine, indeed it is very probable that a young wine would
be more oxidisable, obtaining higher POM-values, than an aged one; the
hydrogen peroxide would have an exclusively paling effect in the latter rather than
oxidant (E.Celotti et al.,2006). In effect, the SO2 treatment obtained the higher
POM-test value and the lesser Color value.
SECOND SET OF TRIALS
Figure 16 shows the Oxygen concentration in milligrams per litre (mg/L) versus the
time (in hours). In this case we worked with a young white wine (Chardonnay,
D.O.C. Grave del Friuli – Italy, vintage 2011). We can observe that the different
treatment behaved very similarly among them in comparison with the previous
aged wine where we could observe differences among the different antioxidant
agents. Also the behavior was slower than in the aged wine.
We are in front of two very different wines in terms of vintage, variety and
winemaking process to make comparisons (Figure 14 and Figure 16). We can
observe these differences and we can make some hypothesis of the situation. We
were expecting a different behavior for the second set of trials using the young

Page | 40
wine. We expected a faster reaction and bigger differences among the treatment
but it did not happened. We can suppose that the aged wine had already the
polyphenols with a degree of oxidation so the behavior of the curves in figure 4
was due to the antioxidants themselves and in a lesser extension due to the
polyphenols for that we could observed this differences among the treatments. In
the second young wine, having more antioxidant support due to a supposed
bigger amount of polyphenols we could not see significantly differences in the
results.
It must be useful in the future to performed further analyses in the wines in terms
of metals (copper and iron) and polyphenols content to understand better the
results.
Figure 16: Oxygen consumption curves registered in a white wine ( Chardonnay,
D.O.C. Grave del Friuli- Italy, vintage 2011) treated with different enological
additives and products. Means and standard deviations of three repetitions are
reported for each point.
0,00
1,00
2,00
3,00
4,00
5,00
6,00
7,00
8,00
9,00
0 100 200 300 400
Ox
yg
en
co
nc
en
tra
tio
n (
mg
/L)
Time (hours)
Control
SO2 100 mg/L
Ascorbic acid (50 mg/L) + SO2 (50 mg/L)
Glutathione (50 mg/L) + SO2 (50 mg/L)
Ascorbic acid (50 mg/L) + Glutathione(50 mg/L)
Yeast Extract 1 g/L

Page | 41
The graph in Figure 17 has been prepared as reported in Materials and Methods
(section 2.4. Statistical analysis). In the table 4 we have reported the equations of
the trend lines, their Slopes and R2 values.
In the Figure 17 we can confirm what was shown in Figure 16, where we could not
practically see differences among the treatments.
Figure 17: One way ANOVA, carried out on the slopes of the lines obtained by
transformation (log 10) of the curves in Figure 16. Means and standard deviations
were calculated and significantly differences were assessed by Tukey HSD test ( p <
0,05)
Mean ±SD Min-Max
b ab ab aab ab
Contr
ol
SO
2 1
00 m
g/L
Ascorb
ic a
cid
+ S
O2
Glu
tath
ione +
SO
2
Glu
tath
ione +
Ascorb
ic a
cid
Yeast
Extr
act
1 g
/L
-0,0140
-0,0120
-0,0100
-0,0080
-0,0060
-0,0040
-0,0020
0,0000
Slo
pe
(m
)

Page | 42
Table 4: Equations of the trend lines obtained by transforming (log 10) the curves
in Figure 16 (average curves) and figure 17 (ANOVA on slopes). Slopes and R2
values are reported
Sample Repetition log [O2 conc.] = -m (time) + q R2 Slope (m)
Control
1 y = -0,0012 x + 2,0121 0,9764 -0,0012
2 y = -0,0015 x + 1,9920 0,9891 -0,0015
3 y = -0,0014 x + 1,9398 0,9085 -0,0014
SO2 100 mg/L
1 y = -0,0015 x + 1,9920 0,9925 -0,0015
2 y = -0,0019 x + 1,9745 0,9767 -0,0019
3 y = -0,0016 x + 1,9909 0,9774 -0,0016
Ascorbic acid (50
mg/L) + SO2 (50
mg/L)
1 y = -0,0019 x + 2,0346 0,9618 -0,0019
2 y = -0,0017 x + 2,0217 0,9797 -0,0017
3 y = -0,0021 x + 2,0192 0,9886 -0,0021
Glutathione (50
mg/L) + SO2 (50
mg/L)
1 y = -0,0024 x + 2,0198 0,9215 -0,0024
2 y = -0,0019 x + 2,0524 0,9470 -0,0019
3 y = -0,0020 x + 2,0233 0,9807 -0,0020
Ascorbic acid (50
mg/L) + Glutathione
(50 mg/L)
1 y = -0,0017 x + 2,0242 0,9773 -0,0017
2 y = -0,0017 x + 1,9957 0,9904 -0,0017
3 y = -0,0013 x + 1,9786 0,9707 -0,0013
Yeast Extract 1 g/L
1 y = -0,0019 x + 2,0100 0,9210 -0,0019
2 y = -0,0015 x + 2,0152 0,8819 -0,0015
3 y = -0,0014 x + 1,9934 0,9809 -0,0014
Page | 43
Table 5: Oxygen concentration, DO 420nm and POM test detected for the wines at
the end of the measures (two weeks). Different letters represents means which are
significantly different (one way ANOVA and Tukey HSD test) at p < 0, 05
Sample
Oxygen concentration
(mg/L)
Mean + St. Dev.
Control 0,92 + 0,37 a
SO2 100 mg/L 0,79 + 0,05 a
Ascorbic acid (50 mg/L) + SO2 (50 mg/L) 0,64 + 0,07 a
Glutathione (50 mg/L) + SO2 (50 mg/L) 0,61 + 0,22 a
Ascorbic acid (50 mg/L) + Glutathione (50
mg/L) 0,77
+ 0,19 a
Yeast Extract 1 g/L 1,54 + 0,22 b
Sample DO 420 nm
Mean + St. Dev.
Control 0,080 + 0,001 b
SO2 100 mg/L 0,079 + 0,000 b
Ascorbic acid (50 mg/L) + SO2 (50 mg/L) 0,078 + 0,001 b
Glutathione (50 mg/L) + SO2 (50 mg/L) 0,079 + 0,001 b
Ascorbic acid (50 mg/L) + Glutathione (50
mg/L) 0,078
+ 0,001 b
Yeast Extract 1 g/L 0,069 + 0,001 a
Sample P.O.M. test
Mean + St. Dev.
Control 52 + 2 a
SO2 100 mg/L 53 + 1 a
Ascorbic acid (50 mg/L) + SO2 (50 mg/L) 47 + 16 a
Glutathione (50 mg/L) + SO2 (50 mg/L) 52 + 4 a
Ascorbic acid (50 mg/L) + Glutathione (50
mg/L) 46
+ 12 a
Yeast Extract 1 g/L 57 + 1 a
We can see first, in table 5, the results of Oxygen concentration reached after 15
days of measurement with the OxySense® equipment. In terms of statistical
differences we can only see the yeast extract treatment as significantly different of
all the other treatments and the Control wine.

Page | 44
If we comment the results in terms of mean values, the Yeast extract treatment
showed the lesser antioxidant activity, slower than the Control wine, both showing
the lesser antioxidant activity. Then, we can observe the SO2 (100mg/L) and the
GSH/Ascorbic acid (50mg/L) treatments, behaving similarly with the medium
antioxidant activity. Finally the Ascorbic acid/SO2 (50mg/L) and the GSH/SO2
(50mg/L) pairs reached the lowest oxygen concentration which means the highest
antioxidant activity.
Regarding the Color measurement with the spectrophotometer, as was already
mentioned in the Introduction of this work, the IDY delayed browning in the wines
measured in terms of the absorbance at 420 nm, the effect increase with increasing
in yeast concentration (Lopez-Toledano A. et al., 2006). In the second set of trials
was used the double IDY concentration and the measurement of the color showed
a slight difference in the color in the Yeast extract treatment respecting to the
others, we can see that this treatment with IDY resulted in a lower absorbance
value at 420 nm wavelength.
Regarding the POM-test technique, we could not observe big differences in the
results that behaved statistically similar. In terms of mean values, the
GSH/Ascorbic acid (50mg/L) and Ascorbic acid/SO2 treatments obtained the
lowest POM-value ( 46 and 47 respectively); this can means that these are the most
stable wines among the other treatments in terms of polyphenols oxidability. The
Yeast extract treatment behaved as the lesser stable wine having the higher POM-
value (57) this can means that this sample has already polyphenols to be oxidized.
Page | 45
4. CONCLUSIONS
Concerning the radical scavenging activity of the different oenological products
and additives tested, we have demonstrated that some of them showed a good
performance, compared with sulfur dioxide. Ascorbic acid, for example, was very
similar to sulfites, in all the tested conditions.
Yeast lees and yeast extract, in particular, had a good activity, even higher than
that detected for the average amounts of SO2 used in winemaking (50 mg/L);
higher sulfite concentrations (500 mg/L) are needed to have similar effects.
Concerning glutathione and its radical scavenging activity compared with SO2, it
did not have the same behavior in wine-like solution than in wine and also it
behaved differently in the different wines used. In wine-like solution it was less
active than SO2 (at the same concentration) in discoloring DPPH, while, in wine it
reacts in a similar way or even better. According to this observation, we can
conclude that the anti-radical action of both GSH and SO2 in wine, also depend on
wine characteristics and composition (level of quinones, acetaldehyde, etc.), so that
on the basis of these results, GSH could not be a potential replacement of sulfites
in all the situations. Obviously, we want to remark that, from this point of view, its
effects on wine composition have still to be evaluated.
The different behavior of the oenological additives and products was clearly
observable also concerning the oxygen consumption measurements. In the first set
of trials, the oxygen consumption was very fast. Yeast lees and ascorbic acid
significantly increased the oxygen consumption rate, respect to the other additives.
In the second set of trials, using a young wine, we had slower oxygen consumption
and less significant differences among the treatments; in these conditions, yeast
extract (IDY) gave the higher oxygen concentration at the end of the monitoring
period (two weeks). In both the performed experiments, IDY in particular, showed
faster oxygen consumption at the beginning of the monitoring time, becoming
slower later. It is difficult to find an explanation of this trend; what is clear is that
the ability of these additives to consume oxygen could be easily reduced with
contact time. In one case, IDY gave also positive effects on wine color protection.
Nevertheless, the storage time was probably too short to allow the evaluation of
significant effects of the different treatments on wine composition. Further trials
shall be performed on different wine types, with longer storage times, to have a
more complete set of results.

Page | 46
5. BIBLIOGRAPHY
Aguilar-Uscanga, ., & Francois, J. M., (2003), “A study of the yeast cell wall
composition and structure in response to growth conditions and mode of
cultivation”, Letters in Applied Microbiology, 37: 268–274
Betes-Saura, C. et al., (1996), “ henolics in white free run juices and wines from
Penedès by high-performance liquid chromatography: Changes during
vilification”, Journal of Agricultural and Food Chemistry, 44, 3040–3046
onilla, Mayen, Merida, and Medina (2001),” Yeast used as fining treatments to
correct browning in white wines”, Journal of Agricultural and food chemistry,49:
1928-1933
Boulton, B. B., Singleton, V. L., Bisson, L. F., and Kunkee, R. E. (1996), “Principles
and Practices of Winemaking”, Springer, New York, p. 408.
radshaw, M. . et al., (2003), “Defining the ascorbic acid crossover from anti-
oxidant to pro-oxidant in a model wine matrix containing (+)-catechin”, J. Agric.
Food Chem.51: 4126–4132
Brand-Williams W., Cuvelier M., erset C., (1995),” Use of a free radical method to
evaluate antioxidant activity”, Lebensm.-Wiss. u.-Technol., 28 (1): 25-30.
uettner, G. R. and Jurkiewic , . A.,(1996), ”Chemistry and biochemistry of
ascorbic acid”, Handbook of Antioxidants, pp. 91–115. Cadenas, E., Packer, L. Eds.,
Marcel Dekker, New York
Caridi, A., 2006, “Enological functions of parietal yeast mannoproteins”, Antonie
Van Leeuwenhoek 89: 417–422
Cassol, T., & Adams, D. O, (1995), “Detection of glutathione in white wines using
an en ymatic analytical method”, American Journal of Enology and Viticulture
46,410.
Castellari, M.et al., (2000), Level of single bioactive phenolic compounds in red
wine as a function of the oxygen supplied during storage, Food Chemistry, 69, 61–
67
Cheynier, V. F.et al., (1986), “Characteri ation of 2-S-glutathioylcaftaric acid and
its hydrolysis in relation to grape wines”, Journal of Agricultural and Food
Chemistry, 34, 217–221
Cheynier, V., Souquet, J. M., & Moutounet, M. (1989). “Glutathione content and
glutathione to hydroxycinnamic acid ratio in Vitis vinifera grapes and musts”,
American Journal of Enology and Viticulture 40, 320–324
Choe, E., &Min, D. . ,(2005), “Chemistry and reactions of reactive oxygen species
in foods”, Journal of Food Science, 70(9), R142 -R159.
Cilliers, J. J. L.; Singleton, V. L., (1990), “Caffeic acid autoxidation and the effects of
thiols”, J. Agric. Food Chem. 38:1789–1796

Page | 47
Comuzzo, P., L. Tat, A. Liessi, L. Brotto, F. Battistutta, and R. Zironi, (2012), “Effect
of different lysis treatments on the characteristics of yeast derivatives for
winemaking”, J. Agric. Food Chem. 60:3211-3222
Cullere et al., (2007), “An assessment of the role played by some oxidation related
aldehydes in wine aroma”, J. Agric. Food Chem. 55: 876–881
Danilewicz J. C., Seccombe J.T. and Whelan J., (2008) “Mechanism of Interaction of
olyphenols, Oxygen, and Sulfur Dioxide in Model Wine and Wine”, Am. J. Enol.
Vitic vol. 59 no. 2, 128-136.
Danilewic , J. C., (2003), “Review of reaction mechanisms of oxygen and proposed
intermediate reduction products in wine: Central role of iron and copper”,
American Journal of Enology and Viticulture, 54, 73–85
Danilewicz, J. C., (2007), “Interaction of sulfur dioxide, polyphenols, and oxygen in
a wine-model system: Central role of iron and copper”, American Journal of
Enology and Viticulture, 58(1), 53–60
Demasi, A. ., crcira, G. A., & Netto, L. E. (2001), “ Cytosolic thinredoxin
peroxidase I is essential for the antioxidant defence of yeast with dysfunctional
mitochondria”, Federation of European iochemical Societies Letters, 509:430–
434
Du Toit, W. J. et al.,(2006), “Oxygen in must and wine: A Review”. South African
Journal of Enology and Viticulture, 27: 76–94
Du Toit, W. J.et al.,(2007), “Using LC–MS to asses glutathione levels in South
African white grape juices and wines made with different levels of oxygen”,
Journal of Agricultural and Food Chemistry 55: 2765–2769
Dubernet, M., & Ribereau-Gayon, P.,(1973), « Presence et significance dans les
moutes et les vins de la tyrosine du raisin », Connaissance de la vigne et du vin, 7 :
283–302.
E.Celotti et al.,(2006), “The analytical evaluation of wine oxidability”, The
Australian and New Zealand Grapegrower and Winemaking 505, 47-52
Elias, R. J., Andersen, & Waterhouse, A. L., (2010), “Controlling the Fenton reaction
in wine. Journal of Agricultural and Food Chemistry, 58, 1699–1707
Eschenbruch R. (1974) “Sulfide and sulfite formation during winemaking”, A
review.
American Journal. Enol. Vitic. 25, 157
Escribano- ail n, M. T.et al., (1995), “ roanthocyanidins in skins from different
grape varieties”, Z. Lebensm. Unters. F. A.,
200, 221–224
Fernández-Zurbano, P. et al., (1995), “ rediction of oxidative browning in white
wines as a function of their chemical composition”, Journal of Agricultural and
Food Chemistry, 43(11), 2813–2817

Page | 48
Fernández-Zurbano, ., Ferreira, V., Escudero, A., & Cacho, J., (1998), “Role of
hydroxycinnamic acids and flavanols in the oxidation and browning of white
wines”, Journal of Agricultural and Food Chemistry, 46(12), 4937–4944
Fracassetti D. et al., 2011, “Quantification of glutathione, catechin and caffeic acid
in grape juice and wine by a novel ultra-performance liquid chromatography
method”, Food Chemistry 128 ,1136–1142
Gallardo-Chac n, J.J. et al.,(2010), “Antioxidant activity of lees cell surface during
sparkling wine sur lie aging”, International Journal of Food Microbiology 143 :48–
53
Gemmill, T.R.and Trimble, R. ., (1999), “Overview of N- and O-linked
oligosaccharide structures found in various yeast species”, iochim. iophys. Acta
1426: 227–237
Jaehrig et al,(2008), “Antioxidative activity of (1–N3), (1–N6)-beta-D-glucan from
Saccharomyces cerevisiae grown on different media”, Food Sci. Technol. 41: 868–
877
Jaehrig et al., (2007), “In vitro potential antioxidant activity of (1–N3), (1–N6)-
beta-D-glucan and protein fractions from Saccharomyces cerevisiae cell walls”, J.
Agric. Food Chem. 55: 4710–4716.
Kath, F. and Kulicke, W.M., (1999). “Mild en ymatic isolation of mannan and
glucan from yeast S. cerevisiae”, Angew. Makromol. Chem. 268: 59–68
Kogan, G., Stasko, A., Bauerova, K., Polovka, M., Soltes, L., Brezova,V., et al. (2005),
“Antioxidant properties of yeast (1-3)-b-D-glucan studied by electron
paramagnetic resonance spectrometry and its activity in the adjuvant arthritis”,
Carbohydrate Polymers, 61: 18–28.
Kutyrev, A. A., & Moskva, V. V., (1991), “Nucleophilic reactions of quinines”.
Russian Chemical Reviews, 60, 72–78
Lavigne, V., & Dubourdieu, D.,(2004), “Affinamento sulle fecce e fresche a dei
vini ianchi”, VigneVini 31 : 58–66
Lavigne, V., ons, A., & Dudourdieu, D. (2007), “Assay of glutathione in must and
wines using capillary electrophoresis and laser-induced fluorescence detection:
Changes in concentration in dry white wines during alcoholic fermentation and
aging”, Journal of Chromatography A, 1139, 130–135
Li, H., Guo, A., & Wang, H. ,(2008), “Mechanisms of oxidative browning of wine”,
Food Chemistry, 108, 1–13
Lipke, .N., Ovalle, R., (1998), “Cell wall architecture in yeast: new structure and
new challenges”, J. acteriol. 180: 3735–3740.
Lopez-Toledano A. et al., (2006), “Yeasts used to delay browning in white wines”,
Food Chemistry 97 498–504

Page | 49
Lopez-Toledano, A et al., (2002), “Yeast induced inhibition of (+)-catechin and (-)-
epicatechin degradation in model solutions”, Journal of Agricultural and Food
Chemistry, 50(6): 1631–1635
Maggu, M.et al., (2007), “Effect of skin contact and pressure on the composition
of Sauvignon lanc must”, Journal of Agricultural and Food Chemistry 55, 10281–
10288
Main, G. L., (1992), “Juice fining treatments to reduce browning and use of
Sulfur dioxide in white wine production”, h.D. Thesis, University of
Arkansas, AR, United States
Marc P. Bradshaw, Celia Barril, Andrew C. Clark, Paul D. Prenzler & Geoffrey R.
Scollary (2011), “Ascorbic Acid: A Review of its Chemistry and Reactivity in
Relation to a Wine Environment”, Critical Reviews in Food Science and Nutrition,
51:6, 479-498
Margalit, Y.,(2004), “Concepts in Wine Chemistry”, (2nd ed.), (Chap. 1 and 5). San
Francisco: Wine Appreciation Guild.
Martínez-Rodríguez, et al., (2001), “Structural and ultrastructural changes in yeast
cells during autolysis in a model wine system and in sparkling wines”, Int. J. Food
Microbiol. 71: 45–51.
Moreaux, V., Birlouez-Aragon, I., and Ducau e, C. (1996), “Copper chelation by
tryptophan inhibits the copper-ascorbate oxidation of tryptophan”, Redox
Report. 2: 191–197.
Müller-Späth H., 1992. Der POM-test. Deutscher Weinbau, 23: 1099-1100.
Oliveira C.M. et al., (2011) , “Review of Oxidation mechanisms occurring in
wines”, Food Research International 44,1115–1126
Osborne, J. P., and C. G. Edwards. 2005. Bacteria in winemaking. In S. Taylor
(ed.),Advances in Food and Nutrition Research, 50:139–177
Palomero et al., (2009), “New genera of yeasts for over-lees aging of red wine”,
Food Chem. 112: 432–441
apadopoulou, D., & Roussis, I. G., (2008), “Inhibition of the decrease of volatile
esters and terpenes during storage of a white wine and a model wine medium by
glutathione and N-acetylcysteine”, International Journal of Food Science and
Technology 43: 1053–1057.
Pérez-Serradilla, J.A. & Luque de Castro, M.D., (2008), “Role of lees in wine
production: a review”. Food Chem. 111: 447–456.
Philip Molyneux, (2003), “The use of free stable radical D H for stimating
antioxidant activity”
Page | 50
Pozo-Bayón M.A. et al. (2009), “Preparados enológicos comerciales a base de
levaduras secas inactivas: modo de acción y principales aplicaciones durante la
vinificación”, ACEnologia
o o- ay n, et al. (2009),(b), “Scientific evidences beyond the application of
inactive dry yeast preparations in winemaking. Food. Res. Int. 42, 754−761.
rieur, C et al., (1994), “Oligomeric and polymeric procyanidins from grape
seeds”, Phytochemistry, 36, 781–784
ueyo et al. (2000), “Release of lipids during yeast autolysis in a model wine
system”. J. Agric. Food Chem. 48: 116–122
Rankine, . (2002), “Making Good Wine” an Macmillan Australia, Sydney,
pp.87–117.
Razmkhab et al., (2002), “Adsorption of phenolic compounds and browning
product in white wine by yeast and their cell walls”, Journal of Agricultural and
food chemistry, 50: 7432-7437
Riberau-Gayon, P., Glories, Y., Maujean, A., & Dubourdieu, D.,2006, Handbook of
enology, vol. 2, The chemistry of wine stabilization and treatments. (2nd
ed.).Chichester: John Wiley and Sons Ltd., (Chap. 6))
Ribéreau-Gayon P, Glories Y, Maujean A, Dubourdieu D (2006) Handbook of
enology: the chemistry of wine stabilization and treatments, vol 2, 2nd edn. Wiley,
Chichester
Ribéreau-Gayon P., Dubourdieu D., Donéche B. and Lonvaud A., (2006), Handbook
of Enology Volume 1, The Microbiology of Wine and Vinifications 2nd Edition.
Ribéreau-Gayon, P., Glories, Y., Maugean, A., & Dubourdieu, D., (2000),
“Handbook of Enology. The chemistry of wine stabili ation and treatments”,
Volume 2, England: John Wiley & Sons, New York
Robards, K., et al. ,(1999), “ henolic compounds and their role in oxidative
processes in fruits”, Food Chemistry, 66, 401–436
Roussis, I. G., Lambropoulos, I., & Tzimas, P. (2007), “ rotection of volatiles in a
wine
with low sulfur dioxide by caffeic acid or glutathione”, American Journal of
Enology and Viticulture, 58: 274–278.
Santos, M.C.et al.,(2011), “Chemical and physical methodologies for the
replacement/reduction of sulfur dioxide use during winemaking: review of their
potentialities and limitations”, Eur Food Res Technol 234:1–12
Saucier, C. T., & Waterhouse, A. L. ,(1999), “Synergetic activity of catechin and
other antioxidants”, Journal of Agricultural and Food Chemistry, 47(11), 4491–
4494

Page | 51
Singleton, V. L. (1987), “Oxygen with phenols and related reactions in musts,
wines, and model systems: Observations and practical implications”, American
Journal of Enology and Viticulture, 38(1), 69–77
Sonni F. et al.,(2011),“Antioxidant Action of Glutathione and the Ascorbic
Acid/Glutathione air in a Model White Wine”, Journal of Agricultural and Food
Chemistry 59, 3940–3949
Souquet, J. M. et al., (1996), « Polymeric proanthocyanidins from grape skins”,
Phytochemistry, 43, 509–512
Sullivan, . J. (2002). “The effects of microoxygenation on red wines”. M.S.Thesis,
California State University, Fresno, CA, United States
Waterhouse, A. L., & Laurie, V. F, (2006), “Oxidation of wine phenolics: A critical
evaluation and hypotheses”. American Journal of Enology and Viticulture, 57,
306–313
Weeks C. (1969)” roduction of sulfurdioxide-binding compounds and of sulfur
dioxide by two Saccharomyces strains”, Am. J. Enol. Vitic. 20, 32
Wildenradt, H. L.,&Singleton, V. L. (1974). “The production of aldehydes as a
result of oxidation of polyphenolic compounds and its relation to wine aging”.
American Journal of Enology and Viticulture, 25(2), 119–126)
Zhao, ., (1999), “Oxygen free radicals and natural antioxidants. eijing” ress of
Science.
Zoecklein, . W., Fugelsang, K. C., Gump, . H., and Nury, F. S. (1995),”Wine
Analysis and roduction”, Chapman and Hall, New York. pp. 178–191

Page | 52
ACKNOWLEDGMENTS
I have taken efforts in this project. However, it would not have been possible
without the kind support and help of many individuals and organizations.
First and foremost I am highly grateful to the EMaVE Consortium for gave me this
opportunity, since they selected me among many people to be part in the Vinifera
Euromaster programme.
I wish to express my gratitude to Prof. Enrico Peterlunguer and to my main
supervisor, Prof. Roberto Zironi, for welcoming me in the Food Science
Department of the University of Udine and giving me the opportunity to develop
this work. Special thanks for my co-supervisor, Dottore Piergiorgio Comuzzo, who
was abundantly helpful and offered me invaluable assistance, support and
guidance.
I would also like to thank Prof. Antonio Morata from the UPM (Universidad
Politécnica de Madrid) – España, for accepting to be part in the Commission of the
final examination of this Mater thesis.
Thank you very much to professors Emilio Celotti and Franco Batistuta for their
availability when it was required.
Finally I wish to express my infinite gratitude to my beloved family; for their
endless love and for encourage me every day through the duration of this
experience in Europe. Especially to my parents, who travelled more than 10.000 km
from Argentina to Udine, to be present in my Master thesis presentation.
My sincere thanks to all of them!

Page | 53
Copyright © 2022 FDOKUMEN