R Rapid case-based mapping of seasonal malaria transmission risk for strategic elimination planning...
12
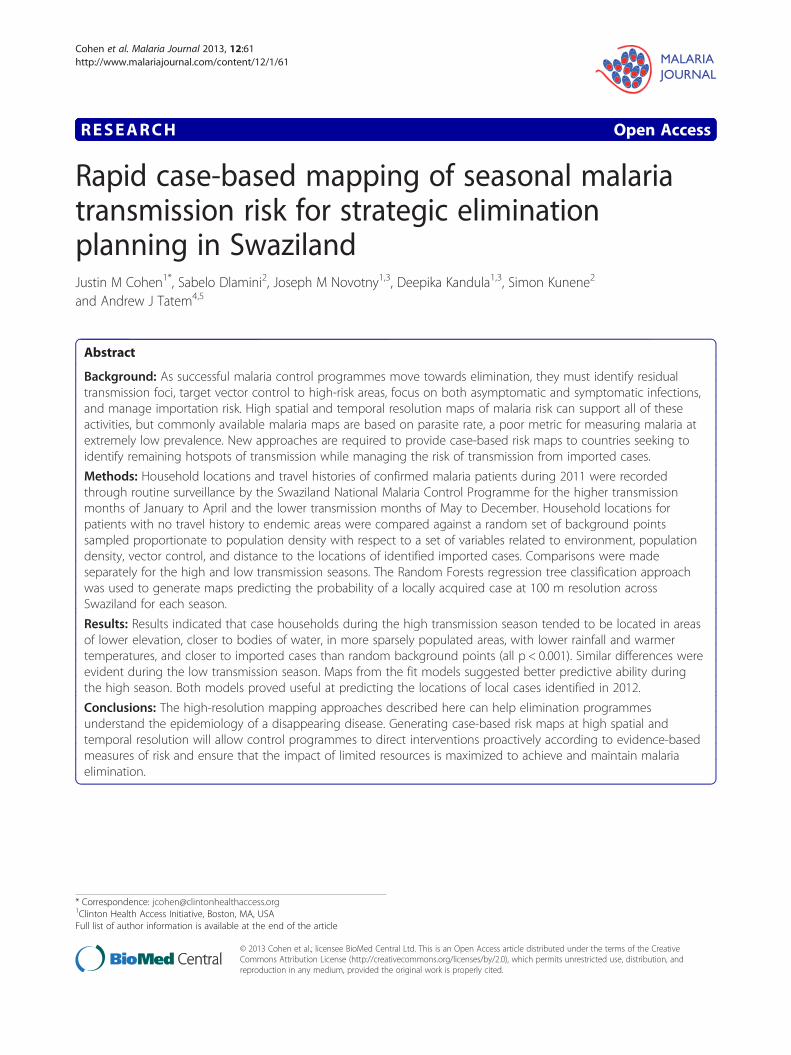
RESEARCH Open Access Rapid case-based mapping of seasonal malaria transmission risk for strategic elimination planning in Swaziland Justin M Cohen 1* , Sabelo Dlamini 2 , Joseph M Novotny 1,3 , Deepika Kandula 1,3 , Simon Kunene 2 and Andrew J Tatem 4,5 Abstract Background: As successful malaria control programmes move towards elimination, they must identify residual transmission foci, target vector control to high-risk areas, focus on both asymptomatic and symptomatic infections, and manage importation risk. High spatial and temporal resolution maps of malaria risk can support all of these activities, but commonly available malaria maps are based on parasite rate, a poor metric for measuring malaria at extremely low prevalence. New approaches are required to provide case-based risk maps to countries seeking to identify remaining hotspots of transmission while managing the risk of transmission from imported cases. Methods: Household locations and travel histories of confirmed malaria patients during 2011 were recorded through routine surveillance by the Swaziland National Malaria Control Programme for the higher transmission months of January to April and the lower transmission months of May to December. Household locations for patients with no travel history to endemic areas were compared against a random set of background points sampled proportionate to population density with respect to a set of variables related to environment, population density, vector control, and distance to the locations of identified imported cases. Comparisons were made separately for the high and low transmission seasons. The Random Forests regression tree classification approach was used to generate maps predicting the probability of a locally acquired case at 100 m resolution across Swaziland for each season. Results: Results indicated that case households during the high transmission season tended to be located in areas of lower elevation, closer to bodies of water, in more sparsely populated areas, with lower rainfall and warmer temperatures, and closer to imported cases than random background points (all p < 0.001). Similar differences were evident during the low transmission season. Maps from the fit models suggested better predictive ability during the high season. Both models proved useful at predicting the locations of local cases identified in 2012. Conclusions: The high-resolution mapping approaches described here can help elimination programmes understand the epidemiology of a disappearing disease. Generating case-based risk maps at high spatial and temporal resolution will allow control programmes to direct interventions proactively according to evidence-based measures of risk and ensure that the impact of limited resources is maximized to achieve and maintain malaria elimination. * Correspondence: [email protected] 1 Clinton Health Access Initiative, Boston, MA, USA Full list of author information is available at the end of the article © 2013 Cohen et al.; licensee BioMed Central Ltd. This is an Open Access article distributed under the terms of the Creative Commons Attribution License (http://creativecommons.org/licenses/by/2.0), which permits unrestricted use, distribution, and reproduction in any medium, provided the original work is properly cited. Cohen et al. Malaria Journal 2013, 12:61 http://www.malariajournal.com/content/12/1/61
Transcript of R Rapid case-based mapping of seasonal malaria transmission risk for strategic elimination planning...
Cohen et al. Malaria Journal 2013, 12:61http://www.malariajournal.com/content/12/1/61
RESEARCH Open Access
Rapid case-based mapping of seasonal malariatransmission risk for strategic eliminationplanning in SwazilandJustin M Cohen1*, Sabelo Dlamini2, Joseph M Novotny1,3, Deepika Kandula1,3, Simon Kunene2
and Andrew J Tatem4,5
Abstract
Background: As successful malaria control programmes move towards elimination, they must identify residualtransmission foci, target vector control to high-risk areas, focus on both asymptomatic and symptomatic infections,and manage importation risk. High spatial and temporal resolution maps of malaria risk can support all of theseactivities, but commonly available malaria maps are based on parasite rate, a poor metric for measuring malaria atextremely low prevalence. New approaches are required to provide case-based risk maps to countries seeking toidentify remaining hotspots of transmission while managing the risk of transmission from imported cases.
Methods: Household locations and travel histories of confirmed malaria patients during 2011 were recordedthrough routine surveillance by the Swaziland National Malaria Control Programme for the higher transmissionmonths of January to April and the lower transmission months of May to December. Household locations forpatients with no travel history to endemic areas were compared against a random set of background pointssampled proportionate to population density with respect to a set of variables related to environment, populationdensity, vector control, and distance to the locations of identified imported cases. Comparisons were madeseparately for the high and low transmission seasons. The Random Forests regression tree classification approachwas used to generate maps predicting the probability of a locally acquired case at 100 m resolution acrossSwaziland for each season.
Results: Results indicated that case households during the high transmission season tended to be located in areasof lower elevation, closer to bodies of water, in more sparsely populated areas, with lower rainfall and warmertemperatures, and closer to imported cases than random background points (all p < 0.001). Similar differences wereevident during the low transmission season. Maps from the fit models suggested better predictive ability duringthe high season. Both models proved useful at predicting the locations of local cases identified in 2012.
Conclusions: The high-resolution mapping approaches described here can help elimination programmesunderstand the epidemiology of a disappearing disease. Generating case-based risk maps at high spatial andtemporal resolution will allow control programmes to direct interventions proactively according to evidence-basedmeasures of risk and ensure that the impact of limited resources is maximized to achieve and maintain malariaelimination.
* Correspondence: [email protected] Health Access Initiative, Boston, MA, USAFull list of author information is available at the end of the article
© 2013 Cohen et al.; licensee BioMed Central Ltd. This is an Open Access article distributed under the terms of the CreativeCommons Attribution License (http://creativecommons.org/licenses/by/2.0), which permits unrestricted use, distribution, andreproduction in any medium, provided the original work is properly cited.
Cohen et al. Malaria Journal 2013, 12:61 Page 2 of 12http://www.malariajournal.com/content/12/1/61
BackgroundRecent reductions in malaria coupled with increased fundinghave resulted in a renewed focus on malaria eradication [1].Many countries have adopted a goal of national malaria elim-ination [2], and the World Health Organization (WHO)recognizes 17 as having pre-elimination or elimination pro-grammes [3]. Achieving elimination is an operationally chal-lenging endeavour requiring a strong evidence base andtargeted interventions [4].Many of the operational requirements for malaria elim-
ination, including identifying residual transmission foci[5], targeting vector control and case detection to highrisk areas [6], focusing not only on clinical disease but alsoasymptomatic infections [4], and managing importationrisk [7] can be facilitated by accurate and timely creationof malaria risk maps. For example, risk maps may allowproactive deployment of vector control measures to high-risk areas to prevent local transmission, or suggest areaswhere active case detection may be used to identify andtreat remaining parasite reservoirs.Parasite rate-based maps for malaria are now widely avail-
able [8-11], but infection prevalence is a poor metric formeasuring malaria at very low levels of endemicity due tothe enormous surveys required for precise measurement insuch contexts [12]. Additionally, while the Bayesianapproaches typically used provide valuable information onspatial uncertainty [13], they can require substantialresources and computing time to produce, neither of whichmay be aligned with the needs of an elimination programme.In very low transmission environments, diagnostically con-firmed malaria incidence provides a more useful measurethan prevalence. Understanding the epidemiology of theseconfirmed cases requires differentiating between importedand locally acquired cases [14]. As endemic transmissiondeclines, an increasing proportion of incident cases may beattributed to transmission chains traced directly to importedcases [15], and such imported cases may therefore becomeincreasingly important drivers of local transmission.Swaziland has achieved its lowest ever recorded malaria
prevalence in recent years [16], and it aims to achieve elim-ination by 2015 [17]. WHO certification of eliminationrequires achieving an absence of all local transmission forthree years, as well as a sufficiently strong surveillance sys-tem to prove that cases would have been identified had theyoccurred [18]. In sub-Saharan Africa, only Lesotho and theisland of Mauritius are considered malaria-free, and onlythe latter achieved that status through active measures.Achieving this goal in Swaziland will require identifyingand interrupting remaining foci of endemic transmission[5] and preventing onward transmission from the importedcases that will continue to occur from endemic neighbours[4]. Focusing limited resources on hotspots of transmissionrather than aiming for untargeted coverage could consider-ably improve the impact of interventions [6].
Swaziland instituted a reactive surveillance system in2009 in which all notifiable diseases, including malaria,identified in health facilities are reported to a central toll-free hotline. Entry of any malaria case into the central data-base triggers an automated phone short message service(SMS) to the national malaria control programme (NMCP)with basic details on the patient. Surveillance agents thenobtain the case patient’s contact details and directions tohis or her household from the health facility where thediagnosis was made. The patient is interviewed at thehousehold after identification; the protocol from 2009–2011 was to complete this follow up within seven days ofthe case report, though the programme now attempts toinvestigate within 48 hours. Among other information, theinterview ascertains travel history, to assist with categoriz-ing the infection as locally acquired or imported, and geo-coordinates for the house location. If there is suspicion oflocal transmission, family members and neighbours livingwithin 1 km of the index case are screened for malaria byrapid diagnostic test, and any individuals who test positiveare referred to the nearest health facility for treatment.Such a surveillance system is a crucial component of an
elimination strategy, but achieving and maintaining elimin-ation will require complementing it with proactive case detec-tion to seek out cases that may never come into contact withreporting health facilities [4]. In Swaziland’s 2010 Malaria Indi-cator Survey, 53.5% of women and 67.4% of children werereported as attending a health facility when febrile [16], leavinga substantial fraction of potential infections that may bemissed by passive surveillance. Furthermore, molecular diag-nostic methods have indicated that in low transmission set-tings such as Swaziland, a majority of infections may beasymptomatic and thus will not be identified by the passivesurveillance system [19]. Understanding and investigating allregions where unobserved transmission may be occurring willbe required before elimination can be achieved.Malaria prevalence in Swaziland is too low for standard
parasite rate-based mapping to be useful [16], so individ-ual case-based approaches are required to predict riskacross the country. This investigation seeks to generatemaps of malaria risk at fine spatial resolution from exist-ing case-based surveillance data, including the locations ofimported cases. Transmission risk maps are derived separ-ately for the high and low transmission seasons in case thekey determinants of transmission change over the courseof the year. Accurate case-based risk mapping of this kindwill help Swaziland to target its vector control and surveil-lance activities most effectively.
MethodsMalaria dataThis investigation investigated transmission risk inSwaziland based on malaria cases identified during 2011(Figure 1). Household locations of cases identified by
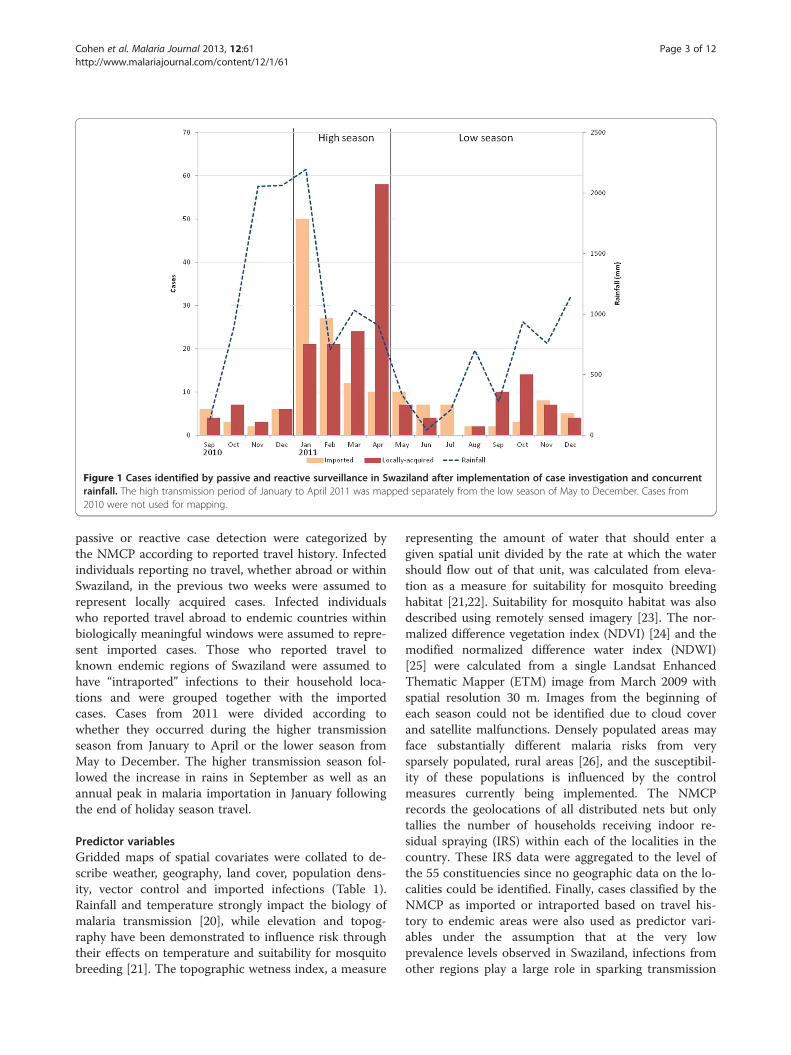
Figure 1 Cases identified by passive and reactive surveillance in Swaziland after implementation of case investigation and concurrentrainfall. The high transmission period of January to April 2011 was mapped separately from the low season of May to December. Cases from2010 were not used for mapping.
Cohen et al. Malaria Journal 2013, 12:61 Page 3 of 12http://www.malariajournal.com/content/12/1/61
passive or reactive case detection were categorized bythe NMCP according to reported travel history. Infectedindividuals reporting no travel, whether abroad or withinSwaziland, in the previous two weeks were assumed torepresent locally acquired cases. Infected individualswho reported travel abroad to endemic countries withinbiologically meaningful windows were assumed to repre-sent imported cases. Those who reported travel toknown endemic regions of Swaziland were assumed tohave “intraported” infections to their household loca-tions and were grouped together with the importedcases. Cases from 2011 were divided according towhether they occurred during the higher transmissionseason from January to April or the lower season fromMay to December. The higher transmission season fol-lowed the increase in rains in September as well as anannual peak in malaria importation in January followingthe end of holiday season travel.
Predictor variablesGridded maps of spatial covariates were collated to de-scribe weather, geography, land cover, population dens-ity, vector control and imported infections (Table 1).Rainfall and temperature strongly impact the biology ofmalaria transmission [20], while elevation and topog-raphy have been demonstrated to influence risk throughtheir effects on temperature and suitability for mosquitobreeding [21]. The topographic wetness index, a measure
representing the amount of water that should enter agiven spatial unit divided by the rate at which the watershould flow out of that unit, was calculated from eleva-tion as a measure for suitability for mosquito breedinghabitat [21,22]. Suitability for mosquito habitat was alsodescribed using remotely sensed imagery [23]. The nor-malized difference vegetation index (NDVI) [24] and themodified normalized difference water index (NDWI)[25] were calculated from a single Landsat EnhancedThematic Mapper (ETM) image from March 2009 withspatial resolution 30 m. Images from the beginning ofeach season could not be identified due to cloud coverand satellite malfunctions. Densely populated areas mayface substantially different malaria risks from verysparsely populated, rural areas [26], and the susceptibil-ity of these populations is influenced by the controlmeasures currently being implemented. The NMCPrecords the geolocations of all distributed nets but onlytallies the number of households receiving indoor re-sidual spraying (IRS) within each of the localities in thecountry. These IRS data were aggregated to the level ofthe 55 constituencies since no geographic data on the lo-calities could be identified. Finally, cases classified by theNMCP as imported or intraported based on travel his-tory to endemic areas were also used as predictor vari-ables under the assumption that at the very lowprevalence levels observed in Swaziland, infections fromother regions play a large role in sparking transmission
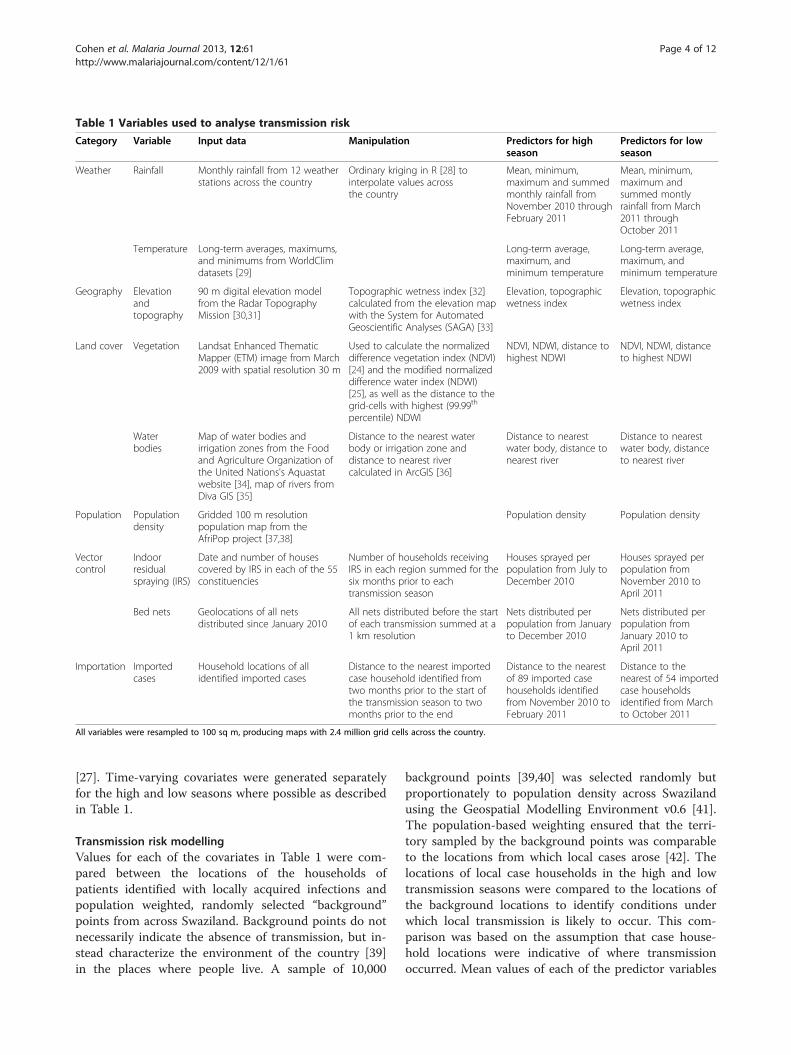
Table 1 Variables used to analyse transmission risk
Category Variable Input data Manipulation Predictors for highseason
Predictors for lowseason
Weather Rainfall Monthly rainfall from 12 weatherstations across the country
Ordinary kriging in R [28] tointerpolate values acrossthe country
Mean, minimum,maximum and summedmonthly rainfall fromNovember 2010 throughFebruary 2011
Mean, minimum,maximum andsummed montlyrainfall from March2011 throughOctober 2011
Temperature Long-term averages, maximums,and minimums from WorldClimdatasets [29]
Long-term average,maximum, andminimum temperature
Long-term average,maximum, andminimum temperature
Geography Elevationandtopography
90 m digital elevation modelfrom the Radar TopographyMission [30,31]
Topographic wetness index [32]calculated from the elevation mapwith the System for AutomatedGeoscientific Analyses (SAGA) [33]
Elevation, topographicwetness index
Elevation, topographicwetness index
Land cover Vegetation Landsat Enhanced ThematicMapper (ETM) image from March2009 with spatial resolution 30 m
Used to calculate the normalizeddifference vegetation index (NDVI)[24] and the modified normalizeddifference water index (NDWI)[25], as well as the distance to thegrid-cells with highest (99.99th
percentile) NDWI
NDVI, NDWI, distance tohighest NDWI
NDVI, NDWI, distanceto highest NDWI
Waterbodies
Map of water bodies andirrigation zones from the Foodand Agriculture Organization ofthe United Nations's Aquastatwebsite [34], map of rivers fromDiva GIS [35]
Distance to the nearest waterbody or irrigation zone anddistance to nearest rivercalculated in ArcGIS [36]
Distance to nearestwater body, distance tonearest river
Distance to nearestwater body, distanceto nearest river
Population Populationdensity
Gridded 100 m resolutionpopulation map from theAfriPop project [37,38]
Population density Population density
Vectorcontrol
Indoorresidualspraying (IRS)
Date and number of housescovered by IRS in each of the 55constituencies
Number of households receivingIRS in each region summed for thesix months prior to eachtransmission season
Houses sprayed perpopulation from July toDecember 2010
Houses sprayed perpopulation fromNovember 2010 toApril 2011
Bed nets Geolocations of all netsdistributed since January 2010
All nets distributed before the startof each transmission summed at a1 km resolution
Nets distributed perpopulation from Januaryto December 2010
Nets distributed perpopulation fromJanuary 2010 toApril 2011
Importation Importedcases
Household locations of allidentified imported cases
Distance to the nearest importedcase household identified fromtwo months prior to the start ofthe transmission season to twomonths prior to the end
Distance to the nearestof 89 imported casehouseholds identifiedfrom November 2010 toFebruary 2011
Distance to thenearest of 54 importedcase householdsidentified from Marchto October 2011
All variables were resampled to 100 sq m, producing maps with 2.4 million grid cells across the country.
Cohen et al. Malaria Journal 2013, 12:61 Page 4 of 12http://www.malariajournal.com/content/12/1/61
[27]. Time-varying covariates were generated separatelyfor the high and low seasons where possible as describedin Table 1.
Transmission risk modellingValues for each of the covariates in Table 1 were com-pared between the locations of the households ofpatients identified with locally acquired infections andpopulation weighted, randomly selected “background”points from across Swaziland. Background points do notnecessarily indicate the absence of transmission, but in-stead characterize the environment of the country [39]in the places where people live. A sample of 10,000
background points [39,40] was selected randomly butproportionately to population density across Swazilandusing the Geospatial Modelling Environment v0.6 [41].The population-based weighting ensured that the terri-tory sampled by the background points was comparableto the locations from which local cases arose [42]. Thelocations of local case households in the high and lowtransmission seasons were compared to the locations ofthe background locations to identify conditions underwhich local transmission is likely to occur. This com-parison was based on the assumption that case house-hold locations were indicative of where transmissionoccurred. Mean values of each of the predictor variables
Cohen et al. Malaria Journal 2013, 12:61 Page 5 of 12http://www.malariajournal.com/content/12/1/61
were compared between case households and the back-ground locations using Satterthwaite t-tests for unequalvariance [43].Given the potential importance of imported infections
for sustaining malaria transmission in Swaziland [15], asecond analysis investigated risk factors associated withwhether or not an imported case led to onward trans-mission. Each imported infection identified in 2011 wasclassified as to whether or not a locally acquired infec-tion was identified within a space-time cylinder consist-ent with onward transmission. Local transmission wasassumed if the household of a locally acquired infectionwas identified within 3 km of the imported case house-hold (based upon the typical maximum dispersal rangeof African vectors [44]) and three to six weeks afteridentification of the imported case (assuming transmis-sion would require two to three weeks for parasite devel-opment inside the mosquito vector, symptoms woulddevelop in an infected human within the following oneto two weeks [45], and up to an additional week mightelapse before the case patient appeared in passive sur-veillance reports).A logistic regression mixed model predicting whether or
not an imported case was associated with a locallyacquired case was fit using the GLIMMIX procedure inSAS software, Version 9.2 of the SAS System for Windows[46]. An exponential structure was used to account forspatial autocorrelation [47]. Predictive variables includedin this model were the same as above but additionallyincluded time-varying rainfall variables describing totalrainfall two, four, six, and eight weeks prior to identifica-tion of the imported case. Initial models were fit to iden-tify the variables from each category (weather, geography,land cover, population density, and vector control) mostassociated with transmission, and then each of those wasentered jointly into a final model. Variables were removedin order of least significance until all remaining in themodel were significant at α = 0.10.
MappingThe regression tree classification approach ‘Random For-est’ [48] was applied using the R [49] package ModelMap[50] to model the probability of a locally acquired case oc-curring in each 100 sq m location across Swaziland. Re-gression trees create a series of rules to partition the datainto a set of groups that are as homogenous as possiblewith respect to the outcome [51]. For example, one suchrule might differentiate the locations of case householdsfrom those of control households based on elevationbelow a certain threshold, while another rule might fur-ther divide the data based on rainfall within specificbounds. In the Random Forest approach, the data are re-peatedly split according to many different branching"trees" of this type, and the final prediction is made by
averaging across all of the individual trees [48]. The freeModelMap package contains a detailed tutorial and ex-ample code for implementing Random Forest in R [52].To assess the accuracy of model predictions, eighty
percent of the locally-acquired cases observed in 2011were selected at random for training the algorithm, withthe other 20% were used for testing. All of the abovepredictor variables were included in the fitting step toproduce a model predicting the probability of a localcase occurring at a particular location as a function ofthe combined covariates. Model quality was assessed byexamining calibration plots [53] and the area under thecurve (AUC) on receiver operating characteristic (ROC)graphs. The fit model was then applied in conjunctionwith the 100 m spatial resolution gridded datasets of allincluded predictive variables to generate a map of pre-dicted risk across Swaziland. Models and maps weregenerated separately for the high and low seasons.
Prospective validationAlthough the AUC values suggested the ability of themodel to predict the locations of local cases not used inthe model fitting, these test points were obtained over thesame time period as the training points and may thus notbe indicative of the true value of the risk map for pro-spective prediction. To examine the utility of the maps forpredicting the occurrence of cases in future transmissionseasons, an additional dataset of locally acquired casesidentified during 2012 was used for validation of the2011-based risk map. The predicted risk at the locationsof 2012 case households according to the Random Forestmaps was compared to predicted risk at other randomlocations across Swaziland. These "control" locations wereselected in two ways: first, 10,000 points were randomlyselected from across Swaziland, and second, 10,000 pointswere selected randomly but proportionally to populationdensity. The high transmission season risk map was usedto examine predicted risk at the locations of householdsof cases occurring from January to April 2012, while thelow transmission season risk map was used for subsequentmonths.
ResultsOf the 372 malaria cases investigated during 2011, 191(51.3%) were classified as locally acquired and 170 wereclassified as imported (45.7%). Eleven were either not clas-sified or categorized as cryptic [54] and were excludedfrom analysis. A total of 314 of these cases had valid coor-dinates that matched the region of the country in whichthe case was reported to live on the investigation form andwere used in analyses. These cases included 118 locallyacquired infections from the higher transmission season ofJanuary to April and 44 from the lower transmission sea-son of May to December. There were 152 imported
Cohen et al. Malaria Journal 2013, 12:61 Page 6 of 12http://www.malariajournal.com/content/12/1/61
infections during 2011 with valid coordinates, of which 143(94.1%) originated outside of Swaziland.Characteristics of the locations of case households and
the background points during the two study periods arecontrasted in Table 2. Of the 152 imported cases used inanalysis, 12 (7.9%) were associated with a locally acquiredcase occurring within 3 km and after three to six weeks.All 12 originated abroad. The final model predicting theprobability of an imported case in 2011 leading to onwardtransmission is reported in Table 3.The ROC plot for the high-season Random Forest model
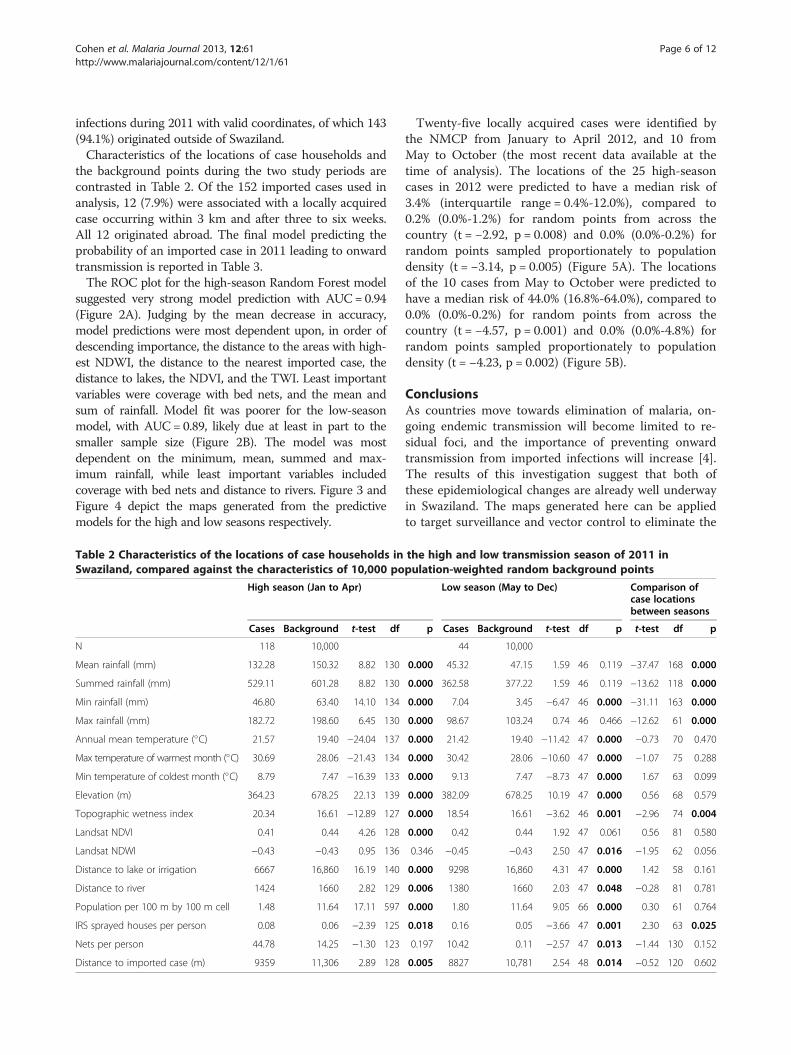
suggested very strong model prediction with AUC= 0.94(Figure 2A). Judging by the mean decrease in accuracy,model predictions were most dependent upon, in order ofdescending importance, the distance to the areas with high-est NDWI, the distance to the nearest imported case, thedistance to lakes, the NDVI, and the TWI. Least importantvariables were coverage with bed nets, and the mean andsum of rainfall. Model fit was poorer for the low-seasonmodel, with AUC= 0.89, likely due at least in part to thesmaller sample size (Figure 2B). The model was mostdependent on the minimum, mean, summed and max-imum rainfall, while least important variables includedcoverage with bed nets and distance to rivers. Figure 3 andFigure 4 depict the maps generated from the predictivemodels for the high and low seasons respectively.
Table 2 Characteristics of the locations of case households inSwaziland, compared against the characteristics of 10,000 po
High season (Jan to Apr)
Cases Background t-test df
N 118 10,000
Mean rainfall (mm) 132.28 150.32 8.82 130
Summed rainfall (mm) 529.11 601.28 8.82 130
Min rainfall (mm) 46.80 63.40 14.10 134
Max rainfall (mm) 182.72 198.60 6.45 130
Annual mean temperature (�C) 21.57 19.40 −24.04 137
Max temperature of warmest month (�C) 30.69 28.06 −21.43 134
Min temperature of coldest month (�C) 8.79 7.47 −16.39 133
Elevation (m) 364.23 678.25 22.13 139
Topographic wetness index 20.34 16.61 −12.89 127
Landsat NDVI 0.41 0.44 4.26 128
Landsat NDWI −0.43 −0.43 0.95 136
Distance to lake or irrigation 6667 16,860 16.19 140
Distance to river 1424 1660 2.82 129
Population per 100 m by 100 m cell 1.48 11.64 17.11 597
IRS sprayed houses per person 0.08 0.06 −2.39 125
Nets per person 44.78 14.25 −1.30 123
Distance to imported case (m) 9359 11,306 2.89 128
Twenty-five locally acquired cases were identified bythe NMCP from January to April 2012, and 10 fromMay to October (the most recent data available at thetime of analysis). The locations of the 25 high-seasoncases in 2012 were predicted to have a median risk of3.4% (interquartile range = 0.4%-12.0%), compared to0.2% (0.0%-1.2%) for random points from across thecountry (t = −2.92, p = 0.008) and 0.0% (0.0%-0.2%) forrandom points sampled proportionately to populationdensity (t = −3.14, p = 0.005) (Figure 5A). The locationsof the 10 cases from May to October were predicted tohave a median risk of 44.0% (16.8%-64.0%), compared to0.0% (0.0%-0.2%) for random points from across thecountry (t = −4.57, p = 0.001) and 0.0% (0.0%-4.8%) forrandom points sampled proportionately to populationdensity (t = −4.23, p = 0.002) (Figure 5B).
ConclusionsAs countries move towards elimination of malaria, on-going endemic transmission will become limited to re-sidual foci, and the importance of preventing onwardtransmission from imported infections will increase [4].The results of this investigation suggest that both ofthese epidemiological changes are already well underwayin Swaziland. The maps generated here can be appliedto target surveillance and vector control to eliminate the
the high and low transmission season of 2011 inpulation-weighted random background points
Low season (May to Dec) Comparison ofcase locationsbetween seasons
p Cases Background t-test df p t-test df p
44 10,000
0.000 45.32 47.15 1.59 46 0.119 −37.47 168 0.000
0.000 362.58 377.22 1.59 46 0.119 −13.62 118 0.000
0.000 7.04 3.45 −6.47 46 0.000 −31.11 163 0.000
0.000 98.67 103.24 0.74 46 0.466 −12.62 61 0.000
0.000 21.42 19.40 −11.42 47 0.000 −0.73 70 0.470
0.000 30.42 28.06 −10.60 47 0.000 −1.07 75 0.288
0.000 9.13 7.47 −8.73 47 0.000 1.67 63 0.099
0.000 382.09 678.25 10.19 47 0.000 0.56 68 0.579
0.000 18.54 16.61 −3.62 46 0.001 −2.96 74 0.004
0.000 0.42 0.44 1.92 47 0.061 0.56 81 0.580
0.346 −0.45 −0.43 2.50 47 0.016 −1.95 62 0.056
0.000 9298 16,860 4.31 47 0.000 1.42 58 0.161
0.006 1380 1660 2.03 47 0.048 −0.28 81 0.781
0.000 1.80 11.64 9.05 66 0.000 0.30 61 0.764
0.018 0.16 0.05 −3.66 47 0.001 2.30 63 0.025
0.197 10.42 0.11 −2.57 47 0.013 −1.44 130 0.152
0.005 8827 10,781 2.54 48 0.014 −0.52 120 0.602
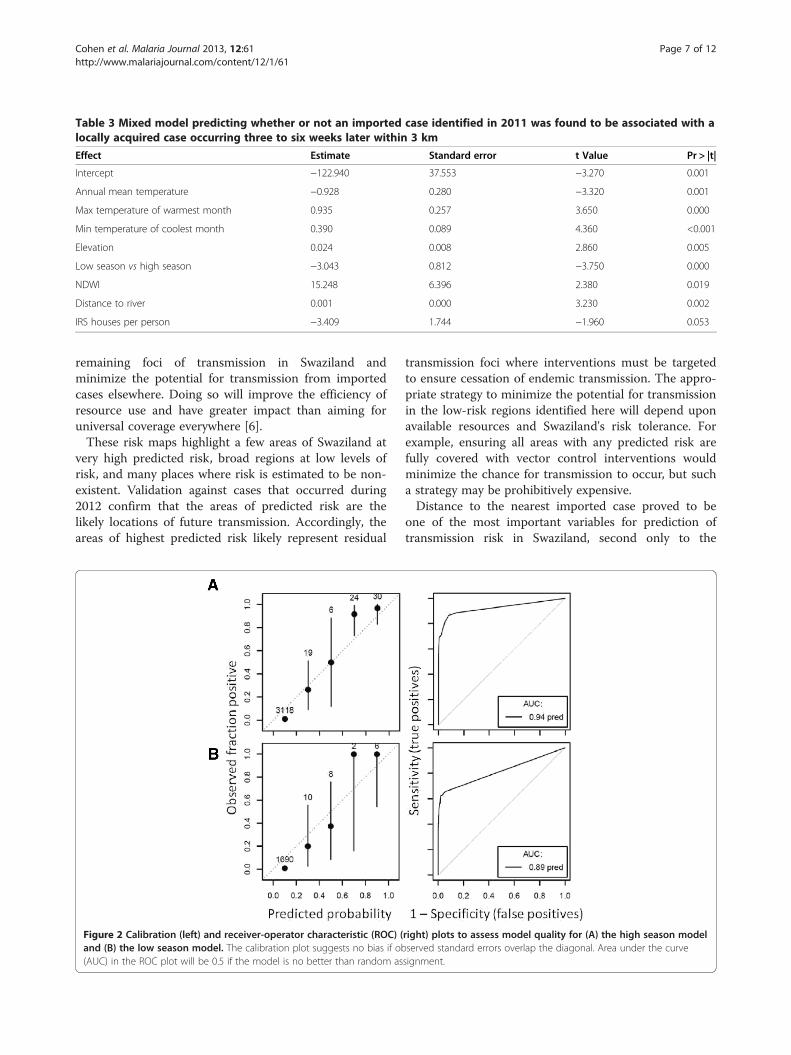
Table 3 Mixed model predicting whether or not an imported case identified in 2011 was found to be associated with alocally acquired case occurring three to six weeks later within 3 km
Effect Estimate Standard error t Value Pr > |t|
Intercept −122.940 37.553 −3.270 0.001
Annual mean temperature −0.928 0.280 −3.320 0.001
Max temperature of warmest month 0.935 0.257 3.650 0.000
Min temperature of coolest month 0.390 0.089 4.360 <0.001
Elevation 0.024 0.008 2.860 0.005
Low season vs high season −3.043 0.812 −3.750 0.000
NDWI 15.248 6.396 2.380 0.019
Distance to river 0.001 0.000 3.230 0.002
IRS houses per person −3.409 1.744 −1.960 0.053
Cohen et al. Malaria Journal 2013, 12:61 Page 7 of 12http://www.malariajournal.com/content/12/1/61
remaining foci of transmission in Swaziland andminimize the potential for transmission from importedcases elsewhere. Doing so will improve the efficiency ofresource use and have greater impact than aiming foruniversal coverage everywhere [6].These risk maps highlight a few areas of Swaziland at
very high predicted risk, broad regions at low levels ofrisk, and many places where risk is estimated to be non-existent. Validation against cases that occurred during2012 confirm that the areas of predicted risk are thelikely locations of future transmission. Accordingly, theareas of highest predicted risk likely represent residual
Figure 2 Calibration (left) and receiver-operator characteristic (ROC) (and (B) the low season model. The calibration plot suggests no bias if ob(AUC) in the ROC plot will be 0.5 if the model is no better than random as
transmission foci where interventions must be targetedto ensure cessation of endemic transmission. The appro-priate strategy to minimize the potential for transmissionin the low-risk regions identified here will depend uponavailable resources and Swaziland's risk tolerance. Forexample, ensuring all areas with any predicted risk arefully covered with vector control interventions wouldminimize the chance for transmission to occur, but sucha strategy may be prohibitively expensive.Distance to the nearest imported case proved to be
one of the most important variables for prediction oftransmission risk in Swaziland, second only to the
right) plots to assess model quality for (A) the high season modelserved standard errors overlap the diagonal. Area under the curvesignment.
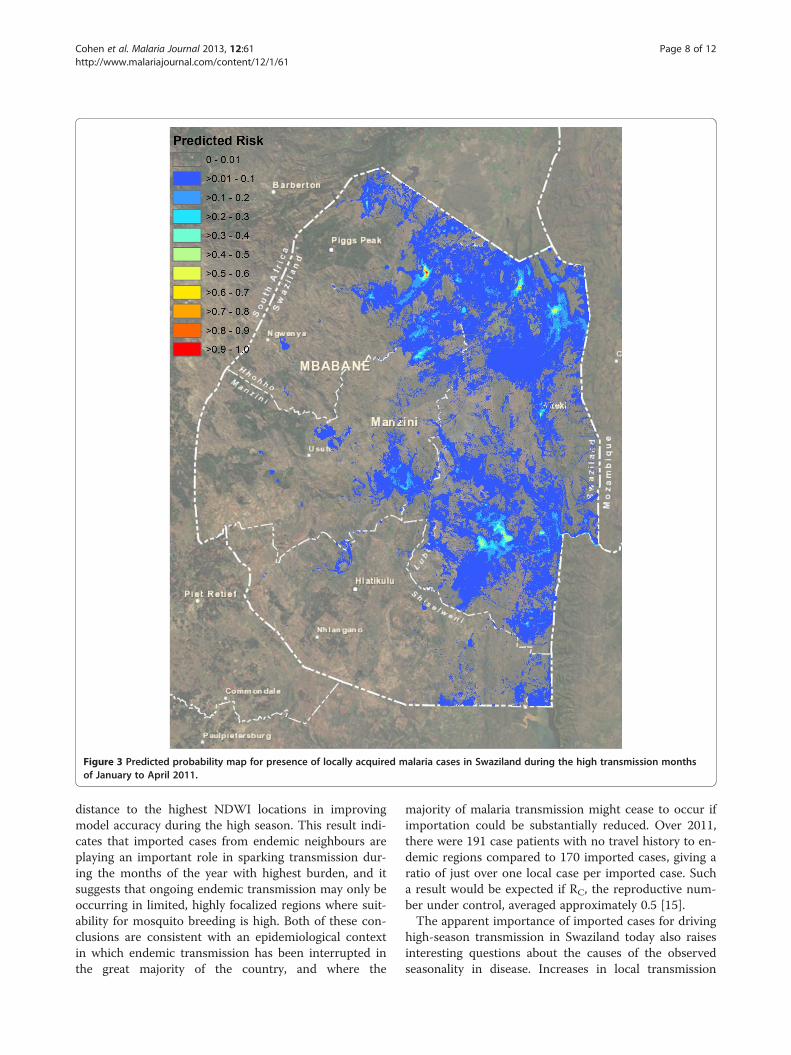
Figure 3 Predicted probability map for presence of locally acquired malaria cases in Swaziland during the high transmission monthsof January to April 2011.
Cohen et al. Malaria Journal 2013, 12:61 Page 8 of 12http://www.malariajournal.com/content/12/1/61
distance to the highest NDWI locations in improvingmodel accuracy during the high season. This result indi-cates that imported cases from endemic neighbours areplaying an important role in sparking transmission dur-ing the months of the year with highest burden, and itsuggests that ongoing endemic transmission may only beoccurring in limited, highly focalized regions where suit-ability for mosquito breeding is high. Both of these con-clusions are consistent with an epidemiological contextin which endemic transmission has been interrupted inthe great majority of the country, and where the
majority of malaria transmission might cease to occur ifimportation could be substantially reduced. Over 2011,there were 191 case patients with no travel history to en-demic regions compared to 170 imported cases, giving aratio of just over one local case per imported case. Sucha result would be expected if RC, the reproductive num-ber under control, averaged approximately 0.5 [15].The apparent importance of imported cases for driving
high-season transmission in Swaziland today also raisesinteresting questions about the causes of the observedseasonality in disease. Increases in local transmission
Figure 4 Predicted probability map for presence of locally acquired malaria cases in Swaziland during the low transmission months ofMay to December 2011.
Cohen et al. Malaria Journal 2013, 12:61 Page 9 of 12http://www.malariajournal.com/content/12/1/61
occurred following the peak rainy season, and rainfallwas found to be an important predictor of risk, particu-larly during the low season months. However, the peakof the rains also coincided with a peak in imported mal-aria cases following the return of travellers from en-demic areas after the holiday season. Although therelative contribution of these two factors is not yet clear,they suggest the importance of a dual strategy that fo-cuses on reducing importation while ensuring that trans-mission potential in high risk areas is minimised. Themultivariate mixed model predicting whether or not an
imported case will lead to local transmission indicatesthat onward transmission risk may be predictable on thebasis of factors including temperature, elevation, wetnessand vector control. This result suggests an evidence-based mechanism for prioritizing responses in highestrisk regions.Prediction of areas of risk during the low season pro-
duced a weaker fitting model than for the high season.In part, this result may be attributed to the fact that only44 case patients with no travel history to endemic areaswere identified during this period. As more surveillance
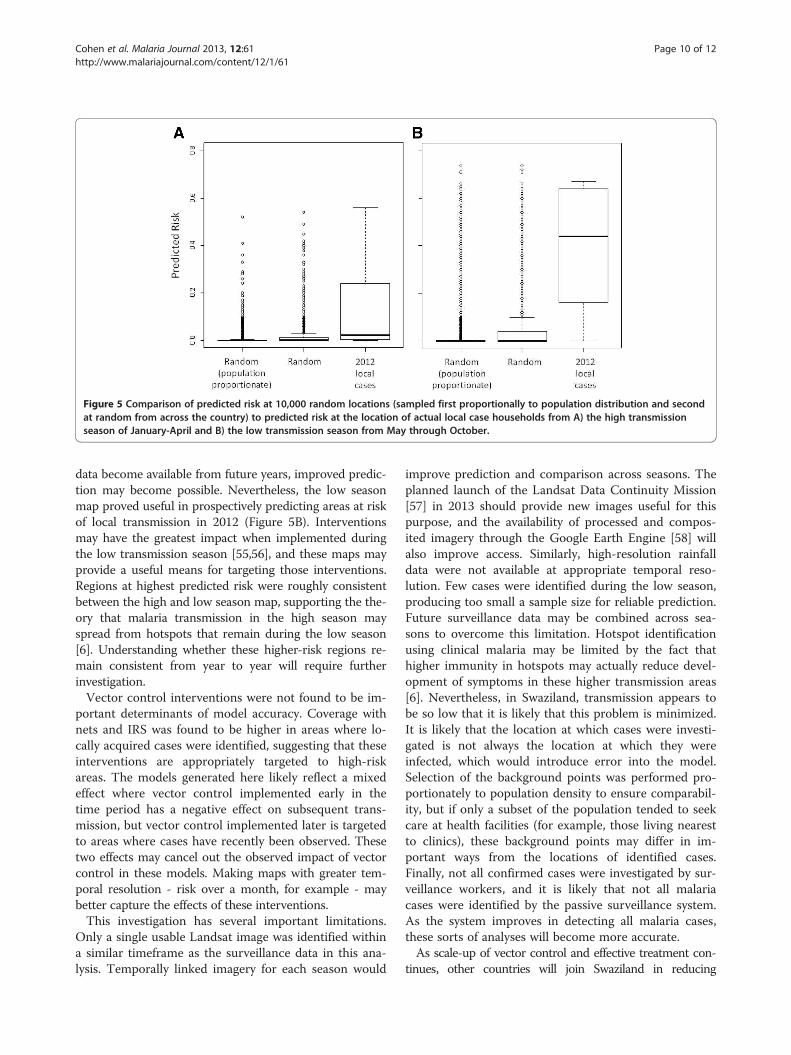
Figure 5 Comparison of predicted risk at 10,000 random locations (sampled first proportionally to population distribution and secondat random from across the country) to predicted risk at the location of actual local case households from A) the high transmissionseason of January-April and B) the low transmission season from May through October.
Cohen et al. Malaria Journal 2013, 12:61 Page 10 of 12http://www.malariajournal.com/content/12/1/61
data become available from future years, improved predic-tion may become possible. Nevertheless, the low seasonmap proved useful in prospectively predicting areas at riskof local transmission in 2012 (Figure 5B). Interventionsmay have the greatest impact when implemented duringthe low transmission season [55,56], and these maps mayprovide a useful means for targeting those interventions.Regions at highest predicted risk were roughly consistentbetween the high and low season map, supporting the the-ory that malaria transmission in the high season mayspread from hotspots that remain during the low season[6]. Understanding whether these higher-risk regions re-main consistent from year to year will require furtherinvestigation.Vector control interventions were not found to be im-
portant determinants of model accuracy. Coverage withnets and IRS was found to be higher in areas where lo-cally acquired cases were identified, suggesting that theseinterventions are appropriately targeted to high-riskareas. The models generated here likely reflect a mixedeffect where vector control implemented early in thetime period has a negative effect on subsequent trans-mission, but vector control implemented later is targetedto areas where cases have recently been observed. Thesetwo effects may cancel out the observed impact of vectorcontrol in these models. Making maps with greater tem-poral resolution - risk over a month, for example - maybetter capture the effects of these interventions.This investigation has several important limitations.
Only a single usable Landsat image was identified withina similar timeframe as the surveillance data in this ana-lysis. Temporally linked imagery for each season would
improve prediction and comparison across seasons. Theplanned launch of the Landsat Data Continuity Mission[57] in 2013 should provide new images useful for thispurpose, and the availability of processed and compos-ited imagery through the Google Earth Engine [58] willalso improve access. Similarly, high-resolution rainfalldata were not available at appropriate temporal reso-lution. Few cases were identified during the low season,producing too small a sample size for reliable prediction.Future surveillance data may be combined across sea-sons to overcome this limitation. Hotspot identificationusing clinical malaria may be limited by the fact thathigher immunity in hotspots may actually reduce devel-opment of symptoms in these higher transmission areas[6]. Nevertheless, in Swaziland, transmission appears tobe so low that it is likely that this problem is minimized.It is likely that the location at which cases were investi-gated is not always the location at which they wereinfected, which would introduce error into the model.Selection of the background points was performed pro-portionately to population density to ensure comparabil-ity, but if only a subset of the population tended to seekcare at health facilities (for example, those living nearestto clinics), these background points may differ in im-portant ways from the locations of identified cases.Finally, not all confirmed cases were investigated by sur-veillance workers, and it is likely that not all malariacases were identified by the passive surveillance system.As the system improves in detecting all malaria cases,these sorts of analyses will become more accurate.As scale-up of vector control and effective treatment con-
tinues, other countries will join Swaziland in reducing
Cohen et al. Malaria Journal 2013, 12:61 Page 11 of 12http://www.malariajournal.com/content/12/1/61
malaria to the point where identification and elimination ofthe final foci of endemic transmission and prevention of on-ward transmission from imported cases become the goals ofanti-malarial efforts. Once malaria incidence has declined tothe point that geolocation of case households is operationallyfeasible, generation of case-based risk maps at high spatialresolution will support control programmes in targetingelimination interventions. Integrating mapping approachesinto user-friendly, rapidly updateable tools [59], potentiallylinked to dynamic transmission models, will provide stra-tegic, evidence-based guidance for adaptive management ofmalaria programmes. Efforts to create user-friendly toolsbased on the models generated here are underway to aidSwaziland's malaria program in rapidly updating risk mapsas new data become available. This sort of case-based map-ping will help ensure that the impact of limited resources ismaximised to achieve and maintain malaria elimination.
AbbreviationsAUC: Area under the curve; ETM: Landsat Enhanced Thematic Mapper;GIS: Geographic information system; IRS: Indoor residual spraying;NDVI: Normalized difference vegetation index; NDWI: Modified normalizeddifference water index; NMCP: National Malaria Control Programme;ROC: Receiver operator characteristic; SAGA: System for AutomatedGeoscientific Analyses; SMS: Short message service; TWI: Topographicwetness index; WHO: World Health Organization.
Competing interestsThe authors declare that they have no competing interests.
Authors' contributionsJMC and AJT conceived of this study. SD and SK oversaw data collection andcontributed to its analysis and interpretation. JMC, SD, JMN, and AJTperformed the statistical analysis and mapping. All authors contributed tointerpretation of results. JC drafted the manuscript, and all authors read andapproved the final manuscript.
AcknowledgementsJMC, JN, and DK acknowledge funding support for this work from the GlobalHealth Group at University of California, San Francisco and the Bill andMelinda Gates Foundation (#1013170). AJT acknowledges funding supportfrom the RAPIDD programme of the Science and Technology Directorate,Department of Homeland Security, and the Fogarty International Center,National Institutes of Health, and is also supported by grants from NIH/NIAID(U19AI089674) and the Bill and Melinda Gates Foundation(#49446 and #1032350).
Author details1Clinton Health Access Initiative, Boston, MA, USA. 2National Malaria ControlProgramme, Mbabane, Swaziland. 3Global Health Group, University ofCalifornia, San Francisco, USA. 4Department of Geography and Environment,University of Southampton, Southampton, UK. 5Fogarty International Center,NIH, Bethesda, MD, USA.
Received: 19 December 2012 Accepted: 10 February 2013Published: 11 February 2013
References1. Mendis K, Rietveld A, Warsame M, Bosman A, Greenwood B, Wernsdorfer
WH: From malaria control to eradication: the WHO perspective. Trop MedInt Health 2009, 14:802–809.
2. Feachem R, Phillips AA, Hwang J, Cotter C, Wielgosz B, Greenwood BM,Sabot O, Rodriguez MH, Abeyasinghe RR, Ghebreyesus TA, Snow RW:Shrinking the malaria map: progress and prospects. Lancet 2010,376:1566–1578.
3. World Health Organization: World Malaria Report 2011. Geneva: WorldHealth Organization; 2011.
4. Moonen B, Cohen JM, Snow RW, Slutsker L, Drakeley C, Smith DL,Abeyasinghe RR, Rodriguez MH, Maharaj R, Tanner M, Targett GA:Operational strategies to achieve and maintain malaria elimination.Lancet 2010, 376:1592–1603.
5. World Health Organization Regional Office for the Eastern Mediterranean:Guidelines on the elimination of residual foci of malaria transmission. Geneva:World Health Organization; 2007.
6. Bousema T, Griffin JT, Sauerwein RW, Smith DL, Churcher TS, Takken W,Ghani A, Drakeley C, Gosling R: Hitting hotspots: spatial targeting ofmalaria for control and elimination. PLoS Med 2012, 9:e1001165.
7. Le Menach A, Tatem AJ, Cohen JM, Hay SI, Randell H, Patil AP, Smith DL:Travel risk, malaria importation and malaria transmission in Zanzibar. SciRep 2011, 1:93.
8. Hay SI, Guerra CA, Gething PW, Patil AP, Tatem AJ, Noor AM, Kabaria CW, ManhBH, Elyazar IR, Brooker S, Smith DL, Moyeed RA, Snow RW: A world malariamap: Plasmodium falciparum endemicity in 2007. PLoS Med 2009, 6:e1000048.
9. Gething PW, Patil AP, Smith DL, Guerra CA, Elyazar IR, Johnston GL, TatemAJ, Hay SI: A new world malaria map: Plasmodium falciparum endemicityin 2010. Malar J 2011, 10:378.
10. Elyazar IRF, Gething PW, Patil AP, Rogayah H, Kusriastuti R, Wismarini DM,Tarmizi SN, Baird JK, Hay SI: Plasmodium falciparum malaria endemicity inIndonesia in 2010. PLoS One 2011, 6:e21315.
11. Noor AM, Clements AC, Gething PW, Moloney G, Borle M, Shewchuk T, HaySI, Snow RW: Spatial prediction of Plasmodium falciparum prevalence inSomalia. Malar J 2008, 7:159.
12. Hay SI, Smith DL, Snow RW: Measuring malaria endemicity from intenseto interrupted transmission. Lancet Infect Dis 2008, 8:369–378.
13. Gething PW, Patil AP, Hay SI: Quantifying aggregated uncertainty inPlasmodium falciparum malaria prevalence and populations at risk viaefficient space-time geostatistical joint simulation. PLoS Comput Biol 2010,6:e1000724.
14. World Health Organization: WHO Expert Committee on Malaria: sixth report.Geneva: World Health Organization; 1957 [World Health OrganizationTechnical Report Series No. 123].
15. Cohen JM, Moonen B, Snow RW, Smith DL: How absolute is zero? Anevaluation of historical and current definitions of malaria elimination.Malar J 2010, 9:213.
16. Swaziland National Malaria Control Programme: Swaziland malaria indicatorsurvey 2010. Manzini, Swaziland: Swaziland Ministry of Health; 2011.
17. Kunene S, Phillips AA, Gosling RD, Kandula D, Novotny JM: A nationalpolicy for malaria elimination in Swaziland: a first for sub-Saharan Africa.Malar J 2011, 10:313.
18. Roll Back Malaria Partnership: Eliminating malaria: learning from the past,looking ahead. Geneva: RBM; 2011 [Progress & Impact Series].
19. Okell LC, Bousema T, Griffin JT, Ouédraogo AL, Ghani AC, Drakeley CJ:Factors determining the occurrence of submicroscopic malaria infectionsand their relevance for control. Nat Commun 2012, 3:1237.
20. Craig MH, Snow RW, Le Sueur D: A climate-based distribution model ofmalaria transmission in sub-Saharan Africa. Parasitol Today 1999, 15:105–110.
21. Cohen JM, Ernst KC, Lindblade KA, Vulule JM, John CC, Wilson ML:Topography-derived wetness indices are associated with household-level malaria risk in two communities in the western Kenyan highlands.Malar J 2008, 7:40.
22. Cohen J, Ernst K, Lindblade K, Vulule J, John C, Wilson M: Local topographicwetness indices predict household malaria risk better than land-use andland-cover in the western Kenya highlands. Malar J 2010, 9:328.
23. Hay S, Snow R, Rogers D: From predicting mosquito habitat to malariaseasons using remotely sensed data: practice, problems andperspectives. Parasitol Today 1998, 14:306–313.
24. Rouse JW, Haas RH, Schell JA, Deering DW: Monitoring vegetation systems inthe Great Plains with ERTS. 1974.
25. Xu H: Modification of normalised difference water index (NDWI) toenhance open water features in remotely sensed imagery. InternationalJournal of Remote Sensing 2006, 27:3025–3033.
26. Hay SI, Guerra CA, Tatem AJ, Atkinson PM, Snow RW: Urbanization, malariatransmission and disease burden in Africa. Nat Rev Microbiol 2005, 3:81–90.
27. Moonen B, Cohen J, Tatem A, Cohen J, Hay S, Sabot O, Smith D: Aframework for assessing the feasibility of malaria elimination. Malar J2010, 9:322.
Cohen et al. Malaria Journal 2013, 12:61 Page 12 of 12http://www.malariajournal.com/content/12/1/61
28. Package “gstat”: Package “gstat”. [http://cran.r-project.org/web/packages/gstat/gstat.pdf].
29. Hijmans RJ, Cameron SE, Parra JL, Jones PG, Jarvis A: Very high resolutioninterpolated climate surfaces for global land areas. Int J Climatology 2005,25:1965–1978.
30. Reuter HI, Nelson A, Jarvis A: An evaluation of void-‐filling interpolationmethods for SRTM data. International Journal of Geographical InformationScience 2007, 21:983–1008.
31. SRTM 90 m Digital Elevation Data: SRTM 90 m Digital Elevation Data. [srtm.csi.cgiar.org].
32. Sørensen R, Zinko U, Seibert J: On the calculation of the topographicwetness index: evaluation of different methods based on fieldobservations. Hydrology and Earth System Sciences 2006, 10:101–112.
33. System for Automated Geoscientific Analyses (SAGA). Hamburg, Germany:Hamburg, Germany; http://www.saga-gis.org.
34. Food and Agriculture Organization of the United Nations: Aquastat: Foodand Agriculture Organization of the United Nations: Aquastat. http://www.fao.org/nr/water/aquastat/water_use_agr/index.stm.
35. DIVA-GIS. [www.diva-gis.org].36. ESRI (Environmental Systems Resource Institute): ArcGIS Desktop 10.0.
Redlands, California: ESRI; 2010.37. Linard C, Gilbert M, Snow RW, Noor AM, Tatem AJ: Population distribution,
settlement patterns and accessibility across Africa in 2010. PLoS One2012, 7:e31743.
38. The AfriPop Project. http://www.afripop.org/.39. Elith JH, Graham CP, Anderson R, Dudík M, Ferrier S, Guisan AJ, Hijmans R,
Huettmann FR, Leathwick J, Lehmann A, Li JG, Lohmann LA, Loiselle B,Manion G, Moritz C, Nakamura M, Nakazawa Y, McC M, Overton J,Townsend Peterson AJ, Phillips S, Richardson K, Scachetti-‐Pereira RE,Schapire R, Soberón J, Williams SS, Wisz ME, Zimmermann N: Novelmethods improve prediction of species’ distributions from occurrencedata. Ecography 2006, 29:129–151.
40. Phillips SJ, Dudík M: Modeling of species distributions with Maxent: newextensions and a comprehensive evaluation. Ecography 2008, 31:161–175.
41. Beyer H: Geospatial Modelling Environment (Version 0.6.0.0). 2012.42. Phillips SJ, Dudík M, Elith J, Graham CH, Lehmann A, Leathwick J, Ferrier S:
Sample selection bias and presence-only distribution models:implications for background and pseudo-absence data. Ecol Appl 2009,19:181–197.
43. Satterthwaite FE: An approximate distribution of estimates of variancecomponents. Biometrics 1946, 2:110–114.
44. Carter R, Mendis KN, Roberts D: Spatial targeting of interventions againstmalaria. Bull World Health Organ 2000, 78:1401–1411.
45. Molineaux L: The epidemiology of human malaria as an explanation ofits distribution, including some implications for its control. In Malaria:principles and practice of malariology. Edited by Wernsdorfer WH, McGregorI. Edinburgh: Churchill Livingstone; 1988. vol. 2.
46. SAS Institute Inc: SAS 9.2 Help and Documentation. Cary, NC: SAS InstituteInc; 2012.
47. Rasmussen S: Modelling of discrete spatial variation in epidemiology withSAS using GLIMMIX. Computer Methods Programs Biomed 2004, 76:83–89.
48. Breiman L: Random Forests. Mach Learn 2001, 45:5–32.49. R Development Core Team: R: A language and environment for statistical
computing. Vienna, Austria: R Foundation for Statistical Computing; 2009.http://www.R-project.org.
50. Freeman E, Frescino T: ModelMap: Modeling and Map production usingRandom Forest and Stochastic Gradient Boosting. USDA Forest Service. Ogden,UT, USA: Rocky Mountain Research Station; 2009.
51. De’ath G, Fabricius KE: Classification and regression trees: a powerful yetsimple technique for ecological data analysis. Ecology 2000, 81:3178–3192.
52. ModelMap: An R Package for Model Creation and Map Production.[http://cran.r-project.org/web/packages/ModelMap/vignettes/VModelMap.pdf].
53. Pearce J, Ferrier S: Evaluating the predictive performance of habitatmodels developed using logistic regression. Ecol Model 2000,133:225–245.
54. World Health Organization: WHO Expert Committee on Malaria: tenth report.Geneva: World Health Organization; 1964 [World Health OrganizationTechnical Report Series No. 272].
55. Griffin JT, Hollingsworth TD, Okell LC, Churcher TS, White M, Hinsley W,Bousema T, Drakeley CJ, Ferguson NM, Basáñez M-G, Ghani AC: Reducing
Plasmodium falciparum malaria transmission in Africa: a model-basedevaluation of intervention strategies. PLoS Med 2010, 7:e1000324.
56. Kern SE, Tiono AB, Makanga M, Gbadoé AD, Premji Z, Gaye O, Sagara I,Ubben D, Cousin M, Oladiran F, Sander O, Ogutu B: Community screeningand treatment of asymptomatic carriers of Plasmodium falciparum withartemether-lumefantrine to reduce malaria disease burden: a modellingand simulation analysis. Malar J 2011, 10:210.
57. National Aeronautics and Space Administration: Landsat: Data ContinuityMission. [ldcm.nasa.gov].
58. Google Earth Engine. [http://earthengine.google.org].59. Kelly GC, Tanner M, Vallely A, Clements A: Malaria elimination: moving
forward with spatial decision support systems. Trends Parasitol 2012,28:297–304.
doi:10.1186/1475-2875-12-61Cite this article as: Cohen et al.: Rapid case-based mapping of seasonalmalaria transmission risk for strategic elimination planning in Swaziland.Malaria Journal 2013 12:61.
Submit your next manuscript to BioMed Centraland take full advantage of:
• Convenient online submission
• Thorough peer review
• No space constraints or color figure charges
• Immediate publication on acceptance
• Inclusion in PubMed, CAS, Scopus and Google Scholar
• Research which is freely available for redistribution
Submit your manuscript at www.biomedcentral.com/submit