
Qx IP I SDI - PHABRIX
251
Qx IP I SDI USER MANUAL Software Release 3.4.2 Manual Revision 16c
-
Upload
khangminh22 -
Category
Documents
-
view
1 -
download
0
Transcript of Qx IP I SDI - PHABRIX
Qx IP I SDIUSER MANUAL
Software Release 3.4.2
Manual Revision 16c

Page II PHABRIX QxUser Manual
About this Manual
Notice
The information in this document has been produced by PHABRIX Ltd with care and is believed to beaccurate. PHABRIX Ltd does not assume responsibility for loss or damage resulting from errors,omissions or inaccuracies herein. This document is subject to change, and revisions may be madeand issued to include such changes.
No part of this document may be reproduced, stored in a retrieval system, or transmitted in any form orby any means, electronic, mechanical, recorded or otherwise without the prior written consent ofPHABRIX Ltd.
Copyright © PHABRIX Ltd. All rights reserved. Software products licensed are owned by PHABRIX Ltdand are protected by international treaty provisions and national copyright laws.
HDMI ® is the registered trademark of HDMI Licensing and is used within the document foridentification purposes only.
PHABRIX® Limited
Omega HouseEnterprise Way,Thatcham, BerkshireRG19 4AE
United Kingdom
phone: + 44 (0)1635 873030
email: [email protected]
www.phabrix.com
PHABRIX QxUser Manual Page III
Revision
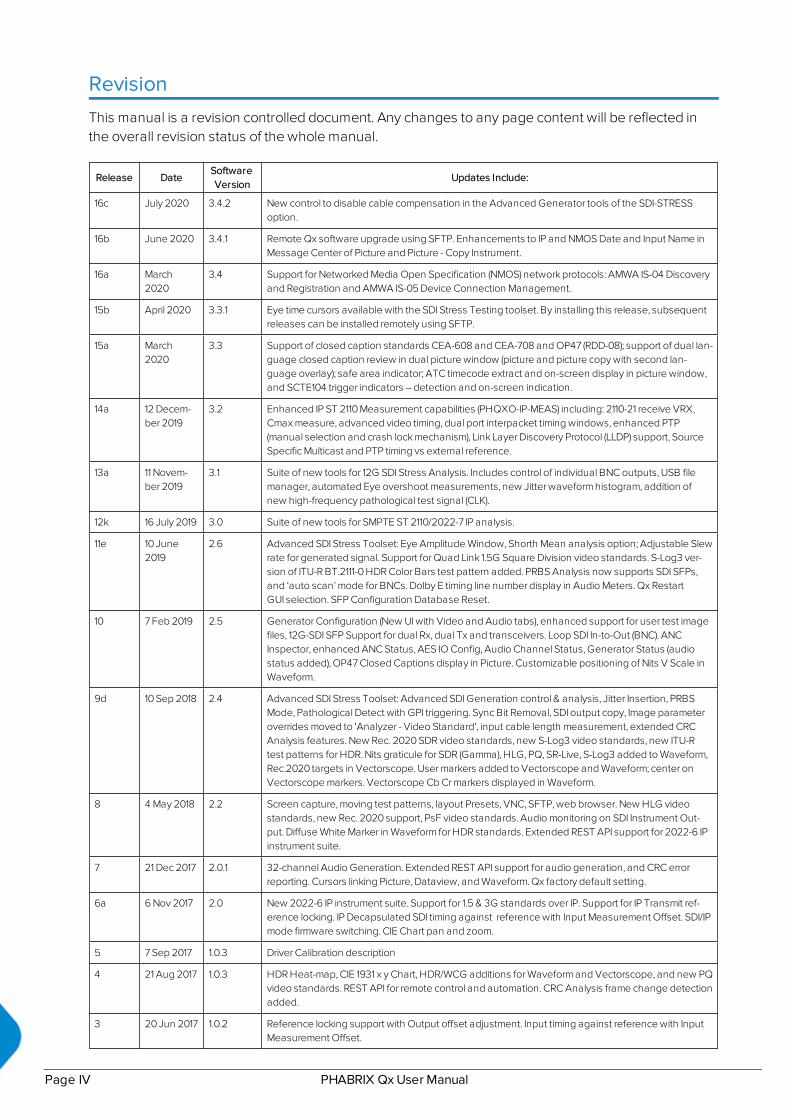
This manual is a revision controlled document. Any changes to any page content will be reflected inthe overall revision status of the whole manual.
Release DateSoftwareVersion
Updates Include:
16c July 2020 3.4.2 New control to disable cable compensation in the Advanced Generator tools of the SDI-STRESSoption.
16b June 2020 3.4.1 Remote Qx software upgrade using SFTP. Enhancements to IP and NMOS Date and Input Name inMessage Center of Picture and Picture - Copy Instrument.
16a March2020
3.4 Support for Networked Media Open Specification (NMOS) network protocols: AMWA IS-04 Discoveryand Registration and AMWA IS-05 Device Connection Management.
15b April 2020 3.3.1 Eye time cursors available with the SDI Stress Testing toolset. By installing this release, subsequentreleases can be installed remotely using SFTP.
15a March2020
3.3 Support of closed caption standards CEA-608 and CEA-708 and OP47 (RDD-08); support of dual lan-guage closed caption review in dual picture window (picture and picture copy with second lan-guage overlay); safe area indicator; ATC timecode extract and on-screen display in picture window,and SCTE104 trigger indicators – detection and on-screen indication.
14a 12 Decem-ber 2019
3.2 Enhanced IP ST 2110 Measurement capabilities (PHQXO-IP-MEAS) including: 2110-21 receive VRX,Cmax measure, advanced video timing, dual port interpacket timing windows, enhanced PTP(manual selection and crash lock mechanism), Link Layer Discovery Protocol (LLDP) support, SourceSpecific Multicast and PTP timing vs external reference.
13a 11 Novem-ber 2019
3.1 Suite of new tools for 12G SDI Stress Analysis. Includes control of individual BNC outputs, USB filemanager, automated Eye overshoot measurements, new Jitter waveform histogram, addition ofnew high-frequency pathological test signal (CLK).
12k 16 July 2019 3.0 Suite of new tools for SMPTE ST 2110/2022-7 IP analysis.
11e 10 June2019
2.6 Advanced SDI Stress Toolset: Eye Amplitude Window, Shorth Mean analysis option; Adjustable Slewrate for generated signal. Support for Quad Link 1.5G Square Division video standards. S-Log3 ver-sion of ITU-R BT.2111-0 HDR Color Bars test pattern added. PRBS Analysis now supports SDI SFPs,and ‘auto scan’ mode for BNCs. Dolby E timing line number display in Audio Meters. Qx RestartGUI selection. SFP Configuration Database Reset.
10 7 Feb 2019 2.5 Generator Configuration (New UI with Video and Audio tabs), enhanced support for user test imagefiles, 12G-SDI SFP Support for dual Rx, dual Tx and transceivers. Loop SDI In-to-Out (BNC). ANCInspector, enhanced ANC Status, AES IO Config, Audio Channel Status, Generator Status (audiostatus added), OP47 Closed Captions display in Picture. Customizable positioning of Nits V Scale inWaveform.
9d 10 Sep 2018 2.4 Advanced SDI Stress Toolset: Advanced SDI Generation control & analysis, Jitter Insertion, PRBSMode, Pathological Detect with GPI triggering. Sync Bit Removal, SDI output copy, Image parameteroverrides moved to 'Analyzer - Video Standard', input cable length measurement, extended CRCAnalysis features. New Rec. 2020 SDR video standards, new S-Log3 video standards, new ITU-Rtest patterns for HDR. Nits graticule for SDR (Gamma), HLG, PQ, SR-Live, S-Log3 added to Waveform,Rec.2020 targets in Vectorscope. User markers added to Vectorscope and Waveform; center onVectorscope markers. Vectorscope Cb Cr markers displayed in Waveform.
8 4 May 2018 2.2 Screen capture, moving test patterns, layout Presets, VNC, SFTP, web browser. New HLG videostandards, new Rec. 2020 support, PsF video standards. Audio monitoring on SDI Instrument Out-put. Diffuse White Marker in Waveform for HDR standards. Extended REST API support for 2022-6 IPinstrument suite.
7 21 Dec 2017 2.0.1 32-channel Audio Generation. Extended REST API support for audio generation, and CRC errorreporting. Cursors linking Picture, Dataview, and Waveform. Qx factory default setting.
6a 6 Nov 2017 2.0 New 2022-6 IP instrument suite. Support for 1.5 & 3G standards over IP. Support for IP Transmit ref-erence locking. IP Decapsulated SDI timing against reference with Input Measurement Offset. SDI/IPmode firmware switching. CIE Chart pan and zoom.
5 7 Sep 2017 1.0.3 Driver Calibration description
4 21 Aug 2017 1.0.3 HDR Heat-map, CIE 1931 x y Chart, HDR/WCG additions for Waveform and Vectorscope, and new PQvideo standards. REST API for remote control and automation. CRC Analysis frame change detectionadded.
3 20 Jun 2017 1.0.2 Reference locking support with Output offset adjustment. Input timing against reference with InputMeasurement Offset.
Page IV PHABRIX QxUser Manual

Release DateSoftwareVersion
Updates Include:
2 21 Mar 2017 1.0.1.227 Addition of Waveform, Vectorscope, HDMI audio and new video standards.
1 23 Jan 2017 1.0.0.196 First release of manual
PHABRIX QxUser Manual Page V
General Safety Information
General Safety
Avoiding Personal Injury
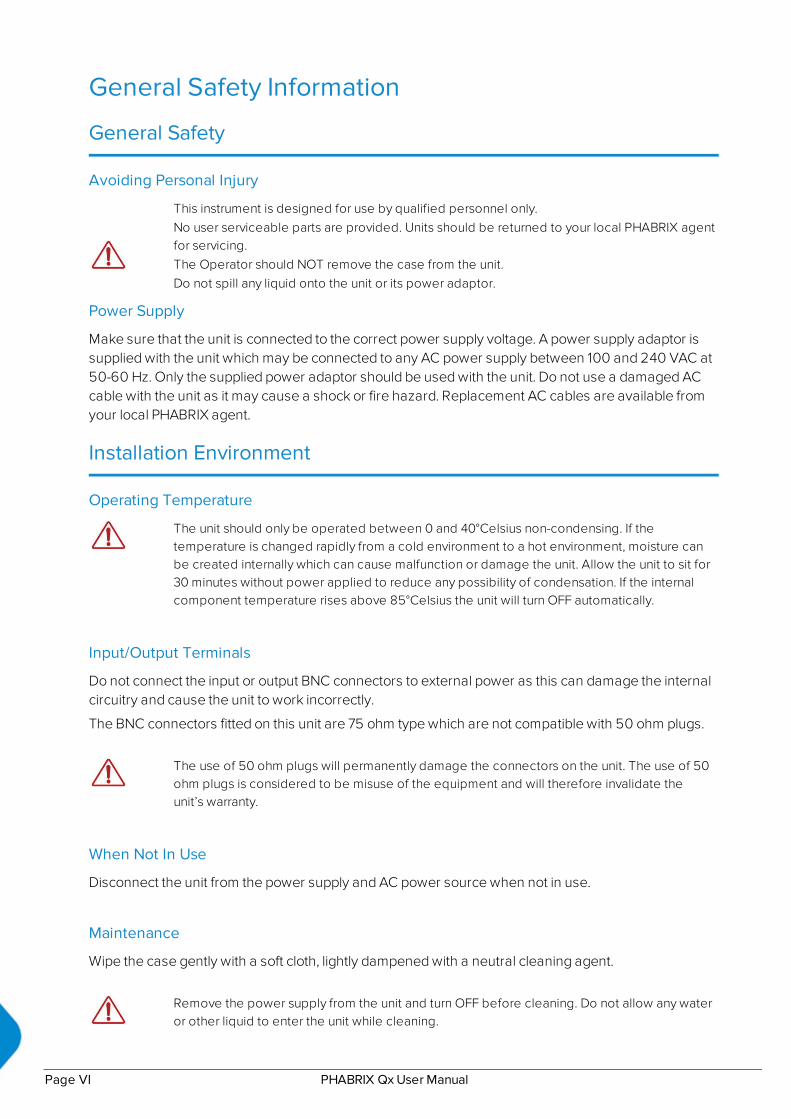
This instrument is designed for use by qualified personnel only.No user serviceable parts are provided. Units should be returned to your local PHABRIX agentfor servicing.The Operator should NOT remove the case from the unit.Do not spill any liquid onto the unit or its power adaptor.
Power Supply
Make sure that the unit is connected to the correct power supply voltage. A power supply adaptor issupplied with the unit which may be connected to any AC power supply between 100 and 240 VAC at50-60 Hz. Only the supplied power adaptor should be used with the unit. Do not use a damaged ACcable with the unit as it may cause a shock or fire hazard. Replacement AC cables are available fromyour local PHABRIX agent.
Installation Environment
Operating Temperature
The unit should only be operated between 0 and 40°Celsius non-condensing. If thetemperature is changed rapidly from a cold environment to a hot environment, moisture canbe created internally which can cause malfunction or damage the unit. Allow the unit to sit for30 minutes without power applied to reduce any possibility of condensation. If the internalcomponent temperature rises above 85°Celsius the unit will turn OFF automatically.
Input/Output Terminals
Do not connect the input or output BNC connectors to external power as this can damage the internalcircuitry and cause the unit to work incorrectly.
The BNC connectors fitted on this unit are 75 ohm type which are not compatible with 50 ohm plugs.
The use of 50 ohm plugs will permanently damage the connectors on the unit. The use of 50ohm plugs is considered to be misuse of the equipment and will therefore invalidate theunit’s warranty.
When Not In Use
Disconnect the unit from the power supply and AC power source when not in use.
Maintenance
Wipe the case gently with a soft cloth, lightly dampened with a neutral cleaning agent.
Remove the power supply from the unit and turn OFF before cleaning. Do not allow any wateror other liquid to enter the unit while cleaning.
Page VI PHABRIX QxUser Manual
RoHS 2 Compliance
PHABRIX products are designed and manufactured using only RoHS compliant components andmaterials. Therefore based on information provided by our suppliers, PHABRIX certifies that ALLproducts that it manufactures are “RoHS-5” compliant and that they do not exceed the designatedlevels of lead, cadmium, mercury, hexavalent chromium, polybrominated biphenyl (PBB) andpolybrominated diphenyl ether flame retardants (PBDE) legislated under the provisions of the“European Parliament and Council Directive” on the “Restriction of the Use of Certain HazardousSubstances in Electrical and Electronic Equipment (2011/65/EC)” and associated regulationscollectively known as the “RoHS Regulations”.
Disposal of Equipment
This product is subject to the European WEEE (Waste Electrical and Electronic Equipment)directive and should be disposed of according to the regulations of each country.
PHABRIX QxUser Manual Page VII

Table of ContentsAbout this Manual III
Notice III
Revision IV
General Safety Information VI
General Safety VI
Avoiding Personal Injury VI
Power Supply VI
Installation Environment VI
Operating Temperature VI
Input/Output Terminals VI
When Not In Use VI
Maintenance VI
RoHS 2 Compliance VII
Disposal of Equipment VII
1 1-1
Getting Started 1-1
Getting StartedQuick Reference 1-2
What's in the Box? 1-2
Mounting the Qx 1-2
Desktop Mounting 1-2
Rack Mounting 1-2
Overview of the Qx Rear Panel Connectors 1-4
Connecting Essential Cables to the Qx 1-5
Powering-up the Qx 1-6
SDI and IP Connections 1-7
Connecting for an SDI Installation Using BNC Connectors 1-7
Connecting for an SDI or IP Installation Using SFP Modules 1-7
Powering-down the Qx 1-9
2 2-1
Workingwith theQx User Interface 2-1
Overview of theQx Product Structure 2-2
Introduction 2-2
Qx Toolsets and Instruments 2-2
StandardQx Toolsets 2-3
Standard Toolset 2-3
SDI and Reference Toolset 2-3
AdvancedQx Toolsets 2-4
Audio and Video Generation Toolset 2-4
12G-SDI Physical Layer Analysis Toolset 2-4
SDI Stress Testing Toolset 2-4
IP Toolsets 2-5
Standard IP Monitoring Toolset for ST 2110 and ST 2022-6 2-5
IP Network Traffic Measurement Toolset for ST 2110 and ST 2022-6 2-5
IP ST 2022-6 Packet Interval Profile Generator Toolset 2-5
Media-related Toolsets 2-6
Advanced High Dynamic Range (HDR) Visualization and Analysis Toolset 2-6
Data View Analyzer with ANC Inspector Toolset 2-6
Page VIII PHABRIX QxUser Manual

Accessing theQx Instruments 2-7
Overview of the Qx Main Screen 2-7
Using the Instrument Launch Menu 2-8
Using the Instrument Bar 2-9
Using the Instrument Bar Options Menu 2-10
Controlling the Audio Monitoring Source 2-10
System Time and Date Display 2-12
Using System State Presets and the Preset Bar 2-12
Overview of theQx InstrumentWindows 2-14
Changing the Border Color of Instrument Windows 2-14
Working with the Qx Instruments 2-15
Selecting Submenu Options and Entering Values 2-15
Resizing an Instrument Window 2-16
Using the Instrument Scroll Bars and Scroll Control Menu 2-17
Taking Screenshots 2-17
Working with Instrument Tabs 2-17
Instrument Icon Quick Reference 2-19
3 3-1
Configuring andChecking theQx 3-1
Qx Network andAutomation 3-2
Overview 3-2
Using VNC to Connect Remotely to the Qx 3-2
Instrument Menu Options 3-3
Setting the Time, Date andNTP Server 3-5
Setting-up the Display 3-7
Modifying the Display Options 3-7
Checking theQx Unit 3-9
Overview 3-9
Checking the Qx System Health Status 3-9
Checking the Qx Licenses 3-10
Restarting the Qx 3-11
Reverting to Factory Default Settings 3-11
Switching the Qx Boot Modes 3-12
Resetting the SFP Configuration Database 3-14
Upgrading theQx 3-16
Upgrading the Qx System Software and Firmware 3-16
Remote Upgrade Using SFTP 3-16
Upgrading the Qx Software Options 3-17
Managing Files with the USB FileManager 3-20
Overview 3-20
Opening the USB File Manager 3-20
Copying Files from Qx to USB 3-21
Uploading Files from USB to the Qx 3-22
Deleting Files from the Qx 3-22
Event Logging on theQx 3-23
Overview 3-23
SDI Modes 3-23
IP Modes 3-23
Remote Connection to theQx 3-25
PHABRIX QxUser Manual Page IX

Overview 3-25
Available Functionality 3-25
Using Virtual Network Computing (VNC) 3-25
Using Secure FTP (SFTP) 3-25
Connecting to the Qx via SFTP 3-26
Using a Web Browser 3-26
Connecting to the Qx via Web Browser 3-26
4 4-1
SDI System Setup andConfiguration 4-1
SDI Connections to theQx 4-2
Overview 4-2
SDI Input and Output Schematic 4-3
SDI Input / Output Configurations (SDI Modes) 4-4
SDI Inputs Using BNC Connectors 4-5
SDI Outputs Using BNC Connectors 4-5
Overview of SDI SFP Connections 4-7
SDI Inputs Using SFP Connectors 4-8
SDI Outputs Using SFP Connectors 4-8
System IO for SDI Modes 4-9
Overview 4-9
System IO for SDI Modes 4-9
Instrument Menu Options 4-9
AES IOConfig (SDI Mode) 4-12
Overview 4-12
Instrument Menu Options 4-13
Video Timing& System Reference (SDI Modes) 4-14
Overview 4-14
Video Timing in SDI Mode 4-14
SDI A vs System Reference 4-14
SDI Co-Timing 4-14
Instrument Menu Options 4-15
SFP (A, B) - Info (SDI Modes) 4-16
Overview 4-16
Instrument Menu Options 4-16
5 5-1
IP System Setup andConfiguration 5-1
Qx IP Connectors andModules 5-2
Overview 5-2
IP Input and Output Schematic (ST 2022-6) 5-3
IP Input and Output Schematic (ST 2110) 5-4
IP Connections to theQx 5-5
Overview 5-5
ST 2110 Input Optical SFP Connection (Analyzer - IP 2110 Mode) 5-5
ST 2022-6 Input Optical SFP Connection (Analyzer - IP 2022-6 Mode) 5-6
ST 2022-6 Output Optical SFP Connection (Generator - IP 2022-6 Mode) 5-6
System IO for IP Modes 5-7
Overview 5-7
System IO for IP Modes 5-7
SFP IP Network 5-8
Page X PHABRIX QxUser Manual

Overview 5-8
Instrument Menu Options 5-9
LLDP Information 5-10
Overview 5-10
Instrument Menu Options 5-11
SFP (A, B) - Info (IP Modes) 5-12
Overview 5-12
Instrument Menu Options 5-12
IP Receive - NMOS (IP 2110 Mode) 5-13
Overview 5-13
Instrument Menu Options 5-14
PTP Info (IP 2110 Mode) 5-16
Overview 5-16
Instrument Menu Options 5-17
Video Timing& System Reference (IP Modes) 5-20
Overview 5-20
Timing in IP 2022-6 Mode: Decapsulated vs System Reference 5-20
Instrument Menu Options 5-21
Video Timing & Setting External Reference in IP 2110 Mode 5-23
Overview 5-23
External Reference vs PTP Tab 5-23
Instrument Menu Options 5-23
IP Receive - Flow Select 5-25
Overview 5-25
Instrument Menu Options 5-26
Multicast Setup (Multicast Requests) 5-28
Using the Instrument Controls 5-28
Flow Protocol Configuration (Flow Config) 5-29
Using the Flow Config Controls 5-29
Analyzer - 2110 Format Setup (IP ST 2110 Mode) 5-32
Overview 5-32
Instrument Menu Options 5-33
Video Timing& System Reference (IP 2110 Mode) 5-35
Overview 5-35
Video Timing in IP 2110 Mode 5-36
Overview 5-36
Media Latency Tab 5-36
Instrument Menu Options 5-37
AES IOConfig (IP Modes) 5-38
Overview 5-38
Instrument Menu Options 5-39
6 6-1
Qx Signal Generation Instruments 6-1
Generate - Video 6-2
Overview 6-2
Instrument Menu Options 6-2
Test Patterns 6-3
User Test Patterns and Images 6-4
Generator Copy and SDI Out Configuration 6-4
PHABRIX QxUser Manual Page XI
Insertion of SMPTE ST352 Payload IDs 6-6
Pathological Signal Insertion 6-7
Output Offset Adjustment (SDI Modes) 6-7
Generate - Audio 6-9
Generator - Status 6-11
Overview 6-11
IP Transmit (SFP B) (ST 2022-6 Mode) 6-12
Overview 6-12
Network Settings 6-13
7 7-1
StandardAnalysis Instruments 7-1
Analyzer - Video Standard (SDI and ST 2022-6 Modes) 7-2
Overview 7-2
Instrument Menu Options 7-2
Ignore Payload Identifier Packets (ST 352) 7-2
Sub Image Pixel Mapping Format Override 7-2
Stats - SDI In A, B, C, D (SDI Modes) 7-3
Overview 7-3
Stats - IP Receive (SFP A) (ST 2022-6 Mode) 7-4
Overview 7-4
8 8-1
Network Analysis Instruments 8-1
Analyzer - 2022-7 Status (IP ST 2110 Mode) 8-2
Overview 8-2
Instrument Menu Options 8-3
SFP (A, B) - Network Stats 8-4
Overview 8-4
9 9-1
Content Analysis Instruments 9-1
Analyzer - Picture 9-2
Overview 9-2
Instrument Menu Options 9-3
Using Closed Captions 9-6
Using Dual Picture Instruments 9-7
Monitoring Closed Captions in Dual Picture Instrument Windows 9-8
Picture Cursor 9-8
Using the Picture Safe Areas 9-9
Displaying the Picture Safe Areas 9-11
Using the Message Center 9-11
SCTE 104 Packet Detection 9-12
Defining Source Input Names 9-12
Displaying the Ancillary Time Code (ATC) 9-13
On Video Loss (IP ST 2110 Mode) 9-14
Analyzer -Waveform 9-15
Overview 9-15
Instrument Menu Options 9-15
Analyzer - Vectorscope 9-17
Overview 9-17
Instrument Menu Options 9-17
Page XII PHABRIX QxUser Manual

Analyzer - CRC Analysis 9-18
Overview 9-18
Instrument Menu Options 9-19
10 10-1
Audio Signal Analysis Instruments 10-1
Analyzer - Audio Channel Status 10-2
Overview 10-2
Raw Data Display 10-3
Instrument Menu Options 10-3
Analyzer - AudioMeters 10-4
Overview 10-4
Instrument Menu Options 10-6
11 11-1
Data Analysis Instruments 11-1
Analyzer - Dataview 11-2
Overview 11-2
Instrument Menu Options 11-3
Analyzer - Ancillary Status 11-4
Overview 11-4
Instrument Menu Options 11-5
Analyzer - Ancillary Inspector 11-8
Overview 11-8
Instrument Menu Options 11-8
12 12-1
IP Network Traffic Measurement 12-1
IP Receive - Interpacket Timing 12-2
Overview 12-2
Interpacket Timing in IP 2022-6 Mode 12-3
IP 2022-6 Instrument Menu Options 12-3
Interpacket Timing in IP 2110 Mode 12-4
IP 2110 Instrument Menu Options 12-5
Analyzer - 2110-21 Status (IP ST 2110 Mode) 12-7
Overview 12-7
Measurements and Instrument Menu Options 12-8
Measurement Prechecks 12-8
Network Compatibility Model Measurement (CINST) 12-8
Virtual Receiver Buffer Measurement (VRX) 12-10
AdvancedMedia TimingMeasurement (IP 2110) 12-13
Overview 12-13
Using the Advanced Video Timing Tab 12-14
Using the Advanced Media Latency Tab 12-14
Instrument Menu Options 12-15
13 13-1
12GPhysical Layer Analysis 13-1
Eye - SDI In A (Physical Layer Analysis Mode) 13-2
Overview 13-2
Instrument Menu Options 13-3
Jitter - SDI In A (Physical Layer Analysis Mode) 13-5
PHABRIX QxUser Manual Page XIII
Overview 13-5
Instrument Menu Options 13-5
14 14-1
Stress-testing Analysis Instruments 14-1
AdvancedGeneration Tools (SDI Stress Mode) 14-2
Overview 14-2
SDI Scrambler 14-2
Sync Bit Insertion (6G / 12G) 14-2
PRBS Mode 14-3
Jitter Insertion 14-3
Slew Rate 14-4
Driver and Output Control 14-4
Cable Compensation 14-4
Eye - SDI In A (SDI Stress Mode) 14-6
Overview 14-6
Using the Eye Time Cursors 14-7
Instrument Menu Options 14-8
PRBS Analysis (SDI Stress Mode) 14-11
Overview 14-11
Instrument Menu Options 14-11
15 15-1
HDR Analysis Instruments 15-1
AdvancedHDR Toolset 15-2
Overview 15-2
HDR Test Patterns 15-2
Transfer Curve and Colorimetry Overrides 15-3
Analyzer - CIE Chart 15-4
Overview 15-4
Instrument Menu Options 15-4
HDR Heat-map (False Color Overlay) 15-6
Instrument Options (HDR) 15-7
16 16-1
Additional System Information 16-1
Using the RESTAPI for Remote Access 16-2
Activating the REST API on the Qx 16-2
Connecting to the Qx Using the REST API 16-2
Using REST API Requests 16-3
Using REST API Requests 16-3
Using REST API Requests in IP Mode 16-4
Driver Calibration 16-5
Overview 16-5
SDI Output Calibration Steps 16-5
A A-1
Qx Technical Specifications A-1
Power A-2
External Locking Reference A-2
SDI Instrument Output A-2
HDMI Instrument Output A-2
USB A-2
Page XIV PHABRIX QxUser Manual
Networking A-3
Rear panel D26 A-3
AES I/O A-3
Longitudinal Timecode (LTC) A-4
Analog Audio Output A-4
GPIO A-4
B B-1
AdvancedMedia Timing Information B-1
Overview B-2
Advanced Media Timing Definitions B-2
Video IP Packet Timing Schematics B-2
Measurements in the Video Timing Tab B-5
Video Timing (First Packet Time) Measurement B-5
Margin Measurement B-7
RTP Offset Measurement B-7
Measurements in the Media Latency Tab B-8
Media Latency Measurement B-8
RTP Clock and Timestamps B-9
RTP Clocks per Timestamp Quotient (RTP / TS) B-10
Working with Non-integer Frame Rates B-11
Un-locked Media Sources B-12
Sources Not Locked to PTP B-12
C C-1
On-goingQx Development C-1
SMPTE UHDTV: SDI Physical Layer Tolerances C-1
D D-1
Supported SFPs D-1
E E-1
SupportedVideo Standards E-1
2K/HD Supported Formats E-1
4K/UHD Supported Formats E-4
PHABRIX QxUser Manual Page XV

1Getting StartedThis chapter describes how to connect your Qx to get it up and running and includes the followingsections:
l Getting Started Quick Reference
l What's in the Box
l Mounting the Qx
l Overview of Qx Rear Panel Connectors
l Connecting Essential Cables to the Qx
l Powering-up the Qx
l SDI and IP Connections
l Powering-down the Qx
PHABRIX QxUser Manual Page 1-1
Getting Started Quick Reference
What's in the Box?On receipt of your Qx shipment, proceed as follows:
1. Check the external packaging for any visible signs of damage.Should you find any damage, contact the courier immediately.
2. Carefully open the packaging and check that it contains the following standard items:
l One Qx unit; either:
l PHABRIX Qx chassis: PHQX01-3G or
l PHABRIX Qx chassis: PHQX01E-3G (with Eye and Jitter Physical Layer Analysis)
l One XLR power cord.
l One AC power adapter (90 - 264 VAC, 120 W)
l PHABRIX USB stick containing standard software with any ordered software options andQx user manual.
3. Check all optional items against your order form or invoice.
4. If you suspect optional items are missing, contact your Distributor or PHABRIX support at:https://phabrix.com/support/
5. Complete the Product Registration form available at:https://phabrix.com/support/product-registration
Mounting the QxYou can install the Qx as a standalone unit on a desktop or rack-mount the unit or units using one ofthe following optional rack-mounting kits:
l For a single Qx unit, use both options:
l Qx 19 inch rack mount kit (PHQXK1)
l Qx mounting kit - 9.5 inch rack (PHQXK3)
l For two Qx units:
l Qx 19 inch rack mount kit (PHQXK2)
Desktop Mounting
To desk mount a standalone Qx unit, place the unit on a clean, level dust-free surface and connect thecables as described in the section "Connecting Essential Cables to the Qx" on page 1-5. Ensure thatthe unit is positioned to allow sufficient airflow for cooling purposes.
Rack Mounting
To rack-mount one or more units in a 19 inch rack, follow the procedure in the instruction guideincluded with the mounting hardware. Ensure that the unit(s) have an unrestricted airflow and accessto the power connectors in the rack.
Page 1-2 PHABRIX QxUser Manual

Figure 1-1: Single Rack Mount Tray with Cover (Option PHQXK1)
Figure 1-2: Dual Rack Mount (Option PHQXK2)
PHABRIX QxUser Manual Page 1-3

Overview of the Qx Rear Panel Connectors
Figure 1-3: Qx Rear Panel Connectors
The Qx rear panel connectors are described in the following table:
Table 1-1 : Key to Qx Rear Panel Connectors
No. Connector No. Connector
1 Generator/Duplicate SDI or Input SDI LoopOutputs Supported formats: HD, 3G, 6G, 12G.SDI 75 R BNC Connectors x 4
7 Micro USB(Factory Service)
2 Analyzer SDI InputsSupported formats: HD, 3G, 6G, 12GSDI 75 R BNC Connectors x 4
8 HDMI Instrument Output(To 1080p60)
3 SDI In A Eye SignalSupported formats: HD, 3G, 6G, 12G
9 Reference Loop75R BNC x 2
4 Analyzer IP or SDI Inputs and/or Generator IPor SDI outputs(SFP+ SDI up to 12G, 12 Gbps copper, fiber, or10G Ethernet).
10 SDI 75R BNC Instrument OutputFormats: 1080p60, 1080p59.94,1080p60 3G-SDI
5 AC Power Socket (10 - 18 V) 11 USB 2.0 Ports x2
6 Stereo Audio OutLTC In, 8x GPI I/O, 4x AES I/OFor details of the connector pinouts, seeAppendix A.
12 Control Network / Management Port10 / 100 / 1000 Base T
Note:The following interfaces are unavailable in this software release:
l LTC In
l SDI instrument output (unavailable in IP 2110 boot-up mode only.)
Page 1-4 PHABRIX QxUser Manual
Connecting Essential Cables to the QxAfter unpacking your Qx unit, you can get it up and running either as a standalone instrument on adesktop, or mounted in a rack, using the appropriate mounting kit, if ordered.
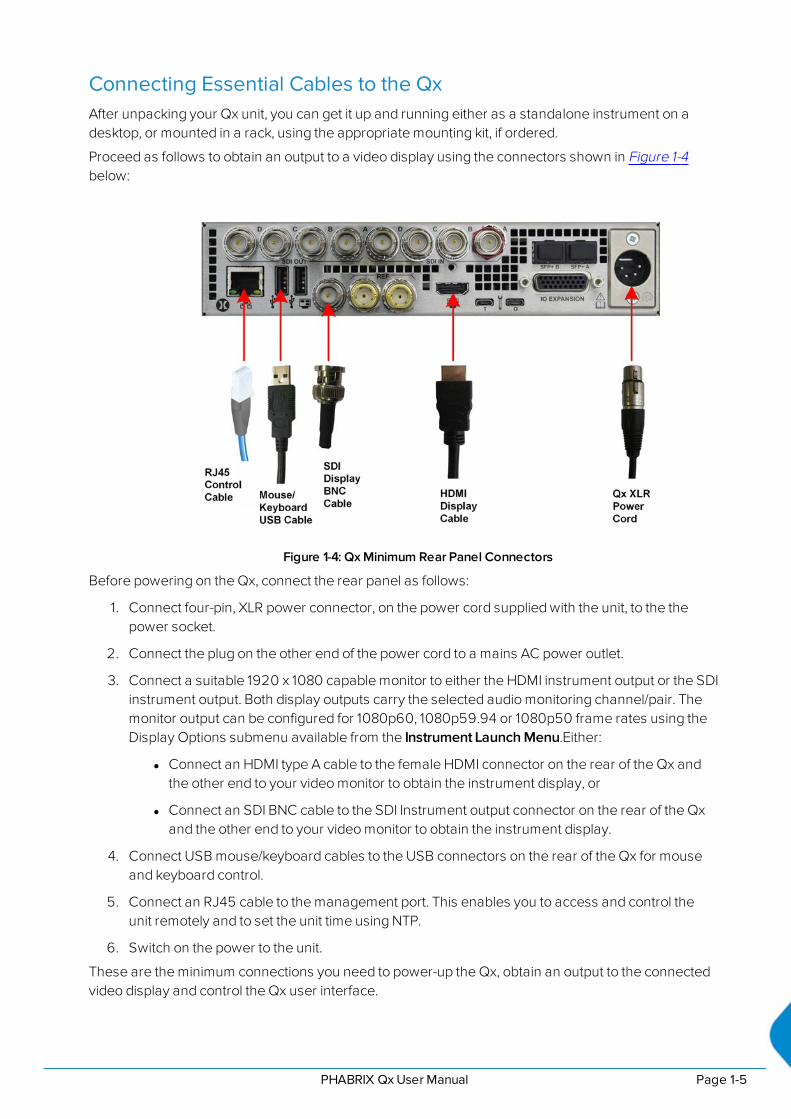
Proceed as follows to obtain an output to a video display using the connectors shown in Figure 1-4below:
Figure 1-4: Qx Minimum Rear Panel Connectors
Before powering on the Qx, connect the rear panel as follows:
1. Connect four-pin, XLR power connector, on the power cord supplied with the unit, to the thepower socket.
2. Connect the plug on the other end of the power cord to a mains AC power outlet.
3. Connect a suitable 1920 x 1080 capable monitor to either the HDMI instrument output or the SDIinstrument output. Both display outputs carry the selected audio monitoring channel/pair. Themonitor output can be configured for 1080p60, 1080p59.94 or 1080p50 frame rates using theDisplay Options submenu available from the Instrument Launch Menu.Either:
l Connect an HDMI type A cable to the female HDMI connector on the rear of the Qx andthe other end to your video monitor to obtain the instrument display, or
l Connect an SDI BNC cable to the SDI Instrument output connector on the rear of the Qxand the other end to your video monitor to obtain the instrument display.
4. Connect USB mouse/keyboard cables to the USB connectors on the rear of the Qx for mouseand keyboard control.
5. Connect an RJ45 cable to the management port. This enables you to access and control theunit remotely and to set the unit time using NTP.
6. Switch on the power to the unit.
These are the minimum connections you need to power-up the Qx, obtain an output to the connectedvideo display and control the Qx user interface.
PHABRIX QxUser Manual Page 1-5
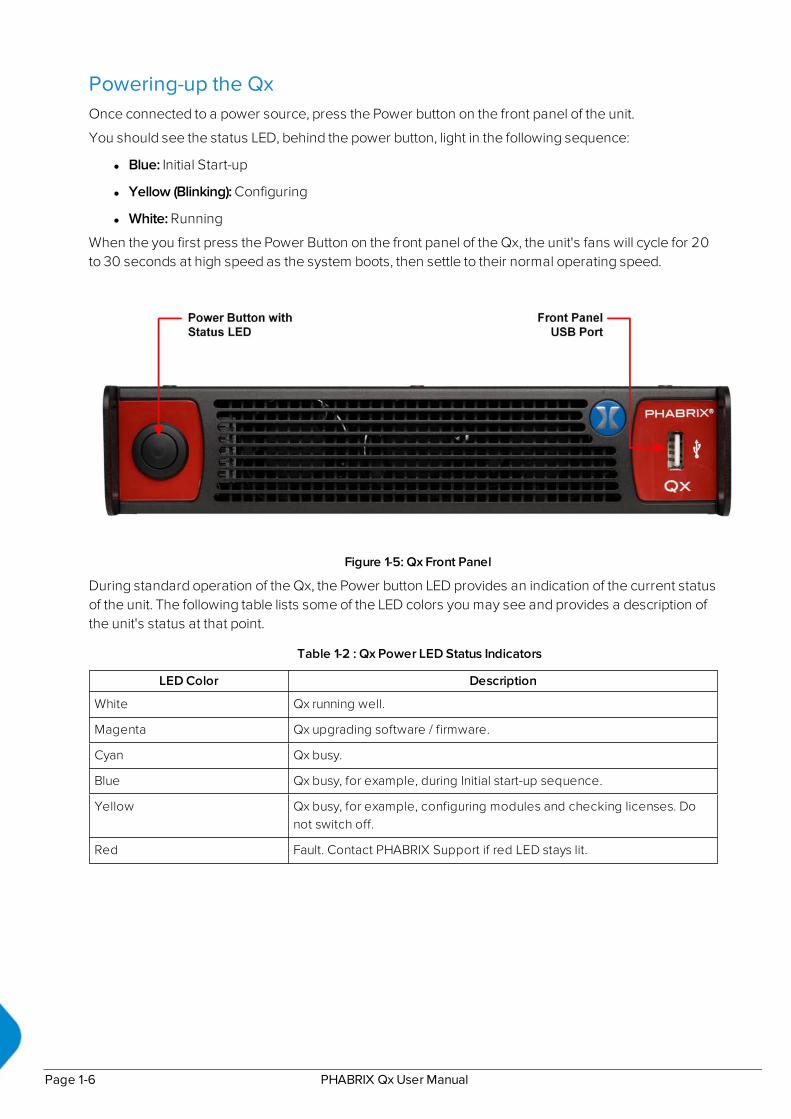
Powering-up the QxOnce connected to a power source, press the Power button on the front panel of the unit.
You should see the status LED, behind the power button, light in the following sequence:
l Blue: Initial Start-up
l Yellow (Blinking): Configuring
l White: Running
When the you first press the Power Button on the front panel of the Qx, the unit's fans will cycle for 20to 30 seconds at high speed as the system boots, then settle to their normal operating speed.
Figure 1-5: Qx Front Panel
During standard operation of the Qx, the Power button LED provides an indication of the current statusof the unit. The following table lists some of the LED colors you may see and provides a description ofthe unit's status at that point.
Table 1-2 : Qx Power LED Status Indicators
LED Color Description
White Qx running well.
Magenta Qx upgrading software / firmware.
Cyan Qx busy.
Blue Qx busy, for example, during Initial start-up sequence.
Yellow Qx busy, for example, configuring modules and checking licenses. Donot switch off.
Red Fault. Contact PHABRIX Support if red LED stays lit.
Page 1-6 PHABRIX QxUser Manual

SDI and IP ConnectionsA key advantage of the Qx is that it includes both Generator and Analyzer, so this guide to the productconsiders both toolsets simultaneously.
Connecting for an SDI Installation Using BNC ConnectorsFor this guide we will assume that you have connected the unit to itself as shown in the followingdiagrams for SDI (BNC or SFP) or IP 2022-6 optical SFP use. For dual link SDI standards also connectSDI Out B to SDI In B, and for quad link SDI standards, connect all four outputs SDI Out A, B, C, D to SDIIn A, B, C, D respectively.
Figure 1-6: Connecting the Internal Qx Generator to the Analyzer Using BNC Connectors
Connecting for an SDI or IP Installation Using SFP ModulesIn IP 2110 mode, both SFP+A and SFP+B are available for decapsulation (reception) and a stable sourceof ST 2059 precision time protocol (PTP) must be available on the network to which SFP+A isconnected.
PHABRIX QxUser Manual Page 1-7

Figure 1-7: Connecting the Internal Qx Generator to the Analyzer Using SFP Connectors
Page 1-8 PHABRIX QxUser Manual
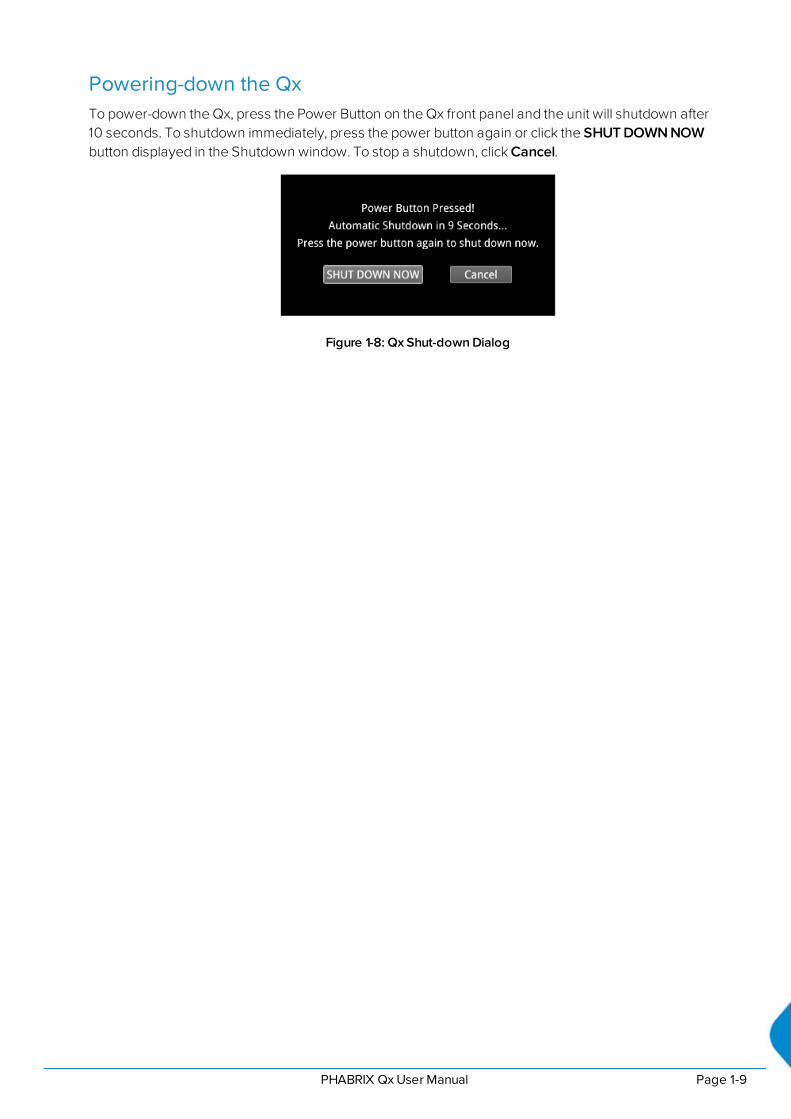
Powering-down the QxTo power-down the Qx, press the Power Button on the Qx front panel and the unit will shutdown after10 seconds. To shutdown immediately, press the power button again or click the SHUT DOWN NOWbutton displayed in the Shutdown window. To stop a shutdown, click Cancel.
Figure 1-8: Qx Shut-down Dialog
PHABRIX QxUser Manual Page 1-9
2Working with the Qx User InterfaceThis chapter describes how to use the key features of the Qx interface and includes the followingsections:
l Overview of the Qx Product Structure
l Overview of the Qx Main Screen
l Using the Instrument Launch Menu
l Using the Instrument Bar
l Overview of the Qx Instrument Windows
l Working with the Qx Instruments
l Working with Instrument Tabs
l Icon Quick Reference
PHABRIX QxUser Manual Page 2-1
Overview of the Qx Product Structure
IntroductionThe Qx is a highly-flexible, modular device, which you can custom-build from a diverse palette of bothstandard and optional components.
This chapter provides an introduction to these components - the Toolsets, Instruments and Optionsavailable with the Qx - which you can combine to create a solution that meets the specific demands ofyour media test and measurement environment.
Qx Toolsets and InstrumentsIn essence, each Qx Instrument is a standalone utility or application designed to provide a specificsolution to a test and measurement task. For example, the Qx provides Instruments to analyze thepicture display or waveform; generate video or audio test signals; decode auxiliary data; providestatus information and so on. You can adapt or modify the functioning of all Qx Instruments using theconfiguration options available in the Instrument right-click submenus.
The Qx Toolsets group together Instruments at a higher functional level to assist with defining yourideal Qx configuration.
It is important to note that Toolsets outside the standard Toolset(s) require additional Options(hardware or software) to enable you to install the license for that Toolset. In addition, you may need torestart the Qx in a different Boot Mode to activate some of the Toolsets described in the followingsections.
As standard, the Qx offers a flexible, user-defined, Instrument layout displaying up to 16 Instrumentwindows simultaneously. Furthermore, by saving different operational layouts for specific tasks asPresets, you can switch easily between bespoke layouts for rapid fault diagnosis, compliancemonitoring and product development.
Page 2-2 PHABRIX QxUser Manual

Standard Qx Toolsets
Standard ToolsetThe standard or core Toolset provides the following Qx Instruments and associated utilities:
l Analyzer - Ancillary Status Instrument
l Analyzer - Audio Channel Status Instrument
l Analyzer - Audio Meters Instrument
l Analyzer - Picture and Analyzer - Picture Copy Instruments
l Analyzer - Vectorscope Instrument
l Analyzer - Waveform Instrument
l Event Logging Instrument
l Network and Automation Instrument
l Supporting standard utilities:
l USB File Manager
l VNC Remote Connection
l REST API.
SDI and Reference ToolsetThe SDI and Reference Toolset provides the following Qx Instruments:
l AES IO Configuration Instrument
l Analyzer - CRC Analysis Instrument
l Analyzer - Video Standard (SDI) Instrument
l Stats - SDI In A Instrument
l Stats - SDI In B Instrument
l Stats - SDI In C Instrument
l Stats - SDI In D Instrument
l System IO Instrument
l Video Timing & System Reference (SDI) Instrument.
PHABRIX QxUser Manual Page 2-3

Advanced Qx Toolsets
Audio and Video Generation ToolsetThe Audio and Video Generation Toolset provides the following Instruments:
Note: This Toolset requires the software option: PHQXO-GEN.
l Generator - Configuration Instrument (Includes separate tabs for Video and Audio signal gen-eration)
l Generator - Status Instrument.
12G-SDI Physical Layer Analysis ToolsetThe 12G-SDI Physical Layer Analysis Toolset provides the following Instruments:
Note: This Toolset requires the additional hardware option for Eye and Jitteranalysis PHQXM-01E Mezzanine.
l Eye - SDI In A Instrument
l Jitter SDI In A Instrument.
SDI Stress Testing ToolsetThe SDI Stress Testing Toolset provides the following Instruments and tools:
Note: This Toolset requires the software option: PHQXO-SDI-STRESS and must be run in bootmode: SDI Stress Toolset.
l Advanced Generator Tools (Additional submenu item in Generator - Configuration Instrument)
l Advanced Eye Analysis (Additional submenu item in Eye - SDI In A Instrument)
l PRBS Analysis Instrument
l Pathological Detection Tools (Additional submenu item in Generator - Configuration Instrument).
Page 2-4 PHABRIX QxUser Manual
IP Toolsets
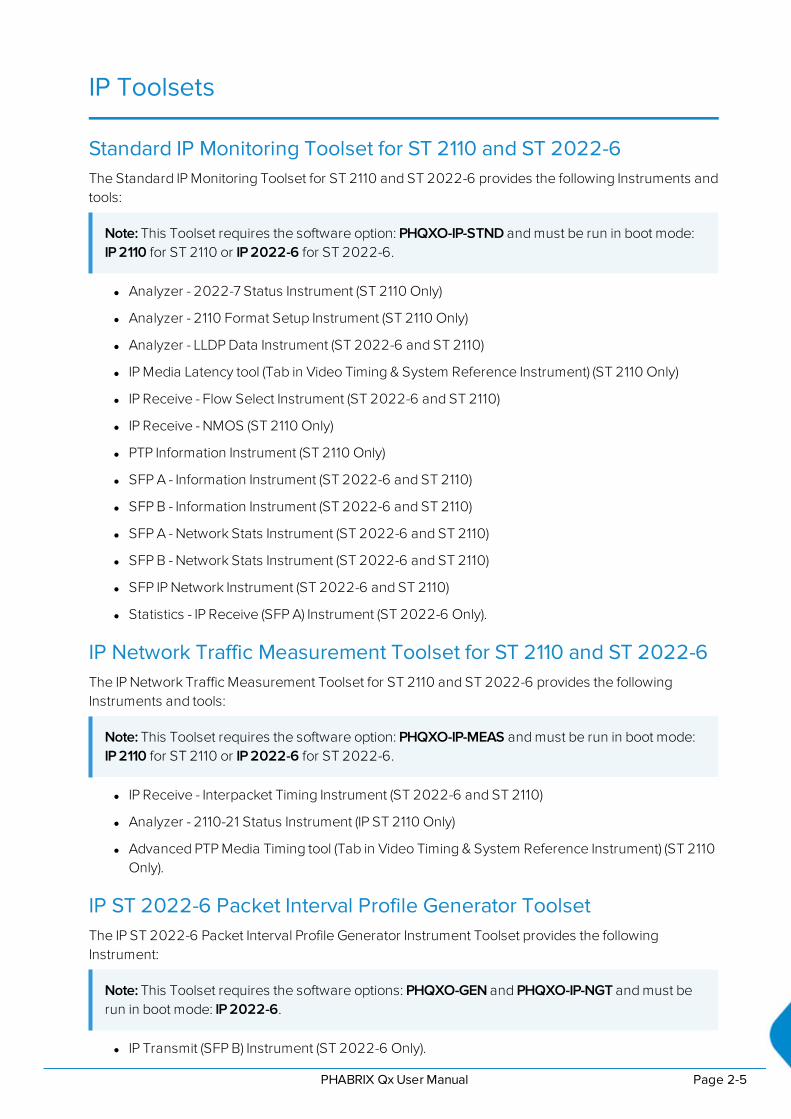
Standard IP Monitoring Toolset for ST 2110 and ST 2022-6The Standard IP Monitoring Toolset for ST 2110 and ST 2022-6 provides the following Instruments andtools:
Note: This Toolset requires the software option: PHQXO-IP-STND and must be run in boot mode:IP 2110 for ST 2110 or IP 2022-6 for ST 2022-6.
l Analyzer - 2022-7 Status Instrument (ST 2110 Only)
l Analyzer - 2110 Format Setup Instrument (ST 2110 Only)
l Analyzer - LLDP Data Instrument (ST 2022-6 and ST 2110)
l IP Media Latency tool (Tab in Video Timing & System Reference Instrument) (ST 2110 Only)
l IP Receive - Flow Select Instrument (ST 2022-6 and ST 2110)
l IP Receive - NMOS (ST 2110 Only)
l PTP Information Instrument (ST 2110 Only)
l SFP A - Information Instrument (ST 2022-6 and ST 2110)
l SFP B - Information Instrument (ST 2022-6 and ST 2110)
l SFP A - Network Stats Instrument (ST 2022-6 and ST 2110)
l SFP B - Network Stats Instrument (ST 2022-6 and ST 2110)
l SFP IP Network Instrument (ST 2022-6 and ST 2110)
l Statistics - IP Receive (SFP A) Instrument (ST 2022-6 Only).
IP Network Traffic Measurement Toolset for ST 2110 and ST 2022-6The IP Network Traffic Measurement Toolset for ST 2110 and ST 2022-6 provides the followingInstruments and tools:
Note: This Toolset requires the software option: PHQXO-IP-MEAS and must be run in boot mode:IP 2110 for ST 2110 or IP 2022-6 for ST 2022-6.
l IP Receive - Interpacket Timing Instrument (ST 2022-6 and ST 2110)
l Analyzer - 2110-21 Status Instrument (IP ST 2110 Only)
l Advanced PTP Media Timing tool (Tab in Video Timing & System Reference Instrument) (ST 2110Only).
IP ST 2022-6 Packet Interval Profile Generator ToolsetThe IP ST 2022-6 Packet Interval Profile Generator Instrument Toolset provides the followingInstrument:
Note: This Toolset requires the software options: PHQXO-GEN and PHQXO-IP-NGT and must berun in boot mode: IP 2022-6.
l IP Transmit (SFP B) Instrument (ST 2022-6 Only).
PHABRIX QxUser Manual Page 2-5

Media-related Toolsets
Advanced High Dynamic Range (HDR) Visualization and Analysis ToolsetThe Advanced High Dynamic Range (HDR) Toolset provides the following Instruments and tools:
Note: This Toolset requires the software option: PHQXO-HDR.
l False Color Highlighting (Additional submenu item in Analyzer - Picture and Analyzer - PictureCopy Instruments)
l Analyzer CIE Chart Instrument.
l HDR Waveform and Gen ( Additional submenu items in Generator - Configuration (Video) andAnalyzer - Waveform Instruments).
Data View Analyzer with ANC Inspector ToolsetThe Data View Analyzer with ANC Inspector Toolset provides the following Instruments:
Note: This Toolset requires the software option: PHQXO-DATA.
l Analyzer - Data View Instrument
l Analyzer - ANC Inspector Instrument.
Page 2-6 PHABRIX QxUser Manual

Accessing the Qx Instruments
Overview of the Qx Main ScreenOn first powering-up the Qx, you will see the following screen displayed:
Figure 2-1: Initial Qx Screen Following Start-up
The Qx Instrument Launch Menu gives you access to all the test and measurement instrumentsavailable under your Qx license(s).
To open the Instrument Launch Menu, click the PHABRIX button in the bottom-left corner of theInstrument Bar.
Figure 2-2: PHABRIX Button to Open the Instrument Launch Menu
PHABRIX QxUser Manual Page 2-7

Using the Instrument Launch MenuThe Instrument Launch Menu provides access to the Qx test and measurement Instruments and othersystem menus available with your Qx. Open the Instrument Launch Menu by clicking the PHABRIXbutton in the bottom-left corner of the screen.
Figure 2-3: Open Qx Launch Menu
The Qx includes four possible boot modes and each boot mode includes a different combination ofoptions in the Instrument Launch Menu. For more information on the different Qx boot modes, see thesection: "Switching the Qx Boot Modes" on page 3-12.
On start up, you will see the following SDI Instrument Launch Menu, displayed by default:
Page 2-8 PHABRIX QxUser Manual

Figure 2-4: Qx Launch Menu in SDI Boot Mode
Each Instrument available in the menu is listed alongside its designated icon. Options listed at the topof the menu, without icons, provide access to system menus and actions, such as switching the bootmode or reverting to default settings.
When you select an instrument from the Instrument Launch menu, the Instrument window opens andits icon is displayed in the Instrument Bar at the bottom of the screen.
As you select each new instrument, the Qx adds another icon to the Instrument Bar.
Figure 2-5: Qx Instrument Bar Showing Icons for Active Instruments
Using the Instrument BarAs you open an Instrument from the Instrument Launch Menu, the Qx adds the corresponding icon forthat Instrument to the Instrument Bar. To identify the Instrument corresponding to an icon, simplyhover the mouse over the icon and the Qx displays a tooltip showing the name of that Instrument.
You can use the Instrument icons to bring a particular Instrument window into focus, a useful feature ifyou have a number of Instruments overlapping on the display. On finishing with an Instrument, right-click its icon and select the option Close "Instrument Name".
PHABRIX QxUser Manual Page 2-9

Figure 2-6: Key Components of the Instrument Bar
To give Instruments in the lower part of the display more screen space, you can hide the InstrumentBar by left-clicking in any of the blank sections of the Bar. Move the cursor back to the bottom of thescreen, at any time, to redisplay the Instrument Bar.
In addition, the Qx displays any configuration presets you define in a Presets Bar, below the InstrumentBar, depending on the setting of the option Auto-hide Presets in the Instrument Bar Options menu. Formore information on saving Presets, see "Using System State Presets and the Preset Bar" on page 2-12
Using the Instrument Bar Options Menu
Further options to control the Instrument and Preset bars are available by right-clicking in theInstrument Bar to display the Instrument Bar Options menu, shown below:
Figure 2-7: Instrument Bar Options Menu
You can close all Instrument windows together by right-clicking the Instrument Bar and selecting theoption Close All Windows from the menu.
When the Auto-hide Presets checkbox in the Options menu is selected, the Presets bar remainshidden when the Instrument Bar is active. To view any saved Presets, uncheck the Auto-hide Presetscheckbox. For more information on saving system Presets, see the section: "Using System StatePresets and the Preset Bar" on page 2-12.
Controlling the Audio Monitoring Source
An icon to control the Audio Monitoring Source is displayed at the right-hand side of the InstrumentBar, before the time and date display. The audio monitoring icon controls the audio monitoring output
Page 2-10 PHABRIX QxUser Manual

of the unit, whether monitoring over HDMI, SDI instrument monitor output, or 26-way D-type. Clickonce to mute or unmute the audio monitoring source.
The audio monitoring source icon changes to display the current status of the audio source as shownin the following table:
Table 2-1 : Audio Source Monitoring Icon States
Audio Icon State Description
Standard state, audio source active (unmuted).
Audio source muted (inactive).
Audio source active (unmuted) and volume slider control dis-played.
Hover over the audio icon to display a tooltip showing the current audio Source channel/pair selected.
To adjust the volume of the audio monitoring source, right-click the Audio icon to display a slidingvolume control. Drag the slider left or right to adjust the volume of the audio monitoring source asrequired.
Figure 2-8: Adjusting the Volume of the Audio Monitoring Source
Use the Analyzer - Audio Meters Instrument to select the target audio monitoring source.
PHABRIX QxUser Manual Page 2-11
System Time and Date Display
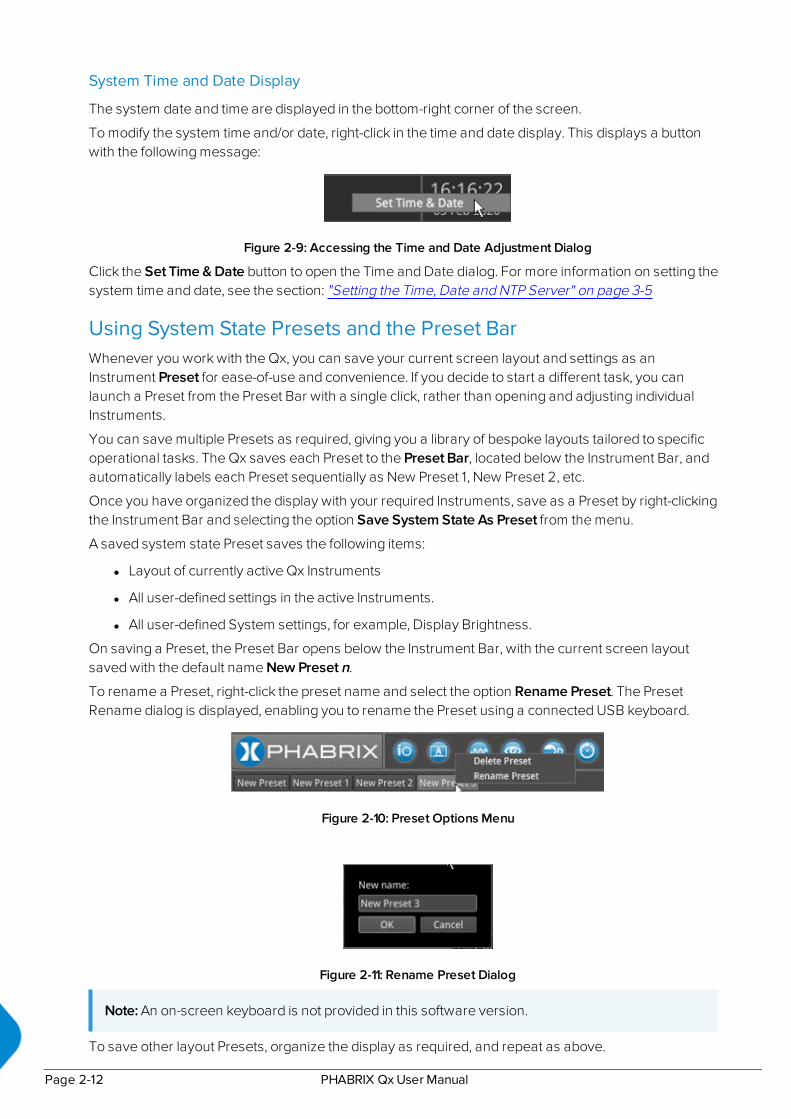
The system date and time are displayed in the bottom-right corner of the screen.
To modify the system time and/or date, right-click in the time and date display. This displays a buttonwith the following message:
Figure 2-9: Accessing the Time and Date Adjustment Dialog
Click the Set Time & Date button to open the Time and Date dialog. For more information on setting thesystem time and date, see the section: "Setting the Time, Date and NTP Server" on page 3-5
Using System State Presets and the Preset BarWhenever you work with the Qx, you can save your current screen layout and settings as anInstrument Preset for ease-of-use and convenience. If you decide to start a different task, you canlaunch a Preset from the Preset Bar with a single click, rather than opening and adjusting individualInstruments.
You can save multiple Presets as required, giving you a library of bespoke layouts tailored to specificoperational tasks. The Qx saves each Preset to the Preset Bar, located below the Instrument Bar, andautomatically labels each Preset sequentially as New Preset 1, New Preset 2, etc.
Once you have organized the display with your required Instruments, save as a Preset by right-clickingthe Instrument Bar and selecting the option Save System State As Preset from the menu.
A saved system state Preset saves the following items:
l Layout of currently active Qx Instruments
l All user-defined settings in the active Instruments.
l All user-defined System settings, for example, Display Brightness.
On saving a Preset, the Preset Bar opens below the Instrument Bar, with the current screen layoutsaved with the default name New Preset n.
To rename a Preset, right-click the preset name and select the option Rename Preset. The PresetRename dialog is displayed, enabling you to rename the Preset using a connected USB keyboard.
Figure 2-10: Preset Options Menu
Figure 2-11: Rename Preset Dialog
Note: An on-screen keyboard is not provided in this software version.
To save other layout Presets, organize the display as required, and repeat as above.
Page 2-12 PHABRIX QxUser Manual

To delete a Preset, right-click the Preset, select the option Delete Preset and confirm the deletion. If youno longer wish to delete the preset, select Cancel.
To hide the Preset bar automatically from view, right-click the Instrument Bar or Preset Bar and checkthe Auto-hide Presets checkbox. To display the Preset Bar, uncheck the checkbox.
PHABRIX QxUser Manual Page 2-13

Overview of the Qx Instrument Windows
Each Qx Instrument window border and its corresponding icon is assigned a color and the icon andInstrument border are displayed in the assigned color to indicate that it is part of one of the followinggroups of Instruments:
l System: Qx Instruments used to configure various elements of the Qx system. Default bordercolor: white.
l Analyzers: Qx Instruments used to analyze characteristics of the video signal and its associatedcomponents. Default border color: orange.
l Generators: Qx Instruments used to generate a video or audio signal. Default bordercolor: cyan.
The color-coding provides easy identification of the Instrument type. You can enable/disable theInstrument borders or modify the assigned color in the Display Options submenu, selected from theInstrument Launch Menu. For more information on setting-up the display, see the section: "Setting-upthe Display" on page 3-7.
Figure 2-12: Qx Full Screen with Active Instruments
Changing the Border Color of Instrument WindowsIf desired, you can change the border color of Analyzer and Generator Instruments as described int heSection: "Setting-up the Display" on page 3-7.
Note: The borders and icons of System Instruments are always colored white.
Instrument borders automatically merge by group color. If you position one Analyzer instrument, forexample, next to another Analyzer, then the border will outline all instruments in the common group, incontact with each other, to aid group recognition.
In addition, signal connectors displayed in instrument windows (for example, in the SystemIO instrument) are displayed in the Analyzer color to indicate an input or the Generator color to indicatean output, when they are active.
Page 2-14 PHABRIX QxUser Manual
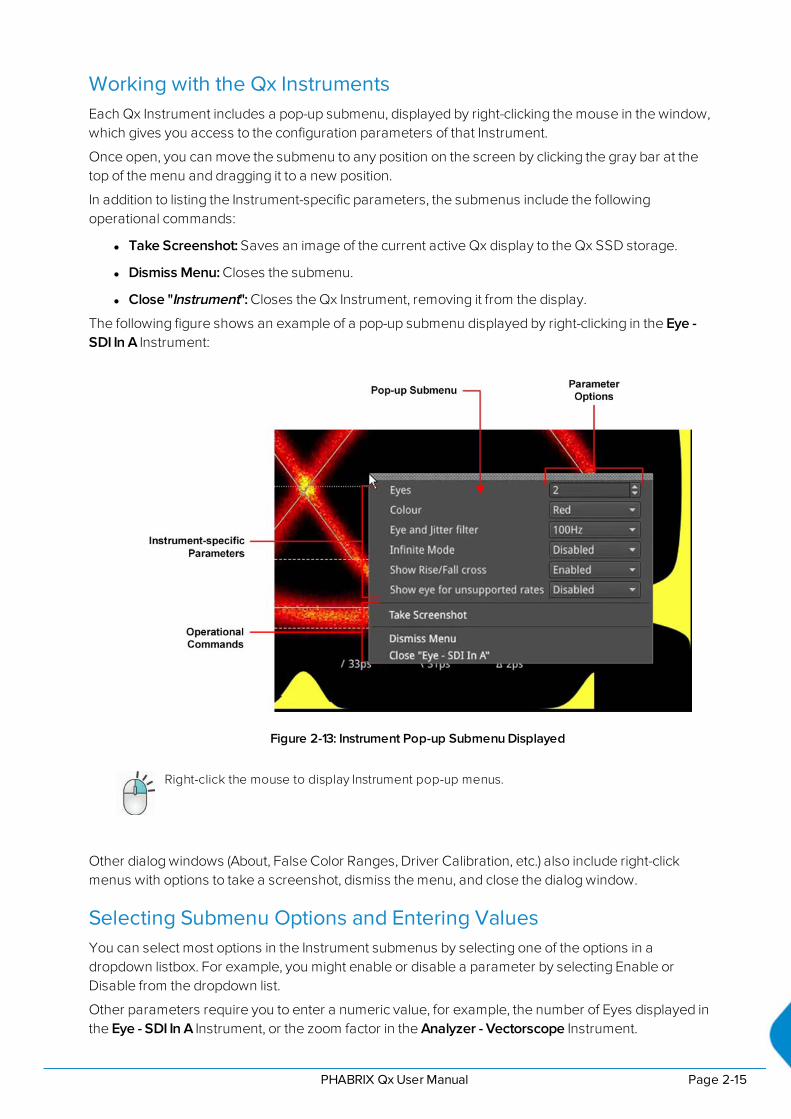
Working with the Qx InstrumentsEach Qx Instrument includes a pop-up submenu, displayed by right-clicking the mouse in the window,which gives you access to the configuration parameters of that Instrument.
Once open, you can move the submenu to any position on the screen by clicking the gray bar at thetop of the menu and dragging it to a new position.
In addition to listing the Instrument-specific parameters, the submenus include the followingoperational commands:
l Take Screenshot: Saves an image of the current active Qx display to the Qx SSD storage.
l Dismiss Menu: Closes the submenu.
l Close "Instrument": Closes the Qx Instrument, removing it from the display.
The following figure shows an example of a pop-up submenu displayed by right-clicking in the Eye -SDI In A Instrument:
Figure 2-13: Instrument Pop-up Submenu Displayed
Right-click the mouse to display Instrument pop-up menus.
Other dialog windows (About, False Color Ranges, Driver Calibration, etc.) also include right-clickmenus with options to take a screenshot, dismiss the menu, and close the dialog window.
Selecting Submenu Options and Entering ValuesYou can select most options in the Instrument submenus by selecting one of the options in adropdown listbox. For example, you might enable or disable a parameter by selecting Enable orDisable from the dropdown list.
Other parameters require you to enter a numeric value, for example, the number of Eyes displayed inthe Eye - SDI In A Instrument, or the zoom factor in the Analyzer - Vectorscope Instrument.
PHABRIX QxUser Manual Page 2-15

Figure 2-14: Adjusting Numeric Values in the Analyzer - Vectorscope Instrument
You can adjust a numeric value using one of the following methods:
l Click the slider button and drag left or right to decrease or increase the value, respectively.
l Click the cursor in the numeric field and scroll the mouse wheel backward or forward todecrease or increase the value, respectively.
l Connect a USB keyboard to the Qx, click in the numeric field and enter the new value using thekeyboard.
Figure 2-15: Manual Entry of a Static IP Address in the Qx Network & Automation Instrument
One further method to enter numeric data is encountered when you choose to enter a static IPaddress manually into the Qx using the Qx Network & Automation Instrument.
If you select the IP addressing mode Static from the dropdown list, the Qx displays a numeric keypad.
To enter an IP address, simply click the numbers on the keypad, then click OK to save the address.
Resizing an Instrument WindowDouble-click in any Instrument window to cycle through a set of standard instrument window sizes.
In many cases, you can manually adjust the size of a window further to suit your requirements. To doso, hover the cursor over one of the borders until a double-headed arrow is displayed, then drag theborder until the Instrument reaches the desired width or height.
Page 2-16 PHABRIX QxUser Manual
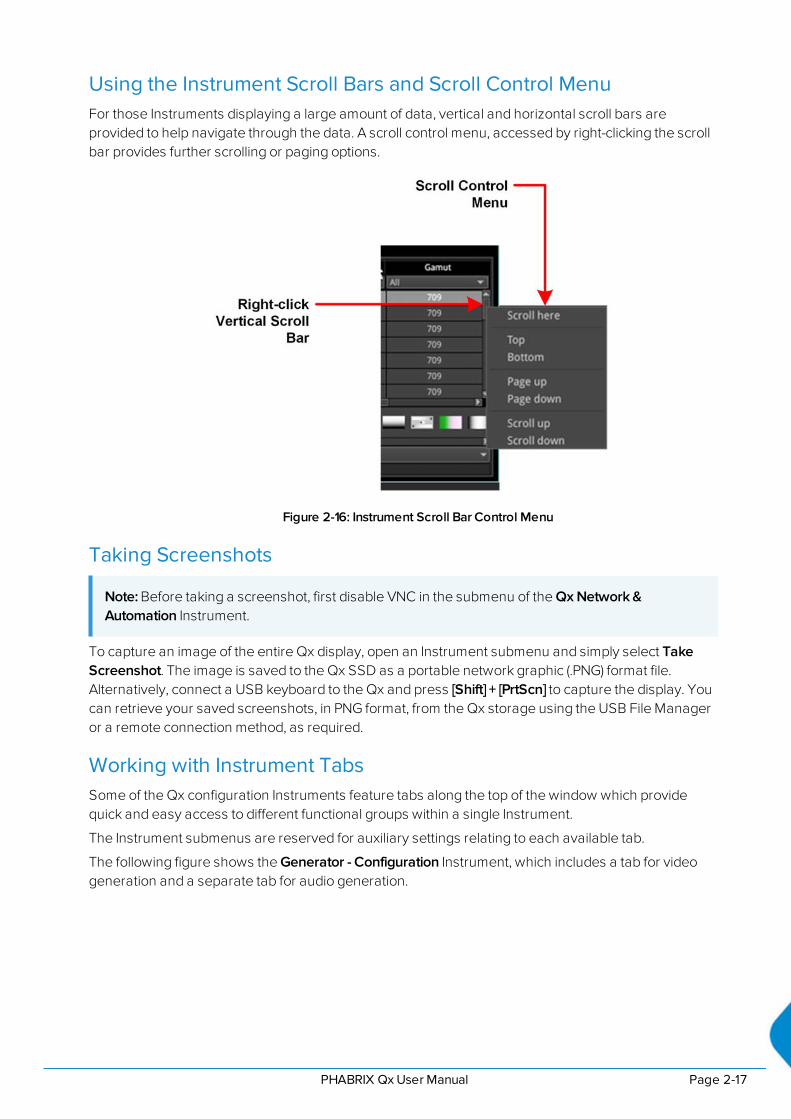
Using the Instrument Scroll Bars and Scroll Control MenuFor those Instruments displaying a large amount of data, vertical and horizontal scroll bars areprovided to help navigate through the data. A scroll control menu, accessed by right-clicking the scrollbar provides further scrolling or paging options.
Figure 2-16: Instrument Scroll Bar Control Menu
Taking Screenshots
Note: Before taking a screenshot, first disable VNC in the submenu of the Qx Network &Automation Instrument.
To capture an image of the entire Qx display, open an Instrument submenu and simply select TakeScreenshot. The image is saved to the Qx SSD as a portable network graphic (.PNG) format file.Alternatively, connect a USB keyboard to the Qx and press [Shift] + [PrtScn] to capture the display. Youcan retrieve your saved screenshots, in PNG format, from the Qx storage using the USB File Manageror a remote connection method, as required.
Working with Instrument TabsSome of the Qx configuration Instruments feature tabs along the top of the window which providequick and easy access to different functional groups within a single Instrument.
The Instrument submenus are reserved for auxiliary settings relating to each available tab.
The following figure shows the Generator - Configuration Instrument, which includes a tab for videogeneration and a separate tab for audio generation.
PHABRIX QxUser Manual Page 2-17

Figure 2-17: Example of Tabs in the Generator - Configuration Instrument
The Qx also uses tabs to present alternative displays of analyzed data. For example, the Analyzer -Ancillary Status Instrument, provides tabs that enable you to switch between the Grid or List dataviews.
Page 2-18 PHABRIX QxUser Manual

Instrument Icon Quick Reference
The icons shown below each represent a different Qx Instrument and are displayed in the QxInstrument Bar when an Instrument is active.
AES IO Config Analyzer - CIE Chart
System IO Analyzer - CRC Analysis
SFP A - Info Analyzer - Data View
SFP B - Info Analyzer - Picture / -Picture Copy
Eye - SDI in A Analyzer - Vectorscope
Jitter SDI in A Analyzer - Waveform
PRBS Analysis Generator - Configuration
Stats - SDI in A Generator - Status
Stats - SDI in B Event Logging
Stats - SDI in C Qx Network & Automation
Stats - SDI in D SFP A - Network Stats
Video Timing & System Reference SFP B - Network Stats
Analyzer - Video Standard (SDI &2022-6)
IP Receive - Flow Select
Analyzer - Ancillary Inspector IP Receive - Interpacket Timing
Analyzer - Ancillary Status Stats - IP Receive (SFP A)
Analyzer - Audio Channel Status IP Transmit (SFP B)
Analyzer - Audio Meters SFP IP Network
PTP Info Analyzer - 2110 Format Setup
Analyzer - 2022-7 Status Analyzer - LLDP Data
Analyzer - 2110-21 Status IP Receive - NMOS
PHABRIX QxUser Manual Page 2-19
3Configuring and Checking the QxThis chapter describes how to set-up some fundamental parameters and check that the unit isworking correctly; it includes the following sections:
l Qx Network and Automation
l Setting the Time and NTP Server
l Setting-up the Display
l Checking the Qx Unit
l Checking the Qx System Health Status
l Checking the Qx Licenses
l Restarting the Qx
l Reverting to Factory Default Settings
l Switching Boot Modes
l Resetting the SFP Configuration Database
l Upgrading the Qx Software, Firmware and Options
l Managing Files with the USB File Manager
l Event Logging on the Qx
l Remote Connection to the Qx
PHABRIX QxUser Manual Page 3-1
Qx Network and Automation
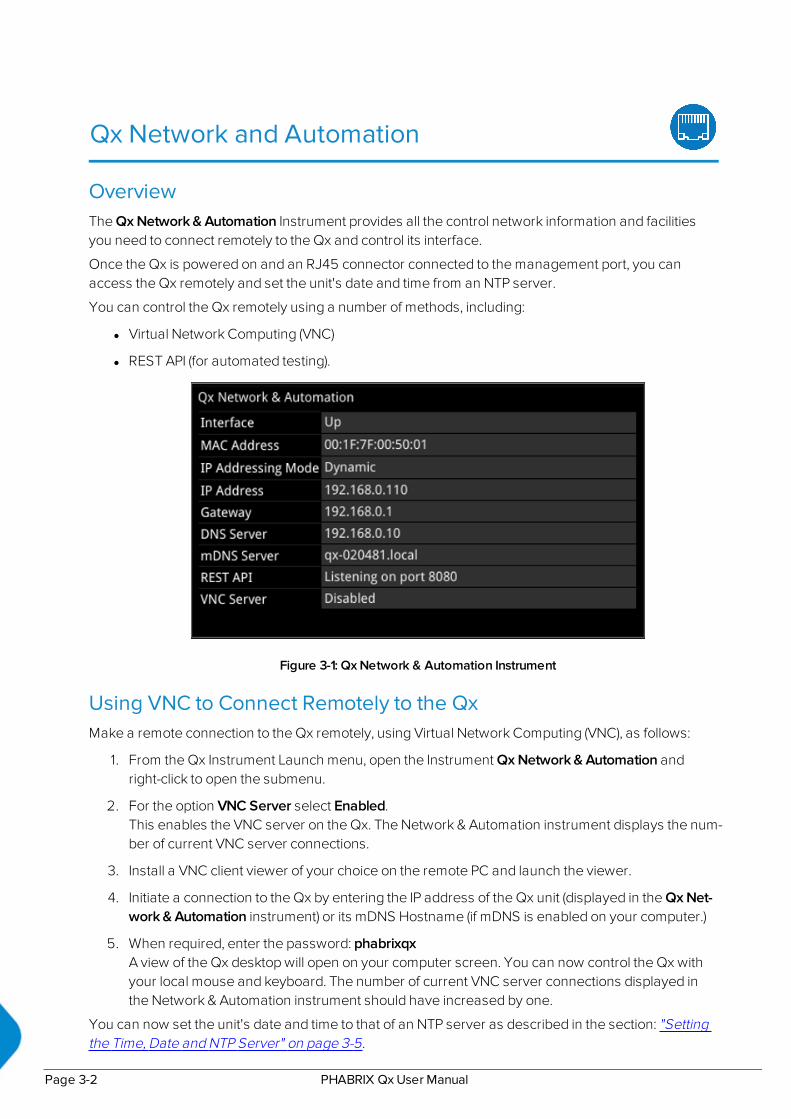
OverviewThe Qx Network & Automation Instrument provides all the control network information and facilitiesyou need to connect remotely to the Qx and control its interface.
Once the Qx is powered on and an RJ45 connector connected to the management port, you canaccess the Qx remotely and set the unit's date and time from an NTP server.
You can control the Qx remotely using a number of methods, including:
l Virtual Network Computing (VNC)
l REST API (for automated testing).
Figure 3-1: Qx Network & Automation Instrument
Using VNC to Connect Remotely to the QxMake a remote connection to the Qx remotely, using Virtual Network Computing (VNC), as follows:
1. From the Qx Instrument Launch menu, open the Instrument Qx Network & Automation andright-click to open the submenu.
2. For the option VNC Server select Enabled.This enables the VNC server on the Qx. The Network & Automation instrument displays the num-ber of current VNC server connections.
3. Install a VNC client viewer of your choice on the remote PC and launch the viewer.
4. Initiate a connection to the Qx by entering the IP address of the Qx unit (displayed in the Qx Net-work & Automation instrument) or its mDNS Hostname (if mDNS is enabled on your computer.)
5. When required, enter the password: phabrixqxA view of the Qx desktop will open on your computer screen. You can now control the Qx withyour local mouse and keyboard. The number of current VNC server connections displayed inthe Network & Automation instrument should have increased by one.
You can now set the unit's date and time to that of an NTP server as described in the section: "Settingthe Time, Date and NTP Server" on page 3-5.
Page 3-2 PHABRIX QxUser Manual

Note: Remote monitoring of the Qx unit audio output is not available over VNC.
Instrument Menu Options
Figure 3-2: Qx Network & Automation Instrument Menu Options
The following table lists the options available in the Qx Network & Automation instrument submenu:
Table 3-1 : Qx Network & Automation Menu Options
Item Options Description
IP addressingmode
DynamicStatic
For remote access to the Qx, you can assign the IPaddress of the Qx either dynamically, on a DHCP enablednetwork, or specify a static IP address manually. Whenassigned dynamically using DHCP, the following IPaddress fields are automatically populated and cannot beedited.
Ethernet IP addrand mask
Enter static IP address andmask (range: 8 to 31) asrequired.
Only active when the static IP addressing mode is selec-ted. Use the dropdown list to select the Mask. The Qxuses CIDR notation; with a default value of /24. Use eithera USB keyboard or click the keypad icon to enter theaddress using the numeric keypad.
Gateway IP Addr Enter the IP address of theGateway as required.
Only active when the static IP addressing mode is selec-ted. Use either a USB keyboard or click the keypad iconto enter the address using the numeric keypad.
DNS Server IPAddr
Enter the IP address of theDNS Server.
Only active when the static IP addressing mode is selec-ted. Use either a USB keyboard or click the keypad iconto enter the address using the numeric keypad.After entering all required static IP parameters, click ApplyIP Parameters.
REST API EnabledDisabled (Default)
When enabled allows remote connection to the Qx usingthe REST API. The Qx Network & Automation window con-tains all the information on the Qx that is needed in orderto submit a REST request. It is recommended to use the IPAddress (or mDNS Hostname if your client’s host supportsit) as the recipient of the request, and the REST API Port isthe port that requests will need to be directed towards.
PHABRIX QxUser Manual Page 3-3
Item Options Description
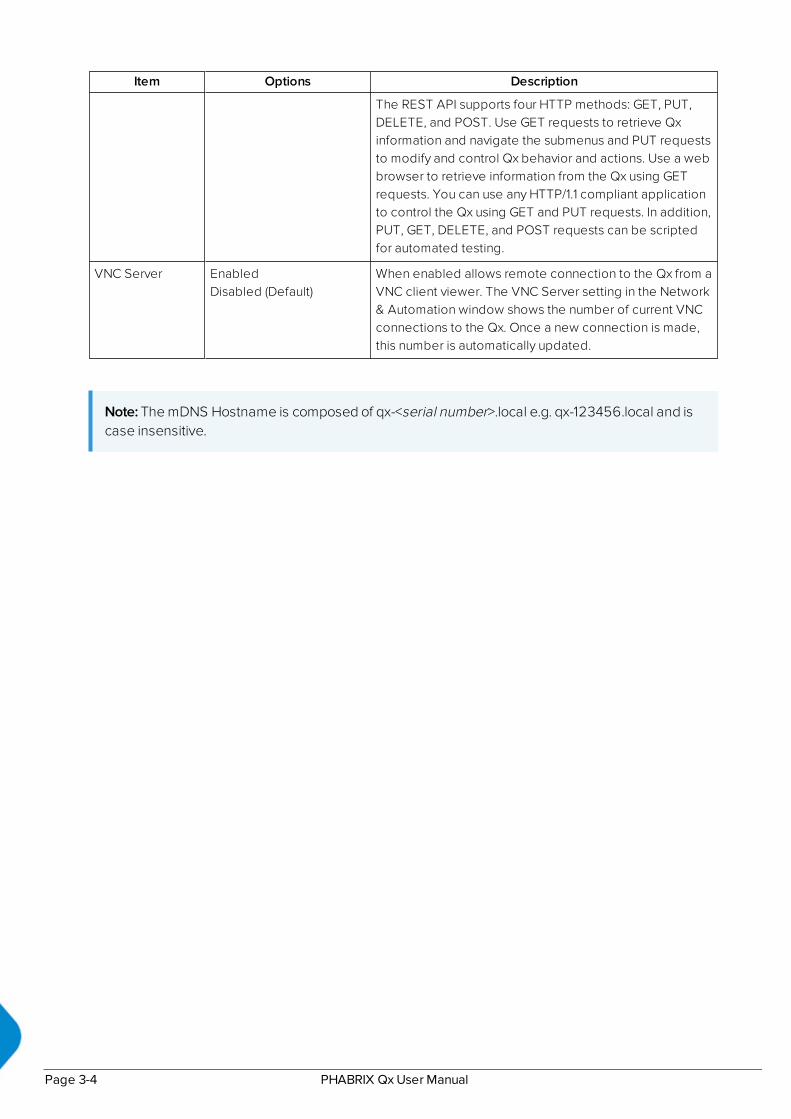
The REST API supports four HTTP methods: GET, PUT,DELETE, and POST. Use GET requests to retrieve Qxinformation and navigate the submenus and PUT requeststo modify and control Qx behavior and actions. Use a webbrowser to retrieve information from the Qx using GETrequests. You can use any HTTP/1.1 compliant applicationto control the Qx using GET and PUT requests. In addition,PUT, GET, DELETE, and POST requests can be scriptedfor automated testing.
VNC Server EnabledDisabled (Default)
When enabled allows remote connection to the Qx from aVNC client viewer. The VNC Server setting in the Network& Automation window shows the number of current VNCconnections to the Qx. Once a new connection is made,this number is automatically updated.
Note: The mDNS Hostname is composed of qx-<serial number>.local e.g. qx-123456.local and iscase insensitive.
Page 3-4 PHABRIX QxUser Manual

Setting the Time, Date and NTP Server
The Qx displays the system date and time in the bottom-right corner of the screen.
Figure 3-3: Qx Date and Time Display
You can configure the Qx to use a date and time transmitted by a target Network Time Protocol (NTP)server or set the time and date manually in the Time and Date dialog.
Configure the date and time as follows:
1. Right-click on the time/date display in the bottom-right corner of the screen.
2. Select: Set Time & Date.This opens the Time and Date dialog.
Figure 3-4: Time and Date Dialog
3. To use the automatic time and date from an NTP server:
a. Select the Automatic checkbox.
b. Enter the address of the NTP Server using a USB keyboard.For example: pool.ntp.org
c. Select your local time zone from the Time Zone list box.
d. Click Update Now and confirm that you are happy with the updated settings.
e. Click Apply to save your changes and quit the dialog.To discard your changes, click Cancel
4. To set a manual time and date for the Qx:
a. De-select the Automatic checkbox.This displays the manual date and time fields.
PHABRIX QxUser Manual Page 3-5
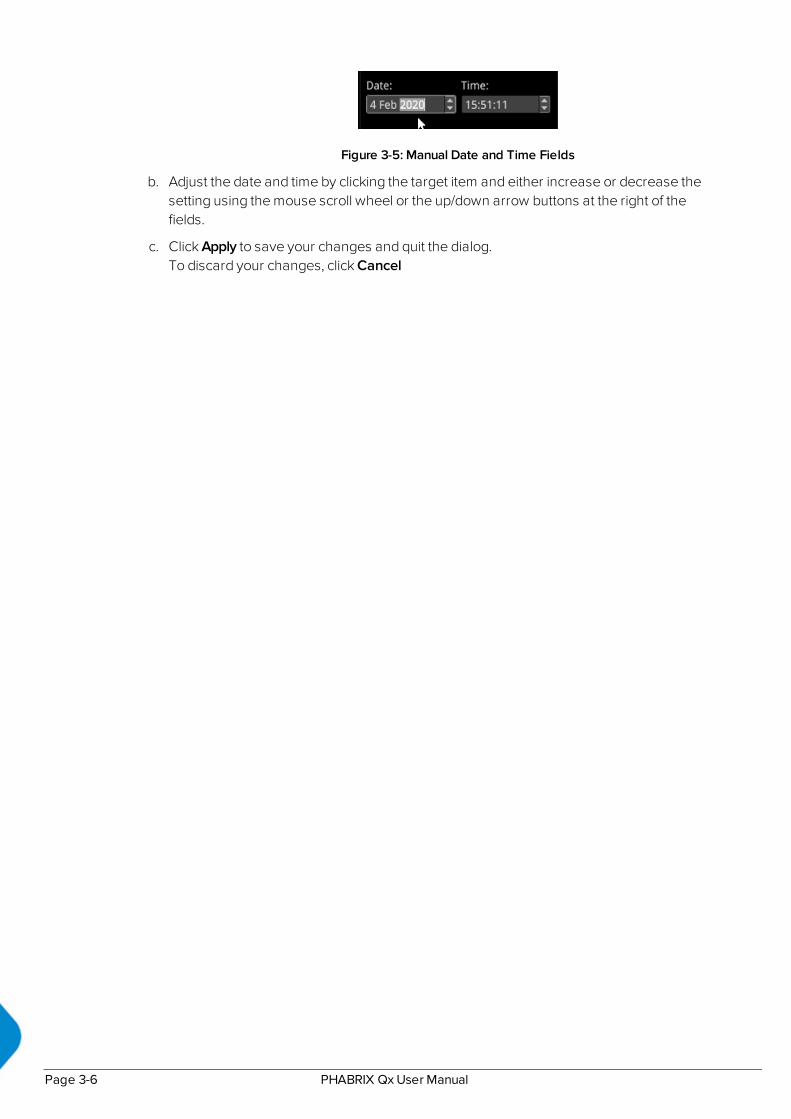
Figure 3-5: Manual Date and Time Fields
b. Adjust the date and time by clicking the target item and either increase or decrease thesetting using the mouse scroll wheel or the up/down arrow buttons at the right of thefields.
c. Click Apply to save your changes and quit the dialog.To discard your changes, click Cancel
Page 3-6 PHABRIX QxUser Manual

Setting-up the Display
Modifying the Display OptionsThe Qx Display options enable you to set the display brightness and output frame rate, or modify theappearance of the Qx Instrument windows on the screen.
Configure the display to which the Qx is connected as follows:
1. Click the PHABRIX button to open the Instrument Launch menu.
2. Select: Display Options.This opens a submenu listing the configurable display options.
Figure 3-6: Display Options in Instrument Launch Menu
3. Select the desired frame rate from the Output Rate dropdown list:
l 50 Hz
l 59.94 Hz
l 60 Hz
4. Drag the Brightness slider left or right to decrease or increase the display brightness to a com-fortable level.
Note: When using the Screenshot function to capture the Qx display, it is recommended toset the brightness to the maximum setting to increase the clarity of the saved image.
5. Choose whether to display a border around the Qx Instruments by enabling or disabling theoption Window Frames.When disabled, you switch off the border color differentiation between Analyzer and GeneratorInstruments.
6. When the option Window Frames is Enabled, you can change the border color of Analyzer orGenerator instruments as follows:
a. Select the dropdown color selector corresponding either to the Analyzer or Generator.This opens the Hue, Saturation, Value (HSV) tool shown below.
Note: The borders and icons of System Instruments are always colored white.
PHABRIX QxUser Manual Page 3-7
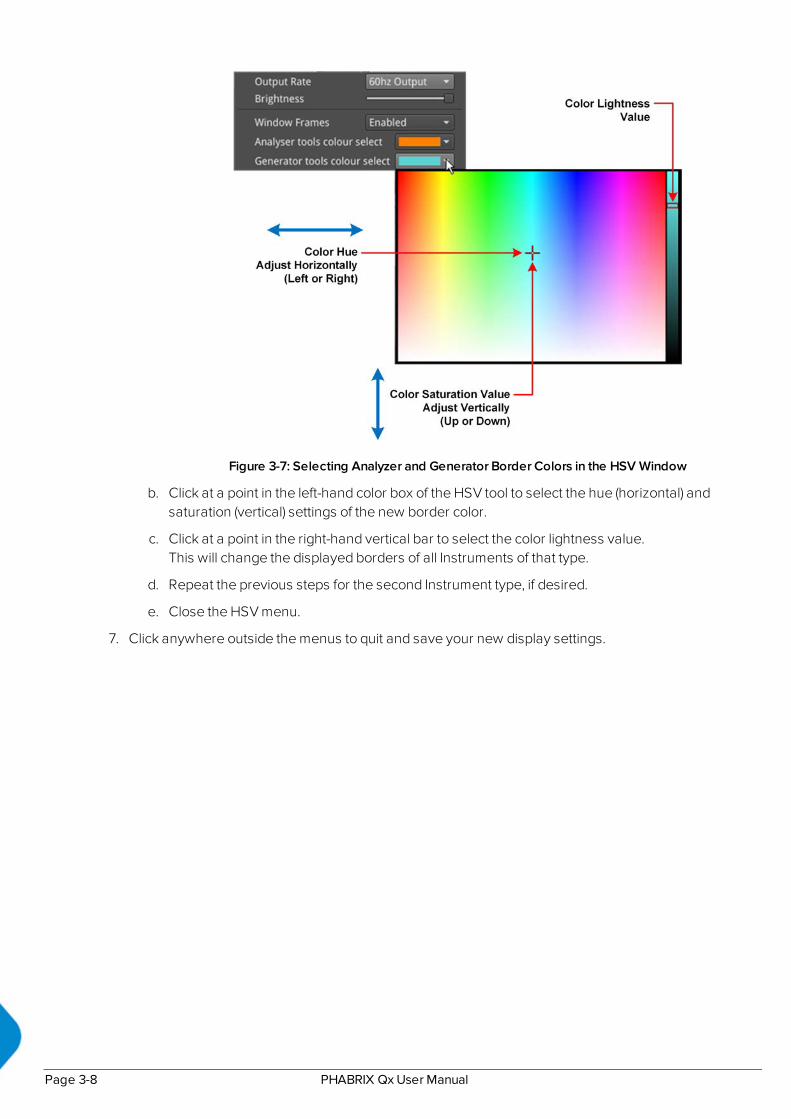
Figure 3-7: Selecting Analyzer and Generator Border Colors in the HSV Window
b. Click at a point in the left-hand color box of the HSV tool to select the hue (horizontal) andsaturation (vertical) settings of the new border color.
c. Click at a point in the right-hand vertical bar to select the color lightness value.This will change the displayed borders of all Instruments of that type.
d. Repeat the previous steps for the second Instrument type, if desired.
e. Close the HSV menu.
7. Click anywhere outside the menus to quit and save your new display settings.
Page 3-8 PHABRIX QxUser Manual

Checking the Qx Unit
OverviewYour Qx unit should now be powered on in the default boot mode (SDI), with the right date and timeshowing, and at least the basic Qx screen displayed with any of your modifications. At this point youshould confirm that the unit is healthy and running correctly, as expected, by checking the following:
l System Health
l Licensing and ordered licensed options
l Software and firmware versions
These items are described in the following sections.
Checking the Qx System Health StatusYou can check the current health status of the Qx unit in the System Health dialog as follows:
1. Click the PHABRIX button to open the Instrument Launch menu.
2. Select: System Health.This opens the System Health dialog displaying the current hardware health of the Qx, includ-ing: CPU and FPGA temperature, voltage (DDR and 5.5V), and cooling fan revolutions.
Figure 3-8: Qx System Health Information
Table 3-2 : System Health Recommended Thresholds
Item Safe Range Description
CPU Temperature Up to 85°C Qx unit will issue a high temperature warning at 80°Cand switch off at 85°C
FPGA Temperature Up to 85°C Qx unit will issue a high temperature warning at 80°Cand switch off at 85°C
PHABRIX QxUser Manual Page 3-9

Item Safe Range Description
5.5 V 5.030 to 5.734 V Hardware switches off the Qx if the voltage movesoutside the safe range.
DDR Voltage 1.283 to 1.580 V Hardware switches off the Qx if the voltage movesoutside the safe range.
Cooling Fans 3000 to 9500 rpm Speed of fans varies with the temperature of theunit. Three cooling fans are located in the front ofthe Qx unit - in left (L), center (C) and right (R) pos-itions.
Checking the Qx LicensesIt is important at this point to confirm that your Qx has been shipped with the software options andcorresponding licenses documented in your original order.
Check the licensing details and other system information in the About dialog as follows:
1. Click the PHABRIX button to open the Instrument Launch menu.
2. Select: About.This opens the About dialog listing detailed information about the Qx system, including:
l Qx software version and build
l Serial number
l License details
l Build ID
l Mezzanine ID
l FPGA details
l Calibration details.
Figure 3-9: Qx Serial Number and License Information
Page 3-10 PHABRIX QxUser Manual

Figure 3-10: Qx Mezzanine ID in About Dialog
Restarting the QxIf at any time you want to restart the Qx, you can do so from the System Settings options, accessedfrom the Instrument Launch menu, without powering-off the Qx unit.
Restart the Qx as follows:
1. Click the PHABRIX button to open the Instrument Launch menu.
2. Select: System Settings.
Figure 3-11: System Settings Option Menu
3. Select: Restart Qx.This opens a Restart confirmation dialog.
Figure 3-12: Display Options in Instrument Launch Menu
4. Click: OK to confirm the restart or Cancel to quit without restarting.When you confirm the restart, the unit immediately enters boot mode and displays its satususing the LED behind the On switch.
Reverting to Factory Default SettingsIf you make configuration changes to the Qx which you would rather discard, you can restore the unitto the factory default settings at any time.
Restore the factory defaults as follows:
PHABRIX QxUser Manual Page 3-11

1. Click the PHABRIX button to open the Instrument Launch menu.
2. Select: Apply Default Settings.This opens a confirmation dialog, shown below, where you are prompted to confirm your choicebefore the factory defaults are restored.
Note: If you restore the factory settings, all your Presets and other configuration changeswill be removed from the Qx. It is recommended to copy all your saved Presets to a USBmemory stick before restoring factory defaults.
Figure 3-13: Confirmation to Restore Factory Default Settings
3. Click: Restore Defaults to confirm or Cancel to quit.
Switching the Qx Boot ModesThe Qx includes four possible boot modes, with each boot mode featuring a different combination ofoptions in the Instrument Launch Menu. The available firmware boot modes are as follows:
l Qx 12G SDI Mode (Default boot mode)
l Qx 12G SDI Stress Mode
l Qx IP 2022-6 Mode
l Qx IP 2110 Mode, supporting:
l SMPTE ST 2110 decapsulation (reception) of video (2110-20), audio (2110-30/2110-31), andANC (2110-40) flows
l SMPTE ST 2022-7 SIPS and ST 2059 (PTP)
On start up, you will see one of the following Instrument Launch Menus, depending on the boot modeand licenses applied to the Qx:
Page 3-12 PHABRIX QxUser Manual
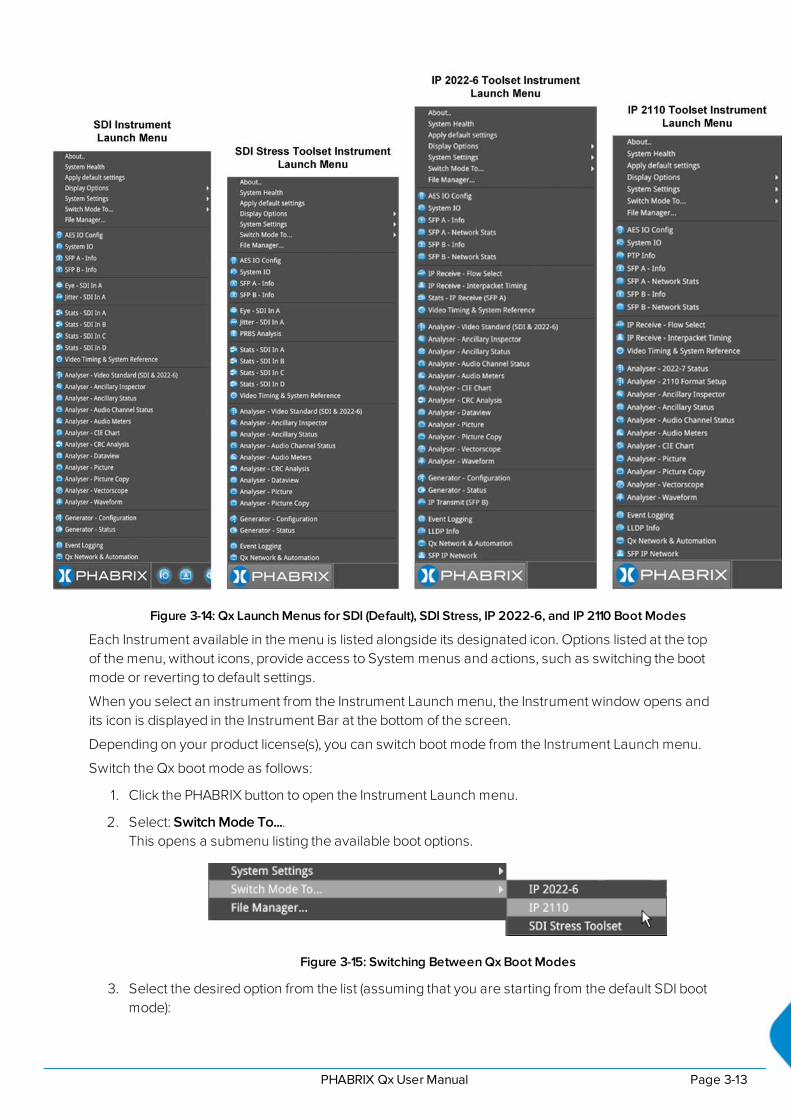
Figure 3-14: Qx Launch Menus for SDI (Default), SDI Stress, IP 2022-6, and IP 2110 Boot Modes
Each Instrument available in the menu is listed alongside its designated icon. Options listed at the topof the menu, without icons, provide access to System menus and actions, such as switching the bootmode or reverting to default settings.
When you select an instrument from the Instrument Launch menu, the Instrument window opens andits icon is displayed in the Instrument Bar at the bottom of the screen.
Depending on your product license(s), you can switch boot mode from the Instrument Launch menu.
Switch the Qx boot mode as follows:
1. Click the PHABRIX button to open the Instrument Launch menu.
2. Select: Switch Mode To....This opens a submenu listing the available boot options.
Figure 3-15: Switching Between Qx Boot Modes
3. Select the desired option from the list (assuming that you are starting from the default SDI bootmode):
PHABRIX QxUser Manual Page 3-13

l IP 2022-6
l IP2110
l SDI Stress Toolset
4. In the Switch Firmware dialog displayed, click Switch to confirm the mode switch.Switching to a different boot mode can take about a minute to complete.
Figure 3-16: Qx Switch Firmware Dialog
5. In the Mode Configuration dialog, select the checkbox Reboot when complete to reboot the Qxautomatically into the new mode.
Figure 3-17: Qx Automatic Reboot Dialog
The Power Button light changes to a fixed yellow color (instead of white) once thereconfiguration request is complete, indicating that a mode switch request has been successful.The Qx unit restarts automatically in the requested mode.
6. If you do not select the Reboot when complete checkbox as described above, the unit pauseson completing the mode reconfiguration and displays a Completion dialog featuring a Rebootbutton.To continue with the mode switch, click Reboot.
Figure 3-18: Qx Reconfiguration Dialog
Resetting the SFP Configuration DatabaseBy default, the Qx SFP Configuration Database contains configuration details for the approved, factorysupplied SFPs.
Note: If you have previously modified the SFP Configuration Database manually to include SFPsthat were not approved, be sure to copy your current list from the Qx before you reset thedatabase values. By doing so, after reset, you can then add your user-defined SFPs to thedatabase again if they are not automatically recognized by the Qx. Contact PHABRIX Support fordetails on SFP configuration procedures.
Page 3-14 PHABRIX QxUser Manual

Update the Qx SFP Configuration Database with the latest standard list of PHABRIX approved SFPs forthis Qx software release as follows:
1. Click the PHABRIX button to open the Instrument Launch menu.
2. Select: System Settings.
3. Select: SFP Configuration Database from the submenu.
Figure 3-19: Resetting the SFP Configuration Database
4. Select: Reset to Factory Values.
5. Select Reset in the confirmation dialog.You are warned that the database will revert to the factory defaults. Any user-defined SFPentries in the database will be deleted. To quit the reset process, select Cancel.
Figure 3-20: Resetting the SFP List to Factory Defaults
Note: If you have not previously modified the database, but have unsupported SFPs that you wishto use after reset, contact PHABRIX Support for information on how these might be added to theSFP database.
PHABRIX QxUser Manual Page 3-15
Upgrading the Qx
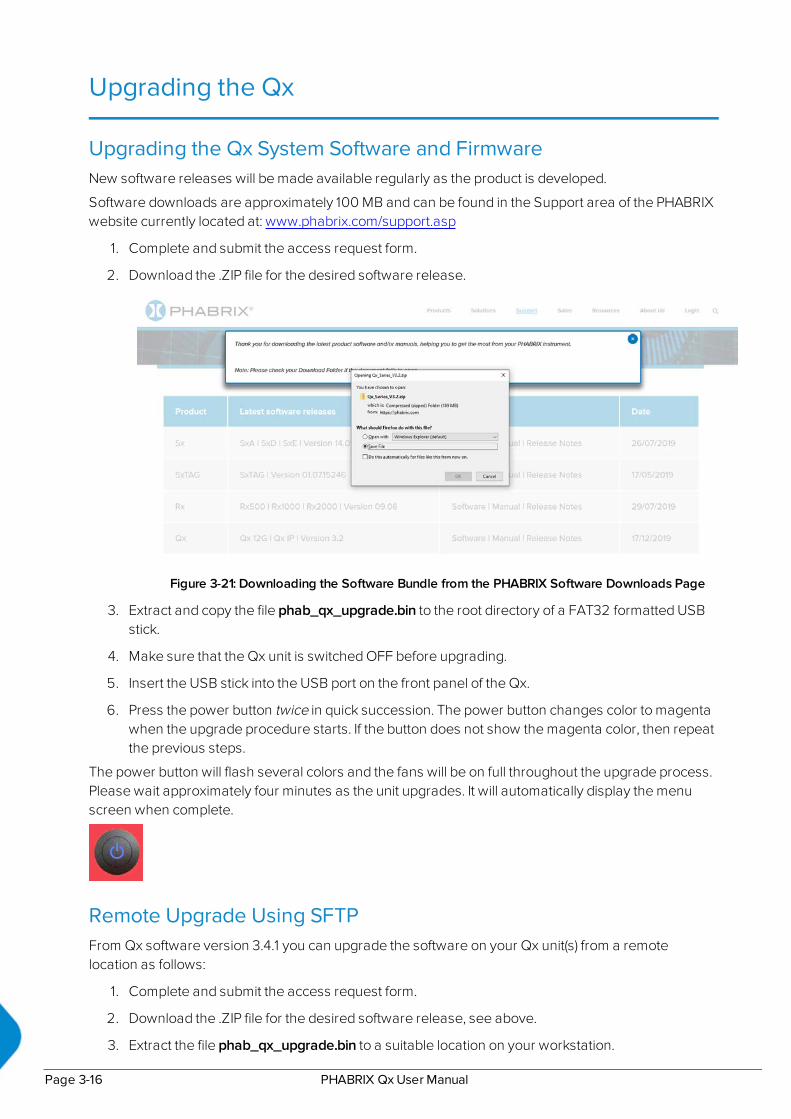
Upgrading the Qx System Software and FirmwareNew software releases will be made available regularly as the product is developed.
Software downloads are approximately 100 MB and can be found in the Support area of the PHABRIXwebsite currently located at: www.phabrix.com/support.asp
1. Complete and submit the access request form.
2. Download the .ZIP file for the desired software release.
Figure 3-21: Downloading the Software Bundle from the PHABRIX Software Downloads Page
3. Extract and copy the file phab_qx_upgrade.bin to the root directory of a FAT32 formatted USBstick.
4. Make sure that the Qx unit is switched OFF before upgrading.
5. Insert the USB stick into the USB port on the front panel of the Qx.
6. Press the power button twice in quick succession. The power button changes color to magentawhen the upgrade procedure starts. If the button does not show the magenta color, then repeatthe previous steps.
The power button will flash several colors and the fans will be on full throughout the upgrade process.Please wait approximately four minutes as the unit upgrades. It will automatically display the menuscreen when complete.
Remote Upgrade Using SFTPFrom Qx software version 3.4.1 you can upgrade the software on your Qx unit(s) from a remotelocation as follows:
1. Complete and submit the access request form.
2. Download the .ZIP file for the desired software release, see above.
3. Extract the file phab_qx_upgrade.bin to a suitable location on your workstation.
Page 3-16 PHABRIX QxUser Manual

4. Log on remotely to a Qx to be upgraded using SFTP, enter:sftp qxuser@<Qx_IP_Address>.For more information, see the section "Using Secure FTP (SFTP)" on page 3-25.
5. Enter the password for the qxuser: phabrixqxYou should see the message Connected to qxuser@<Qx_IP_Address>
6. Use the SFTP put command to upload the Qx upgrade file to the upgrade directory of the Qx:/transfer/upgrade.You should see the percentage completion and time remaining for the transfer displayed at theright of the terminal window.
Figure 3-22: Uploading the Upgrade File Remotely to the Qx
7. On completion of the upload the Qx automatically detects the presence of the upgrade file andstarts its upgrade cycle.
Note: The remote upgrade function requires Qx software version 3.3.1 or higher to be installed onthe target Qx. When this software version is available you can choose to install any availableversion of the Qx software. If, however, you install a version below 3.3.1, the remote upgradefacility will no longer be available on that Qx.
Upgrading the Qx Software OptionsYou can order and install Qx optional software toolkits at any time after purchasing your unit. You willreceive an email from PHABRIX with an encrypted file attachment:Encrypted_file.enc.
Install the software for a Qx toolset option as follows:
1. Make sure that the Qx unit is powered on.
2. Download the email attachment and copy to a blank, FAT32 formatted USB memory stick.
3. Insert the USB memory stick into any of the USB ports on the front or rear of the Qx.The Qx detects the software package and displays a dialog box listing the licenses currently onyour Qx alongside the new licenses available with the option upgrade.
PHABRIX QxUser Manual Page 3-17

Figure 3-23: Confirmation Dialog for Software Option Upgrade
4. Make sure that the new option(s) you have purchased are listed in the New License column witha green check mark then click OK to update the license.After updating the option licenses, the Qx opens a further dialog box requesting you to restartthe Qx to apply your changes and activate the new option(s).
Page 3-18 PHABRIX QxUser Manual
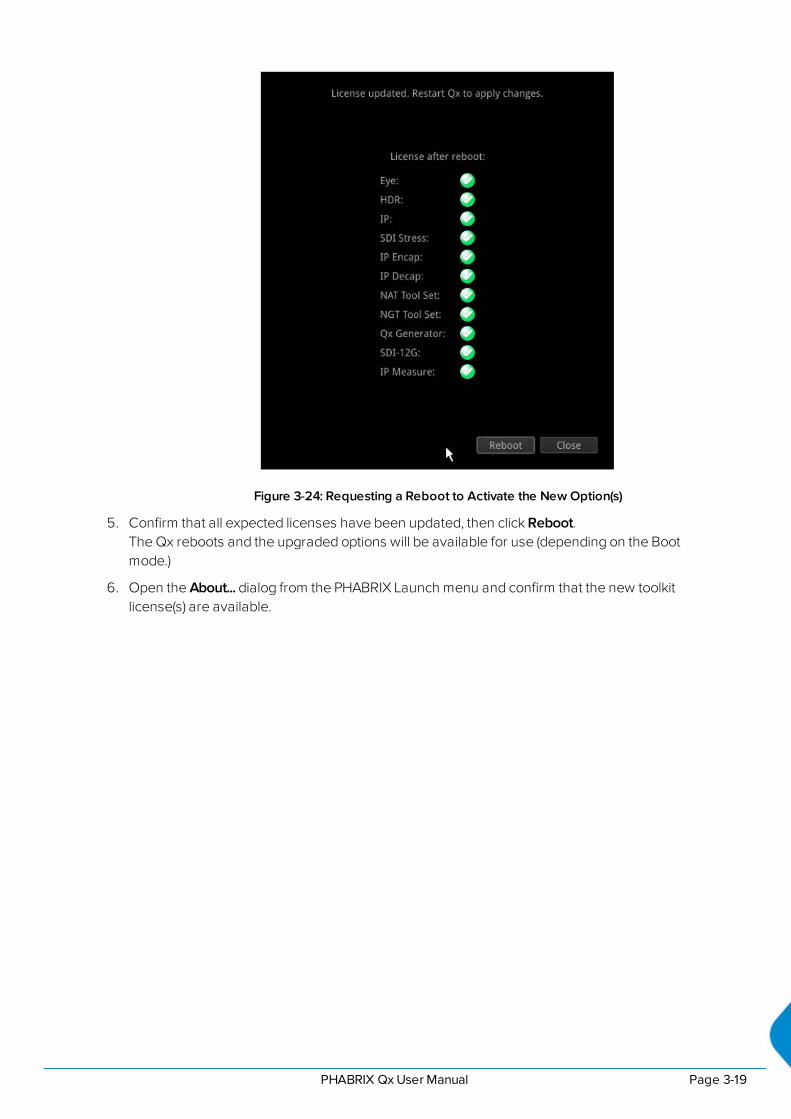
Figure 3-24: Requesting a Reboot to Activate the New Option(s)
5. Confirm that all expected licenses have been updated, then click Reboot.The Qx reboots and the upgraded options will be available for use (depending on the Bootmode.)
6. Open the About... dialog from the PHABRIX Launch menu and confirm that the new toolkitlicense(s) are available.
PHABRIX QxUser Manual Page 3-19
Managing Files with the USB File Manager
OverviewTo transfer and manage your files, the Qx provides a USB File Manager which enables you todownload files from the Qx to a USB memory stick or to upload files from USB to the Qx. To display theUSB File Manager, simply insert a USB memory stick into one of the USB connectors on the front orrear panels of the Qx. When displayed, the USB File Manager window is divided into two panes – theleft-hand pane displays files available on the Qx and the right-hand pane displays files and folders onthe USB stick. You can either select files and then choose a copy option from the right-click menu ordrag selected files and drop them into the desired target window. With the USB File Manager you can:
l Select files on either device
l Copy selected files in two directions (from Qx to USB or USB to Qx)
l Drag and drop selected files between the Qx and USB device(s)
l Rename files on the USB stick.
l Create folders on the Qx or USB stick
l Delete files from the Qx or USB stick.
You can upload or download the following file types to or from the Qx:
l Test patterns
l Screenshots
l Presets
l Qx logfiles
l TIFF image files.
The USB Device drop-down menu in the top-right of the window allows you to select either of up tothree USB devices that may be connected to the Qx USB ports. Available space on both the Qx andUSB stick is displayed at the bottom of the File Manager window.
Note: The USB File Manager is disabled on a remote Qx Client.
Opening the USB File ManagerTo open the USB File Manager:
l Insert a USB memory stick into one of the USB ports on the front or rear panel of the Qx unit.
This automatically opens the following file manager dialog:
Page 3-20 PHABRIX QxUser Manual
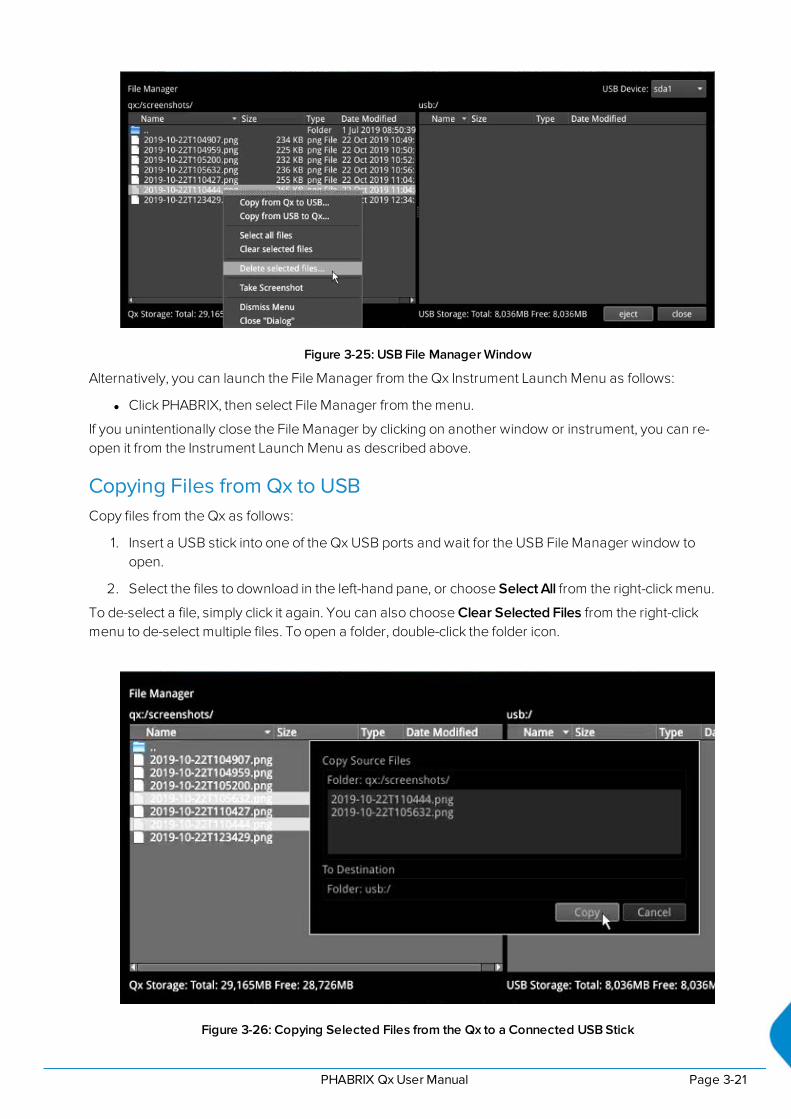
Figure 3-25: USB File Manager Window
Alternatively, you can launch the File Manager from the Qx Instrument Launch Menu as follows:
l Click PHABRIX, then select File Manager from the menu.
If you unintentionally close the File Manager by clicking on another window or instrument, you can re-open it from the Instrument Launch Menu as described above.
Copying Files from Qx to USBCopy files from the Qx as follows:
1. Insert a USB stick into one of the Qx USB ports and wait for the USB File Manager window toopen.
2. Select the files to download in the left-hand pane, or choose Select All from the right-click menu.
To de-select a file, simply click it again. You can also choose Clear Selected Files from the right-clickmenu to de-select multiple files. To open a folder, double-click the folder icon.
Figure 3-26: Copying Selected Files from the Qx to a Connected USB Stick
PHABRIX QxUser Manual Page 3-21

3. Right-click anywhere in the File Manager window and select Copy from Qx to USB... from themenu. This opens the Copy Source Files dialog.
4. Check that the selected files and destination are correct then click Copy to confirm.
Uploading Files from USB to the QxUpload files to the Qx as follows:
1. Insert a USB stick into one of the Qx USB ports and wait for the USB File Manager window toopen.
2. Select the files you want to upload in the right-hand pane, or choose Select All from the right-click menu.
3. Select the target folder on the Qx in the left-hand pane for the uploaded files.
4. Right-click anywhere in the File Manager window and select Copy from USB to Qx... from themenu. This opens the Copy Source Files dialog.
5. Check that the selected files and destination folder are correct then click Copy to confirm.
Deleting Files from the QxDelete files on the Qx as follows:
1. Launch the USB File Manager from the Instrument Launch Menu.
2. Select the files you want to remove in the left-hand pane, or choose Select All from the right-clickmenu.
3. Right-click anywhere in the File Manager window and select Delete selected files... from themenu. This opens the Delete Files dialog.
4. Check that you have selected the correct files then click Delete to confirm.
Page 3-22 PHABRIX QxUser Manual

Event Logging on the Qx
OverviewEvent logging is provided on the Qx, and you can view the logs in the Event Logging Instrumentwindow. The Qx allocates 500 lines for logging detail before overwriting log data. It will also recall thelog data last captured if the unit is started from cold. The setting for logging data will need to be re-entered from a cold start using the right-click submenu. You can also access and save Logs using theREST API.
Figure 3-27: Event Logging and Menu Options
SDI ModesIn SDI mode, right-click the mouse in the instrument window to display the following options:
l Record Jitter Timing Logs > [Enabled, Disabled]
l Record Jitter Alignment Logs > [Enabled, Disabled]
l Record SDI Input Standard Logs > [Enabled, Disabled]
l Record SDI Input Rate Logs > [Enabled, Disabled]
l Record SCTE104 Logs > [Enabled, Disabled]
l Record REST API Request Logs > [Enabled, Disabled]
l Record Reference Locking Logs > [Enabled, Disabled]
l Record SFP Logs > [Enabled, Disabled]
l Record Audio Input Presence Logs > [Enabled, Disabled]
l Clear logs
IP ModesIn IP mode, right-click the mouse in the instrument window to display the following options:
l Record IP Tx Logs > [Enabled, Disabled]
l Record IP Rx Logs > [Enabled, Disabled]
l Record IP Interfaces Logs > [Enabled, Disabled]
PHABRIX QxUser Manual Page 3-23

l Record PTP Logs > [Enabled, Disabled] (note IP 2110 only)
l Record SCTE104 Logs > [Enabled, Disabled]
l Record REST API Request Logs > [Enabled, Disabled]
l Record Reference Locking Logs > [Enabled, Disabled]
l Record SFP Logs > [Enabled, Disabled]
l Record Audio Input Presence Logs > [Enabled, Disabled]
l Clear logs
Page 3-24 PHABRIX QxUser Manual

Remote Connection to the Qx
OverviewVarious methods are provided to enable you to establish a remote connection with a Qx system,depending on your requirements, for example you could establish a remote connection using one ofthe following methods:
l VNC
l REST API
l SFTP
l Web browser.
For further information on the REST API, see the section "Using the REST API for Remote Access" onpage 16-2
Note: If you need to transfer files to or from a Qx and you have direct access to the unit, it isrecommended to use the USB File Manager available from the Instrument Launch Menu.
Available FunctionalityOperational ControlVNC Remotely view the screen and control the Qx interface.
REST API Remotely send Qx operational control commands and retrieve data and statusinformation.
File ManagementSFTP Upgrade the unit remotely; available from software version 3.4.1. Retrieve Log, Pre-
set, and Screenshot files. Delete these files. Add saved presets from another Qx.Add, retrieve, and delete user-created test pattern files.
Web Browser View and retrieve, Log, Preset, Screenshot, and User Test Pattern files. Altern-atively, use the USB File Manager function to transfer files.
Note: In the setup directions that follow, 192.168.0.70 and qx-020094.local are used as examplesonly. Be sure to use the IP Address or mDNS Hostname specific to your Qx unit.
Using Virtual Network Computing (VNC)The virtual network computing or VNC facility of the Qx enables you to connect from a remote locationand provides you with direct screen control of the Qx.
When you enable VNC, the Qx acts as a VNC server, giving you remote access to the unit when youuse a VNC viewer client application on your local computer.
For more information on establishing a remote VNC connection to the Qx, see the section: "QxNetwork and Automation" on page 3-2.
Using Secure FTP (SFTP)You can use Secure FTP (SFTP) to perform the following tasks on the Qx:
PHABRIX QxUser Manual Page 3-25

l Upgrade the Qx software from a remote location
l Retrieve event logs, presets, screenshots and user-defined test pattern files
l Delete event logs, presets, screenshots and user-defined test pattern files
l Upload saved presets from another unit and user-defined test patterns.
Connecting to the Qx via SFTP
Run your chosen SFTP client application on the computer from which you will connect to the Qx (yourSFTP server).
Enter the Qx host address using the specific IP Address of your Qx or its mDNS Hostname (if mDNS isenabled on your computer), in one of the following formats:
l sftp://192.168.0.70
l sftp://qx-020094.local
In addition, enter the following details:
l Username: qxuser
l Password: phabrixqx
l Port: 22
Once connected, open the transfer directory to access the following Qx folders:
l common licenses
l log - for the Event Log
l presets
l screenshots
l sfp
l testPatterns
l upgrade
l userTestPatterns
You can download or delete files from any of these folders. In addition, you can add or upload files tothe presets, upgrade and userTestPatterns folders.
Using a Web BrowserA web browser can be used to view Event Log, Screenshot, Preset, and User Test Patterns files, andretrieve them.
Connecting to the Qx via Web Browser
In the web browser of your choice on your computer, enter the IP address of your Qx, in the followingformat:
l http://192.168.0.70
Once connected, access the logs, presets, screenshots, and userTestPatterns folders as required.View and save files to your computer as required.
Note: Files cannot be deleted using the web browser.
Page 3-26 PHABRIX QxUser Manual

4SDI System Setup and ConfigurationThis chapter describes the System Instruments used to set-up and configure the Qx in SDI mode foryour desired test and measurement functions and includes the following sections:
l SDI Connections to the Qx
l SDI Input and Output Schematic
l SDI Input / Output Configurations (SDI Modes)
l SDI Inputs Using BNC Connectors
l SDI Outputs Using BNC Connectors
l Overview of SDI SFP Connections
l SDI Inputs Using SFP Connectors
l SDI Outputs Using SFP Connectors
l System IO
l AES IO Config
l Video Timing & System Reference
l SFP (A, B) - Info
PHABRIX QxUser Manual Page 4-1
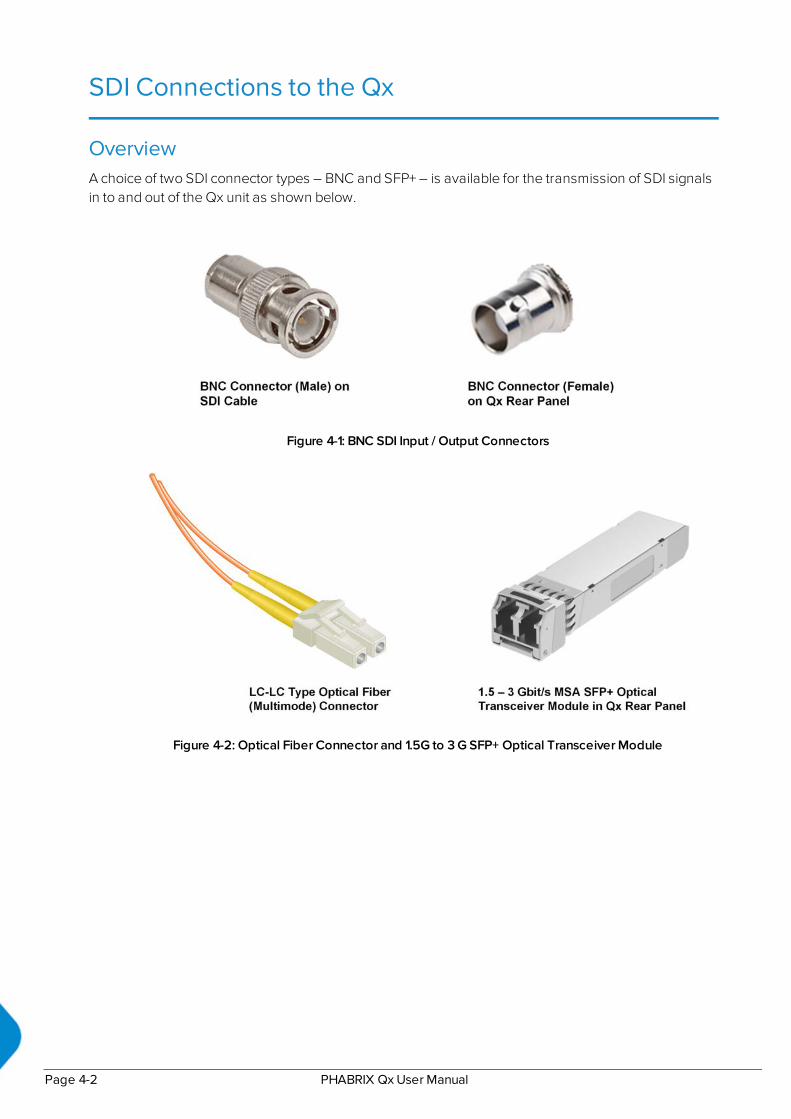
SDI Connections to the Qx
OverviewA choice of two SDI connector types – BNC and SFP+ – is available for the transmission of SDI signalsin to and out of the Qx unit as shown below.
Figure 4-1: BNC SDI Input / Output Connectors
Figure 4-2: Optical Fiber Connector and 1.5G to 3 G SFP+ Optical Transceiver Module
Page 4-2 PHABRIX QxUser Manual

SDI Input and Output SchematicThe following graphic shows a schematic view of the SDI and IP inputs and outputs to and from the QxAnalyzer and Generator circuitry, using either BNC or SFP connectors.
Figure 4-3: Qx SDI Input/Output Connectors to Analyzer / Generator Circuitry
Where:
l EQ = SDI Cable Equalizer
l Tx = Signal Transmitter
l EYE = Qx RTETM Real-time Eye Processing Circuitry
l MSA = Multi-source Agreement standard
For SDI Inputs:
l BNCs: Lead with Input A
l SFPs: Use any input
Note: The Qx SDI BNC Loop feature is available with SDI connector configuration: BNC In / BNCOut only.
Note: It takes marginally longer for the Qx to lock on to SDI Input signals received over SFPconnectors than signals received over BNC connectors.
For SDI Outputs:
l BNCs: Generator Output Copy is optional in combination with SDI BNC Loop configuration
l SFPs: Generator Output copy functionality is always on.
PHABRIX QxUser Manual Page 4-3
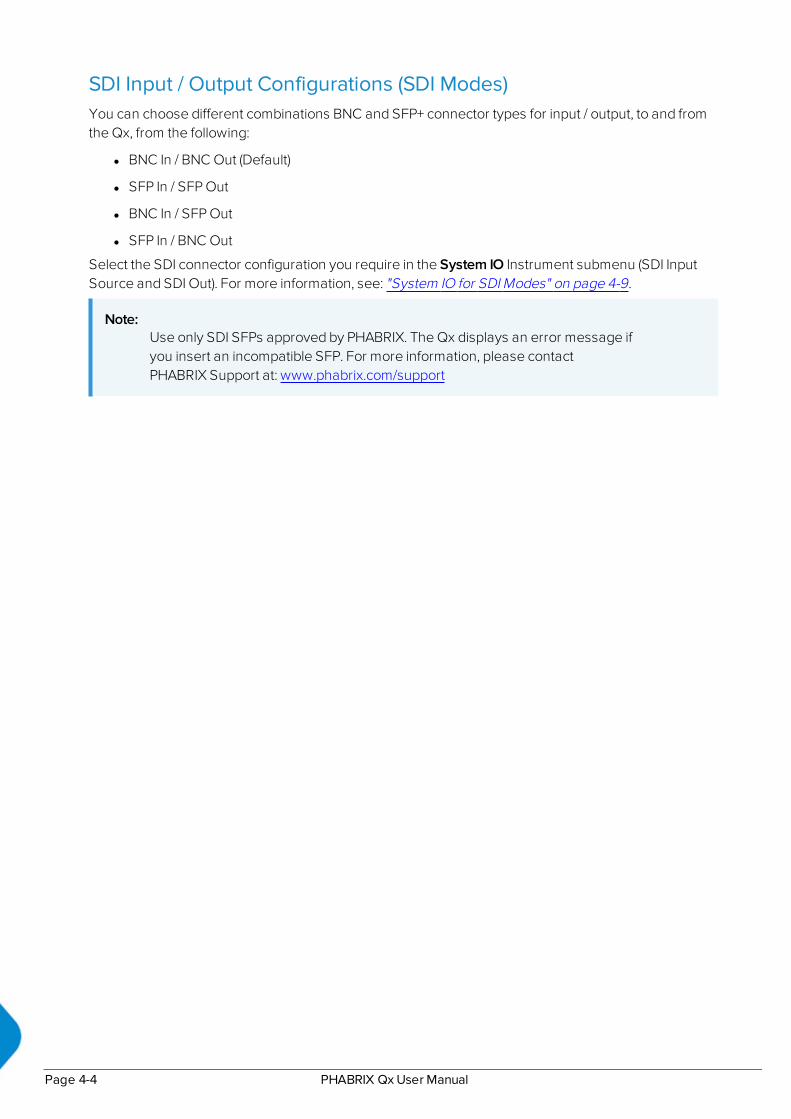
SDI Input / Output Configurations (SDI Modes)You can choose different combinations BNC and SFP+ connector types for input / output, to and fromthe Qx, from the following:
l BNC In / BNC Out (Default)
l SFP In / SFP Out
l BNC In / SFP Out
l SFP In / BNC Out
Select the SDI connector configuration you require in the System IO Instrument submenu (SDI InputSource and SDI Out). For more information, see: "System IO for SDI Modes" on page 4-9.
Note:Use only SDI SFPs approved by PHABRIX. The Qx displays an error message ifyou insert an incompatible SFP. For more information, please contactPHABRIX Support at: www.phabrix.com/support
Page 4-4 PHABRIX QxUser Manual

SDI Inputs Using BNC ConnectorsThe Physical Layer input connection for eye and jitter is the right-most BNC connector (when viewedfrom the rear) fitted with a red- or black-colored nut. This provides the multirate eye and jitterconnection from 1.5G HD-SDI to 12G-SDI. There are four 12G-SDI capable input BNCs for the analyzer:SDI In A, B, C, and D.
Figure 4-4: Qx Rear Panel SDI Input BNC Connectors
Up to four SDI inputs may be connected at any one time, however, the system will automaticallydetermine the signal set to analyze - be it single link, dual link, or quad link - based on the SMPTE ST352 packets present. The algorithm looks to SDI In A first and then determines the overall standard.
If the SMPTE ST 352 packets are known to be incorrect then you have the option to select Ignorepayload identifier packets (ST 352) in the Analyzer - Video Standard window.
SDI BNC In-to-SDI BNC Out signal passthrough is provided by the Loop feature in the System IO,submenu making the input SDI signal(s) available on the SDI BNC output connection.
SDI Outputs Using BNC ConnectorsThe flexibility of the Qx enables you to control the signal on each of the four SDI BNC outputconnectors independently, from either the System IO Instrument or the Generate - Video Instrument.
The Qx Generator can provide up to four SDI output signals which must form part of the same videosignal set. When you enable the Generator Copy mode in the Generate - Video menu it will provideeither:
l Four Single links
l Two Dual links
l One Quad link.
SDI Out A is always present and carries the first signal in the group, SDI Out B is active for dual linkstandards, and SDI Out C and SDI Out D are active for quad link standards.
PHABRIX QxUser Manual Page 4-5

Figure 4-5: Qx Rear Panel SDI Input BNC Connectors
For each of the four output BNC connectors, you can select from the following optional modes:
l Off: Mutes the selected SDI Out connector.
l Generator: When the Generator Copy function is enabled, allows you to copy the Generator out-put to any unused SDI Out BNCs (A, B, C or D). The number of copies depends on the number ofsignals from the Generator. For example, with a single link you can have up to three copies, witha dual link, one copy and with a quad link, no copies as all connectors are used by the primaryGenerator signal.
l Loop SDI in A / B / C / D: Enables you to repeat the signal presented to the SDI BNC inputs as anoutput from the SDI BNC Outputs. When selected, there is a direct mapping between the SDI InBNC and its corresponding SDI Out BNC, for example, SDI In A loops to SDI Out A, SDI In B loopsto SDI Out B, and so on.
If the Generator Copy mode is disabled, the Qx generates a single instance of a link standard asfollows:
l One Single link
l One Dual link
l One Quad link
Note: The Loop feature is available when both the SDI Input Source and SDI Out are set to BNConly. (System IO SDI connector configuration: BNC in / BNC out.)
Page 4-6 PHABRIX QxUser Manual

Overview of SDI SFP ConnectionsThe Qx has two available SFP slots that can be used for SDI SFPs labeled SFP+A and SFP+B. Each slotcan house an SFP that itself has one or two signal lanes. The signal lane can be either an Rx(receiver/input) or Tx (transmitter/output).
With two SDI SFPs inserted, between two to four SDI input/outputs (IOs) are available. The number ofIOs that are inputs or outputs will depend on the inserted SFP types. The Qx can take the following SFPtypes in both SFP+A and SFP+B slots:
l RxRx (Dual Receiver – Two Inputs)
l TxTx (Dual Transmitter – Two Outputs)
l RxTx (Transceiver – One Input, One Output)
l Rx (Single Receiver – One Input)
l Tx (Single Transmitter – One Output)
An RxRx RxRx combination would provide four inputs; TxTx TxTx provides four outputs; Tx RxTxprovides two outputs and one input, and so on.
The Qx maps the SDI signal lane positions (A, B, C, or D) of the installed SFP to internal SDI paths asoutlined in the following table. Whether a lane is an input or output depends on the type of SFPinstalled:
Table 4-1 : Overview of SDI SFP Connections
SFP+ Slot SDI Lane Position QxMapping System IO Rear View
SFP+A Left SDI IO A (Input or Output dependson SFP type. E.g., For an RxTx SFPin slot SFP+A, this would be SDI InA.)
SFP+A Right SDI IO B
SFP+B Left SDI IO C
SFP+B Right SDI IO D
Note: Use only SDI SFPs approved by PHABRIX. The Qx displays an error message if you insert anincompatible SFP. For more information, please contact PHABRIX Support at:www.phabrix.com/support
PHABRIX QxUser Manual Page 4-7
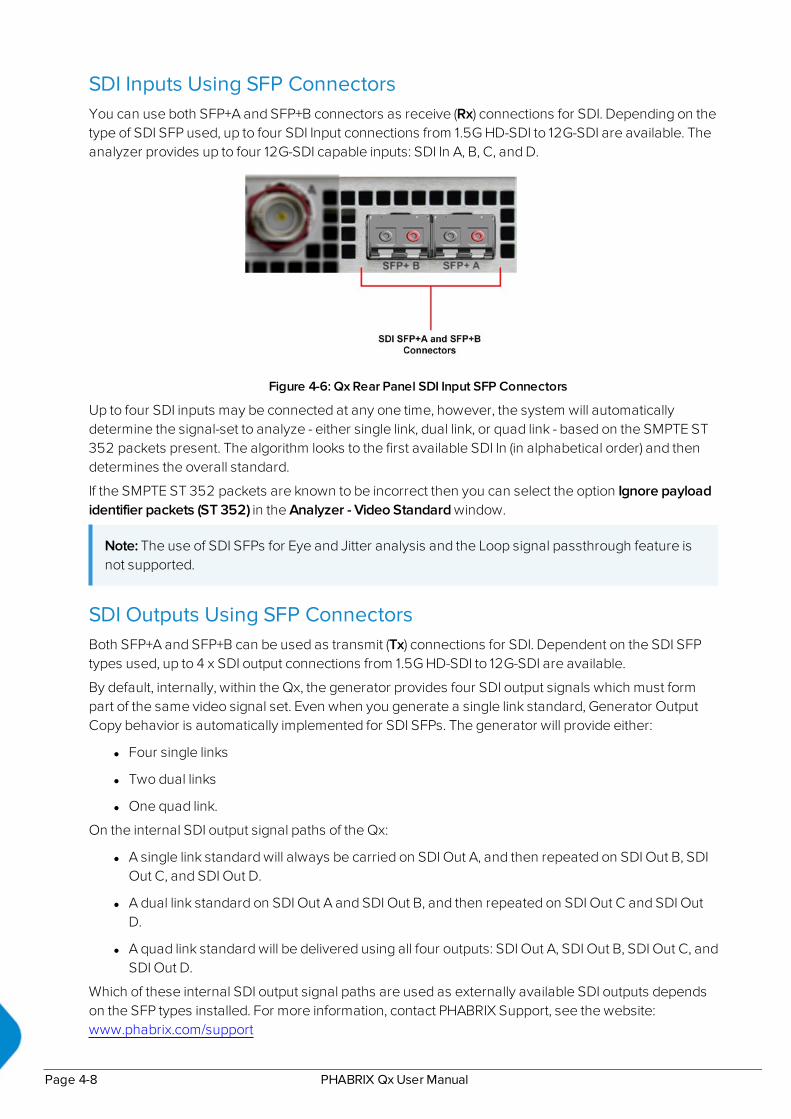
SDI Inputs Using SFP ConnectorsYou can use both SFP+A and SFP+B connectors as receive (Rx) connections for SDI. Depending on thetype of SDI SFP used, up to four SDI Input connections from 1.5G HD-SDI to 12G-SDI are available. Theanalyzer provides up to four 12G-SDI capable inputs: SDI In A, B, C, and D.
Figure 4-6: Qx Rear Panel SDI Input SFP Connectors
Up to four SDI inputs may be connected at any one time, however, the system will automaticallydetermine the signal-set to analyze - either single link, dual link, or quad link - based on the SMPTE ST352 packets present. The algorithm looks to the first available SDI In (in alphabetical order) and thendetermines the overall standard.
If the SMPTE ST 352 packets are known to be incorrect then you can select the option Ignore payloadidentifier packets (ST 352) in the Analyzer - Video Standard window.
Note: The use of SDI SFPs for Eye and Jitter analysis and the Loop signal passthrough feature isnot supported.
SDI Outputs Using SFP ConnectorsBoth SFP+A and SFP+B can be used as transmit (Tx) connections for SDI. Dependent on the SDI SFPtypes used, up to 4 x SDI output connections from 1.5G HD-SDI to 12G-SDI are available.
By default, internally, within the Qx, the generator provides four SDI output signals which must formpart of the same video signal set. Even when you generate a single link standard, Generator OutputCopy behavior is automatically implemented for SDI SFPs. The generator will provide either:
l Four single links
l Two dual links
l One quad link.
On the internal SDI output signal paths of the Qx:
l A single link standard will always be carried on SDI Out A, and then repeated on SDI Out B, SDIOut C, and SDI Out D.
l A dual link standard on SDI Out A and SDI Out B, and then repeated on SDI Out C and SDI OutD.
l A quad link standard will be delivered using all four outputs: SDI Out A, SDI Out B, SDI Out C, andSDI Out D.
Which of these internal SDI output signal paths are used as externally available SDI outputs dependson the SFP types installed. For more information, contact PHABRIX Support, see the website:www.phabrix.com/support
Page 4-8 PHABRIX QxUser Manual
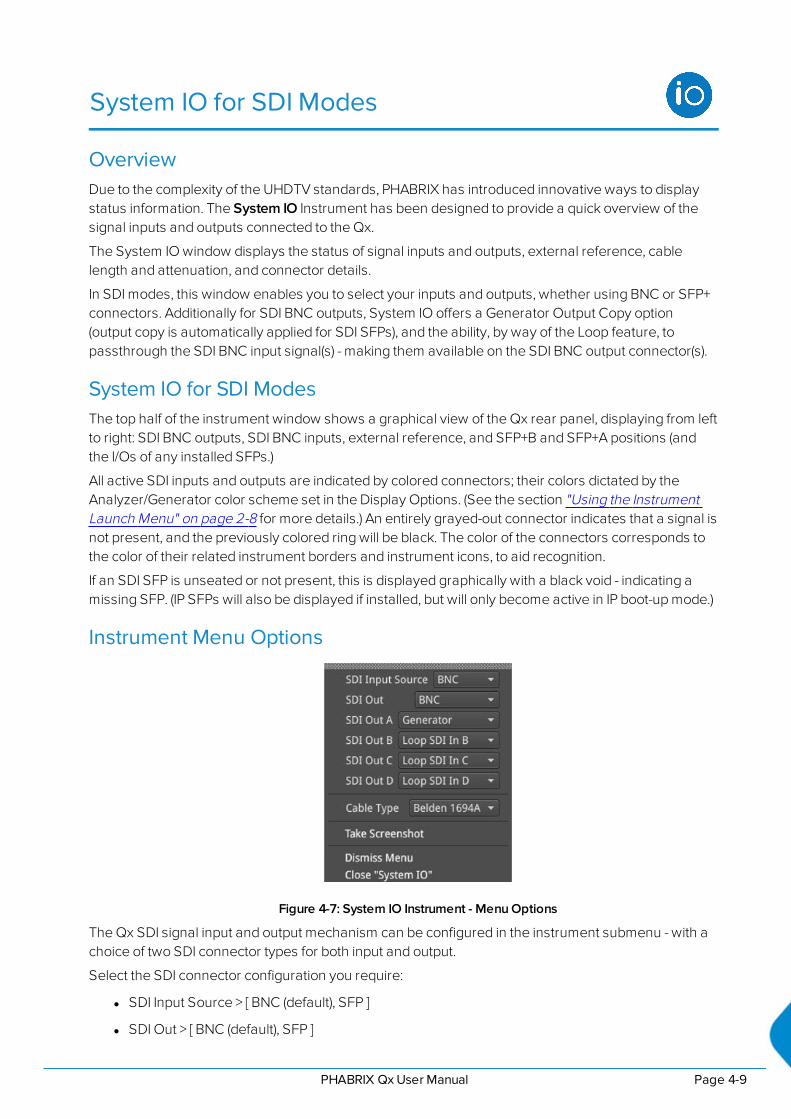
System IO for SDI Modes
OverviewDue to the complexity of the UHDTV standards, PHABRIX has introduced innovative ways to displaystatus information. The System IO Instrument has been designed to provide a quick overview of thesignal inputs and outputs connected to the Qx.
The System IO window displays the status of signal inputs and outputs, external reference, cablelength and attenuation, and connector details.
In SDI modes, this window enables you to select your inputs and outputs, whether using BNC or SFP+connectors. Additionally for SDI BNC outputs, System IO offers a Generator Output Copy option(output copy is automatically applied for SDI SFPs), and the ability, by way of the Loop feature, topassthrough the SDI BNC input signal(s) - making them available on the SDI BNC output connector(s).
System IO for SDI ModesThe top half of the instrument window shows a graphical view of the Qx rear panel, displaying from leftto right: SDI BNC outputs, SDI BNC inputs, external reference, and SFP+B and SFP+A positions (andthe I/Os of any installed SFPs.)
All active SDI inputs and outputs are indicated by colored connectors; their colors dictated by theAnalyzer/Generator color scheme set in the Display Options. (See the section "Using the InstrumentLaunch Menu" on page 2-8 for more details.) An entirely grayed-out connector indicates that a signal isnot present, and the previously colored ring will be black. The color of the connectors corresponds tothe color of their related instrument borders and instrument icons, to aid recognition.
If an SDI SFP is unseated or not present, this is displayed graphically with a black void - indicating amissing SFP. (IP SFPs will also be displayed if installed, but will only become active in IP boot-up mode.)
Instrument Menu Options
Figure 4-7: System IO Instrument - Menu Options
The Qx SDI signal input and output mechanism can be configured in the instrument submenu - with achoice of two SDI connector types for both input and output.
Select the SDI connector configuration you require:
l SDI Input Source > [ BNC (default), SFP ]
l SDI Out > [ BNC (default), SFP ]
PHABRIX QxUser Manual Page 4-9

Figure 4-8: System IO Instrument Showing a 12G BNC Output and BNC input In Use
Figure 4-9: System IO Instrument Showing SFP Outputs and SFP Inputs In Use
Note:BNC in / SFP out and SFP in / BNC out combinations are also supported.
For further details on SDI SFP input and output positioning, see the section"Overview of SDI SFP Connections " on page 4-7.
Additional SDI BNC output control is provided in the instrument submenu. The menu options availabledepend on the selected video standard and whether you are using a single, dual or quad link.
For each SDI Out connector, you can select the following options:
l SDI Out A > [ Off , Generator, Loop SDI In A ]
l SDI Out B > [ Off , Generator, Loop SDI In B ]
l SDI Out C > [ Off , Generator, Loop SDI In C ]
l SDI Out D > [ Off , Generator, Loop SDI In D ]
Signals presented to the SDI BNC Inputs of the Qx can be repeated out on the SDI BNC outputs of theunit, by enabling Loop SDI In A / B / C / D for the appropriate connector(s).
When this Loop feature is activated, there is a one-to-one mapping between the A, B, C, and D, inputsand outputs respectively. The Loop feature disables the generator activity on the SDI BNC outputs,and overrides Output Copy.
Page 4-10 PHABRIX QxUser Manual
Note: To use the Qx Loop SDI feature, you must have a valid input connected to the SDI In A BNC.
The Loop feature is available in a BNC in / BNC out configuration only.
To duplicate output of the generated single link or dual link video standard on all unused SDI OutBNCs, enable the option Generator Copy available in the Generator - Video submenu.
Note: Copying of the Generator output is not applicable to quad link standards as all outputs areused.
Note: Output copy functionality is automatically applied when using SDI SFP outputs.
The presence of external reference and its standard, is also displayed graphically with a coloredconnector. If you set the system to lock to an external reference and achieve a stable lock, then theinner ring of the EXT REF BNC (Figure 4-9) is highlighted in gray. The following EXT REF BNC colorsrelate to various external reference status:
l Gray (reference connected)
l Red (error with reference)
l Black (no reference connected)
Note: The EXT REF BNC shows the status of external reference only; which is not necessarily thesystem reference. Overall system reference is selected in the Timing and System Referenceinstrument window.
Below the graphical connector display, tables display input and output status, cable length andattenuation, external reference standard and status, and SFP type and presence information. You canhover the mouse over the external reference and SFP status information to display tooltips containingadditional status information.
The external reference table displays the following states:
l EXT REF: [No Signal, Unstable, 525/59.94, 625/50, etc...]
If external reference is not currently being used as system reference, its field text will display in yellow.When external reference is the system reference, this table field text will be white.
Measurements for cable length (in meters) and attenuation (in decibels) are displayed for each SDIBNC input. To measure the length of a connected cable, be sure to first select the correct cable typefrom the instrument submenu:
l Cable Type > [Belden 8281, Belden 1505, Belden 1694A, Belden 1855A, Image 1000]
The selected cable type is shown below the SDI In BNC connector view.
PHABRIX QxUser Manual Page 4-11

AES IO Config (SDI Mode)
OverviewThe Qx provides powerful and flexible functionality for handling AES (Audio Engineering Society) inputand output audio signals when present on pins 1 - 4 of the rear panel 26-way D-type connector. Seethe section "Technical Specifications" on page A-2 for more information on the connector pinouts. Youcan use a D-type to BNC converter to access the AES I/Os.
The AES IO Config Instrument provides an interface to configure the AES I/Os as follows:
l Up to four AES signals (a combination of inputs and/or outputs) can be handled at the same time
l SDI Input to AES Output audio conversion is available for both PCM and Dolby encoded audio(using the Transmit - Analyzer)
l Route AES Input signals to other AES outputs to provide a single loop output or up to three copyoutputs (using Transmit - Passthrough).
Figure 4-10: AES IO Config Instrument and Options Menu
The window provides a graphical display of the 26-way D-type rear panel connector of the Qx, andlabels the AES pins (pins 1 - 4). The AES Panel graphic shows the AES I/O BNCs in any AES breakoutboard connected to the Qx rear panel D-type connector.
In both graphics, an active AES I/O is displayed in the Analyzer color when configured as an AES Input(in Receive mode) or in the Generator color when configured as an AES Output (in Transmit mode).
Below the AES Panel graphic, a table lists the status of each AES I/O. For AES Outputs the table alsoshows the transmit mode source. Any issues in theaudio transmit source are highlighted in the tabletext as follows:
l Red: Configuration error
l Yellow: Audio source not present.
Hover the mouse over the error text to display a tooltip describing how to resolve the issue.
Page 4-12 PHABRIX QxUser Manual
Instrument Menu OptionsConfigure the AES I/Os in the instrument submenu as follows:
Each AES I/O can be set as an input (receive), or output (transmit):
l Off: AES I/O is switched off
l Receive: I/O is set to AES Input
l Transmit - Generator: I/O is set to AES Output
The output audio signal source is the Qx audio generator (See the Audio tab of the Generator –Configuration instrument.)
l Transmit - Analyzer: I/O is set to AES Output
The output audio signal comes from Image/Sub-image 1 of the Qx analyzer input (SDI or IP 2022-6)
l Transmit - Passthrough: I/O is set to AES Output
The output audio signal is routed from the chosen AES input Passthrough Source
l AES 1/2/3/4 Mode > [Off, Receive, Transmit - Analyzer, Transmit - Generator, Transmit -Passthrough]
l AES 1/2/3/4 Mode > Transmit - Analyzer/Generator > AES 1/2/3/4 Transmit Pair > [Group 1: Pair 1,Group 1: Pair 2, Group 2: Pair 1, Group 2: Pair 2, Group 3: Pair 1, Group 3: Pair 2, Group 4: Pair 1,Group 4: Pair 2, Group 5: Pair 1, Group 5: Pair 2, Group 6: Pair 1, Group 6: Pair 2, Group 7: Pair 1,Group 7: Pair 2, Group 8: Pair 1, Group 8: Pair 2]
l Passthrough Source > [AES 1, AES 2, AES 3, AES 4]
PHABRIX QxUser Manual Page 4-13
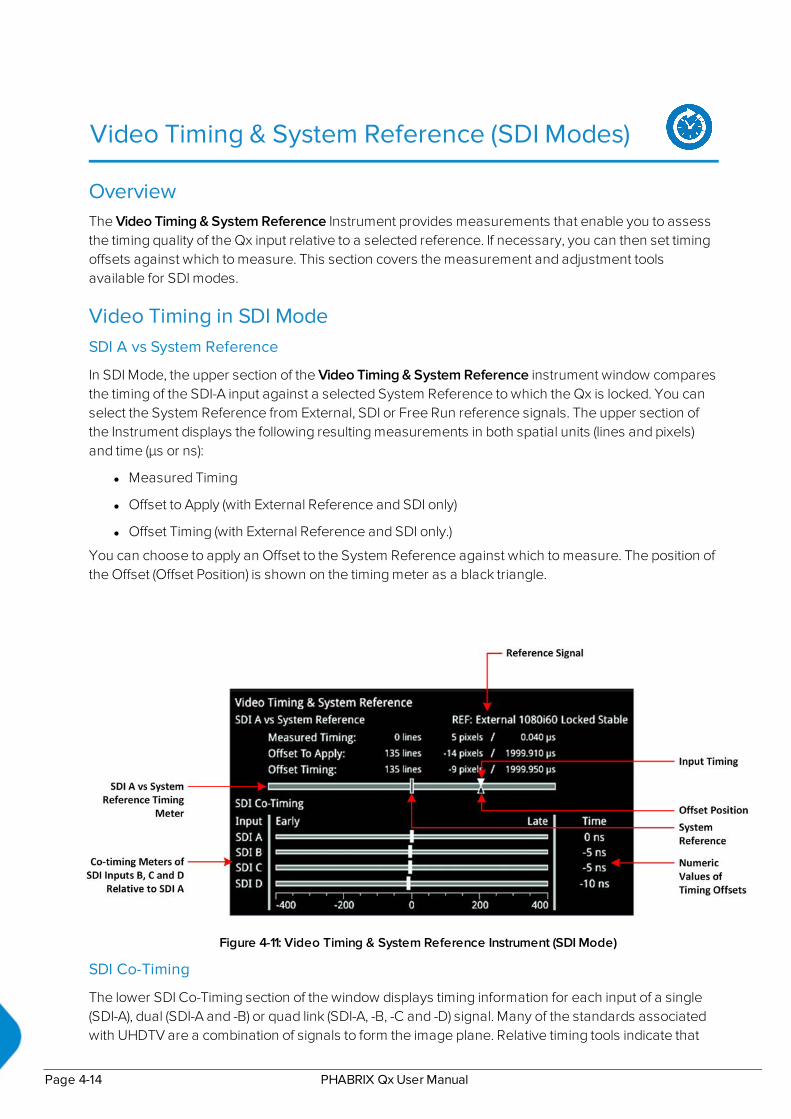
Video Timing & System Reference (SDI Modes)
OverviewThe Video Timing & System Reference Instrument provides measurements that enable you to assessthe timing quality of the Qx input relative to a selected reference. If necessary, you can then set timingoffsets against which to measure. This section covers the measurement and adjustment toolsavailable for SDI modes.
Video Timing in SDI ModeSDI A vs System Reference
In SDI Mode, the upper section of the Video Timing & System Reference instrument window comparesthe timing of the SDI-A input against a selected System Reference to which the Qx is locked. You canselect the System Reference from External, SDI or Free Run reference signals. The upper section ofthe Instrument displays the following resulting measurements in both spatial units (lines and pixels)and time (μs or ns):
l Measured Timing
l Offset to Apply (with External Reference and SDI only)
l Offset Timing (with External Reference and SDI only.)
You can choose to apply an Offset to the System Reference against which to measure. The position ofthe Offset (Offset Position) is shown on the timing meter as a black triangle.
Figure 4-11: Video Timing & System Reference Instrument (SDI Mode)
SDI Co-Timing
The lower SDI Co-Timing section of the window displays timing information for each input of a single(SDI-A), dual (SDI-A and -B) or quad link (SDI-A, -B, -C and -D) signal. Many of the standards associatedwith UHDTV are a combination of signals to form the image plane. Relative timing tools indicate that
Page 4-14 PHABRIX QxUser Manual
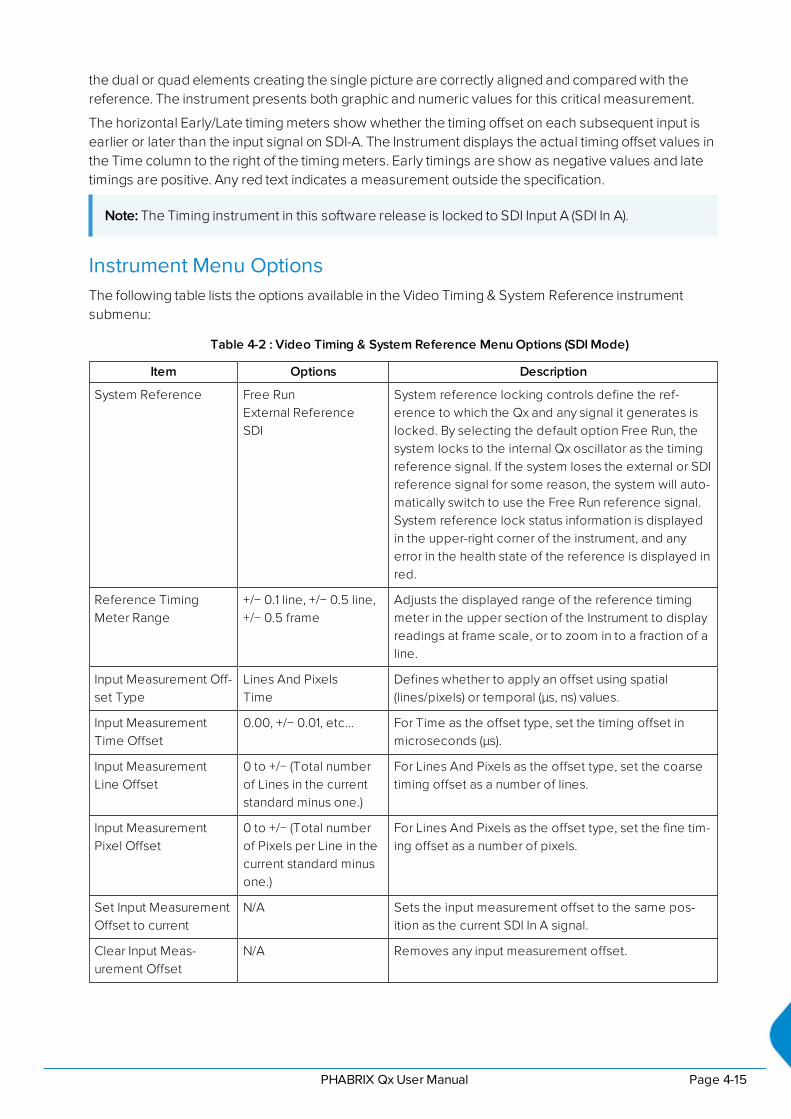
the dual or quad elements creating the single picture are correctly aligned and compared with thereference. The instrument presents both graphic and numeric values for this critical measurement.
The horizontal Early/Late timing meters show whether the timing offset on each subsequent input isearlier or later than the input signal on SDI-A. The Instrument displays the actual timing offset values inthe Time column to the right of the timing meters. Early timings are show as negative values and latetimings are positive. Any red text indicates a measurement outside the specification.
Note: The Timing instrument in this software release is locked to SDI Input A (SDI In A).
Instrument Menu OptionsThe following table lists the options available in the Video Timing & System Reference instrumentsubmenu:
Table 4-2 : Video Timing & System Reference Menu Options (SDI Mode)
Item Options Description
System Reference Free RunExternal ReferenceSDI
System reference locking controls define the ref-erence to which the Qx and any signal it generates islocked. By selecting the default option Free Run, thesystem locks to the internal Qx oscillator as the timingreference signal. If the system loses the external or SDIreference signal for some reason, the system will auto-matically switch to use the Free Run reference signal.System reference lock status information is displayedin the upper-right corner of the instrument, and anyerror in the health state of the reference is displayed inred.
Reference TimingMeter Range
+/− 0.1 line, +/− 0.5 line,+/− 0.5 frame
Adjusts the displayed range of the reference timingmeter in the upper section of the Instrument to displayreadings at frame scale, or to zoom in to a fraction of aline.
Input Measurement Off-set Type
Lines And PixelsTime
Defines whether to apply an offset using spatial(lines/pixels) or temporal (μs, ns) values.
Input MeasurementTime Offset
0.00, +/− 0.01, etc... For Time as the offset type, set the timing offset inmicroseconds (μs).
Input MeasurementLine Offset
0 to +/− (Total numberof Lines in the currentstandard minus one.)
For Lines And Pixels as the offset type, set the coarsetiming offset as a number of lines.
Input MeasurementPixel Offset
0 to +/− (Total numberof Pixels per Line in thecurrent standard minusone.)
For Lines And Pixels as the offset type, set the fine tim-ing offset as a number of pixels.
Set Input MeasurementOffset to current
N/A Sets the input measurement offset to the same pos-ition as the current SDI In A signal.
Clear Input Meas-urement Offset
N/A Removes any input measurement offset.
PHABRIX QxUser Manual Page 4-15

SFP (A, B) - Info (SDI Modes)
OverviewThe SFP - Info windows provide at-a-glance physical status information on each Qx SFP module,including Identifier, Connector, line code (Encoding), Vendor details and approval status for use withthe Qx. More detailed status information for the SFP, such as temperature and voltage are alsodisplayed.
Figure 4-12: SFP (A, B) - Info Instrument
Instrument Menu OptionsTemperature and Power display units can be adjusted via the right-click submenu:
l Temperature Units > [°C, °F]
l Optical Power Units > [mW, dBm]
Page 4-16 PHABRIX QxUser Manual
5IP System Setup and ConfigurationThis chapter describes the System Instruments used to setup and configure the Qx for your desiredtest and measurement functions and includes the following sections:
l Overview
l IP Input and Output Schematics
l IP Connections
l ST 2110 Input Optical SFP Connection (Analyzer - IP 2110 Mode)
l ST 2022-6 Input Optical SFP Connection (Analyzer - IP 2022-6 Mode)
l ST 2022-6 Output Optical SFP Connection (Generator - IP 2022-6 Mode)
l System IO for IP Modes
l SFP IP Network
l LLDP Information (IP ST 2110 Mode)
l SFP (A, B) - Info (IP Modes)
l IP Receive - NMOS (IP 2110 Mode)
l PTP Info (IP 2110 Mode)
l Video Timing & System Reference (IP Modes)
l IP Receive - Flow Select
l Multicast Setup (Multicast Requests)
l Flow Protocol Configuration (Flow Config)
l Analyzer - 2110 Format Setup (IP ST 2110 Mode)
l Video Timing & System Reference (IP 2110 Mode)
l AES IO Configuration (IP Modes)
PHABRIX QxUser Manual Page 5-1

Qx IP Connectors and Modules
OverviewAll IP connections to the Qx are made using SFP+ modules as shown below.
Figure 5-1: Optical Fiber Connector and 10 Gbit/s MSA SFP+ Optical Transceiver Module
Note:The type of SFP+ module supported by the Qx depends on the version ID ofthe Mezzanine interface board as follows:
l Units with Mezzanine ID 0 to 9 support 10G Ethernet MSA SFP+ IPOptical Transceiver Modules supplied by PHABRIX.
l Units with Mezzanine ID 10 and above may use either PHABRIX sup-plied or third party 10Gs Ethernet MSA SFP+ IP Optical Transceiver Mod-ules.
You can find the version of an installed Mezzanine board in the Qx Aboutdialog, see the section: "Checking the Qx Licenses" on page 3-10.
Page 5-2 PHABRIX QxUser Manual

IP Input and Output Schematic (ST 2022-6)The following graphic shows a schematic view of IP inputs and outputs to and from the Qx Analyzerand Generator circuitry, using SFP+ modules.
Figure 5-2: Qx IP Input/Output Modules to Ananlyzer / Generator Circuitry (ST 2022-6)
Where:
l EQ = SDI Cable Equalizer (Not Used with IP)
l Tx = Signal Tramsmitter (Not Used with IP)
l EYE = Qx Eye Processing Circuitry (Not Available with IP)
l MSA = Multi-source Agreement
PHABRIX QxUser Manual Page 5-3
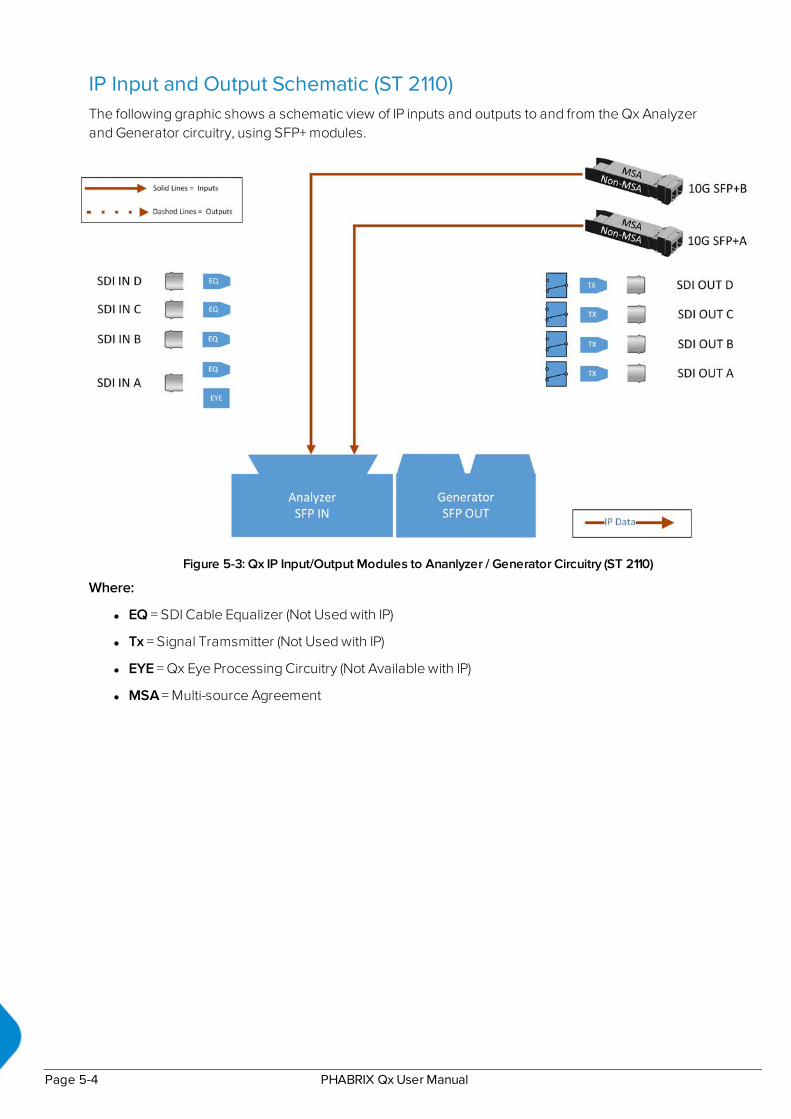
IP Input and Output Schematic (ST 2110)The following graphic shows a schematic view of IP inputs and outputs to and from the Qx Analyzerand Generator circuitry, using SFP+ modules.
Figure 5-3: Qx IP Input/Output Modules to Ananlyzer / Generator Circuitry (ST 2110)
Where:
l EQ = SDI Cable Equalizer (Not Used with IP)
l Tx = Signal Tramsmitter (Not Used with IP)
l EYE = Qx Eye Processing Circuitry (Not Available with IP)
l MSA = Multi-source Agreement
Page 5-4 PHABRIX QxUser Manual

IP Connections to the Qx
OverviewThe Qx standard IP option (PHQXO-IP-STND) supports SMPTE ST 2110 and ST 2022-6 HD/3Gpayloads by way of the 10G SFP+ optical transceiver modules. In addition, advanced IP network trafficmeasurement tools are provided by the option PHQXO-IP-MEAS and a packet interval profilegenerator with PHQXO-IP-NGT.
In ST 2110 mode you can simultaneously analyze ST 2110-20 (video), 2110-30 (PCM) and 2110-31 (AEStransport) audio, 2110-40 ANC media flows while using ST 2022-7 Seamless IP Protection Switching(SIPS). Furthermore, hardware-based time-stamping locked to PTP ensures accurate, real-time,deterministic timing and buffer measurements of media flows through the support of ST 2059Precision Time Protocol (PTP) on SFP+A.
IP connections to the Qx using the rear panel 10G SFP+ optical transceiver module(s) are as follows:
l ST 2110 input on SFP+A and/or SFP+B.
l ST 2110 input on SFP+A and/or SFP+B with ST 2059 Precision Time Protocol (PTP) on SFP+Aonly.
l ST 2110 input with ST 2022-7 SIPS on both SFP+A and SFP+B and ST 2059 Precision Time Pro-tocol (PTP) on SFP+A.
l ST 2022-6 input on SFP+A.
l ST 2022-6 output on SFP+B.
With PHABRIX-supplied SFPs (PHSFP-10GE-SR) you must use LC-to-LC optical, multimode duplex fibercables for IP connections to the Qx SFPs; the following cable specifications are approved by PHABRIX:
l OM1 (62.5/125)
l OM2 (50/125)
l OM3 (50/125)
l OM4 (50/125)
Note: For both SFP+A and SFP+B, use only multimode optical SFPs approved by PHABRIX ormonomode SFPs of your choice. The Qx displays an error message if you insert an incompatibleSFP. For more information, contact PHABRIX Support, see: www.phabrix.com/support
ST 2110 Input Optical SFP Connection (Analyzer - IP 2110 Mode)Since Qx software release 3.01, both SFP+A and SFP+B are available as input connections for ST 2110IP video, audio and ancillary data (ANC) flows.
Support for ST 2059 Precision Time Protocol (PTP) is currently available on SFP+A only.
You can analyze flows on SFP+A or SFP+B, or use both interfaces in tandem in a Seamless IPProtection Switching (SIPS) configuration where ST 2022-7 functionality provides seamlessreconstruction of flows by using the best packets presented on either interface.
You can define the video and audio flow parameters in the Analyzer - 2110 Format Setup Instrument.
In addition, the Qx software provides enhanced IP ST 2110 measurement capabilities with the optionallicense PHQXO-IP-MEAS including:
PHABRIX QxUser Manual Page 5-5
l ST 2110 VRXFull
l ST 2110 CMax
l Advanced video timing
l Dual-port interpacket timing windows
l ST 2059 Precision Time Protocol (PTP)
l Support for Link Layer Discovery Protocol (LLDP)
l Source Specific Multicast
l PTP timing vs External reference
ST 2022-6 Input Optical SFP Connection (Analyzer - IP 2022-6 Mode)The receive (Rx) connection for IP ST 2022-6 video is SFP+A. This is the right-most SFP when viewedfrom the rear and provides the multirate 2022-6 IP video analyzer connection from 1.5G HD-SDI to 3G-SDI over IP.
If the SMPTE ST 352 packets are known to be incorrect then you have the option to select Ignorepayload identifier packets (ST 352) in the Analyzer - Video Standard window.
ST 2022-6 Output Optical SFP Connection (Generator - IP 2022-6 Mode)The transmit (Tx) connection for IP ST 2022-6 video is SFP+B. This is the left-most SFP when viewedfrom the rear. This output provides the multirate 2022-6 IP video packet generation from 1.5G HD-SDIto 3G-SDI over IP.
Page 5-6 PHABRIX QxUser Manual

System IO for IP Modes
OverviewDue to the complexity of the UHDTV standards, PHABRIX has introduced innovative ways to displaystatus information. The System IO Instrument has been designed to provide a quick overview of thesignal inputs and outputs connected to the Qx.
The System IO window displays the status of signal inputs and outputs, external reference, andconnector details.
In IP modes, this window is a more passive status overview of the SFP+ and external referenceconnectors than is the case in SDI modes.
System IO for IP ModesThe active IP SFP+ receive inputs and transmit outputs are indicated in the dialog window by coloredconnectors. The color of the connectors corresponds to the color of their related instrument bordersand instrument icons, to aid recognition.
An entirely grayed-out connector indicates that a signal is not present. If an SFP+ is unseated or notpresent, this is displayed graphically with a black void to indicate a missing SFP+.
The tables display SFP+ type and presence information, together with external reference standardand status details; as with the SDI version of this Instrument.
Figure 5-4: System IO Instrument Showing SFP-A in IP Mode
PHABRIX QxUser Manual Page 5-7
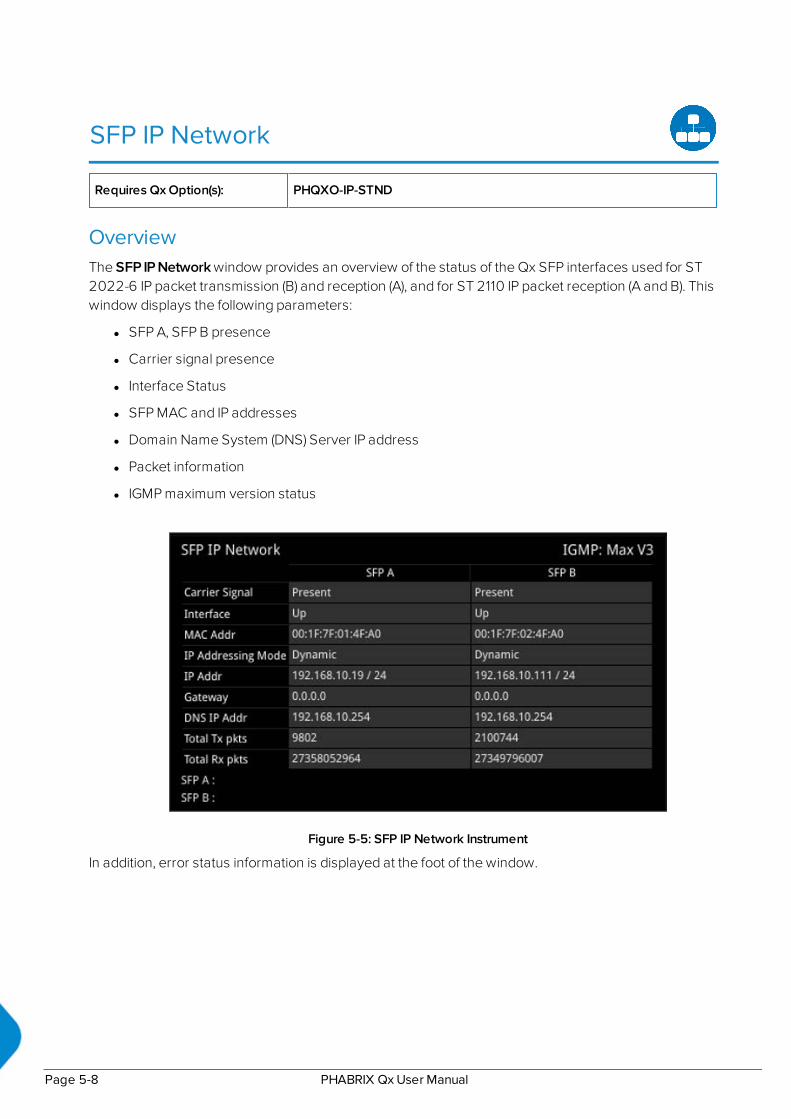
SFP IP Network
Requires Qx Option(s): PHQXO-IP-STND
OverviewThe SFP IP Network window provides an overview of the status of the Qx SFP interfaces used for ST2022-6 IP packet transmission (B) and reception (A), and for ST 2110 IP packet reception (A and B). Thiswindow displays the following parameters:
l SFP A, SFP B presence
l Carrier signal presence
l Interface Status
l SFP MAC and IP addresses
l Domain Name System (DNS) Server IP address
l Packet information
l IGMP maximum version status
Figure 5-5: SFP IP Network Instrument
In addition, error status information is displayed at the foot of the window.
Page 5-8 PHABRIX QxUser Manual

Instrument Menu Options
Figure 5-6: SFP IP Network Menu Options
Right-click in this window to display a submenu you can use to set the IP address (DHCP or Static) andnetwork/subnet mask of each SFP using a USB keyboard or on-screen keypad. The following optionsare available:
IP addressing mode:
l IP addressing mode> [Dynamic, Static]
Static IP address of SFP:
l SFP...IP addr and mask > [set IP address of SFP as required]
Mask selection is via a drop-down menu. Classless Inter-Domain Routing (CIDR) notation is used; witha default value of /24 (i.e. 255.255.255.0):
l SFP...IP addr and mask > [set mask in drop-down, 8 to 31]
Default Gateway:
l SFP...Gateway IP Addr > [set Gateway IP address as required]
DNS Server:
l SFP...DNS IP Addr > [set IP address of DNS Server as required, for example, when manually con-figuring for use with NMOS.]
To save your IP settings, select:
l Apply SFP...IP Parameters
The maximum allowed IGMP version can be set here and also in the PTP Info tool. Selecting thehighest available IGMP Max Version will affect all Qx IGMP requests (including both PTP, by way of PTPInfo, and Media Flows requested by way of the IP Receive - Flow Select tools.)
l IGMP Max Version > [Version no higher than V3, Version no higher than V2, Version no higherthan V1]
PHABRIX QxUser Manual Page 5-9
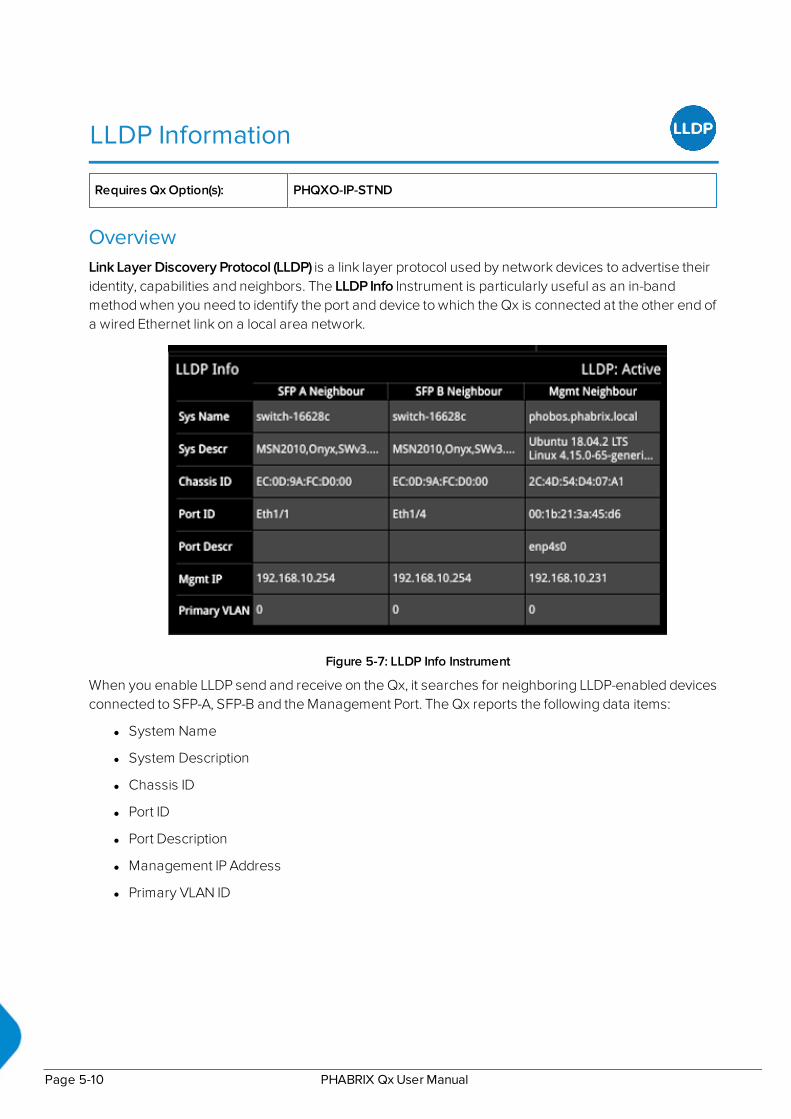
LLDP Information
Requires Qx Option(s): PHQXO-IP-STND
OverviewLink Layer Discovery Protocol (LLDP) is a link layer protocol used by network devices to advertise theiridentity, capabilities and neighbors. The LLDP Info Instrument is particularly useful as an in-bandmethod when you need to identify the port and device to which the Qx is connected at the other end ofa wired Ethernet link on a local area network.
Figure 5-7: LLDP Info Instrument
When you enable LLDP send and receive on the Qx, it searches for neighboring LLDP-enabled devicesconnected to SFP-A, SFP-B and the Management Port. The Qx reports the following data items:
l System Name
l System Description
l Chassis ID
l Port ID
l Port Description
l Management IP Address
l Primary VLAN ID
Page 5-10 PHABRIX QxUser Manual

The Qx can provide the following information over LLDP:
Table 5-1 : LLDP Information Provided by the Qx
Item Qx Reports
System Name: Qx Serial number
System Description: PHABRIX Qx andQx Software Version Number
Chassis ID and subtype: Qx Management MAC address
Port ID and subtype: Qx Management MAC address
Port Description: l Eth0 (Management)
l phabEth0 (SFP A)
l phabEth1 (SFP B)
Management IP Addresses: Management IP address
Instrument Menu OptionsThe Qx provides the ability to restrict some of the information that is communicated over LLDP, forexample, when considering the IT security of your system. These options are enabled, by default, toallow routine maintenance.
Figure 5-8: LLDP Info Menu Options
If you disable the option Send Version Info in System Description, the system description will indicateonly PHABRIX Qx and will not advertise the Qx software version number. If you disable the optionSend Management Port IP Address, the Qx will not advertise its management IP address.
PHABRIX QxUser Manual Page 5-11
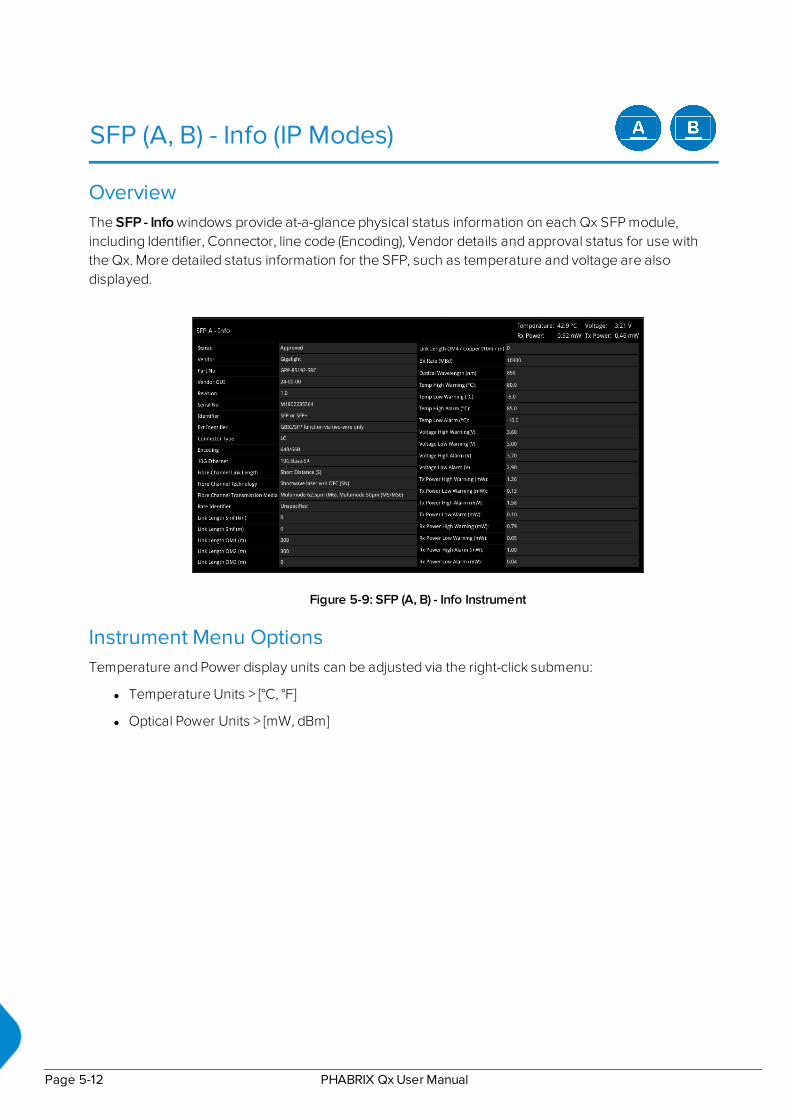
SFP (A, B) - Info (IP Modes)
OverviewThe SFP - Info windows provide at-a-glance physical status information on each Qx SFP module,including Identifier, Connector, line code (Encoding), Vendor details and approval status for use withthe Qx. More detailed status information for the SFP, such as temperature and voltage are alsodisplayed.
Figure 5-9: SFP (A, B) - Info Instrument
Instrument Menu OptionsTemperature and Power display units can be adjusted via the right-click submenu:
l Temperature Units > [°C, °F]
l Optical Power Units > [mW, dBm]
Page 5-12 PHABRIX QxUser Manual
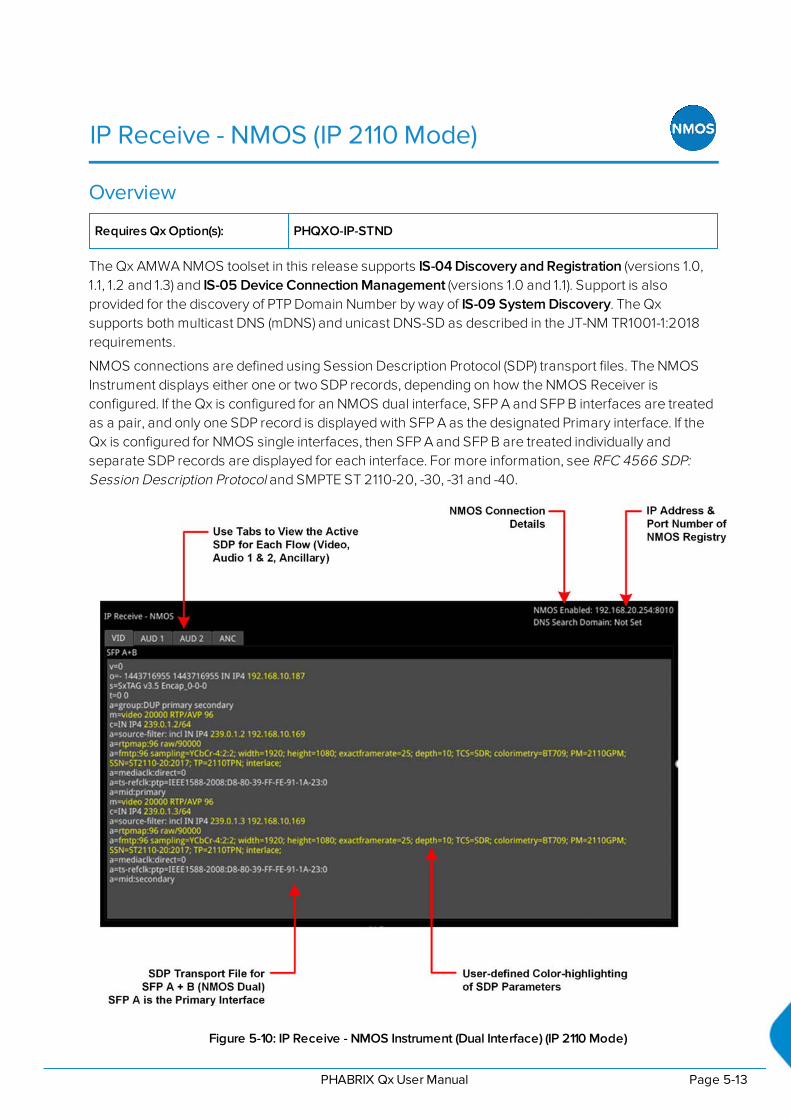
IP Receive - NMOS (IP 2110 Mode)
Overview
Requires Qx Option(s): PHQXO-IP-STND
The Qx AMWA NMOS toolset in this release supports IS-04 Discovery and Registration (versions 1.0,1.1, 1.2 and 1.3) and IS-05 Device Connection Management (versions 1.0 and 1.1). Support is alsoprovided for the discovery of PTP Domain Number by way of IS-09 System Discovery. The Qxsupports both multicast DNS (mDNS) and unicast DNS-SD as described in the JT-NM TR1001-1:2018requirements.
NMOS connections are defined using Session Description Protocol (SDP) transport files. The NMOSInstrument displays either one or two SDP records, depending on how the NMOS Receiver isconfigured. If the Qx is configured for an NMOS dual interface, SFP A and SFP B interfaces are treatedas a pair, and only one SDP record is displayed with SFP A as the designated Primary interface. If theQx is configured for NMOS single interfaces, then SFP A and SFP B are treated individually andseparate SDP records are displayed for each interface. For more information, see RFC 4566 SDP:Session Description Protocol and SMPTE ST 2110-20, -30, -31 and -40.
Figure 5-10: IP Receive - NMOS Instrument (Dual Interface) (IP 2110 Mode)
PHABRIX QxUser Manual Page 5-13

You can use the IP Receive - NMOS Instrument to enable your Qx to act as an NMOS receiver node.As a component of an NMOS-enabled environment, the Qx can register its presence as either a pair ofsingle nodes, or a dual receiver node, for each flow type, with the Central NMOS Registry. In dualreceiver mode, SFP A is the designated primary interface.
Once registered, you can use an NMOS Controller to manage the Qx active connections. Use the tabsabove the SFP A SDP Connection panel to monitor the active video, audio and ancillary SDP transportfiles.
Note: The Qx listens for NMOS communications on UDP Port 3000.
The choice of single/dual NMOS node is independent of the choice of 2022-7 SFP A, SFP B, orSeamless SFP A+B mode selection.
Note: In the event that the Qx is unable to locate the NMOS Registry, it will revert to NMOS Peer toPeer mode and display Peer to Peer in place of the NMOS Registry IP address and port number.
Any changes to connectivity made by the NMOS Controller are dynamically reflected in the IP Receive- NMOS Instrument.
If you are not using DHCP and are configuring the system by specifying the DNS Server manually, doso in the SFP IP Network instrument, see "SFP IP Network" on page 5-8.
Note: The Qx supports 24-bit audio in 2110-30 (PCM) and 32-bit audio in 2110-31 (AES3).
Instrument Menu Options
Figure 5-11: IP Receive - NMOS Instrument Menu Options
The following table lists the options available in the IP Receive - NMOS instrument submenu:
Table 5-2 : IP Receive - NMOS Menu Options
Item Options Description
NMOS Node EnabledDisabled (Default)
When enabled, allows the Qx to act as an NMOS Node,and announce itself as a receiver to the Central NMOSRegistry.
Page 5-14 PHABRIX QxUser Manual
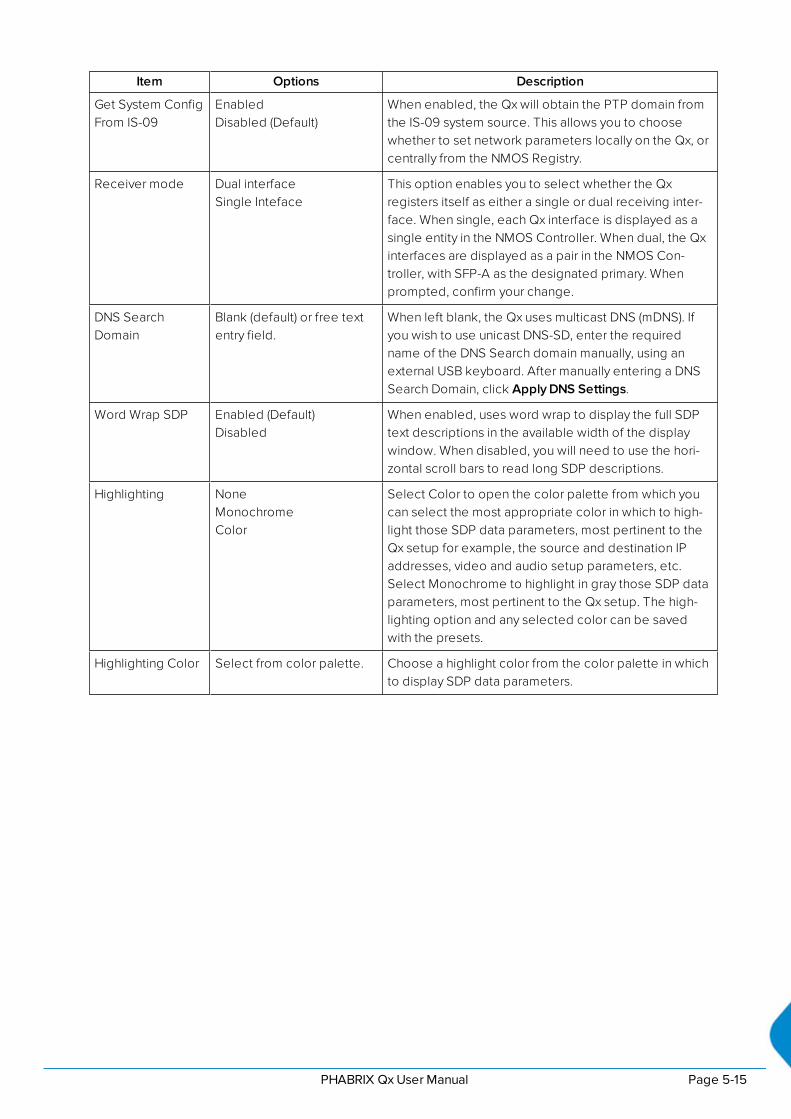
Item Options Description
Get System ConfigFrom IS-09
EnabledDisabled (Default)
When enabled, the Qx will obtain the PTP domain fromthe IS-09 system source. This allows you to choosewhether to set network parameters locally on the Qx, orcentrally from the NMOS Registry.
Receiver mode Dual interfaceSingle Inteface
This option enables you to select whether the Qxregisters itself as either a single or dual receiving inter-face. When single, each Qx interface is displayed as asingle entity in the NMOS Controller. When dual, the Qxinterfaces are displayed as a pair in the NMOS Con-troller, with SFP-A as the designated primary. Whenprompted, confirm your change.
DNS SearchDomain
Blank (default) or free textentry field.
When left blank, the Qx uses multicast DNS (mDNS). Ifyou wish to use unicast DNS-SD, enter the requiredname of the DNS Search domain manually, using anexternal USB keyboard. After manually entering a DNSSearch Domain, click Apply DNS Settings.
Word Wrap SDP Enabled (Default)Disabled
When enabled, uses word wrap to display the full SDPtext descriptions in the available width of the displaywindow. When disabled, you will need to use the hori-zontal scroll bars to read long SDP descriptions.
Highlighting NoneMonochromeColor
Select Color to open the color palette from which youcan select the most appropriate color in which to high-light those SDP data parameters, most pertinent to theQx setup for example, the source and destination IPaddresses, video and audio setup parameters, etc.Select Monochrome to highlight in gray those SDP dataparameters, most pertinent to the Qx setup. The high-lighting option and any selected color can be savedwith the presets.
Highlighting Color Select from color palette. Choose a highlight color from the color palette in whichto display SDP data parameters.
PHABRIX QxUser Manual Page 5-15

PTP Info (IP 2110 Mode)
Overview
Requires Qx Option(s): PHQXO-IP-STND
The PTP Info Instrument provides information about the PTP Grand Master (GM) clock to which the Qxsystem is locked on SFP+A, together with an indication of the quality of the lock to PTP.
You can select PTP as the Qx system reference in the Video Timing & System Reference Instrument.
The selection of IGMP Max Version in this window affects all Qx IGMP requests (that is, both PTP andMedia Flows requested in the IP Receive - Flow Select Instrument.)
Figure 5-12: PTP Info Instrument (IP 2110 Mode)
The PTP Info Instrument features include:
l Control of PTP domain and communication mode (multicast, hybrid without negotiation)
l Indication of PTP lock status
l Grand Master information including Master ID and Best Master Clock Algorithm (BMCA) para-meters
l Indication of estimated frequency and phase lock offset
l Indication of one-step or two-step sync traffic.
The PTP Info status information at the bottom of the screen indicates which SFP is in use and the stateof PTP lock, which you can interpret using the information in the following table:
Table 5-3 : PTP Information Status Messages
PTP Info StatusMessage
PTP InfoStatus Color
PTP Lock State
Listening Red Qx PTP Slave is listening on the selected domain number, buthas not acquired a PTP Master or PTP Delay Request inform-ation.
Frequency Lock Yellow Qx PTP Slave has acquired a PTP Master and has achieved fre-
Page 5-16 PHABRIX QxUser Manual

PTP Info StatusMessage
PTP InfoStatus Color
PTP Lock State
quency lock. The Estimated Phase offset is greater than 2 μs.
Frequency and PhaseLock
White Qx PTP Slave is frequency locked and the estimated phase off-set is less than 2 μs.
In Holdover Yellow Qx PTP Slave had acquired lock, but has now lost the PTPMaster and is in frequency holdover.
Recovered from Hol-dover
Yellow Qx PTP Slave has recovered from a holdover condition wherethe GM was lost but subsequently re-acquired.
Use the Clear Warnings button in the Instrument submenu to remove any yellow warning messagesthat may be displayed following changes to the PTP lock.
Instrument Menu Options
Figure 5-13: PTP Info Instrument Menu Options
The following table lists the options available in the PTP Info instrument submenu:
Table 5-4 : PTP Info Menu Options
Item Options Description
IGMP Max Version Version no higher than V3Version no higher than V2Version no higher than V1
Represents the highest supported version of the Inter-net Group Management Protocol (IGMP). Currently ver-sion 3 is the highest supported version. In the event thatthe network is running IGMP version 2 or version 1, theQx automatically switches down to the lower version ofthe protocol. Currently there is no visual display of theversion at which the Qx is running.
Domain 0 to 127 Defines the IP domain in which the PTP GM is located.
Slave Mode Multicast(Multicast/Multicast)Hybrid(Multicast/Unicast)
The Qx supports two PTP communication modes:
l Multicast (Multicast Announce and Sync, Mult-icast Delay Request, Delay Response)
l Hybrid without negotiation (Multicast Announce
PHABRIX QxUser Manual Page 5-17

Item Options Description
and Sync, Unicast Delay Request, DelayResponse)
In Multicast mode, you can set the Qx automatically toadopt the Master Sync message rate for its multicastDelay Request message rate, by setting the MasterDelay_Req interval to Do not override in Muticast mode.Alternatively, you can set the Delay Request messagerate to manual control by setting the Master Delay_Reqinterval to Override in all modes.In Hybrid mode the Delay Request message rate isalways under manual control.
Master's Delay_Req Interval
Do not override in MulticastMode (Default)Override in all modes
In Multicast Mode, the default Delay_Req interval is setto be the same as the Master Sync message interval.
Delay_Req Inter-val
8 ms, 16, ms, 32 ms, 64 ms,125 ms (Default), 500 ms, 1 s,2 s, 4 s
Allows you manually to define a Delay Request (Delay_Req) message interval. When you set the Slave mode toHybrid or Multicast (MM) and enable Override in allmodes, this is the rate at which the Qx sends Delay_request messages back to the Grand Master (GM).
Announce Rec'tGrace Period
2 - 10 (× Announce Timeout)Default: 3 × AnnounceTimeout
A Grand Master transmits a PTP Announce Message toindicate its presence on the network. Accompanyingthis message is the signaled Announce Message Rateand the Announce Timeout Count. A PTP slave, such asthe Qx, uses this information to confirm that the Master isstill present and active. If the Qx experiences a set ofmissing Announce messages greater than theAnnounce Timeout Count, then it will assume that thePTP Master is missing and will attempt to re-lock. Thetime for this count to trigger is the Announce Timeout.The Announce Receipt Grace Period is a user-definabledelay that is equal to the selected value multiplied bythe Announce Timeout. This delay period allows for aseamless Grand Master change-over before the Qxattempts to re-acquire PTP lock. The default setting isthree times the Announce Receipt timeout but you canchoose between two to ten times the AnnounceReceipt timeout interval.
Latency Offsetsign
+−
Sets the Latency Offset as an increase (positive ( + )value) or decrease (negative ( − ) value.)
Latency Offset(ms, μs, ns scales)
User Defined The long term PTP phase alignment of the Qx can beaffected by network delay asymmetries or, for example,by conversion between a 1G PTP source and a 10G net-work. You can adjust this long-term PTP phase offset bycomparing the 1PPS from the Qx on the GPI output withthe 1PPS from the PTP Grand Master on an oscilloscope.You can then adjust the Qx PTP Latency Offset controlsliders accordingly to bring the Qx 1PPS into time align-ment with the 1PPS of the Grand Master. The value ofthe PTP Latency offset is reported in the PTP Info win-dow.
Page 5-18 PHABRIX QxUser Manual

Item Options Description
PTP Daemon Log-ging
EnabledDisabled (Default)
Enables the Qx to log the activity of the PTP daemonand generate a ptpd logfile for troubleshooting pur-poses.
Update PTP con-figuration
N/A Applies any changes after updating the Qx settings.
Clear Warnings N/A Removes warning messages from the status line at thebottom of the Instrument window.
The Delay Request message rate options are as follows:
Table 5-5 : Options for the Delay Request Message Rate
Delay_Req IntervalDelay Request
Messages/Second
8 ms 125
16 ms 62.5
32 ms 31.25
64 ms 15.625
125 ms 8
250 ms 4
500 ms 2
1 s 1
2 s 0.5
4 s 0.25
PHABRIX QxUser Manual Page 5-19

Video Timing & System Reference (IP Modes)
OverviewThe Video Timing & System Reference Instrument provides measurements that enable you to assessthe timing quality of the Qx input relative to a selected reference. If necessary, you can then set timingoffsets against which to measure. The measurements and adjustment tools available depend on thecurrent mode of the Qx and whether the inputs are received from an SDI or IP system, as summarizedin the following table.
Table 5-6 : Overview of IP Video Timing Functions by License and Boot Mode
Qx Boot Mode
IP ST 2022-6 IP ST 2110
PHQXO-IP-STNDLicense
Decapsulated vs System Reference External Reference vs PTP
Timing in IP 2022-6 Mode: Decapsulated vs System ReferenceIn IP 2022-6 Mode, the upper section of the Video Timing & System Reference instrument windowcompares the timing of the Decapsulated input against a selected System Reference to which the Qxis locked. You can select the System Reference from External or Free Run reference signals. Theupper section of the Instrument displays the following resulting measurements in both spatial units(lines and pixels) and time (μs or ns):
l Measured Timing
l Offset to Apply (with External Reference only)
l Offset Timing (with External Reference only.)
Page 5-20 PHABRIX QxUser Manual

Figure 5-14: Video Timing & System Reference Instrument (IP 2022-6 Mode)
A timing meter dynamically measures the timing of the input (white triangle) against the systemreference (centrally fixed, black vertical rectangle). In addition to measuring the input against anabsolute system reference, you can choose to apply a system reference offset against which tomeasure. The position of any offset is shown on the timing bar as a black triangle.
Instrument Menu Options
The following table lists the options available in the Video Timing & System Reference instrumentsubmenu:
Table 5-7 : Video Timing & System Reference Menu Options (IP 2022-6 Mode)
Item Options Description
System Reference Free RunExternal Reference
System reference locking controls define the ref-erence to which the Qx and any signal it generatesis locked. By selecting the default option Free Run,the system locks to the internal Qx oscillator as thetiming reference signal. If the system loses theexternal reference signal for some reason, the sys-tem will automatically switch to use the Free Run ref-erence signal.System reference lock status information is dis-played in the upper-right corner of the instrument,and any error in the health state of the reference isdisplayed in red.
Reference Timing MeterRange
+/− 0.1 line, +/− 0.5 line,+/− 0.5 frame
Adjusts the displayed range of the reference timingmeter in the upper section of the Instrument to dis-play readings at frame scale, or to zoom in to a frac-tion of a line.
Input Measurement OffsetType
Lines And PixelsTime
Defines whether to apply an offset using spatial(lines/pixels) or temporal (μs, ns) values.
Input Measurement TimeOffset
0.00, +/− 0.01, etc... For Time as the offset type, set the timing offset inmicroseconds (μs).
Input Measurement Line Off-set
0 to +/− (Total numberof Lines in the currentstandard minus one.)
For Lines And Pixels as the offset type, set thecourse timing offset as a number of lines.
PHABRIX QxUser Manual Page 5-21

Item Options Description
Input Measurement PixelOffset
0 to +/− (Total numberof Pixels per Line in thecurrent standard minusone.)
For Lines And Pixels as the offset type, set the finetiming offset as a number of pixels.
Set Input Measurement Off-set to current
N/A Sets the input measurement offset to the same pos-ition as the current Decapsulated signal.
Clear Input MeasurementOffset
N/A Removes any input measurement offset.
Page 5-22 PHABRIX QxUser Manual

Video Timing & Setting External Reference in IP 2110 Mode
Requires Qx Option(s): PHQXO-IP-STND
Overview
In IP 2110 Mode, the Video Timing & System Reference instrument must be stably locked to the samePTP source as the sending device. The Video Timing & System Reference window includes thefollowing two tabs, each providing access to different timing data:
l Media Latency (for more information, see section "Video Timing & System Reference (IP 2110Mode)" on page 5-35
l External Reference vs PTP
External Reference vs PTP Tab
The Ext Ref vs PTP tab is a timing tool for use in a hybrid system to compare the external analogreference to the PTP reference. The system reference must be set to PTP and the Qx PTP lock must bestable with a low PTP Estimated Phase Offset for this measurement to be valid.
The time difference between the external analog reference and PTP is displayed both in units of videolines and pixels, and units of time (μs or ms.)
The accuracy of this measurement is dependent on the long term PTP phase alignment of the Qx. Thiscan be affected by network delay asymmetries or by conversion between a 1G PTP source and a 10Gnetwork.
You can adjust this long-term PTP phase offset by comparing the 1PPS from the Qx on the GPIO withthe 1PPS from the PTP Grand Master on an oscilloscope and adjusting the Qx PTP Latency Offsetcontrols in the submenu of the PTP Info Instrument to bring the Qx 1PPS into time alignment with the1PPS of the Grand Master.
The tab displays any offset between an external reference signal and the PTP reference. It shows thisvalue in units of time as well as in lines and pixels. If the external reference originates from the samesource as PTP then the value displayed should represent the phase offset of the Qx. Use this tool toshow how well your external reference is locked to PTP. If it is not locked to PTP, you will notice thevalue drifting.
Figure 5-15: Ext Ref vs PTP Tab of the Video Timing & System Reference Instrument (IP 2110 Mode)
Instrument Menu Options
The following table lists the options available with a standard core license in the Video Timing &System Reference Instrument submenu in IP ST 2110 Mode:
PHABRIX QxUser Manual Page 5-23

Table 5-8 : Video Timing & System Reference Menu Options (2110 Mode)
Item Options Description
Ext Ref vs PTP Tab Options
System Reference PTPExternal Reference
System reference locking controls define thereference to which the Qx and any signal it generates islocked. In IP 2110 mode, make sure that the systemreference is stably locked to the same PTP source asthe sending device.
System reference lock status information is displayedin the upper-right corner of the instrument, and anyerror in the health state of the reference is displayed inred.
Reference TimingMeter Range
+/− 0.1 line, +/− 0.5 line,+/− 0.5 frame
Adjusts the displayed range of the reference timingmeter in the upper section of the Instrument to displayreadings at frame scale, or to zoom in to a fraction of aline.
Page 5-24 PHABRIX QxUser Manual

IP Receive - Flow Select
Requires Qx Option(s): PHQXO-IP-STND
OverviewThe IP Receive - Flow Select window enables you to instruct the Qx to issue an IGMP requestmanually, categorize each received flow SMPTE protocol type, and then select IP flows for analysis.The Multicast Requests table lists the IP flows together with their parameters. The IP flows includethose that match multicasts to which the Qx has subscribed, together with multicast and unicast flowsthat have been sent to the Qx.
When under AMWA NMOS control, the Qx automatically issues an IGMP request, categorizes andselects a flow, all under the control of a Session Description Protocol (SDP) transport file.
In IP ST 2110 mode the Qx can simultaneously process the following:
l One video flow
l Two audio flows
l One ANC flow.
The audio flows may be either ST 2110-30 (PCM) or ST 2110-31 (AES 3).
In ST 2022-6 mode, you can select one flow at a time for processing. Allocation of a media flow type orprotocol is independent of the Payload Type ID number, so it is possible to have several differentmedia flow types with the same Payload Type ID.
Detailed information for each flow is provided in the Multicast Requests table as follows:
l SFP Port (A or B)
l Qx Channel Allocation (Video, Audio 1, Audio 2, ANC)
l SMPTE Media Protocol (2110-20, -30, -40, etc.)
l Payload Type ID Number
l Destination and Source IP Addresses and Port Numbers
l Synchronization Source (SSRC) Identifier
l Mean Flow Bandwidth averaged over 1 second
l Total Packet Counts
l Sequence Error Count.
Both Sequence Payload and CRC errors are displayed in the Seq errors count column. You can sortthe table by any parameter column, and once configured, left-click a flow for further analysis.
The overall status of the Multicast IGMP requests is displayed above the table, for example: MulticastRequests: 18/18 joins sent. Multicast IGMP join and leave requests can be controlled using thesubmenu, and the maximum level of IGMP requests can be configured in either the PTP Info or SFP IPNetwork Instruments.
Flow protocol configuration management is available from the submenu, and incoming flows withunassigned protocols (Other IP) can also be quickly configured by right-clicking the flow, then assigningthe flow type and analysis path in the configuration window.
PHABRIX QxUser Manual Page 5-25

In IP ST 2110 mode, IP Receive - Flow Select supports the reception of flows on SFP A or SFP B as wellas ST 2022-7 Seamless IP Protection Switching (SIPS) of pairs of flows on SFP A and B. In ST 2022-6mode the reception of IP media flows is available on SFP A, with SFP B reserved for transmission.
Note: SIPS protection of a flow pair is available across SFP A and SFP B, however, SIPS protectionof a flow pair within one SFP is not supported.
Figure 5-16: IP Receive - Flow Select Instrument Displaying Overview of Multicast Requests Sent
Media flows may have already been presented to the Qx either by a unicast sender, a networkorchestrator or by the Qx being attached to a switch or router mirror port or passive optical tap. Inthese situations, the details of the media flow will automatically appear in the Flow Select window.
If the Qx is required to initiate a multicast session by way of an IGMP request then this can be achievedeither automatically, using either the JSON API or NMOS; or manually, by right-clicking in the FlowSelect tool and selecting the option Multicast/Flow Config from the submenu. This displays a windowwith two selectable tabs: Multicast Requests (see "Multicast Setup (Multicast Requests)" on page 5-28)and Flow Configuration (see "Flow Protocol Configuration (Flow Config)" on page 5-29).
IP flows can be accessed using either IGMPv1, v2 or v3 multicast requests, with the maximum level ofan IGMP request configured either by right-clicking on the Flow Select or alternatively in the PTP Info orSFP IP Network Instrument submenus. The selected maximum IGMP multicast level is applied to allmedia ports. Once a multicast group is successfully joined, all flows within it will appear in the IPReceive - Flow Select window.
The IP flows with assigned SMPTE protocols listed in the window are those currently available forselection on the chosen interfaces. Click to select a flow for analysis; the selected flow is thenhighlighted.
Instrument Menu OptionsThe submenu, accessed by right-clicking the IP Receive - Flow Select window, calls-up multicast andflow configuration settings, persistence settings, together with list and selection clearing controls.
Page 5-26 PHABRIX QxUser Manual

Figure 5-17: IP Receive - Flow Select Instrument Options Menu
The following table lists the options available in the IP Receive - Flow Select Instrument submenu:
Table 5-9 : IP Receive - Flow Select Menu Options
Item Options Description
Multicast/Flow Con-fig
Dialog selection Click to open a new dialog box with tabs for Muticast Requests(see "Multicast Setup (Multicast Requests)" on the next page) andFlow Config (see "Flow Protocol Configuration (Flow Config)" onpage 5-29) as previously described.
Request Multicastson boot
Enabled (Default)Disabled
When enabled, sets the Qx to request to receive Multicast flowsautomatically on re-boot.
Re-lock flows onboot
Enabled (Default)Disabled
When enabled, sets the Qx to re-lock to the selected flows auto-matically on re-boot.
Flow Persistence 1 s10 s30 s1 min5 min10 minInfinite
Sets the amount of time that old, inactive flows remain displayedin the Flow Select window
2022-7 ModeSelection
SFP ASFP BSeamless A+B
Choose whether you want to analyze flows available on one orboth SFP receiver interfaces (in IP 2110 mode).The current mode is displayed in the top right-hand corner of theinstrument window (Analyzer Interface).In IP 2022-6 mode, a single video flow can be selected for ana-lysis at a time.In IP 2110 mode up to four flows per interface (one video, twoaudio and one ANC) can be selected at the same time.When ST 2022-7 seamless reconstruction is enabled (SeamlessA+B), up to four pairs (eight flows) are simultaneously used by theQx for Seamless IP Protection Switching (SIPS). Identicalinstances of a flow (in terms of content) must be sent to both SFPinterfaces. The Qx then reconstructs the flow using the best pack-ets from either interface.
Clear input list N/A Click to clear the displayed list of available flows.
Clear Selection N/A Click to deselect the currently analyzed flow(s).
PHABRIX QxUser Manual Page 5-27
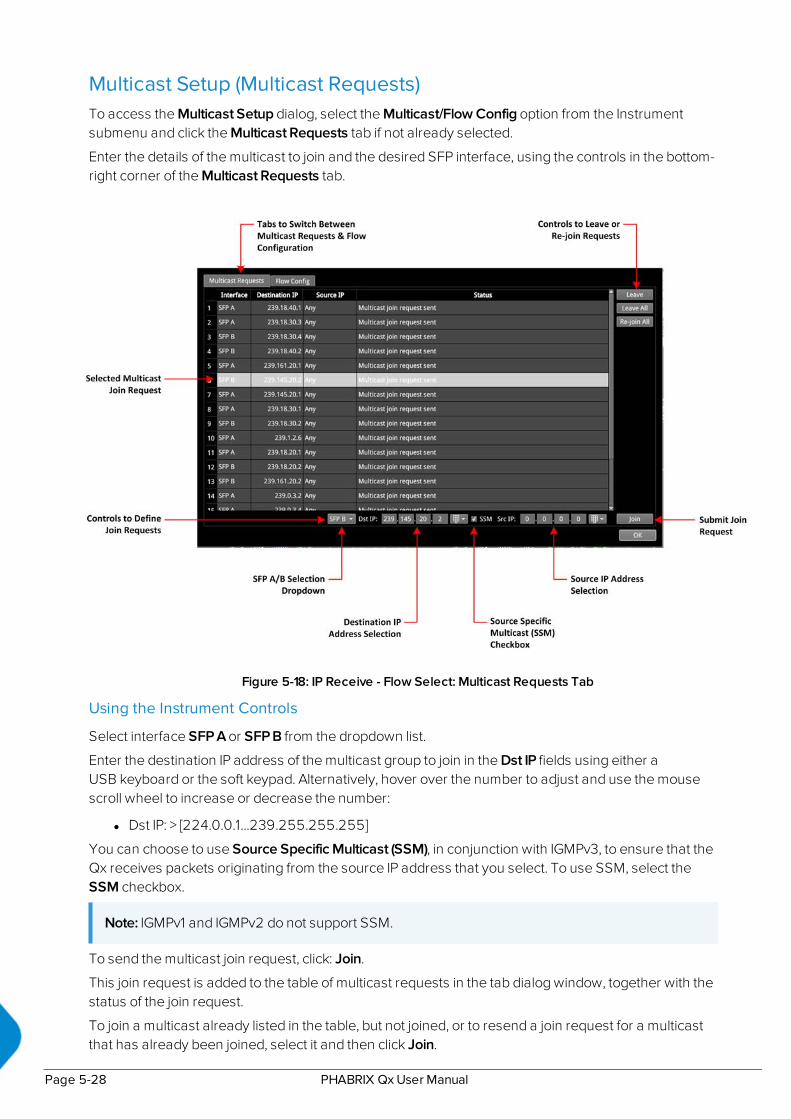
Multicast Setup (Multicast Requests)To access the Multicast Setup dialog, select the Multicast/Flow Config option from the Instrumentsubmenu and click the Multicast Requests tab if not already selected.
Enter the details of the multicast to join and the desired SFP interface, using the controls in the bottom-right corner of the Multicast Requests tab.
Figure 5-18: IP Receive - Flow Select: Multicast Requests Tab
Using the Instrument Controls
Select interface SFP A or SFP B from the dropdown list.
Enter the destination IP address of the multicast group to join in the Dst IP fields using either aUSB keyboard or the soft keypad. Alternatively, hover over the number to adjust and use the mousescroll wheel to increase or decrease the number:
l Dst IP: > [224.0.0.1...239.255.255.255]
You can choose to use Source Specific Multicast (SSM), in conjunction with IGMPv3, to ensure that theQx receives packets originating from the source IP address that you select. To use SSM, select theSSM checkbox.
Note: IGMPv1 and IGMPv2 do not support SSM.
To send the multicast join request, click: Join.
This join request is added to the table of multicast requests in the tab dialog window, together with thestatus of the join request.
To join a multicast already listed in the table, but not joined, or to resend a join request for a multicastthat has already been joined, select it and then click Join.
Page 5-28 PHABRIX QxUser Manual
To exit a multicast, select it from the table in the dialog box, then click:
l Leave
To exit all multicasts, select:
l Leave All
A prompt window is displayed, asking you to confirm that you want to leave all multicasts.
To request to re-join all multicasts currently listed in the dialog box table, select:
l Re-join All
To close the Multicast Requests dialog window, click:
l Ok
To set the Qx to request to re-join all multicasts currently listed in the dialog box table, automatically onreboot, return to the instrument submenu and enable the following:
l Request Multicasts on boot > [Enabled, Disabled]
Flow Protocol Configuration (Flow Config)Having successfully joined a multicast, or if media traffic has already been routed to the Qx, then all theassociated flows will be visible in the Flow Select table.
The multi-flow nature of SMPTE ST 2110 means that a fairly complex labeling procedure is required toidentify the various flows and their specific parameters. Before using an incoming IP flow in ST 2110, itis important first to identify the SMPTE protocol type of flow you are dealing with, in order to analyze itcorrectly.
If an IGMP join has been initiated under NMOS control, then all of the flow parameters will beautomatically configured using the information in the Session Description Protocol (SDP) transport file.
If a media flow type is unknown to the Qx, then the protocol type will be identified as Other IP, and thiswill also automatically appear in the Unconfigured Flows table in the Flow Config dialog.
Configure the Flow protocol either by left-clicking the Other IP label of a flow in the Flow Selectwindow, or by using the Flow Config tool, which maintains the list of flow protocol configurations.
The Qx automatically stores all flow configurations and this list builds up over a period of time. Mediaflows can also be pre-configured, before being requested.
Using the Flow Config Controls
Select Multicast/Flow Config in the Instrument submenu, then click the Flow Config tab.
The dialog box displays the following window:
PHABRIX QxUser Manual Page 5-29
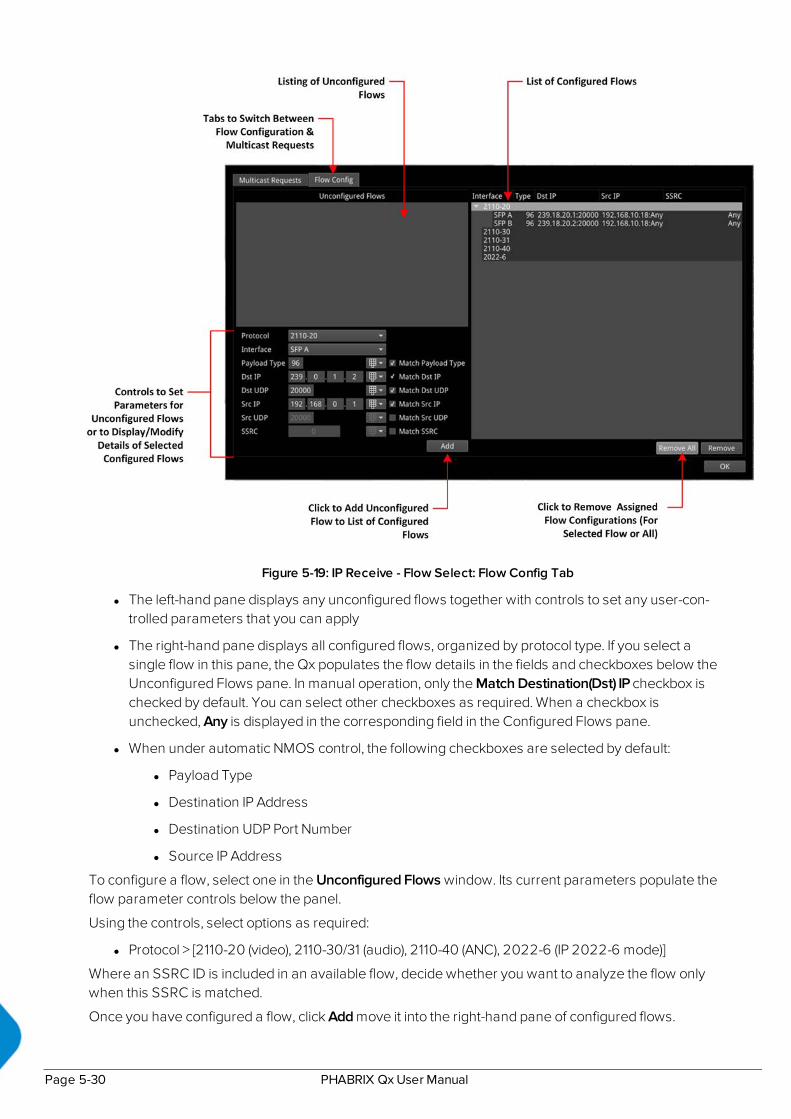
Figure 5-19: IP Receive - Flow Select: Flow Config Tab
l The left-hand pane displays any unconfigured flows together with controls to set any user-con-trolled parameters that you can apply
l The right-hand pane displays all configured flows, organized by protocol type. If you select asingle flow in this pane, the Qx populates the flow details in the fields and checkboxes below theUnconfigured Flows pane. In manual operation, only the Match Destination(Dst) IP checkbox ischecked by default. You can select other checkboxes as required. When a checkbox isunchecked, Any is displayed in the corresponding field in the Configured Flows pane.
l When under automatic NMOS control, the following checkboxes are selected by default:
l Payload Type
l Destination IP Address
l Destination UDP Port Number
l Source IP Address
To configure a flow, select one in the Unconfigured Flows window. Its current parameters populate theflow parameter controls below the panel.
Using the controls, select options as required:
l Protocol > [2110-20 (video), 2110-30/31 (audio), 2110-40 (ANC), 2022-6 (IP 2022-6 mode)]
Where an SSRC ID is included in an available flow, decide whether you want to analyze the flow onlywhen this SSRC is matched.
Once you have configured a flow, click Add move it into the right-hand pane of configured flows.
Page 5-30 PHABRIX QxUser Manual

To remove the current configuration assigned to a flow, click Remove or click Remove All to clear allflow configurations. If you choose Remove All, you are prompted to confirm that you want to remove allconfigured flows. Click Remove All to proceed.
If the flow is still present on one of the SFP interfaces, it will appear back in the Unconfigured Flowswindow, where it can be modified, if required.
On completion, click Ok to close the Flow Config window.
PHABRIX QxUser Manual Page 5-31

Analyzer - 2110 Format Setup(IP ST 2110 Mode)
Requires Qx Option(s): PHQXO-IP-STND
OverviewThe Analyzer - 2110 Format Setup window is where you should define the video and audio parametersto be applied to the flows selected for analysis in the absence of a Session Description Protocol (SDP)record. You can define parameters for one video flow and two audio flows. Where an SDP record isbeing used to select a flow, then the format parameters will be populated automatically from theSDP transport file.
Figure 5-20: Analyzer - 2110 Format Setup Instrument
Features include:
l User-configurable video format parameters for ST 2110-20 flows
l User-configurable audio format parameters for ST 2110-30 flows includes packet time and chan-nel count
l Automatic detection of audio format, channel count and packet time.
Page 5-32 PHABRIX QxUser Manual

Instrument Menu Options
Figure 5-21: Analyzer - 2110 Format Setup Instrument Menu Options
The following table lists the video format parameter options available in the Analyzer - 2110 FormatSetup instrument submenu:
Table 5-10 : Analyzer - 2110 Format Setup Menu Options
Item Options Description
Picture Dimensions 1280 x 7201920 x 10802048 x 1080
Select the appropriate picture dimensions for theflow.
Frame Packing Interlaced (Default)SegmentedProgressive
Select the appropriate frame packing method for theflow.
Field Rate 5059.9460
Select the appropriate frame rate for the flow.
Sampling YCbCr:422 Select the appropriate sampling method for the flow.
Transfer Curve SDRPQHLGS-Log3
Select the appropriate transfer curve for the flow.
Colorimetry BT709BT2020
Select the appropriate colorimetry standard for theflow.
Audio Flow Para-meters
Use auto-detected para-meters (Default)Use override parameters
If you select the option Use override parameters, youcan manually set the following fields (the maximumnumber of Channels depends on the Packet Timeset):
Audio 1 PacketTime
1 ms125 μs
Enabled only when Audio flow parameters option isset to Use override parameters.
Audio 1 Channels 1 to 10 Enabled only when Audio flow parameters option isset to Use override parameters.
PHABRIX QxUser Manual Page 5-33

Item Options Description
Audio 2 PacketTime
1 ms125 μs
Enabled only when Audio flow parameters option isset to Use override parameters.
Audio 2 Channels 1 to 10 Enabled only when Audio flow parameters option isset to Use override parameters.
Page 5-34 PHABRIX QxUser Manual
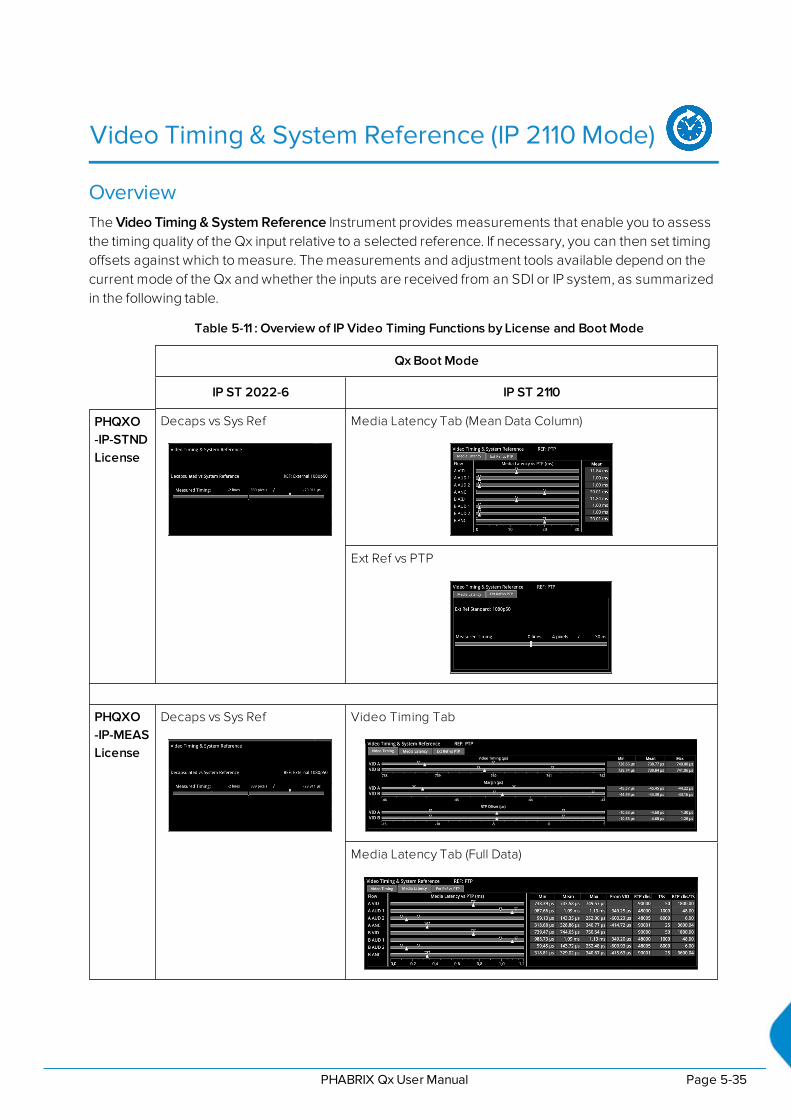
Video Timing & System Reference (IP 2110 Mode)
OverviewThe Video Timing & System Reference Instrument provides measurements that enable you to assessthe timing quality of the Qx input relative to a selected reference. If necessary, you can then set timingoffsets against which to measure. The measurements and adjustment tools available depend on thecurrent mode of the Qx and whether the inputs are received from an SDI or IP system, as summarizedin the following table.
Table 5-11 : Overview of IP Video Timing Functions by License and Boot Mode
Qx Boot Mode
IP ST 2022-6 IP ST 2110
PHQXO-IP-STNDLicense
Decaps vs Sys Ref Media Latency Tab (Mean Data Column)
Ext Ref vs PTP
PHQXO-IP-MEASLicense
Decaps vs Sys Ref Video Timing Tab
Media Latency Tab (Full Data)
PHABRIX QxUser Manual Page 5-35

Video Timing in IP 2110 Mode
Requires Qx Option(s): PHQXO-IP-STND
Overview
In IP 2110 Mode, the Video Timing & System Reference instrument must be stably locked to the samePTP source as the sending device. The Video Timing & System Reference window includes thefollowing two tabs, each providing access to different timing data:
l Media Latency
l External Reference vs PTPFor more information, see section "Video Timing & Setting External Reference in IP 2110 Mode"on page 5-23.
Media Latency Tab
The Media Latency tab displays the end-to-end latency of each flow, between the source and the Qx,when both are locked to PTP. Any latency represents the time delay between the point at which apacket is created and at the source and the point at which it is received. The latency period includesthe length of time it takes to send the packet and the time taken by the packet to travel across thenetwork. The Qx calculates the latency by comparing the timestamp in the RTP packet header with theQx hardware timestamp at the time of ingest.
This tab provides both a graphical display of latency in the horizontal timing meters and a tabulardisplay of the actual corresponding mean values in the right-hand Mean column. In the scalar view, thewhite arrows indicate the current latency, offset from PTP, and the black arrows show the historicalmaximum and minimum values. The actual mean values are shown in the Mean column to the right.
For information on the calculations used in ST 2110 mode, see the section "Advanced Media TimingMeasurement (IP 2110)" on page 12-13.
This tab aims to show the relationship between the video, audio and ancillary data flows andconsequently, to indicate the amount of buffering required at the receiver to synchronize the flows.
Figure 5-22: Media Latency Tab of the Video Timing & System Reference Instrument (IP 2110 Mode)
The Media Latency measure is the difference between the arrival time of a packet and the RTPtimestamp of that packet, averaged over 1 second and is calculated as follows:
Latency = TPA0 – RTPTimestamp (averaged over 1 second)
Where:
Page 5-36 PHABRIX QxUser Manual

l TPA0 is the arrival PTP time of a media packet as measured by the Qx
l RTPTimestamp is the timestamp within the received packet created by the source.
For Video and ANC flows, the RTP timestamp is constant for the entire Frame, so the latency is onlymeasured when the RTP timestamp changes. This occurs on the first packet of a frame for aprogressive flow, or field for an interlaced flow, with the results averaged over 1 second.
For Audio flows, as the RTP timestamp increments with each audio packet the latency is measured forevery packet with the results averaged over 1 second.
To see more detail, you can zoom in on a specific area of interest by clicking anywhere on a timingmeter of interest, which changes the scale to match the values of the specific flow. For example, whenzooming into a video flow, the scale changes from milliseconds (ms) to microseconds (µs). Click themeter again to zoom out and return to the overview. You can also switch between overview and zoomfor individual flow meters by selecting the specific meter from the instrument submenu. See theInstrument options table below.
Instrument Menu Options
The following table lists the options that apply to the Media Latency tab and are available with astandard core license in the Video Timing & System Reference Instrument submenu in IP ST 2110Mode:
Table 5-12 : Video Timing & System Reference Menu Options (2110 Mode)
Item Options Description
Media Latency Tab Options
Latency Meters Zoom Overview, A VID, A AUD 1, AAUD 2, A ANC, B VID, BAUD 1, B AUD 2, B ANC
Select a specific timing meter to switch betweenoverview and zoomed-in view.
Anchor time scale start inOverview mode
Zero (0) or less, Any value Set the start point of the timescale when in Over-view.
Clear Min, Max values N/A Set the historical minimum and maximum valuesback to zero.
PHABRIX QxUser Manual Page 5-37
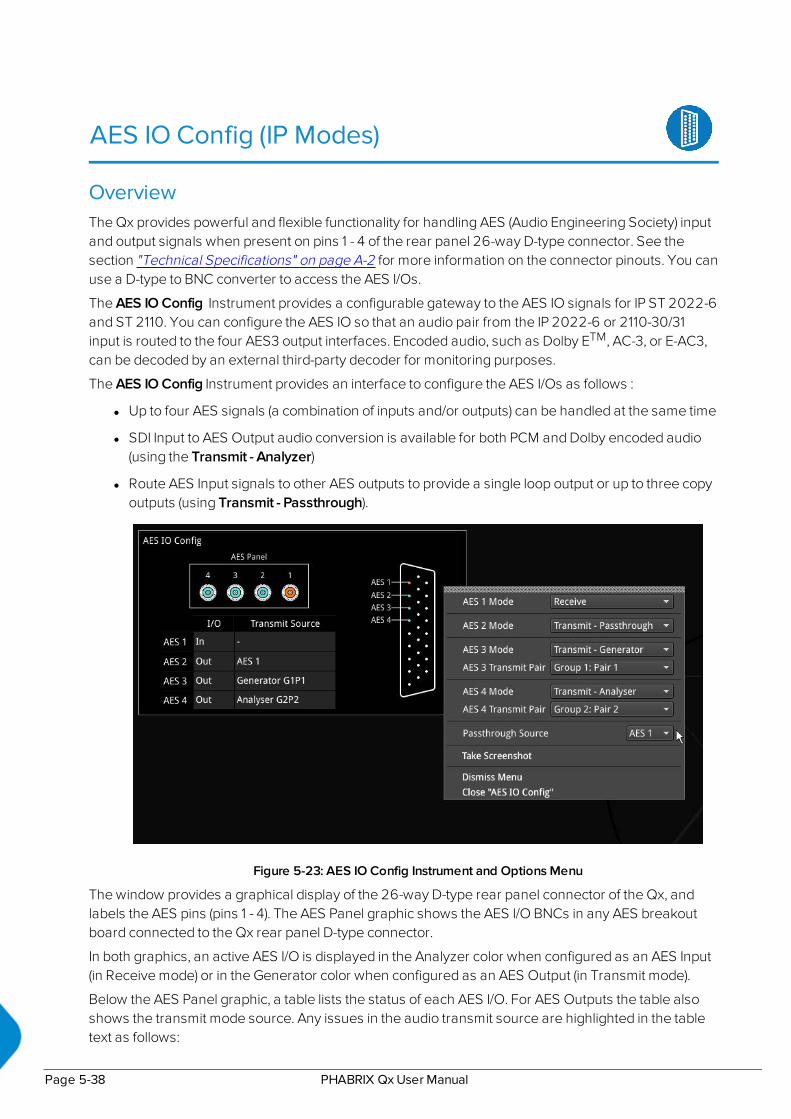
AES IO Config (IP Modes)
OverviewThe Qx provides powerful and flexible functionality for handling AES (Audio Engineering Society) inputand output signals when present on pins 1 - 4 of the rear panel 26-way D-type connector. See thesection "Technical Specifications" on page A-2 for more information on the connector pinouts. You canuse a D-type to BNC converter to access the AES I/Os.
The AES IO Config Instrument provides a configurable gateway to the AES IO signals for IP ST 2022-6and ST 2110. You can configure the AES IO so that an audio pair from the IP 2022-6 or 2110-30/31input is routed to the four AES3 output interfaces. Encoded audio, such as Dolby ETM, AC-3, or E-AC3,can be decoded by an external third-party decoder for monitoring purposes.
The AES IO Config Instrument provides an interface to configure the AES I/Os as follows :
l Up to four AES signals (a combination of inputs and/or outputs) can be handled at the same time
l SDI Input to AES Output audio conversion is available for both PCM and Dolby encoded audio(using the Transmit - Analyzer)
l Route AES Input signals to other AES outputs to provide a single loop output or up to three copyoutputs (using Transmit - Passthrough).
Figure 5-23: AES IO Config Instrument and Options Menu
The window provides a graphical display of the 26-way D-type rear panel connector of the Qx, andlabels the AES pins (pins 1 - 4). The AES Panel graphic shows the AES I/O BNCs in any AES breakoutboard connected to the Qx rear panel D-type connector.
In both graphics, an active AES I/O is displayed in the Analyzer color when configured as an AES Input(in Receive mode) or in the Generator color when configured as an AES Output (in Transmit mode).
Below the AES Panel graphic, a table lists the status of each AES I/O. For AES Outputs the table alsoshows the transmit mode source. Any issues in the audio transmit source are highlighted in the tabletext as follows:
Page 5-38 PHABRIX QxUser Manual
l Red: Configuration error
l Yellow: Audio source not present
Hover the mouse over the error text to display a tooltip describing how to resolve the issue.
Instrument Menu OptionsConfigure the AES I/Os in the instrument submenu as follows:
Each AES I/O can be set as an input (receive), or output (transmit):
l Off: AES I/O is switched off
l Receive: I/O is set to AES Input
l Transmit - Generator: I/O is set to AES Output
The output audio signal source is the Qx audio generator (See the Audio tab of the Generator –Configuration instrument.)
l Transmit - Analyzer: I/O is set to AES Output
The output audio signal comes from Image/Sub-image 1 of the Qx analyzer input (SDI or IP 2022-6)
l Transmit - Passthrough: I/O is set to AES Output
The output audio signal is routed from the chosen AES input Passthrough Source
l AES 1/2/3/4 Mode > [Off, Receive, Transmit - Analyzer, Transmit - Generator, Transmit -Passthrough]
l AES 1/2/3/4 Mode > Transmit - Analyzer/Generator > AES 1/2/3/4 Transmit Pair > [Group 1: Pair 1,Group 1: Pair 2, Group 2: Pair 1, Group 2: Pair 2, Group 3: Pair 1, Group 3: Pair 2, Group 4: Pair 1,Group 4: Pair 2, Group 5: Pair 1, Group 5: Pair 2, Group 6: Pair 1, Group 6: Pair 2, Group 7: Pair 1,Group 7: Pair 2, Group 8: Pair 1, Group 8: Pair 2]
l Passthrough Source > [AES 1, AES 2, AES 3, AES 4]
PHABRIX QxUser Manual Page 5-39

6Qx Signal Generation Instruments
Note: Requires the PHQXO-GEN License.
This chapter describes the Qx signal generator Instruments and includes the following sections:
l Generator Video
l Audio Generator
l Generator - Status
l IP Transmit (SFP B) (IP 2022-6 Mode Only)
PHABRIX QxUser Manual Page 6-1

Generate - Video
Requires Qx Option(s): PHQXO-GEN
OverviewThe Generator - Configuration instrument is available in SDI and ST 2022-6 modes of operation. UHDformats are supported with the PHQXO-UHD option in SDI mode. The generator instrument has twotabs: one to select the generator video standard and test pattern, and one for audio generation. In SDIStress Toolset Mode, the Generate - Video submenu includes advanced generation tools which formpart of the Advanced SDI Stress Toolset [PHQXO-SDI-STRESS].
Figure 6-1: Generate - Video Instrument
With a test pattern selected, click on your chosen video standard to generate it. A traffic light indicatorwill turn yellow to show that generation is in progress. The light will turn green once the video standardhas been successfully generated.
Note: In this software revision the pattern may take up to 8 seconds to be generated.
The Qx provides video standard generation for a wide range of SDI rates, resolutions, frame rates,image mappings color gamuts, and transfer curves, dependent on licenses and boot up mode.
Instrument Menu OptionsTo simplify selection, the generator standards list may be filtered via drop down menus using thefollowing parameters:
l Type > [All, 12G 2-SI, QL 3G A 2-SI, QL 3G A SqDv, QL 3G B 2-SI, QL 3G B SqDv, DL 6G 2-SI, 6G2-SI, QL 1.5G SqDv, 3G A, 3G B, 1.5G]
l Resolution > [All, 1280x720, 1920x1080, 2048x1080, 3840x2160, 4096x2160]
l Frame > [All, 23.98p, 24p, 25p, 29.97p, 30p, 47.95p, 48p, 50i, 50p, 59.94i, 59.94p, 60i, 60p]
l Mapping > [All, YCbCr:422:10, YCbCr:422:12, YCbCrA:4224:12, YCbCr:444:10, YCbCr:444:12,YCbCrA:4444:10, RGB:444:10, RGB:444:12, RGBA:4444:10]
l Gamut > [All, 709, 2020, HLG 2020, PQ 2020, S-Log3 2020]
Page 6-2 PHABRIX QxUser Manual

The Recent history list… provides a list of the most recently generated video standard and test patterncombinations. These can be quickly selected and regenerated from this drop-down menu.
To clear the recent history select:
l Clear recent history list
The Status bar provides information on video generation progress.
Right-click anywhere in the Generate - Video window to display the configuration submenu.
Test PatternsThe list of available test patterns for a selected video standard is displayed at the bottom or in the righthand column of the Generate - Video window. These patterns include:
100% Bars 75% Bars
Bowtie Box – 2 variants
Circle – 2 variants Color Grid
Component Ramps Field Lineup
Gray 10H Step Gray 10V Step
Gray 5H Step Gray 5V Step
Gray Steps – 2 variants Legal Ramp
Luma Ramp – 4 variants MultiBurst
PLUGE – 2 variants SMPTE 219-2 – 2 variants
SMPTE 219 sub super Tartan Bars
Valid Ramps UHD quad Align
ARIB-28 Bars – 4 variants ITU-R BT.2111-0 HDR Color Bars
ITU-R BT.814-4 PLUGE
Figure 6-2: Test Patterns Available in the Qx
Both S-Log3 and SR Live [S-Log3(HDR Live)] test pattern variants are available.
For moving test pattern provision, a bouncing box can be overlaid on top of any Generator test pattern.
l Bouncing box > [Enabled, Disabled]
PHABRIX QxUser Manual Page 6-3
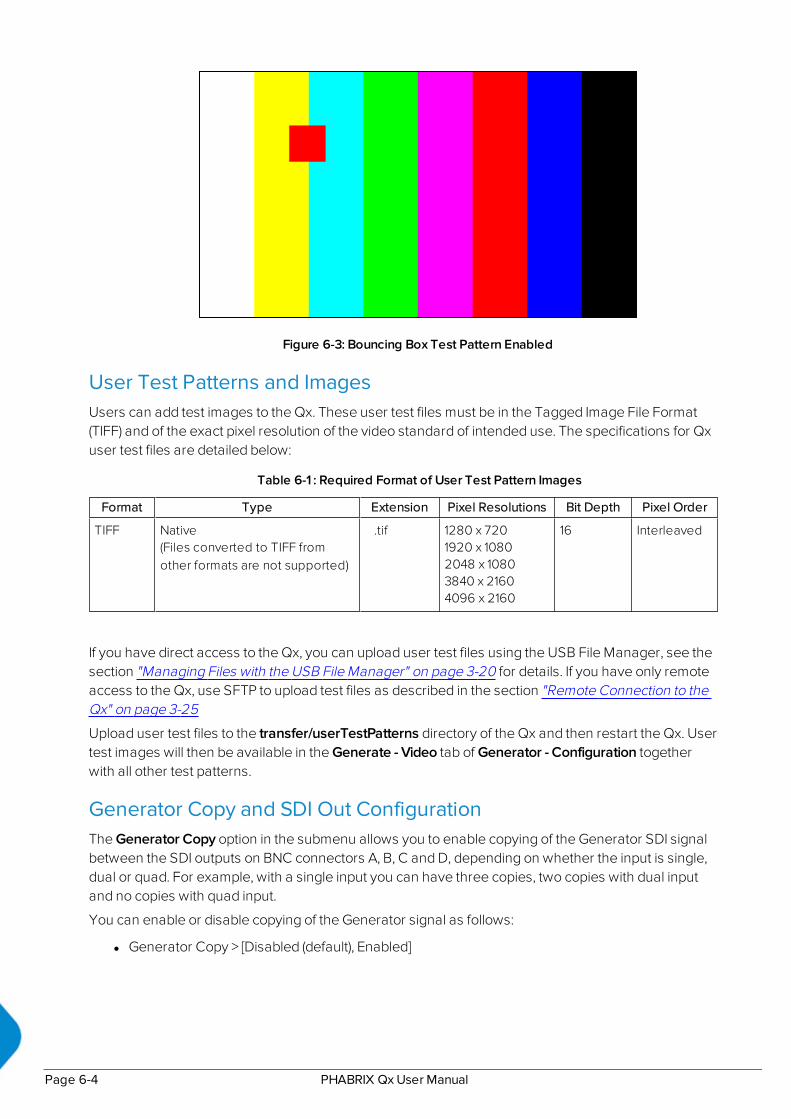
Figure 6-3: Bouncing Box Test Pattern Enabled
User Test Patterns and ImagesUsers can add test images to the Qx. These user test files must be in the Tagged Image File Format(TIFF) and of the exact pixel resolution of the video standard of intended use. The specifications for Qxuser test files are detailed below:
Table 6-1 : Required Format of User Test Pattern Images
Format Type Extension Pixel Resolutions Bit Depth Pixel Order
TIFF Native(Files converted to TIFF fromother formats are not supported)
.tif 1280 x 7201920 x 10802048 x 10803840 x 21604096 x 2160
16 Interleaved
If you have direct access to the Qx, you can upload user test files using the USB File Manager, see thesection "Managing Files with the USB File Manager" on page 3-20 for details. If you have only remoteaccess to the Qx, use SFTP to upload test files as described in the section "Remote Connection to theQx" on page 3-25
Upload user test files to the transfer/userTestPatterns directory of the Qx and then restart the Qx. Usertest images will then be available in the Generate - Video tab of Generator - Configuration togetherwith all other test patterns.
Generator Copy and SDI Out ConfigurationThe Generator Copy option in the submenu allows you to enable copying of the Generator SDI signalbetween the SDI outputs on BNC connectors A, B, C and D, depending on whether the input is single,dual or quad. For example, with a single input you can have three copies, two copies with dual inputand no copies with quad input.
You can enable or disable copying of the Generator signal as follows:
l Generator Copy > [Disabled (default), Enabled]
Page 6-4 PHABRIX QxUser Manual
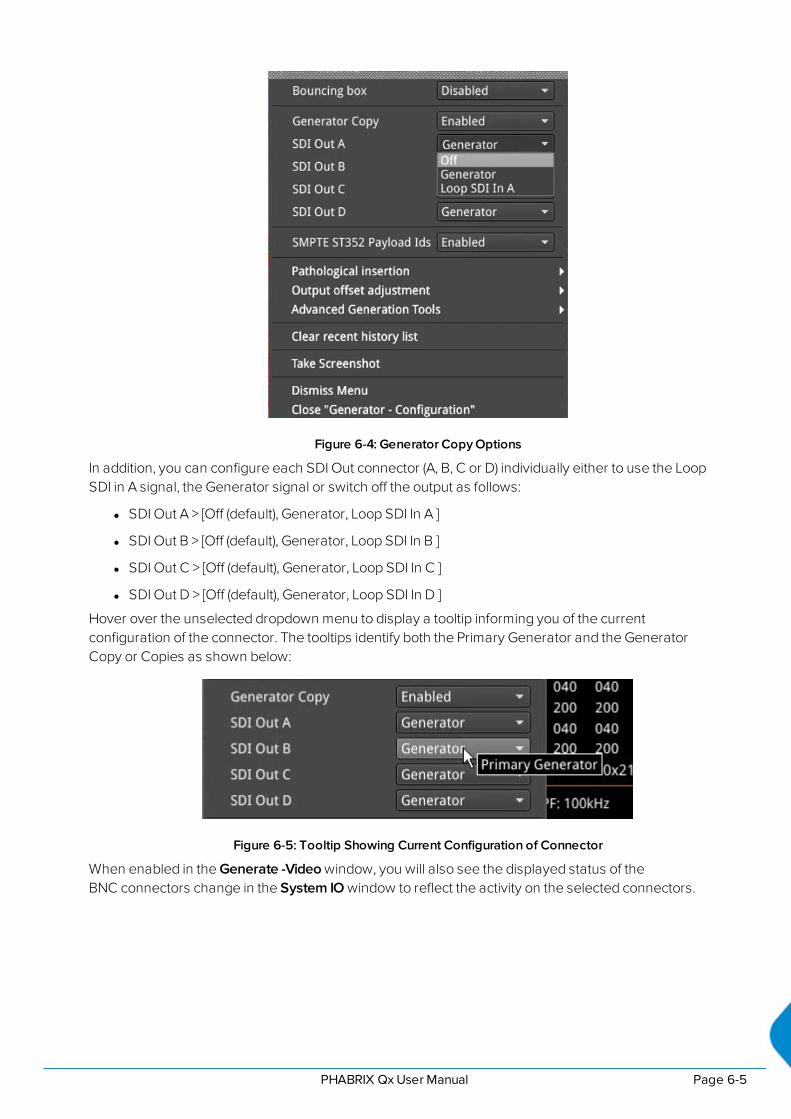
Figure 6-4: Generator Copy Options
In addition, you can configure each SDI Out connector (A, B, C or D) individually either to use the LoopSDI in A signal, the Generator signal or switch off the output as follows:
l SDI Out A > [Off (default), Generator, Loop SDI In A ]
l SDI Out B > [Off (default), Generator, Loop SDI In B ]
l SDI Out C > [Off (default), Generator, Loop SDI In C ]
l SDI Out D > [Off (default), Generator, Loop SDI In D ]
Hover over the unselected dropdown menu to display a tooltip informing you of the currentconfiguration of the connector. The tooltips identify both the Primary Generator and the GeneratorCopy or Copies as shown below:
Figure 6-5: Tooltip Showing Current Configuration of Connector
When enabled in the Generate -Video window, you will also see the displayed status of theBNC connectors change in the System IO window to reflect the activity on the selected connectors.
PHABRIX QxUser Manual Page 6-5
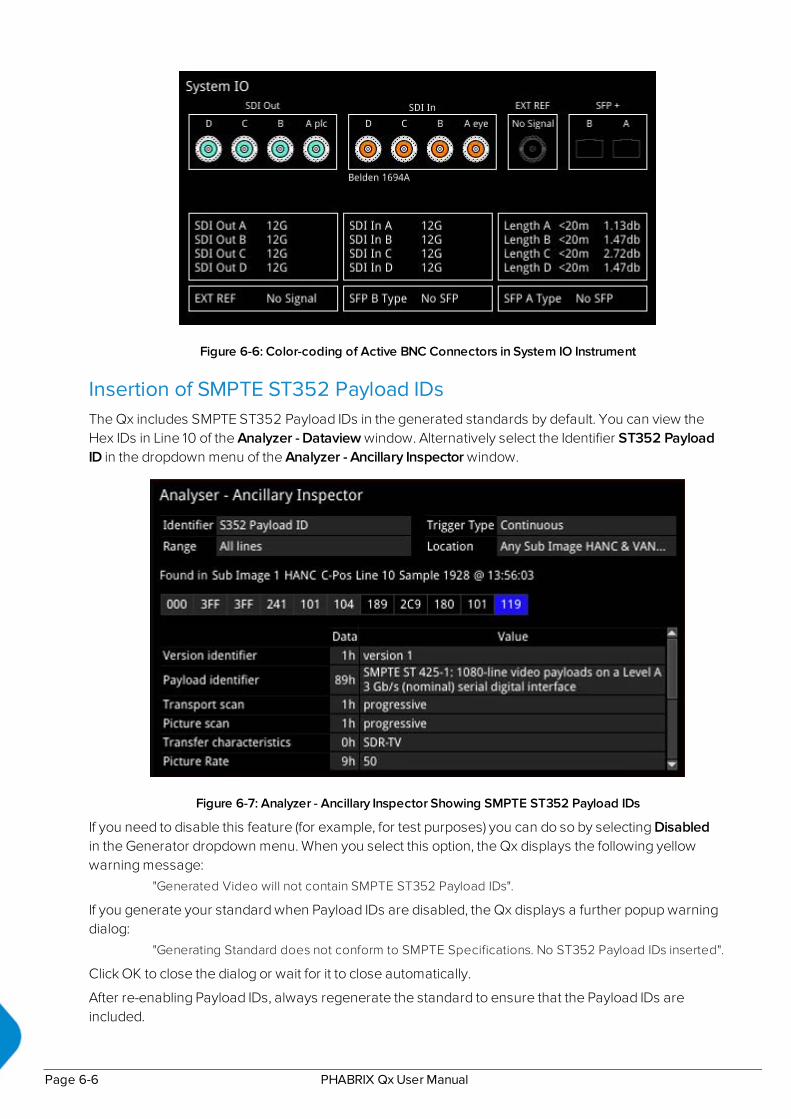
Figure 6-6: Color-coding of Active BNC Connectors in System IO Instrument
Insertion of SMPTE ST352 Payload IDsThe Qx includes SMPTE ST352 Payload IDs in the generated standards by default. You can view theHex IDs in Line 10 of the Analyzer - Dataview window. Alternatively select the Identifier ST352 PayloadID in the dropdown menu of the Analyzer - Ancillary Inspector window.
Figure 6-7: Analyzer - Ancillary Inspector Showing SMPTE ST352 Payload IDs
If you need to disable this feature (for example, for test purposes) you can do so by selecting Disabledin the Generator dropdown menu. When you select this option, the Qx displays the following yellowwarning message:
"Generated Video will not contain SMPTE ST352 Payload IDs".
If you generate your standard when Payload IDs are disabled, the Qx displays a further popup warningdialog:
"Generating Standard does not conform to SMPTE Specifications. No ST352 Payload IDs inserted".
Click OK to close the dialog or wait for it to close automatically.
After re-enabling Payload IDs, always regenerate the standard to ensure that the Payload IDs areincluded.
Page 6-6 PHABRIX QxUser Manual
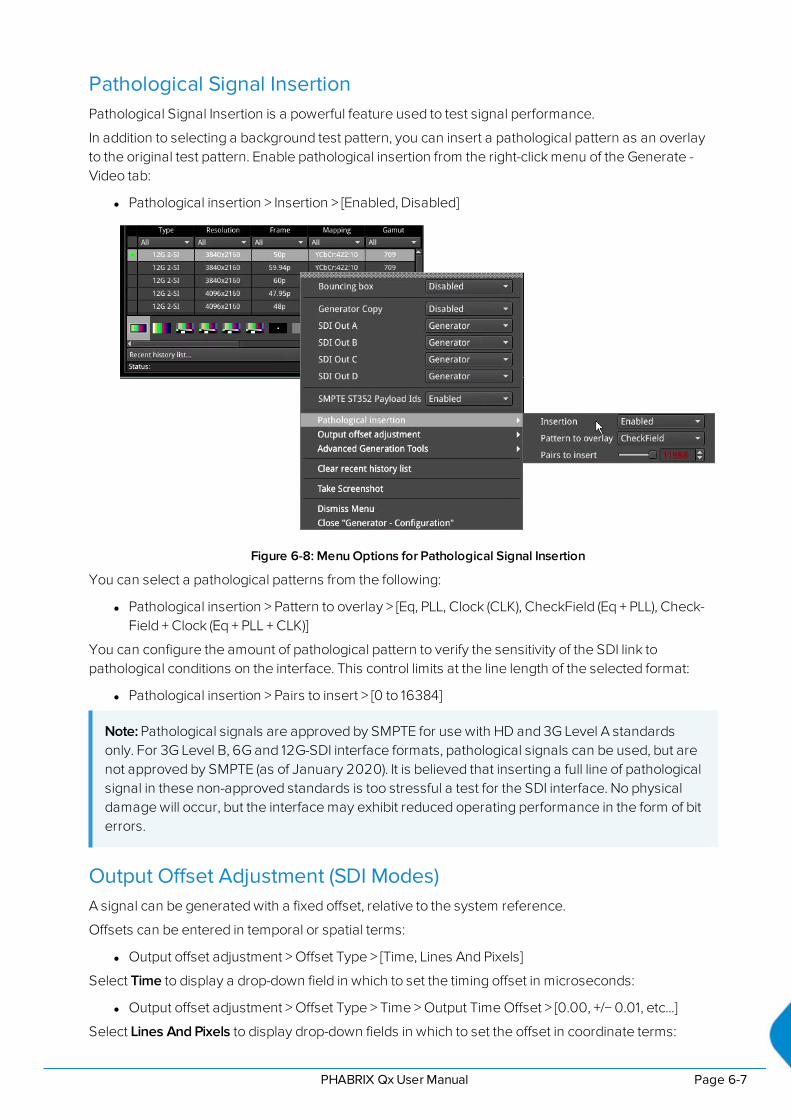
Pathological Signal InsertionPathological Signal Insertion is a powerful feature used to test signal performance.
In addition to selecting a background test pattern, you can insert a pathological pattern as an overlayto the original test pattern. Enable pathological insertion from the right-click menu of the Generate -Video tab:
l Pathological insertion > Insertion > [Enabled, Disabled]
Figure 6-8: Menu Options for Pathological Signal Insertion
You can select a pathological patterns from the following:
l Pathological insertion > Pattern to overlay > [Eq, PLL, Clock (CLK), CheckField (Eq + PLL), Check-Field + Clock (Eq + PLL + CLK)]
You can configure the amount of pathological pattern to verify the sensitivity of the SDI link topathological conditions on the interface. This control limits at the line length of the selected format:
l Pathological insertion > Pairs to insert > [0 to 16384]
Note: Pathological signals are approved by SMPTE for use with HD and 3G Level A standardsonly. For 3G Level B, 6G and 12G-SDI interface formats, pathological signals can be used, but arenot approved by SMPTE (as of January 2020). It is believed that inserting a full line of pathologicalsignal in these non-approved standards is too stressful a test for the SDI interface. No physicaldamage will occur, but the interface may exhibit reduced operating performance in the form of biterrors.
Output Offset Adjustment (SDI Modes)A signal can be generated with a fixed offset, relative to the system reference.
Offsets can be entered in temporal or spatial terms:
l Output offset adjustment > Offset Type > [Time, Lines And Pixels]
Select Time to display a drop-down field in which to set the timing offset in microseconds:
l Output offset adjustment > Offset Type > Time > Output Time Offset > [0.00, +/− 0.01, etc...]
Select Lines And Pixels to display drop-down fields in which to set the offset in coordinate terms:
PHABRIX QxUser Manual Page 6-7
l Output offset adjustment > Offset Type > Lines And Pixels > Output Line Offset > [0 to +/− (Totalnumber of Lines for current standard minus one)]
l Output offset adjustment > Offset Type > Lines And Pixels > Pixel Offset > [0 to +/− (Total numberof Pixels per Line for current standard minus one)]
You can remove the Generator Offset by selecting the following:
l Output offset adjustment > Clear offsets
Page 6-8 PHABRIX QxUser Manual
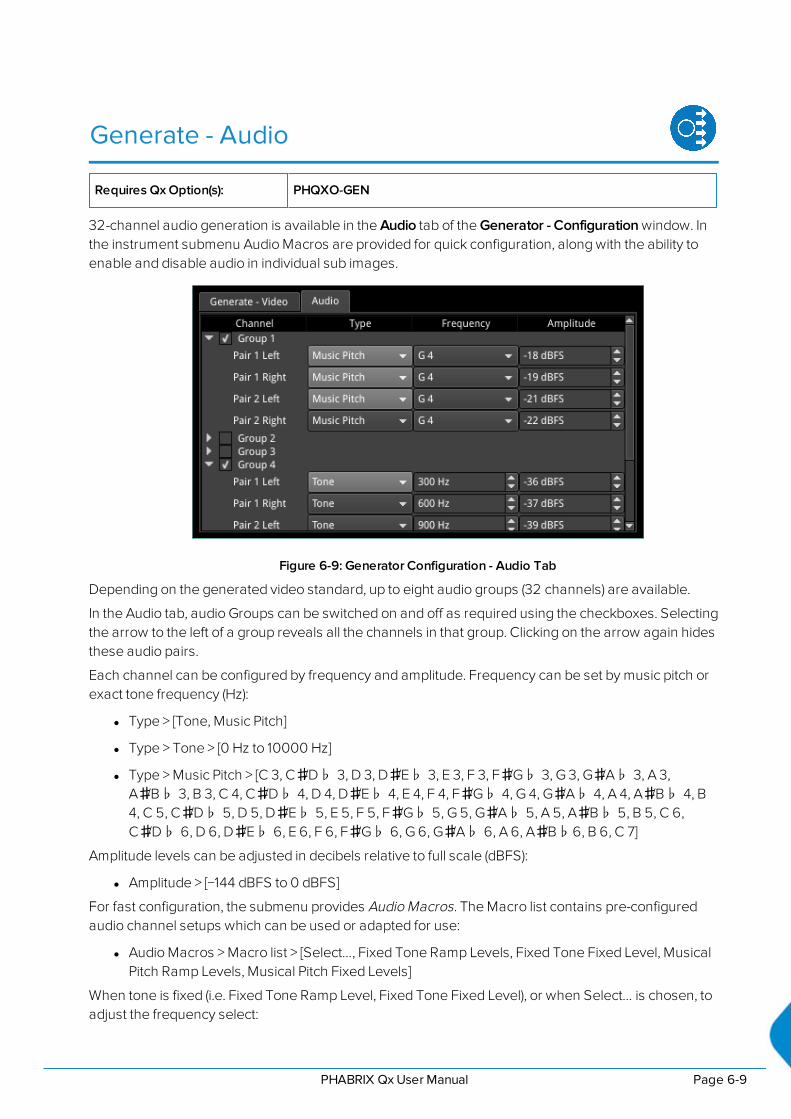
Generate - Audio
Requires Qx Option(s): PHQXO-GEN
32-channel audio generation is available in the Audio tab of the Generator - Configuration window. Inthe instrument submenu Audio Macros are provided for quick configuration, along with the ability toenable and disable audio in individual sub images.
Figure 6-9: Generator Configuration - Audio Tab
Depending on the generated video standard, up to eight audio groups (32 channels) are available.
In the Audio tab, audio Groups can be switched on and off as required using the checkboxes. Selectingthe arrow to the left of a group reveals all the channels in that group. Clicking on the arrow again hidesthese audio pairs.
Each channel can be configured by frequency and amplitude. Frequency can be set by music pitch orexact tone frequency (Hz):
l Type > [Tone, Music Pitch]
l Type > Tone > [0 Hz to 10000 Hz]
l Type > Music Pitch > [C 3, C♯/D♭ 3, D 3, D♯/E♭ 3, E 3, F 3, F♯/G♭ 3, G 3, G♯/A♭ 3, A 3,A♯/B♭ 3, B 3, C 4, C♯/D♭ 4, D 4, D♯/E♭ 4, E 4, F 4, F♯/G♭ 4, G 4, G♯/A♭ 4, A 4, A♯/B♭ 4, B4, C 5, C♯/D♭ 5, D 5, D♯/E♭ 5, E 5, F 5, F♯/G♭ 5, G 5, G♯/A♭ 5, A 5, A♯/B♭ 5, B 5, C 6,C♯/D♭ 6, D 6, D♯/E♭ 6, E 6, F 6, F♯/G♭ 6, G 6, G♯/A♭ 6, A 6, A♯/B♭6, B 6, C 7]
Amplitude levels can be adjusted in decibels relative to full scale (dBFS):
l Amplitude > [−144 dBFS to 0 dBFS]
For fast configuration, the submenu provides Audio Macros. The Macro list contains pre-configuredaudio channel setups which can be used or adapted for use:
l Audio Macros > Macro list > [Select…, Fixed Tone Ramp Levels, Fixed Tone Fixed Level, MusicalPitch Ramp Levels, Musical Pitch Fixed Levels]
When tone is fixed (i.e. Fixed Tone Ramp Level, Fixed Tone Fixed Level), or when Select… is chosen, toadjust the frequency select:
PHABRIX QxUser Manual Page 6-9
l Audio Macros > Fixed frequency > [C 3, C♯/D♭ 3, D 3, D♯/E♭ 3, E 3, F 3, F♯/G♭ 3, G 3, G♯/A♭3, A 3, A♯/B♭ 3, B 3, C 4, C♯/D♭ 4, D 4, D♯/E♭ 4, E 4, F 4, F♯/G♭ 4, G 4, G♯/A♭ 4, A 4,A♯/B♭ 4, B 4, C 5, C♯/D♭ 5, D 5, D♯/E♭ 5, E 5, F 5, F♯/G♭ 5, G 5, G♯/A♭ 5, A 5, A♯/B♭ 5, B5, C 6, C♯/D♭ 6, D 6, D♯/E♭ 6, E 6, F 6, F♯/G♭ 6, G 6, G♯/A♭ 6, A 6, A♯/B♭ 6, B 6, C 7]
When levels are fixed (i.e. Fixed Tone Fixed Level, Musical Pitch Fixed Levels), to adjust amplitudeselect:
l Audio Macros > Fixed Amplitude > [−144 dBFS to 0 dBFS]
The Macros are applied across all audio groups.
Audio can be enabled or disable by Sub image:
l Sub Image Enable > Sub image 1 / 2 / 3 / 4 > [Enabled, Disabled]
Page 6-10 PHABRIX QxUser Manual

Generator - Status
Requires Qx Option(s): PHQXO-GEN
OverviewThe Generator - Status window confirms the generated Video Standard and Test Pattern details. Thewindow shows the generator pattern selected, or PRBS signal selected (available in the SDI StressToolset Mode), and confirms the BNC output (SDI Modes only) or SFP output presence, and SubImage/Full Image mapping information. Audio Presence and Sub Image information is also displayed,along with Video Reference, Output offset adjustment, and Jitter insertion (SDI Stress Toolset Mode)details. This window provides status information only; there are no user settings to configure.
Figure 6-10: Generator - Status Instrument
When you generate a pathological overlay in Generator – Configuration, the Qx detects this for all SDIoutputs. The Pathological PLL(s) and Eq(s) will then display the number of pathological eventsgenerated per second. As one pathological event is created per line this also indicates the number oflines per second on which pathological conditions occur on the interface. The detection of apathological condition is available as a GPI output of the Qx for use in triggering an external analyzerdevice.
Note: Pathological Rate(s) counters are not displayed in PRBS Mode.
PHABRIX QxUser Manual Page 6-11

IP Transmit (SFP B)(ST 2022-6 Mode)
Requires Qx Option(s): PHQXO-IP-STND, PHQXO-GEN and PHQXO-IP-NGT
OverviewThe IP Transmit (SFP B) window is used to transmit the currently generated video standard signal as IPvideo packets.
You can use this tool to simulate IP video network packet jitter introduced under a variety of networkconditions by adjusting the transmission distribution profile.
Figure 6-11: IP Transmit (SFP B) (IP ST 2022-6 Mode)
The histogram shows the interval timing distribution of the packets being generated (each second) -that is: the number of packets being generated each second, against the deviation of each packetinterval from the expected interval time. Transmission status information and prompts are alsodisplayed at the bottom of the window. Hover over this status information to display a tooltip detailingthe Current Transmit Parameters, see the section "Network Settings" on the facing page for moreinformation.
Right-click in the window to display the IP Transmit submenu:
Packet transmission can be switched on and off:
l Transmit > [On, Off]
The type of distribution profile can be selected, and the range of transmission packet intervals can beadjusted. The adjustments are displayed in real-time, in the transmission histogram.
l Distribution Range > [slider +/− 0 to 492 clks]
l Distribution > [Uniform, Gaussian]
The submenu also provides the option to plot the number of transmitted packets on the vertical axis, ineither linear or logarithmic scale:
l Y-Axis Scale > [Linear, Log10]
Page 6-12 PHABRIX QxUser Manual

Network SettingsIP, UDP, MAC, and SSRC network settings for packet transmission are set in the submenu, and can beentered by USB keyboard when Transmit is Off.
Transmission can be either multicast or unicast. The multicast group destination IP address, or the IPaddress of the receive device (in the case of unicast) should be set as the destination IP address; asrequired:
l Dst IP Addr > [set IP address]
The destination MAC address should be set as required, to Automatic for multicast, or SFP A forunicast transmission to the same Qx unit. For unicast transmission to another device, set to Manual,and then enter below, the MAC address of the receive device (in the case of a direct connection) or thefirst switching device in the path of the transmitting Qx (in the case of an indirect connection to thereceive device).
l Dst MAC Addr > [Automatic, Manual, SFP A]
UDP parameters:
l Src UDP Port > [set UDP port number as required]
l Dst UDP Port > [set UDP port number as required]
A Synchronization source identifier (SSRC) can be set for Real-time Transport Protocol (RTP) streamsubscription if required:
l SSRC > [set ID if required]
Once required network settings have been entered, switch on Transmit to start transmission.
Note: Ensure that you are generating a test signal for transmission in the Generator - VideoStandard Instrument.
PHABRIX QxUser Manual Page 6-13

7Standard Analysis InstrumentsThis chapter describes the standard analytical Instruments provided with the Qx and includes thefollowing sections:
l Analyzer - Video Standard
l Stats - SDI in A, B, C, D
l Stats - IP Receive (SFP A)
PHABRIX QxUser Manual Page 7-1
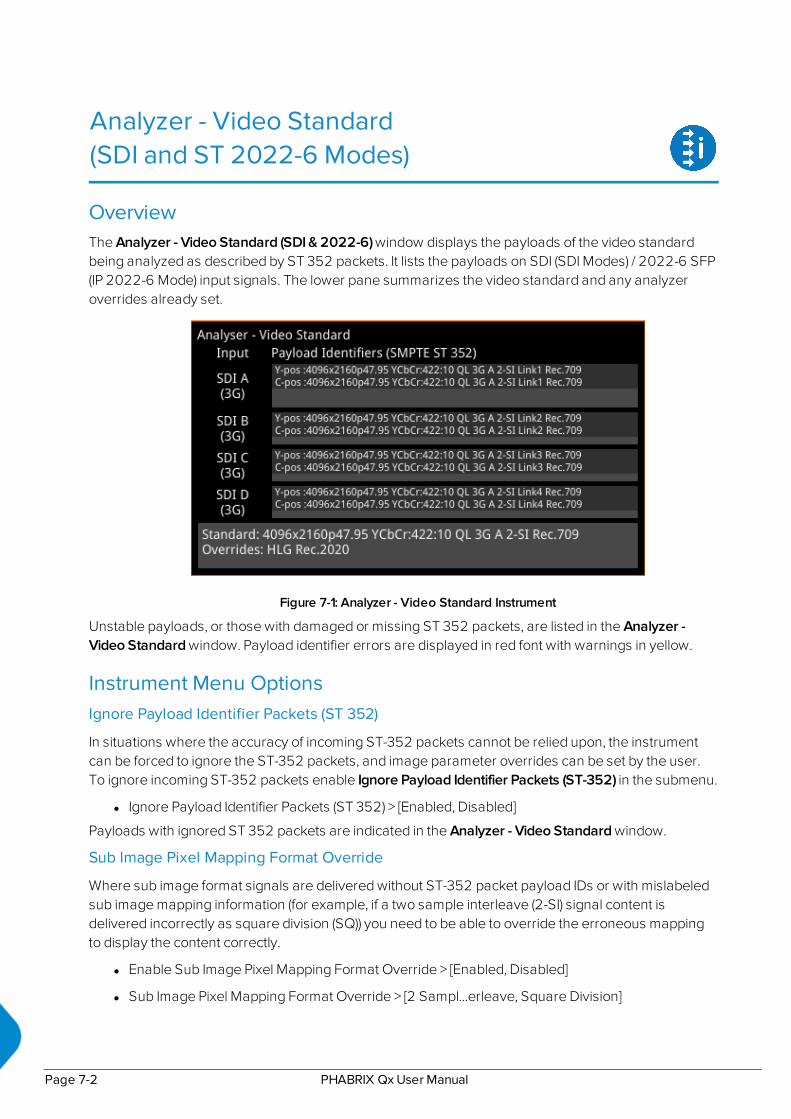
Analyzer - Video Standard(SDI and ST 2022-6 Modes)
OverviewThe Analyzer - Video Standard (SDI & 2022-6) window displays the payloads of the video standardbeing analyzed as described by ST 352 packets. It lists the payloads on SDI (SDI Modes) / 2022-6 SFP(IP 2022-6 Mode) input signals. The lower pane summarizes the video standard and any analyzeroverrides already set.
Figure 7-1: Analyzer - Video Standard Instrument
Unstable payloads, or those with damaged or missing ST 352 packets, are listed in the Analyzer -Video Standard window. Payload identifier errors are displayed in red font with warnings in yellow.
Instrument Menu OptionsIgnore Payload Identifier Packets (ST 352)
In situations where the accuracy of incoming ST-352 packets cannot be relied upon, the instrumentcan be forced to ignore the ST-352 packets, and image parameter overrides can be set by the user.To ignore incoming ST-352 packets enable Ignore Payload Identifier Packets (ST-352) in the submenu.
l Ignore Payload Identifier Packets (ST 352) > [Enabled, Disabled]
Payloads with ignored ST 352 packets are indicated in the Analyzer - Video Standard window.
Sub Image Pixel Mapping Format Override
Where sub image format signals are delivered without ST-352 packet payload IDs or with mislabeledsub image mapping information (for example, if a two sample interleave (2-SI) signal content isdelivered incorrectly as square division (SQ)) you need to be able to override the erroneous mappingto display the content correctly.
l Enable Sub Image Pixel Mapping Format Override > [Enabled, Disabled]
l Sub Image Pixel Mapping Format Override > [2 Sampl...erleave, Square Division]
Page 7-2 PHABRIX QxUser Manual

Stats - SDI In A, B, C, D(SDI Modes)
OverviewThe Stats - SDI In A, B, C and D window provides information to verify the format of the signals beinganalyzed, and input cable length information. A video signal may be comprised of up to four separateSDI signals each providing a sub-image.
Figure 7-2: Stats - SDI In A: Displaying Data from Single 12G Input on Input A
Figure 7-3: Stats - SDI In A: Displaying Data from Quad 3G Input in Four Windows
PHABRIX QxUser Manual Page 7-3

Stats - IP Receive (SFP A)(ST 2022-6 Mode)
Requires Qx Option(s): PHQXO-IP-STND
OverviewThe Stats - IP Receive (SFP A) window provides information to verify the format of the signal beinganalyzed when working in ST 2022-6 mode.
Figure 7-4: Stats - IP Receive (SFP A) Instrument
Page 7-4 PHABRIX QxUser Manual
8Network Analysis InstrumentsThis chapter describes Instruments Qx for the analysis of the network quality and includes thefollowing sections:
l Analyzer - 2022-7 Status
l SFP (A,B) - Network Stats
PHABRIX QxUser Manual Page 8-1
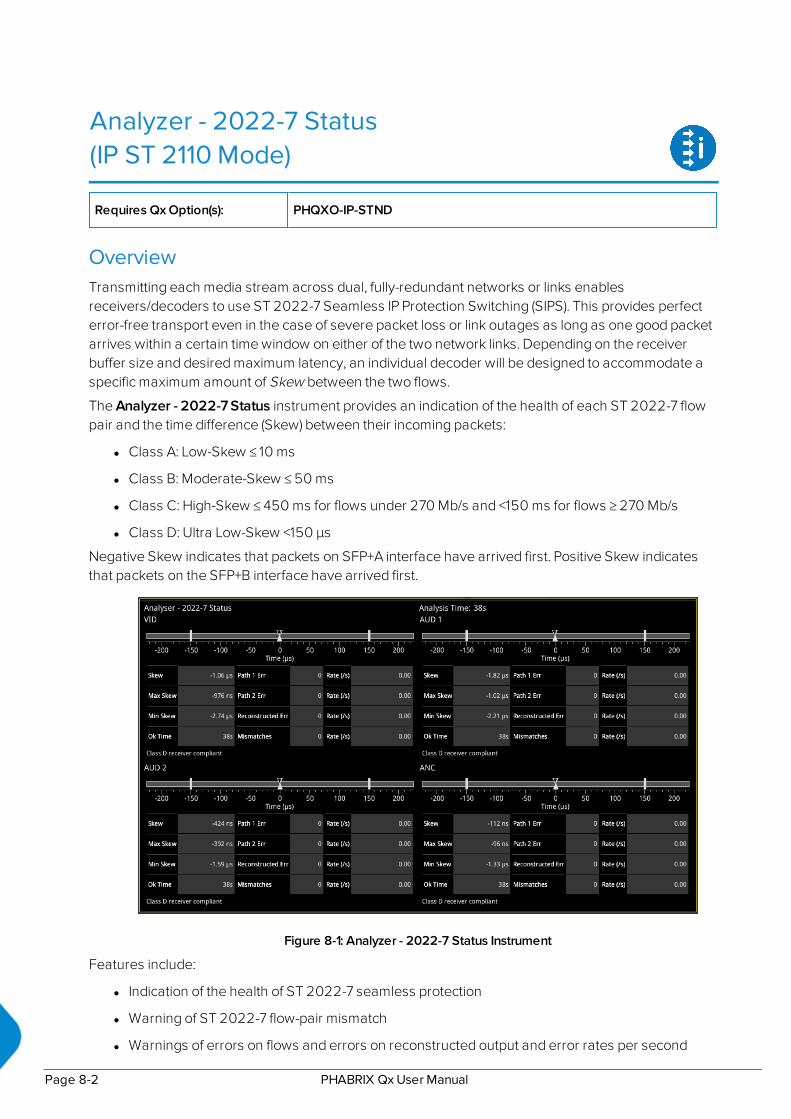
Analyzer - 2022-7 Status(IP ST 2110 Mode)
Requires Qx Option(s): PHQXO-IP-STND
OverviewTransmitting each media stream across dual, fully-redundant networks or links enablesreceivers/decoders to use ST 2022-7 Seamless IP Protection Switching (SIPS). This provides perfecterror-free transport even in the case of severe packet loss or link outages as long as one good packetarrives within a certain time window on either of the two network links. Depending on the receiverbuffer size and desired maximum latency, an individual decoder will be designed to accommodate aspecific maximum amount of Skew between the two flows.
The Analyzer - 2022-7 Status instrument provides an indication of the health of each ST 2022-7 flowpair and the time difference (Skew) between their incoming packets:
l Class A: Low-Skew ≤ 10 ms
l Class B: Moderate-Skew ≤ 50 ms
l Class C: High-Skew ≤ 450 ms for flows under 270 Mb/s and <150 ms for flows ≥ 270 Mb/s
l Class D: Ultra Low-Skew <150 μs
Negative Skew indicates that packets on SFP+A interface have arrived first. Positive Skew indicatesthat packets on the SFP+B interface have arrived first.
Figure 8-1: Analyzer - 2022-7 Status Instrument
Features include:
l Indication of the health of ST 2022-7 seamless protection
l Warning of ST 2022-7 flow-pair mismatch
l Warnings of errors on flows and errors on reconstructed output and error rates per second
Page 8-2 PHABRIX QxUser Manual

l Relative measure of Path Differential (Skew) of flows on SFP B (Blue Network) relative to SFP A(Amber Network), with Class A, B, C, D markers.
Instrument Menu OptionsThe following settings are available in the instrument submenu:
l Receiver Classification > [Class A, Class B, Class C, Class D]
l Reset errors and running time.
The instrument window can be expanded to 1/4 display size (as shown above). In 1/16 display size eachflow can be selected by its tab. Each tab will turn yellow or red to provide an 'at a glance' indication of awarning or an error respectively.
Note: Set video frame rate correctly in the Analyzer - 2110 Format Setup instrument to ensureaccurate video skew measurements.
PHABRIX QxUser Manual Page 8-3
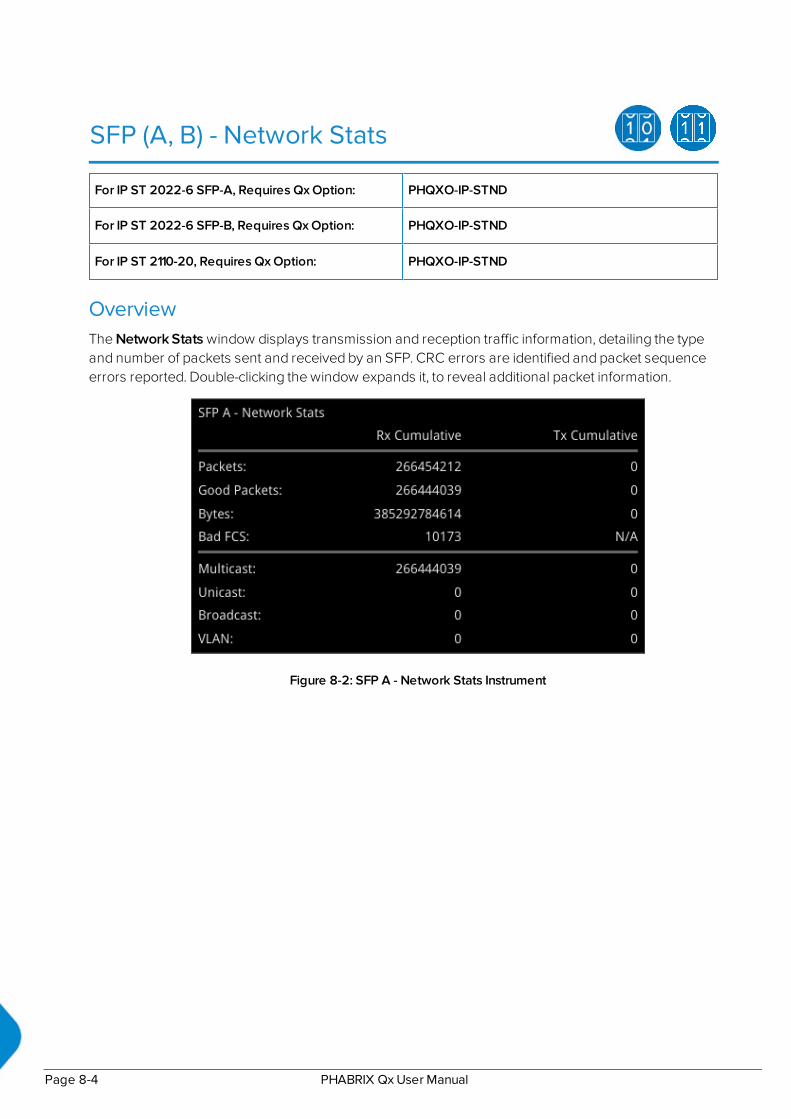
SFP (A, B) - Network Stats
For IP ST 2022-6 SFP-A, Requires Qx Option: PHQXO-IP-STND
For IP ST 2022-6 SFP-B, Requires Qx Option: PHQXO-IP-STND
For IP ST 2110-20, Requires Qx Option: PHQXO-IP-STND
OverviewThe Network Stats window displays transmission and reception traffic information, detailing the typeand number of packets sent and received by an SFP. CRC errors are identified and packet sequenceerrors reported. Double-clicking the window expands it, to reveal additional packet information.
Figure 8-2: SFP A - Network Stats Instrument
Page 8-4 PHABRIX QxUser Manual

9Content Analysis InstrumentsThis chapter describes the Qx Instruments to analyze the quality of the video signal and includes thefollowing sections:
l Analyzer - Picture
l Analyzer - Waveform
l Analyzer - Vectorscope
l Analyzer - CRC Analysis
PHABRIX QxUser Manual Page 9-1

Analyzer - Picture
OverviewThe Picture view shows the generator pattern currently being analyzed by the Qx. Double-clickanywhere in the window to resize the view between:
l One sixteenth (1/16) of the screen
l One quarter (1/4) of the screen
l Full screen.
Some features of the Picture instrument are dynamically linked to the Dataview and WaveformAnalyzer instruments to enable more precise analysis of the picture.
Figure 9-1: Components of the Analyzer - Picture Instrument
In addition to displaying the video picture, you can configure the Picture instrument to overlay variousdata elements, extracted from the ancillary data in the video signal, for quality control purposes,including:
l Closed Captions
l Ancillary Time Code (ATC)
l Picture Cursor and Position Tooltip
l Picture Safe Areas
Page 9-2 PHABRIX QxUser Manual
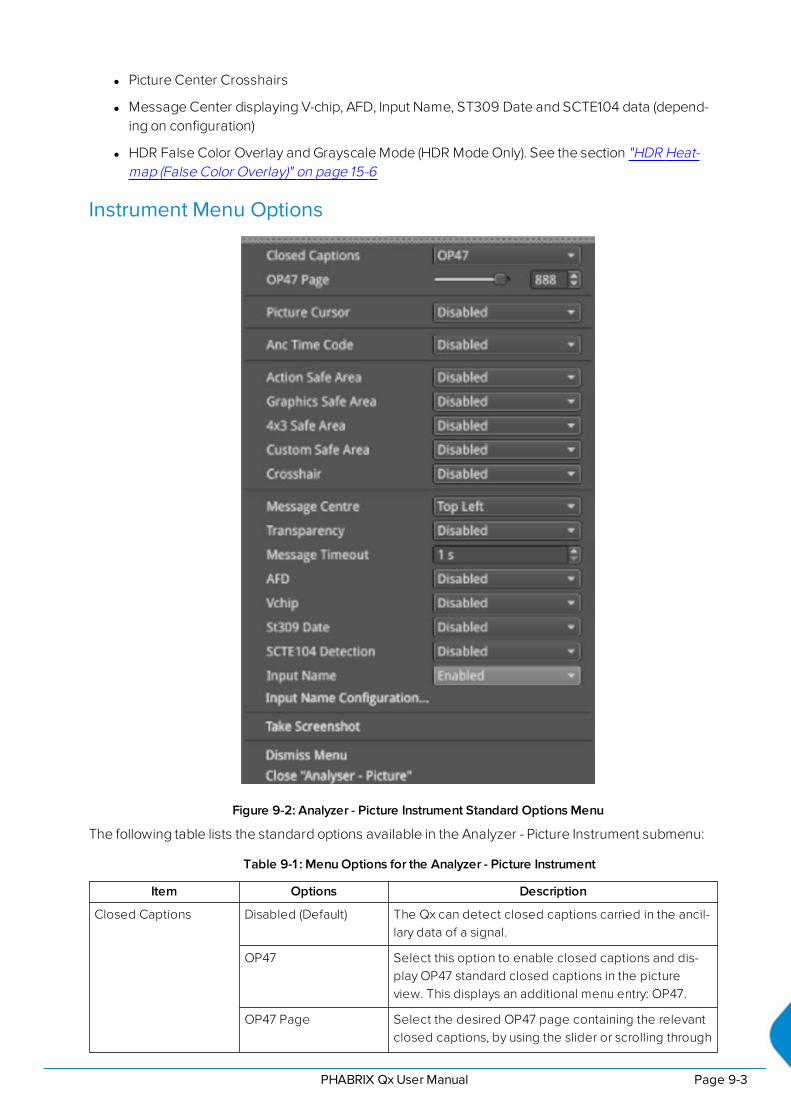
l Picture Center Crosshairs
l Message Center displaying V-chip, AFD, Input Name, ST309 Date and SCTE104 data (depend-ing on configuration)
l HDR False Color Overlay and Grayscale Mode (HDR Mode Only). See the section "HDR Heat-map (False Color Overlay)" on page 15-6
Instrument Menu Options
Figure 9-2: Analyzer - Picture Instrument Standard Options Menu
The following table lists the standard options available in the Analyzer - Picture Instrument submenu:
Table 9-1 : Menu Options for the Analyzer - Picture Instrument
Item Options Description
Closed Captions Disabled (Default) The Qx can detect closed captions carried in the ancil-lary data of a signal.
OP47 Select this option to enable closed captions and dis-play OP47 standard closed captions in the pictureview. This displays an additional menu entry: OP47.
OP47 Page Select the desired OP47 page containing the relevantclosed captions, by using the slider or scrolling through
PHABRIX QxUser Manual Page 9-3

Item Options Description
page numbers in the range:100 to 8ff.
608 Select this option to enable closed captions and dis-play CEA 608 standard closed captions in the pictureview for monitoring. This displays an additional menuentry enabling you to select the desired target field tocontain the CEA 608 format closed captions.
608 in 708 Select this option to enable closed captions and dis-play 608 in 708 standard closed captions in the pictureview for high definition (HD) video. This displays anadditional menu entry enabling you to select thedesired target field to contain the 708 format closedcaptions.
608 Field Select the desired field for the 608 captions, fromeither Field 1 or Field 2.
Picture Cursor Disabled (Default) When enabled, this feature is dynamically linked toboth the Waveform and Dataview Analyzer instrumentsso that measurements from the selected picture pos-ition can be taken from these tools at the same time.
Enabled Allows you to select a specific line and pixel position inthe picture. When you specify the line and pixel num-bers, the Qx positions a visible cross-hair at that pos-ition. You can change the location of the cross-hair byclicking at a different position in the Picture window.Line: Line one to Total number of Active Lines for thecurrent standard.Pixel: Pixel zero to Total number of Active Pixels forthe current standard minus one.
Ancillary Time Code (ATC) Display
Ancillary Time Code Disabled (Default)Enabled
Activates the display of the ATC panel.
Ancillary Time CodeSize
SmallMediumLarge
Increases or decreases the displayed size of the ATCpanel in the picture window.
Ancillary Time CodePosition
BottomMiddleTop
Adjusts the displayed position of the ATC panel on thevertical center-line of the window.
Ancillary Time CodeField
Disabled (Default)Enabled
Activates an optional final digit in the furthest-right pos-ition of the time code to display a field identificationflag for either 25 Hz or 24/30 Hz.
Safe Area Generation
Action Safe Area Disabled (Default)Enabled
Activates display of 16:9 safe area border for actions asa green, dashed border.
Graphics Safe Area Disabled (Default)Enabled
Activates display of 16:9 safe area for graphics as a red,dashed border.
4x3 Safe Area Disabled (Default)Enabled
Activates display of 4:3 safe area as a cyan, dashed bor-der.
Page 9-4 PHABRIX QxUser Manual

Item Options Description
Custom Safe Area Disabled (Default)Enabled
Activates display of a user-defined safe area as awhite, dashed border.
Custom Height % Enter percentage Specifies the custom safe area height as a percentageof the full screen height top and bottom screen edges.
Custom Width % Enter percentage Specifies the custom safe area width as a percentageof the full screen width left and right screen edges.
Custom Height Offset % Enter percentage Specifies the custom safe area height offset as a per-centage from the horizontal center line of the screen.
Custom Width Offset % Enter percentage Specifies the custom safe area width offset as a per-centage from the from the vertical center line of thescreen.
Crosshair Disabled (Default)Enabled
Activates the display of a cross-hair to indicate theimage center.
Message Center Display
Message Center Top LeftTop RightBottom LeftBottom Right
Defines the position of the Message Center panel inthe Analyzer - Picture window by screen quadrant. TheMessage Center displays messages decapsulatedfrom the ancillary data packets and includes SCTE 104ID, AFD and V-Clip.
Transparency Disabled (Default)Enabled
Activates a transparent background to the MessageCenter in the Picture display.
Message Timeout(secs)
1 to 10 seconds Defines the length of time in seconds dynamicSCTE104 messages are displayed in the MessageCenter. SCTE104 messages are removed from the Mes-sage Centre after the timeout period.
AFD Disabled (Default)Enabled
Activates the display of AFD markers in the MessageCenter of the Picture display.
Vchip Disabled (Default)Enabled
Activates the display of V-chip markers in the MessageCenter of the Picture display.
ST309 Date Disabled (Default)Enabled
Displays the date in ST 309 format: dd mmm yyyyy.Once enabled, the date is displayed in the MessageCenter.
SCTE104 Detection Disabled (Default)Enabled
Activates the detection of SCTE104 packets in ancillarydata and displays the message OpID, indicating themessage type, in the selected Hex or decimal format.
SCTE 104 OpID Format Decimal (Default)Hexadecimal
Defines whether to display the OpID of the SCTE104message type in decimal or hex format.
Input Name Disabled (Default)Enabled
Displays the defined source input name of the videostream, for example, the ID of the originating camera.
Input Name Con-figuration...
Opens Input Name Con-figurationDialog Box.
Use the Input Name Configuration dialog to enter asource input name manually or to extract a name fromthe ancillary data.
On Video Loss(IP ST 2110 Mode)
Black ScreenFreeze Last Frame
Choose what should be displayed in the Picture win-dow in the event of video loss.
PHABRIX QxUser Manual Page 9-5

Using Closed CaptionsClosed captions (or subtitles in Europe) are the text-based, encoded and hidden information includedin the ancillary data of the video signal, which can optionally be displayed by the viewer. The Qx candetect closed captions carried in the ancillary data and display them, when enabled, in the Analyzer -Picture Instrument for monitoring purposes.
The following closed caption formats are supported for display by the Qx:
l OP47 (or SMPTE RDD-08): European and Australian standard for closed captions/subtitles onHD TV. Supports the following languages: Czech, English, Finnish ,French, German, Hungarian,Italian, Portuguese, Slovakian, Spanish and Swedish
l 608 and 608 in 708: CEA-608 (or EIA-608) is a legacy US standard for closed captions. CEA-708is the current US standard for closed captions on HD TV and is backward compatible with CEA-608. CEA-708 acts as a wrapper for embedded CEA-608 closed captions, enabling the Qx toextract 608-standard closed captions from 708-standard ancillary data. Supports the followinglanguages: Danish, English, Finnish ,French, German, Italian, Portuguese, Spanish and Swedish.
When configuring the Qx Analyzer - Picture Instrument to display closed captions, use the AncillaryStatus and/or Ancillary Inspector instruments to establish which closed caption system is present inthe video signal. The ANC Status display will show CEA-608, CEA-708 and OP47 data packetsincluded in the vertical ancillary area of the SDI framework. You can then select the correspondingclosed caption option from the Analyzer - Picture submenu.
To display closed captions in the Picture view, enable one of the Closed Captions options from theAnalyzer - Picture submenu and select the desired target page (OP47) or field (608 and 608-in-708) forthe appropriate standard.
When enabled, closed caption/subtitle text is displayed in the Picture area as defined by the format ofthe selected closed caption standard.
Figure 9-3: Closed Captions in the Picture and Picture Copy Windows
The CEA-708 closed caption system (used in the USA and Canada for high definition (HD) video)embeds information in the VANC area of the HD-SDI video framework and uses data identifier (DID)0x61 (Hex) for the Caption Distribution Packet (CDP). Typically this supports up to 6 different closedcaption streams (or services).
The OP-47 closed caption system (used in Europe and Australia for HD-SDI) embeds closed captiontext in the VANC area of the SDI-HD video framework using DID 0x43 (Hex). This system supportsclosed caption pages in the range 0x100 to 0x8FF (Hex).
Page 9-6 PHABRIX QxUser Manual

Using Dual Picture InstrumentsYou can now open two instances of the Analyzer - Picture Instrument, where the second instance is acopy of the first. The same video signal is displayed in both windows and some features, if enabled,are common to both (see below).
When positioned alongside each other, you might use the dual Picture windows to monitor closedcaptions in different languages, or to compare different screen safe areas.
Open two Anlayzer - Picture Instruments as follows:
1. Open the first Analyzer - Picture Instrument from the PHABRIX instrument launch menu.
2. Open the PHABRIX instrument launch menu again and select the option: Analyzer - PictureCopy.You can now manage most overlay elements (excluding the ATC, OP-47 Page and optional HDRfeatures, which are common to both windows) of the two Picture instruments independentlyusing the submenu for each window.
Features common to both windows:
l Ancillary Time Code
l Position of Picture Cursor when enabled
l Closed Caption Standard
l OP-47 page
l All optional HDR functions, see the section "HDR Heat-map (False Color Overlay)" on page 15-6.
Features that can be adjusted independently in both windows:
l Picture Safe Areas and Image Center Crosshairs
l Activation of Picture Cursor
l Field for 608 or 608-in-708 closed captions
l All Message Center features.
Figure 9-4: Two Picture Windows Displayed Side-by-side
PHABRIX QxUser Manual Page 9-7

Monitoring Closed Captions in Dual Picture Instrument Windows
If required, you can open a copy of the Analyzer - Picture instrument to have two Picture windows openat the same time. You can use this feature to monitor closed captions in a different language alongsidethe original language.
Select different language closed captions in dual Picture windows as follows:
1. In the first Picture window, select either of the closed caption standards: 608 or 608-in-708.This will also be automatically selected in the Picture Copy window.
2. In the first Picture window, set the option 608 Field to Field 1.
3. In the Picture Copy window, set the option 608 Field to Field 2.The Qx will now source the closed captions from the two different fields.
Figure 9-5: Dual Analyzer - Picture Instruments Showing Closed Caption Panel
When using either closed caption standard 608 or 608 in 708, select a different field (Field 1 or Field 2)in each Picture Instrument to display a different language in the Picture Copy window.
Note: The OP-47 closed caption page, when selected, is linked between Picture windows so thatthe same page is displayed in both the Picture window and the Picture Copy window.
Picture CursorThe Picture Cursor consists of two intersecting horizontal and vertical dashed lines. With the optionPicture Cursor enabled, you can position the intersection of the cursor either by clicking the mouseanywhere inside the window boundary, or more precisely, by specifying the exact line and pixel in thesubmenu. The Line value adjusts the vertical component of the Picture Cursor and the Pixel valueadjusts the horizontal component.
Page 9-8 PHABRIX QxUser Manual
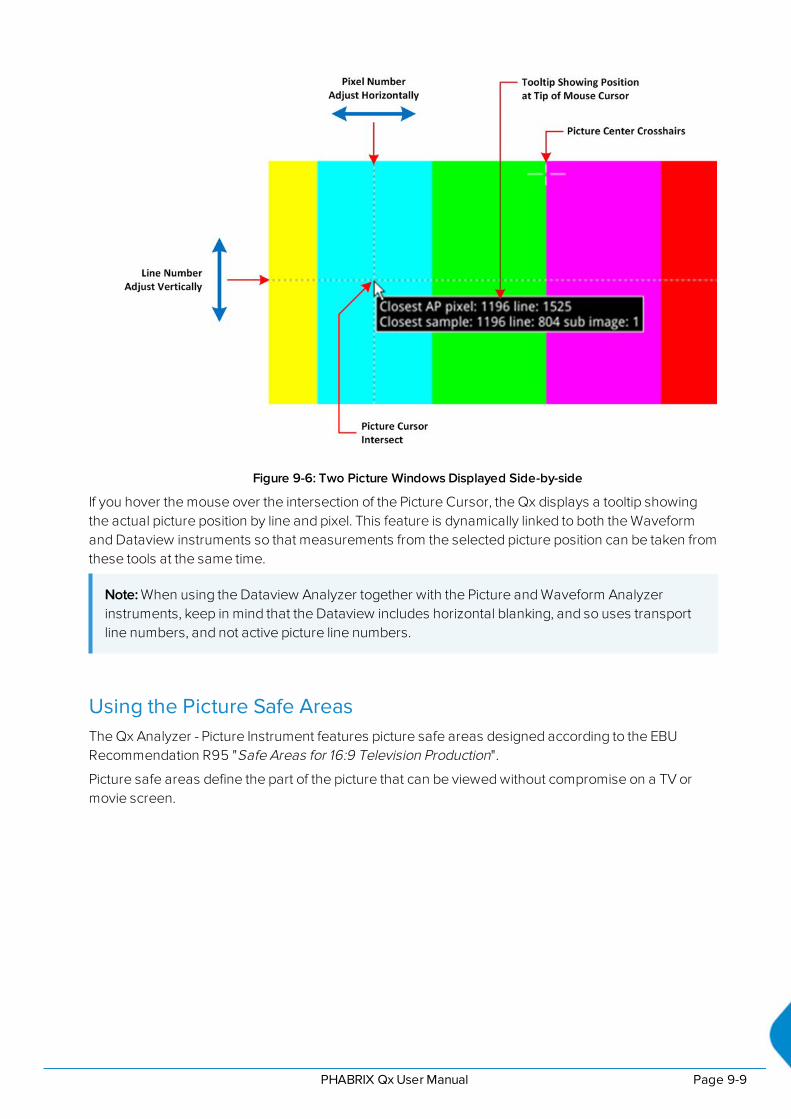
Figure 9-6: Two Picture Windows Displayed Side-by-side
If you hover the mouse over the intersection of the Picture Cursor, the Qx displays a tooltip showingthe actual picture position by line and pixel. This feature is dynamically linked to both the Waveformand Dataview instruments so that measurements from the selected picture position can be taken fromthese tools at the same time.
Note: When using the Dataview Analyzer together with the Picture and Waveform Analyzerinstruments, keep in mind that the Dataview includes horizontal blanking, and so uses transportline numbers, and not active picture line numbers.
Using the Picture Safe AreasThe Qx Analyzer - Picture Instrument features picture safe areas designed according to the EBURecommendation R95 "Safe Areas for 16:9 Television Production".
Picture safe areas define the part of the picture that can be viewed without compromise on a TV ormovie screen.
PHABRIX QxUser Manual Page 9-9
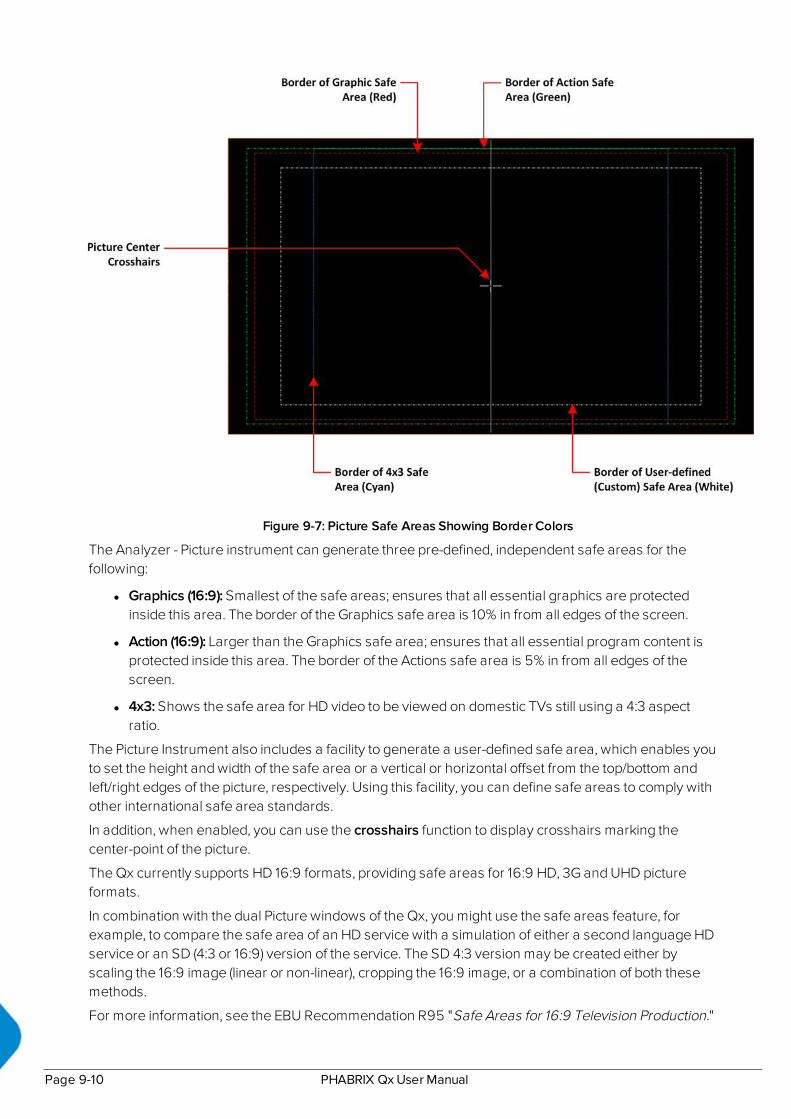
Figure 9-7: Picture Safe Areas Showing Border Colors
The Analyzer - Picture instrument can generate three pre-defined, independent safe areas for thefollowing:
l Graphics (16:9): Smallest of the safe areas; ensures that all essential graphics are protectedinside this area. The border of the Graphics safe area is 10% in from all edges of the screen.
l Action (16:9): Larger than the Graphics safe area; ensures that all essential program content isprotected inside this area. The border of the Actions safe area is 5% in from all edges of thescreen.
l 4x3: Shows the safe area for HD video to be viewed on domestic TVs still using a 4:3 aspectratio.
The Picture Instrument also includes a facility to generate a user-defined safe area, which enables youto set the height and width of the safe area or a vertical or horizontal offset from the top/bottom andleft/right edges of the picture, respectively. Using this facility, you can define safe areas to comply withother international safe area standards.
In addition, when enabled, you can use the crosshairs function to display crosshairs marking thecenter-point of the picture.
The Qx currently supports HD 16:9 formats, providing safe areas for 16:9 HD, 3G and UHD pictureformats.
In combination with the dual Picture windows of the Qx, you might use the safe areas feature, forexample, to compare the safe area of an HD service with a simulation of either a second language HDservice or an SD (4:3 or 16:9) version of the service. The SD 4:3 version may be created either byscaling the 16:9 image (linear or non-linear), cropping the 16:9 image, or a combination of both thesemethods.
For more information, see the EBU Recommendation R95 "Safe Areas for 16:9 Television Production."
Page 9-10 PHABRIX QxUser Manual

Displaying the Picture Safe Areas
Activate a safe picture area in either of the Picture windows as follows:
1. Right-click in the Picture window to open the Instrument submenu.
2. To display one of the standard safe areas, simply select Enabled from the corresponding drop-down list. You can differentiate the safe areas by the color of their border, for example:
l Action Safe Area - Green Dashed-line Border
l Graphics Safe Area - Red Dashed-line Border
l 4x3 Safe Area - Cyan Dashed-line Border
3. To display a custom safe area, set the Custom Safe Area to Enabled.This displays additional fields in which to specify the height and width of the custom safe area,using either:
l An absolute percentage of the screen area for the safe area to occupy, or
l A percentage offset from the horizontal and vertical edges of the picture.
Note: The user-defined custom safe area is displayed with a white dashed-line border
Using the Message CenterThe Qx Message Center is a designated area of the Analyzer - Picture window intended to alert you tothe receipt of certain messages transported as packages in the ancillary data stream. The MessageCenter facilitates quality control of the source video material, both before and during transmission. Onidentifying one of the target message types, the Message Center decapsulates the message anddisplays an appropriate marker, text or ID to reference the message. You can configure the MessageCenter to display the following:
l V-chip Marker: Identifies a parental guidance rating, used primarily in the US and Canada, to cat-egorize age-sensitive material in a TV program. The V-chip hardware in the receiving televisioncan be configured by the viewer to block certain categories of V-chip ratings as desired.
l ST309 Date: The date in ST 309 format: dd mmm yyyyy
l AFD Marker: The Active Format Description is a set of codes used to identify the aspect ratio ofthe video signal and the protected areas of the picture.
l Input Name: The defined source input name of the video stream
l SCTE104 OpID: The industry standard for including specific program signals and markers in thevideo signal at various timepoints, for example, program parts, commercial breaks, etc.
V-chip data is included with closed caption data of type CEA-608 or CEA-608-in-708. V-chip data is notcurrently available with closed captions of type OP-47. If 608 or 608-in-708 closed captions areenabled but unavailable and you then enable the V-chip marker, you will see that the V-chip label inthe Picture submenu is displayed in yellow as a warning. Furthermore, if OP-47 closed captions areenabled, together with the V-chip marker, the V-chip label in the Picture submenu is displayed in yellow
The Message Center separates messages into either static or dynamic message types. Whenenabled, static messages are always displayed in the Message Center and indicate the presence of aV-chip or Active Format Description (AFD) code in the ancillary data. Dynamic messages, however, aredisplayed for a configurable timeout period (in seconds) after which they are removed from theMessage Center. The Qx manages the OpIDs of SCTE104 packages, detected in the ancillary data, asdynamic messages. Each consecutive SCTE104 packet received by the Qx replaces the previousdisplayed OpID.
PHABRIX QxUser Manual Page 9-11
For ease of viewing, you can choose the specific quadrant of the Analyzer - Picture window in which todisplay the Message Center from:
l Top-left quadrant
l Top-right quadrant
l Bottom-left quadrant
l Bottom-right quadrant.
Note: The Message Center is displayed only when you enable at least one of the message types(AFD, V-Chip, ST309 Date, SCTE104 or Input Name) in the submenu.
The layout of the Message Center adapts so that it always displays the static messages closest to thepicture edge, depending on the selected screen quadrant in which it is located. This ensures that theV-chip and AFD codes are always displayed in the same position in the window.
Dynamic SCTE104 OpID codes are appended either above or below the static messages, againdepending on the quadrant in which the Message Center is located.
The AFD packets in ancillary data are used to identify the aspect ratio of the video signal and keyprogram indicators at various timepoints.
You can hover over a SCTE104 OpID in the Message Center to display a tooltip containing the actualtext of the message.
Note: V-chip, AFD ST309 Date, SCTE104 OpID and Input Name data packets will also appear inthe Analyzer - Ancillary Status Instrument and you can view the corresponding packet contents inthe Analyzer - Ancillary Inspector Instrument.
SCTE 104 Packet Detection
SCTE-104 is the broadcast industry standard for including specific program signals and markers in thevideo signal, for example, program parts, commercial breaks, etc.
When this option is enabled, the Analyzer - Picture window displays a list of SCTE-104 messages in theMessage Center, with the most recent displayed at the top of the list. On receipt, the OpID code ofeach SCTE-104 message is displayed for at least two seconds, depending on the configured timeoutperiod.
The Qx displays the following information for each SCTE-104 message received:
l SCTE-104 operation ID (OpID) - identifies the SCTE104 message type.
l Message type as screen tip by hovering over the OpID.
You can choose to display the message OpID in either hexadecimal or decimal format.
If you are interested in SCTE-104 messages, it is recommended to enable SCTE 104 messages in theEvent Logger so that the full message type is saved to the logfile.
Defining Source Input Names
The Qx provides a facility to enter identification strings for input sources, for example, cameras, etc. toidentify the source of the input stream. The source ID is dispayed in the Message Center for 5seconds, with this 5 second timeout being reset each time the Qx receives an Input Name ancillarypacket. If the Qx receives no further Input Name ancillary packets after 5 seconds, then it reports theInput Name as Missing in the Message Center.
You can choose either to enter the input name manually, or configure the Data Identifier (DID) andSecondary Data Identifier (SDID) value of the Input Name in the ancillary data of the input stream.
Page 9-12 PHABRIX QxUser Manual

The Input Name is a an ancillary data packet with the following message structure:
Figure 9-8: Input Name Message Structure
In addition, you can define a prefix to be applied to the source input name, for example: Input ID:.
Enter a source Input Name as follows:
1. Right-click in the Picture or Picture - Copy window to open the submenu.
2. Select Enabled from the Input Name dropdown.This displays the Input Name Configuration... button.
3. Click Input Name Configuration... to open the Input Name Configuration dialog.
4. Using a USB keyboard or over a VNC connection, configure an input name as follows:
a. If you require a standard prefix for your input names, enter the prefix text string into thePrefix field, for example Source ID:.
b. To enter an input name manually, click the User Entered option button and enter thename using up to a maximum of 12 characters.
c. To extract an input name automatically from the ancillary data in the input feed, click theAncillary Data option button and select the target DID and SDID. You can specify theDID/SDID using either decimal (default) or hex notation.
5. Click OK to save the input name.
Figure 9-9: Input Name Configuration Dialog Box
Displaying the Ancillary Time Code (ATC)Time and control code information, used to identify discrete video frames, is carried as the payload ofpackets located in the ancillary data space of the video signal. When you enable the ATC option in theAnalyzer - Picture submenu, the ancillary time code is displayed in a panel overlayed across thePicture window.
The ATC is a 13 character time code with the following format:
PHABRIX QxUser Manual Page 9-13
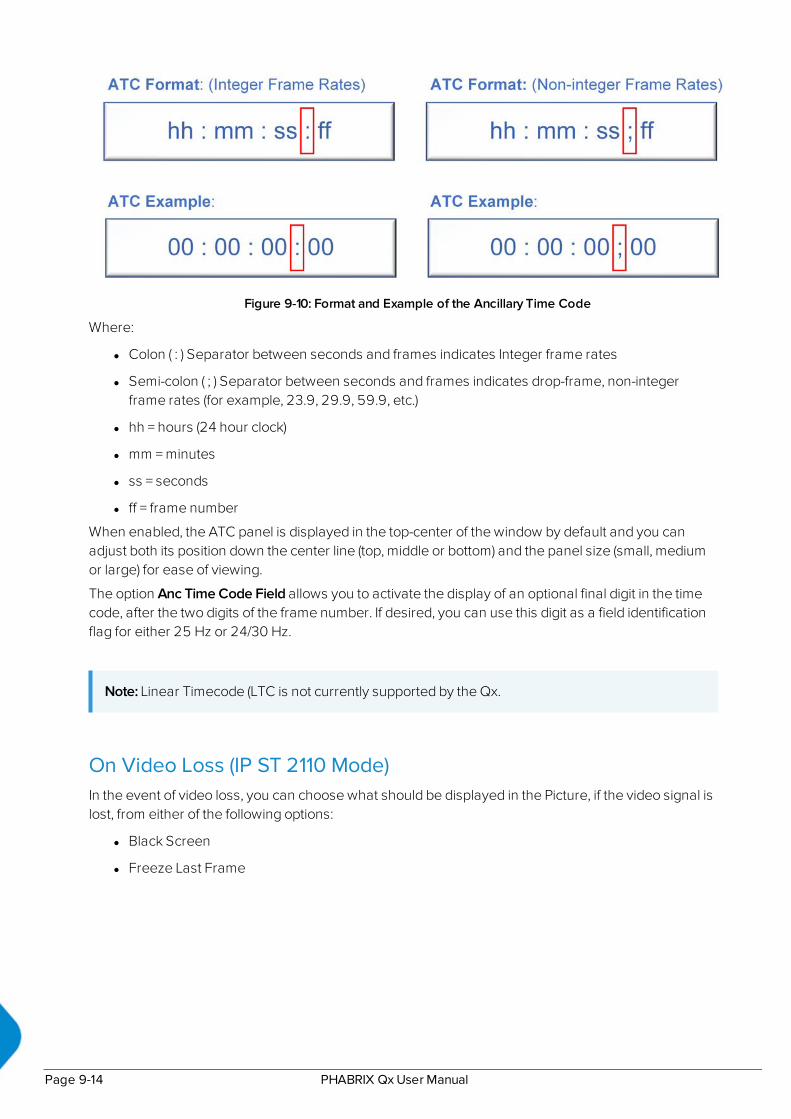
Figure 9-10: Format and Example of the Ancillary Time Code
Where:
l Colon ( : ) Separator between seconds and frames indicates Integer frame rates
l Semi-colon ( ; ) Separator between seconds and frames indicates drop-frame, non-integerframe rates (for example, 23.9, 29.9, 59.9, etc.)
l hh = hours (24 hour clock)
l mm = minutes
l ss = seconds
l ff = frame number
When enabled, the ATC panel is displayed in the top-center of the window by default and you canadjust both its position down the center line (top, middle or bottom) and the panel size (small, mediumor large) for ease of viewing.
The option Anc Time Code Field allows you to activate the display of an optional final digit in the timecode, after the two digits of the frame number. If desired, you can use this digit as a field identificationflag for either 25 Hz or 24/30 Hz.
Note: Linear Timecode (LTC is not currently supported by the Qx.
On Video Loss (IP ST 2110 Mode)In the event of video loss, you can choose what should be displayed in the Picture, if the video signal islost, from either of the following options:
l Black Screen
l Freeze Last Frame
Page 9-14 PHABRIX QxUser Manual

Analyzer - Waveform
OverviewThe Waveform instrument provides various analysis settings including Single Line Mode and PictureCursor control.
Figure 9-11: Analyzer - Waveform Instrument
When the option Picture Cursor is enabled, the cursor is dynamically linked to the cursor in the Pictureinstrument, and to Dataview navigation. Clicking the cursor in a new position in the Waveform windowupdates the pixel and active picture line position selected in the Picture instrument, and the pixel andtransport line position selected in Dataview.
Instrument Menu OptionsYou can use and view Markers in the Cb Cr waveforms when you enable Markers in the Vectorscopeinstrument. The position of the markers tracks the positioning of the user markers in the Vectorscope.
Right-click in the Waveform area to access the waveform setup options:
l Parade Mode > [YCbCr, Y, Cb, Cr, RGB, GBR, YRGB, YGBR, Red, Green, Blue]
l V Scale > [Percent, Hex Value, Decimal Value, Millivolts]
l V Scale Nits > [Hidden, Right Side, Left Side]
l H Scale > [Pixels, % Line]
l Filter > [Flat, Low Pass, Raw]
l Single Line Mode > [Enabled, Disabled]
l Single Line Mode > Enabled > Line Number > [1 to Total no. of Lines for current standard]
l Picture Cursor > [Enabled, Disabled]
l Picture Cursor > Enabled > Pixel Number > [0 to (Total no. of Pixels for current standard −1)]
l Diffuse White Marker > [Enabled, Disabled]
l User Markers (%/Dec/mV) > [Enabled, Disabled]
PHABRIX QxUser Manual Page 9-15

l User Markers > Enabled > Marker 1 > [slider, bottom to top]
l User Markers > Enabled > Marker 2 > [slider, bottom to top]
l H Magnification > [slider 1.00...10.00]
l H Magnification >H Position > [slider, left to right]
l V Magnification > [slider 1.00...4.00]
l V Magnification > V Position > [slider, bottom to top]
l Brightness > [slider 1..31]
l Gamma > [slider 1..255]
l Persistence [slider 1..255]
l Monochrome Mode [Enabled, Disabled]
l S-Log3 Mode [S-Log3, SR Live] for HDR video signals, see the section ."Advanced HDR Toolset"on page 15-2
Page 9-16 PHABRIX QxUser Manual

Analyzer - Vectorscope
OverviewThe Vectorscope is part of the video core toolset that provides X-Y analysis of the video signal(s).
Figure 9-12: Analyzer - Vectoscope Instrument
Instrument Menu OptionsAccess the setup options for the Vectorscope by right-clicking in the vectorscope area:
l Targets > [Off, 75%, 100%]
l User Markers > [Enabled, Disabled]
l User Markers > Enabled > Marker Selected > [Marker 1, Marker 2] > Marker Angle > [slider0.00...359.99]
l User Markers > Enabled > Marker Selected > [Marker 1, Marker 2] > Marker Gain > [slider0.00...100.00]
l I/Q Axes > [Off, I Only, Q Only, Both]
l Filter > [Flat, Low Pass, Raw]
l Center > [Origin, Red, Green, Blue, Magenta, Cyan, Yellow, Marker 1, Marker 2]
l Single Line Mode > [Enabled, Disabled]
l Single Line Mode > Enabled > Line Number > [1 to Total no. of Lines for current standard]
l Zoom > [slider 0.50...4.00]
l Brightness > [slider 1..31]
l Gamma > [slider 1..255]
l Persistence [slider 1..255]
PHABRIX QxUser Manual Page 9-17
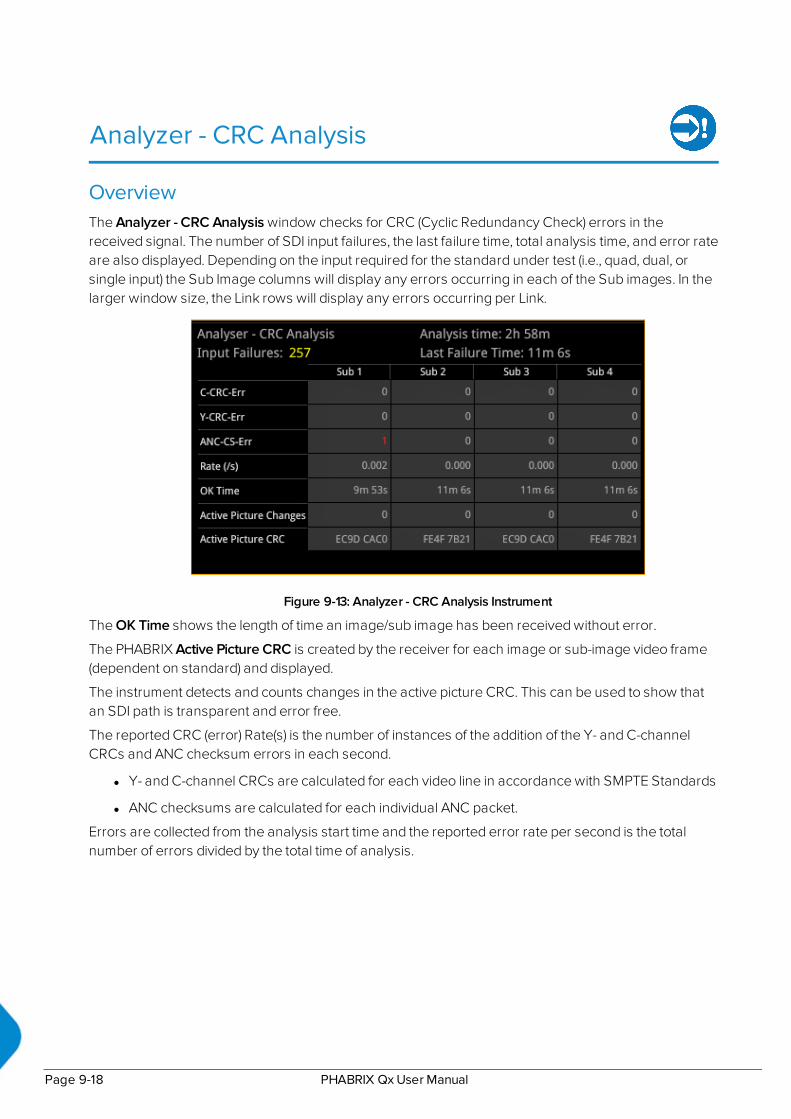
Analyzer - CRC Analysis
OverviewThe Analyzer - CRC Analysis window checks for CRC (Cyclic Redundancy Check) errors in thereceived signal. The number of SDI input failures, the last failure time, total analysis time, and error rateare also displayed. Depending on the input required for the standard under test (i.e., quad, dual, orsingle input) the Sub Image columns will display any errors occurring in each of the Sub images. In thelarger window size, the Link rows will display any errors occurring per Link.
Figure 9-13: Analyzer - CRC Analysis Instrument
The OK Time shows the length of time an image/sub image has been received without error.
The PHABRIX Active Picture CRC is created by the receiver for each image or sub-image video frame(dependent on standard) and displayed.
The instrument detects and counts changes in the active picture CRC. This can be used to show thatan SDI path is transparent and error free.
The reported CRC (error) Rate(s) is the number of instances of the addition of the Y- and C-channelCRCs and ANC checksum errors in each second.
l Y- and C-channel CRCs are calculated for each video line in accordance with SMPTE Standards
l ANC checksums are calculated for each individual ANC packet.
Errors are collected from the analysis start time and the reported error rate per second is the totalnumber of errors divided by the total time of analysis.
Page 9-18 PHABRIX QxUser Manual
Instrument Menu OptionsYou can access the submenu by right-clicking in the instrument window.
You can choose to ignore CRC errors on the switching line by enabling Ignore CRC on switch lines inthe submenu:
l Ignore CRC on switch lines > [Enabled, Disabled]
You can choose to clear the counters on input failure if required by enabling Reset errors on Inputfailure in the submenu:
l Reset errors on Input failure > [Enabled, Disabled]
To reset the instrument:
l Reset errors
l Reset errors and running time.
PHABRIX QxUser Manual Page 9-19

10Audio Signal Analysis InstrumentsThis chapter describes the Qx Audio analytical Instruments and includes the following sections:
l Analyzer - Audio Channel Status
l Analyzer - Audio Meters
PHABRIX QxUser Manual Page 10-1
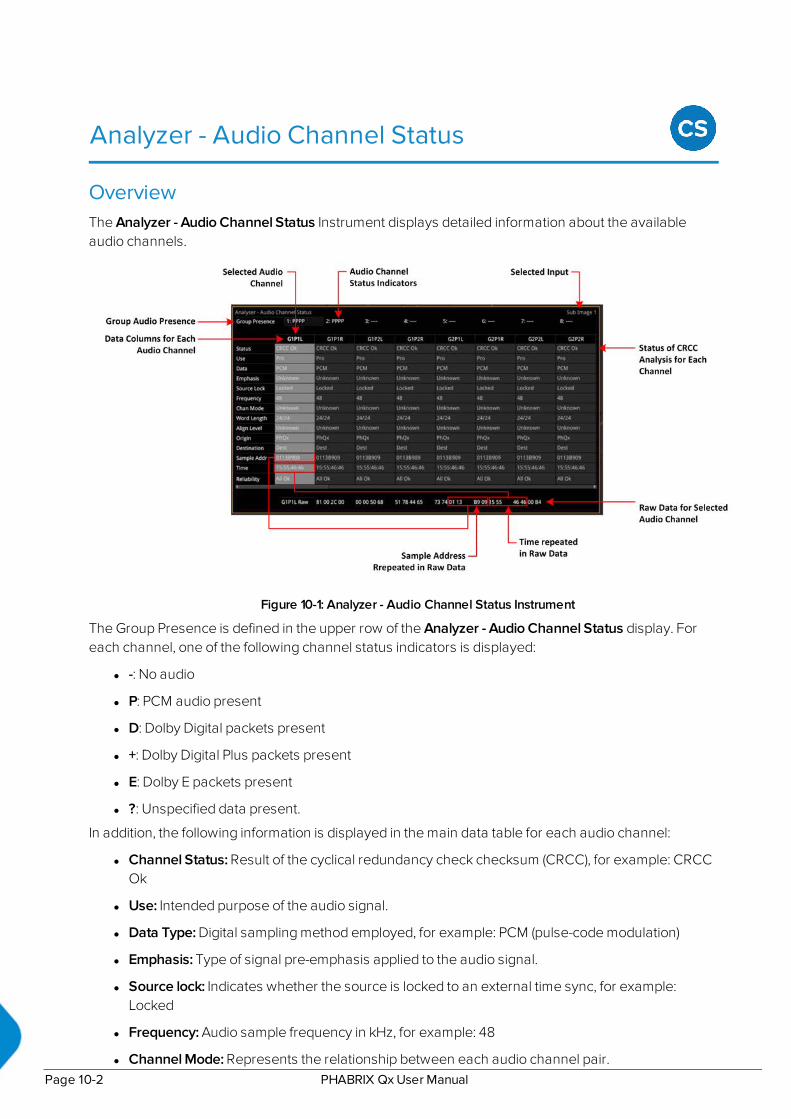
Analyzer - Audio Channel Status
OverviewThe Analyzer - Audio Channel Status Instrument displays detailed information about the availableaudio channels.
Figure 10-1: Analyzer - Audio Channel Status Instrument
The Group Presence is defined in the upper row of the Analyzer - Audio Channel Status display. Foreach channel, one of the following channel status indicators is displayed:
l -: No audio
l P: PCM audio present
l D: Dolby Digital packets present
l +: Dolby Digital Plus packets present
l E: Dolby E packets present
l ?: Unspecified data present.
In addition, the following information is displayed in the main data table for each audio channel:
l Channel Status: Result of the cyclical redundancy check checksum (CRCC), for example: CRCCOk
l Use: Intended purpose of the audio signal.
l Data Type: Digital sampling method employed, for example: PCM (pulse-code modulation)
l Emphasis: Type of signal pre-emphasis applied to the audio signal.
l Source lock: Indicates whether the source is locked to an external time sync, for example:Locked
l Frequency: Audio sample frequency in kHz, for example: 48
l Channel Mode: Represents the relationship between each audio channel pair.Page 10-2 PHABRIX QxUser Manual

l Word Length: Represents the audio word length, for example: 24/24
l Align Level
l Origin: Four ASCII characters indicating the channel origin, for example: PhQx
l Destination: Four ASCII characters indicating channel destination
l Sample Address: A rolling counter that increments with each 48 kHz audio sample
l Time: Local time of the encoded audio
l Reliability: Contains information about the reliability of the channel status word, for example: AllOk.
Use the horizontal and vertical scroll bars to view the full table of channel columns and audio statusparameters.
Raw Data Display
You can click on an audio channel column to select it and display the raw data for that channel in thebottom row of the window.
Each AES3 audio sample, includes the Sample Address and Time occupying eight bytes (14 to 21) witha reliability indication in byte 22 and the cyclical redundancy check checksum (CRCC) in byte 23. Witheach audio sample, the Sample Address and Time are different for each sample, so bytes 14 to 21 willchange, as will the checksum in byte 23.
Instrument Menu OptionsThe following menu options are available for configuring the Analyzer - Audio Channel StatusInstrument:
Table 10-1 : Analyzer - Audio Channel Status Menu Options
Item Options Description
Input Select(SDI / 2022-6modes)
Sub Image 1,Sub Image 2,Sub Image 3,Sub Image 4,AES IO
Selects the target input audio source for analysis. Theselected input is displayed in the top-right corner of theinstrument.
Input Select(IP 2110 mode)
Meters 1 + 2 Flows,AES IO
In IP 2110 mode, you can choose the audio flows currentlyselected on both Analyzer - Audio Meters windows, orAES IO. Audio Channel Status information will only beavailable with a flow using ST 2110-31 (AES 3 transport)
PHABRIX QxUser Manual Page 10-3
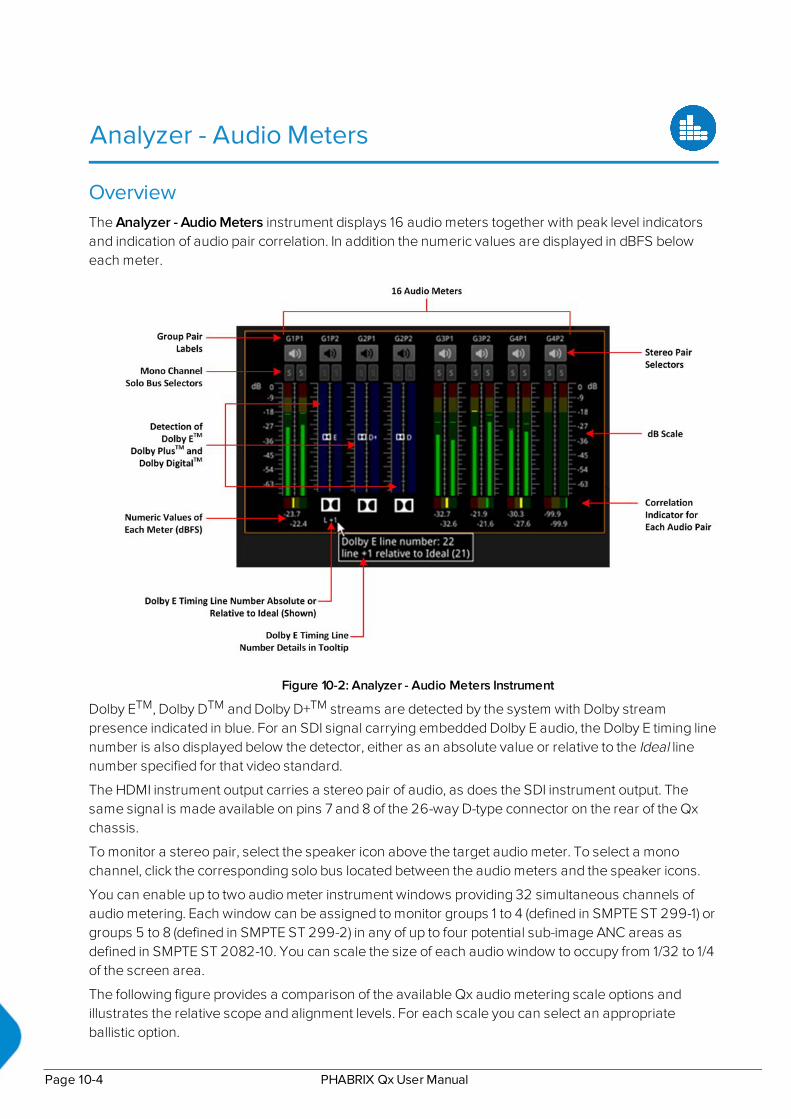
Analyzer - Audio Meters
OverviewThe Analyzer - Audio Meters instrument displays 16 audio meters together with peak level indicatorsand indication of audio pair correlation. In addition the numeric values are displayed in dBFS beloweach meter.
Figure 10-2: Analyzer - Audio Meters Instrument
Dolby ETM, Dolby DTM and Dolby D+TM streams are detected by the system with Dolby streampresence indicated in blue. For an SDI signal carrying embedded Dolby E audio, the Dolby E timing linenumber is also displayed below the detector, either as an absolute value or relative to the Ideal linenumber specified for that video standard.
The HDMI instrument output carries a stereo pair of audio, as does the SDI instrument output. Thesame signal is made available on pins 7 and 8 of the 26-way D-type connector on the rear of the Qxchassis.
To monitor a stereo pair, select the speaker icon above the target audio meter. To select a monochannel, click the corresponding solo bus located between the audio meters and the speaker icons.
You can enable up to two audio meter instrument windows providing 32 simultaneous channels ofaudio metering. Each window can be assigned to monitor groups 1 to 4 (defined in SMPTE ST 299-1) orgroups 5 to 8 (defined in SMPTE ST 299-2) in any of up to four potential sub-image ANC areas asdefined in SMPTE ST 2082-10. You can scale the size of each audio window to occupy from 1/32 to 1/4of the screen area.
The following figure provides a comparison of the available Qx audio metering scale options andillustrates the relative scope and alignment levels. For each scale you can select an appropriateballistic option.
Page 10-4 PHABRIX QxUser Manual

Figure 10-3: Comparison of Qx Audio Metering Scales
PHABRIX QxUser Manual Page 10-5

Instrument Menu OptionsThe following menu options are available for configuring the Analyzer - Audio Meters Instrument:
Table 10-2 : Analyzer - Audio Meter Menu Options
Item Options Description
Input Select Image/Sub-Image 1 Group 1-4Image/Sub Image 1 Group 5-8Sub-Image 2 Group 1-4Sub-Image 2 Group 5-8Sub-Image 3 Group 1-4Sub-Image 3 Group 5-8Sub-Image 4 Group 1-4Sub-Image 4 Group 5-8AES IO
Select the source for each pair of audio meters tometer simultaneously up to 32 audio channels in up totwo Audio Meter instrument windows.
Ballistics PPM Type IPPM Type IIVuVuFrFast
Set the required peak program meter (PPM) ballisticresponsiveness setting for the audio meters.PPM Type I emulates the performance of IEC 60268-10Type I PPM style audio meters typically used by Germanbroadcasters.PPM Type II emulates the performance of IEC 60268-10Type II PPM style audio meters typically used by UKbroadcasters.Vu emulates the performance of IEC 60268-17 Type IPPM style audio meters typically used by US andAustralian broadcasters.VuFr emulates the performance of ITU-R Rec BS.645style audio meters typically used by Frenchbroadcasters.Fast provides instantaneous attack ballistics.
PPM Scale dBFSdBu -18dBFSdBu-20dBFSBBCDIN45406NordicN9
Set the desired scale for the audio meters according toyour standard operating model. The displayed graticuleand audio levels change accordingly to reflect theselected scale.
Hat hold time 0.00...10.00, infinite Sets the minimum time that the signal gate is held openin ms.
Monitor Buttons Enabled (Default)Disabled
Toggle the display of Monitor icons for the audiometers.
Solo Buttons Enabled (Default)Disabled
Toggle the display of Solo icons for each channel of apair.
Dolby E LineNumber
Relative to IdealAbsolute
Select whether to display the Dolby E timing line num-ber relative to the ideal for the selected standard, or asan absolute line number.
Page 10-6 PHABRIX QxUser Manual
11Data Analysis Instruments
Note: Requires the PHQXO-DATA License.
This chapter describes the suite of data analysis Instruments and includes the following sections:
l Analyzer - Dataview
l Analyzer - Ancillary Status
l Analyzer - Ancillary Inspector
PHABRIX QxUser Manual Page 11-1
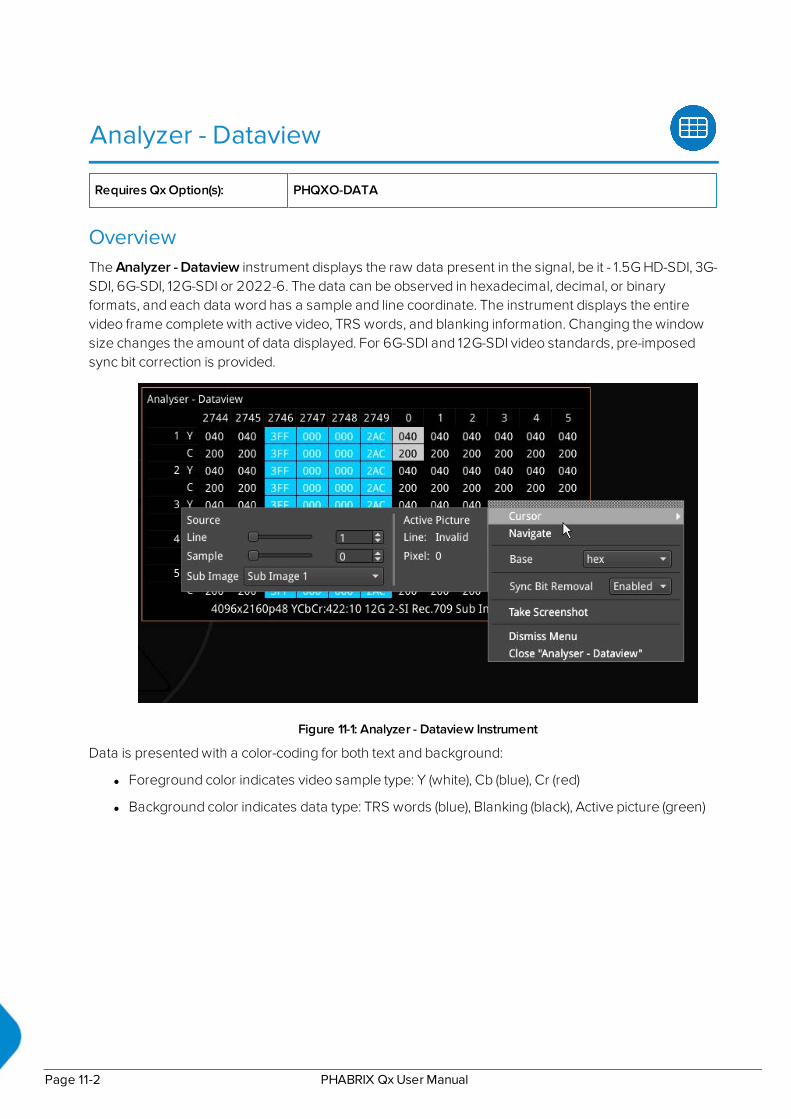
Analyzer - Dataview
Requires Qx Option(s): PHQXO-DATA
OverviewThe Analyzer - Dataview instrument displays the raw data present in the signal, be it - 1.5G HD-SDI, 3G-SDI, 6G-SDI, 12G-SDI or 2022-6. The data can be observed in hexadecimal, decimal, or binaryformats, and each data word has a sample and line coordinate. The instrument displays the entirevideo frame complete with active video, TRS words, and blanking information. Changing the windowsize changes the amount of data displayed. For 6G-SDI and 12G-SDI video standards, pre-imposedsync bit correction is provided.
Figure 11-1: Analyzer - Dataview Instrument
Data is presented with a color-coding for both text and background:
l Foreground color indicates video sample type: Y (white), Cb (blue), Cr (red)
l Background color indicates data type: TRS words (blue), Blanking (black), Active picture (green)
Page 11-2 PHABRIX QxUser Manual

You can quickly navigate the dataview windowusing sample and line selection in the Cursor tool orusing the Navigate keypad (shown, right).
Both tools are dynamically linked to an enabledPicture Cursor in the Waveform and Pictureinstruments.
The Cursor tool provides transport line and samplesliders to move around the dataview, at the sametime as giving the corresponding Active Picture lineand pixel values.
The Navigate keypad allows you to enter thedesired coordinates, and provides buttons for quicknavigation to key locations: first and last samples orlines, end of active video (EAV) and start of activevideo (SAV) TRS words, active picture (AP) furthest -left, right, top, and bottom positions. Figure 11-2: Dataview Navigate Keypad
Instrument Menu OptionsThe following right-click submenu options are available:
l Cursor > Source > Line > [1 to Total number of Lines for current standard]
l Cursor > Source > Sample > [1 to Total number of Lines for current standard]
l Cursor > Source > Sub Image > [Sub Image 1, Sub Image 2, Sub Image 3, Sub Image 4] (standarddependent)
l Navigate > [calls up navigation keypad]
l Base > [hex, decimal, binary]
For 6G-SDI and 12G-SDI video standards the option is provided, to view the data stream before syncbit removal or after sync bit removal.
l Sync Bit Removal > [Enabled, Disabled]
Enabling Sync Bit Removal reverts affected bits to the original value they held prior to sync bitinsertion. You can observe this reversion in the TRS and ADF words.
Note: This feature applies only to 6G-SDI and 12G-SDI video standards, where the inclusion of async bit is defined in the SMPTE standards. Signals not containing sync bits are unaffected.
PHABRIX QxUser Manual Page 11-3

Analyzer - Ancillary Status
OverviewThe Qx Analyzer - Ancillary Status provides a sophisticated, real-time display which analyzes theancillary data present in the signal. UHDTV has a new set of rules for carrying this data and a cleargraphical representation is required to establish compliance. Color-coded signal conditions - present,lost, and error are all available. Additional data is displayed as you resize the instrument.
In addition to the option of a combined view, tabs are provided for separate Grid or List views of theancillary data.
Figure 11-3: Analyzer - Ancillary Status
The Grid view provides a high-level overview of the packets present in the ancillary data.
In the List View tab, you can expand the headings, to allow a granular drill-down of discovered ancillarypackets – providing information on presence, checksum, parity, and data block number (DBN). Youcan select packets in this window for analysis by the Analyzer – Ancillary Inspector.
Color-coding of displayed data provides further health information at a glance:
l White - Indicates ANC packets present and correct
l Red - Indicates ANC packets present but in error
l Yellow - indicates ANC packets present and correct but there has been a previous error.
Page 11-4 PHABRIX QxUser Manual

Instrument Menu Options
Figure 11-4: Analyzer - Ancillary Status Menu Options
From the Analyzer - Ancillary Status instrument submenu, accessible in all views, you can reset theancillary status analysis, inspec tselected packets and set configuration options as follows:
Table 11-1 : Analyzer - Ancillary Status Menu Options
Item Options Description
Reset N/A Select to reset ancillary status analysis (accessible in allviews).
View Tab ViewCombined
The combined view provides both a high-level overviewgrid at the top and an expandable list view below, all in asingle window, as shown in the following screen:
Filter NoneAncillary Packet Type
Change the ancillary packet type being filtered by simplyselecting a different packet type from the Grid.See the following table for a list of available ancillary dataidentifiers.
Inspect Selected packets in Ana-lyzer.
Enables you to select packets from the list and theninitiate ancillary inspection, see for a list of ancillary dataIDs.For more information on ANC inspection, see the section"Analyzer - Ancillary Inspector" on page 11-8.Select Inspect... to send the inspection request over tothe Analyzer - Ancillary Inspector Instrument. If theAnalyzer - Ancillary Inspector is not currently open, therequest opens the instrument. The inspection request isloaded into the Identifier field of the Inspector instrument
PHABRIX QxUser Manual Page 11-5

Item Options Description
and, depending on the trigger setting, reacts as follows:None - the request is loaded, but not acted uponSingle Shot - the ANC Inspector searches for the packettype and displays the result once a matching packet isdetected. (The trigger is then set back to None.)Continuous - the ANC Inspector continuously searches forthe selected packet type and refreshes the displayedresults each time it detects a matching packet type.Note: If a packet type is not selected in the List view, theInspect.. option will be unavailable.
Table 11-2 : List of Ancillary Status Grid Identifiers
Ancillary Status Grid Identifier Description
S353 MPEG Recoding MPEG-2 Recoding Information
S305 SDTI SDTI transport in active frame space
S348 HD SDTI HD-SDTI Transport in active frame space
S427 Link Encryption Link encryption for 1.5 Gb/s Serial Digital Interface
S352 Payload ID Payload identification, HANC space
S4S2016-3 AFD AFD and Bar data
S2016-4 PAN Pan-scan data
S2010 ANSI/SCTE ANSI/SCTE 104 messages
S2031 DVB/SCTE DVB/SCTE VBI data
S2056 MPEG TS MPEG TS packets in VANC
S2068 3D Packing Stereoscopic 3D frame compatible packing and signaling
S2064 Lip Sync Lip sync data as specified by ST 2064-1 or ST 2064-2
ITU-RBT.1685 Structure of inter-station control data conveyed by ancil-lary data packets
OP47 Caption OP47/RDD8 Subtitling distribution packet (SDP)
OP47 VBI/WST OP47/RDD8 Transport of VBI and/or WST data in a VANCMultipacket
ARIB-TR-B29 Metadata to monitor errors of audio and video signals ona broadcasting chain
RDD18 Metadata Acquisition metadata sets for video camera parameters
RP214 KLV Metadata KLV encoded metadata transport
RP223 UMID/ID Packing UMID and Program Identification Label data intoSMPTE 291M Ancillary Data Packets
S2020 Audio Compressed audio metadata
S2051 Two Frame Two frame marker in HANC
RDD8 WSS Wide-screen signalling data
RP215 Film Codes Film codes in VANC space
S12M-2 V-TCode Ancillary time code
Page 11-6 PHABRIX QxUser Manual

Ancillary Status Grid Identifier Description
EIA-708 Caption S334-1 EIA 708B Data mapping into VANC space
EIA-608 Caption S334-1 EIA 608 Data mapping into VANC space
RP207 Program Program description in VANC space
S334-1 Data Data broadcast (DTV) in VANC space
RP208 VBI Data VBI data in VANC space
Mark Deleted S291 - Packet marked for deletion
S299-2 3G Audio Audio data in HANC space (3G)
S299-1 HD Audio Audio data in HANC space (HDTV)
S272 SD Audio Audio data in HANC space (SDTV)
S315 Camera Pos Vamera position (HANC or VANC space)
RP165 EDH Error detection and handling (HANC space)
S12-3 HFR TCode Time code for high frame rate signals
S2103 Generic Time Generic time label
S2108-1 HDR/WCG Extended HDR/WCG
For tooltips on each of the Status Grid Identifiers, hover the mouse cursor over the identifier.
PHABRIX QxUser Manual Page 11-7

Analyzer - Ancillary Inspector
Requires Qx Option(s): PHQXO-DATA
OverviewThe Ancillary (ANC) Inspector monitors the analyzed signal and displays the contents of selectedAncillary packets in the SDI data.
Figure 11-5: Analyzer - Ancillary Inspector Instrument
The window displays both the location of the found packet and the time at which it was found.
The lower part of he window displays the packet in hexadecimal form including individual: headerwords (gray background), data words (black background), and checksum (blue background). Hover themouse over each header word to reveal more detail.
Instrument Menu OptionsThe following menu options are available for configuring the Analyzer - Ancillary Inspector Instrument:
Table 11-3 : Analyzer - Ancillary Inspector Menu Options
Item Options Description
Identifier NoneAncillary Packet Type
Set the Identifier parameter to the ancillary packet typeyou want to find. For a list of ancillary data identifiers, seethe section "Analyzer - Ancillary Status" on page 11-4.
Trigger NoneSingle ShotContinuous
Set Triggers so that when ancillary data exactly matchingthe search parameter(s) is detected, the ANC Inspectortriggers and displays the inspection result in the lowerpart of the window.After detecting a matching packet, when the Trigger isset to Single Shot, the inspection result remains in theresults display area and the trigger state reverts to None.If the Trigger is set to Continuous, it will remain in the cur-rent state after successful detection, and will con-tinuously cause the display to refresh with the results of
Page 11-8 PHABRIX QxUser Manual

Item Options Description
the next successful detection.
Sub Image AnySub Image 1Sub Image 2Sub Image 3Sub Image 4Sub Ima… Link BSub Ima… Link BSub Ima… Link BSub Ima… Link B
Additional ANC inspection parameter to use in the datasearch.
Lines AnyInside RangeOutside Range
Additional ANC inspection parameter to use in the datasearch.
HANC/VANC BothHANCVANC
Additional ANC inspection parameter to use in the datasearch.
Y-Pos/C-Pos BothY-PosC-Pos
Additional ANC inspection parameter to use in the datasearch.
Trigger only onErrors
EnabledDisabled
When enabled, you can select to enable or disable anyof the following:Checksum ErrorsDBN ErrorsParity ErrorsANC Gap Errors
You can set the Identifier parameter in the submenu of the ANC Inspector to search for the ancillarypacket type you want to find.
l Identifier > Select from the following available Identifiers:
Table 11-4 : List of Available Ancillary Data Identifiers
Any Custom S353 MPEG RecodingVANC Space
S353 MPEG RecodingHANC Space
S305 SDTI
S348 HD-SDTI S427 Link Encryption Mes-sage 1
S427 Link Encryption Mes-sage 2
S427 Link EncryptionMetadata
S352 Payload ID
S2016-3 AFD S2016-4 PAN S2010 ANSI/SCTE S2031 DVB/SCTE S2056 MPEG TS
S2068 3D Packing,S2064 Lip Sync
S2108-1 HDR/WCG ITU-R BT.1685 OP47 Caption OP47 VBI/WST
ARIB-TR-B29 RDD18 Metadata RP214 KLV MetadataVANC Space
RP214 KLV MetadataHANC Space
RP223 UMID/ID
S2020 Audio ChannelPair 1/2
S2020 Audio ChannelPair 3/4
S2020 Audio ChannelPair 5/6
S2020 Audio ChannelPair 7/8
S2020 Audio ChannelPair 9/10
S2020 Audio ChannelPair 11/12
S2020 Audio ChannelPair 13/14
S2020 Audio ChannelPair 15/16
S2051 Two Frame RDD8 WSS
S12M-2 V-TCode S2103 Generic Time EIA-708 Caption EIA-608 Caption S12-3 HFR TCode
RP207 Program S334-1 Data RP208 VBI Data Mark Deleted S299-2 3G Audio ControlGroup 8
S299-2 3G Audio ControlGroup 7
S299-2 3G Audio ControlGroup 6
S299-2 3G Audio ControlGroup 5
S299-2 3G Audio AudioGroup 8
S299-2 3G Audio AudioGroup 7
S299-2 3G Audio Audio S299-2 3G Audio Audio S299-1 HD Audio Control S299-1 HD Audio Control S299-1 HD Audio Control
PHABRIX QxUser Manual Page 11-9

Group 6 Group 5 Group 4 Group 3 Group 2
S299-1 HD Audio ControlGroup 1
S299-1 HD Audio AudioGroup 4
S299-1 HD Audio AudioGroup 3
S299-1 HD Audio AudioGroup 2
S299-1 HD Audio AudioGroup 1
S272 SD Audio ControlGroup 4
S272 SD Audio ControlGroup 3
S272 SD Audio ControlGroup 2
S272 SD Audio ControlGroup 1
S315 Camera Pos
RP165 EDH S272 SD Audio Group 4Ext
S272 SD Audio AudioGroup 4
S272 SD Audio Group 3Ext
S272 SD Audio AudioGroup 3
S272 SD Audio Group 2Ext
S272 SD Audio AudioGroup 2
S272 SD Audio Group 1Ext
S272 SD Audio AudioGroup 1
When setting any parameters in ANC Inspector, AND logic applies; so note that all active searchparameters must be met before ANC Inspector can successfully display the results of that search. IfAncillary packet data in the analyzed SDI data does not meet even one of the search conditions set, itwill not be displayed.
In searching for specific data events it is recommended to keep the search parameters as wide aspossible to first establish that you are actually seeing data for the selected ANC packet. Only when theANC Inspector is displaying streaming data, should you introduce more specific search parameters.
ANC Inspector can also be used to search more generally for errors with Trigger only on Errorsenabled (and Identifier set to Any). Where an error is present in a packet, individual data word text willbecome red in the display indicating the exact position of an error within a packet.
Page 11-10 PHABRIX QxUser Manual
12IP Network Traffic Measurement
Note: Requires the PHQXO-IP-MEAS License.
This chapter describes the advanced IP network traffic measurement Instruments available with theIP Measurement option and includes the following sections:
l IP Receive - Interpacket Timing
l Analyzer - 2110-21 Status (IP ST 2110 Mode)
l Advanced Media Timing Measurement (IP 2110)
PHABRIX QxUser Manual Page 12-1

IP Receive - Interpacket Timing
Requires Qx Option(s):PHQXO-IP-NGT (for 2110 only) and either:PHQXO-IP-STND (Single Timing Window) orPHQXO-IP-MEAS (Up to Four Timing Windows)
OverviewEach IP Receive - Interpacket Timing window displays the interpacket arrival timings, in each second,for a single flow.
The number of simultaneously available Interpacket Timing windows depends on the selected modeof the Qx as follows:
l IP 2022-6 Mode: Only one Interpacket Timing window is available.
l IP 2110 Mode: Up to four Interpacket Timing windows are available to track the number of sim-ultaneous IP flows that can be selected. You can switch each window between the availableflows by selecting from the dropdown list in the Instrument submenu.
The Instrument provides analysis of the IP media flow packet reception, and gives a real-timeindication as to the health of the received media flow.
The histogram displays the distribution of all packet arrival intervals, for the selected flow, within agiven second, together with the mean, minimum, and maximum packet intervals for this period. Outliertimes, significantly longer than the expected mean, may indicate significant delays in packetpropagation, or may be indicative of a gapped linear video sender. A high occurrence of such longintervals is characteristic of high jitter in a network.
Features of the Interpacket Timing window include:
l Stream health reporting using a histogram to visualize the distribution of interpacket arrivaltimes (with dynamic auto scaling provided)
l Packet counts (log or linear scales) mapped against arrival times (µs)
l Easy diagnosis of congestion with maximum, mean and minimum interpacket arrival times
l Zoom capability (and linear Y-axis scale) for closer inspection of narrow distribution regions.
l Mouse controls to center, select range, and reset range as follows:
l Single left-click to center on the mouse position without zooming. This can be used topan left and right through the histogram.
l Click and drag to zoom in on the highlighted range.
l Single click of the middle mouse button to reset the scale. This reverts the scale to arange where it shows all the data based on the current Min and Max values. You canalso reset the scale using the instrument submenu.
Page 12-2 PHABRIX QxUser Manual

Interpacket Timing in IP 2022-6 ModeIn IP 2022-6 mode, you can select a single video flow. The interpacket timing window displays thearrival time of packets, sampled over one second, where a packet contains video, audio and ancillarydata.
Figure 12-1: IP Receive - Interpacket Timing Instrument
IP 2022-6 Instrument Menu Options
The menu options available in IP 2022-6 mode are as follows:
Table 12-1 : IP Receive - Interpacket Timing Menu Options (IP 2022-6 Mode)
Item Options Description
Flow VID: [SFP A] This is the only flow that can be selected in IP 2022-6mode.
Y-Axis Scale Log10 (Default)Linear
Select whether to plot the number of received packetson the vertical (Y) axis using either a logarithmic or linearscale.
Scaling Auto (Default)Manual
Select how to control the histogram plot scaling. Whenusing the zoom features, the Scaling setting will default toManual mode. When Manual scaling is selected, you canreset by clicking the Reset Scale option, which becomesavailable.
PHABRIX QxUser Manual Page 12-3

Interpacket Timing in IP 2110 ModeIn IP 2110 mode, one video flow, two audio flows, and a single ancillary flow are available for selection.
The Interpacket Arrival Time windows can be set to display the interpacket timing histograms of theflows on either SFP A, SFP B or SFP A + B with the two sets of histograms overlaid on top of each other.The following screen shows the interpacket timing for the flows on SFP B.
Figure 12-2: IP Receive - Interpacket Timing in IP ST 2110 Mode
When SFP A and B histograms are displayed together, as shown in the following screen, the Qx usesSMPTE ST 2022-7 Seamless IP Protection Switching (SIPS) to reconstruct error free Video, Audio andANC from the flows on both SFP A and SFP B.
l SFP A histograms are colored pink
l SFP B histograms are colored blue
l SFP A + B overlaid histograms are colored purple where they overlap.
Page 12-4 PHABRIX QxUser Manual
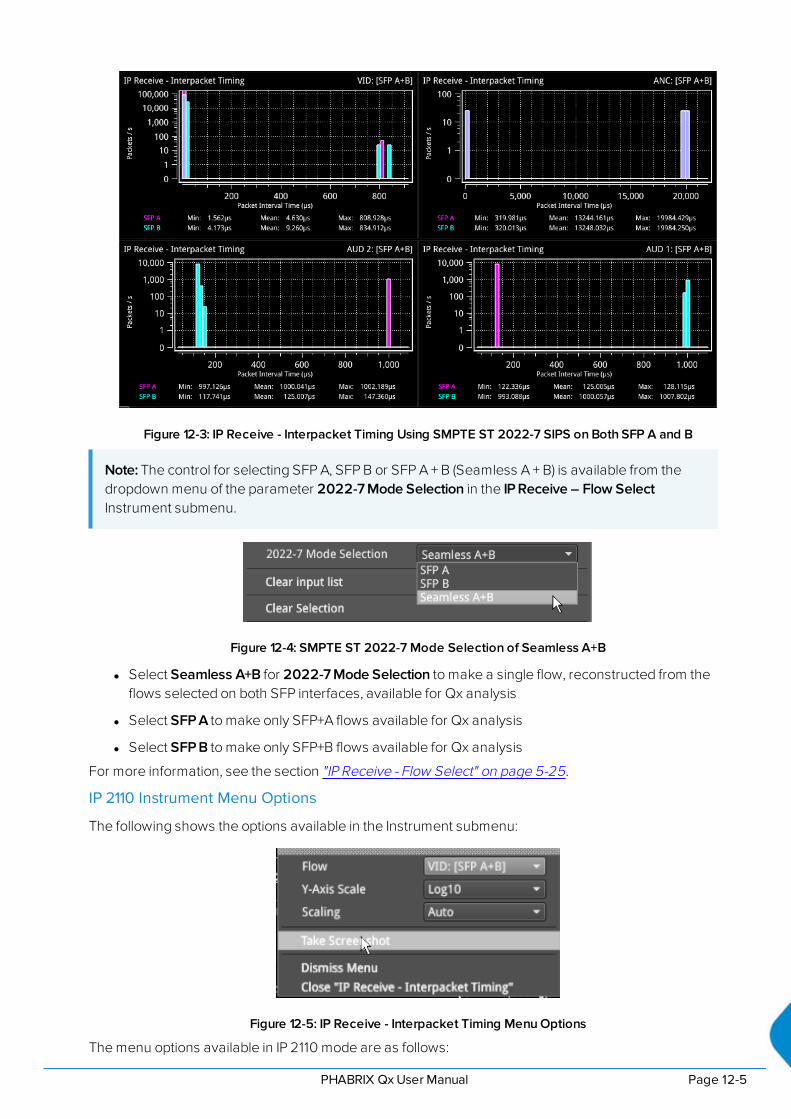
Figure 12-3: IP Receive - Interpacket Timing Using SMPTE ST 2022-7 SIPS on Both SFP A and B
Note: The control for selecting SFP A, SFP B or SFP A + B (Seamless A + B) is available from thedropdown menu of the parameter 2022-7 Mode Selection in the IP Receive – Flow SelectInstrument submenu.
Figure 12-4: SMPTE ST 2022-7 Mode Selection of Seamless A+B
l Select Seamless A+B for 2022-7 Mode Selection to make a single flow, reconstructed from theflows selected on both SFP interfaces, available for Qx analysis
l Select SFP A to make only SFP+A flows available for Qx analysis
l Select SFP B to make only SFP+B flows available for Qx analysis
For more information, see the section "IP Receive - Flow Select" on page 5-25.
IP 2110 Instrument Menu Options
The following shows the options available in the Instrument submenu:
Figure 12-5: IP Receive - Interpacket Timing Menu Options
The menu options available in IP 2110 mode are as follows:
PHABRIX QxUser Manual Page 12-5
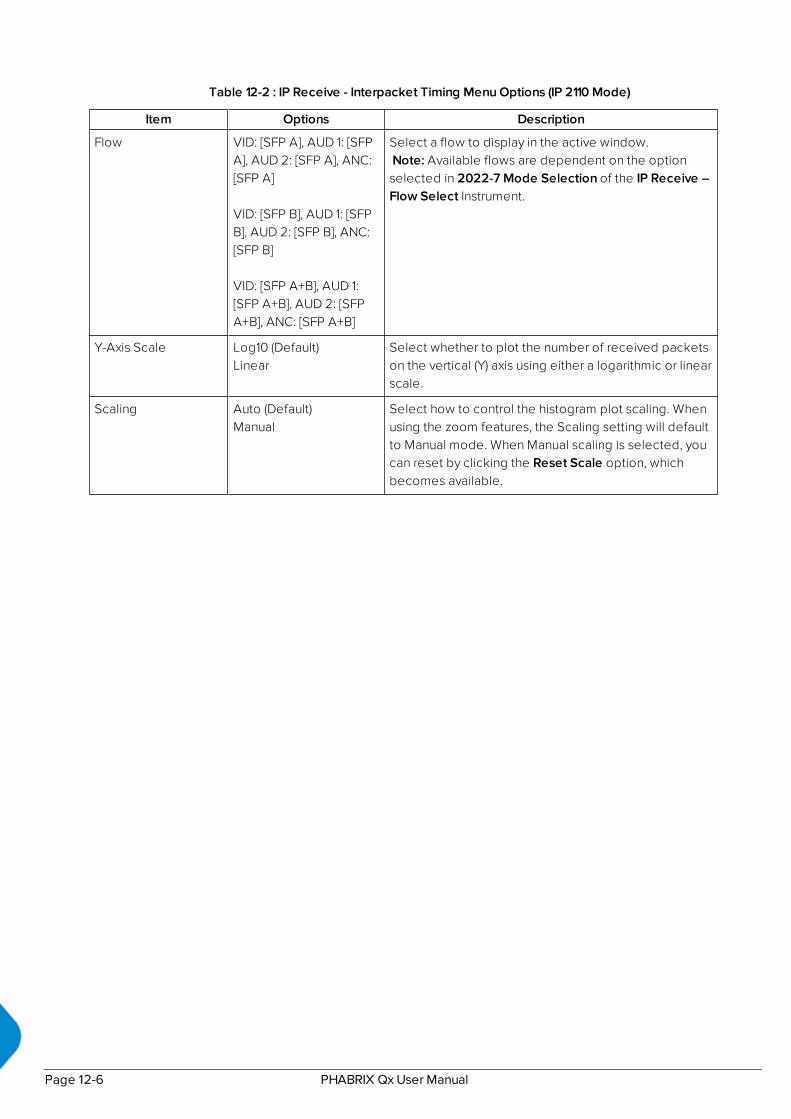
Table 12-2 : IP Receive - Interpacket Timing Menu Options (IP 2110 Mode)
Item Options Description
Flow VID: [SFP A], AUD 1: [SFPA], AUD 2: [SFP A], ANC:[SFP A]
VID: [SFP B], AUD 1: [SFPB], AUD 2: [SFP B], ANC:[SFP B]
VID: [SFP A+B], AUD 1:[SFP A+B], AUD 2: [SFPA+B], ANC: [SFP A+B]
Select a flow to display in the active window.Note: Available flows are dependent on the optionselected in 2022-7 Mode Selection of the IP Receive –Flow Select Instrument.
Y-Axis Scale Log10 (Default)Linear
Select whether to plot the number of received packetson the vertical (Y) axis using either a logarithmic or linearscale.
Scaling Auto (Default)Manual
Select how to control the histogram plot scaling. Whenusing the zoom features, the Scaling setting will defaultto Manual mode. When Manual scaling is selected, youcan reset by clicking the Reset Scale option, whichbecomes available.
Page 12-6 PHABRIX QxUser Manual

Analyzer - 2110-21 Status(IP ST 2110 Mode)
Requires Qx Option(s): PHQXO-IP-STND and PHQXO-IP-MEAS
OverviewThe 2110-21 Status Instrument performs real-time measurements of the parameters constituting theTransmission Traffic Shaping Leaky Bucket Models as defined in SMPTE ST 2110-21:2017. Thestandard describes the following two models:
l Network Compatibility Model (CMax)
l Virtual Receiver Buffer Model (VRXFull)
Use these measurements to determine whether a sender or transmitter meets the requirements to bedefined as one of the following types:
l Narrow: Type N (gapped)
l Narrow Linear: Type NL
l Wide: Type W
Figure 12-6: Analyzer - 2110-21 Status Instrument
A hardware-based sender will typically be able to establish a carefully controlled read schedule ofpackets with low levels of packet jitter and highly accurate RTP timestamps and would typically,therefore, be classified as a Narrow Sender. A software-based sender, without any hardwareassistance, would typically struggle to achieve the same level of control as a hardware-based deviceand may, consequently, be classified as a Wide Sender.
This is an important parameter for a receiving device, as a device with a small buffer (with low latency)may only be capable of handling flows from a Narrow Sender, and is defined as a Narrow Receiver. Areceiver that can accept flows from both Narrow and Wide Senders will have a larger buffer (withlarger latency) and is defined as a Wide Receiver. The Qx is a Wide Receiver.
PHABRIX QxUser Manual Page 12-7

The compatibility of the Qx is as follows:
Table 12-3 : IP ST 2110-21 Status Compatibility
Sender Receiver Qx Compatible ?
Narrow (Gapped or Linear) Narrow Yes
Wide Yes
Wide Narrow No
Wide Yes
Note: The ST 2110-21 specification is a direct measure of the Sender without any interveningnetwork, which will typically introduces packet jitter. Practical measurements made with a switchor router in circuit may not be a true measure of the source. You can use this measurement,however, to establish whether a source, in conjunction with a real network, requires a Narrow orWide Receiver; a consideration which may be useful in low-latency applications.
The thresholds for the maximum values of CFull and VRXFull for Narrow and Wide Senders varies withvideo format and bit depth. A sender must satisfy both criteria, for example:
Table 12-4 : Narrow and Wide Sender Thresholds for Max CFull and VRXFull by Video Format
V H T Color Bit CMaxN CMaxW VRXFullN VRXFullW
1280 720 50 4:2:2 10 4 16 8 720
1280 720 60 4:2:2 10 4 16 8 720
1920 1080 25 4:2:2 10 4 16 8 720
1920 1080 50 4:2:2 10 4 16 8 720
1920 1080 60 4:2:2 10 5 16 8 726
1920 1080 50 4:2:2 12 5 16 8 726
1920 1080 60 4:2:2 12 5 16 8 726
Note: Minimum reported values represent the value of the gap in a gapped flow as the Qx 2110-21Status measurements are not windowed.
Measurements and Instrument Menu OptionsMeasurement Prechecks
Before starting any measurements ensure that the video format parameters entered in the Analyzer -2110 Format Setup Instrument match the video format of the sender.
Network Compatibility Model Measurement (CINST)
The Analyzer - 2110-21 Status submenu for the CInst parameter contains the following options:
Page 12-8 PHABRIX QxUser Manual

Figure 12-7: Analyzer - 2110-21 Status Menu Options for the CINST Parameter
The CINST measurement represents the instantaneous number of packets in the leaky-bucket buffermodel, averaged over one (1) second.
This measurement is performed with a drain rate (beta) of 1.1, that is, the measurement buffer is beingdrained 1.1 times faster than it is being filled. The residue of packets in the buffer model is, therefore, anindication of the peak rate at which packets were being delivered into the buffer by the sender.
The menu options available for the CINST measurement are as follows:
Table 12-5 : Analyzer - 2110-21 Status - CINST Measurement Options
Item Options Description
Interface SFP ASFP B
Select the target interface for the Analyzer - 2110-21 Instru-ment. When analyzing 2022-7 flows, you switch betweenSFP A and SFP B.
Parameter CINSTVRX
Select the target measurement for the Analyzer - 2110-21Status Instrument.
GraphGrid Enabled (Default)Disabled
When enabled, displays a graphical grid pattern in theinstrument background.
System TR Offset TRO Default (Default)Custom
Defines the timing reference offset (TR Offset) setting.The TR Offset is either a default value based on the cur-rent video standard (TRO Default) or a value defined bythe sender to account for network delay. Select whetherto use the Qx default (TRO Default) as the time at whichthe read schedule begins on each frame, or select Cus-tom to override the default with a manual TR Offset byadjusting the TR Offset sliders described below to setthe granularity in ms, µs and ns. The read schedule mustbe set to match that of a Gapped or Linear source, seethe Gapped Mode option below.
TR Offset Slider Con-trols
ms, μs, ns Adjust the slider controls to compensate for the sourceVideo Timing (TR Offset) to obtain an accurate and con-sistent measurement of CINST.
TR Offset ms 0 to 9 Set the timing reference offset in milliseconds (ms).
TR Offset μs 0 to 999 Set the timing reference offset in microseconds (μs).
TR Offset ns 0 to 999 Set the timing reference offset in nanoseconds (ns).
PHABRIX QxUser Manual Page 12-9

Item Options Description
Gapped Mode EnabledDisabled
For a Gapped source, ensure that you enable the optionGapped Mode.
Scaling factor x1000(Use 1100)
100 to 2000 Use the Scaling factor control to change the drain ratepresented as 1000 x the drain rate. The default setting is1100 (x 1.1). If you reduce the scaling factor to 1000, thenthe drain rate becomes equal to the write rate (x 1.0) andthe value of CINST represents the size of the buffer.
Read Offset From Epoch (Default)Toward Epoch
Enables you to set the custom offset relative to theEpoch time, where the Epoch is 00:00:00 UTC on 01January 1970.
Reset Measurements N/A Use this control to reset the measurement to the start.
Note: It is possible to make this measurement if the underlying media is not locked to PTP,however, the encapsulator of the sender should be locked to PTP for this measurement to bevalid.
Virtual Receiver Buffer Measurement (VRX)
A Video RTP sender is required to ensure that the variation in the interval between packets (theinstantaneous ( or INST) rate) meets the parameters for either a narrow or wide sender. These packetsare written into the leaky-bucket buffer and are then drained at a precise read schedule. The sender isrequired to ensure that the maximum size of the leaky-bucket buffer does not exceed the value ofVRXFull for that format and does not underflow, that is, the minimum value of VRX should not benegative.
The Analyzer - 2110-21 Status submenu for the VRX parameter contains the following options:
Figure 12-8: Analyzer - 2110-21 Status Menu Options for the VRX Parameter
The menu options available for the CINST measurement are as follows:
Table 12-6 : Analyzer - 2110-21 Status - VRX Measurement Options
Item Options Description
Interface SFP ASFP B
Select the target interface for the Analyzer - 2110-21 Instru-ment. When analyzing 2022-7 flows, you switch betweenSFP A and SFP B.
Page 12-10 PHABRIX QxUser Manual

Item Options Description
Parameter CINSTVRX
Select the target measurement for the Analyzer - 2110-21Status Instrument.
GraphGrid Enabled (Default)Disabled
When enabled, displays a graphical grid pattern in theinstrument background.
System TR Offset TRO Default (Default)Custom
Defines the timing reference offset (TR Offset) setting.The TR Offset is either a default value based on the cur-rent video standard (TRO Default) or a value defined bythe sender to account for network delay. Select whetherto use the Qx default (TRO Default) as the time at whichthe read schedule begins on each frame, or select Cus-tom to override the default with a manual TR Offset byadjusting the TR Offset sliders described below to set thegranularity in ms, µs and ns. The read schedule must beset to match that of a Gapped or Linear source, see theGapped Mode option below.
TR Offset Slider Con-trols
ms, μs, ns Adjust the slider controls to compensate for the networkdelay, any PTP phase offset, and if required the sourceVideo Timing (TR Offset), to obtain an accurate and con-sistent measurement.
TR Offset ms 0 to 9 Set the timing reference offset in milliseconds (ms).
TR Offset μs 0 to 999 Set the timing reference offset in microseconds (μs).
TR Offset ns 0 to 999 Set the timing reference offset in nanoseconds (ns).
Gapped Mode EnabledDisabled
For a Gapped source, ensure that you enable the optionGapped Mode.
Read Offset From Epoch (Default)Toward Epoch
The Read Offset is the time at which packets are readfrom the leaky bucket. Enables you to set the custom off-set relative to the Epoch time, where the Epoch is00:00:00 UTC on 01 January 1970.
Read Offset Slider Con-trols
ms, μs, ns Adjust the slider controls to compensate for the networkdelay, any PTP phase offset, and if required the sourceVideo Timing (TR Offset), to obtain an accurate and con-sistent measurement of VRX.
Read Offset ms 0 to 100 Set the timing reference offset in milliseconds (ms).
Read Offset μs 0 to 999 Set the timing reference offset in microseconds (μs).
Read Offset ns 0 to 999 Set the timing reference offset in nanoseconds (ns).
Reset Measurements N/A Use this control to reset the measurement to the start.
You can use the Read Offset control for either of the following tasks:
l To perform a SMPTE ST 2110-21 measurement
l To measure the required Read Offset to ensure that the leaky-bucket does not underflow.
To perform the 2110-21 measurement: set the value of the Read Offset to match the value of thenetwork delay. The 2110-21 Instrument will now report the peak sizes (both positive and negative) ofthe leaky-bucket buffer. A negative minimum value indicates that the buffer has underflowed.
To measure the Read Offset: adjust the Read Offset controls so that the VRXMin value is zero andsimultaneously that the VRXMax value is also minimized. The value of the Read Offset with the
PHABRIX QxUser Manual Page 12-11

minimum value for VRXMax and with VRXMin of zero is an indication of the required read offset toensure that there is no underflow. This measurement will be affected by the network latency; PTPPhase of the sender and the Qx; and the Video Timing (TROffset).
The measurement is sensitive to the time difference between the Write and Read schedules and willvary with the source Video Timing (TROffset). If the Source Video Timing is not equal to TRODefault, then,if required, you can compensate for this by choosing Custom mode and entering the value from theVideo Timing & System Reference Instrument.
Note: For this measurement to be valid, both the underlying media and the source encapsulatormust be locked to PTP.
Page 12-12 PHABRIX QxUser Manual
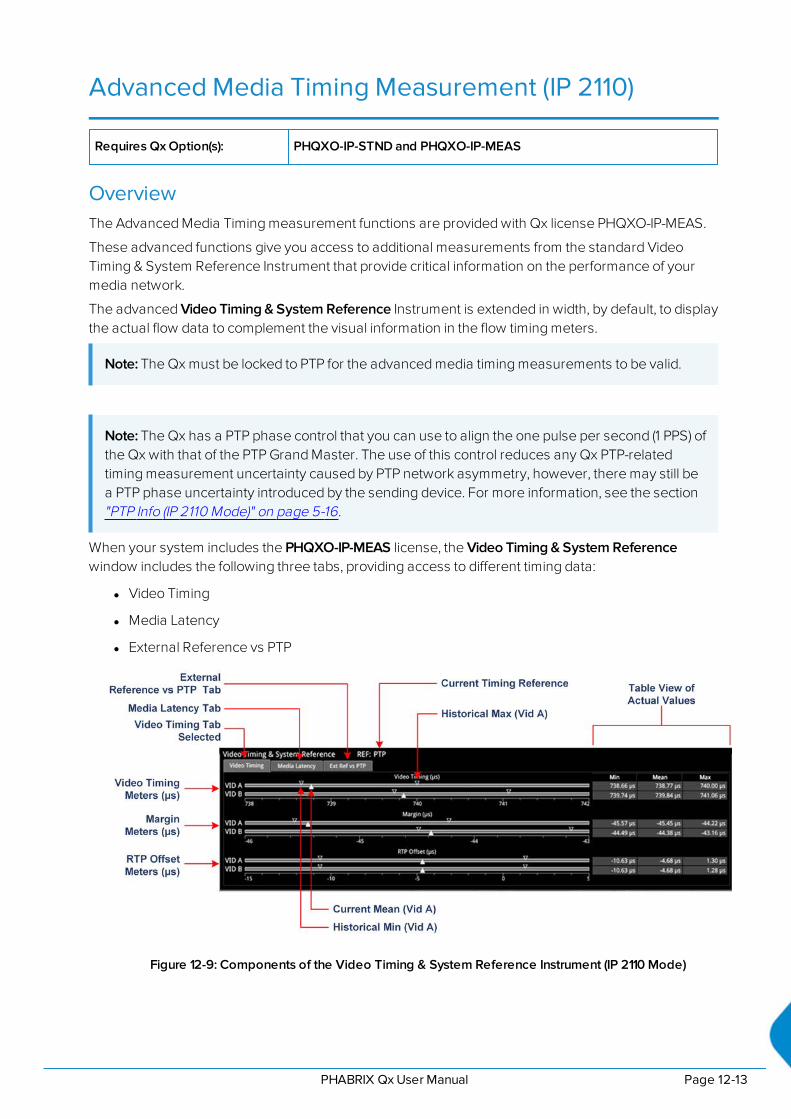
Advanced Media Timing Measurement (IP 2110)
Requires Qx Option(s): PHQXO-IP-STND and PHQXO-IP-MEAS
OverviewThe Advanced Media Timing measurement functions are provided with Qx license PHQXO-IP-MEAS.
These advanced functions give you access to additional measurements from the standard VideoTiming & System Reference Instrument that provide critical information on the performance of yourmedia network.
The advanced Video Timing & System Reference Instrument is extended in width, by default, to displaythe actual flow data to complement the visual information in the flow timing meters.
Note: The Qx must be locked to PTP for the advanced media timing measurements to be valid.
Note: The Qx has a PTP phase control that you can use to align the one pulse per second (1 PPS) ofthe Qx with that of the PTP Grand Master. The use of this control reduces any Qx PTP-relatedtiming measurement uncertainty caused by PTP network asymmetry, however, there may still bea PTP phase uncertainty introduced by the sending device. For more information, see the section"PTP Info (IP 2110 Mode)" on page 5-16.
When your system includes the PHQXO-IP-MEAS license, the Video Timing & System Referencewindow includes the following three tabs, providing access to different timing data:
l Video Timing
l Media Latency
l External Reference vs PTP
Figure 12-9: Components of the Video Timing & System Reference Instrument (IP 2110 Mode)
PHABRIX QxUser Manual Page 12-13

Using the Advanced Video Timing TabIn addition to the mean data values reported in the standard window, this advanced tab also provideslistings of the actual historical minimum and maximum values in the Min and Max columns to the rightof the timing meters.
The advanced Video Timing tab displays the following measurements:
l Video Timing ( μs )
l Margin ( μs )
l RTP Offset ( μs )
Detailed information about these measurements is provided in the Appendix "Advanced Media TimingMeasurements" on page B-2.
Using the Advanced Media Latency TabThe advanced Media Latency tab provides additional media latency measurements to those in thestandard instrument.
Figure 12-10: Media Latency Tab of the Video Timing & System Reference Instrument (IP 2110 Mode)
The Qx displays the media latency data in the following columns for each flow:
l Min: Minimum historical flow latency (since last reset)
l Mean: Mean current flow latency (since last reset)
l Max: Maximum historical flow latency (since last reset)
l From Vid: Displays the difference in latency for the audio (A AUD 1 and A AUD 2) and ancillary (AANC) flows from their related video (A VID) flow. If the flow arrives earlier than its related videoflow, the value is negative and if it arrives later, the value is positive.
l RTP clks: Actual value of the RTP Clock, averaged over one second. For more information, seethe section "Advanced Media Timing Measurement (IP 2110)" on the previous page
l TSs: Number of timestamps received over one second. For more information, see the section"RTP Clock and Timestamps" on page 1
l RTP clks/TS: Quotient of RTP clks and TS provides a measure of the number of RTP Clocks perTimestamp For more information, see the section "RTP Clocks per Timestamp Quotient (RTP /TS)" on page B-10.
Detailed information about the Media Latency measurement is provided in the Appendix "AdvancedMedia Timing Measurements" on page B-2.
Page 12-14 PHABRIX QxUser Manual
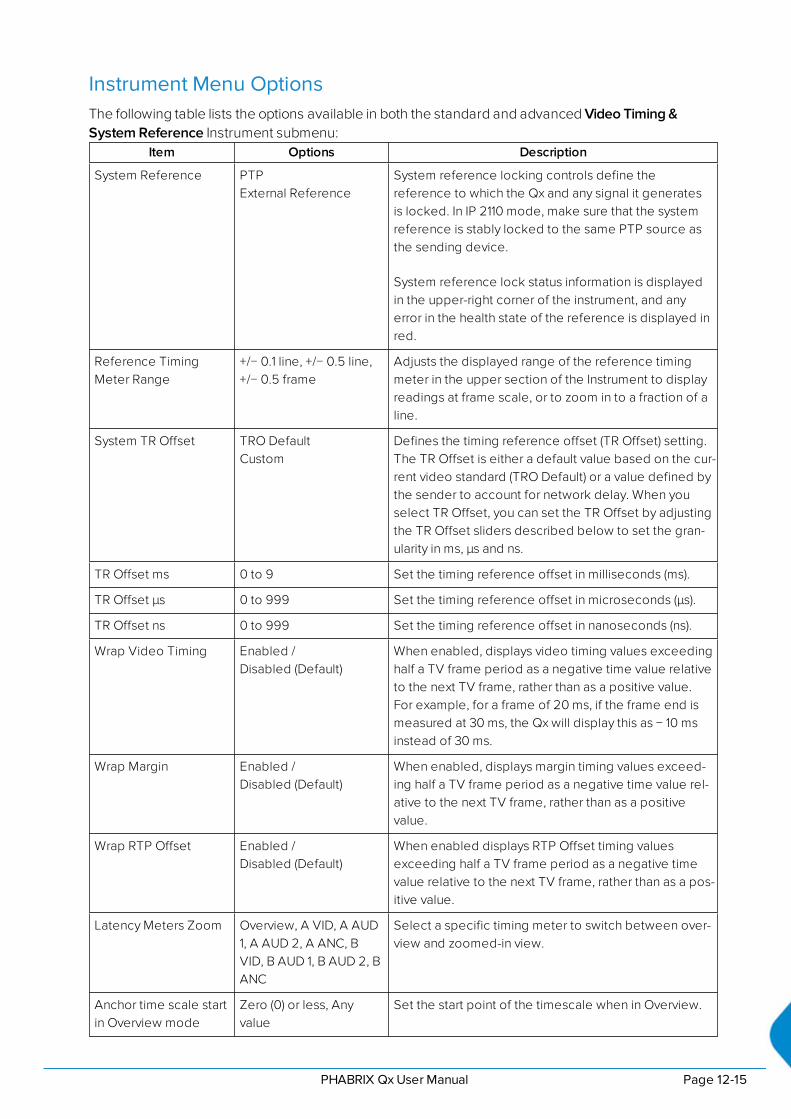
Instrument Menu OptionsThe following table lists the options available in both the standard and advanced Video Timing &System Reference Instrument submenu:
Item Options Description
System Reference PTPExternal Reference
System reference locking controls define thereference to which the Qx and any signal it generatesis locked. In IP 2110 mode, make sure that the systemreference is stably locked to the same PTP source asthe sending device.
System reference lock status information is displayedin the upper-right corner of the instrument, and anyerror in the health state of the reference is displayed inred.
Reference TimingMeter Range
+/− 0.1 line, +/− 0.5 line,+/− 0.5 frame
Adjusts the displayed range of the reference timingmeter in the upper section of the Instrument to displayreadings at frame scale, or to zoom in to a fraction of aline.
System TR Offset TRO DefaultCustom
Defines the timing reference offset (TR Offset) setting.The TR Offset is either a default value based on the cur-rent video standard (TRO Default) or a value defined bythe sender to account for network delay. When youselect TR Offset, you can set the TR Offset by adjustingthe TR Offset sliders described below to set the gran-ularity in ms, µs and ns.
TR Offset ms 0 to 9 Set the timing reference offset in milliseconds (ms).
TR Offset μs 0 to 999 Set the timing reference offset in microseconds (μs).
TR Offset ns 0 to 999 Set the timing reference offset in nanoseconds (ns).
Wrap Video Timing Enabled /Disabled (Default)
When enabled, displays video timing values exceedinghalf a TV frame period as a negative time value relativeto the next TV frame, rather than as a positive value.For example, for a frame of 20 ms, if the frame end ismeasured at 30 ms, the Qx will display this as − 10 msinstead of 30 ms.
Wrap Margin Enabled /Disabled (Default)
When enabled, displays margin timing values exceed-ing half a TV frame period as a negative time value rel-ative to the next TV frame, rather than as a positivevalue.
Wrap RTP Offset Enabled /Disabled (Default)
When enabled displays RTP Offset timing valuesexceeding half a TV frame period as a negative timevalue relative to the next TV frame, rather than as a pos-itive value.
Latency Meters Zoom Overview, A VID, A AUD1, A AUD 2, A ANC, BVID, B AUD 1, B AUD 2, BANC
Select a specific timing meter to switch between over-view and zoomed-in view.
Anchor time scale startin Overview mode
Zero (0) or less, Anyvalue
Set the start point of the timescale when in Overview.
PHABRIX QxUser Manual Page 12-15

Item Options Description
Clear Min, Max values N/A Set the historical minimum and maximum values backto zero.
Page 12-16 PHABRIX QxUser Manual

1312G Physical Layer Analysis
Note: Requires the PHQXM--01E Mezzanine Hardware option.
This chapter describes the Instruments available with the 12G-SDI Physical Layer Analysis Toolsetoption and includes the following sections:
l Eye - SDI In A
l Jitter - SDI In A
PHABRIX QxUser Manual Page 13-1

Eye - SDI In A(Physical Layer Analysis Mode)
Requires Qx Option(s): PHQX01E-12G and PHQXO-GEN
OverviewThe optional instrument Eye - SDI in A, available in the Qx Physical Layer Analysis toolset, enables youto analyze physical layer compliance measurements at up to 12 Gbps. An analog front-end provides abandwidth of more than 30 GHz (5th harmonic of the 6 GHz fundamental for 12G-SDI.) The GUI usesPHABRIX RealTime Eye (RTE™) to generate a reliable, AC coupled, instantaneous physical layer displaywith automatic measurements to SMPTE standards.
You can receive accurate measurements within seconds of connecting an SDI signal. The Qx enablesyou to measure both rise and fall overshoot at the top and bottom of the waveform. In addition, the Qxdisplays amplitude, rise and fall overshoot delta and DC offset - all compulsory measurements whentesting against SMPTE standards. The Qx highlights any measurements exceeding the specification(for example, an eye amplitude greater than 10 %) in red.
Figure 13-1: Standard SDI Eye Pattern Display (3G) with 100 kHz Jitter Filter
Page 13-2 PHABRIX QxUser Manual

Figure 13-2: 3G-SDI Eye Pattern Set to Display 12 Eyes (Using Green Display Color)
Note: A red or black nut fitted to the SDI In A BNC identifies the connector with access to the eyeand jitter circuitry.
Note: The use of SFP inputs with Eye - SDI In A is not supported.
The Eye - SDI In A instrument display also provides:
l Timing jitter thermometer color-coded according to the analyzed SDI standard
l Alignment jitter thermometer color-coded according to the analyzed SDI standard
l Positive and negative Eye amplitude values
l On screen indication of 20 % and 80 % levels for rise and fall time measurement
l Horizontal time histogram of eye crossing point (0 mV threshold)
l Vertical amplitude histogram indicating energy distribution across all samples
l Eye coupled to AC with display of DC offset measurement.
Instrument Menu OptionsThe Physical Layer Analysis toolset provides the following options in the right-click submenu.
Figure 13-3: Eye - SDI In A Menu Options
PHABRIX QxUser Manual Page 13-3

Table 13-1 : Menu Options for the Eye - SDI In A Instrument (SDI Stress Mode)
Item Options Description
Standard Physical Layer Analysis Tools
Eyes 1 to 20(Default = 2)
Sets the default number of eyes displayed in the Instru-ment window.
Color GreenHeatRedFerraraGreen-redBlacklight
Sets the color scheme for the eye display.
Eye and Jitter Filter 10 Hz100 Hz1 kHz10 kHz100 kHz
Sets the frequency of the default jitter filter.Note: This setting controls the filter applied both to theEye - SDI In A instrument andthe Jitter - SDI A instrument.
Infinite Mode Disabled (Default)Enabled
When disabled, eye data points are displayed for a fixedpersistence interval and then removed from the display.When enabled, infinite mode ensures that no datapoints are removed from the eye display over time, soyou will probably observe the eye shape thickening andbecoming less distinct. This can be useful when attempt-ing to identify anomalies in the signal which appearsporadically over time and might be missed in the stand-ard mode.
Show Rise/Fall Cross Disabled (Default)Enabled
Toggle the display of the rise/fall crossing point, whichgives a visual indication of the rise and fall time meas-urements.
Show eye for unsup-ported rates
Disabled (Default)Enabled
Toggle the display of eyes for rates currently unsup-ported by the Qx.
A table showing the SMPTE tolerances for each standard is provided in the section "SMPTE UHDTV:SDI Physical Layer Tolerances" on page C-1.)
Page 13-4 PHABRIX QxUser Manual

Jitter - SDI In A(Physical Layer Analysis Mode)
Requires Qx Option(s): PHQX01E-12G and PHQXO-GEN
OverviewThe Jitter toolset is available on the SDI In A BNC - the rear panel connector fitted with the red or blacknut.
Figure 13-4: Jitter SDI In A Instrument
The Jitter instrument displays automated measurements to SMPTE standards. A Jitter histogram,displayed at the right of the window in yellow, provides additional information about the jitterwaveform.
Readings for each of the filters are displayed as an overlay in the top-right corner of the instrumentwindow. Any values displayed in red text indicate a reading outside the current specification.
Instrument Menu OptionsAs with the Eye instrument, you can display the following submenu options by right-clicking in theinstrument window:
l Scale > [Adjust the scale of the Y-axis in graticule adjustments from 1 UI to 128 UI]
l Trigger > [None, Single Line, Two Lines, Single Field, Frame]
l Eye and jitter filter > [10 Hz, 100 Hz, 1 kHz, 10 kHz, 100 kHz]
Note: This setting controls the filter applied to both the Jitter - SDI A instrument and the Eye - SDI InA instrument. If you hover over the HPF field in the top-left of the screen, a tooltip displays thefrequency response of the current high-pass filter.
l Infinite Mode > [Enabled, Disabled]
l Jitter Color > Waveform color selection
PHABRIX QxUser Manual Page 13-5

Color selection is by way of an HSV tool providing two cursors. The left-hand color rectangle allowsselection of hue (horizontal) and saturation (vertical). The right-hand vertical bar selects color lightness.
l Show jitter for unsupported rates > [Enabled, Disabled]
Trigger modes are useful for correlating jitter content to line and frame-rate frequencies.
Figure 13-5: Jitter SDI In A Menu Options
The Jitter and Eye analysis instruments, used in conjunction with the Jitter Insertion Mode feature ofGenerator – Video Standard - available in SDI Stress Toolset mode [PHQXO-SDI-STRESS], provide anend-to-end jitter generation and analysis toolset.
Note: The use of SFP inputs with the Jitter - SDI In A toolset is not supported.
Page 13-6 PHABRIX QxUser Manual

14Stress-testing Analysis Instruments
Note: Requires the PHQXO-SDI-STRESS License.
The Stress-testing analysis Instruments provide additional SDI stress-testing functions andcomplement the Physical Layer Analysis Instruments described in the previous chapter.
This chapter describes the advanced stress testing Instruments available with the SDI-Stress Toolsetoption and includes the following sections:
l Advanced Generation Tools
l Eye - SDI In A
l PRBS Analysis
PHABRIX QxUser Manual Page 14-1

Advanced Generation Tools(SDI Stress Mode)
Requires Qx Option(s): PHQXO-GEN, PHQX01E-12G and PHQXO-SDI-STRESS
OverviewAs part of the Advanced SDI Stress Toolset [PHQXO-SDI-STRESS], advanced generation tools areprovided in the Generate - Video instrument submenu, in SDI Stress Toolset Mode. The toolsetprovides the following:
l Control over SDI scrambler switch-off
l Sync bit insertion
l A PRBS (pseudo-random binary sequence) mode for end-to-end bit error rate testing (BERT)
l Advanced jitter generation controls – facilitating the generation and bespoke adjustment of jittermeasurement parameters
l Slew rate adjustment
l SDI output gain control
l Driver pre-emphasis
l Cable compensation.
These tools support a wide range of advanced testing and troubleshooting.
SDI ScramblerThe selected video standard data stream can be made to bypass the SMPTE scrambler, just prior tothe output stage. To bypass the scrambler, disable it by selecting:
l Advanced Generation Tools (BNC) > SDI Scrambler > [Enabled, Disabled]
Note: For the generation of conventional video, the default state for the SDI Scrambler is Enabled.
Sync Bit Insertion (6G / 12G)Sync bit insertion prevents the occurrence of a pathological condition that results in the removal ofsync bits, also referred to as potholing. Before the output, a sync bit is applied to the Timing ReferenceSignal (TRS) and Ancillary Data Flag (ADF) words of the generated video standard. Sync Bit Insertioncan be enabled and disabled in the submenu:
l Advanced Generation Tools (BNC) > Sync Bit Insertion > [Enabled, Disabled]
Note: This feature applies only to 6G-SDI and 12G-SDI video standards.
Note: The insertion of the sync bit is observable in the video signal TRS and ADF words seen inAnalyzer - Dataview when the option Sync Bit Removal is disabled.
Page 14-2 PHABRIX QxUser Manual

PRBS ModeIn addition to SDI test signal generation, for the stress testing of SDI infrastructure the Qx offers end-to-end BERT capability, with the addition of PRBS generation and analysis tools.
A variety of PRBS signals can be generated:
l Advanced Generation Tools (BNC) > PRBS Mode > [Disabled, PRBS-7, PRBS-9, PRBS-15, PRBS-23, PRBS-31]
Once selected, a PRBS signal can be inverted. Errors can also be inserted into the stream:
l Advanced Generation Tools (BNC) > PRBS Mode > PRBS Signal Inversion > [Enabled, Disabled]
l Advanced Generation Tools (BNC) > PRBS Mode > PRBS Error Insertion > [Enabled, Disabled]
Note: Both the Generator - Video Standard pane and the Generator – Status instrument indicatewhen a PRBS signal is being generated.
Note: PRBS signal analysis is available in the PRBS – Analysis instrument window.
Jitter InsertionIn order to stress the interface and ensure that receivers comply with SMPTE recommended practiceyou can insert Jitter into any generated SDI signal. You can insert sinusoidal jitter with a frequencyranging from 10 Hz to 10 MHz and adjust the peak-to-peak jitter amplitude.
Enable jitter insertion:
l Advanced Generation Tools (BNC) > Jitter Insertion Mode > [Disabled, Sine]
Enabling jitter insertion reveals a setting for specifying the frequency of the jitter wave:
l Advanced Generation Tools (BNC) > Jitter Insertion Mode > Frequency > [1.0 Hz to 10.0 MHz]
Note: For precision setting adjustment and frequencies below 10 Hz use the up/down arrowbuttons or input values via a USB keyboard.
Peak-to-peak jitter amplitude can be adjusted, with jitter amplitude measured in terms of signal EyeUnit Interval (UI):
l Advanced Generation Tools (BNC) > Jitter Insertion Mode > Amplitude P-P > [slider, 0.01 to127.99 UI, dependent on frequency]
Warning: In this software release, SDI outputs B, C and D may be corrupted when jitter is inserted.
Note: Jitter can be observed in the Eye – SDI In A and Jitter – SDI In A instrument windows. Foranalysis, apply filters and other settings in the Eye and Jitter instruments as required. For moreinformation on Eye and Jitter analysis, see the sections:"Eye - SDI In A (Physical Layer Analysis Mode)" on page 13-2 and "Jitter - SDI In A (Physical LayerAnalysis Mode)" on page 13-5.
PHABRIX QxUser Manual Page 14-3
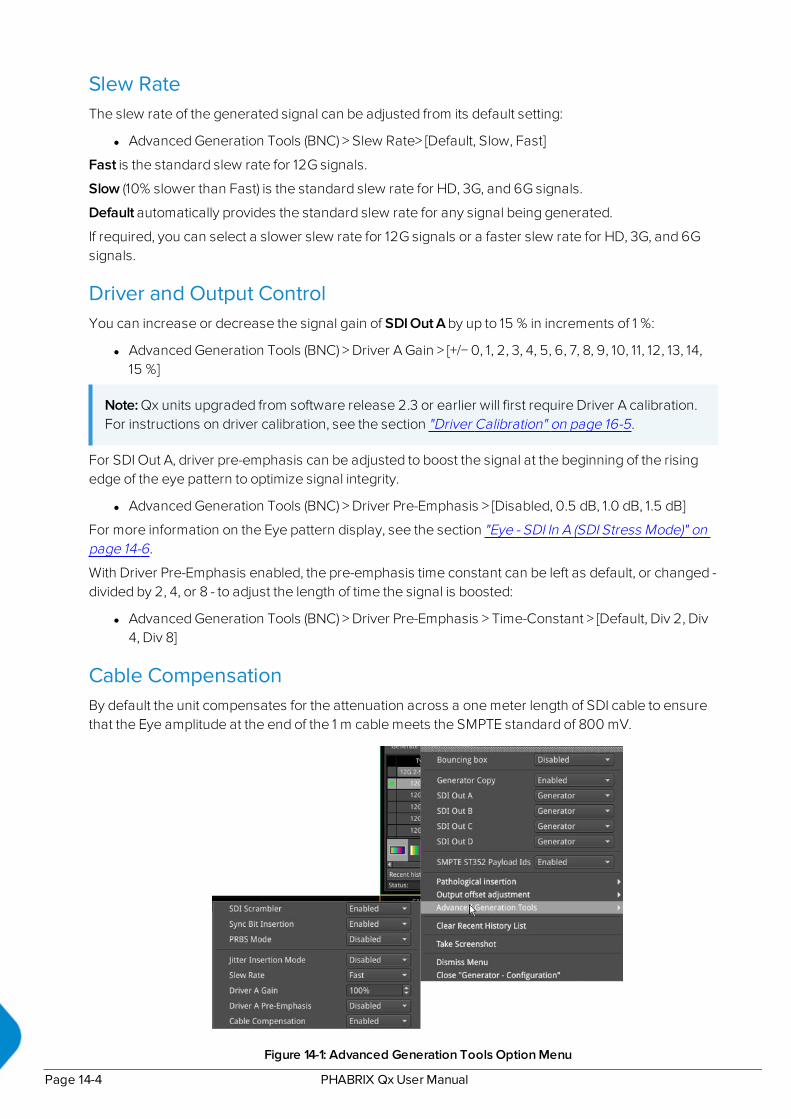
Slew RateThe slew rate of the generated signal can be adjusted from its default setting:
l Advanced Generation Tools (BNC) > Slew Rate> [Default, Slow, Fast]
Fast is the standard slew rate for 12G signals.
Slow (10% slower than Fast) is the standard slew rate for HD, 3G, and 6G signals.
Default automatically provides the standard slew rate for any signal being generated.
If required, you can select a slower slew rate for 12G signals or a faster slew rate for HD, 3G, and 6Gsignals.
Driver and Output ControlYou can increase or decrease the signal gain of SDI Out A by up to 15 % in increments of 1 %:
l Advanced Generation Tools (BNC) > Driver A Gain > [+/− 0, 1, 2, 3, 4, 5, 6, 7, 8, 9, 10, 11, 12, 13, 14,15 %]
Note: Qx units upgraded from software release 2.3 or earlier will first require Driver A calibration.For instructions on driver calibration, see the section "Driver Calibration" on page 16-5.
For SDI Out A, driver pre-emphasis can be adjusted to boost the signal at the beginning of the risingedge of the eye pattern to optimize signal integrity.
l Advanced Generation Tools (BNC) > Driver Pre-Emphasis > [Disabled, 0.5 dB, 1.0 dB, 1.5 dB]
For more information on the Eye pattern display, see the section "Eye - SDI In A (SDI Stress Mode)" onpage 14-6.
With Driver Pre-Emphasis enabled, the pre-emphasis time constant can be left as default, or changed -divided by 2, 4, or 8 - to adjust the length of time the signal is boosted:
l Advanced Generation Tools (BNC) > Driver Pre-Emphasis > Time-Constant > [Default, Div 2, Div4, Div 8]
Cable CompensationBy default the unit compensates for the attenuation across a one meter length of SDI cable to ensurethat the Eye amplitude at the end of the 1 m cable meets the SMPTE standard of 800 mV.
Figure 14-1: Advanced Generation Tools Option Menu
Page 14-4 PHABRIX QxUser Manual

You can use the Cable Compensation option to disable this default attenuation compensation ifrequired, as follows:
l Advanced Generation Tools (BNC) > Cable Compensation > [Enabled (Default), Disabled].
PHABRIX QxUser Manual Page 14-5

Eye - SDI In A(SDI Stress Mode)
Requires Qx Option(s): PHQX01E-12G, PHQXO-GEN and PHQXO-SDI-STRESS
OverviewThe optional instrument Eye - SDI in A, available in the Qx Stress Testing Analysis toolset, providesadditional tools for stress testing and R&D evaluations of your SDI interfaces at up to 12 Gbps. Ananalog front-end supplies a bandwidth of more than 30 GHz (5th harmonic of the 6 GHz fundamentalfor 12G-SDI.) The GUI uses PHABRIX RealTime Eye (RTE™) to generate a reliable, AC-coupled,instantaneous physical layer display with automatic measurements to SMPTE standards.
You can receive accurate measurements within seconds of connecting an SDI signal. The Qx enablesyou to measure both rise and fall overshoot at the top and bottom of the waveform. In addition, the Qxdisplays amplitude, rise and fall overshoot delta and DC offset - all compulsory measurements whentesting against SMPTE standards. The Qx highlights any measurements exceeding the specification(for example, an eye amplitude greater than 10 %) in red.
Figure 14-2: 12G-SDI Eye Pattern Display with 100 kHz Jitter Filter
Use the eye amplitude histogram, showing the distribution of samples over the complete visible eyewaveform, to calculate the automatic eye amplitude measurement. The default analysis method isMode.
Page 14-6 PHABRIX QxUser Manual
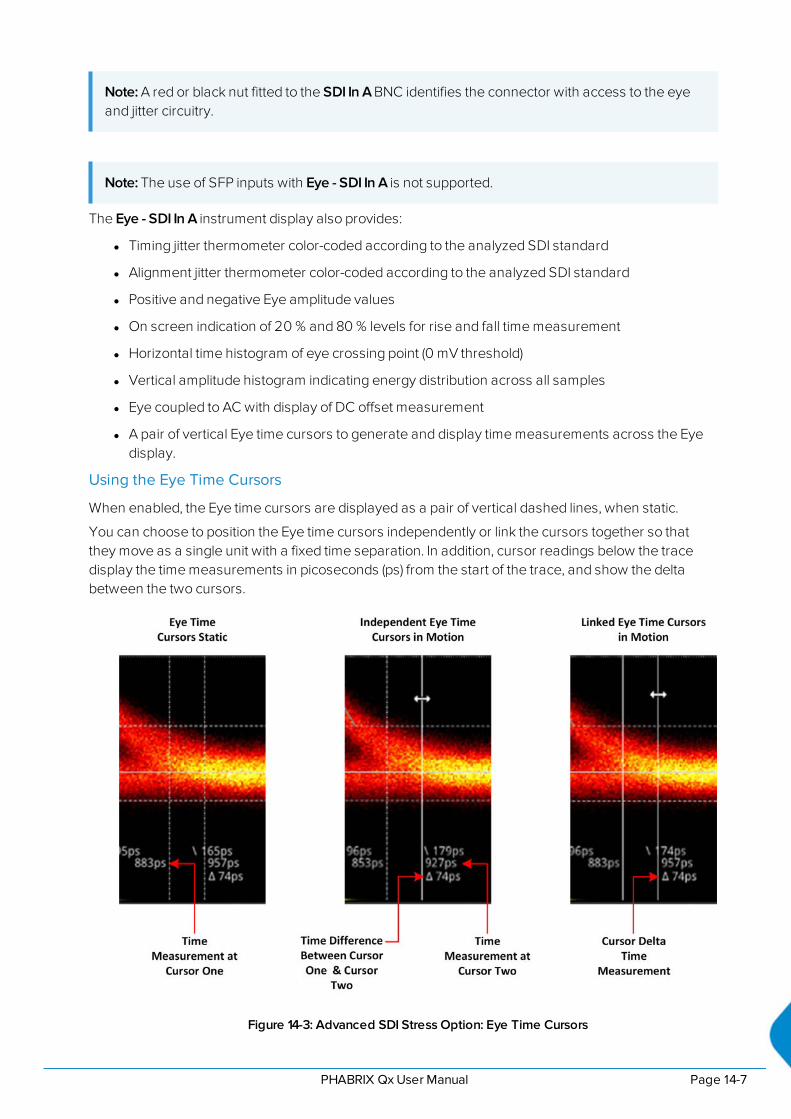
Note: A red or black nut fitted to the SDI In A BNC identifies the connector with access to the eyeand jitter circuitry.
Note: The use of SFP inputs with Eye - SDI In A is not supported.
The Eye - SDI In A instrument display also provides:
l Timing jitter thermometer color-coded according to the analyzed SDI standard
l Alignment jitter thermometer color-coded according to the analyzed SDI standard
l Positive and negative Eye amplitude values
l On screen indication of 20 % and 80 % levels for rise and fall time measurement
l Horizontal time histogram of eye crossing point (0 mV threshold)
l Vertical amplitude histogram indicating energy distribution across all samples
l Eye coupled to AC with display of DC offset measurement
l A pair of vertical Eye time cursors to generate and display time measurements across the Eyedisplay.
Using the Eye Time Cursors
When enabled, the Eye time cursors are displayed as a pair of vertical dashed lines, when static.
You can choose to position the Eye time cursors independently or link the cursors together so thatthey move as a single unit with a fixed time separation. In addition, cursor readings below the tracedisplay the time measurements in picoseconds (ps) from the start of the trace, and show the deltabetween the two cursors.
Figure 14-3: Advanced SDI Stress Option: Eye Time Cursors
PHABRIX QxUser Manual Page 14-7
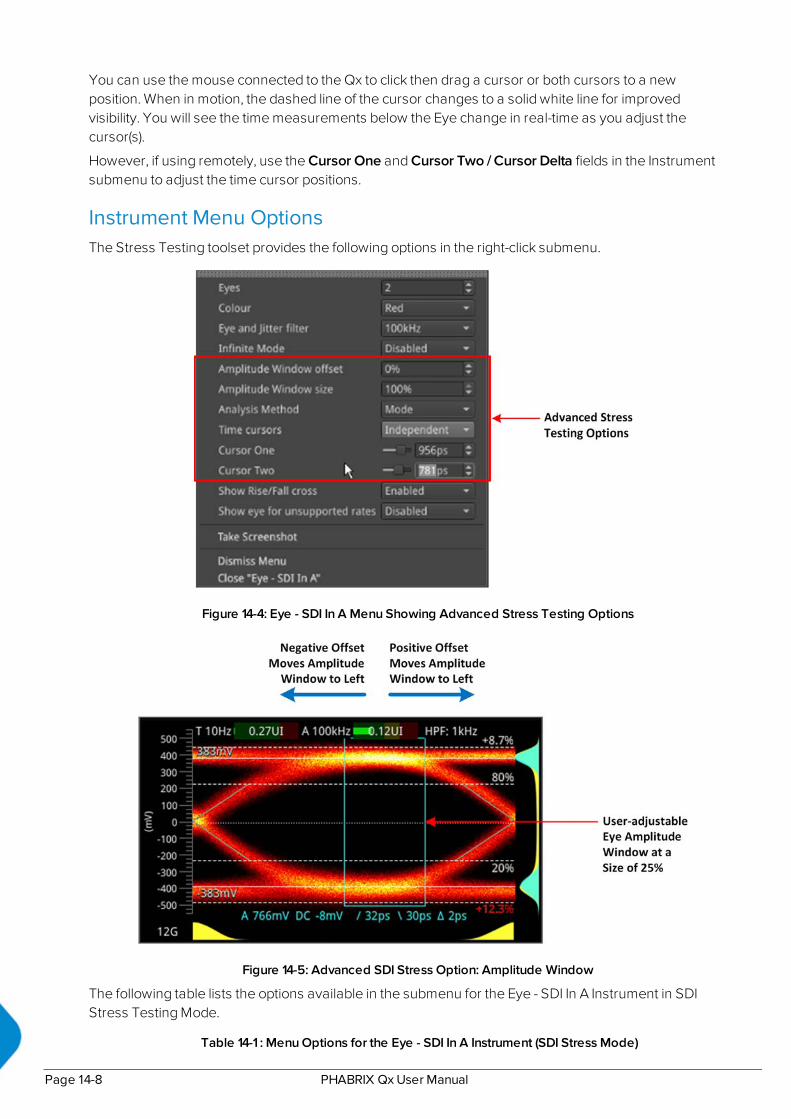
You can use the mouse connected to the Qx to click then drag a cursor or both cursors to a newposition. When in motion, the dashed line of the cursor changes to a solid white line for improvedvisibility. You will see the time measurements below the Eye change in real-time as you adjust thecursor(s).
However, if using remotely, use the Cursor One and Cursor Two / Cursor Delta fields in the Instrumentsubmenu to adjust the time cursor positions.
Instrument Menu OptionsThe Stress Testing toolset provides the following options in the right-click submenu.
Figure 14-4: Eye - SDI In A Menu Showing Advanced Stress Testing Options
Figure 14-5: Advanced SDI Stress Option: Amplitude Window
The following table lists the options available in the submenu for the Eye - SDI In A Instrument in SDIStress Testing Mode.
Table 14-1 : Menu Options for the Eye - SDI In A Instrument (SDI Stress Mode)
Page 14-8 PHABRIX QxUser Manual

Item Options Description
Standard Physical Layer Analysis Tools
Eyes 1 to 20(Default = 2)
Sets the default number of eyes displayed in the Instru-ment window.
Color GreenHeatRedFerraraGreen-redBlacklight
Sets the color scheme for the eye display.
Eye and Jitter Filter 10 Hz100 Hz1 kHz10 kHz100 kHz
Sets the frequency of the default jitter filter.Note: This setting controls the filter applied both tothe Eye - SDI In A instrument andthe Jitter - SDI A instrument.
Infinite Mode Disabled (Default)Enabled
When disabled, eye data points aredisplayed for afixed persistence interval and then removed from thedisplay.When enabled, infinite mode ensures that no datapoints are removed from the eye display over time, soyou will probably observwe the eye shape thickeningand becoming less distinct. This can be useful whenattempting to identify anomalies in the signal whichappear sporadically over time and might be missed inthe standard mode.
Show Rise/Fall Cross Disabled (Default)Enabled
Toggle the display of the rise/fall crossing point, whichgives a visual indication of the rise and fall time meas-urements.
Show eye for unsup-ported rates
Disabled (Default)Enabled
Toggle the display of eyes for rates currently unsup-ported by the Qx.
Stress Option: Amplitude Window
Amplitude Window The Amplitude Window, available in the Advanced SDI Stress Testing toolset, isan additional tool for more detailed analysis and measurement of the eye amp-litude.
Amplitude Window off-set
−49 to 50%0% Default
Only active when the amplitude window size is set toany value between 0 and 99%. Use the offset to movetheAmplitude window to an optimum position on theeye for your measurement. A negative offset movesthe window to the left and a positive offset, to theright.
Amplitude Windowsize
1 to 100%100% (Default)
The amplitude window is defined by the enclosedarea containing the eye data points used for eye amp-litude measurements. All samples in the window areaare used in the amplitude histogram measurement.You can use this option to define a window to focuson a specific part of the eye on which to take the amp-litude measurements. When the size is set to thedefault 100%, the amplitude window is the entire act-ive window of the Instrument.The size percentage relates to the percentage width
PHABRIX QxUser Manual Page 14-9

Item Options Description
of a single eye, so when set to 50% the Amplitude win-dow covers 50% of an eye width and so on.
Stress Option: Analysis Method
Analysis Method Mode (Default)Shorth Mean
Switches the statistical analysis method used for theeye amplitude data. Select between either standardMode analysis or Shorth Mean analysis.
Stress Option: Eye Time Cursors
Time Cursors IndependentLinkedDisabled (Default)
When selected, the Independent option allows you tomove the two cursors independently of each other.When selected, the Linked option allows you to moveboth cursors together, separated by a fixed time delta.You can increase or decrease the separation byadjusting the Cursor Delta setting (see below).
Cursor One Slider and incrementalcombo box
Use the slider or combo box to move the left-handcursor (when set to Independent) or both cursors(when set to Linked) across the Eye display. Increasethe time (in ps) to move to the right or decrease tomove to the left. When set to Independent, you willsee the delta measurement between the two cursorsincrease or decrease.The left hand y-axis is equivalent to 0 ps.
Cursor Two (Independ-ent Cursors)
Slider and incrementalcombo box
Use the slider or combo box to move the right-handcursor across the Eye display. Increase the time (inps) to move to the right or decrease to move to theleft. You will see the delta measurement between thetwo cursors increase or decrease.The left hand y-axis is equivalent to 0 ps.
Cursor Delta (LinkedCursors)
Slider and incrementalcombo box
Use the slider or combo box to adjust the separationbetween linked cursors across the Eye display.Increase the time (in ps) to increase the separation ordecrease to reduce the separation. You will see thatthe delta measurement between the two cursorsremains constant as you position the two cursors as asingle unit.The left hand y-axis is equivalent to 0 ps.
A table showing the SMPTE tolerances for each standard is provided in the section "SMPTE UHDTV:SDI Physical Layer Tolerances" on page C-1.)
Page 14-10 PHABRIX QxUser Manual

PRBS Analysis(SDI Stress Mode)
Requires Qx Option(s): PHQX01E-12G, PHQXO-GEN and PHQXO-SDI-STRESS
OverviewThe PRBS - Analysis instrument displays the total amount of received pseudorandom binary sequence(PRBS) data, total number of errors, bit error rate (BER), and OK time (since last error), for each SDI inputlink (BNC or SFP) on the Qx.
Figure 14-6: PRBS - Analysis
Instrument Menu OptionsFor BNC and SDI SFP inputs, you can manually activate PRBS analysis from the instrument submenu.The incoming PRBS signal type can be selected if known:
l PRBS Analysis Mode > [Disabled, PRBS-7, PRBS-9, PRBS-15, PRBS-23, PRBS-31]
For PRBS analysis on SDI SFP inputs, a further field is displayed where the appropriate signal data rateand divisor must be selected in order for PRBS analysis to be accurate:
l PRBS Data Rate / Divisor > [None, Rate: 1G5 Divisor: 1000, Rate: 1G5 Divisor: 1001, Rate: 3GDivisor: 1000, Rate: 3G Divisor: 1001, Rate: 6G Divisor: 1000, Rate: 6G Divisor: 1001, Rate: 12GDivisor: 1000, Rate: 12G Divisor: 1001]
In addition, for SDI BNC inputs only, automatic PRBS analysis is available. By enabling auto scan mode,the Qx will automatically cycle once, through all available PRBS Analysis modes and select the correctmode for the incoming signal type:
l PRBS auto scan mode > [Enabled, Disabled]
Once auto scan is complete, it will be automatically disabled.
An incoming PRBS signal can be inverted:
l PRBS signal inversion > [Enabled, Disabled]
To reset the PRBS – Analysis table, select:
PHABRIX QxUser Manual Page 14-11
l Reset
Note: PRBS signal generation is available in the Generator - Video Standard instrument submenu,as part of the Advanced Generation Tools, in SDI Stress Toolset Mode [PHQXO-SDI-STRESS].
Page 14-12 PHABRIX QxUser Manual

15HDR Analysis Instruments
Note: This option requires the Advanced High Dynamic Range (HDR) License: PHQXO-HDR .
This chapter describes the Instruments available with the High Dynamic Range (HDR) Toolset optionand includes the following sections:
l Advanced HDR Toolset
l Analyzer - CIE Chart
l HDR Heat-map (False Color Overlay Tools)
PHABRIX QxUser Manual Page 15-1

Advanced HDR Toolset
Requires Qx Option(s): PHQXO-HDR
OverviewThe comprehensive advanced HDR toolset includes a signal generator for HDR test patterns, CIEchart Analyzer, Luma false color highlighting (or heat map), a waveform monitor and vectorscope. TheHDR toolset supports all the main live production formats for both SDR and HDR.
For Standard Dynamic Range (SDR), the toolset supports:
l BT.709
l BT.2020
For High Dynamic Range (HDR), the toolset supports:
l BT.2100 HLG
l PQ
l Sony S-Log3
l Sony SR Live
The Waveform provides a Cd/m2 (nits) graticule along with BT.2048 diffuse white markers. Theflexible user-controlled HDR heatmap highlights signals beyond SDR with seven simultaneousprogrammable color overlay bands with presets for HDR and SDR ranges, plus a user-definablepreset. The CIE 1931 x,y display provides overlays for BT.709, BT.2020 and ST.2086 gamut (P3) toenhance the visualization and analysis of your HDR/WCG content.
An extensive set of test patterns include BT.2111 HDR color bars for HLG, PQ and SR Live as well as afull set of SDR 709 patterns mapped using display light to each of the four HDR formats for line checks,comparative monitor set-up and evaluation of HDR to SDR converters.
HDR Test PatternsIn addition to the standard SDR test patters which are converted to HDR, the Advanced HDR toolsetprovides an additional two native HDR test patterns. These test patterns are available when you selectone of the following HDR WCG options from the Gamut dropdown list of the Generate - VideoInstrument:
l HDR HLG 2020
l HDR PQ 2020
l HDR S-Log3 2020
l HDR SR Live
The list of available test patterns for a selected video standard is displayed at the bottom or in the righthand column of the Generate - Video Instrument. The native HDR test patterns are as follows:
ITU-R BT.2111-0 HDR Color Bars ITU-R BT.814-4 PLUGE – 4 variants
Figure 15-1: HDR Test Patterns Available in the Qx
Page 15-2 PHABRIX QxUser Manual

In addition, all other test patterns are converted to HDR in HDR mode, see the section "Test Patterns"on page 6-3 for a detailed list.
Both S-Log3 and SR Live [S-Log3(HDR Live)] test pattern variants are available.
Figure 15-2: Selecting HDR Gamut from Generator Dropdown List
Transfer Curve and Colorimetry OverridesHDR content may still contain the SMPTE payload ID for SDR and Rec.709 color space (as standard).
When analyzing HDR and WCG (Wide Color Gamut) content, therefore, you can choose to enableoverrides in the submenu of the Analyzer - Video Standard Instrument for the appropriate HDRtransfer curve and color space as follows:
l Enable Transfer Curve Override > [Enabled, Disabled]
l Transfer Curve Override > [SDR-TV, HLG, PQ, S-Log3]
l Enable Colorimetry Override > [Enabled, Disabled]
l Colorimetry Override > [Rec.709, Rec.2020]
PHABRIX QxUser Manual Page 15-3

Analyzer - CIE Chart
Requires Qx Option(s): PHQXO-HDR
OverviewThe CIE 1931 x y chart provides a display of signal chromaticity - complete with Rec. 709, Rec. 2020,ST 2086 gamut overlays and the Illuminant D65 white point reference.
Figure 15-3: Analyzer - CIE Chart Instrument
Instrument Menu OptionsRight-click in the chart area to access the setup submenu for the CIE Chart:
l Rec.709 Triangle > [Enabled, Disabled]
l Rec.2020 Triangle > [Enabled, Disabled]
l ST 2086 Triangle > [P3, Disabled]
l D65 White Point > [Enabled, Disabled]
l Single Line Mode > [Enabled, Disabled]
l Single Line Mode > Enabled > Line Number > [1 to Total no. of Active Lines for current standard]
l Zoom > [slider 1.00...4.00]
l Zoom > x Position > [slider, left to right]
l Zoom > y Position > [slider, bottom to top]
l Brightness > [slider 1..31]
l Gamma > [slider 1..255]
l Persistence [slider 1..255]
l S-Log3 Mode [S-Log3, SR Live]
Page 15-4 PHABRIX QxUser Manual

You can zoom in/out of the chart by hovering the mouse crosshairs over the chart and scrolling themouse wheel up or down. In addition, you can pan across the x or y axes by hovering the mousecrosshairs over the axis in question and scrolling the mouse wheel up or down.
PHABRIX QxUser Manual Page 15-5

HDR Heat-map (False Color Overlay)
Requires Qx Option(s): PHQXO-HDR
A false color overlay can be applied to the picture view, to highlight luminance ranges in the image thatare of particular interest, whether High Dynamic Range (HDR) or otherwise.
The picture can also be displayed in monochrome using grayscale shades. If enabled at the same timeas False Color Highlighting, all image elements outside of the enabled false color overlay luminancerange(s) are displayed in monochrome; leaving the false color highlight elements to stand out more.
Different types of false color overlay may be applied to visualize different image details clearly, and thecustom mode is provided to enable you to create a modified or bespoke overlay.
The range(s) and colors of a selected false color overlay can be modified by adjusting the sevenoverlay bands. Up to seven distinct ranges can be simultaneously enabled in a single overlay. Ifadjusted, the new or modified overlay is designated as the Custom overlay type.
Figure 15-4: Configuring the False Color Overlay
When False Color Highlighting is enabled, a scale with numeric and graphic display of the luminancerange(s) of the overlay in use, is available and the required luminance units for the scale can beselected.
Page 15-6 PHABRIX QxUser Manual
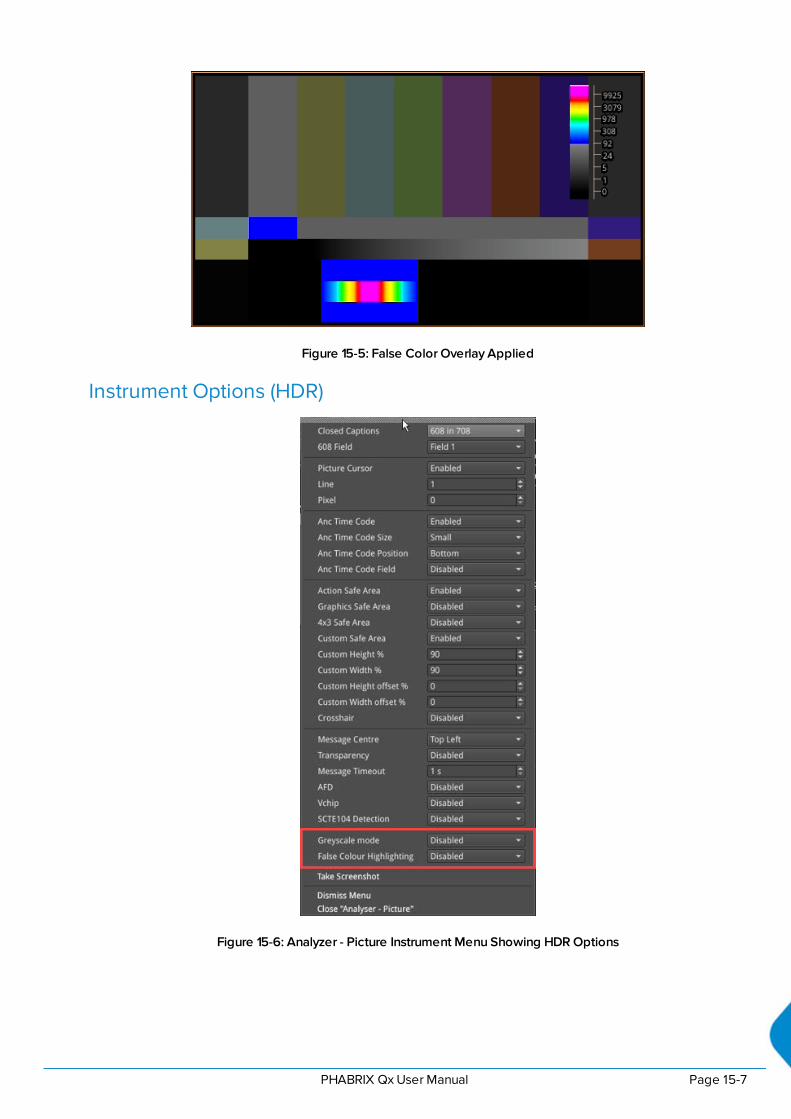
Figure 15-5: False Color Overlay Applied
Instrument Options (HDR)
Figure 15-6: Analyzer - Picture Instrument Menu Showing HDR Options
PHABRIX QxUser Manual Page 15-7

The following table lists the options available with the Advanced HDR Toolset for the Analyzer - Pictureand Analyzer - Picture Copy Instrument submenus:
Table 15-1 : HDR Menu Options for the Analyzer - Picture Instrument
Item Options Description
Grayscale Mode Disabled (Default)Enabled
When enabled, displays the Picture using grayscaleshades rather than color.
False Color OverlayScale
DisabledEnabled (Default)
Displayed when False Color Highlighting is enabled.When active, displays a scale, showing both numericand graphic representation of the luminance range(s)of the selected overlay, at the left-hand side of thewindow.
LuminanceMeasurement
Decimal Level (Default)PQ Nits
Selects the measurement units for luminance used infalse color highlighting.
False Color Ranges Disabled, PQ HDR, SDRAll Bands, SDR Shadow,SDR Skin Tones, SDRHighlights, Out of Range,S-Log3 Out of Range, Cus-tom
Opens False Color Highlighting window. Adjust any ofthe seven overlay bands to modify the range(s) andcolors of a selected false color overlay. You canenable up to seven distinct ranges simultaneously ina single overlay. If adjusted, the new or modified over-lay is designated as the Custom overlay type.
Page 15-8 PHABRIX QxUser Manual

16Additional System InformationThis chapter provides additional information on using the REST API and calibrating the Qx Driver. Itincludes the following sections:
l Using the REST API for Remote Access
l Using REST API Requests
l Driver Calibration
PHABRIX QxUser Manual Page 16-1

Using the REST API for Remote Access
You can use a standard REST API Client to interrogate the Qx remotely by requesting data and statusinformation, or to submit operational control commands.
Activating the REST API on the QxActivate the REST API on the Qx as follows:
1. Open the Qx Instrument: Qx Network & Automation.
2. Right-click in the window to open the submenu.
3. Enable the option: REST API.
When enabled, the REST API status in the Qx Network & Automation window displays the port number(8080) on which the Qx is listening.
Figure 16-1: REST API Enabled in Network & Automation Window
Connecting to the Qx Using the REST APIConnect to the Qx using the REST API as follows:
1. Run your chosen REST API client application on the computer you will use to connect to the Qx.
2. Use either the IP Address or mDNS Hostname (if mDNS is enabled on your computer) of the tar-get Qx unit, together with the port number, to connect to the Qx.
For example, to submit a GET request, enter the specific IP Address or mDNS Hostname of the targetunit, in one of the following formats:
l http://192.168.0.70:8080/api
l http://qx-020094.local:8080/api
See the section "Using REST API Requests" on the facing page for an overview of the Qx GET and PUTrequests for the REST API.
You can script the following REST API requests for use in automated testing:
l PUT
l GET
Page 16-2 PHABRIX QxUser Manual

l DELETE
l POST
Contact PHABRIX for full details of all available Qx REST API requests.
Using REST API RequestsUsing REST API Requests
The REST API request examples provided in this section for guidance use an example IP address(192.168.0.142) and the default REST API Port (8080).
The target base resource for REST API requests is: /api.
The target base URL for requests (GET) is in the format:
l http://192.168.0.142:8080/api or
l http://qx-020094.local:8080/api
You can submit REST API requests to:
l Report the current analyzed standard (GET):
l http://192.168.0.142:8080/api/v1/analyser/status
l Report the currently generated standard (GET):
l http://192.168.0.142:8080/api/v1/generator/status
l Navigate through a list of available generator standards (GET):
l http://192.168.0.142:8080/api/v1/generator/standards
l Select the required URL from the tree structure and use GET again to drill-down to theappropriate color format, bit depth, level, SDR or HDR format, and test pattern.
l Generate a standard (PUT):
l http://192.168.0.142:8080/api/v1/generator/standards/1920x1080p60/ \YCbCr%3A422%3A10/3G_A_Rec.709/100%25%20Bars
l You can also add a pathological overlay, specifying its type and number of pairs by includ-ing a raw payload of, for example:
l {"action":"start","pathological":{"type":"CheckField","pairs":100}}
l Report the currently generated audio standard (GET):
l http://192.168.0.142:8080/api/v1/generator/audio
l Audio generation (PUT):
l http://192.168.0.39:8080/api/v1/generator/audio
l Include a raw payload for QuickConfig of the structure, for example:
l {"mode":"Fixed Tone","quickConfig":{"gainType":"Fixed Levels", \"gain":-10,"pitch":"E 3"}}
l For Custom config raw payload structure, refer to the GET request output structure.
l View instantaneous Eye readings (GET):
l http://192.168.0.142:8080/api/v1/eye/status
l View instantaneous Jitter readings (GET):
l http://192.168.0.142:8080/api/v1/jitter/status
PHABRIX QxUser Manual Page 16-3
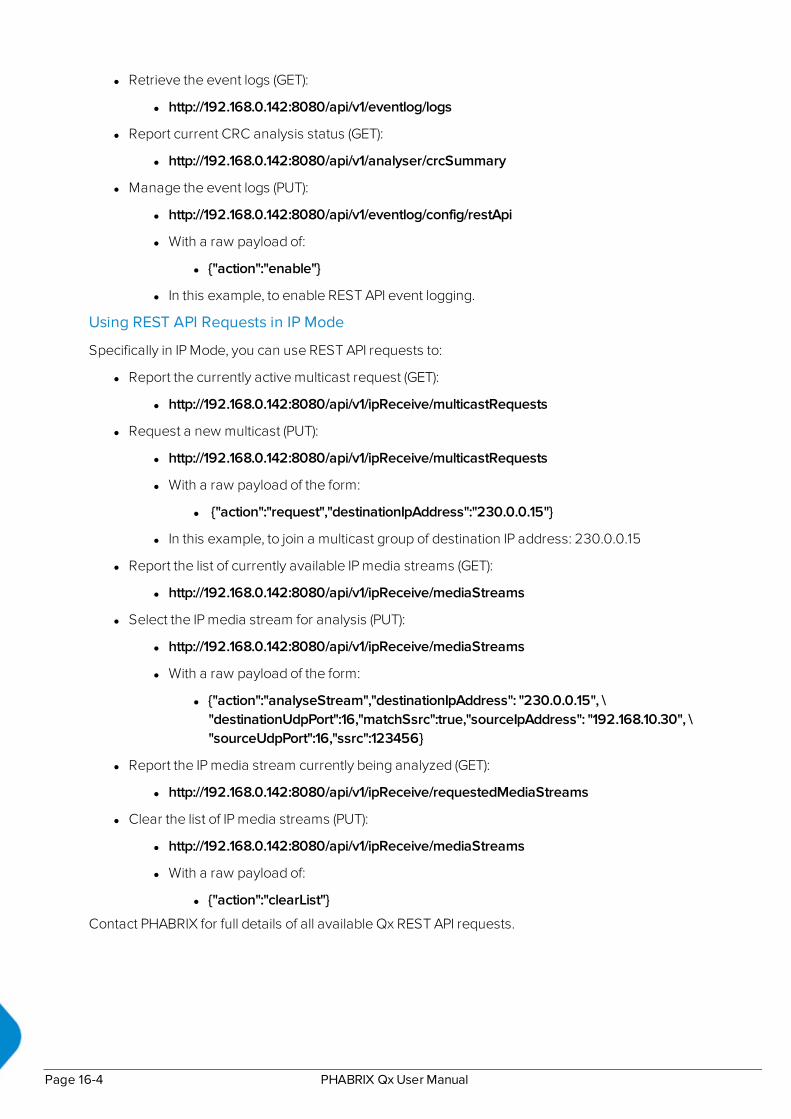
l Retrieve the event logs (GET):
l http://192.168.0.142:8080/api/v1/eventlog/logs
l Report current CRC analysis status (GET):
l http://192.168.0.142:8080/api/v1/analyser/crcSummary
l Manage the event logs (PUT):
l http://192.168.0.142:8080/api/v1/eventlog/config/restApi
l With a raw payload of:
l {"action":"enable"}
l In this example, to enable REST API event logging.
Using REST API Requests in IP Mode
Specifically in IP Mode, you can use REST API requests to:
l Report the currently active multicast request (GET):
l http://192.168.0.142:8080/api/v1/ipReceive/multicastRequests
l Request a new multicast (PUT):
l http://192.168.0.142:8080/api/v1/ipReceive/multicastRequests
l With a raw payload of the form:
l {"action":"request","destinationIpAddress":"230.0.0.15"}
l In this example, to join a multicast group of destination IP address: 230.0.0.15
l Report the list of currently available IP media streams (GET):
l http://192.168.0.142:8080/api/v1/ipReceive/mediaStreams
l Select the IP media stream for analysis (PUT):
l http://192.168.0.142:8080/api/v1/ipReceive/mediaStreams
l With a raw payload of the form:
l {"action":"analyseStream","destinationIpAddress": "230.0.0.15", \"destinationUdpPort":16,"matchSsrc":true,"sourceIpAddress": "192.168.10.30", \"sourceUdpPort":16,"ssrc":123456}
l Report the IP media stream currently being analyzed (GET):
l http://192.168.0.142:8080/api/v1/ipReceive/requestedMediaStreams
l Clear the list of IP media streams (PUT):
l http://192.168.0.142:8080/api/v1/ipReceive/mediaStreams
l With a raw payload of:
l {"action":"clearList"}
Contact PHABRIX for full details of all available Qx REST API requests.
Page 16-4 PHABRIX QxUser Manual

Driver Calibration
Requires Qx Option(s): PHQX01E-12G
OverviewAll PHABRIX Qx units are calibrated and verified before dispatch. Over time, however, the SDIgenerator outputs of the Qx may require recalibration as described in this section.
Figure 16-2: Qx Driver Calibration Window
On units with PHABRIX RTE™ (RealTime Eye) capability, the SDI generator outputs of the Qx can eachbe calibrated using the SDI A Input of the Qx.
Note: Recalibration relies upon the calibration status of the Eye/Jitter analyzer. If in doubt considerreturning the unit to PHABRIX for calibration.
SDI Output Calibration Steps
Warning: Before attempting to calibrate the Qx, make sure that you use a 12G cable that complieswith the specification described below. If in doubt, do not attempt to perform calibration on yourunit.
Calibrate the Qx unit as follows:
Note: If the Qx is in SDI Stress Toolset mode, first disable Jitter Insertion Mode before beginningdriver calibration. See the section "Advanced Generation Tools (SDI Stress Mode)" on page 14-2for further details.
1. Connect a one meter long cable between the SDI A Input (red or black nut) and the SDI Output tobe calibrated. A 12G-SDI grade or compatible cable with 12G-SDI BNCs must be used. A suitablecable type is Belden 1694A.
PHABRIX QxUser Manual Page 16-5
2. Open the Instrument Launch Menu and select: System Settings > Driver Calibration to open thecalibration window.
3. Select the output to calibrate from the dropdown menu, for example, for SDI Output A, selectDriver A and so on.
4. Click Start to begin calibration. It can take up to five minutes to calibrate an output.
5. On completion of calibration for SDI Output A, connect the output side of the cable to SDI OutputB and repeat the steps above, until you have calibrated all Qx SDI Outputs. It may take about 20minutes to calibrate all four outputs.
Page 16-6 PHABRIX QxUser Manual
AQx Technical SpecificationsThis Appendix defines the technical specifications of your Qx and includes the following sections:
l Power
l External Locking Reference
l SDI Instrument Output
l HDMI Instrument Output
l USB Connectors
l Networking
l Rear Panel D26 Connector
l AES Input/Output
l Longitudinal Timecode (LTC)
l Analog Audio Output
l GPIO
PHABRIX QxUser Manual Page A-1
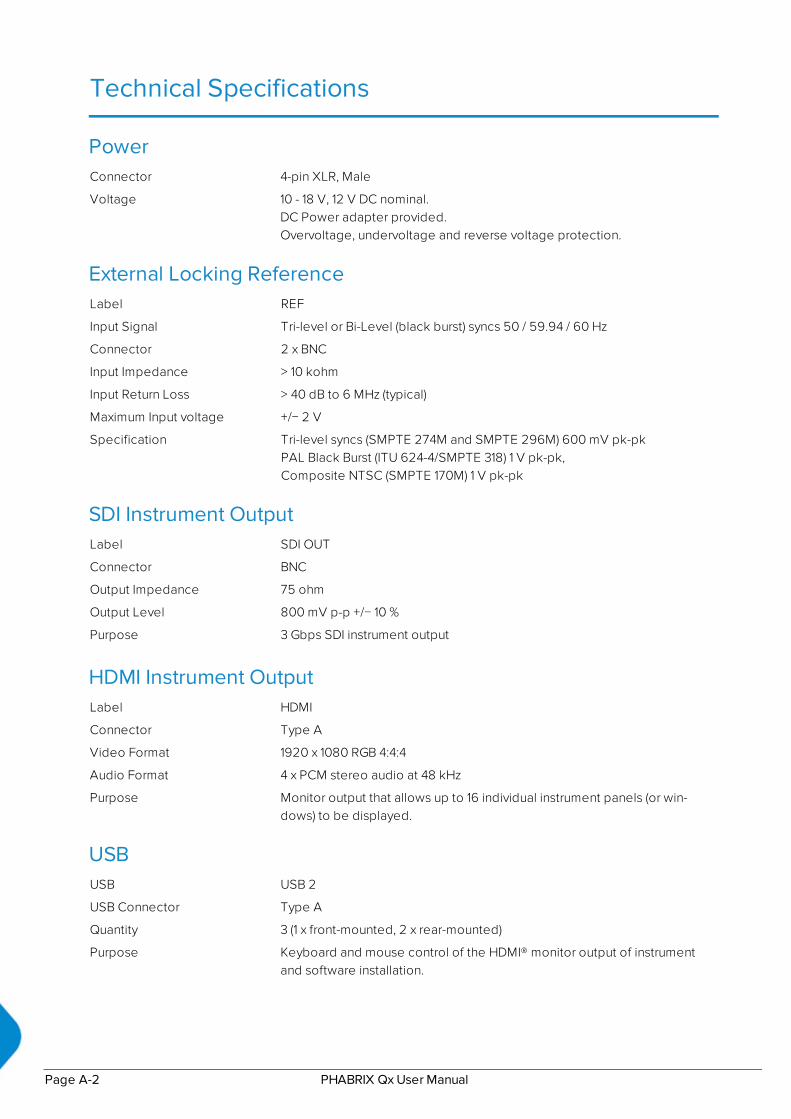
Technical Specifications
PowerConnector 4-pin XLR, Male
Voltage 10 - 18 V, 12 V DC nominal.DC Power adapter provided.Overvoltage, undervoltage and reverse voltage protection.
External Locking ReferenceLabel REF
Input Signal Tri-level or Bi-Level (black burst) syncs 50 / 59.94 / 60 Hz
Connector 2 x BNC
Input Impedance > 10 kohm
Input Return Loss > 40 dB to 6 MHz (typical)
Maximum Input voltage +/− 2 V
Specification Tri-level syncs (SMPTE 274M and SMPTE 296M) 600 mV pk-pkPAL Black Burst (ITU 624-4/SMPTE 318) 1 V pk-pk,Composite NTSC (SMPTE 170M) 1 V pk-pk
SDI Instrument OutputLabel SDI OUT
Connector BNC
Output Impedance 75 ohm
Output Level 800 mV p-p +/− 10 %
Purpose 3 Gbps SDI instrument output
HDMI Instrument OutputLabel HDMI
Connector Type A
Video Format 1920 x 1080 RGB 4:4:4
Audio Format 4 x PCM stereo audio at 48 kHz
Purpose Monitor output that allows up to 16 individual instrument panels (or win-dows) to be displayed.
USBUSB USB 2
USB Connector Type A
Quantity 3 (1 x front-mounted, 2 x rear-mounted)
Purpose Keyboard and mouse control of the HDMI® monitor output of instrumentand software installation.
Page A-2 PHABRIX QxUser Manual

NetworkingEthernet IEEE 802.3 10 / 100 / 1000 Mb/s (10 / 100 / 1000 base-T)
Ethernet Connector RJ-45
Rear panel D26Label I/O Expansion
Connector 26-way D-type
Purpose 8 x GPI I/O, 4 x AES I/O, LTC input, stereo analog audio out
Pinout
Table A-1 : D26 Connector Pin-outs
Pin Number Pin Name Description
1 AES_IO1 Bidirectional AES I/O - 75 ohm unbalanced
2 AES_IO2 Bidirectional AES I/O - 75 ohm unbalanced
3 AES_IO3 Bidirectional AES I/O - 75 ohm unbalanced
4 AES_IO4 Bidirectional AES I/O - 75 ohm unbalanced
5 LTC_RX_P LTC Receive (RX) P (RS-422 compatible)
6 LTC_RX_N LTC Receive (RX) N (RS-422 compatible)
7 AUDIO_R Audio Line Out - right
8 AUDIO_L Audio Line Out - left
9 5V0_GPIO 5 V current limited GPIO supply (500 mA)
10, 11, 12, 13, 14, 15, 16, 17, 18 GND 0 V
19 GPIO-0 Open drain, 10k pull-up to + 5 V
20 GPIO-1 Open drain, 10k pull-up to + 5 V
21 GPIO-2 Open drain, 10k pull-up to + 5 V
22 GPIO-3 Open drain,10k pull-up to + 5 V
23 GPIO-4 Open drain, 10k pull-up to + 5 V
24 GPIO-5 Open drain, 10k pull-up to + 5 V
25 GPIO-6 Open drain, 10k pull-up to + 5 V
26 GPIO-7 Open drain, 10k pull-up to + 5 V
AES I/OConnector 26-way D-type
Pins 1 (AES I/O 1), 2 (AES I/O 2), 3 (AES I/O 3), 4 (AES I/O 4)
Input Impedance 75 ohm terminated
Maximum Input voltage +/− 2 V
PHABRIX QxUser Manual Page A-3

Input Sample Rate 48 kHz synchronous audio
Input Bit Depth 20 bit or 24 bit
Output Sample Rate 48 kHz synchronous to system reference
Output Bit Depth 24 bit
Specification Conforming to AES3-2003 and SMPTE-276M
Purpose 4 x AES I/O audio
Longitudinal Timecode (LTC)Connector 26-way D-type
Pins 5 (RX - P), 6 (RX - N)
Format RS-422 Compatible
Purpose Not currently supported in software
Analog Audio OutputConnector 26-way D-type
Pins 7 (Audio Line Out - Right), 8 (Audio Line Out - Left)
Type Stereo Pair
Level (1 V peak-to-peak analog audio, full scale 0 dBFS)
Purpose Audio Monitoring output
GPIOConnector 26-way D-type
Pins 19 (GPIO - 0), 20 (GPIO - 1), 21 (GPIO - 2), 22 (GPIO - 3),23 (GPIO - 4), 24 (GPIO - 5), 25 (GPIO - 6), 26 (GPIO - 7)
Format Open drain with 10 kohm pull-up to +5 Volts
Power 5 V (pin 9), current-limted GPIO supply for open drain input/outputs. 0 V /signal ground (pins 10 to 18)
Purpose Generator Pathological Rate Detection
Page A-4 PHABRIX QxUser Manual
BAdvanced Media Timing InformationThis Appendix provides additional information about the advanced media timing measurements youcan make using the Video Timing & System Reference Instrument and includes the following sections:
l Overview
l Measurements in the Video Timing Tab
l Measurements in the Media Latency Tab
PHABRIX QxUser Manual Page B-1

Advanced Media Timing Measurements
Requires Qx Option(s): PHQXO1-IP-STND + PHQXO1-IP-MEAS
OverviewThis appendix provides additional detail on the advanced media timing measurements available in theVideo Timing & System Reference Instrument when the PHQXO-IP-MEAS license is installed. Forinformation on using the Instrument, see the sections "Video Timing & Setting External Reference in IP2110 Mode" on page 5-23 and "Video Timing & System Reference (IP 2110 Mode)" on page 5-35
Advanced Media Timing DefinitionsThe following terms are used in this section and are defined as follows:
Table B-1 : Advanced Media Timing Definitions
Term Definition
TPA0 The PTP arrival time of the first packet of a frame, for progressive video, or fieldone, for interlaced video, as measured.
TPR0 The time when the receiver is expected to read the packet from its receive buf-fer. It is set by TROffset which can be either the default value or set in the SessionDescription Protocol (SDP).
N*TFrame The Epoch-aligned start of the last frame as defined in ST 2059-1.
TVD A time-point at which N*TFrame + TROffset is an integer and the time-scale has itsorigin at the SMPTE Epoch as defined in SMPTE ST 2059-1.
RTPTimestamp The time contained in the timestamp within the received packet.
Video IP Packet Timing SchematicsThe graphics on the following pages are provided to illustrate the subsequent descriptions of theadvanced media timing measurements. The first, Figure B-1, shows the IP video packet timing at theSender and Figure B-2 shows the IP video packet timing at the receiver.
Page B-2 PHABRIX QxUser Manual

Figure B-1: Sender Gapped Packet Schedule
PHABRIX QxUser Manual Page B-3

Figure B-2: Receiver Gapped Packet Schedule
Page B-4 PHABRIX QxUser Manual
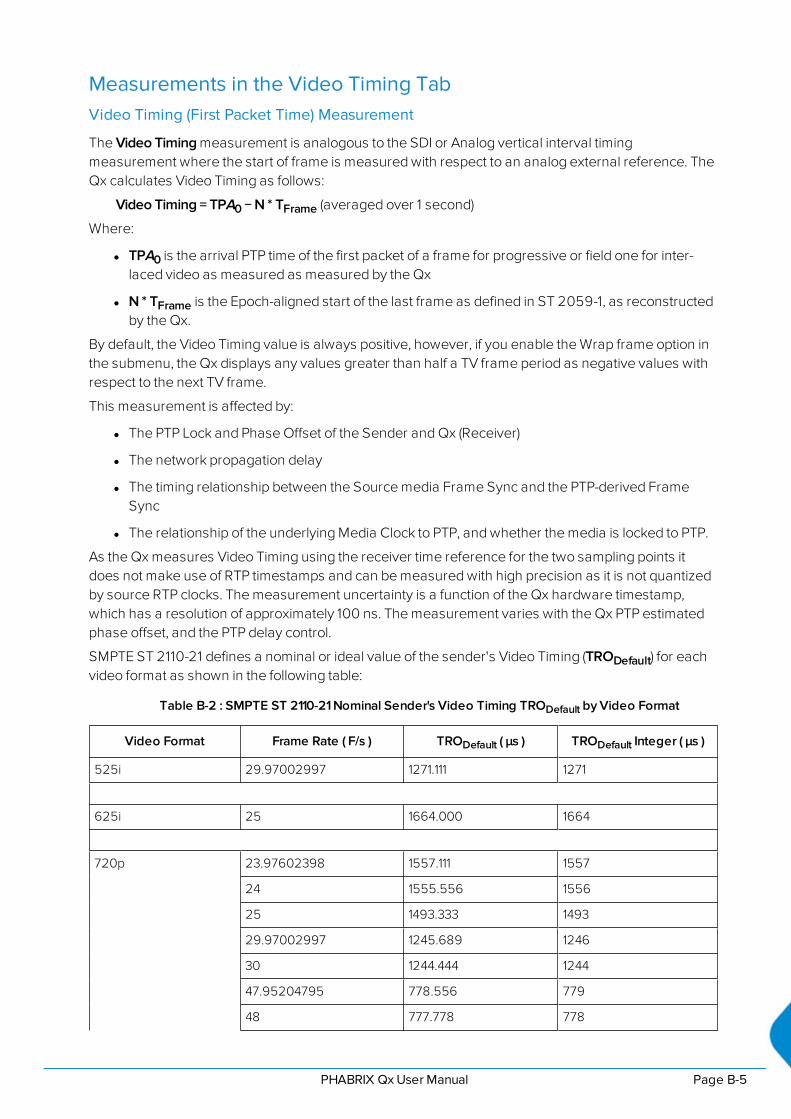
Measurements in the Video Timing TabVideo Timing (First Packet Time) Measurement
The Video Timing measurement is analogous to the SDI or Analog vertical interval timingmeasurement where the start of frame is measured with respect to an analog external reference. TheQx calculates Video Timing as follows:
Video Timing = TPA0 − N * TFrame (averaged over 1 second)
Where:
l TPA0 is the arrival PTP time of the first packet of a frame for progressive or field one for inter-laced video as measured as measured by the Qx
l N * TFrame is the Epoch-aligned start of the last frame as defined in ST 2059-1, as reconstructedby the Qx.
By default, the Video Timing value is always positive, however, if you enable the Wrap frame option inthe submenu, the Qx displays any values greater than half a TV frame period as negative values withrespect to the next TV frame.
This measurement is affected by:
l The PTP Lock and Phase Offset of the Sender and Qx (Receiver)
l The network propagation delay
l The timing relationship between the Source media Frame Sync and the PTP-derived FrameSync
l The relationship of the underlying Media Clock to PTP, and whether the media is locked to PTP.
As the Qx measures Video Timing using the receiver time reference for the two sampling points itdoes not make use of RTP timestamps and can be measured with high precision as it is not quantizedby source RTP clocks. The measurement uncertainty is a function of the Qx hardware timestamp,which has a resolution of approximately 100 ns. The measurement varies with the Qx PTP estimatedphase offset, and the PTP delay control.
SMPTE ST 2110-21 defines a nominal or ideal value of the sender's Video Timing (TRODefault) for eachvideo format as shown in the following table:
Table B-2 : SMPTE ST 2110-21 Nominal Sender's Video Timing TRODefault by Video Format
Video Format Frame Rate ( F/s ) TRODefault ( μs ) TRODefault Integer ( μs )
525i 29.97002997 1271.111 1271
625i 25 1664.000 1664
720p 23.97602398 1557.111 1557
24 1555.556 1556
25 1493.333 1493
29.97002997 1245.689 1246
30 1244.444 1244
47.95204795 778.556 779
48 777.778 778
PHABRIX QxUser Manual Page B-5

Video Format Frame Rate ( F/s ) TRODefault ( μs ) TRODefault Integer ( μs )
50 746.667 747
59.94005994 622.844 623
60 622.222 622
1080i 23.97602398 815.63 816
24 814.815 815
25 782.222 782
29.97002997 652.504 653
30 651.852 652
1080p 23.97602398 1594.185 1594
24 1592.593 1593
25 1528.889 1529
29.97002997 1275.348 1275
30 1274.074 1274
47.95.204795 797.093 797
48 796.296 796
50 764.444 764
59.94005994 637.674 638
60 637.037 637
1080PsF 23.97602398 815.63 816
24 814.815 815
25 782.222 782
29.97002997 652.504 653
30 651.852 652
47.95204795 407.815 408
48 407.407 407
50 391.111 391
59.94005994 326.252 326
60 325.926 326
Note: If the underlying Media Clock is not locked to PTP (for example, if it originates from an SDIplayer that cannot be generator locked (genlocked) being played through an SDI-to-2110 gateway)then the Video Timing measurement will have a value that is determined mainly by the videosource to PTP timing relationship.
Page B-6 PHABRIX QxUser Manual

Note: If the source is not locked to PTP, then the value of the Video Timing measurement will driftcontinuously.
Margin Measurement
The Margin is the difference between the First Packet Time (video timing measurement) and the timeof the first video buffer read in the receiver. The indicated TROffset is used to control the read scheduleof the receiver buffer and the Margin is the amount of buffer pre-fill prior to the start of the buffer readprocess. The Margin is calculated as follows:
Margin = TPA0 − (N*TFrame + TROffset) = First Packet Time − TROffset
The Margin measurement will be affected by the following:
l TROffset
l The PTP Lock and Phase Offset of the Sender and Qx (Receiver)
l The network propagation delay
l The timing relationship between the Source media Frame Sync and the PTP derived FrameSync
l The relationship of the underlying Media Clock to PTP, and whether the media is locked to PTP.
The Qx provides a facility to enter a manual value for the TROffset in the Instrument submenu. In theabsence of a manual value of TROffset, the Qx will use the TRODefault value for that video format, seethe see the table in "Measurements in the Video Timing Tab" on page B-5.
A negative value indicates that the packets are arriving earlier than expected for an idealized system,implying that the receiver has more time to buffer and consequently, has more margin.
A positive value indicates that the packets are arriving later than expected for an idealized system, andthat the size of the available buffer is being reduced.
If the video phase of the source is adjusted so that the Margin is zero, then the measured Video Timingshould then be equal to the TROffset.
Note: If the underlying Media Clock is not locked to PTP (for example, if it originates from an SDIplayer that cannot be genlocked being played through an SDI-to-2110 gateway) then the Marginmeasurement will have a value that is determined mainly by the video source to PTP timingrelationship.
RTP Offset Measurement
This measurement is the difference between the time encoded in the RTP timestamp and the start ofthe frame for progressive or first field for interlaced since the epoch, averaged over 1 second. Acamera will typically timestamp at the image capture instant. An SDI gateway will timestamp at thestart of the frame, and a synthetic source can timestamp at the start of the frame or at the time the firstpacket egresses from the sender. For an SDI to ST 2110 gateway, when the source video timing hasbeen adjusted to give a Video Timing measurement value that is equal to TRDefault (a Margin of zero),then the RTP Offset is an indication of the timing relationship of the source video to PTP. The RTPOffset is calculated as follows:
RTP Offset = RTPTimestamp – N * TFrame (averaged over 1 second)
Where:
l RTPTimestamp is the time contained in the timestamp within the received packet, created by thesource
l N * TFrame is the Epoch-aligned start of the last frame as defined in ST 2059-1 as reconstructedby the Qx.
PHABRIX QxUser Manual Page B-7
In principle, the RTP Offset measurement will be affected by:
l The PTP Lock and Phase Offset of the Sender and Qx (Receiver)
l The relationship of the underlying Media Clock to PTP, and whether the media is locked to PTP.
The Qx calculates the RTP Offset by subtracting the Video Latency measurement from the VideoTiming measurement; a method that is insensitive to the PTP phase offset of the Qx, and the PTP lockor phase of the source.
The PTP time of the RTPTimestamp is limited by the resolution of the source RTP Media Clock. For ST2110-20 Video this clock is 90 kHz and has a quantization of 11 μs. The true PTP time at which a packetis assembled in the sender output buffer will be a point within this 11 μs RTP window so, even in aperfect system, the measurements may include an error of up to 11 μs.
PTP Phase offset can be affected by network asymmetric delay, which differs for both source andreceiver, plus the inherent phase drift of the PTP daemon.
Note: If the underlying media clock is not locked to PTP (for example, if it originates from an SDIplayer that cannot be generator locked (genlocked) being played through an SDI-to-2110 gateway)then the RTP Offset measurement will have a value that is determined mainly by the video sourceto PTP timing relationship.
The RTP Offset is a valid measurement for all ST 2110 flows (gapped, linear, wide, narrow) and ST2022-6 flows that use PTP, where the timing point in ST 2022-6 video is the first active pixel or Frameor Field sync.
Measurements in the Media Latency TabMedia Latency Measurement
The Media Latency measure is the difference between the arrival time of a packet and the timeencoded in the RTP timestamp of that packet, averaged over 1 second. This measurement applies tovideo, ANC, and audio since it does not depend on a frame structure. For video, it applies to the firstpacket of the frame and is calculated as follows:
Latency = TPA0 – RTPTimestamp (averaged over 1 second)
Where:
l TPA0 is the arrival PTP time of the first packet of a frame, for progressive video, or field one, forinterlaced video, as measured by the Qx.
l RTPTimestamp is the time contained in the timestamp within the received packet created by thesource.
For Video and ANC flows, the RTP timestamp is constant for the entire Frame, so the latency is onlymeasured when the RTP timestamp changes. This occurs on the first packet of a frame for aprogressive flow, or field for an interlaced flow, with the results averaged over 1 second.
For Audio flows, as the RTP timestamp increments with each audio packet the latency is measured forevery packet with the results averaged over 1 second.
This measurement will be affected by:
l The Sender Encapsulation Time (packet time)
l PTP Lock and Phase Offset of the Sender and Qx (Receiver)
l Network propagation delay
l The relationship of the underlying Media Clock to PTP and whether the media is locked to PTP.
Page B-8 PHABRIX QxUser Manual
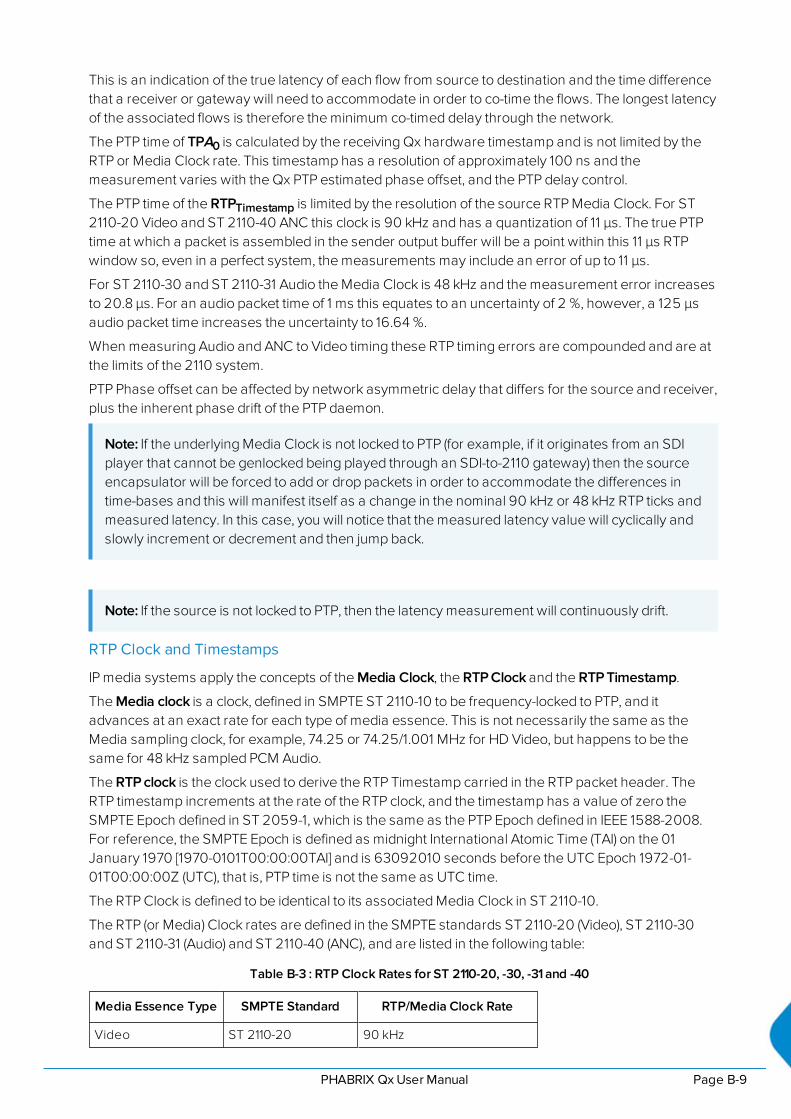
This is an indication of the true latency of each flow from source to destination and the time differencethat a receiver or gateway will need to accommodate in order to co-time the flows. The longest latencyof the associated flows is therefore the minimum co-timed delay through the network.
The PTP time of TPA0 is calculated by the receiving Qx hardware timestamp and is not limited by theRTP or Media Clock rate. This timestamp has a resolution of approximately 100 ns and themeasurement varies with the Qx PTP estimated phase offset, and the PTP delay control.
The PTP time of the RTPTimestamp is limited by the resolution of the source RTP Media Clock. For ST2110-20 Video and ST 2110-40 ANC this clock is 90 kHz and has a quantization of 11 μs. The true PTPtime at which a packet is assembled in the sender output buffer will be a point within this 11 μs RTPwindow so, even in a perfect system, the measurements may include an error of up to 11 μs.
For ST 2110-30 and ST 2110-31 Audio the Media Clock is 48 kHz and the measurement error increasesto 20.8 μs. For an audio packet time of 1 ms this equates to an uncertainty of 2 %, however, a 125 μsaudio packet time increases the uncertainty to 16.64 %.
When measuring Audio and ANC to Video timing these RTP timing errors are compounded and are atthe limits of the 2110 system.
PTP Phase offset can be affected by network asymmetric delay that differs for the source and receiver,plus the inherent phase drift of the PTP daemon.
Note: If the underlying Media Clock is not locked to PTP (for example, if it originates from an SDIplayer that cannot be genlocked being played through an SDI-to-2110 gateway) then the sourceencapsulator will be forced to add or drop packets in order to accommodate the differences intime-bases and this will manifest itself as a change in the nominal 90 kHz or 48 kHz RTP ticks andmeasured latency. In this case, you will notice that the measured latency value will cyclically andslowly increment or decrement and then jump back.
Note: If the source is not locked to PTP, then the latency measurement will continuously drift.
RTP Clock and Timestamps
IP media systems apply the concepts of the Media Clock, the RTP Clock and the RTP Timestamp.
The Media clock is a clock, defined in SMPTE ST 2110-10 to be frequency-locked to PTP, and itadvances at an exact rate for each type of media essence. This is not necessarily the same as theMedia sampling clock, for example, 74.25 or 74.25/1.001 MHz for HD Video, but happens to be thesame for 48 kHz sampled PCM Audio.
The RTP clock is the clock used to derive the RTP Timestamp carried in the RTP packet header. TheRTP timestamp increments at the rate of the RTP clock, and the timestamp has a value of zero theSMPTE Epoch defined in ST 2059-1, which is the same as the PTP Epoch defined in IEEE 1588-2008.For reference, the SMPTE Epoch is defined as midnight International Atomic Time (TAI) on the 01January 1970 [1970-0101T00:00:00TAI] and is 63092010 seconds before the UTC Epoch 1972-01-01T00:00:00Z (UTC), that is, PTP time is not the same as UTC time.
The RTP Clock is defined to be identical to its associated Media Clock in ST 2110-10.
The RTP (or Media) Clock rates are defined in the SMPTE standards ST 2110-20 (Video), ST 2110-30and ST 2110-31 (Audio) and ST 2110-40 (ANC), and are listed in the following table:
Table B-3 : RTP Clock Rates for ST 2110-20, -30, -31 and -40
Media Essence Type SMPTE Standard RTP/Media Clock Rate
Video ST 2110-20 90 kHz
PHABRIX QxUser Manual Page B-9
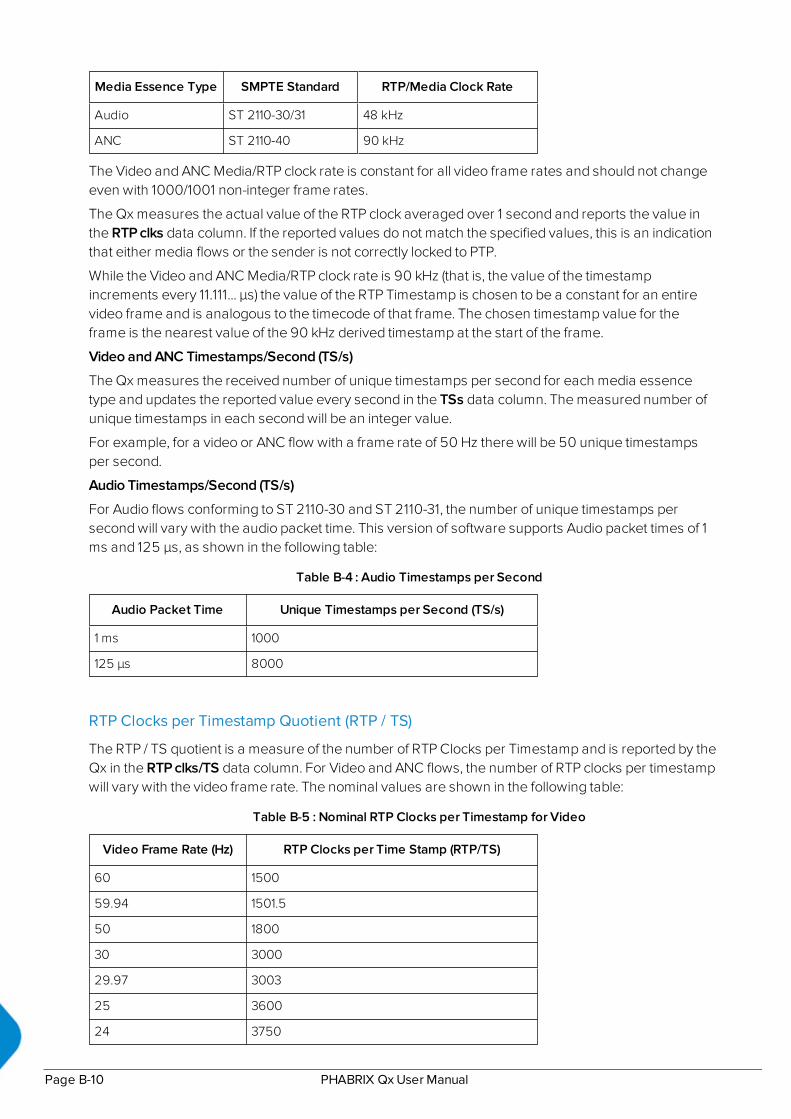
Media Essence Type SMPTE Standard RTP/Media Clock Rate
Audio ST 2110-30/31 48 kHz
ANC ST 2110-40 90 kHz
The Video and ANC Media/RTP clock rate is constant for all video frame rates and should not changeeven with 1000/1001 non-integer frame rates.
The Qx measures the actual value of the RTP clock averaged over 1 second and reports the value inthe RTP clks data column. If the reported values do not match the specified values, this is an indicationthat either media flows or the sender is not correctly locked to PTP.
While the Video and ANC Media/RTP clock rate is 90 kHz (that is, the value of the timestampincrements every 11.111... μs) the value of the RTP Timestamp is chosen to be a constant for an entirevideo frame and is analogous to the timecode of that frame. The chosen timestamp value for theframe is the nearest value of the 90 kHz derived timestamp at the start of the frame.
Video and ANC Timestamps/Second (TS/s)
The Qx measures the received number of unique timestamps per second for each media essencetype and updates the reported value every second in the TSs data column. The measured number ofunique timestamps in each second will be an integer value.
For example, for a video or ANC flow with a frame rate of 50 Hz there will be 50 unique timestampsper second.
Audio Timestamps/Second (TS/s)
For Audio flows conforming to ST 2110-30 and ST 2110-31, the number of unique timestamps persecond will vary with the audio packet time. This version of software supports Audio packet times of 1ms and 125 μs, as shown in the following table:
Table B-4 : Audio Timestamps per Second
Audio Packet Time Unique Timestamps per Second (TS/s)
1 ms 1000
125 μs 8000
RTP Clocks per Timestamp Quotient (RTP / TS)
The RTP / TS quotient is a measure of the number of RTP Clocks per Timestamp and is reported by theQx in the RTP clks/TS data column. For Video and ANC flows, the number of RTP clocks per timestampwill vary with the video frame rate. The nominal values are shown in the following table:
Table B-5 : Nominal RTP Clocks per Timestamp for Video
Video Frame Rate (Hz) RTP Clocks per Time Stamp (RTP/TS)
60 1500
59.94 1501.5
50 1800
30 3000
29.97 3003
25 3600
24 3750
Page B-10 PHABRIX QxUser Manual

Video Frame Rate (Hz) RTP Clocks per Time Stamp (RTP/TS)
23.98 3753.75
For Audio flows the number of RTP clocks/Timestamp will vary with the Audio Packet Time, and isequal to the number of audio samples per packet. For 48 kHz sampled audio the relationship betweenthe Audio Packet Time and the RTP Clocks per timestamp per second is shown in the following table:
Table B-6 : Nominal RTP Clocks per Timestamp for Audio
Audio Packet Time RTP Clocks per timestamp (RTP / TS)
1 ms 48
125 μs 6
Working with Non-integer Frame Rates
For non-integer Video and ANC frame rates such as 60/1.001 (59.94 Hz) the Qx receives 60 uniquetimestamps for 15 or 16 seconds, followed by one second that will contain 59 unique timestamps. Fora 59.94 Hz system, the Qx will, therefore, report 60 TS/s for 15 or 16 seconds followed by 59 TS/s forone second, resulting in a long-term average of 59.94 TS/s.
Similarly, the measured Video and ANC RTP/Media clock rate for a 59.94 Hz system will be 90,090 Hz(90,000 * 1.001) for 15 or 16 seconds, followed by a single second where the measured RTP Clock willbe 88688 Hz or 88687 Hz, resulting in a long-term average of 90,000 Hz.
The reported number of RTP clocks per timestamp will also typically move away from the long-termnominal value for one second. The typical combination of measured values for the RTP Clock Rate,Timestamps/s and RTP Clocks per Timestamp for non-integer Frame and Field rates are given in thefollowing table:
Table B-7 : Typical Reported RTP Clocks per Timestamp for Fractional Frame and Field Rates
Frame or FieldRate (Hz)
Reported RTP/Me-dia Clock Rate
ReportedTimestamps per
Second (TS/s)
RTP Clocks perTimestamp (RTP/TS)
Interval(s)
60 90,000 60 1500 N/A
59.94 90,090 60 1501.5 16 or 17
88,588 59 1501.49
88,589 59 1501.51
50 90,000 50 1800 N/A
30 90,000 30 3000 N/A
29.97 90,090 30 3003 33 or 34
87,087 29 3003
25 90,000 25 3600 N/A
PHABRIX QxUser Manual Page B-11
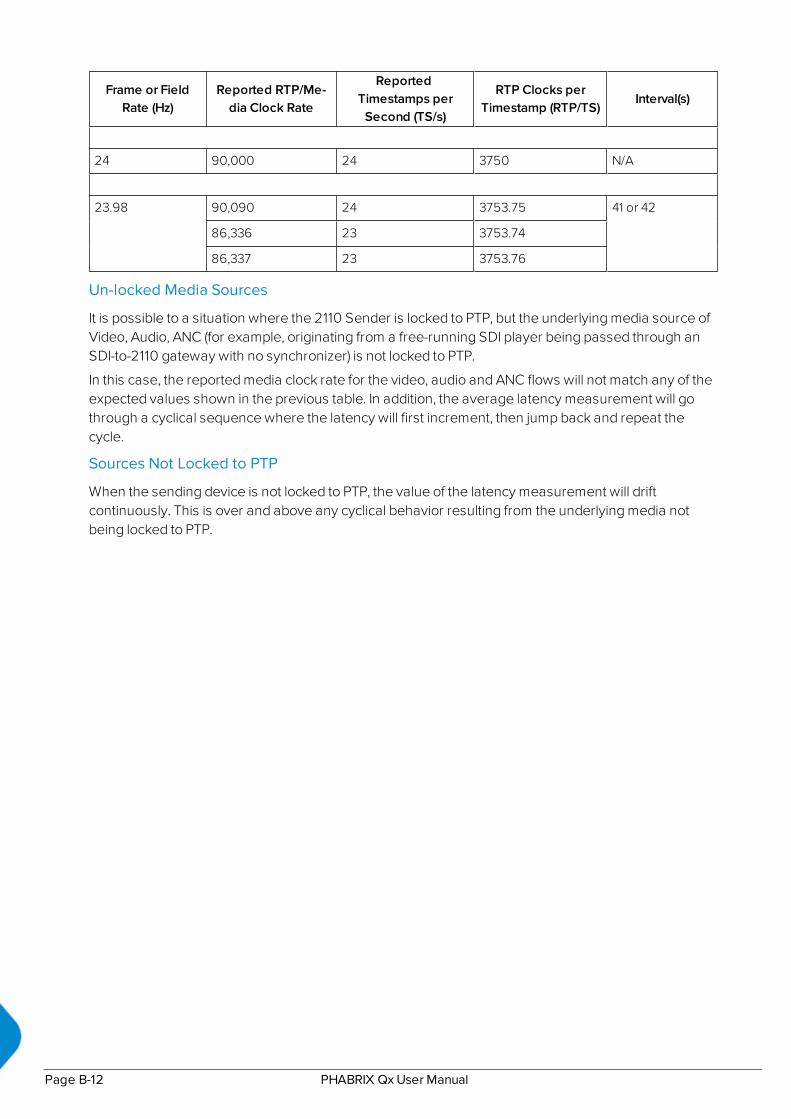
Frame or FieldRate (Hz)
Reported RTP/Me-dia Clock Rate
ReportedTimestamps per
Second (TS/s)
RTP Clocks perTimestamp (RTP/TS)
Interval(s)
24 90,000 24 3750 N/A
23.98 90,090 24 3753.75 41 or 42
86,336 23 3753.74
86,337 23 3753.76
Un-locked Media Sources
It is possible to a situation where the 2110 Sender is locked to PTP, but the underlying media source ofVideo, Audio, ANC (for example, originating from a free-running SDI player being passed through anSDI-to-2110 gateway with no synchronizer) is not locked to PTP.
In this case, the reported media clock rate for the video, audio and ANC flows will not match any of theexpected values shown in the previous table. In addition, the average latency measurement will gothrough a cyclical sequence where the latency will first increment, then jump back and repeat thecycle.
Sources Not Locked to PTP
When the sending device is not locked to PTP, the value of the latency measurement will driftcontinuously. This is over and above any cyclical behavior resulting from the underlying media notbeing locked to PTP.
Page B-12 PHABRIX QxUser Manual

COn-going Qx DevelopmentPHABRIX is committed to developing the toolsets available on the Qx, including upgrades to existinginstruments and the introduction of new instruments. Please do not hesitate to contact PHABRIX at anytime to discuss your requirements for the product or current product timelines.
SMPTE UHDTV: SDI Physical Layer TolerancesThe Qx will automatically measure the SMPTE UHDTV tolerances listed in the following table:
Table C-1 : SMPTE UHDTV Tolerances
Data Rate 1.485 Gbps 2.97 Gbps 5.94 Gbps 11.88 Gbps
Standard SMPTE ST292-1:2012 SMPTE ST424:2012 SMPTE ST2081-1, 10 SMPTE SMPTE ST2082-1,10
Coding Scrambled NRZI Scrambled NRZI Scrambled NRZI Scrambled NRZI
Amplitude 800 mV +/− 10 % 800 mV +/− 10 % 800 mV +/− 10 % 800 mV +/− 10 %
DC Offset 0.0 V +/− 0.5 V 0.0 V +/− 0.5 V 0.0 V +/− 0.5 V 0.0 V +/− 0.5 V
Rise/Fall Time < 270 ps < 135 ps < 80 ps < 45 ps
Rise/Fall Time Difference < 100 ps < 50 ps < 35 ps < 18 ps
Rise/Fall Overshoot < 10 % of Amplitude < 10 % of Amplitude < 10 % of Amplitude < 10 % of Amplitude
Timing Jitter < 1 UI (10 Hz to 148.5 MHz) < 2 UI (10 Hz to 297 MHz) < 4 UI (10 Hz to 594 MHz) < 8 UI (10 Hz to 1188 MHz)
Alignment Jitter < 0.2 UI (100 kHz to 148.5MHz)
< 0.3 UI (100 kHz to 297MHz)
< 0.3 UI (100 kHz to 594MHz)
< 0.3 UI (100 kHz to 1188MHz)
Qx 75 ohm Coaxial CableLength (Belden 1694A)
200 m 200 m 100 m 70 m
The complexity of both analyzing and generating signals for UHDTV is exemplified in the table. Thedata bandwidth testing from HD through to UHDTV at 12 Gbps, standard on the Qx, is immense andthe parameters set by SMPTE require that the instruments measure these critical values forcompliance.
PHABRIX QxUser Manual Page C-1

DSupported SFPsFor information on the SFPs supported by the current Qx software version, please contact PHABRIXSupport at:
l www.phabrix.com/support
PHABRIX QxUser Manual Page D-1
ESupported Video StandardsPlease contact PHABRIX if you require support for any standards not listed here. The current Qxsoftware version supports the following standards:
2K/HD Supported FormatsThe following ST 2022-6 formats are supported by Qx option: PHQXO-IP-STND.
PHABRIX QxUser Manual Page E-1

Table E-1 : Qx Supported 2K/HD Video Standards (SDI and ST 2022-6)
Page E-2 PHABRIX QxUser Manual
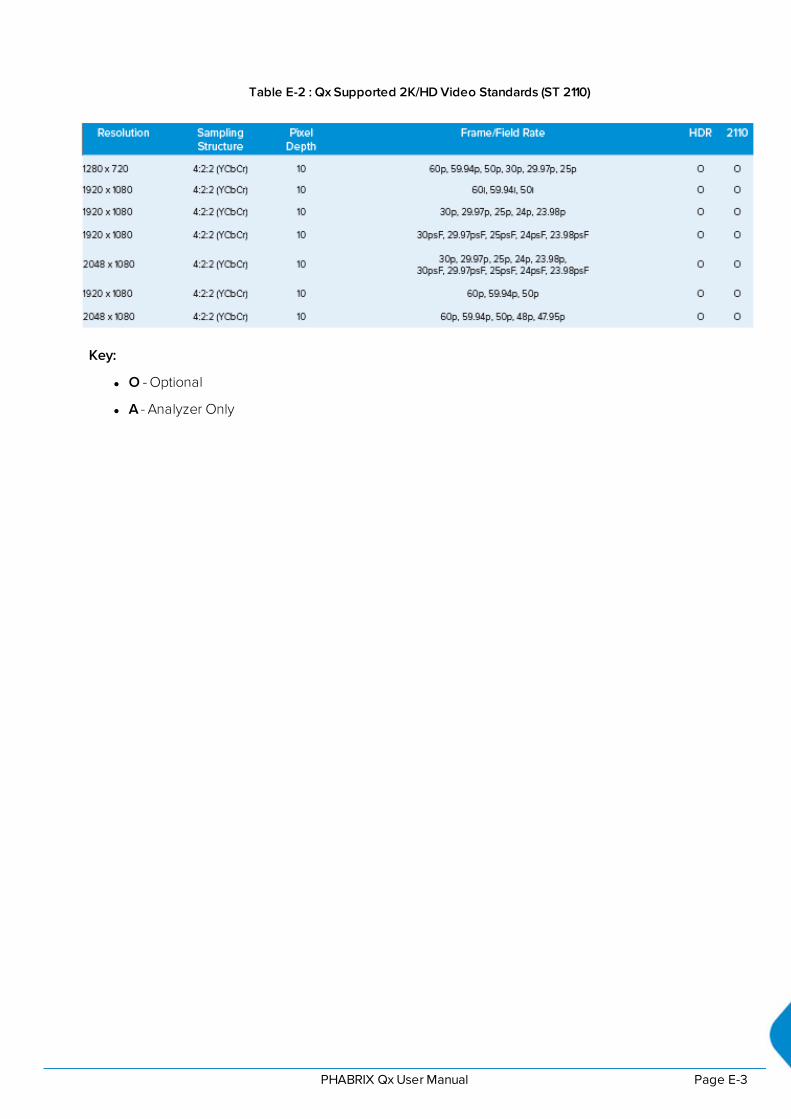
Table E-2 : Qx Supported 2K/HD Video Standards (ST 2110)
Key:
l O - Optional
l A - Analyzer Only
PHABRIX QxUser Manual Page E-3
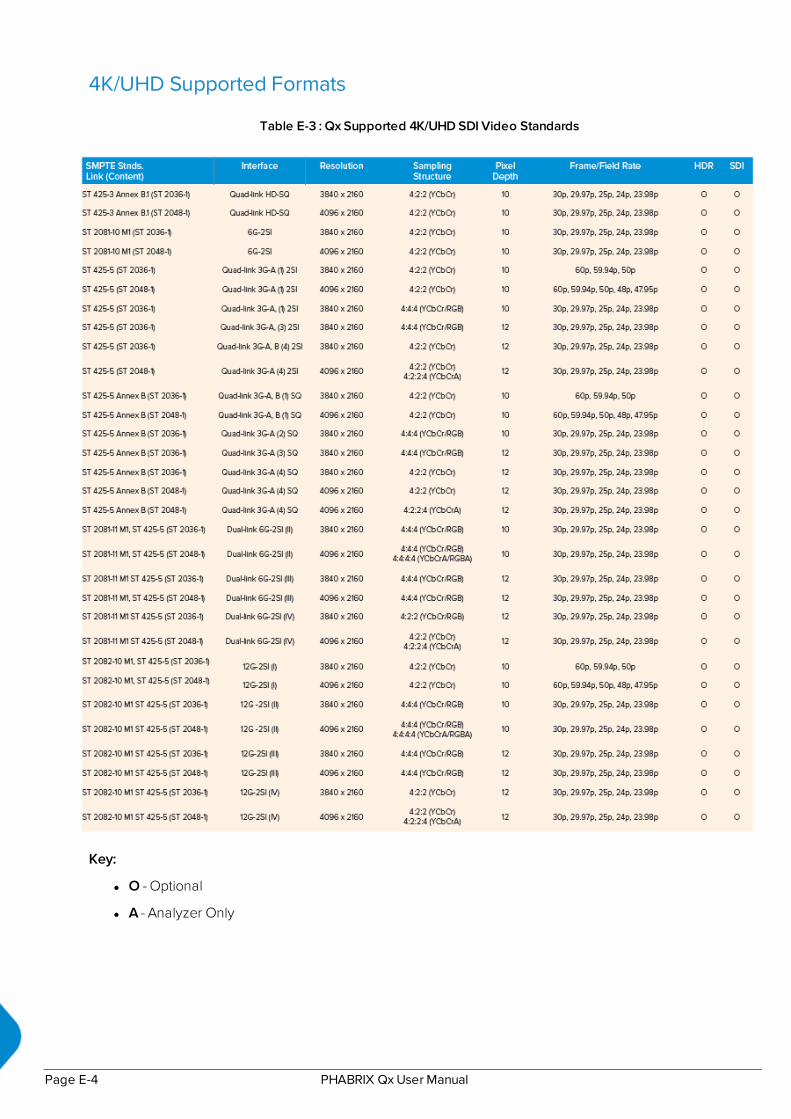
4K/UHD Supported Formats
Table E-3 : Qx Supported 4K/UHD SDI Video Standards
Key:
l O - Optional
l A - Analyzer Only
Page E-4 PHABRIX QxUser Manual

www.phabrix.com
PHABRIXproducts are continuouslybeing updated.Please visit www.phabrix.comfor latest product information