Quay Street Seawall Upgrade Project - Auckland Council
46
REPORT Quay Street Seawall Upgrade Project Ferry Basin Section Coastal Effects Assessment Prepared for Auckland Transport Prepared by Tonkin & Taylor Ltd Date May 2018 Job Number 1004393
-
Upload
khangminh22 -
Category
Documents
-
view
1 -
download
0
Transcript of Quay Street Seawall Upgrade Project - Auckland Council

REPORT
Quay Street Seawall Upgrade Project
Ferry Basin Section Coastal Effects Assessment
Prepared for
Auckland Transport
Prepared by
Tonkin & Taylor Ltd
Date
May 2018
Job Number
1004393


Document Control
Title: Quay Street Seawall Upgrade Project – Ferry Basin Section Coastal Effects Assessment
Date Version Description Prepared by: Reviewed by: Authorised by:
May 2018 01 Coastal Effects Report A. Brown R. Reinen-Hamill R. Reinen-Hamill
Distribution:
Auckland Transport Electronic
Tonkin & Taylor Ltd (FILE) 1 copy

Tonkin & Taylor Ltd Quay Street Seawall Upgrade Project - Ferry Basin Section Coastal Effects Assessment Auckland Transport
May 2018 Job No: 1004393
Table of contents
1 Background and overview 1 1.1 Proposed Quay Street seawall upgrade 2 1.2 Purpose and scope 2
2 Proposed Ferry Basin works 3 2.1 Overview 3 2.2 Construction 3
2.2.1 Piling 4 2.2.2 Pre-cast panel installation 5 2.2.3 Capping beam 5 2.2.4 Backfill 5 2.2.5 Ground Anchor 5 2.2.6 Rock protecting toe 6
3 Coastal setting 10 3.1 General description 10 3.2 Bathymetry 10 3.3 Geology and sediments 11
4 Coastal processes 15 4.1 Wind 15 4.2 Waves 15 4.3 Water levels 16 4.4 Tidal currents 16 4.5 Vessel wakes 17 4.6 Propeller wash 18 4.7 Sediment transport 22
5 Coastal hazard 24 5.1 Extreme water levels 24 5.2 Sea level rise 24 5.3 Tsunami 25
6 Existing structures 31
7 Effects assessment 34 7.1 Short term 34 7.2 Long term 34 7.3 Summary of effects 35
8 Conclusion 36
9 References 37
10 Applicability 38

Tonkin & Taylor Ltd Quay Street Seawall Upgrade Project - Ferry Basin Section Coastal Effects Assessment Auckland Transport
May 2018 Job No: 1004393
Executive summary
Quay Street seawall extends from the western side of Lower Hobson Street to the western side of Marsden Wharf. The proposal is to upgrade the seawall to meet current design standards for seismic performance, and create resilience to future climate and changing use patterns. Completing the upgrade is an important enabler of the wider Downtown Infrastructure Development Programme to ready the precinct for the America’s Cup and APEC events in 2021.
The seawall has been divided into four sections and design options developed accordingly. This report addresses the coastal process effects for the Ferry Basin section. The proposed seawall will consist of a post and panel wall immediately seaward of the existing seawall. It will be approximately 90 m in length and consist of approximately 1.2 m wide “H” shaped reinforced concrete piles spaced at approximately 3 m centre-to-centre spacing. A rock protecting toe will be placed along its length to prevent bed scour from propeller wash undermining the wall. The outside face of the proposed seawall will extend no more than 1.5 m in to the coastal marine area (CMA) from the existing seawall face and the rock protecting toe will be on the seabed and will extend approximately 12 m from the new seawall line, beneath the mean high water spring water level.
Quay Street is formed on land reclaimed from the harbour between 1879 and 1925 by the Auckland Harbour Board, with the seawall constructed post 1900. The Quay Street reclamation fill is underlain by recent marine sediments and Pleistocene sediments of the Tauranga Group. Beneath the sediments, East Coast Bays Formation, part of the local basement Waitematā Group rocks, underlies much of the Urban Auckland area and consists predominantly of an alternating sequence of siltstone and lithic sandstone.
Sediments are derived from local stormwater from the city, from the wider Waitematā Harbour catchment, unarmoured coastal margins, and from reworking of existing intertidal sediments within the harbour. Vessel movements within the Ferry Basin disturb seabed sediments with the remobilised sediment dispersed through the water column and ultimately resettling in natural depositional areas such as the waterfront basins.
At some stage rocks have been placed along the toe of the wall within the Ferry Basin and a sprayed concrete (shotcrete) layer has been applied to the wall. A condition assessment rates the seawall in average to poor condition and states that undermining of the rock protection occurs along its length with consequential cracking of the sprayed concrete.
The seawall sections proposed at the Ferry Basin will be constructed in front of the existing seawall and will therefore have potential effects within the CMA. The short term effect of the construction works is largely related to water clarity due to the piling and removal of rock / bed material for both the temporary works and the seawall itself. Due to the relatively high level of suspended silts generated by vessel wake and propeller wash the relative effect of this process is low. The proposed works cover an existing vertical wall, but the orientation of the wall will be unchanged and the wall footprint will move up to 1.5 m into the CMA. The wall will still be impermeable and reflective so there will be no change to wave reflection patterns off the wall from vessel wakes or propeller jets. It is therefore considered that there will be no long term adverse effects apart from the relatively small change in occupation of the seawall itself.


1
Tonkin & Taylor Ltd Quay Street Seawall Upgrade Project - Ferry Basin Section Coastal Effects Assessment Auckland Transport
May 2018 Job No: 1004393
1 Background and overview
The Quay Street seawall extends from the western side of Lower Hobson Street to the western side of Marsden Wharf at the Downtown Ferry Terminal in Central Auckland. The seawall forms the harbour edge of a historical reclamation, which supports Quay Street and the services contained within the road corridor. The present day layout of the area is given in Figure 1-1.
It has been established that the existing seawall does not meet current design standards for seismic performance, and that there are sections that are in need of general repair due to scour damage to the surface of the seawall. There is also the opportunity to create resilience to future climate and changing use patterns, particularly the impacts of ship wash as ferry and cruise ship operations intensify their activity.
While the upgrade is part of the overall plan for Downtown Auckland, it is also now an important enabler of the wider Downtown Infrastructure Development Programme (Downtown Programme) to ready the precinct for the America’s Cup (AC36) and Asia-Pacific Economic Cooperation (APEC) events in 2021.
The Downtown Programme is a result of a collaboration between Auckland Transport (AT), Auckland Council and Panuku Development Auckland. The Programme includes a number of projects as part of overall improvements to the city centre. In addition to the upgrade of the Quay Street seawall, the Programme includes the proposed relocation of Piers 3 and 4, a proposed Downtown Public Space, a proposed mooring dolphin at the end of Queens Wharf, and proposed streetscape works and bus facilities in Quay Street.
Figure 1-1 Present day layout

2
Tonkin & Taylor Ltd Quay Street Seawall Upgrade Project - Ferry Basin Section Coastal Effects Assessment Auckland Transport
May 2018 Job No: 1004393
1.1 Proposed Quay Street seawall upgrade
The proposed seawall has been divided into four sections for the purpose of resource consent applications and construction, as follows (from west to east):
Princes Wharf section;
Ferry Basin section;
Ferry Building section; and
Queens Wharf to Marsden Wharf section.
A separate resource consent application is being made for each of the sections, and each section will be constructed as a standalone project once consented. The sections may therefore be constructed sequentially, or there may be some overlap in the construction programme.
Resource consent applications for the Princes Wharf, Ferry Basin, and Queens Wharf to Marsden Wharf sections are to be lodged concurrently. Design options are still being considered for the Ferry Building section and the resource consent application for this section will be lodged at a later date.
1.2 Purpose and scope
This report provides an assessment of the actual and potential coastal effects of the proposed upgrade of the Ferry Basin section of the Quay Street seawall.
The proposed works are described in Section 2 with the coastal setting, processes and hazards presented in Sections 3 to 6. A description of existing structures is given in Section 6 and the present day and future effects are assessed and summarised in Section 7. Finally, conclusions are drawn in Section 8.

3
Tonkin & Taylor Ltd Quay Street Seawall Upgrade Project - Ferry Basin Section Coastal Effects Assessment Auckland Transport
May 2018 Job No: 1004393
2 Proposed Ferry Basin works
2.1 Overview
A post and panel wall is proposed for the Ferry Basin section of the Quay Street seawall upgrade.
The location of the Ferry Basin section is indicated in Figure 2-1. For this section, the post and panel wall is proposed immediately seaward of the existing seawall which is shown in Drawing No. 1004393-123, reproduced in Figure 2-2.
Figure 2-1 Location of the Ferry Basin section showing the existing seawall alignment (blue line).
The proposed post and panel wall will be approximately 90 m in length. The wall will consist of approximately 1.2 m wide “H” shaped reinforced concrete piles spaced at approximately 3 m centre-to-centre spacing. The outside face of the proposed seawall will extend no more than 1.5 m in to the CMA from the existing seawall face and the rock protecting toe will extend approximately 12 m from the new seawall line, beneath the waterline. Sections B1 and B2 in Drawing No. 1004393-135 (Figure 2-3) show the location of the proposed post and panel wall relative to the existing seawall as well as the anticipated depth of the piles. The piles will be embedded approximately 3 m into the underlying ECBF rock so that the total depth of the piles will be about 12 to 16 m beneath the ground surface at the top of the existing seawall, as shown on the Ferry Basin Long section on Drawing 1004393-130, Figure 2-4.
2.2 Construction
Construction methodologies have been assessed and are presented in Alta’s construction methodology for resource consent report (Alta, 2018). Three possible construction scenarios are proposed:

4
Tonkin & Taylor Ltd Quay Street Seawall Upgrade Project - Ferry Basin Section Coastal Effects Assessment Auckland Transport
May 2018 Job No: 1004393
Scenario 1: Piers 3 and 4 remain in their current form, with ferries continuing to use these structures during construction;
Scenario 2: Piers 3 and 4 have been previously deconstructed as part of a separate project, and ferries utilising Piers 3 and 4 relocated away from the works area; or
Scenario 3: some of Piers 3 and 4 have been deconstructed as part of a separate project, but some of Piers 3 and 4 remain in their current form. Ferries continue to use the piers that remain.
Construction would be largely undertaken from the landward side of the existing seawall, although a temporary staging platform or barge may be required in the coastal marine area (CMA). Constructing temporary staging would likely involve vibro piling steel tubular sections into the seafloor, framing being constructed across this, and precast concrete slabs being placed on top.
The new seawall construction includes piling, pre-cast installation, capping beam and anchor installation activities. Activities with relevance to the CMA are described in more detail in the following sub-sections.
2.2.1 Piling
The piling consists of installing an approximately 1200 mm diameter steel casing at 3 m centres, with a precast concrete H pile of approximately 900 mm x 900 mm being installed inside and concreted into place. Precast concrete panels are then installed within the H piles. The concrete H pile and precast panels will be installed no greater than 1.5 m in front of the existing wall with flowable fill being placed behind the panels.
The piling method is based on the following approach:
Remove a section of the existing wharf to create pile gates up to 5 m wide or use guide rails installed to provide pile location accuracy.
Localised excavation may be required in front of existing seawall to form a platform.
Oversized starter casing will have teeth and strengthening ring (shoe) welded to the starter casing and will be drilled through the rock apron until it meets refusal.
If an obstruction is encountered, a coring barrel will be used to drill inside the starter casing, coring through the obstruction.
Should core drilling through the obstruction be unsuccessful, a drop tool may be required to break and then remove the obstruction.
Drilling will utilise a casing oscillator while removing spoil until below rock apron.
Once below the rock apron the secondary pile casing (also with teeth) will be drilled inside the started casing, until it is set in competent material to form a groundwater seal.
Polymer may be required to prevent collapse at drilling face and decompression of the pile shaft during excavation. The casing must protrude above the wharf to create positive head. Secondary casing could also be utilised.
A drill bucket or auger can be used to drill and excavate the remaining length of pile. Spoil will be emptied into portable skips for loading out into trucks.
A cleaning bucket will be used to clean the socket in the rock.
Continue piling to required embedment with drilling bucket and cleaning bucket when pile is socketed into ECBF.

5
Tonkin & Taylor Ltd Quay Street Seawall Upgrade Project - Ferry Basin Section Coastal Effects Assessment Auckland Transport
May 2018 Job No: 1004393
2.2.1.1 H pile installation
Installation of the precast H Pile is difficult and requires significant temporary works to secure the H Pile in place to prevent the H Pile from moving during the concrete pour. It is envisaged that a work platform will need to be designed and installed as close as practically possible to the sea floor to install the temporary works required to support the H Pile. It is likely this will involve a temporary scaffolding structure supported off the seafloor (with no embedment) to provide worker access. The existing wharf could also be used to assist in preventing movement of the H pile.
Upon completion of the piling activities with the casing in place at a height determined by the contractor that is above the sea floor, the H Pile will be lowered into the cased borehole using the 150 Tonne crawler crane, the H Piles are anticipated to be up to 25 Tonne each.
The H Pile will need to be suspended off the bottom of the pile approximately 75 mm, (engineer to determine). The post orientation will need to be extremely accurate with centralisers.
With the H Pile secured in place and accurately oriented it can be concreted into position. The concrete will be placed by tremie method, with the casing sitting above sea floor level to contain the cementitious material generated from tremie pour.
Upon completion of the concreting, locking the H Pile in place, the temporary works can be removed with divers then cutting the pile casing at sea floor level.
2.2.2 Pre-cast panel installation
Precast panels are installed one at a time in between the flanges of precast H Piles. The panels will carefully be inserted into flanges of H Piles and lowered to the required height or sitting on previously installed panel, the bearing strips should be applied to the post prior to installation. Divers will likely be required to monitor the precast panel being lowered into position. The top of precast panel installed will require worker access or potentially divers to release the lifting device.
2.2.3 Capping beam
The capping beam will require false work that may utilise the existing wharf structure, temporary propping from the sea floor, recently installed post and panel wall or propping from the 1200 mm diameter casing.
A working platform with safety fencing will be required on the seaward side of the post and panel wall. These temporary works are to be left to the contractor to determine.
2.2.4 Backfill
Backfill behind the new post and panel wall and existing seawall is assumed to be flowable fill. Flowable fill will need to be placed using a concrete pump. Stop End formwork will be required at the end of the walls to contain the flowable fill. In addition, man access or more likely divers will be required to temporarily plug the weep holes in the precast panels during placement of the flowable fill. This final methodology should be left to the contractor to determine, it is not anticipated that there would be any discharge into the environment.
2.2.5 Ground Anchor
The ground anchors are required to be installed 6 m into the ECBF on a 45-degree angle, this gives a length of may be 25 m. The anchors will likely be installed from the land side using a tracked excavator also potentially off a barge or by rope access.

6
Tonkin & Taylor Ltd Quay Street Seawall Upgrade Project - Ferry Basin Section Coastal Effects Assessment Auckland Transport
May 2018 Job No: 1004393
2.2.6 Rock protecting toe
Upon completion of panel installation, flowable fill and ground anchors, a rock protecting toe will need to be placed at the toe of the precast post and panel wall. This will consist of an underlayer and primary rock armour layer, both overlying a geotextile filter fabric. This will likely be placed with excavators from either the landside or from a barge, depending on the area requiring reinstatement.

7
Tonkin & Taylor Ltd Quay Street Seawall Upgrade Project - Ferry Basin Section Coastal Effects Assessment Auckland Transport
May 2018 Job No: 1004393
Figure 2-2 Proposed seawall location (Drawing No. 1004393-123)

8
Tonkin & Taylor Ltd Quay Street Seawall Upgrade Project - Ferry Basin Section Coastal Effects Assessment Auckland Transport
May 2018 Job No: 1004393
Figure 2-3 Cross sections B1 and B2 (Drawing No. 1004393-135)

9
Tonkin & Taylor Ltd Quay Street Seawall Upgrade Project - Ferry Basin Section Coastal Effects Assessment Auckland Transport
May 2018 Job No: 1004393
Figure 2-4 Long section (Drawing 1004393-130)
10
Tonkin & Taylor Ltd Quay Street Seawall Upgrade Project - Ferry Basin Section Coastal Effects Assessment Auckland Transport
May 2018 Job No: 1004393
3 Coastal setting
3.1 General description
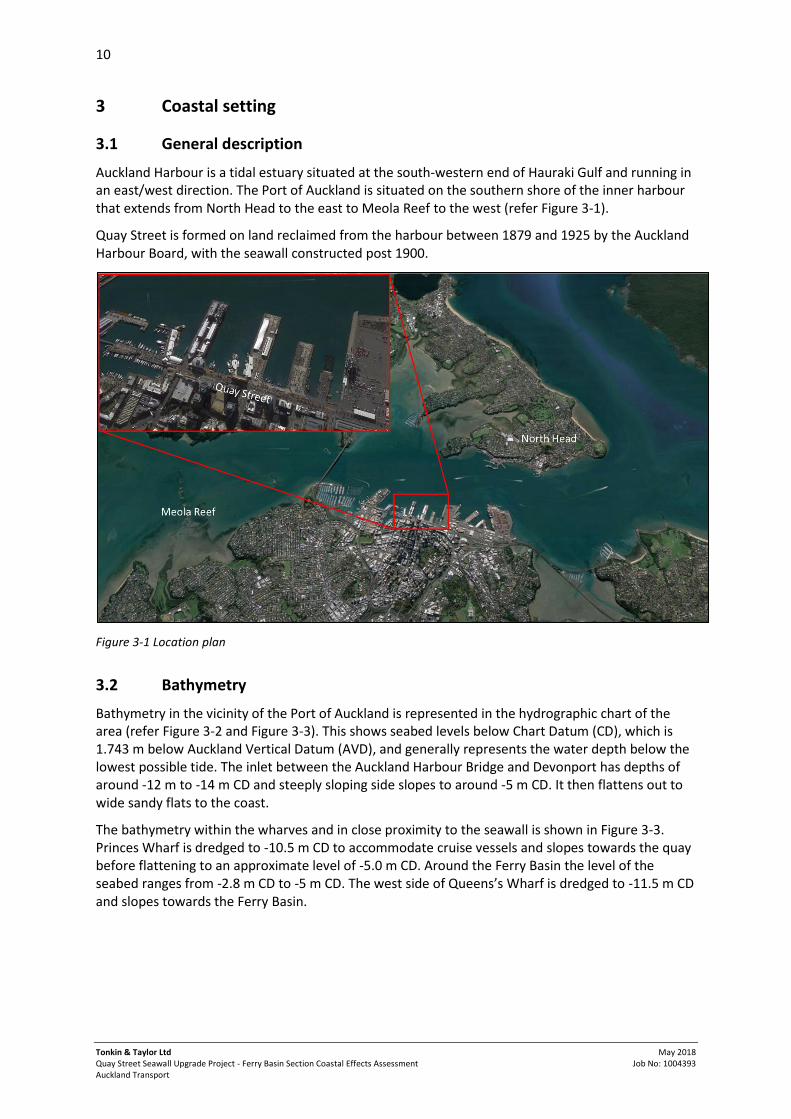
Auckland Harbour is a tidal estuary situated at the south-western end of Hauraki Gulf and running in an east/west direction. The Port of Auckland is situated on the southern shore of the inner harbour that extends from North Head to the east to Meola Reef to the west (refer Figure 3-1).
Quay Street is formed on land reclaimed from the harbour between 1879 and 1925 by the Auckland Harbour Board, with the seawall constructed post 1900.
Figure 3-1 Location plan
3.2 Bathymetry
Bathymetry in the vicinity of the Port of Auckland is represented in the hydrographic chart of the area (refer Figure 3-2 and Figure 3-3). This shows seabed levels below Chart Datum (CD), which is 1.743 m below Auckland Vertical Datum (AVD), and generally represents the water depth below the lowest possible tide. The inlet between the Auckland Harbour Bridge and Devonport has depths of around -12 m to -14 m CD and steeply sloping side slopes to around -5 m CD. It then flattens out to wide sandy flats to the coast.
The bathymetry within the wharves and in close proximity to the seawall is shown in Figure 3-3. Princes Wharf is dredged to -10.5 m CD to accommodate cruise vessels and slopes towards the quay before flattening to an approximate level of -5.0 m CD. Around the Ferry Basin the level of the seabed ranges from -2.8 m CD to -5 m CD. The west side of Queens’s Wharf is dredged to -11.5 m CD and slopes towards the Ferry Basin.

11
Tonkin & Taylor Ltd Quay Street Seawall Upgrade Project - Ferry Basin Section Coastal Effects Assessment Auckland Transport
May 2018 Job No: 1004393
Figure 3-2 Bathymetry of Waitematā Harbour (Source: LINZ Hydrographic Chart NZ5322)
Figure 3-3 Bathymetry of Commercial Harbour (Source: LINZ Hydrographic Chart NZ5322)
3.3 Geology and sediments
The present day downtown Auckland waterfront has been formed by shoreline reclamation and development over the past 150 years. This includes the Auckland Harbour Bridge reclamation, Westhaven Marina, Wynyard Quarter reclamation and wharves, Viaduct Harbour reclamation and wharves, Outer Viaduct Harbour, the Council-owned finger wharves and the Ports of Auckland wharves and terminals.
The Quay Street reclamation fill is underlain by Holocene age marine/alluvial sediments and Pleistocene age sediments of the Tauranga Group. The Holocene age marine/alluvial sediments consist predominantly of firm to stiff sandy silt with varying amounts of organic matter, and the Pleistocene age sediments consist predominantly of hard to stiff silts with occasional organic matter.
Beneath the sediments, Waitematā Group rock (East Coast Bays Formation (ECBF)) are present and consist predominantly of an alternating sequence of siltstone and lithic sandstone. A relatively thin

12
Tonkin & Taylor Ltd Quay Street Seawall Upgrade Project - Ferry Basin Section Coastal Effects Assessment Auckland Transport
May 2018 Job No: 1004393
layer (generally less than 2 m thick) of extremely weathered material mantles the rock. The Waitematā Group underlies much of the Auckland urban area and the total thickness is inferred to be 1000 m to 2000 m.
As shown in Figure 3-4 and Figure 3-5 the shallow shelf adjacent to the main channel comprises silty sands with some shell content. Previous analysis shows more than 30% of the sediment finer than 63 microns and 5% shells (Coastal Consultants NZ Ltd, 2001).
Figure 3-4 Spatial distribution of the proportion of silt and clay sized sediment in surficial deposits (Source: Coastal Consultants NZ Ltd, 2001)

13
Tonkin & Taylor Ltd Quay Street Seawall Upgrade Project - Ferry Basin Section Coastal Effects Assessment Auckland Transport
May 2018 Job No: 1004393
Figure 3-5 Spatial distribution of the proportion of gravel sized sediment in surficial deposits (Source: Coastal Consultants NZ Ltd, 2001)
Numerous geotechnical investigations have been undertaken on land landward of the existing seawall. There is more limited geotechnical investigation data seaward of the seawall, which has been undertaken as part of the present investigations using standard penetrometer testing (SPT), shear vanes and push tube sampling. These results show relatively shallow depths of fine sediment adjacent to the seawall with firmer ECBF material below, although visual evidence is that this material is more weathered near the surface.
Limited sediment sampling within the commercial harbour area was carried out by Gregory and Thompson (1973). The locations of the samples and sediment composition are shown in Figure 3-6 and Table 3-1 respectively. The results confirm predominantly very fine sands to muds in the vicinity of the Quay Street proposed works.
Figure 3-6 Location of sediment sampling in the vicinity of the port (Gregory and Thompson, 1973)

14
Tonkin & Taylor Ltd Quay Street Seawall Upgrade Project - Ferry Basin Section Coastal Effects Assessment Auckland Transport
May 2018 Job No: 1004393
Table 3-1 Sediment properties (Source: Gregory and Thompson, 1973)
Sample No. Sand (%) Silt (%) Clay (%) Median (micron)
175 18 38 43 7.8
176 46 33 21 38.5
177 15 39 46 6.8

15
Tonkin & Taylor Ltd Quay Street Seawall Upgrade Project - Ferry Basin Section Coastal Effects Assessment Auckland Transport
May 2018 Job No: 1004393
4 Coastal processes
4.1 Wind
Wind data was available from the historical National Institute of Water and Atmospheric Research (NIWA) weather gauging station at Mechanics Bay, situated to the east of the Port at 4 m above sea level and covering the period January 1955 to January 1962 (Figure 4-1). This wind rose shows an east/north east, west/south west bimodal wind climate, with the strongest winds occurring from the northern to easterly sectors.
Figure 4-1 Wind rose at Mechanics Bay showing wind speed (m/s) and direction based on daily observations from Jan 1955 to Jan 1962 (Source: CliFlow, NIWA)
4.2 Waves
The inner harbour area is sheltered from swells, and waves are generated from persistent winds acting on the water surface. The area is exposed to wind generated waves from the north-north west to north-east, with the greatest wave heights generated from the north-west at high tides due to the fetch extending into Shoal Bay of around 4 km. The remaining fetches are short (less than 1.5 km). Therefore wind generated wave heights are generally low (less than 0.3 m), with extreme significant wave heights in the order of 1.4 m with periods ranging from 3.5 to 5.7 seconds.

16
Tonkin & Taylor Ltd Quay Street Seawall Upgrade Project - Ferry Basin Section Coastal Effects Assessment Auckland Transport
May 2018 Job No: 1004393
4.3 Water levels
The Waitematā Harbour experiences semi-diurnal tides. The following table sets out commonly used definitions for high tide as measured at the Port of Auckland tide gauge based on astronomic drivers (i.e. excluding storm surge and atmospheric drivers). Tide levels are presented in relation to Chart Datum (CD).
Table 4-1 Predicted high tide water levels at POAL (Stephens et al., 2016 and LINZ, 2017)
Tide level Level (m CD)
Highest recorded sea level (23/01/2011) – 125 to 200 yr ARI 4.12
Highest Astronomic Tide HAT 3.70
Mean High Water Spring MHWS 3.39
Mean High Water Neaps MHWN 2.86
Mean Sea Level MSL 1.90
Mean Low Water Neaps MLWN 0.95
Mean Low Water Springs MLWS 0.41
4.4 Tidal currents
The main tidal currents are generated along the main channel flowing west and east. Measurements of tidal flow are shown in Figure 4-2 and Figure 4-3 for peak ebb and flood conditions. These figures show the concentration of flows in the main channel and the formation of small eddies adjacent to the channel, including the outer parts of the Ferry Basin, although no currents are recorded in the inner part of the basin.
Figure 4-2 Measured tidal flows 3 hour after spring tide (Source: Vennell, 2012)

17
Tonkin & Taylor Ltd Quay Street Seawall Upgrade Project - Ferry Basin Section Coastal Effects Assessment Auckland Transport
May 2018 Job No: 1004393
Figure 4-3 Measured tidal flows 10 hour after spring tide (Source: Vennell, 2012)
4.5 Vessel wakes
Vessels can generate boat wakes and due to the Ferry Basin being a terminus for ferries and also accommodating cruise ships, vessel wake can be a significant contributor to waves and this can affect sediment transport. These waves are generally of a longer period than the wind generated waves (Currie, 2014). Calculations made by Sinclair Knight Mertz predict that the maximum wave heights at 30 m and 150 m from the sailing line for the largest ferry (Superflyte) operating at 12 knots would be about 0.8 m and 0.6 m, respectively (Chin, 2012).
Wave and wake modelling was undertaken by Cardno Pty Ltd (2018) for the America’s Cup 36 resource consent application. The modelling used SWASH software, which employs non-linear shallow water equations to predict wave and wake transmission as well as reflection from breakwaters and quay walls. As part of their analysis they modelled the existing situation.
Based on the analysis of the measured wake heights, a design wake with a wave height of 0.45 m and a period of 5 seconds was run for 30 minutes originating from 30, 45, 60 and 75 degrees. Results for analysis were taken from the last 20 minutes of this run time. The results of this modelling, for the present day layout, are given in Figure 4-4 where the wake height can be seen to propagate through Princes and Queens Wharf and wave reflection effects can be seen off the various existing seawall and wharf structures. Wakes propagating from 30 and 45 degrees are shown to result in the largest wave heights around the Ferry Basin.

18
Tonkin & Taylor Ltd Quay Street Seawall Upgrade Project - Ferry Basin Section Coastal Effects Assessment Auckland Transport
May 2018 Job No: 1004393
Figure 4-4 Wake wave modelling results – existing situation (Source: Cardno, 2017)
4.6 Propeller wash
In general, jets generated by propulsion systems can be compared with free jets. A free jet is defined as the water flowing out of an orifice into the surrounding water without any disturbance by lateral boundaries or walls that may hinder the spreading of the jet (CIRIA, 2007). The jet of water generated from vessel propellers during the mooring process can generate large localised velocities (refer Figure 4-5).
A high level assessment has been undertaken to assess velocities from the main propeller for different vessel types during the berthing and departure process. Assuming up to 15% power output during manoeuvres (PIANC, 2015), the bed velocities at the seawall are presented in Table 4-2 to show the potential for vessel induced scour.
It has been assumed that cruise vessels berth both stern and bow first and once moored, the main propeller has been estimated to be 60 m from the quay at Princes Wharf and 150 m from the quay at Queens Wharf west. The use of thrusters on either the port or starboard side of the vessels will have a scour effect on the wharves to which they are berthing but less of an effect to the proposed seawall along Quay Street. Therefore the use of thrusters has not been assessed. It has conservatively been assumed that cruise vessels berth and depart without the assistance of tug boats.
To determine velocity distribution and bed velocities the PIANC (2015) methodologies have been used. Velocities from the cruise vessels, as seen in Table 4-3, are fairly evenly distributed through the water column by the time they reach the seawall and peak bed velocities near the seawall are around 2.6 m/s.

19
Tonkin & Taylor Ltd Quay Street Seawall Upgrade Project - Ferry Basin Section Coastal Effects Assessment Auckland Transport
May 2018 Job No: 1004393
For the ferries within the Ferry Basin the distribution of propeller wash velocities are shown in Table 4-4. Velocities in line with the propeller reach around 2.8 m/s at 10 m distance. At the seabed, velocities reduce to around 1.4 m/s at MLWS.
It is noted that these are velocities calculated with an empirical formula based on an assumed power value (15% of total power) and lower and higher power use will change these results.
Research on hydraulic erosion of concrete by a submerged jet (Hocheng and Weng, 2002) identified that erosion can occur to 35 MPa concrete and that loss is proportional to exposure time and hydraulic pressure and that material loss started with velocities over 10 m/s. Due to the age of the existing seawall it is unlikely that the wall will be as strong as 35 MPa and therefore the calculated velocities suggest sufficient force to cause material damage to the seawall (as has been observed at the Ferry Building section) and velocities at the seabed are sufficient to cause scour of fine silty sand and erosion of the ECBF rock. Table 4-2 summaries the vessel velocities at the seawall in line with the propeller and the associated bed velocities.
Table 4-2 Summary of vessel velocity distributions
Vessel type Distance to seawall (m) Velocity at centre line (m/s) Bed velocity (m/s)
Cruise 60 3.0 2.6
Ferry 10 2.8 1.4
Figure 4-5 Flow field induced by a main propeller (CIRIA, 2007)

20
Tonkin & Taylor Ltd Quay Street Seawall Upgrade Project - Ferry Basin Section Coastal Effects Assessment Auckland Transport
May 2018 Job No: 1004393
Table 4-3 Velocity distribution from cruise vessels using 15% power
Depth below propeller (m)
Horizontal from propeller (m)
5 10 15 20 25 30 35 40 45 50 55 60 65 70 75 80
Vaxis (0) 35.7 17.8 11.9 8.9 7.1 5.9 5.1 4.5 4.0 3.6 3.2 3.0 2.7 2.5 2.4 2.2
1 19.3 15.3 11.1 8.6 7.0 5.8 5.0 4.4 3.9 3.5 3.2 3.0 2.7 2.5 2.4 2.2
2 3.0 9.6 9.0 7.6 6.5 5.5 4.8 4.3 3.8 3.5 3.2 2.9 2.7 2.5 2.4 2.2
3 0.1 4.5 6.4 6.3 5.7 5.1 4.5 4.1 3.7 3.4 3.1 2.9 2.7 2.5 2.3 2.2
4 0.0 1.5 4.0 4.8 4.8 4.5 4.2 3.8 3.5 3.2 3.0 2.8 2.6 2.4 2.3 2.1
5 0.0 0.4 2.1 3.4 3.9 3.9 3.7 3.5 3.3 3.1 2.9 2.7 2.5 2.4 2.2 2.1
(MHWS at -5m CD) 5.39 0.0 0.2 1.6 2.9 3.5 3.6 3.5 3.4 3.2 3.0 2.8 2.6 2.5 2.3 2.2 2.1
6 0.0 0.1 1.0 2.2 2.9 3.2 3.2 3.2 3.0 2.9 2.7 2.5 2.4 2.3 2.2 2.0
7 0.0 0.0 0.4 1.4 2.1 2.6 2.8 2.8 2.7 2.6 2.5 2.4 2.3 2.2 2.1 2.0
(MLWS at -10.5m CD) 7.91 0.0 0.0 0.2 0.8 1.5 2.0 2.3 2.4 2.5 2.4 2.4 2.3 2.2 2.1 2.0 1.9
9 0.0 0.0 0.0 0.4 1.0 1.5 1.8 2.0 2.1 2.2 2.1 2.1 2.0 2.0 1.9 1.8
10 0.0 0.0 0.0 0.2 0.6 1.1 1.4 1.7 1.9 1.9 1.9 1.9 1.9 1.9 1.8 1.8
(MHWS at -10.5m CD) 10.89 0.0 0.0 0.0 0.1 0.4 0.8 1.1 1.4 1.6 1.7 1.8 1.8 1.8 1.8 1.72 1.7

21
Tonkin & Taylor Ltd Quay Street Seawall Upgrade Project - Ferry Basin Section Coastal Effects Assessment Auckland Transport
May 2018 Job No: 1004393
Table 4-4 Velocity distribution from ferries using 15% power
Depth below propeller (m)
Horizontal from propeller (m)
5 10 15 20 25 30 35 40 45 50 55 60 65 70 75 80
Vaxis (0) 5.6 2.8 1.9 1.4 1.1 0.9 0.8 0.7 0.6 0.6 0.5 0.5 0.4 0.4 0.4 0.4
0.5 4.8 2.7 1.8 1.4 1.1 0.9 0.8 0.7 0.6 0.6 0.5 0.5 0.4 0.4 0.4 0.4
1 3.0 2.4 1.7 1.4 1.1 0.9 0.8 0.7 0.6 0.6 0.5 0.5 0.4 0.4 0.4 0.4
1.5 1.4 2.0 1.6 1.3 1.1 0.9 0.8 0.7 0.6 0.6 0.5 0.5 0.4 0.4 0.4 0.3
2 0.5 1.5 1.4 1.2 1.0 0.9 0.8 0.7 0.6 0.5 0.5 0.5 0.4 0.4 0.4 0.3
(MLWS at -2.8m CD) 2.10 0.4 1.4 1.4 1.2 1.0 0.9 0.8 0.7 0.6 0.5 0.5 0.5 0.4 0.4 0.4 0.3
3 0.0 0.7 1.0 1.0 0.9 0.8 0.7 0.6 0.6 0.5 0.5 0.5 0.4 0.4 0.4 0.3
3.5 0.0 0.4 0.8 0.9 0.8 0.8 0.7 0.6 0.6 0.5 0.5 0.4 0.4 0.4 0.4 0.3
(MHWS at -2.8m CD) 5.08 0.0 0.1 0.3 0.5 0.6 0.6 0.6 0.5 0.5 0.5 0.4 0.4 0.4 0.4 0.3 0.3

22
Tonkin & Taylor Ltd Quay Street Seawall Upgrade Project - Ferry Basin Section Coastal Effects Assessment Auckland Transport
May 2018 Job No: 1004393
4.7 Sediment transport
Sediment transport pathways were evaluated as part of the assessment of fate of dredged sediments from the dredging of Rangitoto Channel (Coastal Consultants, 2001). Figure 4-1 shows the inferred sediment transport pathways that indicate the commercial harbour area is a zone of deposition, but at lower rates than other parts of the Waitematā Harbour.
20 years’ worth of suspended sediment concentrations within the lower Waitematā Harbour were analysed by Beca (2018), the results of this analysis provide a mean ambient sediment concentration of 0.01 kg/m3.
In order to derive suspended sediment concentrations caused by vessel wakes within the Ferry Basin the particle size distribution as provided by Gregory & Thompson (1973) in Table 3-1 have been used. Assuming a vessel wake of 0.45 m with 5 second period and a water depth of 3.21 m (MLWS 0.41 m CD plus bed level of at 2.8 m CD) sediment concentrations may reach up to 0.13 kg/m3 near the surface and have a depth average concentration of around 0.06 kg/m3.
From this analysis we can see that suspended sediment concentrations within the Ferry Basin due to vessel wakes are an order of magnitude higher than the ambient lower Waitematā Harbour.
Beca (2018) describe in the America’s Cup 36 resource consent application coastal process report that sedimentation in the Waitematā Harbour and particularly the city waterfront basins, is largely driven by:
Fine sediments carried in local stormwater from the city, which flocculate on contact with seawater and settle out of suspension in quiescent areas.
Fine sediments derived from the wider Waitematā Harbour catchment and unarmoured coastal margins, and from reworking of existing intertidal sediments with the harbour.
Vessel movements around low tide disturb seabed sediments at the sites. The remobilised sediment is dispersed through the water column and ultimately resettles in natural depositional areas such as the waterfront basins.

23
Tonkin & Taylor Ltd Quay Street Seawall Upgrade Project - Ferry Basin Section Coastal Effects Assessment Auckland Transport
May 2018 Job No: 1004393
Figure 4-1 Inferred transport pathways and depositional zones of fine material showing port area to be a depositional zone (Source: Coastal Consultants, 2001)

24
Tonkin & Taylor Ltd Quay Street Seawall Upgrade Project - Ferry Basin Section Coastal Effects Assessment Auckland Transport
May 2018 Job No: 1004393
5 Coastal hazard
5.1 Extreme water levels
Storm surge results from the combination of barometric set-up due to low atmospheric pressure, and wind stress from winds blowing along or onshore which elevates the water level above the predicted tide. The combined elevation of the predicted tide and storm surge is known as the storm-tide. Stephens et al. (2016) derived extreme sea-level elevations for open-coast locations. The levels for a range of return periods are shown in Table 5-1.
Table 5-1 Extreme water levels at the Ports of Auckland (Source: Stephens, et al. 2016)
AEP 39% 18% 10% 5% 2% 1% 0.5%
ARI 2 yr 5 yr 10 yr 20 yr 50 yr 100 yr 200 yr
Level (m CD)
3.78 3.86 3.92 3.97 4.05 4.10 4.15
Level (m AVD46)
2.04 2.12 2.18 2.23 2.31 2.36 2.41
5.2 Sea level rise
Sea level rise (SLR) is likely to exacerbate the coastal erosion and inundation hazard. Historical sea level rise in New Zealand has averaged 1.7 ± 0.1 mm/year (Bell, 2012). Climate change is predicted to accelerate this rate into the future.
The Ministry for the Environment (MfE, 2017) guidelines on climate change use four sea level rise scenarios based on the Intergovernmental national Panel on Climate Change (IPCC, 2015) projections of three Representative Concentration Pathway (RCP) emission scenarios. These are the median projections of the RCP 2.6, RCP 4.5 and RCP 8.5, and (RCP 8.5+) the upper end of the ‘likely range’ (i.e. 83rd percentile) of the RCP 8.5 projection. The latter is primarily for the purposes of stress-testing adaptation plans where the risk tolerance is low and/or future adaptation options are limited, and for setting a SLR for greenfield development or major new infrastructure where the foreseeable risk is to be avoided (MfE, 2017).
The projections of the potential future scenarios (RCP 2.6, RCP 4.5, RCP 8.5 and RCP 8.5+) adjusted to the New Zealand regional scale shown in Table 5-2 give the specific values used for 2070 and 2120. MfE (2017) provide guidance on minimum SLR allowances for planning instruments for the next 100 years. This includes a level of 0.65 m for non-habitable short-lived assets with a need to be at the coast and either low-consequence or readily adaptable, and 1 m for land use planning controls for existing coastal development and asset planning.
Table 5-2 Sea level rise projections from the 1986-2005 baseline for the four emission scenarios (MfE, 2017)
Year RCP 2.6 M RCP 4.5 M RCP 8.5M RCP 8.5+
2070 0.32 0.36 0.45 0.61
2120 0.55 0.67 1.06 1.36
Note: MSL is the same for both 1986 -2005 and 2006-2011 baselines
A summary of water levels are included in Table 5-3 based on 1 m sea level rise. As discussed in Section 4.2, the adjacent coast is sheltered from waves outside the Hauraki Gulf, with additional

25
Tonkin & Taylor Ltd Quay Street Seawall Upgrade Project - Ferry Basin Section Coastal Effects Assessment Auckland Transport
May 2018 Job No: 1004393
sheltering effects of the wharf structures meaning that only relatively small fetch limited wind waves are expected across the breadth of the harbour channel. Contributions from wave effects to the water levels in Table 5-3 are considered to be negligible. Based on current understanding of sea level rise under the various concentration trajectories, a 1 m sea level rise above the 1986-2005 mean sea level baseline is unlikely to occur over the next 100 years for the median projections of RCP2.6 and 4.5 concentration trajectories. However, it may occur by 2115 based on the median RCP8.5 trajectory.
Table 5-3 Inundation level summary based on 1 m sea level rise
Level Elevation (m CD) Elevation (m AVD46)
Pre
sen
t
Current 1% AEP inundation level (tide + storm surge)
4.10 2.36
Highest Astronomical Tide (HAT) 3.70 1.96
Tim
efr
ame
Current mean high water level (MHWS) 3.39 1.65
10
0 y
ear
s
Future 1% AEP inundation level (1.0 m SLR allowance in AUP)
5.10 3.36
Future HAT (1.0 m SLR allowance) 4.70 2.96
Future MHWS + (1.0 m SLR allowance) 4.39 2.65
5.3 Tsunami
A national tsunami hazard study has been carried out by GNS (Power, 2014). The open coast was divided into 20 km long cells and tsunami heights were estimated at around 250 m intervals along the coast, with the maximum tsunami amplitude within each cell plotted.
Table 5-1 shows the extent of the zone relevant to the Ports of Auckland and the projected return period for maximum tsunami height within this 20 km open coast zone. Figure 5-2 shows the estimated magnitude that an earthquake on each source would need to be to produce a tsunami that would reach this height according to GNS de-aggradation.

26
Tonkin & Taylor Ltd Quay Street Seawall Upgrade Project - Ferry Basin Section Coastal Effects Assessment Auckland Transport
May 2018 Job No: 1004393
Figure 5-1 Coastal cell for Waitematā Harbour (Zone 31) tsunami assessment and projected maximum amplitudes (Source: Power, 2014)

27
Tonkin & Taylor Ltd Quay Street Seawall Upgrade Project - Ferry Basin Section Coastal Effects Assessment Auckland Transport
May 2018 Job No: 1004393
Figure 5-2 De-aggradation for Zone 31 (Source: Power, 2014)
Based on experience with modelling tsunami at Tauranga and Wellington, there is significant
damping of tsunami height within the more sheltered harbour/estuary settings compared to the
more exposed open coasts. An example of damping due to a smaller harbour entrance is shown for
Wellington Harbour that also has a relatively deep entrance channel, similar to the Waitematā Inlet
(Figure 5-3).

28
Tonkin & Taylor Ltd Quay Street Seawall Upgrade Project - Ferry Basin Section Coastal Effects Assessment Auckland Transport
May 2018 Job No: 1004393
Figure 5-3 Maximum flow depth generated by a Mw 9.0 event along the Hikurangi Trench showing significant damping of amplitude within Wellington Harbour (Source: Mueller, et al. 2014). Colour scale is maximum water level in metres (refer scale at right hand side).
NIWA (Lane et al., 2009) carried out more detailed tsunami modelling for the Auckland region. This
study modelled a tsunami generated by a Mw 9.5 earthquake from Peru/Chile at present day MHWS
and MHWS +0.5 m. This event closely matches the required earthquake to generate a 500 year
magnitude tsunami of around 3.6 m, but is less than the 2,500 year magnitude event (Mw 9.63). The
modelling results in the vicinity of the port for velocity and inundation depth are shown in Figure 5-4
to Figure 5-7 for present day and with 0.5 m sea level rise. It is noted that these plots are of limited
resolution due to the size of plots presented in the NIWA report.
These results show low velocities within the port area (less than 0.1 m/s) with greater speeds in the
main channel, typically between 2 to 3 m/s, with localised areas of higher currents. Inundation
depths are typically 0 to 1 m above MHWS, although greater levels of inundation are evident in

29
Tonkin & Taylor Ltd Quay Street Seawall Upgrade Project - Ferry Basin Section Coastal Effects Assessment Auckland Transport
May 2018 Job No: 1004393
localised areas of Lighter Basin and Westhaven Marina (up to 3 m). No inundation risk is identified
along Quay Street.
Figure 5-4 Maximum inundation speed for South American Tsunami scenario at MHWS (Lane et al, 2009)
Figure 5-5 Maximum inundation speed for South American Tsunami scenario at MHWS + 0.5 m (Lane et al, 2009)

30
Tonkin & Taylor Ltd Quay Street Seawall Upgrade Project - Ferry Basin Section Coastal Effects Assessment Auckland Transport
May 2018 Job No: 1004393
Figure 5-6 Maximum inundation depth for South American Tsunami scenario at MHWS (Lane et al, 2009)
Figure 5-7 Maximum inundation depth for South American Tsunami scenario at MHWS + 0.5 m (Lane et al, 2009)

31
Tonkin & Taylor Ltd Quay Street Seawall Upgrade Project - Ferry Basin Section Coastal Effects Assessment Auckland Transport
May 2018 Job No: 1004393
6 Existing structures
A structural dive condition assessment was carried out by GHD (2017). The seawall was split in to seven sections, refer Figure 6-1, and visual condition assessment undertaken. A summary of the findings found at the Ferry Basin are presented here to provide an overview of the existing structures and their condition.
Figure 6-1 Seawall sections from structural dive assessment (Source: GHD, 2017)
Area 3 is located within the Ferry Basin near Piers 3 and 4. The seawall in this area was constructed from 1923 to 1925 of placed rock and mass concrete, with a face height of up to about 4 m. At some stage rocks have been placed along the toe of the wall and a sprayed concrete shotcrete layer has been applied to the wall and also over the rocks at the toe of the wall. A typical cross section of this is shown in Figure 6-2 and photograph in Figure 6-3. The condition assessment rates the seawall in average to poor condition and states that undermining of the rock protection occurs along its length with consequential cracking of the sprayed concrete.
Area 4 is located within the Ferry Basin near Pier 2. The seawall in this area was constructed in 1906 as a mass concrete seawall with bluestone plum aggregate. The condition assessment rates the seawall in very poor condition with severe erosion and wall undermining. Cross sections are not provided for Area 4 but an above water level photograph is given in Figure 6-4.

32
Tonkin & Taylor Ltd Quay Street Seawall Upgrade Project - Ferry Basin Section Coastal Effects Assessment Auckland Transport
May 2018 Job No: 1004393
Figure 6-2 Area 3 typical cross section (Source: GHD, 2017)

33
Tonkin & Taylor Ltd Quay Street Seawall Upgrade Project - Ferry Basin Section Coastal Effects Assessment Auckland Transport
May 2018 Job No: 1004393
Figure 6-3 Area 3 undermining of rock protection at the base of the seawall (Source: GHD, 2017)
Figure 6-4 Area 4 seawall (Source: GHD, 2017)

34
Tonkin & Taylor Ltd Quay Street Seawall Upgrade Project - Ferry Basin Section Coastal Effects Assessment Auckland Transport
May 2018 Job No: 1004393
7 Effects assessment
As set out in the previous sections of this report, the Ferry Basin area is sheltered from wind generated waves and tidal currents and is likely to be an area prone to sedimentation. Vessel wakes, and in particular propeller wash during berthing and departure, is likely to have a material impact on sediment movement within the basin and has contributed to erosion of both the Quay Street seawall and the supporting ECBF rock where ferries are moored in close proximity and the propellers are facing the structure.
The seawall section proposed at the Ferry Basin will be constructed in front of the existing seawall and will therefore have potential effects in the CMA. To facilitate construction there may be a requirement for an additional laydown area within the CMA at the western end of the project area. The following two sub-sections summarise the effects in both the short term considering construction, and the long term.
7.1 Short term
The suspended sediment concentrations within the Ferry Basin have been shown to be an order of magnitude higher than the ambient lower Waitematā Harbour due to the combination of high proportions of silts and clays on the seabed and disturbance from vessel wakes and propeller wash.
Geotechnical borehole investigations indicate that the material likely to be disturbed during excavation and piling operations consists of basalt boulders, cobbles and gravels with small traces of silt.
During the proposed piling works the sediment release mechanisms can be compared to that of a cutter suction dredger as both use a rotating cutter head to bore through the seabed. During this process a fraction of the fragments are expelled during the fragmentation while the turbulence induced by the centrifugal force result in the suspension of sediments around the cutter head.
Coarse material will settle close to the area of disturbance but there is likely to be a visual effect by slightly higher levels of discolouration around the work area as sediment is brought into suspension. If practical to do so, it is recommended that a silt curtain be utilised to contain suspended sediments to the work area.
The settling velocity of silt has been calculated to be around 0.001 m/s. Assuming a water depth of 3 m, the silt particles would take around 50 mins to settle from the water surface to the seabed. Due to the low tidal currents the sediment brought in to suspension is likely to settle back within the commercial harbour area.
The probability of large silt plumes as a result of excavation and piling operations is therefore low and the short term effects to the coastal processes are minor.
7.2 Long term
The potential long term effects of the proposed works on coastal processes relate to changes to the movement and flow of the sea and resulting changes in sediment transport.
The existing coastal environment is a natural sedimentation area, but with vessel wakes causing disturbance, scour and resuspension of sediments on the seabed. The vessel wakes and jets can reflect off the vertical surfaces and result in scour and movements of sediment in areas close to the propeller wash.
The works cover an existing vertical wall, the orientation will be unchanged and the wall footprint will move up to 1.5 m into the CMA. The wall will still be impermeable and reflective so there will be no change to wave reflection patterns off the wall from vessel wakes or propeller jets.

35
Tonkin & Taylor Ltd Quay Street Seawall Upgrade Project - Ferry Basin Section Coastal Effects Assessment Auckland Transport
May 2018 Job No: 1004393
The proposed rock protection at the toe of the wall will act to limit scour effects at the base of the wall and will translate possible scour effects to the seaward edge of the rock protection. This will result in a change in the location of scour effects but not change the scour process. The rock protection will be self-healing in that if it is undermined the rock will naturally settle and continue to provide protection to the base of the seawall. The rock protecting toe will extend approximately 12 m along the seabed and therefore provide additional substrate for encrusting organisms which are likely to quickly re-colonise the area.
The works will not change the future effects of climate change or tsunami in terms of coastal processes, but will improve resilience with a structure designed to withstand the required forces.
7.3 Summary of effects
The short term effect of the construction works is largely related to water clarity due to the piling and removal of rock / bed material. Due to relatively high level of suspended silts in the ambient environment generated by vessel wake and propeller wash the relative effect of this process is low. Low tidal currents will limit the plume extent during piling and construction and it is expected suspended sediments will settle within the commercial harbour area. Apart from the occupation of a small area of the CMA, over the long term the proposed works will have no adverse effect on the physical coastal environment.

36
Tonkin & Taylor Ltd Quay Street Seawall Upgrade Project - Ferry Basin Section Coastal Effects Assessment Auckland Transport
May 2018 Job No: 1004393
8 Conclusion
The seawall sections proposed at the Ferry Basin will be constructed in front of the existing seawall and will therefore have potential effects in the CMA. In addition, to facilitate construction there may be a requirement for a small additional laydown area within the CMA.
A post and panel wall is proposed for the Ferry Basin section of the Quay Street seawall upgrade.
The short term effect of the construction works is largely related to water clarity due to the piling and removal of rock / bed material for both the temporary works and the seawall itself. Due to relatively high levels of suspended sediment generated by vessel wake and propeller wash the relative effect of this process is low. Due to the low tidal currents the sediment brought in to suspension is likely to settle back within the commercial harbour area so the short terms effects to the coastal processes are minor.
The proposed works cover an existing vertical wall, but the orientation of the wall will be unchanged and the wall footprint will move up to 1.5 m into the CMA. The wall will still be impermeable and reflective so there will be no change to wave reflection patterns off the wall from vessel wakes or propeller jets and so it is considered that there will be no long term adverse effects.
The works will not change the future effects of climate change or tsunami in terms of coastal processes, but will improve resilience with a structure designed to withstand the required forces.

37
Tonkin & Taylor Ltd Quay Street Seawall Upgrade Project - Ferry Basin Section Coastal Effects Assessment Auckland Transport
May 2018 Job No: 1004393
9 References
Alta (2018) Quay Street Seawall Consent Methodology
Beca (2018) America’s Cup 36, Auckland 2021 – Coastal Processes & Dredging Technical Report
Cardno Pty Ltd (2018) Americans Cup Investigations – Numerical Wave Modelling
CIRIA, CUR, CETMEF (2007). The Rock Manual. The use of rock in hydraulic engineering (2nd edition). C683, CIRIA, London.
Coastal Consultants NZ Ltd (2001). Rangitoto channel – proposed deepening of commercial shipping channel, Assessment of effects of proposed dredging on sedimentary processes (Draft), prepared for Beca, May 2001. CliFlow, NIWA.
Currie, S (2014) Effect of Ocean Waves on the Viaduct Marina, Auckland. Thesis for the degree of Master of Civil and Environmental Engineering in Coastal Engineering, The University of Auckland.
Chin, C (2012) Wave surge - Viaduct Marina. Sinclair Knight Merz, Auckland.
GHD (2017) Quay Street Seawall Structural Condition Inspection Assessment Report
Gregory, M.R. and S.A. Thompson (1973) Recent sediments of the Waitematā Harbour, University of Auckland, October 1973.
Hannah, J and Bell, R.G. (2012) Regional sea level trends in New Zealand. Journal of Geophysical Research. Vol 117, C01004.
Hocheng, H. and C.H. Weng (2002) Hydraulic erosion of concrete by a submerged jet. Journal of Material Engineering and Performance, pp 256 Vol 11(3) June 2002.
IPCC, 2014: Climate Change 2014: Synthesis Report. Contribution of Working Groups I, II and III to the Fifth Assessment Report of the Intergovernmental Panel on Climate Change [Core Writing Team, R.K. Pachauri and L.A. Meyer (eds.)]. IPCC, Geneva, Switzerland, 151 pp.
Lane, E., R. Walters, J. Arnold, M. Enright, H. Rouston (2009) Auckland Regional Council Tsunami Inundation Study, prepared by National Institute of Water and Atmospheric Research Ltd for Auckland Regional Council, Technical Report 2009/113.
MfE (2017). Preparing for climate change: A guide for local government in New Zealand.
Mueller, C, Power W.L., Wang, X. (2014) Investigation of the effects of earthquake complexity on tsunami inundation hazard in Wellington Harbour. GNS Science Consultancy Report 2014/198.
PIANC (2015). Guideline for protecting berthing structures from scour caused by ships. PIANC Report No. 180. Brussels.
Power, W.L. (2014) Tsunami hazard curves and de-aggradation plots for 20 km coastal sections, derived from the 2013 National Tsunami Hazard Model.
Stephens, S., Wadhwa, S and Tuckey, B (2016). Coastal inundation by storm-tides and waves in the Auckland region. Prepared by the National Institute for Water and Atmospheric Research, NIWA and DHI Ltd for Auckland Council. Auckland Council technical report, TR2016/017T+T (2012). Quay Street seawall geotechnical and ground contamination assessment. Tonkin & Taylor Ltd report ref 28557.002 V1.00 for Auckland Transport, September 2012.
Vennell, R. (2012). Fergusson terminal extension acoustic Doppler current profiler tidal current measurement surveys: 1995 to 2011, Report prepared by Ocean Currents Ltd for Ports of Auckland Ltd, May 2012.

38
Tonkin & Taylor Ltd Quay Street Seawall Upgrade Project - Ferry Basin Section Coastal Effects Assessment Auckland Transport
May 2018 Job No: 1004393
10 Applicability
This report has been prepared for the exclusive use of our client Auckland Transport, with respect to the particular brief given to us and it may not be relied upon in other contexts or for any other purpose, or by any person other than our client, without our prior written agreement.
We understand and agree that Auckland Transport will submit this report to Auckland Council in support of an application for resource consent for the development described herein and that Auckland Council will rely on this report for the purpose of assessing that application.
Tonkin & Taylor Ltd
Report prepared by: Authorised for Tonkin & Taylor Ltd by:
.......................................................... ...........................….......…...............
Andrew Brown Richard Reinen-Hamill
Coastal Engineer Technical Director – Coastal
ANBR \\ttgroup.local\corporate\auckland\projects\1004393\workingmaterial\coastal\report\consenting\ferry_basin\final_final_final\coastal processes ferry basin.docx

39
Tonkin & Taylor Ltd Quay Street Seawall Upgrade Project - Ferry Basin Section Coastal Effects Assessment Auckland Transport
May 2018 Job No: 1004393

40
Tonkin & Taylor Ltd Quay Street Seawall Upgrade Project - Ferry Basin Section Coastal Effects Assessment Auckland Transport
May 2018 Job No: 1004393