Research Article Dual Circularly Polarized Patch Antenna with ...
Upload
independentCategory
view
0download
0
Crystals 2014, 4, 228-240; doi:10.3390/cryst4030228
crystals ISSN 2073-4352
www.mdpi.com/journal/crystals
Article
Quasi-Linear Polarized Modes in Y-Rotated Piezoelectric GaPO4 Plates
Cinzia Caliendo * and Fabio Lo Castro
Istituto di Acustica e Sensoristica Corbino, IDASC-CNR, Via del Fosso del Cavaliere 100,
00133 Roma, Italy; E-Mail: [email protected]
* Author to whom correspondence should be addressed; E-Mail: [email protected];
Tel.: +39-6-4548-8741; Fax: +39-6-4548-8061.
Received: 30 April 2014; in revised form: 14 June 2014 / Accepted: 16 June 2014 /
Published: 7 July 2014
Abstract: The propagation of both surface and flexural acoustic plate modes along
y-rotated x-propagation GaPO4 piezoelectric substrates was studied for several y-cut
angles: the phase velocity and coupling coefficient dispersion curves were theoretically
calculated for two different electroacoustic coupling configurations. The investigation of
the acoustic field profile across the plate thickness revealed the presence of thin plate
modes having polarization predominantly oriented along the propagation direction, and
hence suitable for operation in liquid environment. These modes include the linearly
polarized Anisimkin Jr. and the quasi longitudinal plate modes, AMs and QLs, showing a
phase velocity close to that of the longitudinal bulk acoustic wave propagating in the same
direction. The temperature coefficient of delay (TCD) of these longitudinal modes was
investigated in the −20 to 420 °C temperature range, in order to identify thermally stable or
low TCD cuts. The power flow angle, i.e., the angle between the phase and group velocity
vectors, was also estimated to evaluate the substrate anisotropy effect on the acoustic wave
propagation. The GaPO4 intrinsic properties, such as its resistance to high temperature and
its chemical inertness, make it especially attractive for the development of acoustic
waves-based sensors for applications in harsh liquid environment.
Keywords: GaPO4; Anisimkin Jr. modes; quasi longitudinal modes; piezoelectricity
OPEN ACCESS

Crystals 2014, 4 229
1. Introduction
The electroacoustic devices based on the surface and bulk acoustic waves (SAW and BAW)
propagation, such as resonators or delay lines, are known for their wide range of applications in
chemical, biological and physical sensing fields. When these devices are required to operate in a liquid
environment, they must involve the propagation of specific types of acoustic waves that do not radiate
energy into the liquid. The types of acoustic waves that are suitable as the sensing elements in liquid
environments include Love waves and surface transverse waves (STW), travelling along the surface
of a semi-infinite piezoelectric medium, and shear horizontal acoustic plate modes (SHAPM),
travelling along a piezoelectric finite thickness plate. The shear horizontal polarization of these modes
ensures no coupling between the liquid and the elastic propagating medium [1]. Waves with elliptical
polarization, such as the Rayleigh-like waves, are impractical for use in liquid environments as a
consequence of the high energy loss into the liquid. The fundamental antisymmetric Lamb mode, A0,
while being elliptically polarized, can travel along thin plates that are in contact with a liquid, but only
at a specific plate thickness. As a consequence of the A0 mode dispersive phase velocity, it can be
designed to travel at a velocity lower than the compressional velocity of the surrounding liquid
medium. The plate acts as a waveguide where the ultrasonic wave energy is confined rather than
dispersed into the surrounding medium, and only the evanescent wave penetrates the fluid. The
fundamental symmetric Lamb mode, S0, as well as the higher order symmetrical and antisymmetrical
modes have comparable longitudinal, shear-horizontal and shear-vertical displacement components,
and velocity higher than that of the surrounding liquid medium, and thus they are not suitable for
sensing application in liquids except in some special cases. These cases include linearly polarized
modes, such as the longitudinally polarized Anisimkin Jr. (AMs) and the quasi longitudinal (QLMs)
modes, and the quasi shear horizontal (QSH) modes with negligible particle displacement components
perpendicular to the plate surfaces. The polarization of the AMs is predominantly longitudinal and
uniform through the plate thickness, being the shear vertical and horizontal particle displacement
components negligible. A mode is classified as QLM if the longitudinal displacement component is
dominant but not constant through the plate thickness, being the other two shear components much
smaller than the longitudinal one. The AMs and QLMs, while having high phase velocity (close to that
of the longitudinal bulk acoustic wave, LBAW, traveling in the same direction) are suitable for high
operation frequency f = v/λ, being λ the acoustic wavelength and v the mode phase velocity. A sensor
based on a high-frequency electroacoustic device exhibits superior performances: The higher the
frequency the higher the sensor sensitivity and resolution. AMs were first discovered in quartz
plates [2] and then in LiNbO3 128° y, x + 90° and Te [3]. In reference [4,5] the AM’s propagation is
studied along many piezoelectric substrates, such as Quartz, LiNbO3, LiTaO3, Te, Ba2NaNb5O15,
KH2PO4, Li2B4O7, TeO2, PbMoO4, KDP and ZnO. Viscosity sensors with high-sensitivity,
low-insertion loss, and good stop-band rejection were implemented on quartz, LiNbO3 and LiTaO3 [6].
Unfortunately, the conventional piezoelectric materials such as quartz, AlPO4, LiNbO3 and LiTaO3,
are not suitable to work at high temperature as they undergo α to β phase transition at temperature in
the range from about 300 to 588 °C. Unlike these conventional piezoelectric materials, GaPO4 exhibits
stable properties up to 900 °C. It exhibits a high piezoelectric sensitivity and strong electromechanical
coupling up to about 970 °C and is fully stable against organic solvents, such as ethanol, isopropanol,
Crystals 2014, 4 230
acetone, ethyl-methyl ketone, and dimenthylformamide. GaPO4 is also stable in aqueous solutions in
the 3 to 8.5 pH range: outside this range, it is etched, except by concentrated H2SO4 [7]. Moreover,
GaPO4 shows performances superior to quartz such as thermal stability, piezoelectric coupling and
temperature compensated cuts for BAW and SAW applications. All these properties make GaPO4 a
very attractive choice for a wide range of high-temperature, harsh environment applications, such as for
the monitoring of process variables, such as viscosity of melts, evaluation of material integrity in harsh
environments, e.g., turbine blades, combustion engines and nuclear reactors.
New viable modes, i.e., the longitudinally polarized plate modes, are here theoretically investigated,
that are suitable for sensing application in liquids (e.g., for the determination of density, viscosity,
conductivity, permittivity, and detection of small mass changes). Such acoustic modes have not yet
been fully exploited for sensing applications, thus their study introduces a new element in the
landscape of the acoustic waves (AW) sensor field.
The present paper investigate the acoustic waves propagation along y-rotated x-GaPO4 substrates
for several y-cut angles: The phase velocity, the coupling coefficient, the temperature coefficient of
delay (TCD), the power flow angle (PFA) and the acoustic field profile of the propagating modes were
investigated that are suitable for application in liquid ambient.
2. Acoustic Wave Propagation in Y-Rotated GaPO4
2.1. The SAW Propagation in GaPO4
The SAW propagating along the x direction of a semi-infinite y-rotated GaPO4 substrate is a
generalized SAW (GSAW) as it has three particle displacement components (the longitudinal U1,
the shear horizontal and vertical, U2 and U3) that rapidly decrease in depth. The GSAW phase velocity
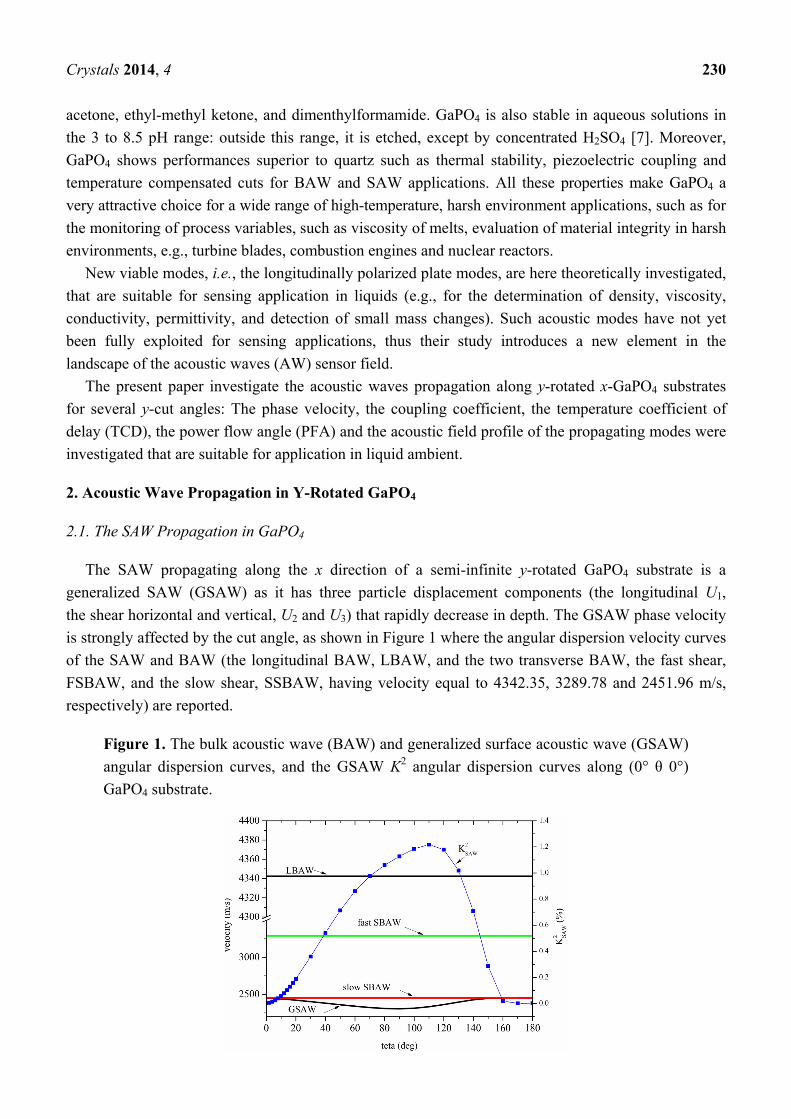
is strongly affected by the cut angle, as shown in Figure 1 where the angular dispersion velocity curves
of the SAW and BAW (the longitudinal BAW, LBAW, and the two transverse BAW, the fast shear,
FSBAW, and the slow shear, SSBAW, having velocity equal to 4342.35, 3289.78 and 2451.96 m/s,
respectively) are reported.
Figure 1. The bulk acoustic wave (BAW) and generalized surface acoustic wave (GSAW)
angular dispersion curves, and the GSAW K2 angular dispersion curves along (0° θ 0°)
GaPO4 substrate.
Crystals 2014, 4 231
In Figure 1, the angle θ means the amount of rotation around the crystal x axes of a y-cut GaPO4
plate and is expressed in the Euler notation. The GSAW phase velocity along (0° θ 0°) GaPO4 is lower
than that of the SSBAW except for the 162° ≤ θ ≤ 169° range. While varying the cut angle and
the velocity moving toward the SSBAW velocity, the shear horizontal amplitude U2 of the GSAW
decreases more and more slowly in the depth and the GSAW loses energy into the bulk. The
electromechanical coupling coefficient, K2, is a measure of the electrical to acoustic energy conversion
efficiency and it was calculated as 2 × (vf − vm)/vf, being vf and vm the GSAW velocity along the free
surface and the surface covered by a infinitesimally thin conductive film. The K2 angular dispersion
curve is also shown in Figure 1. The highest K2 value is equal to 1.22% and it is reached at θ = 110°;
while the velocity moving toward the SBAW velocity, the GSAW K2 approaches the zero value, in
accordance with the increased U2 contribution in the depth. The acoustic waves velocity calculations
along GaPO4 were performed by using Matlab and the software from McGill University [8] in the
lossless approximation; the GaPO4 material data (the mass density, the elastic, piezoelectric, dielectric
constants) as well as the thermal expansion coefficients and the third order temperature coefficients of
the elastic constants, valid in the −50 °C < T < 700 °C temperature range, are referred to [7,9,10], and
are those provided by Piezocryst Advanced Sensorics GmbH, which is an European GaPO4
wafers suppliers.
2.2. The Flexural Plate Waves (FPWs) Propagation in GaPO4
The FPWs propagating along a thin plate consist in two sets of infinite modes: the symmetric waves,
whose particle displacements are symmetric about the central plane of the plate, and the antisymmetric
waves, whose displacements have odd symmetry about the central plane of the plate. For sufficiently
thin plate, only the first symmetric and antisymmetric modes, S0 and A0, propagate: Figure 2 shows the
dispersion curves of a few modes propagating along (0° 90° 0°) GaPO4 plate as an example.
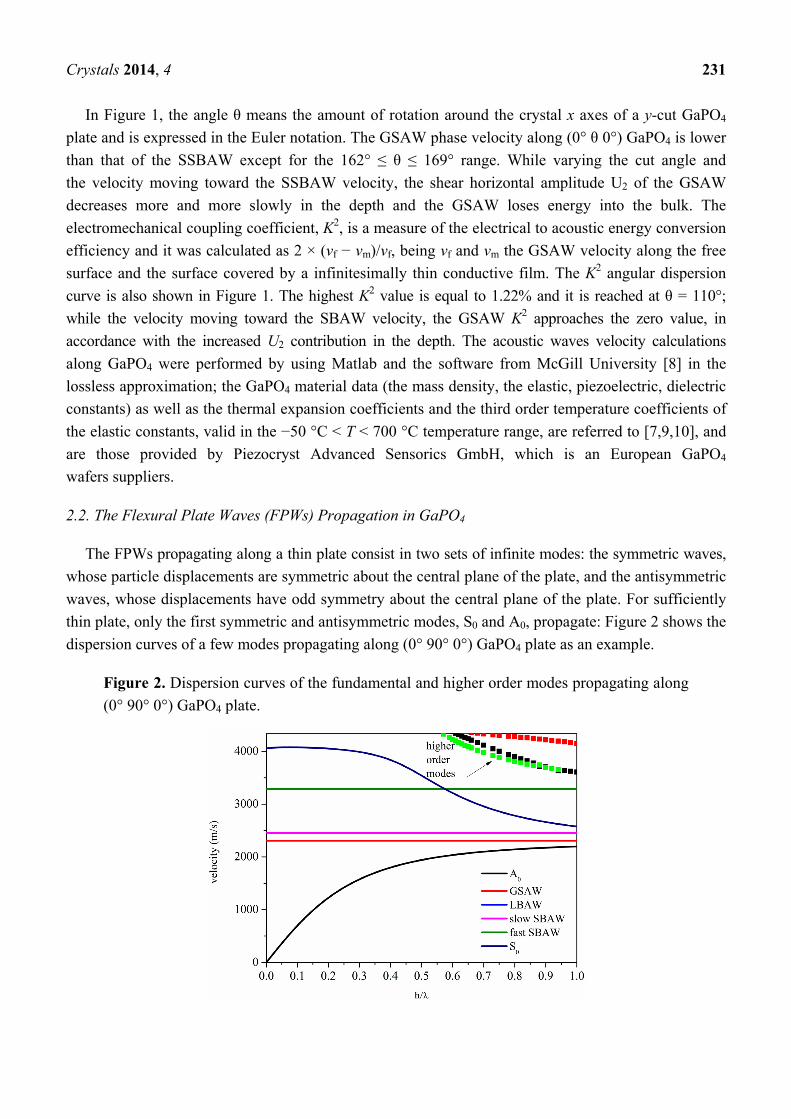
Figure 2. Dispersion curves of the fundamental and higher order modes propagating along
(0° 90° 0°) GaPO4 plate.
Crystals 2014, 4 232
The A0 mode is clearly identified by its reducing velocity as the plate thickness approaches zero. On
the contrary, the dispersion curve of the S0 mode is characterized by a low dispersion region, where
itsvelocity is almost constant and v ≈ vLBAW, followed by a drop in velocity. The magnitude of the flat
zone of the dispersion curve depends on the rotation angle θ, as can be seen in Figure 3 where the S0
velocity dispersion curves are shown for different rotating angles and for plate thickness normalized to
the acoustic wavelength, h/λ, up to 0.5. The low dispersion region reaches its largest amplitude
for θ = 40°.
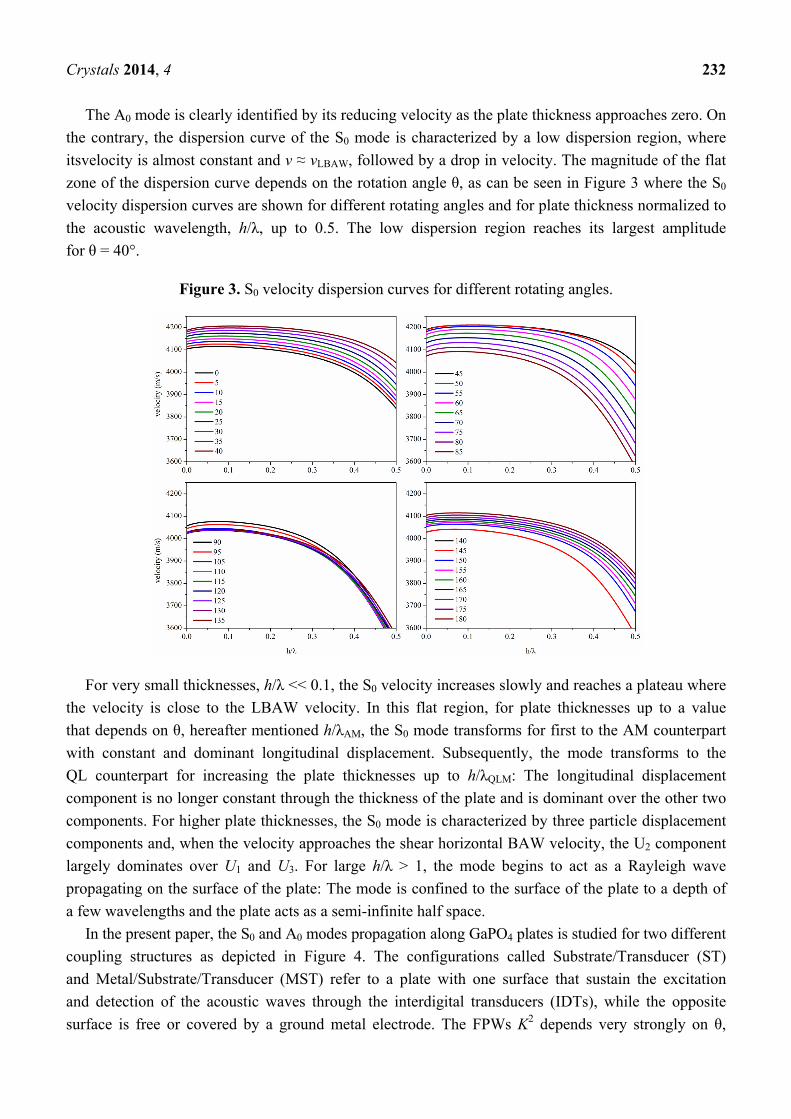
Figure 3. S0 velocity dispersion curves for different rotating angles.
For very small thicknesses, h/λ << 0.1, the S0 velocity increases slowly and reaches a plateau where
the velocity is close to the LBAW velocity. In this flat region, for plate thicknesses up to a value
that depends on θ, hereafter mentioned h/λAM, the S0 mode transforms for first to the AM counterpart
with constant and dominant longitudinal displacement. Subsequently, the mode transforms to the
QL counterpart for increasing the plate thicknesses up to h/λQLM: The longitudinal displacement
component is no longer constant through the thickness of the plate and is dominant over the other two
components. For higher plate thicknesses, the S0 mode is characterized by three particle displacement
components and, when the velocity approaches the shear horizontal BAW velocity, the U2 component
largely dominates over U1 and U3. For large h/λ > 1, the mode begins to act as a Rayleigh wave
propagating on the surface of the plate: The mode is confined to the surface of the plate to a depth of
a few wavelengths and the plate acts as a semi-infinite half space.
In the present paper, the S0 and A0 modes propagation along GaPO4 plates is studied for two different
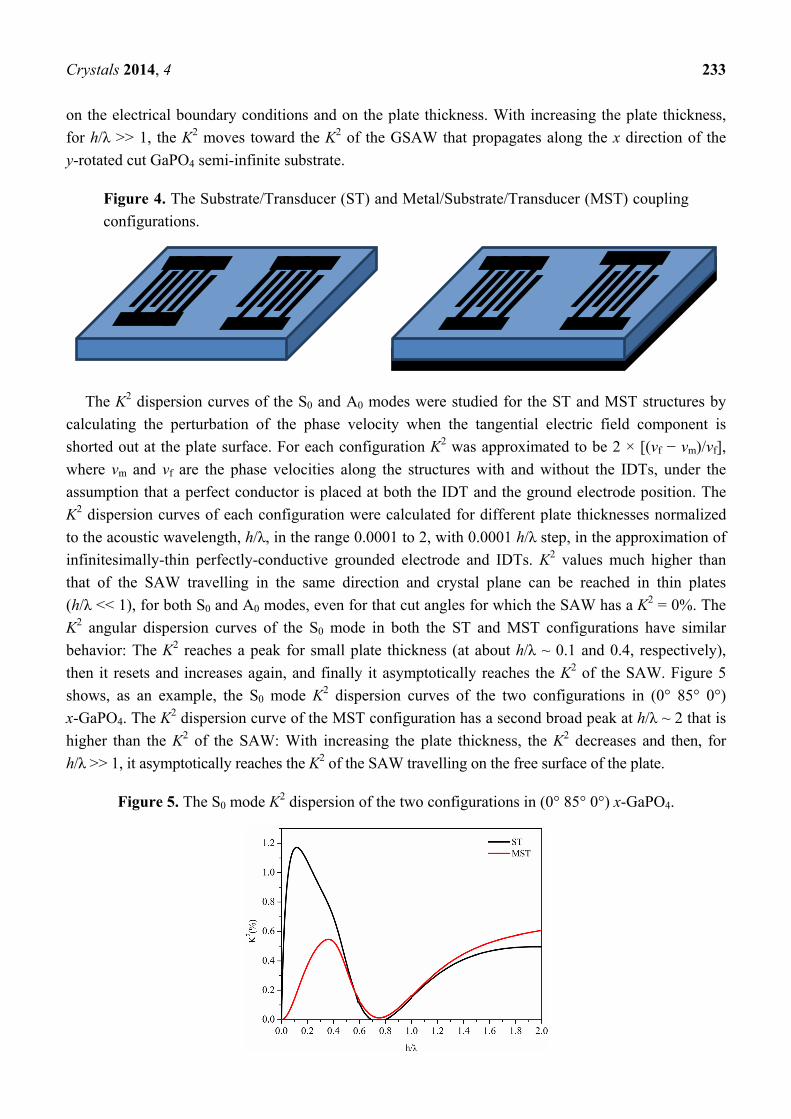
coupling structures as depicted in Figure 4. The configurations called Substrate/Transducer (ST)
and Metal/Substrate/Transducer (MST) refer to a plate with one surface that sustain the excitation
and detection of the acoustic waves through the interdigital transducers (IDTs), while the opposite
surface is free or covered by a ground metal electrode. The FPWs K2 depends very strongly on θ,
Crystals 2014, 4 233
on the electrical boundary conditions and on the plate thickness. With increasing the plate thickness,
for h/λ >> 1, the K2 moves toward the K2 of the GSAW that propagates along the x direction of the
y-rotated cut GaPO4 semi-infinite substrate.
Figure 4. The Substrate/Transducer (ST) and Metal/Substrate/Transducer (MST) coupling
configurations.
The K2 dispersion curves of the S0 and A0 modes were studied for the ST and MST structures by
calculating the perturbation of the phase velocity when the tangential electric field component is
shorted out at the plate surface. For each configuration K2 was approximated to be 2 × [(vf − vm)/vf],
where vm and vf are the phase velocities along the structures with and without the IDTs, under the
assumption that a perfect conductor is placed at both the IDT and the ground electrode position. The
K2 dispersion curves of each configuration were calculated for different plate thicknesses normalized
to the acoustic wavelength, h/λ, in the range 0.0001 to 2, with 0.0001 h/λ step, in the approximation of
infinitesimally-thin perfectly-conductive grounded electrode and IDTs. K2 values much higher than
that of the SAW travelling in the same direction and crystal plane can be reached in thin plates
(h/λ << 1), for both S0 and A0 modes, even for that cut angles for which the SAW has a K2 = 0%. The
K2 angular dispersion curves of the S0 mode in both the ST and MST configurations have similar
behavior: The K2 reaches a peak for small plate thickness (at about h/λ ~ 0.1 and 0.4, respectively),
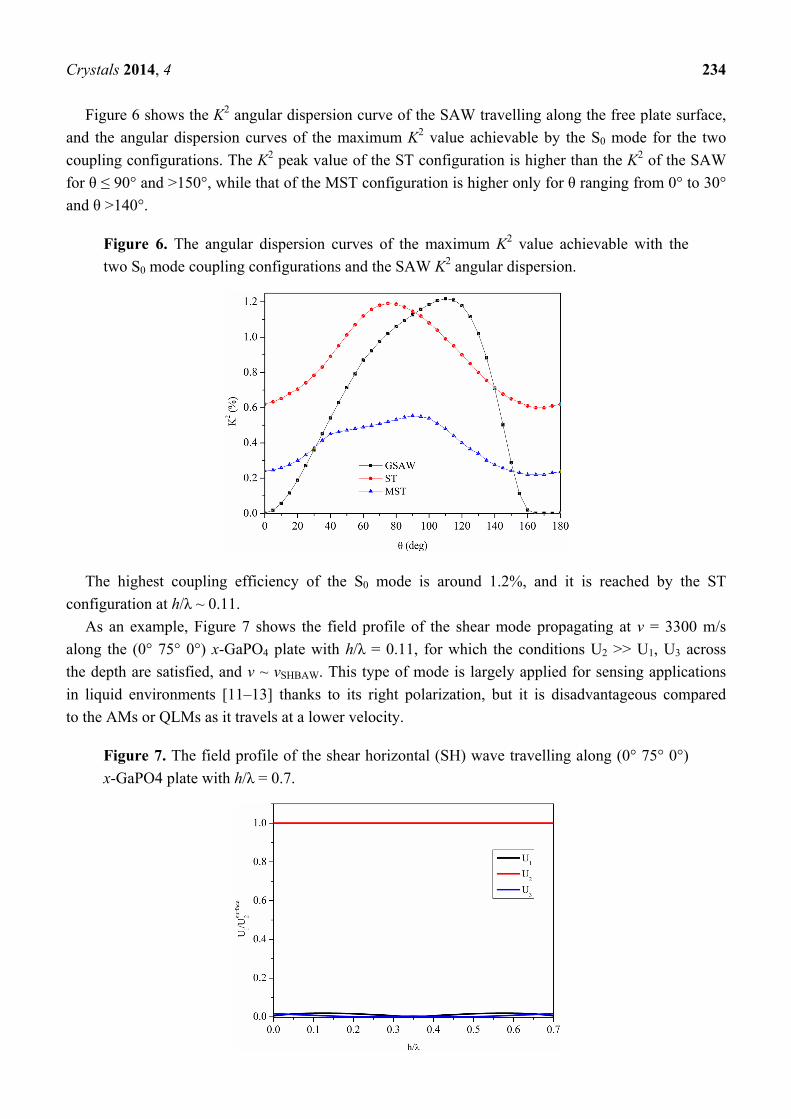
then it resets and increases again, and finally it asymptotically reaches the K2 of the SAW. Figure 5
shows, as an example, the S0 mode K2 dispersion curves of the two configurations in (0° 85° 0°)
x-GaPO4. The K2 dispersion curve of the MST configuration has a second broad peak at h/λ ~ 2 that is
higher than the K2 of the SAW: With increasing the plate thickness, the K2 decreases and then, for
h/λ >> 1, it asymptotically reaches the K2 of the SAW travelling on the free surface of the plate.
Figure 5. The S0 mode K2 dispersion of the two configurations in (0° 85° 0°) x-GaPO4.
Crystals 2014, 4 234
Figure 6 shows the K2 angular dispersion curve of the SAW travelling along the free plate surface,
and the angular dispersion curves of the maximum K2 value achievable by the S0 mode for the two
coupling configurations. The K2 peak value of the ST configuration is higher than the K2 of the SAW
for θ ≤ 90° and >150°, while that of the MST configuration is higher only for θ ranging from 0° to 30°
and θ >140°.
Figure 6. The angular dispersion curves of the maximum K2 value achievable with the
two S0 mode coupling configurations and the SAW K2 angular dispersion.
The highest coupling efficiency of the S0 mode is around 1.2%, and it is reached by the ST
configuration at h/λ ~ 0.11.
As an example, Figure 7 shows the field profile of the shear mode propagating at v = 3300 m/s
along the (0° 75° 0°) x-GaPO4 plate with h/λ = 0.11, for which the conditions U2 >> U1, U3 across
the depth are satisfied, and v ~ vSHBAW. This type of mode is largely applied for sensing applications
in liquid environments [11–13] thanks to its right polarization, but it is disadvantageous compared
to the AMs or QLMs as it travels at a lower velocity.
Figure 7. The field profile of the shear horizontal (SH) wave travelling along (0° 75° 0°)
x-GaPO4 plate with h/λ = 0.7.
Crystals 2014, 4 235
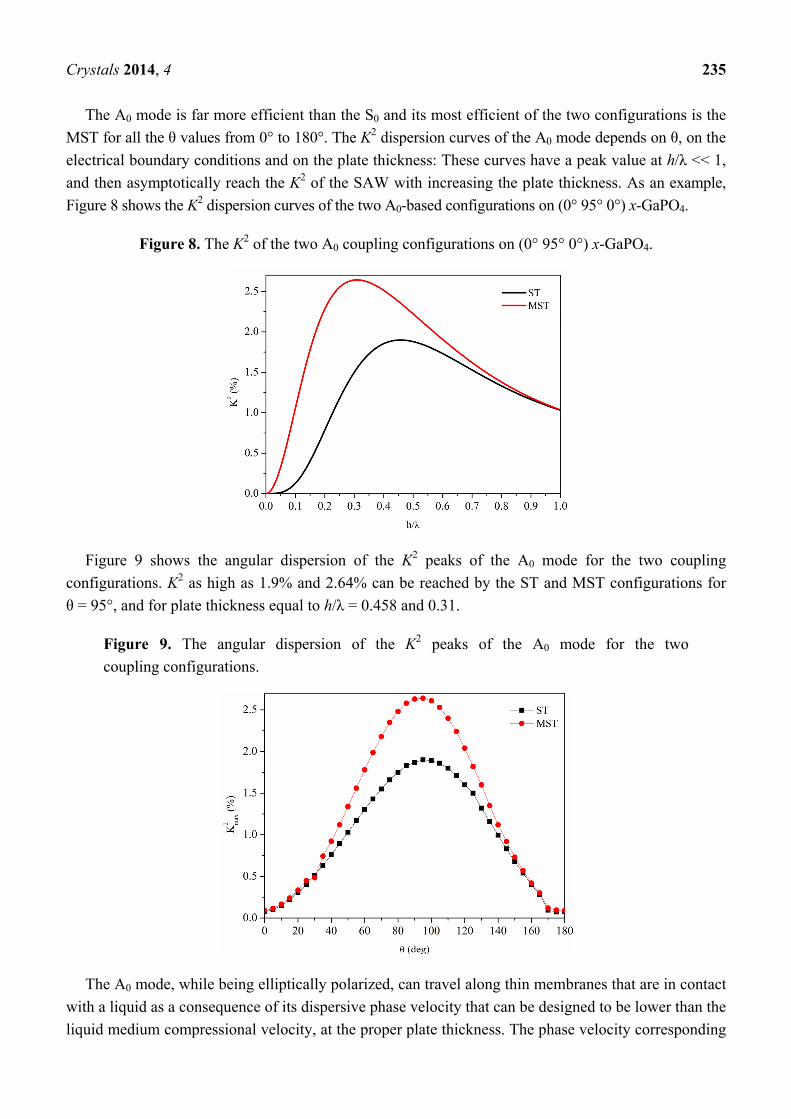
The A0 mode is far more efficient than the S0 and its most efficient of the two configurations is the
MST for all the θ values from 0° to 180°. The K2 dispersion curves of the A0 mode depends on θ, on the
electrical boundary conditions and on the plate thickness: These curves have a peak value at h/λ << 1,
and then asymptotically reach the K2 of the SAW with increasing the plate thickness. As an example,
Figure 8 shows the K2 dispersion curves of the two A0-based configurations on (0° 95° 0°) x-GaPO4.
Figure 8. The K2 of the two A0 coupling configurations on (0° 95° 0°) x-GaPO4.
Figure 9 shows the angular dispersion of the K2 peaks of the A0 mode for the two coupling
configurations. K2 as high as 1.9% and 2.64% can be reached by the ST and MST configurations for
θ = 95°, and for plate thickness equal to h/λ = 0.458 and 0.31.
Figure 9. The angular dispersion of the K2 peaks of the A0 mode for the two
coupling configurations.
The A0 mode, while being elliptically polarized, can travel along thin membranes that are in contact
with a liquid as a consequence of its dispersive phase velocity that can be designed to be lower than the
liquid medium compressional velocity, at the proper plate thickness. The phase velocity corresponding
Crystals 2014, 4 236
to the K2 peak values is 1888 and 1583 m/s for the ST and MST configurations, respectively. Thus,
a little decrease in K2 has to be accepted to reduce the velocity of the A0 mode up to a value lower than
the velocity of the fluid environment (about 1500 m/s for water). Another benefit of the low-velocity
A0 mode is that it allows for inexpensive signal processing equipment to be used, due to its low
resonant frequency f = v/λ.
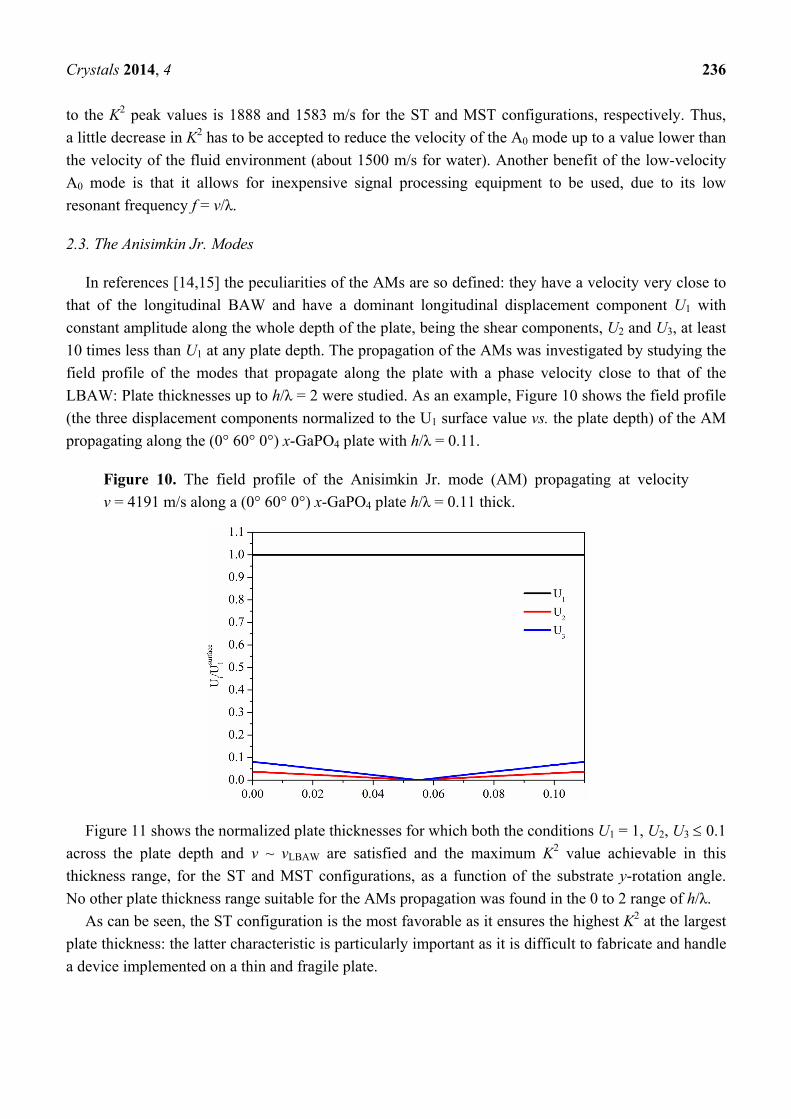
2.3. The Anisimkin Jr. Modes
In references [14,15] the peculiarities of the AMs are so defined: they have a velocity very close to
that of the longitudinal BAW and have a dominant longitudinal displacement component U1 with
constant amplitude along the whole depth of the plate, being the shear components, U2 and U3, at least
10 times less than U1 at any plate depth. The propagation of the AMs was investigated by studying the
field profile of the modes that propagate along the plate with a phase velocity close to that of the
LBAW: Plate thicknesses up to h/λ = 2 were studied. As an example, Figure 10 shows the field profile
(the three displacement components normalized to the U1 surface value vs. the plate depth) of the AM
propagating along the (0° 60° 0°) x-GaPO4 plate with h/λ = 0.11.
Figure 10. The field profile of the Anisimkin Jr. mode (AM) propagating at velocity
v = 4191 m/s along a (0° 60° 0°) x-GaPO4 plate h/λ = 0.11 thick.
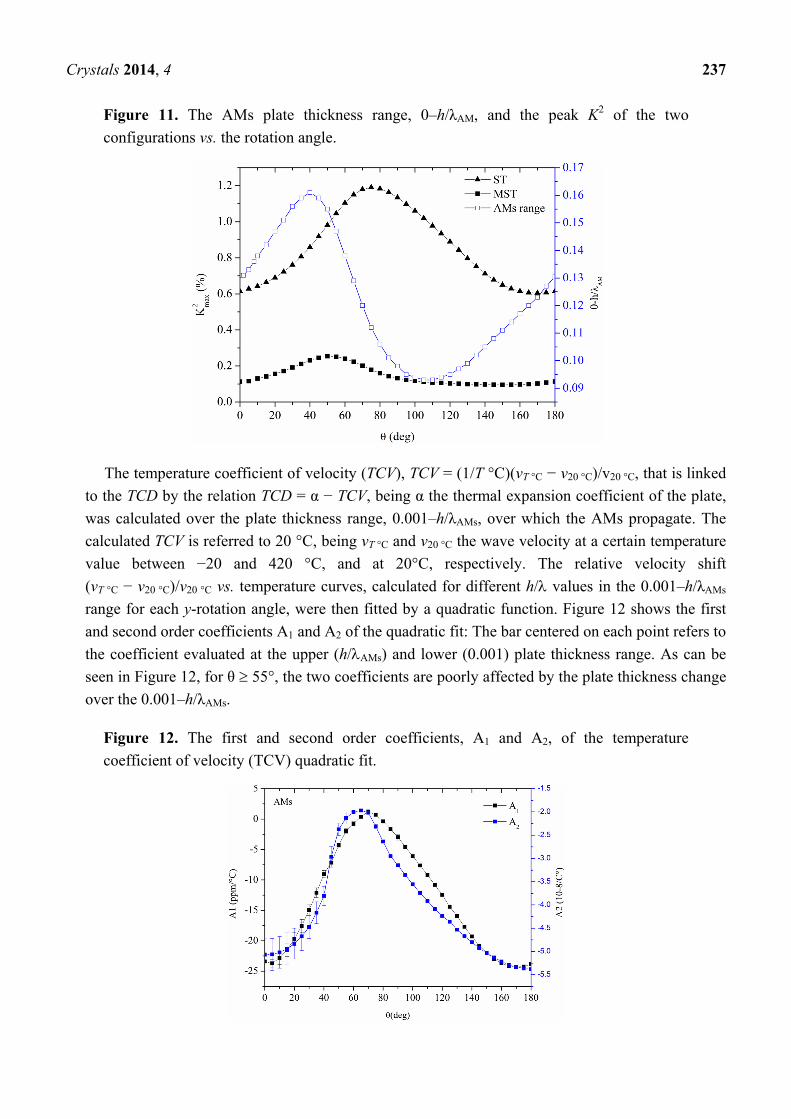
Figure 11 shows the normalized plate thicknesses for which both the conditions U1 = 1, U2, U3 0.1
across the plate depth and v ~ vLBAW are satisfied and the maximum K2 value achievable in this
thickness range, for the ST and MST configurations, as a function of the substrate y-rotation angle.
No other plate thickness range suitable for the AMs propagation was found in the 0 to 2 range of h/λ.
As can be seen, the ST configuration is the most favorable as it ensures the highest K2 at the largest
plate thickness: the latter characteristic is particularly important as it is difficult to fabricate and handle
a device implemented on a thin and fragile plate.
Crystals 2014, 4 237
Figure 11. The AMs plate thickness range, 0–h/λAM, and the peak K2 of the two
configurations vs. the rotation angle.
The temperature coefficient of velocity (TCV), TCV = (1/T °C)(vT °C − v20 °C)/v20 °C, that is linked
to the TCD by the relation TCD = α − TCV, being α the thermal expansion coefficient of the plate,
was calculated over the plate thickness range, 0.001–h/λAMs, over which the AMs propagate. The
calculated TCV is referred to 20 °C, being vT °C and v20 °C the wave velocity at a certain temperature
value between −20 and 420 °C, and at 20°C, respectively. The relative velocity shift
(vT °C − v20 °C)/v20 °C vs. temperature curves, calculated for different h/ values in the 0.001–h/λAMs
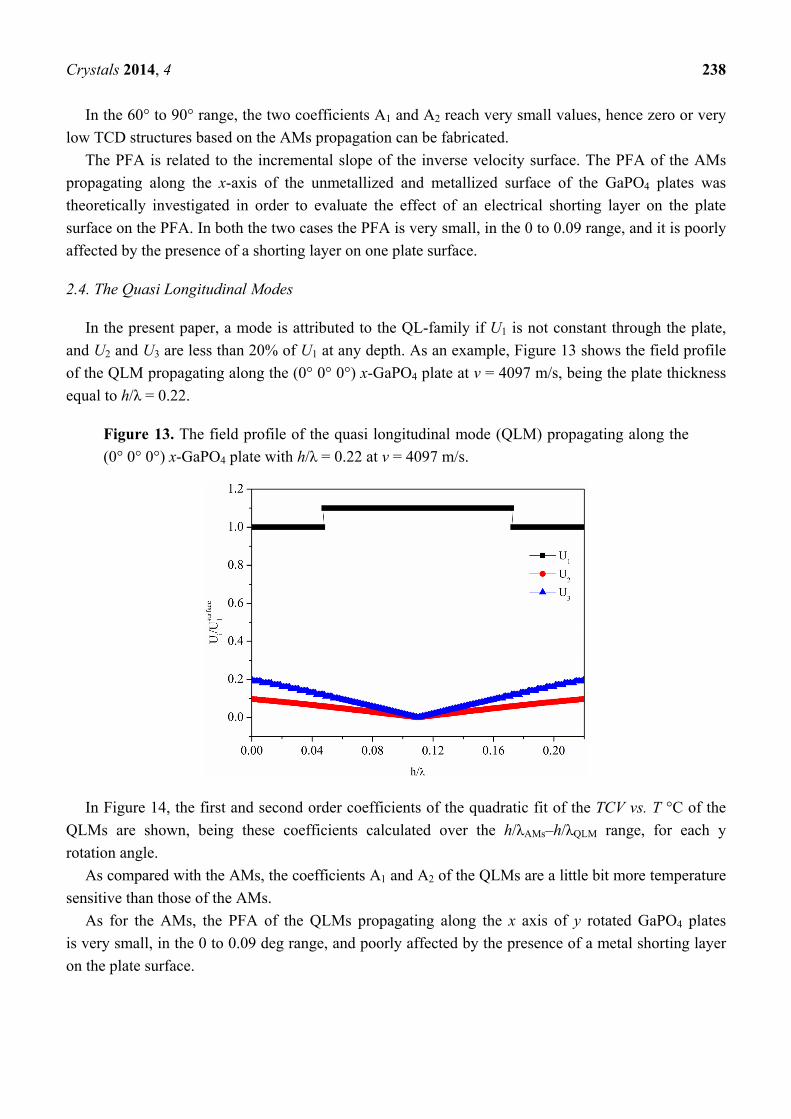
range for each y-rotation angle, were then fitted by a quadratic function. Figure 12 shows the first
and second order coefficients A1 and A2 of the quadratic fit: The bar centered on each point refers to
the coefficient evaluated at the upper (h/AMs) and lower (0.001) plate thickness range. As can be
seen in Figure 12, for θ 55°, the two coefficients are poorly affected by the plate thickness change
over the 0.001–h/λAMs.
Figure 12. The first and second order coefficients, A1 and A2, of the temperature
coefficient of velocity (TCV) quadratic fit.
Crystals 2014, 4 238
In the 60° to 90° range, the two coefficients A1 and A2 reach very small values, hence zero or very
low TCD structures based on the AMs propagation can be fabricated.
The PFA is related to the incremental slope of the inverse velocity surface. The PFA of the AMs
propagating along the x-axis of the unmetallized and metallized surface of the GaPO4 plates was
theoretically investigated in order to evaluate the effect of an electrical shorting layer on the plate
surface on the PFA. In both the two cases the PFA is very small, in the 0 to 0.09 range, and it is poorly
affected by the presence of a shorting layer on one plate surface.
2.4. The Quasi Longitudinal Modes
In the present paper, a mode is attributed to the QL-family if U1 is not constant through the plate,
and U2 and U3 are less than 20% of U1 at any depth. As an example, Figure 13 shows the field profile
of the QLM propagating along the (0° 0° 0°) x-GaPO4 plate at v = 4097 m/s, being the plate thickness
equal to h/λ = 0.22.
Figure 13. The field profile of the quasi longitudinal mode (QLM) propagating along the
(0° 0° 0°) x-GaPO4 plate with h/λ = 0.22 at v = 4097 m/s.
In Figure 14, the first and second order coefficients of the quadratic fit of the TCV vs. T °C of the
QLMs are shown, being these coefficients calculated over the h/λAMs–h/λQLM range, for each y
rotation angle.
As compared with the AMs, the coefficients A1 and A2 of the QLMs are a little bit more temperature
sensitive than those of the AMs.
As for the AMs, the PFA of the QLMs propagating along the x axis of y rotated GaPO4 plates
is very small, in the 0 to 0.09 deg range, and poorly affected by the presence of a metal shorting layer
on the plate surface.

Crystals 2014, 4 239
Figure 14. The first and second order coefficients of the quadratic fit of the TCV of the
QLMs propagating along the (0° θ 0°) GaPO4 plate.
3. Conclusions
The phase velocity and the coupling coefficient of surface and flexural acoustic plate modes
propagating along y-rotated x-propagation GaPO4 piezoelectric substrates has been studied for several
y-cut angles. The investigation of the acoustic field profile across the plate thickness revealed the
presence of new viable modes, the linearly polarized Anisimkin Jr. and the quasi longitudinal plate
modes, AMs and QLs, showing a phase velocity close to that of the longitudinal bulk acoustic wave
propagating in the same direction. These modes are suitable for sensing applications in liquids
(e.g., for the determination of density, viscosity, conductivity, permittivity, and detection of small mass
changes). The TCD of these longitudinal modes was investigated in the −20 to 420 °C temperature
range, in order to identify thermally stable or low TCD cuts. Thanks to the GaPO4 intrinsic properties,
such as its resistance to high temperature and its chemical inertness, electroacoustic devices based on
the propagation of AMs in GaPO4 are especially attractive for applications in harsh liquid
environments. Moreover, such acoustic modes have not yet been fully exploited for sensing
applications, thus their study introduces a new element in the landscape of the AW sensor field.
Author Contributions
Cinzia Caliendo conceived the research and conducted all the theoretical calculations, analyzed and
processed the data, and wrote the manuscript. She is the Primary Investigator. Fabio Lo Castro assisted
the data analysis for graphical outputs.
Conflicts of Interest
The authors declare no conflict of interest.
Crystals 2014, 4 240
References
1. Ballantine, D.S.; White, R.M.; Martin, S.J.; Ricco, A.J.; Zellers, E.T.; Fye, G.C.; Wohltjen, H.
Acoustic Wave Sensors: Theory, Design, & Physico-Chemical Applications; Levy, M., Stern, R., Eds.;
Academic Press: Waltham Chestnut Hill, MA, USA, 1997.
2. Anisimkin, I.V. New type of an acoustic plate mode: Quasi-longitudinal normal wave.
Ultrasonics 2004, 42, 1095–1099.
3. Gulyaev, Y.V. Propagation of the Anisimkin Jr.’ plate modes in LiNbO3 and Te single crystals.
In Proceedings of the IEEE International Ultrasonics Symposium (IUS), Beijing, China,
2–5 November 2008.
4. Anisimkin, V. General Properties of the Anisimkin Jr. Plate Modes. IEEE Trans. Ultrason.
Ferroelectr. Freq. Control 2010, 57, 2028–2034.
5. Anisimkin, V.I.; Pyataikin, I.I.; Voronova, N.V. Propagation of the Anisimkin Jr.’ and
Quasi-Longitudinal Acoustic Plate Modes in Low-Symmetry Crystals of Arbitrary Orientation.
IEEE Trans. Ultrason. Ferroelectr. Freq. Control 2012, 59, 806–810.
6. Anisimkin, I.V.; Anisimkin, V.I. Attenuation of Acoustic Normal Modes in Piezoelectric Plates
Loaded by Viscous Liquids. IEEE Trans. Ultrason. Ferroelectr. Freq. Control 2006, 53,
1487–1492.
7. PIEZOCRYST: Advanced Sensoristics GmBh. Available online: http://www.piezocryst.com
(accessed on 30 April 2014).
8. Adler, E.L.; Farnell, G.W.; Slaboszewicz, J.; Jen, C.K. Interactive PC software for SAW
propagation in anisotropic multilayers. In Proceedings of the IEEE Ultrasonics Symposium,
San Diego, CA, USA, 27–29 October 1982.
9. Wallnofer, W.; Krempl, P.W.; Asenbaum, A. Determination of the elastic anti photoelastic constants
of quartz-type GaPO4 by Brillouin scattering. Phys. Rev. B 1994, 49, 10075–10080.
10. Reiter, C.; Krempl, P.W.; Wallnofer, W.; Leuprecth, G. GaPO4: A Critical Review of Material
Data. In Proceedings of the 9th EFTF, Besancon, France, 8–10 March 1995.
11. Shana, Z.; Josse, F. Analysis of liquid-phase-based sensors utilizing SH surface waves on rotated
Y-cut quartz. In Proceedings of the 1988 Ultrasonics Symposium, Chicago, IL, USA,
2–5 October 1988.
12. Gizeli, E.; Stevenson, A.C.; Goddard, N.J.; Lowe, C.R. Acoustic Love plate sensors: Comparison
with other acoustic devices utilizing surface SH waves. Sens. Actuators B 1993, 13–14, 638–639.
13. Kondoh, J. A Liquid-Phase Sensor Using Shear Horizontal Surface Acoustic Wave Devices.
Electron. Commun. Jpn. 2013, 96, 41–49.
14. Anisimkin, V.I. General Properties of the Anisimkin Jr.’ Plate Modes. In Proceedings of the 2009
IEEE International Ultrasonics Symposium, Roma, Italy, 20–23 September 2009.
15. Gulyaev, Y.V. Properties of the Anisimkin Jr.’ Modes in Quartz Plates. IEEE Trans. Ultrason.
Ferroelectr. Freq. Control 2007, 54, 1382–1385.
© 2014 by the authors; licensee MDPI, Basel, Switzerland. This article is an open access article
distributed under the terms and conditions of the Creative Commons Attribution license
(http://creativecommons.org/licenses/by/3.0/).
Copyright © 2022 FDOKUMEN